UNITED STATES
SECURITIES AND EXCHANGE COMMISSION
Washington, D.C. 20549
FORM 10-K
(Mark One)
[ü] ANNUAL REPORT PURSUANT TO SECTION 13 OR 15(d) OF THE SECURITIES EXCHANGE ACT OF 1934
For the fiscal year ended December 31, 2007
Or
[ ] TRANSITION REPORT PURSUANT TO SECTION 13 OR 15(d) OF THE SECURITIES EXCHANGE ACT OF 1934
For the transition period from _________ to _____________
Commission file number: 333-142283
Verso Paper Holdings LLC
(Exact name of registrant as specified in its charter)
| Delaware | 56-2597634 |
| (State or other jurisdiction of incorporation or organization) | (IRS Employer Identification Number) |
| | |
| 6775 Lenox Center Court, Suite 400 | |
| Memphis, Tennessee 38115-4436 | (901) 369-4100 |
| (Address of principal executive offices) (Zip Code) | (Registrant’s telephone number, including area code) |
Securities registered pursuant to section 12(b) of the Act: None
Securities registered pursuant to Section 12(g) of the Act: None
Indicate by check mark if the registrant is a well-known seasoned issuer, as defined in Rule 405 of the Securities Act. Yes No ü
Indicate by check mark if the registrant is not required to file reports pursuant to Section 13 or Section 15(d) of the Act. Yes No ü
Note – Checking the box above will not relieve any registrant required to file reports pursuant to Section 13 or 15(d) of the Exchange Act from their obligations under those Sections.
Indicate by check mark whether the registrant (1) has filed all reports required to be filed by Section 13 or 15(d) of the Securities Exchange Act of 1934 during the preceding 12 months (or for such shorter period that the registrant was required to file such reports), and (2) has been subject to such filing requirements for the past 90 days. Yes No ü
Indicate by check mark if disclosure of delinquent filers pursuant to Item 405 of Regulation S-K is not contained herein, and will not be contained, to the best of registrant’s knowledge, in definitive proxy or information statements incorporated by reference in Part III of the Form 10-K or any amendment to this Form 10-K. ü
Indicate by check mark whether the registrant is a large accelerated filer, an accelerated filer, a non-accelerated filer, or a smaller reporting company. See definitions of “large accelerated filer,” “accelerated filer,” and “smaller reporting company” in Rule 12b-2 of the Exchange Act. (Check one):
| | | | |
Large accelerated filer ______ | Accelerated filer ______ | Non-accelerated filer __ü__ | Smaller reporting company ______ |
(Do not check if a smaller reporting company)
Indicate by check mark whether the registrant is a shell company (as defined in Rule 12b-2 of the Exchange Act). Yes No ü _
DOCUMENTS INCORPORATED BY REFERENCE: None
Cautionary Note Regarding Forward-Looking Statements
This annual report contains forward-looking statements within the meaning of Section 27A of the Securities Act of 1933, as amended and Section 21E of the Securities Exchange Act of 1934, as amended. These statements relate to future events or our future financial performance, and involve known and unknown risks, uncertainties and other factors that may cause our actual results, levels of activity, performance or achievements to be materially different from any future results, levels of activity, performance or achievements expressed or implied by these forward-looking statements. These risks and other factors include, among other things, those listed in Item 1A, “Risk Factors,” Item 7 — “Management’s Discussion and Analysis of Financial Condition and Results of Operations” and elsewhere in this annual report. In some cases, you can identify forward-looking statements by terminology such as “may,” “will,” “should,” “expect,” “intend,” “plan,” “anticipate,” “believe,” “estimate,” “predict,” “potential,” “continue,” “assumption” or the negative of these terms or other comparable terminology. The forward-looking statements contained herein reflect our current views with respect to future events and are based on our currently available financial, economic and competitive data and on current business plans. Actual events or results may differ materially depending on risks and uncertainties that may affect the Company’s operations, markets, services, prices and other factors. Important factors that could cause actual results to differ materially from those in the forward-looking statements include, but are not limited to: economic factors such as an interruption in the supply of or increased pricing of raw materials due to natural disasters, competitive factors such as pricing actions by our competitors that could affect our operating margins, labor disruptions, and regulatory factors such as changes in governmental regulations involving our products that lead to environmental and legal matters.
We do not undertake any responsibility to release publicly any revisions to these forward-looking statements to take into account events or circumstances that occur after the date of this annual report. Additionally, we do not undertake any responsibility to update you on the occurrence of any unanticipated events which may cause actual results to differ from those expressed or implied by the forward-looking statements contained in this annual report.
Market and Industry Information
Market data and other statistical information used throughout this annual report are based on independent industry publications, government publications, reports by market research firms or other published independent sources. Some data are also based on our good faith estimates which are derived from our review of internal surveys, as well as the independent sources listed above. Although we believe these sources are reliable, we have not independently verified the information. Industry prices for coated paper provided in this annual report are, unless otherwise expressly noted, derived from Resource Information Systems, Inc., or “RISI, Inc.” data. “North American” data included in this annual report that has been derived from RISI, Inc. only includes data from the United States and Canada. U.S. industry pricing data included in this annual report has been derived from RISI, Inc. data; this data represents pricing from the eastern United States only (as defined by RISI, Inc.). Also, any reference to (i) grade No. 3, grade No. 4 and grade No. 5 coated paper relates to 60 lb. basis weight, 50 lb. basis weight and 34 lb. basis weight, respectively, (ii) lightweight coated groundwood paper refers to groundwood paper grades that are a 36 lb. basis weight or less, and (iii) ultra-lightweight coated groundwood paper refers to groundwood paper grades that are a 30 lb. basis weight or less. The RISI, Inc. data included in this annual report has been derived from the following RISI, Inc. publications: 2006 RISI World Graphic Paper forecast; RISI North American Graphic Paper forecast, September 2007; and RISI, Paper Trader: A Monthly Monitor of the North American Graphic Paper Market, December 2007.
PART I
Unless otherwise noted, the terms the “Company,” “Verso Paper,” “we,” “us,” “our” and “Successor” refer collectively to Verso Paper Holdings LLC, a Delaware limited liability company, and its subsidiaries after giving effect to the consummation of the Transactions described under “Business — The Transactions.” References to the “Division” or “Predecessor” refer to the Coated and Supercalendered Papers Division of International Paper Company.
The Transactions
On August 1, 2006, we acquired the assets and certain of the liabilities of the Coated and Supercalendered Papers Division of International Paper Company (“International Paper”) located at the mills in Jay, Maine, Bucksport, Maine, Quinnesec, Michigan and Sartell, Minnesota, together with other related facilities and assets and certain administrative and sales and marketing functions (collectively, the “Acquisition”) pursuant to an Agreement of Purchase and Sale that we entered into with International Paper on June 4, 2006.
We were formed by affiliates of Apollo Management, L.P. (“Apollo”) for the purpose of consummating the Acquisition. In connection with the Acquisition we issued a total of $1,185 million of debt (the “Financing”). The Financing consists of (1) a $285 million term loan B (“Term Loan B”), (2) $350 million of 9⅛% second priority senior secured fixed rate notes due 2014 (the “fixed rate notes”), (3) $250 million of second priority senior secured floating rate notes due 2014 (the “floating rate notes”), and (4) $300 million of 11⅜% senior subordinated notes due 2016 (the “senior subordinated notes”). We refer to the fixed rate notes and the floating rate notes collectively as the “second priority senior secured notes”; the second priority senior secured notes and the senior subordinated notes collectively as the “notes”; and the Acuqisition and the Financing collectively as the “Transactions.” We also obtained a $200 million revolving credit facility (together with Term Loan B, the “Senior Secured Credit Facilities”), which was undrawn at the closing of the Acquisition. In addition to the Financing, affiliates of Apollo, International Paper and certain members of our senior management contributed approximately $289 million of equity.
We are a Delaware limited liability company. Our principal executive offices are located at 6775 Lenox Center Court, Suite 400, Memphis, Tennessee 38115-4436. Our telephone number is (901) 369-4100. Our web site address is www.versopaper.com. Information on our web site is not considered part of this annual report.
General
We are a leading North American supplier of coated papers to catalog and magazine publishers. The market for coated paper, which is comprised of coated groundwood paper and coated freesheet paper, is one of the most attractive segments of the paper industry due to its prospects for volume growth, continued improvement in pricing and the high value-added nature of its products. Coated paper is used primarily in media and marketing applications, including catalogs, magazines and commercial printing applications, which include high-end advertising brochures, annual reports and direct mail advertising. We are North America’s second largest producer of coated groundwood paper, which is used primarily for catalogs and magazines. We also believe we are North America’s lowest cost producer of coated freesheet paper, which is used primarily for annual reports, brochures and magazine covers. In addition to coated paper, we have a strategic presence in supercalendered paper, which is primarily used for retail inserts. We also produce and sell market pulp, which is used in the manufacture of printing and writing paper grades and tissue products.
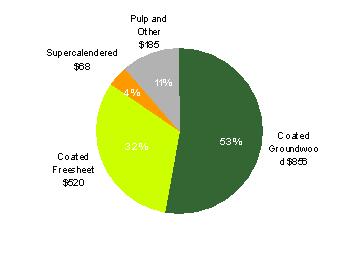
Our primary product lines include coated groundwood paper, coated freesheet paper, supercalendered paper and pulp. Our net sales by product line for the year ended December 31, 2007, are illustrated below:
Net Sales by Product Line
(dollars in millions)
We sell and market our products to approximately 100 customers which comprise 650 end-user accounts. We have long-standing relationships with many leading magazine and catalog publishers, commercial printers, specialty retail merchandisers and paper merchants. We reach our end-users through several distribution channels, including direct sales, commercial printers, paper merchants and brokers. The majority of our products are sold via contracts we maintain with our customers, which generally specify the volumes to be sold to the customer over the contract term, as well as the pricing parameters for those sales. Having a large portion of our sales volume under contract allows us to plan our production runs well in advance, optimizing production over our integrated mill system and thereby increasing overall efficiency and reducing our costs. Most of our contracts are negotiated on an annual basis. Typically, our contracts provide for quarterly price adjustments based on market price movements. Our key customers include leading magazine publishers, such as Condé Nast Publications, Inc., National Geographic Society and Time Inc.; leading catalog producers such as Avon Products, Inc., and Sears Holdings Corporation; leading commercial printers, such as Quad Graphics, Inc., and RR Donnelley & Sons Company; and leading paper merchants and brokers such as Unisource, Worldwide, Inc., the xpedx business unit of International Paper, A.T. Clayton & Co., Inc., and Clifford Paper, Inc.
We operate 11 paper machines at four mills located in Maine, Michigan and Minnesota. The mills have a combined annual production capacity of 1,726,000 tons of coated paper, 102,000 tons of supercalendered paper and 874,000 tons of kraft pulp, of which approximately 610,000 tons are consumed internally and the remainder is sold as market pulp. Over our integrated mill system, the total volume of pulp purchased from third parties is approximately balanced by the amount of pulp that we sell to the market. As a result, our business is generally insulated from fluctuations to earnings caused by fluctuations in the price of pulp. Our facilities are strategically located within close proximity to major publication printing customers, which affords us the ability to more quickly and cost-effectively deliver our products. Our facilities also benefit from convenient and cost-effective access to northern softwood fiber, which is required for the production of lightweight and ultra-lightweight coated groundwood papers, two of the more attractive grades of coated paper.
Industry
Coated Paper Industry Overview
Based on 2007 sales, the size of the global coated paper industry is estimated to be approximately $48 billion, or 54 million tons of coated paper shipments, including approximately $12 billion, or 13 million tons of coated paper shipments, in North America. The coating process adds a smooth uniform layer in the paper, which results in superior color and print definition. As a result, major uses of coated papers include the printing of catalogs, magazines, annual reports, directories and advertising materials. Demand is generally driven by North American advertising and print media trends, which in turn have historically been highly correlated with growth in Gross Domestic Product, or “GDP.”
In North America, coated papers are classified by brightness and fall into five grades, labeled No. 1 to No. 5, with No. 1 having the highest brightness level and No. 5 having the lowest brightness level. Papers graded No. 1, No. 2 and No. 3 are typically coated freesheet grades. No. 4 and No. 5 papers are predominantly groundwood containing grades. Coated groundwood grades are the preferred grades for catalogs and magazines, while coated freesheet is more commonly used in commercial print applications.
Products
We manufacture three main grades of paper: coated groundwood paper, coated freesheet paper and supercalendered paper. These paper grades are differentiated primarily by their respective brightness, weight, print quality, bulk, opacity and strength. We also produce Northern Bleached Hardwood Kraft (“NBHK”) pulp. The following table sets forth our principal products by 2007 tons sold and as a percentage of our 2007 net sales:
| Product | | Tons Sold | | | Net Sales | |
| (tons in thousands, dollars in millions) | | Kts | | | % | | | $ | | | % | |
| Coated groundwood paper | | | 1,063 | | | | 51 | | | $ | 856 | | | | 53 | |
| Coated freesheet paper | | | 600 | | | | 29 | | | | 520 | | | | 32 | |
| Supercalendared paper | | | 105 | | | | 5 | | | | 68 | | | | 4 | |
| Pulp | | | 281 | | | | 13 | | | | 148 | | | | 9 | |
| Other | | | 47 | | | | 2 | | | | 37 | | | | 2 | |
| Total | | | 2,096 | | | | 100 | | | $ | 1,629 | | | | 100 | |
As a result of our scale and technological capabilities, we are able to offer our customers a broad product offering, from ultra-lightweight coated groundwood to heavyweight coated freesheet and supercalendered papers. Our customers have the opportunity to sole-source all of their coated paper needs from us while optimizing their choice of paper products. As our customers’ preferences change, they can switch paper grades to meet their desired balance between cost and performance attributes while maintaining their relationship with us. This “one-stop shop” marketing approach engenders customer loyalty and contributes to the efficiency of our sales organization.
We are also one of the largest rotogravure lightweight coated paper manufacturers in North America. Rotogravure printing is a technique for transferring ink onto coated papers, which typically results in a sharper image with truer colors and less ink trapping than in other printing processes but generally requires a smaller and higher-quality paper. Additionally, we are the only manufacturer in North America with the technological expertise to supply both rotogravure coated groundwood and coated freesheet. This provides us with a significant competitive advantage when selling to customers with long-run, mass publishing needs, as they generally prefer rotogravure products.
Coated groundwood paper. Coated groundwood paper includes a fiber component produced through a mechanical pulping process. The use of such fiber results in a bulkier and more opaque paper that is better suited for applications where lighter weights and/or higher stiffness are required, such as catalogs and magazines. In addition to mechanical pulp, coated groundwood paper typically includes a kraft pulp component to improve brightness and print quality.
Coated freesheet paper. Coated freesheet paper is made from bleached kraft pulp, which is produced using a chemical process to break apart wood fibers and dissolve impurities such as lignin. The use of kraft pulp results in a bright, heavier-weight paper with excellent print qualities, which is well-suited for high-end commercial applications and premium magazines. Coated freesheet contains primarily kraft pulp, with less than 10% mechanical pulp in its composition.
Supercalendered paper. Supercalendered paper consists of groundwood fibers and a very high filler content but does not receive a separate surface coating. Instead, the paper is passed through a supercalendering process in which alternating steel and filled rolls “iron” the paper, giving it a gloss and smoothness that makes it resemble coated paper. Supercalendered papers are primarily used for retail inserts, due to their relatively low price point.
Pulp. We produce and sell NBHK pulp. NBHK pulp is produced through the chemical kraft process using hardwoods. Hardwoods typically have shorter length fibers than softwoods and are used to smooth paper. Kraft describes pulp produced using a chemical process, whereby wood chips are combined with chemicals and steam to separate the wood fibers. The fibers are then washed and pressure screened to remove the chemicals and lignin which originally held the fibers together. Finally, the pulp is bleached to the necessary whiteness and brightness. Kraft pulp is used in applications where brighter and whiter paper is required.
Over our integrated mill system, the total volume of pulp purchased from third parties is approximately balanced by the amount of pulp that we sell to the market. This feature substantially insulates our business from exposure to fluctuations in the price of pulp.
Other products. We also offer recycled paper to help meet specific customer requirements. Additionally, we offer customized product solutions for strategic accounts by producing paper grades with customer-specified weight, brightness and pulp mix characteristics, providing customers with cost benefits and/or brand differentiation.
Manufacturing
We operate 11 paper machines at four mills located in Maine, Michigan and Minnesota. The mills have a combined annual production capacity of 1,726,000 tons of coated paper, 102,000 tons of supercalendered paper and 874,000 tons of kraft pulp, of which approximately 610,000 tons are consumed internally and the remainder is sold as market pulp. Our facilities are strategically located within close proximity to major publication printing customers. The facilities also benefit from convenient and cost-effective access to northern softwood fiber, which is required for the production of lightweight and ultra-lightweight coated papers. All mills and machines operate seven days a week on a twenty-four hours per day basis.
The following table sets forth the locations of our mills, the products they produce and other key operating information:
| | | | | Paper | | Production |
| Mill/Location | | Product/Paper Grades | | Machines | | Capacity* |
| Jay (Androscoggin), ME | | Lightweight Coated Groundwood | | 2 | | 375,800 |
| | | Lightweight Coated Freesheet | | 1 | | 218,900 |
| | | Pulp | | - | | 422,500 |
| Bucksport, ME | | Lightweight and Ultra-Lightweight Coated | | | | |
| | | Groundwood and High Bulk Specialty | | | | |
| | | Coated Groundwood | | 4 | | 516,500 |
| Quinnesec, MI | | Coated Freesheet | | 1 | | 400,000 |
| | | Pulp | | - | | 451,500 |
| Sartell, MN | | Lightweight and Ultra-Lightweight Coated | | | | |
| | | Groundwood | | 1 | | 214,800 |
| | | Supercalendered | | 2 | | 102,000 |
| * We produce 874,000 tons of kraft pulp, of which approximately 610,000 tons are consumed internally and the remainder is sold as market pulp. This data does not include our production capacity for other pulp grades, the entirety of which is consumed internally in the production process for our coated paper. |
We believe we have the lowest cost coated freesheet assets in North America and a highly competitive cost position in coated groundwood. From 1985 to 2006, International Paper invested over $1.7 billion in growth capital expenditures for new machines, product enhancements and capacity expansions. In addition, over $800 million was spent for maintenance and repairs to this equipment as well as for certain environmental, health and safety projects. As a result of these expenditures, we believe that our capacity is sufficient to meet our current growth initiatives without significant additional spending.
The basic raw material of the papermaking process is wood pulp. The first stage of papermaking involves converting wood logs to pulp through either a mechanical or chemical process. Before logs can be processed into pulp, they are passed through a debarking drum to remove the bark. Once separated, the bark is burned as fuel in bark boilers. The wood logs are composed of small cellulose fibers which are bound together by a glue-like substance called lignin. The cellulose fibers are separated from each other through either a mechanical or a kraft pulping process.
After the pulping phase, the fiber furnish is run onto the forming fabric of the paper machine. On the forming fabric, the fibers become interlaced, forming a mat of paper, and much of the water is extracted. The paper web then goes through a pressing and drying process to extract the remaining water. After drying, the web receives a uniform layer of coating that makes the paper smooth and provides uniform ink absorption. After coating, the paper goes through a calendering process that provides a smooth finish by ironing the sheet between multiple soft nips that consist of alternating hard (steel) and soft (cotton or synthetic) rolls. At the dry end, the paper is wound onto spools to form a machine reel and then rewound and slit into smaller rolls on a winder. Finally, the paper is wrapped, labeled and shipped.
Catalog and magazine publishers with longer print runs tend to purchase paper in roll form for use in web printing, a process of printing from a reel of paper as opposed to individual sheets of paper, in order to minimize costs. In contrast, commercial printers typically buy large quantities of sheeted paper in order to satisfy the short-run printing requirements of their customers. We believe that sheeted paper is a less attractive product as it requires additional processing, bigger inventory stocks, a larger sales and marketing team and a different channel strategy. For this reason, we have pursued a deliberate strategy of configuring our manufacturing facilities to produce all web-based papers, which are shipped in roll form and have developed relationships with third-party converters to address any sheeted paper needs of our key customers.
We utilize a manufacturing excellence program, named R-GAP, to ensure timely and accurate reporting, encourage faster operator involvement and provide an overall culture of continuous process improvement. We use multi-variable testing, lean manufacturing, center of excellence teams, source-of-loss initiatives and best practice sharing to constantly improve our manufacturing processes and products. Since 2001, three of our four facilities have participated in OSHA’s Voluntary Protection Program which recognizes outstanding safety programs and performance.
Raw Materials and Suppliers
Our key cost inputs in the papermaking process are wood fiber, market pulp, chemicals and energy.
Wood Fiber. We source our wood fiber from a broad group of timberland and sawmill owners located in our regions.
Kraft Pulp. Overall, we produce 874,000 tons of kraft pulp, with 422,500 tons of pulp at the Androscoggin mill and 451,500 tons of pulp at the Quinnesec mill, of which a total of approximately 610,000 tons are consumed internally. We supplement our internal production of kraft pulp with purchases from third parties. In 2007, these purchases were approximately 187,000 tons of pulp. We purchase the pulp requirements from a variety of suppliers and are not dependent on any single supplier to satisfy our pulp needs. We offset pulp purchases with open-market sales. Over our integrated mill system, the total volume of pulp purchased from third parties is approximately balanced by the amount of pulp that we sell to the market. This feature substantially insulates our business from exposure to fluctuations in the price of pulp.
Chemicals. Chemicals utilized in the manufacturing of coated papers include latex, starch, calcium carbonate, titanium dioxide and others. We purchase these chemicals from a variety of suppliers and are not dependent on any single supplier to satisfy our chemical needs.
Energy. We produce a large portion of our energy requirements, historically producing approximately 50% of our energy needs for our coated paper mills from sources such as waste wood and paper, hydroelectric facilities, chemicals from our pulping process, our own steam recovery boilers and internal energy cogeneration facilities. Our external energy purchases vary across each one of our mills and include fuel oil, natural gas, coal and electricity. While our internal energy production capacity and ability to switch between certain energy sources mitigates the volatility of our overall energy expenditures, we expect prices for energy to remain volatile for the foreseeable future, and our energy costs will increase in a high energy cost environment. We also utilize derivative contracts as part of our risk management strategy to manage our exposure to market fluctuations in energy prices.
Sales, Marketing and Distribution
We reach our end-users through several sales channels. These include selling directly to end-users, through brokers, merchants, and printers. We sell and market products to approximately 100 customers, which comprise 650 end-user accounts.
Sales to End-Users. We sell approximately 43% of our manufacturing output directly to end-users, most of which are catalog and magazine publishers for our paper products. Customers for our pulp products are mostly other paper manufacturers. These customers are typically large, sophisticated buyers who have the scale, resources and expertise to procure paper directly from manufacturers.
Sales to Brokers and Merchants. Our largest indirect paper sales by volume are through brokers and merchants who resell the paper to end-users. In 2007, our total sales to brokers and merchants represented 48% of our total sales.
Brokers typically act as an intermediary between paper manufacturers and smaller end-users who do not have the scale or resources to cost effectively procure paper directly from manufacturers. The majority of sales to brokers are resold to catalog publishers. We work closely with brokers to achieve share targets in the catalog, magazine and insert end-user segments through collaborative selling.
Merchants are similar to brokers in that they act as an intermediary between the manufacturer and the end-user. However, merchants generally take physical delivery of the product and keep inventory on hand. Merchants tend to deal with smaller end-users that lack the scale to warrant direct delivery from the manufacturer. Coated freesheet comprises the majority of our sales to merchants. In most cases, because they are relatively small, the ultimate end-users of paper sold through merchants are generally regional or local catalog or magazine publishers. Our merchant customers include major paper distributors such as xpedx, a division of International Paper, and Unisource Worldwide, Inc., which are large organizations with a broad, diversified client base.
Sales to Printers. In 2007, our total sales to printers represented 8% of our total sales. Nearly all of our sales were to the five largest publication printers in the United States. Printers also effectively act as an intermediary between manufacturers and end-users in that they directly source paper for printing/converting and then resell it to their customers as a finished product.
The majority of our products are delivered directly from our manufacturing facilities to the printer, regardless of the sales channel. In order to serve the grade No. 3 coated freesheet segment, we maintain a network of distribution centers located in the West, Midwest, South and Northeast close to our customer base to provide quick delivery. The majority of our pulp products are delivered to our customers’ paper mills.
Our sales force is organized around our sales channels. We maintain an active dialogue with all of our major customers and track product performance and demand across grades. We have a team of sales representatives and marketing professionals organized into three major sales groups that correspond with our sales channels: direct sales support; support to brokers and merchants; and printer support.
The majority of our products are sold via contracts that we maintain with our customers. Contracted sales are more prevalent for coated groundwood paper, as opposed to coated freesheet paper, which is more often sold without a contract. Our contracts generally specify the volumes to be sold to the customer over the contract term, as well as the pricing parameters for those sales. The large portion of contracted sales allows us to plan our production runs well in advance, optimizing production over our integrated mill system and thereby reducing costs and increasing overall efficiency.
Part of our strategy is to continually reduce the cost to serve our customer base through e-commerce initiatives such as our Online Order Management System, an online system which allows for simplified ordering, tracking and invoicing. In 2007, approximately 28%, or 495,000 tons, of our total coated paper sales volume were placed through our Online Order Management System. We are focused on further developing our technology platform and e-commerce capabilities. To this end, we operate Nextier Solutions, an Internet-based system that has become an industry standard for collaborative production planning, procurement and inventory management process throughout the supply chain. Our customers and competitors use the system to maximize supply chain efficiencies, improve communication and reduce operating costs. Nextier Solutions enables subscribers to monitor their inventories and place orders. Participants pay us subscription and transaction fees for system usage. By leveraging our leadership position in e-commerce for coated papers distribution and management, we should realize a meaningful competitive advantage in our sales, marketing and distribution functions.
Customers
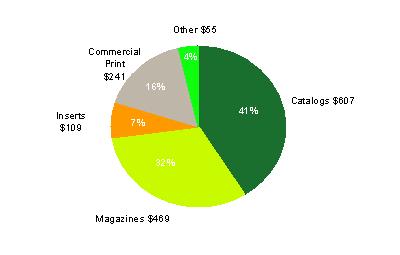
We serve the catalog, magazine, insert and commercial printing markets and have developed long-standing relationships with the premier North American catalog and magazine publishers. The length of our relationships with our top ten customers averages more than 20 years and no single customer accounted for more than 10% of our net sales in 2007. Our key customers include leading magazine publishers such as Condé Nast Publications, Inc., National Geographic Society and Time Inc.; leading catalog producers such as Avon Products, Inc. and Sears Holding Corporation; leading commercial printers such as Quad/Graphics, Inc., and RR Donnelley & Sons Company; and leading paper merchants and brokers, such as A.T. Clayton & Co., Inc., Unisource Worldwide, Inc., the xpedx business unit of International Paper, and Clifford Paper, Inc. See “Risk Factors—We depend on a small number of customers for a significant portion of our business.”
Our net sales, excluding pulp sales, by end-user segment for the year ended December 31, 2007, are illustrated below (dollars in millions):
Research and Development
The primary function of our research and development efforts is to work with customers in developing and modifying products to accommodate their evolving needs and to identify cost saving opportunities within our operations.
Examples of our research and development efforts implemented over the past several years include:
· high-bulk offset and rotogravure coated groundwood;
· lightweight grade No. 4 coated groundwood;
· ultra-lightweight grade No. 5 coated groundwood; and
· rotogravure coated freesheet.
Intellectual Property
We have several patents and patent applications in the United States and various foreign countries. These patents and patent applications generally relate to various paper manufacturing methods and equipment which may become commercially viable in the future. In addition, we have filed trademark applications for “Verso” and “Verso Paper” and, in connection with the Acquisition, acquired several trademarks relating to our products, including Influence®, Velocity®, Liberty®, Advocate® and Trilogy®. In addition to the intellectual property that we own, a significant portion of intellectual property used in our business is licensed on a perpetual, royalty-free, non-exclusive basis from International Paper
Although, in the aggregate, our patents, trademarks, copyrights, and the intellectual property licensed from International Paper are material to our business, financial condition and results of operations, we believe that the loss of any one or any related group of intellectual property rights would not have a material adverse effect on our business, financial condition or results of operations.
Competition
Our business is highly competitive. A significant number of North American competitors produce coated and supercalendered papers, and several overseas manufacturers, principally from Europe, export to North America. We compete based on a number of factors, including:
| · | price; |
| · | product availability; |
| · | the quality of our products; |
| · | our breadth of product offerings; |
| · | our ability to maintain plant efficiencies and high operating rates and thus lower our average; |
| · | manufacturing costs per ton; |
| · | customer service and our ability to distribute our products on time; and |
| · | the availability and/or cost of wood fiber, market pulp, chemicals, energy and other raw materials and labor. |
Foreign competition in North America is also affected by the exchange rate of the U.S. dollar relative to other currencies, especially the euro, market prices in North America and other markets, worldwide supply and demand, and the cost of ocean-going freight.
While our product offering is broad in terms of grades produced (from supercalendered and ultra-lightweight coated groundwood offerings to heavier-weight coated freesheet products), we are focused on producing coated groundwood and coated freesheet in roll form. This strategy is driven by our alignment with catalog and magazine end-users which tend to purchase paper in roll form for use in long runs of web printing in order to minimize costs. Our principal competitors include NewPage Corporation, Bowater Incorporated, UPM-Kymmene Corporation and Sappi Limited, all of which have North American assets. UPM and Sappi are headquartered overseas and also have overseas manufacturing facilities.. See “Risk Factors—The markets in which we operate are highly competitive.”
Employees
As of December 31, 2007, we had approximately 2,900 employees, of whom approximately 35% are unionized and 77% are hourly employees. Employees at two of our four mills are represented by labor unions under a total of four collective bargaining agreements. In 2007, we completed successful labor negotiations for three agreements that were up for renewal during the year. The new agreements will expire in 2011.
We have not experienced any work stoppages during the past several years. We believe that we have good relations with our employees.
Environmental and Other Governmental Regulations
We are subject to federal, state and local environmental, health and safety laws and regulations, including, but not limited to, the Federal Water Pollution Control Act of 1972 (the “Clean Water Act”), the Federal Clean Air Act, the Federal Resource Conservation and Recovery Act and the Comprehensive Environmental Response, Compensation and Liability Act of 1980, (“CERCLA”), the Federal Occupational Health and Safety Act and analogous state and local laws. Among our activities subject to environmental regulation are the emissions of air pollutants, discharges of wastewater and stormwater, operation of dams, storage, treatment and disposal of materials and waste, and remediation of soil, surface water and ground water contamination. Many environmental laws and regulations provide for substantial fines or penalties and criminal sanctions for any failure to comply. In addition, failure to comply with these laws and regulations could result in the interruption of our operations and, in some cases, facility shutdowns.
Certain of these environmental laws, such as CERCLA and analogous state laws, provide for strict, and under certain circumstances, joint and several liability for investigation and remediation of the release of hazardous substances into the environment, including soil and groundwater. These laws may apply to properties presently or formerly owned or operated by an entity or its predecessors, as well as to conditions at properties at which wastes attributable to an entity or its predecessors were disposed. Under these environmental laws, a current or previous owner or operator of real property, and parties that generate or transport hazardous substances that are disposed of at real property, may be held liable for the cost to investigate or clean up such real property and for related damages to natural resources. We handle and dispose of wastes arising from our mill operations, including disposal at on-site landfills. We are required to maintain financial assurance for the expected cost of landfill closure and post-closure care. We may be subject to liability, including liability for investigation and cleanup costs, if contamination is discovered at one of our paper mills or another location where we have disposed of, or arranged for the disposal of, wastes. We could be subject to potentially significant liabilities under, or fines or penalties for any failure to comply with, any environmental rule or regulation. See “Risk Factors — We are subject to various environmental, health and safety regulations that could impose substantial costs or other liabilities upon us and may adversely affect our operating performance and financial condition.”
Compliance with environmental laws and regulations is a significant factor in our business. We have made, and will continue to make, significant expenditures to comply with these requirements. We anticipate that environmental compliance will continue to require increased capital expenditures over time as environmental laws or regulations, or interpretations thereof, change or the nature of our operations require us to make significant additional capital expenditures. A significant portion of anticipated environmental capital expenditures in 2007 will be spent in connection with emission control technology and wastewater effluent controls required to comply with the Federal Clean Air Act and Clean Water Act. Integrated pulp and paper mills are required to install control equipment to limit the release of certain pollutants into the air and water under so-called “Cluster Rule” regulations promulgated by the Environmental Protection Agency in 1998. In addition, our mills will incur increased operating expenses associated with compliance with the Cluster Rule regulations and the operation of the control equipment. We incurred environmental capital expenditures of $3.4 million in 2007 and $10.3 million in 2006, and we expect to incur additional environmental capital expenditures of $5.8 million in 2008.
Permits are required for the operation of our mills and related facilities. The permits are subject to renewal, modification and revocation. We and others have the right to challenge our permit conditions through administrative and legal appeals and review processes. Governmental authorities have the power to enforce compliance with the permits, and violators are subject to civil and criminal penalties, including fines, injunctions or both. Other parties also may have the right to pursue legal actions to enforce compliance with the permits.
You should carefully consider the risks described below as well as the other information contained in this annual report. Any of the following risks could materially adversely affect our business, financial condition or results of operations.
We have limited ability to pass through increases in our costs to our customers. Increases in our costs or decreases in coated or supercalendered paper prices could adversely affect our business, financial condition or results of operations.
Our earnings are sensitive to price changes in coated or supercalendered paper. Fluctuations in paper prices (and coated paper prices in particular) historically have had a direct effect on our net income (loss) and EBITDA for several reasons:
| • | Market prices for paper products are a function of supply and demand, factors over which we have limited control. We therefore have limited ability to control the pricing of our products. Market prices of grade No. 3, 60 lb. basis weight paper, which is an industry benchmark for coated freesheet paper pricing, have fluctuated since 2000 from a high of $980 per ton to a low of $705 per ton. In addition, market prices of grade No. 5, 34 lb. basis weight paper, which is an industry benchmark for coated groundwood paper pricing, have fluctuated between a high of $1,040 per ton to a low of $795 per ton over the same period. Because market conditions determine the price for our paper products, the price for our products could fall below our cash production costs; |
| • | Market prices for paper products typically are not directly affected by raw material costs or other costs of sales, and consequently we have limited ability to pass through increases in our costs to our customers absent increases in the market price. In addition, a significant portion of our sales are pursuant to contracts that limit price increases. Thus, even though our costs may increase, we may not have the ability to increase the prices for our products, or the prices for our products may decline; and |
| • | The manufacturing of coated paper is highly capital-intensive and a large portion of our operating costs are fixed. Additionally, paper machines are large, complex machines that operate more efficiently when operated continuously. Consequently, both we and our competitors typically continue to run our machines whenever marginal sales exceed the marginal costs, adversely impacting prices at times of lower demand. |
Therefore, our ability to achieve acceptable margins is principally dependent on (i) managing our cost structure, (ii) managing changes in raw materials prices, which represent a large component of our operating costs and fluctuate based upon factors beyond our control and (iii) general conditions in the paper market. If the prices of our products decline, or if our raw material costs increase, it could have a material adverse effect on our business, financial condition and results of operations.
The paper industry is cyclical. Fluctuations in supply and demand for our products could materially adversely affect our business, financial condition and results of operations.
The paper industry is a commodity market to a significant extent and is subject to cyclical market pressures. North American demand for coated and supercalendered paper products tends to decline during a weak U.S. economy. Accordingly, general economic conditions and demand for magazines and catalogs may have a material adverse impact on the demand for our products, which could have a material adverse effect on our business, financial condition and results of operations. In addition, currency fluctuations can have a significant impact on the supply of coated paper products in North America. If the U.S. dollar strengthens, imports may increase, which would cause the supply of paper products available in the North American market to increase. Foreign overcapacity also could result in an increase in the supply of paper products available in the North American market. An increased supply of paper available in North America could put downward pressure on prices and/or cause us to lose sales to competitors, either of which could have a material adverse effect on our business, financial condition and results of operations.
We have a limited operating history as a separate company. Accordingly, our Predecessor combined historical financial data may not be representative of our results as a separate company.
We operated as a division of International Paper prior to the Acquisition. Therefore, we have a very limited operating history as a separate company. Our business strategy as an independent entity may not be successful on a long-term basis. Although International Paper, after the completion of the Acquisition, generally no longer sells coated or supercalendered paper, we cannot assure you that our customers will continue to do business with us on the same terms as when we were a division of International Paper or at all. We may not be able to grow our business as planned and may not remain a profitable business. In addition, the historical combined financial data included in this annual report may not necessarily reflect what our results of operations, financial condition and cash flows would have been had we been a separate independent entity pursuing our own strategies during the periods presented. Our limited operating history as a separate entity makes evaluating our business and our future financial prospects difficult. As a result, our business, financial condition and results of operations may differ materially from our expectations based on the historical financial data contained in the annual report.
Our cost structure following the Acquisition is not comparable to the cost structure that we experienced in prior periods. Our management has limited experience managing our business as a separate company with a significant amount of indebtedness. We cannot assure you that our cost structure in future periods will be consistent with our current expectations or will permit us to operate our business profitably.
The markets in which we operate are highly competitive.
Our business is highly competitive. Competition is based largely on price. We compete with foreign producers, some of which are lower cost producers than we are or are subsidized by governments. We also face competition from numerous North American coated and supercalendered paper manufacturers. Some of our competitors have advantages over us, including lower raw material and labor costs and fewer environmental and governmental regulations to comply with than we do. Furthermore, some of our competitors have greater financial and other resources than we do or may be better positioned than we are to compete for certain opportunities.
Our non-U.S. competitors may develop a competitive advantage over us and other U.S. producers if the U.S. dollar strengthens in comparison to the home currency of those competitors or ocean shipping rates decrease. If the U.S. dollar strengthens, if shipping rates decrease or if overseas supply exceeds demand, imports may increase, which would cause the supply of coated paper products available in the North American market to increase. An increased supply of coated paper could cause us to lower our prices or lose sales to competitors, either of which could have a material adverse effect on our business, financial condition and results of operations.
In addition, the following factors will affect our ability to compete:
· product availability;
· the quality of our products;
· our breadth of product offerings;
· our ability to maintain plant efficiencies and high operating rates;
· manufacturing costs per ton;
· customer service and our ability to distribute our products on time; and
· the availability and/or cost of wood fiber, market pulp, chemicals, energy and other raw materials and labor.
If we are unable to obtain energy or raw materials at favorable prices, or at all, it could adversely impact our business, financial condition and results of operations.
We purchase wood fiber, market pulp, chemicals, energy and other raw materials from third parties. We may experience shortages of energy supplies or raw materials or be forced to seek alternative sources of supply. If we are forced to seek alternative sources of supply, we may not be able to do so on terms as favorable as our current terms or at all. In addition, the prices for energy and many of our raw materials, especially petroleum-based chemicals, have been volatile and have increased over the last year. Prices are expected to remain volatile for the foreseeable future. Chemical suppliers that use petroleum-based products in the manufacture of their chemicals may, due to a supply shortage and cost increase, ration the amount of chemicals available to us and/or we may not be able to obtain the chemicals we need to operate our business at favorable prices, if at all. In addition, certain specialty chemicals that we purchase are available only from a small number of suppliers. If any of these suppliers were to cease operations or cease doing business with us, we may be unable to obtain such chemicals at favorable prices, if at all.
The supply of energy or raw materials may be adversely affected by, among other things, hurricanes and other natural disasters or an outbreak or escalation of hostilities between the United States and any foreign power and, in particular, events in the Middle East. For example, timber supply is sometimes limited by fire, insect infestation, disease, ice and wind storms, floods, or other weather conditions. Additionally, due to increased fuel costs, suppliers, distributors and freight carriers have charged fuel surcharges, which have increased our costs. Any significant shortage or significant increase in our energy or raw material costs in circumstances where we cannot raise the price of our products due to market conditions could have a material adverse effect on our business, financial condition and results of operations. Any disruption in the supply of energy or raw materials could also affect our ability to meet customer demand in a timely manner and could harm our reputation. Furthermore, we may be required to post letters of credit or other financial assurance obligations with certain of our energy and other suppliers, which could limit our financial flexibility.
We are involved in continuous manufacturing processes with a high degree of fixed costs. Any interruption in the operations of our manufacturing facilities may affect our operating performance.
We seek to run our paper machines on a nearly continuous basis for maximum efficiency. Any unplanned plant downtime at any of our paper mills results in unabsorbed fixed costs that negatively affect our results of operations for the period in which we experience the downtime. Due to the extreme operating conditions inherent in some of our manufacturing processes, we may incur unplanned business interruptions from time to time and, as a result, we may not generate sufficient cash flow to satisfy our operational needs. In addition, many of the geographic areas where our production is located and where we conduct our business may be affected by natural disasters, including snow storms, forest fires and flooding. Such natural disasters could cause our mills to stop running, which could have a material adverse effect on our business, financial condition and results of operations. Furthermore, during periods of weak demand for paper products, we have in the past and may in the future experience market-related downtime, which could have a material adverse effect on our financial condition and results of operations.
Our operations require substantial ongoing capital expenditures, and we may not have adequate capital resources to fund all of our required capital expenditures.
Our business is capital intensive, and we incur capital expenditures on an ongoing basis to maintain our equipment and comply with environmental laws, as well as to enhance the efficiency of our operations. Our total capital expenditures were $69 million in 2007, including $39 million for maintenance and environmental capital expenditures. We expect to spend approximately $80 million on capital expenditures during 2008, with approximately $69 million for maintenance and environmental capital expenditures, which includes our normal level of approximately $40 million for maintenance and environmental capital expenditures. We anticipate that our available cash resources and cash generated from operations will be sufficient to fund our operating needs and capital expenditures for at least the next year. However, if we require additional funds to fund our capital expenditures, we may not be able to obtain them on favorable terms, or at all. If we cannot maintain or upgrade our facilities and equipment as we require or as necessary to ensure environmental compliance, it could have a material adverse effect on our business, financial condition and results of operations.
We depend on a small number of customers for a significant portion of our business.
Our largest customer, International Paper, accounted for approximately 9% of our net sales in 2007. In 2007, our ten largest customers (including International Paper, Inc.) accounted for approximately 52% of our net sales, while our ten largest end-users accounted for approximately 29% of our net sales. The loss of, or reduction in orders from, any of these customers or other customers could have a material adverse effect on our business, financial condition and results of operations, as could significant customer disputes regarding shipments, price, quality or other matters.
We may not realize certain productivity enhancements or improvements in costs.
As part of our business strategy, we intend to identify opportunities to improve profitability by reducing costs and enhancing productivity. Any cost savings or productivity enhancements that we realize from such efforts may differ materially from our estimates. For example, we have several productivity enhancement initiatives to reduce waste and increase the amount of uptime on our paper machines. We cannot assure you that these initiatives will be completed as anticipated or that the benefits we expect will be achieved on a timely basis or at all.
Rising postal costs could weaken demand for our paper products.
A significant portion of paper is used in magazines, catalogs and other promotional mailings. Many of these materials are distributed through the mail. Future increases in the cost of postage could reduce the frequency of mailings, reduce the number of pages in magazine and advertising materials and/or cause catalog and magazine publishers to use alternate methods to distribute their materials. Any of the foregoing could decrease the demand for our products, which could materially adversely affect our business, financial condition and results of operations.
Our business may suffer if we do not retain our senior management.
We depend on our senior management. The loss of services of members of our senior management team could adversely affect our business until suitable replacements can be found. There may be a limited number of persons with the requisite skills to serve in these positions and we may be unable to locate or employ qualified personnel on acceptable terms. In addition, our future success requires us to continue to attract and retain competent personnel.
A large percentage of our employees are unionized. Wage increases or work stoppages by our unionized employees may have a material adverse effect on our business, financial condition and results of operations.
As of December 31, 2007, approximately 35%, of our employees were represented by labor unions under four collective bargaining agreements at two of our mills. In 2007, we completed successful labor negotiations for three agreements that were up for renewal in during the year, and the new agreements will expire in 2011. We may become subject to material cost increases or additional work rules imposed by agreements with labor unions. This could increase expenses in absolute terms and/or as a percentage of net sales. In addition, although we believe we have good relations with our employees, work stoppages or other labor disturbances may occur in the future. Any of these factors could negatively affect our business, financial condition and results of operations.
We depend on third parties for certain transportation services.
We rely primarily on third parties for transportation of our products to our customers and transportation of our raw materials to us, in particular, by truck and train. If any of our third-party transportation providers fail to deliver our products in a timely manner, we may be unable to sell them at full value. Similarly, if any of our transportation providers fail to deliver raw materials to us in a timely manner, we may be unable to manufacture our products on a timely basis. Shipments of products and raw materials may be delayed due to weather conditions, strikes or other events. Any failure of a third-party transportation provider to deliver raw materials or products in a timely manner could harm our reputation, negatively impact our customer relationships and have a material adverse effect on our business, financial condition and results of operations. In addition, our ability to deliver our products on a timely basis could be adversely affected by the lack of adequate availability of transportation services, especially rail capacity, whether because of work stoppages or otherwise. Furthermore, increases in the cost of our transportation services, including as a result of rising fuel costs, could cause a material adverse effect on our business, financial condition and results of operations.
We are subject to various environmental, health and safety regulations that could impose substantial costs or other liabilities upon us and may adversely affect our operating performance and financial condition.
We are subject to a wide range of federal, state and local general and industry-specific environmental, health and safety laws and regulations, including those relating to air emissions, wastewater discharges, solid and hazardous waste management and disposal and site remediation. Compliance with these laws and regulations is a significant factor in our business. We have made, and will continue to make, significant expenditures to comply with these requirements. In addition, we handle and dispose of wastes arising from our mill operations and operate a number of on-site landfills to handle that waste. We maintain financial assurance for the projected cost of closure and post-closure care for these landfill operations. We could be subject to potentially significant fines, penalties, criminal sanctions, plant shutdowns or interruptions in operations for any failure to comply with applicable environmental, health and safety laws and regulations. Moreover, under certain environmental laws, a current or previous owner or operator of real property, and parties that generate or transport hazardous substances that are disposed of at real property, may be held liable for the full cost to investigate or clean up such real property and for related damages to natural resources. We may be subject to liability, including liability for investigation and cleanup costs, if contamination is discovered at one of our current or former paper mills, other properties or other locations where we have disposed of, or arranged for the disposal of, wastes. International Paper has agreed to indemnify us, subject to certain limitations, for former properties and former off-site shipments, as well as certain other environmental liabilities. There can be no assurance that International Paper will perform under any of its environmental indemnity obligations, which could have a material adverse effect on our financial condition and results of operations. We also could be subject to claims brought pursuant to applicable laws, rules or regulations for property damage or personal injury resulting from the environmental impact of our operations, including due to human exposure to hazardous substances. Increasingly stringent environmental requirements, more aggressive enforcement actions or policies, the discovery of unknown conditions or the bringing of future claims may cause our expenditures for environmental matters to increase, and we may incur material costs associated with these matters. For a further discussion of environmental laws, rules and regulations that affect our business, see “Business — Environmental and Other Governmental Regulations” and “Business – Legal Proceedings.”
Our substantial indebtedness could adversely affect our financial health.
We have and will continue to have a significant amount of indebtedness. On December 31, 2007, we had total indebtedness of $1,156.4 million. The total amount of payments we will need to make on our outstanding indebtedness for each of the next three fiscal years is equal to $109.3 million, $109.0 million and $108.8 million, respectively (assuming the current prevailing interest rates on our outstanding floating rate indebtedness remain the same).
Our substantial indebtedness could have important consequences to you. For example, it could:
| | · | increase our vulnerability to general adverse economic and industry conditions; |
| | | |
| | · | require us to dedicate a substantial portion of our cash flow from operations to payments on our indebtedness, thereby reducing the availability of our cash flow to fund working capital, capital expenditures, research and development efforts and other general corporate purposes; |
| | | |
| | · | increase our vulnerability to and limit our flexibility in planning for, or reacting to, changes in our business and the industry in which we operate; |
| | | |
| | · | expose us to the risk of increased interest rates as borrowings under our senior secured credit facilities and our floating rate notes will be subject to variable rates of interest; |
| | | |
| | · | place us at a competitive disadvantage compared to our competitors that have less debt; and |
| | | |
| | · | limit our ability to borrow additional funds. |
In addition, the indentures and our senior secured credit facilities contain financial and other restrictive covenants that limit our ability to engage in activities that may be in our long-term best interests. Our failure to comply with those covenants could result in an event of default which, if not cured or waived, could result in the acceleration of all of our debts.
We and our subsidiaries may be able to incur substantial additional indebtedness in the future because the terms of the indentures governing our outstanding notes and our senior secured credit facilities do not fully prohibit us or our subsidiaries from doing so. If new indebtedness is added to our and our subsidiaries’ current debt levels, the related risks that we and they now face could intensify.
Because a small number of equity holders own a significant percentage of our common equity interests, they may control all major corporate decisions and our other equity holders may not be able to influence these corporate decisions.
An affiliate of Apollo Management, L.P. (“Apollo”) controls a majority of our common equity and, therefore, Apollo has the power to control our affairs and policies. Apollo also controls the election of our directors, the appointment of our management and the entering into of business combinations or dispositions and other extraordinary transactions. The directors so elected have the authority, subject to the terms of the indentures and our senior secured credit facilities, to issue additional equity interests, implement equity repurchase programs, declare dividends and make other decisions that could be detrimental to owners of the exchange notes.
The interests of Apollo could conflict with the interests of our note holders. For example, if we encounter financial difficulties or are unable to pay our debts as they mature, the interests of Apollo, as equity holders, might conflict with the interests of our note holders. Affiliates of Apollo may also have an interest in pursuing acquisitions, divestitures, financings and other transactions that, in their judgment, could enhance their equity investments, even though such transactions might involve risks to a note holder.
Not Applicable.
Our corporate headquarters are located in Memphis, Tennessee. We operate 11 paper machines at four mills located in Maine, Michigan and Minnesota. We own our principal manufacturing facilities. We also own five hydroelectric dams, four of which provide hydroelectric power to our Androscoggin mill and the fifth of which services our Sartell mill. In addition, we own 16 and lease four woodyards for the purpose of storage and loading of forest products and lease a number of sales offices.
Our headquarters and material facilities as of December 31, 2007, are shown in the following table:
| Location | | Use | | Owned/Leased |
| Memphis, TN | | corporate headquarters | | leased |
| Jay (Androscoggin), ME | | paper mill/kraft pulp mill | | owned |
| Bucksport, ME | | paper mill | | owned |
| Quinnseec, MI | | paper mill/kraft pulp mill | | owned |
| Sartell, MN | | paper mill | | owned |
| West Chester, OH | | sales, distribution and customer service | | leased |
We are involved from time to time in legal proceedings incidental to the conduct of our business. Although the amount of liability that may result from these proceedings cannot be ascertained, we believe that, in the aggregate, they will not result in liabilities that are material to our business, financial condition, results of operations, or cash flows.
In 2005, the Maine Department of Environmental Protection issued a wastewater discharge permit to International Paper for the Androscoggin mill. Shortly thereafter, International Paper, a local public utility company and several environmental interest groups challenged the terms of the permit in an administrative review proceeding before the Maine Board of Environmental Protection, or “BEP.” The review of the Androscoggin mill’s permit was consolidated with reviews of other parties’ permits affecting water quality in the portion of the Androscoggin River downstream from our mill. In February 2008, the BEP issued a final order that imposed more stringent limits on the wastewater discharges for the Androscoggin mill. We anticipate that the new discharge limits will necessitate increased operational and maintenance costs as well as capital expenditures for additional wastewater controls and related improvements. These costs and expenditures may be covered, subject to certain limitations, by an indemnity from International Paper.
Not applicable.
PART II
Our senior secured credit facilities and the indentures governing our second priority senior secured notes and our senior subordinated notes limit our ability to, among other things, pay dividends or make distributions or repurchase or redeem our stock. As of December 31, 2007, we were in compliance with these restrictive covenants.
The following table sets forth our selected historical financial data. The selected historical balance sheet data as of December 31, 2005 and historical statement of operations data for the for the seven months ended July 31, 2006, and for the years ended December 31, 2005 and 2004 have been derived from the combined financial statements of the Coated and Supercalendered Papers Division of International Paper (the “Predecessor” or the “Division”) which have been audited by Deloitte & Touche LLP, independent registered public accounting firm. The selected historical combined statement of operations data for the year ended December 31, 2003, and the combined balance sheet data as of December 31, 2004 and 2003 have been derived from the combined financial statements of the Coated and Supercalendered Papers Division of International Paper that are not included in this annual report. The selected balance sheet data as of December 31, 2007 and 2006 and the statement of operations data for the year ended December 31, 2007, and for the five months ended December 31, 2006, have been derived from the consolidated financial statements of Verso Paper Holdings LLC (the “Successor”) which have been audited by Deloitte & Touche LLP, independent registered public accounting firm.
Our selected historical financial data should be read in conjunction with our “Management’s Discussion and Analysis of Financial Condition and Results of Operations” and the financial statements and the related notes thereto included elsewhere in this annual report.
| | | Successor | | | Successor | | | Predecessor | | | | | | | | | | |
| | | Consolidated | | | Consolidated | | | Combined | | | Predecessor Combined | |
| | | Year | | | Five Months | | | Seven Months | | | | | | | | | |
| | | Ended | | | Ended | | | Ended | | | | | | | | | | |
| | | December 31, | | | December 31, | | | July 31, | | | Year Ended December 31, | |
| (In millions of U.S. dollars) | | 2007 | | | 2006 | | | 2006 | | | 2005 | | | 2004 | | | 2003 | |
| Statement of Operations Data: | | | | | | | | | | | | | | | | | | |
| Net sales | | $ | 1,628.8 | | | $ | 706.8 | | | $ | 904.4 | | | $ | 1,603.8 | | | $ | 1,463.3 | | | $ | 1,343.1 | |
| Costs and expenses: | | | | | | | | | | | | | | | | | | | | | | | | |
| Cost of products sold - (exclusive of depreciation | | | | | | | | | | | | | | | | | | | | | |
| and amortization) | | | 1,403.2 | | | | 589.3 | | | | 771.6 | | | | 1,338.2 | | | | 1,272.5 | | | | 1,154.1 | |
| Depreciation and amortization | | | 123.1 | | | | 48.3 | | | | 72.7 | | | | 129.4 | | | | 130.5 | | | | 138.3 | |
| Selling, general and administrative expenses | | | 52.0 | | | | 14.0 | | | | 34.3 | | | | 65.6 | | | | 65.3 | | | | 81.4 | |
| Restructuring and other charges | | | 19.4 | | | | 10.1 | | | | (0.3 | ) | | | 10.4 | | | | 0.6 | | | | 4.5 | |
| Operating income (loss) | | | 31.1 | | | | 45.1 | | | | 26.1 | | | | 60.2 | | | | (5.6 | ) | | | (35.2 | ) |
| Interest income | | | (1.5 | ) | | | (1.8 | ) | | | - | | | | - | | | | (0.2 | ) | | | (0.1 | ) |
| Interest expense | | | 113.9 | | | | 48.7 | | | | 8.4 | | | | 14.8 | | | | 16.0 | | | | 16.3 | |
| Income (loss) before income taxes and cumulative | | | | | | | | | | | | | | | | | | | | | |
| effect of change in accounting principle | | | (81.3 | ) | | | (1.8 | ) | | | 17.7 | | | | 45.4 | | | | (21.4 | ) | | | (51.4 | ) |
| Provision (benefit) for income taxes | | | - | | | | - | | | | 7.0 | | | | 17.9 | | | | (8.2 | ) | | | (19.8 | ) |
| Income (loss) before cumulative effect | | | (81.3 | ) | | | (1.8 | ) | | | 10.7 | | | | 27.5 | | | | (13.2 | ) | | | (31.6 | ) |
| of change in accounting principle | | | | | | | | | | | | | | | | | | | | | | | | |
| Cumulative effect of change in accounting principle | | | - | | | | - | | | | - | | | | - | | | | - | | | | (0.7 | ) |
| Net income (loss) | | $ | (81.3 | ) | | $ | (1.8 | ) | | $ | 10.7 | | | $ | 27.5 | | | $ | (13.2 | ) | | $ | (32.3 | ) |
| | | | | | | | | | | | | | | | | | | | | | | | | |
| Statement of Cash Flows Data: | | | | | | | | | | | | | | | | | | | | | | | | |
| Cash provided by operating activities | | $ | 38.8 | | | $ | 128.8 | | | $ | 39.3 | | | $ | 116.8 | | | $ | 123.7 | | | $ | 81.0 | |
| Cash used in investing activities | | $ | (67.8 | ) | | $ | (1,391.8 | ) | | $ | (27.6 | ) | | $ | (53.0 | ) | | $ | (111.5 | ) | | $ | (135.2 | ) |
| Cash (used in) provided by financing activities | | $ | (24.9 | ) | | $ | 1,375.4 | | | $ | (11.6 | ) | | $ | (63.8 | ) | | $ | (12.2 | ) | | $ | 54.2 | |
| | | | | | | | | | | | | | | | | | | | | | | | | |
| Other Financial and Operating Data: | | | | | | | | | | | | | | | | | | | | | | | | |
| Capital expenditures | | $ | 69.6 | | | $ | 27.5 | | | $ | 27.7 | | | $ | 53.1 | | | $ | 111.3 | | | $ | 133.3 | |
| Ratio of earnings to fixed charges (1) | | | - | | | | - | | | | 3.47 | | | | 3.69 | | | | - | | | | - | |
| Total tons sold | | | 2,096.3 | | | | 866.4 | | | | 1,145.0 | | | | 2,024.9 | | | | 2,064.6 | | | | 1,934.6 | |
| | | | | | | | | | | | | | | | | | | | | | | | | |
| Balance Sheet Data: | | | | | | | | | | | | | | | | | | | | | | | | |
| Working capital (2) | | $ | 95.6 | | | $ | 154.0 | | | | | | | $ | 87.8 | | | $ | 58.6 | | | $ | 78.9 | |
| Property, plant and equipment, net | | $ | 1,159.9 | | | $ | 1,212.0 | | | | | | | $ | 1,287.0 | | | $ | 1,363.9 | | | $ | 1,384.3 | |
| Total assets | | $ | 1,577.0 | | | $ | 1,692.4 | | | | | | | $ | 1,534.1 | | | $ | 1,585.0 | | | $ | 1,603.4 | |
| Total debt | | $ | 1,156.4 | | | $ | 1,159.3 | | | | | | | $ | 301.2 | | | $ | 302.1 | | | $ | 303.5 | |
| Equity | | $ | 174.9 | | | $ | 279.7 | | | | | | | $ | 1,040.0 | | | $ | 1,075.3 | | | $ | 1,097.0 | |
| (1) For purpose of computing the ratio of earnings to fixed charges, earnings consist of income (loss) before income taxes and cumulative effect of change in accounting principle plus fixed charges. Fixed charges consist of interest expense, amortization of debt issuance costs and a portion of rental expense that management believes is representative of the interest component of rental expense. For the years ended December 31, 2003, 2004, and 2007 and for the five months ended December 31, 2006, earnings were insufficient to cover fixed charges and there was a deficiency of $44.7 million, $14.5 million, $82.5 milliion and $2.0 million, respectively. | |
| | |
| (2) Working capital is defined as current assets net of current liabilities, excluding the current portion of long-term debt and the Division’s accounts payable to International Paper Company—net. | |
The following discussion and analysis of our financial condition and results of operations covers periods prior to the Acquisition. For comparison purposes, the results of operations for the year ended December 31, 2006, are presented on a combined basis, consisting of the historical results of our predecessor for the seven months ended July 31, 2006, and the results of the successor for the period beginning August 1, 2006, and ending on December 31, 2006. Accordingly, the discussion and analysis of historical periods do not fully reflect the significant impact that the Acquisition has had on our financial statements. In addition, the statements in the discussion and analysis regarding industry outlook, our expectations regarding the performance of our business and the other non-historical statements in the discussion and analysis are forward-looking statements. These forward-looking statements are subject to numerous risks and uncertainties, including, but not limited to, the risks and uncertainties described in “Risk Factors.” Our actual results may differ materially from those contained in or implied by any forward-looking statements. You should read the following discussion together with “Risk Factors” and the consolidated and combined financial statements included elsewhere in this annual report.
Overview
We are one of the leading North American suppliers of coated papers to catalog and magazine publishers. Coated paper is used primarily in media and marketing applications, including catalogs, magazines, commercial printing applications, such as high-end advertising brochures, annual reports and direct mail advertising. Within the overall North American coated paper market, we have a leading market share in North American coated groundwood production capacity, which is used primarily for catalogs and magazines. We are also one of North America’s largest producers of coated freesheet paper, which is used primarily for upscale catalogs and magazines, annual reports and magazine covers. To complete our product offering to catalog and magazine customers, we have a strategic presence in supercalendered paper, which is primarily used for retail inserts due to its relatively low cost. In addition, we produce and sell market pulp, which is used in the manufacture of printing and writing paper grades and tissue products.
Stand-Alone Company
On August 1, 2006, an affiliate of Apollo Management L.P. purchased the Coated and Supercalendered Papers Division of International Paper (the “Predecessor” or the “Division”) for approximately $1.4 billion. The Division was acquired under an asset purchase agreement. The Predecessor financial statements for the periods presented represent the Division’s historical combined financial statements. The preparation of this information was based on certain assumptions and estimates, including allocations of costs from International Paper. This financial information may not, however, necessarily reflect the results of operations, financial positions and cash flows that would have occurred if the Division had been a separate, stand-alone entity during the periods presented or our future results of operations, financial position and cash flows. For example, the historical financial statements of the Predecessor in this annual report include expenses for certain corporate services provided by International Paper and allocated based on various methods, including direct consumption, percent of capital employed and number of employees. These historical charges and allocations may not be representative of expenses that we will incur in future reporting periods as we operate as a stand-alone entity.
Selected Factors that Affect our Operating Results
Net Sales
Our sales, which we report net of rebates, allowances and discounts, are a function of the number of tons of paper that we sell and the price at which we sell our paper. The coated paper industry is cyclical, which results in changes in both volume and price. Paper prices historically have been a function of macro-economic factors which influence supply and demand. Price has historically been substantially more variable than volume and can change significantly over relatively short time periods. In the second half of 2006, paper prices began to fall and continued to fall into the first half of 2007. We believe this price decline was driven by several factors, including high customer inventories, high producer inventories and cautious purchasing by customers in advance of a scheduled postal rate increase. In the second half of 2007, some of our North American competitors announced the shutdown of approximately 1 million tons of annual production capacity, which had become uncompetitive from a cost standpoint. This reduction was equivalent to 9% of North American coated paper capacity. As a result of these recent reductions in production capacity and resulting increases in the average operating rate for North American coated paper manufacturers, coated paper pricing began to strengthen in the second half of 2007. During the second quarter of 2007, we announced a $60 per ton price increase on all coated paper grades, effective July 1. In reflection of the beginning of this price increase, our weighted average paper prices rose from $797 per ton in second quarter 2007 to $840 in fourth quarter 2007. We expect our weighted average paper prices to continue to increase as we realize this price increase during 2008. We announced another two price increases in the second half of 2007, totaling a further $125 per ton on coated groundwood grades of paper and another $70 per ton on coated freesheet grades of paper. We began implementing one of these price increases in October 2007 and the other price increase in January 2008. In addition, in the first quarter of 2008, we announced another price increase, effective April 1. This increase is for a further $60 per ton on all coated groundwood grades of paper and another $60 per ton on coated freesheet grades with a basis weight of 55 lbs. or lighter.
We are primarily focused on serving two end-user segments: (i) catalogs and (ii) magazines. In 2006, we believe we had the leading market share for the catalog and magazine segments of coated papers. Coated paper demand is primarily driven by advertising and print media usage. Advertising spending and magazine and catalog circulation tend to be correlated with GDP in the United States and rise with a strong economy.
The majority of our products are sold via contracts we maintain with our customers. Contracted sales are more prevalent for coated groundwood paper, as opposed to coated freesheet paper, which is more often sold without a contract. Our contracts generally specify the volumes to be sold to the customer over the contract term, as well as the pricing parameters for those sales. Most of our contracts are negotiated on an annual basis, with only a few having terms extending beyond one year. Typically, our contracts provide for quarterly price adjustments based on market price movements. The large portion of contracted sales allows us to plan our production runs well in advance, optimizing production over our integrated mill system and thereby reducing costs and increasing overall efficiency.
We reach our end-users through several channels, including printers, brokers, paper merchants and direct sales to end-users. We sell and market our products to approximately 100 customers which comprise 650 end-user accounts. In 2007, no single customer accounted for more than 10% of our total net sales.
Our historical results also include products produced and sold from our paper machine No. 5 at the Androscoggin mill. Pursuant to the terms of a supply agreement entered into in 2005 between International Paper and Thilmany, LLC (“Thilmany”), which acquired International Paper’s Industrial Papers business in June 2005, these products are sold at a variable charge for the paper purchased and a fixed charge for the availability of the machine. The amount included in our net sales for products produced from this machine totaled $37.6 million in 2007. In addition, our historical results include products produced and sold from our paper machine No. 1 (“PM1”) at the Androscoggin mill, which had produced uncoated paper. We shut down our PM1 machine during 2005 to convert its production to softwood pulp. This machine, which began production in the first quarter of 2006, produces approximately 90,000 tons of softwood pulp annually, which is shipped to our Bucksport mill for use in its coated paper production, thereby reducing the Bucksport mill’s third-party purchases of pulp. The amount included in our historical net sales for uncoated paper produced from this machine totaled $20.2 million in 2005.
Cost of Products Sold
The principal components of our cost of sales are chemicals, wood, energy, labor, maintenance and depreciation and amortization. Costs for commodities, including chemicals, wood and energy, are the most variable component of our cost of sales because the prices of many of the commodities that we use can fluctuate substantially, sometimes within a relatively short period of time. In addition, our aggregate commodity purchases fluctuate based on the volume of paper that we produce.
After giving effect to the Acquisition, our cost of goods sold increased as a result of the purchase accounting treatment of the Acquisition. Under the rules of purchase accounting, we adjusted the value of our assets (including the inventory we acquired) and liabilities at closing to their respective estimated fair values. As a result of these adjustments to our asset basis, following the close of the Acquisition, our costs of goods sold increased by such non-cash increase in our asset basis. However, this increase did not have a cash impact and did not affect our cost of sales for any inventory produced after the close of the Acquisition.
Chemicals. Chemicals utilized in the manufacturing of coated papers include latex, starch, calcium carbonate, titanium dioxide and others. We purchase these chemicals from a variety of suppliers and are not dependent on any single supplier to satisfy our chemical needs. In the near term, we expect the rate of inflation for our total chemical costs to be lower than that experienced over the last two years. However, we expect imbalances in supply and demand will drive higher prices for certain chemicals such as starch and sodium chlorate.
Wood. Our costs to purchase wood are affected directly by market costs of wood in our regional markets and indirectly by the effect of higher fuel costs on logging and transportation of timber to our facilities. While we have in place fiber supply agreements that ensure a substantial portion of our wood requirements, purchases under these agreements are typically at market rates.
Energy. We produce a large portion of our energy requirements, historically producing approximately 50% of our energy needs for our coated paper mills from sources such as waste wood and paper, hydroelectric facilities, chemicals from our pulping process, our own steam recovery boilers and internal energy cogeneration facilities. Our external energy purchases vary across each of our mills and include fuel oil, natural gas, coal and electricity. While our internal energy production capacity mitigates the volatility of our overall energy expenditures, we expect prices for energy to remain volatile for the foreseeable future and our energy costs will increase in a high energy cost environment. As prices fluctuate, we have some ability to switch between certain energy sources in order to minimize costs. We also utilize derivative contracts as part of our risk management strategy to manage our exposure to market fluctuations in energy prices.
Labor costs. Labor costs include wages, salary and benefit expenses attributable to our mill personnel. Mill employees at a non-managerial level are compensated on an hourly basis. Management employees at our mills are compensated on a salaried basis. Wages, salary and benefit expenses included in cost of sales do not vary significantly over the short term. In addition, we have not experienced significant labor shortages.
Maintenance. Maintenance expense includes day-to-day maintenance, equipment repairs and larger maintenance projects, such as paper machine shutdowns for periodic maintenance. Day-to-day maintenance expenses have not varied significantly from year-to-year. Larger maintenance projects and equipment expenses can produce year-to-year fluctuations in our maintenance expenses. In conjunction with our periodic maintenance shutdowns, we have incidental incremental costs that are primarily comprised of unabsorbed fixed costs from lower production volumes and other incremental costs for purchased materials and energy that would otherwise be produced as part of the normal operation of our mills.
Depreciation and amortization
Depreciation and amortization expense is lower after the Acquisition as a result of the lower asset bases assigned to property, plant, and equipment. Under the rules of purchase accounting, we have adjusted the value of our assets and liabilities to their respective estimated fair values and any excess of the purchase price over the fair market value of the net assets acquired was allocated to goodwill.
Selling, General and Administrative Expenses
The principal components of our selling, general and administrative expenses are wages, salaries and benefits for our office personnel at our headquarters and our sales force, travel and entertainment expenses, advertising expenses, expenses relating to certain information technology systems and research and development expenses. Also included are allocations of costs for corporate functions historically provided to us by International Paper. For further information about allocated costs, see “Selected Factors that Affect our Operating Results—Corporate Allocations.” In addition, we pay a management fee to Apollo on an annual basis pursuant to a management agreement we entered into with Apollo after the consummation of the Transactions.
Taxes
Prior to the Acquisition on August 1, 2006, the Company was included in the consolidated income tax returns of International Paper. In the Predecessor combined financial statements included in this annual report, income taxes have been presented based on a calculation of the income tax benefit we estimate would have been generated if we had operated as a separate taxpayer. As a result, we have reflected U.S. federal and state income tax expense on our gains based on an allocated rate of 39.4% for the year ended December 31, 2005 and for the seven months ended July 31, 2006. Our predecessor historically settled the current amount due to/from International Paper through a control account. Income taxes have been provided for all items included in the historical statements of income included herein, regardless of when such items were reported for tax purposes or when the taxes were actually paid or refunded. As a result of the Transactions, there was a step-up in the tax basis of our assets, significantly reducing our cash income tax payments. Accordingly, our historical income tax expense may not necessarily reflect and may differ materially from what our cash tax payments would have been or will be as a stand-alone entity.
Corporate Allocations
The historical combined statement of operations for the Predecessor includes allocations of costs for certain corporate functions historically provided to us by International Paper, including:
| · | General corporate expenses. This represents costs related to corporate functions such as accounting, tax, treasury, payroll and benefits administration, certain incentive compensation, risk management, legal, centralized transaction processing and information management and technology. These costs have historically been allocated primarily based on general factors and estimated use of services. These costs are included in selling, general and administrative expenses in the Predecessor’s historical combined statement of operations. |
| · | Employee benefits and incentives. This represents fringe benefit costs and other incentives, including group health and welfare benefits, U.S. pension plans, U.S. post-retirement benefit plans and employee incentive compensation plans. These costs have historically been allocated on an active headcount basis for health and welfare benefits, including U.S. post-retirement plans, on the basis of salary for U.S. pension plans and on a specific identification basis for employee incentive compensation plans. These costs are included in costs of goods sold, selling, general and administrative expenses and restructuring charges in the Predecessor’s historical combined statement of operations. |
| · | Interest expense and debt service costs. International Paper has historically provided financing to us through cash flows from its other operations and debt incurred. The interest expense associated with incurred debt that has been allocated to us based on specifically-identified borrowings is included in interest expense, net in our statements of operations data. Costs associated with the debt are included in other expense (income) in the Predecessor’s historical combined statement of operations. |
Expense allocations from International Paper reflected in the income (loss) in the Predecessor historical combined statements of operations were as follows:
| | | Seven | | | | |
| | | Months Ended | | | Year Ended | |
| | | July 31, | | | December 31, | |
| (In thousands of U.S. dollars) | | 2006 | | | 2005 | |
| | | | | | | |
| General corporate expenses | | $ | 19.5 | | | $ | 44.0 | |
| Employee benefits and incentives (1) | | | 11.3 | | | | 23.9 | |
| Interest expense and debt service costs | | | 8.4 | | | | 14.8 | |
| | | | | | | | | |
| (1) Includes severance payments associated with various headcount reduction initiatives of $7.2 million for 2005. | |
Following the consummation of the Transactions, we no longer have allocations for costs for certain corporate functions historically provided to us by International Paper. We now receive services historically provided by International Paper from our internal operations or third-party service providers. Accordingly, it is unlikely that the expenses we will incur as a stand-alone company for services that were historically provided to us by International Paper will reflect the allocated costs included in the Predecessor’s combined financial statements.
Critical Accounting Policies
The Company’s accounting policies are fundamental to understanding management’s discussion and analysis of results of operations and financial condition. The consolidated condensed financial statements of the Company are prepared in conformity with accounting principles generally accepted in the United States of America and follow general practices within the industries in which it operates. The preparation of the financial statements requires management to make certain judgments and assumptions in determining accounting estimates. Accounting estimates are considered critical if the estimate requires management to make assumptions about matters that were highly uncertain at the time the accounting estimate was made, and different estimates reasonably could have been used in the current period, or changes in the accounting estimate are reasonably likely to occur from period to period, that would have a material impact on the presentation of the Company’s financial condition, changes in financial condition or results of operations.
Management believes the following critical accounting policies are both important to the portrayal of the company’s financial condition and results of operations and require subjective or complex judgments. These judgments about critical accounting estimates are based on information available to us as of the date of the financial statements.
Accounting policies whose application may have a significant effect on the reported results of operations and financial position, and that can require judgments by management that affect their application, include Statement of Financial Accounting Standards (SFAS) No. 5, “Accounting for Contingencies,” SFAS No. 144, “Accounting for the Impairment or Disposal of Long-Lived Assets,” SFAS No. 142, “Goodwill and Other Intangible Assets,” SFAS No. 87, “Employers’ Accounting for Pensions,” and SFAS No. 158, “Employers’ Accounting for Defined Benefit Pension and Other Postretirement Plans.”
Impairment of long-lived assets and goodwill. Long-lived assets are reviewed for impairment upon the occurrence of events or changes in circumstances that indicate that the carrying value of the assets may not be recoverable, as measured by comparing their net book value to the estimated undiscounted future cash flows generated by their use. Impaired assets are recorded at estimated fair value, determined principally using discounted cash flows.
Goodwill and other intangible assets are accounted for in accordance with SFAS No. 142, “Goodwill and Other Intangible Assets.” Intangible assets primarily consist of trademarks, customer-related intangible assets and patents obtained through business acquisitions. An impairment evaluation of the carrying amount of goodwill and other intangible assets with indefinite lives is conducted annually or more frequently if events or changes in circumstances indicate that an asset might be impaired. The Company has identified the following trademarks as intangible assets with an indefinite life: Influence®, Liberty® and Advocate®. Goodwill is evaluated at the reporting unit level. Goodwill has been allocated to the “Coated” segment. Impairment is the condition that exists when the carrying amount of these assets exceed their implied fair value. The valuation as of October 1, 2007, indicated no impairment of goodwill or trademarks assigned indefinite lives.
The evaluation for impairment is performed by comparing the carrying amount of these assets to their estimated fair value. If impairment is indicated, then an impairment charge is recorded to reduce the asset to its estimated fair value. The estimated fair value is generally determined on the basis of discounted future cash flows. Management believes the accounting estimates associated with determining fair value as part of the impairment test is a critical accounting estimate because estimates and assumptions are made about the Company’s future performance and cash flows. While management uses the best information available to estimate future performance and cash flows, future adjustments to management’s projections may be necessary if economic conditions differ substantially from the assumptions used in making the estimates.
Pension and Postretirement Benefit Obligations. The Company offers various pension plans and postretirement benefit plans to employees. The calculation of the obligations and related expenses under these plans requires the use of actuarial valuation methods and assumptions, including the expected long-term rate of return on plan assets, discount rates, projected future compensation increases, health care cost trend rates and mortality rates. Actuarial valuations and assumptions used in the determination of future values of plan assets and liabilities are subject to management judgment and may differ significantly if different assumptions are used.
Contingent liabilities. A liability is contingent if the amount or outcome is not presently known, but may become known in the future as a result of the occurrence of some uncertain future event. The Company estimates its contingent liabilities based on management’s estimates about the probability of outcomes and their ability to estimate the range of exposure. Accounting standards require that a liability be recorded if management determines that it is probable that a loss has occurred and the loss can be reasonably estimated. In addition, it must be probable that the loss will be confirmed by some future event. As part of the estimation process, management is required to make assumptions about matters that are by their nature highly uncertain.
The assessment of contingent liabilities, including legal contingencies, asset retirement obligations and environ-mental costs and obligations, involves the use of critical estimates, assumptions and judgments. Management’s estimates are based on their belief that future events will validate the current assumptions regarding the ultimate outcome of these exposures. However, there can be no assurance that future events will not differ from management’s assessments.
Recent Accounting Developments
Business Combinations—In December 2007, the Financial Accounting Standards Board (FASB) issued SFAS No. 141 (revised 2007), “Business Combinations.” SFAS No. 141-R establishes principles and requirements for how an acquirer recognizes and measures identifiable assets acquired, liabilities assumed and noncontrolling interests; recognizes and measures goodwill acquired in a business combination or gain from a bargain purchase; and establishes disclosure requirements. SFAS No. 141-R is effective for business combinations for which the acquisition date is on or after the beginning of the first annual reporting period beginning on or after December 15, 2008. Early adoption is prohibited. The impact of adopting SFAS No. 141-R is not expected to have a material impact on the Company’s consolidated results of operations or consolidated financial position.
In December 2007, the FASB issued SFAS No. 160, “Noncontrolling Interests in Consolidated Financial Statements – an amendment of ARB No. 51.” SFAS No. 160 establishes accounting and reporting standards for the noncontrolling interest in a subsidiary and for the deconsolidation of a subsidiary. This standard is effective, on a prospective basis, for fiscal years, and interim periods within those years, beginning on or after December 15, 2008. The presentation and disclosure requirements for existing minority interests should be applied retrospectively for all periods presented. Early adoption is prohibited. The impact of adopting SFAS No. 160 is not expected to have a material impact on the Company’s consolidated results of operations or consolidated financial position.
Fair Value Option for Financial Assets and Financial Liabilities—In February 2007, the FASB issued SFAS No. 159, “Fair Value Option for Financial Assets and Financial Liabilities—including an amendment of FASB Statement No. 115,” which permits an entity to measure certain financial assets and financial liabilities at fair value. The Statement’s objective is to improve financial reporting by allowing entities to mitigate volatility in reported earnings caused by the measurement of related assets and liabilities using different attributes, without having to apply complex hedge accounting provisions. The Statement is effective as of the beginning of an entity’s fiscal year beginning after November 15, 2007. The impact of adopting SFAS No. 159 is not expected to have a material impact on the Company’s consolidated results of operations or consolidated financial position.
Fair Value Measurements—In September 2006, the FASB issued SFAS No. 157, “Fair Value Measurements.” SFAS No. 157 does not address “what” to measure at fair value; instead, it addresses “how” to measure fair value. SFAS No. 157 applies (with limited exceptions) to existing standards that require assets and liabilities to be measured at fair value. SFAS No. 157 establishes a fair value hierarchy, giving the highest priority to quoted prices in active markets and the lowest priority to unobservable data and requires new disclosures for assets and liabilities measured at fair value based on their level in the hierarchy. SFAS No. 157 is effective for financial statements issued for fiscal years beginning after November 15, 2007. However, FSP 157-2, “Effective Date of FASB Statement No. 157,” delayed the implementation of SFAS No. 157 for nonfinancial assets and nonfinancial liabilities, except for items that are recognized or disclosed at fair value in the financial statements on a recurring basis, to years beginning after November 15, 2008. The impact of adopting SFAS No. 157 is not expected to have a material impact on the Company’s consolidated results of operations or consolidated financial position.
Financial Summary
Verso Paper’s fourth quarter 2007 results reflect continued improvement and were above our seasonally strong third quarter. Prices for coated paper in fourth quarter 2007 increased more than 4% compared to third quarter 2007, as we continue to realize higher prices resulting from the two price increases previously announced. We expect this trend to continue as coated paper market conditions and order backlogs remain strong resulting from significant capacity closures within the industry and favorable exchange rates. Revenues for the quarter were up over 9% compared to fourth quarter 2006 driven by stronger volumes while prices were relatively flat.
During fourth quarter, in addition to strong volumes and improved sales prices, our operations ran well and generated significant cost improvements. Input prices for our key direct expenses and selling, general and administrative costs were relatively flat for fourth quarter compared to third quarter 2007.
Results of Operations
The following table sets forth certain historical combined financial information for the years ended December 31, 2007, 2006 and 2005. For comparison purposes, we have presented the results of operations for the year ended December 31, 2006, on a combined basis, consisting of the historical results of operations of our Predecessor for the seven months ended July 31, 2006, and the historical results of operations for the Successor for the five months ended December 31, 2006. We believe that this approach is beneficial to the reader by providing an easier-to-read discussion of the results of operations and provides the reader with information from which to analyze our financial results that is consistent with the manner that management reviews and analyzes results of operations.
U.S. GAAP does not contemplate the combination of the financial results of our Predecessor and Successor as the combined information does not include any pro forma assumptions or adjustments and, as a result, does not fully reflect the significant impact the Transactions had on our financial statements. In particular, fair value adjustments to personal property and other property and equipment due to the allocation of the purchase price to assets acquired and liabilities assumed resulted in a lower depreciation expense for the Successor. The pro forma impact of these adjustments on the Predecessor’s results of operations for the seven months ended July 31, 2006, would have been a reduction of $5.4 million in depreciation expense. In addition, intangible assets recognized through the allocation of the purchase price to assets acquired and liabilities assumed resulted in incremental amortization expense for the Successor. The pro forma impact on the Predecessor’s results of operations for the seven months ended July 31, 2006, would have been $0.4 million of amortization expense, resulting in a net pro forma reduction in depreciation and amortization expense of $5.0 million for the twelve months ended December 31, 2006.
Cost of sales in the following table and discussion includes the cost of products sold and depreciation and amortization. The following table and discussion should be read in conjunction with the information contained in our historical combined financial statements and the notes thereto included elsewhere in this annual report. However, our historical results of operations set forth below and elsewhere in this annual report may not necessarily reflect what would have occurred if we had been a separate, stand-alone entity during the periods presented or what will occur in the future.
| | | | | | Combined | | | | | | | | | | |
| | | Successor | | | Successor and | | | Successor | | | | | | | |
| | | Consolidated | | | Predecessor | | | Consolidated | | | Predecessor Combined | |
| | | | | | | | | Five Months | | | Seven Months | | | | |
| | | Year Ended | | | Year Ended | | | Ended | | | Ended | | | Year Ended | |
| | | December 31, | | | December 31, | | | December 31, | | | July 31, | | | December 31, | |
| (In thousands of U.S. dollars) | | 2007 | | | 2006 | | | 2006 | | | 2006 | | | 2005 | |
| | | | | | | | | | | | | | | | |
| Net sales | | $ | 1,628,753 | | | $ | 1,611,250 | | | $ | 706,833 | | | $ | 904,417 | | | $ | 1,603,846 | |
| | | | | | | | | | | | | | | | | | | | | |
| Costs and expenses: | | | | | | | | | | | | | | | | | | | | |
| Cost of products sold - exclusive of | | | | | | | | | | | | | | | | | | | | |
| depreciation and amortization | | | 1,403,144 | | | | 1,360,858 | | | | 589,283 | | | | 771,575 | | | | 1,338,256 | |
| Depreciation and amortization | | | 123,139 | | | | 120,991 | | | | 48,317 | | | | 72,674 | | | | 129,355 | |
| Selling, general and administrative expenses | | | 52,007 | | | | 48,344 | | | | 13,996 | | | | 34,348 | | | | 65,569 | |
| Restructuring and other charges | | | 19,395 | | | | 9,804 | | | | 10,126 | | | | (322 | ) | | | 10,419 | |
| | | | | | | | | | | | | | | | | | | | | |
| Operating income | | | 31,068 | | | | 71,253 | | | | 45,111 | | | | 26,142 | | | | 60,247 | |
| | | | | | | | | | | | | | | | | | | | | |
| Interest income | | | (1,544 | ) | | | (1,821 | ) | | | (1,798 | ) | | | (23 | ) | | | (39 | ) |
| Interest expense | | | 113,881 | | | | 57,155 | | | | 48,741 | | | | 8,414 | | | | 14,823 | |
| | | | | | | | | | | | | | | | | | | | | |
| Income (loss) before income taxes | | | (81,269 | ) | | | 15,919 | | | | (1,832 | ) | | | 17,751 | | | | 45,463 | |
| | | | | | | | | | | | | | | | | | | | | |
| Income tax expense | | | - | | | | 6,994 | | | | - | | | | 6,994 | | | | 17,913 | |
| | | | | | | | | | | | | | | | | | | | | |
| Net income (loss) | | $ | (81,269 | ) | | $ | 8,925 | | | $ | (1,832 | ) | | $ | 10,757 | | | $ | 27,550 | |
2007 Successor to 2006 Combined Successor and Predecessor
Net Sales. Net sales for the year ended December 31, 2007 were $1,628.8 million compared to $1,611.2 million for the year ended December 31, 2006, an increase of 1.1%. The increase was the result of a 4.2% increase in the tons sold in 2007. This increase was partially offset by a 3.0% decrease in the average sales price per ton for all of our products over the comparable period.
Net sales for our coated and supercalendered papers segment were $1,443.2 million for the year ended December 31, 2007, compared to $1,425.2 million for the year ended December 31, 2006, an increase of 1.3%. The increase was primarily due to higher paper volumes, which increased by 6.1% compared to 2006, partially offset by lower paper prices, which decreased 4.6% over the comparable period.
Net sales for our hardwood market pulp segment were $148.0 million for the year ended December 31, 2007, compared to $147.0 million for the year ended December 31, 2006, an increase of 0.7%. The increase was due to higher sales prices of 5.9%, while volumes decreased 5.0% due to an increase in internal consumption.
Net sales for our other segment were $37.6 million for the year ended December 31, 2007, compared to $39.0 million for the year ended December 31, 2006, a decrease of 3.7%. This decrease reflects a 4.1% decline in sales volume, partially offset by a 0.5% increase in average sales prices compared to 2006.
Cost of sales. Cost of sales for the year ended December 31, 2007, was $1,526.3 million compared to $1,481.9 million for the year ended December 31, 2006, an increase of 3.0%, primarily driven by higher sales volume. Our gross margin, excluding depreciation and amortization, was 13.9% for the year ended December 31, 2007, compared to 15.5% for the same period in 2006. This decline reflects the lower average sales prices in 2007. Depreciation and amortization expense for the year ended December 31, 2007, was $123.1 million compared to $121.0 million for the year ended December 31, 2006.
Selling, general and administrative. Selling, general and administrative expenses were $52.0 million for the year ended December 31, 2007, compared to $48.3 million for the same period in 2006, an increase of 7.6%. For the period following the closing of the Acquisition, selling, general and administrative expenses reflect the annual expenses we incurred as a stand-alone business.
Interest expense. Interest expense for the year ended December 31, 2007, increased to $113.9 million from $57.1 for the same period in 2006 due to the debt issued as part of the Acquisition.
Restructuring and other charges. Restructuring and other charges include one-time costs for us to operate as a stand-alone business. The charges for the year ended December 31, 2007, were $19.4 million compared to $10.1 million for the five-month period ended December 31, 2006. In conjunction with the Acquisition, we entered into a transition service agreement with International Paper whereby International Paper continued to provide certain services that were necessary for us to run as a stand-alone business. Included in restructuring and other charges for the year ended December 31, 2007, were charges of $4.7 million incurred under the transition services agreement compared to $6.1 million for the five months ended December 31, 2006. We are no longer operating under the transition services agreement.
Income tax expense. The Company is a limited liability corporation and is not subject to federal income taxes. For the year ended December 31, 2007, and for the five-month period from August 1, 2006, to December 31, 2006, the Company incurred no income taxes, compared to income tax expense of $7.0 million for our Predecessor for the seven months ended July 31, 2006.
2006 Combined Successor and Predecessor to 2005 Predecessor
Net Sales. Net sales for the year ended December 31, 2006 were $1,611.2 million compared to $1,603.8 million for the year ended December 31, 2005, an increase of 0.5%. The increase was the result of a 1.1% increase in the average sales price per ton for all of our products in 2006. This increase was partially offset by a 0.7% decrease in the tons sold over the comparable period.
Net sales for our coated and supercalendered papers segment were $1,425.2 million for the year ended December 31, 2006, compared to $1,400.6 million for the year ended December 31, 2005, an increase of 1.8%. The increase was primarily due to higher paper prices, which increased by 0.9% compared to paper prices in 2005 and higher paper volumes of 0.8% over the comparable period.
Net sales for our hardwood market pulp segment were $147.0 million for the year ended December 31, 2006, compared to $139.8 million for the year ended December 31, 2005, an increase of 5.2%. The increase was due to higher sales prices of 5.9%, while volumes decreased 0.8% due to an increase in internal consumption.
Net sales for our other segment were $39.0 million for the year ended December 31, 2006, compared to $63.4 million for the year ended December 31, 2005, a decrease of 38.5%. The decrease was primarily due to the absence of sales in 2006 from paper machine No. 1 at our Androscoggin mill, which was shut down during 2005 and converted from the production of uncoated paper to the production of softwood pulp used to supply our Bucksport mill.
Cost of sales. Cost of sales for the year ended December 31, 2006 was $1,481.9 million, which included a $5.9 million inventory fair value adjustment, compared to $1,467.6 million for the year ended December 31, 2005, an increase of 1.0%. Our gross margin, excluding depreciation expense, for the year ended December 31, 2006 was 15.5%, compared to 16.6% for the same period in 2005. Excluding the fair value of inventory adjustment, the gross margin for the year ended December 31, 2006 was 15.9%. Depreciation expense for the year ended December 31, 2006 was $121.0 million compared to $129.4 million for the year ended December 31, 2005.
Selling, general and administrative. Selling, general and administrative expenses were $48.3 million for the year ended December 31, 2006, compared to $65.6 million for the same period in 2005, a decrease of 26.3%. The decrease is primarily due to the elimination of an allocation from International Paper for corporate services related to the operation of paper machine No. 1 at the Androscoggin mill, which was shutdown during 2005 and due to the elimination of an allocation from International Paper for corporate services during the five months ended December 31, 2006 compared to receiving a full allocation for the year ended December 31, 2005. For the period following the closing of the Acquisition, selling, general and administrative expenses reflect the actual expenses we incurred as a stand-alone business.
Interest expense. Interest expense for the year ended December 31, 2006 was $57.1 million, compared to $14.8 for the same period in 2005 due to the debt incurred as a result of the Acquisition.
Restructuring and other charges. Restructuring and other charges in the Successor period are one-time transaction costs for us to run as a stand-alone business. The charges for the five-month period ended December 31, 2006, were $10.1 million which included $6.1 million of transition service agreement costs. In the Predecessor period, restructuring and other charges are severance and related costs associated with the permanent shutdown of the No. 1 paper machine at the Androscoggin mill. The charges for the year ended December 31, 2005, were $10.4 million, which included $3.2 million of asset impairment.
Income tax expense. The income tax expense of $7.0 million for the year ended December 31, 2006, is a decrease in tax expense compared to the year ended December 31, 2005 of $17.9 million, primarily due to the Company being treated as a partnership for federal tax purposes during the period from August 1, 2006, through December 31, 2006.
Liquidity and Capital Resources
We rely primarily upon cash flow from operations and borrowings under our revolving credit facility to finance operations, capital expenditures and fluctuations in debt service requirements. On December 31, 2007, $170.6 million was available under our revolving credit facility, which is currently undrawn, after deducting for $29.4 million of standby letters of credit that we have issued.
We believe that our ability to manage cash flow and working capital levels, particularly inventory and accounts payable, will allow us to meet our current and future obligations, pay scheduled principal and interest payments, and provide funds for working capital, capital expenditures and other needs of the business for at least the next twelve months. However, no assurance can be given that this will be the case, and we may require additional debt or equity financing to meet our working capital requirements.
Cash provided by operating activities. For the year ended December 31, 2007, our operating activities generated net cash of $38.8 million, compared to $168.1 million of net cash generated during the comparable period in 2006. The decline was primarily due to a net loss of $81.0 million in 2007 compared to net income of $8.9 million in 2006. Operating activities in 2005 generated net cash of approximately $116.8 million compared to $168.1 million in 2006. The increase in 2006 was primarily driven by improved operations and working capital improvements.
Cash used in investing activities. For the year ended December 31, 2007, we used $67.8 million of net cash in investing activities, primarily due to investments in capital expenditures. This compares to $1,419.4 million of net cash used during the comparable period in 2006, which reflects the $1.4 billion in cash paid for the Acquisition. In 2005, we used $53.0 million of net cash in investing activities, primarily due to investments in capital expenditures.
Cash used in financing activities. For the year ended December 31, 2007, our financing activities used $24.9 million of net cash, which reflected principal payments on debt and $22.1 million in distributions paid to Verso Paper Finance Holdings LLC, our parent company, to provide for interest obligations. In 2006, net cash provided by financing activities was $1,363.8 million, reflecting the net proceeds from the debt issuance and equity contributions. In 2005, financing activities used $63.8 million, driven by distributions of operating cash flows, net of investing activities, to International Paper.
Indebtedness Our aggregate indebtedness at December 31, 2007, was $1,156.4 million, including the current portion of our outstanding borrowings.
We entered into our senior secured credit facilities on August 1, 2006, consisting of:
| · | a $285 million term loan with a maturity of seven years, which was fully drawn on August 1, 2006; and |
| · | a $200 million revolving credit facility with a maturity of six years. No amounts were outstanding at December 31, 2007 or 2006. Letters of credit of $29.4 million and $35.3 million were issued as of December 31, 2007 and 2006, respectively. |
Our senior secured credit facilities are secured by first priority pledges of all the equity interests owned by us in our subsidiaries. Our senior secured credit facilities are also secured by first priority interests in, and mortgages on, substantially all of our tangible and intangible assets and those of each of our direct and indirect subsidiaries. Our obligations under the senior secured credit facilities are also unconditionally guaranteed by Verso Paper Finance Holdings LLC, subject to certain exceptions, and each of its direct and indirect subsidiaries. The term loan facility bears interest at a rate equal to LIBOR plus 1.75% and the interest rate at December 31, 2007, was 6.6%. The revolving credit facility bears interest at a rate equal to LIBOR plus 2.00%. In addition to paying interest on outstanding principal under these senior secured credit facilities, we are required to pay a commitment fee to the lenders under the revolving credit facility in respect of the unutilized commitments thereunder at a rate equal to 0.50% per annum (subject to reduction upon attainment of certain first lien leverage ratios). We also pay customary letter of credit and agency fees.
In addition, on August 1, 2006, we completed an offering of $350 million in aggregate principal amount of 9⅛% second-priority senior fixed-rate notes due 2014, $250 million in aggregate principal amount of second-priority senior secured floating rate notes due 2014, and $300 million in aggregate principal amount of 11⅜% senior subordinated notes due 2016. The floating rate notes bear interest at a rate equal to LIBOR plus 3.75% and the interest rate at December 31, 2007, was 8.7%. The proceeds of the note offerings were used to finance the Acquisition and to pay related fees and expenses. Our second-priority senior secured notes have the benefit of a second-priority security interest in the collateral securing our senior secured credit facilities. The fixed rate notes pay interest semi-annually and the variable rate notes pay interest quarterly. The senior subordinated notes are unsecured and pay interest semi-annually.
All of our senior secured credit facilities contain various restrictive covenants. They prohibit us from prepaying other indebtedness and require us to maintain a maximum consolidated first lien leverage ratio. In addition, our senior secured credit facilities, among other things, restrict our ability to incur indebtedness or liens, make investments or declare or pay any dividends. The indentures governing our second priority senior secured notes and our senior subordinated notes limit our ability to, among other things, to (i) incur additional indebtedness; (ii) pay dividends or make other distributions or repurchase or redeem our stock; (iii) make investments; (iv) sell assets, including capital stock of restricted subsidiaries; (v) enter into agreements restricting our subsidiaries’ ability to pay dividends; (vi) consolidate, merge, sell or otherwise dispose of all or substantially all of our assets; (vii) enter into transactions with our affiliates; and (viii) incur liens. As of December 31, 2007, we were in compliance with all covenants.
On January 31, 2007, Verso Paper Finance Holdings LLC, the parent of the Company, entered into a $250 million senior unsecured term loan facility with a maturity of six years. The senior unsecured term loan facility bears interest at a rate equal to LIBOR plus 6.25% and the interest rate at December 31, 2007 was 9.5%. The net proceeds from the incurrence of the term loan facility were distributed to our equity holders. The loan allows the borrower to pay interest in cash or in-kind through the accumulation of the outstanding principal amount. We believe that our ability to manage cash flow and working capital levels, particularly inventory and accounts payable, will allow us to meet our current and future obligations associated with this loan. However, no assurance can be given that this will be the case and we may require additional debt or equity financing.
Covenant Compliance
Certain covenants contained in the credit agreement governing our senior secured credit facilities and the indentures governing our notes (i) require the maintenance of a senior secured debt to Adjusted EBITDA (as defined below) ratio and (ii) restrict our ability to take certain actions such as incurring additional debt or making acquisitions if we are unable to meet defined Adjusted EBITDA to Fixed Charges (as defined below), senior secured debt to Adjusted EBITDA and consolidated debt to Adjusted EBITDA ratios. The most restrictive of these covenants, the covenants to incur additional indebtedness and the ability to make future acquisitions, require an Adjusted EBITDA to Fixed Charges ratio (measured on a trailing four-quarter basis) of 2.0 : 1.0. Failure to comply with these covenants can result in limiting our long-term growth prospects by hindering our ability to incur future indebtedness or grow through acquisitions. See “Risk Factors—Our substantial indebtedness could adversely affect our financial health.”
EBITDA consists of earnings before interest, taxes depreciation and amortization. Fixed Charges are defined as consolidated interest expense excluding the amortization or write-off of deferred financing costs. Adjusted EBITDA is defined as EBITDA further adjusted to exclude unusual items and other pro forma adjustments permitted in calculating covenant compliance in the indentures governing our notes to test the permissibility of certain types of transactions. We believe that the inclusion of the supplemental adjustments applied in calculating Adjusted EBITDA is appropriate to provide additional information to investors to demonstrate our compliance with our financial covenants and assess our ability to incur additional indebtedness in the future. However, EBITDA and Adjusted EBITDA are not measurements of financial performance under U.S. GAAP, and our EBITDA and Adjusted EBITDA may not be comparable to similarly titled measures of other companies. You should not consider our EBITDA or Adjusted EBITDA as an alternative to operating or net income, determined in accordance with U.S. GAAP, as an indicator of our operating performance, or as an alternative to cash flows from operating activities, determined in accordance with U.S. GAAP, as an indicator of our cash flows or as a measure of liquidity.
For comparison purposes, EBITDA and Adjusted EBITDA for the year ended December 31, 2006, are presented on a combined basis, consisting of the historical results of the Predecessor for the seven months ended July 31, 2006, and the results of the Successor for the five-month period beginning August 1, 2006 and ending December 31, 2006. U.S. GAAP does not contemplate the combination of the financial results of our Predecessor and Successor, as the combined information does not include any pro forma assumptions or adjustments and, as a result, does not fully reflect the significant impact the Transactions have had on our financial statements.
The following table reconciles cash flows from operating activities to EBITDA and Adjusted EBITDA for the periods presented:
| | | | | | Combined | | | | | | | | | | |
| | | Successor | | | Predecessor | | | Successor | | | Predecessor | | | Predecessor | |
| | | Consolidated | | | & Successor | | | Consolidated | | | Combined | | | Combined | |
| | | | | | | | | Five Months | | | Seven Months | | | | |
| | | Year Ended | | | Year Ended | | | Ended | | | Ended | | | Year Ended | |
| | | December 31, | | | December 31, | | | December 31, | | | December 31, | | | December 31, | |
| (in millions of U.S. dollars) | | 2007 | | | 2006 | | | 2006 | | | 2006 | | | 2005 | |
| | | | | | | | | | | | | | | | | |
| Cash flow from operating activities | | $ | 38.8 | | | $ | 168.1 | | | $ | 128.8 | | | $ | 39.3 | | | $ | 116.8 | |
| Income tax expense | | | - | | | | 7.0 | | | | - | | | | 7.0 | | | | 17.9 | |
| Amortization of debt issuance costs | | | (5.4 | ) | | | (2.3 | ) | | | (2.3 | ) | | | - | | | | - | |
| Interest income | | | (1.5 | ) | | | (1.8 | ) | | | (1.8 | ) | | | - | | | | - | |
| Interest expense | | | 113.9 | | | | 57.1 | | | | 48.7 | | | | 8.4 | | | | 14.8 | |
| Loss on disposal of fixed assets | | | (1.0 | ) | | | (1.4 | ) | | | (0.1 | ) | | | (1.3 | ) | | | (6.0 | ) |
| Other, net | | | 1.5 | | | | (0.7 | ) | | | - | | | | (0.7 | ) | | | (1.7 | ) |
| Changes in assets and liabilities, net | | | 7.9 | | | | (33.8 | ) | | | (79.9 | ) | | | 46.1 | | | | 47.8 | |
| EBITDA | | | 154.2 | | | | 192.2 | | | | 93.4 | | | | 98.8 | | | | 189.6 | |
| Lease not assumed (1) | | | - | | | | 5.8 | | | | - | | | | 5.8 | | | | 10.7 | |
| Change in machine use, net (2) | | | - | | | | 2.8 | | | | - | | | | 2.8 | | | | 1.8 | |
| Restructuring, severance and other (3) | | | 19.4 | | | | 9.8 | | | | 10.1 | | | | (0.3 | ) | | | 10.4 | |
| Non-cash compensation/benefits (4) | | | 0.6 | | | | 5.4 | | | | 0.4 | | | | 5.0 | | | | 5.3 | |
| Inventory fair value (5) | | | - | | | | 5.9 | | | | 5.9 | | | | - | | | | - | |
| Other items, net (6) | | | 8.0 | | | | (0.1 | ) | | | (8.2 | ) | | | 8.1 | | | | (1.6 | ) |
| Adjusted EBITDA | | $ | 182.2 | | | $ | 221.8 | | | $ | 101.6 | | | $ | 120.2 | | | $ | 216.2 | |
| | | | | | | | | | | | | | | | | | | | | |
| Cash interest expense, net (7) | | $ | 109.2 | | | | | | | | | | | | | | | | | |
| Adjusted EBITDA to cash interest expense | | | 1.7 | | | | | | | | | | | | | | | | | |
| (1) | Reflects the elimination of the historical rent expense incurred on the Sartell property lease that was not assumed by us in the Acquisition. |
| (2) | Represents the elimination or addition of expected earnings as a result of changes in the use of two of our paper machines at the Jay mill prior to the Acquisition. |
| (3) | Includes restructuring and severance as per our financial statements. Restructuring includes transition and other non-recurring costs associated with the Acquisition. |
| (4) | Represents amortization of certain one-time benefit payments and non-cash benefit payments. Also includes the elimination of historical non-cash stock compensation costs previously incurred by us under International Paper's compensation plan. |
| (5) | Represents the fair value of inventory adjustment related to purchase accounting. |
| (6) | Represents earnings adjustments for exceptional levels of bad debt expense, legal and consulting fees, and other miscellaneous non-recurring items, including adjustments for incremental estimated costs for activities previously part of the corporate allocation as well as other incremental costs we anticipated incurring on a stand-alone basis subsequent to the Transactions |
| (7) | Cash interest expense represents gross interest expense related to the debt, excluding amortization of debt issuance costs. |
Seasonality
We are exposed to fluctuations in quarterly net sales volumes and expenses due to seasonal factors. These seasonal factors are common in the paper industry. Typically, the first two quarters are our slowest quarters due to lower demand for coated paper during this period. Our third quarter is generally our strongest quarter, reflecting an increase in printing related to end-of-year magazines, increased end-of-year direct mailings and holiday season catalogs. Our working capital and accounts receivables generally peak in the third quarter, while inventory generally peaks in the second quarter in anticipation of the third quarter season. We expect our seasonality trends to continue for the foreseeable future.
Effect of Inflation
While inflationary increases in certain input costs, such as energy, wood fiber and chemical costs, have an impact on our operating results, changes in general inflation have had minimal impact on our operating results in the last three years. Sales prices and volumes are more strongly influenced by supply and demand factors in specific markets and by exchange rate fluctuations than by inflationary factors. We cannot assure you, however, that we will not be affected by general inflation in the future.
Contractual Obligations
The following table reflects our contractual obligations and commercial commitments as of December 31, 2007. Commercial commitments include lines of credit, guarantees and other potential cash outflows resulting from a contingent event that requires our performance pursuant to a funding commitment.
| | | Payments due by period (1) | |
| | | | | | Less than | | | | | | | | | More than | |
| (in millions of U.S. dollars) | | Total | | | 1 year | | | 1-3 years | | | 3-5 years | | | 5 years | |
| Long-term debt (1) | | $ | 1,906.0 | | | $ | 109.3 | | | $ | 217.9 | | | $ | 216.8 | | | $ | 1,362.0 | |
| Operating leases | | | 13.6 | | | | 5.4 | | | | 6.6 | | | | 1.6 | | | | - | |
| Purchase obligations (2) | | | 123.1 | | | | 47.8 | | | | 27.7 | | | | 5.5 | | | | 42.1 | |
| Other long-term liabilities (3) | | | 30.2 | | | | 1.1 | | | | 0.3 | | | | 1.2 | | | | 27.6 | |
| Total | | $ | 2,072.9 | | | $ | 163.6 | | | $ | 252.5 | | | $ | 225.1 | | | $ | 1,431.7 | |
| (1) | Long-term debt includes principal payments, commitment fees and accrued interest payable. A portion of interest expense is at a variable rate and has been calculated using current Libor. Actual payments could vary. |
| (2) | Purchase obligations include unconditional purchase obligations for power purchase agreements (gas and electricity), machine clothing and other commitments for advertising, raw materials or storeroom inventory. |
| (3) | Other long-term liabilities reflected above represent the gross amount of asset retirement obligations. |
We are exposed to market risk from fluctuations in our paper prices, interest rates and commodity prices for our inputs.
Paper prices—Our sales, which we report net of rebates, allowances and discounts, are a function of the number of tons of paper that we sell and the price at which we sell our paper. The coated paper industry is cyclical, which results in changes in both volume and price. Paper prices historically have been a function of macro-economic factors, which influences supply and demand. Price has historically been substantially more variable than volume and can change significantly over relatively short time periods.
We are primarily focused on serving two end-user segments: catalogs and magazines. Coated paper demand is primarily driven by advertising and print media usage. Advertising spending and magazine and catalog circulation tend to be correlated with GDP in the United States and rise with a strong economy. The majority of our products are sold via contracts we maintain with our customers. Contracted sales are more prevalent for coated groundwood paper, as opposed to coated freesheet paper, which is more often sold without a contract. Our contracts generally specify the volumes to be sold to the customer over the contract term, as well as the pricing parameters for those sales. The large portion of contracted sales allows us to plan our production runs well in advance, optimizing production over our integrated mill system and thereby reducing costs and increasing overall efficiency.
We reach our end-users through several channels, including printers, brokers, paper merchants and direct sales to end-users. We sell and market our products to approximately 100 customers. In 2007, no single customer accounted for more than 10% of our total net sales.
Interest Rate Risk—We issued fixed- and floating-rate debt to finance the Acquisition in order to manage our variability to cash flows from interest rates. Borrowings under our senior secured credit facilities and our floating-rate notes accrue interest at variable rates, and a 100 basis point increase in quoted interest rates on our debt balances outstanding as of December 31, 2007, under our senior secured credit facilities and our floating-rate notes would increase our annual interest expense by $5.1 million. While we may enter into agreements limiting our exposure to higher interest rates, any such agreements may not offer complete protection from this risk.
Derivatives—In the normal course of business, we utilize derivatives contracts as part of our risk management strategy to manage our exposure to market fluctuations in energy prices. These instruments are subject to credit and market risks in excess of the amount recorded on the balance sheet in accordance with generally accepted accounting principles. Controls and monitoring procedures for these instruments have been established and are routinely reevaluated. We have an Energy Risk Management Policy adopted by the Executive Committee of the Board of Directors and monitored by an Energy Risk Management Committee, which is composed of senior management. Credit risk represents the potential loss that may occur because a party to a transaction fails to perform according to the terms of the contract. The measure of credit exposure is the replacement cost of contracts with a positive fair value. We manage credit risk by entering into financial instrument transactions only through approved counterparties. Market risk represents the potential loss due to the decrease in the value of a financial instrument caused primarily by changes in commodity prices. We manage market risk by establishing and monitoring limits on the types and degree of risk that may be undertaken. However, we do not hedge the entire exposure of our operations from commodity price volatility for a variety of reasons. To the extent we do not hedge against commodity price volatility, our results of operations may be affected either favorably or unfavorably by a shift in the future price curve. As of December 31, 2007, we had net unrealized losses of $1.4 million on open commodity swaps. These swaps had maturities from one to ten months. A 10% adverse change in commodity prices would have a negative impact of approximately $1.8 million on the fair value of such instruments. This quantification of exposure to market risk does not take into account the offsetting impact of changes in prices on anticipated future energy purchases.
Commodity Price Risk—We are subject to changes in our cost of sales caused by movements underlying commodity prices. The principal components of our cost of sales are chemicals, wood, energy, labor, maintenance and depreciation and amortization. Costs for commodities, including chemicals, wood and energy, are the most variable component of our cost of sales because their prices can fluctuate substantially, sometimes within a relatively short period of time. In addition, our aggregate commodity purchases fluctuate based on the volume of paper that we produce.
Chemicals. Chemicals utilized in the manufacturing of coated papers include latex, starch, calcium carbonate, titanium dioxide and others. We purchase these chemicals from a variety of suppliers and are not dependent on any single supplier to satisfy our chemical needs. In the near term, we expect the rate of inflation for our total chemical costs to be lower than that experienced over the last two years. However, we expect imbalances in supply and demand will drive higher prices for certain chemicals such as starch and sodium chlorate.
Wood. Our costs to purchase wood are affected directly by market costs of wood in our regional markets and indirectly by the effect of higher fuel costs on logging and transportation of timber to our facilities. While we have in place fiber supply agreements that ensure a substantial portion of our wood requirements, purchases under these agreements are typically at market rates.
Energy. We produce a large portion of our energy requirements, historically producing approximately 50% of our energy needs for our coated paper mills from sources such as waste wood and paper, hydroelectric facilities, chemicals from our pulping process, our own steam recovery boilers and internal energy cogeneration facilities. Our external energy purchases vary across each of our mills and include fuel oil, natural gas, coal and electricity. While our internal energy production capacity mitigates the volatility of our overall energy expenditures, we expect prices for energy to remain volatile for the foreseeable future and our energy costs will increase in a high energy cost environment. As prices fluctuate, we have some ability to switch between certain energy sources in order to minimize costs. We also utilize derivatives contracts as part of our risk management strategy to manage our exposure to market fluctuations in energy prices.
REPORT OF INDEPENDENT REGISTERED PUBLIC ACCOUNTING FIRM
To the Board of Directors and Members of
Verso Paper Holdings LLC
Memphis, Tennessee
We have audited the accompanying consolidated balance sheets of Verso Paper Holdings LLC (the “Company”), a wholly-owned subsidiary of Verso Paper Finance Holdings LLC, as of December 31, 2007 and 2006 (Successor Company balance sheets), and the related consolidated statements of operations, changes in members’ equity, and cash flows for the period ended December 31, 2007, and the five months ended December 31, 2006 (Successor Company operations). We have also audited the accompanying combined statements of operations and cash flows for the seven months ended July 31, 2006, and the year ended December 31, 2005(Predecessor operations). These financial statements are the responsibility of the Company's management. Our responsibility is to express an opinion on these financial statements based on our audits.
We conducted our audits in accordance with the standards of the Public Company Accounting Oversight Board (United States). Those standards require that we plan and perform the audit to obtain reasonable assurance about whether the financial statements are free of material misstatement. The Company is not required to have, nor were engaged to perform, an audit of its internal control over financial reporting. Our audits include consideration of internal control over financial reporting as a basis for designing audit procedures that are appropriate in the circumstances, but not for the purpose of expressing an opinion on the effectiveness of the Company's internal control over financial reporting. Accordingly, we express no such opinion. An audit also includes examining, on a test basis, evidence supporting the amounts and disclosures in the financial statements, assessing the accounting principles used and significant estimates made by management, as well as evaluating the overall financial statement presentation. We believe that our audits provide a reasonable basis for our opinion.
In our opinion, the Successor Company consolidated financial statements present fairly, in all material respects, the financial position of the Company as of December 31, 2007 and 2006, and the results of its operations and its cash flows for the year ended December 31, 2007, and the five months ended December 31, 2006, in conformity with accounting principles generally accepted in the United States of America. Further, in our opinion, the Predecessor combined financial statements referred to above present fairly, in all material respects, the results of its operations and its cash flows for the seven months ended July 31, 2006, and the year ended December 31, 2005, in conformity with accounting principles generally accepted in the United States of America
As discussed in Note 1 to the Successor Company consolidated financial statements, the Company adopted Statement of Financial Accounting Standards (“SFAS”) No. 158, Employers’ Accounting for Defined Benefit Pension and Other Postretirement Plans –an Amendment of FASB Statements No. 87, 88, 106, and 132(R), as of December 31, 2006.
As discussed in Note 3 to the Successor Company financial statements, on August 1, 2006, the Company acquired the Predecessor.
As discussed in Note 1 to the Predecessor combined financial statements, the accompanying Predecessor combined financial statements have been prepared from the separate records maintained by the Predecessor and International Paper Company and may not necessarily be indicative of the conditions that would have existed or the results of operations if the Predecessor had been operated as an unaffiliated company. Portions of certain expenses represent allocations made from corporate-office items applicable to International Paper Company as a whole.
/s/ Deloitte & Touche LLP
Memphis, Tennessee
March 12, 2008
| VERSO PAPER HOLDINGS LLC | |
| | | | | | | |
| CONSOLIDATED BALANCE SHEETS | |
| | | | | | | |
| | | | | | | |
| | | December 31, | | | December 31, | |
| (In thousands of U.S. dollars) | | 2007 | | | 2006 | |
| | | | | | | |
| ASSETS | | | | | | |
| Current Assets: | | | | | | |
| Cash | | $ | 58,499 | | | $ | 112,448 | |
| Accounts receivable - net | | | 121,351 | | | | 113,489 | |
| Accounts receivable from International Paper Company - net | | | 12,318 | | | | 8,217 | |
| Inventories | | | 119,620 | | | | 140,503 | |
| Prepaid expenses and other assets | | | 3,935 | | | | 5,880 | |
| | | | | | | | | |
| Total Current Assets | | | 315,723 | | | | 380,537 | |
| | | | | | | | | |
| Property, plant and equipment - net | | | 1,159,918 | | | | 1,212,002 | |
| Intangibles and other assets - net | | | 90,843 | | | | 89,304 | |
| Goodwill | | | 10,551 | | | | 10,551 | |
| | | | | | | | | |
| Total Assets | | $ | 1,577,035 | | | $ | 1,692,394 | |
| | | | | | | | | |
| LIABILITIES AND MEMBERS' EQUITY | | | | | | | | |
| Current Liabilities | | | | | | | | |
| Accounts payable | | $ | 128,149 | | | $ | 117,103 | |
| Accounts payable to International Paper Company | | | 3,872 | | | | 29,273 | |
| Accrued liabilities | | | 88,127 | | | | 80,200 | |
| Current maturities of long-term debt | | | 2,850 | | | | 2,850 | |
| | | | | | | | | |
| Total Current Liabilities | | | 222,998 | | | | 229,426 | |
| | | | | | | | | |
| Long-term debt | | | 1,153,588 | | | | 1,156,438 | |
| Other liabilities | | | 25,596 | | | | 26,817 | |
| | | | | | | | | |
| Total Liabilities | | | 1,402,182 | | | | 1,412,681 | |
| | | | | | | | | |
| Commitments and contingencies (Note 16) | | | - | | | | - | |
| Members' Equity | | | | | | | | |
| Paid-in-capital | | | 289,911 | | | | 289,286 | |
| Retained deficit | | | (105,188 | ) | | | (1,832 | ) |
| Accumulated other comprehensive loss | | | (9,870 | ) | | | (7,741 | ) |
| Members' equity | | | 174,853 | | | | 279,713 | |
| | | | | | | | | |
| Total Liabilities and Members' Equity | | $ | 1,577,035 | | | $ | 1,692,394 | |
| | | | | | | | | |
| See notes to Successor's consolidated financial statements. | | | | | | | | |
| VERSO PAPER HOLDINGS LLC (SUCCESSOR) AND | |
| COATED AND SUPERCALENDERED PAPERS DIVISION OF INTERNATIONAL PAPER COMPANY | |
| (PREDECESSOR) | |
| | | | | | | | | | | | | |
| CONSOLIDATED AND COMBINED STATEMENTS OF OPERATIONS | |
| | | | | | | | | | | | | |
| | | Successor | | | Successor | | | Predecessor | | | Predecessor | |
| | | Consolidated | | | Consolidated | | | Combined | | | Combined | |
| | | Year | | | Five Months | | | Seven Months | | | Year | |
| | | Ended | | | Ended | | | Ended | | | Ended | |
| | | December 31, | | | December 31, | | | July 31, | | | December 31, | |
| (In thousands of U.S. dollars) | | 2007 | | | 2006 | | | 2006 | | | 2005 | |
| | | | | | | | | | | | | |
| Net sales | | $ | 1,628,753 | | | $ | 706,833 | | | $ | 904,417 | | | $ | 1,603,846 | |
| | | | | | | | | | | | | | | | | |
| Costs and expenses: | | | | | | | | | | | | | | | | |
| Cost of products sold - (exclusive of | | | | | | | | | | | | | | | | |
| depreciation and amortization) | | | 1,403,144 | | | | 589,283 | | | | 771,576 | | | | 1,338,256 | |
| Depreciation and amortization | | | 123,139 | | | | 48,317 | | | | 72,674 | | | | 129,355 | |
| Selling, general and administrative expenses | | | 52,007 | | | | 13,996 | | | | 34,348 | | | | 65,569 | |
| Restructuring and other charges | | | 19,395 | | | | 10,126 | | | | (322 | ) | | | 10,419 | |
| | | | | | | | | | | | | | | | | |
| Operating income | | | 31,068 | | | | 45,111 | | | | 26,141 | | | | 60,247 | |
| | | | | | | | | | | | | | | | | |
| Interest income | | | (1,544 | ) | | | (1,798 | ) | | | (23 | ) | | | (39 | ) |
| Interest expense | | | 113,881 | | | | 48,741 | | | | 8,414 | | | | 14,823 | |
| | | | | | | | | | | | | | | | | |
| Income (loss) before income taxes | | | (81,269 | ) | | | (1,832 | ) | | | 17,750 | | | | 45,463 | |
| | | | | | | | | | | | | | | | | |
| Income tax expense | | | - | | | | - | | | | 6,993 | | | | 17,913 | |
| | | | | | | | | | | | | | | | | |
| Net income (loss) | | $ | (81,269 | ) | | $ | (1,832 | ) | | $ | 10,757 | | | $ | 27,550 | |
| | | | | | | | | | | | | | | | | |
| Included in the financial statement line items | | | | | | | | | | | | | | | | |
| above are related-party transactions as follows | | | | | | | | | | | | | | | | |
| (Notes 14 and 15): | | | | | | | | | | | | | | | | |
| Net sales | | $ | 191,358 | | | $ | 71,541 | | | $ | 83,797 | | | $ | 167,933 | |
| Purchases included in cost of products sold | | | 17,242 | | | | 2,515 | | | | 119,471 | | | | 198,234 | |
| Selling, general and administrative expenses | | | - | | | | - | | | | 25,481 | | | | 35,707 | |
| Restructuring and other charges | | | 7,506 | | | | 6,100 | | | | - | | | | - | |
| | | | | | | | | | | | | | | | | |
| See notes to Successor's consolidated financial statements and Predecessor's combined financial statements. | |
| VERSO PAPER HOLDINGS LLC | |
| | | | | | | | | | | | | |
| CONSOLIDATED STATEMENTS OF CHANGES IN MEMBERS' EQUITY FOR THE PERIOD AUGUST 1, 2006, | |
| (DATE OF ACQUISITION) TO DECEMBER 31, 2006, AND FOR THE YEAR ENDED DECEMBER 31, 2007 | |
| | | | | | | | | | | | | |
| | | | | | | | | | | | | |
| | | | | | | | | Accumulated | | | | |
| | | | | | | | | Other | | | Total | |
| | | Paid-in- | | | Retained | | | Comprehensive | | | Members' | |
| (In thousands of U.S. dollars) | | Capital | | | (Deficit) | | | Loss | | | Equity | |
| | | | | | | | | | | | | |
| Date of acquisition - August 1, 2006: | | | | | | | | | | |
| Capital contributions | | $ | 288,889 | | | $ | - | | | $ | - | | | $ | 288,889 | |
| Net loss and comprehensive loss | | | - | | | | (1,832 | ) | | | - | | | | (1,832 | ) |
| Equity award expense | | | 397 | | | | - | | | | - | | | | 397 | |
| Adjustment to initially apply FASB No. 158 | | | - | | | | - | | | | (7,741 | ) | | | (7,741 | ) |
| Ending balance - December 31, 2006 | | $ | 289,286 | | | $ | (1,832 | ) | | $ | (7,741 | ) | | $ | 279,713 | |
| | | | | | | | | | | | | | | | | |
| Beginning balance - January 1, 2007 | | $ | 289,286 | | | $ | (1,832 | ) | | $ | (7,741 | ) | | $ | 279,713 | |
| Net loss | | | - | | | | (81,269 | ) | | | - | | | | (81,269 | ) |
| Other comprehensive income (loss): | | | | | | | | | | | | | | | | |
| Net unrealized (losses) on derivative financial | | | | | | | | | | | | | |
| instruments | | | - | | | | - | | | | (2,095 | ) | | | (2,095 | ) |
| Defined benefit pension plan: | | | | | | | | | | | | | | | | |
| Plan amendments | | | - | | | | - | | | | (846 | ) | | | (846 | ) |
| Net gain | | | - | | | | - | | | | 27 | | | | 27 | |
| Prior service cost amortization | | | - | | | | - | | | | 785 | | | | 785 | |
| Comprehensive loss | | | - | | | | (81,269 | ) | | | (2,129 | ) | | | (83,398 | ) |
| Cash distributions | | | - | | | | (22,087 | ) | | | - | | | | (22,087 | ) |
| Equity award expense | | | 625 | | | | - | | | | - | | | | 625 | |
| Ending balance - December 31, 2007 | | $ | 289,911 | | | $ | (105,188 | ) | | $ | (9,870 | ) | | $ | 174,853 | |
| | | | | | | | | | | | | | | | | |
| See notes to Successor's consolidated financial statements. | | | | | | | | | |
| VERSO PAPER HOLDINGS LLC (SUCCESSOR) AND | |
| COATED AND SUPERCALENDERED PAPERS DIVISION OF INTERNATIONAL PAPER COMPANY | |
| (PREDECESSOR) | |
| | | | | | | | | | | | | |
| CONSOLIDATED AND COMBINED STATEMENTS OF CASH FLOWS | |
| | | | | | | | | | | | | |
| | | Successor | | | Successor | | | Predecessor | | | Predecessor | |
| | | Consolidated | | | Consolidated | | | Combined | | | Combined | |
| | | Year | | Five Months | | | Seven Months | | | Year | |
| | | Ended | | Ended | | | Ended | | | Ended | |
| | | December 31, | | December 31, | | | July 31, | | | December 31, | |
| (In thousands of U.S. dollars) | | 2007 | | | 2006 | | | 2006 | | | 2005 | |
| Cash Flows From Operating Activities: | | | | | | | | | | |
| Net income (loss) | | $ | (81,269 | ) | | $ | (1,832 | ) | | $ | 10,757 | | | $ | 27,550 | |
| Adjustments to reconcile net (loss) to net | | | | | | | | | | | | | |
| cash provided by (used in) operating activities: | | | | | | | | | |
| Depreciation and amortization | | | 123,139 | | | | 48,317 | | | | 72,674 | | | | 129,355 | |
| Amortization of debt issuance costs | | | 5,425 | | | | 2,264 | | | | - | | | | - | |
| Loss on disposal of fixed assets | | | 942 | | | | 71 | | | | 1,262 | | | | 6,043 | |
| Other - net | | | (1,504 | ) | | | - | | | | 686 | | | | 1,696 | |
| Changes in assets and liabilities: | | | | | | | | | | | | | |
| Accounts receivable | | | (11,963 | ) | | | (32,302 | ) | | | 23,253 | | | | (30,502 | ) |
| Inventories | | | 20,171 | | | | 5,438 | | | | (55,256 | ) | | | 432 | |
| Prepaid expenses and other assets | | | (8,201 | ) | | | (11,412 | ) | | | (6,396 | ) | | | 604 | |
| Accounts payable | | | (14,355 | ) | | | 64,736 | | | | (8,690 | ) | | | (4,162 | ) |
| Accrued liabilities | | | 6,396 | | | | 53,505 | | | | 983 | | | | (14,249 | ) |
| Net cash provided by operating activities | | | 38,781 | | | | 128,785 | | | | 39,273 | | | | 116,767 | |
| Cash Flows From Investing Activities: | | | | | | | | | | | | | |
| Proceeds from sale of fixed assets | | | 1,789 | | | | - | | | | 32 | | | | 117 | |
| Cash paid for acquisition | | | | | | | (1,364,221 | ) | | | - | | | | - | |
| Capital expenditures | | | (69,582 | ) | | | (27,533 | ) | | | (27,655 | ) | | | (53,096 | ) |
| Net cash used in investing activities | | | (67,793 | ) | | | (1,391,754 | ) | | | (27,623 | ) | | | (52,979 | ) |
| Cash Flows From Financing Activities: | | | | | | | | | | | | | |
| Repayments of debt | | | (2,850 | ) | | | (25,713 | ) | | | (18,754 | ) | | | (963 | ) |
| Proceeds from debt issuance | | | - | | | | 1,185,000 | | | | - | | | | - | |
| Dividends paid | | | (22,087 | ) | | | - | | | | - | | | | - | |
| Equity contributions (distributions) | | | - | | | | 260,286 | | | | 7,105 | | | | (62,816 | ) |
| Debt issue costs | | | - | | | | (44,157 | ) | | | - | | | | - | |
| Net cash provided by (used in) financing activities | | | (24,937 | ) | | | 1,375,416 | | | | (11,649 | ) | | | (63,779 | ) |
| | | | | | | | | | | | | | | | | |
| Net (decrease in) increase in cash | | | (53,949 | ) | | | 112,447 | | | | 1 | | | | 9 | |
| Cash at beginning of period | | | 112,448 | | | | 1 | | | | 46 | | | | 37 | |
| Cash at end of period | | $ | 58,499 | | | $ | 112,448 | | | $ | 47 | | | $ | 46 | |
| | | | | | | | | | | | | | | | | |
| Supplemental Schedule of Non-Cash Financing Activities: | | | | | |
| Non-cash equity investment | | $ | - | | | $ | 29,000 | | | $ | - | | | $ | - | |
| | | | | | | | | | | | | | | | | |
| See notes to Successor's consolidated financial statements and Predecessor's combined financial statements. | |
VERSO PAPER HOLDINGS LLC (SUCCESSOR)
Notes to Consolidated Financial Statements as of December 31, 2007 and 2006, and for the Year Ended
December 31, 2007, and for the Period August 1, 2006 (Date of Acquisition) to December 31, 2006
1. SUMMARY OF BUSINESS AND SIGNIFICANT ACCOUNTING POLICIES
Nature of our Business—Verso Paper Holdings LLC (the “Company”), a wholly-owned subsidiary of Verso Paper Finance Holdings LLC, operates in three operating segments: coated and supercalendared papers; hardwood market pulp; and other, consisting of specialty industrial paper. The Company’s core business platform is as a producer of coated freesheet, coated groundwood, and uncoated supercalendered papers. These products serve customers in the catalog, magazine, inserts, and commercial print markets. The Company includes mills and related woodyards in Bucksport and Jay, Maine; Quinnesec, Michigan; and Sartell, Minnesota. The Company also includes investments in two energy producing assets located at the Bucksport and Jay, Maine, facilities.
Basis of Presentation—The Company acquired the net assets of Coated and Supercalendered Papers Division of International Paper Company as of August 1, 2006. See Note 3. As a result of the Company’s 90% ownership interest, the Company pushed down its basis to the underlying assets and liabilities acquired based on the estimated fair values. The consolidated financial statements include the accounts of Verso Paper Holdings LLC and its wholly-owned, controlled majority-owned and financially controlled subsidiaries. Verso Paper Inc. is a wholly-owned subsidiary with no separate operations. All intercompany balances and transactions are eliminated.
Use of Estimates—The preparation of financial statements in conformity with accounting principles generally accepted in the United States of America requires management to make estimates and assumptions that affect the reported amounts of assets and liabilities, disclosure of contingent assets and liabilities at the date of the financial statements, and the reported amounts of revenues and expenses during the reporting periods. Actual results could differ from these estimates.
Revenue Recognition—Sales are net of rebates, allowances and discounts. Revenue is recognized when the customer takes title and assumes the risks and rewards of ownership. Revenue is recorded at the time of shipment for terms designated f.o.b. (free on board) shipping point. For sales transactions designated f.o.b. destination, which include export sales, revenue is recorded when the product is delivered to the customer’s site and when title and risk of loss are transferred.
Shipping and Handling Costs—Shipping and handling costs, such as freight to customer destinations, are included in cost of products sold in the accompanying consolidated statement of operations. These costs, when included in the sales price charged for the Company’s products, are recognized in net sales.
Planned Maintenance Costs—Maintenance costs for major planned maintenance shutdowns in excess of $0.5 million are deferred over the period in which the maintenance shutdowns occur and expensed ratably over the period until the next major planned shutdown, since the Company believes that operations benefit throughout that period from the maintenance work performed. Other maintenance costs are expensed as incurred.
Cash and Cash Equivalents—Cash includes highly liquid investments with a maturity of three months or less at the date of purchase.
Fair Value of Financial Instruments—Due to the short maturities of the Company’s receivables and payables, the carrying values of these financial instruments approximate their fair values. The fair value of long-term debt was approximately $1.2 billion at December 31, 2007.
Concentrations of Credit Risk—Financial instruments, which consist primarily of trade accounts receivable, expose the Company to concentrations of credit risk. The Company continually monitors the creditworthiness of its customers to whom credit is granted in the normal course of business. Trade accounts receivable balances for sales to unaffiliated customers were approximately $123.4 million at December 31, 2007, compared to $115.4 million at December 31, 2006.
The Company establishes its allowance for doubtful accounts based upon factors surrounding the credit risks of specific customers, historical trends, and other information. The allowance for doubtful accounts was approximately $1.7 million at December 31, 2007, compared to $1.9 million at December 31, 2006. Bad debt expense was negligible for the year ended December 31, 2007, and for the five-month period ended December 31, 2006.
Inventories and Replacement Parts and Other Supplies—Inventory values include all costs directly associated with manufacturing products: materials, labor, and manufacturing overhead. These values are presented at the lower of cost or market. Costs of raw materials, work-in-progress, and finished goods are determined using the first-in, first-out method. Replacement parts and other supplies are stated using the average cost method and are reflected in Inventories and other assets in the consolidated balance sheet (see Notes 4 and 6).
Plant, Property, and Equipment—Plant, property, and equipment is stated at cost, net of accumulated depreciation. Interest is capitalized on projects meeting certain criteria and is included in the cost of the assets. The capitalized interest is depreciated over the same useful lives as the related assets. Expenditures for major repairs and improvements are capitalized, whereas normal repairs and maintenance are expensed as incurred. Interest cost of $1.2 million was capitalized in 2007 and $0.2 million was capitalized in the five-month period ended December 31, 2006.
Depreciation and amortization are computed using the straight-line method for all assets over the assets’ estimated useful lives. Estimated useful lives are as follows:
| | | | Years |
| Building | | | 20 - 40 |
| Machinery and equipment | | | 10 - 20 |
| Furniture and office equipment | | | 3 - 10 |
| Computer hardware | | | 3 - 6 |
| Leasehold improvements | | | Over the terms of the lease or the useful life of the improvements |
Impairment of Long-Lived Assets—Long-lived assets are reviewed for impairment upon the occurrence of events or changes in circumstances that indicate that the carrying value of the assets may not be recoverable, as measured by comparing their net book value to the estimated undiscounted future cash flows generated by their use. Impaired assets are recorded at estimated fair value, determined principally using discounted cash flows.
Deferred Financing Costs—The company capitalizes costs incurred in connection with borrowings or establishment of credit facilities. These costs are amortized as an adjustment to interest expense over the life of the borrowing or life of the credit facility using the effective interest method. In the case of early debt principal repayments, the Company adjusts the value of the corresponding deferred financing costs with a charge to other expense, and similarly adjusts the future amortization expense.
Goodwill and Intangible Assets—The Company accounts for goodwill and other intangible assets in accordance with SFAS No. 142, “Goodwill and Other Intangible Assets.” Intangible assets primarily consist of trademarks, customer-related intangible assets and patents obtained through business acquisitions. The useful lives of trademarks were determined to be indefinite and, therefore, these assets are not amortized. Customer-related intangible assets are amortized over their estimated useful lives of approximately twenty-five years. Patents are amortized over their remaining legal lives of ten years.
The impairment evaluation of the carrying amount of goodwill and other intangible assets with indefinite lives is conducted annually or more frequently if events or changes in circumstances indicate that an asset might be impaired. Goodwill is evaluated at the reporting unit level. Goodwill has been allocated to the “Coated” segment.
The evaluation for impairment is performed by comparing the carrying amount of these assets to their estimated fair value. If the carrying amount exceeds the reporting unit fair value, then the second step of the goodwill impairment test is performed to determine the amount of the impairment loss.
Environmental Costs and Obligations—Costs associated with environmental obligations, such as remediation or closure costs, are accrued when such costs are probable and reasonably estimable. Such accruals are adjusted as further information develops or circumstances change. Costs of future expenditures for environmental obligations are discounted to their present value when the expected cash flows are reliably determinable.
Equity Compensation—The Company accounts for equity awards in accordance with SFAS No. 123 (Revised), “Share-Based Payment.” SFAS No. 123(R) requires that all equity awards to employees be expensed over the period of the award. The Company applies the Black-Scholes method of valuation to determine share-based compensation expense.
Asset Retirement Obligations—In accordance with the provisions of SFAS No. 143, “Accounting for Asset Retirement Obligations,” a liability and an asset are recorded equal to the present value of the estimated costs associated with the retirement of long-lived assets where a legal or contractual obligation exists. The liability is accreted over time, and the asset is depreciated over its useful life. The Company’s asset retirement obligations under this standard relate to closure costs for landfills. Revisions to the liability could occur due to changes in the estimated costs or timing of closure, or possible new federal or state regulations affecting the closure.
On December 31, 2007, the Company had approximately $0.8 million of restricted cash related to an asset retirement obligation in the state of Michigan, which is reflected in other assets on the consolidated balance sheet. This cash deposit is required by the state and may only be used for the future closure of a landfill. The following table presents an analysis related to the company’s assets retirement obligations included in Other liabilities on the consolidated balance sheet:
| | | Year | | | Five Months | |
| | | Ended | | | Ended | |
| | | December 31, | | | December 31, | |
| (In thousands of U.S. dollars) | | 2007 | | | 2006 | |
| | | | | | | |
| Asset retirement obligations, beginning of period | | $ | 11,855 | | | $ | 12,357 | |
| New liabilities | | | 310 | | | | - | |
| Accretion expense | | | 583 | | | | 258 | |
| Settlement of existing liabilities | | | (1,063 | ) | | | (760 | ) |
| Adjustment to existing liabilities | | | (71 | ) | | | - | |
| | | | | | | | | |
| Asset retirement obligations, December 31 | | $ | 11,614 | | | $ | 11,855 | |
Income Taxes—The Company is a limited liability corporation and is not subject to federal income taxes. The Company accounts for its state income taxes in accordance with SFAS No. 109, “Accounting for Income Taxes.”
Postretirement Benefits—Pension plans cover substantially all of the Company’s employees. The defined benefit plan is funded in conformity with the funding requirements of applicable government regulations. Prior service costs are amortized on a straight-line basis over the estimated remaining service periods of employees. Certain employees are covered by defined contribution plans. The Company’s contributions to these plans are based on a percentage of employees’ compensation or employees’ contributions. These plans are funded on a current basis.
The company adopted the provisions of SFAS No. 158, “Employers’ Accounting for Defined Benefit Pension and Other Postretirement Plans, an amendment of FASB Statements No. 87, 88, 106, and 132(R),” as of December 31, 2006.
2. RECENT ACCOUNTING DEVELOPMENTS
Business Combinations—In December 2007, the Financial Accounting Standards Board (FASB) issued SFAS No. 141 (revised 2007), “Business Combinations.” SFAS No. 141-R establishes principles and requirements for how an acquirer recognizes and measures identifiable assets acquired, liabilities assumed and noncontrolling interests; recognizes and measures goodwill acquired in a business combination or gain from a bargain purchase; and establishes disclosure requirements. SFAS No. 141-R is effective for business combinations for which the acquisition date is on or after the beginning of the first annual reporting period beginning on or after December 15, 2008. Early adoption is prohibited. The impact of adopting SFAS No. 141-R is not expected to have a material impact on the Company’s consolidated results of operations or consolidated financial position.
In December 2007, the FASB issued SFAS No. 160, “Noncontrolling Interests in Consolidated Financial Statements – an amendment of ARB No. 51.” SFAS No. 160 establishes accounting and reporting standards for the noncontrolling interest in a subsidiary and for the deconsolidation of a subsidiary. This standard is effective, on a prospective basis, for fiscal years, and interim periods within those years, beginning on or after December 15, 2008. The presentation and disclosure requirements for existing minority interests should be applied retrospectively for all periods presented. Early adoption is prohibited. The impact of adopting SFAS No. 160 is not expected to have a material impact on the Company’s consolidated results of operations or consolidated financial position.
Fair Value Option for Financial Assets and Financial Liabilities—In February 2007, the FASB issued SFAS No. 159, “Fair Value Option for Financial Assets and Financial Liabilities—including an amendment of FASB Statement No. 115,” which permits an entity to measure certain financial assets and financial liabilities at fair value. The Statement’s objective is to improve financial reporting by allowing entities to mitigate volatility in reported earnings caused by the measurement of related assets and liabilities using different attributes, without having to apply complex hedge accounting provisions. The Statement is effective as of the beginning of an entity’s fiscal year beginning after November 15, 2007. The impact of adopting SFAS No. 159 is not expected to have a material impact on the Company’s consolidated results of operations or consolidated financial position.
Defined Benefit Pension and Other Postretirement Plans—In September 2006, the FASB issued SFAS No. 158, “Employers’ Accounting for Defined Benefit Pension and Other Postretirement Plans—an amendment of FASB Statements No. 87, 88, 106, and 132(R),” which requires the recognition of the overfunded or underfunded status of a defined benefit postretirement plan as an asset or liability in the statements of condition. SFAS No. 158 does not change measurement or recognition requirements for periodic pension and postretirement costs. SFAS No. 158 also provides that changes in the funded status of a defined benefit postretirement plan should be recognized in the year such changes occur through comprehensive income. As a result of adopting SFAS No. 158 as of December 31, 2006, unrecognized prior service costs were recognized as a component of accumulated other comprehensive income resulting in a reduction in equity of $7.7 million.
Accounting for Planned Major Maintenance Activities—In September 2006, the FASB issued FASB Staff Position (FSP) AUG AIR-1, "Accounting for Planned Major Maintenance Activities." This FSP eliminates the accrue-in-advance method of accounting for planned major maintenance activities from the American Institute of Certified Public Accountants’ Audit and Accounting Guide, “Audits of Airlines” (the Airline Guide). This method of accounting for planned major maintenance activities was eliminated due to the FASB's belief that the resultant liability does not meet the definition of a liability in FASB Concepts Statement No. 6, “Elements of Financial Statements”. As a result of the elimination of the accrue-in-advance method, the Airline Guide, which provides guidance for all industries that conduct planned major maintenance activities, permits the use of one of the following three remaining methods: (1) direct expensing, (2) built-in overhaul, and (3) deferral. This FSP is effective for fiscal years beginning after December 15, 2006, with early adoption permitted so long as it is as of the beginning of the entity's fiscal year. The Company adopted the FSP at its inception by electing the deferral method.
Fair Value Measurements—In September 2006, the FASB issued SFAS No. 157, “Fair Value Measurements.” SFAS No. 157 does not address “what” to measure at fair value; instead, it addresses “how” to measure fair value. SFAS No. 157 applies (with limited exceptions) to existing standards that require assets and liabilities to be measured at fair value. SFAS No. 157 establishes a fair value hierarchy, giving the highest priority to quoted prices in active markets and the lowest priority to unobservable data and requires new disclosures for assets and liabilities measured at fair value based on their level in the hierarchy. SFAS No. 157 is effective for financial statements issued for fiscal years beginning after November 15, 2007. However, FSP 157-2, “Effective Date of FASB Statement No. 157,” delayed the implementation of SFAS No. 157 for nonfinancial assets and nonfinancial liabilities, except for items that are recognized or disclosed at fair value in the financial statements on a recurring basis, to years beginning after November 15, 2008. The impact of adopting SFAS No. 157 is not expected to have a material impact on the Company’s consolidated results of operations or consolidated financial position.
Sales, Use and Excise Taxes—In June 2006, the FASB ratified the consensuses reached by the Emerging Issues Task Force in Issue No. 06-3, “How Taxes Collected from Customers and Remitted to Governmental Authorities Should be Presented in the Income Statement (That is, Gross Versus Net Presentation).” Issue No. 06-3 requires disclosure of an entity’s accounting policy regarding the presentation of taxes assessed by a governmental authority that are directly imposed on a revenue-producing transaction between a seller and a customer, including sales, use, value added and some excise taxes. The Company presents such taxes on a net basis (excluded from revenues and costs). The adoption of Issue No. 06-3 in 2007 had no impact on the Company’s consolidated results of operations or consolidated financial position.
Accounting for Uncertainty in Income Taxes—In June 2006, the FASB issued Interpretation No. 48, “Accounting for Uncertainty in Income Taxes—an interpretation of FASB Statement No. 109” (FIN 48). FIN 48 clarifies the accounting for uncertainty in income taxes recognized in a company’s financial statements and prescribes a recognition threshold and measurement attribute for the financial statement recognition and measurement of a tax position taken or expected to be taken in a tax return. FIN 48 also provides guidance on description, classification, interest and penalties, accounting in interim periods, disclosure, and transition. FIN 48 is effective for fiscal years beginning after December 15, 2006. The Company applied the provisions of this interpretation beginning January 1, 2007. The adoption of FIN 48 did not have a material impact on the Company’s consolidated results of operations or consolidated financial position.
Accounting for Certain Hybrid Financial Instruments—In February 2006, the FASB issued SFAS No. 155, “Accounting for Certain Hybrid Financial Instruments—an Amendment of FASB Statements No. 133 and 140,” which provides entities relief from having to separately determine the fair value of an embedded derivative that would otherwise be required to be bifurcated in accordance with SFAS No. 133. This statement was effective for all financial instruments acquired, issued, or subject to a remeasurement event occurring after January 1, 2007. The adoption of SFAS No. 155 did not have a material impact on the Company’s consolidated results of operations or consolidated financial position.
3. ACQUISITION
On August 1, 2006, Verso Paper Holdings LLC acquired the Coated and Supercalendered Papers Division of International Paper Company (the “Division” or the “Predecessor”), a producer of coated freesheet, coated groundwood, and uncoated supercalendered papers. The purchase price for the Division as of the acquisition date was $1.4 billion. The purchase price was paid partially in cash and partially through a 10% limited partnership interest in Verso Paper Investment, LP., our indirect parent company.
The Company has allocated the purchase price to the Division’s assets acquired and liabilities assumed at estimated fair values adjusted for the 10% carryover basis of the assets as of the acquisition date. The excess of the purchase price over the fair value of the net assets acquired has been reflected as goodwill.
The following table summarizes the estimated fair values of the assets acquired and liabilities assumed at August 1, 2006 (date of acquisition):
| (In thousands of U.S. dollars) | | | | | |
| Current assets | | | | $ | 237,072 | |
| Property, plant, and equipment | | | | | 1,232,587 | |
| Intangible assets | | | | | 35,912 | |
| Goodwill | | | | | 10,551 | |
| Other assets | | | | | 4,511 | |
| Total assets acquired | | | | | 1,520,633 | |
| | | | | | | |
| Current liabilities | | | | | 110,255 | |
| Long-term obligations | | | | | 17,157 | |
| Total liabilities assumed | | | | | 127,412 | |
| Net assets acquired | | | | $ | 1,393,221 | |
| | | | | | | |
| Identifiable Intangible Assets | | Life | | Amount | |
| Non-amortizable: | | | | | | |
| Trademarks | | Indefinite | | $ | 21,473 | |
| | | | | | | |
| Amortizable: | | | | | | |
| Customer relationships | | 25 years | | | 13,291 | |
| Patents | | 10 years | | | 1,148 | |
| Total intangible assets | | | | $ | 35,912 | |
The acquisition agreement contains various representations, warranties and covenants customary to transactions of this type.
4. INVENTORIES
Inventories by major category as of December 31, 2007 and 2006, include the following:
| | | | | | | |
| | | December 31, | | | December 31, | |
| (In thousands of U.S. dollars) | | 2007 | | | 2006 | |
| | | | | | | |
| Raw materials | | $ | 19,918 | | | $ | 22,147 | |
| Woodyard logs | | | 3,209 | | | | 5,026 | |
| Work-in-process | | | 19,565 | | | | 19,012 | |
| Finished goods | | | 48,167 | | | | 63,894 | |
| Replacement parts and other supplies | | | 28,761 | | | | 30,424 | |
| Inventories | | $ | 119,620 | | | $ | 140,503 | |
5. PROPERTY, PLANT AND EQUIPMENT
Property, plant and equipment as of December 31, 2007 and 2006, were as follows:
| | | | | | | |
| | | December 31, | | | December 31, | |
| (In thousands of U.S. dollars) | | 2007 | | | 2006 | |
| | | | | | | |
| Land and land improvements | | $ | 27,899 | | | $ | 26,093 | |
| Building and leasehold improvements | | | 172,099 | | | | 167,753 | |
| Machinery and equipment | | | 1,096,273 | | | | 1,047,997 | |
| Construction-in-progress | | | 29,406 | | | | 17,689 | |
| | | | 1,325,677 | | | | 1,259,532 | |
| Less: accumulated depreciation | | | (165,759 | ) | | | (47,530 | ) |
| Property, plant and equipment | | $ | 1,159,918 | | | $ | 1,212,002 | |
Depreciation expense was $119.4 million for the year ended December 31, 2007, and was $48.0 million for the five months ended December 31, 2006.
6. INTANGIBLES AND OTHER ASSETS
Intangibles and other assets as of December 31, 2007 and 2006 consist of the following:
| | | December 31, | | | December 31, | |
| (In thousands of U.S. dollars) | | 2007 | | | 2006 | |
| | | | | | | |
| Amortizable intangible assets: | | | | | | |
| Customer relationships - net of accumulated amortization of $1.8 million and | | | | | | |
| $0.2 million, respectively | | $ | 11,470 | | | $ | 13,070 | |
| Patents - net of accumulated amortization of $0.16 million and $0.05 million, | | | | | | | | |
| respectively | | | 985 | | | | 1,100 | |
| Total amortizable intangible assets | | | 12,455 | | | | 14,170 | |
| | | | | | | | | |
| Unamortizable intangible assets: | | | | | | | | |
| Trademarks | | | 21,473 | | | | 21,473 | |
| | | | | | | | | |
| Other assets: | | | | | | | | |
| Financing costs-net of accumulated amortization of $7.7 million and | | | | | | | | |
$2.3 million, respectively | | | 36,468 | | | | 41,893 | |
| Deferred major repair | | | 5,328 | | | | 6,008 | |
Deferred software cost-net of accumulated amortization of $1.3 million | | | 3,765 | | | | - | |
| Replacement parts-net | | | 4,932 | | | | 1,729 | |
| Other | | | 6,422 | | | | 4,031 | |
| Total other assets | | | 56,915 | | | | 53,661 | |
| | | | | | | | | |
| Intangibles and other assets | | $ | 90,843 | | | $ | 89,304 | |
Approximately $1.7 million and $0.3 million of intangible amortization are reflected in depreciation and amortization expense for the year ended December 31, 2007 and for the five months ended December 31, 2006, respectively.
Estimated amortization expense of intangibles is expected to be $1.6 million, $1.4 million, $1.3 million, $1.1 million and $0.9 million in 2008, 2009, 2010, 2011 and 2012, respectively.
Software cost incurred as part of a major systems project was capitalized in 2007 and is being amortized over its anticipated useful life of approximately three years. Approximately $1.3 million of software amortization is reflected in depreciation and amortization expense for the year ended December 31, 2007.
7. ACCRUED LIABILITIES
A summary of accrued liabilities as of December 31, 2007 and 2006 is as follows:
| | | December 31, | | | December 31, | |
| (In thousands of U.S. dollars) | | 2007 | | | 2006 | |
| | | | | | | |
| Payroll and employee benefit costs | | $ | 33,469 | | | $ | 31,723 | |
| Accrued interest | | | 31,861 | | | | 31,770 | |
| Accrued sales rebates | | | 10,900 | | | | 8,520 | |
| Accrued taxes - other than income | | | 2,573 | | | | 6,568 | |
| Freight and other | | | 9,324 | | | | 1,619 | |
| | | | | | | | | |
| Accrued liabilities | | $ | 88,127 | | | $ | 80,200 | |
8. LONG-TERM DEBT
A summary of long-term debt as of December 31, 2007 and 2006, is as follows:
| | | | | | | December 31, | | | December 31, | |
| (In thousands of U.S. dollars) | Maturity | | Rate | | | 2007 | | | 2006 | |
| | | | | | | | | | | |
| First Priority Term Loan B | 8/1/2013 | | LIBOR + 1.75% | | | $ | 256,438 | | | $ | 259,288 | |
| Second Priority Senior Secured Notes - Fixed | 8/1/2014 | | | 9.13 | % | | | 350,000 | | | | 350,000 | |
| Second Priority Senior Secured Notes - Floating | 8/1/2014 | | LIBOR + 3.75% | | | | 250,000 | | | | 250,000 | |
| Senior Subordinated Notes | 8/1/2016 | | | 11.38 | % | | | 300,000 | | | | 300,000 | |
| | | | | | | | | | | | | | |
| | | | | | | | | 1,156,438 | | | | 1,159,288 | |
| Less current maturities | | | | | | | | (2,850 | ) | | | (2,850 | ) |
| Long-term debt | | | | | | | $ | 1,153,588 | | | $ | 1,156,438 | |
The Company entered into Senior Secured Credit Facilities on August 1, 2006, consisting of:
| · | a $285 million term loan with a maturity of seven years, which was fully drawn on August 1, 2006; |
| · | a $200 million revolving credit facility with a maturity of six years. No amounts were outstanding at December 31, 2007 or 2006. Letters of credit of $29.4 million and $35.3 million were issued as of December 31, 2007 and 2006, respectively. |
Our senior secured credit facilities are secured by first priority pledges of all the equity interests owned by us in our subsidiaries. Our senior secured credit facilities are also secured by first priority interests in, and mortgages on, substantially all of our tangible and intangible assets and those of each of our direct and indirect subsidiaries. Our obligations under the senior secured credit facilities are also unconditionally guaranteed by Verso Paper Finance Holdings LLC, our parent company, subject to certain exceptions, and each of its direct and indirect subsidiaries. The term loan facility bears interest at a rate equal to LIBOR plus 1.75% and the interest rate was 6.6% at December 31, 2007, and 7.1% at December 31, 2006. The revolving credit facility bears interest at a rate equal to LIBOR plus 2.00%. In addition to paying interest on outstanding principal under these senior secured credit facilities, we are
required to pay a commitment fee to the lenders under the revolving credit facility in respect of unutilized commitments at a rate equal to 0.50% per annum (subject to reduction upon attainment of certain first lien leverage ratios). We also pay customary letter of credit and agency fees.
On August 1, 2006, the Company completed an offering of $350 million in aggregate principal amount of 9⅛% second-priority senior fixed rate notes due 2014, $250 million in aggregate principal amount of second-priority senior secured floating rate notes due 2014, and $300 million in aggregate principal amount of 11⅜% senior subordinated notes due 2016. The floating-rate notes bear interest at a rate equal to LIBOR plus 3.75% and the interest rate was 8.7% at December 31, 2007, and 9.1% at December 31, 2006. The proceeds of the note offerings were used to finance the Acquisition and to pay related fees and expenses. Our second-priority senior secured notes have the benefit of a second-priority security interest in the collateral securing our senior secured credit facilities. The fixed rate notes pay interest semi-annually and the variable rate notes pays interest quarterly. The senior subordinated notes are unsecured and pay interest semi-annually.
All of our senior secured credit facilities contain various restrictive covenants. They prohibit us from prepaying other indebtedness and require us to maintain a maximum consolidated first lien leverage ratio. In addition, our senior secured credit facilities, among other things, restrict our ability to incur indebtedness or liens, make investments or declare or pay any dividends. The indentures governing our second priority senior secured notes and our senior subordinated notes limit our ability to, among other things, to (i) incur additional indebtedness; (ii) pay dividends or make other distributions or repurchase or redeem our stock; (iii) make investments; (iv) sell assets, including capital stock of restricted subsidiaries; (v) enter into agreements restricting our subsidiaries’ ability to pay dividends; (vi) consolidate, merge, sell or otherwise dispose of all or substantially all of our assets; (vii) enter into transactions with our affiliates; and (viii) incur liens.
The payments required under the long-term debt listed above during the years following December 31, 2007, are set forth below:
| 2008 | | $ | 2,850 | |
| 2009 | | | 2,850 | |
| 2010 | | | 2,850 | |
| 2011 | | | 2,850 | |
| 2012 | | | 2,850 | |
| Thereafter | | | 1,142,188 | |
| Total long-term debt | | | 1,156,438 | |
Interest expense was $109.2 million and $109.1 million of interest was paid during the year ended December 31, 2007. Interest expense was $46.7 million and $14.8 million of interest was paid during the five-month period ended December 31, 2006. In conjunction with the Acquisition, we assumed none of the historical debt of the Predecessor.
Amortization of debt issuance costs was $5.4 million for the year ended December 31, 2007, and is included in interest expense in the consolidated statement of operations. Amortization of debt issuance costs was $2.3 million for the five-month period ended December 31, 2006.
9. OTHER LIABILITIES
Other liabilities as of December 31, 2006, consist of the following:
| | | December 31, | | | December 31, | |
| (In thousands of U.S. dollars) | | 2007 | | | 2006 | |
| Asset retirement obligations | | $ | 11,614 | | | $ | 11,855 | |
| Pension benefit obligation | | | 9,980 | | | | 10,299 | |
| Other, primarily environmental obligations | | | 4,002 | | | | 4,663 | |
| | | | | | | | | |
| Other liabilities | | $ | 25,596 | | | $ | 26,817 | |
10. RETIREMENT PLANS
Defined Benefit Plan
The Company maintains a defined benefit pension plan that provides retirement benefits to hourly employees in Jay, Bucksport and Sartell hired prior to July 1, 2004. These employees generally are eligible to participate in the plan upon completion of one year of service and attainment of age 21. Employees hired after June 30, 2004, who are not eligible for this pension plan receive an additional company contribution to their savings plan (see “Other Plan”). The plan provides defined benefits based on years of credited service times a specified flat dollar benefit rate.
The following table summarizes net periodic benefit cost for the periods ended December 31, 2007 and 2006:
| | | Year | | | Five Months | |
| | | Ended | | | Ended | |
| | | December 31, | | | December 31, | |
| (In thousands of U.S. dollars) | | 2007 | | | 2006 | |
| | | | | | | |
| Components of net periodic benefit cost: | | | | | | |
| Service cost | | $ | 5,278 | | | $ | 2,090 | |
| Interest cost | | | 611 | | | | 193 | |
| Expected return on plan assets | | | (229 | ) | | | - | |
| Amortization of prior service cost | | | 785 | | | | 327 | |
| | | | | | | | | |
| Net periodic benefit cost | | $ | 6,445 | | | $ | 2,610 | |
The following table provides detail on prior service cost and net actuarial gain (loss) recognized in accumulated other comprehensive income at December 31, 2007 and 2006.
| (In thousands of U.S. dollars) | | 2007 | | | 2006 | |
| Amounts recognized in accumulated other comprehensive income: | | | | | | |
| Prior service cost | | $ | 7,803 | | | $ | 7,741 | |
| Net (gain) loss | | | (27 | ) | | | - | |
The estimated prior service cost that will be amortized from accumulated other comprehensive income into net periodic pension cost during 2008 is $.9 million. We expect no plan assets to be returned to the company in 2008.
The Company makes contributions that are sufficient to fully fund its actuarially determined costs, generally equal to the minimum amounts required by the Employee Retirement Income Security Act (ERISA). The Company made contributions of $6.9 million in 2007, with $4.7 million attributable to the 2007 plan year and $2.2 attributable to the 2006 plan year. The Company made a contribution of $1.5 million in January 2008 attributable to the 2007 plan year. In 2008, the Company expects to make an additional contribution of $1.5 million related to the 2007 plan year and contributions of $6.3 million related to the 2008 plan year.
The following table sets forth a reconciliation of the plan’s benefit obligation, plan assets and funded status at December 31, 2007 and 2006:
| | | Year | | | Five Months | |
| | | Ended | | | Ended | |
| | | December 31, | | | December 31, | |
| (In thousands of U.S. dollars) | | 2007 | | | 2006 | |
| Change in Projected Benefit Obligation: | | | | | | |
| Benefit obligation at beginning of period | | $ | 10,351 | | | $ | - | |
| Service cost | | | 5,278 | | | | 2,090 | |
| Interest cost | | | 611 | | | | 193 | |
| Plan amendments | | | 846 | | | | - | |
| Prior service liability | | | - | | | | 8,068 | |
| Actuarial (gain) loss | | | (341 | ) | | | - | |
| Benefits paid | | | (37 | ) | | | - | |
| Benefit obligation on December 31 | | $ | 16,708 | | | $ | 10,351 | |
| | | | | | | | | |
| Change in Plan Assets: | | | | | | | | |
| Plan assets at fair value, beginning of fiscal year | | $ | - | | | $ | - | |
| Actual net return on plan assets | | | (85 | ) | | | - | |
| Employer contributions | | | 6,850 | | | | - | |
| Benefits paid | | | (37 | ) | | | - | |
| Plan assets at fair value, end of fiscal year | | | 6,728 | | | | - | |
| Unfunded projected benefit obligation recognized on the | | | | | | | | |
| Consolidated Balance Sheets as a long-term liability | | $ | (9,980 | ) | | $ | (10,351 | ) |
| | | | | | | | | |
The accumulated benefit obligation at December 31, 2007 and 2006, is $16.7 million and $10.4 million, respectively.
The following table summarizes expected future pension benefit payments:
| (In thousands of U.S. dollars) | | | | |
| 2008 | | $ | 147 | |
| 2009 | | | 299 | |
| 2010 | | | 498 | |
| 2011 | | | 741 | |
| 2012 | | | 1,069 | |
| 2013-2017 | | | 10,410 | |
The Company evaluates its actuarial assumptions annually as of December 31 (the measurement date) and considers changes in these long-term factors based upon market conditions and the requirements of SFAS No. 87, “Employers’ Accounting for Pension.” These assumptions are used to calculate benefit obligations as of December 31 of the current year, and pension expense to be recorded for the following year. The discount rate assumption reflects the yield on a portfolio of high quality fixed-income instruments that have a similar duration to the plan’s liabilities. The expected long-term rate of return assumption reflects the average return expected on the assets invested to provide for the plan’s liabilities.
The actuarial assumptions used in the defined benefit pension plan were as follows:
| | | 2007 | | | 2006 | |
| Weighted average assumptions used to determine | | | | | | |
| benefit obligations as of December 31 measurement date: | | | | | | |
| Discount rate | | | 6.00 | % | | | 5.75 | % |
| Rate of compensation increase | | | N/A | | | | N/A | |
| Weighted average assumptions used to determine net | | | | | | | | |
| periodic benefit cost for the fiscal year: | | | | | | | | |
| Discount rate | | | 5.75 | % | | | 5.75 | % |
| Rate of compensation increase | | | N/A | | | | N/A | |
| Expected long-term return on plan assets | | | 8.00 | | | | N/A | |
The Company’s primary investment objective is to ensure, over the long-term life of the pension plan, an adequate pool of sufficiently liquid assets to support the benefit obligations. In meeting this objective, the pension plan seeks to achieve a high level of investment return through long-term stock and bond investment strategies, consistent with a prudent level of portfolio risk. Any volatility in investment performance compared to investment objectives should be explainable in terms of general economic and market conditions. It is not contemplated at this time that any derivative instruments will be used to achieve investment objectives. The expected return on plan assets assumption for 2008 will be 8.00 percent.
The following table provides the pension plan’s asset allocation on December 31, 2007:
| | | Targeted | | | % of Plan Assets on December 31 | |
| | | Allocation | | | 2007 | | | 2006 | |
| Equity Securities | | | | | | | | | |
| Large capital equity | | | 26.4 | % | | | 25.5 | % | | | N/A | |
| Small capital equity | | | 4.6 | | | | 4.4 | | | | N/A | |
| International equity | | | 17.0 | | | | 17.0 | | | | N/A | |
| | | | | | | | | | | | | |
| Other securities | | | | | | | | | | | | |
| Bond fund | | | 47.0 | | | | 48.2 | | | | N/A | |
| Fixed income fund | | | 5.0 | | | | 4.9 | | | | N/A | |
Defined Contribution Plan
The Company sponsors a defined contribution plan to provide salaried and Quinnesec hourly employees an opportunity to accumulate personal funds and to provide additional benefits for retirement.
As determined by the provisions of the plan, the Company contributes annually a percentage of earnings. The percentage is based on age and years of credited service for employees hired prior to July 1, 2004 and a fixed percentage of earnings to employees hired after June 30, 2004. Expense under this plan was $8.6 million for the year ended December 31, 2007, and was $2.3 million for the five-month period ended December 31, 2006.
Other Plan
The Company sponsors a 401K plan to provide salaried and hourly employees an opportunity to accumulate personal funds and to provide additional benefits for retirement. Contributions may be made on a before-tax basis to the plan. As determined by the provisions of the plan, the Company matches the employees’ basic voluntary contributions. Such contributions to the plans totaled approximately $2.5 million for the year ended December 31, 2007, and $2.3 million for the five months ended December 31, 2006.
11. MANAGEMENT EQUITY AWARDS
Certain members of management were granted the right to purchase “Class A” units of Verso Paper Management LP (a limited partner of the ultimate parent of Verso Paper Holdings, LLC). For each “Class A” unit purchased, a specified number of “Class B” and “Class C” units were granted. The Class B units vest over a 5 year period, 20% at the end of each year of service. The Class C units will vest only if certain performance targets are met. Directors were granted “Class D” units of Verso Paper Management LP and these Class D units are vested at acquisition date.
The fair value of the Class D units granted to directors and restricted Class B units granted to management was approximately $0.3 million in 2007 and $1.4 million in 2006. Equity award expense of $0.6 million was recognized for the year ended December 31, 2007, while $0.4 million was recognized for the five months ended December 31, 2006. The remaining compensation expense will be recognized over the vesting period with the offsetting credit to paid-in-capital.
Assumptions applied under the Black-Scholes option pricing model are as follows: expected term of five years, volatility rate of 36.65% based on industry historical volatility rate, no expected dividends and average risk free rate of 4.7% in 2007 and 4.1% in 2006.
12. BUCKSPORT ENERGY ASSET INVESTMENT
The Company has a joint ownership interest with Bucksport Energy LLC, an unrelated third party, in a cogeneration power plant producing steam and electricity. The plant was built in 2000 by the two parties and is located in Bucksport, Maine. The plant supports the Bucksport paper mill. The mill owns 28% of the steam and electricity produced by the plant. The mill may purchase its remaining steam and electrical needs from the plant at market rates. Each owner, Verso Bucksport LLC and Bucksport Energy LLC, owns its proportional share of the assets. The Company accounts for this investment under the proportional consolidation method. Power generation and operating expenses are divided on the same basis as ownership. The Bucksport mill has cash which is restricted in its use and may be used only to fund the ongoing energy operations of this investment. Approximately $0.2 million of restricted cash is included in prepaid expenses and other assets in the consolidated balance sheet at December 31, 2007 and 2006. Balances included in the consolidated balance sheet at December 31, 2007 and 2006, related to this investment are as follows:
| | | December 31, | | | December 31, | |
| (In thousands of U.S. dollars) | | 2007 | | | 2006 | |
| | | | | | | |
| Other receivables | | $ | 61 | | | $ | 59 | |
| Other current assets | | | 256 | | | | 259 | |
| | | | | | | | | |
| Total current assets | | $ | 317 | | | $ | 318 | |
| | | | | | | | | |
| Property, plant and equipment | | $ | 10,301 | | | $ | 10,301 | |
| Accumulated depreciation | | | (807 | ) | | | (237 | ) |
| | | | | | | | | |
| Net property, plant and equipment | | $ | 9,494 | | | $ | 10,064 | |
| | | | | | | | | |
| Current liabilities | | $ | (84 | ) | | $ | (103 | ) |
13. DERIVATIVES
In the normal course of business, the Company utilizes derivatives contracts as part of its risk management strategy to manage our exposure to market fluctuations in energy prices. These instruments are subject to credit and market risks in excess of the amount recorded on the balance sheet in accordance with generally accepted accounting principles. Controls and monitoring procedures for these instruments have been established and are routinely reevaluated. Credit risk represents the potential loss that may occur because a party to a transaction fails to perform according to the terms of the contract. The measure of credit exposure is the replacement cost of contracts with a positive fair value. The Company manages credit risk by entering into financial instrument transactions only through approved counterparties. Market risk represents the potential loss due to the decrease in the value of a financial instrument caused primarily by changes in commodity prices. The Company manages market risk by establishing and monitoring limits on the types and degree of risk that may be undertaken.
Derivative instruments are recorded on the balance sheet as other assets or other liabilities measured at fair value. Fair value is defined as the amount the Company would receive or pay in the market to replace the derivatives as of the valuation date. Fair value is determined using available market information. For a cash flow hedge accounted for under SFAS No. 133, “Accounting for Derivative Instruments and Hedging Activities,” changes in the fair value of the derivative instrument, to the extent that it is effective, are recorded in accumulated other comprehensive income and subsequently reclassified to earnings as the hedged transaction impacts net income. Any ineffective portion of a cash flow hedge is recognized currently in earnings. Cash flows from derivative contracts are reported as operating activities on the Statements of Cash Flows.
The Company enters into short-term, fixed-price swaps as hedges designed to mitigate the risk of changes in commodity prices for future purchase commitments. Fixed-price swaps involve the exchange of net cash settlements, based on changes in the price of the underlying commodity index compared to the fixed price offering, at specified intervals without the exchange of any underlying principal.
Effective November 1, 2007, the Company designated its hedge relationships as cash flow hedges under SFAS No. 133. For the period of time these hedge relationships were not designated under SFAS No. 133, the swaps were measured at fair value with gains or losses included in current earnings. Subsequent to designation, net losses attributable to effective hedging were recorded in accumulated other comprehensive income, and the ineffective portion continued to be recognized in cost of products sold.
In 2007 the Company entered into these energy swaps to fix the price of purchases of natural gas for consumption, with the objective of minimizing or protecting against the impact of adverse price changes in the energy market. However, we do not hedge the entire exposure of our operations from commodity price volatility for a variety of reasons. To the extent we do not hedge against commodity price volatility, our results of operations may be affected either favorably or unfavorably by a shift in the future price curve. During 2007, net settlements on these swaps resulted in an increase of $2.8 million in cost of products sold. On December 31, 2007, the fair values of these swaps were unrealized losses of $1.4 million. Net unrealized gains on open derivative contracts of $0.7 million were recognized in cost of products sold in 2007. In addition, net losses related to the effective portion of SFAS No. 133 hedges of $2.1 million were recorded in accumulated other comprehensive income on December 31, 2007. Net losses included in other comprehensive income on December 31, 2007, are expected to be reclassified into cost of products sold in the same period when the hedged cash flows affect earnings and will decrease income or increase expense on the respective hedged cash flows. Assuming no change in open cash flow derivative hedge positions, the net losses are expected to be reclassified into earnings within the next year.
14. RELATED PARTY TRANSACTIONS
In conjunction with the Transaction, we entered into a transition service agreement with International Paper whereby International Paper will continue to provide certain services that are necessary for us to run as a stand-alone business. The charges for the year ended December 31, 2007 were $4.7 million and were $6.1 million for the five-month period ended December 31, 2006. As of July 31, 2007, we substantially discontinued the usage of services under this agreement.
The Company had net sales to International Paper of approximately $191.4 million for the year ended December 31, 2007, and $71.5 million for the five months ended December 31, 2006. The Company had purchases from International Paper of approximately $17.2 million for the year ended December 31, 2007 and $2.5 million for the five months ended December 31, 2006.
In 2006, fees of $2.5 million were paid to Apollo as part of the Acquisition transaction costs. For subsequent periods, Apollo and it affiliates entered into a management agreement with us relating to the provision of certain financial and strategic advisory services and consulting services. We paid Apollo an annual fee of $2.8 million for its management services and advice in 2007. Also, under the management agreement, Apollo has the right to act, in return for additional fees, as our financial advisor or investment banker for any merger, acquisition, disposition, finance or the like if we decide we need to engage someone to fill such role. We agreed to indemnify Apollo and its affiliates and their directors, officers and representatives for losses relating to the services contemplated by the management agreement and the engagement of affiliates of Apollo pursuant to, and the performance by them of the services contemplated by, the management agreement.
Upon completion of the Acquisition, we entered into an agreement with International Paper’s Packaging business pursuant to which we arranged for the sale of coated groundwood paper produced from one of its paper machines at its Pine Bluff, Arkansas, mill for a selling commission of 3%. This agreement required that we sell 100% of the output of coated paper from this mill until the end of 2006 at then prevailing market price. The commission was approximately $0.9 million for the five months ended December 31, 2006.
On January 31, 2007, Verso Paper Finance Holdings LLC (Holdings), the parent of the Company, entered into a $250 million senior unsecured term loan facility with a maturity of six years. The senior unsecured term loan facility bears interest at a rate equal to LIBOR plus 6.25%, and the interest rate at December 31, 2007, was 9.5%. The Company has not guaranteed the loan nor have any of the Company’s assets been used for collateral. Holdings has no independent operations, consequently, all cash flows used to service the debt obligation will need to be received via a distribution from the Company. The Company paid distributions of $22.1 million to Holdings in 2007. The Company has no obligation to issue distributions to Holdings. The loan allows the borrower to pay interest in cash or in-kind through the accumulation of the outstanding principal amount.
15. RESTRUCTURING AND OTHER CHARGES
Restructuring and other charges are comprised of transition and other non-recurring costs associated with the acquisition and carve out of our operations from those of International Paper; including costs of a transition service agreement with International Paper, technology migration costs, consulting and legal fees, and other one-time costs related to us operating as a stand-alone business. The charges for the year ended December 31, 2007, were $19.4 million, which included $4.7 million of transition service agreement costs. The charges for the five-month period ended December 31, 2006 were $10.1 million which included $6.1 million of transition service agreement costs.
16. COMMITMENT AND CONTINGENCIES
Operating Leases—The Company has entered into operating lease agreements, which expire at various dates through 2013, related to certain machinery and equipment used in its manufacturing process. Rental expense under operating leases amounted to $5.8 million for the year ended December 31, 2007, and $2.2 million for the five months ended December 31, 2006.
The following, as of December 31, 2007, represents the future minimum rental payments due under non-cancelable operating leases that have initial or remaining lease terms in excess of one year:
| (In thousands of U.S. dollars) | | | |
| 2008 | | $ | 5,356 | |
| 2009 | | | 4,382 | |
| 2010 | | | 2,191 | |
| 2011 | | | 1,098 | |
| 2012 | | | 552 | |
| Thereafter | | | 33 | |
| | | | | |
| Total | | $ | 13,612 | |
Purchase obligations—The Company has entered into unconditional purchase obligations in the ordinary course of business for the purchase of certain raw materials, energy, and services. At December 31, 2007, total unconditional purchase obligations were $123 million, due as follows: 2008–$48 million; 2009–$15 million; 2010–$12 million; 2011–$3 million; 2012–$3 million; and thereafter–$42 million.
Employee Severance Plan—Under the employee severance plan, each of our named executive officers is eligible to receive a termination allowance in the event of a termination of employment due to certain events, including the executive’s job elimination, a facility closing, the executive’s disability, or the executive’s inability to perform the requisite duties of his position despite his reasonable efforts.
The termination allowance is a lump sum amount equal to the number of years or partial years of applicable service with the company, multiplied by the amount of two weeks of base salary. The termination allowance may not be less than the amount of four weeks of base salary. In addition to the termination allowance under the Verso Paper Employee Severance Plan, it is our practice to provide a pro rata amount of annual VIP bonus compensation that would have otherwise been paid to the executive officer if employment had continued through the end of the applicable calendar year.
Contingencies—Contingent liabilities arise in the ordinary course of business, including those related to litigation. Various claims are pending against the Company and its subsidiaries. Although the Company cannot predict the outcome of these claims, after consulting with counsel, management is of the opinion that when resolved, these claims will not have a material adverse effect on the combined financial statements of the Company.
In 2005, the Maine Department of Environmental Protection issued a wastewater discharge permit to International Paper for the Androscoggin mill. Shortly thereafter, International Paper, a local public utility company and several environmental interest groups challenged the terms of the permit in an administrative review proceeding before the Maine Board of Environmental Protection (the “BEP”). The review of the Androscoggin mill’s permit was consolidated with reviews of other parties’ permits affecting water quality in the portion of the Androscoggin River downstream from our mill. In February 2008, the BEP issued a final order that imposed more stringent limits on the wastewater discharges from the Androscoggin mill. We anticipate that the new discharge limits will necessitate increased operational and maintenance costs as well as capital expenditures for additional wastewater controls and related improvements. These costs and expenditures may be covered, subject to certain limitations, by an indemnity from International Paper.
In connection with the Acquisition, we assumed a twelve-year supply agreement with Thilmany LLC for the products produced from our paper machine No. 5 at the Androscoggin mill. This agreement requires Thilmany to pay us a variable charge for the paper purchased and a fixed charge for the availability of the No. 5 paper machine. We are responsible for the No. 5 machine’s routine maintenance and Thilmany is responsible for any capital expenditures specific to the machine. As defined in the agreement, Thilmany has the right to terminate the agreement if certain events occur.
17. INFORMATION BY INDUSTRY SEGMENT
The Company operates in three operating segments; coated and supercalendered papers; hardwood market pulp; and other, consisting of specialty industrial paper. The Company operates in one geographic segment, the United States. The Company’s core business platform is as a producer of coated freesheet, coated groundwood, and uncoated supercalendared papers. These products serve customers in the catalog, magazine, inserts, and commercial print markets. The following table summarizes the industry segment for the periods ended December 31, 2007 and 2006:
| | | Year | | | Five Months | |
| | | Ended | | | Ended | |
| | | December 31, | | | December 31, | |
| (In thousands of U.S. dollars) | | 2007 | | | 2006 | |
| | | | | | | |
| Net Sales: | | | | | | |
| Coated and supercalendered | | $ | 1,443,170 | | | $ | 631,897 | |
| Hardwood market pulp | | | 148,007 | | | | 58,405 | |
| Other | | | 37,576 | | | | 16,531 | |
| Total | | $ | 1,628,753 | | | $ | 706,833 | |
| | | | | | | | | |
| Operating Income (Loss): | | | | | | | | |
| Coated and supercalendered | | $ | (1,496 | ) | | $ | 35,319 | |
| Hardwood market pulp | | | 35,808 | | | | 10,475 | |
| Other | | | (3,244 | ) | | | (683 | ) |
| Total | | $ | 31,068 | | | $ | 45,111 | |
| | | | | | | | | |
| Depreciation and Amortization: | | | | | | | | |
| Coated and supercalendered | | $ | 102,161 | | | $ | 39,894 | |
| Hardwood market pulp | | | 18,278 | | | | 7,527 | |
| Other | | | 2,700 | | | | 896 | |
| Total | | $ | 123,139 | | | $ | 48,317 | |
| | | | | | | | | |
| Capital Spending: | | | | | | | | |
| Coated and supercalendered | | $ | 65,179 | | | $ | 26,243 | |
| Hardwood market pulp | | | 2,649 | | | | 814 | |
| Other | | | 1,754 | | | | 476 | |
| Total | | $ | 69,582 | | | $ | 27,533 | |
18. CONDENSED CONSOLIDATING FINANCIAL INFORMATION
Verso Paper Holdings LLC (the “Company” or “Parent Issuer”) and Verso Paper Inc. are the issuers of 9.125% of Second Priority Senior Secured Fixed Rate Notes due 2014, Second Priority Senior Secured Floating Rate Notes due 2014 and 11.375% Senior Subordinated Notes due 2014 (the “Notes”). The Notes are jointly and severally guaranteed on a full and unconditional basis by the Company’s 100% owned subsidiaries, except Verso Paper Inc. (“Guarantor Subsidiaries”). All subsidiaries other than the Guarantor Subsidiaries are minor. Presented on the following pages are the Company’s condensed consolidating balance sheets, statements of income and statements of cash flows, as required by Rule 3-10 of Regulation S-X of the Securities Exchange Act of 1934, as amended. Prior to the Acquisition, the Predecessor operated as a division of International Paper Company and there were no separate legal entities.
The following condensed consolidating financial statements have been prepared from the Company’s financial information on the same basis of accounting as the consolidated financial statements. Investments in our subsidiaries are accounted for under the equity method. Accordingly, the entries necessary to consolidate the Parent Issuer and Guarantor Subsidiaries are reflected in the Intercompany Eliminations column.
| Condensed Consolidating Balance Sheet | |
| as of December 31, 2007 | |
| | | | | | | | | | | | | | | | |
| | | Parent | | | Subsidiary | | | Guarantor | | | Intercompany | | | | |
| (In thousands of U.S. dollars) | | Issuer | | | Issuer | | | Subsidiaries | | | Eliminations | | | Consolidated | |
| ASSETS | | | | | | | | | | | | | | | |
| Current assets | | $ | - | | | $ | - | | | $ | 315,723 | | | $ | - | | | $ | 315,723 | |
| Property and equipment, net | | | - | | | | - | | | | 1,159,918 | | | | - | | | | 1,159,918 | |
| Intercompany receivable | | | 1,224,307 | | | | - | | | | - | | | | (1,224,307 | ) | | | - | |
| Investment in subsidiaries | | | 138,385 | | | | - | | | | - | | | | (138,385 | ) | | | - | |
| Non-current assets | | | - | | | | - | | | | 101,394 | | | | - | | | | 101,394 | |
| | | | | | | | | | | | | | | | | | | | | |
| Total assets | | $ | 1,362,692 | | | $ | - | | | $ | 1,577,035 | | | $ | (1,362,692 | ) | | $ | 1,577,035 | |
| | | | | | | | | | | | | | | | | | | | | |
| LIABILITIES AND MEMBERS’ EQUITY | | | | | | | | | | | | | | | | | |
| Current liabilities | | $ | 34,251 | | | $ | - | | | $ | 188,747 | | | $ | - | | | $ | 222,998 | |
| Intercompany payable | | | - | | | | - | | | | 1,224,307 | | | | (1,224,307 | ) | | | - | |
| Long-term debt | | | 1,153,588 | | | | - | | | | - | | | | - | | | | 1,153,588 | |
| Other long-term liabilities | | | - | | | | - | | | | 25,596 | | | | - | | | | 25,596 | |
| Members’ equity | | | 174,853 | | | | - | | | | 138,385 | | | | (138,385 | ) | | | 174,853 | |
| | | | | | | | | | | | | | | | | | | | | |
| Total liabilities and members’ equity | | $ | 1,362,692 | | | $ | - | | | $ | 1,577,035 | | | $ | (1,362,692 | ) | | $ | 1,577,035 | |
| Condensed Consolidating Balance Sheet | |
| as of December 31, 2006 | |
| | | | | | | | | | | | | | | | |
| | | Parent | | | Subsidiary | | | Guarantor | | | Intercompany | | | | |
| (In thousands of U.S. dollars) | | Issuer | | | Issuer | | | Subsidiaries | | | Eliminations | | | Consolidated | |
| ASSETS | | | | | | | | | | | | | | | |
| Current assets | | $ | - | | | $ | - | | | $ | 380,537 | | | $ | - | | | $ | 380,537 | |
| Property and equipment, net | | | - | | | | - | | | | 1,212,002 | | | | - | | | | 1,212,002 | |
| Intercompany receivable | | | 1,232,950 | | | | - | | | | - | | | | (1,232,950 | ) | | | - | |
| Investment in subsidiaries | | | 237,820 | | | | - | | | | - | | | | (237,820 | ) | | | - | |
| Non-current assets | | | - | | | | - | | | | 99,855 | | | | - | | | | 99,855 | |
| | | | | | | | | | | | | | | | | | | | | |
| Total assets | | $ | 1,470,770 | | | $ | - | | | $ | 1,692,394 | | | $ | (1,470,770 | ) | | $ | 1,692,394 | |
| | | | | | | | | | | | | | | | | | | | | |
| LIABILITIES AND MEMBERS’ EQUITY | | | | | | | | | | | | | | | | | |
| Current liabilities | | $ | 34,619 | | | $ | - | | | $ | 194,807 | | | $ | - | | | $ | 229,426 | |
| Intercompany payable | | | - | | | | - | | | | 1,232,950 | | | | (1,232,950 | ) | | | - | |
| Long-term debt | | | 1,156,438 | | | | - | | | | - | | | | - | | | | 1,156,438 | |
| Other long-term liabilities | | | - | | | | - | | | | 26,817 | | | | - | | | | 26,817 | |
| Members’ equity | | | 279,713 | | | | - | | | | 237,820 | | | | (237,820 | ) | | | 279,713 | |
| | | | | | | | | | | | | | | | | | | | | |
| Total liabilities and members’ equity | | $ | 1,470,770 | | | $ | - | | | $ | 1,692,394 | | | $ | (1,470,770 | ) | | $ | 1,692,394 | |
| | | | | | | | | | | | | | | | | | | | | |
Certain previously reported amounts have been reclassified to agree with current presentation. The debt, debt issuance costs and accrued interest payable of the parent have been pushed down to the guarantor subsidiaries with a corresponding intercompany receivable recognized by the parent issuer, which is eliminated in consolidation, resulting in no impact to the consolidated totals. | |
| | |
| Condensed Consolidating Statements of Operations | |
| Year Ended December 31, 2007 | |
| | | | | | | | | | | | | | | | |
| | | Parent | | | Subsidiary | | | Guarantor | | | Intercompany | | | | |
| (In thousands of U.S. dollars) | | Issuer | | | Issuer | | | Subsidiaries | | | Eliminations | | | Consolidated | |
| | | | | | | | | | | | | | | | |
| Net sales | | $ | - | | | $ | - | | | $ | 1,628,753 | | | $ | - | | | $ | 1,628,753 | |
| Cost of products sold (exclusive of | | | | | | | | | | | | | | | | | | | | |
| depreciation and amortization) | | | - | | | | - | | | | 1,403,144 | | | | - | | | | 1,403,144 | |
| Depreciation and amortization | | | - | | | | - | | | | 123,139 | | | | - | | | | 123,139 | |
| Selling, general and adminstrative | | | - | | | | - | | | | 52,007 | | | | - | | | | 52,007 | |
| Restructuring and other charges | | | - | | | | - | | | | 19,395 | | | | - | | | | 19,395 | |
| Interest and other income | | | (135,022 | ) | | | - | | | | (1,544 | ) | | | 135,022 | | | | (1,544 | ) |
| Interest expense | | | 112,935 | | | | - | | | | 113,881 | | | | (112,935 | ) | | | 113,881 | |
| Equity in net loss of subsidiaries | | | (81,269 | ) | | | - | | | | - | | | | 81,269 | | | | - | |
| | | | | | | | | | | | | | | | | | | | | |
| Income (loss) before income taxes | | | (59,182 | ) | | | - | | | | (81,269 | ) | | | 59,182 | | | | (81,269 | ) |
| Income tax (benefit) expense | | | - | | | | - | | | | - | | | | - | | | | - | |
| | | | | | | | | | | | | | | | | | | | | |
| Net income (loss) | | $ | (59,182 | ) | | $ | - | | | $ | (81,269 | ) | | $ | 59,182 | | | $ | (81,269 | ) |
| Condensed Consolidating Statements of Operations | |
| Five Months Ended December 31, 2006 | |
| | | | | | | | | | | | | | | | |
| | | Parent | | | Subsidiary | | | Guarantor | | | Intercompany | | | | |
| (In thousands of U.S. dollars) | | Issuer | | | Issuer | | | Subsidiaries | | | Eliminations | | | Consolidated | |
| | | | | | | | | | | | | | | | |
| Net sales | | $ | - | | | $ | - | | | $ | 706,833 | | | $ | - | | | $ | 706,833 | |
| Cost of products sold (exclusive of | | | | | | | | | | | | | | | | | | | | |
| depreciation and amortization) | | | - | | | | - | | | | 589,283 | | | | - | | | | 589,283 | |
| Depreciation and amortization | | | - | | | | - | | | | 48,317 | | | | - | | | | 48,317 | |
| Selling, general and adminstrative | | | - | | | | - | | | | 13,996 | | | | - | | | | 13,996 | |
| Restructuring and other charges | | | - | | | | - | | | | 10,126 | | | | - | | | | 10,126 | |
| Interest income | | | (48,277 | ) | | | - | | | | (1,798 | ) | | | 48,277 | | | | (1,798 | ) |
| Interest expense | | | 48,277 | | | | - | | | | 48,741 | | | | (48,277 | ) | | | 48,741 | |
| Equity in net loss of subsidiaries | | | (1,832 | ) | | | - | | | | - | | | | 1,832 | | | | - | |
| | | | | | | | | | | | | | | | | | | | | |
| Income (loss) before income taxes | | | (1,832 | ) | | | - | | | | (1,832 | ) | | | 1,832 | | | | (1,832 | ) |
| Income tax (benefit) expense | | | - | | | | - | | | | - | | | | - | | | | - | |
| | | | | | | | | | | | | | | | | | | | | |
| Net income (loss) | | $ | (1,832 | ) | | $ | - | | | $ | (1,832 | ) | | $ | 1,832 | | | $ | (1,832 | ) |
| Condensed Consolidating Statements of Cash Flows | |
| Year Ended December 31, 2007 | |
| | | | | | | | | | | | | | | | |
| | | Parent | | | Subsidiary | | | Guarantor | | | Intercompany | | | | |
| (In thousands of U.S. dollars) | | Issuer | | | Issuer | | | Subsidiaries | | | Eliminations | | | Consolidated | |
| | | | | | | | | | | | | | | | |
| Net cash provided by operating activities | | $ | 22,087 | | | $ | - | | | $ | 16,694 | | | | | | $ | 38,781 | |
| | | | | | | | | | | | | | | | | | | | |
| Cash flows from investing activities: | | | | | | | | | | | | | | | | | | | |
| Proceeds from sale of fixed assets | | | - | | | | - | | | | 1,789 | | | | - | | | | 1,789 | |
| Capital expenditures | | | - | | | | - | | | | (69,582 | ) | | | - | | | | (69,582 | ) |
| | | | | | | | | | | | | | | | | | | | | |
| Net cash used in investing activities | | | - | | | | - | | | | (67,793 | ) | | | - | | | | (67,793 | ) |
| | | | | | | | | | | | | | | | | | | | | |
| Cash flows from financing activities: | | | | | | | | | | | | | | | | | | | | |
| Dividends paid | | | (22,087 | ) | | | - | | | | - | | | | - | | | | (22,087 | ) |
| Repayment of advances to | | | | | | | | | | | | | | | | | | | | |
| subsidiaries | | | 2,850 | | | | - | | | | (2,850 | ) | | | - | | | | - | |
| Payments on long-term debt | | | | | | | | | | | | | | | | | | | | |
| under credit agreement | | | (2,850 | ) | | | - | | | | - | | | | - | | | | (2,850 | ) |
| | | | | | | | | | | | | | | | | | | | | |
| Net cash used in financing activities | | | (22,087 | ) | | | - | | | | (2,850 | ) | | | - | | | | (24,937 | ) |
| | | | | | | | | | | | | | | | | | | | | |
| Net change in cash | | | - | | | | - | | | | (53,949 | ) | | | - | | | | (53,949 | ) |
| Cash at beginning of period | | | - | | | | - | | | | 112,448 | | | | - | | | | 112,448 | |
| | | | | | | | | | | | | | | | | | | | | |
| Cash at end of period | | $ | - | | | $ | - | | | $ | 58,499 | | | $ | - | | | $ | 58,499 | |
| Condensed Consolidating Statements of Cash Flows | |
| Five Months Ended December 31, 2006 | |
| | | | | | | | | | | | | | | | |
| | | Parent | | | Subsidiary | | | Guarantor | | | Intercompany | | | | |
| (In thousands of U.S. dollars) | | Issuer | | | Issuer | | | Subsidiaries | | | Eliminations | | | Consolidated | |
| | | | | | | | | | | | | | | | |
| Net cash (used in) provided by operating activities | | $ | (14,707 | ) | | $ | - | | | $ | 143,492 | | | | | | $ | 128,785 | |
| | | | | | | | | | | | | | | | | | | | |
| Cash flows from investing activities: | | | | | | | | | | | | | | | | | | | |
| Cash paid for acquisition | | | (1,364,221 | ) | | | - | | | | - | | | | - | | | | (1,364,221 | ) |
| Capital expenditures | | | - | | | | - | | | | (27,533 | ) | | | - | | | | (27,533 | ) |
| | | | | | | | | | | | | | | | | | | | | |
| Net cash used in investing activities | | | (1,364,221 | ) | | | - | | | | (27,533 | ) | | | - | | | | (1,391,754 | ) |
| | | | | | | | | | | | | | | | | | | | | |
| Cash flows from financing activities: | | | | | | | | | | | | | | | | | | | | |
| Equity contributions | | | 260,286 | | | | - | | | | - | | | | - | | | | 260,286 | |
| Proceeds from debt issuance | | | 1,185,000 | | | | - | | | | - | | | | - | | | | 1,185,000 | |
| Debt issue costs | | | (44,157 | ) | | | - | | | | - | | | | - | | | | (44,157 | ) |
| Repayment of advances to | | | | | | | | | | | | | | | | | | | | |
| subsidiaries | | | 3,512 | | | | - | | | | (3,512 | ) | | | - | | | | - | |
| Payments on long-term debt | | | | | | | | | | | | | | | | | | | | |
| under credit agreement | | | (25,713 | ) | | | - | | | | - | | | | - | | | | (25,713 | ) |
| | | | | | | | | | | | | | | | | | | | | |
| Net cash (used in) provided by financing activities | | | 1,378,928 | | | | - | | | | (3,512 | ) | | | - | | | | 1,375,416 | |
| | | | | | | | | | | | | | | | | | | | | |
| Net change in cash | | | - | | | | - | | | | 112,447 | | | | - | | | | 112,447 | |
| Cash at beginning of period | | | - | | | | - | | | | 1 | | | | - | | | | 1 | |
| | | | | | | | | | | | | | | | | | | | | |
| Cash at end of period | | $ | - | | | $ | - | | | $ | 112,448 | | | $ | - | | | $ | 112,448 | |
COATED AND SUPERCALENDERED PAPERS DIVISION OF INTERNATIONAL PAPER COMPANY (PREDECESSOR)
Notes to Combined Financial Statements for the Seven-Month Period Ended July 31, 2006, and the Year Ended December 31, 2005
1. BASIS OF PRESENTATION
The accompanying combined financial statements have been prepared from the separate records maintained by the Coated and Supercalendered Papers Division and International Paper Company (IPCO) and include allocations of certain IPCO corporate costs and expenses. The liabilities associated with the IPCO corporate costs and expenses have not been allocated to the Division in the accompanying combined balance sheets. These costs and obligations are those of IPCO, not the Division. These liabilities primarily include workers compensation and general liability insurance reserves, payroll taxes and pension, postretirement and postemployment liabilities. In accordance with SFAS No. 57, “Related Party Disclosures,” related party transactions cannot be presumed to be carried out on an arm’s-length basis as the requisite conditions of competitive, free-market dealing may not exist. These combined financial statements may not necessarily be indicative of the conditions that would have existed, or the results of operations that would have resulted, had the Division been operated as an unaffiliated company.
The Coated and Supercalendered Papers Division of International Paper Company (the “Predecessor” or the “Division”) operates in three operating segments: coated and supercalendered papers; hardwood market pulp; and other, consisting of uncoated copy paper and specialty industrial paper. The Division’s core business platform is as a producer of coated freesheet, coated groundwood, and uncoated supercalendered papers. These products serve customers in the catalog, magazine, inserts, and commercial print markets. The Division includes mills and related woodyards in Bucksport and Jay, Maine; Quinnesec, Michigan; and Sartell, Minnesota. The Division also includes investments in two energy producing assets located at the Bucksport and Jay, Maine, facilities.
During the periods presented, the Division was under the control of International Paper Company. The operating results and financial position of the Division were impacted by the nature of this relationship (see Note 4).
2. SUMMARY OF SIGNIFICANT ACCOUNTING POLICIES
Use of Estimates—The preparation of financial statements in conformity with accounting principles generally accepted in the United States of America requires management to make estimates and assumptions that affect the reported amounts of assets and liabilities, disclosure of contingent assets and liabilities at the date of the financial statements, and the reported amounts of revenues and expenses during the reporting periods. Actual results could differ from these estimates.
Revenue Recognition—Sales are reported net of rebates, allowances and discounts. Revenue is recognized when the customer takes title and assumes the risks and rewards of ownership. Revenue is recorded at the time of shipment for terms designated f.o.b. (free on board) shipping point. For sales transactions designated f.o.b. destination, which include export sales, revenue is recorded when the product is delivered to the customer’s site and when title and risk of loss are transferred.
Shipping and Handling Costs—Shipping and handling costs, such as freight to customer destinations, are included in cost of products sold in the accompanying combined statements of operations. These costs, when included in the sales price charged for the Division’s products, are recognized in net sales.
Annual Maintenance Costs—Annual maintenance costs for major planned maintenance shutdowns in excess of $1.0 million are expensed ratably over the year in which the maintenance shutdowns occur since the Company believes that operations benefit throughout the year from the maintenance work performed. These costs, including manufacturing variances and out-of-pocket costs that are directly related to the shutdown, are fully expensed in the year of the shutdown with no amounts remaining accrued at year-end. Other maintenance costs are expensed as incurred.
Affiliate Transactions—All intradivision transactions have been eliminated (see Note 4).
Cash—Cash includes highly liquid investments with a maturity of three months or less at the date of purchase.
Fair Value of Financial Instruments—Due to the short maturities of the Division’s receivables and payables, the carrying values of these financial instruments approximate their fair values. The fair value of the Division’s debt is estimated based on current rates offered for debt of the same maturity. The fair value of debt was approximately $295.7 million as of December 31, 2005.
Concentrations of Credit Risk—Financial instruments, which consist primarily of trade accounts receivable, expose the Division to concentrations of credit risk. The Division continually monitors the creditworthiness of its customers to whom credit is granted in the normal course of business.
The Division establishes its allowance for doubtful accounts based upon factors surrounding the credit risks of specific customers, historical trends, and other information. The allowance for doubtful accounts was approximately $7.3 million on December 31, 2005. Bad debt expense was approximately $1.0 million for the seven months ended July 31, 2006 and approximately $0.2 million for the year ended December 31, 2005.
Inventories and Replacement Parts and Other Supplies—Inventory values include all costs directly associated with manufacturing products: materials, labor, and manufacturing overhead. These values are presented at the lower of cost or market. Costs of raw materials, work-in-progress, and finished goods are determined using the first-in, first-out method. Replacement parts and other supplies are stated using the average cost method.
Property, Plant and Equipment—Property, plant and equipment is stated at cost, net of accumulated depreciation. Interest is capitalized on projects meeting certain criteria and is included in the cost of the assets. The capitalized interest is depreciated over the same useful lives as the related assets. Expenditures for major repairs and improvements are capitalized, whereas normal repairs and maintenance are expensed as incurred.
Depreciation and amortization are computed using the units-of-production method for paper machines and related equipment and the straight-line method for all other assets over the assets’ estimated useful lives. The useful life of machinery and equipment is not expected to differ significantly between the units-of-production method and the straight-line method. Estimated useful lives are as follows:
| | | | Years |
| Building | | | 20 - 40 |
| Machinery and equipment | | | 10 - 20 |
| Furniture and office equipment | | | 3 - 10 |
| Computer hardware | | | 3 - 6 |
| Leasehold improvements | | | Over the terms of the lease or the useful life of the improvements |
Capitalized Software—Software is capitalized and amortized over its anticipated useful life of approximately three years. Software amortization of $0.6 million is reflected in depreciation and amortization expense for 2005. Software is fully amortized as of December 31, 2005.
Impairment of Long-Lived Assets—Long-lived assets are reviewed for impairment upon the occurrence of events or changes in circumstances that indicate that the carrying value of the assets may not be recoverable, as measured by comparing their net book value to the estimated undiscounted future cash flows generated by their use. Impaired assets are recorded at estimated fair value, determined principally using discounted cash flows.
Asset Retirement Obligations—In accordance with the provisions of SFAS No. 143, “Accounting for Asset Retirement Obligations,” a liability and an asset are recorded equal to the present value of the estimated costs associated with the retirement of long-lived assets where a legal or contractual obligation exists. The liability is accreted over time, and the asset is depreciated over its useful life. The Division’s asset retirement obligations under this standard relate to closure costs for landfills.
Income Taxes—The Division’s operating results are included in the income tax returns of IPCO. For the operating results included in the IPCO income tax returns, a charge in lieu of income taxes has been allocated by IPCO to the Division, representing a portion of IPCO’s consolidated tax provision. This tax rate considers IPCO’s federal rate and the state tax apportionment of the various states in which the Division operates. The rate may be different than that determined if the Division were an incorporated entity computing its taxes on a separate return basis.
Environmental Costs and Obligations—Costs associated with environmental obligations, such as remediation or closure costs, are accrued when such costs are probable and reasonably estimable. Such accruals are adjusted as further information develops or circumstances change. Costs of future expenditures for environmental obligations are discounted to their present value when the expected cash flows are reliably determinable.
3. SUPPLEMENTAL FINANCIAL STATEMENT INFORMATION
Interest payments for the seven months ended July 31, 2006, were $7.6 million and were $15.2 million for the year ended December 31, 2005. Total interest expense was $8.4 million for the seven months ended July 31, 2006, and was $14.8 million for the year ended December 31, 2005. In conjunction with the Acquisition, we assumed none of historical debt associated with the Predecessor.
Interest costs related to the development of certain long–term assets are capitalized and amortized over the related assets’ estimated useful lives. Allocated capitalized net interest costs from IPCO to the Division were $0.2 million in 2005.
4. TRANSACTIONS WITH IPCO AND AFFILIATES
Certain services are provided to the Division by IPCO, including corporate management, legal, accounting and tax, treasury, payroll and benefits administration, certain incentive compensation, risk management, information technology and centralized transaction processing. These expenses are included in Selling, general and administrative expenses and Cost of products sold in the combined statements of operations. Expenses for such corporate services included in Selling, general and administrative expenses totaled $25.5 million for the seven months ended July 31, 2006, and $35.7 million for the year ended December 31, 2005. Expenses for such corporate services in Cost of products sold totaled $6.2 million for the seven months ended July 31, 2006, and $8.3 million for the year ended December 31, 2005. These costs are allocated from IPCO to the Division based on various methods, including direct consumption, percent of capital employed, and number of employees.
Substantially, all employees hired prior to July 2004, and retirees of the Division, participate in IPCO’s pension plans and are eligible to receive retirement benefits. IPCO allocates service cost to the Division based upon a percent-of-pay for salaried employees and a calculated flat amount for hourly employees. During the seven-month period ended July 31, 2006, IPCO allocated periodic pension costs to the Division of $7.5 and during the year ended December 31, 2005, IPCO allocated periodic pension costs to the Division of $9.1 million.
IPCO provides certain retiree health care and life insurance benefits to a majority of the Division’s salaried employees and certain of the Division’s hourly employees. IPCO allocates postretirement benefit costs to the Division based upon a percent-of-pay for salaried employees and a calculated flat amount for hourly employees. During the seven-month period ended July 31, 2006, IPCO allocated postretirement benefit costs to the Division of $0.8 million and during the year ended December 31, 2005, IPCO allocated postretirement benefit costs to the Division of $2.7 million.
The Division had net sales to IPCO of approximately $83.8 million for the seven months ended July 31, 2006, $167.9 million for the year ended December 31, 2005. The Division had purchases from IPCO of approximately $119.5 million for the seven months ended July 31, 2006, and purchases of $198.2 million for the year ended December 31, 2005.
5. INCOME TAXES
The results of operations of the Division are included in the income tax returns of IPCO. In the accompanying combined financial statements, the Division has reflected U.S. federal and state income tax expense on its gains based on an allocated rate of 39.4% for seven months ended July 31, 2006 and for the year ended December 31, 2005. The Division settles the current amount due to/from IPCO through the Divisional control account. Income taxes have been provided for all items included in the historical statements of income included herein, regardless of when such items were reported for tax purposes or when the taxes were actually paid or refunded.
6. DIVISIONAL CONTROL ACCOUNT
The Predecessor operated as a division of IPCO. Accordingly, certain operating, financing, and investing activities of the Division are funded through inter-divisional transactions with IPCO and its other operating divisions and subsidiaries. The accompanying combined balance sheets reflect these amounts in the divisional control account.
Intercompany sales and purchases with wholly-owned entities of IPCO may result in payables or receivables that have not been settled through the divisional control account at July 31, 2006 and December 31, 2005. Such amounts are reported separately from the divisional control account. Trade and non-trade transactions that involve U.S. locations are allowed to accumulate in the intercompany accounts. Trade transactions involving non-U.S. locations are settled with cash according to the terms of the sale. Non-trade transactions involving non-U.S. locations are settled with cash by the end of each calendar quarter. There has been no direct interest income or expense allocated to the Division by IPCO with respect to the divisional control account or other net receivables or payables due to/from IPCO.
The changes in the divisional control account for the year ended December 31, 2005, and for the seven months ended July 31, 2006, are as follows:
| | | Seven | | | | |
| | | Months Ended | | | Year Ended | |
| | | July 31, | | | December 31, | |
| (In thousands of U.S. dollars) | | 2006 | | | 2005 | |
| | | | | | | |
| Balance at January 1 | | $ | 1,039,988 | | | $ | 1,075,254 | |
| | | | | | | | | |
| Net Income | | | 10,757 | | | | 27,550 | |
| Contribution of net assets by IPCO (see note 4) | | | 13,342 | | | | - | |
| Funding (distributed to) provided by IPCO | | | 7,105 | | | | (62,816 | ) |
| | | | | | | | | |
| Balance - End of Period | | $ | 1,071,192 | | | $ | 1,039,988 | |
| | | | | | | | | |
| | | | | | | | | |
| | | Seven | | | | | |
| | | Months Ended | | | Year Ended | |
| | | July 31, | | | December 31, | |
| (In thousands of U.S. dollars) | | 2006 | | | 2005 | |
| | | | | | | | | |
| General corporate expenses | | $ | 19.5 | | | $ | 44.0 | |
| Employee benefits and incentives (1) | | | 11.3 | | | | 23.9 | |
| Interest expense and debt service costs | | | 8.4 | | | | 14.8 | |
| | | | | | | | | |
| (1) Includes severance payments associated with various headcount reduction initiatives of $7.2 million and $0.7 million for 2005 and 2004, respectively. | |
7. RESTRUCTURING AND OTHER CHARGES
In March 2005, IPCO announced the indefinite shutdown of the No.1 paper machine at the Jay, Maine mill. Effective December 2005, IPCO permanently decommissioned the No. 1 paper machine and began conversion of it to a pulp dryer. A charge of $6.6 million for severance and related costs was recorded related to the termination of approximately 90 employees. Severance totaling $4.1 million and $0.8 million was paid to employees in December 2005 and January 2006, respectively. In addition, a charge of $3.2 million for an asset impairment was recorded for the No. 1 paper machine and related assets. This machine was a component of the other operating segment until December 2005, when it was reclassified to the pulp operating segment.
8. COMMITMENTS AND CONTINGENCIES
Operating Leases—The Division has entered into operating lease agreements, which expire at various dates through 2013, related to certain machinery and equipment used in its manufacturing process. Rental expense under operating leases amounted to $13.3 million for the year ended December 31, 2005.
The building and land related to the Sartell mill No. 3 paper machine are leased under a long-term operating lease. The lease was remeasured to fair value upon IPCO’s acquisition of Champion International Corporation resulting in an unfavorable fair value adjustment which is being amortized as rent expense over the life of the lease. Pursuant to the terms of the Acquisition, International Paper will transfer the building to Verso Paper at no cost upon expiration of the lease.
Pulp purchase commitment—In December 2004, IPCO entered into a 10-year pulp purchase agreement with the buyer of IPCO’s former Weldwood business. This take-or-pay agreement requires IPCO to purchase 170,000 tons of NBSK pulp at market prices at the time of order and IPCO has allocated approximately 110,000 tons of the required purchases to the Division. In 2005, pulp prices under this agreement ranged between $500 per ton and $550 per ton with an average of approximately $525 per ton. This purchased pulp represents approximately one-third of the Division’s purchased pulp needs. This agreement is transferable with appropriate consent from the seller.
Wood Supply Agreement—IPCO’s Forest Resources business supplies the Division’s mills with their fiber needs at market prices. The Division’s mills receive fiber in various forms (chips, tree length, and custom cut) and species: softwood (pine, spruce, and fir) and hardwood (aspen, maple, and oak). In December 2004, IPCO completed the sale of 1.1 million acres of forestlands in Maine and New Hampshire. As part of that sale, IPCO also entered into a 50-year wood supply agreement. The wood supply agreement covers the Division’s Bucksport and Jay, Maine mills. Wood is delivered at market prices in effect at the time of delivery to the mills. IPCO must purchase a base volume as defined in the agreement and also has the ability to purchase additional wood fiber, defined as “option” volume. The volumes, base and option, are computed as a percentage of the estimated annual harvest. Base volume per year is approximately 310,000 tons, which is roughly 13% of the mills’ wood needs. The agreement includes a limitation of damages section under which IPCO’s maximum potential damages for a default are $15.00 per ton of wood delivered in the first year. This amount is approximately $4.7 million. The supply agreement is assignable by either party with mutual consent.
Androscoggin—PM 5 Agreement—In June 2005, IPCO sold its Industrial Papers business. As part of this transaction, IPCO and the Division entered into a 12-year contract manufacturing arrangement with the buyer, Thilmany LLC. (“Thilmany”), for production from the Jay, Maine mill’s No. 5 paper machine. IPCO deferred approximately $32.5 million of the sales proceeds, to reflect the contract manufacturing agreement. The deferred proceeds are earned by IPCO as volume is produced in accordance with the contract manufacturing agreement. This agreement requires Thilmany to pay the Division a variable charge for the paper purchased and a fixed charge for the availability of the No. 5 paper machine. The deferred amount and related amortization are obligations of IPCO and are not recorded on the Division’s financial statements. The Division’s sales of paper produced on the No. 5 paper machine were approximately $41.8 million for the year ended December 31, 2005. Prior to June 2005, the sales from No. 5 paper machine were primarily to IPCO’s Industrial Paper’s Division. The Division is responsible for the No. 5 paper machine’s routine maintenance capital, and Thilmany is responsible for any capital expenditures specific to the No. 5 paper machine. As defined in the agreement, Thilmany has the right to terminate the agreement if certain events occur, such as IPCO’s failure to produce product for a 75-day consecutive period. Following a 30-day period after such a failure to produce, IPCO would be subject to a penalty payment based on the prior 12-month EBITDA from products produced on the machine multiplied by a factor. The factor at the beginning of the agreement is five and decreases ratably over the life of the agreement. Thilmany has not notified IPCO or the Division of any failure to perform and no liability is accrued. The agreement is transferable with appropriate consent from Thilmany.
Litigation—In March 2006, the Division received approximately $1.0 million from Androscoggin Energy LLC (“AELLC”), as a result of the settlement of a billing dispute. AELLC was a supplier of energy to the Jay, Maine facility that ceased operations in November 2004 and filed for Chapter 11 bankruptcy.
The Division has various other lawsuits, claims, and contingent liabilities arising from the conduct of its business; however, in the opinion of management, they are not expected to have a material adverse effect on the combined results of operations, cash flows, or financial position of the Division.
9. INFORMATION BY INDUSTRY SEGMENT
The Division operates in three operating segments, coated and supercalendered papers; hardwood market pulp; and other, consisting of uncoated copy paper and specialty industrial paper. The Division operates in one geographic segment, the United States. The Division’s core business platform is as a producer of coated freesheet, coated groundwood, and uncoated supercalendered papers. These products serve customers in the catalog, magazine, inserts, and commercial print markets. For management purposes, the operating performance of the Division is reported based on earnings before interest and taxes, excluding the cumulative effect of accounting changes:
| | | Seven Months | | | | |
| | | Ended | | | Year Ended | |
| | | July 31, | | | December 31, | |
| (In thousands of U.S. dollars) | | 2006 | | | 2005 | |
| | | | | | | |
| Net Sales: | | | | | | |
| Coated | | $ | 793,308 | | | $ | 1,402,958 | |
| Pulp | | | 88,634 | | | | 139,825 | |
| Other | | | 22,475 | | | | 61,063 | |
| Total | | $ | 904,417 | | | $ | 1,603,846 | |
| | | | | | | | | |
| Operating Income (Loss): | | | | | | | | |
| Coated | | $ | 14,971 | | | $ | 78,827 | |
| Pulp | | | 10,346 | | | | 10,893 | |
| Other | | | 825 | | | | (29,473 | ) |
| Total | | $ | 26,142 | | | $ | 60,247 | |
| | | | | | | | | |
| Depreciation and Amortization: | | | | | | | | |
| Coated | | $ | 60,881 | | | $ | 107,623 | |
| Pulp | | | 10,417 | | | | 16,282 | |
| Other | | | 1,376 | | | | 5,450 | |
| Total | | $ | 72,674 | | | $ | 129,355 | |
| | | | | | | | | |
| Property, Plant and Equipment: | | | | | | | | |
| Coated | | | | | | $ | 1,064,760 | |
| Pulp | | | | | | | 207,438 | |
| Other | | | | | | | 14,844 | |
| Total | | | | | | $ | 1,287,042 | |
| | | | | | | | | |
| Capital Spending: | | | | | | | | |
| Coated | | $ | 26,449 | | | $ | 47,088 | |
| Pulp | | | 839 | | | | 5,286 | |
| Other | | | 367 | | | | 722 | |
| Total | | $ | 27,655 | | | $ | 53,096 | |
10. SUBSEQUENT EVENT INFORMATION
On August 1, 2006, IPCO completed the previously announced sale of the Division to Verso Paper, an affiliate of Apollo Management L.P., for approximately $1.4 billion. The purchase price was paid partially in cash and partially through a 10% limited partnership interest in Verso Paper Investments L.P., Verso Paper’s indirect parent company.
Not applicable.
Not applicable.
Evaluation of Disclosure Controls and Procedures
We maintain disclosure controls and procedures that are designed to ensure that information required to be disclosed our annual and quarterly reports is recorded, processed, summarized, and reported within the time periods specified in the rules and forms of the SEC and that such information is accumulated and communicated to our management, including our Chief Executive Officer and Chief Financial Officer, as appropriate, to allow timely decisions regarding required disclosure. Any controls and procedures, no matter how well designed and operated, can provide only reasonable assurance of achieving the desired control objectives.
Our management, with the participation of our Chief Executive Officer and Chief Financial Officer, has evaluated the effectiveness of the design and operation of our disclosure controls and procedures as of December 31, 2007. Based upon that evaluation and subject to the foregoing, our Chief Executive Officer and Chief Financial Officer concluded that our disclosure controls and procedures were effective to accomplish their objectives.
Our Chief Executive Officer and Chief Financial Officer do not expect that our disclosure controls or our internal controls will prevent all error and all fraud. The design of a control system must reflect the fact that there are resource constraints and the benefit of controls must be considered relative to their cost. Because of the inherent limitations in all control systems, no evaluation of controls can provide absolute assurance that we have detected all of our control issues and all instances of fraud, if any. The design of any system of controls also is based partly on certain assumptions about the likelihood of future events and there can be no assurance that any design will succeed in achieving our stated goals under all potential future conditions.
Changes in Internal Control Over Financial Reporting
There were no changes in our internal control over financial reporting that occurred during our fiscal quarter ended December 31, 2007, that have materially affected, or are reasonably likely to materially affect, our internal control over financial reporting.
Not applicable.
PART III
The following table provides information regarding our executive officers and directors:
| | | | |
| Michael A. Jackson | | 59 | | President, Chief Executive Officer and Director |
| Robert P. Mundy | | 45 | | Senior Vice President and Chief Financial Officer |
| Lyle Fellows | | 51 | | Senior Vice President of Manufacturing |
| Michael A. Weinhold | | 43 | | Senior Vice President of Sales and Marketing |
| Benjamin Hinchman, IV | | 60 | | Vice President and Chief Information Officer |
| Peter H. Kesser | | 50 | | Vice President, General Counsel and Secretary |
| Craig J. Liska | | 51 | | Vice President of Sustainability |
| Ricardo Moncada | | 54 | | Vice President of Human Resources |
| Michael E. Ducey | | 59 | | Director |
| Joshua J. Harris | | 43 | | Director |
| Scott M. Kleinman | | 35 | | Director |
| David W. Oskin | | 65 | | Director |
| L.H. Puckett, Jr. | | 59 | | Director |
| Jordan C. Zaken | | 33 | | Director |
| David B. Sambur | | 27 | | Director |
Michael A. Jackson. Mr. Jackson was named our President and Chief Executive Officer and a member of our Board of Directors in November 2006. He succeeded L.H. Puckett, Jr., who retired as President and Chief Executive Officer but remains one of our directors. Before joining us, Mr. Jackson worked at Weyerhaeuser Company from 1977 to 2006. During a 29-year career with Weyerhaeuser, he served as Senior Vice President responsible for the Cellulose Fibers, White Papers, Newsprint and Liquid Packaging Board businesses from 2004 to 2006, Vice President of the Fine Papers business from 2002 to 2004, Vice President of the Business Papers business from 2000 to 2002, Vice President of the Recycling business from 1998 to 2000, Vice President of Human Resources and Quality for the Container Board Packaging business from 1993 to 1997, and General Manager of the Tri-Wall business and other packaging plants from 1990 to 1993. On behalf of Weyerhaeuser, Mr. Jackson also served from 2005 to 2006 as Chairman of the Board of North Pacific Paper Corporation (NORPAC), a joint venture with Japan’s Nippon Paper Industries which produces newsprint and uncoated groundwood paper.
Robert P. Mundy. Mr. Mundy has been our Senior Vice President and Chief Financial Officer since August 2006. He has 25 years of finance and accounting experience in the paper industry. Mr. Mundy joined us from International Paper where he worked from 1983 to 2006. At International Paper, he served as Director of Finance of our business from 2002 to 2006, Director of Finance Projects from 2001 to 2002, Controller of Masonite Corporation from 1999 to 2001, Controller of the Petroleum and Minerals business from 1996 to 1999, and in other business functions including company-wide SAP implementation, corporate internal audit, and manufacturing and operational finance at three pulp and paper mills.
Lyle J. Fellows. Mr. Fellows has been our Senior Vice President of Manufacturing since August 2006. He has 27 years of manufacturing experience in the paper industry. Before joining us, Mr. Fellows worked for International Paper from 1981 to 2006, where he served as Vice President of Manufacturing for our business from 2003 to 2006, Manager of the pulp and paper mill in Courtland, Alabama, from 2001 to 2003, Manager of the pulp and paper mill in Saillat, France, from 2000 to 2001, Manufacturing Director of the Arizona Chemical business in Europe from 1998 to 1999, Technical Director of the White Papers business in Europe from 1994 to 1997, and in various manufacturing positions at the pulp and paper mill in Pine Bluffs, Arkansas, from 1981 to 1994.
Michael A. Weinhold. Mr. Weinhold has been our Senior Vice President of Sales and Marketing since August 2006. With 21 years of sales, marketing and manufacturing experience in the paper industry, he is responsible for our sales, marketing, supply chain, customer technical service, e-commerce, product development and Nextier Solutions functions. Mr. Weinhold previously worked in various sales, marketing and management positions in our business at International Paper from 2000 to 2006 and at Champion International Corporation from 1994 to its acquisition by International Paper in 2000. His most recent positions in our business at International Paper were as Business Manager from 2004 to 2006, Business Manager of Sales and Marketing from 2003 to 2004, and Director of Marketing and Product Development from 2001 to 2003.
Benjamin Hinchman, IV. Mr. Hinchman has been our Vice President and Chief Information Officer since August 2006. He has 38 years of experience in the information technology field, during which he has implemented and managed information systems supporting manufacturing, quality control, research and development, sales, order fulfillment, distribution, warehousing, finance and e-commerce. Before joining us, Mr. Hinchman worked at International Paper from 1999 to 2006, where he served as Director of Information Technology of our business in 2006, Director of Information Technology of the xpedx business from 2002 to 2006, and Director of Strategic Technologies from 2000 to 2001. Mr. Hinchman worked for Union Camp Corporation as Director of Information Services for the Fine Papers division from 1995 to its acquisition by International Paper in 1999. He previously worked in various other businesses, holding positions of increasing responsibility in information technology.
Peter H. Kesser. Mr. Kesser has been our Vice President, General Counsel and Secretary since December 2006. During a legal career of almost 25 years, he has concentrated his practice in the areas of corporate, securities, mergers and acquisitions, and commercial law while working for major law firms and public companies. Mr. Kesser was a shareholder with Baker Donelson Bearman Caldwell & Berkowitz PC from 1999 to 2006. He was Vice President, Associate General Counsel and Assistant Secretary of Promus Hotel Corporation, a leading lodging company, from 1998 to 1999. Mr. Kesser was Vice President, General Counsel and Secretary of Arcadian Corporation, a leading nitrogen chemical producer, from 1993 to 1997. He was an attorney with Bracewell & Patterson LLP from 1983 to 1992. Mr. Kesser is the former Chairman of the Business Law section of the Tennessee Bar Association.
Craig J. Liska. Mr. Liska has been our Vice President of Sustainability since October 2006. He is responsible for integrating our sustainability principles of balancing environmental, social and economic values into decisions affecting all aspects of our business as well as for managing our environmental, health and safety functions. Mr. Liska previously worked at Motorola, Inc., from 1990 to 2006 in various environmental positions of increasing responsibility, most recently serving as Corporate Director of International Environment, Health and Safety from 2000 to 2006. Prior to entering the private sector, he was an environmental regulator with the United States Environmental Protection Agency from 1985 to 1989 and with the Illinois Environmental Protection Agency from 1980 to 1985.
Ricardo Moncada. Mr. Moncada has been our Vice President of Human Resources since October 2006. He also served briefly as a human resources consultant for us from June to September 2006 under a transitional arrangement with International Paper. Mr. Moncada has 29 years of experience in the human resources field. He joined us from International Paper where he worked from 1991 to 2006. At International Paper, Mr. Moncada was Vice President of Human Resources of the xpedx business from 2001 to 2006, Director of Human Resources of the Beverage Packaging business from 1997 to 2000, and Vice President of Human Resources of Propal, a joint venture between International Paper and W.R. Grace Co., from 1991 to 1997. He previously worked in human resources with Weyerhaeuser Company from 1986 to 1991 and with Norton Company from 1978 to 1986.
Michael E. Ducey. Mr. Ducey has been one of our directors since March 2007. He was President and Chief Executive Officer and a director of Compass Minerals International, Inc., a producer of salt and specialty fertilizers, from 2002 to 2006, and he remains a consultant to Compass Minerals. Mr. Ducey previously worked for Borden Chemical, Inc., a diversified chemical company, from 1972 to 2002. During his 30-year career with Borden Chemical, he held various management, sales, marketing, planning and commercial development positions, most recently serving as President and Chief Executive Officer from 1999 to 2002 and Executive Vice President and Chief Operating Officer from 1997 to 1999. Mr. Ducey also is a director of UAP Holding Corp., the parent of United Agri Products, Inc.
Joshua J. Harris. Mr. Harris has been one of our directors since August 2006. He is a founding partner and President of Apollo Management, L.P., which was started in 1990. Mr. Harris was a member of the Mergers and Acquisitions Department of Drexel Burnham Lambert Incorporated. He also is a director of AP Alternative Assets L.P., Apollo Global Management LLC, Berry Plastics Group Inc., CEVA International, Inc., Hexion Specialty Chemicals, Inc., Metals USA Holdings Corp., Momentive Performance Materials Inc., and Noranda Aluminum Holding Corporation.
Scott M. Kleinman. Mr. Kleinman has been one of our directors since August 2006. He is a Partner at Apollo Management, L.P., where he has worked since 1996. Mr. Kleinman was employed by Smith Barney Inc. in its Investment Banking division from 1994 to 1995. He also is a director of Hexion Specialty Chemicals, Inc., Momentive Performance Materials Inc., Realogy Corporation, and Noranda Aluminum Holding Corporation.
David W. Oskin. Mr. Oskin has been one of our directors since January 2007. He has been President of Four Winds Ventures, LLC, a private investment company, since 2005. Mr. Oskin worked for 29 years in the paper and forest products industries in various management, distribution, sales and marketing, quality management, human resources and other positions. He spent most of his career with International Paper, where he worked initially from 1975 to 1991 and then again as an Executive Vice President from 1996 to 2003. Between his stints with International Paper, Mr. Oskin was Managing Director and Chief Executive Officer of Carter Holt Harvey Limited, a New Zealand based forest products company. Mr. Oskin also is a director of Pacific Millennium Corporation, Samling Global Limited, and Big Earth Publishing LLC, and he serves as Chairman of the Board of Trustees of Widener University.
L. H. Puckett, Jr. Mr. Puckett has been one of our directors since August 2006. He also was our President and Chief Executive Officer from August 2006 to his retirement in November 2006. Mr. Puckett worked in the paper industry for 32 years in various sales, marketing and management capacities. Before joining us, he worked at International Paper from 1999 to 2006, where he served as Senior Vice President responsible for our business from 2000 to 2006 and Vice President responsible for the Commercial Printing and Imaging Papers businesses from 1999 to 2000. Mr. Puckett worked at Union Camp Corporation from 1974 to its acquisition by International Paper in 1999, where he most recently served from 1998 to 1999 as Senior Vice President responsible for the Fine Papers division, which included the uncoated freesheet, pulp and bleached paperboard businesses.
David B. Sambur. Mr. Sambur has been one of our directors since February 2008. He is a principal at Apollo Management, L.P., where he has worked since 2004. Prior to that time, Mr. Sambur was a member of the Leveraged Finance Group of Salomon Smith Barney Inc. from 2002 to 2004. Mr Sambur graduated summa cum laude and Phi Beta Kappa from Emory University with a BA in economics.
Jordan C. Zaken. Mr. Zaken has been one of our directors since August 2006. He is a Partner at Apollo Management, L.P., where he has worked since 1999. Mr. Zaken was employed by Goldman, Sachs & Co. in its Mergers and Acquisitions Department from 1997 to 1999. He also is a director of Hexion Specialty Chemicals, Inc.
Board Structure
Our Board of Directors has an Audit Committee and Compensation Committee. The duties and responsibilities of the Audit Committee include recommending the appointment or termination of the engagement of independent accountants, overseeing the independent auditor relationship and reviewing significant accounting policies and controls. The duties and responsibilities of the Compensation Committee include reviewing and approving the compensation of officers and directors. The compensation of officers serving on the committee will be determined by the full management committee or the Board of Directors An affiliate of Apollo Management, L.P. controls substantially all of our equity common interests and, therefore, Apollo has the power to control our affairs and policies. Apollo also controls the election of our directors and the appointment of our management. A majority of the members of the Board of Directors are representatives of Apollo.
Code of Conduct
We have adopted a Code of Conduct that applies to all of our directors, officers and employees, including our chief executive officer and chief financial officer. The code satisfies the SEC’s requirements for a “code of ethics.” The code addresses, among other things, honesty and ethical conduct, conflicts of interest, compliance with laws, regulations and policies, confidentiality, and reporting of violations to the code. A copy of the code is posted on our web site at www.versopaper.com.
Compensation Discussion and Analysis
Overview of Executive Compensation
Our philosophy is that executive compensation should be competitive in the marketplace in which we compete for executive talent, but structured to emphasize incentive-based compensation and determined by the achievement of both company and individual performance objectives. In principle, we believe that:
| · | annual base salaries should be competitive with the marketplace average; |
| · | the combination of variable annual compensation and long-term incentive compensation should stress the achievement of short-term and long-term performance objectives and should provide the opportunity to earn more than the marketplace average for performance that exceeds targeted levels; |
| · | long-term incentive compensation opportunities should be targeted at levels that exceed those of our peer group companies; and |
| · | equity ownership by the members of our executive management team should be encouraged, in order to align the short-term and long-term interests of our executive officers with those of the holders of our equity interests. |
We periodically review our compensation practices with reference to wage surveys conducted by compensation consulting firms. This data is integral to our decisions regarding appropriate levels of executive compensation, but we do not benchmark any component of our executive compensation against a specific group of companies or set compensation levels at a designated percentile of peer group compensation. Instead, survey data is used as a general cross-reference to verify that our compensation is at a compensation level that will allow us to attract, retain and motivate members of our management team. For our decisions with respect to 2007 executive compensation, we utilized compensation data and analysis in the 2006 Forest Products Industry Compensation Association Survey conducted by the Stanton Group (the “2006 FPICA Survey”), the 2007 Forest Products Industry Compensation Association Survey conducted by the Stanton Group (the “2007 FPICA Survey” and, together with the 2006 FPICA Survey, the “FPICA Surveys”) and a customized compensation study by Valere Consulting LLC (the “Valere Report”). We reviewed 2006 FPICA data in conjunction with 2007 FPICA data in order to determine trendlines in peer group compensation. Our peer group is comprised of the forest paper industry companies that participated in the 2007 FPICA Survey and the companies studied for the Valere Report, which, in addition to the companies participating in the 2006 FPICA Survey, included manufacturing and paper industry companies similar in size to us that participated in online surveys and published surveys and a large sample of private equity portfolio companies. The list set forth below includes peer group members that are listed by name in the 2007 FPICA Survey and the Valere Report, but does not include the many manufacturing and paper industry companies that participated in online surveys and published studies that were not specified by name in aggregate survey data.
| Accellent Inc. | | AMH Holdings Inc. | | Appleton |
| Appleton Coated | | Avago Technologies | | Blue Ridge Paper Products, Inc. |
| Boise Cascade, LLC | | Bowater, Inc. | | Buckeye Technologies, Inc. |
| Caraustar | | Deltic Timber Corporation | | EXCO Resources Inc. |
| Fraser Papers, Inc. | | Glatfelter | | Graphic Packaging International, Inc. |
| Green Diamond Resource Company | | Hancock Forest Management, Inc. | | International Paper |
| Jazz Pharmaceuticals Inc. | | Language Line | | LIN TV Corp |
| Longview Fibre Paper & Packaging, Inc. | | Lousiana-Pacific Corporation | | MeadWestvaco |
| Menasha Packaging | | Myllykoski North America | | NewPage Corporation |
| Pacific Lumber Company | | Packaging Corporation of America | | Plum Creek Timber Company, Inc. |
| Pope & Talbot, Inc. | | Port Townsend Paper Corporation | | Potlatch Corporation |
| Primedia Inc. | | Rayonier | | Regency Energy Partners |
| Rock-Tenn Company | | Rockwood Holdings | | Roseburg Forest Products Company |
| Safety Products Holdings | | Sappi Fine Paper North America | | Sealy Corp. |
| SierraPine | | Simpson Investment Company | | Smurfit-Stone Container Company |
| Sonoco Products Company | | SP Newsprint Company | | Stora Enso |
| Swanson Group, Inc. | | Temple Inland | | Timber Products Company |
| UPM-Kymmene, Inc. | | Viasystems, Inc. | | West Fraser, Inc. |
| West Linn Paper Company | | Westervelt Company | | Weyerhaeuser Company |
Elements of Executive Compensation
The company’s compensation program for executives consists of the following key elements: annual base salary, a performance-based annual bonus, and long-term equity-based awards, as well as certain perquisites and other benefits, including employer contributions to tax-qualified and non-qualified defined contribution retirement plans.
We believe that this approach best serves our interests and the holders of our equity interests. It enables us to meet the requirements of the highly competitive environment in which we operate, while ensuring that our executive officers are compensated in a way that advances both the short-term and long-term interests of the holders of our equity interests. The variable annual bonus permits individual performance to be recognized and is based, in significant part, on an evaluation of the contribution made by the executive to our overall performance. Long-term equity-based awards relate a significant portion of long-term remuneration directly to appreciation in the value of our equity interests. This type of compensation is intended to align the interests of management with those of the holders of our equity interests, and further serves to promote an executive’s continued service to the organization.
Base Salary. We determine base salaries for our executive officers based on each executive’s position level, taking into account the market salary range for our peer group of companies determined by reference to aggregate survey data. Base salaries are intended to be competitive with the market average. It is our philosophy that total compensation should be weighted less towards fixed compensation and more towards variable performance-based compensation. We intend to continue this shift in total compensation from fixed compensation towards variable compensation opportunities that stress performance.
Annual Bonus. Under our management incentive plan (the “Verso Incentive Plan” or “VIP”), our executive officers have an annual incentive (bonus) opportunity with awards based on the achievement of specified performance goals. For purposes of the 2007 VIP, specific targets were established with respect to a combination of four core performance measures, upon which a specified percentage of the overall bonus pool was based, as follows: (i) earnings before interest, taxes, depreciation and amortization, adjusted for expenses such as start-up cost and/or financial accounting changes, if any (“Adjusted EBITDA”) (60%), (ii) average month-end working capital improvement (“Working Capital”) (20%), (iii) reduction of realizable gap (“R-GAP Reduction”) (10%), and (iv) margin quality improvement (10%). Each of the performance targets for the four performance measures was established with reference to our historical performance, with adjustments based on expected changes during the current year.
With respect to each of these four performance measures, we established “threshold,” “target,” “above target” (only in the case of Adjusted EBITDA), and “maximum” performance levels. We determined “threshold” performance levels for each of the four performance measures to set our expectations, with the intention that it would be reasonably possible that they would be achieved, based on projected performance. The “target” performance levels for each of the four performance measures were set such that there would be a significant amount of challenge to achieve them, based on projected performance. We set the “above target” performance level, which is applicable only for Adjusted EBITDA, such that it would most likely not be achieved, except where actual results are above anticipated performance. The “maximum” performance levels for each of the four performance measures were established with the intention that they would most likely not be achieved, except where actual results significantly exceed anticipated performance.
Individual VIP awards are paid from a bonus pool that is funded based on our achievement of these annual performance goals. The amount of the bonus pool is subject to upward or downward adjustment by the compensation committee based on extraordinary or other unanticipated events and conditions. Once the amount of the bonus pool is determined, we distribute individual VIP awards, within the limits of the pool, based on our evaluation of individual, departmental and functional contributions to our achievement of the performance goals. For 2007, our actual results with respect to the four performance measures corresponded to a funding level of approximately 20% for the bonus pool, which our compensation committee adjusted to a funding level of approximately 40% to take into account unanticipated changes in sales volume and sales price compared to projections for 2007. As reflected in the summary Compensation Table below, the individual evaluations of our executive officers were such that each of them received approximately 40% of the target VIP bonus payable to such executive officer for 2007.
Unit Investment and Award Program. We have established a long-term equity-based compensation program pursuant to which our executive officers have made an investment in non-voting capital interests (“Class A Units”) in our parent, Verso Paper Management LP. The Class A Units purchased by the executives are intended to be substantially economically equivalent to the securities acquired by Apollo in connection with the Acquisition.
In connection with their investment in the Class A Units, our executive officers are entitled to receive awards in the form of non-voting profits interests (“Class B Units” and “Class C Units”) in Verso Paper Management LP, which entitle the executives to share in future profits of the business. The Class B Units, which are intended to be substantially economically equivalent to stock options that vest based on the passage of time, generally vest in five equal annual installments, subject to continuous employment through each applicable vesting date. The Class C Units, which are intended to be substantially economically equivalent to stock options that vest based on the achievement of performance criteria, will generally vest only upon the achievement of a specified internal rate of return.
We have also awarded Class D Units, which are intended to be substantially economically equivalent to stock options that are fully vested as of the date of grant to our non-employee directors under the Limited Partnership Agreement of Verso Paper Management LP (the “LP Agreement”). For more information on the Class D Units, see “Executive Compensation—Director Compensation.”
All executive officers investing in Class A Units and receiving awards of Class B Units and Class C Units are required to execute the LP Agreement and become limited partners thereunder. Under the LP Agreement, the Units purchased or held by the executives are generally subject to transfer restrictions, tag-along rights, drag-along rights, repurchase rights, and piggy-back registration rights.
Analysis. The base salary amounts paid to the named executive officers are approximately at the midpoint salary range of the market average for our peer group companies as determined by reference to the 2007 FPICA Survey, which may be adjusted to reflect an individual named executive officer’s position and experience. For 2007, we confirmed that each named executive officer’s base salary was well within the trendlines for minimum and maximum salary parameters reported by our peer group in the FPICA Surveys, and we determined that each named executive officer’s base salary was within approximately 15% of the applicable midpoint salary reported in the 2007 FPICA Survey. The base salary amount for each named executive officer constituted approximately 55-61% of the total compensation for each such named executive officer. This range of percentages reflects our intention to provide for a meaningful portion of each named executive officer’s compensation to be performance based.
The VIP awards focus on short-term retention and incentive goals. For 2007, the VIP performance goals included a combination of financial targets (e.g., Adjusted EBITDA and Working Capital) and goals relating to core strategic initiatives (e.g., R-GAP Reduction and margin quality improvement). Also, the position and duties of a named executive officer and the relative market average as determined by reference to aggregate survey data for such position was factored into the value of the 2007 VIP award to each such named executive officer.
The awards of Class B Units and Class C Units focus on long-term retention and incentive goals. Each named executive officer was assigned to an award tier and awarded Class B and Class C Units according to the estimated value of such named executive officer’s opportunity and expected ability to affect results.
Perquisites and Other Benefits. We provide financial counseling benefits for our named executive officers. For more information on perquisites, see “Executive Compensation--Summary Compensation Table.”
Our named executive officers are entitled to participate in and receive employer contributions to our 401(k) plan and salaried supplemental retirement plan. For more information on employer contributions to our tax-qualified defined contribution retirement plans, see “Executive Compensation--Summary Compensation Table.”
In 2007, we established a nonqualified deferred compensation plan that allows eligible participants, including our named executive officers, to defer portions of their annual base salary and annual bonus, as well as to receive employer matching contributions with respect to deferrals that would exceed IRS limits under our 401(k) plan. We funded a rabbi trust in connection with the deferred compensation plan.
Our named executive officers are eligible to participate in the same benefit plans provided to our other salaried employees, including health and welfare plans.
Executive Compensation
Summary Compensation Table
The following table sets forth information regarding compensation that we paid and provided to our named executive officers for 2007:
| | | | | | | | | Non-Equity | | | | | |
| | | | | | | | | Incentive | | | | | |
| | | | | | Option | | | Plan | | All Other | | |
| Name and Principal Position | Year | Salary | | | Awards (2) | | Compensation | Compensation | | Total |
| Michael A. Jackson, President, Chief | 2007 | $ | 408,333 | (1) | | $ | 66,355 | | | $ | 166,240 | | $ | 55,663 | (3 | ) | $ | 696,591 |
| Executive Officer and Director | | | | | | | | | | | | | | | | | | |
| Robert P. Mundy, Senior Vice President | 2007 | | 235,175 | | | | 14,653 | | | | 67,430 | | | 54,699 | (4 | ) | | 371,957 |
| and Chief Financial Officer | | | | | | | | | | | | | | | | | | |
| Lyle J. Fellows, Senior Vice President of | 2007 | | 259,880 | | | | 14,653 | | | | 78,060 | | | 81,404 | (5 | ) | | 433,997 |
| Manufacturing | | | | | | | | | | | | | | | | | | |
| Michael A. Weinhold, Senior Vice President | 2007 | | 255,161 | | | | 14,653 | | | | 67,430 | | | 50,826 | (6 | ) | | 388,070 |
| of Marketing | | | | | | | | | | | | | | | | | | |
| Peter H. Kesser, Vice President, General | 2007 | | 238,750 | | | | 9,769 | | | | 59,930 | | | 21,680 | (7 | ) | | 330,129 |
| Counsel and Secretary | | | | | | | | | | | | | | | | | | |
| (1)In January 2008, Mr. Jackson’s annual base salary was increased from $400,000 to $450,000, with retroactive effect to November 1, 2007. |
| (2) Represents 2007 SFAS No. 123R expense relating to Class B Units, without any reduction for risk of forfeiture. |
| (3) Mr. Jackson received $11,853 in employer matching contributions to the 401(k) plan, $9,000 in employer contributions to the salaried supplemental retirement plan, $8,590 in deferred compensation, $2,947 for financial counseling and $23,273 in reportable relocation income. |
| (4) Mr. Mundy received $11,718 in employer matching contributions to the 401(k) plan, $11,250 in employer contributions to the salaried supplemental retirement plan, $4,338 in deferred compensation, $4,614 for financial counseling and $22,779 for unused vacation. |
| (5) Mr. Fellows received $8,963 in employer matching contributions to the 401(k) plan, $20,537 in employer contributions to the salaried supplemental retirement plan, $21,593 in deferred compensation, $5,000 for financial counseling, $25,289 for unused vacation, and $22 as gift/awards. |
| (6) Mr. Weinhold received $11,700 in employer matching contributions to the 401(k) plan, $11,250 in employer contributions to the salaried supplemental retirement plan, $5,079 in deferred compensation, $3,025 for 2007 financial counseliing rolled into 2008, and $19,772 for unused vacation. |
| (7) Mr. Kesser received $11,700 in employer matching contributions to the 401(k) plan and $9,000 in employer contributions to the salaried supplemental retirement plan and $980 in deferred compensation. |
Grants of Plan-Based Awards
The following table sets forth information regarding awards of Class B Units and Class C Units granted to our named executive officers in 2007:
| | | All Other | | | | |
| | | Awards: | | | Grant Date | |
| | | Number of | | | Fair Value | |
| Name | Grant Date | Units (#) | | | of Awards (3) | |
| Michael A. Jackson | 2/16/2007 | | 6,666 | (1 | ) | | $ | 266,641 | |
| | 2/16/2007 | | 13,333 | (2 | ) | | | - | |
| (1) Award of Class B Units. | | | | | | | | | |
| (2) Award of Class C Units | | | | | | | | | |
| (3) Represents grant date fair value of awards of Class B Units and Class C Units in accordance with SFAS No. 123R. | |
Employment Agreements
Michael A. Jackson. Effective November 20, 2006, we entered into an employment agreement with Michael A. Jackson, pursuant to which Mr. Jackson will serve as our Chief Executive Officer for a three-year term, with automatic renewal for additional one-year periods unless either party gives notice of non-extension in accordance with the terms of the agreement.
Under Mr. Jackson’s employment agreement, he is entitled to receive an annual base salary which is subject to increase at the discretion of our Board of Directors. His salary was increased from $400,000 to $450,000 in January 2008 with retroactive effect to November 1, 2007. Mr. Jackson is also entitled to receive an annual bonus with a target bonus equal to 100% of his then current annual base salary. In connection with Mr. Jackson’s relocation to Memphis, Tennessee, the employment agreement also provides for a lump sum payment of $10,000 and the reimbursement of certain relocation expenses incurred by Mr. Jackson. The employment agreement also provides for the grant to Mr. Jackson of a sign-on award, effective November 20, 2006, of 2,000 Class A Units, 1,667 Class B Units, and 3,334 Class C Units. In addition to the foregoing award under his employment agreement, on February 16, 2007, Mr. Jackson purchased an additional 8,000 Class A Units and received additional grants of 6,666 Class B Units and 13,333 Class C Units—for a total of 10,000 Class A Units, 8,333 Class B Units and 16,667 Class Units.
In the event of Mr. Jackson’s termination of employment by us without “Cause” or by him for “Good Reason” (each such term as defined in his employment agreement), Mr. Jackson will be entitled to a severance payment equal to 1.5 times (i) his annual base salary, and (ii) his annual bonus, if any, payable with respect to the calendar year immediately preceding the year in which such termination of employment occurs. The severance amount is payable in equal monthly installments during the 18-month period following the date of such termination of employment.
Under his employment agreement, Mr. Jackson is subject to non-disclosure and non-disparagement obligations in perpetuity, as well as certain non-competition and non-solicitation obligations during the term and the 18-month period following the termination of his employment for any reason.
Outstanding Equity Awards
The following table shows the outstanding awards of Class B Units and Class C Units held by our named executive officers as of December 31, 2007:
| | | | | | Equity Incentive | |
| | Equity Incentive | | | Plan Awards: | |
| | Plan Awards: | | | Market or payout | |
| | Number of Units | | | Value of Units | |
| | That Have Not | | | That Have Not | |
| Name | Vested (#) | | | Vested (#) | |
| Michael A. Jackson | 6,667 | (1 | ) | | $ | - | |
| | 16,667 | (2 | ) | | | | |
| Robert P. Mundy | 1,500 | (1 | ) | | | - | |
| | 3,750 | (2 | ) | | | - | |
| Lyle J. Fellows | 1,500 | (1 | ) | | | - | |
| | 3,750 | (2 | ) | | | - | |
| Michael A. Weinhold | 1,500 | (1 | ) | | | - | |
| | 3,750 | (2 | ) | | | - | |
| Peter H. Kesser | 1,167 | (1 | ) | | | - | |
| | 2,917 | (2 | ) | | | - | |
| (1) Awards of Class B Units, which vest in five annual installments of 20% each beginning on August 1, 2007. | |
| (2) Awards of Class C Units, which vest only if certain performance targets are met. | |
(3) The market or payout value of the unvested awards of Class B Units and Class C Units is not determinable, because there is no public market for the Class B Units and Class C Units. The Class B Units and Class C Units represent profits interests in Verso Paper Management LP, which will have value only if the value of Verso Paper Management LP increases following the date on which the awards of such Class B Units and Class C Units are granted and only after the aggregate amount of capital contributions in respect of all Class A Units has been repaid to the holders of Class A Units. | |
Units Vested
The following table shows the number of Class B Units that vested for each of our named executive officers in 2007. No Class C Units vested in 2007.
| | | Equity Incentive Plan Awards | |
| | | Number of Units | | | | |
| | | Acquired on | | | Value Realized | |
| Name | | Vesting (#) (1) | | | on Vesting (2) | |
| Michael A. Jackson | | | 1,666 | | | $ | - | |
| Robert P. Mundy | | | 375 | | | | - | |
| Lyle J. Fellows | | | 375 | | | | - | |
| Michael A. Weinhold | | | 375 | | | | - | |
| Peter H. Kesser | | | 291 | | | | - | |
| (1) Awards of Class B Units, which vest in five annual installments of 20% each beginning on August 1, 2007. | |
| (2) The market value of vested Class B Units is not determinable because there is no public market for the Class B units. The Class B Units represent profits interests in Verso Paper Management LP, which will have value only if the value of Verso Paper Management LP increases following the date on which the awards of such Class B Units are granted and only after the aggregate amount of capital contributions in respect of all Class A Units has been repaid to the holders of Class A Units. | |
Potential Payments Upon Termination of Employment or Change in Control
Employee Severance Plan. Under our employee severance plan, each of our named executive officers is eligible to receive a termination allowance in the event of a termination of employment due to certain events, including the executive’s job elimination, a facility closing, the executive’s disability, or the executive’s inability to perform the requisite duties of his position despite his reasonable efforts.
The termination allowance is a lump-sum amount equal to the number of years or partial years of applicable service with us, multiplied by the amount of two weeks of base salary. The termination allowance may not be less than the amount of four weeks of base salary. In addition, it is our practice to provide a pro rata amount of annual VIP bonus compensation that would have otherwise been paid to the executive officer if employment had continued through the end of the applicable calendar year.
Confidentiality and Non-Competition Agreements. Each of our named executive officers (with the exception of Mr. Jackson) is party to a confidentiality and non-competition agreement, pursuant to which the executive is subject to non-competition obligations for 12 months following termination of employment. The confidentiality and non-competition agreement provides that if the executive is unable, despite diligent search, to obtain employment consistent with his experience and education, the executive may be entitled to a monthly severance benefit equal to his monthly base pay received in the month prior to the month in which such termination of employment occurs, payable for each month or partial month of unemployment during the 12-month non-competition period. The executive’s entitlement to this “pay for no play” monthly severance benefit is subject to our receipt and reasonable verification of the executive’s written notice of the efforts he has made to secure employment that does not conflict with his non-competition obligations.
Estimated Severance Payments. Assuming the termination of employment of all of our named executive officers as of December 31, 2007, under the circumstances described above, the executives would be entitled to the following severance payments under our employee severance plan and the applicable employment agreement (in the case of Mr. Jackson) or confidentiality and non-competition agreement (in the case of the other named executive officers):
| | | Employee | | | Applicable | | | | | | |
| Name | | Severance Plan | | | Agreement | | | | | Total (2) | |
| Michael A. Jackson | | $ | - | | | $ | 675,000 | | (1 | ) | | $ | 675,000 | |
| Robert P. Mundy | | | 227,788 | | | | 236,900 | | | | | | 464,688 | |
| Lyle J. Fellows | | | 273,127 | | | | 263,011 | | | | | | 536,138 | |
| Michael A. Weinhold | | | 138,402 | | | | 257,032 | | | | | | 395,434 | |
| Peter H. Kesser | | | 18,462 | | | | 240,000 | | | | | | 258,462 | |
| (1) This amount assumes an annual base salary of $450,000, which reflects the increase in Mr. Jackson's annual base salary in January 2008 with retroactive effect to November 1, 2007. This amount includes only the portion of Mr. Jackson’s severance payment equal to 1.5 times his annual base salary, as no annual bonus was payable in respect of the calendar year immediately preceding the assumed year of termination. To the extent that an annual bonus is payable to Mr. Jackson in respect of 2008 or later, his severance payment also would include an amount equal to 1.5 times the annual bonus payable with respect to the year immediately preceding the year in which any such termination of employment occurs. | |
| (2) Total does not include the value of unused vacation days or a prorated annual bonus under the VIP. | | | | | | | | | | | |
Class C Unit Awards. In the event of (i) the termination of employment of one of our named executive officers without “Cause” (as defined in the LP Agreement) on or following August 1, 2007, (ii) a “Change in Control” (as defined in the LP Agreement) occurs within six months following the date of such termination, and (iii) a specified internal rate of return is achieved at the time of such Change in Control, then the Class C Units held by such terminated executive officer will accelerate and vest in full as of the date of such Change in Control. None of our named executive officers receive any other incremental benefits due to a change in control, and in the event of a named executive officer’s termination of employment in connection with a change in control, the executive will be eligible to receive only the severance benefits described above.
Director Compensation
The following table provides a summary of compensation paid to our non-employee directors for 2007. The table shows the amounts earned by such persons for services rendered to us in all capacities in which they served.
| | | Fees Earned | | | | | | | |
| | | or Paid in | | | Option | | | | |
| Name | | Cash (1) | | | Awards | | | Total | |
| Michael E. Ducey | | $ | 46,000 | | | $ | 79,038 | | | $ | 125,038 | |
| Joshua J. Harris | | | 56,000 | | | | - | | | | 56,000 | |
| Scott M. Kleinman | | | 60,000 | | | | - | | | | 60,000 | |
| David W. Oskin | | | 58,000 | | | | - | | | | 58,000 | |
| L.H. Puckett, Jr. | | | 46,000 | | | | - | | | | 46,000 | |
| Jordan C. Zaken | | | 60,000 | | | | - | | | | 60,000 | |
| (1) Represents fees paid in cash during 2007. | | | | | | | | | | | | |
| (2) Represents 2007 SFAS No. 123R expense relating to the grant to Mr. Ducey of an award of 2,000 Class D Units in 2007. The Class D Units are intended to be substantially economically equivalent to stock options that are fully vested as of the date of grant. | |
Compensation Committee Interlocks and Insider Participation
Scott M. Kleinman and Jordan C. Zaken served as members of the Compensation Committee in 2007. Neither Mr. Kleinman nor Mr. Zaken is or was one of our employees. In addition, none of our executive officers serves, or in the past has served, as a member of the board or directors or compensation committee of any entity that has one or more executive officers who serve on our board of directors or Compensation Committee.
Compensation Committee Report
The members of the Compensation Committee have reviewed and discussed with management the Compensation Discussion and Analysis set forth above. Based on the foregoing review and discussion and such other matters the Compensation Committee deemed relevant and appropriate, the Compensation Committee recommended to the Board of Directors that the Compensation Discussion and Analysis be included in this annual report.
We are a wholly-owned, indirect subsidiary of Verso Paper Management LP. Verso Paper Investments LP is the general partner of Verso Paper Management LP and controls all of the voting interests in Verso Paper Management LP. In connection with the Transactions, certain members of our senior management made investments in Verso Paper Management LP, and affiliates of Apollo and International Paper made investments in Verso Paper Investments LP. The limited partner interests in Verso Paper Management LP held by our senior management and the limited partner interests in Verso Paper Investments LP held by International Paper do not have any voting power. Verso Paper Investments Management LLC, an affiliate of Apollo, is the general partner of Verso Paper Investments LP and controls all of the voting interests in Verso Paper Investments LP. Apollo, therefore, controls us through its control of Verso Paper Investments Management LLC, Verso Paper Investments LP, Verso Paper Management LP, and the other entities in the chain of ownership between Verso Paper Management LP and us.
The following table sets forth sets forth information regarding our partnership interests that are beneficially owned by (1) each person who is known to us to be the beneficial owner of more than 5% of such interests, (2) each of our directors and named executive officers, and (3) all of our directors and executive officers as a group. For purposes of this table, “beneficial ownership” is determined in accordance with Rule 13d-3 under the Securities Exchange Act of 1934. Except as otherwise indicated, the persons or entities listed below have sole voting and investment power with respect to the partnership interests beneficially owned by them.
Name and Address of Owner | | Beneficial Ownership Percentage | |
Apollo(1) | | | 100 | % |
Michael A. Jackson(2) | | | — | |
Robert P. Mundy(2) | | | — | |
Lyle J. Fellows(2) | | | — | |
Michael A. Weinhold(2) | | | — | |
Peter H. Kesser(2) | | | — | |
Michael E. Ducey(2) | | | — | |
David W. Oskin(2) | | | — | |
L.H. Puckett, Jr. (2) | | | — | |
Joshua J. Harris(3) | | | 100 | % |
Scott M. Kleinman(3) | | | 100 | % |
Jordan C. Zaken(3) | | | 100 | % |
David B. Sambur(4) | | | — | |
All directors and officers as a group(3) | | | 100 | % |
| (1) | See the introductory paragraph of this section for an explanation of the beneficial ownership of our partnership interests by Apollo. Apollo disclaims beneficial ownership of any such interests except to the extent of any pecuniary interest therein. The address of Apollo is c/o Apollo Management, L.P., 9 West 57th Street, New York, New York 10019. |
| | |
| (2) | The address of Messrs. Jackson, Mundy, Fellows, Weinhold, Kesser, Ducey, Oskin and Puckett is c/o Verso Paper Holdings LLC, 6775 Lenox Center Court, Suite 400, Memphis, Tennessee 38115-4436. |
| | |
| (3) | Messrs. Harris, Kleinman and Zaken, each of whom is a director of Apollo, may be deemed to be a beneficial owner of the partnership interests beneficially owned by Apollo. Each such person disclaims beneficial ownership of any such interests except to the extent of any pecuniary interest therein. The address of Messrs. Harris, Kleinman and Zaken is c/o Apollo Management, L.P., 9 West 57th Street, New York, New York 10019. |
| | |
| (4) | The address of Mr. Sambur, a principal of Apollo, is c/o Apollo Management, L.P., 9 West 57th Street, New York, New York 10019. |
The following discussion relates to transactions with related persons since January 1, 2007.
Management Agreement
Upon completion of the Acquisition, affiliates of Apollo entered into a management agreement with our indirect parent, Verso Paper Investments LP, and us relating to the provision of certain financial and strategic advisory services and consulting services. Under the agreement, upon our written request, Apollo has agreed to advise us with respect to matters that relate to proposed financial transactions, acquisitions and other significant business matters. We pay Apollo an annual fee for its consulting and advising services in an amount equal to the greater of $2.5 million and 1.25% of our Adjusted EBITDA, as defined in the indentures governing our outstanding notes. In addition, Apollo has an exclusive right to act, subject to certain exceptions, in return for additional fees, as our financial advisor or investment banker for any merger, acquisition, disposition, finance or the like if we decide we need to engage someone to fill such role. We agreed to indemnify Apollo and its affiliates and their directors, officers and representatives for losses relating to the services contemplated by the management agreement and the engagement of affiliates of Apollo pursuant to, and the performance by them of the services contemplated by, the management agreement. Since August 1, 2006, we have paid fees to Apollo totaling $5.3 million, which includes the fee we paid Apollo for its advisory services in connection with the Acquisition.
Transition Arrangements
Upon completion of the Acquisition, we entered into a transition services agreement with International Paper whereby International Paper provided us with certain services specified in the agreement that are necessary for us to run as a stand-alone business. Among the transitional services provided by International Paper, or its designated third-party providers, were technical services, application support and maintenance, financial services, telecommunications services, payroll, health and welfare benefits administration, real estate support, and research and development support services. The transition services agreement provided for terms generally ranging from six to twelve months following the consummation of the Acquisition. Since August 1, 2006, we paid fees totaling $10.8 million to International Paper under the transition services agreement. The transition services agreement has expired, and we no longer receive any transitional services from International Paper.
Management Limited Partnership Agreement
In connection with the Transactions, our indirect parent, Verso Paper Management LP, Apollo and certain members of management who invested in Verso Paper Management LP, entered into a limited partnership agreement. Each of our executive officers is a party to the limited partnership agreement. The limited partnership agreement provides for customary restrictions on transfer, put and call rights, tag-along rights, drag-along rights and registration rights which apply to their limited partner interests in Verso Paper Management LP. The limited partnership agreement also contains customary non-solicitation and non-competition covenants applicable to management for one year following the termination of employment. Verso Paper Management LP also entered into an agreement with International Paper granting similar rights described above.
The following table represents fees billed to us for professional services rendered by Deloitte & Touche LLP for the year ended December 31, 2007, and the five months ended December 31, 2006:
| (In thousands of U.S. dollars) | | 2007 | | | 2006 | |
| Audit fees | | $ | 880 | | | $ | 350 | |
| Audit-related fees | | | 110 | | | | 55 | |
| Tax fees | | | - | | | | - | |
| All other | | | 30 | | | | - | |
| Total | | $ | 1,020 | | | $ | 405 | |
Audit fees. For the year ended December 31, 2007, and for the five months ended December 31, 2006, audit fees represents the aggregate fees billed to us by Deloitte & Touche LLP for professional services rendered for the audit of our financial statements and review of interim financial statements.
Audit-related fees. For the year ended December 31, 2007, and for the five months ended December 31, 2006, audit-related fees represent the aggregate fees billed to us by Deloitte & Touche LLP for assurance and related services that are reasonably related to the audit or review of our financial statements, which in both periods includes fees for compliance attestation and other procedures provided in conjunction with documents prepared for our issuance of public debt.
All other. For 2007, aggregate fees billed to us by Deloitte & Touche LLP for professional services related to documentation of internal controls.
The Audit Committee is responsible for pre-approval of all audit and permitted non-audit services to be performed by Deloitte & Touche LLP, as the registered public accounting firm that performs the audit of our consolidated financial statements that are filed with the SEC.
PART IV
Financial Statements
| Financial Statements Filed | | Pages |
| Report of Independent Registered Public Accounting Firm | | 40 |
| Consolidated and Combined Financial Statements | | 41-44 |
| Notes to Consolidated and Combined Financial Statements | | 45-77 |
REPORT OF INDEPENDENT REGISTERED PUBLIC ACCOUNTING FIRM
To the Board of Directors and Members of
Verso Paper Holdings LLC
Memphis, Tennessee
We have audited the accompanying consolidated balance sheets of Verso Paper Holdings LLC (the "Company"), a wholly-owned subsidiary of Verso Paper Finance Holdings LLC, as of December 31, 2007 and 2006 (Successor Company balance sheets), and the related consolidated statements of operations, changes in members’ equity, and cash flows for the year ended December 31, 2007 and the five months ended December 31, 2006 (Successor Company Operations). We have also audited the accompanying combined statements of operations and cash flows for the seven months ended July 31, 2006, and the year ended December 31, 2005 (Predecessor operations), and have issued our report thereon dated March 12, 2008; such financial statements and report are included elsewhere in this Form 10-K. Our audits also included the financial statement schedule of the Company listed in Item 15. This financial statement schedule is the responsibility of the Company's management. Our responsibility is to express an opinion based on our audits. In our opinion, such financial statement schedule, when considered in relation to the basic financial statements taken as a whole, presents fairly, in all material respects, the information set forth therein.
/s/ Deloitte & Touche LLP
Memphis, Tennessee
March 12, 2008
Financial Statement Schedules
Schedule II – Valuation and Qualifying Accounts
Verso Paper Corp. (Successor) and
Coated and Supercalendered Papers Division of International Paper Company (Predecessor)
Valuation and Qualifying Accounts
Year Ended December 31, 2005, and Seven Months Ended July 31, 2006 (Predecessor)
and Five Months Ended December 31, 2006 and Year Ended December 31, 2007 (Successor)
| | | Balance at | | | Charged to | | | Charge-off | | | Balance | |
| | | Beginning | | | Cost and | | | Against | | | at End of | |
| (in thousands of U.S. dollars) | | of Period | | | Expenses | | | Allowances | | | Period | |
| Allowance for uncollectible accounts included under | | | | | | | | | | | | |
| the balance sheet caption "Accounts receivable" | | | | | | | | | | | | |
| (Predecessor): | | | | | | | | | | | | |
| Year Ended December 31, 2005 | | $ | 8,897 | | | $ | 200 | | | $ | (1,795 | ) | | $ | 7,302 | |
| Seven Months Ended July 31, 2006 | | $ | 7,302 | | | $ | 856 | | | $ | (6,323 | ) | | $ | 1,835 | |
| Allowance for uncollectible accounts included under | | | | | | | | | | | | | | | | |
| the balance sheet caption "Accounts receivable" | | | | | | | | | | | | | | | | |
| (Successor): | | | | | | | | | | | | | | | | |
| Five Months Ended December 31, 2006 | | $ | 1,835 | | | $ | 102 | | | $ | - | | | $ | 1,937 | |
| Year Ended December 31, 2007 | | $ | 1,937 | | | $ | (258 | ) | | $ | (2 | ) | | $ | 1,677 | |
| Index to Exhibits | |
| | |
| Exhibit | |
| Number | Description |
| 2.1 | Agreement of Purchase and Sale dated as of June 4, 2006, among International Paper Company, Verso Paper Investments LP, and Verso Paper LLC (incorporated by reference to Exhibit 2.1 to Amendment No. 1 to the Registration Statement on Form S-4 of Verso Paper Holdings LLC (Registration No. 333-142283) filed on June 29, 2007), as amended by Amendment No. 1 to Agreement of Purchase and Sale dated as of August 1, 2006, among such parties (incorporated by reference to Exhibit 2.2 to Amendment No. 1 to the Registration Statement on Form S-1 of Verso Paper Corp. (Registration No. 333-148201) filed on February 13, 2008), and Amendment No. 2 to Agreement of Purchase and Sale dated as of May 31, 2007, among such parties (incorporated by reference to Exhibit 2.3 to Amendment No. 1 to the Registration Statement on Form S-1 of Verso Paper Corp. (Registration No. 333-148201) filed on February 13, 2008). Schedules, exhibits and annexes have been omitted from this filing. We will furnish, as supplementary information, copies of the omitted materials to the SEC upon request. |
| | |
| 3.1* | Certificate of Formation filed June 6, 2006, as amended by Certificate of Amendment filed June 13, 2006, Certificate of Amendment filed June 23, 2006, and Certificate of Amendment filed June 26, 2006, of Verso Paper Holdings LLC. |
| | |
| 3.2* | Amended and Restated Limited Liability Company Agreement of Verso Paper Holdings LLC dated as of January 25, 2007. |
| | |
| 4.1 | Indenture relating to the 9⅛% Second Priority Senior Secured Fixed Rate Notes due 2014 and the Second Priority Senior Secured Floating Rate Notes due 2014, dated as of August 1, 2006, among Verso Paper Holdings LLC, Verso Paper Inc., the Guarantors named therein, and Wilmington Trust Company, as Trustee, including the forms of 9⅛% Second Priority Senior Secured Fixed Rate Initial Note (included as Exhibit A-1), 9⅛% Second Priority Senior Secured Fixed Rate Exchange Note (included as Exhibit B-1), Second Priority Senior Secured Floating Rate Initial Note (included as Exhibit A-2), and Second Priority Senior Secured Floating Rate Exchange Note (included as Exhibit B-2) (incorporated by reference to Exhibits 4.1-4.5 to Amendment No. 1 to the Registration Statement on Form S-4 of Verso Paper Holdings LLC (Registration No. 333-142283) filed on June 29, 2007). |
| | |
| 4.2 | Indenture relating to the 11⅜% Senior Subordinated Notes due 2016, dated as of August 1, 2006, among Verso Paper Holdings LLC, Verso Paper Inc., the Guarantors named therein, and Wilmington Trust Company, as Trustee, including the forms of 11⅜% Senior Subordinated Initial Note (included as Exhibit A) and 11⅜% Senior Subordinated Exchange Note (included as Exhibit B) (incorporated by reference to Exhibits 4.6-4.8 to Amendment No. 1 to the Registration Statement on Form S-4 of Verso Paper Holdings LLC (Registration No. 333-142283) filed on June 29, 2007). |
| | |
| 4.3 | Registration Rights Agreement dated as of August 1, 2006, among Verso Paper Holdings LLC, Verso Paper Inc., the Guarantors named therein, Credit Suisse Securities (USA) LLC, Lehman Brothers Inc., Citigroup Global Markets Inc., Banc of America Securities LLC, ABN AMRO Incorporated, and Fifth Third Securities Inc. (incorporated by reference to Exhibit 4.9 to Amendment No. 1 to the Registration Statement on Form S-4 of Verso Paper Holdings LLC (Registration No. 333-142283) filed on June 29, 2007). |
| | |
| 4.4 | Registration Rights Agreement dated as of August 1, 2006, among Verso Paper Holdings LLC, Verso Paper Inc., the Guarantors named therein, Credit Suisse Securities (USA) LLC, Lehman Brothers Inc., Citigroup Global Markets Inc., Banc of America Securities LLC, ABN AMRO Incorporated, and Fifth Third Securities Inc. (incorporated by reference to Exhibit 4.10 to Amendment No. 1 to the Registration Statement on Form S-4 of Verso Paper Holdings LLC (Registration No. 333-142283) filed on June 29, 2007). |
| | |
| 4.5 | Intercreditor Agreement dated as August 1, 2006, among Credit Suisse, Cayman Islands Branch, as Intercreditor Agent, Wilmington Trust Company, as Trustee, Verso Paper Finance Holdings LLC, Verso Paper Holdings LLC, and the Subsidiaries of Verso Paper Holdings LLC listed therein (incorporated by reference to Exhibit 4.11 to Amendment No. 1 to the Registration Statement on Form S-4 of Verso Paper Holdings LLC (Registration No. 333-142283) filed on June 29, 2007). |
| | |
| 4.6 | Collateral Agreement dated as of August 1, 2006, among Verso Paper Holdings LLC, Verso Paper Inc., the Subsidiaries identified therein, and Wilmington Trust Company, as Collateral Agent (incorporated by reference to Exhibit 4.12 to Amendment No. 1 to the Registration Statement on Form S-4 of Verso Paper Holdings LLC (Registration No. 333-142283) filed on June 29, 2007). |
| | |
| 4.7 | Intellectual Property Security Agreement dated as of August 1, 2006, made by Verso Paper Finance Holdings LLC, Verso Paper Holdings LLC, and the other Verso entities identified therein in favor of Credit Suisse, Cayman Islands Branch, as Administrative Agent (incorporated by reference to Exhibit 4.13 to Amendment No. 1 to the Registration Statement on Form S-4 of Verso Paper Holdings LLC (Registration No. 333-142283) filed on June 29, 2007). |
| | |
| 10.1 | Credit Agreement dated as of August 1, 2006, among Verso Paper Finance Holdings LLC, Verso Paper Holdings LLC, the Lenders party thereto, Credit Suisse, Cayman Islands Branch, as Administrative Agent, Lehman Brothers Inc., as Syndication Agent, and Citigroup Global Markets Inc. and Banc of America Securities LLC, as Documentation Agents (incorporated by reference to Exhibit 10.1 to Amendment No. 1 to the Registration Statement on Form S-4 of Verso Paper Holdings LLC (Registration No. 333-142283) filed on June 29, 2007). |
| | |
| 10.2 | Guarantee and Collateral Agreement dated as of August 1, 2006, among Verso Paper Finance Holdings LLC, Verso Paper Holdings LLC, the Subsidiaries identified therein, and Credit Suisse, Cayman Islands Branch, as Administrative Agent (incorporated by reference to Exhibit 10.2 to Amendment No. 1 to the Registration Statement on Form S-4 of Verso Paper Holdings LLC (Registration No. 333-142283) filed on June 29, 2007). |
| | |
| 10.3 | Intellectual Property Security Agreement dated as of August 1, 2006, made by Verso Paper Holdings LLC and the other Verso entities identified therein in favor of Wilmington Trust Company, as Collateral Agent (incorporated by reference to Exhibit 10.3 to Amendment No. 1 to the Registration Statement on Form S-4 of Verso Paper Holdings LLC (Registration No. 333-142283) filed on June 29, 2007). |
| | |
| 10.4 | Management and Transaction Fee Agreement dated as of August 1, 2006, between Verso Paper LLC, Verso Paper Investments LP, Apollo Management V, L.P., and Apollo Management VI, L.P. (incorporated by reference to Exhibit 10.4 to Amendment No. 1 to the Registration Statement on Form S-4 of Verso Paper Holdings LLC (Registration No. 333-142283) filed on June 29, 2007). |
| | |
| 10.5† | Employment Agreement dated as of November 16, 2006, between Michael A. Jackson and Verso Paper Holdings LLC (incorporated by reference to Exhibit 10.5 to Amendment No. 1 to the Registration Statement on Form S-4 of Verso Paper Holdings LLC (Registration No. 333-142283) filed on June 29, 2007). |
| | |
| 10.6† | Letter Agreement dated as of November 16, 2006, between Michael A. Jackson and Verso Paper Holdings LLC (incorporated by reference to Exhibit 10.6 to Amendment No. 1 to the Registration Statement on Form S-4 of Verso Paper Holdings LLC (Registration No. 333-142283) filed on June 29, 2007). |
| | |
| 10.7* | Second Amended and Restated Limited Partnership Agreement of Verso Paper Management LP dated as of February 26, 2008. |
| | |
| 10.8† | Letter Agreement dated as of February 16, 2007, between Verso Paper Management LP and Michael A. Jackson (incorporated by reference to Exhibit 10.8 to Amendment No. 1 to the Registration Statement on Form S-4 of Verso Paper Holdings LLC (Registration No. 333-142283) filed on June 29, 2007). |
| | |
| 10.9† | Letter Agreement dated as of November 1, 2006, between Verso Paper Management LP and L.H. Puckett (incorporated by reference to Exhibit 10.9 to Amendment No. 1 to the Registration Statement on Form S-4 of Verso Paper Holdings LLC (Registration No. 333-142283) filed on June 29, 2007). |
| | |
| 10.10† | Confidentiality and Non-Competition Agreement dated as of March 20,2007, between Verso Paper Holdings LLC and Robert P. Mundy (incorporated by reference to Exhibit 10.13 to Amendment No. 1 to the Registration Statement on Form S-4 of Verso Paper Holdings LLC (Registration No. 333-142283) filed on June 29, 2007). |
| | |
| 10.11† | Confidentiality and Non-Competition Agreement dated as of March 19, 2007, between Verso Paper Holdings LLC and Lyle J. Fellows (incorporated by reference to Exhibit 10.11 to Amendment No. 1 to the Registration Statement on Form S-4 of Verso Paper Holdings LLC (Registration No. 333-142283) filed on June 29, 2007). |
| | |
| 10.12† | Confidentiality and Non-Competition Agreement dated as of March 19, 2007, between Verso Paper Holdings LLC and Michael A. Weinhold (incorporated by reference to Exhibit 10.12 to Amendment No. 1 to the Registration Statement on Form S-4 of Verso Paper Holdings LLC (Registration No. 333-142283) filed on June 29, 2007). |
| | |
| 10.13*† | Confidentiality and Non-Competition Agreement dated as of March 19, 2007, between Verso Paper Holdings LLC and Peter H. Kesser. |
| | |
| 21.1* | Subsidiaries of Verso Paper Holdings LLC. |
| | |
| 31.1* | Certification of Principal Executive Officer Pursuant to Rule 15d-14(a) under the Securities Exchange Act of 1934. |
| | |
| 31.2* | Certification of Principal Financial Officer Pursuant to Rule 15d-14(a) under the Securities Exchange Act of 1934. |
| | |
| 32.1* | Certification of Principal Executive Officer Pursuant to Rule 15d-14(b) under the Securities Exchange Act of 1934 and Section 1350 of Chapter 63 of Title 18 of the United States Code. |
| | |
| 32.2* | Certification of Principal Financial Officer Pursuant to Rule 15d-14(b) under the Securities Exchange Act of 1934 and Section 1350 of Chapter 63 of Title 18 of the United States Code. |
| | |
| | |
| * Filed with this annual report. |
† Management contract or compensatory plan or arrangement. |
SIGNATURES
Pursuant to the requirements of the Securities Exchange Act of 1934, the registrant has duly caused this report to be signed on its behalf by the undersigned thereunto duly authorized.
| Date: March 12, 2008 | | | | |
| | | VERSO PAPER HOLDINGS LLC (Registrant) |
| | | |
| | | By: | | |
| | | | | Michael A. Jackson President and Chief Executive Officer (Principal Executive Officer) |
| | | | | |
| | | | | |
| | | |
| | | By: | | |
| | | | | Robert P. Mundy Senior Vice President and Chief Financial Officer (Principal Financial and Accounting Officer) |
Pursuant to the requirements of the Securities Exchange Act of 1934, as amended, this report has been signed below by the following persons on behalf of Verso Paper Holdings LLC and in the capacities and on the dates indicated.
| Signature | Capacity | DATE |
| | | |
| /s/ Michael A. Jackson | | President, Chief Executive Officer and Director (Principal Executive Officer) | March 12, 2008 |
| Michael A. Jackson | |
/s/ Robert P. Mundy | | Senior Vice President and Chief Financial Officer (Principal Financial and Accounting Officer) | March 12, 2008 |
Robert P. Mundy | |
| b | | Director | March 12, 2008 |
| Joshua J. Harris | |
/s/ Scott M. Kleinman | | Director | March 12, 2008 |
| Scott M. Kleinman | |
/s/ Jordan C. Zaken | | Director | March 12, 2008 |
| Jordan C. Zaken | | | |
| | | | |
| /s/ David W. Oskin | | Director | March 12, 2008 |
| David W. Oskin | | | |
| | | | |
| /s/ L..H. Puckett, Jr. | | Director | March 12, 2008 |
| L.H. Puckett, Jr. | | | |
| | | | |
| /s/ Michael E. Ducey | | Director | March 12, 2008 |
| Michael E. Ducey | | | |
| | | | |
| /s/ David B. Sambur | | Director | March 12, 2008 |
| David B. Sambur | | | |
97