UNITED STATES
SECURITIES AND EXCHANGE COMMISSION
Washington, DC 20549
FORM 10-K
(Mark One)
[ü] ANNUAL REPORT PURSUANT TO SECTION 13 OR 15(d) OF THE SECURITIES EXCHANGE ACT OF 1934
For the fiscal year ended December 31, 2008
or
[ ] TRANSITION REPORT PURSUANT TO SECTION 13 OR 15(d) OF THE SECURITIES EXCHANGE ACT OF 1934
For the transition period from _________ to _____________
Commission file number: 333-142283
Verso Paper Holdings LLC
(Exact name of registrant as specified in its charter)
Delaware | | 56-2597634 |
| (State or other jurisdiction of incorporation or organization) | | (I.R.S. Employer Identification Number) |
| | | |
6775 Lenox Center Court, Suite 400 | | |
Memphis, Tennessee 38115-4436 | | (901) 369-4100 |
| (Address of principal executive offices) (Zip Code) | | (Registrant’s telephone number, including area code) |
Securities registered pursuant to Section 12(b) of the Act: None
Securities registered pursuant to Section 12(g) of the Act: None
Indicate by check mark if the registrant is a well-known seasoned issuer, as defined in Rule 405 of the Securities Act. Yes No ü
Indicate by check mark if the registrant is not required to file reports pursuant to Section 13 or Section 15(d) of the Act. Yes No ü
Indicate by check mark whether the registrant (1) has filed all reports required to be filed by Section 13 or 15(d) of the Securities Act of 1934 during the preceding 12 months (or for such shorter period that the registrant was required to file such reports), and (2) has been subject to such filing requirements for the past 90 days. Yes ü No
Indicate by check mark if disclosure of delinquent filers pursuant to Item 405 of Regulation S-K (§ 229.405) is not contained herein, and will not be contained, to the best of registrant’s knowledge, in definitive proxy or information statements incorporated by reference in Part III of the Form 10-K or any amendment to this Form 10-K. ü
Indicate by check mark whether the registrant is a large accelerated filer, an accelerated filer, a non-accelerated filer, or a smaller reporting company. See the definitions of “large accelerated filer,” “accelerated filer,” and “smaller reporting company” in Rule 12b-2 of the Exchange Act. (Check one):
| | | | | |
| Large accelerated filer ____ | | Accelerated filer ____ | Non-accelerated filer ü (Do not check if a smaller reporting company) | Smaller reporting company ____ |
Indicate by check mark whether the registrant is a shell company (as defined in Rule 12b-2 of the Act. Yes ______ No __ü__
DOCUMENTS INCORPORATED BY REFERENCE: None
The registrant meets the conditions set forth in General Instruction I(1)(a) and (b) of Form 10-K and is therefore filing this Form 10-K with the reduced disclosure format permitted by General Instruction I(2).
Table of Contents
Forward-Looking Statements
In this annual report, all statements that are not purely historical facts are forward-looking statements within the meaning of Section 27A of the Securities Act of 1933 and Section 21E of the Securities Exchange Act of 1934. Forward-looking statements may be identified by the words “believe,” “expect,” “anticipate,” “project,” “plan,” “predict,” “estimate,” “intend,” “could,” “may,” “might,” and similar expressions. Forward-looking statements are based on currently available business, economic, financial, and other information and reflect management’s current knowledge, assumptions, beliefs, estimates, expectations, and views with respect to future developments and their potential effects on Verso. Actual results could vary materially depending on risks and uncertainties that may affect Verso and its business. For a discussion of such risks and uncertainties, please refer to “Risk Factors,” “Management’s Discussion and Analysis of Financial Condition and Results of Operations,” and other sections of this annual report and to Verso’s other filings with the Securities and Exchange Commission. Except as required by applicable law, we assume no obligation to update any forward-looking statement made in this annual report to reflect subsequent events or circumstances or actual outcomes.
Market and Industry Information
Market data and other statistical information used throughout this annual report are based on independent industry publications, government publications, reports by market research firms or other published independent sources. Some data are also based on our good faith estimates which are derived from our review of internal surveys, as well as the independent sources listed above. Although we believe these sources are reliable, we have not independently verified the information. Industry prices for coated paper provided in this annual report are, unless otherwise expressly noted, derived from Resource Information Systems, Inc., or “RISI, Inc.” data. “North American” data included in this annual report that has been derived from RISI, Inc. only includes data from the United States and Canada. U.S. industry pricing data included in this annual report has been derived from RISI, Inc. data; this data represents pricing from the eastern United States only (as defined by RISI, Inc.). Also, any reference to (i) grade No. 3, grade No. 4, and grade No. 5 coated paper relates to 60 lb. basis weight, 50 lb. basis weight, and 34 lb. basis weight, respectively, (ii) lightweight coated groundwood paper refers to groundwood paper grades that are a 36 lb. basis weight or less, and (iii) ultra-lightweight coated groundwood paper refers to groundwood paper grades that are a 30 lb. basis weight or less. The RISI, Inc. data included in this annual report has been derived from the following RISI, Inc. publications: 2008 RISI World Graphic Paper forecast and RISI, Paper Trader: A Monthly Monitor of the North American Graphic Paper Market, January 2009.
PART I
Unless otherwise noted, the terms “Verso,” “Verso Paper,” “Company,” “we,” “us,” “our,” and “Successor” refer collectively to Verso Paper Holdings LLC, a Delaware limited liability company, and its subsidiaries, and references to the “Division” or “Predecessor” refer to the Coated and Supercalendered Papers Division of International Paper Company, or “International Paper”.
Background
We began operations on August 1, 2006 when we acquired the assets and certain liabilities comprising the business of the Coated and Supercalendered Papers Division of International Paper. We were formed by affiliates of Apollo Management, L.P., or “Apollo,” for the purpose of consummating the acquisition from International Paper, or the “Acquisition.” Verso Paper Corp., of which we are an indirect, wholly-owned subsidiary, went public on May 14, 2008, with an initial public offering, or “IPO," of 14 million shares of common stock at a price of $12 per share which generated $152.2 million in net proceeds.
Our principal executive offices are located at 6775 Lenox Center Court, Suite 400, Memphis, Tennessee 38115-4436. Our telephone number is (901) 369-4100. Our web site address is www.versopaper.com. Information on our web site is not considered part of this annual report.
Overview
We are a leading North American supplier of coated papers to catalog and magazine publishers. The coating process adds a smooth uniform layer in the paper, which results in superior color and print definition. As a result, coated paper is used primarily in media and marketing applications, including catalogs, magazines, and commercial printing applications, such as high-end advertising brochures, annual reports, and direct mail advertising.
We are North America’s second largest producer of coated groundwood paper, which is used primarily for catalogs and magazines. We are also a low cost producer of coated freesheet paper, which is used primarily for annual reports, brochures, and magazine covers. In addition, we have a strategic presence in supercalendered paper, which is primarily used for retail inserts. We also produce and sell market kraft pulp, which is used to manufacture printing and writing paper grades and tissue products.
We operate 11 paper machines at four mills located in Maine, Michigan, and Minnesota. The mills have a combined annual production capacity of 1,693,000 tons of coated paper, 106,000 tons of supercalendered paper, 44,000 tons of ultra-lightweight specialty paper, and 878,000 tons of kraft pulp.
Our net sales (in millions) by product line in 2008, are illustrated below:
We sell and market our products to approximately 100 customers which comprise approximately 650 end-user accounts. We have long-standing relationships with many leading magazine and catalog publishers, commercial printers, specialty retail merchandisers and paper merchants. We reach our end-users through several distribution channels, including direct sales, commercial printers, paper merchants, and brokers.
Industry
Based on 2008 sales, the size of the global coated paper industry is estimated to be approximately $55 billion, or 53 million tons of coated paper shipments, including approximately $12 billion, or 12 million tons of coated paper shipments, in North America. Coated paper is used primarily in media and marketing applications, including catalogs, magazines, and commercial printing applications, which include high-end advertising brochures, annual reports and direct mail advertising. Demand is generally driven by North American advertising and print media trends, which in turn have historically been correlated with growth in Gross Domestic Product, or “GDP.”
In North America, coated papers are classified by brightness and fall into five grades, labeled No. 1 to No. 5, with No. 1 having the highest brightness level and No. 5 having the lowest brightness level. Papers graded No. 1, No. 2, and No. 3 are typically coated freesheet grades. No. 4 and No. 5 papers are predominantly groundwood containing grades. Coated groundwood grades are the preferred grades for catalogs and magazines, while coated freesheet is more commonly used in commercial print applications.
Products
We manufacture three main grades of paper: coated groundwood paper, coated freesheet paper, and supercalendered paper. These paper grades are differentiated primarily by their respective brightness, weight, print quality, bulk, opacity, and strength. We also produce Northern Bleached Hardwood Kraft, or “NBHK,” pulp. The following table sets forth our principal products by 2008 tons sold and as a percentage of our 2008 net sales:
| Product | | Tons Sold | | | Net Sales | |
| (tons in thousands, dollars in millions) | | Kts | | | % | | | $ | | | % | |
| Coated groundwood paper | | | 961 | | | | 49 | | | $ | 938 | | | | 53 | |
| Coated freesheet paper | | | 581 | | | | 30 | | | | 556 | | | | 31 | |
| Supercalendered paper | | | 105 | | | | 5 | | | | 81 | | | | 5 | |
| Pulp | | | 255 | | | | 13 | | | | 147 | | | | 8 | |
| Other | | | 51 | | | | 3 | | | | 45 | | | | 3 | |
| Total | | | 1,953 | | | | 100 | | | $ | 1,767 | | | | 100 | |
As a result of our scale and technological capabilities, we are able to offer our customers a broad product offering, from ultra-lightweight coated groundwood to heavyweight coated freesheet and supercalendered papers. Our customers have the opportunity to sole-source all of their coated paper needs from us while optimizing their choice of paper products. As our customers’ preferences change, they can switch paper grades to meet their desired balance between cost and performance attributes while maintaining their relationship with us.
We are also one of the largest rotogravure lightweight coated paper manufacturers in North America. Rotogravure printing is a technique for transferring ink onto coated papers, which typically results in a sharper image with truer colors and less ink trapping than in other printing processes but generally requires a smaller and higher-quality paper. Additionally, we are the only manufacturer in North America with the technological expertise to supply both rotogravure coated groundwood and coated freesheet.
Coated groundwood paper. Coated groundwood paper includes a fiber component produced through a mechanical pulping process. The use of such fiber results in a bulkier and more opaque paper that is better suited for applications where lighter weights and/or higher stiffness are required, such as catalogs and magazines. In addition to mechanical pulp, coated groundwood paper typically includes a kraft pulp component to improve brightness and print quality.
Coated freesheet paper. Coated freesheet paper is made from bleached kraft pulp, which is produced using a chemical process to break apart wood fibers and dissolve impurities such as lignin. The use of kraft pulp results in a bright, heavier-weight paper with excellent print qualities, which is well-suited for high-end commercial applications and premium magazines. Coated freesheet contains primarily kraft pulp, with less than 10% mechanical pulp in its composition.
Supercalendered paper. Supercalendered paper consists of groundwood fibers and a very high filler content but does not receive a separate surface coating. Instead, the paper is passed through a supercalendering process in which alternating steel and filled rolls “iron” the paper, giving it a gloss and smoothness that makes it resemble coated paper. Supercalendered papers are primarily used for retail inserts, due to their relatively low price point.
Pulp. We produce and sell NBHK pulp. NBHK pulp is produced through the chemical kraft process using hardwoods. Hardwoods typically have shorter length fibers than softwoods and are used to smooth paper. Kraft describes pulp produced using a chemical process, whereby wood chips are combined with chemicals and steam to separate the wood fibers. The fibers are then washed and pressure screened to remove the chemicals and lignin which originally held the fibers together. Finally, the pulp is bleached to the necessary whiteness and brightness. Kraft pulp is used in applications where brighter and whiter paper is required.
Over our integrated mill system, the total volume of pulp purchased from third parties is approximately balanced by the amount of pulp that we sell to the market. This feature substantially insulates our business from exposure to fluctuations in the price of pulp.
Other products. We also offer recycled paper to help meet specific customer requirements. Additionally, we offer customized product solutions for strategic accounts by producing paper grades with customer-specified weight, brightness and pulp mix characteristics, providing customers with cost benefits and/or brand differentiation. Finally, we have recently expanded our offerings to include ultra-lightweight uncoated printing papers and ultra-lightweight coated and uncoated flexible packaging papers.
Manufacturing
We operate 11 paper machines at four mills located in Maine, Michigan, and Minnesota. The mills have a combined annual production capacity of 1,693,000 tons of coated paper, 106,000 tons of supercalendered paper, 44,000 tons of ultra-lightweight specialty paper, and 878,000 tons of kraft pulp. Of the pulp that we produce, we consume approximately 493,000 tons internally and sell the rest. Our facilities are strategically located within close proximity to major publication printing customers. The facilities also benefit from convenient and cost-effective access to northern softwood fiber, which is required for the production of lightweight and ultra-lightweight coated papers. All mills and machines operate seven days a week on a twenty-four hours per day basis.
The following table sets forth the locations of our mills, the products they produce, and other key operating information:
| | | | | Paper | | Production |
| Mill/Location | | Product/Paper Grades | | Machines | | Capacity* |
| Jay (Androscoggin), ME | | Lightweight Coated Groundwood | | 2 | | 366,100 |
| | | Lightweight Coated Freesheet | | 1 | | 246,600 |
| | | Pulp | | - | | 404,600 |
| Bucksport, ME | | Lightweight and Ultra-Lightweight Coated | | | | |
| | | Groundwood and High Bulk Specialty | | | | |
| | | Coated Groundwood | | 4 | | 466,900 |
| | | Ultra-Lightweight Specialty | | | | 44,000 |
| Quinnesec, MI | | Coated Freesheet | | 1 | | 395,400 |
| | | Pulp | | - | | 473,400 |
| Sartell, MN | | Lightweight and Ultra-Lightweight Coated | | | | |
| | | Groundwood | | 1 | | 217,700 |
| | | Supercalendered | | 2 | | 105,600 |
| * We have the capacity to produce 878,000 tons of kraft pulp, of which approximately 493,000 tons are to be consumed internally and the remainder is available to be sold as market pulp. This data does not include our production capacity for other pulp grades, the entirety of which is consumed internally in the production process for our coated paper. |
The basic raw material of the papermaking process is wood pulp. The first stage of papermaking involves converting wood logs to pulp through either a mechanical or chemical process. Before logs can be processed into pulp, they are passed through a debarking drum to remove the bark. Once separated, the bark is burned as fuel in bark boilers. The wood logs are composed of small cellulose fibers which are bound together by a glue-like substance called lignin. The cellulose fibers are then separated from each other through either a mechanical or a kraft pulping process.
After the pulping phase, the fiber furnish is run onto the forming fabric of the paper machine. On the forming fabric, the fibers become interlaced, forming a mat of paper, and much of the water is extracted. The paper web then goes through a pressing and drying process to extract the remaining water. After drying, the web receives a uniform layer of coating that makes the paper smooth and provides uniform ink absorption. After coating, the paper goes through a calendering process that provides a smooth finish by ironing the sheet between multiple soft nips that consist of alternating hard (steel) and soft (cotton or synthetic) rolls. At the dry end, the paper is wound onto spools to form a machine reel and then rewound and split into smaller rolls on a winder. Finally, the paper is wrapped, labeled, and shipped.
Catalog and magazine publishers with longer print runs tend to purchase paper in roll form for use in web printing, a process of printing from a reel of paper as opposed to individual sheets of paper, in order to minimize costs. In contrast, commercial printers typically buy large quantities of sheeted paper in order to satisfy the short-run printing requirements of their customers. We believe that sheeted paper is a less attractive product as it requires additional processing, bigger inventory stocks, a larger sales and marketing team and a different channel strategy. For this reason, we have pursued a deliberate strategy of configuring our manufacturing facilities to produce all web-based papers, which are shipped in roll form and have developed relationships with third-party converters to address any sheeted paper needs of our key customers.
We utilize a manufacturing excellence program, named R-GAP, to ensure timely and accurate reporting, encourage faster operator involvement, and provide an overall culture of continuous process improvement. We use multi-variable testing, lean manufacturing, center of excellence teams, source-of-loss initiatives, and best practice sharing to constantly improve our manufacturing processes and products. Since 2001, three of our four facilities have participated in OSHA’s Voluntary Protection Program which recognizes outstanding safety programs and performance.
Raw Materials and Suppliers
Our key cost inputs in the papermaking process are wood fiber, market kraft pulp, chemicals, and energy.
Wood Fiber. We source our wood fiber from a broad group of timberland and sawmill owners located in our regions.
Kraft Pulp. Overall, we have the capacity to produce 878,000 tons of kraft pulp, consisting of 405,000 tons of pulp at the Androscoggin mill and 473,000 tons of pulp at the Quinnesec mill, of which a total of approximately 493,000 tons are consumed internally. We supplement our internal production of kraft pulp with purchases from third parties. In 2008, these purchases were approximately 166,000 tons of pulp. We purchase the pulp requirements from a variety of suppliers and are not dependent on any single supplier to satisfy our pulp needs.
Chemicals. Chemicals utilized in the manufacturing of coated papers include latex, starch, calcium carbonate, and titanium dioxide. We purchase these chemicals from a variety of suppliers and are not dependent on any single supplier to satisfy our chemical needs.
Energy. We produce a large portion of our energy requirements, historically producing approximately 50% of our energy needs for our coated paper mills from sources such as waste wood and paper, hydroelectric facilities, chemicals from our pulping process, our own steam recovery boilers, and internal energy cogeneration facilities. Our external energy purchases vary across each one of our mills and include fuel oil, natural gas, coal, and electricity. While our internal energy production capacity and ability to switch between certain energy sources mitigates the volatility of our overall energy expenditures, we expect prices for energy to remain volatile for the foreseeable future. We utilize derivative contracts as part of our risk management strategy to manage our exposure to market fluctuations in energy prices.
Sales, Marketing, and Distribution
We reach our end-users through several sales channels. These include selling directly to end-users, through brokers, merchants, and printers. We sell and market products to approximately 100 customers, which comprise approximately 650 end-user accounts.
Sales to End-Users. In 2008, we sold approximately 42% of our paper products directly to end-users, most of which are catalog and magazine publishers. These customers are typically large, sophisticated buyers who have the scale, resources, and expertise to procure paper directly from manufacturers. Customers for our pulp products are mostly other paper manufacturers.
Sales to Brokers and Merchants. Our largest indirect paper sales by volume are through brokers and merchants who resell the paper to end-users. In 2008, our total sales to brokers and merchants represented 45% of our total sales. Brokers typically act as an intermediary between paper manufacturers and smaller end-users who do not have the scale or resources to cost effectively procure paper directly from manufacturers. The majority of the paper sold to brokers is resold to catalog publishers. We work closely with brokers to achieve share targets in the catalog, magazine, and insert end-user segments through collaborative selling.
Merchants are similar to brokers in that they act as an intermediary between the manufacturer and the end-user. However, merchants generally take physical delivery of the product and keep inventory on hand. Merchants tend to deal with smaller end-users that lack the scale to warrant direct delivery from the manufacturer. Coated freesheet comprises the majority of our sales to merchants. In most cases, because they are relatively small, the ultimate end-users of paper sold through merchants are generally regional or local catalog or magazine publishers.
Sales to Printers. In 2008, our total sales to printers represented 9% of our total sales. Nearly all of our sales were to the five largest publication printers in the United States. Printers also effectively act as an intermediary between manufacturers and end-users in that they directly source paper for printing/converting and then resell it to their customers as a finished product.
The majority of our products are delivered directly from our manufacturing facilities to the printer, regardless of the sales channel. In order to serve the grade No. 3 coated freesheet segment, we maintain a network of distribution centers located in the West, Midwest, South, and Northeast close to our customer base to provide quick delivery. The majority of our pulp products are delivered to our customers’ paper mills.
Our sales force is organized around our sales channels. We maintain an active dialogue with all of our major customers and track product performance and demand across grades. We have a team of sales representatives and marketing professionals organized into three major sales groups that correspond with our sales channels: direct sales support; support to brokers and merchants; and printer support.
The majority of our products are sold under contracts with our customers. Contracted sales are more prevalent for coated groundwood paper, as opposed to coated freesheet paper, which is more often sold without a contract. Our contracts generally specify the volumes to be sold to the customer over the contract term, as well as the pricing parameters for those sales. Most of our contracts are negotiated on an annual basis, with only a few having terms extending beyond one year. Typically, our contracts provide for quarterly price adjustments based on market price movements. The large portion of contracted sales allows us to plan our production runs well in advance, optimizing production over our integrated mill system and thereby reducing costs and increasing overall efficiency.
Part of our strategy is to continually reduce the cost to serve our customer base through e-commerce initiatives which allow for simplified ordering, tracking, and invoicing. In 2008, orders totaling $474.3 million, or approximately 30% of our total paper sales, were placed through our online ordering platforms. We are focused on further developing our technology platform and e-commerce capabilities. To this end, we operate Nextier Solutions, an Internet-based system that allows for collaborative production planning, order placement, and inventory management throughout the supply chain. Participants use the system to maximize supply chain efficiencies, improve communication, and reduce operating costs, and they pay us subscription and transaction fees for system usage.
Customers
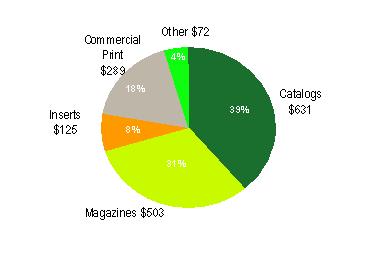
We serve the catalog, magazine, insert, and commercial printing markets and have developed long-standing relationships with the premier North American retailers and catalog and magazine publishers. The length of our relationships with our top ten customers averages more than 20 years and no single customer accounted for more than 10% of our net sales in 2008. Our key customers include leading magazine publishers such as Condé Nast Publications, Inc., Hearst Corporation, National Geographic Society, and Time Inc.; leading catalog producers such as Avon Products, Inc. and Sears Holding Corporation; leading commercial printers such as Quad/Graphics, Inc., and RR Donnelley & Sons Company; and leading paper merchants and brokers, such as A.T. Clayton & Co., Unisource Worldwide, Inc., the xpedx and Bulkley Dunton business units of International Paper, and Clifford Paper, Inc.
Our net sales, excluding pulp sales, by end-user segment in 2008, are illustrated below (dollars in millions):
Research and Development
The primary function of our research and development efforts is to work with customers in developing and modifying products to accommodate their evolving needs and to identify cost-saving opportunities within our operations.
Examples of our research and development efforts implemented over the past several years include:
· high-bulk offset and rotogravure coated groundwood;
· lightweight grade No. 4 coated groundwood;
· ultra-lightweight grade No. 5 coated groundwood; and
· rotogravure coated freesheet
Intellectual Property
We have several patents and patent applications in the United States and various foreign countries. These patents and patent applications generally relate to various paper manufacturing methods and equipment which may become commercially viable in the future. We also have trademarks for our names, Verso® and Verso Paper®, as well as for our products such as Influence®, Velocity®, Liberty®, Advocate,® and Trilogy®. In addition to the intellectual property that we own, we license a significant portion of the intellectual property used in our business on a perpetual, royalty-free, non-exclusive basis from International Paper.
Competition
Our business is highly competitive. A significant number of North American competitors produce coated and supercalendered papers, and several overseas manufacturers, principally from Europe, export to North America. We compete based on a number of factors, including:
· price;
· product availability;
· product quality;
· breadth of product offerings;
· timeliness of product delivery; and
· customer service.
Foreign competition in North America is also affected by the exchange rate of the U.S. dollar relative to other currencies, especially the euro, market prices in North America and other markets, worldwide supply and demand, and the cost of ocean-going freight.
While our product offering is broad in terms of grades produced (from supercalendered and ultra-lightweight coated groundwood offerings to heavier-weight coated freesheet products), we are focused on producing coated groundwood and coated freesheet in roll form. This strategy is driven by our alignment with catalog and magazine end-users which tend to purchase paper in roll form for use in long runs of web printing in order to minimize costs. Our principal competitors include NewPage Corporation, Abitibi Bowater Inc., UPM-Kymmene Corporation, and Sappi Limited, all of which have North American operations. UPM and Sappi are headquartered overseas and also have overseas manufacturing facilities.
Employees
As of December 31, 2008, we had approximately 2,900 employees, of whom approximately 35% are unionized and 75% are hourly employees. Employees at two of our four mills are represented by labor unions under a total of four collective bargaining agreements. In 2007, we completed successful labor negotiations for three agreements that were up for renewal during the year. The new agreements will expire in 2011.
We have not experienced any work stoppages during the past several years. We believe that we have good relations with our employees.
Environmental and Other Governmental Regulations
We are subject to federal, state, and local environmental, health and safety laws and regulations, including the federal Water Pollution Control Act of 1972, or “Clean Water Act,” the federal Clean Air Act, the federal Resource Conservation and Recovery Act, the Comprehensive Environmental Response, Compensation and Liability Act of 1980, or “CERCLA,” the federal Occupational Health and Safety Act, and analogous state and local laws. Our operations also are subject to two regional regimes designed to address climate change, the Regional Greenhouse Gas Initiative in the northeastern United States and the Midwestern Greenhouse Gas Reduction Accord, and in the future we may be subject to additional federal, state, local or supranational legislation related to climate change. Among our activities subject to environmental regulation are the emissions of air pollutants, discharges of wastewater and stormwater, operation of dams, storage, treatment and disposal of materials and waste, and remediation of soil, surface water, and ground water contamination. Many environmental laws and regulations provide for substantial fines or penalties and criminal sanctions for any failure to comply. In addition, failure to comply with these laws and regulations could result in the interruption of our operations and, in some cases, facility shutdowns.
Certain of these environmental laws, such as CERCLA and analogous state laws, provide for strict, and under certain circumstances, joint and several liability for investigation and remediation of the release of hazardous substances into the environment, including soil and groundwater. These laws may apply to properties presently or formerly owned or operated by an entity or its predecessors, as well as to conditions at properties at which wastes attributable to an entity or its predecessors were disposed. Under these environmental laws, a current or previous owner or operator of real property, and parties that generate or transport hazardous substances that are disposed of at real property, may be held liable for the cost to investigate or clean up such real property and for related damages to natural resources. We handle and dispose of wastes arising from our mill operations, including disposal at on-site landfills. We are required to maintain financial assurance for the expected cost of landfill closure and post-closure care. We may be subject to liability, including liability for investigation and cleanup costs, if contamination is discovered at one of our paper mills or another location where we have disposed of, or arranged for the disposal of, wastes. We could be subject to potentially significant liabilities under, or fines or penalties for any failure to comply with, any environmental rule or regulation.
Compliance with environmental laws and regulations is a significant factor in our business. We have made, and will continue to make, significant expenditures to comply with these requirements. We incurred environmental capital expenditures of $9.7 million in 2008 and $3.4 million in 2007, and we expect to incur additional environmental capital expenditures of $1.9 million in 2009. We anticipate that environmental compliance will continue to require increased capital expenditures and operating expenses over time as environmental laws or regulations, or interpretations thereof, change or the nature of our operations require us to make significant additional capital expenditures.
Permits are required for the operation of our mills and related facilities. The permits are subject to renewal, modification, and revocation. We and others have the right to challenge our permit conditions through administrative and legal appeals and review processes. Governmental authorities have the power to enforce compliance with the permits, and violators are subject to civil and criminal penalties, including fines, injunctions or both. Other parties also may have the right to pursue legal actions to enforce compliance with the permits.
Available Information
Our web site is located at www.versopaper.com. We make available free of charge through this web site our annual reports on Form 10-K, quarterly reports on Form 10-Q, current reports on Form 8-K, and amendments to those reports filed with or furnished to the Securities and Exchange Commission, or “SEC,” pursuant to Section 13(a) or 15(d) of the Securities Exchange Act of 1934, as soon as reasonably practicable after they are electronically filed with or furnished to the SEC.
Our business is subject to various risks. Set forth below are certain of the more important risks that we face and that could cause our actual results to differ materially from our historical results. These risks are not the only ones that we face. Our business also could be affected by additional risks that are presently unknown to us or that we currently believe are immaterial to our business.
We have limited ability to pass through increases in our costs to our customers. Increases in our costs or decreases in coated or supercalendered paper prices could have a material adverse effect on our business, financial condition, and results of operations.
Our earnings are sensitive to price changes in coated or supercalendered paper. Fluctuations in paper prices (and coated paper prices in particular) historically have had a direct effect on our net income (loss) and EBITDA for several reasons:
| • | Market prices for paper products are a function of supply and demand, factors over which we have limited control. We therefore have limited ability to control the pricing of our products. Market prices of grade No. 3, 60 lb. basis weight paper, which is an industry benchmark for coated freesheet paper pricing, have fluctuated since 2000 from a high of $1,100 per ton to a low of $705 per ton. In addition, market prices of grade No. 5, 34 lb. basis weight paper, which is an industry benchmark for coated groundwood paper pricing, have fluctuated between a high of $1,120 per ton to a low of $795 per ton over the same period. Because market conditions determine the price for our paper products, the price for our products could fall below our cash production costs. |
| • | Market prices for paper products typically are not directly affected by raw material costs or other costs of sales, and consequently we have limited ability to pass through increases in our costs to our customers absent increases in the market price. In addition, a significant portion of our sales are pursuant to contracts that limit price increases. Thus, even though our costs may increase, we may not have the ability to increase the prices for our products, or the prices for our products may decline. |
| • | The manufacturing of coated paper is highly capital-intensive and a large portion of our operating costs are fixed. Additionally, paper machines are large, complex machines that operate more efficiently when operated continuously. Consequently, both we and our competitors typically continue to run our machines whenever marginal sales exceed the marginal costs, adversely impacting prices at times of lower demand. |
Therefore, our ability to achieve acceptable margins is principally dependent on (1) managing our cost structure, (2) managing changes in raw materials prices, which represent a large component of our operating costs and fluctuate based upon factors beyond our control, and (3) general conditions in the paper market. If the prices of our products decline, or if our raw material costs increase, it could have a material adverse effect on our business, financial condition, and results of operations.
The paper industry is cyclical. Fluctuations in supply and demand for our products could have a material adverse effect on our business, financial condition, and results of operations.
The paper industry is a commodity market to a significant extent and is subject to cyclical market pressures. North American demand for coated and supercalendered paper products tends to decline during a weak U.S. economy. Accordingly, general economic conditions and demand for magazines and catalogs may have a material adverse impact on the demand for our products, which could have a material adverse effect on our business, financial condition, and results of operations. In addition, currency fluctuations can have a significant impact on the supply of coated paper products in North America. If the U.S. dollar strengthens, imports may increase, which would cause the supply of paper products available in the North American market to increase. Foreign overcapacity also could result in an increase in the supply of paper products available in the North American market. An increased supply of paper available in North America could put downward pressure on prices and/or cause us to lose sales to competitors, either of which could have a material adverse effect on our business, financial condition, and results of operations.
Recent global market and economic conditions have been unprecedented and challenging with tighter credit conditions and recession in most major economies expected to continue throughout 2009. Continued concerns about the systemic impact of potential long-term and wide-spread recession, energy costs, geopolitical issues, the availability and cost of credit, and the global housing and mortgage markets have contributed to increased market volatility and diminished expectations for the U.S. economy. These factors have led to a decrease in spending by businesses and consumers alike, and a corresponding decrease in demand for our products. (See “Management’s Discussion and Analysis of Financial Condition and Results of Operations - Selected Factors that Affect Our Operating Results”). Continued turbulence in the U.S. and international markets and economies and prolonged declines in business consumer spending may further adversely affect our business, financial condition, and results of operations.
We have a limited operating history as a separate company. Accordingly, our Predecessor’s combined historical financial data may not be representative of our results as a separate company.
We operated as a division of International Paper prior to the Acquisition. Therefore, we have a very limited operating history as a separate company. Our business strategy as an independent entity may not be successful on a long-term basis. Although International Paper, after the completion of the Acquisition, generally no longer sells coated or supercalendered paper, we cannot assure you that our customers will continue to do business with us on the same terms as when we were a division of International Paper or at all. We may not be able to grow our business as planned and may not remain a profitable business. In addition, the historical combined financial data included in this annual report may not necessarily reflect what our results of operations, financial condition, and cash flows would have been had we been a separate independent entity pursuing our own strategies during the periods presented. Our limited operating history as a separate entity makes evaluating our business and our future financial prospects difficult. As a result, our business, financial condition, and results of operations may differ materially from our expectations based on the historical financial data contained in this annual report.
Our cost structure following the Acquisition is not comparable to the cost structure that we experienced in prior periods. Our management has limited experience managing our business as a separate company with a significant amount of indebtedness. We cannot assure you that our cost structure in future periods will be consistent with our current expectations or will permit us to operate our business profitably.
The markets in which we operate are highly competitive.
Our business is highly competitive. Competition is based largely on price. We compete with foreign producers, some of which are lower cost producers than we are or are subsidized by governments. We also face competition from numerous North American coated and supercalendered paper manufacturers. Some of our competitors have advantages over us, including lower raw material and labor costs and fewer environmental and governmental regulations to comply with than we do. Furthermore, some of our competitors have greater financial and other resources than we do or may be better positioned than we are to compete for certain opportunities.
Our non-U.S. competitors may develop a competitive advantage over us and other U.S. producers if the U.S. dollar strengthens in comparison to the home currency of those competitors or ocean shipping rates decrease. If the U.S. dollar strengthens, if shipping rates decrease, or if overseas supply exceeds demand, imports may increase, which would cause the supply of coated paper products available in the North American market to increase. An increased supply of coated paper could cause us to lower our prices or lose sales to competitors, either of which could have a material adverse effect on our business, financial condition, and results of operations.
In addition, the following factors will affect our ability to compete:
· product availability;
· the quality of our products;
· our breadth of product offerings;
· our ability to maintain plant efficiencies and high operating rates;
· manufacturing costs per ton;
· customer service and our ability to distribute our products on time; and
· the availability and/or cost of wood fiber, market pulp, chemicals, energy, other raw materials, and labor
If we are unable to obtain energy or raw materials at favorable prices, or at all, it could have a material adverse effect on our business, financial condition, and results of operations.
We purchase wood fiber, market pulp, chemicals, energy, and other raw materials from third parties. We may experience shortages of energy supplies or raw materials or be forced to seek alternative sources of supply. If we are forced to seek alternative sources of supply, we may not be able to do so on terms as favorable as our current terms or at all. In addition, the prices for energy and many of our raw materials, especially petroleum-based chemicals, have been volatile and have increased over the last year. Prices are expected to remain volatile for the foreseeable future. Chemical suppliers that use petroleum-based products in the manufacture of their chemicals may, due to a supply shortage and cost increase, ration the amount of chemicals available to us and/or we may not be able to obtain the chemicals we need to operate our business at favorable prices, if at all. In addition, certain specialty chemicals that we purchase are available only from a small number of suppliers. If any of these suppliers were to cease operations or cease doing business with us, we may be unable to obtain such chemicals at favorable prices, if at all.
The supply of energy or raw materials may be adversely affected by, among other things, hurricanes and other natural disasters or an outbreak or escalation of hostilities between the United States and any foreign power and, in particular, events in the Middle East. For example, wood fiber is a commodity and prices historically have been cyclical. The primary source for wood fiber is timber. Environmental litigation and regulatory developments have caused, and may cause in the future, significant reductions in the amount of timber available for commercial harvest in Canada and the United States. In addition, future domestic or foreign legislation, litigation advanced by aboriginal groups, litigation concerning the use of timberlands, the protection of endangered species, the promotion of forest biodiversity, and the response to and prevention of wildfires and campaigns or other measures by environmental activists also could affect timber supplies. The availability of harvested timber may further be limited by factors such as fire and fire prevention, insect infestation, disease, ice and wind storms, droughts, floods, and other natural and man-made causes. Additionally, due to increased fuel costs, suppliers, distributors, and freight carriers have charged fuel surcharges, which have increased our costs. Any significant shortage or significant increase in our energy or raw material costs in circumstances where we cannot raise the price of our products due to market conditions could have a material adverse effect on our business, financial condition, and results of operations. Any disruption in the supply of energy or raw materials also could affect our ability to meet customer demand in a timely manner and could harm our reputation. Furthermore, we may be required to post letters of credit or other financial assurance obligations with certain of our energy and other suppliers, which could limit our financial flexibility.
Currency fluctuations may adversely affect our business, financial condition, and results of operations.
We compete with producers in North America and abroad. Changes in the relative strength or weakness of the U.S. dollar may affect international trade flows of coated paper products. A stronger U.S. dollar may attract imports from foreign producers, increase supply in the United States, and have a downward effect on prices, while a weaker U.S. dollar may encourage U.S. exports. Variations in the exchange rates between the U.S. dollar and other currencies, particularly the Canadian dollar and the euro, may significantly affect our competitive position, including by making it more attractive for foreign producers to restart previously shut-down paper mills or by increasing production capacity in North America or Europe.
We are involved in continuous manufacturing processes with a high degree of fixed costs. Any interruption in the operations of our manufacturing facilities may affect our operating performance.
We seek to run our paper machines on a nearly continuous basis for maximum efficiency. Any downtime at any of our paper mills, including as a result of or in connection with planned maintenance and capital expenditure projects, results in unabsorbed fixed costs that negatively affect our results of operations for the period in which we experience the downtime. Due to the extreme operating conditions inherent in some of our manufacturing processes, we may incur unplanned business interruptions from time to time and, as a result, we may not generate sufficient cash flow to satisfy our operational needs. In addition, many of the geographic areas where our production is located and where we conduct our business may be affected by natural disasters, including snow storms, forest fires, and flooding. Such natural disasters could cause our mills to stop running, which could have a material adverse effect on our business, financial condition, and results of operations. Furthermore, during periods of weak demand for paper products, we have in the past and may in the future experience market-related downtime, which could have a material adverse effect on our financial condition and results of operations.
Our operations require substantial ongoing capital expenditures, and we may not have adequate capital resources to fund all of our required capital expenditures.
Our business is capital intensive, and we incur capital expenditures on an ongoing basis to maintain our equipment and comply with environmental laws, as well as to enhance the efficiency of our operations. Our total capital expenditures were $80 million in 2008, including $56 million for maintenance and environmental capital expenditures. We expect to spend approximately $50 million on capital expenditures during 2009, with approximately $35 million for maintenance and environmental capital expenditures. We anticipate that our available cash resources and cash generated from operations will be sufficient to fund our operating needs and capital expenditures for at least the next year. However, if we require additional funds to fund our capital expenditures, we may not be able to obtain them on favorable terms, or at all. If we cannot maintain or upgrade our facilities and equipment as we require or as necessary to ensure environmental compliance, it could have a material adverse effect on our business, financial condition, and results of operations.
We depend on a small number of customers for a significant portion of our business.
Our largest customer, International Paper, accounted for approximately 8% of our net sales in 2008. In 2008, our ten largest customers (including International Paper) accounted for approximately 48% of our net sales, while our ten largest end-users accounted for approximately 29% of our net sales. The loss of, or reduction in orders from, any of these customers or other customers could have a material adverse effect on our business, financial condition, and results of operations, as could significant customer disputes regarding shipments, price, quality or other matters.
We may not realize certain productivity enhancements or improvements in costs.
As part of our business strategy, we intend to identify opportunities to improve profitability by reducing costs and enhancing productivity. Any cost savings or productivity enhancements that we realize from such efforts may differ materially from our estimates. For example, we have several productivity enhancement initiatives to reduce waste and increase the amount of uptime on our paper machines. We cannot be assured that these initiatives will be completed as anticipated or that the benefits we expect will be achieved on a timely basis or at all.
Rising postal costs could weaken demand for our paper products.
A significant portion of paper is used in magazines, catalogs, and other promotional mailings. Many of these materials are distributed through the mail. Future increases in the cost of postage could reduce the frequency of mailings, reduce the number of pages in magazine and advertising materials and/or cause catalog and magazine publishers to use alternate methods to distribute their materials. Any of the foregoing could decrease the demand for our products, which could have a material adverse effect on our business, financial condition, and results of operations.
Our business may suffer if we do not retain our senior management.
We depend on our senior management. The loss of services of members of our senior management team could adversely affect our business until suitable replacements can be found. There may be a limited number of persons with the requisite skills to serve in these positions and we may be unable to locate or employ qualified personnel on acceptable terms. In addition, our future success requires us to continue to attract and retain competent personnel.
A large percentage of our employees are unionized. Wage increases or work stoppages by our unionized employees may have a material adverse effect on our business, financial condition, and results of operations.
As of December 31, 2008, approximately 35%, of our employees were represented by labor unions under four collective bargaining agreements at two of our mills. In 2007, we completed successful labor negotiations for three agreements that were up for renewal during the year, and the new agreements will expire in 2011. We may become subject to material cost increases or additional work rules imposed by agreements with labor unions. This could increase expenses in absolute terms and/or as a percentage of net sales. In addition, although we believe we have good relations with our employees, work stoppages or other labor disturbances may occur in the future. Any of these factors could negatively affect our business, financial condition, and results of operations.
We depend on third parties for certain transportation services.
We rely primarily on third parties for transportation of our products to our customers and transportation of our raw materials to us, in particular, by truck and train. If any third-party transportation provider fails to deliver our products in a timely manner, we may be unable to sell them at full value. Similarly, if any transportation provider fails to deliver raw materials to us in a timely manner, we may be unable to manufacture our products on a timely basis. Shipments of products and raw materials may be delayed due to weather conditions, strikes or other events. Any failure of a third-party transportation provider to deliver raw materials or products in a timely manner could harm our reputation, negatively impact our customer relationships and have a material adverse effect on our business, financial condition, and results of operations. In addition, our ability to deliver our products on a timely basis could be adversely affected by the lack of adequate availability of transportation services, especially rail capacity, whether because of work stoppages or otherwise. Furthermore, increases in the cost of our transportation services, including as a result of rising fuel costs, could have a material adverse effect on our business, financial condition, and results of operations.
We are subject to various environmental, health and safety laws and regulations that could impose substantial costs or other liabilities upon us and may have a material adverse effect on our business, financial condition, and results of operations.
We are subject to a wide range of federal, state, and local general and industry-specific environmental, health and safety laws and regulations, including those relating to air emissions, wastewater discharges, solid and hazardous waste management and disposal and site remediation. Compliance with these laws and regulations is a significant factor in our business. We have made, and will continue to make, significant expenditures to comply with these requirements. In addition, we handle and dispose of wastes arising from our mill operations and operate a number of on-site landfills to handle that waste. We maintain financial assurance for the projected cost of closure and post-closure care for these landfill operations. We could be subject to potentially significant fines, penalties, criminal sanctions, plant shutdowns or interruptions in operations for any failure to comply with applicable environmental, health and safety laws and regulations. Moreover, under certain environmental laws, a current or previous owner or operator of real property, and parties that generate or transport hazardous substances that are disposed of at real property, may be held liable for the full cost to investigate or clean up such real property and for related damages to natural resources. We may be subject to liability, including liability for investigation and cleanup costs, if contamination is discovered at one of our current or former paper mills, other properties or other locations where we have disposed of, or arranged for the disposal of, wastes. International Paper has agreed to indemnify us, subject to certain limitations, for former properties and former off-site shipments, as well as certain other environmental liabilities. There can be no assurance that International Paper will perform under any of its environmental indemnity obligations, and its failure to do so could have a material adverse effect on our financial condition and results of operations. We also could be subject to claims brought pursuant to applicable laws, rules or regulations for property damage or personal injury resulting from the environmental impact of our operations, including due to human exposure to hazardous substances. Increasingly stringent or new environmental requirements, more aggressive enforcement actions or policies, the discovery of unknown conditions or the bringing of future claims may cause our expenditures for environmental matters to increase, and we may incur material costs associated with these matters.
Our substantial indebtedness could adversely affect our financial health.
We have a significant amount of indebtedness. As of December 31, 2008, we had total indebtedness of $1,245.7 million, including $92.1 million outstanding under our revolving credit facility. The total amount of payments we will need to make on our outstanding long-term indebtedness for each of the next three fiscal years is equal to $104.7 million, $104.5 million, and $104.3 million, respectively (assuming the current prevailing interest rates on our outstanding floating rate indebtedness remain the same).
Our substantial indebtedness could have important consequences for us. For example, it could:
| · | increase our vulnerability to general adverse economic and industry conditions; |
| · | require us to dedicate a substantial portion of our cash flow from operations to payments on our indebtedness, thereby reducing the availability of our cash flow to fund working capital, capital expenditures, research and development efforts, and other general corporate purposes; |
| · | increase our vulnerability to and limit our flexibility in planning for, or reacting to, changes in our business and the industry in which we operate; |
| · | expose us to the risk of increased interest rates as borrowings under our senior secured credit facilities and our floating rate notes will be subject to variable rates of interest; |
| · | place us at a competitive disadvantage compared to our competitors that have less debt; and |
| · | limit our ability to borrow additional funds. |
In addition, the indentures governing our outstanding notes and our senior secured credit facilities contain financial and other restrictive covenants that limit our ability to engage in activities that may be in our long-term best interests. Our failure to comply with those covenants could result in an event of default which, if not cured or waived, could result in the acceleration of all of our debts.
We and our subsidiaries may be able to incur substantial additional indebtedness in the future because the terms of the indentures governing our outstanding notes and our senior secured credit facilities do not fully prohibit us or our subsidiaries from doing so. If new indebtedness is added to our and our subsidiaries’ current debt levels, the related risks that we and they now face could intensify.
Lenders under our revolving credit facility may not fund their commitments.
Lehman Commercial Paper, Inc., or “Lehman,” which filed for bankruptcy in October 2008 is one of the lenders under our revolving credit facility, with a commitment of $15.8 million of the $200 million available under the facility. On October 10, 2008, we requested funding in the amount of $100 million under its revolving credit facility and Lehman failed to fund $7.9 million, the entire portion of its commitment with respect to that borrowing request. Under the credit agreement governing our revolving credit facility, if a lender's commitment is not honored, that portion of the lender's commitment under the revolving credit facility will be unavailable to the extent that the lender's commitment is not replaced by a new commitment from an alternate lender.
Lenders under our revolving credit facility are well-diversified, totaling 15 lenders at December 31, 2008. We currently anticipate that these lenders, other than Lehman, will participate in future requests for funding. However, there can be no assurance that further deterioration in the credit markets and overall economy will not affect the ability of our lenders to meet their funding commitments. Additionally, our lenders have the ability to transfer their commitments to other institutions, and the risk that committed funds may not be available under distressed market conditions could be exacerbated to the extent that consolidation of the commitments under our facilities or among its lenders were to occur.
Not applicable.
Our corporate headquarters are located in Memphis, Tennessee. We own four mills located in Maine, Michigan, and Minnesota at which we operate 11 paper machines. We also own five hydroelectric dams, of which four provide hydroelectric power to our Androscoggin mill and the fifth services our Sartell mill. In addition, we own 14 and lease five woodyards for the purpose of storage and loading of forest products and lease a number of sales offices.
Our headquarters and material facilities as of December 31, 2008, are shown in the following table:
| Location | | Use | | Owned/Leased |
| Memphis, TN | | corporate headquarters | | leased |
| Jay (Androscoggin), ME | | paper mill/kraft pulp mill | | owned |
| Bucksport, ME | | paper mill | | owned |
| Quinnesec, MI | | paper mill/kraft pulp mill | | owned |
| Sartell, MN | | paper mill | | owned |
| West Chester, OH | | sales, distribution and customer service | | leased |
We are involved in legal proceedings incidental to the conduct of our business. We do not believe that any liability that may result from these proceedings will have a material adverse effect on our financial condition or results of operations.
On August 6, 2008, we filed a declaratory judgment suit in the United States District Court for the Eastern District of Wisconsin against NewPage Corporation and NewPage Wisconsin System Inc., in response to a patent infringement claim asserted by NewPage regarding certain of our coated paper products. The action sought a declaration that our coated paper products do not infringe the NewPage patent and that the NewPage patent is invalid. On January 29, 2009, the action was voluntarily dismissed with prejudice pursuant to a settlement agreement between the parties. As part of the settlement, NewPage granted us an irrevocable, perpetual, non-exclusive, worldwide, royalty-free, and fully paid-up right and license for any and all purposes under the NewPage patent and any continuation, division, reissue or non-U.S. counterpart of the patent.
Not applicable.
PART II
Not applicable.
The following table sets forth our selected financial data for the years and as of the dates indicated. The selected statement of operations data for the seven months ended July 31, 2006, and the years ended December 31, 2005 and 2004, and the selected balance sheet data as of December 31, 2005 and 2004, have been derived from the audited combined financial statements of the Coated and Supercalendered Papers Division of International Paper, or the “Predecessor.” The selected statement of operations data for the years ended December 31, 2008 and 2007, and the five months ended December 31, 2006, and the selected balance sheet data as of December 31, 2008, 2007 and 2006, have been derived from the audited consolidated financial statements of Verso Paper Holdings LLC, or the “Successor.” The audited consolidated financial statements of the Successor as of and for the years ended December 31, 2008 and 2007, the audited consolidated financial statements of the Successor for the five months ended December 31, 2006, and the audited combined financial statements of the Predecessor for the seven months ended July 31, 2006, are included elsewhere in this annual report. Our selected financial data should be read in conjunction with “Management’s Discussion and Analysis of Financial Condition and Results of Operations” and the financial statements and their related notes included elsewhere in this annual report.
| | | Successor Consolidated | | | Predecessor Combined | |
| | | | | | | | | Five | | | Seven | | | | | | | |
| | | | | | | | | Months | | | Months | | | | | | | |
| | | Year Ended | | | Ended | | | Ended | | | Year Ended | |
| | | December 31, | | | December 31, | | | July 31, | | | December 31, | |
| (Dollars and tons in millions) | | 2008 | | | 2007 | | | 2006 | | | 2006 | | | 2005 | | | 2004 | |
| Statement of Operations Data: | | | | | | | | | | | | | | | | | | |
| Net sales | | $ | 1,766.8 | | | $ | 1,628.8 | | | $ | 706.8 | | | $ | 904.4 | | | $ | 1,603.8 | | | $ | 1,463.3 | |
| Costs and expenses: | | | | | | | | | | | | | | | | | | | | | | | | |
| Cost of products sold - (exclusive of depreciation | | | | | | | | | | | | | | | | | | | | | |
| and amortization) | | | 1,462.3 | | | | 1,403.2 | | | | 589.3 | | | | 771.6 | | | | 1,338.2 | | | | 1,272.5 | |
| Depreciation and amortization | | | 134.4 | | | | 123.1 | | | | 48.3 | | | | 72.7 | | | | 129.4 | | | | 130.5 | |
| Selling, general, and administrative expenses | | | 79.4 | | | | 52.0 | | | | 14.0 | | | | 34.3 | | | | 65.6 | | | | 65.3 | |
| Restructuring and other charges | | | 27.4 | | | | 19.4 | | | | 10.1 | | | | (0.3 | ) | | | 10.4 | | | | 0.6 | |
| Operating income (loss) | | | 63.3 | | | | 31.1 | | | | 45.1 | | | | 26.1 | | | | 60.2 | | | | (5.6 | ) |
| Interest income | | | (0.8 | ) | | | (1.5 | ) | | | (1.8 | ) | | | - | | | | - | | | | (0.3 | ) |
| Interest expense | | | 103.2 | | | | 113.9 | | | | 48.7 | | | | 8.4 | | | | 14.8 | | | | 16.0 | |
| Income (loss) before income taxes | | | (39.1 | ) | | | (81.3 | ) | | | (1.8 | ) | | | 17.7 | | | | 45.4 | | | | (21.3 | ) |
| Provision (benefit) for income taxes | | | - | | | | - | | | | - | | | | 7.0 | | | | 17.9 | | | | (8.2 | ) |
| Net income (loss) | | $ | (39.1 | ) | | $ | (81.3 | ) | | $ | (1.8 | ) | | $ | 10.7 | | | $ | 27.5 | | | $ | (13.1 | ) |
| | | | | | | | | | | | | | | | | | | | | | | | | |
| Statement of Cash Flows Data: | | | | | | | | | | | | | | | | | | | | | | | | |
| Cash provided by operating activities | | $ | 74.9 | | | $ | 38.8 | | | $ | 128.8 | | | $ | 39.3 | | | $ | 116.8 | | | $ | 123.7 | |
| Cash used in investing activities | | $ | (80.3 | ) | | $ | (67.8 | ) | | $ | (1,391.8 | ) | | $ | (27.6 | ) | | $ | (53.0 | ) | | $ | (111.5 | ) |
| Cash (used in) provided by financing activities | | $ | 66.4 | | | $ | (24.9 | ) | | $ | 1,375.4 | | | $ | (11.6 | ) | | $ | (63.8 | ) | | $ | (12.2 | ) |
| | | | | | | | | | | | | | | | | | | | | | | | | |
| Other Financial and Operating Data: | | | | | | | | | | | | | | | | | | | | | | | | |
| EBITDA (1) | | $ | 197.7 | | | $ | 154.2 | | | $ | 93.4 | | | $ | 98.8 | | | $ | 189.6 | | | $ | 124.9 | |
| Capital expenditures | | $ | (80.4 | ) | | $ | (69.6 | ) | | $ | (27.5 | ) | | $ | (27.7 | ) | | $ | (53.1 | ) | | $ | (111.3 | ) |
| Total tons sold | | | 1,952.7 | | | | 2,096.3 | | | | 866.4 | | | | 1,145.0 | | | | 2,024.9 | | | | 2,064.6 | |
| | | | | | | | | | | | | | | | | | | | | | | | | |
| Balance Sheet Data: | | | | | | | | | | | | | | | | | | | | | | | | |
| Working capital (2) | | $ | 156.3 | | | $ | 95.6 | | | $ | 154.0 | | | | | | | $ | 87.8 | | | $ | 58.6 | |
| Property, plant, and equipment, net | | $ | 1,115.7 | | | $ | 1,159.9 | | | $ | 1,212.0 | | | | | | | $ | 1,287.0 | | | $ | 1,363.9 | |
| Total assets | | $ | 1,614.1 | | | $ | 1,577.0 | | | $ | 1,692.4 | | | | | | | $ | 1,534.1 | | | $ | 1,585.0 | |
| Total debt | | $ | 1,245.7 | | | $ | 1,156.4 | | | $ | 1,159.3 | | | | | | | $ | 301.2 | | | $ | 302.1 | |
| Equity | | $ | 91.7 | | | $ | 174.9 | | | $ | 279.7 | | | | | | | $ | 1,040.0 | | | $ | 1,075.3 | |
| (1) EBITDA consists of earnings before interest, taxes, depreciation, and amortization. EBITDA is a measure commonly used in our industry and we present EBITDA to enhance your understanding of our operating performance. We use EBITDA as one criterion for evaluating our performance relative to that of our peers. We believe that EBITDA is an operating performance measure, and not a liquidity measure, that provides investors and analysts with a measure of operating results unaffected by differences in capital structures, capital investment cycles and ages of related assets among otherwise comparable companies. However, EBITDA is not a measurement of financial performance under U.S. GAAP, and our EBITDA may not be comparable to similarly titled measures of other companies. You should not consider our EBITDA as an alternative to operating or net income, determined in accordance with U.S. GAAP, as an indicator of our operating performance, or as an alternative to cash flows from operating activities, determined in accordance with U.S. GAAP, as an indicator of our cash flows or as a measure of liquidity. |
| (2) Working capital is defined as current assets net of current liabilities, excluding the current portion of long-term debt and the Predecessor's accounts payable to International Paper. |
The following table reconciles net income (loss) to EBITDA for the periods presented:
| | | Successor Consolidated | | | Predecessor Combined | |
| | | | | | | | | Five | | | Seven | | | | | | | |
| | | | | | | | | Months | | | Months | | | | | | | |
| | | Year Ended | | | Ended | | | Ended | | | Year Ended | |
| | | December 31, | | | December 31, | | | July 31, | | | December 31, | |
| (In millions of U.S. dollars) | | 2008 | | | 2007 | | | 2006 | | | 2006 | | | 2005 | | | 2004 | |
| Reconciliation of net income (loss) to EBITDA: | | | | | | | | | | | | | | | | | | |
| Net income (loss) | | $ | (39.1 | ) | | $ | (81.3 | ) | | $ | (1.8 | ) | | $ | 10.7 | | | $ | 27.5 | | | $ | (13.1 | ) |
| Interest expense, net | | | 102.4 | | | | 112.4 | | | | 46.9 | | | | 8.4 | | | | 14.8 | | | | 15.7 | |
| Provision (benefit) for income taxes | | | - | | | | - | | | | - | | | | 7.0 | | | | 17.9 | | | | (8.2 | ) |
| Depreciation and amortization | | | 134.4 | | | | 123.1 | | | | 48.3 | | | | 72.7 | | | | 129.4 | | | | 130.5 | |
| EBITDA | | $ | 197.7 | | | $ | 154.2 | | | $ | 93.4 | | | $ | 98.8 | | | $ | 189.6 | | | $ | 124.9 | |
The following discussion and analysis of our financial condition and results of operations covers periods prior to the Acquisition. For comparison purposes, the results of operations for the year ended December 31, 2006, are presented on a combined basis, consisting of the results of the Predecessor for the seven months ended July 31, 2006, and the results of the Successor for the five months ended December 31, 2006. Accordingly, the discussion and analysis of historical periods do not fully reflect the significant impact that the Acquisition has had on our financial statements. In addition, the statements in the discussion and analysis regarding the industry outlook and our expectations regarding the performance of our business and the other non-historical statements in the discussion and analysis are forward-looking statements. These forward-looking statements are subject to numerous risks and uncertainties, including, but not limited to, the risks and uncertainties described in “Risk Factors.” Our actual results may differ materially from those contained in or implied by any forward-looking statements. The discussion and analysis should be read together with “Risk Factors” and the financial statements and their related notes included elsewhere in this annual report.
Overview
We are a leading North American supplier of coated papers to catalog and magazine publishers. Coated paper is used primarily in media and marketing applications, including catalogs, magazines, and commercial printing applications, such as high-end advertising brochures, annual reports, and direct mail advertising. We are North America’s second largest producer of coated groundwood paper which is used primarily for catalogs and magazines. We are also a low cost producer of coated freesheet paper which is used primarily for annual reports, brochures, and magazine covers. In addition, we have a strategic presence in supercalendered paper which is primarily used for retail inserts. We also produce and sell market kraft pulp which is used to manufacture printing and writing paper grades and tissue products.
Background
We began operations on August 1, 2006, when we acquired the assets and certain liabilities of the business of the Predecessor. We were formed by affiliates of Apollo for the purpose of consummating the Acquisition from International Paper. Verso Paper Corp., of which we are an indirect, wholly-owned subsidiary, went public on May 14, 2008, with an IPO of 14 million shares of common stock at a price of $12 per share which generated $152.2 million in net proceeds.
Stand-Alone Business
The Predecessor’s financial statements for the periods presented represent the Division’s combined financial statements. The preparation of this information was based on certain assumptions and estimates, including allocations of costs from International Paper. This financial information may not, however, necessarily reflect the results of operations, financial positions, and cash flows that would have occurred if the Division had been a separate, stand-alone entity during the periods presented or our future results of operations, financial position, and cash flows. For example, the financial statements of the Predecessor in this annual report include expenses for certain corporate services provided by International Paper and allocated based on various methods, including direct consumption, percent of capital employed, and number of employees. These historical charges and allocations may not be representative of expenses that we will incur in future reporting periods as we operate as a stand-alone entity.
Selected Factors that Affect Our Operating Results
Net Sales
Our sales, which we report net of rebates, allowances, and discounts, are a function of the number of tons of paper that we sell and the price at which we sell our paper. The coated paper industry is cyclical, which results in changes in both volume and price. Paper prices historically have been a function of macro-economic factors which influence supply and demand. Price has historically been substantially more variable than volume and can change significantly over relatively short time periods. Paper prices declined in late 2006 and early 2007, which we believe was due to high customer and producer inventories and cautious purchasing by customers in advance of a scheduled postal rate increase. Beginning in mid-2007, prices began to rebound following announcements by several of our North American competitors of permanent closures of approximately 1 million tons of annual production capacity (approximately 9% of North American coated paper capacity). These market conditions continued into early 2008 with a series of announced price increases by suppliers of coated paper. Meanwhile, customers were rebuilding their paper inventories after a significant depletion in the second half of 2007. In the second half of 2008, we saw a significant weakening in demand as general economic conditions began to worsen. This weakened demand, coupled with the inventory build, put downward pressure on prices in late 2008 and into 2009, and has caused us, and most coated paper producers, to curtail production to match supply with demand.
We are primarily focused on serving two end-user segments: catalogs and magazines. In 2008, we believe we had a leading market share for the catalog and magazine segments of coated papers. Coated paper demand is primarily driven by advertising and print media usage. Advertising spending and magazine and catalog circulation tend to correlated with changes in the GDP of the United States – they rise with a strong economy and contract with a weak economy.
The majority of our products are sold under contracts with our customers. Contracted sales are more prevalent for coated groundwood paper, as opposed to coated freesheet paper, which is more often sold without a contract. Our contracts generally specify the volumes to be sold to the customer over the contract term, as well as the pricing parameters for those sales. Most of our contracts are negotiated on an annual basis, with only a few having terms extending beyond one year. Typically, our contracts provide for quarterly price adjustments based on market price movements. The large portion of contracted sales allows us to plan our production runs well in advance, optimizing production over our integrated mill system and thereby reducing costs and increasing overall efficiency.
We reach our end-users through several channels, including printers, brokers, paper merchants, and direct sales to end-users. We sell and market our products to approximately 100 customers which comprise approximately 650 end-user accounts. In 2008, no single customer accounted for more than 10% of our total net sales.
Our historical results include specialty papers that we manufacture for Thilmany, LLC, or “Thilmany,” on paper machine no. 5 at the Androscoggin mill. Under a long-term supply agreement entered into in 2005 in connection with International Paper’s sale of its Industrial Papers business to Thilmany, these products are sold to Thilmany at a variable charge for the paper purchased and a fixed charge for the availability of the machine. The amounts included in our net sales for the specialty papers sold to Thilmany totaled $42.4 million and $37.6 million in 2008 and 2007, respectively.
Cost of Products Sold
The principal components of our cost of sales are chemicals, wood, energy, labor, maintenance, and depreciation and amortization. Costs for commodities, including chemicals, wood, and energy, are the most variable component of our cost of sales because their prices can fluctuate substantially, sometimes within a relatively short period of time. In addition, our aggregate commodity purchases fluctuate based on the volume of paper that we produce.
After giving effect to the Acquisition, our cost of products sold increased as a result of the purchase accounting treatment of the Acquisition. Under the rules of purchase accounting, we adjusted the value of our assets (including the inventory we acquired) and liabilities at closing to their respective estimated fair values. As a result of these adjustments to our asset basis, following the closing of the Acquisition, our costs of goods sold increased by such non-cash increase in our asset basis. However, this increase did not have a cash impact and did not affect our cost of sales for any inventory produced after the closing of the Acquisition.
Chemicals. Chemicals utilized in the manufacturing of coated papers include latex, starch, calcium carbonate, and titanium dioxide. We purchase these chemicals from a variety of suppliers and are not dependent on any single supplier to satisfy our chemical needs. In the near term, we expect the rate of inflation for our total chemical costs to be lower than that experienced over the last two years. However, we expect that imbalances in supply and demand will drive higher prices for certain chemicals such as starch and sodium chlorate.
Wood. Our costs to purchase wood are affected directly by market costs of wood in our regional markets and indirectly by the effect of higher fuel costs on logging and transportation of timber to our facilities. While we have in place fiber supply agreements that ensure a substantial portion of our wood requirements, purchases under these agreements are typically at market rates.
Energy. We produce a large portion of our energy requirements, historically producing approximately 50% of our energy needs for our coated paper mills from sources such as waste wood and paper, hydroelectric facilities, chemicals from our pulping process, our own steam recovery boilers, and internal energy cogeneration facilities. Our external energy purchases vary across each of our mills and include fuel oil, natural gas, coal, and electricity. While our internal energy production capacity mitigates the volatility of our overall energy expenditures, we expect prices for energy to remain volatile for the foreseeable future and our energy costs to increase in a high energy cost environment. As prices fluctuate, we have some ability to switch between certain energy sources in order to minimize costs. We utilize derivative contracts as part of our risk management strategy to manage our exposure to market fluctuations in energy prices.
Labor. Labor costs include wages, salary, and benefit expenses attributable to our mill personnel. Mill employees at a non-managerial level are compensated on an hourly basis. Management employees at our mills are compensated on a salaried basis. Wages, salary, and benefit expenses included in cost of sales do not vary significantly over the short term. In addition, we have not experienced significant labor shortages.
Maintenance. Maintenance expense includes day-to-day maintenance, equipment repairs, and larger maintenance projects, such as paper machine shutdowns for periodic maintenance. Day-to-day maintenance expenses have not varied significantly from year-to-year. Larger maintenance projects and equipment expenses can produce year-to-year fluctuations in our maintenance expenses. In conjunction with our periodic maintenance shutdowns, we have incidental incremental costs that are primarily comprised of unabsorbed fixed costs from lower production volumes and other incremental costs for purchased materials and energy that would otherwise be produced as part of the normal operation of our mills.
Depreciation and Amortization. Depreciation and amortization expense represents the periodic charge to earnings through which the cost of tangible assets and intangible assets are recognized over the asset’s life. Capital investments can increase our asset bases and produce year-to-year fluctuations in expense. Depreciation was initially lower after the Acquisition as a result of the lower asset bases assigned to property, plant, and equipment, but has subsequently risen due to capital investments.
Selling, General, and Administrative Expenses
The principal components of our selling, general, and administrative expenses are wages, salaries, and benefits for our office personnel at our headquarters and our sales force, travel and entertainment expenses, advertising expenses, expenses relating to certain information technology systems, and research and development expenses. Also included are allocations of costs for corporate functions historically provided to us by International Paper. For further information about allocated costs, see “Corporate Allocations” below. In addition, we previously paid an annual management fee to Apollo under a management agreement pursuant to which Apollo provided us with certain financial and strategic advisory services and consulting services. Upon the consummation of the IPO, Apollo terminated the annual fee arrangement under the management agreement.
Taxes
Prior to the Acquisition, the Division was included in the consolidated income tax returns of International Paper. In the Predecessor’s combined financial statements included in this annual report, income taxes have been presented based on an estimate of the income taxes that would have been generated if the Division had operated as a separate taxpayer. As a result, U.S. federal and state income tax expense is reflected on the Division’s income based on an allocated rate of 39.4% for the seven months ended July 31, 2006. Income taxes have been provided for all items included in the historical statement of operations included herein, regardless of when such items were reported for tax purposes or when the taxes were actually paid or refunded. As a result of the Acquisition, there was a step-up in the tax basis of our assets, significantly reducing our cash income tax payments. Accordingly, our historical income tax expense may not necessarily reflect and may differ materially from what our cash tax payments would have been or will be as a stand-alone entity.
Corporate Allocations
The Predecessor’s combined statement of operations includes allocations of costs for certain corporate functions that historically were provided to us by International Paper, including:
| · | General corporate expenses. This represents costs related to corporate functions such as accounting, tax, treasury, payroll and benefits administration, certain incentive compensation, risk management, legal, centralized transaction processing, and information management and technology. These costs historically were allocated primarily based on general factors and estimated use of services. These costs are included in selling, general, and administrative expenses in the Predecessor’s combined statement of operations. |
| · | Employee benefits and incentives. This represents fringe benefit costs and other incentives, including group health and welfare benefits, U.S. pension plans, U.S. post-retirement benefit plans, and employee incentive compensation plans. These costs historically were allocated on an active headcount basis for health and welfare benefits (including U.S. post-retirement plans), on the basis of salary for U.S. pension plans, and on a specific identification basis for employee incentive compensation plans. These costs are included in costs of products sold, selling, general, and administrative expenses, and restructuring charges in the Predecessor’s combined statement of operations. |
| · | Interest expense and debt service costs. International Paper historically provided financing to the Division through cash flows from its other operations and debt incurred. The interest expense associated with incurred debt that was allocated to the Division based on specifically-identified borrowings is included in interest expense, net, in the Predecessor’s combined statement of operations. Costs associated with the debt are included in other expense in the Predecessor’s combined statement of operations. |
Expense allocations from International Paper reflected in the Predecessor’s combined statement of operations were as follows:
| | | Seven | |
| | | Months Ended | |
| | | July 31, | |
| (In thousands of U.S. dollars) | | 2006 | |
| | | | |
| General corporate expenses | | $ | 19.5 | |
| Employee benefits and incentives | | | 11.3 | |
| Interest expense and debt service costs | | | 8.4 | |
Following the consummation of the Acquisition, we no longer have allocations for costs of certain corporate functions historically provided to the Division by International Paper. We now receive such services from our internal operations or third-party service providers. Accordingly, it is unlikely that the expenses we will incur as a stand-alone company for these services will reflect the allocated costs included in the Predecessor’s combined financial statements.
Critical Accounting Policies
Our accounting policies are fundamental to understanding management’s discussion and analysis of results of operations and financial condition. Our consolidated financial statements are prepared in conformity with accounting principles generally accepted in the United States of America and follow general practices within the industry in which we operate. The preparation of the financial statements requires management to make certain judgments and assumptions in determining accounting estimates. Accounting estimates are considered critical if the estimate requires management to make assumptions about matters that were highly uncertain at the time the accounting estimate was made, and different estimates reasonably could have been used in the current period, or changes in the accounting estimate are reasonably likely to occur from period to period, that would have a material impact on the presentation of our financial condition, changes in financial condition, or results of operations.
Management believes the following critical accounting policies are both important to the portrayal of our financial condition and results of operations and require subjective or complex judgments. These judgments about critical accounting estimates are based on information available to us as of the date of the financial statements.
Accounting policies whose application may have a significant effect on the reported results of operations and financial position, and that can require judgments by management that affect their application, include the following: Statement of Financial Accounting Standards, or “SFAS,” No. 5, Accounting for Contingencies; SFAS No. 144, Accounting for the Impairment or Disposal of Long-Lived Assets; SFAS No. 142, Goodwill and Other Intangible Assets; SFAS No. 87, Employers’ Accounting for Pensions; and SFAS No. 158, Employers’ Accounting for Defined Benefit Pension and Other Postretirement Plans.
Impairment of long-lived assets and goodwill. Long-lived assets are reviewed for impairment upon the occurrence of events or changes in circumstances that indicate that the carrying value of the assets may not be recoverable, as measured by comparing their net book value to the estimated undiscounted future cash flows generated by their use.
Goodwill and other intangible assets are accounted for in accordance with SFAS No. 142, Goodwill and Other Intangible Assets. Intangible assets primarily consist of trademarks, customer-related intangible assets and patents obtained through business acquisitions. Impairment is the condition that exists when the carrying amount of these assets exceed their implied fair value. An impairment evaluation of the carrying amount of goodwill and other intangible assets with indefinite lives is conducted annually or more frequently if events or changes in circumstances indicate that an asset might be impaired. We have identified the following trademarks as intangible assets with an indefinite life: Influence®, Liberty,® and Advocate®. Goodwill is evaluated at the reporting unit level and has been allocated to the “Coated” segment. The valuation as of October 1, 2008, indicated no impairment of goodwill or trademarks assigned indefinite lives.
The evaluation for impairment is performed by comparing the carrying amount of these assets to their estimated fair value. If impairment is indicated, then an impairment charge is recorded to reduce the asset to its estimated fair value. The estimated fair value is generally determined on the basis of discounted future cash flows. Management believes the accounting estimates associated with determining fair value as part of the impairment test is a critical accounting estimate because estimates and assumptions are made about our future performance and cash flows. While management uses the best information available to estimate future performance and cash flows, future adjustments to management’s projections may be necessary if economic conditions differ substantially from the assumptions used in making the estimates.
Pension and Postretirement Benefit Obligations. We offer various pension plans to employees. The calculation of the obligations and related expenses under these plans requires the use of actuarial valuation methods and assumptions, including the expected long-term rate of return on plan assets, discount rates, projected future compensation increases, health care cost trend rates, and mortality rates. Actuarial valuations and assumptions used in the determination of future values of plan assets and liabilities are subject to management judgment and may differ significantly if different assumptions are used.
Contingent liabilities. A liability is contingent if the outcome or amount is not presently known, but may become known in the future as a result of the occurrence of some uncertain future event. We estimate our contingent liabilities based on management’s estimates about the probability of outcomes and their ability to estimate the range of exposure. Accounting standards require that a liability be recorded if management determines that it is probable that a loss has occurred and the loss can be reasonably estimated. In addition, it must be probable that the loss will be confirmed by some future event. As part of the estimation process, management is required to make assumptions about matters that are by their nature highly uncertain.
The assessment of contingent liabilities, including legal contingencies, asset retirement obligations, and environ-mental costs and obligations, involves the use of critical estimates, assumptions, and judgments. Management’s estimates are based on their belief that future events will validate the current assumptions regarding the ultimate outcome of these exposures. However, there can be no assurance that future events will not differ from management’s assessments.
Recent Accounting Developments
Postretirement Benefit Plan Assets. In December 2008, the Financial Accounting Standards Board, or FASB, issued FASB Staff Position on Statement 132(R)-1, or FSP FAS 132(R)-1, Employers’ Disclosure about Postretirement Benefit Plan Assets, which amends SFAS No. 132(R) to require more detailed disclosures about employers’ pension plan assets. New disclosures will include more information on investment strategies, major categories of plan assets, concentrations of risk within plan assets and valuation techniques used to measure the fair value of plan assets. FSP FAS 132(R)-1 is effective for fiscal years ending after December 15, 2009. Since FSP FAS 132(R)-1 only addresses disclosure requirements, the adoption of FSP FAS 132(R)-1 will have no impact on our financial condition or results of operations.
Intangible Assets. In April 2008, the FASB issued FSP FAS 142-3, Determination of the Useful Life of Intangible Assets, which provides guidance on the renewal or extension assumptions used in the determination of the useful life of a recognized intangible asset. The intent of FSP FAS 142-3 is to better match the useful life of the recognized intangible asset to the period of the expected cash flows used to measure its fair value. FSP FAS 142-3 is effective for fiscal years and interim periods beginning after December 15, 2008. The adoption of FSP FAS 142-3 is not expected to have a material impact on our financial condition or results of operations.
Derivatives and Hedging Activities. In March 2008, the FASB issued SFAS No. 161, Disclosures about Derivative Instruments and Hedging Activities. SFAS No. 161 changes the disclosure requirements for derivative instruments and hedging activities. Entities are required to provide enhanced disclosures about (a) how and why an entity uses derivative instruments, (b) how derivative instruments and related hedged items are accounted for under SFAS No. 133, Accounting for Derivative Instruments and Hedging Activities, and its related interpretations, and (c) how derivative instruments and related hedged items affect an entity’s financial position, financial performance, and cash flows. SFAS No. 161 is effective for fiscal years and interim periods beginning after November 15, 2008. Since SFAS No. 161 only addresses disclosure requirements, the adoption of SFAS No. 161 will have no impact on our financial condition or results of operations.
Business Combinations. In December 2007, the FASB issued SFAS No. 141 (revised 2007), Business Combinations. SFAS No. 141-R establishes principles and requirements for how an acquirer recognizes and measures identifiable assets acquired, liabilities assumed, and noncontrolling interests; recognizes and measures goodwill acquired in a business combination or gain from a bargain purchase; and establishes disclosure requirements. SFAS No. 141-R is effective for business combinations for which the acquisition date is on or after the beginning of the first annual reporting period beginning on or after December 15, 2008. Early adoption is prohibited. We will apply the provisions of SFAS No. 141-R to any future acquisitions.
In December 2007, the FASB issued SFAS No. 160, Noncontrolling Interests in Consolidated Financial Statements – an amendment of ARB No. 51. SFAS No. 160 establishes accounting and reporting standards for the noncontrolling interest in a subsidiary and for the deconsolidation of a subsidiary. SFAS No. 160 is effective, on a prospective basis, for fiscal years and interim periods beginning on or after December 15, 2008. The presentation and disclosure requirements for existing minority interests should be applied retrospectively for all periods presented. Early adoption is prohibited. The adoption of SFAS No. 160 is not expected to have a material impact on our financial condition or results of operations.
Fair Value Measurements. In September 2006, the FASB issued SFAS No. 157, Fair Value Measurements. SFAS No. 157 addresses how to measure fair value (not what to measure at fair value) and applies, with limited exceptions, to existing standards that require assets and liabilities to be measured at fair value. SFAS No. 157 establishes a fair value hierarchy, giving the highest priority to quoted prices in active markets and the lowest priority to unobservable data, and requires new disclosures for assets and liabilities measured at fair value based on their level in the hierarchy. SFAS No. 157 is effective for financial statements issued for fiscal years beginning after November 15, 2007. However, FSP 157-2, Effective Date of FASB Statement No. 157, delayed the implementation of SFAS No. 157 for nonfinancial assets and nonfinancial liabilities, except for items that are recognized or disclosed at fair value in the financial statements on a recurring basis, to fiscal years beginning after November 15, 2008. The adoption of the initial provisions of SFAS No. 157 did not have, and the adoption of the remaining provisions of SFAS No. 157 is not expected to have, a material impact on our financial condition or results of operations.
Other new accounting pronouncements issued but not effective until after December 31, 2008, are not expected to have a significant effect on our financial condition or results of operations.
Financial Overview
The United States and global economies are experiencing a period of substantial economic distress and uncertainty. These conditions have resulted in, among other things, a significant weakening in the demand for coated papers. This weakened demand, coupled with increased inventories accumulated earlier in 2008, put downward pressure on coated paper prices in the fourth quarter of 2008. We, like most coated paper producers, have moved to curtail production to match supply with demand. Accordingly, we took almost 75,000 tons of downtime in the fourth quarter of 2008, and, as previously announced, intend to take an additional 100,000 tons of downtime during the first half of 2009. As 2009 progresses, we will continue to monitor the market conditions and will take appropriate actions to balance our supply of coated papers with the demand by our customers.
In the fourth quarter of 2008, our net sales decreased 15.7% as our sales volume fell 26.7% compared to the fourth quarter of 2007. The decline in sales volume was partially offset by a 15.1% increase in the average sales price per ton compared to the same period last year. On a sequential quarter basis, our average sales price dropped less than 1%, reflecting our efforts to sustain our pricing in a difficult economic environment.
In the fourth quarter of 2008, our gross margin dropped to 13.7% from 17.6% in the fourth quarter of 2007. This compression in gross margin reflects increased input prices for our key direct expenses compared to 2007 and $15.8 million of unabsorbed costs resulting from the downtime taken in the fourth quarter of 2008.
Results of Operations
The following table sets forth certain consolidated and combined financial information for the years ended December 31, 2008, 2007 and 2006. For comparison purposes, we have presented the results of operations for 2006, on a combined basis, consisting of the results of the Predecessor for the seven months ended July 31, 2006, and the results of the Successor for the five months ended December 31, 2006. We believe that this approach is beneficial to the reader by providing an easier-to-read discussion of the results of operations and provides the reader with information from which to analyze our financial results that is consistent with the manner that management reviews and analyzes results of operations.
U.S. GAAP does not contemplate the combination of the financial results of the Predecessor and the Successor, as the combined information does not include any pro forma assumptions or adjustments and, as a result, does not fully reflect the significant impact of the Acquisition on our financial statements. In particular, fair value adjustments to personal property and other property and equipment due to the allocation of the purchase price to assets acquired and liabilities assumed resulted in a lower depreciation expense for the Successor. The pro forma impact of these adjustments on the Predecessor’s results of operations for the seven months ended July 31, 2006, would have been a reduction of $5.4 million in depreciation expense. In addition, intangible assets recognized through the allocation of the purchase price to assets acquired and liabilities assumed resulted in incremental amortization expense for the Successor. The pro forma impact on the Predecessor’s results of operations for the seven months ended July 31, 2006, would have been $0.4 million of amortization expense, resulting in a net pro forma reduction in depreciation and amortization expense of $5.0 million for the twelve months ended December 31, 2006.
Cost of sales in the following table and discussion includes the cost of products sold and depreciation and amortization. The following table and discussion should be read in conjunction with the information contained in our consolidated and combined financial statements and the related notes included elsewhere in this annual report. However, our historical results of operations set forth below and elsewhere in this annual report may not necessarily reflect what would have occurred if we had been a separate, stand-alone entity during the periods presented or what will occur in the future.
| | | | | | | | | Combined | | | | | | | |
| | | Successor | | | Successor | | | Successor and | | | Successor | | | Predecessor | |
| | | Consolidated | | | Consolidated | | | Predecessor | | | Consolidated | | | Combined | |
| | | | | | | | | | | | Five Months | | | Seven Months | |
| | | Year Ended | | | Year Ended | | | Year Ended | | | Ended | | | Ended | |
| | | December 31, | | | December 31, | | | December 31, | | | December 31, | | | July 31, | |
| (In thousands of U.S. dollars) | | 2008 | | | 2007 | | | 2006 | | | 2006 | | | 2006 | |
| | | | | | | | | | | | | | | | |
| Net sales | | $ | 1,766,813 | | | $ | 1,628,753 | | | $ | 1,611,250 | | | $ | 706,833 | | | $ | 904,417 | |
| | | | | | | | | | | | | | | | | | | | | |
| Costs and expenses: | | | | | | | | | | | | | | | | | | | | |
| Cost of products sold - exclusive of | | | | | | | | | | | | | | | | | | | | |
| depreciation and amortization | | | 1,462,333 | | | | 1,403,144 | | | | 1,360,859 | | | | 589,283 | | | | 771,576 | |
| Depreciation and amortization | | | 134,344 | | | | 123,139 | | | | 120,991 | | | | 48,317 | | | | 72,674 | |
| Selling, general, and administrative expenses | | | 79,441 | | | | 52,007 | | | | 48,344 | | | | 13,996 | | | | 34,348 | |
| Restructuring and other charges | | | 27,416 | | | | 19,395 | | | | 9,804 | | | | 10,126 | | | | (322 | ) |
| | | | | | | | | | | | | | | | | | | | | |
| Operating income | | | 63,279 | | | | 31,068 | | | | 71,252 | | | | 45,111 | | | | 26,141 | |
| | | | | | | | | | | | | | | | | | | | | |
| Interest income | | | (770 | ) | | | (1,544 | ) | | | (1,821 | ) | | | (1,798 | ) | | | (23 | ) |
| Interest expense | | | 103,200 | | | | 113,881 | | | | 57,155 | | | | 48,741 | | | | 8,414 | |
| | | | | | | | | | | | | | | | | | | | | |
| Income (loss) before income taxes | | | (39,151 | ) | | | (81,269 | ) | | | 15,918 | | | | (1,832 | ) | | | 17,750 | |
| | | | | | | | | | | | | | | | | | | | | |
| Income tax expense | | | - | | | | - | | | | 6,993 | | | | - | | | | 6,993 | |
| | | | | | | | | | | | | | | | | | | | | |
| Net income (loss) | | $ | (39,151 | ) | | $ | (81,269 | ) | | $ | 8,925 | | | $ | (1,832 | ) | | $ | 10,757 | |
2008 Successor Compared to 2007 Successor
Net Sales. Net sales grew 8.5% to $1,766.8 million in 2008 from $1,628.8 million in 2007. The growth was the result of a 16.5% increase in the average sales price per ton for all of our products in 2008. This increase was partially offset by a 6.8% decrease in total sales volume, reflecting lower coated paper demand in a difficult economic environment.
Net sales for our coated and supercalendered papers segment were $1,575.0 million in 2008, compared to $1,443.2 million in 2007, an increase of 9.1%. The improvement reflects a 17.2% increase in average paper sales price which was partially offset by a 6.9% decrease in paper sales volume compared to 2007.
Net sales for our hardwood market pulp segment were relatively stable at $146.4 million in 2008, compared to $148.0 million in 2007. This result reflected a 9.3% decrease in pulp sales volume which was largely offset by a 9.1% increase in average pulp sales price.
Net sales for our other segment increased 20.7% to $45.4 million in 2008, from $37.6 million in 2007. This increase reflects an 11.4% increase in average sales price combined with an 8.4% increase in sales volume compared to 2007.
Cost of sales. Cost of sales, including depreciation and amortization, was $1,596.7 million in 2008 compared to $1,526.3 million in 2007, an increase of 4.6% which was primarily driven by higher input costs. Our gross margin, excluding depreciation and amortization, was 17.2% for 2008 compared to 13.9% for 2007, reflecting the higher average sales price in 2008. Depreciation and amortization expense was $134.4 million in 2008 compared to $123.1 million in 2007.
Selling, general, and administrative expenses. Selling, general, and administrative expenses were $79.4 million in 2008 compared to $52.0 million in 2007. Included in selling, general, and administrative expenses for 2008 is a one-time charge of $10.8 million due to the accelerated vesting of the Legacy Class C Units of Verso Paper Management LP in connection with the IPO.
Interest expense. Interest expense was $103.2 million in 2008 compared to $113.9 million in 2007. The net decrease in interest expense was due to lower interest rates on floating rate debt compared to 2007. Interest expense for 2008 includes $99.2 million of cash interest expense on our outstanding indebtedness and $4.0 million of non-cash interest expense, including amortization of deferred debt issuance costs.
Restructuring and other charges. Restructuring and other charges were $27.4 million in 2008 compared to $19.4 million in 2007. Restructuring and other charges are comprised of transition and other costs associated with the Acquisition, including costs of a transition service agreement with International Paper, technology migration costs, consulting and legal fees, and other one-time costs related to becoming a stand-alone business. Subsequent to the Acquisition, we entered into a management agreement with Apollo relating to the provision of certain financial and strategic advisory services and consulting services. Upon consummation of the IPO, Apollo terminated the annual fee arrangement under the management agreement for a one-time payment of $23.1 million, which is included in the charges for 2008. The charges in 2007 included $5.6 million of transition service agreement costs and $2.8 million of charges under the management agreement. As of September 30, 2007, we substantially discontinued the use of services under the transition service agreement.
2007 Successor Compared to 2006 Combined Successor and Predecessor
Net Sales. Net sales were $1,628.8 million in 2007 compared to $1,611.2 million in 2006, an increase of 1.1%. The increase was the result of a 4.2% increase in total sales volume in 2007, which was partially offset by a 3.0% decrease in average sales price per ton for all of our products compared to 2006.
Net sales for our coated and supercalendered papers segment were $1,443.2 million in 2007 compared to $1,425.2 million in 2006, an increase of 1.3%. The increase was primarily due to a 6.1% increase in paper sales volume which was partially offset by a 4.6% decrease in average paper sales price compared to the prior year.
Net sales for our hardwood market pulp segment were $148.0 million in 2007 compared to $147.0 million in 2006, an increase of 0.7%. This growth resulted from a 5.9% increase in average pulp sales price which was mostly offset by a 5.0% decrease in pulp sales volume due to an increase in our internal consumption of pulp.
Net sales for our other segment were $37.6 million in 2007 compared to $39.0 million in 2006, a decrease of 3.7%. This decrease reflects a 4.1% decline in sales volume which was partially offset by a 0.5% increase in average sales price compared to 2006.
Cost of sales. Cost of sales, including depreciation and amortization, was $1,526.3 million in 2007 compared to $1,481.9 million in 2006, an increase of 3.0% which was primarily driven by higher sales volume. Although the prices of certain commodities used in production were higher in 2007, the operational efficiencies and improvements we implemented, including through our R−GAP continuous cost improvement process, more than offset the increased prices of raw materials. Our gross margin, excluding depreciation and amortization, was 13.9% for 2007 compared to 15.5% for 2006. This decline reflects the lower average sales prices in 2007. Depreciation and amortization expense was $123.1 million in 2007 compared to $121.0 million in 2006.
Selling, general, and administrative expenses. Selling, general, and administrative expenses were $52.0 million in 2007 compared to $48.3 million in 2006, an increase of 7.6%. For the periods following the closing of the Acquisition, selling, general, and administrative expenses reflected the expenses we incurred as a stand-alone business.
Interest expense. Interest expense increased to $113.9 million in 2007 from $57.1 million in 2006 due to the debt incurred as part of the Acquisition. Interest expense in 2007 includes $109.2 million of cash interest expense on our outstanding indebtedness and $4.7 million of non-cash interest expense, including amortization of deferred debt issuance costs.
Restructuring and other charges. Restructuring and other charges were $19.4 million for the year ended December 31, 2007, compared to $10.1 million for the five months ended December 31, 2006. In conjunction with the Acquisition, we entered into a transition service agreement with International Paper whereby International Paper continued to provide certain services that were necessary for us to run as a stand-alone business. The charges in 2007 included $5.6 million of transition service agreement costs and $2.8 million of charges under the management agreement with Apollo. The charges for the five months ended December 31, 2006, included $6.1 million of transition service agreement costs.
Income tax expense. For the year ended December 31, 2007, and for the five months ended December 31, 2006, we incurred no income taxes, compared to our Predecessor’s income tax expense of $7.0 million for the seven months ended July 31, 2006.
Liquidity and Capital Resources
We rely primarily upon cash flow from operations and borrowings under our revolving credit facility to finance operations, capital expenditures, and fluctuations in debt service requirements. We believe that our ability to manage cash flow and working capital levels, particularly inventory and accounts payable, will allow us to meet our current and future obligations, pay scheduled principal and interest payments, and provide funds for working capital, capital expenditures and other needs of the business for at least the next twelve months. However, no assurance can be given that this will be the case, and we may require additional debt or equity financing to meet our working capital requirements. We expect to spend approximately $50 million on capital expenditures during 2009, including approximately $35 million for maintenance and environmental capital expenditures. Thereafter, our annual maintenance and environmental capital expenditures are expected to average approximately $40 million to $50 million per year for the next few years.
Net cash flows from operating activities. Net cash provided by operating activities was $74.9 million in 2008 compared to $38.8 million of net cash provided in 2007. The increase in net cash provided by operating activities was primarily due to improved performance, with a net loss of $39.2 million in 2008 compared to a net loss of $81.3 million in 2007. Operating activities in 2006 generated net cash of approximately $168.1 million. The increase in 2006 was primarily driven by improved operations and working capital improvements.
Net cash flows from investing activities. In 2008 and 2007, we used $80.3 million and $67.8 million, respectively, of net cash in investing activities, primarily for investments in capital expenditures. In 2006, $1,419.4 million of net cash was used, reflecting the $1.4 billion in cash paid for the Acquisition.
Net cash flows from financing activities. In 2008, our financing activities provided $66.4 million of net cash, which reflected $92.1 million in borrowings under the revolving credit facility, $2.8 million in scheduled principal payments made on the senior secured term loan, and $22.8 million in distributions paid to Verso Paper Finance Holdings LLC, or “Verso Finance,” our indirect parent company, to fund interest and other obligations. This compares to $24.9 million of net cash used during 2007, which was comprised of $2.8 million in scheduled principal payments on the senior secured term loan and $22.1 million in distributions to Verso Finance. In 2006, net cash provided by financing activities was $1,363.8 million, reflecting the net proceeds from the debt issuance and equity contributions associated with the Acquisition.
Indebtedness. As of December 31, 2008, our aggregate indebtedness was $1,245.7 million, and we had $59.0 million available for borrowing under our revolving credit facility.
On August 1, 2006, we entered into senior secured credit facilities consisting of:
| · | a $285 million term loan with a maturity of seven years, of which $253.6 million was outstanding as of December 31, 2008; and |
| · | a $200 million revolving credit facility with a maturity of six years, of which $92.1 million was outstanding, $33.1 million in letters of credit were issued, and $59.0 million was available for future borrowing as of December 31, 2008. |
The term loan bears interest at a rate equal to LIBOR plus 1.75%, with the interest rate being 3.3% at December 31, 2008. The revolving credit facility bears interest at a rate equal to LIBOR plus 2.00%, with the weighted average interest rate being 3.35% at December 31, 2008. We are required to pay a commitment fee to the lenders under the revolving credit facility in respect of unutilized commitments at a rate equal to 0.375% per annum (subject to reduction in certain circumstances) and customary letter of credit and agency fees. The senior secured credit facilities are secured by first priority security interests in, and mortgages on, substantially all of our tangible and intangible assets and those of each our direct and indirect subsidiaries. The senior secured credit facilities also are secured by first priority pledges of all the equity interests owned by us in our subsidiaries. The obligations under the senior secured credit facilities are unconditionally guaranteed by Verso Finance and, subject to certain exceptions, each of its direct and indirect subsidiaries. The credit agreement for our senior secured credit facilities contains various covenants which, among other things, prohibit our subsidiaries from prepaying other indebtedness, require us to maintain a maximum consolidated first lien leverage ratio, and restrict our ability to incur indebtedness or liens, make investments, or declare or pay any dividends. As of December 31, 2008, we were in compliance with all such covenants.
On August 1, 2006, we also issued debt securities consisting of:
| · | $350 million aggregate principal amount of 9⅛% second priority senior secured fixed rate notes due 2014; |
| · | $250 million aggregate principal amount of second priority senior secured floating rate notes due 2014; and |
| · | $300 million aggregate principal amount of 11⅜% senior subordinated notes due 2016. |
The original principal amount of each issue of debt securities was outstanding at December 31, 2008. The fixed rate notes and subordinated notes pay interest semi-annually, and the floating rate notes pay interest quarterly. The floating rate notes bear interest at a rate equal to LIBOR plus 3.75% with the interest rate being 6.9% at December 31, 2008. The fixed rate and floating rate notes have the benefit of a second priority security interest in the collateral securing our senior secured credit facilities, while the subordinated notes are unsecured. The indentures governing our notes contain various covenants which limit our ability to, among other things, incur additional indebtedness; pay dividends or make other distributions or repurchase or redeem our stock; make investments; sell assets, including capital stock of restricted subsidiaries; enter into agreements restricting our subsidiaries’ ability to pay dividends; consolidate, merge, sell or otherwise dispose of all or substantially all of our assets; enter into transactions with our affiliates; and incur liens. As of December 31, 2008, we were in compliance with all such covenants.
The Company may elect to retire its outstanding debt in open market purchases, privately negotiated transactions or otherwise. These repurchases may be funded through available cash from operations and borrowings from our credit facilities. Such repurchases are dependent on prevailing market conditions, the Company’s liquidity requirements, contractual restrictions, and other factors.
Covenant Compliance
Certain covenants contained in the credit agreement governing our senior secured credit facilities and the indentures governing our outstanding notes (a) require us to maintain a net first lien secured debt to Adjusted EBITDA (as defined below) ratio that does not exceed 3.25 to 1.00 and (b) restrict our ability to take certain actions, such as incurring additional debt or making acquisitions, if we are unable to maintain an Adjusted EBITDA to Fixed Charges (as defined below) ratio of at least 2.00 to 1.00, in each case measured on a trailing four-quarter basis. Although we do not expect to violate any of the provisions in the agreements governing our outstanding indebtedness, these covenants can result in limiting our long-term growth prospects by hindering our ability to incur future indebtedness or grow through acquisitions.
Fixed Charges, or cash interest expense, represents consolidated interest expense excluding the amortization or write-off of deferred financing costs. Adjusted EBITDA is EBITDA further adjusted to exclude unusual items and other pro forma adjustments. We believe that the inclusion of the supplemental adjustments applied in calculating Adjusted EBITDA are appropriate to provide additional information to investors to demonstrate our compliance with our financial covenants and assess our ability to incur additional indebtedness in the future. However, Adjusted EBITDA is not a measurement of financial performance under U.S. GAAP, and Adjusted EBITDA may not be comparable to similarly titled measures of other companies. You should not consider our Adjusted EBITDA as an alternative to operating or net income, determined in accordance with U.S. GAAP, as an indicator of our operating performance, or as an alternative to cash flows from operating activities, determined in accordance with U.S. GAAP, as an indicator of our cash flows or as a measure of liquidity.
For comparison purposes, EBITDA and Adjusted EBITDA for 2006, are presented on a combined basis, consisting of the results of the Predecessor for the seven months ended July 31, 2006, and the results of the Successor for the five months ended December 31, 2006. U.S. GAAP does not contemplate the combination of the financial results of the Predecessor and the Successor, as the combined information does not include any pro forma assumptions or adjustments and, as a result, does not fully reflect the significant impact of the Acquisition on our financial statements.
The following table reconciles cash flows from operating activities to EBITDA and Adjusted EBITDA for the periods presented:
| | | | | | | | | Combined | | | | | | | |
| | | Successor | | | Successor | | | Predecessor | | | Successor | | | Predecessor | |
| | | Consolidated | | | Consolidated | | | & Successor | | | Consolidated | | | Combined | |
| | | | | | | | | | | | Five Months | | | Seven Months | |
| | | Year Ended | | | Year Ended | | | Year Ended | | | Ended | | | Ended | |
| | | December 31, | | | December 31, | | | December 31, | | | December 31, | | | July 31, | |
| (in millions of U.S. dollars) | | 2008 | | | 2007 | | | 2006 | | | 2006 | | | 2006 | |
| | | | | | | | | | | | | | | | |
| Cash flow from operating activities | | $ | 74.9 | | | $ | 38.8 | | | $ | 168.1 | | | $ | 128.8 | | | $ | 39.3 | |
| Income tax expense | | | - | | | | - | | | | 7.0 | | | | - | | | | 7.0 | |
| Amortization of debt issuance costs | | | (5.4 | ) | | | (5.4 | ) | | | (2.3 | ) | | | (2.3 | ) | | | - | |
| Interest income | | | (0.8 | ) | | | (1.5 | ) | | | (1.8 | ) | | | (1.8 | ) | | | - | |
| Interest expense | | | 103.2 | | | | 113.9 | | | | 57.1 | | | | 48.7 | | | | 8.4 | |
| Loss on disposal of fixed assets | | | (0.7 | ) | | | (1.0 | ) | | | (1.4 | ) | | | (0.1 | ) | | | (1.3 | ) |
| Other, net | | | 22.6 | | | | 1.5 | | | | (0.7 | ) | | | - | | | | (0.7 | ) |
| Changes in assets and liabilities, net | | | 3.9 | | | | 7.9 | | | | (33.8 | ) | | | (79.9 | ) | | | 46.1 | |
| EBITDA | | | 197.7 | | | | 154.2 | | | | 192.2 | | | | 93.4 | | | | 98.8 | |
| Restructuring, severance and other (1) | | | 27.4 | | | | 19.4 | | | | 9.8 | | | | 10.1 | | | | (0.3 | ) |
| Non-cash compensation/benefits (2) | | | 11.2 | | | | 0.6 | | | | 5.4 | | | | 0.4 | | | | 5.0 | |
| Other items, net (3) | | | 3.1 | | | | 8.0 | | | | (0.1 | ) | | | (8.2 | ) | | | 8.1 | |
| Inventory fair value (4) | | | - | | | | - | | | | 5.9 | | | | 5.9 | | | | - | |
| Lease not assumed (5) | | | - | | | | - | | | | 5.8 | | | | - | | | | 5.8 | |
| Change in machine use, net (6) | | | - | | | | - | | | | 2.8 | | | | - | | | | 2.8 | |
| Adjusted EBITDA | | $ | 239.4 | | | $ | 182.2 | | | $ | 221.8 | | | $ | 101.6 | | | $ | 120.2 | |
| | | | | | | | | | | | | | | | | | | | | |
| As adjusted cash interest expense (7) | | $ | 99.2 | | | | | | | | | | | | | | | | | |
| Adjusted EBITDA to cash interest expense | | | 2.4 | | | | | | | | | | | | | | | | | |
| Net first-lien secured debt to Adjusted EBITDA | | | 0.95 | | | | | | | | | | | | | | | | | |
| (1) | Restructuring includes transition and other non-recurring costs associated with the Acquisition as per our financial statements. |
| (2) | Represents amortization of non-cash incentive compensation. |
| (3) | Represents earnings adjustments for legal and consulting fees, and other miscellaneous non-recurring items. |
| (4) | Represents the fair value of inventory adjustment related to purchase accounting. |
| (5) | Reflects the elimination of the historical rent expense incurred on the Sartell property lease that was not assumed by us in the Acquisition. |
| (6) | Represents the elimination or addition of expected earnings as a result of changes in the use of two of our paper machines at the Jay mill prior to the Acquisition. |
| (7) | Cash interest expense represents gross interest expense related to the debt, excluding amortization of debt issuance costs. |
Seasonality
We are exposed to fluctuations in quarterly net sales volumes and expenses due to seasonal factors. These seasonal factors are common in the coated paper industry. Typically, the first two quarters are our slowest quarters due to lower demand for coated paper during this period. Our third quarter is generally our strongest quarter, reflecting an increase in printing related to end-of-year magazines, increased end-of-year direct mailings, and holiday season catalogs. Our working capital and accounts receivable generally peak in the third quarter, while inventory generally peaks in the second quarter in anticipation of the third quarter season. We expect our seasonality trends to continue for the foreseeable future.
Effect of Inflation
While inflationary increases in certain input costs, such as for energy, wood fiber, and chemicals, have an impact on our operating results, changes in general inflation have had minimal impact on our operating results in the last three years. Sales prices and volumes are more strongly influenced by supply and demand factors in specific markets and by exchange rate fluctuations than by inflationary factors. We cannot assure you, however, that we will not be affected by general inflation in the future.
Contractual Obligations
The following table reflects our contractual obligations and commercial commitments as of December 31, 2008. Commercial commitments include lines of credit, guarantees, and other potential cash outflows resulting from a contingent event that requires our performance pursuant to a funding commitment.
| | | Payments due by period | |
| | | | | | Less than | | | | | | | | | More than | |
| (in millions of U.S. dollars) | | Total | | | 1 year | | | 1-3 years | | | 3-5 years | | | 5 years | |
| Long-term debt (1) | | $ | 1,861.7 | | | $ | 104.7 | | | $ | 208.8 | | | $ | 528.4 | | | $ | 1,019.8 | |
| Operating leases | | | 10.6 | | | | 5.1 | | | | 4.3 | | | | 1.1 | | | | 0.1 | |
| Purchase obligations (2) | | | 931.5 | | | | 149.9 | | | | 187.2 | | | | 187.4 | | | | 407.0 | |
| Other long-term liabilities (3) | | | 33.8 | | | | 1.1 | | | | 2.0 | | | | 2.7 | | | | 28.0 | |
| Total | | $ | 2,837.6 | | | $ | 260.8 | | | $ | 402.3 | | | $ | 719.6 | | | $ | 1,454.9 | |
| (1) Long-term debt includes principal payments, commitment fees and accrued interest payable. A portion of interest expense is at a variable rate and has been calculated using current LIBOR. Actual payments could vary. |
| (2) Purchase obligations include unconditional purchase obligations for power purchase agreements (gas and electricity), machine clothing and other commitments for advertising, raw materials or storeroom inventory. |
| (3) Other long-term liabilities reflected above represent the gross amount of asset retirement obligations. | |
We are exposed to market risk from fluctuations in our paper prices, interest rates, energy prices, and commodity prices for our inputs.
Paper Prices
Our sales, which we report net of rebates, allowances, and discounts, are a function of the number of tons of paper that we sell and the price at which we sell our paper. The coated paper industry is cyclical, which results in changes in both volume and price. Paper prices historically have been a function of macro-economic factors, which influence supply and demand. Price has historically been substantially more variable than volume and can change significantly over relatively short time periods.
We are primarily focused on serving two end-user segments: catalogs and magazines. Coated paper demand is primarily driven by advertising and print media usage. Advertising spending and magazine and catalog circulation tend to correlate with changes in the GDP of the United States - they rise with a strong economy and contract with a weak economy.
The majority of our products are sold under contracts with our customers. Contracted sales are more prevalent for coated groundwood paper, as opposed to coated freesheet paper, which is more often sold without a contract. Our contracts generally specify the volumes to be sold to the customer over the contract term, as well as the pricing parameters for those sales. Most of our contracts are negotiated on an annual basis, with only a few having terms extending beyond one year. Typically, our contracts provide for quarterly price adjustments based on market price movements. The large portion of contracted sales allows us to plan our production runs well in advance, optimizing production over our integrated mill system and thereby reducing costs and increasing overall efficiency.
We reach our end-users through several channels, including printers, brokers, paper merchants and direct sales to end-users. We sell and market our products to approximately 100 customers. In 2008, no single customer accounted for more than 10% of our total net sales.
Interest Rates
We issued fixed- and floating-rate debt to finance the Acquisition in order to manage our variability to cash flows from interest rates. Borrowings under our senior secured credit facilities and our floating-rate notes accrue interest at variable rates, and a 100 basis point increase in quoted interest rates on our debt balances outstanding as of December 31, 2008, under our senior secured credit facilities and our floating-rate notes would increase our annual interest expense by $6.0 million. While we may enter into agreements limiting our exposure to higher interest rates, any such agreements may not offer complete protection from this risk.
Derivatives
In the normal course of business, we utilize derivatives contracts as part of our risk management strategy to manage our exposure to market fluctuations in energy prices and interest rates. These instruments are subject to credit and market risks in excess of the amount recorded on the balance sheet in accordance with generally accepted accounting principles. Controls and monitoring procedures for these instruments have been established and are routinely reevaluated. We have an Energy Risk Management Policy which was adopted by our board of directors and is monitored by an Energy Risk Management Committee composed of our senior management. In addition, we have an Interest Rate Risk Committee which was formed to monitor our Interest Rate Risk Management Policy. Credit risk represents the potential loss that may occur because a party to a transaction fails to perform according to the terms of the contract. The measure of credit exposure is the replacement cost of contracts with a positive fair value. We manage credit risk by entering into financial instrument transactions only through approved counterparties. Market risk represents the potential loss due to the decrease in the value of a financial instrument caused primarily by changes in commodity prices or interest rates. We manage market risk by establishing and monitoring limits on the types and degree of risk that may be undertaken.
We do not hedge the entire exposure of our operations from commodity price volatility for a variety of reasons. To the extent that we do not hedge against commodity price volatility, our results of operations may be affected either favorably or unfavorably by a shift in the future price curve. As of December 31, 2008, we had net unrealized losses of $26.9 million on open commodity contracts with maturities of one to twelve months. These derivative instruments involve the exchange of net cash settlements, based on changes in the price of the underlying commodity index compared to the fixed price offering, at specified intervals without the exchange of any underlying principal. A 10% decrease in commodity prices would have a negative impact of approximately $4.4 million on the fair value of such instruments. This quantification of exposure to market risk does not take into account the offsetting impact of changes in prices on anticipated future energy purchases.
We entered into a $250 million notional value receive-variable, pay-fixed interest rate swap in connection with our outstanding floating rate notes that mature in 2014. We are hedging the cash flow exposure on its quarterly variable-rate interest payments due to changes in the benchmark interest rate (three-month LIBOR). As of December 31, 2008, the fair value of this swap was an unrealized loss of $3.7 million. A 10% decrease in interest rates would have a negative impact of approximately $0.5 million on the fair value of this instrument.
Commodity Prices
We are subject to changes in our cost of sales caused by movements underlying commodity prices. The principal components of our cost of sales are chemicals, wood, energy, labor, maintenance, and depreciation and amortization. Costs for commodities, including chemicals, wood, and energy, are the most variable component of our cost of sales because their prices can fluctuate substantially, sometimes within a relatively short period of time. In addition, our aggregate commodity purchases fluctuate based on the volume of paper that we produce.
Chemicals. Chemicals utilized in the manufacturing of coated papers include latex, starch, calcium carbonate, and titanium dioxide. We purchase these chemicals from a variety of suppliers and are not dependent on any single supplier to satisfy our chemical needs. In the near term, we expect the rate of inflation for our total chemical costs to be lower than that experienced over the last two years. However, we expect imbalances in supply and demand will drive higher prices for certain chemicals such as starch and sodium chlorate.
Wood. Our costs to purchase wood are affected directly by market costs of wood in our regional markets and indirectly by the effect of higher fuel costs on logging and transportation of timber to our facilities. While we have in place fiber supply agreements that ensure a substantial portion of our wood requirements, purchases under these agreements are typically at market rates.
Energy. We produce a large portion of our energy requirements, historically producing approximately 50% of our energy needs for our coated paper mills from sources such as waste wood and paper, hydroelectric facilities, chemicals from our pulping process, our own steam recovery boilers, and internal energy cogeneration facilities. Our external energy purchases vary across each of our mills and include fuel oil, natural gas, coal, and electricity. While our internal energy production capacity mitigates the volatility of our overall energy expenditures, we expect prices for energy to remain volatile for the foreseeable future and our energy costs to increase in a high energy cost environment. As prices fluctuate, we have some ability to switch between certain energy sources in order to minimize costs. We utilize derivatives contracts as part of our risk management strategy to manage our exposure to market fluctuations in energy prices.
Off-Balance Sheet Arrangements
None.
Verso Paper Holdings LLC
Consolidated Financial Statements of Successor
For the Years Ended December 31, 2008 and 2007, and
The Five Months Ended December 31, 2006
and
Combined Financial Statements of Predecessor
For the Seven Months Ended July 31, 2006
Index to Financial Statements
| Report of Independent Registered Public Accounting Firm | 41 |
| Consolidated and Combined Financial Statements | |
| Consolidated Balance Sheets | 42 |
| Consolidated and Combined Statements of Operations | 43 |
| Consolidated Statements of Changes in Member’s Equity | 44 |
| Consolidated and Combined Statements of Cash Flows | 45 |
| Notes to Consolidated Financial Statements of Verso Paper Holdings LLC (Successor) | 46 |
Notes to Combined Financial Statements of Coated and Supercalendered Papers Division of International Paper Company (Predecessor) | 72 |
REPORT OF INDEPENDENT REGISTERED PUBLIC ACCOUNTING FIRM
To the Board of Directors and Members of
Verso Paper Holdings LLC
Memphis, Tennessee
We have audited the accompanying consolidated balance sheets of Verso Paper Holdings LLC (the “Company” or “Successor”), a wholly-owned subsidiary of Verso Paper Finance Holdings LLC, as of December 31, 2008 and 2007 (Successor Company balance sheets), and the related consolidated statements of operations, changes in member's equity, and cash flows for the years ended December 31, 2008 and 2007 and the five months ended December 31, 2006 (Successor Company operations). We have also audited the accompanying combined statements of operations and cash flows of the Coated & Supercalendered Papers Division of International Paper Company (the “Predecessor”) for the seven months ended July 31, 2006 (Predecessor operations). These financial statements are the responsibility of the Company's management. Our responsibility is to express an opinion on these financial statements based on our audits.
We conducted our audits in accordance with the standards of the Public Company Accounting Oversight Board (United States). Those standards require that we plan and perform the audit to obtain reasonable assurance about whether the financial statements are free of material misstatement. The Company is not required to have, nor were we engaged to perform, an audit of its internal control over financial reporting. Our audits included consideration of internal control over financial reporting as a basis for designing audit procedures that are appropriate in the circumstances, but not for the purpose of expressing an opinion on the effectiveness of the Company's internal control over financial reporting. Accordingly, we express no such opinion. An audit also includes examining, on a test basis, evidence supporting the amounts and disclosures in the financial statements, assessing the accounting principles used and significant estimates made by management, as well as evaluating the overall financial statement presentation. We believe that our audits provide a reasonable basis for our opinion.
In our opinion, the Successor Company’s consolidated financial statements present fairly, in all material respects, the financial position of the Company as of December 31, 2008 and 2007, and the results of its operations and its cash flows for the years ended December 31, 2008 and 2007 and the five months ended December 31, 2006, in conformity with accounting principles generally accepted in the United States of America. Further, in our opinion, the Predecessor combined financial statements referred to above present fairly, in all material respects, the results of operations and cash flows of the Predecessor for the seven months ended July 31, 2006, in conformity with accounting principles generally accepted in the United States of America.
As discussed in Note 1 to the Successor Company consolidated financial statements, the Company adopted Statement of Financial Accounting Standards (“SFAS”) No. 158, Employers’ Accounting for Defined Benefit Pension and Other Postretirement Plans –an Amendment of FASB Statements No. 87, 88, 106, and 132( R), as of December 31, 2006.
As discussed in Note 1 to the Predecessor combined financial statements, the accompanying Predecessor combined financial statements have been prepared from the separate records maintained by the Predecessor and International Paper Company and may not necessarily be indicative of the conditions that would have existed or the results of operations if the Predecessor had been operated as an unaffiliated company. Portions of certain expenses represent allocations made from corporate-office items applicable to International Paper Company as a whole.
/s/ Deloitte & Touche LLP
Memphis, Tennessee
March 2, 2009
| VERSO PAPER HOLDINGS LLC |
| |
| CONSOLIDATED BALANCE SHEETS |
| | | | | | | | | | | | Predecessor | |
| | | Successor Consolidated | | | Combined | |
| | | Year | | | Year | | | Five Months | | | Seven Months | |
| | | Ended | | | Ended | | | Ended | | | Ended | |
| | | December 31, | | | December 31, | | | December 31, | | | July 31, | |
| (In thousands of U.S. dollars) | | 2008 | | | 2007 | | | 2006 | | | 2006 | |
| Cash Flows From Operating Activities: | | | | | | | | | | | | |
| Net income (loss) | | $ | (39,151 | ) | | $ | (81,269 | ) | | $ | (1,832 | ) | | $ | 10,757 | |
| Adjustments to reconcile net income (loss) to | | | | | | | | | | | | | | | | |
| net cash provided by operating activities: | | | | | | | | | | | | | | | | |
| Depreciation and amortization | | | 134,344 | | | | 123,139 | | | | 48,317 | | | | 72,674 | |
| Amortization of debt issuance costs | | | 5,427 | | | | 5,425 | | | | 2,264 | | | | - | |
| Loss on disposal of fixed assets | | | 722 | | | | 942 | | | | 71 | | | | 1,262 | |
| Equity award expense | | | 11,199 | | | | 625 | | | | - | | | | - | |
| Increase in derivatives, net | | | (27,571 | ) | | | (2,095 | ) | | | - | | | | - | |
| Other - net | | | (6,238 | ) | | | (34 | ) | | | - | | | | 686 | |
| Changes in assets and liabilities: | | | | | | | | | | | | | | | | |
| Accounts receivable | | | 50,625 | | | | (11,963 | ) | | | (32,302 | ) | | | 23,253 | |
| Inventories | | | (76,314 | ) | | | 20,171 | | | | 5,438 | | | | (55,256 | ) |
| Prepaid expenses and other assets | | | (7,982 | ) | | | (8,201 | ) | | | (11,412 | ) | | | (6,396 | ) |
| Accounts payable | | | (9,980 | ) | | | (14,355 | ) | | | 64,736 | | | | (8,690 | ) |
| Accrued liabilities | | | 39,842 | | | | 6,396 | | | | 53,505 | | | | 983 | |
| Net cash provided by operating activities | | | 74,923 | | | | 38,781 | | | | 128,785 | | | | 39,273 | |
| Cash Flows From Investing Activities: | | | | | | | | | | | | | | | | |
| Proceeds from sale of fixed assets | | | 108 | | | | 1,789 | | | | - | | | | 32 | |
| Cash paid for acquisition | | | - | | | | - | | | | (1,364,221 | ) | | | - | |
| Capital expenditures | | | (80,447 | ) | | | (69,582 | ) | | | (27,533 | ) | | | (27,655 | ) |
| Net cash used in investing activities | | | (80,339 | ) | | | (67,793 | ) | | | (1,391,754 | ) | | | (27,623 | ) |
| Cash Flows From Financing Activities: | | | | | | | | | | | | | | | | |
| Proceeds from long-term debt | | | 92,083 | | | | - | | | | 1,185,000 | | | | - | |
| Repayments of long-term debt | | | (2,850 | ) | | | (2,850 | ) | | | (25,713 | ) | | | (18,754 | ) |
| Equity distributions | | | (22,796 | ) | | | (22,087 | ) | | | - | | | | - | |
| Equity contributions | | | - | | | | - | | | | 260,286 | | | | 7,105 | |
| Debt issue costs | | | - | | | | - | | | | (44,157 | ) | | | - | |
| Net cash provided by (used in) financing activities | | | 66,437 | | | | (24,937 | ) | | | 1,375,416 | | | | (11,649 | ) |
| Change in cash and cash equivalents | | | 61,021 | | | | (53,949 | ) | | | 112,447 | | | | 1 | |
| Cash and cash equivalents at beginning of period | | | 58,499 | | | | 112,448 | | | | 1 | | | | 46 | |
| Cash and cash equivalents at end of period | | $ | 119,520 | | | $ | 58,499 | | | $ | 112,448 | | | $ | 47 | |
| | | | | | | | | | | | | | | | | |
| Supplemental Schedule of Non-Cash Financing Activities: | | | | | | | | | | | | | |
| Non-cash equity investment | | $ | - | | | $ | - | | | $ | 29,000 | | | $ | - | |
| | | | | | | | | | | | | | | | | |
| See notes to Successor's consolidated financial statements and Predecessor's combined financial statements. |
VERSO PAPER HOLDINGS LLC (SUCCESSOR)
Notes to Consolidated Financial Statements as of December 31, 2008 and 2007, and for the Years Ended
December 31, 2008, and 2007 and for the Period August 1, 2006 (Date of Acquisition) to December 31, 2006
1. SUMMARY OF BUSINESS AND SIGNIFICANT ACCOUNTING POLICIES
Nature of Business—The accompanying financial statements include the accounts of Verso Paper Holdings LLC, a Delaware limited liability company, and its subsidiaries. Unless otherwise noted, the terms “Verso,” “Verso Paper,” “Company,” “we,” “us,” “our,” and “Successor” refer collectively to Verso Paper Holdings LLC and its subsidiaries, and references to the “Division” or “Predecessor” refer to the Coated and Supercalendered Papers Division of International Paper Company, or “International Paper”.
The Company began operations on August 1, 2006, when it acquired the assets and certain liabilities comprising the business of the Coated and Supercalendered Papers Division of International Paper. The Company was formed by affiliates of Apollo Management, L.P., or “Apollo,” for the purpose of consummating the acquisition from International Paper, or the “Acquisition.” Verso Paper Corp., of which we are an indirect, wholly-owned subsidiary, went public on May 14, 2008, with an initial public offering, or “IPO," of 14 million shares of common stock at a price of $12 per share which generated $152.2 million in net proceeds.
The Company operates, through its subsidiaries, in the following three segments: coated and supercalendered papers; hardwood market pulp; and other, consisting of specialty industrial paper. The Company’s core business platform is as a producer of coated freesheet, coated groundwood, and uncoated supercalendered papers. These products serve customers in the catalog, magazine, inserts, and commercial print markets.
Basis of Presentation—Included in this report are the financial statements of Verso Paper Holdings LLC as of December 31, 2008 and 2007, and for the years ended December 31, 2008 and 2007 and the five months ended December 31, 2006. The notes to the financial statements of the Predecessor for the seven months ended July 31, 2006, follow the notes of the Successor. All material intercompany balances and transactions are eliminated.
Use of Estimates—The preparation of financial statements in conformity with accounting principles generally accepted in the United States of America requires management to make estimates and assumptions that affect the reported amounts of assets and liabilities, disclosure of contingent assets and liabilities at the date of the financial statements, and the reported amounts of revenues and expenses during the reporting periods. Actual results could differ from these estimates.
Revenue Recognition—Sales are net of rebates, allowances, and discounts. Revenue is recognized when the customer takes title and assumes the risks and rewards of ownership. Revenue is recorded at the time of shipment for terms designated f.o.b. (free on board) shipping point. For sales transactions designated f.o.b. destination, which include export sales, revenue is recorded when the product is delivered to the customer’s site and when title and risk of loss are transferred.
Shipping and Handling Costs—Shipping and handling costs, such as freight to customer destinations, are included in cost of products sold in the accompanying consolidated statements of operations. These costs, when included in the sales price charged for the Company’s products, are recognized in net sales.
Planned Maintenance Costs—Maintenance costs for major planned maintenance shutdowns in excess of $0.5 million are deferred over the period in which the maintenance shutdowns occur and expensed ratably over the period until the next major planned shutdown, since the Company believes that operations benefit throughout that period from the maintenance work performed. Other maintenance costs are expensed as incurred.
Environmental Costs and Obligations—Costs associated with environmental obligations, such as remediation or closure costs, are accrued when such costs are probable and reasonably estimable. Such accruals are adjusted as further information develops or circumstances change. Costs of future expenditures for environmental obligations are discounted to their present value when the expected cash flows are reliably determinable.
Equity Compensation—The Company accounts for equity awards in accordance with SFAS No. 123 (Revised), Share-Based Payment. SFAS No. 123(R) requires that all equity awards to employees be expensed over the period of the award. The Company applies the Black-Scholes method of valuation to determine share-based compensation expense.
Income Taxes—The Company is a limited liability corporation and is not subject to federal income taxes. The Company accounts for its state income taxes in accordance with SFAS No. 109, Accounting for Income Taxes.
Fair Value of Financial Instruments—The carrying amounts for cash and cash equivalents, restricted cash, accounts receivable, accounts payable and accrued liabilities, and amounts receivable from or due to related parties approximates fair value due to the short maturity of these instruments. The Company determines the fair value of its long-term debt based on market information and a review of prices and terms available for similar obligations. See also Note 7 and Note 13 for additional information regarding the fair value of financial instruments.
Cash and Cash Equivalents—For cash and cash equivalents, the carrying amounts approximate fair value due to the short-term nature of these instruments. Cash and cash equivalents include highly liquid investments with a maturity of three months or less at the date of purchase.
Inventories and Replacement Parts and Other Supplies—Inventory values include all costs directly associated with manufacturing products: materials, labor, and manufacturing overhead. These values are presented at the lower of cost or market. Costs of raw materials, work-in-progress, and finished goods are determined using the first-in, first-out method. Replacement parts and other supplies are stated using the average cost method and are reflected in Intangibles and other assets on the balance sheet (see Note 3 and Note 5).
Property, Plant, and Equipment—Property, plant, and equipment is stated at cost, net of accumulated depreciation. Interest is capitalized on projects meeting certain criteria and is included in the cost of the assets. The capitalized interest is depreciated over the same useful lives as the related assets. Expenditures for major repairs and improvements are capitalized, whereas normal repairs and maintenance are expensed as incurred. Interest cost of $1.4 million was capitalized in 2008 and $1.2 million was capitalized in 2007.
Depreciation and amortization are computed using the straight-line method for all assets over the assets’ estimated useful lives. Estimated useful lives are as follows:
| | | Years |
| Building | | 20 - 40 |
| Machinery and equipment | | 10 - 20 |
| Furniture and office equipment | | 3 - 10 |
| Computer hardware | | 3 - 6 |
| Leasehold improvements | | Over the terms of the lease or the useful life of the improvements |
The impairment evaluation of the carrying amount of goodwill and other intangible assets with indefinite lives is conducted annually or more frequently if events or changes in circumstances indicate that an asset might be impaired. Goodwill is evaluated at the reporting unit level. Goodwill has been allocated to the “Coated” segment.
The evaluation for impairment is performed by comparing the carrying amount of these assets to their estimated fair value. If the carrying amount exceeds the reporting unit fair value, then the second step of the goodwill impairment test is performed to determine the amount of the impairment loss.
Impairment of Long-Lived Assets—Long-lived assets are reviewed for impairment upon the occurrence of events or changes in circumstances that indicate that the carrying value of the assets may not be recoverable, as measured by comparing their net book value to the estimated undiscounted future cash flows generated by their use. Impaired assets are recorded at estimated fair value, determined principally using discounted cash flows.
Allowance for doubtful accounts—The Company maintains an allowance for doubtful accounts for estimated losses resulting from the inability of customers to make required payments. The Company manages credit risk related to its trade accounts receivable by continually monitoring the creditworthiness of its customers to whom credit is granted in the normal course of business. Trade accounts receivable balances for sales to unaffiliated customers were approximately $64.4 million at December 31, 2008, compared to $104.6 million at December 31, 2007.
The Company establishes its allowance for doubtful accounts based upon factors surrounding the credit risks of specific customers, historical trends, and other information. Based on this assessment, an allowance is maintained that represents what is believed to be ultimately uncollectible from such customers. The allowance for doubtful accounts was approximately $1.9 million at December 31, 2008, compared to $1.7 million at December 31, 2007. Bad debt expense was $1.0 million for the year ended December 31, 2008, and was negligible for the year ended December 31, 2007, and the five-month period ended December 31, 2006.
Deferred Financing Costs—The Company capitalizes costs incurred in connection with borrowings or establishment of credit facilities. These costs are amortized as an adjustment to interest expense over the life of the borrowing or life of the credit facility using the effective interest method. In the case of early debt principal repayments, the Company adjusts the value of the corresponding deferred financing costs with a charge to interest expense, and similarly adjusts the future amortization expense.
Asset Retirement Obligations—In accordance with the provisions of SFAS No. 143, Accounting for Asset Retirement Obligations, a liability and an asset are recorded equal to the present value of the estimated costs associated with the retirement of long-lived assets where a legal or contractual obligation exists. The liability is accreted over time, and the asset is depreciated over its useful life. The Company’s asset retirement obligations under this standard relate to closure and post-closure costs for landfills. Revisions to the liability could occur due to changes in the estimated costs or timing of closure, or possible new federal or state regulations affecting the closure.
On December 31, 2008, the Company had approximately $0.8 million of restricted cash related to an asset retirement obligation in the state of Michigan, which is reflected in other assets on the consolidated balance sheet. This cash deposit is required by the state and may only be used for the future closure of a landfill. The following table presents an analysis related to the company’s assets retirement obligations included in Other liabilities on the accompanying consolidated balance sheet:
| | | Year Ended | | | Year Ended | |
| | | December 31, | | | December 31, | |
| (In thousands of U.S. dollars) | | 2008 | | | 2007 | |
| | | | | | | |
| Asset retirement obligations, January 1 | | $ | 11,614 | | | $ | 11,855 | |
| New liabilities | | | 1,091 | | | | 310 | |
| Accretion expense | | | 599 | | | | 583 | |
| Settlement of existing liabilities | | | (1,306 | ) | | | (1,063 | ) |
| Adjustment to existing liabilities | | | 2,030 | | | | (71 | ) |
| | | | | | | | | |
| Asset retirement obligations, December 31 | | $ | 14,028 | | | $ | 11,614 | |
Derivative Financial Instruments—Derivative financial instruments are recognized as assets or liabilities in the financial statements and measured at fair value. The effective portion of the changes in the fair value of derivative financial instruments that qualify and are designated as cash flow hedges are recorded in other comprehensive income. Changes in the fair value of derivative financial instruments that are entered into as economic hedges are recognized in current earnings. The Company uses derivative financial instruments to manage its exposure to energy prices and interest rate risk.
Postretirement Benefits—Pension plans cover substantially all of the Company’s employees. The defined benefit plan is funded in conformity with the funding requirements of applicable government regulations. Prior service costs are amortized on a straight-line basis over the estimated remaining service periods of employees. Certain employees are covered by defined contribution plans. The Company’s contributions to these plans are based on a percentage of employees’ compensation or employees’ contributions. These plans are funded on a current basis.
The Company adopted the provisions of SFAS No. 158, Employers’ Accounting for Defined Benefit Pension and Other Postretirement Plans, an amendment of FASB Statements No. 87, 88, 106, and 132(R), as of December 31, 2006. The measurement date is December 31.
2. RECENT ACCOUNTING DEVELOPMENTS
Postretirement Benefit Plan Assets—In December 2008, the Financial Accounting Standards Board, or “FASB,” issued FASB Staff Position on Statement 132(R)-1, or FSP FAS 132(R)-1, Employers’ Disclosure about Postretirement Benefit Plan Assets, which amends SFAS No. 132(R) to require more detailed disclosures about employers’ pension plan assets. New disclosures will include more information on investment strategies, major categories of plan assets, concentrations of risk within plan assets and valuation techniques used to measure the fair value of plan assets. FSP FAS 132(R)-1 is effective for fiscal years ending after December 15, 2009. Since FSP FAS 132(R)-1 only addresses new disclosure requirements, the adoption of FSP FAS 132(R)-1 will have no impact on our financial condition or results of operations.
Intangible Assets—In April 2008, the FASB issued FSP FAS 142-3, Determination of the Useful Life of Intangible Assets, which provides guidance on the renewal or extension assumptions used in the determination of the useful life of a recognized intangible asset. The intent of FSP FAS 142-3 is to better match the useful life of the recognized intangible asset to the period of the expected cash flows used to measure its fair value. FSP FAS 142-3 is effective for fiscal years and interim periods beginning after December 15, 2008. The adoption of FSP FAS 142-3 is not expected to have a material impact on our financial condition or results of operations.
Derivatives and Hedging Activities—In March 2008, the FASB, issued SFAS No. 161, Disclosures about Derivative Instruments and Hedging Activities. SFAS No. 161 changes the disclosure requirements for derivative instruments and hedging activities. Entities are required to provide enhanced disclosures about (a) how and why an entity uses derivative instruments, (b) how derivative instruments and related hedged items are accounted for under SFAS No. 133, Accounting for Derivative Instruments and Hedging Activities, and its related interpretations, and (c) how derivative instruments and related hedged items affect an entity’s financial position, financial performance, and cash flows. SFAS No. 161 is effective for fiscal years and interim periods beginning after November 15, 2008. Since SFAS No. 161 only addresses disclosure requirements, the adoption of SFAS No. 161 will have no impact on our financial condition or results of operations.
Business Combinations—In December 2007, the FASB issued SFAS No. 141 (revised 2007), Business Combinations. SFAS No. 141-R establishes principles and requirements for how an acquirer recognizes and measures identifiable assets acquired, liabilities assumed and noncontrolling interests; recognizes and measures goodwill acquired in a business combination or gain from a bargain purchase; and establishes disclosure requirements. SFAS No. 141-R is effective for business combinations for which the acquisition date is on or after the beginning of the first annual reporting period beginning on or after December 15, 2008. Early adoption is prohibited. The Company will apply the provisions of SFAS No. 141-R to any future acquisitions.
In December 2007, the FASB issued SFAS No. 160, Noncontrolling Interests in Consolidated Financial Statements – an amendment of ARB No. 51. SFAS No. 160 establishes accounting and reporting standards for the noncontrolling interest in a subsidiary and for the deconsolidation of a subsidiary. This standard is effective, on a prospective basis, for fiscal years and interim periods beginning on or after December 15, 2008. The presentation and disclosure requirements for existing minority interests should be applied retrospectively for all periods presented. Early adoption is prohibited. The adoption of SFAS No. 160 is not expected to have a material impact on our financial condition or results of operations.
Fair Value Option for Financial Assets and Financial Liabilities—In February 2007, the FASB issued SFAS No. 159, Fair Value Option for Financial Assets and Financial Liabilities-including an amendment of FASB Statement No. 115, which permits an entity to measure certain financial assets and financial liabilities at fair value. The Statement’s objective is to improve financial reporting by allowing entities to mitigate volatility in reported earnings caused by the measurement of related assets and liabilities using different attributes, without having to apply complex hedge accounting provisions. The Statement was effective as of the beginning of an entity’s fiscal year beginning after November 15, 2007. The adoption of SFAS No. 159 did not have a material impact on our financial condition or results of operations.
Fair Value Measurements—In September 2006, the FASB issued SFAS No. 157, Fair Value Measurements. SFAS No. 157 addresses how to measure fair value (not what to measure at fair value) and, applies, with limited exceptions, to existing standards that require assets and liabilities to be measured at fair value. SFAS No. 157 establishes a fair value hierarchy, giving the highest priority to quoted prices in active markets and the lowest priority to unobservable data and requires new disclosures for assets and liabilities measured at fair value based on their level in the hierarchy. SFAS No. 157 was effective for financial statements issued for fiscal years beginning after November 15, 2007. However, FSP 157-2, Effective Date of FASB Statement No. 157, delayed the implementation of SFAS No. 157 for nonfinancial assets and nonfinancial liabilities, except for items that are recognized or disclosed at fair value in the financial statements on a recurring basis, to fiscal years beginning after November 15, 2008. The adoption of the initial provisions of SFAS No. 157 did not have, and the adoption of the remaining provisions of SFAS No. 157 is not expected to have, a material impact on our financial condition or results of operations.
Defined Benefit Pension and Other Postretirement Plans—In September 2006, the FASB issued SFAS No. 158, Employers’ Accounting for Defined Benefit Pension and Other Postretirement Plans-an amendment of FASB Statements No. 87, 88, 106, and 132(R), which requires the recognition of the overfunded or underfunded status of a defined benefit postretirement plan as an asset or liability in the balance sheet. SFAS No. 158 does not change measurement or recognition requirements for periodic pension and postretirement costs. SFAS No. 158 also provides that changes in the funded status of a defined benefit postretirement plan should be recognized in the year such changes occur through comprehensive income. As a result of adopting SFAS No. 158 as of December 31, 2006, unrecognized prior service costs were recognized as a component of accumulated other comprehensive income resulting in a reduction in equity of $7.7 million.
Accounting for Planned Major Maintenance Activities—In September 2006, the FASB issued FSP AUG AIR-1, Accounting for Planned Major Maintenance Activities. This FSP eliminates the accrue-in-advance method of accounting for planned major maintenance activities from the American Institute of Certified Public Accountants’ Audit and Accounting Guide, Audits of Airlines, or the “Airline Guide.” This method of accounting for planned major maintenance activities was eliminated due to the FASB's belief that the resultant liability does not meet the definition of a liability in FASB Concepts Statement No. 6, Elements of Financial Statements. As a result of the elimination of the accrue-in-advance method, the Airline Guide, which provides guidance for all industries that conduct planned major maintenance activities, permits the use of one of the following three remaining methods: (1) direct expensing, (2) built-in overhaul, and (3) deferral. This FSP was effective for fiscal years beginning after December 15, 2006, with early adoption permitted as long as it was as of the beginning of the entity's fiscal year. The Company adopted the FSP at its inception by electing the deferral method.
Sales, Use and Excise Taxes—In June 2006, the FASB ratified the consensuses reached by the Emerging Issues Task Force in Issue No. 06-3, How Taxes Collected from Customers and Remitted to Governmental Authorities Should be Presented in the Income Statement (That is, Gross Versus Net Presentation). Issue No. 06-3 requires disclosure of an entity’s accounting policy regarding the presentation of taxes assessed by a governmental authority that are directly imposed on a revenue-producing transaction between a seller and a customer, including sales, use, value added and some excise taxes. We present such taxes on a net basis (excluded from revenues and costs). The adoption of Issue No. 06-3 in 2007 had no impact on our financial condition or results of operations.
Accounting for Uncertainty in Income Taxes—In June 2006, the FASB issued Interpretation No. 48 (FIN48), Accounting for Uncertainty in Income Taxes-an interpretation of FASB Statement No. 109. FIN 48 clarifies the accounting for uncertainty in income taxes recognized in a company’s financial statements and prescribes a recognition threshold and measurement attribute for the financial statement recognition and measurement of a tax position taken or expected to be taken in a tax return. FIN 48 also provides guidance on description, classification, interest and penalties, accounting in interim periods, disclosure, and transition. FIN 48 was effective for fiscal years beginning after December 15, 2006. The Company applied the provisions of this interpretation beginning January 1, 2007. The adoption of FIN 48 did not have a material impact on our financial condition or results of operations.
Other new accounting pronouncements issued but not effective until after December 31, 2008, are not expected to have a significant effect on our financial condition or results of operations.
3. INVENTORIES
Inventories by major category as of December 31, 2008 and 2007, included the following:
| | | December 31, | | | December 31, | |
| (In thousands of U.S. dollars) | | 2008 | | | 2007 | |
| | | | | | | |
| Raw materials | | $ | 29,858 | | | $ | 19,918 | |
| Woodyard logs | | | 7,970 | | | | 3,209 | |
| Work-in-process | | | 19,001 | | | | 19,565 | |
| Finished goods | | | 113,050 | | | | 48,167 | |
| Replacement parts and other supplies | | | 26,055 | | | | 28,761 | |
| Inventories | | $ | 195,934 | | | $ | 119,620 | |
4. PROPERTY, PLANT, AND EQUIPMENT
Property, plant, and equipment as of December 31, 2008 and 2007, were as follows:
| | | December 31, | | | December 31, | |
| (In thousands of U.S. dollars) | | 2008 | | | 2007 | |
| | | | | | | |
| Land and land improvements | | $ | 29,980 | | | $ | 27,899 | |
| Building and leasehold improvements | | | 174,869 | | | | 172,099 | |
| Machinery and equipment | | | 1,172,178 | | | | 1,096,273 | |
| Construction-in-progress | | | 24,188 | | | | 29,406 | |
| | | | 1,401,215 | | | | 1,325,677 | |
| Less: accumulated depreciation | | | (285,558 | ) | | | (165,759 | ) |
| Property, plant, and equipment | | $ | 1,115,657 | | | $ | 1,159,918 | |
Depreciation expense was $126.4 million and $119.4 million for the years ended December 31, 2008 and 2007, respectively, and was $48.0 million for the five months ended December 31, 2006.
5. INTANGIBLES AND OTHER ASSETS
Intangibles and other assets as of December 31, 2008 and 2007, consisted of the following:
| | | December 31, | | | December 31, | |
| (In thousands of U.S. dollars) | | 2008 | | | 2007 | |
| | | | | | | |
| Amortizable intangible assets: | | | | | | |
| Customer relationships - net of accumulated amortization of $3.3 million and | | | | |
| $1.8 million, respectively | | $ | 10,020 | | | $ | 11,470 | |
| Patents - net of accumulated amortization of $0.28 million and $0.16 million, | | | | | |
| respectively | | | 870 | | | | 985 | |
| Total amortizable intangible assets | | | 10,890 | | | | 12,455 | |
| | | | | | | | | |
| Unamortizable intangible assets: | | | | | | | | |
| Trademarks | | | 21,473 | | | | 21,473 | |
| | | | | | | | | |
| Other assets: | | | | | | | | |
| Financing costs-net of accumulated amortization of $13.1 million and | | | | | |
| $7.7 million, respectively | | | 31,040 | | | | 36,468 | |
| Deferred major repair | | | 9,543 | | | | 5,328 | |
Deferred software cost-net of accumulated amortization of $3.0 million | | | | | |
| and $1.3 million, respectively | | | 2,746 | | | | 3,765 | |
| Replacement parts-net | | | 5,625 | | | | 4,932 | |
| Other | | | 5,536 | | | | 6,422 | |
| Total other assets | | | 54,490 | | | | 56,915 | |
| | | | | | | | | |
| Intangibles and other assets | | $ | 86,853 | | | $ | 90,843 | |
Approximately $1.6 million, $1.7 million, and $0.3 million of intangible amortization are reflected in depreciation and amortization expense for the years ended December 31, 2008 and 2007 and for the five months ended December 31, 2006, respectively.
Estimated amortization expense of intangibles is expected to be $1.4 million, $1.3 million, $1.1 million, $0.9 million, and $0.8 million in 2009, 2010, 2011, 2012, and 2013 respectively.
Software cost incurred as part of a major systems project was capitalized in 2007 and is being amortized over its anticipated useful life of approximately three years. Approximately $1.7 million and $1.3 million of software amortization are reflected in depreciation and amortization expense for the years ended December 31, 2008 and 2007, respectively.
6. ACCRUED LIABILITIES
A summary of accrued liabilities as of December 31, 2008 and 2007, is as follows:
| | | December 31, | | | December 31, | |
| (In thousands of U.S. dollars) | | 2008 | | | 2007 | |
| | | | | | | |
| Payroll and employee benefit costs | | $ | 48,005 | | | $ | 35,780 | |
| Accrued interest | | | 30,805 | | | | 31,861 | |
| Accrued sales rebates | | | 10,966 | | | | 10,900 | |
| Accrued taxes - other than income | | | 1,777 | | | | 2,573 | |
| Derivatives | | | 26,878 | | | | 1,428 | |
| Freight and other | | | 4,218 | | | | 5,585 | |
| | | | | | | | | |
| Accrued liabilities | | $ | 122,649 | | | $ | 88,127 | |
In 2008, a separate category representing the fair value of short-term derivative liabilities has been established and the accrued liability for workers’ compensation has been included in payroll and employee benefit costs. As a result, payroll and employee benefit cost at December 31, 2007, increased by $2.3 million and a derivative liability of $1.4 million was reclassified, resulting in a decrease of $3.7 million in freight and other accrued liabilities from amounts previously reported.
7. LONG-TERM DEBT
A summary of long-term debt as of December 31, 2008 and 2007, is as follows:
| | | | | | | December 31, | | | December 31, | |
| (In thousands of U.S. dollars) | Maturity | | Rate | | | 2008 | | | 2007 | |
| | | | | | | | | | | |
| First Priority Revolving Credit Facility | 8/1/2012 | | LIBOR + 2.00 | % | | $ | 92,083 | | | $ | - | |
| First Priority Term Loan B | 8/1/2013 | | LIBOR + 1.75 | % | | | 253,588 | | | | 256,438 | |
| Second Priority Senior Secured Notes - Fixed | 8/1/2014 | | | 9.13 | % | | | 350,000 | | | | 350,000 | |
| Second Priority Senior Secured Notes - Floating | 8/1/2014 | | LIBOR + 3.75 | % | | | 250,000 | | | | 250,000 | |
| Senior Subordinated Notes | | | | 11.38 | % | | | 300,000 | | | | 300,000 | |
| | | | | | | | | | | | | | |
| | | | | | | | | 1,245,671 | | | | 1,156,438 | |
| Less current maturities | | | | | | | | (2,850 | ) | | | (2,850 | ) |
| Long-term debt | | | | | | | $ | 1,242,821 | | | $ | 1,153,588 | |
The Company entered into senior secured credit facilities on August 1, 2006, consisting of:
| · | a $285 million term loan with a maturity of seven years, of which $253.6 million was outstanding as of December 31, 2008; and |
| · | a $200 million revolving credit facility with a maturity of six years, of which $92.1 million was outstanding, $33.1 million in letters of credit were issued, and $59.0 million was available for future borrowing as of December 31, 2008. |
The term loan bears interest at a rate equal to LIBOR plus 1.75%, with the interest rate being 3.3% at December 31, 2008 and 6.6% at December 31, 2007. The revolving credit facility bears interest at a rate equal to LIBOR plus 2.00%, with the weighted average interest rate being 3.35% at December 31, 2008. The Company is required to pay a commitment fee to the lenders under the revolving credit facility in respect of unutilized commitments at a rate equal to 0.375% per annum (subject to reduction in certain circumstances) and customary letter of credit and agency fees. The senior secured credit facilities are secured by first priority security interests in, and mortgages on, substantially all of the Company’s tangible and intangible assets and those of each of its direct and indirect subsidiaries. The senior secured credit facilities also are secured by first priority pledges of all the equity interests owned by the Company in its subsidiaries. The obligations under the senior secured credit facilities are unconditionally guaranteed by Verso Paper Finance Holdings LLC, or “Verso Finance,” the Company's indirect parent company, and subject to certain exceptions, each of its direct and indirect subsidiaries. The credit agreement for the senior secured credit facilities contains various covenants which, among other things, prohibit the Company’s subsidiaries from prepaying other indebtedness, require the Company to maintain a maximum consolidated first lien leverage ratio, and restrict its ability to incur indebtedness or liens, make investments or declare or pay any dividends. As of December 31, 2008, the Company was in compliance with all such covenants.
The Company also issued debt securities on August 1, 2006, consisting of:
| · | $350 million aggregate principal amount of 9⅛% second priority senior secured fixed rate notes due 2014; |
| · | $250 million aggregate principal amount of second priority senior secured floating rate notes due 2014; and |
| · | $300 million aggregate principal amount of 11⅜% senior subordinated notes due 2016. |
The original principal amount of each issue of debt securities was outstanding at December 31, 2008. The fixed rate notes and subordinated notes pay interest semi-annually, and the floating rate notes pay interest quarterly. The floating rate notes bear interest at a rate equal to LIBOR plus 3.75%, with the interest rate being 6.9% at December 31, 2008, and 8.7% at December 31, 2007. The fixed rate and floating rate notes have the benefit of a second priority security interest in the collateral securing the Company’s senior secured credit facilities, while the subordinated notes are unsecured. The indentures governing the notes contain various covenants which limit the Company’s ability to, among other things, incur additional indebtedness, pay dividends or make other distributions or repurchase or redeem its stock, make investments, sell assets (including capital stock of restricted subsidiaries), enter into agreements restricting the Company’s subsidiaries’ ability to pay dividends, consolidate, merge, sell or otherwise dispose of all or substantially all of its assets, enter into transactions with its affiliates, and incur liens. At December 31, 2008, the Company was in compliance with all such covenants.
The payments required under the long-term debt listed above during the years following December 31, 2008, are set forth below:
| 2009 | | $ | 2,850 | |
| 2010 | | | 2,850 | |
| 2011 | | | 2,850 | |
| 2012 | | | 94,933 | |
| 2013 | | | 242,188 | |
| Thereafter | | | 900,000 | |
| Total long-term debt | | $ | 1,245,671 | |
Interest expense was $99.2 million and $100.8 million of interest was paid during the year ended December 31, 2008. Interest expense was $109.2 million and $109.1 million of interest was paid during the year ended December 31, 2007. Interest expense was $46.7 million and $14.8 million of interest was paid during the five-month period ended December 31, 2006. In conjunction with the Acquisition, we assumed none of the historical debt of the Predecessor.
Amortization of debt issuance costs was $5.4 million in each of the years ended December 31, 2008 and 2007, and is included in interest expense in the consolidated statements of operations. Amortization of debt issuance costs was $2.3 million for the five-month period ended December 31, 2006.
The fair value of long-term debt was approximately $562 million at December 31, 2008, compared to approximately $1.2 billion at December 31, 2007. The Company determines the fair value of its long-term debt based on market information and a review of prices and terms available for similar obligations. The fair value at December 31, 2008, of the $250 million notional value interest rate swap hedging the cash flow exposure of quarterly variable-rate interest payments on the Company’s outstanding floating rate notes that mature in 2014 was an unrealized loss of $3.7 million.
8. OTHER LIABILITIES
Other liabilities as of December 31, 2008 and 2007, consisted of the following:
| | | December 31, | | | December 31, | |
| (In thousands of U.S. dollars) | | 2008 | | | 2007 | |
| Asset retirement obligations | | $ | 14,028 | | | $ | 11,614 | |
| Pension benefit obligation | | | 12,497 | | | | 9,980 | |
| Derivatives | | | 3,677 | | | | - | |
| Other, primarily environmental obligations | | | 1,805 | | | | 4,002 | |
| | | | | | | | | |
| Other liabilities | | $ | 32,007 | | | $ | 25,596 | |
9. RETIREMENT PLANS
Defined Benefit Plan
The Company maintains a defined benefit pension plan that provides retirement benefits to hourly employees in Jay, Bucksport and Sartell hired prior to July 1, 2004. These employees generally are eligible to participate in the plan upon completion of one year of service and attainment of age 21. Employees hired after June 30, 2004, who are not eligible for this pension plan receive an additional company contribution to their savings plan (see “Other Plan”). The plan provides defined benefits based on years of credited service times a specified flat dollar benefit rate.
The following table summarizes net periodic benefit cost for the years ended December 31, 2008 and 2007:
| | | Year Ended | | | Year Ended | |
| | | December 31, | | | December 31, | |
| (In thousands of U.S. dollars) | | 2008 | | | 2007 | |
| | | | | | | |
| Components of net periodic benefit cost: | | | | | | |
| Service cost | | $ | 5,976 | | | $ | 5,278 | |
| Interest cost | | | 998 | | | | 611 | |
| Expected return on plan assets | | | (762 | ) | | | (229 | ) |
| Amortization of prior service cost | | | 871 | | | | 785 | |
| | | | | | | | | |
| Net periodic benefit cost | | $ | 7,083 | | | $ | 6,445 | |
The following table provides detail on prior service cost and net actuarial gain (loss) recognized in accumulated other comprehensive income at December 31, 2008 and 2007.
| (In thousands of U.S. dollars) | | 2008 | | | 2007 | |
| Amounts recognized in accumulated other comprehensive income: | | | | | | |
| Prior service cost | | $ | 6,931 | | | $ | 7,803 | |
| Net actuarial (gain) loss | | | 5,674 | | | | (27 | ) |
The estimated net loss and prior service cost that will be amortized from accumulated other comprehensive income into net periodic actuarial pension cost during 2009 is $0.3 million and $0.9 million, respectively. We expect no plan assets to be returned to the company in 2009.
The Company makes contributions that are sufficient to fully fund its actuarially determined costs, generally equal to the minimum amounts required by the Employee Retirement Income Security Act (ERISA). The Company made contributions of $6.9 million in 2007, with $4.7 million attributable to the 2007 plan year and $2.2 attributable to the 2006 plan year. The Company made contributions of $9.4 million in 2008, with $6.4 million attributable to the 2008 plan year and $3.0 million attributable to the 2007 plan year. The Company made a contribution of $0.2 million in January 2009 attributable to the 2008 plan year. In 2009, the Company expects to make an additional contribution of $1.0 million related to the 2008 plan year and contributions of $5.8 million related to the 2009 plan year.
The following table sets forth a reconciliation of the plan’s benefit obligation, plan assets and funded status at December 31, 2008 and 2007:
| | | Year Ended | | | Year Ended | |
| | | December 31, | | | December 31, | |
| (In thousands of U.S. dollars) | | 2008 | | | 2007 | |
| Change in Projected Benefit Obligation: | | | | | | |
| Benefit obligation at beginning of period | | $ | 16,708 | | | $ | 10,351 | |
| Service cost | | | 5,976 | | | | 5,278 | |
| Interest cost | | | 998 | | | | 611 | |
| Plan amendments | | | - | | | | 846 | |
| Actuarial (gain) loss | | | 1,872 | | | | (341 | ) |
| Benefits paid | | | (101 | ) | | | (37 | ) |
| Benefit obligation on December 31 | | $ | 25,453 | | | $ | 16,708 | |
| | | | | | | | | |
| Change in Plan Assets: | | | | | | | | |
| Plan assets at fair value, beginning of fiscal year | | $ | 6,728 | | | $ | - | |
| Actual net return on plan assets | | | (3,068 | ) | | | (85 | ) |
| Employer contributions | | | 9,397 | | | | 6,850 | |
| Benefits paid | | | (101 | ) | | | (37 | ) |
| Plan assets at fair value, end of fiscal year | | | 12,956 | | | | 6,728 | |
| Unfunded projected benefit obligation recognized on the | | | | | | | | |
| Consolidated Balance Sheets as a long-term liability | | $ | (12,497 | ) | | $ | (9,980 | ) |
The accumulated benefit obligation at December 31, 2008 and 2007, is $25.5 million and $16.7 million, respectively.
The following table summarizes expected future pension benefit payments:
| (In thousands of U.S. dollars) | | | |
| 2009 | | $ | 141 | |
| 2010 | | | 287 | |
| 2011 | | | 481 | |
| 2012 | | | 713 | |
| 2013 | | | 1,032 | |
| 2014-2018 | | | 10,489 | |
The Company evaluates its actuarial assumptions annually as of December 31 (the measurement date) and considers changes in these long-term factors based upon market conditions and the requirements of SFAS No. 87, Employers’ Accounting for Pensions. These assumptions are used to calculate benefit obligations as of December 31 of the current year, and pension expense to be recorded for the following year. The discount rate assumption reflects the yield on a portfolio of high quality fixed-income instruments that have a similar duration to the plan’s liabilities. The expected long-term rate of return assumption reflects the average return expected on the assets invested to provide for the plan’s liabilities.
The actuarial assumptions used in the defined benefit pension plan were as follows:
| | | 2008 | | | 2007 | |
| Weighted average assumptions used to determine | | | | | | |
| benefit obligations as of December 31 measurement date: | | | | | | |
| Discount rate | | | 6.00 | % | | | 6.00 | % |
| Rate of compensation increase | | | N/A | | | | N/A | |
| Weighted average assumptions used to determine net | | | | | | | | |
| periodic benefit cost for the fiscal year: | | | | | | | | |
| Discount rate | | | 6.00 | % | | | 5.75 | % |
| Rate of compensation increase | | | N/A | | | | N/A | |
| Expected long-term return on plan assets | | | 7.50 | | | | 8.00 | |
The Company’s primary investment objective is to ensure, over the long-term life of the pension plan, an adequate pool of sufficiently liquid assets to support the benefit obligations. In meeting this objective, the pension plan seeks to achieve a high level of investment return through long-term stock and bond investment strategies, consistent with a prudent level of portfolio risk. Any volatility in investment performance compared to investment objectives should be explainable in terms of general economic and market conditions. It is not contemplated at this time that any derivative instruments will be used to achieve investment objectives. The expected return on plan assets assumption for 2009 will be 7.50 percent. The expected long-term rate of return on plan assets reflects the weighted-average expected long-term rates of return for the broad categories of investments currently held in the plans (adjusted for expected changes), based on historical rates of return for each broad category, as well as factors that may constrain or enhance returns in the broad categories in the future. The expected long-term rate of return on plan assets is adjusted when there are fundamental changes in expected returns in one or more broad asset categories and when the weighted-average mix of assets in the plans changes significantly.
The following table provides the pension plan’s asset allocation on December 31, 2008:
| | | Targeted | | | % of Plan Assets on December 31 | |
| | | Allocation | | | 2008 | | | 2007 | |
| Equity Securities: | | | | | | | | | |
| Large capital equity | | | 26.4 | % | | | 23.8 | % | | | 25.5 | % |
| Small capital equity | | | 4.6 | | | | 4.0 | | | | 4.4 | |
| International equity | | | 17.0 | | | | 15.1 | | | | 17.0 | |
| | | | | | | | | | | | | |
| Other securities: | | | | | | | | | | | | |
| Bond fund | | | 47.0 | | | | 51.4 | | | | 48.2 | |
| Fixed income fund | | | 5.0 | | | | 5.6 | | | | 4.9 | |
Defined Contribution Plan
The Company sponsors a defined contribution plan to provide salaried and Quinnesec hourly employees an opportunity to accumulate personal funds and to provide additional benefits for retirement.
As determined by the provisions of the plan, the Company contributes annually a percentage of earnings. The percentage is based on age and years of credited service for employees hired prior to July 1, 2004 and a fixed percentage of earnings to employees hired after June 30, 2004. Expense under this plan was $6.9 million and $6.7 million for the years ended December 31, 2008 and 2007, respectively, and was $2.3 million for the five-month period ended December 31, 2006.
Other Plan
The Company sponsors a 401K plan to provide salaried and hourly employees an opportunity to accumulate personal funds and to provide additional benefits for retirement. Contributions may be made on a before-tax basis to the plan. As determined by the provisions of the plan, the Company matches the employees’ basic voluntary contributions. Such contributions to the plans totaled approximately $8.4 million and $8.1 million for the years ended December 31, 2008 and 2007, respectively, and $2.3 million for the five months ended December 31, 2006.
10. EQUITY AWARDS
Simultaneously with the consummation of the IPO, the limited partnership agreement of Verso Paper Corp.’s parent, Verso Paper Management LP, or the “Partnership,” was amended to, among other things, change its equity structure from multiple classes of units representing limited partner interests in the Partnership to a single class of units representing such interests. The conversion from the prior multiple-class unit structure, or the “Legacy Units,” to a new single class of units in the Partnership was designed to correlate the equity structure of the Partnership with the post-IPO equity structure of Verso Paper Corp.
As part of the amendment of the limited partnership agreement of the Partnership, the Legacy Class C Units of the Partnership previously granted to certain members of our management became vested immediately. Prior to the amendment, the Legacy Class C Units were to vest only if certain performance targets were met. As a result of the accelerated vesting of the Legacy Class C Units, the Company recognized $10.8 million of additional equity compensation expense.
Certain members of the Company’s management have been granted Legacy Class B Units, which vest over a five-year period at the rate of 20% per year on each anniversary of the grant date. The Company’s directors have been granted Legacy Class D Units, which were vested upon grant.
The fair value of the restricted Legacy Class B Units granted to management and the Legacy Class D Units granted to directors for the years ended December 31, 2008 and 2007, and for the five months ended December 31, 2006, was approximately $0.1 million, $0.6 million, and $1.4 million, respectively. A summary of Legacy Class B Units activity for the year ended December 31, 2008, is presented below:
| | | Units | | | Weighted-Average Grant-Date Fair Value | |
| Nonvested at December 21, 2007 | | | 339,955 | | | $ | 3.40 | |
| Vested | | | (84,343 | ) | | | 3.40 | |
| Nonvested at December 21, 2008 | | | 255,612 | | | $ | 3.40 | |
Equity award expense for the year ended December 31, 2008, was $11.2 million, which includes the $10.8 million related to the vesting of the Legacy Class C Units. Equity award expense was $0.6 million for the year ended December 31, 2007, and was $0.4 million for the five months ended December 31, 2006. As of December 31, 2008, there was approximately $0.7 million of unrecognized compensation cost related to unvested Legacy Class B Units. This cost is expected to be recognized over a weighted-average period of approximately 2.6 years.
The Company estimates the fair value of management equity awards using the Black-Scholes valuation model. Key input assumptions applied under the Black-Scholes option pricing model for the Legacy Class B Units and the Legacy Class D Units were as follows: expected term of five years based on the vesting period, volatility rate of 36.65% based on industry historical volatility rate, no expected dividends, and average risk free rates of 3.0% in 2008 and 4.2% to 4.7% in 2007.
Assumptions applied under the Black-Scholes option pricing model for the Legacy Class C Units were as follows: expected term of one year based on the lock-up period following the IPO, volatility rate of 36.65% based on industry historical volatility rate, expected dividend rate of 1%, and average risk free rate of 2.0%.
Additionally, the 2008 Stock Incentive Award Plan, which authorized the issuance of up to 4,250,000 shares of common stock of Verso Paper Corp, allows stock awards to be granted to non-employee directors upon approval by the board of directors. During November 2008, the Company granted a director, upon his election to the board, 15,200 options which were immediately vested with a contractual life of 10 years and an exercise price of $1.43. The Company used the Black-Scholes valuation model to estimate a grant date fair value per option of $0.47 for this stock option award. Key input assumptions applied under the Black-Scholes option pricing model were as follows: expected term of five years, volatility rate of 31.82% based on industry historical volatility rate, no expected dividends, and an average risk free rate of 2.58%.
11. BUCKSPORT ENERGY ASSET INVESTMENT
The Company, through its Verso Bucksport LLC subsidiary, has a joint ownership interest with Bucksport Energy LLC, an unrelated third party, in a cogeneration power plant producing steam and electricity. The plant was built in 2000 by the two parties and is located in Bucksport, Maine. Each owner, Verso Bucksport LLC and Bucksport Energy LLC, owns its proportional share of the assets. The Company accounts for this investment under the proportional consolidation method. The plant supports the Bucksport mill. The mill owns 28% of the steam and electricity produced by the plant. The mill may purchase its remaining electrical needs from the plant at market rates. The mill is obligated to purchase the remaining 72% of the steam output at fuel cost plus a contractually fixed fee per unit of steam. Power generation and operating expenses are divided on the same basis as ownership. The Bucksport mill has cash which is restricted in its use and may be used only to fund the ongoing energy operations of this investment. Approximately $0.2 million of restricted cash is included in other assets in the balance sheet at December 31, 2008 and 2007. Balances included in the balance sheet at December 31, 2008 and 2007, related to this investment are as follows:
| | | December 31, | | | December 31, | |
| (In thousands of U.S. dollars) | | 2008 | | | 2007 | |
| | | | | | | |
| Other receivables | | $ | 99 | | | $ | 61 | |
| Other current assets | | | 158 | | | | 256 | |
| Total current assets | | $ | 257 | | | $ | 317 | |
| | | | | | | | | |
| Property, plant and equipment | | $ | 10,699 | | | $ | 10,301 | |
| Accumulated depreciation | | | (1,385 | ) | | | (807 | ) |
| Net property, plant and equipment | | $ | 9,314 | | | $ | 9,494 | |
| Current liabilities | | $ | (84 | ) | | $ | (84 | ) |
12. DERIVATIVE INSTRUMENTS AND HEDGES
In the normal course of business, the Company utilizes derivatives contracts as part of its risk management strategy to manage our exposure to market fluctuations in energy prices and interest rates. These instruments are subject to credit and market risks in excess of the amount recorded on the balance sheet in accordance with generally accepted accounting principles. Controls and monitoring procedures for these instruments have been established and are routinely reevaluated. Credit risk represents the potential loss that may occur because a party to a transaction fails to perform according to the terms of the contract. The measure of credit exposure is the replacement cost of contracts with a positive fair value. The Company manages credit risk by entering into financial instrument transactions only through approved counterparties. Market risk represents the potential loss due to the decrease in the value of a financial instrument caused primarily by changes in commodity prices. The Company manages market risk by establishing and monitoring limits on the types and degree of risk that may be undertaken.
Derivative instruments are recorded on the balance sheet as other assets or other liabilities measured at fair value. Fair value is defined as the price that would be received to sell an asset or paid to transfer a liability in an orderly transaction between market participants at the measurement date. Where available, fair value is based on observable market prices or parameters or derived from such prices or parameters. Where observable prices or inputs are not available, valuation models may be applied. For a cash flow hedge accounted for under SFAS No. 133, “Accounting for Derivative Instruments and Hedging Activities,” changes in the fair value of the derivative instrument, to the extent that it is effective, are recorded in accumulated other comprehensive income and subsequently reclassified to earnings as the hedged transaction impacts net income. Any ineffective portion of a cash flow hedge is recognized currently in earnings. Cash flows from derivative contracts are reported as operating activities on the statements of cash flows.
The Company enters into short-term, fixed-price energy swaps as hedges designed to mitigate the risk of changes in commodity prices for future purchase commitments. These fixed-price swaps involve the exchange of net cash settlements, based on changes in the price of the underlying commodity index compared to the fixed price offering, at specified intervals without the exchange of any underlying principal. Effective November 1, 2007, the Company designated its energy hedging relationships as cash flow hedges under SFAS No. 133. For the period of time these hedge relationships were not designated under SFAS No. 133, the swaps were measured at fair value with gains or losses included in current earnings. Subsequent to designation, net gains or losses attributable to effective hedging are recorded in accumulated other comprehensive income, and the ineffective portion continues to be recognized in cost of products sold. As of December 31, 2008, certain commodity swaps hedging anticipated natural gas purchases for January and February 2009 were de-designated due to modifications in management’s expected usage. As of December 31, 2008, these swaps were measured at fair value with unrealized losses of $1.0 million included in current earnings.
In addition to the hedges designated under SFAS No. 133, the Company has entered into short-term energy swaps for the purpose of creating an economic hedge designed to mitigate the risk of changes in commodity prices for future energy purchase and sale commitments. Net realized gains of $1.8 million from derivative contracts not designated as SFAS No. 133 hedges have been recognized in cost of products sold in 2008.
Net settlements on hedges increased cost of products sold by $3.9 million in 2008 compared to $2.8 million in 2007. On December 31, 2008, the balance sheet impact of these swaps was a derivative liability of $26.9 million compared to a derivative liability of $1.4 million on December 31, 2007. Unrealized losses representing the ineffective portion of these hedges recognized in cost of products sold were negligible in 2008. Net unrealized gains of $0.7 million were recognized in cost of products sold in 2007. Net losses of $29.7 million related to the effective portion of SFAS No. 133 hedges were recorded in accumulated other comprehensive income on December 31, 2008, and are expected to be reclassified into cost of products sold in the period in which the hedged cash flows affect earnings. Assuming no change in open hedge positions, the net losses are expected to be reclassified into earnings through December 2009. Net losses related to the effective portion of SFAS No. 133 hedges recorded in accumulated other comprehensive income on December 31, 2007, were $2.1 million.
In February 2008, the Company entered into a $250 million notional value receive-variable, pay-fixed interest rate swap in connection with the Company’s outstanding floating rate notes that mature in 2014. The notes pay interest quarterly based on a three-month LIBOR. The Company is hedging the cash flow exposure on its quarterly variable-rate interest payments due to changes in the benchmark interest rate (three-month LIBOR). On December 31, 2008, the fair value of this swap was an unrealized loss of $3.7 million. Net losses of $3.9 million were recorded in accumulated other comprehensive income on December 31, 2008, and are expected to be reclassified into interest expense in the period in which the hedged cash flows affect earnings. Net gains reclassified from other comprehensive income decreased interest expense by $0.5 million in 2008. Net losses of approximately $3.5 million are expected to be reclassified from accumulated other comprehensive income into earnings within the next 12 months.
13. FAIR VALUE OF FINANCIAL INSTRUMENTS
In September 2006, the FASB issued SFAS No. 157, Fair Value Measurements, which defines fair value, establishes a framework for measuring fair value, and expands disclosures about fair value measurements. The Company adopted SFAS No. 157 as it relates to financial assets and liabilities as of January 1, 2008. The FASB deferred the effective date of SFAS No. 157 as it relates to fair value measurement for nonfinancial assets and liabilities that are not remeasured at fair value on a recurring basis to years beginning after November 15, 2008. The adoption of the initial provisions of SFAS No. 157 did not have a material impact on the Company’s financial statements.
The fair value framework requires the categorization of assets and liabilities into three levels based upon the assumptions used to value the assets or liabilities. Level 1 provides the most reliable measure of fair value, whereas Level 3 generally requires significant management judgment. The three levels are defined as follows:
▪ Level 1: Unadjusted quoted prices in active markets for identical assets or liabilities at the measurement
date.
▪ Level 2: Observable inputs other than those included in Level 1. For example, quoted prices for similar
assets or liabilities in active markets or quoted prices for identical assets or liabilities in inactive
markets.
▪ Level 3: Unobservable inputs reflecting management’s own assumption about the inputs used in pricing
the asset or liability at the measurement date.
As of December 31, 2008, the fair values of our financial assets and liabilities are categorized as follows:
| (In thousands of U.S. dollars) | | Total | | | Level 1 | | | Level 2 | | | Level 3 | |
| ASSETS | | | | | | | | | | | | |
| Deferred compensation assets (a) | | $ | 177 | | | $ | 177 | | | $ | - | | | $ | - | |
| Regional Greenhouse Gas Initiative carbon credits (a) | | | 230 | | | | - | | | | 230 | | | | - | |
| | | | | | | | | | | | | | | | | |
| Total assets at fair value on December 31, 2008 | | $ | 407 | | | $ | 177 | | | $ | 230 | | | $ | - | |
| | | | | | | | | | | | | | | | | |
| LIABILITIES | | | | | | | | | | | | | | | | |
| Commodity swaps (a) | | $ | 26,878 | | | $ | - | | | $ | 26,878 | | | $ | - | |
| Interest rate swaps (b) | | | 3,677 | | | | - | | | | 3,677 | | | | - | |
| Deferred compensation liabilities (a) | | | 177 | | | | 177 | | | | - | | | | - | |
| | | | | | | | | | | | | | | | | |
| Total liabilities at fair value on December 31, 2008 | | $ | 30,732 | | | $ | 177 | | | $ | 30,555 | | | $ | - | |
| | | | | | | | | | | | | | | | | |
| (a) Based on observable market data. |
| (b) Based on observable inputs for the liability (interest rates and yield curves observable at specific intervals). |
14. RELATED PARTY TRANSACTIONS
In conjunction with the Acquisition, the Company entered into a transition service agreement with International Paper whereby International Paper agreed to continue to provide certain services specified in the agreement that are necessary for the Company to run as a stand-alone business. The charges for the years ended December 31, 2008 and 2007, were $0.2 million and $5.6 million, respectively. As of September 30, 2007, the Company substantially discontinued the use of services under this agreement.
The Company had net sales to International Paper of approximately $165.8 million and $191.4 million for the years ended December 31, 2008 and 2007, respectively, and sales of $71.5 million for the five months ended December 31, 2006. The Company had purchases included in cost of products sold from International Paper of approximately $7.2 million and $11.7 million for the years ended December 31, 2008 and 2007, respectively, and purchases of $2.5 million for the five months ended December 31, 2006.
Subsequent to the Acquisition, the Company entered into a management agreement with Apollo relating to the provision of certain financial and strategic advisory services and consulting services. Management fees to Apollo for these services were $2.8 million for the year ended December 31, 2007. Upon consummation of the IPO, Apollo terminated the annual fee arrangement under the management agreement for its consulting and advisory services, in exchange for a one-time payment of $23.1 million corresponding to the present value of all future annual fee payments pursuant to the terms of the management agreement. Although the annual fee arrangement was terminated in connection with the IPO, the management agreement remains in effect and will expire on August 1, 2018. Under the management agreement, at any time prior to the expiration of the agreement, Apollo has the right to act, in return for additional fees to be mutually agreed by the parties to the management agreement, as the Company’s financial advisor or investment banker for any merger, acquisition, disposition, financing or the like if the Company decides that it needs to engage someone to fill such role. In the event the Company is not able to come to an agreement with Apollo in connection with such role, at the closing of any merger, acquisition, disposition or financing or any similar transaction, the Company has agreed to pay Apollo a fee equal to 1% of the aggregate enterprise value (including the aggregate value of equity securities, warrants, rights, and options acquired or retained; indebtedness acquired, assumed or refinanced; and any other consideration or compensation paid in connection with such transaction). The Company agreed to indemnify Apollo and its affiliates and their directors, officers and representatives for losses relating to the services contemplated by the management agreement and the engagement of affiliates of Apollo pursuant to, and the performance by them of the services contemplated by, the management agreement.
On January 31, 2007, Verso Finance entered into a $250 million senior unsecured floating-rate term loan facility with a maturity of six years. The net proceeds from the term loan were distributed to the equity holders of Verso Paper Management LP. In May 2008, a portion of the net proceeds from the IPO were used to repay $138 million of the outstanding principal of the term loan and to pay a related $1.4 million prepayment penalty. As of December 31, 2008, $112 million was outstanding on the term loan. The term loan allows Verso Finance to pay interest either in cash or in-kind through the accumulation of the outstanding principal amount. The term loan bears interest at a rate equal to LIBOR plus 6.25% on interest payments made in cash and LIBOR plus 7.00% for interest paid in-kind and added to the principal balance. The interest rate in effect on December 31, 2008, was 10.0%. On December 10, 2008, Verso Finance elected to exercise the PIK option for the interest payment pertaining to the 90-day interest period ending January 2, 2009. Verso Finance has no independent operations; consequently, all cash flows used to service the remaining debt obligation will need to be received via a distribution from the Company. The Company paid distributions to Verso Finance of $17.6 million in 2008 and $22.1 million in 2007. Additionally, in 2008 the Company paid $5.2 million of expenses on behalf of Verso Paper Corp. The Company has no obligation to make distributions to Verso Finance or Verso Paper Corp.
On December 31, 2008, the Company had current receivables of $0.6 million due from Verso Paper Corp. and its subsidiaries.
15. RESTRUCTURING AND OTHER CHARGES
Restructuring and other charges are comprised of transition and other non-recurring costs associated with the acquisition and carve out of our operations from those of International Paper; including costs of a transition service agreement with International Paper, technology migration costs, consulting and legal fees, and other one-time costs related to us becoming a stand-alone business. The charges for the year ended December 31, 2008, were $27.4 million, which included a one-time payment of $23.1 million to terminate the annual fee arrangement under the management agreement with Apollo, and $0.2 million of transition service agreement costs. The charges for the year ended December 31, 2007, were $19.4 million, which included $5.6 million of transition service agreement costs and $2.8 million of charges under the management agreement. The charges for the five months ended December 31, 2006, were $10.1 million which included $6.1 million of transition service agreement costs. As of September 30, 2007, the Company substantially discontinued the use of services under this agreement.
16. COMMITMENTS AND CONTINGENCIES
Operating Leases—The Company has entered into operating lease agreements, which expire at various dates through 2013, related to certain machinery and equipment used in its manufacturing process. Rental expense under operating leases amounted to $6.1 million and $5.8 million for the years ended December 31, 2008 and 2007, respectively, and $2.2 million for the five months ended December 31, 2006.
The following, as of December 31, 2008, represents the future minimum rental payments due under non-cancelable operating leases that have initial or remaining lease terms in excess of one year:
| (In thousands of U.S. dollars) | | | |
| 2009 | | $ | 5,085 | |
| 2010 | | | 2,726 | |
| 2011 | | | 1,602 | |
| 2012 | | | 932 | |
| 2013 | | | 143 | |
| Thereafter | | | 73 | |
| | | | | |
| Total | | $ | 10,561 | |
Purchase obligations—The Company has entered into unconditional purchase obligations in the ordinary course of business for the purchase of certain raw materials, energy, and services. At December 31, 2008, total unconditional purchase obligations were $931.5 million, due as follows: 2009–$149.9 million; 2010–$93.7 million; 2011–$93.5 million; 2012–$93.9 million; 2013– $93.5; and thereafter–$407.0 million.
Employee Severance Plan—Under the employee severance plan, each of our named executive officers is eligible to receive a termination allowance in the event of a termination of employment due to certain events, including the executive’s job elimination, a facility closing, the executive’s disability, or the executive’s inability to perform the requisite duties of his position despite his reasonable efforts.
The termination allowance is a lump sum amount equal to a factor based on the number of years or partial years of applicable service with the company, multiplied by the amount of two weeks of base salary. The termination allowance may not be less than the amount of four weeks of base salary. In addition to the termination allowance under the Verso Paper Employee Severance Plan, it is our practice to provide a pro rata amount of annual VIP bonus compensation that would have otherwise been paid to the executive officer if employment had continued through the end of the applicable calendar year.
Contingencies—The Company is involved in legal proceedings incidental to the conduct of its business. The Company does not believe that any liability that may result from these proceedings will have a material adverse effect on our financial statements.
On August 6, 2008, the Company filed a declaratory judgment suit in the United States District Court for the Eastern District of Wisconsin against NewPage Corporation and NewPage Wisconsin System Inc., in response to a patent infringement claim asserted by NewPage regarding certain of the Company’s coated paper products. The action sought a declaration that the Company’s coated paper products do not infringe the NewPage patent and that the NewPage patent is invalid. On January 29, 2009, the action was voluntarily dismissed with prejudice pursuant to a settlement agreement between the parties. As part of the settlement, NewPage granted the Company an irrevocable, perpetual, non-exclusive, worldwide, royalty-free, and fully paid-up right and license for any and all purposes under the NewPage patent and any continuation, division, reissue or non-U.S. counterpart of the patent.
In connection with the Acquisition, the Company assumed a twelve-year supply agreement with Thilmany LLC, or “Thilmany,” for the specialty paper products manufactured on paper machine No. 5 at the Androscoggin mill. The agreement requires Thilmany to pay the Company a variable charge for the paper purchased and a fixed charge for the availability of the No. 5 paper machine. The Company is responsible for the No. 5 machine’s routine maintenance, and Thilmany is responsible for any capital expenditures specific to the machine. Thilmany has the right to terminate the agreement if certain events occur.
17. INFORMATION BY INDUSTRY SEGMENT
The Company operates in three operating segments: coated and supercalendered papers; hardwood market pulp; and other, consisting of specialty industrial paper. The Company operates in one geographic segment, the United States. The Company’s core business platform is as a producer of coated freesheet, coated groundwood, and uncoated supercalendered papers. These products serve customers in the catalog, magazine, inserts, and commercial print markets.
The following table summarizes the industry segments for the periods ended December 31, 2008 and 2007, and the five months ended December 31, 2006:
| | | Year | | | Year | | | Five Months | |
| | | Ended | | | Ended | | | Ended | |
| | | December 31, | | | December 31, | | | December 31, | |
| (In thousands of U.S. dollars) | | 2008 | | | 2007 | | | 2006 | |
| | | | | | | | | | |
| Net Sales: | | | | | | | | | |
| Coated and supercalendered | | $ | 1,575,005 | | | $ | 1,443,170 | | | $ | 631,897 | |
| Hardwood market pulp | | | 146,443 | | | | 148,007 | | | | 58,405 | |
| Other | | | 45,365 | | | | 37,576 | | | | 16,531 | |
| Total | | $ | 1,766,813 | | | $ | 1,628,753 | | | $ | 706,833 | |
| | | | | | | | | | | | | |
| Operating Income (Loss): | | | | | | | | | | | | |
| Coated and supercalendered | | $ | 37,053 | | | $ | (1,496 | ) | | $ | 35,319 | |
| Hardwood market pulp | | | 29,931 | | | | 35,808 | | | | 10,475 | |
| Other | | | (3,705 | ) | | | (3,244 | ) | | | (683 | ) |
| Total | | $ | 63,279 | | | $ | 31,068 | | | $ | 45,111 | |
| | | | | | | | | | | | | |
| Depreciation and Amortization: | | | | | | | | | | | | |
| Coated and supercalendered | | $ | 112,928 | | | $ | 102,161 | | | $ | 39,894 | |
| Hardwood market pulp | | | 18,385 | | | | 18,278 | | | | 7,527 | |
| Other | | | 3,031 | | | | 2,700 | | | | 896 | |
| Total | | $ | 134,344 | | | $ | 123,139 | | | $ | 48,317 | |
| | | | | | | | | | | | | |
| Capital Spending: | | | | | | | | | | | | |
| Coated and supercalendered | | $ | 69,028 | | | $ | 65,179 | | | $ | 26,243 | |
| Hardwood market pulp | | | 8,604 | | | | 2,649 | | | | 814 | |
| Other | | | 2,815 | | | | 1,754 | | | | 476 | |
| Total | | $ | 80,447 | | | $ | 69,582 | | | $ | 27,533 | |
18. CONDENSED CONSOLIDATING FINANCIAL INFORMATION
Presented on the following pages are the Company’s consolidating balance sheets, statements of income, and statements of cash flows, as required by Rule 3-10 of Regulation S-X of the Securities Exchange Act of 1934, as amended. Prior to the Acquisition, the Predecessor operated as a division of International Paper Company, and there were no separate legal entities. The consolidating financial statements have been prepared from the Company’s financial information on the same basis of accounting as the consolidated financial statements. Investments in the Company’s subsidiaries are accounted for under the equity method. Accordingly, the entries necessary to consolidate Verso Paper Holdings LLC (referred to below as “Parent Issuer”) and its subsidiaries other than Verso Paper Inc. that guaranteed the obligations under the debt securities described in Note 7 (referred to below as the “Guarantor Subsidiaries”) are reflected in the Intercompany Eliminations column.
| Condensed Consolidating Balance Sheet |
| as of December 31, 2008 |
| | | Parent | | | Subsidiary | | | Guarantor | | | Intercompany | | | | |
| (In thousands of U.S. dollars) | | Issuer | | | Issuer | | | Subsidiaries | | | Eliminations | | | Consolidated | |
| ASSETS | | | | | | | | | | | | | | | |
| Current assets | | $ | - | | | $ | - | | | $ | 401,011 | | | $ | - | | | $ | 401,011 | |
| Property and equipment, net | | | - | | | | - | | | | 1,115,657 | | | | - | | | | 1,115,657 | |
| Intercompany receivable | | | 1,307,503 | | | | - | | | | - | | | | (1,307,503 | ) | | | - | |
| Investment in subsidiaries | | | 60,663 | | | | - | | | | - | | | | (60,663 | ) | | | - | |
| Non-current assets | | | - | | | | - | | | | 97,404 | | | | - | | | | 97,404 | |
| | | | | | | | | | | | | | | | | | | | | |
| Total assets | | $ | 1,368,166 | | | $ | - | | | $ | 1,614,072 | | | $ | (1,368,166 | ) | | $ | 1,614,072 | |
| | | | | | | | | | | | | | | | | | | | | |
LIABILITIES AND MEMBER’S EQUITY | | | | | | | | | | | | | | | | | | | | |
| Current liabilities | | $ | 33,641 | | | $ | - | | | $ | 213,899 | | | $ | - | | | $ | 247,540 | |
| Intercompany payable | | | - | | | | - | | | | 1,307,503 | | | | (1,307,503 | ) | | | - | |
| Long-term debt | | | 1,242,821 | | | | - | | | | - | | | | - | | | | 1,242,821 | |
| Other long-term liabilities | | | - | | | | - | | | | 32,007 | | | | - | | | | 32,007 | |
Member’s equity | | | 91,704 | | | | - | | | | 60,663 | | | | (60,663 | ) | | | 91,704 | |
| | | | | | | | | | | | | | | | | | | | | |
Total liabilities and member’s equity | | $ | 1,368,166 | | | $ | - | | | $ | 1,614,072 | | | $ | (1,368,166 | ) | | $ | 1,614,072 | |
| Condensed Consolidating Balance Sheet |
| as of December 31, 2007 |
| | | Parent | | | Subsidiary | | | Guarantor | | | Intercompany | | | | |
| (In thousands of U.S. dollars) | | Issuer | | | Issuer | | | Subsidiaries | | | Eliminations | | | Consolidated | |
| ASSETS | | | | | | | | | | | | | | | |
| Current assets | | $ | - | | | $ | - | | | $ | 315,723 | | | $ | - | | | $ | 315,723 | |
| Property and equipment, net | | | - | | | | - | | | | 1,159,918 | | | | - | | | | 1,159,918 | |
| Intercompany receivable | | | 1,224,307 | | | | - | | | | - | | | | (1,224,307 | ) | | | - | |
| Investment in subsidiaries | | | 138,385 | | | | - | | | | - | | | | (138,385 | ) | | | - | |
| Non-current assets | | | - | | | | - | | | | 101,394 | | | | - | | | | 101,394 | |
| | | | | | | | | | | | | | | | | | | | | |
| Total assets | | $ | 1,362,692 | | | $ | - | | | $ | 1,577,035 | | | $ | (1,362,692 | ) | | $ | 1,577,035 | |
| | | | | | | | | | | | | | | | | | | | | |
LIABILITIES AND MEMBER’S EQUITY | | | | | | | | | | | | | | | | | | | | |
| Current liabilities | | $ | 34,251 | | | $ | - | | | $ | 188,747 | | | $ | - | | | $ | 222,998 | |
| Intercompany payable | | | - | | | | - | | | | 1,224,307 | | | | (1,224,307 | ) | | | - | |
| Long-term debt | | | 1,153,588 | | | | - | | | | - | | | | - | | | | 1,153,588 | |
| Other long-term liabilities | | | - | | | | - | | | | 25,596 | | | | - | | | | 25,596 | |
Member’s equity | | | 174,853 | | | | - | | | | 138,385 | | | | (138,385 | ) | | | 174,853 | |
| | | | | | | | | | | | | | | | | | | | | |
Total liabilities and member’s equity | | $ | 1,362,692 | | | $ | - | | | $ | 1,577,035 | | | $ | (1,362,692 | ) | | $ | 1,577,035 | |
| Condensed Consolidating Statements of Operations |
| Year Ended December 31, 2008 |
| | | Parent | | | Subsidiary | | | Guarantor | | | Intercompany | | | | |
| (In thousands of U.S. dollars) | | Issuer | | | Issuer | | | Subsidiaries | | | Eliminations | | | Consolidated | |
| | | | | | | | | | | | | | | | |
| Net sales | | $ | - | | | $ | - | | | $ | 1,766,813 | | | $ | - | | | $ | 1,766,813 | |
| Cost of products sold (exclusive | | | | | | | | | | | | | | | | | | | | |
| of depreciation and amortization) | | | - | | | | - | | | | 1,462,333 | | | | - | | | | 1,462,333 | |
| Depreciation and amortization | | | - | | | | - | | | | 134,344 | | | | - | | | | 134,344 | |
| Selling, general, and administrative expenses | | | - | | | | - | | | | 79,441 | | | | - | | | | 79,441 | |
| Restructuring and other charges | | | - | | | | - | | | | 27,416 | | | | - | | | | 27,416 | |
| Interest and other income | | | (122,315 | ) | | | - | | | | (770 | ) | | | 122,315 | | | | (770 | ) |
| Interest expense | | | 105,007 | | | | - | | | | 103,200 | | | | (105,007 | ) | | | 103,200 | |
| Equity in net loss of subsidiaries | | | (39,151 | ) | | | - | | | | - | | | | 39,151 | | | | - | |
| | | | | | | | | | | | | | | | | | | | | |
| Net loss | | $ | (21,843 | ) | | $ | - | | | $ | (39,151 | ) | | $ | 21,843 | | | $ | (39,151 | ) |
| Condensed Consolidating Statements of Operations |
| Year Ended December 31, 2007 |
| | | Parent | | | Subsidiary | | | Guarantor | | | Intercompany | | | | |
| (In thousands of U.S. dollars) | | Issuer | | | Issuer | | | Subsidiaries | | | Eliminations | | | Consolidated | |
| | | | | | | | | | | | | | | | |
| Net sales | | $ | - | | | $ | - | | | $ | 1,628,753 | | | $ | - | | | $ | 1,628,753 | |
| Cost of products sold (exclusive of | | | | | | | | | | | | | | | | | | | | |
| depreciation and amortization) | | | - | | | | - | | | | 1,403,144 | | | | - | | | | 1,403,144 | |
| Depreciation and amortization | | | - | | | | - | | | | 123,139 | | | | - | | | | 123,139 | |
| Selling, general, and adminstrative expenses | | | - | | | | - | | | | 52,007 | | | | - | | | | 52,007 | |
| Restructuring and other charges | | | - | | | | - | | | | 19,395 | | | | - | | | | 19,395 | |
| Interest and other income | | | (135,022 | ) | | | - | | | | (1,544 | ) | | | 135,022 | | | | (1,544 | ) |
| Interest expense | | | 112,935 | | | | - | | | | 113,881 | | | | (112,935 | ) | | | 113,881 | |
| Equity in net loss of subsidiaries | | | (81,269 | ) | | | - | | | | - | | | | 81,269 | | | | - | |
| | | | | | | | | | | | | | | | | | | | | |
| Net loss | | $ | (59,182 | ) | | $ | - | | | $ | (81,269 | ) | | $ | 59,182 | | | $ | (81,269 | ) |
| Condensed Consolidating Statements of Cash Flows |
| Year Ended December 31, 2008 |
| | | Parent | | | Subsidiary | | | Guarantor | | | Intercompany | | | | |
| (In thousands of U.S. dollars) | | Issuer | | | Issuer | | | Subsidiaries | | | Eliminations | | | Consolidated | |
| | | | | | | | | | | | | | | | |
| Net cash provided by operating activities | | $ | 17,308 | | | $ | - | | | $ | 57,615 | | | $ | - | | | $ | 74,923 | |
| | | | | | | | | | | | | | | | | | | | | |
| Cash flows from investing activities: | | | | | | | | | | | | | | | | | | | | |
| Proceeds from sale of fixed assets | | | - | | | | - | | | | 108 | | | | - | | | | 108 | |
| Capital expenditures | | | - | | | | - | | | | (80,447 | ) | | | - | | | | (80,447 | ) |
| Return of investment in subsidiaries | | | 5,488 | | | | - | | | | (5,488 | ) | | | - | | | | - | |
| Net cash provided by (used in) investing activities | | | 5,488 | | | | - | | | | (85,827 | ) | | | - | | | | (80,339 | ) |
| | | | | | | | | | | | | | | | | | | | | |
| Cash flows from financing activities: | | | | | | | | | | | | | | | | | | | | |
| Equity distributions | | | (22,796 | ) | | | - | | | | - | | | | - | | | | (22,796 | ) |
| Advances to subsidiaries | | | (92,083 | ) | | | - | | | | 92,083 | | | | - | | | | - | |
| Repayment of advances to subsidiaries | | | 2,850 | | | | - | | | | (2,850 | ) | | | - | | | | - | |
| Proceeds from long-term debt | | | 92,083 | | | | - | | | | - | | | | - | | | | 92,083 | |
| Payments on long-term debt | | | | | | | | | | | | | | | | | | | | |
| under credit agreement | | | (2,850 | ) | | | - | | | | - | | | | - | | | | (2,850 | ) |
| Net cash provided by (used in) financing activities | | | (22,796 | ) | | | - | | | | 89,233 | | | | - | | | | 66,437 | |
| | | | | | | | | | | | | | | | | | | | | |
| Change in cash and cash equivalents | | | - | | | | - | | | | 61,021 | | | | - | | | | 61,021 | |
| Cash and cash equivalents at beginning of period | | | - | | | | - | | | | 58,499 | | | | - | | | | 58,499 | |
| | | | | | | | | | | | | | | | | | | | | |
| Cash and cash equivalents at end of period | | $ | - | | | $ | - | | | $ | 119,520 | | | $ | - | | | $ | 119,520 | |
| Condensed Consolidating Statements of Cash Flows |
| Year Ended December 31, 2007 |
| | | Parent | | | Subsidiary | | | Guarantor | | | Intercompany | | | | |
| (In thousands of U.S. dollars) | | Issuer | | | Issuer | | | Subsidiaries | | | Eliminations | | | Consolidated | |
| | | | | | | | | | | | | | | | |
| Net cash provided by operating activities | | $ | 22,087 | | | $ | - | | | $ | 16,694 | | | | | | $ | 38,781 | |
| | | | | | | | | | | | | | | | | | | | |
| Cash flows from investing activities: | | | | | | | | | | | | | | | | | | | |
| Proceeds from sale of fixed assets | | | - | | | | - | | | | 1,789 | | | | - | | | | 1,789 | |
| Capital expenditures | | | - | | | | - | | | | (69,582 | ) | | | - | | | | (69,582 | ) |
| | | | | | | | | | | | | | | | | | | | | |
| Net cash used in investing activities | | | - | | | | - | | | | (67,793 | ) | | | - | | | | (67,793 | ) |
| | | | | | | | | | | | | | | | | | | | | |
| Cash flows from financing activities: | | | | | | | | | | | | | | | | | | | | |
| Equity distributions | | | (22,087 | ) | | | - | | | | - | | | | - | | | | (22,087 | ) |
| Repayment of advances to | | | | | | | | | | | | | | | | | | | | |
| subsidiaries | | | 2,850 | | | | - | | | | (2,850 | ) | | | - | | | | - | |
| Payments on long-term debt | | | | | | | | | | | | | | | | | | | | |
| under credit agreement | | | (2,850 | ) | | | - | | | | - | | | | - | | | | (2,850 | ) |
| | | | | | | | | | | | | | | | | | | | | |
| Net cash used in financing activities | | | (22,087 | ) | | | - | | | | (2,850 | ) | | | - | | | | (24,937 | ) |
| | | | | | | | | | | | | | | | | | | | | |
| Change in cash and cash equivalents | | | - | | | | - | | | | (53,949 | ) | | | - | | | | (53,949 | ) |
| Cash and cash equivalents at beginning of period | | | - | | | | - | | | | 112,448 | | | | - | | | | 112,448 | |
| | | | | | | | | | | | | | | | | | | | | |
| Cash and cash equivalents at end of period | | $ | - | | | $ | - | | | $ | 58,499 | | | $ | - | | | $ | 58,499 | |
19. SUBSEQUENT EVENT
The Company burns alternative fuel mixtures at its Androscoggin and Quinnesec mills in order to produce renewable energy and help manage the Company’s exposure to high energy costs. The federal government has implemented a program that provides incentive payments under certain circumstances for the use of alternative fuels and alternative fuel mixtures in lieu of fossil-based fuels. In the fourth quarter of 2008, the Company filed applications with the Internal Revenue Service for certification of its eligibility to receive incentive payments for its use of black liquor in alternative fuel mixtures in the recovery boilers at the Androscoggin and Quinnesec mills. In January and February 2009, the IRS certified that the Company’s operations at the two mills qualified for the incentive payments. In February 2009, the Company received an incentive payment of $29.7 million for operations at the Androscoggin mill in the fourth quarter of 2008. The Company’s claim for a similar incentive payment for operations at the Quinnesec mill in the fourth quarter of 2008 is expected during March 2009. The federal regulations relating to the alternative fuels mixture incentive program are complex, and further clarification is needed by the Company prior to the recognition of any payment received for financial reporting purposes. The Company will continue to evaluate its opportunities for burning alternative fuel mixtures to produce energy at its mills. Depending on the quantity of alternative fuel mixtures burned, the federal incentive payments that may be received by the Company could be material. At the same time, there can be no assurance that the federal incentive program for alternative fuel mixtures will continue in effect, that its provisions will not be changed in a manner that impacts the Company, that the Company’s operations will remain qualified to receive the incentive payments, or that the Company’s claims for the incentive payments will be approved and paid.
COATED AND SUPERCALENDERED PAPERS DIVISION OF INTERNATIONAL PAPER COMPANY (PREDECESSOR)
Notes to Combined Financial Statements for the Seven-Month Period Ended July 31, 2006
1. BASIS OF PRESENTATION
The accompanying combined financial statements for the seven-month period ended July 31, 2006, have been prepared from the separate records maintained by the Coated and Supercalendered Papers Division and International Paper Company (IPCO) and include allocations of certain IPCO corporate costs and expenses. In accordance with SFAS No. 57, “Related Party Disclosures,” related party transactions cannot be presumed to be carried out on an arm’s-length basis as the requisite conditions of competitive, free-market dealing may not exist. These combined financial statements may not necessarily be indicative of the results of operations that would have resulted had the Division been operated as an unaffiliated company.
The Coated and Supercalendered Papers Division of International Paper Company (the “Predecessor” or the “Division”) operated in three operating segments: coated and supercalendered papers; hardwood market pulp; and other, consisting of uncoated copy paper and specialty industrial paper. The Division’s core business platform is as a producer of coated freesheet, coated groundwood, and uncoated supercalendered papers. These products serve customers in the catalog, magazine, inserts, and commercial print markets. The Division included mills and related woodyards in Bucksport and Jay, Maine; Quinnesec, Michigan; and Sartell, Minnesota. The Division also included investments in two energy producing assets located at the Bucksport and Jay, Maine, facilities.
During the periods presented, the Division was under the control of International Paper Company. The operating results and financial position of the Division were impacted by the nature of this relationship (see Note 4).
2. SUMMARY OF SIGNIFICANT ACCOUNTING POLICIES
Use of Estimates—The preparation of financial statements in conformity with accounting principles generally accepted in the United States of America requires management to make estimates and assumptions that affect the reported amounts of assets and liabilities, disclosure of contingent assets and liabilities at the date of the financial statements, and the reported amounts of revenues and expenses during the reporting periods. Actual results could differ from these estimates.
Revenue Recognition—Sales are reported net of rebates, allowances, and discounts. Revenue is recognized when the customer takes title and assumes the risks and rewards of ownership. Revenue is recorded at the time of shipment for terms designated f.o.b. (free on board) shipping point. For sales transactions designated f.o.b. destination, which include export sales, revenue is recorded when the product is delivered to the customer’s site and when title and risk of loss are transferred.
Shipping and Handling Costs—Shipping and handling costs, such as freight to customer destinations, are included in cost of products sold in the accompanying combined statement of operations. These costs, when included in the sales price charged for the Division’s products, are recognized in net sales.
Annual Maintenance Costs—Annual maintenance costs for major planned maintenance shutdowns in excess of $1.0 million is expensed ratably over the year in which the maintenance shutdowns occur as operations benefit throughout the year from the maintenance work performed. These costs, including manufacturing variances and out-of-pocket costs that are directly related to the shutdown, are fully expensed in the year of the shutdown with no amounts remaining accrued at year-end. Other maintenance costs are expensed as incurred.
Affiliate Transactions—All intradivision transactions have been eliminated (see Note 4).
Property, Plant, and Equipment—Depreciation and amortization on Property, plant, and equipment is computed using the units-of-production method for paper machines and related equipment and the straight-line method for all other assets over the assets’ estimated useful lives. The useful life of machinery and equipment is not expected to differ significantly between the units-of-production method and the straight-line method. Estimated useful lives were as follows:
| | | Years |
| Building | | 20 - 40 |
| Machinery and equipment | | 10 - 20 |
| Furniture and office equipment | | 3 - 10 |
| Computer hardware | | 3 - 6 |
| Leasehold improvements | | Over the terms of the lease or the useful life of the improvements |
Expenditures for major repairs and improvements are capitalized, whereas normal repairs and maintenance are expensed as incurred.
Asset Retirement Obligations—In accordance with the provisions of SFAS No. 143, “Accounting for Asset Retirement Obligations,” a liability and an asset are recorded equal to the present value of the estimated costs associated with the retirement of long-lived assets where a legal or contractual obligation exists. The liability is accreted over time, and the asset is depreciated over its useful life. The Division’s asset retirement obligations under this standard related to closure costs for landfills.
Income Taxes—The Division’s operating results were included in the income tax returns of IPCO. For the operating results included in the IPCO income tax returns, a charge in lieu of income taxes was allocated by IPCO to the Division, representing a portion of IPCO’s consolidated tax provision. This tax rate considers IPCO’s federal rate and the state tax apportionment of the various states in which the Division operated. The rate may be different than that determined if the Division were an incorporated entity computing its taxes on a separate return basis.
Environmental Costs and Obligations—Costs associated with environmental obligations, such as remediation or closure costs, are accrued when such costs are probable and reasonably estimable. Such accruals are adjusted as further information develops or circumstances change. Costs of future expenditures for environmental obligations are discounted to their present value when the expected cash flows are reliably determinable.
3. SUPPLEMENTAL FINANCIAL STATEMENT INFORMATION
Interest payments for the seven months ended July 31, 2006, were $7.6 million. Total interest expense was $8.4 million for the seven months ended July 31, 2006. In conjunction with the Acquisition, we assumed none of the historical debt of the Predecessor.
4. TRANSACTIONS WITH IPCO AND AFFILIATES
Certain services are provided to the Division by IPCO, including corporate management, legal, accounting and tax, treasury, payroll and benefits administration, certain incentive compensation, risk management, information technology, and centralized transaction processing. These expenses are included in Selling, general and administrative expenses and Cost of products sold in the combined statement of operations. Expenses for such corporate services included in Selling, general, and administrative expenses totaled $19.0 million for the seven months ended July 31, 2006. Expenses for such corporate services in Cost of products sold totaled $6.2 million for the seven months ended July 31, 2006. These costs are allocated from IPCO to the Division based on various methods, including direct consumption, percent of capital employed, and number of employees.
Substantially all employees hired prior to July 2004 and retirees of the Division participate in IPCO’s pension plans and are eligible to receive retirement benefits. IPCO allocates service cost to the Division based upon a percent-of-pay for salaried employees and a calculated flat amount for hourly employees. During the seven-month period ended July 31, 2006, IPCO allocated periodic pension costs to the Division of $7.5 million.
IPCO provides certain retiree health care and life insurance benefits to a majority of the Division’s salaried employees and certain of the Division’s hourly employees. IPCO allocates postretirement benefit costs to the Division based upon a percent-of-pay for salaried employees and a calculated flat amount for hourly employees. During the seven-month period ended July 31, 2006, IPCO allocated postretirement benefit costs to the Division of $0.8 million.
The Division had net sales to IPCO of approximately $83.8 million for the seven months ended July 31, 2006. The Division had purchases from IPCO of approximately $119.5 million for the seven months ended July 31, 2006.
5. INCOME TAXES
The results of operations of the Division were included in the income tax returns of IPCO. In the accompanying combined financial statements, the Division reflected U.S. federal and state income tax expense on its income based on an allocated rate of 39.4% for the seven months ended July 31, 2006. Income taxes have been provided for all items included in the historical statement of operations included herein, regardless of when such items were reported for tax purposes or when the taxes were actually paid or refunded.
6. RESTRUCTURING AND OTHER CHARGES
In March 2005, IPCO announced the indefinite shutdown of the No.1 paper machine at the Jay, Maine mill. Effective December 2005, IPCO permanently decommissioned the No. 1 paper machine and began conversion of it to a pulp dryer. Severance totaling $0.8 million was paid to employees in January 2006. This machine was a component of the pulp operating segment.
7. COMMITMENTS AND CONTINGENCIES
Operating Leases—The Division has entered into operating lease agreements, which expire at various dates through 2013, related to certain machinery and equipment used in its manufacturing process.
The building and land related to the Sartell mill No. 3 paper machine are leased under a long-term operating lease. The lease was remeasured to fair value upon IPCO’s acquisition of Champion International Corporation resulting in an unfavorable fair value adjustment which is being amortized as rent expense over the life of the lease. Pursuant to the terms of the Acquisition, International Paper will transfer the building to Verso Paper at no cost upon expiration of the lease.
Pulp purchase commitment—In December 2004, IPCO entered into a 10-year pulp purchase agreement with the buyer of IPCO’s former Weldwood business. This take-or-pay agreement requires IPCO to purchase 170,000 tons of NBSK pulp at market prices at the time of order and IPCO has allocated approximately 110,000 tons of the required purchases to the Division. This purchased pulp represents approximately one-third of the Division’s purchased pulp needs. This agreement is transferable with appropriate consent from the seller.
Wood Supply Agreement—IPCO’s Forest Resources business supplies the Division’s mills with their fiber needs at market prices. The Division’s mills receive fiber in various forms (chips, tree length, and custom cut) and species: softwood (pine, spruce, and fir) and hardwood (aspen, maple, and oak). In December 2004, IPCO completed the sale of 1.1 million acres of forestlands in Maine and New Hampshire. As part of that sale, IPCO also entered into a 50-year wood supply agreement. The wood supply agreement covers the Division’s Bucksport and Jay, Maine mills. Wood is delivered at market prices in effect at the time of delivery to the mills. IPCO must purchase a base volume as defined in the agreement and also has the ability to purchase additional wood fiber, defined as “option” volume. The volumes, base and option, are computed as a percentage of the estimated annual harvest. Base volume per year is approximately 310,000 tons. The agreement includes a limitation of damages section under which IPCO’s maximum potential damages for a default are $15.00 per ton of wood delivered in the first year. This amount is approximately $4.7 million. The supply agreement is assignable by either party with mutual consent.
Androscoggin—PM 5 Agreement—In June 2005, IPCO sold its Industrial Papers business. As part of this transaction, IPCO and the Division entered into a 12-year contract manufacturing arrangement with the buyer, Thilmany LLC. (“Thilmany”), for production from the Jay, Maine mill’s No. 5 paper machine. IPCO deferred approximately $32.5 million of the sales proceeds, to reflect the contract manufacturing agreement. The deferred proceeds are earned by IPCO as volume is produced in accordance with the contract manufacturing agreement. This agreement requires Thilmany to pay the Division a variable charge for the paper purchased and a fixed charge for the availability of the No. 5 paper machine. The deferred amount and related amortization are obligations of IPCO and are not recorded on the Division’s financial statements. The Division is responsible for the No. 5 paper machine’s routine maintenance capital, and Thilmany is responsible for any capital expenditures specific to the No. 5 paper machine. As defined in the agreement, Thilmany has the right to terminate the agreement if certain events occur, such as a failure to produce product for a 75-day consecutive period. Following a 30-day period after such a failure to produce, IPCO would be subject to a penalty payment based on the prior 12-month EBITDA from products produced on the machine multiplied by a factor. The factor at the beginning of the agreement is five and decreases ratably over the life of the agreement. Thilmany has not notified IPCO or the Division of any failure to perform and no liability is accrued. The agreement is transferable with appropriate consent from Thilmany.
Litigation—In March 2006, the Division received approximately $1.0 million from Androscoggin Energy LLC (“AELLC”), as a result of the settlement of a billing dispute. AELLC was a supplier of energy to the Jay, Maine facility that ceased operations in November 2004 and filed for Chapter 11 bankruptcy.
8. INFORMATION BY INDUSTRY SEGMENT
The Division operated in three operating segments, coated and supercalendered papers; hardwood market pulp; and other, consisting of uncoated copy paper and specialty industrial paper. The Division operated in one geographic segment, the United States. The Division’s core business platform was as a producer of coated freesheet, coated groundwood, and uncoated supercalendered papers. These products serve customers in the catalog, magazine, inserts, and commercial print markets. For management purposes, the operating performance of the Division was reported based on earnings before interest and taxes, excluding the cumulative effect of accounting changes:
| | | Seven Months | |
| | | Ended | |
| | | July 31, | |
| (In thousands of U.S. dollars) | | 2006 | |
| | | | |
| Net Sales: | | | |
| Coated | | $ | 793,308 | |
| Pulp | | | 88,634 | |
| Other | | | 22,475 | |
| Total | | $ | 904,417 | |
| | | | | |
| Operating Income (Loss): | | | | |
| Coated | | $ | 14,971 | |
| Pulp | | | 10,346 | |
| Other | | | 825 | |
| Total | | $ | 26,142 | |
| | | | | |
| Depreciation and Amortization: | | | | |
| Coated | | $ | 60,881 | |
| Pulp | | | 10,417 | |
| Other | | | 1,376 | |
| Total | | $ | 72,674 | |
| | | | | |
| Capital Spending: | | | | |
| Coated | | $ | 26,449 | |
| Pulp | | | 839 | |
| Other | | | 367 | |
| Total | | $ | 27,655 | |
Not applicable.
Not applicable.
Evaluation of Disclosure Controls and Procedures
We maintain disclosure controls and procedures that are designed to ensure that information required to be disclosed in reports that we file and submit under the Securities Exchange Act of 1934 is recorded, processed, summarized and reported within the time periods specified in the SEC’s rules and forms and is accumulated and communicated to our management, including our Chief Executive Officer and Chief Financial Officer, as appropriate to allow timely decisions regarding required disclosure.
There are inherent limitations to the effectiveness of any disclosure controls and procedures, including the possibility of human error or the circumvention or overriding of the controls and procedures. Accordingly, even effective disclosure controls and procedures can provide only reasonable assurance of achieving their objectives.
Our management, with the participation of our Chief Executive Officer and Chief Financial Officer, evaluated the effectiveness of the design and operation of our disclosure controls and procedures as of December 31, 2008. Based upon the evaluation, and subject to the foregoing, our Chief Executive Officer and Chief Financial Officer concluded that our disclosure controls and procedures were effective to accomplish their objectives as of December 31, 2008.
Management’s Report on Internal Control Over Financial Reporting
Our management is responsible for establishing and maintaining adequate internal control over financial reporting. Our internal control over financial reporting is a process designed to provide reasonable assurance regarding the reliability of financial reporting and the preparation of financial statements for external purposes in accordance with generally accepted accounting principles.
There are inherent limitations to the effectiveness of any internal control over financial reporting, including the possibility of human error or the circumvention or overriding of the controls. Accordingly, even an effective internal control over financial reporting can provide only reasonable assurance of achieving its objective.
Our management assessed the effectiveness of our internal control over financial reporting as of December 31, 2008.
In making this assessment, management used the framework set forth in Internal Control – Integrated Framework issued by the Committee of Sponsoring Organizations of the Treadway Commission (COSO). Based upon the assessment, and subject to the foregoing, our management concluded that our internal control over financial reporting was effective to accomplish its objective as of December 31, 2008.
This annual report does not include an attestation report of our registered public accounting firm regarding our internal control over financial reporting. Our management’s report was not subject to attestation by our registered public accounting firm pursuant to temporary rules of the SEC that permit us to provide only our management’s report in this annual report.
Changes in Internal Control Over Financial Reporting
There was no change in our internal control over financial reporting during the fourth quarter of 2008 that has materially affected, or is reasonably likely to materially affect, our internal control over financial reporting.
Not applicable.
PART III
The information called for by this item is omitted under the reduced disclosure format permitted by General Instruction I(2)(c) of Form 10-K.
The information called for by this item is omitted under the reduced disclosure format permitted by General Instruction I(2)(c) of Form 10-K.
The information called for by this item is omitted under the reduced disclosure format permitted by General Instruction I(2)(c) of Form 10-K.
The information called for by this item is omitted under the reduced disclosure format permitted by General Instruction I(2)(c) of Form 10-K.
The following table represents fees billed to us for professional services rendered by Deloitte & Touche LLP for the years ended December 31, 2008 and 2007, and the five months ended December 31, 2006:
| | (In thousands of U.S. dollars) | | 2008 | | | 2007 | | | 2006 | |
| | Audit fees | | $ | 939 | | | $ | 870 | | | $ | 350 | |
| | Audit-related fees | | | - | | | | 110 | | | | 55 | |
| | Tax fees | | | - | | | | - | | | | - | |
| | All other | | | 395 | | | | 30 | | | | - | |
| | Total | | $ | 1,334 | | | $ | 1,010 | | | $ | 405 | |
Audit fees. For the years ended December 31, 2008 and 2007, and for the five months ended December 31, 2006, audit fees represents the aggregate fees billed to us by Deloitte & Touche LLP for professional services rendered for the audit of our financial statements and review of interim financial statements.
Audit-related fees. For the years ended December 31, 2008 and 2007, and for the five months ended December 31, 2006, audit-related fees represent the aggregate fees billed to us by Deloitte & Touche LLP for assurance and related services that are reasonably related to the audit or review of our financial statements, which in both periods includes fees for compliance attestation and other procedures provided in conjunction with documents prepared for our issuance of public debt.
All other. For the years ended December 31, 2008 and 2007, aggregate fees billed to us by Deloitte & Touche LLP for professional services related to documentation of internal controls.
The audit committee of our board of directors is responsible for pre-approval of all audit and permitted non-audit services to be performed by Deloitte & Touche LLP, as the registered public accounting firm that performs the audit of our consolidated financial statements that are filed with the SEC.
Part IV
Financial Statements
See the Index to Financial Statements in “Financial Statements and Supplementary Data.”
Financial Statement Schedules
See Schedule I – Valuation Accounts and the report thereon of Deloitte & Touche LLP, Independent Registered Public Accounting Firm, starting on page S-1 of this annual report.
Exhibits
The following exhibits are included with this report:
Exhibit Number | | Description of Exhibit |
| | | |
| 2.1 | | Agreement of Purchase and Sale dated as of June 4, 2006, among International Paper Company, Verso Paper Investments LP and Verso Paper LLC,(1) as amended by Amendment No. 1 to Agreement of Purchase and Sale, dated as of August 1, 2006, among International Paper Company, Verso Paper Investments LP and Verso Paper LLC,(2) and Amendment No. 2 to Agreement of Purchase and Sale, dated as of May 31, 2007, among International Paper Company, Verso Paper Investments LP and Verso Paper LLC.(2) |
| | | |
| 3.1 | | Certificate of Formation filed June 6, 2006, as amended by Certificate of Amendment filed June 13, 2006, Certificate of Amendment filed June 23, 2006, and Certificate of Amendment filed June 26, 2006, of Verso Paper Holdings LLC.(3) |
| | |
| 3.2 | | Amended and Restated Limited Liability Company Agreement of Verso Paper Holdings LLC dated as of January 25, 2007.(3) |
| | | |
| 4.1 | | Indenture relating to the 9 1/8% Second Priority Senior Secured Fixed Rate Notes due 2014 and the Second Priority Senior Secured Floating Rate Notes due 2014, dated as of August 1, 2006, among Verso Paper Holdings LLC, Verso Paper Inc., the Guarantors named therein, and Wilmington Trust Company, as Trustee. (1) |
| | | |
| 4.2 | | Indenture relating to the 11 3/8% Senior Subordinated Notes due 2016, dated as of August 1, 2006, among Verso Paper Holdings LLC, Verso Paper Inc., the Guarantors named therein, and Wilmington Trust Company, as Trustee.(1) |
| | | |
| 4.3 | | Collateral Agreement dated as of August 1, 2006, among Verso Paper Holdings LLC, Verso Paper Inc., the Subsidiaries named therein, and Wilmington Trust Company, as Collateral Agent.(1) |
| | | |
| 4.4 | | Intellectual Property Security Agreement dated as of August 1, 2006, made by Verso Paper Holdings LLC, Verso Paper Inc., Verso Paper LLC, Verso Androscoggin LLC, Verso Bucksport LLC, Verso Quinnesec LLC, Verso Sartell LLC, and Nextier Solutions Corporation in favor of Wilmington Trust Company, as Collateral Agent.(1) |
| 4.5 | | Intercreditor Agreement dated as August 1, 2006, among Credit Suisse, Cayman Islands Branch, as Intercreditor Agent, Wilmington Trust Company, as Trustee, Verso Paper Finance Holdings LLC, Verso Paper Holdings LLC, and the Subsidiaries named therein.(1) |
| | | |
| 4.6 | | Registration Rights Agreement dated as of August 1, 2006, among Verso Paper Holdings LLC, Verso Paper Inc., the Guarantors named therein, Credit Suisse Securities (USA) LLC, Lehman Brothers Inc., Citigroup Global Markets Inc., Banc of America Securities LLC, ABN AMRO Incorporated, and Fifth Third Securities Inc.(1) |
| | | |
| 4.7 | | Registration Rights Agreement dated as of August 1, 2006, among Verso Paper Holdings LLC, Verso Paper Inc., the Guarantors named therein, Credit Suisse Securities (USA) LLC, Lehman Brothers Inc., Citigroup Global Markets Inc., Banc of America Securities LLC, ABN AMRO Incorporated, and Fifth Third Securities Inc. (1) |
| | | |
| 10.1 | | Third Amended and Restated Limited Partnership Agreement of Verso Paper Management LP dated as of May 20, 2008 (form).(2) |
| | | |
| 10.2 | | Registration Rights Agreement among Verso Paper Investments LP and the individual limited partners of Verso Paper Management LP (form).(2) |
| | | |
| 10.3 | | Credit Agreement dated as of August 1, 2006, among Verso Paper Finance Holdings LLC, Verso Paper Holdings LLC, the Lenders party thereto, Credit Suisse, Cayman Islands Branch, as Administrative Agent, Lehman Brothers Inc., as Syndication Agent, and Citigroup Global Markets Inc. and Banc of America Securities LLC, as Documentation Agents.(1) |
| | | |
| 10.4 | | Guarantee and Collateral Agreement dated as of August 1, 2006, among Verso Paper Finance Holdings LLC, Verso Paper Holdings LLC, the Subsidiaries named therein, and Credit Suisse, Cayman Islands Branch, as Administrative Agent.(1) |
| | | |
| 10.5 | | Intellectual Property Security Agreement dated as of August 1, 2006, made by Verso Paper Finance Holdings LLC, Verso Paper Holdings LLC, Verso Paper Inc., Verso Paper LLC, Verso Androscoggin LLC, Verso Bucksport LLC, Verso Quinnesec LLC, Verso Sartell LLC and NexTier Solutions Corporation in favor of Credit Suisse, Cayman Islands Branch, as Administrative Agent.(1) |
| | | |
| 10.6 | | Credit Agreement dated January 31, 2007, among Verso Paper Finance Holdings LLC, Verso Paper Finance Holdings Inc., the Lenders party thereto, Credit Suisse, as Administrative Agent, and Citigroup Global Markets Inc., as Syndication Agent..(2) |
| | | |
| 10.7 | | Management and Transaction Fee Agreement dated as of August 1, 2006, among Verso Paper LLC, Verso Paper Investments LP, Apollo Management V, L.P. and Apollo Management VI, L.P.(1) |
| | | |
| 10.8 | * | Verso Paper Corp. 2008 Incentive Award Plan (form),(2) as amended by the First Amendment to Verso Paper Corp. 2008 Incentive Award Plan.(4) |
| | | |
| 10.9 | * | Stock Option Grant Notice and Stock Option Agreement for Non-Employee Directors (form) pursuant to the Verso Paper Corp. 2008 Incentive Award Plan.(4) |
| | | |
| 10.10 | * | Verso Paper Corp. Senior Executive Incentive Bonus Plan (form).(2) |
| | | |
| 10.11 | * | 2009 Long-Term Cash Award Program for Executives effective as of January 1, 2009, pursuant to the Verso Paper Corp. Senior Executive Bonus Plan.(5) |
| 10.12 | * | Employment Agreement dated as of November 16, 2006, between Mike Jackson and Verso Paper Holdings LLC,(1) as supplemented by the Letter Agreement dated as of November 16, 2006, between Mike Jackson and Verso Paper Holdings LLC,(1) and as amended by the First Amendment to Employment Agreement dated as of January 1, 2008, between Mike Jackson and Verso Paper Holdings LLC,(2) and the Second Amendment to Employment Agreement dated as of December 31, 2008, between Mike Jackson and Verso Paper Holdings LLC.(5) |
| | | |
| 10.13 | * | Letter Agreement dated as of February 16, 2007, between Verso Paper Management LP and Mike Jackson.(1) |
| | | |
| 10.14 | * | Confidentiality and Non-Competition Agreement dated as of January 1, 2008, between Verso Paper Holdings LLC and Lyle J. Fellows,(2) as amended by the First Amendment to Confidentiality and Non-Competition Agreement dated as of December 31, 2008, between Verso Paper Holdings LLC and Lyle J. Fellows.(5) |
| | | |
| 10.15 | * | Confidentiality and Non-Competition Agreement dated as of January 1, 2008, between Verso Paper Holdings LLC and Michael A. Weinhold,(2) as amended by the First Amendment to Confidentiality and Non-Competition Agreement dated as of December 31, 2008, between Verso Paper Holdings LLC and Michael A. Weinhold.(5) |
| | | |
| 10.16 | * | Confidentiality and Non-Competition Agreement dated as of January 1, 2008, between Verso Paper Holdings LLC and Robert P. Mundy,(2) as amended by the First Amendment to Confidentiality and Non-Competition Agreement dated as of December 31, 2008, between Verso Paper Holdings LLC and Robert P. Mundy.(5) |
| | | |
| 10.17 | * | Confidentiality and Non-Competition Agreement dated as of January 1, 2008, between Verso Paper Holdings LLC and Peter H. Kesser,(2) as amended by the First Amendment to Confidentiality and Non-Competition Agreement dated as of December 31, 2008, between Verso Paper Holdings LLC and Peter H. Kesser.(5) |
| | | |
| 10.18 | * | Letter Agreement dated as of November 1, 2006, between Verso Paper Management LP and L.H. Puckett.(1) |
| | | |
| 10.19 | * | Indemnification Agreement between Verso Paper Corp. and its directors and executive officers (form).(2) |
| | | |
| 21 | | Subsidiaries of Verso Paper Holdings LLC(6) |
| | | |
| 23 | | Consent of Resource Information Systems, Inc. |
| | | |
| 31.1 | | Certification of Principal Executive Officer pursuant to Rule 13a-14(a) under Securities Exchange Act of 1934. |
| | | |
| 31.2 | | Certification of Principal Financial Officer pursuant to Rule 13a-14(a) under Securities Exchange Act of 1934. |
| | | |
| 32.1 | | Certification of Principal Executive Officer pursuant to Rule 13a-14(b) under Securities Exchange Act of 1934 and Section 1350 of Chapter 63 of Title 18 of United States Code. |
| | | |
| 32.2 | | Certification of Principal Financial Officer pursuant to Rule 13a-14(b) under Securities Exchange Act of 1934 and Section 1350 of Chapter 63 of Title 18 of the United States Code. |
_____________________
| | |
| (1) | Incorporated by reference to our Registration Statement on Form S-4 (Registration No. 333-142283), as amended. |
| | |
| (2) | Incorporated by reference to the Registration Statement on Form S-1 (Registration No. 333-148201), as amended, of Verso Paper Corp. |
| | |
| (3) | Incorporated by reference to our Annual Report on Form 10-K for the year ended December 31, 2007. |
| | |
| (4) | Incorporated by reference to the Annual Report on Form 10-K of Verso Paper Corp. for the year ended December 31, 2008. |
| | |
| (5) | Incorporated by reference to the Current Report on Form 8-K of Verso Paper Corp. filed on December 31, 2008. |
| | |
| (6) | This exhibit is omitted under the reduced disclosure format permitted by General Instruction I(2)(b) of Form 10-K. |
| | |
| * | An asterisk denotes a management contract or compensatory plan or arrangement. |
Pursuant to the requirements of Section 13 or 15(d) of the Securities Exchange Act of 1934, the registrant has duly caused this report to be signed on its behalf by the undersigned thereunto duly authorized.
| Date: March 30, 2009 | | | | |
| | | VERSO PAPER HOLDINGS LLC. |
| | | |
| | | By: | | |
| | | | | Michael A. Jackson President and Chief Executive Officer |
| | | | | |
| | | By: | | |
| | | | | Robert P. Mundy Senior Vice President and Chief Financial Officer |
Pursuant to the requirements of the Securities Exchange Act of 1934, this report has been signed below by the following persons on behalf of the registrant and in the capacities and on the dates indicated.
| Signature | Position | Date |
| | | |
| /s/ Michael A. Jackson | | | March 30, 2009 |
| Michael A. Jackson | | President, Chief Executive Officer and Director (Principal Executive Officer) |
| /s/ Robert P. Mundy | | | March 30, 2009 |
| Robert P. Mundy | | Senior Vice President and Chief Financial Officer (Principal Financial and Accounting Officer) |
| /s/ Michael E. Ducey | | | March 30, 2009 |
| Michael E. Ducey | | Director |
| | | |
| /s/ Thomas Gutierrez | | | March 30, 2009 |
| Thomas Gutierrez | | Director |
| | | |
| /s/ Scott M. Kleinman | | | |
| Scott M. Kleinman | | Director | March 30, 2009 |
| | | | |
| /s/ David W. Oskin | | | |
| David W. Oskin | | Director | March 30, 2009 |
| | | | |
| /s/ Eric L. Press | | | |
| Eric L. Press | | Director | March 30, 2009 |
| | | | |
| /s/ L.H. Puckett, Jr. | | | |
| L.H. Puckett, Jr. | | Director | March 30, 2009 |
| | | | |
| /s/ David B. Sambur | | | |
| David B. Sambur | | Director | March 30, 2009 |
| | | | |
| /s/ Jordan C. Zaken | | | March 30, 2009 |
| Jordan C. Zaken | | Director |
REPORT OF INDEPENDENT REGISTERED PUBLIC ACCOUNTING FIRM
To the Board of Directors and Members of
Verso Paper Holdings LLC
Memphis, Tennessee
We have audited the accompanying consolidated balance sheets of Verso Paper Holdings LLC (the “Company” or “Successor”), a wholly-owned subsidiary of Verso Paper Finance Holdings LLC, as of December 31, 2008 and 2007 (Successor Company balance sheets), and the related consolidated statements of operations, changes in member's equity, and cash flows for the years ended December 31, 2008 and 2007 and the five months ended December 31, 2006 (Successor Company Operations). We have also audited the accompanying combined statements of operations and cash flows for the seven months ended July 31, 2006 (Predecessor Operations), and have issued our report thereon dated March 2, 2009; such financial statements and report are included elsewhere in this Form 10-K. Our audits also included the financial statement schedule of the Company listed in Item 15. This financial statement schedule is the responsibility of the Company's management. Our responsibility is to express an opinion based on our audits. In our opinion, such financial statement schedule, when considered in relation to the basic financial statements taken as a whole, present fairly, in all material respects, the information set forth therein.
/s/ Deloitte & Touche LLP
Memphis, Tennessee
March 2, 2009
Schedule I – Valuation Accounts
Verso Paper Holdings LLC (Successor) and
Coated and Supercalendered Papers Division of International Paper Company (Predecessor)
For the Seven Months Ended July 31, 2006 (Predecessor)
and Five Months Ended December 31, 2006 and Years Ended December 31, 2007 and 2008 (Successor)
| | | Balance at | | | Charged to | | | Charge-off | | | Balance | |
| | | Beginning | | | Cost and | | | Against | | | at End of | |
| (in thousands of U.S. dollars) | | of Period | | | Expenses | | | Allowances | | | Period | |
| Allowance for uncollectible accounts included under | | | | | | | | | | | | |
| the balance sheet caption "Accounts receivable" | | | | | | | | | | | | |
| (Predecessor): | | | | | | | | | | | | |
| Seven Months Ended July 31, 2006 | | $ | 7,302 | | | $ | 856 | | | $ | (6,323 | ) | | $ | 1,835 | |
| Allowance for uncollectible accounts included under | | | | | | | | | | | | | | | | |
| the balance sheet caption "Accounts receivable" | | | | | | | | | | | | | | | | |
| (Successor): | | | | | | | | | | | | | | | | |
| Five Months Ended December 31, 2006 | | $ | 1,835 | | | $ | 102 | | | $ | - | | | $ | 1,937 | |
| Year Ended December 31, 2007 | | $ | 1,937 | | | $ | (258 | ) | | $ | (2 | ) | | $ | 1,677 | |
| Year Ended December 31, 2008 | | $ | 1,677 | | | $ | 999 | | | $ | (783 | ) | | $ | 1,893 | |
S-2