In this annual report, all statements that are not purely historical facts are forward-looking statements within the meaning of Section 27A of the Securities Act of 1933 and Section 21E of the Securities Exchange Act of 1934. Forward-looking statements may be identified by the words “believe,” “expect,” “anticipate,” “project,” “plan,” “estimate,” “intend,” and similar expressions. Forward-looking statements are based on currently available business, economic, financial, and other information and reflect management’s current beliefs, expectations, and views with respect to future developments and their potential effects on us. Actual results could vary materially depending on risks and uncertainties that may affect us and our business. For a discussion of such risks and uncertainties, please refer to “Risk Factors” and “Management’s Discussion and Analysis of Financial Condition and Results of Operations” and other sections of this annual report and to Verso Paper’s and Verso Holdings’ other filings with the Securities and Exchange Commission. We assume no obligation to update any forward-looking statement made in this annual report to reflect subsequent events or circumstances or actual outcomes.
Market and Industry Information
Market data and other statistical information used throughout this annual report are based on independent industry publications, government publications, reports by market research firms, or other published independent sources. Some data are also based on our good-faith estimates which are derived from our review of internal surveys, as well as the independent sources listed above. Although we believe these sources are reliable, we have not independently verified the information. Industry prices for coated paper provided in this annual report are, unless otherwise expressly noted, derived from RISI, Inc. data. “North American” data included in this annual report that has been derived from RISI, Inc. only includes data from the United States and Canada. Any reference to (i) grade No. 3, grade No. 4 and grade No. 5 coated paper relates to 60 lb. basis weight, 50 lb. basis weight and 34 lb. basis weight, respectively, (ii) lightweight coated groundwood paper refers to groundwood paper grades that are a 36 lb. basis weight or less, and (iii) ultra-lightweight coated groundwood paper refers to groundwood paper grades that are a 30 lb. basis weight or less. The RISI, Inc. data included in this annual report has been derived from the following RISI, Inc. publications: RISI World Graphic Paper Forecast, February 2012 and RISI Paper Trader: A Monthly Monitor of the North American Graphic Paper Market, December 2011.
PART I
Within our organization, Verso Paper Corp. is the ultimate parent entity and the sole member of Verso Paper Finance Holdings One LLC, which is the sole member of Verso Paper Finance Holdings LLC, which is the sole member of Verso Paper Holdings LLC. As used in this report, the term “Verso Paper” refers to Verso Paper Corp.; the term “Verso Finance One” refers to Verso Paper Finance Holdings One LLC; the term “Verso Finance” refers to Verso Paper Finance Holdings LLC; the term “Verso Holdings” refers to Verso Paper Holdings LLC; and the term for any such entity includes its direct and indirect subsidiaries when referring to the entity’s consolidated financial condition or results. Unless otherwise noted, references to “we,” “us,” and “our” refer collectively to Verso Paper and Verso Holdings. Other than Verso Paper’s common stock transactions, Verso Finance’s debt obligation and related financing costs and interest expense, Verso Holdings’ loan to Verso Finance, and the debt obligation of Verso Holdings’ consolidated variable interest entity to Verso Finance, the assets, liabilities, income, expenses, and cash flows presented for all periods represent those of Verso Holdings in all material respects. Unless otherwise noted, the information provided pertains to both Verso Paper and Verso Holdings.
Background
We began operations on August 1, 2006, when we acquired the assets and certain liabilities comprising the business of the Coated and Supercalendered Papers Division of International Paper Company, or International Paper. We were formed by affiliates of Apollo Global Management, LLC, or “Apollo,” for the purpose of consummating the acquisition from International Paper, or the “Acquisition.” Verso Paper went public on May 14, 2008, with an initial public offering, or “IPO," of 14 million shares of common stock.
Our principal executive offices are located at 6775 Lenox Center Court, Suite 400, Memphis, Tennessee 38115-4436. Our telephone number is (901) 369-4100. Our website address is www.versopaper.com. Information on or accessible through our website is not considered part of this annual report.
Overview
We are a leading North American supplier of coated papers to catalog and magazine publishers. The coating process adds a smooth uniform layer in the paper, which results in superior color and print definition. As a result, coated paper is used primarily in media and marketing applications, including catalogs, magazines, and commercial printing applications, such as high-end advertising brochures, annual reports, and direct mail advertising.
We are one of North America’s largest producers of coated groundwood paper, which is used primarily for catalogs and magazines. We are also a low cost producer of coated freesheet paper, which is used primarily for annual reports, brochures, and magazine covers. We also produce and sell market kraft pulp, which is used to manufacture printing and writing paper grades and tissue products.
We operate 9 paper machines at four mills located in Maine, Michigan, and Minnesota. The mills have a combined annual production capacity of 1,505,000 tons of coated and supercalendered paper, 165,000 tons of ultra-lightweight specialty and uncoated papers, and 930,000 tons of kraft pulp.
We sell and market our products to approximately 125 customers which comprise approximately 700 end-user accounts. We have long-standing relationships with many leading magazine and catalog publishers, commercial printers, specialty retail merchandisers, and paper merchants. Our relationships with our ten largest coated paper customers average more than 20 years. We reach our end-users through several distribution channels, including direct sales, commercial printers, paper merchants, and brokers.
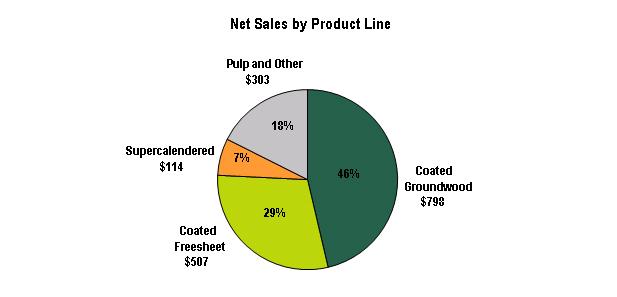
Our net sales (in millions) by product line for the year ended December 31, 2011, are illustrated below:
Industry
Based on 2011 sales, the size of the global coated paper industry is estimated to be approximately $47 billion, or 48 million tons of coated paper shipments, including approximately $9 billion, or 9 million tons of coated paper shipments, in North America. Coated paper is used primarily in media and marketing applications, including catalogs, magazines, and commercial printing applications, which include high-end advertising brochures, annual reports, and direct mail advertising. Demand is generally driven by North American advertising and print media trends, which in turn have historically been correlated with growth in Gross Domestic Product, or “GDP.”
In North America, coated papers are classified by brightness and fall into five grades, labeled No. 1 to No. 5, with No. 1 having the highest brightness level and No. 5 having the lowest brightness level. Papers graded No. 1, No. 2, and No. 3 are typically coated freesheet grades. No. 4 and No. 5 papers are predominantly groundwood containing grades. Coated groundwood grades are the preferred grades for catalogs and magazines, while coated freesheet is more commonly used in commercial print applications.
Products
We manufacture three main grades of paper: coated groundwood paper, coated freesheet paper, and supercalendered paper. These paper grades are differentiated primarily by their respective brightness, weight, print quality, bulk, opacity, and strength. We also produce Northern Bleached Hardwood Kraft, or “NBHK,” pulp. The following table sets forth our principal products by tons sold and as a percentage of our net sales in 2011:
| (Tons in thousands, Dollars in millions) | | Tons Sold | | | Net Sales | |
| Product: | | Kts | | | % | | | $ | | | | % | |
| Coated groundwood paper | | | 886 | | | | 44 | | | $ | 798 | | | | 46 | |
| Coated freesheet paper | | | 570 | | | | 28 | | | | 507 | | | | 29 | |
| Supercalendered paper | | | 145 | | | | 7 | | | | 114 | | | | 7 | |
| Pulp | | | 261 | | | | 13 | | | | 150 | | | | 9 | |
| Other | | | 161 | | | | 8 | | | | 153 | | | | 9 | |
| Total | | | 2,023 | | | | 100 | | | $ | 1,722 | | | | 100 | |
As a result of our scale and technological capabilities, we are able to offer our customers a broad product offering, from ultra-lightweight coated groundwood to heavyweight coated freesheet and supercalendered papers. Our customers have the opportunity to sole-source all of their coated paper needs from us while optimizing their choice of paper products. As our customers’ preferences change, they can switch paper grades to meet their desired balance between cost and performance attributes while maintaining their relationship with us.
We are also the largest rotogravure lightweight coated paper manufacturer in North America. Rotogravure printing is a technique for transferring ink onto coated papers, which typically results in a sharper image with truer colors and less ink trapping than in other printing processes but generally requires a smaller and higher-quality paper. Additionally, we are the only manufacturer in North America that supplies both rotogravure coated groundwood and rotogravure coated freesheet.
Coated groundwood paper. Coated groundwood paper includes a fiber component produced through a mechanical pulping process. The use of such fiber results in a bulkier and more opaque paper that is better suited for applications where lighter weights and/or higher stiffness are required, such as catalogs and magazines. In addition to mechanical pulp, coated groundwood paper typically includes a kraft pulp component to improve brightness and print quality.
Coated freesheet paper. Coated freesheet paper is made from bleached kraft pulp, which is produced using a chemical process to break apart wood fibers and dissolve impurities such as lignin. The use of kraft pulp results in a bright, heavier-weight paper with excellent print qualities, which is well-suited for high-end commercial applications and premium magazines. Coated freesheet contains primarily kraft pulp, with less than 10% mechanical pulp in its composition.
Supercalendered paper. Supercalendered paper consists of groundwood fibers and a very high filler content but does not receive a separate surface coating. Instead, the paper is passed through a supercalendering process in which alternating steel and filled rolls “iron” the paper, giving it a gloss and smoothness that makes it resemble coated paper. Supercalendered papers are primarily used for retail inserts, due to their relatively low price point.
Pulp. We produce and sell NBHK pulp. NBHK pulp is produced through the chemical kraft process using hardwoods. Hardwoods typically have shorter length fibers than softwoods and are used to smooth paper. Kraft describes pulp produced using a chemical process, whereby wood chips are combined with chemicals and steam to separate the wood fibers. The fibers are then washed and pressure screened to remove the chemicals and lignin which originally held the fibers together. Finally, the pulp is bleached to the necessary whiteness and brightness. Kraft pulp is used in applications where brighter and whiter paper is required.
Other products. We also offer recycled paper to help meet specific customer requirements. Additionally, we offer customized product solutions for strategic accounts by producing paper grades with customer-specified weight, brightness and pulp mix characteristics, providing customers with cost benefits and/or brand differentiation. Our product offerings also include ultra-lightweight uncoated printing papers and ultra-lightweight coated and uncoated flexible packaging papers.
Manufacturing
We operate 9 paper machines at four mills located in Maine, Michigan, and Minnesota. We believe our coated paper mills are among the most efficient and lowest cost coated paper mills based on the cash cost of delivery to Chicago, Illinois. We attribute our manufacturing efficiency, in part, to the significant historical investments made in our mills. Our mills have a combined annual production capacity of 1,505,000 tons of coated and supercalendered paper, 165,000 tons of ultra-lightweight specialty and uncoated papers, and 930,000 tons of kraft pulp. Of the pulp that we produce, we consume approximately 635,000 tons internally and sell the rest. Our facilities are strategically located within close proximity to major publication printing customers, which affords us the ability to more quickly and cost-effectively deliver our products. The facilities also benefit from convenient and cost-effective access to northern softwood fiber, which is required for the production of lightweight and ultra-lightweight coated papers.
The following table sets forth the locations of our mills, the products they produce and other key operating information:
| | | | Production |
| | | Paper | Capacity |
| Mill/Location | Product/Paper Grades | Machines | (in tons) |
| Jay (Androscoggin), Maine | Lightweight Coated Groundwood | 2 | 355,000 |
| | Lightweight Coated Freesheet | 1 | 175,000 |
| | Specialty/Uncoated | 1 | 105,000 |
| | Pulp | | 445,000 |
| Bucksport, Maine | Lightweight and Ultra-Lightweight Coated Groundwood and | | |
| | High Bulk Specialty Coated Groundwood | 2 | 350,000 |
| | Specialty/Uncoated | 1 | 55,000 |
| Quinnesec, Michigan | Coated Freesheet | 1 | 410,000 |
| | Specialty/Uncoated | | 5,000 |
| | Pulp | | 485,000 |
| Sartell, Minnesota | Lightweight/Ultra-Lightweight Coated Groundwood and Supercalendered | 1 | 215,000 |
The basic raw material of the papermaking process is wood pulp. The first stage of papermaking involves converting wood logs to pulp through either a mechanical or chemical process. Before logs can be processed into pulp, they are passed through a debarking drum to remove the bark. Once separated, the bark is burned as fuel in bark boilers. The wood logs are composed of small cellulose fibers which are bound together by a glue-like substance called lignin. The cellulose fibers are then separated from each other through either a mechanical or a kraft pulping process.
After the pulping phase, the fiber furnish is run onto the forming fabric of the paper machine. On the forming fabric, the fibers become interlaced, forming a mat of paper, and much of the water is extracted. The paper web then goes through a pressing and drying process to extract the remaining water. After drying, the web receives a uniform layer of coating that makes the paper smooth and provides uniform ink absorption. After coating, the paper goes through a calendering process that provides a smooth finish by ironing the sheet between multiple soft nips that consist of alternating hard (steel) and soft (cotton or synthetic) rolls. At the dry end, the paper is wound onto spools to form a machine reel and then rewound and split into smaller rolls on a winder. Finally, the paper is wrapped, labeled, and shipped.
Catalog and magazine publishers with longer print runs tend to purchase paper in roll form for use in web printing, a process of printing from a reel of paper as opposed to individual sheets of paper, in order to minimize costs. In contrast, commercial printers typically buy large quantities of sheeted paper in order to satisfy the short-run printing requirements of their customers. We believe that sheeted paper is a less attractive product as it requires additional processing, bigger inventory stocks, a larger sales and marketing team and a different channel strategy. For this reason, we have pursued a deliberate strategy of configuring our manufacturing facilities to produce all web-based papers which are shipped in roll form and have developed relationships with third-party converters to address any sheeted paper needs of our key customers.
We utilize a manufacturing excellence program, called R-GAP, to take advantage of the financial opportunities that exist between the current or historical performance of our mills and the best performance possible given usual and normal constraints (i.e., configuration, geographical, and capital constraints). Our continuous improvement process is designed to lower our cost position and enhance operating efficiency through reduced consumption of energy and material inputs, reduced spending on indirect costs, and improved productivity. The program utilizes benchmarking data to identify improvement initiatives and establish performance targets. Detailed action plans are used to monitor the execution of these initiatives and calculate the amount saved. We also use multi-variable testing, lean manufacturing, center of excellence teams, source-of-loss initiatives, and best practice sharing to constantly improve our manufacturing processes and products. Since 2001, three of our four facilities have been recognized at the Occupational Safety and Health Administration, or “OSHA’s,” Star sites as part of OSHA’s Voluntary Protection Program which recognizes outstanding safety programs and performance.
Raw Materials and Suppliers
Our key cost inputs in the papermaking process are wood fiber, market kraft pulp, chemicals, and energy.
Wood Fiber. We source our wood fiber from a broad group of timberland and sawmill owners located in our regions as well as from our 27,000-acre hybrid poplar woodlands located near Alexandria, Minnesota.
Kraft Pulp. Overall, we have the capacity to produce 930,000 tons of kraft pulp, consisting of 445,000 tons of pulp at our Androscoggin mill and 485,000 tons of pulp at our Quinnesec mill, of which a total of approximately 635,000 tons are consumed internally. We supplement our internal production of kraft pulp with purchases from third parties. In 2011, these purchases were approximately 152,000 tons of pulp. We purchase the pulp requirements from a variety of suppliers and are not dependent on any single supplier to satisfy our pulp needs.
Chemicals. Chemicals utilized in the manufacturing of coated papers include latex, starch, calcium carbonate, and titanium dioxide. We purchase these chemicals from a variety of suppliers and are not dependent on any single supplier to satisfy our chemical needs.
Energy. We produce a large portion of our energy requirements, historically producing approximately 50% of our energy needs for our coated paper mills from sources such as waste wood and paper, hydroelectric facilities, chemicals from our pulping process, our own steam recovery boilers, and internal energy cogeneration facilities. Our external energy purchases vary across each of our mills and include fuel oil, natural gas, coal, and electricity. While our internal energy production capacity and ability to switch between certain energy sources mitigates the volatility of our overall energy expenditures, we expect prices for energy to remain volatile for the foreseeable future. We utilize derivative contracts as part of our risk management strategy to manage our exposure to market fluctuations in energy prices.
Sales, Marketing, and Distribution
We reach our end-users through several sales channels. These include selling directly to end-users, through brokers, merchants, and printers. We sell and market products to approximately 125 customers, which comprise approximately 700 end-user accounts.
Sales to End-Users. In 2011, we sold approximately 38% of our paper products directly to end-users, most of which are catalog and magazine publishers. These customers are typically large, sophisticated buyers who have the scale, resources, and expertise to procure paper directly from manufacturers. Customers for our pulp products are mostly other paper manufacturers.
Sales to Brokers and Merchants. Our largest indirect paper sales by volume are through brokers and merchants who resell the paper to end-users. In 2011, our total sales to brokers and merchants represented approximately 47% of our total sales. Brokers typically act as an intermediary between paper manufacturers and smaller end-users who do not have the scale or resources to cost effectively procure paper directly from manufacturers. The majority of the paper sold to brokers is resold to catalog publishers. We work closely with brokers to achieve share targets in the catalog, magazine, and insert end-user segments through collaborative selling.
Merchants are similar to brokers in that they act as an intermediary between the manufacturer and the end-user. However, merchants generally take physical delivery of the product and keep inventory on hand. Merchants tend to deal with smaller end-users that lack the scale to warrant direct delivery from the manufacturer. Coated freesheet comprises the majority of our sales to merchants. In most cases, because they are relatively small, the ultimate end-users of paper sold through merchants are generally regional or local catalog or magazine publishers.
Sales to Printers. In 2011, our total sales to printers represented approximately 15% of our total sales. The majority of our sales were to the two largest publication printers in the United States. Printers also effectively act as an intermediary between manufacturers and end-users in that they directly source paper for printing/converting and then resell it to their customers as a finished product.
The majority of our products are delivered directly from our manufacturing facilities to the printer, regardless of the sales channel. In order to serve the grade No. 3 coated freesheet segment, we maintain a network of distribution centers located in the West, Midwest, South, and Northeast close to our customer base to provide quick delivery. The majority of our pulp products are delivered to our customers’ paper mills.
Our sales force is organized around our sales channels. We maintain an active dialogue with all of our major customers and track product performance and demand across grades. We have a team of sales representatives and marketing professionals organized into three major sales groups that correspond with our sales channels: direct sales support; support to brokers and merchants; and printer support.
Many of our customers provide us with forecasts of their paper needs, which allows us to plan our production runs in advance, optimizing production over our integrated mill system and thereby reducing costs and increasing overall efficiency. Generally, our sales agreements do not extend beyond the calendar year. Typically, our sales agreements provide for quarterly price adjustments based on market price movements.
Part of our strategy is to continually reduce the cost to serve our customer base through e-commerce initiatives which allow for simplified ordering, tracking, and invoicing. In 2011, orders totaling $307.1 million, or approximately 20% of our total paper sales, were placed through our online ordering platforms. We are focused on further developing our technology platform and e-commerce capabilities.
Customers
We serve the catalog, magazine, insert, and commercial printing markets and have developed long-standing relationships with the premier North American retailers and catalog and magazine publishers. The length of our relationships with our top ten customers averages more than 20 years. Our largest customers, Quad/Graphics, Inc. and xpedx, a business of International Paper, and their respective affiliates, accounted for approximately 10% and 9%, respectively, of our net sales in 2011. Our key customers include leading magazine publishers such as Time Inc., Hearst Corporation, and Condé Nast Publications, Inc.; leading catalog producers such as Sears Holding Corporation and Uline, Inc.; leading commercial printers such as Quad/Graphics, Inc. and RR Donnelley & Sons Company; and leading paper merchants and brokers, such as xpedx, Clifford Paper, Inc., and A.T. Clayton & Co.
Our net sales, excluding pulp sales, by end-user segment for the year ended December 31, 2011, are illustrated below (dollars in millions):
Research and Development
The primary function of our research and development efforts is to work with customers in developing and modifying products to accommodate their evolving needs and to identify cost-saving opportunities within our operations.
Examples of our research and development efforts implemented over the past several years include:
| | ● | high-bulk offset and rotogravure coated groundwood; |
| | | |
| | ● | lightweight grade No. 4 coated groundwood; |
| | | |
| | ● | ultra-lightweight grade No. 5 coated groundwood; |
| | | |
| | ● | rotogravure coated freesheet; and |
| | | |
| | ● | innovative and performance driven products for the flexible packaging, label, and specialty printing markets. |
Intellectual Property
We have several patents and patent applications in the United States and various foreign countries. These patents and patent applications generally relate to various paper manufacturing methods and equipment which may become commercially viable in the future. We also have trademarks for our names, Verso® and Verso Paper®, as well as for our products such as Influence®, Velocity®, Liberty®, Advocate® and Clarity®. In addition to the intellectual property that we own, we license a significant portion of the intellectual property used in our business on a perpetual, royalty-free, non-exclusive basis from International Paper.
Competition
Our business is highly competitive. A significant number of North American competitors produce coated and supercalendered papers, and several overseas manufacturers, principally from Europe, export to North America. We compete based on a number of factors, including:
| | ● | price; |
| | | |
| | ● | product availability; |
| | | |
| | ● | product quality; |
| | | |
| | ● | breadth of product offerings; |
| | | |
| | ● | timeliness of product delivery; and |
| | | |
| | ● | customer service. |
Foreign competition in North America is also affected by the exchange rate of the U.S. dollar relative to other currencies, especially the euro, market prices in North America and other markets, worldwide supply and demand, and the cost of ocean-going freight.
While our product offering is broad in terms of grades produced (from supercalendered and ultra-lightweight coated groundwood offerings to heavier-weight coated freesheet products), we are focused on producing coated groundwood and coated freesheet in roll form. This strategy is driven by our alignment with catalog and magazine end-users which tend to purchase paper in roll form for use in long runs of web printing in order to minimize costs. Our principal competitors include NewPage Corporation, Resolute Forest Products, UPM-Kymmene Corporation, and Sappi Limited, all of which have North American operations. UPM and Sappi are headquartered overseas and also have overseas manufacturing facilities.
Employees
As of December 31, 2011, we had approximately 2,600 employees, of whom approximately 30% are unionized and approximately 75% are hourly employees. Employees at two of our four mills are represented by labor unions. As of December 5, 2011, three new collective bargaining agreements with the labor unions were ratified and implemented at the two sites. These new agreements were effective retroactive to May 1, 2011, and will expire on April 30, 2015. We have not experienced any work stoppages during the past several years. We believe that we have good relations with our employees.
Environmental and Other Governmental Regulations
We are subject to a wide range of federal, state, regional, and local general and industry specific environmental, health and safety laws and regulations, including the federal Water Pollution Control Act of 1972, or “Clean Water Act,” the federal Clean Air Act, the federal Resource Conservation and Recovery Act, the Comprehensive Environmental Response, Compensation and Liability Act of 1980, or “CERCLA,” the federal Occupational Safety and Health Act, and analogous state and local laws. Our operations also are subject to two regional regimes designed to address climate change, the Regional Greenhouse Gas Initiative in the northeastern United States and the Midwestern Greenhouse Gas Reduction Accord, and in the future we may be subject to additional federal, state, regional, local, or supranational legislation related to climate change and greenhouse gas controls. Among our activities subject to environmental regulation are the emissions of air pollutants, discharges of wastewater and stormwater, operation of dams, storage, treatment, and disposal of materials and waste, and remediation of soil, surface water and ground water contamination. Many environmental laws and regulations provide for substantial fines or penalties and criminal sanctions for any failure to comply. In addition, failure to comply with these laws and regulations could result in the interruption of our operations and, in some cases, facility shutdowns.
Certain of these environmental laws, such as CERCLA and analogous state laws, provide for strict, and under certain circumstances, joint and several liability for investigation and remediation of the release of hazardous substances into the environment, including soil and groundwater. These laws may apply to properties presently or formerly owned or operated by an entity or its predecessors, as well as to conditions at properties at which wastes attributable to an entity or its predecessors were disposed. Under these environmental laws, a current or previous owner or operator of real property, and parties that generate or transport hazardous substances that are disposed of at real property, may be held liable for the cost to investigate or clean up such real property and for related damages to natural resources. We handle and dispose of wastes arising from our mill operations, including disposal at on-site landfills. We are required to maintain financial assurance (in the form of letters of credit and other similar instruments) for the expected cost of landfill closure and post-closure care. We may be subject to liability, including liability for investigation and cleanup costs, if contamination is discovered at one of our current or former paper mills or another location where we have disposed of, or arranged for the disposal of, wastes. We could be subject to potentially significant fines, penalties, criminal sanctions, plant shutdowns, or interruptions in operations for any failure to comply with applicable environmental, health and safety laws, regulations, and permits.
Compliance with environmental laws and regulations is a significant factor in our business. We have made, and will continue to make, significant expenditures to comply with these requirements and our permits. We incurred environmental capital expenditures of $0.1 million in 2011, $7.3 million in 2010, and $2.6 million in 2009, and we expect to incur additional environmental capital expenditures of approximately $1 million in 2012. We anticipate that environmental compliance will continue to require increased capital expenditures and operating expenses over time as environmental laws or regulations, or interpretations thereof, change or the nature of our operations require us to make significant additional capital expenditures.
Permits are required for the operation of our mills and related facilities. The permits are subject to renewal, modification, and revocation. We and others have the right to challenge our permit conditions through administrative and legal appeals and review processes. Governmental authorities have the power to enforce compliance with the permits, and violators are subject to civil and criminal penalties, including fines, injunctions or both. Other parties also may have the right to pursue legal actions to enforce compliance with the permits.
Available Information
Our website is located at www.versopaper.com. We make available free of charge through this website our annual reports on Form 10-K, quarterly reports on Form 10-Q, current reports on Form 8-K, and amendments to those reports filed with or furnished to the Securities and Exchange Commission, or “SEC,” pursuant to Section 13(a) or 15(d) of the Securities Exchange Act of 1934, as soon as reasonably practicable after they are electronically filed with or furnished to the SEC.
Our business is subject to various risks. Set forth below are certain of the more important risks that we face and that could cause our actual results to differ materially from our historical results. These risks are not the only ones that we face. Our business also could be affected by additional risks that are presently unknown to us or that we currently believe are immaterial to our business.
We have limited ability to pass through increases in our costs to our customers. Increases in our costs or decreases in coated or supercalendered paper prices could have a material adverse effect on our business, financial condition, and results of operations.
Our earnings are sensitive to price changes in coated or supercalendered paper. Fluctuations in paper prices (and coated paper prices in particular) historically have had a direct effect on our net income (loss) and Earnings Before Interest, Taxes, Depreciation and Amortization, or “EBITDA,” for several reasons:
| | ● | Market prices for paper products are a function of supply and demand, factors over which we have limited control. We therefore have limited ability to control the pricing of our products. Market prices of grade No. 3, 60 lb. basis weight paper, which is an industry benchmark for coated freesheet paper pricing, have fluctuated since 2000 from a high of $1,100 per ton to a low of $705 per ton. In addition, market prices of grade No. 5, 34 lb. basis weight paper, which is an industry benchmark for coated groundwood paper pricing, have fluctuated between a high of $1,120 per ton to a low of $795 per ton over the same period. Our average coated paper prices declined from 2008 through the first quarter of 2010. While our average coated paper prices climbed modestly beginning in the second quarter of 2010 through the third quarter of 2011, they have recently declined again. Prices may not improve, and we do not expect prices in 2012 to return to the levels they were at in 2008 before they declined. Recent industry forecasts have predicted that prices for both coated freesheet and coated groundwood will decline in the first quarter of 2012. Because market conditions determine the price for our paper products, the price for our products could fall below our cash production costs. |
| | | |
| | ● | Market prices for paper products typically are not directly affected by raw material costs or other costs of sales, and consequently we have limited ability to pass through increases in our costs to our customers absent increases in the market price. Thus, even though our costs may increase, we may not have the ability to increase the prices for our products, or the prices for our products may decline. |
| | | |
| | ● | The manufacturing of coated paper is highly capital-intensive and a large portion of our operating costs are fixed. Additionally, paper machines are large, complex machines that operate more efficiently when operated continuously. Consequently, both we and our competitors typically continue to run our machines whenever marginal sales exceed the marginal costs, adversely impacting prices at times of lower demand. |
Therefore, our ability to achieve acceptable margins is principally dependent on (1) managing our cost structure, (2) managing changes in raw materials prices, which represent a large component of our operating costs and fluctuate based upon factors beyond our control, and (3) general conditions in the paper market. If the prices of our products decline, or if our raw material costs increase, it could have a material adverse effect on our business, financial condition, and results of operations.
The paper industry is cyclical and North American demand for certain paper products tends to decline during a weak U.S. economy. Fluctuations in supply and demand for our products could have a material adverse effect on our business, financial condition, and results of operations.
The paper industry is a commodity market to a significant extent and is subject to cyclical market pressures. North American demand for coated and supercalendered paper products tends to decline during a weak U.S. economy. Accordingly, general economic conditions and demand for magazines and catalogs may have a material adverse impact on the demand for our products, which may result in a material adverse effect on our business, financial condition and results of operations. In addition, currency fluctuations can have a significant impact on the supply of coated paper products in North America. If the U.S. dollar strengthens, imports may increase, which would cause the supply of paper products available in the North American market to increase. Foreign overcapacity also could result in an increase in the supply of paper products available in the North American market. An increased supply of paper available in North America could put downward pressure on prices and/or cause us to lose sales to competitors, either of which could have a material adverse effect on our business, financial condition and results of operations.
Our substantial indebtedness could adversely affect our ability to raise additional capital to fund our operations, limit our ability to react to changes in the economy or our industry, expose us to interest rate risk to the extent of our variable rate debt, and prevent us from meeting our obligations under our indebtedness.
We are a highly leveraged company. As of December 31, 2011, Verso Paper’s total indebtedness was $1,262.5 million, net of $13.4 million of unamortized discounts. The total amount of payments Verso Paper will need to make on its outstanding long-term indebtedness for each of the next three fiscal years is $119.8 million, $197.8 million, and $586.5 million, respectively (assuming the current prevailing interest rates on our outstanding floating rate indebtedness remain the same). As of December 31, 2011, Verso Holdings’ total indebtedness was $1,201.1 million, net of $13.4 million of unamortized discounts. The total amount of payments Verso Holdings will need to make on its outstanding long-term indebtedness for each of the next three fiscal years is $115.5 million, $114.2 million, and $588.1 million, respectively (assuming the current prevailing interest rates on our outstanding floating rate indebtedness remain the same). Because some of our debt bears variable rates of interest, our interest expense could increase in the future.
Our high degree of leverage could have important consequences, including:
| | ● | increasing our vulnerability to general adverse economic and industry conditions; |
| | | |
| | ● | requiring us to dedicate a substantial portion of our cash flow from operations to payments on our indebtedness, thereby reducing the availability of our cash flow to fund working capital, capital expenditures, research and development efforts, and other general corporate purposes; |
| | | |
| | ● | increasing our vulnerability to, and limiting our flexibility in planning for, or reacting to, changes in our business and the industry in which we operate; |
| | | |
| | ● | exposing us to the risk of increased interest rates as borrowings under our senior secured credit facility and our second priority senior secured floating rate notes are subject to variable rates of interest; |
| | | |
| | ● | placing us at a competitive disadvantage compared to our competitors that have less debt; and |
| | | |
| | ● | limiting our ability to borrow additional funds. |
Despite our current indebtedness levels, we and our subsidiaries may still be able to incur substantially more debt. This could further exacerbate the risks associated with our substantial leverage.
We and our subsidiaries may be able to incur substantial additional indebtedness in the future because the terms of the indentures governing our notes and our senior secured revolving credit facility do not fully prohibit us or our subsidiaries from doing so. In addition, subject to covenant compliance and certain conditions, our senior secured revolving credit facility permits borrowing of up to approximately an additional $159.2 million (as of December 31, 2011). If new indebtedness is added to our and our subsidiaries’ current debt levels, the related risks that we and they now face could intensify.
Our operations require substantial ongoing capital expenditures, and we may not have adequate capital resources to fund all of our required capital expenditures.
Our business is capital intensive, and we incur capital expenditures on an ongoing basis to maintain our equipment and comply with environmental laws, as well as to enhance the efficiency of our operations. Our total capital expenditures were $90 million in 2011. Capital expenditures in 2011 included approximately $36 million for maintenance and environmental capital expenditures. We currently estimate our capital expenditures to range between $85 million and $95 million during 2012, with approximately $30 million reimbursed through government grants for our renewable energy initiatives. Our estimated expenditures for 2012 include approximately $30 million for maintenance and environmental capital expenditures. We anticipate that our available cash resources, including amounts under new credit facilities to be entered into that we obtained commitments for in February 2012, and cash generated from operations will be sufficient to fund our operating needs and capital expenditures for at least the next year. We may also dispose of certain of our non-core assets in order to obtain additional liquidity. However, if we require additional funds to fund our capital expenditures, we may not be able to obtain them on favorable terms, or at all. If we cannot maintain or upgrade our facilities and equipment as we require or as necessary to ensure environmental compliance, it could have a material adverse effect on our business, financial condition, and results of operations.
We will require a significant amount of cash to service our indebtedness and make planned capital expenditures. Our ability to generate cash or refinance our indebtedness depends on many factors beyond our control.
Our ability to make payments on and to refinance our indebtedness and to fund planned capital expenditures and research and development efforts will depend on our ability to generate cash flow in the future and our ability to borrow under our credit facility to the extent of available borrowings. This, to a certain extent, is subject to general economic, financial, competitive, legislative, regulatory, and other factors that are beyond our control. If adverse regional and national economic conditions persist, worsen, or fail to improve significantly, we could experience decreased revenues from our operations attributable to decreases in wholesale and consumer spending levels and could fail to generate sufficient cash to fund our liquidity needs or fail to satisfy the restrictive covenants and borrowing limitations which we are subject to under our indebtedness. Additionally, until December 31, 2009, the United States government provided an excise tax credit to taxpayers for the use of alternative fuel mixtures. As a result of our use of an alternative fuel mixture containing “black liquor,” a byproduct of pulp production, at our Androscoggin and Quinnesec mills, we recognized $238.9 million of alternative fuel mixture tax credits in the year ended December 31, 2009, including approximately $10 million for claims pending at December 31, 2009. The amount recognized in fiscal 2009 includes amounts received for claims for use of the alternative fuel mixture from September 2008 through December 2009. The tax credit, as it relates to liquid fuels derived from biomass, expired on December 31, 2009.
In addition to our debt service needs, our parent company, Verso Finance, will likely need to rely upon distributions from us to service its outstanding term loans, $84.7 million aggregate principal amount of which are outstanding as of December 31, 2011, including for the payment of interest, to the extent that our parent elects to pay interest in cash, and for the payment of principal at maturity in February 2013. Our ability to generate sufficient cash from operations to make distributions to our parent will depend upon our future operating performance, which will be affected by general economic, financial, competitive, legislative, regulatory, business, and other factors beyond our control. In addition, our ability to make distributions to our parent is subject to restrictions in our various debt instruments. For example, the indentures governing our notes generally limit the amount of “restricted payments,” including dividends, that we can make to an amount generally equal to 50% of our consolidated net income (as defined) since July 1, 2006, subject to satisfaction of certain other tests and certain exceptions. Our credit agreement only permits dividends to fund debt service of our parent from a “cumulative credit” basket built from proceeds of equity, certain cash flow and certain other items. In addition, the notes provide certain exceptions to this to permit additional dividends. As described above, our ability to generate net income will depend upon various factors that may be beyond our control. We may not generate sufficient cash flow from operations or be permitted by the terms of our debt instruments to pay dividends or distributions to our parent in amounts sufficient to allow it to pay cash interest on its debt. If Verso Finance is unable to meet its debt service obligations, it could attempt to restructure or refinance its indebtedness or seek additional equity capital. We cannot assure you that our parent will be able to accomplish these actions on satisfactory terms, if at all. A default under the Verso Finance term loans could result in a change of control under our other debt instruments and lead to an acceleration of all outstanding loans under our senior secured credit facility and our outstanding notes.
Based on our current and expected level of operations, we believe our cash flow from operations, available cash, and available borrowings under our senior secured revolving credit facility (or replacement facilities) will be adequate to meet our future liquidity needs for at least the next year.
We cannot assure you, however, that our business will generate sufficient cash flow from operations or that future borrowings will be available to us under our senior secured credit facility or otherwise in an amount sufficient to enable us to pay our indebtedness or to fund our other liquidity needs. Our senior secured revolving credit facility matures in August 2012, our senior subordinated notes mature in 2016, our second-lien floating rate notes mature in 2014 and our parent’s term loan matures in 2013. On February 17, 2012, we obtained $100.0 million of commitments with respect to the syndication of a new accounts receivable securitization facility and approximately $55.0 million of commitments to provide a new and/or extended revolving facility under our existing senior secured revolving credit facility. The terms and conditions of our existing revolving credit facility remain in full force and effect and have not been altered by these new commitments. We may also explore additional steps to raise liquidity including potential dispositions of non-core assets. We may need to refinance all or a portion of our indebtedness on or before the maturity thereof. We cannot assure you that we will be able to refinance any of our indebtedness, including our senior secured credit facility, and our outstanding notes, on commercially reasonable terms or at all. If we cannot service our indebtedness, we may have to take actions such as selling assets, seeking additional equity or reducing or delaying capital expenditures, strategic acquisitions, investments and alliances. We cannot assure you that any such actions, if necessary, could be effected on commercially reasonable terms or at all, or terms that would not require us to breach the terms and conditions of our existing or future debt agreements.
Restrictive covenants in the indentures governing our notes and in our senior secured revolving credit agreement may restrict our ability to pursue our business strategies.
The indentures governing our notes and our senior secured revolving credit agreement limit our ability, among other things, to:
| | ● | incur additional indebtedness; |
| | | |
| | ● | pay dividends or make other distributions or repurchase or redeem our stock; |
| | | |
| | ● | prepay, redeem or repurchase certain of our indebtedness; |
| | | |
| | ● | make investments; |
| | | |
| | ● | sell assets, including capital stock of restricted subsidiaries; |
| | ● | enter into agreements restricting our subsidiaries’ ability to pay dividends; |
| | | |
| | ● | consolidate, merge, sell or otherwise dispose of all or substantially all of our assets; |
| | | |
| | ● | enter into transactions with our affiliates; and |
| | | |
| | ● | incur liens. |
A breach of any of these restrictive covenants could result in a default under the indentures governing our notes and our senior secured revolving credit agreement. If a default occurs, the holders of the notes and the lenders under our senior secured revolving credit facility may elect to declare all borrowings or notes outstanding, together with accrued interest and other fees, to be immediately due and payable. The lenders under our senior secured revolving credit facility would also have the right in these circumstances to terminate any commitments they have to provide further borrowings. If we are unable to repay our indebtedness when due or declared due, the lenders under our senior secured revolving credit facility and our other secured indebtedness will also have the right to proceed against the collateral, including our available cash, granted to them to secure the indebtedness. If the indebtedness under our senior secured revolving credit facility and our outstanding notes were to be accelerated, we cannot assure you that our assets would be sufficient to repay in full our secured indebtedness and we could be forced into bankruptcy or liquidation.
Developments in alternative media could adversely affect the demand for our products.
Trends in advertising, electronic data transmission and storage and the internet could have adverse effects on traditional print media, including our products and those of our customers, but neither the timing nor the extent of those trends can be predicted with certainty. Our magazine and catalog publishing customers may increasingly use, and compete with businesses that use, other forms of media and advertising and electronic data transmission and storage, particularly the internet, instead of paper made by us. As the use of these alternatives grows, demand for our paper products could decline.
Litigation could be costly and harmful to our business.
We are involved from time to time in claims and legal proceedings relating to contractual, employment,
environmental, intellectual property and other matters incidental to the conduct of our business. We do not believe that any currently pending claim or legal proceeding is likely to result in an unfavorable outcome that would have a material adverse effect on our financial condition or results of operations. Nonetheless, claims and legal proceedings could result in unfavorable outcomes that could have a material adverse effect on our financial condition and results of operations.
The markets in which we operate are highly competitive.
Our business is highly competitive. Competition is based largely on price. We compete with foreign producers, some of which are lower cost producers than we are or are subsidized by governments. We also face competition from numerous North American coated and supercalendered paper manufacturers. Some of our competitors have advantages over us, including lower raw material and labor costs and fewer environmental and governmental regulations to comply with than we do. One of our competitors is restructuring through bankruptcy proceedings and it is not possible to predict whether such restructuring will have any effect on competition (such as reduced costs for our competitor). Furthermore, some of our competitors have greater financial and other resources than we do or may be better positioned than we are to compete for certain opportunities.
Our non-U.S. competitors may develop a competitive advantage over us and other U.S. producers if the U.S. dollar strengthens in comparison to the home currency of those competitors or ocean shipping rates decrease. If the U.S. dollar strengthens, if shipping rates decrease or if overseas supply exceeds demand, imports may increase, which would cause the supply of coated paper products available in the North American market to increase. An increased supply of coated paper could cause us to lower our prices or lose sales to competitors, either of which could have a material adverse effect on our business, financial condition, and results of operations.
In addition, the following factors will affect our ability to compete:
| | ● | |
| | | |
| | ● | the quality of our products; |
| | | |
| | ● | our breadth of product offerings; |
| | | |
| | ● | our ability to maintain plant efficiencies and to achieve high operating rates; |
| | | |
| | ● | manufacturing costs per ton; |
| | | |
| | ● | customer service and our ability to distribute our products on time; and |
| | | |
| | ● | the availability and/or cost of wood fiber, market pulp, chemicals, energy and other raw materials, and labor. |
If we are unable to obtain energy or raw materials at favorable prices, or at all, it could have a material adverse effect on our business, financial condition, and results of operations.
We purchase energy, wood fiber, market pulp, chemicals, and other raw materials from third parties. We may experience shortages of energy supplies or raw materials or be forced to seek alternative sources of supply. If we are forced to seek alternative sources of supply, we may not be able to do so on terms as favorable as our current terms or at all. The prices for energy and many of our raw materials, especially petroleum-based chemicals, have recently been volatile and are expected to remain volatile for the foreseeable future. Chemical suppliers that use petroleum-based products in the manufacture of their chemicals may, due to a supply shortage and cost increase, ration the amount of chemicals available to us and/or we may not be able to obtain the chemicals we need to operate our business at favorable prices, if at all. In addition, certain specialty chemicals that we purchase are available only from a small number of suppliers. If any of these suppliers were to cease operations or cease doing business with us, we may be unable to obtain such chemicals at favorable prices, if at all.
The supply of energy or raw materials may be adversely affected by, among other things, natural disasters or an outbreak or escalation of hostilities between the United States and any foreign power. For example, wood fiber is a commodity and prices historically have been cyclical. The primary source for wood fiber is timber. Environmental litigation and regulatory developments have caused, and may cause in the future, significant reductions in the amount of timber available for commercial harvest in Canada and the United States. In addition, future domestic or foreign legislation, litigation advanced by aboriginal groups, litigation concerning the use of timberlands, the protection of endangered species, the promotion of forest biodiversity, and the response to and prevention of wildfires and campaigns or other measures by environmental activists also could affect timber supplies. The availability of harvested timber may further be limited by factors such as fire and fire prevention, insect infestation, disease, ice and wind storms, droughts, floods, and other natural and man-made causes. Additionally, due to increased fuel costs, suppliers, distributors and freight carriers have charged fuel surcharges, which have increased our costs. Any significant shortage or significant increase in our energy or raw material costs in circumstances where we cannot raise the price of our products due to market conditions could have a material adverse effect on our business, financial condition, and results of operations. Any disruption in the supply of energy or raw materials also could affect our ability to meet customer demand in a timely manner and could harm our reputation. Furthermore, we may be required to post letters of credit or other financial assurance obligations with certain of our energy and other suppliers, which could limit our financial flexibility.
Currency fluctuations may adversely affect our business, financial condition, and results of operations.
We compete with producers in North America and abroad. Changes in the relative strength or weakness of the U.S. dollar may affect international trade flows of coated paper products. A stronger U.S. dollar may attract imports from foreign producers, increase supply in the United States, and have a downward effect on prices, while a weaker U.S. dollar may encourage U.S. exports. Variations in the exchange rates between the U.S. dollar and other currencies, particularly the Canadian dollar and the euro, may significantly affect our competitive position, including by making it more attractive for foreign producers to restart previously shut-down paper mills or by increasing production capacity in North America or Europe.
We are involved in continuous manufacturing processes with a high degree of fixed costs. Any interruption in the operations of our manufacturing facilities may affect our operating performance.
We seek to run our paper machines on a nearly continuous basis for maximum efficiency. Any downtime at any of our paper mills, including as a result of or in connection with planned maintenance and capital expenditure projects, results in unabsorbed fixed costs that negatively affect our results of operations for the period in which we experience the downtime. Due to the extreme operating conditions inherent in some of our manufacturing processes, we may incur unplanned business interruptions from time to time and, as a result, we may not generate sufficient cash flow to satisfy our operational needs. In addition, many of the geographic areas where our production is located and where we conduct our business may be affected by natural disasters, including snow storms, forest fires, and flooding. Such natural disasters could cause our mills to stop running, which could have a material adverse effect on our business, financial condition, and results of operations. Furthermore, during periods of weak demand for paper products, such as the current market, we have experienced and may in the future experience market-related downtime, which could have a material adverse effect on our financial condition and results of operations.
We depend on a small number of customers for a significant portion of our business.
Our largest customers, Quad/Graphics, Inc. and xpedx, and their respective affiliates, accounted for approximately 10% and 9%, respectively, of our net sales in 2011. In 2011, our ten largest customers (including Quad/Graphics, Inc. and xpedx, and their respective affiliates) accounted for approximately 53% of our net sales, while our ten largest end-users accounted for approximately 26% of our net sales. The loss of, or reduction in orders from, any of these customers or other customers could have a material adverse effect on our business, financial condition, and results of operations, as could significant customer disputes regarding shipments, price, quality, or other matters.
We may not realize certain productivity enhancements or improvements in costs.
As part of our business strategy, we are in the process of identifying opportunities to improve profitability by reducing costs and enhancing productivity. For example, through our continuous process improvement program, we have implemented focused programs to optimize material and energy sourcing and usage, reduce repair costs, and control overhead. We will continue to utilize the process improvement program to drive further cost reductions and operating improvements in our mill system, and have targeted additional profitability enhancements in the next twelve months. Any cost savings or productivity enhancements that we realize from such efforts may differ materially from our estimates. In addition, any cost savings or productivity enhancements that we realize may be offset, in whole or in part, by reductions in pricing or volume, or through increases in other expenses, including raw material, energy or personnel. We cannot assure you that these initiatives will be completed as anticipated or that the benefits we expect will be achieved on a timely basis or at all.
Rising postal costs could weaken demand for our paper products.
A significant portion of paper is used in magazines, catalogs, and other promotional mailings. Many of these materials are distributed through the mail. Future increases in the cost of postage could reduce the frequency of mailings, reduce the number of pages in magazine and advertising materials, and/or cause catalog and magazine publishers to use alternate methods to distribute their materials. Any of the foregoing could decrease the demand for our products, which could have a material adverse effect on our business, financial condition, and results of operations.
Our business may suffer if we do not retain our senior management.
We depend on our senior management. The loss of services of members of our senior management team could adversely affect our business until suitable replacements can be found. There may be a limited number of persons with the requisite skills to serve in these positions and we may be unable to locate or employ qualified personnel on acceptable terms. In addition, our future success requires us to continue to attract and retain competent personnel.
A large percentage of our employees are unionized. Wage and benefit increases and work stoppages and slowdowns by our unionized employees may have a material adverse effect on our business, financial condition, and results of operations.
As of December 31, 2011, approximately 30%, of our employees were represented by labor unions at two of our mills. As of December 5, 2011, three new collective bargaining agreements with the labor unions were ratified and implemented at the two sites. These new agreements were effective retroactive to May 1, 2011, and will expire on April 30, 2015. We may become subject to material cost increases or additional work rules imposed by agreements with labor unions. This could increase expenses in absolute terms and/or as a percentage of net sales. In addition, although we believe we have good relations with our employees, work stoppages or other labor disturbances may occur in the future. Any of these factors could negatively affect our business, financial condition, and results of operations.
We depend on third parties for certain transportation services.
We rely primarily on third parties for transportation of our products to our customers and transportation of our raw materials to us, in particular, by truck and train. If any third-party transportation provider fails to deliver our products in a timely manner, we may be unable to sell them at full value. Similarly, if any transportation provider fails to deliver raw materials to us in a timely manner, we may be unable to manufacture our products on a timely basis. Shipments of products and raw materials may be delayed due to weather conditions, strikes or other events. Any failure of a third-party transportation provider to deliver raw materials or products in a timely manner could harm our reputation, negatively impact our customer relationships and have a material adverse effect on our business, financial condition, and results of operations. In addition, our ability to deliver our products on a timely basis could be adversely affected by the lack of adequate availability of transportation services, especially rail capacity, whether because of work stoppages or otherwise. Furthermore, increases in the cost of our transportation services, including as a result of rising fuel costs, could have a material adverse effect on our business, financial condition, and results of operations.
We are subject to various environmental, health and safety laws and regulations that could impose substantial costs or other liabilities upon us and may have a material adverse effect on our business, financial condition, and results of operations.
We are subject to a wide range of federal, state, regional, and local general and industry-specific environmental, health and safety laws and regulations, including those relating to air emissions (including greenhouse gases and hazardous air pollutants), wastewater discharges, solid and hazardous waste management and disposal, and site remediation. Compliance with these laws and regulations, and permits issued thereunder, is a significant factor in our business. We have made, and will continue to make, significant expenditures to comply with these requirements and our permits, which may impose increasingly more stringent standards over time as they are renewed or modified by the applicable governmental authorities. In addition, we handle and dispose of wastes arising from our mill operations and operate a number of on-site landfills to handle that waste. We maintain financial assurance (in the form of letters of credit and other similar instruments) for the projected cost of closure and post-closure care for these landfill operations. We could be subject to potentially significant fines, penalties, criminal sanctions, plant shutdowns, or interruptions in operations for any failure to comply with applicable environmental, health and safety laws, regulations, and permits. Moreover, under certain environmental laws, a current or previous owner or operator of real property, and parties that generate or transport hazardous substances that are disposed of at real property, may be held liable for the full cost to investigate or clean up such real property and for related damages to natural resources. We may be subject to liability, including liability for investigation and cleanup costs, if contamination is discovered at one of our current or former paper mills, other properties or other locations where we have disposed of, or arranged for the disposal of, wastes. The 2006 acquisition agreement with International Paper contains an environmental indemnity, subject to certain limitations, for former properties and former off-site shipments related to the business during the time it was owned by International Paper, as well as certain other limited environmental liabilities. There can be no assurance that International Paper will perform under any of its environmental indemnity obligations, and its failure to do so could have a material adverse effect on our financial condition and results of operations. We also could be subject to claims brought pursuant to applicable laws, rules or regulations for property damage or personal injury resulting from the environmental impact of our operations, including due to human exposure to hazardous substances. Increasingly stringent or new environmental requirements, more aggressive enforcement actions or policies, the discovery of unknown conditions or the bringing of future claims may cause our expenditures for environmental matters to increase, and we may incur material costs associated with these matters.
A 2007 decision of the United States Supreme Court held that greenhouse gases are subject to regulation under the Clean Air Act. The Environmental Protection Agency, or “EPA,” has subsequently issued regulations applicable to us which require monitoring of greenhouse gas emissions. The EPA has also issued regulations which require certain new and modified air emissions sources to control their greenhouse gas emission, which may have a material effect on our operations. The United States Congress has in the past, and may in the future, consider legislation which would similarly provide for regulation of greenhouse gas emissions. It is also possible that we could become subject to other federal, state, regional, local, or supranational legislation related to climate change and greenhouse gas controls. We do not expect that we would be disproportionately affected by these measures as compared to similarly situated operators in the United States.
On December 2, 2011, the EPA issued proposed amendments to its "National Emissions Standards for Hazardous Air Pollutants for Major Sources: Industrial, Commercial and Institutional Boilers and Process Heaters." The rule, referred to as the “Boiler MACT” rule, governs emissions of air toxics from boilers and process heaters at industrial facilities. Certain of our boilers may be subject to the new rule. If they are, we may be required to limit our emissions and/or install additional pollution controls. In addition, on December 27, 2011, the EPA published its proposed "National Emissions Standards for Hazardous Air Pollutants from the Pulp and Paper Industry," which is likewise a MACT standard that specifically governs emissions of air toxics from pulp and paper facilities. Whether or not additional measures will be required to comply with these rules, and the cost of any such compliance, is unclear at this time because such rules have not been finalized or are under reconsideration. However, compliance costs could be material and have an adverse effect on our business, financial condition and results of operations.
A downgrade in our debt ratings could result in increased interest and other financial expenses related to future borrowings, and could further restrict our access to additional capital or trade credit.
Standard and Poor’s Ratings Services and Moody’s Investors Service maintain credit ratings for us. Each of these ratings is currently below investment grade. Any decision by these or other ratings agencies to downgrade such ratings in the future could result in increased interest and other financial expenses relating to our future borrowings, and could restrict our ability to obtain financing on satisfactory terms. In addition, any further downgrade could restrict our access to, and negatively impact the terms of, trade credit extended by our suppliers of raw materials.
Lenders under our revolving credit facility may not fund their commitments.
Although the lenders under our revolving credit facility are well-diversified, totaling 14 lenders at December 31, 2011, there can be no assurance that deterioration in the credit markets or overall economy will not affect the ability of our lenders to meet their funding commitments. If a lender fails to honor its commitment under the revolving credit facility, that portion of the credit facility will be unavailable to the extent that the lender’s commitment is not replaced by a new commitment from an alternate lender.
Additionally, our lenders have the ability to transfer their commitments to other institutions, and the risk that committed funds may not be available under distressed market conditions could be exacerbated if consolidation of the commitments under our revolving credit facility or among its lenders were to occur.
Our common stock may cease to be listed on the New York Stock Exchange
Our common stock is currently listed on the New York Stock Exchange, or “NYSE,” under the symbol “VRS.” We may not be able to meet the continued listing requirements of the NYSE, which has notified us that we have fallen below the NYSE’s continued listing standard relating to market capitalization. Our common stock continues to be traded on the NYSE, subject to our compliance with other NYSE continued listing requirements. Under the applicable NYSE rules, we have submitted a plan demonstrating our ability to achieve compliance with the market capitalization standard by June 21, 2013. If we are unable to satisfy the requirements of the NYSE for continued listing, our common stock would be subject to delisting. Any delisting could have a material adverse effect on our share price which, among other things, could cause a downgrade in our debt ratings potentially resulting in increased interest and other financial expenses related to future borrowings, and could further restrict our access to additional capital or trade credit.
Not applicable.
Our corporate headquarters is located in Memphis, Tennessee. We own four mills located in Maine, Michigan, and Minnesota at which we operate 9 paper machines. We own five hydroelectric dams, of which four provide hydroelectric power to our Androscoggin mill and the fifth services our Sartell mill. We also own 15 and lease two woodyards for the purpose of storage and loading of forest products, and we lease a number of sales offices. In addition, we own and lease 27,000 acres of hybrid poplar woodlands located near Alexandria, Minnesota.
Our headquarters and material facilities as of December 31, 2011, are shown in the following table:
| Location | Use | Owned/Leased |
| Memphis, Tennessee | corporate headquarters | leased |
| Jay (Androscoggin), Maine | paper mill/kraft pulp mill | owned |
| Bucksport, Maine | paper mill | owned |
| Quinnesec, Michigan | paper mill/kraft pulp mill | owned |
| Sartell, Minnesota | paper mill | owned |
| West Chester, Ohio | sales, distribution, and customer service | leased |
We are involved in legal proceedings incidental to the conduct of our business. We do not believe that any liability that may result from these proceedings will have a material adverse effect on our financial statements.
Not applicable.
PART II
Market Information
Our common stock is traded on the New York Stock Exchange under the symbol “VRS.” The following table sets forth the high and low sales prices per share of our common stock, as reported by the New York Stock Exchange, for the indicated periods:
| | | High | | | Low | |
| 2011 | | | | | | |
| First quarter | | $ | 6.37 | | | $ | 3.43 | |
| Second quarter | | | 5.44 | | | | 2.51 | |
| Third quarter | | | 3.16 | | | | 1.65 | |
| Fourth quarter | | | 1.95 | | | | 0.85 | |
| 2010 | | | | | | | | |
| First quarter | | $ | 3.96 | | | $ | 2.64 | |
| Second quarter | | | 5.76 | | | | 2.29 | |
| Third quarter | | | 3.23 | | | | 2.05 | |
| Fourth quarter | | | 4.03 | | | | 2.80 | |
Holders
As of February 29, 2012, there were 20 stockholders of record of our common stock.
Dividends
We paid no dividends on our common stock prior to our IPO. Following our IPO in May 2008, we paid cash dividends on our common stock in the amount of $0.03 per share for the second and third quarters, which were declared and paid in the following quarter. We suspended the payment of dividends in 2008 beginning with the fourth quarter dividend. Past dividend payments are not indicative of our future dividend policy, and there can be no assurance that we will declare or pay any cash dividends in the future. Any future determination relating to our dividend policy will be made at the discretion of our board of directors and will depend on then existing conditions, including our financial condition, results of operations, contractual restrictions, capital requirements, business prospects and other factors that our board of directors may deem relevant. Our ability to pay dividends on our common stock is limited by the covenants of our revolving credit facility and the indentures governing our outstanding notes, and may be further restricted by the terms of any of our future debt or preferred securities.
Equity Compensation Plan Information
The table below sets forth information regarding the number of shares of common stock to be issued upon the exercise of the outstanding stock options granted under our equity compensation plans and the shares of common stock remaining available for future issuance under our equity compensation plans as of December 31, 2011.
| | | | Number of securities |
| | Number of | Weighted- | remaining available |
| | securities to be | average | for future issuance |
| | issued upon | exercise | under equity |
| | exercise of | price of | compensation plans |
| | outstanding | outstanding | (excluding securities |
| | options | options | reflected in column (a)) |
| Plan Category | (a) | (b) | (c) |
| Equity compensation plans approved by security holders | 1,781,499 | $3.90 | 1,909,834 |
| Equity compensation plans not approved by security holders | - | - | - |
| Total | 1,781,499 | $3.90 | 1,909,834 |
Stock Repurchases under 2008 Incentive Award Plan
Participants in our 2008 Incentive Award Plan, or the “Plan,” may elect to surrender to us restricted shares of our common stock issued to them pursuant to awards granted under the Plan to satisfy the applicable federal, state, local, and foreign tax withholding obligations that arise upon the vesting of their shares of restricted stock under the Plan. Shares of restricted stock surrendered to us to meet tax withholding obligations are deemed to be repurchased pursuant to the Plan. There were no shares of restricted stock repurchased to meet participants’ tax withholding obligations during the fourth quarter of 2011.
The following tables present our selected financial data as of and for the periods presented for Verso Paper and Verso Holdings. The following information is only a summary and should be read in conjunction with “Management’s Discussion and Analysis of Financial Condition and Results of Operations” and the financial statements and their related notes, and the other financial information, included elsewhere in this annual report.
The selected historical financial data for Verso Paper as of and for the years ended December 31, 2011, 2010, 2009, 2008, and 2007, have been derived from the audited consolidated (2011, 2010, 2009, and 2008) and combined (2007) financial statements of Verso Paper. The selected historical financial data for Verso Holdings as of and for the years ended December 31, 2011, 2010, 2009, 2008, and 2007, have been derived from the audited consolidated financial statements of Verso Holdings. The audited consolidated financial statements of Verso Paper and Verso Holdings as of December 31, 2011 and 2010, and for the years ended December 31, 2011, 2010, and 2009, are included elsewhere in this annual report.
| | | VERSO PAPER | |
| | | Consolidated | | | Combined | |
| (Dollars and tons in millions except | | Year Ended December 31, | |
| per share amounts) | | 2011 | | | 2010 | | | 2009 | | | 2008 | | | 2007 | |
| Statement of Operations Data: | | | | | | | | | | | | | | | |
| Net sales | | $ | 1,722.5 | | | $ | 1,605.3 | | | $ | 1,360.9 | | | $ | 1,766.8 | | | $ | 1,628.8 | |
| Costs and expenses: | | | | | | | | | | | | | | | | | | | | |
| Cost of products sold - (exclusive of | | | | | | | | | | | | | | | | | | | | |
| depreciation, amortization, and depletion) | | | 1,460.3 | | | | 1,410.8 | | | | 1,242.7 | | | | 1,463.2 | | | | 1,403.0 | |
| Depreciation, amortization, and depletion | | | 125.3 | | | | 127.4 | | | | 132.7 | | | | 134.5 | | | | 123.2 | |
| Selling, general, and administrative expenses | | | 78.0 | | | | 71.0 | | | | 61.9 | | | | 79.7 | | | | 53.2 | |
| Goodwill impairment | | | 18.7 | | | | - | | | | - | | | | - | | | | - | |
| Restructuring and other charges | | | 24.5 | | | | - | | | | 1.0 | | | | 27.4 | | | | 19.4 | |
| Total operating expenses | | | 1,706.8 | | | | 1,609.2 | | | | 1,438.3 | | | | 1,704.8 | | | | 1,598.8 | |
| Operating income (loss) | | | 15.7 | | | | (3.9 | ) | | | (77.4 | ) | | | 62.0 | | | | 30.0 | |
| Interest income | | | (0.1 | ) | | | (0.1 | ) | | | (0.3 | ) | | | (0.8 | ) | | | (1.5 | ) |
| Interest expense | | | 126.6 | | | | 128.1 | | | | 123.4 | | | | 125.6 | | | | 143.0 | |
Other income, net(1) | | | 26.1 | | | | (0.9 | ) | | | (307.3 | ) | | | - | | | | - | |
| Income (loss) before income taxes | | | (136.9 | ) | | | (131.0 | ) | | | 106.8 | | | | (62.8 | ) | | | (111.5 | ) |
| Income tax expense | | | 0.2 | | | | 0.1 | | | | 0.8 | | | | - | | | | - | |
| Net income (loss) | | $ | (137.1 | ) | | $ | (131.1 | ) | | $ | 106.0 | | | $ | (62.8 | ) | | $ | (111.5 | ) |
| Per Share Data: | | | | | | | | | | | | | | | | | | | | |
| Earnings (loss) per share: | | | | | | | | | | | | | | | | | | | | |
| Basic | | $ | (2.61 | ) | | $ | (2.50 | ) | | $ | 2.03 | | | $ | (1.35 | ) | | $ | (2.93 | ) |
| Diluted | | | (2.61 | ) | | | (2.50 | ) | | | 2.03 | | | | (1.35 | ) | | | (2.93 | ) |
| Weighted average common shares outstanding | | | | | | | | | | | | | | | | | | | | |
| (in thousands): | | | | | | | | | | | | | | | | | | | | |
| Basic | | | 52,595 | | | | 52,445 | | | | 52,138 | | | | 46,691 | | | | 38,047 | |
| Diluted | | | 52,595 | | | | 52,445 | | | | 52,153 | | | | 46,691 | | | | 38,047 | |
| Statement of Cash Flows Data: | | | | | | | | | | | | | | | | | | | | |
| Cash provided by operating activities | | $ | 14.5 | | | $ | 73.5 | | | $ | 177.2 | | | $ | 54.1 | | | $ | 15.0 | |
| Cash used in investing activities | | | (66.2 | ) | | | (98.3 | ) | | | (34.1 | ) | | | (81.3 | ) | | | (69.1 | ) |
| Cash provided by (used in) financing activities | | | (6.2 | ) | | | 25.5 | | | | (110.5 | ) | | | 88.2 | | | | 0.2 | |
| Other Financial and Operating Data: | | | | | | | | | | | | | | | | | | | | |
EBITDA(2) | | $ | 114.9 | | | $ | 124.4 | | | $ | 362.6 | | | $ | 196.5 | | | $ | 153.2 | |
| Capital expenditures | | | (90.3 | ) | | | (73.6 | ) | | | (34.2 | ) | | | (81.4 | ) | | | (70.9 | ) |
| Total tons sold | | | 2,023.4 | | | | 2,063.6 | | | | 1,724.5 | | | | 1,952.7 | | | | 2,096.3 | |
| Balance Sheet Data: | | | | | | | | | | | | | | | | | | | | |
Working capital(3) | | $ | 142.6 | | | $ | 162.4 | | | $ | 210.6 | | | $ | 151.9 | | | $ | 87.2 | |
| Property, plant and equipment, net | | | 934.7 | | | | 972.7 | | | | 1,022.6 | | | | 1,116.0 | | | | 1,160.2 | |
| Total assets | | | 1,421.5 | | | | 1,516.1 | | | | 1,572.7 | | | | 1,636.4 | | | | 1,603.5 | |
| Total debt | | | 1,262.5 | | | | 1,228.6 | | | | 1,192.4 | | | | 1,357.7 | | | | 1,419.6 | |
| Total equity (deficit) | | | (153.9 | ) | | | (6.8 | ) | | | 125.3 | | | | (10.0 | ) | | | (75.1 | ) |
| (1) | Other income was $307.3 million for the year ended December 31, 2009, which includes $238.9 million in net benefits from alternative fuel mixture tax credits provided by the U.S. government for our use of black liquor in alternative fuel mixtures and $64.8 million in net gains related to the early retirement of debt. |
| (2) | EBITDA consists of earnings before interest, taxes, depreciation, and amortization. EBITDA is a measure commonly used in our industry and we present EBITDA to enhance your understanding of our operating performance. We use EBITDA as one criterion for evaluating our performance relative to that of our peers. We believe that EBITDA is an operating performance measure, and not a liquidity measure, that provides investors and analysts with a measure of operating results unaffected by differences in capital structures, capital investment cycles and ages of related assets among otherwise comparable companies. However, EBITDA is not a measurement of financial performance under U.S. GAAP, and our EBITDA may not be comparable to similarly titled measures of other companies. You should consider our EBITDA in addition to, and not as a substitute for, or superior to, our operating or net income or cash flows from operating activities determined in accordance with U.S. GAAP. The following table reconciles net income (loss) to EBITDA for the periods presented: |
| | | VERSO PAPER | |
| | | Consolidated | | | Combined | |
| | | Year Ended December 31, | |
| (Dollars in millions) | | 2011 | | | 2010 | | | 2009 | | | 2008 | | | 2007 | |
| Reconciliation of net income (loss) to EBITDA: | | | | | | | | | | | | | | | |
| Net income (loss) | | $ | (137.1 | ) | | $ | (131.1 | ) | | $ | 106.0 | | | $ | (62.8 | ) | | $ | (111.5 | ) |
| Income tax expense | | | 0.2 | | | | 0.1 | | | | 0.8 | | | | - | | | | - | |
| Interest expense, net | | | 126.5 | | | | 128.0 | | | | 123.1 | | | | 124.8 | | | | 141.5 | |
| Depreciation, amortization, and depletion | | | 125.3 | | | | 127.4 | | | | 132.7 | | | | 134.5 | | | | 123.2 | |
| EBITDA | | $ | 114.9 | | | $ | 124.4 | | | $ | 362.6 | | | $ | 196.5 | | | $ | 153.2 | |
| (3) | Working capital is defined as current assets net of current liabilities, excluding the current portion of long-term debt. |
| | | VERSO HOLDINGS | |
| | | Year Ended December 31, | |
| (Dollars and tons in millions) | | 2011 | | | 2010 | | | 2009 | | | 2008 | | | 2007 | |
| Statement of Operations Data: | | | | | | | | | | | | | | | |
| Net sales | | $ | 1,722.5 | | | $ | 1,605.3 | | | $ | 1,360.9 | | | $ | 1,766.8 | | | $ | 1,628.8 | |
| Costs and expenses: | | | | | | | | | | | | | | | | | | | | |
| Cost of products sold - (exclusive of depreciation, | | | | | | | | | | | | | | | | | | | | |
| amortization, and depletion) | | | 1,460.3 | | | | 1,410.8 | | | | 1,242.7 | | | | 1,462.3 | | | | 1,403.2 | |
| Depreciation, amortization, and depletion | | | 125.3 | | | | 127.4 | | | | 132.7 | | | | 134.4 | | | | 123.1 | |
| Selling, general, and administrative expenses | | | 78.0 | | | | 70.9 | | | | 61.7 | | | | 79.4 | | | | 52.0 | |
| Goodwill impairment | | | 10.5 | | | | - | | | | - | | | | - | | | | - | |
| Restructuring and other charges | | | 24.5 | | | | - | | | | 1.0 | | | | 27.4 | | | | 19.4 | |
| Total operating expenses | | | 1,698.6 | | | | 1,609.1 | | | | 1,438.1 | | | | 1,703.5 | | | | 1,597.7 | |
| Operating income (loss) | | | 23.9 | | | | (3.8 | ) | | | (77.2 | ) | | | 63.3 | | | | 31.1 | |
| Interest income | | | (1.6 | ) | | | (0.1 | ) | | | (0.2 | ) | | | (0.8 | ) | | | (1.5 | ) |
| Interest expense | | | 122.2 | | | | 122.5 | | | | 116.1 | | | | 103.2 | | | | 113.9 | |
Other income, net(1) | | | 25.8 | | | | (0.7 | ) | | | (273.8 | ) | | | - | | | | - | |
| Net income (loss) | | $ | (122.5 | ) | | $ | (125.5 | ) | | $ | 80.7 | | | $ | (39.1 | ) | | $ | (81.3 | ) |
| Statement of Cash Flows Data: | | | | | | | | | | | | | | | | | | | | |
| Cash provided by operating activities | | $ | 14.6 | | | $ | 75.8 | | | $ | 180.1 | | | $ | 74.9 | | | $ | 38.8 | |
| Cash used in investing activities | | | (66.2 | ) | | | (98.3 | ) | | | (34.1 | ) | | | (80.3 | ) | | | (67.8 | ) |
| Cash provided by (used in) financing activities | | | (6.3 | ) | | | 25.4 | | | | (115.8 | ) | | | 66.4 | | | | (24.9 | ) |
| Other Financial and Operating Data: | | | | | | | | | | | | | | | | | | | | |
EBITDA(2) | | $ | 123.4 | | | $ | 124.3 | | | $ | 329.3 | | | $ | 197.7 | | | $ | 154.2 | |
| Capital expenditures | | | (90.3 | ) | | | (73.6 | ) | | | (34.2 | ) | | | (80.4 | ) | | | (69.6 | ) |
| Total tons sold | | | 2,023.4 | | | | 2,063.6 | | | | 1,724.5 | | | | 1,952.7 | | | | 2,096.3 | |
| Balance Sheet Data: | | | | | | | | | | | | | | | | | | | | |
Working capital(3) | | $ | 142.9 | | | $ | 162.3 | | | $ | 210.4 | | | $ | 156.3 | | | $ | 95.6 | |
| Property, plant, and equipment, net | | | 934.7 | | | | 972.7 | | | | 1,022.6 | | | | 1,115.7 | | | | 1,159.9 | |
| Total assets | | | 1,444.4 | | | | 1,530.5 | | | | 1,560.3 | | | | 1,614.1 | | | | 1,577.0 | |
| Total debt | | | 1,201.1 | | | | 1,172.7 | | | | 1,118.3 | | | | 1,245.7 | | | | 1,156.4 | |
| Total equity (deficit) | | | (61.2 | ) | | | 71.4 | | | | 198.0 | | | | 91.7 | | | | 174.9 | |
| (1) | Other income was $273.8 million for the year ended December 31, 2009, which includes $238.9 million in net benefits from alternative fuel mixture tax credits provided by the U.S. government for our use of black liquor in alternative fuel mixtures and $31.3 million in net gains related to the early retirement of debt. |
| (2) | EBITDA consists of earnings before interest, taxes, depreciation, and amortization. EBITDA is a measure commonly used in our industry and we present EBITDA to enhance your understanding of our operating performance. We use EBITDA as one criterion for evaluating our performance relative to that of our peers. We believe that EBITDA is an operating performance measure, and not a liquidity measure, that provides investors and analysts with a measure of operating results unaffected by differences in capital structures, capital investment cycles and ages of related assets among otherwise comparable companies. However, EBITDA is not a measurement of financial performance under U.S. GAAP, and our EBITDA may not be comparable to similarly titled measures of other companies. You should consider our EBITDA in addition to, and not as a substitute for, or superior to, our operating or net income or cash flows from operating activities determined in accordance with U.S. GAAP. The following table reconciles net income (loss) to EBITDA for the periods presented: |
| | | VERSO HOLDINGS Consolidated | |
| | | Year Ended December 31, | |
| (Dollars in millions) | | 2011 | | | 2010 | | | 2009 | | | 2008 | | | 2007 | |
| Reconciliation of net income (loss) to EBITDA: | | | | | | | | | | | | | | | |
| Net income (loss) | | $ | (122.5 | ) | | $ | (125.5 | ) | | $ | 80.7 | | | $ | (39.1 | ) | | $ | (81.3 | ) |
| Interest expense, net | | | 120.6 | | | | 122.4 | | | | 115.9 | | | | 102.4 | | | | 112.4 | |
| Depreciation, amortization, and depletion | | | 125.3 | | | | 127.4 | | | | 132.7 | | | | 134.4 | | | | 123.1 | |
| EBITDA | | $ | 123.4 | | | $ | 124.3 | | | $ | 329.3 | | | $ | 197.7 | | | $ | 154.2 | |
| (3) | Working capital is defined as current assets net of current liabilities, excluding the current portion of long-term debt. |
The following discussion and analysis of our financial condition and results of operations includes statements regarding the industry outlook and our expectations regarding the performance of our business. These non-historical statements in the discussion and analysis are forward-looking statements. These forward-looking statements are subject to numerous risks and uncertainties, including, but not limited to, the risks and uncertainties described in “Risk Factors.” Our actual results may differ materially from those contained in or implied by any forward-looking statements. The discussion and analysis should be read in conjunction with the “Risk Factors” and financial statements and notes thereto included elsewhere in this annual report. Unless otherwise noted, the information provided pertains to both Verso Paper and Verso Holdings. All assets, liabilities, income, expenses and cash flows presented for all periods represent those of Verso Paper’s indirect, wholly-owned subsidiary, Verso Holdings, in all material respects, except for Verso Paper’s common stock transactions, Verso Finance’s debt obligation and related financing costs and interest expense, Verso Holdings’ loan to Verso Finance, and the debt obligation of Verso Holdings’ consolidated variable interest entity to Verso Finance.
Overview
We are a leading North American supplier of coated papers to catalog and magazine publishers. Coated paper is used primarily in media and marketing applications, including catalogs, magazines, and commercial printing applications, such as high-end advertising brochures, annual reports, and direct mail advertising. We are one of North America’s largest producers of coated groundwood paper which is used primarily for catalogs and magazines. We are also a low cost producer of coated freesheet paper which is used primarily for annual reports, brochures, and magazine covers. We also produce and sell market kraft pulp which is used to manufacture printing and writing paper grades and tissue products.
Background
We began operations on August 1, 2006, when we acquired the assets and certain liabilities of the business of International Paper. We were formed by affiliates of Apollo for the purpose of consummating the Acquisition from International Paper. Verso Paper went public on May 14, 2008, with an IPO of 14 million shares of common stock.
Selected Factors Affecting Operating Results
Net Sales
Our sales, which we report net of rebates, allowances, and discounts, are a function of the number of tons of paper that we sell and the price at which we sell our paper. The coated paper industry is cyclical, which results in changes in both volume and price. Paper prices historically have been a function of macro-economic factors which influence supply and demand. Price has historically been substantially more variable than volume and can change significantly over relatively short time periods. Our average coated paper prices declined from 2008 through the first quarter of 2010. While our average coated paper prices climbed modestly beginning in the second quarter of 2010 through the third quarter of 2011, they have recently declined again. Prices may not improve, and we do not expect prices in 2012 to return to the levels they were at in 2008 before they declined. Recent industry forecasts have predicted that prices for both coated freesheet and coated groundwood will decline in the first quarter of 2012.
We are primarily focused on serving two end-user segments: catalogs and magazines. In 2011, we believe we were a leading North American supplier of coated papers to catalog and magazine publishers. Coated paper demand is primarily driven by advertising and print media usage. Advertising spending and magazine and catalog circulation tend to correlate with changes in the GDP of the United States – they rise with a strong economy and contract with a weak economy.
Many of our customers provide us with forecasts of their paper needs, which allows us to plan our production runs in advance, optimizing production over our integrated mill system and thereby reducing costs and increasing overall efficiency. Generally, our sales agreements do not extend beyond the calendar year. Typically, our sales agreements provide for quarterly price adjustments based on market price movements.
We reach our end-users through several channels, including printers, brokers, paper merchants, and direct sales to end-users. We sell and market our products to approximately 125 customers which comprise approximately 700 end-user accounts. In 2011, Quad/Graphics, Inc. and xpedx, and their respective affiliates, accounted for approximately 10% and 9%, respectively, of our total net sales.
Our historical results include specialty papers that we manufacture for Thilmany, LLC, or “Thilmany,” on paper machine no. 5 at the Androscoggin mill. Under a long-term supply agreement entered into in 2005 in connection with International Paper’s sale of its Industrial Papers business to Thilmany, these products are sold to Thilmany at a variable charge for the paper purchased and a fixed charge for the availability of the machine. The amounts included in our net sales for the specialty papers sold to Thilmany totaled $39.5 million, $37.8 million, and $39.0 million, in 2011, 2010, and 2009, respectively.
Cost of Products Sold
The principal components of our cost of sales are chemicals, wood, energy, labor, maintenance, and depreciation, amortization, and depletion. Costs for commodities, including chemicals, wood, and energy, are the most variable component of our cost of sales because their prices can fluctuate substantially, sometimes within a relatively short period of time. In addition, our aggregate commodity purchases fluctuate based on the volume of paper that we produce.
Chemicals. Chemicals utilized in the manufacturing of coated papers include latex, starch, calcium carbonate, and titanium dioxide. We purchase these chemicals from a variety of suppliers and are not dependent on any single supplier to satisfy our chemical needs. We expect imbalances in supply and demand to periodically create volatility in prices for certain chemicals.
Wood. Our costs to purchase wood are affected directly by market costs of wood in our regional markets and indirectly by the effect of higher fuel costs on logging and transportation of timber to our facilities. While we have in place fiber supply agreements that ensure a substantial portion of our wood requirements, purchases under these agreements are typically at market rates.
Energy. We produce a large portion of our energy requirements, historically producing approximately 50% of our energy needs for our coated paper mills from sources such as waste wood and paper, hydroelectric facilities, chemicals from our pulping process, our own steam recovery boilers and internal energy cogeneration facilities. Our external energy purchases vary across each of our mills and include fuel oil, natural gas, coal, and electricity. While our internal energy production capacity mitigates the volatility of our overall energy expenditures, we expect prices for energy to remain volatile for the foreseeable future and our energy costs to increase in a high energy cost environment. As prices fluctuate, we have some ability to switch between certain energy sources in order to minimize costs. We utilize derivative contracts as part of our risk management strategy to manage our exposure to market fluctuations in energy prices. In January 2012, we completed a $45 million renewable energy project at our mill in Quinnesec, Michigan. The project is delivering 28 megawatts of additional green energy for consumption within the mill, which is equivalent to the amount of electricity consumed by 21,000 homes in a year.
Labor . Labor costs include wages, salary, and benefit expenses attributable to our mill personnel. Mill employees at a non-managerial level are compensated on an hourly basis. Management employees at our mills are compensated on a salaried basis. Wages, salary, and benefit expenses included in cost of sales do not vary significantly over the short term. In addition, we have not experienced significant labor shortages.
Maintenance. Maintenance expense includes day-to-day maintenance, equipment repairs, and larger maintenance projects, such as paper machine shutdowns for periodic maintenance. Day-to-day maintenance expenses have not varied significantly from year-to-year. Larger maintenance projects and equipment expenses can produce year-to-year fluctuations in our maintenance expenses. In conjunction with our periodic maintenance shutdowns, we have incidental incremental costs that are primarily comprised of unabsorbed fixed costs from lower production volumes and other incremental costs for purchased materials and energy that would otherwise be produced as part of the normal operation of our mills.
Depreciation, Amortization, and Depletion. Depreciation, amortization, and depletion expense represents the periodic charge to earnings through which the cost of tangible assets, intangible assets, and natural resources are recognized over the asset’s life. Capital investments can increase our asset bases and produce year-to-year fluctuations in expense.
Selling, General, and Administrative Expenses
The principal components of our selling, general, and administrative expenses are wages, salaries, and benefits for our office personnel at our headquarters and our sales force, travel and entertainment expenses, advertising expenses, expenses relating to certain information technology systems, and research and development expenses.
Critical Accounting Policies
Our accounting policies are fundamental to understanding management’s discussion and analysis of financial condition and results of operations. Our consolidated financial statements are prepared in conformity with accounting principles generally accepted in the United States of America and follow general practices within the industry in which we operate. The preparation of the financial statements requires management to make certain judgments and assumptions in determining accounting estimates. Accounting estimates are considered critical if the estimate requires management to make assumptions about matters that were highly uncertain at the time the accounting estimate was made, and different estimates reasonably could have been used in the current period, or changes in the accounting estimate are reasonably likely to occur from period to period, that would have a material impact on the presentation of our financial condition, changes in financial condition or results of operations.
Management believes the following critical accounting policies are both important to the portrayal of our financial condition and results of operations and require subjective or complex judgments. These judgments about critical accounting estimates are based on information available to us as of the date of the financial statements.
Accounting standards whose application may have a significant effect on the reported results of operations and financial position, and that can require judgments by management that affect their application, include the following: Financial Accounting Standards Board, or “FASB,” Accounting Standards Codification, or “ASC,” Topic 450, Contingencies, ASC Topic 360, Property, Plant, and Equipment, ASC Topic 350, Intangibles – Goodwill and Other, and ASC Topic 715, Compensation – Retirement Benefits.
Impairment of long-lived assets and goodwill. Long-lived assets are reviewed for impairment upon the occurrence of events or changes in circumstances that indicate that the carrying value of the assets may not be recoverable, as measured by comparing their net book value to the estimated undiscounted future cash flows generated by their use.
Goodwill and other intangible assets are accounted for in accordance with ASC Topic 350. Intangible assets primarily consist of trademarks, customer-related intangible assets and patents obtained through business acquisitions. We have identified the following trademarks as intangible assets with an indefinite life: Influence®, Liberty®, and Advocate®. We assess goodwill and indefinite-lived intangible assets at least annually for impairment or more frequently if events occur or circumstances change between annual tests that would more likely than not reduce the fair value of the reporting unit below its carrying amount. Goodwill is evaluated at the reporting unit level and has been allocated to the “Coated” segment.
We test goodwill for impairment by applying a two-step test. The first step is to compare the fair value of the reporting unit with its carrying amount, including goodwill. If the fair value of the reporting unit is less than its carrying amount, goodwill is considered impaired and the loss is measured by performing step two, which involves using a hypothetical purchase price allocation to determine the implied fair value of the goodwill and compare it to the carrying value of the goodwill. For reporting units with zero or negative carrying amounts, step two is required if it is more likely than not that a goodwill impairment exists. An impairment loss is recognized to the extent the implied fair value of the goodwill is less than the carrying amount of the goodwill.
During the fiscal quarter ended September 30, 2011, based on a combination of factors, including the difficult market conditions which have resulted in a decline in customer demand and excess capacity in the coated paper markets and high raw material, energy and distribution costs which have challenged the profitability of our products, we concluded that sufficient indicators existed to require us to perform an interim goodwill impairment analysis as of September 30, 2011. Based on Verso Paper’s deficit equity position, we were required to perform step two of the fair-value-based goodwill impairment analysis. Due to the complexities of the step two analysis which involves an allocation of the fair value, management was unable to make a good faith estimate of the impairment during the third quarter of 2011. Upon finalizing our analysis during the fourth quarter of 2011, Verso Paper recognized a goodwill impairment charge of $18.7 million and Verso Holdings recognized a goodwill impairment charge of $10.5 million. We have no goodwill remaining as of December 31, 2011.
Management believes that the accounting estimates associated with determining fair value as part of an impairment analysis are critical accounting estimates because estimates and assumptions are made about our future performance and cash flows. The estimated fair value is generally determined on the basis of discounted future cash flows. We also consider a market-based approach and a combination of both. While management uses the best information available to estimate future performance and cash flows, future adjustments to management’s projections may be necessary if economic conditions differ substantially from the assumptions used in making the estimates.
Pension Benefit Obligations. We offer various pension plans to employees. The calculation of the obligations and related expenses under these plans requires the use of actuarial valuation methods and assumptions, including the expected long-term rate of return on plan assets, discount rates, projected future compensation increases, health care cost trend rates and mortality rates. Actuarial valuations and assumptions used in the determination of future values of plan assets and liabilities are subject to management judgment and may differ significantly if different assumptions are used.
Contingent liabilities. A liability is contingent if the outcome or amount is not presently known, but may become known in the future as a result of the occurrence of some uncertain future event. We estimate our contingent liabilities based on management’s estimates about the probability of outcomes and their ability to estimate the range of exposure. Accounting standards require that a liability be recorded if management determines that it is probable that a loss has occurred and the loss can be reasonably estimated. In addition, it must be probable that the loss will be confirmed by some future event. As part of the estimation process, management is required to make assumptions about matters that are by their nature highly uncertain.
The assessment of contingent liabilities, including legal contingencies, asset retirement obligations and environmental costs and obligations, involves the use of critical estimates, assumptions, and judgments. Management’s estimates are based on their belief that future events will validate the current assumptions regarding the ultimate outcome of these exposures. However, there can be no assurance that future events will not differ from management’s assessments.
Recent Accounting Developments
ASC Topic 220, Comprehensive Income. Accounting Standards Update, or “ASU,” No. 2011-05, Comprehensive Income (Topic 220): Presentation of Comprehensive Income, changes the existing guidance on the presentation of comprehensive income. Entities will have the option of presenting the components of net income and other comprehensive income in either a single continuous statement of comprehensive income or in two separate but consecutive statements. Entities no longer have the option of presenting the components of other comprehensive income within the statement of changes in stockholders’ equity. ASU No. 2011-05 is effective on a retrospective basis for fiscal years, and interim periods within those years, beginning after December 15, 2011, which for us is the first quarter of 2012. In December 2011, the Financial Accounting Standards Board, or “FASB,” issued ASU No. 2011-12, “Comprehensive Income – Deferral of the Effective Date for Amendments to the Presentation of Reclassifications of Items Out of Accumulated Other Comprehensive Income in Accounting Standards Update No. 2011-05,” which defers changes in ASU No. 2011-05 that related to the presentation of reclassification adjustments. The adoption of the remaining guidance provided in ASU No. 2011-05 will result in a change to our current presentation of comprehensive income but will have no impact on our financial condition, results of operations, or cash flows.
ASC Topic 350, Intangibles – Goodwill and Other. ASU No. 2011-08, Intangibles-Goodwill and Other (Topic 350): Testing Goodwill for Impairment, is intended to simplify goodwill impairment testing by adding a qualitative review step to assess whether the required quantitative impairment analysis that exists today is necessary. Under the new guidance, entities will not be required to calculate the fair value of a business that contains recorded goodwill unless it concludes, based on the qualitative assessment, that it is more likely than not that the fair value of that business is less than its book value. If such a decline in fair value is deemed more likely than not to have occurred, then the quantitative goodwill impairment test prescribed by current accounting principles must be completed; otherwise, goodwill is deemed to be not impaired and no further testing is required until the next annual test date (or sooner if conditions or events before that date raise concerns of potential impairment in the business). The amended goodwill impairment guidance does not affect the manner in which a company estimates fair value. ASU No. 2011-08 is effective for annual and interim goodwill impairment tests performed by us beginning January 1, 2012. Earlier adoption is permitted. We do not expect the adoption of this guidance to have any impact on our consolidated financial statements.
ASC Topic 820, Fair Value Measurements and Disclosures. ASU No. 2011-04, Fair Value Measurement (Topic 820): Amendments to Achieve Common Fair Value Measurement and Disclosure Requirements in U.S. GAAP and IFRSs, provides clarifying guidance on how to measure fair value and additional disclosure requirements. The update does not extend the use of fair value accounting, but does provide guidance on how it should be applied where it is already required or permitted under current U.S. GAAP. ASU No. 2011-04 is effective for annual and interim periods beginning after December 15, 2011, which for us is January 1, 2012, and will not have a material impact on our consolidated financial statements.
Other new accounting pronouncements issued but not effective until after December 31, 2011, are not expected to have a significant effect on our consolidated financial statements.
Financial Overview
In 2011 net sales increased 7.3%, or $117.2 million, as sales prices improved while sales volume decreased compared to 2010. The average sales price for all of our products increased 9.4% compared to 2010 but began to level off by the end of 2011 as sales prices for the fourth quarter of 2011 decreased 1.0% from the third quarter of 2011. Sales volume was down 2.0% in 2011 compared to 2010, primarily due to lower sales volume during the first half of the year, while fourth quarter sales volume increased 6.2% compared to the fourth quarter of 2010 and remained level with the seasonally strong third quarter of 2011. Our gross margin increased to 15.2% in 2011 from 12.1% in 2010, reflecting the increase in sales prices.
Verso Paper’s Adjusted EBITDA (before the pro forma effects of the profitability program) was $202.5 million in 2011 compared to $132.1 million in 2010. (Note: EBITDA and Adjusted EBITDA are non-GAAP financial measures and are defined and reconciled to cash flows from operating activities later in this report). EBITDA adjustments (excluding the pro forma effect of the profitability program) of $87.6 million in 2011 included restructuring charges of $24.5 million, net losses of $26.1 million related to the early retirement of debt in connection with our debt refinancing, goodwill impairment of $18.7 million, and $7.5 million of losses recognized due to the de-designation of certain energy-related derivative contracts. EBITDA adjustments (excluding the pro forma effect of the profitability program) of $7.7 million in 2010 were primarily related to new product development.
In 2011 Verso Paper reported a net loss of $137.1 million, or $2.61 per diluted share, and operating income of $15.7 million. Impacting the results for 2011 were the restructuring costs associated with the shutdown of three paper machines, losses related to debt refinancing, goodwill impairment, and unrealized losses on hedging transactions. In 2010 Verso Paper reported a net loss of $131.1 million, or $2.50 per diluted share, and an operating loss of $3.9 million.
During 2011 we permanently shut down the No. 2 coated groundwood paper machine at our mill in Bucksport, Maine, and two supercalendered paper machines at our mill in Sartell, Minnesota, thereby reducing our annual production capacity by 193,000 tons. In conjunction with these closures, the Bucksport mill’s workforce was reduced by approximately 125 employees and the Sartell mill’s workforce was reduced by approximately 175 employees. The paper machine shutdowns resulted in charges of $24.5 million in the fourth quarter of 2011, of which approximately $10 million is expected to be cash expenditures in the first quarter of 2012. Additionally, Verso Paper and Verso Holdings recognized goodwill impairment charges of $18.7 million and $10.5 million, respectively, which represent a write-off of the full balance of goodwill.
We continue to develop and execute our renewable energy strategy. All of our previously announced energy projects are on schedule and are expected to be completed by the fourth quarter of 2012. In January 2012, we completed a $45 million renewable energy project at our mill in Quinnesec, Michigan. The project is delivering 28 megawatts of additional green energy for consumption within the mill, which is equivalent to the amount of electricity consumed by 21,000 homes in a year. We expect to realize a total positive annual EBITDA impact of approximately $50 million when all the projects are completed. Our capital expenditures increased to $90.3 million in 2011 compared to $73.6 million in 2010, reflecting our investment in these projects. Approximately $24.8 million of the capital expenditures in 2011 were funded from cash restricted for use on the Quinnesec renewable energy project.
Results of Operations
The following table sets forth certain consolidated financial information for the years ended December 31, 2011, 2010, and 2009. Cost of sales in the following table and discussion includes the cost of products sold and depreciation, amortization, and depletion. The following table and discussion should be read in conjunction with the information contained in our consolidated financial statements and the related notes thereto included elsewhere in this annual report.
| | | | | | | | | | | | | | | | | | | |
| | | VERSO PAPER | | | VERSO HOLDINGS | |
| | | Year Ended December 31, | | | Year Ended December 31, | |
| (Dollars in thousands) | | 2011 | | | 2010 | | | 2009 | | | 2011 | | | 2010 | | | 2009 | |
| Net sales | | $ | 1,722,489 | | | $ | 1,605,316 | | | $ | 1,360,854 | | | $ | 1,722,489 | | | $ | 1,605,316 | | | $ | 1,360,854 | |
| Costs and expenses: | | | | | | | | | | | | | | | | | | | | | | | | |
| Cost of products sold - (exclusive of | | | | | | | | | | | | | | | | | | | | | | | | |
| depreciation, amortization, and depletion) | | | 1,460,290 | | | | 1,410,770 | | | | 1,242,743 | | | | 1,460,290 | | | | 1,410,770 | | | | 1,242,743 | |
| Depreciation, amortization, and depletion | | | 125,295 | | | | 127,367 | | | | 132,682 | | | | 125,295 | | | | 127,367 | | | | 132,682 | |
| Selling, general, and administrative expenses | | | 78,059 | | | | 71,043 | | | | 61,889 | | | | 78,007 | | | | 70,989 | | | | 61,655 | |
| Goodwill impairment | | | 18,695 | | | | - | | | | - | | | | 10,551 | | | | - | | | | | |
| Restructuring and other charges | | | 24,464 | | | | - | | | | 979 | | | | 24,464 | | | | - | | | | 979 | |
| Total operating expenses | | | 1,706,803 | | | | 1,609,180 | | | | 1,438,293 | | | | 1,698,607 | | | | 1,609,126 | | | | 1,438,059 | |
| Operating income (loss) | | | 15,686 | | | | (3,864 | ) | | | (77,439 | ) | | | 23,882 | | | | (3,810 | ) | | | (77,205 | ) |
| Interest income | | | (99 | ) | | | (120 | ) | | | (246 | ) | | | (1,614 | ) | | | (124 | ) | | | (241 | ) |
| Interest expense | | | 126,607 | | | | 128,077 | | | | 123,365 | | | | 122,213 | | | | 122,528 | | | | 116,130 | |
| Other (income) loss, net | | | 26,042 | | | | (884 | ) | | | (307,307 | ) | | | 25,812 | | | | (734 | ) | | | (273,796 | ) |
| Income (loss) before income taxes | | | (136,864 | ) | | | (130,937 | ) | | | 106,749 | | | | (122,529 | ) | | | (125,480 | ) | | | 80,702 | |
| Income tax expense | | | 197 | | | | 145 | | | | 746 | | | | - | | | | - | | | | - | |
| Net income (loss) | | $ | (137,061 | ) | | $ | (131,082 | ) | | $ | 106,003 | | | $ | (122,529 | ) | | $ | (125,480 | ) | | $ | 80,702 | |
2011 Compared to 2010
Net Sales. Net sales for 2011 increased 7.3% to $1,722.5 million from $1,605.3 million, as the average sales price for all of our products increased 9.4%, reflecting price increases implemented during 2010 and at the beginning of the second quarter of 2011. This positive impact was partially offset by a 2.0% decline in total sales volume during 2011 compared to 2010.
Net sales for our coated and supercalendered papers segment increased 7.9% to $1,418.8 million in 2011 from $1,315.0 million in 2010. This improvement reflects a 10.7% increase in the average paper sales price per ton in 2011 while paper sales volume decreased 2.5% in 2011 compared to 2010.
Net sales for our market pulp segment decreased 9.0% to $150.1 million in 2011 from $164.9 million in 2010, reflecting a 6.0% decrease in the average sales price per ton combined with a 3.2% decrease in sales volume compared to 2010.
Net sales for our other segment increased 22.5% to $153.6 million in 2011 from $125.4 million in 2010. The improvement in 2011 is due to a 14.9% increase in the average sales price per ton combined with a 6.6% increase in sales volume in 2011 compared to 2010.
Cost of sales. Cost of sales, including depreciation, amortization, and depletion, was $1,585.6 million in 2011 compared to $1,538.2 million in 2010. Our gross margin, excluding depreciation, amortization, and depletion, was 15.2% for 2011 compared to 12.1% for 2010, reflecting higher average sales prices during 2011. Depreciation, amortization, and depletion expenses were $125.3 million for 2011, compared to $127.4 million for 2010.
Selling, general, and administrative. Selling, general, and administrative expenses were $78.0 million for both Verso Paper and Verso Holdings in 2011 compared to $71.0 million and 70.9 million, respectively, in 2010, primarily due to inflation of personnel related costs and certain non-recurring costs including professional fees and severance.
Goodwill impairment. In 2011 Verso Paper and Verso Holdings recognized goodwill impairment charges of $18.7 million and $10.5 million, respectively, which represent a write-off of the full balance of goodwill.
Restructuring and other charges. Restructuring and other charges of $24.5 million in 2011 reflect the permanent shut down of the No. 2 coated groundwood paper machine at our mill in Bucksport, Maine, and two supercalendered paper machines at our mill in Sartell, Minnesota. These charges include $15.0 million of severance and benefit costs, $7.1 million of accelerated depreciation, and $2.3 million due to write-off of spare parts and inventory.
Interest expense. Interest expense for Verso Paper was $126.6 million in 2011, compared to $128.1 million in 2010. Interest expense for Verso Holdings was $122.2 million in 2011 compared to $122.5 million in 2010.
Other (income) loss, net. In 2011 Verso Paper had other losses, net of $26.1 million and Verso Holdings had other losses, net of $25.8 million for Verso Holdings compared to other income, net of $0.9 million and $0.7 million for Verso Paper and Verso Holdings, respectively, in 2010. Included in the results for 2011 were $26.1 million in pre-tax net losses related to the early retirement of debt in connection with our debt refinancing.
2010 Compared to 2009
Net Sales. Net sales for 2010 increased 18.0% to $1,605.3 million from $1,360.9 million, as total sales volume increased 19.7% compared to 2009, reflecting improved economic conditions. This increase was partially offset by a 1.4% decline in the average sales price per ton for all of our products, primarily reflecting the decline of coated paper prices throughout 2009 and into early 2010.
Net sales for our coated and supercalendered papers segment increased 9.7% to $1,315.0 million in 2010 from $1,198.8 million in 2009. This improvement reflects a 16.9% increase in paper sales volume, while the average paper sales price per ton for 2010 decreased 6.2% compared to 2009.
Net sales for our market pulp segment increased 57.8% to $164.9 million in 2010 from $104.5 million in 2009. This increase was due to a 47.6% increase in average sales price per ton combined with a 6.9% increase in sales volume compared to 2009.
Net sales for our other segment increased 117.9% to $125.4 million in 2010 from $57.6 million in 2009. The improvement in 2010 is due to a 124.0% increase in sales volume, reflecting the development of new paper product offerings for our customers. Partially offsetting this increase was a 2.7% decrease in the average sales price per ton compared to 2009.
Cost of sales. Cost of sales, including depreciation, amortization, and depletion, increased 11.8% to $1,538.2 million in 2010 from $1,375.4 million in 2009, primarily reflecting the increase in sales volume. Our gross margin, excluding depreciation, amortization, and depletion, was 12.1% for 2010 compared to 8.7% for 2009, reflecting $74.9 million of unabsorbed costs resulting from approximately 340,000 tons of market downtime, as we curtailed production in response to weak demand for coated papers in 2009. Depreciation, amortization, and depletion expenses were $127.4 million for 2010, compared to $132.7 million for 2009.
Selling, general, and administrative. Selling, general, and administrative expenses were $71.0 million for Verso Paper and $70.9 million for Verso Holdings in 2010, up from $61.9 million for Verso Paper and $61.7 million for Verso Holdings in 2009, mainly due to cost remediation efforts in 2009 associated with challenging economic conditions. Selling, general, and administrative expenses for 2010 reflect a return to more normal levels and are consistent with the amounts incurred in 2008, excluding costs associated with our IPO.
Interest expense. Interest expense for Verso Paper was $128.1 million in 2010 compared to $123.4 million in 2009. The increase in interest expense was primarily due to higher interest rates on outstanding debt in 2010. Interest expense for Verso Holdings was $122.5 million in 2010 compared to $116.1 million in 2009. The increase in interest expense was primarily due to higher interest rates on outstanding debt in 2010.
Other (income) loss, net. Other income, net was $0.9 million for Verso Paper and $0.7 million for Verso Holdings in 2010 compared to $307.3 million and $273.8 million for Verso Paper and Verso Holdings, respectively, in 2009. Included in the results for 2009 were $238.9 million in net benefits from alternative fuel mixture tax credits provided by the U.S. government for our use of black liquor in alternative fuel mixtures. Additionally, Verso Paper and Verso Holdings recognized $64.8 million and $31.3 million, respectively, in net gains related to the early retirement of debt.
Reconciliation of Cash Flows from Operating Activities to Adjusted EBITDA
EBITDA consists of earnings before interest, taxes, depreciation, and amortization. EBITDA is a measure commonly used in our industry, and we present EBITDA to enhance your understanding of our operating performance. We use EBITDA as one criterion for evaluating our performance relative to that of our peers. We believe that EBITDA is an operating performance measure, and not a liquidity measure, that provides investors and analysts with a measure of operating results unaffected by differences in capital structures, capital investment cycles, and ages of related assets among otherwise comparable companies. Adjusted EBITDA is EBITDA further adjusted to exclude unusual items and other pro forma adjustments permitted in calculating covenant compliance under the indentures governing our notes. Adjusted EBITDA aligns the mark-to-market impact of economic hedge contracts used to hedge a portion of future natural gas purchases with the period in which they settle and reflects the amount of net cost savings projected to be realized as a result of specified activities taken during the preceding 12-month period. We believe that the inclusion of the supplemental adjustments applied in calculating Adjusted EBITDA are reasonable and appropriate to provide additional information to investors to demonstrate our compliance with our financial covenants. We also believe that Adjusted EBITDA is a useful liquidity measurement tool for assessing our ability to meet our future debt service, capital expenditures, and working capital requirements.
However, EBITDA and Adjusted EBITDA are not measurements of financial performance under U.S. GAAP, and our EBITDA and Adjusted EBITDA may not be comparable to similarly titled measures of other companies. You should consider our EBITDA and Adjusted EBITDA in addition to, and not as a substitute for or superior to, our operating or net income or cash flows from operating activities, determined in accordance with U.S. GAAP.
The following table reconciles cash flows from operating activities to EBITDA and Adjusted EBITDA for the periods presented:
| | | Verso Paper | |
| | | Year Ended December 31, | |
| (Dollars in millions) | | 2011 | | | 2010 | | | 2009 | |
| Cash flows from operating activities | | $ | 14.5 | | | $ | 73.5 | | | $ | 177.2 | |
| Income tax expense | | | 0.2 | | | | 0.1 | | | | 0.8 | |
| Amortization of debt issuance costs | | | (5.4 | ) | | | (5.7 | ) | | | (5.8 | ) |
| Accretion of discount on long-term debt | | | (4.1 | ) | | | (3.7 | ) | | | (2.1 | ) |
| Loss (gain) on early extinguishment of debt, net | | | (26.1 | ) | | | 0.3 | | | | 64.8 | |
| Goodwill impairment | | | (18.7 | ) | | | - | | | | - | |
| Equity award expense | | | (2.4 | ) | | | (1.7 | ) | | | (0.6 | ) |
| Interest income | | | (0.1 | ) | | | (0.1 | ) | | | (0.3 | ) |
| Interest expense | | | 126.6 | | | | 128.1 | | | | 123.4 | |
| Other, net | | | (1.3 | ) | | | 4.7 | | | | (28.4 | ) |
| Changes in assets and liabilities, net | | | 31.7 | | | | (71.1 | ) | | | 33.6 | |
| EBITDA | | | 114.9 | | | | 124.4 | | | | 362.6 | |
Alternative fuel tax credit(1) | | | - | | | | - | | | | (238.9 | ) |
Loss (gain) on early extinguishment of debt, net(2) | | | 26.1 | | | | (0.3 | ) | | | (64.8 | ) |
Goodwill impairment(3) | | | 18.7 | | | | - | | | | - | |
Restructuring and other charges(4) | | | 24.5 | | | | - | | | | 1.0 | |
Hedge losses(5) | | | 7.5 | | | | - | | | | - | |
Equity award expense(6) | | | 2.4 | | | | 1.7 | | | | 0.6 | |
Other items, net(7) | | | 8.4 | | | | 6.3 | | | | 16.2 | |
| Adjusted EBITDA before pro forma effects of profitability program | | | 202.5 | | | | 132.1 | | | | 76.7 | |
Pro forma effects of profitability program(8) | | | 68.3 | | | | 55.9 | | | | 50.5 | |
| Adjusted EBITDA | | $ | 270.8 | | | $ | 188.0 | | | $ | 127.2 | |
| (1) | Represents earnings from thte federal government's program which provides incentives for the use of alternative fuels. |
| (2) | Represents net losses (gains) recognized from the early extinguishment of debt, net of hedge results. |
| (3) | Represents impairment of goodwill allocated to the coated and supercalendered paper segment. |
| (4) | Represents costs associated with the shut-down of three paper machines in 2011 and transition costs related to the Acquisition in 2009. |
| (5) | Represents losses recognized due to the de-designation of certain energy-related derivative contracts. |
| (6) | Restructuring includes transition and other non-recurring costs associated with the Acquisition as per our financial statements. |
| (6) | Represents amortization of non-cash incentive compensation. |
| (7) | Represents earnings adjustments for product development costs and other miscellaneous non-recurring items. |
| (8) | Represents cost savings expected to be realized as part of our cost savings program. |
Seasonality
We are exposed to fluctuations in quarterly net sales volumes and expenses due to seasonal factors. These seasonal factors are common in the coated paper industry. Typically, the first two quarters are our slowest quarters due to lower demand for coated paper during this period. Our third quarter is generally our strongest quarter, reflecting an increase in printing related to end-of-year magazines, increased end-of-year direct mailings, and holiday season catalogs. Our working capital and accounts receivable generally peak in the third quarter, while inventory generally peaks in the second quarter in anticipation of the third quarter season. We expect our seasonality trends to continue for the foreseeable future.
Liquidity and Capital Resources
We rely primarily upon cash flow from operations and borrowings under our revolving credit facility to finance operations, capital expenditures, and fluctuations in debt service requirements. As of December 31, 2011, $159.2 million was available for future borrowing under our revolving credit facility. Our current revolving credit facility matures in August 2012, but we have obtained $100 million of commitments for a new accounts receivable securitization facility and $55 million of commitments to provide a new, and/or extend our existing, revolving credit facility. We believe that our ability to manage cash flow and working capital levels, particularly inventory and accounts payable, will allow us to meet our current and future obligations, pay scheduled principal and interest payments, and provide funds for working capital, capital expenditures, and other needs of the business for at least the next twelve months. However, no assurance can be given that we will be able to generate sufficient cash flows from operations or that future borrowings will be available under our revolving credit facility (including any replacement facilities) in an amount sufficient to fund our liquidity needs. As we focus on managing our expenses and cash flows, we continue to assess and implement, as appropriate, various earnings enhancement and expense reduction initiatives. Management has developed a company-wide cost reduction program, which it expects to yield an additional $68 million in cost reductions and continues to search for and develop additional cost savings measures.
Verso Paper’s and Verso Holdings’ cash flows from operating, investing and financing activities, as reflected in the consolidated statements of cash flows, are summarized in the following table.
| | | VERSO PAPER | | | VERSO HOLDINGS | |
| | | Year Ended December 31, | | | Year Ended December 31, | |
| (Dollars in thousands) | | 2011 | | | 2010 | | | 2009 | | | 2011 | | | 2010 | | | 2009 | |
| Net cash provided by (used in): | | | | | | | | | | | | | | | | | | |
| Operating activities | | $ | 14,511 | | | $ | 73,480 | | | $ | 177,156 | | | $ | 14,562 | | | $ | 75,821 | | | $ | 180,135 | |
| Investing activities | | | (66,205 | ) | | | (98,266 | ) | | | (34,133 | ) | | | (66,205 | ) | | | (98,266 | ) | | | (34,133 | ) |
| Financing activities | | | (6,217 | ) | | | 25,469 | | | | (110,468 | ) | | | (6,268 | ) | | | 25,389 | | | | (115,760 | ) |
| Net change in cash and cash equivalents | | $ | (57,911 | ) | | $ | 683 | | | $ | 32,555 | | | $ | (57,911 | ) | | $ | 2,944 | | | $ | 30,242 | |
Operating activities. In 2011, Verso Paper’s net cash provided by operating activities of $14.5 million reflects a net loss of $137.1 million adjusted for non-cash depreciation, amortization, depletion, and accretion and non-cash losses on early extinguishment of debt and goodwill impairment totaling $186.6 million and an increase in working capital of $40.5 million, which was primarily due to increases in inventory and accounts receivable. Verso Paper’s net cash provided by operating activities of $73.5 million in 2010 was primarily attributable to a net loss of $131.1 million adjusted for non-cash depreciation, amortization, depletion, and accretion charges of $136.7 million and cash provided by improvements in working capital of $55.5 million. Cash flows from working capital increased primarily due to planned reductions in inventory levels; increased accounts payable reflecting the higher sales volume in 2010; and higher accrued liabilities. Verso Paper’s net cash provided by operating activities of $177.2 million in 2009 was primarily attributable to net income of $106.0 million combined with adjustments of $75.7 million for the impact of non-cash depreciation, amortization, depletion, and accretion charges net of non-cash gains on the early retirement of debt. Net income in 2009 includes $238.9 million in net benefits from alternative fuel mixture tax credits provided by the U.S. government for our use of black liquor in alternative fuel mixtures and $64.8 million in non-cash gains on the early retirement of debt. The tax credit, as it relates to liquid fuels derived from biomass, expired on December 31, 2009. Verso Holdings’ operating cash flows are the same as those of Verso Paper in all material respects.
Investing activities. In 2011, Verso Paper’s net cash used in investing activities of $66.2 million reflects $90.3 million in capital expenditures net of $24.8 million in funds transferred from restricted cash for use on a renewable energy project at our mill in Quinnesec, Michigan. This compares to $98.3 million of net cash used in investing activities in 2010, which included $73.6 million of capital expenditures and $25.1 million of cash transferred to restricted cash for the a renewable energy project. In 2009, Verso Paper’s net cash used in investing activities of $34.1 million was primarily due to capital expenditures. Management significantly reduced annual capital expenditures in 2009 in response to the uncertain economic environment. Verso Holdings’ investing cash flows are the same as those of Verso Paper.
Financing activities. In 2011, Verso Paper’s net cash used in financing activities was $6.2 million, reflecting cash payments of $390.0 million to repurchase long term debt and pay related fees and charges, net of $383.8 million in proceeds from the issuance of $396.0 million aggregate principal amount of second priority senior secured notes net of discount, underwriting fees and issuance costs. Verso Paper’s net cash provided by financing activities was $25.5 million for 2010, reflecting $26.2 million in proceeds from the issuance of $25.0 million in senior secured notes including premium and net of underwriting fees and issuance costs. In 2009, Verso Paper’s net cash used in financing activities was $110.5 million, reflecting principal payments and debt repurchases of $306.8 million on long-term debt and $92.1 million in net payments on our revolving credit facility, partially offset by $288.6 million in proceeds from the issuance of $325.0 million in senior secured notes net of discount, underwriting fees, and issuance costs. Verso Holdings’ financing cash flows are principally the same as those of Verso Paper. However, in 2009, Verso Holdings’ principal payments and debt repurchases were $296.6 million on long-term debt. Additionally, contributions of $12.5 million were made to Verso Finance One to accommodate additional repurchases of debt and $2.9 million of distributions were made to Verso Paper for general corporate purposes.
Indebtedness. As of December 31, 2011, Verso Paper’s total indebtedness was $1,262.5 million, net of $13.4 million of unamortized discounts. As of December 31, 2011, Verso Holdings’ total indebtedness was $1,201.1 million, net of $13.4 million of unamortized discounts.
Revolving Credit Facility. Verso Holdings’ $200 million revolving credit facility had no amounts outstanding, $40.8 million in letters of credit issued and $159.2 million available for future borrowing as of December 31, 2011. The indebtedness under the revolving credit facility bears interest, payable quarterly, at a rate equal to LIBOR plus 3% or prime plus 2% per year. Verso Holdings is required to pay a commitment fee to the lenders in respect of unutilized commitments under the revolving credit facility at a rate equal to 0.5% per year and customary letter of credit and agency fees. The indebtedness under the revolving credit facility is guaranteed jointly and severally by Verso Finance and each of Verso Holdings’ subsidiaries, subject to certain exceptions, and the indebtedness and guarantees are senior secured obligations of Verso Holdings and the guarantors, respectively. The indebtedness under the revolving credit facility and related guarantees are secured by first priority liens, subject to permitted liens, on substantially all of Verso Holdings’, Verso Finance’s, and the subsidiary guarantors’ tangible and intangible assets. The revolving credit facility matures on August 1, 2012.
On February 17, 2012, we obtained $100.0 million of commitments with respect to the syndication of a new accounts receivable securitization facility and approximately $55.0 million of commitments to provide a new and/or extended revolving facility under our existing senior secured revolving credit facility. The accounts receivable facility will bear interest at an initial rate of LIBOR plus 2.00% and the revolving facility will bear interest at an initial rate of LIBOR plus 4.50%. The terms and conditions of our existing revolving credit facility remain in full force and effect and have not been altered by these new commitments.
11.5% Senior Secured Notes due 2014. In June 2009 and January 2010, Verso Holdings issued a total of $350 million aggregate principal amount of 11.5% senior secured notes due 2014. In March 2011, Verso Holdings repurchased and retired a total of $35 million aggregate principal amount of the notes. The notes bear interest, payable semi-annually, at the rate of 11.5% per year. The notes are guaranteed jointly and severally by each of Verso Holdings’ subsidiaries, subject to certain exceptions, and the notes and guarantees are senior secured obligations of Verso Holdings and the guarantors, respectively. The notes and related guarantees are secured by first priority liens, subject to permitted liens, on substantially all of Verso Holdings’ and the guarantors’ tangible and intangible assets. The notes mature on July 1, 2014.
8.75% Second Priority Senior Secured Notes due 2019. In January 2011 and February 2011, Verso Holdings issued a total of $396 million aggregate principal amount of 8.75% second priority senior secured notes due 2019. The notes bear interest, payable semi-annually, at the rate of 8.75% per year. The notes are guaranteed jointly and severally by each of Verso Holdings’ subsidiaries, subject to certain exceptions, and the notes and guarantees are senior secured obligations of Verso Holdings and the guarantors, respectively. The notes and related guarantees are secured by second priority liens, subject to permitted liens, on substantially all of Verso Holdings’ and the guarantors’ tangible and intangible assets, excluding securities of Verso Holdings’ affiliates. The notes mature on February 1, 2019.
Verso Holdings used the net proceeds from the issuance of the 8.75% second priority senior secured notes in January 2011, plus available cash, to repurchase or redeem, and retire all of its 9.13% second priority senior secured fixed rate notes due 2014. Verso Holdings used the net proceeds from the issuance of the 8.75% second priority senior secured notes in February 2011 to redeem and retire $35 million aggregate principal amount of its 11.5% senior secured notes due 2014.
Second Priority Senior Secured Floating Rate Notes due 2014. In August 2006, Verso Holdings issued $250 million aggregate principal amount of second priority senior secured floating rate notes due 2014. As of December 31, 2011, Verso Holdings had repurchased and retired a total of $70 million aggregate principal amount of the notes. The notes bear interest, payable quarterly, at a rate equal to LIBOR plus 3.75% per year. As of December 31, 2011, the interest rate on the notes was 4.18% per year. The notes are guaranteed jointly and severally by each of Verso Holdings’ subsidiaries, subject to certain exceptions, and the notes and guarantees are senior secured obligations of Verso Holdings and the guarantors, respectively. The notes and related guarantees are secured by second priority liens, subject to permitted liens, on substantially all of Verso Holdings’ and the guarantors’ tangible and intangible assets, excluding securities of Verso Holdings’ affiliates. The notes mature on August 1, 2014.
11.38% Senior Subordinated Notes due 2016. In August 2006, Verso Holdings issued $300 million aggregate principal amount of 11.38% senior subordinated notes due 2016. The notes bear interest, payable semi-annually, at the rate of 11.38% per year. The notes are guaranteed jointly and severally by each of Verso Holdings’ subsidiaries, subject to certain exceptions, and the notes and guarantees are unsecured senior subordinated obligations of Verso Holdings and the guarantors, respectively. The notes mature on August 1, 2016.
Verso Finance Senior Unsecured Term Loan. Verso Finance, the parent entity of Verso Holdings, had $84.7 million outstanding on its senior unsecured term loan as of December 31, 2011. The loan allows Verso Finance to pay interest either in cash or in kind through the accumulation of the outstanding principal amount. The loan bears interest, payable quarterly, at a rate equal to LIBOR plus 6.25% per year on interest paid in cash and LIBOR plus 7.00% per year for interest paid in kind, or “PIK,” and added to the principal balance. As of December 31, 2011, the weighted-average interest rate on the loan was 6.83% per year. Verso Finance elected to exercise the PIK option for $5.5 million, $5.1 million, and $8.9 million of interest payments due 2011, 2010, and 2009, respectively. The loan matures on February 1, 2013.
Loan from Verso Paper Finance Holdings LLC/ Verso Paper Holdings LLC. On December 29, 2010, Verso Quinnesec REP LLC, an indirect, wholly-owned subsidiary of Verso Holdings, entered into a financing transaction with Chase NMTC Verso Investment Fund, LLC, the “Investment Fund”, a consolidated variable interest entity. Under this arrangement, Verso Holdings loaned $23.3 million to Verso Finance pursuant to a 6.5% loan due December 29, 2040, and Verso Finance, in turn, loaned the funds on similar terms to the Investment Fund. The Investment Fund then contributed the loan proceeds to certain community development entities, which, in turn, loaned the funds on similar terms to Verso Quinnesec REP LLC, as partial financing for the renewable energy project at our mill in Quinnesec, Michigan.
As a holding company, Verso Paper’s investments in its operating subsidiaries constitute substantially all of its operating assets. Consequently, Verso Paper’s subsidiaries conduct all of its consolidated operations and own substantially all of its operating assets. Verso Paper’s principal source of the cash it needs to pay its debts is the cash that its subsidiaries generate from their operations and their borrowings. Verso Paper’s subsidiaries are not obligated to make funds available to it. The terms of the revolving credit facility and the indentures governing the outstanding notes of Verso Paper’s subsidiaries significantly restrict its subsidiaries from paying dividends and otherwise transferring assets to Verso Paper. Furthermore, Verso Paper’s subsidiaries are permitted under the terms of the revolving credit facility and the indentures to incur additional indebtedness that may severely restrict or prohibit the making of distributions, the payment of dividends, or the making of loans by such subsidiaries to Verso Paper. Although the terms of the debt agreements of Verso Paper’s subsidiaries do not restrict its operating subsidiaries from obtaining funds from their respective subsidiaries to fund their operations and payments on indebtedness, there can be no assurance that the agreements governing the current and future indebtedness of its subsidiaries will permit its subsidiaries to provide Verso Paper with sufficient dividends, distributions or loans to fund its obligations or pay dividends to its stockholders.
We may elect to retire our outstanding debt in open market purchases, privately negotiated transactions, or otherwise. These repurchases may be funded through available cash from operations and borrowings under our revolving credit facility. Such repurchases are dependent on prevailing market conditions, our liquidity requirements, contractual restrictions, and other factors.
Covenant Compliance
The credit agreement and the indentures governing our notes contain affirmative covenants as well as restrictive covenants which limit our ability to, among other things, incur additional indebtedness; pay dividends or make other distributions; repurchase or redeem our stock; make investments; sell assets, including capital stock of restricted subsidiaries; enter into agreements restricting our subsidiaries’ ability to pay dividends; consolidate, merge, sell or otherwise dispose of all or substantially all of our assets; enter into transactions with our affiliates; and incur liens. These covenants can result in limiting our long-term growth prospects by hindering our ability to incur future indebtedness or grow through acquisitions. As of December 31, 2011, we were in compliance in all material respects with the covenants in our debt agreements.
Effect of Inflation
While inflationary increases in certain input costs, such as for energy, wood fiber, and chemicals, have an impact on our operating results, changes in general inflation have had minimal impact on our operating results in the last three years. Sales prices and volumes are more strongly influenced by supply and demand factors in specific markets and by exchange rate fluctuations than by inflationary factors. We cannot assure you, however, that we will not be affected by general inflation in the future.
Contractual Obligations
The following table reflects our contractual obligations and commercial commitments as of December 31, 2011. Commercial commitments include lines of credit, guarantees, and other potential cash outflows resulting from a contingent event that requires our performance pursuant to a funding commitment.
| | | Payments due by period | |
| | | | | | Less than | | | | | | | | | More than | |
| (Dollars in millions) | | Total | | | 1 year | | | 1-3 years | | | 3-5 years | | | 5 years | |
| Verso Paper Holdings LLC | | | | | | | | | | | | | | | |
Long-term debt(1) | | $ | 1,704.7 | | | $ | 114.0 | | | $ | 699.2 | | | $ | 423.3 | | | $ | 468.2 | |
| Operating leases | | | 19.7 | | | | 6.9 | | | | 8.7 | | | | 2.4 | | | | 1.7 | |
Purchase obligations(2) | | | 624.4 | | | | 130.4 | | | | 198.4 | | | | 127.1 | | | | 168.5 | |
Other long-term liabilities(3) | | | 28.6 | | | | 0.2 | | | | 4.8 | | | | 0.6 | | | | 23.0 | |
| Chase NMTC Verso Investment Fund LLC | | | | | | | | | | | | | | | | | | | | |
| Loan from Verso Paper Finance Holdings LLC | | | 67.2 | | | | 1.5 | | | | 3.0 | | | | 3.0 | | | | 59.7 | |
| Total contractual obligations for Verso Paper Holdings LLC | | | 2,444.6 | | | | 253.0 | | | | 914.1 | | | | 556.4 | | | | 721.1 | |
| Long-term debt for Verso Paper Finance Holdings LLC | | | 158.3 | | | | 7.4 | | | | 88.2 | | | | 3.0 | | | | 59.7 | |
| Eliminate loans from affiliates | | | (134.4 | ) | | | (3.0 | ) | | | (6.0 | ) | | | (6.0 | ) | | | (119.4 | ) |
| Total contractual obligations for Verso Paper Corp. | | $ | 2,468.5 | | | $ | 257.4 | | | $ | 996.3 | | | $ | 553.4 | | | $ | 661.4 | |
| (1) | Long-term debt includes principal payments, commitment fees, and interest payable. A portion of interest expense is at a variable rate and has been calculated using current LIBOR. Actual payments could vary. |
| (2) | Purchase obligations include unconditional purchase obligations for power purchase agreements (gas and electricity), machine clothing, and other commitments for advertising, raw materials, or storeroom inventory. |
| (3) | Other long-term liabilities reflected above represent the gross amount of asset retirement obligations. |
We are exposed to market risk from fluctuations in our paper prices, interest rates, energy prices, and commodity prices for our inputs.
Paper Prices
Our sales, which we report net of rebates, allowances, and discounts, are a function of the number of tons of paper that we sell and the price at which we sell our paper. The coated paper industry is cyclical, which results in changes in both volume and price. Paper prices historically have been a function of macro-economic factors, which influence supply and demand. Price has historically been substantially more variable than volume and can change significantly over relatively short time periods.
We are primarily focused on serving two end-user segments: catalogs and magazines. Coated paper demand is primarily driven by advertising and print media usage. Advertising spending and magazine and catalog circulation tend to correlate with GDP in the United States - they rise with a strong economy and contract with a weak economy.
Many of our customers provide us with forecasts of their paper needs, which allows us to plan our production runs in advance, optimizing production over our integrated mill system and thereby reducing costs and increasing overall efficiency. Generally, our sales agreements do not extend beyond the calendar year. Typically, our sales agreements provide for quarterly price adjustments based on market price movements.
We reach our end-users through several channels, including printers, brokers, paper merchants, and direct sales to end-users. We sell and market our products to approximately 125 customers. In 2011, Quad/Graphics, Inc. and xpedx, and their respective affiliates, accounted for approximately 10% and 9%, respectively, of our total net sales.
Interest Rates
We have issued fixed- and floating-rate debt in order to manage our variability to cash flows from interest rates. Borrowings under the revolving credit facility, the second priority senior secured floating rate notes, and Verso Finance’s senior unsecured term loan accrue interest at variable rates; however, there were no amounts outstanding under the revolving credit facility as of December 31, 2011. A 100 basis point increase in quoted interest rates on Verso Paper’s outstanding floating-rate debt as of December 31, 2011, would increase annual interest expense by $2.6 million (of which $0.8 million is attributable to Verso Finance’s senior unsecured term loan on which we have elected to pay interest in kind). A 100 basis point increase in quoted interest rates on Verso Holdings’ outstanding floating-rate notes as of December 31, 2011, would increase annual interest expense by $1.8 million. While we may enter into agreements limiting our exposure to higher interest rates, any such agreements may not offer complete protection from this risk.
Derivatives
In the normal course of business, we utilize derivatives contracts as part of our risk management strategy to manage our exposure to market fluctuations in energy prices and interest rates. These instruments are subject to credit and market risks in excess of the amount recorded on the balance sheet in accordance with generally accepted accounting principles. Controls and monitoring procedures for these instruments have been established and are routinely reevaluated. We have an Energy Risk Management Policy which was adopted by our board of directors and is monitored by an Energy Risk Management Committee composed of our senior management. In addition, we have an Interest Rate Risk Committee which was formed to monitor our Interest Rate Risk Management Policy. Credit risk represents the potential loss that may occur because a party to a transaction fails to perform according to the terms of the contract. The measure of credit exposure is the replacement cost of contracts with a positive fair value. We manage credit risk by entering into financial instrument transactions only through approved counterparties. Market risk represents the potential loss due to the decrease in the value of a financial instrument caused primarily by changes in commodity prices or interest rates. We manage market risk by establishing and monitoring limits on the types and degree of risk that may be undertaken.
We do not hedge the entire exposure of our operations from commodity price volatility for a variety of reasons. To the extent that we do not hedge against commodity price volatility, our results of operations may be affected either favorably or unfavorably by a shift in the future price curve. As of December 31, 2011, we had net unrealized losses of $12.3 million on open commodity contracts with maturities of one to twenty-three months. These derivative instruments involve the exchange of net cash settlements, based on changes in the price of the underlying commodity index compared to the fixed price offering, at specified intervals without the exchange of any underlying principal. A 10% decrease in commodity prices would have a negative impact of approximately $2.7 million on the fair value of such instruments. This quantification of exposure to market risk does not take into account the offsetting impact of changes in prices on anticipated future energy purchases.
Commodity Prices
We are subject to changes in our cost of sales caused by movements underlying commodity prices. The principal components of our cost of sales are chemicals, wood, energy, labor, maintenance, and depreciation, amortization, and depletion. Costs for commodities, including chemicals, wood and energy, are the most variable component of our cost of sales because their prices can fluctuate substantially, sometimes within a relatively short period of time. In addition, our aggregate commodity purchases fluctuate based on the volume of paper that we produce.
Chemicals. Chemicals utilized in the manufacturing of coated papers include latex, starch, calcium carbonate, and titanium dioxide. We purchase these chemicals from a variety of suppliers and are not dependent on any single supplier to satisfy our chemical needs. We expect imbalances in supply and demand to periodically create volatility in prices for certain chemicals.
Wood. Our costs to purchase wood are affected directly by market costs of wood in our regional markets and indirectly by the effect of higher fuel costs on logging and transportation of timber to our facilities. While we have in place fiber supply agreements that ensure a substantial portion of our wood requirements, purchases under these agreements are typically at market rates.
Energy. We produce a large portion of our energy requirements, historically producing approximately 50% of our energy needs for our coated paper mills from sources such as waste wood and paper, hydroelectric facilities, chemicals from our pulping process, our own steam recovery boilers, and internal energy cogeneration facilities. Our external energy purchases vary across each of our mills and include fuel oil, natural gas, coal, and electricity. While our internal energy production capacity mitigates the volatility of our overall energy expenditures, we expect prices for energy to remain volatile for the foreseeable future and our energy costs to increase in a high energy cost environment. As prices fluctuate, we have some ability to switch between certain energy sources in order to minimize costs. We utilize derivatives contracts as part of our risk management strategy to manage our exposure to market fluctuations in energy prices.
Off-Balance Sheet Arrangements
None.
Verso Paper Corp.
MANAGEMENT’S REPORT ON INTERNAL CONTROL OVER FINANCIAL REPORTING - VERSO PAPER CORP.
Our management is responsible for establishing and maintaining adequate internal control over financial reporting, as such term is defined in Rules 13a-15(f) and 15d-15(f) under the Securities Exchange Act of 1934. Under the supervision and with the participation of our management, including our Chief Executive Officer and Chief Financial Officer, we conducted an evaluation of the effectiveness of Verso Paper Corp.’s internal control over financial reporting as of December 31, 2011, based upon the guidelines established in Internal Control — Integrated Framework issued by the Committee of Sponsoring Organizations of the Treadway Commission (COSO). Verso Paper Corp.’s internal control over financial reporting includes policies and procedures that provide reasonable assurance regarding the reliability of financial reporting and the preparation of financial statements for external reporting purposes in accordance with accounting principles generally accepted in the United States of America.
Based on the results of our evaluation, our management concluded that Verso Paper Corp.’s internal control over financial reporting was effective as of December 31, 2011. We reviewed the results of management’s assessment with our Audit Committee.
The effectiveness of Verso Paper Corp.’s internal control over financial reporting as of December 31, 2011, has been audited by Deloitte & Touche LLP, an independent registered public accounting firm, as stated in their attestation report which appears below.
MANAGEMENT’S REPORT ON INTERNAL CONTROL OVER FINANCIAL REPORTING - VERSO PAPER HOLDINGS LLC
Our management is responsible for establishing and maintaining adequate internal control over financial reporting, as such term is defined in Rules 13a-15(f) and 15d-15(f) under the Securities Exchange Act of 1934. Under the supervision and with the participation of our management, including our Chief Executive Officer and Chief Financial Officer, we conducted an evaluation of the effectiveness of Verso Paper Holdings LLC’s internal control over financial reporting as of December 31, 2011, based upon the guidelines established in Internal Control — Integrated Framework issued by the Committee of Sponsoring Organizations of the Treadway Commission (COSO). Verso Paper Holdings LLC’s internal control over financial reporting includes policies and procedures that provide reasonable assurance regarding the reliability of financial reporting and the preparation of financial statements for external reporting purposes in accordance with accounting principles generally accepted in the United States of America.
Based on the results of our evaluation, our management concluded that Verso Paper Holdings LLC’s internal control over financial reporting was effective as of December 31, 2011. We reviewed the results of management’s assessment with our Audit Committee.
The effectiveness of Verso Paper Holdings LLC’s internal control over financial reporting as of December 31, 2011, has been audited by Deloitte & Touche LLP, an independent registered public accounting firm, as stated in their attestation report which appears below.
REPORT OF DELOITTE & TOUCHE LLP, INDEPENDENT REGISTERED PUBLIC ACCOUNTING FIRM, ON CONSOLIDATED FINANCIAL STATEMENTS
We have audited the accompanying consolidated balance sheets of Verso Paper Corp., and subsidiaries, (the “Company”), a majority-owned subsidiary of Verso Paper Management LP, as of December 31, 2011 and 2010, and the related consolidated statements of operations, stockholders' equity, and cash flows for each of the three years in the period ended December 31, 2011. These financial statements are the responsibility of the Company's management. Our responsibility is to express an opinion on these financial statements based on our audits.
We conducted our audits in accordance with the standards of the Public Company Accounting Oversight Board (United States). Those standards require that we plan and perform the audit to obtain reasonable assurance about whether the financial statements are free of material misstatement. An audit includes examining, on a test basis, evidence supporting the amounts and disclosures in the financial statements. An audit also includes assessing the accounting principles used and significant estimates made by management, as well as evaluating the overall financial statement presentation. We believe that our audits provide a reasonable basis for our opinion.
In our opinion, such consolidated financial statements present fairly, in all material respects, the financial position of the Company as of December 31, 2011 and 2010, and the results of their operations and their cash flows for each of the three years in the period ended December 31, 2011, in conformity with accounting principles generally accepted in the United States of America.
We have also audited, in accordance with the standards of the Public Company Accounting Oversight Board (United States), the Company's internal control over financial reporting as of December 31, 2011, based on the criteria established in Internal Control—Integrated Framework issued by the Committee of Sponsoring Organizations of the Treadway Commission and our report dated March 5, 2012 expressed an unqualified opinion on the Company's internal control over financial reporting.
REPORT OF DELOITTE & TOUCHE LLP, INDEPENDENT REGISTERED PUBLIC ACCOUNTING FIRM, ON INTERNAL CONTROL OVER FINANCIAL REPORTING
We conducted our audit in accordance with the standards of the Public Company Accounting Oversight Board (United States). Those standards require that we plan and perform the audit to obtain reasonable assurance about whether effective internal control over financial reporting was maintained in all material respects. Our audit included obtaining an understanding of internal control over financial reporting, assessing the risk that a material weakness exists, testing and evaluating the design and operating effectiveness of internal control based on the assessed risk, and performing such other procedures as we considered necessary in the circumstances. We believe that our audit provides a reasonable basis for our opinion.
A company's internal control over financial reporting is a process designed by, or under the supervision of, the company's principal executive and principal financial officers, or persons performing similar functions, and effected by the company's board of directors, management, and other personnel to provide reasonable assurance regarding the reliability of financial reporting and the preparation of financial statements for external purposes in accordance with generally accepted accounting principles. A company's internal control over financial reporting includes those policies and procedures that (1) pertain to the maintenance of records that, in reasonable detail, accurately and fairly reflect the transactions and dispositions of the assets of the company; (2) provide reasonable assurance that transactions are recorded as necessary to permit preparation of financial statements in accordance with generally accepted accounting principles, and that receipts and expenditures of the company are being made only in accordance with authorizations of management and directors of the company; and (3) provide reasonable assurance regarding prevention or timely detection of unauthorized acquisition, use, or disposition of the company's assets that could have a material effect on the financial statements.
Because of the inherent limitations of internal control over financial reporting, including the possibility of collusion or improper management override of controls, material misstatements due to error or fraud may not be prevented or detected on a timely basis. Also, projections of any evaluation of the effectiveness of the internal control over financial reporting to future periods are subject to the risk that the controls may become inadequate because of changes in conditions, or that the degree of compliance with the policies or procedures may deteriorate.
We have also audited, in accordance with the standards of the Public Company Accounting Oversight Board (United States), the consolidated financial statements as of and for the year ended December 31, 2011 of the Company and our report dated March 5, 2012 expressed an unqualified opinion on those financial statements.
REPORT OF DELOITTE & TOUCHE LLP, INDEPENDENT REGISTERED PUBLIC ACCOUNTING FIRM, ON CONSOLIDATED FINANCIAL STATEMENTS
We have audited the accompanying consolidated balance sheets of Verso Paper Holdings LLC, and subsidiaries, (the “Company”), a wholly-owned subsidiary of Verso Paper Finance Holdings LLC, as of December 31, 2011 and 2010, and the related consolidated statements of operations, member’s equity, and cash flows for each of the three years in the period ended December 31, 2011. These financial statements are the responsibility of the Company's management. Our responsibility is to express an opinion on these financial statements based on our audits.
We conducted our audits in accordance with the standards of the Public Company Accounting Oversight Board (United States). Those standards require that we plan and perform the audit to obtain reasonable assurance about whether the financial statements are free of material misstatement. An audit includes examining, on a test basis, evidence supporting the amounts and disclosures in the financial statements. An audit also includes assessing the accounting principles used and significant estimates made by management, as well as evaluating the overall financial statement presentation. We believe that our audits provide a reasonable basis for our opinion.
In our opinion, such consolidated financial statements present fairly, in all material respects, the financial position of the Company as of December 31, 2011 and 2010, and the results of their operations and their cash flows for each of the three years in the period ended December 31, 2011, in conformity with accounting principles generally accepted in the United States of America.
REPORT OF DELOITTE & TOUCHE LLP, INDEPENDENT REGISTERED PUBLIC ACCOUNTING FIRM, ON INTERNAL CONTROL OVER FINANCIAL REPORTING
We conducted our audit in accordance with the standards of the Public Company Accounting Oversight Board (United States). Those standards require that we plan and perform the audit to obtain reasonable assurance about whether effective internal control over financial reporting was maintained in all material respects. Our audit included obtaining an understanding of internal control over financial reporting, assessing the risk that a material weakness exists, testing and evaluating the design and operating effectiveness of internal control based on the assessed risk, and performing such other procedures as we considered necessary in the circumstances. We believe that our audit provides a reasonable basis for our opinion.
A company's internal control over financial reporting is a process designed by, or under the supervision of, the company's principal executive and principal financial officers, or persons performing similar functions, and effected by the company's board of directors, management, and other personnel to provide reasonable assurance regarding the reliability of financial reporting and the preparation of financial statements for external purposes in accordance with generally accepted accounting principles. A company's internal control over financial reporting includes those policies and procedures that (1) pertain to the maintenance of records that, in reasonable detail, accurately and fairly reflect the transactions and dispositions of the assets of the company; (2) provide reasonable assurance that transactions are recorded as necessary to permit preparation of financial statements in accordance with generally accepted accounting principles, and that receipts and expenditures of the company are being made only in accordance with authorizations of management and directors of the company; and (3) provide reasonable assurance regarding prevention or timely detection of unauthorized acquisition, use, or disposition of the company's assets that could have a material effect on the financial statements.
Because of the inherent limitations of internal control over financial reporting, including the possibility of collusion or improper management override of controls, material misstatements due to error or fraud may not be prevented or detected on a timely basis. Also, projections of any evaluation of the effectiveness of the internal control over financial reporting to future periods are subject to the risk that the controls may become inadequate because of changes in conditions, or that the degree of compliance with the policies or procedures may deteriorate.
We have also audited, in accordance with the standards of the Public Company Accounting Oversight Board (United States), the consolidated financial statements as of and for the year ended December 31, 2011 of the Company and our report dated March 5, 2012 expressed an unqualified opinion on those financial statements.