Item 1. Reports to Stockholders
Delaware Enhanced Global Dividend
and Income Fund
Annual report
November 30, 2016
The figures in the annual report for Delaware Enhanced Global Dividend and Income Fund represent past results, which are not a guarantee of future results. A rise or fall in interest rates can have a significant impact on bond prices. Funds that invest in bonds can lose their value as interest rates rise.
Closed-end fund

Table of contents
Delaware Management Holdings, Inc. and its subsidiaries (collectively known by the marketing name of Delaware Investments) are wholly owned subsidiaries of Macquarie Group Limited, a global provider of banking, financial, advisory, investment and funds management services. For more information, including press releases, please visit delawareinvestments.com/closed-end.
Unless otherwise noted, views expressed herein are current as of Nov. 30, 2016, and subject to change for events occurring after such date.
The Fund is not FDIC insured and is not guaranteed. It is possible to lose the principal amount invested.
Mutual fund advisory services are provided by Delaware Management Company, a series of Delaware Management Business Trust, which is a registered investment advisor. Delaware Investments, a member of Macquarie Group, refers to Delaware Management Holdings, Inc. and its subsidiaries. Macquarie Group refers to Macquarie Group Limited and its subsidiaries and affiliates worldwide.
Neither Delaware Investments nor its affiliates referred to in this document are authorized deposit-taking institutions for the purposes of the Banking Act 1959 (Commonwealth of Australia). The obligations of these entities do not represent deposits or other liabilities of Macquarie Bank Limited (MBL), a subsidiary of Macquarie Group Limited and an affiliate of Delaware Investments. MBL does not guarantee or otherwise provide assurance in respect of the obligations of these entities, unless noted otherwise. The Fund is governed by U.S. laws and regulations.
© 2017 Delaware Management Holdings, Inc.
All third-party marks cited are the property of their respective owners.
Portfolio management review
Delaware Enhanced Global Dividend and Income Fund
December 6, 2016
Performance preview (for the year ended November 30, 2016)
| | | | | | | | | | | | |
| | | | |
Delaware Enhanced Global Dividend and Income Fund @ market price | | | 1-year return | | | | | | | | +8.44 | % |
| | | |
Delaware Enhanced Global Dividend and Income Fund @ NAV | | | 1-year return | | | | | | | | +8.65 | % |
| | | |
Lipper Closed-end Global Funds Average @ market price | | | 1-year return | | | | | | | | +5.92 | % |
| | | |
Lipper Closed-end Global Funds Average @ NAV | | | 1-year return | | | | | | | | +1.32 | % |
Past performance does not guarantee future results.
For complete, annualized performance for Delaware Enhanced Global Dividend and Income Fund, please see the table on page 3.
Index performance returns do not reflect any management fees, transaction costs, or expenses. Indices are unmanaged and one cannot invest directly in an index.
For the fiscal year ended Nov. 30, 2016, Delaware Enhanced Global Dividend and Income Fund returned +8.65% at net asset value (NAV) and +8.44% at market price (both figures reflect all distributions reinvested). Complete annualized performance for the Fund is shown in the table on page 3.
Strength from equities and high yield bonds
Early in the Fund’s fiscal year, global stocks struggled amid concerns about economic growth worldwide. Beginning in February 2016, however, equities began a months-long rally driven in part by better U.S. economic data, improved commodity pricing, and stimulus efforts from monetary markets across Europe and Asia.
The stock market’s rally was briefly interrupted in June by the United Kingdom’s “Brexit” vote to end its involvement in the European Union. Although global stock prices immediately plunged, most equity indices soon rebounded sharply and returned to their previous levels within a few weeks, as investors apparently concluded that the immediate financial impact from Brexit would be manageable. Ongoing stimulus from global central banks also helped lift stock prices, led by economically sensitive companies that benefited from increased optimism on the part of investors.
Global stocks were again strong performers in November, when Donald Trump’s U.S. presidential victory gave Republicans unified control of the country’s federal government. Investors seemed to conclude that the incoming administration’s likely focus on deregulation, lower taxes, and increased fiscal spending could provide a near-term boost to the economy. Coupled with improved economic data, economically sensitive and more-speculative stocks benefited the most. U.S. interest rates rose along with concern about inflation, which in our view made yield-oriented investments, such as dividend-paying stocks, which had been strong performers earlier in the fiscal year, less attractive for investors.
For the full 12-month time frame, high yield bonds, as measured by the Bloomberg Barclays U.S. Corporate High-Yield Index, returned +12.1%, reflecting investors’ increased tolerance of credit risk and an improved financial backdrop for lower-rated issuers. U.S. large-cap value stocks enjoyed a strong performance environment, returning +12.0%, as measured by the Russell 1000® Value Index, for the fiscal year.
Global stocks trailed their U.S. counterparts — in part because of a stronger U.S. dollar that reduced returns for U.S. investors in foreign securities — with the MSCI ACWI (All CountryWorld Index) returning +3.7%. Meanwhile, convertible bonds, as measured by the BofA Merrill Lynch All U.S. Convertibles Index, returned +6.7% for the 12-month period.
Individual outperformers and underperformers
Substantial allocations to U.S. large-cap value stocks and high yield bonds — which together made up close to half of the Fund’s portfolio as of fiscal year end — were significantly positive performance factors. Allocations to international equities and convertibles, which produced lower but still positive returns for the fiscal year, were less helpful.
The Fund was generally positioned defensively. This stance helped performance overall but was a headwind in November 2016. The Fund’s lack of exposure to banks and other interest-rate-sensitive asset classes put it at a relative disadvantage during the market rally. November proved to be the exception, however, in what was otherwise a strong fiscal year for the Fund.
Among the Fund’s individual equity contributors, various holdings added to results. On the international side of the portfolio, Canadian gold producers Yamana Gold and Alamos Gold were strong performers, benefiting from rising gold prices. Generally higher commodity prices also lifted the shares of British-Australian mining company Rio Tinto. Other international equity stocks that added value were Mobile TeleSystems, a Russian telecommunication services company, and Samsung, a Korean electronics manufacturer.
Within the Fund’s U.S. large-cap value subportfolio, contributors included Spectra Energy, which announced a merger with Enbridge, and CSX, a rail company that benefited from an improved economy. Other notable stocks that added value included solid-waste company Waste Management and agricultural producer Archer-Daniels-Midland. Although the Fund’s U.S. large-cap equity investments enjoyed generally strong results, some holdings struggled. For example, we believe healthcare-related positions such as U.K.-based biopharmaceutical manufacturer AstraZeneca, drug distributor Cardinal Health, and healthcare products manufacturer
Portfolio management review
Delaware Enhanced Global Dividend and Income Fund
Abbott Laboratories were weighed down by investors’ concern about U.S. drug pricing trends. Among the Fund’s international equity detractors, we believe pharmaceutical manufacturer Shire was similarly affected by this concern.
Other international equity holdings that detracted from the Fund’s performance during the fiscal period included Italian bank UniCredit, U.K.-based utility company National Grid, and Swedish telecommunication services company Tele2, all of which produced subpar results.
In addition, the Fund used the following derivatives during the fiscal year: foreign currency exchange contracts to facilitate the purchase and sale of securities in the Fund, options contracts to receive premiums for writing options, and credit default swaps to hedge against credit events. Their net effect on Fund performance was minor (that is, less than 0.50 percentage points).
Of final note, the Fund’s use of leverage — a portfolio-management tool designed to obtain a higher return on our equity investments — added to performance in light of the stock market’s increase. Leverage has the effect of magnifying the impact of gains and losses. As a result, it added to the Fund’s results in a strong market environment.
Maintaining a yield-oriented approach
Throughout the fiscal year, we continued to emphasize securities offering competitive yields and the potential for dividend growth. We also maintained our focus on managing the portfolio’s downside risk and seeking to limit potential capital losses.
Turnover in the portfolio was modest throughout the fiscal year. Accordingly, the Fund’s asset allocations finished the period similar to where they began it. As of Nov. 30, 2016, the Fund’s largest asset allocation was in high yield bonds, which made up 35% of the portfolio. The mandate for this Fund is to maintain healthy exposure to international securities; accordingly, the Fund’s weighting in international equities was 29%, international bonds were 5%, and global real estate was 2% of the portfolio. Other meaningful allocations included a 15% stake in convertible securities and a 12% weighting in U.S. large-cap value equities.
Staying defensive amid uncertainty
In the wake of the Brexit vote, November’s U.S. elections, and the December Italian constitutional referendum — coupled with major elections next year in Germany and France — investors face considerable uncertainty about the future. In the U.S., this uncertainty includes questions about the economic effects of regulatory and tax policy, and the direction of interest rates. Against this backdrop, we think defensive positioning remains a prudent course of action, given a wide range of potential outcomes for investors.
For now, amid still low global rates, we continue to operate in a world in which income and yield remain in demand by investors. However, we believe investing for yield alone can be risky as it is dependent on interest rate policies rather than fundamentals. We believe an approach of investing in a diversified mix of securities, throughout the capital structure, has the potential to provide sustainable income and the ability to build capital over time.
Unless otherwise noted, views expressed herein are current as of Nov. 30, 2016, and subject to change for events occurring after such date.
2
Performance summary
Delaware Enhanced Global Dividend and Income Fund
The performance quoted represents past performance and does not guarantee future results. Investment return and principal value of an investment will fluctuate so that shares, when redeemed, may be worth more or less than their original cost. Current performance may be lower or higher than the performance quoted. Please obtain the most recent performance data by calling 866 437-0252 or visiting our website at delawareinvestments.com/closed-end.
Fund performance
| | | | | | | | | | |
Average annual total returns through November 30, 2016 | | 1 year | | | 5 years | | | Lifetime |
| | | |
At market price (inception date June 29, 2007) | | | +8.44 | % | | | +6.06 | % | | +2.83% |
At net asset value (inception date June 29, 2007) | | | +8.65 | % | | | +8.86 | % | | +4.69% |
Diversification may not protect against market risk.
Fixed income securities and bond funds can lose value, and investors can lose principal, as interest rates rise. They also may be affected by economic conditions that hinder an issuer’s ability to make interest and principal payments on its debt.
The Fund may also be subject to prepayment risk, the risk that the principal of a fixed income security that is held by the Fund may be prepaid prior to maturity, potentially forcing the Fund to reinvest that money at a lower interest rate.
High yielding, non-investment-grade bonds (junk bonds) involve higher risk than investment grade bonds.
Narrowly focused investments may exhibit higher volatility than investments in multiple industry sectors.
REIT investments are subject to many of the risks associated with direct real estate ownership, including changes in economic conditions, credit risk, and interest rate fluctuations.
The Funds may invest in derivatives, which may involve additional expenses and are subject to risk, including the risk that an underlying security or securities index moves in the opposite direction from what the portfolio manager anticipated. A derivative transaction depends upon the counterparties’ ability to fulfill their contractual obligations.
International investments entail risks not ordinarily associated with U.S. investments including fluctuation in currency values, differences in accounting principles, or economic or political instability in other nations.
Investing in emerging markets can be riskier than investing in established foreign markets due to increased volatility and lower trading volume.
If and when the Fund invests in forward foreign currency contracts or uses other investments to hedge against currency risks, the Fund will be subject to special risks, including counterparty risk.
The Fund may experience portfolio turnover that approaches or exceeds 100%, which could result in higher transaction costs and tax liability.
If and when the Fund utilizes leverage, the Fund may not be permitted to declare dividends or other distributions with respect to its common shares or purchase its capital stock, unless the Fund meets certain asset coverage requirements.
To the extent the Fund engages in option overwriting, it may receive less total return in certain periods and in other periods greater total return from its option overwriting strategy.
The use of dividend capture strategies will expose the Fund to increased trading costs and potential for capital loss or gain, particularly in the event of significant short-term price movements of stocks subject to dividend capture trading, and resultant dividends may not be qualified dividends eligible to individuals for reduced federal income tax rates.
Closed-end funds, unlike open-end funds, are not continuously offered. After being issued during a one-time-only public offering, shares of closed-end funds are sold in the open market through a securities exchange. Net asset value (NAV) is calculated by subtracting total liabilities by total assets, then dividing by the number of shares outstanding. At the time of sale, your shares may have a market price that is above or below NAV, and may be worth more or less than your original investment.
Performance summary
Delaware Enhanced Global Dividend and Income Fund
The Fund may make distributions of ordinary income and capital gains at calendar year end. Those distributions temporarily cause extraordinarily high yields. There is no assurance that a Fund will repeat that yield in the future. Subsequent monthly distributions that do not include ordinary income or capital gains in the form of dividends will likely be lower.
The “Fund performance” table and the “Performance of a $10,000 investment” graph do not reflect the deduction of taxes the shareholder would pay on Fund distributions or redemptions of Fund shares.
Returns reflect the reinvestment of all distributions. Dividends and distributions, if any, are assumed, for the purpose of this calculation to be reinvested at prices obtained under the Fund’s dividend reinvestment policy. Shares of the Fund were initially offered with a sales charge of 4.50%. Performance since inception does not include the sales charge or any other brokerage commission for purchases made since inception.
Past performance is not a guarantee of future results.
Fund basics
As of November 30, 2016
| | |
Fund objectives | | Fund start date |
The Fund’s primary investment objective is to seek current income. Capital appreciation is a secondary objective. | | June 29, 2007 |
Total Fund net assets | | NYSE symbol |
$181 million | | DEX |
Number of holdings | | |
670 | | |
4
Market price versus net asset value (see notes below)
November 30, 2015 through November 30, 2016
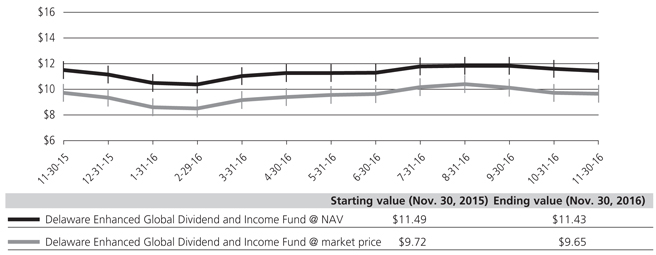
Past performance is not a guarantee of future results.
Performance of a $10,000 investment
Average annual total returns from June 29, 2007 (Fund’s inception) through November 30, 2016
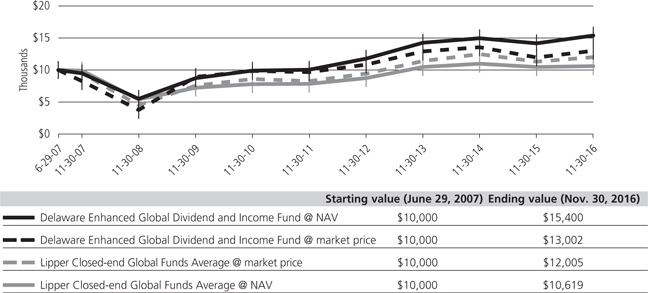
The “Performance of a $10,000 investment” graph assumes $10,000 invested in the Fund on June 29, 2007, and includes the reinvestment of all distributions at market value. The graph assumes $10,000 invested in the Lipper Closed-end Global Funds Average at market price and at NAV. Performance of the Fund and the Lipper class at market value is based on market performance during the period. Performance of the Fund and Lipper class at NAV is based on the fluctuations in NAV during the period. Delaware Enhanced Global Dividend and Income Fund was initially offered with a sales charge of 4.50%. The Fund is currently traded on the secondary market without a sales load. For market price,
Performance summary
Delaware Enhanced Global Dividend and Income Fund
performance shown in both graphs above does not include fees, the initial sales charge, or any brokerage commissions for purchases. For NAV, performance shown in both graphs above does include fees, but does not include the initial sales charge or any brokerage commissions for purchases. Investments in the Fund are not available at NAV.
The Lipper Closed-end Global Funds Average represents the average return of closed-end funds that invest at least 25% of their portfolio in securities traded outside of the United States and that may own U.S. securities as well (source: Lipper).
The Bloomberg Barclays U.S. Corporate High-Yield Index, mentioned on page 1, is composed of U.S. dollar–denominated, non-investment-grade corporate bonds for which the middle rating among Moody’s Investors Service, Inc., Fitch, Inc., and Standard & Poor’s is Ba1/BB+/BB+ or below.
The Russell 1000 Value Index, mentioned on page 1, measures the performance of the large-cap value segment of the U.S. equity universe. It includes those Russell 1000 companies with lower price-to-book ratios and lower forecasted growth values.
Russell Investment Group is the source and owner of the trademarks, service marks, and copyrights related to the Russell Indexes. Russell® is a trademark of Russell Investment Group.
The MSCI ACWI Index, mentioned on page 1, is a free float-adjusted market capitalization weighted index that is designed to measure equity market performance across developed and emerging markets worldwide.
The BofA Merrill Lynch All U.S. Convertibles Index, mentioned on page 1, tracks the performance of domestic corporate convertible bonds and convertible preferred stock issues of all qualities that have a market value of $50 million or more at issuance.
Market price is the price an investor would pay for shares of the Fund on the secondary market. NAV is the total value of one fund share, generally equal to a fund’s net assets divided by the number of shares outstanding.
Past performance is not a guarantee of future results.
6
Security type / sector and country allocations
Delaware Enhanced Global Dividend and Income Fund
As of November 30, 2016 (Unaudited)
Sector designations may be different than the sector designations presented in other fund materials. The sector designations may represent the investment manager’s internal sector classifications.
| | | | |
| Security type / sector | | Percentage
of net assets | |
Common Stock | | | 68.92% | |
Consumer Discretionary | | | 9.09% | |
Consumer Staples | | | 6.80% | |
Diversified REITs | | | 0.63% | |
Energy | | | 5.57% | |
Financials | | | 9.28% | |
Healthcare | | | 8.97% | |
Healthcare REITs | | | 0.32% | |
Hotel REITs | | | 0.70% | |
Industrial REITs | | | 0.48% | |
Industrials | | | 10.00% | |
Information Technology | | | 5.57% | |
Mall REITs | | | 0.52% | |
Manufactured Housing REIT | | | 0.12% | |
Materials | | | 1.94% | |
Mixed REIT | | | 0.03% | |
Mortgage REITs | | | 0.30% | |
Multifamily REITs | | | 0.91% | |
Office REITs | | | 1.28% | |
Self-Storage REIT | | | 0.04% | |
Shopping Center REITs | | | 1.11% | |
Single Tenant REIT | | | 0.24% | |
Telecommunications | | | 3.89% | |
Utilities | | | 1.13% | |
Convertible Preferred Stock | | | 2.15% | |
Exchange-Traded Note | | | 0.02% | |
Agency Collateralized Mortgage Obligations | | | 0.03% | |
Agency Commercial Mortgage-Backed Securities | | | 0.01% | |
Agency Mortgage-Backed Securities | | | 0.03% | |
Commercial Mortgage-Backed Securities | | | 0.02% | |
Convertible Bonds | | | 15.57% | |
Brokerage | | | 0.54% | |
Communications | | | 2.24% | |
Consumer Cyclical | | | 0.98% | |
Consumer Non-Cyclical | | | 2.90% | |
Energy | | | 0.35% | |
Financials | | | 2.01% | |
Industrials | | | 0.53% | |
Real Estate Investment Trusts | | | 1.86% | |
Technology | | | 4.16% | |
Corporate Bonds | | | 44.59% | |
Automotive | | | 0.11% | |
| | | | |
| Security type / sector | | Percentage
of net assets | |
Banking | | | 1.81% | |
Basic Industry | | | 4.63% | |
Brokerage | | | 0.24% | |
Capital Goods | | | 3.42% | |
Communications | | | 3.75% | |
Consumer Cyclical | | | 4.06% | |
Consumer Non-Cyclical | | | 2.58% | |
Electric | | | 0.43% | |
Energy | | | 6.74% | |
Financials | | | 0.50% | |
Healthcare | | | 3.02% | |
Insurance | | | 0.80% | |
Media | | | 5.00% | |
Natural Gas | | | 0.35% | |
Real Estate Investment Trusts | | | 1.48% | |
Services | | | 1.66% | |
Technology | | | 2.56% | |
Transportation | | | 0.38% | |
Utilities | | | 1.07% | |
Non-Agency Asset-Backed Security | | | 0.01% | |
Non-Agency Collateralized Mortgage Obligations | | | 0.06% | |
Senior Secured Loans | | | 2.37% | |
Sovereign Bonds | | | 4.26% | |
U.S. Treasury Obligations | | | 0.72% | |
Leveraged Non-Recourse Security | | | 0.00% | |
Limited Partnership | | | 0.43% | |
Master Limited Partnership | | | 0.23% | |
Preferred Stock | | | 0.92% | |
Rights | | | 0.02% | |
Warrant | | | 0.00% | |
Short-Term Investments | | | 3.91% | |
Total Value of Securities | | | 144.27% | |
Borrowing Under Line of Credit | | | (45.25%) | |
Receivables and Other Assets Net of Liabilities | | | 0.98% | |
Total Net Assets | | | 100.00% | |
Security type / sector and country allocations
Delaware Enhanced Global Dividend and Income Fund
| | | | |
| Country* | | Percentage
of net assets | |
Australia | | | 1.44% | |
Barbados | | | 0.28% | |
Belgium | | | 0.03% | |
Canada | | | 2.81% | |
Cayman Islands | | | 0.92% | |
China/Hong Kong | | | 2.85% | |
Colombia | | | 0.28% | |
Denmark | | | 0.82% | |
France | | | 8.81% | |
Germany | | | 3.26% | |
Indonesia | | | 3.37% | |
Ireland | | | 0.48% | |
Israel | | | 1.14% | |
Italy | | | 0.55% | |
Jamaica | | | 0.52% | |
Japan | | | 11.02% | |
Luxembourg | | | 0.85% | |
Mexico | | | 3.16% | |
Netherlands | | | 3.52% | |
Puerto Rico | | | 0.32% | |
Republic of Korea | | | 1.36% | |
Russia | | | 0.42% | |
Singapore | | | 0.03% | |
Sweden | | | 2.04% | |
Switzerland | | | 2.51% | |
United Kingdom | | | 6.79% | |
United States | | | 80.78% | |
Total | | | 140.36% | |
*Allocation includes all investments except for short-term
investments.
The percentage of net assets exceeds 100.00% because the Fund utilizes a line of credit with The Bank of New York Mellon, as described in Note 7 in “Notes to financial statements.” The Fund utilizes leveraging techniques in an attempt to obtain a higher return for the Fund. There is no assurance that the Fund will achieve its investment objectives through the use of such techniques.
8
Schedule of investments
Delaware Enhanced Global Dividend and Income Fund
November 30, 2016
| | | | | | | | |
| | | Number of
shares | | | Value (U.S. $) | |
| |
Common Stock – 68.92%v | | | | | |
| |
Consumer Discretionary – 9.09% | | | | | |
Bayerische MotorenWerke | | | 19,619 | | | $ | 1,671,981 | |
Ford Motor | | | 80,100 | | | | 957,996 | |
Kering | | | 6,363 | | | | 1,382,484 | |
Mattel | | | 23,600 | | | | 745,052 | |
Nitori Holdings | | | 11,708 | | | | 1,221,918 | |
Publicis Groupe | | | 10,779 | | | | 699,499 | |
Sumitomo Rubber Industries | | | 94,800 | | | | 1,565,292 | |
Target | | | 13,100 | | | | 1,011,844 | |
Techtronic Industries | | | 372,000 | | | | 1,450,783 | |
Toyota Motor | | | 45,905 | | | | 2,667,911 | |
Valeo | | | 16,810 | | | | 937,304 | |
Yue Yuen Industrial Holdings | | | 597,000 | | | | 2,151,247 | |
| | | | | | | | |
| | | | | | | 16,463,311 | |
| | | | | | | | |
Consumer Staples – 6.80% | | | | | |
Archer-Daniels-Midland | | | 12,700 | | | | 549,021 | |
Aryzta † | | | 35,635 | | | | 1,518,352 | |
Carlsberg Class B | | | 17,433 | | | | 1,482,476 | |
Coca-Cola Amatil | | | 150,652 | | | | 1,066,878 | |
Japan Tobacco | | | 55,300 | | | | 1,907,380 | |
Kimberly-Clark | | | 8,700 | | | | 1,005,807 | |
Kraft Heinz | | | 13,200 | | | | 1,077,780 | |
Procter & Gamble | | | 13,600 | | | | 1,121,456 | |
Reynolds American | | | 14,764 | | | | 798,732 | |
Tesco † | | | 485,223 | | | | 1,267,041 | |
Wal-Mart Stores | | | 7,400 | | | | 521,182 | |
| | | | | | | | |
| | | | | | | 12,316,105 | |
| | | | | | | | |
Diversified REITs – 0.63% | | | | | |
Cousins Properties | | | 17,020 | | | | 134,628 | |
Gramercy Property Trust | | | 45,084 | | | | 394,034 | |
Investors Real Estate Trust | | | 10,260 | | | | 64,535 | |
Lexington Realty Trust | | | 14,178 | | | | 146,459 | |
Mapletree Logistics Trust | | | 70,996 | | | | 50,274 | |
Orix JREIT | | | 40 | | | | 60,522 | |
Vornado Realty Trust | | | 1,973 | | | | 192,861 | |
Wereldhave | | | 2,500 | | | | 104,422 | |
| | | | | | | | |
| | | | | | | 1,147,735 | |
| | | | | | | | |
Energy – 5.57% | | | | | |
Chevron | | | 7,300 | | | | 814,388 | |
CNOOC | | | 1,006,000 | | | | 1,268,443 | |
ConocoPhillips | | | 19,200 | | | | 931,584 | |
Occidental Petroleum | | | 7,200 | | | | 513,792 | |
Royal Dutch Shell ADR | | | 20,400 | | | | 1,105,068 | |
Spectra Energy | | | 18,500 | | | | 757,575 | |
Suncor Energy | | | 43,500 | | | | 1,385,342 | |
TOTAL | | | 34,321 | | | | 1,635,243 | |
TOTAL ADR | | | 22,800 | | | | 1,086,648 | |
| | | | | | | | |
| | | Number of
shares | | | Value (U.S. $) | |
| |
Common Stockv (continued) | | | | | |
| |
Energy (continued) | | | | | |
Williams | | | 19,100 | | | $ | 586,370 | |
| | | | | | | | |
| | | | | | | 10,084,453 | |
| | | | | | | | |
Financials – 9.28% | | | | | |
Arthur J. Gallagher | | | 23,800 | | | | 1,198,330 | |
Ashford † | | | 632 | | | | 28,440 | |
AXA | | | 87,876 | | | | 2,070,399 | |
Bank Rakyat Indonesia Persero | | | 1,504,700 | | | | 1,210,200 | |
BB&T | | | 28,800 | | | | 1,303,200 | |
ING Groep | | | 131,792 | | | | 1,794,885 | |
Mitsubishi UFJ Financial Group | | | 495,028 | | | | 2,898,210 | |
Nordea Bank | | | 186,853 | | | | 1,963,184 | |
Nordea Bank FDR | | | 44,231 | | | | 464,329 | |
Solar Capital | | | 8,309 | | | | 168,257 | |
Standard Chartered † | | | 209,663 | | | | 1,681,800 | |
UniCredit | | | 357,559 | | | | 766,255 | |
Wells Fargo & Co. | | | 23,900 | | | | 1,264,788 | |
| | | | | | | | |
| | | | | | | 16,812,277 | |
| | | | | | | | |
Healthcare – 8.97% | | | | | |
Abbott Laboratories | | | 23,400 | | | | 890,838 | |
AbbVie | | | 15,900 | | | | 966,720 | |
Amgen | | | 3,500 | | | | 504,245 | |
AstraZeneca ADR | | | 33,600 | | | | 878,304 | |
Cardinal Health | | | 10,600 | | | | 752,706 | |
Johnson & Johnson | | | 6,300 | | | | 701,190 | |
Merck & Co. | | | 18,500 | | | | 1,132,015 | |
Novartis | | | 31,589 | | | | 2,182,677 | |
Pfizer | | | 38,460 | | | | 1,236,104 | |
Sanofi | | | 32,720 | | | | 2,639,365 | |
Shire | | | 25,114 | | | | 1,464,295 | |
STADA Arzneimittel | | | 21,919 | | | | 1,070,710 | |
Teva Pharmaceutical
Industries ADR | | | 48,900 | | | | 1,843,530 | |
| | | | | | | | |
| | | | | | | 16,262,699 | |
| | | | | | | | |
Healthcare REITs – 0.32% | | | | | |
Alexandria Real Estate Equities | | | 1,552 | | | | 170,084 | |
Healthcare Trust of America Class A | | | 3,897 | | | | 110,207 | |
MedEquities Realty Trust | | | 19,000 | | | | 206,910 | |
Welltower | | | 1,589 | | | | 99,757 | |
| | | | | | | | |
| | | | | | | 586,958 | |
| | | | | | | | |
Hotel REITs – 0.70% | | | | | |
Ashford Hospitality Prime | | | 14,889 | | | | 190,877 | |
Ashford Hospitality Trust | | | 61,800 | | | | 434,454 | |
Hospitality Properties Trust | | | 10,500 | | | | 304,447 | |
Schedule of investments
Delaware Enhanced Global Dividend and Income Fund
| | | | | | | | |
| | | Number of
shares | | | Value (U.S. $) | |
| |
Common Stockv (continued) | | | | | |
| |
Hotel REITs (continued) | | | | | |
Host Hotels & Resorts | | | 5,587 | | | $ | 99,672 | |
Pebblebrook Hotel Trust | | | 3,985 | | | | 114,609 | |
Summit Hotel Properties | | | 9,300 | | | | 132,246 | |
| | | | | | | | |
| | | | | | | 1,276,305 | |
| | | | | | | | |
Industrial REITs – 0.48% | | | | | |
Duke Realty | | | 8,297 | | | | 210,993 | |
Goodman Group | �� | | 49,447 | | | | 243,914 | |
Prologis Property Mexico | | | 116,800 | | | | 168,082 | |
Terreno Realty | | | 9,357 | | | | 254,698 | |
| | | | | | | | |
| | | | | | | 877,687 | |
| | | | | | | | |
Industrials – 10.00% | | | | | |
CSX | | | 18,200 | | | | 651,742 | |
Deutsche Post | | | 62,609 | | | | 1,956,843 | |
East Japan Railway | | | 24,961 | | | | 2,130,756 | |
ITOCHU | | | 190,502 | | | | 2,600,971 | |
Koninklijke Philips | | | 65,458 | | | | 1,882,855 | |
Meggitt | | | 235,529 | | | | 1,392,134 | |
Minebea | | | 144,900 | | | | 1,436,271 | |
Rexel | | | 48,829 | | | | 755,053 | |
Teleperformance | | | 13,929 | | | | 1,360,231 | |
United Technologies | | | 5,400 | | | | 581,688 | |
Vinci | | | 33,037 | | | | 2,143,923 | |
Waste Management | | | 17,600 | | | | 1,223,552 | |
| | | | | | | | |
| | | | | | | 18,116,019 | |
| | | | | | | | |
Information Technology – 5.57% | | | | | |
CA | | | 35,200 | | | | 1,124,992 | |
Canon ADR | | | 25,100 | | | | 725,641 | |
CGI Group Class A † | | | 33,440 | | | | 1,584,000 | |
Cisco Systems | | | 35,800 | | | | 1,067,556 | |
Intel | | | 31,400 | | | | 1,089,580 | |
Playtech | | | 145,240 | | | | 1,561,012 | |
Samsung Electronics | | | 1,646 | | | | 2,458,335 | |
Xerox | | | 51,700 | | | | 483,395 | |
| | | | | | | | |
| | | | | | | 10,094,511 | |
| | | | | | | | |
Mall REITs – 0.52% | | | | | |
General Growth Properties | | | 5,724 | | | | 145,046 | |
Pennsylvania Real Estate Investment Trust | | | 8,500 | | | | 162,945 | |
Simon Property Group | | | 3,570 | | | | 641,351 | |
| | | | | | | | |
| | | | | | | 949,342 | |
| | | | | | | | |
Manufactured Housing REIT – 0.12% | | | | | |
Equity LifeStyle Properties | | | 3,156 | | | | 219,121 | |
| | | | | | | | |
| | | | | | | 219,121 | |
| | | | | | | | |
Materials – 1.94% | | | | | |
Alamos Gold | | | 73,388 | | | | 467,109 | |
| | | | | | | | |
| | | Number of
shares | | | Value (U.S. $) | |
| |
Common Stockv (continued) | | | | | |
| |
Materials (continued) | | | | | |
Dow Chemical | | | 12,700 | | | $ | 707,644 | |
EI du Pont de Nemours & Co. | | | 9,700 | | | | 714,017 | |
Rio Tinto | | | 29,836 | | | | 1,116,191 | |
Tarkett | | | 6,400 | | | | 219,906 | |
Yamana Gold | | | 97,666 | | | | 291,551 | |
| | | | | | | | |
| | | | | | | 3,516,418 | |
| | | | | | | | |
Mixed REIT – 0.03% | | | | | |
PS Business Parks | | | 400 | | | | 44,692 | |
| | | | | | | | |
| | | | | | | 44,692 | |
| | | | | | | | |
Mortgage REITs – 0.30% | | | | | |
Colony Capital | | | 3,765 | | | | 77,220 | |
Starwood Property Trust | | | 20,900 | | | | 469,623 | |
| | | | | | | | |
| | | | | | | 546,843 | |
| | | | | | | | |
Multifamily REITs – 0.91% | | | | | |
ADO Properties 144A # | | | 9,915 | | | | 336,269 | |
American Homes 4 Rent | | | 10,926 | | | | 230,211 | |
Apartment Investment & Management | | | 3,765 | | | | 158,507 | |
Equity Residential | | | 10,265 | | | | 616,003 | |
Gecina | | | 893 | | | | 117,265 | |
Post Properties | | | 2,221 | | | | 144,409 | |
Vonovia | | | 1,371 | | | | 44,216 | |
| | | | | | | | |
| | | | | | | 1,646,880 | |
| | | | | | | | |
Office REITs – 1.28% | | | | | |
alstria office REIT † | | | 33,657 | | | | 411,648 | |
Champion REIT | | | 125,000 | | | | 71,069 | |
Easterly Government Properties | | | 38,559 | | | | 748,045 | |
Equity Commonwealth † | | | 11,822 | | | | 343,784 | |
Hudson Pacific Properties | | | 2,339 | | | | 81,561 | |
Intervest Offices & Warehouses | | | 2,500 | | | | 63,194 | |
Kenedix Office Investment | | | 50 | | | | 266,597 | |
Mack-Cali Realty | | | 6,123 | | | | 165,627 | |
Parkway † | | | 2,127 | | | | 41,689 | |
SL Green Realty | | | 1,235 | | | | 130,120 | |
| | | | | | | | |
| | | | | | | 2,323,334 | |
| | | | | | | | |
Self-Storage REIT – 0.04% | | | | | |
Jernigan Capital | | | 4,000 | | | | 79,560 | |
| | | | | | | | |
| | | | | | | 79,560 | |
| | | | | | | | |
Shopping Center REITs – 1.11% | | | | | |
Brixmor Property Group | | | 4,622 | | | | 112,546 | |
Charter Hall Retail REIT | | | 71,117 | | | | 223,194 | |
DDR | | | 3,924 | | | | 59,723 | |
First Capital Realty | | | 2,922 | | | | 44,288 | |
Kimco Realty | | | 5,734 | | | | 146,446 | |
10
| | | | | | | | |
| | | Number of
shares | | | Value (U.S. $) | |
| |
Common Stockv (continued) | | | | | |
| |
Shopping Center REITs (continued) | | | | | |
Kite Realty Group Trust | | | 12,316 | | | $ | 296,200 | |
Klepierre | | | 1,425 | | | | 53,139 | |
Link REIT | | | 33,000 | | | | 227,190 | |
Ramco-Gershenson Properties Trust | | | 19,634 | | | | 333,189 | |
Retail Properties of America | | | 5,858 | | | | 89,393 | |
Scentre Group | | | 40,548 | | | | 126,957 | |
Urban Edge Properties | | | 2,941 | | | | 79,672 | |
Westfield | | | 16,989 | | | | 114,666 | |
Wheeler Real Estate Investment Trust | | | 68,360 | | | | 111,427 | |
| | | | | | | | |
| | | | | | | 2,018,030 | |
| | | | | | | | |
Single Tenant REIT – 0.24% | | | | | |
STORE Capital | | | 17,193 | | | | 425,011 | |
| | | | | | | | |
| | | | | | | 425,011 | |
| | | | | | | | |
Telecommunications – 3.89% | | | | | |
AT&T | | | 34,400 | | | | 1,328,872 | |
Century Communications =† | | | 125,000 | | | | 0 | |
Mobile TeleSystems ADR | | | 96,900 | | | | 758,727 | |
Nippon Telegraph & Telephone | | | 61,402 | | | | 2,482,271 | |
Tele2 Class B | | | 167,326 | | | | 1,278,149 | |
Verizon Communications | | | 24,200 | | | | 1,207,580 | |
| | | | | | | | |
| | | | | | | 7,055,599 | |
| | | | | | | | |
Utilities – 1.13% | | | | | |
American Water Works | | | 800 | | | | 57,976 | |
Edison International | | | 7,600 | | | | 522,652 | |
National Grid | | | 74,656 | | | | 853,016 | |
National Grid ADR | | | 10,600 | | | | 604,942 | |
| | | | | | | | |
| | | | | | | 2,038,586 | |
| | | | | | | | |
Total Common Stock
(cost $121,478,718) | | | | | | | 124,901,476 | |
| | | | | | | | |
|
| |
Convertible Preferred Stock – 2.15% | |
| |
A Schulman 6.00% exercise price $52.33, expiration date 12/31/49 | | | 440 | | | | 371,268 | |
Bank of America 7.25%exercise price $50.00,expiration date 12/31/49 | | | 566 | | | | 662,786 | |
El Paso Energy Capital Trust I 4.75% exercise price $50.00, expiration date 3/31/28 | | | 10,323 | | | | 518,834 | |
Exelon 6.50% exercise price $43.75, expiration date 6/1/17 | | | 12,500 | | | | 573,125 | |
| | | | | | | | |
| | | Number of
shares | | | Value (U.S. $) | |
| |
Convertible Preferred Stock (continued) | | | | | |
| |
Huntington Bancshares
8.50% exercise price
$11.95, expiration date 12/31/49 | | | 517 | | | $ | 723,826 | |
Teva Pharmaceutical
Industries 7.00% exercise price $75.00, expiration date 12/15/18 | | | 329 | | | | 215,166 | |
Wells Fargo & Co. 7.50%
exercise price $156.71,
expiration date 12/31/49 | | | 695 | | | | 835,647 | |
| | | | | | | | |
Total Convertible Preferred
Stock
(cost $3,773,354) | | | | | | | 3,900,652 | |
| | | | | | | | |
|
| |
Exchange-Traded Note – 0.02% | | | | | |
| |
iPATH S&P 500 VIX
Short-Term Futures ETN † | | | 1,562 | | | | 43,564 | |
| | | | | | | | |
Total Exchange-Traded Note
(cost $1,177,623) | | | | 43,564 | |
| | | | | | | | |
| | |
| | | Principal
amount° | | | | |
| |
Agency Collateralized Mortgage Obligations – 0.03% | |
| |
Fannie Mae REMICS
Series 2001-50 BA
7.00% 10/25/41 | | | 49,814 | | | | 56,959 | |
Freddie Mac REMICS
Series 2557WE
5.00% 1/15/18 | | | 3,913 | | | | 3,971 | |
| | | | | | | | |
Total Agency Collateralized Mortgage Obligations
(cost $54,793) | | | | | | | 60,930 | |
| | | | | | | | |
|
| |
Agency Commercial Mortgage-Backed Securities – 0.01% | | | | | |
| |
FREMF Mortgage Trust | | | | | | | | |
Series 2011-K15 B 144A 5.116% 8/25/44 #● | | | 10,000 | | | | 10,882 | |
Series 2012-K22 B 144A 3.811% 8/25/45 #● | | | 10,000 | | | | 10,297 | |
| | | | | | | | |
Total Agency Commercial Mortgage-Backed
Securities
(cost $21,214) | | | | | | | 21,179 | |
| | | | | | | | |
|
| |
Agency Mortgage-Backed Securities – 0.03% | |
| |
Fannie Mae ARM | | | | | | | | |
2.414% 5/1/43 ● | | | 3,759 | | | | 3,803 | |
2.553% 6/1/43 ● | | | 1,740 | | | | 1,759 | |
2.567% 3/1/38 ● | | | 5,558 | | | | 5,841 | |
Schedule of investments
Delaware Enhanced Global Dividend and Income Fund
| | | | | | | | |
| | | Principal
amount° | | | Value
(U.S. $) | |
| |
Agency Mortgage-Backed Securities (continued) | |
| |
Fannie Mae ARM | | | | | | | | |
2.834% 4/1/36 ● | | | 13,980 | | | $ | 14,767 | |
2.868% 4/1/36 ● | | | 5,042 | | | | 5,276 | |
2.928% 11/1/35 ● | | | 3,782 | | | | 3,980 | |
2.952% 10/1/36 ● | | | 4,402 | | | | 4,604 | |
3.096% 10/1/36 ● | | | 6,403 | | | | 6,744 | |
3.275% 9/1/43 ● | | | 3,097 | | | | 3,190 | |
Fannie Mae S.F. 30 yr | | | | | | | | |
5.50% 9/1/34 | | | 470 | | | | 529 | |
6.50% 5/1/40 | | | 1,010 | | | | 1,157 | |
Freddie Mac ARM | | | | | | | | |
2.681% 10/1/36 ● | | | 7,503 | | | | 7,926 | |
| | | | | | | | |
Total Agency Mortgage-Backed Securities
(cost $57,555) | | | | | | | 59,576 | |
| | | | | | | | |
|
| |
Commercial Mortgage-Backed Securities – 0.02% | |
| |
Banc of America Commercial Mortgage Trust
Series 2007-4 AM
6.007% 2/10/51 ● | | | 35,000 | | | | 35,842 | |
LB-UBS Commercial
Mortgage Trust
Series 2006-C6 AJ
5.452% 9/15/39 ● | | | 8,685 | | | | 8,078 | |
| | | | | | | | |
Total Commercial Mortgage-Backed Securities
(cost $47,825) | | | | | | | 43,920 | |
| | | | | | | | |
|
| |
Convertible Bonds – 15.57% | |
| |
Brokerage – 0.54% | |
Jefferies Group 3.875%
exercise price $44.04,
maturity date 11/1/29 | | | 968,000 | | | | 981,310 | |
| | | | | | | | |
| | | | | | | 981,310 | |
| | | | | | | | |
Communications – 2.24% | |
Alaska Communications Systems Group 6.25%
exercise price $10.28,
maturity date 5/1/18 | | | 1,349,000 | | | | 1,338,883 | |
Clearwire Communications 144A 8.25% exercise price $7.08, maturity date
12/1/40 # | | | 1,291,000 | | | | 1,355,550 | |
DISH Network 144A 3.375%
exercise price $65.18,
maturity date 8/15/26 # | | | 449,000 | | | | 504,003 | |
| | | | | | | | |
| | | Principal
amount° | | | Value
(U.S. $) | |
| |
Convertible Bonds (continued) | |
| |
Communications (continued) | |
Liberty Interactive 144A
1.75% exercise price
$341.10, maturity date
9/30/46 # | | | 639,000 | | | $ | 678,139 | |
Liberty Media 144A 2.25%
exercise price $104.55,
maturity date 9/30/46 # | | | 178,000 | | | | 185,120 | |
| | | | | | | | |
| | | | | | | 4,061,695 | |
| | | | | | | | |
Consumer Cyclical – 0.98% | |
Huron Consulting Group
1.25% exercise price
$79.89, maturity date
10/1/19 | | | 597,000 | | | | 588,418 | |
Meritor 4.00% exercise price
$26.73, maturity date
2/15/27 f | | | 1,149,000 | | | | 1,177,725 | |
| | | | | | | | |
| | | | | | | 1,766,143 | |
| | | | | | | | |
Consumer Non-Cyclical – 2.90% | |
Brookdale Senior Living
2.75% exercise price
$29.33, maturity date
6/15/18 | | | 1,136,000 | | | | 1,104,050 | |
HealthSouth 2.00% exercise
price $37.16, maturity date
12/1/43 | | | 701,000 | | | | 836,381 | |
Hologic 2.00% exercise price
$31.18, maturity date
3/1/42 f | | | 597,000 | | | | 791,025 | |
NuVasive 144A 2.25%
exercise price $59.82,
maturity date 3/15/21 # | | | 285,000 | | | | 353,756 | |
Spectrum Pharmaceuticals
2.75% exercise price
$10.53, maturity date
12/15/18 | | | 922,000 | | | | 811,360 | |
Vector Group
1.75% exercise price
$23.46, maturity date
4/15/20 ● | | | 1,007,000 | | | | 1,135,393 | |
2.50% exercise price $15.22, maturity date 1/15/19 ● | | | 157,000 | | | | 228,004 | |
| | | | | | | | |
| | | | | | | 5,259,969 | |
| | | | | | | | |
Energy – 0.35% | |
Helix Energy Solutions Group
4.25% exercise price
$13.89, maturity date
5/1/22 | | | 569,000 | | | | 621,988 | |
| | | | | | | | |
| | | | | | | 621,988 | |
| | | | | | | | |
12
| | | | | | | | |
| | | Principal
amount° | | | Value (U.S. $) | |
| |
Convertible Bonds (continued) | | | | | |
| |
Financials – 2.01% | | | | | |
Ares Capital 4.75% exercise price $19.87, maturity date 1/15/18 | | | 1,059,000 | | | $ | 1,091,432 | |
Blackhawk Network Holdings 144A 1.50% exercise price $49.83, maturity date 1/15/22 # | | | 734,000 | | | | 752,350 | |
GAIN Capital Holdings 4.125% exercise price $12.00, maturity date 12/1/18 | | | 824,000 | | | | 798,250 | |
New Mountain Finance 5.00% exercise price $15.80, maturity date 6/15/19 | | | 974,000 | | | | 1,005,046 | |
| | | | | | | | |
| | | | | | | 3,647,078 | |
| | | | | | | | |
Industrials – 0.53% | | | | | | | | |
Chart Industries 2.00%exercise price $69.03,maturity date 8/1/18 | | | 962,000 | | | | 954,184 | |
| | | | | | | | |
| | | | | | | 954,184 | |
| | | | | | | | |
Real Estate Investment Trusts – 1.86% | | | | | |
Blackstone Mortgage Trust 5.25% exercise price $27.99, maturity date 12/1/18 | | | 1,069,000 | | | | 1,190,599 | |
Spirit Realty Capital 3.75%exercise price $13.10,maturity date 5/15/21 | | | 916,000 | | | | 960,660 | |
VEREIT 3.75% exercise price $14.99, maturity date 12/15/20 | | | 1,219,000 | | | | 1,225,101 | |
| | | | | | | | |
| | | | | | | 3,376,360 | |
| | | | | | | | |
Technology – 4.16% | | | | | |
Cardtronics 1.00% exercise price $52.35, maturity date 12/1/20 | | | 1,096,000 | | | | 1,219,300 | |
Ciena 144A 3.75% exercise price $20.17, maturity date 10/15/18 # | | | 469,000 | | | | 587,423 | |
Electronics For Imaging 0.75% exercise price $52.72, maturity date 9/1/19 | | | 631,000 | | | | 668,860 | |
j2 Global 3.25% exercise price $69.08, maturity date 6/15/29 | | | 789,000 | | | | 975,401 | |
| | | | | | | | |
| | | Principal
amount° | | | Value (U.S. $) | |
| |
Convertible Bonds (continued) | | | | | |
| |
Technology (continued) | | | | | |
Knowles 144A 3.25%exercise price $18.43,maturity date 11/1/21 # | | | 504,000 | | | $ | 573,930 | |
Nuance Communications 2.75% exercise price $32.30, maturity date 11/1/31 | | | 758,000 | | | | 764,159 | |
NXP Semiconductors 1.00%exercise price $102.84,maturity date 12/1/19 | | | 711,000 | | | | 814,095 | |
PROS Holdings 2.00%exercise price $33.79, maturity date 12/1/19 | | | 862,000 | | | | 883,011 | |
Verint Systems 1.50%exercise price $64.46,maturity date 6/1/21 | | | 1,101,000 | | | | 1,056,960 | |
| | | | | | | | |
| | | | | | | 7,543,139 | |
| | | | | | | | |
Total Convertible Bonds
(cost $26,725,430) | | | | | | | 28,211,866 | |
| | | | | | | | |
|
| |
Corporate Bonds – 44.59% | |
| |
Automotive – 0.11% | | | | | |
Gates Global 144A 6.00% 7/15/22 # | | | 215,000 | | | | 206,400 | |
| | | | | | | | |
| | | | | | | 206,400 | |
| | | | | | | | |
Banking – 1.81% | | | | | |
Bank of America | | | | | | | | |
4.183% 11/25/27 | | | 5,000 | | | | 5,000 | |
4.45% 3/3/26 | | | 25,000 | | | | 25,736 | |
Bank of New York Mellon | | | | | | | | |
2.20% 8/16/23 | | | 5,000 | | | | 4,767 | |
2.50% 4/15/21 | | | 10,000 | | | | 10,007 | |
4.625% 12/29/49 ● | | | 5,000 | | | | 4,587 | |
BB&T 2.45% 1/15/20 | | | 35,000 | | | | 35,222 | |
Capital One Financial | | | | | | | | |
4.20% 10/29/25 | | | 5,000 | | | | 5,017 | |
Citigroup 3.20% 10/21/26 | | | 5,000 | | | | 4,802 | |
Citizens Financial Group | | | | | | | | |
4.30% 12/3/25 | | | 5,000 | | | | 5,066 | |
Credit Suisse Group 144A | | | | | | | | |
6.25% 12/29/49 #● | | | 485,000 | | | | 457,641 | |
Goldman Sachs Group | | | | | | | | |
3.50% 11/16/26 | | | 5,000 | | | | 4,923 | |
5.15% 5/22/45 | | | 5,000 | | | | 5,170 | |
Huntington Bancshares | | | | | | | | |
2.30% 1/14/22 | | | 5,000 | | | | 4,868 | |
JPMorgan Chase & Co. | | | | | | | | |
3.625% 12/1/27 | | | 10,000 | | | | 9,751 | |
Schedule of investments
Delaware Enhanced Global Dividend and Income Fund
| | | | | | | | |
| | | Principal
amount° | | | Value
(U.S. $) | |
| |
Corporate Bonds (continued) | | | | | |
| |
Banking (continued) | | | | | |
JPMorgan Chase & Co. | | | | | | | | |
4.25% 10/1/27 | | | 15,000 | | | $ | 15,447 | |
6.75% 8/29/49 ● | | | 715,000 | | | | 769,519 | |
Lloyds Banking Group | | | | | | | | |
7.50% 4/30/49 ● | | | 245,000 | | | | 250,513 | |
Morgan Stanley | | | | | | | | |
3.125% 7/27/26 | | | 5,000 | | | | 4,800 | |
3.95% 4/23/27 | | | 60,000 | | | | 59,525 | |
PNC Financial Services Group | | | | | | | | |
5.00% 12/29/49 ● | | | 5,000 | | | | 4,863 | |
5.625% 2/1/17 | | | 35,000 | | | | 35,227 | |
Popular 7.00% 7/1/19 | | | 570,000 | | | | 587,100 | |
Royal Bank of Scotland Group | | | | | | | | |
8.625% 12/29/49 ● | | | 455,000 | | | | 448,744 | |
Santander UK Group Holdings | | | | | | | | |
2.875% 10/16/20 | | | 15,000 | | | | 14,833 | |
State Street | | | | | | | | |
2.55% 8/18/20 | | | 5,000 | | | | 5,050 | |
3.10% 5/15/23 | | | 5,000 | | | | 5,001 | |
3.55% 8/18/25 | | | 5,000 | | | | 5,144 | |
Suntrust Banks | | | | | | | | |
2.70% 1/27/22 | | | 5,000 | | | | 5,007 | |
Toronto-Dominion Bank | | | | | | | | |
2.125% 4/7/21 | | | 5,000 | | | | 4,942 | |
2.50% 12/14/20 | | | 5,000 | | | | 5,038 | |
UBS Group | | | | | | | | |
6.875% 12/29/49 ● | | | 400,000 | | | | 388,228 | |
US Bancorp 3.10% 4/27/26 | | | 5,000 | | | | 4,897 | |
USB Capital IX | | | | | | | | |
3.50% 10/29/49 ● | | | 80,000 | | | | 65,420 | |
Westpac Banking | | | | | | | | |
4.322% 11/23/31 ● | | | 5,000 | | | | 4,971 | |
Zions Bancorporation | | | | | | | | |
4.50% 6/13/23 | | | 5,000 | | | | 5,074 | |
| | | | | | | | |
| | | | | | | 3,271,900 | |
| | | | | | | | |
Basic Industry – 4.63% | | | | | |
AK Steel | | | | | | | | |
7.625% 5/15/20 | | | 271,000 | | | | 279,130 | |
7.625% 10/1/21 | | | 135,000 | | | | 141,075 | |
Alcoa Nederland Holding | | | | | | | | |
144A 7.00% 9/30/26 # | | | 200,000 | | | | 212,500 | |
BMC East 144A | | | | | | | | |
5.50% 10/1/24 # | | | 255,000 | | | | 255,000 | |
Boise Cascade 144A | | | | | | | | |
5.625% 9/1/24 # | | | 425,000 | | | | 417,563 | |
Builders FirstSource | | | | | | | | |
144A 5.625% 9/1/24 # | | | 215,000 | | | | 216,881 | |
144A 10.75% 8/15/23 # | | | 540,000 | | | | 621,000 | |
| | | | | | | | |
| | | Principal
amount° | | | Value
(U.S. $) | |
| |
Corporate Bonds (continued) | | | | | |
| |
Basic Industry (continued) | | | | | |
Cemex Finance 144A | | | | | | | | |
6.00% 4/1/24 # | | | 200,000 | | | $ | 199,270 | |
CF Industries 6.875% 5/1/18 | | | 10,000 | | | | 10,550 | |
Chemours | | | | | | | | |
6.625% 5/15/23 | | | 130,000 | | | | 129,025 | |
7.00% 5/15/25 | | | 123,000 | | | | 121,770 | |
Dow Chemical | | | | | | | | |
8.55% 5/15/19 | | | 34,000 | | | | 39,086 | |
Eastman Chemical | | | | | | | | |
4.65% 10/15/44 | | | 10,000 | | | | 9,712 | |
FMG Resources August 2006 | | | | | | | | |
144A 6.875% 4/1/22 # | | | 655,000 | | | | 679,563 | |
144A 9.75% 3/1/22 # | | | 75,000 | | | | 86,895 | |
Freeport-McMoRan | | | | | | | | |
4.55% 11/14/24 | | | 270,000 | | | | 257,850 | |
Georgia-Pacific | | | | | | | | |
8.00% 1/15/24 | | | 20,000 | | | | 25,415 | |
International Paper | | | | | | | | |
4.40% 8/15/47 | | | 5,000 | | | | 4,628 | |
5.15% 5/15/46 | | | 5,000 | | | | 5,064 | |
INVISTA Finance 144A | | | | | | | | |
4.25% 10/15/19 # | | | 10,000 | | | | 10,049 | |
James Hardie International Finance 144A | | | | | | | | |
5.875% 2/15/23 # | | | 415,000 | | | | 434,194 | |
Joseph T Ryerson & Son 144A | | | | | | | | |
11.00% 5/15/22 # | | | 165,000 | | | | 180,263 | |
Kraton Polymers 144A | | | | | | | | |
10.50% 4/15/23 # | | | 380,000 | | | | 422,750 | |
NCI Building Systems 144A | | | | | | | | |
8.25% 1/15/23 # | | | 340,000 | | | | 369,750 | |
New Gold | | | | | | | | |
144A 6.25% 11/15/22 # | | | 146,000 | | | | 147,460 | |
144A 7.00% 4/15/20 # | | | 150,000 | | | | 154,875 | |
NOVA Chemicals 144A | | | | | | | | |
5.00% 5/1/25 # | | | 285,000 | | | | 278,587 | |
Novelis | | | | | | | | |
144A 5.875% 9/30/26 # | | | 65,000 | | | | 65,081 | |
144A 6.25% 8/15/24 # | | | 525,000 | | | | 544,687 | |
PQ 144A 6.75% 11/15/22 # | | | 400,000 | | | | 424,000 | |
Rio Tinto Finance USA | | | | | | | | |
3.75% 6/15/25 | | | 5,000 | | | | 5,165 | |
Steel Dynamics 144A | | | | | | | | |
5.00% 12/15/26 # | | | 245,000 | | | | 246,837 | |
Summit Materials | | | | | | | | |
6.125% 7/15/23 | | | 420,000 | | | | 428,400 | |
8.50% 4/15/22 | | | 120,000 | | | | 132,750 | |
US Concrete 6.375% 6/1/24 | | | 405,000 | | | | 423,225 | |
14
| | | | | | | | |
| | | Principal
amount° | | | Value
(U.S. $) | |
| |
Corporate Bonds (continued) | | | | | |
| |
Basic Industry (continued) | | | | | | | | |
Vale Overseas
6.25% 8/10/26 | | | 385,000 | | | $ | 401,844 | |
| | | | | | | | |
| | | | | | | 8,381,894 | |
| | | | | | | | |
Brokerage – 0.24% | | | | | | | | |
E*TRADE Financial 5.875% 12/29/49 • | | | 400,000 | | | | 399,000 | |
Jefferies Group | | | | | | | | |
5.125% 1/20/23 | | | 10,000 | | | | 10,349 | |
6.45% 6/8/27 | | | 5,000 | | | | 5,420 | |
6.50% 1/20/43 | | | 5,000 | | | | 4,990 | |
Lazard Group
6.85% 6/15/17 | | | 6,000 | | | | 6,170 | |
| | | | | | | | |
| | | | | | | 425,929 | |
| | | | | | | | |
Capital Goods – 3.42% | | | | | | | | |
Ardagh Packaging Finance 144A 7.25% 5/15/24 # | | | 400,000 | | | | 419,500 | |
Ball 5.25% 7/1/25 | | | 200,000 | | | | 208,875 | |
BWAY Holding 144A 9.125% 8/15/21 # | | | 473,000 | | | | 494,285 | |
CCL Industries 144A 3.25% 10/1/26 # | | | 5,000 | | | | 4,783 | |
Cemex | | | | | | | | |
144A 5.70% 1/11/25 # | | | 1,000,000 | | | | 975,000 | |
144A 7.75% 4/16/26 # | | | 400,000 | | | | 430,000 | |
Crane 4.45% 12/15/23 | | | 10,000 | | | | 10,339 | |
Fortive 144A
3.15% 6/15/26 # | | | 5,000 | | | | 4,894 | |
Fortune Brands Home & Security 3.00% 6/15/20 | | | 5,000 | | | | 5,056 | |
Gardner Denver 144A 6.875% 8/15/21 # | | | 714,000 | | | | 706,860 | |
General Electric | | | | | | | | |
2.10% 12/11/19 | | | 35,000 | | | | 35,220 | |
5.55% 5/4/20 | | | 5,000 | | | | 5,553 | |
6.00% 8/7/19 | | | 10,000 | | | | 11,096 | |
KLX 144A 5.875% 12/1/22 # | | | 385,000 | | | | 395,587 | |
Lennox International 3.00% 11/15/23 | | | 5,000 | | | | 4,853 | |
Masco 3.50% 4/1/21 | | | 5,000 | | | | 5,053 | |
Plastipak Holdings 144A 6.50% 10/1/21 # | | | 285,000 | | | | 299,250 | |
Reynolds Group Issuer
8.25% 2/15/21 | | | 187,268 | | | | 193,450 | |
Signode Industrial Group Lux
144A 6.375% 5/1/22 # | | | 360,000 | | | | 364,500 | |
StandardAero Aviation Holdings 144A 10.00% 7/15/23 # | | | 190,000 | | | | 201,637 | |
| | | | | | | | |
| | | Principal
amount° | | | Value
(U.S. $) | |
| |
Corporate Bonds (continued) | | | | | |
| |
Capital Goods (continued) | | | | | | | | |
TransDigm 144A
6.375% 6/15/26 # | | | 765,000 | | | $ | 782,213 | |
United Technologies
3.75% 11/1/46 | | | 5,000 | | | | 4,705 | |
Zekelman Industries
144A 9.875% 6/15/23 # | | | 590,000 | | | | 634,250 | |
| | | | | | | | |
| | | | | | | 6,196,959 | |
| | | | | | | | |
Communications – 3.75% | | | | | | | | |
21st Century Fox America 4.95% 10/15/45 | | | 5,000 | | | | 5,175 | |
Activision Blizzard 144A
3.40% 9/15/26 # | | | 5,000 | | | | 4,746 | |
American Tower Trust I 144A 3.07% 3/15/23 # | | | 20,000 | | | | 19,781 | |
AT&T | | | | | | | | |
4.35% 6/15/45 | | | 5,000 | | | | 4,400 | |
144A 4.50% 3/9/48 # | | | 10,000 | | | | 8,946 | |
CC Holdings GS V
3.849% 4/15/23 | | | 5,000 | | | | 5,105 | |
CenturyLink | | | | | | | | |
5.80% 3/15/22 | | | 210,000 | | | | 207,637 | |
6.75% 12/1/23 | | | 370,000 | | | | 371,387 | |
7.50% 4/1/24 | | | 130,000 | | | | 134,536 | |
Charter Communications | | | | | | | | |
Operating 144A | | | | | | | | |
4.908% 7/23/25 # | | | 10,000 | | | | 10,456 | |
Cogent Communications | | | | | |
Finance 144A | | | | | | | | |
5.625% 4/15/21 # | | | 250,000 | | | | 251,250 | |
Cogent Communications | | | | | |
Group 144A | | | | | | | | |
5.375% 3/1/22 # | | | 215,000 | | | | 218,494 | |
Crown Castle Towers 144A 4.883% 8/15/20 # | | | 30,000 | | | | 32,123 | |
Digicel Group 144A
7.125% 4/1/22 # | | | 1,250,000 | | | | 934,375 | |
Frontier Communications | | | | | |
10.50% 9/15/22 | | | 365,000 | | | | 378,231 | |
11.00% 9/15/25 | | | 19,000 | | | | 19,119 | |
Historic TW 6.875% 6/15/18 | | | 25,000 | | | | 26,845 | |
Lamar Media 5.75% 2/1/26 | | | 360,000 | | | | 381,402 | |
Level 3 Financing
5.375% 5/1/25 | | | 360,000 | | | | 359,100 | |
Sable International Finance 144A 6.875% 8/1/22 # | | | 290,000 | | | | 302,325 | |
Sprint 7.125% 6/15/24 | | | 725,000 | | | | 722,738 | |
Sprint Communications | | | | | | | | |
144A 7.00% 3/1/20 # | | | 190,000 | | | | 204,843 | |
7.00% 8/15/20 | | | 302,000 | | | | 314,080 | |
Schedule of investments
Delaware Enhanced Global Dividend and Income Fund
| | | | | | | | |
| | | Principal
amount° | | | Value
(U.S. $) | |
| |
Corporate Bonds (continued) | | | | | |
| |
Communications (continued) | | | | | |
TimeWarner Cable
7.30% 7/1/38 | | | 10,000 | | | $ | 11,959 | |
T-Mobile USA | | | | | | | | |
6.00% 3/1/23 | | | 195,000 | | | | 204,750 | |
6.00% 4/15/24 | | | 85,000 | | | | 89,463 | |
6.375% 3/1/25 | | | 155,000 | | | | 166,044 | |
6.50% 1/15/26 | | | 320,000 | | | | 346,400 | |
Verizon Communications | | | | | |
1.75% 8/15/21 | | | 5,000 | | | | 4,798 | |
4.125% 8/15/46 | | | 15,000 | | | | 13,434 | |
Viacom 3.45% 10/4/26 | | | 5,000 | | | | 4,788 | |
Wind Acquisition Finance
144A 7.375% 4/23/21 # | | | 605,000 | | | | 618,613 | |
Zayo Group 6.375% 5/15/25 | | | 400,000 | | | | 417,500 | |
| | | | | | | | |
| | | | | | | 6,794,843 | |
| | | | | | | | |
Consumer Cyclical – 4.06% | | | | | |
American Tire Distributors 144A 10.25% 3/1/22 # | | | 460,000 | | | | 431,250 | |
Beacon Roofing Supply 6.375% 10/1/23 | | | 290,000 | | | | 309,575 | |
Boyd Gaming 144A 6.375% 4/1/26 # | | | 870,000 | | | | 911,325 | |
Brinker International 144A 5.00% 10/1/24 # | | | 340,000 | | | | 340,850 | |
CVS Health 3.875% 7/20/25 | | | 5,000 | | | | 5,139 | |
General Motors Financial | | | | | | | | |
3.45% 4/10/22 | | | 10,000 | | | | 9,876 | |
3.70% 5/9/23 | | | 5,000 | | | | 4,925 | |
4.00% 10/6/26 | | | 5,000 | | | | 4,775 | |
Golden Nugget 144A
8.50% 12/1/21 # | | | 120,000 | | | | 126,300 | |
Group 1 Automotive 144A
5.25% 12/15/23 # | | | 255,000 | | | | 250,537 | |
HD Supply 144A
5.75% 4/15/24 # | | | 205,000 | | | | 210,125 | |
Hyundai Capital America 144A
2.55% 2/6/19 # | | | 10,000 | | | | 10,061 | |
JC Penney 8.125% 10/1/19 | | | 400,000 | | | | 434,500 | |
L Brands | | | | | | | | |
6.75% 7/1/36 | | | 200,000 | | | | 198,500 | |
6.875% 11/1/35 | | | 415,000 | | | | 417,075 | |
Landry’s 144A
6.75% 10/15/24 # | | | 410,000 | | | | 411,025 | |
Lennar 4.75% 5/30/25 | | | 215,000 | | | | 206,937 | |
Live Nation Entertainment 144A
4.875% 11/1/24 # | | | 404,000 | | | | 402,990 | |
Lowe’s | | | | | | | | |
3.375% 9/15/25 | | | 5,000 | | | | 5,121 | |
3.70% 4/15/46 | | | 5,000 | | | | 4,595 | |
| | | | | | | | |
| | | Principal
amount° | | | Value
(U.S. $) | |
| |
Corporate Bonds (continued) | | | | | |
| |
Consumer Cyclical (continued) | | | | | |
M/I Homes 6.75% 1/15/21 | | | 400,000 | | | $ | 418,000 | |
Marriott International
3.125% 6/15/26 | | | 5,000 | | | | 4,774 | |
MGM Resorts International
4.625% 9/1/26 | | | 435,000 | | | | 416,513 | |
Mohegan Tribal Gaming | | | | | | | | |
Authority 144A | | | | | | | | |
7.875% 10/15/24 # | | | 610,000 | | | | 613,050 | |
Neiman Marcus Group
144A 8.00% 10/15/21 # | | | 225,000 | | | | 177,750 | |
Penske Automotive Group
5.50% 5/15/26 | | | 395,000 | | | | 381,700 | |
PulteGroup 5.00% 1/15/27 | | | 215,000 | | | | 203,175 | |
Scientific Games International
10.00% 12/1/22 | | | 440,000 | | | | 414,700 | |
Starbucks 2.70% 6/15/22 | | | 5,000 | | | | 5,054 | |
Starwood Hotels & Resorts Worldwide 3.75% 3/15/25 | | | 5,000 | | | | 5,002 | |
Target 3.625% 4/15/46 | | | 5,000 | | | | 4,611 | |
Toyota Motor Credit
2.80% 7/13/22 | | | 5,000 | | | | 5,083 | |
Walgreens Boots Alliance | | | | | | | | |
3.10% 6/1/23 | | | 10,000 | | | | 9,888 | |
3.45% 6/1/26 | | | 10,000 | | | | 9,817 | |
| | | | | | | | |
| | | | | | | 7,364,598 | |
| | | | | | | | |
Consumer Non-Cyclical – 2.58% | | | | | |
Abbott Laboratories
4.90% 11/30/46 | | | 10,000 | | | | 10,124 | |
AbbVie 3.20% 5/14/26 | | | 5,000 | | | | 4,760 | |
Albertsons 144A
6.625% 6/15/24 # | | | 390,000 | | | | 404,079 | |
Altria Group
3.875% 9/16/46 | | | 5,000 | | | | 4,638 | |
Anheuser-Busch InBev
Finance 3.65% 2/1/26 | | | 25,000 | | | | 25,243 | |
Becton Dickinson & Co. | | | | | | | | |
3.734% 12/15/24 | | | 5,000 | | | | 5,130 | |
6.375% 8/1/19 | | | 10,000 | | | | 11,107 | |
Biogen 5.20% 9/15/45 | | | 5,000 | | | | 5,365 | |
Celgene | | | | | | | | |
3.25% 8/15/22 | | | 5,000 | | | | 5,062 | |
3.875% 8/15/25 | | | 5,000 | | | | 5,092 | |
Coca-Cola 2.25% 9/1/26 | | | 5,000 | | | | 4,668 | |
Covidien International
Finance 4.20% 6/15/20 | | | 20,000 | | | | 21,316 | |
Dean Foods 144A | | | | | | | | |
6.50% 3/15/23 # | | | 310,000 | | | | 323,175 | |
16
| | | | | | | | |
| | | Principal
amount° | | | Value
(U.S. $) | |
| |
Corporate Bonds (continued) | | | | | |
| |
Consumer Non-Cyclical (continued) | |
Gilead Sciences
4.15% 3/1/47 | | | 5,000 | | | $ | 4,694 | |
inVentiv Group Holdings
144A 7.50% 10/1/24 # | | | 230,000 | | | | 234,025 | |
JBS USA 144A
5.75% 6/15/25 # | | | 1,430,000 | | | | 1,408,550 | |
Kraft Heinz Foods
3.00% 6/1/26 | | | 5,000 | | | | 4,734 | |
Kronos Acquisition Holdings
144A 9.00% 8/15/23 # | | | 680,000 | | | | 676,600 | |
Molson Coors Brewing
4.20% 7/15/46 | | | 5,000 | | | | 4,637 | |
Mylan 144A
3.95% 6/15/26 # | | | 10,000 | | | | 9,411 | |
Nature’s Bounty 144A
7.625% 5/15/21 # | | | 425,000 | | | | 420,219 | |
Pepsico 2.375% 10/6/26 | | | 5,000 | | | | 4,718 | |
Pfizer 3.00% 12/15/26 | | | 5,000 | | | | 4,935 | |
Post Holdings 144A
7.75% 3/15/24 # | | | 320,000 | | | | 354,400 | |
Prestige Brands 144A
5.375% 12/15/21 # | | | 70,000 | | | | 72,275 | |
Revlon Consumer Products
144A 6.25% 8/1/24 # | | | 230,000 | | | | 227,700 | |
Reynolds American
4.45% 6/12/25 | | | 5,000 | | | | 5,306 | |
Shire Acquisitions Investments Ireland | | | | | | | | |
2.40% 9/23/21 | | | 5,000 | | | | 4,841 | |
2.875% 9/23/23 | | | 5,000 | | | | 4,775 | |
St. Jude Medical
2.80% 9/15/20 | | | 5,000 | | | | 5,000 | |
Sysco 3.30% 7/15/26 | | | 10,000 | | | | 9,803 | |
Teva Pharmaceutical Finance | | | | | | | | |
Netherlands III | | | | | | | | |
2.80% 7/21/23 | | | 10,000 | | | | 9,439 | |
Thermo Fisher Scientific
3.00% 4/15/23 | | | 10,000 | | | | 9,925 | |
US Foods 144A
5.875% 6/15/24 # | | | 335,000 | | | | 345,050 | |
Zimmer Biomet Holdings
4.625% 11/30/19 | | | 30,000 | | | | 31,850 | |
| | | | | | | | |
| | | | | | | 4,682,646 | |
| | | | | | | | |
Electric – 0.43% | | | | | | | | |
Ameren 3.65% 2/15/26 | | | 5,000 | | | | 5,045 | |
Ameren Illinois | | | | | | | | |
9.75% 11/15/18 | | | 45,000 | | | | 51,805 | |
| | | | | | | | |
| | | Principal
amount° | | | Value
(U.S. $) | |
| |
Corporate Bonds (continued) | | | | | |
| |
Electric (continued) | | | | | | | | |
American Transmission Systems 144A 5.25% 1/15/22 # | | | 15,000 | | | $ | 16,711 | |
Berkshire Hathaway Energy
3.75% 11/15/23 | | | 10,000 | | | | 10,492 | |
Black Hills 3.15% 1/15/27 | | | 5,000 | | | | 4,822 | |
Cleveland Electric Illuminating
5.50% 8/15/24 | | | 15,000 | | | | 16,800 | |
CMS Energy 6.25% 2/1/20 | | | 5,000 | | | | 5,562 | |
Commonwealth Edison
5.80% 3/15/18 | | | 5,000 | | | | 5,272 | |
Dominion Resources
3.90% 10/1/25 | | | 5,000 | | | | 5,128 | |
DTE Energy | | | | | | | | |
2.85% 10/1/26 | | | 5,000 | | | | 4,677 | |
3.30% 6/15/22 | | | 5,000 | | | | 5,114 | |
Duke Energy
4.80% 12/15/45 | | | 5,000 | | | | 5,253 | |
Emera 6.75% 6/15/76 ● | | | 395,000 | | | | 423,637 | |
Emera US Finance 144A
4.75% 6/15/46 # | | | 10,000 | | | | 9,868 | |
Entergy Louisiana
4.05% 9/1/23 | | | 15,000 | | | | 15,832 | |
Exelon 3.95% 6/15/25 | | | 10,000 | | | | 10,278 | |
Fortis 144A
3.055% 10/4/26 # | | | 10,000 | | | | 9,398 | |
Great Plains Energy
4.85% 6/1/21 | | | 5,000 | | | | 5,344 | |
IPALCO Enterprises
5.00% 5/1/18 | | | 10,000 | | | | 10,457 | |
Kansas City Power & Light
3.65% 8/15/25 | | | 10,000 | | | | 10,020 | |
LG&E & KU Energy
4.375% 10/1/21 | | | 20,000 | | | | 21,414 | |
Massachusetts Electric 144A
4.004% 8/15/46 # | | | 10,000 | | | | 9,545 | |
National Rural Utilities Cooperative Finance | | | | | | | | |
2.85% 1/27/25 | | | 5,000 | | | | 4,938 | |
4.75% 4/30/43 ● | | | 10,000 | | | | 10,125 | |
New York State Electric & Gas
144A 3.25% 12/1/26 # | | | 5,000 | | | | 4,981 | |
NextEra Energy Capital
Holdings 2.40% 9/15/19 | | | 10,000 | | | | 10,082 | |
NV Energy 6.25% 11/15/20 | | | 5,000 | | | | 5,684 | |
Pennsylvania Electric
5.20% 4/1/20 | | | 10,000 | | | | 10,635 | |
PPL Electric Utilities
3.00% 9/15/21 | | | 10,000 | | | | 10,192 | |
Schedule of investments
Delaware Enhanced Global Dividend and Income Fund
| | | | | | | | |
| | | Principal
amount° | | | Value
(U.S. $) | |
| |
Corporate Bonds (continued) | | | | | |
| |
Electric (continued) | | | | | | | | |
Public Service Co. of New Hampshire 3.50% 11/1/23 | | | 5,000 | | | $ | 5,134 | |
Public Service Co. of Oklahoma
5.15% 12/1/19 | | | 30,000 | | | | 32,368 | |
SCANA 4.125% 2/1/22 | | | 10,000 | | | | 10,151 | |
Southern 3.25% 7/1/26 | | | 10,000 | | | | 9,764 | |
Xcel Energy 3.30% 6/1/25 | | | 5,000 | | | | 5,016 | |
| | | | | | | | |
| | | | | | | 781,544 | |
| | | | | | | | |
Energy – 6.74% | | | | | | | | |
Anadarko Petroleum
6.60% 3/15/46 | | | 10,000 | | | | 11,699 | |
Antero Resources
5.625% 6/1/23 | | | 615,000 | | | | 629,606 | |
Baytex Energy 144A
5.625% 6/1/24 # | | | 340,000 | | | | 286,450 | |
BP Capital Markets | | | | | | | | |
3.216% 11/28/23 | | | 5,000 | | | | 5,002 | |
3.723% 11/28/28 | | | 5,000 | | | | 5,039 | |
Buckeye Partners
3.95% 12/1/26 | | | 5,000 | | | | 4,804 | |
Cheniere Corpus Christi Holdings 144A 7.00% 6/30/24 # | | | 205,000 | | | | 219,350 | |
Dominion Gas Holdings
4.60% 12/15/44 | | | 5,000 | | | | 4,971 | |
Ecopetrol 5.875% 5/28/45 | | | 615,000 | | | | 506,453 | |
Energy Transfer Equity
7.50% 10/15/20 | | | 245,000 | | | | 275,013 | |
Energy Transfer Partners | | | | | | | | |
6.125% 12/15/45 | | | 5,000 | | | | 5,061 | |
9.70% 3/15/19 | | | 7,000 | | | | 8,067 | |
Freeport-McMoran Oil & Gas | | | | | | | | |
6.50% 11/15/20 | | | 425,000 | | | | 439,663 | |
6.875% 2/15/23 | | | 300,000 | | | | 322,500 | |
Genesis Energy | | | | | | | | |
5.75% 2/15/21 | | | 360,000 | | | | 363,600 | |
6.00% 5/15/23 | | | 80,000 | | | | 80,400 | |
6.75% 8/1/22 | | | 244,000 | | | | 250,710 | |
Gulfport Energy
144A 6.00% 10/15/24 # | | | 425,000 | | | | 432,969 | |
Hilcorp Energy I | | | | | | | | |
144A 5.00% 12/1/24 # | | | 208,000 | | | | 211,120 | |
144A 5.75% 10/1/25 # | | | 154,000 | | | | 157,080 | |
Holly Energy Partners
144A 6.00% 8/1/24 # | | | 225,000 | | | | 235,125 | |
Laredo Petroleum
6.25% 3/15/23 | | | 690,000 | | | | 705,525 | |
Murphy Oil 6.875% 8/15/24 | | | 555,000 | | | | 585,525 | |
| | | | | | | | |
| | | Principal
amount° | | | Value
(U.S. $) | |
| |
Corporate Bonds (continued) | | | | | | | | |
| |
Energy (continued) | | | | | | | | |
Murphy Oil USA
6.00% 8/15/23 | | | 395,000 | | | $ | 413,763 | |
Noble Energy
5.05% 11/15/44 | | | 5,000 | | | | 4,770 | |
Noble Holding International
5.25% 3/16/18 | | | 210,000 | | | | 208,425 | |
NuStar Logistics
6.75% 2/1/21 | | | 360,000 | | | | 388,800 | |
Oasis Petroleum
6.875% 3/15/22 | | | 430,000 | | | | 445,050 | |
PDC Energy
1.125% 9/15/21 | | | 395,000 | | | | 440,672 | |
Petroleos Mexicanos | | | | | | | | |
5.50% 6/27/44 | | | 164,000 | | | | 127,674 | |
6.625% 6/15/35 | | | 1,000,000 | | | | 922,600 | |
144A 6.75% 9/21/47 # | | | 326,000 | | | | 286,756 | |
Plains All American Pipeline
8.75% 5/1/19 | | | 10,000 | | | | 11,408 | |
QEP Resources
5.25% 5/1/23 | | | 420,000 | | | | 409,500 | |
Regency Energy Partners
5.00% 10/1/22 | | | 10,000 | | | | 10,592 | |
Sabine Pass Liquefaction
144A 5.00% 3/15/27 # | | | 190,000 | | | | 188,100 | |
Shell International Finance | | | | | | | | |
3.75% 9/12/46 | | | 5,000 | | | | 4,498 | |
4.00% 5/10/46 | | | 5,000 | | | | 4,652 | |
Southwestern Energy
6.70% 1/23/25 | | | 640,000 | | | | 636,800 | |
Targa Resources Partners | | | | | | | | |
144A 5.375% 2/1/27 # | | | 425,000 | | | | 420,750 | |
6.75% 3/15/24 | | | 375,000 | | | | 399,375 | |
Tesoro Logistics
5.25% 1/15/25 | | | 415,000 | | | | 421,225 | |
Transcanada Trust
5.875% 8/15/76 ● | | | 5,000 | | | | 5,187 | |
Transocean 5.55% 10/15/22 | | | 535,000 | | | | 474,813 | |
Williams Partners
7.25% 2/1/17 | | | 20,000 | | | | 20,170 | |
Woodside Finance 144A
8.75% 3/1/19 # | | | 15,000 | | | | 17,009 | |
WPX Energy 7.50% 8/1/20 | | | 200,000 | | | | 212,000 | |
| | | | | | | | |
| | | | | | | 12,220,321 | |
| | | | | | | | |
Financials – 0.50% | | | | | | | | |
AerCap Global Aviation Trust
144A 6.50% 6/15/45 #● | | | 400,000 | | | | 399,500 | |
Affiliated Managers Group
3.50% 8/1/25 | | | 5,000 | | | | 4,747 | |
Air Lease 3.00% 9/15/23 | | | 5,000 | | | | 4,784 | |
18
| | | | | | | | |
| | | Principal amount° | | | Value (U.S. $) | |
| |
Corporate Bonds (continued) | | | | | |
| |
Financials (continued) | | | | | | | | |
Ally Financial
5.75% 11/20/25 | | | 485,000 | | | $ | 481,969 | |
Aviation Capital Group 144A
4.875% 10/1/25 # | | | 5,000 | | | | 5,377 | |
| | | | | | | | |
| | | | | | | 896,377 | |
| | | | | | | | |
Healthcare – 3.02% | | | | | | | | |
Air Medical Group Holdings 144A
6.375% 5/15/23 # | | | 615,000 | | | | 585,019 | |
DaVita | | | | | | | | |
5.00% 5/1/25 | | | 450,000 | | | | 439,875 | |
5.125% 7/15/24 | | | 145,000 | | | | 143,459 | |
Envision Healthcare 144A
6.25% 12/1/24 # | | | 100,000 | | | | 103,750 | |
HCA | | | | | | | | |
5.375% 2/1/25 | | | 715,000 | | | | 700,700 | |
5.875% 2/15/26 | | | 110,000 | | | | 109,863 | |
7.58% 9/15/25 | | | 175,000 | | | | 192,281 | |
HealthSouth | | | | | | | | |
5.75% 11/1/24 | | | 420,000 | | | | 423,150 | |
5.75% 9/15/25 | | | 205,000 | | | | 205,513 | |
Hill-Rom Holdings 144A
5.75% 9/1/23 # | | | 395,000 | | | | 408,825 | |
IASIS Healthcare
8.375% 5/15/19 | | | 550,000 | | | | 484,000 | |
Immucor 11.125% 8/15/19 | | | 85,000 | | | | 78,200 | |
Mallinckrodt International Finance | | | | | | | | |
4.75% 4/15/23 | | | 195,000 | | | | 165,750 | |
144A 5.50% 4/15/25 # | | | 80,000 | | | | 68,400 | |
144A 5.625% 10/15/23 # | | | 245,000 | | | | 222,950 | |
MPH Acquisition Holdings
144A 7.125% 6/1/24 # | | | 575,000 | | | | 605,906 | |
Tenet Healthcare
8.125% 4/1/22 | | | 580,000 | | | | 533,600 | |
| | | | | | | | |
| | | | | | | 5,471,241 | |
| | | | | | | | |
Insurance – 0.80% | | | | | | | | |
American International Group
4.125% 2/15/24 | | | 5,000 | | | | 5,212 | |
Berkshire Hathaway Finance
2.90% 10/15/20 | | | 35,000 | | | | 35,893 | |
Chubb INA Holdings
3.35% 5/3/26 | | | 5,000 | | | | 5,038 | |
HUB International | | | | | | | | |
144A 7.875% 10/1/21 # | | | 435,000 | | | | 445,331 | |
144A 9.25% 2/15/21 # | | | 110,000 | | | | 113,850 | |
Liberty Mutual Group 144A
4.95% 5/1/22 # | | | 5,000 | | | | 5,429 | |
MetLife 6.40% 12/15/36 | | | 100,000 | | | | 108,500 | |
| | | | | | | | |
| | | Principal amount° | | | Value (U.S. $) | |
| |
Corporate Bonds (continued) | | | | | |
| |
Insurance (continued) | | | | | | | | |
Principal Life Global Funding II 144A 3.00% 4/18/26 # | | | 5,000 | | | $ | 4,868 | |
Prudential Financial
5.375% 5/15/45 ● | | | 5,000 | | | | 5,113 | |
TIAA Asset Management Finance | | | | | | | | |
144A 2.95% 11/1/19 # | | | 5,000 | | | | 5,095 | |
144A 4.125% 11/1/24 # | | | 10,000 | | | | 10,139 | |
USI 144A 7.75% 1/15/21 # | | | 420,000 | | | | 428,400 | |
XLIT | | | | | | | | |
4.45% 3/31/25 | | | 5,000 | | | | 4,951 | |
6.50% 12/29/49 ● | | | 365,000 | | | | 279,225 | |
| | | | | | | | |
| | | | | | | 1,457,044 | |
| | | | | | | | |
Media – 5.00% | | | | | | | | |
Altice Luxembourg 144A
7.75% 5/15/22 # | | | 430,000 | | | | 451,500 | |
CCO Holdings | | | | | | | | |
144A 5.50% 5/1/26 # | | | 25,000 | | | | 25,313 | |
144A 5.75% 2/15/26 # | | | 325,000 | | | | 334,750 | |
144A 5.875% 5/1/27 # | | | 460,000 | | | | 470,350 | |
Cequel Communications Holdings I 144A 7.75% 7/15/25 # | | | 325,000 | | | | 349,375 | |
Columbus Cable Barbados
144A 7.375% 3/30/21 # | | | 470,000 | | | | 501,725 | |
CSC Holdings | | | | | | | | |
144A 5.50% 4/15/27 # | | | 200,000 | | | | 197,875 | |
144A | | | | | | | | |
10.875% 10/15/25 # | | | 600,000 | | | | 700,500 | |
DISH DBS 7.75% 7/1/26 | | | 382,000 | | | | 422,587 | |
Gray Television 144A
5.875% 7/15/26 # | | | 615,000 | | | | 588,672 | |
Midcontinent Communications
144A 6.875% 8/15/23 # | | | 315,000 | | | | 332,719 | |
Nexstar Escrow 144A
5.625% 8/1/24 # | | | 580,000 | | | | 575,650 | |
RCN Telecom Services 144A
8.50% 8/15/20 # | | | 315,000 | | | | 334,294 | |
SFR Group 144A
7.375% 5/1/26 # | | | 860,000 | | | | 861,075 | |
Sinclair Television Group
144A 5.125% 2/15/27 # | | | 435,000 | | | | 405,637 | |
Sirius XM Radio 144A
5.375% 4/15/25 # | | | 380,000 | | | | 380,004 | |
Tribune Media
5.875% 7/15/22 | | | 425,000 | | | | 416,585 | |
Schedule of investments
Delaware Enhanced Global Dividend and Income Fund
| | | | | | | | |
| | | Principal
amount° | | | Value
(U.S. $) | |
| |
Corporate Bonds (continued) | | | | | |
| |
Media (continued) | | | | | | | | |
Unitymedia 144A
6.125% 1/15/25 # | | | 400,000 | | | $ | 409,000 | |
Virgin Media Secured Finance
144A 5.25% 1/15/26 # | | | 410,000 | | | | 398,213 | |
VTR Finance 144A
6.875% 1/15/24 # | | | 430,000 | | | | 437,525 | |
WideOpenWest Finance
10.25% 7/15/19 | | | 445,000 | | | | 469,475 | |
| | | | | | | | |
| | | | | | | 9,062,824 | |
| | | | | | | | |
Natural Gas – 0.35% | | | | | | | | |
AmeriGas Partners
5.875% 8/20/26 | | | 615,000 | | | | 614,809 | |
KeySpan Gas East 144A
2.742% 8/15/26 # | | | 5,000 | | | | 4,776 | |
NiSource Finance
6.125% 3/1/22 | | | 5,000 | | | | 5,780 | |
Southern Co. Gas Capital | | | | | | | | |
3.25% 6/15/26 | | | 5,000 | | | | 4,902 | |
3.95% 10/1/46 | | | 10,000 | | | | 9,222 | |
| | | | | | | | |
| | | | | | | 639,489 | |
| | | | | | | | |
Real Estate Investment Trusts – 1.48% | | | | | |
AvalonBay Communities
2.95% 5/11/26 | | | 5,000 | | | | 4,777 | |
Communications Sales & Leasing | | | | | | | | |
144A 6.00% 4/15/23 # | | | 170,000 | | | | 176,800 | |
8.25% 10/15/23 | | | 165,000 | | | | 174,075 | |
Corporate Office Properties | | | | | | | | |
3.60% 5/15/23 | | | 5,000 | | | | 4,831 | |
5.25% 2/15/24 | | | 10,000 | | | | 10,507 | |
CubeSmart 3.125% 9/1/26 | | | 5,000 | | | | 4,738 | |
DDR | | | | | | | | |
3.625% 2/1/25 | | | 5,000 | | | | 4,836 | |
7.50% 4/1/17 | | | 5,000 | | | | 5,093 | |
7.875% 9/1/20 | | | 20,000 | | | | 23,363 | |
Education Realty Operating Partnership 4.60% 12/1/24 | | | 5,000 | | | | 5,020 | |
ESH Hospitality 144A
5.25% 5/1/25 # | | | 580,000 | | | | 562,600 | |
GEO Group | | | | | | | | |
5.125% 4/1/23 | | | 165,000 | | | | 156,750 | |
5.875% 1/15/22 | | | 700,000 | | | | 701,750 | |
5.875% 10/15/24 | | | 140,000 | | | | 135,800 | |
6.00% 4/15/26 | | | 280,000 | | | | 270,200 | |
Hospitality Properties Trust
4.50% 3/15/25 | | | 5,000 | | | | 4,867 | |
Host Hotels & Resorts
4.50% 2/1/26 | | | 5,000 | | | | 5,048 | |
| | | | | | | | |
| | | Principal
amount° | | | Value
(U.S. $) | |
| |
Corporate Bonds (continued) | | | | | | | | |
| |
Real Estate Investment Trusts (continued) | | | | | | | | |
Iron Mountain US Holdings
144A 5.375% 6/1/26 # | | | 420,000 | | | $ | 414,750 | |
Lifestorage 3.50% 7/1/26 | | | 5,000 | | | | 4,824 | |
WP Carey 4.60% 4/1/24 | | | 5,000 | | | | 5,047 | |
| | | | | | | | |
| | | | | | | 2,675,676 | |
| | | | | | | | |
Services – 1.66% | | | | | | | | |
Advanced Disposal Services
144A 5.625% 11/15/24 # | | | 425,000 | | | | 421,813 | |
Herc Rentals | | | | | | | | |
144A 7.50% 6/1/22 # | | | 115,000 | | | | 119,169 | |
144A 7.75% 6/1/24 # | | | 485,000 | | | | 500,763 | |
NES Rentals Holdings
144A 7.875% 5/1/18 # | | | 240,000 | | | | 238,800 | |
Prime Security Services Borrower 144A 9.25% 5/15/23 # | | | 860,000 | | | | 926,650 | |
Team Health 144A
7.25% 12/15/23 # | | | 325,000 | | | | 366,847 | |
United Rentals North America
5.50% 5/15/27 | | | 430,000 | | | | 430,451 | |
| | | | | | | | |
| | | | | | | 3,004,493 | |
| | | | | | | | |
Technology – 2.56% | | | | | | | | |
Analog Devices
3.50% 12/5/26 | | | 5,000 | | | | 4,968 | |
Apple 3.85% 8/4/46 | | | 5,000 | | | | 4,689 | |
CDK Global 5.00% 10/15/24 | | | 395,000 | | | | 386,964 | |
Cisco Systems
1.85% 9/20/21 | | | 5,000 | | | | 4,874 | |
CommScope 144A
5.50% 6/15/24 # | | | 150,000 | | | | 154,103 | |
CommScope Technologies Finance 144A 6.00% 6/15/25 # | | | 240,000 | | | | 251,400 | |
Diamond 1 Finance | | | | | | | | |
144A 6.02% 6/15/26 # | | | 5,000 | | | | 5,269 | |
144A 8.10% 7/15/36 # | | | 310,000 | | | | 354,003 | |
Entegris
144A 6.00% 4/1/22 # | | | 415,000 | | | | 433,156 | |
Fidelity National Information
Services 5.00% 10/15/25 | | | 10,000 | | | | 10,849 | |
First Data 144A
7.00% 12/1/23 # | | | 986,000 | | | | 1,034,689 | |
Infor Software Parent 144A
PIK 7.125% 5/1/21 #T | | | 290,000 | | | | 292,175 | |
Infor US 6.50% 5/15/22 | | | 365,000 | | | | 376,863 | |
Micron Technology 144A
7.50% 9/15/23 # | | | 185,000 | | | | 204,887 | |
Microsemi 144A
9.125% 4/15/23 # | | | 245,000 | | | | 284,813 | |
20
| | | | | | | | |
| | | Principal amount° | | | Value (U.S. $) | |
| |
Corporate Bonds (continued) | | | | | | | | |
| |
Technology (continued) | | | | | | | | |
National Semiconductor
6.60% 6/15/17 | | | 20,000 | | | $ | 20,587 | |
Oracle 4.00% 7/15/46 | | | 5,000 | | | | 4,754 | |
Sensata Technologies UK Financing 144A 6.25% 2/15/26 # | | | 350,000 | | | | 368,375 | |
Solera 144A
10.50% 3/1/24 # | | | 255,000 | | | | 283,050 | |
Western Digital 144A
10.50% 4/1/24 # | | | 140,000 | | | | 162,400 | |
| | | | | | | | |
| | | | | | | 4,642,868 | |
| | | | | | | | |
Transportation – 0.38% | | | | | | | | |
Air Canada 2015-1 Class A | | | | | | | | |
Pass Through Trust 144A | | | | | | | | |
3.60% 3/15/27 #¨ | | | 4,801 | | | | 4,817 | |
American Airlines 2014-1 Class A Pass Through Trust 3.70% 10/1/26 ¨ | | | 4,427 | | | | 4,471 | |
American Airlines 2015-1 Class A Pass Through Trust 3.375% 5/1/27 ¨ | | | 4,646 | | | | 4,605 | |
CSX 3.80% 11/1/46 | | | 5,000 | | | | 4,555 | |
ERAC USA Finance 144A
5.25% 10/1/20 # | | | 15,000 | | | | 16,317 | |
Penske Truck Leasing | | | | | | | | |
144A 3.30% 4/1/21 # | | | 5,000 | | | | 5,069 | |
144A 3.375% 2/1/22 # | | | 5,000 | | | | 5,048 | |
United Airlines 2014-1 Class A Pass Through Trust 4.00% 4/11/26 ¨ | | | 4,576 | | | | 4,740 | |
United Airlines 2014-2 Class A Pass Through Trust 3.75% 9/3/26 ¨ | | | 4,712 | | | | 4,812 | |
United Parcel Service
5.125% 4/1/19 | | | 10,000 | | | | 10,782 | |
XPO Logistics | | | | | | | | |
144A 6.125% 9/1/23 # | | | 185,000 | | | | 189,625 | |
144A 6.50% 6/15/22 # | | | 420,000 | | | | 436,275 | |
| | | | | | | | |
| | | | | | | 691,116 | |
| | | | | | | | |
Utilities – 1.07% | | | | | | | | |
AES | | | | | | | | |
5.50% 4/15/25 | | | 345,000 | | | | 337,237 | |
6.00% 5/15/26 | | | 50,000 | | | | 49,375 | |
Calpine | | | | | | | | |
5.50% 2/1/24 | | | 205,000 | | | | 196,800 | |
5.75% 1/15/25 | | | 540,000 | | | | 517,725 | |
Dynegy
7.625% 11/1/24 | | | 530,000 | | | | 490,250 | |
| | | | | | | | |
| | | Principal amount° | | | Value (U.S. $) | |
| |
Corporate Bonds (continued) | | | | | | | | |
| |
Utilities (continued) | | | | | | | | |
Dynegy
144A 8.00% 1/15/25 # | | | 120,000 | | | $ | 110,700 | |
Enel 144A
8.75% 9/24/73 #● | | | 200,000 | | | | 227,670 | |
| | | | | | | | |
| | | | | | | 1,929,757 | |
| | | | | | | | |
Total Corporate Bonds
(cost $79,959,108) | | | | 80,797,919 | |
| | | | | | | | |
|
| |
Non-Agency Asset-Backed Security – 0.01% | |
|
| |
Nissan Auto Receivables Owner Trust Series 2016-A A2B 0.888% 2/15/19 ● | | | 21,661 | | | | 21,687 | |
| | | | | | | | |
Total Non-Agency
Asset-Backed Security
(cost $21,661) | | | | | | | 21,687 | |
| | | | | | | | |
|
| |
Non-Agency Collateralized Mortgage Obligations – 0.06% | | | | | |
|
| |
Citicorp Mortgage Securities Trust Series 2007-1 2A1 5.50% 1/25/22 | | | 3,909 | | | | 3,901 | |
Citicorp Residential Mortgage Trust Series 2006-3 A5 5.838% 11/25/36 f | | | 100,000 | | | | 102,508 | |
| | | | | | | | |
Total Non-Agency
Collateralized Mortgage
Obligations (cost $90,826) | | | | | | | 106,409 | |
| | | | | | | | |
|
| |
Senior Secured Loans – 2.37%« | | | | | |
|
| |
Accudyne Industries Borrower
1st Lien 4.00% 12/13/19 | | | 323,407 | | | | 289,719 | |
Amaya Holdings 1st Lien
5.00% 8/1/21 | | | 401,947 | | | | 402,550 | |
Applied Systems 2nd Lien
7.50% 1/23/22 | | | 797,331 | | | | 804,972 | |
BJ’s Wholesale Club 2nd Lien
8.50% 3/31/20 | | | 417,999 | | | | 419,253 | |
Blue Ribbon 1st Lien
5.00% 11/13/21 | | | 146,005 | | | | 142,629 | |
Flint Group 2nd Lien
8.25% 9/7/22 | | | 375,000 | | | | 360,937 | |
FMG Resources August 2006
1st Lien 3.75% 6/30/19 | | | 46,986 | | | | 47,074 | |
Frank Russell Tranche B 1st Lien
6.75% 6/1/23 | | | 234,413 | | | | 235,951 | |
Immucor Tranche B2 1st Lien
5.00% 8/17/18 | | | 328,295 | | | | 320,600 | |
Schedule of investments
Delaware Enhanced Global Dividend and Income Fund
| | | | | | | | |
| | | Principal amount° | | | Value (U.S. $) | |
| |
Senior Secured Loans« (continued) | | | | | |
| |
KIK Custom Products 1st Lien
6.00% 8/26/22 | | | 262,549 | | | $ | 263,533 | |
Kronos 2nd Lien
9.25% 10/20/24 | | | 425,000 | | | | 436,460 | |
Mohegan Tribal Gaming Authority Tranche B 1st Lien 5.50% 10/13/23 | | | 194,031 | | | | 194,153 | |
Neiman Marcus Group 1st
Lien 4.25% 10/25/20 | | | 54,578 | | | | 49,728 | |
Solera Tranche B 1st Lien
5.75% 3/3/23 | | | 139,300 | | | | 140,857 | |
Windstream Services 2nd Lien
4.75% 3/30/21 | | | 191,040 | | | | 192,055 | |
| | | | | | | | |
Total Senior Secured Loans
(cost $4,224,327) | | | | | | | 4,300,471 | |
| | | | | | | | |
| |
Sovereign Bonds – 4.26%D | | | | | | | | |
| |
Indonesia – 2.70% | | | | | | | | |
Indonesia Government International Bonds | | | | | | | | |
144A 5.125% 1/15/45 # | | | 1,000,000 | | | | 1,028,874 | |
6.625% 2/17/37 | | | 1,350,000 | | | | 1,623,361 | |
144A 6.75% 1/15/44 # | | | 1,800,000 | | | | 2,245,752 | |
| | | | | | | | |
| | | | | | | 4,897,987 | |
| | | | | | | | |
Mexico – 1.56% | | | | | | | | |
Mexico Government International Bond | | | | | | | | |
3.60% 1/30/25 | | | 1,632,000 | | | | 1,568,352 | |
4.35% 1/15/47 | | | 1,500,000 | | | | 1,252,500 | |
| | | | | | | | |
| | | | | | | 2,820,852 | |
| | | | | | | | |
Total Sovereign Bonds
(cost $7,998,362) | | | | | | | 7,718,839 | |
| | | | | | | | |
| |
U.S. Treasury Obligations – 0.72% | |
| |
U.S. Treasury Bond
2.875% 11/15/46 | | | 85,000 | | | | 82,631 | |
U.S. Treasury Notes | | | | | | | | |
1.125% 7/31/21 | | | 190,000 | | | | 183,988 | |
1.375% 1/31/21 | | | 60,000 | | | | 59,115 | |
1.50% 8/15/26 | | | 1,060,000 | | | | 979,051 | |
| | | | | | | | |
Total U.S. Treasury
Obligations
(cost $1,375,066) | | | | | | | 1,304,785 | |
| | | | | | | | |
| | | | | | | | |
| | | Principal amount° | | | Value (U.S. $) | |
| |
Leveraged Non-Recourse Security – 0.00% | |
| |
JPMorgan Fixed Income Auction Pass Through Trust Series 2007-B 144A 0.00% 1/15/87 #¨ | | | 500,000 | | | $ | 0 | |
| | | | | | | | |
Total Leveraged
Non-Recourse Security
(cost $425,000) | | | | | | | 0 | |
| | | | | | | | |
| | | Number of
shares | | | | |
| |
Limited Partnership – 0.43% | |
| |
Merion Countryside =p† | | | 693,473 | | | | 775,233 | |
| | | | | | | | |
Total Limited Partnership
(cost $660,604) | | | | | | | 775,233 | |
| | | | | | | | |
| |
Master Limited Partnership – 0.23% | |
| |
Ares Management | | | 9,000 | | | | 153,900 | |
Brookfield Infrastructure
Partners | | | 8,100 | | | | 255,150 | |
| | | | | | | | |
Total Master Limited
Partnership (cost $293,810) | | | | | | | 409,050 | |
| | | | | | | | |
| |
Preferred Stock – 0.92% | |
| |
Bank of America 6.50% ● | | | 470,000 | | | | 489,717 | |
Freddie Mac 6.02% | | | 40,000 | | | | 262,000 | |
General Electric 5.00% ● | | | 10,000 | | | | 10,263 | |
GMAC Capital Trust I
6.691% ● | | | 12,000 | | | | 301,800 | |
Integrys Energy Group
| | | | | | | | |
6.00% ● | | | 300 | | | | 7,819 | |
Morgan Stanley 5.55% ● | | | 400,000 | | | | 401,000 | |
Northstar Realty Finance
8.50% | | | 3,580 | | | | 90,753 | |
Vornado Realty Trust 6.625% | | | 3,700 | | | | 93,832 | |
Total Preferred Stock
(cost $2,421,085) | | | | | | | 1,657,184 | |
| | | | | | | | |
| |
Rights – 0.02% | |
| |
Safeway CVR =† | | | 23,200 | | | | 23,546 | |
Safeway CVR =† | | | 23,200 | | | | 1,132 | |
Yamana Gold strike price
$5.30, expiration date 2/17/17 † | | | 6,104 | | | | 1,500 | |
| | | | | | | | |
Total Rights (cost $0) | | | | | | | 26,178 | |
| | | | | | | | |
| | | | | | | | |
| | | Number
of shares | | | Value (U.S. $) | |
| |
Warrant – 0.00% | | | | | | | | |
| |
Wheeler Real Estate
Investment Trust strike
price $5.50, expiration
date 4/29/19 † | | | 12,540 | | | $ | 658 | |
| | | | | | | | |
Total Warrant (cost $104) | | | | 658 | |
| | | | | | | | |
| | | Principal
amount° | | | | |
| |
Short-Term Investments – 3.91% | | | | | |
| |
Discount Notes – 1.70%≠ | | | | | | | | |
Federal Home Loan Bank | | | | | | | | |
0.26% 12/20/16 | | | 305,035 | | | | 305,006 | |
0.29% 12/21/16 | | | 1,761,225 | | | | 1,761,049 | |
0.31% 1/25/17 | | | 100,723 | | | | 100,671 | |
0.38% 1/27/17 | | | 610,069 | | | | 609,741 | |
0.39% 2/3/17 | | | 305,035 | | | | 304,791 | |
| | | | | | | | |
| | | | | | | 3,081,258 | |
| | | | | | | | |
Repurchase Agreements – 2.21% | | | | | |
Bank of America Merrill Lynch 0.22%, dated 11/30/16, to be repurchased on 12/1/16, repurchase price $1,475,518 (collateralized by U.S. government obligations 2.625% 7/15/17; market value $1,505,019) | | | 1,475,509 | | | | 1,475,509 | |
Bank of Montreal 0.25%, dated 11/30/16, to be repurchased on 12/1/16, repurchase price $2,459,198 (collateralized by U.S. government obligations 1.125%–3.75% 1/15/17–8/15/45; market value $2,508,366) | | | 2,459,181 | | | | 2,459,181 | |
BNP Paribas 0.27%, dated 11/30/16, to be repurchased on 12/1/16, repurchase price $75,311 (collateralized by U.S. government obligations 3.00% 11/15/45; market value $76,817) | | | 75,310 | | | | 75,310 | |
| | | | | | | | |
| | | | | | | 4,010,000 | |
| | | | | | | | |
Total Short-Term
Investments
(cost $7,091,135) | | | | | | | 7,091,258 | |
| | | | | | | | |
| | | | |
Total Value of
Securities – 144.27%
(cost $257,897,600) | | $ | 261,452,834 | |
| | | | |
| # | Security exempt from registration under Rule 144A of the Securities Act of 1933, as amended. At Nov. 30, 2016, the aggregate value of Rule 144A securities was $54,162,086, which represents 29.89% of the Fund’s net assets. See Note 11 in “Notes to financial statements.” |
| ¨ | Pass Through Agreement. Security represents the contractual right to receive a proportionate amount of underlying payments due to the counterparty pursuant to various agreements related to the rescheduling of obligations and the exchange of certain notes. |
| v | Securities have been classified by type of business. |
| T | 100% of the income received was in the form of cash. |
| = | Security is being fair valued in accordance with the Fund’s fair valuation policy. At Nov. 30, 2016, the aggregate value of fair valued securities was $799,911, which represents 0.44% of the Fund’s net assets. See Note 1 in “Notes to financial statements.” |
| ≠ | The rate shown is the effective yield at the time of purchase. |
| « | Senior secured loans generally pay interest at rates which are periodically reset by reference to a base lending rate plus a premium. These base lending rates are generally: (i) the prime rate offered by one or more U.S. banks, (ii) the lending rate offered by one or more European banks such as the London Interbank Offered Rate (LIBOR), and (iii) the certificate of deposit rate. Senior secured loans may be subject to restrictions on resale. Stated rate in effect at Nov. 30, 2016. |
| ° | Principal amount shown is stated in U.S. dollars unless noted that the security is denominated in another currency. |
| r | Securities have been classified by country of origin. |
| p | Restricted Security. These investments are in securities not registered under the Securities Act of 1933, as amended, and have certain restrictions on resale which may limit their liquidity. At Nov. 30, 2016, the aggregate value of restricted securities was $775,233, which represented 0.43% of the Fund’s net assets. See Note 11 in “Notes to financial statements.” |
| † | Non- income- producing security. |
| ● | Variable rate security. Each rate shown is as of Nov. 30, 2016. Interest rates reset periodically. |
| f | Step coupon bond. Coupon increases or decreases periodically based on a predetermined schedule. Stated rate in effect at Nov. 30, 2016. |
Schedule of investments
Delaware Enhanced Global Dividend and Income Fund
Unfunded Commitments
The Fund may invest in floating rate loans. In connection with these investments, the Fund may also enter into unfunded corporate loan commitments (commitments). Commitments may obligate the Fund to furnish temporary financing to a borrower until permanent financing can be arranged. In connection with these commitments, the Fund earns a commitment fee, typically set as a percentage of the commitment amount. The following unfunded loan commitment was outstanding at Nov. 30, 2016:
| | | | | | | | | | | | |
Borrower | | Unfunded
Amount | | | Cost | | | Value | |
Grande Communications Networks 7.75% 10/19/17 | | $ | 425,000 | | | $ | 425,000 | | | $ | 425,000 | |
Summary of abbreviations:
ADR – American Depositary Receipt
ARM – Adjustable Rate Mortgage
CVR – Contingent Value Rights
ETN – Exchange-Traded Note
FDR – Finnish Depositary Receipt
LB – Lehman Brothers
PIK – Payment-in-kind
REIT – Real Estate Investment Trust
REMIC – Real Estate Mortgage Investment Conduit
S.F. – Single Family
UBS – Union Bank of Switzerland
yr – Year
See accompanying notes, which are an integral part of the financial statements.
Statement of assets and liabilities
Delaware Enhanced Global Dividend and Income Fund
November 30, 2016
| | | | |
Assets: | | | | |
Investments, at value1 | | $ | 254,361,576 | |
Short-term investments, at value2 | | | 7,091,258 | |
Foreign currencies, at value3 | | | 118,018 | |
Cash | | | 44,430 | |
Dividend and interest receivable | | | 2,303,104 | |
Receivable for securities sold | | | 1,342,604 | |
Foreign tax reclaim receivable | | | 179,235 | |
Other assets4 | | | 105,920 | |
| | | | |
Total assets | | | 265,546,145 | |
| | | | |
Liabilities: | | | | |
Borrowing under line of credit | | | 82,000,000 | |
Payable for securities purchased | | | 1,644,189 | |
Bond proceeds payable4 | | | 353,068 | |
Investment management fees payable to affiliates | | | 204,348 | |
Other accrued expenses | | | 109,379 | |
Interest expense payable on line of credit | | | 8,856 | |
Other affiliates payable | | | 3,065 | |
Accounting and administration expenses payable to affiliates | | | 1,014 | |
Trustees’ fees and expenses payable | | | 1,215 | |
Legal fees payable to affiliates | | | 1,036 | |
Reports and statements to shareholders expenses payable to affiliates | | | 132 | |
| | | | |
Total liabilities | | | 84,326,302 | |
| | | | |
Total Net Assets | | $ | 181,219,843 | |
| | | | |
| |
Net Assets Consist of: | | | | |
Paid-in capital | | $ | 203,647,870 | |
Distributions in excess of net investment income | | | (492,417 | ) |
Accumulated net realized loss on investments | | | (25,459,567 | ) |
Net unrealized appreciation of investments | | | 3,555,234 | |
Net unrealized depreciation of foreign currencies | | | (31,277 | ) |
| | | | |
Total Net Assets | | $ | 181,219,843 | |
| | | | |
| |
Net Asset Value | | | | |
| |
Common Shares | | | | |
Net assets | | $ | 181,219,843 | |
Shares of beneficial interest outstanding | | | 15,850,189 | |
Net asset value per share | | $ | 11.43 | |
| |
1 Investments, at cost | | $ | 250,806,465 | |
2 Short-term investments, at cost | | | 7,091,135 | |
3 Foreign currencies, at cost | | | 121,068 | |
4 See Note 14 in “Notes to financial statements.” | | | | |
See accompanying notes, which are an integral part of the financial statements.
Statement of operations
Delaware Enhanced Global Dividend and Income Fund
Year ended November 30, 2016
| | | | |
Investment Income: | | | | |
Interest | | $ | 6,660,968 | |
Dividends | | | 4,459,843 | |
Foreign tax withheld | | | (283,938 | ) |
| | | | |
| | | 10,836,873 | |
| | | | |
Expenses: | | | | |
Management fees | | | 2,436,722 | |
Interest expense | | | 1,053,243 | |
Legal fees | | | 139,090 | |
Reports and statements to shareholders expenses | | | 137,924 | |
Accounting and administration expenses | | | 82,473 | |
Dividend disbursing and transfer agent fees and expenses | | | 52,407 | |
Custodian fees | | | 52,267 | |
Audit and tax fees | | | 43,978 | |
Trustees’ fees and expenses | | | 8,742 | |
Registration fees | | | 958 | |
Other expenses | | | 88,989 | |
| | | | |
Total operating expenses | | | 4,096,793 | |
| | | | |
Net Investment Income | | | 6,740,080 | |
| | | | |
| |
Net Realized and Unrealized Gain (Loss): | | | | |
Net realized gain (loss) on: | | | | |
Investments | | | (1,055,618 | ) |
Foreign currencies | | | (914,942 | ) |
Foreign currency exchange contracts | | | 96,122 | |
Options written | | | 48,041 | |
Swap contracts | | | (2,637 | ) |
| | | | |
Net realized loss | | | (1,829,034 | ) |
| | | | |
| |
Net change in unrealized appreciation (depreciation) of: | | | | |
Investments | | | 7,413,623 | |
Foreign currencies | | | (16,959 | ) |
Foreign currency exchange contracts | | | 8 | |
Swap contracts | | | 347 | |
| | | | |
Net change in unrealized appreciation (depreciation) | | | 7,397,019 | |
| | | | |
Net Realized and Unrealized Gain | | | 5,567,985 | |
| | | | |
| |
Net Increase in Net Assets Resulting from Operations | | $ | 12,308,065 | |
| | | | |
See accompanying notes, which are an integral part of the financial statements.
26
Statements of changes in net assets
Delaware Enhanced Global Dividend and Income Fund
| | | | | | | | |
| | | Year ended | |
| | | 11/30/16 | | | 11/30/15 | |
Increase (Decrease) in Net Assets from Operations: | | | | | | | | |
Net investment income | | $ | 6,740,080 | | | $ | 8,979,786 | |
Net realized gain (loss) | | | (1,829,034 | ) | | | 2,254,797 | |
Net change in unrealized appreciation (depreciation) | | | 7,397,019 | | | | (23,983,029 | ) |
| | | | | | | | |
Net increase (decrease) in net assets resulting from operations | | | 12,308,065 | | | | (12,748,446 | ) |
| | | | | | | | |
| | |
Dividends and Distributions to Shareholders from: | | | | | | | | |
Net investment income | | | (6,430,971 | ) | | | (11,617,505 | ) |
Return of capital | | | (6,773,374 | ) | | | (2,659,749 | ) |
| | | | | | | | |
| | | (13,204,345 | ) | | | (14,277,254 | ) |
| | | | | | | | |
| | |
Capital Share Transactions: | | | | | | | | |
Cost of shares repurchased1 | | | (138,113 | ) | | | — | |
| | | | | | | | |
Decrease in net assets derived from capital share transactions | | | (138,113 | ) | | | — | |
| | | | | | | | |
Net Decrease in Net Assets | | | (1,034,393 | ) | | | (27,025,700 | ) |
| | |
Net Assets: | | | | | | | | |
Beginning of year | | | 182,254,236 | | | | 209,279,936 | |
| | | | | | | | |
End of year | | $ | 181,219,843 | | | $ | 182,254,236 | |
| | | | | | | | |
Distributions in excess of net investment income | | $ | (492,417 | ) | | $ | (1,065,646 | ) |
| | | | | | | | |
1 See Note 6 in “Notes to financial statements.”
See accompanying notes, which are an integral part of the financial statements.
Statement of cash flows
Delaware Enhanced Global Dividend and Income Fund
Year ended November 30, 2016
| | | | |
Net Cash (including Foreign Currency) Provided by (Used for) Operating Activities: | | | | |
Net increase in net assets resulting from operations | | $ | 12,308,065 | |
| | | | |
| |
Adjustments to reconcile net increase in net assets from operations to cash provided by (used for) operating activities: | | | | |
Amortization of premium and accretion of discount on investments, net | | | 285,987 | |
Proceeds from disposition of investment securities | | | 146,456,112 | |
Purchase of investment securities | | | (134,823,883 | ) |
Net purchases of short-term securities | | | (2,894,444 | ) |
Net realized loss on foreign currencies | | | 914,942 | |
Net realized loss on investments | | | 1,055,618 | |
Net realized gain on options written | | | (48,041 | ) |
Net change in unrealized appreciation (depreciation) of investments | | | (7,413,623 | ) |
Net change in unrealized appreciation (depreciation) of swap contracts | | | (347 | ) |
Net change in unrealized appreciation (depreciation) of foreign currencies | | | 16,959 | |
Net change in unrealized appreciation (depreciation) of foreign currency exchange contracts | | | (8 | ) |
Premiums on options written | | | 48,041 | |
Noncash adjustments for dividend income return of capital | | | 205,425 | |
Increase in receivable for securities sold | | | (531,071 | ) |
Increase in dividends and interest receivable | | | (64,854 | ) |
Increase in foreign tax reclaim receivable | | | (51,339 | ) |
Decrease in upfront payments payable on credit default swap contracts | | | (1,658 | ) |
Decrease in cash collateral held at brokers for certain open derivatives | | | 2,815 | |
Decrease in swaps interest payable | | | (209 | ) |
Decrease in payable for securities purchased | | | (211,549 | ) |
Decrease in variation margin payable on credit default swap contracts | | | (19 | ) |
Decrease in other affiliates payable | | | (262 | ) |
Increase in Trustees’ fees and expenses payable | | | 114 | |
Decrease in accounting and administration expenses payable to affiliates | | | (30 | ) |
Decrease in investment management fees payable to affiliates | | | (5,015 | ) |
Increase in reports and statements to shareholders expenses payable to affiliates | | | 2 | |
Decrease in legal fees payable to affiliates | | | (871 | ) |
Decrease in other accrued expenses payable | | | (11,511 | ) |
Decrease in interest expense payable | | | (11,281 | ) |
| | | | |
Total adjustments | | | 2,916,000 | |
| | | | |
Net cash provided by operating activities | | | 15,224,065 | |
| | | | |
| |
Cash Flows Provided by (Used for) Financing Activities: | | | | |
Increase in borrowing under line of credit | | | 7,000,000 | |
Decrease in borrowing under line of credit | | | (9,000,000 | ) |
Cost of shares repurchased | | | (138,113 | ) |
Cash dividends and distributions paid to shareholders | | | (13,204,345 | ) |
| | | | |
Net cash used for financing activities | | | (15,342,458 | ) |
| | | | |
Effect of exchange rates on cash | | | (16,959 | ) |
| | | | |
Net decrease in cash | | | (135,352 | ) |
Cash at beginning of year* | | | 297,800 | |
| | | | |
Cash at end of year* | | $ | 162,448 | |
| | | | |
| |
Cash paid for interest expense on leverage | | $ | 1,064,524 | |
| | | | |
*Includes foreign currencies, at value as shown on the “Statement of assets and liabilities.”
See accompanying notes, which are an integral part of the financial statements.
28
Financial highlights
Delaware Enhanced Global Dividend and Income Fund
Selected data for each share of the Fund outstanding throughout each period were as follows:
| | | | | | | | | | | | | | | | | | | | |
| | | Year ended | |
| | | 11/30/16 | | | 11/30/15 | | | 11/30/14 | | | 11/30/13 | | | 11/30/12 | |
| |
Net asset value, beginning of period | | $ | 11.490 | | | $ | 13.190 | | | $ | 13.520 | | | $ | 12.020 | | | $ | 11.350 | |
| | | | | |
Income (loss) from investment operations: | | | | | | | | | | | | | | | | | | | | |
Net investment income1 | | | 0.425 | | | | 0.566 | | | | 0.589 | | | | 0.577 | | | | 0.557 | |
Net realized and unrealized gain (loss) | | | 0.348 | | | | (1.366 | ) | | | (0.019 | ) | | | 1.823 | | | | 1.261 | |
| | | | | | | | | | | | | | | | | | | | |
Total from investment operations | | | 0.773 | | | | (0.800 | ) | | | 0.570 | | | | 2.400 | | | | 1.818 | |
| | | | | | | | | | | | | | | | | | | | |
| | | | | |
Less dividends and distributions from: | | | | | | | | | | | | | | | | | | | | |
Net investment income | | | (0.406 | ) | | | (0.732 | ) | | | (0.900 | ) | | | (0.900 | ) | | | (0.627 | ) |
Return of capital | | | (0.427 | ) | | | (0.168 | ) | | | — | | | | — | | | | (0.521 | ) |
| | | | | | | | | | | | | | | | | | | | |
Total dividends and distributions | | | (0.833 | ) | | | (0.900 | ) | | | (0.900 | ) | | | (0.900 | ) | | | (1.148 | ) |
| | | | | | | | | | | | | | | | | | | | |
| | | | | |
Net asset value, end of period | | $ | 11.430 | | | $ | 11.490 | | | $ | 13.190 | | | $ | 13.520 | | | $ | 12.020 | |
| | | | | | | | | | | | | | | | | | | | |
| | | | | |
Market value, end of period | | $ | 9.650 | | | $ | 9.720 | | | $ | 11.960 | | | $ | 12.250 | | | $ | 11.100 | |
| | | | | | | | | | | | | | | | | | | | |
| | | | | |
Total return based on2 : | | | | | | | | | | | | | | | | | | | | |
Net asset value | | | 8.65% | | | | (5.30% | ) | | | 4.94% | | | | 21.19% | | | | 16.85% | |
Market value | | | 8.44% | | | | (11.65% | ) | | | 5.02% | | | | 18.91% | | | | 12.15% | |
| | | | | |
Ratios and supplemental data: | | | | | | | | | | | | | | | | | | | | |
Net assets, end of period (000 omitted) | | $ | 181,220 | | | $ | 182,254 | | | $ | 209,280 | | | $ | 214,429 | | | $ | 190,602 | |
Ratio of expenses to average net assets3,4,5 | | | 2.30% | | | | 2.10% | | | | 1.88% | | | | 1.88% | | | | 2.15% | |
Ratio of net investment income to average net assets6 | | | 3.79% | | | | 4.52% | | | | 4.31% | | | | 4.47% | | | | 4.74% | |
Portfolio turnover | | | 54% | | | | 48% | | | | 56% | | | | 56% | | | | 53% | |
Leverage analysis: | | | | | | | | | | | | | | | | | | | | |
Debt outstanding at end of period at par (000 omitted) | | $ | 82,000 | | | $ | 84,000 | | | $ | 87,000 | | | $ | 65,725 | | | $ | 65,725 | |
Asset coverage per $1,000 of debt outstanding at end of period | | $ | 3,210 | | | $ | 3,170 | | | $ | 3,406 | | | $ | 4,263 | | | $ | 3,900 | |
| |
| 1 | The average shares outstanding method has been applied for per share information. |
| 2 | Total investment return is calculated assuming a purchase of common stock on the opening of the first day and a sale on the closing of the last day of each period reported. Dividends and distributions, if any, are assumed for the purpose of this calculation, to be reinvested at prices obtained under the Fund’s dividend reinvestment plan. Generally, total investment return based on net asset value will be higher than total investment return based on market value in periods where there is an increase in the discount or decrease in the premium of the market value to the net asset value from the beginning to the end of such periods. Conversely, total investment return based on net asset value will be lower than total investment return based on market value in periods where there is a decrease in the discount or an increase in the premium of the market value to the net asset value from the beginning to the end of such periods. |
| 3 | The ratio of interest expense to adjusted average net assets (excluding debt outstanding) for the years ended Nov. 30, 2016, 2015, 2014, 2013, and 2012 were 0.41%, 0.33%, 0.27%, 0.27%, and 0.42%, respectively. |
| 4 | The ratio of expenses before interest expense to adjusted average net assets (excluding debt outstanding) for the years ended Nov. 30, 2016,2015,2014, 2013, and 2012 were 1.19%, 1.14%, 1.13%, 1.15%, and 1.19%, respectively. |
| 5 | The ratio of interest expense to average net assets for the years ended Nov. 30, 2016, 2015, 2014, 2013, and 2012 were 0.59%, 0.47%, 0.37%, 0.36%, and 0.56%, respectively. |
| 6 | The ratio of net investment income to adjusted average net assets (excluding debt outstanding) for the years ended Nov. 30, 2016, 2015, 2014, 2013, and 2012 were 2.63%, 3.15%, 3.21%, 3.38%, and 3.57%, respectively. |
See accompanying notes, which are an integral part of the financial statements.
Notes to financial statements
Delaware Enhanced Global Dividend and Income Fund
November 30, 2016
Delaware Enhanced Global Dividend and Income Fund (Fund) is organized as a Delaware statutory trust, and is a diversified closed-end management investment company under the Investment Company Act of 1940 (1940 Act), as amended. The Fund’s shares trade on the New York Stock Exchange (NYSE) under the symbol DEX.
The primary investment objective of the Fund is to seek current income, with a secondary objective of capital appreciation.
1. Significant Accounting Policies
The following accounting policies are in accordance with U.S. generally accepted accounting principles (U.S. GAAP) and are consistently followed by the Fund.
Security Valuation — Equity securities and exchange-traded funds (ETFs), except those traded on the Nasdaq Stock Market LLC (Nasdaq), are valued at the last quoted sales price as of the time of the regular close of the NYSE on the valuation date. Equity securities and ETFs traded on the Nasdaq are valued in accordance with the Nasdaq Official Closing Price, which may not be the last sales price. If, on a particular day, an equity security or ETF does not trade, the mean between the bid and ask prices will be used, which approximates fair value. Equity securities listed on a foreign exchange are normally valued at the last quoted sales price on the valuation date. U.S. government and agency securities are valued at the mean between the bid and ask prices, which approximates fair value. Other debt securities and credit default swap (CDS) contracts are valued based upon valuations provided by an independent pricing service or broker/counterparty and reviewed by management. To the extent current market prices are not available, the pricing service may take into account developments related to the specific security, as well as transactions in comparable securities. Valuations for fixed income securities utilize matrix systems, which reflect such factors as security prices, yields, maturities, and ratings, and are supplemented by dealer and exchange quotations. For asset-backed securities, collateralized mortgage obligations, commercial mortgage securities and U.S. government agency mortgage securities, pricing vendors utilize matrix pricing which considers prepayment speed, attributes of the collateral, yield or price of bonds of comparable quality, coupon, maturity, and type as well as broker/dealer-supplied prices. Swap prices are derived using daily swap curves and models that incorporate a number of market data factors, such as discounted cash flows, trades, and values of the underlying reference instruments. Foreign currency exchange contracts and foreign cross currency exchange contracts are valued at the mean between the bid and ask prices, which approximates fair value. Interpolated values are derived when the settlement date of the contract is an interim date for which quotations are not available. Exchange-traded options are valued at the last reported sale price or, if no sales are reported, at the mean between the last reported bid and ask prices, which approximates fair value. Generally, other securities and assets for which market quotations are not readily available are valued at fair value as determined in good faith under the direction of the Fund’s Board of Trustees (Board). In determining whether market quotations are readily available or fair valuation will be used, various factors will be taken into consideration, such as market closures or suspension of trading in a security. The Fund may use fair value pricing more frequently for securities traded primarily in non-U.S. markets because, among other things, most foreign markets close well before the Fund values its securities, generally as of 4:00 p.m. Eastern time. The earlier close of these foreign markets gives rise to the possibility that significant events, including broad market moves, government actions or pronouncements, aftermarket trading, or news events may have occurred in the interim. Whenever such a significant event occurs, the Fund may value foreign securities using fair value prices based on third-party vendor modeling tools (international fair value pricing).
Federal and Foreign Income Taxes — No provision for federal income taxes has been made as the Fund intends to continue to qualify for federal income tax purposes as a regulated investment company under Subchapter M of the Internal Revenue Code of 1986, as amended, and make the requisite distributions to shareholders. The Fund evaluates tax positions taken or expected to be taken in the course of preparing the Fund’s tax returns to determine whether the tax positions are “more-likely-than-not” of being sustained by the applicable tax authority. Tax positions not deemed to meet the “more-likely-than-not” threshold are recorded as a tax benefit or expense in the current year. Management has analyzed the Fund’s tax positions taken for all open federal income tax years (Nov. 30, 2013–Nov. 30, 2016), and has concluded that no provision for federal income tax is required in the Fund’s financial statements. In regard to foreign taxes only, the Fund has open tax years in certain foreign countries in which it invests that may date back to the inception of the Fund.
Distributions — The Fund has implemented a managed distribution policy. Under the policy, the Fund is managed with a goal of generating as much of the distribution as possible from net investment income and short-term capital gains. The balance of the distribution will then come from long-term capital gains to the extent permitted, and if necessary, a return of capital. Even though the Fund may realize current year capital gains, such gains may be offset, in whole or in part, by the Fund’s capital loss carryovers from prior years. For federal income tax purposes, the effect of such capital loss carryovers is to convert (to the extent of such current year gains) what would otherwise be non-taxable returns of capital into distributions taxable as ordinary income. The use of such capital loss carryovers in this circumstance will produce no tax benefit for shareholders, and the capital loss carryovers available to offset future capital gains of the Fund will be reduced. Under the Regulated Investment
30
Company Modernization Act of 2010 (Act), this tax effect attributable to the Fund’s capital loss carryovers (the conversion of non-taxable returns of capital into distributions taxable as ordinary income) will no longer apply to net capital losses of the Fund arising in Fund tax years beginning after Nov. 30, 2011. The actual determination of the source of the Fund’s distributions can be made only at year end. Shareholders should receive written notification regarding the actual components and tax treatments of all Fund distributions for the calendar year 2016 in early 2017.
Repurchase Agreements — The Fund may purchase certain U.S. government securities subject to the counterparty’s agreement to repurchase them at an agreed upon date and price. The counterparty will be required on a daily basis to maintain the value of the collateral subject to the agreement at not less than the repurchase price (including accrued interest). The agreements are conditioned upon the collateral being deposited under the Federal Reserve book-entry system with the Fund’s custodian or a third-party sub-custodian. In the event of default or bankruptcy by the other party to the agreement, retention of the collateral may be subject to legal proceedings. All open repurchase agreements as of the date of this report were entered into on Nov. 30, 2016, and matured on the next business day.
Cash and Cash Equivalents — Cash and cash equivalents include deposits held at financial institutions, which are available for the Company’s use with no restrictions, with original maturities of 90 days or less. At Nov. 30, 2016, the Fund did not hold any cash equivalents.
To Be Announced Trades (TBA) — The Fund may contract to purchase or sell securities for a fixed price at a transaction date beyond the customary settlement period (examples: when issued, delayed delivery, forward commitment, or TBA transactions) consistent with the Fund’s ability to manage its investment portfolio and meet redemption requests. These transactions involve a commitment by the Fund to purchase or sell securities for a predetermined price or yield with payment and delivery taking place more than three days in the future, or after a period longer than the customary settlement period for that type of security. No interest will be earned by the Fund on such purchases until the securities are delivered or the transaction is completed; however, the market value may change prior to delivery.
Foreign Currency Transactions — Transactions denominated in foreign currencies are recorded at the prevailing exchange rates on the valuation date in accordance with the Fund’s prospectus. The value of all assets and liabilities denominated in foreign currencies is translated daily into U.S. dollars at the exchange rate of such currencies against the U.S. dollar. Transaction gains or losses resulting from changes in exchange rates during the reporting period or upon settlement of the foreign currency transaction are reported in operations for the current period. The Fund generally bifurcates that portion of realized gains and losses on investments in debt securities which is due to changes in foreign exchange rates from that which is due to changes in market prices of debt securities. That portion of gains (losses), which is due to changes in foreign exchange rates is included on the “Statement of operations” under “Net realized gain (loss) on foreign currencies.” For foreign equity securities, the realized gains and losses are included on the “Statement of operations” under “Net realized and unrealized gain (loss) on investments.” The Fund reports certain foreign currency related transactions as components of realized gains (losses) for financial reporting purposes, whereas such components are treated as ordinary income (loss) for federal income tax purposes.
Use of Estimates — The Fund is an investment company, whose financial statements are prepared in conformity with U.S. GAAP. Therefore, the Fund follows the accounting and reporting guidelines for investment companies. The preparation of financial statements in conformity with U.S. GAAP requires management to make estimates and assumptions that affect the fair value of investments, the reported amounts of assets and liabilities and disclosure of contingent assets and liabilities at the date of the financial statements, and the reported amounts of revenues and expenses during the reporting period. Actual results could differ from those estimates and the differences could be material.
Other — Expenses directly attributable to the Fund are charged directly to the Fund. Other expenses common to various funds within the Delaware Investments® Family of Funds are generally allocated among such funds on the basis of average net assets. Management fees and some other expenses are paid monthly. Security transactions are recorded on the date the securities are purchased or sold (trade date) for financial reporting purposes. Costs used in calculating realized gains and losses on the sale of investment securities are those of the specific securities sold. Dividend income is recorded on the ex-dividend date and interest income is recorded on the accrual basis. Discounts and premiums on debt securities are accreted or amortized to interest income, respectively over the lives of the respective securities using the effective interest method. Realized gains (losses) on paydowns of asset- and mortgage-backed securities are classified as interest income. Distributions received from investments in real estate investment trusts (REITs) are recorded as dividend income on the ex-dividend date, subject to reclassification upon notice of the character of such distributions by the issuer. Distributions received from investments in master limited partnerships are recorded as return of capital on investments on the ex-dividend date. Foreign dividends are also recorded on the ex-dividend date or as soon after the ex-dividend date that the Fund is aware of such dividends, net of all tax withholdings, a portion of which may be reclaimable. Withholding taxes and reclaims on foreign dividends have been recorded in accordance with the Fund’s understanding of the applicable country’s tax rules and rates.
Notes to financial statements
Delaware Enhanced Global Dividend and Income Fund
1. Significant Accounting Policies (continued)
The Fund may receive earnings credits from its custodian when positive cash balances are maintained, which may be used to offset custody fees. There were no such earnings credits for the year ended Nov. 30, 2016.
2. Investment Management, Administration Agreements and Other Transactions with Affiliates
In accordance with the terms of its investment management agreement, the Fund pays Delaware Management Company (DMC), a series of Delaware Management Business Trust, and the investment manager, an annual fee of 0.95%, of the adjusted average daily net assets of the Fund. For purposes of the calculation of investment management fees, adjusted average daily net assets excludes the line of credit liability.
Delaware Investments Fund Services Company (DIFSC), an affiliate of DMC, provides fund accounting and financial administration oversight services to the Fund. For these services, DIFSC’s fees are calculated based on the aggregate daily net assets (excluding the line of credit liability) of the Delaware Investments® Family of Funds at the following annual rate: 0.0050% of the first $30 billion; 0.0045% of the next $10 billion; 0.0040% of the next $10 billion; and 0.0025% of aggregate average daily net assets in excess of $50 billion. The fees payable to DIFSC under the service agreement described above are allocated among all funds in the Delaware Investments Family of Funds on a relative net asset value (NAV) basis. For the year ended Nov. 30, 2016, the Fund was charged $12,151 for these services. This amount is included on the “Statement of operations” under “Accounting and administration expenses.”
As provided in the investment management agreement, the Fund bears a portion of the cost of resources shared with DMC, including the cost of internal personnel of DMC and its affiliates that provide legal, tax, and regulatory reporting services to the Fund. For the year ended Nov. 30, 2016, the Fund was charged $47,338 for internal legal, tax, and regulatory reporting services provided by DMC and/or its affiliates’ employees. This amount is included on the “Statement of operations” under “Legal fees.”
Trustees’ fees include expenses accrued by the Fund for each Trustee’s retainer and meeting fees. Certain officers of DMC and DIFSC are Officers and/or Trustees of the Fund. These Officers and Trustees are paid no compensation by the Fund.
Cross trades for the year ended Nov. 30, 2016 were executed by the Fund pursuant to procedures adopted by the Board designed to ensure compliance with Rule 17a-7 under the 1940 Act. Cross trading is the buying or selling of portfolio securities between funds of investment companies, or between a fund of an investment company and another entity, that are or could be considered affiliates by virtue of having a common investment advisor (or affiliated investment advisors), common directors/trustees and/or common officers. At its regularly scheduled meetings, The Board reviews such transactions for compliance with the procedures adopted by the Board. Pursuant to these procedures, for the year ended Nov. 30, 2016, the Fund engaged in securities purchases of $312,733 and securities sales of $1,806,037, which resulted in net realized gain of $239.
3. Investments
For the year ended Nov. 30, 2016, the Fund made purchases and sales of investment securities other than short-term investments as follows:
| | | | |
Purchases other than U.S. government securities | | $ | 127,840,473 | |
Purchases of U.S. government securities | | | 6,983,410 | |
Sales other than U.S. government securities | | | 139,312,613 | |
Sales of U.S. government securities | | | 7,143,500 | |
At Nov. 30, 2016, the cost and unrealized appreciation (depreciation) of investments for federal income tax purposes were as follows:
| | | | |
Cost of investments | | $ | 259,386,055 | |
| | | | |
Aggregate unrealized appreciation of investments | | $ | 28,039,292 | |
Aggregate unrealized depreciation of investments | | | (25,972,513 | ) |
| | | | |
Net unrealized appreciation of investments | | $ | 2,066,779 | |
| | | | |
U.S. GAAP defines fair value as the price that the Fund would receive to sell an asset or pay to transfer a liability in an orderly transaction between market participants at the measurement date under current market conditions. A three-level hierarchy for fair value measurements has been established based upon the transparency of inputs to the valuation of an asset or liability. Inputs may be observable or unobservable and refer broadly to the assumptions that market participants would use in pricing the asset or liability. Observable inputs reflect the assumptions
32
market participants would use in pricing the asset or liability based on market data obtained from sources independent of the reporting entity. Unobservable inputs reflect the reporting entity’s own assumptions about the assumptions that market participants would use in pricing the asset or liability based on the best information available under the circumstances. The Fund’s investment in its entirety is assigned a level based upon the observability of the inputs which are significant to the overall valuation. The three-level hierarchy of inputs is summarized below.
| | |
| Level 1 – | | Inputs are quoted prices in active markets for identical investments. (Examples: equity securities, open-end investment companies, futures contracts, exchange-traded options contracts) |
| |
| Level 2 – | | Other observable inputs, including, but not limited to: quoted prices for similar assets or liabilities in markets that are active, quoted prices for identical or similar assets or liabilities in markets that are not active, inputs other than quoted prices that are observable for the assets or liabilities (such as interest rates, yield curves, volatilities, prepayment speeds, loss severities, credit risks, and default rates) or other market-corroborated inputs. (Examples: debt securities, government securities, swap contracts, foreign currency exchange contracts, foreign securities utilizing international fair value pricing, broker-quoted securities, fair valued securities) |
| |
| Level 3 – | | Significant unobservable inputs, including the Fund’s own assumptions used to determine the fair value of investments. (Examples: broker-quoted securities, fair valued securities) |
Level 3 investments are valued using significant unobservable inputs. The Fund may also use an income-based valuation approach in which the anticipated future cash flows of the investment are discounted to calculate fair value. Discounts may also be applied due to the nature or duration of any restrictions on the disposition of the investments. Valuations may also be based upon current market prices of securities that are comparable in coupon, rating, maturity, and industry. The derived value of a Level 3 investment may not represent the value which is received upon disposition and this could impact the results of operations.
The following table summarizes the valuation of the Fund’s investments by fair value hierarchy levels as of Nov. 30, 2016:
| | | | | | | | | | | | | | | | |
| Securities | | Level 1 | | | Level 2 | | | Level 3 | | | Total | |
Common Stock | | $ | 124,901,476 | | | $ | — | | | $ | — | | | $ | 124,901,476 | |
Convertible Preferred Stock1 | | | 3,529,384 | | | | 371,268 | | | | — | | | | 3,900,652 | |
Exchange-Traded Note | | | 43,564 | | | | — | | | | — | | | | 43,564 | |
Agency, Asset-Backed and Mortgage-Backed Securities | | | — | | | | 313,701 | | | | — | | | | 313,701 | |
Corporate Debt | | | — | | | | 109,009,785 | | | | — | | | | 109,009,785 | |
Foreign Debt | | | — | | | | 7,718,839 | | | | — | | | | 7,718,839 | |
Senior Secured Loans | | | — | | | | 4,300,471 | | | | — | | | | 4,300,471 | |
Limited Partnership | | | — | | | | — | | | | 775,233 | | | | 775,233 | |
Master Limited Partnership | | | 409,050 | | | | — | | | | — | | | | 409,050 | |
Preferred Stock1 | | | 486,385 | | | | 1,170,799 | | | | — | | | | 1,657,184 | |
Rights1 | | | 1,500 | | | | — | | | | 24,678 | | | | 26,178 | |
Warrant | | | 658 | | | | — | | | | — | | | | 658 | |
U.S. Treasury Obligations | | | — | | | | 1,304,785 | | | | — | | | | 1,304,785 | |
Short-Term Investments | | | — | | | | 7,091,258 | | | | — | | | | 7,091,258 | |
| | | | | | | | | | | | | | | | |
Total Value of Securities | | $ | 129,372,017 | | | $ | 131,280,906 | | | $ | 799,911 | | | $ | 261,452,834 | |
| | | | | | | | | | | | | | | | |
1Security type is valued across multiple levels. Level 1 investments represent exchange-traded investments, Level 2 investments represent investments with observable inputs or matrix-priced investments, and Level 3 investments represent investments without observable inputs. The amounts attributed to Level 1 investments, Level 2 investments, and Level 3 investments represent the following percentages of the total market value of these security types:
| | | | | | | | | | | | | | | | |
| | | Level 1 | | | Level 2 | | | Level 3 | | | Total | |
Convertible Preferred Stock | | | 90.48 | % | | | 9.52 | % | | | — | | | | 100.00 | % |
Preferred Stock | | | 29.35 | % | | | 70.65 | % | | | — | | | | 100.00 | % |
Rights | | | 5.73 | % | | | — | | | | 94.27 | % | | | 100.00 | % |
The securities that have been valued at zero on the “Schedule of investments” are considered to be Level 3 investments in these tables.
Notes to financial statements
Delaware Enhanced Global Dividend and Income Fund
3. Investments (continued)
During the year ended Nov. 30, 2016, there were no transfers between Level 1 investments, Level 2 investments, or Level 3 investments that had a significant impact to the Fund. This does not include transfers between Level 1 investments and Level 2 investments due to the Fund utilizing international fair value pricing during the period. In accordance with the fair valuation procedures described in Note 1, international fair value pricing of securities in the Fund occurs when market volatility exceeds an established rolling threshold. If the threshold is exceeded on a given date, then prices of international securities (those that traded on exchanges that close at a different time than the time that the Fund’s NAV is determined) are established using a separate pricing feed from a third-party vendor designed to establish a price for each such security as of the time that the Fund’s NAV is determined. Further, international fair value pricing uses other observable market-based inputs in place of the closing exchange price due to the events occurring after the close of the exchange or market on which the investment is principally traded, causing a change in classification between levels. The Fund’s policy is to recognize transfers between levels at the beginning of the reporting period.
A reconciliation of Level 3 investments is presented when the Fund has a significant amount of Level 3 investments at the beginning, interim, or end of the period in relation to the Fund’s net assets. Management has determined not to provide a reconciliation of Level 3 investments as they were not considered significant to the Fund’s net assets at the beginning, interim, or end of the year. Management has determined not to provide additional disclosure on Level 3 inputs since the Level 3 investments are not considered significant to the Fund’s net assets at the end of the year.
4. Dividend and Distribution Information
Income and long-term capital gain distributions are determined in accordance with federal income tax regulations, which may differ from U.S. GAAP. Additionally, distributions from net gains on foreign currency transactions and net short-term gains on sales of investment securities are treated as ordinary income for federal income tax purposes. The tax character of dividends and distributions paid during the years ended Nov. 30, 2016 and 2015 was as follows:
| | | | | | | | |
| | | Year ended | |
| | | 11/30/16 | | | 11/30/15 | |
Ordinary income | | $ | 6,430,971 | | | $ | 11,617,505 | |
Return of capital | | | 6,773,374 | | | | 2,659,749 | |
| | | | | | | | |
Total | | $ | 13,204,345 | | | $ | 14,277,254 | |
| | | | | | | | |
5. Components of Net Assets on a Tax Basis
As of Nov. 30, 2016, the components of net assets on a tax basis were as follows:
| | | | |
Shares of beneficial interest | | $ | 203,647,870 | |
Capital loss carryforwards | | | (24,216,381 | ) |
Other temporary differences | | | (247,148 | ) |
Net unrealized depreciation of investments, foreign currencies, and derivatives | | | 2,035,502 | |
| | | | |
Net assets | | $ | 181,219,843 | |
| | | | |
The differences between book basis and tax basis components of net assets are primarily attributable to tax deferral of losses on wash sales, contingent payment debt instruments, partnership income, market discount and premium on debt instruments, troubled debt, trust preferred securities and passive foreign investment companies.
For financial reporting purposes, capital accounts are adjusted to reflect the tax character of permanent book/tax differences. Reclassifications are primarily due to tax treatment of gain (loss) on foreign currency transactions, contingent payment debt instruments, CDS contracts, expiring capital loss carryforwards, partnership income, REITs, market discount and premium on certain debt instruments and paydowns of asset- and mortgage-backed securities and passive foreign investment companies. Results of operations and net assets were not affected by these reclassifications. For the year ended Nov. 30, 2016, the Fund recorded the following reclassifications:
34
| | | | |
Distributions in excess of net investment income | | $ | 264,120 | |
Accumulated net realized loss | | | 12,961,682 | |
Paid-in capital | | | (13,225,802 | ) |
For federal income tax purposes, capital loss carryforwards may be carried forward and applied against future capital gains. $12,990,082 of capital loss carryforwards expired at Nov. 30, 2016. Capital loss carryforwards remaining at Nov. 30, 2016, will expire as follows: $22,248,222 expires in 2017.
On Dec. 22, 2010, the Act was enacted, which changed various technical rules governing the tax treatment of regulated investment companies. The changes were generally effective for taxable years beginning after the date of enactment. Under the Act, the Fund is permitted to carry forward capital losses incurred in taxable years beginning after the date of enactment for an unlimited period. However, any losses incurred during those future taxable years will be required to be utilized prior to the losses incurred in pre-enactment taxable years, which carry an expiration date. As a result of this ordering rule, pre-enactment capital loss carryforwards may be more likely to expire unused. Additionally, post-enactment capital loss carryforwards will retain their character as either short-term or long-term capital losses rather than being considered all short-term as permitted under previous regulation.
Losses incurred that will be carried forward under the Act are as follows:
| | | | |
| | Loss carryforward character |
| | Short-term | | Long-term |
| | $926,645 | | $1,041,514 |
6. Capital Stock
Shares obtained under the Fund’s dividend reinvestment plan are purchased by the Fund’s transfer agent, Computershare, Inc. (Computershare), in the open market, if the shares of the Fund are trading at a discount to the Fund’s NAV on the dividend payment date. However, the dividend reinvestment plan provides that if the shares of the Fund are trading at a premium to the Fund’s NAV on the dividend payment date, the Fund will issue shares to shareholders of record at NAV. During the years ended Nov. 30, 2016 and 2015, the Fund did not issue any shares under the Fund’s dividend reinvestment plan.
On May 19, 2016, the Fund’s Board authorized management to implement an open-market share repurchase program pursuant to which the Fund may purchase up to 10% of the Fund’s shares, from time to time, in open-market transactions, at the discretion of management. The share repurchase program commenced on Aug. 1, 2016 and has no stated expiration date. For the year ended Nov. 30, 2016, the Fund repurchased 13,427 common shares valued at $138,113. The weighted average discount per share at the repurchase date was 14.56%.
7. Line of Credit
For the year ended Nov. 30, 2016, the Fund borrowed a portion of the money available to it pursuant to a $87,000,000 Credit Agreement with The Bank of New York Mellon (BNY Mellon) that was scheduled to expire on June 18, 2016. Effective June 17, 2016, the Fund entered into a new Credit Agreement that is scheduled to terminate on June 16, 2017. The terms of the new Credit Agreement are substantially the same as the terms in the expiring agreement. Depending on market conditions, the amount borrowed by the Fund pursuant to the Credit Agreement may be reduced or possibly increased in the future.
At Nov. 30, 2016, the par value of loans outstanding was $82,000,000, at a variable interest rate of 1.26%. During the year ended Nov. 30, 2016, the average daily balance of loans outstanding was $78,661,202, at a weighted average interest rate of approximately 1.34%.
Interest on borrowings is based on a variable short-term rate plus an applicable margin. The commitment fee under the expiring Credit Agreement was computed at a rate of 0.10% per annum on the unused balance. The rate on the new Credit Agreement is computed at a rate of 0.15% per annum on the unused balance. The loan is collateralized by the Fund’s portfolio.
8. Derivatives
U.S. GAAP requires disclosures that enable investors to understand: (1) how and why an entity uses derivatives; (2) how they are accounted for; and (3) how they affect an entity’s results of operations and financial position.
Notes to financial statements
Delaware Enhanced Global Dividend and Income Fund
8. Derivatives (continued)
Foreign Currency Exchange Contracts — The Fund may enter into foreign currency exchange contracts and foreign cross currency exchange contracts as a way of managing foreign exchange rate risk. The Fund may enter into these contracts to fix the U.S. dollar value of a security that it has agreed to buy or sell for the period between the date the trade was entered into and the date the security is delivered and paid for. The Fund may also use these contracts to hedge the U.S. dollar value of securities it already owns that are denominated in foreign currencies. In addition, the Fund may enter into these contracts to facilitate or expedite the settlement of portfolio transactions. The change in value is recorded as an unrealized gain or loss. When the contract is closed, a realized gain or loss is recorded equal to the difference between the value of the contract at the time it was opened and the value at the time it was closed.
The use of foreign currency exchange contracts and foreign cross currency exchange contracts does not eliminate fluctuations in the underlying prices of the securities, but does establish a rate of exchange that can be achieved in the future. Although foreign currency exchange contracts and foreign cross currency exchange contracts limit the risk of loss due to an unfavorable change in the value of the hedged currency, they also limit any potential gain that might result should the value of the currency change favorably. In addition, the Fund could be exposed to risks if the counterparties to the contracts are unable to meet the terms of their contracts. The Fund’s maximum risk of loss from counterparty credit risk is the value of its currency exchanged with the counterparty. The risk is generally mitigated by having a netting arrangement between the Fund and the counterparty and by the posting of collateral by the counterparty to the Fund to cover the Fund’s exposure to the counterparty. No foreign currency exchange contracts were outstanding at Nov. 30, 2016.
During the year ended Nov. 30, 2016, the Fund entered into foreign currency exchange contracts to hedge the U.S. dollar value of securities it already owns that are denominated in foreign currencies.
Options Contracts — The Fund may enter into options contracts in the normal course of pursuing its investment objectives. The Fund may buy or write options contracts for any number of reasons, including without limitation: to manage the Fund’s exposure to changes in securities prices caused by interest rates or market conditions and foreign currencies; to earn income; as an efficient means of adjusting the Fund’s overall exposure to certain markets; to protect the value of portfolio securities; and as a cash management tool. The Fund may buy or write call or put options on securities, futures, swaps, swaptions, financial indices, and foreign currencies. When the Fund buys an option, a premium is paid and an asset is recorded and adjusted on a daily basis to reflect the current market value of the option purchased. When the Fund writes an option, a premium is received and a liability is recorded and adjusted on a daily basis to reflect the current market value of the option written.
Premiums received from writing options that expire unexercised are treated by the Fund on the expiration date as realized gains. The difference between the premium received and the amount paid on effecting a closing purchase transaction, including brokerage commissions, is treated as realized gain or loss. If a call option is exercised, the premium is added to the proceeds from the sale of the underlying security in determining whether the Fund has a realized gain or loss. If a put option is exercised, the premium reduces the cost basis of the securities purchased by the Fund. The Fund, as writer of an option, bears the market risk of an unfavorable change in the price of the security underlying the written option. When writing options, the Fund is subject to minimal counterparty risk because the counterparty is only obligated to pay premiums and does not bear the market risk of an unfavorable market change. No option contracts were outstanding at Nov. 30, 2016.
Transactions in options written during the year ended Nov. 30, 2016 for the Fund were as follows:
| | | | | | | | | | |
| | | Number of
Contracts | | Premiums |
Options outstanding at Nov. 30, 2015 | | | | — | | | | $ | — | |
Options written | | | | 750 | | | | | 48,041 | |
Options expired | | | | (750 | ) | | | | (48,041 | ) |
| | | | | | | | | | |
Options outstanding at Nov. 30, 2016 | | | | — | | | | $ | — | |
| | | | | | | | | | |
During the year ended Nov. 30, 2016, the Fund used options contracts to receive premiums for writing options.
36
Swap Contracts — The Fund may enter into CDS contracts in the normal course of pursuing its investment objectives. The Fund may enter into CDS contracts in order to hedge against a credit event, to enhance total return or to gain exposure to certain securities or markets. The Fund will not be permitted to enter into any swap transactions unless, at the time of entering into such transactions, the unsecured long-term debt of the actual counterparty combined with any credit enhancements, is rated at least BBB- by Standard & Poor’s Financial Services LLC (S&P) or Baa3 by Moody’s Investors Service, Inc. (Moody’s) or is determined to be of equivalent credit quality by DMC.
Credit Default Swaps. A CDS contract is a risk-transfer instrument through which one party (purchaser of protection) transfers to another party (seller of protection) the financial risk of a credit event (as defined in the CDS agreement), as it relates to a particular reference security or basket of securities (such as an index). In exchange for the protection offered by the seller of protection, the purchaser of protection agrees to pay the seller of protection a periodic amount at a stated rate that is applied to the notional amount of the CDS contract. In addition, an upfront payment may be made or received by the Fund in connection with an unwinding or assignment of a CDS contract. Upon the occurrence of a credit event, the seller of protection would pay the par (or other agreed-upon) value of the reference security (or basket of securities) to the counterparty. Credit events generally include, among others, bankruptcy, failure to pay, and obligation default.
During the year ended Nov. 30, 2016, the Fund entered into CDS contracts as a purchaser of protection. Periodic payments (receipts) on such contracts are accrued daily and recorded as unrealized losses (gains) on swap contracts. Upon payment (receipt), such amounts are recorded as realized losses (gains) on swap contracts. Upfront payments made or received in connection with CDS contracts are amortized over the expected life of the CDS contracts as unrealized losses (gains) on swap contracts. The change in value of CDS contracts is recorded daily as unrealized appreciation or depreciation. A realized gain or loss is recorded upon a credit event (as defined in the CDS agreement) or the maturity or termination of the agreement. Initial margin and variation margin are posted to central counterparties for CDS basket trades, as determined by the applicable central counterparty. During the year ended Nov. 30, 2016, the Fund did not enter into any CDS contracts as a seller of protection.
CDS contracts may involve greater risks than if the Fund had invested in the reference obligation directly. CDS contracts are subject to general market risk, liquidity risk, counterparty risk and credit risk. The Fund’s maximum risk of loss from counterparty credit risk, either as the seller of protection or the buyer of protection, is the fair value of the contract. This risk is mitigated by (1) for bilateral swap contracts, having a netting arrangement between the Fund and the counterparty and by the posting of collateral by the counterparty to the Fund to cover the Fund’s exposure to the counterparty, and (2) for cleared swaps, trading these instruments through a central counterparty.
During the year ended Nov. 30, 2016, the Fund used CDS contracts to hedge against credit events.
Swaps Generally. The value of open swaps may differ from that which would be realized in the event the Fund terminated its position in the contract on a given day. Risks of entering into these contracts include the potential inability of the counterparty to meet the terms of the contracts. This type of risk is generally limited to the amount of favorable movement in the value of the underlying security, instrument, or basket of instruments, if any, at the day of default. Risks also arise from potential losses from adverse market movements and such losses could exceed the unrealized amounts. No swap contracts were outstanding at Nov. 30, 2016.
The effect of derivative instruments on the “Statement of operations” for the year ended Nov. 30, 2016 was as follows:
| | | | | | | | | | | | | | | | | | | | |
| | | Net Realized Gain (Loss) on: |
| | | | |
| | | Foreign
Currency
Exchange
Contracts | | Options
Written | | Swap
Contracts | | Total |
Foreign currency exchange contracts | | | $ | 96,122 | | | | $ | — | | | | $ | — | | | | $ | 96,122 | |
Equity contracts | | | | — | | | | | 48,041 | | | | | — | | | | | 48,041 | |
Credit contracts | | | | — | | | | | — | | | | | (2,637 | ) | | | | (2,637 | ) |
| | | | | | | | | | | | | | | | | | | | |
Total | | | $ | 96,122 | | | | $ | 48,041 | | | | $ | (2,637 | ) | | | $ | 141,526 | |
| | | | | | | | | | | | | | | | | | | | |
Notes to financial statements
Delaware Enhanced Global Dividend and Income Fund
8. Derivatives (continued)
| | | | | | | | | | | | |
| | | Net Change in Unrealized Appreciation (Depreciation) of: | |
| | | |
| | | Foreign
Currency
Exchange
Contracts | | | Swap
Contracts | | | Total | |
Foreign currency exchange contracts | | | $ 8 | | | | $ — | | | | $ 8 | |
Credit contracts | | | — | | | | 347 | | | | 347 | |
Total | | | $ 8 | | | | $347 | | | | $355 | |
Derivatives generally. The table below summarizes the average balance of derivative holdings by the Fund during the year ended Nov. 30, 2016:
| | | | | | | | | | | | | | | | |
| | | Long
Derivatives
Volume | | | Short
Derivatives
Volume | |
Foreign currency exchange contracts (average cost) | | | USD | | | | 24,768 | | | | USD | | | | 72,660 | |
Options contracts (average notional value) | | | | | | | — | | | | | | | | 2,204 | |
Swap contracts (average notional value)* | | | EUR | | | | 8,459 | | | | | | | | — | |
*Long represents buying protection and short represents selling protection.
9. Offsetting
In December 2011, the Financial Accounting Standards Board (FASB) issued guidance that expanded disclosure requirements on the offsetting of certain assets and liabilities. The disclosures are required for investments and derivative financial instruments subject to master netting or similar agreements which are eligible for offset on the “Statement of assets and liabilities” and require an entity to disclose both gross and net information about such investments and transactions in the financial statements. In January 2013, the FASB issued guidance that clarified which investments and transactions are subject to the offsetting disclosure requirements. The scope of the disclosure requirements for offsetting is limited to derivative instruments, repurchase agreements and reverse repurchase agreements, and securities borrowing.
In order to better define its contractual rights and to secure rights that will help the Fund mitigate its counterparty risk, the Fund entered into an International Swaps and Derivatives Association, Inc. Master Agreement (ISDA Master Agreement) or a similar agreement with certain of its derivative contract counterparties. An ISDA Master Agreement is a bilateral agreement between the Fund and a counterparty that governs certain over-the-counter (OTC) derivatives and foreign exchange contracts and typically contains, among other things, collateral posting items and netting provisions in the event of a default and/or termination event. Under an ISDA Master Agreement, the Fund may, under certain circumstances, offset with the counterparty certain derivative financial instruments’ payables and/or receivables with collateral held and/or posted and create one single net payment. The provisions of the ISDA Master Agreement typically permit a single net payment in the event of default (close-out), including the bankruptcy or insolvency of the counterparty. However, bankruptcy, or insolvency laws of a particular jurisdiction may impose restrictions on or prohibitions against the right of offset in bankruptcy, insolvency, or other events.
For financial reporting purposes, the Fund does not offset derivative assets and derivative liabilities that are subject to netting arrangements on the “Statement of assets and liabilities.”
38
At Nov. 30, 2016, the Fund had the following assets and liabilities subject to offsetting provisions:
Master Repurchase Agreements
| | | | | | | | | | | | | | | | | | | | | | | | | |
| | | | | Fair Value of | | | | | | |
| | | | | Non-Cash | | Cash Collateral | | Net Collateral | | |
| Counterparty | | Repurchase Agreements | | Collateral Received(a) | | Received | | Received | | Net Exposure(b) |
Bank of America | | | | | | | | | | | | | | | | | | | | | | | | | |
Merrill Lynch | | | $ | 1,475,509 | | | | $ | (1,475,509 | ) | | | $ | — | | | | $ | (1,475,509 | ) | | | $ | — | |
Bank of Montreal | | | | 2,459,181 | | | | | (2,459,181 | ) | | | | — | | | | | (2,459,181 | ) | | | | — | |
BNP Paribas | | | | 75,310 | | | | | (75,310 | ) | | | | — | | | | | (75,310 | ) | | | | — | |
| | | | | | | | | | | | | | | | | | | | | | | | | |
Total | | | $ | 4,010,000 | | | | $ | (4,010,000 | ) | | | $ | — | | | | $ | (4,010,000 | ) | | | $ | — | |
| | | | | | | | | | | | | | | | | | | | | | | | | |
(a) The value of the related collateral received exceeded the value of the repurchase agreements as of Nov. 30, 2016.
(b) Net exposure represents the receivable (payable) that would be due from (to) the counterparty in the event of default.
10. Securities Lending
The Fund, along with other funds in the Delaware Investments® Family of Funds, may lend its securities pursuant to a security lending agreement (Lending Agreement) with BNY Mellon. At the time a security is loaned, the borrower must post collateral equal to the required percentage of the market value of the loaned security, including any accrued interest. The required percentage is: (1) 102% with respect to U.S. securities and foreign securities that are denominated and payable in U.S. dollars; and (2) 105% with respect to foreign securities. With respect to each loan, if on any business day, the aggregate market value of securities collateral plus cash collateral held is less than the aggregate market value of the securities which are the subject of such loan, the borrower will be notified to provide additional collateral by the end of the following business day which, together with the collateral already held, will be not less than the applicable initial collateral requirements for such security loan. If the aggregate market value of securities collateral and cash collateral held with respect to a security loan exceeds the applicable initial collateral requirement, upon the request of the borrower, BNY Mellon must return enough collateral to the borrower by the end of the following business day to reduce the value of the remaining collateral to the applicable initial collateral requirement for such security loan. As a result of the foregoing, the value of the collateral held with respect to a loaned security on any particular day, may be more or less than the value of the security on loan.
Prior to Dec. 29, 2015, cash collateral received was generally invested in the Delaware Investments Collateral Fund No. 1 (Collective Trust), a pooled account established by BNY Mellon for the use of funds managed by DMC that participate in BNY Mellon’s securities lending program. The Collective Trust sought to maintain a NAV per unit of $1.00.
On Dec. 29, 2015, the assets in the Collective Trust were transferred to a series of individual separate accounts, each corresponding to a Fund. The investment guidelines permit each separate account to hold certain securities that would be considered eligible securities for a money market fund. Cash collateral received is generally invested in government securities; certain obligations issued by government sponsored enterprises; repurchase agreements collateralized by U.S. Treasury securities; obligations issued by the central government of any Organization for Economic Cooperation and Development (OECD) country or its agencies, instrumentalities or establishments; obligations of supranational organizations, commercial paper, notes, bonds and other debt obligations; certificates of deposit, time deposits and other bank obligations; and asset-backed securities.
In the event of default or bankruptcy by the lending agent, realization and/or retention of the collateral may be subject to legal proceedings. In the event the borrower fails to return loaned securities and the collateral received is insufficient to cover the value of the loaned securities and provided such collateral shortfall is not the result of investment losses, the lending agent has agreed to pay the amount of the shortfall to the Fund or, at the discretion of the lending agent, replace the loaned securities. The Fund continues to record dividends or interest, as applicable, on the securities loaned and is subject to changes in value of the securities loaned that may occur during the term of the loan. The Fund has the right under the Lending Agreement to recover the securities from the borrower on demand. With respect to security loans collateralized by non-cash collateral, the Fund receives loan premiums paid by the borrower. With respect to security loans collateralized by cash collateral, the earnings from the collateral investments are shared among the Fund, the security lending agent, and the borrower. The Fund records security lending income net of allocations to the security lending agent and the borrower.
Notes to financial statements
Delaware Enhanced Global Dividend and Income Fund
10. Securities Lending (continued)
The Fund may incur investment losses as a result of investing securities lending collateral. This could occur if an investment in the collateral investment account defaulted or became impaired. Under those circumstances, the value of a Fund’s cash collateral account may be less than the amount the Fund would be required to return to the borrowers of the securities and the Fund would be required to make up for this shortfall.
During the year ended Nov. 30, 2016, the Fund had no securities out on loan.
11. Credit and Market Risk
The Fund borrows through its line of credit for purposes of leveraging. Leveraging may result in higher degrees of volatility because the Fund’s NAV could be subject to fluctuations in short-term interest rates and changes in market value of portfolio securities attributable to the leverage.
Some countries in which the Fund may invest require governmental approval for the repatriation of investment income, capital, or the proceeds of sales of securities by foreign investors. In addition, if there is deterioration in a country’s balance of payments or for other reasons, a country may impose temporary restrictions on foreign capital remittances abroad.
The securities exchanges of certain foreign markets are substantially smaller, less liquid and more volatile than the major securities markets in the United States. Consequently, acquisition and disposition of securities by the Fund may be inhibited. In addition, a significant portion of the aggregate market value of securities listed on the major securities exchanges in emerging markets is held by a smaller number of investors. This may limit the number of shares available for acquisition or disposition by the Fund.
The Fund invests in certain obligations that may have liquidity protection designed to ensure that the receipt of payments due on the underlying security is timely. Such protection may be provided through guarantees, insurance policies, or letters of credit obtained by the issuer or sponsor through third parties, through various means of structuring the transaction or through a combination of such approaches. The Fund will not pay any additional fees for such credit support, although the existence of credit support may increase the price of a security.
The Fund invests in bank loans and other securities that may subject it to direct indebtedness risk, the risk that the Fund will not receive payment of principal, interest, and other amounts due in connection with these investments and will depend primarily on the financial condition of the borrower. Loans that are fully secured offer the Fund more protection than unsecured loans in the event of nonpayment of scheduled interest or principal, although there is no assurance that the liquidation of collateral from a secured loan would satisfy the corporate borrower’s obligation, or that the collateral can be liquidated. Some loans or claims may be in default at the time of purchase. Certain of the loans and the other direct indebtedness acquired by the Fund may involve revolving credit facilities or other standby financing commitments that obligate the Fund to pay additional cash on a certain date or on demand. These commitments may require the Fund to increase its investment in a company at a time when the Fund might not otherwise decide to do so (including at a time when the company’s financial condition makes it unlikely that such amounts will be repaid). To the extent that the Fund is committed to advance additional funds, it will at all times hold and maintain cash or other high grade debt obligations in an amount sufficient to meet such commitments.
As the Fund may be required to rely upon another lending institution to collect and pass on to the Fund amounts payable with respect to the loan and to enforce the Fund’s rights under the loan and other direct indebtedness, an insolvency, bankruptcy, or reorganization of the lending institution may delay or prevent the Fund from receiving such amounts. The highly leveraged nature of many loans may make them especially vulnerable to adverse changes in economic or market conditions. Investments in such loans and other direct indebtedness may involve additional risk to the Fund.
The Fund invests a portion of its assets in high yield fixed income securities, which are securities rated BB or lower by S&P and Ba or lower by Moody’s, or similarly rated by another nationally recognized statistical rating organization. Investments in these higher yielding securities are generally accompanied by a greater degree of credit risk than higher rated securities. Additionally, lower rated securities may be more susceptible to adverse economic and competitive industry conditions than investment grade securities.
The Fund invests in fixed income securities whose value is derived from an underlying pool of mortgages or consumer loans. The value of these securities is sensitive to changes in economic conditions, including delinquencies and/or defaults, and may be adversely affected by shifts in the market’s perception of the issuers and changes in interest rates. Investors receive principal and interest payments as the underlying mortgages and consumer loans are paid back. Some of these securities are collateralized mortgage obligations (CMOs). CMOs are debt securities issued by U.S. government agencies or by financial institutions and other mortgage lenders, which are collateralized by a pool of mortgages held under an
40
indenture. Prepayment of mortgages may shorten the stated maturity of the obligations and can result in a loss of premium, if any has been paid. Certain of these securities may be stripped (securities which provide only the principal or interest feature of the underlying security). The yield to maturity on an interest-only CMO is extremely sensitive not only to changes in prevailing interest rates, but also to the rate of principal payments (including prepayments) on the related underlying mortgage assets. A rapid rate of principal payments may have a material adverse effect on the Fund’s yield to maturity. If the underlying mortgage assets experience greater-than-anticipated prepayments of principal, the Fund may fail to fully recoup its initial investment in these securities even if the securities are rated in the highest rating categories.
The Fund invests in REITs and is subject to the risks associated with that industry. If the Fund holds real estate directly as a result of defaults or receives rental income directly from real estate holdings, its tax status as a regulated investment company may be jeopardized. There were no direct real estate holdings during the year ended Nov. 30, 2016. The Fund’s REIT holdings are also affected by interest rate changes, particularly if the REITs it holds use floating-rate debt to finance their ongoing operations. The Fund also invests in real estate acquired as a result of ownership of securities or other instruments, including issuers that invest, deal, or otherwise engage in transactions in real estate or interests therein. These instruments may include interests in private equity limited partnerships or limited liability companies that hold real estate investments (Real Estate Limited Partnerships). The Fund will limit its investments in Real Estate Limited Partnerships to 5% of its total assets at the time of purchase.
The Fund may invest up to 10% of its net assets in illiquid securities, which may include securities with contractual restrictions on resale, securities exempt from registration under Rule 144A, promulgated under the Securities Act of 1933, as amended, and other securities which may not be readily marketable. The relative illiquidity of these securities may impair the Fund from disposing of them in a timely manner and at a fair price when it is necessary or desirable to do so. While maintaining oversight, the Fund’s Board has delegated to DMC, the day-to-day functions of determining whether individual securities are liquid for purposes of the Fund’s limitation on investments in illiquid securities. Securities eligible for resale pursuant to Rule 144A, which are determined to be liquid, are not subject to the Fund’s 10% limit on investments in illiquid securities. Rule 144A and restricted securities have been identified on the “Schedule of investments.” When monitoring compliance with the Fund’s illiquid limit, certain holdings that are common to multiple clients of the investment manager may be aggregated and considered illiquid in the aggregate solely for monitoring purposes. For purposes of determining illiquidity for financial reporting purposes, only the holdings of this Fund will be considered.
12. Contractual Obligations
The Fund enters into contracts in the normal course of business that contain a variety of indemnifications. The Fund’s maximum exposure under these arrangements is unknown. However, the Fund has not had prior claims or losses pursuant to these contracts. Management has reviewed the Fund’s existing contracts and expects the risk of loss to be remote.
13. Recent Accounting Pronouncements
On Oct. 13, 2016, the Securities and Exchange Commission amended existing rules intended to modernize reporting and disclosure of information. These amendments relate to Regulation S-X which sets forth the form and content of financial statements. At this time, management is evaluating the implications of adopting these amendments and their impact on the financial statements and accompanying notes.
14. General Motors Term Loan Litigation
The Fund received notice of a litigation proceeding related to a General Motors Corporation (G.M.) term loan participation previously held by the Fund in 2009. We believe the matter subject to the litigation notice will likely lead to a recovery from the Fund of certain amounts received by the Fund because a U.S. Court of Appeals has ruled that the Fund and similarly situated investors were unsecured creditors rather than secured lenders of G.M. as a result of an erroneous Uniform Commercial Code filing made by a third party. The Fund received the full principal on the loans in 2009 after the G.M. bankruptcy. However, based upon the court ruling the estate is seeking to recover such amounts arguing that, as unsecured creditors, the Fund should not have received payment in full. Based upon currently available information related to the litigation and the Fund’s potential exposure, the Fund recorded a liability of $353,068 and an asset of $105,920 based on the expected recoveries to unsecured creditors as of Nov. 30, 2016 that resulted in a net decrease in the Fund’s NAV to reflect this likely recovery.
Notes to financial statements
Delaware Enhanced Global Dividend and Income Fund
15. Subsequent Events
Management has determined that no material events or transactions occurred subsequent to Nov. 30, 2016 that would require recognition or disclosure in the Fund’s financial statements.
42
Report of independent
registered public accounting firm
To the Board of Trustees and Shareholders of Delaware Enhanced Global Dividend and Income Fund:
In our opinion, the accompanying statement of assets and liabilities, including the schedule of investments, and the related statements of operations, of changes in net assets, and of cash flows and the financial highlights present fairly, in all material respects, the financial position of Delaware Enhanced Global Dividend and Income Fund (the “Fund”) as of November 30, 2016, the results of its operations and its cash flows for the year then ended, the changes in its net assets for each of the two years in the period then ended and the financial highlights for each of the five years in the period then ended, in conformity with accounting principles generally accepted in the United States of America. These financial statements and financial highlights (hereafter referred to as “financial statements”) are the responsibility of the Fund’s management. Our responsibility is to express an opinion on these financial statements based on our audits. We conducted our audits of these financial statements in accordance with the standards of the Public Company Accounting Oversight Board (United States). Those standards require that we plan and perform the audit to obtain reasonable assurance about whether the financial statements are free of material misstatement. An audit includes examining, on a test basis, evidence supporting the amounts and disclosures in the financial statements, assessing the accounting principles used and significant estimates made by management, and evaluating the overall financial statement presentation. We believe that our audits, which included confirmation of securities as of November 30, 2016 by correspondence with the custodian and brokers, provide a reasonable basis for our opinion.
PricewaterhouseCoopers LLP
Philadelphia, Pennsylvania
January 23, 2017
43
Other Fund information (Unaudited)
Delaware Enhanced Global Dividend and Income Fund
Proxy results
Annual meeting
The Fund held its Annual Meeting of Shareholders on Aug. 17, 2016. At the Annual Meeting, the Fund’s shareholders elected nine Trustees. The results of the voting at the meeting were as follows:
| | | | | | |
| | | | | | | No Ballot |
Nominee | | Shares Voted For | | Shares Withheld | | Received |
Shawn K. Lytle | | 13,881,158.970 | | 479,344.000 | | 1,503,113.030 |
Thomas L. Bennett | | 13,876,436.970 | | 484,066.000 | | 1,503,113.030 |
Ann D. Borowiec | | 13,880,719.970 | | 479,783.000 | | 1,503,113.030 |
Joseph W. Chow | | 13,891,438.970 | | 469,064.000 | | 1,503,113.030 |
John A. Fry | | 13,869,332.970 | | 491,170.000 | | 1,503,113.030 |
Lucinda S. Landreth | | 13,880,319.970 | | 480,183.000 | | 1,503,113.030 |
Frances A. Sevilla-Sacasa | | 13,880,130.970 | | 480,372.000 | | 1,503,113.030 |
Thomas K. Whitford | | 13,874,908.970 | | 485,594.000 | | 1,503,113.030 |
Janet L. Yeomans | | 13,880,382.970 | | 480,120.000 | | 1,503,113.030 |
Changes to portfolio management team
On July 27, 2016, the Fund announced that Adam H. Brown had been appointed as a co-portfolio manager of the Fund. Mr. Brown joined Roger A. Early, Liu-Er Chen, Edward A. “Ned” Gray, Babak Zenouzi, Damon J. Andres, Wayne A. Anglace, Craig C. Dembek, Christopher M. Testa, Paul A. Matlack, John P. McCarthy, and D. Tysen Nutt Jr. in making day-to-day decisions for the Fund.
On Oct. 12, 2016, the Fund announced that Christopher M. Testa would no longer serve as a co-portfolio manager of the Fund.
Fund management
Roger A. Early, CPA, CFA
Executive Director, Head of Fixed Income Investments, Executive Vice President, Co-Chief Investment Officer — Total Return Fixed Income Strategy
Roger A. Early rejoined Delaware Investments in March 2007 as a member of the firm’s taxable fixed income portfolio management team, with primary responsibility for portfolio construction and strategic asset allocation. He became head of fixed income investments in February 2015. During his previous time at the firm, from 1994 to 2001, he was a senior portfolio manager in the same area, and he left Delaware Investments as head of its U.S. investment grade fixed income group. In recent years, Early was a senior portfolio manager at Chartwell Investment Partners and Rittenhouse Financial and was the chief investment officer for fixed income at Turner Investments. Prior to joining Delaware Investments in 1994, he worked for more than 10 years at Federated Investors where he managed more than $25 billion in mutual fund and institutional portfolios in the short-term and investment grade markets. He left the firm as head of institutional fixed income management. Earlier in his career, he held management positions with the Federal Reserve Bank, PNC Financial, Touche Ross, and Rockwell International. Early earned his bachelor’s degree in economics from The Wharton School of the University of Pennsylvania and an MBA with concentrations in finance and accounting from the University of Pittsburgh. He is a member of the CFA Society of Philadelphia.
Mr. Early has been a co-portfolio manager of the Fund since January 2008.
44
Liu-Er Chen, CFA
Senior Vice President, Chief Investment Officer — Emerging Markets and Healthcare
Liu-Er Chen heads the firm’s global Emerging Markets team, and he is also the portfolio manager for Delaware Healthcare Fund, which launched in September 2007. Prior to joining Delaware Investments in September 2006 in his current position, he spent nearly 11 years at Evergreen Investment Management Company, where he most recently worked as managing director and senior portfolio manager. He co-managed the Evergreen Emerging Markets Growth Fund from 1999 to 2001, and became the Fund’s sole manager in 2001. He was also the sole manager of the Evergreen Health Care Fund since its inception in 1999. Chen began his career at Evergreen in 1995 as an analyst covering Asian and global healthcare stocks, before being promoted to portfolio manager in 1998. Prior to his career in asset management, Chen worked for three years in sales, marketing, and business development for major American and European pharmaceutical and medical device companies. He received his medical education in China and he has experience in medical research at both the Chinese Academy of Sciences and Cornell Medical School. He holds an MBA with a concentration in management from Columbia Business School.
Mr. Chen has been a co-portfolio manager of the Fund since June 2007.
Edward A. “Ned” Gray, CFA
Senior Vice President, Chief Investment Officer — Global and International Value Equity
Ned Gray manages the Global and International Value Equity strategies and has worked with the investment team for more than 25 years. Prior to joining Delaware Investments in June 2005 in his current position, Gray worked with the team as a portfolio manager at Arborway Capital and Thomas Weisel Partners. At ValueQuest/TA, which he joined in 1987, Gray was a senior investment professional with responsibilities for portfolio management, security analysis, quantitative research, performance analysis, global research, back office/investment information systems integration, trading, and client and consultant relations. Prior to ValueQuest, he was a research analyst at the Center for Competitive Analysis. Gray received his bachelor’s degree in history from Reed College and a master of arts in law and diplomacy, in international economics, business, and law from Tufts University’s Fletcher School of Law and Diplomacy.
Mr. Gray has been a co-portfolio manager of the Fund since July 2008.
Babak “Bob” Zenouzi
Senior Vice President, Chief Investment Officer — Real Estate Securities and Income Solutions (RESIS)
Bob Zenouzi is the lead manager for the real estate securities and income solutions (RESIS) group at Delaware Investments, which includes the team, its process, and its institutional and retail products, which he created during his prior time with the firm. He also focuses on opportunities in Japan, Singapore, and Malaysia for the firm’s global REIT product. He is also a member of the firm’s asset allocation committee, which is responsible for building and managing multi-asset class portfolios. He rejoined Delaware Investments in May 2006 as senior portfolio manager and head of real estate securities. In his first term with the firm, he spent seven years as an analyst and portfolio manager, leaving in 1999 to work at Chartwell Investment Partners, where from 1999 to 2006 he was a partner and senior portfolio manager on Chartwell’s Small-Cap Value portfolio. He began his career with The Boston Company, where he held several positions in accounting and financial analysis. Zenouzi earned a master’s degree in finance from Boston College and a bachelor’s degree in finance from Babson College. He is a member of the National Association of Real Estate Investment Trusts and the Urban Land Institute.
Mr. Zenouzi has been a co-portfolio manager of the Fund since June 2007.
Damon J. Andres, CFA
Vice President, Senior Portfolio Manager
Damon J. Andres, who joined Delaware Investments in 1994 as an analyst, currently serves as a portfolio manager for the firm’s real estate securities and income solutions (RESIS) group. From 1991 to 1994, he performed investment-consulting services as a consulting associate with Cambridge Associates. Andres earned a bachelor’s degree in business administration with an emphasis in finance and accounting from the University of Richmond.
Mr. Andres has been a co-portfolio manager of the Fund since June 2007.
Other Fund information (Unaudited)
Delaware Enhanced Global Dividend and Income Fund
Fund management (continued)
Wayne A. Anglace, CFA
Vice President, Senior Portfolio Manager
Wayne A. Anglace currently serves as a senior portfolio manager for the firm’s corporate and convertible bond strategies. Prior to joining the firm in March 2007 as a research analyst for the firm’s high grade, high yield, and convertible bond portfolios, he spent more than two years as a research analyst at Gartmore Global Investments for its convertible bond strategy. From 2000 to 2004, Anglace worked in private client research at Deutsche Bank Alex. Brown in Baltimore where he focused on equity research, and he started his financial services career with Ashbridge Investment Management in 1999. Prior to moving to the financial industry, Anglace worked as a professional civil engineer. He earned his bachelor’s degree in civil engineering from Villanova University and an MBA with a concentration in finance from Saint Joseph’s University, and he is a member of the CFA Society of Philadelphia.
Mr. Anglace has been a co-portfolio manager of the Fund since March 2010.
Adam H. Brown, CFA
Senior Vice President, Senior Portfolio Manager
Adam H. Brown is a senior portfolio manager on the firm’s taxable fixed income team. He manages the bank loan portfolios and is a co-portfolio manager for the high yield, fixed rate multisector, and core plus strategies. Brown joined Delaware Investments in April 2011 as part of the firm’s integration of Macquarie Four Corners Capital Management, where he worked since 2002. At Four Corners, he was a co-portfolio manager on four collateralized loan obligations (CLOs) and a senior research analyst supporting noninvestment grade portfolios. Before that, Brown was with the predecessor of Wells Fargo Securities, where he worked in the leveraged finance group arranging senior secured bank loans and high yield bond financings for financial sponsors and corporate issuers. He earned a bachelor’s degree in accounting from the University of Florida and an MBA from the A.B. Freeman School of Business at Tulane University.
Mr. Brown has been a co-portfolio manager of the Fund since July 2016.
Craig C. Dembek, CFA
Senior Vice President, Co-Head of Credit Research, Senior Research Analyst
Craig C. Dembek is co-head of credit research and senior research analyst on the firm’s taxable fixed income team with primary responsibility for banks, brokers, insurance companies, and real estate investment trusts (REITs), as well as oversight for other sectors. He rejoined the firm in March 2007. During his previous time at Delaware Investments, from April 1999 to January 2001, he was a senior investment grade credit analyst. Most recently, he spent four years at Chartwell Investment Partners as a senior fixed income analyst and Turner Investment Partners as a senior fixed income analyst and portfolio manager. Dembek also spent two years at Stein, Roe & Farnham as a senior fixed income analyst. Earlier in his career, he worked for two years as a lead bank analyst at the Federal Reserve Bank of Boston. Dembek earned a bachelor’s degree in finance from Michigan State University and an MBA with a concentration in finance from the University of Vermont.
Mr. Dembek has been a co-portfolio manager of the Fund since December 2012.
Paul A. Matlack, CFA
Senior Vice President, Senior Portfolio Manager, Fixed Income Strategist
Paul A. Matlack is a strategist and senior portfolio manager for the firm’s fixed income team. Matlack rejoined the firm in May 2010. During his previous time at Delaware Investments, from September 1989 to October 2000, he was senior credit analyst, senior portfolio manager, and left the firm as co-head of the high yield group. Most recently, he worked at Chartwell Investment Partners from September 2003 to April 2010 as senior portfolio manager in fixed income, where he managed core, core plus, and high yield strategies. Prior to that, Matlack held senior roles at Turner Investment Partners, PNC Bank, and Mellon Bank. He earned a bachelor’s degree in international relations from the University of Pennsylvania and an MBA with a concentration in finance from George Washington University.
Mr. Matlack has been a co-portfolio manager of the Fund since December 2012.
46
John P. McCarthy, CFA
Senior Vice President, Senior Portfolio Manager, Co-Head of Credit Research
John P. McCarthy is a senior portfolio manager for the firm’s high yield strategies, a role he assumed in July 2016. He is also co-head of credit research on the firm’s taxable fixed income team. McCarthy rejoined Delaware Investments in March 2007 as a senior research analyst, after he worked in the firm’s fixed income area from 1990 to 2000 as a senior high yield analyst and high yield trader, and from 2001 to 2002 as a municipal bond trader. Prior to rejoining Delaware Investments, he was a senior high yield analyst/trader at Chartwell Investment Partners. McCarthy earned a bachelor’s degree in business administration from Babson College, and he is a member of the CFA Society of Philadelphia.
Mr. McCarthy has been a co-portfolio manager of the Fund since December 2012.
D. Tysen Nutt Jr.
Senior Vice President, Senior Portfolio Manager, Team Leader
D. Tysen Nutt Jr. is senior portfolio manager and team leader for the firm’s Large-Cap Value team. Before joining Delaware Investments in 2004 as senior vice president and senior portfolio manager, Nutt led the U.S. Active Large-Cap Value team within Merrill Lynch Investment Managers, where he managed mutual funds and separate accounts for institutions and private clients. He departed Merrill Lynch Investment Managers as a managing director. Prior to joining Merrill Lynch Investment Managers in 1994, Nutt was with Van Deventer & Hoch where he managed large-cap value portfolios for institutions and private clients. He began his investment career at Dean Witter Reynolds, where he eventually became vice president, investments. Nutt earned his bachelor’s degree from Dartmouth College, and he is a member of the New York Society of Security Analysts and the CFA Institute.
Mr. Nutt has been a co-portfolio manager of the Fund since June 2007.
Distribution information
Shareholders were sent monthly notices from the Fund that set forth estimates, on a book basis, of the source or sources from which monthly distributions were paid. Subsequently, certain of these estimates have been revised in part. Listed below is a written statement of the sources of these monthly distributions on a book basis.
| | | | | | | | | | | | | | | | | | | | |
Month | | Investment
Income
per Share | | Return of
Capital
per Share | | Long Term
Capital
Gains
per Share | | Total
Distribution
Amount
per Share |
December 2015 | | | $ | 0.0359 | | | | $ | 0.0391 | | | | $ | — | | | | $ | 0.0750 | |
January 2016 | | | | 0.0262 | | | | | 0.0488 | | | | | — | | | | | 0.0750 | |
February 2016 | | | | 0.0382 | | | | | 0.0368 | | | | | — | | | | | 0.0750 | |
March 2016 | | | | 0.0518 | | | | | 0.0232 | | | | | — | | | | | 0.0750 | |
April 2016 | | | | 0.0319 | | | | | 0.0431 | | | | | — | | | | | 0.0750 | |
May 2016 | | | | 0.0648 | | | | | 0.0102 | | | | | — | | | | | 0.0750 | |
June 2016 | | | | 0.0468 | | | | | 0.0282 | | | | | — | | | | | 0.0750 | |
July 2016 | | | | 0.0236 | | | | | 0.0514 | | | | | — | | | | | 0.0750 | |
August 2016 | | | | 0.0331 | | | | | 0.0419 | | | | | — | | | | | 0.0750 | |
September 2016 | | | | 0.0434 | | | | | 0.0091 | | | | | — | | | | | 0.0525 | |
October 2016 | | | | 0.0291 | | | | | 0.0234 | | | | | — | | | | | 0.0525 | |
November 2016 | | | | 0.0266 | | | | | 0.0259 | | | | | — | | | | | 0.0525 | |
| | | | | | | | | | | | | | | | | | | | |
Total | | | $ | 0.4514 | | | | $ | 0.3811 | | | | $ | — | | | | $ | 0.8325 | |
| | | | | | | | | | | | | | | | | | | | |
Please note that the information in the preceding chart is for book purposes only. Shareholders should be aware that the tax treatment of distributions may differ from their book treatment. For federal income tax purposes, the effect of capital loss carryovers may be to convert (to the extent of such current year gains) what would otherwise be returns of capital into distributions taxable as ordinary income. Under the Regulated Investment Company Modernization Act of 2010 (Act), this tax effect attributable to the Fund’s capital loss carryovers (the conversion of returns of capital into distributions taxable as ordinary income) will no longer apply to net capital losses of the Fund arising in Fund tax years beginning after the date of the enactment. The tax treatment of distributions will be set forth in a Form 1099-DIV.
Other Fund information (Unaudited)
Delaware Enhanced Global Dividend and Income Fund
Dividend reinvestment plan
The Fund offers an automatic dividend reinvestment plan. The following is a restatement of the plan description in the Fund’s prospectus:
Unless the registered owner of the Fund’s common shares elects to receive cash by contacting the Plan Agent (as defined below), all dividends declared for your common shares of the Fund will be automatically reinvested by Computershare, Inc. (the “Plan Agent”), agent for shareholders in administering the Fund’s Dividend Reinvestment Plan (the “Plan”), in additional common shares of the Fund. If a registered owner of common shares elects not to participate in the Plan, you will receive all dividends in cash paid by the Plan Agent, as dividend disbursing agent, by check mailed directly to you (or, if the shares are held in street or other nominee name, then to such nominee), or by ACH if you so elect by contacting the Plan Agent. You may elect not to participate in the Plan and to receive all dividends in cash by sending written instructions or by contacting the Plan Agent, as dividend disbursing agent, at the address set forth below. Participation in the Plan is completely voluntary and may be terminated or resumed at any time without penalty by contacting the Plan Agent before the dividend record date; otherwise such termination or resumption will be effective with respect to any subsequently declared dividend or other distribution. Some brokers may automatically elect to receive cash on your behalf and may reinvest that cash in additional common shares of the Fund for you. If you wish for all dividends declared on your common shares of the Fund to be automatically reinvested pursuant to the Plan, please contact your broker.
The Plan Agent will open an account for each common shareholder under the Plan in the same name in which such shareholder’s common shares are registered. Whenever the Fund declares a dividend or other distribution (together, a “dividend”) payable in cash, non-participants in the Plan will receive cash and participants in the Plan will receive the equivalent in common shares. The common shares will be acquired by the Plan Agent for the participants’ accounts, depending upon the circumstances described below, either (i) through receipt of additional unissued but authorized common shares from the Fund (“newly issued common shares”) or (ii) by purchase of outstanding common shares on the open market (“open-market purchases”) on the New York Stock Exchange or elsewhere.
If, on the payment date for any dividend, the market price per common share plus estimated brokerage commissions is greater than the net asset value per common share (such condition being referred to herein as “market premium”), the Plan Agent will invest the dividend amount in newly issued common shares, including fractions, on behalf of the participants. The number of newly issued common shares to be credited to each participant’s account will be determined by dividing the dollar amount of the dividend by the net asset value per common share on the payment date; provided that, if the net asset value per common share is less than 95% of the market price per common share on the payment date, the dollar amount of the dividend will be divided by 95% of the market price per common share on the payment date.
If, on the payment date for any dividend, the net asset value per common share is greater than the market value per common share plus estimated brokerage commissions (such condition being referred to herein as “market discount”), the Plan Agent will invest the dividend amount in common shares acquired on behalf of the participants in open-market purchases.
In the event of a market discount on the payment date for any dividend, the Plan Agent will have until the last business day before the next date on which the common shares trade on an “ex-dividend” basis or 30 days after the payment date for such dividend, whichever is sooner (the “last purchase date”), to invest the dividend amount in common shares acquired in open-market purchases. It is contemplated that the Fund will pay monthly dividends. Therefore, the period during which open-market purchases can be made will exist only from the payment date of each dividend through the date before the next “ex-dividend” date. If, before the Plan Agent has completed its open-market purchases, the market price of a common share exceeds the net asset value per common share, the average per common share purchase price paid by the Plan Agent may exceed the net asset value of the common shares, resulting in the acquisition of fewer common shares than if the dividend had been paid in newly issued common shares on the dividend payment date. Because of the foregoing difficulty with respect to open market purchases, if the Plan Agent is unable to invest the full dividend amount in open market purchases during the purchase period or if the market discount shifts to a market premium during the purchase period, the Plan Agent may cease making open-market purchases and may invest the uninvested portion of the dividend amount in newly issued common shares at the net asset value per common share at the close of business on the last purchase date; provided that, if the net asset value per common share is less than 95% of the market price per common share on the payment date, the dollar amount of the dividend will be divided by 95% of the market price per common share on the payment date.
The Plan Agent maintains all shareholders’ accounts in the Plan and furnishes written confirmation of all transactions in the accounts, including information needed by shareholders for tax records. Common shares in the account of each Plan participant will be held by the Plan Agent on
48
behalf of the Plan participant, and each shareholder proxy will include those shares purchased or received pursuant to the Plan. The Plan Agent will forward all proxy solicitation materials to participants and vote proxies for shares held under the Plan in accordance with the instructions of the participants.
In the case of shareholders such as banks, brokers or nominees which hold shares for others who are the beneficial owners, the Plan Agent will administer the Plan on the basis of the number of common shares certified from time to time by the record shareholder’s name and held for the account of beneficial owners who participate in the Plan.
There will be no brokerage charges with respect to common shares issued directly by the Fund. However, each participant will pay a pro rata share of brokerage commissions incurred in connection with open-market purchases. The automatic reinvestment of dividends will not relieve participants of any U.S. federal, state or local income tax that may be payable (or required to be withheld) on such dividends. Participants that request a sale of shares through the Plan Agent are subject to a $15.00 sales fee and a brokerage commission of $.12 per share sold.
The Fund reserves the right to amend or terminate the Plan. There is no direct service charge to participants in the Plan; however, the Fund reserves the right to amend the Plan to include a service charge payable by the participants.
All correspondence concerning the Plan should be directed to the Plan Agent at Computershare, Inc., P.O. Box 30170, College Station, TX 77842-3170; telephone: 866 437-0252.
Tax information
The information set forth below is for the Fund’s fiscal year as required by federal income tax laws. Shareholders, however, must report distributions on a calendar year basis for income tax purposes, which may include distributions for portions of two fiscal years of the Fund. Accordingly, the information needed by shareholders for income tax purposes will be sent to them in January of each year. Please consult your tax advisor for proper treatment of this information.
All disclosures are based on financial information available as of the date of this annual report and, accordingly are subject to change. For any and all items requiring reporting, it is the intention of the Fund to report the maximum amount permitted under the Internal Revenue Code and the regulations thereunder.
For the fiscal year ended Nov. 30, 2016, the Fund reports distributions paid during the year as follows:
| | | | | | | | | | | | | | | | |
| | | (A)
Ordinary
Income
Distributions*
(Tax Basis) | | | (B)
Return of
Capital
Distributions
(Tax Basis) | | | Total
Distributions | | | (C)
Qualifying
Dividends1 | |
| | | 48.70% | | | | 51.30% | | | | 100.00% | | | | 21.34% | |
(A) and (B) is based on a percentage of the Fund’s total distributions.
(C) is based on a percentage of the Fund’s ordinary income distributions.
1Qualifying dividends represent dividends which qualify for the corporate dividends received deduction.
| * | For the fiscal year ended Nov. 30, 2016, certain dividends paid by the Fund may be subject to a maximum tax rate of 20%. The percentage of dividends paid by the Fund from ordinary income reported as qualified dividend income is 61.55%. Complete information will be computed and reported in conjunction with your 2016 Form 1099-DIV. |
Investments in limited partnerships
The Fund’s investment policies and techniques that are described in the Fund’s prospectus and statement of additional information are clarified to specifically permit investments in limited partnerships, including limited partnerships that invest in real estate assets and other illiquid or restricted assets.
The Fund may invest in real estate acquired as a result of ownership of securities or other instruments, including issuers that invest, deal, or otherwise engage in transactions in real estate or interests therein. These instruments may include interests in private equity limited
Other Fund information (Unaudited)
Delaware Enhanced Global Dividend and Income Fund
Investments in limited partnerships (continued)
partnerships or limited liability companies that hold real estate investments (“Real Estate Limited Partnerships”). The Fund will limit its investments in Real Estate Limited Partnerships to 5% of its total assets at the time of purchase.
The Fund’s portfolio managers believe investments in Real Estate Limited Partnerships may offer an opportunity to obtain favorable yields and diversification benefits. However, these investments may be subject, but not limited, to the following risks:
| – | The Real Estate Limited Partnerships may include expenses, such as but not limited to general partner or managing member fees, property management fees, borrowing expenses, and acquisition fees, and these fees may reduce the return from the investment. |
| – | The general partner or managing member of the Real Estate Limited Partnership has broad discretion to manage the entity, and the limited partners may have limited rights in connection with key decisions. |
| – | A Real Estate Limited Partnership may require additional capital contributions, and it may be difficult to ascertain the amount of the capital contributions in advance. |
| – | The Fund’s interest in a Real Estate Limited Partnership may become diluted if it does not make requested capital contributions. |
| – | The Fund may not be able to readily liquidate its interest in the Real Estate Limited Partnership without the prior consent of the general partner, managing member or a majority of partnership interests. |
| – | A Real Estate Limited Partnership’s distributions may be subject to “waterfalls” that give preference to majority investors. |
In certain instances, the Real Estate Limited Partnership may be required to indemnify the general partner, the limited partners, the managing member and officers, against legal claims.
Finally, the income from investments in Real Estate Limited Partnerships is unlikely to qualify for purposes of satisfying the income or asset requirements in the Internal Revenue Code for qualification as a regulated investment company (i.e., that at least 90% of gross income from a regulated investment company be derived from certain specified types of assets and that at each calendar quarter least 50% of the value of the total assets be represented by certain specified types of assets).
Share repurchase program
The Fund’s Board authorized management to implement an open-market share repurchase program pursuant to which the Fund may purchase up to 10% of the Fund shares, from time to time, in open-market transactions, at the discretion of management. The repurchase program commenced in August 2016.
The open-market share repurchase program is intended to benefit shareholders by enabling the Fund to acquire its own shares, thereby increasing the proportionate interest of remaining shareholders. It is also hoped that the implementation of the open-market share repurchase program will help bring the market price of the Fund’s shares closer to their true net asset value; however, the success of the program cannot be guaranteed. There can be no certainty regarding the impact of share repurchases on the sustainability or size of a discount.
In exercising its discretion consistent with its portfolio management responsibilities, the investment manager will take into account various other factors, including, but not limited to, the level of the discount, the Fund’s performance, portfolio holdings, dividend history, market conditions, cash on hand, the availability of other attractive investments and whether the sale of certain portfolio securities would be undesirable because of liquidity concerns or because the sale might subject the Fund to adverse tax consequences. Any repurchases would be made on a national securities exchange at the prevailing market price, subject to exchange requirements, federal securities laws and rules that restrict repurchases, and the terms of any outstanding leverage or borrowing of the Fund. If and when the Fund’s 10% threshold is reached, no further repurchases could be completed unless authorized by the Board. Until the 10% threshold is reached, Fund management will have the flexibility to conduct share repurchases if and when it is determined to be appropriate in light of prevailing circumstances.
In the Notes to Financial Statements section, please see note 6 (Capital Stock) for additional information regarding shares repurchased.
50
Board consideration of Delaware Enhanced Global Dividend and Income Fund investment advisory agreement
At a meeting held on Aug. 16–18, 2016 (the “Annual Meeting”), the Board of Trustees (the “Board”), including a majority of disinterested or independent Trustees, approved the renewal of the Investment Advisory Agreement for Delaware Enhanced Global Dividend and Income Fund (the “Fund”). In making its decision, the Board considered information furnished at regular quarterly Board meetings, including reports detailing Fund performance, investment strategies, and expenses, as well as information prepared specifically in connection with the renewal of the investment advisory and sub-advisory contracts. Information furnished specifically in connection with the renewal of the Investment Management Agreement with Delaware Management Company (“DMC”) included materials provided by DMC and its affiliates (“Delaware Investments”) concerning, among other things, the nature, extent, and quality of services provided to the Fund; the costs of such services to the Fund; economies of scale; and the investment manager’s financial condition and profitability. In addition, in connection with the Annual Meeting, reports were provided to the Trustees in May 2016 and included reports provided by Broadridge Financial Solutions (“Broadridge”). The Broadridge reports compared the Fund’s investment performance and expenses with those of other comparable mutual funds. The Independent Trustees reviewed and discussed the Broadridge reports with independent legal counsel to the Independent Trustees. In addition to the information noted above, the Board also requested and received information regarding DMC’s policy with respect to advisory fee levels and its breakpoint philosophy; the structure of portfolio manager compensation; comparative client fee information; and any constraints or limitations on the availability of securities for certain investment styles, which had in the past year inhibited, or which were likely in the future to inhibit, the investment manager’s ability to invest fully in accordance with Fund policies.
In considering information relating to the approval of the Fund’s advisory agreement, the Independent Trustees received assistance and advice from and met separately with independent legal counsel to the Independent Trustees. Although the Board gave attention to all information furnished, the following discussion identifies, under separate headings, the primary factors taken into account by the Board during its contract renewal considerations.
Nature, extent, and quality of service. The Board considered the services provided by DMC to the Fund and its shareholders. In reviewing the nature, extent, and quality of services, the Board considered reports furnished to it throughout the year, which covered matters such as the relative performance of the Fund; compliance of portfolio managers with the investment policies, strategies, and restrictions for the Fund; compliance by DMC (“Management”) personnel with the Code of Ethics adopted throughout the Delaware Investments® Family of Funds complex; and adherence to fair value pricing procedures as established by the Board. The Board was pleased with the current staffing of the Fund’s investment advisor and the emphasis placed on research in the investment process. The Board recognized DMC’s receipt of several industry distinctions during the past several years. The Board gave favorable consideration to DMC’s efforts to control expenditures while maintaining service levels committed to Fund matters. The Board was satisfied with the nature, extent, and quality of the overall services provided by DMC.
Investment performance. The Board placed significant emphasis on the investment performance of the Fund in view of the importance of investment performance to shareholders. Although the Board gave appropriate consideration to performance reports and discussions with portfolio managers at Board meetings throughout the year, the Board gave particular weight to the Broadridge reports furnished for the Annual Meeting. The Broadridge reports prepared for the Fund showed the investment performance of its shares in comparison to a group of similar funds as selected by Broadridge (the “Performance Universe”). A fund with the highest performance ranked first, and a fund with the lowest ranked last. The highest/best performing 25% of funds in the Performance Universe make up the first quartile; the next 25%, the second quartile; the next 25%, the third quartile; and the lowest/worst performing 25% of funds in the Performance Universe make up the fourth quartile. Comparative annualized performance for the Fund was shown for the past 1-, 3-, 5-, and 10-year periods, to the extent applicable, ended Jan. 31, 2016. The Board’s objective is that the Fund’s performance for the periods considered be at or above the median of its Performance Universe.
The Performance Universe for the Fund consisted of the Fund and all leveraged closed–end global funds as selected by Broadridge. The Broadridge report comparison showed that the Fund’s total return for the 1- and 3-year periods was in the fourth quartile of its Performance Universe. The report further showed that the Fund’s total return for the 5-year period was in the second quartile of its Performance Universe. The Fund’s performance results were not in line with the Board’s objective. In evaluating the Fund’s performance, the Board considered recent changes to the Fund’s investment authority relating to investments in limited partnerships and limited liability companies. The Board also considered the performance attribution included in the Meeting materials, as well as the numerous investment and performance reports
Other Fund information (Unaudited)
Delaware Enhanced Global Dividend and Income Fund
Board consideration of Delaware Enhanced Global Dividend and Income Fund investment advisory agreement (continued)
delivered by Management personnel to the Board’s Investments Committee. The Board was satisfied that Management was taking action to improve Fund performance and meet the Board’s performance objective.
Comparative expenses. The Board considered expense comparison data for the Delaware Investments Family of Funds. Management provided the Board with information on pricing levels and fee structures for the Fund as of its most recently completed fiscal year. The Board also focused on the comparative analysis of effective management fees and total expense ratios of the Fund versus effective management fees and expense ratios of a group of similar closed-end funds as selected by Broadridge (the “Expense Group”). In reviewing comparative costs, the Fund’s contractual management fee, and the actual management fee incurred by the Fund were compared with the contractual management fees (assuming all funds in the Expense Group were similar in size to the Fund) and actual management fees (as reported by each fund) within the Expense Group, taking into account any applicable breakpoints and fee waivers. The Fund’s total expenses were also compared with those of its Expense Group. The Board’s objective is to limit the Fund’s total expense ratio to be competitive with that of the Expense Group.
The expense comparisons for the Fund showed that its actual management fee and total expenses were in the quartile with the second highest expenses of its Expense Group. The Fund’s total expenses were not in line with the Board’s objective. In evaluating total expenses, the Board considered the Fund’s reorganization in 2013. The Board was satisfied with Management’s efforts to improve the Fund’s total expense ratio and to bring it in line with the Board’s objective.
Management profitability. The Board considered the level of profits, if any, realized by DMC in connection with the operation of the Fund. In this respect, the Board reviewed the Investment Management Profitability Analysis that addressed the overall profitability of DMC’s business in providing management and other services to each of the individual funds and the Delaware Investments® Family of Funds as a whole. Specific attention was given to the methodology followed in allocating costs for the purpose of determining profitability. Management stated that the level of profits of DMC, to a certain extent, reflects recent operational cost savings and efficiencies initiated by DMC. The Board considered DMC’s efforts to improve services provided to fund shareholders and to meet additional regulatory and compliance requirements resulting from recent industry-wide Securities and Exchange Commission initiatives. The Board also considered the extent to which DMC might derive ancillary benefits from fund operations, including the potential for procuring additional business as a result of the prestige and visibility associated with its role as service provider to the Delaware Investments Family of Funds and the benefits from allocation of fund brokerage to improve trading efficiencies. The Board found that the management fees were reasonable in light of the services rendered and the profitability of DMC.
Economies of scale. As a closed-end fund, the Fund does not issue shares on a continuous basis. Fund assets, therefore, increase primarily as a result of the increase in value of the underlying securities in the Fund. Accordingly, the Board determined that the Fund was not likely to experience significant economies of scale due to asset growth and, therefore, a fee schedule with breakpoints to pass the benefit of economies of scale on to shareholders was not likely to provide the intended effect.
52
Board of trustees / directors and officers addendum
Delaware Investments® Family of Funds
A fund is governed by a Board of Trustees / Directors (“Trustees”), which has oversight responsibility for the management of a fund’s business affairs. Trustees establish procedures and oversee and review the performance of the investment manager and others who perform services for the fund. The independent fund trustees, in particular, are advocates for shareholder interests. Each trustee has served in that capacity since he or she was elected to or appointed to the Board of Trustees, and will continue to serve until his or her retirement or the election of a new trustee in his or her place. The following is a list of the Trustees and Officers with certain background and related information.
| | | | | | | | | | |
Name,
Address,
and Birth Date | | Position(s)
Held with
Fund(s) | | Length of Time
Served | | Principal
Occupation(s)
During the
Past Five Years | | Number of
Portfolios in Fund
Complex Overseen
by Trustee
or Officer | | Other
Directorships
Held by
Trustee
or Officer |
|
| Interested Trustee |
|
| Shawn K. Lytle1,3 2005 Market Street Philadelphia, PA 19103 February 1970 | | President, Chief Executive Officer, and Trustee | | Trustee since September 2015 President and Chief Executive Officer since August 2015 | | Shawn K. Lytle has served as President of Delaware Investments2 since June 2015 and was the Regional Head of Americas for UBS Global Asset Management from 2010 through 2015. | | 62 | | Trustee — UBS Relationship Funds, SMA Relationship Trust, and UBS Funds (May 2010–April 2015) |
|
| Independent Trustees |
|
| Thomas L. Bennett | | Chairman and Trustee | | Trustee since | | Private Investor | | 62 | | Director — |
| 2005 Market Street | | | | March 2005 | | (March 2004–Present) | | | | Bryn Mawr Bank Corp. |
| Philadelphia, PA 19103 | | | | | | | | | | (BMTC) |
| October 1947 | | | | | | | | | | (2007–2011) |
| | | | Chairman since | | | | | | |
| | | | March 2015 | | | | | | |
|
Ann D. Borowiec 2005 Market Street Philadelphia, PA 19103 November 1958 | | Trustee | | Since March 2015 | | Chief Executive Officer Private Wealth Management (2011–2013) and Market Manager, New Jersey Private Bank (2005–2011) — J.P. Morgan Chase & Co. | | 62 | | Director — Banco Santander International Since October 2016 Director — Santander Bank, N.A. Since December 2016 |
|
Joseph W. Chow 2005 Market Street Philadelphia, PA 19103 January 1953 | | Trustee | | Since January 2013 | | Executive Vice President (Emerging Economies Strategies, Risks, and Corporate Administration) State Street Corporation (July 2004–March 2011) | | 62 | | Director and Audit Committee Member – Hercules Technology Growth Capital, Inc. (2004–2014) |
|
| John A. Fry | | Trustee | | Since January 2001 | | President — | | 62 | | Director, Audit |
| 2005 Market Street | | | | | | Drexel University | | | | and Governance |
| Philadelphia, PA 19103 | | | | | | (August 2010–Present) | | | | Committee Member — |
| May 1960 | | | | | | | | | | Community Health |
| | | | | | President — | | | | Systems |
| | | | | | Franklin & Marshall College | | | | |
| | | | | | (July 2002–July 2010) | | | | Director — |
| | | | | | | | | | Drexel Morgan & Co. |
| | | | | | | | | | |
| | | | | | | | | | Director, Audit |
| | | | | | | | | | Committee Member — |
| | | | | | | | | | vTv Therapeutics LLC |
|
Board of trustees / directors and officers addendum
Delaware Investments® Family of Funds
| | | | | | | | | | |
Name,
Address,
and Birth Date | | Position(s)
Held with
Fund(s) | | Length of Time
Served | | Principal
Occupation(s)
During the
Past Five Years | | Number of
Portfolios in Fund
Complex Overseen
by Trustee
or Officer | | Other
Directorships
Held by
Trustee
or Officer |
|
| Independent Trustees (continued) |
|
| Lucinda S. Landreth | | Trustee | | Since March 2005 | | Private Investor | | 62 | | None |
| 2005 Market Street | | | | | | (2004–Present) | | | | |
| Philadelphia, PA 19103 | | | | | | | | | | |
June 1947 | | | | | | | | | | |
|
| Frances A. Sevilla-Sacasa 2005 Market Street Philadelphia, PA 19103 January 1956 | | Trustee | | Since September 2011 | | Chief Executive Officer — Banco Itaú International (April 2012–December 2016) | | 62 | | Trust Manager and Audit Committee Member — Camden Property Trust |
| | | | | | Executive Advisor to Dean (August 2011–March 2012) and Interim Dean (January 2011–July 2011) — University of Miami School of Business Administration | | | | |
| | | | | | President — U.S. Trust, Bank of America Private Wealth Management (Private Banking) (July 2007-December 2008) | | | | |
|
| Thomas K. Whitford | | Trustee | | Since January 2013 | | Vice Chairman | | 62 | | Director — HSBC |
| 2005 Market Street | | | | | | (2010–April 2013) and | | | | Finance Corporation |
| Philadelphia, PA 19103 | | | | | | Chief Administrative | | | | and HSBC North |
| March 1956 | | | | | | Officer (2008–2010) — | | | | America Holdings Inc. |
| | | | | | PNC Financial | | | | |
| | | | | | Services Group | | | | Director — HSBC Bank |
|
Janet L. Yeomans 2005 Market Street Philadelphia, PA 19103 July 1948 | | Trustee | | Since April 1999 | | Vice President and Treasurer (January 2006–July 2012) Vice President — Mergers & Acquisitions (January 2003–January 2006), and Vice President and Treasurer (July 1995–January 2003) 3M Company | | 62 | | Director, Personnel and Compensation Committee Chair, Audit Committee Member and Governance Committee Member — Okabena Company |
| | | | | | | | | | |
| | | | | | | | | | |
|
54
| | | | | | | | | | |
Name,
Address,
and Birth Date | | Position(s)
Held with
Fund(s) | | Length of Time
Served | | Principal
Occupation(s)
During the
Past Five Years | | Number of
Portfolios in Fund
Complex Overseen
by Trustee
or Officer | | Other
Directorships
Held by
Trustee
or Officer |
|
| Officers |
|
David F. Connor 2005 Market Street Philadelphia, PA 19103 December 1963 | | Senior Vice President, General Counsel, and Secretary | | Senior Vice President, since May 2013; General Counsel
since May 2015; Secretary since October 2005 | | David F. Connor has served in various capacities at different times at Delaware Investments. | | 62 | | None3 |
|
Daniel V. Geatens 2005 Market Street Philadelphia, PA 19103 October 1972 | | Vice President and Treasurer | | Treasurer since October 2007 | | Daniel V. Geatens has served in various capacities at different times at Delaware Investments. | | 62 | | None3 |
|
Richard Salus 2005 Market Street Philadelphia, PA 19103 October 1963 | | Senior Vice President and Chief Financial Officer | | Chief Financial Officer since November 2006 | | Richard Salus has served in various capacities at different times at Delaware Investments. | | 62 | | None3 |
| | | | | | | | | | |
| | | | | | | | | | |
| | | | | | | | | | |
|
| 1 | Shawn K. Lytle is considered to be an “Interested Trustee” because he is an executive officer of the Fund’s investment advisor. |
| 2 | Delaware Investments is the marketing name for Delaware Management Holdings, Inc. and its subsidiaries, including the Fund’s investment advisor. |
| 3 | Shawn K. Lytle, David F. Connor, Daniel V. Geatens, and Richard Salus serve in similar capacities for the six portfolios of the Optimum Fund Trust, which have the same investment advisor as the registrant. |
About the organization
This annual report is for the information of Delaware Enhanced Global Dividend and Income Fund shareholders. The figures in this report represent past results that are not a guarantee of future results. The return and principal value of an investment in the Fund will fluctuate so that shares, when sold, may be worth more or less than their original cost.
Notice is hereby given in accordance with Section 23(c) of the Investment Company Act of 1940 that the Fund may, from time to time, purchase shares of its common stock on the open market at market prices.
Board of Trustees
Shawn K. Lytle
President and Chief Executive Officer Delaware Investments® Family of Funds
Philadelphia, PA
Thomas L. Bennett
Chairman of the Board
Delaware Investments Family of Funds Private Investor
Rosemont, PA
Ann D. Borowiec†
Former Chief Executive Officer
Private Wealth Management
J.P. Morgan Chase & Co.
New York, NY
Joseph W. Chow†
Former Executive Vice President
State Street Corporation
Boston, MA
John A. Fry
President
Drexel University
Philadelphia, PA
Lucinda S. Landreth†
Former Chief Investment Officer Assurant, Inc.
New York, NY
Frances A. Sevilla-Sacasa
Chief Executive Officer
Banco Itaú International
Miami, FL
Thomas K. Whitford†
Former Vice Chairman
PNC Financial Services Group
Pittsburgh, PA
Janet L. Yeomans
Former Vice President and Treasurer
3M Company
St. Paul, MN
†Audit committee member
Affiliated officers
David F. Connor
Senior Vice President,
General Counsel, and Secretary
Delaware Investments Family of Funds
Philadelphia, PA
Daniel V. Geatens
Vice President and Treasurer
Delaware Investments Family of Funds Philadelphia, PA
Richard Salus
Senior Vice President and
Chief Financial Officer
Delaware Investments Family of Funds
Philadelphia, PA
The Fund files its complete schedule of portfolio holdings with the Securities and Exchange Commission (SEC) for the first and third quarters of each fiscal year on Form N-Q. The Fund’s Forms N-Q, as well as a description of the policies and procedures that the Fund uses to determine how to vote proxies (if any) relating to portfolio securities are available without charge (i) upon request, by calling 866 437-0252; and (ii) on the SEC’s website at sec.gov. In addition, a description of the policies and procedures that the Fund uses to determine how to vote proxies (if any) relating to portfolio securities and the Schedule of Investments included in the Fund’s most recent Form N-Q are available without charge on the Fund’s website at delawareinvestments.com/closed-end/literature. The Fund’s Forms N-Q may be reviewed and copied at the SEC’s Public Reference Room in Washington, DC; information on the operation of the Public Reference Room may be obtained by calling 800 SEC-0330.
Information (if any) regarding how the Fund voted proxies relating to portfolio securities during the most recently disclosed 12-month period ended June 30 is available without charge (i) through the Fund’s website at delawareinvestments.com/proxy; and (ii) on the SEC’s website at sec.gov.
Investment manager
Delaware Management Company, a series of Delaware Management Business Trust Philadelphia, PA
Principal office of the Fund
2005 Market Street
Philadelphia, PA 19103-7094
Independent registered public accounting firm
PricewaterhouseCoopers LLP
Two Commerce Square
Suite 1800
2001 Market Street
Philadelphia, PA 19103-7042
Registrar and stock transfer agent
Computershare, Inc.
480 Washington Blvd.
Jersey City, NJ 07310
866 437-0252
Website
delawareinvestments.com/closed-end
Delaware Investments, a member of Macquarie Group, refers to Delaware Management Holdings, Inc. and its subsidiaries. Macquarie Group refers to Macquarie Group Limited and its subsidiaries and affiliates worldwide.
Your reinvestment options
Delaware Enhanced Global Dividend and Income Fund offers an automatic dividend reinvestment program. If you would like to change your reinvestment option, and shares are registered in your name, contact Computershare, Inc. at 866 437-0252. You will be asked to put your request in writing. If you have shares registered in “street” name, contact the broker/dealer holding the shares or your financial advisor.
If you choose to receive your dividends in cash, you may now elect to receive them by ACH transfer. Contact Computershare at the number above for more information.
56
Item 2. Code of Ethics
The registrant has adopted a code of ethics that applies to the registrant’s principal executive officer, principal financial officer, principal accounting officer or controller, or persons performing similar functions, regardless of whether these individuals are employed by the registrant or a third party. A copy of the registrant’s Code of Business Ethics has been posted on the Delaware Investments Internet Web site at www.delawareinvestments.com. Any amendments to the Code of Business Ethics, and information on any waiver from its provisions granted by the registrant, will also be posted on this Web site within five business days of such amendment or waiver and will remain on the Web site for at least 12 months.
Item 3. Audit Committee Financial Expert
The registrant’s Board of Trustees has determined that certain members of the registrant’s Audit Committee are audit committee financial experts, as defined below. For purposes of this item, an “audit committee financial expert” is a person who has the following attributes:
a. An understanding of generally accepted accounting principles and financial statements;
b. The ability to assess the general application of such principles in connection with the accounting for estimates, accruals, and reserves;
c. Experience preparing, auditing, analyzing, or evaluating financial statements that present a breadth and level of complexity of accounting issues that are generally comparable to the breadth and complexity of issues that can reasonably be expected to be raised by the registrant’s financial statements, or experience actively supervising one or more persons engaged in such activities;
d. An understanding of internal controls and procedures for financial reporting; and
e. An understanding of audit committee functions.
An “audit committee financial expert” shall have acquired such attributes through:
a. Education and experience as a principal financial officer, principal accounting officer, controller, public accountant, or auditor or experience in one or more positions that involve the performance of similar functions;
b. Experience actively supervising a principal financial officer, principal accounting officer, controller, public accountant, auditor, or person performing similar functions;
c. Experience overseeing or assessing the performance of companies or public accountants with respect to the preparation, auditing, or evaluation of financial statements; or
d. Other relevant experience.
The registrant’s Board of Trustees has also determined that each member of the registrant’s Audit Committee is independent. In order to be “independent” for purposes of this item, the Audit Committee member may not: (i) other than in his or her capacity as a member of the Board of Trustees or any committee thereof, accept directly or indirectly any consulting, advisory or other compensatory fee from the issuer; or (ii) be an “interested person” of the registrant as defined in Section 2(a)(19) of the Investment Company Act of 1940.
The names of the audit committee financial experts on the registrant’s Audit Committee are set forth below:
Item 4. Principal Accountant Fees and Services
PricewaterhouseCoopers LLP (“PwC”), the Independent Accountant to the series portfolios of Delaware Enhanced Global Dividend and Income Fund (“Fund”), has advised the Audit Committee of the Board of Trustees of the Funds (“Audit Committee”) that, as of the date of the filing of this Annual Report on Form N-CSR, it is in discussions with the staff of the Securities and Exchange Commission (“SEC Staff”), or the SEC, regarding the interpretation and application of Rule 2-01(c)(1)(ii)(A) of Regulation S-X, or the Loan Rule.
The Loan Rule prohibits accounting firms, such as PwC, from having certain financial relationships with their audit clients and affiliated entities. Specifically, the Loan Rule provides, in relevant part, that an accounting firm generally would not be independent if it receives a loan from a lender that is a “record or beneficial owner of more than ten percent of the audit client’s equity securities.” Under the SEC Staff’s interpretation of the Loan Rule, based on information provided to us by PwC, some of PwC’s relationships with its lenders who also own shares of one or more funds within the Delaware Investments Family of Funds investment company complex implicate the Loan Rule, calling into question PwC’s independence with respect to the Fund. PwC believes that, in light of the facts of these lending relationships, its ability to exercise objective judgment with respect to the audit of the Fund has not been impaired.
The Audit Committee has considered the lending relationships described by PwC and has concluded that (1) the lending relationships did not affect PwC’s application of objective judgment in conducting its audits and issuing reports on the Fund’s financial statements; and (2) a reasonable investor with knowledge of the lending relationships described by PwC would reach the same conclusion. In making this determination, the Audit Committee considered, among other things, PwC’s description of the relevant lending relationships and PwC’s representation that its objectivity was not impaired in conducting its audit of the Fund’s financial statements. In connection with this determination, PwC advised the Audit Committee that it believes PwC is independent and it continues to have discussions with the SEC Staff.
If the SEC were ultimately to determine that PwC was not independent with respect to the Fund for certain time periods, the Fund’s filings with the SEC that contains the Fund’s financial statements for such periods would be non-compliant with the applicable securities laws. If the SEC determines that PwC was not independent, among other things, the Fund could be required to have independent audits conducted on the Fund’s previously audited financial statements by another registered public accounting firm for the affected periods. The time involved to conduct such independent audits may impair the Fund’s ability to issue shares. Any of the foregoing possible outcomes potentially could have a material adverse effect on the Fund.
The aggregate fees billed for services provided to the registrant by its independent auditors for the audit of the registrant’s annual financial statements and for services normally provided by the independent auditors in connection with statutory and regulatory filings or engagements were $36,050 for the fiscal year ended November 30, 2016.
The aggregate fees billed for services provided to the registrant by its independent auditors for the audit of the registrant’s annual financial statements and for services normally provided by the independent auditors in connection with statutory and regulatory filings or engagements were $34,675 for the fiscal year ended November 30, 2015.
The aggregate fees billed by the registrant’s independent auditors for services relating to the performance of the audit of the registrant’s financial statements and not reported under paragraph (a) of this Item were $0 for the fiscal year ended November 30, 2016.
The aggregate fees billed by the registrant’s independent auditors for services relating to the performance of the audit of the registrant’s financial statements and not reported under paragraph (a) of this Item were $0 for the fiscal year ended November 30, 2015.
The aggregate fees billed by the registrant’s independent auditors for tax-related services provided to the registrant’s investment adviser and other service providers under common control with the adviser and that relate directly to the operations or financial reporting of the registrant were $0 for the registrant’s fiscal year ended November 30, 2016.
The aggregate fees billed by the registrant’s independent auditors for tax-related services provided to the registrant’s investment adviser and other service providers under common control with the adviser and that relate directly to the operations or financial reporting of the registrant were $0 for the registrant’s fiscal year ended November 30, 2015.
The aggregate fees billed for all services provided by the independent auditors to the registrant other than those set forth in paragraphs (a), (b) and (c) of this Item were $0 for the fiscal year ended November 30, 2016.
The aggregate fees billed for all services provided by the independent auditors to the registrant other than those set forth in paragraphs (a), (b) and (c) of this Item were $0 for the fiscal year ended November 30, 2015.
Under the Pre-Approval Policy, the Audit Committee has also pre-approved the services set forth in the table below with respect to the registrant’s investment adviser and other entities controlling, controlled by or under common control with the investment adviser that provide ongoing services to the registrant (the “Control Affiliates”) up to the specified fee limit. This fee limit is based on aggregate fees to the investment adviser and its Control Affiliates.
The Pre-Approval Policy requires the registrant’s independent auditors to report to the Audit Committee at each of its regular meetings regarding all services initiated since the last such report was rendered, including those services authorized by the Pre-Approval Policy.
(f) Not applicable.
(g) The aggregate non-audit fees billed by the registrant’s independent auditors for services rendered to the registrant and to its investment adviser and other service providers under common control with the adviser were $8,665,000 and $11,111,212 for the registrant’s fiscal years ended November 30, 2016 and November 30, 2015, respectively.
(h) In connection with its selection of the independent auditors, the registrant’s Audit Committee has considered the independent auditors’ provision of non-audit services to the registrant’s investment adviser and other service providers under common control with the adviser that were not required to be pre-approved pursuant to Rule 2-01(c)(7)(ii) of Regulation S-X. The Audit Committee has determined that the independent auditors’ provision of these services is compatible with maintaining the auditors’ independence.
Item 5. Audit Committee of Listed Registrants
The registrant has a separately-designated standing Audit Committee established in accordance with Section 3(a)(58)(A) of the Securities Exchange Act of 1934. The members of the registrant’s Audit Committee are Ann D. Borowiec, Joseph W. Chow, Lucinda S. Landreth and Thomas K. Whitford.
Item 6. Investments
(a) Included as part of report to shareholders filed under Item 1 of this Form N-CSR.
(b) Divestment of securities in accordance with Section 13(c) of the Investment Company Act of 1940.
Not applicable.
Item 7. Disclosure of Proxy Voting Policies and Procedures for Closed-End Management Investment Companies
The registrant has formally delegated to its investment adviser (the “Adviser”) the responsibility for making all proxy voting decisions in relation to portfolio securities held by the registrant. If and when proxies need to be voted on behalf of the registrant, the Adviser will vote such proxies pursuant to its Proxy Voting Policies and Procedures (the “Procedures”). The Adviser has established a Proxy Voting Committee (the “Committee”) which is responsible for overseeing the Adviser’s proxy voting process for the registrant. One of the main responsibilities of the Committee is to review and approve the Procedures to ensure that the Procedures are designed to allow the Adviser to vote proxies in a manner consistent with the goal of voting in the best interests of the registrant.
In order to facilitate the actual process of voting proxies, the Adviser has contracted with Institutional Shareholder Services Inc. (“ISS”) to analyze proxy statements on behalf of the registrant and other Adviser clients and vote proxies generally in accordance with the Procedures. The Committee is responsible for overseeing ISS’s proxy voting activities. If a proxy has been voted for the registrant, ISS will create a record of the vote. By no later than August 31 of each year, information (if any) regarding how the registrant voted proxies relating to portfolio securities during the most recently disclosed 12-month period ended June 30 is available without charge (i) through the registrant’s website at delawareinvestments.com; and (ii) on the Commission’s website at sec.gov.
The Procedures contain a general guideline stating that recommendations of company management on an issue (particularly routine issues) should be given a fair amount of weight in determining how proxy issues should be voted. However, the Adviser will normally vote against management’s position when it runs counter to its specific Proxy Voting Guidelines (the “Guidelines”), and the Adviser will also vote against management’s recommendation when it believes that such position is not in the best interests of the registrant.
As stated above, the Procedures also list specific Guidelines on how to vote proxies on behalf of the registrant. Some examples of the Guidelines are as follows: (i) generally vote for shareholder proposals asking that a majority or more of directors be independent; (ii) generally vote against proposals to require a supermajority shareholder vote; (iii) votes on mergers and acquisitions should be considered on a case-by-case basis, determining whether the transaction enhances shareholder value; (iv) generally vote against proposals at companies with more than one class of common stock to increase the number of authorized shares of the class that has superior voting rights; (v) generally vote re-incorporation proposals on a case-by-case basis; (vi) votes with respect to equity-based compensation plans are generally determined on a case-by-case basis; and (vii) generally vote for proposals requesting reports on the level of greenhouse gas emissions from a company’s operations and products.
Because the registrant has delegated proxy voting to the Adviser, the registrant is not expected to encounter any conflict of interest issues regarding proxy voting and therefore does not have procedures regarding this matter. However, the Adviser does have a section in its Procedures that addresses the possibility of conflicts of interest. Most proxies that the Adviser receives on behalf of the registrant are voted by ISS in accordance with the Procedures. Because almost all of the registrant proxies are voted by ISS pursuant to the pre-determined Procedures, it normally will not be necessary for the Adviser to make an actual determination of how to vote a particular proxy, thereby largely eliminating conflicts of interest for the Adviser during the proxy voting process. In the very limited instances where the Adviser is considering voting a proxy contrary to ISS’s recommendation, the Committee will first assess the issue to see if there is any possible conflict of interest involving the Adviser or affiliated persons of the Adviser. If a member of the Committee has actual knowledge of a conflict of interest, the Committee will normally use another independent third party to do additional research on the particular proxy issue in order to make a recommendation to the Committee on how to vote the proxy in the best interests of the registrant. The Committee will then review the proxy voting materials and recommendation provided by ISS and the independent third party to determine how to vote the issue in a manner that the Committee believes is consistent with the Procedures and in the best interests of the registrant.
Item 8. Portfolio Managers of Closed-End Management Investment Companies
The information in the annual report under “Other Fund information – Fund management” is incorporated by reference into this Item 8.
The following chart lists certain information about types of other accounts for which each Fund manager is primarily responsible as of November 30, 2016. Any accounts managed in a personal capacity appear under “Other Accounts” along with the other accounts managed on a professional basis. The personal account information is current as of June 30, 2016.
Individual portfolio managers may perform investment management services for other funds or accounts similar to those provided to the Funds and the investment action for such other fund or account and the Funds may differ. For example, an account or fund may be selling a security, while another account or fund may be purchasing or holding the same security. As a result, transactions executed for one fund or account may adversely affect the value of securities held by another fund, account or the Funds. Additionally, the management of multiple other funds or accounts and the Funds may give rise to potential conflicts of interest, as a portfolio manager must allocate time and effort to multiple other funds or accounts and the Funds. A portfolio manager may discover an investment opportunity that may be suitable for more than one account or fund. The investment opportunity may be limited, however, so that all funds or accounts for which the investment would be suitable may not be able to participate. The Adviser has adopted procedures designed to allocate investments fairly across multiple funds or accounts.
Some of the accounts managed by the portfolio managers have a performance-based fee. This compensation structure presents a potential conflict of interest. The portfolio manager has an incentive to manage this account so as to enhance its performance, to the possible detriment of other accounts for which the investment manager does not receive a performance-based fee.
A portfolio manager’s management of personal accounts also may present certain conflicts of interest. While Delaware’s code of ethics is designed to address these potential conflicts, there is no guarantee that it will do so.
Individual allocations of the bonus pool are based on individual performance measurements, both objective and subjective, as determined by senior management.
Individual allocations of the bonus pool are based on individual performance measurements, both objective and subjective, as determined by senior management.
Individual allocations of the bonus pool are based on individual performance measurements, both objective and subjective, as determined by senior management.
Individual allocations of the bonus pool are based on individual performance measurements, both objective and subjective, as determined by senior management.
For new and recently transitioned portfolio managers, the compensation may be weighted more heavily towards a portfolio manager’s actual contribution and ability to influence performance, rather than longer-term performance. Management intends to move the compensation structure towards longer-term performance for these portfolio managers over time.
Portfolio managers participate in retention programs, including the Delaware Investments Incentive Unit Plan, the Delaware Investments Notional Investment Plan, and the Macquarie Group Employee Retained Equity Plan, for alignment of interest purposes.
The Plan was adopted in order to: assist the Manager in attracting, retaining, and rewarding key employees of the company; enable such employees to acquire or increase an equity interest in the company in order to align the interest of such employees and the Manager; and provide such employees with incentives to expend their maximum efforts. Subject to the terms of the Plan and applicable award agreements, Awards typically vest in 25% increments on a four-year schedule, and shares of common stock underlying the Awards are issued after vesting. The fair market value of the shares of Delaware Management Holdings, Inc., is normally determined as of each March 31, June 30, September 30 and December 31 by an independent appraiser. Generally, a stockholder may put shares back to the company during the put period communicated in connection with the applicable valuation.
As of November 30, 2016, the portfolio managers did not own any shares of the Fund.
Item 10. Submission of Matters to a Vote of Security Holders
Not applicable.
Item 11. Controls and Procedures
The registrant’s principal executive officer and principal financial officer have evaluated the registrant’s disclosure controls and procedures within 90 days of the filing of this report and have concluded that they are effective in providing reasonable assurance that the information required to be disclosed by the registrant in its reports or statements filed under the Securities Exchange Act of 1934 is recorded, processed, summarized and reported within the time periods specified in the rules and forms of the Securities and Exchange Commission.
There were no significant changes in the registrant’s internal control over financial reporting that occurred during the second fiscal quarter of the period covered by the report to stockholders included herein (i.e., the registrant’s fourth fiscal quarter) that have materially affected, or are reasonably likely to materially affect, the registrant’s internal control over financial reporting.
Item 12. Exhibits
Not applicable.
(2) Certifications of Principal Executive Officer and Principal Financial Officer pursuant to Rule 30a-2 under the Investment Company Act of 1940 are attached hereto as Exhibit 99.CERT.
(3) Written solicitations to purchase securities pursuant to Rule 23c-1 under the Securities Exchange Act of 1934.
Not applicable.
(b) Certifications pursuant to Section 906 of the Sarbanes-Oxley Act of 2002 are furnished herewith as Exhibit 99.906CERT.
Pursuant to the requirements of the Securities Exchange Act of 1934 and the Investment Company Act of 1940, the registrant has duly caused this report to be signed on its behalf, by the undersigned, thereunto duly authorized.
Pursuant to the requirements of the Securities Exchange Act of 1934 and the Investment Company Act of 1940, this report has been signed below by the following persons on behalf of the registrant and in the capacities and on the dates indicated.