UNITED STATES SECURITIES AND EXCHANGE COMMISSION
Washington, D.C. 20549
FORM N-CSR
CERTIFIED SHAREHOLDER REPORT OF REGISTERED MANAGEMENT
INVESTMENT COMPANIES
| Investment Company Act file number: | 811-22050 |
| | |
| Exact name of registrant as specified in charter: | Delaware Enhanced Global Dividend and Income Fund |
| | |
| Address of principal executive offices: | 610 Market Street Philadelphia, PA 19106 |
| | |
| Name and address of agent for service: | David F. Connor, Esq. 610 Market Street Philadelphia, PA 19106 |
| | |
| Registrant’s telephone number, including area code: | (800) 523-1918 |
| | |
| Date of fiscal year end: | November 30 |
| | |
| Date of reporting period: | November 30, 2022 |
Item 1. Reports to Stockholders
 | |  |
| | | |
| | | Annual report |
Closed-end fund
Delaware Enhanced Global Dividend and Income Fund
November 30, 2022
The figures in the annual report for Delaware Enhanced Global Dividend and Income Fund represent past results, which are not a guarantee of future results. A rise or fall in interest rates can have a significant impact on bond prices. Funds that invest in bonds can lose their value as interest rates rise.
Table of contents
Delaware Enhanced Global Dividend and Income Fund (“DEX” or the “Fund”), acting pursuant to a Securities and Exchange Commission (“SEC”) exemptive order and with the approval of the Fund’s Board of Trustees (the “Board”), has adopted a managed distribution policy (the “Plan”). The Fund currently makes monthly distributions to common shareholders at a targeted annual distribution rate of 7% of the Fund’s average net asset value (“NAV”) per share. The Fund will calculate the average NAV per share from the previous three full months immediately prior to the distribution based on the number of business days in those three months on which the NAV is calculated. The distribution will be calculated as 7% of the prior three months’ average NAV per share, divided by 12. This distribution methodology is intended to provide shareholders with a consistent, but not guaranteed, income stream and a targeted annual distribution rate and is intended to narrow any discount between the market price and the NAV of the Fund’s common shares, but there is no assurance that the policy will be successful in doing so.
Under the Plan, the Fund is managed with a goal of generating as much of the distribution as possible from net investment income and short-term capital gains. The balance of the distribution will then come from long-term capital gains to the extent permitted, and if necessary, a return of capital. The Fund will generally distribute amounts necessary to satisfy the terms of the Fund’s Plan and the requirements prescribed by excise tax rules and Subchapter M of the Internal Revenue Code (the “Code”). Each monthly distribution to shareholders is expected to be at the fixed percentage described above, except for extraordinary distributions and potential distribution rate increases or decreases to enable the Fund to comply with the distribution requirements imposed by the Code.
The Board may amend, suspend, or terminate the Fund’s Plan at any time without prior notice if it deems such action to be in the best interest of the Fund or its shareholders. The methodology for determining monthly distributions under the Plan will be reviewed at least annually by the Fund’s Board, and the Fund will continue to evaluate its distribution in light of ongoing market conditions. The suspension or termination of the Plan could have the effect of creating a trading discount (if the Fund’s stock is trading at or above NAV) or widening an existing trading discount. The Fund is subject to risks that could have an adverse impact on its ability to maintain distributions under the Plan. Examples of potential risks include, but are not limited to, economic downturns impacting the markets, increased market volatility, portfolio companies suspending or decreasing corporate dividend distributions, and changes in the Code.
Shareholders should not draw any conclusions about the Fund’s investment performance from the amounts of these distributions or from the terms of the Plan. The Fund’s total investment return on NAV is presented in its financial highlights table.
A cumulative summary of the Section 19(a) notices for the Fund’s current fiscal period, if applicable, is included in Other Fund Information. Section 19(a) notices for the Fund, as applicable, are available on the Fund’s website at delawarefunds.com/about/press-releases-closed-end.
Macquarie Asset Management (MAM) is the asset management division of Macquarie Group. MAM is a full-service asset manager offering a diverse range of products across public and private markets including fixed income, equities, multi-asset solutions, private credit, infrastructure, renewables, natural assets, real estate, and asset finance. The Public Investments business is a part of MAM and includes the following investment advisers: Macquarie Investment Management Business Trust (MIMBT), Macquarie Funds Management Hong Kong Limited, Macquarie Investment Management Austria Kapitalanlage AG, Macquarie Investment Management Global Limited, Macquarie Investment Management Europe Limited, and Macquarie Investment Management Europe S.A. For more information, including press releases, please visit delawarefunds.com/closed-end.
Unless otherwise noted, views expressed herein are current as of November 30, 2022, and subject to change for events occurring after such date.
The Fund is not FDIC insured and is not guaranteed. It is possible to lose the principal amount invested.
Advisory services provided by Delaware Management Company, a series of MIMBT, a US registered investment advisor.
Other than Macquarie Bank Limited ABN 46 008 583 542 (“Macquarie Bank”), any Macquarie Group entity noted in this document is not an authorised deposit-taking institution for the purposes of the Banking Act 1959 (Commonwealth of Australia). The obligations of these other Macquarie Group entities do not represent deposits or other liabilities of Macquarie Bank. Macquarie Bank does not guarantee or otherwise provide assurance in respect of the obligations of these other Macquarie Group entities. In addition, if this document relates to an investment, (a) the investor is subject to investment risk including possible delays in repayment and loss of income and principal invested and (b) none of Macquarie Bank or any other Macquarie Group entity guarantees any particular rate of return on or the performance of the investment, nor do they guarantee repayment of capital in respect of the investment.
The Fund is governed by US laws and regulations.
All third-party marks cited are the property of their respective owners.
© 2023 Macquarie Management Holdings, Inc.
Portfolio management review (Unaudited)
Delaware Enhanced Global Dividend and Income Fund
November 30, 2022
Performance preview (for the year ended November 30, 2022)
| Delaware Enhanced Global Dividend and Income Fund @ market price | | | 1-year return | | | | -14.12 | % |
| Delaware Enhanced Global Dividend and Income Fund @ NAV | | | 1-year return | | | | -10.22 | % |
| Lipper Closed-end Global Funds Average @ market price | | | 1-year return | | | | -15.60 | % |
| Lipper Closed-end Global Funds Average @ NAV | | | 1-year return | | | | -12.04 | % |
Past performance does not guarantee future results.
Performance at market price will differ from performance at net asset value (NAV). Although market price returns tend to reflect investment results over time, during shorter periods returns at market price can also be influenced by factors such as changing views about the Fund, market conditions, supply and demand for the Fund’s shares, or changes in the Fund’s distribution rate.
For complete, annualized performance for Delaware Enhanced Global Dividend and Income Fund, please see the table on page 3.
Economic backdrop
At the start of the Fund’s fiscal year in December 2021, equity markets continued to advance, and some US stock indices reached new highs. Globally, inflation also increased to long-term highs, and central banks responded by tightening monetary policy. The US Federal Reserve stepped sharply on the brakes, scaling back its bond purchases and hinting at several interest rate hikes in 2022. Bond yields were relatively stable in the fourth quarter of 2021 despite continuous increases in short-term US yields. The US dollar appreciated against major currencies. Oil prices also rose further, while gas markets eased somewhat at the end of 2021, following dramatic increases in Europe.
In January 2022, persistently high inflation led to frequent and serious discussions at the Fed about implementing interest rate hikes. Investors reacted by selling bonds, which pushed yields higher and equity prices lower. Financial markets also reacted negatively as Russia built up its troops along the Ukraine border. Russia’s invasion in February 2022 prompted unprecedented sanctions – including a freeze on Russian central bank reserves, an oil embargo, and a trading ban on Russian financial stocks. Equities sold off globally while commodity prices soared. Government bonds were briefly in demand as a short-term safe haven, but quickly resumed their downward trend.
Tighter central bank monetary policy characterized the rest of the fiscal year, with the Fed leading the way. From March through September 2022, the Fed raised the federal funds rate five times, including three 0.75-percentage-point increases – at the June, July, and September meetings of the Federal Open Market Committee (FOMC). As a result, the target short-term interest rate rose from a range of zero to 0.25% in January 2022 to 3.00% to 3.25% by the end of the fiscal year. This increase in rates was the Fed’s aggressive attempt to try to bring inflation under control.
Other central banks, including the Bank of England and the European Central Bank, also took repeated steps to tighten monetary policy in their jurisdictions. Meanwhile, equities and bonds posted historically poor performance throughout the measurement period in the face of brutal headwinds and unrelenting negative news. This included soaring inflation, consequent aggressive monetary tightening, ongoing supply chain problems, China’s zero-COVID policy-related lockdowns, the Russia-Ukraine war, and soaring energy prices. The higher prices and disruptions within the oil and gas supply hit Europe hardest as Russia cut off gas to several European Union (EU) countries. In turn, the Group of Seven (G7) nations and later the EU implemented an oil embargo.
Among major central banks, only the Bank of Japan maintained ultra-loose monetary policy as it attempted to keep Japanese yields stable by buying bonds. However, that led to a weakening of the Japanese yen, which fell to a 20-year low.
Markets rallied briefly in July 2022, when a near-term turnaround in inflation seemed possible. Despite investors’ concerns about economic growth slowing, stocks appreciated along with other risk asset classes, including corporate, high yield, convertible, and emerging market bonds. A key reason for this appreciation was the decline in yields on US and euro-zone government bonds, leading to significant price gains. However, the tide turned again in mid-August and the bear market returned for most asset classes as hope for a slowdown of inflation was dashed. Central banks reaffirmed their intentions to continue aggressively tightening monetary policy. Recession fears mounted and the energy crisis worsened as Russia announced it was shutting down a gas pipeline for maintenance. German bond yields rose sharply, and the euro fell below parity with the US dollar for the first time in 20 years.
The picture worsened even further in September 2022, with heavy losses among virtually all asset classes. Energy prices continued to fall while the European inflation rate reached double digits and central banks planned further interest rate hikes. As the fiscal period ended, the market showed its friendlier side. Although inflation remained high and central banks continued to raise interest rates, increasing data indicating an economic slowdown gave rise to hopes of a turnaround in monetary policy.
Markets were in recovery mode in November. After the Fed’s expected interest rate hike of 0.75 percentage points at the beginning of the month, poorer economic data during the month and slightly declining inflation rates fueled hopes of slower rate hikes in the near
1
Portfolio management review (Unaudited)
Delaware Enhanced Global Dividend and Income Fund
future. Against this backdrop, both equities and bonds rose strongly. Thanks to sharply falling risk premiums, investment grade corporate and emerging market government bonds performed particularly well. The US dollar weakened, and the price of oil fell due to weaker demand. China relaxed its zero-COVID policy somewhat, but record-high infections led to new restrictions, resulting in protests and somewhat deteriorating market sentiment toward the month’s end.
Within the Fund
For the fiscal year ended November 30, 2022, Delaware Enhanced Global Dividend and Income Fund returned -10.22% at net asset value (NAV) and -14.12% at market price (both figures reflect all distributions reinvested). For the Fund’s complete, annualized performance, please see the table on page 3.
Individual contributors and detractors
During the fiscal year, private real estate and US large-cap equities were the largest contributors to performance, while international equities and US high yield fixed income were the largest detractors from performance. The Fund’s exposure to Russian equities prior to the invasion of Ukraine was very limited due to the Fund’s nuanced emerging markets allocation, and thus had only a marginal negative impact on performance.
Within the Fund’s private real estate allocation, Merion Countryside L.P. and Merion Campions Walk L.P. were the largest contributors to performance, and we took the opportunity to exit those investments at favorable terms during the fiscal year. Within US large-cap equities, Cardinal Health Inc. and Merck & Co Inc. made the largest contributions to performance.
In contrast, within the Fund’s international equity allocation, adidas AG and Fresenius Medical Care AG & Co. KGaA detracted the most from the Fund’s performance. Within US high yield, Bausch Health Companies Inc. and AMC Networks Inc. were the largest detractors from performance.
Portfolio positioning
We regularly invest across multiple asset classes, searching for securities that offer a competitive yield and the opportunity for dividend growth. We also prioritize managing downside risk while seeking to limit any capital losses. Our asset shifts throughout the fiscal year reflected these priorities.
The Fund’s largest allocations were in international equities and in US high yield; however, we reduced the Fund’s exposure to equities, with the proceeds going into US convertibles.
During the fiscal year, the Fund used foreign currency exchange contracts to facilitate the purchase and sale of securities, and credit default swap (CDS) contracts to hedge against credit events. These derivative securities did not have a material effect on performance during the fiscal year.
The Fund’s use of leverage – a portfolio management tool designed to obtain a potentially higher return on the Fund’s investments – detracted from performance. Leverage magnifies the effect of gains and losses.
During the fiscal year, the Fund had distributions of capital as further discussed in Note 4 in “Notes to financial statements” and in the section “Other Fund information.”
The economic outlook is still challenging, with recession probabilities for 2023 now elevated. We don’t believe equity valuations fully reflect this economic backdrop, as historically recessions have typically been accompanied by declining corporate earnings as well. At the same time, bond yields – while somewhat down from their October and November 2022 highs – have risen, which might provide more downside protection in fixed income. We continue to expect a restrictive central bank policy and think this might be a headwind for many riskier asset classes as well.
In our view, a thoughtful active management approach is needed given the increased uncertainty. We believe vigilant and continuous assessment of the current market environment offers opportunities to take advantage of market dislocations and may help us achieve what we consider to be attractive risk-adjusted returns through an active focus on portfolio risk and diversification.
2
Performance summary (Unaudited)
Delaware Enhanced Global Dividend and Income Fund
The performance quoted represents past performance and does not guarantee future results. Investment return, principal value, and market value of an investment will fluctuate so that shares, when sold, may be worth more or less than their original cost. Current performance may be lower or higher than the performance quoted. Please obtain the most recent performance data by calling 866 437-0252 or visiting our website at delawarefunds.com/closed-end.
Fund performance
| Average annual total returns through November 30, 2022 | | 1 year | | 5 year | | 10 year | |
| At market price (inception date June 29, 2007) | | -14.12% | | +0.35% | | +4.80% |
| At net asset value (inception date June 29, 2007) | | -10.22% | | +1.19% | | +5.33% | |
Diversification may not protect against market risk.
Fixed income securities and bond funds can lose value, and investors can lose principal, as interest rates rise. They also may be affected by economic conditions that hinder an issuer’s ability to make interest and principal payments on its debt. This includes prepayment risk, the risk that the principal of a bond that is held by a portfolio will be prepaid prior to maturity at the time when interest rates are lower than what the bond was paying. A portfolio may then have to reinvest that money at a lower interest rate.
High yielding, non-investment-grade bonds (junk bonds) involve higher risk than investment grade bonds. The high yield secondary market is particularly susceptible to liquidity problems when institutional investors, such as mutual funds and certain other financial institutions, temporarily stop buying bonds for regulatory, financial, or other reasons. In addition, a less liquid secondary market makes it more difficult to obtain precise valuations of the high yield securities.
Narrowly focused investments may exhibit higher volatility than investments in multiple industry sectors.
Real estate investment trust (REIT) investments are subject to many of the risks associated with direct real estate ownership, including changes in economic conditions, credit risk, and interest rate fluctuations.
The Fund may invest in derivatives, which may involve additional expenses and are subject to risk, including the risk that an underlying security or securities index moves in the opposite direction from what the portfolio manager anticipated. A derivatives transaction depends upon the counterparties’ ability to fulfill their contractual obligations.
International investments entail risks including fluctuation in currency values, differences in accounting principles, or economic or political instability. Investing in emerging markets can be riskier than investing in established foreign markets due to increased volatility, lower trading volume, and higher risk of market closures. In many emerging markets, there is substantially less publicly available information and the available information may be incomplete or misleading. Legal claims are generally more difficult to pursue.
If and when the Fund invests in forward foreign currency contracts or uses other investments to hedge against currency risks, the Fund will be subject to special risks, including counterparty risk.
The Fund may experience portfolio turnover in excess of 100%, which could result in higher transaction costs and tax liability.
The Fund borrows through a line of credit for purposes of leveraging. Leveraging may result in higher degrees of volatility because the Fund’s net asset value could be subject to fluctuations in short-term interest rates and changes in market value of portfolio securities attributable to leverage. Leverage magnifies the potential for gain and the risk of loss. As a result, a relatively small decline in the value of the underlying investments could result in a relatively large loss. In addition, the leverage through the line of credit is dependent on the credit provider’s ability to fulfill its contractual obligations.
To the extent the Fund engages in option overwriting, it may receive less total return in certain periods and in other periods greater total return from its option overwriting strategy.
The use of dividend capture strategies will expose the Fund to increased trading costs and potential for capital loss or gain, particularly in the event of significant short-term price movements of stocks subject to dividend capture trading, and resultant dividends may not be qualified dividends eligible to individuals for reduced federal income tax rates.
3
Performance summary (Unaudited)
Delaware Enhanced Global Dividend and Income Fund
IBOR risk is the risk that changes related to the use of the London interbank offered rate (LIBOR) or similar rates (such as EONIA) could have adverse impacts on financial instruments that reference these rates. The abandonment of these rates and transition to alternative rates could affect the value and liquidity of instruments that reference them and could affect investment strategy performance.
The disruptions caused by natural disasters, pandemics, or similar events could prevent the Fund from executing advantageous investment decisions in a timely manner and could negatively impact the Fund’s ability to achieve its investment objective and the value of the Fund’s investments.
Closed-end fund shares do not represent a deposit or obligation of, and are not guaranteed or endorsed by, any bank or other insured depository institution, and are not federally insured by the Federal Deposit Insurance Corporation or any other government agency.
Closed-end funds, unlike open-end funds, are not continuously offered. After being issued during a one-time-only public offering, shares of closed-end funds are sold in the open market through a securities exchange. Net asset value (NAV) is calculated by subtracting total liabilities from total assets, then dividing by the number of shares outstanding. At the time of sale, your shares may have a market price that is above or below NAV, and may be worth more or less than your original investment.
The Fund may make distributions of ordinary income and capital gains at calendar year end. Those distributions may temporarily cause extraordinarily high yields. There is no assurance that a Fund will repeat that yield in the future. Subsequent monthly distributions that do not include ordinary income or capital gains in the form of dividends will likely be lower.
The “Fund performance” table and the “Performance of a $10,000 investment” graph do not reflect the deduction of taxes the shareholder would pay on Fund distributions or redemptions of Fund shares.
Returns reflect the reinvestment of all distributions. Dividends and distributions, if any, are assumed, for the purpose of this calculation to be reinvested at prices obtained under the Fund’s dividend reinvestment policy. Shares of the Fund were initially offered with a sales charge of 4.50%. Performance since inception does not include the sales charge or any other brokerage commission for purchases made since inception.
Past performance does not guarantee future results.
Fund basics
As of November 30, 2022
| Fund objectives | | Fund start date |
| The Fund’s primary investment objective is to seek current income, with a secondary objective of capital appreciation. | | June 29, 2007 |
| | | |
| Total net assets | | NYSE symbol |
| $93.5 million | | DEX |
| | | |
| Number of holdings | | |
| 475 | | |
4
Market price versus net asset value (see notes below and on next page)
For the period November 30, 2021 through November 30, 2022
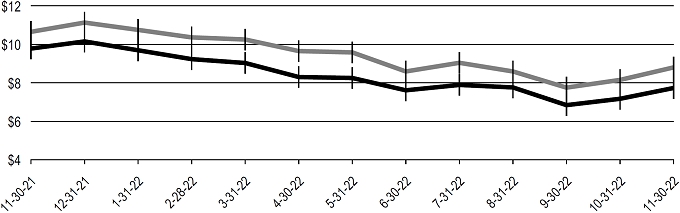
| | | | Starting value | | Ending value |
 | Delaware Enhanced Global Dividend and Income Fund @ NAV | | $10.65 | | $8.80 |
 | Delaware Enhanced Global Dividend and Income Fund @ market price | | $ 9.78 | | $7.73 |
Past performance does not guarantee future results.
Performance of a $10,000 investment
For the period November 30, 2012 through November 30, 2022

| | | | Starting value | | Ending value |
 | Lipper Closed-end Global Funds Average @ market price | | $10,000 | | $19,882 |
| Lipper Closed-end Global Funds Average @ NAV | | $10,000 | | $17,579 |
| Delaware Enhanced Global Dividend and Income Fund @ NAV | | $10,000 | | $16,808 |
 | Delaware Enhanced Global Dividend and Income Fund @ market price | | $10,000 | | $15,988 |
The “Performance of a $10,000 investment” graph assumes $10,000 invested in the Fund on November 30, 2012 and includes the reinvestment of all distributions at market value. The graph also assumes $10,000 invested in the Lipper Closed-end Global Funds Average at market price and at NAV.
Performance of the Fund and the Lipper peer group at market value is based on market performance during the period. Performance of the Fund and the Lipper peer group at NAV is based on the fluctuations in NAV during the period. Delaware Enhanced Global Dividend and Income Fund was initially offered with a sales charge of 4.50%. For market price, performance shown in both graphs above does not include fees, the
5
Performance summary (Unaudited)
Delaware Enhanced Global Dividend and Income Fund
initial sales charge, or any brokerage commissions for purchases. For NAV, performance shown in both graphs above includes fees, but does not include the initial sales charge or any brokerage commissions for purchases. Investments in the Fund are not available at NAV.
The Lipper Closed-end Global Funds Average represents the average return of closed-end funds that invest at least 25% of their portfolios in securities traded outside of the United States and that may own US securities as well (source: Lipper).
Market price is the price an investor would pay for shares of the Fund on the secondary market.
NAV is the total value of one fund share, generally equal to a fund’s net assets divided by the number of shares outstanding.
Past performance does not guarantee future results.
6
Security type / sector and country allocations
Delaware Enhanced Global Dividend and Income Fund
As of November 30, 2022 (Unaudited)
Sector designations may be different from the sector designations presented in other Fund materials.
| Security type / sector | | Percentage
of net assets |
| Convertible Bonds | | | 14.65 | % | |
| Basic Industry | | | 0.27 | % | |
| Brokerage | | | 0.13 | % | |
| Capital Goods | | | 0.34 | % | |
| Communications | | | 1.53 | % | |
| Consumer Cyclical | | | 0.91 | % | |
| Consumer Non-Cyclical | | | 4.38 | % | |
| Electric | | | 0.94 | % | |
| Energy | | | 0.63 | % | |
| Financials | | | 0.97 | % | |
| Industrials | | | 0.50 | % | |
| Real Estate Investment Trusts | | | 0.55 | % | |
| Technology | | | 2.93 | % | |
| Transportation | | | 0.57 | % | |
| Corporate Bonds | | | 39.78 | % | |
| Automotive | | | 1.37 | % | |
| Banking | | | 0.94 | % | |
| Basic Industry | | | 3.59 | % | |
| Brokerage | | | 0.19 | % | |
| Capital Goods | | | 1.87 | % | |
| Communications | | | 2.47 | % | |
| Consumer Cyclical | | | 0.39 | % | |
| Consumer Goods | | | 0.64 | % | |
| Consumer Non-Cyclical | | | 0.30 | % | |
| Energy | | | 6.22 | % | |
| Financials | | | 1.28 | % | |
| Healthcare | | | 2.90 | % | |
| Insurance | | | 1.44 | % | |
| Leisure | | | 3.44 | % | |
| Media | | | 3.62 | % | |
| Natural Gas | | | 0.40 | % | |
| Real Estate | | | 0.24 | % | |
| Retail | | | 1.99 | % | |
| Services | | | 2.24 | % | |
| Technology & Electronics | | | 0.91 | % | |
| Transportation | | | 1.63 | % | |
| Utilities | | | 1.71 | % | |
| Sovereign Bonds | | | 7.54 | % | |
| Albania | | | 0.17 | % | |
| Angola | | | 0.18 | % | |
| Armenia | | | 0.16 | % | |
| Bermuda | | | 0.41 | % | |
| Brazil | | | 0.18 | % | |
| Chile | | | 0.23 | % | |
| Colombia | | | 0.29 | % | |
| Dominican Republic | | | 0.68 | % | |
| Honduras | | | 0.29 | % | |
| Indonesia | | | 0.42 | % | |
| Ivory Coast | | | 0.66 | % | |
| Morocco | | | 0.55 | % | |
| Pakistan | | | 0.07 | % | |
| Panama | | | 0.24 | % | |
| Paraguay | | | 0.77 | % | |
| Peru | | | 0.43 | % | |
| Republic of North Macedonia | | | 0.18 | % | |
| Senegal | | | 0.27 | % | |
| South Africa | | | 0.70 | % | |
| Uzbekistan | | | 0.66 | % | |
| Supranational Banks | | | 1.02 | % | |
| Common Stocks | | | 67.19 | % | |
| Communication Services | | | 4.23 | % | |
| Consumer Discretionary | | | 9.33 | % | |
| Consumer Staples | | | 15.27 | % | |
| Energy | | | 2.92 | % | |
| Financials | | | 4.28 | % | |
| Healthcare | | | 9.28 | % | |
| Industrials | | | 5.83 | % | |
| Information Technology | | | 12.12 | % | |
| Materials | | | 3.00 | % | |
| Media | | | 0.00 | % | |
| Real Estate | | | 0.35 | % | |
| Utilities | | | 0.58 | % | |
| Convertible Preferred Stock | | | 2.42 | % | |
| Exchange-Traded Funds | | | 0.38 | % | |
| Leveraged Non-Recourse Security | | | 0.00 | % | |
| Short-Term Investments | | | 2.14 | % | |
| Total Value of Securities | | | 135.12 | % | |
| Borrowings Under Line of Credit | | | (36.47 | %) | |
| Receivables and Other Assets Net of Liabilities | | | 1.35 | % | |
| Total Net Assets | | | 100.00 | % | |
Security type / sector and country allocations
Delaware Enhanced Global Dividend and Income Fund
| Country* | | Percentage
of net assets |
| Albania | | | 0.17 | % | |
| Angola | | | 0.18 | % | |
| Argentina | | | 0.04 | % | |
| Armenia | | | 0.16 | % | |
| Australia | | | 0.31 | % | |
| Bermuda | | | 0.41 | % | |
| Brazil | | | 0.88 | % | |
| Canada | | | 0.58 | % | |
| Chile | | | 1.03 | % | |
| China | | | 2.42 | % | |
| Colombia | | | 0.66 | % | |
| Denmark | | | 1.77 | % | |
| Dominican Republic | | | 0.68 | % | |
| France | | | 7.26 | % | |
| Germany | | | 5.44 | % | |
| Guatemala | | | 0.37 | % | |
| Honduras | | | 0.29 | % | |
| Hong Kong | | | 0.27 | % | |
| India | | | 1.61 | % | |
| Indonesia | | | 1.22 | % | |
| Ivory Coast | | | 0.66 | % | |
| Jamaica | | | 0.19 | % | |
| Japan | | | 3.79 | % | |
| Kazakhstan | | | 0.55 | % | |
| Kuwait | | | 0.22 | % | |
| Luxembourg | | | 0.18 | % | |
| Mexico | | | 1.01 | % | |
| Morocco | | | 0.73 | % | |
| Netherlands | | | 2.52 | % | |
| Pakistan | | | 0.07 | % | |
| Panama | | | 0.40 | % | |
| Paraguay | | | 1.09 | % | |
| Peru | | | 0.66 | % | |
| Qatar | | | 0.18 | % | |
| Republic of Korea | | | 2.12 | % | |
| Republic of North Macedonia | | | 0.18 | % | |
| Russia | | | 0.00 | % | |
| Senegal | | | 0.27 | % | |
| South Africa | | | 0.70 | % | |
| Spain | | | 2.09 | % | |
| Supranational | | | 1.02 | % | |
| Sweden | | | 3.91 | % | |
| Switzerland | | | 5.24 | % | |
| Taiwan | | | 1.58 | % | |
| Tanzania | | | 0.18 | % | |
| Thailand | | | 0.06 | % | |
| Turkey | | | 0.07 | % | |
| Ukraine | | | 0.23 | % | |
| United Arab Emirates | | | 0.20 | % | |
| United Kingdom | | | 7.39 | % | |
| United States | | | 68.72 | % | |
| Uzbekistan | | | 0.66 | % | |
| Zambia | | | 0.36 | % | |
| Total | | | 132.98 | % | |
| * | Allocation includes all investments except for short-term. |
The percentage of net assets exceeds 100.00% because the Fund utilizes a line of credit with The Bank of New York Mellon, as described in Note 7 in “Notes to financial statements.” The Fund utilizes leveraging techniques in an attempt to obtain a higher return for the Fund. There is no assurance that the Fund will achieve its investment objectives through the use of such techniques.
8
Schedule of investments
Delaware Enhanced Global Dividend and Income Fund
November 30, 2022
| | | Principal
amount° | | Value (US $) |
| Convertible Bonds — 14.65%~ | | | | | |
| Basic Industry — 0.27% | | | | | |
Ivanhoe Mines 144A 2.50%
exercise price $9.31,
maturity date 4/15/26 # | | 189,000 | | $ | 256,374 |
| | | | | | 256,374 |
| Brokerage — 0.13% | | | | | |
New Mountain Finance
144A 7.50% exercise
price $14.20, maturity
date 10/15/25 # | | 120,000 | | | 122,026 |
| | | | | | 122,026 |
| Capital Goods — 0.34% | | | | | |
Kaman 3.25% exercise price
$65.26, maturity date
5/1/24 | | 346,000 | | | 321,953 |
| | | | | | 321,953 |
| Communications — 1.53% | | | | | |
Cable One 1.125% exercise
price $2,275.83, maturity
date 3/15/28 | | 541,000 | | | 388,979 |
DISH Network 3.375%
exercise price $65.18,
maturity date 8/15/26 | | 647,000 | | | 420,550 |
Liberty Broadband 144A
1.25% exercise price
$900.01, maturity date
9/30/50 # | | 461,000 | | | 441,984 |
Liberty Latin America 2.00%
exercise price $20.65,
maturity date 7/15/24 | | 203,000 | | | 180,797 |
| | | | | | 1,432,310 |
| Consumer Cyclical — 0.91% | | | | | |
Cheesecake Factory
0.375% exercise price
$77.09, maturity date
6/15/26 | | 667,000 | | | 557,362 |
Ford Motor 0.00%
exercise price $16.85, maturity
date 3/15/26 ^ | | 284,000 | | | 294,792 |
| | | | | �� | 852,154 |
| Consumer Non-Cyclical — 4.38% | | | | | |
BioMarin Pharmaceutical
0.599% exercise price
$124.67, maturity date
8/1/24 | | 246,000 | | | 259,981 |
Chefs' Warehouse 1.875%
exercise price $44.20,
maturity date 12/1/24 | | 572,000 | | | 638,066 |
Chegg 4.266% exercise
price $107.55, maturity
date 9/1/26 ^ | | 706,000 | | | 562,584 |
Coherus Biosciences 1.50%
exercise price $19.26,
maturity date 4/15/26 | | 394,000 | | | 271,899 |
Collegium Pharmaceutical
2.625% exercise price
$29.19, maturity date
2/15/26 | | 288,000 | | | 285,420 |
CONMED 144A 2.25%
exercise price $145.33,
maturity date 6/15/27 # | | 455,000 | | | 405,632 |
Integra
LifeSciences Holdings
0.50% exercise price
$73.67, maturity date
8/15/25 | | 462,000 | | | 447,447 |
Ionis Pharmaceuticals
0.125% exercise price
$83.28, maturity date
12/15/24 | | 362,000 | | | 330,501 |
Jazz Investments I 2.00%
exercise price $155.81,
maturity date 6/15/26 | | 219,000 | | | 260,199 |
Paratek Pharmaceuticals
4.75% exercise price
$15.90, maturity date
5/1/24 | | 709,000 | | | 628,812 |
| | | | | | 4,090,541 |
| Electric — 0.94% | | | | | |
NextEra Energy Partners
144A 0.357% exercise
price $75.33, maturity
date 11/15/25 #, ^ | | 163,000 | | | 179,545 |
NRG Energy 2.75% exercise
price $43.46, maturity
date 6/1/48 | | 297,000 | | | 339,174 |
Ormat Technologies 144A
2.50% exercise price
$90.27, maturity date
7/15/27 # | | 302,000 | | | 359,682 |
| | | | | | 878,401 |
9
Schedule of investments
Delaware Enhanced Global Dividend and Income Fund
| | | Principal
amount° | | Value (US $) |
| Convertible Bonds~ (continued) | | | | | |
| Energy — 0.63% | | | | | |
Helix Energy Solutions
Group 6.75% exercise
price $6.97, maturity date
2/15/26 | | 464,000 | | $ | 591,043 |
| | | | | 591,043 |
| Financials — 0.97% | | | | | |
FTI Consulting 2.00%
exercise price $101.38,
maturity date 8/15/23 | | 263,000 | | | 450,914 |
Repay Holdings 144A
2.575% exercise price
$33.60, maturity date
2/1/26 #, ^ | | 609,000 | | | 454,070 |
| | | | | 904,984 |
| Industrials — 0.50% | | | | | |
Chart Industries 144A 1.00%
exercise price $58.73,
maturity date 11/15/24 # | | 175,000 | | | 430,237 |
Danimer Scientific 144A
3.25% exercise price
$10.79, maturity date
12/15/26 # | | 88,000 | | | 38,818 |
| | | | | | 469,055 |
| Real Estate Investment Trusts — 0.55% | | | | | |
Blackstone Mortgage Trust
4.75% exercise price
$36.23, maturity date
3/15/23 | | 378,000 | | | 379,890 |
Summit Hotel Properties
1.50% exercise price
$11.88, maturity date
2/15/26 | | 144,000 | | | 132,264 |
| | | | | 512,154 |
| Technology — 2.93% | | | | | |
Block 0.125% exercise price
$121.01, maturity date
3/1/25 | | 256,000 | | | 251,200 |
InterDigital 144A 3.50%
exercise price $77.49,
maturity date 6/1/27 # | | 556,000 | | | 526,532 |
ON Semiconductor 1.625%
exercise price $20.72,
maturity date 10/15/23 | | 172,000 | | | 623,586 |
Palo Alto Networks 0.75%
exercise price $88.78,
maturity date 7/1/23 | | 214,000 | | | 411,522 |
Quotient Technology 1.75%
exercise price $17.36,
maturity date 12/1/22 | | 260,000 | | | 261,282 |
Semtech 144A 1.625%
exercise price $37.27,
maturity date 11/1/27 # | | 198,000 | | | 207,702 |
Vishay Intertechnology
2.25% exercise price
$31.20, maturity date
6/15/25 | | 285,000 | | | 279,471 |
Wolfspeed 144A 0.25%
exercise price $127.22,
maturity date 2/15/28 # | | 181,000 | | | 175,117 |
| | | | | | 2,736,412 |
| Transportation — 0.57% | | | | | |
Spirit Airlines 1.00%
exercise price $49.07,
maturity date 5/15/26 | | 647,000 | | | 535,069 |
| | | | | | 535,069 |
Total Convertible Bonds
(cost $13,357,961) | | | | | 13,702,476 |
| | | | | | |
| Corporate Bonds — 39.78%~ | | | | | |
| Automotive — 1.37% | | | | | |
Allison Transmission 144A
5.875% 6/1/29 # | | 580,000 | | | 548,869 |
| Ford Motor 4.75% 1/15/43 | | 115,000 | | | 85,236 |
Ford Motor Credit 3.375%
11/13/25 | | 495,000 | | | 457,256 |
Goodyear Tire & Rubber
5.25% 7/15/31 | | 220,000 | | | 188,854 |
| | | | | | 1,280,215 |
| Banking — 0.94% | | | | | |
Banco Continental 144A
2.75% 12/10/25 # | | 200,000 | | | 174,457 |
Banco Nacional de Panama
144A 2.50% 8/11/30 # | | 200,000 | | | 154,900 |
BBVA Bancomer 144A
5.125% 1/18/33 #, μ | | 200,000 | | | 173,660 |
Development Bank of
Kazakhstan 144A 10.95%
5/6/26 # | KZT | 100,000,000 | | | 171,797 |
| NBK SPC 144A 1.625% 9/15/27 #, μ | | 240,000 | | | 208,920 |
| | | | | | 883,734 |
| Basic Industry — 3.59% | | | | | |
AngloGold Ashanti Holdings
3.75% 10/1/30 | | 200,000 | | | 173,244 |
10
| | | Principal
amount° | | Value (US $) |
| Corporate Bonds~ (continued) | | | | | |
| Basic Industry (continued) | | | | | |
Antofagasta 144A 5.625%
5/13/32 # | | 200,000 | | $ | 193,690 |
Avient 144A 5.75%
5/15/25 # | | 153,000 | | | 149,357 |
Chemours 144A 5.75%
11/15/28 # | | 285,000 | | | 250,658 |
First Quantum Minerals
144A 7.50% 4/1/25 # | | 345,000 | | | 340,425 |
FMG Resources August
2006 144A 5.875%
4/15/30 # | | 215,000 | | | 201,761 |
Freeport-McMoRan 5.45%
3/15/43 | | 270,000 | | | 242,413 |
INEOS Quattro Finance
2 144A 3.375% 1/15/26 # | | 400,000 | | | 356,072 |
Koppers 144A 6.00%
2/15/25 # | | 394,000 | | | 367,553 |
| Metinvest 8.50% 4/23/26 | | 200,000 | | | 113,000 |
Novelis 144A 4.75%
1/30/30 # | | 280,000 | | | 249,296 |
| OCP 144A 3.75% 6/23/31 # | | 200,000 | | | 164,445 |
| Olin | | | | | |
| 5.00% 2/1/30 | | 310,000 | | | 281,714 |
| 5.125% 9/15/27 | | 293,000 | | | 275,002 |
| | | | | | 3,358,630 |
| Brokerage — 0.19% | | | | | |
| XP 144A 3.25% 7/1/26 # | | 200,000 | | | 178,573 |
| | | | | | 178,573 |
| Capital Goods — 1.87% | | | | | |
Ardagh Packaging Finance
144A 5.25% 8/15/27 # | | 330,000 | | | 250,189 |
Madison IAQ 144A 5.875%
6/30/29 # | | 240,000 | | | 177,838 |
Sealed Air 144A 5.00%
4/15/29 # | | 215,000 | | | 200,167 |
| Terex 144A 5.00% 5/15/29 # | | 330,000 | | | 298,977 |
TK Elevator US Newco
144A 5.25% 7/15/27 # | | 465,000 | | | 422,683 |
TransDigm 144A 6.25%
3/15/26 # | | 233,000 | | | 232,150 |
UltraTech Cement 144A
2.80% 2/16/31 # | | 200,000 | | | 162,714 |
| | | | | | 1,744,718 |
| Communications — 2.47% | | | | | |
Altice France 144A 5.50%
10/15/29 # | | 420,000 | | | 337,319 |
Altice France Holding 144A
6.00% 2/15/28 # | | 255,000 | | | 171,471 |
Consolidated
Communications | | | | | |
| 144A 5.00% 10/1/28 # | | 135,000 | | | 102,180 |
| 144A 6.50% 10/1/28 # | | 205,000 | | | 169,187 |
CT Trust 144A 5.125%
2/3/32 # | | 200,000 | | | 173,496 |
Digicel International Finance
144A 8.75% 5/25/24 # | | 200,000 | | | 175,276 |
Frontier Communications
Holdings | | | | | |
| 144A 5.00% 5/1/28 # | | 33,000 | | | 29,404 |
| 144A 5.875% 10/15/27 # | | 320,000 | | | 304,896 |
| 144A 6.75% 5/1/29 # | | 240,000 | | | 201,931 |
Millicom International
Cellular 144A 4.50%
4/27/31 # | | 200,000 | | | 164,290 |
| T-Mobile USA | | | | | |
| 2.625% 4/15/26 | | 155,000 | | | 142,325 |
| 3.375% 4/15/29 | | 155,000 | | | 137,229 |
| 3.50% 4/15/31 | | 111,000 | | | 96,853 |
VTR Comunicaciones 144A
4.375% 4/15/29 # | | 200,000 | | | 105,936 |
| | | | | | 2,311,793 |
| Consumer Cyclical — 0.39% | | | | | |
Hutama Karya Persero 144A
3.75% 5/11/30 # | | 400,000 | | | 365,000 |
| | | | | | 365,000 |
| Consumer Goods — 0.64% | | | | | |
Pilgrim's Pride 144A 4.25%
4/15/31 # | | 215,000 | | | 186,602 |
| Post Holdings | | | | | |
| 144A 5.625% 1/15/28 # | | 325,000 | | | 310,547 |
| 144A 5.75% 3/1/27 # | | 100,000 | | | 97,609 |
| | | | | | 594,758 |
| Consumer Non-Cyclical — 0.30% | | | | | |
Central American Bottling
144A 5.25% 4/27/29 # | | 200,000 | | | 180,531 |
| MHP Lux 6.95% 4/3/26 | | 200,000 | | | 103,000 |
| | | | | | 283,531 |
| Energy — 6.22% | | | | | |
Ascent Resources Utica
Holdings | | | | | |
| 144A 5.875% 6/30/29 # | | 260,000 | | | 234,766 |
| 144A 7.00% 11/1/26 # | | 125,000 | | | 122,703 |
Callon Petroleum 144A
8.00% 8/1/28 # | | 280,000 | | | 276,958 |
CNX Midstream Partners
144A 4.75% 4/15/30 # | | 120,000 | | | 100,221 |
11
Schedule of investments
Delaware Enhanced Global Dividend and Income Fund
| | | Principal
amount° | | Value (US $) |
| Corporate Bonds~ (continued) | | | | | |
| Energy (continued) | | | | | |
CNX Resources 144A
6.00% 1/15/29 # | | 285,000 | | $ | 269,686 |
Crestwood Midstream
Partners 144A 6.00%
2/1/29 # | | 303,000 | | | 279,833 |
EQM Midstream Partners
144A 4.75% 1/15/31 # | | 382,000 | | | 322,047 |
Galaxy Pipeline Assets
Bidco 144A 2.16%
3/31/34 # | | 226,542 | | | 191,919 |
| Genesis Energy | | | | | |
| 7.75% 2/1/28 | | 400,000 | | | 382,392 |
| 8.00% 1/15/27 | | 295,000 | | | 281,945 |
Geopark 144A 5.50%
1/17/27 # | | 200,000 | | | 175,519 |
| Hilcorp Energy I | | | | | |
| 144A 6.00% 4/15/30 # | | 240,000 | | | 220,979 |
| 144A 6.00% 2/1/31 # | | 25,000 | | | 23,065 |
| 144A 6.25% 4/15/32 # | | 113,000 | | | 103,811 |
| Murphy Oil 6.375% 7/15/28 | | 485,000 | | | 479,165 |
| NuStar Logistics | | | | | |
| 5.625% 4/28/27 | | 327,000 | | | 308,031 |
| 6.00% 6/1/26 | | 69,000 | | | 66,986 |
| Occidental Petroleum | | | | | |
| 6.45% 9/15/36 | | 125,000 | | | 125,465 |
| 6.60% 3/15/46 | | 265,000 | | | 270,650 |
| 6.625% 9/1/30 | | 95,000 | | | 99,227 |
| PDC Energy 5.75% 5/15/26 | | 328,000 | | | 313,706 |
Qatar Energy 144A 2.25%
7/12/31 # | | 200,000 | | | 167,011 |
| Southwestern Energy | | | | | |
| 5.375% 2/1/29 | | 35,000 | | | 33,075 |
| 5.375% 3/15/30 | | 155,000 | | | 145,919 |
| 7.75% 10/1/27 | | 180,000 | | | 185,394 |
Tengizchevroil Finance Co.
International 144A
2.625% 8/15/25 # | | 400,000 | | | 342,000 |
| USA Compression Partners | | | | | |
| 6.875% 4/1/26 | | 30,000 | | | 28,772 |
| 6.875% 9/1/27 | | 140,000 | | | 133,891 |
Weatherford International
144A 8.625% 4/30/30 # | | 135,000 | | | 129,626 |
| | | | | | 5,814,762 |
| Financials — 1.28% | | | | | |
Ally Financial 8.00%
11/1/31 | | 205,000 | | | 220,260 |
Castlelake Aviation Finance
DAC 144A 5.00%
4/15/27 # | | 320,000 | | | 272,533 |
Corp Inmobiliaria Vesta
144A 3.625% 5/13/31 # | | 200,000 | | | 152,937 |
Hightower Holding 144A
6.75% 4/15/29 # | | 180,000 | | | 150,019 |
Midcap Financial Issuer
Trust 144A 6.50%
5/1/28 # | | 205,000 | | | 179,116 |
MSCI 144A 3.625%
11/1/31 # | | 265,000 | | | 223,497 |
| | | | | | 1,198,362 |
| Healthcare — 2.90% | | | | | |
1375209 BC 144A 9.00%
1/30/28 # | | 78,000 | | | 77,025 |
| Bausch Health | | | | | |
| 144A 11.00% 9/30/28 # | | 138,000 | | | 106,605 |
| 144A 14.00% 10/15/30 # | | 27,000 | | | 15,115 |
| Centene 4.625% 12/15/29 | | 205,000 | | | 190,882 |
Cheplapharm Arzneimittel
144A 5.50% 1/15/28 # | | 210,000 | | | 174,878 |
| CHS 144A 4.75% 2/15/31 # | | 180,000 | | | 132,110 |
DaVita 144A 4.625%
6/1/30 # | | 245,000 | | | 198,691 |
Encompass Health 5.75%
9/15/25 | | 361,000 | | | 357,647 |
| HCA | | | | | |
| 5.875% 2/15/26 | | 136,000 | | | 137,181 |
| 7.58% 9/15/25 | | 159,000 | | | 165,652 |
ModivCare Escrow Issuer
144A 5.00% 10/1/29 # | | 220,000 | | | 185,407 |
Service Corp International
4.00% 5/15/31 | | 515,000 | | | 441,865 |
| Tenet Healthcare | | | | | |
| 144A 4.25% 6/1/29 # | | 295,000 | | | 256,298 |
| 144A 6.125% 10/1/28 # | | 310,000 | | | 274,063 |
| | | | | | 2,713,419 |
| Insurance — 1.44% | | | | | |
HUB International 144A
5.625% 12/1/29 # | | 305,000 | | | 267,617 |
| NFP | | | | | |
| 144A 6.875% 8/15/28 # | | 240,000 | | | 203,329 |
| 144A 7.50% 10/1/30 # | | 80,000 | | | 77,236 |
Sagicor Financial 144A
5.30% 5/13/28 # | | 200,000 | | | 179,082 |
| USI 144A 6.875% 5/1/25 # | | 632,000 | | | 620,255 |
| | | | | | 1,347,519 |
| Leisure — 3.44% | | | | | |
| Boyd Gaming | | | | | |
| 4.75% 12/1/27 | | 306,000 | | | 285,102 |
| 144A 4.75% 6/15/31 # | | 55,000 | | | 48,061 |
Caesars Entertainment
144A 6.25% 7/1/25 # | | 535,000 | | | 529,475 |
12
| | | Principal
amount° | | Value (US $) |
| Corporate Bonds~ (continued) | | | | | |
| Leisure (continued) | | | | | |
| Carnival | | | | | |
| 144A 5.75% 3/1/27 # | | 550,000 | | $ | 409,750 |
| 144A 7.625% 3/1/26 # | | 400,000 | | | 337,782 |
Hilton Domestic Operating
144A 4.00% 5/1/31 # | | 220,000 | | | 185,341 |
Hilton Worldwide Finance
4.875% 4/1/27 | | 355,000 | | | 341,865 |
Royal Caribbean Cruises
144A 5.50% 4/1/28 # | | 639,000 | | | 522,325 |
Scientific Games
International 144A 7.25%
11/15/29 # | | 190,000 | | | 186,368 |
Wyndham Hotels & Resorts
144A 4.375% 8/15/28 # | | 413,000 | | | 369,830 |
| | | | | | 3,215,899 |
| Media — 3.62% | | | | | |
AMC Networks 4.25%
2/15/29 | | 655,000 | | | 488,997 |
| CCO Holdings | | | | | |
| 144A 4.50% 8/15/30 # | | 310,000 | | | 261,559 |
| 4.50% 5/1/32 | | 70,000 | | | 57,842 |
| 144A 5.125% 5/1/27 # | | 205,000 | | | 194,261 |
| 144A 5.375% 6/1/29 # | | 235,000 | | | 213,541 |
CMG Media 144A 8.875%
12/15/27 # | | 265,000 | | | 201,898 |
| CSC Holdings | | | | | |
| 144A 3.375% 2/15/31 # | | 480,000 | | | 347,093 |
| 144A 5.00% 11/15/31 # | | 325,000 | | | 205,907 |
Cumulus Media New
Holdings 144A 6.75%
7/1/26 # | | 190,000 | | | 159,524 |
Directv Financing 144A
5.875% 8/15/27 # | | 225,000 | | | 206,718 |
Gray Television 144A 4.75%
10/15/30 # | | 610,000 | | | 452,346 |
Sirius XM Radio 144A
4.00% 7/15/28 # | | 490,000 | | | 433,562 |
VZ Secured Financing 144A
5.00% 1/15/32 # | | 200,000 | | | 165,752 |
| | | | | | 3,389,000 |
| Natural Gas — 0.40% | | | | | |
ENN Energy Holdings 144A
4.625% 5/17/27 # | | 200,000 | | | 193,226 |
Infraestructura Energetica
Nova 144A 3.75%
1/14/28 # | | 200,000 | | | 178,498 |
| | | | | | 371,724 |
| Real Estate — 0.24% | | | | | |
| VICI Properties | | | | | |
| 144A 3.875% 2/15/29 # | | 35,000 | | | 30,761 |
| 144A 5.75% 2/1/27 # | | 195,000 | | | 189,205 |
| | | | | | 219,966 |
| Retail — 1.99% | | | | | |
| Asbury Automotive Group | | | | | |
| 144A 4.625% 11/15/29 # | | 285,000 | | | 249,073 |
| 4.75% 3/1/30 | | 135,000 | | | 115,654 |
| Bath & Body Works | | | | | |
| 6.875% 11/1/35 | | 300,000 | | | 271,910 |
| 6.95% 3/1/33 | | 199,000 | | | 172,930 |
CP Atlas Buyer 144A 7.00%
12/1/28 # | | 115,000 | | | 84,330 |
Levi Strauss & Co. 144A
3.50% 3/1/31 # | | 262,000 | | | 215,419 |
LSF9 Atlantis Holdings 144A
7.75% 2/15/26 # | | 278,000 | | | 256,940 |
Murphy Oil USA 144A 3.75%
2/15/31 # | | 270,000 | | | 221,429 |
PetSmart 144A 7.75%
2/15/29 # | | 290,000 | | | 268,608 |
| | | | | | 1,856,293 |
| Services — 2.24% | | | | | |
Aramark Services 144A
5.00% 2/1/28 # | | 435,000 | | | 407,423 |
GFL Environmental 144A
3.75% 8/1/25 # | | 105,000 | | | 98,434 |
Iron Mountain 144A 4.50%
2/15/31 # | | 565,000 | | | 473,781 |
NESCO Holdings II 144A
5.50% 4/15/29 # | | 205,000 | | | 180,598 |
Prime Security Services
Borrower 144A 5.75%
4/15/26 # | | 405,000 | | | 401,434 |
United Rentals North
America 3.875% 2/15/31 | | 270,000 | | | 232,616 |
Univar Solutions USA 144A
5.125% 12/1/27 # | | 250,000 | | | 240,876 |
White Cap Buyer 144A
6.875% 10/15/28 # | | 70,000 | | | 60,432 |
White Cap Parent 144A PIK
8.25% 3/15/26 #, « | | 2,000 | | | 1,706 |
| | | | | | 2,097,300 |
| Technology & Electronics — 0.91% | | | | | |
| Entegris Escrow | | | | | |
| 144A 4.75% 4/15/29 # | | 92,000 | | | 83,383 |
| 144A 5.95% 6/15/30 # | | 265,000 | | | 247,867 |
Go Daddy Operating 144A
3.50% 3/1/29 # | | 290,000 | | | 245,435 |
13
Schedule of investments
Delaware Enhanced Global Dividend and Income Fund
| | | Principal
amount° | | | Value (US $) |
| Corporate Bonds~ (continued) | | | | | |
| Technology & Electronics (continued) | | | | | |
Sensata Technologies 144A
4.00% 4/15/29 # | | 85,000 | | $ | 74,088 |
SS&C Technologies 144A
5.50% 9/30/27 # | | 205,000 | | | 196,248 |
| | | | | | 847,021 |
| Transportation — 1.63% | | | | | |
American Airlines 144A
5.75% 4/20/29 # | | 124,017 | | | 115,586 |
Delta Air Lines 7.375%
1/15/26 | | 382,000 | | | 395,150 |
Laredo Petroleum 144A
7.75% 7/31/29 # | | 195,000 | | | 186,225 |
Mileage Plus Holdings 144A
6.50% 6/20/27 # | | 256,500 | | | 255,537 |
Rutas 2 and 7 Finance 144A
3.413% 9/30/36 #, ^ | | 186,666 | | | 116,037 |
Seaspan 144A 5.50%
8/1/29 # | | 320,000 | | | 246,931 |
| United Airlines | | | | | |
| 144A 4.375% 4/15/26 # | | 100,000 | | | 93,202 |
| 144A 4.625% 4/15/29 # | | 125,000 | | | 111,408 |
| | | | | | 1,520,076 |
| Utilities — 1.71% | | | | | |
| Calpine | | | | | |
| 144A 5.00% 2/1/31 # | | 520,000 | | | 450,349 |
| 144A 5.25% 6/1/26 # | | 65,000 | | | 62,352 |
Clean Renewable Power
Mauritius 144A 4.25%
3/25/27 # | | 191,000 | | | 164,272 |
| Consorcio Transmantaro | | | | | |
| 144A 5.20% 4/11/38 # | | 200,000 | | | 179,983 |
| PG&E 5.25% 7/1/30 | | 165,000 | | | 149,672 |
Sociedad de Transmision
Austral 144A 4.00%
1/27/32 # | | 200,000 | | | 170,439 |
Vistra
144A 7.00% 12/15/26 #,
μ, ψ | | 290,000 | | | 259,770 |
144A 8.00% 10/15/26 #,
μ, ψ | | 170,000 | | | 161,814 |
| | | | | | 1,598,651 |
Total Corporate Bonds
(cost $42,178,956) | | | | | 37,190,944 |
| | | | | | |
| Sovereign Bonds — 7.54%Δ | | | | | |
| Albania — 0.17% | | | | | |
Albania Government
International Bond
3.50% 11/23/31 | EUR | 191,000 | | | 159,151 |
| | | | | | 159,151 |
| Angola — 0.18% | | | | | |
Angolan Government
International Bond
9.375% 5/8/48 | | 200,000 | | | 167,655 |
| | | | | | 167,655 |
| Armenia — 0.16% | | | | | |
Republic of Armenia
International Bond
144A 3.60% 2/2/31 # | | 200,000 | | | 153,748 |
| | | | | | 153,748 |
| Bermuda — 0.41% | | | | | |
Bermuda Government
International Bonds | | | | | |
| 144A 5.00% 7/15/32 # | | 200,000 | | | 193,012 |
| 5.00% 7/15/32 | | 200,000 | | | 193,012 |
| | | | | | 386,024 |
| Brazil — 0.18% | | | | | |
Brazil Notas do Tesouro
Nacional Serie F
10.00% 1/1/33 | BRL | 1,000,000 | | | 164,725 |
| | | | | | 164,725 |
| Chile — 0.23% | | | | | |
Chile Government
International Bond
4.34% 3/7/42 | | 250,000 | | | 213,985 |
| | | | | | 213,985 |
| Colombia — 0.29% | | | | | |
Colombia Government
International Bonds | | | | | |
| 4.125% 2/22/42 | | 217,000 | | | 133,920 |
| 5.20% 5/15/49 | | 200,000 | | | 133,064 |
| | | | | | 266,984 |
| Dominican Republic — 0.68% | | | | | |
Dominican Republic
International Bonds | | | | | |
| 144A 4.875% 9/23/32 # | | 550,000 | | | 456,049 |
| 144A 5.50% 2/22/29 # | | 200,000 | | | 183,907 |
| | | | | | 639,956 |
| Honduras — 0.29% | | | | | |
Honduras Government
International Bond
144A 5.625% 6/24/30 # | | 350,000 | | | 267,403 |
| | | | | | 267,403 |
| Indonesia — 0.42% | | | | | |
Perusahaan Penerbit SBSN
Indonesia III
4.70% 6/6/32 | | 400,000 | | | 396,038 |
| | | | | | 396,038 |
14
| | | Principal
amount° | | Value (US $) |
| Sovereign BondsΔ (continued) | | | | | |
| Ivory Coast — 0.66% | | | | | |
Ivory Coast Government
International Bonds | | | | | |
| 144A 6.125% 6/15/33 # | | 600,000 | | $ | 537,000 |
| 144A 6.875% 10/17/40 # | EUR | 100,000 | | | 80,062 |
| | | | | | 617,062 |
| Morocco — 0.55% | | | | | |
Morocco Government
International Bond
144A 2.375% 12/15/27 # | | 600,000 | | | 517,716 |
| | | | | | 517,716 |
| Pakistan — 0.07% | | | | | |
Pakistan Water & Power
Development Authority
7.50% 6/4/31 | | 200,000 | | | 62,514 |
| | | | | | 62,514 |
| Panama — 0.24% | | | | | |
Panama Bonos del Tesoro
3.362% 6/30/31 | | 200,000 | | | 164,870 |
Panama Government
International Bond 144A
3.75% 4/17/26 # | | 67,000 | | | 62,962 |
| | | | | | 227,832 |
| Paraguay — 0.77% | | | | | |
Paraguay Government
International Bonds | | | | | |
| 144A 2.739% 1/29/33 # | | 200,000 | | | 160,050 |
| 144A 4.95% 4/28/31 # | | 400,000 | | | 386,500 |
| 5.60% 3/13/48 | | 200,000 | | | 171,400 |
| | | | | | 717,950 |
| Peru — 0.43% | | | | | |
Peruvian Government
International Bond 2.392% 1/23/26 | | 433,000 | | | 401,373 |
| | | | | | 401,373 |
| Republic of North Macedonia — 0.18% | | | | | |
North Macedonia
Government International
Bond
144A 1.625% 3/10/28 # | EUR | 200,000 | | | 166,699 |
| | | | | | 166,699 |
| Senegal — 0.27% | | | | | |
Senegal Government
International Bond
144A 6.25% 5/23/33 # | | 300,000 | | | 251,940 |
| | | | | | 251,940 |
| South Africa — 0.70% | | | | | |
Republic of South Africa
Government International
Bonds | | | | | |
| 4.85% 9/30/29 | | 200,000 | | | 181,885 |
| 5.65% 9/27/47 | | 400,000 | | | 305,688 |
| 5.75% 9/30/49 | | 216,000 | | | 165,106 |
| | | | | | 652,679 |
| Uzbekistan — 0.66% | | | | | |
Republic of Uzbekistan
International Bonds | | | | | |
| 144A 3.90% 10/19/31 # | | 200,000 | | | 161,959 |
| 144A 5.375% 2/20/29 # | | 500,000 | | | 456,567 |
| | | | | | 618,526 |
Total Sovereign Bonds
(cost $8,376,833) | | | | | 7,049,960 |
| | | | | | |
| Supranational Banks — 1.02% | | | | | |
Banque Ouest Africaine de
Developpement
144A 4.70% 10/22/31 # | | 400,000 | | | 330,600 |
Central American Bank for
Economic Integration
144A 2.00% 5/6/25 # | | 200,000 | | | 185,221 |
Corp Andina de Fomento
5.25% 11/21/25 | | 200,000 | | | 200,690 |
European Investment Bank
5.50% 1/23/23 | MXN | 4,734,000 | | | 241,288 |
Total Supranational Banks
(cost $1,046,346) | | | | | 957,799 |
| | | | | |
| | | Number of
shares | | | |
| Common Stocks — 67.19%~ | | | | | |
| Communication Services — 4.23% | | | | | |
| Alphabet Class A † | | 360 | | | 36,356 |
| Alphabet Class C † | | 220 | | | 22,319 |
| America Movil ADR Class L | | 3,932 | | | 76,517 |
| AT&T | | 16,327 | | | 314,784 |
| Baidu ADR † | | 1,103 | | | 119,786 |
| Comcast Class A | | 3,200 | | | 117,248 |
| Grupo Televisa ADR | | 9,346 | | | 51,029 |
| Interpublic Group | | 537 | | | 18,451 |
| KDDI | | 18,200 | | | 541,351 |
| LG Uplus | | 5,829 | | | 53,885 |
| NAVER | | 346 | | | 50,296 |
| Orange | | 60,220 | | | 611,905 |
| Publicis Groupe | | 11,360 | | | 747,675 |
| Sitios Latinoamerica † | | 3,932 | | | 1,753 |
| SK Telecom | | 5,509 | | | 210,034 |
15
Schedule of investments
Delaware Enhanced Global Dividend and Income Fund
| | | Number of
shares | | Value (US $) |
| Common Stocks~ (continued) | | | | | |
| Communication Services (continued) | | | | | |
| Telefonica Brasil ADR | | 4,970 | | $ | 36,331 |
| Tencent Holdings | | 12,000 | | | 453,796 |
| TIM ADR | | 3,015 | | | 37,567 |
| Turkcell Iletisim Hizmetleri | | 12,891 | | | 23,540 |
| Verizon Communications | | 10,546 | | | 411,083 |
| VK GDR =, † | | 1,295 | | | 0 |
| Weibo ADR † | | 922 | | | 14,697 |
| Yandex Class A =, † | | 1,288 | | | 0 |
| | | | | | 3,950,403 |
| Consumer Discretionary — 9.33% | | | | | |
| adidas AG | | 9,750 | | | 1,256,853 |
| Alibaba Group Holding † | | 4,700 | | | 51,151 |
| Alibaba Group Holding ADR † | | 2,912 | | | 254,975 |
| Amazon.com † | | 563 | | | 54,352 |
| Americanas | | 15,100 | | | 30,262 |
| ANTA Sports Products | | 8,600 | | | 102,213 |
| APA | | 1,928 | | | 90,327 |
| Arcos Dorados Holdings Class A | | 4,348 | | | 32,566 |
| Astra International | | 308,300 | | | 119,281 |
| Bath & Body Works | | 2,886 | | | 122,655 |
| Best Buy | | 1,301 | | | 110,975 |
| eBay | | 1,004 | | | 45,622 |
| Ethan Allen Interiors | | 1,144 | | | 32,547 |
| Genuine Parts | | 1,300 | | | 238,329 |
| H & M Hennes & Mauritz Class B | | 59,120 | | | 662,878 |
| Home Depot | | 1,389 | | | 450,022 |
| JD.com Class A | | 571 | | | 16,301 |
| JD.com ADR | | 5,540 | | | 316,777 |
| LG Electronics | | 616 | | | 46,483 |
| Lowe's | | 819 | | | 174,078 |
| Macy's | | 4,358 | | | 102,413 |
| NIKE Class B | | 893 | | | 97,953 |
| PulteGroup | | 3,200 | | | 143,296 |
| Ross Stores | | 1,227 | | | 144,381 |
| Sodexo | | 17,860 | | | 1,710,516 |
| Starbucks | | 683 | | | 69,802 |
| Sturm Ruger & Co. | | 134 | | | 7,361 |
| Swatch Group | | 5,210 | | | 1,394,128 |
| Tesla † | | 90 | | | 17,523 |
| TJX | | 5,189 | | | 415,379 |
| Tractor Supply | | 686 | | | 155,249 |
| Trip.com Group ADR † | | 1,739 | | | 55,561 |
| Yum China Holdings | | 3,550 | | | 199,071 |
| | | | | 8,721,280 |
| Consumer Staples — 15.27% | | | | | |
| Altria Group | | 3,241 | | | 150,966 |
| Archer-Daniels-Midland | | 1,500 | | | 146,250 |
| Asahi Group Holdings | | 11,400 | | | 365,619 |
| BRF ADR † | | 10,989 | | | 20,000 |
| Consumer Staples (continued) | | | | | |
| Coca-Cola Femsa ADR | | 1,476 | | | 100,826 |
| Conagra Brands | | 7,300 | | | 277,254 |
| Danone | | 24,480 | | | 1,286,603 |
| Diageo | | 47,010 | | | 2,171,016 |
| Essity Class B | | 56,880 | | | 1,392,809 |
Fomento Economico Mexicano
ADR | | 639 | | | 51,037 |
| General Mills | | 2,100 | | | 179,130 |
| Hengan International Group | | 7,500 | | | 34,571 |
| Kao | | 32,800 | | | 1,312,738 |
| Koninklijke Ahold Delhaize | | 75,240 | | | 2,192,652 |
| Nestle | | 18,090 | | | 2,153,137 |
| Philip Morris International | | 1,807 | | | 180,104 |
| Procter & Gamble | | 900 | | | 134,244 |
| Seven & i Holdings | | 12,100 | | | 492,337 |
| Tingyi Cayman Islands Holding | | 22,000 | | | 35,982 |
| Tsingtao Brewery Class H | | 10,000 | | | 94,665 |
| Unilever | | 28,850 | | | 1,442,533 |
| Uni-President China Holdings | | 49,000 | | | 43,010 |
| Vector Group | | 2,186 | | | 24,265 |
| | | | | 14,281,748 |
| Energy — 2.92% | | | | | |
| Chevron | | 635 | | | 116,402 |
China Petroleum & Chemical
Class H | | 122,000 | | | 57,596 |
| ConocoPhillips | | 2,304 | | | 284,567 |
| Coterra Energy | | 2,701 | | | 75,385 |
| Devon Energy | | 547 | | | 37,480 |
| EOG Resources | | 369 | | | 52,372 |
| EQT | | 1,857 | | | 78,755 |
| Exxon Mobil | | 2,838 | | | 315,983 |
| Gazprom PJSC = | | 45,850 | | | 0 |
| Kinder Morgan | | 5,248 | | | 100,342 |
| LUKOIL PJSC = | | 916 | | | 0 |
| Marathon Petroleum | | 1,491 | | | 181,619 |
| Petroleo Brasileiro ADR | | 7,879 | | | 92,106 |
| Reliance Industries GDR 144A # | | 13,560 | | | 902,384 |
| Rosneft Oil PJSC = | | 24,551 | | | 0 |
| TotalEnergies ADR | | 2,500 | | | 156,050 |
| Viper Energy Partners | | 783 | | | 25,862 |
| Williams | | 7,310 | | | 253,657 |
| | | | | 2,730,560 |
| Financials — 4.28% | | | | | |
| Akbank | | 36,846 | | | 34,221 |
| Allstate | | 1,000 | | | 133,900 |
| Ally Financial | | 1,469 | | | 39,678 |
| American Financial Group | | 989 | | | 140,656 |
| American International Group | | 4,500 | | | 283,995 |
| Ameriprise Financial | | 390 | | | 129,460 |
16
| | | Number of
shares | | Value (US $) |
| Common Stocks~ (continued) | | | | | |
| Financials (continued) | | | | | |
| Banco Bradesco ADR | | 14,732 | | $ | 43,754 |
| Banco Santander Brasil ADR | | 5,102 | | | 27,194 |
| Bangkok Bank | | 14,400 | | | 58,800 |
| Bank Central Asia | | 435,700 | | | 258,840 |
| BlackRock | | 196 | | | 140,336 |
| Blackstone | | 1,118 | | | 102,331 |
| Carlyle Group | | 1,989 | | | 61,997 |
| Discover Financial Services | | 1,715 | | | 185,837 |
| Evercore Class A | | 331 | | | 38,125 |
| Fidelity National Financial | | 908 | | | 36,647 |
Grupo Financiero Banorte
Class O | | 8,076 | | | 64,816 |
| ICICI Bank ADR | | 11,547 | | | 273,895 |
| Invesco | | 4,949 | | | 94,575 |
| Itau Unibanco Holding ADR | | 15,411 | | | 76,747 |
| Jackson Financial Class A | | 2,355 | | | 87,959 |
| MetLife | | 5,291 | | | 405,820 |
| Moelis & Co. Class A | | 1,042 | | | 45,035 |
| Ping An Insurance Group Co. of China Class H | | 16,000 | | | 98,784 |
| Principal Financial Group | | 2,105 | | | 188,776 |
| Prudential Financial | | 1,429 | | | 154,375 |
| Rithm Capital | | 2,908 | | | 26,317 |
| S&P Global | | 162 | | | 57,154 |
| Samsung Life Insurance | | 947 | | | 53,163 |
| Sberbank of Russia PJSC =, † | | 27,428 | | | 0 |
| Synchrony Financial | | 3,071 | | | 115,408 |
| Truist Financial | | 6,200 | | | 290,222 |
| US Bancorp | | 5,400 | | | 245,106 |
| XP Class A † | | 355 | | | 6,216 |
| | | | | 4,000,139 |
| Healthcare — 9.28% | | | | | |
| AbbVie | | 2,709 | | | 436,637 |
| AmerisourceBergen | | 1,076 | | | 183,662 |
| Amgen | | 650 | | | 186,160 |
| BeiGene ADR † | | 158 | | | 30,274 |
| Bristol-Myers Squibb | | 2,315 | | | 185,848 |
| Cardinal Health | | 2,700 | | | 216,459 |
| Cigna | | 400 | | | 131,556 |
| CVS Health | | 1,200 | | | 122,256 |
| Fresenius Medical Care AG & Co. | | 23,050 | | | 720,929 |
| Gilead Sciences | | 1,705 | | | 149,750 |
| Johnson & Johnson | | 2,630 | | | 468,140 |
| Merck & Co. | | 4,704 | | | 518,005 |
| Novo Nordisk Class B | | 13,170 | | | 1,652,020 |
| Pfizer | | 5,061 | | | 253,708 |
| Roche Holding | | 4,140 | | | 1,352,223 |
| Smith & Nephew | | 141,460 | | | 1,864,612 |
| UnitedHealth Group | | 130 | | | 71,209 |
| Viatris | | 11,886 | | | 131,103 |
| | | | | | 8,674,551 |
| Industrials — 5.83% | | | | | |
| Boise Cascade | | 1,138 | | | 84,258 |
| Caterpillar | | 1,000 | | | 236,410 |
| Honeywell International | | 1,300 | | | 285,415 |
| Intertek Group | | 22,180 | | | 1,087,477 |
| Knorr-Bremse | | 14,200 | | | 809,465 |
| Lockheed Martin | | 487 | | | 236,288 |
| Makita | | 36,200 | | | 833,887 |
| Masco | | 783 | | | 39,761 |
| Otis Worldwide | | 67 | | | 5,232 |
| Raytheon Technologies | | 2,200 | | | 217,184 |
| Robert Half International | | 270 | | | 21,271 |
| Securitas Class B | | 194,500 | | | 1,595,458 |
| | | | | | 5,452,106 |
| Information Technology — 12.12% | | | | | |
| Accenture Class A | | 98 | | | 29,491 |
| Amadeus IT Group † | | 36,190 | | | 1,956,703 |
| Apple | | 5,195 | | | 769,016 |
| Applied Materials | | 583 | | | 63,897 |
| Broadcom | | 950 | | | 523,478 |
| Cisco Systems | | 9,099 | | | 452,402 |
| Dell Technologies Class C | | 1,792 | | | 80,264 |
| Fidelity National Information Services | | 3,000 | | | 217,740 |
| Getnet Adquirencia e Servicos para Meios de Pagamento ADR | | 637 | | | 1,089 |
| Hon Hai Precision Industry | | 51,000 | | | 166,989 |
| HP | | 4,289 | | | 128,842 |
| International Business Machines | | 1,800 | | | 268,020 |
| KLA | | 353 | | | 138,782 |
| Lam Research | | 248 | | | 117,150 |
| MediaTek | | 17,000 | | | 410,785 |
| Microchip Technology | | 323 | | | 25,578 |
| Micron Technology | | 395 | | | 22,772 |
| Microsoft | | 2,419 | | | 617,184 |
| Monolithic Power Systems | | 283 | | | 108,095 |
| NetApp | | 1,713 | | | 115,816 |
| NVIDIA | | 974 | | | 164,830 |
| Oracle | | 2,300 | | | 190,969 |
| Paychex | | 1,222 | | | 151,565 |
| QUALCOMM | | 1,059 | | | 133,953 |
| Samsung Electronics | | 16,308 | | | 783,582 |
| SAP | | 15,380 | | | 1,706,513 |
| SK Hynix | | 8,762 | | | 578,292 |
| SK Square † | | 7,074 | | | 204,952 |
| Sohu.com ADR † | | 2,260 | | | 33,403 |
17
Schedule of investments
Delaware Enhanced Global Dividend and Income Fund
| | | Number of
shares | | Value (US $) |
| Common Stocks~ (continued) | | | | | |
| Information Technology (continued) | | | | | |
| Taiwan Semiconductor Manufacturing | | 56,000 | | $ | 899,352 |
| Texas Instruments | | 1,000 | | | 180,460 |
| Western Union | | 6,420 | | | 94,117 |
| | | | | 11,336,081 |
| Materials — 3.00% | | | | | |
| Air Liquide | | 13,290 | | | 1,934,906 |
| BHP Group ADR | | 745 | | | 46,786 |
| Cemex ADR † | | 6,204 | | | 28,352 |
| CF Industries Holdings | | 896 | | | 96,938 |
| Cia de Minas Buenaventura ADR | | 4,888 | | | 39,886 |
| Dow | | 1,485 | | | 75,690 |
| DuPont de Nemours | | 3,500 | | | 246,785 |
| Grupo Mexico Class B | | 18,589 | | | 75,632 |
| Rio Tinto ADR | | 506 | | | 34,732 |
| Ryerson Holding | | 718 | | | 21,174 |
Sociedad Quimica y Minera de
Chile ADR | | 1,033 | | | 102,432 |
| Vale ADR | | 6,381 | | | 105,287 |
| | | | | 2,808,600 |
| Media — 0.00% | | | | | |
| Century Communications =, † | | 125,000 | | | 0 |
| | | | | | 0 |
| Real Estate — 0.35% | | | | | |
| Equity Residential | | 3,500 | | | 227,010 |
| Iron Mountain | | 934 | | | 50,744 |
| VICI Properties | | 1,305 | | | 44,631 |
| | | | | 322,385 |
| Utilities — 0.58% | | | | | |
| Edison International | | 3,600 | | | 239,976 |
| Entergy | | 1,500 | | | 174,405 |
| Kunlun Energy | | 52,000 | | | 40,344 |
| Vistra | | 3,755 | | | 91,359 |
| | | | | | 546,084 |
Total Common Stocks
(cost $68,116,977) | | | | 62,823,937 |
| | | | | |
| Convertible Preferred Stock — 2.42% | | | | | |
2020 Mandatory
Exchangeable Trust 144A
6.50% exercise price
$47.09, maturity date
5/16/23 # | | 223 | | | 227,012 |
Algonquin Power & Utilities
7.75% exercise price
$18.00, maturity date
6/15/24 | | 4,686 | | | 122,773 |
Bank of America 7.25%
exercise price $50.00 ω | | 268 | | | 326,550 |
El Paso Energy Capital Trust
I 4.75% exercise price
$34.49, maturity date
3/31/28 | | 8,410 | | | 385,599 |
Elanco Animal Health 5.00%
exercise price $38.40,
maturity date 2/1/23 | | 6,166 | | | 127,883 |
Lyondellbasell Advanced
Polymers 6.00% exercise
price $52.33 ω | | 361 | | | 306,850 |
RBC Bearings 5.00%
exercise price $226.60,
maturity date 10/15/24 | | 3,166 | | | 366,591 |
UGI 7.25% exercise price
$52.57, maturity date
6/1/24 | | 4,473 | | | 394,742 |
Total Convertible Preferred Stock
(cost $2,635,816) | | | | | 2,258,000 |
| | | | | | |
| Exchange-Traded Funds — 0.38% |
| iShares MSCI EAFE ETF | | 110 | | | 7,383 |
iShares Trust iShares ESG Aware
MSCI EAFE ETF | | 5,120 | | | 344,576 |
Vanguard FTSE Developed
Markets ETF | | 170 | | | 7,380 |
Total Exchange-Traded Funds
(cost $302,151) | | | | | 359,339 |
| | | | | | |
| | | Principal
amount° | | | |
| Leveraged Non-Recourse Security — 0.00% |
JPMorgan Fixed Income
Auction Pass Through
Trust
Series 2007-B Class B
144A 0.002%
1/15/87 #, =, ◆ | | 500,000 | | | 500 |
Total Leveraged Non-Recourse Security
(cost $425,000) | | | | | 500 |
| | | | | | |
| | | Number of
shares | | | |
| Short-Term Investments — 2.14% |
| Money Market Mutual Funds — 2.14% | | | | |
BlackRock Liquidity
FedFund – Institutional
Shares (seven-day
effective yield 3.55%) | | 499,016 | | | 499,016 |
18
| | | Number of
shares | | Value (US $) |
| Short-Term Investments (continued) | | | | | |
| Money Market Mutual Funds (continued) | | | | | |
Fidelity Investments Money
Market Government
Portfolio – Class I (seven-
day effective yield 3.56%) | | 499,016 | | $ | 499,016 |
Goldman Sachs Financial
Square Government Fund
– Institutional Shares
(seven-day effective yield
3.80%) | | 499,016 | | | 499,016 |
Morgan Stanley Institutional
Liquidity Funds
Government Portfolio –
Institutional Class (seven-
day effective yield 3.62%) | | 499,016 | | | 499,016 |
Total Short-Term Investments
(cost $1,996,064) | | | | | 1,996,064 |
Total Value of
Securities—135.12%
(cost $138,436,104) | | | | $ | 126,339,019 |
| ° | Principal amount shown is stated in USD unless noted that the security is denominated in another currency. |
| ~ | Securities have been classified by type of business. Aggregate classification by country of origin has been presented in “Security type / sector and country allocations” on page 7. |
| # | Security exempt from registration under Rule 144A of the Securities Act of 1933, as amended. At November 30, 2022, the aggregate value of Rule 144A securities was $37,293,985, which represents 39.89% of the Fund's net assets. See Note 11 in “Notes to financial statements." |
| ^ | Zero-coupon security. The rate shown is the effective yield at the time of purchase. |
| μ | Fixed to variable rate investment. The rate shown reflects the fixed rate in effect at November 30, 2022. Rate will reset at a future date. |
| « | PIK. The first payment of cash and/or principal will be made after November 30, 2022. |
| ψ | Perpetual security. Maturity date represents next call date. |
| Δ | Securities have been classified by country of risk. |
| † | Non-income producing security. |
| = | The value of this security was determined using significant unobservable inputs and is reported as a Level 3 security in the disclosure table located in Note 3 in “Notes to financial statements.” |
| ω | Perpetual security with no stated maturity date. |
| ◆ | Pass Through Agreement. Security represents the contractual right to receive a proportionate amount of underlying payments due to the counterparty pursuant to various agreements related to the rescheduling of obligations and the exchange of certain notes. |
The following foreign currency exchange contracts were outstanding at November 30, 2022:1
Foreign Currency Exchange Contracts
| Counterparty | | Currency to
Receive (Deliver) | | In Exchange For | | Settlement
Date | | Unrealized
Depreciation |
| BNYM | | CHF | | (41,739 | ) | | USD | | 43,766 | | | 12/1/22 | | $ | (348 | ) |
| JPMCB | | EUR | | (374,693 | ) | | USD | | 388,921 | | | 2/3/23 | | | (3,031 | ) |
| JPMCB | | MXN | | (4,758,957 | ) | | USD | | 240,516 | | | 2/3/23 | | | (3,271 | ) |
| Total Foreign Currency Exchange Contracts | | | $ | (6,650 | ) |
The use of foreign currency exchange contracts involves elements of market risk and risks in excess of the amounts disclosed in the financial statements. The foreign currency exchange contracts presented above represent the Fund's total exposure in such contracts, whereas only the net unrealized appreciation (depreciation) is reflected in the Fund's net assets.
| 1 | See Note 8 in “Notes to financial statements.” |
| Summary of abbreviations: |
| ADR – American Depositary Receipt |
| AG – Aktiengesellschaft |
| BNYM – Bank of New York Mellon |
| DAC – Designated Activity Company |
19
Schedule of investments
Delaware Enhanced Global Dividend and Income Fund
| Summary of abbreviations: |
| EAFE – Europe, Australasia, and Far East |
| ESG – Environmental, Social, and Governance |
| ETF – Exchange-Traded Fund |
| FTSE – Financial Times Stock Exchange |
| GDR – Global Depositary Receipt |
| JPMCB – JPMorgan Chase Bank |
| MSCI – Morgan Stanley Capital International |
| PIK – Payment-in-kind |
| PJSC – Private Joint Stock Company |
| S&P – Standard & Poor’s Financial Services LLC |
| |
| Summary of currencies: |
| BRL – Brazilian Real |
| CHF – Swiss Franc |
| EUR – European Monetary Unit |
| KZT – Kazakhstani Tenge |
| MXN – Mexican Peso |
| USD – US Dollar |
See accompanying notes, which are an integral part of the financial statements.
20
Statement of assets and liabilities
Delaware Enhanced Global Dividend and Income Fund
November 30, 2022
| Assets: | | |
| Investments, at value* | | $ | 126,339,019 | |
| Foreign currencies, at valueΔ | | | 120,799 | |
| Dividends and interest receivable | | | 879,141 | |
| Receivable for securities sold | | | 420,034 | |
| Foreign tax reclaims receivable | | | 366,430 | |
| Prepaid expenses | | | 919 | |
| Other assets | | | 843 | |
| Total Assets | | | 128,127,185 | |
| Liabilities: | | | | |
| Due to custodian | | | 15,636 | |
| Borrowing under line of credit | | | 34,100,000 | |
| Payable for securities purchased | | | 250,034 | |
| Other accrued expenses | | | 130,468 | |
| Investment management fees payable to affiliates | | | 96,658 | |
| Interest expense payable on line of credit | | | 13,281 | |
| Administration expenses payable to affiliates | | | 12,200 | |
| Unrealized depreciation on foreign currency exchange contracts | | | 6,650 | |
| Total Liabilities | | | 34,624,927 | |
| Total Net Assets | | $ | 93,502,258 | |
| | | | | |
| Net Assets Consist of: | | | | |
| Paid-In Capital | | $ | 106,804,387 | |
| Total distributable earnings (loss) | | | (13,302,129 | ) |
| Total Net Assets | | $ | 93,502,258 | |
| | | | | |
| Common Shares: | | | | |
| Net assets | | $ | 93,502,258 | |
| Shares of beneficial interest outstanding | | | 10,620,971 | |
| Net asset value per share | | $ | 8.80 | |
| | | | | | |
| * Investments, at cost | | $ | 138,436,104 | |
| Δ Foreign currencies, at cost | | | 119,299 | |
See accompanying notes, which are an integral part of the financial statements.
21
Statement of operations
Delaware Enhanced Global Dividend and Income Fund
Year ended November 30, 2022
| Investment Income: | | |
| Interest | | $ | 2,805,571 | |
| Dividends | | | 2,223,249 | |
| Foreign tax withheld | | | (172,705 | ) |
| | | | 4,856,115 | |
| | | | | |
| Expenses: | | | | |
| Management fees | | | 1,357,721 | |
| Interest expense | | | 865,990 | |
| Dividend disbursing and transfer agent fees and expenses | | | 173,193 | |
| Reports and statements to shareholders expenses | | | 77,654 | |
| Accounting and administration expenses | | | 59,444 | |
| Legal fees | | | 58,475 | |
| Audit and tax fees | | | 46,165 | |
| Custodian fees | | | 33,124 | |
| Trustees’ fees and expenses | | | 4,460 | |
| Registration fees | | | 134 | |
| Other expenses | | | 154,050 | |
| Total operating expenses | | | 2,830,410 | |
| Net Investment Income (Loss) | | | 2,025,705 | |
| | | | | |
| Net Realized and Unrealized Gain (Loss): | | | | |
| Net realized gain (loss) on: | | | | |
| Investments | | | 4,730,448 | |
| Foreign currencies | | | (137,010 | ) |
| Foreign currency exchange contracts | | | 38,745 | |
| Swap contracts | | | 63,169 | |
| Net realized gain (loss) | | | 4,695,352 | |
| | | | | |
| Net change in unrealized appreciation (depreciation) on: | | | | |
| Investments | | | (19,847,616 | ) |
| Foreign currencies | | | (29,877 | ) |
| Foreign currency exchange contracts | | | 6,866 | |
| Swap contracts | | | (65,025 | ) |
| Net change in unrealized appreciation (depreciation) | | | (19,935,652 | ) |
| Net Realized and Unrealized Gain (Loss) | | | (15,240,300 | ) |
| Net Increase (Decrease) in Net Assets Resulting from Operations | | $ | (13,214,595 | ) |
See accompanying notes, which are an integral part of the financial statements.
22
Statements of changes in net assets
Delaware Enhanced Global Dividend and Income Fund
| | | Year ended |
| | | 11/30/22 | | 11/30/21 |
| Increase (Decrease) in Net Assets from Operations: | | | | | | | | |
| Net investment income (loss) | | $ | 2,025,705 | | | $ | 3,326,197 | |
| Net realized gain (loss) | | | 4,695,352 | | | | 11,665,476 | |
| Net change in unrealized appreciation (depreciation) | | | (19,935,652 | ) | | | (3,491,270 | ) |
| Net increase (decrease) in net assets resulting from operations | | | (13,214,595 | ) | | | 11,500,403 | |
| | | | | | | | | |
| Dividends and Distributions to Shareholders from: | | | | | | | | |
| Distributable earnings | | | (7,353,650 | ) | | | (6,699,278 | ) |
| Return of capital | | | (257,002 | ) | | | (1,684,023 | ) |
| Total distributions to shareholders | | | (7,610,652 | ) | | | (8,383,301 | ) |
| | | | | | | | | |
| Capital Share Transactions: | | | | | | | | |
| Cost of shares redeemed1 | | | (5,096,790 | ) | | | (7,445,547 | ) |
| Decrease in net assets derived from capital share transactions | | | (5,096,790 | ) | | | (7,445,547 | ) |
| Net Decrease in Net Assets | | | (25,922,037 | ) | | | (4,328,445 | ) |
| | | | | | | | | |
| Net Assets: | | | | | | | | |
| Beginning of year | | | 119,424,295 | | | | 123,752,740 | |
| End of year | | $ | 93,502,258 | | | $ | 119,424,295 | |
| 1 | See Note 6 in “Notes to financial statements.” |
See accompanying notes, which are an integral part of the financial statements.
23
Statement of cash flows
Delaware Enhanced Global Dividend and Income Fund
Year ended November 30, 2022
| Cash flows provided by (used for) operating activities: | | |
| Net increase (decrease) in net assets resulting from operations | | $ | (13,214,595 | ) |
Adjustments to reconcile net increase (decrease) in net assets from operations to
net cash provided by (used for) operating activities: | | | | |
| Amortization of premium and accretion of discount on investments, net | | | 201,304 | |
| Proceeds from disposition of investment securities | | | 76,868,366 | |
| Purchase of investment securities | | | (53,286,166 | ) |
| Proceeds (purchase) from disposition of short-term investment securities, net | | | 5,241,976 | |
| Net realized (gain) loss on investments | | | (4,762,934 | ) |
| Net change in unrealized (appreciation) depreciation of investments | | | 19,914,091 | |
| Net change in unrealized (appreciation) depreciation of swap contracts | | | 65,025 | |
| Net change in unrealized (appreciation) depreciation of foreign currencies | | | 29,877 | |
| Net change in unrealized (appreciation) depreciation of foreign currency exchange contracts | | | (6,866 | ) |
| Net realized (gain)/loss on sales of investments from changes in the foreign exchange rates | | | 76,261 | |
| Return of capital distributions on investments | | | 73,688 | |
| (Increase) decrease in receivable for securities sold | | | 1,197,891 | |
| (Increase) decrease in dividends and interest receivable | | | 211,544 | |
| Increase (decrease) in foreign tax reclaims receivable | | | (12,934 | ) |
| Increase (decrease) in prepaid expenses | | | (919 | ) |
| Increase (decrease) in other assets | | | (843 | ) |
| (Increase) decrease in upfront payments paid on credit default swap contracts | | | 180,722 | |
| Increase (decrease) in payable for securities purchased | | | (110,026 | ) |
| Increase (decrease) in Trustees’ fees and expenses payable to affiliates | | | (375 | ) |
| Increase (decrease) in accounting and administration expenses payable to affiliates | | | 11,343 | |
| Increase (decrease) in investment management fees payable to affiliates | | | (43,098 | ) |
| Increase (decrease) in reports and statements to shareholders expenses payable to affiliates | | | (1,297 | ) |
| Increase (decrease) in legal fees payable to affiliates | | | (129 | ) |
| Increase (decrease) in other accrued expenses | | | (21,658 | ) |
| (Increase) decrease in interest expense payable on line of credit | | | 8,983 | |
| Increase (decrease) in other liabilities | | | (558 | ) |
| Total adjustments | | | 45,833,268 | |
| Net cash provided by (used for) operating activities | | | 32,618,673 | |
| Cash provided by (used for) financing activities: | | | | |
| Cash payments to reduce borrowing under line of credit | | | (19,900,000 | ) |
| Cost of shares redeemed, net of change in payable for fund shares redeemed | | | (5,223,722 | ) |
| Cash dividends and distributions paid to shareholders | | | (7,610,652 | ) |
| Increase (decrease) in cash collateral due to broker | | | (210,000 | ) |
| Increase (decrease) in bank overdraft | | | 15,636 | |
| Net cash provided by (used for) financing activities | | | (32,928,738 | ) |
| | | | | |
| Effect of exchange rates on cash | | | (29,877 | ) |
| Net increase (decrease) in cash | | | (339,942 | ) |
| Cash and foreign currencies at beginning of year | | | 460,741 | |
| Cash and foreign currencies at end of year | | $ | 120,799 | |
| Cash paid for interest expense on payable on line of credit | | $ | 857,007 | |
| The following table provides a reconciliation of cash and foreign currencies reported within the "Statement of assets and liabilities" that sum to the total of the same amounts shown above at November 30, 2022: | | |
| Foreign currencies, at value | | $ | 120,799 | |
| Total cash and foreign currencies at end of year | | $ | 120,799 | |
See accompanying notes, which are an integral part of the financial statements.
24
Financial highlights
Delaware Enhanced Global Dividend and Income Fund
Selected data for each share of the Fund outstanding throughout each period were as follows:
| | | Year ended |
| | | 11/30/22 | | 11/30/21 | | 11/30/20 | | 11/30/19 | | 11/30/18 |
| Net asset value, beginning of period | | $ | 10.65 | | | $ | 10.40 | | | $ | 11.03 | | | $ | 10.88 | | | $ | 13.08 | |
| Income (loss) from investment operations: | | | | | | | | | | | | | | | | | | | | |
| Net investment income1 | | | 0.18 | | | | 0.29 | | | | 0.30 | | | | 0.38 | | | | 0.50 | |
| Net realized and unrealized gain (loss) | | | (1.34 | ) | | | 0.68 | | | | (0.11 | ) | | | 0.87 | | | | (1.61 | ) |
| Total from investment operations | | | (1.16 | ) | | | 0.97 | | | | 0.19 | | | | 1.25 | | | | (1.11 | ) |
| Less dividends and distributions from: | | | | | | | | | | | | | | | | | | | | |
| Net investment income | | | (0.67 | ) | | | (0.57 | ) | | | (0.33 | ) | | | (0.40 | ) | | | (0.38 | ) |
| Net realized gain | | | — | | | | — | | | | — | | | | — | | | | (0.56 | ) |
| Return of capital | | | (0.02 | ) | | | (0.15 | ) | | | (0.49 | ) | | | (0.70 | ) | | | (0.15 | ) |
| Total dividends and distributions | | | (0.69 | ) | | | (0.72 | ) | | | (0.82 | ) | | | (1.10 | ) | | | (1.09 | ) |
| Net asset value, end of period | | $ | 8.80 | | | $ | 10.65 | | | $ | 10.40 | | | $ | 11.03 | | | $ | 10.88 | |
| Market value, end of period | | $ | 7.73 | | | $ | 9.78 | | | $ | 9.60 | | | $ | 10.12 | | | $ | 9.60 | |
| Total return based on:2 | | | | | | | | | | | | | | | | | | | | |
| Net asset value | | | (10.22% | ) | | | 9.95% | | | | 3.35% | | | | 13.53% | 3 | | | (8.38% | ) |
| Market value | | | (14.12% | ) | | | 9.39% | | | | 3.97% | | | | 18.05% | 3 | | | (11.74% | ) |
| Ratios and supplemental data: | | | | | | | | | | | | | | | | | | | | |
| Net assets, end of period (000 omitted) | | $ | 93,502 | | | $ | 119,424 | | | $ | 123,753 | | | $ | 132,453 | | | $ | 137,831 | |
| Ratio of expenses to average net assets4, 5, 6, 7 | | | 2.73% | | | | 2.26% | | | | 2.47% | | | | 3.52% | | | | 3.02% | |
| Ratio of net investment income to average net assets8 | | | 1.95% | | | | 2.59% | | | | 3.00% | | | | 3.53% | | | | 4.06% | |
| Portfolio turnover | | | 39% | | | | 56% | | | | 62% | | | | 135% | 9 | | | 34% | |
| Leverage analysis: | | | | | | | | | | | | | | | | | | | | |
| Debt outstanding at end of period at par (000 omitted) | | $ | 34,100 | | | $ | 54,000 | | | $ | 45,600 | | | $ | 60,600 | | | $ | 65,600 | |
| Asset coverage per $1,000 of debt outstanding at end of period | | $ | 3,742 | | | $ | 3,212 | | | $ | 3,714 | | | $ | 3,186 | | | $ | 3,101 | |
| 1 | Calculated using average shares outstanding. |
| 2 | Total return is calculated assuming a purchase of common stock on the opening of the first day and a sale on the closing of the last day of each period reported. Dividends and distributions, if any, are assumed for the purpose of this calculation, to be reinvested at prices obtained under the Fund’s dividend reinvestment plan. Generally, total investment return based on net asset value will be higher than total investment return based on market value in periods where there is an increase in the discount or decrease in the premium of the market value to the net asset value from the beginning to the end of such periods. Conversely, total return based on net asset value will be lower than total return based on market value in periods where there is a decrease in the discount or an increase in the premium of the market value to the net asset value from the beginning to the end of such periods. |
| 3 | General Motors term loan litigation were included in total return. If excluded, the impact on the total return would be 0.02% lower. |
| 4 | Expense ratios do not include expenses of any investment companies in which the Fund invests. |
| 5 | The ratio of expenses before interest expense to adjusted average net assets (excluding debt outstanding) for the years ended November 30, 2022, 2021, 2020, 2019, and 2018 were 1.38%, 1.34%, 1.29%, 1.43%, and 1.31%, respectively. |
| 6 | The ratio of interest expense to adjusted average net assets (excluding debt outstanding) for the years ended November 30, 2022, 2021, 2020, 2019, and 2018 were 0.61%, 0.28%, 0.45%, 1.00%, and 0.81%, respectively. |
| 7 | The ratio of interest expense to average net assets for the years ended November 30, 2022, 2021, 2020, 2019, and 2018 were 0.84%, 0.40%, 0.63%, 1.45%, and 1.15%, respectively. |
| 8 | The ratio of net investment income to adjusted average net assets (excluding debt outstanding) for the years ended November 30, 2022, 2021, 2020, 2019, and 2018 were 1.42%, 1.85%, 2.12%, 2.43%, and 2.85%, respectively. |
| 9 | The Fund’s portfolio turnover rate increased substantially during the year ended November 30, 2019, due to the enhanced income strategy by engaging in dividend capture trading. |
See accompanying notes, which are an integral part of the financial statements.
25
Notes to financial statements
Delaware Enhanced Global Dividend and Income Fund
November 30, 2022
Delaware Enhanced Global Dividend and Income Fund (Fund) is organized as a Delaware statutory trust, and is a diversified closed-end management investment company under the Investment Company Act of 1940, as amended (1940 Act). The Fund’s shares trade on the New York Stock Exchange (NYSE) under the symbol DEX.
1. Significant Accounting Policies
The Fund follows accounting and reporting guidance under Financial Accounting Standards Board (FASB) Accounting Standards Codification Topic 946, Financial Services — Investment Companies. The following accounting policies are in accordance with US generally accepted accounting principles (US GAAP) and are consistently followed by the Fund.
Security Valuation — Equity securities and exchange-traded funds (ETFs), except those traded on the Nasdaq Stock Market LLC (Nasdaq), are valued at the last quoted sales price as of the time of the regular close of the NYSE on the valuation date. Equity securities and ETFs traded on the Nasdaq are valued in accordance with the Nasdaq Official Closing Price, which may not be the last sales price. If, on a particular day, an equity security or ETF does not trade, the mean between the bid and the ask prices will be used, which approximates fair value. Equity securities listed on a foreign exchange are normally valued at the last quoted sales price on the valuation date. US government and agency securities are valued at the mean between the bid and ask prices, which approximates fair value. Other debt securities and credit default swap contracts (CDS) contracts are valued based upon valuations provided by an independent pricing service or broker/counterparty and reviewed by management. To the extent current market prices are not available, the pricing service may take into account developments related to the specific security, as well as transactions in comparable securities. Valuations for fixed income securities utilize matrix systems, which reflect such factors as security prices, yields, maturities, and ratings, and are supplemented by dealer and exchange quotations. For asset-backed securities, collateralized mortgage obligations (CMOs), commercial mortgage securities, and US government agency mortgage securities, pricing vendors utilize matrix pricing which considers prepayment speed, attributes of the collateral, yield or price of bonds of comparable quality, coupon, maturity, and type as well as broker/dealer-supplied prices. Open-end investment companies, other than ETFs, are valued at their published net asset value (NAV). Foreign currency exchange contracts are valued at the mean between the bid and ask prices, which approximates fair value. Interpolated values are derived when the settlement date of the contract is an interim date for which quotations are not available. Swap prices are derived using daily swap curves and models that incorporate a number of market data factors, such as discounted cash flows, trades, and values of the underlying reference instruments. Generally, other securities and assets for which market quotations are not readily available are valued at fair value as determined in good faith by the Fund's valuation designee, Delaware Management Company (DMC). Subject to the oversight of the Fund's Board of Trustees (Board), DMC, as valuation designee, has adopted policies and procedures to fair value securities for which market quotations are not readily available consistent with the requirements of Rule 2a-5 under the 1940 Act. In determining whether market quotations are readily available or fair valuation will be used, various factors will be taken into consideration, such as market closures or suspension of trading in a security. Restricted securities and private placements are valued at fair value.
Federal and Foreign Income Taxes — No provision for federal income taxes has been made as the Fund intends to continue to qualify for federal income tax purposes as a regulated investment company under Subchapter M of the Internal Revenue Code of 1986, as amended, and make the requisite distributions to shareholders. The Fund evaluates tax positions taken or expected to be taken in the course of preparing the Fund's tax returns to determine whether the tax positions are “more-likely-than-not” of being sustained by the applicable tax authority. Tax positions not deemed to meet the “more-likely-than-not” threshold are recorded as a tax benefit or expense in the current year. Management has analyzed the Fund's tax positions taken or expected to be taken on the Fund's federal income tax returns through the year ended November 30, 2022, and for all open tax years (years ended November 30, 2019–November 30, 2021), and has concluded that no provision for federal income tax is required in the Fund's financial statements. In regard to foreign taxes only, the Fund has open tax years in certain foreign countries in which it invests that may date back to the inception of the Fund. If applicable, the Fund recognizes interest accrued on unrecognized tax benefits in interest expense and penalties in “Other” on the “Statement of operations.” During the year ended November 30, 2022, the Fund did not incur any interest or tax penalties.
Distributions — The Fund has implemented a managed distribution policy. Under the policy, the Fund is managed with a goal of generating as much of the distribution as possible from net investment income and short-term capital gains. The balance of the distribution will then come from long-term capital gains to the extent permitted, and if necessary, a return of capital. A return of capital may occur for example, when some or all of the money that you invested in the Fund is paid back to you. A return of capital distribution does not necessarily reflect the Fund’s investment performance and should not be confused with “yield” or “income.” Even though the Fund may realize current year capital gains, such gains may be offset, in whole or in part, by the Fund’s capital loss carryovers from prior years. The Fund’s managed distribution policy is described in more detail on the inside front cover of this report.
26
Underlying Funds — The Fund may invest in other investment companies (Underlying Funds) to the extent permitted by the 1940 Act. The Underlying Funds in which the Fund may invest include ETFs. The Fund will indirectly bear the investment management fees and other expenses of any Underlying Funds.
Cash and Cash Equivalents — Cash and cash equivalents include deposits held at financial institutions, which are available for the Fund’s use with no restrictions, with original maturities of 90 days or less.
Foreign Currency Transactions — Transactions denominated in foreign currencies are recorded at the prevailing exchange rates on the valuation date in accordance with the Fund’s prospectus. The value of all assets and liabilities denominated in foreign currencies is translated daily into US dollars at the exchange rate of such currencies against the US dollar. Transaction gains or losses resulting from changes in exchange rates during the reporting period or upon settlement of the foreign currency transaction are reported in operations for the current period. The Fund generally bifurcates that portion of realized gains and losses on investments in debt securities which is due to changes in foreign exchange rates from that which is due to changes in market prices of debt securities. That portion of gains (losses), attributable to changes in foreign exchange rates, is included on the “Statement of operations” under “Net realized gain (loss) on foreign currencies.” For foreign equity securities, the realized gains and losses are included on the “Statement of operations” under “Net realized gain (loss) on investments.” The Fund reports certain foreign currency related transactions as components of realized gains (losses) for financial reporting purposes, whereas such components are treated as ordinary income (loss) for federal income tax purposes.
Derivative Financial Instruments — The Fund may invest in various derivative financial instruments. These instruments are used to obtain exposure to a security, commodity, index, market, and/or other assets without owning or taking physical custody of securities, commodities and/ or other referenced assets or to manage market, equity, credit, interest rate, foreign currency exchange rate, commodity and/or other risks. Derivative financial instruments may give rise to a form of economic leverage and involve risks, including the imperfect correlation between the value of a derivative financial instrument and the underlying asset, possible default of the counterparty to the transaction or illiquidity of the instrument. Pursuant to Rule 18f-4 under the 1940 Act, among other things, the Fund must either use derivative financial instruments with embedded leverage in a limited manner or comply with an outer limit on fund leverage risk based on value-at-risk. The Fund's successful use of a derivative financial instrument depends on the investment adviser's ability to predict pertinent market movements accurately, which cannot be assured. The use of these instruments may result in losses greater than if they had not been used, may limit the amount of appreciation the Fund can realize on an investment and/or may result in lower distributions paid to shareholders. The Fund's investments in these instruments, if any, are discussed in detail in the Notes to Financial Statements.
Segregation and Collateralizations — In certain cases, based on requirements and agreements with certain exchanges and third-party broker-dealers, the Fund may deliver collateral in connection with certain investments (e.g., futures contracts, foreign currency exchange contracts, options written, securities with extended settlement periods, and swaps). Certain countries require that cash reserves be held while investing in companies incorporated in that country. These cash reserves and cash collateral that has been pledged/received to cover obligations of the Fund under derivative contracts, if any, will be reported separately on the "Statement of assets and liabilities" as cash collateral due to/from broker. Securities collateral pledged for the same purpose, if any, is noted on the "Schedule of investments."
Use of Estimates — The preparation of financial statements in conformity with US GAAP requires management to make estimates and assumptions that affect the fair value of investments, the reported amounts of assets and liabilities and disclosure of contingent assets and liabilities at the date of the financial statements, and the reported amounts of revenues and expenses during the reporting period. Actual results could differ from those estimates and the differences could be material.
Other — Expenses directly attributable to the Fund are charged directly to the Fund. Other expenses common to various funds within the Delaware Funds by Macquarie® (Delaware Funds) are generally allocated among such funds on the basis of average net assets. Management fees and certain other expenses are paid monthly. Security transactions are recorded on the date the securities are purchased or sold (trade date) for financial reporting purposes. Costs used in calculating realized gains and losses on the sale of investment securities are those of the specific securities sold. Dividend income is recorded on the ex-dividend date and interest income is recorded on the accrual basis. Income and capital gain distributions from any Underlying Funds in which the Fund invests are recorded on the ex-dividend date. Discounts and premiums on debt securities are accreted or amortized to interest income, respectively, over the lives of the respective securities using the effective interest method. Premiums on callable debt securities are amortized to interest income to the earliest call date using the effective interest method. Realized gains (losses) on paydowns of asset- and mortgage-backed securities are classified as interest income. Distributions received from investments in real estate investment trusts (REITs) are recorded as dividend income on the ex-dividend date, subject to reclassification
27
Notes to financial statements
Delaware Enhanced Global Dividend and Income Fund
1. Significant Accounting Policies (continued)
upon notice of the character of such distributions by the issuer, which are estimated. Distributions received from investments in master limited partnerships are recorded as return of capital on investments on the ex-dividend date. Foreign dividends are also recorded on the ex-dividend date or as soon after the ex-dividend date that the Fund is aware of such dividends, net of all tax withholdings, a portion of which may be reclaimable. Withholding taxes and reclaims on foreign dividends have been recorded in accordance with the Fund’s understanding of the applicable country’s tax rules and rates.
2. Investment Management, Administration Agreements, and Other Transactions with Affiliates
In accordance with the terms of its investment management agreement, the Fund pays DMC, a series of Macquarie Investment Management Business Trust, and the investment manager, an annual fee of 0.95%, calculated daily and paid monthly, of the adjusted average daily net assets of the Fund. For purposes of the calculation of investment management fees, adjusted average daily net assets excludes the line of credit liability.
DMC's affiliate, Macquarie Investment Management Austria Kapitalanlage AG (MIMAK), acts as sub-advisor to the Manager and provides asset allocation services to the Fund. MIMAK has primary day-to-day responsibility for managing the Fund and may allocate assets to its affiliate, Macquarie Investment Management Global Limited (MIMGL), to invest in real estate investment trust securities and other equity asset classes to which MIMAK may allocate assets. MIMAK may also allocate assets to the Manager.
DMC, and as applicable, MIMAK, may seek investment advice and recommendations from its affiliates: Macquarie Investment Management Europe Limited, MIMAK, and MIMGL (together, the “Affiliated Fixed Income Sub-Advisors”). The Manager may also permit these Affiliated Fixed Income Sub-Advisors to execute Fund fixed income security trades on behalf of the Manager and exercise investment discretion for securities in certain markets where DMC believes it will be beneficial to utilize an Affiliated Fixed Income Sub-Advisor’s specialized market knowledge. DMC may permit its affiliates, MIMGL and Macquarie Funds Management Hong Kong Limited (together, the “Affiliated Equity Sub-Advisors”), to execute Fund equity security trades on behalf of the Manager. The Manager may also seek quantitative support from MIMGL. Although the Affiliated Equity Sub-Advisors serve as sub-advisors, DMC has ultimate responsibility for all investment advisory services. For these services, DMC, not the Fund, may pay each Affiliated Fixed Income Sub-Advisor and Affiliated Equity Sub-Advisor a portion of its investment management fee.
Delaware Investments Fund Services Company (DIFSC), an affiliate of DMC, provides fund accounting and financial administration oversight services to the Fund. For these services, DIFSC’s fees are calculated daily and paid monthly, based on the aggregate daily net assets (excluding the line of credit liability) of all funds within the Delaware Funds at the following annual rates: 0.00475% of the first $35 billion; 0.0040% of the next $10 billion; 0.0025% of the next $45 billion; and 0.0015% of aggregate average daily net assets in excess of $90 billion (Total Fee). Each fund in the Delaware Funds pays a minimum of $4,000, which, in aggregate, is subtracted from the Total Fee. Each fund then pays its portion of the remainder of the Total Fee on a relative NAV basis. This amount is included on the “Statement of operations” under “Accounting and administration expenses.” For the year ended November 30, 2022, the Fund paid $17,724 for these services.
As provided in the investment management agreement, the Fund bears a portion of the cost of certain resources shared with DMC, including the cost of internal personnel of DMC and/or its affiliates that provide legal and regulatory reporting services to the Fund. For the year ended November 30, 2022 the Fund paid $31,619 for internal legal and regulatory reporting services provided by DMC and/or its affiliates’ employees. This amount is included on the “Statement of operations” under “Legal fees.”
Trustees’ fees include expenses accrued by the Fund for each Trustee’s retainer and meeting fees. Certain officers of DMC and DIFSC are officers and/or Trustees of the Fund. These officers and Trustees are paid no compensation by the Fund.
In addition to the management fees and other expenses of the Fund, the Fund indirectly bears the investment management fees and other expenses of any Underlying Funds in which it invests. The amount of these fees and expenses incurred indirectly by the Fund will vary based upon the expense and fee levels of any Underlying Funds and the number of shares that are owned of any Underlying Funds at different times.
28
3. Investments
For the year ended November 30, 2022, the Fund made purchases and sales of investment securities other than short-term investments as follows:
| Purchases | | $ | 53,286,166 |
| Sales | | | 76,868,366 |
The tax cost of investments and derivatives includes adjustments to net unrealized appreciation (depreciation) which may not necessarily be the final tax cost basis adjustments but which approximate the tax basis unrealized gains and losses that may be realized and distributed to shareholders. At November 30, 2022, the cost and unrealized appreciation (depreciation) of investments and derivatives for federal income tax purposes for the Fund were as follows:
| Cost of investments and derivatives | | $ | 139,634,498 | |
| Aggregate unrealized appreciation of investments and derivatives | | $ | 8,284,721 | |
| Aggregate unrealized depreciation of investments and derivatives | | | (21,586,850 | ) |
| Net unrealized depreciation of investments and derivatives | | $ | (13,302,129 | ) |
US GAAP defines fair value as the price that the Fund would receive to sell an asset or pay to transfer a liability in an orderly transaction between market participants at the measurement date under current market conditions. A three-level hierarchy for fair value measurements has been established based upon the transparency of inputs to the valuation of an asset or liability. Inputs may be observable or unobservable and refer broadly to the assumptions that market participants would use in pricing the asset or liability. Observable inputs reflect the assumptions market participants would use in pricing the asset or liability based on market data obtained from sources independent of the reporting entity. Unobservable inputs reflect the reporting entity’s own assumptions about the assumptions that market participants would use in pricing the asset or liability based on the best information available under the circumstances. The Fund's investment in its entirety is assigned a level based upon the observability of the inputs which are significant to the overall valuation. The three-level hierarchy of inputs is summarized as follows:
| Level 1 – | Inputs are quoted prices in active markets for identical investments. (Examples: equity securities, open-end investment companies, futures contracts, and exchange-traded options contracts) |
| | |
| Level 2 – | Other observable inputs, including, but not limited to: quoted prices for similar assets or liabilities in markets that are active, quoted prices for identical or similar assets or liabilities in markets that are not active, inputs other than quoted prices that are observable for the assets or liabilities (such as interest rates, yield curves, volatilities, prepayment speeds, loss severities, credit risks, and default rates) or other market-corroborated inputs. (Examples: debt securities, government securities, swap contracts, foreign currency exchange contracts, foreign securities utilizing international fair value pricing, broker-quoted securities, and fair valued securities) |
| | |
| Level 3 – | Significant unobservable inputs, including the Fund's own assumptions used to determine the fair value of investments. (Examples: broker-quoted securities and fair valued securities) |
Level 3 investments are valued using significant unobservable inputs. The Fund may also use an income-based valuation approach in which the anticipated future cash flows of the investment are discounted to calculate fair value. Discounts may also be applied due to the nature or duration of any restrictions on the disposition of the investments. Valuations may also be based upon current market prices of securities that are comparable in coupon, rating, maturity, and industry. The derived value of a Level 3 investment may not represent the value which is received upon disposition and this could impact the results of operations.
29
Notes to financial statements
Delaware Enhanced Global Dividend and Income Fund
3. Investments (continued)
The following table summarizes the valuation of the Fund’s investments by fair value hierarchy levels as of November 30, 2022:
| | | Level 1 | | Level 2 | | Level 3 | | Total |
| Securities | | | | | | | | | | | | | | | |
| Assets: | | | | | | | | | | | | | | | |
| Common Stocks | | | | | | | | | | | | | | | |
| Communication Services | | $ | 1,257,921 | | $ | 2,692,482 | | | $ | — | 1,2 | | $ | 3,950,403 | |
| Consumer Discretionary | | | 3,162,405 | | | 5,558,875 | | | | — | | | | 8,721,280 | |
| Consumer Staples | | | 1,264,076 | | | 13,017,672 | | | | — | | | | 14,281,748 | |
| Energy | | | 1,770,580 | | | 959,980 | | | | — | 1,2 | | | 2,730,560 | |
| Financials | | | 3,589,352 | | | 410,787 | | | | — | 1,2 | | | 4,000,139 | |
| Healthcare | | | 3,084,767 | | | 5,589,784 | | | | — | | | | 8,674,551 | |
| Industrials | | | 1,125,819 | | | 4,326,287 | | | | — | | | | 5,452,106 | |
| Information Technology | | | 4,628,913 | | | 6,707,168 | | | | — | | | | 11,336,081 | |
| Materials | | | 873,694 | | | 1,934,906 | | | | — | | | | 2,808,600 | |
| Media | | | — | | | — | | | | — | 2 | | | — | |
| Real Estate | | | 322,385 | | | — | | | | — | | | | 322,385 | |
| Utilities | | | 505,740 | | | 40,344 | | | | — | | | | 546,084 | |
| Convertible Bonds | | | — | | | 13,702,476 | | | | — | | | | 13,702,476 | |
| Convertible Preferred Stock | | | 2,258,000 | | | — | | | | — | | | | 2,258,000 | |
| Corporate Bonds | | | — | | | 37,190,944 | | | | — | | | | 37,190,944 | |
| Exchange-Traded Funds | | | 359,339 | | | — | | | | — | | | | 359,339 | |
Leveraged Non-Recourse
Security | | | — | | | — | | | | 500 | | | | 500 | |
| Sovereign Bonds | | | — | | | 7,049,960 | | | | — | | | | 7,049,960 | |
| Supranational Banks | | | — | | | 957,799 | | | | — | | | | 957,799 | |
| Short-Term Investments | | | 1,996,064 | | | — | | | | — | | | | 1,996,064 | |
| Total Value of Securities | | $ | 26,199,055 | | $ | 100,139,464 | | | $ | 500 | | | $ | 126,339,019 | |
| | | | | | | | | | | | | | | | |
| Derivatives3 | | | | | | | | | | | | | | | |
| Liabilities: | | | | | | | | | | | | | | | |
Foreign Currency Exchange
Contracts | | $ | — | | $ | (6,650 | ) | | $ | — | | | $ | (6,650 | ) |
| 1 | The value represents valuations of Russian Common Stocks for which Management has determined include significant unobservable inputs as of November 30, 2022. |
| 2 | The security that has been valued at zero on the “Schedule of investments” is considered to be Level 3 investments in this table. |
| 3 | Foreign currency exchange contracts are valued at the unrealized appreciation (depreciation) on the instrument at the year end. |
The Fund’s policy is to recognize transfers into or out of Level 3 investments based on fair value at the beginning of the reporting year.
A reconciliation of Level 3 investments is presented when the Fund has a significant amount of Level 3 investments at the beginning or end of the year in relation to the Fund’s net assets. Management has determined not to provide additional disclosure on Level 3 investments since the Level 3 investments are not considered significant to the Fund’s net assets at the end of the year.
30
The following is a reconciliation of investments in which significant unobservable inputs (Level 3) were used in determining fair value for the
Fund:
| | | Common
Stock | | Limited
Partnerships | | Leveraged
Non-Recourse
Security | | Total |
| Balance as of 11/30/21 | | | — | | | | 2,538,534 | | | | 500 | | | $ | 2,539,034 | |
| Sales | | | — | | | | (5,289,348 | ) | | | — | | | | (5,289,348 | ) |
| Net realized gain (loss) | | | — | | | | 4,586,813 | | | | — | | | | 4,586,813 | |
| Return of capital | | | — | | | | (18,029 | ) | | | — | | | | (18,029 | ) |
| Corporate actions | | | 558,090 | | | | — | | | | — | | | | 558,090 | |
| Transfers into Level 3 | | | 118,347 | | | | — | | | | — | | | | 118,347 | |
| Net change in unrealized appreciation (depreciation) | | | (676,437 | ) | | | (1,817,970 | ) | | | — | | | | (2,494,407 | ) |
| Balance as of 11/30/22 | | $ | — | | | $ | — | | | $ | 500 | | | $ | 500 | |
| Net change in unrealized appreciation (depreciation) from Level 3 investments still held as of 11/30/22 | | $ | (676,437 | ) | | $ | — | | | $ | — | | | $ | (676,437 | ) |
4. Dividend and Distribution Information
Income and long-term capital gain distributions are determined in accordance with federal income tax regulations, which may differ from US GAAP. Additionally, distributions from net gains on foreign currency transactions and net short-term gains on sales of investment securities are treated as ordinary income for federal income tax purposes. The tax character of dividends and distributions paid during the years ended November 30, 2022 and 2021 were as follows:
| | | Year ended |
| | | 11/30/22 | | 11/30/21 |
| Ordinary income | | $ | 2,330,130 | | | $ | 3,881,022 | |
| Long-term capital gains | | | 5,023,520 | | | | 2,818,256 | |
| Return of capital | | | 257,002 | | | | 1,684,023 | |
| Total | | $ | 7,610,652 | | | $ | 8,383,301 | |
5. Components of Net Assets on a Tax Basis
As of November 30, 2022, the components of net assets on a tax basis were as follows:
| Shares of beneficial interest | | $ | 106,804,387 | |
| Unrealized depreciation of investments, foreign currencies, and derivatives | | | (13,302,129 | ) |
| Net assets | | $ | 93,502,258 | |
The differences between book basis and tax basis components of net assets are primarily attributable to tax deferral of losses on wash sales, market discount and premium on debt instruments, mark-to-market on foreign currency exchange contracts, and tax deferral of losses on straddles.
For financial reporting purposes, capital accounts are adjusted to reflect the tax character of permanent book/tax differences. Reclassifications are primarily due to tax treatment of partnerships. Results of operations and net assets were not affected by these reclassifications. For the year ended November 30, 2022, the Fund recorded the following reclassifications:
| Paid-in capital | | $ | (171 | ) |
| Total distributable earnings (loss) | | | 171 | |
31
Notes to financial statements
Delaware Enhanced Global Dividend and Income Fund
6. Capital Stock
Shares obtained under the Fund’s dividend reinvestment plan are purchased by the Fund’s transfer agent, Computershare, Inc., in the open market, if the shares of the Fund are trading at a discount to the Fund’s NAV on the dividend payment date. However, the dividend reinvestment plan provides that if the shares of the Fund are trading at a premium to the Fund’s NAV on the dividend payment date, the Fund will issue shares to shareholders of record at NAV. During the years ended November 30, 2022 and 2021, the Fund did not issue any shares under the Fund’s dividend reinvestment plan.
The Fund implemented an open-market share repurchase program pursuant to which the Fund may purchase up to 10% of the Fund’s shares, from time to time, in open-market transactions, at the discretion of management. The share repurchase program commenced on August 1, 2016 and has no stated expiration date. For the year ended November 30, 2022, the Fund repurchased 36,934 common shares valued at $367,667. The weighted average discount per share at the repurchase date was 8.61% for the year ended November 30, 2022. For the year ended November 30, 2021, the Fund repurchased 87,229 common shares valued at $877,792. The weighted average discount per share at the repurchase date was 8.32% for the year ended November 30, 2021.
The Fund intends to repurchase its common shares, at such times and in such amounts as is deemed advisable and in accordance with applicable law, subject to various factors, including the limitations imposed by the federal securities laws governing the repurchase of an issuer’s shares by the issuer.
On July 7, 2022, the Fund’s Board approved a tender offer for the Fund’s common shares in accordance with the Fund’s Annual Measurement Period program. The tender offer authorized the Fund to purchase up to 5% of its issued and outstanding shares at a price equal to 98% of the Fund’s NAV at the close of business on the NYSE on June 30, 2022, the first business day following the expiration of the offer. The tender offer commenced on June 1, 2022 and expired on June 29, 2022. In connection with the tender offer, the Fund purchased 558,998 shares at a total cost of $4,729,123. The tender offer was oversubscribed and all tenders of shares were subject to pro-ration (at a ratio of approximately 14.59%) in accordance with the terms of the tender offer.
7. Line of Credit
For the year ended November 30, 2022, the Fund borrowed a portion of the money available to it pursuant to a $70,000,000 Amended and Restated Credit Agreement with The Bank of New York Mellon (BNY Mellon) that expired on June 10, 2022. Effective June 10, 2022, the Fund entered into Amendment No. 7 to the Amended and Restated Credit Agreement in the Commitment Amount of $55,000,000 that is scheduled to terminate on June 9, 2023. Depending on market conditions and amount borrowed, the amount borrowed by the Fund pursuant to the Credit Agreement may be reduced or possibly increased in the future.
At November 30, 2022, the par value of loans outstanding was $34,100,000, at a variable interest rate of 0.99%. The carrying value of the loan approximates fair value. During the year ended November 30, 2022, the average daily balance of loans outstanding was $39,219,726, at a weighted average interest rate of approximately 2.18%.
Interest on borrowings is based on a variable short-term rate plus an applicable margin. The commitment fee under the Amended and Restated Credit Agreement was computed at a rate of 0.15% per annum on the unused balance. The loan is collateralized by the Fund’s portfolio.
8. Derivatives
US GAAP requires disclosures that enable investors to understand: (1) how and why an entity uses derivatives; (2) how they are accounted for; and (3) how they affect an entity’s results of operations and financial position.
Foreign Currency Exchange Contracts — The Fund may enter into foreign currency exchange contracts and foreign cross currency exchange contracts as a way of managing foreign exchange rate risk. The Fund may enter into these contracts to fix the US dollar value of a security that it has agreed to buy or sell for the period between the date the trade was entered into and the date the security is delivered and paid for. The Fund may also enter into these contracts to hedge the US dollar value of securities it already owns that are denominated in foreign currencies. In addition, the Fund may enter into these contracts to facilitate or expedite the settlement of portfolio transactions. The change in value is recorded as an unrealized gain or loss. When the contract is closed, a realized gain or loss is recorded equal to the difference between the value of the contract at the time it was opened and the value at the time it was closed.
32
The use of foreign currency exchange contracts and foreign cross currency exchange contracts does not eliminate fluctuations in the underlying prices of the securities, but does establish a rate of exchange that can be achieved in the future. Although foreign currency exchange contracts and foreign cross currency exchange contracts limit the risk of loss due to an unfavorable change in the value of the hedged currency, they also limit any potential gain that might result should the value of the currency change favorably. In addition, the Fund could be exposed to risks if the counterparties to the contracts are unable to meet the terms of their contracts. The Fund’s maximum risk of loss from counterparty credit risk is the value of its currency exchanged with the counterparty. The risk is generally mitigated by having a netting arrangement between the Fund and the counterparty and by the posting of collateral by the counterparty to the Fund to cover the Fund’s exposure to the counterparty.
During the year ended November 30, 2022, the Fund entered into foreign currency exchange contracts to fix the US dollar value of a security between trade date and settlement date and to hedge the US dollar value of securities it already owns that are denominated in foreign currencies.
Swap Contracts — The Fund may enter into CDS contracts in the normal course of pursuing its investment objective. The Fund may enter into CDS contracts in order to hedge against a credit event, to enhance total return, or to gain exposure to certain securities or markets. Swap agreements are bilaterally negotiated agreements between a Fund and counterparty to exchange or swap investment cash flows, assets, foreign currencies or market-linked returns at specified, future intervals. Swap agreements are privately negotiated in the over-the-counter market (OTC swaps). If the OTC swap entered is one of the swaps identified by a relevant regulator as a swap that is required to be cleared, then it will be cleared through a third party, known as a central counterparty or derivatives clearing organization (centrally cleared swaps).
Credit Default Swaps. A CDS contract is a risk-transfer instrument through which one party (purchaser of protection) transfers to another party (seller of protection) the financial risk of a credit event (as defined in the CDS agreement), as it relates to a particular reference security or basket of securities (such as an index). In exchange for the protection offered by the seller of protection, the purchaser of protection agrees to pay the seller of protection a periodic amount at a stated rate that is applied to the notional amount of the CDS contract. In addition, an upfront payment may be made or received by the Fund in connection with an unwinding or assignment of a CDS contract. Upon the occurrence of a credit event, the seller of protection would pay the par (or other agreed-upon) value of the reference security (or basket of securities) to the counterparty. Credit events generally include, among others, bankruptcy, failure to pay, and obligation default.
During the year ended November 30, 2022, the Fund entered into CDS contracts as a purchaser of protection. Periodic payments (receipts) on such contracts are accrued daily and recorded as unrealized losses (gains) on swap contracts. Upon payment (receipt), such amounts are recorded as realized losses (gains) on swap contracts. Upfront payments made or received in connection with CDS contracts are amortized over the expected life of the CDS contracts as unrealized losses (gains) on swap contracts. The change in value of CDS contracts is recorded daily as unrealized appreciation or depreciation. A realized gain or loss is recorded upon a credit event (as defined in the CDS agreement) or the maturity or termination of the agreement. Initial margin and variation margin are posted to central counterparties for centrally cleared CDS basket trades, as determined by the applicable central counterparty. During the year ended November 30, 2022, the Fund did not enter into any CDS contracts as a seller of protection.
CDS contracts may involve greater risks than if the Fund had invested in the reference obligation directly. CDS contracts are subject to general market risk, liquidity risk, counterparty risk, and credit risk. The Fund’s maximum risk of loss from counterparty credit risk, either as the seller of protection or the buyer of protection, is the fair value of the contract. This risk is mitigated by (1) for bilateral swap contracts, having a netting arrangement between the Fund and the counterparty and by the posting of collateral by the counterparty to the Fund to cover the Fund’s exposure to the counterparty, and (2) for cleared swaps, trading these instruments through a central counterparty.
During the year ended November 30, 2022, the Fund used CDS contracts to hedge against credit events.
Swaps Generally. For centrally cleared swaps, payments are received from the broker or paid to the broker each day, based on the daily fluctuation in the market value of the contract. These receipts or payments are known as “variation margin” and are recorded by the Fund as unrealized gains or losses until the contracts are closed. When the contracts are closed, the Fund records a realized gain or loss equal to the difference between the value of the contract at the time it was opened and the value at the time it was closed. The value of open swaps may differ from that which would be realized in the event the Fund terminated its position in the contract on a given day. Risks of entering into these contracts include the potential inability of the counterparty to meet the terms of the contracts. This type of risk is generally limited to the amount of favorable movement in the value of the underlying security, instrument, or basket of instruments, if any, at the day of default. Risks also arise from potential losses from adverse market movements and such losses could exceed the unrealized amounts shown on the “Schedule of investments.”
33
Notes to financial statements
Delaware Enhanced Global Dividend and Income Fund
8. Derivatives (continued)
Fair values of derivative instruments as of November 30, 2022 were as follows:
| | Liability
Derivatives Fair
Value |
| Statement of Assets and | Currency |
| Liabilities Location | | | Contracts | |
| Unrealized depreciation on foreign currency exchange contracts | | $ | (6,650 | ) | |
| | | | | | | |
The effect of derivative instruments on the “Statement of operations” for the year ended November 30, 2022 was as follows:
| | Net Realized Gain (Loss) on: |
| | Foreign
Currency
Exchange
Contracts | | Swap
Contracts | | Total |
| Currency contracts | | $ | 38,745 | | | | $ | — | | | | $ | 38,745 | |
| Credit contracts | | | — | | | | | 63,169 | | | | | 63,169 | |
| Total | | $ | 38,745 | | | | $ | 63,169 | | | | $ | 101,914 | |
| | | | | | | | | | | | | | | |
| | Net Change in Unrealized Appreciation (Depreciation)
on: |
| | Foreign
Currency
Exchange
Contracts | | Swap
Contracts | | Total |
| Currency contracts | | $ | 6,866 | | | | $ | — | | | | $ | 6,866 | |
| Credit contracts | | | — | | | | | (65,025 | ) | | | | (65,025 | ) |
| Total | | $ | 6,866 | | | | $ | (65,025 | ) | | | $ | (58,159 | ) |
The table below summarizes the average balance of derivative holdings by the Fund during the year ended November 30, 2022:
| | | Long Derivative
Volume | | Short Derivative
Volume |
| Foreign currency exchange contracts (average notional value) | | $ | 373,042 | | | | $ | 911,161 | |
| CDS contracts (average notional value)* | | | 156,718 | | | | | — | |
| * | Long represents buying protection and short represents selling protection. |
9. Offsetting
The Fund entered into an International Swaps and Derivatives Association, Inc. Master Agreement (ISDA Master Agreement) or a similar agreement with certain of its derivative contract counterparties in order to better define its contractual rights and to secure rights that will help the Fund mitigate its counterparty risk. An ISDA Master Agreement is a bilateral agreement between the Fund and a counterparty that governs certain over-the-counter derivatives and foreign exchange contracts and typically contains, among other things, collateral posting items and netting provisions in the event of a default and/or termination event. Under an ISDA Master Agreement, the Fund may, under certain circumstances, offset with the counterparty certain derivative financial instruments’ payables and/or receivables with collateral held and/or posted and create one single net payment. The provisions of the ISDA Master Agreement typically permit a single net payment in the event of default (close-out), including the bankruptcy or insolvency of the counterparty. However, bankruptcy or insolvency laws of a particular jurisdiction may impose restrictions on or prohibitions against the right of offset in bankruptcy, insolvency, or other events.
For financial reporting purposes, the Fund does not offset derivative assets and derivative liabilities that are subject to netting arrangements on the “Statement of assets and liabilities.”
34
At November 30, 2022, the Fund had the following assets and liabilities subject to offsetting provisions:
Offsetting of Financial Assets and Liabilities and Derivative Assets and Liabilities
| Counterparty | | Gross Value of
Derivative Asset | | Gross Value of
Derivative
Liability | | Net
Position |
| Bank of New York Mellon | | | $ | — | | | | $ | (348 | ) | | | $ | (348 | ) |
| JPMorgan Chase Bank | | | | — | | | | | (6,302 | ) | | | | (6,302 | ) |
| Total | | | $ | — | | | | $ | (6,650 | ) | | | $ | (6,650 | ) |
| Counterparty | | Net Position | | Fair Value of
Non-Cash
Collateral Received | | Cash Collateral
Received | | Fair Value of
Non-Cash
Collateral Pledged | | Cash Collateral
Pledged | | Net Exposure(a) |
| Bank of New Mellon | | | $ | (348 | ) | | | $ | — | | | | $ | — | | | | $ | — | | | | $ | — | | | | $ | (348 | ) |
| JPMorgan Chase Bank | | | | (6,302 | ) | | | $ | — | | | | $ | — | | | | $ | — | | | | $ | — | | | | | (6,302 | ) |
| Total | | | $ | (6,650 | ) | | | $ | — | | | | $ | — | | | | $ | — | | | | $ | — | | | | $ | (6,650 | ) |
| (a) | Net exposure represents the receivable (payable) that would be due from (to) the counterparty in the event of default. |
10. Securities Lending
The Fund, along with other funds in Delaware Funds, may lend its securities pursuant to a security lending agreement (Lending Agreement) with BNY Mellon. At the time a security is loaned, the borrower must post collateral equal to the required percentage of the market value of the loaned security, including any accrued interest. The required percentage is: (1) 102% with respect to US securities and foreign securities that are denominated and payable in US dollars; and (2) 105% with respect to foreign securities. With respect to each loan, if on any business day the aggregate market value of securities collateral plus cash collateral held is less than the aggregate market value of the securities which are the subject of such loan, the borrower will be notified to provide additional collateral by the end of the following business day, which, together with the collateral already held, will be not less than the applicable initial collateral requirements for such security loan. If the aggregate market value of securities collateral and cash collateral held with respect to a security loan exceeds the applicable initial collateral requirement, upon the request of the borrower, BNY Mellon must return enough collateral to the borrower by the end of the following business day to reduce the value of the remaining collateral to the applicable initial collateral requirement for such security loan. As a result of the foregoing, the value of the collateral held with respect to a loaned security on any particular day, may be more or less than the value of the security on loan. The collateral percentage with respect to the market value of the loaned security is determined by the security lending agent.
Cash collateral received by the Fund is generally invested in an individual separate account. The investment guidelines permit each separate account to hold certain securities that would be considered eligible securities for a money market fund. Cash collateral received is generally invested in government securities; certain obligations issued by government sponsored enterprises; repurchase agreements collateralized by US Treasury securities; obligations issued by the central government of any Organization for Economic Cooperation and Development (OECD) country or its agencies, instrumentalities, or establishments; obligations of supranational organizations; commercial paper, notes, bonds, and other debt obligations; certificates of deposit, time deposits, and other bank obligations; certain money market funds; and asset-backed securities. The Fund can also accept US government securities and letters of credit (non-cash collateral) in connection with securities loans.
In the event of default or bankruptcy by the lending agent, realization and/or retention of the collateral may be subject to legal proceedings. In the event the borrower fails to return loaned securities and the collateral received is insufficient to cover the value of the loaned securities and provided such collateral shortfall is not the result of investment losses, the lending agent has agreed to pay the amount of the shortfall to the Fund or, at the discretion of the lending agent, replace the loaned securities. The Fund continues to record dividends or interest, as applicable, on the securities loaned and is subject to changes in value of the securities loaned that may occur during the term of the loan. The Fund has the right under the Lending Agreement to recover the securities from the borrower on demand. With respect to security loans collateralized by non-cash collateral, the Fund receives loan premiums paid by the borrower. With respect to security loans collateralized by cash collateral, the earnings from the collateral investments are shared among the Fund, the security lending agent, and the borrower. The Fund records security lending income net of allocations to the security lending agent and the borrower.
35
Notes to financial statements
Delaware Enhanced Global Dividend and Income Fund
10. Securities Lending (continued)
The Fund may incur investment losses as a result of investing securities lending collateral. This could occur if an investment in the collateral investment account defaulted or became impaired. Under those circumstances, the value of the Fund’s cash collateral account may be less than the amount the Fund would be required to return to the borrowers of the securities and the Fund would be required to make up for this shortfall.
During the year ended November 30, 2022, the Fund had no securities out on loan.
11. Credit and Market Risk
An outbreak of infectious respiratory illness caused by a novel coronavirus known as COVID-19 was first detected in China in December 2019 and has now been detected globally. This coronavirus has resulted in travel restrictions, closed international borders, enhanced health screenings at ports of entry and elsewhere, disruption of and delays in healthcare service preparation and delivery, prolonged quarantines, cancellations, supply chain disruptions, and lower consumer demand, as well as general concern and uncertainty. The impact of COVID-19, and other infectious illness outbreaks that may arise in the future, could adversely affect the economies of many nations or the entire global economy, individual issuers and capital markets in ways that cannot necessarily be foreseen. In addition, the impact of infectious illnesses in emerging market countries may be greater due to generally less established healthcare systems. Public health crises caused by the COVID-19 outbreak may exacerbate other pre-existing political, social and economic risks in certain countries or globally. The duration of the COVID-19 outbreak and its effects cannot be determined with certainty.
Beginning in late February 2022, global financial markets have experienced and may continue to experience significant volatility related to military action by Russia in Ukraine. As a result of this military action, the US and many other countries have imposed sanctions on Russia and certain Russian individuals, banks and corporations. The ongoing hostilities and resulting sanctions are expected to have a severe adverse effect on the region’s economies and more globally, including significant negative impact on markets for certain securities and commodities, such as oil and natural gas. Any cessation of trading on the Russian securities markets will impact the value and liquidity of certain portfolio holdings. The extent and duration of military action, sanctions, and resulting market disruptions are impossible to predict, but could be substantial and prolonged and impact your Funds’ performance.
When interest rates rise, fixed income securities (i.e. debt obligations) generally will decline in value. These declines in value are greater for fixed income securities with longer maturities or durations.
IBOR is the risk that changes related to the use of the London interbank offered rate (LIBOR) and other interbank offered rate (collectively, IBORs) could have adverse impacts on financial instruments that reference LIBOR (or the corresponding IBOR). The abandonment of LIBOR could affect the value and liquidity of instruments that reference LIBOR. The use of alternative reference rate products may impact investment strategy performance. These risks may also apply with respect to changes in connection with other IBORs, such as the euro overnight index average (EONIA), which are also the subject of recent reform.
Investments in equity securities in general are subject to market risks that may cause their prices to fluctuate over time. Fluctuations in the value of equity securities in which the Fund invests will cause the NAV of the Fund to fluctuate.
The Fund borrows through its line of credit for purposes of leveraging. Leveraging may result in higher degrees of volatility because the Fund’s NAV could be subject to fluctuations in short-term interest rates and changes in market value of portfolio securities attributable to the leverage. Leverage magnifies the potential for gain and the risk of loss. As a result, a relatively small decline in the value of the underlying investments could result in a relatively large loss. In addition, the leverage through the line of credit is dependent on the credit provider’s ability to fulfill its contractual obligations.
Some countries in which the Fund may invest require governmental approval for the repatriation of investment income, capital, or the proceeds of sales of securities by foreign investors. In addition, if there is deterioration in a country’s balance of payments or for other reasons, a country may impose temporary restrictions on foreign capital remittances abroad.
The securities exchanges of certain foreign markets are substantially smaller, less liquid, and more volatile than the major securities markets in the US. Consequently, acquisition and disposition of securities by the Fund may be inhibited. In addition, a significant portion of the aggregate
36
market value of equity securities listed on the major securities exchanges in emerging markets is held by a smaller number of investors. This may limit the number of shares available for acquisition or disposition by the Fund.
The Fund invests in certain obligations that may have liquidity protection designed to ensure that the receipt of payments due on the underlying security is timely. Such protection may be provided through guarantees, insurance policies, or letters of credit obtained by the issuer or sponsor through third parties, through various means of structuring the transaction or through a combination of such approaches. The Fund will not pay any additional fees for such credit support, although the existence of credit support may increase the price of a security.
The Fund invests in bank loans and other securities that may subject it to direct indebtedness risk, the risk that the Fund will not receive payment of principal, interest, and other amounts due in connection with these investments and will depend primarily on the financial condition of the borrower. Loans that are fully secured offer the Fund more protection than unsecured loans in the event of nonpayment of scheduled interest or principal, although there is no assurance that the liquidation of collateral from a secured loan would satisfy the corporate borrower’s obligation, or that the collateral can be liquidated. Some loans or claims may be in default at the time of purchase. Certain of the loans and the other direct indebtedness acquired by the Fund may involve revolving credit facilities or other standby financing commitments that obligate the Fund to pay additional cash on a certain date or on demand. These commitments may require the Fund to increase its investment in a company at a time when the Fund might not otherwise decide to do so (including at a time when the company’s financial condition makes it unlikely that such amounts will be repaid). To the extent that the Fund is committed to advance additional funds, it will at all times hold and maintain cash or other high-grade debt obligations in an amount sufficient to meet such commitments. When a loan agreement is purchased, the Fund may pay an assignment fee. On an ongoing basis, the Fund may receive a commitment fee based on the undrawn portion of the underlying line of credit portion of a loan agreement. Prepayment penalty fees are received upon the prepayment of a loan agreement by a borrower. Prepayment penalty, facility, commitment, consent, and amendment fees are recorded to income as earned or paid.
As the Fund may be required to rely upon another lending institution to collect and pass on to the Fund amounts payable with respect to the loan and to enforce the Fund’s rights under the loan and other direct indebtedness, an insolvency, bankruptcy, or reorganization of the lending institution may delay or prevent the Fund from receiving such amounts. The highly leveraged nature of many loans may make them especially vulnerable to adverse changes in economic or market conditions. Investments in such loans and other direct indebtedness may involve additional risk to the Fund.
The Fund invests a portion of its assets in high yield fixed income securities, which are securities rated lower than BBB- by Standard & Poor’s Financial Services LLC and Baa3 by Moody’s Investors Service, Inc., or similarly rated by another nationally recognized statistical rating organization. Investments in these higher yielding securities are generally accompanied by a greater degree of credit risk than higher rated securities. Additionally, lower rated securities may be more susceptible to adverse economic and competitive industry conditions than investment grade securities.
The Fund invests in fixed income securities whose value is derived from an underlying pool of mortgages or consumer loans. The value of these securities is sensitive to changes in economic conditions, including delinquencies and/or defaults, and may be adversely affected by shifts in the market’s perception of the issuers and changes in interest rates. Investors receive principal and interest payments as the underlying mortgages and consumer loans are paid back. Some of these securities are CMOs. CMOs are debt securities issued by US government agencies or by financial institutions and other mortgage lenders, which are collateralized by a pool of mortgages held under an indenture. Prepayment of mortgages may shorten the stated maturity of the obligation and can result in a loss of premium, if any has been paid. Certain of these securities may be stripped (securities which provide only the principal or interest feature of the underlying security). The yield to maturity on an interest-only CMO is extremely sensitive not only to changes in prevailing interest rates, but also to the rate of principal payments (including prepayments) on the related underlying mortgage assets. A rapid rate of principal payments may have a material adverse effect on the Fund’s yield to maturity. If the underlying mortgage assets experience greater than anticipated prepayments of principal, the Fund may fail to fully recoup its initial investment in these securities even if the securities are rated in the highest rating categories.
The Fund invests in REITs and is subject to the risks associated with that industry. If the Fund holds real estate directly as a result of defaults or receives rental income directly from real estate holdings, its tax status as a regulated investment company may be jeopardized. There were no direct real estate holdings during the year ended November 30, 2022. The Fund’s REIT holdings are also affected by interest rate changes, particularly if the REITs it holds use floating rate debt to finance their ongoing operations. The Fund also invests in real estate acquired as a result of ownership of securities or other instruments, including issuers that invest, deal, or otherwise engage in transactions in real estate or interests therein. These instruments may include interests in private equity limited partnerships or limited liability companies that hold real estate
37
Notes to financial statements
Delaware Enhanced Global Dividend and Income Fund
11. Credit and Market Risk (continued)
investments (Real Estate Limited Partnerships). The Fund will limit its investments in Real Estate Limited Partnerships to 5% of its total assets at the time of purchase. As of November 30, 2022, there were no unfunded commitment for the limited partnership outstanding in the fund.
The Fund may invest up to 10% of its net assets in illiquid securities, which may include securities with contractual restrictions on resale, securities exempt from registration under Rule 144A promulgated under the Securities Act of 1933, as amended, and other securities which may not be readily marketable. The relative illiquidity of these securities may impair the Fund from disposing of them in a timely manner and at a fair price when it is necessary or desirable to do so. While maintaining oversight, the Board has delegated to DMC the day-to-day functions of determining whether individual securities are liquid for purposes of the Fund’s limitation on investments in illiquid securities. Securities eligible for resale pursuant to Rule 144A, which are determined to be liquid, are not subject to the Fund’s 10% limit on investments in illiquid securities. Rule 144A securities have been identified on the “Schedule of investments.”
12. Contractual Obligations
The Fund enters into contracts in the normal course of business that contain a variety of indemnifications. The Fund’s maximum exposure under these arrangements is unknown. However, the Fund has not had prior claims or losses pursuant to these contracts. Management has reviewed the Fund’s existing contracts and expects the risk of loss to be remote.
13. Recent Accounting Pronouncements
In March 2020, FASB issued an Accounting Standards Update (ASU), ASU 2020-04, Reference Rate Reform (Topic 848) – Facilitation of the Effects of Reference Rate Reform on Financial Reporting. The amendments in ASU 2020-04 provide optional temporary financial reporting relief from the effect of certain types of contract modifications due to the planned discontinuation of LIBOR and other interbank-offered based reference rates as of the end of 2021. In March 2021, the administrator for LIBOR announced the extension of the publication of a majority of the USD LIBOR settings to June 30, 2023. ASU 2020-04 is effective for certain reference rate-related contract modifications that occur during the period March 12, 2020 through December 31, 2022. Management is currently evaluating ASU 2020-04, but does not believe there will be a material impact.
14. Subsequent Events
On August 11, 2022, the Board of the Fund approved the reorganization of the Fund into abrdn Global Dynamic Dividend Fund (“Acquiring Fund”). On December 12, 2022, Fund shareholders voted to approve the reorganization of the Fund into the Acquiring Fund. It is currently expected that the reorganization will occur on or about March 10, 2023, subject to the satisfaction of customary closing conditions.
On November 30, 2022, the Fund’s Board approved an issuer tender offer to purchase for cash up to 30% (or 3,186,291) of its issued and outstanding common shares, without par value (the “tender offer”). The tender offer commenced on Thursday, January 12, 2023, and will expire, unless extended, at 5:00pm ET, on Friday, February 10, 2023, and purchases will be made at a price per share equal to 98% of the Fund’s net asset value per share as of the close of trading on the first business day after the expiration of the tender offer. If more shares are tendered than the amount the Board has authorized to purchase, the Fund will purchase a number of shares equal to the tender offer amount on a pro-rated basis.
Management has determined that no other material events or transactions occurred subsequent to November 30, 2022, that would require recognition or disclosure in the Fund’s financial statements.
38
Report of independent
registered public accounting firm
To the Board of Trustees and Shareholders of Delaware Enhanced Global Dividend and Income Fund
Opinion on the Financial Statements
We have audited the accompanying statement of assets and liabilities, including the schedule of investments, of Delaware Enhanced Global Dividend and Income Fund (the “Fund”) as of November 30, 2022, the related statements of operations and cash flows for the year ended November 30, 2022, the statements of changes in net assets for each of the two years in the period ended November 30, 2022, including the related notes, and the financial highlights for each of the five years in the period ended November 30, 2022 (collectively referred to as the “financial statements”). In our opinion, the financial statements present fairly, in all material respects, the financial position of the Fund as of November 30, 2022, the results of its operations and its cash flows for the year then ended, the changes in its net assets for each of the two years in the period ended November 30, 2022 and the financial highlights for each of the five years in the period ended November 30, 2022 in conformity with accounting principles generally accepted in the United States of America.
Basis for Opinion
These financial statements are the responsibility of the Fund’s management. Our responsibility is to express an opinion on the Fund’s financial statements based on our audits. We are a public accounting firm registered with the Public Company Accounting Oversight Board (United States) (PCAOB) and are required to be independent with respect to the Fund in accordance with the U.S. federal securities laws and the applicable rules and regulations of the Securities and Exchange Commission and the PCAOB.
We conducted our audits of these financial statements in accordance with the standards of the PCAOB. Those standards require that we plan and perform the audit to obtain reasonable assurance about whether the financial statements are free of material misstatement, whether due to error or fraud.
Our audits included performing procedures to assess the risks of material misstatement of the financial statements, whether due to error or fraud, and performing procedures that respond to those risks. Such procedures included examining, on a test basis, evidence regarding the amounts and disclosures in the financial statements. Our audits also included evaluating the accounting principles used and significant estimates made by management, as well as evaluating the overall presentation of the financial statements. Our procedures included confirmation of securities owned as of November 30, 2022 by correspondence with the custodian, transfer agents and brokers; when replies were not received from brokers, we performed other auditing procedures. We believe that our audits provide a reasonable basis for our opinion.
/s/PricewaterhouseCoopers LLP
Philadelphia, Pennsylvania
January 27, 2023
We have served as the auditor of one or more investment companies in Delaware Funds by Macquarie® since 2010.
39
Other Fund information (Unaudited)
Delaware Enhanced Global Dividend and Income Fund
Proxy results
The Fund held its Annual Meeting of Shareholders (the “Annual Meeting”) on August 10, 2022. At the Annual Meeting, the Fund’s shareholders elected 13 Directors. The results of the voting at the meeting were as follows:
| Nominee | | Shares voted for | | Shares withheld | | No ballot received |
| Shawn K. Lytle | | | 6,276,758 | | | | 2,100,761 | | | | 2,802,450 | |
| Jerome D. Abernathy | | | 6,275,209 | | | | 2,102,310 | | | | 2,802,450 | |
| Thomas L. Bennett | | | 6,235,738 | | | | 2,141,781 | | | | 2,802,450 | |
| Ann D. Borowiec | | | 6,281,297 | | | | 2,096,222 | | | | 2,802,450 | |
| Joseph W. Chow | | | 6,274,553 | | | | 2,102,966 | | | | 2,802,450 | |
| H. Jeffrey Dobbs | | | 6,274,788 | | | | 2,102,731 | | | | 2,802,450 | |
| John A. Fry | | | 6,237,183 | | | | 2,140,336 | | | | 2,802,450 | |
| Joseph Harroz, Jr. | | | 6,274,432 | | | | 2,103,087 | | | | 2,802,450 | |
| Sandra A.J. Lawrence | | | 6,283,842 | | | | 2,093,677 | | | | 2,802,450 | |
| Francis A. Sevilla-Sacasa | | | 6,246,146 | | | | 2,131,373 | | | | 2,802,450 | |
| Thomas K. Whitford | | | 6,278,170 | | | | 2,099,349 | | | | 2,802,450 | |
| Christianna Wood | | | 6,287,261 | | | | 2,090,258 | | | | 2,802,450 | |
| Janet L. Yeomans | | | 6,251,375 | | | | 2,126,144 | | | | 2,802,450 | |
Fund management
On April 5, 2022, the Fund announced that Aaron D. Young had been appointed a co-manager of the Fund. The portfolio management team responsible for making the day-to-day investment decisions for the Fund includes Åsa Annerstedt, Adam H. Brown, Liu-Er Chen, Chris Gowlland, Jens Hansen, Allan Saustrup Jensen, Claus Juul, Nikhil G. Lalvani, Benjamin Leung, Stefan Löwenthal, John P. McCarthy, Klaus Petersen, Scot Thompson, Michael G. Wildstein, Jürgen Wurzer, and Aaron D. Young. Listed below are the biographies for each member of the portfolio management team.
Åsa Annerstedt
Vice President, Portfolio Manager
Åsa Annerstedt is a Portfolio Manager for the firm’s Global Equity team. She joined Macquarie Asset Management (MAM) in June 2018. Annerstedt has been a portfolio manager since 2013. Previously, she was a member of the investment committee of a European Union fund dedicated to the financing of companies. Between 1999 and 2009, she managed award-winning European Small Cap and Global Equity portfolios at SEB Asset Management in Denmark. She started her career in 1996 as a business controller and consultant in Sweden. Annerstedt attended Ecole Supérieur de Commerce in Paris and Marseille and earned a master’s degree in finance and international trade from Lund University in Sweden.
Ms. Annerstedt has been a co-portfolio manager of the Fund since July 2019.
Adam H. Brown, CFA
Managing Director, Senior Portfolio Manager
Adam H. Brown is a Senior Portfolio Manager for the firm’s high yield strategies within Macquarie Asset Management Fixed Income (MFI). He manages MFI’s bank loan portfolios and is a co-portfolio manager for the high yield, fixed rate multisector, and core plus strategies. Brown joined Macquarie Asset Management (MAM) in April 2011 as part of the firm’s integration of Macquarie Four Corners Capital Management, where he had worked since 2002. At Four Corners, he was a co-portfolio manager on the firm’s collateralized loan obligations (CLOs) and a senior research analyst supporting noninvestment grade portfolios. Before that, Brown was with the predecessor of Wells Fargo Securities, where he worked in the leveraged finance group arranging senior secured bank loans and high yield bond financings for financial sponsors and corporate issuers. He earned an MBA from the A.B. Freeman School of Business at Tulane University and a bachelor’s degree in Accounting from the University of Florida.
Mr. Brown has been a co-portfolio manager of the Fund since July 2016.
40
Liu-Er Chen, CFA
Managing Director, Chief Investment Officer — Emerging Markets and Healthcare
Liu-Er Chen heads the firm’s global Emerging Markets team, and he is also the portfolio manager for Delaware Healthcare Fund, which launched in September 2007. Prior to joining Macquarie Asset Management (MAM) in September 2006 in his current position, he spent nearly 11 years at Evergreen Investment Management Company, where he most recently worked as managing director and senior portfolio manager. He co-managed the Evergreen Emerging Markets Growth Fund from 1999 to 2001, and became the Fund’s sole manager in 2001. He was also the sole manager of the Evergreen Health Care Fund since its inception in 1999. Chen began his career at Evergreen in 1995 as an analyst covering Asian and global healthcare stocks, before being promoted to portfolio manager in 1998. Prior to his career in asset management, Chen worked for three years in sales, marketing, and business development for major American and European pharmaceutical and medical device companies. He received his medical education in China, and he has experience in medical research at both the Chinese Academy of Sciences and Cornell Medical School. He holds an MBA with a concentration in management from Columbia Business School.
Mr. Chen has been a co-portfolio manager of the Fund since June 2007.
Chris Gowlland, CFA
Senior Vice President, Head of Equity Quantitative Research
Chris Gowlland is the Head of Equity Quantitative Research, a role he assumed in July 2019. As part of his role, he also serves as portfolio manager for certain portfolios managed by the Global Equity team and for several different strategies in the firm’s multi-asset class offerings. Previously, he was a senior quantitative analyst for the firm’s equity department. Prior to joining Macquarie Asset Management (MAM) in May 2007, he spent seven years working in fundamental equity research and corporate finance for Morgan Stanley and Commerzbank Securities, followed by two years as a quantitative strategist at Morgan Stanley and at State Street Global Markets. Gowlland holds a bachelor’s degree in Chinese and Spanish from the University of Leeds (U.K.), a master’s degree in development studies from Brown University, and another master’s degree in international management from Thunderbird. He also spent several years in a Ph.D. program in political economy at Harvard University. Gowlland is a member of the CFA Institute, the CFA Society New York, the CFA Society of Philadelphia, and the Society of Quantitative Analysts.
Mr. Gowlland has been a co-portfolio manager of the Fund since March 2019.
Jens Hansen
Managing Director, Chief Investment Officer — Global Equity Team
Jens Hansen heads the firm’s Global Equity team and is a portfolio manager for the team’s strategies. He joined Macquarie Asset Management (MAM) in June 2018. Hansen has been a portfolio manager since 2001. Hansen started his career in 1982 with Spar Nord Bank, where he worked as an analyst and trader of bonds, equities, and derivatives. In 1994, he joined Nykredit Bank, where he worked as a bond trader. He attended the Aarhus School of Business where he gained a graduate diploma in business administration within finance and international trade.
Mr. Hansen has been a co-portfolio manager of the Fund since March 2019.
Allan Saustrup Jensen, CFA, CAIA®
Vice President, Portfolio Manager
Allan Saustrup Jensen joined Macquarie Asset Management (MAM) in May 2020 as a Portfolio Manager for the firm’s Global Equity team. He has more than 20 years of experience in the asset management industry. Prior to joining MAM, he spent five years at European Capital Partners as a fund manager. From 2010 to 2015, Jensen was a trader at European Value Partners. Prior to that, he spent four years at UBS Wealth Management as a portfolio manager. He began his investment career at Nordea Bank. Jensen attended Copenhagen Business School where he earned a Graduate Diploma in finance.
Mr. Jensen has been a co-portfolio manager of the Fund since May 2020.
41
Other Fund information (Unaudited)
Delaware Enhanced Global Dividend and Income Fund
Fund management (continued)
Claus Juul
Vice President, Portfolio Manager
Claus Juul is a Portfolio Manager for the firm’s Global Equity team. He joined Macquarie Asset Management (MAM) in June 2018. Juul has been a portfolio manager since 2004. Prior to that, he was an equity analyst at Spar Nord Bank before becoming vice president of the research department in 2001. He started his career in 1998 with Sydbank as an equity analyst. He attended the Aarhus School of Business where he gained a master’s degree in economics and business administration.
Mr. Juul has been a co-portfolio manager of the Fund since March 2019.
Nikhil G. Lalvani, CFA
Managing Director, Senior Portfolio Manager, Team Leader
Nikhil G. Lalvani is a Senior Portfolio Manager for the firm’s US Large Cap Value Equity team and assumed the role of Team Leader in October 2018. At Macquarie Asset Management (MAM), Lalvani has worked as both a fundamental and quantitative analyst. Prior to joining the firm in 1997 as an account analyst, he was a research associate with Bloomberg. Lalvani holds a bachelor’s degree in finance from The Pennsylvania State University. He is a member of the CFA Institute and the CFA Society of Philadelphia.
Mr. Lalvani has been a co-portfolio manager of the Fund since January 2019.
Benjamin Leung, CFA
Managing Director, Co-Head of Systematic Investments, Head of Research
Benjamin Leung is the Co-Head of the Macquarie Systematic Investments (MSI) team, a role he assumed in August 2014. In addition to the day-to-day management of the global portfolios, he is also the head of research, responsible for driving the continual evolution of the systematic investment process. Leung joined the MSI team in May 2005 as a quantitative analyst, where his responsibilities included the development and maintenance of various quantitative models. Following his successful efforts to expand the quantitative capability to international markets, he formed the foundation of the current systematic investment approach. Prior to joining the MSI team, he worked as a software engineer for Macquarie’s Investment Banking Group Information Services Division in Sydney. Leung received a Bachelor of Engineering with Honours and a Master’s in Commerce from the University of New South Wales.
Mr. Leung has been a co-portfolio manager of the Fund since January 2021.
Stefan Löwenthal, CFA
Managing Director, Chief Investment Officer — Global Multi Asset Team
Stefan Löwenthal is the Chief Investment Officer for Macquarie Asset Management’s Global Multi Asset team, a role he assumed in February 2013. He heads the global multi asset team, which is responsible for asset allocation and portfolio construction, the management of multi asset funds and institutional accounts, as well as the development of new investment strategies. In addition, Löwenthal oversees all research, portfolio management, and thought leadership activities of the team. He chairs the firm’s Investment Policy Committee and is a member of the Professional Series Multi Manager Committee and the Private Infrastructure Fund Governance Committee. He joined Macquarie in February 2008 as a portfolio manager on the global multi asset team. He holds a Master of Management Science from Vienna University of Economics and Business. Löwenthal is a member of the CFA Society Austria and is a frequent speaker at industry events and universities.
Mr. Löwenthal has been a co-portfolio manager of the Fund since September 2020.
42
John P. McCarthy, CFA
Managing Director, Senior Portfolio Manager
John P. McCarthy is a Senior Portfolio Manager for the Macquarie Asset Management Fixed Income (MFI) high yield strategies, a role he assumed in July 2016. From December 2012 to June 2016, he was co-head of credit research for MFI. McCarthy rejoined Macquarie Asset Management (MAM) in March 2007 as a senior research analyst, after he worked in the firm’s fixed income area from 1990 to 2000 as a senior high yield analyst and high yield trader, and from 2001 to 2002 as a municipal bond trader. Prior to rejoining the firm, he was a senior high yield analyst/trader at Chartwell Investment Partners. McCarthy earned a bachelor’s degree in business administration from Babson College, and he is a member of the CFA Society of Philadelphia.
Mr. McCarthy has been a co-portfolio manager of the Fund since December 2012.
Klaus Petersen, CFA
Managing Director, Senior Portfolio Manager
Klaus Petersen is a Senior Portfolio Manager for the firm’s Global Equity team. He joined Macquarie Asset Management (MAM) in June 2018. Petersen has been a portfolio manager since 2006. Previously, he worked for ATP, Denmark’s largest pension fund, beginning in 1999 as a senior portfolio manager and later in the role as team leader of the technology, media, and telecommunications (TMT) team. He joined Codan Bank in 1996, first as a senior sales analyst and later as a senior portfolio manager. Between 1988 and 1996, Petersen worked for various brokers as an equity sales analyst. He started his career in 1984 as an administrator of pension pools at Faellesbanken in Denmark. Petersen attended the Copenhagen Business School where he gained a graduate diploma in business administration (financial and management accounting).
Mr. Petersen has been a co-portfolio manager of the Fund since March 2019.
Scot Thompson
Managing Director, Co-Head of Systematic Investments, Portfolio Manager
Scot Thompson is the Co-Head of the Macquarie Systematic Investments (MSI) team, a role he assumed in August 2014. His responsibilities include the day-to-day management of the global portfolios, oversight of the trading function, development of new strategies, and client engagement. From June 2003 to August 2014, Thompson was the equities head of product, responsible for product design, development, and client relationships for the firm’s Australian and global equities product range. Before that, he was a member of the firm’s private equity fund-of-fund and performance analytics teams. Prior to joining Macquarie in November 2001 as a quantitative performance analyst, he worked on the performance analytics team for Cogent Investment Administration, where he was responsible for investment performance and attribution reporting for a variety of clients over all asset classes. Thompson also work in civil engineering before moving to finance, working for several Australian companies as a project manager focusing on underground installations, quarrying, and mining. He received a Bachelor of Civil Engineering from the University of Sydney and a Master of Applied Finance from Macquarie University.
Mr. Thompson has been a co-portfolio manager of the Fund since January 2021.
Michael G. Wildstein, CFA
Senior Managing Director, Head of US Credit and Insurance
Michael G. Wildstein is Head of US Credit and Insurance for Macquarie Asset Management Fixed Income (MFI). He manages corporate credit-related portfolios. Before joining the team, he was a senior corporate bond analyst for MFI, focused on the telecommunications sector for high-grade and high yield portfolios. Prior to joining Macquarie Asset Management (MAM) in March 2007 as a senior research analyst, Wildstein spent five years at Merrill Lynch Investment Managers in various roles that included portfolio manager for the core bond team, corporate bond research analyst, and corporate bond trader. Prior to this, Wildstein worked in finance, corporate strategy, and business development with several firms including RCN Corporation and AT&T Local Services. He earned an MBA from Drexel University and a bachelor’s degree from the University of Tampa.
Mr. Wildstein has been a co-portfolio manager of the Fund since September 2020.
43
Other Fund information (Unaudited)
Delaware Enhanced Global Dividend and Income Fund
Fund management (continued)
Jürgen Wurzer, CFA
Senior Vice President, Deputy Head of Portfolio Management — Global Multi Asset Team
Jürgen Wurzer is the Deputy Head of Portfolio Management for Macquarie Asset Management’s Global Multi Asset team, a role he assumed in April 2018. He is responsible for designing and managing multi asset strategies, overseeing quantitative research and modelling, as well as analyzing global equity markets. He initially joined Macquarie in January 2007, focusing on multi asset solutions. Prior to re-joining Macquarie in April 2018, he was part of the multi asset management team at Erste Asset Management from September 2016 to March 2018. He graduated from University of Applied Sciences Wiener Neustadt with a master’s degree. Wurzer is a lecturer for asset allocation, quantitative finance, and portfolio and risk management at several educational institutions.
Mr. Wurzer has been a co-portfolio manager of the Fund since September 2020.
Aaron D. Young
Senior Vice President, Portfolio Manager
Aaron D. Young is a Portfolio Manager for Ivy Investments, now part of Macquarie Asset Management’s Delaware Management Company. He joined Macquarie Asset Management (MAM) as part of Delaware Funds that were involved in a transaction that closed on April 30, 2021. He joined Ivy Investments in 2005 as a fixed income analyst with an emphasis in credit research and derivative securities. He joined the Asset Strategy team at Ivy Investments as an investment analyst in 2007. He had served as an assistant portfolio manager for investment companies managed by Ivy Investments (or its affiliates) since 2012 and has been a portfolio manager on the multi-asset investment team since 2016. He earned a bachelor’s degree in philosophy from the University of Missouri and holds an MBA with an emphasis in finance and strategy from the Olin School of Business at Washington University.
Mr. Young has been a co-portfolio manager of the Fund since April 2022.
Dividend reinvestment plan
Pursuant to the Fund’s Dividend Reinvestment Plan (the “DRIP”), unless you elect to receive distributions in cash (i.e., opt-out), all dividends, including any capital gain dividends, on your common shares will be automatically reinvested by Computershare Trust Company, N.A., as agent for the shareholders (the “DRIP Agent”), in additional common shares under the DRIP. You may elect not to participate in the DRIP by contacting the DRIP Agent. If you do not participate, you will receive all cash distributions paid by check mailed directly to you by Computershare, Inc. as dividend paying agent.
If you participate in the DRIP, the number of common shares you will receive will be determined as follows:
(1) If the market price of the common shares on the record date (or, if the record date is not a New York Stock Exchange (“NYSE”) trading day, the immediately preceding trading day) for determining shareholders eligible to receive the relevant dividend or distribution (the “determination date”) is equal to or exceeds 98% of the net asset value per share of the common shares, the Fund will issue new common shares at a price equal to the greater of:
(a) 98% of the net asset value per share at the close of trading on the NYSE on the determination date or
(b) 95% of the market price of the common shares on the determination date.
(2) If 98% of the net asset value per share of the common shares exceeds the market price of the common shares on the determination date, the DRIP Agent will receive the dividend or distribution in cash and will buy common shares in the open market, on the NYSE or elsewhere, for your account as soon as practicable commencing on the trading day following the determination date and terminating no later than the earlier of (a) 30 days after the dividend or distribution payment date, or (b) the record date for the next succeeding dividend or distribution to be made to the shareholders; except when necessary to comply with applicable provisions of the federal securities laws. If during this period: (i) the market price rises so that it equals or exceeds 98% of the net asset value per share of the common shares at the close of trading on the NYSE on the determination date before the DRIP Agent has completed the open market purchases, or (ii) if the DRIP Agent is unable to invest the full amount eligible to be reinvested in open market purchases, the DRIP Agent will cease purchasing common shares in the open market and the Fund
44
shall issue the remaining common shares at a price per share equal to the greater of (a) 98% of the net asset value per share at the close of trading on the NYSE on the determination date, or (b) 95% of the then-current market price per share.
Common shares in your account will be held by the DRIP Agent in non-certificated form. Any proxy you receive will include all shares of common shares you have received under the DRIP.
You may withdraw from the DRIP (i.e., opt-out) by notifying the DRIP Agent in writing at P.O. Box 43078, Providence, Rhode Island 02940-3078. Such withdrawal will be effective immediately if notice is received by the DRIP Agent prior to any dividend or distribution record date; otherwise such withdrawal will be effective as soon as practicable after the DRIP Agent’s investment of the most recently declared dividend or distribution on the common shares. The DRIP may be amended or supplemented by the Fund upon notice in writing mailed to shareholders at least 30 days prior to the record date for the payment of any dividend or distribution by the Fund for which the termination is to be effective. Upon any termination, the DRIP Agent will continue to hold whole shares for you in non-certificated form until otherwise notified by you, and will cause a cash adjustment for any fractional shares to be delivered to you after deducting brokerage commissions actually incurred. You may elect to notify the DRIP Agent in advance of such termination, or at any time following termination, to have the DRIP Agent sell part or all of your common shares on your behalf. You will be charged a service charge and the DRIP Agent is authorized to deduct brokerage charges actually incurred for this transaction from the proceeds.
There is no service charge for reinvestment of your dividends or distributions in common shares. However, all participants will pay a per share processing fee, which includes any brokerage commissions incurred by the DRIP Agent when it makes open market purchases. Because all dividends and distributions will be automatically reinvested in additional common shares, this allows you to add to your investment through dollar cost averaging, which may lower the average cost of your common shares over time. Dollar cost averaging is a technique for lowering the average cost per share over time if the Fund’s net asset value declines. While dollar cost averaging has definite advantages, it cannot assure profit or protect against loss in declining markets.
Automatically reinvesting dividends and distributions does not mean that you do not have to pay income taxes due upon receiving dividends and distributions. Investors will be subject to income tax on amounts reinvested under the DRIP.
The Fund reserves the right to amend or terminate the DRIP if, in the judgment of the Board, the change is warranted. There is no direct service charge to participants in the DRIP; however, the Fund reserves the right to amend the DRIP to include a service charge payable by the participants.
Additional information about the DRIP and your account may be obtained from the DRIP Agent at P.O. Box 43078, Providence, Rhode Island 02940-3078 or by calling the DRIP Agent at (800)-426-5523.
Section 19(a) notices
The following table sets forth the estimated amount of the sources of distribution for purposes of Section 19 of the 1940 Act, as amended, and the related rules adopted thereunder. The Fund estimates the following percentages, of the total distribution amount per share, attributable to (i) net investment income, (ii) net realized short-term capital gain, (iii) net realized long-term capital gain, and (iv) return of capital or other capital source. These percentages are disclosed for the fiscal year-to-date cumulative distribution amount per share for the Fund.
The amounts and sources of distributions reported in these 19(a) notices are only estimates and not being provided for tax reporting purposes. The actual amounts and sources of the amounts for tax reporting purposes will depend upon the Fund’s investment experience during the remainder of its fiscal year and may be subject to changes based on tax regulations. Shareholders will receive a Form 1099-DIV for the calendar year that will tell you how to report these distributions for federal income tax purposes.
45
Other Fund information (Unaudited)
Delaware Enhanced Global Dividend and Income Fund
Section 19(a) notices (continued)
Total Cumulative Distributions
for the year ended
November 30, 2022 |
Net
Investment
Income | | Net
Realized
Short-
Term
Capital
Gains | | Net
Realized
Long-
Term
Capital
Gains | | Return
of
Capital | | Total
Per
Common
Share |
| $0.2058 | | $0.0153 | | $0.3876 | | $0.0850 | | $0.6937 |
| | | | | | | | | |
Percentage Breakdown of the
Total Cumulative Distributions
for the year ended
November 30, 2022 |
Net
Investment
Income | | Net
Realized
Short-
Term
Capital
Gains | | Net
Realized
Long-
Term
Capital
Gains | | Return
of
Capital | | Total
Per
Common
Share |
| 29.67% | | 2.21% | | 55.87% | | 12.25% | | 100.00% |
Shareholders should not draw any conclusions about the Fund’s investment performance from the amount of these distributions or from the terms of the Fund’s managed distribution policy. The Fund estimates (as of the date hereof) that it has distributed more than its income and net realized capital gains for the current fiscal year; therefore, a portion of your distribution may be a return of capital. A return of capital may occur for example, when some or all of the money that you invested in the Fund is paid back to you. A return of capital distribution does not necessarily reflect the Fund’s investment performance and should not be confused with “yield” or “income.” The Fund’s managed distribution policy is described in more detail on the inside front cover of this report.
Presented below are return figures, based on the change in the Fund’s net asset value per share (“NAV”), compared to the annualized distribution rate as a percentage of the NAV as of November 30, 2022.
Fund Performance and Distribution Information
| Fiscal Year (11/30/21 through 11/30/22) | 7.88 | % |
| Annualized Distribution Rate as a Percentage of NAV^ | 7.88 | % |
| Cumulative Distribution Rate on NAV^^ | (10.22 | )% |
| Cumulative Total Return on NAV for fiscal year ended 11/30/22 | | |
| Average Annual Total Return on NAV for the 5-Year Period Ending 11/30/22** | 1.19 | % |
^ Based on the Fund’s NAV as of November 30, 2022.
^^ Cumulative distribution rate is the cumulative amount of distributions paid during the Fund’s fiscal year ending November 30, 2022 based on the Fund’s NAV as of November 30, 2022.
*Cumulative total return is based on the change in NAV including distributions paid and assuming reinvestment of these distributions for the period December 1, 2021 through November 30, 2022.
**The 5-year average annual total return is based on change in NAV including distributions paid and assuming reinvestment of these distributions and is through the last business day of the month prior to the month of the current distribution record date.
46
While the NAV performance may be indicative of the Fund’s investment performance, it does not measure the value of a shareholder’s investment in the Fund. The value of a shareholder’s investment in the Fund is determined by the Fund’s market price, which is based on the supply and demand for the Fund’s shares in the open market.
Tax information
The information set forth below is for the Fund’s fiscal year as required by federal income tax laws. Shareholders, however, must report distributions on a calendar year basis for income tax purposes, which may include distributions for portions of two fiscal years of the Fund. Accordingly, the information needed by shareholders for income tax purposes will be sent to them in January of each year. Please consult your tax advisor for proper treatment of this information.
All disclosures are based on financial information available as of the date of this annual report and, accordingly are subject to change. For any and all items requiring reporting, it is the intention of the Fund to report the maximum amount permitted under the Internal Revenue Code and the regulations thereunder.
For the fiscal year ended November 30, 2022, the Fund reports distributions paid during the year as follows:
| (A) Long-Term Capital Gains Distribution (Tax Basis) | 66.00% |
| (B) Ordinary Income Distributions (Tax Basis)* | 30.62% |
| (C) Return of Capital Distributions (Tax Basis) | 3.38% |
| Total Distributions (Tax Basis) | 100.00% |
| (D) Qualifying Dividends1 | 31.55% |
(A), (B), and (C) are based on a percentage of the Fund’s total distributions.
(D) is based on the Fund’s ordinary income distributions.
| 1 | Qualified dividends represent dividends which qualify for the corporate dividends received deduction. |
| * | For the fiscal year ended November 30, 2022, certain dividends paid by the Fund may be subject to a maximum tax rate of 20%. The percentage of dividends paid by the Fund from ordinary income reported as qualified income is 87.70%. Complete information will be computed and reported in conjunction with your 2022 Form 1099-DIV, as applicable. |
The Fund intends to pass through foreign tax credits in the maximum amount of $96,557. The gross foreign source income earned during fiscal year 2022 was $1,422,662. Complete information will be computed and reported in conjunction with your 2022 Form 1099-DIV.
Form N-PORT and proxy voting information
The Fund files its complete schedule of portfolio holdings with the Securities and Exchange Commission (SEC) for the first and third quarters of each fiscal year on Form N-PORT. The Fund’s Form N-PORT, as well as a description of the policies and procedures that the Fund uses to determine how to vote proxies (if any) relating to portfolio securities, are available without charge (i) upon request, by calling 866 437-0252; and (ii) on the SEC’s website at sec.gov. In addition, a description of the policies and procedures that the Fund uses to determine how to vote proxies (if any) relating to portfolio securities and the Schedule of Investments included in the Fund’s most recent Form N-PORT are available without charge on the Fund’s website at delawarefunds.com/closed-end.
Information (if any) regarding how the Fund voted proxies relating to portfolio securities during the most recently disclosed 12-month period ended June 30 is available without charge (i) through the Fund’s website at delawarefunds.com/proxy; and (ii) on the SEC’s website at sec.gov.
Tender offer
As described in Note 4 to the Financial Statements, the Fund conducted a tender offer in June 2022 in accordance with the terms of the Fund’s annual Tender Offer Measurement Period program. Since the Fund’s organization in 2007, the Fund has conducted tender offers in 2018, 2019, 2021 and 2022.
Annual Tender Offer Measurement Period
The Fund’s Board has adopted an annual Tender Offer Measurement Period to provide a periodic liquidity opportunity to Fund shareholders. Specifically, if the Fund is trading at an average discount to net asset value of more than 10% during a 12-week measurement period
47
Other Fund information (Unaudited)
Delaware Enhanced Global Dividend and Income Fund
Annual Tender Offer Measurement Period (continued)
established each year by the Board commencing during the first calendar quarter of the year and ending in the second calendar quarter, the Fund will consider conducting a tender offer during the second calendar quarter, subject to the conditions in the following paragraph. The average discount will be determined on the basis of the discount or premium, as the case may be, as of the last trading day in each week during such 12-week period.
Under the Tender Offer Measurement Period program, the Fund does not accept tenders or effect repurchases if: (1) such transactions, if consummated, would (a) result in delisting of the Fund’s shares from the New York Stock Exchange (“NYSE”) (for example, if the Fund’s capitalization would fall below the minimum threshold for continued listing); (b) impair the Fund’s status as a regulated investment company under the Internal Revenue Code of 1986, as amended; or (c) result in a failure to comply with the applicable asset coverage requirements in the event any senior securities are issued and outstanding (including those required by rating agencies or lenders, if any); (2) the amount of shares tendered would require liquidation of such a substantial portion of the Fund’s portfolio securities that the Fund would not be able to liquidate portfolio securities in an orderly manner in light of the existing market conditions or such liquidation would have an adverse effect on the NAV of the Fund to the detriment of non-tendering shareholders; (3) there is any (a) legal action or proceeding instituted or threatened challenging such transactions or otherwise adversely affecting the Fund that, in the Board’s judgment, would be material to the Fund; (b) suspension of or limitation on prices for trading securities generally on the NYSE or other national securities exchange(s), or the National Association of Securities Dealers Automated Quotation System (“NASDAQ”) National Market System; (c) declaration of a banking moratorium by Federal or state authorities or any suspension of payment by banks in the United States or New York State; (d) limitation affecting the Fund or the issuers of its portfolio securities imposed by federal or state authorities on the extension of credit by lending institutions; (e) commencement of war, armed hostilities or other international or national calamity directly or indirectly involving the United States; or (f) other event or condition that, in the Board’s judgment, would have a material adverse effect on the Fund or its shareholders if tendered shares were purchased; or (4) the Board determines that effecting any such transaction would constitute a breach of its fiduciary duty owed to the Fund or its shareholders. The Board may modify these exceptions in light of experience.
There can be no assurance that a tender offer will reduce or eliminate any spread between market price and the net asset value of the Fund’s shares. The market price of the shares will, among other things, be determined by the relative demand for and supply of shares in the market, the Fund’s investment performance, the Fund’s dividends and yields, and investor perception of the Fund’s overall attractiveness as an investment as compared with other investment alternatives. Nevertheless, the fact that a tender offer may be conducted may result in more of a reduction in the spread between market price and net asset value than might otherwise be the case.
Fund strategies and risks
What are the Fund’s principal investment strategies?
The Fund seeks to achieve its objectives by focusing on broad diversification within its portfolio by investing globally in dividend-paying or income-generating securities across multiple asset classes. The Fund may invest in a variety of dividend-paying or income-generating securities. Not all investments, however, are required to pay dividends or interest. Under normal market conditions, the Fund will invest at least 80% of its net assets in a combination of dividend-paying or income-generating securities across multiple asset classes, including but not limited to, equity securities of large, well-established companies; securities issued by real estate companies (including real estate investment trusts (REITs) and real estate operating companies (REOCs), debt securities (such as government bonds, investment grade and high risk, high yield corporate bonds, and convertible bonds), and emerging market securities. In addition, under normal market conditions, the Fund will invest: (1) at most 60% of its net assets in securities of US issuers; (2) at least 40% of its net assets in securities of non-US issuers, unless market conditions are not deemed favorable by the Manager, in which case the Fund would invest at least 30% of its net assets in the securities of non-US issuers; and (3) up to 25% of its net assets in securities issued by real estate companies (including real estate investment trusts and real estate industry operating companies). The Fund utilizes leveraging techniques in an attempt to obtain higher return for the Fund.
The Fund may not invest more than 25% of the Fund’s net assets in any one industry nor, with regard to 75% of the Fund’s total assets, will more than 5% be invested in the securities of any one issuer. In addition, the Manager will use a combination of dividend capture trading, option overwriting, realization of gains on the sale of securities, dividend growth and currency forwards to enhance the sustainability of the income stream.
48
The Manager will determine the proportion of the Fund’s assets to be allocated among the various asset classes based on its analysis of economic and market conditions and its assessment of the income and potential for appreciation that can be achieved from investments in such asset classes.
US equities — The Fund invests primarily in securities of large-capitalization companies that the Manager believes generate income and/or have long-term capital appreciation potential. The Manager follows a value, quality and income-oriented investment philosophy in selecting stocks for the Fund using a research-intensive approach that considers factors such as: a security price that reflects a market valuation that is judged to be below the estimated present or future value of the company; favorable earnings growth prospects; expected above-average return on equity and dividend yield; the financial condition of the issuer; and various qualitative factors.
Securities issued by real estate companies — The Fund may invest in REITs and REIT-equivalents located in any country (including the United States and developed, developing, emerging market countries). The Fund may invest in REOCs located in any country (including the United States and emerging market countries). The Fund may invest in securities that represent a variety of different sectors in the real estate industry. Under certain market conditions, the Fund may shift more of its investments to US real estate companies. The Fund may invest in securities issued in any currency and may hold foreign currency.
International equities — The Manager’s investment strategy in international equities seeks long-term growth without undue risk to principal. The Fund invests primarily in equity securities, including common or ordinary stocks, which provide the potential for capital appreciation. The Fund will invest in foreign securities, including direct investments in securities of foreign issuers and investments in depositary receipts (such as American, European and Global Depositary Receipts ("ADR," "GDRs," and "EDRs," respectively)) that represent indirect interests in securities of foreign issuers. The Fund is not limited in the amount of assets it may invest in such foreign securities.
Emerging market equities — The Manager’s emerging markets strategy seeks long-term capital appreciation and the Fund may invest in a broad range of emerging market equity securities, including common or ordinary stocks. The Manager’s primary emphasis will be on the stocks of companies considered to be from an emerging market country. Under normal circumstances, the Fund intends to, although it is not required to, invest a significant portion of its assets in securities of issuers located in any foreign country (in addition to the United States), including emerging markets.
Convertible securities — The Fund may invest without limit in convertible securities, which are another category of income generating equity securities. These securities may be of any credit quality, including those rated below investment grade by a nationally recognized statistical rating organization (NRSRO) or those that are unrated but deemed equivalent to non-investment grade. The Fund principally invests in convertible securities that offer favorable upside participation and downside protection relative to the underlying equity security that it is linked to. The Manager primarily utilizes convertible securities to invest in sectors or industries of the market which the Manager believes represent attractive investment opportunities but do not offer attractive yields or diversification through traditional equity or debt securities. The convertible structure enables the Manager to gain this exposure while still realizing income returns and minimizing volatility.
US investment grade fixed income — In managing the Fund’s assets allocated to the investment-grade sector, the Fund will invest principally in debt obligations issued or guaranteed by the US government, its agencies or instrumentalities, and by US corporations. The corporate debt obligations in which the Fund may invest include bonds, notes, debentures, and commercial paper of US companies. The US government securities in which the Fund may invest include a variety of securities that are issued or guaranteed as to the payment of principal and interest by the US government, and by various agencies or instrumentalities which have been established or sponsored by the US government. The investment-grade sector of the Fund’s assets may also be invested in mortgage-backed securities issued or guaranteed by the US government, its agencies, or instrumentalities or by government sponsored corporations. Other mortgage-backed securities in which the Fund may invest are issued by certain private, non-government entities. Subject to quality limitations, the Fund may also invest in securities which are backed by assets such as receivables on home equity and credit card loans, automobile, mobile home, recreational vehicle and other loans, wholesale dealer floor plans, and leases. Securities purchased by the Fund within this sector will be rated in one of the four highest rating categories by an NRSRO, such as those rated AAA, AA, A, and BBB by the Standard & Poor’s Ratings Group ("S&P") OR Fitch, Inc. ("Fitch") or Aaa, Aa, A, and Baa by Moody’s Investors Service, Inc. ("Moody's"), or will be unrated securities that the Manager determines are of comparable quality.
US high yield fixed income — The Fund will invest its assets that are allocated to the domestic high yield sector primarily in those securities having a liberal and consistent yield and those tending to reduce the risk of market fluctuations. The Fund may invest in domestic corporate debt obligations, including notes, which may be convertible or non-convertible, commercial paper, units consisting of bonds with stock or warrants to buy stock attached, debentures, convertible debentures, zero coupon bonds, and pay-in-kind securities ("PIKs"). The Fund will invest in both
49
Other Fund information (Unaudited)
Delaware Enhanced Global Dividend and Income Fund
What are the Fund’s principal investment strategies? (continued)
rated and unrated bonds. The rated bonds that the Fund may purchase in this sector will generally be rated BB or lower by S&P or Fitch, Ba or lower by Moody’s, or similarly rated by another NRSRO. Unrated bonds may be more speculative in nature than rated bonds.
International developed markets fixed income — The international developed markets fixed income sector invests primarily in fixed income securities of issuers organized or having a majority of their assets or deriving a majority of their operating income in international developed markets. These fixed income securities may include foreign government securities, debt obligations of foreign companies, and securities issued by supranational entities.
Emerging markets fixed income — The Fund may purchase securities of issuers in any foreign country, developed and underdeveloped. These investments may include direct obligations of issuers located in emerging markets countries. Fixed income securities in the emerging markets fixed income sector may include foreign government securities, debt obligations of foreign companies, and securities issued by supranational entities.
Other strategies
The Fund may use leverage by borrowing through its line of credit. The Fund reserves the right, if the Manager believes that market conditions are appropriate, to use leverage to the extent permitted by the 1940 Act requirements. The Fund also may borrow money as a temporary measure for extraordinary or emergency purposes, including the payment of dividends and the settlement of securities transactions, which otherwise might require untimely dispositions of Fund securities. The Fund may use a variety of additional strategies that would be viewed as potentially adding leverage to the portfolio. These include the sale of credit default swap (CDS) contracts and the use of other derivatives instruments and reverse repurchase agreements.
The Fund may, but is under no obligation to, from time to time employ a variety of investment techniques to hedge against fluctuations in the price of portfolio securities, to enhance total return or to provide a substitute for the purchase or sale of securities. Some of these techniques, such as purchases of put and call options, options on stock indices and stock index futures and entry into certain credit derivatives transactions, may be used as hedges against or substitutes for investments in equity securities. Other techniques such as the purchase of interest rate futures and entry into transactions involving interest rate swaps, options on interest rate swaps, and certain credit derivatives are hedges against or substitutes for investments in debt securities. The Fund might use CDS contracts to limit or to reduce the risk exposure of the Fund to defaults of the issuer or issuers of its holdings (i.e., to reduce risk when the Fund owns or has exposure to such securities). The Fund also might use CDS contracts to create or vary exposure to securities or markets. The aggregate notional amount (typically, the principal amount of the reference security or securities) of the Fund’s investments in the CDS contracts will be limited to 15% of its total net assets. The Fund may also use swaps, financial futures contracts, options on financial futures, or options based on either an index of long-term securities or on equity securities whose prices, in the opinion of the Manager, correlate with the prices of the Fund’s investments.
The Fund may also invest in collateralized mortgage obligations and real estate mortgage investment conduits; bank loans (rated below investment grade); Brady Bonds; other investment companies, including open-end, closed-end, or unregistered investment companies; master limited partnerships; repurchase agreements; privately-placed debt and other securities whose resale is restricted under applicable securities laws, restricted securities, including securities eligible for resale without registration pursuant to Rule 144A under the 1933 Act; short-term investments (including time deposits, certificates of deposit and bankers’ acceptances issued by a US commercial bank; commercial paper and short-term corporate obligations with the highest quality rating by a NRSRO or, if not so rated, of comparable quality as determined by the Manager; US government securities; and repurchase agreements collateralized by securities); options on foreign currencies; forward foreign currency contracts; relatively new or unseasoned companies which are in their early stages of development, or small companies positioned in new and emerging industries where the opportunity for rapid growth is expected to be above average; securities on a when-issued or delayed-delivery basis.
The Fund may invest in other investment companies which can include open-end funds, closed-end funds, unit investment trusts and business development companies to the extent permitted by the 1940 Act, SEC rules thereunder and exemptions thereto.
The Fund may invest up to 10% of the value of its net assets in illiquid securities.
50
In response to unfavorable market conditions, the Fund may make temporary investments in cash or cash equivalents or other high-quality, short-term instruments. These investments may not be consistent with the Fund’s investment objective. To the extent that the Fund holds such instruments, it may be unable to achieve its investment objective. Further, the Fund is authorized to borrow up to 5% of its total assets for temporary defensive purposes such as the clearance of portfolio transactions, the payment of dividends or in connection with tender offers or shares repurchases.
The Fund may from time to time engage in short sales of securities, for investment or for hedging purposes. The Fund may also sell short individual stocks that the Fund expects to underperform other stocks which the Fund holds. For hedging purposes, the Fund may purchase or sell short futures contracts on global equity indexes. In addition, the Fund may loan up to 25% of its assets to qualified broker/dealers or institutional investors for their use relating to short sales or other securities transactions. The Fund may lend its portfolio securities to banks or dealers which meet the creditworthiness standards established by the Board of Trustees of the Fund. For additional information regarding Securities Lending, see Note 8 in “Notes to financial statements.”
Macquarie Investment Management Austria Kapitalanlage AG (MIMAK) serves as sub-advisor to the Fund’s investment manager and provides asset allocation services. MIMAK has primary day-to-day responsibility for managing the Fund, and may allocate assets to its affiliate, Macquarie Investment Management Global Limited (MIMGL), to invest in real estate investment trust securities and other equity asset classes to which MIMAK may allocate assets. In addition, MIMAK may seek investment advice and recommendations relating to fixed income securities from the Manager’s affiliates: Macquarie Investment Management Europe Limited (MIMEL) and MIMGL. MIMAK may also permit MIMGL, and Macquarie Funds Management Hong Kong Limited (MFMHKL) to execute Fund equity security trades on behalf of MIMAK. MIMAK may also permit MIMEL and MIMGL to exercise investment discretion and perform trading for fixed income securities in certain markets where MIMAK believes it will be beneficial to utilize MIMEL’s or MIMGL’s specialized market knowledge, and MIMAK may also seek quantitative support from MIMGL.
What are the principal risks of investing in the Fund?
Investing in any closed-end fund involves the risk that you may lose part or all of the money you invest. Over time, the value of your investment in the Fund will increase and decrease according to changes in the value of the securities in the Fund’s portfolio. An investment in the Fund may not be appropriate for all investors. The Fund’s principal risks include:
Net asset value discount risk — The risk that a closed-end investment company will trade at a discount from its net asset value (NAV).
Market risk — The risk that all or a majority of the securities in a certain market — such as the stock or bond market — will decline in value because of factors such as adverse political or economic conditions, future expectations, investor confidence, or heavy institutional selling.
Active management and selection risk — The risk that the securities selected by a fund’s management will underperform the markets, the relevant indices, or the securities selected by other funds with similar investment objectives and investment strategies. The securities and sectors selected may vary from the securities and sectors included in the relevant index.
Credit risk — The risk that an issuer of a debt security, including a governmental issuer or an entity that insures a bond, may be unable to make interest payments and/or repay principal in a timely manner. For a further discussion of credit and market risks, see Note 11 in “Notes to financial statements.”
Equity risk — The risk that stocks and other equity securities generally fluctuate in value more than bonds.
Issuer risk — The risk that the value of an issuer’s securities may decline for a number of reasons which directly relate to the issuer, such as management performance, financial leverage, and reduced demand for the issuer’s goods and services.
Interest rate risk — The risk that the prices of bonds and other fixed income securities will increase as interest rates fall and decrease as interest rates rise. Interest rate changes are influenced by a number of factors, such as government policy, monetary policy, inflation expectations, and the supply and demand of bonds. Bonds and other fixed income securities with longer maturities or duration generally are more sensitive to interest rate changes. A fund may be subject to a greater risk of rising interest rates due to the current period of historically low interest rates.
51
Other Fund information (Unaudited)
Delaware Enhanced Global Dividend and Income Fund
What are the principal risks of investing in the Fund? (continued)
Liquidity risk — The possibility that investments cannot be readily sold within seven calendar days at approximately the price at which a fund has valued them. Where registration is required to sell a security, a fund may be obligated to pay all or part of the registration expenses, and a considerable period may elapse between the decision to sell and the time the fund may be permitted to sell a security under an effective registration statement. If, during such a period, adverse market conditions were to develop, the fund might obtain a less favorable price than prevailed when it decided to sell. Restricted securities for which no market exists and other illiquid investments are valued at fair value as determined in accordance with procedures approved and periodically reviewed by the Trustees of the fund.
High yield risk — The risk that high yield securities, commonly known as “junk bonds,” are subject to reduced creditworthiness of issuers, increased risk of default, and a more limited and less liquid secondary market. High yield securities may also be subject to greater price volatility and risk of loss of income and principal than are higher-rated securities. High yield bonds are sometimes issued by municipalities that have less financial strength and therefore have less ability to make projected debt payments on the bonds.
Foreign risk — The risk that foreign securities (particularly in emerging markets) may be adversely affected by political instability, changes in currency exchange rates, inefficient markets and higher transaction costs, foreign economic conditions, the imposition of economic or trade sanctions, or inadequate or different regulatory and accounting standards.
Company size risk — The risk that investments in small- and/or medium-sized companies may be more volatile than those of larger companies because of limited financial resources or dependence on narrow product lines.
Leveraging risk — The risk that certain fund transactions using leveraging techniques may give rise to leverage, causing a fund to be more volatile than if it had not been leveraged, which may result in increased losses to a fund. Leveraging techniques, such as borrowing, will pose certain risks for shareholders, including the possibility of higher volatility of both the NAV and market value of the shares. There can be no assurance that a fund would be able to realize a higher net return on its investment portfolio than the then current dividend interest rate on any senior securities. In such event, the fund leveraged capital structure would result in a lower yield to the shareholders than if the fund were not leveraged. Accordingly, the effect of leverage in a declining market is likely to be a greater decline in the NAV of shares than if a fund were not leveraged, which may be reflected in a greater decline in the market price of the shares.
Real estate industry risk — This risk includes, among others: possible declines in the value of real estate; risks related to general and local economic conditions; possible lack of availability of mortgage funds; overbuilding; extended vacancies of properties; increases in competition, property taxes, and operating expenses; changes in zoning laws; costs resulting from the cleanup of, and liability to third parties resulting from, environmental problems; casualty for condemnation losses; uninsured damages from floods, earthquakes, or other natural disasters; limitations on and variations in rents; and changes in interest rates. REITs are subject to substantial cash flow dependency, defaults by borrowers, self-liquidation, and the risk of failing to qualify for tax-free pass-through of income under the Internal Revenue Code of 1986, as amended (Internal Revenue Code), or other similar statutes in non-US countries and/or to maintain exemptions from the Investment Company Act of 1940, as amended.
Derivatives risk — Derivatives contracts, such as futures, forward foreign currency contracts, options, and swaps, may involve additional expenses (such as the payment of premiums) and are subject to significant loss if a security, index, reference rate, or other asset or market factor to which a derivatives contract is associated, moves in the opposite direction from what the portfolio manager anticipated. When used for hedging, the change in value of the derivatives instrument may also not correlate specifically with the currency, rate, or other risk being hedged, in which case a fund may not realize the intended benefits. Derivatives contracts are also subject to the risk that the counterparty may fail to perform its obligations under the contract due to, among other reasons, financial difficulties (such as a bankruptcy or reorganization).
Counterparty risk — The risk that a counterparty to a derivatives contract (such as a swap, futures, or options contract) or a repurchase agreement may fail to perform its obligations under the contract or agreement due to, among other reasons, financial difficulties (such as a bankruptcy or reorganization).
Call options risk — The risk of potential losses if equity markets or an individual equity security do not move as expected and the potential for greater losses than if these techniques had not been used. By writing covered call options, the fund will not benefit from any potential increases in the value of a fund asset above the exercise price, but will bear the risk of declines in the value of the asset. Writing call options may expose a fund to additional costs. Derivatives may be difficult to sell, unwind or value.
52
Loans and other indebtedness risk — The risk that a fund will not receive payment of principal, interest, and other amounts due in connection with these investments and will depend primarily on the financial condition of the borrower and the lending institution. A fund’s ability to sell its loans or to realize their full value upon sale may also be impaired due to the lack of an active trading market, irregular trading activity, wide bid/ ask spreads, contractual restrictions, and extended trade settlement periods. In addition, certain loans in which a fund invests may not be considered securities. A fund therefore may not be able to rely upon the anti-fraud provisions of the federal securities laws with respect to these investments.
Currency risk — The risk that fluctuations in exchange rates between the US dollar and foreign currencies and between various foreign currencies may cause the value of an investment to decline.
Forward foreign currency risk — The use of forward foreign currency contracts may substantially change a fund’s exposure to currency exchange rates and could result in losses to a fund if currencies do not perform as the portfolio manager expects. The use of these investments as a hedging technique to reduce a fund’s exposure to currency risks may also reduce its ability to benefit from favorable changes in currency exchange rates.
Lower rated convertible securities and preferred stock risk — The risk that lower rated convertible securities and preferred stock are subject to a more limited and less liquid secondary trading market, greater price volatility, and reduced creditworthiness of issuers. The lack of a liquid secondary market for certain securities also may make it more difficult for a fund to obtain accurate market quotations for purposes of pricing its portfolio and calculating its NAV. Lower quality convertible securities and preferred stocks may have speculative elements or characteristics; their future cannot be considered as well assured and earnings and asset protection may be moderate or poor in comparison to investment grade securities. In addition, such lower quality securities face major ongoing uncertainties or exposure to adverse business, financial or economic conditions, which could lead to inadequate capacity to meet timely payments.
Securities lending risk — The risk that in a securities lending transaction, the borrower would fail financially at a time when the value of the security increases. In addition, should the borrower become insolvent, a fund could be faced with loss of rights in the collateral. For additional discussion on Securities lending risk, see Note 10 in “Notes to financial statements.”
IBOR risk — The risk that changes related to the use of the London Interbank Offered Rate (LIBOR) or similar interbank offered rates (“IBORs,” such as the Euro Overnight Index Average (EONIA)) could have adverse impacts on financial instruments that reference LIBOR or a similar rate. While some instruments may contemplate a scenario where LIBOR or a similar rate is no longer available by providing for an alternative rate setting methodology, not all instruments have such fallback provisions and the effectiveness of replacement rates is uncertain. The abandonment of LIBOR and similar rates could affect the value and liquidity of instruments that reference such rates, especially those that do not have fallback provisions. The use of alternative reference rate products may impact investment strategy performance.
Board Consideration of Investment Management Agreement and Sub-Advisory Agreements at a Meeting Held on August 9-11, 2022
At a meeting held on August 9-11, 2022 (the “Annual Contract Renewal Meeting”), the Board of Trustees (the “Board”), including a majority of Trustees each of whom is not an “interested person” as defined under the Investment Company Act of 1940 (the “Independent Trustees”), approved the renewal of the Delaware Enhanced Global Dividend and Income Fund (the “Fund”) Investment Management Agreement with Delaware Management Company (“DMC”); and the Sub-Advisory Agreements with Macquarie Investment Management Global Limited (“MIMGL”), Macquarie Investment Management Austria Kapitalanlage AG (“MIMAK”), Macquarie Investment Management Europe Limited (“MIMEL”), and Macquarie Funds Management Hong Kong Limited (“MFMHKL” and together with MIMGL, MIMAK and MIMEL, the “Affiliated Sub-Advisers”).
Prior to the Meeting, including at a Board meeting held in May 2022, the Trustees conferred extensively among themselves and with representatives of DMC about these matters. Also, the Board was assisted by the applicable Investment Committee, with each Investment Committee assisting the full Board in the discharge of its duties in reviewing investment performance and other matters throughout the year. The Independent Trustees were assisted in their evaluation of the Investment Management Agreement and the Sub-Advisory Agreements by independent legal counsel, from whom they received separate legal advice and with whom they met separately.
In providing information to the Board, DMC was guided by a detailed set of requests for information submitted to them by independent legal counsel on behalf of the Independent Trustees at the start of the Board’s annual contract renewal process earlier in 2022. In considering and approving the Investment Management Agreement and the Sub-Advisory Agreements, the Trustees considered the information they believed
53
Other Fund information (Unaudited)
Delaware Enhanced Global Dividend and Income Fund
Board Consideration of Investment Management Agreement and Sub-Advisory Agreements at a Meeting Held on August 9-11, 2022 (continued)
relevant, including but not limited to the information discussed below. The Board considered not only the specific information presented in connection with the Meeting, but also the knowledge gained over time through interaction with DMC about various topics. In this regard, the Board reviewed reports of DMC at each of its quarterly meetings, which included information about, among other things, Fund performance, investment strategies, and expenses. In addition, the Investment Committees confer with portfolio managers at various times throughout the year. In considering information relating to the approval of the Fund’s Investment Management Agreement and the Sub-Advisory Agreements, the Independent Trustees also received information from an independent fund consultant, JDL Consultants, LLC (“JDL”).
The Board did not identify any particular information or consideration that was all-important or controlling, and each individual Trustee may have attributed different weights to various factors.
After its deliberations, the Board unanimously approved the continuation of the Investment Management Agreement and the Sub-Advisory Agreements for a one-year term. The following summarizes a number of important, but not necessarily all, factors considered by the Board in support of its approval.
Nature, extent, and quality of services. The Board received and considered various information regarding the nature, extent, and quality of the advisory services provided to the Fund by DMC under its Investment Management Agreement, and the experience of the officers and employees of DMC who provide these services, including the Fund’s co-portfolio managers. The Board’s review included consideration of DMC’s investment process and oversight and research and analysis capabilities, and its ability to attract and retain qualified investment professionals. The Board considered information regarding DMC’s programs for risk management, including investment, operational, liquidity, valuation, and compliance risks. The Board also considered the additional services provided to the Fund due to the fact that the Fund is a closed-end fund, including, but not limited to, leverage management and monitoring, evaluating, and, where appropriate, making recommendations with respect to the Fund’s trading discount, managed distribution program and distribution rates. The Board received information with respect to the cybersecurity program and business continuity plans of DMC and its affiliates. The Board also considered non-advisory services that DMC and its affiliates provide to the Delaware Funds, including third party oversight, transfer agent, internal audit, valuation, portfolio trading, and legal and compliance. The Board took into account the benefits to shareholders of investing in a Fund that is part of a family of funds managed by an affiliate of Macquarie Group Ltd. (“Macquarie”), the parent company of DMC, and the resources available to DMC as part of Macquarie’s global asset management business.
The Board received and considered various information with respect to the services provided by the Affiliated Sub-Advisers under the Sub- Advisory Agreements and the credentials and experience of the officers and employees of the Affiliated Sub-Advisers who provide these services, including the Fund’s co-portfolio managers. The Board considered the division of responsibilities between DMC and the Affiliated Sub- Advisers and the oversight provided by DMC. The Board considered the expertise of the Affiliated Sub-Advisers with respect to certain asset classes and/or investment styles. The Affiliated Sub-Advisers are part of Macquarie’s global investment platform that has offices and personnel that are located around the world. As a result, the Board noted that DMC had stated that the Affiliated Sub-Advisers can provide research, investment and trading analysis on the markets and economies of various countries in which the Fund may invest, make recommendations regarding securities and assist with security trades, as applicable. The Board took into account that the Sub-Advisory Agreements may benefit the Fund and its shareholders by permitting DMC to use the resources and talents of the Affiliated Sub-Advisers in managing the Fund.
The Board concluded that, overall, it was satisfied with the nature, extent and quality of services provided (and expected to be provided) to the Fund by DMC and the Affiliated Sub-Advisers.
Investment performance. The Board received and considered information with respect to the investment performance of the Fund, including performance reports and discussions with portfolio managers at meetings of the Board’s Investment Committees throughout the year as well as reports provided by Broadridge Financial Solutions, an independent investment company data provider (“Broadridge”), furnished for the Annual Contract Renewal Meeting. The Broadridge reports prepared for the Fund showed its investment performance in comparison to a group of similar funds (the “Performance Universe”). The Board received a description of the methodology used by Broadridge to select the funds in the Performance Universe. Comparative annualized performance for the Fund was shown for the past 1-, 3-, 5-, and 10-year periods and since inception, as applicable, ended December 31, 2021.
54
The Performance Universe for the Fund consisted of the Fund and all leveraged closed-end global funds, regardless of asset size. The Board noted that the Broadridge report comparison showed that the Fund’s total return for the 1- and 10-year periods was in the third quartile and for the 3- and 5-year periods was in the fourth quartile of its Performance Universe. The Broadridge report comparison showed that the Fund’s total return for the 1-, 3-, 5-, and 10-year periods was below the median of its Performance Universe. The Board also noted that the Broadridge report showed that the Fund outperformed its benchmark index for the 1-, 3-, 5-, and 10-year periods. The Board noted the explanations from DMC and the Affiliated Sub-Advisers concerning the reasons for the Fund’s relative performance versus the Performance Universe and its benchmark for the various periods.
Comparative expenses. The Board received and considered expense data for the Fund. Management provided the Board with information on pricing levels and fee structures for the Fund as of its most recently completed fiscal year. The Board also considered the comparative analysis of contractual management fees and actual total expense ratios of the Fund versus contractual management fees and actual total expense ratios of a group of similar funds as selected by Broadridge (the “Expense Group”). In reviewing comparative costs, the Fund’s contractual management fee and the actual management fee (for common and leveraged assets) incurred by the Fund were compared with the contractual management fees (assuming all funds were similar in size to the Fund) and actual management fees, taking into account any applicable breakpoints and fee waivers, with the Fund’s expense universe, which is comprised of the Fund, its Expense Group and all other leveraged closed-end global, excluding outliers (the “Expense Universe”). The Fund’s total expenses were also compared with those of its Expense Universe.
The expense comparisons for the Fund showed that its actual management fee (for both common and leveraged assets) was slightly below the median of its Expense Universe and its actual total expenses (for common and leveraged assets) were above its Expense Group average.
The Board also received and considered information about the nature and extent of services offered and fee rates charged by DMC to other types of clients with investment strategies similar to those of the Fund. In this regard, the Board received information about the significantly greater scope of services, and compliance, reporting and other legal burdens and risks of managing registered investment companies compared with those associated with managing assets of other types of clients, including third-party sub-advised fund clients, unregistered funds and separately managed accounts.
The Board noted that DMC, and not the Fund, pays the sub-advisory fees to the Affiliated Sub-Advisers and, accordingly, that the retention of the Affiliated Sub-Advisers does not increase the fees and expenses incurred by the Fund.
Based on its consideration of the factors and information it deemed relevant, including those described here, the Board determined that the compensation payable to DMC under the Investment Management Agreement and the Affiliated Sub-Advisers under the Sub-Advisory Agreements was reasonable.
Economies of scale. The Board received and considered information about the potential for DMC to realize economies of scale in the provision of management services to the Fund, the difficulties of calculating economies of scale at an individual Fund level and the extent to which potential scale benefits are shared with shareholders. The Board reviewed the Fund’s advisory fee pricing and structure. The Board noted that the Fund may also benefit from economies of scale through DMC’s investment in its business, including investments in business infrastructure, technology and cybersecurity.
Management profitability. The Board received and considered the Investment Management Profitability Analysis that addressed the overall profitability of DMC’s business in providing management and other services to the Fund and the Delaware Funds as a whole, including the methodology used by DMC in allocating costs for the purpose of determining profitability. The Board also reviewed a report prepared by JDL regarding DMC’s profitability as compared to certain peer fund complexes and the Independent Trustees discussed DMC’s profitability in such context with representatives from JDL. Based on its review, the Board determined that DMC’s profitability was not excessive in light of the nature, extent and quality of the services provided to the Fund.
Ancillary benefits. The Board received and considered information regarding the extent to which DMC and its affiliates might derive ancillary benefits from fund operations, including the potential for procuring additional business as a result of the prestige and visibility associated with its role as investment manager to the Delaware Funds; the benefits from allocation of fund brokerage to improve trading efficiencies; and the fees that various affiliates received for serving as transfer agent and for overseeing fund accounting and financial administration services to the
55
Other Fund information (Unaudited)
Delaware Enhanced Global Dividend and Income Fund
Board Consideration of Investment Management Agreement and Sub-Advisory Agreements at a Meeting Held on August 9-11, 2022
(continued)
Delaware Funds. The Board received information from DMC regarding its view of the performance of its affiliates in providing transfer agent and fund accounting and financial administration oversight services and the organizational structure employed to provide these services pursuant to their contracts with the Fund.
Based on its consideration of the factors and information it deemed relevant, including the costs of providing investment management and other services to the Fund and the ongoing commitment of DMC and its affiliates to the Fund, the Board did not find that any ancillary benefits received by DMC and its affiliates were unreasonable.
Conclusion. Based on its review, consideration and evaluation of all factors it believed relevant, including the above-described factors and conclusions, the Board, including all of the Independent Trustees, approved the continuation of DMC’s Investment Management Agreement and of the Affiliated Sub-Advisers’ Sub-Advisory Agreements for an additional one-year period.
56
Board of trustees / directors and officers addendum
Delaware Funds by Macquarie®
A fund is governed by a Board of Trustees / Directors (“Trustees”), which has oversight responsibility for the management of a fund’s business affairs. Trustees establish procedures and oversee and review the performance of the investment manager and others who perform services for the fund. The independent fund trustees, in particular, are advocates for shareholder interests. Each trustee has served in that capacity since he or she was elected to or appointed to the Board of Trustees, and will continue to serve until his or her retirement or the election of a new trustee in his or her place. The following is a list of the Trustees and Officers as of December 31, 2022 with certain background and related information.
Name,
Address,
and Birth Year | | Position(s)
Held with
the Fund | | Length of Time
Served1 | | Number of
Funds in Fund
Complex Overseen
by Trustee | | Principal
Occupation(s)
During the
Past Five Years | | Other
Directorships
Held by Trustee
During the
Past Five Years |
| Interested Trustee |
Shawn K. Lytle2
100 Independence
610 Market Street
Philadelphia, PA
19106-2354
1970 | | President, Chief Executive Officer, and Trustee | | President and Chief Executive Officer since August 2015 Trustee since September 2015 | | 127 | | Macquarie Asset Management3 (2015–Present) -Global Head of Macquarie Asset Management Public Investments (2019–Present) -Head of Americas of Macquarie Group (2017–Present) -Deputy Global Head of Macquarie Asset Management (2017–2019) -Head of Macquarie Asset Management Americas (2015–2017) | | None |
| Independent Trustees |
Jerome D. Abernathy
100 Independence
610 Market Street
Philadelphia, PA
19106-2354
1959 | | Trustee | | Since January 2019 | | 127 | | Stonebrook Capital Management, LLC (financial technology: macro factors and databases) -Managing Member (1993-Present) | | None |
Thomas L. Bennett4
100 Independence
610 Market Street
Philadelphia, PA
19106-2354
1947 | | Chair and Trustee | | Trustee since March 2005
Chair since March 2015 | | 127 | | Private Investor (2004–Present) | | None |
Ann D. Borowiec
100 Independence
610 Market Street
Philadelphia, PA
19106-2354
1958 | | Trustee | | Since March 2015 | | 127 | | J.P. Morgan Chase & Co. (1987-2013) -Chief Executive Officer, Private Wealth Management (2011– 2013) | | Banco Santander International (2016–2019) Santander Bank, N.A. (2016-2019) |
Joseph W. Chow
100 Independence
610 Market Street
Philadelphia, PA
19106-2354
1953 | | Trustee | | Since January 2013 | | 127 | | Private Investor (2011–Present) | | None |
57
Board of trustees / directors and officers addendum
Delaware Funds by Macquarie®
Name,
Address,
and Birth Year | | Position(s)
Held with
the Fund | | Length of Time
Served1 | | Number of
Funds in Fund
Complex Overseen
by Trustee | | Principal
Occupation(s)
During the
Past Five Years | | Other
Directorships
Held by Trustee
During the
Past Five Years |
H. Jeffrey Dobbs
100 Independence
610 Market Street
Philadelphia, PA
19106-2354
1955 | | Trustee | | Since April 20195 | | 127 | | KPMG LLP (2002-2015) -Global Sector Chairman, Industrial Manufacturing (2010-2015) | | TechAccel LLC (2015–Present) PatientsVoices, Inc. (2018–Present) Valparaiso University Board (2012-Present) Ivy Funds Complex (2019- 2021) |
John A. Fry
100 Independence
610 Market Street
Philadelphia, PA
19106-2354
1960 | | Trustee | | Since January 2001 | | 127 | | Drexel University -President (2010–Present) | | Federal Reserve Bank of Philadelphia (2020–Present) FS Credit Real Estate Income Trust, Inc. (2018–Present) vTv Therapeutics Inc. (2017–Present) Community Health Systems (2004–Present) Drexel Morgan & Co. (2015–2019) |
Joseph Harroz, Jr.
100 Independence
610 Market Street
Philadelphia, PA
19106-2354
1967 | | Trustee | | Since November 19985 | | 127 | | University of Oklahoma -President (2020–Present) -Interim President (2019–2020) -Vice President and Dean, College of Law (2010–2019) Brookhaven Investments LLC (commercial enterprises) -Managing Member (2019–Present) St. Clair, LLC (commercial enterprises) -Managing Member (2019–Present) | | OU Medicine, Inc. (2020–Present) Big 12 Athletic Conference (2019-Present) Valliance Bank (2007–Present) Ivy Funds Complex (1998-2021) |
58
Name,
Address,
and Birth Year | | Position(s)
Held with
the Fund | | Length of Time
Served1 | | Number of
Funds in Fund
Complex Overseen
by Trustee | | Principal
Occupation(s)
During the
Past Five Years | | Other
Directorships
Held by Trustee
During the
Past Five Years |
Sandra A.J. Lawrence
100 Independence
610 Market Street
Philadelphia, PA
19106-2354
1957 | | Trustee | | Since April 20195 | | 127 | | Children’s Mercy Hospitals and Clinics (2005–2019) -Chief Administrative Officer (2016–2019) | | Brixmor Property Group Inc. (2021-Present) Sera Prognostics Inc. (biotechnology) (2021-Present) Recology (resource recovery) (2021-Present) Evergy, Inc., Kansas City Power & Light Company, KCP&L Greater Missouri Operations Company, Westar Energy, Inc. and Kansas Gas and Electric Company (related utility companies) (2018-Present) National Association of Corporate Directors (2017-Present) Ivy Funds Complex (2019-2021) American Shared Hospital Services (medical device) (2017-2021) Westar Energy (utility) (2004-2018) |
Frances A. Sevilla-Sacasa
100 Independence
610 Market Street
Philadelphia, PA
19106-2354
1956 | | Trustee | | Since September 2011 | | 127 | | Banco Itaú International -Chief Executive Officer (2012–2016) | | Florida Chapter of National Association of Corporate Directors (2021-Present) Callon Petroleum Company (2019-Present) Camden Property Trust (2011-Present) New Senior Investment Group Inc. (2021) Carrizo Oil & Gas, Inc. (2018-2019) |
Thomas K. Whitford
100 Independence
610 Market Street
Philadelphia, PA
19106-2354
1956 | | Trustee | | Since January 2013 | | 127 | | PNC Financial Services Group (1983–2013) -Vice Chairman (2009- 2013) | | HSBC USA Inc. (2014–2022) HSBC North America Holdings Inc. (2013–2022) HSBC Finance Corporation (2013–2018) |
Christianna Wood
100 Independence
610 Market Street
Philadelphia, PA
19106-2354
1959 | | Trustee | | Since January 2019 | | 127 | | Gore Creek Capital, Ltd. -Chief Executive Officer and President (2009– Present) | | The Merger Fund (2013–2021), The Merger Fund VL (2013–2021), WCM Alternatives: Event- Driven Fund (2013–2021), and WCM Alternatives: Credit Event Fund (2017–2021) Grange Insurance (2013–Present) H&R Block Corporation (2008–Present) |
59
Board of trustees / directors and officers addendum
Delaware Funds by Macquarie®
Name,
Address,
and Birth Year | | Position(s)
Held with
the Fund | | Length of Time
Served1 | | Number of
Funds in Fund
Complex Overseen
by Trustee | | Principal
Occupation(s)
During the
Past Five Years | | Other
Directorships
Held by Trustee
During the
Past Five Years |
Janet L. Yeomans
100 Independence
610 Market Street
Philadelphia, PA
19106-2354
1948 | | Trustee | | Since April 1999 | | 127 | | 3M Company (1995-2012) -Vice President and Treasurer (2006–2012) | | Okabena Company (2009–2017) |
| Officers | | | | | | | | | | |
David F. Connor
100 Independence
610 Market Street
Philadelphia, PA
19106-2354
1963 | | Senior Vice President, General Counsel, and Secretary | | Senior Vice President, since May 2013; General Counsel since May 2015; Secretary since October 2005 | | 127 | | David F. Connor has served in various capacities at different times at Macquarie Asset Management. | | None6 |
Daniel V. Geatens
100 Independence
610 Market Street
Philadelphia, PA
19106-2354
1972 | | Senior Vice President and Treasurer | | Senior Vice President and Treasurer since October 2007 | | 127 | | Daniel V. Geatens has served in various capacities at different times at Macquarie Asset Management. | | None6 |
Richard Salus
100 Independence
610 Market Street
Philadelphia, PA
19106-2354
1963 | | Senior Vice President and Chief Financial Officer | | Senior Vice President and Chief Financial Officer since November 2006 | | 127 | | Richard Salus has served in various capacities at different times at Macquarie Asset Management. | | None |
| 1 | “Length of Time Served” refers to the time since the Trustee or officer began serving one or more of the trusts in the Delaware Funds complex. |
| 2 | Shawn K. Lytle is considered to be an “Interested Trustee” because he is an executive officer of the Funds' investment advisor. |
| 3 | Macquarie Asset Management is the marketing name for certain companies comprising the asset management division of Macquarie Group, including the Funds' investment advisor, principal underwriter, and transfer agent. |
| 4 | Mr. Bennett retired from the Board effective December 31, 2022 and Mr. Whitford became Chair of the Board effective January 1, 2023. |
| 5 | Includes time served on the Board of Ivy Funds prior to the date when Ivy Funds joined the Delaware Funds complex. |
| 6 | David F. Connor serves as Senior Vice President and Secretary, and Daniel V. Geatens serves as Senior Vice President, Treasurer, and Chief Financial Officer, for the six portfolios of the Optimum Fund Trust, which have the same investment manager, principal underwriter, and transfer agent as the Funds. Mr. Geatens also serves as the Chief Financial Officer and Treasurer for Macquarie Global Infrastructure Total Return Fund Inc., which has the same investment manager as the Funds. |
60
Delaware Funds by Macquarie® privacy practices notice
We are committed to protecting the privacy of our potential, current, and former customers. To provide the products and services you request, we must collect personal information about you. We do not sell your personal information to third parties. We collect your personal information and share it with third parties as necessary to provide you with the products or services you request and to administer your business with us. This notice describes our current privacy practices. While your relationship with us continues, we will update and send our privacy practices notice as required by law. We are committed to continuing to protect your personal information even after that relationship ends. You do not need to take any action because of this notice.
Information we may collect and use
We collect personal information about you to help us identify you as our potential, current, or former customer; to process your requests and transactions; to offer investment services to you; or to tell you about our products or services we believe you may want to use. The type of personal information we collect depends on the products or services you request and may include the following:
| · | Information from you: When you submit your application or other forms or request information on our products (online or otherwise), you give us information such as your name, address, Social Security number, and your financial history. |
| · | Information about your transactions: We keep information about your transactions with us, such as the products you buy from us; the amount you paid for those products; your investment activity; and your account balances. |
| · | Information from your employer: In connection with administering your retirement plan, we may obtain information about you from your employer. |
| · | Information received from third parties: In order to verify your identity or to prevent fraud, we may obtain information about you from third parties. |
How we use your personal information
We do not disclose nonpublic personal information about our potential, current, and former customers unless allowed or required by law. We may share your personal information within our companies and with certain service providers. They use this information to process transactions you have requested; provide customer service; and inform you of products or services we offer that you may find useful. Our service providers may or may not be affiliated with us. They include financial service providers (for example, third-party administrators; broker/dealers; and other financial services companies with whom we have joint marketing agreements). Our service providers also include nonfinancial companies and individuals (for example, consultants; information services vendors; and companies that perform mailing or marketing services on our behalf). Information obtained from a report prepared by a service provider may be kept by the service provider and shared with other persons; however, we require our service providers to protect your personal information and to use or disclose it only for the work they are performing for us, or as permitted by law.
We also may provide information to regulatory authorities, law enforcement officials, and others to prevent fraud or when we believe in good faith that the law requires disclosure. In the event of a sale of all or part of our businesses, we may share customer information as part of the sale. We do not sell or share your information with outside marketers who may want to offer you their own products and services.
| This page is not part of the annual report. | i |
Delaware Funds by Macquarie® privacy practices notice
Security of information
Keeping your information safe is one of our most important responsibilities. We maintain physical, electronic, and procedural safeguards to protect your information. Our employees are authorized to access your information only when they need it to provide you with products and services or to maintain your accounts. Employees who have access to your personal information are required to keep it strictly confidential. We provide training to our employees about the importance of protecting the privacy of your information.
Macquarie Asset Management (MAM) is the asset management division of Macquarie Group.
Other than Macquarie Bank Limited ABN 46 008 583 542 ("Macquarie Bank"), any Macquarie Group entity noted in this document is not an authorized deposit-taking institution for the purposes of the Banking Act 1959 (Commonwealth of Australia). The obligations of these other Macquarie Group entities do not represent deposits or other liabilities of Macquarie Bank. Macquarie Bank does not guarantee or otherwise provide assurance in respect of the obligations of these other Macquarie Group entities. In addition, if this document relates to an investment, (a) the investor is subject to investment risk including possible delays in repayment and loss of income and principal invested and (b) none of Macquarie Bank or any other Macquarie Group entity guarantees any particular rate of return on or the performance of the investment, nor do they guarantee repayment of capital in respect of the investment.
This privacy practices notice is being provided on behalf of the following:
Delaware Funds by Macquarie
Delaware Investments Fund Services Company
Delaware Management Company
Revised March 2022
| ii | This page is not part of the annual report. |
This page intentionally left blank.
This page intentionally left blank.
This page intentionally left blank.
Macquarie Asset Management (MAM) is the asset management division of Macquarie Group. MAM is a full-service asset manager offering a diverse range of products across public and private markets including fixed income, equities, multi-asset solutions, private credit, infrastructure, renewables, natural assets, real estate, and asset finance. The Public Investments business is a part of MAM and includes the following investment advisers: Macquarie Investment Management Business Trust (MIMBT), Macquarie Funds Management Hong Kong Limited, Macquarie Investment Management Austria Kapitalanlage AG, Macquarie Investment Management Global Limited, Macquarie Investment Management Europe Limited, and Macquarie Investment Management Europe S.A. For more information, including press releases, please visit delawarefunds.com/closed-end.
Other than Macquarie Bank Limited ABN 46 008 583 542 ("Macquarie Bank"), any Macquarie Group entity noted in this document is not an authorized deposit-taking institution for the purposes of the Banking Act 1959 (Commonwealth of Australia). The obligations of these other Macquarie Group entities do not represent deposits or other liabilities of Macquarie Bank. Macquarie Bank does not guarantee or otherwise provide assurance in respect of the obligations of these other Macquarie Group entities. In addition, if this document relates to an investment, (a) the investor is subject to investment risk including possible delays in repayment and loss of income and principal invested and (b) none of Macquarie Bank or any other Macquarie Group entity guarantees any particular rate of return on or the performance of the investment, nor do they guarantee repayment of capital in respect of the investment.
The Fund is governed by US laws and regulations.
| | | |
| vi This page is not part of the annual report. |  | 
(2661382)
AR-DEX-123 |
| | | |
| | | |
Item 2. Code of Ethics
The registrant has adopted a code of ethics that applies to the registrant’s principal executive officer, principal financial officer, principal accounting officer or controller, or persons performing similar functions, regardless of whether these individuals are employed by the registrant or a third party. A copy of the registrant’s Code of Business Ethics has been posted on the Delaware Funds by Macquarie® Internet Web site at www.delawarefunds.com. Any amendments to the Code of Business Ethics, and information on any waiver from its provisions granted by the registrant, will also be posted on this Web site within five business days of such amendment or waiver and will remain on the Web site for at least 12 months.
Item 3. Audit Committee Financial Expert
The registrant’s Board of Trustees has determined that certain members of the registrant’s Audit Committee are audit committee financial experts, as defined below. For purposes of this item, an “audit committee financial expert” is a person who has the following attributes:
a. An understanding of generally accepted accounting principles and financial statements;
b. The ability to assess the general application of such principles in connection with the accounting for estimates, accruals, and reserves;
c. Experience preparing, auditing, analyzing, or evaluating financial statements that present a breadth and level of complexity of accounting issues that are generally comparable to the breadth and complexity of issues that can reasonably be expected to be raised by the registrant’s financial statements, or experience actively supervising one or more persons engaged in such activities;
d. An understanding of internal controls and procedures for financial reporting; and
e. An understanding of audit committee functions.
An “audit committee financial expert” shall have acquired such attributes through:
a. Education and experience as a principal financial officer, principal accounting officer, controller, public accountant, or auditor or experience in one or more positions that involve the performance of similar functions;
b. Experience actively supervising a principal financial officer, principal accounting officer, controller, public accountant, auditor, or person performing similar functions;
c. Experience overseeing or assessing the performance of companies or public accountants with respect to the preparation, auditing, or evaluation of financial statements; or
d. Other relevant experience.
The registrant’s Board of Trustees has also determined that each member of the registrant’s Audit Committee is independent. In order to be “independent” for purposes of this item, the Audit Committee member may not: (i) other than in his or her capacity as a member of the Board of Trustees or any committee thereof, accept directly or indirectly any consulting, advisory or other compensatory fee from the issuer; or (ii) be an “interested person” of the registrant as defined in Section 2(a)(19) of the Investment Company Act of 1940.
The names of the audit committee financial experts on the registrant’s Audit Committee are set forth below:
H. Jeffrey Dobbs
Sandra A.J. Lawrence
Frances Sevilla-Sacasa, Chair
Item 4. Principal Accountant Fees and Services
(a) Audit fees.
The aggregate fees billed for services provided to the registrant by its independent auditors for the audit of the registrant’s annual financial statements and for services normally provided by the independent auditors in connection with statutory and regulatory filings or engagements were $36,366 for the fiscal year ended November 30, 2022.
The aggregate fees billed for services provided to the registrant by its independent auditors for the audit of the registrant’s annual financial statements and for services normally provided by the independent auditors in connection with statutory and regulatory filings or engagements were $33,363 for the fiscal year ended November 30, 2021.
(b) Audit-related fees.
The aggregate fees billed by the registrant’s independent auditors for services relating to the performance of the audit of the registrant’s financial statements and not reported under paragraph (a) of this Item were $0 for the fiscal year ended November 30, 2022.
The aggregate fees billed by the registrant’s independent auditors for services relating to the performance of the audit of the financial statements of the registrant’s investment adviser and other service providers under common control with the adviser and that relate directly to the operations or financial reporting of the registrant were $2,050,189 for the registrant’s fiscal year ended November 30, 2022. The percentage of these fees relating to services approved by the registrant’s Audit Committee pursuant to the de minimis exception from the pre-approval requirement in Rule 2-01(c)(7)(i)(C) of Regulation S-X was 0%. These audit-related services were as follows: year-end audit procedures; group reporting and subsidiary statutory audits.
The aggregate fees billed by the registrant’s independent auditors for services relating to the performance of the audit of the registrant’s financial statements and not reported under paragraph (a) of this Item were $0 for the fiscal year ended November 30, 2021.
The aggregate fees billed by the registrant’s independent auditors for services relating to the performance of the audit of the financial statements of the registrant’s investment adviser and other service providers under common control with the adviser and that relate directly to the operations or financial reporting of the registrant were $1,134,001 for the registrant’s fiscal year ended November 30, 2021. The percentage of these fees relating to services approved by the registrant’s Audit Committee pursuant to the de minimis exception from the pre-approval requirement in Rule 2-01(c)(7)(i)(C) of Regulation S-X was 0%. These audit-related services were as follows: year-end audit procedures; group reporting and subsidiary statutory audits.
(c) Tax fees.
The aggregate fees billed by the registrant’s independent auditors for tax-related services provided to the registrant were $9,024 for the fiscal year ended November 30, 2022. The percentage of these fees relating to services approved by the registrant’s Audit Committee pursuant to the de minimis exception from the pre-approval requirement in Rule 2-01(c)(7)(i)(C) of Regulation S-X was 0%. These tax-related services were as follows: review of income tax returns and review of annual excise distribution calculations.
The aggregate fees billed by the registrant’s independent auditors for tax-related services provided to the registrant’s investment adviser and other service providers under common control with the adviser and that relate directly to the operations or financial reporting of the registrant were $0 for the registrant’s fiscal year ended November 30, 2022.
The aggregate fees billed by the registrant’s independent auditors for tax-related services provided to the registrant were $8,434 for the fiscal year ended November 30, 2021. The percentage of these fees relating to services approved by the registrant’s Audit Committee pursuant to the de minimis exception from the pre-approval requirement in Rule 2-01(c)(7)(i)(C) of Regulation S-X was 0%. These tax-related services were as follows: review of income tax returns and review of annual excise distribution calculations.
The aggregate fees billed by the registrant’s independent auditors for tax-related services provided to the registrant’s investment adviser and other service providers under common control with the adviser and that relate directly to the operations or financial reporting of the registrant were $0 for the registrant’s fiscal year ended November 30, 2021.
(d) All other fees.
The aggregate fees billed for all services provided by the independent auditors to the registrant other than those set forth in paragraphs (a), (b) and (c) of this Item were $0 for the fiscal year ended November 30, 2022.
The aggregate fees billed for all services other than those set forth in paragraphs (b) and (c) of this Item provided by the registrant’s independent auditors to the registrant’s adviser and other service providers under common control with the adviser and that relate directly to the operations or financial reporting of the registrant were $0 for the registrant’s fiscal year ended November 30, 2022. The percentage of these fees relating to services approved by the registrant’s Audit Committee pursuant to the de minimis exception from the pre-approval requirement in Rule 2-01(c)(7)(i)(C) of Regulation S-X was 0%.
The aggregate fees billed for all services provided by the independent auditors to the registrant other than those set forth in paragraphs (a), (b) and (c) of this Item were $0 for the fiscal year ended November 30, 2021.
The aggregate fees billed for all services other than those set forth in paragraphs (b) and (c) of this Item provided by the registrant’s independent auditors to the registrant’s adviser and other service providers under common control with the adviser and that relate directly to the operations or financial reporting of the registrant were $0 for the registrant’s fiscal year ended November 30, 2021. The percentage of these fees relating to services approved by the registrant’s Audit Committee pursuant to the de minimis exception from the pre-approval requirement in Rule 2-01(c)(7)(i)(C) of Regulation S-X was 0%.
(e) The registrant’s Audit Committee has established pre-approval policies and procedures as permitted by Rule 2-01(c)(7)(i)(B) of Regulation S-X (the “Pre-Approval Policy”) with respect to services provided by the registrant’s independent auditors. Pursuant to the Pre-Approval Policy, the Audit Committee has pre-approved the services set forth in the table below with respect to the registrant up to the specified fee limits. Certain fee limits are based on aggregate fees to the registrant and other registrants within the Delaware Funds by Macquarie®.
| Service | Range of Fees |
| Audit Services | |
| Statutory audits or financial audits for new Funds | up to $50,000 per Fund |
| Services associated with SEC registration statements (e.g., Form N-1A, Form N-14, etc.), periodic reports and other documents filed with the SEC or other documents issued in connection with securities offerings (e.g., comfort letters for closed-end Fund offerings, consents), and assistance in responding to SEC comment letters | up to $10,000 per Fund |
| Consultations by Fund management as to the accounting or disclosure treatment of transactions or events and/or the actual or potential impact of final or proposed rules, standards or interpretations by the SEC, FASB, or other regulatory or standard-setting bodies (Note: Under SEC rules, some consultations may be considered “audit-related services” rather than “audit services”) | up to $25,000 in the aggregate |
| Audit-Related Services | |
| Consultations by Fund management as to the accounting or disclosure treatment of transactions or events and /or the actual or potential impact of final or proposed rules, standards or interpretations by the SEC, FASB, or other regulatory or standard-setting bodies (Note: Under SEC rules, some consultations may be considered “audit services” rather than “audit-related services”) | up to $25,000 in the aggregate |
| Tax Services | |
| U.S. federal, state and local and international tax planning and advice (e.g., consulting on statutory, regulatory or administrative developments, evaluation of Funds’ tax compliance function, etc.) | up to $25,000 in the aggregate |
| U.S. federal, state and local tax compliance (e.g., excise distribution reviews, etc.) | up to $5,000 per Fund |
| Review of federal, state, local and international income, franchise and other tax returns | up to $5,000 per Fund |
Under the Pre-Approval Policy, the Audit Committee has also pre-approved the services set forth in the table below with respect to the registrant’s investment adviser and other entities controlling, controlled by or under common control with the investment adviser that provide ongoing services to the registrant (the “Control Affiliates”) up to the specified fee limit. This fee limit is based on aggregate fees to the investment adviser and its Control Affiliates.
| Service | Range of Fees |
| Non-Audit Services | |
| Services associated with periodic reports and other documents filed with the SEC and assistance in responding to SEC comment letters | up to $10,000 in the aggregate |
The Pre-Approval Policy requires the registrant’s independent auditors to report to the Audit Committee at each of its regular meetings regarding all services initiated since the last such report was rendered, including those services authorized by the Pre-Approval Policy.
(f) Not applicable.
(g) The aggregate non-audit fees billed by the registrant’s independent auditors for services rendered to the registrant and to its investment adviser and other service providers under common control with the adviser were $9,044,000 and $9,044,000 for the registrant’s fiscal years ended November 30, 2022 and November 30, 2021, respectively.
(h) In connection with its selection of the independent auditors, the registrant’s Audit Committee has considered the independent auditors’ provision of non-audit services to the registrant’s investment adviser and other service providers under common control with the adviser that were not required to be pre-approved pursuant to Rule 2-01(c)(7)(ii) of Regulation S-X. The Audit Committee has determined that the independent auditors’ provision of these services is compatible with maintaining the auditors’ independence.
Item 5. Audit Committee of Listed Registrants
The registrant has a separately-designated standing Audit Committee established in accordance with Section 3(a)(58)(A) of the Securities Exchange Act of 1934. The members of the registrant’s Audit Committee are H. Jeffrey Dobbs, Sandra A.J. Lawrence, and Frances A. Sevilla-Sacasa.
Item 6. Investments
(a) Included as part of report to shareholders filed under Item 1 of this Form N-CSR.
(b) Divestment of securities in accordance with Section 13(c) of the Investment Company Act of 1940.
Not applicable.
Item 7. Disclosure of Proxy Voting Policies and Procedures for Closed-End Management Investment Companies
The registrant has formally delegated to its investment adviser, Delaware Management Company, a series of Macquarie Investment Management Business Trust (the “Adviser”) the responsibility for making all proxy voting decisions in relation to portfolio securities held by the registrant. If and when proxies need to be voted on behalf of the registrant, the Adviser and any Macquarie affiliates advising the registrant (collectively, “Macquarie Asset Management Public Investments”) will vote such proxies pursuant to Macquarie Asset Management Public Investment’s (“MPI”) Proxy Voting Policies and Procedures (the “Procedures”). MPIhas established a Proxy Voting Committee (the “Committee”), which is responsible for overseeing MPI’s proxy voting process for the registrant. One of the main responsibilities of the Committee is to review and approve the Procedures to ensure that the Procedures are designed to allow MPI to vote proxies in a manner consistent with the goal of voting in the best interests of the registrant.
In order to facilitate the actual process of voting proxies, MPI has contracted with proxy advisory firms to analyze proxy statements on behalf of the registrant and other MPI clients and provide MPI with research recommendations on upcoming proxy votes in accordance with the Procedures. The Committee is responsible for overseeing the proxy advisory firms’ services. If a proxy has been voted for the registrant, the proxy advisory firm will create a record of the vote. By no later than August 31 of each year, information (if any) regarding how the registrant voted proxies relating to portfolio securities during the most recently disclosed 12-month period ended June 30 is available without charge (i) through the registrant’s website at http://www.delawarefunds.com/proxy; and (ii) on the Securities and Exchange Commission’s website at http://www.sec.gov.
When determining whether to invest in a particular company, one of the factors MPI may consider is the quality and depth of the company’s management. As a result, MPI believes that recommendations of management on any issue (particularly routine issues) should be given a fair amount of weight in determining how proxy issues should be voted. Thus, on many issues, MPI’s votes are cast in accordance with the recommendations of the company’s management. However, MPI may vote against management’s position when it runs counter to its specific Proxy Voting Guidelines (the “Guidelines”), and MPI will also vote against management’s recommendation when it believes that such position is not in the best interests of the registrant.
As stated above, the Procedures also list specific Guidelines on how to vote proxies on behalf of the registrant. Some examples of the Guidelines are as follows: (i) generally vote for shareholder proposals asking that a majority or more of directors be independent; (ii) generally vote for management or shareholder proposals to reduce supermajority vote requirements, taking into account: ownership structure; quorum requirements; and vote requirements; (iii) votes on mergers and acquisitions should be considered on a case-by-case basis; (iv) generally vote re-incorporation proposals on a case-by-case basis; (v) votes with respect to equity-based compensation plans are generally determined on a case-by-case basis; (vi) generally vote for proposals requesting that a company report on its policies, initiatives, oversight mechanisms, and ethical standards related to social, economic, and environmental sustainability, unless company already provides similar reports through other means or the company has formally committed to the implementation of a reporting program based on Global Reporting Initiative guidelines or a similar standard; and (vii) generally vote for management proposals to institute open-market share repurchase plans in which all shareholders may participate on equal terms.
Because the registrant has delegated proxy voting to the Adviser, the registrant is not expected to encounter any conflict of interest issues regarding proxy voting and therefore does not have procedures regarding this matter. However, the Adviser does have a section in its Procedures that addresses the possibility of conflicts of interest. Most of the proxies which the Adviser receives on behalf of its clients are voted in accordance with the Procedures. Since the Procedures are pre-determined by the Committee, application of the Procedures by the Adviser’s portfolio management teams when voting proxies after reviewing the proxy and research provided by the proxy advisory firm should in most instances adequately address any potential conflicts of interest. If the Adviser becomes aware of a conflict of interest in an upcoming proxy vote, the proxy vote will generally be referred to the Committee or the Committee’s delegates for review. If the portfolio management team for such proxy intends to vote in accordance with the proxy advisory firm’s recommendation pursuant to our Procedures, then no further action is needed to be taken by the Committee. If MPI’s portfolio management team is considering voting a proxy contrary to the proxy advisory firm’s research recommendation under the Procedures, the Committee or its delegates will assess the proposed vote to determine if it is reasonable. The Committee or its delegates will also assess whether any business or other material relationships between MPI and a portfolio company (unrelated to the ownership of the portfolio company’s securities) could have influenced an inconsistent vote on that company’s proxy. If the Committee or its delegates determines that the proposed proxy vote is unreasonable or unduly influenced by a conflict, the portfolio management team will be required to vote the proxy in accordance with the proxy advisory firm’s research recommendation or abstain from voting.
Item 8. Portfolio Managers of Closed-End Management Investment Companies
The information in the annual report under “Other Fund information – Fund management” is incorporated by reference into this Item 8.
Other Accounts Managed
The following chart lists certain information about types of other accounts for which each Fund manager is primarily responsible as of November 30, 2022. Any accounts managed in a personal capacity appear under “Other Accounts” along with the other accounts managed on a professional basis.
| | No. of
Accounts | Total Assets
Managed | No. of Accounts with
Performance-
Based Fees | Total Assets in
Accounts with
Performance-
Based Fees |
| Åsa Annerstedt | | | | |
Registered Investment Companies | 9 | $2.4 billion | 0 | $0 |
Other Pooled Investment Vehicles | 7 | $2.5 billion | 0 | $0 |
| Other Accounts | 11 | $3.3 billion | 0 | $0 |
| Adam H. Brown | | | | |
Registered Investment Companies | 6 | $10.3 billion | 0 | $0 |
Other Pooled Investment Vehicles | 1 | $179.5 million | 0 | $0 |
| Other Accounts | 5 | $141.9 million | 0 | $0 |
| Liu-Er Chen | | | | |
Registered Investment Companies | 6 | $6.5 billion | 0 | $0 |
Other Pooled Investment Vehicles | 3 | $660.6 million | 0 | $0 |
| Other Accounts | 4 | $602.2 million | 0 | $0 |
| Chris Gowlland | | | | |
Registered Investment Companies | 10 | $2.5 billion | 0 | $0 |
Other Pooled Investment Vehicles | 0 | $0 | 0 | $0 |
| Other Accounts | 1 | $81.1 million | 0 | $0 |
| Jens Hansen | | | | |
Registered Investment Companies | 9 | $2.4 billion | 0 | $0 |
Other Pooled Investment Vehicles | 7 | $2.5 billion | 0 | $0 |
| Other Accounts | 11 | $3.3 billion | 0 | $0 |
| Allan Saustrup Jensen | | | | |
Registered Investment Companies | 9 | $2.4 billion | 0 | $0 |
Other Pooled Investment Vehicles | 7 | $2.5 billion | 0 | $0 |
| Other Accounts | 11 | $3.3 billion | 0 | $0 |
| Claus Juul | | | | |
Registered Investment Companies | 9 | $2.4 billion | 0 | $0 |
Other Pooled Investment Vehicles | 7 | $2.5 billion | 0 | $0 |
| Other Accounts | 11 | $3.3 billion | 0 | $0 |
| Nikhil G. Lalvani | | | | |
Registered Investment Companies | 8 | $11.0 billion | 0 | $0 |
Other Pooled Investment Vehicles | 4 | $828.0 million | 0 | $0 |
| Other Accounts | 25 | $4.4 billion | 0 | $0 |
| John P. McCarthy | | | | |
Registered Investment Companies | 10 | $5.2 billion | 0 | $0 |
Other Pooled Investment Vehicles | 2 | $399.5 million | 0 | $0 |
| Other Accounts | 5 | $189.8 million | 0 | $0 |
| Klaus Petersen | | | | |
Registered Investment Companies | 9 | $2.4 billion | 0 | $0 |
Other Pooled Investment Vehicles | 7 | $2.5 billion | 0 | $0 |
| Other Accounts | 11 | $3.3 billion | 0 | $0 |
| Stefan Löwenthal | | | | |
Registered Investment Companies | 22 | $8.1 billion | 0 | $0 |
Other Pooled Investment Vehicles | 65 | $2.4 billion | 0 | $0 |
| Other Accounts | 17 | $1.6 billion | 0 | $0 |
| Juergen Wurzer | | | | |
Registered Investment Companies | 22 | $8.1 billion | 0 | $0 |
Other Pooled Investment Vehicles | 65 | $2.4 billion | 0 | $0 |
| Other Accounts | 17 | $1.6 billion | 0 | $0 |
| Michael Wildstein | | | | |
Registered Investment Companies | 8 | $2.7 billion | 0 | $0 |
Other Pooled Investment Vehicles | 9 | $945.0 | 0 | $0 |
| Other Accounts | 11 | $7.0 billion | 1 | $437.5 million |
| Benjamin Leung | | | | |
Registered Investment Companies | 20 | $4.2 billion | 0 | $0 |
Other Pooled Investment Vehicles | 38 | $9.0 billion | 11 | $3.9 billion |
| Other Accounts | 29 | $26.2 billion | 4 | $3.0 billion |
| Scot Thompson | | | | |
Registered Investment Companies | 20 | $4.2 billion | 0 | $0 |
Other Pooled Investment Vehicles | 38 | $9.0 billion | 11 | $3.9 billion |
| Other Accounts | 29 | $26.2 billion | 4 | $3.0 billion |
DESCRIPTION OF MATERIAL CONFLICTS OF INTEREST
Individual portfolio managers may perform investment management services for other funds or accounts similar to those provided to the Funds and the investment action for such other fund or account and the Funds may differ. For example, an account or fund may be selling a security, while another account or fund may be purchasing or holding the same security. As a result, transactions executed for one fund or account may adversely affect the value of securities held by another fund, account or the Funds. Additionally, the management of multiple other funds or accounts and the Funds may give rise to potential conflicts of interest, as a portfolio manager must allocate time and effort to multiple other funds or accounts and the Funds. A portfolio manager may discover an investment opportunity that may be suitable for more than one account or fund. The investment opportunity may be limited, however, so that all funds or accounts for which the investment would be suitable may not be able to participate. The Adviser has adopted procedures designed to allocate investments fairly across multiple funds or accounts.
Some of the accounts managed by the portfolio managers have a performance-based fee. This compensation structure presents a potential conflict of interest. The portfolio manager has an incentive to manage this account so as to enhance its performance, to the possible detriment of other accounts for which the investment manager does not receive a performance-based fee.
A portfolio manager’s management of personal accounts also may present certain conflicts of interest. While the Adviser’s code of ethics is designed to address these potential conflicts, there is no guarantee that it will do so.
Compensation Structure
Each portfolio’s manager’s compensation consists of the following:
Base Salary – Each named portfolio manager receives a fixed base salary. Salaries are determined by a comparison to industry data prepared by third parties to ensure that portfolio manager salaries are in line with salaries paid at peer investment advisory firms.
Bonus – (Mr. Lalvani only) Each named portfolio manager is eligible to receive an annual cash bonus. The bonus pool is determined by the revenues associated with the products a portfolio manager manages. Macquarie Asset Management keeps a percentage of the revenues and the remaining percentage of revenues (minus appropriate expenses associated with relevant product and the investment management team) creates the "bonus pool" for the product. Various members of the team have the ability to earn a percentage of the bonus pool. The pool is allotted based on subjective factors and objective factors. The primary objective factor is the 1-, 3-, and 5-year performance of the funds managed relative to the performance of the appropriate Morningstar, Inc. (“Morningstar”) peer groups and the performance of institutional composites relative to the appropriate indices. Three- and five-year performance is weighted more heavily and there is no objective award for a fund whose performance falls below the 50th percentile for a given time period.
Individual allocations of the bonus pool are based on individual performance measurements, both objective and subjective, as determined by senior management.
(Mr. Gowlland only) Fixed remuneration takes into consideration the role of individuals and market conditions. Remuneration is reviewed on a yearly basis in February/March and takes effect from April 1 of that year. Aggregate staff profit share is linked to Macquarie Group’s profitability and return on ordinary equity, with the allocation of individual profit share being based on factors including contribution to profit, use of capital, funding and risk. Macquarie Group operates profit share retention arrangements for employees meeting certain pay thresholds, to ensure an appropriate balance between short and longer-term incentives. Compensation is not directly based on the pre or post tax performance of the Fund over a certain period. However, performance of the Fund may be one factor taken into account in determining compensation.
(Messrs. Hansen, Petersen, Jensen and Juul and Ms. Annerstedt only) Fixed remuneration is determined by the individual’s skills, contribution to MGL’s success and competitor analysis to attract and retain the highest caliber staff. Performance based remuneration is in the form of profit share which is discretionary in nature and truly variable. Performance-based profit share is allocated to Macquarie Group Limited (MGL) businesses and, in turn,to individuals based on performance. Performance is primarily assessed based on relative contribution to profits while taking into account capital usage and risk management. This results in businesses and individuals being motivated to increase earnings and to use shareholder funds efficiently, consistent with prudent risk-taking. The Global Equity team is a separate profit center within MGL and they receive a portion of the profits generated by the Global Equity Business. Performance assessment and profit share split is a function of many aspects; these are listed below in decreasing order of significance:
• Profitability of the funds managed. As revenue is generated from both the management fees, profitability is a function of the assets under management;
• Performance of equity funds excess to benchmark and relative to peers over 1, 3, and 5 years;
• Research quality and efficiency;
• Product development initiative; and
• Overall business unit profitability.
In addition, other qualitative measures are used in assessing individual performance, such as: how business is done, governance and compliance, long-term sustainability, people leadership, and adherence to MGL’s goals and values. Staff are motivated to work co-operatively given that their profit share will reflect MGL’s overall performance, the relative performance of their business and their individual contribution. MGL endorses profit share retention whereby a proportion is retained and notionally invested in underlying assets/funds the individual is responsible for to align employees’ interests with those of the wider business.
(Mr. Chen only) The portfolio manager is eligible to receive an annual cash bonus. The bonus pool is determined by the revenues associated with the products the portfolio manager manages. Macquarie Asset Management keeps a percentage of the revenues and the remaining percentage of revenues (minus appropriate expenses associated with relevant product and the investment management team) creates the "bonus pool" for the product. Various members of the team have the ability to earn a percentage of the bonus pool with the most senior contributor generally having the largest share. The pool is allotted based on subjective factors (50%) and objective factors (50%). The primary objective factor is the 1-, 3-, and 5-year performance of the funds managed relative to the performance of the appropriate Morningstar peer groups and the performance of institutional composites relative to the appropriate indices. Three- and five-year performance are weighted more heavily and there is no objective award for a fund whose performance falls below the 50th percentile for a given time period.
Individual allocations of the bonus pool are based on individual performance measurements, both objective and subjective, as determined by senior management.
(Messrs. Löwenthal and Wurzer only) Each named portfolio manager is eligible to receive an annual cash bonus. The bonus pool is determined by the revenues associated with the products a portfolio manager manages. Macquarie Asset Management keeps a percentage of the revenues and the remaining percentage of revenues (minus appropriate expenses associated with relevant product and the investment management team) creates the "bonus pool" for the product. Various members of the team have the ability to earn a percentage of the bonus pool with the most senior contributors generally having the largest share. Individual allocations of the bonus pool are based on individual performance measurements, both objective and subjective, as determined by senior management.
(Messrs. Leung and Thompson only) Each named portfolio manager is eligible to receive an annual cash bonus. The bonus pool is determined by the revenues associated with the products a portfolio manager manages. Macquarie Asset Management keeps a percentage of the revenues and the remaining percentage of revenues (minus appropriate expenses associated with relevant product and the investment management team) creates the "bonus pool" for the product. Various members of the team have the ability to earn a percentage of the bonus pool with the most senior contributor generally having the largest share. Individual allocations of the bonus pool are based on individual performance measurements, both objective and subjective, as determined by senior management.
(Messrs. Brown, McCarthy and Wildstein only) An objective component is added to the bonus for each manager that is reflective of account performance relative to an appropriate peer group or database. The following paragraph describes the structure of the non-guaranteed bonus.
Each portfolio manager is eligible to receive an annual cash bonus, which is based on quantitative and qualitative factors. There is one pool for bonus payments for the fixed income department. The pool is allotted based on subjective factors and objective factors. The amount of the pool for bonus payments is determined by assets managed (including investment companies, insurance product-related accounts and other separate accounts), management fees and related expenses (including fund waiver expenses) for registered investment companies, pooled vehicles, and managed separate accounts. For investment companies, each manager is compensated according to the Fund’s Broadridge or Morningstar peer group percentile ranking on a 1-, 3-, and 5-year basis, with longer term performance more heavily weighted. For managed separate accounts the portfolio managers are compensated according to the composite percentile ranking against the eVestment Alliance database (or similar sources of relative performance data) on a one-, three-, and five-year basis, with longer term performance more heavily weighted; composite performance relative to the benchmark is also evaluated for the same time periods. Incentives reach maximum potential at the top 25th-30th percentile. The remaining portion of the bonus is discretionary as determined by Macquarie Asset Management and takes into account subjective factors.
For new and recently transitioned portfolio managers, the compensation may be weighted more heavily towards a portfolio manager’s actual contribution and ability to influence performance, rather than longer-term performance. Management intends to move the compensation structure towards longer-term performance for these portfolio managers over time.
Portfolio managers participate in retention programs, including the Macquarie Asset Management Public Investments Notional Investment Plan and the Macquarie Group Employee Retained Equity Plan, for alignment of interest purposes.
Macquarie Asset Management Public Investments Notional Investment Plan - A portion of a portfolio manager’s retained profit share may be notionally exposed to the return of certain funds within MAM Funds pursuant to the terms of the Macquarie Asset Management Public Investments Notional Investment Plan. The retained amount will vest in equal tranches over a period ranging from four to five years after the date of investment (depending on the level of the employee).
Macquarie Group Employee Retained Equity Plan - A portion of a portfolio manager’s retained profit share may be invested in the Macquarie Group Employee Retained Equity Plan (“MEREP”), which is used to deliver remuneration in the form of Macquarie equity. The main type of award currently being offered under the MEREP is units comprising a beneficial interest in a Macquarie share held in a trust for the employee, subject to the vesting and forfeiture provisions of the MEREP. Subject to vesting conditions, vesting and release of the shares occurs in a period ranging from four to five years after the date of investment (depending on the level of the employee).
Other Compensation - Portfolio managers may also participate in benefit plans and programs available generally to all employees.
Ownership of Securities
As of November 30, 2022, the portfolio managers did not own any shares of the Fund.
Item 9. Purchases of Equity Securities by Closed-End Management Investment Company and Affiliated Purchasers.
| | (a) | (b) | (c) | (d) |
| | | | | |
| Period | Total Number of
Shares
Purchased(1) | Average
Price
Paid per
Share | Total Number of
Shares Purchased
as Part of
Publicly
Announced Plans
or Program | Maximum Number (or
Approximate Dollar
Value) of Shares that
May Yet Be Purchased
Under the Plans or
Programs |
| Month #1 (6/1/2022 - 6/30/2022) | 49,698 | $7.82 | 0 | 11,179,968.6820 |
| Month #2 (7/1/2022 - 7/31/2022) | 0 | $8.46 | 558,998 | 10,620,970.6820 |
| Month #3 (8/1/2022 - 8/31/2022) | 0 | - | 0 | 10,620,970.6820 |
| Month #4 (9/1/2021 - 9/30/2022) | 0 | - | 0 | 10,620,970.6820 |
| Month #5 (10/1/2022 - 10/31/2022) | 0 | - | 0 | 10,620,970.6820 |
| Month #6 (11/1/2022 - 11/30/2022) | 0 | - | 0 | 10,620,970.6820 |
| Total | 49,698 | $8.14 | 558,998 | 10,620,970.6820 |
| 1. | The Board previously authorized an open-market share repurchase program pursuant to which the Fund may purchase, from time to time, Fund shares in open-market transactions, at the discretion of management. Effective May 19, 2022, the Board approved a modification to the Fund’s previously announced open-market share repurchase program to authorize the Fund to repurchase up to 5% of the Fund’s shares outstanding in open market transactions as of that date, at the discretion of management. |
Item 10. Submission of Matters to a Vote of Security Holders
Not applicable.
Item 11. Controls and Procedures
The registrant’s principal executive officer and principal financial officers, or persons performing similar functions, have concluded that the registrant’s disclosure controls and procedures (as defined in Rule 30a-3(c) under the Investment Company Act of 1940, as amended (17 CFR 270.30a-3(c))) are effective, as of a date within 90 days of the filing of this report, based on their evaluation of these controls and procedures required by Rule 30a-3(b) under the Investment Company Act of 1940 (17 CFR 270.30a-3(b)) and Rules 13a-15(b) or 15d-15(b) under the Securities Exchange Act of 1934, as amended (17 CFR 240.13a-15(b) or 240.15d-15(b)) and provide reasonable assurance that the information required to be disclosed by the registrant in its reports or statements filed under the Securities Exchange Act of 1934 is recorded, processed, summarized and reported within the time periods specified in the rules and forms of the Securities and Exchange Commission.
There were no significant changes in the registrant’s internal control over financial reporting (as defined in Rule 30a-3(d) under the Investment Company Act of 1940 (17 CFR 270.30a-3(d)) that occurred during the period covered by the report to stockholders included herein that have materially affected, or are reasonably likely to materially affect, the registrant’s internal control over financial reporting.
Item 12. Disclosure of Securities Lending Activities for Closed-End Management Investment Companies
Not applicable.
Item 13. Exhibits
Not applicable.
(2) Certifications of Principal Executive Officer and Principal Financial Officer pursuant to Rule 30a-2 under the Investment Company Act of 1940 are attached hereto as Exhibit 99.CERT.
(3) Written solicitations to purchase securities pursuant to Rule 23c-1 under the Securities Exchange Act of 1934.
Not applicable.
SIGNATURES
Pursuant to the requirements of the Securities Exchange Act of 1934 and the Investment Company Act of 1940, the registrant has duly caused this report to be signed on its behalf, by the undersigned, thereunto duly authorized.
DELAWARE ENHANCED GLOBAL DIVIDEND AND INCOME FUND
| /s/SHAWN K. LYTLE | |
| By: | Shawn K. Lytle | |
| Title: | President and Chief Executive Officer | |
| Date: | February 3, 2023 | |
| | | |
Pursuant to the requirements of the Securities Exchange Act of 1934 and the Investment Company Act of 1940, this report has been signed below by the following persons on behalf of the registrant and in the capacities and on the dates indicated.
| /s/SHAWN K. LYTLE | |
| By: | Shawn K. Lytle | |
| Title: | President and Chief Executive Officer | |
| Date: | February 3, 2023 | |
| | | |
| /s/RICHARD SALUS | |
| By: | Richard Salus | |
| Title: | Chief Financial Officer | |
| Date: | February 3, 2023 | |
| | | |