UNITED STATES
SECURITIES AND EXCHANGE COMMISSION
Washington, D.C. 20549
FORM N-CSR
CERTIFIED SHAREHOLDER REPORT OF REGISTERED
MANAGEMENT INVESTMENT COMPANIES
Investment Company Act file number 811-22083
Fidelity Central Investment Portfolios II LLC
(Exact name of registrant as specified in charter)
245 Summer St., Boston, MA 02210
(Address of principal executive offices) (Zip code)
Margaret Carey, Secretary
245 Summer St.
Boston, Massachusetts 02210
(Name and address of agent for service)
Registrant's telephone number, including area code:
617-563-7000
| |
Date of fiscal year end: | December 31 |
|
|
Date of reporting period: | June 30, 2024 |
Item 1.
Reports to Stockholders
| |
| | SEMI-ANNUAL SHAREHOLDER REPORT | AS OF JUNE 30, 2024 | |
| | Fidelity® International Credit Central Fund Fidelity® International Credit Central Fund true |
| | | |
This semi-annual shareholder report contains information about Fidelity® International Credit Central Fund for the period January 1, 2024 to June 30, 2024. You can find additional information about the Fund at fundresearch.fidelity.com/prospectus/sec. You can also request this information by contacting us at 1-800-544-8544.
What were your Fund costs for the last six months?(based on hypothetical $10,000 investment)
| | Costs of a $10,000 investment | Costs paid as a percentage of a $10,000 investment | |
| Fidelity® International Credit Central Fund | $ 0 A | 0.01% | |
A Amount represents less than $.50
Key Fund Statistics (as of June 30, 2024)
KEY FACTS | | |
| Fund Size | $92,142,306 | |
| Number of Holdings | 188 | |
| Portfolio Turnover | 103% | |
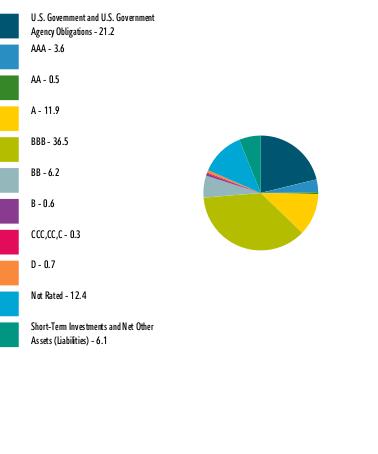
What did the Fund invest in?
(as of June 30, 2024)
| U.S. Government and U.S. Government Agency Obligations | 21.2 |
| AAA | 3.6 |
| AA | 0.5 |
| A | 11.9 |
| BBB | 36.5 |
| BB | 6.2 |
| B | 0.6 |
| CCC,CC,C | 0.3 |
| D | 0.7 |
| Not Rated | 12.4 |
| Short-Term Investments and Net Other Assets (Liabilities) | 6.1 |
QUALITY DIVERSIFICATION (% of Fund's net assets) |
|
| |
| We have used ratings from Moody's Investors Service, Inc. Where Moody's® ratings are not available, we have used S&P® ratings. All ratings are as of the date indicated and do not reflect subsequent changes. |
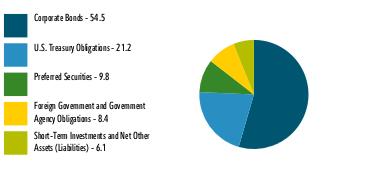
| Corporate Bonds | 54.5 |
| U.S. Treasury Obligations | 21.2 |
| Preferred Securities | 9.8 |
| Foreign Government and Government Agency Obligations | 8.4 |
| Short-Term Investments and Net Other Assets (Liabilities) | 6.1 |
ASSET ALLOCATION (% of Fund's net assets) |
|
|
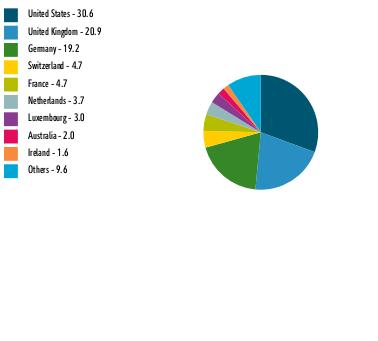
| United States | 30.6 |
| United Kingdom | 20.9 |
| Germany | 19.2 |
| Switzerland | 4.7 |
| France | 4.7 |
| Netherlands | 3.7 |
| Luxembourg | 3.0 |
| Australia | 2.0 |
| Ireland | 1.6 |
| Others | 9.6 |
GEOGRAPHIC DIVERSIFICATION (% of Fund's net assets) |
|
| |
|
TOP HOLDINGS (% of Fund's net assets) | | |
| US Treasury Notes | 13.0 | |
| US Treasury Bonds | 8.2 | |
| German Federal Republic | 7.9 | |
| NatWest Group PLC | 2.2 | |
| Lloyds Banking Group PLC | 2.2 | |
| UBS Group AG | 2.0 | |
| Barclays PLC | 2.0 | |
| HSBC Holdings PLC | 2.0 | |
| Deutsche Bank AG | 1.9 | |
| ING Groep NV | 1.9 | |
| | 43.3 | |
| |
| Fidelity, the Fidelity Investments Logo and all other Fidelity trademarks or service marks used herein are trademarks or service marks of FMR LLC. Any third-party marks that are used herein are trademarks or service marks of their respective owners. © 2024 FMR LLC. All rights reserved. |
| | For additional information about the Fund; including its prospectus, financial information, holdings and proxy information, scan the QR code or visit fundresearch.fidelity.com/prospectus/sec 1.9916168.100 3016-TSRS-0824 |
Item 2.
Code of Ethics
Not applicable.
Item 3.
Audit Committee Financial Expert
Not applicable.
Item 4.
Principal Accountant Fees and Services
Not applicable.
Item 5.
Audit Committee of Listed Registrants
Not applicable.
Item 6.
Investments
(a)
Not applicable.
(b)
Not applicable
Item 7.
Financial Statements and Financial Highlights for Open-End Management Investment Companies
Fidelity® International Credit Central Fund
Semi-Annual Report
June 30, 2024
Contents
To view a fund's proxy voting guidelines and proxy voting record for the 12-month period ended June 30, visit http://www.fidelity.com/proxyvotingresults or visit the Securities and Exchange Commission's (SEC) web site at http://www.sec.gov.
You may also call 1-800-544-8544 to request a free copy of the proxy voting guidelines.
Standard & Poor's, S&P and S&P 500 are registered service marks of The McGraw-Hill Companies, Inc. and have been licensed for use by Fidelity Distributors Corporation.
Other third-party marks appearing herein are the property of their respective owners.
All other marks appearing herein are registered or unregistered trademarks or service marks of FMR LLC or an affiliated company. © 2024 FMR LLC. All rights reserved.
A fund files its complete schedule of portfolio holdings with the SEC for the first and third quarters of each fiscal year on Form N-PORT. Forms N-PORT are available on the SEC's web site at http://www.sec.gov. A fund's Forms N-PORT may be reviewed and copied at the SEC's Public Reference Room in Washington, DC. Information regarding the operation of the SEC's Public Reference Room may be obtained by calling 1-800-SEC-0330.
Item 7: Financial Statements and Financial Highlights for Open-End Management Investment Companies (Semi-Annual Report)
Fidelity® International Credit Central Fund
Schedule of Investments June 30, 2024 (Unaudited)
Showing Percentage of Net Assets
| Nonconvertible Bonds - 54.5% |
| | | Principal Amount (a) | Value ($) |
| Australia - 1.7% | | | |
| Leighton Finance U.S.A. Pty Ltd. 1.5% 5/28/29 (Reg. S) | EUR | 442,000 | 412,376 |
| QBE Insurance Group Ltd.: | | | |
| 2.5% 9/13/38 (Reg. S) (b) | GBP | 297,000 | 323,368 |
| 6.75% 12/2/44 (Reg. S) (b) | | 860,000 | 858,925 |
TOTAL AUSTRALIA | | | 1,594,669 |
| Belgium - 0.5% | | | |
| KBC Group NV 6.324% 9/21/34 (b)(c) | | 437,000 | 453,596 |
| Czech Republic - 0.5% | | | |
| CPI Property Group SA 7% 5/7/29 (Reg. S) | EUR | 400,000 | 420,489 |
| Denmark - 1.4% | | | |
| Danske Bank A/S: | | | |
| 2.25% 1/14/28 (Reg. S) (b) | GBP | 395,000 | 460,986 |
| 4.75% 6/21/30 (Reg. S) (b) | EUR | 570,000 | 635,290 |
| Jyske Bank A/S 5.125% 5/1/35 (Reg. S) (b) | EUR | 211,000 | 230,636 |
TOTAL DENMARK | | | 1,326,912 |
| Finland - 0.6% | | | |
| Nordea Bank Abp 4.125% 5/5/28 (Reg. S) | EUR | 504,000 | 549,918 |
| France - 4.7% | | | |
| BNP Paribas SA: | | | |
| 2.159% 9/15/29 (b)(c) | | 473,000 | 412,794 |
| 2.5% 3/31/32 (Reg. S) (b) | EUR | 300,000 | 305,318 |
| 4.125% 5/24/33 (Reg. S) | EUR | 400,000 | 443,604 |
| Electricite de France SA: | | | |
| 4.75% 10/12/34 (Reg. S) | EUR | 400,000 | 449,542 |
| 5.5% 1/25/35 (Reg. S) | GBP | 400,000 | 486,518 |
| Engie SA: | | | |
| 3.875% 3/6/36 (Reg. S) | EUR | 400,000 | 423,546 |
| 4.25% 9/6/34 (Reg. S) | EUR | 300,000 | 327,808 |
| Holding d'Infrastructures et des Metiers de l'Environnement 0.625% 9/16/28 (Reg. S) | EUR | 396,000 | 360,107 |
| RCI Banque SA 5.5% 10/9/34 (Reg. S) (b)(d) | EUR | 200,000 | 213,668 |
| Societe Generale 6.691% 1/10/34 (b)(c) | | 862,000 | 888,904 |
TOTAL FRANCE | | | 4,311,809 |
| Germany - 7.7% | | | |
| ACCENTRO Real Estate AG 5.625% 2/13/26 (Reg. S) | EUR | 478,800 | 205,108 |
| AGPS BondCo PLC 4.625% 1/14/26 (Reg. S) (b) | EUR | 1,700,000 | 591,700 |
| Amprion GmbH 3.625% 5/21/31 (Reg. S) | EUR | 100,000 | 106,887 |
| Bayer U.S. Finance LLC: | | | |
| 6.375% 11/21/30 (c) | | 613,000 | 628,185 |
| 6.5% 11/21/33 (c) | | 676,000 | 691,550 |
| Commerzbank AG: | | | |
| 4.875% 10/16/34 (Reg. S) (b) | EUR | 100,000 | 106,744 |
| 8.625% 2/28/33 (Reg. S) (b) | GBP | 200,000 | 267,914 |
| Deutsche Bank AG: | | | |
| 3.25% 5/24/28 (Reg. S) (b) | EUR | 600,000 | 630,393 |
| 6.125% 12/12/30 (Reg. S) (b) | GBP | 900,000 | 1,151,108 |
| E.ON SE 3.375% 1/15/31 (Reg. S) | EUR | 214,000 | 226,863 |
| EnBW Energie Baden-Wuerttemberg AG 1.375% 8/31/81 (Reg. S) (b) | EUR | 500,000 | 468,260 |
| Robert Bosch GmbH 4.375% 6/2/43 (Reg. S) | EUR | 200,000 | 218,206 |
| RWE Finance U.S. LLC 5.875% 4/16/34 (c) | | 458,000 | 458,511 |
| Schaeffler AG 4.75% 8/14/29 (Reg. S) | EUR | 400,000 | 431,164 |
| Sirius Real Estate Ltd. 1.125% 6/22/26 (Reg. S) | EUR | 300,000 | 301,070 |
| ZF Europe Finance BV 2% 2/23/26 (Reg. S) | EUR | 200,000 | 205,700 |
| ZF Finance GmbH 2% 5/6/27 (Reg. S) | EUR | 400,000 | 399,721 |
TOTAL GERMANY | | | 7,089,084 |
| Hong Kong - 0.8% | | | |
| Prudential Funding Asia PLC 2.95% 11/3/33 (Reg. S) (b) | | 780,000 | 691,919 |
| Ireland - 1.4% | | | |
| AIB Group PLC: | | | |
| 2.25% 4/4/28 (Reg. S) (b) | EUR | 450,000 | 462,081 |
| 5.25% 10/23/31 (Reg. S) (b) | EUR | 100,000 | 114,440 |
| 6.608% 9/13/29 (b)(c) | | 441,000 | 455,210 |
| Bank of Ireland Group PLC 5.601% 3/20/30 (b)(c) | | 269,000 | 267,436 |
TOTAL IRELAND | | | 1,299,167 |
| Italy - 0.8% | | | |
| ENEL Finance International NV 5.5% 6/26/34 (c) | | 300,000 | 292,330 |
| Intesa Sanpaolo SpA 6.625% 6/20/33 (c) | | 436,000 | 449,446 |
TOTAL ITALY | | | 741,776 |
| Luxembourg - 3.0% | | | |
| Alpha Trains Finance SA 2.064% 6/30/30 | EUR | 371,000 | 385,550 |
| Blackstone Property Partners Europe LP: | | | |
| 1% 5/4/28 (Reg. S) | EUR | 397,000 | 374,272 |
| 1.75% 3/12/29 (Reg. S) | EUR | 983,000 | 928,133 |
| 2.625% 10/20/28 (Reg. S) | GBP | 241,000 | 265,497 |
| CBRE Global Investors Pan European Core Fund 4.75% 3/27/34 (Reg. S) | EUR | 246,000 | 267,058 |
| Logicor Financing SARL: | | | |
| 1.625% 1/17/30 (Reg. S) | EUR | 289,000 | 265,889 |
| 2% 1/17/34 (Reg. S) | EUR | 212,000 | 179,347 |
| Prologis International Funding II SA 4.375% 7/1/36 (Reg. S) (d) | EUR | 100,000 | 106,763 |
TOTAL LUXEMBOURG | | | 2,772,509 |
| Mexico - 0.6% | | | |
| Petroleos Mexicanos 5.95% 1/28/31 | | 735,000 | 590,756 |
| Netherlands - 3.7% | | | |
| ABN AMRO Bank NV 3.875% 1/15/32 (Reg. S) | EUR | 300,000 | 322,058 |
| Cooperatieve Rabobank UA 4% 1/10/30 (Reg. S) | EUR | 500,000 | 546,913 |
| ING Groep NV: | | | |
| 4.5% 5/23/29 (Reg. S) (b) | EUR | 700,000 | 767,832 |
| 4.75% 5/23/34 (Reg. S) (b) | EUR | 800,000 | 906,561 |
| Koninklijke KPN NV 3.875% 2/16/36 (Reg. S) | EUR | 200,000 | 211,533 |
| REWE International Finance 4.875% 9/13/30 (Reg. S) | EUR | 300,000 | 333,840 |
| Universal Music Group NV 4% 6/13/31 (Reg. S) | EUR | 276,000 | 301,755 |
TOTAL NETHERLANDS | | | 3,390,492 |
| Norway - 0.3% | | | |
| DNB Bank ASA 0.25% 2/23/29 (Reg. S) (b) | EUR | 246,000 | 232,818 |
| Poland - 0.5% | | | |
| GTC Aurora Luxembourg SA 2.25% 6/23/26 (Reg. S) | EUR | 532,000 | 491,975 |
| Portugal - 0.3% | | | |
| Fidelidade-Companhia de Seguros SA 4.25% 9/4/31 (Reg. S) (b) | EUR | 300,000 | 310,427 |
| Spain - 0.8% | | | |
| Banco Bilbao Vizcaya Argentaria SA 6.033% 3/13/35 (b) | | 200,000 | 199,451 |
| Werfenlife SA 4.625% 6/6/28 (Reg. S) | EUR | 500,000 | 546,684 |
TOTAL SPAIN | | | 746,135 |
| Sweden - 0.8% | | | |
| Heimstaden AB 4.375% 3/6/27 (Reg. S) | EUR | 700,000 | 522,605 |
| Samhallsbyggnadsbolaget I Norden AB 2.25% 8/12/27 (Reg. S) | EUR | 215,000 | 162,790 |
TOTAL SWEDEN | | | 685,395 |
| Switzerland - 3.2% | | | |
| Argentum Netherlands BV: | | | |
| 5.625% 8/15/52 (Reg. S) (b) | | 377,000 | 371,204 |
| 5.75% 8/15/50 (Reg. S) (b) | | 740,000 | 732,600 |
| UBS Group AG: | | | |
| 4.125% 6/9/33 (Reg. S) (b) | EUR | 602,000 | 650,389 |
| 4.75% 3/17/32 (Reg. S) (b) | EUR | 812,000 | 908,979 |
| Zurich Finance (Ireland) DAC 3.5% 5/2/52 (Reg. S) (b) | | 391,000 | 324,608 |
TOTAL SWITZERLAND | | | 2,987,780 |
| United Kingdom - 17.9% | | | |
| Admiral Group PLC 8.5% 1/6/34 (Reg. S) | GBP | 455,000 | 637,336 |
| Anglian Water (Osprey) Financing PLC 2% 7/31/28 (Reg. S) | GBP | 286,000 | 292,571 |
| Anglian Water Services Financing PLC: | | | |
| 5.875% 6/20/31 (Reg. S) | GBP | 130,000 | 166,369 |
| 6.293% 7/30/30 (Reg. S) | GBP | 225,000 | 294,932 |
| Barclays PLC: | | | |
| 5.262% 1/29/34 (Reg. S) (b) | EUR | 589,000 | 673,809 |
| 8.407% 11/14/32 (Reg. S) (b) | GBP | 273,000 | 363,732 |
| BAT Capital Corp. 5.834% 2/20/31 | | 2,000 | 2,028 |
| BAT International Finance PLC 4.125% 4/12/32 (Reg. S) | EUR | 563,000 | 591,490 |
| Heathrow Funding Ltd. 6% 3/5/32 (Reg. S) | GBP | 400,000 | 501,726 |
| HSBC Holdings PLC: | | | |
| 4.787% 3/10/32 (Reg. S) (b) | EUR | 163,000 | 182,838 |
| 4.856% 5/23/33 (Reg. S) (b) | EUR | 1,020,000 | 1,151,816 |
| 8.201% 11/16/34 (Reg. S) (b) | GBP | 360,000 | 493,536 |
| Imperial Brands Finance Netherlands BV 5.25% 2/15/31 (Reg. S) | EUR | 603,000 | 677,594 |
| John Lewis PLC 6.125% 1/21/25 | GBP | 1,076,000 | 1,361,437 |
| Lloyds Banking Group PLC: | | | |
| 1.985% 12/15/31 (b) | GBP | 201,000 | 232,487 |
| 4.75% 9/21/31 (Reg. S) (b) | EUR | 1,190,000 | 1,328,817 |
| Marks & Spencer PLC 4.5% 7/10/27 (Reg. S) | GBP | 186,000 | 227,804 |
| Mobico Group PLC 4.875% 9/26/31 (Reg. S) | EUR | 639,000 | 649,363 |
| NatWest Group PLC: | | | |
| 2.105% 11/28/31 (Reg. S) (b) | GBP | 202,000 | 234,251 |
| 4.771% 2/16/29 (Reg. S) (b) | EUR | 943,000 | 1,040,234 |
| 7.416% 6/6/33 (Reg. S) (b) | GBP | 544,000 | 713,045 |
| NGG Finance PLC 2.125% 9/5/82 (Reg. S) (b) | EUR | 460,000 | 453,556 |
| Reckitt Benckiser Treasury Services PLC 3.875% 9/14/33 (Reg. S) | EUR | 417,000 | 448,725 |
| Severn Trent Utilities Finance PLC 4.625% 11/30/34 (Reg. S) | GBP | 307,000 | 359,836 |
| Southern Water Services Finance Ltd.: | | | |
| 1.625% 3/30/27 (Reg. S) | GBP | 100,000 | 108,711 |
| 2.375% 5/28/28 (Reg. S) | GBP | 110,000 | 119,176 |
| SW Finance I PLC 7.375% 12/12/41 (Reg. S) | GBP | 216,000 | 265,370 |
| Tesco Corporate Treasury Services PLC 2.75% 4/27/30 (Reg. S) | GBP | 605,000 | 678,670 |
| The Berkeley Group PLC 2.5% 8/11/31 (Reg. S) | GBP | 467,000 | 459,723 |
| Travis Perkins PLC 3.75% 2/17/26 (Reg. S) | GBP | 315,000 | 377,525 |
| Tritax EuroBox PLC 0.95% 6/2/26 (Reg. S) | EUR | 225,000 | 227,527 |
| Virgin Money UK PLC 7.625% 8/23/29 (Reg. S) (b) | GBP | 499,000 | 679,844 |
| Vodafone Group PLC 4.875% 10/3/78 (Reg. S) (b) | GBP | 169,000 | 210,001 |
| Whitbread PLC 2.375% 5/31/27 (Reg. S) | GBP | 236,000 | 272,037 |
TOTAL UNITED KINGDOM | | | 16,477,916 |
| United States of America - 3.3% | | | |
| Blackstone Private Credit Fund 4.875% 4/14/26 | GBP | 564,000 | 691,388 |
| Carrier Global Corp. 4.5% 11/29/32 | EUR | 156,000 | 174,647 |
| Duke Energy Corp. 3.85% 6/15/34 | EUR | 216,000 | 223,681 |
| Ford Motor Credit Co. LLC 4.445% 2/14/30 | EUR | 208,000 | 224,231 |
| JPMorgan Chase & Co. 3.761% 3/21/34 (Reg. S) (b) | EUR | 299,000 | 318,294 |
| Morgan Stanley 3.955% 3/21/35 (Reg. S) (b) | EUR | 430,000 | 457,649 |
| Southern Co. 1.875% 9/15/81 (b) | EUR | 333,000 | 317,474 |
| Verizon Communications, Inc. 3.75% 2/28/36 | EUR | 182,000 | 192,499 |
| Warnermedia Holdings, Inc. 4.693% 5/17/33 (Reg. S) | EUR | 350,000 | 372,793 |
| WP Carey, Inc. 4.25% 7/23/32 | EUR | 100,000 | 106,736 |
TOTAL UNITED STATES OF AMERICA | | | 3,079,392 |
| TOTAL NONCONVERTIBLE BONDS (Cost $53,733,452) | | | 50,244,934 |
| | | | |
| U.S. Government and Government Agency Obligations - 21.2% |
| | | Principal Amount (a) | Value ($) |
| U.S. Treasury Obligations - 21.2% | | | |
| U.S. Treasury Bonds: | | | |
| 4.375% 8/15/43 | | 1,994,000 | 1,924,677 |
| 4.5% 2/15/44 | | 1,700,000 | 1,667,594 |
| 4.625% 5/15/44 | | 150,000 | 149,719 |
| 6.25% 5/15/30 (e)(f) | | 3,534,000 | 3,876,632 |
| U.S. Treasury Notes: | | | |
| 3.75% 12/31/30 | | 383,000 | 369,984 |
| 3.875% 8/15/33 | | 184,000 | 177,014 |
| 4% 1/31/29 | | 2,888,000 | 2,843,552 |
| 4.25% 2/28/29 | | 2,555,000 | 2,543,522 |
| 4.25% 6/30/31 | | 620,000 | 617,191 |
| 4.5% 11/15/33 | | 326,000 | 329,005 |
| 4.625% 4/30/29 | | 4,950,000 | 5,006,846 |
| | | | |
| TOTAL U.S. GOVERNMENT AND GOVERNMENT AGENCY OBLIGATIONS (Cost $19,540,118) | | | 19,505,736 |
| | | | |
| Foreign Government and Government Agency Obligations - 8.4% |
| | | Principal Amount (a) | Value ($) |
| Canada - 0.2% | | | |
| Canadian Government 2.75% 6/1/33 | CAD | 250,000 | 172,190 |
| Germany - 7.8% | | | |
| German Federal Republic: | | | |
| 2.1% 11/15/29(Reg. S) | EUR | 2,150,000 | 2,262,144 |
| 2.2% 4/13/28(Reg. S) | EUR | 1,600,000 | 1,693,948 |
| 2.5% 7/4/44 | EUR | 1,109,000 | 1,150,931 |
| 3.25% 7/4/42 | EUR | 1,851,000 | 2,134,770 |
TOTAL GERMANY | | | 7,241,793 |
| Japan - 0.4% | | | |
| Japan Government 0.8% 3/20/34 | JPY | 59,600,000 | 362,082 |
| TOTAL FOREIGN GOVERNMENT AND GOVERNMENT AGENCY OBLIGATIONS (Cost $7,873,050) | | | 7,776,065 |
| | | | |
| Preferred Securities - 9.8% |
| | | Principal Amount (a) | Value ($) |
| Australia - 0.4% | | | |
| QBE Insurance Group Ltd. 5.25% (Reg. S) (b)(g) | | 323,000 | 318,617 |
| Czech Republic - 0.3% | | | |
| CPI Property Group SA 3.75% (Reg. S) (b)(g) | EUR | 494,000 | 277,889 |
| Finland - 0.3% | | | |
| Citycon Oyj 7.875% (Reg. S) (b)(g) | EUR | 347,000 | 290,056 |
| Germany - 3.5% | | | |
| Aroundtown Finance Sarl 7.875% (b)(g) | | 1,400,000 | 1,010,478 |
| Aroundtown SA 3.375% (Reg. S) (b)(g) | EUR | 1,100,000 | 773,282 |
| Grand City Properties SA 1.5% (Reg. S) (b)(g) | EUR | 800,000 | 548,885 |
| Volkswagen International Finance NV 3.875% (Reg. S) (b)(g) | EUR | 900,000 | 898,541 |
TOTAL GERMANY | | | 3,231,186 |
| Ireland - 0.2% | | | |
| AIB Group PLC 6.25% (Reg. S) (b)(g) | EUR | 160,000 | 171,493 |
| Sweden - 0.7% | | | |
| Heimstaden Bostad AB 3.248% (Reg. S) (b)(g) | EUR | 558,000 | 455,169 |
| Samhallsbyggnadsbolaget I Norden AB 2.624% (Reg. S) (b)(g) | EUR | 495,000 | 189,701 |
TOTAL SWEDEN | | | 644,870 |
| Switzerland - 1.5% | | | |
| Credit Suisse Group AG Claim (g)(h)(i) | | 9,515,000 | 1,046,650 |
| UBS Group AG 7% (Reg. S) (b)(g) | | 300,000 | 307,201 |
TOTAL SWITZERLAND | | | 1,353,851 |
| United Kingdom - 2.9% | | | |
| Barclays PLC: | | | |
| 7.125% (b)(g) | GBP | 200,000 | 251,297 |
| 8.875% (b)(g) | GBP | 430,000 | 558,318 |
| British American Tobacco PLC 3% (Reg. S) (b)(g) | EUR | 900,000 | 923,103 |
| Lloyds Banking Group PLC 5.125% (b)(g) | GBP | 280,000 | 349,279 |
| Mobico Group PLC 4.25% (Reg. S) (b)(g) | GBP | 198,000 | 230,216 |
| SSE PLC 3.74% (Reg. S) (b)(g) | GBP | 320,000 | 392,785 |
TOTAL UNITED KINGDOM | | | 2,704,998 |
| TOTAL PREFERRED SECURITIES (Cost $21,237,850) | | | 8,992,960 |
| | | | |
| Money Market Funds - 4.7% |
| | | Shares | Value ($) |
Fidelity Cash Central Fund 5.38% (j) (Cost $4,316,770) | | 4,315,907 | 4,316,770 |
| | | | |
| TOTAL INVESTMENT IN SECURITIES - 98.6% (Cost $106,701,240) | 90,836,465 |
NET OTHER ASSETS (LIABILITIES) - 1.4% | 1,305,841 |
| NET ASSETS - 100.0% | 92,142,306 |
| | |
| Futures Contracts |
| | Number of contracts | Expiration Date | Notional Amount ($) | Value ($) | Unrealized Appreciation/ (Depreciation) ($) |
| Purchased | | | | | |
| | | | | | |
| Bond Index Contracts | | | | | |
| ASX 10 Year Treasury Bond Index Contracts (Australia) | 10 | Sep 2024 | 757,619 | 607 | 607 |
| TME 10 Year Canadian Note Contracts (Canada) | 31 | Sep 2024 | 2,720,785 | 21,780 | 21,780 |
| | | | | | |
| TOTAL BOND INDEX CONTRACTS | | | | | 22,387 |
| | | | | | |
| Treasury Contracts | | | | | |
| CBOT 2-Year U.S. Treasury Note Contracts (United States) | 20 | Sep 2024 | 4,084,375 | 6,528 | 6,528 |
| CBOT Long Term U.S. Treasury Bond Contracts (United States) | 34 | Sep 2024 | 4,022,625 | 30,481 | 30,481 |
| | | | | | |
| TOTAL TREASURY CONTRACTS | | | | | 37,009 |
| | | | | | |
| TOTAL PURCHASED | | | | | 59,396 |
| | | | | | |
| Sold | | | | | |
| | | | | | |
| Bond Index Contracts | | | | | |
| ICE Long Gilt Contracts (United Kingdom) | 11 | Sep 2024 | 1,356,721 | (4,057) | (4,057) |
| | | | | | |
| TOTAL FUTURES CONTRACTS | | | | | 55,339 |
| The notional amount of futures purchased as a percentage of Net Assets is 12.6% |
| The notional amount of futures sold as a percentage of Net Assets is 1.5% |
For the period, the average monthly notional amount at value for futures contracts in the aggregate was $37,606,153.
| Forward Foreign Currency Contracts |
Currency Purchased
| Currency Sold | Counterparty | Settlement Date | Unrealized Appreciation/ (Depreciation) ($) |
| | | | | | | |
| CAD | 250,000 | USD | 182,670 | Citibank, N. A. | 7/02/24 | 72 |
| EUR | 114,000 | USD | 124,464 | Brown Brothers Harriman & Co | 8/22/24 | (2,066) |
| EUR | 67,000 | USD | 72,178 | Brown Brothers Harriman & Co | 8/22/24 | (242) |
| EUR | 58,000 | USD | 62,873 | Canadian Imperial Bk. of Comm. | 8/22/24 | (600) |
| EUR | 55,000 | USD | 59,320 | JPMorgan Chase Bank, N.A. | 8/22/24 | (268) |
| EUR | 725,000 | USD | 777,469 | JPMorgan Chase Bank, N.A. | 8/22/24 | 939 |
| GBP | 25,000 | USD | 31,845 | Bank of America, N.A. | 8/22/24 | (231) |
| GBP | 308,000 | USD | 389,517 | JPMorgan Chase Bank, N.A. | 8/22/24 | (27) |
| USD | 64,220 | AUD | 97,000 | Citibank, N. A. | 8/22/24 | (580) |
| USD | 234,091 | CAD | 320,000 | Citibank, N. A. | 8/22/24 | (105) |
| USD | 195,686 | CAD | 267,000 | Citibank, N. A. | 8/22/24 | 278 |
| USD | 411,904 | EUR | 378,000 | BNP Paribas S.A. | 8/22/24 | 6,058 |
| USD | 88,427 | EUR | 81,000 | Bank of America, N.A. | 8/22/24 | 1,460 |
| USD | 1,079,407 | EUR | 993,000 | Brown Brothers Harriman & Co | 8/22/24 | 13,256 |
| USD | 125,291 | EUR | 115,000 | Brown Brothers Harriman & Co | 8/22/24 | 1,820 |
| USD | 41,007,467 | EUR | 37,923,000 | Goldman Sachs Bank USA | 8/22/24 | 290,828 |
| USD | 169,779 | EUR | 158,000 | JPMorgan Chase Bank, N.A. | 8/22/24 | 140 |
| USD | 54,537 | EUR | 50,000 | JPMorgan Chase Bank, N.A. | 8/22/24 | 854 |
| USD | 47,970 | EUR | 44,000 | JPMorgan Chase Bank, N.A. | 8/22/24 | 728 |
| USD | 15,357,016 | GBP | 12,263,000 | Bank of America, N.A. | 8/22/24 | (150,467) |
| USD | 44,745 | GBP | 35,000 | Brown Brothers Harriman & Co | 8/22/24 | 485 |
| USD | 388,906 | JPY | 59,700,000 | Citibank, N. A. | 8/22/24 | 14,831 |
| | | | | | | |
| TOTAL FORWARD FOREIGN CURRENCY CONTRACTS | | 177,163 |
| Unrealized Appreciation | | | 331,749 |
| Unrealized Depreciation | | | (154,586) |
For the period, the average contract value for forward foreign currency contracts was $158,808,035. Contract value represents contract amount in United States dollars plus or minus unrealized appreciation or depreciation, respectively.
| Credit Default Swaps |
| Underlying Reference | | Maturity Date | Clearinghouse / Counterparty | Fixed Payment Received/ (Paid) | Payment Frequency | Notional Amount(1) | Value ($) | Upfront Premium Received/ (Paid) ($) | Unrealized Appreciation/ (Depreciation) ($) |
| Buy Protection | | | | | | | | | | |
| AXA SA | | Jun 2029 | Goldman Sachs Bank USA | (1%) | Quarterly | EUR | 210,000 | (306) | 2,590 | 2,284 |
| AXA SA | | Jun 2029 | Goldman Sachs Bank USA | (1%) | Quarterly | EUR | 210,000 | (306) | 2,590 | 2,284 |
| AXA SA | | Jun 2029 | Goldman Sachs Bank USA | (1%) | Quarterly | EUR | 430,000 | (626) | 5,304 | 4,678 |
| Assicurazioni Generali SpA | | Jun 2029 | BNP Paribas S.A. | (1%) | Quarterly | EUR | 1,400,000 | 20,044 | (13,381) | 6,663 |
| BMW Finance NV | | Jun 2029 | BNP Paribas S.A. | (1%) | Quarterly | EUR | 550,000 | (11,413) | 13,986 | 2,573 |
| BMW Finance NV | | Jun 2029 | BNP Paribas S.A. | (1%) | Quarterly | EUR | 850,000 | (17,638) | 21,625 | 3,987 |
| BMW Finance NV | | Jun 2029 | BNP Paribas S.A. | (1%) | Quarterly | EUR | 1,100,000 | (22,826) | 27,864 | 5,038 |
| Heidelberg Materials AG | | Jun 2029 | BNP Paribas S.A. | (5%) | Quarterly | EUR | 450,000 | (90,733) | 94,198 | 3,465 |
| Heidelberg Materials AG | | Jun 2029 | BNP Paribas S.A. | (5%) | Quarterly | EUR | 1,100,000 | (221,793) | 231,218 | 9,425 |
| Intesa Sanpaolo SpA | | Jun 2029 | JPMorgan Chase Bank, N.A. | (1%) | Quarterly | EUR | 500,000 | 15,041 | (11,098) | 3,943 |
| Societe Generale | | Jun 2029 | Goldman Sachs Bank USA | (1%) | Quarterly | EUR | 550,000 | 11,866 | (3,752) | 8,114 |
| UniCredit SpA | | Jun 2029 | Goldman Sachs Bank USA | (1%) | Quarterly | EUR | 450,000 | 13,867 | (9,774) | 4,093 |
| | | | | | | | | | | |
| TOTAL CREDIT DEFAULT SWAPS | | | | | | | | (304,823) | 361,370 | 56,547 |
(1)Notional amount is stated in U.S. Dollars unless otherwise noted.
Currency Abbreviations
| AUD | - | Australian dollar |
| CAD | - | Canadian dollar |
| EUR | - | European Monetary Unit |
| GBP | - | British pound sterling |
| JPY | - | Japanese yen |
| USD | - | U.S. dollar |
Legend
| (a) | Amount is stated in United States dollars unless otherwise noted. |
| (b) | Coupon rates for floating and adjustable rate securities reflect the rates in effect at period end. |
| (c) | Security exempt from registration under Rule 144A of the Securities Act of 1933. These securities may be resold in transactions exempt from registration, normally to qualified institutional buyers. At the end of the period, the value of these securities amounted to $4,997,962 or 5.4% of net assets. |
| (d) | Security or a portion of the security purchased on a delayed delivery or when-issued basis. |
| (e) | Security or a portion of the security was pledged to cover margin requirements for futures contracts. At period end, the value of securities pledged amounted to $352,312. |
| (f) | Security or a portion of the security has been segregated as collateral for open forward foreign currency contracts and bi-lateral over the counter (OTC) swaps. At period end, the value of securities pledged amounted to $682,756. |
| (g) | Security is perpetual in nature with no stated maturity date. |
| (h) | Non-income producing - Security is in default. |
| (i) | Coupon is indexed to a floating interest rate which may be multiplied by a specified factor and/or subject to caps or floors. |
| (j) | Affiliated fund that is generally available only to investment companies and other accounts managed by Fidelity Investments. The rate quoted is the annualized seven-day yield of the fund at period end. A complete unaudited listing of the fund's holdings as of its most recent quarter end is available upon request. In addition, each Fidelity Central Fund's financial statements are available on the SEC's website or upon request. |
Affiliated Central Funds
Fiscal year to date information regarding the Fund's investments in Fidelity Central Funds, including the ownership percentage, is presented below.
| Affiliate | Value, beginning of period ($) | Purchases ($) | Sales Proceeds ($) | Dividend Income ($) | Realized Gain (loss) ($) | Change in Unrealized appreciation (depreciation) ($) | Value, end of period ($) | % ownership, end of period |
| Fidelity Cash Central Fund 5.38% | 11,501,764 | 43,992,706 | 51,177,737 | 214,752 | 38 | (1) | 4,316,770 | 0.0% |
| Fidelity Securities Lending Cash Central Fund 5.38% | - | 10,786,135 | 10,786,135 | 848 | - | - | - | 0.0% |
| Total | 11,501,764 | 54,778,841 | 61,963,872 | 215,600 | 38 | (1) | 4,316,770 | |
| | | | | | | | | |
Amounts in the dividend income column in the above table include any capital gain distributions from underlying funds, which are presented in the corresponding line item in the Statement of Operations, if applicable.
Amounts in the dividend income column for Fidelity Securities Lending Cash Central Fund represents the income earned on investing cash collateral, less rebates paid to borrowers and any lending agent fees associated with the loan, plus any premium payments received for lending certain types of securities.
Amounts included in the purchases and sales proceeds columns may include in-kind transactions, if applicable.
Investment Valuation
The following is a summary of the inputs used, as of June 30, 2024, involving the Fund's assets and liabilities carried at fair value. The inputs or methodology used for valuing securities may not be an indication of the risk associated with investing in those securities. For more information on valuation inputs, and their aggregation into the levels used below, please refer to the Investment Valuation section in the accompanying Notes to Financial Statements.
| Valuation Inputs at Reporting Date: |
| Description | Total ($) | Level 1 ($) | Level 2 ($) | Level 3 ($) |
Investments in Securities: | | | | |
|
| Corporate Bonds | 50,244,934 | - | 50,244,934 | - |
|
| U.S. Government and Government Agency Obligations | 19,505,736 | - | 19,505,736 | - |
|
| Foreign Government and Government Agency Obligations | 7,776,065 | - | 7,776,065 | - |
|
| Preferred Securities | 8,992,960 | - | 8,992,960 | - |
|
| Money Market Funds | 4,316,770 | 4,316,770 | - | - |
| Total Investments in Securities: | 90,836,465 | 4,316,770 | 86,519,695 | - |
Derivative Instruments: Assets | | | | |
Futures Contracts | 59,396 | 59,396 | - | - |
Forward Foreign Currency Contracts | 331,749 | - | 331,749 | - |
Swaps | 60,818 | - | 60,818 | - |
| Total Assets | 451,963 | 59,396 | 392,567 | - |
| Liabilities | | | | |
Futures Contracts | (4,057) | (4,057) | - | - |
Forward Foreign Currency Contracts | (154,586) | - | (154,586) | - |
Swaps | (365,641) | - | (365,641) | - |
| Total Liabilities | (524,284) | (4,057) | (520,227) | - |
| Total Derivative Instruments: | (72,321) | 55,339 | (127,660) | - |
Value of Derivative Instruments
The following table is a summary of the Fund's value of derivative instruments by primary risk exposure as of June 30, 2024. For additional information on derivative instruments, please refer to the Derivative Instruments section in the accompanying Notes to Financial Statements.
Primary Risk Exposure / Derivative Type | Value |
| Asset ($) | Liability ($) |
| Credit Risk | | |
Swaps (a) | 60,818 | (365,641) |
| Total Credit Risk | 60,818 | (365,641) |
| Foreign Exchange Risk | | |
Forward Foreign Currency Contracts (b) | 331,749 | (154,586) |
| Total Foreign Exchange Risk | 331,749 | (154,586) |
| Interest Rate Risk | | |
Futures Contracts (c) | 59,396 | (4,057) |
| Total Interest Rate Risk | 59,396 | (4,057) |
| Total Value of Derivatives | 451,963 | (524,284) |
(a)For bi-lateral over-the-counter (OTC) swaps, reflects gross value which is presented in the Statement of Assets and Liabilities in the bi-lateral OTC swaps, at value line-items.
(b)Gross value is presented in the Statement of Assets and Liabilities in the unrealized appreciation/depreciation on forward foreign currency contracts line-items.
(c)Reflects gross cumulative appreciation (depreciation) on futures contracts as presented in the Schedule of Investments. In the Statement of Assets and Liabilities, the period end daily variation margin is included in receivable or payable for daily variation margin on futures contracts, and the net cumulative appreciation (depreciation) is included in Total accumulated earnings (loss).
Financial Statements (Unaudited)
| Statement of Assets and Liabilities |
| | | | June 30, 2024 (Unaudited) |
| | | | | |
| Assets | | | | |
| Investment in securities, at value - See accompanying schedule: | | | | |
Unaffiliated issuers (cost $102,384,470) | $ | 86,519,695 | | |
Fidelity Central Funds (cost $4,316,770) | | 4,316,770 | | |
| | | | | |
| | | | | |
| Total Investment in Securities (cost $106,701,240) | | | $ | 90,836,465 |
| Foreign currency held at value (cost $1,360,845) | | | | 1,357,354 |
| Unrealized appreciation on forward foreign currency contracts | | | | 331,749 |
| Receivable for fund shares sold | | | | 940 |
| Dividends receivable | | | | 8,612 |
| Interest receivable | | | | 1,398,357 |
| Distributions receivable from Fidelity Central Funds | | | | 16,495 |
| Bi-lateral OTC swaps, at value | | | | 60,818 |
Total assets | | | | 94,010,790 |
| Liabilities | | | | |
| Payable for investments purchased | | | | |
Regular delivery | $ | 938,101 | | |
Delayed delivery | | 320,502 | | |
| Unrealized depreciation on forward foreign currency contracts | | 154,586 | | |
| Payable for fund shares redeemed | | 47,702 | | |
| Bi-lateral OTC swaps, at value | | 365,641 | | |
| Payable for daily variation margin on futures contracts | | 35,479 | | |
| Payable for daily variation margin on centrally cleared swaps | | 2,005 | | |
| Other payables and accrued expenses | | 4,468 | | |
| Total liabilities | | | | 1,868,484 |
| Net Assets | | | $ | 92,142,306 |
| Net Assets consist of: | | | | |
| Paid in capital | | | $ | 216,357,840 |
| Total accumulated earnings (loss) | | | | (124,215,534) |
| Net Assets | | | $ | 92,142,306 |
Net Asset Value, offering price and redemption price per share ($92,142,306 ÷ 1,141,363 shares) | | | $ | 80.73 |
| Statement of Operations |
| | | | Six months ended June 30, 2024 (Unaudited) |
| Investment Income | | | | |
| Dividends | | | $ | 421,029 |
| Interest | | | | 3,464,916 |
| Income from Fidelity Central Funds (including $848 from security lending) | | | | 215,600 |
| Income before foreign taxes withheld | | | $ | 4,101,545 |
| Less foreign taxes withheld | | | | (5,662) |
| Total income | | | | 4,095,883 |
| Expenses | | | | |
| Custodian fees and expenses | $ | 5,419 | | |
| Independent trustees' fees and expenses | | 303 | | |
| Miscellaneous | | 1 | | |
| Total expenses before reductions | | 5,723 | | |
| Expense reductions | | (2,683) | | |
| Total expenses after reductions | | | | 3,040 |
| Net Investment income (loss) | | | | 4,092,843 |
| Realized and Unrealized Gain (Loss) | | | | |
| Net realized gain (loss) on: | | | | |
| Investment Securities: | | | | |
| Unaffiliated issuers | | (12,635,632) | | |
| Redemptions in-kind | | (4,628,712) | | |
| Fidelity Central Funds | | 38 | | |
| Forward foreign currency contracts | | 2,443,786 | | |
| Foreign currency transactions | | (134,995) | | |
| Futures contracts | | (322,385) | | |
| Swaps | | (78,164) | | |
| Total net realized gain (loss) | | | | (15,356,064) |
| Change in net unrealized appreciation (depreciation) on: | | | | |
| Investment Securities: | | | | |
| Unaffiliated issuers | | 14,251,178 | | |
| Fidelity Central Funds | | (1) | | |
| Forward foreign currency contracts | | 2,695,768 | | |
| Assets and liabilities in foreign currencies | | (80,811) | | |
| Futures contracts | | (1,576,201) | | |
| Swaps | | 86,633 | | |
| Total change in net unrealized appreciation (depreciation) | | | | 15,376,566 |
| Net gain (loss) | | | | 20,502 |
| Net increase (decrease) in net assets resulting from operations | | | $ | 4,113,345 |
| Statement of Changes in Net Assets |
| |
| | Six months ended June 30, 2024 (Unaudited) | | Year ended December 31, 2023 |
| Increase (Decrease) in Net Assets | | | | |
| Operations | | | | |
| Net investment income (loss) | $ | 4,092,843 | $ | 11,447,388 |
| Net realized gain (loss) | | (15,356,064) | | (62,808,886) |
| Change in net unrealized appreciation (depreciation) | | 15,376,566 | | 67,796,221 |
| Net increase (decrease) in net assets resulting from operations | | 4,113,345 | | 16,434,723 |
| Distributions to shareholders | | (3,270,320) | | (10,069,714) |
| | | | | |
| Affiliated share transactions | | | | |
| Proceeds from sales of shares | | 11,603,938 | | 35,866,979 |
| Reinvestment of distributions | | 3,270,320 | | 10,069,714 |
| Cost of shares redeemed | | (165,091,289) | | (172,439,294) |
| | | | | |
Net increase (decrease) in net assets resulting from share transactions | | (150,217,031) | | (126,502,601) |
| Total increase (decrease) in net assets | | (149,374,006) | | (120,137,592) |
| | | | | |
| Net Assets | | | | |
| Beginning of period | | 241,516,312 | | 361,653,904 |
| End of period | $ | 92,142,306 | $ | 241,516,312 |
| | | | | |
| Other Information | | | | |
| Shares | | | | |
| Sold | | 145,897 | | 467,702 |
| Issued in reinvestment of distributions | | 40,930 | | 131,428 |
| Redeemed | | (2,079,008) | | (2,232,453) |
| Net increase (decrease) | | (1,892,181) | | (1,633,323) |
| | | | | |
Financial Highlights
Fidelity® International Credit Central Fund |
| |
| | Six months ended (Unaudited) June 30, 2024 | | Years ended December 31, 2023 | | 2022 | | 2021 | | 2020 | | 2019 |
Selected Per-Share Data | | | | | | | | | | | | |
| Net asset value, beginning of period | $ | 79.62 | $ | 77.49 | $ | 100.66 | $ | 104.23 | $ | 101.26 | $ | 94.83 |
| Income from Investment Operations | | | | | | | | | | | | |
Net investment income (loss) A,B | | 1.676 | | 3.322 | | 2.720 | | 2.309 | | 3.060 | | 2.744 |
| Net realized and unrealized gain (loss) | | .487 | | 1.936 | | (20.165) | | (2.501) | | 5.002 | | 9.957 |
| Total from investment operations | | 2.163 | | 5.258 | | (17.445) | | (.192) | | 8.062 | | 12.701 |
| Distributions from net investment income | | (1.053) | | (3.128) | | (5.143) | | (2.087) C | | (3.418) | | (3.022) C |
| Distributions from net realized gain | | - | | - | | (.563) | | (1.291) C | | (1.674) | | (3.040) C |
| Distributions from tax return of capital | | - | | - | | (.019) | | - | | - | | (.209) |
| Total distributions | | (1.053) | | (3.128) | | (5.725) | | (3.378) | | (5.092) | | (6.271) |
| Net asset value, end of period | $ | 80.73 | $ | 79.62 | $ | 77.49 | $ | 100.66 | $ | 104.23 | $ | 101.26 |
Total Return D,E | | | | 7.02% | | (17.51)% | | (.18)% | | 8.11% | | 13.57% |
Ratios to Average Net Assets B,F,G | | | | | | | | | | | | |
| Expenses before reductions | | .01% H,I | | -% J | | -% J | | -% J | | .01% | | .01% |
| Expenses net of fee waivers, if any | | | | -% J | | -% J | | -% J | | .01% | | .01% |
| Expenses net of all reductions | | -% H,I,J | | -% J | | -% J | | -% J | | .01% | | .01% |
| Net investment income (loss) | | 4.20% H,I | | 4.25% | | 3.08% | | 2.27% | | 2.97% | | 2.72% |
| Supplemental Data | | | | | | | | | | | | |
| Net assets, end of period (000 omitted) | $ | 92,142 | $ | 241,516 | $ | 361,654 | $ | 655,303 | $ | 455,948 | $ | 310,543 |
Portfolio turnover rate K | | | | 73% | | 25% | | 52% | | 67% | | 84% |
ACalculated based on average shares outstanding during the period.
BNet investment income (loss) is affected by the timing of the declaration of dividends by any underlying mutual funds or exchange-traded funds (ETFs). Net investment income (loss) of any mutual funds or ETFs is not included in the Fund's net investment income (loss) ratio.
CThe amount shown reflects reclassifications related to book to tax differences that were made in the year shown.
DTotal returns for periods of less than one year are not annualized.
ETotal returns would have been lower if certain expenses had not been reduced during the applicable periods shown.
FFees and expenses of any underlying mutual funds or exchange-traded funds (ETFs) are not included in the Fund's expense ratio. The Fund indirectly bears its proportionate share of these expenses. For additional expense information related to investments in Fidelity Central Funds, please refer to the "Investments in Fidelity Central Funds" note found in the Notes to Financial Statements section of the most recent Annual or Semi-Annual report.
GExpense ratios reflect operating expenses of the class. Expenses before reductions do not reflect amounts reimbursed, waived, or reduced through arrangements with the investment adviser, brokerage services, or other offset arrangements, if applicable, and do not represent the amount paid by the class during periods when reimbursements, waivers or reductions occur.
HAnnualized.
IProxy expenses are not annualized.
JAmount represents less than .005%.
KAmount does not include the portfolio activity of any underlying mutual funds or exchange-traded funds (ETFs).
LPortfolio turnover rate excludes securities received or delivered in-kind.
Notes to Financial Statements
(Unaudited)For the period ended June 30, 2024
1. Organization.
Fidelity International Credit Central Fund (the Fund) is a fund of Fidelity Central Investment Portfolios II LLC (the LLC) and is authorized to issue an unlimited number of shares. Shares of the Fund are only offered to other investment companies and accounts managed by Fidelity Management & Research Company LLC (FMR), or its affiliates (the Investing Funds). The LLC is registered under the Investment Company Act of 1940, as amended (the 1940 Act), as an open-end management investment company organized as a Delaware Limited Liability Company.
2. Investments in Fidelity Central Funds.
Funds may invest in Fidelity Central Funds, which are open-end investment companies generally available only to other investment companies and accounts managed by the investment adviser and its affiliates. The Schedule of Investments lists any Fidelity Central Funds held as an investment as of period end, but does not include the underlying holdings of each Fidelity Central Fund. An investing fund indirectly bears its proportionate share of the expenses of the underlying Fidelity Central Funds.
Based on its investment objective, each Fidelity Central Fund may invest or participate in various investment vehicles or strategies that are similar to those of the investing fund. These strategies are consistent with the investment objectives of the investing fund and may involve certain economic risks which may cause a decline in value of each of the Fidelity Central Funds and thus a decline in the value of the investing fund.
| Fidelity Central Fund | Investment Manager | Investment Objective | Investment Practices | Expense RatioA |
| Fidelity Money Market Central Funds | Fidelity Management & Research Company LLC (FMR) | Each fund seeks to obtain a high level of current income consistent with the preservation of capital and liquidity. | Short-term Investments | Less than .005% |
A Expenses expressed as a percentage of average net assets and are as of each underlying Central Fund's most recent annual or semi-annual shareholder report.
A complete unaudited list of holdings for each Fidelity Central Fund is available upon request or at the Securities and Exchange Commission website at www.sec.gov. In addition, the financial statements of the Fidelity Central Funds which contain the significant accounting policies (including investment valuation policies) of those funds, and are not covered by the Report of Independent Registered Public Accounting Firm, are available on the Securities and Exchange Commission website or upon request.
3. Significant Accounting Policies.
The Fund is an investment company and applies the accounting and reporting guidance of the Financial Accounting Standards Board (FASB) Accounting Standards Codification Topic 946 Financial Services - Investment Companies. The financial statements have been prepared in conformity with accounting principles generally accepted in the United States of America (GAAP), which require management to make certain estimates and assumptions at the date of the financial statements. Actual results could differ from those estimates. Subsequent events, if any, through the date that the financial statements were issued have been evaluated in the preparation of the financial statements. The Fund's Schedule of Investments lists any underlying mutual funds or exchange-traded funds (ETFs) but does not include the underlying holdings of these funds. The following summarizes the significant accounting policies of the Fund:
Investment Valuation. Investments are valued as of 4:00 p.m. Eastern time on the last calendar day of the period. The Board of Directors (the Board) has designated the Fund's investment adviser as the valuation designee responsible for the fair valuation function and performing fair value determinations as needed. The investment adviser has established a Fair Value Committee (the Committee) to carry out the day-to-day fair valuation responsibilities and has adopted policies and procedures to govern the fair valuation process and the activities of the Committee. In accordance with these fair valuation policies and procedures, which have been approved by the Board, the Fund attempts to obtain prices from one or more third party pricing services or brokers to value its investments. When current market prices, quotations or currency exchange rates are not readily available or reliable, investments will be fair valued in good faith by the Committee, in accordance with the policies and procedures. Factors used in determining fair value vary by investment type and may include market or investment specific events, transaction data, estimated cash flows, and market observations of comparable investments. The frequency that the fair valuation procedures are used cannot be predicted and they may be utilized to a significant extent. The Committee manages the Fund's fair valuation practices and maintains the fair valuation policies and procedures. The Fund's investment adviser reports to the Board information regarding the fair valuation process and related material matters.
The Fund categorizes the inputs to valuation techniques used to value its investments into a disclosure hierarchy consisting of three levels as shown below:
Level 1 - unadjusted quoted prices in active markets for identical investments
Level 2 - other significant observable inputs (including quoted prices for similar investments, interest rates, prepayment speeds, etc.)
Level 3 - unobservable inputs (including the Fund's own assumptions based on the best information available)
Valuation techniques used to value the Fund's investments by major category are as follows:
Debt securities, including restricted securities, are valued based on evaluated prices received from third party pricing services or from brokers who make markets in such securities. Corporate bonds, foreign government and government agency obligations, preferred securities, and U.S. government and government agency obligations are valued by pricing services who utilize matrix pricing which considers yield or price of bonds of comparable quality, coupon, maturity and type or by broker-supplied prices. Swaps are marked-to-market daily based on valuations from third party pricing services, registered derivatives clearing organizations (clearinghouses) or broker-supplied valuations. These pricing sources may utilize inputs such as interest rate curves, credit spread curves, default possibilities and recovery rates. When independent prices are unavailable or unreliable, debt securities and swaps may be valued utilizing pricing methodologies which consider similar factors that would be used by third party pricing services. For foreign debt securities, when significant market or security specific events arise, valuations may be determined in good faith in accordance with procedures adopted by the Board. Debt securities and swaps are generally categorized as Level 2 in the hierarchy but may be Level 3 depending on the circumstances.
The U.S. dollar value of forward foreign currency contracts is determined using currency exchange rates supplied by a pricing service and are categorized as Level 2 in the hierarchy. Futures contracts are valued at the settlement price established each day by the board of trade or exchange on which they are traded and are categorized as Level 1 in the hierarchy. Investments in open-end mutual funds, including the Fidelity Central Funds, are valued at their closing net asset value (NAV) each business day and are categorized as Level 1 in the hierarchy.
Changes in valuation techniques may result in transfers in or out of an assigned level within the disclosure hierarchy. The aggregate value of investments by input level as of June 30, 2024 is included at the end of the Fund's Schedule of Investments.
Foreign Currency. Foreign-denominated assets, including investment securities, and liabilities are translated into U.S. dollars at the exchange rates at period end. Purchases and sales of investment securities, income and dividends received, and expenses denominated in foreign currencies are translated into U.S. dollars at the exchange rate in effect on the transaction date.
The effects of exchange rate fluctuations on investments are included with the net realized and unrealized gain (loss) on investment securities. Other foreign currency transactions resulting in realized and unrealized gain (loss) are disclosed separately.
Realized gains and losses on foreign currency transactions arise from the disposition of foreign currency, realized changes in the value of foreign currency between the trade and settlement dates on security transactions, and the difference between the amounts of dividends, interest and foreign withholding taxes recorded on transaction date and the U.S. dollar equivalent of the amounts actually received or paid. Unrealized gains and losses on assets and liabilities in foreign currencies arise from changes in the value of foreign currency, and from assets and liabilities denominated in foreign currencies, other than investments, which are held at period end.
Investment Transactions and Income. For financial reporting purposes, the Fund's investment holdings and NAV include trades executed through the end of the last business day of the period. The NAV per share for processing shareholder transactions is calculated as of the close of business of the New York Stock Exchange (NYSE), normally 4:00 p.m. Eastern time and includes trades executed through the end of the prior business day. Gains and losses on securities sold are determined on the basis of identified cost. Dividend income is recorded on the ex-dividend date. Income and capital gain distributions from Fidelity Central Funds, if any, are recorded on the ex-dividend date. Interest income is accrued as earned and includes coupon interest and amortization of premium and accretion of discount on debt securities as applicable. Investment income is recorded net of foreign taxes withheld where recovery of such taxes is uncertain. Debt obligations may be placed on non-accrual status and related interest income may be reduced by ceasing current accruals and writing off interest receivables when the collection of all or a portion of interest has become doubtful based on consistently applied procedures. A debt obligation is removed from non-accrual status when the issuer resumes interest payments or when collectability of interest is reasonably assured. Funds may file withholding tax reclaims in certain jurisdictions to recover a portion of amounts previously withheld. Any withholding tax reclaims income is included in the Statement of Operations in foreign taxes withheld. Any receivables for withholding tax reclaims are included in the Statement of Assets and Liabilities in dividends receivable.
Expenses. Expenses directly attributable to a fund are charged to that fund. Expenses attributable to more than one fund are allocated among the respective funds on the basis of relative net assets or other appropriate methods. Expenses included in the accompanying financial statements reflect the expenses of that fund and do not include any expenses associated with any underlying mutual funds or exchange-traded funds. Although not included in a fund's expenses, a fund indirectly bears its proportionate share of these expenses through the net asset value of each underlying mutual fund or exchange-traded fund. Expense estimates are accrued in the period to which they relate and adjustments are made when actual amounts are known.
Income Tax Information and Distributions to Shareholders. Each year, the Fund intends to qualify as a regulated investment company under Subchapter M of the Internal Revenue Code, including distributing substantially all of its taxable income and realized gains. As a result, no provision for U.S. Federal income taxes is required. The Fund files a U.S. federal tax return, in addition to state and local tax returns as required. The Fund's federal income tax returns are subject to examination by the Internal Revenue Service (IRS) for a period of three fiscal years after they are filed. State and local tax returns may be subject to examination for an additional fiscal year depending on the jurisdiction. Foreign taxes are provided for based on the Fund's understanding of the tax rules and rates that exist in the foreign markets in which it invests.
Distributions are declared and recorded on the ex-dividend date. Income and capital gain distributions are determined in accordance with income tax regulations, which may differ from GAAP.
Capital accounts within the financial statements are adjusted for permanent book-tax differences. These adjustments have no impact on net assets or the results of operations. Capital accounts are not adjusted for temporary book-tax differences which will reverse in a subsequent period.
Book-tax differences are primarily due to futures contracts, swaps, foreign currency transactions, market discount, capital loss carryforwards and losses deferred due to wash sales and excise tax regulations.
As of period end, the cost and unrealized appreciation (depreciation) in securities, and derivatives if applicable, for federal income tax purposes were as follows:
| Gross unrealized appreciation | $1,410,303 |
| Gross unrealized depreciation | (16,804,560) |
| Net unrealized appreciation (depreciation) | $(15,394,257) |
| Tax cost | $106,519,771 |
Capital loss carryforwards are only available to offset future capital gains of the Fund to the extent provided by regulations and may be limited. The capital loss carryforward information presented below, including any applicable limitation, is estimated as of prior fiscal period end and is subject to adjustment.
Short-term | $(16,977,348) |
Long-term | (80,352,224) |
| Total capital loss carryforward | $(97,329,572) |
Delayed Delivery Transactions and When-Issued Securities. During the period, certain Funds transacted in securities on a delayed delivery or when-issued basis. Payment and delivery may take place after the customary settlement period for that security. The price of the underlying securities and the date when the securities will be delivered and paid for are fixed at the time the transaction is negotiated. Securities purchased on a delayed delivery or when-issued basis are identified as such in the Schedule of Investments. Compensation for interest forgone in the purchase of a delayed delivery or when-issued debt security may be received. With respect to purchase commitments, each applicable Fund identifies securities as segregated in its records with a value at least equal to the amount of the commitment. Payables and receivables associated with the purchases and sales of delayed delivery securities having the same coupon, settlement date and broker are offset. Delayed delivery or when-issued securities that have been purchased from and sold to different brokers are reflected as both payables and receivables in the Statement of Assets and Liabilities under the caption "Delayed delivery", as applicable. Losses may arise due to changes in the value of the underlying securities or if the counterparty does not perform under the contract's terms, or if the issuer does not issue the securities due to political, economic, or other factors.
Restricted Securities (including Private Placements). Funds may invest in securities that are subject to legal or contractual restrictions on resale. These securities generally may be resold in transactions exempt from registration or to the public if the securities are registered. Disposal of these securities may involve time-consuming negotiations and expense, and prompt sale at an acceptable price may be difficult. Information regarding restricted securities held at period end is included at the end of the Schedule of Investments, if applicable.
4. Derivative Instruments.
Risk Exposures and the Use of Derivative Instruments. The Fund's investment objectives allow for various types of derivative instruments, including futures contracts, forward foreign currency contracts and swaps. Derivatives are investments whose value is primarily derived from underlying assets, indices or reference rates and may be transacted on an exchange or over-the-counter (OTC). Derivatives may involve a future commitment to buy or sell a specified asset based on specified terms, to exchange future cash flows at periodic intervals based on a notional principal amount, or for one party to make one or more payments upon the occurrence of specified events in exchange for periodic payments from the other party.
Derivatives were used to increase returns, to gain exposure to certain types of assets, to facilitate transactions in foreign-denominated securities and to manage exposure to certain risks as defined below. The success of any strategy involving derivatives depends on analysis of numerous economic factors, and if the strategies for investment do not work as intended, the objectives may not be achieved.
Derivatives were used to increase or decrease exposure to the following risk(s):
| | |
| Credit Risk | Credit risk relates to the ability of the issuer of a financial instrument to make further principal or interest payments on an obligation or commitment that it has to a fund. |
| Foreign Exchange Risk | Foreign exchange rate risk relates to fluctuations in the value of an asset or liability due to changes in currency exchange rates. |
| Interest Rate Risk | Interest rate risk relates to the fluctuations in the value of interest-bearing securities due to changes in the prevailing levels of market interest rates. |
Funds are also exposed to additional risks from investing in derivatives, such as liquidity risk and counterparty credit risk. Liquidity risk is the risk that a fund will be unable to close out the derivative in the open market in a timely manner. Counterparty credit risk is the risk that the counterparty will not be able to fulfill its obligation to a fund. Derivative counterparty credit risk is managed through formal evaluation of the creditworthiness of all potential counterparties. On certain OTC derivatives such as forward foreign currency contracts and bi-lateral swaps, a fund attempts to reduce its exposure to counterparty credit risk by entering into an International Swaps and Derivatives Association, Inc. (ISDA) Master Agreement with each of its counterparties. The ISDA Master Agreement gives a fund the right to terminate all transactions traded under such agreement upon the deterioration in the credit quality of the counterparty beyond specified levels. The ISDA Master Agreement gives each party the right, upon an event of default by the other party or a termination of the agreement, to close out all transactions traded under such agreement and to net amounts owed under each transaction to one net payable by one party to the other. To mitigate counterparty credit risk on bi-lateral OTC derivatives, a fund receives collateral in the form of cash or securities once net unrealized appreciation on outstanding derivative contracts under an ISDA Master Agreement exceeds certain applicable thresholds, subject to certain minimum transfer provisions. The collateral received is held in segregated accounts with the custodian bank in accordance with the collateral agreements entered into between a fund, the counterparty and the custodian bank. A fund could experience delays and costs in gaining access to the collateral even though it is held by the custodian bank. The maximum risk of loss to a fund from counterparty credit risk related to bi-lateral OTC derivatives is generally the aggregate unrealized appreciation and unpaid counterparty payments in excess of any collateral pledged by the counterparty to a fund. A fund may be required to pledge collateral for the benefit of the counterparties on bi-lateral OTC derivatives in an amount not less than each counterparty's unrealized appreciation on outstanding derivative contracts, subject to certain minimum transfer provisions, and any such pledged collateral is identified in the Schedule of Investments. Exchange-traded contracts are not covered by the ISDA Master Agreement; however counterparty credit risk related to these contracts may be mitigated by the protection provided by the exchange on which they trade.
Investing in derivatives may involve greater risks than investing in the underlying assets directly and, to varying degrees, may involve risk of loss in excess of any initial investment and collateral received and amounts recognized in the Statement of Assets and Liabilities. In addition, there may be the risk that the change in value of the derivative contract does not correspond to the change in value of the underlying instrument.
Net Realized Gain (Loss) and Change in Net Unrealized Appreciation (Depreciation) on Derivatives. The table below, which reflects the impacts of derivatives on the financial performance, summarizes the net realized gain (loss) and change in net unrealized appreciation (depreciation) for derivatives during the period as presented in the Statement of Operations.
| Primary Risk Exposure / Derivative Type | Net Realized Gain (Loss)($) | Change in Net Unrealized Appreciation (Depreciation)($) |
| Fidelity International Credit Central Fund | | |
| Credit Risk | | |
| Swaps | (78,164) | 86,633 |
| Total Credit Risk | (78,164) | 86,633 |
| Foreign Exchange Risk | | |
| Forward Foreign Currency Contracts | 2,443,786 | 2,695,768 |
| Total Foreign Exchange Risk | 2,443,786 | 2,695,768 |
| Interest Rate Risk | | |
| Futures Contracts | (322,385) | (1,576,201) |
| Total Interest Rate Risk | (322,385) | (1,576,201) |
| Totals | 2,043,237 | 1,206,200 |
If there are any open positions at period end, a summary of the value of derivatives by primary risk exposure is included at the end of the Schedule of Investments.
Forward Foreign Currency Contracts. Forward foreign currency contracts represent obligations to purchase or sell foreign currency on a specified future date at a price fixed at the time the contracts are entered into. Forward foreign currency contracts were used to facilitate transactions in foreign-denominated securities and to manage exposure to certain foreign currencies.
Forward foreign currency contracts are valued daily and fluctuations in exchange rates on open contracts are recorded as unrealized appreciation or (depreciation) and reflected in total accumulated earnings (loss) in the Statement of Assets and Liabilities. When the contract is closed, a gain or loss is realized equal to the difference between the closing value and the value at the time it was opened. Non-deliverable forward foreign currency exchange contracts are settled with the counterparty in cash without the delivery of foreign currency. The net realized gain (loss) and change in net unrealized appreciation (depreciation) on forward foreign currency contracts during the period is presented in the Statement of Operations.
Any open forward foreign currency contracts at period end are presented in the Schedule of Investments under the caption "Forward Foreign Currency Contracts." The contract amount and unrealized appreciation (depreciation) reflects each contract's exposure to the underlying currency at period end, and is representative of volume of activity during the period unless an average contract value is presented.
Futures Contracts. A futures contract is an agreement between two parties to buy or sell a specified underlying instrument for a fixed price at a specified future date. Futures contracts were used to manage exposure to the bond market and fluctuations in interest rates.
Upon entering into a futures contract, a fund is required to deposit either cash or securities (initial margin) with a clearing broker in an amount equal to a certain percentage of the face value of the contract. Futures contracts are marked-to-market daily and subsequent daily payments are made or received by a fund depending on the daily fluctuations in the value of the futures contracts and are recorded as unrealized appreciation or (depreciation). This receivable and/or payable, if any, is included in daily variation margin on futures contracts in the Statement of Assets and Liabilities. Realized gain or (loss) is recorded upon the expiration or closing of a futures contract. The net realized gain (loss) and change in net unrealized appreciation (depreciation) on futures contracts during the period is presented in the Statement of Operations.
Any open futures contracts at period end are presented in the Schedule of Investments under the caption "Futures Contracts". The notional amount at value reflects each contract's exposure to the underlying instrument or index at period end, and is representative of volume of activity during the period unless an average notional amount is presented. Any securities deposited to meet initial margin requirements are identified in the Schedule of Investments. Any cash deposited to meet initial margin requirements is presented as segregated cash with brokers for derivative instruments in the Statement of Assets and Liabilities.
Swaps. A swap is a contract between two parties to exchange future cash flows at periodic intervals based on a notional principal amount. A bi-lateral OTC swap is a transaction between a fund and a dealer counterparty where cash flows are exchanged between the two parties for the life of the swap.
Bi-lateral OTC swaps are marked-to-market daily and changes in value are reflected in the Statement of Assets and Liabilities in the bi-lateral OTC swaps at value line items. Any upfront premiums paid or received upon entering a bi-lateral OTC swap to compensate for differences between stated terms of the swap and prevailing market conditions (e.g. credit spreads, interest rates or other factors) are recorded in total accumulated earnings (loss) in the Statement of Assets and Liabilities and amortized to realized gain or (loss) ratably over the term of the swap. Any unamortized upfront premiums are presented in the Schedule of Investments.
Payments are exchanged at specified intervals, accrued daily commencing with the effective date of the contract and recorded as realized gain or (loss). Some swaps may be terminated prior to the effective date and realize a gain or loss upon termination. The net realized gain (loss) and change in net unrealized appreciation (depreciation) on swaps during the period is presented in the Statement of Operations.
Any open swaps at period end are included in the Schedule of Investments under the caption "Swaps", and are representative of volume of activity during the period unless an average notional amount is presented.
Credit Default Swaps. Credit default swaps enable a fund to buy or sell protection against specified credit events on a single-name issuer or a traded credit index. Under the terms of a credit default swap the buyer of protection (buyer) receives credit protection in exchange for making periodic payments to the seller of protection (seller) based on a fixed percentage applied to a notional principal amount. In return for these payments, the seller will be required to make a payment upon the occurrence of one or more specified credit events. A fund enters into credit default swaps as a seller to gain credit exposure to an issuer and/or as a buyer to obtain a measure of protection against defaults of an issuer. Periodic payments are made over the life of the contract by the buyer provided that no credit event occurs.
For credit default swaps on most corporate and sovereign issuers, credit events include bankruptcy, failure to pay or repudiation/moratorium. For credit default swaps on corporate or sovereign issuers, the obligation that may be put to the seller is not limited to the specific reference obligation described in the Schedule of Investments. For credit default swaps on asset-backed securities, a credit event may be triggered by events such as failure to pay principal, maturity extension, rating downgrade or write-down. For credit default swaps on asset-backed securities, the reference obligation described represents the security that may be put to the seller. For credit default swaps on a traded credit index, a specified credit event may affect all or individual underlying securities included in the index.
As a seller, if an underlying credit event occurs, a fund will pay a net settlement amount of cash equal to the notional amount of the swap less the recovery value of the reference obligation or underlying securities comprising an index. Only in the event of the industry's inability to value the underlying asset will a fund be required to take delivery of the reference obligation or underlying securities comprising an index and pay an amount equal to the notional amount of the swap.
As a buyer, if an underlying credit event occurs, a fund will receive a net settlement amount of cash equal to the notional amount of the swap less the recovery value of the reference obligation or underlying securities comprising an index. Only in the event of the industry's inability to value the underlying asset will a fund be required to deliver the reference obligation or underlying securities comprising an index in exchange for payment of an amount equal to the notional amount of the swap.
Typically, the value of each credit default swap and credit rating disclosed for each reference obligation in the Schedule of Investments, where a fund is the seller, can be used as measures of the current payment/performance risk of the swap. As the value of the swap changes as a positive or negative percentage of the total notional amount, the payment/performance risk may decrease or increase, respectively. In addition to these measures, the investment adviser monitors a variety of factors including cash flow assumptions, market activity and market sentiment as part of its ongoing process of assessing payment/performance risk.
5. Purchases and Sales of Investments.
Purchases and sales of securities, other than short-term securities, U.S. government securities and in-kind transactions, as applicable, are noted in the table below.
| | Purchases ($) | Sales ($) |
| Fidelity International Credit Central Fund | 63,905,171 | 118,130,150 |
6. Fees and Other Transactions with Affiliates.
Management Fee and Expense Contract. Fidelity Management & Research Company LLC (the investment adviser) provides the Fund with investment management services. The Fund does not pay any fees for these services. Pursuant to the Fund's expense contract, the investment adviser also pays all other expenses of the Fund, excluding custody fees, the compensation of the independent Directors, and certain miscellaneous expenses such as proxy and shareholder meeting expenses.
Interfund Trades. Funds may purchase from or sell securities to other Fidelity Funds under procedures adopted by the Board. The procedures have been designed to ensure these interfund trades are executed in accordance with Rule 17a-7 of the 1940 Act. Any interfund trades are included within the respective purchases and sales amounts shown in the Purchases and Sales of Investments note. During the period, there were no interfund trades.
Affiliated Redemptions In-Kind. Shares that were redeemed in-kind for investments, including accrued interest and cash, if any, are shown in the table below. The net realized gain or loss on investments delivered through in-kind redemptions is included in the "Net realized gain (loss) on: Redemptions in-kind" line in the accompanying Statement of Operations. The amount of the in-kind redemptions is included in share transactions in the accompanying Statement of Changes in Net Assets. There was no gain or loss for federal income tax purposes.
| | Shares | Total net realized gain or loss ($) | Total Proceeds ($) |
| Fidelity International Credit Central Fund | 1,208,359 | (4,628,712) | 95,472,483 |
Sub-Advisory Arrangements. Effective March 1, 2024, the Fund's sub-advisory agreements with FMR Investment Management (UK) Limited, Fidelity Management & Research (Hong Kong) Limited, and Fidelity Management & Research (Japan) Limited were amended to provide that the investment adviser pays each sub-adviser monthly fees equal to 110% of the sub-adviser's costs for providing sub-advisory services.
7. Security Lending.
Funds lend portfolio securities from time to time in order to earn additional income. Lending agents are used, including National Financial Services (NFS), an affiliate of the investment adviser. Pursuant to a securities lending agreement, NFS will receive a fee, which is capped at 9.9% of a fund's daily lending revenue, for its services as lending agent. A fund may lend securities to certain qualified borrowers, including NFS. On the settlement date of the loan, a fund receives collateral (in the form of U.S. Treasury obligations, letters of credit and/or cash) against the loaned securities and maintains collateral in an amount not less than 100% of the market value of the loaned securities during the period of the loan. The market value of the loaned securities is determined at the close of business of a fund and any additional required collateral is delivered to a fund on the next business day. A fund or borrower may terminate the loan at any time, and if the borrower defaults on its obligation to return the securities loaned because of insolvency or other reasons, a fund may apply collateral received from the borrower against the obligation. A fund may experience delays and costs in recovering the securities loaned. Any cash collateral received is invested in the Fidelity Securities Lending Cash Central Fund. Any loaned securities are identified as such in the Schedule of Investments, and the value of loaned securities and cash collateral at period end, as applicable, are presented in the Statement of Assets and Liabilities. Security lending income represents the income earned on investing cash collateral, less rebates paid to borrowers and any lending agent fees associated with the loan, plus any premium payments received for lending certain types of securities. Security lending income is presented in the Statement of Operations as a component of income from Fidelity Central Funds. Affiliated security lending activity, if any, was as follows:
| | Total Security Lending Fees Paid to NFS ($) | Security Lending Income From Securities Loaned to NFS ($) | Value of Securities Loaned to NFS at Period End ($) |
| Fidelity International Credit Central Fund | 90 | - | - |
8. Expense Reductions.
Through arrangements with the Fund's custodian, credits realized as a result of certain uninvested cash balances were used to reduce the Fund's expenses by $2,683.
9. Other.
A fund's organizational documents provide former and current directors and officers with a limited indemnification against liabilities arising in connection with the performance of their duties to the fund. In the normal course of business, a fund may also enter into contracts that provide general indemnifications. A fund's maximum exposure under these arrangements is unknown as this would be dependent on future claims that may be made against a fund. The risk of material loss from such claims is considered remote.
At the end of the period, mutual funds managed by the investment adviser or its affiliates were the owners of record of all of the outstanding shares of the Fund.
10. Risk and Uncertainties.
Many factors affect a fund's performance. Developments that disrupt global economies and financial markets, such as pandemics, epidemics, outbreaks of infectious diseases, war, terrorism, and environmental disasters, may significantly affect a fund's investment performance. The effects of these developments to a fund will be impacted by the types of securities in which a fund invests, the financial condition, industry, economic sector, and geographic location of an issuer, and a fund's level of investment in the securities of that issuer. Significant concentrations in security types, issuers, industries, sectors, and geographic locations may magnify the factors that affect a fund's performance.
Item 8: Changes in and Disagreements with Accountants for Open-End Management Investment Companies
Note: This is not applicable for any fund included in this document.
Item 9: Proxy Disclosures for Open-End Management Investment Companies
Note: This is not applicable for any fund included in this document.
Item 10: Remuneration Paid to Directors, Officers, and others of Open-End Management Investment Companies
Note: This information is disclosed as part of the financial statements for each Fund as part of Item 7: Financial Statements and Financial Highlights for Open-End Management Investment companies.
Item 11: Statement Regarding Basis for Approval of Investment Advisory Contract
Board Approval of Investment Advisory Contracts
Fidelity International Credit Central Fund
At its January 2024 meeting, the Board of Trustees, including the Independent Trustees (together, the Board), approved an amended and restated management contract with Fidelity Management & Research Company LLC (FMR) (the Management Contract), and amended and restated sub-advisory agreements (the Sub-Advisory Contracts, and together with the Management Contract, the Advisory Contracts) for the fund, including the fund's sub-advisory agreements with FMR Investment Management (UK) Limited (FMR UK), Fidelity Management & Research (Hong Kong) Limited (FMR H.K.), and Fidelity Management & Research (Japan) Limited (FMR Japan). The Advisory Contracts will be effective March 1, 2024. The Board will consider the annual renewal of the fund's Advisory Contracts in September 2024, following its review of additional materials provided by FMR.
Management Contract. The Board approved the Management Contract, which eliminates the fee that FMR previously received from each investing fund's investment adviser. The Board noted the fund will continue to pay no management fee to FMR for services provided under the Management Contract.
Sub-Advisory Contracts. In connection with the Management Contract changes, the Board considered the Sub-Advisory Contracts, which changed the arrangements for fees paid by FMR to the sub-advisers under the agreements. The Board noted that the agreements with FMR UK, FMR H.K., and FMR Japan were amended to provide that FMR will compensate each sub-adviser at a fee equal to 110% of the sub-adviser's costs incurred in providing services under the agreement. The Board considered that, under the Sub-Advisory Contracts, FMR, and not the fund, will continue to pay the sub-advisory fees to each applicable sub-adviser.
The Board considered that the approval of the fund's Advisory Contracts will not result in any changes in the investment process or strategies employed in the management of the fund's assets or the day-to-day management of the fund or the persons primarily responsible for such management. Further, the Board considered that the Management Contract would not change the obligations and services of FMR and its affiliates on behalf of the fund, and, in particular, there would be no change in the nature and level of advisory, management, administration, transfer agent, and pricing and bookkeeping services provided to the fund by FMR and its affiliates.
In connection with its consideration of future renewals of the fund's Advisory Contracts, the Board will consider: (i) the nature, extent and quality of services provided to the funds, including shareholder and administrative services and investment performance; (ii) the competitiveness of the management fee and total expenses for the fund; (iii) the costs of the services and profitability, including the revenues earned and the expenses incurred in conducting the business of developing, marketing, distributing, managing, administering, and servicing the fund and its shareholders, to the extent applicable; and (iv) whether there have been economies of scale in respect of the Fidelity funds, whether the Fidelity funds (including the fund) have appropriately benefited from any such economies of scale, and whether there is the potential for realization of any further economies.
Based on its evaluation of all of the conclusions noted above, and after considering all factors it believed relevant, the Board concluded that the fund's management fee structure is fair and reasonable, and that the fund's Advisory Contracts should be approved.
1.9882754.107
ICF-SANN-0824
Item 8.
Changes in and Disagreements with Accountants for Open-End Management Investment Companies
See Item 7.
Item 9.
Proxy Disclosures for Open-End Management Investment Companies
See Item 7.
Item 10.
Remuneration Paid to Directors, Officers, and Others of Open-End Management Investment Companies
See Item 7.
Item 11.
Statement Regarding Basis for Approval of Investment Advisory Contract
See Item 7.
Item 12.
Disclosure of Proxy Voting Policies and Procedures for Closed-End Management Investment Companies
Not applicable.
Item 13.
Portfolio Managers of Closed-End Management Investment Companies
Not applicable.
Item 14.
Purchases of Equity Securities by Closed-End Management Investment Company and Affiliated Purchasers
Not applicable.
Item 15.
Submission of Matters to a Vote of Security Holders
There were no material changes to the procedures by which shareholders may recommend nominees to the Fidelity Central Investment Portfolios II LLC’s Board of Trustees.
Item 16.
Controls and Procedures
(a)(i) The President and Treasurer and the Chief Financial Officer have concluded that the Fidelity Central Investment Portfolios II LLC’s (the “Trust”) disclosure controls and procedures (as defined in Rule 30a-3(c) under the Investment Company Act) provide reasonable assurances that material information relating to the Trust is made known to them by the appropriate persons, based on their evaluation of these controls and procedures as of a date within 90 days of the filing date of this report.
(a)(ii) There was no change in the Trust’s internal control over financial reporting (as defined in Rule 30a-3(d) under the Investment Company Act) that occurred during the period covered by this report that has materially affected, or is reasonably likely to materially affect, the Trust’s internal control over financial reporting.
Item 17.
Disclosure of Securities Lending Activities for Closed-End Management Investment Companies
Not applicable.
Item 18.
Recovery of Erroneously Awarded Compensation
(a)
Not applicable.
(b)
Not applicable.
Item 19.
Exhibits
SIGNATURES
Pursuant to the requirements of the Securities Exchange Act of 1934 and the Investment Company Act of 1940, the registrant has duly caused this report to be signed on its behalf by the undersigned, thereunto duly authorized.
Fidelity Central Investment Portfolios II LLC
|
By: | /s/Laura M. Del Prato |
| Laura M. Del Prato |
| President and Treasurer (Principal Executive Officer) |
|
|
Date: | August 22, 2024 |
Pursuant to the requirements of the Securities Exchange Act of 1934 and the Investment Company Act of 1940, this report has been signed below by the following persons on behalf of the registrant and in the capacities and on the dates indicated.
|
By: | /s/Laura M. Del Prato |
| Laura M. Del Prato |
| President and Treasurer (Principal Executive Officer) |
|
|
Date: | August 22, 2024 |
|
By: | /s/John J. Burke III |
| John J. Burke III |
| Chief Financial Officer (Principal Financial Officer) |
|
|
Date: | August 22, 2024 |