Prospector Capital Appreciation Fund
Prospector Opportunity Fund
Beginning on April 30, 2021, as permitted by regulations adopted by the Securities and Exchange Commission, paper copies of the Funds’ shareholder reports will no longer be sent by mail, unless you specifically request paper copies of the reports. Instead, the reports will be made available on the Funds’ website, www.prospectorfunds.com, and you will be notified by mail each time a report is posted and provided with a website link to access the report.
If you already elected to receive shareholder reports electronically, you will not be affected by this change and you need not take any action. You may elect to receive shareholder reports and other communications from the Funds electronically by contacting your financial intermediary (such as a broker-dealer or bank) or, if you are a direct investor, by calling (877) 734-7862.
You may elect to receive all future reports in paper free of charge. If you invest through a financial intermediary, you can contact your financial intermediary to request that you continue to receive paper copies of your shareholder reports. If you invest directly with the Funds, you can call (877) 734-7862 to let the Funds know you wish to continue receiving paper copies of your shareholder reports. Your election to receive reports in paper will apply to all funds held in your account if you invest through your financial intermediary or all funds held with the fund complex if you invest directly with the Funds.
Annual Report
| www.prospectorfunds.com | December 31, 2023 |
PROSPECTOR FUNDS, INC.
January 25, 2024
“A great business at a fair price is superior to a fair business at a great price.”
Charlie Munger
Dear Shareholders of the Prospector Capital Appreciation Fund and Prospector Opportunity Fund,
We would be remiss to not acknowledge the passing of legendary value investor, and long-time Warren Buffett partner, Charlie Munger. As has been written about many times over, Buffett credited Munger for transforming his approach to value investing – rather than looking for dirt cheap “cigar-butts,” Munger was a strong proponent of buying very good businesses at fair prices. At Prospector, we consider ourselves among the many value investors who have utilized a variation of this approach for decades. We owe a debt of gratitude to Charlie, and his contributions to the world of investing.
We entered 2023 in the midst of very restrictive monetary policy, a deeply inverted yield curve, significantly higher interest rates and the continued drying up of consumers’ post-pandemic excess savings. A Wall Street Journal survey of economists pegged the chances of a recession at 63% heading into the year. This foreboding backdrop was followed in March by the largest bank failures on record… Not the greatest setup for a bull market.
What would follow is one of the more bifurcated markets in memory – with technology stocks dominating virtually everything else. More specifically, a handful of mega-cap tech stocks, now known as the “Magnificent 7” captured headlines (and asset flows) much of the year, stemming from excitement over the prospects for artificial intelligence. These names, (which include: Microsoft, Amazon.com, Meta Platforms, Apple, Alphabet, Nvidia, and Tesla) gained an average of 105% for the year, with Apple being the laggard – up 49%. They alone contributed over 16 percentage points of the S&P 500’s 26.3% return for the year. Notably, the strength and size of these stocks masked investor unease elsewhere regarding the prospects for inflation and the economy. Indeed, the equal-weighted S&P 500 had produced a negative return through the end of October as 10-year Treasury yields peaked over 5%, fueling fears of a Fed-induced recession.
However, sentiment sharply reversed in November, when the Consumer Price Index (CPI) came in below expectations, seemingly putting an elusive “soft landing” for the U.S. economy into view. This kicked off a stock market rally, which only picked up steam in December, following what most thought was a dovish Federal Reserve meeting. Bonds rallied on expectations of an end to the Fed’s hiking cycle, and the decline in interest rates helped fuel what some have called a “dash for trash” rally, where the most levered and speculative stocks led the market. Unsurprisingly, given Prospector’s quality bias, the Funds participated in a portion of the year-end rally, but trailed on a relative basis.
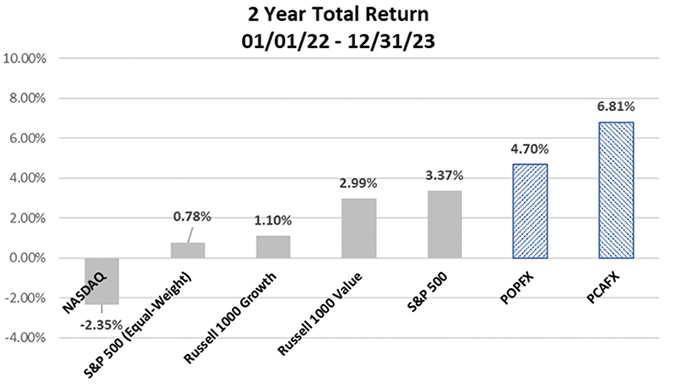
Despite the dramatic uplift in November and December, and the remarkable tech-stock rally during the year (which saw the NASDAQ return 45%, and Russell 1000 Growth Index gain 43%, outpacing its Value counterpart by over 31%), one could be forgiven had they awakened from a Rip Van Winkle-like two-year slumber, only to think not much had happened during their sleep. After all, while 2022 and 2023 both felt like wild rides at times, and had their share of volatility, cumulative returns for the aforementioned indices have been fairly unremarkable over the period (as seen in the chart below). We have also included Prospector Capital Appreciation Fund and Prospector Opportunity Fund returns for the period. We view investing as a marathon, not a sprint…over longer periods, quality companies that produce solid cash flows can often produce favorable returns (hat tip to the late Mr. Munger).
PROSPECTOR FUNDS, INC.
Performance data quoted represents past performance and does not guarantee future results. Investment returns and principal value will fluctuate, and when sold, may be worth more or less than their original cost. Performance current to the most recent month-end may be lower or higher than the performance quoted and can be obtained by calling 877-734-7862. See Disclosure on page 6 for index descriptions.
Financial Services Update
The reemergence of inflation in recent years has had a significant impact on the insurance industry. Claims inflation from natural catastrophes, labor, repair costs and supplies, as well as legal settlements, has created a need for property-casualty (P-C) insurers to both increase their carried reserves for previously accrued claims as well as increase expected expenses for claims yet to occur. The companies have been raising prices now for years to get ahead of this significant change in loss trend. We have meaningful investments in companies who, in our view, have the ability to reserve accordingly and price at necessary levels to improve margins and returns. Insurance brokers (middle-men) have also benefited meaningfully from these price increases, as their commissions and fees have accelerated somewhat consistently with the higher premiums paid by their customers.
This new era of higher absolute interest rates has also had a meaningful impact on property-casualty investment portfolios. Insurers’ portfolios do not turnover 100% every year, but in general, property-casualty insurers’ portfolio durations tend to be about 3-4, and the benefit of investing today’s collected premiums at yields well in excess of existing portfolio yields will accrue for years to come. Insurance brokers have also benefited from the higher short-term yields attained on the “float” they manage (premiums collected from customers and remitted to insurance carriers).
Life insurance companies’ investment portfolios turn over even less rapidly than property-casualty insurers’, but the benefit does accrue to their financials as well (over a longer period of time). However, we have meaningful investments in companies whose cash generation and portfolio turnover compares favorably to others in the sector. Additionally, these companies have benefited from a meaningful normalization of mortality post the worst days of the pandemic.
PROSPECTOR FUNDS, INC.
We are pleased with how our investments in both P-C and Life insurers have performed with the aforementioned tailwinds. However, we are constantly reassessing the attractiveness of these investments versus other opportunities we find, and we have reduced our exposure in certain areas of insurance where pricing is no longer in excess of loss inflation and/or where valuations no longer appear to have room to expand. As always, we diligently strive to more heavily weight the Funds in the opportunities where we see the greatest asymmetry of returns and it is through this lens that reductions in insurance will be made.
During the second half of 2023 we added bank exposure in the Funds, which aided your participation in the late year bank rally. However, while we increased our weighting to banks over the second half of the year, both Funds remain poised to further increase exposure should potential headwinds abate.
At this point, banks have realized the majority of expected net interest margin compression. While this substantial overhang has been absorbed, there are other potential headwinds which keep us from getting significantly more bullish. The late 2023 bank rally was predicated on market optimism for a soft landing and rate cuts. This is well reflected in Street estimates for credit losses which are optimistic in nature as loss reserves remain materially below historical averages. A slowdown in the economy could result in a 15% to 25%+ reduction in forward EPS from higher loss provisioning. Other headwinds include: a modest loan growth outlook, rising capital levels, increasing regulatory costs, limited capital return, a weak M&A backdrop, non-bank market share gains and continued cost headwinds from inflation. We maintain a robust watchlist of potential ideas and patiently await a better entry point on fundamentals and valuations before we decide to further increase the Funds’ exposure.
Prospector Opportunity Fund Highlights
The Prospector Opportunity Fund increased 11.63% for the year 2023. This compared to a 17.23% increase for the Russell Midcap and a 16.93% gain for the Russell 2000 Index. Much of the relative underperformance to the benchmarks could be attributed to your portfolio’s underweight, and underperformance in technology holdings, as the Opportunity Fund’s allocation to high-quality technology companies significantly underperformed those of the benchmarks. Additionally, on a broader basis, the portfolio lagged the late-year rally, which, as discussed above, was led by lower-quality, more levered companies.
The top contributing sector to the Opportunity Fund’s performance for the year was industrials, where your portfolio of high-quality companies with exposure to automation, electrification, clean energy, and defense performed well during the year. Top contributors here included: Curtis Wright, Moog, Pentair, Carrier, and Eaton. The next top contributing sector was financial services, where the Fund’s insurance (both property-casualty and life/health) holdings, as well as insurance brokerage names, had significant gains during the period.
Prospector Capital Appreciation Fund Highlights
For the full year 2023, the Prospector Capital Appreciation Fund increased 11.34%. This compared to a 26.29% gain in the S&P 500. The majority of the relative underperformance to the S&P 500 is attributed to the Fund’s underweight, and underperformance in technology holdings given your portfolio’s allocation to high-quality technology companies significantly underperformed those of the benchmark. The Capital Appreciation Fund’s performance was more in line with the Russell 3000 Value’s 11.66% return for the year. Similar to the Opportunity Fund, on a broader basis, the Capital Appreciation Fund also had lower relative performance versus the benchmarks during the late-year rally, as our higher-quality names did not perform as well as those in the benchmarks.
PROSPECTOR FUNDS, INC.
The Capital Appreciation Fund’s return, similar to the Opportunity Fund, was led by industrials, where your portfolio of high-quality companies with exposure to automation, electrification, clean energy, and defense performed well during the year. The Fund’s largest contributors within industrials were Eaton, Pentair and Curtis Wright. Financial services was the second largest contributing sector during 2023. Property-casualty insurers and insurance brokers led performers here. Lastly, despite your portfolio’s underweight to the sector, technology was the third largest contributing sector for the period. Your portfolio’s Palo Alto convertible security (sold during the year), was the largest contributor among technology holdings.
Outlook
Since early 2022, the Federal Reserve has aggressively raised interest rates in an effort to lower inflation, causing significant uncertainty within stock and bond markets. While the rate of inflation has subsided, and the consensus appears to be we have reached an end to the Fed hiking cycle, declaring victory would be premature. The U.S. and rest of the world continue to manage the impacts of inflation, higher interest rates, and geopolitical events. In our assessment, there remains a possibility of Federal Reserve policy error and / or recession, though barring extraneous events, we still lean towards slowdown and not recession per se.
The biggest risk right now would seem to be from a “shock to the system” during this period of relative weakness while we are transitioning from the pandemic economy to a more normalized economy. Certainly, the traumatic events in Israel, and the risk of potential systemic shock that might spread from the Middle East in the months to come, keep us up at night as we are sure they do you as well. As always, with our bias towards quality, we strive to mitigate any downside, while also participating in the upside.
Meanwhile, employment remains strong. Heavy fiscal stimulus from already passed U.S. legislation for defense, infrastructure, semiconductors, and energy investment are only now beginning to be awarded. The spending will not peak until later in the decade. Relatively high energy costs in Europe, and Germany in particular, makes manufacturing here relatively more attractive. Political risk in China makes that country less attractive to do business in. All told, U.S. manufacturing is being called upon to step up. Barring a major crisis, Ronald Reagan’s termed “willing workers” should be able to find jobs…and pay their bills. Furthermore, supply / demand imbalances in the labor market suggest further wage gains to come which will partially mitigate the impact of inflation on the consumer. We expect continued pressure on housing prices as a result of higher interest rates and affordability concerns. However, the shortage of housing after over a decade of underinvestment following the Great Financial Crisis should prevent a disastrous decline in home prices. Lower-income consumers have been most impacted by the current inflationary environment, but consumer balance sheets remain generally healthy for the majority of Americans, and consumer credit quality remains strong at the moment.
While what we see argues for a more inflationary and higher interest rate environment than seen in the past ten years, it also does not argue for a recession. Nonetheless, the unexpected can occur. Should a recession happen in the near term, the factors highlighted above suggest it could be less significant than the previous two recessionary periods. We are also mindful that 2024 is an election year, the result of which could have implications on companies, sectors and the overall economy.
PROSPECTOR FUNDS, INC.
Following years of lower interest rates helping to drive ever-higher growth-stock valuations, we feel value investing is ripe for a period of outperformance. We continue to find opportunities to invest in quality businesses with solid balance sheets and cash flows, whose share prices have detached from our assessment of the fundamentals. The bargains inherent in your portfolio should attract acquirers and other investors over time.
Thank you for entrusting us with your money.
Respectfully submitted,
| | |
| Kevin R. O’Brien | Jason A. Kish | Steven R. Labbe |
Performance data quoted represents past performance; past performance does not guarantee future results.
This report must be preceded or accompanied by a prospectus.
Opinions expressed are those of the Funds and are subject to change, are not guaranteed, and should not be considered a recommendation to buy or sell any security.
Mutual fund investing involves risk. Principal loss is possible. Investments in debt securities typically decrease in value when interest rates rise. This risk is usually greater for longer-term debt securities. The Funds invest in foreign securities which involve greater volatility and political, economic and currency risks and differences in accounting methods. The Funds invest in smaller and mid-cap companies, which involve additional risks such as limited liquidity and greater volatility. The Funds may hold restricted securities purchased through private placements. Such securities can be difficult to sell without experiencing delays or additional costs. Derivatives involve risks different from, and in certain cases, greater than the risks presented by more traditional investments. These risks are fully disclosed in the prospectus.
Growth and value investing each have unique risks and potential for rewards. Growth stocks typically are more volatile than value stocks; however, value stocks have a lower expected growth rate in earnings and sales.
The S&P 500 Index is a broad based unmanaged index of 500 stocks, which is widely recognized as representative of the equity market in general. The Russell 2000 Index is an unmanaged small-cap index that measures the performance of the 2,000 smallest companies in the Russell 3000 Index. The Russell MidCap Index is an unmanaged mid-cap index that measures the performance of the 800 smallest companies in the Russell 1000 Index. You cannot invest directly in an index. The NASDAQ Composite Index is a broad-based capitalization-weighted index of stocks in all three NASDAQ tiers: Global Select, Global Market and Capital Market. The S&P 500 Equal Weighted Index (EWI) is the equal-weight version of the widely-used S&P500. The index includes the same constituents as the capitalization weighted S&P 500, but each company in the S&P 500 EWI is allocated a fixed weight – or 0.2% of the index total at each quarterly rebalance. The Russell 1000 Growth Index measures the performance of those Russell 1000 companies with higher price-to-book ratios and higher forecasted growth values. The Russell 1000 Value Index measures the performance of those Russell 1000 companies with lower price-to-book ratios and lower forecasted growth values. The Russell 3000 Value Index measures the performance of those Russell 3000 Index companies with lower price-to-book ratios and lower forecasted growth values. All index returns include the effect of reinvested dividends.
Frank Russell Company “Russell” is the source and owner of the trademarks, service marks and copyrights related to the Russell Indexes. Russell® is a trademark of Frank Russell Company. Neither Russell nor its licensors accept any liability for any errors or omissions in the Russell Indexes and/or Russell ratings or underlying data and no party may rely on any Russell Indexes and/or Russell ratings and/or underlying data contained in this communication. No further distribution of Russell Data is permitted without Russell’s express written consent. Russell does not promote, sponsor or endorse the content of this communication.
Fund holdings and/or security allocations are subject to change at any time and are not recommendations to buy or sell any security. Please see the Schedule of Investments section in this report for a full listing of the Fund’s holdings.
Prospector Funds, Inc. are distributed by Quasar Distributors, LLC.
PROSPECTOR FUNDS, INC.
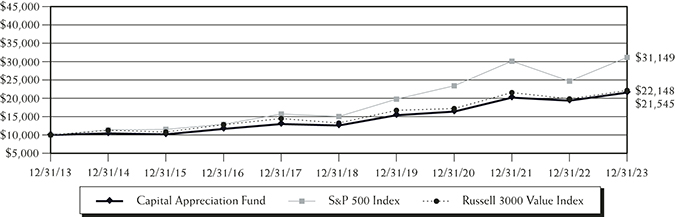
Capital Appreciation Fund
The chart assumes an initial investment of $10,000. Performance reflects waivers of fee and operating expenses in effect. In the absence of such waivers, total return would be reduced. Past performance is not predictive of future performance. Investment return and principal value will fluctuate, so that your shares, when redeemed, may be worth more or less than their original cost. The Fund imposes a 2.00% redemption fee on redemption of shares held 60 days or less. Performance data does not reflect the redemption fee. If reflected, total return would be reduced. Performance current to the most recent month-end may be lower or higher than the performance quoted and can be obtained by calling 877-734-7862. Performance assumes the reinvestment of capital gains and income distributions. The performance does not reflect the deduction of taxes that a shareholder would pay on Fund distributions or the redemption of Fund shares.
Average Annual Rates of Return (%) – As of December 31, 2023
| | One Year | Three Year | Five Year | Ten Year | Since Inception(1) |
| Capital Appreciation Fund | 11.34% | 9.60% | 11.37% | 7.98% | 6.83% |
S&P 500 Index(2) | 26.29% | 10.00% | 15.69% | 12.03% | 9.41% |
Russell 3000 Value Index(3) | 11.66% | 8.81% | 10.84% | 8.28% | 6.69% |
| (1) | September 28, 2007 |
| (2) | The Standard & Poor’s 500 Index (S&P 500) is an unmanaged, capitalization-weighted index generally representative of the U.S. market for large capitalization stocks. This Index cannot be invested in directly. |
| (3) | The Russell 3000 Value Index is a market-capitalization weighted index based on the Russell 3000 Index, which measures how U.S. stocks in the equity value segment perform by including only value stocks. This index cannot be invested in directly. |
The following is expense information for the Prospector Capital Appreciation Fund as disclosed in the Fund’s most recent prospectus dated April 28, 2023:
| Gross Expenses: 1.77% | Net Expenses: 1.26% |
Prospector Partners Asset Management, LLC (the “Adviser”) has contractually agreed to waive its management fees and pay Fund expenses, in order to ensure that Total Annual Fund Operating Expenses (excluding interest, acquired fund fees and expenses, brokerage commissions and extraordinary expenses) do not exceed 1.25% of the average daily net assets of the Fund.The Adviser is permitted to recoup fee waivers and/or expense payments made in the prior three fiscal years from the date the fees were waived and/or Fund expenses were paid. The Operating Expenses Limitation Agreement is indefinite but cannot be terminated through at least September 30, 2024. Thereafter, the agreement may be terminated at any time upon 60 days’ written notice by the Trust’s Board of Trustees (the “Board”) or the Adviser.
PROSPECTOR FUNDS, INC.
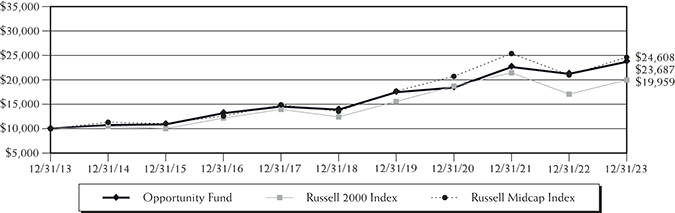
Opportunity Fund
The chart assumes an initial investment of $10,000. Performance reflects waivers of fee and operating expenses in effect. In the absence of such waivers, total return would be reduced. Past performance is not predictive of future performance. Investment return and principal value will fluctuate, so that your shares, when redeemed, may be worth more or less than their original cost. The Fund imposes a 2.00% redemption fee on redemption of shares held 60 days or less. Performance data does not reflect the redemption fee. If reflected, total return would be reduced. Performance current to the most recent month-end may be lower or higher than the performance quoted and can be obtained by calling 877-734-7862. Performance assumes the reinvestment of capital gains and income distributions. The performance does not reflect the deduction of taxes that a shareholder would pay on Fund distributions or the redemption of Fund shares.
Average Annual Rates of Return (%) – As of December 31, 2023
| | One Year | Three Year | Five Year | Ten Year | Since Inception(1) |
| Opportunity Fund | 11.63% | 8.76% | 11.27% | 9.01% | 9.09% |
Russell 2000 Index(2) | 16.93% | 2.22% | 9.97% | 7.16% | 7.24% |
Russell Midcap Index(3) | 17.23% | 5.92% | 12.68% | 9.42% | 8.56% |
| (1) | September 28, 2007 |
| (2) | An unmanaged small-cap index that measures the performance of the 2,000 smallest companies in the Russell 3000 Index. This index cannot be invested in directly. |
| (3) | An unmanaged mid-cap index that measures the performance of the 800 smallest companies in the Russell 1000 Index. This index cannot be invested in directly. |
The following is expense information for the Prospector Opportunity Fund as disclosed in the Fund’s most recent prospectus dated April 28, 2023:
| Gross Expenses: 1.35% | Net Expenses: 1.26% |
Prospector Partners Asset Management, LLC (the “Adviser”) has contractually agreed to waive its management fees and pay Fund expenses, in order to ensure that Total Annual Fund Operating Expenses (excluding interest, acquired fund fees and expenses, brokerage commissions and extraordinary expenses) do not exceed 1.25% of the average daily net assets of the Fund.The Adviser is permitted to recoup fee waivers and/or expense payments made in the prior three fiscal years from the date the fees were waived and/or Fund expenses were paid. The Operating Expenses Limitation Agreement is indefinite but cannot be terminated through at least September 30, 2024. Thereafter, the agreement may be terminated at any time upon 60 days’ written notice by the Trust’s Board of Trustees (the “Board”) or the Adviser.
PROSPECTOR FUNDS, INC.
Expense Example (Unaudited)
December 31, 2023
As a shareholder of the Fund, you incur two types of costs: (1) transaction costs, which may include but are not limited to, redemption fees, wire transfer fees, maintenance fee (IRA accounts), and exchange fees; and (2) ongoing costs, including investment advisory fees; distribution and/or service fees; and other Fund expenses. This Example is intended to help you understand your ongoing costs (in dollars) of investing in the Fund and to compare these costs with the ongoing costs of investing in other mutual funds. The Example is based on an investment of $1,000 invested at the beginning of the period and held for the entire period (July 1, 2023 – December 31, 2023).
ACTUAL EXPENSES
The first line of the table below provides information about actual account values and actual expenses. Although the Fund charges no sales load or transaction fees, you will be assessed fees for outgoing wire transfers, returned checks and stop payment orders at prevailing rates charged by U.S. Bancorp Fund Services, LLC, the Fund’s transfer agent. The example below includes, but is not limited to, investment advisory fees, shareholder servicing fees and other Fund expenses. However, the example below does not include portfolio trading commissions and related expenses, interest expense and other extraordinary expenses as determined under generally accepted accounting principles. You may use the information in this line, together with the amount you invested, to estimate the expenses that you paid over the period. Simply divide your account value by $1,000 (for example, an $8,600 account value divided by $1,000 = 8.6), then multiply the result by the number in the first line under the heading entitled “Expenses Paid During Period” to estimate the expenses you paid on your account during this period.
HYPOTHETICAL EXAMPLE FOR COMPARISON PURPOSES
The second line of the table below provides information about hypothetical account values and hypothetical expenses based on the Fund’s actual expense ratio and an assumed rate of return of 5% per year before expenses, which is not the Fund’s actual return. The hypothetical account values and expenses may not be used to estimate the actual ending account balance or expenses you paid for the period. You may use this information to compare the ongoing costs of investing in the Fund and other funds. To do so, compare this 5% hypothetical example with the 5% hypothetical examples that appear in the shareholder reports of the other funds.
Please note that the expenses shown in the table are meant to highlight your ongoing costs only and do not reflect any transactional costs, such as redemption fees or exchange fees. Therefore, the second line of the table is useful in comparing ongoing costs only, and will not help you determine the relative total costs of owning different funds. In addition, if these transactional costs were included, your costs would have been higher.
| | | | Expenses Paid |
| | Beginning Account | Ending Account | During Period(1) |
| | Value (07/01/23) | Value (12/31/23) | (07/01/23 to 12/31/23) |
Capital Appreciation Actual(2) | $1,000.00 | $1,061.60 | $6.50 |
| Capital Appreciation Hypothetical | | | |
| (5% return before expenses) | 1,000.00 | 1,018.90 | 6.36 |
Opportunity Actual(2) | 1,000.00 | 1,069.10 | 6.52 |
| Opportunity Hypothetical | | | |
| (5% return before expenses) | 1,000.00 | 1,018.90 | 6.36 |
| (1) | Expenses are equal to the Fund’s annualized expense ratio for the most recent six-month period of 1.25% and 1.25% for Capital Appreciation Fund and Opportunity Fund, respectively, multiplied by the average account value over the period, multiplied by 184/365 to reflect the one-half year period. |
| (2) | Based on the actual returns for the six-month period ended December 31, 2023 of 6.16% and 6.91% for Capital Appreciation Fund and Opportunity Fund, respectively. |
PROSPECTOR FUNDS, INC.
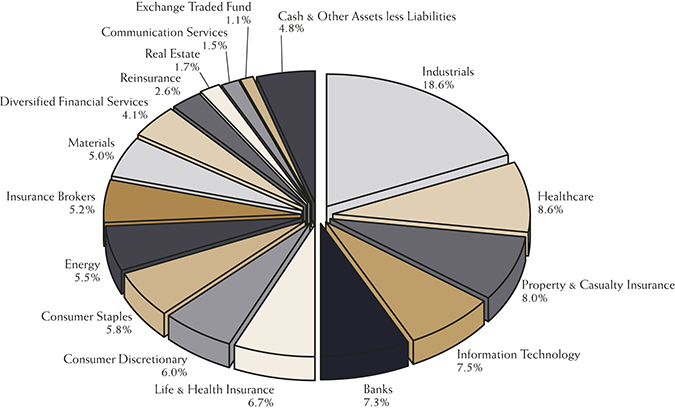
Sector Allocation (% of net assets) (Unaudited)
as of December 31, 2023(1)(2)
Capital Appreciation Fund
Top 10 Holdings (% of net assets) (Unaudited)
as of December 31, 2023(1)(3)
Capital Appreciation Fund
| | Eaton | 3.8% |
| | Akamai Technologies, 0.38%, 09/01/2027 | 2.8% |
| | Globe Life | 2.7% |
| | BioMarin Pharmaceutical, 0.60%, 08/01/2024 | 2.7% |
| | Brown & Brown | 2.7% |
| | Merck & Co. | 2.6% |
| | Leidos Holdings | 2.6% |
| | Dropbox, 0.00%, 03/01/2028 | 2.5% |
| | Curtiss-Wright | 2.5% |
| | Hess | 2.5% |
| | (1) | Fund holdings and sector allocations are subject to change at any time and are not recommendations to buy or sell any security. | |
| | (2) | Sector allocation includes all investment types. | |
| | (3) | First American Treasury Obligations Fund excluded from top 10 holdings. | |
PROSPECTOR FUNDS, INC.
Sector Allocation (% of net assets) (Unaudited)
as of December 31, 2023(1)(2)
Opportunity Fund
Top 10 Holdings (% of net assets) (Unaudited)
as of December 31, 2023(1)(3)
| | Curtiss-Wright | 4.2% |
| | Littelfuse | 3.5% |
| | Globe Life | 3.1% |
| | Leidos Holdings | 2.8% |
| | Primerica | 2.7% |
| | Arthur J. Gallagher & Co. | 2.6% |
| | Brown & Brown | 2.6% |
| | Fairfax Financial Holdings | 2.4% |
| | Trimble | 2.2% |
| | Carrier Global | 2.2% |
| | (1) | Fund holdings and sector allocations are subject to change at any time and are not recommendations to buy or sell any security. | |
| | (2) | Sector allocation includes all investment types. | |
| | (3) | First American Treasury Obligations Fund excluded from top 10 holdings. | |
| | | | |
PROSPECTOR FUNDS, INC.
Schedule of Investments
December 31, 2023
Capital Appreciation Fund
Description | | Shares | | | Value | |
| | | | | | | |
| COMMON STOCKS – 75.3% | | | | | | |
| | | | | | | |
| Banks – 3.3% | | | | | | |
| Ameris Bancorp | | | 9,922 | | | $ | 526,362 | |
| First Bancorp | | | 17,985 | | | | 295,853 | |
| SouthState | | | 3,445 | | | | 290,930 | |
| | | | | | | | 1,113,145 | |
| Communication Services – 1.8% | | | | | | | | |
Alphabet, Inc. – Class A(a) | | | 4,205 | | | | 587,396 | |
| | | | | | | | | |
| Consumer Discretionary – 3.3% | | | | | | | | |
| Darden Restaurants | | | 2,355 | | | | 386,927 | |
Expedia Group(a) | | | 2,713 | | | | 411,806 | |
| Texas Roadhouse | | | 2,525 | | | | 308,631 | |
| | | | | | | | 1,107,364 | |
| Consumer Staples – 6.1% | | | | | | | | |
| Church & Dwight | | | 4,055 | | | | 383,441 | |
| Colgate-Palmolive | | | 8,700 | | | | 693,477 | |
| Mondelez International – Class A | | | 8,965 | | | | 649,335 | |
| Nestle | | | 2,555 | | | | 296,223 | |
| | | | | | | | 2,022,476 | |
| Diversified Financial Services – 3.0% | | | | | | | | |
Berkshire Hathaway – Class B(a) | | | 1,035 | | | | 369,143 | |
| Federated Hermes – Class B | | | 6,425 | | | | 217,551 | |
| Fidelity National Information Services | | | 7,095 | | | | 426,196 | |
| | | | | | | | 1,012,890 | |
| Energy – 4.5% | | | | | | | | |
| Hess | | | 5,750 | | | | 828,920 | |
| Pioneer Natural Resources | | | 3,020 | | | | 679,138 | |
| | | | | | | | 1,508,058 | |
| Health Care – 7.9% | | | | | | | | |
| Abbott Laboratories | | | 6,410 | | | | 705,549 | |
| AstraZeneca – ADR | | | 4,855 | | | | 326,984 | |
| Dentsply Sirona | | | 14,455 | | | | 514,453 | |
Hologic(a) | | | 3,400 | | | | 242,930 | |
| Merck & Co. | | | 7,875 | | | | 858,533 | |
| | | | | | | | 2,648,449 | |
See Notes to the Financial Statements
PROSPECTOR FUNDS, INC.
Schedule of Investments – Continued
December 31, 2023
Capital Appreciation Fund
Description | | Shares | | | Value | |
| | | | | | | |
COMMON STOCKS – 75.3% (Continued) | | | | | | |
| | | | | | | |
| Industrials – 14.5% | | | | | | |
| Curtiss-Wright | | | 3,805 | | | $ | 847,716 | |
| Eaton | | | 5,310 | | | | 1,278,755 | |
| Leidos Holdings | | | 7,890 | | | | 854,013 | |
| Paychex | | | 2,475 | | | | 294,797 | |
| Pentair | | | 9,205 | | | | 669,296 | |
| Raytheon Technologies | | | 5,400 | | | | 454,356 | |
| Sensata Technologies Holding | | | 11,730 | | | | 440,696 | |
| | | | | | | | 4,839,629 | |
| Information Technology – 5.7% | | | | | | | | |
| Littelfuse | | | 1,333 | | | | 356,657 | |
| Microsoft | | | 1,210 | | | | 455,008 | |
Trimble(a) | | | 14,355 | | | | 763,686 | |
Zebra Technologies – Class A(a) | | | 1,235 | | | | 337,563 | |
| | | | | | | | 1,912,914 | |
| Insurance Brokers – 5.1% | | | | | | | | |
| Arthur J. Gallagher & Co. | | | 3,630 | | | | 816,314 | |
| Brown & Brown | | | 12,520 | | | | 890,298 | |
| | | | | | | | 1,706,612 | |
| Life & Health Insurance – 3.7% | | | | | | | | |
| Globe Life | | | 7,545 | | | | 918,378 | |
| Voya Financial | | | 4,415 | | | | 322,118 | |
| | | | | | | | 1,240,496 | |
| Materials – 3.5% | | | | | | | | |
Axalta Coating Systems(a) | | | 17,295 | | | | 587,511 | |
| Louisiana-Pacific | | | 3,790 | | | | 268,446 | |
| PPG Industries | | | 2,043 | | | | 305,530 | |
| | | | | | | | 1,161,487 | |
| Property & Casualty Insurance – 8.3% | | | | | | | | |
| Fairfax Financial Holdings | | | 840 | | | | 773,440 | |
Fidelis Insurance Holdings(a) | | | 21,902 | | | | 277,498 | |
| First American Financial | | | 3,525 | | | | 227,151 | |
| Progressive | | | 2,490 | | | | 396,607 | |
| W.R. Berkley | | | 8,100 | | | | 572,832 | |
| White Mountains Insurance Group | | | 341 | | | | 513,208 | |
| | | | | | | | 2,760,736 | |
| | | | | | | | | |
See Notes to the Financial Statements
PROSPECTOR FUNDS, INC.
Schedule of Investments – Continued
December 31, 2023
Capital Appreciation Fund
Description | | Shares | | | Value | |
| | | | | | | |
COMMON STOCKS – 75.3% (Continued) | | | | | | |
| | | | | | | |
| Real Estate – 2.1% | | | | | | |
| Four Corners Property Trust | | | 13,470 | | | $ | 340,791 | |
Howard Hughes Holdings(a) | | | 4,381 | | | | 374,795 | |
| | | | | | | | 715,586 | |
| Reinsurance – 2.5% | | | | | | | | |
| Everest Re Group | | | 1,745 | | | | 616,997 | |
| RenaissanceRe Holdings | | | 1,194 | | | | 234,024 | |
| | | | | | | | 851,021 | |
| Total Common Stocks | | | | | | | | |
| (Cost $16,926,646) | | | | | | | 25,188,259 | |
| | | | | | | | | |
| | | Par | | | | | |
| CONVERTIBLE BONDS – 17.4% | | | | | | | | |
| | | | | | | | | |
| Health Care – 3.9% | | | | | | | | |
| BioMarin Pharmaceutical, 0.60%, 08/01/2024 | | | 921,000 | | | | 907,738 | |
| NuVasive, 0.38%, 03/15/2025 | | | 445,000 | | | | 409,400 | |
| | | | | | | | 1,317,138 | |
| Industrials – 1.9% | | | | | | | | |
| Chart Industries, 1.00%, 11/15/2024 | | | 72,000 | | | | 167,314 | |
| Middleby, 1.00%, 09/01/2025 | | | 377,000 | | | | 459,186 | |
| | | | | | | | 626,500 | |
| Information Technology – 9.9% | | | | | | | | |
| Akamai Technologies, 0.38%, 09/01/2027 | | | 826,000 | | | | 919,750 | |
Dropbox, 0.00%, 03/01/2028(b) | | | 843,000 | | | | 848,269 | |
| Verint Systems, 0.25%, 04/15/2026 | | | 827,000 | | | | 726,209 | |
| Vishay Intertechnology, 2.25%, 06/15/2025 | | | 837,000 | | | | 811,726 | |
| | | | | | | | 3,305,954 | |
| Real Estate – 1.7% | | | | | | | | |
| Zillow Group, 2.75%, 05/15/2025 | | | 521,000 | | | | 572,475 | |
| Total Convertible Bonds | | | | | | | | |
| (Cost $5,551,282) | | | | | | | 5,822,067 | |
See Notes to the Financial Statements
PROSPECTOR FUNDS, INC.
Schedule of Investments – Continued
December 31, 2023
Capital Appreciation Fund
Description | | Shares | | | Value | |
| | | | | | | |
| EXCHANGE TRADED FUNDS – 0.9% | | | | | | |
Aberdeen Standard Physical Platinum Shares Fund(a) | | | 3,290 | | | $ | 299,916 | |
| Total Exchange Traded Funds | | | | | | | | |
| (Cost $292,393) | | | | | | | 299,916 | |
| | | | | | | | | |
| SHORT-TERM INVESTMENTS – 6.4% | | | | | | | | |
| Money Market Funds – 6.4% | | | | | | | | |
First American Treasury Obligations Fund – Class X, 5.29%(c) | | | 2,135,365 | | | | 2,135,365 | |
| Total Short-Term Investments | | | | | | | | |
| (Cost $2,135,365) | | | | | | | 2,135,365 | |
| Total Investments – 100.0% | | | | | | | | |
| (Cost $24,905,686) | | | | | | | 33,445,607 | |
| Liabilities in Excess of Other Assets – (0.0)% | | | | | | | (17,812 | ) |
| Total Net Assets – 100.0% | | | | | | $ | 33,427,795 | |
Percentages are stated as a percent of net assets.
ADR – American Depositary Receipt
| (a) | Non-income producing security. |
| (b) | Zero coupon bonds make no periodic interest payments but are issued at a discount from par value. |
| (c) | The rate shown represents the 7-day effective yield as of December 31, 2023. |
The Global Industry Classification Standard (GICS®) was developed by and/or is the exclusive property of MSCI, Inc. and Standard & Poor’s Financial Services LLC (“S&P”). GICS is a service mark of MSCI, Inc. and S&P and has been licensed for use by U.S. Bank Global Fund Services.
See Notes to the Financial Statements
PROSPECTOR FUNDS, INC.
Schedule of Investments
December 31, 2023
Opportunity Fund
Description | | Shares | | | Value | |
| | | | | | | |
| COMMON STOCKS – 94.1% | | | | | | |
| | | | | | | |
| Banks – 7.3% | | | | | | |
| Ameris Bancorp | | | 60,824 | | | $ | 3,226,713 | |
| Citigroup | | | 64,070 | | | | 3,295,760 | |
| First Bancorp | | | 129,715 | | | | 2,133,812 | |
| Origin Bancorp | | | 49,950 | | | | 1,776,722 | |
| PNC Financial Services Group | | | 17,410 | | | | 2,695,939 | |
| SouthState | | | 19,125 | | | | 1,615,106 | |
| Stellar Bancorp | | | 77,509 | | | | 2,157,851 | |
| | | | | | | | 16,901,903 | |
| Communication Services – 1.5% | | | | | | | | |
Alphabet, Inc. – Class C(a) | | | 13,700 | | | | 1,930,741 | |
Alphabet, Inc. – Class A(a) | | | 10,575 | | | | 1,477,222 | |
| | | | | | | | 3,407,963 | |
| Consumer Discretionary – 6.0% | | | | | | | | |
| Darden Restaurants | | | 26,450 | | | | 4,345,734 | |
| eBay | | | 40,800 | | | | 1,779,696 | |
Expedia Group(a) | | | 19,040 | | | | 2,890,082 | |
| Home Depot | | | 7,850 | | | | 2,720,418 | |
| Texas Roadhouse | | | 17,610 | | | | 2,152,470 | |
| | | | | | | | 13,888,400 | |
| Consumer Staples – 5.8% | | | | | | | | |
| Church & Dwight | | | 49,900 | | | | 4,718,544 | |
| Colgate-Palmolive | | | 51,930 | | | | 4,139,340 | |
| Mondelez International – Class A | | | 63,425 | | | | 4,593,873 | |
| | | | | | | | 13,451,757 | |
| Diversified Financial Services – 4.1% | | | | | | | | |
| CBOE Global Markets | | | 21,800 | | | | 3,892,607 | |
| Federated Hermes – Class B | | | 88,025 | | | | 2,980,527 | |
| Fidelity National Information Services | | | 42,525 | | | | 2,554,477 | |
| | | | | | | | 9,427,611 | |
| Energy – 5.5% | | | | | | | | |
| Devon Energy | | | 45,850 | | | | 2,077,005 | |
| Hess | | | 13,700 | | | | 1,974,992 | |
| Pioneer Natural Resources | | | 21,197 | | | | 4,766,781 | |
| Schlumberger | | | 28,100 | | | | 1,462,324 | |
| Suncor Energy | | | 73,100 | | | | 2,342,124 | |
| | | | | | | | 12,623,226 | |
See Notes to the Financial Statements
PROSPECTOR FUNDS, INC.
Schedule of Investments – Continued
December 31, 2023
Opportunity Fund
Description | | Shares | | | Value | |
| | | | | | | |
COMMON STOCKS – 94.1% (Continued) | | | | | | |
| | | | | | | |
| Health Care – 8.6% | | | | | | |
| Abbott Laboratories | | | 44,050 | | | $ | 4,848,583 | |
| Cigna | | | 10,505 | | | | 3,145,722 | |
| Dentsply Sirona | | | 100,340 | | | | 3,571,101 | |
Henry Schein(a) | | | 34,500 | | | | 2,611,995 | |
Hologic(a) | | | 15,650 | | | | 1,118,193 | |
| Merck & Co. | | | 35,598 | | | | 3,880,894 | |
| Pfizer | | | 28,625 | | | | 824,114 | |
| | | | | | | | 20,000,602 | |
| Industrials – 18.6% | | | | | | | | |
| Carrier Global | | | 87,675 | | | | 5,036,929 | |
| Curtiss-Wright | | | 43,425 | | | | 9,674,655 | |
| Eaton | | | 8,070 | | | | 1,943,417 | |
| Leidos Holdings | | | 59,040 | | | | 6,390,489 | |
| Moog – Class A | | | 27,520 | | | | 3,984,346 | |
| Otis Worldwide | | | 43,875 | | | | 3,925,496 | |
| Pentair | | | 52,500 | | | | 3,817,275 | |
| Sensata Technologies Holding | | | 109,350 | | | | 4,108,280 | |
| Tecnoglass | | | 30,225 | | | | 1,381,585 | |
V2X(a)
| | | 58,300 | | | | 2,707,452 | |
| | | | | | | | 42,969,924 | |
| Information Technology – 7.5% | | | | | | | | |
| Littelfuse | | | 30,145 | | | | 8,065,596 | |
| Teradyne | | | 15,650 | | | | 1,698,338 | |
Trimble(a) | | | 97,295 | | | | 5,176,094 | |
Zebra Technologies – Class A(a) | | | 8,645 | | | | 2,362,938 | |
| | | | | | | | 17,302,966 | |
| Insurance Brokers – 5.2% | | | | | | | | |
| Arthur J. Gallagher & Co. | | | 27,200 | | | | 6,116,736 | |
| Brown & Brown | | | 84,950 | | | | 6,040,795 | |
| | | | | | | | 12,157,531 | |
| Life & Health Insurance – 6.7% | | | | | | | | |
| Globe Life | | | 59,250 | | | | 7,211,910 | |
| Primerica | | | 30,050 | | | | 6,183,088 | |
| Voya Financial | | | 30,600 | | | | 2,232,576 | |
| | | | | | | | 15,627,574 | |
See Notes to the Financial Statements
PROSPECTOR FUNDS, INC.
Schedule of Investments – Continued
December 31, 2023
Opportunity Fund
Description | | Shares | | | Value | |
| | | | | | | |
COMMON STOCKS – 94.1% (Continued) | | | | | | |
| | | | | | | |
| Materials – 5.0% | | | | | | |
Axalta Coating Systems(a) | | | 122,825 | | | $ | 4,172,365 | |
| Newmont Goldcorp | | | 59,600 | | | | 2,466,844 | |
| PPG Industries | | | 25,680 | | | | 3,840,444 | |
Victoria Gold(a) | | | 192,036 | | | | 1,021,632 | |
| | | | | | | | 11,501,285 | |
| Property & Casualty Insurance – 8.0% | | | | | | | | |
| Fairfax Financial Holdings | | | 6,140 | | | | 5,653,475 | |
Fidelis Insurance Holdings(a) | | | 152,376 | | | | 1,930,604 | |
| First American Financial | | | 24,180 | | | | 1,558,159 | |
| Progressive | | | 17,620 | | | | 2,806,514 | |
| W.R. Berkley | | | 57,020 | | | | 4,032,454 | |
| White Mountains Insurance Group | | | 1,744 | | | | 2,624,737 | |
| | | | | | | | 18,605,943 | |
| Real Estate – 1.7% | | | | | | | | |
Howard Hughes Holdings(a) | | | 45,950 | | | | 3,931,023 | |
| | | | | | | | | |
| Reinsurance – 2.6% | | | | | | | | |
| Everest Re Group | | | 12,550 | | | | 4,437,429 | |
| RenaissanceRe Holdings | | | 8,560 | | | | 1,677,760 | |
| | | | | | | | 6,115,189 | |
| Total Common Stocks | | | | | | | | |
| (Cost $148,778,473) | | | | | | | 217,912,897 | |
| | | | | | | | | |
| EXCHANGE TRADED FUNDS – 1.1% | | | | | | | | |
Aberdeen Standard Physical Platinum Shares Fund(a) | | | 27,960 | | | | 2,548,834 | |
| Total Exchange Traded Funds | | | | | | | | |
| (Cost $2,393,570) | | | | | | | 2,548,834 | |
See Notes to the Financial Statements
PROSPECTOR FUNDS, INC.
Schedule of Investments – Continued
December 31, 2023
Opportunity Fund
Description | | Shares | | | Value | |
| | | | | | | |
| SHORT-TERM INVESTMENTS – 4.8% | | | | | | |
| | | | | | | |
| Money Market Funds – 4.8% | | | | | | |
First American Treasury Obligations Fund – Class X, 5.29%(b) | | | 11,075,317 | | | $ | 11,075,317 | |
| Total Short-Term Investments | | | | | | | | |
| (Cost $11,075,317) | | | | | | | 11,075,317 | |
| Total Investments – 100.0% | | | | | | | | |
| (Cost $162,247,360) | | | | | | | 231,537,048 | |
| Other Assets in Excess of Liabilities – 0.0% | | | | | | | 152,238 | |
| TOTAL NET ASSETS – 100.0% | | | | | | $ | 231,689,286 | |
Percentages are stated as a percent of net assets.
| (a) | Non-income producing security. |
| (b) | The rate shown represents the 7-day effective yield as of December 31, 2023. |
The Global Industry Classification Standard (GICS®) was developed by and/or is the exclusive property of MSCI, Inc. and Standard & Poor’s Financial Services LLC (“S&P”). GICS is a service mark of MSCI, Inc. and S&P and has been licensed for use by U.S. Bank Global Fund Services.
See Notes to the Financial Statements
PROSPECTOR FUNDS, INC.
Statements of Assets and Liabilities
December 31, 2023
| | | Capital Appreciation Fund | | | Opportunity Fund | |
| ASSETS: | | | | | | |
| Investments, at market value | | | | | | |
| (Cost of $24,905,686 and $162,247,360 respectively) | | $ | 33,445,607 | | | $ | 231,537,048 | |
| Cash | | | 3,996 | | | | — | |
| Receivable for dividends and interest | | | 37,410 | | | | 163,167 | |
| Receivable for capital shares sold | | | 100 | | | | 276,526 | |
| Prepaid expenses | | | 15,211 | | | | 21,559 | |
| Total assets | | | 33,502,324 | | | | 231,998,300 | |
| | | | | | | | | |
| LIABILITIES: | | | | | | | | |
| Payable to Investment Adviser, net | | | 11,198 | | | | 176,018 | |
| Payable for administration fees | | | 6,601 | | | | 38,197 | |
| Payable for audit & tax fees | | | 51,933 | | | | 51,932 | |
| Accrued distribution fees | | | — | | | | 13,565 | |
| Accrued expenses and other liabilities | | | 4,797 | | | | 29,302 | |
| Total liabilities | | | 74,529 | | | | 309,014 | |
| | | | | | | | | |
| NET ASSETS | | $ | 33,427,795 | | | $ | 231,689,286 | |
| | | | | | | | | |
| COMPOSITION OF NET ASSETS: | | | | | | | | |
| Portfolio capital | | $ | 24,926,205 | | | $ | 162,886,077 | |
| Total distributable earnings | | | 8,501,590 | | | | 68,803,209 | |
| Total net assets | | $ | 33,427,795 | | | $ | 231,689,286 | |
| | | | | | | | | |
| CAPITAL STOCK, $0.001 par value | | | | | | | | |
| Authorized | | | 500,000,000 | | | | 500,000,000 | |
| Issued and outstanding | | | 1,606,228 | | | | 9,024,639 | |
| | | | | | | | | |
| NET ASSET VALUE, REDEMPTION PRICE, | | | | | | | | |
| AND OFFERING PRICE PER SHARE | | $ | 20.81 | | | $ | 25.67 | |
See Notes to the Financial Statements
PROSPECTOR FUNDS, INC.
Statements of Operations
For the Year Ended December 31, 2023
| | | Capital Appreciation Fund | | | Opportunity Fund | |
| INVESTMENT INCOME: | | | | | | |
| Interest income | | $ | 155,669 | | | $ | 720,695 | |
| Dividend income | | | 379,139 | | | | 3,400,396 | |
| Less: Foreign taxes withheld | | | (4,475 | ) | | | (35,795 | ) |
| Total investment income | | | 530,333 | | | | 4,085,296 | |
| | | | | | | | | |
| EXPENSES: | | | | | | | | |
| Investment advisory fees | | | 287,172 | | | | 2,169,543 | |
| Audit & tax fees | | | 53,174 | | | | 53,174 | |
| Administration fees | | | 45,220 | | | | 235,210 | |
| Registration fees | | | 26,191 | | | | 34,550 | |
| Compliance expenses | | | 23,402 | | | | 23,404 | |
| Transfer agent fees | | | 21,394 | | | | 42,707 | |
| Legal fees | | | 11,709 | | | | 113,216 | |
| Distribution fees | | | 9,295 | | | | 193,263 | |
| Other expenses | | | 8,863 | | | | 25,840 | |
| Custodian fees | | | 7,014 | | | | 16,007 | |
| Directors’ fees | | | 6,908 | | | | 53,102 | |
| Fund accounting fees | | | 3,266 | | | | 4,768 | |
| Postage and printing fees | | | 1,185 | | | | 10,999 | |
| Total expenses | | | 504,793 | | | | 2,975,783 | |
| Less: Fee waivers | | | (145,828 | ) | | | (264,247 | ) |
| Total net expenses | | | 358,965 | | | | 2,711,536 | |
| NET INVESTMENT INCOME | | | 171,368 | | | | 1,373,760 | |
| | | | | | | | | |
| REALIZED AND UNREALIZED GAINS (LOSSES): | | | | | | | | |
| Net realized gain (loss) on investments | | | 764,890 | | | | (1,265,464 | ) |
| Net change in unrealized | | | | | | | | |
| appreciation/depreciation of investments | | | 2,340,936 | | | | 24,109,477 | |
| Net gain on investments | | | 3,105,826 | | | | 22,844,013 | |
| NET INCREASE IN NET ASSETS | | | | | | | | |
| RESULTING FROM OPERATIONS | | $ | 3,277,194 | | | $ | 24,217,773 | |
See Notes to the Financial Statements
PROSPECTOR FUNDS, INC.
Statements of Changes in Net Assets
| | | Capital Appreciation Fund | |
| | | Year Ended | | | Year Ended | |
| | | December 31, 2023 | | | December 31, 2022 | |
| OPERATIONS: | | | | | | |
| Net investment income | | $ | 171,368 | | | $ | 159,261 | |
| Net realized gain on investments | | | 764,890 | | | | 1,084,861 | |
| Net change in unrealized appreciation/ | | | | | | | | |
| depreciation of investments | | | 2,340,936 | | | | (2,427,505 | ) |
| Net increase (decrease) resulting from operations | | | 3,277,194 | | | | (1,183,383 | ) |
| | | | | | | | | |
| CAPITAL SHARE TRANSACTIONS: | | | | | | | | |
| Proceeds from shares sold | | | 4,847,335 | | | | 736,594 | |
| Proceeds from reinvestment of distributions | | | 955,918 | | | | 1,502,026 | |
| Payments for shares redeemed | | | (2,112,791 | ) | | | (1,885,568 | ) |
| Redemption fees | | | 6,010 | | | | — | |
| Net increase from capital share transactions | | | 3,696,472 | | | | 353,052 | |
| | | | | | | | | |
| DISTRIBUTIONS PAID TO SHAREHOLDERS | | | (990,607 | ) | | | (1,563,757 | ) |
| | | | | | | | | |
| TOTAL INCREASE (DECREASE) IN NET ASSETS | | | 5,983,059 | | | | (2,394,088 | ) |
| | | | | | | | | |
| NET ASSETS: | | | | | | | | |
| Beginning of year | | | 27,444,736 | | | | 29,838,824 | |
| End of year | | $ | 33,427,795 | | | $ | 27,444,736 | |
| | | | | | | | | |
| TRANSACTIONS IN SHARES: | | | | | | | | |
| Shares sold | | | 240,535 | | | | 36,114 | |
| Shares issued in reinvestment of distributions | | | 47,323 | | | | 74,914 | |
| Shares redeemed | | | (104,990 | ) | | | (91,044 | ) |
| Net increase | | | 182,868 | | | | 19,984 | |
See Notes to the Financial Statements
PROSPECTOR FUNDS, INC.
Statements of Changes in Net Assets
| | | Opportunity Fund | |
| | | Year Ended | | | Year Ended | |
| | | December 31, 2023 | | | December 31, 2022 | |
| OPERATIONS: | | | | | | |
| Net investment income | | $ | 1,373,760 | | | $ | 1,478,901 | |
| Net realized gain (loss) on investments | | | (1,265,464 | ) | | | 6,742,021 | |
| Net change in unrealized appreciation/ | | | | | | | | |
| depreciation of investments | | | 24,109,477 | | | | (23,067,084 | ) |
| Net increase (decrease) resulting from operations | | | 24,217,773 | | | | (14,846,162 | ) |
| | | | | | | | | |
| CAPITAL SHARE TRANSACTIONS: | | | | | | | | |
| Proceeds from shares sold | | | 16,910,139 | | | | 23,652,634 | |
| Proceeds from reinvestment of distributions | | | 1,267,736 | | | | 7,679,303 | |
| Payments for shares redeemed | | | (19,917,787 | ) | | | (38,656,260 | ) |
| Redemption fees | | | 625 | | | | 785 | |
| Net decrease from capital share transactions | | | (1,739,287 | ) | | | (7,323,538 | ) |
| | | | | | | | | |
| DISTRIBUTIONS PAID TO SHAREHOLDERS | | | (1,376,520 | ) | | | (8,373,387 | ) |
| | | | | | | | | |
| TOTAL INCREASE (DECREASE) IN NET ASSETS | | | 21,101,966 | | | | (30,543,087 | ) |
| | | | | | | | | |
| NET ASSETS: | | | | | | | | |
| Beginning of year | | | 210,587,320 | | | | 241,130,407 | |
| End of year | | $ | 231,689,286 | | | $ | 210,587,320 | |
| | | | | | | | | |
| TRANSACTIONS IN SHARES: | | | | | | | | |
| Shares sold | | | 699,684 | | | | 978,935 | |
| Shares issued in reinvestment of distributions | | | 51,304 | | | | 317,458 | |
| Shares redeemed | | | (825,965 | ) | | | (1,606,706 | ) |
| Net decrease | | | (74,977 | ) | | | (310,313 | ) |
See Notes to the Financial Statements
PROSPECTOR FUNDS, INC.
Financial Highlights
| | | Capital Appreciation Fund | |
| | | Year Ended December 31, | |
| | | 2023 | | | 2022 | | | 2021 | | | 2020 | | | 2019 | |
| For a Fund share outstanding | | | | | | | | | | | | | | | |
| throughout the year | | | | | | | | | | | | | | | |
| | | | | | | | | | | | | | | | |
| NET ASSET VALUE: | | | | | | | | | | | | | | | |
| Beginning of year | | $ | 19.28 | | | $ | 21.26 | | | $ | 19.60 | | | $ | 18.80 | | | $ | 16.34 | |
| | | | | | | | | | | | | | | | | | | | | |
| OPERATIONS: | | | | | | | | | | | | | | | | | | | | |
Net investment income(1) | | | 0.11 | | | | 0.11 | | | | 0.09 | | | | 0.12 | | | | 0.14 | |
| Net realized and unrealized gain (loss) on investments | | | 2.06 | | | | (0.93 | ) | | | 4.32 | | | | 1.07 | | | | 3.47 | |
| Total from operations | | | 2.17 | | | | (0.82 | ) | | | 4.41 | | | | 1.19 | | | | 3.61 | |
| | | | | | | | | | | | | | | | | | | | | |
| LESS DISTRIBUTIONS: | | | | | | | | | | | | | | | | | | | | |
| From net investment income | | | (0.11 | ) | | | (0.11 | ) | | | (0.20 | ) | | | (0.02 | ) | | | (0.12 | ) |
| From net realized gains | | | (0.53 | ) | | | (1.05 | ) | | | (2.55 | ) | | | (0.37 | ) | | | (1.03 | ) |
| Total distributions | | | (0.64 | ) | | | (1.16 | ) | | | (2.75 | ) | | | (0.39 | ) | | | (1.15 | ) |
| | | | | | | | | | | | | | | | | | | | | |
| NET ASSET VALUE: | | | | | | | | | | | | | | | | | | | | |
| End of year | | $ | 20.81 | | | $ | 19.28 | | | $ | 21.26 | | | $ | 19.60 | | | $ | 18.80 | |
| | | | | | | | | | | | | | | | | | | | | |
TOTAL RETURN(3) | | | 11.34 | % | | | (4.07 | )% | | | 23.25 | % | | | 6.40 | % | | | 22.33 | % |
| | | | | | | | | | | | | | | | | | | | | |
| SUPPLEMENTAL DATA AND RATIOS: | | | | | | | | | | | | | | | | | | | | |
| Net assets, end of year (in thousands) | | $ | 33,428 | | | $ | 27,445 | | | $ | 29,839 | | | $ | 26,163 | | | $ | 29,371 | |
| Ratio of expenses to average net assets: | | | | | | | | | | | | | | | | | | | | |
| Before expense reimbursement | | | 1.76 | % | | | 1.76 | % | | | 1.78 | % | | | 2.00 | % | | | 1.95 | % |
| After expense reimbursement | | | 1.25 | % | | | 1.25 | % | | | 1.25 | % | | | 1.25 | % | | | 1.29 | %(2) |
| Ratio of net investment income (loss) | | | | | | | | | | | | | | | | | | | | |
| to average net assets: | | | | | | | | | | | | | | | | | | | | |
| Before expense reimbursement | | | 0.09 | % | | | 0.07 | % | | | (0.17 | )% | | | (0.09 | )% | | | 0.08 | % |
| After expense reimbursement | | | 0.60 | % | | | 0.58 | % | | | 0.36 | % | | | 0.66 | % | | | 0.74 | % |
| Portfolio turnover rate | | | 41 | % | | | 33 | % | | | 32 | % | | | 40 | % | | | 25 | % |
| (1) | Per share amounts calculated using the Pre-ROC method of calculation. The Pre-ROC method of calculation subtracts the prior undistributed net investment income per share from the current year undistributed net investment income per share and adds in an current year income distribution amounts per share. |
| (2) | On September 5, 2019, the Adviser lowered the limit of annual operating expenses from 1.30% to 1.25% of average daily net assets. |
| (3) | Total return is a measure of the change in the value of an investment in the Fund over the years covered and assumes the reinvestment of capital gains and income distributions. Returns shown reflect waivers of fee and operating expenses in effect. In the absence of such waivers, total return would be reduced. The returns do not reflect the deduction of taxes that a shareholder would pay on Fund distributions or the redemption of Fund shares. |
See Notes to the Financial Statements
PROSPECTOR FUNDS, INC.
Financial Highlights
| | | Opportunity Fund | |
| | | Year Ended December 31, | |
| | | 2023 | | | 2022 | | | 2021 | | | 2020 | | | 2019 | |
| For a Fund share outstanding | | | | | | | | | | | | | | | |
| throughout the year | | | | | | | | | | | | | | | |
| | | | | | | | | | | | | | | | |
| NET ASSET VALUE: | | | | | | | | | | | | | | | |
| Beginning of year | | $ | 23.14 | | | $ | 25.63 | | | $ | 22.78 | | | $ | 22.18 | | | $ | 18.47 | |
| | | | | | | | | | | | | | | | | | | | | |
| OPERATIONS: | | | | | | | | | | | | | | | | | | | | |
Net investment income(1) | | | 0.15 | | | | 0.17 | | | | 0.11 | | | | 0.13 | | | | 0.23 | |
| Net realized and unrealized gain (loss) on investments | | | 2.53 | | | | (1.71 | ) | | | 4.99 | | | | 1.06 | | | | 4.49 | |
| Total from operations | | | 2.68 | | | | (1.54 | ) | | | 5.10 | | | | 1.19 | | | | 4.72 | |
| | | | | | | | | | | | | | | | | | | | | |
| LESS DISTRIBUTIONS: | | | | | | | | | | | | | | | | | | | | |
| From net investment income | | | (0.03 | ) | | | (0.17 | ) | | | (0.10 | ) | | | (0.17 | ) | | | (0.23 | ) |
| From net realized gains | | | (0.12 | ) | | | (0.78 | ) | | | (2.15 | ) | | | (0.42 | ) | | | (0.78 | ) |
| Total distributions | | | (0.15 | ) | | | (0.95 | ) | | | (2.25 | ) | | | (0.59 | ) | | | (1.01 | ) |
| | | | | | | | | | | | | | | | | | | | | |
| NET ASSET VALUE: | | | | | | | | | | | | | | | | | | | | |
| End of year | | $ | 25.67 | | | $ | 23.14 | | | $ | 25.63 | | | $ | 22.78 | | | $ | 22.18 | |
| | | | | | | | | | | | | | | | | | | | | |
TOTAL RETURN(3) | | | 11.63 | % | | | (6.20 | )% | | | 22.88 | % | | | 5.43 | % | | | 25.73 | % |
| | | | | | | | | | | | | | | | | | | | | |
| SUPPLEMENTAL DATA AND RATIOS: | | | | | | | | | | | | | | | | | | | | |
| Net assets, end of year (in thousands) | | $ | 231,689 | | | $ | 210,587 | | | $ | 241,130 | | | $ | 224,011 | | | $ | 142,685 | |
| Ratios of expenses to average net assets: | | | | | | | | | | | | | | | | | | | | |
| Before expense reimbursement | | | 1.37 | % | | | 1.34 | % | | | 1.34 | % | | | 1.39 | % | | | 1.50 | % |
| After expense reimbursement | | | 1.25 | % | | | 1.25 | % | | | 1.25 | % | | | 1.25 | % | | | 1.29 | %(2) |
| Ratio of net investment income to average net assets: | | | | | | | | | | | | | | | | | | | | |
| Before expense reimbursement | | | 0.51 | % | | | 0.58 | % | | | 0.28 | % | | | 0.63 | % | | | 0.85 | % |
| After expense reimbursement | | | 0.63 | % | | | 0.67 | % | | | 0.37 | % | | | 0.77 | % | | | 1.06 | % |
| Portfolio turnover rate | | | 32 | % | | | 44 | % | | | 29 | % | | | 52 | % | | | 27 | % |
| (1) | Per share amounts calculated using the Pre-ROC method of calculation. The Pre-ROC method of calculation subtracts the prior undistributed net investment income per share from the current year undistributed net investment income per share and adds in an current year income distribution amounts per share. |
| (2) | On September 5, 2019, the Adviser lowered the limit of annual operating expenses from 1.30% to 1.25% of average daily net assets. |
| (3) | Total return is a measure of the change in the value of an investment in the Fund over the years covered and assumes the reinvestment of capital gains and income distributions. Returns shown reflect waivers of fee and operating expenses in effect. In the absence of such waivers, total return would be reduced. The returns do not reflect the deduction of taxes that a shareholder would pay on Fund distributions or the redemption of Fund shares. |
See Notes to the Financial Statements
PROSPECTOR FUNDS, INC.
Notes to the Financial Statements
December 31, 2023
1. ORGANIZATION
Prospector Funds, Inc. (the “Corporation”) was organized as a Maryland corporation on June 6, 2007 and is registered under the Investment Company Act of 1940 (the “1940 Act”), as amended, as an open-end diversified management investment company. The Corporation issues its shares in series, each series representing a distinct portfolio with its own investment objectives and policies. There are two series presently authorized, the Prospector Capital Appreciation Fund and the Prospector Opportunity Fund (individually a “Fund” and collectively the “Funds”). Each Fund is an investment company and accordingly follows the investment company accounting and reporting guidance of the Financial Accounting Standards Board ("FASB") Accounting Standards Codification Topic 946 Financial Services – Investment Companies. The Funds commenced operations on September 28, 2007.
2. FAIR VALUE MEASUREMENT
The following is a summary of significant accounting policies consistently followed by the Funds:
Security Valuation – The Funds have adopted fair value accounting standards which establish an authoritative definition of fair value and set out a hierarchy for measuring fair value. These standards require additional disclosures about the various inputs and valuation techniques used to develop the measurements of fair value, a discussion in changes in valuation techniques and related inputs during the period and expanded disclosure of valuation levels for major security types. These inputs are summarized in the three broad levels listed below:
| Level 1 – | Unadjusted quoted prices in active markets for identical assets or liabilities that the Funds have the ability to access. |
| | |
| Level 2 – | Observable inputs other than quoted prices included in Level 1 that are observable for the asset or liability, either directly or indirectly. These inputs may include quoted prices for the identical instrument on an inactive market, prices for similar instruments, interest rates, prepayment speeds, credit risk, yield curves, default rates, discounts and similar data. |
| | |
| Level 3 – | Unobservable inputs for the asset or liability, to the extent relevant observable inputs are not available, representing the Funds’ own assumptions about the assumptions a market participant would use in valuing the asset or liability, and would be based on the best information available. |
Following is a description of the valuation techniques applied to the Funds’ major categories of assets and liabilities measured at fair value on a recurring basis. The Funds’ investments are carried at fair value.
Common Stock – Securities that are primarily traded on a national securities exchange are valued at the last sale price on the exchange on which they are primarily traded on the day of valuation or, if there has been no sale on such day, at the last bid price on the day of valuation. To the extent these securities are actively traded and valuation adjustments are not applied, they are categorized in Level 1 of the fair value hierarchy.
Convertible and Corporate Bonds – Convertible and corporate bonds, including listed issues, are valued at fair value on the basis of valuations furnished by an independent pricing service which utilizes both dealer-supplied valuations and formula-based techniques. The pricing service may consider recently executed transactions in securities of the issuer or comparable issuers, market price quotations (where observable), bond spreads, and fundamental data relating to the issuer. Convertible and corporate bonds are generally categorized in Level 2 of the fair value hierarchy.
PROSPECTOR FUNDS, INC.
Notes to the Financial Statements – Continued
December 31, 2023
Investment Companies – Investments in open-end mutual funds, including money market funds, are valued at their net asset value per share. Exchange Traded Funds (“ETFs”) are valued at the closing exchange price. To the extent these securities are actively traded and valuation adjustments are not applied, they are categorized in Level 1 of the fair value hierarchy.
The Board of Directors (the “Board”) has adopted a pricing and valuation policy for use by the Funds and its Valuation Designee (as defined below) in calculating the Funds’ NAV. Pursuant to Rule 2a-5 under the 1940 Act, the Funds have designated Prospector Partners Asset Management, LLC (the “Investment Adviser”) as its “Valuation Designee” to perform all of the fair value determinations as well as to perform all of the responsibilities that may be performed by the Valuation Designee in accordance with Rule 2a-5. The Valuation Designee is authorized to make all necessary determinations of the fair values of portfolio securities and other assets for which market quotations are not readily available or if it is deemed that the prices obtained from brokers and dealers or independent pricing services are unreliable.
The inputs or methodology used for valuing securities are not an indication of the risk associated with investing in those securities.
As of December 31, 2023, neither the Capital Appreciation Fund nor the Opportunity Fund held any fair valued securities. As of December 31, 2023, the Funds’ investments in securities were classified as follows:
| | | Level 1 | | | Level 2 | | | Level 3 | | | Total | |
| Capital Appreciation Fund | | | | | | | | | | | | |
| Common Stocks | | $ | 25,188,259 | | | $ | — | | | $ | — | | | $ | 25,188,259 | |
| Convertible Bonds | | | — | | | | 5,822,067 | | | | — | | | | 5,822,067 | |
| Exchange Traded Fund | | | 299,916 | | | | — | | | | — | | | | 299,916 | |
| Short-Term Investment | | | 2,135,365 | | | | — | | | | — | | | | 2,135,365 | |
| Total Investments | | $ | 27,623,540 | | | $ | 5,822,067 | | | $ | — | | | $ | 33,445,607 | |
| | | | | | | | | | | | | | | | | |
| | | | | | | | | | | | | | | | | |
| | | Level 1 | | | Level 2 | | | Level 3 | | | Total | |
| Opportunity Fund | | | | | | | | | | | | | | | | |
| Common Stocks | | $ | 217,912,897 | | | $ | — | | | $ | — | | | $ | 217,912,897 | |
| Exchange Traded Fund | | | 2,548,834 | | | | — | | | | — | | | | 2,548,834 | |
| Short-Term Investment | | | 11,075,317 | | | | — | | | | — | | | | 11,075,317 | |
| Total Investments | | $ | 231,537,048 | | | $ | — | | | $ | — | | | $ | 231,537,048 | |
Refer to the Funds’ Schedule of Investments for further sector breakout.
The Funds may invest in derivative financial instruments in order to manage risk or gain exposure to various other investments or markets. The Funds’ investment objectives allow the Funds to enter into various types of derivative contracts, including, but not limited to, futures contracts, forward foreign exchange contracts, and purchased and written options. Derivatives may contain various risks including the potential inability of the counterparty to fulfill their obligations under the terms of the contract, the potential for an illiquid secondary market, and the potential for market movements which may expose the funds to gains or losses in excess of the amounts shown on the Statements of Assets and Liabilities. As of and for the year ended December 31, 2023, the Funds held no derivative instruments.
PROSPECTOR FUNDS, INC.
Notes to the Financial Statements – Continued
December 31, 2023
3. SIGNIFICANT ACCOUNTING POLICIES
Cash – The Funds may invest a portion of their assets in cash or cash equivalents. These cash equivalents may include money market instruments, such as securities issued by the U.S. Government and its agencies, bankers’ acceptances, commercial paper, bank certificates of deposit and investment companies that invest primarily in such instruments. As of December 31, 2023, cash held by the Funds represents cash held at financial institutions, and money market instruments held were not considered to be cash equivalents and were classified as investments.
Distributions to Shareholders – Dividends from net investment income and distributions of net realized capital gains, if any, will be declared and paid at least annually. The character of distributions made during the period from net investment income or net realized gains may differ from the characterization for federal income tax purposes due to differences in the recognition of income, expense and gain items for financial statement and tax purposes. All net short-term capital gains are included in ordinary income for tax purposes.
Use of Estimates – The preparation of financial statements in conformity with accounting principles generally accepted in the United States of America (“U.S. GAAP”) requires management to make estimates and assumptions that affect the reported amounts of assets and liabilities and disclosure of contingent assets and liabilities at the date of the financial statements and the reported amounts of revenues and expenses during the reporting period. Actual results could differ from those estimates.
Federal Income Taxes – The Funds intend to meet the requirements of subchapter M of the Internal Revenue Code applicable to regulated investment companies and to distribute substantially all net taxable investment income and net realized gains to shareholders in a manner which results in no tax cost to the Funds. Therefore, no federal income or excise tax provision is required. As of December 31, 2023, the Funds did not have any tax positions that did not meet the “more-likely-than-not” threshold of being sustained by the applicable tax authority. Generally, each of the tax years in the four-year period ended December 31, 2023 remains subject to examination by taxing authorities.
Reclassification of Capital Accounts – U.S. GAAP requires that certain components of net assets relating to permanent differences primarily related to tax equalization debits be reclassified between financial and tax reporting. These reclassifications have no effect on net assets or net asset value per share. For the fiscal year ended December 31, 2023, the Capital Appreciation Fund increased portfolio capital by $27,989 and decreased distributable earnings by $27,989. For the fiscal year ended December 31, 2023, the Opportunity Fund did not make any reclassifications. The difference between book and tax relates primarily to equalization, and reclassification of dividends.
Foreign Currency Translation – The books and records relating to the Funds’ non-U.S. dollar denominated investments are maintained in U.S. dollars on the following bases: (1) market value of investment securities, assets, and liabilities if any, are translated at the current rate of exchange; and (2) purchases and sales of investment securities, income, and expenses are translated at the relevant rates of exchange prevailing on the respective dates of such transactions. The Funds do not isolate the portion of realized and unrealized gains and losses on investments in equity securities that is due to changes in the foreign exchange rates from that which is due to changes in market prices of equity securities. The Funds report certain foreign currency-related transactions as components of realized gains for financial reporting purposes, whereas such components are treated as ordinary income for federal income tax purposes.
Illiquid or Restricted Securities – A security may be considered illiquid if it lacks a readily available market. Securities are generally considered liquid if they can be sold or disposed of in the ordinary course of business within seven days at approximately the price at which the security is valued by the Funds. Illiquid securities may be valued
PROSPECTOR FUNDS, INC.
Notes to the Financial Statements – Continued
December 31, 2023
under methods approved by the Board as reflecting fair value. The Funds intends to invest no more than 15% of its total assets in illiquid securities. Certain restricted securities may be considered illiquid. Restricted securities are often purchased in private placement transactions, are not registered under the Securities Act of 1933, may have contractual restrictions on resale, and may be valued under methods approved by the Board as reflecting fair value. Certain restricted securities eligible for resale to qualified institutional investors, including Rule 144A securities, are not subject to the limitation on the Funds’ investment in illiquid securities if they are determined to be liquid in accordance with procedures adopted by the Board. As of December 31, 2023, neither Funds hold Rule 144A securities. At December 31, 2023, the Funds had no investments in illiquid securities and no restricted securities. Refer to the Schedule of Investments for further detail.
Expenses – Expenses directly attributable to a Fund are charged to that Fund, while expenses attributable to more than one Fund are allocated among the respective Funds based on relative net assets or another appropriate basis.
Other – Investment and shareholder transactions are recorded on the trade date. The Funds determine the gain or loss realized from the investment transactions on the basis of identified cost. Dividend income is recognized on the ex-dividend date. Interest income, including amortization of bond premium and discount, is recognized on an accrual basis. Shareholders may be subject to a redemption fee equal to 2% of the amount redeemed if Funds’ shares are sold within 60 days or less following the date of their purchase.
Other Regulatory Matters – In October 2022, the Securities and Exchange Commission (the “SEC”) adopted a final rule relating to Tailored Shareholder Reports for Mutual Funds and Exchange-Traded Funds; Fee Information in Investment Company Advertisements. The rule and form amendments will, among other things, require the Funds to transmit concise and visually engaging shareholder reports that highlight key information. The amendments will require that funds tag information in a structured data format and that certain more in-depth information be made available online and available for delivery free of charge to investors on request. The amendments became effective on January 24, 2023. There is an 18-month transition period after the effective date of the amendment.
Market Risk Factors – In the normal course of operations and in pursuit of their investment objectives, the Funds are exposed to the following market risk factors:
| | • | Stock Market Risk, which is the chance that stock prices overall will decline. Stock markets tend to move in cycles, with periods of rising prices and periods of falling prices. When the stock market is subject to significant volatility, the risks associated with an investment in the Fund may increase. Markets may experience periods of high volatility and reduced liquidity and, during such periods, the Fund may experience high levels of shareholder redemptions, and may have to sell securities at times when the Fund would otherwise not do so, potentially at unfavorable prices. |
| | | |
| | • | Convertible Securities Risk, which is the risk that, with respect to a convertible security and prior to its conversion to equity, the price of the convertible security will normally vary with changes in the price of the underlying equity security, and the convertible security will generally offer interest or dividend yields that are lower than nonconvertible debt securities of similar quality. |
| | | |
| | • | Interest Rate Risk, which is the chance that the value of debt securities overall will decline because of rising interest rates. Interest rate risk is generally greater for fixed-income securities with longer maturities or durations, but increasing interest rates may have an adverse effect on the value of the Funds’ investment portfolio as a whole. The Funds may be subject to a greater risk of rising interest rates than would normally |
PROSPECTOR FUNDS, INC.
Notes to the Financial Statements – Continued
December 31, 2023
| | | be the case due to the recent end of a period of historically low rates and the effects of potential central bank monetary policy, and government fiscal policy, initiatives and resulting market reactions to those initiatives. |
| | | |
| | • | Income Risk, which is the chance that the Funds’ income will decline because of falling interest rates. |
| | | |
| | • | Credit Risk, which is the chance that a debt issuer will fail to pay interest and principal in a timely manner, or that negative perceptions of the issuer’s ability to make such payments will cause the price of that debt to decline. |
| | | |
| | • | High Yield Securities Risk, which is the risk that debt securities in the lower rating categories are subject to a greater probability of loss in principal and interest than higher-rated securities and are generally considered to be predominantly speculative with respect to the issuer’s capacity to pay interest and repay principal. |
| | | |
| | • | Foreign Securities Risk, which is the risk associated with investments in foreign countries. The following factors make foreign securities more volatile: political, economic and social instability; foreign securities may be harder to sell; brokerage commissions and other fees may be higher for foreign securities; and foreign companies may not be subject to the same disclosure and reporting standards as U.S. companies. |
| | | |
| | • | Currency Risk, which is the risk that the value of foreign securities may be affected by changes in currency exchange rates. |
| | | |
| | • | Smaller and Mid-Sized Companies Risk, which is the risk that the securities of such issuers may be comparatively more volatile in price than those of companies with larger capitalizations, and may lack the depth of management and established markets for their products and/or services that may be associated with investments in larger issuers. |
| | | |
| | • | Value Investing Risk, which is the risk that value securities may not increase in price as anticipated by the Investment Manager, and may even decline further in value, if other investors fail to recognize the company’s value, or favor investing in faster-growing companies, or if the events or factors that the Investment Manager believes will increase a security’s market value do not occur. |
| | | |
| | • | Restricted Securities Risk, which is the risk that restricted securities may have terms that limit their resale to other investors or may require registration under applicable securities laws before they may be sold publicly. It may not be possible to sell certain restricted securities at any particular time or at an acceptable price. |
Subsequent Events – Management of the Funds has evaluated Fund-related events and transactions that occurred subsequent to December 31, 2023, through the date of issuance of the Funds’ financial statements. There were no events or transactions that occurred during this period that materially impacted the amounts or disclosures in the Funds’ financial statements.
4. INVESTMENT TRANSACTIONS, DISTRIBUTABLE EARNINGS, AND DISTRIBUTIONS PAID
During the year ended December 31, 2023, purchases of securities and proceeds from sales of securities, other than temporary investments in short-term securities, were as follows:
| | | Purchases | | | Sales | |
| | | | | | | | | |
| Capital Appreciation Fund | | $ | 13,323,099 | | | $ | 11,172,979 | |
| Opportunity Fund | | | 64,521,180 | | | | 68,821,479 | |
There were no purchases or sales of long-term U.S. Government securities.
PROSPECTOR FUNDS, INC.
Notes to the Financial Statements – Continued
December 31, 2023
The aggregate gross unrealized appreciation and depreciation of securities held by the Funds and the total cost of securities for federal income tax purposes at December 31, 2023, the Funds’ most recently completed fiscal year end, were as follows:
| | | Aggregate | | | Aggregate | | | Net | | | Federal | |
| | | Gross | | | Gross | | | Appreciation/ | | | Income | |
| | | Appreciation | | | Depreciation | | | (Depreciation) | | | Tax Cost | |
| | | | | | | | | | | | | | | | | |
| Capital Appreciation Fund | | $ | 8,874,001 | | | $ | (368,812 | ) | | $ | 8,505,189 | | | $ | 24,940,867 | |
| Opportunity Fund | | | 71,271,088 | | | | (2,200,386 | ) | | | 69,070,702 | | | | 162,466,111 | |
The difference between book-basis and tax-basis unrealized appreciation is attributable primarily to wash sales and different book and tax accounting methods for certain securities.
At December 31, 2023, the components of accumulated earnings (deficit) on a tax-basis were as follows:
| | | Undistributed | | | Undistributed | | | Other | | | | | | Total | |
| | | Ordinary | | | Long-Term | | | Accumulated | | | Unrealized | | | Distributable | |
| | | Income | | | Capital Gains | | | Losses | | | Appreciation | | | Earnings | |
| | | | | | | | | | | | | | | | | | | | | |
| Capital Appreciation Fund | | $ | 8,781 | | | $ | — | | | $ | (12,380 | ) | | $ | 8,505,189 | | | $ | 8,501,590 | |
| Opportunity Fund | | | 1,037,662 | | | | — | | | | (1,305,155 | ) | | | 69,070,702 | | | | 68,803,209 | |
As of December 31, 2023, the Capital Appreciation Fund had a short-term capital loss carryover of $1,305,155. A regulated investment company may elect for any taxable year to treat any portion of any qualified late year loss as arising on the first day of the next taxable year. Qualified late year losses are certain capital and ordinary losses which occur during the portion of the Fund’s taxable year subsequent to October 31. The Capital Appreciation Fund plans to defer, on a tax basis, late year losses of $12,380 The Opportunity Fund does not plan to defer any late year losses.
The tax character of distributions paid during the fiscal year ended December 31, 2023 were as follows:
| | | Ordinary | | | Long Term | | | | |
| | | Income | * | | Capital Gains | **
| | Total | |
| | | | | | | | | | | | | |
| Capital Appreciation Fund | | $ | 170,792 | | | $ | 819,815 | | | $ | 990,607 | |
| Opportunity Fund | | | 345,575 | | | | 1,030,945 | | | | 1,376,520 | |
The tax character of distributions paid during the fiscal year ended December 31, 2022 were as follows:
| | | Ordinary | | | Long Term | | | | |
| | | Income | * | | Capital Gains | **
| | Total | |
| | | | | | | | | | | | | |
| Capital Appreciation Fund | | $ | 150,299 | | | $ | 1,413,458 | | | $ | 1,563,757 | |
| Opportunity Fund | | | 1,469,012 | | | | 6,904,375 | | | | | |
| * |
| For federal income tax purposes, distributions of short-term capital gains are included in ordinary income distributions. |
| ** |
| The Funds designate long-term capital gain dividends pursuant to IRC Sec. 852(b)(3)(C). |
PROSPECTOR FUNDS, INC.
Notes to the Financial Statements – Continued
December 31, 2023
5. AGREEMENTS
The Funds have entered into an Investment Advisory Agreement with the Investment Adviser, with whom certain directors and officers of the Corporation are affiliated, to furnish investment advisory services to the Funds. Pursuant to this Agreement, the Investment Adviser is entitled to receive an investment advisory fee, calculated daily and payable monthly, at the annual rate of 1.00% as applied to each Fund’s daily net assets.
The Investment Adviser has contractually agreed to waive its investment advisory fee and reimburse each Fund’s other expenses to the extent necessary to ensure that each Fund’s operating expenses do not exceed 1.25% of its average daily net assets. As of December 31, 2023, the Investment Adviser had outstanding waivers of $16,692 and $16,146 for the Capital Appreciation Fund and Opportunity Fund, respectively. Fees waived and expenses reimbursed by the Investment Adviser may be recouped by the Investment Adviser for a period of three fiscal years following the fiscal year during which such waiver or reimbursement was made if such recoupment can be achieved without exceeding the expense limit in effect at the time the waiver or reimbursement occurred. As of December 31, 2023, the Investment Adviser did not recoup any previously waived fees or reimbursed expenses. The Fee Waiver and Expense Limitation Agreement will be in effect through at least September 30, 2024. Waived fees and reimbursed expenses subject to potential recovery by year of expiration are as follows:
| Expiration | Capital Appreciation Fund | | Opportunity Fund | |
| | | | | | | | | | | |
| 12/31/24 | | | | $ | 147,451 | | | $ | 202,416 | |
| 12/31/25 | | | | | 140,905 | | | | 208,540 | |
| 12/31/26 | | | | | 145,828 | | | | 264,247 | |
| Total | | | | $ | 434,184 | | | $ | 675,203 | |
As of December 31, 2023, it was possible, but not probable, those amounts would be recovered by the Investment Adviser. At the end of each fiscal year in the future, the Funds will continue to assess the potential recovery of waived/reimbursed fees and expenses for financial reporting purposes.
Quasar Distributors, LLC (“Quasar”) serves as distributor of the Funds’ shares pursuant to a Distribution Agreement with the Corporation. Each Fund’s shares are sold on a no-load basis and, therefore, Quasar receives no sales commission or sales load for providing services to the Funds. The Corporation has adopted a plan pursuant to Rule 12b-1 under the 1940 Act (the “12b-1 Plan”), which authorizes the Corporation to reimburse Quasar and certain financial intermediaries who assist in distributing each Fund’s shares or who provide shareholder services to Fund shareholders a distribution and/or shareholder servicing fee of up to 0.25% of each Fund’s average daily net assets (computed on an annual basis). All or a portion of the fee may be used by the Funds or Quasar to pay the Fund’s distribution fees and costs of printing reports and prospectuses for potential investors and the costs of other distribution and shareholder services expenses. During the year ended December 31, 2023, the Capital Appreciation Fund and Opportunity Fund incurred expenses of $9,295 and $193,263 respectively, pursuant to the 12b-1 Plan.
U.S. Bancorp Fund Services, LLC, doing business as U.S. Bank Global Fund Services, serves as transfer agent, administrator and fund accountant for the Funds. U.S. Bank N.A. serves as custodian for the Funds.
6. INDEMNIFICATIONS
The Funds enter into contracts that contain a variety of indemnifications. The Funds’ maximum exposure under these arrangements is unknown. However, the Funds have not had prior claims or losses pursuant to these contracts and expect the risk of loss to be remote.
PROSPECTOR FUNDS, INC.
Report of Independent Registered Public Accounting Firm
To the Shareholders and the Board of Directors of Prospector Funds, Inc.
Opinion on the Financial Statements
We have audited the accompanying statements of assets and liabilities of Prospector Funds, Inc. (the “Corporation”) (comprising the Prospector Capital Appreciation Fund and Prospector Opportunity Fund (collectively referred to as the “Funds”)), including the schedules of investments, as of December 31, 2023, and the related statements of operations for the year then ended, the statements of changes in net assets for each of the two years in the period then ended, the financial highlights for each of the five years in the period then ended and the related notes (collectively referred to as the “financial statements”). In our opinion, the financial statements present fairly, in all material respects, the financial position of each of the Funds comprising Prospector Funds, Inc. at December 31, 2023, the results of their operations for the year then ended, the changes in their net assets for each of the two years in the period then ended and their financial highlights for each of the five years in the period then ended, in conformity with U.S. generally accepted accounting principles.
Basis for Opinion
These financial statements are the responsibility of the Corporation’s management. Our responsibility is to express an opinion on each of the Funds’ financial statements based on our audits. We are a public accounting firm registered with the Public Company Accounting Oversight Board (United States) (“PCAOB”) and are required to be independent with respect to the Corporation in accordance with the U.S. federal securities laws and the applicable rules and regulations of the Securities and Exchange Commission and the PCAOB.
We conducted our audits in accordance with the standards of the PCAOB. Those standards require that we plan and perform the audit to obtain reasonable assurance about whether the financial statements are free of material misstatement, whether due to error or fraud. The Corporation is not required to have, nor were we engaged to perform, an audit of the Corporation’s internal control over financial reporting. As part of our audits, we are required to obtain an understanding of internal control over financial reporting but not for the purpose of expressing an opinion on the effectiveness of the Corporation’s internal control over financial reporting. Accordingly, we express no such opinion.
Our audits included performing procedures to assess the risks of material misstatement of the financial statements, whether due to error or fraud, and performing procedures that respond to those risks. Such procedures included examining, on a test basis, evidence regarding the amounts and disclosures in the financial statements. Our procedures included confirmation of securities owned as of December 31, 2023, by correspondence with the custodian and brokers. Our audits also included evaluating the accounting principles used and significant estimates made by management, as well as evaluating the overall presentation of the financial statements. We believe that our audits provide a reasonable basis for our opinion.
We have served as the auditor of one or more Prospector Funds, Inc. investment companies since 2007.
Minneapolis, Minnesota
February 27, 2024
PROSPECTOR FUNDS, INC.
Additional Information (Unaudited)
December 31, 2023
BOARD APPROVAL OF INVESTMENT ADVISORY AGREEMENT
The Corporation’s independent directors (the “directors”) unanimously approved the continuance of the Investment Advisory Agreement (the “Advisory Agreement”) between the Funds and Prospector Partners Asset Management, LLC (the “Advisor”) at a Board of Directors meeting held on September 7, 2023.
In preparation for the meeting, the directors had requested from the Advisor and evaluated a memorandum providing certain information requested by the Board pursuant to Section 15(c) of the 1940 Act, including (i) expense, compliance and other information as it relates to the Advisor; (ii) performance of other accounts managed by its affiliate Prospector Partners, LLC with similar investment objectives derived from data compiled by the Advisor and (iii) expense and other information for other registered investment companies with similar investment objectives derived from data compiled by the Advisor based upon comparative peer groups selected in consultation with the independent directors. Prior to voting, the directors reviewed the proposed approval of the Advisory Agreement with management and with counsel to the Corporation and reviewed a memorandum from such counsel discussing the legal standards for their consideration of the proposed approval. In reaching their determinations relating to approval of the continuance of the Advisory Agreement, the directors considered all factors they believed relevant including the following:
| | 1. | the nature, extent and quality of investment, and other services to be rendered by the Advisor; |
| | | |
| | 2. | payments to be received by the Advisor from all sources with respect to the Funds; |
| | | |
| | 3. | comparative fee and expense data for the Funds and other investment companies with similar investment objectives; |
| | | |
| | 4. | the extent to which economies of scale may be realized as the Funds grow and whether fee levels reflect these economies of scale for the benefit of investors; |
| | | |
| | 5. | the Advisor’s policies and practices regarding allocation of portfolio transactions of the Funds, including the extent to which the Advisor may benefit from soft dollar arrangements; |
| | | |
| | 6. | fall-out benefits which the Advisor and its affiliates may receive from their relationships to the Funds; |
| | | |
| | 7. | information about fees charged by the Advisor to other clients with similar investment objectives; |
| | | |
| | 8. | the professional experience and qualifications of the Funds’ portfolio managers and other senior personnel of the Advisor; |
| | | |
| | 9. | profitability of the Advisor; and |
| | | |
| | 10. | the terms of the Advisory Agreement. |
The directors also considered their overall confidence in the integrity and competence of the Advisor and its investment team. In their deliberations, the directors did not identify any particular information that was all- important or controlling, and each director attributed different weights to the various factors. The directors determined that the overall arrangements between the Funds and the Advisor, as provided in the Advisory Agreement, were fair and reasonable in light of the services performed, expenses expected to be incurred and such other matters as the directors considered relevant in the exercise of their reasonable judgment.
The material factors and conclusions that formed the basis for the directors reaching their determinations to approve the continuance of the Advisory Agreement (including their determinations that the Advisor should be the investment adviser for the Funds, and that the fees payable to the Advisor pursuant to the Advisory Agreement continue to be appropriate) were separately discussed by the directors.
PROSPECTOR FUNDS, INC.
Additional Information (Unaudited) – Continued
December 31, 2023
Nature, extent and quality of services provided by the Advisor
The directors noted that, under the Advisory Agreement, the Advisor, subject to the control of the directors, administers the Funds’ business and other affairs. The directors also noted that the Advisor manages the investment of the assets of the Funds, including making purchases and sales of portfolio securities consistent with each Fund’s investment objective and policies.
The directors considered the scope and quality of services provided by the Advisor under the Advisory Agreement, the cyclical nature of value investing, the quality of the investment research capabilities of the Advisor and the other resources it proposes to dedicate to performing services for the Funds and the Advisor’s active management style. The directors also considered the portfolio managers’ experience, reputation and investment philosophy noting that the Advisor’s investment style and stock selection process have remained consistent even in difficult market environments. The quality of administrative and other services also were considered. The directors concluded that, overall, they continue to be satisfied with the nature, extent and quality of services proposed to be provided to the Funds under the Advisory Agreement.
Advisor Fees; Performance of the Fund
The directors considered the advisory fee rate paid by the Funds to the Advisor and information prepared by the Advisor based upon the peer groups selected with the input of the independent directors concerning fee rates paid by other comparable funds. The directors recognized that it is difficult to make comparisons of advisory fees because there are variations in the services that are included in the fees paid by other funds, but determined that the current advisory fee rate of 1.00% was in line with other comparable funds.
The directors also considered the performance of each Fund compared to each Fund’s benchmarks and peer groups. The directors noted that the Opportunity Fund outperformed its Lipper peers across the five-year, ten-year and since-inception time periods. The Directors noted that the Capital Appreciation Fund outperformed the Lipper peer group average for the three-year, five-year, ten-year and since-inception time periods. The directors concluded that the advisory fee rate, taking into account performance and the other factors mentioned, was in line with comparable funds.
Other Fund Expenses
The directors also considered the total expense ratio of the Funds in comparison to the fees and expenses of the funds included in their respective peer groups. The directors noted that the expense ratios of some of the comparable funds were lower because of waivers or reimbursements by those funds’ investment advisers, which in some cases were voluntary and perhaps temporary. In particular, the directors noted that the Advisor’s fee waiver/expense reimbursement pursuant to the Fee Waiver and Expenses Reimbursement Agreement was contractual in nature and customary for the industry. The directors concluded that each Fund’s expense ratio was reasonable. Finally, the directors noted that there may be economies of scale as the Funds grow and concluded that it may be appropriate to consider those issues in the future.
Advisor Profitability
The directors noted that the Advisor also provides the Funds with such office space, administrative and other services (exclusive of, and in addition to, any such services provided by any other retained by the Funds) and
PROSPECTOR FUNDS, INC.
Additional Information (Unaudited) – Continued
December 31, 2023
executive and other personnel as are necessary for the Funds’ operations. The directors considered that the Advisor pays all of the compensation of the officers of the Company that are affiliated persons of the Advisor, pays a portion of the insurance costs and paid the cost of the organization of the Funds (without reimbursement), through its affiliate, Prospector Partners, LLC.
The directors also noted that the Advisor has contractually agreed to waive, through September 30, 2024, its management fee and/or reimburse each Fund’s other expenses to the extent necessary to ensure that each Fund’s operating expenses do not exceed 1.25% of its average daily net assets. Under the terms of the Fee Waiver and Expense Reimbursement Agreement at the present asset levels of the Funds, the Advisor has received only a portion of its earned management fee. It was also noted that the Advisor does not receive “fall out” benefits commonly received by managers of mutual funds that provide transfer agency, distribution or printing services in-house. The directors considered the expenses of the Advisor and the services provided by the Advisor and that the Advisor expects to be cash flow positive after considering an allocation of expenses from its affiliated advisor, Prospector Partners, LLC and before considering any allocation of income to the owners of the affiliated advisor.
PROSPECTOR FUNDS, INC.
Additional Information (Unaudited) – Continued
December 31, 2023
LIQUIDITY RISK MANAGEMENT PROGRAM
The Funds have adopted and implemented a written liquidity risk management program as required by Rule 22e-4 (the “Liquidity Rule”) under the Investment Company Act of 1940, as amended. The program is reasonably designed to assess and manage the Funds’ liquidity risk, taking into consideration, among other factors, the Funds’ investment strategy and the liquidity of its portfolio investments during normal and reasonably foreseeable stressed conditions; its short and long-term cash flow projections; and its cash holdings and access to other funding sources. The Board approved the appointment of a Liquidity Administrator Committee, which includes representatives from Prospector Partners Asset Management, LLC, the Funds’ investment adviser.
The Liquidity Administrator Committee is responsible for the program’s administration and oversight and for reporting to the Board on at least an annual basis regarding the program’s operation and effectiveness. The Liquidity Administrator Committee updated its assessment of the Fund’s liquidity risk profile, considering additional data gathered in the 12 months ended September 30, 2023 and the adequacy and effectiveness of the liquidity risk management program’s operations since its inception on June 1, 2019 (the “Review Period”) in order to prepare a written report for the Board (the “Report”) for consideration at its meeting held on December 5, 2023. The Report noted that during the Review Period the Funds did not experience unusual stress or disruption to its operations related to purchase and redemption activity. It further noted that during the Review Period the Funds held adequate levels of cash and highly liquid investments to meet shareholder redemption activities in accordance with applicable requirements. The Report concluded that (i) the Funds’ liquidity risk management program is reasonably designed to prevent violations of the Liquidity Rule and (ii) the Funds’ liquidity risk management program had been effectively implemented during the Review Period.
PROSPECTOR FUNDS, INC.
Additional Information (Unaudited) – Continued
December 31, 2023
AVAILABILITY OF FUND PORTFOLIO INFORMATION
The Funds file complete schedules of portfolio holdings with the SEC for the first and third quarters of each fiscal year on Part F of Form N-PORT, which is available on the SEC’s website at www.sec.gov. The Funds’ Part F of Form N-PORT may be reviewed and copied at the SEC’s Public Reference Room in Washington, D.C. For information on the Public Reference Room call 1-800-SEC-0330. In addition, the Funds’ Form N-Q or Part F of Form N-PORT is available without charge upon request by calling 1-877-734-7862.
AVAILABILITY OF PROXY VOTING INFORMATION
A description of the Funds’ Proxy Voting Policies and Procedures is available without charge, upon request, by calling 1-877-734-7862. Information regarding how the Funds voted proxies relating to portfolio securities during the most recent 12 month period ended June 30, is available (1) without charge, upon request, by calling 1-877-734-7862, or (2) on the SEC’s website at www.sec.gov.
QUALIFIED DIVIDEND INCOME/DIVIDENDS RECEIVED DEDUCTION
For the fiscal year ended December 31, 2023, certain dividends paid by the Funds may be reported as qualified dividend income and may be eligible for taxation at capital gain rates. The percentage of dividends declared from ordinary income designated as qualified dividend income was 100% and 100% for the Capital Appreciation Fund and Opportunity Fund, respectively.
For corporate shareholders, the percent of ordinary income distributions qualifying for the corporate dividends received deduction for the fiscal year ended December 31, 2023 was 100% and 100% for the Capital Appreciation Fund and Opportunity Fund, respectively.
ADDITIONAL INFORMATION APPLICABLE TO FOREIGN SHAREHOLDERS ONLY
The percent of ordinary income distributions designated as interest related dividends for the fiscal year ended December 31, 2023 was 28.88% and 17.35% for the Capital Appreciation Fund and Opportunity Fund, respectively.
The percent of ordinary income distributions designated as short-term capital gain distributions under Internal Revenue Section 871(k)(2)(C) for the fiscal year ended December 31, 2023 was 0.00% and 0.00% for the Capital Appreciation Fund and Opportunity Fund, respectively.
PROSPECTOR FUNDS, INC.
Additional Information (Unaudited) – Continued
December 31, 2023
| DIRECTORS & OFFICERS TABLE | | | | | |
| | | | Term of | | | Number of | | |
| | | | Office | | | Portfolios | | Other |
| | | | and | | Principal | in Fund | | Directorships |
| Name, | | | Length | | Occupation | Complex | | Served |
| Year of Birth | | | of Time | | During Past | Overseen | | During Past |
| and Address^ | Position | | Served* | | 5 Years | by Director | | 5 Years |
| Independent Board Members |
| Harvey D. Hirsch* | Director | | Indefinite; | | Retired. | 2 | | None. |
| Year of Birth: 1941 | | | Since | | | | | |
| | | | September 7, | | | | | |
| | | | 2007 | | | | | |
| | | | | | | | | |
| Joseph Klein III* | Director | | Indefinite; | | Managing Director of Gauss | 2 | | Ionis |
| Year of Birth: 1961 | | | Since | | Capital Advisors, LLC, | | | Pharmaceuticals, |
| | | | September 7, | | a financial consulting and | | | Inc.; Akcea |
| | | | 2007 | | investment advisory firm | | | Therapeutics, |
| | | | | | focused on biopharmaceuticals | | | Inc. |
| | | | | | since he founded the company | | | |
| | | | | | in March 1998. | | | |
| | | | | | | | | |
| Roy L. Nersesian* | Director | | Indefinite; | | Professor of the Leon Hess | 2 | | None. |
| Year of Birth: 1939 | | | Since | | School of Business, Monmouth | | | |
| | | | September 7, | | University, since September 1985. | | | |
| | | | 2007 | | Adjunct Professor of the Center | | | |
| | | | | | for Energy and Marine | | | |
| | | | | | Transportation, Columbia | | | |
| | | | | | University, since September 2000. | | | |
| | | | | | | | | |
| John T. Rossello, Jr.* | Director | | Indefinite; | | Retired. | 2 | | None. |
| Year of Birth: 1951 | | | Since | | | | | |
| | | | September 7, | | | | | |
| | | | 2007 | | | | | |
| | | | | | | | | |
PROSPECTOR FUNDS, INC.
Additional Information (Unaudited) – Continued
December 31, 2023
| | | | Term of | | | Number of | | |
| | | | Office | | | Portfolios | | Other |
| | | | and | | Principal | in Fund | | Directorships |
| Name, | | | Length | | Occupation | Complex | | Served |
| Year of Birth | | | of Time | | During Past | Overseen | | During Past |
| and Address^ | Position | | Served* | | 5 Years | by Director | | 5 Years |
| Interested Board Members and Officers |
| John D. Gillespie†* | Director | | Indefinite; | | Managing member of | 2 | | None. |
| Year of Birth: 1959 | President | | Since | | the Investment Adviser. | | | |
| | | | September 7, | | Managing member of | | | |
| | | | 2007 | | Prospector Partners, LLC, | | | |
| | | | | | an affiliate of the Investment | | | |
| | | | | | Manager, and portfolio | | | |
| | | | | | manager of the investment | | | |
| | | | | | funds sponsored by Prospector | | | |
| | | | | | Partners, LLC from 1997 | | | |
| | | | | | through 2021. | | | |
| | | | | | | | | |
| Kevin R. O’Brien | Executive | | Indefinite; | | Portfolio Manager at | N/A | | None. |
| Year of Birth: 1963 | Vice | | Since | | the Investment Manager. | | | |
| | President | | September 7, | | Portfolio Manager at | | | |
| | | | 2007 | | Prospector Partners, LLC | | | |
| | | | | | since April 2003. | | | |
| | | | | | | | | |
| Jason A. Kish | Executive | | Indefinite; | | Portfolio Manager at | N/A | | None. |
| Year of Birth: 1973 | Vice | | Since | | the Investment Manager. | | | |
| | President | | February, | | Director of Research | | | |
| | | | 2013 | | since 2010. | | | |
| | | | | | | | | |
| Steven R. Labbe | Executive | | Indefinite; | | Portfolio Manager at | N/A | | None. |
| Year of Birth: 1972 | Vice | | Since | | the Investment Manager. | | | |
| | President | | July, | | Analyst since 2012. | | | |
| | | | 2020 | | | | | |
| | | | | | | | | |
| Peter N. Perugini, Jr. | Secretary | | Indefinite; | | Chief Financial Officer at | N/A | | None. |
| Year of Birth: 1970 | Treasurer | | Secretary | | Prospector Partners, LLC | | | |
| | | | Since | | since 2000. | | | |
| | | | September 7, | | | | | |
| | | | 2007 | | | | | |
| | | | Indefinite; | | | | | |
| | | | Treasurer | | | | | |
| | | | Since | | | | | |
| | | | June 6, | | | | | |
| | | | 2007 | | | | | |
PROSPECTOR FUNDS, INC.
Additional Information (Unaudited) – Continued
December 31, 2023
| | | | Term of | | | Number of | | |
| | | | Office | | | Portfolios | | Other |
| | | | and | | Principal | in Fund | | Directorships |
| Name, | | | Length | | Occupation | Complex | | Served |
| Year of Birth | | | of Time | | During Past | Overseen | | During Past |
| and Address^ | Position | | Served* | | 5 Years | by Director | | 5 Years |
| Frederick Teufel | Chief | | Indefinite; | | Director at | N/A | | None. |
| Year of Birth: 1959 | Compliance | | Since | | Vigilant Compliance, LLC | | | |
| | Officer | | June 22 | | since September 2020. | | | |
| | | | 2022 | | | | | |
| | | | | | | | | |
| Benjamin Eirich | Assistant | | Indefinite; | | Assistant Vice President, U.S. | N/A | | None. |
| Year of Birth: 1981 | Secretary | | Since | | Bancorp Fund Services, LLC | | | |
| | | | September 5, | | a mutual fund service provider, | | | |
| | | | 2019 | | since June 2008. | | | |
| | | | | | | | | |
| ^ | The address for all directors and officers is 370 Church Street, Guilford, Connecticut 06437. |
| * | Each of the Company’s directors was elected by written consent of the sole shareholder of the Funds on September 7, 2007. |
| † | John D. Gillespie is an interested director of the Fund because he is also the managing member of the Investment Manager. |
(This Page Intentionally Left Blank.)
DIRECTORS
John D. Gillespie
Harvey D. Hirsch
Joseph Klein III
Roy L. Nersesian
John T. Rossello, Jr.
INVESTMENT ADVISER
Prospector Partners Asset Management, LLC
370 Church Street
Guilford, CT 06437
DISTRIBUTOR
Quasar Distributors, LLC
111 East Kilbourn Avenue, Suite 2200
Milwaukee, WI 53202
CUSTODIAN
U.S. Bank, N.A.
1555 North River Center Drive
Milwaukee, WI 53212
ADMINISTRATOR AND TRANSFER AGENT
U.S. Bancorp Fund Services, LLC
Third Floor
615 East Michigan Street
Milwaukee, WI 53202
INDEPENDENT REGISTERED PUBLIC ACCOUNTING FIRM
Ernst & Young LLP
700 Nicollet Mall, Suite 500
Minneapolis, MN 55402
LEGAL COUNSEL
Seward & Kissel LLP
One Battery Plaza
New York, NY 10004
This report must be accompanied or preceded by a prospectus.
The Funds’ Statement of Additional Information contains additional information about the
Funds’ directors and is available without charge upon request by calling 1-877-734-7862.
| (b) | Not applicable for this Registrant |
Item 2. Code of Ethics.
The registrant has adopted a code of ethics that applies to the registrant’s principal executive officer and principal financial officer. The registrant has not made any substantive amendments to its code of ethics during the period covered by this report.
The registrant has not granted any waivers from any provisions of the code of ethics during the period covered by this report.
A copy of the registrant’s code of ethics that applies to the registrant’s principal executive officer and principal financial officer is filed herewith.
Item 3. Audit Committee Financial Expert.
The registrant’s board of directors has determined that there is at least one audit committee financial expert serving on its audit committee. John Rossello, Jr. is the “audit committee financial expert” and is considered to be “independent” as each term is defined in Item 3 of Form N‑CSR.
Item 4. Principal Accountant Fees and Services.
The registrant has engaged its principal accountant to perform audit services, audit-related services, tax services and other services during the past two fiscal periods. “Audit services” refer to performing an audit of the registrant's annual financial statements or services that are normally provided by the accountant in connection with statutory and regulatory filings or engagements for the past fiscal year. “Audit-related services” refer to the assurance and related services by the principal accountant that are reasonably related to the performance of the audit. “Tax services” refer to professional services rendered by the principal accountant for tax compliance, tax advice, and tax planning, including reviewing the Fund’s tax returns and distribution calculations. The following table details the aggregate fees billed or expected to be billed for each of the last two fiscal periods for audit fees, audit-related fees, tax fees and other fees by the principal accountant.
| | FYE 12/31/2023 | FYE 12/31/2022 |
(a) Audit Fees | $90,000 | $85,000 |
(b) Audit-Related Fees | $0 | $0 |
(c) Tax Fees | $13,870 | $13,100 |
(d) All Other Fees | $0 | $0 |
(e)(1) The audit committee has adopted pre-approval policies and procedures that require the audit committee to pre‑approve all audit and non‑audit services that exceed $10,000 for the registrant. All of the principal accountant’s hours spent on auditing the registrant’s financial statements were attributed to work performed by full‑time permanent employees of the principal accountant.
(e)(2) The percentage of fees billed by Ernst & Young applicable to non-audit services pursuant to waiver of pre-approval requirement was as follows:
| | FYE 12/31/2023 | FYE 12/31/2022 |
Audit-Related Fees | 0% | 0% |
Tax Fees | 0% | 0% |
All Other Fees | 0% | 0% |
(f) All of the principal accountant’s hours spent on auditing the registrant’s financial statements were attributed to work performed by full‑time permanent employees of the principal accountant.
(g) The following table indicates the non-audit fees, other than the tax services as noted above, billed or expected to be billed by the registrant’s accountant for services to the registrant and to the registrant’s investment adviser (and any other controlling entity, etc.—not sub-adviser) for the last two years.
(h) The audit committee of the board of trustees/directors has considered whether the provision of non-audit services that were rendered to the registrant's investment adviser is compatible with maintaining the principal accountant's independence and has concluded that the provision of such non-audit services by the accountant has not compromised the accountant’s independence.
Non-Audit Related Fees | FYE 12/31/2023 | FYE 12/31/2022 |
Registrant | $13,870 | $13,100 |
Registrant’s Investment Adviser | $0 | $0 |
(j) Not applicable.
Item 5. Audit Committee of Listed Registrants.
Not applicable to open-end investment companies.
Item 6. Schedule of Investments.
(a) Schedule of Investments is included as part of the report to shareholders filed under Item 1 of this Form.
(b) Not applicable.
Item 7. Disclosure of Proxy Voting Policies and Procedures for Closed-End Management Investment Companies.
Not applicable to open-end investment companies.
Item 8. Portfolio Managers of Closed-End Management Investment Companies.
Not applicable to open-end investment companies.
Item 9. Purchases of Equity Securities by Closed‑End Management Investment Company and Affiliated Purchases.
Not applicable to open-end investment companies.
Item 10. Submission of Matters to a Vote of Security Holders.
Not Applicable.
Item 11. Controls and Procedures.
| (a) | The Registrant’s President and Treasurer have reviewed the Registrant's disclosure controls and procedures (as defined in Rule 30a-3(c) under the Investment Company Act of 1940 (the “Act”)) as of a date within 90 days of the filing of this report, as required by Rule 30a-3(b) under the Act and Rules 13a-15(b) or 15d‑15(b) under the Securities Exchange Act of 1934. Based on their review, such officers have concluded that the disclosure controls and procedures are effective in ensuring that information required to be disclosed in this report is appropriately recorded, processed, summarized and reported and made known to them by others within the Registrant and by the Registrant’s service provider. |
| (b) | There were no significant changes in the Registrant's internal control over financial reporting (as defined in Rule 30a-3(d) under the Act) that occurred during the period covered by this report that has materially affected, or is reasonably likely to materially affect, the Registrant's internal control over financial reporting. |
Item 12. Disclosure of Securities Lending Activities for Closed-End Management Investment Companies
Not applicable to open-end investment companies.
Item 13. Exhibits.
(3) Any written solicitation to purchase securities under Rule 23c‑1 under the Act sent or given during the period covered by the report by or on behalf of the registrant to 10 or more persons. Not applicable to open-end investment companies.
(4) Change in the registrant’s independent public accountant. There was no change in the registrant’s independent public accountant for the period covered by this report.
SIGNATURES
Pursuant to the requirements of the Securities Exchange Act of 1934 and the Investment Company Act of 1940, the registrant has duly caused this report to be signed on its behalf by the undersigned, thereunto duly authorized.
(Registrant) Prospector Funds, Inc.
By (Signature and Title)* /s/John D. Gillespie
John D. Gillespie, President
Date March 4, 2024
Pursuant to the requirements of the Securities Exchange Act of 1934 and the Investment Company Act of 1940, this report has been signed below by the following persons on behalf of the registrant and in the capacities and on the dates indicated.
By (Signature and Title)* /s/John D. Gillespie
John D. Gillespie, President
Date March 4, 2024
By (Signature and Title)* /s/Peter N. Perugini, Jr.
Peter N. Perugini, Jr., Treasurer
Date March 4, 2024
* Print the name and title of each signing officer under his or her signature.