Prospector Capital Appreciation Fund
Prospector Opportunity Fund
Annual Report
| www.prospectorfunds.com | December 31, 2022 |
PROSPECTOR FUNDS, INC.
January 19, 2023
Dear Shareholders of the Prospector Capital Appreciation Fund and Prospector Opportunity Fund,
“This time is different.” As 2022 began, that sentiment seemed pervasive. With the S&P 500 trading close to all-time highs, continuing to be led by mega-cap technology and growth stocks, despite rising interest rates and worrisome inflation readings, the time-tested rule that ultimately, the stock market is a discounting mechanism, was seemingly being ignored. However, as the year progressed and inflation continued to surge, reaching a 40-year+ high of 9.0% in June, this time proved, unequivocally, not to be different. The Federal Reserve, in an effort to tamp down consumer prices, aggressively raised rates – ultimately by fully 425 basis points on the year. As interest rates continued to rise, the market rotated from “voting machine” to “weighing machine” (to once again use a favorite Benjamin Graham metaphor) as expected future cash flows were discounted at much higher interest rates and the present value of formerly nosebleed valuations were adjusted much lower. Against this backdrop, value stocks trounced growth (the S&P 500 Value Index’s decline of 7% bested its growth counterpart by nearly 23%), and many of the leaders over the past decade were hit hardest. For example, the so-called “FAANG” stocks saw an average decline of over 46% for the year, with Apple, the best performer among the group, declining over 26%. Indeed, there was seemingly no place to hide in 2022 as both stocks and bonds fell by more than 10% for the first time on record according to Ned Davis Research.
As 2023 begins, the market remains on edge. An unprecedented pandemic brought with it unprecedented economic and social impacts. An abrupt, global shutdown in 2020 led to drastic reductions in economic activity, followed by an equally abrupt reopening, supply and labor shortages with corresponding inflationary effects – the results of which we are still feeling today. Central banks globally have been tightening policy as a result, and recession fears abound. According to a recent Morgan Stanley report, “of the 38 central banks around with world, 32 (or 84%) have hiked their main policy rate over the last six months.” Domestically, as we indicated in our last quarterly writing, we continue to fear the impacts of a potentially too-hawkish Fed. Although the CPI has declined month over month since the peak in June, it remains stubbornly high (over 6% at the last reading) and the employment market remains very tight. Meanwhile, the rapid rise in interest rates has caused the housing market to come to a virtual halt, as the 30-year mortgage rate, which ended 2021 at 3.31%, reached a high of 7.16% in October 2022 and remains well north of 6%. Other signs of cooling include the ISM Manufacturing Index1, which recently registered a 48.4 (a level indicative of a contracting economy) and the ISM Services PMI2 Index for December also indicated contraction after 30 months straight of growth. Despite this, the Federal Reserve has indicated an unwillingness to cease tightening until inflation is closer to their 2% target, and are willing to slow the economy considerably to do so.
_________________
| 1 | The ISM Manufacturing Index is a monthly gauge of U.S. economic activity based on a survey of purchasing managers at more than 300 manufacturing firms. |
| 2 | The ISM Services PMI index is a monthly gauge of U.S. economic activity based on a survey of purchasing managers at non-manufacturing industries. The non-manufacturing PMI captures business conditions in the services sectors, such as new orders, production, employment, prices and inventories to determine whether the industry contracted or expanded during the period. |
PROSPECTOR FUNDS, INC.
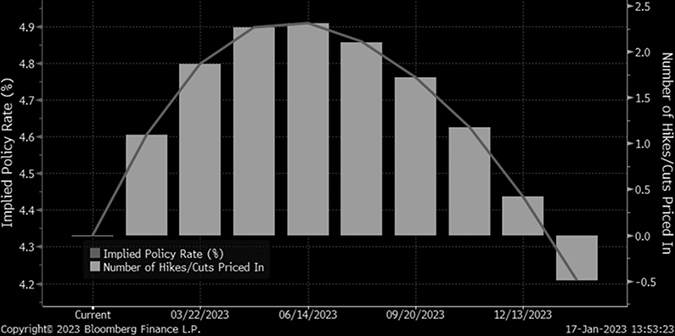
Moreover, the Fed’s “dot plot” (the central bank’s own projection of where they estimate the Fed funds rate will be in the future) indicates a plan to hold rates flat in 2023 once the terminal rate of tightening is reached – a plan which implicitly assumes a relatively strong economy. However, market expectations are not as sanguine and predict an economy not able to withstand short-term interest rates at such a restrictive level. As can be seen in the table below, market expectations are for the Fed to cut rates several times in the back half of 2023.
Thus, it seems the market shares our concerns of a Fed-induced recession. If the central bank does pivot in the coming months, it would not be surprising to see a knee-jerk rotation back into growth stocks and the tech leaders of the past decade. However, we are dubious this would be sustained, given there are many arguments to be made that we are in a “higher for longer” period when it comes to inflation and interest rates. Some of the major factors which impact our reasoning include:
| | – | The Fed has only just begun their process of Quantitative Tightening. It is unknown what the impact of attempting to reduce their $9 trillion balance sheet will be. If they become more aggressive selling Treasuries, it could cause rates to rise above where they would otherwise be – just as rates were potentially artificially low during much of Quantitative Easing. |
| | | |
| | – | China’s recent decision to abandon their “zero-COVID” policy and reopen the economy will likely fuel demand for autos, and other durable goods, real estate, etc. over the coming years. Given the size of China’s economy, potential for demand shocks exist, which could once again bring about inflationary supply / demand imbalances. |
| | | |
| | – | Also related to China, a further chilling of our relationship with the country, especially when it comes to their intentions with Taiwan, could further the trend of domestic “onshoring” we have seen following COVID-induced supply chain disruptions, as more companies move manufacturing hubs and reliance on supplies away from China. This could serve to reverse decades of deflationary productivity gains. |
| | | |
| | – | The Russia / Ukraine war remains an unknown, and an escalation by Putin could lead to further disruptions in the supply of energy, wheat, and other commodities, which would be additive to inflation. |
PROSPECTOR FUNDS, INC.
In addition to these above factors, historically, as can be seen in the chart below, once growth/value rotations happen, they typically last for years.
Source: FactSet Research Systems
Portfolio Positioning
Despite all the unknowns, and persistent volatility, we are encouraged by the fact that once again fundamentals and valuations seem to matter. We are in a proverbial “stock-pickers’ market,” and the backdrop of volatility has allowed us to find misvalued opportunities. The environment has allowed us to add cyclically exposed, quality companies at what we feel are discount prices. This includes companies exposed to the auto, housing, and technology industries. Many names in these groups are down 30-50% from their highs and we think as the Fed pauses, investors will seek out these beaten-up industries. Unsurprisingly, we have done this in our typical gradual fashion.
A key overweight in both Funds is the property-casualty insurance sector. The Funds own underwriters and insurance brokers which are exposed to rising prices for insurance risk and whose investment income should also benefit from higher interest rates. We believe renewals at 4/1, and mid-year will show continued strength, which will benefit your holdings.
We have decreased exposure to banks in recent months in both the Opportunity Fund and Capital Appreciation Fund. We are concerned about rising credit and deposit costs along with marks on banks’ fixed income portfolios. However, the group is inexpensive on earnings and disliked by investors. This is in addition to the fact that capital levels remain healthy and bank underwriting has been conservative versus prior cycles. It is possible we will increase exposure to this beaten up group as 2023 progresses.
Importantly, while we highlight sector-level movements, bottom-up analysis is essential, and we follow and find opportunities anywhere we see attractively priced businesses with conservatively-stated balance sheets and reliable cash flows. Needless to say, the current environment is keeping us very busy.
PROSPECTOR FUNDS, INC.
Prospector Opportunity Fund Highlights
The Prospector Opportunity Fund declined 6.20% for the year 2022. This compared to a 17.32% decrease for the Russell Midcap and a 20.44% decline for the Russell 2000. The primary source of the Fund’s relative outperformance for the year was derived from superior stock selection within Financials, driven by our investments in property-casualty and life insurance. Within property-casualty, an increasingly positive pricing environment led to gains for most portfolio holdings during the year, while in life insurance, your portfolio’s positioning in less-levered, more defensive names helped results. Healthcare and industrials also contributed significantly to relative outperformance, with healthcare aided by investments in pharmaceutical companies Merck and Pfizer, as well as managed care organization, Cigna. Curtis-Wright (CW) was the Fund’s top contributor within industrials given a solid demand backdrop for its defense & aerospace businesses. There is also growing investor interest in CW’s nuclear energy business, as this alternative energy source has gained renewed focus with the war in Ukraine.
The Opportunity Fund’s most significant underperformance versus the benchmarks was within information technology and materials. FARO Technologies and Littelfuse were the biggest detractors from performance within tech given a weak sales environment, which we view as temporary. In materials, our investments in gold miners underperformed given a combination of cost inflation, mine-specific downtimes, and the impact of foreign exchange headwinds.
Prospector Capital Appreciation Fund Highlights
For the full year 2022, the Prospector Capital Appreciation Fund declined 4.07% as compared to the S&P 500’s loss of 18.11% and a 7.98% decline for the Russell 3000 Value. Your portfolio’s high-quality and value bias helped stem losses amidst the market’s downturn. As was the case with the benchmarks, energy was your portfolio’s top contributor to performance. The Fund also saw a positive contribution from financials and healthcare, where stock and sub-industry selection helped results. Within financials, the biggest area of outperformance included property-casualty related names, which saw significant gains during the year as the outlook for insurance rates continued to improve. Healthcare benefited our exposure to large pharmaceutical names, including Merck and Astrazeneca.
While the Fund was underweight technology versus the S&P 500, aiding relative results, positions within the sector were collectively the Fund’s largest negative contribution for the year. The Capital Appreciation Fund had an overweight technology weighting when compared to the Russell 3000 Value, due to the Fund’s convert allocation to the sector, but better performance within the sector aided relative results versus the Value index.
Outlook
Equity and bond market declines have been pronounced. The Federal Reserve has aggressively raised interest rates in an effort to lower inflation, and equity and bond markets are likely to remain volatile until investors sense the Fed is about to pivot to a less restrictive stance. The U.S. and rest of the world continue to manage the impacts of high inflation, Russia’s invasion of Ukraine, and China’s rotation from a “zero-COVID” policy. In our assessment, markets reflect a reasonably high probability of recession.
Employment remains strong. Supply / demand imbalances in the labor market bode well for the health of the consumer given full employment and the prospect for further wage gains, which partially mitigates the impact of inflation on the consumer. We expect continued pressure on housing prices as a result of higher interest rates and affordability concerns. However, the shortage of housing after over a decade of underinvestment following the Great Financial Crisis should prevent a disastrous decline in home prices. Lower-income consumers have been most
impacted by the current inflationary environment, but consumer balance sheets remain generally healthy for the majority of Americans, and consumer credit quality remains strong at the moment. COVID mortality has improved and related pent-up demand is impacting many areas of the economy. These are reasons to believe a recession could be less significant than the previous two recessionary periods.
Following years of lower interest rates helping to drive ever-higher growth-stock valuations, we feel value investing is ripe for a period of outperformance. Further, given the recent market correction, we are finding opportunities to invest in quality businesses with solid balance sheets and cash flows, whose share prices have detached from our assessment of the fundamentals. The bargains inherent in your portfolio should attract acquirers and other investors over time.
Thank you for entrusting us with your money.
Respectfully submitted,
| John D. Gillespie | Kevin R. O’Brien | Jason A. Kish | Steven R. Labbe |
Performance data quoted represents past performance; past performance does not guarantee future results.
This report must be preceded or accompanied by a prospectus.
Opinions expressed are those of the Funds and are subject to change, are not guaranteed, and should not be considered a recommendation to buy or sell any security.
Mutual fund investing involves risk. Principal loss is possible. Investments in debt securities typically decrease in value when interest rates rise. This risk is usually greater for longer-term debt securities. The Funds invest in foreign securities which involve greater volatility and political, economic and currency risks and differences in accounting methods. The Funds invest in smaller and mid-cap companies, which involve additional risks such as limited liquidity and greater volatility. The Funds may hold restricted securities purchased through private placements. Such securities can be difficult to sell without experiencing delays or additional costs. Derivatives involve risks different from, and in certain cases, greater than the risks presented by more traditional investments. These risks are fully disclosed in the prospectus.
Growth and value investing each have unique risks and potential for rewards. Growth stocks typically are more volatile than value stocks; however, value stocks have a lower expected growth rate in earnings and sales.
Free Cash Flow (FCF) is revenue less operating expenses including interest expenses and maintenance capital spending. It is the discretionary cash that a company has after all expenses and is available for purposes such as dividend payments, investing back into the business or share repurchases. Free Cash Flow Yield is an overall return evaluation ratio on a stock that standardizes the free cash flow per share that a company expects to earn against its market price per
The S&P 500 Index is a broad based unmanaged index of 500 stocks, which is widely recognized as representative of the equity market in general. The Russell 2000 Index is an unmanaged small-cap index that measures the performance of the 2,000 smallest companies in the Russell 3000 Index. The Russell MidCap Index is an unmanaged mid-cap index that measures the performance of the 800 smallest companies in the Russell 1000 Index. You cannot invest directly in an index.
Fund holdings and/or security allocations are subject to change at any time and are not recommendations to buy or sell any security. Please see the Schedule of Investments section in this report for a full listing of the Fund’s holdings. Prospector Funds, Inc. are distributed by Quasar Distributors, LLC.
PROSPECTOR FUNDS, INC.
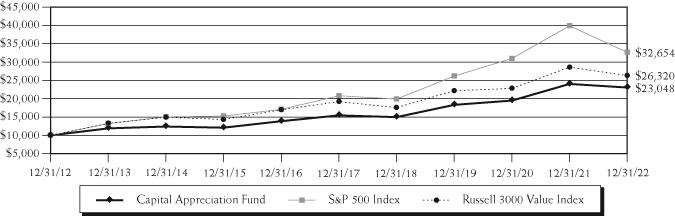
Capital Appreciation Fund
The chart assumes an initial investment of $10,000. Performance reflects waivers of fee and operating expenses in effect. In the absence of such waivers, total return would be reduced. Past performance is not predictive of future performance. Investment return and principal value will fluctuate, so that your shares, when redeemed, may be worth more or less than their original cost. The Fund imposes a 2.00% redemption fee on redemption of shares held 60 days or less. Performance data does not reflect the redemption fee. If reflected, total return would be reduced. Performance current to the most recent month-end may be lower or higher than the performance quoted and can be obtained by calling 877-734-7862. Performance assumes the reinvestment of capital gains and income distributions. The performance does not reflect the deduction of taxes that a shareholder would pay on Fund distributions or the redemption of Fund shares.
Average Annual Rates of Return (%) – As of December 31, 2022
| | One Year | Three Year | Five Year | Ten Year | Since Inception(1) |
| Capital Appreciation Fund | -4.07% | 7.95% | 8.33% | 8.71% | 6.54% |
S&P 500 Index(2) | -18.11% | 7.66% | 9.42% | 12.56% | 8.39% |
Russell 3000 Value Index(3) | -7.98% | 5.88% | 6.50% | 10.16% | 6.38% |
Gross expense ratio as of most recent prospectus: 1.79%
| (1) | September 28, 2007 |
| (2) | The Standard & Poor’s 500 Index (S&P 500) is an unmanaged, capitalization-weighted index generally representative of the U.S. market for large capitalization stocks. This Index cannot be invested in directly. |
| (3) | The Russell 3000 Value Index is a market-capitalization weighted index based on the Russell 3000 Index, which measures how U.S. stocks in the equity value segment perform by including only value stocks. This index cannot be invested in directly. |
PROSPECTOR FUNDS, INC.
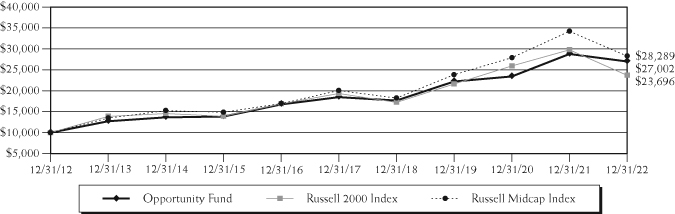
Opportunity Fund
The chart assumes an initial investment of $10,000. Performance reflects waivers of fee and operating expenses in effect. In the absence of such waivers, total return would be reduced. Past performance is not predictive of future performance. Investment return and principal value will fluctuate, so that your shares, when redeemed, may be worth more or less than their original cost. The Fund imposes a 2.00% redemption fee on redemption of shares held 60 days or less. Performance data does not reflect the redemption fee. If reflected, total return would be reduced. Performance current to the most recent month-end may be lower or higher than the performance quoted and can be obtained by calling 877-734-7862. Performance assumes the reinvestment of capital gains and income distributions. The performance does not reflect the deduction of taxes that a shareholder would pay on Fund distributions or the redemption of Fund shares.
Average Annual Rates of Return (%) – As of December 31, 2022
| | One Year | Three Year | Five Year | Ten Year | Since Inception(1) |
| Opportunity Fund | -6.20% | 6.71% | 7.88% | 10.44% | 8.93% |
Russell 2000 Index(2) | -20.44% | 3.10% | 4.13% | 9.01% | 6.63% |
Russell Midcap Index(3) | -17.32% | 5.88% | 7.10% | 10.96% | 8.01% |
Gross expense ratio as of most recent prospectus: 1.35%
| (1) | September 28, 2007 |
| (2) | The Russell 2000 Index is a market capitalization-weighted index that measures the performance of the 2,000 smallest companies in the Russell 3000 Index. This index cannot be invested in directly. |
| (3) | The Russell Midcap Index is a market capitalization-weighted index that measures the performance of the 800 smallest companies in the Russell 1000 Index. This index cannot be invested in directly. |
PROSPECTOR FUNDS, INC.
Expense Example (Unaudited)
December 31, 2022
As a shareholder of the Fund, you incur two types of costs: (1) transaction costs, which may include but are not limited to, redemption fees, wire transfer fees, maintenance fee (IRA accounts), and exchange fees; and (2) ongoing costs, including investment advisory fees; distribution and/or service fees; and other Fund expenses. This Example is intended to help you understand your ongoing costs (in dollars) of investing in the Fund and to compare these costs with the ongoing costs of investing in other mutual funds. The Example is based on an investment of $1,000 invested at the beginning of the period and held for the entire period (July 1, 2022 – December 31, 2022).
ACTUAL EXPENSES
The first line of the table below provides information about actual account values and actual expenses. Although the Fund charges no sales load or transaction fees, you will be assessed fees for outgoing wire transfers, returned checks and stop payment orders at prevailing rates charged by U.S. Bancorp Fund Services, LLC, the Fund’s transfer agent. The example below includes, but is not limited to, investment advisory fees, shareholder servicing fees and other Fund expenses. However, the example below does not include portfolio trading commissions and related expenses, interest expense and other extraordinary expenses as determined under generally accepted accounting principles. You may use the information in this line, together with the amount you invested, to estimate the expenses that you paid over the period. Simply divide your account value by $1,000 (for example, an $8,600 account value divided by $1,000 = 8.6), then multiply the result by the number in the first line under the heading entitled “Expenses Paid During Period” to estimate the expenses you paid on your account during this period.
HYPOTHETICAL EXAMPLE FOR COMPARISON PURPOSES
The second line of the table below provides information about hypothetical account values and hypothetical expenses based on the Fund’s actual expense ratio and an assumed rate of return of 5% per year before expenses, which is not the Fund’s actual return. The hypothetical account values and expenses may not be used to estimate the actual ending account balance or expenses you paid for the period. You may use this information to compare the ongoing costs of investing in the Fund and other funds. To do so, compare this 5% hypothetical example with the 5% hypothetical examples that appear in the shareholder reports of the other funds.
Please note that the expenses shown in the table are meant to highlight your ongoing costs only and do not reflect any transactional costs, such as redemption fees or exchange fees. Therefore, the second line of the table is useful in comparing ongoing costs only, and will not help you determine the relative total costs of owning different funds. In addition, if these transactional costs were included, your costs would have been higher.
| | | | Expenses Paid |
| | Beginning Account | Ending Account | During Period(1) |
| | Value (07/01/22) | Value (12/31/22) | (07/01/22 to 12/31/22) |
Capital Appreciation Actual(2) | $1,000.00 | $1,053.50 | $6.47 |
Capital Appreciation Hypothetical | | | |
(5% return before expenses) | 1,000.00 | 1,018.90 | 6.36 |
| | | | |
Opportunity Actual(2) | 1,000.00 | 1,063.70 | 6.50 |
Opportunity Hypothetical | | | |
(5% return before expenses) | 1,000.00 | 1,018.90 | 6.36 |
| (1) | Expenses are equal to the Fund’s annualized expense ratio for the most recent six-month period of 1.25% and 1.25% for Capital Appreciation Fund and Opportunity Fund, respectively, multiplied by the average account value over the period, multiplied by 184/365 to reflect the one-half year period. |
| (2) | Based on the actual returns for the six-month period ended December 31, 2022 of 5.35% and 6.37% for Capital Appreciation Fund and Opportunity Fund, respectively. |
PROSPECTOR FUNDS, INC.
Sector Allocation (% of net assets) (Unaudited)
as of December 31, 2022(1)(2)
Capital Appreciation Fund
Top 10 Holdings (% of net assets) (Unaudited)
as of December 31, 2022(1)(3)
Capital Appreciation Fund
| | Eaton | | | 3.3 | % |
| | Merck & Co. | | | 3.3 | % |
| | Globe Life | | | 3.0 | % |
| | BioMarin Pharmaceutical, 0.599%, 08/01/2024 | | | 2.8 | % |
| | Brown & Brown | | | 2.7 | % |
| | Hess | | | 2.7 | % |
| | Arthur J. Gallagher & Co. | | | 2.6 | % |
| | Kaman, 3.250%, 05/01/2024 | | | 2.5 | % |
| | Verint Systems, 0.250%, 04/15/2026 | | | 2.3 | % |
| | Liberty Media, 2.125%, 03/31/2048 | | | 2.0 | % |
| | (1) | Fund holdings and sector allocations are subject to change at any time and are not recommendations to buy or sell any security. | |
| | (2) | Sector allocation includes all investment types. | |
| | (3) | First American Treasury Obligations Fund excluded from top 10 holdings. | |
PROSPECTOR FUNDS, INC.
Sector Allocation (% of net assets) (Unaudited)
as of December 31, 2022(1)(2)
Opportunity Fund
Top 10 Holdings (% of net assets) (Unaudited)
as of December 31, 2022(1)(3)
Opportunity Fund
| | Curtiss-Wright | | | 3.9 | % |
| | Globe Life | | | 3.4 | % |
| | Federated Hermes, Class B | | | 3.0 | % |
| | Brown & Brown | | | 2.8 | % |
| | Littelfuse | | | 2.7 | % |
| | Arthur J. Gallagher & Co. | | | 2.7 | % |
| | Darden Restaurants | | | 2.3 | % |
| | Medtronic | | | 2.2 | % |
| | Merck & Co. | | | 2.1 | % |
| | Pioneer Natural Resources | | | 2.1 | % |
| | (1) | Fund holdings and sector allocations are subject to change at any time and are not recommendations to buy or sell any security. | |
| | (2) | Sector allocation includes all investment types. | |
| | (3) | First American Treasury Obligations Fund excluded from top 10 holdings. | |
PROSPECTOR FUNDS, INC.
Schedule of Investments
December 31, 2022
Capital Appreciation Fund
Description | | Shares | | | Value | |
| | | | | | | |
| COMMON STOCKS – 74.6% | | | | | | |
| | | | | | | |
| Banks – 6.6% | | | | | | |
Comerica | | | 5,100 | | | $ | 340,935 | |
First Bancorp | | | 21,750 | | | | 276,660 | |
KeyCorp | | | 13,950 | | | | 243,009 | |
Pinnacle Financial Partners | | | 4,430 | | | | 325,162 | |
SouthState | | | 4,300 | | | | 328,348 | |
Synovus Financial | | | 8,200 | | | | 307,910 | |
| | | | | | | | 1,822,024 | |
| | | | | | | | | |
| Communication Services – 0.8% | | | | | | | | |
Alphabet, Inc. – Class A* | | | 2,575 | | | | 227,192 | |
| | | | | | | | | |
| Consumer Discretionary – 2.9% | | | | | | | | |
Darden Restaurants | | | 3,020 | | | | 417,757 | |
Expedia Group* | | | 1,898 | | | | 166,265 | |
Texas Roadhouse | | | 2,450 | | | | 222,827 | |
| | | | | | | | 806,849 | |
| | | | | | | | | |
| Consumer Staples – 6.2% | | | | | | | | |
Church & Dwight | | | 4,150 | | | | 334,531 | |
Colgate-Palmolive | | | 2,275 | | | | 179,247 | |
Hostess Brands* | | | 10,175 | | | | 228,327 | |
Mondelez International, Class A | | | 7,190 | | | | 479,214 | |
Nestle | | | 2,260 | | | | 261,868 | |
Walgreens Boots Alliance | | | 5,780 | | | | 215,941 | |
| | | | | | | | 1,699,128 | |
| | | | | | | | | |
| Diversified Financial Services – 3.7% | | | | | | | | |
Berkshire Hathaway, Class B* | | | 1,570 | | | | 484,973 | |
Federated Hermes, Class B | | | 14,300 | | | | 519,233 | |
| | | | | | | | 1,004,206 | |
| | | | | | | | | |
| Energy – 4.7% | | | | | | | | |
Hess | | | 5,270 | | | | 747,391 | |
Pioneer Natural Resources | | | 2,425 | | | | 553,846 | |
| | | | | | | | 1,301,237 | |
| | | | | | | | | |
| Healthcare – 7.4% | | | | | | | | |
Abbott Laboratories | | | 1,785 | | | | 195,975 | |
AstraZeneca – ADR | | | 4,410 | | | | 298,998 | |
Merck & Co. | | | 8,050 | | | | 893,148 | |
See Notes to the Financial Statements
PROSPECTOR FUNDS, INC.
Schedule of Investments – Continued
December 31, 2022
Capital Appreciation Fund
Description | | Shares | | | Value | |
| | | | | | | |
COMMON STOCKS – 74.6% (Continued) | | | | | | |
| | | | | | | |
| Healthcare – 7.4% (Continued) | | | | | | |
NuVasive* | | | 5,500 | | | $ | 226,820 | |
Pfizer | | | 8,000 | | | | 409,920 | |
| | | | | | | | 2,024,861 | |
| | | | | | | | | |
| Industrials – 10.3% | | | | | | | | |
Curtiss-Wright | | | 3,000 | | | | 500,970 | |
Eaton | | | 5,820 | | | | 913,449 | |
Fortune Brands Innovations | | | 1,000 | | | | 57,110 | |
Leidos Holdings | | | 3,500 | | | | 368,165 | |
Pentair | | | 6,750 | | | | 303,615 | |
Raytheon Technologies | | | 4,150 | | | | 418,818 | |
Sensata Technologies Holding | | | 6,450 | | | | 260,451 | |
| | | | | | | | 2,822,578 | |
| | | | | | | | | |
| Information Technology – 5.2% | | | | | | | | |
FARO Technologies* | | | 3,500 | | | | 102,935 | |
Fidelity National Information Services | | | 4,000 | | | | 271,400 | |
Microsoft | | | 1,100 | | | | 263,802 | |
Oracle | | | 5,481 | | | | 448,017 | |
Paychex | | | 2,150 | | | | 248,454 | |
Zebra Technologies – Class A* | | | 400 | | | | 102,564 | |
| | | | | | | | 1,437,172 | |
| | | | | | | | | |
| Insurance Brokers – 6.2% | | | | | | | | |
Arthur J. Gallagher & Co. | | | 3,807 | | | | 717,772 | |
Brown & Brown | | | 13,230 | | | | 753,713 | |
Marsh & McLennan | | | 1,400 | | | | 231,672 | |
| | | | | | | | 1,703,157 | |
| | | | | | | | | |
| Life & Health Insurance – 5.0% | | | | | | | | |
Globe Life | | | 6,840 | | | | 824,562 | |
Voya Financial | | | 8,750 | | | | 538,038 | |
| | | | | | | | 1,362,600 | |
| | | | | | | | | |
| Materials – 4.1% | | | | | | | | |
Agnico Eagle Mines | | | 5,450 | | | | 283,345 | |
Axalta Coating Systems* | | | 14,200 | | | | 361,674 | |
Louisiana-Pacific | | | 3,320 | | | | 196,544 | |
PPG Industries | | | 2,163 | | | | 271,976 | |
| | | | | | | | 1,113,539 | |
See Notes to the Financial Statements
PROSPECTOR FUNDS, INC.
Schedule of Investments – Continued
December 31, 2022
Capital Appreciation Fund
Description | | Shares | | | Value | |
| | | | | | | |
COMMON STOCKS – 74.6% (Continued) | | | | | | |
| | | | | | | |
| Property & Casualty Insurance – 6.2% | | | | | | |
Fairfax Financial Holdings | | | 770 | | | $ | 457,472 | |
First American Financial | | | 4,475 | | | | 234,222 | |
Markel* | | | 257 | | | | 338,595 | |
W.R. Berkley | | | 4,000 | | | | 290,280 | |
White Mountains Insurance Group | | | 273 | | | | 386,112 | |
| | | | | | | | 1,706,681 | |
| | | | | | | | | |
| Real Estate – 2.3% | | | | | | | | |
Four Corners Property Trust | | | 12,370 | | | | 320,754 | |
Howard Hughes* | | | 4,036 | | | | 308,431 | |
| | | | | | | | 629,185 | |
| | | | | | | | | |
| Reinsurance – 3.0% | | | | | | | | |
Everest Re Group | | | 1,550 | | | | 513,468 | |
RenaissanceRe Holdings | | | 1,659 | | | | 305,638 | |
| | | | | | | | 819,106 | |
| | | | | | | | | |
| Total Common Stocks | | | | | | | | |
| (Cost $14,356,192) | | | | | | | 20,479,515 | |
| | | | | | | | | |
| | | Par | | | | | |
| | | | | | | | | |
| CONVERTIBLE BONDS – 18.6% | | | | | | | | |
| | | | | | | | | |
| Communication Services – 2.0% | | | | | | | | |
Liberty Media | | | | | | | | |
2.125%, 03/31/2048 (a) | |
| 594,300 | | | | 557,453 | |
| | | | | | | | | |
| Healthcare – 5.3% | | | | | | | | |
BioMarin Pharmaceutical | | | | | | | | |
0.599%, 08/01/2024 | | | 723,000 | | | | 767,320 | |
Ligand Pharmaceuticals | | | | | | | | |
0.750%, 05/15/2023 | | | 297,000 | | | | 289,018 | |
NuVasive | | | | | | | | |
0.375%, 03/15/2025 | | | 445,000 | | | | 389,820 | |
| | | | | | | | 1,446,158 | |
| | | | | | | | | |
| Industrials – 3.0% | | | | | | | | |
Chart Industries | | | | | | | | |
1.000%, 11/15/2024 (a) | | | 72,000 | | | | 142,992 | |
Kaman | | | | | | | | |
3.250%, 05/01/2024 | | | 724,000 | | | | 672,958 | |
| | | | | | | | 815,950 | |
See Notes to the Financial Statements
PROSPECTOR FUNDS, INC.
Schedule of Investments – Continued
December 31, 2022
Capital Appreciation Fund
Description | | Par | | | Value | |
| | | | | | | |
CONVERTIBLE BONDS – 18.6% (Continued) | | | | | | |
| | | | | | | |
| Information Technology – 6.5% | | | | | | |
Akamai Technologies | | | | | | |
0.125%, 05/01/2025 | | $ | 435,000 | | | $ | 456,750 | |
0.375%, 09/01/2027 | | | 218,000 | | | | 209,934 | |
Palo Alto Networks | | | | | | | | |
0.750%, 07/01/2023 | | | 297,000 | | | | 469,260 | |
Verint Systems | | | | | | | | |
0.250%, 04/15/2026 | | | 740,000 | | | | 643,800 | |
| | | | | | | | 1,779,744 | |
| | | | | | | | | |
| Real Estate – 1.8% | | | | | | | | |
Zillow Group | | | | | | | | |
2.750%, 05/15/2025 | | | 521,000 | | | | 495,471 | |
| Total Convertible Bonds | | | | | | | | |
| (Cost $5,048,867) | | | | | | | 5,094,776 | |
| | | | | | | | | |
| | | Shares | | | |
| |
| EXCHANGE TRADED FUND – 1.0% | | | | | | | | |
Aberdeen Standard Physical Platinum Shares Fund* | | | | | | | | |
| (Cost $243,096) | | | 2,750 | | | | 273,021 | |
| SHORT-TERM INVESTMENT – 5.6% | | | | | | | | |
First American Treasury Obligations Fund, Class X, 4.197%^ | | | | | | | | |
| (Cost $1,530,320) | | | 1,530,320 | | | | 1,530,320 | |
| Total Investments – 99.8% | | | | | | | | |
| (Cost $21,178,475) | | | | | | | 27,377,632 | |
| Other Assets and Liabilities, Net – 0.2% | | | | | | | 67,104 | |
| Total Net Assets – 100.0% | | | | | | $ | 27,444,736 | |
| * | Non-income producing security |
| (a) | Security purchased within the terms of a private placement memorandum, exempt from registration under Rule 144A of the Securities Act of 1933, as amended, and may be sold only to dealers in that program or other “qualified institutional buyers.” As of December 31, 2022, the value of these investments was $700,445 or 2.6% of total net assets. |
| ^ | The rate shown is the seven-day yield effective December 31, 2022. |
ADR – American Depositary Receipt
The industry classifications included in the Schedule of Investments are in accordance with the Global Industry Classification Standard (GICS®) and were developed by and/or are the exclusive property of MSCI, Inc. (MSCI) and Standard & Poor Financial Services LLC (S&P). GICS is a service mark of MSCI and S&P and has been licensed for use by U.S. Bank Global Fund Services.
See Notes to the Financial Statements
PROSPECTOR FUNDS, INC.
Schedule of Investments
December 31, 2022
Opportunity Fund
Description | | Shares | | | Value | |
| | | | | | | |
| COMMON STOCKS – 94.8% | | | | | | |
| | | | | | | |
| Banks – 12.0% | | | | | | |
Bank of N.T. Butterfield & Son | | | 91,500 | | | $ | 2,727,615 | |
Citigroup | | | 24,020 | | | | 1,086,424 | |
Comerica | | | 34,100 | | | | 2,279,585 | |
First Bancorp | | | 173,900 | | | | 2,212,008 | |
HarborOne Bancorp | | | 120,794 | | | | 1,679,037 | |
KeyCorp | | | 189,950 | | | | 3,308,929 | |
Origin Bancorp | | | 63,750 | | | | 2,339,625 | |
Pinnacle Financial Partners | | | 35,470 | | | | 2,603,498 | |
QCR Holdings | | | 51,550 | | | | 2,558,942 | |
SouthState | | | 21,450 | | | | 1,637,922 | |
Stellar Bancorp | | | 95,659 | | | | 2,818,114 | |
| | | | | | | | 25,251,699 | |
| | | | | | | | | |
| Communication Services – 0.8% | | | | | | | | |
Alphabet, Inc. – Class A* | | | 4,600 | | | | 405,858 | |
Alphabet, Inc. – Class C* | | | 13,700 | | | | 1,215,601 | |
| | | | | | | | 1,621,459 | |
| | | | | | | | | |
| Consumer Discretionary – 6.9% | | | | | | | | |
Darden Restaurants | | | 35,100 | | | | 4,855,383 | |
eBay | | | 56,100 | | | | 2,326,467 | |
Expedia Group* | | | 14,800 | | | | 1,296,480 | |
Home Depot | | | 6,050 | | | | 1,910,953 | |
Noodles & Company* | | | 456,062 | | | | 2,503,780 | |
Texas Roadhouse | | | 17,600 | | | | 1,600,720 | |
| | | | | | | | 14,493,783 | |
| | | | | | | | | |
| Consumer Staples – 5.0% | | | | | | | | |
Church & Dwight | | | 49,400 | | | | 3,982,134 | |
Colgate-Palmolive | | | 14,650 | | | | 1,154,273 | |
Hostess Brands* | | | 80,525 | | | | 1,806,981 | |
Mondelez International, Class A | | | 53,450 | | | | 3,562,443 | |
| | | | | | | | 10,505,831 | |
| | | | | | | | | |
| Diversified Financial Services – 6.9% | | | | | | | | |
A-Mark Precious Metals | | | 31,458 | | | | 1,092,536 | |
CBOE Global Markets | | | 21,800 | | | | 2,735,246 | |
Diamond Hill Investment Group | | | 8,500 | | | | 1,572,670 | |
Federated Hermes, Class B | | | 175,950 | | | | 6,388,745 | |
State Street | | | 36,230 | | | | 2,810,361 | |
| | | | | | | | 14,599,558 | |
See Notes to the Financial Statements
PROSPECTOR FUNDS, INC.
Schedule of Investments – Continued
December 31, 2022
Opportunity Fund
Description | | Shares | | | Value | |
| | | | | | | |
COMMON STOCKS – 94.8% (Continued) | | | | | | |
| | | | | | | |
| Energy – 6.1% | | | | | | |
Devon Energy | | | 40,150 | | | $ | 2,469,626 | |
Hess | | | 13,700 | | | | 1,942,934 | |
Pioneer Natural Resources | | | 18,927 | | | | 4,322,738 | |
Schlumberger | | | 34,300 | | | | 1,833,678 | |
Suncor Energy | | | 73,100 | | | | 2,319,463 | |
| | | | | | | | 12,888,439 | |
| | | | | | | | | |
| Healthcare – 9.0% | | | | | | | | |
Cigna | | | 7,600 | | | | 2,518,184 | |
Henry Schein* | | | 31,750 | | | | 2,535,872 | |
Medtronic | | | 59,750 | | | | 4,643,770 | |
Merck & Co. | | | 39,548 | | | | 4,387,851 | |
NuVasive* | | | 55,900 | | | | 2,305,316 | |
Pfizer | | | 51,550 | | | | 2,641,422 | |
| | | | | | | | 19,032,415 | |
| | | | | | | | | |
| Industrials – 14.9% | | | | | | | | |
Carrier Global Corp. | | | 83,100 | | | | 3,427,875 | |
Curtiss-Wright | | | 49,500 | | | | 8,266,005 | |
Fortune Brands Innovations | | | 7,450 | | | | 425,469 | |
Leidos Holdings | | | 35,700 | | | | 3,755,283 | |
Moog | | | 36,550 | | | | 3,207,628 | |
Otis Worldwide | | | 41,350 | | | | 3,238,119 | |
Pentair | | | 56,200 | | | | 2,527,876 | |
Sensata Technologies Holding | | | 75,000 | | | | 3,028,500 | |
Vectrus* | | | 84,600 | | | | 3,493,134 | |
| | | | | | | | 31,369,889 | |
| | | | | | | | | |
| Information Technology – 5.5% | | | | | | | | |
FARO Technologies* | | | 53,950 | | | | 1,586,669 | |
Fidelity National Information Services | | | 30,775 | | | | 2,088,084 | |
Littelfuse | | | 26,130 | | | | 5,753,826 | |
PayPal Holdings* | | | 13,450 | | | | 957,909 | |
Zebra Technologies – Class A* | | | 4,650 | | | | 1,192,307 | |
| | | | | | | | 11,578,795 | |
| | | | | | | | | |
| Insurance Brokers – 6.3% | | | | | | | | |
Arthur J. Gallagher & Co. | | | 30,100 | | | | 5,675,054 | |
Brown & Brown | | | 101,900 | | | | 5,805,243 | |
Marsh & McLennan | | | 11,250 | | | | 1,861,650 | |
| | | | | | | | 13,341,947 | |
See Notes to the Financial Statements
PROSPECTOR FUNDS, INC.
Schedule of Investments – Continued
December 31, 2022
Opportunity Fund
Description | | Shares | | | Value | |
| | | | | | | |
COMMON STOCKS – 94.8% (Continued) | | | | | | |
| | | | | | | |
| Life & Health Insurance – 7.4% | | | | | | |
Globe Life | | | 59,250 | | | $ | 7,142,587 | |
Primerica | | | 30,050 | | | | 4,261,691 | |
Voya Financial | | | 67,550 | | | | 4,153,650 | |
| | | | | | | | 15,557,928 | |
| | | | | | | | | |
| Materials – 3.8% | | | | | | | | |
Axalta Coating Systems* | | | 99,700 | | | | 2,539,359 | |
Newmont Goldcorp | | | 40,750 | | | | 1,923,400 | |
PPG Industries | | | 20,750 | | | | 2,609,105 | |
Victoria Gold* | | | 192,036 | | | | 1,015,871 | |
| | | | | | | | 8,087,735 | |
| | | | | | | | | |
| Property & Casualty Insurance – 5.4% | | | | | | | | |
Fairfax Financial Holdings | | | 6,140 | | | | 3,647,897 | |
Markel* | | | 2,050 | | | | 2,700,855 | |
W.R. Berkley | | | 30,625 | | | | 2,222,456 | |
White Mountains Insurance Group | | | 1,895 | | | | 2,680,155 | |
| | | | | | | | 11,251,363 | |
| | | | | | | | | |
| Real Estate – 1.7% | | | | | | | | |
Howard Hughes* | | | 45,950 | | | | 3,511,499 | |
| | | | | | | | | |
| Reinsurance – 3.1% | | | | | | | | |
Everest Re Group | | | 12,550 | | | | 4,157,439 | |
RenaissanceRe Holdings | | | 13,010 | | | | 2,396,832 | |
| | | | | | | | 6,554,271 | |
| | | | | | | | | |
| Total Common Stocks | | | | | | | | |
| (Cost $154,807,572) | | | | | | | 199,646,611 | |
| | | | | | | | | |
| | | | | | | | | |
| EXCHANGE TRADED FUND – 1.1% | | | | | | | | |
Aberdeen Standard Physical Platinum Shares Fund* | | | | | | | | |
| (Cost $1,963,602) | | | 23,200 | | | | 2,303,296 | |
See Notes to the Financial Statements
PROSPECTOR FUNDS, INC.
Schedule of Investments – Continued
December 31, 2022
Opportunity Fund
Description | | Shares | | | Value | |
| | | | | | | |
| SHORT-TERM INVESTMENT – 4.2% | | | | | | |
First American Treasury Obligations Fund, Class X, 4.197%^ | | | | | | |
| (Cost $8,777,884) | | | 8,777,884 | | | $ | 8,777,884 | |
| Total Investments – 100.1% | | | | | | | | |
| (Cost $165,549,058) | | | | | | | 210,727,791 | |
| Other Assets and Liabilities, Net – (0.1)% | | | | | | | (140,471 | ) |
| Total Net Assets – 100.0% | | | | | | $ | 210,587,320 | |
| * | Non-income producing security |
| ^ | The rate shown is the seven-day yield effective December 31, 2022. |
The industry classifications included in the Schedule of Investments are in accordance with the Global Industry Classification Standard (GICS®) and were developed by and/or are the exclusive property of MSCI, Inc. (MSCI) and Standard & Poor Financial Services LLC (S&P). GICS is a service mark of MSCI and S&P and has been licensed for use by U.S. Bank Global Fund Services.
See Notes to the Financial Statements
PROSPECTOR FUNDS, INC.
Statements of Assets and Liabilities
December 31, 2022
| | | Capital Appreciation Fund | | | Opportunity Fund | |
| ASSETS: | | | | | | |
Investments, at market value | | | | | | |
(Cost of $21,178,475 and $165,549,058 respectively) | | $ | 27,377,632 | | | $ | 210,727,791 | |
Cash | | | 3,771 | | | | 4,814 | |
Receivable for dividends and interest | | | 42,918 | | | | 240,227 | |
Receivable for capital shares sold | | | 997 | | | | 36,180 | |
Receivable for investments sold | | | 82,326 | | | | — | |
Prepaid expenses | | | 10,372 | | | | 21,997 | |
Total assets | | | 27,518,016 | | | | 211,031,009 | |
| | | | | | | | | |
| LIABILITIES: | | | | | | | | |
Payable to Investment Adviser, net | | | 3,227 | | | | 125,130 | |
Payable for administration fees | | | 8,904 | | | | 52,502 | |
Payable for audit & tax fees | | | 48,005 | | | | 48,005 | |
Payable for capital shares redeemed | | | — | | | | 168,968 | |
Accrued distribution fees | | | 2,090 | | | | 20,529 | |
Accrued expenses and other liabilities | | | 11,054 | | | | 28,555 | |
Total liabilities | | | 73,280 | | | | 443,689 | |
| | | | | | | | | |
| NET ASSETS | | $ | 27,444,736 | | | $ | 210,587,320 | |
| | | | | | | | | |
| COMPOSITION OF NET ASSETS: | | | | | | | | |
Portfolio capital | | $ | 21,201,744 | | | $ | 164,625,364 | |
Total distributable earnings | | | 6,242,992 | | | | 45,961,956 | |
Total net assets | | $ | 27,444,736 | | | $ | 210,587,320 | |
| | | | | | | | | |
| CAPITAL STOCK, $0.001 par value | | | | | | | | |
Authorized | | | 500,000,000 | | | | 500,000,000 | |
Issued and outstanding | | | 1,423,360 | | | | 9,099,616 | |
| | | | | | | | | |
| NET ASSET VALUE, REDEMPTION PRICE, | | | | | | | | |
| AND OFFERING PRICE PER SHARE | | $ | 19.28 | | | $ | 23.14 | |
See Notes to the Financial Statements
PROSPECTOR FUNDS, INC.
Statements of Operations
For the Year Ended December 31, 2022
| | | Capital Appreciation Fund | | | Opportunity Fund | |
| INVESTMENT INCOME: | | | | | | |
Interest income | | $ | 97,515 | | | $ | 183,603 | |
Dividend income | | | 410,485 | | | | 4,093,168 | |
Less: Foreign taxes withheld | | | (4,325 | ) | | | (43,900 | ) |
Total investment income | | | 503,675 | | | | 4,232,871 | |
| | | | | | | | | |
| EXPENSES: | | | | | | | | |
Investment advisory fees | | | 275,531 | | | | 2,203,176 | |
Audit & tax fees | | | 54,845 | | | | 54,845 | |
Administration fees | | | 36,284 | | | | 220,867 | |
Registration fees | | | 27,450 | | | | 41,961 | |
Transfer agent fees | | | 20,125 | | | | 42,812 | |
Legal fees | | | 19,155 | | | | 148,527 | |
Distribution fees | | | 12,576 | | | | 122,119 | |
Compliance expenses | | | 12,282 | | | | 14,234 | |
Other expenses | | | 10,380 | | | | 28,621 | |
Custodian fees | | | 6,304 | | | | 18,472 | |
Directors’ fees | | | 6,291 | | | | 53,199 | |
Fund accounting fees | | | 3,497 | | | | 4,929 | |
Postage and printing fees | | | 599 | | | | 8,748 | |
Total expenses | | | 485,319 | | | | 2,962,510 | |
Less: Fee waivers | | | (140,905 | ) | | | (208,540 | ) |
Total net expenses | | | 344,414 | | | | 2,753,970 | |
| NET INVESTMENT INCOME | | | 159,261 | | | | 1,478,901 | |
| | | | | | | | | |
| REALIZED AND UNREALIZED GAINS (LOSSES): | | | | | | | | |
Net realized gain on investments | | | 1,084,861 | | | | 6,742,021 | |
Net change in unrealized | | | | | | | | |
appreciation/depreciation of investments | | | (2,427,505 | ) | | | (23,067,084 | ) |
Net loss on investments | | | (1,342,644 | ) | | | (16,325,063 | ) |
| NET DECREASE IN NET ASSETS | | | | | | | | |
| RESULTING FROM OPERATIONS | | $ | (1,183,383 | ) | | $ | (14,846,162 | ) |
See Notes to the Financial Statements
PROSPECTOR FUNDS, INC.
Statements of Changes in Net Assets
| | | Capital Appreciation Fund | |
| | | Year Ended | | | Year Ended | |
| | | December 31, 2022 | | | December 31, 2021 | |
| OPERATIONS: | | | | | | |
Net investment income | | $ | 159,261 | | | $ | 100,090 | |
Net realized gain on investments | | | 1,084,861 | | | | 3,410,914 | |
Net change in unrealized appreciation/ | | | | | | | | |
depreciation of investments | | | (2,427,505 | ) | | | 2,285,188 | |
Net increase (decrease) resulting from operations | | | (1,183,383 | ) | | | 5,796,192 | |
| | | | | | | | | |
| CAPITAL SHARE TRANSACTIONS: | | | | | | | | |
Proceeds from shares sold | | | 736,594 | | | | 757,981 | |
Proceeds from reinvestment of distributions | | | 1,502,026 | | | | 3,303,926 | |
Payments for shares redeemed | | | (1,885,568 | ) | | | (2,778,187 | ) |
Net increase from capital share transactions | | | 353,052 | | | | 1,283,720 | |
| | | | | | | | | |
| DISTRIBUTIONS PAID TO SHAREHOLDERS | | | (1,563,757 | ) | | | (3,404,519 | ) |
| | | | | | | | | |
| TOTAL INCREASE (DECREASE) IN NET ASSETS | | | (2,394,088 | ) | | | 3,675,393 | |
| | | | | | | | | |
| NET ASSETS: | | | | | | | | |
Beginning of year | | | 29,838,824 | | | | 26,163,431 | |
End of year | | $ | 27,444,736 | | | $ | 29,838,824 | |
| | | | | | | | | |
| TRANSACTIONS IN SHARES: | | | | | | | | |
Shares sold | | | 36,114 | | | | 34,662 | |
Shares issued in reinvestment of distributions | | | 74,914 | | | | 163,642 | |
Shares redeemed | | | (91,044 | ) | | | (129,669 | ) |
Net increase | | | 19,984 | | | | 68,635 | |
See Notes to the Financial Statements
PROSPECTOR FUNDS, INC.
Statements of Changes in Net Assets
| | | Opportunity Fund | |
| | | Year Ended | | | Year Ended | |
| | | December 31, 2022 | | | December 31, 2021 | |
| OPERATIONS: | | | | | | |
Net investment income | | $ | 1,478,901 | | | $ | 833,864 | |
Net realized gain on investments | | | 6,742,021 | | | | 22,865,818 | |
Net change in unrealized appreciation/ | | | | | | | | |
depreciation of investments | | | (23,067,084 | ) | | | 24,234,426 | |
Net increase (decrease) resulting from operations | | | (14,846,162 | ) | | | 47,934,108 | |
| | | | | | | | | |
| CAPITAL SHARE TRANSACTIONS: | | | | | | | | |
Proceeds from shares sold | | | 23,652,634 | | | | 65,226,397 | |
Proceeds from reinvestment of distributions | | | 7,679,303 | | | | 13,906,185 | |
Payments for shares redeemed | | | (38,656,260 | ) | | | (89,858,554 | ) |
Redemption fees | | | 785 | | | | 4,907 | |
Net decrease from capital share transactions | | | (7,323,538 | ) | | | (10,721,065 | ) |
| | | | | | | | | |
| DISTRIBUTIONS PAID TO SHAREHOLDERS | | | (8,373,387 | ) | | | (20,094,014 | ) |
| | | | | | | | | |
| TOTAL INCREASE (DECREASE) IN NET ASSETS | | | (30,543,087 | ) | | | 17,119,029 | |
| | | | | | | | | |
| NET ASSETS: | | | | | | | | |
Beginning of year | | | 241,130,407 | | | | 224,011,378 | |
End of year | | $ | 210,587,320 | | | $ | 241,130,407 | |
| | | | | | | | | |
| TRANSACTIONS IN SHARES: | | | | | | | | |
Shares sold | | | 978,935 | | | | 2,506,659 | |
Shares issued in reinvestment of distributions | | | 317,458 | | | | 569,459 | |
Shares redeemed | | | (1,606,706 | ) | | | (3,498,948 | ) |
Net decrease | | | (310,313 | ) | | | (422,830 | ) |
See Notes to the Financial Statements
PROSPECTOR FUNDS, INC.
Financial Highlights
| | | Capital Appreciation Fund | |
| | | Year Ended December 31, | |
| | | 2022 | | | 2021 | | | 2020 | | | 2019 | | | 2018 | |
For a Fund share outstanding | | | | | | | | | | | | | | | |
throughout the year | | | | | | | | | | | | | | | |
| | | | | | | | | | | | | | | | |
| NET ASSET VALUE: | | | | | | | | | | | | | | | |
Beginning of year | | $ | 21.26 | | | $ | 19.60 | | | $ | 18.80 | | | $ | 16.34 | | | $ | 17.63 | |
| | | | | | | | | | | | | | | | | | | | | |
| OPERATIONS: | | | | | | | | | | | | | | | | | | | | |
Net investment income | | | 0.11 | | | | 0.09 | | | | 0.12 | | | | 0.14 | | | | 0.12 | |
Net realized and unrealized gain (loss) on investments | | | (0.93 | ) | | | 4.32 | | | | 1.07 | | | | 3.47 | | | | (0.67 | ) |
Total from operations | | | (0.82 | ) | | | 4.41 | | | | 1.19 | | | | 3.61 | | | | (0.55 | ) |
| | | | | | | | | | | | | | | | | | | | | |
| LESS DISTRIBUTIONS: | | | | | | | | | | | | | | | | | | | | |
From net investment income | | | (0.11 | ) | | | (0.20 | ) | | | (0.02 | ) | | | (0.12 | ) | | | (0.12 | ) |
From net realized gains | | | (1.05 | ) | | | (2.55 | ) | | | (0.37 | ) | | | (1.03 | ) | | | (0.62 | ) |
Total distributions | | | (1.16 | ) | | | (2.75 | ) | | | (0.39 | ) | | | (1.15 | ) | | | (0.74 | ) |
| | | | | | | | | | | | | | | | | | | | | |
| NET ASSET VALUE: | | | | | | | | | | | | | | | | | | | | |
End of year | | $ | 19.28 | | | $ | 21.26 | | | $ | 19.60 | | | $ | 18.80 | | | $ | 16.34 | |
| | | | | | | | | | | | | | | | | | | | | |
| TOTAL RETURN | | | (4.07 | )% | | | 23.25 | % | | | 6.40 | % | | | 22.33 | % | | | (3.07 | )% |
| | | | | | | | | | | | | | | | | | | | | |
| SUPPLEMENTAL DATA AND RATIOS: | | | | | | | | | | | | | | | | | | | | |
Net assets, end of year (in thousands) | | $ | 27,445 | | | $ | 29,839 | | | $ | 26,163 | | | $ | 29,371 | | | $ | 25,179 | |
Ratio of expenses to average net assets: | | | | | | | | | | | | | | | | | | | | |
| Before expense reimbursement | | | 1.76 | % | | | 1.78 | % | | | 2.00 | % | | | 1.95 | % | | | 1.97 | % |
| After expense reimbursement | | | 1.25 | % | | | 1.25 | % | | | 1.25 | % | | | 1.29 | % | | | 1.30 | % |
Ratio of net investment income (loss) | | | | | | | | | | | | | | | | | | | | |
to average net assets: | | | | | | | | | | | | | | | | | | | | |
| Before expense reimbursement | | | 0.07 | % | | | (0.17 | )% | | | (0.09 | )% | | | 0.08 | % | | | (0.00 | )% |
| After expense reimbursement | | | 0.58 | % | | | 0.36 | % | | | 0.66 | % | | | 0.74 | % | | | 0.67 | % |
Portfolio turnover rate | | | 33 | % | | | 32 | % | | | 40 | % | | | 25 | % | | | 28 | % |
| | | | | | | | | | | | | | | | | | | | | |
See Notes to the Financial Statements
PROSPECTOR FUNDS, INC.
Financial Highlights
| | | Opportunity Fund | |
| | | Year Ended December 31, | |
| | | 2022 | | | 2021 | | | 2020 | | | 2019 | | | 2018 | |
For a Fund share outstanding | | | | | | | | | | | | | | | |
throughout the year | | | | | | | | | | | | | | | |
| | | | | | | | | | | | | | | | |
| NET ASSET VALUE: | | | | | | | | | | | | | | | |
Beginning of year | | $ | 25.63 | | | $ | 22.78 | | | $ | 22.18 | | | $ | 18.47 | | | $ | 20.85 | |
| | | | | | | | | | | | | | | | | | | | | |
| OPERATIONS: | | | | | | | | | | | | | | | | | | | | |
Net investment income | | | 0.17 | | | | 0.11 | | | | 0.13 | | | | 0.23 | | | | 0.19 | |
Net realized and unrealized gain (loss) on investments | | | (1.71 | ) | | | 4.99 | | | | 1.06 | | | | 4.49 | | | | (1.11 | ) |
Total from operations | | | (1.54 | ) | | | 5.10 | | | | 1.19 | | | | 4.72 | | | | (0.92 | ) |
| | | | | | | | | | | | | | | | | | | | | |
| LESS DISTRIBUTIONS: | | | | | | | | | | | | | | | | | | | | |
From net investment income | | | (0.17 | ) | | | (0.10 | ) | | | (0.17 | ) | | | (0.23 | ) | | | (0.19 | ) |
From net realized gains | | | (0.78 | ) | | | (2.15 | ) | | | (0.42 | ) | | | (0.78 | ) | | | (1.27 | ) |
Total distributions | | | (0.95 | ) | | | (2.25 | ) | | | (0.59 | ) | | | (1.01 | ) | | | (1.46 | ) |
| | | | | | | | | | | | | | | | | | | | | |
| NET ASSET VALUE: | | | | | | | | | | | | | | | | | | | | |
End of year | | $ | 23.14 | | | $ | 25.63 | | | $ | 22.78 | | | $ | 22.18 | | | $ | 18.47 | |
| | | | | | | | | | | | | | | | | | | | | |
| TOTAL RETURN | | | (6.20 | )% | | | 22.88 | % | | | 5.43 | % | | | 25.73 | % | | | (4.38 | )% |
| | | | | | | | | | | | | | | | | | | | | |
| SUPPLEMENTAL DATA AND RATIOS: | | | | | | | | | | | | | | | | | | | | |
Net assets, end of year (in thousands) | | $ | 210,587 | | | $ | 241,130 | | | $ | 224,011 | | | $ | 142,685 | | | $ | 114,251 | |
Ratios of expenses to average net assets: | | | | | | | | | | | | | | | | | | | | |
| Before expense reimbursement | | | 1.34 | % | | | 1.34 | % | | | 1.39 | % | | | 1.50 | % | | | 1.53 | % |
| After expense reimbursement | | | 1.25 | % | | | 1.25 | % | | | 1.25 | % | | | 1.29 | % | | | 1.30 | % |
Ratio of net investment income to average net assets: | | | | | | | | | | | | | | | | | | | | |
| Before expense reimbursement | | | 0.58 | % | | | 0.28 | % | | | 0.63 | % | | | 0.85 | % | | | 0.66 | % |
| After expense reimbursement | | | 0.67 | % | | | 0.37 | % | | | 0.77 | % | | | 1.06 | % | | | 0.89 | % |
Portfolio turnover rate | | | 44 | % | | | 29 | % | | | 52 | % | | | 27 | % | | | 39 | % |
See Notes to the Financial Statements
PROSPECTOR FUNDS, INC.
Notes to the Financial Statements
December 31, 2022
1. ORGANIZATION
Prospector Funds, Inc. (the “Corporation”) was organized as a Maryland corporation on June 6, 2007 and is registered under the Investment Company Act of 1940 (the “1940 Act”), as amended, as an open-end diversified management investment company. The Corporation issues its shares in series, each series representing a distinct portfolio with its own investment objectives and policies. There are two series presently authorized, the Prospector Capital Appreciation Fund and the Prospector Opportunity Fund (individually a “Fund” and collectively the “Funds”). Each Fund is an investment company and accordingly follows the investment company accounting and reporting guidance of the Financial Accounting Standards Board (“FASB”) Accounting Standards Codification Topic 946 Financial Services – Investment Companies. The Funds commenced operations on September 28, 2007.
2. FAIR VALUE MEASUREMENT
The following is a summary of significant accounting policies consistently followed by each Fund:
Security Valuation – The Fund has adopted fair value accounting standards which establish an authoritative definition of fair value and set out a hierarchy for measuring fair value. These standards require additional disclosures about the various inputs and valuation techniques used to develop the measurements of fair value, a discussion in changes in valuation techniques and related inputs during the period and expanded disclosure of valuation levels for major security types. These inputs are summarized in the three broad levels listed below:
| Level 1 – | Unadjusted quoted prices in active markets for identical assets or liabilities that the Fund has the ability to access. |
| | |
| Level 2 – | Observable inputs other than quoted prices included in Level 1 that are observable for the asset or liability, either directly or indirectly. These inputs may include quoted prices for the identical instrument on an inactive market, prices for similar instruments, interest rates, prepayment speeds, credit risk, yield curves, default rates, discounts and similar data. |
| | |
| Level 3 – | Unobservable inputs for the asset or liability, to the extent relevant observable inputs are not available, representing the Fund’s own assumptions about the assumptions a market participant would use in valuing the asset or liability, and would be based on the best information available. |
Following is a description of the valuation techniques applied to the Fund’s major categories of assets and liabilities measured at fair value on a recurring basis. The Fund’s investments are carried at fair value.
Common Stock – Securities that are primarily traded on a national securities exchange are valued at the last sale price on the exchange on which they are primarily traded on the day of valuation or, if there has been no sale on such day, at the last bid price on the day of valuation. To the extent these securities are actively traded and valuation adjustments are not applied, they are categorized in Level 1 of the fair value hierarchy.
Convertible and Corporate Bonds – Convertible and corporate bonds, including listed issues, are valued at fair value on the basis of valuations furnished by an independent pricing service which utilizes both dealer-supplied valuations and formula-based techniques. The pricing service may consider recently executed transactions in securities of the issuer or comparable issuers, market price quotations (where observable), bond spreads, and fundamental data relating to the issuer. Convertible and corporate bonds are generally categorized in Level 2 of the fair value hierarchy.
PROSPECTOR FUNDS, INC.
Notes to the Financial Statements – Continued
December 31, 2022
Investment Companies – Investments in open-end mutual funds, including money market funds, are valued at their net asset value per share. Exchange Traded Funds (“ETFs”) are valued at the closing exchange price. To the extent these securities are actively traded and valuation adjustments are not applied, they are categorized in Level 1 of the fair value hierarchy.
Securities for which market quotations are not readily available, or if the closing price does not represent fair value, are valued following procedures approved by the Funds’ board of directors (the “Board”). These procedures consider many factors, including the type of security, size of holding, trading volume and news events. There can be no assurance that the Funds could obtain the fair value assigned to a security if they were to sell the security at approximately the time at which the Funds determine their net asset values per share. These types of securities are generally categorized in Level 2 or Level 3 of the fair value hierarchy. As of and for the year ended December 31, 2022, the Funds did not hold investments in Level 3 securities.
The inputs or methodology used for valuing securities are not an indication of the risk associated with investing in those securities.
As of December 31, 2022 each Fund’s investments in securities were classified as follows:
| | | Level 1 | | | Level 2 | | | Level 3 | | | Total | |
| Capital Appreciation Fund | | | | | | | | | | | | |
| Common Stocks | | $ | 20,479,515 | | | $ | — | | | $ | — | | | $ | 20,479,515 | |
| Convertible Bonds | | | — | | | | 5,094,776 | | | | — | | | | 5,094,776 | |
| Exchange Traded Fund | | | 273,021 | | | | — | | | | — | | | | 273,021 | |
| Short-Term Investment | | | 1,530,320 | | | | — | | | | — | | | | 1,530,320 | |
| Total Investments | | $ | 22,282,856 | | | $ | 5,094,776 | | | $ | — | | | $ | 27,377,632 | |
| | | | | | | | | | | | | |
| | | Level 1 | | | Level 2 | | | Level 3 | | | Total | |
| Opportunity Fund | | | | | | | | | | | | | | | | |
| Common Stocks | | $ | 199,646,611 | | | $ | — | | | $ | — | | | $ | 199,646,611 | |
| Exchange Traded Fund | | | 2,303,296 | | | | — | | | | — | | | | 2,303,296 | |
| Short-Term Investment | | | 8,777,884 | | | | — | | | | — | | | | 8,777,884 | |
| Total Investments | | $ | 210,727,791 | | | $ | — | | | $ | — | | | $ | 210,727,791 | |
Refer to each Fund’s Schedule of Investments for further sector breakout.
The Funds may invest in derivative financial instruments in order to manage risk or gain exposure to various other investments or markets. The Funds’ investment objectives allow the Funds to enter into various types of derivative contracts, including, but not limited to, futures contracts, forward foreign exchange contracts, and purchased and written options. Derivatives may contain various risks including the potential inability of the counterparty to fulfill their obligations under the terms of the contract, the potential for an illiquid secondary market, and the potential for market movements which may expose the funds to gains or losses in excess of the amounts shown on the Statements of Assets and Liabilities. As of and for the year ended December 31, 2022, the Funds held no derivative instruments.
3. SIGNIFICANT ACCOUNTING POLICIES
Distributions to Shareholders – Dividends from net investment income and distributions of net realized capital gains, if any, will be declared and paid at least annually. The character of distributions made during the period from net investment income or net realized gains may differ from the characterization for federal income tax purposes
PROSPECTOR FUNDS, INC.
Notes to the Financial Statements – Continued
December 31, 2022
due to differences in the recognition of income, expense and gain items for financial statement and tax purposes. All net short-term capital gains are included in ordinary income for tax purposes.
Use of Estimates – The preparation of financial statements in conformity with accounting principles generally accepted in the United States of America (“U.S. GAAP”) requires management to make estimates and assumptions that affect the reported amounts of assets and liabilities and disclosure of contingent assets and liabilities at the date of the financial statements and the reported amounts of revenues and expenses during the reporting period. Actual results could differ from those estimates.
Federal Income Taxes – The Funds intend to meet the requirements of subchapter M of the Internal Revenue Code applicable to regulated investment companies and to distribute substantially all net taxable investment income and net realized gains to shareholders in a manner which results in no tax cost to the Funds. Therefore, no federal income or excise tax provision is required. As of December 31, 2022, the Funds did not have any tax positions that did not meet the “more-likely-than-not” threshold of being sustained by the applicable tax authority. Generally, each of the tax years in the four-year period ended December 31, 2022 remains subject to examination by taxing authorities.
Reclassification of Capital Accounts – U.S. GAAP requires that certain components of net assets relating to permanent differences be reclassified between financial and tax reporting. These reclassifications have no effect on net assets or net asset value per share. For the fiscal year ended December 31, 2022, the Capital Appreciation Fund increased portfolio capital by $88,370 and decreased distributable earnings by $88,370 and the Opportunity Fund increased portfolio capital by $1,452,976 and decreased distributable earnings by $1,452,976.
Foreign Currency Translation – The books and records relating to the Funds’ non-U.S. dollar denominated investments are maintained in U.S. dollars on the following bases: (1) market value of investment securities, assets, and liabilities are translated at the current rate of exchange; and (2) purchases and sales of investment securities, income, and expenses, if any, are translated at the relevant rates of exchange prevailing on the respective dates of such transactions. The Funds do not isolate the portion of gains and losses on investments in equity securities that is due to changes in the foreign exchange rates from that which is due to changes in market prices of equity securities. The Funds report certain foreign currency-related transactions as components of realized gains for financial reporting purposes, whereas such components are treated as ordinary income for federal income tax purposes.
Illiquid or Restricted Securities – A security may be considered illiquid if it lacks a readily available market. Securities are generally considered liquid if they can be sold or disposed of in the ordinary course of business within seven days at approximately the price at which the security is valued by the Fund. Illiquid securities may be valued under methods approved by the Board as reflecting fair value. Each Fund intends to invest no more than 15% of its total assets in illiquid securities. Certain restricted securities may be considered illiquid. Restricted securities are often purchased in private placement transactions, are not registered under the Securities Act of 1933, may have contractual restrictions on resale, and may be valued under methods approved by the Board as reflecting fair value. Certain restricted securities eligible for resale to qualified institutional investors, including Rule 144A securities, are not subject to the limitation on a Fund’s investment in illiquid securities if they are determined to be liquid in accordance with procedures adopted by the Board. As of December 31, 2022, the Board has deemed all Rule 144A securities held within the Capital Appreciation Fund to be liquid. At December 31, 2022, the Funds had no investments in illiquid securities and no restricted securities other than Rule 144A securities. Refer to the Schedule of Investments for further detail.
PROSPECTOR FUNDS, INC.
Notes to the Financial Statements – Continued
December 31, 2022
Expenses – Expenses directly attributable to a Fund are charged to that Fund, while expenses attributable to more than one Fund are allocated among the respective Funds based on relative net assets or another appropriate basis.
Other – Investment and shareholder transactions are recorded on the trade date. Each Fund determines the gain or loss realized from the investment transactions on the basis of identified cost. Dividend income is recognized on the ex-dividend date. Interest income, including amortization of bond premium and discount, is recognized on an accrual basis. Shareholders may be subject to a redemption fee equal to 2% of the amount redeemed if Funds’ shares are sold within 60 days or less following the date of their purchase.
Subsequent Events – Management of the Funds has evaluated Fund related events and transactions that occurred subsequent to December 31, 2022, through the date of issuance of the Funds’ financial statements. There were no events or transactions that occurred during this period that materially impacted the amounts or disclosures in the Funds’ financial statements.
4. INVESTMENT TRANSACTIONS, DISTRIBUTABLE EARNINGS, AND DISTRIBUTIONS PAID
During the year ended December 31, 2022, purchases of securities and proceeds from sales of securities, other than temporary investments in short-term securities, were as follows:
| | | Purchases | | | Sales | |
Capital Appreciation Fund | | $ | 8,549,644 | | | $ | 9,513,619 | |
Opportunity Fund | | | 92,693,507 | | | | 104,657,832 | |
There were no purchases or sales of long-term U.S. Government securities.
The aggregate gross unrealized appreciation and depreciation of securities held by the Funds and the total cost of securities for federal income tax purposes at December 31, 2022, the Funds’ most recently completed fiscal year end, were as follows:
| | | Aggregate | | | Aggregate | | | Net | | | Federal | |
| | | Gross | | | Gross | | | Appreciation/ | | | Income | |
| | | Appreciation | | | Depreciation | | | (Depreciation) | | | Tax Cost | |
Capital Appreciation Fund | | $ | 6,819,022 | | | $ | (654,814 | ) | | $ | 6,164,208 | | | $ | 21,213,699 | |
Opportunity Fund | | | 51,048,690 | | | | (6,125,055 | ) | | | 44,923,635 | | | | 165,805,399 | |
The difference between book-basis and tax-basis unrealized appreciation is attributable primarily to wash sales and different book and tax accounting methods for certain securities.
At December 31, 2022, the components of accumulated earnings (deficit) on a tax-basis were as follows:
| | | Undistributed | | | Undistributed | | | Other | | | | | | Total | |
| | | Ordinary | | | Long-Term | | | Accumulated | | | Unrealized | | | Distributable | |
| | | Income | | | Capital Gains | | | Losses | | | Appreciation | | | Earnings | |
Capital Appreciation Fund
| | $
| 7,928
| | | $ | 70,856
| | | $
| —
| | | $
| 6,164,208
| | | $
| 6,242,992
| |
Opportunity Fund | | | 7,376 | | | | 1,030,945 | | | | — | | | | 44,923,635 | | | | 45,961,956 | |
PROSPECTOR FUNDS, INC.
Notes to the Financial Statements – Continued
December 31, 2022
As of December 31, 2022, the Funds did not have any capital loss carryovers. A regulated investment company may elect for any taxable year to treat any portion of any qualified late year loss as arising on the first day of the next taxable year. Qualified late year losses are certain capital and ordinary losses which occur during the portion of the Fund’s taxable year subsequent to October 31. The Capital Appreciation Fund and the Opportunity Fund did not defer any late year losses.
The tax character of distributions paid during the fiscal year ended December 31, 2022 were as follows:
| | | Ordinary | | | Long Term | | | | |
| | | Income* | | | Capital Gains** | | | Total | |
Capital Appreciation Fund | | $ | 150,299 | | | $ | 1,413,458 | | | $ | 1,563,757 | |
Opportunity Fund | | | 1,469,012 | | | | 6,904,375 | | | | 8,373,387 | |
The tax character of distributions paid during the fiscal year ended December 31, 2021 were as follows:
| | | Ordinary | | | Long Term | | | | |
| | | Income* | | | Capital Gains** | | | Total | |
Capital Appreciation Fund | | $ | 309,712 | | | $ | 3,094,807 | | | $ | 3,404,519 | |
Opportunity Fund | | | 4,263,777 | | | | 15,830,237 | | | | 20,094,014 | |
| * | | For federal income tax purposes, distributions of short-term capital gains are included in ordinary income distributions. |
| ** | | Funds designate long-term capital gain dividends pursuant to IRC Sec. 852(b)(3)(C). |
5. AGREEMENTS
The Funds have entered into an Investment Advisory Agreement with Prospector Partners Asset Management, LLC (the “Investment Adviser”), with whom certain directors and officers of the Corporation are affiliated, to furnish investment advisory services to the Funds. Pursuant to this Agreement, the Investment Adviser is entitled to receive an investment advisory fee, calculated daily and payable monthly, at the annual rate of 1.00% as applied to each Fund’s daily net assets.
The Investment Adviser has contractually agreed to waive its investment advisory fee and reimburse each Fund’s other expenses to the extent necessary to ensure that each Fund’s operating expenses do not exceed 1.25% of its average daily net assets. Fees waived and expenses reimbursed by the Investment Adviser may be recouped by the Investment Adviser for a period of three fiscal years following the fiscal year during which such waiver or reimbursement was made if such recoupment can be achieved without exceeding the expense limit in effect at the time the waiver or reimbursement occurred. As of December 31, 2022, the Investment Adviser did not recoup any previously waived fees or reimbursed expenses. The Fee Waiver and Expense Limitation Agreement will be in effect through at least September 30, 2023 . Waived fees and reimbursed expenses subject to potential recovery by year of expiration are as follows:
| Expiration | | Capital Appreciation Fund | | | Opportunity Fund | |
12/31/23 | | $ | 181,184 | | | $ | 220,158 | |
12/31/24 | | | 147,451 | | | | 202,416 | |
12/31/25 | | | 140,905 | | | | 208,540 | |
Total | | $ | 469,540 | | | $ | 631,114 | |
PROSPECTOR FUNDS, INC.
Notes to the Financial Statements – Continued
December 31, 2022
As of December 31, 2022, it was possible, but not probable, those amounts would be recovered by the Investment Adviser. At the end of each fiscal year in the future, the Funds will continue to assess the potential recovery of waived/reimbursed fees and expenses for financial reporting purposes.
Quasar Distributors, LLC (“Quasar”) serves as distributor of the Funds’ shares pursuant to a Distribution Agreement with the Corporation. Each Fund’s shares are sold on a no-load basis and, therefore, Quasar receives no sales commission or sales load for providing services to the Funds. The Corporation has adopted a plan pursuant to Rule 12b-1 under the 1940 Act (the “12b-1 Plan”), which authorizes the Corporation to reimburse Quasar and certain financial intermediaries who assist in distributing each Fund’s shares or who provide shareholder services to Fund shareholders a distribution and/or shareholder servicing fee of up to 0.25% of each Fund’s average daily net assets (computed on an annual basis). All or a portion of the fee may be used by the Funds or Quasar to pay the Fund’s distribution fees and costs of printing reports and prospectuses for potential investors and the costs of other distribution and shareholder services expenses. During the year ended December 31, 2022, the Capital Appreciation Fund and Opportunity Fund incurred expenses of $12,576 and $122,119 respectively, pursuant to the 12b-1 Plan.
U.S. Bancorp Fund Services, LLC, doing business as U.S. Bank Global Fund Services, serves as transfer agent, administrator and fund accountant for the Funds. U.S. Bank N.A. serves as custodian for the Funds.
6. INDEMNIFICATIONS
The Funds enter into contracts that contain a variety of indemnifications. The Funds’ maximum exposure under these arrangements is unknown. However, the Funds have not had prior claims or losses pursuant to these contracts and expect the risk of loss to be remote.
PROSPECTOR FUNDS, INC.
Report of Independent Registered Public Accounting Firm
To the Shareholders and the Board of Directors of Prospector Funds, Inc.
Opinion on the Financial Statements
We have audited the accompanying statements of assets and liabilities of Prospector Funds, Inc. (the “Corporation”) (comprising the Prospector Capital Appreciation Fund and Prospector Opportunity Fund (collectively referred to as the “Funds”)), including the schedules of investments, as of December 31, 2022, and the related statements of operations for the year then ended, the statements of changes in net assets for each of the two years in the period then ended, the financial highlights for each of the five years in the period then ended and the related notes (collectively referred to as the “financial statements”). In our opinion, the financial statements present fairly, in all material respects, the financial position of each of the Funds comprising Prospector Funds, Inc. at December 31, 2022, the results of their operations for the year then ended, the changes in their net assets for each of the two years in the period then ended and their financial highlights for each of the five years in the period then ended, in conformity with U.S. generally accepted accounting principles.
Basis for Opinion
These financial statements are the responsibility of the Corporation’s management. Our responsibility is to express an opinion on each of the Funds’ financial statements based on our audits. We are a public accounting firm registered with the Public Company Accounting Oversight Board (United States) (“PCAOB”) and are required to be independent with respect to the Corporation in accordance with the U.S. federal securities laws and the applicable rules and regulations of the Securities and Exchange Commission and the PCAOB.
We conducted our audits in accordance with the standards of the PCAOB. Those standards require that we plan and perform the audit to obtain reasonable assurance about whether the financial statements are free of material misstatement, whether due to error or fraud. The Corporation is not required to have, nor were we engaged to perform, an audit of the Corporation’s internal control over financial reporting. As part of our audits, we are required to obtain an understanding of internal control over financial reporting but not for the purpose of expressing an opinion on the effectiveness of the Corporation’s internal control over financial reporting. Accordingly, we express no such opinion.
Our audits included performing procedures to assess the risks of material misstatement of the financial statements, whether due to error or fraud, and performing procedures that respond to those risks. Such procedures included examining, on a test basis, evidence regarding the amounts and disclosures in the financial statements. Our procedures included confirmation of securities owned as of December 31, 2022, by correspondence with the custodian and brokers. Our audits also included evaluating the accounting principles used and significant estimates made by management, as well as evaluating the overall presentation of the financial statements. We believe that our audits provide a reasonable basis for our opinion.
We have served as the auditor of one or more Prospector Funds, Inc. investment companies since 2007.
Minneapolis, Minnesota
February 23, 2023
PROSPECTOR FUNDS, INC.
Additional Information (Unaudited)
December 31, 2022
BOARD APPROVAL OF INVESTMENT ADVISORY AGREEMENT
The Corporation’s independent directors (the “directors”) unanimously approved the continuance of the Investment Advisory Agreement (the “Advisory Agreement”) between the Funds and Prospector Partners Asset Management, LLC (the “Advisor”) at a Board of Directors meeting held on August 30, 2022.
In preparation for the meeting, the directors had requested from the Advisor and evaluated a memorandum providing certain information requested by the Board pursuant to Section 15(c) of the 1940 Act, including (i) expense, compliance and other information as it relates to the Advisor; (ii) performance of other accounts managed by its affiliate Prospector Partners, LLC with similar investment objectives derived from data compiled by the Advisor and (iii) expense and other information for other registered investment companies with similar investment objectives derived from data compiled by the Advisor based upon comparative peer groups selected in consultation with the independent directors. Prior to voting, the directors reviewed the proposed approval of the Advisory Agreement with management and with counsel to the Corporation and reviewed a memorandum from such counsel discussing the legal standards for their consideration of the proposed approval. In reaching their determinations relating to approval of the continuance of the Advisory Agreement, the directors considered all factors they believed relevant including the following:
| | 1. | | the nature, extent and quality of investment, and other services to be rendered by the Advisor; |
| | 2. | | payments to be received by the Advisor from all sources with respect to the Funds; |
| | 3. | | comparative fee and expense data for the Funds and other investment companies with similar investment objectives; |
| | 4. | | the extent to which economies of scale may be realized as the Funds grow and whether fee levels reflect these economies of scale for the benefit of investors; |
| | 5. |
| the Advisor’s policies and practices regarding allocation of portfolio transactions of the Funds, including the extent to which the Advisor may benefit from soft dollar arrangements;
|
| | 6. | | fall-out benefits which the Advisor and its affiliates may receive from their relationships to the Funds; |
| | 7. | | information about fees charged by the Advisor to other clients with similar investment objectives; |
| | 8. | | the professional experience and qualifications of the Funds’ portfolio managers and other senior personnel of the Advisor; |
| | 9. | | profitability of the Advisor; and |
| | 10. | | the terms of the Advisory Agreement. |
The directors also considered their overall confidence in the integrity and competence of the Advisor and its investment team. In their deliberations, the directors did not identify any particular information that was all- important or controlling, and each director attributed different weights to the various factors. The directors determined that the overall arrangements between the Funds and the Advisor, as provided in the Advisory Agreement, were fair and reasonable in light of the services performed, expenses expected to be incurred and such other matters as the directors considered relevant in the exercise of their reasonable judgment.
The material factors and conclusions that formed the basis for the directors reaching their determinations to approve the continuance of the Advisory Agreement (including their determinations that the Advisor should be the investment adviser for the Funds, and that the fees payable to the Advisor pursuant to the Advisory Agreement continue to be appropriate) were separately discussed by the directors.
PROSPECTOR FUNDS, INC.
Additional Information (Unaudited) – Continued
December 31, 2022
Nature, extent and quality of services provided by the Advisor
The directors noted that, under the Advisory Agreement, the Advisor, subject to the control of the directors, administers the Funds’ business and other affairs. The directors also noted that the Advisor manages the investment of the assets of the Funds, including making purchases and sales of portfolio securities consistent with each Fund’s investment objective and policies.
The directors considered the scope and quality of services provided by the Advisor under the Advisory Agreement, the cyclical nature of value investing, the quality of the investment research capabilities of the Advisor and the other resources it proposes to dedicate to performing services for the Funds and the Advisor’s active management style. The directors also considered the portfolio managers’ experience, reputation and investment philosophy noting that the Advisor’s investment style and stock selection process have remained consistent even in difficult market environments. The quality of administrative and other services also were considered. The directors concluded that, overall, they continue to be satisfied with the nature, extent and quality of services proposed to be provided to the Funds under the Advisory Agreement.
Advisor Fees; Performance of the Fund
The directors considered the advisory fee rate paid by the Funds to the Advisor and information prepared by the Advisor based upon the peer groups selected with the input of the independent directors concerning fee rates paid by other comparable funds. The directors recognized that it is difficult to make comparisons of advisory fees because there are variations in the services that are included in the fees paid by other funds, but determined that the current advisory fee rate of 1.00% was in line with other comparable funds.
The directors also considered the performance of each Fund compared to each Fund’s benchmarks and peer groups. The directors noted that the Opportunity Fund outperformed its Lipper peers across the one-year, five-year, ten-year and since-inception time periods. The Directors noted that the Capital Appreciation Fund outperformed the Lipper peer group average for the one-year, three-year, five-year, ten-year and since-inception time periods. The directors concluded that the advisory fee rate, taking into account performance and the other factors mentioned, was in line with comparable funds.
Other Fund Expenses
The directors also considered the total expense ratio of the Funds in comparison to the fees and expenses of the funds included in their respective peer groups. The directors noted that the expense ratios of some of the comparable funds were lower because of waivers or reimbursements by those funds’ investment advisers, which in some cases were voluntary and perhaps temporary. In particular, the directors noted that the Advisor’s fee waiver/expense reimbursement pursuant to the Fee Waiver and Expenses Reimbursement Agreement was contractual in nature and customary for the industry. The directors concluded that each Fund’s expense ratio was reasonable. Finally, the directors noted that there may be economies of scale as the Funds grow and concluded that it may be appropriate to consider those issues in the future.
Advisor Profitability
The directors noted that the Advisor also provides the Funds with such office space, administrative and other services (exclusive of, and in addition to, any such services provided by any other retained by the Funds) and
PROSPECTOR FUNDS, INC.
Additional Information (Unaudited) – Continued
December 31, 2022
executive and other personnel as are necessary for the Funds’ operations. The directors considered that the Advisor pays all of the compensation of the officers of the Company that are affiliated persons of the Advisor, pays a portion of the insurance costs and paid the cost of the organization of the Funds (without reimbursement), through its affiliate, Prospector Partners, LLC.
The directors also noted that the Advisor has contractually agreed to waive, through September 30, 2023, its management fee and/or reimburse each Fund’s other expenses to the extent necessary to ensure that each Fund’s operating expenses do not exceed 1.25% of its average daily net assets. Under the terms of the Fee Waiver and Expense Reimbursement Agreement at the present asset levels of the Funds, the Advisor has received only a portion of its earned management fee. It was also noted that the Advisor does not receive “fall out” benefits commonly received by managers of mutual funds that provide transfer agency, distribution or printing services in-house. The directors considered the expenses of the Advisor and the services provided by the Advisor and that the Advisor expects to be cash flow positive after considering an allocation of expenses from its affiliated advisor, Prospector Partners, LLC and before considering any allocation of income to the owners of the affiliated advisor.
PROSPECTOR FUNDS, INC.
Additional Information (Unaudited) – Continued
December 31, 2022
LIQUIDITY RISK MANAGEMENT PROGRAM
The Funds have adopted and implemented a written liquidity risk management program as required by Rule 22e-4 (the “Liquidity Rule”) under the Investment Company Act of 1940, as amended. The program is reasonably designed to assess and manage the Funds’ liquidity risk, taking into consideration, among other factors, the Funds’ investment strategy and the liquidity of its portfolio investments during normal and reasonably foreseeable stressed conditions; its short and long-term cash flow projections; and its cash holdings and access to other funding sources. The Board approved the appointment of a Liquidity Administrator Committee, which includes representatives from Prospector Partners Asset Management, LLC, the Funds’ investment adviser.
The Liquidity Administrator Committee is responsible for the program’s administration and oversight and for reporting to the Board on at least an annual basis regarding the program’s operation and effectiveness. The Liquidity Administrator Committee updated its assessment of the Fund’s liquidity risk profile, considering additional data gathered in the 12 months ended September 30, 2022 and the adequacy and effectiveness of the liquidity risk management program’s operations since its inception on June 1, 2019 (the “Review Period”) in order to prepare a written report for the Board (the “Report”) for consideration at its meeting held on December 6, 2022. The Report noted that during the Review Period the Funds did not experience unusual stress or disruption to its operations related to purchase and redemption activity. It further noted that during the Review Period the Funds held adequate levels of cash and highly liquid investments to meet shareholder redemption activities in accordance with applicable requirements. The Report concluded that (i) the Funds’ liquidity risk management program is reasonably designed to prevent violations of the Liquidity Rule and (ii) the Funds’ liquidity risk management program had been effectively implemented during the Review Period.
PROSPECTOR FUNDS, INC.
Additional Information (Unaudited) – Continued
December 31, 2022
AVAILABILITY OF FUND PORTFOLIO INFORMATION
The Funds file complete schedules of portfolio holdings with the SEC for the first and third quarters of each fiscal year on Part F of Form N-PORT, which is available on the SEC’s website at www.sec.gov. The Funds’ Part F of Form N-PORT may be reviewed and copied at the SEC’s Public Reference Room in Washington, D.C. For information on the Public Reference Room call 1-800-SEC-0330. In addition, the Funds’ Form N-Q or Part F of Form N-PORT is available without charge upon request by calling 1-877-734-7862.
AVAILABILITY OF PROXY VOTING INFORMATION
A description of the Funds’ Proxy Voting Policies and Procedures is available without charge, upon request, by calling 1-877-734-7862. Information regarding how the Funds voted proxies relating to portfolio securities during the most recent 12 month period ended June 30, is available (1) without charge, upon request, by calling 1-877-734-7862, or (2) on the SEC’s website at www.sec.gov.
QUALIFIED DIVIDEND INCOME/DIVIDENDS RECEIVED DEDUCTION
For the fiscal year ended December 31, 2022, certain dividends paid by the Funds may be reported as qualified dividend income and may be eligible for taxation at capital gain rates. The percentage of dividends declared from ordinary income designated as qualified dividend income was 100% and 100% for the Capital Appreciation Fund and Opportunity Fund, respectively.
For corporate shareholders, the percent of ordinary income distributions qualifying for the corporate dividends received deduction for the fiscal year ended December 31, 2022 was 100% and 100% for the Capital Appreciation Fund and Opportunity Fund, respectively.
ADDITIONAL INFORMATION APPLICABLE TO FOREIGN SHAREHOLDERS ONLY
The percent of ordinary income distributions designated as interest related dividends for the fiscal year ended December 31, 2022 was 19.40% and 4.34% for the Capital Appreciation Fund and Opportunity Fund, respectively.
The percent of ordinary income distributions designated as short-term capital gain distributions under Internal Revenue Section 871(k)(2)(C) for the fiscal year ended December 31, 2022 was 0.00% and 0.00% for the Capital Appreciation Fund and Opportunity Fund, respectively.
PROSPECTOR FUNDS, INC.
Additional Information (Unaudited) – Continued
December 31, 2022
DIRECTORS & OFFICERS TABLE
| | | Term of | Number of | | |
| | | Office | Portfolios | Other | |
| | | and | Principal | in Fund | Directorships |
| Name, | | Length | Occupation | Complex | Served |
| Year of Birth | | of Time | During Past | Overseen | During Past |
| and Address^ | Position | Served* | 5 Years | by Director | 5 Years |
| Independent Board Members |
| | | | | | |
| Harvey D. Hirsch* | Director | Indefinite; | Retired. | 2 | None. |
Year of Birth: 1941 | | Since | | | |
| | | September 7, | | | |
| | | 2007 | | | |
| | | | | | |
| Joseph Klein III* | Director | Indefinite; | Managing Director of Gauss | 2 | Ionis |
Year of Birth: 1961 | | Since | Capital Advisors, LLC, | | Pharmaceuticals, |
| | | September 7, | a financial consulting and | | Inc.; Akcea |
| | | 2007 | investment advisory firm | | Therapeutics, |
| | | | focused on biopharmaceuticals | | Inc. |
| | | | since he founded the company | | |
| | | | in March 1998. | | |
| | | | | | |
| Roy L. Nersesian* | Director | Indefinite; | Professor of the Leon Hess | 2 | None. |
Year of Birth: 1939 | | Since | School of Business, Monmouth | | |
| | | September 7, | University, since September 1985. | | |
| | | 2007 | Adjunct Professor of the Center | | |
| | | | for Energy and Marine | | |
| | | | Transportation, Columbia | | |
| | | | University, since September 2000. | | |
| | | | | | |
| John T. Rossello, Jr.* | Director | Indefinite; | Retired. | 2 | None. |
Year of Birth: 1951 | | Since | | | |
| | | September 7, | | | |
| | | 2007 | | | |
PROSPECTOR FUNDS, INC.
Additional Information (Unaudited) – Continued
December 31, 2022
| | | Term of | | Number of | |
| | | Office | | Portfolios | Other |
| | | and | Principal | in Fund | Directorships |
| Name, | | Length | Occupation | Complex | Served |
| Year of Birth | | of Time | During Past | Overseen | During Past |
| and Address^ | Position | Served* | 5 Years | by Director | 5 Years |
| Interested Board Members and Officers |
| |
| John D. Gillespie†* | Director | Indefinite; | Managing member of | 2 | None. |
Year of Birth: 1959 | President | Since | the Investment Adviser. | | |
| | | September 7, | Managing member of | | |
| | | 2007 | Prospector Partners, LLC, | | |
| | | | an affiliate of the Investment | | |
| | | | Manager, and portfolio | | |
| | | | manager of the investment | | |
| | | | funds sponsored by Prospector | | |
| | | | Partners, LLC from 1997 | | |
| | | | through 2021. | | |
| | | | | | |
| Kevin R. O’Brien | Executive | Indefinite; | Portfolio Manager at | N/A | None. |
Year of Birth: 1963 | Vice | Since | the Investment Manager. | | |
| | President | September 7, | Portfolio Manager at | | |
| | | 2007 | Prospector Partners, LLC | | |
| | | | since April 2003. | | |
| | | | | | |
| Jason A. Kish | Executive | Indefinite; | Portfolio Manager at | N/A | None. |
Year of Birth: 1973 | Vice | Since | the Investment Manager. | | |
| | President | February, | Director of Research | | |
| | | 2013 | since 2010. | | |
| | | | | | |
| Steven R. Labbe | Executive | Indefinite; | Portfolio Manager at | N/A | None. |
Year of Birth: 1972 | Vice | Since | the Investment Manager. | | |
| | President | July, | Analyst since 2012. | | |
| | | 2020 | | | |
| | | | | | |
| Peter N. Perugini, Jr. | Secretary | Indefinite; | Chief Financial Officer at | N/A | None. |
Year of Birth: 1970 | Treasurer | Secretary | Prospector Partners, LLC | | |
| | | Since | since 2000. | | |
| | | September 7, | | | |
| | | 2007 | | | |
| | | Indefinite; | | | |
| | | Treasurer | | | |
| | | Since | | | |
| | | June 6, | | | |
| | | 2007 | | | |
PROSPECTOR FUNDS, INC.
Additional Information (Unaudited) – Continued
December 31, 2022
| | | Term of | | Number of | |
| | | Office | | Portfolios | Other |
| | | and | Principal | in Fund | Directorships |
| Name, | | Length | Occupation | Complex | Served |
| Year of Birth | | of Time | During Past | Overseen | During Past |
| and Address^ | Position | Served* | 5 Years | by Director | 5 Years |
| | | | | | |
| Frederick Teufel | Chief | Indefinite; | Director at | N/A | None. |
Year of Birth: 1959 | Compliance | Since | Vigilant Compliance, LLC | | |
| | Officer | June 22 | since September 2020. | | |
| | | 2022 | | | |
| | | | | | |
| Benjamin Eirich | Assistant | Indefinite; | Assistant Vice President, U.S. | N/A | None. |
Year of Birth: 1981 | Secretary | Since | Bancorp Fund Services, LLC | | |
| | | September 5, | a mutual fund service provider, | | |
| |
| | since June 2008. | | |
| ^ | The address for all directors and officers is 370 Church Street, Guilford, Connecticut 06437. |
| * | Each of the Company’s directors was elected by written consent of the sole shareholder of the Funds on September 7, 2007. |
| † | John D. Gillespie is an interested director of the Fund because he is also the managing member of the Investment Manager. |
(This Page Intentionally Left Blank.)
DIRECTORS
John D. Gillespie
Harvey D. Hirsch
Joseph Klein III
Roy L. Nersesian
John T. Rossello, Jr.
INVESTMENT ADVISER
Prospector Partners Asset Management, LLC
370 Church Street
Guilford, CT 06437
DISTRIBUTOR
Quasar Distributors, LLC
111 East Kilbourn Avenue, Suite 2200
Milwaukee, WI 53202
CUSTODIAN
U.S. Bank, N.A.
1555 North River Center Drive
Milwaukee, WI 53212
ADMINISTRATOR AND TRANSFER AGENT
U.S. Bancorp Fund Services, LLC
Third Floor
615 East Michigan Street
Milwaukee, WI 53202
INDEPENDENT REGISTERED PUBLIC ACCOUNTING FIRM
Ernst & Young LLP
700 Nicollet Mall, Suite 500
Minneapolis, MN 55402
LEGAL COUNSEL
Seward & Kissel LLP
One Battery Plaza
New York, NY 10004
This report must be accompanied or preceded by a prospectus.
The Funds’ Statement of Additional Information contains additional information about the
Funds’ directors and is available without charge upon request by calling 1-877-734-7862.
| (b) | Not applicable for this Registrant |
Item 2. Code of Ethics.
The registrant has adopted a code of ethics that applies to the registrant’s principal executive officer and principal financial officer. The registrant has not made any substantive amendments to its code of ethics during the period covered by this report.
The registrant has not granted any waivers from any provisions of the code of ethics during the period covered by this report.
A copy of the registrant’s code of ethics that applies to the registrant’s principal executive officer and principal financial officer is filed herewith.
Item 3. Audit Committee Financial Expert.
The registrant’s board of directors has determined that there is at least one audit committee financial expert serving on its audit committee. John Rossello, Jr. is the “audit committee financial expert” and is considered to be “independent” as each term is defined in Item 3 of Form N‑CSR.
Item 4. Principal Accountant Fees and Services.
The registrant has engaged its principal accountant to perform audit services, audit-related services, tax services and other services during the past two fiscal periods. “Audit services” refer to performing an audit of the registrant's annual financial statements or services that are normally provided by the accountant in connection with statutory and regulatory filings or engagements for the past fiscal year. “Audit-related services” refer to the assurance and related services by the principal accountant that are reasonably related to the performance of the audit. “Tax services” refer to professional services rendered by the principal accountant for tax compliance, tax advice, and tax planning, including reviewing the Fund’s tax returns and distribution calculations. The following table details the aggregate fees billed or expected to be billed for each of the last two fiscal periods for audit fees, audit-related fees, tax fees and other fees by the principal accountant.
| | FYE 12/31/2022 | FYE 12/31/2021 |
(a) Audit Fees | $85,000 | $83,500 |
(b) Audit-Related Fees | $0 | $0 |
(c) Tax Fees | $13,100 | $12,480 |
(d) All Other Fees | $0 | $0 |
(e)(1) The audit committee has adopted pre-approval policies and procedures that require the audit committee to pre‑approve all audit and non‑audit services that exceed $5,000 for the registrant. All of the principal accountant’s hours spent on auditing the registrant’s financial statements were attributed to work performed by full‑time permanent employees of the principal accountant.
(e)(2) The percentage of fees billed by Ernst & Young applicable to non-audit services pursuant to waiver of pre-approval requirement was as follows:
| | FYE 12/31/2022 | FYE 12/31/2021 |
Audit-Related Fees | 0% | 0% |
Tax Fees | 0% | 0% |
All Other Fees | 0% | 0% |
(f) All of the principal accountant’s hours spent on auditing the registrant’s financial statements were attributed to work performed by full‑time permanent employees of the principal accountant.
(g) The following table indicates the non-audit fees, other than the tax services as noted above, billed or expected to be billed by the registrant’s accountant for services to the registrant and to the registrant’s investment adviser (and any other controlling entity, etc.—not sub-adviser) for the last two years.
(h) The audit committee of the board of trustees/directors has considered whether the provision of non-audit services that were rendered to the registrant's investment adviser is compatible with maintaining the principal accountant's independence and has concluded that the provision of such non-audit services by the accountant has not compromised the accountant’s independence.
Non-Audit Related Fees | FYE 12/31/2022 | FYE 12/31/2021 |
Registrant | $13,100 | $12,480 |
Registrant’s Investment Adviser | $0 | $0 |
Item 5. Audit Committee of Listed Registrants.
Not applicable to open-end investment companies.
Item 6. Schedule of Investments.
(a) Schedule of Investments is included as part of the report to shareholders filed under Item 1 of this Form.
(b) Not applicable.
Item 7. Disclosure of Proxy Voting Policies and Procedures for Closed-End Management Investment Companies.
Not applicable to open-end investment companies.
Item 8. Portfolio Managers of Closed-End Management Investment Companies.
Not applicable to open-end investment companies.
Item 9. Purchases of Equity Securities by Closed‑End Management Investment Company and Affiliated Purchases.
Not applicable to open-end investment companies.
Item 10. Submission of Matters to a Vote of Security Holders.
Not Applicable.
Item 11. Controls and Procedures.
| (a) | The Registrant’s President and Treasurer have reviewed the Registrant's disclosure controls and procedures (as defined in Rule 30a-3(c) under the Investment Company Act of 1940 (the “Act”)) as of a date within 90 days of the filing of this report, as required by Rule 30a-3(b) under the Act and Rules 13a-15(b) or 15d‑15(b) under the Securities Exchange Act of 1934. Based on their review, such officers have concluded that the disclosure controls and procedures are effective in ensuring that information required to be disclosed in this report is appropriately recorded, processed, summarized and reported and made known to them by others within the Registrant and by the Registrant’s service provider. |
| (b) | There were no significant changes in the Registrant's internal control over financial reporting (as defined in Rule 30a-3(d) under the Act) that occurred during the period covered by this report that has materially affected, or is reasonably likely to materially affect, the Registrant's internal control over financial reporting. |
Item 12. Disclosure of Securities Lending Activities for Closed-End Management Investment Companies
Not applicable to open-end investment companies.
Item 13. Exhibits.
(3) Any written solicitation to purchase securities under Rule 23c‑1 under the Act sent or given during the period covered by the report by or on behalf of the registrant to 10 or more persons. Not applicable to open-end investment companies.
(4) Change in the registrant’s independent public accountant. There was no change in the registrant’s independent public accountant for the period covered by this report.
SIGNATURES
Pursuant to the requirements of the Securities Exchange Act of 1934 and the Investment Company Act of 1940, the registrant has duly caused this report to be signed on its behalf by the undersigned, thereunto duly authorized.
(Registrant) Prospector Funds, Inc.
By (Signature and Title)* /s/ John D. Gillespie
John D. Gillespie, President
Date February 28, 2023
Pursuant to the requirements of the Securities Exchange Act of 1934 and the Investment Company Act of 1940, this report has been signed below by the following persons on behalf of the registrant and in the capacities and on the dates indicated.
By (Signature and Title)* /s/ John D. Gillespie
John D. Gillespie, President
Date February 28, 2023
By (Signature and Title)* /s/ Peter N. Perugini, Jr.
Peter N. Perugini, Jr., Treasurer
Date February 28, 2023
* Print the name and title of each signing officer under his or her signature.