Prospector Capital Appreciation Fund
Prospector Opportunity Fund
Beginning on April 30, 2021, as permitted by regulations adopted by the Securities and Exchange Commission, paper copies of the Funds’ shareholder reports will no longer be sent by mail, unless you specifically request paper copies of the reports. Instead, the reports will be made available on the Funds’ website, www.prospectorfunds.com, and you will be notified by mail each time a report is posted and provided with a website link to access the report.
If you already elected to receive shareholder reports electronically, you will not be affected by this change and you need not take any action. You may elect to receive shareholder reports and other communications from the Funds electronically by contacting your financial intermediary (such as a broker-dealer or bank) or, if you are a direct investor, by calling (877) 734-7862.
You may elect to receive all future reports in paper free of charge. If you invest through a financial intermediary, you can contact your financial intermediary to request that you continue to receive paper copies of your shareholder reports. If you invest directly with the Funds, you can call (877) 734-7862 to let the Funds know you wish to continue receiving paper copies of your shareholder reports. Your election to receive reports in paper will apply to all funds held in your account if you invest through your financial intermediary or all funds held with the fund complex if you invest directly with the Funds.
Annual Report
| www.prospectorfunds.com | December 31, 2019 |
January 31, 2020
Dear Shareholders of the Prospector Capital Appreciation Fund and Prospector Opportunity Fund,
Reflecting on the market in 2019, and heading into a new decade, we can’t help but be reminded of the similarities to the turn of the century. The S&P 500’s strong, 31.49% return in 2019 was, once again, driven by technology stocks, and growth stocks significantly outpaced their value brethren – akin to 1999, the last year of the so called “dot-com bubble.” However, digging a bit deeper, we are also reminded of the extremes reached in 1999, when S&P 500 technology stocks collectively returned over 70% for the second year in a row, and defensive sectors such as consumer staples, utilities and healthcare significantly declined for the year. As readers likely know, the year 2000 brought the end of tech-stock mania, and the beginning of seven years of value-investing dominance. While we aren’t making any predictions of history repeating itself, what we do know is we are over a decade into a growth-stock driven bull market, and likely late in the economic cycle. At some point, we will see an economic contraction; and in times of stress, balance sheet strength matters. Thus, it seems prudent to take a look at the overall debt picture.
A Discussion of the Debt Situation
“Debt, we’ve learned, is the match that lights the fire of every crisis. Every crisis has its own set of villains – pick your favorite: bankers, regulators, central bankers, politicians, overzealous consumers, credit rating agencies – but all require one similar ingredient to create a true crisis: too much leverage.”
– Andrew Ross Sorkin
“Only when the tide goes out do you discover who has been swimming naked.”
– Warren E. Buffett
Corporate Debt
An accommodative monetary policy does not come without costs. The most obvious being the dependency on cheap and abundant debt. Nonfinancial corporate debt as a percentage of GDP is higher today than before the financial crisis. While the credit environment is strong and we aren’t forecasting impending doom, current debt levels instill caution. This is especially the case given the outlook for slower economic growth coupled with the ongoing trade war and political uncertainty. We are also concerned with the higher formation of distressed debt in recent months. Today, the ratio of high yield debt trading at distressed levels has risen to nearly 10%, a sharp jump from 6% in July.
Ironically, our greatest area of concern is lower-rated investment-grade credits (i.e. BBB-rated debt). Today, the U.S. BBB bond market exceeds $3.1 trillion and accounts for fully 53% of all investment grade bonds ($7 trillion of BBB-rated debt is outstanding on a global basis). In context, there is over 5x more domestic BBB debt today versus pre-crisis levels, while non-investment grade debt has “only” doubled. Those bonds closest to the precipice of non-investment grade status, the BBB-minus issuers, comprise 27% of the BBB category, up from 23% in 2007. The growth in this most vulnerable BBB-minus sector is headlined by energy, healthcare, and industrial borrowers.

Interestingly, the number of BBB issuers is relatively unchanged for over a decade, indicative of the BBB cohort taking on additional leverage. That said, part of the growth is explained by the change in the composition of BBB issuers. Post financial crisis, multiple financial institutions with massive balance sheets were downgraded to BBB, although to be fair, most of these are BBB plus, three full notches above high yield. Citigroup alone explains 14% of total BBB debt growth since 2010. While some financial institutions “belong” in the BBB category, we would argue traditional banks such as Citigroup do not, as they now have enhanced regulatory oversight, better liquidity profiles, and carry significant excess capital. Additionally, high-risk lending activities have shifted from the banks to “shadow lenders” post-crisis. Alternative asset managers, credit funds, specialty finance companies, and BDCs (business development companies) originate a large portion of this risky debt and often with “covenant-lite” structures. You can rest assured that we have avoided investing in these non-traditional entities.
What does a recession look like for the BBB issuers? Post the 2001 recession, 15% of BBB issuers realized downgrades to high-yield status in the following three years. In 2008, that figure was 11%. However, in both recessions, over 40% of issuers were labeled as having the potential of being downgraded to high yield. The next recession could be more material for BBB issuers given the staggering growth of debt versus prior cycles, and the higher weighting of BBB-minus within the cohort. Not surprisingly, we’ve conservatively positioned the Funds toward more highly-rated companies.
Consumer Debt
Consumer debt is also an area of concern, but to a lesser extent. Domestic consumer debt is now $14 trillion – above levels realized prior to the financial crisis. However, real GDP has increased over 20% since then, which supports a higher debt level. Additionally, the credit profiles of consumers are stronger and subprime borrowings are at reasonable levels. While the majority of consumer debt remains in the form of secured mortgages, the composition of the remaining has changed. Auto loans have grown disproportionately, nearly doubling to $1.2 trillion since post-crisis lows. Despite recent worries, credit quality has held up and lenders have tightened their standards. Also
concerning is the growth in student debt which has tripled since 2007 to $1.6 trillion. While not an immediate concern, it is a long-term problem as debt incurred today restricts future growth. In your portfolio, we have avoided consumer finance stocks given the inferior risk/reward dynamic. At this point in the cycle, we favor investing in traditional banks which carry lower risk with upside potential given a positive loan growth outlook, strong underlying credit quality, potential for mergers & acquisitions (M&A), and attractive shareholder-return policies.
Another form of consumer leverage is margin debt. Today, it stands shy of $600 billion as compared to $450 billion at the start of the 2008 recession and over $400 billion at the height of the tech bubble. On a margin debt/GDP basis, we are in-line with peaks realized during the tech bubble and the year prior to the financial crisis. While margin debt/GDP has been elevated for a number of years, it remains an area of concern and could exacerbate market corrections as realized in the recent Q4 2018 sell-off.
U.S. Government Debt
Today, national debt/GDP is 104% as compared to 63% in 2007 and projected to represent 144% of GDP by 20491. The national debt is akin to student loans – while not an immediate concern, it could become a major problem. The higher the debt burden, the greater the servicing costs which could otherwise be used for other expenditures. To illustrate the severity, if interest rates are one percentage point higher versus projections, the debt/GDP burden would reach 200% by 2049 (likewise if GDP growth undershoots projections). At this level, a combination of fiscal tightening, further debt issuance, and quantitative easing may be needed – which would likely have negative implications on the economy.
| | (As of September 30, 2019) |
_____________
1 Congress of the United States – Congressional Budget Office “The 2019 Long-Term Budget Outlook”
To put national debt in a global context, the United States is one of the most indebted nations in the G-20. The only countries more indebted are Japan at 236% of GDP and Italy at 132% of GDP. Going forward, investors may shift allocations to less-indebted countries such as the United Kingdom, Canada, Australia, Germany, South Korea, China and, over the long term, to emerging economies such as India, Brazil, and Indonesia. This could result in higher national borrowing costs and a slower growth rate for the United States.
A Hiccup in the Repo Market
Near the end of the third quarter, the overnight funding market (commonly referred to as the “repo market” – where banks go to obtain short-term funding) exhibited a level of instability not seen since the financial crisis. In summary, approximately $150 billion in corporate tax payments came due at the same time as U.S. Treasuries being auctioned. Consequently, there was an outflow of bank deposits from the private sector (potentially also exacerbated by withdrawals by depositors making payments for quarterly individual tax estimates). As bank deposits/reserves were depleted, the cost of funding in the repo (short for repurchase) market spiked above Fed funds on multiple occasions to as high as 9% due to the reduction in liquidity. In response, the Federal Reserve is intervening by offering a daily borrowing line which has reduced the cost of borrowing toward the desired range of Fed funds.
In the short term, the Fed has stabilized the market and this incident is being viewed as a simple “glitch.” However, we believe there is elevated risk of additional liquidity shortages going forward. One driver being the implementation of Dodd-Frank and Basel III regulations. These regulations force banks to hold large amounts of liquid assets and de-emphasize growth, causing banks to reduce lending activities. This exacerbated the recent liquidity crunch as large banks did not lend money overnight despite advantageous rates. Another risk factor is cash is in short supply since the Fed began quantitative tightening – shrinking its balance sheet by nearly 40% since 2017. As the Fed reduced its balance sheet, it also reduced the amount of cash in the banking system. Less cash in the banking system equates to a greater chance of overnight liquidity shortages.
Equity Markets / Portfolio Implications
Clearly, the Fed has fueled a leveraging cycle since it began to employ its accommodative monetary policies. It’s a virtual certainty that we will go through a credit/deleveraging cycle of some form in the future. While we have little ability in predicting the cycle, we can evaluate corporate balance sheets with scrutiny. It should come as no surprise that your portfolio is largely invested in companies with conservative balance sheets that should exhibit resilience through a credit/economic cycle while exhibiting attractive earnings growth in the current environment.
Additionally, and specifically related to the aforementioned overnight funding situation, we tend to favor banks which hold significant excess capital, have “vanilla” balance sheets, a low dependency on overnight borrowings, and small enough to be exempt from onerous regulatory requirements. While not immune, we expect your holdings to be more resilient to any potential stress in the money markets. That said, we are hopeful this liquidity issue will abate over time. We have confidence that the Federal Reserve will let its balance sheet expand over time which would inject cash into the system, thereby improving liquidity. Furthermore, there is momentum from the Federal Reserve and OCC behind scrapping a margin requirement rule which would free up $40 billion in capital for lending activities among other proposed reforms.
Portfolio Addition – Swedish Match
A recent addition to both the Opportunity Fund and Capital Appreciation Fund is the Stockholm-based tobacco company Swedish Match AB (SWMA-SS). Given that description, one may be surprised to learn that the company has a vision for “a world without cigarettes.” Instead, Swedish Match offers quality nicotine-containing products that are recognized as safer alternatives to cigarettes, especially snus and non-tobacco nicotine pouches.
Snus is a moist, smokeless form of tobacco that is often packaged in pouches that users place in their upper lip. Due to the lack of combustion and subsequent inhalation of smoke, along with lower levels of nitrosamines (a known carcinogen), Swedish snus is considerably safer than smoking cigarettes. While not as popular in the United States, snus has a long and established history in Sweden. In fact, snus are actually more popular than cigarette smoking amongst Swedish men, and, Sweden boasts dramatically lower smoking rates than other European populations. Perhaps it is not a coincidence that Sweden also boasts some of the lowest number of male mortalities attributable to tobacco out of that same sample group. The company believes that these products are incrementally beneficial to public health by both being safer to use than cigarettes, and by helping users quit smoking.
The market for snus is an attractive one. It is estimated that the Scandinavian snus market amounted to 430 million cans in 2018 with volumes growing +6% in both Sweden and Norway, where Swedish Match has a strong #1 market share position. On the contrary, cigarette volumes have been declining across the developed world for several years as health risks and regulatory burdens push users towards other forms of nicotine consumption.
Given the nature of the category, investing in tobacco comes with inherent risks associated with societal perception, government regulation, and of course, public & private litigation. An investor in tobacco stocks who saw the mass litigation of the mid-1990’s understands this, as does anyone following along with recent rise in teen-vaping related hospitalizations. This is why, as a tobacco-based company, it is important to take a holistic approach towards corporate-social responsibility and incorporate the needs of all stakeholders into your considerations.
For Swedish Match, this means developing their very own quality standard for Swedish snus (termed GOTHIATEK®) that goes beyond the existing international standards in ensuring their products have a high and lasting quality, along with low levels of harmful substances. Their efforts in this field have culminated in the FDA’s first ever authorization of the marketing of products through the modified risk tobacco product (MRTP) pathway for eight Swedish Match products. In plain English, the FDA, for the first time ever with any brand, concluded that using these products instead of cigarettes puts you at a lower risk of mouth cancer, heart disease, lung cancer, stroke, emphysema, and chronic bronchitis. We believe this MRTP authorization speaks to the company’s keen ability to navigate this difficult and costly regulatory environment.
Having discussed the merits of Swedish snus at length, we would be remiss not to mention the company’s newest growth driver and product that caught our attention in the first place. Zyn is a new way for users to enjoy nicotine in a smoke-free, spit-free, and tobacco-free way that we believe improves upon the existing products in the cigarette-alternative category. The all-white nicotine pouches come in a variety of strengths and flavors, and contain only pharmaceutical-grade nicotine salt and food-grade additives for flavor and texture. The product is currently available in Scandinavia, the United States, and eight additional European countries. Swedish Match has benefitted from having an existing distribution footprint for its products in the United States, and they have leveraged this in order to rapidly roll out to over 60,000 stores in 2019.
Swedish Match is a company with a healthy balance sheet and a historically stable free cash flow generation. Their conservative balance sheet, with a 2.6x Net Debt/ Free Cash Flow (“FCF”) ratio vs peer average 4.6x, is further
complimented by what we consider a more attractive growth profile. With the addition of Zyn, SWMA is expected to grow earnings at a 14% 3yr-CAGR (compound annual growth rate) through 2021, which compares favorably to their peer set who are generally growing at 5%. At 12/31/19, SWMA shares are valued at 17.6x 2020 estimated earnings and a FCF yield of 4.8%, which we believe is more than reasonable given their superior growth prospects.
Prospector Opportunity Fund Highlights
The Prospector Opportunity Fund increased 25.73% during 2019. This solid absolute return landed in between our two benchmarks. The Russell Midcap returned 30.54% while the Russell 2000 earned 25.52%. Our benchmarks’ performance was, once again, driven by the substantial weighting in technology and internet shares which lead the market. The other significant sector that drove benchmark performance was industrials, another economically cyclical group. Prospector Opportunity Fund performance was driven by our overweight in defensive financials such as community banks and property-casualty insurance. As is typical of our positioning in the Fund, we were overweight the defensive consumer staples sector as well. Our top ten contributors for the year included five financials: RenaissanceRe (a reinsurer), Brown & Brown (an insurance intermediary), Globe Life (a life insurer), Key Corp (a bank), and Federated Investors (an asset manager). Three of the top ten operate in more economically cyclical industries: industrial IT company, Leidos Holdings; energy-related industrial, Powell Industries; and oil & gas producer, Hess Corp.
The largest detractor from performance was Noodles & Co, a fast casual restaurant chain. Like many restaurant companies we have invested in over time, Noodles has had a volatile history with periods of growth and success followed by bouts of operational indigestion. We have bought and sold the shares a few times over their seven-year history as a public company. We believe that the Noodles franchise has tremendous expansion capacity once management further refines the business model. We also view Noodles as an attractive takeout candidate to a larger diversified, more mature restaurant operator seeking a new concept with significant growth potential.
Prospector Capital Appreciation Fund Highlights
The Prospector Capital Appreciation Fund increased 22.33% for the full year 2019. While this is a good absolute return, it trailed the benchmark S&P 500’s 31.49% gain for the year. This is unsurprising given the Capital Appreciation Fund’s more defensive positioning, and the (increasingly) technology-heavy nature of the S&P 500. Financial service names, which for your portfolio consists largely of property-casualty insurance companies and over-capitalized banks, drove the Fund’s performance, contributing about 7.47% to performance. Stand out performers amongst financials included reinsurer RenaissanceRe, insurance broker Brown & Brown (both propelled by an increasingly favorable property-casualty rate environment) and retirement services company Voya Financial, which was aided by several shareholder-friendly actions.
Given the strong market, your portfolio had very few decliners for the full year. However, the biggest detractor from performance was Telephone and Data Systems, Inc. (TDS), the Chicago-based telecom company and majority owner of U.S. Cellular. TDS has been a long-time holding in the Capital Appreciation Fund, and unfortunately, has been a disappointment. While, in our estimation, the private market value for TDS is much higher than where the stock trades, the investment has been a lesson in the importance of shareholder-friendly management. TDS management has, thus far, not shown a willingness to unlock value by selling either their thousands of cellular towers, or the entire company – and the stock has languished as a result. As of the date of this writing, we continue to hold the position given the attractive upside / downside equation, but we continue to evaluate the situation.
Outlook
After a ten-year post-financial crisis period of consistent underlying conditions for equity investing, fundamentals are shifting. Modest economic growth, macro and geopolitical concerns weigh on the outlook. The upcoming Unites States presidential election is in focus, and a shift in power could lead to market volatility. Against this backdrop, however, the U.S. economy remains fundamentally healthy and continues to be a global leader.
Interest and mortgage rates continue near historically low levels, with the ten year Treasury having retraced by over 130 basis points from the October 2018 highs as inflation remains benign and economic growth moderates. Although we are clearly late in the economic cycle, the odds of a 2020 recession without a full-blown trade war seem low.
We believe investment-grade corporations have decent balance sheets and are currently producing acceptable free cash flows. We are carefully monitoring aggregate corporate debt levels (especially the BBB- debt which is a single notch above junk status), which now sit above pre-2008 crisis levels. The 2018 corporate tax cuts and the ability to repatriate foreign cash holdings should continue to drive higher employment, M&A activity, and capital returns including buybacks and dividends. Profit margins remain near all-time high levels, currently 10%, and look to be at some risk from higher wages and input costs.
In our estimation, equity valuations remain at elevated levels. In our estimation, the S&P 500 is in the ninth decile on trailing operating earnings. Equities look most reasonable when comparing earnings yields to Treasury or even high-grade corporate bond yields. In any case, we believe there are values inherent in your portfolio that should attract acquirers and other investors over time. Meanwhile, we believe equities are a superior asset allocation alternative to bonds over the longer term.
Thank you for entrusting us with your money.
Respectfully submitted,
| John D. Gillespie | Kevin R. O’Brien | Jason A. Kish |
Performance data quoted represents past performance; past performance does not guarantee future results.
Opinions expressed are those of the Funds and are subject to change, are not guaranteed, and should not be considered a recommendation to buy or sell any security.
Mutual fund investing involves risk. Principal loss is possible. Investments in debt securities typically decrease in value when interest rates rise. This risk is usually greater for longer-term debt securities. The Funds invest in foreign securities which involve greater volatility and political, economic and currency risks and differences in accounting methods. The Funds invest in smaller and mid-cap companies, which involve additional risks such as limited liquidity and greater volatility. The Funds may hold restricted securities purchased through private placements. Such securities can be difficult to sell without experiencing delays or additional costs. Derivatives involve risks different from, and in certain cases, greater than the risks presented by more traditional investments. These risks are fully disclosed in the prospectus.
Growth and value investing each have unique risks and potential for rewards. Growth stocks typically are more volatile than value stocks; however, value stocks have a lower expected growth rate in earnings and sales.
Bond ratings are grades given to bonds that indicate their credit quality as determined by private independent rating services such as Standard & Poor’s, Moody’s and Fitch. These firms evaluate a bond issuer’s financial strength, or its ability to pay a bond’s principal and interest in a timely fashion. Ratings are expressed as letters ranging from ‘AAA’, which is the highest grade, to ‘D’, which is the lowest grade. To be considered an investment grade issue, the company must be rated at ‘BBB’ or higher by Standard and Poor’s or Moody’s.
“Covenant-lite” loans are a type of financing that is issued with fewer restrictions on the borrower and fewer protections for the lender
Net debt is a company’s total debt minus cash and cash equivalents.
Free Cash Flow is revenue less operating expenses including interest expenses and maintenance capital spending. It is the discretionary cash that a company has after all expenses and is available for purposes such as dividend payments, investing back into the business or share repurchases.
CAGR is the rate of return that would be required for an investment to grow from its beginning balance to its ending balance, assuming the profits were reinvested at the end of each year of the investment’s lifespan.
Forward price-to-earnings ratio is the ratio for valuing a company that measures its current share price relative to its forecasted per-share earnings.
Free Cash Flow (FCF) Yield is an overall return evaluation ratio on a stock that standardizes the free cash flow per share that a company expects to earn against its market price per share.
The S&P 500 Index is a broad based unmanaged index of 500 stocks, which is widely recognized as representative of the equity market in general. You cannot invest directly in an index.
The Russell 2000 Index is an unmanaged small-cap index that measures the performance of the 2,000 smallest companies in the Russell 3000 Index. You cannot invest directly in an index.
The Russell MidCap Index is an unmanaged mid-cap index that measures the performance of the 800 smallest companies in the Russell 1000 Index. You cannot invest directly in an index.
Basis point is a unit that is equal to 1/100th of 1% and is used to denote the change in a financial instrument.
Fund holdings and/or security allocations are subject to change at any time and are not recommendations to buy or sell any security. Please see the Schedule of Investments section in this report for a full listing of the Fund’s holdings.
Prospector Funds, Inc. are distributed by Quasar Distributors, LLC.
Capital Appreciation Fund
The chart assumes an initial investment of $10,000. Performance reflects waivers of fee and operating expenses in effect. In the absence of such waivers, total return would be reduced. Past performance is not predictive of future performance. Investment return and principal value will fluctuate, so that your shares, when redeemed, may be worth more or less than their original cost. Performance assumes the reinvestment of capital gains and income distributions. The performance does not reflect the deduction of taxes that a shareholder would pay on Fund distributions or the redemption of Fund shares.
Average Annual Rates of Return (%) – As of December 31, 2019
| | One Year | Three Year | Five Year | Ten Year | Since Inception(1) |
| Capital Appreciation Fund | 22.33% | 9.71% | 8.10% | 8.13% | 6.19% |
S&P 500 Index(2) | 31.49% | 15.27% | 11.70% | 13.56% | 8.56% |
| (1) | September 28, 2007 |
| (2) | The Standard & Poor’s 500 Index (S&P 500) is an unmanaged, capitalization-weighted index generally representative of the U.S. market for large capitalization stocks. This Index cannot be invested in directly. |
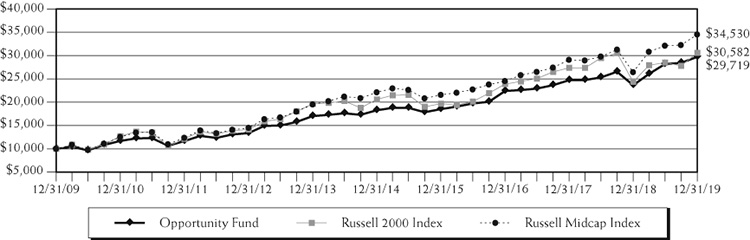
Opportunity Fund
The chart assumes an initial investment of $10,000. Performance reflects waivers of fee and operating expenses in effect. In the absence of such waivers, total return would be reduced. Past performance is not predictive of future performance. Investment return and principal value will fluctuate, so that your shares, when redeemed, may be worth more or less than their original cost. Performance assumes the reinvestment of capital gains and income distributions. The performance does not reflect the deduction of taxes that a shareholder would pay on Fund distributions or the redemption of Fund shares.
Average Annual Rates of Return (%) – As of December 31, 2019
| | One Year | Three Year | Five Year | Ten Year | Since Inception(1) |
| Opportunity Fund | 25.73% | 9.87% | 10.22% | 11.51% | 9.47% |
Russell 2000 Index(2) | 25.52% | 8.59% | 8.23% | 11.83% | 7.52% |
Russell Midcap Index(3) | 30.54% | 12.06% | 9.33% | 13.19% | 8.54% |
| (1) | September 28, 2007 |
| (2) | An unmanaged small-cap index that measures the performance of the 2,000 smallest companies in the Russell 3000 Index. This index cannot be invested in directly. |
| (3) | An unmanaged mid-cap index that measures the performance of the 800 smallest companies in the Russell 1000 Index. This index cannot be invested in directly. |
Expense Example (Unaudited)
December 31, 2019
As a shareholder of the Fund, you incur two types of costs: (1) transaction costs, which may include but are not limited to, redemption fees, wire transfer fees, maintenance fee (IRA accounts), and exchange fees; and (2) ongoing costs, including management fees; distribution and/or service fees; and other Fund expenses. This Example is intended to help you understand your ongoing costs (in dollars) of investing in the Fund and to compare these costs with the ongoing costs of investing in other mutual funds. The Example is based on an investment of $1,000 invested at the beginning of the period and held for the entire period (July 1, 2019 – December 31, 2019).
ACTUAL EXPENSES
The first line of the table below provides information about actual account values and actual expenses. Although the Fund charges no sales load or transaction fees, you will be assessed fees for outgoing wire transfers, returned checks and stop payment orders at prevailing rates charged by U.S. Bancorp Fund Services, LLC, the Fund’s transfer agent. The example below includes, but is not limited to, management fees, shareholder servicing fees and other Fund expenses. However, the example below does not include portfolio trading commissions and related expenses, interest expense and other extraordinary expenses as determined under generally accepted accounting principles. You may use the information in this line, together with the amount you invested, to estimate the expenses that you paid over the period. Simply divide your account value by $1,000 (for example, an $8,600 account value divided by $1,000 = 8.6), then multiply the result by the number in the first line under the heading entitled “Expenses Paid During Period” to estimate the expenses you paid on your account during this period.
HYPOTHETICAL EXAMPLE FOR COMPARISON PURPOSES
The second line of the table below provides information about hypothetical account values and hypothetical expenses based on the Fund’s actual expense ratio and an assumed rate of return of 5% per year before expenses, which is not the Fund’s actual return. The hypothetical account values and expenses may not be used to estimate the actual ending account balance or expenses you paid for the period. You may use this information to compare the ongoing costs of investing in the Fund and other funds. To do so, compare this 5% hypothetical example with the 5% hypothetical examples that appear in the shareholder reports of the other funds.
Please note that the expenses shown in the table are meant to highlight your ongoing costs only and do not reflect any transactional costs, such as redemption fees or exchange fees. Therefore, the second line of the table is useful in comparing ongoing costs only, and will not help you determine the relative total costs of owning different funds. In addition, if these transactional costs were included, your costs would have been higher.
| | | | Expenses Paid |
| | Beginning Account | Ending Account | During Period(1) |
| | Value (07/01/19) | Value (12/31/19) | (07/01/19 to 12/31/19) |
Capital Appreciation Actual(2) | $1,000.00
| $1,051.00
| $6.57
|
| Capital Appreciation Hypothetical | | | |
| (5% return before expenses) | 1,000.00 | 1,018.80 | 6.46 |
| | | | |
Opportunity Actual(2) | 1,000.00 | 1,054.60 | 6.58 |
| Opportunity Hypothetical | | | |
| (5% return before expenses) | 1,000.00 | 1,018.80 | 6.46 |
| (1) | Expenses are equal to the Fund’s annualized expense ratio for the most recent six-month period of 1.27% and 1.27% for Capital Appreciation Fund and Opportunity Fund, respectively, multiplied by the average account value over the period, multiplied by 184/365 to reflect the one-half year period. |
| (2) | Based on the actual returns for the six-month period ended December 31, 2019 of 5.10% and 5.46% for Capital Appreciation Fund and Opportunity Fund, respectively. |
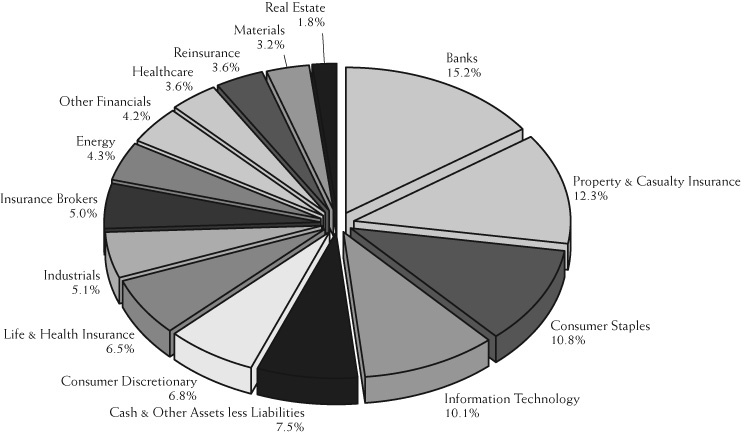
Sector Allocation (% of net assets) (Unaudited)
as of December 31, 2019(1)(2)
Capital Appreciation Fund
Top 10 Holdings (% of net assets) (Unaudited)
as of December 31, 2019(1)(3)
Capital Appreciation Fund
| | RenaissanceRe Holdings | 3.5% | |
| | Brown & Brown | 3.5% | |
| | Verint Systems, 1.500%, 06/01/2021 | 3.0% | |
| | Abbott Laboratories | 2.9% | |
| | Forestar Group, 3.750%, 03/01/2020 | 2.8% | |
| | Hess | 2.7% | |
| | Coca-Cola | 2.7% | |
| | Berkshire Hathaway, Class B | 2.5% | |
| | Akamai Technologies, 0.125%, 05/01/2025 | 2.4% | |
| | Liberty Media, 2.125%, 03/31/2048 | 2.3% | |
| | (1) | Fund holdings and sector allocations are subject to change at any time and are not recommendations to buy or sell any security. | |
| | (2) | Sector allocation includes all investment types. | |
| | (3) | Invesco Treasury Portfolio excluded from top 10 holdings. | |
Sector Allocation (% of net assets) (Unaudited)
as of December 31, 2019(1)(2)
Opportunity Fund
Top 10 Holdings (% of net assets) (Unaudited)
as of December 31, 2019(1)(3)
Opportunity Fund
| | Brown & Brown | 4.2% | |
| | RenaissanceRe Holdings | 3.6% | |
| | Globe Life | 3.4% | |
| | Newmont Goldcorp | 2.3% | |
| | Swedish Match | 2.3% | |
| | Mercury General | 2.1% | |
| | Axis Capital Holdings | 2.0% | |
| | Nestle | 1.9% | |
| | KeyCorp | 1.8% | |
| | Hess | 1.6% | |
| | (1) | Fund holdings and sector allocations are subject to change at any time and are not recommendations to buy or sell any security. | |
| | (2) | Sector allocation includes all investment types. | |
| | (3) | Invesco Treasury Portfolio excluded from top 10 holdings. | |
Schedule of Investments
December 31, 2019
Capital Appreciation Fund
Description | | Shares | | | Value | |
| COMMON STOCKS – 75.9% | | | | | | |
| | | | | | | |
| Banks – 5.0% | | | | | | |
| Brookline Bancorp | | | 14,800 | | | $ | 243,608 | |
| Dime Community Bancshares | | | 11,200 | | | | 233,968 | |
| Fifth Third Bancorp | | | 8,600 | | | | 264,364 | |
| Kearny Financial | | | 12,800 | | | | 177,024 | |
| KeyCorp | | | 13,500 | | | | 273,240 | |
| OceanFirst Financial | | | 10,800 | | | | 275,832 | |
| | | | | | | | 1,468,036 | |
| Communication Services – 1.6% | | | | | | | | |
| Telephone & Data Systems | | | 18,475 | | | | 469,819 | |
| | | | | | | | | |
| Consumer Discretionary – 2.1% | | | | | | | | |
| Darden Restaurants | | | 2,900 | | | | 316,129 | |
| Lowe’s Companies | | | 2,450 | | | | 293,412 | |
| | | | | | | | 609,541 | |
| Consumer Staples – 13.7% | | | | | | | | |
| Campbell Soup | | | 4,150 | | | | 205,093 | |
| Coca-Cola | | | 14,225 | | | | 787,354 | |
| Colgate-Palmolive | | | 6,900 | | | | 474,996 | |
| JM Smucker | | | 2,850 | | | | 296,770 | |
| Mondelez International, Class A | | | 7,250 | | | | 399,330 | |
| Nestle | | | 6,100 | | | | 660,424 | |
| Swedish Match | | | 9,600 | | | | 494,844 | |
| Tootsie Roll Industries | | | 11,521 | | | | 393,327 | |
| Walgreens Boots Alliance | | | 5,150 | | | | 303,644 | |
| | | | | | | | 4,015,782 | |
| Energy – 5.9% | | | | | | | | |
| Devon Energy | | | 5,600 | | | | 145,432 | |
| Exxon Mobil | | | 3,750 | | | | 261,675 | |
| Hess | | | 12,000 | | | | 801,720 | |
| Suncor Energy | | | 15,600 | | | | 511,680 | |
| | | | | | | | 1,720,507 | |
| Healthcare – 6.2% | | | | | | | | |
| Abbott Laboratories | | | 9,850 | | | | 855,571 | |
| AstraZeneca – ADR | | | 6,200 | | | | 309,132 | |
| Merck & Co. | | | 7,350 | | | | 668,482 | |
| | | | | | | | 1,833,185 | |
See Notes to the Financial Statements
Schedule of Investments – Continued
December 31, 2019
Capital Appreciation Fund
Description | | Shares | | | Value | |
COMMON STOCKS – 75.9% (Continued) | | | | | | |
| | | | | | | |
| Industrials – 4.3% | | | | | | |
| Eaton | | | 6,450 | | | $ | 610,944 | |
| Pentair | | | 7,600 | | | | 348,612 | |
| Regal Beloit | | | 3,700 | | | | 316,757 | |
| | | | | | | | 1,276,313 | |
| Information Technology – 7.5% | | | | | | | | |
| FARO Technologies* | | | 7,000 | | | | 352,450 | |
| FLIR Systems | | | 12,450 | | | | 648,272 | |
| Leidos Holdings | | | 3,000 | | | | 293,670 | |
| Microsoft | | | 2,600 | | | | 410,020 | |
| Oracle | | | 5,700 | | | | 301,986 | |
| Science Applications International | | | 2,200 | | | | 191,444 | |
| | | | | | | | 2,197,842 | |
| Insurance Brokers – 3.5% | | | | | | | | |
| Brown & Brown | | | 25,700 | | | | 1,014,636 | |
| | | | | | | | | |
| Life & Health Insurance – 4.3% | | | | | | | | |
| Aflac | | | 10,400 | | | | 550,160 | |
| Globe Life | | | 3,400 | | | | 357,850 | |
| Voya Financial | | | 5,700 | | | | 347,586 | |
| | | | | | | | 1,255,596 | |
| Materials – 3.3% | | | | | | | | |
| Domtar | | | 13,951 | | | | 533,486 | |
| Louisiana-Pacific | | | 14,800 | | | | 439,116 | |
| | | | | | | | 972,602 | |
| Multi-line Insurance – 1.6% | | | | | | | | |
| Loews | | | 9,100 | | | | 477,659 | |
| | | | | | | | | |
| Property & Casualty Insurance – 10.9% | | | | | | | | |
| Axis Capital Holdings | | | 9,600 | | | | 570,624 | |
| Berkshire Hathaway, Class B* | | | 3,250 | | | | 736,125 | |
| Employers Holdings | | | 3,400 | | | | 141,950 | |
| First American Financial | | | 4,875 | | | | 284,310 | |
| Hanover Insurance Group | | | 3,100 | | | | 423,677 | |
| Lancashire Holdings | | | 32,000 | | | | 325,112 | |
| Mercury General | | | 7,800 | | | | 380,094 | |
| ProAssurance | | | 9,300 | | | | 336,102 | |
| | | | | | | | 3,197,994 | |
See Notes to the Financial Statements
Schedule of Investments – Continued
December 31, 2019
Capital Appreciation Fund
Description | | Shares | | | Value | |
COMMON STOCKS – 75.9% (Continued) | | | | | | |
| | | | | | | |
| Real Estate – 2.5% | | | | | | |
| Four Corners Property Trust | | | 13,048 | | | $ | 367,823 | |
| Howard Hughes* | | | 2,950 | | | | 374,060 | |
| | | | | | | | 741,883 | |
| Reinsurance – 3.5% | | | | | | | | |
| RenaissanceRe Holdings | | | 5,289 | | | | 1,036,750 | |
| | | | | | | | | |
| Total Common Stocks | | | | | | | | |
| (Cost $16,288,193) | | | | | | | 22,288,145 | |
| | | | | | | | | |
| | | Par | | | | | |
| CONVERTIBLE BONDS – 18.1% | | | | | | | | |
| | | | | | | | | |
| Communication Services – 2.3% | | | | | | | | |
| Liberty Media | | | | | | | | |
| 2.125%, 03/31/2048 (a) | | $ | 636,300 | | | | 669,388 | |
| | | | | | | | | |
| Consumer Discretionary – 0.5% | | | | | | | | |
| Booking Holdings | | | | | | | | |
| 0.900%, 09/15/2021 | | | 127,000 | | | | 146,352 | |
| | | | | | | | | |
| Healthcare – 1.9% | | | | | | | | |
| Ligand Pharmaceuticals | | | | | | | | |
| 0.750%, 05/15/2023 | | | 631,000 | | | | 544,578 | |
| | | | | | | | | |
| Industrials – 2.2% | | | | | | | | |
| Chart Industries | | | | | | | | |
| 1.000%, 11/15/2024 (a) | | | 384,000 | | | | 504,613 | |
| Kaman | | | | | | | | |
| 3.250%, 05/01/2024 | | | 127,000 | | | | 152,019 | |
| | | | | | | | 656,632 | |
| Information Technology – 8.4% | | | | | | | | |
| Akamai Technologies | | | | | | | | |
| 0.125%, 05/01/2025 | | | 639,000 | | | | 705,933 | |
| Palo Alto Networks | | | | | | | | |
| 0.750%, 07/01/2023 | | | 441,000 | | | | 486,419 | |
| Synaptics | | | | | | | | |
| 0.500%, 06/15/2022 | | | 368,500 | | | | 408,587 | |
| Verint Systems | | | | | | | | |
| 1.500%, 06/01/2021 | | | 810,000 | | | | 871,587 | |
| | | | | | | | 2,472,526 | |
See Notes to the Financial Statements
Schedule of Investments – Continued
December 31, 2019
Capital Appreciation Fund
Description | | Par | | | Value | |
CONVERTIBLE BONDS – 18.1% (Continued) | | | | | | |
| | | | | | | |
| Real Estate – 2.8% | | | | | | |
| Forestar Group | | | | | | |
| 3.750%, 03/01/2020 | | $ | 825,000 | | | $ | 825,051 | |
| | | | | | | | | |
| Total Convertible Bonds | | | | | | | | |
| (Cost $4,964,504) | | | | | | | 5,314,527 | |
| | | | | | | | | |
| CORPORATE BOND – 1.4% | | | | | | | | |
| | | | | | | | | |
| Information Technology – 1.4% | | | | | | | | |
| FLIR Systems | | | | | | | | |
| 3.125%, 06/15/2021 | | | | | | | | |
| (Cost $404,581) | | | 400,000 | | | | 403,250 | |
| | | | | | | | | |
| | | Shares | | | | | |
| SHORT-TERM INVESTMENT – 4.7% | | | | | | | | |
| Invesco Treasury Portfolio, 1.496%^ | | | | | | | | |
| (Cost $1,379,033) | | | 1,379,033 | | | | 1,379,033 | |
| Total Investments – 100.1% | | | | | | | | |
| (Cost $23,036,311) | | | | | | | 29,384,955 | |
| Other Assets and Liabilities, Net – (0.1)% | | | | | | | (13,739 | ) |
| Total Net Assets – 100.0% | | | | | | $ | 29,371,216 | |
| * | | Non-income producing security |
| (a) | | Security purchased within the terms of a private placement memorandum, exempt from registration under Rule 144A of the Securities Act of 1933, as amended, and may be sold only to dealers in that program or other “qualified institutional buyers.” As of December 31, 2019, the value of these investments was $1,174,001 or 4.0% of total net assets. |
| ^ | | The rate shown is the seven-day yield effective December 31, 2019. |
ADR – American Depositary Receipt
The industry classifications included in the Schedule of Investments are in accordance with the Global Industry Classification Standard (GICS®) and were developed by and/or are the exclusive property of MSCI, Inc. (MSCI) and Standard & Poor Financial Services LLC (S&P). GICS is a service mark of MSCI and S&P and has been licensed for use by U.S. Bank Global Fund Services.
See Notes to the Financial Statements
Schedule of Investments
December 31, 2019
Opportunity Fund
Description | | Shares | | | Value | |
| COMMON STOCKS – 92.2% | | | | | | |
| | | | | | | |
| Banks – 15.2% | | | | | | |
| Bank of N.T. Butterfield & Son | | | 51,700 | | | $ | 1,913,934 | |
| Brookline Bancorp | | | 70,800 | | | | 1,165,368 | |
| Central Pacific Financial | | | 52,900 | | | | 1,564,782 | |
| Central Valley Community Bancorp | | | 31,200 | | | | 676,104 | |
| Citigroup | | | 13,870 | | | | 1,108,074 | |
| Comerica | | | 12,200 | | | | 875,350 | |
| Dime Community Bancshares | | | 54,400 | | | | 1,136,416 | |
| Fifth Third Bancorp | | | 45,300 | | | | 1,392,522 | |
| HarborOne Bancorp* | | | 133,294 | | | | 1,464,901 | |
| HomeTrust Bancshares | | | 33,490 | | | | 898,537 | |
| Kearny Financial | | | 101,526 | | | | 1,404,105 | |
| KeyCorp | | | 128,500 | | | | 2,600,840 | |
| OceanFirst Financial | | | 66,200 | | | | 1,690,748 | |
| PCSB Financial | | | 70,800 | | | | 1,433,700 | |
| Waterstone Financial | | | 78,000 | | | | 1,484,340 | |
| Western New England Bancorp | | | 96,935 | | | | 933,484 | |
| | | | | | | | 21,743,205 | |
| Consumer Discretionary – 6.8% | | | | | | | | |
| Darden Restaurants | | | 15,600 | | | | 1,700,556 | |
| eBay | | | 54,700 | | | | 1,975,217 | |
| Home Depot | | | 10,200 | | | | 2,227,476 | |
| Hyatt Hotels, Class A | | | 13,400 | | | | 1,202,114 | |
| Noodles & Company* | | | 305,304 | | | | 1,691,384 | |
| William Hill | | | 370,400 | | | | 924,602 | |
| | | | | | | | 9,721,349 | |
| Consumer Staples – 10.8% | | | | | | | | |
| Carlsberg A/S, Class B | | | 6,100 | | | | 909,984 | |
| Church & Dwight | | | 28,400 | | | | 1,997,656 | |
| Colgate-Palmolive | | | 32,000 | | | | 2,202,880 | |
| JM Smucker | | | 10,950 | | | | 1,140,223 | |
| Mondelez International, Class A | | | 34,000 | | | | 1,872,720 | |
| Nestle | | | 24,400 | | | | 2,641,695 | |
| Swedish Match | | | 63,000 | | | | 3,247,412 | |
| Tootsie Roll Industries | | | 40,468 | | | | 1,381,578 | |
| | | | | | | | 15,394,148 | |
See Notes to the Financial Statements
Schedule of Investments – Continued
December 31, 2019
Opportunity Fund
Description | | Shares | | | Value | |
COMMON STOCKS – 92.2% (Continued) | | | | | | |
| | | | | | | |
| Diversified Financial Services – 4.2% | | | | | | |
| CBOE Global Markets | | | 10,500 | | | $ | 1,260,000 | |
| Federated Investors, Class B | | | 59,700 | | | | 1,945,623 | |
| Franklin Resources | | | 32,600 | | | | 846,948 | |
| Invesco | | | 48,100 | | | | 864,838 | |
| Jefferies Financial Group | | | 50,500 | | | | 1,079,185 | |
| | | | | | | | 5,996,594 | |
| Energy – 4.3% | | | | | | | | |
| Devon Energy | | | 27,000 | | | | 701,190 | |
| Hess | | | 35,100 | | | | 2,345,031 | |
| Noble Energy | | | 58,200 | | | | 1,445,688 | |
| Schlumberger | | | 42,200 | | | | 1,696,440 | |
| | | | | | | | 6,188,349 | |
| Healthcare – 3.6% | | | | | | | | |
| AstraZeneca – ADR | | | 13,700 | | | | 683,082 | |
| Johnson & Johnson | | | 5,200 | | | | 758,524 | |
| Medtronic | | | 14,000 | | | | 1,588,300 | |
| Merck & Co. | | | 23,048 | | | | 2,096,215 | |
| | | | | | | | 5,126,121 | |
| Industrials – 5.1% | | | | | | | | |
| CIRCOR International* | | | 18,900 | | | | 873,936 | |
| Landstar System | | | 8,750 | | | | 996,363 | |
| Moog | | | 12,200 | | | | 1,041,026 | |
| Pentair | | | 40,900 | | | | 1,876,083 | |
| Powell Industries | | | 14,183 | | | | 694,825 | |
| Regal Beloit | | | 21,400 | | | | 1,832,054 | |
| | | | | | | | 7,314,287 | |
| Information Technology – 10.1% | | | | | | | | |
| FARO Technologies* | | | 36,500 | | | | 1,837,775 | |
| FLIR Systems | | | 43,100 | | | | 2,244,217 | |
| Leidos Holdings | | | 23,450 | | | | 2,295,520 | |
| Littelfuse | | | 8,400 | | | | 1,606,920 | |
| Maxim Integrated Products | | | 35,600 | | | | 2,189,756 | |
| Microsoft | | | 10,500 | | | | 1,655,850 | |
| Paychex | | | 24,450 | | | | 2,079,717 | |
| Xilinx | | | 5,250 | | | | 513,293 | |
| | | | | | | | 14,423,048 | |
See Notes to the Financial Statements
Schedule of Investments – Continued
December 31, 2019
Opportunity Fund
Description | | Shares | | | Value | |
COMMON STOCKS – 92.2% (Continued) | | | | | | |
| | | | | | | |
| Insurance Brokers – 5.0% | | | | | | |
| Arthur J. Gallagher & Co. | | | 11,400 | | | $ | 1,085,622 | |
| Brown & Brown | | | 153,450 | | | | 6,058,206 | |
| | | | | | | | 7,143,828 | |
| Life & Health Insurance – 6.5% | | | | | | | | |
| Aflac | | | 26,300 | | | | 1,391,270 | |
| Globe Life | | | 46,000 | | | | 4,841,500 | |
| Primerica | | | 12,150 | | | | 1,586,304 | |
| Voya Financial | | | 23,700 | | | | 1,445,226 | |
| | | | | | | | 9,264,300 | |
| Materials – 3.2% | | | | | | | | |
| Domtar | | | 9,700 | | | | 370,928 | |
| Kinross Gold* | | | 97,100 | | | | 460,254 | |
| Newmont Goldcorp | | | 75,500 | | | | 3,280,475 | |
| Victoria Gold* | | | 59,186 | | | | 385,301 | |
| | | | | | | | 4,496,958 | |
| Property & Casualty Insurance – 12.3% | | | | | | | | |
| Axis Capital Holdings | | | 49,100 | | | | 2,918,504 | |
| Cincinnati Financial | | | 11,150 | | | | 1,172,422 | |
| Employers Holdings | | | 48,200 | | | | 2,012,350 | |
| Hanover Insurance Group | | | 17,150 | | | | 2,343,890 | |
| Kemper | | | 23,300 | | | | 1,805,750 | |
| Lancashire Holdings | | | 203,300 | | | | 2,065,477 | |
| Mercury General | | | 60,500 | | | | 2,948,165 | |
| ProAssurance | | | 17,600 | | | | 636,064 | |
| Selective Insurance Group | | | 24,550 | | | | 1,600,415 | |
| | | | | | | | 17,503,037 | |
| Real Estate – 1.5% | | | | | | | | |
| Cousins Properties | | | 32,723 | | | | 1,348,188 | |
| Howard Hughes* | | | 5,900 | | | | 748,120 | |
| | | | | | | | 2,096,308 | |
| Reinsurance – 3.6% | | | | | | | | |
| RenaissanceRe Holdings | | | 26,050 | | | | 5,106,321 | |
| | | | | | | | | |
| Total Common Stocks | | | | | | | | |
| (Cost $100,014,615) | | | | | | | 131,517,853 | |
See Notes to the Financial Statements
Schedule of Investments – Continued
December 31, 2019
Opportunity Fund
Description | | Par | | | Value | |
| CONVERTIBLE BOND – 0.3% | | | | | | |
| | | | | | | |
| Real Estate – 0.3% | | | | | | |
| Forestar Group | | | | | | |
| 3.750%, 03/01/2020 | | | | | | |
| (Cost $450,908) | | $ | 450,000 | | | $ | 450,028 | |
| | | | | | | | | |
| | | Shares | | | | | |
| SHORT-TERM INVESTMENT – 7.1% | | | | | | | | |
| Invesco Treasury Portfolio, 1.496%^ | | | | | | | | |
| (Cost $10,177,189) | | | 10,177,189 | | | | 10,177,189 | |
| Total Investments – 99.6% | | | | | | | | |
| (Cost $110,642,712) | | | | | | | 142,145,070 | |
| Other Assets and Liabilities, Net – 0.4% | | | | | | | 539,440 | |
| Total Net Assets – 100.0% | | | | | | $ | 142,684,510 | |
| * | | Non-income producing security |
| ^ | | The rate shown is the seven-day yield effective December 31, 2019. |
ADR – American Depositary Receipt
The industry classifications included in the Schedule of Investments are in accordance with the Global Industry Classification Standard (GICS®) and were developed by and/or are the exclusive property of MSCI, Inc. and Standard & Poor Financial Services LLC (S&P). GICS is a service mark of MSCI and S&P and has been licensed for use by U.S. Bank Global Fund Services.
See Notes to the Financial Statements
Statements of Assets and Liabilities
December 31, 2019
| | | Capital Appreciation Fund | | | Opportunity Fund | |
| ASSETS: | | | | | | |
| Investments, at market value | | | | | | |
| (Cost of $23,036,311 and $110,642,712, respectively) | | $ | 29,384,955 | | | $ | 142,145,070 | |
| Receivable for dividends and interest | | | 50,164 | | | | 186,888 | |
| Receivable for capital shares sold | | | 67 | | | | 541,617 | |
| Receivable for investments sold | | | 62,979 | | | | — | |
| Prepaid expenses | | | 10,898 | | | | 20,877 | |
| Total assets | | | 29,509,063 | | | | 142,894,452 | |
| | | | | | | | | |
| LIABILITIES: | | | | | | | | |
| Payable for capital shares redeemed | | | — | | | | 20,000 | |
| Payable for investments purchased | | | 61,272 | | | | — | |
| Payable to Adviser, net | | | 5,728 | | | | 83,045 | |
| Payable for administration fees | | | 8,835 | | | | 23,883 | |
| Payable for audit & tax fees | | | 46,862 | | | | 46,862 | |
| Accrued distribution fees | | | 1,344 | | | | 9,257 | |
| Accrued expenses and other liabilities | | | 13,806 | | | | 26,895 | |
| Total liabilities | | | 137,847 | | | | 209,942 | |
| | | | | | | | | |
| NET ASSETS | | $ | 29,371,216 | | | $ | 142,684,510 | |
| | | | | | | | | |
| COMPOSITION OF NET ASSETS: | | | | | | | | |
| Portfolio capital | | $ | 22,624,750 | | | $ | 109,743,824 | |
| Total distributable earnings | | | 6,746,466 | | | | 32,940,686 | |
| Total net assets | | $ | 29,371,216 | | | $ | 142,684,510 | |
| | | | | | | | | |
CAPITAL STOCK, $0.001 par value | | | | | | | | |
| Authorized | | | 500,000,000 | | | | 500,000,000 | |
| Issued and outstanding | | | 1,561,992 | | | | 6,432,704 | |
| | | | | | | | | |
| NET ASSET VALUE, REDEMPTION PRICE, | | | | | | | | |
| AND OFFERING PRICE PER SHARE | | $ | 18.80 | | | $ | 22.18 | |
See Notes to the Financial Statements
Statements of Operations
For the Year Ended December 31, 2019
| | | Capital Appreciation Fund | | | Opportunity Fund | |
| INVESTMENT INCOME: | | | | | | |
| Interest income | | $ | 98,632 | | | $ | 156,369 | |
| Dividend income | | | 470,542 | | | | 2,909,159 | |
| Less: Foreign taxes withheld | | | (5,371 | ) | | | (12,737 | ) |
| Total investment income | | | 563,803 | | | | 3,052,791 | |
| | | | | | | | | |
| EXPENSES: | | | | | | | | |
| Investment advisory fees | | | 299,362 | | | | 1,393,812 | |
| Administration fees | | | 55,040 | | | | 139,107 | |
| Audit & tax fees | | | 46,859 | | | | 46,859 | |
| Fund accounting fees | | | 41,381 | | | | 48,775 | |
| Transfer agent fees | | | 25,097 | | | | 51,260 | |
| Registration fees | | | 24,791 | | | | 29,620 | |
| Distribution fees | | | 13,512 | | | | 90,576 | |
| Legal fees | | | 11,880 | | | | 57,118 | |
| Directors’ fees | | | 11,172 | | | | 50,899 | |
| Custodian fees | | | 6,515 | | | | 9,397 | |
| Other expenses | | | 6,511 | | | | 21,336 | |
| Postage and printing fees | | | 2,553 | | | | 13,498 | |
| Total expenses | | | 544,673 | | | | 1,952,257 | |
| Less: Fee waivers | | | (185,326 | ) | | | (278,377 | ) |
| Total net expenses | | | 359,347 | | | | 1,673,880 | |
| NET INVESTMENT INCOME | | | 204,456 | | | | 1,378,911 | |
| | | | | | | | | |
| REALIZED AND UNREALIZED GAINS: | | | | | | | | |
| Net realized gain on investments | | | 2,027,696 | | | | 5,973,772 | |
| Net change in unrealized | | | | | | | | |
| appreciation/depreciation of investments | | | 3,298,601 | | | | 21,649,594 | |
| Net gain on investments | | | 5,326,297 | | | | 27,623,366 | |
| NET INCREASE IN NET ASSETS | | | | | | | | |
| RESULTING FROM OPERATIONS | | $ | 5,530,753 | | | $ | 29,002,277 | |
See Notes to the Financial Statements
Statements of Changes in Net Assets
| | | Capital Appreciation Fund | |
| | | Year Ended | | | Year Ended | |
| | | December 31, 2019 | | | December 31, 2018 | |
| OPERATIONS: | | | | | | |
| Net investment income | | $ | 204,456 | | | $ | 180,678 | |
| Net realized gain on investments | | | 2,027,696 | | | | 794,617 | |
| Net change in unrealized appreciation/ | | | | | | | | |
| depreciation of investments | | | 3,298,601 | | | | (1,752,060 | ) |
| Net increase (decrease) resulting from operations | | | 5,530,753 | | | | (776,765 | ) |
| | | | | | | | | |
| CAPITAL SHARE TRANSACTIONS: | | | | | | | | |
| Proceeds from shares sold | | | 123,779 | | | | 85,822 | |
| Proceeds from reinvestment of distributions | | | 1,541,077 | | | | 1,050,298 | |
| Payments for shares redeemed | | | (1,297,679 | ) | | | (848,281 | ) |
| Net increase from capital share transactions | | | 367,177 | | | | 287,839 | |
| | | | | | | | | |
| DISTRIBUTIONS PAID TO SHAREHOLDERS | | | (1,706,127 | ) | | | (1,096,660 | ) |
| | | | | | | | | |
| TOTAL INCREASE (DECREASE) IN NET ASSETS | | | 4,191,803 | | | | (1,585,586 | ) |
| | | | | | | | | |
| NET ASSETS: | | | | | | | | |
| Beginning of year | | | 25,179,413 | | | | 26,764,999 | |
| End of year | | $ | 29,371,216 | | | $ | 25,179,413 | |
| | | | | | | | | |
| TRANSACTIONS IN SHARES: | | | | | | | | |
| Shares sold | | | 6,939 | | | | 4,959 | |
| Shares issued in reinvestment of distributions | | | 84,489 | | | | 64,753 | |
| Shares redeemed | | | (70,708 | ) | | | (46,542 | ) |
| Net increase | | | 20,720 | | | | 23,170 | |
See Notes to the Financial Statements
Statements of Changes in Net Assets
| | | Opportunity Fund | |
| | | Year Ended | | | Year Ended | |
| | | December 31, 2019 | | | December 31, 2018 | |
| OPERATIONS: | | | | | | |
| Net investment income | | $ | 1,378,911 | | | $ | 1,119,160 | |
| Net realized gain on investments | | | 5,973,772 | | | | 7,722,717 | |
| Net change in unrealized appreciation/ | | | | | | | | |
| depreciation of investments | | | 21,649,594 | | | | (14,581,541 | ) |
| Net increase (decrease) resulting from operations | | | 29,002,277 | | | | (5,739,664 | ) |
| | | | | | | | | |
| CAPITAL SHARE TRANSACTIONS: | | | | | | | | |
| Proceeds from shares sold | | | 15,922,060 | | | | 20,253,107 | |
| Proceeds from reinvestment of distributions | | | 5,660,674 | | | | 7,888,798 | |
| Payments for shares redeemed | | | (15,972,405 | ) | | | (16,227,515 | ) |
| Redemption fees | | | 1,272 | | | | 4,959 | |
| Net increase from capital share transactions | | | 5,611,601 | | | | 11,919,349 | |
| | | | | | | | | |
| DISTRIBUTIONS PAID TO SHAREHOLDERS | | | (6,180,425 | ) | | | (8,537,974 | ) |
| | | | | | | | | |
| TOTAL INCREASE (DECREASE) IN NET ASSETS | | | 28,433,453 | | | | (2,358,289 | ) |
| | | | | | | | | |
| NET ASSETS: | | | | | | | | |
| Beginning of year | | | 114,251,057 | | | | 116,609,346 | |
| End of year | | $ | 142,684,510 | | | $ | 114,251,057 | |
| | | | | | | | | |
| TRANSACTIONS IN SHARES: | | | | | | | | |
| Shares sold | | | 745,627 | | | | 958,762 | |
| Shares issued in reinvestment of distributions | | | 264,517 | | | | 430,611 | |
| Shares redeemed | | | (763,386 | ) | | | (796,796 | ) |
| Net increase | | | 246,758 | | | | 592,577 | |
See Notes to the Financial Statements
Financial Highlights
| | | Capital Appreciation Fund | |
| | | Year Ended December 31, | |
| | | 2019 | | | 2018 | | | 2017 | | | 2016 | | | 2015 | |
| For a Fund share outstanding | | | | | | | | | | | | | | | |
| throughout the year | | | | | | | | | | | | | | | |
| | | | | | | | | | | | | | | | |
| NET ASSET VALUE: | | | | | | | | | | | | | | | |
| Beginning of year | | $ | 16.34 | | | $ | 17.63 | | | $ | 16.80 | | | $ | 14.84 | | | $ | 15.61 | |
| | | | | | | | | | | | | | | | | | | | | |
| OPERATIONS: | | | | | | | | | | | | | | | | | | | | |
| Net investment income | | | 0.14 | | | | 0.12 | | | | 0.09 | | | | 0.22 | | | | 0.21 | |
| Net realized and unrealized | | | | | | | | | | | | | | | | | | | | |
| gain (loss) on investments | | | 3.47 | | | | (0.67 | ) | | | 1.82 | | | | 1.96 | | | | (0.60 | ) |
| Total from operations | | | 3.61 | | | | (0.55 | ) | | | 1.91 | | | | 2.18 | | | | (0.39 | ) |
| | | | | | | | | | | | | | | | | | | | | |
| LESS DISTRIBUTIONS: | | | | | | | | | | | | | | | | | | | | |
| From net investment income | | | (0.12 | ) | | | (0.12 | ) | | | (0.09 | ) | | | (0.22 | ) | | | (0.37 | ) |
| From net realized gains | | | (1.03 | ) | | | (0.62 | ) | | | (0.99 | ) | | | — | | | | (0.01 | ) |
| Total distributions | | | (1.15 | ) | | | (0.74 | ) | | | (1.08 | ) | | | (0.22 | ) | | | (0.38 | ) |
| | | | | | | | | | | | | | | | | | | | | |
| NET ASSET VALUE: | | | | | | | | | | | | | | | | | | | | |
| End of year | | $ | 18.80 | | | $ | 16.34 | | | $ | 17.63 | | | $ | 16.80 | | | $ | 14.84 | |
| | | | | | | | | | | | | | | | | | | | | |
| TOTAL RETURN | | | 22.33 | % | | | (3.07 | )% | | | 11.38 | % | | | 14.68 | % | | | (2.52 | )% |
| | | | | | | | | | | | | | | | | | | | | |
| SUPPLEMENTAL DATA AND RATIOS: | | | | | | | | | | | | | | | | | | | | |
| Net assets, end of year (in thousands) | | $ | 29,371 | | | $ | 25,179 | | | $ | 26,765 | | | $ | 25,663 | | | $ | 24,328 | |
| Ratio of expenses to average net assets: | | | | | | | | | | | | | | | | | | | | |
| Before expense reimbursement | | | 1.95 | % | | | 1.97 | % | | | 2.02 | % | | | 2.06 | % | | | 1.88 | % |
| After expense reimbursement | | | 1.29 | % | | | 1.30 | % | | | 1.30 | % | | | 1.30 | % | | | 1.30 | % |
| Ratio of net investment income (loss) | | | | | | | | | | | | | | | | | | | | |
| to average net assets: | | | | | | | | | | | | | | | | | | | | |
| Before expense reimbursement | | | 0.08 | % | | | (0.00 | )% | | | (0.23 | )% | | | 0.58 | % | | | 0.47 | % |
| After expense reimbursement | | | 0.74 | % | | | 0.67 | % | | | 0.49 | % | | | 1.34 | % | | | 1.05 | % |
| Portfolio turnover rate | | | 25 | % | | | 28 | % | | | 23 | % | | | 32 | % | | | 35 | % |
See Notes to the Financial Statements
Financial Highlights
| | | Opportunity Fund | |
| | | Year Ended December 31, | |
| | | 2019 | | | 2018 | | | 2017 | | | 2016 | | | 2015 | |
| For a Fund share outstanding | | | | | | | | | | | | | | | |
| throughout the year | | | | | | | | | | | | | | | |
| | | | | | | | | | | | | | | | |
| NET ASSET VALUE: | | | | | | | | | | | | | | | |
| Beginning of year | | $ | 18.47 | | | $ | 20.85 | | | $ | 20.17 | | | $ | 17.29 | | | $ | 20.75 | |
| | | | | | | | | | | | | | | | | | | | | |
| OPERATIONS: | | | | | | | | | | | | | | | | | | | | |
| Net investment income | | | 0.23 | | | | 0.19 | | | | 0.11 | | | | 0.13 | | | | 0.14 | |
| Net realized and unrealized | | | | | | | | | | | | | | | | | | | | |
| gain (loss) on investments | | | 4.49 | | | | (1.11 | ) | | | 1.98 | | | | 3.50 | | | | 0.18 | |
| Total from operations | | | 4.72 | | | | (0.92 | ) | | | 2.09 | | | | 3.63 | | | | 0.32 | |
| | | | | | | | | | | | | | | | | | | | | |
| LESS DISTRIBUTIONS: | | | | | | | | | | | | | | | | | | | | |
| From net investment income | | | (0.23 | ) | | | (0.19 | ) | | | (0.10 | ) | | | (0.22 | ) | | | (0.17 | ) |
| From net realized gains | | | (0.78 | ) | | | (1.27 | ) | | | (1.31 | ) | | | (0.53 | ) | | | (3.61 | ) |
| Total distributions | | | (1.01 | ) | | | (1.46 | ) | | | (1.41 | ) | | | (0.75 | ) | | | (3.78 | ) |
| | | | | | | | | | | | | | | | | | | | | |
| NET ASSET VALUE: | | | | | | | | | | | | | | | | | | | | |
| End of year | | $ | 22.18 | | | $ | 18.47 | | | $ | 20.85 | | | $ | 20.17 | | | $ | 17.29 | |
| | | | | | | | | | | | | | | | | | | | | |
| TOTAL RETURN | | | 25.73 | % | | | (4.38 | )% | | | 10.33 | % | | | 21.02 | % | | | 1.33 | % |
| | | | | | | | | | | | | | | | | | | | | |
| SUPPLEMENTAL DATA AND RATIOS: | | | | | | | | | | | | | | | | | | | | |
| Net assets, end of year (in thousands) | | $ | 142,685 | | | $ | 114,251 | | | $ | 116,609 | | | $ | 106,542 | | | $ | 86,128 | |
| Ratio of expenses to average net assets: | | | | | | | | | | | | | | | | | | | | |
| Before expense reimbursement | | | 1.50 | % | | | 1.53 | % | | | 1.58 | % | | | 1.59 | % | | | 1.61 | % |
| After expense reimbursement | | | 1.29 | % | | | 1.30 | % | | | 1.30 | % | | | 1.30 | % | | | 1.30 | % |
| Ratio of net investment income | | | | | | | | | | | | | | | | | | | | |
| to average net assets: | | | | | | | | | | | | | | | | | | | | |
| Before expense reimbursement | | | 0.85 | % | | | 0.66 | % | | | 0.23 | % | | | 0.41 | % | | | 0.28 | % |
| After expense reimbursement | | | 1.06 | % | | | 0.89 | % | | | 0.51 | % | | | 0.70 | % | | | 0.59 | % |
| Portfolio turnover rate | | | 27 | % | | | 39 | % | | | 26 | % | | | 42 | % | | | 36 | % |
See Notes to the Financial Statements
Notes to the Financial Statements
December 31, 2019
1. ORGANIZATION
Prospector Funds, Inc. (the “Corporation”) was organized as a Maryland corporation on June 6, 2007 and is registered under the Investment Company Act of 1940 (the “1940 Act”), as amended, as an open-end diversified management investment company. The Corporation issues its shares in series, each series representing a distinct portfolio with its own investment objectives and policies. There are two series presently authorized, the Prospector Capital Appreciation Fund and the Prospector Opportunity Fund (individually a “Fund” and collectively the “Funds”). Each Fund is an investment company and accordingly follows the investment company accounting and reporting guidance of the Financial Accounting Standards Board (“FASB”) Accounting Standard Board Codification Topic 946 Financial Services – Investment Companies. The Funds commenced operations on September 28, 2007.
2. FAIR VALUE MEASUREMENT
The following is a summary of significant accounting policies consistently followed by each Fund:
Security Valuation – The Fund has adopted fair value accounting standards which establish an authoritative definition of fair value and set out a hierarchy for measuring fair value. These standards require additional disclosures about the various inputs and valuation techniques used to develop the measurements of fair value, a discussion in changes in valuation techniques and related inputs during the period and expanded disclosure of valuation levels for major security types. These inputs are summarized in the three broad levels listed below:
| Level 1 – | Unadjusted quoted prices in active markets for identical assets or liabilities that the Fund has the ability to access. |
| | |
| Level 2 – | Observable inputs other than quoted prices included in Level 1 that are observable for the asset or liability, either directly or indirectly. These inputs may include quoted prices for the identical instrument on an inactive market, prices for similar instruments, interest rates, prepayment speeds, credit risk, yield curves, default rates, discounts and similar data. |
| | |
| Level 3 – | Unobservable inputs for the asset or liability, to the extent relevant observable inputs are not available, representing the Fund’s own assumptions about the assumptions a market participant would use in valuing the asset or liability, and would be based on the best information available. |
Following is a description of the valuation techniques applied to the Fund’s major categories of assets and liabilities measured at fair value on a recurring basis. The Fund’s investments are carried at fair value.
Common Stock – Securities that are primarily traded on a national securities exchange are valued at the last sale price on the exchange on which they are primarily traded on the day of valuation or, if there has been no sale on such day, at the last bid price on the day of valuation. To the extent these securities are actively traded and valuation adjustments are not applied, they are categorized in Level 1 of the fair value hierarchy.
Convertible and Corporate Bonds – Convertible and corporate bonds, including listed issues, are valued at fair value on the basis of valuations furnished by an independent pricing service which utilizes both dealer-supplied valuations and formula-based techniques. The pricing service may consider recently executed transactions in securities of the issuer or comparable issuers, market price quotations (where observable), bond spreads, and fundamental data relating to the issuer. Convertible and corporate bonds are generally categorized in Level 2 of the fair value hierarchy.
Notes to the Financial Statements – Continued
December 31, 2019
Investment Companies – Investments in open-end mutual funds, including money market funds, are valued at their net asset value per share. To the extent these securities are actively traded and valuation adjustments are not applied, they are categorized in Level 1 of the fair value hierarchy.
Securities for which market quotations are not readily available, or if the closing price does not represent fair value, are valued following procedures approved by the Funds’ board of directors. These procedures consider many factors, including the type of security, size of holding, trading volume and news events. There can be no assurance that the Fund could obtain the fair value assigned to a security if they were to sell the security at approximately the time at which the Fund determines their net asset values per share.
The inputs or methodology used for valuing securities are not an indication of the risk associated with investing in those securities.
As of December 31, 2019, each Fund’s investments in securities were classified as follows:
| | | Level 1 | | | Level 2 | | | Level 3 | | | Total | |
| Capital Appreciation Fund | | | | | | | | | | | | |
| Common Stocks | | $ | 22,288,145 | | | $ | — | | | $ | — | | | $ | 22,288,145 | |
| Convertible Bonds | | | — | | | | 5,314,527 | | | | — | | | | 5,314,527 | |
| Corporate Bonds | | | — | | | | 403,250 | | | | — | | | | 403,250 | |
| Short-Term Investment | | | 1,379,033 | | | | — | | | | — | | | | 1,379,033 | |
| Total Investments | | $ | 23,667,178 | | | $ | 5,717,777 | | | $ | — | | | $ | 29,384,955 | |
| | | | | | | | | | | | | | | | | |
| | | Level 1 | | | Level 2 | | | Level 3 | | | Total | |
| Opportunity Fund | | | | | | | | | | | | | | | | |
| Common Stocks | | $ | 131,517,853 | | | $ | — | | | $ | — | | | $ | 131,517,853 | |
| Convertible Bond | | | — | | | | 450,028 | | | | — | | | | 450,028 | |
| Short-Term Investment | | | 10,177,189 | | | | — | | | | — | | | | 10,177,189 | |
| Total Investments | | $ | 141,695,042 | | | $ | 450,028 | | | $ | — | | | $ | 142,145,070 | |
There were no level 3 investments held as of and during the year ended December 31, 2019.
Refer to each Fund’s Schedule of Investments for further sector breakout.
The Funds may invest in derivative financial instruments in order to manage risk or gain exposure to various other investments or markets. The Funds’ investment objectives allow the Funds to enter into various types of derivative contracts, including, but not limited to, futures contracts, forward foreign exchange contracts, and purchased and written options. Derivatives may contain various risks including the potential inability of the counterparty to fulfill their obligations under the terms of the contract, the potential for an illiquid secondary market, and the potential for market movements which may expose the funds to gains or losses in excess of the amounts shown on the Statements of Assets and Liabilities. As of and for the year ended December 31, 2019, the Funds held no derivative instruments.
3. SIGNIFICANT ACCOUNTING POLICIES
Distributions to Shareholders – Dividends from net investment income and distributions of net realized capital gains, if any, will be declared and paid at least annually. The character of distributions made during the period from net investment income or net realized gains may differ from the characterization for federal income tax purposes due to differences in the recognition of income, expense and gain items for financial statement and tax purposes. All net short-term capital gains are included in ordinary income for tax purposes.
Notes to the Financial Statements – Continued
December 31, 2019
Use of Estimates – The preparation of financial statements in conformity with accounting principles generally accepted in the United States of America (“U.S. GAAP”) requires management to make estimates and assumptions that affect the reported amounts of assets and liabilities and disclosure of contingent assets and liabilities at the date of the financial statements and the reported amounts of revenues and expenses during the reporting period. Actual results could differ from those estimates.
Federal Income Taxes – The Funds intend to meet the requirements of subchapter M of the Internal Revenue Code applicable to regulated investment companies and to distribute substantially all net taxable investment income and net realized gains to shareholders in a manner which results in no tax cost to the Funds. Therefore, no federal income or excise tax provision is required. As of December 31, 2019, the Funds did not have any tax positions that did not meet the “more-likely-than-not” threshold of being sustained by the applicable tax authority. Generally, each of the tax years in the four-year period ended December 31, 2019 remains subject to examination by taxing authorities.
Reclassification of Capital Accounts – U.S. GAAP requires that certain components of net assets relating to permanent differences be reclassified between financial and tax reporting. These reclassifications have no effect on net assets or net asset value per share. For the fiscal year ended December 31, 2019, there were no reclassifications made on the Statements of Assets and Liabilities.
Foreign Currency Translation – The books and records relating to the Funds’ non-U.S. dollar denominated investments are maintained in U.S. dollars on the following bases: (1) market value of investment securities, assets, and liabilities are translated at the current rate of exchange; and (2) purchases and sales of investment securities, income, and expenses are translated at the relevant rates of exchange prevailing on the respective dates of such transactions. The Funds do not isolate the portion of gains and losses on investments in equity securities that is due to changes in the foreign exchange rates from that which is due to changes in market prices of equity securities. The Funds report certain foreign currency-related transactions as components of realized gains for financial reporting purposes, whereas such components are treated as ordinary income for federal income tax purposes.
Illiquid or Restricted Securities – A security may be considered illiquid if it lacks a readily available market. Securities are generally considered liquid if they can be sold or disposed of in the ordinary course of business within seven days at approximately the price at which the security is valued by the Fund. Illiquid securities may be valued under methods approved by the Funds’ board of directors as reflecting fair value. Each Fund intends to invest no more than 15% of its total assets in illiquid securities. Certain restricted securities may be considered illiquid. Restricted securities are often purchased in private placement transactions, are not registered under the Securities Act of 1933, may have contractual restrictions on resale, and may be valued under methods approved by the Funds’ board of directors as reflecting fair value. Certain restricted securities eligible for resale to qualified institutional investors, including Rule 144A securities, are not subject to the limitation on a Fund’s investment in illiquid securities if they are determined to be liquid in accordance with procedures adopted by the Funds’ board of directors. At December 31, 2019, the Funds had no investments in illiquid securities.
Expenses – Expenses directly attributable to a Fund are charged to that Fund, while expenses attributable to more than one Fund are allocated among the respective Funds based on relative net assets or another appropriate basis.
Other – Investment and shareholder transactions are recorded on the trade date. Each Fund determines the gain or loss realized from the investment transactions on the basis of identified cost. Dividend income is recognized on the ex-dividend date. Interest income, including amortization of bond premium and discount, is recognized on an accrual basis.
Notes to the Financial Statements – Continued
December 31, 2019
New Accounting Pronouncements and Other Matters – In March 2017, the FASB issued ASU No. 2017-08, Premium Amortization on Purchased Callable Debt Securities, which amends the accounting standards to shorten the amortization period of certain purchased callable debt securities to the earliest call date. The ASU is effective for fiscal years and interim periods within those fiscal years beginning after December 15, 2018. The Funds have adopted the new amendment as of January 1, 2019. This adoption of the ASU did not have a material impact on the financial statements and did not impact net assets of the Funds.
Subsequent Events – Management of the Funds has evaluated fund related events and transactions that occurred subsequent to December 31, 2019, through the date of issuance of the Funds’ financial statements. There were no events or transactions that occurred during this period that materially impacted the amounts or disclosures in the Funds’ financial statements.
4. INVESTMENT TRANSACTIONS, DISTRIBUTABLE EARNINGS, AND DISTRIBUTIONS PAID
During the year ended December 31, 2019, purchases of securities and proceeds from sales of securities, other than temporary investments in short-term securities, were as follows:
| | Purchases | Sales | |
| Capital Appreciation Fund | $ 6,613,041 | $ 8,483,894 | |
| Opportunity Fund | 33,402,022 | 38,451,443 | |
There were no purchases or sales of long-term U.S. Government securities.
The aggregate gross unrealized appreciation and depreciation of securities held by the Funds and the total cost of securities for federal income tax purposes at December 31, 2019, were as follows:
| | Aggregate | Aggregate | Net | Federal | |
| | Gross | Gross | Appreciation/ | Income | |
| | Appreciation | Depreciation | (Depreciation) | Tax Cost | |
| Capital Appreciation Fund | $ 6,452,809 | $ (210,437) | $ 6,242,372 | $ 23,142,804 | |
| Opportunity Fund | 33,092,790 | (1,715,088) | 31,377,702 | 110,766,081 | |
The difference between book-basis and tax-basis unrealized appreciation is attributable primarily to wash sales and differences in book and tax accounting methods for certain securities.
At December 31, 2019, the components of accumulated earnings (deficit) on a tax-basis were as follows:
| | Undistributed | Undistributed | Other | | Total | |
| | Ordinary | Long-Term | Accumulated | Unrealized | Distributable | |
| | Income | Capital Gains | Losses | Appreciation | Earnings | |
| Capital Appreciation Fund | $ 19,309 | $ 488,770 | $(3,985) | $ 6,242,372 | $ 6,746,466 | |
| Opportunity Fund | 120,695 | 1,445,504 | (3,215) | 31,377,702 | 32,940,686 | |
As of December 31, 2019, the Funds did not have any capital loss carryovers. A regulated investment company may elect for any taxable year to treat any portion of any qualified late year loss as arising on the first day of the next taxable year. Qualified late year losses are certain capital and ordinary losses which occur during the portion of the Fund’s taxable year subsequent to October 31. The Funds did not defer any late year losses.
Notes to the Financial Statements – Continued
December 31, 2019
The tax character of distributions paid during the fiscal year ended December 31, 2019 were as follows:
| | Ordinary | Long Term | | |
| | Income* | Capital Gains** | Total | |
| Capital Appreciation Fund | $ 224,121 | $1,482,006 | $1,706,127 | |
| Opportunity Fund | 1,420,190 | 4,760,235 | 6,180,425 | |
The tax character of distributions paid during the fiscal year ended December 31, 2018 were as follows:
| | Ordinary | Long Term | | |
| | Income* | Capital Gains** | Total | |
| Capital Appreciation Fund | $ 229,872 | $ 866,788 | $1,096,660 | |
| Opportunity Fund | 1,257,291 | 7,280,683 | 8,537,974 | |
| * | | For federal income tax purposes, distributions of short-term capital gains are included in ordinary income distributions. |
| ** | | Funds designate long-term capital gain dividends pursuant to IRC Sec. 852(b)(3)(C). |
5. AGREEMENTS
The Funds have entered into an Investment Advisory Agreement with Prospector Partners Asset Management, LLC (the “Adviser”), with whom certain directors and officers of the Corporation are affiliated, to furnish investment advisory services to the Funds. Pursuant to this Agreement, the Adviser is entitled to receive an advisory fee, calculated daily and payable monthly, at the annual rate of 1.00% as applied to each Fund’s average daily net assets. Prior to September 19, 2019, the advisory fee was at an annual rate of 1.10% as applied to each Fund’s average daily net assets.
The Adviser has contractually agreed to waive a portion of its management fee and reimburse each Fund’s expenses (excluding interest, acquired fund fees and expenses, brokerage commission, and extraordinary expenses) to the extent necessary to ensure that each Fund’s operating expenses do not exceed 1.25% of its average daily net assets. Prior to September 19, 2019, the limit on operating expenses was 1.30% of each Funds average daily net assets. Fees waived and expenses reimbursed by the Adviser may be recouped by the Adviser for a period of three fiscal years following the fiscal year during which such waiver or reimbursement was made if such recoupment can be achieved without exceeding the expense limit in effect at the time the waiver or reimbursement occurred. As of December 31, 2019, the Adviser did not recoup any previously waived fees or reimbursed expenses. The Fee Waiver and Expense Limitation Agreement will be in effect through at least September 30, 2020. Waived fees and reimbursed expenses subject to potential recovery by year of expiration are as follows:
| Expiration | | Capital Appreciation Fund | | | Opportunity Fund | |
| 12/31/20 | | $ | 186,958 | | | $ | 302,782 | |
| 12/31/21 | | | 182,097 | | | | 286,686 | |
| 12/31/22 | | | 185,326 | | | | 278,377 | |
| Total | | $ | 554,381 | | | $ | 867,845 | |
As of December 31, 2019, it was possible, but not probable, those amounts would be recovered by the Adviser. At the end of each fiscal year in the future, the Funds will continue to assess the potential recovery of waived/reimbursed fees and expenses for financial reporting purposes.
Notes to the Financial Statements – Continued
December 31, 2019
Quasar, a subsidiary of U.S. Bancorp, serves as distributor of the Funds’ shares pursuant to a Distribution Agreement with the Corporation. Each Fund’s shares are sold on a no-load basis and, therefore, Quasar receives no sales commission or sales load for providing services to the Funds. The Corporation has adopted a plan pursuant to Rule 12b-1 under the 1940 Act (the “12b-1 Plan”), which authorizes the Corporation to reimburse Quasar and certain financial intermediaries who assist in distributing each Fund’s shares or who provide shareholder services to Fund shareholders a distribution and/or shareholder servicing fee of up to 0.25% of each Fund’s average daily net assets (computed on an annual basis). All or a portion of the fee may be used by the Funds or Quasar to pay the Fund’s distribution fees and costs of printing reports and prospectuses for potential investors and the costs of other distribution and shareholder services expenses. During the year ended December 31, 2019, the Capital Appreciation Fund and Opportunity Fund incurred expenses of $13,512 and $90,576 respectively, pursuant to the 12b-1 Plan.
U.S. Bancorp Fund Services, LLC, doing business as U.S. Bank Global Fund Services serves as transfer agent, administrator and fund accountant for the Funds. U.S. Bank N.A. serves as custodian for the Funds.
6. INDEMNIFICATIONS
The Funds enter into contracts that contain a variety of indemnifications. The Funds’ maximum exposure under these arrangements is unknown. However, the Funds have not had prior claims or losses pursuant to these contracts and expect the risk of loss to be remote.
Report of Independent Registered Public Accounting Firm
To the Shareholders and the Board of Directors of Prospector Funds, Inc.
Opinion on the Financial Statements
We have audited the accompanying statements of assets and liabilities of Prospector Funds, Inc. (the “Corporation”) (comprising the Prospector Capital Appreciation Fund and Prospector Opportunity Fund (collectively referred to as the “Funds”)), including the schedules of investments, as of December 31, 2019, and the related statements of operations for the year then ended, the statements of changes in net assets for each of the two years in the period then ended, the financial highlights for each of the five years in the period then ended and the related notes (collectively referred to as the “financial statements”). In our opinion, the financial statements present fairly, in all material respects, the financial position of each of the Funds comprising Prospector Funds, Inc. at December 31, 2019, the results of their operations for the year then ended, the changes in their net assets for each of the two years in the period then ended and their financial highlights for each of the five years in the period then ended, in conformity with U.S. generally accepted accounting principles.
Basis for Opinion
These financial statements are the responsibility of the Corporation’s management. Our responsibility is to express an opinion on each of the Funds’ financial statements based on our audits. We are a public accounting firm registered with the Public Company Accounting Oversight Board (United States) (“PCAOB”) and are required to be independent with respect to the Corporation in accordance with the U.S. federal securities laws and the applicable rules and regulations of the Securities and Exchange Commission and the PCAOB.
We conducted our audits in accordance with the standards of the PCAOB. Those standards require that we plan and perform the audit to obtain reasonable assurance about whether the financial statements are free of material misstatement, whether due to error or fraud. The Corporation is not required to have, nor were we engaged to perform, an audit of the Corporation’s internal control over financial reporting. As part of our audits we are required to obtain an understanding of internal control over financial reporting but not for the purpose of expressing an opinion on the effectiveness of the Corporation’s internal control over financial reporting. Accordingly, we express no such opinion.
Our audits included performing procedures to assess the risks of material misstatement of the financial statements, whether due to error or fraud, and performing procedures that respond to those risks. Such procedures included examining, on a test basis, evidence regarding the amounts and disclosures in the financial statements. Our procedures included confirmation of securities owned as of December 31, 2019, by correspondence with the custodian and brokers. Our audits also included evaluating the accounting principles used and significant estimates made by management, as well as evaluating the overall presentation of the financial statements. We believe that our audits provide a reasonable basis for our opinion.
We have served as the auditor of one or more Prospector Funds, Inc. investment companies since 2007.
Minneapolis, Minnesota
February 25, 2020
Additional Information (Unaudited)
December 31, 2019
BOARD APPROVAL OF INVESTMENT ADVISORY AGREEMENT
The Corporation’s independent directors (the “directors”) unanimously approved the continuance of the Investment Advisory Agreement (the “Advisory Agreement”) between the Funds and Prospector Partners Asset Management, LLC (the “Advisor”) at a Board of Director’s meeting held on September 5, 2019.
In preparation for the meeting, the directors had requested from the Advisor and evaluated a memorandum providing certain information requested by the Board pursuant to Section 15(c) of the 1940 Act, including (i) expense, compliance and other information as it relates to the Advisor; (ii) performance of other accounts managed by its affiliate Prospector Partners, LLC with similar investment objectives derived from data compiled by the Advisor and (iii) expense and other information for other registered investment companies with similar investment objectives derived from data compiled by the Advisor based upon comparative peer groups selected in consultation with the independent directors. Prior to voting, the directors reviewed the proposed approval of the Advisory Agreement with management and with counsel to the Corporation and reviewed a memorandum from such counsel discussing the legal standards for their consideration of the proposed approval. In reaching their determinations relating to approval of the continuance of the Advisory Agreement, the directors considered all factors they believed relevant including the following:
| | 1. | | the nature, extent and quality of investment, and other services to be rendered by the Advisor; |
| | 2. | | payments to be received by the Advisor from all sources with respect to the Funds; |
| | 3. | | comparative fee and expense data for the Funds and other investment companies with similar investment objectives; |
| | 4. | | the extent to which economies of scale may be realized as the Funds grow and whether fee levels reflect these economies of scale for the benefit of investors; |
| | 5. | | the Advisor’s policies and practices regarding allocation of portfolio transactions of the Funds, including the extent to which the Advisor may benefit from soft dollar arrangements; |
| | 6. | | fall-out benefits which the Advisor and its affiliates may receive from their relationships to the Funds; |
| | 7. | | information about fees charged by the Advisor to other clients with similar investment objectives; |
| | 8. | | the professional experience and qualifications of the Funds’ portfolio managers and other senior personnel of the Advisor; |
| | 9. | | profitability of the Advisor; and |
| | 10. | | the terms of the Advisory Agreement. |
The directors also considered their overall confidence in the integrity and competence of the Advisor and its investment team. In their deliberations, the directors did not identify any particular information that was all-important or controlling, and each director attributed different weights to the various factors. The directors determined that the overall arrangements between the Funds and the Advisor, as provided in the Advisory Agreement, were fair and reasonable in light of the services performed, expenses expected to be incurred and such other matters as the directors considered relevant in the exercise of their reasonable judgment.
The material factors and conclusions that formed the basis for the directors reaching their determinations to approve the continuance of the Advisory Agreement (including their determinations that the Advisor should be the investment adviser for the Funds, and that the fees payable to the Advisor pursuant to the Advisory Agreement, taking into consideration the proposed reduction in fees, continue to be appropriate) were separately discussed by the directors.
Additional Information (Unaudited) – Continued
December 31, 2019
Nature, extent and quality of services provided by the Advisor
The directors noted that, under the Advisory Agreement, the Advisor, subject to the control of the directors, administers the Funds’ business and other affairs. The directors also noted that the Advisor manages the investment of the assets of the Funds, including making purchases and sales of portfolio securities consistent with each Fund’s investment objective and policies.
The directors considered the scope and quality of services provided by the Advisor under the Advisory Agreement, the cyclical nature of value investing, the quality of the investment research capabilities of the Advisor and the other resources it proposes to dedicate to performing services for the Funds and the Advisor’s active management style. The directors also considered the portfolio managers’ experience, reputation and investment philosophy noting that the Advisor’s investment style and stock selection process have remained consistent even in difficult market environments. The quality of administrative and other services also were considered. The directors concluded that, overall, they continue to be satisfied with the nature, extent and quality of services proposed to be provided to the Funds under the Advisory Agreement.
Advisor Fees; Performance of the Fund
The directors considered the advisory fee rate paid by the Funds to the Advisor and information prepared by the Advisor based upon the peer groups selected with the input of the independent directors concerning fee rates paid by other comparable funds. The directors recognized that it is difficult to make comparisons of advisory fees because there are variations in the services that are included in the fees paid by other funds, but determined that the proposed reduction in the advisory fee rate from 1.10% to 1.00% was in line with other comparable funds.
The directors also considered the performance of each Fund compared to each Fund’s benchmarks and peer groups. The directors noted that the Opportunity Fund outperformed its peers across the one-year, three-year, five-year, ten-year and since inception time periods, further noting the Opportunity Fund’s number two ranking since inception. The Directors noted that the Capital Appreciation Fund outperformed the peer group average for the periods since inception, one-year, three-year and five-year periods. The directors concluded that the advisory fee rate, taking into account performance and the other factors mentioned, was in line with comparable funds.
Other Fund Expenses
The directors also considered the total expense ratio of the Funds in comparison to the fees and expenses of the funds included in their respective peer groups. The directors noted that the expense ratios of some of the comparable funds were lower because of waivers or reimbursements by those funds’ investment advisers, which in some cases were voluntary and perhaps temporary. In particular, the directors noted that the Advisor’s fee waiver/expense reimbursement pursuant to the Fee Waiver and Expenses Reimbursement Agreement was contractual in nature and customary for the industry. Taking into consideration the proposed reduction in the fee waiver/expense reimbursement rate from 1.30% to 1.25%, the directors concluded that the Funds’ expense ratio was reasonable. Finally, the directors noted that there may be economies of scale as the Funds grow and concluded that it may be appropriate to consider those issues in the future.
Additional Information (Unaudited) – Continued
December 31, 2019
Advisor Profitability
The directors noted that the Advisor also provides the Funds with such office space, administrative and other services (exclusive of, and in addition to, any such services provided by any other retained by the Funds) and executive and other personnel as are necessary for the Funds’ operations. The directors considered that the Advisor pays all of the compensation of the officers of the Company that are affiliated persons of the Advisor, pays a portion of the insurance costs and paid the cost of the organization of the Funds (without reimbursement), through its affiliate, Prospector Partners, LLC.
The directors also noted that the Advisor has contractually agreed to waive, through September 30, 2020, its management fee and/or reimburse each Fund’s other expenses to the extent necessary to ensure that each Fund’s operating expenses do not exceed 1.30% of its average daily net assets and proposed to lower this to 1.25% of its average daily net assets effective September 19, 2019. Under the terms of the Fee Waiver and Expense Reimbursement Agreement at the present asset levels of the Funds, the Advisor has received only a portion of its earned management fee. It was also noted that the Advisor does not receive “fall out” benefits commonly received by managers of mutual funds that provide transfer agency, distribution or printing services in-house. The directors considered the expenses of the Advisor and the services provided by the Advisor and that the Advisor expects to be cash flow positive after considering an allocation of expenses from its affiliated advisor, Prospector Partners, LLC and before considering any allocation of income to the owners of the affiliated advisor.
Additional Information (Unaudited) – Continued
December 31, 2019
AVAILABILITY OF FUND PORTFOLIO INFORMATION
The Funds file complete schedules of portfolio holdings with the SEC for the first and third quarters of each fiscal year on Form N-Q or Part F of Form N-PORT (beginning with filings after March 31, 2020), which is available on the SEC’s website at www.sec.gov. The Funds’ Form N-Q or Part F of Form N-PORT may be reviewed and copied at the SEC’s Public Reference Room in Washington, D.C. For information on the Public Reference Room call 1-800-SEC-0330. In addition, the Funds’ Form N-Q or Part F of Form N-PORT is available without charge upon request by calling 1-877-734-7862.
AVAILABILITY OF PROXY VOTING INFORMATION
A description of the Funds’ Proxy Voting Policies and Procedures is available without charge, upon request, by calling 1-877-734-7862. Information regarding how the Funds voted proxies relating to portfolio securities during the most recent 12 month period ended June 30, is available (1) without charge, upon request, by calling 1-877-734-7862, or (2) on the SEC’s website at www.sec.gov.
QUALIFIED DIVIDEND INCOME/DIVIDENDS RECEIVED DEDUCTION
For the fiscal year ended December 31, 2019, certain dividends paid by the Funds may be reported as qualified dividend income and may be eligible for taxation at capital gain rates. The percentage of dividends declared from ordinary income designated as qualified dividend income was 100% and 100% for the Capital Appreciation Fund and Opportunity Fund, respectively.
For corporate shareholders, the percent of ordinary income distributions qualifying for the corporate dividends received deduction for the fiscal year ended December 31, 2019 was 100% and 100% for the Capital Appreciation Fund and Opportunity Fund, respectively.
ADDITIONAL INFORMATION APPLICABLE TO FOREIGN SHAREHOLDERS ONLY
The percent of ordinary income distributions designated as interest related dividends for the fiscal year ended December 31, 2019 was 21.58% and 5.15% for the Capital Appreciation Fund and Opportunity Fund, respectively.
The percent of ordinary income distributions designated as short-term capital gain distributions under Internal Revenue Section 871(k)(2)(C) for the fiscal year ended December 31, 2019 was 18.06% and 2.60% for the Capital Appreciation Fund and Opportunity Fund, respectively.
Additional Information (Unaudited)
December 31, 2019
DIRECTORS & OFFICERS TABLE
| | | Term of | | Number of | |
| | | Office | | Portfolios | Other |
| | | and | Principal | in Fund | Directorships |
| Name, | | Length | Occupation | Complex | Served |
| Year of Birth | | of Time | During Past | Overseen | During Past |
| and Address^ | Position | Served* | 5 Years | by Director | 5 Years |
| Independent Board Members |
| | | | | | |
| Harvey D. Hirsch* | Director | Indefinite; | Retired. | 2 | None. |
| Year of Birth: 1941 | | Since | | | |
| | | September 7, | | | |
| | | 2007 | | | |
| | | | | | |
| Joseph Klein III* | Director | Indefinite; | Managing Director of Gauss | 2 | Ionis |
| Year of Birth: 1961 | | Since | Capital Advisors, LLC, | | Pharmaceuticals, |
| | | September 7, | a financial consulting and | | Inc.; Akcea |
| | | 2007 | investment advisory firm | | Therapeutics, |
| | | | focused on biopharmaceuticals | | Inc. |
| | | | since he founded the company | | |
| | | | in March 1998. | | |
| | | | | | |
| Roy L. Nersesian* | Director | Indefinite; | Professor of the Leon Hess | 2 | None. |
| Year of Birth: 1939 | | Since | School of Business, Monmouth | | |
| | | September 7, | University, since September 1985. | | |
| | | 2007 | Adjunct Professor of the Center | | |
| | | | for Energy and Marine | | |
| | | | Transportation, Columbia | | |
| | | | University, since September 2000. | | |
| | | | | | |
| John T. Rossello, Jr.* | Director | Indefinite; | Retired. | 2 | None. |
| Year of Birth: 1951 | | Since | | | |
| | | September 7, | | | |
| | | 2007 | | | |
Additional Information (Unaudited) – Continued
December 31, 2019
| | | Term of | | Number of | |
| | | Office | | Portfolios | Other |
| | | and | Principal | in Fund | Directorships |
| Name, | | Length | Occupation | Complex | Served |
| Year of Birth | | of Time | During Past | Overseen | During Past |
| and Address^ | Position | Served* | 5 Years | by Director | 5 Years |
| Interested Board Members and Officers |
| | | | | | |
| John D. Gillespie†* | Director | Indefinite; | Managing member of | 2 | White |
| Year of Birth: 1959 | President | Since | the Investment Manager. | | Mountains |
| | | September 7, | Managing member of | | Insurance |
| | | 2007 | Prospector Partners, LLC, | | Group, Ltd. |
| | | | an affiliate of the Investment | | |
| | | | Manager, and portfolio | | |
| | | | manager of the investment | | |
| | | | funds sponsored by Prospector | | |
| | | | Partners, LLC since 1997. | | |
| | | | | | |
| Kevin R. O’Brien | Executive | Indefinite; | Portfolio Manager at | N/A | None. |
| Year of Birth: 1963 | Vice | Since | the Investment Manager. | | |
| | President | September 7, | Portfolio Manager at | | |
| | | 2007 | Prospector Partners, LLC | | |
| | | | since April 2003. | | |
| | | | | | |
| Jason A. Kish | Executive | Indefinite; | Portfolio Manager at | N/A | None. |
| Year of Birth: 1973 | Vice | Since | the Investment Manager. | | |
| | President | February, | Director of Research | | |
| | | 2013 | since 2010. | | |
| | | | | | |
| Peter N. Perugini, Jr. | Secretary | Indefinite; | Chief Financial Officer at | N/A | None. |
| Year of Birth: 1970 | Treasurer | Secretary | Prospector Partners, LLC | | |
| | | Since | since 2000. | | |
| | | September 7, | | | |
| | | 2007 | | | |
| | | Indefinite; | | | |
| | | Treasurer | | | |
| | | Since | | | |
| | | June 6, | | | |
| | | 2007 | | | |
Additional Information (Unaudited) – Continued
December 31, 2019
| | | Term of | | Number of | |
| | | Office | | Portfolios | Other |
| | | and | Principal | in Fund | Directorships |
| Name, | | Length | Occupation | Complex | Served |
| Year of Birth | | of Time | During Past | Overseen | During Past |
| and Address^ | Position | Served* | 5 Years | by Director | 5 Years |
| Kim Just | Chief | Indefinite; | Chief Compliance Officer at | N/A | None. |
| Year of Birth: 1967 | Compliance | Since | Prospector Partners, LLC | | |
| | Officer | September 7, | since March 2006. | | |
| | | 2007 | | | |
| | | | | | |
| Benjamin Eirich | Assistant | Indefinite; | Assistant Vice President, U.S. | N/A | None. |
| Year of Birth: 1981 | Secretary | Since | Bancorp Fund Services, LLC | | |
| | | September 5, | a mutual fund service provider, | | |
| | | 2019 | since June 2008. | | |
| ^ | The address for all directors and officers is 370 Church Street, Guilford, Connecticut 06437. |
| * | Each of the Company’s directors was elected by written consent of the sole shareholder of the Funds on September 7, 2007. |
| † | John D. Gillespie is an interested director of the Fund because he is also the managing member of the Investment Manager. |
DIRECTORS
John D. Gillespie
Harvey D. Hirsch
Joseph Klein III
Roy L. Nersesian
John T. Rossello, Jr.
INVESTMENT ADVISER
Prospector Partners Asset Management, LLC
370 Church Street
Guilford, CT 06437
DISTRIBUTOR
Quasar Distributors, LLC
777 East Wisconsin Avenue
Milwaukee, WI 53202
CUSTODIAN
U.S. Bank, N.A.
1555 North River Center Drive
Milwaukee, WI 53212
ADMINISTRATOR AND TRANSFER AGENT
U.S. Bancorp Fund Services, LLC
Third Floor
615 East Michigan Street
Milwaukee, WI 53202
INDEPENDENT REGISTERED PUBLIC ACCOUNTING FIRM
Ernst & Young LLP
220 South Sixth Street, Suite 1400
Minneapolis, MN 55402
LEGAL COUNSEL
Seward & Kissel LLP
One Battery Plaza
New York, NY 10004
This report must be accompanied or preceded by a prospectus.
The Funds’ Statement of Additional Information contains additional information about the
Funds’ directors and is available without charge upon request by calling 1-877-734-7862.
Item 2. Code of Ethics.
The registrant has adopted a code of ethics that applies to the registrant’s principal executive officer and principal financial officer. The registrant has not made any substantive amendments to its code of ethics during the period covered by this period.
The registrant has not granted any waivers from any provisions of the code of ethics during the period covered by this report.
A copy of the registrant’s code of ethics that applies to the registrant’s principal executive officer and principal financial officer is filed herewith.
Item 3. Audit Committee Financial Expert.
The registrant’s board of directors has determined that there is at least one audit committee financial expert serving on its audit committee. John Rossello, Jr. is the “audit committee financial expert” and is considered to be “independent” as each term is defined in Item 3 of Form N‑CSR.
Item 4. Principal Accountant Fees and Services.
The registrant has engaged its principal accountant to perform audit services, audit-related services, tax services and other services during the past two fiscal periods. “Audit services” refer to performing an audit of the registrant's annual financial statements or services that are normally provided by the accountant in connection with statutory and regulatory filings or engagements for the past fiscal year. “Audit-related services” refer to the assurance and related services by the principal accountant that are reasonably related to the performance of the audit. “Tax services” refer to professional services rendered by the principal accountant for tax compliance, tax advice, and tax planning, including reviewing the Fund’s tax returns and distribution calculations. The following table details the aggregate fees billed or expected to be billed for each of the last two fiscal periods for audit fees, audit-related fees, tax fees and other fees by the principal accountant.
| | FYE 12/31/2019 | FYE 12/31/2018 |
Audit Fees | $82,400 | $80,000 |
Audit-Related Fees | $0 | $0 |
Tax Fees | $11,330 | $11,000 |
All Other Fees | $0 | $0 |
| | | |
The audit committee has adopted pre-approval policies and procedures that require the audit committee to pre‑approve all audit and non‑audit services that exceed $5,000 for the registrant. All of the principal accountant’s hours spent on auditing the registrant’s financial statements were attributed to work performed by full‑time permanent employees of the principal accountant.
The audit committee noted that as indicated in the table below, for the registrant’s prior two fiscal periods, no fees were billed by the registrant’s independent public accountants in connection with non-audit services rendered to the registrant’s investment adviser, and any entity controlling, controlled by, or under common control with the investment adviser that provides ongoing services to the registrant.
Non-Audit Related Fees | FYE 12/31/2019 | FYE 12/31/2018 |
Registrant | $0 | $0 |
Registrant’s Investment Adviser | $0 | $0 |
Item 5. Audit Committee of Listed Registrants.
Not applicable to open-end investment companies.
Item 6. Schedule of Investments.
Schedule of Investments is included as part of the report to shareholders filed under Item 1 of this Form.
Item 7. Disclosure of Proxy Voting Policies and Procedures for Closed-End Management Investment Companies.
Not applicable to open-end investment companies.
Item 8. Portfolio Managers of Closed-End Management Investment Companies.
Not applicable to open-end investment companies.
Item 9. Purchases of Equity Securities by Closed‑End Management Investment Company and Affiliated Purchases.
Not applicable to open-end investment companies.
Item 10. Submission of Matters to a Vote of Security Holders.
Not Applicable.
Item 11. Controls and Procedures.
(a) | The Registrant’s President and Treasurer have reviewed the Registrant's disclosure controls and procedures (as defined in Rule 30a-3(c) under the Investment Company Act of 1940 (the “Act”)) as of a date within 90 days of the filing of this report, as required by Rule 30a-3(b) under the Act and Rules 13a-15(b) or 15d‑15(b) under the Securities Exchange Act of 1934. Based on their review, such officers have concluded that the disclosure controls and procedures are effective in ensuring that information required to be disclosed in this report is appropriately recorded, processed, summarized and reported and made known to them by others within the Registrant and by the Registrant’s service provider. |
(b) | There were no significant changes in the Registrant's internal control over financial reporting (as defined in Rule 30a-3(d) under the Act) that occurred during the period covered by this report that has materially affected, or is reasonably likely to materially affect, the Registrant's internal control over financial reporting. |
Item 12. Disclosure of Securities Lending Activities for Closed-End Management Investment Companies
Not applicable to open-end investment companies.
Item 13. Exhibits.
| (a) | (1) Any code of ethics or amendment thereto, that is the subject of the disclosure required by Item 2, to the extent that the registrant intends to satisfy Item 2 requirements through filing an exhibit. Filed herewith. |
(2) A separate certification for each principal executive officer and principal financial officer pursuant to Section 302 of the Sarbanes-Oxley Act of 2002. Filed herewith.
(3) Any written solicitation to purchase securities under Rule 23c‑1 under the Act sent or given during the period covered by the report by or on behalf of the registrant to 10 or more persons. Not applicable to open-end investment companies.
(4) Change in the registrant’s independent public accountant. There was no change in the registrant’s independent public accountant for the period covered by this report.
| (b) | Certifications pursuant to Section 906 of the Sarbanes‑Oxley Act of 2002. Furnished herewith. |
SIGNATURES
Pursuant to the requirements of the Securities Exchange Act of 1934 and the Investment Company Act of 1940, the registrant has duly caused this report to be signed on its behalf by the undersigned, thereunto duly authorized.
(Registrant) Prospector Funds, Inc.
By (Signature and Title)* /s/John D. Gillespie
John D. Gillespie, President
Date March 6, 2020
Pursuant to the requirements of the Securities Exchange Act of 1934 and the Investment Company Act of 1940, this report has been signed below by the following persons on behalf of the registrant and in the capacities and on the dates indicated.
By (Signature and Title)* /s/John D. Gillespie
John D. Gillespie, President
Date March 6, 2020
By (Signature and Title)* /s/Peter N. Perugini, Jr.
Peter N. Perugini, Jr., Treasurer
Date March 6, 2020
* Print the name and title of each signing officer under his or her signature.