Prospector Capital Appreciation Fund
Prospector Opportunity Fund
| | Annual Report |
| | |
| www.prospectorfunds.com | December 31, 2016 |
PROSPECTOR FUNDS, INC.
February 7, 2017
Dear Shareholders of the Prospector Capital Appreciation Fund and Prospector Opportunity Fund,
The Donald Trump election has changed the equity investing landscape considerably. The centerpiece of the U.S. government’s strategy to manage the economy for the last decade has been monetary policy, essentially pegging the price of money near zero and supplementing that with quantitative easing to keep the yield curve from steepening sharply. Those days are over for now. The old strategy served its purpose during the aftermath of the great financial crisis but delivered diminishing returns in recent years with prominent unintended side effects such as disproportionately helping the rich get richer through financial asset inflation and exporting the benefits of easy monetary conditions to emerging market economies. President Trump and the Republican-controlled congress seem keen to substitute fiscal policy as the dominant tool for managing the U.S. economy for the foreseeable future. The elements of fiscal policy most likely include tax cuts for individuals (except for the top 1%) and corporations, plus a lower tax rate for the repatriation of cash held offshore by U.S. companies. Also on the agenda is an infrastructure spending program to rebuild roads, bridges, airports, tunnels, and ports. These fiscal policies will likely bring a sharper domestic focus and rekindle the faint embers of inflation. The abandonment of the dominant decade-long monetary policy also likely signals the end of the outperformance of “bond substitute,” high-yielding equities which enjoyed a long tailwind under the old “lower for longer” consensus.
Foreign policy conditions also are shifting noticeably. In Asia, President Trump’s rhetoric has called into question the notion of the One China policy, which has ruffled feathers in Beijing as well as with the old hands of the U.S. diplomatic corps. Our withdrawal from the TPP fulfills a campaign promise, but leaves our historical allies in the region uneasy. Unsettling Europe, President Trump has stated he believes NATO is obsolete. His natural allies there include the new UK Prime Minister, Theresa May, elected after the surprise Brexit vote last June as well as leaders of the emerging populist opposition parties who are poised to make election runs in France and the Netherlands this year. Regarding the Middle East, President Trump is on record favoring a move of the U.S. Embassy to Jerusalem from Tel Aviv, a provocative endorsement of President Netanyahu’s plan to relocate the Israeli capital to the ancient city. Finally closer to home, President Trump vows to renegotiate NAFTA. We’re moving forward with plans to build a wall along the Mexican border (which Mexico will theoretically pay for) and discouraging imports from Mexico with threats of tariffs. Simultaneously we are fast-tracking pipeline builds to facilitate energy imports from Canada. In our professional careers managing equity assets, we have not witnessed such broad uncertainty with respect to U.S. foreign relations policy.
In summary, the fiscal policy initiatives make good sense in theory. They have contributed importantly to an increase in business confidence and driven a stock market rally since the election (the Trump bump). The details of these plans will be revealed over the coming months, giving investors much to digest. The rhetoric on trade and foreign policy is unsettling. There too details will emerge that will shape our conclusions.
Financials Update
Meanwhile, the best performing sector during the Trump bump has been financials, with the S&P Financials up 20% in an up 8% S&P 500 since election night. Investors moved quickly to add beaten down financial stocks to their portfolios in anticipation of higher rates and reduced financial regulatory burdens. Recall that financials were the worst performing sector of the S&P 500 for the ten year period ending September 2016, down 15% in absolute terms while the overall S&P 500 rose 100% in that same period. The reasoning was simple, return on equity (ROE) compression due to falling interest rates lowered returns and regulatory rules raised equity requirements. Given the recent sharp rally in the sector accompanied by a slew of Wall Street analysts urging caution towards the shares, it makes sense to put the rally in perspective.
PROSPECTOR FUNDS, INC.
For example, take KeyCorp (KEY), the Cleveland-based regional bank and a position in the Opportunity Fund. In the five years prior to the financial crisis, KEY averaged an impressive mid-teens ROE which was driven by a 362 basis point net interest margin, a 6.7% capital ratio and a 0.54% non-performing assets ratio. Since the crisis, KEY has been a casualty of U.S. economic and Fed policy - with all the aforementioned ratios significantly impacted. By 2016, KEY’s net interest margin fell to 292 basis points, and the capital ratio expanded to 8.1%. As a result, the ROE has slid to 6.2%. Not surprisingly the valuation, as measured by price to tangible book, contracted as well from pre-crisis levels of 1.7x-2.7x to levels as low as 0.9x in early 2016. Since election night, KEY has rallied 27% and the price to tangible book and price to earnings ratios have risen to 1.8x and 14x 2017 estimated earnings, respectively. These valuation levels have not been seen in five years for KEY, so should we sell? Not so fast. While investments rarely move straight in one direction and it would not surprise us at all if the market in general, and financial stocks in particular, consolidate or even correct in the near term given the sharpness of the recent rally. When we examine the potential impact of rising interest rates on the net interest margin, an uptick in the loan/deposit ratio and a reduction of the corporate tax rate, we can sensibly construct a scenario where earnings per share can rise 40-50% from the current level. Additionally, KEY has an impressive noninterest income profile which has grown over 20% in the past three years, partly driven by their growing investment banking unit and we believe this growth trend will continue. Finally, the acquisition of First Niagara has added significant scale to KEY along with introducing many synergy opportunities. No single action is dependent upon another. If KEY executes reasonably well, the shares could easily command a much higher price to tangible book valuation as its history demonstrates. This looks like a relatively low risk, solid return investment proposition to us, even from the higher valuation post Trump bump.
Property-Casualty: M&A is Back
After a flurry of merger and acquisition activity in 2015, this year had gotten off to a slow start in terms of property-casualty company deals. Recall that takeovers have represented an important catalyst to realize value from our investment process. Happily, the tide seems to be turning. In October, Endurance Specialty Holdings (ENH – a top three position in both the Prospector Opportunity Fund and Prospector Capital Appreciation Fund) agreed to be acquired by Sompo Holdings. Two other deals made headlines this quarter – Liberty Mutual announced an acquisition of Ironshore, for 1.5x tangible book value (TBV), and Fairfax Financial announced its acquisition of Allied World Assurance for 1.6x TBV. The strategic industry buyers in these transactions were not “new” buyers, nor are they likely done acquiring. As we have written about previously, the drivers of consolidation are compelling and remain in place. Additionally, underwriting profitability challenges are increasing, due to a sustained weakness in pricing, the prospect for loss inflation, and declining benefits from favorable reserve development on business written in prior years. The list of buyers continues to include foreign insurers (particularly Asian-based companies), historically-successful acquirers (Fairfax, Liberty Mutual, Markel, Alleghany, to name a few), and potentially even, “non-traditional” buyers (pension funds and asset managers).
We suspect that recent macro developments may accelerate the consummation of deals. Prospects for corporate tax reform increase the potential earnings accretion. Higher interest rates, and the Fed’s estimates for additional rate increases, make funding acquisitions with debt potentially more expensive as time passes. Comparatively impressive GDP growth in the U.S., and persistent U.S. dollar relative strength, should keep foreign companies interested.
Many of the positions in both Funds incorporate our view on the likelihood of that company being a buyer or a seller. The prospect of a transaction is rarely the primary reason for ownership; we maintain our focus on finding attractive opportunities amongst companies with conservatively-stated balance sheets and/or under-valued fran-
PROSPECTOR FUNDS, INC.
chises and situations. We are particularly attracted to investments with those attributes AND the prospect of a premium realization (we like to have more than one way to win). Therefore, your portfolio includes companies with unique skill-sets (e.g., 3rd party asset management), dominant market position and limited growth opportunities, as well as respected franchises in relatively better businesses. We continue to believe that the private market value for the companies in your portfolio exceeds their current publicly-traded prices.
Prospector Opportunity Fund Highlights
The Prospector Opportunity Fund appreciated 21.02% during the year ended December 31, 2016. This compares favorably to the 13.80% rise in the Russell Midcap Total Return Index, but was just behind the 21.31% gain in the Russell 2000 Total Return Index. The Fund’s largest sector, financial services was the largest contributor to the solid result. Performance in this sector was positively impacted by the acquisition of Endurance Specialty as well as strong gains from names that benefit from deregulation and rising interest rates. Important contributors included HomeTrust, OceanFirst, Primerica, and KeyCorp. Among our top ten contributors were two oil price rebound beneficiaries, Powell and Circor, as well as Newmont Mining, which benefited from the rebound in gold prices.
2016 was an excellent year for bank stock investing, with the KBW Regional Bank Index advancing 39%. A core Prospector approach to bank stock investing is to own smaller, overcapitalized depository institutions who offer a limited set of products and services in a well-defined geography. We can bring our bottom-up disciplined analytical approach to bear on these companies and glean insights that lead to solid investment decisions. This strategy has served us well over many years as our holdings have participated in the consolidation of the banking sector as sellers. Strong post-election performance was due to the fact that smaller banks should benefit from the economic agenda proposed by the Trump administration. First, most of our bank holdings are relatively full tax payers, so any reduction in corporate taxes would have a positive impact. Second, regulations have placed a proportionately large burden on these institutions due to their smaller size. Last, many of our holdings have large amounts of excess capital that could be deployed into an environment where spreads are wider and lending opportunities are more plentiful.
Key detractors from Fund performance were holdings in the consumer discretionary and healthcare sectors. While our stocks outperformed their respective sector holdings within the Russell Midcap index, they were the two worst performing sectors.
One of our largest purchases during the second half of 2016 was Hiscox (HSX-LON), a London-based re/insurance company. We were attracted to Hiscox because it exhibited many of the qualities we like to see in a property-casualty insurance company. The company has a best-in-class management team with a top notch brand, is an excellent capital manager, and had lagged the sector during 2016. In addition, the company should benefit from rising interest rates due to its short-duration investment portfolio and investment leverage. In addition, the insurer has a strong Lloyd’s business, excellent high-net-worth franchise in the UK, and a growing direct small-ticket U.S. retail business. We were able to purchase the stock at less than 1.9x tangible book value and 14x 2018 EPS, which is a healthy discount to the price that Mitsui Sumitomo paid for competitor Amlin (2.4x TBV in September 2015).
While the largest sale during the six months ended December 31st was the aforementioned Endurance Specialty Holdings (which received a takeover bid from Sompo Holdings at over a 40% premium to previous day’s closing price), next largest was Brinker International (EAT). We exited our long position in Brinker, the operator of the Chili’s and Maggiano’s restaurant chains – an idea we detailed in our June 30, 2016 letter. As you may recall from that communication, we felt the company could benefit from easing comparisons in the “oil markets” to which it was overexposed, and that expectations were too low – especially in light of the company’s consistent free cash flow generation. More recently we became concerned by data points that challenged our thesis. First, our process of
PROSPECTOR FUNDS, INC.
regular restaurant visits did not suggest that Brinker’s operating performance had improved in the way we had anticipated. Moreover, we began to again question the company’s sustainable free cash flow generation ability, which we now view as threated by a potential increase in capital expenditures. Finally a well publicized dustup between a Chili’s restaurant manager in Texas and a veteran on Veterans Day amidst a Chili’s promotion turned into a public relations nightmare. Since the stock had outperformed in the post-election runup, we sold the position. Ideally, we seek to own securities for long-term capital appreciation—but when the facts change, we can as well.
Prospector Capital Appreciation Fund Highlights
The Prospector Capital Appreciation Fund advanced 14.68% during the year ended December 31, 2016. This surpassed the benchmark S&P 500’s return of 11.96%. Financial service company holdings were the top contributors to the Fund’s performance for the year (contributing over 500 basis points of performance), with Endurance Specialty Holdings (ENH) leading the way, adding over 125 basis points to performance. Readers may recall ENH from our discussion of largest purchases in the year end 2015 letter. Overall, M&A activity was modest during the year – with only three acquisitions benefiting the Fund. In addition to ENH, Post Properties (a long-time REIT holding), and Dreamworks Animation were acquired at premiums in 2016. It is a positive sign that, subsequent to year end, portfolio holding Clayton Williams Energy has agreed to be acquired at a substantial premium by Noble Energy. We expect consolidation activity to continue to unlock value in your portfolio.
The largest purchase since our last communication was the initiation of a position in Brown & Brown (BRO), a leading insurance brokerage company. The insurance intermediary business is an attractive one in the current macro environment, given the outlook for revenue growth, attractive margins, and free cash flow generation. Modest GDP growth, relatively stable insurance industry pricing, and M&A opportunities remain consistent revenue drivers, and the business is not balance sheet centric. Additionally should interest rates increase, insurance brokers would benefit from the additional income earned on their premium balances.
Brown & Brown has many positive attributes relative to its peers. The company has an enviable position in the “middle market,” where insurance industry pricing remains the most stable, and has no direct/meaningful exposure to the most price-competitive segments (e.g., reinsurance or Lloyds). BRO remains of the size where acquisitions of smaller/private companies (numbering thousands in the U.S.) contribute importantly to growth in revenues and earnings, without the accompanying risks associated with larger transactions. Revenues are derived entirely from the U.S., which has greater GDP growth than many of the large, mature economies, and currency exchange risk (or Brexit) is not a factor. Street sentiment is poor, with only two “sell-side” analysts recommending the name. BRO generates the highest margins of the peer group, and unlike some peers, these margins are not “adjusted” for numerous items every quarter. Shares of BRO carry an attractive free cash flow yield of about 6%, the highest in their peer group.
The next largest purchase in the last six months of the year was Validus Holdings (VR), which, like Endurance, is a Bermuda-based property-casualty re/insurer which is also held in the Opportunity Fund. Validus has many of the same traits we saw in Endurance, and in our view is a very suitable replacement for the ENH position (which was the largest sale from the Fund during the period). VR (as discussed in more detail in the Opportunity Fund section of the December 31, 2015 letter) sells at what we believe to be an attractive valuation, is a well-run company with substantial insider ownership, and a solid long-term track record. We would not be at all surprised if the company was approached as an acquisition target, and believe the company to be a long-term winner regardless.
PROSPECTOR FUNDS, INC.
Outlook
After an eight year post-financial crisis period of consistent underlying conditions for equity investing, things have changed. The interest rate cycle appears to have reached an inflection point as has the regulatory cycle. One thing that hasn’t changed is that the equity market continues to perform better than the underlying economy. The U.S. economy remains in a modest growth mode, although expectations are rising at the margin since the election. Our economy’s performance remains the global leader and should continue, but our companies face headwinds from the strong U.S. dollar and weaker economic growth across international markets. Europe’s position is uncertain in the aftermath of the Brexit vote in the UK with key elections ahead in France and the Netherlands.
Energy prices, despite the recent rally, are still lower than recent history. This should stimulate consumer spending and confidence in the long run both here and for non-oil producing countries abroad. We continue to enjoy the competitive advantage of a long-term supply of abundant cheap natural gas. Importantly, the U.S. consumer will benefit from lower energy prices and less expensive imports as a result of the strong dollar.
Interest and mortgage rates continue near historically low levels, although they have moved off the lows and look poised to move higher still. Ultimately, higher rates will likely accompany better economic performance and some inflation, both of which are relative positives for equities compared to bonds. Much depends on the path and pace of interest rates’ return to normalcy.
Investment-grade corporations have solid balance sheets and are accumulating excess cash and capital. Importantly, they are also spending on new capital projects, new employees, and new acquisitions. They are buttressed by the prospect of meaningful corporate tax cuts and the possibility of an even lower rate for repatriated cash, of which there is more than $3 trillion. High-yield financing remains abundant and relatively inexpensive. Profit margins sit near all-time high levels, currently 9%.
In our estimation equity valuations remain near extended levels, in the tenth decile on trailing operating earnings. Pro forma for corporate tax relief to 20%, the valuation level would drop only to the ninth decile. We feel we are in the late stages of a bull market, although nothing is certain in the investment world. Equities look most reasonable when comparing earnings yields to Treasury or even corporate bond yields. In any case, the values inherent in your portfolio should attract acquirers and other investors over time. Meanwhile, we believe equities are a superior asset allocation alternative to bonds over the longer term.
Thank you for entrusting us with your money.
Respectfully submitted,
| John D. Gillespie | Kevin R. O’Brien | Jason A. Kish | |
Performance data quoted represents past performance; past performance does not guarantee future results.
Opinions expressed are those of the Funds and are subject to change, are not guaranteed, and should not be considered a recommendation to buy or sell any security.
Mutual fund investing involves risk. Principal loss is possible. Investments in debt securities typically decrease in value when interest rates rise. This risk is usually greater for longer-term debt securities. The Funds invest in foreign securities which involve greater volatility and political, economic and currency risks and differences in accounting methods. The Funds invest in smaller and mid-cap companies, which involve additional risks such as limited liquidity and greater volatility. The Funds may hold restricted securities purchased through private placements. Such securities can be difficult to sell without experiencing delays or additional costs. Derivatives involve
PROSPECTOR FUNDS, INC.
risks different from, and in certain cases, greater than the risks presented by more traditional investments. These risks are fully disclosed in the prospectus.
The S&P 500 Index is a broad based unmanaged index of 500 stocks, which is widely recognized as representative of the equity market in general. You cannot invest directly in an index.
The Russell 2000 Index is an unmanaged small-cap index that measures the performance of the 2,000 smallest companies in the Russell 3000 Index. You cannot invest directly in an index.
The Russell MidCap Index is an unmanaged mid-cap index that measures the performance of the 800 smallest companies in the Russell 1000 Index. You cannot invest directly in an index.
KBW Regional Bank Index is a modified market capitalization weighted index designed to track the performance of U.S. regional banks or thrifts that are publicly traded in the U.S.
Capital ratio measures the extent to which a financial institution finances its operations by issuing shares and retaining profits, expressed as a percentage of its assets.
Nonperforming assets refers to a classification for loans on the books of financial institutions that are in default or are in arrears on scheduled payments of principal or interest.
Price to earnings ratio is the ratio for valuing a company that measures its current share price relative to its per-share earnings.
Basis point is a unit that is equal to 1/100th of 1% and is used to denote the change in a financial instrument.
Cash flow measures the cash generating capability of a company by adding non-cash charges (e.g. depreciation) and interest expense to pretax income.
Free cash flow is revenue less operating expenses including interest expenses and maintenance capital spending. It is the discretionary cash that a company has after all expenses and is available for purposes such as dividend payments, investing back into the business or share repurchases.
Return on equity is the amount of net income returned as a percentage of shareholders’ equity.
Tangible book value is the total net asset value of a company (book value) minus intangible assets and goodwill.
Price to tangible book value is a valuation ratio expressing the price of a security compared to its hard, or tangible, book value as reported in the company’s balance sheet.
Stocks are generally perceived to have more financial risk than bonds in that bond holders have a claim on firm operations or assets that is senior to that of equity holders. In addition, stock prices are generally more volatile than bond prices. Investments in debt securities typically decrease in value when interest rates rise. This risk is usually greater for longer-term debt securities. A stock may trade with more or less liquidity than a bond depending on the number of shares and bonds outstanding, the size of the company, and the demand for the securities. Similarly, the transaction costs involved in trading a stock may be more or less than a particular bond depending on the factors mentioned above and whether the stock or bond trades upon an exchange. Depending on the entity issuing the bond, it may or may or may not afford additional protections to the investor, such as a guarantee of return of principal by a government or bond insurance company. There is typically no guarantee of any kind associated with the purchase of an individual stock. Bonds are often owned by individuals interested in current income while stocks are generally owned by individuals seeking price appreciation with income a secondary concern. The tax treatment of returns of bonds and stocks also differs given differential tax treatment of income versus capital gain.
Fund holdings and/or security allocations are subject to change at any time and are not recommendations to buy or sell any security. Please see the Schedule of Investments section in this report for a full listing of the Fund’s holdings.
Prospector Funds, Inc. are distributed by Quasar Distributors, LLC.
PROSPECTOR FUNDS, INC.
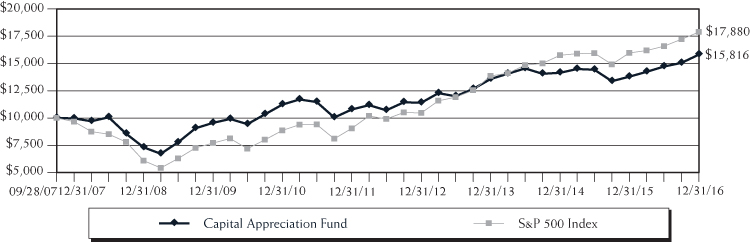
Capital Appreciation Fund
The chart assumes an initial investment of $10,000. Performance reflects waivers of fee and operating expenses in effect. In the absence of such waivers, total return would be reduced. Past performance is not predictive of future performance. Investment return and principal value will fluctuate, so that your shares, when redeemed may be worth more or less than their original cost. Performance assumes the reinvestment of capital gains and income distributions. The performance does not reflect the deduction of taxes that a shareholder would pay on Fund distributions or the redemption of Fund shares.
Average Annual Rates of Return (%) – As of December 31, 2016
| | One Year | Three Year | Five Year | Since Inception(1) |
| Capital Appreciation Fund | 14.68% | 5.21% | 7.97% | 5.08% |
S&P 500 Index(2) | 11.96% | 8.87% | 14.66% | 6.48% |
| (1) | September 28, 2007 |
| (2) | The Standard & Poor’s 500 Index (S&P 500) is an unmanaged, capitalization-weighted index generally representative of the U.S. market for large capitalization stocks. This Index cannot be invested in directly. |
PROSPECTOR FUNDS, INC.
Opportunity Fund
The chart assumes an initial investment of $10,000. Performance reflects waivers of fee and operating expenses in effect. In the absence of such waivers, total return would be reduced. Past performance is not predictive of future performance. Investment return and principal value will fluctuate, so that your shares, when redeemed may be worth more or less than their original cost. Performance assumes the reinvestment of capital gains and income distributions. The performance does not reflect the deduction of taxes that a shareholder would pay on Fund distributions or the redemption of Fund shares.
Average Annual Rates of Return (%) – As of December 31, 2016
��
| | One Year | Three Year | Five Year | Since Inception(1) |
| Opportunity Fund | 21.02% | 9.60% | 13.94% | 9.34% |
Russell 2000 Index(2) | 21.31% | 6.74% | 14.46% | 7.17% |
Russell Midcap Index(3) | 13.80% | 7.92% | 14.72% | 7.43% |
| (1) | September 28, 2007 |
| (2) | An unmanaged small-cap index that measures the performance of the 2,000 smallest companies in the Russell 3000 Index. This index cannot be invested in directly. |
| (3) | An unmanaged mid-cap index that measures the performance of the 800 smallest companies in the Russell 1000 Index. This index cannot be invested in directly. |
PROSPECTOR FUNDS, INC.
Expense Example
December 31, 2016
As a shareholder of the Fund, you incur two types of costs: (1) transaction costs, which may include but are not limited to, redemption fees, wire transfer fees, maintenance fee (IRA accounts), and exchange fees; and (2) ongoing costs, including management fees; distribution and/or service fees; and other Fund expenses. This Example is intended to help you understand your ongoing costs (in dollars) of investing in the Fund and to compare these costs with the ongoing costs of investing in other mutual funds. The Example is based on an investment of $1,000 invested at the beginning of the period and held for the entire period (July 1, 2016 – December 31, 2016).
ACTUAL EXPENSES
The first line of the table below provides information about actual account values and actual expenses. Although the Fund charges no sales load or transaction fees, you will be assessed fees for outgoing wire transfers, returned checks and stop payment orders at prevailing rates charged by U.S. Bancorp Fund Services, LLC, the Fund’s transfer agent. The example below includes, but is not limited to, management fees, shareholder servicing fees and other Fund expenses. However, the example below does not include portfolio trading commissions and related expenses, interest expense and other extraordinary expenses as determined under generally accepted accounting principles. You may use the information in this line, together with the amount you invested, to estimate the expenses that you paid over the period. Simply divide your account value by $1,000 (for example, an $8,600 account value divided by $1,000 = 8.6), then multiply the result by the number in the first line under the heading entitled “Expenses Paid During Period” to estimate the expenses you paid on your account during this period.
HYPOTHETICAL EXAMPLE FOR COMPARISON PURPOSES
The second line of the table below provides information about hypothetical account values and hypothetical expenses based on the Fund’s actual expense ratio and an assumed rate of return of 5% per year before expenses, which is not the Fund’s actual return. The hypothetical account values and expenses may not be used to estimate the actual ending account balance or expenses you paid for the period. You may use this information to compare the ongoing costs of investing in the Fund and other funds. To do so, compare this 5% hypothetical example with the 5% hypothetical examples that appear in the shareholder reports of the other funds.
Please note that the expenses shown in the table are meant to highlight your ongoing costs only and do not reflect any transactional costs, such as redemption fees or exchange fees. Therefore, the second line of the table is useful in comparing ongoing costs only, and will not help you determine the relative total costs of owning different funds. In addition, if these transactional costs were included, your costs would have been higher.
| | | | Expenses Paid |
| | Beginning Account | Ending Account | During Period(1) |
| | Value (07/01/16) | Value (12/31/2016) | (07/01/16 to 12/31/2016) |
Capital Appreciation Actual(2) | $1,000.00 | $1,074.40 | $6.78 |
| Capital Appreciation Hypothetical | | | |
| (5% return before expenses) | 1,000.00 | 1,018.60 | 6.60 |
| | | | |
Opportunity Actual(2) | 1,000.00 | 1,135.90 | 6.98 |
| Opportunity Hypothetical | | | |
| (5% return before expenses) | 1,000.00 | 1,018.60 | 6.60 |
| (1) | Expenses are equal to the Fund’s annualized expense ratio for the most recent six-month period of 1.30% and 1.30% for Capital Appreciation Fund and Opportunity Fund, respectively, multiplied by the average account value over the period, multiplied by 184/366 to reflect the one-half year period. |
| (2) | Based on the actual returns for the six-month period ended December 31, 2016 of 7.44% and 13.59% for Capital Appreciation Fund and Opportunity Fund, respectively. |
PROSPECTOR FUNDS, INC.
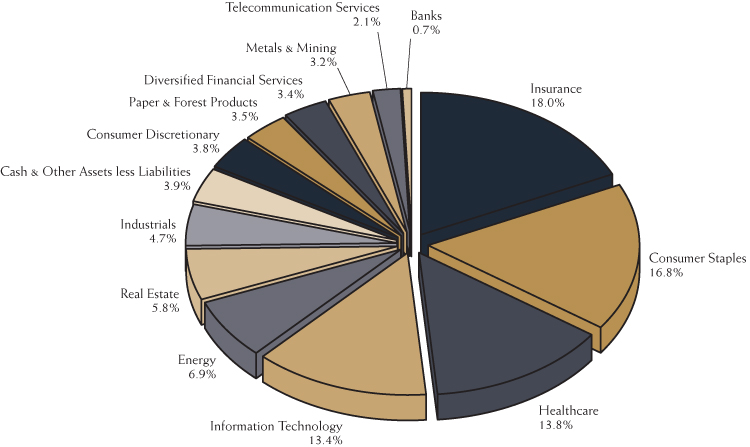
Sector Allocation (% of net assets) (Unaudited)
as of December 31, 2016(1)(2)
Capital Appreciation Fund
Top 10 Holdings (% of net assets) (Unaudited)
as of December 31, 2016(1)(3)
Capital Appreciation Fund
| | Forestar Group, 3.750%, 03/01/2020 | | | 3.2 | % |
| | Chart Industries, 2.000%, 08/01/2018 | | | 3.1 | % |
| | Hartford Financial Services Group | | | 3.0 | % |
| | RTI International, 1.625%, 10/15/2019 | | | 2.9 | % |
| | Hologic, 0.000%, 12/15/2043 | | | 2.6 | % |
| | FLIR Systems | | | 2.6 | % |
| | Verint Systems, 1.500%, 06/01/2021 | | | 2.6 | % |
| | Domtar | | | 2.4 | % |
| | Brown & Brown | | | 2.3 | % |
| | Mondelez International, Class A | | | 2.2 | % |
| | (1) | Fund holdings and sector allocations are subject to change at any time and are not recommendations to buy or sell any security. | |
| | (2) | Sector allocation includes all investment types. | |
| | (3) | Invesco Treasury Portfolio excluded from top 10 holdings. | |
PROSPECTOR FUNDS, INC.
Sector Allocation (% of net assets) (Unaudited)
as of December 31, 2016(1)(2)
Opportunity Fund
Top 10 Holdings (% of net assets) (Unaudited)
as of December 31, 2016(1)(3)
Opportunity Fund
| | Brown & Brown | | | 3.3 | % |
| | Validus Holdings | | | 3.0 | % |
| | HomeTrust Bancshares | | | 2.9 | % |
| | OceanFirst Financial | | | 2.6 | % |
| | Torchmark | | | 2.4 | % |
| | RenaissanceRe Holdings | | | 2.2 | % |
| | Hess | | | 2.1 | % |
| | Federated Investors Class B | | | 2.0 | % |
| | T. Rowe Price Group | | | 2.0 | % |
| | CIRCOR International | | | 1.9 | % |
| | (1) | Fund holdings and sector allocations are subject to change at any time and are not recommendations to buy or sell any security. | |
| | (2) | Sector allocation includes all investment types. | |
| | (3) | Invesco Treasury Portfolio excluded from top 10 holdings. | |
PROSPECTOR FUNDS, INC.
Schedule of Investments
December 31, 2016
Capital Appreciation Fund
Description | | Shares | | | Value | |
| | | | | | | |
| COMMON STOCKS – 73.9% | | | | | | |
| | | | | | | |
| Banks – 0.7% | | | | | | |
| Comerica | | | 2,600 | | | $ | 177,086 | |
| | | | | | | | | |
| Consumer Discretionary – 2.2% | | | | | | | | |
| Darden Restaurants | | | 3,400 | | | | 247,248 | |
| Lowe’s Companies | | | 4,500 | | | | 320,040 | |
| | | | | | | | 567,288 | |
| | | | | | | | | |
| Consumer Staples – 15.8% | | | | | | | | |
| Campbell Soup | | | 4,100 | | | | 247,927 | |
| Coca-Cola | | | 13,000 | | | | 538,980 | |
| Colgate-Palmolive | | | 6,100 | | | | 399,184 | |
| Diageo – ADR | | | 3,430 | | | | 356,514 | |
| Edgewell Personal Care* | | | 3,300 | | | | 240,867 | |
| Energizer Holdings | | | 2,200 | | | | 98,142 | |
| Mondelez International, Class A | | | 12,950 | | | | 574,073 | |
| Nestle | | | 5,700 | | | | 408,902 | |
| Tootsie Roll Industries | | | 14,018 | | | | 557,216 | |
| Walgreens Boots Alliance | | | 5,150 | | | | 426,214 | |
| Wal-Mart Stores | | | 3,040 | | | | 210,125 | |
| | | | | | | | 4,058,144 | |
| | | | | | | | | |
| Diversified Financial Services – 3.4% | | | | | | | | |
| Invesco | | | 7,800 | | | | 236,652 | |
| Leucadia National | | | 10,300 | | | | 239,475 | |
| T. Rowe Price Group | | | 5,100 | | | | 383,826 | |
| | | | | | | | 859,953 | |
| | | | | | | | | |
| Energy – 6.9% | | | | | | | | |
| Clayton Williams Energy* | | | 2,000 | | | | 238,520 | |
| ConocoPhillips | | | 6,200 | | | | 310,868 | |
| Hess | | | 6,700 | | | | 417,343 | |
| Noble Energy | | | 10,600 | | | | 403,436 | |
| Suncor Energy | | | 12,600 | | | | 411,894 | |
| | | | | | | | 1,782,061 | |
| | | | | | | | | |
| Healthcare – 9.1% | | | | | | | | |
| Abbott Laboratories | | | 14,600 | | | | 560,786 | |
| AstraZeneca – ADR | | | 12,100 | | | | 330,572 | |
| Eli Lilly & Co. | | | 2,600 | | | | 191,230 | |
| GlaxoSmithKline – ADR | | | 12,850 | | | | 494,853 | |
See Notes to the Financial Statements
PROSPECTOR FUNDS, INC.
Schedule of Investments – Continued
December 31, 2016
Capital Appreciation Fund
Description | | Shares | | | Value | |
| | | | | | | |
COMMON STOCKS – 73.9% (Continued) | | | | | | |
| | | | | | | |
Healthcare – 9.1% (Continued) | | | | | | |
| Johnson & Johnson | | | 4,900 | | | $ | 564,529 | |
| Merck & Co. | | | 3,100 | | | | 182,497 | |
| | | | | | | | 2,324,467 | |
| | | | | | | | | |
| Industrials – 1.5% | | | | | | | | |
| Eaton | | | 5,750 | | | | 385,768 | |
| | | | | | | | | |
| Information Technology – 7.8% | | | | | | | | |
| Automatic Data Processing | | | 4,000 | | | | 411,120 | |
| FLIR Systems | | | 18,150 | | | | 656,848 | |
| Microsoft | | | 7,050 | | | | 438,087 | |
| Paychex | | | 3,000 | | | | 182,640 | |
| Science Applications International | | | 3,700 | | | | 313,760 | |
| | | | | | | | 2,002,455 | |
| | | | | | | | | |
| Insurance – 18.0% | | | | | | | | |
| Berkshire Hathaway, Class B* | | | 3,400 | | | | 554,132 | |
| Brown & Brown | | | 13,200 | | | | 592,152 | |
| CNA Financial | | | 4,100 | | | | 170,150 | |
| Endurance Specialty Holdings | | | 2,200 | | | | 203,280 | |
| First American Financial | | | 7,400 | | | | 271,062 | |
| Hartford Financial Services Group | | | 16,200 | | | | 771,930 | |
| Loews | | | 9,100 | | | | 426,153 | |
| MetLife | | | 5,100 | | | | 274,839 | |
| RenaissanceRe Holdings | | | 3,414 | | | | 465,055 | |
| Selective Insurance Group | | | 8,500 | | | | 365,925 | |
| Validus Holdings | | | 9,600 | | | | 528,096 | |
| | | | | | | | 4,622,774 | |
| | | | | | | | | |
| Metals & Mining – 0.3% | | | | | | | | |
| Alamos Gold, Class A | | | 12,322 | | | | 84,282 | |
| | | | | | | | | |
| Paper & Forest Products – 3.5% | | | | | | | | |
| Domtar | | | 15,851 | | | | 618,665 | |
| Louisiana-Pacific* | | | 14,800 | | | | 280,164 | |
| | | | | | | | 898,829 | |
| | | | | | | | | |
| Real Estate – 2.6% | | | | | | | | |
| Four Corners Property Trust | | | 21,348 | | | | 438,061 | |
| Mid-America Apartment Communities | | | 2,378 | | | | 232,854 | |
| | | | | | | | 670,915 | |
See Notes to the Financial Statements
PROSPECTOR FUNDS, INC.
Schedule of Investments – Continued
December 31, 2016
Capital Appreciation Fund
| Description | | Shares | | | Value | |
| | | | | | | |
COMMON STOCKS – 73.9% (Continued) | | | | | | |
| | | | | | | |
| Telecommunication Services – 2.1% | | | | | | |
| Telephone & Data Systems | | | 18,800 | | | $ | 542,756 | |
| Total Common Stocks | | | | | | | | |
| (Cost $15,857,300) | | | | | | | 18,976,778 | |
| | | | | | | | | |
| | | Par | | | | | |
| | | | | | | | | |
| CONVERTIBLE BONDS – 19.8% | | | | | | | | |
| | | | | | | | | |
| Consumer Discretionary – 1.6% | | | | | | | | |
| Shutterfly | | | | | | | | |
| 0.250%, 05/15/2018 | | $ | 403,000 | | | | 407,786 | |
| | | | | | | | | |
| Healthcare – 3.3% | | | | | | | | |
| Hologic | | | | | | | | |
| 0.000%, 12/15/2043 | | | 550,000 | | | | 674,094 | |
| Medicines | | | | | | | | |
| 1.375%, 06/01/2017 | | | 132,000 | | | | 174,157 | |
| | | | | | | | 848,251 | |
| | | | | | | | | |
| Industrials – 3.2% | | | | | | | | |
| Chart Industries | | | | | | | | |
| 2.000%, 08/01/2018 | | | 825,000 | | | | 806,437 | |
| | | | | | | | | |
| Information Technology – 5.6% | | | | | | | | |
| Akamai Technologies | | | | | | | | |
| 0.000%, 02/15/2019 | | | 290,000 | | | | 301,056 | |
| Electronics For Imaging | | | | | | | | |
| 0.750%, 09/01/2019 | | | 460,000 | | | | 487,887 | |
| Verint Systems | | | | | | | | |
| 1.500%, 06/01/2021 | | | 700,000 | | | | 655,813 | |
| | | | | | | | 1,444,756 | |
| | | | | | | | | |
| Metals & Mining – 2.9% | | | | | | | | |
| RTI International | | | | | | | | |
| 1.625%, 10/15/2019 | | | 725,000 | | | | 749,922 | |
| | | | | | | | | |
| Real Estate – 3.2% | | | | | | | | |
| Forestar Group | | | | | | | | |
| 3.750%, 03/01/2020 | | | 825,000 | | | | 818,813 | |
| Total Convertible Bonds | | | | | | | | |
| (Cost $5,076,169) | | | | | | | 5,075,965 | |
See Notes to the Financial Statements
PROSPECTOR FUNDS, INC.
Schedule of Investments – Continued
December 31, 2016
Capital Appreciation Fund
Description | | Par | | | Value | |
| | | | | | | |
| CORPORATE BONDS – 2.4% | | | | | | |
| | | | | | | |
| Consumer Staples – 1.0% | | | | | | |
| CVS Health | | | | | | |
| 2.250%, 08/12/2019 | | $ | 263,000 | | | $ | 264,443 | |
| | | | | | | | | |
| Healthcare – 1.4% | | | | | | | | |
| Amgen | | | | | | | | |
| 2.200%, 05/22/2019 | | | 350,000 | | | | 352,702 | |
| Total Corporate Bonds | | | | | | | | |
| (Cost $616,139) | | | | | | | 617,145 | |
| | | | | | | | | |
| | | Shares | | | | | |
| | | | | | | | | |
| SHORT-TERM INVESTMENT – 3.9% | | | | | | | | |
| Invesco Treasury Portfolio, 0.256%^ | | | | | | | | |
| (Cost $1,000,247) | | | 1,000,247 | | | | 1,000,247 | |
| Total Investments – 100.0% | | | | | | | | |
| (Cost $22,549,855) | | | | | | | 25,670,135 | |
| Other Assets and Liabilities, Net – 0.0% | | | | | | | (6,893 | ) |
| Total Net Assets – 100.0% | | | | | | $ | 25,663,242 | |
| * | Non-income producing security |
| ADR – American Depositary Receipt |
| ^ | The rate shown is the annualized seven-day effective yield as of December 31, 2016. |
See Notes to the Financial Statements
PROSPECTOR FUNDS, INC.
Schedule of Investments
December 31, 2016
Opportunity Fund
Description | | Shares | | | Value | |
| | | | | | | |
| COMMON STOCKS – 89.5% | | | | | | |
| | | | | | | |
| Banks – 22.9% | | | | | | |
| Bank of N.T. Butterfield & Son | | | 46,300 | | | $ | 1,455,672 | |
| Beneficial Bancorp | | | 79,800 | | | | 1,468,320 | |
| Blue Hills Bancorp | | | 49,700 | | | | 931,875 | |
| BSB Bancorp* | | | 19,900 | | | | 576,105 | |
| Capital Bank Financial, Class A | | | 9,700 | | | | 380,725 | |
| Capital City Bank Group | | | 21,100 | | | | 432,128 | |
| Central Pacific Financial | | | 40,900 | | | | 1,285,078 | |
| Citigroup | | | 28,870 | | | | 1,715,744 | |
| Clifton Bancorp | | | 47,881 | | | | 810,147 | |
| Comerica | | | 10,600 | | | | 721,966 | |
| First Connecticut Bancorp | | | 47,300 | | | | 1,071,345 | |
| HomeTrust Bancshares* | | | 118,400 | | | | 3,066,560 | |
| KeyCorp | | | 109,600 | | | | 2,002,392 | |
| OceanFirst Financial | | | 90,700 | | | | 2,723,721 | |
| Oritani Financial | | | 40,450 | | | | 758,437 | |
| SI Financial Group | | | 51,200 | | | | 788,480 | |
| Stonegate Bank | | | 13,800 | | | | 575,874 | |
| Waterstone Financial | | | 100,100 | | | | 1,841,840 | |
| Western New England Bancorp | | | 197,035 | | | | 1,842,277 | |
| | | | | | | | 24,448,686 | |
| | | | | | | | | |
| Chemicals – 1.5% | | | | | | | | |
| H.B. Fuller | | | 32,300 | | | | 1,560,413 | |
| | | | | | | | | |
| Consumer Discretionary – 7.2% | | | | | | | | |
| Darden Restaurants | | | 18,200 | | | | 1,323,504 | |
| Del Frisco’s Restaurant Group* | | | 97,300 | | | | 1,654,103 | |
| Habit Restaurants* | | | 55,800 | | | | 962,550 | |
| Home Depot | | | 11,900 | | | | 1,595,552 | |
| Hyatt Hotels, Class A* | | | 16,600 | | | | 917,316 | |
| Noodles & Company* | | | 85,800 | | | | 351,780 | |
| Ruth’s Hospitality Group | | | 48,500 | | | | 887,550 | |
| | | | | | | | 7,692,355 | |
| | | | | | | | | |
| Consumer Staples – 7.7% | | | | | | | | |
| Church & Dwight | | | 44,600 | | | | 1,970,874 | |
| Diageo – ADR | | | 10,600 | | | | 1,101,764 | |
| Mondelez International, Class A | | | 38,800 | | | | 1,720,004 | |
| Nestle | | | 16,000 | | | | 1,147,795 | |
| Stock Spirits Group | | | 456,000 | | | | 1,015,775 | |
See Notes to the Financial Statements
PROSPECTOR FUNDS, INC.
Schedule of Investments – Continued
December 31, 2016
Opportunity Fund
Description | | Shares | | | Value | |
| | | | | | | |
COMMON STOCKS – 89.5% (Continued) | | | | | | |
| | | | | | | |
Consumer Staples – 7.7% (Continued) | | | | | | |
| Tootsie Roll Industries | | | 31,203 | | | $ | 1,240,319 | |
| | | | | | | | 8,196,531 | |
| | | | | | | | | |
| Diversified Financial Services – 7.4% | | | | | | | | |
| Federated Investors, Class B | | | 76,000 | | | | 2,149,280 | |
| Franklin Resources | | | 26,600 | | | | 1,052,828 | |
| Invesco | | | 48,100 | | | | 1,459,354 | |
| Leucadia National | | | 50,500 | | | | 1,174,125 | |
| T. Rowe Price Group | | | 27,900 | | | | 2,099,754 | |
| | | | | | | | 7,935,341 | |
| | | | | | | | | |
| Energy – 3.6% | | | | | | | | |
| Hess | | | 35,100 | | | | 2,186,379 | |
| Noble Energy | | | 42,400 | | | | 1,613,744 | |
| | | | | | | | 3,800,123 | |
| | | | | | | | | |
| Healthcare – 5.8% | | | | | | | | |
| Aralez Pharmaceuticals* | | | 137,200 | | | | 605,052 | |
| AstraZeneca – ADR | | | 16,200 | | | | 442,584 | |
| GlaxoSmithKline – ADR | | | 24,500 | | | | 943,495 | |
| Haemonetics* | | | 21,900 | | | | 880,380 | |
| Invacare | | | 37,500 | | | | 489,375 | |
| Merck & Co. | | | 15,448 | | | | 909,424 | |
| Patterson Companies | | | 45,700 | | | | 1,875,071 | |
| | | | | | | | 6,145,381 | |
| | | | | | | | | |
| Industrials – 3.8% | | | | | | | | |
| CIRCOR International | | | 31,800 | | | | 2,063,184 | |
| Landstar System | | | 13,100 | | | | 1,117,430 | |
| Powell Industries | | | 21,300 | | | | 830,700 | |
| | | | | | | | 4,011,314 | |
| | | | | | | | | |
| Information Technology – 8.3% | | | | | | | | |
| FLIR Systems | | | 56,800 | | | | 2,055,592 | |
| Maxim Integrated Products | | | 20,300 | | | | 782,971 | |
| Microsoft | | | 26,600 | | | | 1,652,924 | |
| Paychex | | | 26,000 | | | | 1,582,880 | |
| Synopsys* | | | 9,600 | | | | 565,056 | |
| VeriSign* | | | 9,900 | | | | 753,093 | |
| Xilinx | | | 23,500 | | | | 1,418,695 | |
| | | | | | | | 8,811,211 | |
See Notes to the Financial Statements
PROSPECTOR FUNDS, INC.
Schedule of Investments – Continued
December 31, 2016
Opportunity Fund
Description | | Shares | | | Value | |
| | | | | | | |
COMMON STOCKS – 89.5% (Continued) | | | | | | |
| | | | | | | |
| Insurance – 17.8% | | | | | | |
| Brown & Brown | | | 77,600 | | | $ | 3,481,136 | |
| CNA Financial | | | 15,100 | | | | 626,650 | |
| Hanover Insurance Group | | | 18,100 | | | | 1,647,281 | |
| Hiscox | | | 84,600 | | | | 1,060,341 | |
| Primerica | | | 14,900 | | | | 1,030,335 | |
| ProAssurance | | | 11,900 | | | | 668,780 | |
| RenaissanceRe Holdings | | | 17,300 | | | | 2,356,606 | |
| Safety Insurance Group | | | 7,400 | | | | 545,380 | |
| Selective Insurance Group | | | 23,600 | | | | 1,015,980 | |
| State National Companies | | | 60,400 | | | | 837,144 | |
| Torchmark | | | 34,200 | | | | 2,522,592 | |
| Validus Holdings | | | 57,500 | | | | 3,163,075 | |
| | | | | | | | 18,955,300 | |
| | | | | | | | | |
| Metals & Mining – 1.7% | | | | | | | | |
| Kinross Gold* | | | 79,800 | | | | 248,178 | |
| Newmont Mining | | | 44,900 | | | | 1,529,743 | |
| Victoria Gold* | | | 96,500 | | | | 40,048 | |
| | | | | | | | 1,817,969 | |
| | | | | | | | | |
| Paper & Forest Products – 0.4% | | | | | | | | |
| Domtar | | | 12,300 | | | | 480,069 | |
| | | | | | | | | |
| Real Estate – 1.4% | | | | | | | | |
| Cousins Properties | | | 130,892 | | | | 1,113,891 | |
| Easterly Government Properties | | | 200 | | | | 4,004 | |
| Four Corners Property Trust | | | 18,547 | | | | 380,584 | |
| | | | | | | | 1,498,479 | |
| | | | | | | | | |
| Total Common Stocks | | | | | | | | |
| (Cost $75,915,652) | | | | | | | 95,353,172 | |
| | | | | | | | | |
| | | Par | | | | | |
| | | | | | | | | |
| CONVERTIBLE BOND – 0.4% | | | | | | | | |
| | | | | | | | | |
| Real Estate – 0.4% | | | | | | | | |
| Forestar Group | | | | | | | | |
| 3.750%, 03/01/2020 | | | | | | | | |
| (Cost $467,059) | | $ | 450,000 | | | | 446,625 | |
See Notes to the Financial Statements
PROSPECTOR FUNDS, INC.
Schedule of Investments – Continued
December 31, 2016
Opportunity Fund
Description | | Shares | | | Value | |
| | | | | | | |
| SHORT-TERM INVESTMENT – 8.2% | | | | | | |
| Invesco Treasury Portfolio, institutional Class, 0.256%^ | | | | | | |
| (Cost $8,683,558) | | | 8,683,558 | | | $ | 8,683,558 | |
| Total Investments – 98.1% | | | | | | | | |
| (Cost $85,066,269) | | | | | | | 104,483,355 | |
| Other Assets and Liabilities, Net – 1.9% | | | | | | | 2,059,077 | |
| Total Net Assets – 100.0% | | | | | | $ | 106,542,432 | |
| * | Non-income producing security |
| ADR –American Depositary Receipt |
| ^ | The rate shown is the annualized seven-day effective yield as of December 31, 2016. |
See Notes to the Financial Statements
PROSPECTOR FUNDS, INC.
Statements of Assets and Liabilities
December 31, 2016
| | | Capital Appreciation Fund | | | Opportunity Fund | |
| ASSETS: | | | | | | |
| Investments, at market value | | | | | | |
| (Cost $22,549,855 and $85,066,269, respectively) | | $ | 25,670,135 | | | $ | 104,483,355 | |
| Cash | | | 5,254 | | | | — | |
| Receivable for investment securities sold | | | — | | | | 1,880,159 | |
| Receivable for dividends and interest | | | 57,048 | | | | 115,502 | |
| Receivable for capital shares sold | | | 6 | | | | 234,318 | |
| Prepaid expenses | | | 12,142 | | | | 21,572 | |
| Total assets | | | 25,744,585 | | | | 106,734,906 | |
| | | | | | | | | |
| LIABILITIES: | | | | | | | | |
| Payable for capital shares redeemed | | | — | | | | 1,440 | |
| Payable to adviser, net | | | 9,677 | | | | 72,773 | |
| Accrued distribution fees | | | 4,020 | | | | 21,966 | |
| Accrued expenses and other liabilities | | | 67,646 | | | | 96,295 | |
| Total liabilities | | | 81,343 | | | | 192,474 | |
| | | | | | | | | |
| NET ASSETS | | $ | 25,663,242 | | | $ | 106,542,432 | |
| | | | | | | | | |
| COMPOSITION OF NET ASSETS: | | | | | | | | |
| Portfolio capital | | $ | 22,144,412 | | | $ | 85,683,340 | |
| Distributions in excess of net investment income | | | (1,841 | ) | | | (6,827 | ) |
| Accumulated net realized gain on investments | | | 400,495 | | | | 1,456,282 | |
| Net unrealized appreciation of investments | | | 3,120,176 | | | | 19,409,637 | |
| Total net assets | | $ | 25,663,242 | | | $ | 106,542,432 | |
| | | | | | | | | |
CAPITAL STOCK, $0.0001 par value | | | | | | | | |
| Authorized | | | 500,000,000 | | | | 500,000,000 | |
| Issued and outstanding | | | 1,527,913 | | | | 5,282,090 | |
| | | | | | | | | |
| NET ASSET VALUE, REDEMPTION PRICE, | | | | | | | | |
| AND OFFERING PRICE PER SHARE | | $ | 16.80 | | | $ | 20.17 | |
See Notes to the Financial Statements
PROSPECTOR FUNDS, INC.
Statements of Operations
For the Year Ended December 31, 2016
| | | Capital Appreciation Fund | | | Opportunity Fund | |
| INVESTMENT INCOME: | | | | | | |
| Interest income | | $ | 85,528 | | | $ | 37,474 | |
| Dividend income | | | 554,078 | | | | 1,812,518 | |
| Less: Foreign taxes withheld | | | (807 | ) | | | (486 | ) |
| Total investment income | | | 638,799 | | | | 1,849,506 | |
| | | | | | | | | |
| EXPENSES: | | | | | | | | |
| Investment advisory fees | | | 266,120 | | | | 1,018,360 | |
| Administration fees | | | 51,012 | | | | 96,046 | |
| Fund accounting fees | | | 40,215 | | | | 40,885 | |
| Audit fees | | | 32,053 | | | | 32,053 | |
| Transfer agent fees | | | 25,345 | | | | 43,681 | |
| Registration fees | | | 25,178 | | | | 25,232 | |
| Directors’ fees | | | 16,381 | | | | 44,659 | |
| Legal fees | | | 14,752 | | | | 53,899 | |
| Distribution fees | | | 12,104 | | | | 79,256 | |
| Other expenses | | | 6,751 | | | | 20,799 | |
| Custodian fees | | | 6,239 | | | | 9,078 | |
| Postage and printing fees | | | 2,645 | | | | 10,059 | |
| Total expenses | | | 498,795 | | | | 1,474,007 | |
| Less: Fee waivers | | | (184,289 | ) | | | (270,491 | ) |
| Total net expenses | | | 314,506 | | | | 1,203,516 | |
| NET INVESTMENT INCOME | | | 324,293 | | | | 645,990 | |
| | | | | | | | | |
| REALIZED AND UNREALIZED GAINS: | | | | | | | | |
| Net realized gain on investments | | | 631,615 | | | | 3,963,408 | |
| Net change in unrealized appreciation of investments | | | 2,350,669 | | | | 13,795,516 | |
| Net gain on investments | | | 2,982,284 | | | | 17,758,924 | |
| | | | | | | | | |
| NET INCREASE IN NET ASSETS | | | | | | | | |
| RESULTING FROM OPERATIONS | | $ | 3,306,577 | | | $ | 18,404,914 | |
See Notes to the Financial Statements
PROSPECTOR FUNDS, INC.
Statements of Changes in Net Assets
| | | Capital Appreciation Fund | |
| | | Year Ended | | | Year Ended | |
| | | December 31, 2016 | | | December 31, 2015 | |
| | | | | | | |
| OPERATIONS: | | | | | | |
| Net investment income | | $ | 324,293 | | | $ | 343,707 | |
| Net realized gain on investments | | | 631,615 | | | | 1,180,372 | |
| Net change in unrealized appreciation of investments | | | 2,350,669 | | | | (1,834,615 | ) |
| Net increase (decrease) resulting from operations | | | 3,306,577 | | | | (310,536 | ) |
| | | | | | | | | |
| CAPITAL SHARE TRANSACTIONS: | | | | | | | | |
| Proceeds from shares sold | | | 62,641 | | | | 417,337 | |
| Proceeds from reinvestment of distributions | | | 322,596 | | | | 600,524 | |
| Payments for shares redeemed | | | (2,025,395 | ) | | | (14,169,392 | ) |
| Redemption fees | | | 91 | | | | — | |
| Net decrease from capital share transactions | | | (1,640,067 | ) | | | (13,151,531 | ) |
| | | | | | | | | |
| DISTRIBUTIONS PAID FROM: | | | | | | | | |
| Net investment income | | | (331,651 | ) | | | (591,093 | ) |
| Net realized gains | | | — | | | | (16,120 | ) |
| Total distributions to shareholders | | | (331,651 | ) | | | (607,213 | ) |
| | | | | | | | | |
| TOTAL INCREASE (DECREASE) IN NET ASSETS | | | 1,334,859 | | | | (14,069,280 | ) |
| | | | | | | | | |
| NET ASSETS: | | | | | | | | |
| Beginning of period | | | 24,328,383 | | | | 38,397,663 | |
| | | | | | | | | |
| End of period (including undistributed | | | | | | | | |
| (distributions in excess of) net investment income | | | | | | | | |
| of $(1,841) and $5,664, respectively) | | $ | 25,663,242 | | | $ | 24,328,383 | |
| | | | | | | | | |
| TRANSACTIONS IN SHARES: | | | | | | | | |
| Shares sold | | | 3,882 | | | | 27,311 | |
| Shares issued in reinvestment of distributions | | | 19,145 | | | | 40,169 | |
| Shares redeemed | | | (134,596 | ) | | | (887,942 | ) |
| Net decrease | | | (111,569 | ) | | | (820,462 | ) |
See Notes to the Financial Statements
PROSPECTOR FUNDS, INC.
Statements of Changes in Net Assets
| | | Opportunity Fund | |
| | | Year Ended | | | Year Ended | |
| | | December 31, 2016 | | | December 31, 2015 | |
| OPERATIONS: | | | | | | |
| Net investment income | | $ | 645,990 | | | $ | 524,064 | |
| Net realized gain on investments | | | 3,963,408 | | | | 10,522,273 | |
| Net change in unrealized appreciation of investments | | | 13,795,516 | | | | (9,460,368 | ) |
| Net increase resulting from operations | | | 18,404,914 | | | | 1,585,969 | |
| | | | | | | | | |
| CAPITAL SHARE TRANSACTIONS: | | | | | | | | |
| Proceeds from shares sold | | | 14,729,319 | | | | 16,837,669 | |
| Proceeds from reinvestment of distributions | | | 3,580,862 | | | | 14,137,645 | |
| Payments for shares redeemed | | | (12,419,401 | ) | | | (22,745,865 | ) |
| Redemption fees | | | 3,259 | | | | 70 | |
| Net increase from capital share transactions | | | 5,894,039 | | | | 8,229,519 | |
| | | | | | | | | |
| DISTRIBUTIONS PAID FROM: | | | | | | | | |
| Net investment income | | | (1,137,845 | ) | | | (664,542 | ) |
| Net realized gains | | | (2,746,242 | ) | | | (14,471,784 | ) |
| Total distributions to shareholders | | | (3,884,087 | ) | | | (15,136,326 | ) |
| | | | | | | | | |
| TOTAL INCREASE (DECREASE) IN NET ASSETS | | | 20,414,866 | | | | (5,320,838 | ) |
| | | | | | | | | |
| NET ASSETS: | | | | | | | | |
| Beginning of period | | | 86,127,566 | | | | 91,448,404 | |
| | | | | | | | | |
| End of period (including distributions | | | | | | | | |
| in excess of net investment income | | | | | | | | |
| of $(6,827) and $(212,323), respectively) | | $ | 106,542,432 | | | $ | 86,127,566 | |
| | | | | | | | | |
| TRANSACTIONS IN SHARES: | | | | | | | | |
| Shares sold | | | 819,972 | | | | 867,302 | |
| Shares issued in reinvestment of distributions | | | 176,920 | | | | 808,790 | |
| Shares redeemed | | | (695,195 | ) | | | (1,102,411 | ) |
| Net increase | | | 301,697 | | | | 573,681 | |
See Notes to the Financial Statements
PROSPECTOR FUNDS, INC.
Financial Highlights
| | | Capital Appreciation Fund | |
| | | Year Ended December 31, | |
| | | 2016 | | | 2015 | | | 2014 | | | 2013 | | | 2012 | |
| For a Fund share outstanding | | | | | | | | | | | | | | | |
| throughout the period | | | | | | | | | | | | | | | |
| | | | | | | | | | | | | | | | |
| NET ASSET VALUE: | | | | | | | | | | | | | | | |
| Beginning of period | | $ | 14.84 | | | $ | 15.61 | | | $ | 17.11 | | | $ | 15.19 | | | $ | 14.90 | |
| | | | | | | | | | | | | | | | | | | | | |
| OPERATIONS: | | | | | | | | | | | | | | | | | | | | |
| Net investment income | | | 0.22 | | | | 0.21 | | | | 0.11 | | | | 0.18 | | | | 0.31 | |
| Net realized and unrealized | | | | | | | | | | | | | | | | | | | | |
| gain (loss) on investments | | | 1.96 | | | | (0.60 | ) | | | 0.63 | | | | 2.72 | | | | 0.54 | |
| Total from operations | | | 2.18 | | | | (0.39 | ) | | | 0.74 | | | | 2.90 | | | | 0.85 | |
| | | | | | | | | | | | | | | | | | | | | |
| LESS DISTRIBUTIONS: | | | | | | | | | | | | | | | | | | | | |
| From net investment income | | | (0.22 | ) | | | (0.37 | ) | | | (0.27 | ) | | | (0.17 | ) | | | (0.34 | ) |
| From net realized gains | | | — | | | | (0.01 | ) | | | (1.97 | ) | | | (0.81 | ) | | | (0.22 | ) |
| Total distributions | | | (0.22 | ) | | | (0.38 | ) | | | (2.24 | ) | | | (0.98 | ) | | | (0.56 | ) |
| | | | | | | | | | | | | | | | | | | | | |
| NET ASSET VALUE: | | | | | | | | | | | | | | | | | | | | |
| End of period | | $ | 16.80 | | | $ | 14.84 | | | $ | 15.61 | | | $ | 17.11 | | | $ | 15.19 | |
| | | | | | | | | | | | | | | | | | | | | |
| TOTAL RETURN | | | 14.68 | % | | | (2.52 | )% | | | 4.18 | % | | | 19.10 | % | | | 5.76 | % |
| | | | | | | | | | | | | | | | | | | | | |
| SUPPLEMENTAL DATA AND RATIOS: | | | | | | | | | | | | | | | | | | | | |
| Net assets, end of period (in thousands) | | $ | 25,663 | | | $ | 24,328 | | | $ | 38,398 | | | $ | 41,659 | | | $ | 39,104 | |
| Ratio of expenses to average net assets: | | | | | | | | | | | | | | | | | | | | |
| Before expense reimbursement | | | 2.06 | % | | | 1.88 | % | | | 1.74 | % | | | 1.77 | % | | | 1.77 | % |
| After expense reimbursement | | | 1.30 | % | | | 1.30 | % | | | 1.30 | % | | | 1.30 | % | | | 1.37 | % |
| Ratio of net investment income | | | | | | | | | | | | | | | | | | | | |
| to average net assets: | | | | | | | | | | | | | | | | | | | | |
| Before expense reimbursement | | | 0.58 | % | | | 0.47 | % | | | 0.05 | % | | | 0.61 | % | | | 1.10 | % |
| After expense reimbursement | | | 1.34 | % | | | 1.05 | % | | | 0.49 | % | | | 1.08 | % | | | 1.50 | % |
| Portfolio turnover rate | | | 32 | % | | | 35 | % | | | 48 | % | | | 31 | % | | | 15 | % |
See Notes to the Financial Statements
PROSPECTOR FUNDS, INC.
Financial Highlights
| | | Opportunity Fund | |
| | | Year Ended December 31, | |
| | | 2016 | | | 2015 | | | 2014 | | | 2013 | | | 2012 | |
| For a Fund share outstanding | | | | | | | | | | | | | | | |
| throughout the period | | | | | | | | | | | | | | | |
| | | | | | | | | | | | | | | | |
| NET ASSET VALUE: | | | | | | | | | | | | | | | |
| Beginning of period | | $ | 17.29 | | | $ | 20.75 | | | $ | 21.51 | | | $ | 18.05 | | | $ | 16.62 | |
| | | | | | | | | | | | | | | | | | | | | |
| OPERATIONS: | | | | | | | | | | | | | | | | | | | | |
| Net investment income | | | 0.13 | | | | 0.14 | | | | 0.13 | | | | 0.07 | | | | 0.20 | |
| Net realized and unrealized | | | | | | | | | | | | | | | | | | | | |
| gain on investments | | | 3.50 | | | | 0.18 | | | | 1.48 | | | | 4.84 | | | | 2.22 | |
| Total from operations | | | 3.63 | | | | 0.32 | | | | 1.61 | | | | 4.91 | | | | 2.42 | |
| | | | | | | | | | | | | | | | | | | | | |
| LESS DISTRIBUTIONS: | | | | | | | | | | | | | | | | | | | | |
| From net investment income | | | (0.22 | ) | | | (0.17 | ) | | | (0.16 | ) | | | (0.07 | ) | | | (0.20 | ) |
| From net realized gains | | | (0.53 | ) | | | (3.61 | ) | | | (2.21 | ) | | | (1.38 | ) | | | (0.79 | ) |
| Total distributions | | | (0.75 | ) | | | (3.78 | ) | | | (2.37 | ) | | | (1.45 | ) | | | (0.99 | ) |
| | | | | | | | | | | | | | | | | | | | | |
| NET ASSET VALUE: | | | | | | | | | | | | | | | | | | | | |
| End of period | | $ | 20.17 | | | $ | 17.29 | | | $ | 20.75 | | | $ | 21.51 | | | $ | 18.05 | |
| | | | | | | | | | | | | | | | | | | | | |
| TOTAL RETURN | | | 21.02 | % | | | 1.33 | % | | | 7.36 | % | | | 27.25 | % | | | 14.63 | % |
| | | | | | | | | | | | | | | | | | | | | |
| SUPPLEMENTAL DATA AND RATIOS: | | | | | | | | | | | | | | | | | | | | |
| Net assets, end of period (in thousands) | | $ | 106,542 | | | $ | 86,128 | | | $ | 91,448 | | | $ | 97,751 | | | $ | 70,549 | |
| Ratio of expenses to average net assets: | | | | | | | | | | | | | | | | | | | | |
| Before expense reimbursement | | | 1.59 | % | | | 1.61 | % | | | 1.53 | % | | | 1.57 | % | | | 1.64 | % |
| After expense reimbursement | | | 1.30 | % | | | 1.30 | % | | | 1.30 | % | | | 1.30 | % | | | 1.36 | % |
| Ratio of net investment income | | | | | | | | | | | | | | | | | | | | |
| to average net assets: | | | | | | | | | | | | | | | | | | | | |
| Before expense reimbursement | | | 0.41 | % | | | 0.28 | % | | | 0.23 | % | | | 0.08 | % | | | 0.84 | % |
| After expense reimbursement | | | 0.70 | % | | | 0.59 | % | | | 0.46 | % | | | 0.35 | % | | | 1.12 | % |
| Portfolio turnover rate | | | 42 | % | | | 36 | % | | | 40 | % | | | 25 | % | | | 43 | % |
See Notes to the Financial Statements
PROSPECTOR FUNDS, INC.
Notes to the Financial Statements
December 31, 2016
1. ORGANIZATION
Prospector Funds, Inc. (the “Corporation”) was organized as a Maryland corporation on June 6, 2007 and is registered under the Investment Company Act of 1940 (the “1940 Act”), as amended, as an open-end diversified management investment company. The Corporation issues its shares in series, each series representing a distinct portfolio with its own investment objectives and policies. There are two series presently authorized, the Prospector Capital Appreciation Fund and the Prospector Opportunity Fund (individually a “Fund” and collectively the “Funds”). Each Fund is an investment company and accordingly follows the investment company accounting and reporting guidance of the Financial Accounting Standards Board (“FASB”) Accounting Standard Board Codification Topic 946 Financial Services – Investment Companies. The Funds commenced operations on September 28, 2007.
2. FAIR VALUE MEASUREMENT
The following is a summary of significant accounting policies consistently followed by each Fund:
Security Valuation – The Fund has adopted fair value accounting standards which establish an authoritative definition of fair value and set out a hierarchy for measuring fair value. These standards require additional disclosures about the various inputs and valuation techniques used to develop the measurements of fair value, a discussion in changes in valuation techniques and related inputs during the period and expanded disclosure of valuation levels for major security types. These inputs are summarized in the three broad levels listed below:
| Level 1 – | Unadjusted quoted prices in active markets for identical assets or liabilities that the Fund has the ability to access. |
| | |
| Level 2 – | Observable inputs other than quoted prices included in Level 1 that are observable for the asset or liability, either directly or indirectly. These inputs may include quoted prices for the identical instrument on an inactive market, prices for similar instruments, interest rates, prepayment speeds, credit risk, yield curves, default rates, discounts and similar data. |
| | |
| Level 3 – | Unobservable inputs for the asset or liability, to the extent relevant observable inputs are not available, representing the Fund’s own assumptions about the assumptions a market participant would use in valuing the asset or liability, and would be based on the best information available. |
Following is a description of the valuation techniques applied to the Fund’s major categories of assets and liabilities measured at fair value on a recurring basis. The Fund’s investments are carried at fair value.
Common Stock – Securities that are primarily traded on a national securities exchange are valued at the last sale price on the exchange on which they are primarily traded on the day of valuation or, if there has been no sale on such day, at the last bid price on the day of valuation. To the extent these securities are actively traded and valuation adjustments are not applied, they are categorized in Level 1 of the fair value hierarchy.
Convertible and Corporate Bonds – Convertible and corporate bonds, including listed issues, are valued at fair value on the basis of valuations furnished by an independent pricing service which utilizes both dealer-supplied valuations and formula-based techniques. The pricing service may consider recently executed transactions in securities of the issuer or comparable issuers, market price quotations (where observable), bond spreads, and fundamental data relating to the issuer. Convertible and corporate bonds are generally categorized in Level 2 of the fair value hierarchy.
PROSPECTOR FUNDS, INC.
Notes to the Financial Statements – Continued
December 31, 2016
Investment Companies – Investments in other mutual funds, including money market funds, are valued at their net asset value per share. To the extent these securities are actively traded and valuation adjustments are not applied, they are categorized in Level 1 of the fair value hierarchy.
Securities for which market quotations are not readily available, or if the closing price does not represent fair value, are valued following procedures approved by the Board of Directors. These procedures consider many factors, including the type of security, size of holding, trading volume and news events. There can be no assurance that the Fund could obtain the fair value assigned to a security if they were to sell the security at approximately the time at which the Fund determines their net asset values per share.
The inputs or methodology used for valuing securities are not an indication of the risk associated with investing in those securities.
As of December 31, 2016, each Fund’s investments in securities were classified as follows:
| | | Level 1 | | | Level 2 | | | Level 3 | | | Total | |
| | | | | | | | | | | | | |
| Capital Appreciation Fund | | | | | | | | | | | | |
| Common Stocks | | $ | 18,976,778 | | | $ | — | | | $ | — | | | $ | 18,976,778 | |
| Convertible Bonds | | | — | | | | 5,075,965 | | | | — | | | | 5,075,965 | |
| Corporate Bonds | | | — | | | | 617,145 | | | | — | | | | 617,145 | |
| Short-Term Investment | | | 1,000,247 | | | | — | | | | — | | | | 1,000,247 | |
| Total Investments | | $ | 19,977,025 | | | $ | 5,693,110 | | | $ | — | | | $ | 25,670,135 | |
| | | | | | | | | | | | | |
| | | Level 1 | | | Level 2 | | | Level 3 | | | Total | |
| | | | | | | | | | | | | | | | | |
| Opportunity Fund | | | | | | | | | | | | | | | | |
| Common Stocks | | $ | 95,353,172 | | | $ | — | | | $ | — | | | $ | 95,353,172 | |
| Convertible Bond | | | — | | | | 446,625 | | | | — | | | | 446,625 | |
| Short-Term Investment | | | 8,683,558 | | | | — | | | | — | | | | 8,683,558 | |
| Total Investments | | $ | 104,036,730 | | | $ | 446,625 | | | $ | — | | | $ | 104,483,355 | |
Refer to each Fund’s Schedule of Investments for further sector breakout.
Transfers between levels are recognized at the beginning of the reporting period. During the year ended December 31, 2016, the Funds recognized no transfers between levels. The Funds did not invest in any Level 3 investments during the period.
The Funds may invest in derivative financial instruments in order to manage risk or gain exposure to various other investments or markets. The Funds’ investment objectives allow the Funds to enter into various types of derivative contracts, including, but not limited to, futures contracts, forward foreign exchange contracts, and purchased and written options. Derivatives may contain various risks including the potential inability of the counterparty to fulfill their obligations under the terms of the contract, the potential for an illiquid secondary market, and the potential for market movements which may expose the funds to gains or losses in excess of the amounts shown on the Statements of Assets and Liabilities. As of and for the year ended December 31, 2016, the Funds held no derivative instruments.
PROSPECTOR FUNDS, INC.
Notes to the Financial Statements – Continued
December 31, 2016
3. SIGNIFICANT ACCOUNTING POLICIES
Distributions to Shareholders – Dividends from net investment income and distributions of net realized capital gains, if any, will be declared and paid at least annually. The character of distributions made during the period from net investment income or net realized gains may differ from the characterization for federal income tax purposes due to differences in the recognition of income, expense and gain items for financial statement and tax purposes. All short-term capital gains are included in ordinary income for tax purposes.
Use of Estimates – The preparation of financial statements in conformity with accounting principles generally accepted in the United States of America requires management to make estimates and assumptions that affect the reported amounts of assets and liabilities and disclosure of contingent assets and liabilities at the date of the financial statements and the reported amounts of revenues and expenses during the reporting period. Actual results could differ from those estimates.
Federal Income Taxes – The Funds intend to meet the requirements of subchapter M of the Internal Revenue Code applicable to regulated investment companies and to distribute substantially all net taxable investment income and net realized gains to shareholders in a manner which results in no tax cost to the Funds. Therefore, no federal income or excise tax provision is required. As of December 31, 2016, the Funds did not have any tax positions that did not meet the “more-likely-than-not” threshold of being sustained by the applicable tax authority. Generally, each of the tax years in the four-year period ended December 31, 2016 remains subject to examination by taxing authorities.
Reclassification of Capital Accounts – GAAP requires that certain components of net assets relating to permanent differences be reclassified between financial and tax reporting. These reclassifications have no effect on net assets or net asset value per share. The difference between book and tax relates primarily to contingent preferred debt instruments, foreign currency and reclassifications of dividends. For the fiscal year ended December 31, 2016, the following reclassifications were made on the Statements of Assets and Liabilities:
| | | Distributions in | | | Accumulated | | | | |
| | | Excess of Net | | | Net Realized | | | | |
| | | Investment Income | | | Gain | | | Portfolio Capital | |
| | | | | | | | | | | | | |
| Capital Appreciation Fund | | $ | (147 | ) | | $ | 147 | | | $ | — | |
| Opportunity Fund | | | 697,351 | | | | (697,351 | ) | | | — | |
Foreign Currency Translation – The books and records relating to the Funds’ non-U.S. dollar denominated investments are maintained in U.S. dollars on the following bases: (1) market value of investment securities, assets, and liabilities are translated at the current rate of exchange; and (2) purchases and sales of investment securities, income, and expenses are translated at the relevant rates of exchange prevailing on the respective dates of such transactions. The Funds do not isolate the portion of gains and losses on investments in equity securities that is due to changes in the foreign exchange rates from that which is due to changes in market prices of equity securities. The Funds report certain foreign currency-related transactions as components of realized gains for financial reporting purposes, whereas such components are treated as ordinary income for federal income tax purposes.
Illiquid or Restricted Securities – A security may be considered illiquid if it lacks a readily available market. Securities are generally considered liquid if they can be sold or disposed of in the ordinary course of business within seven days at approximately the price at which the security is valued by the Fund. Illiquid securities may be valued under methods approved by the Funds’ board of directors as reflecting fair value. Each Fund intends to invest
PROSPECTOR FUNDS, INC.
Notes to the Financial Statements – Continued
December 31, 2016
no more than 15% of its total assets in illiquid securities. Certain restricted securities may be considered illiquid. Restricted securities are often purchased in private placement transactions, are not registered under the Securities Act of 1933, may have contractual restrictions on resale, and may be valued under methods approved by the Funds’ board of directors as reflecting fair value. Certain restricted securities eligible for resale to qualified institutional investors, including Rule 144A securities, are not subject to the limitation on a Fund’s investment in illiquid securities if they are determined to be liquid in accordance with procedures adopted by the Funds’ board of directors. At December 31, 2016, the Funds had no investments in illiquid securities.
Expenses – Expenses directly attributable to a Fund are charged to that Fund, while expenses attributable to more than one Fund are allocated among the respective Funds based on relative net assets or another appropriate basis.
Other – Investment and shareholder transactions are recorded on the trade date. Each Fund determines the gain or loss realized from the investment transactions on the basis of identified cost. Dividend income is recognized on the ex-dividend date. Interest income, including amortization of bond premium and discount, is recognized on an accrual basis.
Subsequent Events – Management has evaluated fund related events and transactions that occurred subsequent to December 31, 2016, through the date of issuance of the Funds’ financial statements. There were no events or transactions that occurred during this period that materially impacted the amounts or disclosures in the Funds’ financial statements.
4. INVESTMENT TRANSACTIONS
During the year ended December 31, 2016, purchases of securities and proceeds from sales of securities, other than temporary investments in short-term securities, were as follows:
| | | Purchases | | | Sales | |
| | | | | | | | | |
| Capital Appreciation Fund | | $ | 7,462,111 | | | $ | 9,727,818 | |
| Opportunity Fund | | | 36,882,558 | | | | 35,625,320 | |
There were no purchases or sales of long-term U.S. Government securities.
The aggregate gross unrealized appreciation and depreciation of securities held by the Funds and the total cost of securities for federal income tax purposes at December 31, 2016, the Funds’ most recently completed fiscal year end, were as follows:
| | | Aggregate | | | Aggregate | | | | | | Federal | |
| | | Gross | | | Gross | | | | | | Income | |
| | | Appreciation | | | Depreciation | | | Net | | | Tax Cost | |
| | | | | | | | | | | | | | | | | |
| Capital Appreciation Fund | | $ | 3,565,922 | | | $ | (533,290 | ) | | $ | 3,032,632 | | | $ | 22,637,503 | |
| Opportunity Fund | | | 22,080,334 | | | | (2,473,598 | ) | | | 19,606,736 | | | | 84,876,619 | |
The difference between book-basis and tax-basis unrealized appreciation is attributable primarily to wash sales and different book and tax accounting methods for certain securities.
At December 31, 2016, the Funds’ most recently completed fiscal year end, components of accumulated earnings (deficit) on a tax-basis were as follows:
PROSPECTOR FUNDS, INC.
Notes to the Financial Statements – Continued
December 31, 2016
| | | Undistributed | | | Undistributed | | | Other | | | | | | Total | |
| | | Ordinary | | | Long-Term | | | Accumulated | | | Unrealized | | | Accumulated | |
| | | Income | | | Capital Gains | | | Losses | | | Appreciation | | | Earnings | |
| | | | | | | | | | | | | | | | | | | | | |
| Capital Appreciation Fund | | $ | 166,474 | | | $ | 328,304 | | | $ | (8,580 | ) | | $ | 3,032,632 | | | $ | 3,518,830 | |
| Opportunity Fund | | | — | | | | 1,266,632 | | | | (14,276 | ) | | | 19,606,736 | | | | 20,859,092 | |
As of December 31, 2016, the Funds did not have any capital loss carryovers. A regulated investment company may elect for any taxable year to treat any portion of any qualified late year loss as arising on the first day of the next taxable year. Qualified late year losses are certain capital, and ordinary losses which occur during the portion of the Fund’s taxable year subsequent to October 31. The Capital Appreciation Fund and the Opportunity Fund do not plan to defer any late year losses.
The tax character of distributions paid during the fiscal year ended December 31, 2016 were as follows:
| | | Ordinary | | | Long Term | | | | |
| | | Income* | | | Capital Gains** | | | Total | |
| Capital Appreciation Fund | | $ | 331,651 | | | $ | — | | | $ | 331,651 | |
| Opportunity Fund | | | 1,133,169 | | | | 2,750,918 | | | | 3,884,087 | |
The tax character of distributions paid during the fiscal year ended December 31, 2015 were as follows:
| | | Ordinary | | | Long Term | | | | |
| | | Income* | | | Capital Gains** | | | Total | |
| Capital Appreciation Fund | | $ | 591,102 | | | $ | 16,111 | | | $ | 607,213 | |
| Opportunity Fund | | | 1,459,542 | | | | 13,676,784 | | | | 15,136,326 | |
| * | | For federal income tax purposes, distributions of short-term capital gains are included in ordinary income distributions. |
| ** | | Funds designate long-term capital gain dividends pursuant to IRC Sec. 852(b)(3)(C). |
5. AGREEMENTS
The Funds have entered into an Investment Advisory Agreement with Prospector Partners Asset Management, LLC (the “Adviser”), with whom certain directors and officers of the Corporation are affiliated, to furnish investment advisory services to the Funds. Pursuant to this Agreement, the Adviser is entitled to receive a management fee, calculated daily and payable monthly, at the annual rate of 1.10% as applied to each Fund’s daily net assets.
The Adviser has contractually agreed to waive its management fee and reimburse each Fund’s other expenses to the extent necessary to ensure that each Fund’s operating expenses do not exceed 1.30% of its average daily net assets. Fees waived and expenses reimbursed by the Adviser may be recouped by the Adviser for a period of three fiscal years following the fiscal year during which such waiver or reimbursement was made if such recoupment can be achieved without exceeding the expense limit in effect at the time the waiver or reimbursement occurred. As of December 31, 2016, the Adviser did not recoup any previously waived expenses. The Operating Expense Limitation Agreement will be in effect through at least September 30, 2017. Waived fees and reimbursed expenses subject to potential recovery by year of expiration are as follows:
PROSPECTOR FUNDS, INC.
Notes to the Financial Statements – Continued
December 31, 2016
| Expiration | | Capital Appreciation Fund | | | Opportunity Fund | |
| | | | | | | | | |
| 12/31/17 | | $ | 174,159 | | | $ | 250,997 | |
| 12/31/18 | | | 189,898 | | | | 272,070 | |
| 12/31/19 | | | 184,289 | | | | 270,491 | |
| Total | | $ | 548,346 | | | $ | 793,558 | |
As of December 31, 2016, it was possible, but not probable, those amounts would be recovered by the Adviser. At the end of each fiscal year in the future, the Funds will continue to assess the potential recovery of waived/reimbursed fees and expenses for financial reporting purposes.
Quasar Distributors, LLC (“Quasar”), a subsidiary of U.S. Bancorp, serves as distributor of the Funds’ shares pursuant to a Distribution Agreement with the Corporation. Each Fund’s shares are sold on a no-load basis and, therefore, Quasar receives no sales commission or sales load for providing services to the Funds. The Corporation has adopted a plan pursuant to Rule 12b-1 under the 1940 Act (the “12b-1 Plan”), which authorizes the Corporation to reimburse Quasar and certain financial intermediaries who assist in distributing each Fund’s shares or who provide shareholder services to Fund shareholders a distribution and/or shareholder servicing fee of up to 0.25% of each Fund’s average daily net assets (computed on an annual basis). All or a portion of the fee may be used by the Funds or Quasar to pay the Fund’s distribution fees and costs of printing reports and prospectuses for potential investors and the costs of other distribution and shareholder services expenses. During the year ended December 31, 2016, Capital Appreciation Fund and Opportunity Fund incurred expenses of $12,104 and $79,256 respectively, pursuant to the 12b-1 Plan.
U.S. Bancorp Fund Services, LLC serves as transfer agent, administrator and fund accountant for the Funds. U.S. Bank N.A. serves as custodian for the Funds.
6. INDEMNIFICATIONS
The Funds enter into contracts that contain a variety of indemnifications. The Funds’ maximum exposure under these arrangements is unknown. However, the Funds have not had prior claims or losses pursuant to these contracts and expect the risk of loss to be remote.
PROSPECTOR FUNDS, INC.
Report of Independent Registered Public Accounting Firm
The Board of Directors and Shareholders
Prospector Funds, Inc.:
We have audited the accompanying statements of assets and liabilities, including the schedule of investments, of Prospector Funds, Inc., (comprised of, the Prospector Capital Appreciation Fund and the Prospector Opportunity Fund (the Funds)) as of December 31, 2016, and the related statements of operations for the year then ended, the statements of changes in net assets for each of the two years in the period then ended, and the financial highlights for each of the five years in the period then ended. These financial statements and financial highlights are the responsibility of the Funds’ management. Our responsibility is to express an opinion on these financial statements and financial highlights based on our audits.
We conducted our audits in accordance with the standards of the Public Company Accounting Oversight Board (United States). Those standards require that we plan and perform the audit to obtain reasonable assurance about whether the financial statements and financial highlights are free of material misstatement. We were not engaged to perform an audit of the Funds’ internal control over financial reporting. Our audits included consideration of internal control over financial reporting as a basis for designing audit procedures that are appropriate in the circumstances, but not for the purpose of expressing an opinion on the effectiveness of the Funds’ internal control over financial reporting. Accordingly, we express no such opinion. An audit also includes examining, on a test basis, evidence supporting the amounts and disclosures in the financial statements and financial highlights, assessing the accounting principles used and significant estimates made by management, and evaluating the overall financial statement presentation. Our procedures included confirmation of securities owned as of December 31, 2016, by correspondence with the custodian. We believe that our audits provide a reasonable basis for our opinion.
In our opinion, the financial statements and financial highlights referred to above present fairly, in all material respects, the financial position of each of the respective Funds at December 31, 2016, the results of their operations for the year then ended, the changes in their net assets for the two years in the period then ended, and the financial highlights for each of the five years in the period then ended, in conformity with U.S. generally accepted accounting principles.
Chicago, Illinois
February 24, 2017
PROSPECTOR FUNDS, INC.
Additional Information (Unaudited)
December 31, 2016
BOARD APPROVAL OF INVESTMENT ADVISORY AGREEMENT
The Corporation’s independent directors (the “directors”) unanimously approved the continuance of the Investment Advisory Agreement (the “Advisory Agreement”) between the Funds and the Prospector Partners Asset Management, LLC (the “Investment Manager”) at a Board of Director’s meeting held on September 1, 2016.
In preparation for the meeting, the directors had requested from the Investment Manager and evaluated a memorandum providing certain information requested by the Board pursuant to Section 15(c) of the 1940 Act, including (i) expense, compliance and other information as it relates to the Investment Manager; (ii) performance of other accounts managed by its affiliate Prospector Partners, LLC with similar investment objectives derived from data compiled by the Investment Manager and (iii) expense and other information for other registered investment companies with similar investment objectives derived from data compiled by the Investment Manager based upon comparative peer groups selected in consultation with the independent directors. Prior to voting, the directors reviewed the proposed approval of the Advisory Agreement with management and with counsel to the Corporation and reviewed a memorandum from such counsel discussing the legal standards for their consideration of the proposed approval. In reaching their determinations relating to approval of the continuance of the Advisory Agreement, the directors considered all factors they believed relevant including the following:
| | 1. | the nature, extent and quality of investment, and other services to be rendered by the Investment Manager; |
| | | |
| | 2. | payments to be received by the Investment Manager from all sources with respect to the Funds; |
| | | |
| | 3. | comparative fee and expense data for the Funds and other investment companies with similar investment objectives; |
| | | |
| | 4. | the extent to which economies of scale may be realized as the Funds grow and whether fee levels reflect these economies of scale for the benefit of investors; |
| | | |
| | 5. | the Investment Manager’s policies and practices regarding allocation of portfolio transactions of the Funds, including the extent to which the Investment Manager may benefit from soft dollar arrangements; |
| | | |
| | 6. | fall-out benefits which the Investment Manager and its affiliates may receive from their relationships to the Funds; |
| | | |
| | 7. | information about fees charged by the Investment Manager to other clients with similar investment objectives; |
| | | |
| | 8. | the professional experience and qualifications of the Funds’ portfolio managers and other senior personnel of the Investment Manager; |
| | | |
| | 9. | profitability of the Investment Manager; and |
| | | |
| | 10. | the terms of the Advisory Agreement. |
The directors also considered their overall confidence in the integrity and competence of the Investment Manager and the portfolio managers. In their deliberations, the directors did not identify any particular information that was all-important or controlling, and each director attributed different weights to the various factors. The directors determined that the overall arrangements between the Funds and the Investment Manager, as provided in the Advisory Agreement, were fair and reasonable in light of the services performed, expenses expected to be incurred and such other matters as the directors considered relevant in the exercise of their reasonable judgment.
The material factors and conclusions that formed the basis for the directors reaching their determinations to approve the continuance of the Advisory Agreement (including their determinations that the Investment Manager
PROSPECTOR FUNDS, INC.
Additional Information (Unaudited) – Continued
December 31, 2016
should be the investment adviser for the Funds, and that the fees payable to the Investment Manager pursuant to the Advisory Agreement are appropriate) were separately discussed by the directors.
Nature, extent and quality of services provided by the Investment Manager
The directors noted that, under the Advisory Agreement, the Investment Manager, subject to the control of the directors, administers the Funds’ business and other affairs. The Investment Manager manages the investment of the assets of the Funds, including making purchases and sales of portfolio securities consistent with each Fund’s investment objective and policies.
The directors considered the scope and quality of services provided by the Investment Manager under the Advisory Agreement. The directors considered the quality of the investment research capabilities of the Investment Manager and the other resources it proposes to dedicate to performing services for the Funds and the Investment Manager’s active management style. The directors also considered the portfolio managers’ experience, reputation and investment philosophy noting that the Investment Manager’s investment style and stock selection process have remained consistent even in difficult market environments. The quality of administrative and other services also were considered. The directors concluded that, overall, they were satisfied with the nature, extent and quality of services proposed to be provided to the Funds under the Advisory Agreement.
Investment Manager Fees; Performance of the Fund
The directors considered the advisory fee rate paid by the Funds to the Investment Manager and information prepared by the Investment Manager based upon the peer groups selected with the input of the independent directors concerning fee rates paid by other comparable funds. The directors recognized that it is difficult to make comparisons of advisory fees because there are variations in the services that are included in the fees paid by other funds, but determined that the proposed advisory fee rate was in line with other comparable funds.
The directors also considered the performance of each Fund compared to each Fund’s benchmarks and peer groups. The directors noted that the Opportunity Fund was ranked in the top three funds among its peers across all comparative time periods, further noting the Opportunity Fund’s number one ranking since inception. The Directors noted that while the Capital Appreciation Fund underperfomed its benchmark across all comparative periods, the Fund was in the peer group’s first quartile for the since inception, one-year and three-year periods. The directors concluded that the advisory fee rate, taking into account performance and the other factors mentioned, was in line with comparable funds.
Other Fund Expenses
The directors also considered the total expense ratio of the Funds in comparison to the fees and expenses of the funds included in the comparison. The directors noted that the expense ratios of some of the comparable funds also were lower because of waivers or reimbursements by those funds’ investment advisers, which in some cases were voluntary and perhaps temporary. In particular, the directors noted that the Investment Manager’s fee waiver pursuant to the Fee Waiver and Expenses Reimbursement Agreement was contractual in nature and customary for the industry. The directors concluded that the Funds’ expense ratio was satisfactory. Finally, the directors noted that there may be economies of scale as the Funds grow and concluded that it may be appropriate to consider those issues in the future.
PROSPECTOR FUNDS, INC.
Additional Information (Unaudited) – Continued
December 31, 2016
Investment Manager Profitability
The directors noted that the Investment Manager also provides the Funds with such office space, administrative and other services (exclusive of, and in addition to, any such services provided by any other retained by the Funds) and executive and other personnel as are necessary for the Funds’ operations. The directors considered that the Investment Manager pays all of the compensation of the officers of the Company that are affiliated persons of the Investment Manager, pays a portion of the insurance costs and paid the cost of the organization of the Funds (without reimbursement).
The directors also noted that the Investment Manager has contractually agreed to waive, through September 30, 2017, its management fee and/or reimburse each Fund’s other expenses to the extent necessary to ensure that each Fund’s operating expenses do not exceed 1.30% of its average daily net assets. Under the terms of the Waiver and Expense Reimbursement Agreement at the present asset levels of the Funds, the Investment Manager has received only a portion of its management fee amounts. It was also noted that the Investment Manager does not receive “fall out” benefits commonly received by managers of mutual funds that provide transfer agency, distribution or printing services in-house. The directors considered the expenses of the Investment Manager and the services provided by the Investment Manager and determined that the Investment Manager was cash flow positive after considering an allocation of expenses from its affiliated advisor, Prospector Partners, LLC.
PROSPECTOR FUNDS, INC.
Additional Information (Unaudited) – Continued
December 31, 2016
AVAILABILITY OF FUND PORTFOLIO INFORMATION
The Funds file complete schedules of portfolio holdings with the SEC for the first and third quarters of each fiscal year on Form N-Q, which is available on the SEC’s website at www.sec.gov. The Funds’ Form N-Q may be reviewed and copied at the SEC’s Public Reference Room in Washington, D.C. For information on the Public Reference Room call 1-800-SEC-0330. In addition, the Funds’ Form N-Q is available without charge upon request by calling 1-877-734-7862.
AVAILABILITY OF PROXY VOTING INFORMATION
A description of the Funds’ Proxy Voting Policies and Procedures is available without charge, upon request, by calling 1-877-734-7862. Information regarding how the Funds voted proxies relating to portfolio securities during the most recent 12 month period ended June 30, is available (1) without charge, upon request, by calling 1-877-734-7862, or (2) on the SEC’s website at www.sec.gov.
QUALIFIED DIVIDEND INCOME/DIVIDENDS RECEIVED DEDUCTION
For the fiscal year ended December 31, 2016, certain dividends paid by the Funds may be subject to a maximum tax rate of 23.8%, as provided for by the American Taxpayer Relief Act of 2012. The percentage of dividends declared from ordinary income designated as qualified dividend income was 100% and 96.05% for the Capital Appreciation Fund and Opportunity Fund, respectively.
For corporate shareholders, the percent of ordinary income distributions qualifying for the corporate dividends received deduction for the fiscal year ended December 31, 2016 was 94.71% and 93.89% for the Capital Appreciation Fund and Opportunity Fund, respectively.
ADDITIONAL INFORMATION APPLICABLE TO FOREIGN SHAREHOLDERS ONLY
The percent of ordinary income distributions designated as interest related dividends for the fiscal year ended December 31, 2016 was 14.90% and 2.43% for the Capital Appreciation Fund and Opportunity Fund, respectively.
The percent of ordinary income distributions designated as short-term capital gain distributions under Internal Revenue Section 871(k)(2)(C) for the fiscal year ended December 31, 2016 was 0.00% and 26.98% for the Capital Appreciation Fund and Opportunity Fund, respectively.
PROSPECTOR FUNDS, INC.
Additional Information (Unaudited) – Continued
December 31, 2016
DIRECTORS & OFFICERS TABLE
| | | Term of | | Number of | |
| | | Office | | Portfolios | Other |
| | | and | Principal | in Fund | Directorships |
| Name, | | Length | Occupation | Complex | Served |
| Year of Birth | | of Time | During Past | Overseen | During Past |
| and Address^ | Position | Served* | 5 Years | by Director | 5 Years |
| |
| Independent Board Members |
| | | | | | |
| Harvey D. Hirsch* | Director | Indefinite; | Retired, | 2 | None. |
| Year of Birth: 1941 | | Since | Senior Vice President, | | |
| | | September 7, | Marketing, Van Eck | | |
| | | 2007 | Associates Corporation, | | |
| | | | an investment adviser, | | |
| | | | from May 2007 to August 2014. | | |
| | | | | | |
| | | | | | |
| Joseph Klein III* | Director | Indefinite; | Managing Director of Gauss | 2 | Ionis |
| Year of Birth: 1961 | | Since | Capital Advisors, LLC, | | Pharmaceuticals, |
| | | September 7, | a financial consulting and | | Inc. |
| | | 2007 | investment advisory firm | | |
| | | | focused on biopharmaceuticals | | |
| | | | since he founded the company | | |
| | | | in March 1998. | | |
| | | | | | |
| | | | | | |
| Roy L. Nersesian* | Director | Indefinite; | Professor of the Leon Hess | 2 | None. |
| Year of Birth: 1939 | | Since | School of Business, Monmouth | | |
| | | September 7, | University, since September 1985. | | |
| | | 2007 | Adjunct Professor of the Center | | |
| | | | for Energy and Marine | | |
| | | | Transportation, Columbia | | |
| | | | University, since September 2000. | | |
| | | | Consultant, Poten & Partners, | | |
| | | | provider of brokerage and | | |
| | | | consulting services to the | | |
| | | | energy and ocean transportation | | |
| | | | industries, since September 1992. | | |
| | | | | | |
| | | | | | |
| John T. Rossello, Jr.* | Director | Indefinite; | Retired. | 2 | None. |
| Year of Birth: 1951 | | Since | | | |
| | | September 7, | | | |
| | | 2007 | | | |
PROSPECTOR FUNDS, INC.
Additional Information (Unaudited) – Continued
December 31, 2016
| | | Term of | | Number of | |
| | | Office | | Portfolios | Other |
| | | and | Principal | in Fund | Directorships |
| Name, | | Length | Occupation | Complex | Served |
| Year of Birth | | of Time | During Past | Overseen | During Past |
| and Address^ | Position | Served* | 5 Years | by Director | 5 Years |
| |
| Interested Board Members and Officers |
| | | | | | |
| John D. Gillespie†* | Director | Indefinite; | Managing member of | 2 | White |
| Year of Birth: 1959 | President | Since | the Investment Manager. | | Mountains |
| | | September 7, | Managing member of | | Insurance |
| | | 2007 | Prospector Partners, LLC, | | Group, Ltd. |
| | | | an affiliate of the Investment | | |
| | | | Manager, and portfolio | | |
| | | | manager of the investment | | |
| | | | funds sponsored by Prospector | | |
| | | | Partners, LLC since 1997. | | |
| | | | | | |
| | | | | | |
| Kevin R. O’Brien | Executive | Indefinite; | Portfolio Manager at | N/A | None. |
| Year of Birth: 1963 | Vice | Since | the Investment Manager. | | |
| | President | September 7, | Portfolio Manager at | | |
| | | 2007 | Prospector Partners, LLC | | |
| | | | since April 2003. | | |
| | | | | | |
| | | | | | |
| Jason A. Kish | Executive | Indefinite; | Portfolio Manager at | N/A | None. |
| Year of Birth: 1973 | Vice | Since | the Investment Manager. | | |
| | President | February, | Director of Research | | |
| | | 2013 | since 2010. | | |
| | | | | | |
| | | | | | |
| Peter N. Perugini, Jr. | Secretary | Indefinite; | Chief Financial Officer at | N/A | None. |
| Year of Birth: 1970 | Treasurer | Secretary | Prospector Partners, LLC | | |
| | | Since | since 2000. | | |
| | | September 7, | | | |
| | | 2007 | | | |
| | | Indefinite; | | | |
| | | Treasurer | | | |
| | | Since | | | |
| | | June 6, | | | |
| | | 2007 | | | |
PROSPECTOR FUNDS, INC.
Additional Information (Unaudited) – Continued
December 31, 2016
| | | Term of | | Number of | |
| | | Office | | Portfolios | Other |
| | | and | Principal | in Fund | Directorships |
| Name, | | Length | Occupation | Complex | Served |
| Year of Birth | | of Time | During Past | Overseen | During Past |
| and Address^ | Position | Served* | 5 Years | by Director | 5 Years |
| | | | | | |
| Kim Just | Chief | Indefinite; | Chief Compliance Officer at | N/A | None. |
| Year of Birth: 1967 | Compliance | Since | Prospector Partners, LLC | | |
| | Officer | September 7, | since March 2006. | | |
| | | 2007 | | | |
| | | | | | |
| | | | | | |
| Brian Wiedmeyer | Assistant | Indefinite; | Vice President for US | N/A | None. |
| Year of Birth: 1973 | Secretary | Since | Bancorp Fund Services, LLC, | | |
| | | September 7, | a mutual fund service provider, | | |
| | | 2007 | since January 2005. | | |
| ^ | The address for all directors and officers is 370 Church Street, Guilford, Connecticut 06437. |
| * | Each of the Company’s directors was elected by written consent of the sole shareholder of the Funds on September 7, 2007. |
| † | John D. Gillespie is an interested director of the Fund because he is also the managing member of the Investment Manager. |
(This Page Intentionally Left Blank.)
DIRECTORS
John D. Gillespie
Harvey D. Hirsch
Joseph Klein III
Roy L. Nersesian
John T. Rossello, Jr.
INVESTMENT ADVISER
Prospector Partners Asset Management, LLC
370 Church Street
Guilford, CT 06437
DISTRIBUTOR
Quasar Distributors, LLC
615 East Michigan Street
Milwaukee, WI 53202
CUSTODIAN
U.S. Bank, N.A.
1555 North River Center Drive
Milwaukee, WI 53212
ADMINISTRATOR AND TRANSFER AGENT
U.S. Bancorp Fund Services, LLC
Third Floor
615 E. Michigan Street
Milwaukee, WI 53202
INDEPENDENT REGISTERED PUBLIC ACCOUNTING FIRM
Ernst & Young LLP
155 North Wacker Drive
Chicago, IL 60606
LEGAL COUNSEL
Seward & Kissel LLP
One Battery Plaza
New York, NY 10004
This report should be accompanied or preceded by a prospectus.
The Funds’ Statement of Additional Information contains additional information about the
Funds’ directors and is available without charge upon request by calling 1-877-734-7862.