UNITED STATES
SECURITIES AND EXCHANGE COMMISSION
Washington, D.C. 20549
FORM N-CSR
CERTIFIED SHAREHOLDER REPORT OF REGISTERED
MANAGEMENT INVESTMENT COMPANIES
Investment Company Act file number 811-22077
Prospector Funds, Inc.
(Exact name of registrant as specified in charter)
370 Church St., Guilford, CT 06437
(Address of principal executive offices) (Zip code)
Prospector Partners Asset Management, LLC, 370 Church St., Guilford, CT 06437
(Name and address of agent for service)
(203) 458-1500
Registrant's telephone number, including area code
Date of fiscal year end: December 31, 2015
Date of reporting period: December 31, 2015
Item 1. Report to Stockholders.
PROSPECTOR CAPITAL APPRECIATION FUND
PROSPECTOR OPPORTUNITY FUND
| | ANNUAL REPORT |
| | |
| www.prospectorfunds.com | DECEMBER 31, 2015 |
PROSPECTOR FUNDS, INC.
February 5, 2016
Dear Shareholders of the Prospector Capital Appreciation Fund and Prospector Opportunity Fund,
The U.S. stock market had mixed results in 2015. The large capitalization S&P 500 showed a small positive total return while the Russell Midcap and Russell 2000 indices posted modest losses for the full year. Not surprisingly there was meaningful dispersion of returns among sectors. A breakage in the coordinated global monetary policy that has generally been in effect since 2009 is a major factor, as are concerns about economic weakness in China and its ripple effects across the globe. The slowdown in economic conditions there has contributed to a global selloff in commodity prices, which severely impacts commodity-based emerging market economies. Oil prices continued their slide through the year, with Brent crude prices ending the year off over 75% from the 2014 highs. Given this backdrop, energy and commodity-related sectors performed poorly during the year, while consumer discretionary stocks led the market.
In December the Fed raised interest rates in the U.S. for the first time since June 2006, ending a period of seven years of near-zero rates. While the 25 basis point rise is, in itself, not that significant an action, it represents an inflection point change in course and likely signals multiple future increases and the end of the unprecedented Fed accommodation policies that fueled stock prices to more than double from the recessionary lows of the financial crisis. While it is not unusual for the Fed to begin to tighten money six years into an economic expansion cycle, this move seems controversial. Conventional wisdom would suggest the Fed believes that the U.S. economy is healthy enough to withstand higher rates, so it can turn its attention towards fighting future inflation. What is unusual this time is that the cost of business borrowing, as measured by credit spreads over the corresponding Treasury rate, is already elevated. Further, there are clear signals that the availability of credit is also reduced. The high yield market plummeted towards the end of the year and fell 5% for the full year, ending the year with yields above 9%. History clearly argues that the stock market is vulnerable to correction when the Fed tightens monetary conditions with investment grade corporate spreads at current levels or higher. In fact, over the last 100 years, the Fed has tightened money six times when Baa 20 year corporate bond spreads were at current levels or higher, each time the market suffered a decline, averaging 28%. As of the date of this letter, we have already endured a significant pullback: 24% decline in the Russell 2000 and 13% of the S&P 500 from peak to trough.
The good news, which could have an offsetting impact, is that the rest of the world is still printing money as fast as they can. Europe, still in the midst of substantial quantitative easing, appears to be improving slowly even as the continent struggles to find the right balance in dealing with the historic influx of refugees streaming into the region from war-torn areas in the Middle East and Africa. This is adding strain to the fabric of the European Union as it continues to grapple with the Greek rescue effort. Additionally, Asian central banks, including both China’s and Japan’s, are likely to continue their easy money policies. The U.S. economy is outperforming on a relative basis. However, much of the improvement for our leading multinational corporations from a rebound in Europe will be muted by weaker end markets in China and the emerging markets, as well as potential continued strengthening of the U.S. dollar due to our divergent monetary policy.
Overall, the environment for equity investing is less certain. The U.S. has broken ranks with coordinated central bank quantitative easing strategies that have pinned interest rates near record low levels and encouraged investors to buy risk assets.
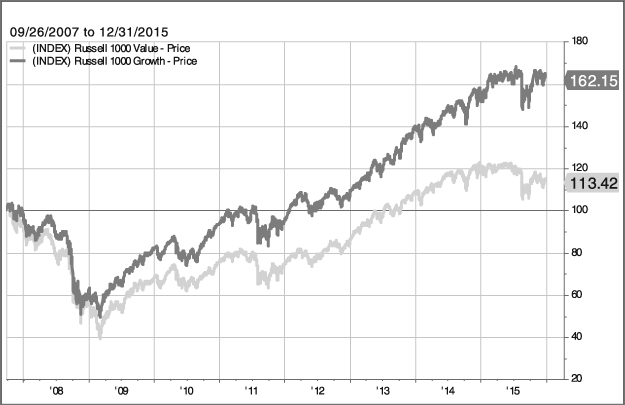
Digging a bit deeper into domestic markets, it is noteworthy that even during the recent sell-off, the long period of “growth” stocks’ outperformance versus “value” has continued. Indeed, during 2015, the Russell 1000 Growth
PROSPECTOR FUNDS, INC.
Index outperformed its “Value” counterpart by almost 10%, with the Value Index declining more than 3%. Since September 27, 2007 (the Funds’ inception date), the Growth Index has outperformed by an astounding 49% (see chart below), as an increasingly greater premium has been placed on companies and industries which are showing unit growth during this tepid economic recovery. While, to an extent, this makes sense (after all, as interest rates decline, discounted future cash flows should, in theory, be worth more - and growth companies are most levered to this equation), this leverage works both ways. As the economy continues to strengthen, and interest rates eventually increase, we think it quite possible that this trend reverses. Much as was the case during the “tech bubble” of the late-90’s, we are unwilling to proclaim “value investing” dead.
Source: Factset
Property-Casualty Insurance Merger Mania
2015 could be deemed the “year of the property-casualty merger.” We saw: foreign buyers targeting the higher marginal returns of reinsurance versus cash; strategic acquisitions of U.S.-concentrated, specialty insurers and mergers between Bermuda and Lloyds vehicles. Asian companies are strategically buying their way into western insurers as a way to diversify their geographic concentration. Interestingly, China Re, the nation’s largest reinsurer, recently raised $2 billion via an initial public offering. Time will tell as to whether they plan on using the proceeds to participate in the wave of mergers and acquisitions (M&A).
Perhaps the most noteworthy of these property-casualty deals was the landmark announcement on July 1, that ACE Limited (ACE) was to acquire Chubb (CB). We view this significant transaction as potentially a “game changer” for two reasons. First, the 30% premium price and 1.75x tangible book value when combined with ACE’s willingness to incur 30% dilution in its own tangible book value per share represent new ground on transaction terms. Second, this deal raises the stakes on other large carriers to consider the benefits of participating as buyers or sellers in consolidation. ACE and CB are each independently bellwether insurance companies with unique franchises
PROSPECTOR FUNDS, INC.
in attractive business lines. Each company’s prospects are better than that of the average insurance company, particularly within this environment of low interest rates, modest loss inflation, and challenging organic growth. A confluence of factors likely contributed to this deal, including: (1) ACE’s successful, historical track record of delivering growth and earnings accretion via acquisitions; (2) Chubb’s impending retirement of its CEO; (3) complimentary business profiles; (4) the recent favorable investment community reaction to deals with both challenges and significant tangible book value dilution, but potentially meaningful EPS accretion.
We suspect these recent deals have opened eyes amongst the board members of publicly-traded insurers. This industry has begged consolidation for years, but the long-term track record of large-scale M&A has been mixed at best, with the high-activity period of the late 1990s coming to mind. Many executives running companies today have witnessed those mistakes first hand, as have long-term investors in the sector. Investors have recently shown a willingness to give management teams the benefit of the doubt. The lessons of the past, combined with the benefits of today’s technology and advanced analytics (transparency, risk management, etc.), may prove to be difference makers; time will tell if this time can be different.
Prospector Partners has a long history in investing in property-casualty insurance stocks, and Prospector Opportunity Fund and Prospector Capital Appreciation Fund both have meaningful exposure to the sector, with several holdings being potentially attractive takeover candidates in our view. Several such investments are described below.
Prospector Opportunity Fund Highlights
The Prospector Opportunity Fund appreciated 1.33% during the year ended December 31, 2015. This compares favorably to the 2.44% decline in the Russell Midcap Total Return Index and the 4.41% fall in the Russell 2000 Total Return Index. The Fund’s largest sectors (financials, consumer, technology) all contributed positively to results. Financial stock performance was positively impacted by insurance M&A activity (Stancorp Financial, Chubb) as well as solid gains from community banks in geographies unaffected by energy credits (HomeTrust, OceanFirst, Oritani). Consumer winners came from both the “Steady Eddie” staples segment (Lancaster Colony, Tootsie Roll) as well as several restaurant company turnarounds such as McDonald’s and Del Frisco’s. Our best performer in technology was Verisign which owns the registry for the .com and .net internet domains.
Not surprisingly, the key detractors from Fund performance were holdings impacted by the sharp decline in oil prices, such as Hess in the energy sector and Powell Industries in the industrial category. We continue to evaluate opportunities in these sectors. However the search for strong balance sheets and sustainable free cash flow generation ability at today’s oil price level is proving a difficult standard for many of these companies to achieve.
The largest purchase in the last six months ended December 31, 2015 was property-casualty re/insurer Validus Holdings (VR). Validus is well managed, conservatively reserved, and has generated double-digit increases in tangible book value over many years. Despite this, shares sell for less than 120% of tangible book value, a valuation merely consistent with an “average” Bermudian re/insurance company (most of which lack these attributes).
Validus is a market leader in property-catastrophe reinsurance, the segment of the reinsurance industry under the most pressure and change. Importantly, VR also leads in the management of third-party capital supporting the assumption of catastrophic risks (this means that VR will use “other people’s money” to support insurance risk in exchange for a fee – a higher return business model). We have witnessed several M&A transactions in the sector this year; as we contemplate the relative attractiveness of the remaining publicly-traded re/insurance companies, we can’t
PROSPECTOR FUNDS, INC.
help but think this asset management capability could be quite attractive to either a foreign buyer and/or a larger asset management firm. Additionally, Validus has meaningful operations in Lloyds, a market where participants have recently sold to larger enterprises at significant premiums to tangible book values (160%-240%+). Buying above-average companies at average multiples, with an M&A “call option,” makes sense to us in this environment.
We see value in insurance companies with conservatively-stated balance sheets (debt leverage, underwriting leverage, likely reserve redundancies) and/or niche franchises (excess & surplus lines, nonstandard auto, high-hazard workers compensation, medical malpractice), and your portfolio includes companies with these attributes.
2015 was an interesting year for bank stock investing. A core Prospector approach to bank stock investing is to own smaller depository institutions who offer a limited set of products and services in a well-defined geography. We can bring our bottom-up disciplined analytical approach to bear on these companies and glean insights that lead to solid investment decisions. This strategy has served us well over many years as our holdings have participated in the consolidation of the banking sector as sellers. Medium-sized and smaller banks with limited or no exposure to the oil patch, commodities or China and the emerging markets had solid results in 2015. The NASDAQ bank index (a decent proxy) was up 7% last year. Looking forward into 2016, the outlook is a bit more challenging. Valuations are higher on average as many of these institutions were bid up during 2015 on the expectations of higher rates. In our view, the actual benefit from modestly higher rates could well prove to be less than the current expectations. In addition, we are beginning to anticipate a turn on the credit cycle, which has been an industry tailwind since the end of the financial crisis. On the positive side, this group should continue to benefit strongly from consolidation. During the last six months ended December 31, 2015 we trimmed shares of Oritani Financial, a long-time holding, as the stock outperformed on the anticipation of a Fed rate hike and potential consolidation.
Prospector Capital Appreciation Fund Highlights
The Prospector Capital Appreciation Fund declined 2.52% during the year ended December 31, 2015. This compares to a 1.38% increase for the benchmark S&P 500. Even when considering the recent unfavorable climate for “value” investing (see discussion above), we are barely satisfied with this result. Declines in energy-related holdings were the cause of the current year loss (and then some). While we believed (and continue to believe) oil is at unsustainably low prices, we clearly would have been better off with no energy exposure in 2015. During this downturn, we are constantly evaluating the balance sheet strength and cash flow positions of the Fund’s oil & gas holdings – mindful that in order to benefit from the eventual rise in energy prices, firms must first be able to withstand an extended unfavorable market.
The Fund benefited during 2015 from investments in the healthcare sector, where two convertible bonds (Hologic and Medicines Company) were among top contributors for the year. Additionally, consumer-related investments added significantly to performance. Specifically, McDonald’s, which we believe is in the early innings of a turn-around, was the year’s top contributor. Mondelez (Oreo cookies, Nabisco, Cadbury, etc.), Darden (Olive Garden) and Campbell Soup also contributed nicely. Lastly, performance was aided by merger and acquisition activity, with the take outs of RTI International Metals, Hospira, HomeAway and Cablevision all contributing positively to results.
One of the largest common stock purchases since our last communication was Endurance Specialty Holdings (ENH). Endurance is a Bermuda-based property-casualty re/insurer, with premiums split roughly equally between reinsurance and specialty insurance. The company is run by long-time industry veteran, John Charman, who joined the company in May, 2013 after a long tenure at Axis Capital Holdings (a company he formed after a long career at Lloyds, and which compounded book value plus dividends at 14% under his helm). Mr. Charman, a very well-
PROSPECTOR FUNDS, INC.
respected industry leader, has recruited an abundance of talented underwriters since joining Endurance. This should be a source of profitable growth for the company (as opposed to the adverse selection that often comes from competing aggressively to gain business). Additionally, Mr. Charman has de-risked the balance sheet since arriving at the company, reducing exposure to large catastrophic events significantly.
Despite Mr. Charman’s successful track record, Endurance sells for a modest premium above tangible book value, and below where peers trade. This is perhaps partly due to the view that Endurance is more likely an acquirer rather than a seller. Indeed, ENH recently closed on the acquisition of Montpelier Re – a deal we view positively, as it brings a Lloyds platform (where Mr. Charman has extensive underwriting experience, and where recent merger activity has valued entities at greater than twice tangible book value), as well as exposure to third-party capital management. The third-party capital business has become more and more relevant as companies have turned to the capital markets to purchase reinsurance protection via catastrophe bonds, or insurance-linked securities. This has been a growing business, and a source of fee income for the industry.
Finally, Mr. Charman is also heavily invested in Endurance’s success, with ownership of over 3.5% of outstanding shares (valued at near $150 million). We like this alignment of interest, as we do Mr. Charman’s decades-long record of value creation, and feel that ENH should trade at a premium to peers. If this should not come to pass in a reasonable amount of time, it would surprise no one to see Endurance go from buyer to seller.
Outlook
Despite the volatility in today’s headlines, the underlying conditions for equity investing remain consistent. Whether that remains true under the emerging Fed policy of tighter money is the key question. The U.S. economy remains in the slow growth pattern which has existed since the end of the financial crisis. Our economy’s performance is the global leader and should continue as such, but our companies face headwinds from the strong U.S. dollar and weakening economic growth across China and the emerging markets. Europe’s position is improving. Importantly, the U.S. consumer will benefit from lower energy prices and less expensive imports as a result of the strong dollar.
Low oil prices should stimulate consumer spending and confidence in the long run both here and for non-oil producing countries abroad. In the short run, however, the sharp decline in oil prices has had an unsettling effect on markets and consumers. We continue to enjoy the competitive advantage of a long-term supply of abundant cheap natural gas.
Interest and mortgage rates continue near historically low levels. Our best guess (at the risk of looking like a stopped clock) is that longer term rates will be materially higher in five years, although they are unlikely to move much this year. Ultimately, higher rates will likely accompany better economic performance and possibly higher inflation, both of which are relative positives for equities compared to bonds. Much depends on the path and pace of interest rates’ return to normalcy. In addition, the wealth effect on the U.S. consumer from rising home prices should also aid consumer spending.
Corporations as a whole have solid balance sheets and are accumulating excess cash and capital. Importantly, they are also spending on new capital projects, new employees, and new acquisitions. A notable exception is in the energy sector where levered balance sheets are stressed by reduced profits and cash flow stemming from the low price of oil. Acquisition activity could slow as financing becomes more expensive and difficult to secure. This and higher costs of floating debt could pressure profit margins in the near term which sit near all-time high levels, currently 8%. The offset could be an improvement in revenue growth from the low single-digit levels of the past few years.
PROSPECTOR FUNDS, INC.
Equity valuations remain near extended levels. We feel we are in the latter stages of a bull market, although nothing is certain in the investment world. Equities look reasonable when comparing earnings yields to Treasury or even corporate bond yields. In any case, the values inherent in your portfolio should attract acquirers and other investors over time. Meanwhile, we believe equities are a superior asset allocation alternative to bonds over the longer term.
Thank you for entrusting us with your money.
Respectfully submitted,
| John D. Gillespie | Kevin R. O’Brien | Jason A. Kish |
Performance data quoted represents past performance; past performance does not guarantee future results.
Opinions expressed are those of the Funds and are subject to change, are not guaranteed, and should not be considered a recommendation to buy or sell any security.
Mutual fund investing involves risk. Principal loss is possible. Investments in debt securities typically decrease in value when interest rates rise. This risk is usually greater for longer-term debt securities. The Funds invest in foreign securities which involve greater volatility and political, economic and currency risks and differences in accounting methods. The Funds invest in smaller and mid-cap companies, which involve additional risks such as limited liquidity and greater volatility. The Funds may hold restricted securities purchased through private placements. Such securities can be difficult to sell without experiencing delays or additional costs. Derivatives involve risks different from, and in certain cases, greater than the risks presented by more traditional investments. These risks are fully disclosed in the prospectus.
Stocks are generally perceived to have more financial risk than bonds in that bond holders have a claim on firm operations or assets that is senior to that of equity holders. In addition, stock prices are generally more volatile than bond prices. Investments in debt securities typically decrease in value when interest rates rise. This risk is usually greater for longer-term debt securities. A stock may trade with more or less liquidity than a bond depending on the number of shares and bonds outstanding, the size of the company, and the demand for the securities. Similarly, the transaction costs involved in trading a stock may be more or less than a particular bond depending on the factors mentioned above and whether the stock or bond trades upon an exchange. Depending on the entity issuing the bond, it may or may or may not afford additional protections to the investor, such as a guarantee of return of principal by a government or bond insurance company. There is typically no guarantee of any kind associated with the purchase of an individual stock. Bonds are often owned by individuals interested in current income while stocks are generally owned by individuals seeking price appreciation with income a secondary concern. The tax treatment of returns of bonds and stocks also differs given differential tax treatment of income versus capital gain.
The S&P 500 Index is a broad based unmanaged index of 500 stocks, which is widely recognized as representative of the equity market in general. You cannot invest directly in an index.
The Russell 2000 Index is an unmanaged small-cap index that measures the performance of the 2,000 smallest companies in the Russell 3000 Index. You cannot invest directly in an index.
The Russell MidCap Index is an unmanaged mid-cap index that measures the performance of the 800 smallest companies in the Russell 1000 Index. You cannot invest directly in an index.
The Russell 1000 Growth Index measures the performance of those Russell 1000 companies with higher price-to-book ratios and higher forecasted growth values.
The Russell 1000 Value Index measures the performance of those Russell 1000 companies with lower price-to-book ratios and lower forecasted growth values.
The NASDAQ Bank Index is a broad based capitalization-weighted index of domestic and foreign common stocks of banks that are traded on the Nasdaq MarketSystem as well as the SmallCap Market.
Basis point is a unit that is equal to 1/100th of 1% and is used to denote the change in a financial instrument.
PROSPECTOR FUNDS, INC.
Cash flow measures the cash generating capability of a company by adding non-cash charges (e.g. depreciation) and interest expense to pretax income.
Free cash flow is revenue less operating expenses including interest expenses and maintenance capital spending. It is the discretionary cash that a company has after all expenses and is available for purposes such as dividend payments, investing back into the business or share repurchases.
Book value is the total value of a company’s assets that shareholders would theoretically receive if a company were liquidated.
Fund holdings and/or security allocations are subject to change at any time and are not recommendations to buy or sell any security. Please see the Schedule of Investments section in this report for a full listing of the Fund’s holdings.
Prospector Funds, Inc. are distributed by Quasar Distributors, LLC.
PROSPECTOR FUNDS, INC.
Capital Appreciation Fund
The chart assumes an initial investment of $10,000. Performance reflects waivers of fee and operating expenses in effect. In the absence of such waivers, total return would be reduced. Past performance is not predictive of future performance. Investment return and principal value will fluctuate, so that your shares, when redeemed may be worth more or less than their original cost. Performance assumes the reinvestment of capital gains and income distributions. The performance does not reflect the deduction of taxes that a shareholder would pay on Fund distributions or the redemption of Fund shares.
Average Annual Rates of Return (%) – As of December 31, 2015
| | One Year | Three Year | Five Year | Since Inception(1) |
| Capital Appreciation Fund | -2.52% | 6.55% | 4.19% | 3.97% |
S&P 500 Index(2) | 1.38% | 15.13% | 12.57% | 5.83% |
| | | | | |
| (1) | September 28, 2007 |
| (2) | The Standard & Poor’s 500 Index (S&P 500) is an unmanaged, capitalization-weighted index generally representative of the U.S. market for large capitalization stocks. This Index cannot be invested in directly. |
PROSPECTOR FUNDS, INC.
Opportunity Fund
The chart assumes an initial investment of $10,000. Performance reflects waivers of fee and operating expenses in effect. In the absence of such waivers, total return would be reduced. Past performance is not predictive of future performance. Investment return and principal value will fluctuate, so that your shares, when redeemed may be worth more or less than their original cost. Performance assumes the reinvestment of capital gains and income distributions. The performance does not reflect the deduction of taxes that a shareholder would pay on Fund distributions or the redemption of Fund shares.
Average Annual Rates of Return (%) – As of December 31, 2015
| | One Year | Three Year | Five Year | Since Inception(1) |
| Opportunity Fund | 1.33% | 11.45% | 9.63% | 8.01% |
Russell 2000 Index(2) | -4.41% | 11.65% | 9.19% | 5.57% |
Russell Midcap Index(3) | -2.44% | 14.18% | 11.44% | 6.68% |
| (1) | September 28, 2007 |
| (2) | An unmanaged small-cap index that measures the performance of the 2,000 smallest companies in the Russell 3000 Index. This index cannot be invested in directly. |
| (3) | An unmanaged mid-cap index that measures the performance of the 800 smallest companies in the Russell 1000 Index. This index cannot be invested in directly. |
PROSPECTOR FUNDS, INC.
EXPENSE EXAMPLE
DECEMBER 31, 2015
As a shareholder of the Fund, you incur two types of costs: (1) transaction costs, which may include but are not limited to, redemption fees, wire transfer fees, maintenance fee (IRA accounts), and exchange fees; and (2) ongoing costs, including management fees; distribution and/or service fees; and other Fund expenses. This Example is intended to help you understand your ongoing costs (in dollars) of investing in the Fund and to compare these costs with the ongoing costs of investing in other mutual funds. The Example is based on an investment of $1,000 invested at the beginning of the period and held for the entire period (July 1, 2015 – December 31, 2015).
ACTUAL EXPENSES
The first line of the table below provides information about actual account values and actual expenses. Although the Fund charges no sales load or transaction fees, you will be assessed fees for outgoing wire transfers, returned checks and stop payment orders at prevailing rates charged by U.S. Bancorp Fund Services, LLC, the Fund’s transfer agent. The example below includes, but is not limited to, management fees, shareholder servicing fees and other Fund expenses. However, the example below does not include portfolio trading commissions and related expenses, interest expense and other extraordinary expenses as determined under generally accepted accounting principles. You may use the information in this line, together with the amount you invested, to estimate the expenses that you paid over the period. Simply divide your account value by $1,000 (for example, an $8,600 account value divided by $1,000 = 8.6), then multiply the result by the number in the first line under the heading entitled “Expenses Paid During Period” to estimate the expenses you paid on your account during this period.
HYPOTHETICAL EXAMPLE FOR COMPARISON PURPOSES
The second line of the table below provides information about hypothetical account values and hypothetical expenses based on the Fund’s actual expense ratio and an assumed rate of return of 5% per year before expenses, which is not the Fund’s actual return. The hypothetical account values and expenses may not be used to estimate the actual ending account balance or expenses you paid for the period. You may use this information to compare the ongoing costs of investing in the Fund and other funds. To do so, compare this 5% hypothetical example with the 5% hypothetical examples that appear in the shareholder reports of the other funds.
Please note that the expenses shown in the table are meant to highlight your ongoing costs only and do not reflect any transactional costs, such as redemption fees or exchange fees. Therefore, the second line of the table is useful in comparing ongoing costs only, and will not help you determine the relative total costs of owning different funds. In addition, if these transactional costs were included, your costs would have been higher.
| | | | Expenses Paid |
| | Beginning Account | Ending Account | During Period(1) |
| | Value (07/01/2015) | Value (12/31/2015) | (07/01/2015 to 12/31/2015) |
| | | | |
Capital Appreciation Actual(2) | $1,000.00 | $ 955.80 | $6.41 |
| Capital Appreciation Hypothetical | | | |
| (5% return before expenses) | 1,000.00 | 1,018.65 | 6.61 |
Opportunity Actual(2) | 1,000.00 | 985.30 | 6.51 |
| Opportunity Hypothetical | | | |
| (5% return before expenses) | 1,000.00 | 1,018.65 | 6.61 |
| (1) | Expenses are equal to the Fund’s annualized expense ratio for the most recent six-month period of 1.30% and 1.30% for Capital Appreciation Fund and Opportunity Fund, respectively, multiplied by the average account value over the period, multiplied by 184/365 to reflect the one-half year period. |
| (2) | Based on the actual returns for the six-month period ended December 31, 2015 of -4.42% and -1.47% for Capital Appreciation Fund and Opportunity Fund, respectively. |
PROSPECTOR FUNDS, INC.
SECTOR ALLOCATION (% OF NET ASSETS) (UNAUDITED)
AS OF DECEMBER 31, 2015(1)(2)
Capital Appreciation Fund
TOP 10 HOLDINGS (% OF NET ASSETS) (UNAUDITED)
AS OF DECEMBER 31, 2015(1)(3)
Capital Appreciation Fund
| | McDonald’s | | | 3.5 | % |
| | RTI International, 1.625%, 10/15/2019 | | | 3.5 | % |
| | Hologic, 0.000%, 12/15/2043 | | | 3.4 | % |
| | Chart Industries, 2.000%, 08/01/2018 | | | 2.9 | % |
| | Tootsie Roll Industries | | | 2.9 | % |
| | Abbott Laboratories | | | 2.8 | % |
| | Forest City Enterprises, 3.625%, 08/15/2020 | | | 2.7 | % |
| | Forestar Group, 3.750%, 03/01/2020 | | | 2.7 | % |
| | Domtar | | | 2.5 | % |
| | Coca-Cola | | | 2.4 | % |
| (1) | Fund holdings and sector allocations are subject to change at any time and are not recommendations to buy or sell any security. | |
| (2) | Sector allocation includes all investment types. | |
| | (3) | Invesco Treasury Portfolio excluded from top 10 holdings. | |
PROSPECTOR FUNDS, INC.
SECTOR ALLOCATION (% OF NET ASSETS) (UNAUDITED)
AS OF DECEMBER 31, 2015(1)(2)
Opportunity Fund
TOP 10 HOLDINGS (% OF NET ASSETS) (UNAUDITED)
AS OF DECEMBER 31, 2015(1)
Opportunity Fund
| | HomeTrust Bancshares | | | 2.8 | % |
| | Endurance Specialty Holdings | | | 2.7 | % |
| | Brown & Brown | | | 2.3 | % |
| | Patterson Companies | | | 2.2 | % |
| | Tootsie Roll Industries | | | 2.2 | % |
| | McDonald’s | | | 2.1 | % |
| | Lancaster Colony | | | 2.1 | % |
| | CIRCOR International | | | 2.0 | % |
| | Hologic, 2.000%, 12/15/2037 | | | 2.0 | % |
| | OceanFirst Financial | | | 1.9 | % |
| (1) | Fund holdings and sector allocations are subject to change at any time and are not recommendations to buy or sell any security. | |
| (2) | Sector allocation includes all investment types. | |
PROSPECTOR FUNDS, INC.
SCHEDULE OF INVESTMENTS
DECEMBER 31, 2015
Capital Appreciation Fund
Description | | Shares | | | Value | |
| | | | | | | |
| COMMON STOCKS – 71.7% | | | | | | |
| | | | | | | |
| Chemicals – 0.4% | | | | | | |
| E.I. Du Pont de Nemours | | | 1,500 | | | $ | 99,900 | |
| | | | | | | | | |
| Consumer Discretionary – 8.3% | | | | | | | | |
| Darden Restaurants | | | 4,900 | | | | 311,836 | |
| DreamWorks Animation SKG, Class A* | | | 14,700 | | | | 378,819 | |
| McDonald’s | | | 7,200 | | | | 850,608 | |
| Yum! Brands | | | 6,600 | | | | 482,130 | |
| | | | | | | | 2,023,393 | |
| Consumer Staples – 14.9% | | | | | | | | |
| Campbell Soup | | | 5,000 | | | | 262,750 | |
| Coca-Cola | | | 13,500 | | | | 579,960 | |
| Colgate-Palmolive | | | 4,600 | | | | 306,452 | |
| Diageo – ADR | | | 3,830 | | | | 417,738 | |
| Edgewell Personal Care | | | 3,300 | | | | 258,621 | |
| Energizer Holdings | | | 2,700 | | | | 91,962 | |
| Mondelez International, Class A | | | 10,150 | | | | 455,126 | |
| Tootsie Roll Industries | | | 21,960 | | | | 693,717 | |
| Walgreens Boots Alliance | | | 4,150 | | | | 353,393 | |
| Wal-Mart Stores | | | 3,600 | | | | 220,680 | |
| | | | | | | | 3,640,399 | |
| Diversified Financial Services – 3.8% | | | | | | | | |
| Legg Mason | | | 9,250 | | | | 362,878 | |
| Leucadia National | | | 10,300 | | | | 179,117 | |
| T. Rowe Price Group | | | 5,400 | | | | 386,046 | |
| | | | | | | | 928,041 | |
| Energy – 4.3% | | | | | | | | |
| Clayton Williams Energy* | | | 4,400 | | | | 130,108 | |
| ConocoPhillips | | | 9,300 | | | | 434,217 | |
| Hess | | | 7,100 | | | | 344,208 | |
| Murphy Oil | | | 6,400 | | | | 143,680 | |
| | | | | | | | 1,052,213 | |
| Healthcare – 9.9% | | | | | | | | |
| Abbott Laboratories | | | 15,200 | | | | 682,632 | |
| AstraZeneca – ADR | | | 8,700 | | | | 295,365 | |
| Eli Lilly & Co. | | | 2,600 | | | | 219,076 | |
| GlaxoSmithKline – ADR | | | 6,850 | | | | 276,398 | |
See Notes to the Financial Statements
PROSPECTOR FUNDS, INC.
SCHEDULE OF INVESTMENTS – CONTINUED
DECEMBER 31, 2015
Capital Appreciation Fund
Description | | Shares | | �� | Value | |
| | | | | | | |
| COMMON STOCKS – 71.7% (CONTINUED) | | | | | | |
| | | | | | | |
| Healthcare – 9.9% (Continued) | | | | | | |
| Johnson & Johnson | | | 4,900 | | | $ | 503,328 | |
| Merck & Co. | | | 8,200 | | | | 433,124 | |
| | | | | | | | 2,409,923 | |
| Industrials – 1.8% | | | | | | | | |
| Eaton | | | 8,550 | | | | 444,942 | |
| | | | | | | | | |
| Information Technology – 7.6% | | | | | | | | |
| Automatic Data Processing | | | 4,000 | | | | 338,880 | |
| Comtech Telecommunications | | | 14,600 | | | | 293,314 | |
| FLIR Systems | | | 14,850 | | | | 416,840 | |
| Microsoft | | | 7,050 | | | | 391,134 | |
| Paychex | | | 3,000 | | | | 158,670 | |
| Science Applications International | | | 5,600 | | | | 256,368 | |
| | | | | | | | 1,855,206 | |
| Insurance – 10.1% | | | | | | | | |
| American International Group | | | 3,700 | | | | 229,289 | |
| Berkshire Hathaway, Class B* | | | 2,300 | | | | 303,692 | |
| CNA Financial | | | 4,100 | | | | 144,115 | |
| Donegal Group, Class A | | | 7,100 | | | | 99,968 | |
| Endurance Specialty Holdings | | | 5,600 | | | | 358,344 | |
| First American Financial | | | 4,500 | | | | 161,550 | |
| Loews | | | 9,100 | | | | 349,440 | |
| RenaissanceRe Holdings | | | 1,914 | | | | 216,646 | |
| Selective Insurance Group | | | 5,200 | | | | 174,616 | |
| State Auto Financial | | | 19,700 | | | | 405,623 | |
| | | | | | | | 2,443,283 | |
| Metals & Mining – 0.2% | | | | | | | | |
| Alamos Gold, Class A | | | 12,322 | | | | 40,540 | |
| | | | | | | | | |
| Paper & Forest Products – 3.6% | | | | | | | | |
| Domtar | | | 16,451 | | | | 607,864 | |
| Louisiana-Pacific* | | | 14,800 | | | | 266,548 | |
| | | | | | | | 874,412 | |
See Notes to the Financial Statements
PROSPECTOR FUNDS, INC.
SCHEDULE OF INVESTMENTS – CONTINUED
DECEMBER 31, 2015
Capital Appreciation Fund
Description | | Shares | | | Value | |
| | | | | | | |
| COMMON STOCKS – 71.7% (CONTINUED) | | | | | | |
| | | | | | | |
| Real Estate – 3.8% | | | | | | |
| Four Corners Property Trust* | | | 14,233 | | | $ | 343,869 | |
| Howard Hughes* | | | 1,200 | | | | 135,792 | |
| Post Properties | | | 7,250 | | | | 428,910 | |
| | | | | | | | 908,571 | |
| Telecommunication Services – 2.1% | | | | | | | | |
| Telephone & Data Systems | | | 20,000 | | | | 517,800 | |
| | | | | | | | | |
| Utilities – 0.9% | | | | | | | | |
| FirstEnergy | | | 4,100 | | | | 130,093 | |
| TransAlta | | | 26,500 | | | | 93,810 | |
| | | | | | | | 223,903 | |
| Total Common Stocks | | | | | | | | |
| (Cost $16,512,541) | | | | | | | 17,462,526 | |
| | | | | | | | | |
| | | Par | | | | | |
| | | | | | | | | |
| CONVERTIBLE BONDS – 21.4% | | | | | | | | |
| | | | | | | | | |
| Healthcare – 4.7% | | | | | | | | |
| Hologic | | | | | | | | |
| 0.000%, 12/15/2043 | | $ | 650,000 | | | | 827,125 | |
| Medicines | | | | | | | | |
| 1.375%, 06/01/2017 | | | 232,000 | | | | 330,165 | |
| | | | | | | | 1,157,290 | |
| Industrials – 2.9% | | | | | | | | |
| Chart Industries | | | | | | | | |
| 2.000%, 08/01/2018 | | | 825,000 | | | | 713,625 | |
| | | | | | | | | |
| Information Technology – 4.1% | | | | | | | | |
| HomeAway | | | | | | | | |
| 0.125%, 04/01/2019 | | | 500,000 | | | | 499,375 | |
| Verint Systems | | | | | | | | |
| 1.500%, 06/01/2021 | | | 525,000 | | | | 492,187 | |
| | | | | | | | 991,562 | |
| Metals & Mining – 3.5% | | | | | | | | |
| RTI International | | | | | | | | |
| 1.625%, 10/15/2019 | | | 825,000 | | | | 844,078 | |
| | | | | | | | | |
See Notes to the Financial Statements
PROSPECTOR FUNDS, INC.
SCHEDULE OF INVESTMENTS – CONTINUED
DECEMBER 31, 2015
Capital Appreciation Fund
Description | | Par | | | Value | |
| | | | | | | |
| CONVERTIBLE BONDS – 21.4% (CONTINUED) | | | | | | |
| | | | | | | |
| Real Estate – 6.2% | | | | | | |
| Forest City Enterprises | | | | | | |
| 4.250%, 08/15/2018 | | $ | 150,000 | | | $ | 173,344 | |
| 3.625%, 08/15/2020 | | | 625,000 | | | | 664,062 | |
| Forestar Group | | | | | | | | |
| 3.750%, 03/01/2020 | | | 825,000 | | | | 662,063 | |
| | | | | | | | 1,499,469 | |
| Total Convertible Bonds | | | | | | | | |
| (Cost $5,375,383) | | | | | | | 5,206,024 | |
| | | | | | | | | |
| | | | | | | | | |
| CORPORATE BONDS – 5.4% | | | | | | | | |
| | | | | | | | | |
| Consumer Staples – 3.5% | | | | | | | | |
| CVS Health | | | | | | | | |
| 2.250%, 08/12/2019 | | | 463,000 | | | | 462,391 | |
| Walgreens Boots Alliance | | | | | | | | |
| 2.700%, 11/18/2019 | | | 400,000 | | | | 399,247 | |
| | | | | | | | 861,638 | |
| Healthcare – 1.9% | | | | | | | | |
| Amgen | | | | | | | | |
| 2.200%, 05/22/2019 | | | 450,000 | | | | 449,432 | |
| Total Corporate Bonds | | | | | | | | |
| (Cost $1,321,993) | | | | | | | 1,311,070 | |
| | | | | | | | | |
| | | Shares | | | | | |
| | | | | | | | | |
| SHORT-TERM INVESTMENT – 3.2% | | | | | | | | |
| Invesco Treasury Portfolio, Institutional Class, 0.130%^ | | | | | | | | |
| (Cost $772,524) | | | 772,524 | | | | 772,524 | |
| Total Investments – 101.7% | | | | | | | | |
| (Cost $23,982,441) | | | | | | | 24,752,144 | |
| Other Assets and Liabilities, Net – (1.7)% | | | | | | | (423,761 | ) |
| Total Net Assets – 100.0% | | | | | | $ | 24,328,383 | |
| | | | | | | | | |
| * | Non-income producing security |
| ADR – American Depositary Receipt |
| ^ | The rate shown is the annualized seven-day effective yield as of December 31, 2015. |
See Notes to the Financial Statements
PROSPECTOR FUNDS, INC.
SCHEDULE OF INVESTMENTS
DECEMBER 31, 2015
Opportunity Fund
Description | | Shares | | | Value | |
| | | | | | | |
| COMMON STOCKS – 88.4% | | | | | | |
| | | | | | | |
| Banks – 19.0% | | | | | | |
| Beneficial Bancorp* | | | 75,100 | | | $ | 1,000,332 | |
| Blue Hills Bancorp | | | 60,800 | | | | 930,848 | |
| Capital City Bank Group | | | 21,100 | | | | 323,885 | |
| Central Pacific Financial | | | 45,300 | | | | 997,506 | |
| Chicopee Bancorp | | | 26,200 | | | | 454,308 | |
| Citigroup | | | 9,470 | | | | 490,073 | |
| Clifton Bancorp | | | 86,784 | | | | 1,244,483 | |
| First Connecticut Bancorp | | | 77,400 | | | | 1,347,534 | |
| First Defiance Financial | | | 8,900 | | | | 336,242 | |
| First Foundation* | | | 16,700 | | | | 393,953 | |
| HomeTrust Bancshares* | | | 118,400 | | | | 2,397,600 | |
| Metro Bancorp | | | 20,580 | | | | 645,800 | |
| OceanFirst Financial | | | 81,700 | | | | 1,636,451 | |
| Oritani Financial | | | 76,750 | | | | 1,266,375 | |
| SI Financial Group | | | 48,600 | | | | 663,390 | |
| Waterstone Financial | | | 100,100 | | | | 1,411,410 | |
| Westfield Financial | | | 100,500 | | | | 844,200 | |
| | | | | | | | 16,384,390 | |
| Chemicals – 1.4% | | | | | | | | |
| H.B. Fuller | | | 33,600 | | | | 1,225,392 | |
| | | | | | | | | |
| Consumer Discretionary – 6.7% | | | | | | | | |
| Darden Restaurants | | | 10,400 | | | | 661,856 | |
| Del Frisco’s Restaurant Group* | | | 66,300 | | | | 1,062,126 | |
| Home Depot | | | 11,900 | | | | 1,573,775 | |
| Hyatt Hotels, Class A* | | | 13,300 | | | | 625,366 | |
| McDonald’s | | | 15,500 | | | | 1,831,170 | |
| | | | | | | | 5,754,293 | |
| Consumer Staples – 8.0% | | | | | | | | |
| Church & Dwight | | | 18,600 | | | | 1,578,768 | |
| Diageo – ADR | | | 7,200 | | | | 785,304 | |
| Lancaster Colony | | | 15,800 | | | | 1,824,268 | |
| Stock Spirits Group | | | 396,800 | | | | 816,027 | |
| Tootsie Roll Industries | | | 59,518 | | | | 1,880,174 | |
| | | | | | | | 6,884,541 | |
| | | | | | | | | |
See Notes to the Financial Statements
PROSPECTOR FUNDS, INC.
SCHEDULE OF INVESTMENTS – CONTINUED
DECEMBER 31, 2015
Opportunity Fund
Description | | Shares | | | Value | |
| | | | | | | |
| COMMON STOCKS – 88.4% (CONTINUED) | | | | | | |
| | | | | | | |
| Diversified Financial Services – 7.6% | | | | | | |
| Federated Investors, Class B | | | 34,400 | | | $ | 985,560 | |
| Franklin Resources | | | 39,300 | | | | 1,447,026 | |
| Invesco | | | 38,500 | | | | 1,288,980 | |
| Legg Mason | | | 26,200 | | | | 1,027,826 | |
| Leucadia National | | | 50,500 | | | | 878,195 | |
| T. Rowe Price Group | | | 12,700 | | | | 907,923 | |
| | | | | | | | 6,535,510 | |
| Energy – 3.2% | | | | | | | | |
| Hess | | | 31,800 | | | | 1,541,664 | |
| Murphy Oil | | | 53,200 | | | | 1,194,340 | |
| | | | | | | | 2,736,004 | |
| Healthcare – 6.2% | | | | | | | | |
| AstraZeneca – ADR | | | 16,200 | | | | 549,990 | |
| Haemonetics* | | | 21,900 | | | | 706,056 | |
| Invacare | | | 27,400 | | | | 476,486 | |
| Merck & Co. | | | 24,148 | | | | 1,275,497 | |
| Patterson Companies | | | 41,700 | | | | 1,885,257 | |
| POZEN* | | | 68,600 | | | | 468,538 | |
| | | | | | | | 5,361,824 | |
| Industrials – 6.4% | | | | | | | | |
| Celadon Group | | | 58,100 | | | | 574,609 | |
| CIRCOR International | | | 40,300 | | | | 1,698,645 | |
| Landstar System | | | 19,700 | | | | 1,155,405 | |
| Powell Industries | | | 38,400 | | | | 999,552 | |
| Tyco International | | | 33,300 | | | | 1,061,937 | |
| | | | | | | | 5,490,148 | |
| Information Technology – 9.3% | | | | | | | | |
| Comtech Telecommunications | | | 19,300 | | | | 387,737 | |
| FLIR Systems | | | 47,300 | | | | 1,327,711 | |
| Maxim Integrated Products | | | 20,300 | | | | 771,400 | |
| Microsoft | | | 26,600 | | | | 1,475,768 | |
| Paychex | | | 23,800 | | | | 1,258,782 | |
| Synopsys* | | | 11,600 | | | | 529,076 | |
| VeriSign* | | | 13,500 | | | | 1,179,360 | |
| Xilinx | | | 23,600 | | | | 1,108,492 | |
| | | | | | | | 8,038,326 | |
See Notes to the Financial Statements
PROSPECTOR FUNDS, INC.
SCHEDULE OF INVESTMENTS – CONTINUED
DECEMBER 31, 2015
Opportunity Fund
Description | | Shares | | | Value | |
| | | | | | | |
| COMMON STOCKS – 88.4% (CONTINUED) | | | | | | |
| | | | | | | |
| Insurance – 14.9% | | | | | | |
| AMERISAFE | | | 8,500 | | | $ | 432,650 | |
| Brown & Brown | | | 61,500 | | | | 1,974,150 | |
| CNA Financial | | | 18,900 | | | | 664,335 | |
| Endurance Specialty Holdings | | | 36,400 | | | | 2,329,236 | |
| Infinity Property & Casualty | | | 10,392 | | | | 854,534 | |
| Lancashire Holdings | | | 39,800 | | | | 368,470 | |
| Primerica | | | 21,300 | | | | 1,005,999 | |
| RenaissanceRe Holdings | | | 9,500 | | | | 1,075,305 | |
| Selective Insurance Group | | | 13,600 | | | | 456,688 | |
| State National Companies | | | 60,400 | | | | 592,524 | |
| Validus Holdings | | | 32,500 | | | | 1,504,425 | |
| XL Group | | | 39,660 | | | | 1,553,879 | |
| | | | | | | | 12,812,195 | |
| Metals & Mining – 1.3% | | | | | | | | |
| Kinross Gold* | | | 132,100 | | | | 240,422 | |
| Newmont Mining | | | 49,900 | | | | 897,701 | |
| Victoria Gold* | | | 96,500 | | | | 11,300 | |
| | | | | | | | 1,149,423 | |
| Paper & Forest Products – 0.5% | | | | | | | | |
| Domtar | | | 12,300 | | | | 454,485 | |
| | | | | | | | | |
| Real Estate – 3.0% | | | | | | | | |
| Easterly Government Properties | | | 200 | | | | 3,436 | |
| Forestar Group* | | | 29,700 | | | | 324,918 | |
| Four Corners Property Trust* | | | 12,366 | | | | 298,763 | |
| Howard Hughes* | | | 4,700 | | | | 531,852 | |
| Parkway Properties | | | 69,750 | | | | 1,090,192 | |
| Winthrop Realty Trust | | | 23,000 | | | | 298,310 | |
| | | | | | | �� | 2,547,471 | |
| Utilities – 0.9% | | | | | | | | |
| Public Service Enterprise Group | | | 19,100 | | | | 738,979 | |
| Total Common Stocks | | | | | | | | |
| (Cost $71,053,647) | | | | | | | 76,112,981 | |
See Notes to the Financial Statements
PROSPECTOR FUNDS, INC.
SCHEDULE OF INVESTMENTS – CONTINUED
DECEMBER 31, 2015
Opportunity Fund
Description | | Par | | | Value | |
| | | | | | | |
| CONVERTIBLE BONDS – 3.2% | | | | | | |
| | | | | | | |
| Healthcare – 2.8% | | | | | | |
| Hologic | | | | | | |
| 2.000%, 12/15/2037 | | $ | 1,000,000 | | | $ | 1,692,500 | |
| Medicines | | | | | | | | |
| 1.375%, 06/01/2017 | | | 525,000 | | | | 747,141 | |
| | | | | | | | 2,439,641 | |
| Real Estate – 0.4% | | | | | | | | |
| Forestar Group | | | | | | | | |
| 3.750%, 03/01/2020 | | | 450,000 | | | | 361,125 | |
| Total Convertible Bonds | | | | | | | | |
| (Cost $2,243,286) | | | | | | | 2,800,766 | |
| | | | | | | | | |
| | | | | | | | | |
| | | Shares | | | | | |
| SHORT-TERM INVESTMENT – 0.7% | | | | | | | | |
| Invesco Treasury Portfolio, Institutional Class, 0.130%^ | | | | | | | | |
| (Cost $583,820) | | | 583,820 | | | | 583,820 | |
| Total Investments – 92.3% | | | | | | | | |
| (Cost $73,880,753) | | | | | | | 79,497,567 | |
| Other Assets and Liabilities, Net – 7.7% | | | | | | | 6,629,999 | |
| Total Net Assets – 100.0% | | | | | | $ | 86,127,566 | |
| * | Non-income producing security |
| ADR – American Depositary Receipt |
| ^ | The rate shown is the annualized seven-day effective yield as of December 31, 2015. |
See Notes to the Financial Statements
PROSPECTOR FUNDS, INC.
STATEMENTS OF ASSETS AND LIABILITIES
DECEMBER 31, 2015
| | | Capital Appreciation Fund | | | Opportunity Fund | |
| ASSETS: | | | | | | |
| Investments, at market value | | | | | | |
| (Cost $23,982,441 and $73,880,753, respectively) | | $ | 24,752,144 | | | $ | 79,497,567 | |
| Cash | | | — | | | | 108,170 | |
| Receivable for investment securities sold | | | — | | | | 110,053 | |
| Receivable for dividends and interest | | | 75,317 | | | | 56,640 | |
| Receivable for capital shares sold | | | 35 | | | | 6,735,290 | |
| Prepaid expenses | | | 13,451 | | | | 19,716 | |
| Total assets | | | 24,840,947 | | | | 86,527,436 | |
| | | | | | | | | |
| LIABILITIES: | | | | | | | | |
| Payable for investment securities purchased | | | 451,830 | | | | — | |
| Payable for capital shares redeemed | | | — | | | | 274,177 | |
| Payable to adviser, net | | | 1,553 | | | | 40,524 | |
| Distribution Payable | | | — | | | | 6,077 | |
| Accrued distribution fees | | | 2,037 | | | | 7,396 | |
| Accrued expenses and other liabilities | | | 57,144 | | | | 71,696 | |
| Total liabilities | | | 512,564 | | | | 399,870 | |
| | | | | | | | | |
| NET ASSETS | | $ | 24,328,383 | | | $ | 86,127,566 | |
| | | | | | | | | |
| COMPOSITION OF NET ASSETS: | | | | | | | | |
| Portfolio capital | | $ | 23,784,479 | | | $ | 79,789,301 | |
| Undistributed net investment income | | | 5,664 | | | | (212,323 | ) |
| Accumulated net realized gain (loss) on investments | | | (231,267 | ) | | | 936,467 | |
| Net unrealized appreciation of investments | | | 769,507 | | | | 5,614,121 | |
| Total net assets | | $ | 24,328,383 | | | $ | 86,127,566 | |
CAPITAL STOCK, $0.0001 par value | | | | | | | | |
| Authorized | | | 500,000,000 | | | | 500,000,000 | |
| Issued and outstanding | | | 1,639,482 | | | | 4,980,393 | |
| | | | | | | | | |
| NET ASSET VALUE, REDEMPTION PRICE, | | | | | | | | |
| AND OFFERING PRICE PER SHARE | | $ | 14.84 | | | $ | 17.29 | |
See Notes to the Financial Statements
PROSPECTOR FUNDS, INC.
STATEMENTS OF OPERATIONS
FOR THE YEAR ENDED DECEMBER 31, 2015
| | | Capital Appreciation Fund | | | Opportunity Fund | |
| INVESTMENT INCOME: | | | | | | |
| Interest income | | $ | 134,269 | | | $ | (16,101 | ) |
| Dividend income | | | 640,018 | | | | 1,696,194 | |
| Less: Foreign taxes withheld | | | (5,218 | ) | | | (8,461 | ) |
| Total investment income | | | 769,069 | | | | 1,671,632 | |
| | | | | | | | | |
| EXPENSES: | | | | | | | | |
| Investment advisory fees | | | 359,922 | | | | 971,019 | |
| Administration fees | | | 52,316 | | | | 93,224 | |
| Fund accounting fees | | | 41,101 | | | | 40,912 | |
| Audit fees | | | 32,850 | | | | 32,850 | |
| Transfer agent fees | | | 27,097 | | | | 41,684 | |
| Directors’ fees | | | 26,903 | | | | 74,781 | |
| Legal fees | | | 22,134 | | | | 58,569 | |
| Registration fees | | | 18,048 | | | | 18,048 | |
| Distribution fees | | | 13,086 | | | | 45,148 | |
| Other expenses | | | 12,188 | | | | 24,210 | |
| Custodian fees | | | 7,377 | | | | 9,393 | |
| Postage and printing fees | | | 2,238 | | | | 9,800 | |
| Total expenses | | | 615,260 | | | | 1,419,638 | |
| Less: Fee waivers | | | (189,898 | ) | | | (272,070 | ) |
| Total net expenses | | | 425,362 | | | | 1,147,568 | |
| NET INVESTMENT INCOME | | | 343,707 | | | | 524,064 | |
| | | | | | | | | |
| REALIZED AND UNREALIZED GAINS (LOSSES): | |
| Net realized gain on investments | | | 1,180,372 | | | | 10,522,273 | |
| Net change in unrealized appreciation of investments | | | (1,834,615 | ) | | | (9,460,368 | ) |
| Net gain (loss) on investments | | | (654,243 | ) | | | 1,061,905 | |
| | | | | | | | | |
| NET INCREASE (DECREASE) IN NET ASSETS | |
| RESULTING FROM OPERATIONS | | $ | (310,536 | ) | | $ | 1,585,969 | |
See Notes to the Financial Statements
PROSPECTOR FUNDS, INC.
STATEMENTS OF CHANGES IN NET ASSETS
| | | Capital Appreciation Fund | |
| | | Year Ended | | | Year Ended | |
| | | December 31, 2015 | | | December 31, 2014 | |
| OPERATIONS: | | | | | | |
| Net investment income | | $ | 343,707 | | | $ | 195,345 | |
| Net realized gain on investments | | | 1,180,372 | | | | 2,895,290 | |
| Net change in unrealized appreciation of investments | | | (1,834,615 | ) | | | (1,475,357 | ) |
| Net increase (decrease) resulting from operations | | | (310,536 | ) | | | 1,615,278 | |
| | | | | | | | | |
| CAPITAL SHARE TRANSACTIONS: | | | | | | | | |
| Proceeds from shares sold | | | 417,337 | | | | 824,222 | |
| Proceeds from reinvestment of distributions | | | 600,524 | | | | 4,821,050 | |
| Payments for shares redeemed | | | (14,169,392 | ) | | | (5,690,411 | ) |
| Redemption fees | | | — | | | | — | |
| Net decrease from capital share transactions | | | (13,151,531 | ) | | | (45,139 | ) |
| | | | | | | | | |
| DISTRIBUTIONS PAID FROM: | | | | | | | | |
| Net investment income | | | (591,093 | ) | | | (583,975 | ) |
| Net realized gains | | | (16,120 | ) | | | (4,247,435 | ) |
| Total distributions to shareholders | | | (607,213 | ) | | | (4,831,410 | ) |
| | | | | | | | | |
| TOTAL DECREASE IN NET ASSETS | | | (14,069,280 | ) | | | (3,261,271 | ) |
| | | | | | | | | |
| NET ASSETS: | | | | | | | | |
| Beginning of period | | | 38,397,663 | | | | 41,658,934 | |
| | | | | | | | | |
| End of period (including undistributed (distributions | | | | | | | | |
| in excess of) net investment income of $5,664 and | | | | | | | | |
| $(23,066), respectively) | | $ | 24,328,383 | | | $ | 38,397,663 | |
| | | | | | | | | |
| TRANSACTIONS IN SHARES: | | | | | | | | |
| Shares sold | | | 27,311 | | | | 47,397 | |
| Shares issued in reinvestment of distributions | | | 40,169 | | | | 305,323 | |
| Shares redeemed | | | (887,942 | ) | | | (326,944 | ) |
| Net increase (decrease) | | | (820,462 | ) | | | 25,776 | |
See Notes to the Financial Statements
PROSPECTOR FUNDS, INC.
STATEMENTS OF CHANGES IN NET ASSETS
| | | Opportunity Fund | |
| | | Year Ended | | | Year Ended | |
| | | December 31, 2015 | | | December 31, 2014 | |
| OPERATIONS: | | | | | | |
| Net investment income | | $ | 524,064 | | | $ | 492,389 | |
| Net realized gain on investments | | | 10,522,273 | | | | 13,250,418 | |
| Net change in unrealized appreciation of investments | | | (9,460,368 | ) | | | (6,230,397 | ) |
| Net increase resulting from operations | | | 1,585,969 | | | | 7,512,410 | |
| | | | | | | | | |
| CAPITAL SHARE TRANSACTIONS: | | | | | | | | |
| Proceeds from shares sold | | | 16,837,669 | | | | 26,051,436 | |
| Proceeds from reinvestment of distributions | | | 14,137,645 | | | | 9,091,295 | |
| Payments for shares redeemed | | | (22,745,865 | ) | | | (39,376,434 | ) |
| Redemption fees | | | 70 | | | | 381 | |
| Net increase (decrease) from capital share transactions | | | 8,229,519 | | | | (4,233,322 | ) |
| | | | | | | | | |
| DISTRIBUTIONS PAID FROM: | | | | | | | | |
| Net investment income | | | (664,542 | ) | | | (641,229 | ) |
| Net realized gains | | | (14,471,784 | ) | | | (8,940,235 | ) |
| Total distributions to shareholders | | | (15,136,326 | ) | | | (9,581,464 | ) |
| | | | | | | | | |
| TOTAL DECREASE IN NET ASSETS | | | (5,320,838 | ) | | | (6,302,376 | ) |
| | | | | | | | | |
| NET ASSETS: | | | | | | | | |
| Beginning of period | | | 91,448,404 | | | | 97,750,780 | |
| | | | | | | | | |
| End of period (including distributions in excess of net | | | | | | | | |
| investment income of $(212,323) and | | | | | | | | |
| $(74,282), respectively) | | $ | 86,127,566 | | | $ | 91,448,404 | |
| | | | | | | | | |
| TRANSACTIONS IN SHARES: | | | | | | | | |
| Shares sold | | | 867,302 | | | | 1,198,108 | |
| Shares issued in reinvestment of distributions | | | 808,790 | | | | 433,952 | |
| Shares redeemed | | | (1,102,411 | ) | | | (1,770,195 | ) |
| Net increase (decrease) | | | 573,681 | | | | (138,135 | ) |
See Notes to the Financial Statements
PROSPECTOR FUNDS, INC.
FINANCIAL HIGHLIGHTS
| | | Capital Appreciation Fund | |
| | | Year Ended December 31, | |
| | | 2015 | | | 2014 | | | 2013 | | | 2012 | | | 2011 | |
| For a Fund share outstanding | | | | | | | | | | | | | | | |
| throughout the period | | | | | | | | | | | | | | | |
| | | | | | | | | | | | | | | | |
| NET ASSET VALUE: | | | | | | | | | | | | | | | |
| Beginning of period | | $ | 15.61 | | | $ | 17.11 | | | $ | 15.19 | | | $ | 14.90 | | | $ | 15.92 | |
| | | | | | | | | | | | | | | | | | | | | |
| OPERATIONS: | | | | | | | | | | | | | | | | | | | | |
| Net investment income | | | 0.21 | | | | 0.11 | | | | 0.18 | | | | 0.31 | | | | 0.15 | |
| Net realized and unrealized | | | | | | | | | | | | | | | | | | | | |
| gain (loss) on investments | | | (0.60 | ) | | | 0.63 | | | | 2.72 | | | | 0.54 | | | | (0.79 | ) |
| Total from operations | | | (0.39 | ) | | | 0.74 | | | | 2.90 | | | | 0.85 | | | | (0.64 | ) |
| | | | | | | | | | | | | | | | | | | | | |
| LESS DISTRIBUTIONS: | | | | | | | | | | | | | | | | | | | | |
| From net investment income | | | (0.37 | ) | | | (0.27 | ) | | | (0.17 | ) | | | (0.34 | ) | | | (0.17 | ) |
| From net realized gains | | | (0.01 | ) | | | (1.97 | ) | | | (0.81 | ) | | | (0.22 | ) | | | (0.21 | ) |
| Total distributions | | | (0.38 | ) | | | (2.24 | ) | | | (0.98 | ) | | | (0.56 | ) | | | (0.38 | ) |
| | | | | | | | | | | | | | | | | | | | | |
| NET ASSET VALUE: | | | | | | | | | | | | | | | | | | | | |
| End of period | | $ | 14.84 | | | $ | 15.61 | | | $ | 17.11 | | | $ | 15.19 | | | $ | 14.90 | |
| | | | | | | | | | | | | | | | | | | | | |
| TOTAL RETURN | | | (2.52 | )% | | | 4.18 | % | | | 19.10 | % | | | 5.76 | % | | | (4.00 | )% |
| | | | | | | | | | | | | | | | | | | | | |
| SUPPLEMENTAL DATA AND RATIOS: | | | | | | | | | | | | | | | | | | | | |
| Net assets, end of period (in thousands) | | $ | 24,328 | | | $ | 38,398 | | | $ | 41,659 | | | $ | 39,104 | | | $ | 53,737 | |
| Ratio of expenses to average net assets: | | | | | | | | | | | | | | | | | | | | |
| Before expense reimbursement | | | 1.88 | % | | | 1.74 | % | | | 1.77 | % | | | 1.77 | % | | | 1.70 | % |
| After expense reimbursement | | | 1.30 | % | | | 1.30 | % | | | 1.30 | % | | | 1.37 | % | | | 1.50 | % |
| Ratio of net investment income | | | | | | | | | | | | | | | | | | | | |
| to average net assets: | | | | | | | | | | | | | | | | | | | | |
| Before expense reimbursement | | | 0.47 | % | | | 0.05 | % | | | 0.61 | % | | | 1.10 | % | | | 0.63 | % |
| After expense reimbursement | | | 1.05 | % | | | 0.49 | % | | | 1.08 | % | | | 1.50 | % | | | 0.83 | % |
| Portfolio turnover rate | | | 35 | % | | | 48 | % | | | 31 | % | | | 15 | % | | | 24 | % |
| | | | | | | | | | | | | | | | | | | | | |
See Notes to the Financial Statements
PROSPECTOR FUNDS, INC.
FINANCIAL HIGHLIGHTS
| | | Opportunity Fund | |
| | | Year Ended December 31, | |
| | | 2015 | | | 2014 | | | 2013 | | | 2012 | | | 2011 | |
| For a Fund share outstanding | | | | | | | | | | | | | | | |
| throughout the period | | | | | | | | | | | | | | | |
| | | | | | | | | | | | | | | | |
| NET ASSET VALUE: | | | | | | | | | | | | | | | |
| Beginning of period | | $ | 20.75 | | | $ | 21.51 | | | $ | 18.05 | | | $ | 16.62 | | | $ | 17.45 | |
| | | | | | | | | | | | | | | | | | | | | |
| OPERATIONS: | | | | | | | | | | | | | | | | | | | | |
| Net investment income | | | 0.14 | | | | 0.13 | | | | 0.07 | | | | 0.20 | | | | 0.07 | |
| Net realized and unrealized | | | | | | | | | | | | | | | | | | | | |
| gain (loss) on investments | | | 0.18 | | | | 1.48 | | | | 4.84 | | | | 2.22 | | | | (0.11 | ) |
| Total from operations | | | 0.32 | | | | 1.61 | | | | 4.91 | | | | 2.42 | | | | (0.04 | ) |
| | | | | | | | | | | | | | | | | | | | | |
| LESS DISTRIBUTIONS: | | | | | | | | | | | | | | | | | | | | |
| From net investment income | | | (0.17 | ) | | | (0.16 | ) | | | (0.07 | ) | | | (0.20 | ) | | | (0.05 | ) |
| From net realized gains | | | (3.61 | ) | | | (2.21 | ) | | | (1.38 | ) | | | (0.79 | ) | | | (0.74 | ) |
| Total distributions | | | (3.78 | ) | | | (2.37 | ) | | | (1.45 | ) | | | (0.99 | ) | | | (0.79 | ) |
| | | | | | | | | | | | | | | | | | | | | |
| NET ASSET VALUE: | | | | | | | | | | | | | | | | | | | | |
| End of period | | $ | 17.29 | | | $ | 20.75 | | | $ | 21.51 | | | $ | 18.05 | | | $ | 16.62 | |
| | | | | | | | | | | | | | | | | | | | | |
| TOTAL RETURN | | | 1.33 | % | | | 7.36 | % | | | 27.25 | % | | | 14.63 | % | | | (0.21 | )% |
| | | | | | | | | | | | | | | | | | | | | |
| SUPPLEMENTAL DATA AND RATIOS: | |
| Net assets, end of period (in thousands) | | $ | 86,128 | | | $ | 91,448 | | | $ | 97,751 | | | $ | 70,549 | | | $ | 59,715 | |
| Ratio of expenses to average net assets: | | | | | | | | | | | | | | | | | | | | |
| Before expense reimbursement | | | 1.61 | % | | | 1.53 | % | | | 1.57 | % | | | 1.64 | % | | | 1.70 | % |
| After expense reimbursement | | | 1.30 | % | | | 1.30 | % | | | 1.30 | % | | | 1.36 | % | | | 1.50 | % |
| Ratio of net investment income | | | | | | | | | | | | | | | | | | | | |
| to average net assets: | | | | | | | | | | | | | | | | | | | | |
| Before expense reimbursement | | | 0.28 | % | | | 0.23 | % | | | 0.08 | % | | | 0.84 | % | | | 0.20 | % |
| After expense reimbursement | | | 0.59 | % | | | 0.46 | % | | | 0.35 | % | | | 1.12 | % | | | 0.40 | % |
| Portfolio turnover rate | | | 36 | % | | | 40 | % | | | 25 | % | | | 43 | % | | | 45 | % |
See Notes to the Financial Statements
PROSPECTOR FUNDS, INC.
NOTES TO THE FINANCIAL STATEMENTS
DECEMBER 31, 2015
Prospector Funds, Inc. (the “Corporation”) was organized as a Maryland corporation on June 6, 2007 and is registered under the Investment Company Act of 1940 (the “1940 Act”), as amended, as an open-end diversified management investment company. The Corporation issues its shares in series, each series representing a distinct portfolio with its own investment objectives and policies. There are two series presently authorized, the Prospector Capital Appreciation Fund and the Prospector Opportunity Fund (individually a “Fund” and collectively the “Funds”). Each Fund is an investment company and accordingly follows the investment company accounting and reporting guidance of the Financial Accounting Standards Board (“FASB”) Accounting Standard Board Codification Topic 946 Financial Services – Investment Companies. The Funds commenced operations on September 28, 2007.
| 2. | FAIR VALUE MEASUREMENT |
The following is a summary of significant accounting policies consistently followed by each Fund:
Security Valuation – The Fund has adopted fair value accounting standards which establish an authoritative definition of fair value and set out a hierarchy for measuring fair value. These standards require additional disclosures about the various inputs and valuation techniques used to develop the measurements of fair value, a discussion in changes in valuation techniques and related inputs during the period and expanded disclosure of valuation levels for major security types. These inputs are summarized in the three broad levels listed below:
| Level 1 – | Unadjusted quoted prices in active markets for identical assets or liabilities that the Fund has the ability to access. |
| | |
| Level 2 – | Observable inputs other than quoted prices included in Level 1 that are observable for the asset or liability, either directly or indirectly. These inputs may include quoted prices for the identical instrument on an inactive market, prices for similar instruments, interest rates, prepayment speeds, credit risk, yield curves, default rates, discounts and similar data. |
| | |
| Level 3 – | Unobservable inputs for the asset or liability, to the extent relevant observable inputs are not available, representing the Fund’s own assumptions about the assumptions a market participant would use in valuing the asset or liability, and would be based on the best information available. |
Following is a description of the valuation techniques applied to the Fund’s major categories of assets and liabilities measured at fair value on a recurring basis. The Fund’s investments are carried at fair value.
Common Stock – Securities that are primarily traded on a national securities exchange are valued at the last sale price on the exchange on which they are primarily traded on the day of valuation or, if there has been no sale on such day, at the last bid price on the day of valuation. To the extent these securities are actively traded and valuation adjustments are not applied, they are categorized in Level 1 of the fair value hierarchy.
Convertible and Corporate Bonds – Convertible and corporate bonds, including listed issues, are valued at fair value on the basis of valuations furnished by an independent pricing service which utilizes both dealer-supplied valuations and formula-based techniques. The pricing service may consider recently executed transactions in securities of the issuer or comparable issuers, market price quotations (where observable), bond spreads, and fundamental data relating to the issuer. Convertible and corporate bonds are generally categorized in Level 2 of the fair value hierarchy.
PROSPECTOR FUNDS, INC.
NOTES TO THE FINANCIAL STATEMENTS – CONTINUED
DECEMBER 31, 2015
Investment Companies – Investments in other mutual funds, including money market funds, are valued at their net asset value per share. To the extent these securities are actively traded and valuation adjustments are not applied, they are categorized in Level 1 of the fair value hierarchy.
Securities for which market quotations are not readily available, or if the closing price does not represent fair value, are valued following procedures approved by the Board of Directors. These procedures consider many factors, including the type of security, size of holding, trading volume and news events. There can be no assurance that the Fund could obtain the fair value assigned to a security if they were to sell the security at approximately the time at which the Fund determines their net asset values per share.
The inputs or methodology used for valuing securities are not an indication of the risk associated with investing in those securities.
As of December 31, 2015, each Fund’s investments in securities were classified as follows:
| | | Level 1 | | | Level 2 | | | Level 3 | | | Total | |
| Capital Appreciation Fund | | | | | | | | | | | | |
| Common Stocks | | $ | 17,462,526 | | | $ | — | | | $ | — | | | $ | 17,462,526 | |
| Convertible Bonds | | | — | | | | 5,206,024 | | | | — | | | | 5,206,024 | |
| Corporate Bonds | | | — | | | | 1,311,070 | | | | — | | | | 1,311,070 | |
| Short-Term Investment | | | 772,524 | | | | — | | | | — | | | | 772,524 | |
| Total Investments | | $ | 18,235,050 | | | $ | 6,517,094 | | | $ | — | | | $ | 24,752,144 | |
| | | | | | | | | | | | | | | | | |
| | | Level 1 | | | Level 2 | | | Level 3 | | | Total | |
| Opportunity Fund | | | | | | | | | | | | | | | | |
| Common Stocks | | $ | 76,112,981 | | | $ | — | | | $ | — | | | $ | 76,112,981 | |
| Convertible Bonds | | | — | | | | 2,800,766 | | | | — | | | | 2,800,766 | |
| Short-Term Investment | | | 583,820 | | | | — | | | | — | | | | 583,820 | |
| Total Investments | | $ | 76,696,801 | | | $ | 2,800,766 | | | $ | — | | | $ | 79,497,567 | |
Refer to each Fund’s Schedule of Investments for further sector breakout.
Transfers between levels are recognized at the beginning of the reporting period. During the year ended December 31, 2015, the Funds recognized no transfers between levels. The Funds did not invest in any Level 3 investments during the period.
The Funds may invest in derivative financial instruments in order to manage risk or gain exposure to various other investments or markets. The Funds’ investment objectives allow the Funds to enter into various types of derivative contracts, including, but not limited to, futures contracts, forward foreign exchange contracts, and purchased and written options. Derivatives may contain various risks including the potential inability of the counterparty to fulfill their obligations under the terms of the contract, the potential for an illiquid secondary market, and the potential for market movements which may expose the funds to gains or losses in excess of the amounts shown on the Statements of Assets and Liabilities. As of and for the year ended December 31, 2015, the Funds held no derivative instruments.
PROSPECTOR FUNDS, INC.
NOTES TO THE FINANCIAL STATEMENTS – CONTINUED
DECEMBER 31, 2015
| 3. | SIGNIFICANT ACCOUNTING POLICIES |
Distributions to Shareholders – Dividends from net investment income and distributions of net realized capital gains, if any, will be declared and paid at least annually. The character of distributions made during the period from net investment income or net realized gains may differ from the characterization for federal income tax purposes due to differences in the recognition of income, expense and gain items for financial statement and tax purposes. All short-term capital gains are included in ordinary income for tax purposes.
Use of Estimates – The preparation of financial statements in conformity with accounting principles generally accepted in the United States of America requires management to make estimates and assumptions that affect the reported amounts of assets and liabilities and disclosure of contingent assets and liabilities at the date of the financial statements and the reported amounts of revenues and expenses during the reporting period. Actual results could differ from those estimates.
Federal Income Taxes – The Funds intend to meet the requirements of subchapter M of the Internal Revenue Code applicable to regulated investment companies and to distribute substantially all net taxable investment income and net realized gains to shareholders in a manner which results in no tax cost to the Funds. Therefore, no federal income or excise tax provision is required. As of December 31, 2015, the Funds did not have any tax positions that did not meet the “more-likely-than-not” threshold of being sustained by the applicable tax authority. Generally, each of the tax years in the four-year period ended December 31, 2015 remains subject to examination by taxing authorities.
Reclassification of Capital Accounts – GAAP requires that certain components of net assets relating to permanent differences be reclassified between financial and tax reporting. These reclassifications have no effect on net assets or net asset value per share. For the fiscal year ended December 31, 2015, the following reclassifications were made on the Statements of Assets and Liabilities:
| | Undistributed | Accumulated | |
| | Net Investment | Net Realized | |
| | Income | Gain(Loss) | Portfolio Capital |
| Capital Appreciation Fund | $276,116 | $(276,117) | $1 |
| Opportunity Fund | 2,437 | (2,436) | (1) |
Foreign Currency Translation – The books and records relating to the Funds’ non-U.S. dollar denominated investments are maintained in U.S. dollars on the following bases: (1) market value of investment securities, assets, and liabilities are translated at the current rate of exchange; and (2) purchases and sales of investment securities, income, and expenses are translated at the relevant rates of exchange prevailing on the respective dates of such transactions. The Funds do not isolate the portion of gains and losses on investments in equity securities that is due to changes in the foreign exchange rates from that which is due to changes in market prices of equity securities. The Funds report certain foreign currency-related transactions as components of realized gains for financial reporting purposes, whereas such components are treated as ordinary income for federal income tax purposes.
Illiquid or Restricted Securities – A security may be considered illiquid if it lacks a readily available market. Securities are generally considered liquid if they can be sold or disposed of in the ordinary course of business within seven days at approximately the price at which the security is valued by the Fund. Illiquid securities may be valued under methods approved by the Funds’ board of directors as reflecting fair value. Each Fund intends to invest no more than 15% of its total assets in illiquid securities. Certain restricted securities may be considered illiquid.
PROSPECTOR FUNDS, INC.
NOTES TO THE FINANCIAL STATEMENTS – CONTINUED
DECEMBER 31, 2015
Restricted securities are often purchased in private placement transactions, are not registered under the Securities Act of 1933, may have contractual restrictions on resale, and may be valued under methods approved by the Funds’ board of directors as reflecting fair value. Certain restricted securities eligible for resale to qualified institutional investors, including Rule 144A securities, are not subject to the limitation on a Fund’s investment in illiquid securities if they are determined to be liquid in accordance with procedures adopted by the Funds’ board of directors. At December 31, 2015, the Funds had no investments in illiquid securities.
Expenses – Expenses directly attributable to a Fund are charged to that Fund, while expenses attributable to more than one Fund are allocated among the respective Funds based on relative net assets or another appropriate basis.
Other – Investment and shareholder transactions are recorded on the trade date. Each Fund determines the gain or loss realized from the investment transactions on the basis of identified cost. Dividend income is recognized on the ex-dividend date. Interest income, including amortization of bond premium and discount, is recognized on an accrual basis.
Subsequent Events – Management has evaluated fund related events and transactions that occurred subsequent to December 31, 2015, through the date of issuance of the Funds’ financial statements. There were no events or transactions that occurred during this period that materially impacted the amounts or disclosures in the Funds’ financial statements.
| 4. | INVESTMENT TRANSACTIONS |
During the year ended December 31, 2015, purchases of securities and proceeds from sales of securities, other than temporary investments in short-term securities, were as follows:
| | | Purchases | | | Sales | |
| Capital Appreciation Fund | | $ | 10,893,331 | | | $ | 22,224,556 | |
| Opportunity Fund | | | 29,517,420 | | | | 39,410,831 | |
There were no purchases or sales of long-term U.S. Government securities.
During the year ended December 31, 2015, the Opportunity Fund recognized interest income of $47,936 offset by amortization of bond premiums of $64,037.
The aggregate gross unrealized appreciation and depreciation of securities held by the Funds and the total cost of securities for federal income tax purposes at December 31, 2015, the Funds’ most recently completed fiscal year end, were as follows:
| | | Aggregate | | | Aggregate | | | | | | Federal | |
| | | Gross | | | Gross | | | | | | Income | |
| | | Appreciation | | | Depreciation | | | Net | | | Tax Cost | |
| Capital Appreciation Fund | | $ | 2,598,383 | | | $ | (1,917,756 | ) | | $ | 680,627 | | | $ | 24,071,517 | |
| Opportunity Fund | | | 12,304,637 | | | | (6,901,098 | ) | | | 5,403,539 | | | | 74,094,028 | |
The difference between book-basis and tax-basis unrealized appreciation is attributable primarily to wash sales.
PROSPECTOR FUNDS, INC.
NOTES TO THE FINANCIAL STATEMENTS – CONTINUED
DECEMBER 31, 2015
At December 31, 2015, the Funds’ most recently completed fiscal year end, components of accumulated earnings on a tax-basis were as follows:
| | | Undistributed | | | Undistributed | | | Other | | | | | | Total | |
| | | Ordinary | | | Long-Term | | | Accumulated | | | Unrealized | | | Accumulated | |
| | | Income | | | Capital Gains | | | Losses | | | Appreciation | | | Earnings | |
| Capital Appreciation Fund | | $ | 15,637 | | | $ | — | | | $ | (152,164 | ) | | $ | 680,431 | | | $ | 543,904 | |
| Opportunity Fund | | | 334,158 | | | | 611,292 | | | | (8,031 | ) | | | 5,400,846 | | | | 6,338,265 | |
As of December 31, 2015, Capital Appreciation Fund and Opportunity Fund had $142,191 and $0, respectively, in long-term capital loss carryovers which will be permitted to be carried over for an unlimited period. A regulated investment company may elect for any taxable year to treat any portion of any qualified late year loss as arising on the first day of the next taxable year. Qualified late year losses are certain capital, and ordinary losses which occur during the portion of the Fund’s taxable year subsequent to October 31. The Capital Appreciation Fund and the Opportunity Fund do not plan to defer any late year losses.
The tax character of distributions paid during the fiscal year ended December 31, 2015 were as follows:
| | | Ordinary | | | Long-Term | | | | |
| | | Income* | | | Capital Gains | ** | | Total | |
| Capital Appreciation Fund | | $ | 591,102 | | | $ | 16,111 | | | $ | 607,213 | |
| Opportunity Fund | | | 1,459,542 | | | | 13,676,784 | | | | 15,136,326 | |
The tax character of distributions paid during the fiscal year ended December 31, 2014 were as follows:
| | | Ordinary | | | Long-Term | | | | |
| | | Income | * | | Capital Gains | ** | | Total | |
| Capital Appreciation Fund | | $ | 864,748 | | | $ | 3,966,662 | | | $ | 4,831,410 | |
| Opportunity Fund | | | 1,448,014 | | | | 8,133,450 | | | | 9,581,464 | |
| * | | For federal income tax purposes, distributions of short-term capital gains are included in ordinary income distributions. |
| | | |
| ** | | Funds designate long-term capital gain dividends pursuant to IRC Sec. 852(b)(3)(C). |
The Funds have entered into an Investment Advisory Agreement with Prospector Partners Asset Management, LLC (the “Adviser”), with whom certain directors and officers of the Corporation are affiliated, to furnish investment advisory services to the Funds. Pursuant to this Agreement, the Adviser is entitled to receive a management fee, calculated daily and payable monthly, at the annual rate of 1.10% as applied to each Fund’s daily net assets.
The Adviser has contractually agreed to waive its management fee and reimburse each Fund’s other expenses to the extent necessary to ensure that each Fund’s operating expenses do not exceed 1.30% of its average daily net assets. Fees waived and expenses reimbursed by the Adviser may be recouped by the Adviser for a period of three fiscal years following the fiscal year during which such waiver or reimbursement was made if such recoupment can be achieved without exceeding the expense limit in effect at the time the waiver or reimbursement occurred. As of December 31, 2015, the Adviser did not recoup any previously waived expenses. The Operating Expense Limitation Agreement will be in effect through at least September 30, 2016. Waived fees and reimbursed expenses subject to potential recovery by year of expiration are as follows:
PROSPECTOR FUNDS, INC.
NOTES TO THE FINANCIAL STATEMENTS – CONTINUED
DECEMBER 31, 2015
| Expiration | | Capital Appreciation Fund | | | Opportunity Fund | |
| 12/31/16 | | $ | 188,732 | | | $ | 237,316 | |
| 12/31/17 | | | 174,159 | | | | 250,997 | |
| 12/31/18 | | | 189,898 | | | | 272,070 | |
| Total | | $ | 552,789 | | | $ | 760,383 | |
As of December 31, 2015, it was possible, but not probable, those amounts would be recovered by the Adviser. At the end of each fiscal year in the future, the Funds will continue to assess the potential recovery of waived/reimbursed fees and expenses for financial reporting purposes.
Quasar Distributors, LLC (“Quasar”), a subsidiary of U.S. Bancorp, serves as distributor of the Funds’ shares pursuant to a Distribution Agreement with the Corporation. Each Fund’s shares are sold on a no-load basis and, therefore, Quasar receives no sales commission or sales load for providing services to the Funds. The Corporation has adopted a plan pursuant to Rule 12b-1 under the 1940 Act (the “12b-1 Plan”), which authorizes the Corporation to reimburse Quasar and certain financial intermediaries who assist in distributing each Fund’s shares or who provide shareholder services to Fund shareholders a distribution and/or shareholder servicing fee of up to 0.25% of each Fund’s average daily net assets (computed on an annual basis). All or a portion of the fee may be used by the Funds or Quasar to pay the Fund’s distribution fees and costs of printing reports and prospectuses for potential investors and the costs of other distribution and shareholder services expenses. During the year ended December 31, 2015, Capital Appreciation Fund and Opportunity Fund incurred expenses of $13,086 and $45,148 respectively, pursuant to the 12b-1 Plan.
U.S. Bancorp Fund Services, LLC serves as transfer agent, administrator and fund accountant for the Funds. U.S. Bank N.A. serves as custodian for the Funds.
The Funds enter into contracts that contain a variety of indemnifications. The Funds’ maximum exposure under these arrangements is unknown. However, the Funds have not had prior claims or losses pursuant to these contracts and expect the risk of loss to be remote.
PROSPECTOR FUNDS, INC.
REPORT OF INDEPENDENT REGISTERED PUBLIC ACCOUNTING FIRM
The Board of Directors and Shareholders
Prospector Funds, Inc.:
We have audited the accompanying statements of assets and liabilities, including the schedule of investments, of Prospector Funds, Inc., comprised of, the Prospector Capital Appreciation Fund and the Prospector Opportunity Fund (the Funds) as of December 31, 2015, and the related statements of operations for the year then ended, the statements of changes in net assets for the two years in the period then ended, and the financial highlights for each of the five years in the period then ended. These financial statements and financial highlights are the responsibility of the Funds’ management. Our responsibility is to express an opinion on these financial statements and financial highlights based on our audits.
We conducted our audits in accordance with the standards of the Public Company Accounting Oversight Board (United States). Those standards require that we plan and perform the audit to obtain reasonable assurance about whether the financial statements and financial highlights are free of material misstatement. We were not engaged to perform an audit of the Funds’ internal control over financial reporting. Our audits included consideration of internal control over financial reporting as a basis for designing audit procedures that are appropriate in the circumstances, but not for the purpose of expressing an opinion on the effectiveness of the Funds’ internal control over financial reporting. Accordingly, we express no such opinion. An audit also includes examining, on a test basis, evidence supporting the amounts and disclosures in the financial statements and financial highlights, assessing the accounting principles used and significant estimates made by management, and evaluating the overall financial statement presentation. Our procedures included confirmation of securities owned as of December 31, 2015, by correspondence with the custodian and brokers or by other appropriate auditing procedures where replies from brokers were not received. We believe that our audits provide a reasonable basis for our opinion.
In our opinion, the financial statements and financial highlights referred to above present fairly, in all material respects, the financial position of the Funds at December 31, 2015, the results of their operations for the year then ended, the changes in their net assets for the two years in the period then ended, and the financial highlights for each of the five years in the period then ended, in conformity with U.S. generally accepted accounting principles.
Chicago, Illinois
February 26, 2016
PROSPECTOR FUNDS, INC.
ADDITIONAL INFORMATION (UNAUDITED)
BOARD APPROVAL OF INVESTMENT ADVISORY AGREEMENT
The Corporation’s independent directors (the “directors”) unanimously approved the continuance of the Investment Advisory Agreement (the “Advisory Agreement”) between the Funds and the Prospector Partners Asset Management, LLC (the “Investment Manager”) at a Board of Director’s meeting held on September 2, 2015.
In preparation for the meeting, the directors had requested from the Investment Manager and evaluated a memorandum providing certain information requested by the Board pursuant to Section 15(c) of the 1940 Act, including (i) expense, compliance and other information as it relates to the Investment Manager; (ii) performance of other accounts managed by its affiliate Prospector Partners, LLC with similar investment objectives derived from data compiled by the Investment Manager and (iii) expense and other information for other registered investment companies with similar investment objectives derived from data compiled by the Investment Manager based upon comparative peer groups selected in consultation with the independent directors. Prior to voting, the directors reviewed the proposed approval of the Advisory Agreement with management and with counsel to the Corporation and reviewed a memorandum from such counsel discussing the legal standards for their consideration of the proposed approval. In reaching their determinations relating to approval of the continuance of the Advisory Agreement, the directors considered all factors they believed relevant including the following:
| | 1. | the nature, extent and quality of investment, and other services to be rendered by the Investment Manager; |
| | | |
| | 2. | payments to be received by the Investment Manager from all sources with respect to the Funds; |
| | | |
| | 3. | comparative fee and expense data for the Funds and other investment companies with similar investment objectives; |
| | | |
| | 4. | the extent to which economies of scale may be realized as the Funds grow and whether fee levels reflect these economies of scale for the benefit of investors; |
| | | |
| | 5. | the Investment Manager’s policies and practices regarding allocation of portfolio transactions of the Funds, including the extent to which the Investment Manager may benefit from soft dollar arrangements; |
| | | |
| | 6. | fall-out benefits which the Investment Manager and its affiliates may receive from their relationships to the Funds; |
| | | |
| | 7. | information about fees charged by the Investment Manager to other clients with similar investment objectives; |
| | | |
| | 8. | the professional experience and qualifications of the Funds’ portfolio managers and other senior personnel of the Investment Manager; |
| | | |
| | 9. | profitability of the Investment Manager; and |
| | | |
| | 10. | the terms of the Advisory Agreement. |
The directors also considered their overall confidence in the integrity and competence of the Investment Manager and the portfolio managers. In their deliberations, the directors did not identify any particular information that was all-important or controlling, and each director attributed different weights to the various factors. The directors determined that the overall arrangements between the Funds and the Investment Manager, as provided in the Advisory Agreement, were fair and reasonable in light of the services performed, expenses expected to be incurred and such other matters as the directors considered relevant in the exercise of their reasonable judgment.
The material factors and conclusions that formed the basis for the directors reaching their determinations to approve the continuance of the Advisory Agreement (including their determinations that the Investment Manager
PROSPECTOR FUNDS, INC.
ADDITIONAL INFORMATION (UNAUDITED) – CONTINUED
should be the investment adviser for the Funds, and that the fees payable to the Investment Manager pursuant to the Advisory Agreement are appropriate) were separately discussed by the directors.
Nature, extent and quality of services provided by the Investment Manager
The directors noted that, under the Advisory Agreement, the Investment Manager, subject to the control of the directors, administers the Funds’ business and other affairs. The Investment Manager manages the investment of the assets of the Funds, including making purchases and sales of portfolio securities consistent with each Fund’s investment objective and policies.
The directors considered the scope and quality of services provided by the Investment Manager under the Advisory Agreement. The directors considered the quality of the investment research capabilities of the Investment Manager and the other resources it proposes to dedicate to performing services for the Funds and the Investment Manager’s active management style. The directors also considered the portfolio managers’ experience, reputation and investment philosophy noting that the Investment Manager’s investment style and stock selection process have remained consistent even in difficult market environments. The quality of administrative and other services also were considered. The directors concluded that, overall, they were satisfied with the nature, extent and quality of services proposed to be provided to the Funds under the Advisory Agreement.
Investment Manager Fees; Performance of the Fund
The directors considered the advisory fee rate paid by the Funds to the Investment Manager and information prepared by the Investment Manager based upon the peer groups selected by the independent directors concerning fee rates paid by other comparable funds. The directors recognized that it is difficult to make comparisons of advisory fees because there are variations in the services that are included in the fees paid by other funds, but determined that the proposed advisory fee rate was in line with other comparable funds.
The directors also considered the performance of each Fund compared to each Fund’s benchmarks and industry averages. The directors noted that although the Opportunity Fund underperformed its benchmarks during the three and five-year periods, from the period from inception through June 30, 2015, the Opportunity Fund was in the first quartile for the one-year period compared to its peer group and outperformed its peer group for all periods. The Directors noted that although it had not been the case in the past, the Capital Appreciation Fund now underperformed its benchmark in recent periods. The directors concluded that the advisory fee rate, taking into account performance and the other factors mentioned, was in line with comparable funds.
Other Fund Expenses
The directors also considered the total expense ratio of the Funds in comparison to the fees and expenses of the funds included in the comparison. The directors noted that the expense ratios of some of the comparable funds also were lower because of waivers or reimbursements by those funds’ investment advisers, which in some cases were voluntary and perhaps temporary. In particular, the directors noted that the Investment Manager’s fee waiver pursuant to the Fee Waiver and Expenses Reimbursement Agreement was contractual in nature and customary for the industry. The directors concluded that the Funds’ expense ratio was satisfactory. Finally, the directors noted that there may be economies of scale as the Funds grow and concluded that it may be appropriate to consider those issues in the future.
PROSPECTOR FUNDS, INC.
ADDITIONAL INFORMATION (UNAUDITED) – CONTINUED
Investment Manager Profitability
The directors noted that the Investment Manager also provides the Funds with such office space, administrative and other services (exclusive of, and in addition to, any such services provided by any other retained by the Funds) and executive and other personnel as are necessary for the Funds’ operations. The directors considered that the Investment Manager pays all of the compensation of the officers of the Company that are affiliated persons of the Investment Manager, pays a portion of the insurance costs and paid the cost of the organization of the Funds (without reimbursement).
The directors also noted that the Investment Manager has contractually agreed to waive, through September 30, 2016, its management fee and/or reimburse each Fund’s other expenses to the extent necessary to ensure that each Fund’s operating expenses do not exceed 1.30% of its average daily net assets. Under the terms of the Waiver and Expense Reimbursement Agreement at the present asset levels of the Funds, the Investment Manager has received only a portion of its management fee amounts. It was also noted that the Investment Manager does not receive “fall out” benefits commonly received by managers of mutual funds that provide transfer agency, distribution or printing services in-house. The directors considered the expenses of the Investment Manager and the services provided by the Investment Manager and determined that the Investment Manager was cash flow positive after considering an allocation of expenses from its affiliated advisor, Prospector Partners, LLC.
PROSPECTOR FUNDS, INC.
ADDITIONAL INFORMATION (UNAUDITED) – CONTINUED
AVAILABILITY OF FUND PORTFOLIO INFORMATION
The Funds file complete schedules of portfolio holdings with the SEC for the first and third quarters of each fiscal year on Form N-Q, which is available on the SEC’s website at www.sec.gov. The Funds’ Form N-Q may be reviewed and copied at the SEC’s Public Reference Room in Washington, D.C. For information on the Public Reference Room call 1-800-SEC-0330. In addition, the Funds’ Form N-Q is available without charge upon request by calling 1-877-734-7862.
AVAILABILITY OF PROXY VOTING INFORMATION
A description of the Funds’ Proxy Voting Policies and Procedures is available without charge, upon request, by calling 1-877-734-7862. Information regarding how the Funds voted proxies relating to portfolio securities during the most recent 12 month period ended June 30, is available (1) without charge, upon request, by calling 1-877-734-7862, or (2) on the SEC’s website at www.sec.gov.
QUALIFIED DIVIDEND INCOME/DIVIDENDS RECEIVED DEDUCTION
For the fiscal year ended December 31, 2015, certain dividends paid by the Funds may be subject to a maximum tax rate of 23.8%, as provided for by the American Taxpayer Relief Act of 2012. The percentage of dividends declared from ordinary income designated as qualified dividend income was 96.57% and 81.34% for the Capital Appreciation Fund and Opportunity Fund, respectively.
For corporate shareholders, the percent of ordinary income distributions qualifying for the corporate dividends received deduction for the fiscal year ended December 31, 2015 was 88.73% and 74.22% for the Capital Appreciation Fund and Opportunity Fund, respectively.
ADDITIONAL INFORMATION APPLICABLE TO FOREIGN SHAREHOLDERS ONLY
The percent of ordinary income distributions designated as interest related dividends for the fiscal year ended December 31, 2015 was 21.39% and 1.63% for the Capital Appreciation Fund and Opportunity Fund, respectively.
The percent of ordinary income distributions designated as short-term capital gain distributions under Internal Revenue Section 871(k)(2)(C) for the fiscal year ended December 31, 2015 was 0.00% and 54.72% for the Capital Appreciation Fund and Opportunity Fund, respectively.
PROSPECTOR FUNDS, INC.
ADDITIONAL INFORMATION (UNAUDITED) – CONTINUED
DIRECTORS & OFFICERS TABLE
| | | | | | |
| | | Term of | | Number of | |
| | | Office | | Portfolios | Other |
| | | and | Principal | in Fund | Directorships |
| Name, | | Length | Occupation | Complex | Served |
| Year of Birth | | of Time | During Past | Overseen | During Past |
| and Address^ | Position | Served* | 5 Years | by Director | 5 Years |
| |
| INDEPENDENT BOARD MEMBERS |
| | | | | | |
| Harvey D. Hirsch* | Director | Indefinite; | Retired, | 2 | None. |
| Year of Birth: 1941 | | Since | Senior Vice President, | | |
| | | September 7, | Marketing, Van Eck | | |
| | | 2007 | Associates Corporation, | | |
| | | | an investment adviser, | | |
| | | | from May 2007 to August 2014. | | |
| | | | | | |
| Joseph Klein III* | Director | Indefinite; | Managing Director of Gauss | 2 | ISIS |
| Year of Birth: 1961 | | Since | Capital Advisors, LLC, | | Pharmaceuticals, |
| | | September 7, | a financial consulting and | | Inc. |
| | | 2007 | investment advisory firm | | Savient |
| | | | focused on biopharmaceuticals | | Pharmaceuticals, |
| | | | since he founded the company | | Inc. |
| | | | in March 1998. | | |
| | | | | | |
| Roy L. Nersesian* | Director | Indefinite; | Professor of the Leon Hess | 2 | None |
| Year of Birth: 1939 | | Since | School of Business, Monmouth | | |
| | | September 7, | University, since September 1985. | | |
| | | 2007 | Adjunct Professor of the Center | | |
| | | | for Energy and Marine | | |
| | | | Transportation, Columbia | | |
| | | | University, since September 2000. | | |
| | | | Consultant, Poten & Partners, | | |
| | | | provider of brokerage and | | |
| | | | consulting services to the | | |
| | | | energy and ocean transportation | | |
| | | | industries, since September 1992. | | |
PROSPECTOR FUNDS, INC.
ADDITIONAL INFORMATION (UNAUDITED) – CONTINUED
| | | Term of | | Number of | |
| | | Office | | Portfolios | Other |
| | | and | Principal | in Fund | Directorships |
| Name, | | Length | Occupation | Complex | Served |
| Year of Birth | | of Time | During Past | Overseen | During Past |
| and Address^ | Position | Served* | 5 Years | by Director | 5 Years |
| | | | | | |
| John T. Rossello, Jr.* | Director | Indefinite; | Retired. | 2 | None |
| Year of Birth: 1951 | | Since | Partner at | | |
| | | September 7, | PricewaterhouseCoopers LLP, | | |
| | | 2007 | an accounting firm, from | | |
| | | | October 1988 to June 2007. | | |
| | | | | | |
| INTERESTED BOARD MEMBERS AND OFFICERS |
| | | | | | |
| John D. Gillespie†* | Director | Indefinite; | Managing member of | 2 | White |
| Year of Birth: 1959 | President | Since | the Investment Manager. | | Mountains |
| | | September 7, | Managing member of | | Insurance |
| | | 2007 | Prospector Partners, LLC, | | Group, Ltd. |
| | | | an affiliate of the Investment | | |
| | | | Manager, and portfolio manager | | |
| | | | of the investment funds | | |
| | | | sponsored by Prospector | | |
| | | | Partners, LLC since 1997. | | |
| | | | | | |
| Kevin R. O’Brien | Executive | Indefinite; | Portfolio Manager at | N/A | None |
| Year of Birth: 1963 | Vice | Since | the Investment Manager. | | |
| President | September 7, | Portfolio Manager at | | |
| | | 2007 | Prospector Partners, LLC | | |
| | | | since April 2003. | | |
| | | | | | |
| Jason A. Kish | Executive | Indefinite; | Portfolio Manager at the | N/A | None |
| Year of Birth: 1973 | Vice | Since | Investment Manager. | | |
| President | February, | Director of Research | | |
| | | 2013 | since 2010. | | |
| | | | Analyst at Prospector | | |
| | | | Partners, LLC from | | |
| | | | 1997-2010. | | |
PROSPECTOR FUNDS, INC.
ADDITIONAL INFORMATION (UNAUDITED) – CONTINUED
| | | Term of | | Number of | |
| | | Office | | Portfolios | Other |
| | | and | Principal | in Fund | Directorships |
| Name, | | Length | Occupation | Complex | Served |
| Year of Birth | | of Time | During Past | Overseen | During Past |
| and Address^ | Position | Served* | 5 Years | by Director | 5 Years |
| | | | | | |
| Peter N. Perugini, Jr. | Secretary | Indefinite; | Chief Financial Officer at | N/A | None |
| Year of Birth: 1970 | Treasurer | Secretary | Prospector Partners, LLC | | |
| | | Since | since 2000. | | |
| | | September 7, | | | |
| | | 2007 | | | |
| | | Indefinite; | | | |
| | | Treasurer | | | |
| | | Since | | | |
| | | June 6, | | | |
| | | 2007 | | | |
| | | | | | |
| Kim Just | Chief | Indefinite; | Chief Compliance Officer at | N/A | None |
| Year of Birth: 1967 | Compliance | Since | Prospector Partners, LLC | | |
| | Officer | September 7, | since March 2006. | | |
| | | 2007 | | | |
| | | | | | |
| Brian Wiedmeyer | Assistant | Indefinite; | Vice President for US | N/A | None |
| Year of Birth: 1973 | Secretary | Since | Bancorp Fund Services, LLC, | | |
| | | September 7, | a mutual fund service provider, | | |
| | | 2007 | since January 2005. | | |
| ^ | The address for all directors and officers is 370 Church Street, Guilford, Connecticut 06437. |
| * | Each of the Company’s directors was elected by written consent of the sole shareholder of the Funds on September 7, 2007. |
| † | John D. Gillespie is an interested director of the Fund because he is also the managing member of the Investment Manager. |
(This Page Intentionally Left Blank.)
DIRECTORS
John D. Gillespie
Harvey D. Hirsch
Joseph Klein III
Roy L. Nersesian
John T. Rossello, Jr.
INVESTMENT ADVISER
Prospector Partners Asset Management, LLC
370 Church Street
Guilford, CT 06437
DISTRIBUTOR
Quasar Distributors, LLC
615 East Michigan Street
Milwaukee, WI 53202
CUSTODIAN
U.S. Bank, N.A.
1555 North River Center Drive
Milwaukee, WI 53212
ADMINISTRATOR AND TRANSFER AGENT
U.S. Bancorp Fund Services, LLC
Third Floor
615 E. Michigan Street
Milwaukee, WI 53202
INDEPENDENT REGISTERED PUBLIC ACCOUNTING FIRM
Ernst & Young LLP
155 North Wacker Drive
Chicago, IL 60606
LEGAL COUNSEL
Seward & Kissel LLP
One Battery Plaza
New York, NY 10004
This report should be accompanied or preceded by a prospectus.
The Funds’ Statement of Additional Information contains additional information about the
Funds’ directors and is available without charge upon request by calling 1-877-734-7862.
Item 2. Code of Ethics.
The registrant has adopted a code of ethics that applies to the registrant’s principal executive officer and principal financial officer. The registrant has not made any substantive amendments to its code of ethics during the period covered by this period.
The registrant has not granted any waivers from any provisions of the code of ethics during the period covered by this report.
A copy of the registrant’s code of ethics that applies to the registrant’s principal executive officer and principal financial officer is filed herewith.
Item 3. Audit Committee Financial Expert.
The registrant’s board of directors has determined that there is at least one audit committee financial expert serving on its audit committee. John Rossello, Jr. is the “audit committee financial expert” and is considered to be “independent” as each term is defined in Item 3 of Form N‑CSR.
Item 4. Principal Accountant Fees and Services.
The registrant has engaged its principal accountant to perform audit services, audit-related services, tax services and other services during the past two fiscal periods. “Audit services” refer to performing an audit of the registrant's annual financial statements or services that are normally provided by the accountant in connection with statutory and regulatory filings or engagements for the past fiscal year. “Audit-related services” refer to the assurance and related services by the principal accountant that are reasonably related to the performance of the audit. “Tax services” refer to professional services rendered by the principal accountant for tax compliance, tax advice, and tax planning, including reviewing the Fund’s tax returns and distribution calculations. The following table details the aggregate fees billed or expected to be billed for each of the last two fiscal periods for audit fees, audit-related fees, tax fees and other fees by the principal accountant.
| | FYE 12/31/2015 | FYE 12/31/2014 |
| Audit Fees | $58,500 | $56,500 |
| Audit-Related Fees | $0 | $0 |
| Tax Fees | $7,100 | $6,900 |
| All Other Fees | $0 | $0 |
| | | |
The audit committee has adopted pre-approval policies and procedures that require the audit committee to pre‑approve all audit and non‑audit services that exceed $5,000 for the registrant. All of the principal accountant’s hours spent on auditing the registrant’s financial statements were attributed to work performed by full‑time permanent employees of the principal accountant.
The audit committee noted that as indicated in the table below, for the registrant’s prior two fiscal periods, no fees were billed by the registrant’s independent public accountants in connection with non-audit services rendered to the registrant’s investment adviser, and any entity controlling, controlled by, or under common control with the investment adviser that provides ongoing services to the registrant.
| Non-Audit Related Fees | FYE 12/31/2015 | FYE 12/31/2014 |
| Registrant | $0 | $0 |
| Registrant’s Investment Adviser | $0 | $0 |
Item 5. Audit Committee of Listed Registrants.
Not applicable to open-end investment companies.
Item 6. Schedule of Investments.
Schedule of Investments is included as part of the report to shareholders filed under Item 1 of this Form.
Item 7. Disclosure of Proxy Voting Policies and Procedures for Closed-End Management Investment Companies.
Not applicable to open-end investment companies.
Item 8. Portfolio Managers of Closed-End Management Investment Companies.
Not applicable to open-end investment companies.
Item 9. Purchases of Equity Securities by Closed‑End Management Investment Company and Affiliated Purchases.
Not applicable to open-end investment companies.
Item 10. Submission of Matters to a Vote of Security Holders.
Not Applicable.
Item 11. Controls and Procedures.
| (a) | The Registrant’s President and Treasurer have reviewed the Registrant's disclosure controls and procedures (as defined in Rule 30a-3(c) under the Investment Company Act of 1940 (the “Act”)) as of a date within 90 days of the filing of this report, as required by Rule 30a-3(b) under the Act and Rules 13a-15(b) or 15d‑15(b) under the Securities Exchange Act of 1934. Based on their review, such officers have concluded that the disclosure controls and procedures are effective in ensuring that information required to be disclosed in this report is appropriately recorded, processed, summarized and reported and made known to them by others within the Registrant and by the Registrant’s service provider. |
| (b) | There were no significant changes in the Registrant's internal control over financial reporting (as defined in Rule 30a-3(d) under the Act) that occurred during the second fiscal quarter of the period covered by this report that has materially affected, or is reasonably likely to materially affect, the Registrant's internal control over financial reporting. |
Item 12. Exhibits.
| (a) | (1) Any code of ethics or amendment thereto, that is subject of the disclosure required by Item 2, to the extent that the registrant intends to satisfy Item 2 requirements through filing an exhibit. Filed herewith |
(2) Certifications pursuant to Section 302 of the Sarbanes-Oxley Act of 2002. Filed herewith.
(3) Any written solicitation to purchase securities under Rule 23c‑1 under the Act sent or given during the period covered by the report by or on behalf of the registrant to 10 or more persons. Not applicable to open-end investment companies.
| (b) | Certification pursuant to Section 906 of the Sarbanes‑Oxley Act of 2002. Furnished herewith. |
SIGNATURES
Pursuant to the requirements of the Securities Exchange Act of 1934 and the Investment Company Act of 1940, the registrant has duly caused this report to be signed on its behalf by the undersigned, thereunto duly authorized.
(Registrant) Prospector Funds, Inc.
By (Signature and Title)* /s/John D. Gillespie
John D. Gillespie, President
Date March 4, 2016
Pursuant to the requirements of the Securities Exchange Act of 1934 and the Investment Company Act of 1940, this report has been signed below by the following persons on behalf of the registrant and in the capacities and on the dates indicated.
By (Signature and Title)* /s/John D. Gillespie
John D. Gillespie, President
Date March 4, 2016
By (Signature and Title)* /s/Peter N. Perugini, Jr.
Peter N. Perugini, Jr., Treasurer
Date March 4, 2016
* Print the name and title of each signing officer under his or her signature.