Prospector Capital Appreciation Fund
Prospector Opportunity Fund
Annual Report
| www.prospectorfunds.com | December 31, 2018 |
January 28, 2019
Dear Shareholders of the Prospector Capital Appreciation Fund and Prospector Opportunity Fund,
What a difference a year can make . . .
A year ago the stock market outlook was rather sanguine, which is not surprising after the S&P 500 posted a strong 21.82% gain for 2017. The consensus was for the record-setting bull market to continue notching gains on the heels of healthy economic growth, strong corporate earnings, a prolongation of the low interest rate environment relative to history, and the continuation of near-pristine credit quality. Looking back, these were “glass half full” conditions. The dramatic price appreciation of Bitcoin and related cryptocurrencies at the end of 2017 accurately reflected the market sentiment at the time.
Fast forward twelve months and conditions are different. The stock market bulls are quiet and a tone of elevated caution has taken hold of the market (not to mention that the Bitcoin bubble has ‘popped’ and sold off 80%). You might recall that in our last communication, we outlined our case for a flattening yield curve going forward and the possibility of an inversion in the not so distant future. In the latter part of 2018, we did see a brief inversion in certain portions of the curve and the 10-year / 2-year treasury rate spread ended the year at a meager 21 basis points (the spread started the year at 54 basis points). In our view the bond market has historically been a more reliable predictor of the future than the stock market. As such, concern about a recession appearing sometime in the next 18 months has increased markedly.
It’s easy to arrive at a more guarded outlook on the market when one considers these factors: the negative impact from tariffs, deteriorating trade relations with China, a possible slowdown in global economic growth, concerns over peak margins, worries over future credit quality, a weakening Chinese economy, the uncertainty surrounding Brexit, a Fed perceived as not dovish enough, and concerns over the health of the housing sector. Yikes! In December 2018, we did briefly breach the 20% sell off threshold in several market benchmarks which most often technically defines a bear market. Revered ex-Fed Chairman Alan Greenspan declared the bull market over and that investors should prepare for the worst (though to our benefit his track record on these predictions is rather poor).
All this said, we are not sounding the recession horn just yet, nor are we necessarily expecting bear market conditions to persist for the full year 2019. Actually, we remain cautiously optimistic on the year ahead (the reasons why are reflected in the ‘Outlook’ section of this letter). However, we strive to position your portfolio in a way to capture upside potential in the market while managing risk through careful security selection should a bear market scenario come to pass. In fact, should we be entering a period of market turmoil, this is a time where we believe the Prospector Partners approach to investing will demonstrate value.
Ten Year anniversary of Financial Crisis: Lessons Learned
On September 15th of 2008, a bit over a decade ago, Lehman Brothers collapsed and failed. This watershed event precipitated the worst of the global financial crisis. One day later, AIG was rescued from a similar fate by a Fed bailout. In short order, the equity markets fell by 40%, credit spreads gapped wider, correlations between risk assets spiked, liquidity dried up, and worry (fear) gripped the minds of the financially aware. It was the most difficult performance year for Prospector in our 21-year history. The tiniest of silver linings was that this traumatic experience generated important go forward lessons for your team at Prospector.
As we crossed the ten-year anniversary, we couldn’t help but notice a couple of parallels between 2008 and 2018, such as the late summer all-time high price levels for the U.S. stock market and a long in the tooth economic cycle.
These parallels, and the subsequent fourth quarter correction, compelled us to revisit and restate some of the critical lessons we learned or relearned in 2008.
Excess leverage can be the root cause of permanent financial loss.
It isn’t only the amount of financial leverage that’s a concern, but the borrowings’ characteristics or terms matter as well. There are no guarantees that debt refinancing will be available at all or on decent terms. For example, long term debentures are far superior to covenant-laden bank loans. At Prospector, we believe our intense focus on balance sheet strength and free cash flow generating businesses can potentially protect us from permanent losses as a result of excess debt.
Never underestimate the value of liquidity.
A liquid investment offers key advantages such as the ability to sell it if a better idea comes to your attention or add to the idea if your timing was early (the averaging down process). Within the portfolio, we strive to maintain good liquidity on each position with a general guideline of owning less than a day’s trading volume. This way we feel comfortable that we can buy or sell a position within a week at 20% of the daily volume. To the extent we own illiquid investments in the future, their weighting in the overall portfolio would certainly be modest.
Always maintain a “margin of safety”.
There are no perfect analyses. “Stuff” happens. No matter how comprehensive and diligent we strive to be as analysts, unforeseen events eventually transpire that lead to uncontemplated outcomes. We strive to anticipate all permutations and leave what we see as a “margin of safety” at the portfolio level by managing position sizes, sector concentrations, currency exposures, etc. We never over bet our hand with respect to a single fundamental driver of performance. A corollary lesson is that new financial products created by Wall Street are often risky and, although back tested plenty, haven’t been stress tested sufficiently. Caveat emptor.
The imperfection of risk versus reward.
Prospector’s favorite all time investments actually combine low risk and high reward. These investments are rarely available, but can abound during the depths of a crisis. Two things are critical at that point. First, you must be able to recognize them for what they are. This is where a disciplined approach around security analysis and valuation such as free cash flow and private market value helps a lot. Second, you must have the dry powder to actually buy them.
In crisis, start buying on the way down.
You often have to start buying on the descent in a crisis because that is where the lion’s share of the volume will trade. Once sentiment changes, there are often very few shares for sale at the same deeply discounted prices where there was abundant supply on the way down.
Keep your cash reserves safe and liquid.
Don’t succumb to temptation during good times and reach for incremental yield with your dry powder cash. The only broad asset category that maintained value and liquidity during the 2008 crisis was U.S. Treasury securities. Plenty of over-trusting folks discovered less than creditworthy sub-prime notes in their money market funds, a couple of which “broke the buck” of a $1 NAV.
Rating agencies and regulators may be unreliable.
Don’t trust them. Governments are the ultimate short-term thinkers, always willing to kick the can down the road. This is driven by reelection cycles. Interestingly, one could make the case that the epicenter of the 2008 crisis, the sub-prime housing market, was created and cultivated by poor government policies imposed over the prior 15 years.
This reminds us that the new financial regulatory framework of Dodd Frank and Basel, crafted in the aftermath of the crisis with the intention of lowering risk in the banking sector, remains largely untested.
There is nothing as expensive as a cheery consensus.
It feels reassuring and comfortable at family gatherings and cocktail parties to own popular positions where most agree that the business is outstanding and the management is superior. However, price is a critical component of risk. It is critical to combat complacency and cycle out of winning positions that have become risky by virtue of their higher valuations. During a crisis, premium valuations could melt away without any company-specific catalyst as the market resets.
Bank Sector Update
In 2018, the market had disdain for financial services stocks in general. While the Opportunity Fund has a heavier weighting towards banks, both Funds were impacted. Within the financial services sector, bank stocks were the weakest sub group by far. S&P 500 banks finished the year down 16.44% while the S&P financials index finished down 13.04%. Additionally, within the Russell 2000, the bank sector fell 15.50% while the overall Russell 2000 Financial group retreated by 10.93%. There were a few key reasons for this and all of which are perceived as potential headwinds for the sector going into 2019.
First off, while rate hikes are traditionally a good thing for banks (and we saw four in 2018), they were certainly not viewed as such last year. Typically, a rate hike allows banks to reprice loans in the short term and lag on deposit rates over the long term, thus capturing a higher net interest margin spread between what it receives on interest from loans versus what it pays out as interest to deposit holders. However, this year, banks experienced a meaningful ramp in deposit costs as both corporate and retail customers demanded higher deposit rates and refused to sit idle and accept a low rate relative to Fed Funds. As a result, banks have ‘given up’ a greater portion of the benefit from higher rates in the form of paying higher deposit rates to customers which has constrained earnings growth. These deposit pricing pressures remain a constant topic of focus with investors.
Additional rate hikes have also put pressure on the yield curve which flattened over the course of the year. In short, this puts more pressure on the net interest margin of banks which is another headwind to earnings. Recall that banks typically borrow on the short end of the curve and loan out at the long end, making a steeper curve preferable. Also, with an inversion realized in parts of the curve in December, some investors viewed this as a canary in a coal mine, i.e. a warning sign that a recession is just around the corner. For banks, a recession squeezes profits as credit quality deteriorates and loans turn sour. If this all seems bad enough, loan growth disappointed investors’ expectations in 2018. Despite some encouraging data that loan growth is rebounding, investors are still concerned that deteriorating U.S.-China trade relations, global political uncertainty, recession fears, and slowing economic growth will temper loan growth expectations.
While the consensus outlook for the bank sector seems dire, we believe these fears are heavily discounted in current bank stock valuations. First off, while deposit costs have accelerated, there is still room for net interest margins to expand further albeit at a more modest pace. Second, even though a few portions of the yield curve have inverted,
this data point alone is not nearly enough evidence to support the argument that a recession is imminent and that credit quality will soon turn adversely. Despite all the talk about a recession, credit quality in the U.S. remains strong and bank management teams enter this period of uncertainty with much more fortified balance sheets than prior to the last downturn a decade ago. Finally, banks still have multiple tailwinds in place in the form of an improved regulatory environment, a strong domestic economic backdrop, the potential for higher capital return, and an improving loan growth outlook per recent Fed data. In our view, the market has essentially priced in much of the downside risk and is largely ignoring the positive tailwinds. As a result, we still see plenty of high-quality opportunities in the sector that also exhibit ‘defensive’ attributes should credit turn and / or deposit costs rip higher. We detail several of these opportunities in the Fund sections below.
New Position – Leidos
Leidos Holdings, Inc. (LDOS) was the largest purchase in both Funds during the second half of the year. Established in 1969, Leidos is the largest pure-play defense-services company with more than $10 billion in revenue. It has strong capability in cyber, cloud migration, IT services for defense and intelligence, healthcare, and logistics. We view the defense services sector as attractive due it its strong cash flow characteristics, and steady, recession-resistant business model. The sector has recovered from several years of decline following the drawdowns in Iraq and Afghanistan. Leidos became the largest peer after acquiring a major asset from Lockheed Martin in 2016.
We find Leidos particularly appealing. First, Leidos has a solid balance sheet with 3.3x net debt / free cash flow, which is similar to its defense services peers. Second, it has the strongest free cash flow yield in the group at 7.1%. Third, as the largest player with the broadest set of skills, we believe Leidos is less likely to conduct risky acquisitions going forward which is important since the industry may further consolidate. Fourth, management proved their operational abilities over the past few years by successfully achieving cash generation per dollar of sales to a peer-leading 10%. Finally, with their leading cost structure, they are in good stead to compete for future business.
The latter part of the year was bumpy for defense, as it was for many sectors. Surprises from Washington were mostly to blame. In October, the President spoke about cutting the defense budget 2% in FY20, only to reverse course in December and sign onto plans for growth in FY20. Later in December came the partial government shutdown. Fortunately, the Department of Defense and some other agencies were fully funded already. Analysts are estimating about 10% of the defense services sector sales are impacted. Nonetheless, the sector has seen shutdowns before and can navigate. This will pass, and lost sales are often recoverable. Ultimately, we believe defense spending is dictated by the threat environment. The threat levels are growing, not shrinking. Despite occasional noise from individual politicians, we believe there is broad bipartisan support for defense. Furthermore, as IT and other needs become more complex, we believe there remains a trend towards more outsourcing by government, which should benefit Leidos.
Prospector Opportunity Fund Highlights
The Prospector Opportunity Fund declined 4.38% for the full year of 2018. This result compared to the 11.01% fall in the Russell 2000 Index and the 9.06% dip in the Russell Midcap Index. Once again, growth stocks outperformed value stocks within the Russell 2000 and the Russell Midcap universes, both for the second half and full year of 2018. Even though we are disappointed to register a loss for the calendar year, we are satisfied to have outperformed meaningfully during the difficult market conditions that we experienced in the later stages of the year.
Healthcare stocks delivered the best sector performance with Merck, Haemonetics, and Medtronic as the standouts. Technology companies were the other significant positive contributors fueled by strong gains at Microsoft, Verisign (which was sold during the second half of the year) and Xilinx. On the flip side, we suffered declines in cyclical groups such as financial stocks, our largest overweight, as well as the energy, material, industrial, and consumer discretionary sectors. Importantly, our stock picks outperformed their index components in four out of these five weak sectors.
As mentioned earlier, banks stocks underperformed during 2018. Given this backdrop, we took advantage of several perceived opportunities in the sector. During the second half of the year, we added to the portfolio’s position in Comerica Incorporated (CMA). Comerica is one of the nation’s most revered commercial banks with $71 billion in assets and with operations in California, Michigan, Texas, Arizona, and Florida. One of the primary reasons why we are attracted to Comerica is due to its high quality deposit base. Fully 52% of Comerica’s deposit base is in the form of noninterest bearing transaction / checking accounts, while only 4% of their deposit base is in the form of high-cost CDs. As a result, Comerica has less deposit pricing pressures than many of its peers as the bank effectively pays nothing on the majority of its deposit base. Another reason why we are drawn to the stock is due to its large tangible common equity capital buffer of 10.1% which is materially above peers. This provides a greater capital cushion against credit losses should we enter a recessionary environment. Should a recession not occur, Comerica can use the excess capital to grow organically and return the capital to shareholders via share repurchases and dividends. Either way, both avenues would help improve upon the bank’s already impressive 16.3% ROE. Finally, we view Comerica as an attractive acquisition candidate given its strong deposit franchise and excess capital base. The best part is that the stock trades at a discount valuation at 1.6x tangible book value, 9x 2019E EPS and at an 8% core deposit premium post the selloff in the bank sector.
We also added to your portfolio’s holdings in PCSB Financial Corporation (PCSB). PCSB Financial (formerly Putnam County Savings Bank) is a community bank with $1.5 billion in assets that operates in the Greater New York City Area. While PCSB Financial has a robust history dating back to 1871, the bank recently went public in April of 2017. We like that they should experience lower deposit pricing pressures. First, the bank has a very low loan / deposit ratio of 79% compared to peers in their market who are often at 100%+. This implies that PCSB Financial has ample runway to fund loan growth going forward. Meanwhile, competitors who are at the upper spectrum on the loan / deposit ratio must rely on higher cost borrowings from the Fed or must raise deposit rates in order to fund loan growth (all options which constrain earnings growth).
Additionally, PCSB Financial also has a very high capital base (19.3% of tangible common equity / tangible assets to be exact), which can be used to fund growth as an alternative to paying up for new deposits. The excess capital base has other added benefits. One is that it provides a greater capital cushion against credit losses should we enter a recessionary environment. Absent that, PCSB Financial can use their excess capital to grow organically and drive EPS growth. Further, the bank can utilize the excess capital for shareholder return in the form of share repurchases – especially if the stock is deemed undervalued or if attractive loan growth opportunities are not available. Finally, we view PCSB Financial as an attractive acquisition candidate given its strong geographic footprint in affluent markets and overfunded balance sheet. The stock trades at an attractive valuation at 125% of tangible book value and a 4% deposit premium.
While the consensus outlook for the bank sector remains bearish going into 2019, we remain confident in our outlook for your bank portfolio given our stock selection process.
Prospector Capital Appreciation Fund Highlights
The Prospector Capital Appreciation Fund declined 3.07% for the full year 2018. This result compared to the S&P 500’s decline of 4.38%. While we are never happy with a down year, when we consider that despite the market’s late-year swoon, growth-oriented stocks continued to significantly outperform in 2018, with the technology sector once again being a market leader, we are satisfied our strategy was borne out.
Despite the negative backdrop of a stock market selloff and widening high yield bond spreads, your convertible security positions had a modest positive benefit during the year. Significant gains in Shutterfly and Chart Industries converts helped here. Looking at sector-specific performance, healthcare names were your portfolio’s top gainers during 2018, with Abbott Labs, Merck and AstraZeneca all significant positive contributors. The Capital Appreciation Fund was also aided by positive contributions from consumer cyclicals (Shutterfly converts being the top gainer here) as well as communications services (specifically, Telephone and Data Systems). The largest decliners during the period were materials and energy-exposed names, as oil’s dramatic selloff hit energy names hard, and top-10 position Domtar faded late in the year, accounting for the bulk of the weakness in materials. The Fund’s largest sector, financial services, saw only modest declines during the year, significantly outperforming the S&P 500 financials, which saw double-digit percentage declines in 2018. Within financials, our insurance holdings aided performance, with Validus, which was acquired at a significant premium early in the year, the top contributor.
Given the market’s aforementioned distaste for banks in 2018, we saw an opportunity to either initiate or add to positions in several lenders during the year. These banks share similar qualities of being over-capitalized, attractively valued and, in our view, are prime acquisition candidates. Included amongst these purchases were: Comerica (detailed in the Opportunity Fund section above), two New Jersey banks (Kearny Financial, and long-time POPFX portfolio holding, Oritani Financial), Georgia-based SunTrust, as well as New York’s Dime Community Bancshares. While your Capital Appreciation portfolio’s overall bank weighting remains relatively modest, we feel we were able to take advantage of the negative environment to increase exposure to lenders that offer the potential for upside in the event of an acquisition.
The largest portfolio movement during the period was the sale of our entire Hartford Financial Services (HIG) position, formerly a top five holding. Despite earning an over twenty percent gain during our holding period, this is a disappointing outcome. You may recall from our June, 2016 letter, we viewed HIG as a collection of solid insurance businesses, selling at an attractive valuation, and also a takeout candidate. Since our purchase, management had been executing well, and the market was beginning to re-rate the stock. However, circumstances changed materially in August when HIG entered into an agreement to purchase fellow property-casualty insurer Navigators Group for $2.1 billion. HIG diluted their book value significantly, and added a substantial amount of leverage by doing the deal – making the stock much less attractive in our view and also creating an effective “poison pill” for potential suitors. While we weren’t happy to immediately liquidate a large position, the material change to our thesis necessitated the sale.
Outlook
After a ten-year post-financial crisis period of consistent underlying conditions for equity investing, fundamentals are shifting. Tightening monetary conditions and slowing economic growth overseas have given U.S. investors pause and led to a rerating of risk assets, e.g. a compression of stock market multiples and spread widening for all types of borrowers. Regardless, the U.S. economy remains fundamentally healthy and continues to be a global leader.
Interest and mortgage rates continue near historically low levels, having retraced by 50 basis points from the November highs as inflation remains benign and economic growth moderated slightly. Although we are clearly late in the economic cycle, the odds of a 2019 recession without a full-blown trade war seem modest.
Investment-grade corporations have solid balance sheets and are currently producing acceptable free cash flows. We are carefully monitoring aggregate corporate debt levels (especially the BBB- debt which is a single notch above junk status), which now sit above pre-2008 crisis levels. The 2018 corporate tax cuts and the ability to repatriate foreign cash holdings should continue to drive higher employment, M&A activity, and capital returns including buybacks and dividends. Profit margins remain near all-time high levels, currently 11%, and look to be at some risk from higher wages, interest expense, and input costs.
In our estimation, equity valuations have moderated from extremely elevated levels. We have moved to the seventh decile from the tenth decile over the past year on trailing operating earnings. As a result, equities look most reasonable when comparing earnings yields to Treasury or even corporate bond yields. In any case, we believe the values inherent in your portfolio should attract acquirers and other investors over time. Meanwhile, we believe equities are a superior asset allocation alternative to bonds over the longer term.
Thank you for entrusting us with your money.
Respectfully submitted,
| John D. Gillespie | Kevin R. O’Brien | Jason A. Kish |
Performance data quoted represents past performance; past performance does not guarantee future results.
Opinions expressed are those of the Funds and are subject to change, are not guaranteed, and should not be considered a recommendation to buy or sell any security.
Mutual fund investing involves risk. Principal loss is possible. Investments in debt securities typically decrease in value when interest rates rise. This risk is usually greater for longer-term debt securities. The Funds invest in foreign securities which involve greater volatility and political, economic and currency risks and differences in accounting methods. The Funds invest in smaller and mid-cap companies, which involve additional risks such as limited liquidity and greater volatility. The Funds may hold restricted securities purchased through private placements. Such securities can be difficult to sell without experiencing delays or additional costs. Derivatives involve risks different from, and in certain cases, greater than the risks presented by more traditional investments. These risks are fully disclosed in the prospectus.
The S&P 500 Index is a broad based unmanaged index of 500 stocks, which is widely recognized as representative of the equity market in general. You cannot invest directly in an index.
The Russell 2000 Index is an unmanaged small-cap index that measures the performance of the 2,000 smallest companies in the Russell 3000 Index. You cannot invest directly in an index.
The Russell MidCap Index is an unmanaged mid-cap index that measures the performance of the 800 smallest companies in the Russell 1000 Index. You cannot invest directly in an index.
The Russell 2000 Bank Index is comprised of the smallest banks, savings, thrift and lending companies in the Russell 3000 Index.
The Russell 2000 Financials Index is comprised of the smallest financial services companies in the Russell 3000 Index.The S&P 500 Financials Index is the S&P 500 financials sector GICS level 1 index.
The S&P Bank Index is the S&P 500 banks industry group GICS level 2 index.
Basis point is a unit that is equal to 1/100th of 1% and is used to denote the change in a financial instrument.
Free cash flow is revenue less operating expenses including interest expenses and maintenance capital spending. It is the discretionary cash that a company has after all expenses and is available for purposes such as dividend payments, investing back into the business or share repurchases.
Tangible Book value is the total net asset value of a company’s assets that shareholders would theoretically receive if a company were liquidated less intangible assets and goodwill.
Tangible common equity / tangible assets include common equity less goodwill and other intangible assets over tangible assets. Tangible assets include a company’s total assets less goodwill and other intangible assets.
Fund holdings and/or security allocations are subject to change at any time and are not recommendations to buy or sell any security. Please see the Schedule of Investments section in this report for a full listing of the Fund’s holdings.
Prospector Funds, Inc. are distributed by Quasar Distributors, LLC.
Capital Appreciation Fund
The chart assumes an initial investment of $10,000. Performance reflects waivers of fee and operating expenses in effect. In the absence of such waivers, total return would be reduced. Past performance is not predictive of future performance. Investment return and principal value will fluctuate, so that your shares, when redeemed, may be worth more or less than their original cost. Performance assumes the reinvestment of capital gains and income distributions. The performance does not reflect the deduction of taxes that a shareholder would pay on Fund distributions or the redemption of Fund shares.
Average Annual Rates of Return (%) – As of December 31, 2018
| | One Year | Three Year | Five Year | Ten Year | Since Inception(1) |
| Capital Appreciation Fund | -3.07% | 7.38% | 4.69% | 8.85% | 4.87% |
S&P 500 Index(2) | -4.38% | 9.26% | 8.49% | 13.12% | 6.73% |
| (1) | September 28, 2007 |
| (2) | The Standard & Poor’s 500 Index (S&P 500) is an unmanaged, capitalization-weighted index generally representative of the U.S. market for large capitalization stocks. This Index cannot be invested in directly. |
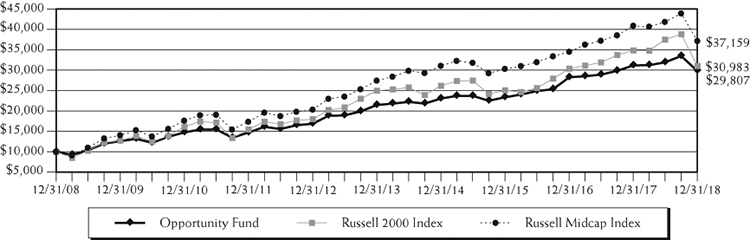
Opportunity Fund
The chart assumes an initial investment of $10,000. Performance reflects waivers of fee and operating expenses in effect. In the absence of such waivers, total return would be reduced. Past performance is not predictive of future performance. Investment return and principal value will fluctuate, so that your shares, when redeemed, may be worth more or less than their original cost. Performance assumes the reinvestment of capital gains and income distributions. The performance does not reflect the deduction of taxes that a shareholder would pay on Fund distributions or the redemption of Fund shares.
Average Annual Rates of Return (%) – As of December 31, 2018
| | One Year | Three Year | Five Year | Ten Year | Since Inception(1) |
| Opportunity Fund | -4.38% | 8.48% | 6.79% | 11.54% | 8.14% |
Russell 2000 Index(2) | -11.01% | 7.36% | 4.41% | 11.97% | 6.05% |
Russell Midcap Index(3) | -9.06% | 7.04% | 6.26% | 14.03% | 6.78% |
| (1) | September 28, 2007 |
| (2) | An unmanaged small-cap index that measures the performance of the 2,000 smallest companies in the Russell 3000 Index. This index cannot be invested in directly. |
| (3) | An unmanaged mid-cap index that measures the performance of the 800 smallest companies in the Russell 1000 Index. This index cannot be invested in directly. |
Expense Example (Unaudited)
December 31, 2018
As a shareholder of the Fund, you incur two types of costs: (1) transaction costs, which may include but are not limited to, redemption fees, wire transfer fees, maintenance fee (IRA accounts), and exchange fees; and (2) ongoing costs, including management fees; distribution and/or service fees; and other Fund expenses. This Example is intended to help you understand your ongoing costs (in dollars) of investing in the Fund and to compare these costs with the ongoing costs of investing in other mutual funds. The Example is based on an investment of $1,000 invested at the beginning of the period and held for the entire period (July 1, 2018 – December 31, 2018).
ACTUAL EXPENSES
The first line of the table below provides information about actual account values and actual expenses. Although the Fund charges no sales load or transaction fees, you will be assessed fees for outgoing wire transfers, returned checks and stop payment orders at prevailing rates charged by U.S. Bancorp Fund Services, LLC, the Fund’s transfer agent. The example below includes, but is not limited to, management fees, shareholder servicing fees and other Fund expenses. However, the example below does not include portfolio trading commissions and related expenses, interest expense and other extraordinary expenses as determined under generally accepted accounting principles. You may use the information in this line, together with the amount you invested, to estimate the expenses that you paid over the period. Simply divide your account value by $1,000 (for example, an $8,600 account value divided by $1,000 = 8.6), then multiply the result by the number in the first line under the heading entitled “Expenses Paid During Period” to estimate the expenses you paid on your account during this period.
HYPOTHETICAL EXAMPLE FOR COMPARISON PURPOSES
The second line of the table below provides information about hypothetical account values and hypothetical expenses based on the Fund’s actual expense ratio and an assumed rate of return of 5% per year before expenses, which is not the Fund’s actual return. The hypothetical account values and expenses may not be used to estimate the actual ending account balance or expenses you paid for the period. You may use this information to compare the ongoing costs of investing in the Fund and other funds. To do so, compare this 5% hypothetical example with the 5% hypothetical examples that appear in the shareholder reports of the other funds.
Please note that the expenses shown in the table are meant to highlight your ongoing costs only and do not reflect any transactional costs, such as redemption fees or exchange fees. Therefore, the second line of the table is useful in comparing ongoing costs only, and will not help you determine the relative total costs of owning different funds. In addition, if these transactional costs were included, your costs would have been higher.
| | | | Expenses Paid |
| | Beginning Account | Ending Account | During Period(1) |
| | Value (07/01/18) | Value (12/31/18) | (07/01/18 to 12/31/18) |
Capital Appreciation Actual(2) | $1,000.00 | $ 954.10 | $6.40 |
| Capital Appreciation Hypothetical | | | |
| (5% return before expenses) | 1,000.00 | 1,018.65 | 6.61 |
| | | | |
Opportunity Actual(2) | 1,000.00 | 933.80 | 6.34 |
| Opportunity Hypothetical | | | |
| (5% return before expenses) | 1,000.00 | 1,018.65 | 6.61 |
| (1) | Expenses are equal to the Fund’s annualized expense ratio for the most recent six-month period of 1.30% and 1.30% for Capital Appreciation Fund and Opportunity Fund, respectively, multiplied by the average account value over the period, multiplied by 184/365 to reflect the one-half year period. |
| (2) | Based on the actual returns for the six-month period ended December 31, 2018 of -4.59% and -6.62% for Capital Appreciation Fund and Opportunity Fund, respectively. |
Sector Allocation (% of net assets) (Unaudited)
as of December 31, 2018(1)(2)
Capital Appreciation Fund
Top 10 Holdings (% of net assets) (Unaudited)
as of December 31, 2018(1)(3)
Capital Appreciation Fund
| | RenaissanceRe Holdings | 3.5% | |
| | Brown & Brown | 3.4% | |
| | Forestar Group, 3.750%, 03/01/2020 | 3.2% | |
| | Abbott Laboratories | 3.2% | |
| | Verint Systems, 1.500%, 06/01/2021 | 3.1% | |
| | Coca-Cola | 2.7% | |
| | Berkshire Hathaway, Class B | 2.6% | |
| | Chart Industries, 1.000%, 11/15/2024 | 2.5% | |
| | Merck & Co. | 2.5% | |
| | Liberty Media, 2.125%, 03/31/2048 | 2.4% | |
| | (1) | Fund holdings and sector allocations are subject to change at any time and are not recommendations to buy or sell any security. | |
| | (2) | Sector allocation includes all investment types. | |
| | (3) | Invesco Treasury Portfolio excluded from top 10 holdings. | |
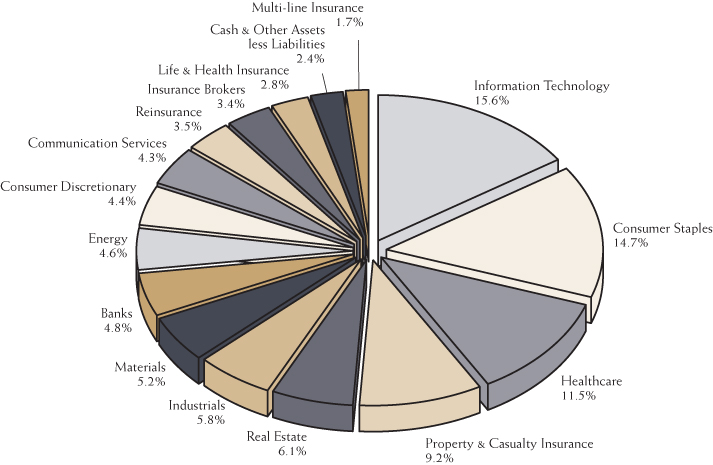
Sector Allocation (% of net assets) (Unaudited)
as of December 31, 2018(1)(2)
Opportunity Fund
Top 10 Holdings (% of net assets) (Unaudited)
as of December 31, 2018(1)(3)
Opportunity Fund
| | Brown & Brown | 4.5% | |
| | RenaissanceRe Holdings | 3.7% | |
| | Federated Investors, Class B | 2.9% | |
| | Torchmark | 2.5% | |
| | Mercury General | 2.3% | |
| | Kearny Financial | 2.3% | |
| | White Mountains Insurance Group | 2.2% | |
| | Mondelez International, Class A | 2.1% | |
| | Newmont Mining | 2.1% | |
| | Cincinnati Financial | 2.0% | |
| | (1) | Fund holdings and sector allocations are subject to change at any time and are not recommendations to buy or sell any security. | |
| | (2) | Sector allocation includes all investment types. | |
| | (3) | Invesco Treasury Portfolio excluded from top 10 holdings. | |
Schedule of Investments
December 31, 2018
Capital Appreciation Fund
Description | | Shares | | | Value | |
| COMMON STOCKS – 76.6% | | | | | | |
| | | | | | | |
| Banks – 4.8% | | | | | | |
| Comerica | | | 3,700 | | | $ | 254,153 | |
| Dime Community Bancshares | | | 16,600 | | | | 281,868 | |
| Kearny Financial | | | 19,700 | | | | 252,554 | |
| Oritani Financial | | | 12,500 | | | | 184,375 | |
| SunTrust Banks | | | 4,800 | | | | 242,112 | |
| | | | | | | | 1,215,062 | |
| Communication Services – 2.3% | | | | | | | | |
| Telephone & Data Systems | | | 17,875 | | | | 581,652 | |
| | | | | | | | | |
| Consumer Discretionary – 2.0% | | | | | | | | |
| Lowe’s Companies | | | 5,500 | | | | 507,980 | |
| | | | | | | | | |
| Consumer Staples – 13.7% | | | | | | | | |
| Campbell Soup | | | 7,900 | | | | 260,621 | |
| Coca-Cola | | | 14,225 | | | | 673,554 | |
| Colgate-Palmolive | | | 8,400 | | | | 499,968 | |
| Mondelez International, Class A | | | 14,050 | | | | 562,421 | |
| Nestle | | | 7,000 | | | | 568,318 | |
| Tootsie Roll Industries | | | 16,107 | | | | 537,974 | |
| Walgreens Boots Alliance | | | 5,150 | | | | 351,900 | |
| | | | | | | | 3,454,756 | |
| Energy – 4.6% | | | | | | | | |
| Exxon Mobil | | | 2,800 | | | | 190,932 | |
| Hess | | | 12,900 | | | | 522,450 | |
| Suncor Energy | | | 15,600 | | | | 436,332 | |
| | | | | | | | 1,149,714 | |
| Healthcare – 10.1% | | | | | | | | |
| Abbott Laboratories | | | 11,000 | | | | 795,630 | |
| AstraZeneca – ADR | | | 14,000 | | | | 531,720 | |
| Johnson & Johnson | | | 4,575 | | | | 590,404 | |
| Merck & Co. | | | 8,300 | | | | 634,203 | |
| | | | | | | | 2,551,957 | |
| Industrials – 3.3% | | | | | | | | |
| Eaton | | | 8,150 | | | | 559,579 | |
| Regal Beloit | | | 3,700 | | | | 259,185 | |
| | | | | | | | 818,764 | |
See Notes to the Financial Statements
Schedule of Investments – Continued
December 31, 2018
Capital Appreciation Fund
Description | | Shares | | | Value | |
COMMON STOCKS – 76.6% (Continued) | | | | | | |
| | | | | | | |
| Information Technology – 8.9% | | | | | | |
| FARO Technologies * | | | 5,500 | | | $ | 223,520 | |
| FLIR Systems | | | 12,450 | | | | 542,073 | |
| Leidos Holdings | | | 5,500 | | | | 289,960 | |
| Microsoft | | | 5,050 | | | | 512,928 | |
| Oracle | | | 5,700 | | | | 257,355 | |
| Paychex | | | 3,000 | | | | 195,450 | |
| Science Applications International | | | 3,200 | | | | 203,840 | |
| | | | | | | | 2,225,126 | |
| Insurance Brokers – 3.4% | | | | | | | | |
| Brown & Brown | | | 31,400 | | | | 865,384 | |
| | | | | | | | | |
| Life & Health Insurance – 2.8% | | | | | | | | |
| Aflac | | | 10,400 | | | | 473,824 | |
| Voya Financial | | | 5,700 | | | | 228,798 | |
| | | | | | | | 702,622 | |
| Materials – 3.4% | | | | | | | | |
| Domtar | | | 15,251 | | | | 535,768 | |
| Louisiana-Pacific | | | 14,800 | | | | 328,856 | |
| | | | | | | | 864,624 | |
| Multi-line Insurance – 1.7% | | | | | | | | |
| Loews | | | 9,100 | | | | 414,232 | |
| | | | | | | | | |
| Property & Casualty Insurance – 9.2% | | | | | | | | |
| Axis Capital Holdings | | | 8,200 | | | | 423,448 | |
| Berkshire Hathaway, Class B * | | | 3,250 | | | | 663,585 | |
| First American Financial | | | 7,575 | | | | 338,148 | |
| Hanover Insurance Group | | | 2,700 | | | | 315,279 | |
| Lancashire Holdings | | | 34,700 | | | | 267,583 | |
| Mercury General | | | 6,100 | | | | 315,431 | |
| | | | | | | | 2,323,474 | |
| Real Estate – 2.9% | | | | | | | | |
| Four Corners Property Trust | | | 16,948 | | | | 444,038 | |
| Howard Hughes * | | | 2,950 | | | | 287,979 | |
| | | | | | | | 732,017 | |
| Reinsurance – 3.5% | | | | | | | | |
| RenaissanceRe Holdings | | | 6,589 | | | | 880,949 | |
| Total Common Stocks | | | | | | | | |
| (Cost $16,140,505) | | | | | | | 19,288,313 | |
See Notes to the Financial Statements
Schedule of Investments – Continued
December 31, 2018
Capital Appreciation Fund
Description | | Par | | | Value | |
| CONVERTIBLE BONDS – 16.6% | | | | | | |
| | | | | | | |
| Consumer Discretionary – 2.4% | | | | | | |
| Liberty Media | | | | | | |
| 2.125%, 03/31/2048 (a) | | $ | 636,300 | | | $ | 595,017 | |
| | | | | | | | | |
| Industrials – 2.5% | | | | | | | | |
| Chart Industries | | | | | | | | |
| 1.000%, 11/15/2024 (a) | | | 511,000 | | | | 634,713 | |
| | | | | | | | | |
| Information Technology – 6.7% | | | | | | | | |
| Akamai Technologies | | | | | | | | |
| 0.125%, 05/01/2025 (a) | | | 639,000 | | | | 585,995 | |
| Synaptics | | | | | | | | |
| 0.500%, 06/15/2022 | | | 368,500 | | | | 322,917 | |
| Verint Systems | | | | | | | | |
| 1.500%, 06/01/2021 | | | 810,000 | | | | 783,581 | |
| | | | | | | | 1,692,493 | |
| Materials – 1.8% | | | | | | | | |
| RTI International | | | | | | | | |
| 1.625%, 10/15/2019 | | | 460,000 | | | | 457,700 | |
| | | | | | | | | |
| Real Estate – 3.2% | | | | | | | | |
| Forestar Group | | | | | | | | |
| 3.750%, 03/01/2020 | | | 825,000 | | | | 800,537 | |
| Total Convertible Bonds | | | | | | | | |
| (Cost $4,276,191) | | | | | | | 4,180,460 | |
| | | | | | | | | |
| CORPORATE BONDS – 4.4% | | | | | | | | |
| | | | | | | | | |
| Communication Services – 2.0% | | | | | | | | |
| Verizon Communications | | | | | | | | |
| 3.500%, 11/01/2021 | | | 500,000 | | | | 505,356 | |
| | | | | | | | | |
| Consumer Staples – 1.0% | | | | | | | | |
| CVS Health | | | | | | | | |
| 2.250%, 08/12/2019 | | | 263,000 | | | | 261,711 | |
| | | | | | | | | |
| Healthcare – 1.4% | | | | | | | | |
| Amgen | | | | | | | | |
| 2.200%, 05/22/2019 | | | 350,000 | | | | 348,649 | |
| Total Corporate Bonds | | | | | | | | |
| (Cost $1,117,495) | | | | | | | 1,115,716 | |
See Notes to the Financial Statements
Schedule of Investments – Continued
December 31, 2018
Capital Appreciation Fund
Description | | Shares | | | Value | |
| SHORT-TERM INVESTMENT – 2.4% | | | | | | |
| Invesco Treasury Portfolio, 2.290%^ | | | | | | |
| (Cost $605,737) | | | 605,737 | | | $ | 605,737 | |
| Total Investments – 100.0% | | | | | | | | |
| (Cost $22,139,928) | | | | | | | 25,190,226 | |
| Other Assets and Liabilities, Net – (0.0)% | | | | | | | (10,813 | ) |
| Total Net Assets – 100.0% | | | | | | $ | 25,179,413 | |
| * | | Non-income producing security |
| (a) | | Security purchased within the terms of a private placement memorandum, exempt from registration under Rule 144A of the Securities Act of 1933, as amended, and may be sold only to dealers in that program or other “qualified institutional buyers.” As of December 31, 2018, the value of these investments were $1,815,725 or 7.2% of total net assets. |
| ^ | | The rate shown is the annualized seven-day yield effective as of December 31, 2018. |
ADR – American Depositary Receipt
The industry classifications included in the Schedule of Investments are in accordance with the Global Industry Classification Standard (GICS®). GICS was developed by and/or is the exclusive property of MSCI, Inc. and Standard & Poor Financial Services LLC (S&P). GICS is a service mark of MSCI and S&P and has been licensed for use by U.S. Bank Global Fund Services.
See Notes to the Financial Statements
Schedule of Investments
December 31, 2018
Opportunity Fund
Description | | Shares | | | Value | |
| COMMON STOCKS – 95.4% | | | | | | |
| | | | | | | |
| Banks – 19.1% | | | | | | |
| Bank of N.T. Butterfield & Son | | | 42,000 | | | $ | 1,316,700 | |
| Central Pacific Financial | | | 67,700 | | | | 1,648,495 | |
| Central Valley Community Bancorp | | | 31,200 | | | | 588,744 | |
| Citigroup | | | 13,870 | | | | 722,072 | |
| Comerica | | | 19,100 | | | | 1,311,979 | |
| Dime Community Bancshares | | | 85,700 | | | | 1,455,186 | |
| HomeTrust Bancshares | | | 50,790 | | | | 1,329,682 | |
| Kearny Financial | | | 201,226 | | | | 2,579,717 | |
| KeyCorp | | | 126,600 | | | | 1,871,148 | |
| OceanFirst Financial | | | 30,100 | | | | 677,551 | |
| Oritani Financial | | | 101,850 | | | | 1,502,288 | |
| PCSB Financial | | | 70,800 | | | | 1,384,848 | |
| People’s United Financial | | | 56,925 | | | | 821,428 | |
| PNC Financial Services Group | | | 8,400 | | | | 982,044 | |
| SunTrust Banks | | | 19,300 | | | | 973,492 | |
| Waterstone Financial | | | 78,000 | | | | 1,307,280 | |
| Western New England Bancorp | | | 130,235 | | | | 1,307,559 | |
| | | | | | | | 21,780,213 | |
| Consumer Discretionary – 7.5% | | | | | | | | |
| Darden Restaurants | | | 7,000 | | | | 699,020 | |
| eBay* | | | 54,700 | | | | 1,535,429 | |
| Home Depot | | | 11,900 | | | | 2,044,658 | |
| Hyatt Hotels, Class A | | | 16,600 | | | | 1,122,160 | |
| Noodles & Company* | | | 153,104 | | | | 1,070,197 | |
| Ruth’s Hospitality Group | | | 52,800 | | | | 1,200,144 | |
| William Hill | | | 452,300 | | | | 893,577 | |
| | | | | | | | 8,565,185 | |
| Consumer Staples – 9.7% | | | | | | | | |
| Carlsberg A/S, Class B | | | 6,100 | | | | 648,333 | |
| Church & Dwight | | | 28,400 | | | | 1,867,584 | |
| Colgate-Palmolive | | | 32,000 | | | | 1,904,640 | |
| Mondelez International, Class A | | | 60,800 | | | | 2,433,824 | |
| Nestle | | | 27,400 | | | | 2,224,560 | |
| Tootsie Roll Industries | | | 60,559 | | | | 2,022,670 | |
| | | | | | | | 11,101,611 | |
See Notes to the Financial Statements
Schedule of Investments – Continued
December 31, 2018
Opportunity Fund
Description | | Shares | | | Value | |
COMMON STOCKS – 95.4% (Continued) | | | | | | |
| | | | | | | |
| Diversified Financial Services – 5.4% | | | | | | |
| Federated Investors, Class B | | | 123,500 | | | $ | 3,278,925 | |
| Franklin Resources | | | 38,400 | | | | 1,138,944 | |
| Invesco | | | 48,100 | | | | 805,194 | |
| Jefferies Financial Group | | | 50,500 | | | | 876,680 | |
| | | | | | | | 6,099,743 | |
| Energy – 2.2% | | | | | | | | |
| Hess | | | 35,100 | | | | 1,421,550 | |
| Noble Energy | | | 58,200 | | | | 1,091,832 | |
| | | | | | | | 2,513,382 | |
| Healthcare – 5.2% | | | | | | | | |
| AstraZeneca – ADR | | | 25,400 | | | | 964,692 | |
| Medtronic | | | 14,000 | | | | 1,273,440 | |
| Merck & Co. | | | 30,148 | | | | 2,303,609 | |
| Patterson Companies | | | 73,150 | | | | 1,438,129 | |
| | | | | | | | 5,979,870 | |
| Industrials – 3.8% | | | | | | | | |
| CIRCOR International* | | | 27,300 | | | | 581,490 | |
| Landstar System | | | 13,100 | | | | 1,253,277 | |
| Powell Industries | | | 45,700 | | | | 1,142,957 | |
| Regal Beloit | | | 19,800 | | | | 1,386,990 | |
| | | | | | | | 4,364,714 | |
| Information Technology – 9.2% | | | | | | | | |
| FARO Technologies* | | | 29,600 | | | | 1,202,944 | |
| FLIR Systems | | | 43,100 | | | | 1,876,574 | |
| Leidos Holdings | | | 30,900 | | | | 1,629,048 | |
| Maxim Integrated Products | | | 18,300 | | | | 930,555 | |
| Microsoft | | | 20,800 | | | | 2,112,656 | |
| Paychex | | | 26,000 | | | | 1,693,900 | |
| Xilinx | | | 12,300 | | | | 1,047,591 | |
| | | | | | | | 10,493,268 | |
| Insurance Brokers – 4.5% | | | | | | | | |
| Brown & Brown | | | 187,150 | | | | 5,157,854 | |
See Notes to the Financial Statements
Schedule of Investments – Continued
December 31, 2018
Opportunity Fund
Description | | Shares | | | Value | |
COMMON STOCKS – 95.4% (Continued) | | | | | | |
| | | | | | | |
| Life & Health Insurance – 4.8% | | | | | | |
| Aflac | | | 26,300 | | | $ | 1,198,228 | |
| Primerica | | | 14,900 | | | | 1,455,879 | |
| Torchmark | | | 37,800 | | | | 2,817,234 | |
| | | | | | | | 5,471,341 | |
| Materials – 3.0% | | | | | | | | |
| Domtar | | | 12,300 | | | | 432,099 | |
| Kinross Gold* | | | 97,100 | | | | 314,604 | |
| Newmont Mining | | | 70,200 | | | | 2,432,430 | |
| Victoria Gold* | | | 887,800 | | | | 244,234 | |
| | | | | | | | 3,423,367 | |
| Property & Casualty Insurance – 16.4% | | | | | | | | |
| Axis Capital Holdings | | | 44,700 | | | | 2,308,308 | |
| Cincinnati Financial | | | 29,950 | | | | 2,318,729 | |
| Employers Holdings | | | 48,200 | | | | 2,022,954 | |
| Hanover Insurance Group | | | 17,450 | | | | 2,037,636 | |
| Lancashire Holdings | | | 228,200 | | | | 1,759,725 | |
| Mercury General | | | 51,600 | | | | 2,668,236 | |
| Safety Insurance Group | | | 5,850 | | | | 478,589 | |
| Selective Insurance Group | | | 23,600 | | | | 1,438,184 | |
| United Fire Group | | | 22,700 | | | | 1,258,715 | |
| White Mountains Insurance Group | | | 2,881 | | | | 2,471,005 | |
| | | | | | | | 18,762,081 | |
| Real Estate – 0.9% | | | | | | | | |
| Cousins Properties | | | 130,892 | | | | 1,034,047 | |
| | | | | | | | | |
| Reinsurance – 3.7% | | | | | | | | |
| RenaissanceRe Holdings | | | 31,900 | | | | 4,265,030 | |
| Total Common Stocks | | | | | | | | |
| (Cost $99,138,310) | | | | | | | 109,011,706 | |
| | | | | | | | | |
| | | Par | | | | | |
| CONVERTIBLE BOND – 0.4% | | | | | | | | |
| | | | | | | | | |
| Real Estate – 0.4% | | | | | | | | |
| Forestar Group | | | | | | | | |
| 3.750%, 03/01/2020 | | | | | | | | |
| (Cost $456,370) | | $ | 450,000 | | | | 436,657 | |
See Notes to the Financial Statements
Schedule of Investments – Continued
December 31, 2018
Opportunity Fund
Description | | Shares | | | Value | |
| SHORT-TERM INVESTMENT – 4.8% | | | | | | |
| Invesco Treasury Portfolio, 2.290%^ | | | | | | |
| (Cost $5,496,408) | | | 5,496,408 | | | $ | 5,496,408 | |
| Total Investments – 100.6% | | | | | | | | |
| (Cost $105,091,088) | | | | | | | 114,944,771 | |
| Other Assets and Liabilities, Net – (0.6)% | | | | | | | (693,714 | ) |
| Total Net Assets – 100.0% | | | | | | $ | 114,251,057 | |
| * | Non-income producing security |
| ^ | The rate shown is the annualized seven-day yield effective as of December 31, 2018. |
ADR – American Depositary Receipt
The industry classifications included in the Schedule of Investments are in accordance with the Global Industry Classification Standard (GICS®). GICS was developed by and/or is the exclusive property of MSCI, Inc. and Standard & Poor Financial Services LLC (S&P). GICS is a service mark of MSCI and S&P and has been licensed for use by U.S. Bank Global Fund Services.
See Notes to the Financial Statements
Statements of Assets and Liabilities
December 31, 2018
| | | Capital Appreciation Fund | | | Opportunity Fund | |
| ASSETS: | | | | | | |
| Investments, at market value | | | | | | |
| (Cost of $22,139,928 and $105,091,088, respectively) | | $ | 25,190,226 | | | $ | 114,944,771 | |
| Cash | | | 2,174 | | | | 10,527 | |
| Receivable for dividends and interest | | | 53,036 | | | | 177,386 | |
| Receivable for capital shares sold | | | 22 | | | | 550,947 | |
| Prepaid expenses | | | 9,133 | | | | 18,924 | |
| Total assets | | | 25,254,591 | | | | 115,702,555 | |
| | | | | | | | | |
| LIABILITIES: | | | | | | | | |
| Payable for capital shares redeemed | | | 75 | | | | 937,779 | |
| Payable for investments purchased | | | — | | | | 330,729 | |
| Payable to Adviser, net | | | 6,620 | | | | 73,611 | |
| Payable for administration fees | | | 8,316 | | | | 22,517 | |
| Payable for audit & tax fees | | | 43,503 | | | | 43,503 | |
| Payable for legal fees | | | 1,509 | | | | 7,407 | |
| Accrued distribution fees | | | 1,424 | | | | 9,706 | |
| Accrued expenses and other liabilities | | | 13,731 | | | | 26,246 | |
| Total liabilities | | | 75,178 | | | | 1,451,498 | |
| | | | | | | | | |
| NET ASSETS | | $ | 25,179,413 | | | $ | 114,251,057 | |
| | | | | | | | | |
| COMPOSITION OF NET ASSETS: | | | | | | | | |
| Portfolio capital | | $ | 22,257,573 | | | $ | 104,132,223 | |
| Total distributable earnings | | | 2,921,840 | | | | 10,118,834 | |
| Total net assets | | $ | 25,179,413 | | | $ | 114,251,057 | |
| | | | | | | | | |
CAPITAL STOCK, $0.0001 par value | | | | | | | | |
| Authorized | | | 500,000,000 | | | | 500,000,000 | |
| Issued and outstanding | | | 1,541,272 | | | | 6,185,946 | |
| | | | | | | | | |
| NET ASSET VALUE, REDEMPTION PRICE, | | | | | | | | |
| AND OFFERING PRICE PER SHARE | | $ | 16.34 | | | $ | 18.47 | |
See Notes to the Financial Statements
Statements of Operations
For the Year Ended December 31, 2018
| | | Capital Appreciation Fund | | | Opportunity Fund | |
| INVESTMENT INCOME: | | | | | | |
| Interest income | | $ | 96,414 | | | $ | 174,112 | |
| Dividend income | | | 440,927 | | | | 2,588,753 | |
| Less: Foreign taxes withheld | | | (4,717 | ) | | | (14,636 | ) |
| Total investment income | | | 532,624 | | | | 2,748,229 | |
| | | | | | | | | |
| EXPENSES: | | | | | | | | |
| Investment advisory fees | | | 297,801 | | | | 1,378,443 | |
| Administration fees | | | 53,040 | | | | 136,406 | |
| Audit & tax fees | | | 45,503 | | | | 45,503 | |
| Fund accounting fees | | | 41,515 | | | | 49,197 | |
| Transfer agent fees | | | 24,835 | | | | 48,264 | |
| Registration fees | | | 24,257 | | | | 29,512 | |
| Distribution fees | | | 12,733 | | | | 92,049 | |
| Directors’ fees | | | 11,725 | | | | 50,377 | |
| Legal fees | | | 8,879 | | | | 40,836 | |
| Custodian fees | | | 6,310 | | | | 10,515 | |
| Other expenses | | | 5,702 | | | | 22,222 | |
| Postage and printing fees | | | 1,743 | | | | 12,431 | |
| Total expenses | | | 534,043 | | | | 1,915,755 | |
| Less: Fee waivers | | | (182,097 | ) | | | (286,686 | ) |
| Total net expenses | | | 351,946 | | | | 1,629,069 | |
| NET INVESTMENT INCOME | | | 180,678 | | | | 1,119,160 | |
| | | | | | | | | |
| REALIZED AND UNREALIZED GAINS (LOSSES): | | | | | | | | |
| Net realized gain on investments | | | 794,617 | | | | 7,722,717 | |
| Net change in unrealized | | | | | | | | |
| appreciation/depreciation of investments | | | (1,752,060 | ) | | | (14,581,541 | ) |
| Net loss on investments | | | (957,443 | ) | | | (6,858,824 | ) |
| NET DECREASE IN NET ASSETS | | | | | | | | |
| RESULTING FROM OPERATIONS | | $ | (776,765 | ) | | $ | (5,739,664 | ) |
See Notes to the Financial Statements
Statements of Changes in Net Assets
| | | Capital Appreciation Fund | |
| | | Year Ended | | | Year Ended | |
| | | December 31, 2018 | | | December 31, 2017 | |
| OPERATIONS: | | | | | | |
| Net investment income | | $ | 180,678 | | | $ | 127,327 | |
| Net realized gain on investments | | | 794,617 | | | | 1,021,358 | |
| Net change in unrealized appreciation/ | | | | | | | | |
| depreciation of investments | | | (1,752,060 | ) | | | 1,682,148 | |
| Net increase (decrease) resulting from operations | | | (776,765 | ) | | | 2,830,833 | |
| | | | | | | | | |
| CAPITAL SHARE TRANSACTIONS: | | | | | | | | |
| Proceeds from shares sold | | | 85,822 | | | | 263,509 | |
| Proceeds from reinvestment of distributions | | | 1,050,298 | | | | 1,496,681 | |
| Payments for shares redeemed | | | (848,281 | ) | | | (1,934,889 | ) |
| Redemption fees | | | — | | | | 21 | |
| Net increase (decrease) from capital share transactions | | | 287,839 | | | | (174,678 | ) |
| | | | | | | | | |
| DISTRIBUTIONS PAID TO SHAREHOLDERS | | | (1,096,660 | ) | | | (1,554,398 | )* |
| | | | | | | | | |
| TOTAL INCREASE (DECREASE) IN NET ASSETS | | | (1,585,586 | ) | | | 1,101,757 | |
| | | | | | | | | |
| NET ASSETS: | | | | | | | | |
| Beginning of year | | | 26,764,999 | | | | 25,663,242 | |
| End of year | | $ | 25,179,413 | | | $ | 26,764,999 | ** |
| | | | | | | | | |
| TRANSACTIONS IN SHARES: | | | | | | | | |
| Shares sold | | | 4,959 | | | | 15,323 | |
| Shares issued in reinvestment of distributions | | | 64,753 | | | | 84,654 | |
| Shares redeemed | | | (46,542 | ) | | | (109,788 | ) |
| Net increase (decrease) | | | 23,170 | | | | (9,811 | ) |
| * | | Includes income distributions of $131,991 and net realized gain distributions of $1,422,407. |
| ** | | Includes distributions in excess of net investment income of $6,421. |
See Notes to the Financial Statements
Statements of Changes in Net Assets
| | | Opportunity Fund | |
| | | Year Ended | | | Year Ended | |
| | | December 31, 2018 | | | December 31, 2017 | |
| OPERATIONS: | | | | | | |
| Net investment income | | $ | 1,119,160 | | | $ | 557,560 | |
| Net realized gain on investments | | | 7,722,717 | | | | 5,417,263 | |
| Net change in unrealized appreciation/ | | | | | | | | |
| depreciation of investments | | | (14,581,541 | ) | | | 5,023,381 | |
| Net increase (decrease) resulting from operations | | | (5,739,664 | ) | | | 10,998,204 | |
| | | | | | | | | |
| CAPITAL SHARE TRANSACTIONS: | | | | | | | | |
| Proceeds from shares sold | | | 20,253,107 | | | | 12,146,454 | |
| Proceeds from reinvestment of distributions | | | 7,888,798 | | | | 6,917,514 | |
| Payments for shares redeemed | | | (16,227,515 | ) | | | (12,535,701 | ) |
| Redemption fees | | | 4,959 | | | | 1,267 | |
| Net increase from capital share transactions | | | 11,919,349 | | | | 6,529,534 | |
| | | | | | | | | |
| DISTRIBUTIONS PAID TO SHAREHOLDERS | | | (8,537,974 | ) | | | (7,460,824 | )* |
| | | | | | | | | |
| TOTAL INCREASE (DECREASE) IN NET ASSETS | | | (2,358,289 | ) | | | 10,066,914 | |
| | | | | | | | | |
| NET ASSETS: | | | | | | | | |
| Beginning of year | | | 116,609,346 | | | | 106,542,432 | |
| End of year | | $ | 114,251,057 | | | $ | 116,609,346 | ** |
| | | | | | | | | |
| TRANSACTIONS IN SHARES: | | | | | | | | |
| Shares sold | | | 958,762 | | | | 586,858 | |
| Shares issued in reinvestment of distributions | | | 430,611 | | | | 329,877 | |
| Shares redeemed | | | (796,796 | ) | | | (605,456 | ) |
| Net increase | | | 592,577 | | | | 311,279 | |
| * | | Includes income distributions of $544,927 and net realized gain distributions of $6,915,897. |
| ** | | Includes distributions in excess of net investment income of $5,623. |
See Notes to the Financial Statements
Financial Highlights
| | | Capital Appreciation Fund | |
| | | Year Ended December 31, | |
| | | 2018 | | | 2017 | | | 2016 | | | 2015 | | | 2014 | |
| For a Fund share outstanding | | | | | | | | | | | | | | | |
| throughout the period | | | | | | | | | | | | | | | |
| | | | | | | | | | | | | | | | |
| NET ASSET VALUE: | | | | | | | | | | | | | | | |
| Beginning of period | | $ | 17.63 | | | $ | 16.80 | | | $ | 14.84 | | | $ | 15.61 | | | $ | 17.11 | |
| | | | | | | | | | | | | | | | | | | | | |
| OPERATIONS: | | | | | | | | | | | | | | | | | | | | |
| Net investment income | | | 0.12 | | | | 0.09 | | | | 0.22 | | | | 0.21 | | | | 0.11 | |
| Net realized and unrealized | | | | | | | | | | | | | | | | | | | | |
| gain (loss) on investments | | | (0.67 | ) | | | 1.82 | | | | 1.96 | | | | (0.60 | ) | | | 0.63 | |
| Total from operations | | | (0.55 | ) | | | 1.91 | | | | 2.18 | | | | (0.39 | ) | | | 0.74 | |
| | | | | | | | | | | | | | | | | | | | | |
| LESS DISTRIBUTIONS: | | | | | | | | | | | | | | | | | | | | |
| From net investment income | | | (0.12 | ) | | | (0.09 | ) | | | (0.22 | ) | | | (0.37 | ) | | | (0.27 | ) |
| From net realized gains | | | (0.62 | ) | | | (0.99 | ) | | | — | | | | (0.01 | ) | | | (1.97 | ) |
| Total distributions | | | (0.74 | ) | | | (1.08 | ) | | | (0.22 | ) | | | (0.38 | ) | | | (2.24 | ) |
| | | | | | | | | | | | | | | | | | | | | |
| NET ASSET VALUE: | | | | | | | | | | | | | | | | | | | | |
| End of period | | $ | 16.34 | | | $ | 17.63 | | | $ | 16.80 | | | $ | 14.84 | | | $ | 15.61 | |
| | | | | | | | | | | | | | | | | | | | | |
| TOTAL RETURN | | | (3.07 | )% | | | 11.38 | % | | | 14.68 | % | | | (2.52 | )% | | | 4.18 | % |
| | | | | | | | | | | | | | | | | | | | | |
| SUPPLEMENTAL DATA AND RATIOS: | | | | | | | | | | | | | | | | | | | | |
| Net assets, end of period (in thousands) | | $ | 25,179 | | | $ | 26,765 | | | $ | 25,663 | | | $ | 24,328 | | | $ | 38,398 | |
| Ratio of expenses to average net assets: | | | | | | | | | | | | | | | | | | | | |
| Before expense reimbursement | | | 1.97 | % | | | 2.02 | % | | | 2.06 | % | | | 1.88 | % | | | 1.74 | % |
| After expense reimbursement | | | 1.30 | % | | | 1.30 | % | | | 1.30 | % | | | 1.30 | % | | | 1.30 | % |
| Ratio of net investment income (loss) | | | | | | | | | | | | | | | | | | | | |
| to average net assets: | | | | | | | | | | | | | | | | | | | | |
| Before expense reimbursement | | | (0.00 | )% | | | (0.23 | )% | | | 0.58 | % | | | 0.47 | % | | | 0.05 | % |
| After expense reimbursement | | | 0.67 | % | | | 0.49 | % | | | 1.34 | % | | | 1.05 | % | | | 0.49 | % |
| Portfolio turnover rate | | | 28 | % | | | 23 | % | | | 32 | % | | | 35 | % | | | 48 | % |
See Notes to the Financial Statements
Financial Highlights
| | | Opportunity Fund | |
| | | Year Ended December 31, | |
| | | 2018 | | | 2017 | | | 2016 | | | 2015 | | | 2014 | |
| For a Fund share outstanding | | | | | | | | | | | | | | | |
| throughout the period | | | | | | | | | | | | | | | |
| | | | | | | | | | | | | | | | |
| NET ASSET VALUE: | | | | | | | | | | | | | | | |
| Beginning of period | | $ | 20.85 | | | $ | 20.17 | | | $ | 17.29 | | | $ | 20.75 | | | $ | 21.51 | |
| | | | | | | | | | | | | | | | | | | | | |
| OPERATIONS: | | | | | | | | | | | | | | | | | | | | |
| Net investment income | | | 0.19 | | | | 0.11 | | | | 0.13 | | | | 0.14 | | | | 0.13 | |
| Net realized and unrealized | | | | | | | | | | | | | | | | | | | | |
| gain (loss) on investments | | | (1.11 | ) | | | 1.98 | | | | 3.50 | | | | 0.18 | | | | 1.48 | |
| Total from operations | | | (0.92 | ) | | | 2.09 | | | | 3.63 | | | | 0.32 | | | | 1.61 | |
| | | | | | | | | | | | | | | | | | | | | |
| LESS DISTRIBUTIONS: | | | | | | | | | | | | | | | | | | | | |
| From net investment income | | | (0.19 | ) | | | (0.10 | ) | | | (0.22 | ) | | | (0.17 | ) | | | (0.16 | ) |
| From net realized gains | | | (1.27 | ) | | | (1.31 | ) | | | (0.53 | ) | | | (3.61 | ) | | | (2.21 | ) |
| Total distributions | | | (1.46 | ) | | | (1.41 | ) | | | (0.75 | ) | | | (3.78 | ) | | | (2.37 | ) |
| | | | | | | | | | | | | | | | | | | | | |
| NET ASSET VALUE: | | | | | | | | | | | | | | | | | | | | |
| End of period | | $ | 18.47 | | | $ | 20.85 | | | $ | 20.17 | | | $ | 17.29 | | | $ | 20.75 | |
| | | | | | | | | | | | | | | | | | | | | |
| TOTAL RETURN | | | (4.38 | )% | | | 10.33 | % | | | 21.02 | % | | | 1.33 | % | | | 7.36 | % |
| | | | | | | | | | | | | | | | | | | | | |
| SUPPLEMENTAL DATA AND RATIOS: | | | | | | | | | | | | | | | | | | | | |
| Net assets, end of period (in thousands) | | $ | 114,251 | | | $ | 116,609 | | | $ | 106,542 | | | $ | 86,128 | | | $ | 91,448 | |
| Ratio of expenses to average net assets: | | | | | | | | | | | | | | | | | | | | |
| Before expense reimbursement | | | 1.53 | % | | | 1.58 | % | | | 1.59 | % | | | 1.61 | % | | | 1.53 | % |
| After expense reimbursement | | | 1.30 | % | | | 1.30 | % | | | 1.30 | % | | | 1.30 | % | | | 1.30 | % |
| Ratio of net investment income | | | | | | | | | | | | | | | | | | | | |
| to average net assets: | | | | | | | | | | | | | | | | | | | | |
| Before expense reimbursement | | | 0.66 | % | | | 0.23 | % | | | 0.41 | % | | | 0.28 | % | | | 0.23 | % |
| After expense reimbursement | | | 0.89 | % | | | 0.51 | % | | | 0.70 | % | | | 0.59 | % | | | 0.46 | % |
| Portfolio turnover rate | | | 39 | % | | | 26 | % | | | 42 | % | | | 36 | % | | | 40 | % |
See Notes to the Financial Statements
Notes to the Financial Statements
December 31, 2018
1. ORGANIZATION
Prospector Funds, Inc. (the “Corporation”) was organized as a Maryland corporation on June 6, 2007 and is registered under the Investment Company Act of 1940 (the “1940 Act”), as amended, as an open-end diversified management investment company. The Corporation issues its shares in series, each series representing a distinct portfolio with its own investment objectives and policies. There are two series presently authorized, the Prospector Capital Appreciation Fund and the Prospector Opportunity Fund (individually a “Fund” and collectively the “Funds”). Each Fund is an investment company and accordingly follows the investment company accounting and reporting guidance of the Financial Accounting Standards Board (“FASB”) Accounting Standard Board Codification Topic 946 Financial Services – Investment Companies. The Funds commenced operations on September 28, 2007.
2. FAIR VALUE MEASUREMENT
The following is a summary of significant accounting policies consistently followed by each Fund:
Security Valuation – The Fund has adopted fair value accounting standards which establish an authoritative definition of fair value and set out a hierarchy for measuring fair value. These standards require additional disclosures about the various inputs and valuation techniques used to develop the measurements of fair value, a discussion in changes in valuation techniques and related inputs during the period and expanded disclosure of valuation levels for major security types. These inputs are summarized in the three broad levels listed below:
| Level 1 – | Unadjusted quoted prices in active markets for identical assets or liabilities that the Fund has the ability to access. |
| | |
| Level 2 – | Observable inputs other than quoted prices included in Level 1 that are observable for the asset or liability, either directly or indirectly. These inputs may include quoted prices for the identical instrument on an inactive market, prices for similar instruments, interest rates, prepayment speeds, credit risk, yield curves, default rates, discounts and similar data. |
| | |
| Level 3 – | Unobservable inputs for the asset or liability, to the extent relevant observable inputs are not available, representing the Fund’s own assumptions about the assumptions a market participant would use in valuing the asset or liability, and would be based on the best information available. |
Following is a description of the valuation techniques applied to the Fund’s major categories of assets and liabilities measured at fair value on a recurring basis. The Fund’s investments are carried at fair value.
Common Stock – Securities that are primarily traded on a national securities exchange are valued at the last sale price on the exchange on which they are primarily traded on the day of valuation or, if there has been no sale on such day, at the last bid price on the day of valuation. To the extent these securities are actively traded and valuation adjustments are not applied, they are categorized in Level 1 of the fair value hierarchy.
Convertible and Corporate Bonds – Convertible and corporate bonds, including listed issues, are valued at fair value on the basis of valuations furnished by an independent pricing service which utilizes both dealer-supplied valuations and formula-based techniques. The pricing service may consider recently executed transactions in securities of the issuer or comparable issuers, market price quotations (where observable), bond spreads, and fundamental data relating to the issuer. Convertible and corporate bonds are generally categorized in Level 2 of the fair value hierarchy.
Notes to the Financial Statements – Continued
December 31, 2018
Investment Companies – Investments in other mutual funds, including money market funds, are valued at their net asset value per share. To the extent these securities are actively traded and valuation adjustments are not applied, they are categorized in Level 1 of the fair value hierarchy.
Securities for which market quotations are not readily available, or if the closing price does not represent fair value, are valued following procedures approved by the Funds’ board of directors. These procedures consider many factors, including the type of security, size of holding, trading volume and news events. There can be no assurance that the Fund could obtain the fair value assigned to a security if they were to sell the security at approximately the time at which the Fund determines their net asset values per share.
The inputs or methodology used for valuing securities are not an indication of the risk associated with investing in those securities.
As of December 31, 2018, each Fund’s investments in securities were classified as follows:
| | | Level 1 | | | Level 2 | | | Level 3 | | | Total | |
| Capital Appreciation Fund | | | | | | | | | | | | |
| Common Stocks | | $ | 19,288,313 | | | $ | — | | | $ | — | | | $ | 19,288,313 | |
| Convertible Bonds | | | — | | | | 4,180,460 | | | | — | | | | 4,180,460 | |
| Corporate Bonds | | | — | | | | 1,115,716 | | | | — | | | | 1,115,716 | |
| Short-Term Investment | | | 605,737 | | | | — | | | | — | | | | 605,737 | |
| Total Investments | | $ | 19,894,050 | | | $ | 5,296,176 | | | $ | — | | | $ | 25,190,226 | |
| | | | | | | | | | | | | |
| | | Level 1 | | | Level 2 | | | Level 3 | | | Total | |
| Opportunity Fund | | | | | | | | | | | | | | | | |
| Common Stocks | | $ | 109,011,706 | | | $ | — | | | $ | — | | | $ | 109,011,706 | |
| Convertible Bond | | | — | | | | 436,657 | | | | — | | | | 436,657 | |
| Short-Term Investment | | | 5,496,408 | | | | — | | | | — | | | | 5,496,408 | |
| Total Investments | | $ | 114,508,114 | | | $ | 436,657 | | | $ | — | | | $ | 114,944,771 | |
Refer to each Fund’s Schedule of Investments for further sector breakout.
The Funds may invest in derivative financial instruments in order to manage risk or gain exposure to various other investments or markets. The Funds’ investment objectives allow the Funds to enter into various types of derivative contracts, including, but not limited to, futures contracts, forward foreign exchange contracts, and purchased and written options. Derivatives may contain various risks including the potential inability of the counterparty to fulfill their obligations under the terms of the contract, the potential for an illiquid secondary market, and the potential for market movements which may expose the funds to gains or losses in excess of the amounts shown on the Statements of Assets and Liabilities. As of and for the year ended December 31, 2018, the Funds held no derivative instruments.
3. SIGNIFICANT ACCOUNTING POLICIES
Distributions to Shareholders – Dividends from net investment income and distributions of net realized capital gains, if any, will be declared and paid at least annually. The character of distributions made during the period from net investment income or net realized gains may differ from the characterization for federal income tax purposes due to differences in the recognition of income, expense and gain items for financial statement and tax purposes. All short-term capital gains are included in ordinary income for tax purposes.
Notes to the Financial Statements – Continued
December 31, 2018
Use of Estimates – The preparation of financial statements in conformity with accounting principles generally accepted in the United States of America (“U.S. GAAP”) requires management to make estimates and assumptions that affect the reported amounts of assets and liabilities and disclosure of contingent assets and liabilities at the date of the financial statements and the reported amounts of revenues and expenses during the reporting period. Actual results could differ from those estimates.
Federal Income Taxes – The Funds intend to meet the requirements of subchapter M of the Internal Revenue Code applicable to regulated investment companies and to distribute substantially all net taxable investment income and net realized gains to shareholders in a manner which results in no tax cost to the Funds. Therefore, no federal income or excise tax provision is required. As of December 31, 2018, the Funds did not have any tax positions that did not meet the “more-likely-than-not” threshold of being sustained by the applicable tax authority. Generally, each of the tax years in the four-year period ended December 31, 2018 remains subject to examination by taxing authorities.
Reclassification of Capital Accounts – U.S. GAAP requires that certain components of net assets relating to permanent differences be reclassified between financial and tax reporting. These reclassifications have no effect on net assets or net asset value per share. For the fiscal year ended December 31, 2018, there were no reclassifications made on the Statements of Assets and Liabilities.
Foreign Currency Translation – The books and records relating to the Funds’ non-U.S. dollar denominated investments are maintained in U.S. dollars on the following bases: (1) market value of investment securities, assets, and liabilities are translated at the current rate of exchange; and (2) purchases and sales of investment securities, income, and expenses are translated at the relevant rates of exchange prevailing on the respective dates of such transactions. The Funds do not isolate the portion of gains and losses on investments in equity securities that is due to changes in the foreign exchange rates from that which is due to changes in market prices of equity securities. The Funds report certain foreign currency-related transactions as components of realized gains for financial reporting purposes, whereas such components are treated as ordinary income for federal income tax purposes.
Illiquid or Restricted Securities – A security may be considered illiquid if it lacks a readily available market. Securities are generally considered liquid if they can be sold or disposed of in the ordinary course of business within seven days at approximately the price at which the security is valued by the Fund. Illiquid securities may be valued under methods approved by the Funds’ board of directors as reflecting fair value. Each Fund intends to invest no more than 15% of its total assets in illiquid securities. Certain restricted securities may be considered illiquid. Restricted securities are often purchased in private placement transactions, are not registered under the Securities Act of 1933, may have contractual restrictions on resale, and may be valued under methods approved by the Funds’ board of directors as reflecting fair value. Certain restricted securities eligible for resale to qualified institutional investors, including Rule 144A securities, are not subject to the limitation on a Fund’s investment in illiquid securities if they are determined to be liquid in accordance with procedures adopted by the Funds’ board of directors. At December 31, 2018, the Funds had no investments in illiquid securities.
Expenses – Expenses directly attributable to a Fund are charged to that Fund, while expenses attributable to more than one Fund are allocated among the respective Funds based on relative net assets or another appropriate basis.
Other – Investment and shareholder transactions are recorded on the trade date. Each Fund determines the gain or loss realized from the investment transactions on the basis of identified cost. Dividend income is recognized on the ex-dividend date. Interest income, including amortization of bond premium and discount, is recognized on an accrual basis.
Notes to the Financial Statements – Continued
December 31, 2018
New Accounting Pronouncements and Other Matters – In August 2018, FASB issued Accounting Standards Update 2018-13, Fair Value Measurement (Topic 820): Disclosure Framework-Changes to the Disclosure Requirements for Fair Value Measurement (“ASU 2018-13”). The primary focus of ASU 2018-13 is to improve the effectiveness of the disclosure requirements for fair value measurements. The changes affect all companies that are required to include fair value measurement disclosures. In general, the amendments in ASU 2018-13 are effective for all entities for fiscal years and interim periods within those fiscal years, beginning after December 15, 2019. An entity is permitted to early adopt the removed or modified disclosures upon the issuance of ASU 2018-13 and may delay adoption of the additional disclosures, which are required for public companies only, until their effective date. Management has evaluated the ASU 2018-13 and has adopted the disclosure requirements.
Subsequent Events – Management of the Funds has evaluated fund related events and transactions that occurred subsequent to December 31, 2018, through the date of issuance of the Funds’ financial statements. There were no events or transactions that occurred during this period that materially impacted the amounts or disclosures in the Funds’ financial statements.
4. INVESTMENT TRANSACTIONS, DISTRIBUTABLE EARNINGS, AND DISTRIBUTIONS PAID
During the year ended December 31, 2018, purchases of securities and proceeds from sales of securities, other than temporary investments in short-term securities, were as follows:
| | Purchases | Sales |
| Capital Appreciation Fund | $ 7,568,452 | $ 7,183,270 |
| Opportunity Fund | 51,893,976 | 44,959,807 |
There were no purchases or sales of long-term U.S. Government securities.
The aggregate gross unrealized appreciation and depreciation of securities held by the Funds and the total cost of securities for federal income tax purposes at December 31, 2018, the Funds’ most recently completed fiscal year end, were as follows:
| | Aggregate | Aggregate | Net | Federal |
| | Gross | Gross | Appreciation/ | Income |
| | Appreciation | Depreciation | (Depreciation) | Tax Cost |
| Capital Appreciation Fund | $ 3,849,596 | $ (886,928) | $2,962,668 | $ 22,227,525 |
| Opportunity Fund | 18,147,000 | (8,303,264) | 9,843,736 | 105,098,829 |
The difference between book-basis and tax-basis unrealized appreciation is attributable primarily to wash sales and different book and tax accounting methods for certain securities.
At December 31, 2018, components of accumulated earnings (deficit) on a tax-basis were as follows:
| | Undistributed | Undistributed | Other | | Total |
| | Ordinary | Long-Term | Accumulated | Unrealized | Distributable |
| | Income | Capital Gains | Losses | Appreciation | Earnings |
| Capital Appreciation Fund | $ — | $ — | $(40,828) | $2,962,668 | $ 2,921,840 |
| Opportunity Fund | 48,717 | 230,800 | (4,419) | 9,843,736 | 10,118,834 |
Notes to the Financial Statements – Continued
December 31, 2018
As of December 31, 2018, the Funds did not have any capital loss carryovers. A regulated investment company may elect for any taxable year to treat any portion of any qualified late year loss as arising on the first day of the next taxable year. Qualified late year losses are certain capital and ordinary losses which occur during the portion of the Fund’s taxable year subsequent to October 31. The Capital Appreciation Fund plans to defer, on a tax basis, late year losses of $35,346. The Opportunity Fund does not plan to defer any late year losses.
The tax character of distributions paid during the fiscal year ended December 31, 2018 was as follows:
| | Ordinary | | Long Term | | |
| | Income | * | Capital Gains | ** | Total |
| Capital Appreciation Fund | $ 229,872 | | $ 866,788 | | $1,096,660 |
| Opportunity Fund | 1,257,291 | | 7,280,683 | | 8,537,974 |
The tax character of distributions paid during the fiscal year ended December 31, 2017 was as follows:
| | Ordinary | | Long Term | | |
| | Income | * | Capital Gains | ** | Total |
| Capital Appreciation Fund | $ 305,965 | | $1,248,433 | | $1,554,398 |
| Opportunity Fund | 1,207,785 | | 6,253,039 | | 7,460,824 |
| * | | For federal income tax purposes, distributions of short-term capital gains are included in ordinary income distributions. |
| ** | | Funds designate long-term capital gain dividends pursuant to IRC Sec. 852(b)(3)(C). |
5. AGREEMENTS
The Funds have entered into an Investment Advisory Agreement with Prospector Partners Asset Management, LLC (the “Adviser”), with whom certain directors and officers of the Corporation are affiliated, to furnish investment advisory services to the Funds. Pursuant to this Agreement, the Adviser is entitled to receive a management fee, calculated daily and payable monthly, at the annual rate of 1.10% as applied to each Fund’s daily net assets.
The Adviser has contractually agreed to waive its management fee and reimburse each Fund’s other expenses to the extent necessary to ensure that each Fund’s operating expenses do not exceed 1.30% of its average daily net assets. Fees waived and expenses reimbursed by the Adviser may be recouped by the Adviser for a period of three fiscal years following the fiscal year during which such waiver or reimbursement was made if such recoupment can be achieved without exceeding the expense limit in effect at the time the waiver or reimbursement occurred. As of December 31, 2018, the Adviser did not recoup any previously waived fees or reimbursed expenses. The Fee Waiver and Expense Limitation Agreement will be in effect through at least September 30, 2020. Waived fees and reimbursed expenses subject to potential recovery by year of expiration are as follows:
| Expiration | | Capital Appreciation Fund | | | Opportunity Fund | |
| 12/31/19 | | $ | 184,289 | | | $ | 270,491 | |
| 12/31/20 | | | 186,958 | | | | 302,782 | |
| 12/31/21 | | | 182,097 | | | | 286,686 | |
| Total | | $ | 553,344 | | | $ | 859,959 | |
Notes to the Financial Statements – Continued
December 31, 2018
As of December 31, 2018, it was possible, but not probable, those amounts would be recovered by the Adviser. At the end of each fiscal year in the future, the Funds will continue to assess the potential recovery of waived/reimbursed fees and expenses for financial reporting purposes.
Quasar Distributors, LLC (“Quasar”), a subsidiary of U.S. Bancorp, serves as distributor of the Funds’ shares pursuant to a Distribution Agreement with the Corporation. Each Fund’s shares are sold on a no-load basis and, therefore, Quasar receives no sales commission or sales load for providing services to the Funds. The Corporation has adopted a plan pursuant to Rule 12b-1 under the 1940 Act (the “12b-1 Plan”), which authorizes the Corporation to reimburse Quasar and certain financial intermediaries who assist in distributing each Fund’s shares or who provide shareholder services to Fund shareholders a distribution and/or shareholder servicing fee of up to 0.25% of each Fund’s average daily net assets (computed on an annual basis). All or a portion of the fee may be used by the Funds or Quasar to pay the Fund’s distribution fees and costs of printing reports and prospectuses for potential investors and the costs of other distribution and shareholder services expenses. During the year ended December 31, 2018, Capital Appreciation Fund and Opportunity Fund incurred expenses of $12,733 and $92,049 respectively, pursuant to the 12b-1 Plan.
U.S. Bancorp Fund Services, LLC, doing business as U.S. Bank Global Fund Services, serves as transfer agent, administrator and fund accountant for the Funds. U.S. Bank N.A. serves as custodian for the Funds.
6. INDEMNIFICATIONS
The Funds enter into contracts that contain a variety of indemnifications. The Funds’ maximum exposure under these arrangements is unknown. However, the Funds have not had prior claims or losses pursuant to these contracts and expect the risk of loss to be remote.
Report of Independent Registered Public Accounting Firm
To the Shareholders and the Board of Directors of Prospector Funds, Inc.
Opinion on the Financial Statements
We have audited the accompanying statements of assets and liabilities of Prospector Funds, Inc. (the “Corporation”) (comprising the Prospector Capital Appreciation Fund and the Prospector Opportunity Fund (individually a “Fund” and collectively referred to as the “Funds”)), including the schedules of investments, as of December 31, 2018, and the related statements of operations for the year then ended, the statements of changes in net assets for each of the two years in the period then ended, the financial highlights for each of the five years in the period then ended and the related notes (collectively referred to as the “financial statements”). In our opinion, the financial statements present fairly, in all material respects, the financial position of each of the Funds comprising Prospector Funds, Inc. at December 31, 2018, the results of their operations for the year then ended, the changes in their net assets for each of the two years in the period then ended and their financial highlights for each of the five years in the period then ended, in conformity with U.S. generally accepted accounting principles.
Basis for Opinion
These financial statements are the responsibility of the Corporation’s management. Our responsibility is to express an opinion on each of the Funds’ financial statements based on our audits. We are a public accounting firm registered with the Public Company Accounting Oversight Board (United States) (“PCAOB”) and are required to be independent with respect to the Corporation in accordance with the U.S. federal securities laws and the applicable rules and regulations of the Securities and Exchange Commission and the PCAOB.
We conducted our audits in accordance with the standards of the PCAOB. Those standards require that we plan and perform the audit to obtain reasonable assurance about whether the financial statements are free of material misstatement, whether due to error or fraud. The Corporation is not required to have, nor were we engaged to perform, an audit of the Corporation’s internal control over financial reporting. As part of our audits we are required to obtain an understanding of internal control over financial reporting but not for the purpose of expressing an opinion on the effectiveness of the Corporation’s internal control over financial reporting. Accordingly, we express no such opinion.
Our audits included performing procedures to assess the risks of material misstatement of the financial statements, whether due to error or fraud, and performing procedures that respond to those risks. Such procedures included examining, on a test basis, evidence regarding the amounts and disclosures in the financial statements. Our procedures included confirmation of securities owned as of December 31, 2018, by correspondence with the custodian and brokers. Our audits also included evaluating the accounting principles used and significant estimates made by management, as well as evaluating the overall presentation of the financial statements. We believe that our audits provide a reasonable basis for our opinion.
We have served as the auditor of one or more Prospector Funds, Inc. investment companies since 2007.
Minneapolis, Minnesota
February 22, 2019
Additional Information (Unaudited)
December 31, 2018
BOARD APPROVAL OF INVESTMENT ADVISORY AGREEMENT
The Corporation’s independent directors (the “directors”) unanimously approved the continuance of the Investment Advisory Agreement (the “Advisory Agreement”) between the Funds and Prospector Partners Asset Management, LLC (the “Advisor”) at a Board of Director’s meeting held on August 30, 2018.
In preparation for the meeting, the directors had requested from the Advisor and evaluated a memorandum providing certain information requested by the Board pursuant to Section 15(c) of the 1940 Act, including (i) expense, compliance and other information as it relates to the Advisor; (ii) performance of other accounts managed by its affiliate Prospector Partners, LLC with similar investment objectives derived from data compiled by the Advisor and (iii) expense and other information for other registered investment companies with similar investment objectives derived from data compiled by the Advisor based upon comparative peer groups selected in consultation with the independent directors. Prior to voting, the directors reviewed the proposed approval of the Advisory Agreement with management and with counsel to the Corporation and reviewed a memorandum from such counsel discussing the legal standards for their consideration of the proposed approval. In reaching their determinations relating to approval of the continuance of the Advisory Agreement, the directors considered all factors they believed relevant including the following:
| 1. | | the nature, extent and quality of investment, and other services to be rendered by the Advisor; |
| 2. | | payments to be received by the Advisor from all sources with respect to the Funds; |
| 3. | | comparative fee and expense data for the Funds and other investment companies with similar investment objectives; |
| 4. | | the extent to which economies of scale may be realized as the Funds grow and whether fee levels reflect these economies of scale for the benefit of investors; |
| 5. | | the Advisor’s policies and practices regarding allocation of portfolio transactions of the Funds, including the extent to which the Advisor may benefit from soft dollar arrangements; |
| 6. | | fall-out benefits which the Advisor and its affiliates may receive from their relationships to the Funds; |
| 7. | | information about fees charged by the Advisor to other clients with similar investment objectives; |
| 8. | | the professional experience and qualifications of the Funds’ portfolio managers and other senior personnel of the Advisor; |
| 9. | | profitability of the Advisor; and |
| 10. | | the terms of the Advisory Agreement. |
The directors also considered their overall confidence in the integrity and competence of the Advisor and its investment team. In their deliberations, the directors did not identify any particular information that was all-important or controlling, and each director attributed different weights to the various factors. The directors determined that the overall arrangements between the Funds and the Advisor, as provided in the Advisory Agreement, were fair and reasonable in light of the services performed, expenses expected to be incurred and such other matters as the directors considered relevant in the exercise of their reasonable judgment.
The material factors and conclusions that formed the basis for the directors reaching their determinations to approve the continuance of the Advisory Agreement (including their determinations that the Advisor should be the investment adviser for the Funds, and that the fees payable to the Advisor pursuant to the Advisory Agreement continue to be appropriate) were separately discussed by the directors.
Additional Information (Unaudited) – Continued
December 31, 2018
Nature, extent and quality of services provided by the Advisor
The directors noted that, under the Advisory Agreement, the Advisor, subject to the control of the directors, administers the Funds’ business and other affairs. The directors also noted that the Advisor manages the investment of the assets of the Funds, including making purchases and sales of portfolio securities consistent with each Fund’s investment objective and policies.
The directors considered the scope and quality of services provided by the Advisor under the Advisory Agreement, the cyclical nature of value investing, the quality of the investment research capabilities of the Advisor and the other resources it proposes to dedicate to performing services for the Funds and the Advisor’s active management style. The directors also considered the portfolio managers’ experience, reputation and investment philosophy noting that the Advisor’s investment style and stock selection process have remained consistent even in difficult market environments. The quality of administrative and other services also were considered. The directors concluded that, overall, they continue to be satisfied with the nature, extent and quality of services proposed to be provided to the Funds under the Advisory Agreement.
Advisor Fees; Performance of the Fund
The directors considered the advisory fee rate paid by the Funds to the Advisor and information prepared by the Advisor based upon the peer groups selected with the input of the independent directors concerning fee rates paid by other comparable funds. The directors recognized that it is difficult to make comparisons of advisory fees because there are variations in the services that are included in the fees paid by other funds, but determined that the proposed advisory fee rate was in line with other comparable funds.
The directors also considered the performance of each Fund compared to each Fund’s benchmarks and peer groups. The directors noted that the Opportunity Fund was ranked in the top six funds among its peers across the three-year, five-year, ten-year and since inception time periods (but lagged this group for the one-year period), further noting the Opportunity Fund’s number one ranking since inception. The Directors noted that while the Capital Appreciation Fund underperfomed its benchmark across all comparative periods, the Fund was in the peer group’s second quartile for the since inception,one-year, three-year and five-year periods. The directors concluded that the advisory fee rate, taking into account performance and the other factors mentioned, was in line with comparable funds.
Other Fund Expenses
The directors also considered the total expense ratio of the Funds in comparison to the fees and expenses of the funds included in their respective peer groups. The directors noted that the expense ratios of some of the comparable funds were lower because of waivers or reimbursements by those funds’ investment advisers, which in some cases were voluntary and perhaps temporary. In particular, the directors noted that the Advisor’s fee waiver/expense reimbursement pursuant to the Fee Waiver and Expenses Reimbursement Agreement was contractual in nature and customary for the industry. The directors concluded that the Funds’ expense ratio was reasonable. Finally, the directors noted that there may be economies of scale as the Funds grow and concluded that it may be appropriate to consider those issues in the future.
Additional Information (Unaudited) – Continued
December 31, 2018
Advisor Profitability
The directors noted that the Advisor also provides the Funds with such office space, administrative and other services (exclusive of, and in addition to, any such services provided by any other retained by the Funds) and executive and other personnel as are necessary for the Funds’ operations. The directors considered that the Advisor pays all of the compensation of the officers of the Company that are affiliated persons of the Advisor, pays a portion of the insurance costs and paid the cost of the organization of the Funds (without reimbursement), through its affiliate, Prospector Partners, LLC.
The directors also noted that the Advisor has contractually agreed to waive, through September 30, 2019, its management fee and/or reimburse each Fund’s other expenses to the extent necessary to ensure that each Fund’s operating expenses do not exceed 1.30% of its average daily net assets. Under the terms of the Fee Waiver and Expense Reimbursement Agreement at the present asset levels of the Funds, the Advisor has received only a portion of its earned management fee. It was also noted that the Advisor does not receive “fall out” benefits commonly received by managers of mutual funds that provide transfer agency, distribution or printing services in-house. The directors considered the expenses of the Advisor and the services provided by the Advisor and that the Advisor expects to be cash flow positive after considering an allocation of expenses from its affiliated advisor, Prospector Partners, LLC and before considering any allocation of income to the owners of the affiliated advisor.
Additional Information (Unaudited) – Continued
December 31, 2018
AVAILABILITY OF FUND PORTFOLIO INFORMATION
The Funds file complete schedules of portfolio holdings with the SEC for the first and third quarters of each fiscal year on Form N-Q, which is available on the SEC’s website at www.sec.gov. The Funds’ Form N-Q may be reviewed and copied at the SEC’s Public Reference Room in Washington, D.C. For information on the Public Reference Room call 1-800-SEC-0330. In addition, the Funds’ Form N-Q is available without charge upon request by calling 1-877-734-7862.
AVAILABILITY OF PROXY VOTING INFORMATION
A description of the Funds’ Proxy Voting Policies and Procedures is available without charge, upon request, by calling 1-877-734-7862. Information regarding how the Funds voted proxies relating to portfolio securities during the most recent 12 month period ended June 30, is available (1) without charge, upon request, by calling 1-877-734-7862, or (2) on the SEC’s website at www.sec.gov.
QUALIFIED DIVIDEND INCOME/DIVIDENDS RECEIVED DEDUCTION
For the fiscal year ended December 31, 2018, certain dividends paid by the Funds may be subject to a maximum tax rate of 23.8%, as provided for by the American Taxpayer Relief Act of 2012. The percentage of dividends declared from ordinary income designated as qualified dividend income was 100% and 100% for the Capital Appreciation Fund and Opportunity Fund, respectively. For corporate shareholders, the percent of ordinary income distributions qualifying for the corporate dividends received deduction for the fiscal year ended December 31, 2018 was 100% and 100% for the Capital Appreciation Fund and Opportunity Fund, respectively.
ADDITIONAL INFORMATION APPLICABLE TO FOREIGN SHAREHOLDERS ONLY
The percent of ordinary income distributions designated as interest related dividends for the fiscal year ended December 31, 2018 was 21.25% and 6.11% for the Capital Appreciation Fund and Opportunity Fund, respectively.
The percent of ordinary income distributions designated as short-term capital gain distributions under Internal Revenue Section 871(k)(2)(C) for the fiscal year ended December 31, 2018 was 21.98% and 12.21% for the Capital Appreciation Fund and Opportunity Fund, respectively.
Additional Information (Unaudited)
December 31, 2018
DIRECTORS & OFFICERS TABLE
| | | Term of | | Number of | |
| | | Office | | Portfolios | Other |
| | | and | Principal | in Fund | Directorships |
| Name, | | Length | Occupation | Complex | Served |
| Year of Birth | | of Time | During Past | Overseen | During Past |
| and Address^ | Position | Served* | 5 Years | by Director | 5 Years |
| Independent Board Members |
| | | | | | |
| Harvey D. Hirsch* | Director | Indefinite; | Retired, | 2 | None. |
| Year of Birth: 1941 | | Since | Senior Vice President, | | |
| | | September 7, | Marketing, Van Eck | | |
| | | 2007 | Associates Corporation, | | |
| | | | an investment adviser, | | |
| | | | from May 2007 to August 2014. | | |
| | | | | | |
| Joseph Klein III* | Director | Indefinite; | Managing Director of Gauss | 2 | Ionis |
| Year of Birth: 1961 | | Since | Capital Advisors, LLC, | | Pharmaceuticals, |
| | | September 7, | a financial consulting and | | Inc. |
| | | 2007 | investment advisory firm | | |
| | | | focused on biopharmaceuticals | | |
| | | | since he founded the company | | |
| | | | in March 1998. | | |
| | | | | | |
| Roy L. Nersesian* | Director | Indefinite; | Professor of the Leon Hess | 2 | None. |
| Year of Birth: 1939 | | Since | School of Business, Monmouth | | |
| | | September 7, | University, since September 1985. | | |
| | | 2007 | Adjunct Professor of the Center | | |
| | | | for Energy and Marine | | |
| | | | Transportation, Columbia | | |
| | | | University, since September 2000. | | |
| | | | | | |
| John T. Rossello, Jr.* | Director | Indefinite; | Retired. | 2 | None. |
| Year of Birth: 1951 | | Since | | | |
| | | September 7, | | | |
| | | 2007 | | | |
Additional Information (Unaudited) – Continued
December 31, 2018
| | | Term of | | Number of | |
| | | Office | | Portfolios | Other |
| | | and | Principal | in Fund | Directorships |
| Name, | | Length | Occupation | Complex | Served |
| Year of Birth | | of Time | During Past | Overseen | During Past |
| and Address^ | Position | Served* | 5 Years | by Director | 5 Years |
| Interested Board Members and Officers |
| | | | | | |
| John D. Gillespie†* | Director | Indefinite; | Managing member of | 2 | White |
| Year of Birth: 1959 | President | Since | the Investment Manager. | | Mountains |
| | | September 7, | Managing member of | | Insurance |
| | | 2007 | Prospector Partners, LLC, | | Group, Ltd. |
| | | | an affiliate of the Investment | | |
| | | | Manager, and portfolio | | |
| | | | manager of the investment | | |
| | | | funds sponsored by Prospector | | |
| | | | Partners, LLC since 1997. | | |
| | | | | | |
| Kevin R. O’Brien | Executive | Indefinite; | Portfolio Manager at | N/A | None. |
| Year of Birth: 1963 | Vice | Since | the Investment Manager. | | |
| | President | September 7, | Portfolio Manager at | | |
| | | 2007 | Prospector Partners, LLC | | |
| | | | since April 2003. | | |
| | | | | | |
| Jason A. Kish | Executive | Indefinite; | Portfolio Manager at | N/A | None. |
| Year of Birth: 1973 | Vice | Since | the Investment Manager. | | |
| | President | February, | Director of Research | | |
| | | 2013 | since 2010. | | |
| | | | | | |
| Peter N. Perugini, Jr. | Secretary | Indefinite; | Chief Financial Officer at | N/A | None. |
| Year of Birth: 1970 | Treasurer | Secretary | Prospector Partners, LLC | | |
| | | Since | since 2000. | | |
| | | September 7, | | | |
| | | 2007 | | | |
| | | Indefinite; | | | |
| | | Treasurer | | | |
| | | Since | | | |
| | | June 6, | | | |
| | | 2007 | | | |
Additional Information (Unaudited) – Continued
December 31, 2018
| | | Term of | | Number of | |
| | | Office | | Portfolios | Other |
| | | and | Principal | in Fund | Directorships |
| Name, | | Length | Occupation | Complex | Served |
| Year of Birth | | of Time | During Past | Overseen | During Past |
| and Address^ | Position | Served* | 5 Years | by Director | 5 Years |
| Kim Just | Chief | Indefinite; | Chief Compliance Officer at | N/A | None. |
| Year of Birth: 1967 | Compliance | Since | Prospector Partners, LLC | | |
| | Officer | September 7, | since March 2006. | | |
| | | 2007 | | | |
| | | | | | |
| Brian Wiedmeyer | Assistant | Indefinite; | Vice President for US | N/A | None. |
| Year of Birth: 1973 | Secretary | Since | Bancorp Fund Services, LLC, | | |
| | | September 7, | a mutual fund service provider, | | |
| | | 2007 | since January 2005. | | |
| ^ | The address for all directors and officers is 370 Church Street, Guilford, Connecticut 06437. |
| * | Each of the Company’s directors was elected by written consent of the sole shareholder of the Funds on September 7, 2007. |
| † | John D. Gillespie is an interested director of the Fund because he is also the managing member of the Investment Manager. |
DIRECTORS
John D. Gillespie
Harvey D. Hirsch
Joseph Klein III
Roy L. Nersesian
John T. Rossello, Jr.
INVESTMENT ADVISER
Prospector Partners Asset Management, LLC
370 Church Street
Guilford, CT 06437
DISTRIBUTOR
Quasar Distributors, LLC
777 East Wisconsin Avenue
Milwaukee, WI 53202
CUSTODIAN
U.S. Bank, N.A.
1555 North River Center Drive
Milwaukee, WI 53212
ADMINISTRATOR AND TRANSFER AGENT
U.S. Bancorp Fund Services, LLC
Third Floor
615 East Michigan Street
Milwaukee, WI 53202
INDEPENDENT REGISTERED PUBLIC ACCOUNTING FIRM
Ernst & Young LLP
220 South Sixth Street, Suite 1400
Minneapolis, MN 55402
LEGAL COUNSEL
Seward & Kissel LLP
One Battery Plaza
New York, NY 10004
This report should be accompanied or preceded by a prospectus.
The Funds’ Statement of Additional Information contains additional information about the
Funds’ directors and is available without charge upon request by calling 1-877-734-7862.
Item 2. Code of Ethics.
The registrant has adopted a code of ethics that applies to the registrant’s principal executive officer and principal financial officer. The registrant has not made any substantive amendments to its code of ethics during the period covered by this period.
The registrant has not granted any waivers from any provisions of the code of ethics during the period covered by this report.
A copy of the registrant’s code of ethics that applies to the registrant’s principal executive officer and principal financial officer is filed herewith.
Item 3. Audit Committee Financial Expert.
The registrant’s board of directors has determined that there is at least one audit committee financial expert serving on its audit committee. John Rossello, Jr. is the “audit committee financial expert” and is considered to be “independent” as each term is defined in Item 3 of Form N‑CSR.
Item 4. Principal Accountant Fees and Services.
The registrant has engaged its principal accountant to perform audit services, audit-related services, tax services and other services during the past two fiscal periods. “Audit services” refer to performing an audit of the registrant's annual financial statements or services that are normally provided by the accountant in connection with statutory and regulatory filings or engagements for the past fiscal year. “Audit-related services” refer to the assurance and related services by the principal accountant that are reasonably related to the performance of the audit. “Tax services” refer to professional services rendered by the principal accountant for tax compliance, tax advice, and tax planning, including reviewing the Fund’s tax returns and distribution calculations. The following table details the aggregate fees billed or expected to be billed for each of the last two fiscal periods for audit fees, audit-related fees, tax fees and other fees by the principal accountant.
| | FYE 12/31/2018 | FYE 12/31/2017 |
| Audit Fees | $80,000 | $70,000 |
| Audit-Related Fees | $0 | $0 |
| Tax Fees | $11,000 | $9,600 |
| All Other Fees | $0 | $0 |
| | | |
The audit committee has adopted pre-approval policies and procedures that require the audit committee to pre‑approve all audit and non‑audit services that exceed $5,000 for the registrant. All of the principal accountant’s hours spent on auditing the registrant’s financial statements were attributed to work performed by full‑time permanent employees of the principal accountant.
The audit committee noted that as indicated in the table below, for the registrant’s prior two fiscal periods, no fees were billed by the registrant’s independent public accountants in connection with non-audit services rendered to the registrant’s investment adviser, and any entity controlling, controlled by, or under common control with the investment adviser that provides ongoing services to the registrant.
| Non-Audit Related Fees | FYE 12/31/2018 | FYE 12/31/2017 |
| Registrant | $0 | $0 |
| Registrant’s Investment Adviser | $0 | $0 |
Item 5. Audit Committee of Listed Registrants.
Not applicable to open-end investment companies.
Item 6. Schedule of Investments.
Schedule of Investments is included as part of the report to shareholders filed under Item 1 of this Form.
Item 7. Disclosure of Proxy Voting Policies and Procedures for Closed-End Management Investment Companies.
Not applicable to open-end investment companies.
Item 8. Portfolio Managers of Closed-End Management Investment Companies.
Not applicable to open-end investment companies.
Item 9. Purchases of Equity Securities by Closed‑End Management Investment Company and Affiliated Purchases.
Not applicable to open-end investment companies.
Item 10. Submission of Matters to a Vote of Security Holders.
Not Applicable.
Item 11. Controls and Procedures.
| (a) | The Registrant’s President and Treasurer have reviewed the Registrant's disclosure controls and procedures (as defined in Rule 30a-3(c) under the Investment Company Act of 1940 (the “Act”)) as of a date within 90 days of the filing of this report, as required by Rule 30a-3(b) under the Act and Rules 13a-15(b) or 15d‑15(b) under the Securities Exchange Act of 1934. Based on their review, such officers have concluded that the disclosure controls and procedures are effective in ensuring that information required to be disclosed in this report is appropriately recorded, processed, summarized and reported and made known to them by others within the Registrant and by the Registrant’s service provider. |
| (b) | There were no significant changes in the Registrant's internal control over financial reporting (as defined in Rule 30a-3(d) under the Act) that occurred during the second fiscal quarter of the period covered by this report that has materially affected, or is reasonably likely to materially affect, the Registrant's internal control over financial reporting. |
Item 12. Disclosure of Securities Lending Activities for Closed-End Management Investment Companies
Not applicable to open-end investment companies.
Item 13. Exhibits.
| (a) | (1) Any code of ethics or amendment thereto, that is the subject of the disclosure required by Item 2, to the extent that the registrant intends to satisfy Item 2 requirements through filing an exhibit. Not applicable for semi-annual reports. |
(2) A separate certification for each principal executive officer and principal financial officer pursuant to Section 302 of the Sarbanes-Oxley Act of 2002. Filed herewith.
(3) Any written solicitation to purchase securities under Rule 23c‑1 under the Act sent or given during the period covered by the report by or on behalf of the registrant to 10 or more persons. Not applicable to open-end investment companies.
(4) Change in the registrant’s independent public accountant. There was no change in the registrant’s independent public accountant for the period covered by this report.
| (b) | Certifications pursuant to Section 906 of the Sarbanes‑Oxley Act of 2002. Furnished herewith. |
SIGNATURES
Pursuant to the requirements of the Securities Exchange Act of 1934 and the Investment Company Act of 1940, the registrant has duly caused this report to be signed on its behalf by the undersigned, thereunto duly authorized.
(Registrant) Prospector Funds, Inc.
By (Signature and Title)* /s/John D. Gillespie
John D. Gillespie, President
Date February 27, 2019
Pursuant to the requirements of the Securities Exchange Act of 1934 and the Investment Company Act of 1940, this report has been signed below by the following persons on behalf of the registrant and in the capacities and on the dates indicated.
By (Signature and Title)* /s/John D. Gillespie
John D. Gillespie, President
Date February 27, 2019
By (Signature and Title)* /s/Peter N. Perugini, Jr.
Peter N. Perugini, Jr., Treasurer
Date February 27, 2019
* Print the name and title of each signing officer under his or her signature.