Prospector Capital Appreciation Fund
Prospector Opportunity Fund
Annual Report
| www.prospectorfunds.com | December 31, 2017 |
January 30, 2018
Dear Shareholders of the Prospector Capital Appreciation Fund and Prospector Opportunity Fund,
We often repeat the mantra “now is the most difficult time to invest” in our communications to you. This feels especially germane today. A significant stock market correction is overdue after nine years of upward markets. We are concerned that the consequences of a correction, should it occur, could be high.
The U.S. economy continues to expand, even accelerating from a below 2% annualized rate a year ago, to an above 3% current growth rate. Economic conditions are healthy globally as well. Interest rates remain close to historically low levels and short rates in particular are gently lifting at a pace that would make Goldilocks proud. Corporate earnings delivered a strong statement in 2017, well above the expectations that were in place when the year began, driven by healthy business conditions and reduced regulation.
All of this manifested itself in a fantastic year for stocks, both in the U.S. and around the world. 2017 was an extraordinary year in the stock market which increased every month for the first time in history, a feat accompanied with record low levels of volatility. Stocks in the U.S., as represented by the S&P 500, rose 21.83% for the full year without once experiencing a 3% correction, another first. Growth stocks outperformed value stocks by a significant amount, regardless of the size of the company. Large growth stocks, as measured by the Russell 1000 Growth Index, rose 30.21%, easily outpacing the Russell 1000 Value Index which posted a 13.64% gain. In addition large capitalization shares handily beat their smaller capitalization brethren with the Russell 1000 Index earning 21.68% as compared to the Russell 2000 Index which gained 14.65%.
The key driver of these strong results was the technology sector which delivered almost 40% of the total return for the S&P 500. By year end 2017, the technology sector represented 24% of the market capitalization of the S&P 500, the third highest sector weighting ever (after the technology sector during 1999-00 internet “bubble” and the energy sector in 1980-81). Other strong sectors included healthcare, which rebounded sharply from dual fears over the repeal of Obamacare and/or price controls, and consumer discretionary, which was propelled by strong performance from Amazon and Netflix.
While we are satisfied with the absolute performance of the Funds, we are somewhat disappointed with the performance relative to broad market indices. Our value orientation and affinity for also investing in smaller and medium sized companies conspired to mute our gains. With the benefit of hindsight, 2017 was not a year to play defense of any sort.
While the environment for equity investing was benign in 2017, there are no shortage of issues to worry about either. China is finding its way through a tough transition from an emerging market, export driven country to a global economic leader with a difficult North Korean neighbor rattling its sabre on the world stage. The UK is attempting to extricate itself from the European Union, which has other issues such as the Catalan independence movement to consider. Iran’s nuclear ambitions continue to loom unabated, adding fuel to the combustible Middle East equation.
Recent Catastrophic Events
The hurricane season of 2017 will likely be remembered for many years, given the significant catastrophic activity experienced. In total, current estimates of insured losses from all catastrophes in 2017 is about $135B, potentially the highest level ever recorded. These losses have validated the risk management models for many companies and the negative impact was well contained in the context of balance sheet positions. Recent years had experienced
relatively light catastrophic loss experience, and at a minimum, this year’s results will be a healthy reminder of the volatility inherent in the business.
There are both cyclical and secular forces at work in the insurance and reinsurance industries. In our view, the huge catastrophe losses will have a demonstrable cyclical impact and a negligible secular impact. Pricing will cyclically improve in catastrophe-prone lines of business such as homeowners, personal auto, commercial property, and business interruption, as well as property reinsurance. Indeed, during the recent January 1st reinsurance renewal period, pricing improved in catastrophe-prone lines of business and will likely improve at the mid-year renewals in a similar manner. Recent industry pricing surveys for U.S. primary commercial lines have illustrated pricing stability and personal lines pricing trends have been favorable for some time; we suspect that higher reinsurance costs will likely further this trend. At the same time, nontraditional capital sources that have entered the industry, mostly through the reinsurance channel, will continue to grow in scope and influence.
This nontraditional capital, which is able to react quickly to industry events, has served to somewhat mute the sharp rate hikes once seen following large industry events. In part due to this dynamic, we had concentrated your portfolios’ reinsurance holdings to a handful of what we believe are the best run companies with solid balance sheets and which were trading well below our estimates of private market value. Examples of companies fitting this description, and which were holdings in both Funds during hurricane season are RenaissanceRe (RNR) and Validus Holdings (VR).
It’s noteworthy that, while we went into storm season comfortable in our reinsurance-exposed holdings, we made some modest tactical changes in both Funds as storms approached or hit – using our industry knowledge to trim names which we felt could be over-exposed to certain catastrophes, and adding to names which were likely to weather the events relatively well (or even be net beneficiaries from the catastrophes). We will go into more specifics in the Highlights sections below.
Subsequent to year end, AIG announced the acquisition of Validus (on the date it was announced, a significant position in both Funds) for $68.00 per share – a 46% premium to the prior day’s close, and significantly above where the stock traded prior to hurricane season. This transaction illustrates the attractive growth opportunities in third-party (reinsurance) capital management (of which VR is an industry leader), as well as the longer-term pressures faced by management teams of traditional reinsurance companies. We also believe this reaffirms our thesis that these portfolio companies trade significantly below private market value.
Prospector Opportunity Fund Highlights
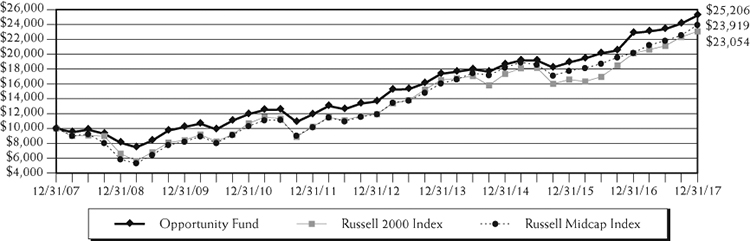
The Prospector Opportunity Fund advanced 10.33% for the year ended December 31, 2017. While this is an acceptable absolute result, it trailed in comparison to the 14.65% increase in the Russell 2000 Index and the 18.52% rise in the Russell Midcap Index. The outstanding returns in the overall stock market were heavily fueled by technology and healthcare stocks. The portfolio underweighting in POPFX to these two sectors hampered our results. Also our value orientation worked against us as growth investing decisively led the market. Our results were broadly in line with other value investors who are active in the small and midcap arena.
Not surprisingly our second half of 2017 portfolio activity was dominated by a repositioning of our insurance holdings in the wake of the heavy catastrophe losses incurred in Texas, Florida, Puerto Rico, and California. Specifically, our two largest purchases during the second half were White Mountains Insurance Group and Cincinnati Financial. White Mountains is a merchant banking operation with expert insurance and reinsurance
operating and acquisition skills plus significant undeployed capital following the 2017 sale of OneBeacon Insurance Group. White Mountains is well poised to opportunistically deploy capital into an improving fundamental insurance pricing market. Also White Mountains sells for an attractive discount to tangible book value valuation. Cincinnati Financial is a solid regional underwriter with a long tradition of conservative reserving whose stock has lagged the growth-oriented stock market the last few years. The improved pricing environment post catastrophe translates into better business conditions for this blue chip company which sells for a reasonable 1.6 times tangible book value.
Another top purchase during the second half was Powell Industries which sells systems that manage the flow of electricity in heavy industry, including oil & gas. Not surprisingly, the profitability of Powell has collapsed with the decline in energy prices since 2015. Powell management has elected to endure the downturn, hold onto their skilled labor force, and await the recovery which is signaled by the 2017 oil price rise. This strategy is enabled by Powell’s pristine balance sheet. Tom Powell, the Chairman and founder is 77, and would have no shortage of bidders should he decide to entertain them. The combination of a fortress balance sheet and a share price that fell from $70 to current levels below $30 make this an attractive investment.
On the sales side, POPFX benefited from merger and acquisition activity. Buffalo Wild Wings was the largest divestiture from the portfolio following a buyout from Arby’s restaurant Group. We owned Buffalo Wild Wings for less than a year and remained attracted to the potential turnaround of this unique franchise. We believe Arby’s has a winner on their hands. Another large divestiture was State National Companies, a growing insurance enterprise bought in a cash transaction at a 38% premium by Markel Insurance.
Prospector Capital Appreciation Fund Highlights
The Prospector Capital Appreciation Fund gained 11.38% for the year ended December 31, 2017. As mentioned above, these results trailed the tech-heavy benchmark S&P 500, but were more in line with value indices. While we are never happy trailing “the market,” we gain comfort when considering your portfolio’s holdings, which we constantly question as to valuation and downside protection offered. This includes our allocation to fixed income and convertible securities – many of which trade near par value, but offer the ability to participate in the upside of their relevant stocks. Significantly, your portfolio’s relative underweight to technology stocks explained the majority of the Fund’s underperformance relative to the S&P 500 during 2017. It should be noted that while the tech sector certainly contains many well-run companies with solid balance sheets, our under exposure has historically stemmed from avoiding companies threatened by short product cycles that could be made obsolete in the blink of an eye (we have a similar aversion to consumer stocks exposed to the latest fashion trends).
A significant portion of portfolio movements during the second half of 2017 could be attributed to the aforementioned trading surrounding the summer’s hurricanes (Harvey, Irma, and Maria). More specifically, as hurricane Irma approached Florida, we sold positions we believed would be more heavily impacted than peers to the (then forecasted) direct hit up the center of the state. The largest such position being Validus – a company we admire, and viewed as a potential takeout target. For this reason, we re-initiated a position in the company following storm season and have benefited from their acquisition by AIG. We also added to positions which would likely benefit either from potentially increasing insurance rates (e.g., insurance broker Brown & Brown), or from real estate demand just outside of Harvey-impacted Houston (e.g., real estate developer Howard Hughes).
The Fund’s convert position was also reduced during the latter part of the year. This was due to our Hologic (HOLX) issue being called by the company as well as the sale of our Electronics for Imaging (EFII) position – small additions of convertibles did not fully offset these deletions. Given still low interest rates, issuances of convertible
securities remains sparse (when debt is so cheap, companies don’t feel the need to add a convertible feature and opt to issue straight debt instead). Add to that the long-running bull market, and the pool of attractive converts continues to dwindle. We do, however, occasionally find the attractive issue, and continue to look for opportunities. Patience is a virtue.
Delving into the convert sales a bit more: As you may recall from our first half 2015 letter, after a successful investment in HOLX’s 2037 convertible, we initiated a position in the 2043 issue given better downside protection while still being able to participate in much of the upside. We felt that new CEO (at the time) Steve MacMillan had effected positive change quickly, and that there could be more upside. While we eked out a small gain in the 2043 issue, it was called by the company before we could achieve the larger gains we believed attainable. We continue to follow the company closely.
The EFII convert was sold under very different circumstances. Electronics for Imaging, a leader in the manufacturing of digital printers (which are in a period of secular growth as they take share from analog printing), saw its stock take a hit of over 40% when it was announced they were conducting an internal review of their accounting policies. EFII has a strong balance sheet and a history of producing solid cash flows; and, while the accounting issue seemed likely to be less severe than the plummeting stock price would suggest, prudency dictated that we sell the convert position (which we purchased slightly above par) at a small loss and follow the story from the sidelines.
Outlook
After a nine year post-financial crisis period of consistent underlying conditions for equity investing, things are slightly shifting. The interest rate and regulatory cycles have reached an inflection point. One thing that hasn’t changed is that the equity market continues to perform better than the underlying economy. The U.S. economy remains in a modest growth mode with signs of improvement. Our economy’s performance remains a global leader, but the margin has shrunk relative to Europe and the rest of the world.
Energy prices are still low, despite their 2017 increase. This stimulates consumer spending and confidence in the long run both here and for non-oil producing countries abroad. In the U.S. we enjoy the competitive advantage of a long-term supply of abundant cheap natural gas. The USD Index fell 10% in 2017, reversing the strong dollar trend and giving a boost to our export competitiveness.
Interest and mortgage rates continue near historically low levels, although they have moved off the lows and look poised to move higher still. Ultimately, higher rates will likely accompany better economic performance and some inflation, both of which are relative positives for equities compared to bonds. Much depends on the path and pace of interest rates’ return to normalcy. The yield curve flattened markedly in recent months, which is usually a precursor to an economic slowdown. Although we are clearly late in the economic cycle, the odds of an imminent recession seem low.
Investment-grade corporations have solid balance sheets and are accumulating excess cash and capital. Importantly, post tax reform they should start to spend more on new capital projects, new employees, and new acquisitions. The corporate tax cuts and the inducement to repatriate foreign cash holdings, of which there is more than $3 trillion, is fueling optimism. High-yield financing remains abundant and relatively inexpensive. Profit margins sit near all-time high levels, currently 10%.
In our estimation equity valuations remain at historically extended levels, in the tenth decile on trailing operating earnings. We feel we are in the later stages of a bull market, although nothing is certain. Equities look most reasonable when comparing earnings yields to Treasury or even corporate bond yields. In any case, the values inherent in your portfolio should attract acquirers and other investors over time. Meanwhile, we believe equities are a superior asset allocation alternative to bonds over the longer term.
Thank you for entrusting us with your money.
Respectfully submitted,
| John D. Gillespie | Kevin R. O’Brien | Jason A. Kish |
Performance data quoted represents past performance; past performance does not guarantee future results.
Opinions expressed are those of the Funds and are subject to change, are not guaranteed, and should not be considered a recommendation to buy or sell any security.
Mutual fund investing involves risk. Principal loss is possible. Investments in debt securities typically decrease in value when interest rates rise. This risk is usually greater for longer-term debt securities. The Funds invest in foreign securities which involve greater volatility and political, economic and currency risks and differences in accounting methods. The Funds invest in smaller and mid-cap companies, which involve additional risks such as limited liquidity and greater volatility. The Funds may hold restricted securities purchased through private placements. Such securities can be difficult to sell without experiencing delays or additional costs. Derivatives involve risks different from, and in certain cases, greater than the risks presented by more traditional investments. These risks are fully disclosed in the prospectus.
The S&P 500 Index is a broad based unmanaged index of 500 stocks, which is widely recognized as representative of the equity market in general. You cannot invest directly in an index.
The Russell 1000 Growth Index is an unmanaged index that measures the performance of the large-cap growth segment of the U.S. equity universe. It includes those Russell 1000 companies with higher price-to-book ratios and higher forecasted growth values. You cannot invest directly in an index.
The Russell 1000 Value Index is an unmanaged index that measures the performance of the large-cap value segment of the U.S. equity universe. It includes those Russell 1000 companies with lower price-to-book ratios and lower expected growth values.
The Russell 1000 Index is an unmanaged index that measures the performance of the highest-ranking 1,000 stocks in the Russell 3000 Index, which represents about 90% of the total market capitalization of that index. You cannot invest directly in an index.
The Russell 2000 Index is an unmanaged small-cap index that measures the performance of the 2,000 smallest companies in the Russell 3000 Index. You cannot invest directly in an index.
The Russell MidCap Index is an unmanaged mid-cap index that measures the performance of the 800 smallest companies in the Russell 1000 Index. You cannot invest directly in an index.
Tangible Book value is the total net asset value of a company’s assets that shareholders would theoretically receive if a company were liquidated less intangible assets and goodwill.
The U.S. dollar index is a measure of the value of the U.S. dollar relative to the value of a basket of currencies of the majority of the U.S.’s most significant trading partners.
Fund holdings and/or security allocations are subject to change at any time and are not recommendations to buy or sell any security. Please see the Schedule of Investments section in this report for a full listing of the Fund’s holdings.
Prospector Funds, Inc. are distributed by Quasar Distributors, LLC.
Capital Appreciation Fund
The chart assumes an initial investment of $10,000. Performance reflects waivers of fee and operating expenses in effect. In the absence of such waivers, total return would be reduced. Past performance is not predictive of future performance. Investment return and principal value will fluctuate, so that your shares, when redeemed may be worth more or less than their original cost. Performance assumes the reinvestment of capital gains and income distributions. The performance does not reflect the deduction of taxes that a shareholder would pay on Fund distributions or the redemption of Fund shares.
Average Annual Rates of Return (%) – As of December 31, 2017
| | One Year | Three Year | Five Year | Ten Year | Since Inception(1) |
| Capital Appreciation Fund | 11.38% | 7.58% | 9.09% | 5.86% | 5.67% |
S&P 500 Index(2) | 21.83% | 11.41% | 15.79% | 8.50% | 7.88% |
| (1) | September 28, 2007 |
| (2) | The Standard & Poor’s 500 Index (S&P 500) is an unmanaged, capitalization-weighted index generally representative of the U.S. market for large capitalization stocks. This Index cannot be invested in directly. |
Opportunity Fund
The chart assumes an initial investment of $10,000. Performance reflects waivers of fee and operating expenses in effect. In the absence of such waivers, total return would be reduced. Past performance is not predictive of future performance. Investment return and principal value will fluctuate, so that your shares, when redeemed may be worth more or less than their original cost. Performance assumes the reinvestment of capital gains and income distributions. The performance does not reflect the deduction of taxes that a shareholder would pay on Fund distributions or the redemption of Fund shares.
Average Annual Rates of Return (%) – As of December 31, 2017
| | One Year | Three Year | Five Year | Ten Year | Since Inception(1) |
| Opportunity Fund | 10.33% | 10.60% | 13.07% | 9.69% | 9.44% |
Russell 2000 Index(2) | 14.65% | 9.96% | 14.12% | 8.71% | 7.88% |
Russell Midcap Index(3) | 18.52% | 9.58% | 14.96% | 9.11% | 8.46% |
| (1) | September 28, 2007 |
| (2) | An unmanaged small-cap index that measures the performance of the 2,000 smallest companies in the Russell 3000 Index. This index cannot be invested in directly. |
| (3) | An unmanaged mid-cap index that measures the performance of the 800 smallest companies in the Russell 1000 Index. This index cannot be invested in directly. |
Expense Example
December 31, 2017
As a shareholder of the Fund, you incur two types of costs: (1) transaction costs, which may include but are not limited to, redemption fees, wire transfer fees, maintenance fee (IRA accounts), and exchange fees; and (2) ongoing costs, including management fees; distribution and/or service fees; and other Fund expenses. This Example is intended to help you understand your ongoing costs (in dollars) of investing in the Fund and to compare these costs with the ongoing costs of investing in other mutual funds. The Example is based on an investment of $1,000 invested at the beginning of the period and held for the entire period (July 1, 2017 – December 31, 2017).
ACTUAL EXPENSES
The first line of the table below provides information about actual account values and actual expenses. Although the Fund charges no sales load or transaction fees, you will be assessed fees for outgoing wire transfers, returned checks and stop payment orders at prevailing rates charged by U.S. Bancorp Fund Services, LLC, the Fund’s transfer agent. The example below includes, but is not limited to, management fees, shareholder servicing fees and other Fund expenses. However, the example below does not include portfolio trading commissions and related expenses, interest expense and other extraordinary expenses as determined under generally accepted accounting principles. You may use the information in this line, together with the amount you invested, to estimate the expenses that you paid over the period. Simply divide your account value by $1,000 (for example, an $8,600 account value divided by $1,000 = 8.6), then multiply the result by the number in the first line under the heading entitled “Expenses Paid During Period” to estimate the expenses you paid on your account during this period.
HYPOTHETICAL EXAMPLE FOR COMPARISON PURPOSES
The second line of the table below provides information about hypothetical account values and hypothetical expenses based on the Fund’s actual expense ratio and an assumed rate of return of 5% per year before expenses, which is not the Fund’s actual return. The hypothetical account values and expenses may not be used to estimate the actual ending account balance or expenses you paid for the period. You may use this information to compare the ongoing costs of investing in the Fund and other funds. To do so, compare this 5% hypothetical example with the 5% hypothetical examples that appear in the shareholder reports of the other funds.
Please note that the expenses shown in the table are meant to highlight your ongoing costs only and do not reflect any transactional costs, such as redemption fees or exchange fees. Therefore, the second line of the table is useful in comparing ongoing costs only, and will not help you determine the relative total costs of owning different funds. In addition, if these transactional costs were included, your costs would have been higher.
| | | | Expenses Paid |
| | Beginning Account | Ending Account | During Period(1) |
| | Value (07/01/2017) | Value (12/31/2017) | (07/01/2017 to 12/31/2017) |
Capital Appreciation Actual(2) | $1,000.00 | $1,070.40 | $6.78 |
| Capital Appreciation Hypothetical | | | |
| (5% return before expenses) | 1,000.00 | 1,018.65 | 6.61 |
| | | | |
Opportunity Actual(2) | 1,000.00 | 1,078.70 | 6.81 |
| Opportunity Hypothetical | | | |
| (5% return before expenses) | 1,000.00 | 1,018.65 | 6.61 |
| (1) | Expenses are equal to the Fund’s annualized expense ratio for the most recent six-month period of 1.30% and 1.30% for Capital Appreciation Fund and Opportunity Fund, respectively, multiplied by the average account value over the period, multiplied by 184/365 to reflect the one-half year period. |
| (2) | Based on the actual returns for the six-month period ended December 31, 2017 of 7.04% and 7.87% for Capital Appreciation Fund and Opportunity Fund, respectively. |
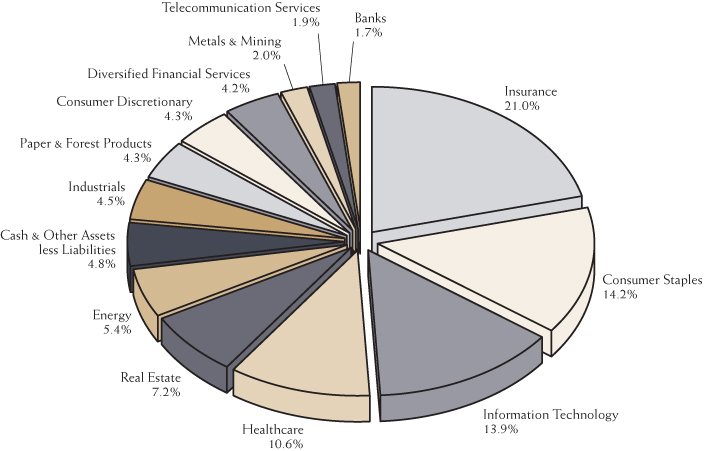
Sector Allocation (% of net assets) (Unaudited)
as of December 31, 2017(1)(2)
Capital Appreciation Fund
Top 10 Holdings (% of net assets) (Unaudited)
as of December 31, 2017(1)(3)
Capital Appreciation Fund
| Hartford Financial Services Group | 3.3% |
| Forestar Group, 3.750%, 03/01/2020 | 3.1% |
| Brown & Brown | 3.0% |
| Verint Systems, 1.500%, 06/01/2021 | 2.9% |
| Domtar | 2.8% |
| Abbott Laboratories | 2.7% |
| FLIR Systems | 2.6% |
| Coca-Cola | 2.6% |
| Johnson & Johnson | 2.5% |
| Berkshire Hathaway, Class B | 2.4% |
| (1) | Fund holdings and sector allocations are subject to change at any time and are not recommendations to buy or sell any security. |
| (2) | Sector allocation includes all investment types. |
| (3) | Invesco Treasury Portfolio excluded from top 10 holdings. |
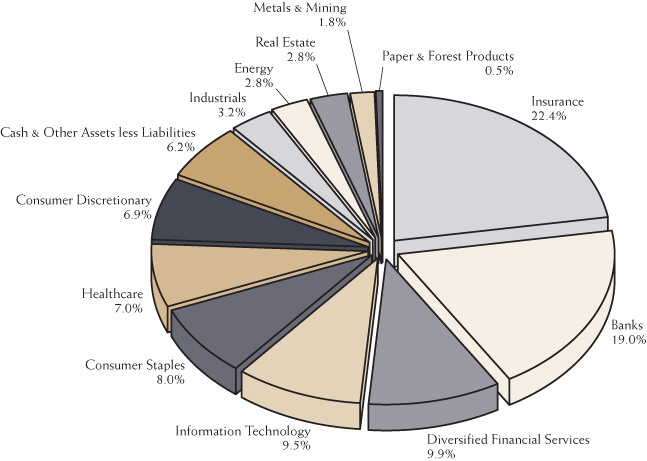
Sector Allocation (% of net assets) (Unaudited)
as of December 31, 2017(1)(2)
Opportunity Fund
Top 10 Holdings (% of net assets) (Unaudited)
as of December 31, 2017(1)(3)
Opportunity Fund
| Brown & Brown | 3.9% |
| Federated Investors, Class B | 2.9% |
| Torchmark | 2.8% |
| T. Rowe Price Group | 2.8% |
| HomeTrust Bancshares | 2.4% |
| Validus Holdings | 2.3% |
| Del Frisco’s Restaurant Group | 2.1% |
| RenaissanceRe Holdings | 2.0% |
| FLIR Systems | 2.0% |
| Microsoft | 2.0% |
| (1) | Fund holdings and sector allocations are subject to change at any time and are not recommendations to buy or sell any security. |
| (2) | Sector allocation includes all investment types. |
| (3) | Invesco Treasury Portfolio excluded from top 10 holdings. |
Schedule of Investments
December 31, 2017
Capital Appreciation Fund
Description | | Shares | | | Value | |
| COMMON STOCKS – 77.1% | | | | | | |
| | | | | | | |
| Banks – 1.7% | | | | | | |
| Associated Banc-Corp | | | 6,500 | | | $ | 165,100 | |
| Comerica | | | 1,900 | | | | 164,939 | |
| Opus Bank* | | | 4,900 | | | | 133,770 | �� |
| | | | | | | | 463,809 | |
| Consumer Discretionary – 2.3% | | | | | | | | |
| Lowe’s Companies | | | 6,600 | | | | 613,404 | |
| | | | | | | | | |
| Consumer Staples – 13.2% | | | | | | | | |
| Campbell Soup | | | 4,100 | | | | 197,251 | |
| Coca-Cola | | | 15,125 | | | | 693,935 | |
| Colgate-Palmolive | | | 7,900 | | | | 596,055 | |
| Mondelez International, Class A | | | 13,250 | | | | 567,100 | |
| Nestle | | | 6,300 | | | | 541,783 | |
| Tootsie Roll Industries | | | 15,638 | | | | 569,223 | |
| Walgreens Boots Alliance | | | 5,150 | | | | 373,993 | |
| | | | | | | | 3,539,340 | |
| Diversified Financial Services – 4.2% | | | | | | | | |
| Invesco | | | 7,800 | | | | 285,012 | |
| Leucadia National | | | 10,300 | | | | 272,847 | |
| T. Rowe Price Group | | | 5,300 | | | | 556,129 | |
| | | | | | | | 1,113,988 | |
| Energy – 5.4% | | | | | | | | |
| Hess | | | 10,200 | | | | 484,194 | |
| Noble Energy | | | 18,063 | | | | 526,356 | |
| Suncor Energy | | | 11,800 | | | | 433,296 | |
| | | | | | | | 1,443,846 | |
| Healthcare – 9.3% | | | | | | | | |
| Abbott Laboratories | | | 12,600 | | | | 719,082 | |
| AstraZeneca – ADR | | | 14,000 | | | | 485,800 | |
| GlaxoSmithKline – ADR | | | 5,650 | | | | 200,405 | |
| Johnson & Johnson | | | 4,725 | | | | 660,177 | |
| Merck & Co. | | | 7,600 | | | | 427,652 | |
| | | | | | | | 2,493,116 | |
| Industrials – 2.2% | | | | | | | | |
| Eaton | | | 7,450 | | | | 588,624 | |
See Notes to the Financial Statements
Schedule of Investments – Continued
December 31, 2017
Capital Appreciation Fund
Description | | Shares | | | Value | |
COMMON STOCKS – 77.1% (Continued) | | | | | | |
| | | | | | | |
| Information Technology – 7.5% | | | | | | |
| FARO Technologies* | | | 6,400 | | | $ | 300,800 | |
| FLIR Systems | | | 14,950 | | | | 696,969 | |
| Microsoft | | | 6,700 | | | | 573,118 | |
| Paychex | | | 3,000 | | | | 204,240 | |
| Science Applications International | | | 3,200 | | | | 245,024 | |
| | | | | | | | 2,020,151 | |
| Insurance – 21.0% | | | | | | | | |
| Aflac | | | 4,600 | | | | 403,788 | |
| Arch Capital Group* | | | 2,950 | | | | 267,772 | |
| Berkshire Hathaway, Class B* | | | 3,250 | | | | 644,215 | |
| Brown & Brown | | | 15,700 | | | | 807,922 | |
| Cincinnati Financial | | | 3,200 | | | | 239,904 | |
| First American Financial | | | 9,775 | | | | 547,791 | |
| Hanover Insurance Group | | | 2,000 | | | | 216,160 | |
| Hartford Financial Services Group | | | 15,800 | | | | 889,224 | |
| Loews | | | 9,100 | | | | 455,273 | |
| RenaissanceRe Holdings | | | 4,214 | | | | 529,236 | |
| Selective Insurance Group | | | 6,500 | | | | 381,550 | |
| Validus Holdings | | | 5,100 | | | | 239,292 | |
| | | | | | | | 5,622,127 | |
| Paper & Forest Products – 4.3% | | | | | | | | |
| Domtar | | | 15,251 | | | | 755,229 | |
| Louisiana-Pacific* | | | 14,800 | | | | 388,648 | |
| | | | | | | | 1,143,877 | |
| Real Estate – 4.1% | | | | | | | | |
| Camden Property Trust | | | 1,400 | | | | 128,884 | |
| EastGroup Properties, Inc. | | | 1,400 | | | | 123,732 | |
| Four Corners Property Trust | | | 20,248 | | | | 520,374 | |
| Howard Hughes* | | | 2,500 | | | | 328,175 | |
| | | | | | | | 1,101,165 | |
| Telecommunication Services – 1.9% | | | | | | | | |
| Telephone & Data Systems | | | 17,875 | | | | 496,925 | |
| Total Common Stocks | | | | | | | | |
| (Cost $15,861,991) | | | | | | | 20,640,372 | |
See Notes to the Financial Statements
Schedule of Investments – Continued
December 31, 2017
Capital Appreciation Fund
Description | | Par | | | Value | |
| CONVERTIBLE BONDS – 15.8% | | | | | | |
| | | | | | | |
| Consumer Discretionary – 2.0% | | | | | | |
| Shutterfly | | | | | | |
| 0.250%, 05/15/2018 | | $ | 523,000 | | | $ | 520,385 | |
| | | | | | | | | |
| Industrials – 2.3% | | | | | | | | |
| Chart Industries | | | | | | | | |
| 2.000%, 08/01/2018 | | | 625,000 | | | | 623,438 | |
| | | | | | | | | |
| Information Technology – 6.4% | | | | | | | | |
| Akamai Technologies | | | | | | | | |
| 0.000%, 02/15/2019 | | | 580,000 | | | | 583,625 | |
| Synaptics | | | | | | | | |
| 0.500%, 06/15/2022 | | | 368,500 | | | | 339,941 | |
| Verint Systems | | | | | | | | |
| 1.500%, 06/01/2021 | | | 810,000 | | | | 786,713 | |
| | | | | | | | 1,710,279 | |
| Metals & Mining – 2.0% | | | | | | | | |
| RTI International | | | | | | | | |
| 1.625%, 10/15/2019 | | | 460,000 | | | | 524,975 | |
| | | | | | | | | |
| Real Estate – 3.1% | | | | | | | | |
| Forestar Group | | | | | | | | |
| 3.750%, 03/01/2020 | | | 825,000 | | | | 832,734 | |
| Total Convertible Bonds | | | | | | | | |
| (Cost $4,185,312) | | | | | | | 4,211,811 | |
| | | | | | | | | |
| CORPORATE BONDS – 2.3% | | | | | | | | |
| | | | | | | | | |
| Consumer Staples – 1.0% | | | | | | | | |
| CVS Health | | | | | | | | |
| 2.250%, 08/12/2019 | | | 263,000 | | | | 262,205 | |
| | | | | | | | | |
| Healthcare – 1.3% | | | | | | | | |
| Amgen | | | | | | | | |
| 2.200%, 05/22/2019 | | | 350,000 | | | | 350,071 | |
| Total Corporate Bonds | | | | | | | | |
| (Cost $614,903) | | | | | | | 612,276 | |
See Notes to the Financial Statements
Schedule of Investments – Continued
December 31, 2017
Capital Appreciation Fund
Description | | Shares | | | Value | |
| SHORT-TERM INVESTMENT – 4.9% | | | | | | |
| Invesco Treasury Portfolio, 1.170%^ | | | | | | |
| (Cost $1,320,999) | | | 1,320,999 | | | $ | 1,320,999 | |
| Total Investments – 100.1% | | | | | | | | |
| (Cost $21,983,205) | | | | | | | 26,785,458 | |
| Other Assets and Liabilities, Net – (0.1)% | | | | | | | (20,459 | ) |
| Total Net Assets – 100.0% | | | | | | $ | 26,764,999 | |
| * | Non-income producing security |
ADR – American Depositary Receipt
| ^ | The rate shown is the annualized seven-day yield effective as of December 31, 2017. |
See Notes to the Financial Statements
Schedule of Investments
December 31, 2017
Opportunity Fund
Description | | Shares | | | Value | |
| COMMON STOCKS – 93.4% | | | | | | |
| | | | | | | |
| Banks – 19.0% | | | | | | |
| Associated Banc-Corp | | | 29,400 | | | $ | 746,760 | |
| Bank of N.T. Butterfield & Son | | | 46,300 | | | | 1,680,227 | |
| Beneficial Bancorp | | | 94,500 | | | | 1,554,525 | |
| Blue Hills Bancorp | | | 42,500 | | | | 854,250 | |
| BSB Bancorp* | | | 10,680 | | | | 312,390 | |
| Central Pacific Financial | | | 47,800 | | | | 1,425,874 | |
| Citigroup | | | 15,970 | | | | 1,188,328 | |
| Clifton Bancorp | | | 13,372 | | | | 228,661 | |
| Comerica | | | 7,100 | | | | 616,351 | |
| First Connecticut Bancorp | | | 34,700 | | | | 907,405 | |
| HomeTrust Bancshares* | | | 106,600 | | | | 2,744,951 | |
| KeyCorp | | | 109,600 | | | | 2,210,632 | |
| OceanFirst Financial | | | 44,100 | | | | 1,157,625 | |
| Opus Bank* | | | 21,600 | | | | 589,680 | |
| Oritani Financial | | | 40,450 | | | | 663,380 | |
| PCSB Financial* | | | 67,300 | | | | 1,282,065 | |
| SI Financial Group | | | 51,200 | | | | 752,640 | |
| Waterstone Financial | | | 100,100 | | | | 1,706,705 | |
| Western New England Bancorp | | | 144,735 | | | | 1,577,611 | |
| | | | | | | | 22,200,060 | |
| Consumer Discretionary – 6.9% | | | | | | | | |
| Del Frisco’s Restaurant Group* | | | 157,700 | | | | 2,404,925 | |
| Habit Restaurants* | | | 82,100 | | | | 784,055 | |
| Home Depot | | | 11,900 | | | | 2,255,407 | |
| Hyatt Hotels, Class A* | | | 16,600 | | | | 1,220,764 | |
| Noodles & Company* | | | 103,763 | | | | 544,756 | |
| Ruth’s Hospitality Group | | | 38,800 | | | | 840,020 | |
| | | | | | | | 8,049,927 | |
| Consumer Staples – 8.0% | | | | | | | | |
| Church & Dwight | | | 37,000 | | | | 1,856,290 | |
| Coca-Cola | | | 25,300 | | | | 1,160,764 | |
| Colgate-Palmolive | | | 15,200 | | | | 1,146,840 | |
| Mondelez International, Class A | | | 36,400 | | | | 1,557,920 | |
| Nestle | | | 24,200 | | | | 2,081,133 | |
| Tootsie Roll Industries | | | 41,439 | | | | 1,508,380 | |
| | | | | | | | 9,311,327 | |
See Notes to the Financial Statements
Schedule of Investments – Continued
December 31, 2017
Opportunity Fund
Description | | Shares | | | Value | |
COMMON STOCKS – 93.4% (Continued) | | | | | | |
| | | | | | | |
| Diversified Financial Services – 9.9% | | | | | | |
| Federated Investors, Class B | | | 94,600 | | | $ | 3,413,168 | |
| Franklin Resources | | | 40,900 | | | | 1,772,197 | |
| Invesco | | | 48,100 | | | | 1,757,574 | |
| Leucadia National | | | 50,500 | | | | 1,337,745 | |
| T. Rowe Price Group | | | 30,700 | | | | 3,221,351 | |
| | | | | | | | 11,502,035 | |
| Energy – 2.8% | | | | | | | | |
| Hess | | | 35,100 | | | | 1,666,197 | |
| Noble Energy | | | 53,600 | | | | 1,561,904 | |
| | | | | | | | 3,228,101 | |
| Healthcare – 7.0% | | | | | | | | |
| AstraZeneca – ADR | | | 25,400 | | | | 881,380 | |
| GlaxoSmithKline – ADR | | | 24,500 | | | | 869,015 | |
| Haemonetics* | | | 18,600 | | | | 1,080,288 | |
| Invacare | | | 37,500 | | | | 631,875 | |
| Medtronic | | | 12,700 | | | | 1,025,525 | |
| Merck & Co. | | | 30,148 | | | | 1,696,428 | |
| Patterson Companies | | | 55,900 | | | | 2,019,667 | |
| | | | | | | | 8,204,178 | |
| Industrials – 3.2% | | | | | | | | |
| CIRCOR International | | | 22,400 | | | | 1,090,432 | |
| Landstar System | | | 13,100 | | | | 1,363,710 | |
| Powell Industries | | | 45,700 | | | | 1,309,305 | |
| | | | | | | | 3,763,447 | |
| Information Technology – 9.5% | | | | | | | | |
| FARO Technologies* | | | 24,400 | | | | 1,146,800 | |
| FLIR Systems | | | 49,800 | | | | 2,321,676 | |
| Maxim Integrated Products | | | 20,300 | | | | 1,061,284 | |
| Microsoft | | | 26,600 | | | | 2,275,364 | |
| Paychex | | | 26,000 | | | | 1,770,080 | |
| Synopsys* | | | 6,700 | | | | 571,108 | |
| VeriSign* | | | 9,900 | | | | 1,132,956 | |
| Xilinx | | | 12,300 | | | | 829,266 | |
| | | | | | | | 11,108,534 | |
See Notes to the Financial Statements
Schedule of Investments – Continued
December 31, 2017
Opportunity Fund
Description | | Shares | | | Value | |
COMMON STOCKS – 93.4% (Continued) | | | | | | |
| | | | | | | |
| Insurance – 22.4% | | | | | | |
| Arch Capital Group* | | | 6,500 | | | $ | 590,005 | |
| Brown & Brown | | | 87,300 | | | | 4,492,458 | |
| Cincinnati Financial | | | 23,700 | | | | 1,776,789 | |
| Hanover Insurance Group | | | 20,000 | | | | 2,161,600 | |
| Hartford Financial Services Group | | | 25,500 | | | | 1,435,140 | |
| Hiscox | | | 84,715 | | | | 1,674,490 | |
| Primerica | | | 14,900 | | | | 1,513,095 | |
| RenaissanceRe Holdings | | | 18,500 | | | | 2,323,415 | |
| Safety Insurance Group | | | 7,400 | | | | 594,960 | |
| Selective Insurance Group | | | 23,600 | | | | 1,385,320 | |
| Torchmark | | | 35,600 | | | | 3,229,276 | |
| Validus Holdings | | | 57,000 | | | | 2,674,440 | |
| White Mountains Insurance Group | | | 2,640 | | | | 2,247,379 | |
| | | | | | | | 26,098,367 | |
| Metals & Mining – 1.8% | | | | | | | | |
| Kinross Gold* | | | 79,800 | | | | 344,736 | |
| Newmont Mining | | | 44,900 | | | | 1,684,648 | |
| Victoria Gold* | | | 96,500 | | | | 33,601 | |
| | | | | | | | 2,062,985 | |
| Paper & Forest Products – 0.5% | | | | | | | | |
| Domtar | | | 12,300 | | | | 609,096 | |
| | | | | | | | | |
| Real Estate – 2.4% | | | | | | | | |
| Camden Property Trust | | | 6,000 | | | | 552,360 | |
| Cousins Properties | | | 130,892 | | | | 1,210,751 | |
| Easterly Government Properties | | | 200 | | | | 4,268 | |
| EastGroup Properties | | | 6,100 | | | | 539,118 | |
| Four Corners Property Trust | | | 18,547 | | | | 476,658 | |
| | | | | | | | 2,783,155 | |
| Total Common Stocks | | | | | | | | |
| (Cost 84,479,258) | | | | | | | 108,921,212 | |
| | | | | | | | | |
| | | Par | | | | | |
| CONVERTIBLE BOND – 0.4% | | | | | | | | |
| | | | | | | | | |
| Real Estate – 0.4% | | | | | | | | |
| Forestar Group | | | | | | | | |
| 3.750%, 03/01/2020 | | | | | | | | |
| (Cost $461,757) | | $ | 450,000 | | | | 454,219 | |
See Notes to the Financial Statements
Schedule of Investments – Continued
December 31, 2017
Opportunity Fund
Description | | Shares | | | Value | |
| SHORT-TERM INVESTMENT – 6.3% | | | | | | |
| Invesco Treasury Portfolio, 1.170%^ | | | | | | |
| (Cost $7,291,396) | | | 7,291,396 | | | $ | 7,291,396 | |
| Total Investments – 100.1% | | | | | | | | |
| (Cost $92,232,411) | | | | | | | 116,666,827 | |
| Other Assets and Liabilities, Net – (0.1)% | | | | | | | (57,481 | ) |
| Total Net Assets – 100.0% | | | | | | $ | 116,609,346 | |
| * | Non-income producing security |
ADR – American Depositary Receipt
| ^ | The rate shown is the annualized seven-day yield effective as of December 31, 2017. |
See Notes to the Financial Statements
Statements of Assets and Liabilities
December 31, 2017
| | | Capital Appreciation Fund | | | Opportunity Fund | |
| ASSETS: | | | | | | |
| Investments, at market value | | | | | | |
| (Cost of $21,983,205 and $92,232,411, respectively) | | $ | 26,785,458 | | | $ | 116,666,827 | |
| Receivable for dividends and interest | | | 62,224 | | | | 131,217 | |
| Receivable for capital shares sold | | | 4 | | | | 1,535,854 | |
| Prepaid expenses | | | 9,187 | | | | 18,313 | |
| Total assets | | | 26,856,873 | | | | 118,352,211 | |
| | | | | | | | | |
| LIABILITIES: | | | | | | | | |
| Payable for capital shares redeemed | | | 11,746 | | | | 1,538,313 | |
| Payable to adviser, net | | | 8,583 | | | | 80,424 | |
| Accrued distribution fees | | | 1,948 | | | | 10,283 | |
| Accrued expenses and other liabilities | | | 69,597 | | | | 113,845 | |
| Total liabilities | | | 91,874 | | | | 1,742,865 | |
| | | | | | | | | |
| NET ASSETS | | $ | 26,764,999 | | | $ | 116,609,346 | |
| | | | | | | | | |
| COMPOSITION OF NET ASSETS: | | | | | | | | |
| Portfolio capital | | $ | 21,969,734 | | | $ | 92,212,874 | |
| Distributions in excess of net investment income | | | (6,421 | ) | | | (5,623 | ) |
| Accumulated net realized loss on investments | | | (638 | ) | | | (30,923 | ) |
| Net unrealized appreciation of investments | | | 4,802,324 | | | | 24,433,018 | |
| Total net assets | | $ | 26,764,999 | | | $ | 116,609,346 | |
| | | | | | | | | |
CAPITAL STOCK, $0.0001 par value | | | | | | | | |
| Authorized | | | 500,000,000 | | | | 500,000,000 | |
| Issued and outstanding | | | 1,518,102 | | | | 5,593,369 | |
| | | | | | | | | |
| NET ASSET VALUE, REDEMPTION PRICE, | | | | | | | | |
| AND OFFERING PRICE PER SHARE | | $ | 17.63 | | | $ | 20.85 | |
See Notes to the Financial Statements
Statements of Operations
For the Year Ended December 31, 2017
| | | Capital Appreciation Fund | | | Opportunity Fund | |
| INVESTMENT INCOME: | | | | | | |
| Interest income | | $ | 74,731 | | | $ | 82,552 | |
| Dividend income | | | 396,496 | | | | 1,913,031 | |
| Less: Foreign taxes withheld | | | (4,019 | ) | | | (6,978 | ) |
| Total investment income | | | 467,208 | | | | 1,988,605 | |
| | | | | | | | | |
| EXPENSES: | | | | | | | | |
| Investment advisory fees | | | 287,592 | | | | 1,210,884 | |
| Administration fees | | | 53,819 | | | | 118,151 | |
| Audit & tax fees | | | 41,846 | | | | 41,846 | |
| Fund accounting fees | | | 40,225 | | | | 43,313 | |
| Registration fees | | | 24,770 | | | | 26,269 | |
| Transfer agent fees | | | 24,726 | | | | 44,621 | |
| Legal fees | | | 14,049 | | | | 60,322 | |
| Distribution fees | | | 13,172 | | | | 92,322 | |
| Directors’ fees | | | 12,006 | | | | 50,262 | |
| Other expenses | | | 6,034 | | | | 22,370 | |
| Custodian fees | | | 5,838 | | | | 8,774 | |
| Postage and printing fees | | | 2,762 | | | | 14,693 | |
| Total expenses | | | 526,839 | | | | 1,733,827 | |
| Less: Fee waivers | | | (186,958 | ) | | | (302,782 | ) |
| Total net expenses | | | 339,881 | | | | 1,431,045 | |
| NET INVESTMENT INCOME | | | 127,327 | | | | 557,560 | |
| | | | | | | | | |
| REALIZED AND UNREALIZED GAINS: | | | | | | | | |
| Net realized gain on investments | | | 1,021,358 | | | | 5,417,263 | |
| Net change in unrealized appreciation of investments | | | 1,682,148 | | | | 5,023,381 | |
| Net gain on investments | | | 2,703,506 | | | | 10,440,644 | |
| | | | | | | | | |
| NET INCREASE IN NET ASSETS | | | | | | | | |
| RESULTING FROM OPERATIONS | | $ | 2,830,833 | | | $ | 10,998,204 | |
See Notes to the Financial Statements
Statements of Changes in Net Assets
| | | Capital Appreciation Fund | |
| | | Year Ended | | | Year Ended | |
| | | December 31, 2017 | | | December 31, 2016 | |
| OPERATIONS: | | | | | | |
| Net investment income | | $ | 127,327 | | | $ | 324,293 | |
| Net realized gain on investments | | | 1,021,358 | | | | 631,615 | |
| Net change in unrealized appreciation of investments | | | 1,682,148 | | | | 2,350,669 | |
| Net increase resulting from operations | | | 2,830,833 | | | | 3,306,577 | |
| | | | | | | | | |
| CAPITAL SHARE TRANSACTIONS: | | | | | | | | |
| Proceeds from shares sold | | | 263,509 | | | | 62,641 | |
| Proceeds from reinvestment of distributions | | | 1,496,681 | | | | 322,596 | |
| Payments for shares redeemed | | | (1,934,889 | ) | | | (2,025,395 | ) |
| Redemption fees | | | 21 | | | | 91 | |
| Net decrease from capital share transactions | | | (174,678 | ) | | | (1,640,067 | ) |
| | | | | | | | | |
| DISTRIBUTIONS PAID FROM: | | | | | | | | |
| Net investment income | | | (131,991 | ) | | | (331,651 | ) |
| Net realized gains | | | (1,422,407 | ) | | | — | |
| Total distributions to shareholders | | | (1,554,398 | ) | | | (331,651 | ) |
| | | | | | | | | |
| TOTAL INCREASE IN NET ASSETS | | | 1,101,757 | | | | 1,334,859 | |
| | | | | | | | | |
| NET ASSETS: | | | | | | | | |
| Beginning of period | | | 25,663,242 | | | | 24,328,383 | |
| | | | | | | | | |
| End of period (including distributions | | | | | | | | |
| in excess of net investment income of | | | | | | | | |
| $(6,421) and $(1,841), respectively) | | $ | 26,764,999 | | | $ | 25,663,242 | |
| | | | | | | | | |
| TRANSACTIONS IN SHARES: | | | | | | | | |
| Shares sold | | | 15,323 | | | | 3,882 | |
| Shares issued in reinvestment of distributions | | | 84,654 | | | | 19,145 | |
| Shares redeemed | | | (109,788 | ) | | | (134,596 | ) |
| Net decrease | | | (9,811 | ) | | | (111,569 | ) |
See Notes to the Financial Statements
Statements of Changes in Net Assets
| | | Opportunity Fund | |
| | | Year Ended | | | Year Ended | |
| | | December 31, 2017 | | | December 31, 2016 | |
| OPERATIONS: | | | | | | |
| Net investment income | | $ | 557,560 | | | $ | 645,990 | |
| Net realized gain on investments | | | 5,417,263 | | | | 3,963,408 | |
| Net change in unrealized appreciation of investments | | | 5,023,381 | | | | 13,795,516 | |
| Net increase resulting from operations | | | 10,998,204 | | | | 18,404,914 | |
| | | | | | | | | |
| CAPITAL SHARE TRANSACTIONS: | | | | | | | | |
| Proceeds from shares sold | | | 12,146,454 | | | | 14,729,319 | |
| Proceeds from reinvestment of distributions | | | 6,917,514 | | | | 3,580,862 | |
| Payments for shares redeemed | | | (12,535,701 | ) | | | (12,419,401 | ) |
| Redemption fees | | | 1,267 | | | | 3,259 | |
| Net increase from capital share transactions | | | 6,529,534 | | | | 5,894,039 | |
| | | | | | | | �� | |
| DISTRIBUTIONS PAID FROM: | | | | | | | | |
| Net investment income | | | (544,927 | ) | | | (1,137,845 | ) |
| Net realized gains | | | (6,915,897 | ) | | | (2,746,242 | ) |
| Total distributions to shareholders | | | (7,460,824 | ) | | | (3,884,087 | ) |
| | | | | | | | | |
| TOTAL INCREASE IN NET ASSETS | | | 10,066,914 | | | | 20,414,866 | |
| | | | | | | | | |
| NET ASSETS: | | | | | | | | |
| Beginning of period | | | 106,542,432 | | | | 86,127,566 | |
| | | | | | | | | |
| End of period (including distributions | | | | | | | | |
| in excess of net investment income of | | | | | | | | |
| $(5,623) and $(6,827), respectively) | | $ | 116,609,346 | | | $ | 106,542,432 | |
| | | | | | | | | |
| TRANSACTIONS IN SHARES: | | | | | | | | |
| Shares sold | | | 586,858 | | | | 819,972 | |
| Shares issued in reinvestment of distributions | | | 329,877 | | | | 176,920 | |
| Shares redeemed | | | (605,456 | ) | | | (695,195 | ) |
| Net increase | | | 311,279 | | | | 301,697 | |
See Notes to the Financial Statements
Financial Highlights
| | | Capital Appreciation Fund | |
| | | Year Ended December 31, | |
| | | 2017 | | | 2016 | | | 2015 | | | 2014 | | | 2013 | |
| For a Fund share outstanding | | | | | | | | | | | | | | | |
| throughout the period | | | | | | | | | | | | | | | |
| | | | | | | | | | | | | | | | |
| NET ASSET VALUE: | | | | | | | | | | | | | | | |
| Beginning of period | | $ | 16.80 | | | $ | 14.84 | | | $ | 15.61 | | | $ | 17.11 | | | $ | 15.19 | |
| | | | | | | | | | | | | | | | | | | | | |
| OPERATIONS: | | | | | | | | | | | | | | | | | | | | |
| Net investment income | | | 0.09 | | | | 0.22 | | | | 0.21 | | | | 0.11 | | | | 0.18 | |
| Net realized and unrealized | | | | | | | | | | | | | | | | | | | | |
| gain (loss) on investments | | | 1.82 | | | | 1.96 | | | | (0.60 | ) | | | 0.63 | | | | 2.72 | |
| Total from operations | | | 1.91 | | | | 2.18 | | | | (0.39 | ) | | | 0.74 | | | | 2.90 | |
| | | | | | | | | | | | | | | | | | | | | |
| LESS DISTRIBUTIONS: | | | | | | | | | | | | | | | | | | | | |
| From net investment income | | | (0.09 | ) | | | (0.22 | ) | | | (0.37 | ) | | | (0.27 | ) | | | (0.17 | ) |
| From net realized gains | | | (0.99 | ) | | | — | | | | (0.01 | ) | | | (1.97 | ) | | | (0.81 | ) |
| Total distributions | | | (1.08 | ) | | | (0.22 | ) | | | (0.38 | ) | | | (2.24 | ) | | | (0.98 | ) |
| | | | | | | | | | | | | | | | | | | | | |
| NET ASSET VALUE: | | | | | | | | | | | | | | | | | | | | |
| End of period | | $ | 17.63 | | | $ | 16.80 | | | $ | 14.84 | | | $ | 15.61 | | | $ | 17.11 | |
| | | | | | | | | | | | | | | | | | | | | |
| TOTAL RETURN | | | 11.38 | % | | | 14.68 | % | | | (2.52 | )% | | | 4.18 | % | | | 19.10 | % |
| | | | | | | | | | | | | | | | | | | | | |
| SUPPLEMENTAL DATA AND RATIOS: | | | | | | | | | | | | | | | | | | | | |
| Net assets, end of period (in thousands) | | $ | 26,765 | | | $ | 25,663 | | | $ | 24,328 | | | $ | 38,398 | | | $ | 41,659 | |
| Ratio of expenses to average net assets: | | | | | | | | | | | | | | | | | | | | |
| Before expense reimbursement | | | 2.02 | % | | | 2.06 | % | | | 1.88 | % | | | 1.74 | % | | | 1.77 | % |
| After expense reimbursement | | | 1.30 | % | | | 1.30 | % | | | 1.30 | % | | | 1.30 | % | | | 1.30 | % |
| Ratio of net investment income (loss) | | | | | | | | | | | | | | | | | | | | |
| to average net assets: | | | | | | | | | | | | | | | | | | | | |
| Before expense reimbursement | | | (0.23 | )% | | | 0.58 | % | | | 0.47 | % | | | 0.05 | % | | | 0.61 | % |
| After expense reimbursement | | | 0.49 | % | | | 1.34 | % | | | 1.05 | % | | | 0.49 | % | | | 1.08 | % |
| Portfolio turnover rate | | | 23 | % | | | 32 | % | | | 35 | % | | | 48 | % | | | 31 | % |
See Notes to the Financial Statements
Financial Highlights
| | | Opportunity Fund | |
| | | Year Ended December 31, | |
| | | 2017 | | | 2016 | | | 2015 | | | 2014 | | | 2013 | |
| For a Fund share outstanding | | | | | | | | | | | | | | | |
| throughout the period | | | | | | | | | | | | | | | |
| | | | | | | | | | | | | | | | |
| NET ASSET VALUE: | | | | | | | | | | | | | | | |
| Beginning of period | | $ | 20.17 | | | $ | 17.29 | | | $ | 20.75 | | | $ | 21.51 | | | $ | 18.05 | |
| | | | | | | | | | | | | | | | | | | | | |
| OPERATIONS: | | | | | | | | | | | | | | | | | | | | |
| Net investment income | | | 0.11 | | | | 0.13 | | | | 0.14 | | | | 0.13 | | | | 0.07 | |
| Net realized and unrealized | | | | | | | | | | | | | | | | | | | | |
| gain on investments | | | 1.98 | | | | 3.50 | | | | 0.18 | | | | 1.48 | | | | 4.84 | |
| Total from operations | | | 2.09 | | | | 3.63 | | | | 0.32 | | | | 1.61 | | | | 4.91 | |
| | | | | | | | | | | | | | | | | | | | | |
| LESS DISTRIBUTIONS: | | | | | | | | | | | | | | | | | | | | |
| From net investment income | | | (0.10 | ) | | | (0.22 | ) | | | (0.17 | ) | | | (0.16 | ) | | | (0.07 | ) |
| From net realized gains | | | (1.31 | ) | | | (0.53 | ) | | | (3.61 | ) | | | (2.21 | ) | | | (1.38 | ) |
| Total distributions | | | (1.41 | ) | | | (0.75 | ) | | | (3.78 | ) | | | (2.37 | ) | | | (1.45 | ) |
| | | | | | | | | | | | | | | | | | | | | |
| NET ASSET VALUE: | | | | | | | | | | | | | | | | | | | | |
| End of period | | $ | 20.85 | | | $ | 20.17 | | | $ | 17.29 | | | $ | 20.75 | | | $ | 21.51 | |
| | | | | | | | | | | | | | | | | | | | | |
| TOTAL RETURN | | | 10.33 | % | | | 21.02 | % | | | 1.33 | % | | | 7.36 | % | | | 27.25 | % |
| | | | | | | | | | | | | | | | | | | | | |
| SUPPLEMENTAL DATA AND RATIOS: | | | | | | | | | | | | | | | | | | | | |
| Net assets, end of period (in thousands) | | $ | 116,609 | | | $ | 106,542 | | | $ | 86,128 | | | $ | 91,448 | | | $ | 97,751 | |
| Ratio of expenses to average net assets: | | | | | | | | | | | | | | | | | | | | |
| Before expense reimbursement | | | 1.58 | % | | | 1.59 | % | | | 1.61 | % | | | 1.53 | % | | | 1.57 | % |
| After expense reimbursement | | | 1.30 | % | | | 1.30 | % | | | 1.30 | % | | | 1.30 | % | | | 1.30 | % |
| Ratio of net investment income | | | | | | | | | | | | | | | | | | | | |
| to average net assets: | | | | | | | | | | | | | | | | | | | | |
| Before expense reimbursement | | | 0.23 | % | | | 0.41 | % | | | 0.28 | % | | | 0.23 | % | | | 0.08 | % |
| After expense reimbursement | | | 0.51 | % | | | 0.70 | % | | | 0.59 | % | | | 0.46 | % | | | 0.35 | % |
| Portfolio turnover rate | | | 26 | % | | | 42 | % | | | 36 | % | | | 40 | % | | | 25 | % |
See Notes to the Financial Statements
Notes to the Financial Statements
December 31, 2017
1. ORGANIZATION
Prospector Funds, Inc. (the “Corporation”) was organized as a Maryland corporation on June 6, 2007 and is registered under the Investment Company Act of 1940 (the “1940 Act”), as amended, as an open-end diversified management investment company. The Corporation issues its shares in series, each series representing a distinct portfolio with its own investment objectives and policies. There are two series presently authorized, the Prospector Capital Appreciation Fund and the Prospector Opportunity Fund (individually a “Fund” and collectively the “Funds”). Each Fund is an investment company and accordingly follows the investment company accounting and reporting guidance of the Financial Accounting Standards Board (“FASB”) Accounting Standard Board Codification Topic 946 Financial Services – Investment Companies. The Funds commenced operations on September 28, 2007.
2. FAIR VALUE MEASUREMENT
The following is a summary of significant accounting policies consistently followed by each Fund:
Security Valuation – The Fund has adopted fair value accounting standards which establish an authoritative definition of fair value and set out a hierarchy for measuring fair value. These standards require additional disclosures about the various inputs and valuation techniques used to develop the measurements of fair value, a discussion in changes in valuation techniques and related inputs during the period and expanded disclosure of valuation levels for major security types. These inputs are summarized in the three broad levels listed below:
| Level 1 – | Unadjusted quoted prices in active markets for identical assets or liabilities that the Fund has the ability to access. |
| | |
| Level 2 – | Observable inputs other than quoted prices included in Level 1 that are observable for the asset or liability, either directly or indirectly. These inputs may include quoted prices for the identical instrument on an inactive market, prices for similar instruments, interest rates, prepayment speeds, credit risk, yield curves, default rates, discounts and similar data. |
| | |
| Level 3 – | Unobservable inputs for the asset or liability, to the extent relevant observable inputs are not available, representing the Fund’s own assumptions about the assumptions a market participant would use in valuing the asset or liability, and would be based on the best information available. |
Following is a description of the valuation techniques applied to the Fund’s major categories of assets and liabilities measured at fair value on a recurring basis. The Fund’s investments are carried at fair value.
Common Stock – Securities that are primarily traded on a national securities exchange are valued at the last sale price on the exchange on which they are primarily traded on the day of valuation or, if there has been no sale on such day, at the last bid price on the day of valuation. To the extent these securities are actively traded and valuation adjustments are not applied, they are categorized in Level 1 of the fair value hierarchy.
Convertible and Corporate Bonds – Convertible and corporate bonds, including listed issues, are valued at fair value on the basis of valuations furnished by an independent pricing service which utilizes both dealer-supplied valuations and formula-based techniques. The pricing service may consider recently executed transactions in securities of the issuer or comparable issuers, market price quotations (where observable), bond spreads, and fundamental data relating to the issuer. Convertible and corporate bonds are generally categorized in Level 2 of the fair value hierarchy.
Notes to the Financial Statements – Continued
December 31, 2017
Investment Companies – Investments in other mutual funds, including money market funds, are valued at their net asset value per share. To the extent these securities are actively traded and valuation adjustments are not applied, they are categorized in Level 1 of the fair value hierarchy.
Securities for which market quotations are not readily available, or if the closing price does not represent fair value, are valued following procedures approved by the Board of Directors. These procedures consider many factors, including the type of security, size of holding, trading volume and news events. There can be no assurance that the Fund could obtain the fair value assigned to a security if they were to sell the security at approximately the time at which the Fund determines their net asset values per share.
The inputs or methodology used for valuing securities are not an indication of the risk associated with investing in those securities.
As of December 31, 2017, each Fund’s investments in securities were classified as follows:
| | | Level 1 | | | Level 2 | | | Level 3 | | | Total | |
| Capital Appreciation Fund | | | | | | | | | | | | |
| Common Stocks | | $ | 20,640,372 | | | $ | — | | | $ | — | | | $ | 20,640,372 | |
| Convertible Bonds | | | — | | | | 4,211,811 | | | | — | | | | 4,211,811 | |
| Corporate Bonds | | | — | | | | 612,276 | | | | — | | | | 612,276 | |
| Short-Term Investment | | | 1,320,999 | | | | — | | | | — | | | | 1,320,999 | |
| Total Investments | | $ | 21,961,371 | | | $ | 4,824,087 | | | $ | — | | | $ | 26,785,458 | |
| | | | | | | | | | | | | |
| | | Level 1 | | | Level 2 | | | Level 3 | | | Total | |
| Opportunity Fund | | | | | | | | | | | | | | | | |
| Common Stocks | | $ | 108,921,212 | | | $ | — | | | $ | — | | | $ | 108,921,212 | |
| Convertible Bond | | | — | | | | 454,219 | | | | — | | | | 454,219 | |
| Short-Term Investment | | | 7,291,396 | | | | — | | | | — | | | | 7,291,396 | |
| Total Investments | | $ | 116,212,608 | | | $ | 454,219 | | | $ | — | | | $ | 116,666,827 | |
Refer to each Fund’s Schedule of Investments for further sector breakout.
Transfers between levels are recognized at the beginning of the reporting period. During the year ended December 31, 2017, the Funds recognized no transfers between levels. The Funds did not invest in any Level 3 investments during the period.
The Funds may invest in derivative financial instruments in order to manage risk or gain exposure to various other investments or markets. The Funds’ investment objectives allow the Funds to enter into various types of derivative contracts, including, but not limited to, futures contracts, forward foreign exchange contracts, and purchased and written options. Derivatives may contain various risks including the potential inability of the counterparty to fulfill their obligations under the terms of the contract, the potential for an illiquid secondary market, and the potential for market movements which may expose the funds to gains or losses in excess of the amounts shown on the Statements of Assets and Liabilities. As of and for the year ended December 31, 2017, the Funds held no derivative instruments.
Notes to the Financial Statements – Continued
December 31, 2017
3. SIGNIFICANT ACCOUNTING POLICIES
Distributions to Shareholders – Dividends from net investment income and distributions of net realized capital gains, if any, will be declared and paid at least annually. The character of distributions made during the period from net investment income or net realized gains may differ from the characterization for federal income tax purposes due to differences in the recognition of income, expense and gain items for financial statement and tax purposes. All short-term capital gains are included in ordinary income for tax purposes.
Use of Estimates – The preparation of financial statements in conformity with accounting principles generally accepted in the United States of America requires management to make estimates and assumptions that affect the reported amounts of assets and liabilities and disclosure of contingent assets and liabilities at the date of the financial statements and the reported amounts of revenues and expenses during the reporting period. Actual results could differ from those estimates.
Federal Income Taxes – The Funds intend to meet the requirements of subchapter M of the Internal Revenue Code applicable to regulated investment companies and to distribute substantially all net taxable investment income and net realized gains to shareholders in a manner which results in no tax cost to the Funds. Therefore, no federal income or excise tax provision is required. As of December 31, 2017, the Funds did not have any tax positions that did not meet the “more-likely-than-not” threshold of being sustained by the applicable tax authority. Generally, each of the tax years in the four-year period ended December 31, 2017 remains subject to examination by taxing authorities.
Reclassification of Capital Accounts – GAAP requires that certain components of net assets relating to permanent differences be reclassified between financial and tax reporting. These reclassifications have no effect on net assets or net asset value per share. The difference between book and tax relates primarily to contingent preferred debt instruments, foreign currency and reclassifications of dividends. For the fiscal year ended December 31, 2017, the following reclassifications were made on the Statements of Assets and Liabilities:
| | | Distributions in | | | Accumulated | | | | |
| | | Excess of | | | Net Realized | | | | |
| | | Investment Income | | | Loss | | | Portfolio Capital | |
| Capital Appreciation Fund | | $ | 84 | | | $ | (84 | ) | | $ | — | |
| Opportunity Fund | | | (11,429 | ) | | | 11,429 | | | | — | |
Foreign Currency Translation – The books and records relating to the Funds’ non-U.S. dollar denominated investments are maintained in U.S. dollars on the following bases: (1) market value of investment securities, assets, and liabilities are translated at the current rate of exchange; and (2) purchases and sales of investment securities, income, and expenses are translated at the relevant rates of exchange prevailing on the respective dates of such transactions. The Funds do not isolate the portion of gains and losses on investments in equity securities that is due to changes in the foreign exchange rates from that which is due to changes in market prices of equity securities. The Funds report certain foreign currency-related transactions as components of realized gains for financial reporting purposes, whereas such components are treated as ordinary income for federal income tax purposes.
Illiquid or Restricted Securities – A security may be considered illiquid if it lacks a readily available market. Securities are generally considered liquid if they can be sold or disposed of in the ordinary course of business within seven days at approximately the price at which the security is valued by the Fund. Illiquid securities may be valued under methods approved by the Funds’ board of directors as reflecting fair value. Each Fund intends to invest no
Notes to the Financial Statements – Continued
December 31, 2017
more than 15% of its total assets in illiquid securities. Certain restricted securities may be considered illiquid. Restricted securities are often purchased in private placement transactions, are not registered under the Securities Act of 1933, may have contractual restrictions on resale, and may be valued under methods approved by the Funds’ board of directors as reflecting fair value. Certain restricted securities eligible for resale to qualified institutional investors, including Rule 144A securities, are not subject to the limitation on a Fund’s investment in illiquid securities if they are determined to be liquid in accordance with procedures adopted by the Funds’ board of directors. At December 31, 2017, the Funds had no investments in illiquid securities.
Expenses – Expenses directly attributable to a Fund are charged to that Fund, while expenses attributable to more than one Fund are allocated among the respective Funds based on relative net assets or another appropriate basis.
Other – Investment and shareholder transactions are recorded on the trade date. Each Fund determines the gain or loss realized from the investment transactions on the basis of identified cost. Dividend income is recognized on the ex-dividend date. Interest income, including amortization of bond premium and discount, is recognized on an accrual basis.
Subsequent Events – Management has evaluated fund related events and transactions that occurred subsequent to December 31, 2017, through the date of issuance of the Funds’ financial statements. There were no events or transactions that occurred during this period that materially impacted the amounts or disclosures in the Funds’ financial statements.
4. INVESTMENT TRANSACTIONS
During the year ended December 31, 2017, purchases of securities and proceeds from sales of securities, other than temporary investments in short-term securities, were as follows:
| | | Purchases | | | Sales | |
| Capital Appreciation Fund | | $ | 5,799,815 | | | $ | 7,546,561 | |
| Opportunity Fund | | | 28,264,031 | | | | 26,831,459 | |
There were no purchases or sales of long-term U.S. Government securities.
The aggregate gross unrealized appreciation and depreciation of securities held by the Funds and the total cost of securities for federal income tax purposes at December 31, 2017, the Funds’ most recently completed fiscal year end, were as follows:
| | | Aggregate | | | Aggregate | | | Net | | | Federal | |
| | | Gross | | | Gross | | | Appreciation/ | | | Income | |
| | | Appreciation | | | Depreciation | | | Depreciation | | | Tax Cost | |
| Capital Appreciation Fund | | $ | 4,942,892 | | | $ | (228,164 | ) | | $ | 4,714,728 | | | $ | 22,070,801 | |
| Opportunity Fund | | | 25,772,294 | | | | (1,346,902 | ) | | | 24,425,392 | | | | 92,240,038 | |
The difference between book-basis and tax-basis unrealized appreciation is attributable primarily to wash sales and different book and tax accounting methods for certain securities.
Notes to the Financial Statements – Continued
December 31, 2017
At December 31, 2017, the Funds’ most recently completed fiscal year end, components of accumulated earnings (deficit) on a tax-basis were as follows:
| | | Undistributed | | | Undistributed | | | Other | | | | | | Total | |
| | | Ordinary | | | Long-Term | | | Accumulated | | | Unrealized | | | Accumulated | |
| | | Income | | | Capital Gains | | | Losses | | | Appreciation | | | Earnings | |
| Capital Appreciation Fund | | $ | 24,744 | | | $ | 62,772 | | | $ | (6,979 | ) | | $ | 4,714,728 | | | $ | 4,795,265 | |
| Opportunity Fund | | | — | | | | — | | | | (28,920 | ) | | | 24,425,392 | | | | 24,396,472 | |
As of December 31, 2017, the Funds did not have any capital loss carryovers. A regulated investment company may elect for any taxable year to treat any portion of any qualified late year loss as arising on the first day of the next taxable year. Qualified late year losses are certain capital, and ordinary losses which occur during the portion of the Fund’s taxable year subsequent to October 31. The Capital Appreciation Fund did not defer any late year losses. The Opportunity Fund plans to defer, on a tax basis, late year losses of $23,297.
The tax character of distributions paid during the fiscal year ended December 31, 2017 were as follows:
| | | Ordinary | | | Long Term | | | | |
| | | Income* | | | Capital Gains** | | | Total | |
| Capital Appreciation Fund | | $ | 305,965 | | | $ | 1,248,433 | | | $ | 1,554,398 | |
| Opportunity Fund | | | 1,207,785 | | | | 6,253,039 | | | | 7,460,824 | |
The tax character of distributions paid during the fiscal year ended December 31, 2016 were as follows:
| | | Ordinary | | | Long Term | | | | |
| | | Income* | | | Capital Gains** | | | Total | |
| Capital Appreciation Fund | | $ | 331,651 | | | $ | — | | | $ | 331,651 | |
| Opportunity Fund | | | 1,133,169 | | | | 2,750,918 | | | | 3,884,087 | |
| * | | For federal income tax purposes, distributions of short-term capital gains are included in ordinary income distributions. |
| ** | | Funds designate long-term capital gain dividends pursuant to IRC Sec. 852(b)(3)(C). |
5. AGREEMENTS
The Funds have entered into an Investment Advisory Agreement with Prospector Partners Asset Management, LLC (the “Adviser”), with whom certain directors and officers of the Corporation are affiliated, to furnish investment advisory services to the Funds. Pursuant to this Agreement, the Adviser is entitled to receive a management fee, calculated daily and payable monthly, at the annual rate of 1.10% as applied to each Fund’s daily net assets.
The Adviser has contractually agreed to waive its management fee and reimburse each Fund’s other expenses to the extent necessary to ensure that each Fund’s operating expenses do not exceed 1.30% of its average daily net assets. Fees waived and expenses reimbursed by the Adviser may be recouped by the Adviser for a period of three fiscal years following the fiscal year during which such waiver or reimbursement was made if such recoupment can be achieved without exceeding the expense limit in effect at the time the waiver or reimbursement occurred. As of December 31, 2017, the Adviser did not recoup any previously waived expenses. The Operating Expense
Notes to the Financial Statements – Continued
December 31, 2017
Limitation Agreement will be in effect through at least September 30, 2018. Waived fees and reimbursed expenses subject to potential recovery by year of expiration are as follows:
| Expiration | | Capital Appreciation Fund | | | Opportunity Fund | |
| 12/31/18 | | $ | 189,898 | | | $ | 272,070 | |
| 12/31/19 | | | 184,289 | | | | 270,491 | |
| 12/31/20 | | | 186,958 | | | | 302,782 | |
| Total | | $ | 561,145 | | | $ | 845,343 | |
As of December 31, 2017, it was possible, but not probable, those amounts would be recovered by the Adviser. At the end of each fiscal year in the future, the Funds will continue to assess the potential recovery of waived/reimbursed fees and expenses for financial reporting purposes.
Quasar Distributors, LLC (“Quasar”), a subsidiary of U.S. Bancorp, serves as distributor of the Funds’ shares pursuant to a Distribution Agreement with the Corporation. Each Fund’s shares are sold on a no-load basis and, therefore, Quasar receives no sales commission or sales load for providing services to the Funds. The Corporation has adopted a plan pursuant to Rule 12b-1 under the 1940 Act (the “12b-1 Plan”), which authorizes the Corporation to reimburse Quasar and certain financial intermediaries who assist in distributing each Fund’s shares or who provide shareholder services to Fund shareholders a distribution and/or shareholder servicing fee of up to 0.25% of each Fund’s average daily net assets (computed on an annual basis). All or a portion of the fee may be used by the Funds or Quasar to pay the Fund’s distribution fees and costs of printing reports and prospectuses for potential investors and the costs of other distribution and shareholder services expenses. During the year ended December 31, 2017, Capital Appreciation Fund and Opportunity Fund incurred expenses of $13,172 and $92,322 respectively, pursuant to the 12b-1 Plan.
U.S. Bancorp Fund Services, LLC serves as transfer agent, administrator and fund accountant for the Funds. U.S. Bank N.A. serves as custodian for the Funds.
6. INDEMNIFICATIONS
The Funds enter into contracts that contain a variety of indemnifications. The Funds’ maximum exposure under these arrangements is unknown. However, the Funds have not had prior claims or losses pursuant to these contracts and expect the risk of loss to be remote.
Report of Independent Registered Public Accounting Firm
To the Shareholders and the Board of Directors of
Prospector Funds, Inc.:
Opinion on the Financial Statements
We have audited the accompanying statements of assets and liabilities of Prospector Funds, Inc. (the “Corporation”) (comprising the Prospector Capital Appreciation Fund and the Prospector Opportunity Fund (individually a “Fund” and collectively referred to as the “Funds”)), including the schedules of investments, as of December 31, 2017, and the related statements of operations for the year then ended, the statements of changes in net assets for each of the two years in the period then ended, the financial highlights for each of the five years in the period then ended and the related notes (collectively referred to as the “financial statements”). In our opinion, the financial statements present fairly, in all material respects, the financial position of each of the Funds comprising the Corporation at December 31, 2017, the results of their operations for the year then ended, the changes in their net assets for each of the two years in the period then ended and their financial highlights for each of the five years in the period then ended, in conformity with U.S. generally accepted accounting principles.
Basis for Opinion
These financial statements are the responsibility of the Corporation’s management. Our responsibility is to express an opinion on each of the Funds’ financial statements based on our audits. We are a public accounting firm registered with the Public Company Accounting Oversight Board (United States) (“PCAOB”) and are required to be independent with respect to the Corporation in accordance with the U.S. federal securities laws and the applicable rules and regulations of the Securities and Exchange Commission and the PCAOB.
We conducted our audits in accordance with the standards of the PCAOB. Those standards require that we plan and perform the audit to obtain reasonable assurance about whether the financial statements are free of material misstatement, whether due to error or fraud. The Corporation is not required to have, nor were we engaged to perform, an audit of the Corporation’s internal control over financial reporting. As part of our audits we are required to obtain an understanding of internal control over financial reporting but not for the purpose of expressing an opinion on the effectiveness of the Corporation’s internal control over financial reporting. Accordingly, we express no such opinion.
Our audits included performing procedures to assess the risks of material misstatement of the financial statements, whether due to error or fraud, and performing procedures that respond to those risks. Such procedures included examining, on a test basis, evidence regarding the amounts and disclosures in the financial statements. Our procedures included confirmation of securities owned as of December 31, 2017, by correspondence with the custodian. Our audits also included evaluating the accounting principles used and significant estimates made by management, as well as evaluating the overall presentation of the financial statements. We believe that our audits provide a reasonable basis for our opinion.
We have served as the auditor of one or more Prospector Funds, Inc. investment companies since 2007.
Chicago, Illinois
February 23, 2018
Additional Information (Unaudited)
December 31, 2017
BOARD APPROVAL OF INVESTMENT ADVISORY AGREEMENT
The Corporation’s independent directors (the “directors”) unanimously approved the continuance of the Investment Advisory Agreement (the “Advisory Agreement”) between the Funds and Prospector Partners Asset Management, LLC (the “Investment Manager”) at a Board of Director’s meeting held on August 31, 2017.
In preparation for the meeting, the directors had requested from the Investment Manager and evaluated a memorandum providing certain information requested by the Board pursuant to Section 15(c) of the 1940 Act, including (i) expense, compliance and other information as it relates to the Investment Manager; (ii) performance of other accounts managed by its affiliate Prospector Partners, LLC with similar investment objectives derived from data compiled by the Investment Manager and (iii) expense and other information for other registered investment companies with similar investment objectives derived from data compiled by the Investment Manager based upon comparative peer groups selected in consultation with the independent directors. Prior to voting, the directors reviewed the proposed approval of the Advisory Agreement with management and with counsel to the Corporation and reviewed a memorandum from such counsel discussing the legal standards for their consideration of the proposed approval. In reaching their determinations relating to approval of the continuance of the Advisory Agreement, the directors considered all factors they believed relevant including the following:
| 1. | | the nature, extent and quality of investment, and other services to be rendered by the Investment Manager; |
| | | |
| 2. | | payments to be received by the Investment Manager from all sources with respect to the Funds; |
| | | |
| 3. | | comparative fee and expense data for the Funds and other investment companies with similar investment objectives; |
| | | |
| 4. | | the extent to which economies of scale may be realized as the Funds grow and whether fee levels reflect these economies of scale for the benefit of investors; |
| | | |
| 5. | | the Investment Manager’s policies and practices regarding allocation of portfolio transactions of the Funds, including the extent to which the Investment Manager may benefit from soft dollar arrangements; |
| | | |
| 6. | | fall-out benefits which the Investment Manager and its affiliates may receive from their relationships to the Funds; |
| | | |
| 7. | | information about fees charged by the Investment Manager to other clients with similar investment objectives; |
| | | |
| 8. | | the professional experience and qualifications of the Funds’ portfolio managers and other senior personnel of the Investment Manager; |
| | | |
| 9. | | profitability of the Investment Manager; and |
| | | |
| 10. | | the terms of the Advisory Agreement. |
The directors also considered their overall confidence in the integrity and competence of the Investment Manager and its investment team. In their deliberations, the directors did not identify any particular information that was all-important or controlling, and each director attributed different weights to the various factors. The directors determined that the overall arrangements between the Funds and the Investment Manager, as provided in the Advisory Agreement, were fair and reasonable in light of the services performed, expenses expected to be incurred and such other matters as the directors considered relevant in the exercise of their reasonable judgment.
The material factors and conclusions that formed the basis for the directors reaching their determinations to approve the continuance of the Advisory Agreement (including their determinations that the Investment Manager
Additional Information (Unaudited) – Continued
December 31, 2017
should be the investment adviser for the Funds, and that the fees payable to the Investment Manager pursuant to the Advisory Agreement continue to be appropriate) were separately discussed by the directors.
Nature, extent and quality of services provided by the Investment Manager
The directors noted that, under the Advisory Agreement, the Investment Manager, subject to the control of the directors, administers the Funds’ business and other affairs. The Investment Manager manages the investment of the assets of the Funds, including making purchases and sales of portfolio securities consistent with each Fund’s investment objective and policies.
The directors considered the scope and quality of services provided by the Investment Manager under the Advisory Agreement, the cyclical nature of value investing, the quality of the investment research capabilities of the Investment Manager and the other resources it proposes to dedicate to performing services for the Funds and the Investment Manager’s active management style. The directors also considered the portfolio managers’ experience, reputation and investment philosophy noting that the Investment Manager’s investment style and stock selection process have remained consistent even in difficult market environments. The quality of administrative and other services also were considered. The directors concluded that, overall, they continue to be satisfied with the nature, extent and quality of services proposed to be provided to the Funds under the Advisory Agreement.
Investment Manager Fees; Performance of the Fund
The directors considered the advisory fee rate paid by the Funds to the Investment Manager and information prepared by the Investment Manager based upon the peer groups selected with the input of the independent directors concerning fee rates paid by other comparable funds. The directors recognized that it is difficult to make comparisons of advisory fees because there are variations in the services that are included in the fees paid by other funds, but determined that the proposed advisory fee rate was in line with other comparable funds.
The directors also considered the performance of each Fund compared to each Fund’s benchmarks and peer groups. The directors noted that the Opportunity Fund was ranked in the top two funds among its peers across the three-year and since inception time periods, further noting the Opportunity Fund’s number one ranking since inception. The Directors noted that while the Capital Appreciation Fund underperfomed its benchmark across all comparative periods, the Fund was in the peer group’s second quartile for the since inception,three-year and five-year periods. The directors concluded that the advisory fee rate, taking into account performance and the other factors mentioned, was in line with comparable funds.
Other Fund Expenses
The directors also considered the total expense ratio of the Funds in comparison to the fees and expenses of the funds included in their respective peer groups. The directors noted that the expense ratios of some of the comparable funds also were lower because of waivers or reimbursements by those funds’ investment advisers, which in some cases were voluntary and perhaps temporary. In particular, the directors noted that the Investment Manager’s fee waiver pursuant to the Fee Waiver and Expenses Reimbursement Agreement was contractual in nature and customary for the industry. The directors concluded that the Funds’ expense ratio was reasonable. Finally, the directors noted that there may be economies of scale as the Funds grow and concluded that it may be appropriate to consider those issues in the future.
Additional Information (Unaudited) – Continued
December 31, 2017
Investment Manager Profitability
The directors noted that the Investment Manager also provides the Funds with such office space, administrative and other services (exclusive of, and in addition to, any such services provided by any other retained by the Funds) and executive and other personnel as are necessary for the Funds’ operations. The directors considered that the Investment Manager pays all of the compensation of the officers of the Company that are affiliated persons of the Investment Manager, pays a portion of the insurance costs and paid the cost of the organization of the Funds (without reimbursement).
The directors also noted that the Investment Manager has contractually agreed to waive, through September 30, 2018, its management fee and/or reimburse each Fund’s other expenses to the extent necessary to ensure that each Fund’s operating expenses do not exceed 1.30% of its average daily net assets. Under the terms of the Waiver and Expense Reimbursement Agreement at the present asset levels of the Funds, the Investment Manager has received only a portion of its earned management fee. It was also noted that the Investment Manager does not receive “fall out” benefits commonly received by managers of mutual funds that provide transfer agency, distribution or printing services in-house. The directors considered the expenses of the Investment Manager and the services provided by the Investment Manager and determined that the Investment Manager was cash flow positive after considering an allocation of expenses from its affiliated advisor, Prospector Partners, LLC.
Additional Information (Unaudited) – Continued
December 31, 2017
AVAILABILITY OF FUND PORTFOLIO INFORMATION
The Funds file complete schedules of portfolio holdings with the SEC for the first and third quarters of each fiscal year on Form N-Q, which is available on the SEC’s website at www.sec.gov. The Funds’ Form N-Q may be reviewed and copied at the SEC’s Public Reference Room in Washington, D.C. For information on the Public Reference Room call 1-800-SEC-0330. In addition, the Funds’ Form N-Q is available without charge upon request by calling 1-877-734-7862.
AVAILABILITY OF PROXY VOTING INFORMATION
A description of the Funds’ Proxy Voting Policies and Procedures is available without charge, upon request, by calling 1-877-734-7862. Information regarding how the Funds voted proxies relating to portfolio securities during the most recent 12 month period ended June 30, is available (1) without charge, upon request, by calling 1-877-734-7862, or (2) on the SEC’s website at www.sec.gov.
QUALIFIED DIVIDEND INCOME/DIVIDENDS RECEIVED DEDUCTION
For the fiscal year ended December 31, 2017, certain dividends paid by the Funds may be subject to a maximum tax rate of 23.8%, as provided for by the American Taxpayer Relief Act of 2012. The percentage of dividends declared from ordinary income designated as qualified dividend income was 100% and 100% for the Capital Appreciation Fund and Opportunity Fund, respectively.
For corporate shareholders, the percent of ordinary income distributions qualifying for the corporate dividends received deduction for the fiscal year ended December 31, 2017 was 97.18% and 100% for the Capital Appreciation Fund and Opportunity Fund, respectively.
ADDITIONAL INFORMATION APPLICABLE TO FOREIGN SHAREHOLDERS ONLY
The percent of ordinary income distributions designated as interest related dividends for the fiscal year ended December 31, 2017 was 17.03% and 3.36% for the Capital Appreciation Fund and Opportunity Fund, respectively.
The percent of ordinary income distributions designated as short-term capital gain distributions under Internal Revenue Section 871(k)(2)(C) for the fiscal year ended December 31, 2017 was 56.86% and 53.57% for the Capital Appreciation Fund and Opportunity Fund, respectively.
Additional Information (Unaudited) – Continued
December 31, 2017
DIRECTORS & OFFICERS TABLE
| | | Term of | | Number of | |
| | | Office | | Portfolios | Other |
| | | and | Principal | in Fund | Directorships |
| Name, | | Length | Occupation | Complex | Served |
| Year of Birth | | of Time | During Past | Overseen | During Past |
| and Address^ | Position | Served* | 5 Years | by Director | 5 Years |
| Independent Board Members |
| |
| Harvey D. Hirsch* | Director | Indefinite; | Retired, | 2 | None. |
| Year of Birth: 1941 | | Since | Senior Vice President, | | |
| | | September 7, | Marketing, Van Eck | | |
| | | 2007 | Associates Corporation, | | |
| | | | an investment adviser, | | |
| | | | from May 2007 to August 2014. | | |
| | | | | | |
| Joseph Klein III* | Director | Indefinite; | Managing Director of Gauss | 2 | Ionis |
| Year of Birth: 1961 | | Since | Capital Advisors, LLC, | | Pharmaceuticals, |
| | | September 7, | a financial consulting and | | Inc. |
| | | 2007 | investment advisory firm | | |
| | | | focused on biopharmaceuticals | | |
| | | | since he founded the company | | |
| | | | in March 1998. | | |
| | | | | | |
| Roy L. Nersesian* | Director | Indefinite; | Professor of the Leon Hess | 2 | None. |
| Year of Birth: 1939 | | Since | School of Business, Monmouth | | |
| | | September 7, | University, since September 1985. | | |
| | | 2007 | | | |
| | | | Adjunct Professor of the Center | | |
| | | | for Energy and Marine | | |
| | | | Transportation, Columbia | | |
| | | | University, since September 2000. | | |
| | | | | | |
| John T. Rossello, Jr.* | Director | Indefinite; | Retired. | 2 | None. |
| Year of Birth: 1951 | | Since | | | |
| | | September 7, | | | |
| | | 2007 | | | |
Additional Information (Unaudited) – Continued
December 31, 2017
| | | Term of | | Number of | |
| | | Office | | Portfolios | Other |
| | | and | Principal | in Fund | Directorships |
| Name, | | Length | Occupation | Complex | Served |
| Year of Birth | | of Time | During Past | Overseen | During Past |
| and Address^ | Position | Served* | 5 Years | by Director | 5 Years |
| Interested Board Members and Officers |
| |
| John D. Gillespie†* | Director | Indefinite; | Managing member of | 2 | White |
| Year of Birth: 1959 | President | Since | the Investment Manager. | | Mountains |
| | | September 7, | | | Insurance |
| | | 2007 | Managing member of | | Group, Ltd. |
| | | | Prospector Partners, LLC, | | |
| | | | an affiliate of the Investment | | |
| | | | Manager, and portfolio | | |
| | | | manager of the investment | | |
| | | | funds sponsored by Prospector | | |
| | | | Partners, LLC since 1997. | | |
| | | | | | |
| Kevin R. O’Brien | Executive | Indefinite; | Portfolio Manager at | N/A | None. |
| Year of Birth: 1963 | Vice | Since | the Investment Manager. | | |
| | President | September 7, | | | |
| | | 2007 | Portfolio Manager at | | |
| | | | Prospector Partners, LLC | | |
| | | | since April 2003. | | |
| | | | | | |
| Jason A. Kish | Executive | Indefinite; | Portfolio Manager at | N/A | None. |
| Year of Birth: 1973 | Vice | Since | the Investment Manager. | | |
| | President | February, | | | |
| | | 2013 | Director of Research | | |
| | | | since 2010. | | |
| | | | | | |
| Peter N. Perugini, Jr. | Secretary | Indefinite; | Chief Financial Officer at | N/A | None. |
| Year of Birth: 1970 | Treasurer | Secretary | Prospector Partners, LLC | | |
| | | Since | since 2000. | | |
| | | September 7, | | | |
| | | 2007 | | | |
| | | Indefinite; | | | |
| | | Treasurer | | | |
| | | Since | | | |
| | | June 6, | | | |
| | | 2007 | | | |
Additional Information (Unaudited) – Continued
December 31, 2017
| | | Term of | | Number of | |
| | | Office | | Portfolios | Other |
| | | and | Principal | in Fund | Directorships |
| Name, | | Length | Occupation | Complex | Served |
| Year of Birth | | of Time | During Past | Overseen | During Past |
| and Address^ | Position | Served* | 5 Years | by Director | 5 Years |
| Kim Just | Chief | Indefinite; | Chief Compliance Officer at | N/A | None. |
| Year of Birth: 1967 | Compliance | Since | Prospector Partners, LLC | | |
| | Officer | September 7, | since March 2006. | | |
| | | 2007 | | | |
| | | | | | |
| Brian Wiedmeyer | Assistant | Indefinite; | Vice President for US | N/A | None. |
| Year of Birth: 1973 | Secretary | Since | Bancorp Fund Services, LLC, | | |
| | | September 7, | a mutual fund service provider, | | |
| | | 2007 | since January 2005. | | |
| ^ | The address for all directors and officers is 370 Church Street, Guilford, Connecticut 06437. |
| * | Each of the Company’s directors was elected by written consent of the sole shareholder of the Funds on September 7, 2007. |
| † | John D. Gillespie is an interested director of the Fund because he is also the managing member of the Investment Manager. |
(This Page Intentionally Left Blank.)
DIRECTORS
John D. Gillespie
Harvey D. Hirsch
Joseph Klein III
Roy L. Nersesian
John T. Rossello, Jr.
INVESTMENT ADVISER
Prospector Partners Asset Management, LLC
370 Church Street
Guilford, CT 06437
DISTRIBUTOR
Quasar Distributors, LLC
777 East Wisconsin Avenue
Milwaukee, WI 53202
CUSTODIAN
U.S. Bank, N.A.
1555 North River Center Drive
Milwaukee, WI 53212
ADMINISTRATOR AND TRANSFER AGENT
U.S. Bancorp Fund Services, LLC
Third Floor
615 East Michigan Street
Milwaukee, WI 53202
INDEPENDENT REGISTERED PUBLIC ACCOUNTING FIRM
Ernst & Young LLP
155 North Wacker Drive
Chicago, IL 60606
LEGAL COUNSEL
Seward & Kissel LLP
One Battery Plaza
New York, NY 10004
This report should be accompanied or preceded by a prospectus.
The Funds’ Statement of Additional Information contains additional information about the
Funds’ directors and is available without charge upon request by calling 1-877-734-7862.
Item 2. Code of Ethics.
The registrant has adopted a code of ethics that applies to the registrant’s principal executive officer and principal financial officer. The registrant has not made any substantive amendments to its code of ethics during the period covered by this period.
The registrant has not granted any waivers from any provisions of the code of ethics during the period covered by this report.
A copy of the registrant’s code of ethics that applies to the registrant’s principal executive officer and principal financial officer is filed herewith.
Item 3. Audit Committee Financial Expert.
The registrant’s board of directors has determined that there is at least one audit committee financial expert serving on its audit committee. John Rossello, Jr. is the “audit committee financial expert” and is considered to be “independent” as each term is defined in Item 3 of Form N‑CSR.
Item 4. Principal Accountant Fees and Services.
The registrant has engaged its principal accountant to perform audit services, audit-related services, tax services and other services during the past two fiscal periods. “Audit services” refer to performing an audit of the registrant's annual financial statements or services that are normally provided by the accountant in connection with statutory and regulatory filings or engagements for the past fiscal year. “Audit-related services” refer to the assurance and related services by the principal accountant that are reasonably related to the performance of the audit. “Tax services” refer to professional services rendered by the principal accountant for tax compliance, tax advice, and tax planning, including reviewing the Fund’s tax returns and distribution calculations. The following table details the aggregate fees billed or expected to be billed for each of the last two fiscal periods for audit fees, audit-related fees, tax fees and other fees by the principal accountant.
| | FYE 12/31/2017 | FYE 12/31/2016 |
| Audit Fees | $70,000 | $60,800 |
| Audit-Related Fees | $0 | $0 |
| Tax Fees | $9,600 | $7,400 |
| All Other Fees | $0 | $0 |
| | | |
The audit committee has adopted pre-approval policies and procedures that require the audit committee to pre‑approve all audit and non‑audit services that exceed $5,000 for the registrant. All of the principal accountant’s hours spent on auditing the registrant’s financial statements were attributed to work performed by full‑time permanent employees of the principal accountant.
The audit committee noted that as indicated in the table below, for the registrant’s prior two fiscal periods, no fees were billed by the registrant’s independent public accountants in connection with non-audit services rendered to the registrant’s investment adviser, and any entity controlling, controlled by, or under common control with the investment adviser that provides ongoing services to the registrant.
| Non-Audit Related Fees | FYE 12/31/2017 | FYE 12/31/2016 |
| Registrant | $0 | $0 |
| Registrant’s Investment Adviser | $0 | $0 |
Item 5. Audit Committee of Listed Registrants.
Not applicable to open-end investment companies.
Item 6. Schedule of Investments.
Schedule of Investments is included as part of the report to shareholders filed under Item 1 of this Form.
Item 7. Disclosure of Proxy Voting Policies and Procedures for Closed-End Management Investment Companies.
Not applicable to open-end investment companies.
Item 8. Portfolio Managers of Closed-End Management Investment Companies.
Not applicable to open-end investment companies.
Item 9. Purchases of Equity Securities by Closed‑End Management Investment Company and Affiliated Purchases.
Not applicable to open-end investment companies.
Item 10. Submission of Matters to a Vote of Security Holders.
Not Applicable.
Item 11. Controls and Procedures.
| (a) | The Registrant’s President and Treasurer have reviewed the Registrant's disclosure controls and procedures (as defined in Rule 30a-3(c) under the Investment Company Act of 1940 (the “Act”)) as of a date within 90 days of the filing of this report, as required by Rule 30a-3(b) under the Act and Rules 13a-15(b) or 15d‑15(b) under the Securities Exchange Act of 1934. Based on their review, such officers have concluded that the disclosure controls and procedures are effective in ensuring that information required to be disclosed in this report is appropriately recorded, processed, summarized and reported and made known to them by others within the Registrant and by the Registrant’s service provider. |
| (b) | There were no significant changes in the Registrant's internal control over financial reporting (as defined in Rule 30a-3(d) under the Act) that occurred during the second fiscal quarter of the period covered by this report that has materially affected, or is reasonably likely to materially affect, the Registrant's internal control over financial reporting. |
Item 12. Exhibits.
| (a) | (1) Any code of ethics or amendment thereto, that is subject of the disclosure required by Item 2, to the extent that the registrant intends to satisfy Item 2 requirements through filing an exhibit. Filed herewith |
(2) Certifications pursuant to Section 302 of the Sarbanes-Oxley Act of 2002. Filed herewith.
(3) Any written solicitation to purchase securities under Rule 23c‑1 under the Act sent or given during the period covered by the report by or on behalf of the registrant to 10 or more persons. Not applicable to open-end investment companies.
| (b) | Certification pursuant to Section 906 of the Sarbanes‑Oxley Act of 2002. Furnished herewith. |
SIGNATURES
Pursuant to the requirements of the Securities Exchange Act of 1934 and the Investment Company Act of 1940, the registrant has duly caused this report to be signed on its behalf by the undersigned, thereunto duly authorized.
(Registrant) Prospector Funds, Inc.
By (Signature and Title)* /s/John D. Gillespie
John D. Gillespie, President
Date March 2, 2018
Pursuant to the requirements of the Securities Exchange Act of 1934 and the Investment Company Act of 1940, this report has been signed below by the following persons on behalf of the registrant and in the capacities and on the dates indicated.
By (Signature and Title)* /s/John D. Gillespie
John D. Gillespie, President
Date March 2, 2018
By (Signature and Title)* /s/Peter N. Perugini
Peter N. Perugini, Jr., Treasurer
Date March 2, 2018
* Print the name and title of each signing officer under his or her signature.