UNITED STATES
SECURITIES AND EXCHANGE COMMISSION
Washington, D.C. 20549
FORM N-CSR
CERTIFIED SHAREHOLDER REPORT OF REGISTERED
MANAGEMENT INVESTMENT COMPANIES
Investment Company Act file number 811-22077
Prospector Funds, Inc.
(Exact name of registrant as specified in charter)
370 Church St., Guilford, CT 06437
(Address of principal executive offices) (Zip code)
Prospector Partners Asset Management, LLC, 370 Church St., Guilford, CT 06437
(Name and address of agent for service)
(203) 458-1500
Registrant's telephone number, including area code
Date of fiscal year end: December 31, 2014
Date of reporting period: December 31, 2014
Item 1. Report to Stockholders.
Prospector Capital Appreciation Fund
Prospector Opportunity Fund
Annual Report
| www.prospectorfunds.com | December 31, 2014 |
February 11, 2015
Dear Shareholders of the Prospector Capital Appreciation Fund and Prospector Opportunity Fund,
2014 was marked by a strong rally in mega-cap stocks. For the year, the benchmark S&P 500 (which has a weighted market cap of approximately $133 billion) gained nearly 14%, however, smaller companies fared worse. The Russell 2000, for example, returned only 5% for the year. Even within the S&P 500, there was much dispersion, with the largest 100 companies gaining a median 16%, vs. 6% for the smallest 100 companies. A notable exception to the year’s strong advance were commodity-related stocks, especially oil. There, while the large global majors fared much better than their mid-sized and smaller competitors, the sharp decline in oil late in the year caused a broad sell off in oil and gas stocks. Credit markets were impacted as well. Energy companies make up approximately 17% of the BBB credit market and 15% of the high yield market and were responsible for significant spread widening in the fourth quarter.
The sharp decline in oil prices came as a surprise to most investors. Indeed, a “cheery consensus” has a humbling habit of being turned on end, especially when held with great certainty by a large number of people and a large amount of committed capital. A case in point is the “U.S. energy renaissance.” It turns out all that investment in oil production has resulted in a lot of oil and falling prices. While it may take months for the price of oil to settle, we believe the ultimate price over the medium term could likely be significantly higher than the current price. Given OPEC can’t be looked upon as the world’s price “regulator,” significant uncertainty has been introduced to the equation as energy companies budget future projects. Thus, capital budgets are currently being cut, rig counts are declining, and ultimately this will lead to reduced oil production.
The U.S. dollar significantly strengthened against the euro, yen, and British pound, adding vigor to a selloff in other commodities, which was spurred by concerns over Europe’s health and China’s deceleration. Finally, the U.S. Federal Reserve stood quietly aside as the third round of Quantitative Easing drew to a close, no doubt encouraged by the steady recovery in the U.S. economy. Central bankers in Europe and Japan aggressively printed money in an attempt to shore up their flagging local economies. The strong dollar creates a significant negative headwind for U.S. based multinational corporations in the consumer staple, technology, and industrial sectors, both in terms of price competitiveness for exported goods and translation of foreign profits back into U.S. dollars.
Prospector Opportunity Fund Highlights
The Opportunity Fund’s return for both the six month and twelve month periods ended December 31, 2014 exceeded the Russell 2000 index return and lagged the Russell Midcap index returns for the respective time periods. Our returns were hurt by dismal performance from the materials sector, with gold miners Newmont and Kinross Gold leading the detractors. Slowing global growth and volatile currency markets precipitated a sharp selloff in commodities prices, including gold.
The Fund’s top performing sectors for 2014 included consumer staples and industrials. Top performers in staples included Church & Dwight and Monster Beverage. Church & Dwight did well in 2014 because of solid organic growth, a good new product lineup (e.g., expanded Oxi into dish wash & detergent), laundry detergent price wars abating, and finally the expectation of an accretive transaction from this outstanding management team. Monster did well largely because of a partnership with Coca Cola, whereby the company became Coke’s exclusive energy brand. As part of the agreement, Coke also took a 16.7% stake in Monster. Coke needed growth and Monster is a share gainer in a two-player market. Finally, for Monster, overseas expansion potential is enhanced by aligning with a global beverages company.
Among industrials, truckers Landstar and Celadon drove healthy gains. Trucking underperformed other industrials in 2013 due to challenges in passing along heavy labor cost inflation. In 2014, transports outperformed due to the steady improvement in the U.S. economy, the group’s lack of international exposure, the falling diesel prices which helped their margins, and finally by the belief that the U.S. consumer demand picture would improve as a result of falling gasoline prices. As we enter 2015, signs of improving truckload volumes and pricing are evident.
One of our largest purchases during the year was Tootsie Roll. The iconic candy company has wonderful brands in Tootsie Roll, Dots, Blow Pops, Charms, Junior Mints, Razzles, and Sugar Babies. While the Company has struggled to improve its top line over the past two years, management has done a better job of improving both net income and free cash flow. We purchased our shares at a free cash flow yield of over 5% which compares favorably to other consumer staples peers. Additionally, we believe an acquirer could improve cash flows by trimming the cost structure. With the recent passing of Tootsie Roll’s CEO, and significant owner, Melvin Gordon, a sale of the company could be in the cards.
One of largest sales during the quarter was the elimination of our position in Silgan. The Company is a leading manufacturer of metal food cans, closures and plastic containers. When we bought our position in Silgan, the free cash flow yield approached 6%. Due to share price appreciation, this important metric had fallen to 4%. This increased valuation in conjunction with a slowdown in food volumes led us to exit our position.
Prospector Capital Appreciation Fund Highlights
In a strong year for the stock market, the one sector of the S&P 500 that declined during the year was energy due to the rapid decline in the price of oil late in the year. Your Capital Appreciation Fund’s performance was negatively impacted by our oil and gas holdings. Exploration and production (E&P) holdings, including Clayton Williams, Talisman Energy, WPX Energy and Murphy Oil were all among the largest detractors for the year. Our long-held strategy for energy investing is to buy mid-major companies that run individual projects that are of the size and scale to attract major oil company consolidation. Given the smaller companies have been hit the hardest, this strategy has not been beneficial during the recent downturn. For example, Talisman, a company we have long thought an attractive potential target, indeed agreed to a takeout by Repsol for a 131% premium to the stock’s recent trading lows. Unfortunately, the takeover price is still over 30% below Talisman’s price at the beginning of 2014. Any recovery in the price of oil from today’s panic lows should lead to significant appreciation in our oil and gas holdings.
The Fund’s relative underperformance for the year ended December 31, 2014 was also impacted by a significant underweight to the technology sector, which was the S&P 500’s top contributing sector, as well as a more mid-cap focus. As mentioned earlier in the letter, the market’s gains were driven by mega-cap stocks in 2014. Given our “private market value” focus (using prices set by third parties in recent arms-length transactions to find stocks selling below their intrinsic value), we are often drawn to companies that are small enough to be acquisition targets. While your portfolio did benefit from several mergers during the year, overall, this positioning hurt relative performance.
Despite still slow convertible bond issuances by companies, we’ve recently found a few converts to buy. One of those issues, Chart Industries 2.0% 08-01-18’s, was the largest purchase in the last six months of the year. Chart, which facilitates the processing and transportation of liquefied natural gas (LNG), has seen its stock take a drubbing lately, as China has slowed and oil prices have tanked. China is seen as one of the biggest growth markets for LNG, as new emissions standards make cleaner-burning LNG an attractive alternative to diesel fuel. However, given oil’s drop in price, the spread between diesel (which is highly correlated to the price of oil) and LNG has narrowed, lessening the incentive to switch vehicles to LNG. Additionally, the growth of the U.S. LNG market has been disappointing, as approvals for export terminals and transitioning of trucks from diesel to LNG have been
slow. Despite the recent headwinds, there is an attractive long-term story. China has a long-term incentive to make the switch to cleaner LNG, and Europe is an attractive market for domestic LNG exports given their current reliance on Russian natural gas. Meanwhile, Chart sits with a very strong balance sheet (there is very little debt other than the convert issue), and has a track record of producing solid cash flows even during tough times – making the convert a very attractive risk / reward investment.
Another significant purchase during the second half of 2014 was GlaxoSmithKline, plc American Depository Receipts. Glaxo, the U.K.-based healthcare company, has been a dramatic underperformer in recent years, as management has over-promised and under-delivered. In our opinion, an opportunity to purchase Glaxo shares on the cheap was created as weary investors threw in the towel following disappointing earnings and guidance. The disappointing results came largely from price competition in their Respiratory franchise (where they are the global leader), as well as a near-term margin “reset” which will follow the closing of a large transaction with Novartis (Glaxo is swapping their sub-scale oncology business for Novartis’ vaccines business, most of the consumer business, and cash). While the company is certainly facing some near-term headwinds, we think investors are missing that roughly half the company will be vaccines and consumer healthcare following the Novartis deal. Both of these businesses are high-growth, long-duration products with less patent risk than the pharmaceutical business. Thus, these businesses typically are afforded a higher valuation by the market. Glaxo also has an opportunity to trim a bloated cost structure and improve margins. Similar restructurings by the likes of Abbott and Pfizer have been highly successful at unlocking value. While we wait for the market to potentially recognize the long-term positives in the Glaxo story, we have earned a 6% dividend yield on our position – a dividend Glaxo management has stated that they seek to not only maintain, but to grow.
Outlook
The economy has remained in slow growth recovery mode since the end of the financial crisis. The modestly better U.S. economic performance we experienced in the second half of 2014 should continue but faces challenges from weakening economic growth across the globe and the strong U.S. dollar. Europe’s position is even weaker. Oil prices have fallen over 50% in recent months which should stimulate consumer spending and confidence in the long run both here and abroad. In the near term, the U.S. will feel the negative impacts from abandoned drilling projects and job creation in the energy sector. We will continue to enjoy the competitive advantage of a long-term supply of abundant cheap natural gas. In addition, the wealth effect on the U.S. consumer from rising 401k balances and higher home prices should also spur consumer spending.
Interest and mortgage rates continue near historically low levels. Our best guess is those rates will be materially higher in five years, although they are unlikely to move much in 2015. This will eventually cause trouble for bond investors. Ultimately, higher rates will likely accompany better economic conditions and possibly higher inflation, both of which are relative positives for equities compared to bonds. Much depends on the path and pace of interest rates’ return to normalcy.
Equity valuations remain near extended levels due to the strong stock market. We estimate that the S&P 500 trades in the eighth decile on trailing operating earnings. Let’s not forget that those earnings benefit from record high profit margins. We feel we are in the latter stages of a bull market, although nothing is certain in the investment world. Equities do look reasonable when comparing earnings yields to Treasury or even corporate bond yields. Returns in bonds are more tightly clustered around market averages due to the dominating influence of interest rates on the overall result.
Corporations have terrific balance sheets and are accumulating excess cash and capital. Importantly, they are also starting to spend on new capital projects, new employees, and new acquisitions. This could pressure profit mar-
gins in the near term which sit near all-time high levels, currently 10%. The offset should be an improvement in revenue growth from the low single digit levels of the past few years. In any case, we think the values inherent in the portfolio should attract acquirers and other investors over time. Meanwhile we believe equities are a superior asset allocation alternative to bonds over the longer term.
Thank you for entrusting us with your money.
Respectfully submitted,
| John D. Gillespie | Kevin R. O’Brien | Jason A. Kish |
Performance data quoted represents past performance; past performance does not guarantee future results.
Opinions expressed are those of the Funds and are subject to change, are not guaranteed, and should not be considered a recommendation to buy or sell any security.
Mutual fund investing involves risk. Principal loss is possible. Investments in debt securities typically decrease in value when interest rates rise. This risk is usually greater for longer-term debt securities. The Funds invest in foreign securities which involve greater volatility and political, economic and currency risks and differences in accounting methods. The Funds invest in smaller and mid-cap companies, which involve additional risks such as limited liquidity and greater volatility. The Funds may hold restricted securities purchased through private placements. Such securities can be difficult to sell without experiencing delays or additional costs. Derivatives involve risks different from, and in certain cases, greater than the risks presented by more traditional investments. These risks are fully disclosed in the prospectus.
Stocks are generally perceived to have more financial risk than bonds in that bond holders have a claim on firm operations or assets that is senior to that of equity holders. In addition, stock prices are generally more volatile than bond prices. Investments in debt securities typically decrease in value when interest rates rise. This risk is usually greater for longer-term debt securities. A stock may trade with more or less liquidity than a bond depending on the number of shares and bonds outstanding, the size of the company, and the demand for the securities. Similarly, the transaction costs involved in trading a stock may be more or less than a particular bond depending on the factors mentioned above and whether the stock or bond trades upon an exchange. Depending on the entity issuing the bond, it may or may or may not afford additional protections to the investor, such as a guarantee of return of principal by a government or bond insurance company. There is typically no guarantee of any kind associated with the purchase of an individual stock. Bonds are often owned by individuals interested in current income while stocks are generally owned by individuals seeking price appreciation with income a secondary concern. The tax treatment of returns of bonds and stocks also differs given differential tax treatment of income versus capital gain.
The S&P 500 Index is a broad based unmanaged index of 500 stocks, which is widely recognized as representative of the equity market in general. You cannot invest directly in an index.
The Russell 2000 Index is an unmanaged small-cap index that measures the performance of the 2,000 smallest companies in the Russell 3000 Index. You cannot invest directly in an index.
The Russell MidCap Index is an unmanaged mid-cap index that measures the performance of the 800 smallest companies in the Russell 1000 index. You cannot invest directly in an index.
Cash flow measures the cash generating capability of a company by adding non-cash charges (e.g. depreciation) and interest expense to pretax income.
Free cash flow is revenue less operating expenses including interest expenses and maintenance capital spending. It is the discretionary cash that a company has after all expenses and is available for purposes such as dividend payments, investing back into the business or share repurchases.
Fund holdings and/or security allocations are subject to change at any time and are not recommendations to buy or sell any security. Please see the Schedule of Investments section in this report for a full listing of the Fund’s holdings.
Prospector Funds, Inc. are distributed by Quasar Distributors, LLC.
Capital Appreciation Fund
The chart assumes an initial investment of $10,000. Performance reflects waivers of fee and operating expenses in effect. In the absence of such waivers, total return would be reduced. Past performance is not predictive of future performance. Investment return and principal value will fluctuate, so that your shares, when redeemed may be worth more or less than their original cost. Performance assumes the reinvestment of capital gains and income distributions. The performance does not reflect the deduction of taxes that a shareholder would pay on Fund distributions or the redemption of Fund shares.
Average Annual Rates of Return (%) – As of December 31, 2014
| | One Year | Three Year | Five Year | Since Inception(1) |
| Capital Appreciation Fund | 4.18% | 9.48% | 8.16% | 4.89% |
S&P 500 Index(2) | 13.69% | 20.41% | 15.45% | 6.46% |
| (2) | The Standard & Poor’s 500 Index (S&P 500) is an unmanaged, capitalization-weighted index generally representative of the U.S. market for large capitalization stocks. This Index cannot be invested in directly. |
Opportunity Fund
The chart assumes an initial investment of $10,000. Performance reflects waivers of fee and operating expenses in effect. In the absence of such waivers, total return would be reduced. Past performance is not predictive of future performance. Investment return and principal value will fluctuate, so that your shares, when redeemed may be worth more or less than their original cost. Performance assumes the reinvestment of capital gains and income distributions. The performance does not reflect the deduction of taxes that a shareholder would pay on Fund distributions or the redemption of Fund shares.
Average Annual Rates of Return (%) – As of December 31, 2014
| | One Year | Three Year | Five Year | Since Inception(1) |
| Opportunity Fund | 7.36% | 16.12% | 12.81% | 8.96% |
Russell 2000 Index(2) | 4.89% | 19.21% | 15.55% | 7.03% |
Russell Midcap Index(3) | 13.22% | 21.40% | 17.19% | 8.00% |
| (2) | An unmanaged small-cap index that measures the performance of the 2,000 smallest companies in the Russell 3000 Index. This index cannot be invested in directly. |
| (3) | An unmanaged mid-cap index that measures the performance of the 800 smallest companies in the Russell 1000 Index. This index cannot be invested in directly. |
Expense Example
December 31, 2014
As a shareholder of the Fund, you incur two types of costs: (1) transaction costs, which may include but are not limited to, redemption fees, wire transfer fees, maintenance fee (IRA accounts), and exchange fees; and (2) ongoing costs, including management fees; distribution and/or service fees; and other Fund expenses. This Example is intended to help you understand your ongoing costs (in dollars) of investing in the Fund and to compare these costs with the ongoing costs of investing in other mutual funds. The Example is based on an investment of $1,000 invested at the beginning of the period and held for the entire period (July 1, 2014 – December 31, 2014).
ACTUAL EXPENSES
The first line of the table below provides information about actual account values and actual expenses. Although the Fund charges no sales load or transaction fees, you will be assessed fees for outgoing wire transfers, returned checks and stop payment orders at prevailing rates charged by U.S. Bancorp Fund Services, LLC, the Fund’s transfer agent. The example below includes, but is not limited to, management fees, shareholder servicing fees and other Fund expenses. However, the example below does not include portfolio trading commissions and related expenses, interest expense and other extraordinary expenses as determined under generally accepted accounting principles. You may use the information in this line, together with the amount you invested, to estimate the expenses that you paid over the period. Simply divide your account value by $1,000 (for example, an $8,600 account value divided by $1,000 = 8.6), then multiply the result by the number in the first line under the heading entitled “Expenses Paid During Period” to estimate the expenses you paid on your account during this period.
HYPOTHETICAL EXAMPLE FOR COMPARISON PURPOSES
The second line of the table below provides information about hypothetical account values and hypothetical expenses based on the Fund’s actual expense ratio and an assumed rate of return of 5% per year before expenses, which is not the Fund’s actual return. The hypothetical account values and expenses may not be used to estimate the actual ending account balance or expenses you paid for the period. You may use this information to compare the ongoing costs of investing in the Fund and other funds. To do so, compare this 5% hypothetical example with the 5% hypothetical examples that appear in the shareholder reports of the other funds.
Please note that the expenses shown in the table are meant to highlight your ongoing costs only and do not reflect any transactional costs, such as redemption fees or exchange fees. Therefore, the second line of the table is useful in comparing ongoing costs only, and will not help you determine the relative total costs of owning different funds. In addition, if these transactional costs were included, your costs would have been higher.
| | | | Expenses Paid |
| | Beginning Account | Ending Account | During Period(1) |
| | Value (07/01/2014) | Value (12/31/2014) | (07/01/2014 to 12/31/2014) |
Capital Appreciation Actual(2) | $1,000.00 | $ 972.40 | $6.46 |
| Capital Appreciation Hypothetical | | | |
| (5% return before expenses) | 1,000.00 | 1,018.65 | 6.61 |
| | | | |
Opportunity Actual(2) | 1,000.00 | 1,036.90 | 6.67 |
| Opportunity Hypothetical | | | |
| (5% return before expenses) | 1,000.00 | 1,018.65 | 6.61 |
| (1) | Expenses are equal to the Fund's annualized expense ratio for the most recent six-month period of 1.30% and 1.30% for Capital Appreciation Fund and Opportunity Fund, respectively, multiplied by the average account value over the period, multiplied by 184/365 to reflect the one-half year period. |
| (2) | Based on the actual returns for the six-month period ended December 31, 2014 of -2.76% and 3.69% for Capital Appreciation Fund and Opportunity Fund, respectively. |
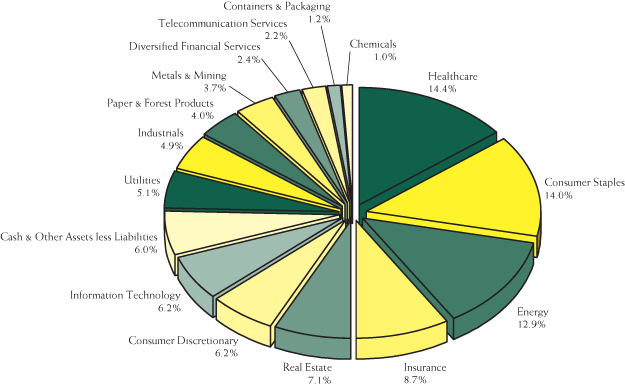
Sector Allocation (% of net assets) (Unaudited)
as of December 31, 2014(1)(2)
Capital Appreciation Fund
Top 10 Holdings (% of net assets) (Unaudited)
as of December 31, 2014(1)(3)
Capital Appreciation Fund
| | RTI International, 1.625%, 10/15/2019 | | | 3.5 | % |
| | Abbott Laboratories | | | 3.0 | % |
| | Post Properties | | | 2.9 | % |
| | InterOil, 2.750%, 11/15/2015 | | | 2.9 | % |
| | Merck & Co. | | | 2.8 | % |
| | Domtar | | | 2.8 | % |
| | Coca-Cola | | | 2.6 | % |
| | FirstEnergy | | | 2.6 | % |
| | Chart Industries, 2.000%, 08/01/2018 | | | 2.6 | % |
| | McDonald's | | | 2.5 | % |
| | (1) | Fund holdings and sector allocations are subject to change at any time and are not recommendations to buy or sell any security. |
| | (2) | Sector allocation includes all investment types. |
| | (3) | Invesco Treasury Portfolio excluded from top 10 holdings. |
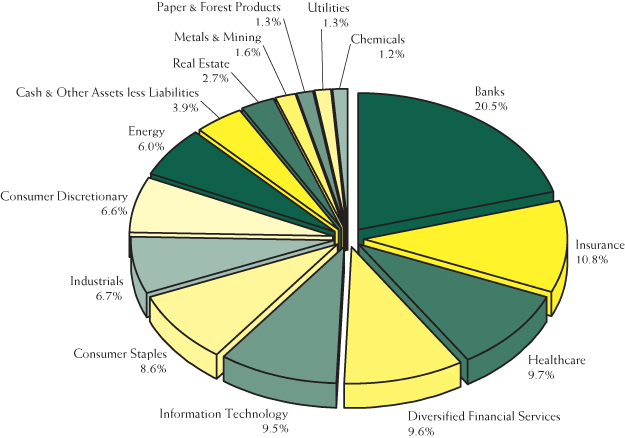
Sector Allocation (% of net assets) (Unaudited)
as of December 31, 2014(1)(2)
Opportunity Fund
Top 10 Holdings (% of net assets) (Unaudited)
as of December 31, 2014(1)(3)
Opportunity Fund
| | Murphy Oil | | | 2.9 | % |
| | Invesco | | | 2.9 | % |
| | Franklin Resources | | | 2.5 | % |
| | Hess | | | 2.5 | % |
| | Endurance Specialty Holdings | | | 2.2 | % |
| | HomeTrust Bancshares | | | 2.1 | % |
| | Brown & Brown | | | 1.9 | % |
| | Clifton Bancorp | | | 1.9 | % |
| | Patterson Companies | | | 1.8 | % |
| | Church & Dwight | | | 1.8 | % |
| | (1) | Fund holdings and sector allocations are subject to change at any time and are not recommendations to buy or sell any security. |
| | (2) | Sector allocation includes all investment types. |
| | (3) | Invesco Treasury Portfolio excluded from top 10 holdings. |
Schedule of Investments
December 31, 2014
Capital Appreciation Fund
| Description | | Shares | | | Value | |
| | | | | | | |
| COMMON STOCKS – 74.7% | | | | | | |
| | | | | | | |
| Chemicals – 1.0% | | | | | | |
| E.I. Du Pont de Nemours | | | 5,400 | | | $ | 399,276 | |
| | | | | | | | | |
| Consumer Discretionary – 6.2% | | | | | | | | |
| Cablevision Systems, Class A | | | 16,800 | | | | 346,752 | |
| Darden Restaurants | | | 9,400 | | | | 551,122 | |
| DreamWorks Animation SKG, Class A* | | | 24,200 | | | | 540,386 | |
| McDonald’s | | | 10,200 | | | | 955,740 | |
| | | | | | | | 2,394,000 | |
| Consumer Staples – 13.2% | | | | | | | | |
| Campbell Soup | | | 13,600 | | | | 598,400 | |
| Coca-Cola | | | 23,900 | | | | 1,009,058 | |
| Colgate-Palmolive | | | 2,900 | | | | 200,651 | |
| Diageo – ADR | | | 4,930 | | | | 562,464 | |
| Energizer Holdings | | | 3,400 | | | | 437,104 | |
| Tootsie Roll Industries | | | 29,185 | | | | 894,520 | |
| Walgreens Boots Alliance | | | 7,700 | | | | 586,740 | |
| Wal-Mart Stores | | | 8,900 | | | | 764,332 | |
| | | | | | | | 5,053,269 | |
| Diversified Financial Services – 2.4% | | | | | | | | |
| Legg Mason | | | 11,750 | | | | 627,098 | |
| Leucadia National | | | 13,200 | | | | 295,944 | |
| | | | | | | | 923,042 | |
| Energy – 8.8% | | | | | | | | |
| Centrus Energy, Class A* | | | 25,561 | | | | 109,912 | |
| Clayton Williams Energy* | | | 6,200 | | | | 395,560 | |
| ConocoPhillips | | | 13,700 | | | | 946,122 | |
| Hess | | | 10,100 | | | | 745,582 | |
| Murphy Oil | | | 9,000 | | | | 454,680 | |
| Talisman Energy | | | 72,400 | | | | 566,892 | |
| WPX Energy* | | | 12,300 | | | | 143,049 | |
| | | | | | | | 3,361,797 | |
| Healthcare – 12.6% | | | | | | | | |
| Abbott Laboratories | | | 25,200 | | | | 1,134,504 | |
| Eli Lilly & Co. | | | 5,900 | | | | 407,041 | |
| GlaxoSmithKline – ADR | | | 17,250 | | | | 737,265 | |
| Hospira* | | | 3,900 | | | | 238,875 | |
See Notes to the Financial Statements
Schedule of Investments – Continued
December 31, 2014
Capital Appreciation Fund
| Description | | Shares | | | Value | |
| | | | | | | |
COMMON STOCKS – 74.7% (Continued) | | | | | | |
| | | | | | | |
| Healthcare – 12.6% (Continued) | | | | | | |
| Johnson & Johnson | | | 5,700 | | | $ | 596,049 | |
| Merck & Co. | | | 19,100 | | | | 1,084,689 | |
| Sanofi – ADR | | | 14,100 | | | | 643,101 | |
| | | | | | | | 4,841,524 | |
| Industrials – 2.3% | | | | | | | | |
| Curtiss-Wright | | | 3,900 | | | | 275,301 | |
| Eaton | | | 5,400 | | | | 366,984 | |
| Sulzer | | | 2,400 | | | | 255,884 | |
| | | | | | | | 898,169 | |
| Information Technology – 5.1% | | | | | | | | |
| Automatic Data Processing | | | 8,300 | | | | 691,971 | |
| CDK Global | | | 3,433 | | | | 139,929 | |
| Comtech Telecommunications | | | 13,600 | | | | 428,672 | |
| Microsoft | | | 1,700 | | | | 78,965 | |
| Paychex | | | 4,600 | | | | 212,382 | |
| Science Applications International | | | 4,600 | | | | 227,838 | |
| Xerox | | | 12,600 | | | | 174,636 | |
| | | | | | | | 1,954,393 | |
| Insurance – 8.7% | | | | | | | | |
| American International Group | | | 8,000 | | | | 448,080 | |
| Berkshire Hathaway, Class B* | | | 5,300 | | | | 795,795 | |
| CNA Financial | | | 9,900 | | | | 383,229 | |
| Donegal Group, Class A | | | 7,100 | | | | 113,458 | |
| First American Financial | | | 8,800 | | | | 298,320 | |
| Loews | | | 13,900 | | | | 584,078 | |
| Platinum Underwriters Holdings | | | 2,000 | | | | 146,840 | |
| State Auto Financial | | | 25,100 | | | | 557,722 | |
| | | | | | | | 3,327,522 | |
| Metals & Mining – 0.2% | | | | | | | | |
| AuRico Gold | | | 24,420 | | | | 80,098 | |
| | | | | | | | | |
| Paper & Forest Products – 4.0% | | | | | | | | |
| Deltic Timber | | | 1,700 | | | | 116,280 | |
| Domtar | | | 26,551 | | | | 1,067,881 | |
| Louisiana-Pacific* | | | 20,600 | | | | 341,136 | |
| | | | | | | | 1,525,297 | |
See Notes to the Financial Statements
Schedule of Investments – Continued
December 31, 2014
Capital Appreciation Fund
| Description | | Shares | | | Value | |
| | | | | | | |
COMMON STOCKS – 74.7% (Continued) | | | | | | |
| | | | | | | |
| Real Estate – 2.9% | | | | | | |
| Post Properties | | | 18,700 | | | $ | 1,098,999 | |
| | | | | | | | | |
| Telecommunication Services – 2.2% | | | | | | | | |
| Telephone & Data Systems | | | 33,400 | | | | 843,350 | |
| | | | | | | | | |
| Utilities – 5.1% | | | | | | | | |
| FirstEnergy | | | 25,600 | | | | 998,144 | |
| NRG Energy | | | 21,701 | | | | 584,842 | |
| Public Service Enterprise Group | | | 2,300 | | | | 95,243 | |
| TransAlta | | | 32,000 | | | | 289,920 | |
| | | | | | | | 1,968,149 | |
| Total Common Stocks | | | | | | | | |
| (Cost $25,086,905) | | | | | | | 28,668,885 | |
| | | | | | | | | |
| | | Par | | | | | |
| CONVERTIBLE BONDS – 18.1% | | | | | | | | |
| | | | | | | | | |
| Consumer Staples – 0.8% | | | | | | | | |
| Chiquita Brands | | | | | | | | |
| 4.250%, 08/15/2016 | | $ | 325,000 | | | | 324,797 | |
| | | | | | | | | |
| Containers & Packaging – 1.2% | | | | | | | | |
| Owens-Brockway | | | | | | | | |
| 3.000%, 06/01/2015 (a) | | | 475,000 | | | | 475,297 | |
| | | | | | | | | |
| Energy – 2.9% | | | | | | | | |
| InterOil | | | | | | | | |
| 2.750%, 11/15/2015 | | | 1,090,000 | | | | 1,096,813 | |
| | | | | | | | | |
| Healthcare – 1.8% | | | | | | | | |
| Hologic | | | | | | | | |
| 2.000%, 12/15/2037 | | | 550,000 | | | | 685,781 | |
| | | | | | | | | |
| Industrials – 2.6% | | | | | | | | |
| Chart Industries | | | | | | | | |
| 2.000%, 08/01/2018 | | | 1,025,000 | | | | 980,797 | |
See Notes to the Financial Statements
Schedule of Investments – Continued
December 31, 2014
Capital Appreciation Fund
| Description | | Par | | | Value | |
| | | | | | | |
CONVERTIBLE BONDS – 18.1% (Continued) | | | | | | |
| | | | | | | |
| Information Technology – 1.1% | | | | | | |
| HomeAway | | | | | | |
| 0.125%, 04/01/2019 (a) | | $ | 460,000 | | | $ | 431,537 | |
| | | | | | | | | |
| Metals & Mining – 3.5% | | | | | | | | |
| RTI International | | | | | | | | |
| 1.625%, 10/15/2019 | | | 1,375,000 | | | | 1,336,328 | |
| | | | | | | | | |
| Real Estate – 4.2% | | | | | | | | |
| Forest City Enterprises | | | | | | | | |
| 4.250%, 08/15/2018 | | | 150,000 | | | | 171,187 | |
| 3.625%, 08/15/2020 | | | 625,000 | | | | 664,844 | |
| Forestar Group | | | | | | | | |
| 3.750%, 03/01/2020 | | | 825,000 | | | | 786,328 | |
| | | | | | | | 1,622,359 | |
| Total Convertible Bonds | | | | | | | | |
| (Cost $7,067,551) | | | | | | | 6,953,709 | |
| | | | | | | | | |
| CORPORATE BONDS – 1.2% | | | | | | | | |
| | | | | | | | | |
| Energy – 1.2% | | | | | | | | |
| Centrus Energy | | | | | | | | |
| 8.000%, 09/30/2019 (b) | | | | | | | | |
| (Cost $1,325,846) | | | 896,226 | | | | 461,889 | |
See Notes to the Financial Statements
Schedule of Investments – Continued
December 31, 2014
Capital Appreciation Fund
| Description | | Shares | | | Value | |
| | | | | | | |
| SHORT-TERM INVESTMENT – 6.1% | | | | | | |
| | | | | | | |
| Invesco Treasury Portfolio, 0.010%^ | | | | | | |
| (Cost $2,343,564) | | | 2,343,564 | | | $ | 2,343,564 | |
| Total Investments – 100.1% | | | | | | | | |
| (Cost $35,823,866) | | | | | | | 38,428,047 | |
| Other Assets and Liabilities, Net – (0.1)% | | | | | | | (30,384 | ) |
| Total Net Assets – 100.0% | | | | | | $ | 38,397,663 | |
| * | Non-income producing security |
ADR – American Depositary Receipt
| (a) | Security purchased within the terms of a private placement memorandum, exempt from registration under Rule 144A of the Securities Act of 1933, as amended, and may be sold only to dealers in that program or other "qualified institutional buyers." As of December 31, 2014, the value of these investments was $906,834 or 2.4% of total net assets. |
| (b) | A portion of this security is restricted for sale and considered illiquid. |
| ^ | Variable Rate Security – the rate shown is the annualized seven-day effective yield as of December 31, 2014. |
See Notes to the Financial Statements
Schedule of Investments
December 31, 2014
Opportunity Fund
| Description | | Shares | | | Value | |
| | | | | | | |
| COMMON STOCKS – 94.3% | | | | | | |
| | | | | | | |
| Banks – 20.5% | | | | | | |
| Brookline Bancorp | | | 120,300 | | | $ | 1,206,609 | |
| Capital Bank Financial, Class A* | | | 33,000 | | | | 884,400 | |
| Capital City Bank Group | | | 21,100 | | | | 327,894 | |
| Central Pacific Financial | | | 42,600 | | | | 915,900 | |
| Chicopee Bancorp | | | 26,200 | | | | 438,850 | |
| Citigroup | | | 15,170 | | | | 820,849 | |
| City National | | | 6,900 | | | | 557,589 | |
| Clifton Bancorp | | | 126,184 | | | | 1,714,840 | |
| Dime Community Bancshares | | | 39,200 | | | | 638,176 | |
| First Defiance Financial | | | 22,200 | | | | 756,132 | |
| HomeTrust Bancshares* | | | 115,600 | | | | 1,925,896 | |
| Meridian Bancorp* | | | 52,900 | | | | 593,538 | |
| Metro Bancorp* | | | 25,280 | | | | 655,258 | |
| OceanFirst Financial | | | 87,200 | | | | 1,494,608 | |
| Oritani Financial | | | 69,750 | | | | 1,074,150 | |
| PacWest Bancorp | | | 18,300 | | | | 831,918 | |
| ServisFirst Bancshares | | | 34,300 | | | | 1,130,185 | |
| SI Financial Group | | | 52,700 | | | | 587,078 | |
| Waterstone Financial | | | 107,300 | | | | 1,410,995 | |
| Westfield Financial | | | 105,000 | | | | 770,700 | |
| | | | | | | | 18,735,565 | |
| Chemicals – 1.2% | | | | | | | | |
| H.B. Fuller | | | 25,400 | | | | 1,131,062 | |
| | | | | | | | | |
| Consumer Discretionary – 6.6% | | | | | | | | |
| Darden Restaurants | | | 11,800 | | | | 691,834 | |
| Denny’s* | | | 120,100 | | | | 1,238,231 | |
| Home Depot | | | 11,900 | | | | 1,249,143 | |
| Hyatt Hotels, Class A* | | | 14,900 | | | | 897,129 | |
| Johnson Outdoors, Class A | | | 25,467 | | | | 794,570 | |
| McDonald's | | | 12,100 | | | | 1,133,770 | |
| | | | | | | | 6,004,677 | |
| Consumer Staples – 8.6% | | | | | | | | |
| Church & Dwight | | | 20,900 | | | | 1,647,129 | |
| Diageo – ADR | | | 6,100 | | | | 695,949 | |
| J & J Snack Foods | | | 8,600 | | | | 935,422 | |
| Lancaster Colony | | | 14,800 | | | | 1,385,872 | |
| Orkla | | | 113,400 | | | | 778,265 | |
See Notes to the Financial Statements
Schedule of Investments – Continued
December 31, 2014
Opportunity Fund
| Description | | Shares | | | Value | |
| | | | | | | |
COMMON STOCKS – 94.3% (Continued) | | | | | | |
| | | | | | | |
| Consumer Staples – 8.6% (Continued) | | | | | | |
| PepsiCo | | | 7,900 | | | $ | 747,024 | |
| Tootsie Roll Industries | | | 53,200 | | | | 1,630,580 | |
| | | | | | | | 7,820,241 | |
| Diversified Financial Services – 9.6% | | | | | | | | |
| Franklin Resources | | | 41,100 | | | | 2,275,707 | |
| IntercontinentalExchange | | | 1,600 | | | | 350,864 | |
| Invesco | | | 67,700 | | | | 2,675,504 | |
| Legg Mason | | | 28,000 | | | | 1,494,360 | |
| Leucadia National | | | 54,500 | | | | 1,221,890 | |
| PICO Holdings* | | | 39,200 | | | | 738,920 | |
| | | | | | | | 8,757,245 | |
| Energy – 6.0% | | | | | | | | |
| Hess | | | 30,500 | | | | 2,251,510 | |
| Murphy Oil | | | 53,200 | | | | 2,687,664 | |
| Talisman Energy | | | 74,500 | | | | 583,335 | |
| | | | | | | | 5,522,509 | |
| Healthcare – 8.4% | | | | | | | | |
| AMAG Pharmaceuticals* | | | 23,500 | | | | 1,001,570 | |
| Auxilium Pharmaceuticals* | | | 16,300 | | | | 560,475 | |
| Eli Lilly & Co. | | | 13,400 | | | | 924,466 | |
| Haemonetics* | | | 26,100 | | | | 976,662 | |
| Invacare | | | 59,000 | | | | 988,840 | |
| Merck & Co. | | | 27,348 | | | | 1,553,093 | |
| Patterson Companies | | | 34,400 | | | | 1,654,640 | |
| | | | | | | | 7,659,746 | |
| Industrials – 6.7% | | | | | | | | |
| Celadon Group | | | 46,394 | | | | 1,052,680 | |
| Landstar System | | | 14,200 | | | | 1,029,926 | |
| Northrop Grumman | | | 7,800 | | | | 1,149,642 | |
| Regal-Beloit | | | 11,500 | | | | 864,800 | |
| Sulzer | | | 7,400 | | | | 788,976 | |
| Tyco International | | | 27,400 | | | | 1,201,764 | |
| | | | | | | | 6,087,788 | |
| Information Technology – 9.5% | | | | | | | | |
| EMC | | | 17,400 | | | | 517,476 | |
| Maxim Integrated Products | | | 28,200 | | | | 898,734 | |
| Microsoft | | | 21,000 | | | | 975,450 | |
See Notes to the Financial Statements
Schedule of Investments – Continued
December 31, 2014
Opportunity Fund
| Description | | Shares | | | Value | |
| | | | | | | |
COMMON STOCKS – 94.3% (Continued) | | | | | | |
| | | | | | | |
| Information Technology – 9.5% (Continued) | | | | | | |
| NetApp | | | 23,200 | | | $ | 961,640 | |
| Paychex | | | 34,000 | | | | 1,569,780 | |
| Synopsys* | | | 27,000 | | | | 1,173,690 | |
| Verifone Systems* | | | 7,000 | | | | 260,400 | |
| VeriSign* | | | 24,500 | | | | 1,396,500 | |
| Xilinx | | | 22,500 | | | | 974,025 | |
| | | | | | | | 8,727,695 | |
| Insurance – 10.8% | | | | | | | | |
| Brown & Brown | | | 53,200 | | | | 1,750,812 | |
| Catlin Group | | | 136,727 | | | | 1,429,922 | |
| Chubb | | | 6,000 | | | | 620,820 | |
| CNA Financial | | | 25,900 | | | | 1,002,589 | |
| Endurance Specialty Holdings | | | 33,900 | | | | 2,028,576 | |
| Infinity Property & Casualty | | | 10,392 | | | | 802,886 | |
| Platinum Underwriters Holdings | | | 20,700 | | | | 1,519,794 | |
| XL Group | | | 21,200 | | | | 728,644 | |
| | | | | | | | 9,884,043 | |
| Metals & Mining – 1.6% | | | | | | | | |
| Kinross Gold* | | | 132,100 | | | | 372,522 | |
| Newmont Mining | | | 57,500 | | | | 1,086,750 | |
| Victoria Gold* | | | 96,500 | | | | 8,685 | |
| | | | | | | | 1,467,957 | |
| Paper & Forest Products – 1.3% | | | | | | | | |
| Deltic Timber | | | 9,000 | | | | 615,600 | |
| Domtar | | | 14,400 | | | | 579,168 | |
| | | | | | | | 1,194,768 | |
| Real Estate – 2.2% | | | | | | | | |
| Forestar Group* | | | 29,700 | | | | 457,380 | |
| Howard Hughes* | | | 3,000 | | | | 391,260 | |
| Parkway Properties | | | 44,450 | | | | 817,436 | |
| Winthrop Realty Trust | | | 23,000 | | | | 358,570 | |
| | | | | | | | 2,024,646 | |
| Utilities – 1.3% | | | | | | | | |
| Public Service Enterprise Group | | | 28,200 | | | | 1,167,763 | |
| | | | | | | | | |
| Total Common Stocks | | | | | | | | |
| (Cost $71,124,787) | | | | | | | 86,185,705 | |
See Notes to the Financial Statements
Schedule of Investments – Continued
December 31, 2014
Opportunity Fund
| Description | | Par | | | Value | |
| | | | | | | |
| CONVERTIBLE BONDS – 1.8% | | | | | | |
| | | | | | | |
| Healthcare – 1.3% | | | | | | |
| Hologic | | | | | | |
| 2.000%, 12/15/2037 | | $ | 1,000,000 | | | $ | 1,246,875 | |
| | | | | | | | | |
| Real Estate – 0.5% | | | | | | | | |
| Forestar Group | | | | | | | | |
| 3.750%, 03/01/2020 | | | 450,000 | | | | 428,906 | |
| Total Convertible Bonds | | | | | | | | |
| (Cost $1,660,799) | | | | | | | 1,675,781 | |
| | | | | | | | | |
| | | Shares | | | | | |
| SHORT-TERM INVESTMENT – 3.3% | | | | | | | | |
| Invesco Treasury Portfolio, 0.010%^ | | | | | | | | |
| (Cost $3,000,963) | | | 3,000,963 | | | | 3,000,963 | |
| Total Investments – 99.4% | | | | | | | | |
| (Cost $75,786,549) | | | | | | | 90,862,449 | |
| Other Assets and Liabilities, Net – 0.6% | | | | | | | 585,955 | |
| Total Net Assets – 100.0% | | | | | | $ | 91,448,404 | |
| * | Non-income producing security |
ADR – American Depositary Receipt
| ^ | Variable Rate Security – the rate shown is the annualized seven-day effective yield as of December 31, 2014. |
See Notes to the Financial Statements
Statements of Assets and Liabilities
December 31, 2014
| | | Capital Appreciation Fund | | | Opportunity Fund | |
| ASSETS: | | | | | | |
| Investments, at market value | | | | | | |
| (Cost $35,823,866 and $75,786,549, respectively) | | $ | 38,428,047 | | | $ | 90,862,449 | |
| Cash | | | 5,330 | | | | 9,106 | |
| Receivable for investment securities sold | | | 240,713 | | | | 637,809 | |
| Receivable for dividends and interest | | | 110,265 | | | | 134,122 | |
| Receivable for capital shares sold | | | — | | | | 59,107 | |
| Prepaid expenses | | | 9,222 | | | | 15,840 | |
| Total assets | | | 38,793,577 | | | | 91,718,433 | |
| | | | | | | | | |
| LIABILITIES: | | | | | | | | |
| Payable for investment securities purchased | | | 295,957 | | | | — | |
| Payable for capital shares redeemed | | | — | | | | 81,125 | |
| Payable to adviser, net | | | 18,801 | | | | 55,479 | |
| Accrued distribution fees | | | 3,704 | | | | 18,406 | |
| Accrued expenses and other liabilities | | | 77,452 | | | | 115,019 | |
| Total liabilities | | | 395,914 | | | | 270,029 | |
| | | | | | | | | |
| NET ASSETS | | $ | 38,397,663 | | | $ | 91,448,404 | |
| | | | | | | | | |
| COMPOSITION OF NET ASSETS: | | | | | | | | |
| Portfolio capital | | $ | 36,936,009 | | | $ | 71,559,783 | |
| Distributions in excess of net investment income | | | (23,066 | ) | | | (74,282 | ) |
| Accumulated net realized gain (loss) on investments | | | (1,119,402 | ) | | | 4,888,414 | |
| Net unrealized appreciation of investments | | | 2,604,122 | | | | 15,074,489 | |
| Total net assets | | $ | 38,397,663 | | | $ | 91,448,404 | |
| | | | | | | | | |
CAPITAL STOCK, $0.0001 par value | | | | | | | | |
| Authorized | | | 500,000,000 | | | | 500,000,000 | |
| Issued and outstanding | | | 2,459,944 | | | | 4,406,712 | |
| | | | | | | | | |
| NET ASSET VALUE, REDEMPTION PRICE, | | | | | | | | |
| AND OFFERING PRICE PER SHARE | | $ | 15.61 | | | $ | 20.75 | |
See Notes to the Financial Statements
Statements of Operations
For the Year Ended December 31, 2014
| | | Capital Appreciation Fund | | | Opportunity Fund | |
| INVESTMENT INCOME: | | | | | | |
| Interest income | | $ | 120,237 | | | $ | 29,232 | |
| Dividend income | | | 610,467 | | | | 1,876,010 | |
| Less: Foreign taxes withheld | | | (14,976 | ) | | | (12,426 | ) |
| Total investment income | | | 715,728 | | | | 1,892,816 | |
| | | | | | | | | |
| EXPENSES: | | | | | | | | |
| Investment advisory fees | | | 440,324 | | | | 1,184,977 | |
| Administration fees | | | 51,826 | | | | 117,463 | |
| Fund accounting fees | | | 40,620 | | | | 44,313 | |
| Directors' fees | | | 32,847 | | | | 69,283 | |
| Audit fees | | | 31,705 | | | | 31,705 | |
| Transfer agent fees | | | 28,094 | | | | 42,730 | |
| Registration fees | | | 24,325 | | | | 24,465 | |
| Distribution fees | | | 10,899 | | | | 66,100 | |
| Legal fees | | | 10,761 | | | | 32,026 | |
| Other expenses | | | 10,677 | | | | 21,001 | |
| Custodian fees | | | 9,383 | | | | 8,267 | |
| Postage and printing fees | | | 3,081 | | | | 9,094 | |
| Total expenses | | | 694,542 | | | | 1,651,424 | |
| Less: Fee waivers | | | (174,159 | ) | | | (250,997 | ) |
| Total net expenses | | | 520,383 | | | | 1,400,427 | |
| NET INVESTMENT INCOME | | | 195,345 | | | | 492,389 | |
| | | | | | | | | |
| REALIZED AND UNREALIZED GAINS (LOSSES): | | | | | | | | |
| Net realized gain on investments | | | 2,895,290 | | | | 13,250,418 | |
| Net change in unrealized appreciation of investments | | | (1,475,357 | ) | | | (6,230,397 | ) |
| Net gain on investments | | | 1,419,933 | | | | 7,020,021 | |
| | | | | | | | | |
| NET INCREASE IN NET ASSETS | | | | | | | | |
| RESULTING FROM OPERATIONS | | $ | 1,615,278 | | | $ | 7,512,410 | |
See Notes to the Financial Statements
Statements of Changes in Net Assets
| | | Capital Appreciation Fund | |
| | | Year Ended | | | Year Ended | |
| | | December 31, 2014 | | | December 31, 2013 | |
| OPERATIONS: | | | | | | |
| Net investment income | | $ | 195,345 | | | $ | 433,097 | |
| Net realized gain on investments | | | 2,895,290 | | | | 2,968,186 | |
| Net change in unrealized | | | | | | | | |
| appreciation (depreciation) of investments | | | (1,475,357 | ) | | | 3,577,184 | |
| Net increase resulting from operations | | | 1,615,278 | | | | 6,978,467 | |
| | | | | | | | | |
| CAPITAL SHARE TRANSACTIONS: | | | | | | | | |
| Proceeds from shares sold | | | 824,222 | | | | 2,014,107 | |
| Proceeds from reinvestment of distributions | | | 4,821,050 | | | | 2,243,850 | |
| Payments for shares redeemed | | | (5,690,411 | ) | | | (6,418,748 | ) |
| Redemption fees | | | — | | | | 8 | |
| Net decrease from capital share transactions | | | (45,139 | ) | | | (2,160,783 | ) |
| | | | | | | | | |
| DISTRIBUTIONS PAID FROM: | | | | | | | | |
| Net investment income | | | (583,975 | ) | | | (384,267 | ) |
| Net realized gains | | | (4,247,435 | ) | | | (1,878,037 | ) |
| Total distributions to shareholders | | | (4,831,410 | ) | | | (2,262,304 | ) |
| | | | | | | | | |
| TOTAL INCREASE (DECREASE) IN NET ASSETS | | | (3,261,271 | ) | | | 2,555,380 | |
| | | | | | | | | |
| NET ASSETS: | | | | | | | | |
| Beginning of period | | | 41,658,934 | | | | 39,103,554 | |
| | | | | | | | | |
| End of period (including distributions | | | | | | | | |
| in excess of net investment income of | | | | | | | | |
| $(23,066) and $(66,313), respectively) | | $ | 38,397,663 | | | $ | 41,658,934 | |
| | | | | | | | | |
| TRANSACTIONS IN SHARES: | | | | | | | | |
| Shares sold | | | 47,397 | | | | 122,206 | |
| Shares issued in reinvestment of distributions | | | 305,323 | | | | 131,143 | |
| Shares redeemed | | | (326,944 | ) | | | (393,613 | ) |
| Net increase (decrease) | | | 25,776 | | | | (140,264 | ) |
See Notes to the Financial Statements
Statements of Changes in Net Assets
| | | Opportunity Fund | |
| | | Year Ended | | | Year Ended | |
| | | December 31, 2014 | | | December 31, 2013 | |
| OPERATIONS: | | | | | | |
| Net investment income | | $ | 492,389 | | | $ | 308,275 | |
| Net realized gain on investments | | | 13,250,418 | | | | 5,996,465 | |
| Net change in unrealized | | | | | | | | |
| appreciation (depreciation) of investments | | | (6,230,397 | ) | | | 14,322,805 | |
| Net increase resulting from operations | | | 7,512,410 | | | | 20,627,545 | |
| | | | | | | | | |
| CAPITAL SHARE TRANSACTIONS: | | | | | | | | |
| Proceeds from shares sold | | | 26,051,436 | | | | 15,314,117 | |
| Proceeds from reinvestment of distributions | | | 9,091,295 | | | | 5,887,496 | |
| Payments for shares redeemed | | | (39,376,434 | ) | | | (8,369,938 | ) |
| Redemption fees | | | 381 | | | | 219 | |
| Net increase (decrease) from capital share transactions | | | (4,233,322 | ) | | | 12,831,894 | |
| | | | | | | | | |
| DISTRIBUTIONS PAID FROM: | | | | | | | | |
| Net investment income | | | (641,229 | ) | | | (307,152 | ) |
| Net realized gains | | | (8,940,235 | ) | | | (5,950,554 | ) |
| Total distributions to shareholders | | | (9,581,464 | ) | | | (6,257,706 | ) |
| | | | | | | | | |
| TOTAL INCREASE (DECREASE) IN NET ASSETS | | | (6,302,376 | ) | | | 27,201,733 | |
| | | | | | | | | |
| NET ASSETS: | | | | | | | | |
| Beginning of period | | | 97,750,780 | | | | 70,549,047 | |
| | | | | | | | | |
| End of period (including distributions | | | | | | | | |
| in excess of net investment income of | | | | | | | | |
| $(74,282) and $(10,409), respectively) | | $ | 91,448,404 | | | $ | 97,750,780 | |
| | | | | | | | | |
| TRANSACTIONS IN SHARES: | | | | | | | | |
| Shares sold | | | 1,198,108 | | | | 766,993 | |
| Shares issued in reinvestment of distributions | | | 433,952 | | | | 274,220 | |
| Shares redeemed | | | (1,770,195 | ) | | | (404,150 | ) |
| Net increase (decrease) | | | (138,135 | ) | | | 637,063 | |
See Notes to the Financial Statements
Financial Highlights
| | | Capital Appreciation Fund | |
| | | Year Ended December 31, | |
| | | 2014 | | | 2013 | | | 2012 | | | 2011 | | | 2010 | |
| For a Fund share outstanding | | | | | | | | | | | | | | | |
| throughout the period | | | | | | | | | | | | | | | |
| | | | | | | | | | | | | | | | |
| NET ASSET VALUE: | | | | | | | | | | | | | | | |
| Beginning of period | | $ | 17.11 | | | $ | 15.19 | | | $ | 14.90 | | | $ | 15.92 | | | $ | 13.95 | |
| | | | | | | | | | | | | | | | | | | | | |
| OPERATIONS: | | | | | | | | | | | | | | | | | | | | |
| Net investment income | | | 0.11 | | | | 0.18 | | | | 0.31 | | | | 0.15 | | | | 0.14 | |
| Net realized and unrealized | | | | | | | | | | | | | | | | | | | | |
| gain (loss) on investments | | | 0.63 | | | | 2.72 | | | | 0.54 | | | | (0.79 | ) | | | 2.30 | |
| Total from operations | | | 0.74 | | | | 2.90 | | | | 0.85 | | | | (0.64 | ) | | | 2.44 | |
| | | | | | | | | | | | | | | | | | | | | |
| LESS DISTRIBUTIONS: | | | | | | | | | | | | | | | | | | | | |
| From net investment income | | | (0.27 | ) | | | (0.17 | ) | | | (0.34 | ) | | | (0.17 | ) | | | (0.16 | ) |
| From net realized gains | | | (1.97 | ) | | | (0.81 | ) | | | (0.22 | ) | | | (0.21 | ) | | | (0.31 | ) |
| Total distributions | | | (2.24 | ) | | | (0.98 | ) | | | (0.56 | ) | | | (0.38 | ) | | | (0.47 | ) |
| | | | | | | | | | | | | | | | | | | | | |
| NET ASSET VALUE: | | | | | | | | | | | | | | | | | | | | |
| End of period | | $ | 15.61 | | | $ | 17.11 | | | $ | 15.19 | | | $ | 14.90 | | | $ | 15.92 | |
| | | | | | | | | | | | | | | | | | | | | |
| TOTAL RETURN | | | 4.18 | % | | | 19.10 | % | | | 5.76 | % | | | (4.00 | )% | | | 17.52 | % |
| | | | | | | | | | | | | | | | | | | | | |
| SUPPLEMENTAL DATA AND RATIOS: | | | | | | | | | | | | | | | | | | | | |
| Net assets, end of period (in thousands) | | $ | 38,398 | | | $ | 41,659 | | | $ | 39,104 | | | $ | 53,737 | | | $ | 43,535 | |
| Ratio of expenses to average net assets: | | | | | | | | | | | | | | | | | | | | |
| Before expense reimbursement | | | 1.74 | % | | | 1.77 | % | | | 1.77 | % | | | 1.70 | % | | | 2.01 | % |
| After expense reimbursement | | | 1.30 | % | | | 1.30 | % | | | 1.37 | % | | | 1.50 | % | | | 1.50 | % |
| Ratio of net investment income | | | | | | | | | | | | | | | | | | | | |
| to average net assets: | | | | | | | | | | | | | | | | | | | | |
| Before expense reimbursement | | | 0.05 | % | | | 0.61 | % | | | 1.10 | % | | | 0.63 | % | | | 0.55 | % |
| After expense reimbursement | | | 0.49 | % | | | 1.08 | % | | | 1.50 | % | | | 0.83 | % | | | 1.06 | % |
| Portfolio turnover rate | | | 48 | % | | | 31 | % | | | 15 | % | | | 24 | % | | | 27 | % |
See Notes to the Financial Statements
Financial Highlights
| | | Opportunity Fund | |
| | | Year Ended December 31, | |
| | | 2014 | | | 2013 | | | 2012 | | | 2011 | | | 2010 | |
| For a Fund share outstanding | | | | | | | | | | | | | | | |
| throughout the period | | | | | | | | | | | | | | | |
| | | | | | | | | | | | | | | | |
| NET ASSET VALUE: | | | | | | | | | | | | | | | |
| Beginning of period | | $ | 21.51 | | | $ | 18.05 | | | $ | 16.62 | | | $ | 17.45 | | | $ | 15.10 | |
| | | | | | | | | | | | | | | | | | | | | |
| OPERATIONS: | | | | | | | | | | | | | | | | | | | | |
| Net investment income | | | 0.13 | | | | 0.07 | | | | 0.20 | | | | 0.07 | | | | 0.09 | |
| Net realized and unrealized | | | | | | | | | | | | | | | | | | | | |
| gain (loss) on investments | | | 1.48 | | | | 4.84 | | | | 2.22 | | | | (0.11 | ) | | | 2.47 | |
| Total from operations | | | 1.61 | | | | 4.91 | | | | 2.42 | | | | (0.04 | ) | | | 2.56 | |
| | | | | | | | | | | | | | | | | | | | | |
| LESS DISTRIBUTIONS: | | | | | | | | | | | | | | | | | | | | |
| From net investment income | | | (0.16 | ) | | | (0.07 | ) | | | (0.20 | ) | | | (0.05 | ) | | | (0.12 | ) |
| From net realized gains | | | (2.21 | ) | | | (1.38 | ) | | | (0.79 | ) | | | (0.74 | ) | | | (0.09 | ) |
| Total distributions | | | (2.37 | ) | | | (1.45 | ) | | | (0.99 | ) | | | (0.79 | ) | | | (0.21 | ) |
| | | | | | | | | | | | | | | | | | | | | |
| NET ASSET VALUE: | | | | | | | | | | | | | | | | | | | | |
| End of period | | $ | 20.75 | | | $ | 21.51 | | | $ | 18.05 | | | $ | 16.62 | | | $ | 17.45 | |
| | | | | | | | | | | | | | | | | | | | | |
| TOTAL RETURN | | | 7.36 | % | | | 27.25 | % | | | 14.63 | % | | | (0.21 | )% | | | 16.94 | % |
| | | | | | | | | | | | | | | | | | | | | |
| SUPPLEMENTAL DATA AND RATIOS: | | | | | | | | | | | | | | | | | | | | |
| Net assets, end of period (in thousands) | | $ | 91,448 | | | $ | 97,751 | | | $ | 70,549 | | | $ | 59,715 | | | $ | 37,575 | |
| Ratio of expenses to average net assets: | | | | | | | | | | | | | | | | | | | | |
| Before expense reimbursement | | | 1.53 | % | | | 1.57 | % | | | 1.64 | % | | | 1.70 | % | | | 2.05 | % |
| After expense reimbursement | | | 1.30 | % | | | 1.30 | % | | | 1.36 | % | | | 1.50 | % | | | 1.50 | % |
| Ratio of net investment income | | | | | | | | | | | | | | | | | | | | |
| to average net assets: | | | | | | | | | | | | | | | | | | | | |
| Before expense reimbursement | | | 0.23 | % | | | 0.08 | % | | | 0.84 | % | | | 0.20 | % | | | 0.04 | % |
| After expense reimbursement | | | 0.46 | % | | | 0.35 | % | | | 1.12 | % | | | 0.40 | % | | | 0.59 | % |
| Portfolio turnover rate | | | 40 | % | | | 25 | % | | | 43 | % | | | 45 | % | | | 45 | % |
See Notes to the Financial Statements
Notes to the Financial Statements
December 31, 2014
Prospector Funds, Inc. (the “Corporation”) was organized as a Maryland corporation on June 6, 2007 and is registered under the Investment Company Act of 1940 (the “1940 Act”), as amended, as an open-end diversified management investment company. The Corporation issues its shares in series, each series representing a distinct portfolio with its own investment objectives and policies. There are two series presently authorized, the Prospector Capital Appreciation Fund and the Prospector Opportunity Fund (individually a “Fund” and collectively the “Funds”). The Funds commenced operations on September 28, 2007.
The following is a summary of significant accounting policies consistently followed by each Fund:
Security Valuation – The Fund has adopted fair value accounting standards which establish an authoritative definition of fair value and set out a hierarchy for measuring fair value. These standards require additional disclosures about the various inputs and valuation techniques used to develop the measurements of fair value, a discussion in changes in valuation techniques and related inputs during the period and expanded disclosure of valuation levels for major security types. These inputs are summarized in the three broad levels listed below:
| Level 1 – | Unadjusted quoted prices in active markets for identical assets or liabilities that the Fund has the ability to access. |
| | |
| Level 2 – | Observable inputs other than quoted prices included in Level 1 that are observable for the asset or liability, either directly or indirectly. These inputs may include quoted prices for the identical instrument on an inactive market, prices for similar instruments, interest rates, prepayment speeds, credit risk, yield curves, default rates, discounts and similar data. |
| | |
| Level 3 – | Unobservable inputs for the asset or liability, to the extent relevant observable inputs are not available, representing the Fund’s own assumptions about the assumptions a market participant would use in valuing the asset or liability, and would be based on the best information available. |
Following is a description of the valuation techniques applied to the Fund’s major categories of assets and liabilities measured at fair value on a recurring basis. The Fund’s investments are carried at fair value.
Common Stock – Securities that are primarily traded on a national securities exchange shall be valued at the last sale price on the exchange on which they are primarily traded on the day of valuation or, if there has been no sale on such day, at the last bid price on the day of valuation. To the extent these securities are actively traded and valuation adjustments are not applied, they are categorized in Level 1 of the fair value hierarchy.
Convertible and Corporate Bonds – Convertible and corporate bonds, including listed issues, are valued at fair value on the basis of valuations furnished by an independent pricing service which utilizes both dealer-supplied valuations and formula-based techniques. The pricing service may consider recently executed transactions in securities of the issuer or comparable issuers, market price quotations (where observable), bond spreads, and fundamental data relating to the issuer. Convertible and corporate bonds are generally categorized in Level 2 of the fair value hierarchy.
Investment Companies – Investments in other mutual funds, including money market funds, are valued at their net asset value per share. To the extent these securities are actively traded and valuation adjustments are not applied, they are categorized in Level 1 of the fair value hierarchy.
Notes to the Financial Statements – Continued
December 31, 2014
Securities for which market quotations are not readily available, or if the closing price does not represent fair value, are valued following procedures approved by the Board of Directors. These procedures consider many factors, including the type of security, size of holding, trading volume and news events. There can be no assurance that the Fund could obtain the fair value assigned to a security if they were to sell the security at approximately the time at which the Fund determines their net asset values per share.
The inputs or methodology used for valuing securities are not an indication of the risk associated with investing in those securities.
As of December 31, 2014, each Fund's investments in securities were classified as follows:
| | | Level 1 | | | Level 2 | | | Level 3 | | | Total | |
| | | | | | | | | | | | | |
| Capital Appreciation Fund | | | | | | | | | | | | |
| Common Stocks | | $ | 28,668,885 | | | $ | — | | | $ | — | | | $ | 28,668,885 | |
| Convertible Bonds | | | — | | | | 6,953,709 | | | | — | | | | 6,953,709 | |
| Corporate Bond | | | — | | | | 461,889 | | | | — | | | | 461,889 | |
| Short-Term Investment | | | 2,343,564 | | | | — | | | | — | | | | 2,343,564 | |
| Total Investments | | $ | 31,012,449 | | | $ | 7,415,598 | | | $ | — | | | $ | 38,428,047 | |
| | | | | | | | | | | | | |
| | | Level 1 | | | Level 2 | | | Level 3 | | | Total | |
| | | | | | | | | | | | | | | | | |
| Opportunity Fund | | | | | | | | | | | | | | | | |
| Common Stocks | | $ | 86,185,705 | | | $ | — | | | $ | — | | | $ | 86,185,705 | |
| Convertible Bonds | | | — | | | | 1,675,781 | | | | — | | | | 1,675,781 | |
| Short-Term Investment | | | 3,000,963 | | | | — | | | | — | | | | 3,000,963 | |
| Total Investments | | $ | 89,186,668 | | | $ | 1,675,781 | | | $ | — | | | $ | 90,862,449 | |
Refer to each Fund’s Schedule of Investments for further sector breakout.
Transfers between levels are recognized at the beginning of the reporting period. During the year ended December 31, 2014, the Funds recognized no transfers between levels. The Funds did not invest in any Level 3 investments during the period.
The Funds may invest in derivative financial instruments in order to manage risk or gain exposure to various other investments or markets. The Funds’ investment objectives allow the Funds to enter into various types of derivative contracts, including, but not limited to, futures contracts, forward foreign exchange contracts, and purchased and written options. Derivatives may contain various risks including the potential inability of the counterparty to fulfill their obligations under the terms of the contract, the potential for an illiquid secondary market, and the potential for market movements which may expose the funds to gains or losses in excess of the amounts shown on the Statements of Assets and Liabilities. As of and for the year ended December 31, 2014, the Funds held no derivative instruments.
| 3. | SIGNIFICANT ACCOUNTING POLICIES |
Each of the Funds is a diversified open-end management investment company which follows specialized accounting and reporting under Accounting Standards Codification Topic 946, Financial Services – Investment Companies.
Distributions to Shareholders – Dividends from net investment income and distributions of net realized capital gains, if any, will be declared and paid at least annually. The character of distributions made during the period from net investment income or net realized gains may differ from the characterization for federal income tax purposes
Notes to the Financial Statements – Continued
December 31, 2014
due to differences in the recognition of income, expense and gain items for financial statement and tax purposes. All short-term capital gains are included in ordinary income for tax purposes.
Use of Estimates – The preparation of financial statements in conformity with accounting principles generally accepted in the United States of America requires management to make estimates and assumptions that affect the reported amounts of assets and liabilities and disclosure of contingent assets and liabilities at the date of the financial statements and the reported amounts of revenues and expenses during the reporting period. Actual results could differ from those estimates.
Federal Income Taxes – The Funds intend to meet the requirements of subchapter M of the Internal Revenue Code applicable to regulated investment companies and to distribute substantially all net taxable investment income and net realized gains to shareholders in a manner which results in no tax cost to the Funds. Therefore, no federal income or excise tax provision is required. As of December 31, 2014, the Funds did not have any tax positions that did not meet the “more-likely-than-not” threshold of being sustained by the applicable tax authority. Generally, tax authorities can examine all the tax returns filed for the last three years.
Reclassification of Capital Accounts – GAAP requires that certain components of net assets relating to permanent differences be reclassified between financial and tax reporting. These reclassifications have no effect on net assets or net asset value per share. For the fiscal year ended December 31, 2014, the following reclassifications were made on the Statements of Assets and Liabilities:
| | | Undistributed | | | Accumulated | | | | |
| | | Net Investment | | | Net Realized | | | | |
| | | Income | | | Gain (Loss) | | | Portfolio Capital | |
| | | | | | | | | | | | | |
| Capital Appreciation Fund | | $ | 431,877 | | | $ | (431,877 | ) | | $ | — | |
| Opportunity Fund | | | 84,967 | | | | (84,967 | ) | | | — | |
Foreign Currency Translation – The books and records relating to the Funds’ non-U.S. dollar denominated investments are maintained in U.S. dollars on the following bases: (1) market value of investment securities, assets, and liabilities are translated at the current rate of exchange; and (2) purchases and sales of investment securities, income, and expenses are translated at the relevant rates of exchange prevailing on the respective dates of such transactions. The Funds do not isolate the portion of gains and losses on investments in equity securities that is due to changes in the foreign exchange rates from that which is due to changes in market prices of equity securities. The Funds report certain foreign currency-related transactions as components of realized gains for financial reporting purposes, whereas such components are treated as ordinary income for federal income tax purposes.
Illiquid or Restricted Securities – A security may be considered illiquid if it lacks a readily available market. Securities are generally considered liquid if they can be sold or disposed of in the ordinary course of business within seven days at approximately the price at which the security is valued by the Fund. Illiquid securities may be valued under methods approved by the Funds’ board of directors as reflecting fair value. Each Fund intends to invest no more than 15% of its total assets in illiquid securities. Certain restricted securities may be considered illiquid. Restricted securities are often purchased in private placement transactions, are not registered under the Securities Act of 1933, may have contractual restrictions on resale, and may be valued under methods approved by the Funds’ board of directors as reflecting fair value. Certain restricted securities eligible for resale to qualified institutional investors, including Rule 144A securities, are not subject to the limitation on a Fund’s investment in illiquid securi-
Notes to the Financial Statements – Continued
December 31, 2014
ties if they are determined to be liquid in accordance with procedures adopted by the Funds’ board of directors. At December 31, 2014, Prospector Capital Appreciation Fund had investments in illiquid securities with a total value of $37,336 or 0.1% of total net assets.
Information concerning illiquid securities is as follows:
Capital Appreciation Fund
| | | | | | Date | | | Cost | |
| Issuer | | Par | | | Acquired | | | Basis | |
| | | | | | | | | | | | | |
| Centrus Energy | | $ | 79,777 | | | | 9/11 | | | $ | 116,475 | |
Expenses – Expenses directly attributable to a Fund are charged to that Fund, while expenses attributable to more than one Fund are allocated among the respective Funds based on relative net assets or another appropriate basis.
Other – Investment and shareholder transactions are recorded on the trade date. Each Fund determines the gain or loss realized from the investment transactions on the basis of identified cost. Dividend income is recognized on the ex-dividend date. Interest income, including amortization of bond premium and discount, is recognized on an accrual basis.
Subsequent Events – Management has evaluated fund related events and transactions that occurred subsequent to December 31, 2014, through the date of issuance of the Funds’ financial statements. There were no events or transactions that occurred during this period that materially impacted the amounts or disclosures in the Funds’ financial statements.
| 4. | INVESTMENT TRANSACTIONS |
During the year ended December 31, 2014, purchases of securities and proceeds from sales of securities, other than temporary investments in short-term securities, were as follows:
| | | Purchases | | | Sales | |
| | | | | | | | | |
| Capital Appreciation Fund | | $ | 18,197,218 | | | $ | 23,169,393 | |
| Opportunity Fund | | | 38,856,776 | | | | 48,599,766 | |
There were no purchases or sales of long-term U.S. Government securities.
The aggregate gross unrealized appreciation and depreciation of securities held by the Funds and the total cost of securities for federal income tax purposes at December 31, 2014, were as follows:
| | | Aggregate | | | Aggregate | | | | | | Federal | |
| | | Gross | | | Gross | | | | | | Income | |
| | | Appreciation | | | Depreciation | | | Net | | | Tax Cost | |
| | | | | | | | | | | | | | | | | |
| Capital Appreciation Fund | | $ | 5,179,043 | | | $ | (2,751,182 | ) | | $ | 2,427,861 | | | $ | 36,000,186 | |
| Opportunity Fund | | | 18,579,777 | | | | (3,568,924 | ) | | | 15,010,853 | | | | 75,851,596 | |
Notes to the Financial Statements – Continued
December 31, 2014
At December 31, 2014 components of accumulated earnings (deficit) on a tax-basis were as follows:
| | | | | | | | | | | | | | | Total | |
| | | Undistributed | | | Undistributed | | | Other | | | | | | Accumulated | |
| | | Ordinary | | | Long-Term | | | Accumulated | | | Unrealized | | | Earnings | |
| | | Income | | | Capital Gains | | | Losses | | | Appreciation | | | (Deficit) | |
| | | | | | | | | | | | | | | | | | | | | |
| Capital Appreciation Fund | | $ | 73,082 | | | $ | 16,111 | | | $ | (1,055,400 | ) | | $ | 2,427,861 | | | $ | 1,461,654 | |
| Opportunity Fund | | | — | | | | 4,888,414 | | | | (10,646 | ) | | | 15,010,853 | | | | 19,888,621 | |
As of December 31, 2014, the Funds did not have any capital loss carryovers. A regulated investment company may elect for any taxable year to treat any portion of any qualified late year loss as arising on the first day of the next taxable year. Qualified late year losses are certain capital, and ordinary losses which occur during the portion of the Fund’s taxable year subsequent to October 31. For the taxable year ended December 31, 2014, the Capital Appreciation Fund deferred on a tax basis, short-term post-October losses (“late year losses”) of $(28,533) and long-term late year losses of $(1,072,404). The Opportunity Fund does not plan to defer any late year losses.
The tax character of distributions paid during the fiscal year ended December 31, 2014 were as follows:
| | | Ordinary | | | Long Term | | | | |
| | | Income | | | Capital Gains | | | Total | |
| | | | | | | | | | | | | |
| Capital Appreciation Fund | | $ | 864,748 | | | $ | 3,966,662 | | | $ | 4,831,410 | |
| Opportunity Fund | | | 1,448,014 | | | | 8,133,450 | | | | 9,581,464 | |
The tax character of distributions paid during the fiscal year ended December 31, 2013 were as follows:
| | | Ordinary | | | Long Term | | | | |
| | | Income | | | Capital Gains | | | Total | |
| | | | | | | | | | | | | |
| Capital Appreciation Fund | | $ | 454,484 | | | $ | 1,807,820 | | | $ | 2,262,304 | |
| Opportunity Fund | | | 564,316 | | | | 5,693,390 | | | | 6,257,706 | |
The Funds have entered into an Investment Advisory Agreement with Prospector Partners Asset Management, LLC (the “Adviser”), with whom certain directors and officers of the Corporation are affiliated, to furnish investment advisory services to the Funds. Pursuant to this Agreement, the Adviser is entitled to receive a management fee, calculated daily and payable monthly, at the annual rate of 1.10% as applied to each Fund’s daily net assets.
The Adviser has contractually agreed to waive its management fee and/or reimburse each Fund’s other expenses to the extent necessary to ensure that each Fund’s operating expenses do not exceed 1.30% of its average daily net assets. Any such reduction made by the Adviser in its fees or payment of expenses which are the Fund’s obligation are subject to possible reimbursement by the Fund to the Adviser within three years after the fees have been waived and/or reimbursed. Expenses waived and/or reimbursed by the Adviser may be recouped by the Adviser if such recoupment can be achieved without exceeding the expense limit in effect at the time the waiver and/or reimbursement occurred. As of December 31, 2014, the Adviser did not recoup any previously waived expenses. The Operating Expense Limitation Agreement will be in effect through at least September 30, 2016. Waived/reimbursed fees and expenses subject to potential recovery by year of expiration are as follows:
Notes to the Financial Statements – Continued
December 31, 2014
| Expiration | | Capital Appreciation Fund | | | Opportunity Fund | |
| | | | | | | | | |
| 12/31/15 | | $ | 186,758 | | | $ | 183,148 | |
| 12/31/16 | | | 188,732 | | | | 237,316 | |
| 12/31/17 | | | 174,159 | | | | 250,997 | |
| Total | | $ | 549,649 | | | $ | 671,461 | |
As of December 31, 2014, it was possible, but not probable, those amounts would be recovered by the Adviser. At the end of each fiscal year in the future, the Funds will continue to assess the potential recovery of waived/reimbursed fees and expenses for financial reporting purposes.
Quasar Distributors, LLC (“Quasar”), a subsidiary of U.S. Bancorp, serves as distributor of the Funds’ shares pursuant to a Distribution Agreement with the Corporation. Each Fund’s shares are sold on a no-load basis and, therefore, Quasar receives no sales commission or sales load for providing services to the Funds. The Corporation has adopted a plan pursuant to Rule 12b-1 under the 1940 Act (the “12b-1 Plan”), which authorizes the Corporation to reimburse Quasar and certain financial intermediaries who assist in distributing each Fund’s shares or who provide shareholder services to Fund shareholders a distribution and/or shareholder servicing fee of up to 0.25% of each Fund’s average daily net assets (computed on an annual basis). All or a portion of the fee may be used by the Funds or Quasar to pay the Fund’s distribution fees and costs of printing reports and prospectuses for potential investors and the costs of other distribution and shareholder services expenses. During the year ended December 31, 2014, Capital Appreciation Fund and Opportunity Fund incurred expenses of $10,899 and $66,100, respectively, pursuant to the 12b-1 Plan.
U.S. Bancorp Fund Services, LLC serves as transfer agent, administrator and fund accountant for the Funds. U.S. Bank, N.A. serves as custodian for the Funds.
The Funds enter into contracts that contain a variety of indemnifications. The Funds’ maximum exposure under these arrangements is unknown. However, the Funds have not had prior claims or losses pursuant to these contracts and expect the risk of loss to be remote.
Report of Independent Registered Public Accounting Firm
The Board of Directors and Shareholders
Prospector Funds, Inc.:
We have audited the accompanying statements of assets and liabilities, including the schedule of investments, of Prospector Funds, Inc., comprised of, the Prospector Capital Appreciation Fund and the Prospector Opportunity Fund (the Funds) as of December 31, 2014, and the related statements of operations for the year then ended, the statements of changes in net assets for the two years in the period then ended, and financial highlights for each of the five years in the period then ended. These financial statements and financial highlights are the responsibility of the Funds’ management. Our responsibility is to express an opinion on these financial statements and financial highlights based on our audits.
We conducted our audits in accordance with the standards of the Public Company Accounting Oversight Board (United States). Those standards require that we plan and perform the audit to obtain reasonable assurance about whether the financial statements and financial highlights are free of material misstatement. We were not engaged to perform an audit of the Funds’ internal control over financial reporting. Our audits included consideration of internal control over financial reporting as a basis for designing audit procedures that are appropriate in the circumstances, but not for the purpose of expressing an opinion on the effectiveness of the Funds’ internal control over financial reporting. Accordingly, we express no such opinion. An audit also includes examining, on a test basis, evidence supporting the amounts and disclosures in the financial statements and financial highlights, assessing the accounting principles used and significant estimates made by management, and evaluating the overall financial statement presentation. Our procedures included confirmation of securities owned as of December 31, 2014, by correspondence with the custodian and brokers or by other appropriate auditing procedures where replies from brokers were not received. We believe that our audits provide a reasonable basis for our opinion.
In our opinion, the financial statements and financial highlights referred to above present fairly, in all material respects, the financial position of the Funds at December 31, 2014, the results of their operations for the year then ended, the changes in their net assets for the two years in the period then ended, and the financial highlights for each of the five years in the period then ended, in conformity with U.S. generally accepted accounting principles.
Chicago, Illinois
February 20, 2015
Additional Information (Unaudited)
BOARD APPROVAL OF INVESTMENT ADVISORY AGREEMENT
The Corporation’s independent directors (the “directors”) unanimously approved the continuance of the Investment Advisory Agreement (the “Advisory Agreement”) between the Funds and the Prospector Partners Asset Management, LLC (the “Investment Manager”) at a Board of Director’s meeting held on September 4, 2014.
In preparation for the meeting, the directors had requested from the Investment Manager and evaluated a memorandum providing certain information requested by the Board pursuant to Section 15(c) of the 1940 Act, including (i) expense, compliance and other information as it relates to the Investment Manager; (ii) performance of other accounts managed by its affiliate Prospector Partners, LLC with similar investment objectives derived from data compiled by the Investment Manager and (iii) expense and other information for other registered investment companies with similar investment objectives derived from data compiled by the Investment Manager based upon comparative peer groups selected in consultation with the independent directors. Prior to voting, the directors reviewed the proposed approval of the Advisory Agreement with management and with counsel to the Corporation and reviewed a memorandum from such counsel discussing the legal standards for their consideration of the proposed approval. In reaching their determinations relating to approval of the continuance of the Advisory Agreement, the directors considered all factors they believed relevant including the following:
| | 1. | the nature, extent and quality of investment, and other services to be rendered by the Investment Manager; |
| | 2. | payments to be received by the Investment Manager from all sources with respect to the Funds; |
| | 3. | comparative fee and expense data for the Funds and other investment companies with similar investment objectives; |
| | 4. | the extent to which economies of scale may be realized as the Funds grow and whether fee levels reflect these economies of scale for the benefit of investors; |
| | 5. | the Investment Manager’s policies and practices regarding allocation of portfolio transactions of the Funds, including the extent to which the Investment Manager may benefit from soft dollar arrangements; |
| | 6. | fall-out benefits which the Investment Manager and its affiliates may receive from their relationships to the Funds; |
| | 7. | information about fees charged by the Investment Manager to other clients with similar investment objectives; |
| | 8. | the professional experience and qualifications of the Funds’ portfolio managers and other senior personnel of the Investment Manager; |
| | 9. | profitability of the Investment Manager; and |
| | 10. | the terms of the Advisory Agreement. |
The directors also considered their overall confidence in the integrity and competence of the Investment Manager and the portfolio managers. In their deliberations, the directors did not identify any particular information that was all-important or controlling, and each director attributed different weights to the various factors. The directors determined that the overall arrangements between the Funds and the Investment Manager, as provided in the Advisory Agreement, were fair and reasonable in light of the services performed, expenses expected to be incurred and such other matters as the directors considered relevant in the exercise of their reasonable judgment.
The material factors and conclusions that formed the basis for the directors reaching their determinations to approve the continuance of the Advisory Agreement (including their determinations that the Investment Manager
Additional Information (Unaudited) – Continued
should be the investment adviser for the Funds, and that the fees payable to the Investment Manager pursuant to the Advisory Agreement are appropriate) were separately discussed by the directors.
Nature, extent and quality of services provided by the Investment Manager
The directors noted that, under the Advisory Agreement, the Investment Manager, subject to the control of the directors, administers the Funds’ business and other affairs. The Investment Manager manages the investment of the assets of the Funds, including making purchases and sales of portfolio securities consistent with each Fund’s investment objective and policies.
The directors considered the scope and quality of services provided by the Investment Manager under the Advisory Agreement. The directors considered the quality of the investment research capabilities of the Investment Manager and the other resources it proposes to dedicate to performing services for the Funds. The directors also considered the portfolio managers’ experience, reputation and investment philosophy noting that the Investment Manager’s investment style and stock selection process have remained consistent even in difficult market environments. The quality of administrative and other services also were considered. The directors concluded that, overall, they were satisfied with the nature, extent and quality of services proposed to be provided to the Funds under the Advisory Agreement.
Investment Manager Fees; Performance of the Fund
The directors considered the advisory fee rate paid by the Funds to the Investment Manager and information prepared by the Investment Manager based upon the peer groups selected by the independent directors concerning fee rates paid by other comparable funds. The directors recognized that it is difficult to make comparisons of advisory fees because there are variations in the services that are included in the fees paid by other funds, but determined that the proposed advisory fee rate was in line with other comparable funds.
The directors also considered the performance of each Fund compared to each Fund’s benchmarks and industry averages. The directors noted that although the Opportunity Fund underperformed its benchmarks during the one, three and five-year periods, from the period from inception through June 30, 2014, the Opportunity Fund was in the first quartile for annualized performance compared to its peer group. The Directors noted that although it had not been the case in the past, the Capital Appreciation Fund now underperformed its benchmark in recent periods and from the period from inception through June 30, 2014. The directors concluded that the advisory fee rate, taking into account performance and the other factors mentioned, was in line with comparable funds.
Other Fund Expenses
The directors also considered the total expense ratio of the Funds in comparison to the fees and expenses of the funds included in the comparison. The directors noted that the expense ratios of some of the comparable funds also were lower because of waivers or reimbursements by those funds’ investment advisers, which in some cases were voluntary and perhaps temporary. In particular, the directors noted that the Investment Manager’s fee waiver pursuant to the Fee Waiver and Expenses Reimbursement Agreement was contractual in nature and customary for the industry. The directors concluded that the Funds’ expense ratio was satisfactory. Finally, the directors noted that there may be economies of scale as the Funds grow and concluded that it may be appropriate to consider those issues in the future.
Additional Information (Unaudited) – Continued
Investment Manager Profitability
The directors noted that the Investment Manager also provides the Funds with such office space, administrative and other services (exclusive of, and in addition to, any such services provided by any other retained by the Funds) and executive and other personnel as are necessary for the Funds’ operations. The directors considered that the Investment Manager pays all of the compensation of the officers of the Company that are affiliated persons of the Investment Manager, pays a portion of the insurance costs and paid the cost of the organization of the Funds (without reimbursement).
The directors also noted that the Investment Manager has contractually agreed to waive, through September 30, 2015, its management fee and/or reimburse each Fund’s other expenses to the extent necessary to ensure that each Fund’s operating expenses do not exceed 1.30% of its average daily net assets. Under the terms of the Waiver and Expense Reimbursement Agreement at the present asset levels of the Funds, the Investment Manager has received only a portion of its management fee amounts. It was also noted that the Investment Manager does not receive “fall out” benefits commonly received by managers of mutual funds that provide transfer agency, distribution or printing services in-house. The directors considered the expenses of the Investment Manager and the services provided by the Investment Manager and determined that the Investment Manager was cash flow positive without considering an allocation of expenses from its affiliated advisor, Prospector Partners, LLC based upon the expenses.
Additional Information (Unaudited) – Continued
AVAILABILITY OF FUND PORTFOLIO INFORMATION
The Funds file complete schedules of portfolio holdings with the SEC for the first and third quarters of each fiscal year on Form N-Q, which is available on the SEC’s website at www.sec.gov. The Funds’ Form N-Q may be reviewed and copied at the SEC’s Public Reference Room in Washington, D.C. For information on the Public Reference Room call 1-800-SEC-0330. In addition, the Funds’ Form N-Q is available without charge upon request by calling 1-877-734-7862.
AVAILABILITY OF PROXY VOTING INFORMATION
A description of the Funds’ Proxy Voting Policies and Procedures is available without charge, upon request, by calling 1-877-734-7862. Information regarding how the Funds voted proxies relating to portfolio securities during the most recent 12 month period ended June 30, is available (1) without charge, upon request, by calling 1-877-734-7862, or (2) on the SEC’s website at www.sec.gov.
QUALIFIED DIVIDEND INCOME/DIVIDENDS RECEIVED DEDUCTION
For the fiscal year ended December 31, 2014, certain dividends paid by the Funds may be subject to a maximum tax rate of 23.8%, as provided for by the American Taxpayer Relief Act of 2012. The percentage of dividends declared from ordinary income designated as qualified dividend income was 81.80% and 100.00% for the Capital Appreciation Fund and Opportunity Fund, respectively.
For corporate shareholders, the percent of ordinary income distributions qualifying for the corporate dividends received deduction for the fiscal year ended December 31, 2014 was 67.25% and 100.00% for the Capital Appreciation Fund and Opportunity Fund, respectively.
ADDITIONAL INFORMATION APPLICABLE TO FOREIGN SHAREHOLDERS ONLY
The percent of ordinary income distributions designated as interest related dividends for the fiscal year ended December 31, 2014 was 18.01% and 1.32% for the Capital Appreciation Fund and Opportunity Fund, respectively.
The percent of ordinary income distributions designated as short-term capital gain distributions under Internal Revenue Section 871(k)(2)(C) for the fiscal year ended December 31, 2014 was 32.47% and 58.49% for the Capital Appreciation Fund and Opportunity Fund, respectively.
Additional Information (Unaudited) – Continued
DIRECTORS & OFFICERS TABLE
| | | Term of | | Number of | |
| | | Office | | Portfolios | Other |
| | | and | Principal | in Fund | Directorships |
| Name, | | Length | Occupation | Complex | Served |
| Year of Birth | | of Time | During Past | Overseen | During Past |
| and Address^ | Position | Served* | 5 Years | by Director | 5 Years |
| |
| Independent Board Members |
| | | | | | |
Harvey D. Hirsch* | Director | Indefinite; | Retired. | 2 | None |
| Year of Birth: 1941 | | Since | Senior Vice President, | | |
| | | September 7, | Marketing, Van Eck | | |
| | | 2007 | Associates Corporation, | | |
| | | | an investment adviser, | | |
| | | | from May 2007 to August 2014. | | |
| | | | | | |
Joseph Klein III* | Director | Indefinite; | Managing Director of Gauss | 2 | ISIS |
| Year of Birth: 1961 | | Since | Capital Advisors, LLC, | | Pharmaceuticals, |
| | | September 7, | a financial consulting and | | Inc. |
| | | 2007 | investment advisory firm | | BioMarin |
| | | | focused on biopharmaceuticals | | Pharmaceutical, |
| | | | since he founded the company | | Inc. |
| | | | in March 1998. | | OSI |
| | | | | | Pharmaceuticals, |
| | | | | | Inc. |
| | | | | | Savient |
| | | | | | Pharmaceuticals, |
| | | | | | Inc. |
| | | | | | PDL BioPharma |
| | | | | | Inc. |
| | | | | | |
Roy L. Nersesian* | Director | Indefinite; | Professor of the Leon Hess | 2 | None |
| Year of Birth: 1939 | | Since | School of Business, Monmouth | | |
| | | September 7, | University, since September 1985. | | |
| | | 2007 | Adjunct Professor of the Center | | |
| | | | for Energy and Marine | | |
| | | | Transportation, Columbia | | |
| | | | University, since September 2000. | | |
| | | | Consultant, Poten & Partners, | | |
| | | | provider of brokerage and | | |
| | | | consulting services to the | | |
| | | | energy and ocean transportation | | |
| | | | industries, since September 1992. | | |
| | | | | | |
Additional Information (Unaudited) – Continued
| | | Term of | | Number of | |
| | | Office | | Portfolios | Other |
| | | and | Principal | in Fund | Directorships |
| Name, | | Length | Occupation | Complex | Served |
| Year of Birth | | of Time | During Past | Overseen | During Past |
| and Address^ | Position | Served* | 5 Years | by Director | 5 Years |
| | | | | | |
John T. Rossello, Jr.* | Director | Indefinite; | Retired. | 2 | None |
| Year of Birth: 1951 | | Since | Partner at | | |
| | | September 7, | PricewaterhouseCoopers LLP, | | |
| | | 2007 | an accounting firm, from | | |
| | | | October 1988 to June 2007. | | |
| | | | | | |
| Interested Board Members and Officers |
| | | | | | |
John D. Gillespie†* | Director | Indefinite; | Managing member of | 2 | White |
| Year of Birth: 1959 | President | Since | the Investment Manager. | | Mountains |
| | | September 7, | Managing member of | | Insurance |
| | | 2007 | Prospector Partners, LLC, | | Group, Ltd. |
| | | | an affiliate of the Investment | | |
| | | | Manager, and portfolio manager | | |
| | | | of the investment funds | | |
| | | | sponsored by Prospector | | |
| | | | Partners, LLC since 1997. | | |
| | | | Chairman and President of | | |
| | | | White Mountains Advisors, | | |
| | | | an investment adviser, from | | |
| | | | 2002 to 2005. | | |
| | | | | | |
| Kevin R. O’Brien | Executive | Indefinite; | Portfolio Manager at | N/A | None |
| Year of Birth: 1963 | Vice | Since | the Investment Manager. | | |
| | President | September 7, | Portfolio Manager at | | |
| | | 2007 | Prospector Partners, LLC | | |
| | | | since April 2003. | | |
| | | | Managing Director of White | | |
| | | | Mountains Advisors, LLC from | | |
| | | | April 2003 to August 2005. | | |
| | | | | | |
| Jason A. Kish | Executive | Indefinite; | Portfolio Manager at the | N/A | None |
| Year of Birth: 1973 | Vice | Since | Investment Manager. | | |
| | President | February, | Director of Research | | |
| | | 2013 | since 2010. | | |
| | | | Analyst at Prospector | | |
| | | | Partners, LLC from | | |
| | | | 1997-2010. | | |
Additional Information (Unaudited) – Continued
| | | Term of | | Number of | |
| | | Office | | Portfolios | Other |
| | | and | Principal | in Fund | Directorships |
| Name, | | Length | Occupation | Complex | Served |
| Year of Birth | | of Time | During Past | Overseen | During Past |
| and Address^ | Position | Served* | 5 Years | by Director | 5 Years |
| | | | | | |
| Peter N. Perugini, Jr. | Secretary | Indefinite; | Chief Financial Officer at | N/A | None |
| Year of Birth: 1970 | Treasurer | Secretary | Prospector Partners, LLC | | |
| | | Since | since 2000. | | |
| | | September 7, | | | |
| | | 2007 | | | |
| | | Indefinite; | | | |
| | | Treasurer | | | |
| | | Since | | | |
| | | June 6, | | | |
| | | 2007 | | | |
| | | | | | |
| Kim Just | Chief | Indefinite; | Chief Compliance Officer at | N/A | None |
| Year of Birth: 1967 | Compliance | Since | Prospector Partners, LLC | | |
| | Officer | September 7, | since March 2006. | | |
| | | 2007 | | | |
| | | | | | |
| Brian Wiedmeyer | Assistant | Indefinite; | Vice President for US | N/A | None |
| Year of Birth: 1973 | Secretary | Since | Bancorp Fund Services, LLC, | | |
| | | September 7, | a mutual fund service provider, | | |
| | | 2007 | since January 2005. | | |
| | | | | | |
| ^ | The address for all directors and officers is 370 Church Street, Guilford, Connecticut 06437. |
| * | Each of the Company’s directors was elected by written consent of the sole shareholder of the Funds on September 7, 2007. |
| † | John D. Gillespie is an interested director of the Fund because he is also the managing member of the Investment Manager. |
(This Page Intentionally Left Blank.)
DIRECTORS
John D. Gillespie
Harvey D. Hirsch
Joseph Klein III
Roy L. Nersesian
John T. Rossello, Jr.
INVESTMENT ADVISER
Prospector Partners Asset Management, LLC
370 Church Street
Guilford, CT 06437
DISTRIBUTOR
Quasar Distributors, LLC
615 East Michigan Street
Milwaukee, WI 53202
CUSTODIAN
U.S. Bank, N.A.
1555 North River Center Drive
Milwaukee, WI 53212
ADMINISTRATOR AND TRANSFER AGENT
U.S. Bancorp Fund Services, LLC
Third Floor
615 E. Michigan Street
Milwaukee, WI 53202
INDEPENDENT REGISTERED PUBLIC ACCOUNTING FIRM
Ernst & Young LLP
155 North Wacker Drive
Chicago, IL 60606
LEGAL COUNSEL
Seward & Kissel LLP
One Battery Plaza
New York, NY 10004
This report should be accompanied or preceded by a prospectus.
The Funds’ Statement of Additional Information contains additional information about the
Funds’ directors and is available without charge upon request by calling 1-877-734-7862.
Item 2. Code of Ethics.
The registrant has adopted a code of ethics that applies to the registrant’s principal executive officer and principal financial officer. The registrant has not made any substantive amendments to its code of ethics during the period covered by this period.
The registrant has not granted any waivers from any provisions of the code of ethics during the period covered by this report.
A copy of the registrant’s code of ethics that applies to the registrant’s principal executive officer and principal financial officer is filed herewith.
Item 3. Audit Committee Financial Expert.
The registrant’s board of directors has determined that there is at least one audit committee financial expert serving on its audit committee. John Rossello, Jr. is the “audit committee financial expert” and is considered to be “independent” as each term is defined in Item 3 of Form N-CSR.
Item 4. Principal Accountant Fees and Services.
The registrant has engaged its principal accountant to perform audit services, audit-related services, tax services and other services during the past two fiscal periods. “Audit services” refer to performing an audit of the registrant's annual financial statements or services that are normally provided by the accountant in connection with statutory and regulatory filings or engagements for the past fiscal year. “Audit-related services” refer to the assurance and related services by the principal accountant that are reasonably related to the performance of the audit. “Tax services” refer to professional services rendered by the principal accountant for tax compliance, tax advice, and tax planning, including reviewing the Fund’s tax returns and distribution calculations. The following table details the aggregate fees billed or expected to be billed for each of the last two fiscal periods for audit fees, audit-related fees, tax fees and other fees by the principal accountant.
| | FYE 12/31/2014 | FYE 12/31/2013 |
| Audit Fees | $56,500 | $54,600 |
| Audit-Related Fees | $0 | $0 |
| Tax Fees | $6,900 | $6,650 |
| All Other Fees | $0 | $0 |
| | | |
The audit committee has adopted pre-approval policies and procedures that require the audit committee to pre-approve all audit and non-audit services that exceed $5,000 for the registrant. All of the principal accountant’s hours spent on auditing the registrant’s financial statements were attributed to work performed by full-time permanent employees of the principal accountant.
The audit committee noted that as indicated in the table below, for the registrant’s prior two fiscal periods, no fees were billed by the registrant’s independent public accountants in connection with non-audit services rendered to the registrant’s investment adviser, and any entity controlling, controlled by, or under common control with the investment adviser that provides ongoing services to the registrant.
| Non-Audit Related Fees | FYE 12/31/2014 | FYE 12/31/2013 |
| Registrant | $0 | $0 |
| Registrant’s Investment Adviser | $0 | $0 |
Item 5. Audit Committee of Listed Registrants.
Not applicable to open-end investment companies.
Item 6. Schedule of Investments.
Schedule of Investments is included as part of the report to shareholders filed under Item 1 of this Form.
Item 7. Disclosure of Proxy Voting Policies and Procedures for Closed-End Management Investment Companies.
Not applicable to open-end investment companies.
Item 8. Portfolio Managers of Closed-End Management Investment Companies.
Not applicable to open-end investment companies.
Item 9. Purchases of Equity Securities by Closed-End Management Investment Company and Affiliated Purchases.
Not applicable to open-end investment companies.
Item 10. Submission of Matters to a Vote of Security Holders.
Not Applicable.
Item 11. Controls and Procedures.
| (a) | The Registrant’s President and Treasurer have reviewed the Registrant's disclosure controls and procedures (as defined in Rule 30a-3(c) under the Investment Company Act of 1940 (the “Act”)) as of a date within 90 days of the filing of this report, as required by Rule 30a-3(b) under the Act and Rules 13a-15(b) or 15d-15(b) under the Securities Exchange Act of 1934. Based on their review, such officers have concluded that the disclosure controls and procedures are effective in ensuring that information required to be disclosed in this report is appropriately recorded, processed, summarized and reported and made known to them by others within the Registrant and by the Registrant’s service provider. |
| (b) | There were no significant changes in the Registrant's internal control over financial reporting (as defined in Rule 30a-3(d) under the Act) that occurred during the second fiscal quarter of the period covered by this report that has materially affected, or is reasonably likely to materially affect, the Registrant's internal control over financial reporting. |
Item 12. Exhibits.
| (a) | (1) Any code of ethics or amendment thereto, that is subject of the disclosure required by Item 2, to the extent that the registrant intends to satisfy Item 2 requirements through filing an exhibit. Filed herewith |
(2) Certifications pursuant to Section 302 of the Sarbanes-Oxley Act of 2002. Filed herewith.
(3) Any written solicitation to purchase securities under Rule 23c-1 under the Act sent or given during the period covered by the report by or on behalf of the registrant to 10 or more persons. Not applicable to open-end investment companies.
| (b) | Certification pursuant to Section 906 of the Sarbanes-Oxley Act of 2002. Furnished herewith. |
SIGNATURES
Pursuant to the requirements of the Securities Exchange Act of 1934 and the Investment Company Act of 1940, the registrant has duly caused this report to be signed on its behalf by the undersigned, thereunto duly authorized.
(Registrant) Prospector Funds, Inc.
By (Signature and Title)* /s/ John D. Gillespie
John D. Gillespie, President
Date March 3, 2015
Pursuant to the requirements of the Securities Exchange Act of 1934 and the Investment Company Act of 1940, this report has been signed below by the following persons on behalf of the registrant and in the capacities and on the dates indicated.
By (Signature and Title)* /s/ John D. Gillespie
John D. Gillespie, President
Date March 3, 2015
By (Signature and Title)* /s/ Peter N. Perugini, Jr. Peter N. Perugini, Jr., Treasurer
* Print the name and title of each signing officer under his or her signature.