FORM 6-K
SECURITIES AND EXCHANGE COMMISSION
Washington, D.C. 20549
Report of Foreign Issuer
Pursuant to Rule 13a-16 or 15d-16
of the Securities Exchange Act of 1934
For the month of August, 2013
Commission File Number: 1-33659
COSAN LIMITED
(Translation of registrant’s name into English)
Av. Juscelino Kubitschek, 1726 – 6th floor
São Paulo, SP 04543-000 Brazil
(Address of principal executive offices)
Indicate by check mark whether the registrant files or will file annual reports under cover of Form 20-F or Form 40-F:
| Form 20-F | X | Form 40-F |
| Yes | No | X |
| Yes | No | X |
COSAN LIMITED
Item | ||
| 1. | Earnings Release 2nd Quarter of Fiscal Year 2013 – April, May and June 2013 |

Pro forma EBITDA, including Raízen, increases
35% to R$833 million in 2Q 2013
São Paulo, August 7, 2013 – COSAN LIMITED (NYSE: CZZ; BM&FBovespa: CZLQ11) and COSAN S.A. INDÚSTRIA E COMÉRCIO (BM&FBovespa: CSAN3) announce today their results for the second quarter of 2013 (2Q 2013), comprised of April, May and June 2013. The results are consolidated in accordance with the accounting principles adopted in Brazil and abroad (IFRS).
| 2Q 2013 Highlights | |||||||
| Earnings Conference Call | |||||||
Portuguese August 8, 2013 9:00 am (EST) Tel: + 55 11 4688 6361 Code: COSAN English August 8, 2013 10:00 am (EST) Tel (BR): + 55 11 4688 6361 Tel (US): +1 786 924 6977 Toll-free (US): +1 855 281 6021 Code: COSAN Investor Relations E-mail: ri@cosan.com.br Telephone: +55 11 3897 9797 Site: www.cosan.com.br/ir | ● | Change in Cosan’s fiscal year, which now follows the calendar year | |||||
| ● | Adoption of IFRS 11 to recognize Raízen under the equity pick-up method | ||||||
| ● | Raízen Combustíveis’ net revenue grows 14.5% y-o-y | ||||||
| ● | Raízen Energia’s crushing totals 18.5 million/tonnes | ||||||
| ● | Record expansion of Comgás’ distribution network, reaching 380 km in the quarter | ||||||
| ● | Rumo reaches R$85 million EBITDA | ||||||
| 2Q 2013 | 2Q 2012 | Summmary of Financial Informations - Cosan Cosolidated | YTD 2013 | YTD 2012 | |||
| (apr - jun) | (apr - jun) | Amount in R$ MM | (jan - jun) | (jan - jun) | |||
| 2,225.9 | 422.2 | Net Revenue | 4,215.1 | 761.4 | |||
| 626.1 | 116.0 | Gross Profit | 1,229.8 | 189.6 | |||
| 28.1% | 27.5% | Gross Margin (%) | 29.2% | 24.9% | |||
| 286.8 | 52.1 | Operating Profit | 630.2 | (151.9) | |||
| 381.6 | 66.8 | EBITDA | 976.9 | 304.9 | |||
| 17.1% | 15.8% | EBITDA Margin (%) | 23.2% | 40.0% | |||
Fiscal Year Definitions: 2Q 2013 – quarter ended June 30, 2013 2Q 2012 – quarter ended June 30, 2012 YTD 2013 – semester beginning January 1, 2013 and closing June 30, 2013 YTD 2012 – semester beginning January 1, 2012 and closing June 30, 2012 | (32.4) | (14.4) | Equity Pick-up | 60.2 | 271.5 | ||
| (139.6) | (10.1) | Net Income (Loss) before non-controlling Interest | (21.7) | 140.8 | |||
| (198.0) | (17.1) | Net Income (Loss) | (168.2) | 132.5 | |||
| -8.9% | -4.0% | Net Margin (%) | -4.0% | 17.4% | |||
| 298.2 | 58.3 | CAPEX1 | 534.1 | 138.5 | |||
| 6,818.6 | 1,278.9 | Net Debt | 6,818.6 | 1,278.9 | |||
| 13,042.7 | 9,329.5 | Shareholders' Equity and Minority Shareholders | 13,042.7 | 9,329.5 | |||
| Note 1: Net of acquisition of interest in other companies and of cash received from divestments | |||||||

1 of 49
 | Earnings Release 2nd Quarter of Fiscal Year 2013 - April, May and June 201 |
| A. | Highlights and Business Units |
A.1 Change in the Fiscal Year
As approved by the 2013 Annual/Extraordinary Shareholders’ Meeting, held on July 31, 2013, Cosan’s fiscal year will now coincide with the calendar year, no longer following the harvest year, commencing on January 1st and ending on December 31st of each year. Exceptionally in 2013, the fiscal year will be comprised of 9 (nine) months, commencing on April 1st, 2013 and ending on December 31st, 2013. To allow for comparability with the upcoming years, we will provide an analysis of pro-forma results of the first 6 (six) months of 2013 (YTD 2013), the period between January 1st and June 30th, 2013, compared to the same period of the previous year (YTD 2012).
A.2 Adoption of IFRS 11 (CPC19)
With the adoption of account regulation IFRS 11 (CPC19) – Joint Arrangements, Cosan will no longer proportionally consolidate Raízen’s results in its balance sheet, income statement and cash flow statement, reporting Raízen’s investments and results only in the “Equity Pick-up” line, considering our share (50%) in Net Income. This change does not impact Cosan’s Net Income, Shareholders’ Equity and Cash Flow.
For comparability purposes, given the relevance of Raízen’s operations for Cosan’s consolidated results, we will continue to disclose the performances of Raízen Combustíveis and Raízen Energia individually in this Earnings Release.
2 of 49
| Earnings Release 2nd Quarter of Fiscal Year 2013 - April, May and June 201 |
A.3 Business Units
As in prior earnings releases, we present herein a specific section for each business unit, including key operating data, as well as an analysis of the results, from net revenue to EBITDA.
From this quarter onwards, in order to provide a better understanding of Cosan’s operations, we will provide a section dedicated to the Lubricants and Specialties segment. Additionally, the section Other Businesses will only report the results from Cosan’s corporate structure, contingencies related to businesses contributed to Raízen prior to its formation, as well as other investments.
Our business units (reportable segments) are as follows:
3 of 49
| Earnings Release 2nd Quarter of Fiscal Year 2013 - April, May and June 201 |
A.4 Cosan’s Consolidated Results by Business Unit
Cosan’s consolidated financial information comprises 100% of the results of Comgás, Rumo Lubrificantes e Especialidades, Radar and Other Businesses. As previously mentioned, due to the adoption of the accounting rule IFRS 11, Raízen Energia e Combustíveis’ results are presented under the “Equity Pick-up” line and reflect the proportional interest (50%) in the result. Adjustments and Eliminations represent intercompany balances and transactions.
EBITDA reported here is in compliance with CVM Rule 527/12, published by CVM (Brazil’s Securities and Exchange Commission) on October 4, 2012, and may differ from the figures disclosed in prior periods due to equity pick-up. Consequently, the EBITDA now consists of operating income before financial expenses, plus depreciation, amortization and equity pick-up.
| 2Q 2013 | 2Q 2012 | EBITDA (Reconciliation ICVM 527) | YTD 2013 | YTD 2012 |
| (apr - jun) | (apr - jun) | Amounts in R$ MM | (jan - jun) | (jan - jun) |
| (198.0) | (17.1) | Net Income | (168.2) | 132.5 |
| 32.4 | 14.4 | (-) Equity Pick-up | (60.2) | (271.5) |
| - | 0.9 | (-) Income from Discontinued Operations | 3.4 | 4.3 |
| 58.4 | 6.0 | (+) Minority Shareholders | 143.1 | 3.9 |
| 78.8 | (89.4) | (+) Income Taxes | 219.4 | (116.2) |
| 315.3 | 137.2 | (+) Net Financial Expense (Revenue) | 492.8 | 211.1 |
| 127.1 | 29.1 | (+) Depreciation and Amortization | 286.5 | 69.3 |
| 413.9 | 81.2 | EBITDA (before ICVM 527) | 916.7 | 33.4 |
| (32.4) | (14.4) | (+) Equity Pick-up | 60.2 | 271.5 |
| 381.6 | 66.8 | EBITDA (after ICVM 527) | 976.9 | 304.9 |
| - | (0.9) | (+) Reclassification of Discontinued Operations2 | (3.4) | (4.3) |
| - | - | (-) Gross effect of Raízen formation | - | 100.3 |
| 381.6 | 65.9 | Adjusted EBITDA (after ICVM 527) | 973.5 | 400.9 |
Note 2: Due to the sale of the sugar retailing business represented by Cosan Alimentos, the Company reclassified the results of this unit to the discontinued operation line as required by the accounting rule IFRS5/CPC31 – Non-current Assets Held for Sale and Discontinued Operations.
4 of 49
| Earnings Release 2nd Quarter of Fiscal Year 2013 - April, May and June 201 |
We present below the 2Q 2013 results by business unit for all units described above. All information reflects 100% of the units’ financial performance, regardless of Cosan's interest in them.
According to CVM Instruction 527/12 for EBITDA calculation, the R$114.3 million difference between equity pick-up of Other Businesses of R$81.9 million and the R$32.4 negative result in the Accounting Consolidated relates to elimination of net incomes of businesses controlled by Cosan for consolidation purposes. The same adjustment is carried out for YTD 2013.
Results by Business Unit 2Q 2013 Pro forma | Comgás | Rumo | Lubricants and Specialties | Radar | Othes Businesses | Consolidated Book | Raízen Combustíveis | Raízen Energia | 50% Raízen | Adjusts and Eliminations | Consolidated | |||||||||||||||||||||||||||||||||
| Net Revenue | 1,605.7 | 214.3 | 386.1 | 19.9 | 0.0 | 2,225.9 | 11,778.5 | 1,478.3 | (6,628.4 | ) | (88.6 | ) | 8,765.7 | |||||||||||||||||||||||||||||||
| Cost of Goods and Services | (1,179.4 | ) | (131.0 | ) | (283.3 | ) | (6.1 | ) | (0.0 | ) | (1,599.8 | ) | (11,223.5 | ) | (1,252.4 | ) | 6,238.0 | 88.6 | (7,749.2 | ) | ||||||||||||||||||||||||
| Gross Profit | 426.3 | 83.3 | 102.7 | 13.8 | 0.0 | 626.1 | 555.0 | 225.8 | (390.4 | ) | - | 1,016.5 | ||||||||||||||||||||||||||||||||
| Gross Margin(%) | 26.5 | % | 38.9 | % | 26.6 | % | 69.5 | % | 99.7 | % | 28.1 | % | 4.7 | % | 15.3 | % | 5.9 | % | - | 11.6 | % | |||||||||||||||||||||||
| Selling Expenses | (120.7 | ) | - | (59.1 | ) | - | - | (179.8 | ) | (247.1 | ) | (113.1 | ) | 180.1 | - | (359.9 | ) | |||||||||||||||||||||||||||
| General and Administrative Expenses | (76.1 | ) | (17.7 | ) | (15.3 | ) | (5.0 | ) | (31.0 | ) | (145.1 | ) | (88.1 | ) | (131.5 | ) | 109.8 | - | (255.0 | ) | ||||||||||||||||||||||||
| Other Operating Revenues (Expenses) | (5.1 | ) | 0.2 | (0.2 | ) | 9.0 | (18.1 | ) | (14.3 | ) | 79.9 | 9.2 | (44.5 | ) | - | 30.2 | ||||||||||||||||||||||||||||
| Equity Pick-up | - | - | (0.0 | ) | - | 81.9 | (32.4 | ) | - | (0.7 | ) | 0.3 | 36.2 | 3.5 | ||||||||||||||||||||||||||||||
| Depreciation and Amortization | (90.0 | ) | (19.2 | ) | (17.0 | ) | (0.2 | ) | (0.6 | ) | (127.1 | ) | (117.7 | ) | (423.5 | ) | 270.6 | - | (397.7 | ) | ||||||||||||||||||||||||
| EBITDA | 314.3 | 84.9 | 45.1 | 18.1 | 33.5 | 381.7 | 417.4 | 413.2 | (415.3 | ) | 36.2 | 833.0 | ||||||||||||||||||||||||||||||||
| EBITDA Margin (%) | 19.6 | % | 39.6 | % | 11.7 | % | 91.2 | % | n/a | 17.1 | % | 3.5 | % | 27.9 | % | 6.3 | % | - | 9.5 | % | ||||||||||||||||||||||||
| Unitary EBITDA Margin (R$/cbm) | - | - | - | - | - | - | 74 | - | - | - | - | |||||||||||||||||||||||||||||||||
| Results by Business Unit YTD 2013 Pro forma | Comgás | Rumo | Lubricants and Specialties | Radar | Othes Businesses | Consolidated | Raízen Combustíveis | Raízen Energia | 50% Raízen | Adjusts and Eliminations | Consolidated | |||||||||||||||||||||||||||||||||
| Net Revenue | 3,053.4 | 382.7 | 743.8 | 35.3 | 0.0 | 4,215.1 | 22,725.6 | 3,828.6 | (13,277.1 | ) | (265.0 | ) | 17,227.2 | |||||||||||||||||||||||||||||||
| Cost of Goods and Services | (2,211.8 | ) | (226.2 | ) | (541.2 | ) | (6.1 | ) | 0.0 | (2,985.3 | ) | (21,575.1 | ) | (3,343.4 | ) | 12,459.2 | 262.6 | (15,182.0 | ) | |||||||||||||||||||||||||
| Gross Profit | 841.6 | 156.5 | 202.5 | 29.2 | 0.0 | 1,229.8 | 1,150.5 | 485.2 | (817.8 | ) | (2.4 | ) | 2,045.2 | |||||||||||||||||||||||||||||||
| Gross Margin(%) | 27.6 | % | 40.9 | % | 27.2 | % | 82.8 | % | 100.3 | % | 29.2 | % | 5.1 | % | 12.7 | % | 6.2 | % | - | 11.9 | % | |||||||||||||||||||||||
| Selling Expenses | (272.2 | ) | - | (106.1 | ) | - | - | (378.3 | ) | (512.9 | ) | (309.8 | ) | 411.4 | - | (789.7 | ) | |||||||||||||||||||||||||||
| General and Administrative Expenses | (146.6 | ) | (34.4 | ) | (36.1 | ) | (9.8 | ) | (55.9 | ) | (282.9 | ) | (180.7 | ) | (266.8 | ) | 223.8 | - | (506.6 | ) | ||||||||||||||||||||||||
| Other Operating Revenues (Expenses) | (6.5 | ) | (5.8 | ) | 1.2 | 63.4 | 9.2 | 61.5 | 147.2 | 35.7 | (91.5 | ) | - | 153.0 | ||||||||||||||||||||||||||||||
| Equity Pick-up | - | - | (0.0 | ) | 0.0 | 280.5 | 60.2 | - | (10.0 | ) | 5.0 | (57.8 | ) | (2.6 | ) | |||||||||||||||||||||||||||||
| Depreciation and Amortization | (212.3 | ) | (37.7 | ) | (34.9 | ) | (0.4 | ) | (1.1 | ) | (286.4 | ) | (236.2 | ) | (889.3 | ) | 562.7 | - | (849.1 | ) | ||||||||||||||||||||||||
| EBITDA | 628.6 | 153.9 | 96.4 | 83.2 | 234.8 | 976.9 | 840.3 | 823.6 | (832.0 | ) | (60.3 | ) | 1,748.5 | |||||||||||||||||||||||||||||||
| EBITDA Margin (%) | 20.6 | % | 40.2 | % | 13.0 | % | n/a | n/a | 23.2 | % | 3.7 | % | 21.5 | % | 6.3 | % | - | 10.1 | % | |||||||||||||||||||||||||
| Unitary EBITDA Margin (R$/cbm) | - | - | - | - | - | - | 77 | - | - | - | - | |||||||||||||||||||||||||||||||||
5 of 49
| Earnings Release 2nd Quarter of Fiscal Year 2013 - April, May and June 201 |
B. Results by Business Unit
B.1 Raízen Combustíveis
We present below the results of Raízen Combustíveis, the business unit that distributes and trades fuels through a network of franchised Shell gas stations, in addition to supplying fuels to industrial clients and distributing aviation fuel.
As previously mentioned, due to the adoption of accounting rule IFRS 11 – Joint Arrangements, Cosan no longer consolidates Raízen in its balance sheet, financial statement and cash flow statement. Raízen’s result is reported under the “Equity Pick-up” line. Due to Raízen’s relevance to Cosan’s financial information, we will continue to report the performance of this segment separately in this earnings release.
Raízen Combustíveis year-to-date results for 2013 (YTD 2013) are pro forma, and consider the first six months (January 2013 to June 2013) of Raízen Combustíveis operations, to enable comparability of the periods. The same applies to the year-to-date results for 2012 (YTD 2012), which considers the months of January through June 2012.
Net Revenue
| 2Q 2013 | 2Q 2012 | Sales Breakdown | YTD 2013 | YTD 2012 | |||||||||||||||||||
| (apr - jun) | (apr - jun) | Chg.% | Amounts in R$ MM | (jan - jun) | (jan - jun) | Chg.% | |||||||||||||||||
| 11,778.5 | 10,285.8 | 14.5 | % | Fuel Sales | 22,725.6 | 20,267.7 | 12.1 | % | |||||||||||||||
| 672.3 | 540.4 | 24.4 | % | Ethanol | 1,330.3 | 1,085.0 | 22.6 | % | |||||||||||||||
| 4,724.0 | 4,258.9 | 10.9 | % | Gasoline | 9,130.8 | 8,438.2 | 8.2 | % | |||||||||||||||
| 5,117.2 | 4,083.8 | 25.3 | % | Diesel | 9,581.0 | 7,959.3 | 20.4 | % | |||||||||||||||
| 1,126.4 | 1,259.7 | -10.6 | % | Aviation | 2,403.5 | 2,436.0 | -1.3 | % | |||||||||||||||
| 138.7 | 143.0 | -3.0 | % | Other Products | 280.1 | 349.2 | -19.8 | % | |||||||||||||||
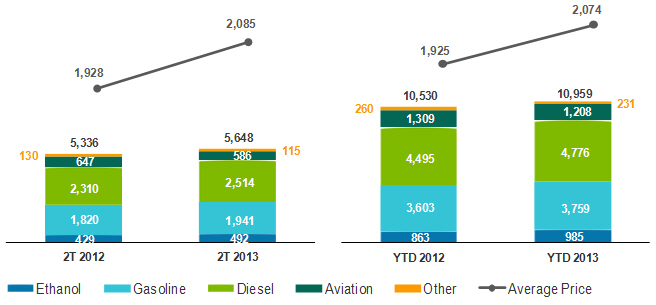
In 2Q 2013, net revenue of Raízen Combustíveis increased by 14.5% compared to 2Q 2012, totaling R$ 11.8 billion, driven by a 5.8% increase in total fuel sales volume, mainly ethanol and diesel, which grew 14.7% and 8.8%, respectively. In addition, the average price of products sold was up 8.1% in the same period, thanks to the increase in gasoline and diesel prices announced by Petrobras in the first quarter of 2013.
Compared to the previous quarter (1Q 2013, previously 4Q13), net revenue increased by 7.6% and volumes by 6.3%, chiefly due to the usual seasonality between the quarters.
6 of 49
| Earnings Release 2nd Quarter of Fiscal Year 2013 - April, May and June 201 |
Parity between gasoline and ethanol prices during 2Q 2013 was above 70% in most Brazilian markets, being below 70% at the end of the period in only four States (São Paulo, Paraná, Goiás and Mato Grosso), maintaining gasoline consumption above that of ethanol.
Fuels
Volume Sold (million liters) and Average Unit Price (R$/cbm)
Inventories
| Fuels Inventories | 2Q 2013 | 2Q 2012 | ||||||||||
| (apr - jun) | (apr - jun) | Chg.% | ||||||||||
| 000' cbm | 442.5 | 431.2 | 2.6 | % | ||||||||
| R$'MM | 852.7 | 765.7 | 11.4 | % | ||||||||
| R$/cbm | 1,926.8 | 1,776.0 | 8.5 | % | ||||||||
Cost of Goods Sold
| 2Q 2013 | 2Q 2012 | COGS | YTD 2013 | YTD 2012 | |||||||||||||||||||
| (apr - jun) | (apr - jun) | Chg.% | Amounts in R$ MM | (jan - jun) | (jan - jun) | Chg.% | |||||||||||||||||
| (11,223.5 | ) | (9,738.9 | ) | 15.2 | % | Fuel Sales | (21,575.1 | ) | (19,055.6 | ) | 13.2 | % | |||||||||||
| Average Unitary Cost (R$/cbm) | |||||||||||||||||||||||
| (1,987 | ) | (1,825 | ) | 8.9 | % | Fuel Sales | (1,969 | ) | (1,810 | ) | 8.8 | % | |||||||||||
In 2Q 2013, the cost of goods sold by Raízen Combustíveis amounted to R$ 11.2 billion, up 15.2% compared to the R$ 9.7 billion reported in 2Q 2012. This increase is mainly due to higher volumes sold, as well as to the increase in the average unit cost for gasoline, ethanol and diesel in the quarter compared to the same period of the previous year. YTD 2013, total cost was R$ 21.6 billion, up 13.2% year-over-year. Average unit cost rose 8.9% to R$1,987/cbm, compared to R$1,825/cbm reported in 2Q 2012.
7 of 49
| Earnings Release 2nd Quarter of Fiscal Year 2013 - April, May and June 201 |
Gross Profit
| 2Q 2013 | 2Q 2012 | Gross Profit | YTD 2013 | YTD 2012 | |||||||||||||||||||
| (apr - jun) | (apr - jun) | Chg.% | Amounts in R$ MM | (jan - jun) | (jan - jun) | Chg.% | |||||||||||||||||
| 555.0 | 546.9 | 1.5 | % | Gross Profit | 1,150.5 | 1,212.1 | -5.1 | % | |||||||||||||||
| 4.7 | % | 5.3 | % | -0.6 p.p. | Gross Margin (%) | 5.1 | % | 6.0 | % | -0.9 p.p. | |||||||||||||
| 98.3 | 102.5 | -4.1 | % | Unitary Gross Margin (R$/cbm) | 105.0 | 115.1 | -8.8 | % | |||||||||||||||
Gross profit of Raízen Combustíveis was R$ 555.0 million in 2Q 2013, 1.5% above the figure reported in the same period of the previous year. Gross margin was 4.7%, in 2Q 2013, a 0.6 p.p. decrease y-o-y. Measured in Reais per cubic meter, gross margin amounted to R$ 98/cbm, 4.1% below the margin reported in the previous year.
The 4.1% decrease in Raízen Combustíveis’ unit gross margin is mainly explained by the following factors:
| ● | Lower volume sold to the aviation segment, which undergone a route optimization process by airlines in the quarter; |
| ● | Change in the criteria used to recognize bonus to resellers, which generated a negative, non-recurring adjustment of R$ 8.5 million in 2Q 2013; and |
| ● | Early beginning of the 2013/2014 when compared to the previous one, leading to a proportionally higher sale of ethanol - whose unit gross margin is lower - in the total mix during 2Q 2013. |
Excluding the impact of the aviation segment, volume growth of Raízen Combustíveis other products was of 8.0% in 2Q 2013 compared to 2Q 2012.
Selling, General and Administrative Expenses
| 2Q 2013 | 2Q 2012 | SG&A Expenses | YTD 2013 | YTD 2012 | |||||||||||||||||||
| (apr - jun) | (apr - jun) | Chg.% | Amounts in R$ MM | (jan - jun) | (jan - jun) | Chg.% | |||||||||||||||||
| 555.0 | 546.9 | 1.5 | % | Selling Expenses | (512.9 | ) | (640.0 | ) | -19.9 | % | |||||||||||||
| 0.0 | 0.1 | -60.5 | % | G&A Expenses | (180.7 | ) | (200.8 | ) | -10.0 | % | |||||||||||||
| 98.3 | 102.5 | -4.1 | % | Other Operational Revenues/Expenses | 147.2 | 129.7 | 13.5 | % | |||||||||||||||
Raízen Combustíveis’s selling expenses were up 2.1% in 2Q 2013, totaling R$ 247.1 million. YTD 2013, selling expenses decreased by 19.9%, amounting to R$ 512.9 million.
8 of 49
| Earnings Release 2nd Quarter of Fiscal Year 2013 - April, May and June 201 |
General and administrative expenses totaled R$ 88.1 million in 2Q 2013, down 1.6% y-o-y. YTD 2013, general and administrative expenses amounted to
R$ 180.7 million, a 10.0% decrease compared to YTD 2012, reflecting Raízen Combustíveis’ restructuring process held in the previous fiscal year.
Other operating revenues and expenses reached R$79.9 million in 2Q 2013, comprised of merchandise fees, convenience store royalties, revenue from leases, fees for the sale of lubricants at Raízen Combustíveis services stations, and revenues from assets sale.
EBITDA
| 2Q 2013 | 2Q 2012 | EBITDA | YTD 2013 | YTD 2012 | |||||||||||||||||||
| (apr - jun) | (apr - jun) | Chg.% | Amounts in R$ MM | (jan - jun) | (jan - jun) | Chg.% | |||||||||||||||||
| 417.4 | 367.4 | 13.6 | % | EBITDA | 840.3 | 718.3 | -19.9 | % | |||||||||||||||
| 3.5 | % | 3.6 | % | -0.1 p.p. | EBITDA Margin (%) | 3.7 | % | 3.5 | % | -0.1 p.p. | |||||||||||||
| 74 | 69 | 7.3 | % | Unitary EBITDA Margin (R$/cbm) | 77 | 68 | 13.5 | % | |||||||||||||||
In 2Q 2013, Raízen Combustíveis’ EBITDA increased by 13.6% compared to 2Q 2012, totaling R$ 417.4 million. EBITDA margin was 3.5%, a 0.1 p.p decrease compared to 2Q 2012. When measured in relation to the volume sold, EBITDA margin was R$ 74/cbm in the quarter, up 7.3% y-o-y.
During this quarter, Raízen Combustíveis underwent a change in the criteria used to recognize bonus to resellers, which generated a negative, non-recurring adjustment of R$ 8.5 million in 2Q 2013 EBITDA.
YTD 2013, EBITDA was R$ 840.3 million, 17.0% higher than YTD 2012, with an EBITDA margin of 3.7%. The EBITDA margin in relation to the volume sold in the same period was R$ 77/cbm, 12.4% above the R$ 68/cbm reported in YTD 2012.
Capex
| 2Q 2013 | 2Q 2012 | CAPEX | YTD 2013 | YTD 2012 | |||||||||||||||||||
| (apr - jun) | (apr - jun) | Chg.% | Amounts in R$ MM | (jan - jun) | (jan - jun) | Chg.% | |||||||||||||||||
| 89.3 | 160.5 | -44.4 | % | CAPEX | 242.8 | 356.7 | -31.9 | % | |||||||||||||||
Raízen Combustíveis’s Capex was R$ 89.3 million in 2Q 2013. Main investments in the period focused on new contracts and the renewal of existing ones with resellers, investments in the reseller stations network, expenditures in health, safety and the environment (HSE), as well as other initiatives relating to logistics, distribution and trading.
9 of 49
| Earnings Release 2nd Quarter of Fiscal Year 2013 - April, May and June 201 |
B.2 Raízen Energia
The following are the results for Raízen Energia, whose core business is the production and sale of a variety of products derived from sugarcane, including raw sugar (Very High Polarization VHP), anhydrous and hydrous ethanol, as well as activities related to energy cogeneration from sugarcane bagasse and ethanol trading.
As previously mentioned, due to the adoption of accounting rule IFRS 11 – Joint Arrangements, Cosan no longer consolidates Raízen in its balance sheet, financial statement and cash flow statement, Raízen’s result is reported under the “Equity Pick-up” line. Due to Raízen’s relevance to Cosan’s financial information, we will continue to report the performance of this segment separately in this earnings release.
Raízen Energia year-to-date results for 2013 (YTD 2013) are pro forma, and consider the first six months (January 2013 to June 2013) of Raízen Energia operations, to enable comparability of the periods. The same applies to the year-to-date results for 2012 (YTD 2012), which considers the months of January through June 2012.
Production Figures
During 2Q 2013, Raízen Energia operated 24 sugar, ethanol and energy cogeneration mills, with a crushing capacity of 65.6 million tonnes of sugarcane per year.
| 2Q 2013 | 2Q 2012 | Operational Figures | YTD 2013 | YTD 2012 | |||||||||||||||||||
| (apr - jun) | (apr - jun) | Chg.% | (jan - jun) | (jan - jun) | Chg.% | ||||||||||||||||||
| 18,534 | 11,064 | 67.5 | % | Crushed Sugarcane | 18,534 | 11,064 | 67.5 | % | |||||||||||||||
| 11,022 | 6,456 | 70.7 | % | Own (‘000 tonnes) | 11,022 | 6,456 | 70.7 | % | |||||||||||||||
| 7,512 | 4,608 | 63.0 | % | Suppliers (‘000 tonnes) | 7,512 | 4,608 | 63.0 | % | |||||||||||||||
| 121.3 | 119.8 | 1.2 | % | Sugarcane TRS (kg/tonne) | 121.3 | 119.8 | 1.2 | % | |||||||||||||||
| 94 | % | 90 | % | 4.0 p.p | Mechanization (%) | 94 | % | 90 | % | 4.0 p.p | |||||||||||||
| Production | |||||||||||||||||||||||
| 1,190 | 643 | 85.0 | % | Sugar | 1,190 | 643 | 85.0 | % | |||||||||||||||
| 866 | 396 | 118.8 | % | Raw Sugar (‘000 tonnes) | 866 | 396 | 118.8 | % | |||||||||||||||
| 323 | 247 | 30.9 | % | White Sugar (‘000 tonnes) | 323 | 247 | 30.9 | % | |||||||||||||||
| 595 | 350 | 70.0 | % | Ethanol | 595 | 350 | 70.0 | % | |||||||||||||||
| 260 | 131 | 98.2 | % | Anhydrous Ethanol (‘000 cbm) | 260 | 131 | 98.2 | % | |||||||||||||||
| 335 | 219 | 53.2 | % | Hydrous Ethanol (‘000 cbm) | 335 | 219 | 53.2 | % | |||||||||||||||
10 of 49
| Earnings Release 2nd Quarter of Fiscal Year 2013 - April, May and June 201 |
CentralSouth Region
Unlike the 2012/2013 harvest, when the beginning of the crop was intentionally delayed in an attempt to leave the sugarcane longer in the field to recover lost productivity, the beginning of the 2013/2014 crop was moved forward by most of the mills, due to the quantity of available sugarcane in the Brazilian Central-south fields, as after the excellent off-season climate, a recovery to historical productivity levels is already in place. This increase in productivity, coupled with a 3% larger area, should lead to a higher sugarcane availability in the region, according to estimates provided by specialized consulting companies.
However, the climate prevented many mills to perform as initially expected. Above average rainfall during April, May and June 2013 caused long pauses in harvesting, with a direct impact in the processed sugarcane volume.
Out of the processed sugarcane volume during 2Q 2013, 41.8% was used in sugar production, resulting in 8.9 million tonnes, while ethanol production totaled 7.6 billion liters – of which 2.9 billion liters were anhydrous and 4.7 billion, hydrous. All products increased year-over-year. Thanks to the return of the mandatory mix in gasoline back to the 25% level (previously, 20%), anhydrous alcohol production doubled in the period.
Raízen Energia
Raízen Energia recorded 18.5 million tonnes of crushed sugarcane in 2Q 2013, an increase of 67.5% over 2Q 2012 (11.1 million tonnes), nearly 60% of which was own sugarcane, and 40% from suppliers. The main reason for the increase in crushing was the one-month-early beginning of the 2013/14 harvest compared to 2012/13.
During 2Q 2013, the mechanization of own sugarcane harvesting reached 94.3% and the TRS of the sugarcane reached 121.3 kg/tonne in the same period, up 1.2% compared to 2Q 2012 when the TRS level was 119.8 kg/tonne, thanks to the investments in sugar cane field renewals.
Agricultural productivity measured by tonnes of sugarcane per hectare (TCH) reached 86.5 t/ha in 2Q 2013, a 10.3% growth compared to the 78.4 t/ha reported in 2Q 2012.
The sugarcane field reached an average age of 3.1 years in 2Q 2013 due to renewal of approximately 20% of the company’s own fields in the quarter. Raízen Energia’s production mix was concentrated in sugar, with approximately 55% of sugarcane crushed used to make this product, totaling 1.2 million tonnes of sugar and 595 million liters of ethanol produced.
11 of 49
| Earnings Release 2nd Quarter of Fiscal Year 2013 - April, May and June 201 |
Net revenue
| 2Q 2013 | 2Q 2012 | Sales Breakdown | YTD 2013 | YTD 2012 | |||||||||||||||||||
| (apr - jun) | (apr - jun) | Chg.% | Amounts in R$ MM | (jan - jun) | (jan - jun) | Chg.% | |||||||||||||||||
| 1,478.3 | 1,264.1 | 16.9 | % | Net Operating Revenue | 3,828.6 | 2,457.4 | 55.8 | % | |||||||||||||||
| 759.1 | 624.7 | 21.5 | % | Sugar Sales | 1,935.8 | 1,290.4 | 50.0 | % | |||||||||||||||
| 185.3 | 206.8 | -10.4 | % | Domestic Market | 383.6 | 465.6 | -17.6 | % | |||||||||||||||
| 573.9 | 417.9 | 37.3 | % | Foreign Market | 1,552.3 | 824.8 | 88.2 | % | |||||||||||||||
| 580.7 | 535.5 | 8.4 | % | Ethanol Sales | 1,704.0 | 1,036.9 | 64.3 | % | |||||||||||||||
| 323.2 | 185.1 | 74.6 | % | Domestic Market | 852.1 | 549.1 | 55.2 | % | |||||||||||||||
| 187.6 | 200.1 | -6.2 | % | Foreign Market | 510.8 | 337.5 | 51.3 | % | |||||||||||||||
| 69.9 | 150.4 | -53.5 | % | Trading | 341.1 | 150.4 | 126.9 | % | |||||||||||||||
| 97.2 | 71.0 | 36.9 | % | Energy Cogeneration | 110.3 | 72.3 | 52.6 | % | |||||||||||||||
| 41.1 | 32.9 | 25.1 | % | Other Products and Services | 78.4 | 57.7 | 35.9 | % | |||||||||||||||
Raízen Energia’s net revenue reached R$ 1.5 billion in 2Q 2013, up 16.9% year-over-year, due to the earlier beginning of the 2013/14 crop compared to 2012/13. Higher volumes sold of sugar, ethanol and electric energy were the main drivers of the increase in net revenue in the period.
Sugar Sales
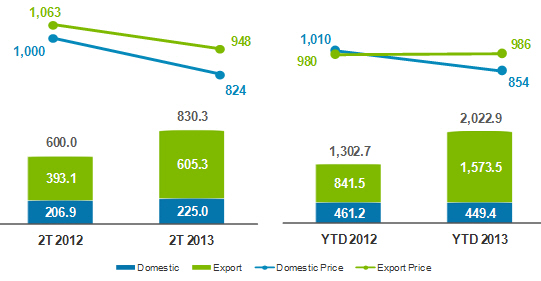
During 2Q 2013 net revenue from sugar sales totaled R$ 759.1 million, 21.5% higher than the R$ 624.7 million recorded in 2Q 2012. Sugar sales represented approximately 51% of Raízen Energia’s net revenue.
The 38.4% expansion in volumes sold during the quarter, equivalent to R$ 210.5 million, was the main driver of net revenue increase, which offset the 12.2% decrease in the average price, from R$ 1.041/tonne in 2Q 2012 to R$ 914/tonne in 2Q 2013.
Sugar
Sales Volume (’000 tonnes) and Average Unit Price (R$/tonne)
12 of 49
| Earnings Release 2nd Quarter of Fiscal Year 2013 - April, May and June 201 |
Sugar Inventories
| Sugar Inventories | 2Q 2013 | 2Q 2012 | ||||||||||
| (apr - jun) | (apr - jun) | Chg.% | ||||||||||
| ´000 tonne | 436.0 | 193.9 | 124.9 | % | ||||||||
| R$'MM | 334.9 | 180.0 | 86.0 | % | ||||||||
| R$/tonne | 768.0 | 928.1 | -17.2 | % | ||||||||
Ethanol Sales
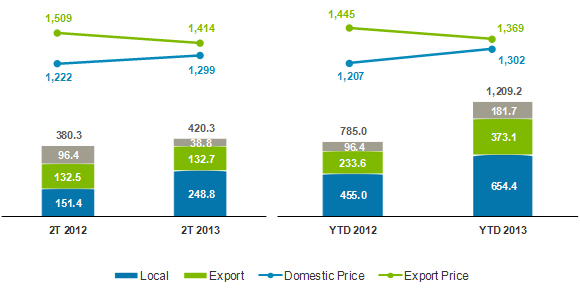
Net revenue from ethanol sales totaled R$ 580.7 million in 2Q 2013, up 8.4% compared to 2Q 2012. Despite lower average ethanol price in the quarter, which went from R$ 1,356/cbm in 2Q 2012 to R$ 1,339/cbm in 2Q 2013, the approximately 34% increase in volume sold more than offset the reduction in prices and was the main reason for the increase in net revenue.
Ethanol sales in the foreign market accounted for 32% of total volume sold in 2Q 2013 and had a R$ 115/cbm premium over prices in the domestic market.
Net revenue from ethanol trading, which represents purchase and sale transactions in the international market, totaled R$ 69.9 million in the quarter and approximately 40 million liters in the period.
Ethanol
Sales Volume (million liters) and Average Unit Price (R$/cbm)
13 of 49
| Earnings Release 2nd Quarter of Fiscal Year 2013 - April, May and June 201 |
Ethanol Inventories
| Ethanol Inventories | 2Q 2013 | 2Q 2012 | ||||||||||
| (apr - jun) | (apr - jun) | Chg.% | ||||||||||
| ´000 cbm | 300.0 | 193.0 | 55.4 | % | ||||||||
| R$'MM | 356.2 | 318.7 | 11.8 | % | ||||||||
| R$/cbm | 1,187.3 | 1,651.2 | -28.1 | % | ||||||||
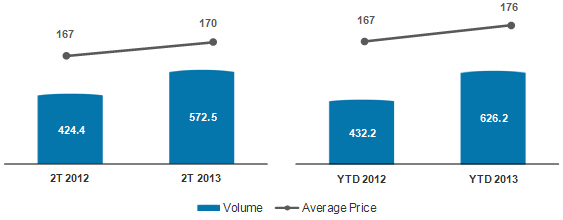
Energy Cogeneration
All of Raízen Energia’s 24 mills generate energy and are self-sufficient, and 13 sell surplus energy from cogeneration.
Net revenue from energy sales in 2Q 2013 reached R$ 97.2 million, up 36.9% compared to 2Q 2012. In the quarter, total volume sold amounted to 572.5 thousand MWh at an average price of R$ 170/MWh, 1.5% above the average price of R$ 167/MWh in 2Q 2012.
The 34.9% increase in the total volume of energy sold, as well as higher average prices in 2Q 2013, were the main factors driving the increase in net revenue. Energy resale in the spot market also contributed to the increase in revenue between quarters.
Electric Energy
Sales Volume (‘000 MWh) and Average Unit Price (R$/MWh)
Other Products and Services
In 2Q 2013, revenue from other products and services reached R$ 41.1 million, up 25.1% over 2Q 2012, relative to the sale of steam, molasses and raw materials to service providers in the agricultural industry.
14 of 49
| Earnings Release 2nd Quarter of Fiscal Year 2013 - April, May and June 201 |
Cost of Goods Sold
Raízen Energia's cost of goods sold is reported together with the average unit costs, net of the effects of depreciation and amortization (cash cost).
| 2Q 2013 | 2Q 2012 | COGS per Product | YTD 2013 | YTD 2012 | |||||||||||||||||||
| (apr - jun) | (apr - jun) | Chg.% | Amounts in R$ MM | (jan - jun) | (jan - jun) | Chg.% | |||||||||||||||||
| (1,252.4 | ) | (1,094.2 | ) | 14.5 | % | Cost of Goods Sold | (3,343.4 | ) | (1,851.3 | ) | 80.6 | % | |||||||||||
| (612.6 | ) | (494.1 | ) | 24.0 | % | Sugar | (1,438.2 | ) | (972.1 | ) | 47.9 | % | |||||||||||
| (472.0 | ) | (368.5 | ) | 28.1 | % | Ethanol | (1,202.5 | ) | (818.0 | ) | 47.0 | % | |||||||||||
| (65.9 | ) | (145.0 | ) | -54.5 | % | Trading | (339.2 | ) | (145.0 | ) | 133.9 | % | |||||||||||
| (49.3 | ) | (43.2 | ) | 14.0 | % | Energy Cogeneration | (60.2 | ) | (43.3 | ) | 39.0 | % | |||||||||||
| (52.7 | ) | (43.4 | ) | 21.4 | % | Others | (303.4 | ) | 127.2 | n/a | |||||||||||||
Average Unitary Costs3 | |||||||||||||||||||||||
| (499.5 | ) | (548.7 | ) | -9.0 | % | Cash Cost of Sugar (R$/tonne) | (502.8 | ) | (536.4 | ) | -6.2 | % | |||||||||||
| (848.8 | ) | (882.4 | ) | -3.8 | % | Cash Cost of Ethanol (R$/’000 liters) | (828.5 | ) | (848.1 | ) | -2.3 | % | |||||||||||
Note 3: Average unit costs represent the cash cost, which is net of plantation and cultivation area depreciation and amortization, agricultural depreciation (machinery and equipment), industrial depreciation, and harvest off-season maintenance.
In 2Q 2013, Raízen Energia’s cost of goods sold totaled R$ 1.3 billion, up 14.5% from the R$ 1.1 billion recorded in 2Q 2012. The main factors that led to higher cost were higher volumes of sugar, ethanol and energy produced and sold, thanks to the early beginning of the 2013/14 crop. The R$303.4 million recorded at Other Products in YTD 2013 reflects the impact of the negative variation of the biological asset’s fair value of the end of 2012/2013 crop and the beginning of 2013/2014 crop.
Some factors offsetting the rise in Raízen Energia’s cost of goods sold in 2Q 2013 were the following:
| ● | Greater dilution of seeding and crop management costs, due to a 1.2% higher TRS, from 119.8 kg/tonne in 2Q 2012 to 121.3 kg/tonne in 2Q 2013; |
| ● | 10.3% increase in sugarcane field productivity – represented by a higher TCH, which was 86.5 in 2Q 2013 compared to 78.4 in 2Q 2012; |
| ● | 11.8% decrease in the cost of CONSECANA’s TCH, of R$ 0.4426 in 2Q 2013 compared to R$ 0.5020 in 2Q 2012, which has a direct impact on the cost of sugarcane from suppliers; |
15 of 49
| Earnings Release 2nd Quarter of Fiscal Year 2013 - April, May and June 201 |
Gross Profit
| 2Q 2013 | 2Q 2012 | Gross Profit and Gross Margin | YTD 2013 | YTD 2012 | |||||||||||||||||||
| (apr - jun) | (apr - jun) | Chg.% | Amounts in R$ MM | (jan - jun) | (jan - jun) | Chg.% | |||||||||||||||||
| 225.8 | 169.9 | 32.9 | % | Gross Profit | 485.2 | 606.1 | -20.0 | % | |||||||||||||||
| 146.5 | 130.6 | 12.2 | % | Sugar | 497.7 | 318.3 | 56.4 | % | |||||||||||||||
| 19.3 | % | 20.9 | % | -1.6 p.p. | Sugar Gross Margin (%) | 25.7 | % | 24.7 | % | 1.0 p.p | |||||||||||||
| 45.4 | % | 47.3 | % | -1.9 p.p. | Sugar (Cash) Gross Margin (%) | 47.5 | % | 45.9 | % | 1.6 p.p | |||||||||||||
| 38.8 | 16.7 | 133.1 | % | Ethanol | 160.4 | 68.5 | 134.0 | % | |||||||||||||||
| 7.6 | % | 4.3 | % | 3.3 p.p | Ethanol Gross Margin (%) | 11.8 | % | 7.7 | % | 4.0 p.p | |||||||||||||
| 36.6 | % | 34.9 | % | 1.7 p.p | Ethanol (Cash) Gross Margin (%) | 37.5 | % | 34.1 | % | 3.4 p.p | |||||||||||||
| 4.0 | 5.4 | -25.3 | % | Trading | 2.0 | 5.4 | -63.7 | % | |||||||||||||||
| 5.7 | % | 3.6 | % | 2.2 p.p | Ethanol Trading Margin (%) | 0.6 | % | 3.6 | % | -3.0 p.p. | |||||||||||||
| 48.0 | 27.8 | 72.5 | % | Energy Cogeneration | 50.1 | 29.0 | 72.9 | % | |||||||||||||||
| (11.5 | ) | (10.5 | ) | 9.8 | % | Other | (225.0 | ) | 184.9 | n/a | |||||||||||||
Raízen Energia recorded gross profit of R$225.8 million in 2Q 2013, up 32.9% compared to the R$ 169.6 million recorded in 2Q 2012.
The result from the sale of sugar reached R$ 146.5 million, 12.2% higher than the 2Q 2012 result. This result represented nearly 65% of Raízen Energia’s gross profit and was the main driver of the increase in this line in the period. The result from the sale of ethanol increased by 133.1% compared to the same quarter of 2012, reaching R$ 38.8 million. The sale of electric energy resulted in gross profit of R$ 48.0 million, up 72.5% year-over-year.
Other products and services recorded negative gross profit of R$ 11.5 million basically due to the loss (non-cash) of R$ 3.3 million from the negative variation of the biological asset’s fair value, in addition to the R$5.2 million in amortization of business combination, recognized at cost in 2Q 2013.
Selling, General and Administrative Expenses
| 2Q 2013 | 2Q 2012 | SG & A Expenses | YTD 2013 | YTD 2012 | |||||||||||||||||||
| (apr - jun) | (apr - jun) | Chg.% | Amounts in R$ MM | (jan - jun) | (jan - jun) | Chg.% | |||||||||||||||||
| (113.1 | ) | (88.1 | ) | 28.4 | % | Selling Expenses | (309.8 | ) | (165.7 | ) | 87.0 | % | |||||||||||
| (131.5 | ) | (110.5 | ) | 19.0 | % | General and Administrative Expenses | (266.8 | ) | (247.1 | ) | 8.0 | % | |||||||||||
Raízen Energia’s selling expenses amounted to R$ 113.1 million in 2Q 2013, up 28.4% compared to 2Q 2012, basically due to higher volumes sold and exported, which led to higher freight, logistics and port lifting expenses.
General and administrative expenses totaled R$ 131.5 million, a 19.0% increase compared to the R$110.5 million reported in 2Q 2012, mainly as a result of institutional expenses linked to marketing campaigns, increase in personnel expenses mainly connected to the collective bargaining agreement and long term incentives, as well as advisory services hired in the quarter.
16 of 49
| Earnings Release 2nd Quarter of Fiscal Year 2013 - April, May and June 201 |
EBITDA
| 2Q 2013 | 2Q 2012 | EBITDA | YTD 2013 | YTD 2012 | |||||||||||||||||||
| (apr - jun) | (apr - jun) | Chg.% | Amounts in R$ MM | (jan - jun) | (jan - jun) | Chg.% | |||||||||||||||||
| 413.2 | 317.8 | 30.0 | % | EBITDA | 823.6 | 802.9 | 2.6 | % | |||||||||||||||
| 28.0 | % | 25.1 | % | 2.8 p.p | Margin EBITDA (%) | 21.5 | % | 32.7 | % | -11.2 p.p. | |||||||||||||
Raízen Energia’s EBITDA reached R$ 413.2 million in 2Q 2013, a 30.0% increase compared to the R$ 317.8 million reported in 2Q 2012.
17 of 49
| Earnings Release 2nd Quarter of Fiscal Year 2013 - April, May and June 201 |
Hedge
Volume positions and fixed sugar prices agreed with traders or through derivative financial instruments as of June 30, 2013, and foreign exchange derivatives contracted by Raízen Energia to hedge future cash flows, are summarized as follows:
| Summary of Hedge Operations at June 30, 20134 | ||||||||
| 2013 / 2014 | 2014 / 2015 | |||||||
| Sugar | ||||||||
| NY #11 | ||||||||
| Volume (‘000 tonne) | 2,159.4 | 511.2 | ||||||
| Average Price (¢US$/lb) | 19.1 | 18.2 | ||||||
| Exchange Rate | ||||||||
| US$ | ||||||||
| Volume (US$ million) | 945.6 | 212.9 | ||||||
| Average Price (R$/US$) | 2.14 | 2.32 | ||||||
Note 4: The table presents hedge coverage taking into consideration the crop-years ending on 03/31/2014 and 03/31/2015, respectively.
Hedge Accounting Impacts
Raízen Energia has been using cash flow hedge accounting for certain derivative financial instruments in order to hedge against the price risk for sugar and against the foreign exchange risk for revenues from sugar exports.
The table below shows the expected transfer of gain/loss balances from shareholders’ equity as at June 30, 2013 to the net operating income of Raízen Energia5 in future years, broken down by coverage period for the following hedging instruments.
| Expiration Period - (R$MM) | ||||||||||||||
| Derivative | Market | Risk | 2013 | 2014 | Total | |||||||||
| Futures | OTC/NYBOT | NY#11 | 156.5 | 16.3 | 172.8 | |||||||||
| (=) Hedge Accounting impact | 156.5 | 16.3 | 172.8 | |||||||||||
| (-) Deferred Income Tax | (53.2 | ) | (5.6 | ) | (58.8 | ) | ||||||||
| (=) Asset Valuation Adjustment | 103.3 | 10.8 | 114.1 | |||||||||||
Note 5: The table above shows 100% of the hedge accounting gains/losses reclassified to shareholders’ equity. As Cosan has a 50% stake in Raízen Energia, the hedge accounting will proportionally impact the Other Comprehensive Income in Cosan’s shareholders’ equity.
18 of 49
| Earnings Release 2nd Quarter of Fiscal Year 2013 - April, May and June 201 |
Capex
| 2Q 2013 | 2Q 2012 | CAPEX | YTD 2013 | YTD 2012 | |||||||||||||||||||
| (apr - jun) | (apr - jun) | Chg.% | Amounts in R$ MM | (jan - jun) | (jan - jun) | Chg.% | |||||||||||||||||
| 476.2 | 606.3 | -21.5 | % | Total CAPEX | 1,493.4 | 1,454.6 | 2.7 | % | |||||||||||||||
| 369.4 | 541.6 | -31.8 | % | Operating CAPEX | 1,118.4 | 1,206.4 | -7.3 | % | |||||||||||||||
| 274.8 | 320.9 | -14.4 | % | Biological Assets | 458.8 | 543.6 | -15.6 | % | |||||||||||||||
| 69.7 | 115.2 | -39.5 | % | Inter-Harvest Maintenance Costs | 473.3 | 436.2 | 8.5 | % | |||||||||||||||
| 14.7 | 11.8 | 24.7 | % | SSMA and Sustaining | 32.9 | 82.0 | -59.9 | % | |||||||||||||||
| 7.4 | 74.0 | -90.0 | % | Mechanization | 92.0 | 124.9 | -26.3 | % | |||||||||||||||
| 2.8 | 19.7 | -85.6 | % | Industrial | 61.4 | 19.7 | 211.7 | % | |||||||||||||||
| 106.8 | 64.7 | 65.1 | % | Expasion CAPEX | 375.0 | 248.2 | 51.1 | % | |||||||||||||||
| 10.7 | 40.7 | -73.7 | % | Cogeneration Projects | 42.8 | 149.7 | -71.4 | % | |||||||||||||||
| 96.1 | 24.0 | n/a | Expansion and Other Projects | 332.2 | 98.5 | n/a | |||||||||||||||||
Raízen Energia’s Capex totaled R$ 476.2 million in 2Q 2013, 21.5% lower than the figures reported in 2Q 2012.
Investments in biological assets amounted to R$ 274.8 million, in line with the field renovation strategy to maintain the average age of sugarcane fields at high productivity levels.
Offseason maintenance, comprising industrial and agricultural maintenance, received investments of R$ 69.7 million, and health, safety and the environment (HSE), R$ 14.7 million.
Expansion-related and other projects totaled R$96.1 million in 2Q 2013 and R$332.2 million in YTD 2013. Main highlights are related to the expansion in production capacity of some units such as Tarumã, Caarapó and Paraguaçu, R$ 10.7 million to complete cogeneration projects and initiatives aiming at economic gains such as vinasse concentration, conversion of hydrous into anhydrous ethanol, biomass projects, expansion of mechanized fields, as well as operational improvements.
19 of 49
| Earnings Release 2nd Quarter of Fiscal Year 2013 - April, May and June 201 |
B.3 Comgás
We present below the results of Companhia de Gás de São Paulo - Comgás, the business unit that represents the distribution and commercialization of natural gas in the concession region in the State of São Paulo.
Periods presented on a pro forma basis reflect Comgás’ accounting information disclosed prior to its consolidation to Cosan’s financial statements, or represent a combination of quarters of calendar years 2012 and 2013.
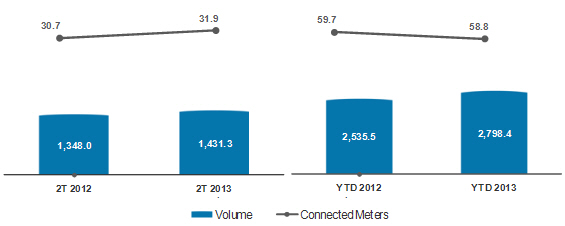
Volumes Sold
| 2Q 2013 | 2Q 2012 | Volume Sold | YTD 2013 | YTD 2012 | |||||||||||||||||||
| (apr - jun) | (apr - jun) | Chg.% | Volume ('000 cbm) | (jan - jun) | (jan - jun) | Chg.% | |||||||||||||||||
| 1,431,346 | 1,347,967 | 6.2 | % | Total Gas Sales | 2,798,361 | 2,535,514 | 10.4 | % | |||||||||||||||
| 1,196,404 | 1,185,318 | 0.9 | % | Gas Sales | 2,334,777 | 2,340,647 | -0.3 | % | |||||||||||||||
| 58,729 | 50,732 | 15.8 | % | Residential | 100,544 | 91,614 | 9.7 | % | |||||||||||||||
| 30,142 | 27,899 | 8.0 | % | Commercial | 55,935 | 54,095 | 3.4 | % | |||||||||||||||
| 958,996 | 946,683 | 1.3 | % | Industrial | 1,887,142 | 1,881,221 | 0.3 | % | |||||||||||||||
| 85,401 | 89,713 | -4.8 | % | Cogeneration | 168,060 | 175,747 | -4.4 | % | |||||||||||||||
| 63,135 | 70,290 | -10.2 | % | Vehicular | 123,096 | 137,969 | -10.8 | % | |||||||||||||||
| 234,943 | 162,650 | 44.4 | % | Thermal Power | 463,585 | 194,868 | 137.9 | % | |||||||||||||||
Comgás focuses its business on the expansion of both the residential and commercial markets and on the development of the cogeneration and NGV. The industrial segment, which growth is linked to the GDP evolution, is the most relevant in terms of volumes.
During 2Q 2013, the company distributed 58.7 million cbm of gas to the residential segment, an increase of 15.8% compared to the 50.7 million cbm distributed in 2Q 2012. At the end of the quarter, the residential segment closed the quarter with 916,418 meters connected, a 7.1% growth compared to 2Q 2012, when meters connected amounted to 855,988. In 2Q 2013, the residential segment contribution margin was 28%, and represented 4% of the total distributed volume.
The commercial segment accounted for 30.1 million cbm of gas distributed by Comgás in 2Q 2013, up 8.0% compared to 2Q 2012, when total volume distributed was 27.9 million cbm. This volume represents 2% of the total distributed volume of gas in 2Q 2013, with a contribution margin of 8%. During 2Q 2013, 343 new commercial clients were connected.
The industrial segment totaled 959.0 million cbm of gas distributed in 2Q 2013, up 1.3% compared to the 946.7 million cbm distributed in 2Q 2012. Comgás’ strategy contemplates the maintenance and loyalty of this customer base, by means of developing new applications for natural gas while working to add new customers in its concession area. In 2Q 2013, Comgás had 1,012 clients in this segment, accounting for 67% of the total gas sales for the quarter with a 60% contribution margin.
20 of 49
| Earnings Release 2nd Quarter of Fiscal Year 2013 - April, May and June 201 |
Thanks to the downtime for maintenance at two big clients, volume sold to the cogeneration market fell 4.8% over 2Q 2012, from 89.7 million cbm in 2Q 2012 to 85.4 million cbm in 2Q 2013, and represented 6% of total volume distributed with a contribution margin of 2%.
In 2Q 2013 the automotive segment represented 4% of total distributed volume, reaching 63.1 million cbm. The 10.2% decrease in volume sold compared to 2Q 2012 is explained by the segment’s high sensitivity to price changes and the competition from other fuels.
The volume sold to the thermal power generation segment in this quarter reached 235.0 million cbm, up 44.4% compared to the 162.7 million cbm sold in 2Q 2012. In 2Q 2013, this segment represented 17% of the total volume of gas sold, with a contribution margin of 2%.
Comgás’ gas supply contracts do not include thermal power plants. If thermal power plants need to dispatch gas, Petrobras will supply the Company the additional volume, as these are “back to back” contracts.
Natural Gas
Volume of Gas Sold (million cbm) and New AHU6 Connected (thousand units)
Note 6: New AHU (autonomous home units) connected in the period.
21 of 49
| Earnings Release 2nd Quarter of Fiscal Year 2013 - April, May and June 201 |
Operating Revenue
| 2Q 2013 | 2Q 2012 | Sales Breakdown | YTD 2013 | YTD 2012 | |||||||||||||||||||
| (apr - jun) | (apr - jun) | Chg.% | Amounts in R$ MM | (jan - jun) | (jan - jun) | Chg.% | |||||||||||||||||
| 1,960.3 | 1,577.2 | 24.3 | % | Gross Operating Revenue | 3,731.8 | 2,973.8 | 25.5 | % | |||||||||||||||
| 1,776.6 | 1,462.6 | 21.5 | % | Gas Sales | 3,406.1 | 2,771.2 | 22.9 | % | |||||||||||||||
| 207.2 | 162.4 | 27.5 | % | Residential | 351.9 | 287.6 | 22.4 | % | |||||||||||||||
| 74.1 | 61.6 | 20.4 | % | Commercial | 135.9 | 117.1 | 16.1 | % | |||||||||||||||
| 1,268.9 | 1,042.3 | 21.7 | % | Industrial | 2,469.9 | 2,024.2 | 22.0 | % | |||||||||||||||
| 73.9 | 79.1 | -6.5 | % | Cogeneration | 154.3 | 160.3 | -3.8 | % | |||||||||||||||
| 90.5 | 59.3 | 52.6 | % | Thermal Power | 175.2 | 70.5 | 148.6 | % | |||||||||||||||
| 61.9 | 57.8 | 7.0 | % | Vehicular | 119.0 | 111.5 | 6.7 | % | |||||||||||||||
| 174.2 | 107.9 | 61.4 | % | Construction Revenue | 309.3 | 189.3 | 63.4 | % | |||||||||||||||
| 9.6 | 6.7 | 42.2 | % | Other | 16.4 | 13.4 | 22.4 | % | |||||||||||||||
| (354.7 | ) | (298.7 | ) | 18.8 | % | Tax on Sales | (678.4 | ) | (575.0 | ) | 18.0 | % | |||||||||||
| 1,605.7 | 1,278.5 | 25.6 | % | Net Operating Revenue | 3,053.4 | 2,398.9 | 27.3 | % | |||||||||||||||
| 1,424.0 | 1,164.6 | 22.3 | % | Gas Sales | 2,732.0 | 2,197.6 | 24.3 | % | |||||||||||||||
| 174.1 | 107.9 | 61.4 | % | Construction Revenue - ICPC01 | 309.3 | 189.3 | 63.4 | % | |||||||||||||||
| 7.5 | 6.1 | 23.4 | % | Other | 12.1 | 12.0 | 1.0 | % | |||||||||||||||
Comgás recorded gross revenue of R$ 2.0 billion in 2Q 2013, up 24.3% compared to the R$ 1.6 billion reported in 2Q 2012. Net revenue from sales and services totaled R$ 1.6 billion, a 25.6% increase compared to the same period of the previous year.
Increased rates, as approved by the São Paulo State Sanitation and Energy Regulatory Agency (ARSESP) resolutions nos. 340, 379 and 421, were the main drivers of the variations in Natural Gas Sales Revenue. In order to establish the new rates, ARSESP considered the increased cost of natural gas, especially imported gas (subject to agency review), which was impacted by the stronger dollar and the higher average contracted oil price per barrel, key elements for natural gas price formation in Brazil.
Cost of Goods and Services
| 2Q 2013 | 2Q 2012 | COGS | YTD 2013 | YTD 2012 | |||||||||||||||||||
| (apr - jun) | (apr - jun) | Chg.% | Amounts in R$ MM | (jan - jun) | (jan - jun) | Chg.% | |||||||||||||||||
| (1,179.4 | ) | (1,007.2 | ) | 17.1 | % | Cost of Goods and Services | (2,211.8 | ) | (1,808.6 | ) | 22.3 | % | |||||||||||
| (898.1 | ) | (804.8 | ) | 11.6 | % | Natural Gas | (1,705.4 | ) | (1,438.7 | ) | 18.5 | % | |||||||||||
| (107.1 | ) | (94.5 | ) | 13.3 | % | Transportation and other Gas services | (197.1 | ) | (180.6 | ) | 9.1 | % | |||||||||||
| (174.1 | ) | (107.9 | ) | 61.4 | % | Construction - ICPC 01 | (309.3 | ) | (189.3 | ) | 0.6 | ||||||||||||
Comgás’ total cost of goods and services sold, comprised of commodity costs, transportation and construction reached R$ 1.2 billion in 2Q 2013, 17.1% higher than the R$ 1.0 billion recorded in 2Q 2012.
22 of 49
| Earnings Release 2nd Quarter of Fiscal Year 2013 - April, May and June 201 |
These increases are chiefly explained by the increased cost of natural gas deriving from gas supply contracts priced in U.S. dollars. According to the methodology of each contract, the cost of gas is adjusted annually by inflation, as measured by the Market Price Index (Brasil and/or U.S.) and quarterly by a basket of fuel oils that varies according to the price of oil per barrel on the international market.
The differences between real costs incurred and the cost of gas included in the rate charged to customers (as per the ARSESP fee structure) are accrued to the regulatory account and are passed through or charged according to regulatory resolutions in periodic adjustments or rate reviews. On June 30, 2013, the regulatory account had a positive balance of approximately R$364 million payable to Comgás.
The regulatory account represents a balance payable or receivable related to the difference between the prices of the gas bought by Comgás and the one used in the tariff composition. This balance is not recorded, so when we refer to its normalization, it means to consider this asset and/or liability as if it was recorded.
Gross Profit
| 2Q 2013 | 2Q 2012 | Gross Profit | YTD 2013 | YTD 2012 | |||||||||||||||||||
| (apr - jun) | (apr - jun) | Chg.% | Amounts in R$ MM | (jan - jun) | (jan - jun) | Chg.% | |||||||||||||||||
| 426.3 | 271.3 | 57.1 | % | Gross Profit | 841.6 | 590.3 | 42.6 | % | |||||||||||||||
| 26.5 | % | 21.2 | % | 5.3 p.p | Gross Margin (%) | 27.6 | % | 24.6 | % | 3.0 p.p | |||||||||||||
Comgás recorded gross profit of R$ 426.3 million in 2Q 2013, 57.1% above the R$ 271.3 million reported in 2Q 2012. This variation is primarily explained by (i) (i) activity in the Regulatory Account; (ii) 6.16% weighted average tariff adjustment in May 2013; and (iii) increased volume sold in 2Q 2013.
Selling, General and Administrative Expenses
| 2Q 2013 | 2Q 2012 | SG&A Expenses | YTD 2013 | YTD 2012 | |||||||||||||||||||
| (apr - jun) | (apr - jun) | Chg.% | Amounts in R$ MM | (jan - jun) | (jan - jun) | Chg.% | |||||||||||||||||
| (120.7 | ) | (104.9 | ) | 15.1 | % | Selling Expenses | (272.2 | ) | (198.7 | ) | 37.0 | % | |||||||||||
| (76.1 | ) | (67.2 | ) | 13.3 | % | G&A Expenses | (146.6 | ) | (134.8 | ) | 8.8 | % | |||||||||||
| (5.1 | ) | (1.2 | ) | n/a | Other Operating Revenues (Expenses) | (6.5 | ) | (5.7 | ) | 13.8 | % | ||||||||||||
Comgás’ selling expenses totaled R$ 120.7 million in 2Q 2013, up 15% compared to the 2Q 2012 figure of R$ 104.9 million. Excluding the effect in the amount of R$ 8.9 million of the goodwill amortization (concession rights) allocated under selling expenses, the increase in selling expenses would have been 6.6% q-o-q.
23 of 49
| Earnings Release 2nd Quarter of Fiscal Year 2013 - April, May and June 201 |
General and administrative expenses were R$ 76.1 million in 2Q 2013, representing a 13.3% increase compared to the R$ 67.2 million reported in 2Q 2012.
EBITDA
| 2Q 2013 | 2Q 2012 | EBITDA | YTD 2013 | YTD 2012 | |||||||||||||||||||
| (apr - jun) | (apr - jun) | Chg.% | Amounts in R$ MM | (jan - jun) | (jan - jun) | Chg.% | |||||||||||||||||
| 314.3 | 168.8 | 86.2 | % | EBITDA | 628.7 | 388.9 | 61.6 | % | |||||||||||||||
| 19.6 | % | 13.2 | % | 6.4 p.p | EBITDA Margin (%) | 20.6 | % | 16.2 | % | 4.4 p.p | |||||||||||||
| 330.9 | 318.9 | 3.8 | % | Normalizade EBITDA | 592.9 | 587.6 | 0.9 | % | |||||||||||||||
| 20.6 | % | 22.3 | % | -1.7 p.p. | Normalized EBITDA Margin (%) | 19.4 | % | 22.6 | % | -3.2 p.p. | |||||||||||||
Comgás’s EBITDA reached R$ 314.3 million in 2Q 2013, an increase of 86.2% compared to the figure reported in 2Q 2012, of R$ 168.8 million. EBITDA margin reached 19.6%, 6.4 p.p. above the 2Q 2012. EBITDA adjusted by the Regulatory Account was R$ 330.9 million in 2Q 2013, up 3.8% compared to the R$ 318.9 million reported in 2Q 2012.
CAPEX
| 2Q 2013 | 2Q 2012 | CAPEX | YTD 2013 | YTD 2012 | |||||||||||||||||||
| (apr - jun) | (apr - jun) | Chg.% | Amounts in R$ MM | (jan - jun) | (jan - jun) | Chg.% | |||||||||||||||||
| 219.9 | 147.0 | 49.6 | % | CAPEX | 394.4 | 268.1 | 47.1 | % | |||||||||||||||
Comgás’ investments totaled R$ 219.9 million during 2Q 2013, 49.6% higher y-o-y. Of this total, 66% were invested in network expansion, reinforcing the expansion strategy to regions not serviced by Comgás, in addition to network penetration.
24 of 49
| Earnings Release 2nd Quarter of Fiscal Year 2013 - April, May and June 201 |
B.4 Rumo Logística
We present below the results of Rumo Logística, company responsible for providing integrated logistics solutions for sugar and other agricultural commodities exports, offering transportation, storage and port loading services.
Net revenue
| 2Q 2013 | 2Q 2012 | Sales Breakdown | YTD 2013 | YTD 2012 | |||||||||||||||||||
| (apr - jun) | (apr - jun) | Chg.% | Amounts in R$ MM | (jan - jun) | (jan - jun) | Chg.% | |||||||||||||||||
| 214.3 | 104.9 | 104.3 | % | Net Operating Revenue | 382.7 | 179.2 | 113.6 | % | |||||||||||||||
| 172.2 | 77.7 | 121.6 | % | Transportation | 300.7 | 131.3 | 129.0 | % | |||||||||||||||
| 36.8 | 24.7 | 49.1 | % | Loading | 73.4 | 42.2 | 74.1 | % | |||||||||||||||
| 5.3 | 2.5 | 113.6 | % | Other | 8.6 | 5.7 | 51.9 | % | |||||||||||||||
In 2Q 2013, Rumo’s net revenue totaled R$ 214.3 million, up 104.3% compared to the same period of the previous year. YTD 2013, net revenue reached
R$ 382.7 million, a 113.6% increase compared to YTD 2012.
Net revenue from transportation in 2Q 2013 totaled R$ 172.2 million, up 121.6% compared to the same period of the previous year, mostly due to (i) increased sugar volumes transported; (ii) higher average prices for rail transportation; and (iii) adjustments to maintain contractual balance in rail and road transportation with America Latina Logistica (ALL), Rumo’s partner in transportation.
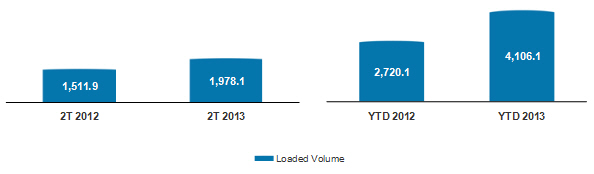
Rumo’s loading volume in the quarter was 30.8% higher than 2Q 2012, reaching 1,978 mil tonnes. In addition to sugar, approximately 60 thousand tonnes of soybeans were lifted. Loading revenue increased by 49.1% in the period, leveraging not only from the increase in volume, but also from higher average prices during the quarter.
Loading Volume
(‘000 tonne)
25 of 49
| Earnings Release 2nd Quarter of Fiscal Year 2013 - April, May and June 201 |
Cost of Services Provided
| 2Q 2013 | 2Q 2012 | Costs of Services | YTD 2013 | YTD 2012 | |||||||||||||||||||
| (apr - jun) | (apr - jun) | Chg.% | Amounts in R$ MM | (jan - jun) | (jan - jun) | Chg.% | |||||||||||||||||
| (131.0 | ) | (70.3 | ) | 86.4 | % | Cost of Services | (226.2 | ) | (147.7 | ) | 53.2 | % | |||||||||||
Cost of services provided includes railway and highway freight, port elevation, transshipment and storage costs in upstate São Paulo and at the Port of Santos.
In 2Q 2013, cost of services provided by Rumo increased 86.4% compared to 2Q 2012, as a result of increased volume and cost of freight, mainly from road transportation.
Gross Profit
| 2Q 2013 | 2Q 2012 | Gross Profit | YTD 2013 | YTD 2012 | |||||||||||||||||||
| (apr - jun) | (apr - jun) | Chg.% | Amounts in R$ MM | (jan - jun) | (jan - jun) | Chg.% | |||||||||||||||||
| 83.3 | 34.6 | 140.7 | % | Gross Profit | 156.5 | 31.5 | 397.0 | % | |||||||||||||||
| 38.9 | % | 33.0 | % | 5.9 p.p | Gross Margin (%) | 40.9 | % | 17.6 | % | 23.3 p.p | |||||||||||||
In 2Q 2013, Rumo reported gross profit of R$ 83.3 million, 140.7% higher than in 2Q 2012. Gross margin increased by 5.9 p.p., reaching 38.9% in 2Q 2013 compared to 33.0% in 2Q 2012.
General and Administrative Expenses
| 2Q 2013 | 2Q 2012 | G&A Expenses | YTD 2013 | YTD 2012 | |||||||||||||||||||
| (apr - jun) | (apr - jun) | Chg.% | Amounts in R$ MM | (jan - jun) | (jan - jun) | Chg.% | |||||||||||||||||
| (17.7 | ) | (12.1 | ) | 46.5 | % | G&A Expenses | (34.4 | ) | (23.8 | ) | 44.5 | % | |||||||||||
General and administrative expenses amounted to R$17.7 million in 2Q 2013, up 46.5% compared to 2Q 2012 mostly due to the adequacy in Rumo’s administrative structure to a new operating level, leading to an increase in personnel and in services hired.
EBITDA
| 2Q 2013 | 2Q 2012 | EBITDA | YTD 2013 | YTD 2012 | |||||||||||||||||||
| (apr - jun) | (apr - jun) | Chg.% | Amounts in R$ MM | (jan - jun) | (jan - jun) | Chg.% | |||||||||||||||||
| 84.9 | 42.8 | 98.4 | % | EBITDA | 154.0 | 63.4 | 142.9 | % | |||||||||||||||
| 39.6 | % | 40.8 | % | -1.2 p.p. | Margin EBITDA (%) | 40.2 | % | 35.4 | % | 4.8 p.p | |||||||||||||
Rumo’s EBITDA was R$ 84.9 million in 2Q 2013, with an EBITDA margin of 39.6%, up 98.4% and down 1.2 p.p compared to 2Q 2012, respectively.
26 of 49
| Earnings Release 2nd Quarter of Fiscal Year 2013 - April, May and June 201 |
CAPEX
| 2Q 2013 | 2Q 2012 | CAPEX | YTD 2013 | YTD 2012 | |||||||||||||||||||
| (apr - jun) | (apr - jun) | Chg.% | Amounts in R$ MM | (jan - jun) | (jan - jun) | Chg.% | |||||||||||||||||
| 69.1 | 47.5 | 45.4 | % | CAPEX | 126.1 | 93.1 | 35.4 | % | |||||||||||||||
Rumo’s investments in 2Q 2013 totaled R$ 69.1 million, 45.4% above the R$ 47.5 million reported in 2Q 2012. YTD 2013, Rumo invested R$ 126.1 million.
In the quarter, the main investments were directed to the following initiatives:
| (i) | R$ 35.3 million in the permanent railroad operated by América Latina Logística (ALL); |
| (ii) | R$ 16.8 million in improvements at the Santos port terminal, including construction of the high performance rail discharging grid in partnership with Copersucar (ongoing), interconnection between South and North terminals and adequacy of scales, works to cover the South terminal quay (ongoing) and recurring investments related to equipment maintenance and warehouse infrastructure; |
| (iii) | R$ 8.3 million in other initiatives, including investments in transshipment terminals at the countryside of São Paulo state. |
27 of 49
| Earnings Release 2nd Quarter of Fiscal Year 2013 - April, May and June 201 |
B.5 - Lubricants and Specialties
With the objective of offering a better understanding of Cosan’s operations, starting this quarter we will provide the complete results of the Lubricants and Specialties segment, comprised of industrialization and distribution of lubricants under the brands Mobil and Comma, resale of base oil and automotive specialties in Brazil and other 40 countries, through plants located in Rio de Janeiro, Brazil and Kent, United Kingdom.
For comparability purposes, results referring to 2012 of the Lubricants and Specialties segment are pro forma, and include the results of the international operations, as follows:
| ● | 2Q 2012 – three months (April, May and June 2012) of the combination of the Lubricants and Specialties with the international operations results |
| ● | YTD 2012 – six months (January to June 2013) of the combination of the Lubricants and Specialties with the international operations results |
Net revenue
| 2Q 2013 | 2Q 2012 | Sales Breakdown | YTD 2013 | YTD 2012 | |||||||||||||||||||
| (apr - jun) | (apr - jun) | Chg. % | Amounts in R$ MM | (jan - jun) | (jan - jun) | Chg.% | |||||||||||||||||
| 386.1 | 364.7 | 5.8 | % | Net Operating Revenue | 743.8 | 677.2 | 9.8 | % | |||||||||||||||
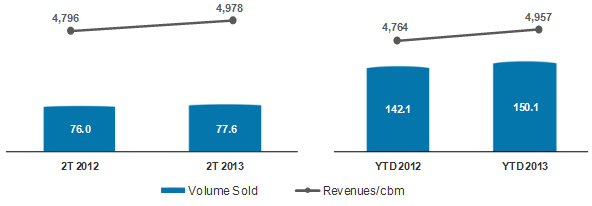
Net revenue from the sale of lubricants, resale of base oil and other Lubricants and Specialties products and services reached R$386.1 million in 2Q 2013, a 5.8% increase compared to 2Q 2012, mainly due to the 2.0% increase in volumes sold and higher average unit prices. Total average unit revenue grew by 3.8%, from R$ 4,796/cbm in 2Q 2012 to R$ 4,978/cbm in 2Q 2013.
Lubricants, Base Oils and Other Products
Sales Volume (Millions of liters) and Average Unit Revenue (R$/cbm)
28 of 49
| Earnings Release 2nd Quarter of Fiscal Year 2013 - April, May and June 201 |
Cost of Goods and Services
| 2Q 2013 | 2Q 2012 | COGS | YTD 2013 | YTD 2012 | |||||||||||||||||||
| (apr - jun) | (apr - jun) | Chg. % | Amounts in R$ MM | (jan - jun) | (jan - jun) | Chg.% | |||||||||||||||||
| (283.3 | ) | (277.1 | ) | 2.3 | % | Cost of Goods and Services | (541.2 | ) | (507.0 | ) | 6.7 | % | |||||||||||
The cost of goods sold and services of the Lubricants and Specialties segment amounted to R$ 283.3 million in 2Q 2013, up 2.3% y-o-y due to higher volumes sold in the period, as well as higher unit costs of base oils, main raw material used to produce lubricants and other products.
Gross Profit
| 2Q 2013 | 2Q 2012 | Gross Profit | YTD 2013 | YTD 2012 | |||||||||||||||||||
| (apr - jun) | (apr - jun) | Chg. % | Amounts in R$ MM | (jan - jun) | (jan - jun) | Chg.% | |||||||||||||||||
| 102.7 | 87.7 | 17.2 | % | Gross Profit | 202.5 | 170.2 | 19.0 | % | |||||||||||||||
| 26.6 | % | 24.0 | % | 2.6 p.p | Gross Margin (%) | 27.2 | % | 25.1 | % | 2.1 p.p | |||||||||||||
Gross profit increased by 17.2% in the quarter, reaching R$ 102.7 million compared to R$ 87.7 million reported in 2Q 2012. Gross margin was 26.6% in the quarter, a 2.6 p.p growth y-o-y when reported gross margin was 24.0%.
Selling, General and Administrative Expenses
| 2Q 2013 | 2Q 2012 | SG&A | YTD 2013 | YTD 2012 | |||||||||||||||||||
| (apr - jun) | (apr - jun) | Chg. % | Amounts in R$ MM | (jan - jun) | (jan - jun) | Chg.% | |||||||||||||||||
| (74.4 | ) | (69.8 | ) | 6.6 | % | Total expenses | (142.2 | ) | (125.2 | ) | 13.6 | % | |||||||||||
Selling, general and administrative expenses increased by 6.6% in 2Q 2013 compared to 2Q 2012 and totaled R$74.4 million, thanks to the adequacy of the Lubricants and Specialties structure to the business internationalization initiatives held in recent years.
EBITDA
| 2Q 2013 | 2Q 2012 | EBITDA | YTD 2013 | YTD 2012 | |||||||||||||||||||
| (apr - jun) | (apr - jun) | Chg. % | Amounts in R$ MM | (jan - jun) | (jan - jun) | Chg.% | |||||||||||||||||
| 45.1 | 30.5 | 47.8 | % | EBITDA | 96.4 | 68.3 | 41.1 | % | |||||||||||||||
| 11.7 | % | 8.4 | % | 3.3 p.p | EBITDA Margin (%) | 13.0 | % | 10.1 | % | 2.9 p.p | |||||||||||||
EBITDA in 2Q 2013 amounted to R$ 45.1 million, up 47.8% compared to 2Q 2012. EBITDA margin in the quarter reached 11.7%, a 3.3 p.p increase in the same comparison with 2Q 2012. The temporary reduction in marketing campaign expenses explains part of the EBITDA expansion.
29 of 49
| Earnings Release 2nd Quarter of Fiscal Year 2013 - April, May and June 201 |
B.6 Radar
Below are the results for Radar, whose main activity is investment in agricultural properties and leasing to the Brazilian rural real estate market.
Radar’s results are presented on two separate bases – accounting and pro-forma – for comparability purposes among the periods.
The major differences between both bases are as follows:
| ● | 2Q 2012 – three months (April, May and June 2012) of the combination of Radar’s operations with the results of Cosan's lands |
| ● | YTD 2012 – six months (January to June 2013) of the combination of Radar’s operations with the results of Cosan's lands |
Assets Portfolio
| State | Culture | % | Area (hectare) | Área (acre) | Market Value (5) ( R$MM) | ||||||||||||
| São Paulo | Sugarcane | 65 | % | 70,281 | 173,593 | 2,087 | |||||||||||
| Maranhão | Sugarcane | 15 | % | 16,651 | 41,129 | 143 | |||||||||||
| Mato Grosso | Grains | 11 | % | 12,303 | 30,388 | 153 | |||||||||||
| Bahia | Grains | 7 | % | 7,155 | 17,674 | 76 | |||||||||||
| Goiás | Sugarcane | 1 | % | 672 | 1,659 | 16 | |||||||||||
| Mato Grosso do Sul | Sugarcane | 0 | % | 417 | 1,029 | 2 | |||||||||||
| Total | 100 | % | 107,479 | 265,471 | 2,476 | ||||||||||||
Radar closed 2Q 2013 with a land portfolio of R$2.5 billion, and total area of 107,500 hectares (265.5 thousand acres), distributed throughout six Brazilian states.
Net Revenue
| 2Q 2013 | 2Q 2012 | YTD 2013 | YTD 2012 | ||||||||||||||||||||
| (apr - jun) | (apr - jun) | Chg. % | Amounts in R$ MM | (jan - jun) | (jan - jun) | Chg.% | |||||||||||||||||
| 19.9 | 35.1 | -43.3 | % | Net Operating Revenue | 35.3 | 55.2 | -36.1 | % | |||||||||||||||
| 5.7 | 17.3 | n/a | Property Sale | 5.7 | 17.3 | n/a | |||||||||||||||||
| 14.2 | 17.7 | -20.0 | % | Land Lease | 29.6 | 37.8 | -21.8 | % | |||||||||||||||
| (6.1 | ) | (18.3 | ) | n/a | Cost of Property Sales | (6.1 | ) | (18.3 | ) | n/a | |||||||||||||
| (6.1 | ) | (18.3 | ) | n/a | Property Sale | (6.1 | ) | (18.3 | ) | n/a | |||||||||||||
| 13.8 | 16.8 | -17.5 | % | Gross Profit | 29.2 | 36.8 | -20.7 | % | |||||||||||||||
| 69.5 | % | 47.8 | % | 21.8 p.p | Gross Margin (%) | 82.8 | % | 66.8 | % | 16.0 p.p | |||||||||||||
In 2Q 2013, Radar’s net revenue totaled R$ 19.9 million, of which R$5.7 million came from the sale of assets and R$14.2 million from leasing of agricultural lands. The decline of 43.3% over 2Q 2012 is due to the higher asset sale in the
30 of 49
| Earnings Release 2nd Quarter of Fiscal Year 2013 - April, May and June 201 |
same period of previous year and the drop in revenues from land leasing, mainly related to the variation in agricultural commodities prices, which impact indexes of leasing contracts.
Cost of services provided by Radar in 2Q 2013 amounted to R$6.1 million due to assets sales carried out in the quarter. The variation between revenue and cost related to property sale is due to the fact that the sale was concluded when the asset was reassessed and registered by fair value of R$ 6.1 million, for accounting purposes. However, the appreciation registered with the sale of this property, for R$5.7 million in 2Q 2013, was approximately 124% when compared to the cost of acquisition in 2009.
Radar’s gross profit was R$13.8 million for 2Q13, a 17.5% decrease due to the asset sale held in 2Q12. YTD, gross profit was R$29.2 million, with a gross margin of 82.8%.
General and Administrative Expenses
| 2Q 2013 | 2Q 2012 | G&A Expenses | YTD 2013 | YTD 2012 | |||||||||||||||||||
| (apr - jun) | (apr - jun) | Chg. % | Amounts in R$ MM | (jan - jun) | (jan - jun) | Chg. % | |||||||||||||||||
| (5.0 | ) | (5.8 | ) | -14.0 | % | G&A Expenses | (9.8 | ) | (8.7 | ) | 12.5 | % | |||||||||||
Radar’s general and administrative expenses dropped 14.0% in 2Q13 compared to 2Q12, thanks to the Company’s timeline of projects, which, contrary to what happened in 2012, were postponed for the second half of the year. There was no change in the Company’s expense profile or expense allocation strategy. In 2Q 2013, general and administrative expenses were 0.4% of the assets under management, compared to 1.6% in 2008, attesting the scale gains by use of technology and efficiency in land management.
In 2Q 2013, other operating revenues totaled R$8.9 million and basically refer to the marking to fair value of the land portfolio made by Radar based on market indexes.
EBITDA
| 2Q 2013 | 2Q 2012 | EBITDA | YTD 2013 | YTD 2012 | |||||||||||||||||||
| (apr - jun) | (apr - jun) | Chg. % | Amounts in R$ MM | (jan - jun) | (jan - jun) | Chg. % | |||||||||||||||||
| 18.1 | 12.5 | 44.4 | % | EBITDA | 83.3 | 31.3 | 166.4 | % | |||||||||||||||
| 90.9 | % | 35.7 | % | n/a | EBITDA Margin (%) | 236.0 | % | 56.7 | % | n/a | |||||||||||||
Radar posted EBITDA of R$18.1 million in 2Q 2013, a 44.4% increase year-over-year, and EBITDA margin of 90.9%. YTD 2013, EBITDA was R$83.3 million, a 166.4% increase year-over-year.
31 of 49
| Earnings Release 2nd Quarter of Fiscal Year 2013 - April, May and June 201 |
B.7 Other Businesses
Below we report the results for our Other Businesses, which consist of Cosan’s corporate structure, as well as effects from contingencies from businesses contributed to Raízen before its formation, as well as other investments.
| 2Q 2013 | 2Q 2012 | YTD 2013 | YTD 2012 | ||||||||||||||||||||
| (apr - jun) | (apr - jun) | Chg. % | Amounts in R$ MM | (jan - jun) | (jan - jun) | Chg.% | |||||||||||||||||
| (31.0 | ) | (30.7 | ) | 1.1 | % | G&A Expenses | (55.9 | ) | (62.9 | ) | -11.1 | % | |||||||||||
| (18.1 | ) | 36.2 | n/a | Other Revenues (Expenses) | 9.2 | 60.2 | -84.8 | % | |||||||||||||||
| 2Q 2013 | 2Q 22 | EBITDA | YTD 2013 | YTD 2012 | |||||||||||||||||||
| (apr - jun) | (apr - jun) | Chg. % | Amounts in R$ MM | (jan - jun) | (jan - jun) | Chg.% | |||||||||||||||||
| 33.5 | 54.5 | -38.5 | % | EBITDA | 234.8 | 214.2 | 9.7 | % | |||||||||||||||
| (48.4 | ) | 11.6 | n/a | EBITDA | (45.6 | ) | (191.4 | ) | -76.2 | % | |||||||||||||
| - | - | - | EBITDA Margin (%) | - | - | - | |||||||||||||||||
Cosan’s general and administrative expenses are mainly comprised of personnel expenses, which include salaries, taxes, consultancy and advisory services and legal fees. In 2Q 2013 these expenses were R$31.0 million, in line year-over-year.
Other operating revenues from Other Businesses totaled an expense of R$ 18.1 million in 2Q 2013, compared to revenue of R$ 36.2 million in 2Q 2012. The amount reported in this quarter basically reflects provisions for contingencies, while the revenue reported in the same period of last year was mainly impacted by the result in the sale of aviation fuel distribution infrastructure assets, as determined by Brazil’s Antitrust body (CADE).
In 2Q 2013, the segment’s EBITDA totaled R$ 33.5 million, principally due to equity pick-up. Other Businesses segment results by adjusting EBITDA for this effect would have been negative R$48.4 million.
32 of 49
| Earnings Release 2nd Quarter of Fiscal Year 2013 - April, May and June 201 |
C. Other Items in the Consolidated Result
Financial Result
| 2Q 2013 | 2Q 2012 | Financial Results | YTD 2013 | YTD 2012 | |||||||||||
| (apr - jun) | (apr - jun) | Amounts in R$ MM | (jan - jun) | (jan - jun) | |||||||||||
| (160.6 | ) | (38.1 | ) | Gross Debt Charges | (160.6 | ) | (38.1 | ) | |||||||
| 38.9 | 19.0 | Income from Financial Investments | 38.9 | 19.0 | |||||||||||
| (121.7 | ) | (19.2 | ) | (=) Subtotal: Net Debt Interests | (121.7 | ) | (19.2 | ) | |||||||
| (19.6 | ) | (29.3 | ) | Other Charges and Monetary Variation | (19.6 | ) | (29.3 | ) | |||||||
| (309.8 | ) | (84.2 | ) | Exchange Rate Variation | (309.8 | ) | (84.2 | ) | |||||||
| 149.9 | 17.7 | Gains (losses) with Derivatives | 149.9 | 17.7 | |||||||||||
| (14.1 | ) | (22.3 | ) | Amortization, Debt Cost and Other | (14.1 | ) | (22.3 | ) | |||||||
| (315.3 | ) | (137.2 | ) | (=) Financial, Net | (315.3 | ) | (137.2 | ) | |||||||
Net financial result for 2Q 2013 was a net financial expense of R$315.3 million, versus a net financial expense of R$137.2 million in 2Q 2012, mainly as a result of: (i) increased debt charges, due to new debt related to Comgás acquisition and effects of Comgás debt consolidation of as of November 2012; and (ii) negative foreign exchange variation of R$309.8 million, partially offset by net derivative gains on exchange rate and interests in the amount of R$149.9 million.
Financial investments closed the quarter with positive income of R$38.9 million, compared to R$19.0 million in 2Q 2012, mainly due to consolidation of Radar and Comgás, as of July and November 2012, respectively.
The negative result from exchange variation reflects the depreciation of the Real against the dollar (R$2.2156/US$ on June 30, 2013 versus R$2.0017/US$ on March 31, 2013), and its impact on foreign-denominated debt, leading to a non-cash impact on the consolidated financial result. All foreign-denominated debt is hedged by means of exchange swaps, except for the principal amount of the US$ 500 million Perpetual Bond and debt amounting to R$182.1 million related to an acquisition held abroad. In 2Q 2012, there was also a depreciation of the Real against the dollar (R$2.0213/US$ on June 30, 2012, versus R$1.8222/US$ on March 31, 2012), which generated an exchange variation expense of R$84.2 million in that period.
In 2Q13, we had a R$206.3 million positive result from exchange swaps amounting and a R$56.5 million negative result with interest rate swaps, summing up to a positive net swap result of R$149.9 million, thanks to the risk policy adopted by the Company, in which the cash flow from foreign-denominated debt is hedged against foreign exchange effects, except for the debt in pound sterling related to the acquisition of a business in the United Kingdom and the principal amount of the Company’s perpetual bond.
33 of 49
| Earnings Release 2nd Quarter of Fiscal Year 2013 - April, May and June 201 |
Income Tax and Social Contribution
| 2Q 2013 | 2Q 2012 | Income Tax and Social Contribution | YTD 2013 | YTD 2012 | |||||||||||
| (apr - jun) | (apr - jun) | Amounts in R$ MM | (jan - jun) | (jan - jun) | |||||||||||
| (60.8 | ) | (99.5 | ) | Income (loss) before income tax | 197.7 | 24.5 | |||||||||
| (78.8 | ) | 89.4 | Total of Deferred and Current Income Tax and Social Contribution | (219.4 | ) | 116.2 | |||||||||
| (53.2 | ) | 94.0 | Deferred Income Tax Expenses | (166.1 | ) | 123.8 | |||||||||
| (25.6 | ) | (4.6 | ) | Current Income Tax Expenses | (53.3 | ) | (7.5 | ) | |||||||
| 42.1 | % | 4.6 | % | Effective Rate - Current (%) | -27.0 | % | -30.8 | % | |||||||
In 2Q 2013, total expenses with Income Tax and Social Contribution (IT/SC) were R$78.8 million, mainly due to the negative effects related to unrecorded fiscal credits on tax loss of the period (unrecorded tax shield) in the amount of R$74.2 million, as well as adjustments of permanent tax differences from equity pick-up, principally Raízen’s.
The expense with current income tax and social contribution represents the amount disbursed and to be disbursed, net of refunds, recovery and offsetting of taxes of the same type. The breakdown below provides a better understanding of the IT/SC per business unit.
| 2Q 2013 | |||||||||||||||||||||||||
Income Tax and Social Contribution | Comgás | Rumo | Lubricants and | Radar7 | Other | Consolidado | |||||||||||||||||||
Amount in R$ MM | Specialties | Business | |||||||||||||||||||||||
| Net Income before Taxes | 167.5 | 72.6 | (2.9 | ) | 18.5 | (202.2 | ) | (60.8 | ) | ||||||||||||||||
| Nominal Rate of Income Tax and Social Contribution (%) | 34.0 | % | 34.0 | % | 34.0 | % | 34.0 | % | 34.0 | % | 34.0 | % | |||||||||||||
| Income Tax and Social Contribtions Theoretical Expense | (56.9 | ) | (24.7 | ) | 1.0 | (6.3 | ) | 68.7 | 20.7 | ||||||||||||||||
| (-) Non-taxable Permanent Differences / Equity Pick-up | (0.1 | ) | (1.0 | ) | (0.1 | ) | 5.2 | 25.1 | (9.8 | ) | |||||||||||||||
| (-) Tax Loss | - | - | - | - | (74.2 | ) | (74.2 | ) | |||||||||||||||||
| (-) Non-taxable Income (Loss) from Overseas Companies and Other | - | - | (0.03 | ) | - | (15.4 | ) | (15.5 | ) | ||||||||||||||||
| Income Tax Effective Expenses | (57.0 | ) | (25.7 | ) | 0.9 | (1.1 | ) | 4.2 | (78.8 | ) | |||||||||||||||
| Income Tax and Social Contribution Effective Rate (%) | 34.0 | % | 35.4 | % | 30.0 | % | 6.1 | % | 2.1 | % | -129.7 | % | |||||||||||||
| Expenses (Revenues) com IR/CS | (57.0 | ) | (25.7 | ) | 0.9 | (1.1 | ) | 4.2 | (79.3 | ) | |||||||||||||||
| Current | (66.4 | ) | 42.6 | (0.2 | ) | (1.6 | ) | (0.0 | ) | (25.6 | ) | ||||||||||||||
| Effective Rate - Current Rate (%) | 39.6 | % | n/a | -7.7 | % | 8.7 | % | - | -42.1 | % | |||||||||||||||
| Deferred | 9.4 | (68.3 | ) | 1.1 | 0.5 | 4.2 | (53.2 | ) | |||||||||||||||||
| Note 7: Radar adopts tax regime for entities taxed on presumed profits | |||||||||||||||||||||||||
34 of 49
| Earnings Release 2nd Quarter of Fiscal Year 2013 - April, May and June 201 |
Net Income
| 2Q 2013 | 2Q 2012 | Net Income | YTD 2013 | YTD 2012 | |||||||||||
| (apr - jun) | (apr - jun) | Amounts in R$ MM | (jan - jun) | (jan - jun) | |||||||||||
| (198.0 | ) | (17.1 | ) | Net Income | (168.2 | ) | 132.5 | ||||||||
Cosan recorded net loss of R$198.0 million in the quarter, higher than the R$17.1 million loss recorded in 2Q 2012, mainly due to (i) R$66.0 million negative exchange variation on the US$ 500 million Perpetual Bond; (ii) R$74.2 million negative impact due to Cosan’s unrecorded deferred fiscal credits (unrecorded tax shield); and (iii) R$ 93.0 million negative impact from exchange variation on Raízen’s debt.
35 of 49
| Earnings Release 2nd Quarter of Fiscal Year 2013 - April, May and June 201 |
D. Indebtedness
At the close of 2Q 2013, Cosan’s consolidated pro forma debt (excluding PESA) was R$11.6 billion, compared to R$11.2 billion in 1Q 2013 (previously 4Q13). The breakdown of the debt of Cosan and its Subsidiaries is presented below, as well as the debt of Raízen presented on a pro forma basis and in a 50% proportion, given that as from this quarter, its balance sheet, income statement and cash flow will not be proportionally consolidated by Cosan.
Cosan and Subsidiaries
Gross debt was R$8.4 billion in 2Q 2013, up 3.2% from 1Q 2013.
The key events in the period were:
| (i) | amortization of principal and interests of R$257.0 million, including BNDES, Finame and credit assignment; |
| (ii) | Approximately R$150 million raised from BNDES to subsidiaries Comgás and Rumo; and |
| (iii) | provision for interest, monetary and exchange variation in the period, in the amount of R$160 million. |
Raízen
The combined gross debt of Raízen (50%) totaled R$3.2 billion at the close of 2Q 2013, up 8.0% sequentially.
In the quarter, the following changes in principal and interest on the debt were made:
| (i) | Amortization of principal and interests of R$243 million related toAdvances on Foreign Exchange Contracts, Prepayments, Credit Notes and Working Capital; |
| (ii) | R$257 million raised under Finem, Advances on Foreign Exchange Contracts, Prepayments, Credit Notes and Working Capital facilities; |
| (iii) | Provision for Interest, Monetary and Exchange Variation in the period, in the amount of R$224 million. |
| Earnings Release 2nd Quarter of Fiscal Year 2013 - April, May and June 201 |
Cosan – Pro forma Consolidated
The cash balance totaled R$2.5 billion at the end of 2Q 2013, as compared to R$2.6 billion in 1Q 2013. Pro forma net debt in the quarter was R$9.1 billion, compared to R$8.6 billion in the previous quarter, equivalent to leverage of 2.3x pro forma EBITDA of R$3.9 billion of the last 12 months, which include Comgás and Radar.
| Debt per Business Units (Amount in R$ MM) | 2Q 2013 | 1Q 2013 | ||||||||||||||
| Comgás | (apr - jun) | (jan - mar) | % ST | Chg.% | ||||||||||||
| Credit Assignment | - | 60.9 | 0 | % | -100.0 | % | ||||||||||
| Leasing | 1.7 | 2.0 | 75 | % | -15.6 | % | ||||||||||
| Promissory Notes | 409.5 | 402.1 | 100 | % | 1.8 | % | ||||||||||
| EIB | 597.0 | 528.9 | 0 | % | 12.9 | % | ||||||||||
| 4131 Resolution | 561.5 | 549.1 | 51 | % | 2.3 | % | ||||||||||
| BNDES | 1,136.1 | 1,097.3 | 22 | % | 3.5 | % | ||||||||||
| Debentures | 71.8 | 70.3 | 54 | % | 2.2 | % | ||||||||||
| Debt Notes Allocation | (2.1 | ) | - | 100 | % | n/a | ||||||||||
| Financial Instruments - MTM | (238.2 | ) | (134.9 | ) | 15 | % | 76.6 | % | ||||||||
| Total Comgás | 2,537.3 | 2,575.7 | - | -1.5 | % | |||||||||||
| Rumo | - | - | - | - | ||||||||||||
| Finame | 749.5 | 714.7 | 13 | % | 4.9 | % | ||||||||||
| Expenses with Placement of Debt | (1.6 | ) | (1.7 | ) | 14 | % | -2.2 | % | ||||||||
| Total Rumo | 747.8 | 713.0 | - | 4.9 | % | |||||||||||
| Lubrificantes e Especialidades | - | - | - | - | ||||||||||||
| Finame | 0.2 | 0.2 | 0 | % | 0.0 | % | ||||||||||
| Foreing Loan | 182.1 | 167.0 | 0 | % | 9.0 | % | ||||||||||
Total Lubrificantes e Especialidades | 182.3 | 167.3 | - | 9.0 | % | |||||||||||
| Other Business | - | - | - | - | ||||||||||||
| Perpetual Bonds | 1,121.8 | 1,019.6 | 1 | % | 10.0 | % | ||||||||||
| Credit Notes | 376.8 | 369.5 | 100 | % | 2.0 | % | ||||||||||
| Debentures | 1,448.3 | 1,417.1 | 3 | % | 2.2 | % | ||||||||||
| FINEP | 89.9 | 89.9 | 0 | % | 0.0 | % | ||||||||||
| Senior Notes 2018 | 872.9 | 852.7 | 3 | % | n/d | |||||||||||
| Senior Notes 2023 | 1,124.3 | 1,009.3 | 1 | % | n/d | |||||||||||
| Expenses with Placement of Debt | (52.4 | ) | (53.2 | ) | 17 | % | -1.4 | % | ||||||||
| Bonus over Perpetual Bonds | 6.1 | 6.1 | 41 | % | -0.3 | % | ||||||||||
| Financial Instruments - MTM | (31.6 | ) | (0.9 | ) | 0 | % | n/a | |||||||||
| Total Other Business | 4,956.0 | 4,710.2 | - | 5.2 | % | |||||||||||
| Cosan Consolidated | - | - | - | - | ||||||||||||
| Total Debt | 8,423.4 | 8,166.1 | - | 3.2 | % | |||||||||||
| Cash and Cash Equivalents and Secutities | (1,604.8 | ) | (1,644.6 | ) | - | -2.4 | % | |||||||||
| Net Debt | 6,818.6 | 6,521.5 | - | 4.6 | % | |||||||||||
| - | - | - | - | |||||||||||||
| Raízen | - | - | - | - | ||||||||||||
| Senior Notes 2014 | 803.1 | 713.2 | 3 | % | 12.6 | % | ||||||||||
| BNDES | 1,444.5 | 1,492.4 | 14 | % | -3.2 | % | ||||||||||
| Term Loan | 1,069.2 | 1,038.4 | 6 | % | 3.0 | % | ||||||||||
| Prepaid Exports | 947.9 | 918.3 | 35 | % | 3.2 | % | ||||||||||
| Senior Notes 2017 | 911.9 | 814.8 | 3 | % | 11.9 | % | ||||||||||
| Advances on Exchange Contracts | 177.9 | 51.1 | 100 | % | 248.4 | % | ||||||||||
| Credit Notes | 355.7 | 318.9 | 0 | % | 11.5 | % | ||||||||||
| Finame | 131.7 | 136.2 | 45 | % | -3.3 | % | ||||||||||
| Finem | 470.9 | 375.0 | 10 | % | 25.6 | % | ||||||||||
| Rural Credit | 67.3 | 41.7 | 100 | % | 61.6 | % | ||||||||||
| Debt Notes Allocation | (21.5 | ) | (22.4 | ) | 40 | % | -4.0 | % | ||||||||
| Other | 43.6 | 47.8 | 100 | % | -8.7 | % | ||||||||||
Total Raízen8 | 6,402.2 | 5,925.3 | - | 8.0 | % | |||||||||||
| Raízen's Debt ( 50% ) | 3,201.1 | 2,962.6 | - | 8.0 | % | |||||||||||
| Cash and Cash Equivalents and Secutities Raízen | (899.6 | ) | (949.1 | ) | - | -5.2 | % | |||||||||
| Net Debt Raízen | 2,301.5 | 2,013.5 | - | 14.3 | % | |||||||||||
| Consolidated Proforma | - | - | - | - | ||||||||||||
| Total Debt (including Raízen) | 11,624.5 | 11,128.7 | - | 4.5 | % | |||||||||||
| Cash and Cash Equivalents and Secutities (including Raízen) | (2,504.5 | ) | (2,593.7 | ) | - | -3.4 | % | |||||||||
| Pro forma Net Debt | 9,120.1 | 8,535.0 | - | 6.9 | % | |||||||||||
Note 8: Excluding PESA debt
37 of 49
| Earnings Release 2nd Quarter of Fiscal Year 2013 - April, May and June 201 |
E. Share Performance
The common shares issued by Cosan S.A. have been listed on BM&FBovespa since 2005, the year of its IPO on the “Novo Mercado” segment under the ticker symbol CSAN3, and are included in the portfolios of the Ibovespa, IBrX, IBrX-50, IBrA, MLCX, ICO2, INDX, ICON, IVBX-2, IGC, IGCT and ITAG indexes.
The shares issued by Cosan Limited, Cosan S.A.'s parent company, have been listed on the NYSE since its IPO in 2007, under the ticker symbol CZZ. The Company has also issued share deposit certificates (Brazilian Depositary Receipts - BDR) on the BM&FBovespa under the symbol CZLT11.
The tables and graphs below represent the performance of shares issued by the companies:
| Summary 2Q 2013 | CSAN3 | CZLT11 | CZZ | ||
| Stock Type | Common Share | BDR | Class A | ||
| Listed in | BM&FBovespa | BM&FBovespa | NYSE | ||
| Closing Price in 06/28/2013 | R$ | 43.26 | R$ | 16.16 | USD 36.60 |
| Higher Price | R$ | 49.02 | R$ | 20.95 | USD 43.00 |
Average Price | R$ | 45.35 | R$ | 19.04 | USD 39.42 |
| Lower Price | R$ | 41.34 | R$ | 15.34 | USD 34.69 |
| Average Daily Traded Volume | R$ 49.6 million | R$ 20.0 million | R$ 8.7 million | ||
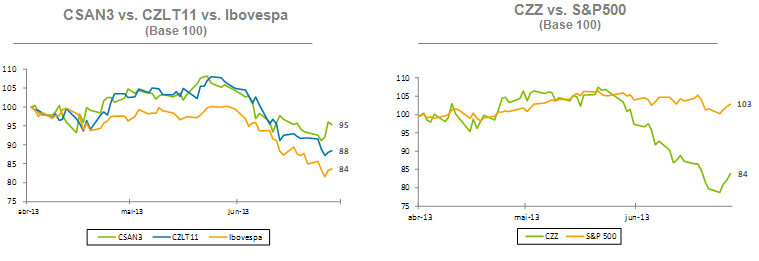 |
38 of 49
| Earnings Release 2nd Quarter of Fiscal Year 2013 - April, May and June 201 |
F. Guidance
This section contains the guidance broken down by variation range for some key parameters in Cosan’s consolidated results for the calendar year of 2013, that is, from January 1, 2013 to December 31, 2013. In addition, other parts of this Earnings Release may contain forecasts. Such projections and guidance are but estimates and indications, and as such these do not represent any guarantee of prospective results.
This guidance considers the current operations of the Cosan group, which includes Comgás, Rumo, Lubricants and Specialties, Radar and Other Businesses, as well as Raízen Combustíveis and Raízen Energia.
Cosan’s consolidated EBITDA is presented pro forma, including 50% of the results of Raízen Combustíveis and Raízen Energia. As previously stated, as of the adoption of the IFRS 11 – Joint Arrangements, Raízen’s results will no longer be proportionally consolidated on Cosan’s, and will be recorded only in the “Equity Pick-up” line, considering our share (50%) in Net Income. In addition, Comgás’ EBITDA will continue to be presented according to Brazilian accounting practices (IFRS), which do not consider the effects of the regulatory Current Account.
| FY12 | FY13 | 2013 | |||||||||
| (apr/2011 - mar/2012) | (apr/2012 - mar/2013) | (jan/2013 - dec/2013) | |||||||||
| Cosan | Net Revenue (R$MM) | 23.391 | 30.017 | 35.000 | ≤ ∆ ≤ 38.000 | ||||||
| Consolidated | EBITDA (R$MM) | 2.117 | 3.143 | 3.950 | ≤ ∆ ≤ 4.350 | ||||||
Capex (R$MM)9 | 2.134- | 2.178- | 2.950 | ≤ ∆ ≤ 3.200 | |||||||
| Raízen | Volume of Fuels Sold (million liters) | 20.914 | 21.967 | 22.500 | ≤ ∆ ≤ 24.000 | ||||||
| Combustíveis | EBITDA (R$MM) | 1.305 | 1.658 | 1.600 | ≤ ∆ ≤ 1.800 | ||||||
| Volume of Sugar Cane Crushed (thousand tonnes) | 52.958 | 56.221 | 59.000 | ≤ ∆ ≤ 62.000 | |||||||
| Volume of Sugar Sold (thousand tonnes) | 3.969 | 4.230 | 4.300 | ≤ ∆ ≤ 4.600 | |||||||
| Raízen Energia | Volume of Ethanol Sold (million liters) | 1.921 | 2.323 | 2.100 | ≤ ∆ ≤ 2.300 | ||||||
| Volume of Energy Sold (thousand of MWh) | 1.233 | 3.035 | 1.900 | ≤ ∆ ≤ 2.100 | |||||||
| EBITDA (R$MM) | 2.235 | 2.408 | 2.400 | ≤ ∆ ≤ 2.700 | |||||||
| Rumo | Volume of Loading (thousand tonnes) | 7.759 | 8.566 | 8.500 | ≤ ∆ ≤ 10.500 | ||||||
| EBITDA (R$MM) | 211 | 297 | 330 | ≤ ∆ ≤ 370 | |||||||
| Radar | EBITDA (R$MM) | - | 180 | 140 | ≤ ∆ ≤ 160 | ||||||
| Cosan L&E | Total Volume Sold (million Liters) | 217 | 287 | 270 | ≤ ∆ ≤ 310 | ||||||
EBITDA (R$MM)9 | - | - | 140 | ≤ ∆ ≤ 170 | |||||||
| Number of Clients (thousand) | 1.099 | 1.215 | 1.290 | ≤ ∆ ≤ 1.318 | |||||||
| Comgás | Network Expansion (km) | 1.100 | 1.282 | 1.200 | ≤ ∆ ≤ 1.350 | ||||||
| Total Volume of Gas Sold (thousand cbm) | 4.835 | 5.259 | 5.200 | ≤ ∆ ≤ 5.700 | |||||||
EBITDA IFRS (R$MM) 9 | 716 | 962 | 1.350 | ≤ ∆ ≤ 1.550 | |||||||
Note 9: Amounts revised on June 30, 2013.
39 of 49
| Earnings Release 2nd Quarter of Fiscal Year 2013 - April, May and June 201 |
Disclaimer
This document contains forward-looking statements and estimates. These forward-looking statements and estimates are solely forecasts and do not represent any guarantee of prospective results. All stakeholders should know that these statements and estimates are and will be, depending on the case, subject to risks, uncertainties and factors related to the operations and business environment of Cosan and its subsidiaries, and therefore the actual results of these companies may significantly differ from the estimated or implied prospective results contained in such forward-looking statements and estimates.
| Earnings Release 2nd Quarter of Fiscal Year 2013 - April, May and June 201 |
E. Financial Statements
E.1 Cosan S/A Consolidated
| Cosan Consolidated | 2Q 2013 | 2Q 2012 | ||||||
| Income Statement for the period | Jun 30, 2013 | Jun 30, 2012 | ||||||
| Net Operating Revenue | 2,225,938 | 422,246 | ||||||
| Gross Profit | 626,076 | 115,992 | ||||||
| Sales, general and administrative expenses | (324,947 | ) | (104,981 | ) | ||||
| Other operating income (expenses), net | (14,300 | ) | 41,125 | |||||
| Financial revenue | 57,716 | 24,995 | ||||||
| Financial expenses | (213,153 | ) | (95,697 | ) | ||||
| Foreign exchange variation | (309,760 | ) | (84,221 | ) | ||||
| Derivative | 149,934 | 17,717 | ||||||
| Equity pick up | (32,360 | ) | (14,413 | ) | ||||
| Income and Social Contribution Taxes | (78,836 | ) | 89,374 | |||||
| Net Income (loss) | (139,630 | ) | (10,109 | ) | ||||
| Cosan Consolidated | 2Q 2013 | 1Q 2013 | ||||||
| Balance Sheet | Jun 30, 2013 | Mar 31, 2013 | ||||||
| Accounts receivable | 1,018,243 | 857,136 | ||||||
| Inventories | 274,147 | 275,697 | ||||||
| Other current assets | 777,269 | 764,254 | ||||||
| Investments | 92,295 | 50,556 | ||||||
| investments in jointly owned subsidiaries | 8,551,222 | 8,582,741 | ||||||
| Investment Property | 2,477,955 | 2,473,438 | ||||||
| Property, Plant and Equipment | 1,206,120 | 1,178,297 | ||||||
| Intangible | 9,756,656 | 9,614,898 | ||||||
| Other non-current assets | 2,409,205 | 2,115,858 | ||||||
| Total Assets | 26,563,112 | 25,912,875 | ||||||
| Loans and Financing | (7,088,424 | ) | (6,657,306 | ) | ||||
| Suppliers | (970,343 | ) | (799,479 | ) | ||||
| Salaries Payable | (109,172 | ) | (94,262 | ) | ||||
| Other current liabilities | (804,889 | ) | (595,110 | ) | ||||
| Other non-current liabilities | (4,547,563 | ) | (4,428,244 | ) | ||||
| Net Equity | (13,042,721 | ) | (13,338,474 | ) | ||||
| Total Liabilities | (26,563,112 | ) | (25,912,875 | ) | ||||
41 of 49
| Earnings Release 2nd Quarter of Fiscal Year 2013 - April, May and June 201 |
| Statement of Cash Flow | 2Q 2013 | 2Q 2012 | ||||||
| Consolidated | Jun 30, 2013 | Jun 30, 2012 | ||||||
| Cash flow from operating activities | ||||||||
| Net loss before social contribution and income taxes | (60,794 | ) | (99,483 | ) | ||||
| Non-cash Adjustments: | ||||||||
| Depreciation and Amortization | 127,108 | 29,098 | ||||||
| Equity pick up | (3,800 | ) | (10,462 | ) | ||||
| Equity pick up in jointly owned subsidiaries | 36,160 | 24,875 | ||||||
| Losses (gains) in non current assets disposals | 5,146 | (62,938 | ) | |||||
| Stock option | 2,152 | 3,323 | ||||||
| Fair value of investment properties | (7,665 | ) | - | |||||
| Judicial demands' provision | 25,085 | 25,937 | ||||||
| Interest, monetary and exchange variations, net | 357,484 | 244,830 | ||||||
| Other | 5,443 | 649 | ||||||
| Variation on assets and liabilities: | 486,319 | 155,829 | ||||||
| Accounts receivable | (159,774 | ) | (53,365 | ) | ||||
| Restricted Cash | 18,220 | 15,647 | ||||||
| Inventories | 4,509 | (35,234 | ) | |||||
| Taxes receivable | (40,786 | ) | (23,177 | ) | ||||
| Related Parties | (13,915 | ) | (50,130 | ) | ||||
| Advances to Suppliers | 4,422 | (1,955 | ) | |||||
| Suppliers | 192,097 | 14,943 | ||||||
| Salaries payable | 10,839 | 12,357 | ||||||
| Provision for judicial demands from legal proceedings | (94,342 | ) | 12,186 | |||||
| Taxes payable | (41,755 | ) | (19,380 | ) | ||||
| Cash provided from discontinued operations | - | 53,501 | ||||||
| Other assets and liabilities, net | (9,735 | ) | (134,830 | ) | ||||
Net cash provided (used) in operating activities | 356,099 | (53,608 | ) | |||||
| Cash flow from investments | ||||||||
| Acquisition, net of acquired cash and advances for future capital increases | (59,588 | ) | (196,910 | ) | ||||
| Redemption of shares in subsidiaries | - | - | ||||||
| Additions on property, plant and equipment; software; and other intangible assets | (298,166 | ) | (58,310 | ) | ||||
| Cash received on sale of property, plant and equipment; intagible assets and investments | 65,350 | 134,552 | ||||||
| Net cash provided (used) in investments | (292,404 | ) | (120,668 | ) | ||||
| Cash flow from financing activities | ||||||||
| Loans and financing funding | 148,942 | 264,304 | ||||||
| Loans and financing amortization | (265,462 | ) | (74,150 | ) | ||||
| Derivative financial instruments | 24,408 | (20,832 | ) | |||||
| Related parties | - | - | ||||||
| Treasury shares purchases | (25,700 | ) | - | |||||
| Exercise of stock option plan | 5,998 | - | ||||||
Net cash provided (used) in financing activities | (111,814 | ) | 169,322 | |||||
| Cash and cash equivalents net decrease | (48,119 | ) | (4,954 | ) | ||||
| Cash and cash equivalents at the beginning of the period | 1,538,753 | 998,240 | ||||||
| Cash and cash equivalents at the end of the period | 1,490,634 | 993,286 | ||||||
42 of 49
| Earnings Release 2nd Quarter of Fiscal Year 2013 - April, May and June 201 |
E.2 Raízen Combustiveis
| Raízen Combustíveis | 2Q 2013 | 2Q 2012 | ||||||
| Income Statement for the period | Jun 30, 2013 | Jun 30, 2012 | ||||||
| Net Operating Revenue | 11,778,509 | 10,285,828 | ||||||
| Gross Profit | 555,000 | 546,917 | ||||||
| Sales, general and administrative expenses | (335,266 | ) | (331,634 | ) | ||||
| Other operating income (expenses), net | 79,927 | 40,694 | ||||||
| Financial revenue | (19,964 | ) | (26,474 | ) | ||||
| Financial expenses | 28,523 | 40,620 | ||||||
| Foreign exchange variation | (110,444 | ) | (97,237 | ) | ||||
| Derivative | 59,709 | 4,611 | ||||||
| Equity pick up | - | - | ||||||
| Income and Social Contribution Taxes | (87,568 | ) | (59,792 | ) | ||||
| Non-controlling interests | (5,131 | ) | (4,616 | ) | ||||
| Raízen Combustíveis | 2Q 2013 | 1Q 2013 | ||||||
| Balance Sheet | Jun 30, 2013 | Mar 31, 2013 | ||||||
| Accounts receivable | 1,245,179 | 1,290,683 | ||||||
| Inventories | 852,711 | 906,870 | ||||||
| Other current assets | 1,410,561 | 1,266,617 | ||||||
| Investments | - | - | ||||||
| Property, Plant and Equipment | 2,567,133 | 2,617,134 | ||||||
| Intangible | 4,015,732 | 4,043,571 | ||||||
| Other non-current assets | 1,247,219 | 1,269,344 | ||||||
| Total Assets | 11,338,535 | 11,394,219 | ||||||
| Loans and Financing | (596,348 | ) | (562,901 | ) | ||||
| Suppliers | (576,231 | ) | (684,546 | ) | ||||
| Other current liabilities | (735,182 | ) | (844,407 | ) | ||||
| Other non-current liabilities | (2,617,923 | ) | (2,648,162 | ) | ||||
| Net Equity | (6,812,851 | ) | (6,654,203 | ) | ||||
| Total Liabilities | (11,338,535 | ) | (11,394,219 | ) | ||||
43 of 49
| Earnings Release 2nd Quarter of Fiscal Year 2013 - April, May and June 201 |
E.3 Raízen Energia
| Raízen Energia | 2Q 2013 | 2Q 2012 | ||||||
| Income Statement for the period | Jun 30, 2013 | Jun 30, 2012 | ||||||
| Net Operating Revenue | 1,478,260 | 1,264,122 | ||||||
| Gross Profit | 225,812 | 169,941 | ||||||
| Sales, general and administrative expenses | (244,618 | ) | (198,576 | ) | ||||
| Other operating income (expenses), net | 9,153 | 3,323 | ||||||
| Financial revenue | (108,852 | ) | (127,356 | ) | ||||
| Financial expenses | 66,520 | 166,538 | ||||||
| Foreign exchange variation | (218,418 | ) | (254,551 | ) | ||||
| Derivative | (85,583 | ) | (59,961 | ) | ||||
| Equity pick up | (682 | ) | (5,670 | ) | ||||
| Income and Social Contribution Taxes | 119,555 | 143,829 | ||||||
| Non-controlling interests | - | (357 | ) | |||||
| Raízen Energia | 2Q 2013 | 1Q 2013 | ||||||
| Balance Sheet | Jun 30, 2013 | Mar 31, 2013 | ||||||
| Accounts receivable | 349,025 | 378,161 | ||||||
| Inventories | 886,917 | 365,555 | ||||||
| Other current assets | 1,124,832 | 1,077,335 | ||||||
| Investments | 215,105 | 234,951 | ||||||
| Biological assets | 2,020,333 | 1,978,477 | ||||||
| Property, Plant and Equipment | 9,769,483 | 9,896,478 | ||||||
| Intangible | 3,063,170 | 3,050,310 | ||||||
| Other non-current assets | 1,566,141 | 1,360,709 | ||||||
| Total Assets | 18,995,006 | 18,341,976 | ||||||
| Loans and Financing | (4,497,839 | ) | (4,011,579 | ) | ||||
| Suppliers | (513,768 | ) | (491,797 | ) | ||||
| Other current liabilities | (1,921,873 | ) | (1,513,785 | ) | ||||
| Other non-current liabilities | (1,670,334 | ) | (1,699,138 | ) | ||||
| Net Equity | (10,391,192 | ) | (10,625,677 | ) | ||||
| Total Liabilities | (18,995,006 | ) | (18,341,976 | ) | ||||
44 of 49
| Earnings Release 2nd Quarter of Fiscal Year 2013 - April, May and June 201 |
E.3 Comgás
| Comgás | 2Q 2013 | 2Q 2012 | ||||||
| Income Statement for the period | Jun 30, 2013 | Jun 30, 2012 | ||||||
| Net Operating Revenue | 1,605,651 | 1,278,523 | ||||||
| Gross Profit | 426,227 | 271,332 | ||||||
| Sales, general and administrative expenses | (196,829 | ) | (171,082 | ) | ||||
| Other operating income (expenses), net | (5,133 | ) | (1,198 | ) | ||||
| Financial revenue | 10,090 | 6,317 | ||||||
| Financial expenses | (54,917 | ) | (38,376 | ) | ||||
| Foreign exchange variation | (106,488 | ) | 578 | |||||
| Derivative | 94,503 | (16,150 | ) | |||||
| Equity pick up | - | - | ||||||
| Income and Social Contribution Taxes | (57,016 | ) | (12,239 | ) | ||||
| Net Income (loss) | 110,437 | 39,182 | ||||||
| Comgás | 2Q 2013 | 1Q 2013 | ||||||
| Balance Sheet | Jun 30, 2013 | Mar 31, 2013 | ||||||
| Accounts receivable | 658,801 | 569,168 | ||||||
| Inventories | 114,270 | 108,837 | ||||||
| Other current assets | 295,527 | 340,041 | ||||||
| Investments | - | - | ||||||
| investments in jointly owned subsidiaries | - | - | ||||||
| Investment Property | - | - | ||||||
| Property, Plant and Equipment | - | - | ||||||
| Intangible | 8,200,248 | 8,071,839 | ||||||
| Other non-current assets | 278,418 | 184,269 | ||||||
| Total Assets | 9,547,264 | 9,274,154 | ||||||
| Loans and Financing | (2,416,221 | ) | (2,383,095 | ) | ||||
| Suppliers | (813,000 | ) | (678,172 | ) | ||||
| Salaries Payable | (39,167 | ) | (34,002 | ) | ||||
| Other current liabilities | (100,859 | ) | (105,463 | ) | ||||
| Other non-current liabilities | (839,918 | ) | (845,093 | ) | ||||
| Net Equity | (5,338,099 | ) | (5,228,329 | ) | ||||
| Total Liabilities | (9,547,264 | ) | (9,274,154 | ) | ||||
45 of 49
| Earnings Release 2nd Quarter of Fiscal Year 2013 - April, May and June 201 |
E.4 Rumo
| Rumo | 2Q 2013 | 2Q 2012 | ||||||
| Income Statement for the period | Jun 30, 2013 | Jun 30, 2012 | ||||||
| Net Operating Revenue | 214,337 | 104,894 | ||||||
| Gross Profit | 83,289 | 34,616 | ||||||
| Sales, general and administrative expenses | (17,728 | ) | (12,118 | ) | ||||
| Other operating income (expenses), net | 185 | 4,872 | ||||||
| Financial revenue | 14,113 | 9,738 | ||||||
| Financial expenses | (7,404 | ) | (9,159 | ) | ||||
| Foreign exchange variation | 140 | 132 | ||||||
| Derivative | - | - | ||||||
| Equity pick up | - | - | ||||||
| Income and Social Contribution Taxes | (25,721 | ) | (9,647 | ) | ||||
| Net Income (loss) | 46,874 | 18,434 | ||||||
| Rumo | 2Q 2013 | 1Q 2013 | ||||||
| Balance Sheet | Jun 30, 2013 | Mar 31, 2013 | ||||||
| Accounts receivable | 125,804 | 80,865 | ||||||
| Inventories | 5,110 | 6,153 | ||||||
| Other current assets | 115,508 | 41,581 | ||||||
| Investments | - | - | ||||||
| investments in jointly owned subsidiaries | - | - | ||||||
| Investment Property | - | - | ||||||
| Property, Plant and Equipment | 975,535 | 952,915 | ||||||
| Intangible | 705,148 | 677,860 | ||||||
| Other non-current assets | 27,559 | 28,518 | ||||||
| Total Assets | 1,954,665 | 1,787,892 | ||||||
| Loans and Financing | (173,810 | ) | (192,901 | ) | ||||
| Suppliers | (98,081 | ) | (46,391 | ) | ||||
| Salaries Payable | (15,493 | ) | (14,330 | ) | ||||
| Other current liabilities | (154,526 | ) | (134,685 | ) | ||||
| Other non-current liabilities | (191,930 | ) | (125,632 | ) | ||||
| Net Equity | (1,320,824 | ) | (1,273,953 | ) | ||||
| Total Liabilities | (1,954,665 | ) | (1,787,892 | ) | ||||
46 of 49
| Earnings Release 2nd Quarter of Fiscal Year 2013 - April, May and June 201 |
E.5 Lubricants and Specialties
| Lubricants and Specialties | 2Q 2013 | 2Q 2012 | ||||||
| Income Statement for the period | Jun 30, 2013 | Jun 30, 2012 | ||||||
| Net Operating Revenue | 386,057 | 312,235 | ||||||
| Gross Profit | 102,725 | 76,702 | ||||||
| Sales, general and administrative expenses | (74,408 | ) | (62,211 | ) | ||||
| Other operating income (expenses), net | (246 | ) | 14 | |||||
| Financial revenue | 19,271 | 12,665 | ||||||
| Financial expenses | (12,469 | ) | (11,565 | ) | ||||
| Foreign exchange variation | (12,009 | ) | (4,342 | ) | ||||
| Derivative | 520 | - | ||||||
| Equity pick up | - | (43 | ) | |||||
| Income and Social Contribution Taxes | (8,659 | ) | (15,717 | ) | ||||
| Net Income (loss) | 14,725 | (4,497 | ) | |||||
| Lubricants and Specialties | 2Q 2013 | 1Q 2013 | ||||||
| Balance Sheet | Jun 30, 2013 | Mar 31, 2013 | ||||||
| Accounts receivable | 208,706 | 180,223 | ||||||
| Inventories | 154,767 | 160,707 | ||||||
| Other current assets | 54,987 | 82,077 | ||||||
| Investments | 22,178 | - | ||||||
| investments in jointly owned subsidiaries | - | - | ||||||
| Investment Property | - | - | ||||||
| Property, Plant and Equipment | 182,399 | 176,512 | ||||||
| Intangible | 848,517 | 862,955 | ||||||
| Other non-current assets | (39,085 | ) | (73,490 | ) | ||||
| Total Assets | 1,432,469 | 1,388,984 | ||||||
| Loans and Financing | (24,129 | ) | 784,696 | |||||
| Suppliers | (56,375 | ) | (71,979 | ) | ||||
| Salaries Payable | (19,513 | ) | (15,334 | ) | ||||
| Other current liabilities | (89,941 | ) | (47,689 | ) | ||||
| Other non-current liabilities | (346,964 | ) | (427,228 | ) | ||||
| Net Equity | (895,547 | ) | (1,611,450 | ) | ||||
| Total Liabilities | (1,432,469 | ) | (1,388,984 | ) | ||||
47 of 49
| Earnings Release 2nd Quarter of Fiscal Year 2013 - April, May and June 201 |
E.6 Radar
| Radar | 2Q 2013 | 2Q 2012 | ||||||
| Income Statement for the period | Jun 30, 2013 | Jun 30, 2012 | ||||||
| Net Operating Revenue | 19,880 | 35,077 | ||||||
| Gross Profit | 13,823 | 16,753 | ||||||
| Sales, general and administrative expenses | (4,998 | ) | (5,809 | ) | ||||
| Other operating income (expenses), net | 8,981 | 1,029 | ||||||
| Financial revenue | 939 | 2,491 | ||||||
| Financial expenses | (232 | ) | - | |||||
| Equity pick up | 29 | - | ||||||
| Income and Social Contribution Taxes | (1,135 | ) | (2,220 | ) | ||||
| Net Income (loss) | 17,407 | 12,244 | ||||||
| Radar | 2Q 2013 | 1Q 2013 | ||||||
| Balance Sheet | Jun 30, 2013 | Mar 31, 2013 | ||||||
| Accounts receivable | 24,692 | 26,639 | ||||||
| Inventories | - | - | ||||||
| Other current assets | 8,985 | 7,386 | ||||||
| Investments | - | - | ||||||
| investments in jointly owned subsidiaries | - | - | ||||||
| Investment Property | 2,477,955 | 2,473,438 | ||||||
| Property, Plant and Equipment | 11,661 | 11,852 | ||||||
| Intangible | 92 | 99 | ||||||
| Other non-current assets | 9,363 | 48,298 | ||||||
| Total Assets | 2,532,748 | 2,567,712 | ||||||
| Loans and Financing | 94,273 | 29,982 | ||||||
| Suppliers | (1,069 | ) | (996 | ) | ||||
| Salaries Payable | (14,558 | ) | (13,390 | ) | ||||
| Other current liabilities | (33,449 | ) | (26,244 | ) | ||||
| Other non-current liabilities | (75,707 | ) | (74,813 | ) | ||||
| Net Equity | (2,502,238 | ) | (2,482,251 | ) | ||||
| Total Liabilities | (2,532,748 | ) | (2,567,712 | ) | ||||
48 of 49
| Earnings Release 2nd Quarter of Fiscal Year 2013 - April, May and June 201 |
E.7 Other Businesses
| Other Businesses | 2Q 2013 | 2Q 2012 | ||||||
| Income Statement for the period | Jun 30, 2013 | Jun 30, 2012 | ||||||
| Net Operating Revenue | 13 | 5,117 | ||||||
| Gross Profit | 12 | 4,674 | ||||||
| Sales, general and administrative expenses | (30,984 | ) | (30,652 | ) | ||||
| Other operating income (expenses), net | (18,087 | ) | 36,239 | |||||
| Financial revenue | 16,122 | 10,827 | ||||||
| Financial expenses | (140,950 | ) | (83,208 | ) | ||||
| Foreign exchange variation | (191,403 | ) | (80,011 | ) | ||||
| Derivative | 54,911 | 17,717 | ||||||
| Equity pick up | 81,914 | 42,895 | ||||||
| Income and Social Contribution Taxes | 13,695 | 114,738 | ||||||
| Net Income (loss) | (214,770 | ) | 33,219 | |||||
| Other Businesses | 2Q 2013 | 1Q 2013 | ||||||
| Balance Sheet | Jun 30, 2013 | Mar 31, 2013 | ||||||
| Accounts receivable | 240 | 241 | ||||||
| Inventories | - | - | ||||||
| Other current assets | 394,383 | 386,503 | ||||||
| Investments | 5,973,672 | 6,639,826 | ||||||
| investments in jointly owned subsidiaries | 8,551,222 | 8,582,741 | ||||||
| Investment Property | - | - | ||||||
| Property, Plant and Equipment | 36,525 | 37,018 | ||||||
| Intangible | 2,651 | 2,145 | ||||||
| Other non-current assets | 2,537,345 | 2,336,571 | ||||||
| Total Assets | 17,496,038 | 17,985,045 | ||||||
| Loans and Financing | (4,568,537 | ) | (4,935,034 | ) | ||||
| Suppliers | (1,818 | ) | (1,941 | ) | ||||
| Salaries Payable | (20,441 | ) | (17,206 | ) | ||||
| Other current liabilities | (501,932 | ) | (357,475 | ) | ||||
| Other non-current liabilities | (3,513,743 | ) | (3,341,628 | ) | ||||
| Net Equity | (8,889,567 | ) | (9,331,761 | ) | ||||
| Total Liabilities | (17,496,038 | ) | (17,985,045 | ) | ||||
49 of 49
SIGNATURES
Pursuant to the requirements of the Securities Exchange Act of 1934, the registrant has duly caused this report to be signed on its behalf by the undersigned, thereunto duly authorized.
| COSAN LIMITED | ||||||
| Date: | August 9, 2013 | By: | /s/ Marcelo Eduardo Martins | |||
| Name: | Marcelo Eduardo Martins | |||||
| Title: | Chief Financial Officer and Investor Relations Officer | |||||