FORM 6-K
SECURITIES AND EXCHANGE COMMISSION
Washington, D.C. 20549
Report of Foreign Issuer
Pursuant to Rule 13a-16 or 15d-16
of the Securities Exchange Act of 1934
For the month of November, 2013
Commission File Number: 1-33659
COSAN LIMITED
(Translation of registrant’s name into English)
Av. Juscelino Kubitschek, 1726 – 6th floor
São Paulo, SP 04543-000 Brazil
(Address of principal executive offices)
Indicate by check mark whether the registrant files or will file annual reports under cover of Form 20-F or Form 40-F:
| Form 20-F | X | Form 40-F |
Indicate by check mark if the registrant is submitting the Form 6-K in paper as permitted by Regulation S-T Rule 101(b)(1):
| Yes | No | X |
Indicate by check mark if the registrant is submitting the Form 6-K in paper as permitted by Regulation S-T Rule 101(b)(7):
| Yes | No | X |
COSAN LIMITED
Item | ||
| 1. | Earnings Release 3rd Quarter of Fiscal Year 2013 – July, August and September 2013 |
Item 1

Earnings Release
3rd Quarter of Fiscal Year 2013 – July, August and September 2013
Pro forma Net Revenue of R$9.5 billion and
growth in all businesses in the 3Q 2013
| São Paulo, November 6, 2013 – COSAN LIMITED (NYSE: CZZ; BM&FBovespa: CZLQ11) and COSAN S.A. INDÚSTRIA E COMÉRCIO (BM&FBovespa: CSAN3) announce today their results for the third quarter of 2013 (3Q 2013), comprised of July, August and September 2013. The results are consolidated in accordance with the accounting principles adopted in Brazil and abroad (IFRS). |
Earnings Conference Call Portuguese November 7, 2013 8:00 am (US-EST) Tel: + 55 11 4688 6361 Code: COSAN English November 7, 2013 9:00 am (US-EST) Tel (BR): + 55 11 4688 6361 Tel (US): +1 786 924 6977 Toll-free (US): +1 855 281 6021 Code: COSAN Investor Relations E-mail: ri@cosan.com.br Telephone: +55 11 3897 9797 Site: www.cosan.com.br/ir | 3Q 2013 Highlights ● Pro forma consolidated EBITDA, including Raízen, totaled R$1.2 billion ● Raízen Combustíveis post EBITDA of R$ 483 million with 9.3% increase in sales volume ● Raizen Energia’s EBITDA of R$900 million ● Record investment in the quarter and 10% growth in the number of Comgás’s clients ● Rumo EBITDA reaches R$115 million ● Increase of 17.5% in Lubricants and Specialties sales volume |
 | 3Q 2013 | 3Q 2012 | Summmary of Financial Informations - Cosan Cosolidated | YTD 2013 | YTD 2012 | ||||||||||
| (jul - sep) | (jul - sep) | Amount in R$ MM | (jan - sep) | (jan - sep) | |||||||||||
| 2,434.5 | 608.4 | Net Revenue | 6,649.7 | 1,369.8 | |||||||||||
| 721.5 | 191.5 | Gross Profit | 1,951.4 | 381.5 | |||||||||||
| 29.6% | 31.5% | Gross Margin (%) | 29.3% | 27.9% | |||||||||||
| 378.2 | 70.3 | Operating Profit | 1,008.4 | 34.4 | |||||||||||
| 722.6 | 386.9 | EBITDA | 1,699.5 | 691.8 | |||||||||||
| 29.7% | 63.6% | EBITDA Margin (%) | 25.6% | 50.5% | |||||||||||
| 191.0 | 282.5 | Equity Pick-up | 251.3 | 554.1 | |||||||||||
| 317.0 | 302.4 | Net Income (Loss) before non-controlling Interest | 295.2 | 443.1 | |||||||||||
| 208.8 | 283.2 | Net Income (Loss) | 40.6 | 415.7 | |||||||||||
| 8.6% | 46.6% | Net Margin (%) | 0.6% | 30.3% | |||||||||||
| 397.4 | 270.0 | CAPEX1 | 931.4 | 408.4 | |||||||||||
| 7,181.3 | 1,053.2 | Net Debt | 7,181.3 | 1,053.2 | |||||||||||
| 13,257.0 | 13,338.5 | Shareholders' Equity and Minority Shareholders | 13,257.0 | 13,338.5 | |||||||||||
Note1: Net of acquisition of interest in other companies and of cash received from divestments

1 of 48
| | Earnings Release 3rd Quarter of Fiscal Year 2013 – July, August and September 2013 |
| A. | Highlights and Business Units |
A.1 Business Units
As in prior earnings releases, we present herein a specific section for each business unit, including key operating data, as well as an analysis of the results, from net revenue to EBITDA.
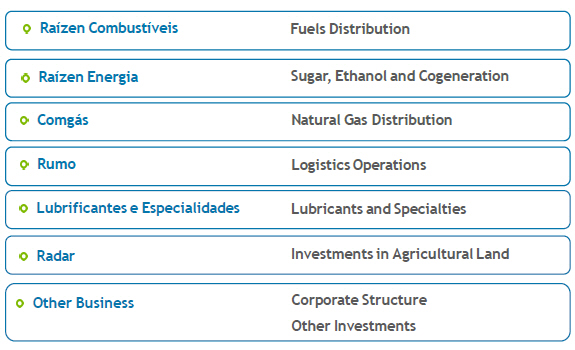
Our business units (reportable segments) are as follows:
2 of 48
| | Earnings Release 3rd Quarter of Fiscal Year 2013 – July, August and September 2013 |
A.2 Cosan’s Consolidated Results
Cosan’s consolidated financial information comprises 100% of the results of Comgás, Rumo, Lubrificantes e Especialidades, Radar and Other Businesses. As of April 1, 2013, due to the adoption of the accounting rule IFRS 11, Raízen Energia e Combustíveis’ results are presented under the “Equity Pick-up” line and reflect the proportional interest (50%) in the result. Adjustments and Eliminations represent intercompany balances and transactions.
EBITDA reported here is in compliance with CVM Rule 527/12, published by CVM (Brazil’s Securities and Exchange Commission) on October 4, 2012, and may differ from the figures disclosed in prior periods due to equity pick-up. Consequently, the EBITDA now consists of operating income before financial expenses, plus depreciation, amortization and equity pick-up.
| 3Q 2013 | 3Q 2012 | EBITDA (Reconciliation ICVM 527) | YTD 2013 | YTD 2012 | |||||||||||
| (jul - sep) | (jul - sep) | Amounts in R$ MM | (jan-sep) | (jan-sep) | |||||||||||
| 208.8 | 283.2 | Net Income | 40.6 | 415.7 | |||||||||||
| (191.0 | ) | (282.5 | ) | (-) Equity Pick-up | (251.2 | ) | (554.0 | ) | |||||||
| - | (5.8 | ) | (-) Income from Discontinued Operations | 3.4 | (1.5 | ) | |||||||||
| 108.1 | 24.9 | (+) Minority Shareholders | 251.2 | 28.8 | |||||||||||
| 119.3 | 41.3 | (+) Income Taxes | 338.7 | (74.9 | ) | ||||||||||
| 132.9 | 9.1 | (+) Net Financial Expense (Revenue) | 625.7 | 220.2 | |||||||||||
| 153.4 | 34.1 | (+) Depreciation and Amortization | 439.9 | 103.4 | |||||||||||
| 531.6 | 104.3 | EBITDA (before ICVM 527) | 1,448.3 | 137.7 | |||||||||||
| 191.0 | 282.5 | (+) Equity Pick-up | 251.2 | 554.0 | |||||||||||
| 722.6 | 386.9 | EBITDA (after ICVM 527) | 1,699.5 | 691.8 | |||||||||||
| - | 5.8 | (+) Reclassification of Discontinued Operations2 | (3.4 | ) | 1.5 | ||||||||||
| - | - | (-) Gross effect of Raízen formation | - | 100.3 | |||||||||||
| 722.6 | 392.6 | Adjusted EBITDA (after ICVM 527) | 1,696.1 | 793.5 | |||||||||||
Note 2: Due to the sale of the sugar retailing business represented by Cosan Alimentos, the Company reclassified the results of this unit to the discontinued operation line as required by the accounting rule IFRS5/CPC31 – Non-current Assets Held for Sale and Discontinued Operations
3 of 48
| | Earnings Release 3rd Quarter of Fiscal Year 2013 – July, August and September 2013 |
We present below the 3Q 2013 results by business unit for all units described above. All information reflects 100% of the units’ financial performance, regardless of Cosan's interest in them.
According to CVM Instruction 527/12 for EBITDA calculation, the R$160.3 million difference between equity pick-up of Other Businesses of R$351.3 million and the amount of R$191.0 result in the same line in the Accounting Consolidated relates to elimination of net incomes of businesses controlled by Cosan for consolidation purposes. The same adjustment is carried out for YTD 2013.
| Results by Business Unit | Comgás | Rumo | Lubricants and Specialties | Radar | Other Businesses | Consolidated | Raízen Combustíveis | Raízen Energia | 50% Raízen | Adjusts and Eliminations | Consolidated | |||||||||||||||||||||||||||||||||
3Q 2013 Pro forma | ||||||||||||||||||||||||||||||||||||||||||||
| Net Revenue | 1,682.5 | 328.5 | 407.3 | 16.1 | 0.0 | 2,434.5 | 12,737.2 | 3,246.7 | (7,992.0 | ) | (878.6 | ) | 9,547.9 | |||||||||||||||||||||||||||||||
| Cost of Goods and Services | (1,198.6 | ) | (203.4 | ) | (311.0 | ) | 0.0 | 0.0 | (1,713.0 | ) | (12,077.2 | ) | (2,520.6 | ) | 7,298.9 | 868.6 | (8,143.3 | ) | ||||||||||||||||||||||||||
| Gross Profit | 484.0 | 125.1 | 96.3 | 16.1 | 0.0 | 721.6 | 660.0 | 726.1 | (693.0 | ) | (10.0 | ) | 1,404.6 | |||||||||||||||||||||||||||||||
| Gross Margin(%) | 28.8 | % | 38.1 | % | 23.6 | % | 100.0 | % | 100.0 | % | 29.6 | % | 5.2 | % | 22.4 | % | -13.8 | % | - | 14.7 | % | |||||||||||||||||||||||
| Selling Expenses | (157.2 | ) | - | (64.3 | ) | - | - | (221.5 | ) | (263.1 | ) | (223.8 | ) | 243.4 | - | (464.9 | ) | |||||||||||||||||||||||||||
| General and Administrative Expenses | (72.8 | ) | (17.3 | ) | (19.2 | ) | (5.3 | ) | (39.1 | ) | (153.7 | ) | (99.7 | ) | (134.8 | ) | 117.3 | - | (270.9 | ) | ||||||||||||||||||||||||
| Other Operating Revenues (Expenses) | (0.0 | ) | (12.6 | ) | 6.9 | 46.8 | (9.2 | ) | 31.8 | 66.3 | (19.9 | ) | (23.2 | ) | - | 55.0 | ||||||||||||||||||||||||||||
| Equity Pick-up | - | - | (6.5 | ) | - | 351.3 | 191.0 | - | (11.7 | ) | 5.8 | (197.2 | ) | (12.0 | ) | |||||||||||||||||||||||||||||
| Depreciation and Amortization | (115.1 | ) | (19.8 | ) | (17.8 | ) | (0.3 | ) | (0.5 | ) | (153.4 | ) | (119.6 | ) | (564.5 | ) | 342.1 | - | (495.5 | ) | ||||||||||||||||||||||||
| EBITDA | 369.0 | 115.0 | 30.9 | 57.9 | 303.5 | 722.6 | 483.1 | 900.5 | (691.8 | ) | (207.2 | ) | 1,207.2 | |||||||||||||||||||||||||||||||
| EBITDA Margin (%) | 21.9 | % | 35.0 | % | 7.6 | % | 358.5 | % | n/a | 29.7 | % | 3.8 | % | 27.7 | % | -15.8 | % | - | 12.6 | % | ||||||||||||||||||||||||
| Results by Business Unit | Comgás | Rumo | Lubricants and Specialties | Radar | Other Businesses | Consolidated | Raízen Combustíveis | Raízen Energia | 50% Raízen | Adjusts and Eliminations | Consolidated | |||||||||||||||||||||||||||||||||
YTD 2013 Pro forma | ||||||||||||||||||||||||||||||||||||||||||||
| Net Revenue | 4,735.9 | 711.2 | 1,151.1 | 51.4 | 0.0 | 6,649.7 | 35,462.8 | 7,075.3 | (21,269.1 | ) | (1,143.6 | ) | 26,775.2 | |||||||||||||||||||||||||||||||
| Cost of Goods and Services | (3,410.4 | ) | (429.6 | ) | (852.3 | ) | (6.1 | ) | 0.0 | (4,698.3 | ) | (33,652.3 | ) | (5,864.0 | ) | 19,758.2 | 1,131.2 | (23,325.3 | ) | |||||||||||||||||||||||||
| Gross Profit | 1,325.6 | 281.6 | 298.8 | 45.4 | 0.0 | 1,951.4 | 1,810.5 | 1,211.3 | (1,510.9 | ) | (12.4 | ) | 3,449.9 | |||||||||||||||||||||||||||||||
| Gross Margin(%) | 28.0 | % | 39.6 | % | 26.0 | % | 88.2 | % | 100.1 | % | 29.3 | % | 5.1 | % | 17.1 | % | 7.1 | % | 1.1 | % | 12.9 | % | ||||||||||||||||||||||
| Selling Expenses | (429.4 | ) | - | (170.4 | ) | - | - | (599.7 | ) | (776.0 | ) | (533.6 | ) | 654.8 | - | (1,254.6 | ) | |||||||||||||||||||||||||||
| General and Administrative Expenses | (219.4 | ) | (51.7 | ) | (55.3 | ) | (15.1 | ) | (95.0 | ) | (436.6 | ) | (280.5 | ) | (401.6 | ) | 341.0 | - | (777.6 | ) | ||||||||||||||||||||||||
| Other Operating Revenues (Expenses) | (6.5 | ) | (18.4 | ) | 8.1 | 110.2 | (0.0 | ) | 93.3 | 213.6 | 15.9 | (114.7 | ) | - | 208.0 | |||||||||||||||||||||||||||||
| Equity Pick-up | - | - | (6.5 | ) | 0.0 | 631.7 | 251.2 | - | (21.6 | ) | 10.8 | (255.0 | ) | (14.6 | ) | |||||||||||||||||||||||||||||
| Depreciation and Amortization | (327.4 | ) | (57.5 | ) | (52.6 | ) | (0.7 | ) | (1.6 | ) | (439.8 | ) | (355.8 | ) | (1,453.8 | ) | 904.8 | - | (1,344.6 | ) | ||||||||||||||||||||||||
| EBITDA | 997.6 | 269.0 | 127.3 | 141.1 | 538.3 | 1,699.5 | 1,323.4 | 1,724.1 | (1,523.8 | ) | (267.5 | ) | 2,955.7 | |||||||||||||||||||||||||||||||
| EBITDA Margin (%) | 21.1 | % | 37.8 | % | 11.1 | % | 274.4 | % | n/a | 25.6 | % | 3.7 | % | 24.4 | % | 7.2 | % | 23.4 | % | 11.0 | % | |||||||||||||||||||||||
4 of 48
| | Earnings Release 3rd Quarter of Fiscal Year 2013 – July, August and September 2013 |
B. Results by Business Unit
B.1 Raízen Combustíveis
We present below the results of Raízen Combustíveis, the business unit that distributes and trades fuels through a network of franchised Shell gas stations, in addition to supplying fuels to industrial clients and distributing aviation fuel.
As mentioned in the previous quarter, due to the adoption of accounting rule IFRS 11 – Joint Arrangements, Cosan no longer consolidates Raízen in its balance sheet, financial statement and cash flow statement. Raízen’s result is reported under the “Equity Pick-up” line. Due to Raízen’s relevance to Cosan’s financial information, we will report the performance of this segment separately.
Year-to-date results for 2013 (YTD 2013) are pro forma, and consider the first nine months (January 2013 to September 2013) of Raízen Combustíveis operations, to enable comparability of the periods. The same applies to the year-to-date results for 2012 (YTD 2012), which considers the months of January through September 2012.
Net Revenue
| 3Q 2013 | 3Q 2012 | Sales Breakdown | YTD 2013 | YTD 2012 | |||||||||||||||||||
| (jul - sep) | (jul - sep) | Chg.% | Amounts in R$ MM | (jan - sep) | (jan - sep) | Chg.% | |||||||||||||||||
| 12,737.2 | 10,915.5 | 16.7 | % | Fuel Sales | 35,462.8 | 31,183.2 | 13.7 | % | |||||||||||||||
| 756.1 | 553.9 | 36.5 | % | Ethanol | 2,086.4 | 1,638.9 | 27.3 | % | |||||||||||||||
| 4,911.6 | 4,356.7 | 12.7 | % | Gasoline | 14,042.4 | 12,794.9 | 9.8 | % | |||||||||||||||
| 5,631.7 | 4,629.2 | 21.7 | % | Diesel | 15,212.6 | 12,588.6 | 20.8 | % | |||||||||||||||
| 1,290.0 | 1,221.8 | 5.6 | % | Aviation | 3,693.4 | 3,657.9 | 1.0 | % | |||||||||||||||
| 147.9 | 153.9 | -3.9 | % | Other Products | 428.0 | 503.0 | -14.9 | % | |||||||||||||||
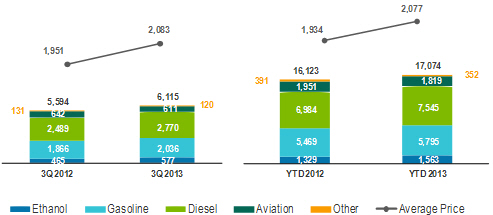
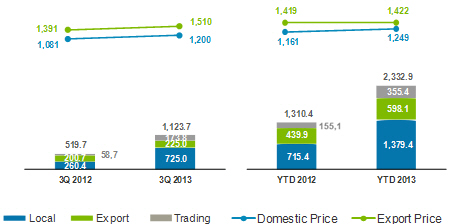
In the 3Q 2013, net revenue of Raízen Combustíveis totaled R$12.7 billion, an increase of 16.7% compared to 3Q 2012, driven by a 9.3% increase in total fuel sales volume for the period, mainly ethanol and diesel, which grew 24.0% and 11.3%, respectively. In addition to the increase in the vehicle fleet year-over-year, the growth in the network of Shell resellers to 4,774 service stations in 3Q 2013 also contributed to the increase in net revenue.
Quarter-over-quarter, total net revenue rose 8.1%, while the volume sold increased 8.3%, chiefly due to the usual seasonality between the quarters.
The average price of products sold was up 6.8% when compared to 3Q 2012, due to the increase in gasoline and diesel prices announced by Petrobras in the first quarter of 2013.
5 of 48
| | Earnings Release 3rd Quarter of Fiscal Year 2013 – July, August and September 2013 |
The increase in gasoline prices contributed to higher competitiveness of ethanol in the domestic market in four Brazilian states (São Paulo, Paraná, Goiás and Mato Grosso), where the price parity between ethanol and gasoline was below 70%.
In 3Q 2013, the aviation segment recorded a 4.8% reduction in volumes sold year-over-year, which was more than offset by the 10.9% increase in average price, resulting a growth of 5.6% in net revenue. Compared to 2Q 2012, volumes sold in this segment improved reporting an increase of 4.3%.
Fuels
Volume Sold (million liters) and Average Unit Price (R$/cbm)
Inventories
| Fuels Inventories | 3Q 2013 | 3Q 2012 | ||||||||||
| (jul - sep) | (jul - sep) | Chg.% | ||||||||||
| 000' cbm | 731.9 | 445.4 | 64.3 | % | ||||||||
| R$'MM | 1,302.8 | 803.5 | 62.1 | % | ||||||||
| R$/cbm | 1,780.2 | 1,804.0 | -1.3 | % | ||||||||
6 of 48
| | Earnings Release 3rd Quarter of Fiscal Year 2013 – July, August and September 2013 |
Cost of Goods Sold
| 3Q 2013 | 3Q 2012 | COGS | YTD 2013 | YTD 2012 | |||||||||||||||||||
| (jul - sep) | (jul - sep) | Chg.% | Amounts in R$ MM | (jan - sep) | (jan - sep) | Chg.% | |||||||||||||||||
| (12,077.2 | ) | (10,335.3 | ) | 16.9 | % | Fuel Sales | (33,652.3 | ) | (29,390.9 | ) | 14.5 | % | |||||||||||
| Average Unitary Cost (R$/cbm) | |||||||||||||||||||||||
| (1,975 | ) | (1,848 | ) | 6.9 | % | Fuel Sales | (1,971 | ) | (1,823 | ) | 8.1 | % | |||||||||||
In line with the growth in sales volume and rising prices of gasoline and diesel, the cost of goods sold by Raízen Combustíveis was R$12.1 billion in the 3Q 2013, up 16.9% compared to the 3Q 2012. Average unit cost rose 6.9% from R$1,848/cbm in the 3Q 2012 to R$1,975/cbm reported in 3Q 2013. When compared to 2Q 2013 the cost of goods sold grew 7.6%.
Gross Profit
| 3Q 2013 | 3Q 2012 | Gross Profit | YTD 2013 | YTD 2012 | |||||||||||||||||||
| (jul - sep) | (jul - sep) | Chg.% | Amounts in R$ MM | (jan - sep) | (jan - sep) | Chg.% | |||||||||||||||||
| 660.0 | 580.2 | 13.8 | % | Gross Profit | 1,810.5 | 1,792.3 | 1.0 | % | |||||||||||||||
| 5.2 | % | 5.3 | % | -0.1 p.p. | Gross Margin (%) | 5.1 | % | 5.7 | % | -0.6 p.p. | |||||||||||||
| 107.9 | 103.7 | 4.1 | % | Unitary Gross Margin (R$/cbm) | 106.0 | 111.2 | -4.6 | % | |||||||||||||||
Raízen Combustíveis reported gross income of R$660.0 million for 3Q 2013, an increase of 13.8% from the R$580.2 million recorded in 3Q 2012. Gross margin reached 5.2% and, measured in BRL per cbm, it totaled R$108/cbm, an increase of 4.1% year-over-year. Quarter-over-quarter, gross income rose 18.9%, and the gross margin measured in BRL per cbm was 10.2% higher than the R$98/cbm recorded in the previous quarter.
The key factors impacting the growth in gross margin for the quarter were the recovery in volumes of the aviation segment, which has a higher unit gross margin, compared to 2Q 2013 and initiatives to reduce logistics costs.
Selling, General and Administrative Expenses
| 3Q 2013 | 3Q 2012 | SG&A Expenses | YTD 2013 | YTD 2012 | |||||||||||||||||||
| (jul - sep) | (jul - sep) | Chg.% | Amounts in R$ MM | (jan - sep) | (jan - sep) | Chg.% | |||||||||||||||||
| (263.1 | ) | (243.1 | ) | 8.2 | % | Selling Expenses | (776.0 | ) | (876.0 | ) | -11.4 | % | |||||||||||
| (99.7 | ) | (92.3 | ) | 8.0 | % | G&A Expenses | (280.5 | ) | (293.1 | ) | -4.3 | % | |||||||||||
| 66.3 | (2.6 | ) | n/a | Other Operational Revenues/Expenses | 213.6 | 127.1 | 68.0 | % | |||||||||||||||
Raízen Combustíveis’s selling expenses were up 8.2% in 3Q 2013, totaling R$ 263.1 million, chiefly due to higher volumes sold in the period in addition to institutional expenses related to marketing campaign. When compared to 2Q 2013 the cost of goods sold grew 6.5%.
7 of 48
| | Earnings Release 3rd Quarter of Fiscal Year 2013 – July, August and September 2013 |
General and administrative expenses totaled R$99.7 million in 3Q 2013, up 8.0% y-o-y. When compared to 2Q 2013 the cost of goods sold grew 13.2%.
Other operating revenues and expenses reached R$66.3 million in 3Q 2013, comprised mainly of merchandise fees, convenience store royalties, revenue from leases, fees for the sale of lubricants at Raízen Combustíveis services stations, and revenues from assets sale. It is important to mention that Raízen Combustíveis had a non-recurring write-off of approximately R$25 million in its result in 3Q 2012 due to a revision in the base of property, plant and equipment disposed of in prior quarters.
EBITDA
| 3Q 2013 | 3Q 2012 | EBITDA | YTD 2013 | YTD 2012 | |||||||||||||||||||
| (jul - sep) | (jul - sep) | Chg.% | Amounts in R$ MM | (jan - sep) | (jan - sep) | Chg.% | |||||||||||||||||
| 483.1 | 375.5 | 28.7 | % | EBITDA | 1,323.4 | 1,093.8 | 21.0 | % | |||||||||||||||
| 3.8 | % | 3.4 | % | 0.4 p.p | EBITDA Margin (%) | 3.7 | % | 3.5 | % | 0.2 p.p | |||||||||||||
In 3Q 2013, Raízen Combustíveis’ EBITDA increased by 28.7% compared to 3Q 2012, totaling R$483.1 million. EBITDA margin was 3.8%, a 0.4 p.p increase compared to 3Q 2012. Compared to the EBITDA of R$417.4 million reported 2Q 2013, the growth was 15.7%, which shows a recovery related to specific effects occurred in June 2013.
Capex
| 3Q 2013 | 3Q 2012 | CAPEX | YTD 2013 | YTD 2012 | |||||||||||||||||||
| (jul - sep) | (jul - sep) | Chg.% | Amounts in R$ MM | (jan - sep) | (jan - sep) | Chg.% | |||||||||||||||||
| 143.4 | 197.4 | -27.3 | % | CAPEX | 386.2 | 554.1 | -30.3 | % | |||||||||||||||
Raízen Combustíveis’s Capex was R$143.4 million in 3Q 2013, decrease of 27.3% y-o-y mainly due to the completion of the “Esso” to “Shell” rebranding process, postponement of investments and the consolidation of the network growth based on rebates to dealers according to volumes targets.
These rebates are accounted as deductions from gross revenue totaling R$26.7 million this quarter impacting EBITDA margin in R$4.4/cbm, while in 3Q 2012 this bonus was of R$13.4 million or R$2.4/cbm. In the 2Q 2013 the same impact in EBITDA margin was R$33.6 million or R$5.9/cbm.
8 of 48
| | Earnings Release 3rd Quarter of Fiscal Year 2013 – July, August and September 2013 |
B.2 Raízen Energia
The following are the results for Raízen Energia, whose core business is the production and sale of a variety of products derived from sugarcane, including raw sugar (Very High Polarization VHP), anhydrous and hydrous ethanol, as well as activities related to energy cogeneration from sugarcane bagasse and ethanol trading.
As mentioned in the previous quarter, due to the adoption of accounting rule IFRS 11 – Joint Arrangements, Cosan no longer consolidates Raízen in its balance sheet, financial statement and cash flow statement, Raízen’s result is reported under the “Equity Pick-up” line. Due to Raízen’s relevance to Cosan’s financial information, we will report the performance of this segment separately.
Year-to-date results for 2013 (YTD 2013) are pro forma, and consider the first nine months (January 2013 to September 2013) of Raízen Energia operations, to enable comparability of the periods. The same applies to the year-to-date results for 2012 (YTD 2012), which considers the months of January through September 2012.
Production Figures
CenterSouth Region
The rainy weather in the beginning of the harvest season affected not only the crushing in the period – especially between May and June—but also the sugar and ethanol production after that period. The rain in most of the Central-South region of Brazil has changed the physiology of the sugarcane which, from then on, was expected to strongly concentrate sugar in the cane. But the TRS levels were below expectations – an average 1.3% lower than in the previous year between June and September – and the sugar production was also affected, since the lower quality cane favors the production of ethanol.
From July to September, mills managed to maximize the crushing pace and crushed nearly 260 million tons of sugarcane. But they also faced weather issues, which prevented this figure from being even higher. The second half of September, for instance, recorded a decrease of over 20% in processed volumes compared to the first half of the month.
The number of crushing days lost this harvest due to rain in the Central-South region is above the average of the past years. Also, a higher mechanization level demands a longer time to resume crushing right after the rains, which delays the mills’ operation pace.
9 of 48
| | Earnings Release 3rd Quarter of Fiscal Year 2013 – July, August and September 2013 |
Out of the processed sugarcane volume until the end of September, 45.1% was used in sugar production, resulting in 25.2 million tons, while ethanol production totaled 18.8 billion liters – of which 8.1 billion liters were anhydrous and 10.8 billion, hydrous. All products increased year-over-year, however, although the cane crushing is 15.4% higher than the previous year, low levels of TRS caused an increase of only 5% in the sugar production volume in the period.
Raízen Energia
During 3Q 2013, Raízen Energia operated 24 sugar, ethanol and energy cogeneration mills, with a crushing capacity of 65.6 million tons of sugarcane per year.
| 3Q 2013 | 3Q 2012 | Operational Figures | YTD 2013 | YTD 2012 | |||||||||||||||||||
| (jul - sep) | (jul - sep) | Chg.% | (jan - sep) | (jan - sep) | Chg.% | ||||||||||||||||||
| 26,824 | 27,314 | -1.8 | % | Crushed Sugarcane | 45,358 | 38,378 | 18.2 | % | |||||||||||||||
| 11,745 | 12,612 | -6.9 | % | Own (‘000 tonnes) | 22,767 | 19,068 | 19.4 | % | |||||||||||||||
| 15,079 | 14,702 | 2.6 | % | Suppliers (‘000 tonnes) | 22,591 | 19,310 | 17.0 | % | |||||||||||||||
| 135.4 | 147.0 | -7.9 | % | Sugarcane TRS (kg/tonne) | 128.4 | 132.1 | -2.8 | % | |||||||||||||||
| 94.0 | % | 91.3 | % | 2.7 p.p | Mechanization (%) | 94.0 | % | 91.3 | % | 2.7 p.p | |||||||||||||
| Production | |||||||||||||||||||||||
| 2,128 | 2,152 | -1.1 | % | Sugar | 3,318 | 2,800 | 18.5 | % | |||||||||||||||
| 1,337 | 1,275 | 4.9 | % | Raw Sugar (‘000 tonnes) | 2,203 | 1,671 | 31.9 | % | |||||||||||||||
| 791 | 877 | -9.8 | % | White Sugar (‘000 tonnes) | 1,114 | 1,129 | -1.3 | % | |||||||||||||||
| 884 | 924 | -4.3 | % | Ethanol | 1,479 | 1,274 | 16.1 | % | |||||||||||||||
| 456 | 408 | 11.8 | % | Anhydrous Ethanol (‘000 cbm) | 716 | 539 | 32.8 | % | |||||||||||||||
| 428 | 516 | -17.1 | % | Hydrous Ethanol (‘000 cbm) | 763 | 735 | 3.9 | % | |||||||||||||||
Raízen Energia recorded 26.8 million tons of crushed sugarcane in 3Q 2013, a decrease of 1.8% over 3Q 2012 (27.3 million tons). About 44% of which was own sugarcane, and 56% from suppliers.
During 3Q 2013, the mechanization of own sugarcane harvesting reached 94.0% and the TRS of the sugarcane reached 135.4 kg/ton in the same period, down 7.9% compared to 3Q 2012 when the TRS level was 147.0 kg/ton, thanks to the increased occurrence of rain early in the crop season which ultimately diluted the concentration of total sugars in the harvested cane.
Agricultural productivity measured in tons of sugarcane per hectare (TCH) reached 86.8 t/ha in 3Q 2013, a 6.2% growth compared to the 81.7 t/ha reported in 3Q 2012.
The sugarcane field reached an average age of 3.1 years due to renewal of approximately 20% of the company’s own fields in the interseason period. Production mix was concentrated in sugar, with approximately 60% of sugarcane crushed used to make this product, totaling 2.1 million tons of sugar and 884 million liters of ethanol produced
10 of 48
| | Earnings Release 3rd Quarter of Fiscal Year 2013 – July, August and September 2013 |
Net revenue
| 3Q 2013 | 3Q 2012 | Sales Breakdown | YTD 2013 | YTD 2012 | |||||||||||||||||||
| (jul - sep) | (jul - sep) | Chg.% | Amounts in R$ MM | (jan - sep) | (jan - sep) | Chg.% | |||||||||||||||||
| 3,246.7 | 2,248.4 | 44.4 | % | Net Operating Revenue | 7,075.3 | 4,705.8 | 50.4 | % | |||||||||||||||
| 1,492.3 | 1,302.2 | 14.6 | % | Sugar Sales | 3,428.2 | 2,592.6 | �� | 32.2 | % | ||||||||||||||
| 211.7 | 261.1 | -18.9 | % | Domestic Market | 595.3 | 726.7 | -18.1 | % | |||||||||||||||
| 1,280.6 | 1,041.1 | 23.0 | % | Foreign Market | 2,832.8 | 1,865.9 | 51.8 | % | |||||||||||||||
| 1,519.8 | 717.0 | 112.0 | % | Ethanol Sales | 3,223.8 | 1,753.9 | 83.8 | % | |||||||||||||||
| 870.4 | 281.5 | 209.2 | % | Domestic Market | 1,722.4 | 830.6 | 107.4 | % | |||||||||||||||
| 339.7 | 286.9 | 18.4 | % | Foreign Market | 850.5 | 624.4 | 36.2 | % | |||||||||||||||
| 309.7 | 148.6 | 108.4 | % | Trading | 650.8 | 299.0 | 117.7 | % | |||||||||||||||
| 153.3 | 163.9 | -6.5 | % | Energy Cogeneration | 263.6 | 236.2 | 11.6 | % | |||||||||||||||
| 81.4 | 65.3 | 24.7 | % | Other Products and Services | 159.8 | 123.0 | 29.9 | % | |||||||||||||||
Raízen Energia’s net revenue reached R$3.2 billion in 3Q 2013, up 44.4% compared to the 3Q 2012, when the reported amount was R$2.2 billion. The key drivers of the growth in net revenue in the period were the higher volumes of sugar and ethanol sold, and the better prices of ethanol both in domestic and international markets.
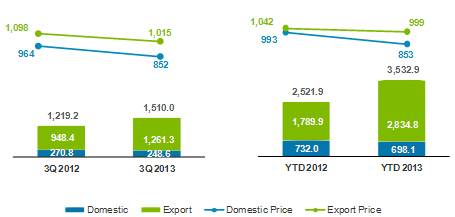
Sugar Sales
During 3Q 2013 net revenue from sugar sales totaled R$1.5 billion, 14.6% higher than the R$1.3 billion recorded in 3Q 2012. Revenue from sugar sales represented approximately 46% of Raízen Energia’s net revenue in the 3Q 2013.
The main driver of net revenue increase in the 3Q 2013 was the 23.8% expansion in volumes sold, equivalent to R$310.5 million, which more than offset the 7.5% decrease in the average price, from R$ 1.068/ton in 3Q 2012 to R$ 988/ton in 3Q 2013.
Sugar
Sales Volume (’000 tons) and Average Unit Price (R$/ton)
11 of 48
| | Earnings Release 3rd Quarter of Fiscal Year 2013 – July, August and September 2013 |
Sugar Inventories
| Sugar Inventories | 3Q 2013 | 3Q 2012 | ||||||||||
| (jul - sep) | (jul - sep) | Chg.% | ||||||||||
| ´000 tonne | 1,087.0 | 1,134.4 | -4.2 | % | ||||||||
| R$'MM | 746.6 | 794.8 | -6.1 | % | ||||||||
| R$/tonne | 686.8 | 700.6 | -2.0 | % | ||||||||
Ethanol Sales
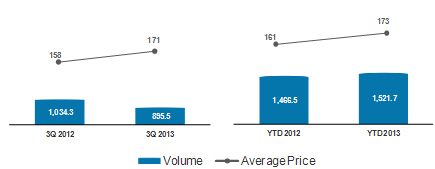
Net revenue from ethanol sales totaled R$1.5 billion in 3Q 2013, up 112.0% compared to 3Q 2012, which was R$717.0 million. The revenue increase is justified by a 4.6% increase in average price as well as by an increase of 103.6% in sales volume in the quarter.
Sales of ethanol in the domestic market reached 65% of total sales in 3Q 2013, mainly driven by the higher demand for anhydrous ethanol in the Central-South region—38% higher than in the same period last year – mainly due to the mandatory increase to 25% in the gasoline blend.
In the 3Q 2013, net revenue from ethanol trading, which represents purchase and sale transactions in the international market, totaled R$309.7 million, moving approximately 174 million liters in the period.
Ethanol
Sales Volume (million liters) and Average Unit Price (R$/cbm)
12 of 48
| | Earnings Release 3rd Quarter of Fiscal Year 2013 – July, August and September 2013 |
Ethanol Inventories
| Ethanol Inventories | 3Q 2013 | 3Q 2012 | ||||||||||
| (jul - sep) | (jul - sep) | Chg.% | ||||||||||
| ´000 cbm | 653.0 | 656.5 | -0.5 | % | ||||||||
| R$'MM | 720.4 | 743.0 | -3.0 | % | ||||||||
| R$/cbm | 1,103.2 | 1,131.7 | -2.5 | % | ||||||||
Energy Cogeneration
All of Raízen Energia’s 24 mills generate energy and are self-sufficient, and 13 sell surplus energy from cogeneration.
Net revenue from energy sales in 3Q 2013 reached R$153.3 million, down 6.5% compared to 3Q 2012. During the quarter, total energy sales volume amounted to 895.5 thousand MWh with an average price of R$ 171/MWh, 8.0% above the average price of R$158/MWh in 3Q 2012.
The reduction in energy resale operations in the spot market contributed to the 13.4% decline in the total volume of energy sold, and was the main driver for the drop in net revenue in the quarter.
Electric Energy
Sales Volume (‘000 MWh) and Average Unit Price (R$/MWh)
Other Products and Services
In 3Q 2013, revenue from other products and services totaled R$81.4 million, representing growth of 24.7% over 3Q 2012, relative to the sale of steam, molasses and raw materials to service providers in the agricultural industry.
13 of 48
| | Earnings Release 3rd Quarter of Fiscal Year 2013 – July, August and September 2013 |
Cost of Goods Sold
Raízen Energia's cost of goods sold is reported together with the average unit costs, net of the effects of depreciation and amortization (cash cost).
| 3Q 2013 | 3Q 2012 | COGS per Product | YTD 2013 | YTD 2012 | |||||||||||||||||||
| (jul - sep) | (jul - sep) | Chg.% | Amounts in R$ MM | (jan - sep) | (jan - sep) | Chg.% | |||||||||||||||||
| (2,520.7 | ) | (1,667.9 | ) | 51.1 | % | Cost of Goods Sold | (5,864.1 | ) | (3,519.2 | ) | 66.6 | % | |||||||||||
| (1,048.2 | ) | (858.8 | ) | 22.1 | % | Sugar | (2,486.4 | ) | (1,830.9 | ) | 35.8 | % | |||||||||||
| (1,037.6 | ) | (497.5 | ) | 108.6 | % | Ethanol | (2,240.1 | ) | (1,315.5 | ) | 70.3 | % | |||||||||||
| (297.2 | ) | (138.4 | ) | 114.8 | % | Trading | (636.4 | ) | (283.4 | ) | 124.6 | % | |||||||||||
| (59.2 | ) | (91.5 | ) | -35.2 | % | Energy Cogeneration | (119.4 | ) | (134.8 | ) | -11.4 | % | |||||||||||
| (78.4 | ) | (81.8 | ) | -4.1 | % | Others | (381.8 | ) | 45.4 | -940.4 | % | ||||||||||||
Average Unitary Costs3 | |||||||||||||||||||||||
| (500.0 | ) | (483.2 | ) | 3.5 | % | Cash Cost of Sugar (R$/tonne) | (501.6 | ) | (510.6 | ) | -1.8 | % | |||||||||||
| (895.0 | ) | (650.4 | ) | 37.6 | % | Cash Cost of Ethanol (R$/’000 liters) | (860.4 | ) | (768.3 | ) | 12.0 | % | |||||||||||
Note 3: Average unit costs represent the cash cost, which is net of plantation and cultivation area depreciation and amortization, agricultural depreciation (machinery and equipment), industrial depreciation, and harvest off-season maintenance.
In 3Q 2013, Raízen Energia’s cost of goods sold totaled R$2.5 billion, up 51.1% (compared to a 44.4% increase in net revenues) from the R$1.7 billion recorded in 3Q 2012. The higher volumes of sugar and ethanol sold, were the main drivers for the cost increase in this quarter. Important to mention that approximately 35% of the total ethanol sold in 3Q 2013 was originated in from domestic market, which explains the higher costs.
In addition, there was less dilution on planting and treatment costs, due to a 7.9% drop in the level of TRS, from 147.0 kg/ton in 3Q 2012 to 135.4 kg/ton in 3Q 2013.
Some factors offsetting the rise in Raízen Energia’s cost of goods sold were the following:
| · | 6.2% increase in sugarcane field productivity – represented by a higher TCH, which was 86.8 in 3Q 2013 compared to 81.7 in 3Q 2012; |
| · | 7.6% decrease in the cost of CONSECANA’s TCH, from R$0.4806 in 3Q 2012 to R$0.4439 in 3Q 2013, which has a direct impact on the cost of sugarcane from suppliers; |
14 of 48
| | Earnings Release 3rd Quarter of Fiscal Year 2013 – July, August and September 2013 |
Gross Profit
| 3Q 2013 | 3Q 2012 | Gross Profit and Gross Margin | YTD 2013 | YTD 2012 | |||||||||||||||||||
| (jul - sep) | (jul - sep) | Chg.% | Amounts in R$ MM | (jan - sep) | (jan - sep) | Chg.% | |||||||||||||||||
| 726.1 | 580.4 | 25.1 | % | Gross Profit | 1,211.2 | 1,186.6 | 2.1 | % | |||||||||||||||
| 444.1 | 443.4 | 0.2 | % | Sugar | 941.8 | 761.7 | 23.6 | % | |||||||||||||||
| 29.8 | % | 34.1 | % | -4.3 p.p. | Sugar Gross Margin (%) | 27.5 | % | 29.4 | % | -1.9 p.p. | |||||||||||||
| 49.4 | % | 54.8 | % | -5.3 p.p. | Sugar (Cash) Gross Margin (%) | 48.3 | % | 50.3 | % | -2.0 p.p. | |||||||||||||
| 172.5 | 70.9 | 143.3 | % | Ethanol | 332.9 | 139.4 | 138.7 | % | |||||||||||||||
| 14.3 | % | 12.5 | % | 1.8 p.p | Ethanol Gross Margin (%) | 12.9 | % | 9.6 | % | 3.4 p.p | |||||||||||||
| 29.7 | % | 46.6 | % | -16.9 p.p. | Ethanol (Cash) Gross Margin (%) | 33.9 | % | 39.0 | % | -5.1 p.p. | |||||||||||||
| 12.4 | 10.2 | 21.6 | % | Trading | 14.4 | 15.6 | -7.7 | % | |||||||||||||||
| 4.0 | % | 6.9 | % | -2.9 p.p. | Ethanol Trading Margin (%) | 2.2 | % | 5.2 | % | -3.0 p.p. | |||||||||||||
| 94.0 | 72.5 | 29.8 | % | Energy Cogeneration | 144.1 | 101.5 | 42.1 | % | |||||||||||||||
| 3.0 | (16.5 | ) | n/a | Other Products and Services | (222.0 | ) | 168.4 | n/a | |||||||||||||||
Raízen Energia recorded gross profit of R$726.1 million in 3Q 2013, representing an increase of 25.1% compared to the R$580.4 million recorded in 3Q 2012.
The gross profit from the sale of sugar reached R$444.1 million, 0.2% higher than the 3Q 2012 result. This result represented nearly 61% of Raízen Energia’s gross profit. The result from the sale of ethanol increased by 143.3% in the period to R$172.5 million and was the main driver for the increase in this line in the period. The sale of electricity resulted in gross profit of R$94.0 million, up 29.8% year-over-year.
Other products and services totaled R$3.0 million and was impacted by the non-cash loss of R$6.4 million from the negative variation of the biological asset’s fair value, in addition to the R$6.7 million in amortization of business combination, recognized at cost in 3Q 2013.
Selling, General and Administrative Expenses
| 3Q 2013 | 3Q 2012 | SG & A Expenses | YTD 2013 | YTD 2012 | |||||||||||||||||||
| (jul - sep) | (jul - sep) | Chg.% | Amounts in R$ MM | (jan - sep) | (jan - sep) | Chg.% | |||||||||||||||||
| (223.8 | ) | (167.9 | ) | 33.3 | % | Selling Expenses | (533.6 | ) | (333.6 | ) | 60.0 | % | |||||||||||
| (134.8 | ) | (121.3 | ) | 11.1 | % | General and Administrative Expenses | (401.6 | ) | (368.4 | ) | 9.0 | % | |||||||||||
Raízen Energia’s selling expenses amounted to R$223.8 million in 3Q 2013, up 33.3% compared to 3Q 2012. Higher expenses with freight, logistics and ship loading at the port were the main drivers for the selling expenses and were caused by increase in exports volumes.
In 3Q 2013, general and administrative expenses totaled R$134.8 million, representing 11.1% increase compared to the R$121.3 million reported in 3Q 2012. This increase is related to personnel expenses mainly connected to the collective bargaining agreement, as well as institutional expenses linked to marketing campaigns continuing from the previous quarter.
15 of 48
| | Earnings Release 3rd Quarter of Fiscal Year 2013 – July, August and September 2013 |
EBITDA
| 3Q 2013 | 3Q 2012 | EBITDA | YTD 2013 | YTD 2012 | |||||||||||||||||||
| (jul - sep) | (jul - sep) | Chg.% | Amounts in R$ MM | (jan - sep) | (jan - sep) | Chg.% | |||||||||||||||||
| 900.5 | 849.5 | 6.0 | % | EBITDA | 1,724.2 | 1,652.4 | 4.3 | % | |||||||||||||||
| 27.7 | % | 37.8 | % | -10.0 p.p. | Margin EBITDA (%) | 24.4 | % | 35.1 | % | -10.7 p.p. | |||||||||||||
Raízen Energia’s EBITDA reached R$900.5 million in 3Q 2013, 6.0% increase compared to the R$849.5 million reported in 3Q 2012, despite a reduction of 9.4% of the average of sugar equivalent price (which accounts for the sale of both sugar and ethanol) in the period.
16 of 48
| | Earnings Release 3rd Quarter of Fiscal Year 2013 – July, August and September 2013 |
Hedge
Volume positions and fixed sugar prices agreed with traders or through derivative financial instruments as of September 30, 2013, and foreign exchange derivatives contracted by Raízen Energia to hedge future cash flows, are summarized as follows:
Summary of Hedge Operations at Sep 30, 20134 | ||||||||
| Sugar | 2013 / 2014 | 2014 / 2015 | ||||||
| NY #11 | ||||||||
| Volume (‘000 ton) | 2,695.8 | 961.1 | ||||||
| Average Price (¢US$/lb) | 18.59 | 17.90 | ||||||
| Exchange Rate | ||||||||
| US$ | ||||||||
| Volume (US$ mm) | 1,145.1 | 397.7 | ||||||
| Average Price (R$/US$) | 2.18 | 2.41 | ||||||
Note 4: The table presents hedge coverage taking into consideration the crop-years ending on 03/31/2014 and 03/31/2015, respectively.
Hedge Accounting Impacts
Raízen Energia has been using cash flow hedge accounting for certain derivative financial instruments in order to hedge against the sugar price risk for revenues from exports.
The table below shows the expected transfer of gain/loss balances from shareholders’ equity as at September 30, 2013 to the net operating income of Raízen Energia5 in future years, broken down by coverage period for the following hedging instruments.
| Expiration Period - (R$MM) | ||||||||||||||
| Derivative | Market | Risk | 2013 | 2014 | Total | |||||||||
| Futures | OTC/NYBOT | NY#11 | 23.9 | (9.5 | ) | 14.4 | ||||||||
| (=) Hedge Accounting impact | 23.9 | (9.5 | ) | 14.4 | ||||||||||
| (-) Deferred Income Tax | (8.1 | ) | 3.2 | (4.9 | ) | |||||||||
| (=) Asset Valuation Adjustment | 15.8 | (6.3 | ) | 9.5 | ||||||||||
Note 5: The table above shows 100% of the hedge accounting gains/losses reclassified to shareholders’ equity. As Cosan has a 50% stake in Raízen Energia, the hedge accounting will proportionally impact the Other Comprehensive Income in Cosan’s shareholders’ equity.
17 of 48
| | Earnings Release 3rd Quarter of Fiscal Year 2013 – July, August and September 2013 |
Capex
| 3Q 2013 | 3Q 2012 | CAPEX | YTD 2013 | YTD 2012 | |||||||||||||||||||
| (jul - sep) | (jul - sep) | Chg.% | Amounts in R$ MM | (jan - sep) | (jan - sep) | Chg.% | |||||||||||||||||
| 433.6 | 360.8 | 20.2 | % | Total CAPEX | 1,927.0 | 1,815.4 | 6.1 | % | |||||||||||||||
| 309.3 | 277.1 | 11.6 | % | Operating CAPEX | 1,427.7 | 1,483.5 | -3.8 | % | |||||||||||||||
| 250.6 | 233.2 | 7.5 | % | Biological Assets | 709.4 | 776.8 | -8.7 | % | |||||||||||||||
| 9.7 | 7.7 | 26.0 | % | Inter-Harvest Maintenance Costs | 483.0 | 443.9 | 8.8 | % | |||||||||||||||
| 15.5 | 10.6 | 46.2 | % | SSMA and Sustaining | 48.4 | 92.6 | -47.8 | % | |||||||||||||||
| 30.4 | 15.1 | 101.3 | % | Mechanization | 122.4 | 140.0 | -12.6 | % | |||||||||||||||
| 3.1 | 10.5 | -70.5 | % | Industrial | 64.5 | 30.2 | 113.6 | % | |||||||||||||||
| 124.3 | 83.7 | 48.5 | % | Expasion CAPEX | 499.3 | 331.9 | 50.4 | % | |||||||||||||||
| 3.7 | 16.0 | -76.9 | % | Cogeneration Projects | 46.5 | 165.7 | -72.0 | % | |||||||||||||||
| 120.6 | 67.7 | 78.1 | % | Expansion and Other Projects | 452.8 | 166.2 | 172.4 | % | |||||||||||||||
Raízen Energia’s Capex totaled R$433.6 million in 3Q 2013, representing an increase of 20.2% over the R$360.8 million reported in 3Q 2012.
Investments in biological assets amounted to R$250.6 million in 3Q 2013, 7.5% higher compared to the same quarter of the previous period, due to the field renovation strategy to maintain sugarcane fields at high productivity levels.
Investment in cogeneration in the 3Q 2013 decreased by 76.9% compared to 3Q 2012 due to the completion of these projects.
Expansion-related and other projects increased 78.1% q-o-q and totaled R$120.6 million due to the beginning of expenditure related to new expansion in crushing capacity projects at the Paraguaçu and Caarapó units. Also, this line includes other projects such as initiatives aiming at vinasse concentration, conversion of hydrous into anhydrous ethanol, biomass projects, expansion of mechanized fields, as well as operational improvements.
18 of 48
| | Earnings Release 3rd Quarter of Fiscal Year 2013 – July, August and September 2013 |
B.3 Comgás
We present below the results of Comgás, the business unit that distributes and commercializes natural gas in the concession region in the State of São Paulo.
The 3Q 2012 and YTD 2012 periods reflect Comgás’ accounting information disclosed prior to its consolidation to Cosan’s financial statements, or represent a combination of quarters of calendar years 2012 and 2013
Volumes Sold
| 3Q 2013 | 3Q 2012 | Volume Sold | YTD 2013 | YTD 2012 | |||||||||||||||||||
| (jul - sep) | (jul - sep) | Chg.% | Volume ('000 cbm) | (jan - sep) | (jan - sep) | Chg.% | |||||||||||||||||
| 1,307,881 | 1,294,207 | 1.1 | % | Total Gas Sales | 4,106,242 | 3,829,720 | 7.2 | % | |||||||||||||||
| 1,222,369 | 1,218,851 | 0.3 | % | Gas Sales | 3,557,146 | 3,559,497 | -0.1 | % | |||||||||||||||
| 65,372 | 56,789 | 15.1 | % | Residential | 165,916 | 148,403 | 11.8 | % | |||||||||||||||
| 31,503 | 29,293 | 7.5 | % | Commercial | 87,438 | 83,388 | 4.9 | % | |||||||||||||||
| 984,268 | 970,248 | 1.4 | % | Industrial | 2,871,410 | 2,851,469 | 0.7 | % | |||||||||||||||
| 79,450 | 92,440 | -14.1 | % | Cogeneration | 247,510 | 268,186 | -7.7 | % | |||||||||||||||
| 61,776 | 70,081 | -11.9 | % | Vehicular | 184,872 | 208,050 | �� | -11.1 | % | ||||||||||||||
| 85,511 | 75,356 | 13.5 | % | Thermal Power | 549,096 | 270,224 | 103.2 | % | |||||||||||||||
Comgás focuses its business on the expansion of both residential and commercial markets and on the development of the cogeneration and NGV. The industrial segment, which growth is linked to the GDP evolution in the concession area, is the most relevant in terms of volumes.
During 3Q 2013, the company distributed 65.4 million cbm of gas to the residential segment, an increase of 15.1% compared to the 50.7 million cbm volume distributed in 3Q 2012, reaching 56.8 million cbm. Volume variations in the segment are explained basically by the connection of new customers to the network. The segment ended September with 936,034 meters connected, a 7.4% growth compared to 3Q 2012, when meters connected amounted to 871,934. In 3Q 2013, the residential segment contributed with 28% to the margin and represented 5% of the total distributed volume.
The commercial segment accounted for 31.5 million cbm of gas distributed by Comgás in 3Q 2013, representing growth of 7.5% compared to 3Q 2012, when total volume distributed was 29.3 million cbm. This volume represents 2% of the total distributed volume of gas in 3Q 2013, with a 8% margin contribution. During 3Q 2013, 101 new commercial clients were connected.
The industrial segment totaled 984.3 million cbm of gas distributed in 3Q 2013, up 1.4% compared to the 970.3 million cbm distributed in 3Q 2012. Comgás’ strategy contemplates the maintenance and loyalty of this customer base, by means of developing new applications for natural gas while working to add new customers in its concession area. At the close of 3Q 2013, Comgás had 1,018 clients in this segment, accounting for 75% of the total gas sales for the quarter with a contribution to the margin of 60%.
19 of 48
| | Earnings Release 3rd Quarter of Fiscal Year 2013 – July, August and September 2013 |
Thanks to the downtime for maintenance at two clients, volume sold to the cogeneration market fell 14.1% over 3Q 2012, from 92.4 million cbm in 3Q 2012 to 79.5 million cbm in 3Q 2013, and represented 6% of total volume distributed with a 2% contribution to the margin.
In 3Q 2013 the automotive segment represented 5% of total distributed volume, reaching 61.8 million cbm. The 11.9% decrease in volume sold compared to 3Q 2012 is explained by the segment’s high sensitivity to price changes and the competition from other fuels.
The volume distributed to the thermal power generation segment in the 3Q 2013 reached 85.5 million cbm, up 13.5% compared to the 3Q 212, when the volume sold was 75.4 million cbm. In the quarter, this segment represented 7% of the total volume of gas sold contributing with 2% contribution to the margin.
Comgás’ gas supply contracts do not include thermal power plants volumes. If thermal power plants need to dispatch gas, Petrobras will supply the Company the additional volume, as these are “back to back” contracts.
Natural Gas
Volume of Gas Sold (million cbm) and New AHU6 Connected (thousand units)
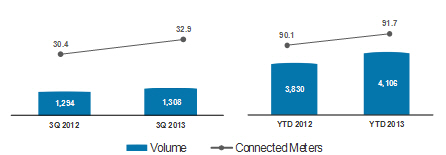
Note 6: New AHU (autonomous home units) connected in the period.
20 of 48
| | Earnings Release 3rd Quarter of Fiscal Year 2013 – July, August and September 2013 |
Operating Revenue
| 3Q 2013 | 3Q 2012 | Sales Breakdown | YTD 2013 | YTD 2012 | |||||||||||||||||||
| (jul - sep) | (jul - sep) | Chg.% | Amounts in R$ MM | (jan - sep) | (jan - sep) | Chg.% | |||||||||||||||||
| 2,065.1 | 1,753.9 | 17.7 | % | Gross Operating Revenue | 5,796.9 | 4,727.8 | 22.6 | % | |||||||||||||||
| 1,851.5 | 1,623.8 | 14.0 | % | Gas Sales | 5,257.6 | 4,395.0 | 19.6 | % | |||||||||||||||
| 239.8 | 191.5 | 25.2 | % | Residential | 591.8 | 479.1 | 23.5 | % | |||||||||||||||
| 80.7 | 68.7 | 17.6 | % | Commercial | 216.6 | 185.8 | 16.6 | % | |||||||||||||||
| 1,357.2 | 1,172.9 | 15.7 | % | Industrial | 3,827.0 | 3,197.1 | 19.7 | % | |||||||||||||||
| 74.0 | 100.3 | -26.2 | % | Cogeneration | 228.3 | 260.6 | -12.4 | % | |||||||||||||||
| 35.7 | 28.3 | 26.2 | % | Thermal Power | 210.9 | 98.8 | 113.5 | % | |||||||||||||||
| 64.0 | 62.1 | 3.2 | % | Vehicular | 183.0 | 173.6 | 5.4 | % | |||||||||||||||
| 204.4 | 105.0 | 94.8 | % | Construction Revenue | 513.7 | 294.2 | 74.6 | % | |||||||||||||||
| 9.2 | 25.2 | -63.5 | % | Other | 25.6 | 38.6 | -33.7 | % | |||||||||||||||
| (382.6 | ) | (340.5 | ) | 12.4 | % | Tax on Sales | (1,061.0 | ) | (915.4 | ) | 15.9 | % | |||||||||||
| 1,682.5 | 1,413.5 | 19.0 | % | Net Operating Revenue | 4,735.9 | 3,812.4 | 24.2 | % | |||||||||||||||
| 1,469.2 | 1,285.7 | 14.3 | % | Gas Sales | 4,201.1 | 3,483.3 | 20.6 | % | |||||||||||||||
| 204.4 | 105.0 | 94.8 | % | Construction Revenue | 513.7 | 294.2 | 74.6 | % | |||||||||||||||
| 8.9 | 22.8 | -60.8 | % | Other | 21.1 | 34.8 | -39.5 | % | |||||||||||||||
Comgás recorded gross revenue of R$2.1 billion in 3Q 2013, up 17.7% compared to the R$1.8 billion reported in 3Q 2012. Net revenue from sales and services totaled R$ 1.7 billion, a 19.0% increase compared to the same period of the previous year.
Tariff increases, as approved by the São Paulo State Sanitation and Energy Regulatory Agency (ARSESP) resolutions nos. 340, 379 and 421, were the main drivers of the variations in Natural Gas Sales Revenue. In order to establish the new tariff, ARSESP considered the increased cost of natural gas, especially imported gas (subject to agency review), which was impacted by the stronger dollar and the higher average contracted oil price per barrel, key elements for natural gas price formation in Brazil.
Cost of Goods and Services
| 3Q 2013 | 3Q 2012 | COGS | YTD 2013 | YTD 2012 | |||||||||||||||||||
| (jul - sep) | (jul - sep) | Chg.% | Amounts in R$ MM | (jan - sep) | (jan - sep) | Chg.% | |||||||||||||||||
| (1,198.6 | ) | (990.0 | ) | 21.1 | % | Cost of Goods and Services | (3,410.4 | ) | (2,798.6 | ) | 21.9 | % | |||||||||||
| (887.8 | ) | (791.8 | ) | 12.1 | % | Natural Gas | (2,593.2 | ) | (2,230.5 | ) | 16.3 | % | |||||||||||
| (106.3 | ) | (93.2 | ) | 14.0 | % | Transportation and other Gas services | (303.4 | ) | (273.9 | ) | 10.8 | % | |||||||||||
| (204.4 | ) | (105.0 | ) | 94.8 | % | Construction | (513.7 | ) | (294.2 | ) | 74.6 | % | |||||||||||
Comgás’ cost of goods and services sold, comprised of commodity costs, transportation and construction totaled R$1.2 billion in 3Q 2013, representing an increase of 21.1% to R$900.0 million recorded in 3Q 2012.
The increase in the natural gas cost and transportation & other lines are chiefly due to the increase in gas cost due to supply agreements priced in dollars, and the lower amount of gas offered in auctions by Petrobras in 2013. The change in the construction cost line directly relates to the higher level of investment during the year.
21 of 48
| | Earnings Release 3rd Quarter of Fiscal Year 2013 – July, August and September 2013 |
The differences between actual costs incurred and the cost of gas included in the tariff charged to customers (as per the ARSESP tariff structure) are accrued to the regulatory account and are passed through or charged according to regulatory resolutions in periodic adjustments or tariff reviews. This balance is monthly adjusted by the SELIC rate. On September 30, 2013, the Regulatory account had a positive balance of approximately R$350 million payable to Comgás.
The regulatory account represents a balance payable or receivable related to the difference between the prices of the gas bought by Comgás and the one used in the tariff composition. This balance is not recorded, so when we refer to its normalization, it means to consider this asset and/or liability as if it was recorded.
Gross Profit
| 3Q 2013 | 3Q 2012 | Gross Profit | YTD 2013 | YTD 2012 | |||||||||||||||||||
| (jul - sep) | (jul - sep) | Chg.% | Amounts in R$ MM | (jan - sep) | (jan - sep) | Chg.% | |||||||||||||||||
| 484.0 | 423.5 | 14.3 | % | Gross Profit | 1,325.6 | 1,013.7 | 30.8 | % | |||||||||||||||
| 28.8 | % | 30.0 | % | -1.2 p.p. | Gross Margin (%) | 28.0 | % | 26.6 | % | 1.4 p.p | |||||||||||||
Comgás recorded gross profit of R$484.0 million in 3Q 2013, growth of 14.3% compared to the 3Q 2012. This variation is primarily explained by (i) activity in the Regulatory Account; (ii) 6.16% weighted average tariff adjustment in May 2013; and (iii) increased volume sold in 3Q 2013.
Selling, General and Administrative Expense
| 3Q 2013 | 3Q 2012 | SG&A Expenses | YTD 2013 | YTD 2012 | |||||||||||||||||||
| (jul - sep) | (jul - sep) | Chg.% | Amounts in R$ MM | (jan - sep) | (jan - sep) | Chg.% | |||||||||||||||||
| (157.2 | ) | (104.6 | ) | 50.3 | % | Selling Expenses | (429.4 | ) | (303.3 | ) | 41.6 | % | |||||||||||
| (72.8 | ) | (75.7 | ) | -3.8 | % | G&A Expenses | (219.4 | ) | (210.5 | ) | 4.2 | % | |||||||||||
| (0.0 | ) | (2.2 | ) | -99.2 | % | Other Operating Revenues (Expenses) | (6.5 | ) | (7.9 | ) | -17.8 | % | |||||||||||
Comgás’ selling expenses totaled R$157.2 million in 3Q 2013, representing an increase of 50.3% compared to the 3Q 2012 figure of R$104.6 million. Excluding the effect in the amount of R$30.9 million of the goodwill amortization (concession rights) allocated under selling expenses in the 3Q 2013, the increase in selling expenses would have been 20.8% q-o-q due to allowance for doubtful accounts.
General and administrative expenses totaled R$72.8 million in 3Q 2013, representing a 3.8% decrease compared to the R$75.7 million reported in 3Q 2012.
22 of 48
| | Earnings Release 3rd Quarter of Fiscal Year 2013 – July, August and September 2013 |
EBITDA
| 3Q 2013 | 3Q 2012 | EBITDA | YTD 2013 | YTD 2012 | |||||||||||||||||||
| (jul - sep) | (jul - sep) | Chg.% | Amounts in R$ MM | (jan - sep) | (jan - sep) | Chg.% | |||||||||||||||||
| 369.0 | 318.3 | 15.9 | % | EBITDA | 997.7 | 708.6 | 40.8 | % | |||||||||||||||
| 21.9 | % | 22.5 | % | -0.6 p.p. | EBITDA Margin (%) | 21.1 | % | 18.6 | % | 2.5 p.p | |||||||||||||
| 348.8 | 312.3 | 11.7 | % | Normalizade EBITDA | 941.6 | 900.0 | 4.6 | % | |||||||||||||||
| 20.7 | % | 22.1 | % | -1.4 p.p. | Normalized EBITDA Margin (%) | 19.9 | % | 23.6 | % | -3.7 p.p. | |||||||||||||
Comgás’s EBITDA reached R$369.0 million in 3Q 2013, an increase of 15.9% compared to the figure reported in 3Q 2012, of R$318.3 million.
EBITDA margin for the quarter reached 21.9%, 0.6 p.p. below the 3Q 2012. When normalized by the Regulatory Account, EBITDA reached R$348.8 million in the period, up 11.7% compared to the R$312.3 million reported in 3Q 2012.
CAPEX
| 3Q 2013 | 3Q 2012 | CAPEX | YTD 2013 | YTD 2012 | |||||||||||||||||||
| (jul - sep) | (jul - sep) | Chg.% | Amounts in R$ MM | (jan - sep) | (jan - sep) | Chg.% | |||||||||||||||||
| 248.4 | 158.4 | 56.8 | % | CAPEX | 642.8 | 426.5 | 50.7 | % | |||||||||||||||
Comgás’ investments totaled R$248.4 million during 3Q 2013, 56.8% higher y-o-y. Of this total, 65% were invested in network expansion, reinforcing the expansion strategy to regions not served by Comgás, in addition to network penetration.
23 of 48
| | Earnings Release 3rd Quarter of Fiscal Year 2013 – July, August and September 2013 |
B.4 Rumo Logística
We present below the results of Rumo Logística, company responsible for providing integrated logistics solutions for sugar and other agricultural commodities exports, offering transportation, storage and port loading services.
Net revenue
| 3Q 2013 | 3Q 2012 | Sales Breakdown | YTD 2013 | YTD 2012 | |||||||||||||||||||
| (jul - sep) | (jul - sep) | Chg.% | Amounts in R$ MM | (jan - sep) | (jan - sep) | Chg.% | |||||||||||||||||
| 328.5 | 217.9 | 50.8 | % | Net Operating Revenue | 711.2 | 397.1 | 79.1 | % | |||||||||||||||
| 270.9 | 166.4 | 62.8 | % | Transportation | 571.5 | 297.7 | 92.0 | % | |||||||||||||||
| 54.5 | 47.6 | 14.4 | % | Loading | 127.9 | 89.8 | 42.5 | % | |||||||||||||||
| 3.1 | 3.9 | -19.7 | % | Other | 11.8 | 9.6 | 22.8 | % | |||||||||||||||
In 3Q 2013, Rumo’s net revenue totaled R$328.5 million, up 50.8% compared to the same period of the previous year.
Net revenue from transportation in 3Q 2013 totaled R$270.9 million, up 62.8% compared to the same period of the previous year, mostly due to (i) increased sugar volumes transported; (ii) higher average prices for transportation; and (iii) reimbursement for road transportation additional costs compared to the negotiated rail freight under the contract with America Latina Logística (ALL).
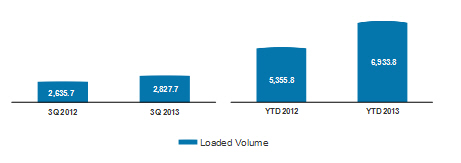
Rumo’s loading volume in the quarter was 7.3% higher than 3Q 2012, reaching 2.8 million tons of sugar. Loading revenue increased by 14.4% in the period, leveraging not only from the increase in volume, but also from higher average prices when compared to the same period last year.
Loading Volume
(‘000 ton)
24 of 48
| | Earnings Release 3rd Quarter of Fiscal Year 2013 – July, August and September 2013 |
Cost of Services Provided
| 3Q 2013 | 3Q 2012 | Costs of Services | YTD 2013 | YTD 2012 | |||||||||||||||||||
| (jul - sep) | (jul - sep) | Chg.% | Amounts in R$ MM | (jan - sep) | (jan - sep) | Chg.% | |||||||||||||||||
| (203.4 | ) | (133.7 | ) | 52.1 | % | Cost of Services | (429.6 | ) | (281.4 | ) | 52.7 | % | |||||||||||
Cost of services provided includes railway and highway freight, port elevation, transshipment and storage costs in upstate São Paulo and at the Port of Santos.
In 3Q 2013, cost of services provided by Rumo was R$203.4 million, an increase of 52.1% compared to 3Q 2012, as a result of increased volume and cost of freight, mainly due to contingent contracting on road transportation to the Port of Santos.
Gross Profit
| 3Q 2013 | 3Q 2012 | Gross Profit | YTD 2013 | YTD 2012 | |||||||||||||||||||
| (jul - sep) | (jul - sep) | Chg.% | Amounts in R$ MM | (jan - sep) | (jan - sep) | Chg.% | |||||||||||||||||
| 125.1 | 84.2 | 48.6 | % | Gross Profit | 281.6 | 115.7 | 143.4 | % | |||||||||||||||
| 38.1 | % | 38.6 | % | -0.5 p.p. | Gross Margin (%) | 39.6 | % | 29.1 | % | 10.5 p.p | |||||||||||||
In 3Q 2013, Rumo reported gross profit of R$125.1 million, 48.6% higher than in 3Q 2012. Gross margin for the quarter decreased by 0.5 p.p., reaching 38.1% in 3Q 2013 compared to 38.6% in 3Q 2012.
General and Administrative Expenses
| 3Q 2013 | 3Q 2012 | G&A Expenses | YTD 2013 | YTD 2012 | |||||||||||||||||||
| (jul - sep) | (jul - sep) | Chg.% | Amounts in R$ MM | (jan - sep) | (jan - sep) | Chg.% | |||||||||||||||||
| (17.3 | ) | (14.1 | ) | 22.6 | % | G&A Expenses | (51.7 | ) | (37.9 | ) | 36.4 | % | |||||||||||
The adequacy in Rumo’s administrative structure for new growth projects led general and administrative expenses to the amount of R$17.3 million in 3Q 2013.
EBITDA
| 3Q 2013 | 3Q 2012 | EBITDA | YTD 2013 | YTD 2012 | |||||||||||||||||||
| (jul - sep) | (jul - sep) | Chg.% | Amounts in R$ MM | (jan - sep) | (jan - sep) | Chg.% | |||||||||||||||||
| 115.0 | 85.9 | 33.9 | % | EBITDA | 269.0 | 149.3 | 80.2 | % | |||||||||||||||
| 35.0 | % | 39.4 | % | -4.4 p.p. | Margin EBITDA (%) | 37.8 | % | 37.6 | % | 0.2 p.p | |||||||||||||
In 3Q 2013, Rumo recorded EBITDA of R$115.0 million, and EBITDA margin of 35.0%, a decrease of 4.4 p.p. year-over-year, negatively impacted by the allowance for doubtful accounts in the amount of R$15.8 million recognized in September 2013, under the accounting policy adopted by the company.
25 of 48
CAPEX
| 3Q 2013 | 3Q 2012 | CAPEX | YTD 2013 | YTD 2012 | |||||||||||||||||||
| (jul - sep) | (jul - sep) | Chg.% | Amounts in R$ MM | (jan - sep) | (jan - sep) | Chg.% | |||||||||||||||||
| 87.2 | 82.8 | 5.3 | % | CAPEX | 213.3 | 175.9 | 21.2 | % | |||||||||||||||
Rumo’s investments in 3Q 2013 totaled R$87.2 million, 5.3% above the R$82.8 million reported in 3Q 2012.
The main investments were directed to the following initiatives:
| (i) | R$47.0 million in permanent railroad operated by América Latina Logística (ALL); |
| (ii) | R$20.4 million in improvements at the Santos port terminal, including discharging capacity increase, improvements on reception rout belts and shipping terminal, works to cover the South terminal quay (ongoing) and recurring investments related to equipment and warehouse infrastructure; |
| (iii) | R$19.8 million in other initiatives, mainly investments in transshipment terminals at the countryside of São Paulo state |
26 of 48
| | Earnings Release 3rd Quarter of Fiscal Year 2013 – July, August and September 2013 |
B.5 Lubricants and Specialties
The result of the Lubricants and Specialties segment, is comprised of industrialization and distribution of lubricants under the brands Mobil and Comma, resale of base oil and automotive specialties in Brazil and other 40 countries, through plants located in Rio de Janeiro, Brazil and Kent, United Kingdom.
Net revenue
| 3Q 2013 | 3Q 2012 | Sales Breakdown | YTD 2013 | YTD 2012 | |||||||||||||||||||
| (jul - sep) | (jul - sep) | Chg. % | Amounts in R$ MM | (jan - sep) | (jan - sep) | Chg.% | |||||||||||||||||
| 407.3 | 369.6 | 10.2 | % | Net Operating Revenue | 1,151.1 | 1,046.8 | 10.0 | % | |||||||||||||||
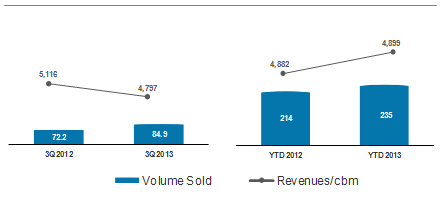
Net revenue from the sale of lubricants, resale of base oil and other Lubricants and Specialties products and services reached R407.3 million in 3Q 2013, a 10.2% increase compared to 3Q 2012, mainly due to the 17.6% increase in volumes sold, mainly base oils.
Total average unit revenue decreased by 6.2%, from R$5,116/cbm in 3Q 2012 to R$4,797/cbm in 3Q 2013, reflection of the higher share of base oil in the mix, product that has the lower unit price.
Lubricants, Base Oils and Other Products
Sales Volume (Millions of liters) and Average Unit Revenue (R$/cbm)
27 of 48
| | Earnings Release Third Quarter of 2013 Fiscal Year – July, August and September, 2013 |
Cost of Goods and Services
| 3Q 2013 | 3Q 2012 | COGS | YTD 2013 | YTD 2012 | |||||||||||||||||||
| (jul - sep) | (jul - sep) | Chg. % | Amounts in R$ MM | (jan - sep) | (jan - sep) | Chg.% | |||||||||||||||||
| (311.0 | ) | (281.9 | ) | 10.3 | % | Cost of Goods and Services | (852.3 | ) | (789.0 | ) | 8.0 | % | |||||||||||
| Average Unitary Cost (R$/cbm) | |||||||||||||||||||||||
| (3,663.1 | ) | (3,902.3 | ) | -6.1 | % | Lubricants Sales and Base Oil | (3,627.2 | ) | (3,679.9 | ) | -1.4 | % | |||||||||||
The cost of goods sold and services of the Lubricants and Specialties segment increased 10.3%, compared to 3Q 2012, to R$311.0 million. The average unitary cost decreased 6.1% from R$3,902/cbm in 3Q 2012 to R$3,663/cbm in 3Q 2013 mainly due to higher operational efficiency related to economies of scale and higher base oil participation in the volumes sold in the period.
Gross Profit
| 3Q 2013 | 3Q 2012 | Gross Profit | YTD 2013 | YTD 2012 | |||||||||||||||||||
| (jul - sep) | (jul - sep) | Chg. % | Amounts in R$ MM | (jan - sep) | (jan - sep) | Chg.% | |||||||||||||||||
| 96.3 | 87.7 | 9.8 | % | Gross Profit | 298.8 | 257.9 | 15.9 | % | |||||||||||||||
| 23.6 | % | 23.7 | % | -0.1 p.p. | Gross Margin (%) | 26.0 | % | 24.6 | % | 1.3 p.p | |||||||||||||
Gross profit increased by 9.8% in the quarter, reaching R$96.3 million compared to R$87.7 million reported in 3Q 2012. Gross margin was 23.6% in the quarter, remaining stable over the same period last year.
Selling, General and Administrative Expenses
| 3Q 2013 | 3Q 2012 | SG&A | YTD 2013 | YTD 2012 | |||||||||||||||||||
| (jul - sep) | (jul - sep) | Chg. % | Amounts in R$ MM | (jan - sep) | (jan - sep) | Chg.% | |||||||||||||||||
| (83.5 | ) | (66.6 | ) | 6.6 | % | Total expenses | (225.7 | ) | (191.8 | ) | 17.6 | % | |||||||||||
Selling, general and administrative expenses increased by 25.3% in 3Q 2013 compared to 3Q 2012 and totaled R$83.5 million, mainly due to the expansion of business activities in Brazil and business internationalization operations by higher volumes sold.
EBITDA
| 3Q 2013 | 3Q 2012 | EBITDA | YTD 2013 | YTD 2012 | |||||||||||||||||||
| (jul - sep) | (jul - sep) | Chg. % | Amounts in R$ MM | (jan - sep) | (jan - sep) | Chg.% | |||||||||||||||||
| 30.9 | 33.9 | -8.8 | % | EBITDA | 127.3 | 102.2 | 24.6 | % | |||||||||||||||
| 7.6 | % | 9.2 | % | -1.6 p.p. | EBITDA Margin (%) | 11.1 | % | 9.8 | % | 1.3 p.p | |||||||||||||
EBITDA for the Lubricants and Specialties segment in 3Q 2013 was R$30.9 million and EBITDA margin was 7.6%, down 1.6 p.p as compared to 3Q 2012 and can be attributed to higher expenses pegged to commercial expenses in the period.
28 of 48
| | Earnings Release Third Quarter of 2013 Fiscal Year – July, August and September, 2013 |
B.6 Radar
Below are the results for Radar, whose main activity is investment in agricultural properties and leasing to the Brazilian rural real estate market.
For comparability purposes, Radar’s YTD 2013 results are presented in pro-forma basis and considers nine months (January to September 2013) of the combination of Radar’s operations with the results of Cosan's lands. The same applies to the year 2012 (YTD 2012) which comprises the period from January to September 2012.
Assets Portfolio
| State | Culture | % | Area (hectare) | Area (acre) | Market Value ( R$MM) | ||||||||||||
| São Paulo | Sugarcane | 65 | % | 70,281 | 173,593 | 2,127 | |||||||||||
| Maranhão | Grains | 15 | % | 16,651 | 41,129 | 145 | |||||||||||
| Mato Grosso | Grains | 11 | % | 12,303 | 30,388 | 156 | |||||||||||
| Bahia | Grains | 7 | % | 7,155 | 17,674 | 77 | |||||||||||
| Goiás | Sugarcane | 1 | % | 672 | 1,659 | 16 | |||||||||||
| Mato Grosso do Sul | Sugarcane | 0 | % | 417 | 1,029 | 2 | |||||||||||
| Total | 100 | % | 107,478 | 265,471 | 2,523 | ||||||||||||
Radar closed 3Q 2013 with a land portfolio of R$2.5 billion, and total area of 107,500 hectares (265.5 thousand acres), distributed throughout six Brazilian states.
Net Revenue
| 3Q 2013 | 3Q 2012 | YTD 2013 | YTD 2012 | ||||||||||||||||||||
| (jul - sep) | (jul - sep) | Chg. % | Amounts in R$ MM | (jan - sep) | (jan - sep) | Chg.% | |||||||||||||||||
| 16.1 | 20.9 | -22.7 | % | Net Revenue | 51.4 | 76.1 | -32.4 | % | |||||||||||||||
| - | 4.7 | -100.0 | % | Property Sale | 5.7 | 22.0 | -74.2 | % | |||||||||||||||
| 16.1 | 16.2 | -0.3 | % | Land Lease | 45.7 | 54.0 | -15.4 | % | |||||||||||||||
| 0.0 | (1.7 | ) | -100.0 | % | Cost of Property Sales | (6.1 | ) | (20.1 | ) | -69.8 | % | ||||||||||||
| 0.0 | (1.7 | ) | -100.0 | % | Property Sale | (6.1 | ) | (20.1 | ) | -69.8 | % | ||||||||||||
| 16.1 | 19.2 | -15.7 | % | Gross Profit | 45.4 | 56.0 | -19.0 | % | |||||||||||||||
| 100.0 | % | 91.7 | % | 0.1 p.p | Gross Margin (%) | 88.2 | % | 73.6 | % | 0.2 p.p | |||||||||||||
In 3Q 2013, Radar’s net revenue totaled R$16.1 million, comprised exclusively from leasing of agricultural lands.
In 3Q 2013, Radar recorded no cost of services provided because it didn’t sell any assets in the period. All costs related to land leasing are incurred by the operator of the agricultural properties, so Radar has no cost related to this operation. Radar’s gross profit was R$16.1 million, a 15.7% decrease over the same period last year.
29 of 48
| | Earnings Release Third Quarter of 2013 Fiscal Year – July, August and September, 2013 |
General and Administrative Expenses
| 3Q 2013 | 3Q 2012 | G&A Expenses | YTD 2013 | YTD 2012 | |||||||||||||||||||
| (jul - sep) | (jul - sep) | Chg. % | Amounts in R$ MM | (jan - sep) | (jan - sep) | Chg. % | |||||||||||||||||
| (5.3 | ) | (4.0 | ) | 34.2 | % | G&A Expenses | (15.1 | ) | (12.7 | ) | 19.3 | % | |||||||||||
| 46.8 | 3.0 | n/a | Other Operational Revenues/Expenses | 110.2 | 5.1 | n/a | |||||||||||||||||
Radar’s general and administrative expenses was R$5.3 million, an increase of 34.2% in 3Q 2013 compared to 2Q 2012.
In 3Q 2013, other operating revenues totaled R$46.8 million and basically refer to gains with Radar’s land portfolio appreciation based on market indexes variation (FNP) in the period.
EBITDA
| 3Q 2013 | 3Q 2012 | EBITDA | YTD 2013 | YTD 2012 | |||||||||||||||||||
| (jul - sep) | (jul - sep) | Chg. % | Amounts in R$ MM | (jan - sep) | (jan - sep) | Chg. % | |||||||||||||||||
| 57.9 | 18.6 | 210.5 | % | EBITDA | 141.2 | 49.9 | 182.8 | % | |||||||||||||||
Radar posted EBITDA of R$57.9 million in 3Q 2013, a 210.5% increase year-over-year.
30 of 48
| | Earnings Release Third Quarter of 2013 Fiscal Year – July, August and September, 2013 |
B.7 Other Businesses
Below we report the results for our Other Businesses, which consist of Cosan’s corporate structure, as well as effects from contingencies from businesses contributed to Raízen before its formation, as well as other investments.
| 3Q 2013 | 3Q 2012 | YTD 2013 | YTD 2012 | ||||||||||||||||||||
| (jul - sep) | (jul - sep) | Chg. % | Amounts in R$ MM | (jan - sep) | (jan - sep) | Chg.% | |||||||||||||||||
| (39.1 | ) | (33.4 | ) | 17.2 | % | G&A Expenses | (95.0 | ) | (96.2 | ) | -1.3 | % | |||||||||||
| (9.2 | ) | (0.5 | ) | n/a | Other Revenues (Expenses) | (0.0 | ) | 59.7 | -100.1 | % | |||||||||||||
| 3Q 2013 | 3Q 2012 | EBITDA | YTD 2013 | YTD 2012 | |||||||||||||||||||
| (jul - sep) | (jul - sep) | Chg. % | Amounts in R$ MM | (jan - sep) | (jan - sep) | Chg.% | |||||||||||||||||
| 303.5 | 316.6 | -4.1 | % | EBITDA | 538.3 | 530.7 | 1.4 | % | |||||||||||||||
| - | - | 0.0 | % | (-) Gross Effects of Raizen's formation | - | 100.3 | n/a | ||||||||||||||||
| (351.3 | ) | (350.7 | ) | 0.2 | % | (-) Equity Pick-up | (631.7 | ) | (656.0 | ) | -3.7 | % | |||||||||||
| (47.8 | ) | (34.1 | ) | 39.9 | % | Adjusted EBITDA | (93.4 | ) | (125.3 | ) | -25.5 | % | |||||||||||
Cosan’s general and administrative expenses are mainly comprised of personnel expenses, which include salaries, taxes, as well as consultancy services totaling R$39.1 million in 3Q 2013, 17.2% higher than the same period last year.
Other operating revenues from Other Businesses totaled an expense of R$9.2 million in 3Q 2013, compared to revenue of R$0.5 million in 3Q 2012, basically reflecting payment of legal fees.
In 3Q 2013, the segment’s EBITDA totaled R$303.5 million, principally due to equity pick-up. Other Businesses segment results by adjusting EBITDA for this effect would have been negative R$47.8 million.
31 of 48
| | Earnings Release Third Quarter of 2013 Fiscal Year – July, August and September, 2013 |
C. Other Items in the Consolidated Result
Financial Result
| 3Q 2013 | 3Q 2012 | Financial Results | YTD 2013 | YTD 2012 | |||||||||||
| (jul - sep) | (jul - sep) | Amounts in R$ MM | (jan-sep) | (jan-sep) | |||||||||||
| (138.1 | ) | (40.3 | ) | Gross Debt Charges | (448.4 | ) | (114.6 | ) | |||||||
| 29.0 | 13.8 | Income from Financial Investments | 91.2 | 47.4 | |||||||||||
| (109.1 | ) | (26.4 | ) | (=) Subtotal: Net Debt Interests | (357.2 | ) | (67.2 | ) | |||||||
| 35.9 | 9.8 | Other Charges and Monetary Variation | 17.8 | (100.8 | ) | ||||||||||
| (16.9 | ) | (3.9 | ) | Exchange Rate Variation | (314.0 | ) | (60.3 | ) | |||||||
| (29.4 | ) | 15.7 | Gains (losses) with Derivatives | 118.3 | 35.5 | ||||||||||
| (13.5 | ) | (4.3 | ) | Amortization, Debt Cost and Other | (90.6 | ) | (27.4 | ) | |||||||
| (132.9 | ) | (9.1 | ) | (=) Financial, Net | (625.7 | ) | (220.3 | ) | |||||||
Net financial result for 3Q 2013 was a financial expense of R$132.9 million, versus a net financial expense of R$9.1 million in 3Q 2012, as a result of: (i) increased debt charges due to Comgás acquisition and consolidation of its debt as of November 2012; and (ii) negative foreign exchange variation of R$16.9 million, and (iii) net derivative loss on exchange rate and interest in the amount of R$29.4 million.
Financial investments closed the quarter with positive income of R$29.0 million, compared to R$13.8 million in 3Q 2012, mainly due to consolidation of Radar and Comgás, as of November 2012.
The negative result from exchange variation reflects the depreciation of the Real against the dollar (R$2.2300/US$ on September 30, 2013 versus R$2.2156/US$ on June 30, 2013), and its impact on foreign-denominated debt, leading to a non-cash impact on the consolidated financial result.
All foreign-denominated debt is hedged by means of exchange swaps, except for the principal amount of the US$ 500 million Perpetual Bond. In 3Q 2012, there was also a depreciation of the Real against the dollar (R$2.0306/US$ on September 30, 2012, versus R$2.0213/US$ on June 30, 2012), which generated an exchange variation expense of R$3.9 million in that period.
From July 1, 2013, the operation of Senior Notes in 2023 and its related derivatives to hedge exposure to foreign currency risk and interest were designated in hedge accounting (fair value hedge), which represented a gain of R$50.6 million in net financial income in 3Q 2013. The hedge consists in the use of cash flow swaps, exchanging foreign currency risk of foreign currency (USD) for local currency (BRL) and prefixed interest rate for percentage of the CDI (domestic market index).
32 of 48
| | Earnings Release Third Quarter of 2013 Fiscal Year – July, August and September, 2013 |
In 3Q 2013, we had a R$11.5 million positive result from exchange swaps amounting and a R$40.9 million negative result with interest rate swaps, summing up to a negative net swap result of R$29.4 million.
Income Tax and Social Contribution
| 3Q 2013 | 3Q 2012 | Income Tax and Social Contribution | YTD 2013 | YTD 2012 | |||||||||||
| (jul - sep) | (jul - sep) | Amounts in R$ MM | (jan-sep) | (jan-sep) | |||||||||||
| 436.3 | 343.7 | Income (Loss) before Income Tax | 634.0 | 368.2 | |||||||||||
| (119.3 | ) | (41.3 | ) | Total of Tax and Social Contribution | (338.7 | ) | 74.9 | ||||||||
| (20.1 | ) | (23.0 | ) | Deferred Income Tax Expenses | (186.1 | ) | 100.8 | ||||||||
| (99.3 | ) | (18.3 | ) | Current Income Tax Expenses | (152.6 | ) | (25.8 | ) | |||||||
| -22.8 | % | -5.3 | % | Effective Rate - Current (%) | -24.1 | % | -7.0 | % | |||||||
In 3Q 2013, total expenses with Income Tax and Social Contribution (IT/SC) were R$119.3 million, mainly due to the negative effects related to unrecorded fiscal credits relative to tax loss of the period (unused tax shield) in the amount of R$47.1 million, as well as adjustments of permanent tax differences from equity pick-up, mainly Raízen’s.
The expense with current income tax and social contribution represents the amount disbursed and to be disbursed, net of refunds, recovery and offsetting of taxes of the same type. The breakdown below provides a better understanding of the IT/SC per business unit.
| 3Q 2013 | |||||||||||||||||||||||||
| Income Tax and Social Contribution | Comgás | Rumo | Lubricants and Specialties | Radar7 | Other Business | Consolidated | |||||||||||||||||||
| Amount in R$ MM | |||||||||||||||||||||||||
| Net Income before Taxes | 218.6 | 100.1 | 12.2 | 58.5 | 200.6 | 436.3 | |||||||||||||||||||
| Nominal Rate of Income Tax and Social Contribution (%) | -34 | % | -34 | % | -34 | % | -34 | % | -34 | % | -34 | % | |||||||||||||
| Income Tax and Social Contribtions Theoretical Expense | (74.3 | ) | (34.0 | ) | (4.1 | ) | (19.9 | ) | (68.2 | ) | (148.3 | ) | |||||||||||||
| (-) Non-taxable Permanent Differences / Equity Pick-up | (0.8 | ) | (0.0 | ) | (2.3 | ) | (0.0 | ) | 119.3 | 63.9 | |||||||||||||||
| (-) Tax Loss and Negative Basis | - | - | (4.7 | ) | - | (42.4 | ) | (47.1 | ) | ||||||||||||||||
| (-) Different Tax Regime for Entities Taxed on Presumed Profits | - | - | - | 14.1 | - | 14.1 | |||||||||||||||||||
| (-) Other | 0.4 | 0.4 | (0.9 | ) | 2.2 | (4.1 | ) | (1.9 | ) | ||||||||||||||||
| Income Tax Effective Expenses | (74.7 | ) | (33.7 | ) | (12.0 | ) | (3.6 | ) | 4.6 | (119.3 | ) | ||||||||||||||
| Income Tax and Social Contribution Effective Rate (%) | 34 | % | 34 | % | 99 | % | 6 | % | -2 | % | 27 | % | |||||||||||||
| Expenses (Revenues) com IR/CS | (74.7 | ) | (33.7 | ) | (12.0 | ) | (3.6 | ) | 4.6 | (119.3 | ) | ||||||||||||||
| Current | (66.8 | ) | (31.3 | ) | 1.3 | (2.7 | ) | 0.2 | (99.3 | ) | |||||||||||||||
| Effective Rate - Current Rate (%) | 31 | % | 31 | % | -11 | % | 5 | % | 0 | % | 23 | % | |||||||||||||
| Deferred | (7.9 | ) | (2.3 | ) | (13.3 | ) | (1.0 | ) | 4.4 | (20.1 | ) | ||||||||||||||
Note7: Radar adopts tax regime for entities taxed on presumed profits
33 of 48
| | Earnings Release Third Quarter of 2013 Fiscal Year – July, August and September, 2013 |
Net Income
| 3Q 2013 | 3Q 2012 | Net income | YTD 2013 | YTD 2012 | |||||||||||
| (jul - sep) | (jul - sep) | Amounts in R$ MM | (jan-sep) | (jan-sep) | |||||||||||
| 208.8 | 283.2 | Net Income | 40.6 | 415.7 | |||||||||||
Cosan recorded net income of R$208.8 million in the quarter, lower than the R$283.2 million income recorded in 3Q 2012, mainly due to (i) negative impact of R$47.1 million due to Cosan’s unrecorded deferred fiscal credits (unused tax shield) of the holding, (ii) negative impact in the financial result line of R$42.5 million in exchange variation and derivatives and (iii) increase of net financial expenses of R$61.2 million due to the debt raised for Comgás acquisition offset by net income equity pick up of R$86.5 million related to Cosan’s 60.1% stake.
34 of 48
| | Earnings Release Third Quarter of 2013 Fiscal Year – July, August and September, 2013 |
D. Indebtedness
At the close of 3Q 2013, Cosan’s consolidated pro forma debt (excluding PESA) was R$12.0 billion, compared to R$11.6 billion in 2Q 2013. The breakdown of the debt of Cosan and Subsidiaries is presented below, as well as the debt of Raízen presented on a pro forma basis and in a 50% proportion.
Cosan and Subsidiaries
Gross debt was R$8.5 billion in 3Q 2013, up 0.8% from 2Q 2013.
The key events in the period were:
| (i) | Amortization of principal and interests of R$460 million, including BNDES, Finame, Senior Notes and Perpetual Bonds; |
| (ii) | Approximately R$261 million raised from BNDES and Resolution 4131 to subsidiary Comgás; |
| (iii) | Provision for interest, monetary and exchange variation in the period, in the amount of R$200 million. |
| (iv) | Change in fair value of Comgás’ foreign currency denominated debt and 2023 Senior Notes in the amount of R$66 million due to the adoption of hedge accounting. |
Raízen
The combined gross debt of Raízen totaled R$3.5 billion at the close of 3Q 2013, up 9.7% sequentially.
In the quarter, the following changes in principal and interest on the debt were made:
| (i) | Amortization of principal and interests of R$225 million related to prepayments, credit restricted cash and senior notes; |
| (ii) | R$471 million raised under prepayments of R$255 million and credit notes of 125 million; |
| (iii) | Provision for interest, monetary and exchange variation in the period, in the amount of R$64 million. |
Cosan – Pro forma Consolidated
The cash balance totaled R$2.1 billion at the end of 3Q 2013, as compared to R$2.5 billion in 2Q 2013. Pro forma net debt in the quarter was R$9.9 billion, compared to R$9.1 billion in the previous quarter, equivalent to leverage of 2.4x pro forma EBITDA of R$4.1 billion of the last 12 months, which include pro forma Comgás.
35 of 48
| | Earnings Release Third Quarter of 2013 Fiscal Year – July, August and September, 2013 |
| Debt per Business Units (Amount in R$ MM) | ||||||||||||||||
| 3Q 2013 | 2Q 2013 | |||||||||||||||
| Comgás | (jul-sep) | (apr-jun) | % ST | Chg.% | ||||||||||||
| Leasing | 1.4 | 1.7 | 92 | % | -17.6 | % | ||||||||||
| Promissory Notes | 418.4 | 409.5 | 100 | % | 2.2 | % | ||||||||||
| EIB | 602.6 | 597.0 | 1 | % | 0.9 | % | ||||||||||
| 4131 Resolution | 504.8 | 561.5 | 23 | % | -10.1 | % | ||||||||||
| BNDES | 1,230.6 | 1,136.1 | 21 | % | 8.3 | % | ||||||||||
| Debentures | 33.9 | 71.8 | 100 | % | -52.9 | % | ||||||||||
| Debt Notes Allocation | (3.9 | ) | (2.1 | ) | 19 | % | n/a | |||||||||
| Financial Instruments - MTM | (180.0 | ) | (238.2 | ) | 16 | % | -24.5 | % | ||||||||
| Total Comgás | 2,607.8 | 2,537.3 | 0 | % | 2.8 | % | ||||||||||
| Rumo | ||||||||||||||||
| Finame | 731.9 | 749.5 | 15 | % | -2.3 | % | ||||||||||
| Expenses with Placement of Debt | (1.5 | ) | (1.6 | ) | 11 | % | -6.6 | % | ||||||||
| Total Rumo | 730.4 | 747.8 | - | -2.3 | % | |||||||||||
| Lubricants and Specialties | ||||||||||||||||
| Finame | 0.2 | 0.2 | 0 | % | 0.0 | % | ||||||||||
| Foreing Loan | 196.9 | 182.1 | 0 | % | 8.2 | % | ||||||||||
| Total Lubricants and Specialties | 197.2 | 182.3 | - | 8.1 | % | |||||||||||
| Other Business | ||||||||||||||||
| Perpetual Bonds | 1,129.1 | 1,121.8 | 1 | % | 0.6 | % | ||||||||||
| Credit Notes | 385.6 | 376.8 | 100 | % | 2.3 | % | ||||||||||
| Debentures | 1,423.6 | 1,448.3 | 2 | % | -1.7 | % | ||||||||||
| FINEP | 89.9 | 89.9 | 0 | % | 0.0 | % | ||||||||||
| Senior Notes 2018 | 853.6 | 872.9 | 0 | % | n/d | |||||||||||
| Senior Notes 2023 | 1,067.1 | 1,124.3 | 0 | % | n/d | |||||||||||
| Expenses with Placement of Debt | (52.6 | ) | (52.4 | ) | 17 | % | 0.3 | % | ||||||||
| Bonus over Perpetual Bonds | 5.5 | 6.1 | 46 | % | -9.8 | % | ||||||||||
| Financial Instruments - MTM | 51.9 | (31.6 | ) | 0 | % | n/a | ||||||||||
| Total Other Business | 4,953.7 | 4,956.0 | - | 0.0 | % | |||||||||||
| Cosan Consolidated | ||||||||||||||||
| Total Debt | 8,489.2 | 8,423.4 | - | 0.8 | % | |||||||||||
| Cash and Cash Equivalents and Secutities | (1,307.9 | ) | (1,604.8 | ) | - | -18.5 | % | |||||||||
| Net Debt | 7,181.3 | 6,818.6 | - | 5.3 | % | |||||||||||
| Raízen | ||||||||||||||||
| Senior Notes 2014 | 789.8 | 803.1 | 100 | % | -1.7 | % | ||||||||||
| BNDES | 1,419.2 | 1,444.5 | 14 | % | -1.7 | % | ||||||||||
| Term Loan | 1,123.4 | 1,069.2 | 11 | % | 5.1 | % | ||||||||||
| Prepaid Exports | 1,277.6 | 947.9 | 17 | % | 34.8 | % | ||||||||||
| Senior Notes 2017 | 902.2 | 911.9 | 1 | % | -1.1 | % | ||||||||||
| Advances on Exchange Contracts | 179.7 | 177.9 | 100 | % | 1.0 | % | ||||||||||
| Credit Notes | 613.4 | 355.7 | 0 | % | 72.4 | % | ||||||||||
| Finame | 115.7 | 131.7 | 45 | % | -12.1 | % | ||||||||||
| Finem | 545.5 | 470.9 | 9 | % | 15.9 | % | ||||||||||
| Rural Credit | 78.5 | 67.3 | 87 | % | 16.6 | % | ||||||||||
| Debt Notes Allocation | (22.5 | ) | (21.5 | ) | 64 | % | 4.4 | % | ||||||||
| Other | 0.1 | 43.6 | 100 | % | -99.8 | % | ||||||||||
Total Raízen8 | 7,022.8 | 6,402.2 | - | 9.7 | % | |||||||||||
| Raízen's Debt ( 50% ) | 3,511.4 | 3,201.1 | - | 9.7 | % | |||||||||||
| Cash and Cash Equivalents and Secutities Raízen | (800.5 | ) | (899.6 | ) | - | -11.0 | % | |||||||||
| Net Debt Raízen | 2,710.9 | 2,301.5 | - | 17.8 | % | |||||||||||
| Consolidated Proforma | ||||||||||||||||
| Total Debt (including Raízen) | 12,000.5 | 11,624.5 | - | 3.2 | % | |||||||||||
| Cash and Cash Equivalents and Secutities (including Raízen) | (2,108.4 | ) | (2,504.5 | ) | - | -15.8 | % | |||||||||
| Pro forma Net Debt | 9,892.1 | 9,120.1 | - | 8.5 | % | |||||||||||
Note 8: Excluding PESA debt.
36 of 48
| | Earnings Release Third Quarter of 2013 Fiscal Year – July, August and September, 2013 |
E. Share Performance
The common shares issued by Cosan S.A. have been listed on BM&FBovespa since 2005, the year of its IPO on the “Novo Mercado” segment under the ticker symbol CSAN3, and are included in the portfolios of the Ibovespa, IBrX, IBrX-50, IBrA, MLCX, ICO2, INDX, ICON, IVBX-2, IGC, IGCT and ITAG indexes.
The shares issued by Cosan Limited, Cosan S.A.'s parent company, have been listed on the NYSE since its IPO in 2007, under the ticker symbol CZZ. The Company has also issued share deposit certificates (Brazilian Depositary Receipts - BDR) on the BM&FBovespa under the symbol CZLT33.
The tables and graphs below represent the performance of shares issued by the companies:
| 3Q 2013 Summary | CSAN3 | CZLT33 | CZZ | ||
| Stock Type | Common Share | BDR | Class A | ||
| Listed in | BM&FBovespa | BM&FBovespa | NYSE | ||
| Closing Price in december 28/06/2013 | R$ | 42.72 | R$ | 15.37 | USD 36.60 |
| Higher Price | R$ | 43.80 | R$ | 16.76 | USD 43.00 |
| Average Price | R$ | 42.10 | R$ | 15.07 | USD 39.42 |
| Lower Price | R$ | 39.90 | R$ | 13.20 | USD 34.69 |
| Average Daily Traded Volume | R$51.7 million | R$10.1 million | USD16.3 million | ||
CSAN3 vs. CZLT33 vs. Ibovespa (Base 100) | CZZ vs. S&P500 (Base 100) |
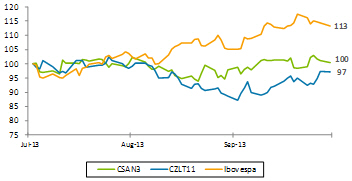 | 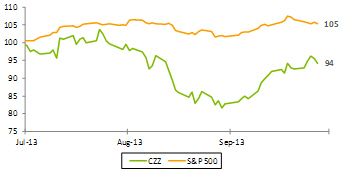 |
37 of 48
| | Earnings Release Third Quarter of 2013 Fiscal Year – July, August and September, 2013 |
F. Guidance
This section contains the guidance broken down by variation range for some key parameters in Cosan’s consolidated results for the calendar year of 2013, that is, from January 1, 2013 to December 31, 2013. In addition, other parts of this Earnings Release may contain forecasts. Such projections and guidance are but estimates and indications, and as such these do not represent any guarantee of prospective results.
This guidance considers the current operations of the Cosan group, which includes Comgás, Rumo, Lubricants and Specialties, Radar and Other Businesses, as well as Raízen Combustíveis and Raízen Energia.
Cosan’s consolidated EBITDA is presented pro forma, including 50% of the results of Raízen Combustíveis and Raízen Energia. As previously stated, as of the adoption of the IFRS 11 – Joint Arrangements, Raízen’s results will no longer be proportionally consolidated on Cosan’s, and will be recorded only in the “Equity Pick-up” line, considering our share (50%) in Net Income. In addition, Comgás’ EBITDA will continue to be presented according to Brazilian accounting practices (IFRS), which do not consider the effects of the regulatory Current Account.
| FY12 | FY13 | 2013 | ||
| (apr/2011 - mar/2012) | (apr/2012 - mar/2013) | (jan/2013 - dec/2013) | ||
| Cosan Consolidated | Net Revenue (R$MM) | 23,391 | 30,017 | 35,000 ≤ ∆ ≤ 38,000 |
| EBITDA (R$MM) | 2,117 | 3,143 | 3,950 ≤ ∆ ≤ 4,350 | |
Capex (R$MM) 9 | 2,134 | 2,178 | 2,800 ≤ ∆ ≤ 3,000 | |
| Raízen Combustíveis | Volume of Fuels Sold (million liters) | 20,914 | 21,967 | 22,500 ≤ ∆ ≤ 24,000 |
| EBITDA (R$MM) | 1,305 | 1,658 | 1,600 ≤ ∆ ≤ 1,800 | |
| Raízen Energia | Volume of Sugar Cane Crushed (thousand tonnes) | 52,958 | 56,221 | 59,000 ≤ ∆ ≤ 62,000 |
| Volume of Sugar Sold (thousand tonnes) | 3,969 | 4,230 | 4,300 ≤ ∆ ≤ 4,600 | |
| Volume of Ethanol Sold (million liters) | 1,921 | 2,323 | 2,100 ≤ ∆ ≤ 2,300 | |
| Volume of Energy Sold (thousand of MWh) | 1,233 | 3,035 | 1,900 ≤ ∆ ≤ 2,100 | |
| EBITDA (R$MM) | 2,235 | 2,408 | 2,400 ≤ ∆ ≤ 2,700 | |
| Rumo | Volume of Loading (thousand tonnes) | 7,759 | 8,566 | 8,500 ≤ ∆ ≤ 10,500 |
| EBITDA (R$MM) | 211 | 297 | 330 ≤ ∆ ≤ 370 | |
| Radar | EBITDA (R$MM) | - | 180.000 | 140 ≤ ∆ ≤ 160 |
| Lubricants and Specialties | Total Volume Sold (million Liters) | 217 | 287 | 270 ≤ ∆ ≤ 310 |
| EBITDA (R$MM) | 140 ≤ ∆ ≤ 170 | |||
| Comgás | Number of Clients (thousand) 9 | 1,099 | 1,215 | 1,320 ≤ ∆ ≤ 1,330 |
Network Expansion (km) 9 | 1,100 | 1,282 | 1,350 ≤ ∆ ≤ 1,450 | |
| Total Volume of Gas Sold (thousand cbm) | 4,835 | 5,259 | 5,200 ≤ ∆ ≤ 5,700 | |
| EBITDA IFRS (R$MM) | 716 | 962 | 1,350 ≤ ∆ ≤ 1,550 |
Note 9: Amounts revised on 09/30/2013.
38 of 48
| | Earnings Release Third Quarter of 2013 Fiscal Year – July, August and September, 2013 |
Disclaimer
This document contains forward-looking statements and estimates. These forward-looking statements and estimates are solely forecasts and do not represent any guarantee of prospective results. All stakeholders should know that these statements and estimates are and will be, depending on the case, subject to risks, uncertainties and factors related to the operations and business environment of Cosan and its subsidiaries, and therefore the actual results of these companies may significantly differ from the estimated or implied prospective results contained in such forward-looking statements and estimates.
39 of 48
| | Earnings Release Third Quarter of 2013 Fiscal Year – July, August and September, 2013 |
E. Financial Statements
E.1 Cosan S/A Consolidated
| Cosan Consolidated | 3Q 2013 | 3Q 2012 | ||||||
| Income Statement for the period | Sep 30, 2013 | Sep 30, 2012 | ||||||
| Net Operating Revenue | 2,434,511 | 608,440 | ||||||
| Gross Profit | 721,548 | 191,512 | ||||||
| Sales, general and administrative expenses | (375,153 | ) | (118,191 | ) | ||||
| Other operating income (expenses), net | 31,827 | (3,038 | ) | |||||
| Financial revenue | 48,578 | 42,003 | ||||||
| Financial expenses | (135,167 | ) | (62,929 | ) | ||||
| Foreign exchange variation | (16,906 | ) | (3,906 | ) | ||||
| Derivative | (29,435 | ) | 15,685 | |||||
| Equity pick up | 191,022 | 282,524 | ||||||
| Income and Social Contribution Taxes | (119,349 | ) | (41,275 | ) | ||||
| Net Income (loss) | 316,965 | 302,385 | ||||||
| Cosan Consolidated | 3Q 2013 | 2Q 2013 | ||||||
| Balance Sheet | Sep 30, 2013 | Jun 30, 2013 | ||||||
| Cash and Cash Equivalents | 1,202,229 | 1,490,634 | ||||||
| Securities | 105,658 | 114,190 | ||||||
| Accounts Rreceivable | 997,114 | 1,018,244 | ||||||
| Inventories | 292,076 | 274,147 | ||||||
| Other Current Assets | 726,005 | 777,266 | ||||||
| Investments | 89,516 | 92,296 | ||||||
| Investments in Jointly Owned Subsidiaries | 8,468,438 | 8,551,222 | ||||||
| Investment Property | 2,523,405 | 2,477,955 | ||||||
| Property, Plant and Equipment | 1,249,958 | 1,206,120 | ||||||
| Intangible | 9,973,856 | 9,756,657 | ||||||
| Other Non-Current Assets | 2,398,497 | 2,409,203 | ||||||
| Total Assets | 28,026,752 | 28,167,934 | ||||||
| Loans and Financing | (8,617,159 | ) | (8,693,246 | ) | ||||
| Suppliers | (841,972 | ) | (970,344 | ) | ||||
| Salaries Payable | (105,593 | ) | (109,171 | ) | ||||
| Other current liabilities | (625,575 | ) | (804,883 | ) | ||||
| Other non-current liabilities | (4,579,437 | ) | (4,547,565 | ) | ||||
| Net Equity | (13,257,016 | ) | (13,042,725 | ) | ||||
| Total Liabilities | (28,026,752 | ) | (28,167,934 | ) | ||||
40 of 48
| | Earnings Release Third Quarter of 2013 Fiscal Year – July, August and September, 2013 |
E.2 Raízen Combustiveis
| Raízen Combustíveis | 3Q 2013 | 3Q 2012 | ||||||
| Income Statement for the period | Sep 30, 2013 | Sep 30, 2012 | ||||||
| Net Operating Revenue | 12,737,213 | 10,915,520 | ||||||
| Gross Profit | 659,996 | 580,265 | ||||||
| Sales, general and administrative expenses | (362,825 | ) | (335,462 | ) | ||||
| Other operating income (expenses), net | 66,328 | (2,611 | ) | |||||
| Financial revenue | 23,386 | 36,451 | ||||||
| Financial expenses | (18,952 | ) | (27,777 | ) | ||||
| Foreign exchange variation | (7,319 | ) | (6,081 | ) | ||||
| Derivative | (12,032 | ) | 3,454 | |||||
| Income and Social Contribution Taxes | (119,280 | ) | (55,132 | ) | ||||
| Net Income (loss) | 229,302 | 193,108 | ||||||
| Raízen Combustíveis | 3Q 2013 | 2Q 2013 | ||||||
| Balance Sheet | Sep 30, 2013 | Jun 30, 2013 | ||||||
| Cash and Cash Equivalents | 354,503 | 168,930 | ||||||
| Accounts Receivable | 1,326,865 | 1,390,114 | ||||||
| Inventories | 1,302,834 | 852,711 | ||||||
| Other Current Assets | 857,282 | 1,445,431 | ||||||
| Property, Plant and Equipment | 2,519,491 | 2,567,133 | ||||||
| Intangible | 4,028,655 | 4,015,732 | ||||||
| Other Non-Current Assets | 1,110,940 | 1,102,284 | ||||||
| Total Assets | 11,500,570 | 11,542,335 | ||||||
| Loans and Financing | (787,527 | ) | (800,148 | ) | ||||
| Suppliers | (529,708 | ) | (576,231 | ) | ||||
| Salaries Payable | (254,561 | ) | (166,216 | ) | ||||
| Other current liabilities | (712,163 | ) | (568,966 | ) | ||||
| Other non-current liabilities | (2,615,511 | ) | (2,617,923 | ) | ||||
| Net Equity | (6,601,100 | ) | (6,812,851 | ) | ||||
| Total Liabilities | (11,500,570 | ) | (11,542,335 | ) | ||||
41 of 48
| | Earnings Release Third Quarter of 2013 Fiscal Year – July, August and September, 2013 |
E.3 Raízen Energia
| Raízen Energia | 3Q 2013 | 3Q 2012 | ||||||
| Income Statement for the period | Sep 30, 2013 | Sep 30, 2012 | ||||||
| Net Operating Revenue | 3,246,729 | 2,248,339 | ||||||
| Gross Profit | 726,101 | 580,395 | ||||||
| Sales, general and administrative expenses | (358,584 | ) | (289,159 | ) | ||||
| Other operating income (expenses), net | (19,891 | ) | 9,685 | |||||
| Financial revenue | 55,193 | 173,230 | ||||||
| Financial expenses | (114,059 | ) | (122,629 | ) | ||||
| Foreign exchange variation | (25,128 | ) | (26,420 | ) | ||||
| Derivative | 26,403 | (8,711 | ) | |||||
| Equity pick up | (11,655 | ) | (4,955 | ) | ||||
| Income and Social Contribution Taxes | (94,462 | ) | (44,919 | ) | ||||
| Net Income (loss) | 183,918 | 266,517 | ||||||
| Raízen Energia | 3Q 2013 | 2Q 2013 | ||||||
| Balance Sheet | Sep 30, 2013 | Jun 30, 2013 | ||||||
| Cash and Cash Equivalents | 1,246,573 | 1,630,331 | ||||||
| Accounts Rreceivable | 494,724 | 349,025 | ||||||
| Inventories | 1,707,606 | 886,917 | ||||||
| Other Current Assets | 1,275,795 | 1,308,570 | ||||||
| Investments | 1,936,168 | 215,105 | ||||||
| Property, Plant and Equipment | 9,485,631 | 9,769,483 | ||||||
| Intangible | 3,062,760 | 3,062,170 | ||||||
| Other Non-Current Assets | 1,822,915 | 3,587,474 | ||||||
| Total Assets | 21,032,172 | 20,809,075 | ||||||
| Loans and Financing | (6,963,654 | ) | (6,311,908 | ) | ||||
| Suppliers | (730,321 | ) | (513,768 | ) | ||||
| Salaries Payable | (872,731 | ) | (1,017,216 | ) | ||||
| Other current liabilities | (279,758 | ) | (904,657 | ) | ||||
| Other non-current liabilities | (1,676,670 | ) | (1,670,334 | ) | ||||
| Net Equity | (10,509,038 | ) | (10,391,192 | ) | ||||
| Total Liabilities | (21,032,172 | ) | (20,809,075 | ) | ||||
42 of 48
| | Earnings Release Third Quarter of 2013 Fiscal Year – July, August and September, 2013 |
E.3 Comgás
| Comgás | 3Q 2013 | 3Q 2012 | ||||||
| Income Statement for the period | Sep 30, 2013 | Sep 30, 2012 | ||||||
| Net Operating Revenue | 1,682,530 | 1,413,476 | ||||||
| Gross Profit | 483,958 | 423,464 | ||||||
| Sales, general and administrative expenses | (229,988 | ) | (180,284 | ) | ||||
| Other operating income (expenses), net | (17 | ) | (2,216 | ) | ||||
| Financial revenue | 14,557 | - | ||||||
| Financial expenses | (38,144 | ) | (47,312 | ) | ||||
| Foreign exchange variation | (6,929 | ) | - | |||||
| Derivative | (4,809 | ) | - | |||||
| Income and Social Contribution Taxes | (74,689 | ) | (65,608 | ) | ||||
| Net Income (loss) | 143,939 | 128,045 | ||||||
| Comgás | 3Q 2013 | 2Q 2013 | ||||||
Balance Sheet | Sep 30, 2013 | Jun 30, 2013 | ||||||
| Cash and Cash Equivalents | 459,598 | 359,285 | ||||||
| Accounts Rreceivable | 564,233 | 658,801 | ||||||
| Inventories | 113,330 | 114,270 | ||||||
| Other Current Assets | 252,383 | 295,527 | ||||||
| Intangible | 8,353,844 | 8,200,248 | ||||||
| Other Non-Current Assets | 285,227 | 278,418 | ||||||
| Total Assets | 10,028,615 | 9,906,549 | ||||||
| Loans and Financing | (2,787,767 | ) | (2,775,506 | ) | ||||
| Suppliers | (694,029 | ) | (813,000 | ) | ||||
| Salaries Payable | (49,274 | ) | (39,167 | ) | ||||
| Other current liabilities | (160,832 | ) | (100,859 | ) | ||||
| Other non-current liabilities | (854,055 | ) | (839,918 | ) | ||||
| Net Equity | (5,482,658 | ) | (5,338,099 | ) | ||||
| Total Liabilities | (10,028,615 | ) | (9,906,549 | ) | ||||
43 of 48
| | Earnings Release Third Quarter of 2013 Fiscal Year – July, August and September, 2013 |
E.4 Rumo
| Rumo | 3Q 2013 | 3Q 2012 | ||||||
| Income Statement for the period | Sep 30, 2013 | Sep 30, 2012 | ||||||
| Net Operating Revenue | 328,500 | 20,902 | ||||||
| Gross Profit | 125,139 | 19,161 | ||||||
| Sales, general and administrative expenses | (17,286 | ) | (3,959 | ) | ||||
| Other operating income (expenses), net | (12,613 | ) | 3,010 | |||||
| Financial revenue | 14,534 | 2,724 | ||||||
| Financial expenses | (9,555 | ) | (207 | ) | ||||
| Foreign exchange variation | (109 | ) | (2 | ) | ||||
| Income and Social Contribution Taxes | (33,657 | ) | (3,419 | ) | ||||
| Net Income (loss) | 66,452 | 17,308 | ||||||
| Rumo | 3Q 2013 | 2Q 2013 | ||||||
| Balance Sheet | Sep 30, 2013 | Jun 30, 2013 | ||||||
| Cash and Cash Equivalents | 547,287 | 563,945 | ||||||
| Securities | 8,864 | 10,094 | ||||||
| Accounts Rreceivable | 195,739 | 125,804 | ||||||
| Inventories | 4,667 | 5,110 | ||||||
| Other Current Assets | 47,643 | 115,508 | ||||||
| Property, Plant and Equipment | 1,003,323 | 975,535 | ||||||
| Intangible | 743,679 | 705,148 | ||||||
| Other Non-Current Assets | 11,025 | 27,559 | ||||||
| Total Assets | 2,562,227 | 2,528,703 | ||||||
| Loans and Financing | (730,424 | ) | (747,849 | ) | ||||
| Suppliers | (81,923 | ) | (98,081 | ) | ||||
| Salaries Payable | (12,230 | ) | (15,493 | ) | ||||
| Other current liabilities | (158,422 | ) | (154,526 | ) | ||||
| Other non-current liabilities | (192,017 | ) | (191,930 | ) | ||||
| Net Equity | (1,387,211 | ) | (1,320,824 | ) | ||||
| Total Liabilities | (2,562,227 | ) | (2,528,703 | ) | ||||
44 of 48
| | Earnings Release Third Quarter of 2013 Fiscal Year – July, August and September, 2013 |
E.5 Lubricants and Specialties
| Lubricants and Specialties | 3Q 2013 | 3Q 2012 | ||||||
| Income Statement for the period | Sep 30, 2013 | Sep 30, 2012 | ||||||
| Net Operating Revenue | 407,322 | 369,608 | ||||||
| Gross Profit | 96,293 | 87,674 | ||||||
| Sales, general and administrative expenses | (83,485 | ) | (66,626 | ) | ||||
| Other operating income (expenses), net | 6,879 | (3,076 | ) | |||||
| Financial revenue | 3,560 | 11,058 | ||||||
| Financial expenses | (15,400 | ) | 3,622 | |||||
| Foreign exchange variation | 15,355 | (4,452 | ) | |||||
| Derivative | (4,512 | ) | - | |||||
| Equity pick up | (6,534 | ) | - | |||||
| Income and Social Contribution Taxes | (11,992 | ) | (10,045 | ) | ||||
| Net Income (loss) | 163 | 18,155 | ||||||
| Lubricants and Specialties | 3Q 2013 | 2Q 2013 | ||||||
| Balance Sheet | Sep 30, 2013 | Jun 30, 2013 | ||||||
| Cash and Cash Equivalents | 68,905 | 156,157 | ||||||
| Securities | 580 | 2,055 | ||||||
| Accounts Rreceivable | 214,428 | 208,706 | ||||||
| Inventories | 174,077 | 154,766 | ||||||
| Other Current Assets | 64,672 | 64,613 | ||||||
| Investments | 15,864 | 22,178 | ||||||
| Property, Plant and Equipment | 192,552 | 182,399 | ||||||
| Intangible | 873,680 | 848,517 | ||||||
| Other Non-Current Assets | (64,430 | ) | (58,508 | ) | ||||
| Total Assets | 1,540,328 | 1,580,883 | ||||||
| Loans and Financing | (197,185 | ) | (182,341 | ) | ||||
| Suppliers | (63,547 | ) | (56,375 | ) | ||||
| Salaries Payable | (15,362 | ) | (19,513 | ) | ||||
| Other current liabilities | (95,731 | ) | (89,822 | ) | ||||
| Other non-current liabilities | (327,301 | ) | (343,286 | ) | ||||
| Net Equity | (841,202 | ) | (889,546 | ) | ||||
| Total Liabilities | (1,540,328 | ) | (1,580,883 | ) | ||||
45 of 48
| | Earnings Release Third Quarter of 2013 Fiscal Year – July, August and September, 2013 |
E.6 Radar
| Radar | 3Q 2013 | 3Q 2012 | ||||||
| Income Statement for the period | Sep 30, 2013 | Sep 30, 2012 | ||||||
| Net Operating Revenue | 16,147 | 20,902 | ||||||
| Gross Profit | 16,146 | 19,161 | ||||||
| Sales, general and administrative expenses | (5,314 | ) | (3,959 | ) | ||||
| Other operating income (expenses), net | 46,800 | 3,010 | ||||||
| Financial revenue | 1,051 | 2,724 | ||||||
| Financial expenses | (178 | ) | (209 | ) | ||||
| Income and Social Contribution Taxes | (3,625 | ) | (3,419 | ) | ||||
| Net Income (loss) | 54,881 | 17,308 | ||||||
| Radar | 3Q 2013 | 2Q 2013 | ||||||
| Balance Sheet | Sep 30, 2013 | Jun 30, 2013 | ||||||
| Cash and Cash Equivalents | 13,524 | 270 | ||||||
| Securities | 94,685 | 94,003 | ||||||
| Accounts Rreceivable | 22,473 | 24,692 | ||||||
| Other Current Assets | 8,300 | 8,985 | ||||||
| Investment Property | 2,523,405 | 2,477,955 | ||||||
| Property, Plant and Equipment | 11,437 | 11,661 | ||||||
| Intangible | 85 | 92 | ||||||
| Other Non-Current Assets | 4,864 | 9,363 | ||||||
| Total Assets | 2,678,773 | 2,627,021 | ||||||
| Suppliers | (936 | ) | (1,069 | ) | ||||
| Salaries Payable | (15,928 | ) | (14,558 | ) | ||||
| Other current liabilities | (27,185 | ) | (33,449 | ) | ||||
| Other non-current liabilities | (76,997 | ) | (75,707 | ) | ||||
| Net Equity | (2,557,727 | ) | (2,502,238 | ) | ||||
| Total Liabilities | (2,678,773 | ) | (2,627,021 | ) | ||||
46 of 48
| | Earnings Release Third Quarter of 2013 Fiscal Year – July, August and September, 2013 |
E.7 Other Businesses
| Other Businesses | 3Q 2013 | 3Q 2012 | ||||||
| Income Statement for the period | Sep 30, 2013 | Sep 30, 2012 | ||||||
| Net Operating Revenue | 12 | - | ||||||
| Gross Profit | 12 | 442 | ||||||
| Sales, general and administrative expenses | (39,080 | ) | (33,534 | ) | ||||
| Other operating income (expenses), net | (9,222 | ) | (458 | ) | ||||
| Financial revenue | 18,018 | 19,439 | ||||||
| Financial expenses | (75,032 | ) | (58,322 | ) | ||||
| Foreign exchange variation | (25,223 | ) | 539 | |||||
| Derivative | (20,114 | ) | 15,685 | |||||
| Equity pick up | 351,264 | 350,855 | ||||||
| Income and Social Contribution Taxes | 4,614 | (4,390 | ) | |||||
| Net Income (loss) | 205,238 | 290,257 | ||||||
| Other Businesses | 3Q 2013 | 2Q 2013 | ||||||
| Balance Sheet | Sep 30, 2013 | Jun 30, 2013 | ||||||
| Cash and Cash Equivalents | 112,915 | 410,977 | ||||||
| Securities | 1,529 | 8,038 | ||||||
| Accounts Rreceivable | 241 | 241 | ||||||
| Inventories | 2 | 1 | ||||||
| Other Current Assets | 413,259 | 384,754 | ||||||
| Investments | 6,086,566 | 5,973,673 | ||||||
| Subsidiaries | 8,468,439 | 8,551,222 | ||||||
| Property, Plant and Equipment | 42,646 | 36,525 | ||||||
| Intangible | 2,567 | 2,652 | ||||||
| Other Non-Current Assets | 2,563,693 | 2,556,766 | ||||||
| Total Assets | 17,691,857 | 17,924,849 | ||||||
| Loans and Financing | (4,901,781 | ) | (4,987,550 | ) | ||||
| Suppliers | (1,536 | ) | (1,819 | ) | ||||
| Salaries Payable | (12,799 | ) | (20,440 | ) | ||||
| Other current liabilities | (243,657 | ) | (502,045 | ) | ||||
| Other non-current liabilities | (3,530,947 | ) | (3,517,423 | ) | ||||
| Net Equity | (9,001,137 | ) | (8,895,572 | ) | ||||
| Total Liabilities | (17,691,857 | ) | (17,924,849 | ) | ||||
47 of 48
| | Earnings Release Third Quarter of 2013 Fiscal Year – July, August and September, 2013 |
F. Financial Statements including Raízen
F.1 Cosan S/A Consolidated including Raízen
| Cosan Consolidated | 3Q 2013 | 3Q 2012 | ||||||
| Income Statement for the period | Sep 30, 2013 | Sep 30, 2012 | ||||||
| Net Operating Revenue | 9,548 | 7,032 | ||||||
| Gross Profit | 1,405 | 772 | ||||||
| Sales, general and administrative expenses | (736 | ) | (431 | ) | ||||
| Other operating income (expenses), net | 55 | 1 | ||||||
| Financial revenue | 84 | 142 | ||||||
| Financial expenses | (198 | ) | (134 | ) | ||||
| Foreign exchange variation | (33 | ) | (20 | ) | ||||
| Derivative | (22 | ) | 13 | |||||
| Equity pick up | (12 | ) | 54 | |||||
| Income and Social Contribution Taxes | (222 | ) | (91 | ) | ||||
| Net Income (loss) | 209 | 283 | ||||||
| Cosan Consolidated | 3Q 2013 | 2Q 2013 | ||||||
| Balance Sheet | Sep 30, 2013 | Jun 30, 2013 | ||||||
| Cash and Cash Equivalents | 2,003 | 2,390 | ||||||
| Securities | 106 | 114 | ||||||
| Accounts Rreceivable | 1,922 | 1,899 | ||||||
| Inventories | 1,785 | 1,144 | ||||||
| Other Current Assets | 1,260 | 1,414 | ||||||
| Investments | 202 | 200 | ||||||
| Investment Property | 2,523 | 2,478 | ||||||
| Biological Assets | 968 | 1,010 | ||||||
| Property, Plant and Equipment | 7,244 | 7,377 | ||||||
| Intangible | 13,520 | 13,299 | ||||||
| Other Non-Current Assets | 3,282 | 3,277 | ||||||
| Total Assets | 34,815 | 34,603 | ||||||
| Loans and Financing | (12,493 | ) | (12,249 | ) | ||||
| Suppliers | (1,472 | ) | (1,515 | ) | ||||
| Salaries Payable | (288 | ) | (339 | ) | ||||
| Other current liabilities | (979 | ) | (1,165 | ) | ||||
| Other non-current liabilities | (6,272 | ) | (6,240 | ) | ||||
| Net Equity | (13,311 | ) | (13,094 | ) | ||||
| Total Liabilities | (34,815 | ) | (34,603 | ) | ||||
48 of 48
SIGNATURES
Pursuant to the requirements of the Securities Exchange Act of 1934, the registrant has duly caused this report to be signed on its behalf by the undersigned, thereunto duly authorized.
| COSAN LIMITED | |||||
| Date: | November 7, 2013 | By: | /s/ Marcelo Eduardo Martins | ||
| Name: | Marcelo Eduardo Martins | ||||
| Title: | Chief Financial Officer and Investor Relations Officer | ||||