FORM 6-K
SECURITIES AND EXCHANGE COMMISSION
Washington, D.C. 20549
Report of Foreign Issuer
Pursuant to Rule 13a-16 or 15d-16
of the Securities Exchange Act of 1934
For the month of May, 2014
Commission File Number: 1-33659
COSAN LIMITED
(Translation of registrant’s name into English)
Av. Juscelino Kubitschek, 1726 – 6th floor
São Paulo, SP 04543-000 Brazil
(Address of principal executive offices)
Indicate by check mark whether the registrant files or will file annual reports under cover of Form 20-F or Form 40-F:
| Form 20-F | X | Form 40-F |
Indicate by check mark if the registrant is submitting the Form 6-K in paper as permitted by Regulation S-T Rule 101(b)(1):
| Yes | No | X |
Indicate by check mark if the registrant is submitting the Form 6-K in paper as permitted by Regulation S-T Rule 101(b)(7):
| Yes | No | X |
COSAN LIMITED
Item | |
| 1. | Earnings Release for 1st Quarter of Fiscal Year 2014 |
| 2. | Cosan Limited consolidated interim financial statements at March 31, 2014 and report of independent registered public accounting firm |
Item 1

Earnings Release
1st Quarter of Fiscal Year 2014
Pro forma EBITDA of R$1 billion and Net Income
of R$256 million in the 1Q14
São Paulo, May 13, 2014 – COSAN LIMITED (NYSE: CZZ; BM&FBovespa: CZLT33) and COSAN S.A. INDÚSTRIA E COMÉRCIO (BM&FBovespa: CSAN3) announce today their results for the first quarter (1Q14) comprised of January, February and March 2014. The results are consolidated in accordance with the accounting principles adopted in Brazil and internationally (IFRS).
Earnings Conference Call | 1Q14 Highlights | |
Portuguese May 14, 2014 10:00 A.M. (EST time) Phone: + 55 11 3193-1001 + 55 11 2820-4001 Access Code: COSAN English May 14, 2014 11:00 P.M. (EST Time) Phone (BR): + 55 11 3193-1001 + 55 11 2820-4001 Phone (USA): +1 786 924 6977 Access Code: COSAN | o Increase of 9.6% in Raízen Combustíveis’s volume and EBITDA reached R$521 million. o Raízen Energy ended the crop year 2013/14 with EBITDA of R$2.4 billion. o Volume growth of 5.9% in Comgás commercial segment and the addition of 418 new clients. o Rumo’s growth of 27% in loading volume and EBITDA of R$93 million. o Gain of 19% from Radar’s property sales. |
 | Summary of Financial Information - Cosan Pro forma¹ | 1Q14 | 1Q13 |
| Amount in R$ MM | (Jan-Mar) | (Jan-Mar) | |
| Net Revenue | 9,593.4 | 8,461.5 | |
| Gross Profit | 1,217.5 | 1,028.8 | |
| Gross Margin (%) | 12.7% | 12.2% | |
| Operating Profit | 567.9 | 466.1 | |
| EBITDA | 1,026.4 | 911.5 | |
| EBITDA Margin (%) | 10.7% | 10.8% | |
| Equity Pick-up | (16.0) | (6.1) | |
| Net Income before non-controlling Interest | 311.6 | 117.5 | |
| Net Income | 256.1 | 27.1 | |
| CAPEX | 835.6 | 829.8 | |
| Net Debt | 9,616.8 | 8,535.0 | |
| Shareholders' Equity and Minority Shareholders | 13,769.1 | 13,366.1 |
Note 1: Considering the consolidation of 50% of the Raízen Combustíveis and Raízen Energia results.

1 of 49
 | Earnings Release 1st Quarter of Fiscal Year 2014 |
A. Highlights and Business Units
A.1 Business Units
As we have done in prior quarters, we will continue to present a specific section for each business unit, including their key operating data, and an analysis of the results, from net revenue to EBITDA.
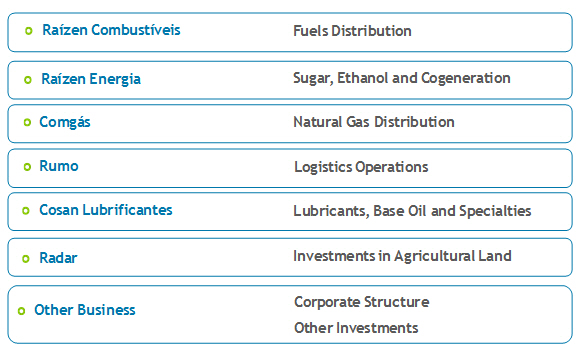
Our business units (reportable segments) are organized as follows:
2 of 49
| Earnings Release 1st Quarter of Fiscal Year 2014 |
A.2 Cosan Consolidated Result
For Cosan‘s Consolidated financial information, we considered 100% of the results of Comgás, Rumo, Cosan Lubrificantes, Radar, and Other Businesses. Starting April 1, 2013, with the adoption of IFRS 11, Raízen Energia e Combustíveis’s results are reported in the “Equity Pick-up” line, considering a proportionate interest (50%) in the result. Adjustments and Eliminations represent intercompany balances and transactions.
EBITDA reported herein is in compliance with CVM Rule 527/12, published by the Brazilian Securities and Exchange Commission on October 4, 2012, and may differ from the amounts disclosed in prior periods due to equity accounting adjustment. Consequently, the EBITDA now consists of operating profit before financial expenses, plus depreciation, amortization and equity pick-up.
| EBITDA (Reconciliation ICVM 527) | 1Q14 | 1Q13 | |
| Amounts in R$ MM | (Jan-Mar) | (Jan-Mar) | Chg. % |
| Net Income | 256.1 | 27.1 | n/a |
| (-) Equity Pick-up | (221.8) | (92.6) | n/a |
| (-) Income from Discontinued Operations | - | 3.4 | n/a |
| (+) Minority Shareholders | 51.8 | 84.8 | -38.9% |
| (+) Income Taxes | 59.6 | 139.2 | -57.2% |
| (+) Net Financial Expense (Revenue) | 106.2 | 177.5 | -40.2% |
| (+) Depreciation and Amortization | 160.4 | 159.4 | 0.6% |
| EBITDA (before ICVM 527) | 412.3 | 498.9 | -17.4% |
| (+) Equity Pick-up | 221.8 | 92.6 | n/a |
| EBITDA (after ICVM 527) | 634.1 | 591.5 | 7.2% |
| (+) Reclassification of Discontinued Operations² | - | (3.4) | n/a |
| (-) Gross effect of Raízen formation | - | - | n/a |
| Adjusted EBITDA (after ICVM 527) | 634.1 | 588.1 | 7.8% |
Note 2: Due to the sale of the sugar t retail business represented by Cosan Alimentos, the Company reclassified this unit’s results to discontinued operations, as required by accounting rules IFRS5/CPC31 – Non-current Asset Held for Sale and Discontinued Operation.
3 of 49
| Earnings Release 1st Quarter of Fiscal Year 2014 |
Below we report the results for 1Q14 for each business unit for all segments detailed above. All information reflect 100% of their financial performance, regardless of Cosan’s interest.
For purposes of consolidated EBITDA reconciliation, the Adjustments and Eliminations column refers to the elimination of net incomes from businesses controlled by Cosan for consolidation purposes. The same adjustment is applied when we consider Raízen’s results for EBITDA calculation.
Results by Business Unit 1Q14 | Comgás | Rumo | Cosan Lubricants | Radar | Other Businesses | Adjusts and Eliminations | Consolidated | Raízen Combustíveis | Raízen Energia | 50% Raízen | Adjusts and Eliminations | Consolidated Pro forma |
| Net Revenue | 1,517.4 | 207.9 | 368.3 | 63.6 | 0.1 | - | 2,157.2 | 13,011.0 | 2,604.8 | (7,807.9) | (371.6) | 9,593.4 |
| Cost of Goods and Services | (1,069.0) | (123.5) | (290.0) | (38.3) | 0.0 | - | (1,520.8) | (12,340.7) | (2,113.0) | 7,226.8 | 371.6 | (8,376.0) |
| Gross Profit | 448.4 | 84.4 | 78.3 | 25.2 | 0.1 | - | 636.4 | 670.3 | 491.9 | (581.1) | - | 1,217.5 |
| Gross Margin(%) | 29.6% | 40.6% | 21.3% | 39.7% | 118.1% | n/a | 29.5% | 5.2% | 18.9% | 7.4% | - % | 12.7% |
| Selling Expenses | (150.3) | - | (56.3) | - | - | - | (206.6) | (283.5) | (163.2) | 223.3 | - | (430.0) |
| General and Administrative Expenses | (67.1) | (20.0) | (17.4) | (8.4) | (32.3) | - | (145.1) | (105.1) | (140.4) | 122.7 | - | (267.8) |
| Other Operating Revenues (Expenses) | (7.1) | 6.7 | 0.4 | (23.0) | (9.7) | - | (32.8) | 101.8 | 60.2 | (81.0) | - | 48.2 |
| Equity Pick-up | - | (0.0) | (1.3) | 0.0 | 369.8 | (146.7) | 221.8 | 5.3 | (10.4) | 2.6 | (235.2) | (16.0) |
| Depreciation and Amortization | (118.2) | (21.7) | (19.5) | (0.2) | (0.7) | - | (160.4) | (132.5) | (495.9) | 314.2 | - | (474.5) |
| EBITDA | 342.0 | 92.8 | 23.2 | (5.9) | 328.6 | (146.7) | 634.1 | 521.2 | 734.0 | (627.6) | (235.2) | 1,026.4 |
| EBITDA Margin (%) | 22.5% | 44.7% | 6.3% | -9.3% | n/a | n/a | 29.4% | 4.% | 28.2% | 8.% | - % | 10.7% |
4 of 49
| Earnings Release 1st Quarter of Fiscal Year 2014 |
B. Result by Business Unit
B.1 Raízen Combustíveis
Below you will find the results of Raízen Combustíveis, the business unit that distributes and trades fuels through a network of franchised Shell service stations, in addition to supplying fuels to industrial clients and distributing aviation fuel.
Following the adoption of IFRS 11 – Joint Arrangements, starting in April 2013 Cosan no longer consolidates Raízen in its balance sheet, statement of income and cash flows, and the result from this business unit has been reported under “Equity Accounting Result” ever since. Given Raízen’s materiality in Cosan’s financial information, we will report this segment’s performance separately.
Net Revenue
| Sales Breakdown | 1Q14 | 1Q13 | |
| Amounts in R$ MM | (Jan-Mar) | (Jan-Mar) | Chg. % |
| Fuel Sales | 13,011.0 | 10,947.1 | 18.9% |
| Ethanol | 930.2 | 658.0 | 41.4% |
| Gasoline | 5,147.6 | 4,406.8 | 16.8% |
| Diesel | 5,435.3 | 4,463.8 | 21.8% |
| Aviation | 1,339.8 | 1,277.1 | 4.9% |
| Other Products | 158.1 | 141.4 | 11.8% |
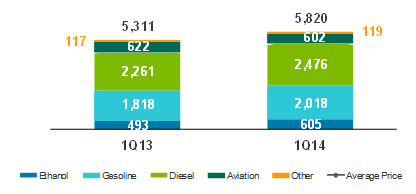
Raízen Combustíveis’ net revenue of 1Q14 grew 18.9% year-over-year to R$13.0 billion, chiefly due to the 9.6% increase in total fuel sales volume in the period, higher than the market’s growth, according to ANP data, especially ethanol and gasoline, which grew by 22.7% and 11.0% respectively.
This increase in volume sold is mainly due to the expansion of the network of service stations and the growth of the vehicle fleet between quarters. Additionally, the average price of products sold rose 8.5% year-over-year, basically due to the rise in Gasoline and Diesel prices by Petrobrás in 2013 as well as the average price of ethanol in the period.
The rise in Gasoline prices increased Ethanol’s competitiveness in only three Brazilian states (Mato Grosso, Paraná and São Paulo) where the parity between Ethanol and Gasoline prices remained below 70% in the quarter.
In the aviation segment, despite the lower volume sold in 1Q14 (3.1% lower compared to 1Q13), the average price grew by 8.3%, resulting in an increase of 4.9% in net revenue.
5 of 49
| Earnings Release 1st Quarter of Fiscal Year 2014 |
The network of Shell service stations ended 1Q14 with nearly 4,970 stations and 900 convenience stores.
Fuels
Volume (million liters) and Average Unit Price (R$/cbm)
Inventories
| Fuels Inventories | |||
| 03/31/2014 | 03/31/2014 | Chg. % | |
| 000' cbm | 459.8 | 443.9 | 3.6% |
| R$'MM | 942.0 | 906.9 | 3.9% |
| R$/cbm | 2,048.9 | 2,042.8 | 0.3% |
Cost of Goods Sold
| COGS | 1Q14 | 1Q13 | |
| Amounts in R$ MM | (Jan-Mar) | (Jan-Mar) | Chg. % |
| Fuel Sales | (12,340.7) | (10,351.6) | 19.2% |
In 1Q14, Raízen Combustíveis’ cost of goods sold totaled R$12.3 billion, an increase of 19.2% compared to 1Q13, mainly due to the higher volume sold and price increases.
Gross Profit
| Gross Profit | 1Q14 | 1Q13 | |
| Amounts in R$ MM | (Jan-Mar) | (Jan-Mar) | Chg. % |
| Gross Profit | 670.3 | 595.5 | 12.6% |
| Gross Margin (%) | 5.2% | 5.4% | -0.2 p.p. |
6 of 49
| Earnings Release 1st Quarter of Fiscal Year 2014 |
Gross profit in 1Q14 totaled R$670.3 million, an increase of 12.6% compared to the R$595.5 million recorded in 1Q13. Gross margin in the quarter was 5.2%, in line with the same period last year.
Selling, General, and Administrative Expenses
| SG&A Expenses | 1Q14 | 1Q13 | |
| Amounts in R$ MM | (Jan-Mar) | (Jan-Mar) | Chg. % |
| Selling Expenses | (283.5) | (265.8) | 6.6% |
| G&A Expenses | (105.1) | (92.6) | 13.5% |
| Other Operational Revenues/Expenses | 101.8 | 67.3 | 51.2% |
Raízen Combustíveis’ selling expenses totaled R$283.5 million in 1Q14, 6.6% higher compared to 1Q13, mainly due to the increase of fuel sales volume in the period, which raises freight and logistics costs.
General and administrative expenses were R$105.1 million in 1Q14, up 13.5% compared to 1Q13, due to the increase in personnel expenses, mainly because of the collective wage agreement applied in the period.
Other operating revenues and expenses include merchandising fees, convenience store royalties, revenue from leases, fees for the sale of lubricants at Raízen Combustíveis services stations, and revenues from the sale of assets, and totaled R$101.8 million in 1Q14.
EBITDA
| EBITDA | 1Q14 | 1Q13 | |
| Amounts in R$ MM | (Jan-Mar) | (Jan-Mar) | Chg. % |
| EBITDA | 521.2 | 422.9 | 23.2% |
| EBITDA Margin (%) | 4.0% | 3.9% | 0.1 p.p. |
Raízen Combustíveis’s EBITDA was R$521.2 million in 1Q14, an increase of 23.2% over 1Q13. EBTIDA margin was 4.0%, up 0.1 p.p. compared to 1Q13.
Capex
| CAPEX | 1Q14 | 1Q13 | |
| Amounts in R$ MM | (Jan-Mar) | (Jan-Mar) | Chg. % |
| CAPEX | 277.8 | 153.5 | 81.0% |
Raízen Combustíveis’s capex totaled R$277.8 million in 1Q14, 81.0% higher than 1Q13. The main expenses are related to accelerated conversion of service stations in the period, as well as expenses with logistics, distribution and trading initiatives.
7 of 49
| Earnings Release 1st Quarter of Fiscal Year 2014 |
As mentioned in the previous quarters, the reseller network growth model is chiefly based on bonuses for the achievement of volume targets. The bonus is accounted for as deduction from gross revenue, and totaled R$22.0 million in 1Q14, adversely impacting EBITDA. In 1Q13 bonus payment amounted to R$17.9 million.
8 of 49
| Earnings Release 1st Quarter of Fiscal Year 2014 |
B.2 Raízen Energia
The following are the results for Raízen Energia, whose core business is the production and sale of a variety of products derived from sugarcane, including raw sugar (Very High Polarization - VHP), anhydrous and hydrous ethanol, as well as activities related to energy cogeneration from sugarcane bagasse and ethanol trading.
As mentioned in prior quarters, after adopting IFRS 11 – Joint Arrangements, Cosan no longer consolidates Raízen in its balance sheet, statement of income and cash flows, and the result from this business unit has been reported under “Equity Accounting Result” ever since. Given Raízen’s materiality in Cosan’s financial information, we will report this segment’s performance separately.
In this release, we are reporting Raízen Energia’s performance for the first quarter of 2014 as well as over the twelve month period to March 2014, which includes the end-of-crop results for the 2013/14 season. For comparison purposes, the crop for the same period of 2013/14 will also be presented.
Production Figures
Central-South Region
During the first quarter of 2014, the South Central region sugarcane producing regions of Brazil experienced severe drought, mainly in São Paulo state. In the period, rainfall was 28% lower than the average.
In 1Q14, mills in the South Central region of Brazil finished the crop and crushed a marginal volume of 1.6 million tons of sugarcane. The total recorded at harvest was 596 million tons of sugarcane, which represents a new crushing record in the sector and a growth of 12% compared to the previous crop.
Brazil’s drought in 1Q14, coupled with the high prices of ethanol and the volume of cane that was available but not processed in last year’s crops by some mills, led some units to start operations in mid-March for the crop of 2014/15.
During the 2013/14 crop, the region processed 596 million tons, and allocated 45.2% to sugar production, totaling a volume of 34.3 million tons compared to 34.1 million in 2012/13. Meanwhile, a total of 25.6 billion liters of ethanol were produced. Of this amount, 44% was anhydrous ethanol (approximately 11 billion liters), while hydrous ethanol totaled 14.6 billion liters (56%).
9 of 49
| Earnings Release 1st Quarter of Fiscal Year 2014 |
Raízen Energia
In 1Q14, Raízen Energia operated 24 sugar, ethanol and energy cogeneration mills, with a crushing capacity of 65.5 million tons of sugarcane per crop year.
| 1Q14 | 1Q13 | Operational Figures | 2013/14 | 2012/13 | |
| (Jan-Mar) | (Jan-Mar) | (Apr/13-Mar/14) | (Apr/12-Mar/13) | Var. % | |
| - | - | Crushed Sugarcane | 61,441 | 56,221 | 9.3% |
| - | - | Own (‘000 tons) | 31,009 | 28,299 | 9.6% |
| - | - | Suppliers (‘000 tons) | 30,432 | 27,922 | 9.0% |
| - | - | Sugarcane TRS (kg/ton) | 131 | 134 | -2.0% |
| - | - | Mechanization (%) | 94.8% | 91.7% | 3.1 p.p. |
| Production | |||||
| - | - | Sugar | 4,493 | 4,162 | 8.0% |
| - | - | Raw Sugar (‘000 tons) | 2,991 | 2,575 | 16.2% |
| - | - | White Sugar (‘000 tons) | 1,502 | 1,587 | -5.4% |
| - | - | Ethanol | 2,037 | 1,903 | 7.1% |
| - | - | Anhydrous Ethanol (‘000 cbm) | 987 | 833 | 18.5% |
| - | - | Hydrous Ethanol (‘000 cbm) | 1,050 | 1,070 | -1.8% |
All Raízen Energia mills ended activities in December 2013, and therefore there was no crushing or production in 1Q14.
The volume of cane crushed during the 2013/14 crop totaled 61.4 million tons, an increase of 9.3% compared to the 56.2 million tons of cane crushed in the 2012/13 crop. Nearly 49.5% of the crushed amount was third-party sugarcane while 50.5% was own sugarcane, including agricultural partners.
In the crop 2013/14, 94.8% of own sugarcane was harvested mechanically and the TRS of the sugarcane reached 130.9 kg/ton, down 2.0% year-over-year mainly due to unfavorable weather conditions during the harvest, causing the concentration of total sugars in the harvested cane to be diluted.
Agricultural productivity - measured in tons of sugarcane per hectare (TCH) - reached 83.9 t/ha in the 2013/14 crop, an increase of 3.5% compared to the 2012/13 crop, which reached 81.1 t/ha.
The average age of the sugarcane fields reached 3.1 years, reflecting the appropriate renewal of the own sugarcane plantation areas during the crop 2013/2014. The production mix was concentrated in sugar again, with 58.0% of sugarcane crushed used to make this product, totaling 4.5 million tons of sugar and 2.0 billion liters of ethanol produced.
10 of 49
| Earnings Release 1st Quarter of Fiscal Year 2014 |
Net Revenue
| 1Q14 | 1Q13 | Sales Breakdown | 2013/14 | 2012/13 | ||
| (Jan-Mar) | (Jan-Mar) | Chg.% | Amounts in R$ MM | (Apr/13-Mar/14) | (Apr/12-Mar/13) | Chg.% |
| 2,604.8 | 2,350.4 | 10,8% | Net Operating Revenue | 9,455.2 | 8,468.2 | 11.7% |
| 1,225.5 | 1,176.7 | 4.1% | Sugar Sales | 4,353.1 | 4,354.0 | 0.0% |
| 270.9 | 198.3 | 36.6% | Domestic Market | 940.4 | 899.2 | 4.6% |
| 954.5 | 978.4 | -2.4% | Foreign Market | 3,412.7 | 3,454.8 | -1.2% |
| 1,321.3 | 1,123.3 | 17.6% | Ethanol Sales | 4,464.5 | 3,313.3 | 34.7% |
| 663.9 | 528.9 | 25.5% | Domestic Market | 2,379.3 | 1,328.4 | 79.1% |
| 210.1 | 323.2 | -35.0% | Foreign Market | 868.7 | 1,266.2 | -31.4% |
| 447.2 | 271.2 | 64.9% | Trading | 1,216.5 | 718.8 | 69.2% |
| 27.3 | 13.1 | n/a | Energy Cogeneration | 403.8 | 569.7 | -29.1% |
| 30.8 | 37.2 | -17.2% | Other Products and Services | 233.8 | 231.2 | 1.1% |
Raízen Energia’s net revenue in 1Q14 totaled R$2.6 billion, an increase of 10.8% compared to 1Q13, when the reported revenue was R$2.4 billion.
The main reasons for the net revenue increase during the quarter was the higher volume of all products sold, as well as an increase in the average ethanol prices, both domestic and foreign markets, and energy (electricity) prices.
In the 2013/14 crop, net revenue reached R$9.5 billion, compared to the R$8.5 billion recorded in 2012/13, an increase of 11.7% between crops, mainly due to the higher volume of sales and higher average price of ethanol in the period.
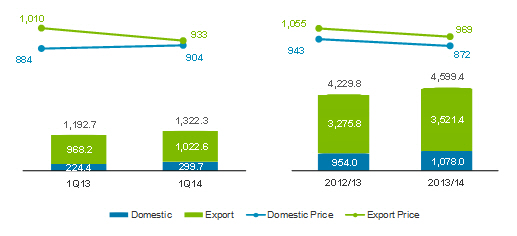
Sugar Sales
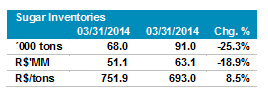
In 1Q14, net revenue from sugar sales totaled R$1.2 billion, 4.1% higher than reported in 1Q13. Sugar sales accounted for 47.0% of Raízen Energia’s overall net revenue in 1Q14.
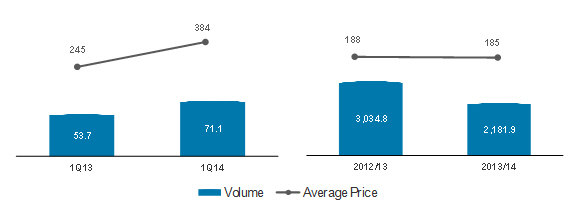
During the quarter, the total volume of sugar sold was 1.3 million tons, an increase of 10.9% compared to 1Q13, generating an effect equivalent to R$127.9 million in net revenue. This increase was partially offset by a decrease of 6.1% in the average price, which went from R$986.6/t in 1Q13 to R$926.8/t in 1Q14. This lower average price is due a decrease in sugar sales to the foreign market in 1Q14 (77.3% compared to 81.2% in 1Q13). The devaluation of the Brazilian real against the US dollar and Raízen’s successful fixed price strategy offset lower commodity prices.
Net revenue from sugar sales in the 2013/14 crop finished in line with the crop in 2012/13, totaling R$4.4 billion. There was an increase of 8.7% in the total volume of sugar sold during the 2013/14 crop, mainly in the domestic market, which grew 13.1% year-over-year, impacted by the lower average prices in the 2013/14 crop - both in the domestic and foreign markets.
11 of 49
| Earnings Release 1st Quarter of Fiscal Year 2014 |
Sugar
Volume Sold (‘000 tons) and Average Unit Price (R$/ton)
Sugar Inventories
Ethanol Sales
Net revenue from ethanol sales in 1Q14 reached R$1.3 billion, 17.6% up from 1Q13 (R$1.1 billion). Ethanol sales accounted for 50.7% of Raízen Energia. This increase is explained by the rise of 6.9% in sales volumes, and the increase of 10.0% of the average price, which was up from R$1.424/cbm in 1Q13 to R$1.566/cbm in 1Q14.
Sales of ethanol in the domestic market reached 55.8% of total sales in 1Q14, mainly driven by the higher demand that caused an increase from 20% to 25% in the mandatory mix of ethanol in gasoline, and the increased competitiveness of hydrous ethanol versus gasoline in three Brazilian states (Mato Grosso, Paraná and São Paulo).
Ethanol exports were lower in 1Q14 year-over-year due to a lower demand from the international market, and to the stronger competitiveness of corn ethanol, produced in the United States.
Net revenue from ethanol sales in the 2013/14 crop totaled R$4.5 billion compared to R$3.3 billion in the 2012/13 crop, an increase of 34.7% year-over-
12 of 49
| Earnings Release 1st Quarter of Fiscal Year 2014 |
year. This growth is mostly due to the higher volume sold of 32.0%, as well as the increase of 2.1% in the average price.
Net revenue from ethanol trading operations totaled R$1.2 billion in the 2013/14 crop, 69.2% higher than reported in the 2012/13 crop, due to the higher volume handled, which totaled approximately 679 million liters, representing an increase of 110.8% compared to the 2012/13 crop.
Ethanol
Volume Sold (million liters) and Average Unit Price (R$/cbm)

Ethanol Inventories
| Ethanol Inventories | |||
| 03/31/2014 | 03/31/2013 | Chg. % | |
| ´000 cbm | 108.0 | 61.0 | 77.2% |
| R$'MM | 124.5 | 71.4 | 74.5% |
| R$/cbm | 1,153.0 | 1,170.0 | -1.4% |
Energy Cogeneration
All of Raízen Energia’s 24 mills generate energy and are self-sufficient, and 13 sell surplus energy from cogeneration.
In 1Q14, net revenue from energy sales totaled R$27.3 million, an increase of 107.5% compared to 1Q13, when the value reported was R$13.1 million. During the quarter, total energy sold increased by 32.4%, reaching 71,100 MWh, reflex of extended cogeneration initiatives in the period between harvests. The average price was R$384/MWh, 56.8% higher than the average price in 1Q13, due to the higher volume of transactions in the spot market in 1Q14.
13 of 49
| Earnings Release 1st Quarter of Fiscal Year 2014 |
In the 2013/14 crop, net revenue from energy sales totaled R$403.8 million, a decrease of 29.1% compared to the 2012/13 crop, when the reported value was R$569.7 million. The decrease in net revenue was mainly due to a 28.1% drop in the volume sold, as well as in the average price, going from R$188/MWh in the 2012/13 crop to R$185/MWh in the 2013/14 crop.
Electric Energy
Volume Sold (’000 MWh) and Average Unit Price (R$/MWh)
Other Products and Services
In 1Q14, net revenue from other products and services totaled R$30.8 million, down 17.2% year-over-year. In the 2013/14 crop, this revenue totaled R$233.8 million, 1.1% lower than reported in the 2012/13 crop. These revenues are relative to the sale of sugarcane, steam, molasses and raw materials to service providers in the agricultural industry.
Cost of Goods Sold
Raízen Energia's cost of goods sold is reported together with the average unit costs, net of the effects of depreciation and amortization (cash cost).
| 1Q14 | 1Q13 | COGS per Product | 2013/14 | 2012/13 | ||
| (Jan-Mar) | (Jan-Mar) | Chg. % | Amounts in R$ MM | (Apr/13-Mar/14) | (Apr/12-Mar/13) | Chg. % |
| (2,113.0) | (2,091.0) | 1.1% | Cost of Goods Sold | (7,703.0) | (6,881.9) | 11.9% |
| (958.4) | (825.6) | 16.1% | Sugar | (3,276.0) | (2,997.4) | 9.3% |
| (721.2) | (730.5) | -1.3% | Ethanol | (2,787.9) | (2,317.9) | 20.3% |
| (428.4) | (273.2) | 56.8% | Trading | (1,170.0) | (705.5) | 65.8% |
| (14.9) | (10.9) | 36.6% | Energy Cogeneration | (163.6) | (399.0) | -59.0% |
| 10.0 | (250.7) | n/a | Others | (305.5) | (462.0) | -33.9% |
| Average Unitary Costs² | ||||||
| (529.9) | (505.2) | 4.9% | Cash Cost of Sugar (R$/ton) | (511.6) | (493.4) | 3.7% |
| (834.1) | (816.5) | 2.2% | Cash Cost of Ethanol (R$/’000 liters) | (852.7) | (775.4) | 10.0% |
Note 2: Average unit costs represent the cash cost, which is net of plantation and cultural treat depreciation and amortization, agricultural depreciation (machinery and equipment), industrial depreciation, and harvest off-season maintenance.
14 of 49
| Earnings Release 1st Quarter of Fiscal Year 2014 |
Raízen Energia’s cost of goods sold was R$2.1 billion in 1Q14, in line with the value reported in the same period last year. In the 2013/14 crop, the cost of goods sold totaled R$7.7 billion, 11.9% higher than in the 2012/13 crop, mainly due to the higher volumes of sugar and ethanol sold.
Also, the lower dilution of fixed costs caused by a decrease of 1.9% in the TSR level, which went from 133.4 kg/ton in the 2012/13 crop to 130.9 kg/ton in the 2013/14 crop, directly impacted the sugarcane cost.
The unit cost of products made by Raízen Energia was also impacted by the following factors:
| · | Decrease in the cost of the TSR kilo released by CONSECANA of 3.3%, from R$0.4728 in 1Q13 to R$0.4572 in 1Q14; |
| · | Increase in the agricultural productivity of sugarcane fields, represented by a higher TCH (ton of cane per hectare) level of 83.9 in the 2013/14 crop compared to 81.1 in the 2012/13 crop. |
Gross Profit
| 1Q14 | 1Q13 | Gross Profit and Gross Margin | 2013/14 | 2012/13 | ||
| (Jan-Mar) | (Jan-Mar) | Chg. % | Amounts in R$ MM | (Apr/13-Mar/14) | (Apr/12-Mar/13) | Chg. % |
| 491.9 | 259.4 | 89.6% | Gross Profit | 1,752.2 | 1,586.3 | 10.5% |
| 267.0 | 351.1 | -23.9% | Sugar | 1,077.1 | 1,356.6 | -20.6% |
| 21.8% | 29.8% | -7.9 p.p. | Sugar Gross Margin (%) | 24.7% | 31.2% | -6.3 p.p. |
| 42.8% | 48.8% | -5.9 p.p. | Sugar (Cash) Gross Margin (%) | 45.9% | 52.1% | -6.0 p.p. |
| 152.8 | 121.7 | 25.6% | Ethanol | 460.2 | 276.6 | 66.4% |
| 17.5% | 14.3% | 3.3 p.p. | Ethanol Gross Margin (%) | 14.2% | 10.7% | 3.5 p.p. |
| 42.2% | 38.1% | 4.2 p.p. | Ethanol (Cash) Gross Margin (%) | 36.1% | 39.1% | -3.0 p.p. |
| 18.8 | (2.1) | n/a | Trading | 46.5 | 13.3 | n/a |
| 4.2% | -0.8% | 5.0 p.p. | Ethanol Trading Margin (%) | 3.8% | 1.8% | 2.2 p.p. |
| 12.3 | 2.2 | n/a | Energy Cogeneration | 240.3 | 170.7 | 40.8% |
| 45.2% | 16.8% | 28.4 p.p. | Energy Cogeneration Margin (%) | 59.5% | 30.0% | 29.7 p.p. |
| 40.9 | (213.5) | n/a | Other Products and Services | (71.7) | (231.4) | -69.0% |
In 1Q14, Raízen Energia’s gross profit totaled R$491.9 million, an increase of 89.6% compared to 1Q13, when the gross profit reported was R$259.4 million.
Gross profit from the sale of sugar reached R$267.0 million in 1Q14, a decrease of 23.9% year-over-year. The result from the sale of ethanol rose 25.6% year-over-year to R$152.8 million in 4Q13. The sale of electric energy resulted in gross profit of R$12.3 million, significantly up year-over-year.
The result from the sale of other products and services totaled R$ 40.9 million in the quarter and was mostly impacted by the gain (non-cash impact) of R$54.7
15 of 49
| Earnings Release 1st Quarter of Fiscal Year 2014 |
million from the positive effect of the biological asset’s fair value and agricultural produce.
In the 2013/14 crop, gross profit totaled R$1.8 billion, an increase of 10.5% compared to the gross profit reported in the previous period, which reached R$1.6 billion.
The gross profit from sugar sales was R$1.1 billion, 20.6% lower than reported in the 2012/13 crop. The gross profit from ethanol sales was 66.4% higher than reported in the 2012/13 crop, totaling R$460.2 million. Meanwhile, the sales of energy (electricity) resulted in gross profit of R$240.3 million, 40.8% higher than reported in the previous crop.
The result from the sale of other products and services in the 2013/14 crop was negative by R$71.7 million, impacted by the loss (non-cash impact) of R$73.4 million, due to the negative effect variation of the biological asset’s fair value and agricultural produce.
Selling, General & Administrative Expenses
| 1Q14 | 1Q13 | SG & A Expenses | 2013/14 | 2012/13 | ||
| (Jan-Mar) | (Jan-Mar) | Chg. % | Amounts in R$ MM | (Apr/13-Mar/14) | (Apr/13-Mar/14) | Chg. % |
| (163.2) | (196.7) | -17.0% | Selling Expenses | (637.3) | (638.8) | -0.2% |
| (140.4) | (135.3) | 3.7% | General and Administrative Expenses | (552.0) | (490.2) | 12.6% |
Raízen Energia’s selling expenses totaled R$163.2 million in 1Q14, a decrease of 17.0% year-over-year, mainly due to the lower volume of sugar sales in the foreign market, reducing freight, logistics and port elevation costs. In the 2013/14 crop, selling expenses totaled R$637.3 million, remaining in line with the value reported in the previous crop.
General and administrative expenses reached R$140.4 million in 1Q14, 3.7% higher than reported in 1Q13, which amounted R$135.3 million. In the 2013/14 crop, general and administrative expenses were R$552.0 million, an increase of 12.6% compared to the 2012/13 crop, mostly because of higher compensation and benefits costs.
16 of 49
| Earnings Release 1st Quarter of Fiscal Year 2014 |
EBITDA
| 1Q14 | 1Q13 | EBITDA | 2013/14 | 2012/13 | ||
| (Jan-Mar) | (Jan-Mar) | Chg. % | Amounts in R$ MM | (Apr/13-Mar/14) | (Apr/12-Mar/13) | Chg. % |
| 734.0 | 410.5 | 78.8% | EBITDA | 2,435.9 | 2,408.3 | 1.1% |
| 28.2% | 17.5% | 10.7 p.p. | EBITDA Margin (%) | 25.8% | 28.4% | -2.7 p.p. |
Raízen Energia's EBITDA totaled R$734.0 million in 1Q14, an increase of 78.8% compared to 1Q13, when the reported value reached R$410.5 million. In the 2013/14 crop, EBITDA was R$2.4 billion, remaining flat compared to the 2012/13 crop.
The significant increase in Raízen Energia's EBITDA compared to previous quarters is due to the successful strategy of building and carrying over stocks of sugar and ethanol from 4Q 2013 to 1Q14, which were sold at higher prices.
| 1Q14 | 1Q13 | EBITDA Ex-Biological Asset | 2013/14 | 2012/13 | ||
| (Jan-Mar) | (Jan-Mar) | Chg. % | Amounts in R$ MM | (Apr/13-Mar/14) | (Apr/13-Mar/14) | Chg. % |
| 734.0 | 410.5 | 78.8% | EBITDA | 2,435.9 | 2,408.3 | 1.1% |
| (54.7) | 209.7 | n/a | (+) Biological Asset Effect | 73.4 | 227.7 | -67,8% |
| 679.3 | 620.2 | 9.5% | EBITDA Ex-Biological Asset | 2,509.3 | 2,636.0 | -4.8% |
When the effects of the biological asset are adjusted in Raízen Energia’s EBITDA, we notice a growth of 9.5%, totaling R$679.3 million in 1Q14. In the accumulated harvest, EBITDA remained almost unchanged, from R$2.64 billion in the 2012/13 crop to R$2.51 billion in the 2013/14 crop.
17 of 49
| Earnings Release 1st Quarter of Fiscal Year 2014 |
Hedge
Volume positions and fixed sugar prices agreed with traders or through derivative financial instruments as of March 31, 2014, and foreign exchange derivatives contracted by Raízen Energia to hedge future cash flows, are as follows:
Summary of Hedge Operations at Mar 31, 20144 | ||
| Sugar | 2014/15 | 2015/16 |
| NY11 | ||
| Volume (‘000 ton) | 1,647.4 | 25.0 |
| Average Price (¢US$/lb) | 18.16 | 18.50 |
| Exchange Rate | ||
| US$ | ||
| Volume (US$ mm) | 686.2 | 10.6 |
| Average Price (R$/US$) | 2.41 | 2.71 |
Note 4: The table above shows the hedging coverage onsidering the crop years ending on 3/31/2014 and 3/31/2015 respectively.
Impacts of Hedge Accounting
Raízen Energia has been using cash flow hedge accounting for certain derivative financial instruments in order to hedge against the price risk for sugar over revenues from sugar exports.
The table below shows the expected transfer of gain/loss balances from the shareholders’ equity as at March 31, 2014 to the net operating income of Raízen Energia5 in future years, broken down by coverage period for the following hedging instruments:
| Expiration Period - (R$MM) | |||||
| Derivative | Market | Risk | 2014 | 2015 | Total |
| Futures | OTC/NYBOT | NY#11 | (16.4) | (0.9) | (17.4) |
| (=) Hedge Accounting impact | (16.4) | (0.9) | (17.4) | ||
| (-) Deferred Income Tax | 5.6 | 0.3 | 5.9 | ||
| (=) Asset Valuation Adjustment | (10.8) | (0.6) | (11.4) | ||
Note 5 The table above shows 100% of the hedge accounting gains/losses reclassified to shareholders’ equity. As Cosan holds a 50% interest at Raízen Energia, hedge accounting will have a proportionate impact on Other Comprehensive Income in Cosan’s shareholders’ equity.
18 of 49
| Earnings Release 1st Quarter of Fiscal Year 2014 |
Capex
| 1Q14 | 1Q13 | CAPEX | 2013/14 | 2012/13 | ||
| (Jan-Mar) | (Jan-Mar) | Chg. % | Amounts in R$ MM | (Apr/13-Mar/14) | (Apr/12-Mar/13) | Chg. % |
| 1,009.1 | 1,017.2 | -0.8% | Total CAPEX | 2,522.4 | 2,404.6 | 4.9% |
| 698.4 | 749.1 | -6.8% | Operating CAPEX | 1,777.9 | 1,934.1 | -8.1% |
| 166.3 | 184.0 | -9.6% | Biological Assets | 917.6 | 948.8 | -3.3% |
| 370.3 | 403.7 | -8.3% | Inter-Harvest Maintenance Costs | 570.9 | 602.3 | -5.2% |
| 63.1 | 18.2 | 247.6% | SSMA and Sustaining | 120.6 | 64.6 | 86.7% |
| 89.3 | 84.6 | 5.5% | Mechanization | 148.8 | 205.3 | -27.5% |
| 9.5 | 58.6 | -83.8% | Industrial | 20.0 | 113.1 | -82.3% |
| 310.7 | 268.2 | 15.9% | Expasion CAPEX | 744.5 | 470.4 | 58.3% |
| 63.1 | 18.2 | -88.7% | Cogeneration Projects | 120.6 | 64.6 | -81.3% |
| 89.3 | 84.6 | 30.0% | Expansion and Other Projects | 148.8 | 205.3 | 97.3% |
Raízen Energia recorded Capex of R$1.0 billion in 1Q14, remaining almost in line with 1Q13.
The main operating capital expenditures in the quarter were focused on investments in biological assets, agricultural and industrial interharvest maintenance, crushing expansion projects in Paraguaçu and Caarapó, and 2G Ethanol.
The expenditures in biological assets totaled R$166.3 million, 9.6% lower than the same period last year. The reduction in the industrial line compared to 1Q13 is due to finalization of investment in the Diamante, Zanin and Jataí units.
Investments in the cogeneration projects had a decrease of 88.8% compared to the same quarter of the previous period, mainly due to the completion of the Univalem project.
The Expansion and other projects line totaled R$307.0 million of expenditure in crushing expansion projects at the Paraguaçu and Caarapó units. This line also includes other initiatives such as projects for vinasse concentration, biomass projects, expansion of mechanized planting, and operating improvements.
19 of 49
| Earnings Release 1st Quarter of Fiscal Year 2014 |
B.3 Comgás
In this section we report on the results of Comgás, our natural gas distribution business unit operating in the concession area consisting of the Metropolitan Region of São Paulo, the Administrative Region of Campinas, Baixada Santista, and Vale do Paraíba in São Paulo state.
Volumes Sold
| Volume Sold | 1Q14 | 1Q13 | |
| Volume ('000 cbm) | (Jan-Mar) | (Jan-Mar) | Chg.% |
| Total Gas Sales | 1,313,066 | 1,367,015 | -3.9% |
| Gas Sales - without thermal power | 1,106,133 | 1,138,373 | -2.8% |
| Residential | 37,908 | 41,815 | -9.3% |
| Commercial | 27,322 | 25,793 | 5.9% |
| Industrial | 912,916 | 928,145 | -1.6% |
| Cogeneration | 74,891 | 82,659 | -9.4% |
| Vehicular | 53,095 | 59,961 | -11.5% |
| Thermal Power | 206,933 | 228,642 | -9.5% |
Comgás’s business strategy is focused on growing the residential and commercial segments, and on developing the cogeneration and VNG segments. The industrial segment growth - the most representative in terms of volume - has its performance linked to the industrial activity in the concession area. The Company's distribution network totaled 11,273 km in March 2014, of which 335 km were added in 1Q14.
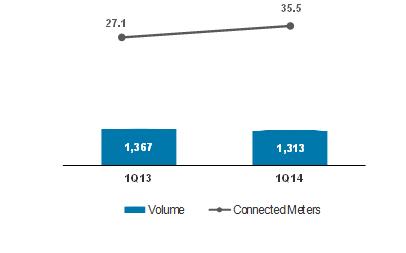
In 1Q14, the company distributed 37.9 million cbm of gas in the residential segment, 9.3% less than the volume distributed in 1Q13, which reached 41.8 million cbm. The difference of volume in this segment is mainly explained by high temperatures in the first quarter of 2014 compared to the same period of 2013, which reduced the consumption for heating water for bathing/showering throughout the customer base with natural gas heaters. The segment closed the quarter with 970,439 meters connected, an increase of 8.1% compared to 1Q13 (897,974 meters). The residential segment accounted for 3% of the total volume distributed in 1Q14, representing 18% of Comgás’s total margin.
Comgás distributed 27.3 million cbm of gas in the commercial segment during 1Q14, 5.9% higher than 1Q13, in which the total volume of distribution was 25.8 million cbm. This variation is explained by the addition of 1,280 new clients in the last 12 months - 418 added in the first quarter of 2014. This market represents 2% of the total volume of gas distributed in the quarter and 8% of Comgás’s total margin.
20 of 49
| Earnings Release 1st Quarter of Fiscal Year 2014 |
The industrial segment totaled 912.9 million cbm in 1Q14, 1.6% lower than 1Q13 (928,100,000 cbm). This variation is related to the performance of the economy and the low industrial activity in the period. At the quarter end, Comgás had 1,033 clients in this segment, accounting for 70% of the total distributed in the period, representing 68% of the total margin.
The cogeneration segment saw a reduction of 9.4% in the volume of gas distributed, reaching 74.9 million cbm in 1Q14 compared to 82.6 million cbm in 1Q13. This decrease is mainly due to lower production of some plants, because of preventive or corrective maintenance, as well as reducing the level of activity, especially in the textile sector. The segment represents 6% of the total volume of natural gas distributed by Comgás in the year, contributing 3% to the gross margin.
In 1Q14, the automotive segment represented 4% of the total volume of gas distributed by the company, totaling 53.1 million cbm. However, this number is 11.5% less than the volume of gas sold in 1Q13. This segment contributed 1% to Comgás’s gross margin. Despite the lower volume sold, this was the first quarter that the number of installations of the VNG kit in vehicles has increased in recent years, with 670 conversions in 1Q14, 4.5% higher than 1Q13 with 641 conversions.
In the thermal generation segment, sales reached 206.9 million cbm in 1Q14, a decrease of 9.5% compared to 1Q13. The segment accounted for 16% of the total volume of gas sold by Comgás in 1Q14, representing 2% of the total margin. It is important to note that Comgás’s gas supply contracts do not include thermal power plants. If thermal power plants need to dispatch gas, Petrobras will supply the Company the additional volume, because these are “back to back” contracts.
Natural Gas
Volume of Gas Sold (million cbm) and New Customers Connected (thousand units)
21 of 49
| Earnings Release 1st Quarter of Fiscal Year 2014 |
Operating Revenue
| Sales Breakdown | 1Q14 | 1Q13 | |
| Amounts in R$ MM | (Jan-Mar) | (Jan-Mar) | Chg.% |
| Gross Operating Revenue | 1,864.6 | 1,771.5 | 5.3% |
| Gas Sales | 1,737.3 | 1,629.5 | 6.6% |
| Residential | 142.4 | 144.7 | -1.6% |
| Commercial | 70.2 | 61.8 | 13.6% |
| Industrial | 1,302.2 | 1,200.9 | 8.4% |
| Cogeneration | 75.5 | 80.3 | -6.0% |
| Thermal Power | 87.6 | 84.7 | 3.4% |
| Vehicular | 59.4 | 57.1 | 4.1% |
| Construction Revenue | 117.6 | 135.2 | -13.0% |
| Other | 9.6 | 6.8 | 41.6% |
| Tax on Sales | (347.2) | (323.8) | 7.2% |
| Net Operating Revenue | 1,517.4 | 1,447.7 | 4.8% |
| Gas Sales | 1,391.3 | 1,305.1 | 6.6% |
| Construction Revenue | 117.6 | 135.2 | -13.0% |
| Other | 8.5 | 7.4 | 14.2% |
Comgás’s net revenue from sales and services reached R$1.5 billion in 1Q14, an increase of 4.8% compared to 1Q13, when the total was R$1.4 billion.
Increased rates, as approved by ARSESP resolutions no. 421 and 455, were the main drivers of the changes in Revenue from the Sale of Natural Gas. To establish the new rates, the ARSESP considered the period's inflation, as well as the increased cost of natural gas, especially imported gas. This cost is impacted by the appreciation of the dollar and the average contracted oil price per barrel, key elements for Bolivian natural gas price formation.
Cost of Goods Sold and Services Provided
| COGS | 1Q14 | 1Q13 | |
| Amounts in R$ MM | (Jan-Mar) | (Jan-Mar) | Chg.% |
| Cost of Goods and Services | (1,069.0) | (1,032.4) | 3.5% |
| Natural Gas | (951.3) | (897.2) | 6.0% |
| Construction - ICPC 01 | (117.6) | (135.2) | -13.0% |
In 1Q14, the cost of goods sold and services by Comgás totaled R$1.1 billion, an increase of 3.5% compared to 1Q13, in which the value was reported at R$1.0 billion.
22 of 49
| Earnings Release 1st Quarter of Fiscal Year 2014 |
The rising cost of natural gas can be explained mainly by the increase in the cost of natural gas in supply contracts priced in dollars. The variation in the construction cost line is directly linked to lower levels of investment during 1Q14.
The rise of the US dollar against the Brazilian Real strongly impacted the cost of gas, and the ARSESP’s transfers were not enough to fully recover the amount of the regulatory current account for the quarter. The Agency authorizes the rate updates so as to pass through the natural gas cost. Because the billed gas is indexed to the US dollar by Petrobrás, the amounts are passed on to users.
It is worth noting that the differences between the actual cost incurred and the cost of gas included in the rate and billed to clients, according to the rate structure defined by ARSESP, are accumulated in the regulatory current account and passed through/billed as determined by the regulatory authority in the periodic price adjustments or rate revisions. This balance is adjusted on a monthly basis at the SELIC rate. On March 31, 2014, the regulatory current account recorded a balance of R$296.7 million for Comgás, after a recovery of R$50.7 million in 1Q14.
The regulatory current account represents a receivable or payable balance according to the difference between the price of the natural gas acquired by Comgás and the price considered to form the rate. This balance is not accounted for, and therefore when we refer to its normalization, it means we consider this asset and/or liability as if it had been accounted for.
Gross Profit
| Gross Profit | 1Q14 | 1Q13 | |
| Amounts in R$ MM | (Jan-Mar) | (Jan-Mar) | Chg. % |
| Gross Profit | 448.4 | 415.4 | 8.0% |
| Gross Margin (%) | 29.6% | 28.7% | 0.9 p.p. |
In 1Q14, Comgás reported gross profit of R$448.4 million, up 7.9% year-over-year (R$415.4 million in 1Q13).
Selling, General, and Administrative Expenses
| SG&A Expenses | 1Q14 | 1Q13 | |
| Amounts in R$ MM | (Jan-Mar) | (Jan-Mar) | Chg. % |
| Selling Expenses | (150.3) | (151.5) | -0.8% |
| G&A Expenses | (67.1) | (70.5) | -4.7% |
| Other Operating Revenues (Expenses) | (7.1) | (1.4) | n/a |
Comgás’ selling expenses totaled R$150.3 million in 1Q14, 0.8% lower than the R$151.5 million reported in 1Q13.
In 1Q14, general and administrative expenses were R$67.1 million, 4.7% lower than the R$70.5 million reported in 1Q13.
23 of 49
| Earnings Release 1st Quarter of Fiscal Year 2014 |
EBITDA
| EBITDA | 1Q14 | 1Q13 | |
| Amounts in R$ MM | (Jan-Mar) | (Jan-Mar) | Chg. % |
| EBITDA | 342.0 | 314.4 | 8.8% |
| EBITDA Margin (%) | 22.5% | 21.7% | 0.8 p.p. |
| Normalizade EBITDA | 282.8 | 262.0 | 7.9% |
| Normalized EBITDA Margin (%) | 18.6% | 18.1% | 0.5 p.p. |
Comgás’ EBITDA reached R$342.0 million in 1Q14, an increase of 8.8% year-over-year, with EBITDA margin of 22.5%. Normalized by the regulatory current account, EBITDA totaled R$282.8 million for the quarter, up 7.9% year-over-year.
Capex
| CAPEX | 1Q14 | 1Q13 | |
| Amounts in R$ MM | (Jan-Mar) | (Jan-Mar) | Chg. % |
| CAPEX | 155.8 | 174.5 | -10.7% |
In 1Q14, capex reached R$155.8 million, a decrease of 10.7% compared to the R$174.5 million spent in the same period of 2013. This variation can be explained by high investments in the RETAP project during 2013.
Of the total investments made during the quarter, approximately 69% was in the expansion of the gas distribution network. A total of 335 km of network was added during the quarter, 11.5% higher than in 1Q13.
24 of 49
| Earnings Release 1st Quarter of Fiscal Year 2014 |
B.4 Rumo
Below we report on Rumo’s results, the company responsible for providing integrated logistics services, consisting of transportation, storage and port elevation for sugar and other agricultural commodities.
Net Revenue
| Net Revenue Breakdown | 1Q14 | 1Q13 | |
| Amounts in R$ MM | (Jan-Mar) | (Jan-Mar) | Chg.% |
| Net Operating Revenue | 207.9 | 168.4 | 23.5% |
| Transportation | 154.9 | 128.5 | 20.6% |
| Loading | 49.4 | 36.6 | 34.9% |
| Other | 3.6 | 3.3 | 9.5% |
Rumo’s net revenue totaled R$207.9 million in 1Q14, 23.5% higher than reported in 1Q13, due to higher transportation and elevation volumes in the period.
Net revenue from transportation totaled R$154.9 million in 1Q14, up 20.6% year-over-year. This increase was mainly due to growth of approximately 60% of the sugar volume transported following the sale of inventories built in 4Q 2013 by leading producers in the market.
Rumo’s sugar elevation volume totaled 2.7 million tons in 1Q14, 27.3% higher than 1Q13. Revenue from elevation was R$49.4 million, an increase of 34.9% compared to the same period last year due to new contracts signed during 1Q14 and the dislocation of sugar volume shipments following the same dynamic explained in the transportation operation.
Port Elevation Volume
(thousand t)

25 of 49
| Earnings Release 1st Quarter of Fiscal Year 2014 |
Cost of Services Provided
| Costs of Services | 1Q14 | 1Q13 | |
| Amounts in R$ MM | (Jan-Mar) | (Jan-Mar) | Chg. % |
| Cost of Services | (123.5) | (95.2) | 29.8% |
Rumo’s cost of services provided includes railway and highway freight, port elevation, transshipment and storage costs in upstate São Paulo and at the Port of Santos.
The cost of services provided by Rumo in 1Q14 was R$123.5 million, 29.8% higher than the R$95.2 million reported in 1Q13. This growth is mostly due to higher transportation and elevation volumes in the period, as well as higher freight costs, mainly impacted by the contingent contracting of highway transportation to the port of Santos.
Gross Profit
| Gross Profit | 1Q14 | 1Q13 | |
| Amounts in R$ MM | (Jan-Mar) | (Jan-Mar) | Chg. % |
| Gross Profit | 84.4 | 73.2 | 15.3% |
| Gross Margin (%) | 40.6% | 43.5% | -2.9 p.p. |
Rumo had a 15.3% growth in its gross profit, from R$73.2 million in 1Q13 to R$84.4 million in 1Q14, and the gross margin was 40.6%.
General and Administrative Expenses
| G&A Expenses | 1Q14 | 1Q13 | |
| Amounts in R$ MM | (Jan-Mar) | (Jan-Mar) | Chg. % |
| G&A Expenses | (20.0) | (16.7) | 19.6% |
Rumo’s general and administrative expenses totaled R$20.0 million in 1Q14, 19.6% higher than the R$16.7 million reported in 1Q13, reflecting the adjustment in the administrative structure for new logistics projects in ports and rail.
EBITDA
| EBITDA | 1Q14 | 1Q13 | |
| Amounts in R$ MM | (Jan-Mar) | (Jan-Mar) | Chg. % |
| EBITDA | 92.8 | 69.1 | 34.4% |
| EBITDA Margin (%) | 44.7% | 41.0% | 3.6 p.p. |
Rumo’s EBITDA totaled R$92.8 million in 1Q14, representing an increase of 34.4% compared to the R$69.1 million reported in 1Q13. The EBITDA margin rose by 3.6 percentage points, from 41.0% in 1Q13 to 44.7% in 1Q14.
26 of 49
| Earnings Release 1st Quarter of Fiscal Year 2014 |
Capex
| CAPEX | 1Q14 | 1Q13 | |
| Amounts in R$ MM | (Jan-Mar) | (Jan-Mar) | Chg. % |
| CAPEX | 14.0 | 57.0 | -75.5% |
In 1Q14, Rumo’s capital expenditure totaled R$14.0 million, and was invested in the following initiatives:
| (i) | R$9.5 million in improvements to the port terminal of Santos, including increased unloading capacity, construction of the coverage of the South terminal and improvements in the rail yard between terminals XVI and XIX. |
| (ii) | R$1.3 million in improvements in the internal logistics of the transfer terminal in Sumaré, São Paulo. |
| (iii) | R$3.2 million related to several initiatives undertaken during the maintenance shutdown of the terminals in the sugar interharvest period. |
27 of 49
| Earnings Release 1st Quarter of Fiscal Year 2014 |
B.5 Cosan Lubrificantes
Results of the lubricants segment include the manufacturing and distribution of Mobil and Comma lubricants, resale of base oil and automotive specialties in Brazil and in 40 other countries through two plants located in Rio de Janeiro, Brazil, and in Kent, U.K.
Net Revenue
| Sales Breakdown | 1Q14 | 1Q13 | |
| Amounts in R$ MM | (Jan-Mar) | (Jan-Mar) | Chg.% |
| Net Operating Revenue | 368.3 | 357.7 | 3.0% |
Net revenues from the sales of lubricants, resale of base oil and other products and services of Cosan Lubrificantes totaled R$368.3 million in 1Q14, 3.0% higher than the R$357.7 million reported in 1Q13, due to the increase of international business sales.
As a result, the total unit average revenue grew 2.4% in the quarter, from R$4,933/cbm reported in 1Q13 to R$5,050/cbm.
Lubricants, Base Oils, and Other Products
Volume (million liters) and Average Unit Revenue (R$/’000 liters)

Cost of Goods Sold and Services Provided
| COGS | 1Q14 | 1Q13 | |
| Amounts in R$ MM | (Jan-Mar) | (Jan-Mar) | Chg. % |
| Cost of Goods and Services | (290.0) | (257.8) | 12.5% |
| COGS (R$/cbm) | |||
| Lubrificants and Base Oil | (3,977) | (3,557) | 11.8% |
The cost of goods sold and services provided by Cosan Lubrificantes in 1Q14 rose 12.5% compared to 1Q13, reaching R$290.0 million, an increase caused
28 of 49
| Earnings Release 1st Quarter of Fiscal Year 2014 |
mainly by the foreign exchange rate impact, which affects the costs of importing base oil.
Consequently, the average total unit cost in 1Q14 was R$3,977/cbm, 11.8% higher than the R$3,556/cbm reported in 1Q13.
Gross Profit
| Gross Profit | 1Q14 | 1Q13 | |
| Amounts in R$ MM | (Jan-Mar) | (Jan-Mar) | Chg. % |
| Gross Profit | 78.3 | 99.9 | -21.6% |
| Gross Margin (%) | 21.3% | 27.9% | -6.7 p.p. |
Gross profit totalled R$78.3 million in 1Q14, and the gross margin was 21.3%, 6.6 percentage points less than in 1Q13, which was 27.9%.
Selling, General & Administrative Expenses
| SG&A | 1Q14 | 1Q13 | |
| Amounts in R$ MM | (Jan-Mar) | (Jan-Mar) | Chg. % |
| Total Expenses | (73.7) | (67.6) | 9.0% |
Selling, general and administrative expenses grew 9.0% in 1Q14, reaching R$73.7 million, mainly due to the expansion of international trading activities impacted by the exchange rate effect linked to these operations.
EBITDA
| EBITDA | 1Q14 | 1Q13 | |
| Amounts in R$ MM | (Jan-Mar) | (Jan-Mar) | Chg. % |
| EBITDA | 23.2 | 47.6 | -51.1% |
| EBITDA Margin (%) | 6.3% | 13.3% | -7.0 p.p. |
Cosan Lubrificantes’ EBITDA was R$23.2 million in 1Q14 with a margin of 6.3%.
29 of 49
| Earnings Release 1st Quarter of Fiscal Year 2014 |
B.6 Radar
Below we report on Radar’s results, whose main activity is investment in agricultural properties, land leasing in the Brazilian rural real estate market, and portfolio management.
Assets Portfolio
| State | Culture | % | Area (hectare) | Area (acre) | Market Value ( R$MM) |
| Third-party Land | - | - | 129,041 | 318,730 | 1,617 |
| Owned Land | - | 100.0% | 106,259 | 262,461 | 2,534 |
| São Paulo | Sugarcane | 65% | 69,260 | 171,073 | 2,129 |
| Maranhão | Grains | 16% | 16,651 | 41,129 | 145 |
| Mato Grosso | Grains | 12% | 12,303 | 30,388 | 164 |
| Bahia | Grains | 7% | 7,155 | 17,674 | 80 |
| Goiás | Sugarcane | 1% | 672 | 1,659 | 16 |
| Mato Grosso do Sul | Sugarcane | 0% | 218 | 538 | 2 |
| Total |
Radar closed 1Q14 with a land portfolio of R$2.5 billion, and total area of 106.3 thousand hectares (262.5 thousand acres), distributed throughout six Brazilian states. Considering third-party assets managed by Radar, total area under management is 235.3 thousand hectares (581.2 thousand acres), equivalent to R$4.2 billion.
Net Revenue, Cost of Products and Gross Profit
| 1Q14 | 1Q13 | ||
| Amounts in R$ MM | (Jan-Mar) | (Jan-Mar) | Chg. % |
| Net Revenue | 63.6 | 15.4 | n/a |
| Property Sale | 45.6 | - | n/a |
| Land Lease | 16.1 | 15.4 | 4.8% |
| Cost of Property Sales | 1.8 | - | n/a |
| Property Sale | (38.3) | 0.0 | n/a |
| Gross Profit | 25.2 | 15.4 | 64.1% |
| Gross Margin (%) | 39.7% | 100.0% | -60.3 p.p. |
Radar’s net revenue was R$63.6 million in 1Q14, mainly impacted by (i) sales of land in amount of R$45.6 million, (ii) and the increase in leasing prices due to the fluctuation of variables that make up agricultural commodities prices and impact the agreements’ indexes in amount of R$17.9 million.
Radar’s cost of goods sold in 1Q14 was R$38.3 million and refers to the sale of assets during the period.
Gross profit in the quarter was R$25.2 million, compared to R$15.4 million during the same period last year.
30 of 49
| Earnings Release 1st Quarter of Fiscal Year 2014 |
General and Administrative Expenses
| G&A Expenses | 1Q14 | 1Q13 | |
| Amounts in R$ MM | (Jan-Mar) | (Jan-Mar) | Chg. % |
| G&A Expenses | (8.4) | (4.8) | 73.2% |
| Other Operational Revenues (Expenses) | (23.0) | 54.4 | n/a |
In 1Q14, Radar’s general and administrative expenses totaled R$8.4 million, up 73.2% compared to 1Q13, mainly due to increased compensation and benefits expenses. Other operating revenues are the gain/loss from valuation of Radar’s own portfolio.
EBITDA
| EBITDA | 1Q14 | 1Q13 | |
| Amounts in R$ MM | (Jan-Mar) | (Jan-Mar) | Chg. % |
| EBITDA | (5.9) | 65.2 | n/a |
Radar’s EBITDA was negative by R$5.9 million in 1Q14, impacted by the devaluation of 0.9% of its land portfolio in the period, following the change in market indexes.
31 of 49
| Earnings Release 1st Quarter of Fiscal Year 2014 |
B.7 Other Businesses
Below we report on the results of the Other Businesses segment, which comprises Cosan’s corporate structure, effects of contingencies from businesses contributed to Raízen prior to its formation, and other investments.
| General and Administrative Expenses | 1Q14 | 1Q13 | |
| Amounts in R$ MM | (Jan-Mar) | (Jan-Mar) | Chg. % |
| G&A Expenses | (32.3) | (25.2) | 28.2% |
| Other Revenues (Expenses) | (9.7) | 27.3 | n/a |
| EBITDA | 1Q14 | 1Q13 | |
| Amounts in R$ MM | (Jan-Mar) | (Jan-Mar) | Chg. % |
| EBITDA | 328.6 | 201.4 | 63.2% |
| (-) Equity Pick-up | (369.8) | (195.9) | 88.8% |
| Adjusted EBITDA | (41.2) | 5.4 | n/a |
Cosan’s general and administrative expenses mostly consist of personnel expenses, which include payroll, charges, and consulting services. In 1Q14, general and administrative expenses totaled R$32.3 million, 28.2% higher than reported in 1Q13, due to higher spending on its own and contracted labor force during the period.
In 1Q14, other revenues and expenses of this segment totaled R$9.7 million, and consist of provision net effects, reversals, and payment of contingencies and attorneys’ fees. During 1Q13, other revenues and expenses totalled R$27.3 million, mainly due to the positive impact of the sale of land in Rio de Janeiro.
In 1Q14, this segment’s EBITDA totaled R$328.6 million, exclusively due to the equity accounting result in the period. Adjusted for this effect, this segment’s EBITDA was negative by R$41.2 million.
32 of 49
| Earnings Release 1st Quarter of Fiscal Year 2014 |
C. Other Items in the Consolidated Result
Financial Result
| Financial Results | 1Q14 | 1Q13 | |
| Amounts in R$ MM | (Jan-Mar) | (Jan-Mar) | Chg. % |
| Gross Debt Charges | (180.8) | (155.4) | 16.3% |
| Income from Financial Investments | 30.2 | 22.8 | 32.3% |
| (=) Subtotal: Net Debt Interests | (150.5) | (132.6) | 13.6% |
| Other Charges and Monetary Variation | 29.7 | 3.9 | n/a |
| Exchange Rate Variation | 77.9 | (0.1) | n/a |
| Gains (losses) with Derivatives | (50.6) | (5.3) | n/a |
| Amortization, Debt Cost and Other | (12.6) | (43.5) | -71.1% |
| (=) Financial, Net | (106.2) | (177.6) | -40.2% |
In 1Q14, debt charges were up by R$25.4 million compared to 1Q13, due to the variation in the interest rate between the periods, since the level of debt did not show any significant variations.
Revenue from financial investments closed 1Q14 with a positive amount of R$30.2 million, compared to R$22.8 million in 1Q13.
Other charges and monetary variations, consisting of interest on contingencies, interest on tax, monetary variation and other interests, totaled a net revenue of R$29.7 million in 1Q14, compared to R$3.9 million in 1Q13.
The positive result from the foreign exchange rate variation in the quarter reflects the devaluation of the US Dollar against the Brazilian Real by 4% (R$2.2630/US$ on March 31, 2014 versus R$2.3426/US$ on December 31, 2013), and the impact on debt denominated in dollars, causing a non-cash effect on the consolidated financial result. However, it is worth noting that all debts denominated in foreign currency are mainly hedged by foreign exchange swaps, except for the principal of the Perpetual Bond in the amount of US$500 million. In 1Q13, the US Dollar also depreciated versus the Brazilian Real by 1% (R$2.0138/US$ on March 31, 2013 versus R$2.0435/US$ on December 31, 2012).
In 1Q14 we recorded a negative result with derivatives totaling R$50.6 million, offsetting the costs on the debt hedges mentioned above.
Amortization, debt cost and others closed 1Q14 with expenses of R$12.6 million, compared to expenses of R$43.5 million in 1Q13, when there was amortization of transaction costs on the issue of Debentures, due to liquidation of the first series, with proceeds equivalent to the 2018 and 2023 Senior Notes at the end of 1Q13.
33 of 49
| Earnings Release 1st Quarter of Fiscal Year 2014 |
Income Tax and Social Contribution
| Income Tax and Social Contribution | 1Q14 | 1Q13 | |
| Amounts in R$ MM | (Jan-Mar) | (Jan-Mar) | Chg.% |
| Income (Loss) before Income Tax | 367.5 | 254.5 | 44.4% |
| Total of Tax and Social Contribution | (59.6) | (139.2) | -57.2% |
| Deferred Income Tax Expenses | (29.0) | (111.5) | -74.0% |
| Current Income Tax Expenses | (30.5) | (27.7) | 10.1% |
| Effective Rate - Current (%) | -8.3% | -10.9% | 2.6 p.p. |
In 1Q13, the expense with Income Tax and Social Contribution showed a decrease from R$79.6 million to R$59.6 million in 1Q14, mainly from the constitution of tax credit on accumulated losses from 4Q13. The effective rate was 8.3% in 1Q14, against 10.9% in 1Q13.
The table below shows the Income Tax and Social Contribution expenses broken down by business unit:
Income Tax and Social Contribution Amount in R$ MM | Comgás | Rumo | Lubricants | Radar5 | Other Business | Adjusts and Eliminations | Consolidated |
| Net Income before Taxes | 167.3 | 75.0 | 29.0 | (3.0) | 246.0 | (146.7) | 367.5 |
| Nominal Rate of Income Tax and Social Contribution (%) | -34.0% | -34.0% | -34.0% | -34.0% | -34.0% | -34.0% | -34.0% |
| Income Tax and Social Contribtions Theoretical Expense | (56.9) | (25.5) | (9.9) | 1.0 | (83.6) | 49.9 | (125.0) |
| Non-taxable Permanent Differences / Equity Pick-up | (1.5) | (0.0) | (0.4) | - | 125.6 | (49.9) | 73.7 |
| Tax Loss and Negative Basis | - | - | - | (3.7) | - | - | (3.7) |
| Interest on capital | - | - | - | - | (7.0) | - | (7.0) |
| Other | (0.5) | 0.3 | 13.1 | - | (10.4) | - | 2.4 |
| Income Tax Effective Expenses | (59.0) | (25.2) | 2.8 | (2.7) | 24.6 | - | (59.6) |
| Income Tax and Social Contribution Effective Rate (%) | -35.2% | -33.7% | n/a | n/a | n/a | - % | -16.2% |
| Expenses (Revenues) com IR/CS | (59.0) | (25.2) | 2.8 | (2.7) | 24.6 | - | (59.6) |
| Current | (22.5) | (17.4) | 14.0 | (4.6) | - | - | (30.5) |
| Effective Rate - Current Rate (%) | -13.5% | -23.2% | n/a | n/a | - % | - % | -8.3% |
| Deferred | (36.4) | (7.8) | (11.3) | 1.9 | 24.6 | - | (29.0) |
Note 5: Radar adopt tax regime for entities taxed on presumed profits
Current income tax and social security expenses represents the calculated tax amount payable/(recoverable). The amount effectively paid may still be deducted from existing tax credits
34 of 49
| Earnings Release 1st Quarter of Fiscal Year 2014 |
Net Income
| Net Income | 1Q14 | 1Q13 |
| Amounts in R$ MM | (Jan-Mar) | (Jan-Mar) |
| Net Income | 256.1 | 27.1 |
Cosan’s net income was R$256.1 million in 1Q14, higher than the R$27.1 million reported in 1Q13.
The main drivers of this change in net income during the period were:
| Net Income | 1Q14 |
| Amounts in R$ MM | (Jan-Mar) |
| Net Income - 1Q13 | 27.1 |
| EBIT Variation | |
| Comgás | 31.8 |
| Rumo | 20.6 |
| Radar | (71.1) |
| Lubrificantes | (24.7) |
| Other Business | (44.1) |
| EBIT Businesses Total | (87.5) |
| Variation in Other Lines | |
| Financial Result | 71.3 |
| Equity Pick-Up | 129.2 |
| Income Taxes | 79.7 |
| Non-Controlling Interest | 33.0 |
| Dicountinued Operation | 3.4 |
| Net Income - 1Q14 | 256.1 |
| (i) | Increase in the equity accounting result line of R$129.2 million due to Raízen’s results, discussed in the sections above; |
| (ii) | Improvement of R$71.3 million in financial results mainly to the foreign exchange rate variation and amortization of transaction costs in the quarters; |
| (iii) | EBIT’s reduction and profit of non-controlling shareholders of R$54.5 million. |
35 of 49
| Earnings Release 1st Quarter of Fiscal Year 2014 |
D. Indebtedness
At the close of 1Q14, Cosan’s pro forma consolidated gross debt (excluding PESA) was R$12.4 billion, compared to R$12 billion in 4Q13. Below are the separate debts of Cosan and Subsidiaries, and also Raízen’s debts, which are pro forma at a proportion of 50%.
Cosan and Subsidiaries
Gross debt totaled R$8.6 billion in 1Q14, a decrease of 1% from 4Q13.
The key events in the period were:
| (i) | Raising of approximately R$190.2 million through funding from BNDES; |
| (ii) | Amortization of principal and interest of R$415.9 million, mainly related to debentures, Senior Notes and credit notes; |
| (iii) | Positive effect from foreign exchange variation of R$46.7 million; |
| (iv) | Accrual of interest and derivatives fair value result of R$187.1 million in the period. |
Raízen
The combined gross debt of Raízen totaled R$7.9 billion in 4Q13, up 11.9% year-over-year.
In the quarter, changes in debt principal and interest were as follows:
The combined gross debt of Raízen totaled R$7.6 billion at the end of 1Q14, a reduction of 2.8% compared to 4T2013.
During the quarter, changes in debt principal and interest were as follows:
| (i) | Raising of R$461.8 million, mainly through funding lines from BNDES and credit notes, as well as other rural credit, ACC, and other funding transactions; |
| (ii) | Amortization of principal and interest of R$674.7 million related to prepayments, ACC, BNDES, among others; |
| (iii) | Positive effect of foreign exchange variation of R$124.5 million; |
| (iv) | Provision for interest and monetary variation in the amount of R$119.5 million. |
Cosan – Pro forma Consolidated
Cash available totaled R$2.8 billion in 1Q14, up from R$2.3 billion in 4Q 2013. Net pro forma indebtedness totaled R$9.6 billion for the quarter, as compared to R$10.3 billion in 4Q13, equal to a leverage of 2.4x pro forma LTM EBITDA (R$4.1 billion).
36 of 49
| Earnings Release 1st Quarter of Fiscal Year 2014 |
| Debt per Business Units (Amount in R$ MM) | 1T14 | 4T13 | ||
| Comgás | (Jan-Mar) | (Jan-Mar) | % ST | Chg. % |
| Leasing | 0.7 | 1.1 | 100.0% | -29.9% |
| EIB | 632.4 | 633.2 | 7.5% | -0.1% |
| 4131 Resolution | 397.8 | 413.5 | 0.4% | -3.8% |
| BNDES | 1,342.0 | 1,215.1 | 16.5% | 10.4% |
| Debentures | 602.1 | 588.9 | 7.7% | n/a |
| Debt Notes Allocation | (10.8) | (10.4) | 20.6% | n/a |
| Financial Instruments - MTM | (192.5) | (209.5) | -28.0% | -8.1% |
| Total Comgás | 2,771.7 | 2,631.9 | - | 5.3% |
| Rumo | ||||
| Finame | 682.8 | 707.5 | 16.1% | -3.5% |
| Finem | 7.6 | - | 0.7% | n/a |
| Expenses with Placement of Debt | (1.5) | (1.5) | 13.0% | -0.3% |
| Total Rumo | 688.9 | 706.0 | - | - % |
| Cosan Lubricants | ||||
| Finame | 0.2 | 0.2 | 13.0% | - % |
| Foreing Loan | 206.3 | 209.3 | 0.1% | -1.5% |
| Total Lubrificantes | 206.5 | 209.6 | - | -1.5% |
| Other Business | ||||
| Perpetual Bonds | 1,145.8 | 1,186.1 | 1.2% | -3.4% |
| Credit Notes | 304.1 | 395.4 | 100.0% | -23.1% |
| Debentures | 1,426.0 | 1,464.2 | 1.8% | -2.6% |
| FINEP | 89.9 | 89.9 | 4.3% | - % |
| Senior Notes 2018 | 853.8 | 873.8 | - % | -2.3% |
| Senior Notes 2023 | 1,087.2 | 1,110.0 | - % | -2.1% |
| Expenses with Placement of Debt | (48.2) | (51.2) | 19.0% | -5.9% |
| Bonus over Perpetual Bonds | 4.3 | 5.1 | 60.0% | -15.4% |
| Financial Instruments - MTM | 30.1 | 24.8 | - % | 21.4% |
| Total Other Business | 4,892.9 | 5,098.0 | - | -4.0% |
| Cosan Consolidated | ||||
| Total Debt | 8,560.1 | 8,645.4 | - | -1.0% |
| Cash and Cash Equivalents and Secutities | (1,593.4) | (1,562.5) | - | 2.0% |
| Net Debt | 6,966.7 | 7,082.9 | - | -1.6% |
| Raízen | ||||
| Senior Notes 2014 | 801.5 | 849.1 | 100.0% | -5.6% |
| Senior Notes 2017 | 915.6 | 964.2 | 1.0% | -5.0% |
| BNDES | 1,319.9 | 1,370.7 | 14.9% | -3.7% |
| Term Loan | 1,140.4 | 1,121.6 | 10.7% | 1.7% |
| Prepaid Exports | 1,076.9 | 1,119.5 | 17.3% | -3.8% |
| Advances on Exchange Contracts | - | 189.5 | - % | -100.0% |
| Credit Notes | 643.6 | 628.0 | 61.2% | 2.5% |
| Finame | 108.8 | 100.9 | 38.6% | 7.8% |
| Finem | 812.6 | 627.4 | 9.9% | 29.5% |
| Debentures | 791.7 | 767.1 | 5.3% | n/a |
| Rural Credit | 50.2 | 49.6 | 100.0% | 1.3% |
| Debt Notes Allocation | (23.4) | (24.5) | 37.0% | -4.5% |
| Other | - | 96.7 | 100.0% | n/a |
Total Raízen6 | 7,637.9 | 7,859.8 | - | -2.8% |
| Cash and Cash Equivalents and Secutities Raízen | 3,818.9 | 3,929.9 | - | -2.8% |
| Net Debt Raízen | (1,168.8) | (693.7) | - | 68.5% |
| Consolidated Proforma | 2,650.1 | 3,236.2 | - | -18.1% |
| Consolidated Proforma | ||||
| Total Debt | 12,379.0 | 12,575.0 | - | -1.6% |
| Cash and Cash Equivalents and Secutities (including Raízen) | (2,762.2) | (2,256.3) | - | 22.4% |
| Pro forma Net Debt | 9,616.8 | 10,318.8 | - | -6.8% |
Note 6: Excluding PESA debt.
37 of 49
| Earnings Release 1st Quarter of Fiscal Year 2014 |
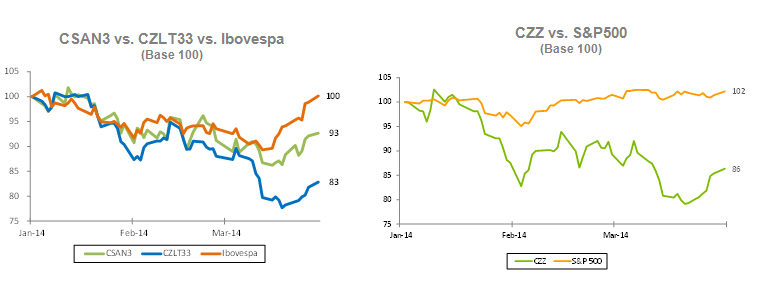
E. Stock Performance
The common shares issued by Cosan S.A. have been listed on BM&FBovespa since 2005, the year of its IPO on the “Novo Mercado” segment under the ticker symbol CSAN3, and are included in the portfolios of the Ibovespa, IBrX, IBrX-50, IBrA, MLCX, ICO2, INDX, ICON, IVBX-2, IGC, IGCT and ITAG indexes.
The shares issued by Cosan Limited, Cosan S.A.'s parent company, have been listed on NYSE since its IPO in 2007, under the ticker symbol CZZ. The company has also issued share deposit certificates (Brazilian Depositary Receipts - BDR) on the BM&FBovespa under the symbol CZLT33.
The tables and graphs below represent the performance of shares issued by the companies:
| 1Q14 Summary | CSAN3 | CZLT33 | CZZ | ||
| Stock Type | Common Share | BDR | Class A | ||
| Listed in | BM&FBovespa | BM&FBovespa | NYSE | ||
| Closing Price in december 03/31/2014 | R$ | 34.92 | R$ | 25.93 | USD 11.40 |
| Higher Price | R$ | 38.36 | R$ | 31.55 | USD 13.54 |
| Average Price | R$ | 35.28 | R$ | 28.30 | USD 11.91 |
| Lower Price | R$ | 32.48 | R$ | 24.31 | USD 10.45 |
| Average Daily Traded Volume | R$50.9 million | R$14.1 million | USD13.9 million | ||
38 of 49
| Earnings Release 1st Quarter of Fiscal Year 2014 |
F. Guidance
This section contains the guidance broken down by variation range for some key parameters in Cosan’s consolidated results for the 2014. In addition, other parts of this Earnings Release may contain forecasts. Such projections and guidance are but estimates and indications, and as such these do not represent any guarantee of prospective results.
This guidance considers the operations of the Cosan group today, which include Comgás, Rumo, Cosan Lubrificantes e Especialidades, Radar, and Other Businesses, as well as the operations of Raízen Combustíveis and Raízen Energia.
Cosan’s consolidated EBITDA is pro forma, including 50% of the results of Raízen Combustíveis and Raízen Energia. As mentioned before, following the adoption of IFRS 11 – Joint Arrangements, Raízen is not longer proportionately consolidated in Cosan, and is only reported under “Equity Accounting Result,” considering our 50% interest in Net Income. Moreover, Comgás’s EBITDA continues to be reported under Brazilian accounting principles (IFRS), which does not consider the effects of the Regulatory Current Account.
| FY13 | 2013 | 2014 | ||
| (apr/2012 - mar/2013) | (jan/2013 - dec/2013) | (jan/2014 - dec/2014) | ||
Cosan Consolidado | Net Revenue (R$MM) | 30,017 | 36,165 | 37,500 ≤ ∆ ≤ 40,500 |
| EBITDA (R$MM) | 3,124 | 3,964 | 4,150 ≤ ∆ ≤ 4,650 | |
| Capex (R$MM) | 2,178 | 2,895 | 2,500 ≤ ∆ ≤ 2,800 | |
Raízen Combustíveis | Volume of Fuels Sold (million liters) | 21,967 | 23,214 | 22,500 ≤ ∆ ≤ 24,000 |
| EBITDA (R$MM) | 1,658 | 1,928 | 2,000 ≤ ∆ ≤ 2,200 | |
| CAPEX (R$MM) | 524 | 835 | 750 ≤ ∆ ≤ 850 | |
| #VALUE! | ||||
| Raízen Energia | Volume of Sugar Cane Crushed (thousand tons) | 56,221 | 61,441 | 61,000 ≤ ∆ ≤ 63,000 |
| Volume of Sugar Sold (thousand tons) | 4,230 | 4,470 | 4,400 ≤ ∆ ≤ 4,700 | |
| Volume of Ethanol Sold (million liters) | 2,323 | 2,475 | 2,300 ≤ ∆ ≤ 2,600 | |
| Volume of Energy Sold (thousand of MWh) | 3,035 | 2,165 | 2,000 ≤ ∆ ≤ 2,200 | |
| EBITDA (R$MM) | 2,408 | 2,112 | 2,300 ≤ ∆ ≤ 2,700 | |
| CAPEX (R$MM) | 2,405 | 2,531 | 2,000 ≤ ∆ ≤ 2,200 | |
| Rumo | Volume of Loading (thousand tons) | 8,566 | 9.177 | 10,500 ≤ ∆ ≤ 12,500 |
| EBITDA (R$MM) | 297 | 358 | 400 ≤ ∆ ≤ 450 | |
| CAPEX (R$MM) | 267 | 255 | 250 ≤ ∆ ≤ 300 | |
| Radar | EBITDA (R$MM) | 180 | 228 | 170 ≤ ∆ ≤ 200 |
Cosan Lubrificantes | Total Volume Sold (million Liters) | 287 | 316 | 270 ≤ ∆ ≤ 310 |
| EBITDA (R$MM) | n/a | 140 | 140 ≤ ∆ ≤ 170 | |
| CAPEX (R$MM) | n/a | 93 | 60 ≤ ∆ ≤ 80 | |
| 2012 | 2013 | 2014 | ||
| (jan/2012 - dez/2012) | (jan/2013 - dez/2013) | (jan/2014 - dez/2014) | ||
| Comgás | Number of Clients (thousand) | 1,215 | 1,334 | 1,420 ≤ ∆ ≤ 1,450 |
| Total Volume of Gas Sold (thousand cbm) | 5,259 | 5,457 | 5,200 ≤ ∆ ≤ 5,700 | |
| EBITDA IFRS (R$MM) | 962 | 1,338 | 1,300 ≤ ∆ ≤ 1,550 | |
| CAPEX (R$MM) | 546 | 852 | 680 ≤ ∆ ≤ 780 |
39 of 49
| Earnings Release 1st Quarter of Fiscal Year 2014 |
Disclaimer
This document contains forward-looking statements and estimates. These forward-looking statements and estimates are solely forecasts and do not represent any guarantee of prospective results. All stakeholders should know that these statements and estimates are and will be, depending on the case, subject to risks, uncertainties and factors related to the operations and business environment of Cosan and its subsidiaries, and therefore the actual results of these companies may significantly differ from the estimated or implied prospective results contained in such forward-looking statements and estimates.
40 of 49
| Earnings Release 1st Quarter of Fiscal Year 2014 |
G. Financial Statements
G.1 Cosan S/A Consolidated
| Cosan Consolidated | 1Q14 | 1Q13 |
| Income Statement For The Period | 03/31/2014 | 03/31/2013 |
| Net Operating Revenue | 2,157,186 | 1,989,210 |
| Gross Profit | 636,392 | 603,773 |
| Sales, General And Administrative Expenses | (351,713) | (336,220) |
| Other Operating Income (Expenses), Net | (32,792) | 71,863 |
| Financial Revenue | 47,731 | 59,525 |
| Financial Expenses | (181,147) | (231,643) |
| Foreign Exchange Variation | 77,860 | (85) |
| Derivative | (50,622) | (5,321) |
| Equity Pick Up | 221,802 | 92,609 |
| Income And Social Contribution Taxes | (59,562) | (139,219) |
| Equity Attributable To Non-Controlling Interests | (51,827) | (84,771) |
| Net Income From Discontinued Operations | (0) | (3,369) |
| Net Income (Loss) | 256,122 | 27,142 |
| Cosan Consolidated | 1Q14 | 4Q13 |
| Balance Sheet | 03/31/2014 | 12/31/2013 |
| Cash And Cash Equivalents | 1,472,480 | 1,474,553 |
| Securities | 120,875 | 87,978 |
| Accounts Rreceivable | 869,707 | 844,483 |
| Inventories | 269,594 | 311,980 |
| Other Current Assets | 866,883 | 827,647 |
| Investments | 8,566,180 | 8,602,469 |
| Investment Property | 2,263,356 | 2,281,509 |
| Biological Assets | (0) | (0) |
| Property, Plant And Equipment | 1,296,841 | 1,271,604 |
| Intangible | 10,081,690 | 10,078,040 |
| Other Non-Current Assets | 2,679,263 | 2,818,698 |
| Total Assets | 28,486,869 | 28,598,373 |
| Loans And Financing | (8,722,463) | (8,830,159) |
| Suppliers | (825,409) | (862,429) |
| Salaries Payable | (68,099) | (103,296) |
| Other Current Liabilities | (642,667) | (683,936) |
| Other Non-Current Liabilities | (4,514,591) | (4,601,183) |
| Net Equity | (13,713,640) | (13,515,370) |
| Total Liabilities | (28,486,869) | (28,598,373) |
41 of 49
| Earnings Release 1st Quarter of Fiscal Year 2014 |
G.2 Raízen Combustiveis
| Raízen Combustíveis | 1Q14 | 1Q13 |
| Income Statement For The Period | 03/31/2014 | 03/31/2013 |
| Net Operating Revenue | 13,010,956 | 10,947,101 |
| Gross Profit | 670,295 | 595,495 |
| Sales, General And Administrative Expenses | (388,603) | (358,398) |
| Other Operating Income (Expenses), Net | 101,760 | 67,303 |
| Financial Revenue | 17,667 | 33,207 |
| Financial Expenses | (20,044) | (22,715) |
| Foreign Exchange Variation | 32,882 | 14,903 |
| Derivative | (29,844) | (19,156) |
| Equity Pick Up | 5,254 | - |
| Income And Social Contribution Taxes | (118,019) | (90,861) |
| Equity Attributable To Non-Controlling Interests | (7,309) | (4,453) |
| Net Income (Loss) | 264,039 | 215,325 |
| Raízen Combustíveis | 1Q14 | 4Q13 |
| Balance Sheet | 03/31/2014 | 12/31/2013 |
| Cash And Cash Equivalents | 566,606 | 328,992 |
| Accounts Rreceivable | 1,190,832 | 1,435,095 |
| Inventories | 941,982 | 1,057,049 |
| Other Current Assets | 557,552 | 484,475 |
| Investments | 255,711 | 254,826 |
| Property, Plant And Equipment | 2,503,252 | 2,494,486 |
| Intangible | 4,092,153 | 4,038,314 |
| Other Non-Current Assets | 1,349,945 | 1,403,117 |
| Total Assets | 11,458,033 | 11,496,354 |
| Loans And Financing | (815,208) | (862,521) |
| Suppliers | (777,950) | (551,176) |
| Salaries Payable | (86,164) | (60,091) |
| Other Current Liabilities | (718,443) | (525,188) |
| Other Non-Current Liabilities | (2,456,469) | (2,715,727) |
| Net Equity | (6,603,799) | (6,781,651) |
| Total Liabilities | (11,458,033) | (11,496,354) |
42 of 49
| Earnings Release 1st Quarter of Fiscal Year 2014 |
G.3 Raízen Energia
| Raízen Energia | 1Q14 | 1Q13 |
| Income Statement For The Period | 03/31/2014 | 03/31/2013 |
| Net Operating Revenue | 2,604,833 | 2,350,364 |
| Gross Profit | 491,873 | 259,406 |
| Sales, General And Administrative Expenses | (303,558) | (332,020) |
| Other Operating Income (Expenses), Net | 60,169 | 26,595 |
| Financial Revenue | 65,911 | 46,012 |
| Financial Expenses | (128,398) | (89,552) |
| Foreign Exchange Variation | 78,784 | 31,211 |
| Derivative | 48,129 | 20,842 |
| Equity Pick Up | (10,363) | (9,272) |
| Income And Social Contribution Taxes | (96,089) | 24,445 |
| Equity Attributable To Non-Controlling Interests | - | 53 |
| Net Income (Loss) | 206,458 | (22,280) |
| Raízen Energia | 1Q14 | 4Q13 |
| Balance Sheet | 03/31/2014 | 12/31/2013 |
| Cash And Cash Equivalents | 1,771,015 | 1,058,483 |
| Accounts Rreceivable | 356,004 | 416,746 |
| Inventories | 453,810 | 2,026,925 |
| Other Current Assets | 1,409,016 | 1,279,553 |
| Investments | 162,266 | 408,591 |
| Biological Assets | 2,036,693 | 1,867,765 |
| Property, Plant And Equipment | 10,322,749 | 9,504,874 |
| Intangible | 3,329,949 | 3,100,227 |
| Other Non-Current Assets | 1,418,139 | 1,534,557 |
| Total Assets | 21,259,641 | 21,197,721 |
| Loans And Financing | (7,580,843) | (7,732,778) |
| Suppliers | (637,863) | (633,505) |
| Salaries Payable | (292,468) | (249,919) |
| Other Current Liabilities | (618,828) | (495,240) |
| Other Non-Current Liabilities | (1,630,735) | (1,693,036) |
| Net Equity | (10,498,904) | (10,393,243) |
| Total Liabilities | (21,259,641) | (21,197,721) |
43 of 49
| Earnings Release 1st Quarter of Fiscal Year 2014 |
G.4 Comgás
| Comgás | 1Q14 | 1Q13 |
| Income Statement For The Period | 03/31/2014 | 03/31/2013 |
| Net Operating Revenue | 1,517,379 | 1,447,743 |
| Gross Profit | 448,410 | 415,369 |
| Sales, General And Administrative Expenses | (217,462) | (221,994) |
| Other Operating Income (Expenses), Net | (7,112) | (1,358) |
| Financial Revenue | 15,459 | 9,627 |
| Financial Expenses | (71,389) | (55,598) |
| Foreign Exchange Variation | 35,266 | (12,833) |
| Derivative | (35,885) | 8,779 |
| Income And Social Contribution Taxes | (58,963) | (48,541) |
| Net Income (Loss) | 108,323 | 93,451 |
| Comgás | 1Q14 | 4Q13 |
| Balance Sheet | 03/31/2014 | 12/31/2013 |
| Cash And Cash Equivalents | 783,560 | 535,957 |
| Accounts Rreceivable | 592,520 | 582,889 |
| Inventories | 116,527 | 121,253 |
| Other Current Assets | 237,879 | 248,803 |
| Intangible | 8,486,121 | 8,450,541 |
| Other Non-Current Assets | 325,473 | 332,918 |
| Total Assets | 10,542,080 | 10,272,361 |
| Loans And Financing | (2,964,239) | (2,841,387) |
| Suppliers | (727,212) | (706,397) |
| Salaries Payable | (35,873) | (59,417) |
| Other Current Liabilities | (300,472) | (301,089) |
| Other Non-Current Liabilities | (905,865) | (863,768) |
| Net Equity | (5,608,419) | (5,500,303) |
| Total Liabilities | (10,542,080) | (10,272,361) |
44 of 49
| Earnings Release 1st Quarter of Fiscal Year 2014 |
G.5 Rumo
| Rumo | 1Q14 | 1Q13 |
| Income Statement For The Period | 03/31/2014 | 03/31/2013 |
| Net Operating Revenue | 207,934 | 168,383 |
| Gross Profit | 84,403 | 73,233 |
| Sales, General And Administrative Expenses | (19,974) | (16,696) |
| Other Operating Income (Expenses), Net | 6,702 | (5,992) |
| Financial Revenue | 12,227 | 8,873 |
| Financial Expenses | (8,487) | (10,120) |
| Foreign Exchange Variation | 113 | 24 |
| Equity Pick Up | (0) | (0) |
| Income And Social Contribution Taxes | (25,243) | (16,539) |
| Equity Attributable To Non-Controlling Interests | 221 | (764) |
| Net Income (Loss) | 49,962 | 32,019 |
| Rumo | 1Q14 | 4Q13 |
| Balance Sheet | 03/31/2014 | 12/31/2013 |
| Cash And Cash Equivalents | 462,982 | 497,753 |
| Accounts Rreceivable | 26,551 | 32,506 |
| Inventories | 5,250 | 5,237 |
| Other Current Assets | 28,782 | 22,389 |
| Property, Plant And Equipment | 1,021,712 | 1,013,149 |
| Intangible | 739,302 | 755,635 |
| Other Non-Current Assets | 270,994 | 234,965 |
| Total Assets | 2,555,573 | 2,561,634 |
| Loans And Financing | (688,916) | (705,974) |
| Suppliers | (57,227) | (82,872) |
| Salaries Payable | (7,965) | (12,522) |
| Other Current Liabilities | (338,549) | (127,287) |
| Other Non-Current Liabilities | (207,141) | (198,620) |
| Net Equity | (1,255,775) | (1,434,359) |
| Total Liabilities | (2,555,573) | (2,561,634) |
45 of 49
| Earnings Release 1st Quarter of Fiscal Year 2014 |
G.6 Cosan Lubrificantes
| Cosan Lubrificantes | 1Q14 | 1Q13 |
| Income Statement For The Period | 03/31/2014 | 03/31/2013 |
| Net Operating Revenue | 368,269 | 357,699 |
| Gross Profit | 78,273 | 99,788 |
| Sales, General And Administrative Expenses | (73,657) | (67,552) |
| Other Operating Income (Expenses), Net | 408 | (2,487) |
| Financial Revenue | (207) | 9,146 |
| Financial Expenses | 42,683 | (15,310) |
| Foreign Exchange Variation | (9,989) | (2,041) |
| Derivative | (7,221) | 5,586 |
| Equity Pick Up | (1,298) | (0) |
| Income And Social Contribution Taxes | (20,792) | (13,897) |
| Net Income (Loss) | 8,200 | 13,233 |
| Cosan Lubrificantes | 1Q14 | 4Q13 |
| Balance Sheet | 03/31/2014 | 12/31/2013 |
| Cash And Cash Equivalents | 72,124 | 57,892 |
| Accounts Rreceivable | 197,946 | 200,796 |
| Inventories | 147,816 | 185,490 |
| Other Current Assets | 44,715 | 45,227 |
| Investments | 13,592 | 15,364 |
| Property, Plant And Equipment | 198,289 | 197,137 |
| Intangible | 852,997 | 867,238 |
| Other Non-Current Assets | (110,068) | (93,658) |
| Total Assets | 1,417,411 | 1,476,074 |
| Loans And Financing | (206,502) | (209,579) |
| Suppliers | (38,889) | (70,102) |
| Salaries Payable | (9,674) | (13,039) |
| Other Current Liabilities | (102,057) | (107,826) |
| Other Non-Current Liabilities | (242,479) | (327,564) |
| Net Equity | (817,810) | (747,964) |
| Total Liabilities | (1,417,411) | (1,476,074) |
46 of 49
| Earnings Release 1st Quarter of Fiscal Year 2014 |
G.7 Radar
| Radar | 1Q14 | 1Q13 |
| Income Statement For The Period | 03/31/2014 | 03/31/2013 |
| Net Operating Revenue | 63,552 | 15,383 |
| Gross Profit | 25,244 | 15,383 |
| Sales, General And Administrative Expenses | (8,350) | (4,821) |
| Other Operating Income (Expenses), Net | (23,045) | 54,417 |
| Financial Revenue | 3,413 | 585 |
| Financial Expenses | (268) | (261) |
| Foreign Exchange Variation | - | (3) |
| Income And Social Contribution Taxes | (2,726) | (3,423) |
| Net Income From Discontinued Operations | - | (1) |
| Net Income (Loss) | (5,732) | 61,877 |
| Radar | 1Q14 | 4Q13 |
| Balance Sheet | 03/31/2014 | 12/31/2013 |
| Cash And Cash Equivalents | 7,968 | 13,408 |
| Securities | 120,875 | 87,978 |
| Accounts Rreceivable | 51,402 | 28,051 |
| Other Current Assets | 285,267 | 323,476 |
| Investment Property | 2,263,356 | 2,281,509 |
| Property, Plant And Equipment | 10,999 | 11,195 |
| Intangible | 83 | 89 |
| Other Non-Current Assets | 4,499 | 4,884 |
| Total Assets | 2,744,448 | 2,750,590 |
| Suppliers | (766) | (1,216) |
| Salaries Payable | (6,366) | (4,247) |
| Other Current Liabilities | (30,414) | (31,020) |
| Other Non-Current Liabilities | (84,207) | (85,951) |
| Net Equity | (2,622,696) | (2,628,156) |
| Total Liabilities | (2,744,449) | (2,750,590) |
47 of 49
| Earnings Release 1st Quarter of Fiscal Year 2014 |
G.8 Outros Negócios
| Cosan Other Business | 1Q14 | 1Q13 |
| Income Statement For The Period | 03/31/2014 | 03/31/2014 |
| Net Operating Revenue | 52 | - |
| Gross Profit | 62 | - |
| Sales, General And Administrative Expenses | (32,270) | (25,157) |
| Other Operating Income (Expenses), Net | (9,745) | 27,283 |
| Financial Revenue | 19,955 | 31,294 |
| Financial Expenses | (146,802) | (150,354) |
| Foreign Exchange Variation | 52,470 | 14,768 |
| Derivative | (7,516) | (19,687) |
| Equity Pick Up | 369,814 | 192,689 |
| Income And Social Contribution Taxes | 48,162 | (56,819) |
| Net Income (Loss) | 294,130 | 14,017 |
| Cosan Other Business | 1Q14 | 4Q13 |
| Balance Sheet | 03/31/2014 | 31/12/2014 |
| Cash And Cash Equivalents | 145,846 | 369,543 |
| Accounts Rreceivable | 1,288 | 241 |
| Inventories | 1 | - |
| Other Current Assets | 625,730 | 332,013 |
| Investments | 14,545,861 | 14,599,620 |
| Property, Plant And Equipment | 65,841 | 50,429 |
| Intangible | 3,187 | 3,949 |
| Other Non-Current Assets | 2,590,876 | 2,755,373 |
| Total Assets | 17,978,628 | 18,111,168 |
| Loans And Financing | (4,862,806) | (5,073,219) |
| Suppliers | (1,315) | (1,562) |
| Salaries Payable | (8,221) | (14,071) |
| Other Current Liabilities | (227,289) | (260,693) |
| Other Non-Current Liabilities | (3,476,786) | (3,543,628) |
| Net Equity | (9,402,213) | (9,217,995) |
| Total Liabilities | (17,978,628) | (18,111,168) |
48 of 49
| Earnings Release 1st Quarter of Fiscal Year 2014 |
H. Financial Statements including Raízen
H.1 Cosan S/A Consolidated, including Raízen
| Cosan Pro forma Consolidated | 1Q14 | 1Q13 |
| Income Statement For The Period | 03/31/2014 | 03/31/2014 |
| Net Operating Revenue | 9,593,449 | 8,461,521 |
| Gross Profit | 1,217,476 | 1,028,778 |
| Sales, General And Administrative Expenses | (697,793) | (681,428) |
| Other Operating Income (Expenses), Net | 48,173 | 118,811 |
| Financial Revenue | 89,520 | 99,135 |
| Financial Expenses | (255,368) | (287,777) |
| Foreign Exchange Variation | 133,693 | 22,972 |
| Derivative | (41,479) | (4,479) |
| Equity Pick Up | (16,001) | (6,104) |
| Income And Social Contribution Taxes | (166,616) | (172,427) |
| Equity Attributable To Non-Controlling Interests | (55,482) | (86,971) |
| Net Income From Discontinued Operations | 0 | (3,369) |
| Net Income (Loss) | 256,122 | 27,142 |
| Cosan Pro foma Consolidated | 1Q14 | 4Q13 |
| Balance Sheet | 03/31/2014 | 31/12/2014 |
| Cash And Cash Equivalents | 2,641,291 | 2,168,291 |
| Securities | 120,875 | 87,978 |
| Accounts Rreceivable | 1,643,125 | 1,800,122 |
| Inventories | 954,499 | 1,853,967 |
| Other Current Assets | 1,718,233 | 1,541,048 |
| Investments | 296,326 | 401,684 |
| Investment Property | 2,263,356 | 2,281,509 |
| Biological Assets | 1,018,346 | 933,882 |
| Property, Plant And Equipment | 7,701,346 | 7,271,590 |
| Intangible | 13,792,741 | 13,647,311 |
| Other Non-Current Assets | 3,669,957 | 3,854,960 |
| Total Assets | 35,820,094 | 35,842,343 |
| Loans And Financing | (12,920,488) | (13,512,665) |
| Suppliers | (1,533,315) | (1,495,452) |
| Salaries Payable | (257,415) | (258,301) |
| Other Current Liabilities | (1,179,314) | (979,367) |
| Other Non-Current Liabilities | (6,160,481) | (6,011,815) |
| Net Equity | (13,769,080) | (13,584,743) |
| Total Liabilities | (35,820,094) | (35,842,343) |
49 of 49
Item 2
Cosan Limited
Consolidated interim financial statements at
March 31, 2014 and report of independent
registered public accounting firm
Cosan Limited
Consolidated interim financial statements
For the quarter ended March 31, 2014 and 2013
Contents
| Report of independent registered public accounting firm | 3 |
| Consolidated statement of financial position | 4 |
| Consolidated statement of profit or loss and | |
| other comprehensive income | 6 |
| Statement of changes in shareholders’ equity | 8 |
| Consolidated statement of cash flows | 10 |
| Notes to the consolidated interim financial statements | 12 |
2
Report of Independent Registered Public Accounting Firm
To the Board of Directors and Shareholders
Cosan Limited
Introduction
We have reviewed the consolidated interim accounting information of Cosan Limited, included in the Quarterly Information Form (ITR) for the quarter ended March 31, 2014, comprising the balance sheet at that date and the statements of income and comprehensive income for the quarter and three-month period then ended, and the statements of changes in equity and cash flows for the three-month period then ended, and a summary of significant accounting policies and other explanatory information.
Management is responsible for the preparation of the consolidated interim accounting information in accordance with the International Accounting Standard (IAS) 34 - Interim Financial Reporting issued by the International Accounting Standards Board (IASB), as well as the presentation of this information in accordance with the standards issued by the Brazilian Securities Commission (CVM), applicable to the preparation of the Quarterly Information (ITR). Our responsibility is to express a conclusion on this interim accounting information based on our review.
Scope of review
We conducted our review in accordance with Brazilian and International Standards on Reviews of Interim Financial Information (NBC TR 2410 – Review of Interim Financial Information Performed by the Independent Auditor of the Entity and ISRE 2410 – Review of Interim Financial Information Performed by the Independent Auditor of the Entity, respectively). A review of interim information consists of making inquiries, primarily of persons responsible for financial and accounting matters, and applying analytical and other review procedures. A review is substantially less in scope than an audit conducted in accordance with Brazilian and International Standards on Auditing and consequently does not enable us to obtain assurance that we would become aware of all significant matters that might be identified in an audit. Accordingly, we do not express an audit opinion.
Conclusion on the consolidated interim information
Based on our review, nothing has come to our attention that causes us to believe that the accompanying consolidated interim accounting information included in the quarterly information referred to above has not been prepared, in all material respects, in accordance with IAS 34 applicable to the preparation of the Quarterly Information, and presented in accordance with the standards issued by the CVM.
Campinas, May 13, 2014.
PricewaterhouseCoopers
Auditores Independentes
CRC 2SP000160/O-5 “F”
Valdir Augusto de Assunção
Contador CRC 1SP135319/O-9
3
Cosan Limited
Consolidated statement of financial position
March 31, 2014 and December 31, 2013
(In thousands of Brazilian Reais - R$)
| Note | March 31, 2014 | December 31, 2013 | ||||||||||
| Assets | ||||||||||||
| Cash and cash equivalents | 4 | 1,505,327 | 1,509,565 | |||||||||
| Investment securities | 120,875 | 87,978 | ||||||||||
| Trade receivables | 5 | 869,707 | 844,483 | |||||||||
| Inventories | 269,594 | 311,980 | ||||||||||
| Receivables from related parties | 7 | 48,956 | 46,788 | |||||||||
| Income tax receivable | 48,951 | 56,340 | ||||||||||
| Other current tax receivable | 80,360 | 85,433 | ||||||||||
| Other financial assets | 6 | 64,492 | 63,054 | |||||||||
| Dividends receivable | 131,433 | 26,350 | ||||||||||
| Other assets | 204,681 | 217,927 | ||||||||||
| 3,344,376 | 3,249,898 | |||||||||||
| Assets held for sale | 23 | 271,030 | 314,104 | |||||||||
| Current assets | 3,615,406 | 3,564,002 | ||||||||||
| Trade receivables | 5 | 258,748 | 238,460 | |||||||||
| Deferred tax assets | 16 | 223,893 | 232,188 | |||||||||
| Receivables from related parties | 7 | 398,763 | 504,481 | |||||||||
| Income tax receivable | 49,268 | 49,268 | ||||||||||
| Other non-current tax receivable | 17,866 | 18,366 | ||||||||||
| Judicial deposits | 17 | 358,535 | 361,554 | |||||||||
| Other financial assets | 6 | 414,855 | 407,107 | |||||||||
| Derivative financial instruments | 24 | 469,770 | 513,934 | |||||||||
| Other non-current asset | 487,564 | 493,340 | ||||||||||
| Equity method investments | 8 | 103,607 | 103,316 | |||||||||
| Investment in joint ventures | 9 | 8,462,573 | 8,498,259 | |||||||||
| Investment property | 10 | 2,263,356 | 2,281,509 | |||||||||
| Property, plant and equipment | 11 | 1,296,841 | 1,271,910 | |||||||||
| Intangible assets | 12 | 10,081,690 | 10,078,040 | |||||||||
| Non-current assets | 24,887,329 | 25,051,732 | ||||||||||
| Total assets | 28,502,735 | 28,615,734 | ||||||||||
| The accompanying notes are an integral part of these consolidated interim financial statements. | ||||||||||||
4
Cosan Limited
Consolidated statement of financial position
March 31, 2014 and December 31, 2013
(In thousands of Brazilian Reais - R$)
| Note | March 31, 2014 | December 31, 2013 | ||||||||||
| Liabilities | ||||||||||||
| Loans and borrowings | 13 | 875,408 | 1,050,862 | |||||||||
| Derivative financial instruments | 24 | 67,315 | 50,879 | |||||||||
| Trade payables | 14 | 825,409 | 862,429 | |||||||||
| Employee benefits payable | 68,099 | 103,296 | ||||||||||
| Income tax payable | 23,458 | 28,143 | ||||||||||
| Other current tax payable | 15 | 187,454 | 199,056 | |||||||||
| Dividends payable | 152,274 | 92,759 | ||||||||||
| Payables to related parties | 7 | 76,570 | 105,463 | |||||||||
| Other current liabilities | 97,537 | 157,806 | ||||||||||
| Current liabilities | 2,373,524 | 2,650,693 | ||||||||||
| Loans and borrowings | 13 | 8,107,969 | 8,042,094 | |||||||||
| Derivative financial instruments | 24 | 246,384 | 280,462 | |||||||||
| Other non-current tax payable | 15 | 1,011,068 | 1,010,767 | |||||||||
| Provision for legal proceedings | 17 | 656,173 | 722,458 | |||||||||
| Pension and post-employment benefits | 26 | 344,911 | 339,135 | |||||||||
| Deferred tax liabilities | 16 | 1,718,498 | 1,698,622 | |||||||||
| Other non-current liabilities | 537,556 | 551,739 | ||||||||||
| Non-current liabilities | 12,622,559 | 12,645,277 | ||||||||||
| Total liabilities | 14,996,083 | 15,295,970 | ||||||||||
| Equity | 18 | |||||||||||
| Share capital | 5,328 | 5,328 | ||||||||||
| Additional paid in capital | 3,833,316 | 3,828,858 | ||||||||||
| Other comprehensive income | (114,867 | ) | (84,887 | ) | ||||||||
| Retained earnings | 2,277,782 | 2,136,975 | ||||||||||
| Equity attributable to: | ||||||||||||
| Owners of the Company | 6,001,559 | 5,886,274 | ||||||||||
| Non-controlling interests | 8 | 7,505,093 | 7,433,490 | |||||||||
| Total equity | 13,506,652 | 13,319,764 | ||||||||||
| Total equity and liabilities | 28,502,735 | 28,615,734 | ||||||||||
| The accompanying notes are an integral part of these consolidated interim financial statements. | ||||||||||||
5
Cosan Limited
Consolidated statement of profit or loss and other comprehensive income
For the quarter ended March 31, 2014 and 2013
(In thousands of Brazilian Reais – R$, except earnings per share)
| Note | March 31, 2014 | March 31, 2013 | ||||||||||
| Net sales | 20 | 2,157,186 | 1,989,210 | |||||||||
| Cost of sales | (1,520,794 | ) | (1,385,437 | ) | ||||||||
| Gross profit | 636,392 | 603,773 | ||||||||||
| Selling expenses | (206,618 | ) | (198,477 | ) | ||||||||
| General and administrative expenses | (147,577 | ) | (139,071 | ) | ||||||||
| Other income (expense), net | 22 | (32,792 | ) | 71,863 | ||||||||
| Operating (expense) income | (386,987 | ) | (265,685 | ) | ||||||||
Income before financial results, equity in income of associates and income taxes | 249,405 | 338,088 | ||||||||||
| Equity in income of investees | ||||||||||||
| Equity in income of associates | 8 | (1,189 | ) | (1,468 | ) | |||||||
| Equity in income of jointly controlled entity | 9 | 222,990 | 94,077 | |||||||||
| 221,801 | 92,609 | |||||||||||
| Financial results | 21 | |||||||||||
| Finance expense | (185,465 | ) | (233,999 | ) | ||||||||
| Finance income | 48,352 | 59,541 | ||||||||||
| Foreign exchange losses, net | 75,737 | (71 | ) | |||||||||
| Derivatives | (61,082 | ) | (5,321 | ) | ||||||||
| (122,458 | ) | (179,850 | ) | |||||||||
| Profit before taxes | 348,748 | 250,847 | ||||||||||
| Income taxes expenses | 16 | |||||||||||
| Current | (30,539 | ) | (27,736 | ) | ||||||||
| Deferred | (29,023 | ) | 9,071 | |||||||||
| (59,562 | ) | (18,665 | ) | |||||||||
| Profit from continuing operations | 289,186 | 232,182 | ||||||||||
| Loss from discontinued operations, net of tax | - | (3,369 | ) | |||||||||
| Profit for the period | 289,186 | 228,813 | ||||||||||
| Other comprehensive income | ||||||||||||
Items that will not be reclassified to profit or loss: | ||||||||||||
| Actuarial loss on defined benefit plan | (359 | ) | (52,253 | ) | ||||||||
Taxes on items that will not be reclassified to profit or loss | 122 | 17,766 | ||||||||||
| (237 | ) | (34,487 | ) | |||||||||
6
Cosan Limited
Consolidated statement of profit or loss and other comprehensive income
For the quarter ended March 31, 2014 and 2013
(In thousands of Brazilian Reais – R$, except earnings per share)
Items that may be reclassified to profit or loss: | ||||||||||||
| Foreign currency translation effect | (3,523 | ) | 5,567 | |||||||||
Loss on cash flow hedge in jointly controlled entity | (74,408 | ) | (12,335 | ) | ||||||||
Changes in fair value of available for sale securities | 914 | 10,426 | ||||||||||
Taxes on items that may be reclassified subsequently to profit or loss | 24,988 | 649 | ||||||||||
| (52,029 | ) | 4,307 | ||||||||||
Other comprehensive (loss) income for the period, net of tax | (52,266 | ) | (30,180 | ) | ||||||||
| Total comprehensive income for the period | 236,920 | 198,633 | ||||||||||
| Profit attributable to: | ||||||||||||
Owners of the Company (including discontinued operations) | 140,807 | 88,363 | ||||||||||
| Non-controlling interests | 148,379 | 140,450 | ||||||||||
| Total comprehensive income attributable to: | ||||||||||||
| Owners of the Company | 110,827 | 67,551 | ||||||||||
| Non-controlling interests | 126,093 | 131,082 | ||||||||||
| Basic earnings per share | 19 | |||||||||||
| Continuing operations | R$ 0.53 | R$ 0.33 | ||||||||||
| Discontinued operations | - | (R$ 0.01 | ) | |||||||||
| R$ 0.53 | R$ 0.32 | |||||||||||
| Diluted earnings per share | 19 | |||||||||||
| Continuing operations | R$ 0.41 | R$ 0.21 | ||||||||||
| Discontinued operations | - | (R$ 0.01 | ) | |||||||||
| R$ 0.41 | R$ 0.20 | |||||||||||
| The accompanying notes are an integral part of these consolidated interim financial statements. | ||||||||||||
7
Cosan Limited
Statement of changes in shareholders’ equity
For the quarter ended March 31, 2014 and 2013
(In thousands of Brazilian Reais - R$)
| Capital reserve | ||||||||||||||
| Equity | ||||||||||||||
| Additional | Other | attributable | Non- | |||||||||||
| Share | paid in | comprehensive | Retained | to owners | controlling | Total | ||||||||
| capital | capital | income (loss) | earnings | of the Company | interests | equity | ||||||||
| At January 1, 2014 | 5,328 | 3,828,858 | (84,887) | 2,136,975 | 5,886,274 | 7,433,490 | 13,319,764 | |||||||
| Profit for the period | - | - | - | 140,807 | 140,807 | 148,379 | 289,186 | |||||||
| Other comprehensive income | ||||||||||||||
| Foreign currency translation effects | - | - | 534 | - | 534 | (4,057) | (3,523) | |||||||
| Loss on cash flow hedge in jointly controlled entity | - | - | (30,596) | - | (30,596) | (18,513) | (49,109) | |||||||
| Actuarial gain on defined benefit plan | - | - | (96) | - | (96) | (141) | (237) | |||||||
Changes in fair value of available forsale securities | - | - | 178 | - | 178 | 425 | 603 | |||||||
| Total comprehensive income for the period | - | - | (29,980) | 140,807 | 110,827 | 126,093 | 236,920 | |||||||
Contributions by and distributions to owners of the Company | ||||||||||||||
| Share options exercised | - | 2,861 | - | - | 2,861 | 1,731 | 4,592 | |||||||
| Share based compensation | - | 1,597 | - | - | 1,597 | 966 | 2,563 | |||||||
| Dividends | - | - | - | - | - | (57,187) | (57,187) | |||||||
Total contributions by and distributions to owners of the Company | - | 4,458 | - | - | 4,458 | (54,490) | (50,032) | |||||||
| At March 31, 2014 | 5,328 | 3,833,316 | (114,867) | 2,277,782 | 6,001,559 | 7,505,093 | 13,506,652 | |||||||
| The accompanying notes are an integral part of these consolidated interim financial statements. | ||||||||||||||
8
Cosan Limited
Statement of changes in shareholders’ equity
For the quarter ended March 31, 2014 and 2013
(In thousands of Brazilian Reais - R$)
| Capital reserve | ||||||||||||||
| Equity | ||||||||||||||
| Additional | Other | attributable | Non- | |||||||||||
| Share | paid in | comprehensive | Retained | to owners | controlling | Total | ||||||||
| capital | capital | income (loss) | earnings | of the Company | interests | equity | ||||||||
| At January 1, 2013 | 5,328 | 3,778,022 | (38,096) | 2,105,688 | 5,850,942 | 7,330,986 | 13,181,928 | |||||||
| Profit for the period | - | - | - | 88,363 | 88,363 | 140,450 | 228,813 | |||||||
| Other comprehensive income | ||||||||||||||
| Foreign currency translation effects | - | - | 4,515 | - | 4,515 | 1,052 | 5,567 | |||||||
| Loss on cash flow hedge in jointly controlled entity | - | - | (5,072) | - | (5,072) | (3,069) | (8,141) | |||||||
| Actuarial gain on defined benefit plan | - | - | (21,486) | - | (21,486) | (13,001) | (34,487) | |||||||
Changes in fair value of available for sale securities | - | - | 1,231 | - | 1,231 | 5,650 | 6,881 | |||||||
| Total comprehensive income for the period | - | - | (20,812) | 88,363 | 67,551 | 131,082 | 198,633 | |||||||
Contributions by and distributions to owners of the Company | ||||||||||||||
| Share options exercised | - | 1,302 | - | - | 1,302 | 788 | 2,090 | |||||||
| Share based compensation | - | 2,071 | - | - | 2,071 | 1,253 | 3,324 | |||||||
| Dividends | - | - | - | - | - | (66,516) | (66,516) | |||||||
Total contributions by and distributions to owners of the Company | - | 3,373 | - | - | 3,373 | (64,475) | (61,102) | |||||||
| Transactions with owners of the Company | ||||||||||||||
| Corporate reorganization - Raízen Group | - | (3,927) | - | - | (3,927) | (2,379) | (6,306) | |||||||
| Business combination - COMGÁS | - | 78,811 | - | - | 78,811 | 19,192 | 98,003 | |||||||
| Business combination - Radar | - | 570 | - | - | 570 | (205,705) | (205,135) | |||||||
| Total transactions with owners of the Company | - | 75,454 | - | - | 75,454 | (188,892) | (113,438) | |||||||
| At March 31, 2013 | 5,328 | 3,856,849 | (58,908) | 2,194,051 | 5,997,320 | 7,208,701 | 13,206,021 | |||||||
| The accompanying notes are an integral part of these consolidated interim financial statements. | ||||||||||||||
9
Cosan Limited
Consolidated statement of cash flows
For the quarter ended March 31, 2014 and 2013
(In thousands of Brazilian Reais - R$)
| Note | March 31, 2014 | March 31, 2013 | ||||||||||
| Cash flows from operating activities | ||||||||||||
| Profit before taxes | 348,748 | 250,847 | ||||||||||
| Adjustments for: | ||||||||||||
| Depreciation and amortization | 11 / 12 | 160,378 | 159,352 | |||||||||
| Equity in income of associates | 8 | 1,188 | 1,468 | |||||||||
| Equity in income of jointly controlled entity | 9 | (222,990 | ) | (94,077 | ) | |||||||
| Gain on disposals assets | 2,052 | 7,011 | ||||||||||
| Equity-settled share-based payment transactions | 2,563 | 3,322 | ||||||||||
| Change in fair value of investment property | 10 | 18,153 | (52,861 | ) | ||||||||
| Change in fair value of assets held for sale | 23 | 4,767 | - | |||||||||
| Provision for judicial demands | 18,491 | 16,183 | ||||||||||
| Indexation charges, interest and exchange gains/losses, net | 149,321 | 154,987 | ||||||||||
| Other | 17,966 | 7,812 | ||||||||||
| 500,637 | 454,044 | |||||||||||
| Changes in: | ||||||||||||
| Trade receivables | (58,421 | ) | (48,688 | ) | ||||||||
| Investment securities | (29,050 | ) | - | |||||||||
| Restricted cash | - | (14,276 | ) | |||||||||
| Inventories | 41,623 | 11,676 | ||||||||||
| Recoverable taxes | 666 | 6,262 | ||||||||||
| Related parties | (52,651 | ) | (3,735 | ) | ||||||||
| Trade payables | (83,936 | ) | 72,743 | |||||||||
| Employee benefits | (44,683 | ) | (43,588 | ) | ||||||||
| Provision for judicial demands | (6,595 | ) | (1,086 | ) | ||||||||
| Income and other taxes | (57,758 | ) | (192,237 | ) | ||||||||
| Other | 34,630 | (158,608 | ) | |||||||||
| (256,175 | ) | (371,537 | ) | |||||||||
| Net cash generated by operating activities | 244,462 | 82,507 | ||||||||||
| Cash flows from investing activities | ||||||||||||
| Capital increase provided by the associates | (6,944 | ) | (6,958 | ) | ||||||||
| Dividends received from jointly controlled entity | 197,000 | 345,290 | ||||||||||
| Acquisition of property, plant and equipment and intangible assets | 11 / 12 | (192,169 | ) | (251,360 | ) | |||||||
Proceeds from sale of property, plant and equipment, intangible and investments | 100 | 53,306 | ||||||||||
| Net cash generated by (used in) investing activities | (2,013 | ) | 140,278 | |||||||||
10
Cosan Limited
Consolidated statement of cash flows
For the quarter ended March 31, 2014 and 2013
(In thousands of Brazilian Reais - R$)
| Cash flows from financing activities | ||||||||||||
| Loans and borrowings raised | 191,150 | 2,549,245 | ||||||||||
| Payment of principal and interest on loans and borrowings | (416,868 | ) | (2,555,305 | ) | ||||||||
| Derivative financial instruments | (30,997 | ) | - | |||||||||
| Dividends paid | - | (149,430 | ) | |||||||||
| Treasury shares | - | (3 | ) | |||||||||
| Proceeds from exercise of share options | 4,592 | 2,090 | ||||||||||
| Net cash used in financing activities | (252,123 | ) | (153,403 | ) | ||||||||
| (Decrease) increase in cash and cash equivalents | (9,674 | ) | 69,382 | |||||||||
| Cash and cash equivalents at the beginning of the period | 1,509,565 | 1,469,974 | ||||||||||
| Effect of exchange rate changes on cash held | 5,436 | 4,716 | ||||||||||
| Cash and cash equivalents at the ended of the period | 1,505,327 | 1,544,072 | ||||||||||
| Supplemental cash flow information | ||||||||||||
| Interest paid | 316,961 | 42,116 | ||||||||||
| Income taxes paid | 27,874 | 163,399 | ||||||||||
| The accompanying notes are an integral part of these consolidated interim financial statements. | ||||||||||||
11
Cosan Limited
Notes to the consolidated interim financial statements
For the quarter ended March 31, 2014 and 2013
(Amounts in thousands of Brazilian Reais – R$, unless otherwise stated)
| 1 | Operations |
Cosan Limited (“Cosan”) was incorporated in Bermuda on April 30, 2007. Cosan’s class A common shares are traded on the New York Stock Exchange (NYSE – CZZ). The BDRs (Brazilian Depositary Receipts) representing Cosan’s class A common shares are listed on the Brazilian Stock Exchange (BM&FBovespa – CZLT33). Mr. Rubens Ometto Silveira Mello is the ultimate controlling shareholder of Cosan. Cosan controls Cosan S.A. Indústria e Comércio (“Cosan S.A.”) and its subsidiaries with a 62.30 % interest. Cosan, Cosan S.A. and its subsidiaries are collectively referred to as the “Company”.
The Company’s primary activities are in the following business segments: (i) Piped natural gas distribution to part of the State of São Paulo through its subsidiary Companhia de Gás de São Paulo – COMGÁS (“COMGÁS”), which has been consolidated since November 2012; (ii) Logistics services including transportation, port loading and storage of sugar, through its subsidiary Rumo Logística Operadora Multimodal S.A. (“Rumo”); (iii) Purchase, sale and leasing of agricultural land through its subsidiary, Radar Propriedades Agrícolas S.A. ("Radar"); (iv) Production and distribution of lubricants under the Mobil licensed trademark in Brazil, Bolivia, Uruguay and Paraguay, in addition to the European and Asian market using the Comma brand and corporate activities; and (v) other investments, in addition to the corporate structures of the Company (“Cosan’s other business”).
The Company also holds interests in two jointly controlled entities ("Joint Ventures" or "JVs"): (i) Raízen Combustíveis S.A. (“Raízen Combustíveis”), fuel distribution business, and (ii) Raízen Energia S.A. (“Raízen Energia”), production and marketing of sugar, ethanol and energy cogeneration, produced from sugar cane bagasse. Cosan and Royal Dutch Shell (“Shell”) share control of the two entities, where each owns 50% of the economic control. Up until the adoption of IFRS11 – Joint Arrangements (“IFRS 11”), these investments were accounted for using the proportional consolidation method. As from the adoption of IFRS 11 in fiscal year ended December 31, 2013, these investments are accounted for under the equity method.
The Annual General Shareholders' Meeting held on July 31, 2013, approved a fiscal year end change from March 31st to December 31st. This change was driven by changes in the Company’s investment portfolio, in which other businesses that do not use the harvest year (March 31st) have become more significant. With this change, the Company’s fiscal year begins on January 1st and ends on December 31st. These consolidated financial statements are for the three months ended March 31, 2014.
| 2 | Basis of preparation |
| 2.1 | Statement of compliance |
The interim consolidated financial statements have been prepared in accordance with IAS 34 - Interim Financial Reporting, as issued by the International Accounting Standards Board (IASB).
These interim consolidated financial statements were authorized for issue by the Board of Directors on May 13, 2014.
| 2.2 | Basis of consolidation |
The consolidated financial statements include the accounts of Cosan and its subsidiaries. Cosan’s subsidiaries are listed below:
12
Cosan Limited
Notes to the consolidated interim financial statements
For the quarter ended March 31, 2014 and 2013
(Amounts in thousands of Brazilian Reais – R$, unless otherwise stated)
| Ownership percentage | ||||||||
| March 31, 2014 | December 31, 2013 | |||||||
| Directly owned subsidiary | ||||||||
| Cosan S.A. | 62.30 | 62.30 | ||||||
| Interest of Cosan S.A. in its subsidiaries | ||||||||
Administração de Participações Aguassanta Ltda.(1) | - | 65.00 | ||||||
| Águas da Ponte Alta S.A. | 65.00 | 65.00 | ||||||
| Aldwych Temple Venture Capital Ltd. | 100.00 | 100.00 | ||||||
| Bioinvestments Negócios e Participações S.A. | 65.00 | 65.00 | ||||||
| Comma Oil Chemicals | 100.00 | 100.00 | ||||||
| Companhia de Gás de São Paulo - COMGÁS | 60.05 | 60.05 | ||||||
| Cosan Biomassa S.A. | 100.00 | 100.00 | ||||||
| Cosan Cayman II Limited | 100.00 | 100.00 | ||||||
| Cosan Global Limited | 100.00 | 100.00 | ||||||
| Cosan Infraestrutura S.A. | 100.00 | 100.00 | ||||||
| Cosan Investimentos e Participações S.A. | 100.00 | 100.00 | ||||||
| Cosan Lubes Investments Limited | 100.00 | 100.00 | ||||||
| Cosan Lubrificantes e Especialidades S.A. | 100.00 | 100.00 | ||||||
| Cosan Luxembourg S.A. | 100.00 | 100.00 | ||||||
| Cosan Overseas Limited | 100.00 | 100.00 | ||||||
| Cosan US, Inc. | 100.00 | 100.00 | ||||||
Logispot Armazéns Gerais S.A.(2) | 38.25 | 38.25 | ||||||
| Nova Agrícola Ponte Alta S.A. | 29.50 | 29.50 | ||||||
| Nova Amaralina S.A. Propriedades Agrícolas | 29.50 | 29.50 | ||||||
| Nova Santa Barbara Agrícola S.A. | 29.50 | 29.50 | ||||||
| Novo Rumo Logística S.A. | 100.00 | 100.00 | ||||||
| Pasadena Empreendimentos e Participações S.A. | 100.00 | 100.00 | ||||||
| Proud Participações S.A. | 65.00 | 65.00 | ||||||
| Radar II Propriedades Agrícolas S.A. | 65.00 | 65.00 | ||||||
| Radar Propriedades Agrícolas S.A. | 29.50 | 29.50 | ||||||
| Rumo Logística Operadora Multimodal S.A. | 75.00 | 75.00 | ||||||
| Cosan Paraguay S.A. | 100.00 | 100.00 | ||||||
| Terras da Ponte Alta S.A. | 29.50 | 29.50 | ||||||
| Vale da Ponte Alta S.A. | 65.00 | 65.00 | ||||||
| (1) | Incorporated in March 2014; |
| (2) | Cosan has control over this subsidiary through an interest of 51% held by Rumo. |
13
Cosan Limited
Notes to the consolidated interim financial statements
For the quarter ended March 31, 2014 and 2013
(Amounts in thousands of Brazilian Reais – R$, unless otherwise stated)
| 3 | Operating segments |
Segment information
The following segment information is based on the information used by Cosan's senior management to assess the performance of the operating segments and to make decisions with regards to the allocation of resources. This information is prepared on a consistent basis with the accounting policies used in the preparation of the consolidated financial statements. Cosan evaluates operating performance based on the measure of EBITDA. A reconciliation of EBITDA to profit (loss) of the period is presented below.
Operating segments
| I. | Raízen Energia: production and marketing of a variety of products derived from sugar cane, including raw sugar (VHP), anhydrous and hydrated ethanol, and activities related to energy cogeneration from sugarcane bagasse. In addition, this segment holds interests in companies engaged in research and development on new technology; |
| II. | Raízen Combustíveis: distribution and marketing of fuels, mainly through a franchised network of service stations under the brand "Shell" and "Esso" throughout Brazil; |
| III. | COMGÁS: distribution of piped natural gas to part of the State of São Paulo (approximately 180 municipalities, including the region called Greater São Paulo) to customers in the industrial, residential, commercial, automotive, thermogeneration and cogeneration sectors; |
| IV. | Rumo: logistics services for transport, storage and port loading of commodities, mainly for sugar products; |
| V. | Radar: management, buying, selling and leasing of agricultural; |
| VI. | Lubricants: production and distribution of lubricants under the Mobil brand in Brazil, Bolivia, Uruguay and Paraguay, as well as European and Asian market with a Comma trademark; Following the adoption of IFRS 11, whereby the Company no longer proportionally consolidates the results of Raízen Energia and Raízen Combustíveis, the Lubricants segment met the quantitative thresholds to be separately reportable, and the comparative segment information has been restated; |
| VII. | Cosan´s others business: other investments, in addition to the corporate activities of the Company. |
The segments Raízen Energia and Raízen Combustíveis are equity accounted for under the equity method and not consolidated in these interim consolidated financial statements. However, the Company’s senior management continues to review segment information of 100% of the results of these segments and a reconciliation of these segments to the entity’s financial information is presented in the column “Joint Venture deconsolidation”.
The following assets and statement of profit or loss selected information by segment was prepared on the same basis as the accounting practices used in the preparation of consolidated information:
14
Cosan Limited
Notes to the consolidated interim financial statements
For the quarter ended March 31, 2014 and 2013
(Amounts in thousands of Brazilian Reais – R$, unless otherwise stated)
| March 31, 2014 | |||||||||||||||||||
| Raízen Energia | Raízen Combustíveis | COMGÁS | Rumo | Radar | Lubricants | Cosan´s other business | Joint Venture deconsolidation | Segment elimination | Consolidated | ||||||||||
| Statement of profit or loss: | |||||||||||||||||||
| Net sales | 2,604,833 | 13,010,956 | 1,517,378 | 207,935 | 63,552 | 368,269 | 52 | (15,615,789) | - | 2,157,186 | |||||||||
| Domestic market | 992,922 | 13,010,956 | 1,517,378 | 178,931 | 63,552 | 368,269 | 52 | (14,003,878) | - | 2,128,182 | |||||||||
| External market | 1,611,911 | - | - | 29,004 | - | - | - | (1,611,911) | - | 29,004 | |||||||||
| Gross profit | 491,873 | 670,295 | 448,410 | 84,403 | 25,244 | 78,273 | 62 | (1,162,168) | - | 636,392 | |||||||||
| Selling, general and administrative expenses | (303,558) | (388,603) | (217,462) | (19,974) | (8,350) | (73,657) | (34,752) | 692,161 | - | (354,195) | |||||||||
| Other income (expenses) | 60,169 | 101,760 | (7,112) | 6,702 | (23,045) | 408 | (9,745) | (161,929) | - | (32,792) | |||||||||
| Financial income | 65,911 | 17,667 | 15,459 | 12,227 | 3,413 | (207) | 20,576 | (83,578) | (3,116) | 48,352 | |||||||||
| Financial expense | (128,398) | (20,044) | (71,389) | (8,487) | (268) | 42,683 | (151,120) | 148,442 | 3,116 | (185,465) | |||||||||
| Foreign exchange losses, net | 78,784 | 32,882 | 35,266 | 113 | - | (9,989) | 50,347 | (111,666) | - | 75,737 | |||||||||
| Derivatives | 48,129 | (29,844) | (35,885) | - | - | (7,221) | (17,976) | (18,285) | - | (61,082) | |||||||||
| Equity in income of associates | (10,363) | 5,254 | - | - | - | (1,298) | 146,823 | 5,109 | (146,714) | (1,189) | |||||||||
| Equity in income of jointly controlled entity | - | - | - | - | - | - | 222,990 | - | - | 222,990 | |||||||||
| Income taxes expenses | (96,089) | (118,019) | (58,963) | (25,243) | (2,726) | (20,792) | 48,162 | 214,108 | - | (59,562) | |||||||||
| Profit (loss) for the period | 206,458 | 271,348 | 108,324 | 49,741 | (5,732) | 8,200 | 275,368 | (477,806) | (146,714) | 289,187 | |||||||||
| Other selected data: | |||||||||||||||||||
| Depreciation and amortization | 495,854 | 132,466 | 118,168 | 21,715 | 242 | 19,517 | 736 | (628,320) | - | 160,378 | |||||||||
| EBITDA | 733,975 | 521,172 | 342,004 | 92,846 | (5,909) | 23,243 | 326,115 | (1,255,147) | (146,714) | 631,585 | |||||||||
| Addition to PP&E, intangible and biological assets (cash) | 1,009,050 | 277,800 | 155,810 | 13,947 | 40 | 5,916 | 16,456 | (1,286,850) | - | 192,169 | |||||||||
| Reconciliation of EBITDA | |||||||||||||||||||
| Profit (loss) for the period | 206,458 | 271,348 | 108,324 | 49,741 | (5,732) | 8,200 | 275,368 | (477,806) | (146,714) | 289,187 | |||||||||
| Income taxes expenses | 96,089 | 118,019 | 58,963 | 25,243 | 2,726 | 20,792 | (48,162) | (214,108) | - | 59,562 | |||||||||
| Financial result, net | (64,426) | (661) | 56,549 | (3,853) | (3,145) | (25,266) | 98,173 | 65,087 | - | 122,458 | |||||||||
| Depreciation and amortization | 495,854 | 132,466 | 118,168 | 21,715 | 242 | 19,517 | 736 | (628,320) | - | 160,378 | |||||||||
| EBITDA | 733,975 | 521,172 | 342,004 | 92,846 | (5,909) | 23,243 | 326,115 | (1,255,147) | (146,714) | 631,585 | |||||||||
15
Cosan Limited
Notes to the consolidated interim financial statements
For the quarter ended March 31, 2014 and 2013
(Amounts in thousands of Brazilian Reais – R$, unless otherwise stated)
| March 31, 2013 | |||||||||||||||||||
| Raízen Energia | Raízen Combustíveis | COMGÁS | Rumo | Radar | Lubricants | Cosan´s other business | Joint Venture deconsolidation | Segment elimination | Consolidated | ||||||||||
| Statement of profit or loss: | |||||||||||||||||||
| Net sales | 2,350,366 | 10,947,101 | 1,447,743 | 168,385 | 15,383 | 357,699 | - | (13,297,467) | - | 1,989,210 | |||||||||
| Domestic market | 777,634 | 10,947,101 | 1,447,743 | 151,095 | 15,383 | 357,699 | - | (11,724,735) | - | 1,971,920 | |||||||||
| External market | 1,572,732 | - | - | 17,290 | - | - | - | (1,572,732) | - | 17,290 | |||||||||
| Gross profit | 259,406 | 595,495 | 415,369 | 73,233 | 15,383 | 99,788 | - | (854,901) | - | 603,773 | |||||||||
| Selling, general and administrative expenses | (332,020) | (358,398) | (221,994) | (16,696) | (4,821) | (67,552) | (26,485) | 690,418 | - | (337,548) | |||||||||
| Other income (expenses) | 26,595 | 67,303 | (1,358) | (5,992) | 54,417 | (2,487) | 27,283 | (93,898) | - | 71,863 | |||||||||
| Financial income | 46,012 | 33,207 | 9,627 | 8,873 | 585 | 9,146 | 31,310 | (79,219) | - | 59,541 | |||||||||
| Financial expense | (89,552) | (22,715) | (55,598) | (10,120) | (261) | (15,310) | (152,710) | 112,267 | - | (233,999) | |||||||||
| Foreign exchange losses, net | 31,211 | 14,903 | (12,833) | 24 | (3) | (2,041) | 14,782 | (46,114) | - | (71) | |||||||||
| Derivatives | 20,842 | (19,156) | 8,779 | - | - | 5,587 | (19,687) | (1,686) | - | (5,321) | |||||||||
| Equity in income of associates | (9,272) | - | - | - | - | - | 98,612 | 9,272 | (100,080) | (1,468) | |||||||||
| Equity in income of jointly controlled entity | - | - | - | - | - | - | 94,077 | - | - | 94,077 | |||||||||
| Income taxes expenses | 24,445 | (90,861) | (48,541) | (16,539) | (3,423) | (13,897) | 63,735 | 66,416 | - | (18,665) | |||||||||
| Profit (loss) for the period | (22,333) | 219,778 | 93,451 | 32,783 | 61,877 | 13,234 | 127,548 | (197,445) | (100,080) | 228,813 | |||||||||
| Other selected data: | |||||||||||||||||||
| Depreciation and amortization | 465,752 | 118,464 | 122,338 | 18,514 | 222 | 17,815 | 463 | (584,216) | - | 159,352 | |||||||||
| EBITDA | 410,461 | 422,864 | 314,355 | 69,059 | 65,201 | 47,564 | 190,581 | (833,325) | (100,080) | 586,680 | |||||||||
| Addition to PP&E, intangible and biological assets (cash) | 1,017,140 | 153,544 | 174,533 | 57,015 | 2,360 | 16,045 | 1,407 | (1,170,684) | - | 251,360 | |||||||||
| Reconciliation of EBITDA | |||||||||||||||||||
| Profit (loss) for the period | (22,333) | 219,778 | 93,451 | 32,783 | 61,877 | 13,234 | 127,548 | (197,445) | (100,080) | 228,813 | |||||||||
| Income taxes expenses | (24,445) | 90,861 | 48,541 | 16,539 | 3,423 | 13,897 | (63,735) | (66,416) | - | 18,665 | |||||||||
| Financial result, net | (8,513) | (6,239) | 50,025 | 1,223 | (321) | 2,618 | 126,305 | 14,752 | - | 179,850 | |||||||||
| Depreciation and amortization | 465,752 | 118,464 | 122,338 | 18,514 | 222 | 17,815 | 463 | (584,216) | - | 159,352 | |||||||||
| EBITDA | 410,461 | 422,864 | 314,355 | 69,059 | 65,201 | 47,564 | 190,581 | (833,325) | (100,080) | 586,680 | |||||||||
16
Cosan Limited
Notes to the consolidated interim financial statements
For the quarter ended March 31, 2014 and 2013
(Amounts in thousands of Brazilian Reais – R$, unless otherwise stated)
| March 31, 2014 | |||||||||||||||||||
| Statement of financial position: | Raízen Energia | Raízen Combustíveis | COMGÁS | Rumo | Radar | Lubricants | Cosan´s other business | Joint Venture deconsolidation | Segment elimination | Consolidated | |||||||||
| Cash and cash equivalents | 1,771,015 | 566,606 | 783,560 | 462,982 | 7,968 | 72,124 | 178,693 | (2,337,621) | - | 1,505,327 | |||||||||
| Investment securities | - | - | - | - | 120,875 | - | - | - | - | 120,875 | |||||||||
| Trade receivables | 356,004 | 1,190,832 | 592,520 | 26,551 | 51,402 | 197,946 | 1,288 | (1,546,836) | - | 869,707 | |||||||||
| Inventories | 453,810 | 941,982 | 116,527 | 5,250 | - | 147,816 | 1 | (1,395,792) | - | 269,594 | |||||||||
| Other current assets | 1,409,016 | 557,552 | 237,879 | 28,782 | 285,267 | 44,715 | 676,182 | (1,966,568) | (422,922) | 849,903 | |||||||||
| Equity method investments | 162,266 | 255,711 | - | - | - | 13,592 | 12,283,340 | (417,977) | (12,193,325) | 103,607 | |||||||||
| Investment in joint ventures | - | - | - | - | - | - | 8,471,068 | - | (8,495) | 8,462,573 | |||||||||
| Biological assets | 2,036,693 | - | - | - | - | - | - | (2,036,693) | - | - | |||||||||
| Investment property | - | - | - | - | 2,263,356 | - | - | - | - | 2,263,356 | |||||||||
| Property, plant and equipment | 10,322,749 | 2,503,252 | - | 1,021,712 | 10,999 | 198,289 | 65,841 | (12,826,001) | - | 1,296,841 | |||||||||
| Intangible assets | 3,329,949 | 4,092,153 | 8,486,121 | 739,302 | 83 | 852,997 | 3,187 | (7,422,102) | - | 10,081,690 | |||||||||
| Non-current other assets | 1,418,139 | 1,349,945 | 325,473 | 270,994 | 4,499 | (110,068) | 2,590,875 | (2,768,084) | (402,511) | 2,679,262 | |||||||||
| Loans and borrowings | (7,580,843) | (815,208) | (2,964,239) | (688,916) | - | (206,502) | (5,123,720) | 8,396,051 | - | (8,983,377) | |||||||||
| Trade payables | (637,863) | (777,950) | (727,212) | (57,227) | (766) | (38,889) | (1,315) | 1,415,813 | - | (825,409) | |||||||||
| Employee benefits payable | (292,468) | (86,164) | (35,873) | (7,965) | (6,366) | (9,674) | (8,221) | 378,632 | - | (68,099) | |||||||||
| Other current liabilities | (618,828) | (718,443) | (300,472) | (338,549) | (30,414) | (102,057) | (256,665) | 1,337,271 | 423,546 | (604,608) | |||||||||
| Other non-current liabilities | (1,630,735) | (2,456,469) | (905,865) | (207,141) | (84,207) | (242,479) | (3,476,785) | 4,087,204 | 401,887 | (4,514,590) | |||||||||
| Total assets (net of liabilities) allocated by segment | 10,498,904 | 6,603,799 | 5,608,419 | 1,255,775 | 2,622,696 | 817,810 | 15,403,772 | (17,102,703) | (12,201,820) | 13,506,652 | |||||||||
| Total assets | 21,259,641 | 11,458,033 | 10,542,080 | 2,555,573 | 2,744,449 | 1,417,411 | 24,270,475 | (32,717,674) | (13,027,253) | 28,502,735 | |||||||||
17
Cosan Limited
Notes to the consolidated interim financial statements
For the quarter ended March 31, 2014 and 2013
(Amounts in thousands of Brazilian Reais – R$, unless otherwise stated)
| December 31, 2013 | |||||||||||||||||||
| Statement of financial position: | Raízen Energia | Raízen Combustíveis | COMGÁS | Rumo | Radar | Lubricants | Cosan´s other business | Joint Venture deconsolidated | Segment elimination | Consolidated | |||||||||
| Cash and cash equivalents | 1,058,483 | 328,992 | 535,957 | 497,753 | 13,408 | 57,892 | 404,555 | (1,387,475) | - | 1,509,565 | |||||||||
| Investment securities | - | - | - | - | 87,978 | - | - | - | - | 87,978 | |||||||||
| Trade receivables | 416,746 | 1,435,095 | 582,889 | 32,506 | 28,051 | 200,796 | 241 | (1,851,841) | - | 844,483 | |||||||||
| Inventories | 2,026,925 | 1,057,049 | 121,253 | 5,237 | - | 185,490 | - | (3,083,974) | - | 311,980 | |||||||||
| Other current assets | 1,279,553 | 484,475 | 248,803 | 22,389 | 323,476 | 45,227 | 384,101 | (1,764,028) | (214,000) | 809,996 | |||||||||
| Equity method investments | 408,591 | 254,826 | - | - | - | 15,364 | 12,183,241 | (663,417) | (12,095,289) | 103,316 | |||||||||
| Investment in joint ventures | - | - | - | - | - | - | 8,498,259 | - | - | 8,498,259 | |||||||||
| Biological assets | 1,867,765 | - | - | - | - | - | - | (1,867,765) | - | - | |||||||||
| Investment property | - | - | - | - | 2,281,509 | - | - | - | - | 2,281,509 | |||||||||
| Property, plant and equipment | 9,504,874 | 2,494,486 | - | 1,013,149 | 11,195 | 197,137 | 50,429 | (11,999,360) | - | 1,271,910 | |||||||||
| Intangible assets | 3,100,227 | 4,038,314 | 8,450,541 | 755,635 | 89 | 867,826 | 3,949 | (7,138,541) | - | 10,078,040 | |||||||||
| Other non-current asset | 1,534,557 | 1,403,117 | 332,918 | 234,965 | 4,884 | (93,658) | 2,755,374 | (2,937,674) | (415,785) | 2,818,698 | |||||||||
| Loans and borrowings | (7,732,778) | (862,521) | (2,841,387) | (705,974) | - | (209,579) | (5,336,016) | 8,595,299 | - | (9,092,956) | |||||||||
| Trade payables | (633,505) | (551,176) | (706,397) | (82,872) | (1,216) | (70,102) | (1,562) | 1,184,681 | (280) | (862,429) | |||||||||
| Employee benefits payable | (249,919) | (60,091) | (59,417) | (12,522) | (4,247) | (13,039) | (14,071) | 310,010 | - | (103,296) | |||||||||
| Other current liabilities | (495,240) | (525,188) | (301,089) | (127,287) | (31,020) | (107,826) | (280,602) | 1,020,428 | 213,718 | (634,106) | |||||||||
| Other non-current liabilities | (1,693,036) | (2,715,727) | (863,768) | (198,620) | (85,951) | (327,564) | (3,543,628) | 4,408,763 | 416,348 | (4,602,901) | |||||||||
| Total assets (net of liabilities) allocated by segment | 10,393,243 | 6,781,651 | 5,500,303 | 1,434,359 | 2,628,156 | 747,964 | 15,104,289 | (17,174,894) | (12,095,307) | 13,319,764 | |||||||||
| Total assets | 21,197,721 | 11,496,354 | 10,272,361 | 2,561,634 | 2,750,590 | 1,476,074 | 24,280,149 | (32,694,075) | (12,725,074) | 28,615,734 | |||||||||
18
Cosan Limited
Notes to the consolidated interim financial statements
For the quarter ended March 31, 2014 and 2013
(Amounts in thousands of Brazilian Reais – R$, unless otherwise stated)
Detailed net sales by segment:
March 31, 2014 | March 31, 2013 | |||||||
| Raízen Energia | ||||||||
| Sugar | 1,225,469 | 1,176,667 | ||||||
| Ethanol | 1,321,277 | 1,123,323 | ||||||
| Cogeneration | 27,266 | 13,139 | ||||||
| Other | 30,821 | 37,237 | ||||||
| 2,604,833 | 2,350,366 | |||||||
| Raízen Combustíveis | ||||||||
| Fuels | 13,010,956 | 10,947,101 | ||||||
| 13,010,956 | 10,947,101 | |||||||
| COMGÁS | ||||||||
| Industrial | 1,025,427 | 945,740 | ||||||
| Residential | 112,176 | 113,986 | ||||||
| Thermo generation | 87,595 | 84,682 | ||||||
| Cogeneration | 63,834 | 68,325 | ||||||
| Automotive | 46,796 | 44,954 | ||||||
| Commercial | 55,457 | 48,853 | ||||||
| Construction revenue | 117,641 | 135,161 | ||||||
| Other | 8,453 | 6,042 | ||||||
| 1,517,378 | 1,447,743 | |||||||
| Rumo | ||||||||
| Port loading | 49,428 | 36,634 | ||||||
| Logistics | 154,947 | 128,498 | ||||||
| Other | 3,559 | 3,251 | ||||||
| 207,935 | 168,383 | |||||||
| Radar | ||||||||
| Property sale | 45,590 | - | ||||||
| Land lease | 16,128 | 15,383 | ||||||
| Land lease | 1,834 | - | ||||||
| 63,552 | 15,383 | |||||||
| Lubricants | ||||||||
| Lubricants | 319,188 | 324,088 | ||||||
| Basic Oil | 46,023 | 31,122 | ||||||
| Other | 3,058 | 2,490 | ||||||
| 368,269 | 357,700 | |||||||
| Cosan’s other business | 52 | - | ||||||
| Joint Venture deconsolidated | (15,615,789 | ) | (13,297,467 | ) | ||||
| Total | 2,157,186 | 1,989,210 | ||||||
19
Cosan Limited
Notes to the consolidated interim financial statements
For the quarter ended March 31, 2014 and 2013
(Amounts in thousands of Brazilian Reais – R$, unless otherwise stated)
| 4 | Cash and cash equivalents |
March 31, 2014 | December 31, 2013 | |||||||
| Brazilian Reais | ||||||||
| Short-term investments | 1,416,998 | 1,387,295 | ||||||
| U.S. Dollars | ||||||||
| Cash and bank deposits | 88,329 | 122,270 | ||||||
| 1,505,327 | 1,509,565 | |||||||
| Short-term investments are mainly comprised of exclusive funds as presented below: | ||||||||
| March 31, 2014 | December 31, 2013 | |||||||
| Exclusive funds | ||||||||
| Commitment transactions | 441,580 | 662,262 | ||||||
| Bank certificate of deposits - CDB | 110,939 | 175,895 | ||||||
| 552,519 | 838,157 | |||||||
| Bank investments | ||||||||
| Bank certificate of deposits - CDB | 212,359 | 147,782 | ||||||
| Commitment transactions | 538,074 | 342,894 | ||||||
| Other financial investments | 114,046 | 58,462 | ||||||
| 864,479 | 549,138 | |||||||
| 1,416,998 | 1,387,295 | |||||||
| 5 | Trade receivables |
The balance of trade receivables is comprised of the following:
March 31, 2014 | December 31, 2013 | |||||||
| Domestic | 1,136,557 | 1,087,118 | ||||||
| Foreign | 27,986 | 24,453 | ||||||
Allowance for doubtful accounts | (36,087 | ) | (28,628 | ) | ||||
| 1,128,455 | 1,082,943 | |||||||
| Current | 869,707 | 844,483 | ||||||
| Non-current | 258,748 | 238,460 | ||||||
20
Cosan Limited
Notes to the consolidated interim financial statements
For the quarter ended March 31, 2014 and 2013
(Amounts in thousands of Brazilian Reais – R$, unless otherwise stated)
On October 10, 2013, ALL – América Latina Logística S.A. (“ALL”), issued a press release announcing that it had initiated legal actions in relation to the contracts entered with Rumo. Rumo then filed a request for arbitration against ALL, among other administrative and judicial measures to enforce its contractual rights and to require ALL comply with the terms of the agreement signed in 2009, as amended, including the 4th and 5th amendment signed on May 31, 2013. There are no judicial decisions suspending the validity of the contracts signed between ALL and Rumo. On May 12, 2014, Rumo and ALL required the suspension of the litigation in accordance with art. 265, item II of CPC - Civil Procedure Code, including any resources or incident, for the period of six months, without prejudice to the parties when the eventual resumption of its course.
As of March 31, 2014, Rumo has recorded accounts receivable from ALL amounting to R$ 245,559 (R$ 225,401 on December 31, 2013) for services provided under the agreements in accordance with IAS 18 - Revenue. Additionally, revenue totaling R$ 95,600, including penalties and interest, was not recorded because not all the criteria for revenue recognition have been met.
| 6 | Other financial assets |
| March 31, 2014 | December 31, 2013 | |||||||
| Exxon Mobil financial assets | 314,847 | 309,378 | ||||||
Receivable from sale of discontinued operations(a) | 164,500 | 160,783 | ||||||
| 479,347 | 470,161 | |||||||
| Current | 64,492 | 63,054 | ||||||
| Non-current | 414,855 | 407,107 | ||||||
| a) | Remaining balance the alienation of Cosan Alimentos. |
21
Cosan Limited
Notes to the consolidated interim financial statements
For the quarter ended March 31, 2014 and 2013
(Amounts in thousands of Brazilian Reais – R$, unless otherwise stated)
| 7 | Related parties |
| a) | Receivables from and payables to related parties are as follows: |
March 31, 2014 | December 31, 2013 | |||||||
| Current assets | ||||||||
| Commercial operations | ||||||||
| Raízen Energia S.A. | 26,307 | 27,681 | ||||||
| Transport services | 8,775 | 10,538 | ||||||
| Lubricants | 2,623 | 3,086 | ||||||
| Other | 14,909 | 14,057 | ||||||
| Raízen Combustíveis S.A. | 4,779 | 4,048 | ||||||
| Aguassanta Participações S.A. | 6,440 | 6,368 | ||||||
| Other | 5,239 | - | ||||||
| 42,765 | 38,097 | |||||||
| Corporate operation / Agreements | ||||||||
| Raízen Energia S.A. | 3 | 1,468 | ||||||
| 3 | 1,468 | |||||||
| Financial operations | ||||||||
| Rezende Barbosa Group | 6,188 | 7,223 | ||||||
| 6,188 | 7,223 | |||||||
| 48,956 | 46,788 | |||||||
| Receivables under the | ||||||||
| framework agreement | ||||||||
| Raízen Energia S.A. | 261,547 | 305,183 | ||||||
| Raízen Combustíveis S.A. | 30,252 | 90,756 | ||||||
| 291,799 | 395,939 | |||||||
| Financial operations | ||||||||
| Rezende Barbosa Group | 106,230 | 107,002 | ||||||
| 106,230 | 107,002 | |||||||
| Corporate restructuring | 734 | 1,540 | ||||||
| 734 | 1,540 | |||||||
| 398,763 | 504,481 | |||||||
| Total | 447,719 | 551,269 | ||||||
22
Cosan Limited
Notes to the consolidated interim financial statements
For the quarter ended March 31, 2014 and 2013
(Amounts in thousands of Brazilian Reais – R$, unless otherwise stated)
| Current liabilities | ||||||||
| Commercial operations | ||||||||
| Shell Brazil Holding B.V. | 2,332 | 5,986 | ||||||
| Raízen Energia S.A. | 19,894 | 18,491 | ||||||
| Advances from port services | 3,885 | 7,998 | ||||||
| Shared expenses | 11,640 | 10,204 | ||||||
| Other | 4,369 | 289 | ||||||
| Raízen Combustíveis S.A. | 591 | 1,709 | ||||||
| Other | 66 | 34 | ||||||
| 22,883 | 26,220 | |||||||
| Corporate operations / Agreements | ||||||||
| Raízen Combustíveis S.A. | 9,091 | 8,800 | ||||||
| Raízen Energia S.A. | 44,596 | 70,443 | ||||||
| 53,687 | 79,243 | |||||||
| Total | 76,570 | 105,463 | ||||||
| b) | Related party transactions are as follows: |
Commercial operations of Cosan among its subsidiaries and jointly controlled entities are carried out at market prices and market conditions. During quarter ended March 31, 2014 and 2013 no loss for doubtful accounts was recorded with regards to receivables from related parties.
| March 31, 2014 | March 31, 2013 | |||||||
| Sales of goods and services | ||||||||
| Raízen Energia S.A. | 93,571 | 96,825 | ||||||
| Other | 14 | - | ||||||
| 93,585 | 96,825 | |||||||
| Purchase of goods / Inputs | ||||||||
| Raízen Energia S.A. | (1 | ) | (1 | ) | ||||
| Raízen Combustíveis S.A. | (364 | ) | (208 | ) | ||||
| (365 | ) | (209 | ) | |||||
| Shared income (expense) | ||||||||
| Aguassanta Participações S.A. | 106 | 91 | ||||||
| Raízen Energia S.A. | (3,520 | ) | (2,083 | ) | ||||
| (3,414 | ) | (1,992 | ) | |||||
| Financial result | ||||||||
| Rezende Barbosa Group | 167 | 330 | ||||||
| Raízen Energia S.A. | 616 | 516 | ||||||
| Ethanol Participações | (45 | ) | (288 | ) | ||||
| Aldwich Temple Venture Capital Ltd. | (66 | ) | (67 | ) | ||||
| Other | 98 | (79 | ) | |||||
| 770 | 412 | |||||||
| Total | 90,576 | 95,036 | ||||||
23
Cosan Limited
Notes to the consolidated interim financial statements
For the quarter ended March 31, 2014 and 2013
(Amounts in thousands of Brazilian Reais – R$, unless otherwise stated)
| 8 | Equity method investments |
| Issued shares of the investee | Number of shares held by Cosan | Percentage of interest (%) | At December 31, 2013 | Equity income of investees | Equity method adjustments | Capital increase | Other | At March 31, 2014 | Equity income of investees March 31, 2013 | |||||||||||
Tellus Brasil Participações Ltda.(a) | 65,957,282 | 33,638,214 | 51.00 | 78,821 | 446 | 103 | 3,507 | - | 82,877 | 59 | ||||||||||
| Novvi Limited | 200,002 | 100,001 | 50.00 | 15,364 | (1,298) | (473) | - | - | 13,593 | - | ||||||||||
| Vertical UK LLP | - | - | 50.00 | 8,126 | 666 | (1,654) | - | - | 7,138 | - | ||||||||||
| Other investments | - | - | - | 1,005 | (1,003) | - | - | (3) | (1) | (1,527) | ||||||||||
| Total | 103,316 | (1,189) | (2,024) | 3,507 | (3) | 103,607 | (1,468) |
b) Non-controlling interest:
| Issued shares of the investee | Number of shares held by non-controlling | Ownership percentage of non-controlling interest (%) | At December 31, 2013 | Equity in income of investee of non-controlling | Equity method adjustments | Dividends | At March 31, 2014 | |||||||||
| Logispot Armazéns Gerais S.A. | 2,040,816 | 1,000,000 | 61.75 | 37,219 | (221) | - | (141) | 36,857 | ||||||||
| Rumo Logística Operadora Multimodal S.A. | 956,917 | 239,229 | 25.00 | 349,285 | 12,491 | - | (57,046) | 304,730 | ||||||||
| Radar Propriedades Agrícolas S.A. | 21,148,989 | 17,147,822 | 81.08 | 1,607,793 | (3,934) | 219 | - | 1,604,078 | ||||||||
| Radar II Propriedades Agrícolas S.A. | 830,690,258 | 290,710,861 | 35.00 | 328,192 | (590) | 16 | - | 327,618 | ||||||||
| Companhia de Gás de São Paulo - "COMGÁS" | 119,822,797 | 47,864,807 | 39.95 | 1,961,238 | 43,275 | (83) | - | 2,004,430 | ||||||||
| Elimination of participation Radar II in Radar | - | - | - | (505,215) | 806 | (44) | - | (504,453) | ||||||||
| Cosan S.A. Indústria e Comércio | 407,214,353 | 252,444,538 | 37.70 | 3,654,978 | 99,250 | (22,395) | - | 3,731,833 | ||||||||
| Total | 7,433,490 | 151,077 | (22,287) | (57,187) | 7,505,093 |
| 9 | Investment in jointly controlled entities |
Cosan has joint control over Raízen Energia and Raízen Combustíveis by virtue of its 50% share in the equity shares of both companies and the requirement for unanimous consent by all parties over decisions related to the relevant activities of the arrangements. The investments have been classified as joint ventures under IFRS 11 and therefore the equity method of accounting is used in the consolidated financial statements. Prior to the adoption of IFRS 11, Cosan's interests in Raízen Energia and Raízen Combustíveis were proportionately consolidated.
Investments in jointly controlled entities had the following change in the period:
24
Cosan Limited
Notes to the consolidated interim financial statements
For the quarter ended March 31, 2014 and 2013
(Amounts in thousands of Brazilian Reais – R$, unless otherwise stated)
| Equity in income of jointly controlled entity March 31, 2013 | ||||||||||||||||||||
| Issued shares of the investee | Number of shares held by Cosan | Percentage of interest (%) | December 31, 2013 | Equity in income of jointly controlled entity | Equity method adjustments | Dividends | Other equity effects | March 31, 2014 | ||||||||||||
| Raízen Combustíveis S.A. | 3,303,168,484 | 1,651,584,242 | 50.00 | 3,326,482 | 111,983 | - | (200,500) | - | 3,237,965 | 107,663 | ||||||||||
| Raízen Energia S.A. | 5,902,595,634 | 2,951,297,817 | 50.00 | 5,171,777 | 111,007 | (61,928) | (518) | 4,270 | 5,224,608 | (13,586) | ||||||||||
| Total | 8,498,259 | 222,990 | (61,928) | (201,018) | 4,270 | 8,462,573 | 94,077 |
The statement of financial position and statement of profit or loss of jointly controlled entities are disclosed in Note 4, Segments.
The cash flows and comprehensive income of the jointly controlled entities Raízen Energia and Raízen Combustíveis for the period ended March 31, 2014 and March 31, 2013 are presented below:
| Raízen Energia | Raízen Combustíveis | ||||||
| March 31, 2014 | March 31, 2013 | March 31, 2014 | March 31, 2013 | ||||
| Cash flow | |||||||
| Operating activities | 1,829,954 | 1,691,394 | 997,678 | 352,792 | |||
| Investing activities | (1,007,923) | (1,059,472) | (323,134) | 86,976 | |||
| Financing activities | (109,499) | (475,730) | (436,930) | (393,136) | |||
| Increase in cash | |||||||
| and cash equivalents | 712,532 | 156,192 | 237,614 | 46,632 | |||
| Other comprehensive (loss) income | 91,484 | (35,585) | 271,498 | 219,779 | |||
25
Cosan Limited
Notes to the consolidated interim financial statements
For the quarter ended March 31, 2014 and 2013
(Amounts in thousands of Brazilian Reais – R$, unless otherwise stated)
According to the terms of the Framework Agreement of Joint Venture Raízen, Cosan is responsible for legal proceedings that existed prior to the formation of Raízen, which are net of judicial deposits as of April 1, 2011, as well as tax installments on the REFIS (tax refinancing) program, recorded in "Other taxes payable". Additionally, Cosan is party to a credit line (stand-by) facility granted to Raízen in the amount of US Dollars 500,000 thousand, which was unused at March 31, 2014.
| 10 | Investment property |
The balance of investment property is as follows:
| At December 31, 2013 | 2,281,509 |
| Change in fair value | (18,153) |
| At March 31, 2014 | 2,263,356 |
26
Cosan Limited
Notes to the consolidated interim financial statements
For the quarter ended March 31, 2014 and 2013
(Amounts in thousands of Brazilian Reais – R$, unless otherwise stated)
| 11 | Property, plant and equipment |
| Land, buildings and improvements | Machinery, equipment and facilities | Rail cars and locomotives | Construction in progress | Other | Total | ||||||
| Cost | |||||||||||
| At December 31, 2013 | 447,240 | 359,262 | 436,064 | 284,262 | 35,100 | 1,561,928 | |||||
| Additions | 1,624 | 3,047 | - | 30,432 | - | 35,104 | |||||
| Disposals | - | (1,070) | - | - | (844) | (1,914) | |||||
Transfers (i) | 28,877 | 56,399 | - | (83,027) | 5,097 | 7,346 | |||||
| At March 31, 2014 | 477,741 | 417,638 | 436,064 | 231,667 | 39,353 | 1,602,464 | |||||
| Depreciation | |||||||||||
| At December 31, 2013 | (80,419) | (153,996) | (41,584) | - | (14,019) | (290,018) | |||||
| Additions | (3,831) | (8,045) | (3,416) | - | (1,092) | (16,383) | |||||
| Disposals | - | - | - | - | 778 | 778 | |||||
| At March 31, 2014 | (84,250) | (162,041) | (45,000) | - | (14,333) | (305,623) | |||||
| At December 31, 2013 | 366,821 | 205,266 | 394,480 | 284,262 | 21,081 | 1,271,910 | |||||
| At March 31, 2014 | 393,491 | 255,598 | 391,064 | 231,667 | 25,021 | 1,296,841 | |||||
| (i) Refer to intangible transfers due to the capitalization of these assets. | |||||||||||
Capitalization of borrowing costs
Capitalized borrowing costs for the quarter ended March 31, 2014, amounted to R$ 1,978 (March 31, 2013 R$ 1,575). The weighted average interest rate used to capitalize interest on the balance of construction in progress, was 5.92% p.a. for the quarter ended March 31,2014 (5,84% p.a. for the quarter ended March 31,2013).
27
Cosan Limited
Notes to the consolidated interim financial statements
For the quarter ended March 31, 2014 and 2013
(Amounts in thousands of Brazilian Reais – R$, unless otherwise stated)
| 12 | Intangible assets |
| Goodwill | Concession intangible asset - COMGÁS | Improvements in public concessions and operation licenses | Trademarks | Related customer relationships | Other | Total | ||||||||
| Cost | ||||||||||||||
| At December 31, 2013 | 703,956 | 8,307,282 | 751,555 | 252,474 | 719,186 | 200,825 | 10,935,278 | |||||||
| Additions | - | 122,329 | - | - | 32,145 | 2,592 | 157,066 | |||||||
| Disposals | - | (2,863) | - | - | (1,975) | - | (4,838) | |||||||
Transfers (i) | - | - | (4,812) | - | - | (2,534) | (7,346) | |||||||
| At March 31, 2014 | 703,956 | 8,426,748 | 746,743 | 252,474 | 749,356 | 200,883 | 11,080,160 | |||||||
| Amortization | ||||||||||||||
| At December 31, 2013 | - | (306,437) | (102,119) | (114,132) | (273,120) | (61,430) | (857,238) | |||||||
| Additions | - | (75,980) | (8,989) | (5,707) | (40,662) | (12,809) | (144,147) | |||||||
| Disposals | - | 1,808 | - | - | 1,107 | - | 2,915 | |||||||
| At March 31, 2014 | - | (380,609) | (111,108) | (119,839) | (312,675) | (74,239) | (998,469) | |||||||
| At December 31, 2013 | 703,956 | 8,000,845 | 649,436 | 138,342 | 446,066 | 139,395 | 10,078,040 | |||||||
| At March 31, 2014 | 703,956 | 8,046,139 | 635,635 | 132,635 | 436,681 | 126,644 | 10,081,690 | |||||||
| (i) Refer to intangible transfers due to the capitalization of these assets. | ||||||||||||||
Capitalization of borrowing costs
Capitalized borrowing costs for the quarter ended March 31, 2014, amounted to R$ 4,452 (March 31, 2013 R $ 4,310). The weighted average interest rate used to capitalize borrowing costs on the balance of construction in progress, was 9.62% p.a. for the quarter ended March 31, 2014 (7.23% p.a. for the quarter ended March 31, 2013).
28
Cosan Limited
Notes to the consolidated interim financial statements
For the quarter ended March 31, 2014 and 2013
(Amounts in thousands of Brazilian Reais – R$, unless otherwise stated)
| Intangible assets (excluding goodwill) | Annual rate of amortization - % | March 31, 2014 | December 31, 2013 | |||
Concession intangible asset - COMGÁS (a) | Over the concession term | 8,046,139 | 8,000,845 | |||
Improvements in public grants (b) | Over the concession term | 376,380 | 387,245 | |||
Operating license for port terminal (c) | 4.00 | 259,255 | 262,190 | |||
| 635,635 | 649,435 | |||||
| Trademarks | ||||||
| Mobil | 10.00 | 108,431 | 114,138 | |||
| União | 2.00 | - | - | |||
| Comma | 24,204 | 24,204 | ||||
| 132,635 | 138,342 | |||||
| Relationship with customers | ||||||
| COMGÁS | 3.00 | 372,047 | 375,184 | |||
| Lubricants | 6.00 | 64,635 | 70,883 | |||
| 436,682 | 446,067 | |||||
| Other | ||||||
| Software licenses | 20.00 | 81,881 | 91,695 | |||
| Other | Up to 20 | 44,762 | 47,700 | |||
| 126,643 | 139,395 | |||||
| 9,377,734 | 9,374,084 |
| a) | Refers to the concession intangible asset for the public gas distribution service, which represents the right to charge users for the supply of gas and is comprised of: (i) the concession rights recognized in the business combination and (ii) concession assets as disclosed; |
| b) | Refers to improvements made to the federal railways in relation to the transportation agreement entered by Rumo; |
| c) | License port operations and customer relationships of Rumo, recognized as a result of business combinations. |
Impairment testing of cash-generating units containing goodwill.
During the period ended March 31, 2014, no impairment indicator was identified that would require the performance of an impairment test.
29
Cosan Limited
Notes to the consolidated interim financial statements
For the quarter ended March 31, 2014 and 2013
(Amounts in thousands of Brazilian Reais – R$, unless otherwise stated)
| 13 | Loans and borrowings |
| Interest | ||||||||||
| Description(a) | Index(b) | Interest rate(c) (%) | March 31, 2014 | December 31, 2013 | Maturity date | |||||
| Senior Notes Due 2018 | Pre-fixed | 9.50 | 853,512 | 873,589 | mar-18 | |||||
| Senior Notes Due 2023 | Dollar (US$) | 5.00 | 1,065,194 | 1,086,716 | mar-23 | |||||
| BNDES | TJLP | 7.95 | 466,297 | 526,716 | jun-17 | |||||
| BNDES | SELIC | 10.70 | 206,944 | 159,894 | oct-20 | |||||
| BNDES | TJ462 | 7.94 | 665,151 | 525,636 | oct-20 | |||||
| Perpetual notes | Dollar (US$) | 8.25 | 1,145,924 | 1,186,221 | - | |||||
| Working capital | Dollar (US$) + LIBOR | 4.24 | 173,227 | 262,796 | sep-16 | |||||
| Working capital | 113% CDI | 11.92 | 87,687 | - | sep-16 | |||||
| Credit notes | 110% CDI | 11.61 | 302,526 | 393,646 | aug-14 | |||||
| FINAME | Pre-fixed | 4.23 | 266,118 | 277,298 | nov-22 | |||||
| FINAME | URTJLP | 7.06 | 415,412 | 428,916 | may-22 | |||||
| Finem | Pre-fixed | 3.50 | 2,114 | - | jan-24 | |||||
| Finem | URTJLP | 6.74 | 5,511 | - | jan-22 | |||||
| Leasing | CDI | 10.55% | 748 | 1,068 | oct-14 | |||||
| Foreign loans | LIBOR UK semiannual | 4.27 | 206,264 | 209,340 | jun-17 | |||||
| EIB | Dollar (US$) + LIBOR | 2.12 | 632,428 | 633,223 | sep-21 | |||||
| Resolution 4131 | Dollar (US$) + LIBOR | 2.87 | 397,788 | 413,477 | feb-18 | |||||
| Debentures | CDI | 12.98 | 1,406,520 | 1,443,941 | oct-20 | |||||
| Non-convertible debentures | CDI | 11.69 | 162,779 | 164,144 | aub-14 | |||||
| Debentures | Fixed rate+IPCA | 11.31 | 432,103 | 417,231 | sep-20 | |||||
| FINEP | Pre-fixed | 5.00 | 89,130 | 89,104 | jan-21 | |||||
| 8,983,377 | 9,092,956 | |||||||||
| Current | 875,408 | 1,050,862 | ||||||||
| Non-current | 8,107,969 | 8,042,094 |
| a) | Loans and borrowings are guaranteed by promissory notes and endorsements of the Company and its jointly-controlled entities and controlling shareholders, besides other guarantees, such as: (i) credit rights originated from the expansion contracts of the logistic segment and gas distribution (BNDES), (ii) underlying assets (property, plant and equipment and Intangible assets) being financed (FINAME); |
| b) | TJLP and URTJLP are long-term interest rates set on loans by the BNDES, the Brazilian National Development Bank. SELIC is the benchmark interest rate set by the Central Bank of Brazil. CDI is a benchmark interbank lending rate in Brazil. IPCA is the benchmark consumer price index used by the Central Bank of Brazil to set monetary policy. |
| c) | As at March 31, 2014, except where otherwise indicated. |
The fair value of loans and borrowings are as follows:
30
Cosan Limited
Notes to the consolidated interim financial statements
For the quarter ended March 31, 2014 and 2013
(Amounts in thousands of Brazilian Reais – R$, unless otherwise stated)
| Carrying amount | Fair value | |||||||
| March 31, 2014 | December 31, 2013 | March 31, 2014 | December 31, 2013 | |||||
| Senior / perpetual notes | 3,064,629 | 3,174,894 | 2,919,963 | 2,977,658 | ||||
| Financing | 5,918,748 | 5,918,062 | 5,918,748 | 5,918,062 | ||||
| Total | 8,983,377 | 9,092,956 | 8,838,711 | 8,895,720 | ||||
| 14 | Trade payables |
| March 31, 2014 | December 31, 2013 | ||
| Natural gas suppliers | 611,142 | 590,168 | |
| Materials and services suppliers | 214,267 | 272,261 | |
| 825,409 | 862,429 |
| 15 | Other taxes payable |
| March 31, 2014 | December 31, 2013 | ||
| ICMS – State VAT | 84,532 | 77,466 | |
| INSS - Social security | 2,112 | 2,842 | |
| PIS - Revenue tax | 3,949 | 5,170 | |
| COFINS- Revenue tax | 24,822 | 30,470 | |
| Recovery program – REFIS | 1,076,578 | 1,075,019 | |
| Other | 6,529 | 18,856 | |
| 1,198,522 | 1,209,823 | ||
| Current | 187,454 | 199,056 | |
| Non-current | 1,011,068 | 1,010,767 |
31
Cosan Limited
Notes to the consolidated interim financial statements
For the quarter ended March 31, 2014 and 2013
(Amounts in thousands of Brazilian Reais – R$, unless otherwise stated)
| 16 | Income tax and social contribution |
| a) | Reconciliation of income and social contribution tax expenses |
| March 31, 2014 | March 31, 2013 | |||
| Profit before taxes | 348,748 | 250,847 | ||
| Income tax and social contribution at | ||||
| nominal rate (34%) | (118,574) | (85,288) | ||
| Adjustments to reconcile to effective tax rate | ||||
| Equity method investments (non taxable income) | 75,412 | 31,487 | ||
| Permanent differences (donations, gifts, etc.) | (1,704) | (860) | ||
| Stock options | (872) | (1,130) | ||
| Interest on capital | (6,970) | (6,800) | ||
| Tax losses | (674) | (65,006) | ||
| Losses from offshore companies | (6,654) | - | ||
Tax basis differences related to entities taxed on the Brazilian presumed profits method | (3,748) | 16,315 | ||
| Foreign exchange effects of foreign subsidiaries | (7,145) | (16,452) | ||
Tax effect of unrealized gain on investment in Joint Venture(i) | - | 120,554 | ||
| Other | (2,472) | (11,485) | ||
Income tax and social contribution expense (current and deferred) | (59,562) | (18,665) | ||
| Effective rate - % | 17.08 | 7.44 |
| (i) Tax benefit created related to a downstream reverse merger in Raízen that resulted in a gain to Cosan’s statement of profit or loss. The gain is not taxable income and so appears in the tax reconciliation. | |||
32
Cosan Limited
Notes to the consolidated interim financial statements
For the quarter ended March 31, 2014 and 2013
(Amounts in thousands of Brazilian Reais – R$, unless otherwise stated)
| b) | Deferred income tax assets and liabilities |
| March 31, 2014 | December 31, 2013 | |||||||||
| Basis | Income taxes (25%) | Social contribution (9%) | Total income taxes (34%) | Total income taxes (34%) | ||||||
| Tax loss carryforwards | ||||||||||
| Income tax loss carryforwards | 1,335,328 | 333,832 | - | 333,832 | 282,656 | |||||
| Social contribution tax loss carryforwards | 1,342,549 | - | 120,829 | 120,829 | 102,410 | |||||
| Temporary differences | ||||||||||
| Foreign currency receivables and payables | 336,287 | 84,072 | 30,266 | 114,338 | 11,603 | |||||
| Tax deductible goodwill | 1,422,668 | 355,667 | 128,040 | 483,707 | 514,893 | |||||
| Provision for judicial demands | 528,068 | 132,017 | 47,526 | 179,543 | 194,985 | |||||
| Allowance for doubtful accounts | 158,617 | 39,659 | 14,276 | 53,935 | 54,258 | |||||
| Profit sharing | 9,728 | 2,432 | 876 | 3,308 | 67,057 | |||||
| Derivatives instruments unrealized gains | (130,124) | (32,531) | (11,711) | (44,242) | 107,489 | |||||
| Unrealized gain on sale of investments | (90,864) | (22,716) | (8,178) | (30,894) | (30,894) | |||||
| Other temporary differences | (137,847) | (34,462) | (12,406) | (46,868) | (38,897) | |||||
| Property, plant and equipment | (90,013) | (22,503) | (8,101) | (30,604) | (28,018) | |||||
| Gain on formation of Joint Ventures | (3,338,342) | (834,586) | (300,451) | (1,135,037) | (1,135,041) | |||||
| Unrealized gains on investment property | (2,258,589) | (45,172) | (24,393) | (69,565) | (70,309) | |||||
| Assets held for sale | (275,797) | (5,516) | (2,979) | (8,495) | (9,636) | |||||
| Concession contract | 31,881 | 7,970 | 2,869 | 10,839 | 11,579 | |||||
| Regulatory asset | 296,729 | 74,182 | 26,706 | 100,888 | 118,228 | |||||
| Gains or losses on actuarial liabilities | 297,835 | 74,459 | 26,804 | 101,263 | 41,593 | |||||
| Business combination - Property, plant and equipment | (110,919) | (27,730) | (9,983) | (37,713) | (38,097) | |||||
| Business combination - Intangible assets | (4,203,232) | (1,050,808) | (378,291) | (1,429,099) | (1,441,910) | |||||
| Business combination - Other fair value adjustments | (50,085) | (12,521) | (4,508) | (17,029) | (17,706) | |||||
| Other | (433,941) | (108,486) | (39,055) | (147,541) | (162,677) | |||||
| Total | (1,092,741) | (401,864) | (1,494,605) | (1,466,434) |
33
Cosan Limited
Notes to the consolidated interim financial statements
For the quarter ended March 31, 2014 and 2013
(Amounts in thousands of Brazilian Reais – R$, unless otherwise stated)
| Deferred income tax - Assets | 223,893 | 232,188 | ||||||||
| Deferred income tax - Liabilities | (1,718,498) | (1,698,622) | ||||||||
| Total net deferred taxes | (1,494,605) | (1,466,434) |
| c) | Changes in deferred income taxes, net: |
| At December 31, 2013– Net deferred tax liability | (1,466,434) |
| Income | (29,023) |
| Other comprehensive income | (32) |
| Other | 884 |
| At March 31, 2014 - Net deferred tax liability | (1,494,605) |
In November 2013, Provisional Measure (MP) 627 was issued, promoting changes to corporate income taxes. This measure, among other things, revokes the Transitional Tax Regime, introduced by Law 11.941/2009, and establishes that records prepared under international accounting standards (IFRS) be the bases for determination of taxes on income. The measure comes into effect in 2015, but may be early adopted in 2014 at the taxpayer's option. The Company analyzed the provisions of this MP and concluded that are no significant effects to be recorded in the financial statements for the period ended March 31, 2014. This analysis will be reviewed be reviewed again once the measure is enacted as there may be amendments to the bill.
34
Cosan Limited
Notes to the consolidated interim financial statements
For the quarter ended March 31, 2014 and 2013
(Amounts in thousands of Brazilian Reais – R$, unless otherwise stated)
| 17 | Provision for legal proceedings |
| March 31, 2014 | December 31, 2013 | |||
| Tax | 342,310 | 410,890 | ||
| Civil | 146,753 | 146,011 | ||
| Labor | 167,110 | 165,557 | ||
| 656,173 | 722,458 | |||
Judicial deposits as at March 31, 2014, and December 31, 2013, are as follow:
| March 31, 2014 | December 31, 2013 | |||
| Tax | 275,403 | 294,991 | ||
| Labor | 39,865 | 32,904 | ||
| Civil and environmental | 43,267 | 33,659 | ||
| 358,535 | 361,554 |
| Changes in provision for legal proceedings: | ||||||||
| Tax | Civil | Labor | Total | |||||
| At December 31, 2013 | 410,890 | 146,011 | 165,557 | 722,458 | ||||
| Increases | 1,369 | 4,858 | 16,030 | 22,257 | ||||
| Settlement or write-offs | (77,419) | (5,783) | (23,092) | (106,294) | ||||
| Reclassification | 1,848 | (2,060) | 212 | - | ||||
| Interest and accruals | 5,622 | 3,727 | 8,403 | 17,752 | ||||
| At March 31, 2014 | 342,310 | 146,753 | 167,110 | 656,173 | ||||
35
Cosan Limited
Notes to the consolidated interim financial statements
For the quarter ended March 31, 2014 and 2013
(Amounts in thousands of Brazilian Reais – R$, unless otherwise stated)
Judicial claims deemed to be probable losses, accrued
| a) | Tax claims |
Legal proceedings in relation to tax payments, as at March 31, 2014 and December 31, 2013, are as follow:
| March 31, 2014 | December 31, 2013 | |||
| Offset with FINSOCIAL | 233,342 | 230,775 | ||
IPC - 89(i) | - | 74,879 | ||
| INSS - Social security | 46,845 | 46,291 | ||
| State VAT - ICMS credits | 20,215 | 20,114 | ||
| PIS and COFINS - Revenue taxes | 6,473 | 6,541 | ||
| IPI - Excise tax | 979 | 993 | ||
| Federal income taxes | 329 | 329 | ||
| Other | 34,127 | 30,968 | ||
| 342,310 | 410,890 |
| (i) | In 1993, Cosan Lubrificantes e Especialidades ("Cosan CLE") filed a lawsuit to challenge the balance sheet inflation accounting index (“IPC”) established by the Federal Government in 1989, considering that this index did not reflect the actual rate of inflation. The use of this index led the Company to overpay income and social contribution taxes. Cosan CLE obtained a favorable preliminary court ruling that allowed it to recalculate its financial position, using indices that better reflected the actual inflation over the period. In doing so the Company adjusted the amounts of income and social contribution taxes payable and offset the overpayments in subsequent years until 1997. Despite the favorable court rulings, the tax authorities issued a notice of infringement to the Company challenging all of the taxes that were offset. The judicial demands has been reclassified to remote loss and therefore the provision of the R$ 75,144 was reversed and R$ 13,839 recorded under income tax expense for previous years and interest of the R$ 61,305 for judicial demands. |
| b) | Civil and environmental |
The Company and its subsidiaries are parties to a number of civil legal claims related to (i) indemnification for material and moral damages, (ii) public civil claims related to burning of sugarcane stubble, and (iii) environmental matters.
The Company and its subsidiaries are also parties to a number of labor claims filed by former employees and service providers challenging, among other things, unpaid overtime, night shift premiums and risk premiums, employment guarantees, and the reimbursement of withholdings from payroll such as social contributions and trade union charges, among others.
36
Cosan Limited
Notes to the consolidated interim financial statements
For the quarter ended March 31, 2014 and 2013
(Amounts in thousands of Brazilian Reais – R$, unless otherwise stated)
Judicial claims deemed as possible losses, and therefore not accrued
| a) | Tax claims |
Tax claims for which an unfavorable outcome is deemed possible and, therefore, not provisioned are as follow:
| March 31, 2014 | December 31, 2013 | |||
ICMS - State VAT(i) | 1,496,898 | 1,291,685 | ||
| IRRF | 621,659 | 637,130 | ||
| Federal income taxes | 722,325 | 726,815 | ||
| INSS - social security and other | 506,428 | 508,053 | ||
| IPI - Excise tax credit - NT | 405,705 | 430,981 | ||
| PIS and COFINS - Revenue taxes | 515,263 | 506,813 | ||
| Compensation with IPI - IN 67/98 | 115,921 | 115,004 | ||
| Other | 689,000 | 637,619 | ||
| 5,073,199 | 4,854,100 |
| (i) | ICMS (State VAT): Refers mainly to (i) Tax assessments filed against the Company for alleged unpaid ICMS and non-compliance with regulations, in connection with the partnership and manufacturing upon demand, with Central Paulista Açúcar e Álcool Ltda., between May to December 2006 and May to December 2007, (ii) ICMS levied on the remittances for the export of crystallized sugar, which the Company understands are tax exempted. However, the tax authorities, classify crystallized sugar as a semi-finished product therefore, subject to ICMS taxation and (iii), ICMS with holdings rate differences on the sale of ethanol to companies located in other states, which subsequently had their tax registrations revoked, (iv) disallowance of ICMS tax credits in the sale of diesel fuel to customers engaged in the agroindustrial business. The State Tax Administration understands that because the diesel fuel sold is for agricultural use, which is not the Company’s core business, ICMS cannot be offset, (e) ICMS payments on inventory differences arising from erroneous calculations by the State Tax Administration and (f) requirement resulting from disallowance of ICMS credits arising from purchases of goods from companies that, after operations had their tax registrations revoked. It happens that the State Treasury. |
| b) | Civil and labor |
The main civil and labor claims for which unfavorable outcomes are deemed possible are as follow:
| March 31, 2014 | December 31, 2013 | ||
| Civil | 793,828 | 832,311 | |
| Labor | 515,441 | 502,697 | |
| 1,309,269 | 1,335,008 |
37
Cosan Limited
Notes to the consolidated interim financial statements
For the quarter ended March 31, 2014 and 2013
(Amounts in thousands of Brazilian Reais – R$, unless otherwise stated)
| 18 | Stockholder’ Equity |
| a) | Share capital |
As of March 31, 2014 Cosan Limited’s share capital is comprised of the following:
| Shareholders | Class A and / or BDRs | % | Class B1 shares | % | ||||
| Queluz Holding Limited | 5,241,111 | 3.01 | 66,321,766 | 68.85 | ||||
| Usina Costa Pinto S.A. Açúcar e Álcool | - | - | 30,010,278 | 31.15 | ||||
| MSOR Participações | 1,811,250 | 1.04 | - | - | ||||
| Usina Bom Jesus | 255,000 | 0.15 | - | - | ||||
| Gávea funds | 22,384,370 | 12.84 | - | - | ||||
| Other | 144,663,610 | 82.97 | - | - | ||||
| Total | 174,355,341 | 100.00 | 96,332,044 | 100.00 |
Class B1 shares entitle the holder to 10 votes per share and Class A share are entitled to one vote per share.
| b) | Treasury shares |
On September 16, 2011, the Board of Directors approved the repurchase of the Company’s own shares to be held in treasury, canceled or sold. The deadline for completion of the transaction was 365 days and the maximum repurchase price was US$ 100 million. The Company holds 5,996,502 treasury shares as of March 31, 2014 (5,996,502 shares on December 31, 2013) with a market value of R$ 11.40 as at March 31, 2014 (R$ 13.72 on December 31, 2013).
38
Cosan Limited
Notes to the consolidated interim financial statements
For the quarter ended March 31, 2014 and 2013
(Amounts in thousands of Brazilian Reais – R$, unless otherwise stated)
| c) | Other comprehensive income |
| December 31, | Comprehensive | March 31, | ||||
| 2013 | income | 2014 | ||||
| Foreign currency translation differences | (223,038) | (3,523) | (226,561) | |||
Gain (loss) on cash flow hedge in jointly controlled entity | 43,384 | (49,109) | (5,725) | |||
Revaluation of investment property reclassified from property, plant and equipment | 190,735 | - | 190,735 | |||
| Defined benefit actuarial plan losses | 16,092 | (237) | 15,855 | |||
Changes in value of available for sale financial assets | (7,480) | 603 | (6,877) | |||
| Total | 19,693 | (52,266) | (32,573) | |||
| Attributable to: | ||||||
| Owners of the Company | (84,887) | (29,980) | (114,867) | |||
| Non-controlling interests | 104,580 | (22,286) | 82,294 |
| 19 | Earnings per share |
Earnings per share is calculated by dividing net income by the weighted average number of capital shares in outstanding during the year. Diluted earnings per share is calculated by adjusting average shares outstanding for the conversion of all potentially dilutive options.
The following table sets forth the calculation of earnings per share for the quarter ended on March 31, 2014, and 2013 (in thousands of Brazilian Reais, except per share amounts):
| March 31, 2014 | March 31, 2013 | |||
| Numerator | ||||
| Net income from continuing operations | ||||
| Basic | 140,807 | 88,363 | ||
| Dilutive effect of subsidiary’s stock option plan | (17,973) | (18,060) | ||
| Dilutive effect of put option | (15,601) | (15,601) | ||
| Diluted | 107,233 | 54,702 | ||
| Loss from discontinued operations | - | (3,369) | ||
| Denominator | ||||
| Weighted average number of shares outstanding | 264,690,883 | 264,842,445 | ||
| Basic earnings (loss) per share | ||||
| Continuing operations | R$ 0.53 | R$ 0.33 | ||
| Discontinued operations | - | (R$ 0.01) | ||
| R$ 0.53 | R$ 0.32 |
39
Cosan Limited
Notes to the consolidated interim financial statements
For the quarter ended March 31, 2014 and 2013
(Amounts in thousands of Brazilian Reais – R$, unless otherwise stated)
| Diluted earnings (loss) per share | ||||
| Continuing operations | R$ 0.41 | R$ 0.21 | ||
| Discontinued operations | - | (R$ 0.01) | ||
| R$ 0.41 | R$ 0.20 |
| 20 | Gross Sales |
| March 31, 2014 | March 31, 2013 | |||
Taxable gross revenue from sales of products and services | 2,547,442 | 2,328,816 | ||
| Construction revenue | 117,641 | 135,161 | ||
| Indirect taxes and deductions | (507,897) | (474,767) | ||
| Net revenue | 2,157,186 | 1,989,210 |
| 21 | Financial results |
| March 31, 2014 | March 31, 2013 | |||
| Financial expanse | ||||
| Interest expense | (155,708) | (183,859) | ||
| Indexation charges | (17,185) | (6,637) | ||
| Bank fees | (12,572) | (43,503) | ||
| (185,465) | (233,999) | |||
| Financial income | ||||
| Interest income | 16,208 | 35,018 | ||
| Indexation credits | 1,929 | 1,687 | ||
| Income from short term investments | 30,215 | 22,836 | ||
| Other | - | - | ||
| 48,352 | 59,541 | |||
Foreign exchange effects, net(1) | ||||
| Foreign exchange effects, net | 75,737 | (71) | ||
| 75,737 | (71) | |||
| Derivative income (losses) | ||||
| Exchange rate and interest rate derivatives | (61,082) | (5,321) | ||
| (61,082) | (5,321) | |||
| (122,458) | (179,850) |
(1) Includes gains (and losses) on foreign exchange rates relating to assets and liabilities denominated in foreign currency. | |||
40
Cosan Limited
Notes to the consolidated interim financial statements
For the quarter ended March 31, 2014 and 2013
(Amounts in thousands of Brazilian Reais – R$, unless otherwise stated)
| 22 | Other, net |
| March 31, 2014 | 1 | March 31, 2013 | ||
| Profit (loss) on port operations | 5,343 | (4,845) | ||
| Provisions for legal proceedings | (18,441) | (18,326) | ||
| (Loss) gain on disposal of non-current assets | (2,052) | 15,548 | ||
| Rental income | 167 | 184 | ||
Changes in the fair value of investment property | (18,153) | 52,753 | ||
| Change in fair value for available-for-sale assets | (4,767) | - | ||
| Provision for loan losses | 1,347 | (72) | ||
| Gain on corporate restructuring | 4,299 | - | ||
| Other, net | (535) | 26,621 | ||
| (32,792) | 71,863 |
| 23 | Assets held for sale |
Assets held for sale were reduced by R$ 43,074 in the period, comprising R$ 38,307 on the disposal of farms and R$ 4,767 upon changes in fair value.
| 24 | Financial instruments |
Financial risk management
Overview
The Company is exposed to the following risks related to the use of financial instruments:
| · | Foreign exchange risk; |
| · | Interest rate risk; |
| · | Credit risk; |
| · | Liquidity risk. |
This note presents information about the exposure of the Company and its subsidiaries to the above risks, as well as the objectives of the Company's risk management policies, these policy and processes for the assessment and management of risks.
Risk management structure
The risks inherent to each type of business market are managed and monitored by the Company and, where applicable, risk committees are convened to discuss and determine the hedging strategy of the Company in accordance with its policies and guidelines.
41
Cosan Limited
Notes to the consolidated interim financial statements
For the quarter ended March 31, 2014 and 2013
(Amounts in thousands of Brazilian Reais – R$, unless otherwise stated)
As at March 31, 2014 and December 31, 2013, the fair values relating to transactions involving derivative financial instruments to mitigate the Company’s risk exposure were measured at fair market value using observable inputs such as quoted prices in active markets, or discounted cash flows based on market curves, and are presented below:
| Notional | Fair value | |||||||||
| March 31, 2014 | December 31, 2013 | March 31, 2014 | December 31, 2013 | P&L(I) | ||||||
| COMGÁS derivatives | ||||||||||
| Exchange rate risk | ||||||||||
| Exchange rate derivatives | ||||||||||
| Swap agreements | 828,442 | 828,442 | 192,536 | 209,532 | 192,536 | |||||
| 828,442 | 828,442 | 192,536 | 209,532 | 192,536 | ||||||
| Other subsidiaries derivatives | ||||||||||
| Exchange rate risk | ||||||||||
| Exchange rate derivatives | ||||||||||
| Term agreements | 171,089 | 232,220 | 14,202 | 25,713 | 14,202 | |||||
| 171,089 | 232,220 | 14,202 | 25,713 | 14,202 | ||||||
| Interest rate and exchange rate risk | ||||||||||
| Swap agreements (interest rate) | 181,617 | 181,617 | (13,012) | (13,573) | (13,012) | |||||
Swap agreements (interest and exchange rate) | 1,662,806 | 1,662,806 | (37,655) | (39,078) | (37,655) | |||||
| 1,844,423 | 1,844,423 | (50,667) | (52,652) | (50,667) | ||||||
| Total financial instruments contracted by Company | 156,071 | 182,593 | 156,071 | |||||||
| Assets | 469,770 | 513,934 | ||||||||
| Liabilities | (313,699) | (331,341) | ||||||||
Foreign exchange risk
The table below shows the consolidated position at March 31, 2014 of derivatives used to hedge exchange rates:
| Derivatives | Purchased / Sold | Market | Agreement | Maturity date | Notional (US$) | Notional (R$) | Fair Value (R$) | |||||||
| Composition of balance of derivative financial instruments non designated in hedge accounting | ||||||||||||||
| Financial instruments contracted by COMGÁS: | ||||||||||||||
| Swap/flx cx | N/A | OTC/Cetip | Cross-Cur Swap | Jul-17 | 75,000 | 153,899 | 16,336 | |||||||
| Swap/flx cx | N/A | OTC/Cetip | Cross-Cur Swap | Feb-18 | 50,000 | 99,385 | 13,408 | |||||||
| Swap/flx cx | N/A | OTC/Cetip | Cross-Cur Swap | Aug-18 | 50,000 | 115,000 | (3,191) | |||||||
| Swap/flx cx | N/A | OTC/Cetip | Cross-Cur Swap | Jun-20 | 84,381 | 154,933 | 45,354 | |||||||
| Swap/flx cx | N/A | OTC/Cetip | Cross-Cur Swap | Sep-20 | 39,922 | 69,580 | 22,737 | |||||||
| Swap/flx cx | N/A | OTC/Cetip | Cross-Cur Swap | May-21 | 71,400 | 115,497 | 46,651 | |||||||
| Swap/flx cx | N/A | OTC/Cetip | Cross-Cur Swap | Sep-21 | 72,435 | 120,148 | 51,241 | |||||||
| �� | ||||||||||||||
| At March 31, 2014 | 443,138 | 828,442 | 192,536 | |||||||||||
| At December 31, 2013 | 443,138 | 828,442 | 209,532 | |||||||||||
42
Cosan Limited
Notes to the consolidated interim financial statements
For the quarter ended March 31, 2014 and 2013
(Amounts in thousands of Brazilian Reais – R$, unless otherwise stated)
| Financial instruments contracted by other subsidiaries: | ||||||||||||||
| Term | Purchased | OTC | NDF | Feb-14 | 3,358 | 8,015 | (320) | |||||||
| Term | Purchased | OTC | NDF | May-14 | 10,385 | 22,083 | 1,635 | |||||||
| Term | Purchased | OTC | NDF | Aug-14 | 10,385 | 22,509 | 1,758 | |||||||
| Term | Purchased | OTC | NDF | Nov-14 | 10,385 | 22,927 | 1,895 | |||||||
| Term | Purchased | OTC | NDF | Feb-15 | 10,385 | 23,310 | 2,055 | |||||||
| Term | Purchased | OTC | NDF | May-15 | 10,385 | 23,668 | 2,231 | |||||||
| Term | Purchased | OTC | NDF | Aug-15 | 10,385 | 24,092 | 2,379 | |||||||
| Term | Purchased | OTC | NDF | Nov-15 | 10,385 | 24,485 | 2,569 | |||||||
| Sub-total Term at March 31, 2014 | 76,053 | 171,089 | 14,202 | |||||||||||
| Sub-total Term at December 31, 2013 | 102,971 | 232,220 | 25,713 | |||||||||||
| Swap | N/A | OTC | Swap | Dec-14 | 81,972 | 181,617 | (549) | |||||||
| Swap | N/A | OTC | Swap | Sep-16 | 75,000 | 179,063 | (12,161) | |||||||
| Swap | N/A | OTC | Swap | Mar-18 | - | - | (4,401) | |||||||
| Swap | N/A | OTC | Swap | Mar-23 | 675,000 | 1,483,743 | (34,474) | |||||||
| Swap | Amortization Gain / Loss D1 | - | - | 918 | ||||||||||
| Sub-total Swap at March 31, 2014 | 831,972 | 1,844,423 | (50,667) | |||||||||||
| Sub-total Swap at December 31, 2013 | 831,972 | 1,844,423 | (52,649) | |||||||||||
| At March 31, 2014 | 908,025 | 2,015,512 | (36,465) | |||||||||||
| At December 31, 2013 | 934,943 | 2,076,643 | (26,936) | |||||||||||
At March 31, 2014 and December 31, 2013, the Company and its subsidiaries had the following net exposure to the exchange rate variations on assets and liabilities denominated in US Dollars and British pounds:
| March 31, 2014 | December 31, 2013 | |||
| Cash and cash equivalents | 64,829 | 1,387,295 | ||
| Trade receivables | 27,986 | 24,453 | ||
| Loans and borrowings | (3,731,116) | (3,814,871) | ||
| Foreign exchange exposure, net | (3,638,301) | (2,403,123) | ||
Interest rate risk
The Company and its subsidiaries monitor the fluctuations in variable interest rates in connection with its borrowings, especially those that accrue interest using LIBOR, and uses derivative instruments in order to mitigate variable interest rate fluctuation risks.
43
Cosan Limited
Notes to the consolidated interim financial statements
For the quarter ended March 31, 2014 and 2013
(Amounts in thousands of Brazilian Reais – R$, unless otherwise stated)
Credit risk
The credit risk on cash and cash equivalents, bank deposits in national and foreign financial institutions are determined using the rating instruments accepted by the market as follows:
| Investment securities | ||
| AAA | 1,219,706 | |
| AA | 197,292 | |
| At March 31, 2014 | 1,416,998 | |
Liquidity risk
The table below demonstrates the Company’s non-derivative financial liabilities classified by due date at March 31, 2014. The amounts disclosed in the table are the contracted undiscounted cash flows.
| March 31, 2014 | December 31, 2013 | |||||||||||
| Until 1 year | 1 -2 years | 3 – 5 years | More than 5 years | Total | Total | |||||||
| Loans and borrowings | (566,733) | (370,568) | (2,372,973) | (6,019,285) | (9,329,559) | (10,996,388) | ||||||
| Trade payables | (825,409) | - | - | - | (825,409) | (862,429) | ||||||
| REFIS payable | (65,510) | (71,980) | (213,355) | (725,733) | (1,076,578) | (1,010,767) | ||||||
| Total | (1,457,652) | (442,548) | (2,586,328) | (6,745,018) | (11,231,546) | (12,869,584) | ||||||
Hedge accounting
To mitigate the Company’s risks from volatility of foreign exchange rates and interest rates, the Company entered into certain derivative contracts that were designated for hedge accounting (fair value hedge) as of July 1, 2013, with the purpose of protecting the "2023 Senior Notes". The hedge relationship consists of swapping the cash flows (cross currency interest rate swaps) with a foreign currency risk (USD) for local currency (BRL) and a fixed interest rate for a fixed percentage of the CDI (local market). The table below shows the fair value and gain recognized in the statement of profit or loss:
| March 31, 2014 | ||
| Fair value of the Senior Notes 2023 | 1,087,223 | |
| Loss recognized in the financial result | (27,584) |
Fair value
The fair value of financial assets and liabilities is determined by reference to the price at which they could be exchanged in a current transaction between parties willing to negotiate, and not in a forced sale or liquidation (Note 25).
44
Cosan Limited
Notes to the consolidated interim financial statements
For the quarter ended March 31, 2014 and 2013
(Amounts in thousands of Brazilian Reais – R$, unless otherwise stated)
Sensitivity analysis
A sensitivity analysis of the effects of changes in the relevant risk factors to which the Company is exposed to as of March 31, 2014 is presented below:
a) | Sensitivity analysis on changes in foreign exchange rates |
The probable scenario was defined based on the US Dollar market rates as at March 31, 2014, which determines the fair values of the derivatives at that date. Stressed scenarios were defined based on impacts of a 25% and 50% change in the US Dollar exchange rates used in the probable scenario.
Impacts on P&L(i) | ||||||||||||
| Risk factor | Probable scenario | Variation scenario (25%) Increase | Variation scenario (50%) Increase | Variation scenario (25%) Decrease | Variation scenario (50%) Decrease | |||||||
| COMGÁS Derivatives | ||||||||||||
| Exchange rate and interest risks | ||||||||||||
| Exchange rate derivatives | ||||||||||||
| Swap contracts | Decrease in exchange | |||||||||||
| rate R$/US$ and | ||||||||||||
| increase in CDI curve | 192,536 | 512,678 | 813,972 | (112,773) | (439,256) | |||||||
| Exchange rate risks | ||||||||||||
| Exchange rate derivatives | ||||||||||||
| Term agreements | ||||||||||||
| Purchasing agreements | Decrease in exchange | |||||||||||
| rate R$/US$ | 14,202 | 56,608 | 99,015 | (28,206) | (70,613) | |||||||
| Interest rate risk | ||||||||||||
| Swap contracts | Decrease in LIBOR curve | (549) | (238) | 72 | (860) | (1,171) | ||||||
| Swap contracts | No risk - asset and | |||||||||||
| liabilities same position | (16,865) | - | - | - | - | |||||||
| Exchange rate and interest risks | ||||||||||||
| Swap contracts | Decrease in exchange | |||||||||||
| rate R$/US$ and | ||||||||||||
| increase in CDI curve | (34,170) | 125,688 | 317,906 | (249,789) | (449,544) | |||||||
| Total impact | 155,154 | 694,736 | 1,230,965 | (391,628) | (960,584) | |||||||
| (i) Exposure to fluctuations of COMGÁS absorbed by the asset (liability), which are passed on to customers through periodic tariff revisions. | |||||||||||
Based on the financial instruments denominated in US Dollars at March 31, 2014 the Company performed a sensitivity analysis by increasing and decreasing the exchange rate for R$/US$ by 25% and 50%. The probable scenario considers the estimated exchange rates at the due date of the transactions, as follows:
45
Cosan Limited
Notes to the consolidated interim financial statements
For the quarter ended March 31, 2014 and 2013
(Amounts in thousands of Brazilian Reais – R$, unless otherwise stated)
| Exchange rate sensitivity analysis (R$/US$) | ||||||||||||
| Scenario | ||||||||||||
| March 31, 2014 | Probable | 25% | 50% | -25% | -50% | |||||||
| At March 31, 2014 | 2.2630 | 2.2630 | 2.8288 | 3.3945 | 1.6973 | 1.1315 | ||||||
Consider the above scenarios profit or loss would be impacted as follows:
| Exchange rate exposure | March 31, 2014 | |||||||||
| Balance | 25% | 50% | -25% | -50% | ||||||
| Bonds and Debentures - USD | (2,232,984) | (558,246) | (1,116,492) | 558,246 | 1,116,492 | |||||
| Loans and borrowings - USD | (1,291,405) | (322,851) | (645,702) | 322,851 | 645,702 | |||||
| Loans and borrowings - GBP | (206,263) | (51,566) | (103,132) | 51,566 | 103,132 | |||||
| Effect on profit or loss | (932,663) | (1,865,326) | 932,663 | 1,865,326 | ||||||
| b) | Sensitivity analysis on changes in interest rates |
The Company performed a sensitivity analysis on the interest rates on loans and borrowings and returns on CDI investments with increases and decreases of 25% and 50%, the results of which are presented below:
| Exposure interest rate | ||||||||||
| March 31, 2014 | ||||||||||
| Operation | Balance | 25% | 50% | -25% | -50% | |||||
| Short term investments | 1,416,998 | 37,373 | 74,747 | (37,373) | (74,747) | |||||
| Securities | 120,875 | 3,188 | 6,376 | (3,188) | (6,376) | |||||
| Loans and borrowings | (2,427,296) | (64,020) | (128,040) | 64,020 | 128,040 | |||||
| Profit of the period | (23,459) | (46,917) | 23,459 | 46,917 | ||||||
The categories of financial instruments are presented below:
| Financial assets at fair value through profit or loss | Loans and receivables | Total | ||||
| Assets | ||||||
| Cash and cash equivalents | - | 1,505,327 | 1,505,327 | |||
| Trade receivables | - | 1,128,455 | 1,128,455 | |||
| Derivative financial instruments | 469,770 | - | 469,770 | |||
| Securities | - | 120,875 | 120,875 | |||
| Dividends receivable | - | 131,433 | 131,433 | |||
| Judicial deposits | - | 358,535 | 358,535 | |||
| Other financial assets | - | 479,347 | 479,347 | |||
| 469,770 | 3,723,972 | 4,193,742 |
46
Cosan Limited
Notes to the consolidated interim financial statements
For the quarter ended March 31, 2014 and 2013
(Amounts in thousands of Brazilian Reais – R$, unless otherwise stated)
| Financial liabilities at fair value through profit or loss | Other financial liabilities | Total | ||||
| Liabilities | ||||||
| Loans and borrowings | - | (8,983,377) | (8,983,377) | |||
| Derivative financial instruments | (313,699) | - | (313,699) | |||
| Trade payables | - | (825,409) | (825,409) | |||
| Dividends payable | - | (152,274) | (152,274) | |||
| (313,699) | (9,961,060) | (10,274,759) |
Capital management
The Company's policy is to maintain a solid capital base to promote the confidence of investors, creditors and the market, and to ensure the future development of the business. Management monitors that the return on capital is adequate for each of its businesses, which the Company defines as the result of operating activities divided by total net equity.
| 25 | Fair value hierarchy |
Below is the fair value classification of the Company’s financial instruments:
Financial instruments measured at fair value | Level 1 | Level 2 | Total | |||
| At March 31, 2014 | ||||||
| Derivative financial assets | - | 469,770 | 469,770 | |||
| Derivative financial liabilities | - | (313,699) | (313,699) | |||
| Pension plan assets | 281,142 | - | 281,142 | |||
| Securities | - | 120,875 | 120,875 | |||
| Total | 281,142 | 276,946 | 558,088 | |||
| At December 31, 2013 | ||||||
| Derivative financial assets | - | 513,934 | 513,934 | |||
| Derivative financial liabilities | - | (735,793) | (735,793) | |||
| Pension plan assets | 281,142 | - | 281,142 | |||
| Securities | - | 87,978 | 87,978 | |||
| Total | 281,142 | (133,881) | 147,261 |
47
Cosan Limited
Notes to the consolidated interim financial statements
For the quarter ended March 31, 2014 and 2013
(Amounts in thousands of Brazilian Reais – R$, unless otherwise stated)
| 26 | Pension and post-employment benefit plans |
The following is the balance of pension and post-employment benefit plan:
| March 31, 2014 | December 31, 2013 | |||
| Futura | 72,386 | 71,065 | ||
| Futura II | 848 | 828 | ||
| COMGÁS | 271,677 | 267,242 | ||
| Total | 344,911 | 339,135 |
Pension plans
Defined benefit
The Company's subsidiary Cosan Lubrificantes e Especialidades S.A. has a non-contributory defined benefit pension plan (Futura, formerly Previd Exxon) for certain employees upon retirement. This plan was amended to close it to new entrants and it was approved by the relevant authorities on May 5, 2011. During the quarter ended on March 31, 2014, the amount of contributions totaled R$ 2,277.
Defined contribution
COMGÁS offers a supplementary retirement plan, through a defined contribution Free Benefit Generating Plan (“PGBL”). During the quarter ended on March 31, 2014, employers’ contributions to the plan totaled R$ 8,186. For the quarter ended on March 31, 2014, an actuarial loss of R$ 316 was recognized in other comprehensive income.
| 27 | Share-based payment |
At the annual and extraordinary general shareholders’ meeting held on July 29, 2011, the guidelines for the outlining and structuring of the stock option compensation plan for Cosan S.A.’s executives and employees was approved, authorizing the issue of up to 5% of shares comprising Cosan S.A.’s total capital. This stock option plan was created to attract and retain executives and key employees, offering them the opportunity to become Cosan S.A.’s shareholders.
| Weighted- | ||||
| Number of | average | |||
| options | exercise price | |||
| At December 31, 2013 | 9,345,000 | 23.74 | ||
| Share options exercised | (190,000) | (24.17) | ||
| At March 31, 2014 | 9,155,000 | 24.19 | ||
48
Cosan Limited
Notes to the consolidated interim financial statements
For the quarter ended March 31, 2014 and 2013
(Amounts in thousands of Brazilian Reais – R$, unless otherwise stated)
| 28 | Subsequent events |
Following the Material Facts dated February 24, 2014, April 01, 2014 and April 15, 2014, the merger of shares issued by ALL – AMÉRICA LATINA LOGÍSTICA S.A. (“ALL”) into RUMO LOGÍSTICA OPERADORA MULTIMODAL S.A. (“Rumo”), Company’s subsidiary, pursuant to article 252 of Law 6,404/76 (“Stock Merger”), was approved at the Extraordinary General Meetings of Rumo and ALL, held on April 08, 2014.
The execution of the Stock Merger is still conditional upon approval by the Brazilian Antitrust Board (“CADE”), the National Transportation Agency (“ANTT”), as well as any other public administration agencies whose prior authorizations are necessary and other conditions precedent contained in the association proposal presented by Rumo to ALL on February 24, 2014 ("Proposal").
In addition to approving the Stock Merger by the Extraordinary General Meetings, its subsidiary
Cosan Infraestrutura S.A. has entered, along with the intervention of the Company and some of its subsidiaries and parent company, into a Shareholders’ Agreement with BNDES PARTICIPAÇÕES S.A. - BNDESPAR, whose effectiveness is also subject to conditions precedent to the fulfillment of the Stock Merger.
In addition to the Shareholders' Agreement with BNDESPAR, the Shareholders Agreement originally signed by Cosan with the funds managed by Gávea Investments and TPG in June 30, 2011, remains valid.
***
49
SIGNATURES
Pursuant to the requirements of the Securities Exchange Act of 1934, the registrant has duly caused this report to be signed on its behalf by the undersigned, thereunto duly authorized.
| COSAN LIMITED | ||||||
| Date: | May 14, 2014 | By: | /s/ Marcelo Eduardo Martins | |||
| Name: | Marcelo Eduardo Martins | |||||
| Title: | Chief Financial Officer and Investor Relations Officer | |||||