FORM 6-K
SECURITIES AND EXCHANGE COMMISSION
Washington, D.C. 20549
Report of Foreign Issuer
Pursuant to Rule 13a-16 or 15d-16
of the Securities Exchange Act of 1934
For the month of February, 2014
Commission File Number: 1-33659
COSAN LIMITED
(Translation of registrant’s name into English)
Av. Juscelino Kubitschek, 1726 – 6th floor
São Paulo, SP 04543-000 Brazil
(Address of principal executive offices)
Indicate by check mark whether the registrant files or will file annual reports under cover of Form 20-F or Form 40-F:
| Form 20-F | X | Form 40-F |
Indicate by check mark if the registrant is submitting the Form 6-K in paper as permitted by Regulation S-T Rule 101(b)(1):
| Yes | No | X |
Indicate by check mark if the registrant is submitting the Form 6-K in paper as permitted by Regulation S-T Rule 101(b)(7):
| Yes | No | X |
COSAN LIMITED
Item | |
| 1. | Earnings Release for 4th Quarter and Fiscal Year 2013 |
Item 1

Earnings Release
4th Quarter and Fiscal Year 2013


Proforma EBITDA grows 46%, totaling R$4 billion in 2013
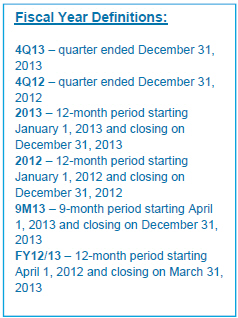
São Paulo, February 26, 2014 – COSAN LIMITED (NYSE: CZZ; BM&FBovespa: CZLQ33) and COSAN S.A. INDÚSTRIA E COMÉRCIO (BM&FBovespa: CSAN3) announce today their results for the fourth quarter (4Q 2013) comprised of October, November, and December 2013 and fiscal year 2013 (9M 2013), representing the 9 -month period from March to December 2013. The results are consolidated in accordance with the accounting principles adopted in Brazil and internationally (IFRS).
| Earnings Conference Call | 2013 Highlights | |
Portuguese February 27, 2014 10:00 A.M. (Brasilia time) Phone: + 55 11 4965 8336 + 55 11 4706 0951 Access Code: COSAN English February 27, 2014 11:00 A.M. (Brasilia time) Phone (BR): + 55 11 4965 8336 + 55 11 4706 0951 Phone (USA): +1 786 924 6977 Access Code: COSAN | o Increase of 6.2% in Raízen Combustíveis’s volume sold, and rise of 22% in EBITDA to R$ 1.93 billion o Raízen Energia’s crushing grows 9.3% to 61.4 million tons o Growth of 10% in Comgás’s customers base o Rumo’s EBITDA up 44% to R$358 million o Radar reaches R$4.1 billion in assets under management, 232,000 hectares in its portfolio |
 | 4Q 2013 | 4Q 2012 | Summmary of Financial Informations - Cosan Consolidated | 2013 | 2012 | |
| (oct - dec) | (oct - dec) | Amount in R$ MM | (jan-dec) | (jan-dec) | ||
| 9,390.0 | 8,397.1 | Net Revenue | 36,165.2 | 27,149.7 | ||
| 1,156.5 | 1,057.2 | Gross Profit | 4,606.4 | 2,927.8 | ||
| 12.3% | 12.6% | Gross Margin (%) | 12.7% | 10.8% | ||
| 585.7 | 555.7 | Operating Profit | 2,197.7 | 1,206.0 | ||
| 1,022.3 | 1,014.8 | EBITDA | 3,964.2 | 2,614.8 | ||
| 10.9% | 12.1% | EBITDA Margin (%) | 11.0% | 9.6% | ||
| - | - | Gross Effects of Raízen's Formation | - | 100.3 | ||
| 1,022.3 | 1,014.8 | Adjusted EBITDA2 | 3,964.2 | 2,715.1 | ||
| 10.9% | 12.1% | Adjusted EBITDA Margin (%) | 11.0% | 10.0% | ||
| 4.5 | 3.2 | Equity Pick-up | (10.2) | 97.6 | ||
| 354.6 | 307.6 | Net Income before non-controlling Interest | 649.1 | 750.3 | ||
| 229.8 | 339.3 | Net Income | 261.3 | 746.8 | ||
| - | - | Net Effects of Raízen's Formation | - | 66.2 | ||
| 229.8 | 339.3 | Adjusted Net Income | 261.3 | 813.0 | ||
| 2.4% | 4.0% | Net Adjusted Margin (%) | 0.7% | 3.0% | ||
| 806.6 | 621.1 | CAPEX3 | 2,894.7 | 2,214.3 | ||
| 10,318.8 | 8,832.9 | Net Debt | 10,318.8 | 8,832.9 | ||
| 13,571.2 | 13,462.9 | Shareholders' Equity and Minority Shareholders | 13,571.2 | 13,462.9 |
1 of 50
| | Earnings Release 4th Quarter and Fiscal Year 2013 |
Message from the CEO
In 2013, Cosan followed its strategy of focusing on high value added projects with efficiency and simplicity. We consolidated our presence in the the Energy and Logistics segments, writing with our partners, employees and shareholders a story of value generation through efficient and modern operations. Now we announce to the market our plan of proposing to the shareholders the spin-off of Cosan SA’s assets into Cosan Energia and Cosan Logística.
Our strategy places us in essential activities, our businesses grow aligned with the country’s great initiatives and have proven to be increasingly resilient and complementary. Cosan’s operations reported significant growth in results in spite of all adversities and challenges in the market.
At Cosan Energia, Comgás surpassed the mark of 1,300,000 customers, and we broke our investment record, with more than R$850 million invested. We also implemented a plan to improve customer service, and duplicated our efforts in several segments so as to widen the opportunities to expand this business.
At Raízen, the strategy of converting service stations ramped up during the year and has already proven to be fruitful as its sales volume shows. We have also acquired a 10% interest at STP – Serviços e Tecnologia de Pagamentos, the company that controls the Sem Parar and Via Fácil electronic payment systems. We announced a plant in Piracicaba (São Paulo), with construction works already ongoing in 2014, to produce second generation ethanol (2G) with capacity for 40 million liters a year. We increased the return on capital by implementing several initiatives that will continue to be prioritized during 2014.
We have moved forward in our lubricants businesses (Mobil and Comma brands), with record high sales volumes, market share and profitability. At Radar, we increased our portfolio to over 232,000 hectares of land under management, totaling R$4.1 billion in agricultural properties.
Cosan Logística, through Rumo, broke its record in sugar shipments at the Port of Santos, thanks to a team of distinguished professionals who have done a successful work. We have also invested in improvements in the Port’s facilities and infrastructure. We have recently formalized to ALL-América Latina Logística’s (ALL) shareholders a proposal for the merger of ALL into Rumo; should it be accepted and approved of, it will result in the formation of a large railway and port logistics integrated company.
We continue to strive to focus on increasingly better results, preserving our culture of entrepreneurism and operating efficiency.
Marcos Marinho Lutz
CEO Cosan
2 of 50
��
| | Earnings Release 4th Quarter and Fiscal Year 2013 |
| A. | Highlights and Business Units |
A.1 Business Units
As we have done in prior quarters, we will continue to present a specific section for each business unit, including their key operating data, and an analysis of the results, from net revenue to EBITDA.
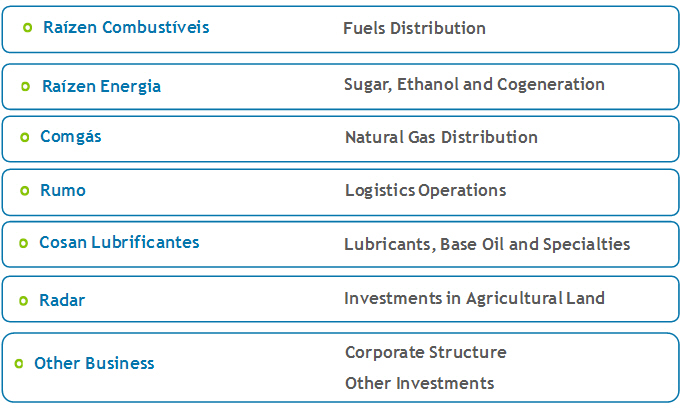
Our business units (reportable segments) are organized as follows:
3 of 50
| | Earnings Release 4th Quarter and Fiscal Year 2013 |
A.2 Cosan Consolidated Result
To enable comparability with Cosan‘s Consolidated financial information, we considered 100% of the results of Comgás, Rumo, Cosan Lubrificantes e Especialidades, Radar, and Other Businesses. Starting April 1, 2013, with the adoption of IFRS 11, Raízen Energia e Combustíveis’s results are reported in the “Equity Accounting Result” line, considering a proportionate interest (50%) in the result. Adjustments and Eliminations represent intercompany balances and transactions.
Moreover, due to a change in the portfolio and in line with market demands, the Annual General Meeting held on 7/31/2013 determined that Cosan’s fiscal year no longer follows the crop year (April to March), but follows the calendar year instead (January to December). Therefore, the results reported herein as FY2013 (9 months from April to December 2013) and FY13 (12 months from April 2012 to March 2013) are not comparable. But to enable comparability, we have added the columns referring to the proforma 12-month period (January to December) for 2012 and 2013.
EBITDA reported herein is in compliance with CVM Rule 527/12, published by the Brazilian Securities and Exchange Commission on October 4, 2012, and may differ from the amounts disclosed in prior periods due to equity accounting adjustment. Consequently, the EBITDA now consists of operating profit before financial expenses, plus depreciation, amortization and equity accounting.
| 4Q 2013 | 4Q 2012 | EBITDA (Reconciliation ICVM 527) | 2013 | 2012 | 9M 2013 | FY 12/13 |
| (oct - dec) | (oct - dec) | Amounts in R$ MM | (jan-dec) | (jan-dec) | (mar/13-dec/13) | (apr/12-mar/13) |
| 229.8 | 339.3 | Net Income | 261.3 | 746.8 | 234.1 | 626.4 |
| (88.9) | (193.1) | (-) Equity Pick-up | (340.1) | (747.1) | (247.5) | (553.8) |
| - | (137.4) | (-) Income from Discontinued Operations | 3.4 | (138.9) | - | (138.9) |
| 122.6 | 101.9 | (+) Minority Shareholders | 373.9 | 130.8 | 289.1 | 217.7 |
| (155.6) | 38.4 | (+) Income Taxes | 178.4 | (40.7) | 39.2 | 126.4 |
| 252.1 | 87.0 | (+) Net Financial Expense (Revenue) | 877.8 | 307.2 | 700.3 | 410.9 |
| 158.7 | 112.3 | (+) Depreciation and Amortization | 598.5 | 215.7 | 439.1 | 334.8 |
| 518.6 | 348.4 | EBITDA (before ICVM 527) | 1,953.1 | 473.8 | 1,454.4 | 1,023.4 |
| 88.9 | 193.1 | (+) Equity Pick-up | 340.1 | 747.1 | 247.5 | 553.8 |
| 607.5 | 541.5 | EBITDA (after ICVM 527) | 2,293.3 | 1,220.9 | 1,701.9 | 1,577.2 |
| - | 137.4 | (+) Reclassification of Discontinued Operations¹ | (3.4) | 138.9 | - | 138.9 |
| - | - | (-) Gross effect of Raízen formation | - | - | - | - |
| 607.5 | 678.9 | Adjusted EBITDA (after ICVM 527) | 2,289.9 | 1,359.7 | 1,701.9 | 1,716.1 |
Note 1: Due to the disposal of the retail sugar trading business represented by Cosan Alimentos, the company reclassified this unit’s results to discontinued operations, as required by accounting rules IFRS5/CPC31 – Non-current Asset Held for Sale and Discontinued Operation.
4 of 50
| | Earnings Release 4th Quarter and Fiscal Year 2013 |
Below we report the results for 4Q13 and 2013 for each business unit for all segments detailed above. All information reflect 100% of their financial performance, regardless of Cosan’s interest.
For purposes of consolidated EBITDA reconciliation, the Adjustments and Eliminations column refers to the elimination of net incomes from businesses controlled by Cosan for consolidation purposes. The same adjustment is applied when we consider Raízen’s results for EBITDA calculation.
Results by Business Unit 4Q 2013 Pro forma | Comgás | Rumo | Lubricants | Radar | Other Businesses | Adjusts and Eliminations | Consolidated | Raízen Combustíveis | Raízen Energia | 50% Raízen | Adjusts and Eliminations | Consolidated | ||||||||||||||||||||||||||||||||||||
| Net Revenue | 1,600.7 | 206.5 | 391.8 | 18.7 | 0.0 | 0.0 | 2,217.8 | 13,064.8 | 2,125.4 | (7,595.1 | ) | (422.9 | ) | 9,390.0 | ||||||||||||||||||||||||||||||||||
| Cost of Goods and Services | (1,146.2 | ) | (113.0 | ) | (306.2 | ) | - | 0.0 | 0.0 | (1,565.4 | ) | (12,363.8 | ) | (1,817.0 | ) | 7,090.4 | 422.4 | (8,233.4 | ) | |||||||||||||||||||||||||||||
| Gross Profit | 454.5 | 93.5 | 85.6 | 18.7 | 0.0 | 0.0 | 652.4 | 701.0 | 308.4 | (504.7 | ) | (0.5 | ) | 1,156.5 | ||||||||||||||||||||||||||||||||||
| Gross Margin(%) | 28.4 | % | 45.3 | % | 21.9 | % | 100.0 | % | n/a | n/a | 29.4 | % | 5.4 | % | 14.5 | % | 6.6 | % | 0.00 | 12.3 | % | |||||||||||||||||||||||||||
| Selling Expenses | (144.5 | ) | - | (58.2 | ) | - | - | - | (202.7 | ) | (297.9 | ) | (137.2 | ) | 217.5 | (0.0 | ) | (420.2 | ) | |||||||||||||||||||||||||||||
| General and Administrative Expenses | (90.3 | ) | (22.6 | ) | (18.1 | ) | (8.1 | ) | (26.2 | ) | (0.0 | ) | (165.2 | ) | (98.1 | ) | (145.3 | ) | 121.7 | 0.0 | (286.9 | ) | ||||||||||||||||||||||||||
| Other Operating Revenues (Expenses) | 3.6 | (1.9 | ) | (2.3 | ) | 75.4 | 0.8 | (0.0 | ) | 75.6 | 146.0 | (24.5 | ) | (60.7 | ) | 0.0 | 136.3 | |||||||||||||||||||||||||||||||
| Equity Pick-up | - | - | (1.3 | ) | - | 227.5 | (137.4 | ) | 88.9 | 4.8 | (11.7 | ) | 3.5 | (81.0 | ) | 4.5 | ||||||||||||||||||||||||||||||||
| Depreciation and Amortization | 117.1 | 20.0 | 20.7 | 0.2 | 0.7 | - | 158.7 | 148.4 | 398.6 | (273.5 | ) | - | 432.2 | |||||||||||||||||||||||||||||||||||
| EBITDA | 340.3 | 89.0 | 26.5 | 86.3 | 202.9 | (137.4 | ) | 607.5 | 604.3 | 388.3 | (496.3 | ) | (81.5 | ) | 1,022.3 | |||||||||||||||||||||||||||||||||
| EBITDA Margin (%) | 21.3 | % | 43.1 | % | 6.8 | % | n/a | n/a | n/a | 27.4 | % | 4.6 | % | 18.3 | % | 6.5 | % | n/a | 10.9 | % | ||||||||||||||||||||||||||||
Results by Business Unit 2013 Pro forma | Comgás | Rumo | Lubricants | Radar | Other Businesses | Adjusts and Eliminations | Consolidated | Raízen Combustíveis | Raízen Energia | 50% Raízen | Adjusts and Eliminations | Consolidated | ||||||||||||||||||||||||||||||||||||
| Net Revenue | 6,336.6 | 917.7 | 1,542.9 | 70.1 | 0.0 | 0.0 | 8,867.5 | 48,527.7 | 9,200.7 | (28,864.2 | ) | (1,566.5 | ) | 36,165.2 | ||||||||||||||||||||||||||||||||||
| Cost of Goods and Services | (4,556.6 | ) | (542.6 | ) | (1,158.4 | ) | (6.1 | ) | 0.0 | 0.0 | (6,263.7 | ) | (46,016.1 | ) | (7,681.0 | ) | 26,848.6 | 1,553.5 | (31,558.7 | ) | ||||||||||||||||||||||||||||
| Gross Profit | 1,780.1 | 375.1 | 384.5 | 64.1 | 0.0 | 0.0 | 2,603.8 | 2,511.5 | 1,519.7 | (2,015.6 | ) | (12.9 | ) | 4,606.4 | ||||||||||||||||||||||||||||||||||
| Gross Margin(%) | 28.1 | % | 40.9 | % | 24.9 | % | 91.4 | % | n/a | n/a | 29.4 | % | 5.2 | % | 16.5 | % | 7.0 | % | 0.01 | 12.7 | % | |||||||||||||||||||||||||||
| Selling Expenses | (573.9 | ) | - | (228.5 | ) | - | - | - | (802.4 | ) | (1,073.9 | ) | (670.8 | ) | 872.4 | (0.0 | ) | (1,674.8 | ) | |||||||||||||||||||||||||||||
| General and Administrative Expenses | (309.7 | ) | (74.3 | ) | (73.4 | ) | (23.2 | ) | (121.2 | ) | (0.0 | ) | (601.8 | ) | (378.5 | ) | (546.9 | ) | 462.7 | 0.0 | (1,064.5 | ) | ||||||||||||||||||||||||||
| Other Operating Revenues (Expenses) | (3.0 | ) | (20.4 | ) | (8.0 | ) | 185.6 | 0.8 | 0.0 | 155.1 | 359.5 | (8.6 | ) | (175.4 | ) | 0.0 | 330.6 | |||||||||||||||||||||||||||||||
| Equity Pick-up | - | - | (7.8 | ) | 0.0 | 850.2 | (502.3 | ) | 340.1 | 4.8 | (33.3 | ) | 14.3 | (336.0 | ) | (10.2 | ) | |||||||||||||||||||||||||||||||
| Depreciation and Amortization | 444.5 | 77.5 | 73.3 | 0.9 | 2.3 | 0.0 | 598.5 | 504.2 | 1,852.4 | (1,178.3 | ) | - | 1,776.8 | |||||||||||||||||||||||||||||||||||
| EBITDA | 1,337.9 | 358.0 | 140.1 | 227.4 | 732.1 | (502.3 | ) | 2,293.3 | 1,927.7 | 2,112.4 | (2,020.1 | ) | (349.0 | ) | 3,964.2 | |||||||||||||||||||||||||||||||||
| EBITDA Margin (%) | 21.1 | % | 39.0 | % | 9.1 | % | n/a | n/a | n/a | 25.9 | % | 4.0 | % | 23.0 | % | 7.0 | % | n/a | 11.0 | % | ||||||||||||||||||||||||||||
5 of 50
| | Earnings Release 4th Quarter and Fiscal Year 2013 |
B. Result by Business Unit
B.1 Raízen Combustíveis
Below you will find the results of Raízen Combustíveis, the business unit that distributes and trades fuels through a network of franchised Shell service stations, in addition to supplying fuels to industrial clients and distributing aviation fuel.
Following the adoption of IFRS 11 – Joint Arrangements, starting in April 2013 Cosan no longer consolidates Raízen in its balance sheet, statement of income and cash flows, and the result from this business unit has been reported under “Equity Accounting Result” ever since. Given Raízen’s materiality in Cosan’s financial information, we will report this segment’s performance separately.
Results referring to 2013 are proforma, considering twelve months (January to December 2013) of Raízen Combustíveis’s results for better comparability. The same applies to 2012, which considers January to December 2012.
Net Revenue
| 4Q 2013 | 4Q 2012 | Sales Breakdown | 2013 | 2012 | 9M 2013 | FY 12/13 | ||
| (oct - dec) | (oct - dec) | Chg.% | Amounts in R$ MM | (jan-dec) | (jan-dec) | Chg.% | (mar/13-dec/13) | (apr/12-mar/13) |
| 13,064.8 | 11,383.8 | 14.8% | Fuel Sales | 48,527.7 | 42,567.1 | 14.0% | 37,580.6 | 43,532.2 |
| 901.9 | 649.3 | 38.9% | Ethanol | 2,988.2 | 2,288.2 | 30.6% | 2,330.2 | 2,401.6 |
| 5,193.5 | 4,666.4 | 11.3% | Gasoline | 19,235.9 | 17,461.4 | 10.2% | 14,829.1 | 17,688.8 |
| 5,512.9 | 4,667.5 | 18.1% | Diesel | 20,725.5 | 17,256.1 | 20.1% | 16,261.7 | 17,844.4 |
| 1,308.3 | 1,245.3 | 5.1% | Aviation | 5,001.7 | 4,903.2 | 2.0% | 3,724.6 | 5,003.9 |
| 148.3 | 155.3 | -4.5% | Other Products | 576.3 | 658.3 | -12.5% | 434.9 | 593.5 |
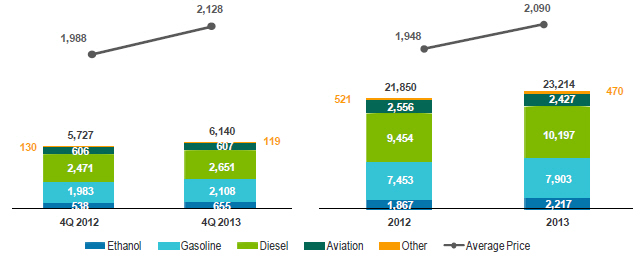
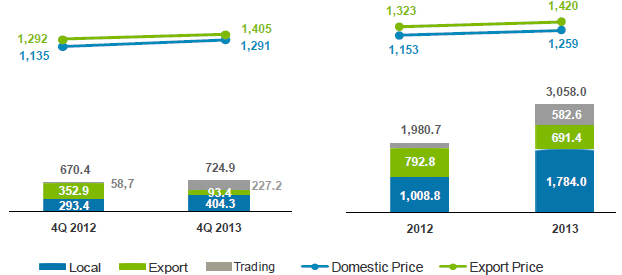
In 4Q13, Raízen Combustíveis’s net revenue grew 14.8% year-over-year to R$13.1 billion, chiefly due to the 7.2% increase in total fuel sales volume in the period, especially ethanol, which was up 21.7%. Additionally, the average price of products sold rose 7% year-over-year, basically due to the rise in mogas and diesel prices by Petrobras in 2013. The average ethanol price also rose 14.1% in the quarter.
In 2013, net revenue was up 14% to R$ 48.5 billion, and the average price of products sold rose 7.3% versus 2012.
The rise in mogas prices increased ethanol’s competitiveness in the domestic market, and in four Brazilian states (São Paulo, Paraná, Goiás, and Mato Grosso) the parity between ethanol and gasoline prices remained below 70% in the quarter.
6 of 50
| | Earnings Release 4th Quarter and Fiscal Year 2013 |
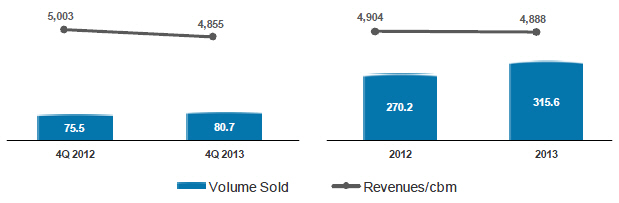
The aviation segment saw a reduction of 5.1% in volumes sold in 2013 year-over-year, a decrease that was offset by a higher average price, resulting in an increase of 2% in the segment’s overall net revenue.
The network of Shell service stations closed 2013 with nearly 4,860 stations and 850 convenience stores.
Fuels
Volume (million liters) and Average Unit Price (R$/m³)
Inventories
| Fuels Inventories | |||
| 31-dec-2013 | 31-dec-2012 | Chg.% | |
| 000' cbm | 524.2 | 446.5 | 17.4% |
| R$'MM | 1,057.0 | 829.7 | 27.4% |
| R$/cbm | 2,016.3 | 1,858.3 | 8.5% |
Cost of Goods Sold
| 4Q 2013 | 4Q 2012 | COGS | 2013 | 2012 | 9M 2013 | FY 12/13 | ||
| (oct - dec) | (oct - dec) | Chg.% | Amounts in R$ MM | (jan-dec) | (jan-dec) | Chg.% | (mar/13-dec/13) | (apr/12-mar/13) |
| (12,363.8) | (10,773.2) | 14.8% | Fuel Sales | (46,016.1) | (40,164.1) | 14.6% | (35,664.5) | (41,199.0) |
In 4Q13, Raízen Combustíveis’s cost of goods sold totaled R$12.4 billion, up 14.8% year-over-year, driven by higher sales volumes. Overall cost rose 14.6% to R$46 billion in 2013. The increase in cost of goods sold is basically due to higher mogas and diesel prices and to the higher sales volumes in 2013.
7 of 50
| | Earnings Release 4th Quarter and Fiscal Year 2013 |
Gross Profit
| 4Q 2013 | 4Q 2012 | Gross Profit | 2013 | 2012 | 9M 2013 | FY 12/13 | ||
| (oct - dec) | (oct - dec) | Chg.% | Amounts in R$ MM | (jan-dec) | (jan-dec) | Chg.% | (mar/13-dec/13) | (apr/12-mar/13) |
| 701.0 | 610.6 | 14.8% | Gross Profit | 2,511.5 | 2,403.0 | 4.5% | 1,916.0 | 2,333.2 |
| 5.4% | 5.4% | 0.0 p.p | Gross Margin (%) | 5.2% | 5.6% | -0.4 p.p. | 5.1% | 5.4% |
Raízen Combustíveis reported gross income of R$701 million for 4Q13, an increase of 14.8% from the R$610.6 million recorded in 4Q12. Gross margin was 5.4% in the quarter. In 2013, gross profit was R$5.1 billion, up 4.5% year-over-year.
Selling, General, and Administrative Expenses
| 4Q 2013 | 4Q 2012 | SG&A Expenses | 2013 | 2012 | 9M 2013 | FY 12/13 | ||
| (oct - dec) | (oct - dec) | Chg.% | Amounts in R$ MM | (jan-dec) | (jan-dec) | Chg.% | (mar/13-dec/13) | (apr/12-mar/13) |
| (297.9) | (275.9) | 8.0% | Selling Expenses | (1,073.9) | (1,151.9) | -6.8% | (808.1) | (1,026.9) |
| (98.1) | (87.1) | 12.6% | G&A Expenses | (378.5) | (380.2) | -0.4% | (285.9) | (361.6) |
| 146.0 | 114.1 | 27.9% | Other Operational Revenues/Expenses | 359.5 | 241.2 | 49.0% | 292.2 | 219.5 |
Raízen Combustíveis’s selling expenses amounted to R$297.9 million in 4Q13, up 8% year-over-year, driven by higher freight expenses due to the higher volumes sold. In 2013, selling expenses were down 6.8% to R$1.1 billion.
General and administrative expenses amounted to R$98.1 million in 4Q13, up 12.6% year-over-year. General and administrative expenses totaled R$378.5 million in 2013, unchanged from 2012.
Other operating revenues and expenses include merchandise fees, convenience store royalties, revenue from leases, fees for the sale of lubricants at Raízen Combustíveis services stations, and revenues from the sale of assets, and totaled R$146 million in 4Q13.
EBITDA
| 4Q 2013 | 4Q 2012 | EBITDA | 2013 | 2012 | 9M 2013 | FY 12/13 | ||
| (oct - dec) | (oct - dec) | Chg.% | Amounts in R$ MM | (jan-dec) | (jan-dec) | Chg.% | (mar/13-dec/13) | (apr/12-mar/13) |
| 604.3 | 492.7 | 22.7% | EBITDA | 1,927.7 | 1,586.5 | 21.5% | 1,504.8 | 1,658.5 |
| 4.6% | 4.3% | 0.3 p.p | EBITDA Margin (%) | 4.0% | 3.7% | 0.3 p.p | 4.0% | 3.8% |
Raízen Combustíveis’s EBITDA was R$604.3 million in 4Q13, an increase of 22.7% over 4Q12. EBITDA margin was 4.6%, an increase of 0.3 p.p. in the same period. EBITDA was R$1.9 million in 2013, an increase of 21.5% over 2012.
8 of 50
| | Earnings Release 4th Quarter and Fiscal Year 2013 |
Capex
| 4Q 2013 | 4Q 2012 | CAPEX | 2013 | 2012 | 9M 2013 | FY 12/13 | ||
| (oct - dec) | (oct - dec) | Chg.% | Amounts in R$ MM | (jan-dec) | (jan-dec) | Chg.% | (mar/13-dec/13) | (apr/12-mar/13) |
| 448.6 | 165.8 | 170.6% | CAPEX | 834.8 | 719.9 | 16.0% | 681.3 | 677.2 |
Raízen Combustíveis’s Capex totaled R$448.6 million in 4Q13, and focused on new contracts and the renewal of existing contracts with resellers, investments in health, safety and the environment (HSE), as well as other logistics, distribution, and trading initiatives. In the quarter, the company also invested R$250 million in the acquisition of a 10% interest at STP – Serviços eTecnologia de Pagamentos, responsible for the Sem Parar and Via Fácil electronic payment systems.
As mentioned in the previous quarter, the reseller network growth model is chiefly based on bonuses for the achievement of volume targets. The bonus is accounted for as deduction from gross revenue, and totaled R$29.9 million in 4Q13, adversely impacting EBITDA. In 4Q12 bonus payment amounted to R$19.7 million. In 2013, the impact was of R$111.9 million.
9 of 50
| | Earnings Release 4th Quarter and Fiscal Year 2013 |
B.2 Raízen Energia
The following are the results for Raízen Energia, whose core business is the production and sale of a variety of products derived from sugarcane, including raw sugar (Very High Polarization - VHP), anhydrous and hydrous ethanol, as well as activities related to energy cogeneration from sugarcane bagasse and ethanol trading.
As mentioned in prior quarters, after adopting IFRS 11 – Joint Arrangements, Cosan no longer consolidates Raízen in its balance sheet, statement of income and cash flows, and the result from this business unit has been reported under “Equity Accounting Result” ever since. Given Raízen’s materiality in Cosan’s financial information, we will report this segment’s performance separately.
Results referring to 2013 are proforma, considering twelve months (January to December 2013) of Raízen Energia’s results for better comparability. The same applies to 2012, which considers January to December 2012.
Production Figures
Central-South Region
The period from October to December of the 2013/14 harvest was marked by the persistence of a scarce rainfall climate pattern, and mills recorded large volumes of cane crushing. But even with the dry climate in the period, the amount of TRS (total recoverable sugars) per ton of cane reached only 133.5 kg/t due to the rainfall early in the harvest, which impacted the plant’s physiology.
In the period, mills in the Center-South managed to crush nearly 152 million tons of sugarcane, up 1.6% year-over-year. Average productivity was of 74.5 t/ha in the quarter, below expectations for the beginning of the harvest, contributing to the average productivity of the harvest to remain slightly below 80 t/ha.
The production mix was 45.5% for sugar production, and 54.5% for ethanol production. So far, production has reached 34.2 million tons of sugar and 25.3 billion liters of ethanol (14.3 billion liters of hydrous ethanol and 11 billion liters of anhydrous ethanol). Growth in anhydrous ethanol production is mostly due to the increase in May 2013 in the mandatory anhydrous mix into mogas from 20% to the current 25%.
10 of 50
| | Earnings Release 4th Quarter and Fiscal Year 2013 |
Raízen Energia
Raízen Energia’s fiscal year follows the crop year, currently starting on April 1 of every year and closing on March 31 of the following year. Therefore, operating and financial information for 2013 and 2012 do not represent a complete harvest because they combine the first quarter of one harvest and three quarters of a subsequent harvest, thus, not reflecting the commercial strategy of one single harvest. For that reason, the results for Cosan reflect this mismatch.
In 4Q13, Raízen Energia operated 24 sugar, ethanol and energy cogeneration mills, with a crushing capacity of 65.55 million tonnes of sugarcane per crop year.
| 4Q 2013 | 4Q 2012 | Operational Figures | YTD 2013 | YTD 2012 | 9M 2013 | FY 12/13 | ||
| (oct - dec) | (oct - dec) | Chg.% | (jan-dec) | (jan-dec) | Chg.% | (mar/13-dec/13) | (apr/12-mar/13) | |
| 16,081 | 17,843 | -9.9% | Crushed Sugarcane | 61,440 | 56,221 | 9.3% | 61,440 | 56,221 |
| 7,688 | 9,231 | -16.7% | Own (‘000 tonnes) | 30,455 | 28,299 | 7.6% | 30,455 | 28,299 |
| 8,393 | 8,612 | -2.5% | Suppliers (‘000 tonnes) | 30,984 | 27,922 | 11.0% | 30,984 | 27,922 |
| 134.3 | 136.3 | -1.5% | Sugarcane TRS (kg/tonne) | 130.9 | 133.4 | -1.9% | 130.9 | 133.4 |
| 95.5% | 92.5% | 3.0 p.p | Mechanization (%) | 94.8% | 91.8% | 3.0 p.p | 94.8% | 91.8% |
| Production | ||||||||
| 1,175 | 1,361 | -13.7% | Sugar | 4,493 | 4,161 | 8.0% | 4,493 | 4,162 |
| 788 | 904 | -12.8% | Raw Sugar (‘000 tonnes) | 2,991 | 2,575 | 16.2% | 2,991 | 2,575 |
| 387 | 457 | -15.3% | White Sugar (‘000 tonnes) | 1,502 | 1,586 | -5.3% | 1,501 | 1,587 |
| 558 | 628 | -11.1% | Ethanol | 2,037 | 1,903 | 7.0% | 2,038 | 1,903 |
| 271 | 294 | -7.8% | Anhydrous Ethanol (‘000 cbm) | 987 | 833 | 18.5% | 988 | 833 |
| 287 | 334 | -14.1% | Hydrous Ethanol (‘000 cbm) | 1,050 | 1,069 | -1.7% | 1,050 | 1,070 |
Raízen Energia crushed a total of 16.1 million tons of cane in 4Q13, a decrease of 9.9% year-over-year (17.8 million tons in 3Q13). The main factor causing this decrease in crushing is that the 2013/14 harvest started earlier compared to the 2012/13 harvest, year when the largest crushing volumes were concentrated in the fourth quarter. Nearly 49% of the crushed amount were third-party sugarcane, and 51% were proprietary sugarcane, including agricultural partners.
In 4Q13, 95.5% of proprietary sugarcane was harvested mechanically and the TRS of the sugarcane reached 134.3 kg/ton, down 1.5% year-over-year due to unfavorable weather conditions during the year, causing the concentration of total sugars in the harvested cane to be diluted.
Agricultural productivity measured in tons of cane per hectare (TCH) reached 77.2 t/ha in 4Q13, down 4.8% year-over-year, but higher than the average of 74.5 t/ha in the Center-South.
The average age of the sugarcane fields reached 3.1 years, reflecting the appropriate renewal of the proprietary sugarcane plantation areas from the beginning of the harvest up to December/2013. The production mix was concentrated in sugar, with 56.8% of sugarcane crushed used to make this product, totaling 1.2 million tons of sugar and 558 million liters of ethanol produced.
11 of 50
| | Earnings Release 4th Quarter and Fiscal Year 2013 |
Net Revenue
| 4Q 2013 | 4Q 2012 | Sales Breakdown | YTD 2013 | YTD 2012 | 9M 2013 | FY 12/13 | ||
| (oct - dec) | (oct - dec) | Chg.% | Amounts in R$ MM | (jan-dec) | (jan-dec) | Chg.% | (mar/13-dec/13) | (apr/12-mar/13) |
| 2,125.4 | 2,605.4 | -18.4% | Net Operating Revenue | 9,200.7 | 7,311.2 | 25.8% | 6,850.3 | 8,468.4 |
| 876.2 | 1,250.4 | -29.9% | Sugar Sales | 4,304.3 | 3,843.1 | 12.0% | 3,127.6 | 4,354.1 |
| 272.5 | 233.0 | 16.9% | Domestic Market | 867.8 | 959.7 | -9.6% | 669.5 | 899.3 |
| 603.7 | 1,017.5 | -40.7% | Foreign Market | 3,436.5 | 2,883.4 | 19.2% | 2,458.2 | 3,454.9 |
| 1,042.8 | 937.6 | 11.2% | Ethanol Sales | 4,266.5 | 2,691.5 | 58.5% | 3,143.2 | 3,313.4 |
| 521.9 | 332.9 | 56.8% | Domestic Market | 2,244.4 | 1,163.5 | 92.9% | 1,715.4 | 1,328.4 |
| 131.2 | 456.0 | -71.2% | Foreign Market | 981.8 | 1,080.4 | -9.1% | 658.6 | 1,266.2 |
| 389.6 | 148.7 | 162.1% | Trading | 1,040.4 | 447.6 | 132.4% | 769.2 | 718.8 |
| 126.1 | 321.7 | -60.8% | Energy Cogeneration | 389.7 | 557.9 | -30.2% | 376.5 | 569.7 |
| 80.4 | 95.8 | -16.0% | Other Products and Services | 240.2 | 218.7 | 9.8% | 202.9 | 231.1 |
In 4Q13 Raízen Energia's net revenue was R$2.1 billion, down 18.4% from 4Q12, when reported revenue was R$2.6 billion. The key factors causing this reduction were lower sugar sale volume sold, and the decrease in this product’s prices both in the domestic and international markets.
We have also observed a behavior that was symmetrical with the growth of 16.9% in net revenue in 2Q13 (April to June 2013), evidencing the production and sales strategy were dislocated between the 2012/13 and 2013/14 harvests.
Sugar Sales
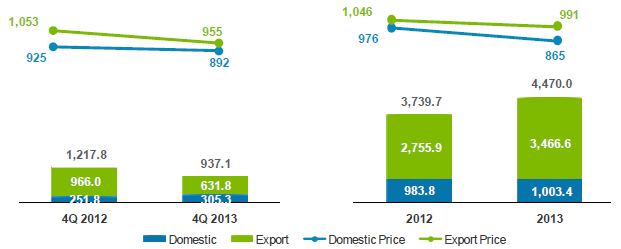
Net revenue from sugar sales was R$876.2 billion in 4Q13, a decrease of 29.9% from 4Q12, when reported revenue was R$1.3 billion. Sugar sales accounted for 41.2% of Raízen Energia’s overall net revenue in 4Q13.
The key driver of this decrease in net revenue in the period was the reduction of 23.1% in sales volumes, which generated an impact of R$288.2 million, offset by the decrease of 8.9% in the average price, which fell from R$1,027/ton in 4Q12 to R$935/ton in 4Q13.
12 of 50
| | Earnings Release 4th Quarter and Fiscal Year 2013 |
Sugar
Volume Sold (‘000 tons) and Average Unit Price (R$/ton)
Sugar Inventories
| Sugar Inventories | |||
| 31-dec-2013 | 31-dec-2012 | Chg.% | |
| ´000 tonne | 1,374.0 | 1,290.9 | 6.4% |
| R$'MM | 981.1 | 895.2 | 9.6% |
| R$/tonne | 714.1 | 693.5 | 3.0% |
Ethanol Sales
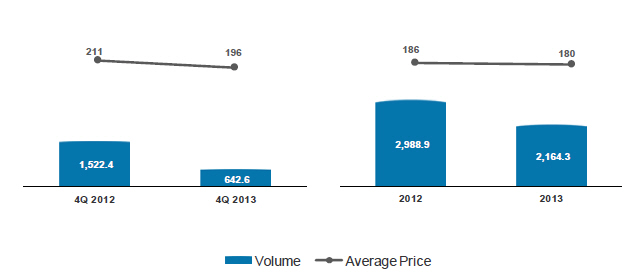
Net revenue from ethanol sales in 4Q13 reached R$1 billion, an increase of 11.2% from 4Q12 (R$937.6 million). Ethanol sales accounted for 49.1% of Raízen Energia’s overall net revenue in 4Q13.
This increase is explained by the rise of 8% in sales volumes, and the increase of 7.7% in the average price, which was up from R$1.221/m³ in 4Q12 to R$1.314/m³ in 4Q13.
Sales of ethanol in the domestic market reached 55.7% of total sales in 4Q13, mainly driven by the increase from 20% to 25% in the mandatory mix of ethanol in mogas, causing a higher demand for this product, and the increased competitiveness of hydrous ethanol versus mogas in some regions in Brazil, especially in São Paulo.
Ethanol exports were lower in 4Q13 year-over -year due to a lower demand from the international market, and to the stronger competitiveness of corn ethanol, produced in the United States.
13 of 50
| | Earnings Release 4th Quarter and Fiscal Year 2013 |
Ethanol
Volume Sold (million liters) and Average Unit Price (R$/m³)
Ethanol Inventories
| Ethanol Inventories | |||
| 31-dec-2013 | 31-dec-2012 | Chg.% | |
| ´000 cbm | 731.0 | 680.8 | 7.4% |
| R$'MM | 833.1 | 767.9 | 8.5% |
| R$/cbm | 1,139.7 | 1,128.1 | 1.0% |
Energy Cogeneration
All of Raízen Energia’s 24 mills generate energy and are self-sufficient, and 13 sell surplus energy from cogeneration.
In 4Q13, net revenue from energy sales totaled R$ 126.1 million, representing a decrease of 60.8% year-over-year. In the quarter, a total of 642,800 MWh of energy was sold at an average of R$196.2/MWh, price that was 7.1% lower year-over-year (R$211/MWh in 4Q12).
Reduced energy resale operations added to the decrease in total energy sales volume, and was the key driver of the decrease in net revenue in the period.
14 of 50
| | Earnings Release 4th Quarter and Fiscal Year 2013 |
Electric Energy
Volume Sold (’000 MWh) and Average Unit Price (R$/MWh)
Other Products and Services
In 4Q13, net revenue from other products and services totaled R$80.4 million, down 16.1% year-over-year. These revenues are relative to the sale of sugarcane, steam, molasses and raw materials to service providers in the agricultural industry.
Cost of Goods Sold
Raízen Energia's cost of goods sold is reported together with the average unit costs, net of the effects of depreciation and amortization (cash cost).
| 4Q 2013 | 4Q 2012 | COGS per Product | YTD 2013 | YTD 2012 | 9M 2013 | FY 12/13 | ||
| (oct - dec) | (oct - dec) | Chg.% | Amounts in R$ MM | (jan-dec) | (jan-dec) | Chg.% | (mar/13-dec/13) | (apr/12-mar/13) |
| (1,817.0) | (2,028.8) | -10.4% | Cost of Goods Sold | (7,681.0) | (5,548.0) | 38.4% | (5,590.1) | (6,881.9) |
| (656.8) | (819.0) | -19.8% | Sugar | (3,143.1) | (2,649.9) | 18.6% | (2,317.6) | (2,997.4) |
| (557.2) | (721.4) | -22.8% | Ethanol | (2,797.3) | (2,037.0) | 37.3% | (2,066.7) | (2,317.9) |
| (378.4) | (148.9) | 154.1% | Trading | (1,014.8) | (432.3) | 134.8% | (741.6) | (705.5) |
| (40.1) | (253.4) | -84.2% | Energy Cogeneration | (159.6) | (388.1) | -58.9% | (148.6) | (399.0) |
| (184.5) | (86.1) | 114.2% | Others | (566.3) | (40.7) | n/a | (315.6) | (462.0) |
| Average Unitary Costs² | ||||||||
| (515.0) | (464.8) | 10.8% | Cash Cost of Sugar (R$/tonne) | (504.4) | (495.7) | 1.8% | (555.6) | (492.5) |
| (795.4) | (770.7) | 3.2% | Cash Cost of Ethanol (R$/’000 liters) | (847.4) | (769.1) | 10.2% | (766.5) | (764.7) |
Note 2: Average unit costs represent the cash cost, which is net of plantation and cultivation depreciation and amortization, agricultural depreciation (machinery and equipment), industrial depreciation, and harvest off-season maintenance.
Raízen Energia’s cost of goods sold totaled R$1.8 billion for 4Q13, down 10.4% over 4Q12 (R$2 billion). This decrease was mainly driven by lower volumes of sugar sold in the quarter.
Also, the 5.2% decrease in the TSR/kg cost of CONSECANA, down from R$0.4743 in 4Q12 to R$0.4494 in 4Q13, directly impacted the cost of sugarcane from suppliers.
15 of 50
| | Earnings Release 4th Quarter and Fiscal Year 2013 |
The unit cost of products made by Raízen Energia was also impacted by the following factors:
o | Lower dilution of fixed costs caused by a decrease of 1.5% in the TSR level—from 136.3 kg/ton in 4Q12 to 134.3 kg/ton in 4Q13; |
o | Lower agricultural productivity of sugarcane fields—represented by a lower TCH level (ton of cane per hectare), which was 77.2 in 4Q13. |
Gross Profit
| 4Q 2013 | 4Q 2012 | Gross Profit and Gross Margin | YTD 2013 | YTD 2012 | 9M 2013 | FY 12/13 | |||
| (oct - dec) | (oct - dec) | Chg.% | Amounts in R$ MM | (jan-dec) | (jan-dec) | Chg.% | (mar/13-dec/13) | (apr/12-mar/13) | |
| 308.4 | 576.5 | -46.5% | Gross Profit | 1,519.7 | 1,763.2 | -13.8% | 1,260.3 | 1,586.4 | |
| 219.4 | 431.4 | -49.1% | Sugar | 1,161.2 | 1,193.2 | -2.7% | 810.1 | 1,356.7 | |
| 25.0% | 34.5% | -9.5 p.p. | Sugar Gross Margin (%) | 27.0% | 31.0% | -4.0 p.p. | 25.9% | 31.2% | |
| 44.9% | 54.7% | -9.8 p.p. | Sugar (Cash) Gross Margin (%) | 47.6% | 51.8% | -4.2 p.p. | 41.8% | 52.2% | |
| 96.0 | 67.5 | 42.3% | Ethanol | 428.9 | 206.9 | 107.3% | 307.2 | 276.6 | |
| 14.7% | 8.6% | 6.1 | p.p | Ethanol Gross Margin (%) | 13.3% | 9.2% | 4.1 p.p | 12.9% | 10.7% |
| 39.4% | 36.9% | 2.5 | p.p | Ethanol (Cash) Gross Margin (%) | 35.0% | 38.2% | -3.3 p.p. | 41.0% | 39.2% |
| 11.2 | (0.3) | n/a | Trading | 25.6 | 15.3 | 66.9% | 27.7 | 13.3 | |
| 2.9% | -0.2% | 3.1 | p.p | Ethanol Trading Margin (%) | 2.5% | 3.4% | -0.9 p.p. | 3.6% | 1.8% |
| 85.9 | 68.3 | 25.9% | Energy Cogeneration | 230.1 | 169.7 | 35.6% | 227.9 | 170.7 | |
| (104.1) | 9.6 | n/a | Other Products and Services | (326.1) | 178.0 | n/a | (112.6) | (230.9) | |
Raízen Energia reported gross profit of R$308.4 million in 4Q13, down 46.5% over the R$576.5 million reported in 4Q12.
Gross profit from the sale of sugar reached R$219.4 million in 4Q13, a decrease of 49.1% year-over-year, the key driver of the decrease in Raízen Energia’s gross profit for the quarter due to lower volumes sold and lower average prices in the quarter. The result from the sale of ethanol rose 42.3% year-over-year to R$96 million in 4Q13. The sale of electric energy resulted in gross profit of R$85.9 million, up 25.9% year-over-year.
The result from the sale of other products and services was a R$104.1 million loss in 4Q13, suffering an impact of R$118.3 million from the negative variation of the biological asset’s fair value (non-cash effect) due to a more challenging scenario for sugar and ethanol prices. Also, R$4.9 million in amortizations from business combinations were recognized in cost in 4Q12.
Selling, General & Administrative Expenses
| 4Q 2013 | 4Q 2012 | SG & A Expenses | YTD 2013 | YTD 2012 | 9M 2013 | FY 12/13 | ||
| (oct - dec) | (oct - dec) | Chg.% | Amounts in R$ MM | (jan-dec) | (jan-dec) | Chg.% | (mar/13-dec/13) | (apr/12-mar/13) |
| (137.2) | (186.1) | -26.3% | Selling Expenses | (670.8) | (519.7) | 29.1% | (474.1) | (638.8) |
| (145.3) | (123.2) | 17.9% | General and Administrative Expenses | (546.9) | (491.6) | 11.2% | (411.6) | (490.3) |
16 of 50
| | Earnings Release 4th Quarter and Fiscal Year 2013 |
Raízen Energia’s selling expenses dropped 26.3% year-over-year to R$137.2 million in 4Q13, due to the lower exports volume, which resulted in lower costs with freight, logistics and port elevation.
General and administrative expenses amounted to R$145.3 million in 4Q13, up 17.9% year-over-year (R$123.2 million in 4Q12), resulting from the recognition of expenses with claims prior to the formation of Raízen.
EBITDA
| 4Q 2013 | 4Q 2012 | EBITDA | YTD 2013 | YTD 2012 | 9M 2013 | FY 12/13 | ||
| (oct - dec) | (oct - dec) | Chg.% | Amounts in R$ MM | (jan-dec) | (jan-dec) | Chg.% | (mar/13-dec/13) | (apr/12-mar/13) |
| 388.3 | 830.5 | -53.2% | EBITDA | (670.8) | (519.7) | 29.1% | (474.1) | (638.8) |
| 18.3% | 31.9% | -13.6 p.p. | Margin EBITDA (%) | 23.0% | 34.0% | 0.1 p.p | 24.8% | 28.4% |
Raízen Energia reported EBITDA of R$388.3 million for 4Q13, down 53.2% over the R$830.5 million reported in 4Q12.
This reduction is explained by the different strategies adopted in the 2012/13 and 2013/14 harvests. In the first, we postponed the beginning of the harvest to the first half of May 2012 due to the need for increased concentration of TRS in the sugarcane fields. On the other hand, the 2013/14 harvest started nearly one month earlier, resulting in lower sales volumes in 4Q13.
Therefore, the relative dislocation of the harvests, the strategy of building sugar and ethanol inventories for trading in 1Q14, and the negative impact of R$118.3 million from the negative variation of the biological asset’s fair value (non-cash effect) were the key drivers of the decrease in Raízen Energia’s EBITDA year-over-year.
| EBITDA Ex-Biological Asset | 1Q 2012 | 2Q 2012 | 3Q 2012 | 4Q 2012 | 2012 | 1Q 2013 | 2Q 2013 | 3Q 2013 | 4Q 2013 | 2013 |
| Amounts in R$ MM | (jan - mar) | (apr - jun) | (jul - sep) | (oct - dec) | (jan - dec) | (jan - mar) | (apr - jun) | (jul - sep) | (oct - dec) | (jan - dec) |
| EBITDA | 485.1 | 317.8 | 849.5 | 830.5 | 2,482.9 | 410.5 | 413.2 | 900.5 | 388.3 | 2,112.5 |
| (+) Biological Asset Variation | (195.9) | (34.9) | 76.8 | 43.7 | (110.3) | 139.4 | 3.3 | 6.4 | 118.3 | 267.4 |
| EBITDA Ex-Biological Asset | 289.2 | 282.9 | 926.3 | 874.2 | 2,372.6 | 549.9 | 416.5 | 906.9 | 506.6 | 2,379.9 |
When the effects of the biological asset are adjusted in the EBITDA reported for the last 12 months, EBITDA remained practically unchanged (R$2.3 billion in 2012 and R$ 2.4 billion in 2013).
17 of 50
| | Earnings Release 4th Quarter and Fiscal Year 2013 |
Hedge
Volume positions and fixed sugar prices agreed with traders or through derivative financial instruments as of December 31, 2013, and foreign exchange derivatives contracted by Raízen Energia to hedge future cash flows, are as follows:
| Summary of Hedge Operations at Dec 31, 2013³ | |||
| Sugar | 2013 / 2014 | 2014 / 2015 | |
| NY #11 | |||
| Volume (‘000 ton) | 2,997.6 | 1,266.2 | |
| Average Price (¢US$/lb) | 18.6 | 18.2 | |
| Exchange Rate | |||
| US$ | |||
| Volume (US$ mm) | 1,275.1 | 526.0 | |
| Average Price (R$/US$) | 2.2 | 2.4 | |
Note 3: The table above shows the hedging coverage considering the crop years ending on 3/31/2014 and 3/31/2015 respectively.
Impacts of Hedge Accounting
Raízen Energia has been using cash flow hedge accounting for certain derivative financial instruments in order to hedge against the price risk for sugar over revenues from sugar exports.
The table below shows the expected transfer of gain/loss balances from the shareholders’ equity as at December 31, 2013 to the net operating income of Raízen Energia4 in future years, broken down by coverage period for the following hedging instruments:
| Expiration Period - (R$MM) | |||||
| Derivative | Market | Risk | 2013 | 2014 | Total |
| Futures | OTC/NYBOT | NY#11 | 50.3 | 81.2 | 131.5 |
| (=) Hedge Accounting impact | 50.3 | 81.2 | 131.5 | ||
| (-) Deferred Income Tax | (17.1) | (27.6) | (44.7) | ||
| (=) Asset Valuation Adjustment | 33.2 | 53.6 | 86.8 | ||
Note 4: The table above shows 100% of the hedge accounting gains/losses reclassified to shareholders’ equity. As Cosan holds a 50% interest at Raízen Energia, hedge accounting will have a proportionate impact on Other Comprehensive Income in Cosan’s shareholders’ equity.
18 of 50
| | Earnings Release 4th Quarter and Fiscal Year 2013 |
Capex
| 4Q 2013 | 4Q 2012 | CAPEX | YTD 2013 | YTD 2012 | 9M 2013 | FY 12/13 | ||
| (oct - dec) | (oct - dec) | Chg.% | Amounts in R$ MM | (jan-dec) | (jan-dec) | Chg.% | (mar/13-dec/13) | (apr/12-mar/13) |
| 603.6 | 499.4 | 20.9% | Total CAPEX | 2,530.6 | 2,314.8 | 9.3% | 1,513.3 | 2,404.5 |
| 400.5 | 418.8 | -4.4% | Operating CAPEX | 1,828.2 | 1,902.3 | -3.9% | 1,079.1 | 1,934.1 |
| 225.9 | 263.1 | -14.1% | Biological Assets | 935.3 | 1,039.9 | -10.1% | 751.2 | 948.8 |
| 121.3 | 75.7 | 60.2% | Inter-Harvest Maintenance Costs | 604.3 | 519.6 | 16.3% | 200.6 | 602.3 |
| 27.2 | 24.1 | 13.3% | SSMA and Sustaining | 75.6 | 116.7 | -35.2% | 57.5 | 64.6 |
| 21.8 | 31.6 | -31.1% | Mechanization | 144.2 | 171.6 | -16.0% | 59.5 | 205.3 |
| 4.3 | 24.4 | -82.4% | Industrial | 68.8 | 54.6 | 26.0% | 10.2 | 113.1 |
| 203.1 | 80.6 | 152.0% | Expasion CAPEX | 702.4 | 412.5 | 70.3% | 434.2 | 470.4 |
| 1.1 | 26.4 | -95.7% | Cogeneration Projects | 47.6 | 192.1 | -75.2% | 15.5 | 102.7 |
| 202.0 | 54.2 | 272.6% | Expansion and Other Projects | 654.8 | 220.4 | 197.1% | 418.7 | 367.7 |
Raízen Energia recorded Capex of R$603.6 million in 4Q13, an increase of 20.9% over 4Q12, when Capex amounted to R$499.4 million. In FY2013, which represents the 9-month period from April to December 2013 (accumulated 2013/14 harvest), Raízen Energia reported total Capex of R$1.5 billion.
The key operating capital expenditures were concentrated in biological assets and agricultural and industrial interharvest maintenance.
Expenses with biological assets totaled R$225.9 million in 4Q13, down 14.1% year-over-year. The increase of 60.2% in expenditures with off-season maintenance is mainly due to the advanced purchase of materials.
The Expansion and Other Projects line totaled R$202 million in initial investments in new crushing expansion projects at the Paraguaçu and Caarapó units, and the purchase of agricultural assets. This line also includes other initiatives such as projects for vinasse concentration, biomass projects, expansion of mechanized planting, and operating improvements.
19 of 50
| | Earnings Release 4th Quarter and Fiscal Year 2013 |
B.3 Comgás
In this section we report on the results of Comgás, our natural gas distribution business unit operating in the concession area consisting of the Metropolitan Region of São Paulo, the Administrative Region of Campinas, Baixada Santista, and Vale do Paraíba in São Paulo state.
The 4Q12 and 2012 reflect Comgás’s accounting information disclosed prior to the beginning of its consolidation in November 2012 in Cosan’s financial statements, or represent the combination of quarters of calendar years 2012 and 2013.
Volumes Sold
| 4Q 2013 | 4Q 2012 | Volume Sold | 2013 | 2012 | 9M 2013 | FY 12/13 | ||
| (oct - dec) | (oct - dec) | Chg.% | Volume ('000 cbm) | (jan-dec) | (jan-dec) | Chg.% | (mar/13-dec/13) | (apr/12-mar/13) |
| 1,350,712 | 1,428,912 | -5.5% | Total Gas Sales | 5,456,954 | 5,258,632 | 3.8% | 4,089,939 | 2,293,332 |
| 1,146,045 | 1,172,122 | -2.2% | Gas Sales | 4,703,190 | 4,731,618 | -0.6% | 3,564,817 | 1,895,952 |
| 58,810 | 50,470 | 16.5% | Residential | 224,726 | 198,873 | 13.0% | 182,911 | 74,860 |
| 31,755 | 28,275 | 12.3% | Commercial | 119,194 | 111,663 | 6.7% | 93,401 | 44,641 |
| 916,867 | 937,275 | -2.2% | Industrial | 3,788,277 | 3,788,744 | 0.0% | 2,860,132 | 1,532,246 |
| 75,547 | 89,344 | -15.4% | Cogeneration | 323,057 | 357,529 | -9.6% | 240,398 | 139,674 |
| 63,065 | 66,759 | -5.5% | Vehicular | 247,937 | 274,809 | -9.8% | 187,976 | 104,531 |
| 204,667 | 256,790 | -20.3% | Thermal Power | 753,764 | 527,014 | 43.0% | 525,121 | 397,380 |
Comgás strategy is to focus its businesses on growing the residential and commercial segments, and on developing the cogeneration and NGV segments. Growth of the industrial segment, the most representative in terms of volume, is aligned with the evolution of the industrial GDP in the concession area. The Company’s distribution network totaled 10,938 kilometers in December 2013, considering that 1,629 kilometers were added during the year.
In 4Q13, the company distributed 58.8 million m³ of gas in the residential segment, an increase of 16.5% compared to 4Q12 (50.5 million m³). In 2013, the residential segment accounted for the consumption of 224.7 million m³ of gas, an increase of 13% year-over-year (198.9 million m³ in 2012). The residential segment closed the year with 952,662 meters connected, up 7.4% year-over-year (887,162 meters in 2012). The residential segment represented 4% of the total volume distributed in 2013, accounting for 26% of Comgás’s total margin.
Comgás distributed 31.8 million m³ of natural gas in the commercial segment in 4Q13, an increase of 12.3% year-over-year (28.3 million m³ in 4Q12). This increase is explained by the addition of 1,029 new clients in the last 12 months. In 2013, the commercial segment was responsible for the distribution of 119.2 million m³ of gas, up 6.7% year-over-year (111.7 million m³ in 2012). This represents 2% of the total volume distributed in 2013, accounting for 8% of Comgás’s total margin.
20 of 50
| | Earnings Release 4th Quarter and Fiscal Year 2013 |
The industrial segment totaled 916.9 million m³ of gas in 4Q13, down 2.2% compared to the 937.3 million m³ distributed in 4Q12. In 2013, the industrial segment consumed 3,788.3 million m³ of natural gas, nearly unchanged from the 3,788.7 million m³ distributed in 2012. These variations are related with the performance of the economy and the industrial activity in the period. In December 2013, Comgás had 1,032 clients in this segment, accounting for 69% of the total gas distributed for the quarter, representing 61% of the total margin.
The industrial segment has several activity sectors with different performance levels, which are affected by economic developments and specific characteristics. Also, each client has a different activity profile, so there may be volatility within a same sector. Therefore, in addition to economic aspects that directly affect natural gas consumption due to the impact on industrial production, industrial customers can have specific situations at their plants that can turn into opportunities or setbacks for demand.
The cogeneration segment saw a reduction of 15.4% in the volume of natural gas distributed, reaching 75.5 million m³ in 4Q13 versus 89.3 million m³ in 4Q12. In 2013, this market’s distributed volume fell 9.6% year-over-year, from 357.5 million m³ in 2012 to 323.1 million m³. This decrease is basically due to a maintenance shutdown at two clients and a reduction in the production of some plants because of the market crisis, especially in the textile sector. This segment represents 6% of the total volume of natural gas distributed by Comgás in 2013, or 3% of the total margin.
In 2013, the automotive sector represented 5% of the total volume of natural gas distributed by the Company, reaching 247.9 million m³. The reduction of 5.5% in the volume of natural gas sold in the quarter compared to 4Q12 was the smaller quarterly variation during the year, resulting from the different actions Comgás has been taking to recoup this segment’s volume. Year-over-year, there was a reduction of 9.8% from 274.8 million m³ in 2012 to 247.9 million m³ in 2013.
In the thermal generation segment, sales reached 204.7 million m³ in 4Q13, down 20.3% compared to 4Q12. In 2013, the total volume distributed reached 753.8 million m³, up 43% compared to 2012 (527 million m³). This variation occurred because the thermal power plant dispatched close to its maximum capacity in 2013. This segment represented 14% of the total volume of natural gas sold by Comgás in 2013 and 2% of the total margin. It is important to note that Comgás’s gas supply contracts do not include thermal power plants. If thermal power plants need to dispatch gas, Petrobras will supply the Company the additional volume, because these are “back to back” contracts.
21 of 50
| | Earnings Release 4th Quarter and Fiscal Year 2013 |
Natural Gas
Volume of Gas Sold (million m³) and New AHU5 Connected (thousand units)
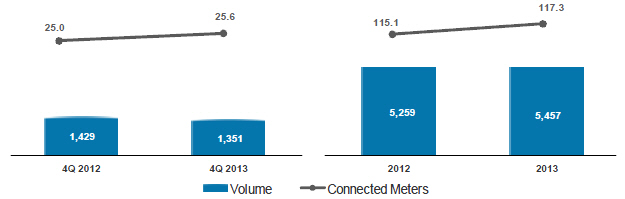
Note 5: New AHU (Autonomous Home Units) connected in the period.
Operating Revenue
| 4Q 2013 | 4Q 2012 | Sales Breakdown | 2013 | 2012 | 9M 2013 | FY 12/13 | ||
| (oct - dec) | (oct - dec) | Chg.% | Amounts in R$ MM | (jan-dec) | (jan-dec) | Chg.% | (mar/13-dec/13) | (apr/12-mar/13) |
| 1,960.4 | 1,792.0 | 9.4% | Gross Operating Revenue | 7,757.4 | 6,519.8 | 19.0% | 5,985.8 | 2,934.9 |
| 1,794.0 | 1,631.3 | 10.0% | Gas Sales | 7,051.6 | 6,026.3 | 17.0% | 5,422.0 | 2,694.0 |
| 216.8 | 171.6 | 26.3% | Residential | 808.6 | 650.7 | 24.3% | 663.8 | 257.6 |
| 81.8 | 67.2 | 21.8% | Commercial | 298.5 | 252.9 | 18.0% | 236.7 | 106.7 |
| 1,268.8 | 1,148.7 | 10.5% | Industrial | 5,095.8 | 4,345.8 | 17.3% | 3,894.9 | 1,947.3 |
| 74.5 | 86.0 | -13.4% | Cogeneration | 302.7 | 346.6 | -12.7% | 222.4 | 135.4 |
| 85.8 | 97.0 | -11.5% | Thermal Power | 296.7 | 195.8 | 51.6% | 212.1 | 148.7 |
| 66.2 | 60.8 | 9.0% | Vehicular | 249.3 | 234.4 | 6.3% | 192.2 | 98.2 |
| 157.9 | 152.8 | 3.3% | Construction Revenue | 671.6 | 447.0 | 50.2% | 536.5 | 230.0 |
| 8.6 | 7.9 | 7.8% | Other | 34.1 | 46.5 | -26.6% | 27.3 | 10.9 |
| (359.7) | (212.1) | 69.6% | Tax on Sales | (1,420.7) | (1,127.6) | 26.0% | (1,096.9) | (535.9) |
| 1,600.7 | 1,467.2 | 9.1% | Net Operating Revenue | 6,336.6 | 5,279.6 | 20.0% | 4,888.9 | 2,399.0 |
| 1,435.2 | 1,307.2 | 9.8% | Gas Sales | 5,636.3 | 4,790.5 | 17.7% | 4,328.4 | 2,159.2 |
| 157.9 | 152.8 | 3.3% | Construction Revenue | 671.6 | 447.0 | 50.2% | 536.5 | 230.0 |
| 7.6 | 7.2 | 5.7% | Other | 28.7 | 42.0 | -31.7% | 24.1 | 9.7 |
Net revenue from sales and services totaled R$1.6 billion in 4Q13, an increase of 9.1% year-over-year. Comgás recorded net revenue of R$6.3 billion in 2013, an increase of 20% over 2012, when net revenue amounted to R$5.3 billion.
Increased rates, as approved by ARSESP resolutions no. 421 and 455, were the main drivers of the changes in Revenue from the Sale of Natural Gas. To establish the new rates, the São Paulo State Sanitation and Energy Regulatory Agency (ARSESP) considered the increased cost of natural gas, especially imported gas (subject to agency review), impacted by the appreciation of the dollar and the higher average contracted oil price per barrel, key elements for natural gas price formation in Brazil.
22 of 50
| | Earnings Release 4th Quarter and Fiscal Year 2013 |
Cost of Goods Sold and Services Provided
| 4Q 2013 | 4Q 2012 | COGS | 2013 | 2012 | 9M 2013 | FY 12/13 | ||
| (oct - dec) | (oct - dec) | Chg.% | Amounts in R$ MM | (jan-dec) | (jan-dec) | Chg.% | (mar/13-dec/13) | (apr/12-mar/13) |
| (1,146.2) | (1,083.3) | 5.8% | Cost of Goods and Services | (4,556.6) | (3,881.9) | 17.4% | (3,524.2) | (1,738.3) |
| (881.8) | (840.4) | 4.9% | Natural Gas | (3,475.0) | (3,070.9) | 13.2% | (2,768.8) | (1,439.1) |
| (106.5) | (90.1) | 18.3% | Transportation and other Gas services | (409.9) | (363.9) | 12.6% | (218.9) | (69.2) |
| (157.9) | (152.8) | 3.3% | Construction | (671.6) | (447.0) | 50.2% | (536.4) | (230.0) |
In 4Q13, the cost of goods sold and services provided by Comgás, consisting of raw material (commodity), transportation and construction costs, reached R$ 1.2 billion, an increase of 5.8% from the R$1.1 billion reported in 4Q12. In 2013, this line totaled R$4.6 billion, up 17.4% year-over-year (R$3.9 billion in 2012).
The increase in the natural gas, transportation and other costs lines are chiefly due to the increase in the cost of natural gas in supply contracts priced in dollars, and the lower amount of gas auctioned by Petrobrás during 2013. The change in the construction cost line directly relates to higher investments made during 2013.
The differences between the actual cost incurred and the cost of gas included in the rate and billed to clients (according to the rate structure determined by ARSESP) are accumulated in the regulatory current account and passed through/billed as determined by the regulatory authority in the periodic price adjustments or rate revisions. This balance is adjusted on a monthly basis at the SELIC rate. On December 31, 2013, the regulatory current account recorded a balance of R$348 million for Comgás. On the same date in 2012, the balance was R$381 million for Comgás.
The regulatory current account represents a receivable or payable balance according to the difference between the price of the natural gas acquired by Comgás and the price considered to form the rate. This balance is not accounted for, and therefore when we refer to its normalization, it means we consider this asset and/or liability as if it had been accounted for.
The appreciation of the dollar versus the real impacted the cost of natural gas, and ARSESP’s transfers were not enough to recover the amounts of the regulatory current account. The agency authorizes rate updates so as to pass through the natural gas cost, and because the billed gas is dollar-indexed by Petrobras, the amounts are transferred to users.
23 of 50
| | Earnings Release 4th Quarter and Fiscal Year 2013 |
Gross Profit
| 4Q 2013 | 4Q 2012 | Gross Profit | 2013 | 2012 | 9M 2013 | FY 12/13 | ||
| (oct - dec) | (oct - dec) | Chg.% | Amounts in R$ MM | (jan-dec) | (jan-dec) | Chg.% | (mar/13-dec/13) | (apr/12-mar/13) |
| 454.5 | 383.9 | 18.4% | Gross Profit | 1,780.1 | 1,397.7 | 27.4% | 1,364.7 | 660.7 |
| 28.4% | 26.2% | 2.2 p.p | Gross Margin (%) | 28.1% | 26.5% | 1.6 p.p | 27.9% | 27.5% |
In 4Q13, Comgás reported gross profit of R$454.5 million, up 18.4% year-over-year (R$383.9 million in 4Q12). In 2013, gross profit was R$1.8 billion, up 27.4% year-over-year (R$1.4 billion in 2012).
Selling, General, and Administrative Expenses
| 4Q 2013 | 4Q 2012 | SG&A Expenses | 2013 | 2012 | 9M 2013 | FY 12/13 | ||
| (oct - dec) | (oct - dec) | Chg.% | Amounts in R$ MM | (jan-dec) | (jan-dec) | Chg.% | (mar/13-dec/13) | (apr/12-mar/13) |
| (144.5) | (143.3) | 0.9% | Selling Expenses | (573.9) | (446.5) | 28.5% | (422.4) | (259.8) |
| (90.3) | (82.8) | 9.1% | G&A Expenses | (309.7) | (293.3) | 5.6% | (239.3) | (127.7) |
| 3.6 | (1.5) | n/a | Other Operating Revenues (Expenses) | (3.0) | (9.5) | -68.6% | (1.6) | (2.2) |
In 4Q13, Comgás’s selling expenses totaled R$144.5 million, an increase of 0.9% year-over-year (R$143.3 million in 4Q12). Selling expenses were R$573.9 million for 2013, up 28.4% year-over-year.
In 4Q13, general and administrative expenses were R$90.3 million, down 9.1% from the R$82.8 million reported in 4Q12. In 2013, Comgás’s general and administrative expenses were R$309.7 million, up 5.6% year-over-year.
EBITDA
| 4Q 2013 | 4Q 2012 | EBITDA | 2013 | 2012 | 9M 2013 | FY 12/13 | ||
| (oct - dec) | (oct - dec) | Chg.% | Amounts in R$ MM | (jan-dec) | (jan-dec) | Chg.% | (mar/13-dec/13) | (apr/12-mar/13) |
| 340.3 | 258.9 | 31.4% | EBITDA | 1,337.9 | 967.5 | 38.3% | 1,023.6 | 471.5 |
| 21.3% | 17.6% | 3.6 p.p | EBITDA Margin (%) | 21.1% | 18.3% | 2.8 p.p | 20.9% | 19.7% |
| 328.8 | 271.4 | 21.1% | Normalizade EBITDA | 1,270.4 | 1,171.3 | 8.5% | 1,008.4 | 435.3 |
| 20.5% | 18.5% | 2.0 p.p | Normalized EBITDA Margin (%) | 20.0% | 22.2% | -2.1 p.p. | 20.6% | 18.1% |
Comgás’s EBITDA reached R$340.3 million in 4Q13, an increase of 31.4% year-over-year. In 2013, EBITDA totaled R$1.3 billion, an increase of 38.3% year-over-year, with EBITDA margin of 21.1%. Normalized by the regulatory current account, EBITDA totaled R$328.8 million for the quarter, and R$1.3 billion for 2013, up 8.5% year-over-year.
24 of 50
| | Earnings Release 4th Quarter and Fiscal Year 2013 |
Capex
| 4Q 2013 | 4Q 2012 | CAPEX | 2013 | 2012 | 9M 2013 | FY 12/13 | ||
| (oct - dec) | (oct - dec) | Chg.% | Amounts in R$ MM | (jan-dec) | (jan-dec) | Chg.% | (mar/13-dec/13) | (apr/12-mar/13) |
| 209.4 | 189.3 | 10.6% | CAPEX | 852.2 | 615.8 | 38.4% | 677.7 | 294.4 |
In 4Q13, Capex reached R$209.4 million, an increase of 10.6% year-over-year (R$189.3 million in 4Q12). In 2013, Capex totaled R$852.2 million, the largest amount ever invested by Comgás in one single year, and up 38.4% year-over-year.
Of total investments made during the year, approximately 64% was in gas distribution network expansion. A total of 1,629 kilometers of network were added in 2013 (459 kilometers in the fourth quarter alone), up 26% year-over-year. This expansion allowed for the network to reach cities that were not served by Comgás, and also helped consolidate the operations in cities already served by the Company.
Another project that stood out in the period was the RETAP, improvement of the high-pressure network with the purpose of meeting the increased demand for natural gas in the Metropolitan Region of São Paulo, with investments of nearly R$113 million during 2013.
25 of 50
| | Earnings Release 4th Quarter and Fiscal Year 2013 |
B.4 Rumo
Below we report on Rumo’s results, the company responsible for providing integrated logistics services, consisting of transportation, storage and port elevation for sugar and other agricultural commodities.
Net Revenue
| 4Q 2013 | 4Q 2012 | Sales Breakdown | 2013 | 2012 | 9M 2013 | FY 12/13 | ||
| (oct - dec) | (oct - dec) | Chg.% | Amounts in R$ MM | (jan-dec) | (jan-dec) | Chg.% | (mar/13-dec/13) | (apr/12-mar/13) |
| 206.5 | 221.6 | -6.8% | Net Operating Revenue | 917.7 | 618.6 | 48.4% | 749.4 | 712.7 |
| 154.4 | 176.8 | -12.6% | Transportation | 726.0 | 474.4 | 53.0% | 597.5 | 549.3 |
| 46.9 | 41.1 | 14.2% | Loading | 174.8 | 130.9 | 33.6% | 138.2 | 150.0 |
| 5.2 | 3.7 | 39.5% | Other | 16.9 | 13.3 | 27.4% | 13.6 | 13.3 |
Rumo’s net revenue totaled R$206.5 million for 4Q13, down 6.8% year-over-year due to lower transportation and elevation volumes in the period. In 2013, net revenue reached R$917.7 million, an increase of 48.4% year-over-year;
Net revenue from transportation totaled R$726 million in 2013, an increase of 53% year-over-year especially due to (1) increase in sugar volumes transported, and (2) recognition by Rumo of a reimbursement of additional costs for the contracting of highway transportation compared to the cost of railway freight set in the contract with America Latina Logística (ALL).
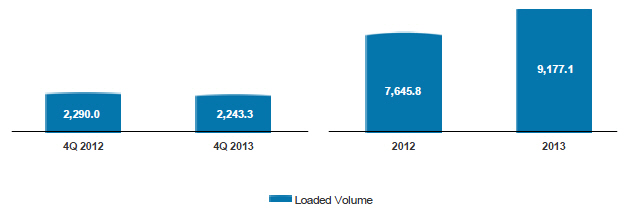
Rumo’s sugar elevation volume was 9.2 million tonnes in 2013, an increase of 20% compared to 2012. Revenue from elevation rose 33.6% in the period, driven by the growth in volumes, especially due to new contracts signed in the period.
Elevation Volume
(thousand t)
26 of 50
| | Earnings Release 4th Quarter and Fiscal Year 2013 |
Cost of Services Provided
| 4Q 2013 | 4Q 2012 | Costs of Services | 2013 | 2012 | 9M 2013 | FY 12/13 | ||
| (oct - dec) | (oct - dec) | Chg.% | Amounts in R$ MM | (jan-dec) | (jan-dec) | Chg.% | (mar/13-dec/13) | (apr/12-mar/13) |
| (113.0) | (121.4) | -6.9% | Cost of Services | (542.6) | (402.8) | 34.7% | (447.4) | (420.6) |
Rumo’s cost of services provided includes railway and highway freight, port elevation, transshipment and storage costs in upstate São Paulo and at the Port of Santos.
In 2013, cost of services provided totaled R$542.6 million, up 34.7% year-over-year, resulting from the increase in volumes and freight cost, especially impacted by the contingent contracting of highway transportation to the Port of Santos.
Gross Profit
| 4Q 2013 | 4Q 2012 | Gross Profit | 2013 | 2012 | 9M 2013 | FY 12/13 | ||
| (oct - dec) | (oct - dec) | Chg.% | Amounts in R$ MM | (jan-dec) | (jan-dec) | Chg.% | (mar/13-dec/13) | (apr/12-mar/13) |
| 93.5 | 100.1 | -6.6% | Gross Profit | 375.1 | 215.8 | 3.3% | 301.9 | 292.1 |
| 45.3% | 45.2% | 0.1 p.p | Gross Margin (%) | 40.9% | 34.9% | 6.0 p.p | 40.3% | 41.0% |
Rumo’s gross profit totaled R$375.1 million in 2013, up 3.3% year-over-year, while gross margin rose 6 p.p. to 40.9% in the year, versus 34.9% in 2012.
General and Administrative Expenses
| 4Q 2013 | 4Q 2012 | G&A Expenses | 2013 | 2012 | 9M 2013 | FY 12/13 | ||
| (oct - dec) | (oct - dec) | Chg.% | Amounts in R$ MM | (jan-dec) | (jan-dec) | Chg.% | (mar/13-dec/13) | (apr/12-mar/13) |
| (22.6) | (15.2) | 48.5% | G&A Expenses | (74.3) | (53.1) | 39.8% | (57.6) | (58.1) |
Adapting Rumo’s administrative structure for the new growth projects resulted in general and administrative expenses of R$74.3 million in 2013.
EBITDA
| 4Q 2013 | 4Q 2012 | EBITDA | 2013 | 2012 | 9M 2013 | FY 12/13 | ||
| (oct - dec) | (oct - dec) | Chg.% | Amounts in R$ MM | (jan-dec) | (jan-dec) | Chg.% | (mar/13-dec/13) | (apr/12-mar/13) |
| 89.0 | 98.9 | -10.1% | EBITDA | 358.0 | 248.2 | 44.2% | 288.9 | 296.7 |
| 43.1% | 44.6% | -1.5 p.p. | Margin EBITDA (%) | 39.0% | 40.1% | -1.1 p.p. | 38.6% | 41.6% |
Rumo reported EBITDA of R$358 million for 2013, up 44.2% over the R$248.2 million reported in 2012, with a margin of 39%.
In October 2013, Rumo filed an arbitrage claim against ALL, demanding that the contractual relation between the companies be complied with. Due to the filing of the lawsuit, Rumo stopped recognizing some revenues under the agreement, which totaled R$18.6 million in 4Q13. Rumo’s not accounting for these amounts as revenue does not eliminate the validity of the relative collection, and Rumo is certain that it will receive these amounts of the ongoing lawsuits.
27 of 50
| | Earnings Release 4th Quarter and Fiscal Year 2013 |
Considering the amounts of the provision for doubtful accounts and those not recognized in revenue during 2013 (R$34.4 million), Rumo’s EBITDA would have been R$392.4 million.
Capex
| 4Q 2013 | 4Q 2012 | CAPEX | 2013 | 2012 | 9M 2013 | FY 12/13 | ||
| (oct - dec) | (oct - dec) | Chg.% | Amounts in R$ MM | (jan-dec) | (jan-dec) | Chg.% | (mar/13-dec/13) | (apr/12-mar/13) |
| 41.8 | 79.3 | -47.3% | CAPEX | 255.0 | 255.2 | -0.1% | 198.0 | 266.7 |
Rumo’s capital expenditures amounted to R$255 million in 2013, and were invested in the following:
| (i) | R$124.8 million in railways on the network operated by ALL; |
| (ii) | R$89.7 million in improvements in the port terminal of Santos, including increase in unloading capacity, improvement of the terminal’s reception and expedition conveyor routes, construction of the coverage of the South terminal’s quay; and recurring investments in warehouse equipment and infrastructure; |
| (iii) | R$40.5 million in other initiatives, especially investments in transshipment terminals in upstate São Paulo. |
28 of 50
| | Earnings Release 4th Quarter and Fiscal Year 2013 |
B.5 Cosan Lubrificantes
Results of the lubricants segment include the manufacturing and distribution of Mobil and Comma lubricants, resale of base oil and automotive specialties in Brazil and in 40 other countries through two plants located in Rio de Janeiro, Brazil, and in Kent, U.K.
Net Revenue
| 4Q 2013 | 4Q 2012 | Sales Breakdown | 2013 | 2012 | 9M 2013 | FY 12/13 | ||
| (oct - dec) | (oct - dec) | Chg. % | Amounts in R$ MM | (jan-dec) | (jan-dec) | Chg.% | (mar/13-dec/13) | (apr/12-mar/13) |
| 391.8 | 377.9 | 3.7% | Net Operating Revenue | 1,542.9 | 1,325.1 | 16.4% | 1,185.2 | 1,417.5 |
Net revenue from the sale of lubricants, resale of base oil and other products and services of Cosan Lubrificantes totaled R$391.8 million in 4Q13, up 3.7% year-over-year (R$377.9 million in 4Q12). In 2013, net revenue rose 16.4% year-over-year, reaching R$1.5 billion, due to the increase of 16.8% in volume sold, especially of base oils.
Total unit average revenue was down 0.3%, from R$4,904/m³ in 2012 to R$4,888/m³ in 2013, reflecting a larger stake of base oil in the mix, which is a product with lower unit value.
Lubricants, Base Oils, and Other Products
Volume (million liters) and Average Unit Revenue (R$/’000 liters)
29 of 50
| | Earnings Release 4th Quarter and Fiscal Year 2013 |
Cost of Goods Sold and Services Provided
| 4Q 2013 | 4Q 2012 | COGS | 2013 | 2012 | 9M 2013 | FY 12/13 | ||
| (oct - dec) | (oct - dec) | Chg. % | Amounts in R$ MM | (jan-dec) | (jan-dec) | Chg.% | (mar/13-dec/13) | (apr/12-mar/13) |
| (306.2) | (275.3) | 11.2% | Cost of Goods and Services | (1,158.4) | (985.4) | 17.6% | (900.5) | (1,050.7) |
In 2013, cost of goods sold and services provided by Cosan Lubrificantes rose 17.6% year-over-year, reaching R$1.2 billion. This increase was due to higher volumes sold and the increase in the foreign exchange rate, which has a direct impact on imports of base oil and other inputs.
Total unit average cost remained unchanged year-over-year, reaching R$3,670/m³ in 2013, reflecting a larger stake of base oil in the mix, which is a product with lower unit cost.
Gross Profit
| 4Q 2013 | 4Q 2012 | Gross Profit | 2013 | 2012 | 9M 2013 | FY 12/13 | ||
| (oct - dec) | (oct - dec) | Chg. % | Amounts in R$ MM | (jan-dec) | (jan-dec) | Chg.% | (mar/13-dec/13) | (apr/12-mar/13) |
| 85.6 | 102.6 | -16.5% | Gross Profit | 384.5 | 339.7 | 13.2% | 284.7 | 366.8 |
| 21.9% | 27.2% | -5.3 p.p. | Gross Margin (%) | 24.9% | 25.6% | -0.7 p.p. | 24.0% | 25.9% |
Gross profit rose 13.2% year-over-year to R$384.5 million in 2013 (R$339.7 million in 2012). Gross margin reached 24.9% in 2013, practically unchanged year-over-year.
Selling, General & Administrative Expenses
| 4Q 2013 | 4Q 2012 | SG&A | 2013 | 2012 | 9M 2013 | FY 12/13 | ||
| (oct - dec) | (oct - dec) | Chg. % | Amounts in R$ MM | (jan-dec) | (jan-dec) | Chg.% | (mar/13-dec/13) | (apr/12-mar/13) |
| (76.2) | (75.8) | 0.6% | Total expenses | (301.9) | (253.7) | 19.0% | (234.1) | (272.4) |
Selling, general, and administrative expenses rose 19% year-over-year in 2013, totaling R$301.9 million, mainly due to the expansion of trading activities in Brazil and higher volumes sold by international operations.
EBITDA
| 4Q 2013 | 4Q 2012 | EBITDA | 2013 | 2012 | 9M 2013 | FY 12/13 | ||
| (oct - dec) | (oct - dec) | Chg. % | Amounts in R$ MM | (jan-dec) | (jan-dec) | Chg.% | (mar/13-dec/13) | (apr/12-mar/13) |
| 26.5 | 38.8 | -31.6% | EBITDA | 140.1 | 121.1 | 15.7% | 92.7 | 137.4 |
| 6.8% | 10.3% | -3.5 p.p. | EBITDA Margin (%) | 9.1% | 9.1% | 0.0 p.p | 7.8% | 9.7% |
Cosan Lubrificantes’s EBITDA was R$140.1 million for 2013, with a margin of 9.1%, down 0.1 p.p. The 15.7% growth is due to the higher sales volume in the period.
30 of 50
| | Earnings Release 4th Quarter and Fiscal Year 2013 |
B.6 Radar
Below we report on Radar’s results, whose main activity is investment in agricultural properties, land leasing in the Brazilian rural real estate market, and portfolio management.
Radar’s 2012 results are proforma, considering twelve months (January to December 2012) of the combination of Radar’s operations with Cosan’s land results for better comparability.
Assets Portfolio
| State | Culture | % | Area (hectare) | Area (acre) | Market Value ( R$MM) | |
| Third-party land | - | - | 124,726 | 308,072 | 1,541 | |
| Owned Land | - | 100% | 107,279 | 264,980 | 2,596 | |
| São Paulo | Sugarcane | 66% | 70,281 | 173,593 | 2,192 | |
| Maranhão | Grains | 16% | 16,651 | 41,129 | 142 | |
| Mato Grosso | Grains | 11% | 12,303 | 30,388 | 164 | |
| Bahia | Grains | 7% | 7,155 | 17,674 | 80 | |
| Goiás | Sugarcane | 1% | 672 | 1,659 | 16 | |
| Mato Grosso do Sul | Sugarcane | 0% | 218 | 538 | 2 | |
| Total | 232,005 | 573,052 | 4,137 |
Radar closed 2013 with a land portfolio of R$2.6 billion, and total area of 107,3 thousand hectares (265,0 thousand acres), distributed throughout six Brazilian states. Considering third-party assets managed by Radar, total area under management is 232,0 thousand hectares (573,1 thousand acres), equivalent to R$4.1 billion.
Net Revenue
| 4Q 2013 | 4Q 2012 | 2013 | 2012 | 9M 2013 | FY 12/13 | |||
| (oct - dec) | (oct - dec) | Chg. % | Amounts in R$ MM | (jan-dec) | (jan-dec) | Chg.% | (mar/13-dec/13) | (apr/12-mar/13) |
| 18.7 | 15.6 | 19.9% | Net Revenue | 70.1 | 91.7 | -23.5% | 54.8 | 51.9 |
| - | - | - | Property Sale | 5.7 | 22.0 | -74.2% | 5.7 | 4.7 |
| 18.7 | 15.6 | 19.9% | Land Lease | 64.4 | 69.6 | -7.5% | 49.1 | 47.2 |
| - | - | - | Cost of Property Sales | (6.1) | (20.1) | -69.8% | (6.1) | (1.7) |
| - | - | - | Property Sale | (6.1) | (20.1) | -69.8% | (6.1) | (1.7) |
| 18.7 | 15.6 | 19.9% | Gross Profit | 64.1 | 71.6 | -10.5% | 48.7 | 50.2 |
| 100.0% | 100.0% | 0.0 p.p | Gross Margin (%) | 91.4% | 78.1% | 13.3 p.p | 88.9% | 96.6% |
Radar’s net revenue was R$18.7 million in 4Q13, up 19.9% year-over-year (R$15.6 million in 4Q12). In 2013, Radar recorded net revenue of R$70.1 million, down 23.5% year-over-year, mainly impacted by lower sales of land, and the reduction in leasing prices due to the fluctuation of variables that make up agricultural commodities prices and impact the agreements’ indexes.
31 of 50
| | Earnings Release 4th Quarter and Fiscal Year 2013 |
Cost of services provided by Radar reached R$6.1 million in 2013, and refers to the sale of assets in 2Q13.
Gross profit was R$64.1 million, down 10.5% year-over-year.
General and Administrative Expenses
| 4Q 2013 | 4Q 2012 | G&A Expenses | 2013 | 2012 | 9M 2013 | FY 12/13 | ||
| (oct - dec) | (oct - dec) | Chg. % | Amounts in R$ MM | (jan-dec) | (jan-dec) | Chg.% | (mar/13-dec/13) | (apr/12-mar/13) |
| (8.1) | (6.1) | 32.1% | G&A Expenses | (23.2) | (18.8) | 23.5% | (18.3) | (14.9) |
Radar’s general and administrative expenses totaled R$23.5 million in 2013, up 23.5% year-over-year. Other operating revenues are the gain from valuation of Radar’s own portfolio and portfolio under management.
EBITDA
| 4Q 2013 | 4Q 2012 | EBITDA | 2013 | 2012 | 9M 2013 | FY 12/13 | ||
| (oct - dec) | (oct - dec) | Chg. % | Amounts in R$ MM | (jan-dec) | (jan-dec) | Chg.% | (mar/13-dec/13) | (apr/12-mar/13) |
| 86.3 | 96.6 | -10.7% | EBITDA | 227.5 | 146.5 | 55.3% | 162.3 | 180.4 |
Radar’s EBITDA reached R$227.5 million in 2013, an increase of 55.3% year-over-year, impacted by the valuation of 7.2% of its land portfolio based on an independent appraisal.
32 of 50
| | Earnings Release 4th Quarter and Fiscal Year 2013 |
B.7 Other Businesses
Below we report on the results of the Other Businesses segment, which comprises Cosan’s corporate structure, effects of contingencies from businesses contributed to Raízen prior to its formation, and other investments.
| 4Q 2013 | 4Q 2012 | 2013 | 2012 | 9M 2013 | FY 12/13 | |||
| (oct - dec) | (oct - dec) | Chg. % | Amounts in R$ MM | (jan-dec) | (jan-dec) | Chg.% | (mar/13-dec/13) | (apr/12-mar/13) |
| (26.2) | (38.1) | -31.2% | G&A Expenses | (121.2) | (134.3) | -9.8% | (96.3) | (127.0) |
| 0.8 | (5.4) | n/a | Other Revenues (Expenses) | 0.8 | 54.4 | -98.6% | (26.5) | 57.7 |
| 4Q 2013 | 4Q 2012 | EBITDA | 2013 | 2012 | 9M 2013 | FY 12/13 | ||
| (oct - dec) | (oct - dec) | Chg. % | Amounts in R$ MM | (jan-dec) | (jan-dec) | Chg.% | (mar/13-dec/13) | (apr/12-mar/13) |
| 202.9 | 273.3 | -25.8% | EBITDA | 732.1 | 795.8 | -8.0% | 533.3 | 836.9 |
| - | - | - | (-) Gross Effects of Raizen's formation | - | 100.3 | n/a | - | - |
| (227.5) | (316.3) | -28.1% | (-) Equity Pick-up | (850.2) | (964.1) | -11.8% | (654.2) | (899.7) |
| (24.7) | (43.0) | -42.6% | Adjusted EBITDA | (118.1) | (68.0) | 73.7% | (120.9) | (62.8) |
Cosan’s general and administrative expenses mostly consist of personnel expenses, which include payroll, charges, and consulting services, and totaled R$121.2 million in 2013, down 9.8% year-over-year.
Other revenues and expenses of this segment totaled R$0.8 million in 2013, and consist of provision net effects, reversals, and payment of contingencies and attorney’s fees, in addition to the result from the sale of assets. In 2012, other revenues and expenses totaled R$54.4 million, impacted by the sale of aviation fuel distribution infrastructure assets, as determined by the Brazilian Antitrust Board (CADE).
In 2013, this segment’s EBITDA amounted to R$732.1 million, exclusively due to the equity accounting result. Adjusted for this effect, the segment’s EBITDA was a negative R$118.1 million.
33 of 50
| | Earnings Release 4th Quarter and Fiscal Year 2013 |
C. Other Items in the Consolidated Result
Financial Result
| 4Q 2013 | 4Q 2012 | Financial Results | 2013 | 2012 | 9M 2013 | FY 12/13 |
| (oct - dec) | (oct - dec) | Amounts in R$ MM | (jan-dec) | (jan-dec) | (mar/13-dec/13) | (apr/12-mar/13) |
| (198.6) | (111.0) | Gross Debt Charges | (717.4) | (225.6) | (555.0) | (189.4) |
| 31.3 | 27.1 | Income from Financial Investments | 107.4 | 74.5 | 99.2 | 83.3 |
| (167.3) | (83.9) | (=) Subtotal: Net Debt Interests | (610.1) | (151.1) | (455.8) | (106.1) |
| (55.3) | (31.4) | Other Charges and Monetary Variation | (81.5) | (132.2) | (89.9) | (199.1) |
| (105.7) | (5.6) | Exchange Rate Variation | (311.1) | (65.9) | (323.8) | (81.0) |
| 93.0 | 43.3 | Gains (losses) with Derivatives | 211.3 | 78.9 | 213.5 | 74.5 |
| (16.8) | (9.5) | Amortization, Debt Cost and Other | (86.5) | (36.9) | (44.3) | (99.2) |
| (252.1) | (87.0) | (=) Financial, Net | (877.8) | (307.2) | (700.3) | (410.9) |
Net financial result for 4Q13 was an expense of R$252.1 million, versus an expense of R$87 million in 4Q12.
In 4Q13, debt charges were up by R$90.7 million year-over-year, mainly due to the consolidation of Comgás’s results starting in November 2012, and the effect of the cost of the debt incurred for its acquisition and an increment in the reference interest rate for most debts (increase of the CDI to 2.31%p.a. in 4Q13 from 1.41%p.a. in 4Q12).
Revenue from financial investments reached R$31.3 million in 4Q13, up from R$27.1 million in 4Q12, also reflecting the consolidation of Comgás’s results starting in November 2012, and the increase in the CDI rate year-over-year.
The negative result from the foreign exchange rate variation in the quarter reflects the appreciation of the dollar against the Brazilian real by 5.1% (R$2.3426/US$ on December 31, 2013 versus R$2.2300/US$ on September 30, 2013), and the impact on debts denominated in dollars, causing a non-cash effect on the consolidated financial result. But it is important to note that all debts denominated in foreign currency are hedged by foreign exchange swaps, except for the principal of the Perpetual Bond in the amount of US$500 million. In 4Q12 the dollar also appreciated versus the real (R$2.0435/US$ on December 31, 2012 versus R$2.0306/US$ on September 30, 2012), but at a lower rate of 0.6%.
In 4Q13 we recorded a positive result with foreign exchange derivatives in the amount of R$117.2 million, which offset the currency depreciation over debts hedged through foreign exchange derivatives as mentioned above.
The financial result for 2013 was a net expense of R$877.8 million, up from R$ 307.2 million in 2012. This increment is due to the consolidation of Comgás for only two months of 2012, while in 2013 both Comgás’s debt and the funding for its acquisition were consolidated for the whole year.
34 of 50
| | Earnings Release 4th Quarter and Fiscal Year 2013 |
Income Tax and Social Contribution
| 4Q 2013 | 4Q 2012 | Income Tax and Social Contribution | 2013 | 2012 | 9M 2013 | FY 12/13 |
| (oct - dec) | (oct - dec) | Amounts in R$ MM | (jan-dec) | (jan-dec) | (mar/13-dec/13) | (apr/12-mar/13) |
| 196.7 | 342.2 | Income (Loss) before Income Tax | 816.9 | 698.0 | 562.4 | 831.5 |
| 155.6 | (38.4) | Total of Tax and Social Contribution | (178.4) | 40.7 | (39.2) | (126.4) |
| 160.8 | 11.0 | Deferred Income Tax Expenses | (20.7) | 116.0 | 90.8 | (26.3) |
| (5.1) | (49.4) | Current Income Tax Expenses | (157.7) | (75.3) | (130.0) | (100.0) |
| -2.6% | -14.4% | Effective Rate - Current (%) | -19.3% | -10.8% | -23.1% | -12.0% |
In 4Q13, the result with income tax and social security was a gain of R$155.6 million, basically due to the accounting for a deferred income tax asset over tax losses and social security negative bases that had not been accounted for in prior quarters. We have resumed the accounting for such tax credits because of a revision of future scenarios and the corresponding projects of taxable results.
In 2013, the consolidated income tax expense totaled R$178.4 million, representing an effective rate of 19.3%. The difference from the nominal rate of 34% is mainly due to the different taxation (estimated profit taxation system) used at subsidiary Radar, and the equity accounting result of Raízen, which is not taxable.
For a better understanding, below are the income tax and social security expenses broken down by business unit.
4Q 2013 Income Tax and Social Contribution Amount in R$ MM | Comgás | Rumo | Lubricants | Radar7 | Other Business | Adjusts and Eliminations | Consolidated | |||||||||||||||||||||
| Net Income before Taxes | 174.4 | 70.9 | 2.5 | 87.6 | (1.2 | ) | (137.4 | ) | 196.8 | |||||||||||||||||||
| Nominal Rate of Income Tax and Social Contribution (%) | -34 | % | -34 | % | -34 | % | -34 | % | -34 | % | -34 | % | -34 | % | ||||||||||||||
| Income Tax and Social Contribtions Theoretical Expense | (59.3 | ) | (24.1 | ) | (0.8 | ) | (29.8 | ) | 0.4 | 46.7 | (66.9 | ) | ||||||||||||||||
| Non-taxable Permanent Differences / Equity Pick-up | (1.1 | ) | (0.0 | ) | (0.4 | ) | (0.0 | ) | 77.2 | (46.7 | ) | 28.9 | ||||||||||||||||
| Tax Loss and Negative Basis | - | - | - | - | 188.6 | - | 188.6 | |||||||||||||||||||||
| Interest on Capital | - | - | - | 24.3 | 0.0 | - | 24.3 | |||||||||||||||||||||
| Different Tax Regime for Entities Taxed on Presumed Profits | 38.2 | - | - | - | (53.5 | ) | - | (15.3 | ) | |||||||||||||||||||
| Other | 1.1 | 0.3 | (8.6 | ) | (0.0 | ) | 3.1 | - | (4.0 | ) | ||||||||||||||||||
| Income Tax Effective Expenses | (21.0 | ) | (23.8 | ) | (9.9 | ) | (5.5 | ) | 215.8 | - | 155.6 | |||||||||||||||||
| Income Tax and Social Contribution Effective Rate (%) | 12 | % | 34 | % | n/d | 6 | % | n/d | 0 | % | -79 | % | ||||||||||||||||
| Expenses (Revenues) com IR/CS | (21.0 | ) | (23.8 | ) | (9.9 | ) | (5.5 | ) | 215.8 | - | 155.6 | |||||||||||||||||
| Current | 8.9 | (16.9 | ) | (3.7 | ) | 0.5 | 6.2 | - | (5.1 | ) | ||||||||||||||||||
| Effective Rate - Current Rate (%) | -5 | % | 24 | % | 150 | % | -1 | % | 512 | % | 0 | % | 3 | % | ||||||||||||||
| Deferred | (29.9 | ) | (6.9 | ) | (6.1 | ) | (5.9 | ) | 209.7 | - | 160.8 | |||||||||||||||||
| 2013 Income Tax and Social Contribution Amount in R$ MM | Comgás | Rumo | Lubricants | Radar7 | Other Business | Adjusts and Eliminations | Consolidated | |||||||||||||||||||||
| Net Income before Taxes | 702.4 | 293.0 | 42.8 | 229.9 | 51.1 | (502.3 | ) | 816.9 | ||||||||||||||||||||
| Nominal Rate of Income Tax and Social Contribution (%) | -34 | % | -34 | % | -34 | % | -34 | % | -34 | % | -34 | % | -34 | % | ||||||||||||||
| Income Tax and Social Contribtions Theoretical Expense | (238.8 | ) | (99.6 | ) | (14.5 | ) | (78.2 | ) | (17.4 | ) | 170.8 | (277.8 | ) | |||||||||||||||
| Non-taxable Permanent Differences / Equity Pick-up | (3.2 | ) | (0.6 | ) | (2.7 | ) | 0.0 | 288.1 | (170.8 | ) | 110.9 | |||||||||||||||||
| Tax Loss and Negative Basis | - | - | - | 63.8 | (0.5 | ) | - | 63.3 | ||||||||||||||||||||
| Different Tax Regime for Entities Taxed on Presumed Profits | 38.2 | - | - | - | (60.3 | ) | - | (22.1 | ) | |||||||||||||||||||
| Other | 2.5 | 0.5 | (21.9 | ) | 0.8 | (34.5 | ) | - | (52.8 | ) | ||||||||||||||||||
| Income Tax Effective Expenses | (201.3 | ) | (99.7 | ) | (39.1 | ) | (13.7 | ) | 175.4 | - | (178.4 | ) | ||||||||||||||||
| Income Tax and Social Contribution Effective Rate (%) | 29 | % | 34 | % | 92 | % | 6 | % | n/d | 0 | % | 22 | % | |||||||||||||||
| Expenses (Revenues) com IR/CS | (201.3 | ) | (99.7 | ) | (39.1 | ) | (13.7 | ) | 175.4 | - | (178.4 | ) | ||||||||||||||||
| Current | (144.1 | ) | (15.3 | ) | 0.4 | (5.3 | ) | 6.5 | - | (157.7 | ) | |||||||||||||||||
| Effective Rate - Current Rate (%) | 21 | % | 5 | % | -1 | % | 2 | % | -13 | % | 0 | % | 19 | % | ||||||||||||||
| Deferred | (57.2 | ) | (84.4 | ) | (39.5 | ) | (8.4 | ) | 168.9 | - | (20.7 | ) | ||||||||||||||||
Note7: Radar adopts tax regime for entities taxed on presumed profits
Current income tax and social security expenses represents the calculated tax amount payable/(recoverable). The amount effectively paid may still be deducted from existing tax credits
35 of 50
| | Earnings Release 4th Quarter and Fiscal Year 2013 |
Net Income
| 4Q 2013 | 4Q 2012 | Net Income | 2013 | 2012 | 9M 2013 | FY 12/13 |
| (oct - dec) | (oct - dec) | Amounts in R$ MM | (jan-dec) | (jan-dec) | (mar/13-dec/13) | (apr/12-mar/13) |
| 229.8 | 339.3 | Net Income | 261.3 | 746.8 | 234.1 | 626.4 |
Cosan’s net income was R$229.8 million for 4Q13, down 32.3% from the R$339.3 million reported for 4Q12.
The key drivers of this decrease in 4Q13 were the following:
| 4Q 2013 | Net Income | 2013 | |||||
| (oct-dec) | Amount in R$ MM | (jan-dec) | |||||
| 339.3 | Net Income Previous Period | 746.8 | |||||
| EBIT Businesses | |||||||
| 144.2 | Comgás | 814.4 | |||||
| (12.1 | ) | Rumo | 110.2 | ||||
| (10.3 | ) | Radar | 111.9 | ||||
| (16.0 | ) | Lubrificantes | 9.1 | ||||
| 18.1 | Outros | 50.9 | |||||
| 123.9 | EBIT Businesses Total | 1,096.6 | |||||
| (165.1 | ) | Financial Result | (570.6 | ) | |||
| (104.2 | ) | Equity Pick-up | (407.0 | ) | |||
| 194.1 | Income Taxes | (219.2 | ) | ||||
| (20.7 | ) | Non-controlling Interest | (243.1 | ) | |||
| (137.4 | ) | Dicountinued operation | (142.2 | ) | |||
| 229.8 | Net Income | 261.3 | |||||
| (i) | An increase in net financial expenses of R$165.1 million, mainly due to the acquisition and consolidation of Comgás, and the effect of the foreign exchange rate variation over dollar-denominated debts in the period. In 2013, this effect totaled R$570.6 million; |
| (ii) | A decrease in Raízen’s equity accounting result in the amount of R$107.1 million due to the strategy of forming inventories, to biological assets, and to the foreign exchange rate variation over debts; |
| (iii) | A decrease of R$137.4 million due to the disposal of the control of the Sugar Retail business in October 2012. In 2013, this impact was of R$142.2 million; |
| (iv) | Offset by a better performance of the businesses in the period, as commented above, and the consolidation of Comgás starting in November 2012; |
| (v) | Income tax increment of R$194 million (non-cash effect). |
36 of 50
| | Earnings Release 4th Quarter and Fiscal Year 2013 |
D. Indebtedness
At the close of 4Q13, Cosan’s proforma consolidated debt (excluding PESA) was R$12.6 billion, compared to R$12 billion in 3Q13. Below are the separate debts of Cosan and Subsidiaries, and also Raízen’s debts, which are proforma at a proportion of 50%.
Cosan and Subsidiaries
Gross debt totaled R$8.6 billion in 4Q13, an increase of 1.8% from 3Q13.
The key events in the period were:
| (i) | Funding of nearly R$553.4 million through the issue of debentures at Comgás; |
| (ii) | Amortization of principal and interest in the amount of R$666,5 million, in the modality of Resolution 4,131 and in Promissory Notes, mainly at Comgás; |
| (iii) | Accrual for interest, foreign exchange variation, and derivatives fair value result, in the amount of R$269.2 million in the period. |
Raízen
The combined gross debt of Raízen totaled R$7.9 billion in 4Q13, up 11.9% year-over-year.
In the quarter, changes in debt principal and interest were as follows:
| (i) | Raising of R$1.4 billion, mainly through the issue of debentures for the amount of R$750 million, and other rural credit, ACC and other funding transactions. |
| (ii) | Amortization of principal and interest in the amount of R$928.4 million related to prepayment, foreign exchange contract advances, rural credit, BNDES, and others; |
| (iii) | Accrual for interest of R$139.6 million, and for foreign exchange variation in the amount of R$212.8 million. |
Cosan – proforma Consolidated
Cash available totaled R$2.3 billion in 4Q13, up from R$2.1 billion in 3Q13. Net proforma indebtedness totaled R$10.3 billion for the quarter, as compared to R$9.9 billion in 3Q13, equal to a leverage of 2.6x proforma LTM EBITDA (R$4 billion).
37 of 50
| | Earnings Release 4th Quarter and Fiscal Year 2013 |
| Debt per Business Units (Amount in R$ MM) | ||||
| 4Q 2013 | 3Q 2013 | |||
| Comgás | (oct - dec) | (jul-sep) | % ST | Chg.% |
| Leasing | 1.1 | 1.4 | 100% | -22.9% |
| Promissory Notes | - | 418.4 | 0% | n/a |
| EIB | 633.2 | 602.6 | 6% | 5.1% |
| 4131 Resolution | 413.5 | 504.8 | 1% | -18.1% |
| BNDES | 1,215.1 | 1,230.6 | 21% | -1.3% |
| Debentures | 588.9 | 33.9 | 7% | n/a |
| Debt Notes Allocation | (10.4) | (3.9) | 21% | n/a |
| Financial Instruments - MTM | (209.8) | (180.0) | -23% | 16.6% |
| Total Comgás | 2,631.6 | 2,607.8 | - | 0.9% |
| Rumo | ||||
| Finame | 707.5 | 731.9 | 15% | -3.3% |
| Expenses with Placement of Debt | (1.5) | (1.5) | 11% | -2.6% |
| Total Rumo | 706.0 | 730.4 | - | -3.3% |
| Cosan Lubricants | ||||
| Finame | 0.2 | 0.2 | 6% | 0.0% |
| Foreing Loan | 209.3 | 196.9 | 0% | 6.3% |
| Total Lubricants | 209.6 | 197.2 | - | 6.3% |
| Other Business | ||||
| Perpetual Bonds | 1,186.1 | 1,129.1 | 1% | 5.0% |
| Credit Notes | 395.4 | 385.6 | 100% | 2.5% |
| Debentures | 1,464.2 | 1,423.6 | 4% | 2.8% |
| FINEP | 89.9 | 89.9 | 0% | 0.0% |
| Senior Notes 2018 | 873.8 | 853.6 | 3% | 2.4% |
| Senior Notes 2023 | 1,110.0 | 1,067.1 | 2% | 4.0% |
| Expenses with Placement of Debt | (51.2) | (52.6) | 18% | -2.7% |
| Bonus over Perpetual Bonds | 5.1 | 5.5 | 52% | -7.1% |
| Financial Instruments - MTM | 24.8 | 51.9 | 0% | -52.3% |
| Total Other Business | 5,098.0 | 4,953.7 | - | 2.9% |
| Cosan Consolidated | ||||
| Total Debt | 8,645.2 | 8,489.1 | - | 1.8% |
| Cash and Cash Equivalents and Secutities | (1,562.5) | (1,307.9) | - | 19.5% |
| Net Debt | 7,082.6 | 7,181.3 | - | -1.4% |
| Raízen | ||||
| Senior Notes 2014 | 849.1 | 789.8 | 100.0% | 7.5% |
| BNDES | 1,370.7 | 1,419.2 | 14% | -3.4% |
| Term Loan | 1,121.6 | 1,123.4 | 6% | -0.2% |
| Prepaid Exports | 1,119.5 | 1,277.6 | 1% | -12.4% |
| Senior Notes 2017 | 964.2 | 902.2 | 3% | 6.9% |
| Advances on Exchange Contracts | 189.5 | 179.7 | 100% | 5.4% |
| Credit Notes | 628.0 | 613.4 | 1% | 2.4% |
| Finame | 100.9 | 115.7 | 45% | -12.8% |
| Finem | 627.4 | 545.5 | 9% | 15.0% |
| Rural Credit | 767.1 | - | 2% | n/a |
| Debt Notes Allocation | 49.6 | 78.5 | 100% | -36.8% |
| Other | (24.5) | (22.5) | 37% | 9.2% |
Total Raízen8 | 96.7 | 0.1 | 100% | n/a |
| Raízen's Debt ( 50% ) | 7,859.8 | 7,022.8 | - | 11.9% |
| Cash and Cash Equivalents and Secutities Raízen | 3,929.9 | 3,511.4 | - | 11.9% |
| Net Debt Raízen | (693.7) | (800.5) | - | -13.3% |
| Consolidated Proforma | 3,236.2 | 2,710.9 | - | 19.4% |
| Total Debt (including Raízen) | ||||
| Cash and Cash Equivalents and Secutities (including Raízen) | 12,575.0 | 12,000.5 | - | 4.8% |
| Cash and Cash Equivalents and Secutities | (2,256.3) | (2,108.4) | - | 7.0% |
| Pro forma Net Debt | 10,318.8 | 9,892.1 | - | 4.3% |
Note 8: Excluding the PESA debt.
38 of 50
| | Earnings Release 4th Quarter and Fiscal Year 2013 |
E. Stock Performance
The common shares issued by Cosan S.A. have been listed on BM&FBovespa since 2005, the year of its IPO on the “Novo Mercado” segment under the ticker symbol CSAN3, and are included in the portfolios of the Ibovespa, IBrX, IBrX-50, IBrA, MLCX, ICO2, INDX, ICON, IVBX-2, IGC, IGCT and ITAG indexes.
The shares issued by Cosan Limited, Cosan S.A.'s parent company, have been listed on NYSE since its IPO in 2007, under the ticker symbol CZZ. The company has also issued share deposit certificates (Brazilian Depositary Receipts - BDR) on the BM&FBovespa under the symbol CZLT33.
The tables and graphs below represent the performance of shares issued by the companies:
| 4Q 2013 Summary | CSAN3 | CZLT33 | CZZ | ||
| Stock Type | Common Share | BDR | Class A | ||
| Listed in | BM&FBovespa | BM&FBovespa | NYSE | ||
| Closing Price in december 12/31/2013 | R$ | 39.58 | R$ | 33.00 | USD 13.72 |
| Higher Price | R$ | 48.17 | R$ | 42.34 | USD 21.31 |
| Average Price | R$ | 43.44 | R$ | 36.71 | USD 17.11 |
| Lower Price | R$ | 39.28 | R$ | 32.05 | USD 13.20 |
| Average Daily Traded Volume | R$50.6 million | R$9 million | USD17,9million | ||
| CSAN3 vs. CZLT33 vs. Ibovespa (Base 100) | CZZ vs. S&P500 (Base 100) | |
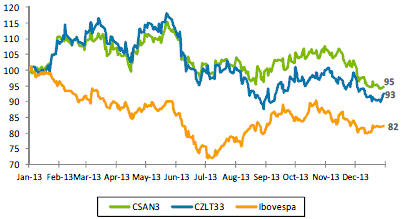 | 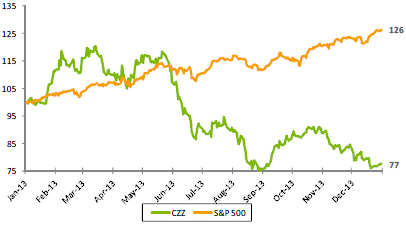 |
39 of 50
| | Earnings Release 4th Quarter and Fiscal Year 2013 |
F. Guidance
This section contains the guidance broken down by variation range for some key parameters in Cosan’s consolidated results for the 2014. In addition, other parts of this Earnings Release may contain forecasts. Such projections and guidance are but estimates and indications, and as such these do not represent any guarantee of prospective results.
This guidance considers the operations of the Cosan group today, which include Comgás, Rumo, Cosan Lubrificantes e Especialidades, Radar, and Other Businesses, as well as the operations of Raízen Combustíveis and Raízen Energia.
Cosan’s consolidated EBITDA is proforma, including 50% of the results of Raízen Combustíveis and Raízen Energia. As mentioned before, following the adoption of IFRS 11 – Joint Arrangements, Raízen is not longer proportionately consolidated in Cosan, and is only reported under “Equity Accounting Result,” considering our 50% interest in Net Income. Moreover, Comgás’s EBITDA continues to be reported under Brazilian accounting principles (IFRS), which does not consider the effects of the Regulatory Current Account.
| FY13 | 2013 dec | 2014 dec | |||
| (abr/2012 - mar/2013) | (jan/2013 - dec/2013) | (jan/2014 - dec/2014) | |||
| Cosan | EBITDA (R$MM) | 3,124 | 3,964 | 4.150 | ≤ ∆ ≤ 4.650 |
| Consolidado | Capex (R$MM) | 2,178 | 2,895 | 2.500 | ≤ ∆ ≤ 2.800 |
| Raízen | EBITDA (R$MM) | 1,658 | 1,928 | 2.000 | ≤∆ ≤ 2.200 |
| Combustíveis9 | CAPEX (R$MM) | 524 | 835 | 750 | ≤ ∆ ≤ 850 |
| Volume of Sugar Cane Crushed (thousand tonnes) | 56,221 | 61,441 | 61.000 | ≤∆ ≤ 63.000 | |
| Volume of Sugar Sold (thousand tonnes) | 4,230 | 4,470 | 4.400 | ≤ ∆ ≤ 4.700 | |
| Raízen Energia | Volume of Ethanol Sold (million liters) | 2,323 | 2,475 | 2.300 | ≤ ∆ ≤ 2.600 |
| Volume of Energy Sold (thousand of MWh) | 3,035 | 2,165 | 2.000 | ≤ ∆ ≤ 2.200 | |
| EBITDA (R$MM) | 2,408 | 2,112 | 2.300 | ≤ ∆ ≤ 2.700 | |
| CAPEX (R$MM) | 2,405 | 2,531 | 2.000 | ≤ ∆ ≤ 2.200 | |
| Volume of Loading (thousand tonnes) | 8,566 | 9,177 | 10.500 | ≤ ∆ ≤ 12.500 | |
| Rumo | EBITDA (R$MM) | 297 | 358 | 400 | ≤ ∆ ≤ 450 |
| CAPEX (R$MM) | 267 | 255 | 250 | ≤ ∆ ≤ 300 | |
| Radar | EBITDA (R$MM) | 180 | 228 | 170 | ≤ ∆ ≤ 200 |
| Cosan | Total Volume Sold (million Liters) | 287 | 316 | 270 | ≤ ∆ ≤ 310 |
| Lubrificantes | EBITDA (R$MM) | n/a | 140 | 140 | ≤ ∆ ≤ 170 |
| 2012 | 2013 | 2014 | |||
| (jan/2012 - dec/2012) | (jan/2013 - dec/2013) | (jan/2014 - dec/2014) | |||
| Number of Clients (thousand) | 1,215 | 1,334 | 1.420 | ≤ ∆ ≤ 1.450 | |
| Comgás | Total Volume of Gas Sold (thousand cbm) | 5,259 | 5,457 | 5.200 | ≤ ∆ ≤ 5.700 |
| EBITDA IFRS (R$MM) | 962 | 1,338 | 1.300 | ≤ ∆ ≤ 1.550 | |
| CAPEX (R$MM) | 546 | 852 | 680 | ≤ ∆ ≤ 780 | |
Note 9: Preliminary figures subject to revision after Raízen’s budget proceeding is finalized.
40 of 50
| | Earnings Release 4th Quarter and Fiscal Year 2013 |
Disclaimer
This document contains forward-looking statements and estimates. These forward-looking statements and estimates are solely forecasts and do not represent any guarantee of prospective results. All stakeholders should know that these statements and estimates are and will be, depending on the case, subject to risks, uncertainties and factors related to the operations and business environment of Cosan and its subsidiaries, and therefore the actual results of these companies may significantly differ from the estimated or implied prospective results contained in such forward-looking statements and estimates.
41 of 50
| | Earnings Release 4th Quarter and Fiscal Year 2013 |
E. Financial Statements
E.1 Cosan S/A consolidated
| Cosan Consolidated | 4Q 2013 | 4Q 2012 | ||||||
| Income Statement for the period | Dec 31, 2013 | Dec 31, 2012 | ||||||
| Net Operating Revenue | 2,217,765 | 1,566,314 | ||||||
| Gross Profit | 652,361 | 463,624 | ||||||
| Sales, general and administrative expenses | (367,925 | ) | (300,657 | ) | ||||
| Other operating income (expenses), net | 75,557 | 73,160 | ||||||
| Financial revenue | 73,354 | 51,940 | ||||||
| Financial expenses | (445,535 | ) | (176,861 | ) | ||||
| Foreign exchange variation | 2,916 | (5,380 | ) | |||||
| Derivative | 117,150 | 43,318 | ||||||
| Equity pick up | 88,870 | 193,052 | ||||||
| Income and Social Contribution Taxes | 155,649 | (38,422 | ) | |||||
| Equity attributable to non-controlling interests | (122,611 | ) | (101,948 | ) | ||||
| Net Income from discontinued operations | - | 137,449 | ||||||
| Net Income (loss) | 229,786 | 339,276 | ||||||
| Cosan Consolidated | 4Q 2013 | 3Q 2013 | ||||||
| Balance Sheet | Dec 31, 2013 | Sep 30, 2013 | ||||||
| Cash and Cash Equivalents | 1,474,553 | 1,202,229 | ||||||
| Securities | 87,978 | 105,658 | ||||||
| Accounts Rreceivable | 844,483 | 997,114 | ||||||
| Inventories | 311,980 | 292,076 | ||||||
| Other Current Assets | 827,648 | 733,857 | ||||||
| Investments | 103,316 | 89,516 | ||||||
| Investments in Jointly Owned Subsidiaries | 8,498,259 | 8,468,438 | ||||||
| Investment Property | 2,281,509 | 2,523,405 | ||||||
| Property, Plant and Equipment | 1,271,910 | 1,249,958 | ||||||
| Intangible | 10,078,040 | 9,973,855 | ||||||
| Other Non-Current Assets | 2,818,698 | 2,466,499 | ||||||
| Total Assets | 28,598,374 | 28,102,605 | ||||||
| Loans and Financing | (8,830,159 | ) | (8,617,159 | ) | ||||
| Suppliers | (862,431 | ) | (841,972 | ) | ||||
| Salaries Payable | (103,295 | ) | (105,593 | ) | ||||
| Other current liabilities | (683,938 | ) | (627,022 | ) | ||||
| Other non-current liabilities | (4,603,182 | ) | (4,653,842 | ) | ||||
| Net Equity | (13,515,369 | ) | (13,257,017 | ) | ||||
| Total Liabilities | (28,598,374 | ) | (28,102,605 | ) | ||||
42 of 50
| | Earnings Release 4th Quarter and Fiscal Year 2013 |
E.2 Raízen Combustiveis
| Raízen Combustíveis | 4Q 2013 | 4Q 2012 | ||||||
| Income Statement for the period | Dec 31, 2013 | Dec 31, 2012 | ||||||
| Net Operating Revenue | 13,064,848 | 11,383,783 | ||||||
| Gross Profit | 701,019 | 610,536 | ||||||
| Sales, general and administrative expenses | (395,908 | ) | (363,045 | ) | ||||
| Other operating income (expenses), net | 145,956 | 114,134 | ||||||
| Financial revenue | 17,161 | 23,083 | ||||||
| Financial expenses | (24,502 | ) | (19,092 | ) | ||||
| Foreign exchange variation | (63,656 | ) | (5,426 | ) | ||||
| Derivative | 28,889 | 8,996 | ||||||
| Income and Social Contribution Taxes | (91,236 | ) | (109,053 | ) | ||||
| Equity attributable to non-controlling interests | (4,402 | ) | (7,330 | ) | ||||
| Net Income (loss) | 318,147 | 252,803 | ||||||
| Raízen Combustíveis | 4Q 2013 | 3Q 2013 | ||||||
| Balance Sheet | Dec 31, 2013 | Sep 30, 2013 | ||||||
| Cash and Cash Equivalents | 328,992 | 354,503 | ||||||
| Accounts Receivable | 1,435,095 | 1,326,865 | ||||||
| Inventories | 1,057,049 | 1,302,834 | ||||||
| Other Current Assets | 484,475 | 857,282 | ||||||
| Investments | 254,826 | - | ||||||
| Property, Plant and Equipment | 2,494,488 | 2,519,491 | ||||||
| Intangible | 4,038,312 | 4,028,655 | ||||||
| Other Non-Current Assets | 1,403,117 | 1,110,940 | ||||||
| Total Assets | 11,496,354 | 11,500,570 | ||||||
| Loans and Financing | (862,521 | ) | (787,527 | ) | ||||
| Suppliers | (551,176 | ) | (529,708 | ) | ||||
| Salaries Payable | (60,091 | ) | (254,561 | ) | ||||
| Other current liabilities | (525,188 | ) | (712,163 | ) | ||||
| Other non-current liabilities | (2,715,727 | ) | (2,615,511 | ) | ||||
| Net Equity | (6,781,651 | ) | (6,601,100 | ) | ||||
| Total Liabilities | (11,496,354 | ) | (11,500,570 | ) | ||||
43 of 50
| | Earnings Release 4th Quarter and Fiscal Year 2013 |
E.3 Raízen Energia
| Raízen Energia | 4Q 2013 | 4Q 2012 | ||||||
| Income Statement for the period | Dec 31, 2013 | Dec 31, 2012 | ||||||
| Net Operating Revenue | 2,125,399 | 2,605,413 | ||||||
| Gross Profit | 308,436 | 576,578 | ||||||
| Sales, general and administrative expenses | (282,514 | ) | (309,329 | ) | ||||
| Other operating income (expenses), net | (24,471 | ) | 10,235 | |||||
| Financial revenue | 64,517 | 38,408 | ||||||
| Financial expenses | (123,093 | ) | (97,253 | ) | ||||
| Foreign exchange variation | (127,314 | ) | (16,375 | ) | ||||
| Derivative | (56,454 | ) | (7,832 | ) | ||||
| Equity pick up | (11,738 | ) | (3,210 | ) | ||||
| Income and Social Contribution Taxes | 97,106 | (67,167 | ) | |||||
| Equity attributable to non-controlling interests | - | (347 | ) | |||||
| Net Income (loss) | (155,525 | ) | 123,709 | |||||
| Raízen Energia | 4Q 2013 | 3Q 2013 | ||||||
| Balance Sheet | Dec 31, 2013 | Sep 30, 2013 | ||||||
| Cash and Cash Equivalents | 1,058,483 | 1,246,573 | ||||||
| Accounts Rreceivable | 416,746 | 494,724 | ||||||
| Inventories | 2,026,925 | 1,707,606 | ||||||
| Other Current Assets | 1,279,553 | 1,275,795 | ||||||
| Investments | 408,591 | 1,936,168 | ||||||
| Biological Assets | 1,867,765 | - | ||||||
| Property, Plant and Equipment | 9,504,874 | 9,485,631 | ||||||
| Intangible | 3,100,227 | 3,062,760 | ||||||
| Other Non-Current Assets | 1,534,557 | 1,822,915 | ||||||
| Total Assets | 21,197,721 | 21,032,172 | ||||||
| Loans and Financing | (7,732,778 | ) | (6,963,654 | ) | ||||
| Suppliers | (633,505 | ) | (730,321 | ) | ||||
| Salaries Payable | (249,919 | ) | (872,731 | ) | ||||
| Other current liabilities | (495,240 | ) | (279,758 | ) | ||||
| Other non-current liabilities | (1,693,036 | ) | (1,676,670 | ) | ||||
| Net Equity | (10,393,243 | ) | (10,509,038 | ) | ||||
| Total Liabilities | (21,197,721 | ) | (21,032,172 | ) | ||||
44 of 50
| | Earnings Release 4th Quarter and Fiscal Year 2013 |
E.3 Comgás
| Comgás | 4Q 2013 | 4Q 2012 | ||||||
| Income Statement for the period | Dec 31, 2013 | Dec 31, 2012 | ||||||
| Net Operating Revenue | 1,600,715 | 1,467,168 | ||||||
| Gross Profit | 454,516 | 383,914 | ||||||
| Sales, general and administrative expenses | (234,860 | ) | (223,628 | ) | ||||
| Other operating income (expenses), net | 3,552 | (1,521 | ) | |||||
| Financial revenue | 20,012 | 9,811 | ||||||
| Financial expenses | (70,028 | ) | (53,717 | ) | ||||
| Foreign exchange variation | (49,032 | ) | (129 | ) | ||||
| Derivative | 50,205 | 15,077 | ||||||
| Income and Social Contribution Taxes | (21,035 | ) | (19,426 | ) | ||||
| Net Income (loss) | 153,328 | 110,381 | ||||||
| Comgás | 4Q 2013 | 3Q 2013 | ||||||
| Balance Sheet | Dec 31, 2013 | Sep 30, 2013 | ||||||
| Cash and Cash Equivalents | 535,957 | 459,598 | ||||||
| Accounts Rreceivable | 582,889 | 564,233 | ||||||
| Inventories | 121,253 | 113,330 | ||||||
| Other Current Assets | 248,803 | 252,383 | ||||||
| Intangible | 8,450,541 | 8,353,844 | ||||||
| Other Non-Current Assets | 332,918 | 285,227 | ||||||
| Total Assets | 10,272,361 | 10,028,615 | ||||||
| Loans and Financing | (2,841,387 | ) | (2,787,767 | ) | ||||
| Suppliers | (706,397 | ) | (694,029 | ) | ||||
| Salaries Payable | (59,417 | ) | (49,274 | ) | ||||
| Other current liabilities | (301,089 | ) | (160,832 | ) | ||||
| Other non-current liabilities | (863,768 | ) | (854,055 | ) | ||||
| Net Equity | (5,500,303 | ) | (5,482,658 | ) | ||||
| Total Liabilities | (10,272,361 | ) | (10,028,615 | ) | ||||
45 of 50
| | Earnings Release 4th Quarter and Fiscal Year 2013 |
E.4 Rumo
| Rumo | 4Q 2013 | 4Q 2012 | ||||||
| Income Statement for the period | Dec 31, 2013 | Dec 31, 2012 | ||||||
| Net Operating Revenue | 206,512 | 221,568 | ||||||
| Gross Profit | 93,478 | 100,132 | ||||||
| Sales, general and administrative expenses | (22,574 | ) | (15,203 | ) | ||||
| Other operating income (expenses), net | (1,934 | ) | (3,855 | ) | ||||
| Financial revenue | 12,644 | 8,757 | ||||||
| Financial expenses | (11,016 | ) | (8,757 | ) | ||||
| Foreign exchange variation | 341 | (67 | ) | |||||
| Income and Social Contribution Taxes | (23,788 | ) | (26,817 | ) | ||||
| Equity attributable to non-controlling interests | 1,409 | 623 | ||||||
| Net Income (loss) | 48,560 | 54,814 | ||||||
| Rumo | 4Q 2013 | 3Q 2013 | ||||||
| Balance Sheet | Dec 31, 2013 | Sep 30, 2013 | ||||||
| Cash and Cash Equivalents | 497,753 | 547,287 | ||||||
| Securities | - | 8,864 | ||||||
| Accounts Rreceivable | 32,506 | 195,739 | ||||||
| Inventories | 5,237 | 4,667 | ||||||
| Other Current Assets | 22,389 | 47,643 | ||||||
| Property, Plant and Equipment | 1,013,149 | 1,003,323 | ||||||
| Intangible | 755,635 | 743,679 | ||||||
| Other Non-Current Assets | 234,965 | 11,025 | ||||||
| Total Assets | 2,561,634 | 2,562,227 | ||||||
| Loans and Financing | (705,974 | ) | (730,424 | ) | ||||
| Suppliers | (82,872 | ) | (81,923 | ) | ||||
| Salaries Payable | (12,522 | ) | (12,230 | ) | ||||
| Other current liabilities | (127,287 | ) | (158,422 | ) | ||||
| Other non-current liabilities | (198,620 | ) | (192,017 | ) | ||||
| Net Equity | (1,434,359 | ) | (1,387,211 | ) | ||||
| Total Liabilities | (2,561,634 | ) | (2,562,227 | ) | ||||
46 of 50
| | Earnings Release 4th Quarter and Fiscal Year 2013 |
E.5 Cosan Lubricants & Specialties
| Lubricants and Specialties | 4Q 2013 | 4Q 2012 | ||||||
| Income Statement for the period | Dec 31, 2013 | Dec 31, 2012 | ||||||
| Net Operating Revenue | 391,822 | 377,932 | ||||||
| Gross Profit | 85,650 | 102,615 | ||||||
| Sales, general and administrative expenses | (76,208 | ) | (75,788 | ) | ||||
| Other operating income (expenses), net | (2,295 | ) | (3,668 | ) | ||||
| Financial revenue | (3,389 | ) | (3,071 | ) | ||||
| Financial expenses | - | - | ||||||
| Foreign exchange variation | - | - | ||||||
| Derivative | - | - | ||||||
| Equity pick up | (1,278 | ) | (67 | ) | ||||
| Income and Social Contribution Taxes | (9,865 | ) | (3,875 | ) | ||||
| Net Income (loss) | (7,385 | ) | 16,145 | |||||
| Lubricants and Specialties | 4Q 2013 | 3Q 2013 | ||||||
| Balance Sheet | Dec 31, 2013 | Sep 30, 2013 | ||||||
| Cash and Cash Equivalents | 57,892 | 68,905 | ||||||
| Securities | - | 580 | ||||||
| Accounts Rreceivable | 200,796 | 214,428 | ||||||
| Inventories | 185,490 | 174,077 | ||||||
| Other Current Assets | 45,227 | 64,672 | ||||||
| Investments | 15,364 | 15,864 | ||||||
| Property, Plant and Equipment | 197,137 | 192,552 | ||||||
| Intangible | 867,826 | 873,680 | ||||||
| Other Non-Current Assets | (93,658 | ) | (64,430 | ) | ||||
| Total Assets | 1,476,074 | 1,540,328 | ||||||
| Loans and Financing | (209,579 | ) | (197,185 | ) | ||||
| Suppliers | (70,102 | ) | (63,547 | ) | ||||
| Salaries Payable | (13,039 | ) | (15,362 | ) | ||||
| Other current liabilities | (107,826 | ) | (95,731 | ) | ||||
| Other non-current liabilities | (327,564 | ) | (327,301 | ) | ||||
| Net Equity | 747,964 | (841,202 | ) | |||||
| Total Liabilities | (1,476,074 | ) | (1,540,328 | ) | ||||
47 of 50
| | Earnings Release 4th Quarter and Fiscal Year 2013 |
E.6 Radar
| Radar | 4Q 2013 | 4Q 2012 | ||||||
| Income Statement for the period | Dec 31, 2013 | Dec 31, 2012 | ||||||
| Net Operating Revenue | 18,704 | 15,568 | ||||||
| Gross Profit | 18,704 | 15,568 | ||||||
| Sales, general and administrative expenses | (8,057 | ) | (6,118 | ) | ||||
| Other operating income (expenses), net | 75,410 | 86,917 | ||||||
| Financial revenue | 1,822 | 1,175 | ||||||
| Financial expenses | (306 | ) | (953 | ) | ||||
| Income and Social Contribution Taxes | (5,469 | ) | (6,338 | ) | ||||
| Net Income (loss) | 82,104 | 90,251 | ||||||
| Radar | 4Q 2013 | 3Q 2013 | ||||||
| Balance Sheet | Dec 31, 2013 | Sep 30, 2013 | ||||||
| Cash and Cash Equivalents | 13,408 | 13,524 | ||||||
| Securities | 87,978 | 94,685 | ||||||
| Accounts Rreceivable | 28,051 | 22,473 | ||||||
| Other Current Assets | 323,476 | 8,300 | ||||||
| Investment Property | 2,281,509 | 2,523,405 | ||||||
| Property, Plant and Equipment | 11,195 | 11,437 | ||||||
| Intangible | 89 | 85 | ||||||
| Other Non-Current Assets | 4,884 | 4,864 | ||||||
| Total Assets | 2,750,590 | 2,678,773 | ||||||
| Suppliers | (1,216 | ) | (936 | ) | ||||
| Salaries Payable | (4,247 | ) | (15,928 | ) | ||||
| Other current liabilities | (31,020 | ) | (27,185 | ) | ||||
| Other non-current liabilities | (85,951 | ) | (76,997 | ) | ||||
| Net Equity | (2,628,156 | ) | (2,557,727 | ) | ||||
| Total Liabilities | (2,750,590 | ) | (2,678,773 | ) | ||||
48 of 50
| | Earnings Release 4th Quarter and Fiscal Year 2013 |
E.7 Other Businesses
| Other Businesses | 4Q 2013 | 4Q 2012 | ||||||
| Income Statement for the period | Dec 31, 2013 | Dec 31, 2012 | ||||||
| Net Operating Revenue | 15 | (0 | ) | |||||
| Gross Profit | 15 | (0 | ) | |||||
| Sales, general and administrative expenses | (26,224 | ) | (38,101 | ) | ||||
| Other operating income (expenses), net | 826 | (5,372 | ) | |||||
| Financial revenue | (203,366 | ) | (70,390 | ) | ||||
| Financial expenses | - | - | ||||||
| Foreign exchange variation | - | - | ||||||
| Derivative | - | - | ||||||
| Equity pick up | 227,546 | 316,298 | ||||||
| Income and Social Contribution Taxes | 215,809 | (2,494 | ) | |||||
| Equity attributable to non-controlling interests | - | (1,110 | ) | |||||
| Net Income from discontinued operations | - | 137,449 | ||||||
| Net Income (loss) | 214,607 | 336,279 | ||||||
| Other Businesses | 4Q 2013 | 3Q 2013 | ||||||
| Balance Sheet | Dec 31, 2013 | Sep 30, 2013 | ||||||
| Cash and Cash Equivalents | 369,543 | 112,915 | ||||||
| Securities | - | 1,529 | ||||||
| Accounts Rreceivable | 241 | 241 | ||||||
| Inventories | - | 2 | ||||||
| Other Current Assets | 332,014 | 413,259 | ||||||
| Investments | 6,101,361 | 6,086,566 | ||||||
| Investments in Jointly Owned Subsidiaries | 8,498,259 | 8,468,439 | ||||||
| Property, Plant and Equipment | 50,429 | 42,646 | ||||||
| Intangible | 3,949 | 2,567 | ||||||
| Other Non-Current Assets | 2,755,373 | 2,638,097 | ||||||
| Total Assets | 18,111,169 | 17,766,261 | ||||||
| Loans and Financing | (5,073,219 | ) | (4,901,783 | ) | ||||
| Suppliers | (1,562 | ) | (1,537 | ) | ||||
| Salaries Payable | (14,070 | ) | (12,799 | ) | ||||
| Other current liabilities | (260,977 | ) | (243,656 | ) | ||||
| Other non-current liabilities | (3,543,346 | ) | (3,605,350 | ) | ||||
| Net Equity | (9,217,995 | ) | (9,001,136 | ) | ||||
| Total Liabilities | (18,111,169 | ) | (17,766,261 | ) | ||||
49 of 50
| | Earnings Release 4th Quarter and Fiscal Year 2013 |
F. Financial Statements including Raízen
F.1 Cosan S/A consolidated, including Raízen
| Cosan Consolidated | 4Q 2013 | 3Q 2013 | ||||||
| Income Statement for the period | Dec 31, 2013 | Sep 30, 2013 | ||||||
| Net Operating Revenue | 9,389,991 | 8,397,096 | ||||||
| Gross Profit | 1,156,547 | 1,057,181 | ||||||
| Sales, general and administrative expenses | (707,136 | ) | (636,844 | ) | ||||
| Other operating income (expenses), net | 136,300 | 135,344 | ||||||
| Financial revenue | 114,193 | 82,685 | ||||||
| Financial expenses | (519,333 | ) | (235,033 | ) | ||||
| Foreign exchange variation | (92,569 | ) | (16,280 | ) | ||||
| Derivative | 103,367 | 43,900 | ||||||
| Equity pick up | 4,461 | 3,192 | ||||||
| Income and Social Contribution Taxes | 158,767 | (126,532 | ) | |||||
| Equity attributable to non-controlling interests | (124,812 | ) | (105,786 | ) | ||||
| Net Income from discontinued operations | - | 137,449 | ||||||
| Net Income (loss) | 229,787 | 339,276 | ||||||
| Cosan Consolidated | 4Q 2013 | 3Q 2013 | ||||||
| Balance Sheet | Dec 31, 2013 | Sep 30, 2013 | ||||||
| Cash and Cash Equivalents | 2,168,291 | 2,002,767 | ||||||
| Securities | 87,978 | 105,658 | ||||||
| Accounts Rreceivable | 1,770,403 | 1,814,482 | ||||||
| Inventories | 1,840,976 | 1,784,846 | ||||||
| Other Current Assets | 1,576,808 | 1,260,112 | ||||||
| Investments | 418,755 | 201,793 | ||||||
| Investment Property | 2,281,509 | 2,523,405 | ||||||
| Biological Assets | 933,882 | 968,084 | ||||||
| Property, Plant and Equipment | 7,263,095 | 7,244,022 | ||||||
| Intangible | 13,647,310 | 13,519,563 | ||||||
| Other Non-Current Assets | 3,822,569 | 3,389,893 | ||||||
| Total Assets | 35,811,576 | 34,814,625 | ||||||
| Loans and Financing | (13,127,808 | ) | (12,492,749 | ) | ||||
| Suppliers | (1,454,769 | ) | (1,471,986 | ) | ||||
| Salaries Payable | (258,301 | ) | (287,748 | ) | ||||
| Other current liabilities | (1,056,318 | ) | (979,143 | ) | ||||
| Other non-current liabilities | (6,343,162 | ) | (6,272,335 | ) | ||||
| Net Equity | (13,571,218 | ) | (13,310,665 | ) | ||||
| Total Liabilities | (35,811,576 | ) | (34,814,626 | ) | ||||
50 of 50
SIGNATURES
Pursuant to the requirements of the Securities Exchange Act of 1934, the registrant has duly caused this report to be signed on its behalf by the undersigned, thereunto duly authorized.
| COSAN LIMITED | ||||
| Date: | February 28, 2014 | By: | /s/ Marcelo Eduardo Martins | |
| Name: | Marcelo Eduardo Martins | |||
| Title: | Chief Financial Officer and Investor Relations Officer | |||