
Exhibit (c)(17) DRAFT Presentation to the Special Committee of the Board of Directors of OSLO Strictly Private & Confidential February 7, 2019Exhibit (c)(17) DRAFT Presentation to the Special Committee of the Board of Directors of OSLO Strictly Private & Confidential February 7, 2019
DR DRAFT AFT GENERAL INFORMATION AND LIMITATIONS This presentation, and the oral or video presentation that supplements it, have been developed by and are proprietary to Sandler O'Neill & Partners, L.P. and were prepared exclusively for the benefit and internal use of the recipient. Neither the printed presentation nor the oral or video presentation that supplements it, nor any of their contents, may be reproduced, distributed or used for any other purpose without the prior written consent of Sandler O'Neill & Partners, L.P. The analyses contained herein rely upon information obtained from the recipient or from public sources, the accuracy of which has not been verified, and cannot be assured, by Sandler O'Neill & Partners, L.P. Moreover, many of the projections and financial analyses herein are based on estimated financial performance prepared by or in consultation with the recipient and are intended only to suggest estimated ranges of results. Finally, the printed presentation is incomplete without the oral or video presentation that supplements it. SandlerO’Neill & Partners, L.P. prohibits employees from offering, directly or indirectly, favorable research, a specific rating or a specific price target, or offering or threatening to change research, a rating or a price target to a company as consideration or inducement for the receipt of business or compensation. The Firm also prohibits research analysts from being compensated for their involvement in, or based upon, specific investment banking transactions. Sandler O'Neill & Partners, L.P. is a limited partnership, the sole general partner of which is Sandler O'Neill & Partners Corp., a New York corporation. Sandler O'Neill & Partners, L.P. is a registered broker-dealer and a member of the Financial Industry Regulatory Authority. Sandler O'Neill Mortgage Finance L.P. is an indirect subsidiary of Sandler O'Neill & Partners Corp. This material is protected under applicable copyright laws and does not carry any rights of publication or disclosure.DR DRAFT AFT GENERAL INFORMATION AND LIMITATIONS This presentation, and the oral or video presentation that supplements it, have been developed by and are proprietary to Sandler O'Neill & Partners, L.P. and were prepared exclusively for the benefit and internal use of the recipient. Neither the printed presentation nor the oral or video presentation that supplements it, nor any of their contents, may be reproduced, distributed or used for any other purpose without the prior written consent of Sandler O'Neill & Partners, L.P. The analyses contained herein rely upon information obtained from the recipient or from public sources, the accuracy of which has not been verified, and cannot be assured, by Sandler O'Neill & Partners, L.P. Moreover, many of the projections and financial analyses herein are based on estimated financial performance prepared by or in consultation with the recipient and are intended only to suggest estimated ranges of results. Finally, the printed presentation is incomplete without the oral or video presentation that supplements it. SandlerO’Neill & Partners, L.P. prohibits employees from offering, directly or indirectly, favorable research, a specific rating or a specific price target, or offering or threatening to change research, a rating or a price target to a company as consideration or inducement for the receipt of business or compensation. The Firm also prohibits research analysts from being compensated for their involvement in, or based upon, specific investment banking transactions. Sandler O'Neill & Partners, L.P. is a limited partnership, the sole general partner of which is Sandler O'Neill & Partners Corp., a New York corporation. Sandler O'Neill & Partners, L.P. is a registered broker-dealer and a member of the Financial Industry Regulatory Authority. Sandler O'Neill Mortgage Finance L.P. is an indirect subsidiary of Sandler O'Neill & Partners Corp. This material is protected under applicable copyright laws and does not carry any rights of publication or disclosure.
DR DRAFT AFT Table of Contents I. Preliminary OSLO Financial Analyses II. BERLIN Liquidity Analysis III. AppendixDR DRAFT AFT Table of Contents I. Preliminary OSLO Financial Analyses II. BERLIN Liquidity Analysis III. Appendix

DRAFT I. Preliminary OSLO Financial AnalysesDRAFT I. Preliminary OSLO Financial Analyses
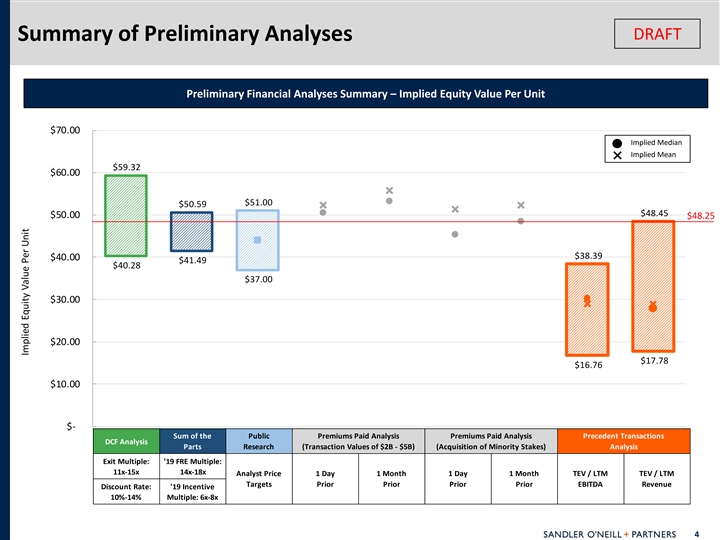
DRAFT Summary of Preliminary Analyses Preliminary Financial Analyses Summary – Implied Equity Value Per Unit $70.00 Implied Median Implied Mean $59.32 $60.00 $51.00 $50.59 $48.45 $50.00 $48.25 $38.39 $40.00 $41.49 $40.28 $37.00 $30.00 $20.00 $17.78 $16.76 $10.00 $- Sum of the Public Premiums Paid Analysis Premiums Paid Analysis Precedent Transactions DCF Analysis Parts Research (Transaction Values of $2B - $5B) (Acquisition of Minority Stakes) Analysis Exit Multiple: '19 FRE Multiple: 11x-15x 14x-18x Analyst Price 1 Day 1 Month 1 Day 1 Month TEV / LTM TEV / LTM Targets Prior Prior Prior Prior EBITDA Revenue Discount Rate: '19 Incentive 10%-14% Multiple: 6x-8x 4 Implied Equity Value Per UnitDRAFT Summary of Preliminary Analyses Preliminary Financial Analyses Summary – Implied Equity Value Per Unit $70.00 Implied Median Implied Mean $59.32 $60.00 $51.00 $50.59 $48.45 $50.00 $48.25 $38.39 $40.00 $41.49 $40.28 $37.00 $30.00 $20.00 $17.78 $16.76 $10.00 $- Sum of the Public Premiums Paid Analysis Premiums Paid Analysis Precedent Transactions DCF Analysis Parts Research (Transaction Values of $2B - $5B) (Acquisition of Minority Stakes) Analysis Exit Multiple: '19 FRE Multiple: 11x-15x 14x-18x Analyst Price 1 Day 1 Month 1 Day 1 Month TEV / LTM TEV / LTM Targets Prior Prior Prior Prior EBITDA Revenue Discount Rate: '19 Incentive 10%-14% Multiple: 6x-8x 4 Implied Equity Value Per Unit

Discounted Cash Flow Analysis DRAFT Distributable Earnings Basis (1) Assumptions Discount Rate Discount Date 12/31/18 Risk Free Rate 3.50% Discount Rate 11.61% Plus: Size Premium 0.96% Terminal Multiple 13.0x Plus: Equity Risk Premium 5.00% Plus: Industry Premium 2.15% Discount Rate 11.61% ($Millions) 12/31/18 2019E 2020E 2021E 2022E 2023E Fee related earnings and other $ - $ 259.8 $ 336.0 $ 323.4 $ 455.3 $ 536.6 Incentive income, net 3 37.6 267.6 242.6 188.9 2 88.4 G.P. income distributions 111.6 101.3 137.4 1 25.7 118.2 Distributable earnings $ - $ 709.0 $ 704.9 $ 703.4 $ 770.0 $ 943.2 Distributable earnings attributable to OCGH non-controlling interest (386.0) (383.7) (382.9) (419.2) (513.5) Non-Operating Group income / (expense) (2.9) (2.9) (2.9) (2.9) (2.9) Distributable earnings - Class A income taxes (3.6) (3.6) (8.6) ( 17.2) (28.6) Tax receivable agreement payments (14.7) (15.6) (16.0) (16.7) (16.2) Interest expense / (income) (0.9) (0.6) (3.3) (3.2) (4.3) Cash replacement for equity based compensation (26.9) (26.9) ( 26.9) (26.9) ( 26.9) Pro-forma distributable earnings - Class A $ 274.1 $ 271.7 $ 262.8 $ 284.0 $ 350.9 Add: Depreciation and amortization 4.6 4.7 4.8 5.0 5.1 Less: Changes in net working capital ( 14.0) (3.8) (4.3) (1.4) (1.3) Less: Capital expenditures (5.9) (6.2) (6.5) (6.9) (7.2) Unlevered free cash flow - Class A $ - $ 258.8 $ 266.4 $ 256.8 $ 280.7 $ 347.5 Terminal Value $ - $ - $ - $ - $ - $ 4,562 Value Per Class A Unit Sensitivity Equity Value Terminal Multiple PV of Unlevered Free Cash Flows $ 1,012 PV of Terminal Value 2,633 11.0x 12.0x 13.0x 14.0x 15.0x Enterprise Value $ 3,645 10.0% $ 47.19 $ 50.22 $ 53.26 $ 56.29 $ 59.32 Class A Units (mm) 71.7 11.0% $ 45.33 $ 48.23 $ 51.13 $ 54.03 $ 56.93 Enterprise Value Per Unit $ 50.83 12.0% $ 43.56 $ 46.33 $ 49.10 $ 51.88 $ 54.65 (2) Net Debt (as of 12/31/18) (0.88) 13.0% $ 41.88 $ 44.53 $ 47.18 $ 49.83 $ 52.49 Value per Class A Unit $ 49.95 14.0% $ 40.28 $ 42.82 $ 45.36 $ 47.89 $ 50.43 Source: OSLO 5-Year Plan, as provided by OSLO management; subject to further discussion with OSLO management (1) Risk Free Rate, Size Premium, Equity Risk Premium, and Industry Premium sourced from Duff & Phelps Cost of Capital Navigator (2) Net Debt is equal to Class A unitholders’ proportionate share of debt obligations ($746M), plus preferred ($401M), less cash & cash equivalents ($461M) and U.S. Treasury and other securities ($547M) 5 Discount RateDiscounted Cash Flow Analysis DRAFT Distributable Earnings Basis (1) Assumptions Discount Rate Discount Date 12/31/18 Risk Free Rate 3.50% Discount Rate 11.61% Plus: Size Premium 0.96% Terminal Multiple 13.0x Plus: Equity Risk Premium 5.00% Plus: Industry Premium 2.15% Discount Rate 11.61% ($Millions) 12/31/18 2019E 2020E 2021E 2022E 2023E Fee related earnings and other $ - $ 259.8 $ 336.0 $ 323.4 $ 455.3 $ 536.6 Incentive income, net 3 37.6 267.6 242.6 188.9 2 88.4 G.P. income distributions 111.6 101.3 137.4 1 25.7 118.2 Distributable earnings $ - $ 709.0 $ 704.9 $ 703.4 $ 770.0 $ 943.2 Distributable earnings attributable to OCGH non-controlling interest (386.0) (383.7) (382.9) (419.2) (513.5) Non-Operating Group income / (expense) (2.9) (2.9) (2.9) (2.9) (2.9) Distributable earnings - Class A income taxes (3.6) (3.6) (8.6) ( 17.2) (28.6) Tax receivable agreement payments (14.7) (15.6) (16.0) (16.7) (16.2) Interest expense / (income) (0.9) (0.6) (3.3) (3.2) (4.3) Cash replacement for equity based compensation (26.9) (26.9) ( 26.9) (26.9) ( 26.9) Pro-forma distributable earnings - Class A $ 274.1 $ 271.7 $ 262.8 $ 284.0 $ 350.9 Add: Depreciation and amortization 4.6 4.7 4.8 5.0 5.1 Less: Changes in net working capital ( 14.0) (3.8) (4.3) (1.4) (1.3) Less: Capital expenditures (5.9) (6.2) (6.5) (6.9) (7.2) Unlevered free cash flow - Class A $ - $ 258.8 $ 266.4 $ 256.8 $ 280.7 $ 347.5 Terminal Value $ - $ - $ - $ - $ - $ 4,562 Value Per Class A Unit Sensitivity Equity Value Terminal Multiple PV of Unlevered Free Cash Flows $ 1,012 PV of Terminal Value 2,633 11.0x 12.0x 13.0x 14.0x 15.0x Enterprise Value $ 3,645 10.0% $ 47.19 $ 50.22 $ 53.26 $ 56.29 $ 59.32 Class A Units (mm) 71.7 11.0% $ 45.33 $ 48.23 $ 51.13 $ 54.03 $ 56.93 Enterprise Value Per Unit $ 50.83 12.0% $ 43.56 $ 46.33 $ 49.10 $ 51.88 $ 54.65 (2) Net Debt (as of 12/31/18) (0.88) 13.0% $ 41.88 $ 44.53 $ 47.18 $ 49.83 $ 52.49 Value per Class A Unit $ 49.95 14.0% $ 40.28 $ 42.82 $ 45.36 $ 47.89 $ 50.43 Source: OSLO 5-Year Plan, as provided by OSLO management; subject to further discussion with OSLO management (1) Risk Free Rate, Size Premium, Equity Risk Premium, and Industry Premium sourced from Duff & Phelps Cost of Capital Navigator (2) Net Debt is equal to Class A unitholders’ proportionate share of debt obligations ($746M), plus preferred ($401M), less cash & cash equivalents ($461M) and U.S. Treasury and other securities ($547M) 5 Discount Rate

Sum of the Parts Analysis DRAFT Economic Net Income Basis ($Millions) Value 2019E Multiple of Fees Fee Related Earnings Fee related earnings, less equity based compensation $ 2 16.7 Less: Portion attributable to OCGH non- controlling interest (118.0) Less: Non-Operating Group income / (expense) (2.9) Less: Income taxes - Class A (3.6) Fee related earnings - Class A $ 92.3 16.0x $ 1,476.5 Incentives Created, Net Incentives created, net $ 3 11.0 Less: Portion attributable to OCGH non- controlling interest ( 169.3) Incentives created - Class A $ 1 41.7 7.0x $ 9 92.0 Sub-Total $ 2 34.0 $ 2,468.5 (1) Add: NAV of Balance Sheet Investments (as of 12/31/18) 1,021.0 Less: Tax Receivable Agreement (as of 12/31/18) ( 188.4) Total Value $ 3,301.1 Class A Units (mm) 71.7 Value Per Class A Unit $ 4 6.04 Value Per Class A Unit Sensitivity Fee Related Earnings (FRE) Multiple 14.0x 15.0x 16.0x 17.0x 18.0x 6.0x $ 41.49 $ 42.78 $ 44.06 $ 45.35 $ 46.64 6.5x $ 42.48 $ 43.77 $ 45.05 $ 46.34 $ 47.63 7.0x $ 43.47 $ 44.75 $ 46.04 $ 47.33 $ 48.61 7.5x $ 44.45 $ 45.74 $ 47.03 $ 48.32 $ 49.60 8.0x $ 45.44 $ 46.73 $ 48.02 $ 49.30 $ 50.59 Source: OSLO 5-Year Plan, as provided by OSLO management; subject to further discussion with OSLO management (1) NAV of Balance Sheet Investments is equal to Class A Unitholders’ proportionate share of principal investments ($1,771M), plus accrued net carry ($812M, less 25% risk discount), less debt obligations ($746M), less preferred ($401M), plus cash & cash equivalents ($461M) and U.S. Treasury and other securities ($547M) 6 Incentive Income MultipleSum of the Parts Analysis DRAFT Economic Net Income Basis ($Millions) Value 2019E Multiple of Fees Fee Related Earnings Fee related earnings, less equity based compensation $ 2 16.7 Less: Portion attributable to OCGH non- controlling interest (118.0) Less: Non-Operating Group income / (expense) (2.9) Less: Income taxes - Class A (3.6) Fee related earnings - Class A $ 92.3 16.0x $ 1,476.5 Incentives Created, Net Incentives created, net $ 3 11.0 Less: Portion attributable to OCGH non- controlling interest ( 169.3) Incentives created - Class A $ 1 41.7 7.0x $ 9 92.0 Sub-Total $ 2 34.0 $ 2,468.5 (1) Add: NAV of Balance Sheet Investments (as of 12/31/18) 1,021.0 Less: Tax Receivable Agreement (as of 12/31/18) ( 188.4) Total Value $ 3,301.1 Class A Units (mm) 71.7 Value Per Class A Unit $ 4 6.04 Value Per Class A Unit Sensitivity Fee Related Earnings (FRE) Multiple 14.0x 15.0x 16.0x 17.0x 18.0x 6.0x $ 41.49 $ 42.78 $ 44.06 $ 45.35 $ 46.64 6.5x $ 42.48 $ 43.77 $ 45.05 $ 46.34 $ 47.63 7.0x $ 43.47 $ 44.75 $ 46.04 $ 47.33 $ 48.61 7.5x $ 44.45 $ 45.74 $ 47.03 $ 48.32 $ 49.60 8.0x $ 45.44 $ 46.73 $ 48.02 $ 49.30 $ 50.59 Source: OSLO 5-Year Plan, as provided by OSLO management; subject to further discussion with OSLO management (1) NAV of Balance Sheet Investments is equal to Class A Unitholders’ proportionate share of principal investments ($1,771M), plus accrued net carry ($812M, less 25% risk discount), less debt obligations ($746M), less preferred ($401M), plus cash & cash equivalents ($461M) and U.S. Treasury and other securities ($547M) 6 Incentive Income Multiple

DRAFT OSLO Analyst Estimates OSLO Analyst Recommendations and Price Targets ($Millions, except per unit data) As of Current Price Target Adjusted Revenue ANI / Unit DE / Unit Date Rating Current Previous 2019E 2020E 2019E 2020E 2019E 2020E Autonomous 2/5/19 Hold $ 4 4.00 $ 4 4.00 n/a n/a n/a n/a n/a n/a Bank of America Merrill Lynch 2/5/19 Hold 44.00 46.00 1,573 1,680 3.51 3.94 3.47 4.18 Credit Suisse 2/5/19 Hold 43.00 45.00 1 ,405 1 ,533 2.46 2 .93 3.31 3.80 Deutsche Bank 2/5/19 Hold 37.00 39.00 n/a n/a n/a n/a 3.26 2.30 Goldman Sachs 2/6/19 Hold 43.00 4 4.00 1,377 1,542 n/a n/a 3.73 4.01 Jefferies 10/1/18 Hold 41.00 41.00 n/a n/a n/a n/a n/a n/a JP Morgan 2/6/19 Hold 5 1.00 5 0.00 1,618 1 ,685 3.31 3.56 n/a 3.43 Keefe, Bruyette & Woods 2/5/19 Hold 4 5.00 47.00 1,557 1,681 2.99 3.40 3.40 3.81 Morgan Stanley 1/4/19 Buy 4 8.00 48.00 1 ,521 1,649 2.92 3.25 3.36 3.60 Oppenheimer 2/5/19 Hold n/a n/a n/a n/a 3.22 3.47 3.66 3.89 Wells Fargo 2/5/19 Hold 44.00 44.00 1,512 1,672 2.95 3.65 n/a n/a High $ 51.00 $ 50.00 $ 1,618 $ 1 ,685 $ 3.51 $ 3.94 $ 3.73 $ 4.18 Low $ 3 7.00 $ 3 9.00 $ 1,377 $ 1 ,533 $ 2.46 $ 2.93 $ 3.26 $ 2.30 Mean $ 4 4.00 $ 4 4.80 $ 1,509 $ 1 ,635 $ 3.05 $ 3.46 $ 3.46 $ 3.63 Median $ 4 4.00 $ 4 4.50 $ 1 ,521 $ 1 ,672 $ 2.99 $ 3.47 $ 3.40 $ 3.81 $ 42.65 OSLO (2/6/19 closing price) Source: Analyst research reports, Company materials, FactSet 7DRAFT OSLO Analyst Estimates OSLO Analyst Recommendations and Price Targets ($Millions, except per unit data) As of Current Price Target Adjusted Revenue ANI / Unit DE / Unit Date Rating Current Previous 2019E 2020E 2019E 2020E 2019E 2020E Autonomous 2/5/19 Hold $ 4 4.00 $ 4 4.00 n/a n/a n/a n/a n/a n/a Bank of America Merrill Lynch 2/5/19 Hold 44.00 46.00 1,573 1,680 3.51 3.94 3.47 4.18 Credit Suisse 2/5/19 Hold 43.00 45.00 1 ,405 1 ,533 2.46 2 .93 3.31 3.80 Deutsche Bank 2/5/19 Hold 37.00 39.00 n/a n/a n/a n/a 3.26 2.30 Goldman Sachs 2/6/19 Hold 43.00 4 4.00 1,377 1,542 n/a n/a 3.73 4.01 Jefferies 10/1/18 Hold 41.00 41.00 n/a n/a n/a n/a n/a n/a JP Morgan 2/6/19 Hold 5 1.00 5 0.00 1,618 1 ,685 3.31 3.56 n/a 3.43 Keefe, Bruyette & Woods 2/5/19 Hold 4 5.00 47.00 1,557 1,681 2.99 3.40 3.40 3.81 Morgan Stanley 1/4/19 Buy 4 8.00 48.00 1 ,521 1,649 2.92 3.25 3.36 3.60 Oppenheimer 2/5/19 Hold n/a n/a n/a n/a 3.22 3.47 3.66 3.89 Wells Fargo 2/5/19 Hold 44.00 44.00 1,512 1,672 2.95 3.65 n/a n/a High $ 51.00 $ 50.00 $ 1,618 $ 1 ,685 $ 3.51 $ 3.94 $ 3.73 $ 4.18 Low $ 3 7.00 $ 3 9.00 $ 1,377 $ 1 ,533 $ 2.46 $ 2.93 $ 3.26 $ 2.30 Mean $ 4 4.00 $ 4 4.80 $ 1,509 $ 1 ,635 $ 3.05 $ 3.46 $ 3.46 $ 3.63 Median $ 4 4.00 $ 4 4.50 $ 1 ,521 $ 1 ,672 $ 2.99 $ 3.47 $ 3.40 $ 3.81 $ 42.65 OSLO (2/6/19 closing price) Source: Analyst research reports, Company materials, FactSet 7

Premiums Paid Analysis DRAFT Closed Transactions Between $2B and $5B Since 1/1/16 • We have included transactions with the following criteria to review recent premiums paid on public M&A transactions – All industries; public targets on a global basis – Transaction equity values between $2.0 billion and $5.0 billion – Transactions closed since January 1, 2016 – 184 transactions Premium to Target Spot Price Implied Equity Value Per Unit (based on 2/6/19 Unit Price) $52.19 $50.45 $52.83 $51.08 $55.68 $53.21 36.0% 30.6% 24.7% 23.9% 22.4% 24.0% 19.8% 18.3% 12.0% 0.0% 1 Day Prior 1 Week Prior 1 Month Prior Mean Median Source: S&P Global Market Intelligence 8Premiums Paid Analysis DRAFT Closed Transactions Between $2B and $5B Since 1/1/16 • We have included transactions with the following criteria to review recent premiums paid on public M&A transactions – All industries; public targets on a global basis – Transaction equity values between $2.0 billion and $5.0 billion – Transactions closed since January 1, 2016 – 184 transactions Premium to Target Spot Price Implied Equity Value Per Unit (based on 2/6/19 Unit Price) $52.19 $50.45 $52.83 $51.08 $55.68 $53.21 36.0% 30.6% 24.7% 23.9% 22.4% 24.0% 19.8% 18.3% 12.0% 0.0% 1 Day Prior 1 Week Prior 1 Month Prior Mean Median Source: S&P Global Market Intelligence 8
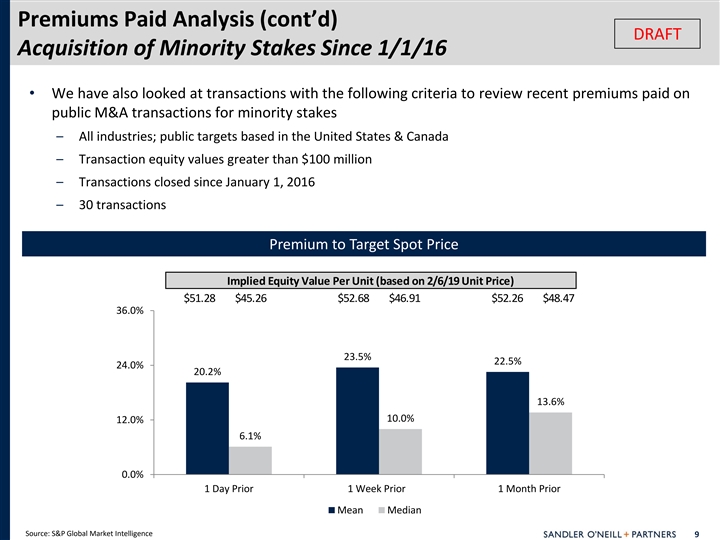
Premiums Paid Analysis (cont’d) DRAFT Acquisition of Minority Stakes Since 1/1/16 • We have also looked at transactions with the following criteria to review recent premiums paid on public M&A transactions for minority stakes – All industries; public targets based in the United States & Canada – Transaction equity values greater than $100 million – Transactions closed since January 1, 2016 – 30 transactions Premium to Target Spot Price Implied Equity Value Per Unit (based on 2/6/19 Unit Price) $51.28 $45.26 $52.68 $46.91 $52.26 $48.47 36.0% 23.5% 22.5% 24.0% 20.2% 13.6% 10.0% 12.0% 6.1% 0.0% 1 Day Prior 1 Week Prior 1 Month Prior Mean Median Source: S&P Global Market Intelligence 9Premiums Paid Analysis (cont’d) DRAFT Acquisition of Minority Stakes Since 1/1/16 • We have also looked at transactions with the following criteria to review recent premiums paid on public M&A transactions for minority stakes – All industries; public targets based in the United States & Canada – Transaction equity values greater than $100 million – Transactions closed since January 1, 2016 – 30 transactions Premium to Target Spot Price Implied Equity Value Per Unit (based on 2/6/19 Unit Price) $51.28 $45.26 $52.68 $46.91 $52.26 $48.47 36.0% 23.5% 22.5% 24.0% 20.2% 13.6% 10.0% 12.0% 6.1% 0.0% 1 Day Prior 1 Week Prior 1 Month Prior Mean Median Source: S&P Global Market Intelligence 9
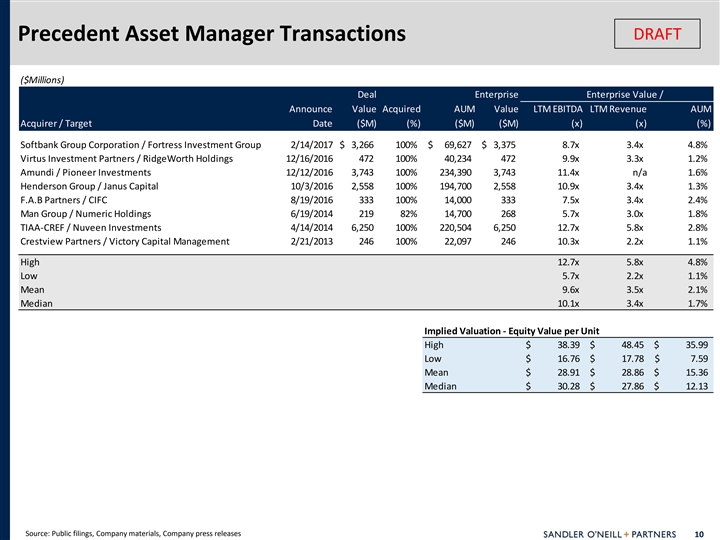
DRAFT Precedent Asset Manager Transactions ($Millions) Deal Enterprise Enterprise Value / Announce Value Acquired AUM Value LTM EBITDA LTM Revenue AUM Acquirer / Target Date ($M) (%) ($M) ($M) (x) (x) (%) Softbank Group Corporation / Fortress Investment Group 2/14/2017 $ 3,266 100% $ 69,627 $ 3,375 8.7x 3.4x 4.8% Virtus Investment Partners / RidgeWorth Holdings 12/16/2016 472 100% 40,234 472 9.9x 3.3x 1.2% Amundi / Pioneer Investments 12/12/2016 3,743 100% 234,390 3,743 11.4x n/a 1.6% Henderson Group / Janus Capital 10/3/2016 2,558 100% 194,700 2,558 10.9x 3.4x 1.3% F.A.B Partners / CIFC 8/19/2016 333 100% 1 4,000 333 7.5x 3.4x 2.4% Man Group / Numeric Holdings 6/19/2014 219 82% 14,700 268 5.7x 3.0x 1.8% TIAA-CREF / Nuveen Investments 4/14/2014 6,250 100% 220,504 6,250 12.7x 5.8x 2.8% Crestview Partners / Victory Capital Management 2/21/2013 246 100% 22,097 246 10.3x 2.2x 1.1% High 12.7x 5.8x 4.8% Low 5.7x 2.2x 1.1% Mean 9.6x 3.5x 2.1% Median 10.1x 3.4x 1.7% Implied Valuation - Equity Value per Unit High $ 38.39 $ 48.45 $ 35.99 Low $ 1 6.76 $ 1 7.78 $ 7 .59 Mean $ 28.91 $ 28.86 $ 1 5.36 Median $ 3 0.28 $ 27.86 $ 1 2.13 Source: Public filings, Company materials, Company press releases 10DRAFT Precedent Asset Manager Transactions ($Millions) Deal Enterprise Enterprise Value / Announce Value Acquired AUM Value LTM EBITDA LTM Revenue AUM Acquirer / Target Date ($M) (%) ($M) ($M) (x) (x) (%) Softbank Group Corporation / Fortress Investment Group 2/14/2017 $ 3,266 100% $ 69,627 $ 3,375 8.7x 3.4x 4.8% Virtus Investment Partners / RidgeWorth Holdings 12/16/2016 472 100% 40,234 472 9.9x 3.3x 1.2% Amundi / Pioneer Investments 12/12/2016 3,743 100% 234,390 3,743 11.4x n/a 1.6% Henderson Group / Janus Capital 10/3/2016 2,558 100% 194,700 2,558 10.9x 3.4x 1.3% F.A.B Partners / CIFC 8/19/2016 333 100% 1 4,000 333 7.5x 3.4x 2.4% Man Group / Numeric Holdings 6/19/2014 219 82% 14,700 268 5.7x 3.0x 1.8% TIAA-CREF / Nuveen Investments 4/14/2014 6,250 100% 220,504 6,250 12.7x 5.8x 2.8% Crestview Partners / Victory Capital Management 2/21/2013 246 100% 22,097 246 10.3x 2.2x 1.1% High 12.7x 5.8x 4.8% Low 5.7x 2.2x 1.1% Mean 9.6x 3.5x 2.1% Median 10.1x 3.4x 1.7% Implied Valuation - Equity Value per Unit High $ 38.39 $ 48.45 $ 35.99 Low $ 1 6.76 $ 1 7.78 $ 7 .59 Mean $ 28.91 $ 28.86 $ 1 5.36 Median $ 3 0.28 $ 27.86 $ 1 2.13 Source: Public filings, Company materials, Company press releases 10
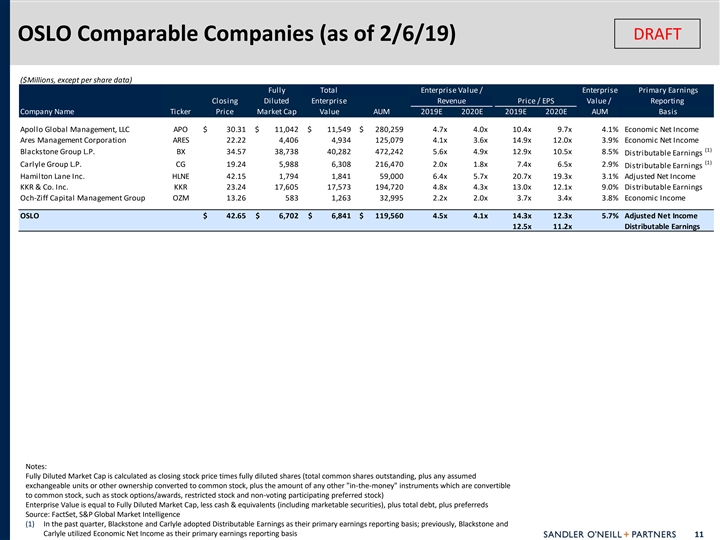
DRAFT OSLO Comparable Companies (as of 2/6/19) ($Millions, except per share data) Fully Total Enterprise Value / Enterprise Primary Earnings Closing Diluted Enterprise Revenue Price / EPS Value / Reporting Company Name Ticker Price Market Cap Value AUM 2019E 2020E 2019E 2020E AUM Basis Apollo Global Management, LLC APO $ 3 0.31 $ 11,042 $ 1 1,549 $ 280,259 4.7x 4.0x 10.4x 9.7x 4.1% Economic Net Income Ares Management Corporation ARES 22.22 4 ,406 4 ,934 1 25,079 4.1x 3.6x 14.9x 12.0x 3.9% Economic Net Income (1) Blackstone Group L.P. BX 34.57 38,738 40,282 472,242 5.6x 4.9x 12.9x 10.5x 8.5% Distributable Earnings (1) Carlyle Group L.P. CG 1 9.24 5 ,988 6,308 2 16,470 2.0x 1.8x 7.4x 6.5x 2.9% Distributable Earnings Hamilton Lane Inc. HLNE 4 2.15 1,794 1,841 59,000 6.4x 5.7x 20.7x 19.3x 3.1% Adjusted Net Income KKR & Co. Inc. KKR 23.24 1 7,605 1 7,573 1 94,720 4.8x 4.3x 13.0x 12.1x 9.0% Distributable Earnings Och-Ziff Capital Management Group OZM 13.26 583 1 ,263 3 2,995 2.2x 2.0x 3.7x 3.4x 3.8% Economic Income OSLO $ 4 2.65 $ 6,702 $ 6 ,841 $ 1 19,560 4.5x 4.1x 14.3x 12.3x 5.7% Adjusted Net Income 12.5x 11.2x Distributable Earnings Notes: Fully Diluted Market Cap is calculated as closing stock price times fully diluted shares (total common shares outstanding, plus any assumed exchangeable units or other ownership converted to common stock, plus the amount of any other in-the-money instruments which are convertible to common stock, such as stock options/awards, restricted stock and non-voting participating preferred stock) Enterprise Value is equal to Fully Diluted Market Cap, less cash & equivalents (including marketable securities), plus total debt, plus preferreds Source: FactSet, S&P Global Market Intelligence (1) In the past quarter, Blackstone and Carlyle adopted Distributable Earnings as their primary earnings reporting basis; previously, Blackstone and Carlyle utilized Economic Net Income as their primary earnings reporting basis 11DRAFT OSLO Comparable Companies (as of 2/6/19) ($Millions, except per share data) Fully Total Enterprise Value / Enterprise Primary Earnings Closing Diluted Enterprise Revenue Price / EPS Value / Reporting Company Name Ticker Price Market Cap Value AUM 2019E 2020E 2019E 2020E AUM Basis Apollo Global Management, LLC APO $ 3 0.31 $ 11,042 $ 1 1,549 $ 280,259 4.7x 4.0x 10.4x 9.7x 4.1% Economic Net Income Ares Management Corporation ARES 22.22 4 ,406 4 ,934 1 25,079 4.1x 3.6x 14.9x 12.0x 3.9% Economic Net Income (1) Blackstone Group L.P. BX 34.57 38,738 40,282 472,242 5.6x 4.9x 12.9x 10.5x 8.5% Distributable Earnings (1) Carlyle Group L.P. CG 1 9.24 5 ,988 6,308 2 16,470 2.0x 1.8x 7.4x 6.5x 2.9% Distributable Earnings Hamilton Lane Inc. HLNE 4 2.15 1,794 1,841 59,000 6.4x 5.7x 20.7x 19.3x 3.1% Adjusted Net Income KKR & Co. Inc. KKR 23.24 1 7,605 1 7,573 1 94,720 4.8x 4.3x 13.0x 12.1x 9.0% Distributable Earnings Och-Ziff Capital Management Group OZM 13.26 583 1 ,263 3 2,995 2.2x 2.0x 3.7x 3.4x 3.8% Economic Income OSLO $ 4 2.65 $ 6,702 $ 6 ,841 $ 1 19,560 4.5x 4.1x 14.3x 12.3x 5.7% Adjusted Net Income 12.5x 11.2x Distributable Earnings Notes: Fully Diluted Market Cap is calculated as closing stock price times fully diluted shares (total common shares outstanding, plus any assumed exchangeable units or other ownership converted to common stock, plus the amount of any other in-the-money instruments which are convertible to common stock, such as stock options/awards, restricted stock and non-voting participating preferred stock) Enterprise Value is equal to Fully Diluted Market Cap, less cash & equivalents (including marketable securities), plus total debt, plus preferreds Source: FactSet, S&P Global Market Intelligence (1) In the past quarter, Blackstone and Carlyle adopted Distributable Earnings as their primary earnings reporting basis; previously, Blackstone and Carlyle utilized Economic Net Income as their primary earnings reporting basis 11
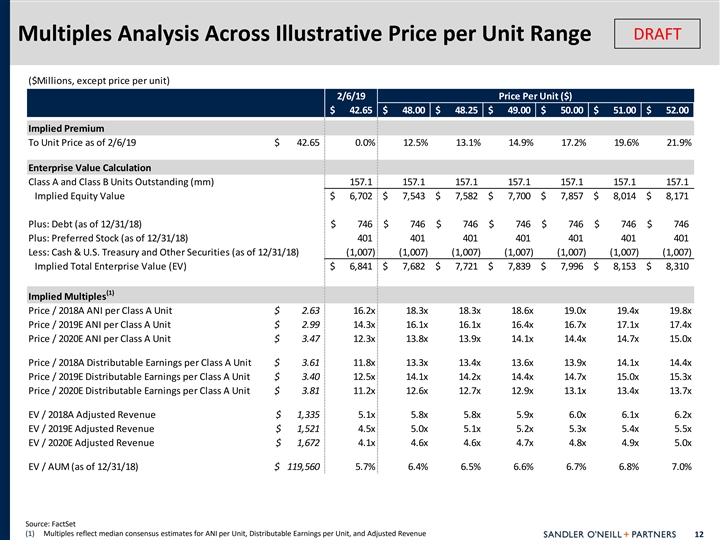
DRAFT Multiples Analysis Across Illustrative Price per Unit Range ($Millions, except price per unit) 2/6/19 Price Per Unit ($) $ 4 2.65 $ 48.00 $ 48.25 $ 4 9.00 $ 5 0.00 $ 5 1.00 $ 5 2.00 Implied Premium To Unit Price as of 2/6/19 $ 42.65 0.0% 12.5% 13.1% 14.9% 17.2% 19.6% 21.9% Enterprise Value Calculation Class A and Class B Units Outstanding (mm) 1 57.1 1 57.1 157.1 157.1 157.1 157.1 157.1 Implied Equity Value $ 6,702 $ 7 ,543 $ 7,582 $ 7,700 $ 7,857 $ 8 ,014 $ 8,171 Plus: Debt (as of 12/31/18) $ 746 $ 746 $ 746 $ 746 $ 746 $ 746 $ 746 Plus: Preferred Stock (as of 12/31/18) 401 401 401 401 401 401 401 Less: Cash & U.S. Treasury and Other Securities (as of 12/31/18) (1,007) (1,007) (1,007) (1,007) (1,007) (1,007) (1,007) Implied Total Enterprise Value (EV) $ 6,841 $ 7 ,682 $ 7 ,721 $ 7,839 $ 7 ,996 $ 8,153 $ 8 ,310 (1) Implied Multiples Price / 2018A ANI per Class A Unit $ 2.63 16.2x 18.3x 18.3x 18.6x 19.0x 19.4x 19.8x Price / 2019E ANI per Class A Unit $ 2.99 14.3x 16.1x 16.1x 16.4x 16.7x 17.1x 17.4x Price / 2020E ANI per Class A Unit $ 3.47 12.3x 13.8x 13.9x 14.1x 14.4x 14.7x 15.0x Price / 2018A Distributable Earnings per Class A Unit $ 3.61 11.8x 13.3x 13.4x 13.6x 13.9x 14.1x 14.4x Price / 2019E Distributable Earnings per Class A Unit $ 3.40 12.5x 14.1x 14.2x 14.4x 14.7x 15.0x 15.3x Price / 2020E Distributable Earnings per Class A Unit $ 3.81 11.2x 12.6x 12.7x 12.9x 13.1x 13.4x 13.7x EV / 2018A Adjusted Revenue $ 1,335 5.1x 5.8x 5.8x 5.9x 6.0x 6.1x 6.2x EV / 2019E Adjusted Revenue $ 1,521 4.5x 5.0x 5.1x 5.2x 5.3x 5.4x 5.5x EV / 2020E Adjusted Revenue $ 1,672 4.1x 4.6x 4.6x 4.7x 4.8x 4.9x 5.0x EV / AUM (as of 12/31/18) $ 119,560 5.7% 6.4% 6.5% 6.6% 6.7% 6.8% 7.0% Source: FactSet (1) Multiples reflect median consensus estimates for ANI per Unit, Distributable Earnings per Unit, and Adjusted Revenue 12DRAFT Multiples Analysis Across Illustrative Price per Unit Range ($Millions, except price per unit) 2/6/19 Price Per Unit ($) $ 4 2.65 $ 48.00 $ 48.25 $ 4 9.00 $ 5 0.00 $ 5 1.00 $ 5 2.00 Implied Premium To Unit Price as of 2/6/19 $ 42.65 0.0% 12.5% 13.1% 14.9% 17.2% 19.6% 21.9% Enterprise Value Calculation Class A and Class B Units Outstanding (mm) 1 57.1 1 57.1 157.1 157.1 157.1 157.1 157.1 Implied Equity Value $ 6,702 $ 7 ,543 $ 7,582 $ 7,700 $ 7,857 $ 8 ,014 $ 8,171 Plus: Debt (as of 12/31/18) $ 746 $ 746 $ 746 $ 746 $ 746 $ 746 $ 746 Plus: Preferred Stock (as of 12/31/18) 401 401 401 401 401 401 401 Less: Cash & U.S. Treasury and Other Securities (as of 12/31/18) (1,007) (1,007) (1,007) (1,007) (1,007) (1,007) (1,007) Implied Total Enterprise Value (EV) $ 6,841 $ 7 ,682 $ 7 ,721 $ 7,839 $ 7 ,996 $ 8,153 $ 8 ,310 (1) Implied Multiples Price / 2018A ANI per Class A Unit $ 2.63 16.2x 18.3x 18.3x 18.6x 19.0x 19.4x 19.8x Price / 2019E ANI per Class A Unit $ 2.99 14.3x 16.1x 16.1x 16.4x 16.7x 17.1x 17.4x Price / 2020E ANI per Class A Unit $ 3.47 12.3x 13.8x 13.9x 14.1x 14.4x 14.7x 15.0x Price / 2018A Distributable Earnings per Class A Unit $ 3.61 11.8x 13.3x 13.4x 13.6x 13.9x 14.1x 14.4x Price / 2019E Distributable Earnings per Class A Unit $ 3.40 12.5x 14.1x 14.2x 14.4x 14.7x 15.0x 15.3x Price / 2020E Distributable Earnings per Class A Unit $ 3.81 11.2x 12.6x 12.7x 12.9x 13.1x 13.4x 13.7x EV / 2018A Adjusted Revenue $ 1,335 5.1x 5.8x 5.8x 5.9x 6.0x 6.1x 6.2x EV / 2019E Adjusted Revenue $ 1,521 4.5x 5.0x 5.1x 5.2x 5.3x 5.4x 5.5x EV / 2020E Adjusted Revenue $ 1,672 4.1x 4.6x 4.6x 4.7x 4.8x 4.9x 5.0x EV / AUM (as of 12/31/18) $ 119,560 5.7% 6.4% 6.5% 6.6% 6.7% 6.8% 7.0% Source: FactSet (1) Multiples reflect median consensus estimates for ANI per Unit, Distributable Earnings per Unit, and Adjusted Revenue 12
DRAFT II. BERLIN Liquidity AnalysisDRAFT II. BERLIN Liquidity Analysis
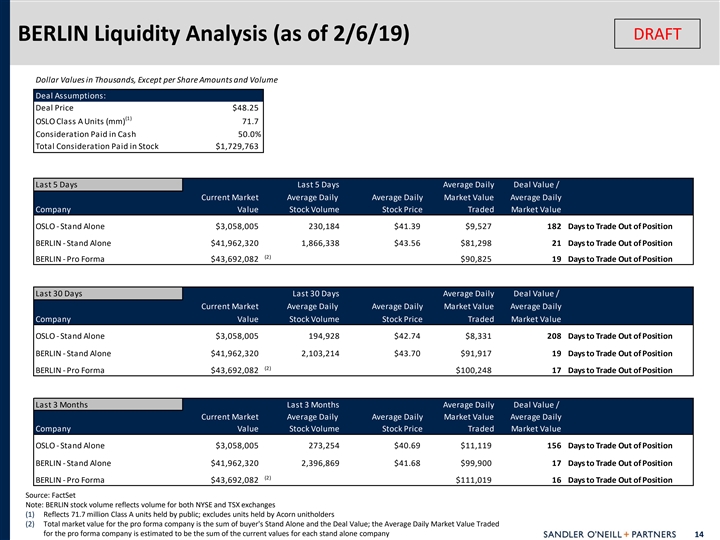
DRAFT BERLIN Liquidity Analysis (as of 2/6/19) Dollar Values in Thousands, Except per Share Amounts and Volume Deal Assumptions: Deal Price $48.25 (1) OSLO Class A Units (mm) 71.7 Consideration Paid in Cash 50.0% Total Consideration Paid in Stock $1,729,763 Last 5 Days Last 5 Days Average Daily Deal Value / Current Market Average Daily Average Daily Market Value Average Daily Company Value Stock Volume Stock Price Traded Market Value OSLO - Stand Alone $3,058,005 2 30,184 $41.39 $9,527 182 Days to Trade Out of Position BERLIN - Stand Alone $41,962,320 1 ,866,338 $43.56 $81,298 21 Days to Trade Out of Position (2) BERLIN - Pro Forma $43,692,082 $90,825 19 Days to Trade Out of Position Last 30 Days Last 30 Days Average Daily Deal Value / Current Market Average Daily Average Daily Market Value Average Daily Company Value Stock Volume Stock Price Traded Market Value OSLO - Stand Alone $3,058,005 194,928 $42.74 $8,331 208 Days to Trade Out of Position BERLIN - Stand Alone $41,962,320 2 ,103,214 $43.70 $91,917 19 Days to Trade Out of Position (2) BERLIN - Pro Forma $43,692,082 $100,248 17 Days to Trade Out of Position Last 3 Months Last 3 Months Average Daily Deal Value / Current Market Average Daily Average Daily Market Value Average Daily Company Value Stock Volume Stock Price Traded Market Value OSLO - Stand Alone $3,058,005 273,254 $40.69 $11,119 156 Days to Trade Out of Position BERLIN - Stand Alone $41,962,320 2,396,869 $41.68 $99,900 17 Days to Trade Out of Position (2) BERLIN - Pro Forma $43,692,082 $111,019 16 Days to Trade Out of Position Source: FactSet Note: BERLIN stock volume reflects volume for both NYSE and TSX exchanges (1) Reflects 71.7 million Class A units held by public; excludes units held by Acorn unitholders (2) Total market value for the pro forma company is the sum of buyer's Stand Alone and the Deal Value; the Average Daily Market Value Traded for the pro forma company is estimated to be the sum of the current values for each stand alone company 14DRAFT BERLIN Liquidity Analysis (as of 2/6/19) Dollar Values in Thousands, Except per Share Amounts and Volume Deal Assumptions: Deal Price $48.25 (1) OSLO Class A Units (mm) 71.7 Consideration Paid in Cash 50.0% Total Consideration Paid in Stock $1,729,763 Last 5 Days Last 5 Days Average Daily Deal Value / Current Market Average Daily Average Daily Market Value Average Daily Company Value Stock Volume Stock Price Traded Market Value OSLO - Stand Alone $3,058,005 2 30,184 $41.39 $9,527 182 Days to Trade Out of Position BERLIN - Stand Alone $41,962,320 1 ,866,338 $43.56 $81,298 21 Days to Trade Out of Position (2) BERLIN - Pro Forma $43,692,082 $90,825 19 Days to Trade Out of Position Last 30 Days Last 30 Days Average Daily Deal Value / Current Market Average Daily Average Daily Market Value Average Daily Company Value Stock Volume Stock Price Traded Market Value OSLO - Stand Alone $3,058,005 194,928 $42.74 $8,331 208 Days to Trade Out of Position BERLIN - Stand Alone $41,962,320 2 ,103,214 $43.70 $91,917 19 Days to Trade Out of Position (2) BERLIN - Pro Forma $43,692,082 $100,248 17 Days to Trade Out of Position Last 3 Months Last 3 Months Average Daily Deal Value / Current Market Average Daily Average Daily Market Value Average Daily Company Value Stock Volume Stock Price Traded Market Value OSLO - Stand Alone $3,058,005 273,254 $40.69 $11,119 156 Days to Trade Out of Position BERLIN - Stand Alone $41,962,320 2,396,869 $41.68 $99,900 17 Days to Trade Out of Position (2) BERLIN - Pro Forma $43,692,082 $111,019 16 Days to Trade Out of Position Source: FactSet Note: BERLIN stock volume reflects volume for both NYSE and TSX exchanges (1) Reflects 71.7 million Class A units held by public; excludes units held by Acorn unitholders (2) Total market value for the pro forma company is the sum of buyer's Stand Alone and the Deal Value; the Average Daily Market Value Traded for the pro forma company is estimated to be the sum of the current values for each stand alone company 14

DRAFT BERLIN Share Volume (as of 2/6/19) BERLIN Daily Trading Volume (Thousands) 8,000 BAM - NYSE BAM - TSX Combined Volume 1 Month Average 1,008 1,095 2,103 $ 86,764 3 Month Average 1,228 1,169 2,397 $ 100,285 7,000 6 Month Average 1,129 1,062 2,192 $ 92,112 LTM Average 1,030 1,027 2,057 $ 84,488 6,000 5,000 4,000 3,000 2,000 1,000 0 Feb-18 Mar-18 Apr-18 May-18 Jun-18 Jul-18 Aug-18 Sep-18 Oct-18 Nov-18 Dec-18 Jan-19 Feb-19 BAM - TSX BAM - NYSE Source: FactSet 15 Volume (Thousands of Shares)DRAFT BERLIN Share Volume (as of 2/6/19) BERLIN Daily Trading Volume (Thousands) 8,000 BAM - NYSE BAM - TSX Combined Volume 1 Month Average 1,008 1,095 2,103 $ 86,764 3 Month Average 1,228 1,169 2,397 $ 100,285 7,000 6 Month Average 1,129 1,062 2,192 $ 92,112 LTM Average 1,030 1,027 2,057 $ 84,488 6,000 5,000 4,000 3,000 2,000 1,000 0 Feb-18 Mar-18 Apr-18 May-18 Jun-18 Jul-18 Aug-18 Sep-18 Oct-18 Nov-18 Dec-18 Jan-19 Feb-19 BAM - TSX BAM - NYSE Source: FactSet 15 Volume (Thousands of Shares)
DRAFT III. AppendixDRAFT III. Appendix
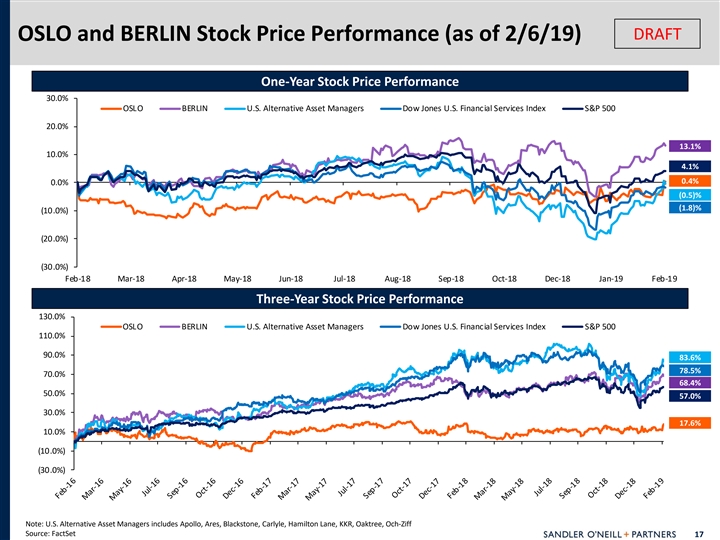
DRAFT OSLO and BERLIN Stock Price Performance (as of 2/6/19) One-Year Stock Price Performance 30.0% OSLO BERLIN U.S. Alternative Asset Managers Dow Jones U.S. Financial Services Index S&P 500 20.0% 13.1% 10.0% 4.1% 0.4% 0.0% (0.5)% (1.8)% (10.0%) (20.0%) (30.0%) Feb-18 Mar-18 Apr-18 May-18 Jun-18 Jul-18 Aug-18 Sep-18 Oct-18 Dec-18 Jan-19 Feb-19 Three-Year Stock Price Performance 130.0% OSLO BERLIN U.S. Alternative Asset Managers Dow Jones U.S. Financial Services Index S&P 500 110.0% 90.0% 83.6% 78.5% 70.0% 68.4% 50.0% 57.0% 30.0% 17.6% 10.0% (10.0%) (30.0%) Note: U.S. Alternative Asset Managers includes Apollo, Ares, Blackstone, Carlyle, Hamilton Lane, KKR, Oaktree, Och-Ziff Source: FactSet 17DRAFT OSLO and BERLIN Stock Price Performance (as of 2/6/19) One-Year Stock Price Performance 30.0% OSLO BERLIN U.S. Alternative Asset Managers Dow Jones U.S. Financial Services Index S&P 500 20.0% 13.1% 10.0% 4.1% 0.4% 0.0% (0.5)% (1.8)% (10.0%) (20.0%) (30.0%) Feb-18 Mar-18 Apr-18 May-18 Jun-18 Jul-18 Aug-18 Sep-18 Oct-18 Dec-18 Jan-19 Feb-19 Three-Year Stock Price Performance 130.0% OSLO BERLIN U.S. Alternative Asset Managers Dow Jones U.S. Financial Services Index S&P 500 110.0% 90.0% 83.6% 78.5% 70.0% 68.4% 50.0% 57.0% 30.0% 17.6% 10.0% (10.0%) (30.0%) Note: U.S. Alternative Asset Managers includes Apollo, Ares, Blackstone, Carlyle, Hamilton Lane, KKR, Oaktree, Och-Ziff Source: FactSet 17
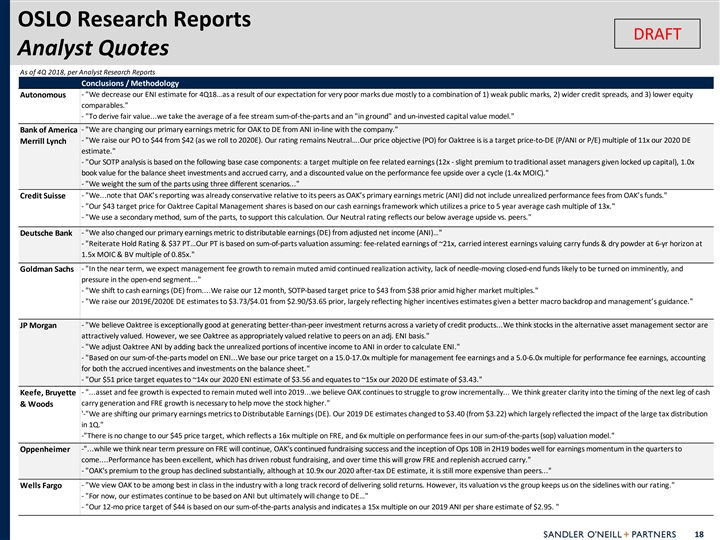
OSLO Research Reports DRAFT Analyst Quotes As of 4Q 2018, per Analyst Research Reports Conclusions / Methodology - We decrease our ENI estimate for 4Q18…as a result of our expectation for very poor marks due mostly to a combination of 1) weak public marks, 2) wider credit spreads, and 3) lower equity Autonomous comparables. - To derive fair value...we take the average of a fee stream sum-of-the-parts and an in ground and un-invested capital value model. - We are changing our primary earnings metric for OAK to DE from ANI in-line with the company. Bank of America - We raise our PO to $44 from $42 (as we roll to 2020E). Our rating remains Neutral….Our price objective (PO) for Oaktree is is a target price-to-DE (P/ANI or P/E) multiple of 11x our 2020 DE Merrill Lynch estimate. - Our SOTP analysis is based on the following base case components: a target multiple on fee related earnings (12x - slight premium to traditional asset managers given locked up capital), 1.0x book value for the balance sheet investments and accrued carry, and a discounted value on the performance fee upside over a cycle (1.4x MOIC). - We weight the sum of the parts using three different scenarios... - We...note that OAK’s reporting was already conservative relative to its peers as OAK’s primary earnings metric (ANI) did not include unrealized performance fees from OAK’s funds. Credit Suisse - Our $43 target price for Oaktree Capital Management shares is based on our cash earnings framework which utilizes a price to 5 year average cash multiple of 13x. - We use a secondary method, sum of the parts, to support this calculation. Our Neutral rating reflects our below average upside vs. peers. - We also changed our primary earnings metric to distributable earnings (DE) from adjusted net income (ANI)… Deutsche Bank - Reiterate Hold Rating & $37 PT…Our PT is based on sum-of-parts valuation assuming: fee-related earnings of ~21x, carried interest earnings valuing carry funds & dry powder at 6-yr horizon at 1.5x MOIC & BV multiple of 0.85x. - In the near term, we expect management fee growth to remain muted amid continued realization activity, lack of needle-moving closed-end funds likely to be turned on imminently, and Goldman Sachs pressure in the open-end segment... - We shift to cash earnings (DE) from....We raise our 12 month, SOTP-based target price to $43 from $38 prior amid higher market multiples. - We raise our 2019E/2020E DE estimates to $3.73/$4.01 from $2.90/$3.65 prior, largely reflecting higher incentives estimates given a better macro backdrop and management’s guidance. JP Morgan - We believe Oaktree is exceptionally good at generating better-than-peer investment returns across a variety of credit products...We think stocks in the alternative asset management sector are attractively valued. However, we see Oaktree as appropriately valued relative to peers on an adj. ENI basis. - We adjust Oaktree ANI by adding back the unrealized portions of incentive income to ANI in order to calculate ENI. - Based on our sum-of-the-parts model on ENI...We base our price target on a 15.0-17.0x multiple for management fee earnings and a 5.0-6.0x multiple for performance fee earnings, accounting for both the accrued incentives and investments on the balance sheet. - Our $51 price target equates to ~14x our 2020 ENI estimate of $3.56 and equates to ~15x our 2020 DE estimate of $3.43. Keefe, Bruyette - ...asset and fee growth is expected to remain muted well into 2019...we believe OAK continues to struggle to grow incrementally... We think greater clarity into the timing of the next leg of cash carry generation and FRE growth is necessary to help move the stock higher. & Woods '- We are shifting our primary earnings metrics to Distributable Earnings (DE). Our 2019 DE estimates changed to $3.40 (from $3.22) which largely reflected the impact of the large tax distribution in 1Q. - There is no change to our $45 price target, which reflects a 16x multiple on FRE, and 6x multiple on performance fees in our sum-of-the-parts (sop) valuation model. - ...while we think near term pressure on FRE will continue, OAK's continued fundraising success and the inception of Ops 10B in 2H19 bodes well for earnings momentum in the quarters to Oppenheimer come....Performance has been excellent, which has driven robust fundraising, and over time this will grow FRE and replenish accrued carry. - OAK's premium to the group has declined substantially, although at 10.9x our 2020 after-tax DE estimate, it is still more expensive than peers... Wells Fargo - We view OAK to be among best in class in the industry with a long track record of delivering solid returns. However, its valuation vs the group keeps us on the sidelines with our rating. - For now, our estimates continue to be based on ANI but ultimately will change to DE… - Our 12-mo price target of $44 is based on our sum-of-the-parts analysis and indicates a 15x multiple on our 2019 ANI per share estimate of $2.95. 18OSLO Research Reports DRAFT Analyst Quotes As of 4Q 2018, per Analyst Research Reports Conclusions / Methodology - We decrease our ENI estimate for 4Q18…as a result of our expectation for very poor marks due mostly to a combination of 1) weak public marks, 2) wider credit spreads, and 3) lower equity Autonomous comparables. - To derive fair value...we take the average of a fee stream sum-of-the-parts and an in ground and un-invested capital value model. - We are changing our primary earnings metric for OAK to DE from ANI in-line with the company. Bank of America - We raise our PO to $44 from $42 (as we roll to 2020E). Our rating remains Neutral….Our price objective (PO) for Oaktree is is a target price-to-DE (P/ANI or P/E) multiple of 11x our 2020 DE Merrill Lynch estimate. - Our SOTP analysis is based on the following base case components: a target multiple on fee related earnings (12x - slight premium to traditional asset managers given locked up capital), 1.0x book value for the balance sheet investments and accrued carry, and a discounted value on the performance fee upside over a cycle (1.4x MOIC). - We weight the sum of the parts using three different scenarios... - We...note that OAK’s reporting was already conservative relative to its peers as OAK’s primary earnings metric (ANI) did not include unrealized performance fees from OAK’s funds. Credit Suisse - Our $43 target price for Oaktree Capital Management shares is based on our cash earnings framework which utilizes a price to 5 year average cash multiple of 13x. - We use a secondary method, sum of the parts, to support this calculation. Our Neutral rating reflects our below average upside vs. peers. - We also changed our primary earnings metric to distributable earnings (DE) from adjusted net income (ANI)… Deutsche Bank - Reiterate Hold Rating & $37 PT…Our PT is based on sum-of-parts valuation assuming: fee-related earnings of ~21x, carried interest earnings valuing carry funds & dry powder at 6-yr horizon at 1.5x MOIC & BV multiple of 0.85x. - In the near term, we expect management fee growth to remain muted amid continued realization activity, lack of needle-moving closed-end funds likely to be turned on imminently, and Goldman Sachs pressure in the open-end segment... - We shift to cash earnings (DE) from....We raise our 12 month, SOTP-based target price to $43 from $38 prior amid higher market multiples. - We raise our 2019E/2020E DE estimates to $3.73/$4.01 from $2.90/$3.65 prior, largely reflecting higher incentives estimates given a better macro backdrop and management’s guidance. JP Morgan - We believe Oaktree is exceptionally good at generating better-than-peer investment returns across a variety of credit products...We think stocks in the alternative asset management sector are attractively valued. However, we see Oaktree as appropriately valued relative to peers on an adj. ENI basis. - We adjust Oaktree ANI by adding back the unrealized portions of incentive income to ANI in order to calculate ENI. - Based on our sum-of-the-parts model on ENI...We base our price target on a 15.0-17.0x multiple for management fee earnings and a 5.0-6.0x multiple for performance fee earnings, accounting for both the accrued incentives and investments on the balance sheet. - Our $51 price target equates to ~14x our 2020 ENI estimate of $3.56 and equates to ~15x our 2020 DE estimate of $3.43. Keefe, Bruyette - ...asset and fee growth is expected to remain muted well into 2019...we believe OAK continues to struggle to grow incrementally... We think greater clarity into the timing of the next leg of cash carry generation and FRE growth is necessary to help move the stock higher. & Woods '- We are shifting our primary earnings metrics to Distributable Earnings (DE). Our 2019 DE estimates changed to $3.40 (from $3.22) which largely reflected the impact of the large tax distribution in 1Q. - There is no change to our $45 price target, which reflects a 16x multiple on FRE, and 6x multiple on performance fees in our sum-of-the-parts (sop) valuation model. - ...while we think near term pressure on FRE will continue, OAK's continued fundraising success and the inception of Ops 10B in 2H19 bodes well for earnings momentum in the quarters to Oppenheimer come....Performance has been excellent, which has driven robust fundraising, and over time this will grow FRE and replenish accrued carry. - OAK's premium to the group has declined substantially, although at 10.9x our 2020 after-tax DE estimate, it is still more expensive than peers... Wells Fargo - We view OAK to be among best in class in the industry with a long track record of delivering solid returns. However, its valuation vs the group keeps us on the sidelines with our rating. - For now, our estimates continue to be based on ANI but ultimately will change to DE��� - Our 12-mo price target of $44 is based on our sum-of-the-parts analysis and indicates a 15x multiple on our 2019 ANI per share estimate of $2.95. 18

OSLO Research Reports DRAFT Analyst Quotes (cont’d) As of 3Q 2018, per Analyst Research Reports Conclusions / Methodology Jefferies - Despite limited signs of distress, trends across the business remain strong with growth opportunities in real estate, global credit, emerging markets and direct lending; all working to ease the pressure on FRE. - ...with net accrued incentives of ~$900M, we would anticipate a pick up in DE in 2019. - Our PT reflects a 16x multiple on the relatively stable base net management fees and a discounted 8x multiple on the more volatile net performance fees we expect in 2018. Morgan Stanley - n/a 19OSLO Research Reports DRAFT Analyst Quotes (cont’d) As of 3Q 2018, per Analyst Research Reports Conclusions / Methodology Jefferies - Despite limited signs of distress, trends across the business remain strong with growth opportunities in real estate, global credit, emerging markets and direct lending; all working to ease the pressure on FRE. - ...with net accrued incentives of ~$900M, we would anticipate a pick up in DE in 2019. - Our PT reflects a 16x multiple on the relatively stable base net management fees and a discounted 8x multiple on the more volatile net performance fees we expect in 2018. Morgan Stanley - n/a 19


