Table of Contents
UNITED STATES
SECURITIES AND EXCHANGE COMMISSION
Washington, D.C. 20549
FORM N-CSR
CERTIFIED SHAREHOLDER REPORT OF REGISTERED
MANAGEMENT INVESTMENT COMPANIES
Investment Company Act file number: 811-22099
Gateway Trust
(Exact name of Registrant as specified in charter)
399 Boylston Street, Boston, Massachusetts 02116
(Address of principal executive offices) (Zip code)
Coleen Downs Dinneen, Esq.
NGAM Distribution, L.P.
399 Boylston Street
Boston, Massachusetts 02116
(Name and address of agent for service)
Registrant’s telephone number, including area code: (617) 449-2810
Date of fiscal year end: November 30
Date of reporting period: November 30, 2014
Table of Contents
Item 1. Reports to Stockholders.
The Registrant’s annual report transmitted to shareholders pursuant to Rule 30e-1 under the Investment Company Act of 1940 is as follows:
Table of Contents
ANNUAL REPORT
November 30, 2014

Gateway International Fund
Loomis Sayles Dividend Income Fund
(formerly Loomis Sayles Capital Income Fund)
Loomis Sayles Emerging Markets Opportunities Fund
Loomis Sayles Senior Floating Rate and Fixed Income Fund
Vaughan Nelson Select Fund
Portfolio Review page 1
Portfolio of Investments page 20
Financial Statements page 55
Notes to Financial Statements page 79
Table of Contents
| Managers: | Symbols: | |
| Daniel M. Ashcraft, CFA® | Class A GAIAX | |
| Michael T. Buckius, CFA® | Class C GAICX | |
| Kenneth H. Toft, CFA® | Class Y GAIYX | |
| Gateway Investment Advisers, LLC |
Objective:
Over the long term, the Fund seeks to capture the majority of the returns associated with international developed market equity investments, while exposing investors to less risk than such investments generally.
Market Conditions
Over the 12-month period ended November 30, 2014, the international equity market moved up and down but ended essentially where it began. The key themes were a slowdown in Chinese economic growth, geopolitical uncertainty and the currency impact of strong monetary stimulus sponsored by certain foreign governments. Early in the period, foreign stock markets lost ground, due in part to evidence of slowing Chinese growth and concerns over rising tensions between Russia and the Ukraine. From February through the start of July, the markets advanced nicely as concerns lessened about the economic impact of geopolitical tension and Japan embarked on the third leg of its economic stimulus plan, dubbed “Abe-nomics” after the country’s prime minister. From its July peak through mid-October, stocks suffered a double digit decline, as Japan reported second quarter economic contraction, the European financial sector showed signs of deterioration and concern grew that Russian sanctions on Ukrainian trading partners could stifle already weakening global economic growth. In the final six weeks of the fiscal year, the international markets bounced back on announcements of expanding monetary stimulus programs from both the European Central Bank and the Bank of Japan. Currency losses had a significant impact on index returns in U.S. dollars, as the currency component of the MSCI EAFE Index lost 7.88% over the course of the fiscal year.
The CBOE EFA ETF Volatility Index (“VXEFA”), which measures the expected volatility of the iShares® MSCI EAFE Index Fund (“EFA”), was below its long-term average for much of the period. The VXEFA began the fiscal year at 14.37, declined to a low of 10.65 in late December, and rose to 22.49 during the first selloff of the year on February 3rd. It hit an ultimate peak of 26.48 at the October market bottom before declining to end the fiscal year at 14.66. The average level for the year was 15.19.
Performance Results
For the 12 months ended November 30, 2014, Class A shares of Gateway International Fund returned -2.24% at net asset value. The MSCI EAFE Index (Net) returned -0.02% in U.S. dollars for the same period.
1 |
Table of Contents
Explanation of Fund Performance
Despite a larger loss than the MSCI EAFE Index over the 12-month period, the Fund’s performance was consistent with expectations given its risk profile in each of the advancing and declining periods for the index. Gateway International Fund seeks to generate returns by selling at-the-money index ETF call options, which substitute less variable option premium for market price appreciation, and uses some of the cash flow to mitigate price declines in the portfolio by purchasing out-of-the-money index ETF put options. An option is described as being at-the-money when the price of the underlying instrument is the same as the strike price. Additionally, an option is described as being out-of-the-money when the price of the underlying instrument is above the strike price for a put option (an option to sell). During the most significant market advance from February 4th to July 3rd, the Fund had a return of 4.91%, underperforming the MSCI EAFE Index by 808 basis points. When the MSCI EAFE Index advances, the Fund’s index-tracking equity portfolio generates gains but the Fund’s return is limited to cash flow earned from written EFA call options less losses from purchased EFA put options. It is not unusual for the Fund to underperform during a period of above normal return for the MSCI EAFE Index — particularly when implied volatility is below average for much of the period.
During the most significant decline for the index, -13.60% from July 3rd to October 16th, the Fund lost 7.46% and outperformed the index by 614 basis points, as index call options written on EFA aided performance relative to the index. The Fund also experienced a small gain from index put options purchased on EFA during periods of decline. Over the last three weeks of October, the Fund had put protection on 80-95% of the portfolio. During this period, management made adjustments to the call and put portfolios to achieve a relative risk profile consistent with the Fund’s history. Put protection was restored to 100% by month-end as markets rallied and volatility declined.
Consistent with its objective, the measured risk of the Fund was low relative to the EFA, as its standard deviation for the period was 5.77%, versus 12.31% for the EFA.
The EFA options the Fund uses are U.S. dollar denominated, therefore the currency exposure of the Fund is less than that of the MSCI EAFE Index. As a result, the Fund’s currency losses were less than those of the index for the period.
Outlook
As the European Central Bank and the Bank of Japan expanded monetary stimulus programs, the U.S. Federal Reserve tapered its monetary stimulus. This de-synchronization of global central bank action may be an important factor affecting both international equity market volatility and currency volatility going forward. Coupled with ongoing geopolitical concerns, we believe that the international equity market environment will be one that demonstrates more volatility and one that is much more reactive to changes in market fundamentals as well as central bank actions.
| 2
Table of Contents
GATEWAY INTERNATIONAL FUND
Growth of $10,000 Investment in Class A Shares3
March 30, 2012 (inception) through November 30, 2014
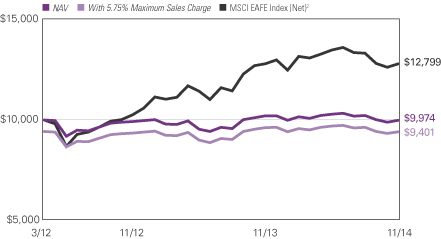
Average Annual Total Returns — November 30, 20143
| 1 Year | Life of Fund | |||||||
Class A (Inception 3/30/2012) | ||||||||
NAV | -2.24 | % | -0.10 | % | ||||
With 5.75% Maximum Sales Charge | -7.86 | -2.29 | ||||||
Class C (Inception 3/30/2012) | ||||||||
NAV | -3.03 | -0.81 | ||||||
With CDSC1 | -3.99 | -0.81 | ||||||
Class Y (Inception 3/30/2012) | ||||||||
NAV | -1.86 | 0.21 | ||||||
Comparative Performance | ||||||||
MSCI EAFE Index (Net)2 | -0.02 | 9.71 | ||||||
Past performance does not guarantee future results. The table(s) do not reflect taxes shareholders might owe on any Fund distributions or when they redeem their shares. Performance for periods less than one year is cumulative, not annualized. Returns reflect changes in share price and reinvestment of dividends and capital gains, if any. Unlike a fund, an index is not managed and does not reflect fees and expenses.
| 1 | Performance for Class C shares assumes a 1% contingent deferred sales charge (“CDSC”) applied when you sell shares within one year of purchase. |
| 2 | MSCI EAFE Index (Net) (Europe, Australasia, Far East) is an unmanaged index that is designed to measure the equity market performance of developed markets, excluding the United States and Canada. |
| 3 | Fund performance has been increased by fee waivers and/or expense reimbursements, if any, without which performance would have been lower. |
3 |
Table of Contents
LOOMIS SAYLES DIVIDEND INCOME FUND
(formerly Loomis Sayles Capital Income Fund)
| Managers: | Symbols: | |
| Arthur J. Barry, CFA® | Class A LSCAX | |
| Matthew J. Eagan, CFA®* | Class C LSCCX | |
| Daniel J. Fuss, CFA®, CIC | Class Y LSCYX | |
| Warren N. Koontz, CFA®, CIC** | ||
| Adam C. Liebhoff*** | ||
| Elaine M. Stokes* | ||
| Loomis, Sayles & Company, L.P. | ||
| * | Matthew J. Eagan and Elaine M. Stokes became co-portfolio managers of the Fund effective October 15, 2014. |
| ** | Effective August 25, 2014 Warren Koontz no longer serves as co-portfolio manager of the Fund. |
| *** | Adam C. Liebhoff became a co-portfolio manager of the Fund effective September 12, 2014. |
Objective:
The Fund’s investment goal is high total return through a combination of current income and capital appreciation.
Market Conditions
During the 12 months that ended November 30, 2014, the United States remained a bright spot for equity investors from a total return perspective. Most S&P 500® Index sectors generated strong gains, with energy being the unsurprising laggard due to falling oil prices. The dividend yield on the index remained approximately 2.00%, as dividend increases kept pace with higher equity prices. As of the end of November, more than 80% of S&P 500® Index companies paid cash dividends, the highest number in several years.
Performance Results
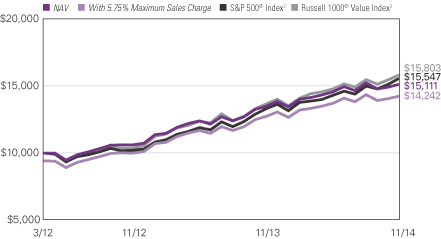
For the 12-month period ended November 30, 2014, Class A shares of Loomis Sayles Dividend Income Fund returned 11.95% at net asset value. The Fund underperformed its primary benchmark, the S&P 500® Index, which returned 16.86% for the period. The Fund also underperformed its secondary benchmark, the Russell 1000® Value Index, which returned 15.62%.
Explanation of Fund Performance
Stock selection was particularly strong for the Fund in the energy and information technology sectors. However, a relative overweight position in the weak energy sector and an underweight position in the strong technology sector contributed to the Fund’s lagging results versus the S&P 500® Index. The Fund’s relative weights in these sectors were driven by the availability of yield-oriented investments. In addition, stock selection in healthcare detracted from performance, primarily due to specific holdings in the pharmaceutical industry. The Fund’s fixed-income positions did not meaningfully contribute to overall performance.
| 4
Table of Contents
LOOMIS SAYLES DIVIDEND INCOME FUND
Primary detractors for the 12-month period included Royal Dutch Shell, American Eagle Outfitters and Transocean Partners. Royal Dutch Shell, an integrated energy company, trailed the market primarily due to falling oil prices. An increase in oil supply and a decision by the Organization of the Petroleum Exporting Countries (OPEC) to maintain production quotas led to the decline in oil prices. American Eagle Outfitters, a U.S. clothing retailer, continued to struggle in a highly competitive teen apparel space after announcing a weak second quarter and forward guidance. In addition, the unexplained firing of the company’s highly regarded CEO in January caused substantial pressure on the stock early in the year. We exited the name in June. In addition, Transocean Partners, an offshore driller, underperformed as falling oil prices clouded the long-term demand outlook for the drilling rigs that Transocean operates.
In terms of individual holdings, Eli Lilly, Apple and Microsoft were the largest positive contributors to Fund performance. Eli Lilly, a pharmaceutical company held in the Fund since November 2013, outperformed after a lackluster 2013 calendar year. The stock was a strong performer during 2014 as negative sentiment surrounding the stock dissipated. Apple outperformed due to a combination of several positive news items and data points. In particular, a strong earnings report (driven by iPhone sales), stabilizing gross margins, excitement around the company’s upcoming product launches and mean reversion from prior underperformance led to a strong 12-month gain. In addition, shares of Microsoft rose on a restructuring plan, announced in the third quarter, that was larger than Wall Street analysts anticipated. The plan, which will mainly address headcount and more closely align operations from its recently acquired Nokia Devices & Services business, has the potential to raise earnings per share (EPS) going forward.
Outlook
We believe there is pent up spending demand from the U.S. consumer. The job market is better, household balance sheets are improving and household income is showing slight gains. A stronger U.S. dollar and falling energy prices should contribute to an increase in consumer spending.
Although we are preparing for rising interest rates, we have tempered our yield expectations. Despite U.S. economic momentum, global factors, including sluggish growth outside the United States, low yields and geopolitical risks, are weighing on U.S. rates. At this point, our preference is to find equity investments offering higher yields due to lagging share prices. We believe these investments have the potential to provide ballast to the portfolio should interest rates begin to rise. As always, we will look for individual holdings that offer a risk/reward balance combined with yield.
5 |
Table of Contents
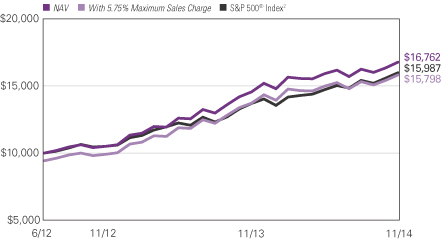
LOOMIS SAYLES DIVIDEND INCOME FUND
Growth of $10,000 Investment in Class A Shares4
March 30, 2012 (inception) through November 30, 2014
Average Annual Total Returns — November 30, 20144
| 1 Year | Life of Fund | |||||||
Class A (Inception 3/30/2012) | ||||||||
NAV | 11.95 | % | 16.72 | % | ||||
With 5.75% Maximum Sales Charge | 5.48 | 14.16 | ||||||
Class C (Inception 3/30/2012) | ||||||||
NAV | 11.14 | 15.84 | ||||||
With CDSC1 | 10.14 | 15.84 | ||||||
Class Y (Inception 3/30/2012) | ||||||||
NAV | 12.22 | 16.99 | ||||||
Comparative Performance | ||||||||
S&P 500® Index2 | 16.86 | 18.02 | ||||||
Russell 1000® Value Index3 | 15.62 | 18.74 | ||||||
Past performance does not guarantee future results. The table(s) do not reflect taxes shareholders might owe on any Fund distributions or when they redeem their shares. Performance for periods less than one year is cumulative, not annualized. Returns reflect changes in share price and reinvestment of dividends and capital gains, if any. Unlike a fund, an index is not managed and does not reflect fees and expenses.
| 1 | Performance for Class C shares assumes a 1% contingent deferred sales charge (“CDSC”) applied when you sell shares within one year of purchase. |
| 2 | S&P 500® Index is a widely recognized measure of U.S. stock market performance. It is an unmanaged index of 500 common stocks chosen for market size, liquidity, and industry group representation, among other factors. |
| 3 | Russell 1000® Value Index is an unmanaged index that measures the performance of the large-cap value segment of the U.S. equity universe. It includes those Russell 1000® companies with lower price-to-book ratios and lower expected growth values. |
| 4 | Fund performance has been increased by fee waivers and/or expense reimbursements, if any, without which performance would have been lower. |
| 6
Table of Contents
LOOMIS SAYLES EMERGING MARKETS OPPORTUNITIES FUND
| Managers: | Symbols: | |||
| Elisabeth Colleran, CFA® | Class A | LEOAX | ||
| Peter A. Frick, CFA® | Class C | LEOCX | ||
| Peter N. Marber | Class N | LEONX | ||
| David W. Rolley, CFA® | Class Y | LEOYX | ||
| Edgardo Sternberg | ||||
| Loomis, Sayles & Company, L.P. | ||||
Objective
The Fund seeks high total investment return through a combination of current income and capital appreciation.
Market Conditions
Global growth concerns continued in 2014, as Europe and Japan struggled with deflationary pressures and anemic growth, while China continued to moderate its growth projections. Although the U.S. economy transitioned from recovery to expansion, other major developed markets sputtered, and geopolitical anxiety from conflicts in Russia/Ukraine and the Middle East intensified the cautious sentiment. Weaker global growth and disinflationary trends led to lower bond yields in developed markets. Central bank activity remained a principal factor influencing markets even as policies started to deviate regionally. The Federal Reserve (the Fed) and the Bank of England contemplated interest rate hikes while the Bank of Japan and European Central Bank (ECB) became increasingly more accommodative.
After a strong run during the first half of 2014, emerging market bonds came under pressure through the end of the period. An increase in market volatility and geopolitical risk led to a mixed and moderate selloff. Performance improved in October before cooling off once again in November. The economies of China, Brazil and Russia faced substantial headwinds during the period, and a quick recovery does not appear imminent. In particular, signs of disinflation emerged in China, and growth remained modestly below the robust figures of previous periods. The recent slide in oil prices significantly influenced emerging market performance. Net oil importers, such as Turkey and Indonesia, benefited from the lower prices, while net exporters, such as Venezuela, struggled.
Performance Results
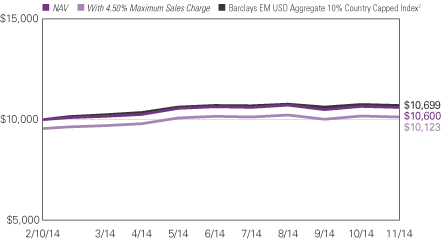
For the period from the Fund’s inception on February 10, 2014, through its fiscal year end on November 30, 2014, Class A shares of Loomis Sayles Emerging Markets Opportunities Fund returned 6.00% at net asset value. The Fund underperformed its benchmark, the Barclays EM USD Aggregate 10% Country Capped Index, which returned 6.99%.
Explanation of Fund Performance
The Fund’s gains were largely driven by its allocation to hard currency bonds. In addition, issue selection in corporate sectors added value. However, yield curve (a curve that shows
7 |
Table of Contents
the relationship among bond yields across the maturity spectrum) positioning weighed on relative results. Small exposures to local emerging market currencies also detracted from relative return, as the U.S. dollar staged a strong rally.
An overall bias toward the short end of the U.S. dollar yield curve detracted from relative results, as rates fell broadly. The greatest downward pressure in yields was concentrated at the longest end of the curve, causing this portion of the curve to be the best-performing maturity bucket. Since the Fund was underweight in longer-maturity bonds in favor of shorter maturities, this positioning detracted from performance.
In addition, small exposures to the Ugandan shilling, Kenyan shilling and Zambian kwacha weighed on results. These out-of-benchmark positions were modest, but they detracted from relative results as the U.S. dollar staged a significant rally. Investors moved into the U.S. dollar in anticipation of further divergence among leading central bank policies and deflationary pressures in other hard currency blocs. Underweight exposure to sovereign issuers also contributed to the Fund’s underperformance, as this sector was one of the better performers during the period. More specifically, underweight exposure to Turkish and Indonesian hard currency issues detracted from results as the bonds performed well.
Holdings in the basic industrials, capital goods, communications, banking and technology sectors performed well versus the Fund’s benchmark. In addition, a cautious stance in bonds with exposure to Brazil, Russia and Ukraine aided return. An overweight position in consumer goods (cyclical and non-cyclical) also enhanced relative results. Furthermore, an underweight position in the government-owned sector added value. This segment underperformed corporates and sovereigns during most of the period. Interest rate futures were used to manage duration and contributed to results.
Outlook
The outlook for global growth remains cautious, as investors await the market’s reaction to activity of the leading central banks in 2015. U.S. growth remains on solid footing and should provide some support for emerging markets, provided the Fed’s rate hike strategy unfolds at a measured pace. We expect slow and gradual rate increases from the Fed, given subdued inflationary pressures, mild wage growth and ongoing concerns about weaker demand abroad.
Stagnant growth in Europe and the potential for enhanced liquidity measures by the ECB could provide support to the higher yielding bonds of emerging markets. However, we believe some idiosyncratic stories will emerge, placing even more importance on credit and security selection. We do not believe the Russia/Ukraine crisis is over and believe it could plausibly spill into the broader markets, depending on the response of the United States and Europe. We suspect world demand for oil may catch up to excess supply in approximately 12 months, but we doubt oil price uncertainties will be resolved in the short term. The effects of lower oil costs should be relatively short lived, but we will closely monitor the potential distress experienced by Organization of the Petroleum Exporting Countries (OPEC) members.
| 8
Table of Contents
LOOMIS SAYLES EMERGING MARKETS OPPORTUNITIES FUND
Growth of $10,000 Investment in Class A Shares3
February 10, 2014 (inception) through November 30, 2014
Total Returns — November 30, 20143
Life of Fund | ||||
Class A (Inception 2/10/2014) | ||||
NAV | 6.00 | % | ||
With 4.50% Maximum Sales Charge | 1.24 | |||
Class C (Inception 2/10/2014) | ||||
NAV | 5.20 | |||
With CDSC1 | 4.20 | |||
Class N (Inception 2/10/2014) | ||||
NAV | 6.18 | |||
Class Y (Inception 2/10/2014) | ||||
NAV | 6.18 | |||
| Comparitive Performance | ||||
| Barclays EM USD Aggregate 10% Country Capped Index2 | 6.99 | |||
Past performance does not guarantee future results. The table(s) do not reflect taxes shareholders might owe on any Fund distributions or when they redeem their shares. Performance for periods less than one year is cumulative, not annualized. Returns reflect changes in share price and reinvestment of dividends and capital gains, if any. Unlike a fund, an index is not managed and does not reflect fees and expenses.
| 1 | Performance for Class C shares assumes a 1% contingent deferred sales charge (“CDSC”) applied when you sell shares within one year of purchase. |
| 2 | The Barclays EM USD Aggregate 10% Country Capped Index includes USD denominated debt from sovereign, quasi-sovereign, and corporate EM issuers. The index is broad-based in its coverage by sector and by country, and includes a 10% Country cap. |
| 3 | Fund performance has been increased by fee waivers and/or expense reimbursements, if any, without which performance would have been lower. |
9 |
Table of Contents
LOOMIS SAYLES SENIOR FLOATING RATE AND FIXED INCOME FUND
| Managers: | Symbols: | |
| Kevin J. Perry | Class A LSFAX | |
| John R. Bell | Class C LSFCX | |
| Loomis, Sayles & Company, L.P. | Class Y LSFYX |
Objective:
The Fund seeks to provide a high level of current income.
Market Conditions
Bank loan market activity during the first quarter of 2014 was similar to most of 2013, with loan income constituting the majority of the returns earned and lower-rated loans continuing to drive performance. In April 2014, the 95-week streak of positive bank loan retail fund flows ended, and the long-anticipated default of TXU Energy occurred. The bank loan market quickly adjusted to the retail outflows, as collateralized loan obligations (CLOs) stepped in to fill the demand and exert their influence on the market. Overall, there was little bank loan price movement during the first half of 2014. Challenges emerged during the third quarter with bank loan-focused mutual funds and high yield funds that own bank loans experiencing retail outflows due to redemptions. Bank loan prices dropped slightly in October but regained some ground in November. During the last few months of the period, bank loan supply outpaced demand. The asset level of the S&P/LSTA Leveraged Loan® Index ended the period at a new high of $823 billion, an increase of 22% from the prior year.
Performance Results
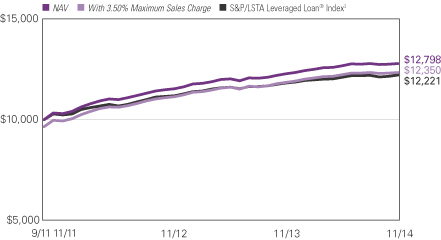
For the 12-month period ended November 30, 2014, Class A shares of Loomis Sayles Senior Floating Rate and Fixed Income Fund returned 4.22% at net asset value. The Fund outperformed its benchmark, the S&P/LSTA Leveraged Loan® Index, which returned 3.37%.
Explanation of Fund Performance
As part of our general investment strategy, we did not make any significant tactical shifts during the 12-month period. Instead, we focused on credit selection and generating a high level of current income, reserving our tactical flexibility to manage exposures based on significant shifts in our macroeconomic view.
We targeted a yield advantage relative to the index in most market conditions, which helped the Fund’s performance even as retail outflows persisted during most of the period. Overall, the Fund’s bank loan returns were positive across all rating categories. In terms of sectors, the Fund’s allocations to technology and healthcare aided relative performance during the period, while oil-related holdings suffered due to falling oil prices.
After subtracting cash held for the purpose of settling purchases, the Fund ended the period with approximately 86% of its portfolio invested in bank loans, 11% in bonds and 3% in
| 10
Table of Contents
LOOMIS SAYLES SENIOR FLOATING RATE AND FIXED INCOME FUND
cash equivalents. The Fund’s allocation to bonds increased only two percentage points over the period, as few high yield bonds met the low duration (price sensitivity to interest rate changes), competitive return profile we seek for the Fund. We added some high yield bonds during periods of market weakness and sold some high yield bonds at yields below our expectations for bank loan benchmark returns.
We began using leverage (borrowing capital at a lower interest rate relative to the interest rates on bank loans) at the end of 2013, slightly increasing exposure during the third quarter of 2014. Overall, though, our use of leverage remained modest. We believe the cost of leverage is attractive given our market outlook, and we do not view this strategy as a significant driver of return.
Outlook
We believe overall market volatility is likely to increase if the Federal Reserve (the Fed) raises interest rates in 2015 to reflect a growing economy. Bank loans would not be immune to the resulting rate hike pressures, but they could benefit fundamentally (from a good economy) and technically (from demand related to rising rates) should the Fed move in that direction.
We expect CLO demand for bank loans to remain relatively strong even without Fed action. Such strength would reflect a history of strong returns with extremely low default rates, as well as a desire to finalize structures before new risk retention rules take effect in late 2016. Bank loan fund managers generally expect the default rate to remain relatively stable during the coming year. This expectation is largely due to the combination of a slow-growth macroeconomic environment, solid company fundamentals and low expected maturities (approximately $22.2 billion total for the remainder of 2014 and all of 2015 and 2016). However, exogenous shocks, such as political events or geopolitical unrest, may disrupt market expectations.
11 |
Table of Contents
LOOMIS SAYLES SENIOR FLOATING RATE AND FIXED INCOME FUND
Growth of $10,000 Investment in Class A Shares4
September 30, 2011 (inception) through November 30, 2014
Average Annual Total Returns — November 30, 20144
| 1 Year | Life of Fund | |||||||
| Class A (Inception 9/30/11) | ||||||||
| NAV | 4.22 | % | 8.10 | % | ||||
| With 3.50% Maximum Sales Charge | 0.60 | 6.88 | ||||||
| Class C (Inception 9/30/11) | ||||||||
| NAV | 3.47 | 7.32 | ||||||
| With CDSC2 | 2.48 | 7.32 | ||||||
| Class Y (Inception 9/30/11)1 | ||||||||
| NAV | 4.49 | 8.38 | ||||||
| Comparative Performance | ||||||||
| S&P / LSTA Leveraged Loan® Index3 | 3.37 | 6.55 | ||||||
Past performance does not guarantee future results. The table(s) do not reflect taxes shareholders might owe on any Fund distributions or when they redeem their shares. Performance for periods less than one year is cumulative, not annualized. Returns reflect changes in share price and reinvestment of dividends and capital gains, if any. Unlike a fund, an index is not managed and does not reflect fees and expenses.
| 1 | 9/30/11 represents the date Class Y shares were first registered for public sale under the Securities Act of 1933. 9/16/11 represents commencement of operations for Class Y shares for accounting and financial reporting purposes only. |
| 2 | Performance for Class C shares assumes a 1% contingent deferred sales charge (“CDSC”) applied when you sell shares within one year of purchase. |
| 3 | S&P/LSTA Leveraged Loan® Index reflects the market-weighted performance of institutional leveraged loans based upon real-time market weightings, spreads and interest payments. |
| 4 | Fund performance has been increased by fee waivers and/or expense reimbursements, if any, without which performance would have been lower. |
| 12
Table of Contents
VAUGHAN NELSON SELECT FUND
| Managers: | Symbols: | |
| Dennis G. Alff, CFA® | Class A VNSAX | |
| Chad D. Fargason, PhD | Class C VNSCX | |
| Chris D. Wallis, CFA® | Class Y VNSYX | |
| Scott J. Weber, CFA® | ||
| Vaughan Nelson Investment Management, L.P. | ||
Objective:
The Fund seeks long-term capital appreciation.
Market Conditions
The equity markets continued to advance even as the Federal Reserve (the Fed) ended its monthly bond-buying program known as quantitative easing, which began in 2009. While the Fed ended quantitative easing and planned to raise interest rates in 2015, the European Central Bank committed to easier monetary policy. The current market volatility and deteriorating market breadth may continue as capital markets adjust to global shifts in central bank policy and to escalating geopolitical tensions. We believe the market is discounting continued modest improvement in earnings growth and an inflationary environment where deflationary risks are modestly higher than inflationary risks. We continue to expect U.S. companies to face margin pressures as the Fed raises interest rates, as capital expenditures accelerate, and as rising operating costs challenge modest revenue growth.
Performance Results
For the 12-month period ended November 30, 2014, Class A shares of Vaughan Nelson Select Fund returned 15.31% at net asset value. The Fund underperformed its benchmark, the S&P 500® Index, which returned 16.86%.
Explanation of Fund Performance
Stock selection detracted modestly from results relative to the benchmark. However, our team’s focus on company specific valuations and fundamentals led to certain overweighted sector positions, which aided relative performance. Healthcare and industrials were the biggest contributors to relative performance by sector, while the information technology and consumer discretionary sectors were the biggest relative detractors.
In the healthcare sector, significant overweights relative to the index in UnitedHealth Group and Mallinckrodt and an out-of-index position in Valeant Pharmaceuticals were the most significant contributors. UnitedHealth benefits from being the industry leader in the managed care industry, which has a meaningful secular tailwind in the form of pricing power and moderating healthcare utilization trends. UnitedHealth’s performance stood out as concerns over headwinds from the Affordable Care Act abated. A new position in Mallinckrodt aided relative results as the company closed its acquisition of Questcor in August 2014. Following up on a strong 2013, Valeant Pharmaceuticals continued to be a strong performer as a result of the company’s consistent execution of mergers and acquisitions and cost cutting.
13 |
Table of Contents
In the industrials sector, the Fund had more exposure than the index to General Dynamics and an out-of-index position in Hertz Global Holdings, both of which were standout performers. General Dynamics was added to the portfolio in 2014. The company had a great year as its defense contracting business is near a trough from cuts in government spending, and growth in its private aviation business, Gulfstream, is accelerating with the economic expansion and new product introductions. Hertz Global Holdings contributed nicely to relative results as the company continued to benefit from industry consolidation and the announced spin off of its equipment rental business. We exited Hertz during the year.
Elsewhere in the portfolio, Avago Technologies, Harman International, Microsoft and Walgreen contributed solid gains to Fund performance.
Stock selection in information technology and consumer discretionary detracted from relative performance. An out-of-index position in Cabela’s in Consumer Discretionary was one of the largest detractors for the period. Cabela’s underperformed as same store sales failed to improve after several quarters of negative growth. We exited the position in 2014 as visibility into the company’s ability to execute its growth plan was clouded. An overweight in Symantec Corporation hurt relative performance in the information technology sector as CEO Steve Bennett was abruptly dismissed by the board. We exited the position as much of our investment thesis was predicated on Mr. Bennett’s ability to turn the company around.
During the period, exposure to healthcare increased on the substantial appreciation in UnitedHealth Group and new positions initiated in Mallinckrodt and Medtronic. In consumer staples, a new position in Anheuser-Busch InBev accounted for the entire increase in the Fund’s consumer staples weight. The Fund’s energy weight declined after we exited Oasis Petroleum, which underperformed and Phillips 66, which outperformed. The decrease in the Fund’s energy weight was partially offset by the addition of Cabot Oil & Gas. The Fund’s exposure to information technology declined on the sale of Symantec and a reduction in the portfolio’s weight in eBay. However, we view the change in the Fund’s technology weight as a net addition. We initiated a position in Priceline in 2014, which is included in the consumer discretionary sector but we view it as a technology company.
Outlook
Despite the potential for a correction in equity markets, we expect the credit market to remain supportive of equity values over the medium term and will welcome any correction as an opportunity to make attractive investments. Even without a broader equity market correction, we expect market breadth to continue to narrow. Companies can no longer rely on a recovery in consumption, lower interest rates, share repurchases and delayed capital expenditures to drive earnings growth. Going forward, we believe that companies will be required to increase capital expenditures, research and development and other operating costs in order to sustain or grow earnings. Further, a strengthening U.S. dollar is likely to affect top line sales growth, especially for the multinationals that generate a significant portion of their revenues outside of the United States. While the nature of the current bull market is changing, we believe certain individual stocks will perform well despite the increasing market headwinds. We continue to seek investments in companies that have better pricing power, lower earnings variability, higher profitability and stronger balance sheets than the broader investment universe. We do not favor any single industry or sector and continue to look for companies with the characteristics noted above that trade at attractive valuations.
| 14
Table of Contents
VAUGHAN NELSON SELECT FUND
Growth of $10,000 Investment in Class A Shares3
June 29, 2012 (inception) through November 30, 2014
Average Annual Total Returns — November 30, 20143
| 1 Year | Life of Fund | |||||||
Class A (Inception 6/29/2012) | ||||||||
NAV | 15.31 | % | 23.77 | % | ||||
With 5.75% Maximum Sales Charge | 8.66 | 20.78 | ||||||
Class C (Inception 6/29/2012) | ||||||||
NAV | 14.54 | 22.89 | ||||||
With CDSC1 | 13.54 | 22.89 | ||||||
Class Y (Inception 6/29/2012) | ||||||||
NAV | 15.66 | 24.11 | ||||||
Comparative Performance | ||||||||
S&P 500® Index2 | 16.86 | 21.45 | ||||||
Past performance does not guarantee future results. The table(s) do not reflect taxes shareholders might owe on any Fund distributions or when they redeem their shares. Performance for periods less than one year is cumulative, not annualized. Returns reflect changes in share price and reinvestment of dividends and capital gains, if any. Unlike a fund, an index is not managed and does not reflect fees and expenses.
| 1 | Performance for Class C shares assumes a 1% contingent deferred sales charge (“CDSC”) applied when you sell shares within one year of purchase. |
| 2 | S&P 500® Index is a widely recognized U.S. stock market performance. It is an unmanaged index of 500 common stocks chosen for market size, liquidity, and industry group representation, among other factors. |
| 3 | Fund performance has been increased by fee waivers and/or expense reimbursements, if any, without which performance would have been lower. |
15 |
Table of Contents
ADDITIONAL INFORMATION
The views expressed in this report reflect those of the portfolio managers as of the dates indicated. The managers’ views are subject to change at any time without notice based on changes in market or other conditions. References to specific securities or industries should not be regarded as investment advice. Because the funds are actively managed, there is no assurance that they will continue to invest in the securities or industries mentioned.
ADDITIONAL INDEX INFORMATION
This document may contain references to third party copyrights, indexes, and trademarks, each of which is the property of its respective owner. Such owner is not affiliated with Natixis Global Asset Management or any of its related or affiliated companies (collectively “NGAM”) and does not sponsor, endorse or participate in the provision of any NGAM services, funds or other financial products.
The index information contained herein is derived from third parties and is provided on an “as is” basis. The user of this information assumes the entire risk of use of this information. Each of the third party entities involved in compiling, computing or creating index information, disclaims all warranties (including, without limitation, any warranties of originality, accuracy, completeness, timeliness, non-infringement, merchantability and fitness for a particular purpose) with respect to such information.
PROXY VOTING INFORMATION
A description of the Funds’ proxy voting policies and procedures is available without charge, upon request, by calling Natixis Funds at 800-225-5478; on the Funds’ website at ngam.natixis.com; and on the Securities and Exchange Commission’s (SEC) website at www.sec.gov. Information regarding how the Funds voted proxies relating to portfolio securities during the 12 months ended June 30, 2014 is available from the Funds’ website and the SEC’s website.
QUARTERLY PORTFOLIO SCHEDULES
The Funds file a complete schedule of portfolio holdings with the SEC for the first and third quarters of each fiscal year on Form N-Q. The Funds’ Forms N-Q is available on the SEC’s website at www.sec.gov and may be reviewed and copied at the SEC’s Public Reference Room in Washington, DC. Information on the operation of the Public Reference Room may be obtained by calling 800-SEC-0330.
| 16
Table of Contents
UNDERSTANDING FUND EXPENSES
As a mutual fund shareholder, you incur different costs: transaction costs, including sales charges (loads) on purchases and contingent deferred sales charges on redemptions and ongoing costs, including management fees, distribution and/or service fees (12b-1 fees), and other fund expenses. Certain exemptions may apply. These costs are described in more detail in the Funds’ prospectus. The following examples are intended to help you understand the ongoing costs of investing in the Funds and help you compare these with the ongoing costs of investing in other mutual funds.
The first line in the table of each class of Fund shares shows the actual account values and actual Fund expenses you would have paid on a $1,000 investment in the Fund from June 1, 2014 through November 30, 2014. To estimate the expenses you paid over the period, simply divide your account value by $1,000 (for example $8,600 account value divided by $1,000 = 8.60) and multiply the result by the number in the Expenses Paid During Period column as shown below for your class.
The second line in the table for each class of Fund shares provides information about hypothetical account values and hypothetical expenses based on the Fund’s actual expense ratios and an assumed rate of return of 5% per year before expenses, which is not the Fund’s actual return. The hypothetical account values and expenses may not be used to estimate the actual ending account balance or expenses you paid on your investment for the period. You may use this information to compare the ongoing costs of investing in each Fund and other funds. To do so, compare this 5% hypothetical example with the 5% hypothetical examples that appear in the shareholder reports of the other funds.
Please note that the expenses shown reflect ongoing costs only, and do not include any transaction costs, such as sales charges. Therefore, the second line in the table of each Fund is useful in comparing ongoing costs only, and will not help you determine the relative costs of owning different funds. If transaction costs were included, total costs would be higher.
| GATEWAY INTERNATIONAL FUND | BEGINNING ACCOUNT VALUE 6/1/2014 | ENDING ACCOUNT VALUE 11/30/2014 | EXPENSES PAID DURING PERIOD* 6/1/2014 – 11/30/2014 | |||||||||
| Class A | ||||||||||||
| Actual | $1,000.00 | $969.80 | $6.67 | |||||||||
| Hypothetical (5% return before expenses) | $1,000.00 | $1,018.30 | $6.83 | |||||||||
| Class C | ||||||||||||
| Actual | $1,000.00 | $965.40 | $10.35 | |||||||||
| Hypothetical (5% return before expenses) | $1,000.00 | $1,014.54 | $10.61 | |||||||||
| Class Y | ||||||||||||
| Actual | $1,000.00 | $970.00 | $5.43 | |||||||||
| Hypothetical (5% return before expenses) | $1,000.00 | $1,019.55 | $5.57 | |||||||||
| * | Expenses are equal to the Fund’s annualized expense ratio (after waiver/reimbursement): 1.35%, 2.10% and 1.10% for Class A, C and Y, respectively, multiplied by the average account value over the period, multiplied by the number of days in the most recent half-year (183), divided by 365 (to reflect the half-year period). |
17 |
Table of Contents
| LOOMIS SAYLES DIVIDEND INCOME FUND (formerly Loomis Sayles Capital Income Fund) | BEGINNING ACCOUNT VALUE 6/1/2014 | ENDING ACCOUNT VALUE 11/30/2014 | EXPENSES PAID DURING PERIOD* 6/1/2014 – 11/30/2014 | |||||||||
| Class A | ||||||||||||
| Actual | $1,000.00 | $1,037.90 | $6.13 | |||||||||
| Hypothetical (5% return before expenses) | $1,000.00 | $1,019.05 | $6.07 | |||||||||
| Class C | ||||||||||||
| Actual | $1,000.00 | $1,034.00 | $9.94 | |||||||||
| Hypothetical (5% return before expenses) | $1,000.00 | $1,015.29 | $9.85 | |||||||||
| Class Y | ||||||||||||
| Actual | $1,000.00 | $1,039.20 | $4.86 | |||||||||
| Hypothetical (5% return before expenses) | $1,000.00 | $1,020.31 | $4.81 | |||||||||
| * | Expenses are equal to the Fund’s annualized expense ratio (after waiver/reimbursement): 1.20%, 1.95% and 0.95% for Class A, C and Y, respectively, multiplied by the average account value over the period, multiplied by the number of days in the most recent fiscal half-year (183), divided by 365 (to reflect the half-year period). |
| LOOMIS SAYLES EMERGING MARKETS OPPORTUNITIES FUND | BEGINNING ACCOUNT VALUE 6/1/2014 | ENDING ACCOUNT VALUE 11/30/2014 | EXPENSES PAID DURING PERIOD* 6/1/2014 – 11/30/2014 | |||||||||
| Class A | ||||||||||||
| Actual | $1,000.00 | $1,004.30 | $6.28 | |||||||||
| Hypothetical (5% return before expenses) | $1,000.00 | $1,018.80 | $6.33 | |||||||||
| Class C | ||||||||||||
| Actual | $1,000.00 | $1,001.20 | $10.03 | |||||||||
| Hypothetical (5% return before expenses) | $1,000.00 | $1,015.04 | $10.10 | |||||||||
| Class N | ||||||||||||
| Actual | $1,000.00 | $1,005.50 | $4.78 | |||||||||
| Hypothetical (5% return before expenses) | $1,000.00 | $1,020.31 | $4.81 | |||||||||
| Class Y | ||||||||||||
| Actual | $1,000.00 | $1,006.50 | $5.03 | |||||||||
| Hypothetical (5% return before expenses) | $1,000.00 | $1,020.05 | $5.06 | |||||||||
| * | Expenses are equal to the Fund’s annualized expense ratio (after waiver/reimbursement): 1.25%, 2.00%, 0.95% and 1.00% for Class A, C, N and Y, respectively, multiplied by the average account value over the period, multiplied by the number of days in the most recent half-year (183), divided by 365 (to reflect the half-year period). |
| 18
Table of Contents
| LOOMIS SAYLES SENIOR FLOATING RATE AND FIXED INCOME FUND | BEGINNING ACCOUNT VALUE 6/1/2014 | ENDING ACCOUNT VALUE 11/30/2014 | EXPENSES PAID DURING PERIOD* 6/1/2014 – 11/30/2014 | |||||||||
| Class A | ||||||||||||
| Actual | $1,000.00 | $1,009.20 | $5.54 | |||||||||
| Hypothetical (5% return before expenses) | $1,000.00 | $1,019.55 | $5.57 | |||||||||
| Class C | ||||||||||||
| Actual | $1,000.00 | $1,005.50 | $9.30 | |||||||||
| Hypothetical (5% return before expenses) | $1,000.00 | $1,015.79 | $9.35 | |||||||||
| Class Y | ||||||||||||
| Actual | $1,000.00 | $1,010.50 | $4.28 | |||||||||
| Hypothetical (5% return before expenses) | $1,000.00 | $1,020.81 | $4.31 | |||||||||
| * | Expenses are equal to the Fund’s annualized expense ratio (after waiver/reimbursement): 1.10%, 1.85% and 0.85% for Class A, C and Y, respectively, multiplied by the average account value over the period, multiplied by the number of days in the most recent fiscal half-year (183), divided by 365 (to reflect the half-year period). |
| VAUGHAN NELSON SELECT FUND | BEGINNING ACCOUNT VALUE 6/1/2014 | ENDING ACCOUNT VALUE 11/30/2014 | EXPENSES PAID DURING PERIOD* 6/1/2014 – 11/30/2014 | |||||||||
| Class A | ||||||||||||
| Actual | $1,000.00 | $1,054.20 | $7.21 | |||||||||
| Hypothetical (5% return before expenses) | $1,000.00 | $1,018.05 | $7.08 | |||||||||
| Class C | ||||||||||||
| Actual | $1,000.00 | $1,050.70 | $11.05 | |||||||||
| Hypothetical (5% return before expenses) | $1,000.00 | $1,014.29 | $10.86 | |||||||||
| Class Y | ||||||||||||
| Actual | $1,000.00 | $1,055.50 | $5.93 | |||||||||
| Hypothetical (5% return before expenses) | $1,000.00 | $1,019.30 | $5.82 | |||||||||
| * | Expenses are equal to the Fund’s annualized expense ratio (after waiver/reimbursement): 1.40%, 2.15% and 1.15% for Class A, C and Y, respectively, multiplied by the average account value over the period, multiplied by the number of days in the most recent fiscal half-year (183), divided by 365 (to reflect the half-year period). |
19 |
Table of Contents
Portfolio of Investments – as of November 30, 2014
Gateway International Fund
| Shares | Description | Value (†) | ||||||
| Common Stocks* — 97.5% of Net Assets | ||||||||
| Australia — 7.6% | ||||||||
| 7,734 | Amcor Ltd.(b) | $ | 79,934 | |||||
| 15,074 | Aurizon Holdings Ltd.(b) | 59,084 | ||||||
| 5,846 | Australia & New Zealand Banking Group Ltd.(c)(d) | 158,644 | ||||||
| 4,104 | BHP Billiton Ltd.(c)(d) | 106,466 | ||||||
| 8,286 | Brambles Ltd.(b) | 68,445 | ||||||
| 3,040 | Commonwealth Bank of Australia(c)(d) | 208,594 | ||||||
| 1,109 | CSL Ltd.(b) | 77,819 | ||||||
| 4,913 | National Australia Bank Ltd.(c)(d) | 136,162 | ||||||
| 3,876 | Newcrest Mining Ltd.(b)(e) | 33,635 | ||||||
| 2,348 | Orica Ltd.(b) | 36,280 | ||||||
| 5,088 | Origin Energy Ltd.(b) | 52,970 | ||||||
| 4,042 | QBE Insurance Group Ltd.(b) | 37,296 | ||||||
| 1,225 | Rio Tinto Ltd.(b) | 61,412 | ||||||
| 7,334 | Suncorp Group Ltd.(b) | 89,430 | ||||||
| 2,652 | Wesfarmers Ltd.(b) | 93,523 | ||||||
| 2,168 | Woodside Petroleum Ltd.(b) | 65,916 | ||||||
| 3,366 | Woolworths Ltd.(b) | 88,984 | ||||||
|
| |||||||
| 1,454,594 | ||||||||
|
| |||||||
| Euro Zone — 31.2% | ||||||||
| 1,686 | Accor S.A.(b) | 79,537 | ||||||
| 1,044 | Air Liquide S.A.(c)(d) | 131,530 | ||||||
| 1,382 | Airbus Group NV(b) | 84,244 | ||||||
| 991 | Allianz SE, (Registered)(c)(d) | 170,744 | ||||||
| 801 | Alstom S.A.(b)(e) | 28,107 | ||||||
| 1,652 | Anheuser-Busch InBev NV(c)(d) | 194,305 | ||||||
| 899 | ASML Holding NV(b) | 95,021 | ||||||
| 3,650 | AXA S.A.(b) | 88,219 | ||||||
| 17,001 | Banco Bilbao Vizcaya Argentaria S.A.(c)(d) | 182,708 | ||||||
| 30,471 | Banco Santander S.A.(c)(d) | 274,409 | ||||||
| 1,528 | BASF SE(c)(d) | 138,571 | ||||||
| 1,610 | Bayer AG, (Registered)(c)(d) | 242,219 | ||||||
| 951 | Bayerische Motoren Werke AG(b) | 108,713 | ||||||
| 1,326 | Belgacom S.A.(b) | 52,386 | ||||||
| 2,336 | BNP Paribas S.A.(c)(d) | 150,024 | ||||||
| 951 | Bouygues S.A.(b) | 35,779 | ||||||
| 346 | Casino Guichard Perrachon S.A.(b) | 33,347 | ||||||
| 151 | Continental AG(b) | 31,775 | ||||||
| 2,247 | Daimler AG, (Registered)(c)(d) | 189,548 | ||||||
| 1,322 | Danone(b) | 93,243 | ||||||
| 2,492 | Deutsche Bank AG, (Registered)(b) | 81,372 | ||||||
| 2,554 | Deutsche Post AG(b) | 84,738 | ||||||
| 6,633 | Deutsche Telekom AG(b) | 112,790 | ||||||
| 5,074 | E.ON AG(b) | 89,900 | ||||||
| 991 | Electricite de France S.A.(b) | 29,684 | ||||||
| 19,509 | Enel SpA(b) | 94,174 | ||||||
| 5,568 | ENI SpA(c)(d) | 110,927 | ||||||
See accompanying notes to financial statements.
| 20
Table of Contents
Portfolio of Investments – as of November 30, 2014
Gateway International Fund – (continued)
| Shares | Description | Value (†) | ||||||
| Euro Zone — continued | ||||||||
| 81,525 | Governor & Co. of the Bank of Ireland (The)(b)(e) | $ | 33,543 | |||||
| 27,627 | Governor & Co. of the Bank of Ireland (The)(b)(e) | 11,337 | ||||||
| 9,153 | ING Groep NV(c)(d)(e) | 133,903 | ||||||
| 39,924 | Intesa Sanpaolo SpA(b) | 122,960 | ||||||
| 1,087 | Kone OYJ, Class B(b) | 50,066 | ||||||
| 977 | Koninklijke DSM NV(b) | 64,273 | ||||||
| 2,994 | Koninklijke Philips NV(b) | 90,170 | ||||||
| 1,468 | Legrand S.A.(b) | 77,015 | ||||||
| 453 | Linde AG(b) | 85,322 | ||||||
| 578 | LVMH Moet Hennessy Louis Vuitton S.A.(b) | 103,953 | ||||||
| 7,369 | Nokia OYJ(b) | 61,228 | ||||||
| 4,652 | Orange S.A.(b) | 82,035 | ||||||
| 722 | OSRAM Licht AG(b)(e) | 29,990 | ||||||
| 534 | Pernod-Ricard S.A.(b) | 63,316 | ||||||
| 1,674 | Sampo OYJ, A Shares(b) | 82,620 | ||||||
| 1,933 | Sanofi(c)(d) | 186,816 | ||||||
| 1,998 | SAP SE(c)(d) | 140,924 | ||||||
| 1,467 | Schneider Electric SE(b) | 119,771 | ||||||
| 1,720 | SCOR SE(b) | 53,709 | ||||||
| 1,948 | SES S.A.(b) | 72,553 | ||||||
| 1,576 | Siemens AG, (Registered)(c)(d) | 186,406 | ||||||
| 13,772 | Snam SpA(b) | 73,031 | ||||||
| 1,945 | Societe Generale S.A.(b) | 96,597 | ||||||
| 861 | Sodexo(b) | 86,905 | ||||||
| 48,700 | Telecom Italia SpA(b) | 43,173 | ||||||
| 10,197 | Telefonica S.A.(c)(d) | 163,572 | ||||||
| 944 | Thales S.A.(b) | 50,119 | ||||||
| 2,212 | ThyssenKrupp AG(b)(e) | 58,469 | ||||||
| 3,157 | Total S.A.(c)(d) | 176,288 | ||||||
| 831 | Umicore S.A.(b) | 33,786 | ||||||
| 8,666 | UniCredit SpA(b) | 64,052 | ||||||
| 3,257 | Unilever NV(c)(d) | 132,674 | ||||||
| 1,439 | Vinci S.A.(b) | 77,809 | ||||||
| 425 | Volkswagen AG(b) | 96,227 | ||||||
|
| |||||||
| 6,012,626 | ||||||||
|
| |||||||
| Hong Kong — 4.0% | ||||||||
| 30,556 | AIA Group Ltd.(b) | 176,186 | ||||||
| 69,205 | Bank of China Ltd., Class H(b) | 35,630 | ||||||
| 14,567 | CLP Holdings Ltd.(b) | 126,649 | ||||||
| 3,584 | CNOOC Ltd.(b) | 5,179 | ||||||
| 8,680 | Galaxy Entertainment Group Ltd.(b) | 59,152 | ||||||
| 4,059 | Hang Seng Bank Ltd.(b) | 67,594 | ||||||
| 4,256 | Hong Kong Exchanges & Clearing Ltd.(b) | 92,554 | ||||||
| 7,747 | Hutchison Whampoa Ltd.(b) | 96,973 | ||||||
| 2,284 | Tencent Holdings Ltd.(b) | 36,645 | ||||||
| 9,346 | Wharf Holdings Ltd. (The)(b) | 67,265 | ||||||
|
| |||||||
| 763,827 | ||||||||
|
| |||||||
See accompanying notes to financial statements.
21 |
Table of Contents
Portfolio of Investments – as of November 30, 2014
Gateway International Fund – (continued)
| Shares | Description | Value (†) | ||||||
| Japan — 20.4% | ||||||||
| 2,135 | Advantest Corp.(b) | $ | 25,578 | |||||
| 1,407 | Asahi Group Holdings Ltd.(b) | 43,872 | ||||||
| 5,800 | Astellas Pharma, Inc.(b) | 83,486 | ||||||
| 2,109 | Bridgestone Corp.(b) | 72,550 | ||||||
| 1,647 | Canon, Inc.(c)(d) | 52,612 | ||||||
| 2,120 | Coca-Cola West Co. Ltd.(b) | 29,060 | ||||||
| 1,386 | Credit Saison Co. Ltd.(b) | 25,945 | ||||||
| 2,611 | Daiichi Sankyo Co. Ltd.(b) | 38,542 | ||||||
| 836 | Daikin Industries Ltd.(b) | 55,499 | ||||||
| 1,770 | Denso Corp.(b) | 82,720 | ||||||
| 1,505 | Dentsu, Inc.(b) | 56,444 | ||||||
| 1,790 | Eisai Co. Ltd.(b) | 64,218 | ||||||
| 455 | FANUC Corp.(c)(d) | 76,823 | ||||||
| 154 | Fast Retailing Co. Ltd.(b) | 56,206 | ||||||
| 2,265 | FUJIFILM Holdings Corp.(b) | 74,911 | ||||||
| 1,444 | Hamamatsu Photonics KK(b) | 72,945 | ||||||
| 16,781 | Hankyu Hanshin Holdings, Inc.(b) | 92,198 | ||||||
| 2,084 | Hitachi Construction Machinery Co. Ltd.(b) | 45,021 | ||||||
| 11,589 | Hitachi Ltd.(b) | 89,540 | ||||||
| 2,640 | Honda Motor Co. Ltd.(c)(d) | 79,859 | ||||||
| 2,330 | Idemitsu Kosan Co. Ltd.(b) | 39,787 | ||||||
| 2,152 | Japan Tobacco, Inc.(b) | 69,010 | ||||||
| 1,245 | JGC Corp.(b) | 26,789 | ||||||
| 2,342 | JTEKT Corp.(b) | 38,875 | ||||||
| 6,125 | Kaneka Corp.(b) | 32,466 | ||||||
| 1,668 | Kao Corp.(b) | 61,776 | ||||||
| 1,204 | KDDI Corp.(c)(d) | 77,132 | ||||||
| 7,708 | Keikyu Corp.(b) | 58,907 | ||||||
| 2,766 | Komatsu Ltd.(b) | 65,473 | ||||||
| 1,538 | Konami Corp.(b) | 29,019 | ||||||
| 2,397 | Kurita Water Industries Ltd.(b) | 49,722 | ||||||
| 443 | Lawson, Inc.(b) | 27,297 | ||||||
| 4,659 | Mitsubishi Corp.(b) | 88,080 | ||||||
| 4,106 | Mitsubishi Estate Co. Ltd.(b) | 92,542 | ||||||
| 20,835 | Mitsubishi UFJ Financial Group, Inc.(b) | 120,041 | ||||||
| 10,517 | Mitsubishi UFJ Lease & Finance Co. Ltd.(b) | 49,628 | ||||||
| 4,790 | Mitsui & Co. Ltd.(b) | 66,086 | ||||||
| 3,304 | Mitsui Fudosan Co. Ltd.(b) | 95,621 | ||||||
| 12,148 | Nomura Holdings, Inc.(b) | 73,072 | ||||||
| 1,039 | NTT Data Corp.(d) | 39,650 | ||||||
| 4,615 | NTT DOCOMO, Inc.(b) | 72,046 | ||||||
| 5,410 | Panasonic Corp.(b) | 69,583 | ||||||
| 3,592 | Ricoh Co. Ltd.(b) | 38,963 | ||||||
| 1,217 | Secom Co. Ltd.(b) | 70,434 | ||||||
| 1,583 | Seven & I Holdings Co. Ltd.(b) | 59,009 | ||||||
| 1,207 | Shin-Etsu Chemical Co. Ltd.(c)(d) | 81,320 | ||||||
| 2,429 | Shionogi & Co. Ltd.(b) | 60,444 | ||||||
| 1,707 | Softbank Corp.(c)(d) | 113,763 | ||||||
See accompanying notes to financial statements.
| 22
Table of Contents
Portfolio of Investments – as of November 30, 2014
Gateway International Fund – (continued)
| Shares | Description | Value (†) | ||||||
| Japan —continued | ||||||||
| 3,074 | Sony Corp.(b) | $ | 67,376 | |||||
| 2,242 | Sumitomo Corp.(b) | 23,927 | ||||||
| 1,794 | Sumitomo Metal Mining Co. Ltd.(b) | 27,471 | ||||||
| 1,932 | Sumitomo Realty & Development Co. Ltd.(b) | 66,837 | ||||||
| 1,672 | Suzuki Motor Corp.(b) | 52,710 | ||||||
| 4,182 | Taiyo Nippon Sanso Corp.(b) | 49,232 | ||||||
| 1,697 | Takeda Pharmaceutical Co. Ltd.(b) | 71,129 | ||||||
| 897 | TDK Corp.(b) | 54,092 | ||||||
| 2,200 | Terumo Corp.(b) | 50,059 | ||||||
| 645 | Tokyo Electron Ltd.(c)(d) | 44,968 | ||||||
| 1,375 | Toyo Suisan Kaisha Ltd.(b) | 46,578 | ||||||
| 4,413 | Toyota Motor Corp.(c)(d) | 271,412 | ||||||
| 1,801 | Toyota Tsusho Corp.(b) | 42,641 | ||||||
| 1,158 | Trend Micro, Inc.(b) | 35,193 | ||||||
| 1,826 | Yamato Holdings Co. Ltd.(b) | 41,336 | ||||||
|
| |||||||
| 3,929,525 | ||||||||
|
| |||||||
| Sweden — 3.6% | ||||||||
| 3,554 | Atlas Copco AB, Class A(b) | 102,504 | ||||||
| 1,992 | Hennes & Mauritz AB, Series B(b) | 85,313 | ||||||
| 1,666 | Hexagon AB, B Shares(b) | 52,939 | ||||||
| 7,343 | Nordea Bank AB(b) | 91,717 | ||||||
| 2,596 | Svenska Cellulosa AB SCA, B Shares(b) | 61,211 | ||||||
| 1,842 | Svenska Handelsbanken AB, A Shares(b) | 89,875 | ||||||
| 2,814 | Swedbank AB, A Shares(b) | 73,769 | ||||||
| 6,636 | Telefonaktiebolaget LM Ericsson, Class B(b) | 83,399 | ||||||
| 4,779 | Volvo AB, B Shares(b) | 52,260 | ||||||
|
| |||||||
| 692,987 | ||||||||
|
| |||||||
| Switzerland — 10.0% | ||||||||
| 5,204 | ABB Ltd., (Registered)(c)(d) | 116,858 | ||||||
| 852 | Aryzta AG(b) | 67,942 | ||||||
| 604 | Baloise Holding AG, (Registered)(b) | 78,812 | ||||||
| 2,830 | Credit Suisse Group AG, (Registered)(b) | 75,549 | ||||||
| 458 | Kuehne & Nagel International AG, (Registered)(b) | 61,833 | ||||||
| 4,920 | Nestle S.A., (Registered)(c)(d) | 369,262 | ||||||
| 3,815 | Novartis AG, (Registered)(c)(d) | 369,111 | ||||||
| 1,125 | Roche Holding AG(c)(d) | 336,820 | ||||||
| 425 | Schindler Holding AG(b) | 60,618 | ||||||
| 449 | Sonova Holding AG, (Registered)(b) | 67,932 | ||||||
| 146 | Sulzer AG, (Registered)(b) | 16,330 | ||||||
| 827 | Swatch Group AG (The), (Registered)(b) | 76,183 | ||||||
| 201 | Swiss Life Holding AG, (Registered)(b) | 46,038 | ||||||
| 1,834 | Transocean Ltd.(b) | 38,465 | ||||||
| 7,812 | UBS AG, (Registered)(b) | 140,520 | ||||||
|
| |||||||
| 1,922,273 | ||||||||
|
| |||||||
| United Kingdom — 20.7% | ||||||||
| 3,105 | Anglo American PLC(b) | 64,047 | ||||||
| 871 | Associated British Foods PLC(b) | 43,564 | ||||||
See accompanying notes to financial statements.
23 |
Table of Contents
Portfolio of Investments – as of November 30, 2014
Gateway International Fund – (continued)
| Shares | Description | Value (†) | ||||||
| United Kingdom —continued | ||||||||
| 2,262 | AstraZeneca PLC(c)(d) | $ | 168,063 | |||||
| 7,033 | Aviva PLC(b) | 56,007 | ||||||
| 3,187 | Babcock International Group PLC(b) | 56,533 | ||||||
| 30,726 | Barclays PLC(b) | 117,402 | ||||||
| 4,998 | BG Group PLC(c)(d) | 70,286 | ||||||
| 4,156 | BHP Billiton PLC(c)(d) | 98,031 | ||||||
| 32,624 | BP PLC(c)(d) | 213,879 | ||||||
| 3,298 | British American Tobacco PLC(c)(d) | 195,251 | ||||||
| 21,198 | BT Group PLC(b) | 135,885 | ||||||
| 3,148 | Bunzl PLC(b) | 87,804 | ||||||
| 15,611 | Centrica PLC(b) | 69,437 | ||||||
| 944 | Croda International PLC(b) | 36,205 | ||||||
| 4,713 | Diageo PLC(c)(d) | 145,460 | ||||||
| 8,377 | GlaxoSmithKline PLC(c)(d) | 194,589 | ||||||
| 19,609 | Glencore PLC(b) | 98,064 | ||||||
| 30,425 | HSBC Holdings PLC(c)(d) | 303,138 | ||||||
| 112,195 | Lloyds Banking Group PLC(b)(e) | 140,973 | ||||||
| 5,747 | Meggitt PLC(b) | 45,150 | ||||||
| 11,619 | National Grid PLC(c)(d) | 168,927 | ||||||
| 728 | Next PLC(b) | 77,065 | ||||||
| 10,341 | Old Mutual PLC(b) | 32,340 | ||||||
| 5,802 | Prudential PLC(c)(d) | 140,218 | ||||||
| 1,390 | Reckitt Benckiser Group PLC(c)(d) | 114,009 | ||||||
| 2,115 | Rio Tinto PLC(c)(d) | 98,437 | ||||||
| 9,266 | Royal Dutch Shell PLC, A Shares(c)(d) | 308,721 | ||||||
| 1,810 | SABMiller PLC(b) | 100,668 | ||||||
| 1,360 | Shire PLC(b) | 97,064 | ||||||
| 3,352 | Standard Chartered PLC(b) | 49,071 | ||||||
| 17,778 | Tesco PLC(b) | 51,862 | ||||||
| 2,798 | Unilever PLC(c)(d) | 118,097 | ||||||
| 46,017 | Vodafone Group PLC(b) | 168,652 | ||||||
| 6,233 | WPP PLC(c)(d) | 130,495 | ||||||
|
| |||||||
| 3,995,394 | ||||||||
|
| |||||||
Total Common Stocks (Identified Cost $15,855,722) | 18,771,226 | |||||||
|
| |||||||
| Purchased Options — 0.2% | ||||||||
| 49,800 | On iShares® MSCI EAFE ETF, Put expiring December 20, 2014 at 53.00 | 1,245 | ||||||
| 54,000 | On iShares® MSCI EAFE ETF, Put expiring December 20, 2014 at 54.00 | 2,970 | ||||||
| 50,000 | On iShares® MSCI EAFE ETF, Put expiring December 20, 2014 at 57.00 | 3,000 | ||||||
| 36,800 | On iShares® MSCI EAFE ETF, Put expiring January 17, 2015 at 55.00 | 3,680 | ||||||
| 45,000 | On iShares® MSCI EAFE ETF, Put expiring January 17, 2015 at 57.00 | 6,975 | ||||||
| 51,900 | On iShares® MSCI EAFE ETF, Put expiring January 17, 2015 at 58.00 | 10,120 | ||||||
| 49,800 | On iShares® MSCI EAFE ETF, Put expiring January 17, 2015 at 59.00 | 14,193 | ||||||
|
| |||||||
Total Purchased Options (Identified Cost $148,925) | 42,183 | |||||||
|
| |||||||
See accompanying notes to financial statements.
| 24
Table of Contents
Portfolio of Investments – as of November 30, 2014
Gateway International Fund – (continued)
Principal Amount | Description | Value (†) | ||||||
| Short-Term Investments — 2.5% | ||||||||
| $ | 487,882 | Tri-Party Repurchase Agreement with Fixed Income Clearing Corporation, dated 11/28/2014 at 0.010% to be repurchased at $487,882 on 12/01/2014 collateralized by $490,000 U.S. Treasury Note, 2.125% due 9/30/2021 valued at $497,963 including accrued interest (Note 2 of Notes to Financial Statements) (Identified Cost $487,882) | $ | 487,882 | ||||
|
| |||||||
Total Investments — 100.2% (Identified Cost $16,492,529)(a) | 19,301,291 | |||||||
| Other assets less liabilities — (0.2)% | (42,849 | ) | ||||||
|
| |||||||
| Net Assets — 100.0% | $ | 19,258,442 | ||||||
|
| |||||||
| Shares | ||||||||
| Written Options — (0.7%) | ||||||||
| 41,500 | On iShares® MSCI EAFE ETF, OTC Call expiring December 05, 2014 at 64.00(f) | $ | (12,018 | ) | ||||
| 27,400 | On iShares® MSCI EAFE ETF, OTC Call expiring December 05, 2014 at 62.50(f) | (41,715 | ) | |||||
| 45,900 | On iShares® MSCI EAFE ETF, OTC Call expiring December 12, 2014 at 64.00(f) | (21,876 | ) | |||||
| 40,900 | On iShares® MSCI EAFE ETF, OTC Call expiring December 12, 2014 at 65.00(f) | (5,115 | ) | |||||
| 46,600 | On iShares® MSCI EAFE ETF, OTC Call expiring December 20, 2014 at 64.00(f) | (14,294 | ) | |||||
| 39,500 | On iShares® MSCI EAFE ETF, OTC Call expiring January 17, 2015 at 65.00(f) | (13,810 | ) | |||||
| 45,700 | On iShares® MSCI EAFE ETF, OTC Call expiring February 20, 2015 at 65.00(f) | (30,679 | ) | |||||
|
| |||||||
Total Written Options (Premiums Received $169,256) | $ | (139,507 | ) | |||||
|
| |||||||
| (†) | See Note 2 of Notes to Financial Statements. | |||||||
| * | Common stocks are grouped by geographical regions that correspond to the markets underlying the iShares MSCI EAFE ETFs on which the Fund writes call options and buys put options. | |||||||
| (a) | Federal Tax Information: | |||||||
| At November 30, 2014, the net unrealized appreciation on investments based on a cost of $16,556,312 for federal income tax purposes was as follows: | ||||||||
| Aggregate gross unrealized appreciation for all investments in which there is an excess of value over tax cost | $ | 3,279,175 | ||||||
| Aggregate gross unrealized depreciation for all investments in which there is an excess of tax cost over value | (534,196 | ) | ||||||
|
| |||||||
| Net unrealized appreciation | $ | 2,744,979 | ||||||
|
| |||||||
| (b) | All of this security has been designated to cover the Fund’s obligations under open outstanding call options. | |||||||
| (c) | A portion of this security has been pledged as collateral for outstanding call options. | |||||||
| (d) | A portion of this security has been designated to cover the Fund’s obligations under open outstanding call options. | |||||||
| (e) | Non-income producing security. | |||||||
| (f) | Counterparty is UBS AG. | |||||||
| ETF | Exchange Traded Fund | |||||||
| OTC | Over-the-Counter | |||||||
See accompanying notes to financial statements.
25 |
Table of Contents
Portfolio of Investments – as of November 30, 2014
Gateway International Fund – (continued)
Industry Summary at November 30, 2014
Banks | 13.8 | % | ||
Pharmaceuticals | 9.9 | |||
Insurance | 5.5 | |||
Oil, Gas & Consumable Fuels | 5.4 | |||
Food Products | 4.5 | |||
Automobiles | 4.1 | |||
Chemicals | 3.6 | |||
Metals & Mining | 3.4 | |||
Diversified Telecommunication Services | 3.1 | |||
Beverages | 3.0 | |||
Machinery | 2.9 | |||
Wireless Telecommunication Services | 2.2 | |||
Other Investments, less than 2% each | 36.3 | |||
Short-Term Investments | 2.5 | |||
|
| |||
Total Investments | 100.2 | |||
Other assets less liabilities (including open written options) | (0.2 | ) | ||
|
| |||
Net Assets | 100.0 | % | ||
|
|
Country of Risk Summary at November 30, 2014
Japan | 20.4 | % | ||
United Kingdom | 18.1 | |||
Switzerland | 10.3 | |||
France | 10.0 | |||
Germany | 9.6 | |||
Australia | 7.6 | |||
Netherlands | 4.3 | |||
Sweden | 3.6 | |||
Hong Kong | 3.6 | |||
Spain | 3.2 | |||
Italy | 2.6 | |||
Other Investments, less than 2% each | 4.4 | |||
Short-Term Investments | 2.5 | |||
|
| |||
Total Investments | 100.2 | |||
Other assets less liabilities (including open written options) | (0.2 | ) | ||
|
| |||
Net Assets | 100.0 | % | ||
|
|
See accompanying notes to financial statements.
| 26
Table of Contents
Portfolio of Investments – as of November 30, 2014
Gateway International Fund – (continued)
Currency Exposure Summary at November 30, 2014
Euro | 31.2 | % | ||
British Pound | 20.7 | |||
Japanese Yen | 20.4 | |||
Swiss Franc | 10.0 | |||
Australian Dollar | 7.6 | |||
Hong Kong Dollar | 4.0 | |||
Swedish Krona | 3.6 | |||
United States Dollar | 2.7 | |||
|
| |||
Total Investments | 100.2 | |||
Other assets less liabilities (including open written options) | (0.2 | ) | ||
|
| |||
Net Assets | 100.0 | % | ||
|
|
See accompanying notes to financial statements.
27 |
Table of Contents
Portfolio of Investments – as of November 30, 2014
Loomis Sayles Dividend Income Fund*
| Shares | Description | Value (†) | ||||||
| Common Stocks — 79.9% of Net Assets | ||||||||
| Aerospace & Defense — 1.2% | ||||||||
| 2,781 | Northrop Grumman Corp. | $ | 391,926 | |||||
|
| |||||||
| Automobiles — 1.8% | ||||||||
| 16,753 | General Motors Co. | 560,053 | ||||||
|
| |||||||
| Banks — 7.3% | ||||||||
| 27,242 | Fifth Third Bancorp | 548,109 | ||||||
| 13,127 | JPMorgan Chase & Co. | 789,720 | ||||||
| 5,337 | PNC Financial Services Group, Inc. (The) | 466,827 | ||||||
| 9,474 | Wells Fargo & Co. | 516,144 | ||||||
|
| |||||||
| 2,320,800 | ||||||||
|
| |||||||
| Beverages — 1.8% | ||||||||
| 5,614 | PepsiCo, Inc. | 561,961 | ||||||
|
| |||||||
| Capital Markets — 1.3% | ||||||||
| 12,758 | Federated Investors, Inc., Class B | 401,112 | ||||||
|
| |||||||
| Chemicals — 2.9% | ||||||||
| 6,686 | E.I. du Pont de Nemours & Co. | 477,380 | ||||||
| 19,324 | Tronox Ltd., Class A | 435,756 | ||||||
|
| |||||||
| 913,136 | ||||||||
|
| |||||||
| Communications Equipment — 1.7% | ||||||||
| 19,332 | Cisco Systems, Inc. | 534,336 | ||||||
|
| |||||||
| Diversified Consumer Services — 1.5% | ||||||||
| 13,920 | H&R Block, Inc. | 468,269 | ||||||
|
| |||||||
| Diversified Telecommunication Services — 1.8% | ||||||||
| 11,642 | Verizon Communications, Inc. | 588,969 | ||||||
|
| |||||||
| Electric Utilities — 1.6% | ||||||||
| 10,187 | Northeast Utilities | 515,870 | ||||||
|
| |||||||
| Electrical Equipment — 3.3% | ||||||||
| 19,404 | ABB Ltd., Sponsored ADR | 435,038 | ||||||
| 9,241 | Eaton Corp. PLC | 626,817 | ||||||
|
| |||||||
| 1,061,855 | ||||||||
|
| |||||||
| Energy Equipment & Services — 1.7% | ||||||||
| 4,474 | National Oilwell Varco, Inc. | 299,937 | ||||||
| 15,974 | Transocean Partners LLC | 250,472 | ||||||
|
| |||||||
| 550,409 | ||||||||
|
| |||||||
| Hotels, Restaurants & Leisure — 1.3% | ||||||||
| 25,407 | SeaWorld Entertainment, Inc. | 424,043 | ||||||
|
| |||||||
| Industrial Conglomerates — 1.6% | ||||||||
| 18,707 | General Electric Co. | 495,548 | ||||||
|
| |||||||
| Insurance — 3.8% | ||||||||
| 19,000 | FNF Group | 615,600 | ||||||
| 10,747 | MetLife, Inc. | 597,641 | ||||||
|
| |||||||
| 1,213,241 | ||||||||
|
| |||||||
See accompanying notes to financial statements.
| 28
Table of Contents
Portfolio of Investments – as of November 30, 2014
Loomis Sayles Dividend Income Fund* – (continued)
| Shares | Description | Value (†) | ||||||
| Media — 2.7% | ||||||||
| 6,850 | Omnicom Group, Inc. | $ | 529,300 | |||||
| 2,251 | Time Warner Cable, Inc. | 336,029 | ||||||
|
| |||||||
| 865,329 | ||||||||
|
| |||||||
| Multi-Utilities — 1.4% | ||||||||
| 8,602 | PG&E Corp. | 434,401 | ||||||
|
| |||||||
| Multiline Retail — 1.2% | ||||||||
| 6,275 | Kohl’s Corp.(b) | 374,116 | ||||||
|
| |||||||
| Oil, Gas & Consumable Fuels — 7.1% | ||||||||
| 5,162 | Chevron Corp.(c) | 561,987 | ||||||
| 4,272 | HollyFrontier Corp. | 174,383 | ||||||
| 15,597 | PBF Energy, Inc., Class A | 440,771 | ||||||
| 11,129 | Regency Energy Partners LP(d) | 317,065 | ||||||
| 7,638 | Royal Dutch Shell PLC, ADR | 530,383 | ||||||
| 14,023 | Southcross Energy Partners LP(d) | 244,561 | ||||||
|
| |||||||
| 2,269,150 | ||||||||
|
| |||||||
| Pharmaceuticals — 14.1% | ||||||||
| 8,864 | AbbVie, Inc. | 613,389 | ||||||
| 8,239 | Bristol-Myers Squibb Co. | 486,513 | ||||||
| 11,097 | Eli Lilly & Co.(c) | 755,928 | ||||||
| 12,094 | GlaxoSmithKline PLC, Sponsored ADR | 561,766 | ||||||
| 10,686 | Merck & Co., Inc. | 645,434 | ||||||
| 25,968 | Pfizer, Inc.(c) | 808,903 | ||||||
| 12,806 | Sanofi, ADR | 618,402 | ||||||
|
| |||||||
| 4,490,335 | ||||||||
|
| |||||||
| REITs – Diversified — 2.6% | ||||||||
| 17,623 | Outfront Media, Inc. | 476,878 | ||||||
| 9,790 | Weyerhaeuser Co.(b) | 345,685 | ||||||
|
| |||||||
| 822,563 | ||||||||
|
| |||||||
| REITs – Hotels — 1.7% | ||||||||
| 10,135 | Ryman Hospitality Properties, Inc. | 527,831 | ||||||
|
| |||||||
| REITs – Office Property — 1.5% | ||||||||
| 18,800 | Columbia Property Trust, Inc. | 473,760 | ||||||
|
| |||||||
| REITs – Shopping Centers — 1.3% | ||||||||
| 24,058 | Washington Prime Group, Inc. | 414,519 | ||||||
|
| |||||||
| Road & Rail — 1.6% | ||||||||
| 4,591 | Norfolk Southern Corp. | 512,539 | ||||||
|
| |||||||
| Software — 3.8% | ||||||||
| 13,488 | Microsoft Corp. | 644,861 | ||||||
| 21,867 | Symantec Corp. | 570,510 | ||||||
|
| |||||||
| 1,215,371 | ||||||||
|
| |||||||
| Technology Hardware, Storage & Peripherals — 1.7% | ||||||||
| 4,492 | Apple, Inc. | 534,234 | ||||||
|
| |||||||
See accompanying notes to financial statements.
29 |
Table of Contents
Portfolio of Investments – as of November 30, 2014
Loomis Sayles Dividend Income Fund* – (continued)
| Shares | Description | Value (†) | ||||||
| Tobacco — 1.8% | ||||||||
| 6,789 | Philip Morris International, Inc. | $ | 590,168 | |||||
|
| |||||||
| Transportation Infrastructure — 1.0% | ||||||||
| 4,597 | Macquarie Infrastructure Co. LLC | 323,169 | ||||||
|
| |||||||
| Wireless Telecommunication Services — 1.8% | ||||||||
| 15,895 | Vodafone Group PLC, Sponsored ADR | 580,962 | ||||||
|
| |||||||
Total Common Stocks (Identified Cost $22,154,757) | 25,429,975 | |||||||
|
| |||||||
Principal Amount (‡) | ||||||||
| Bonds and Notes — 13.6% | ||||||||
| Non-Convertible Bonds — 12.7% | ||||||||
| Banking — 2.3% | ||||||||
| $ | 300,000 | BNP Paribas S.A., (fixed rate to 6/25/2037, variable rate thereafter), 7.195%, 144A(e) | 348,000 | |||||
| 100,000 | Morgan Stanley, 8.000%, 5/09/2017, (AUD) | 93,449 | ||||||
| 280,000 | Royal Bank of Scotland Group PLC, 4.700%, 7/03/2018 | 292,352 | ||||||
|
| |||||||
| 733,801 | ||||||||
|
| |||||||
| Chemicals — 0.6% | ||||||||
| 65,000 | Hexion U.S. Finance Corp./Hexion Nova Scotia Finance ULC, 9.000%, 11/15/2020 | 52,975 | ||||||
| 150,000 | Momentive Specialty Chemicals, Inc., 9.200%, 3/15/2021(f) | 139,500 | ||||||
|
| |||||||
| 192,475 | ||||||||
|
| |||||||
| Consumer Cyclical Services — 0.1% | ||||||||
| 45,000 | ServiceMaster Co. LLC (The), 7.450%, 8/15/2027 | 45,225 | ||||||
|
| |||||||
| Finance Companies — 1.0% | ||||||||
| 370,000 | Navient LLC, Series A, MTN, 5.625%, 8/01/2033 | 309,875 | ||||||
|
| |||||||
| Healthcare — 0.9% | ||||||||
| 125,000 | HCA, Inc., 7.500%, 12/15/2023 | 135,000 | ||||||
| 150,000 | HCA, Inc., 7.500%, 11/06/2033 | 157,500 | ||||||
|
| |||||||
| 292,500 | ||||||||
|
| |||||||
| Home Construction — 1.1% | ||||||||
| 215,000 | Lennar Corp., 4.750%, 11/15/2022 | 208,012 | ||||||
| 125,000 | Pulte Group, Inc., 6.000%, 2/15/2035 | 121,250 | ||||||
| 30,000 | Pulte Group, Inc., 6.375%, 5/15/2033 | 30,525 | ||||||
|
| |||||||
| 359,787 | ||||||||
|
| |||||||
| Independent Energy — 0.4% | ||||||||
| 75,000 | Halcon Resources Corp., 9.750%, 7/15/2020 | 57,375 | ||||||
| 10,000 | Rosetta Resources, Inc., 5.875%, 6/01/2022 | 9,600 | ||||||
| 50,000 | Rosetta Resources, Inc., 5.875%, 6/01/2024 | 47,000 | ||||||
| 15,000 | SM Energy Co., 5.000%, 1/15/2024 | 13,763 | ||||||
|
| |||||||
| 127,738 | ||||||||
|
| |||||||
See accompanying notes to financial statements.
| 30
Table of Contents
Portfolio of Investments – as of November 30, 2014
Loomis Sayles Dividend Income Fund* – (continued)
Principal Amount (‡) | Description | Value (†) | ||||||
| Media Entertainment — 0.7% | ||||||||
| $ | 185,000 | R.R. Donnelley & Sons Co., 6.000%, 4/01/2024 | $ | 185,925 | ||||
| 22,000 | R.R. Donnelley & Sons Co., 7.250%, 5/15/2018 | 24,310 | ||||||
|
| |||||||
| 210,235 | ||||||||
|
| |||||||
| Metals & Mining — 1.2% | ||||||||
| 50,000 | Alcoa, Inc., 5.900%, 2/01/2027 | 54,426 | ||||||
| 45,000 | Alcoa, Inc., 6.750%, 1/15/2028 | 51,837 | ||||||
| 155,000 | Cliffs Natural Resources, Inc., 6.250%, 10/01/2040 | 100,556 | ||||||
| 200,000 | United States Steel Corp., 6.650%, 6/01/2037 | 190,000 | ||||||
|
| |||||||
| 396,819 | ||||||||
|
| |||||||
| Retailers — 1.0% | ||||||||
| 365,000 | J.C. Penney Corp., Inc., 6.375%, 10/15/2036 | 259,150 | ||||||
| 90,000 | Nine West Holdings, Inc., 6.125%, 11/15/2034 | 56,250 | ||||||
|
| |||||||
| 315,400 | ||||||||
|
| |||||||
| Supermarkets — 1.2% | ||||||||
| 400,000 | New Albertson’s, Inc., 8.000%, 5/01/2031 | 374,000 | ||||||
|
| |||||||
| Transportation Services — 0.2% | ||||||||
| 75,000 | APL Ltd., 8.000%, 1/15/2024(f) | 67,500 | ||||||
|
| |||||||
| Wireless — 0.7% | ||||||||
| 2,900,000 | America Movil SAB de CV, 8.460%, 12/18/2036, (MXN) | 207,028 | ||||||
|
| |||||||
| Wirelines — 1.3% | ||||||||
| 400,000 | Telecom Italia Capital S.A., 6.000%, 9/30/2034 | 401,000 | ||||||
|
| |||||||
Total Non-Convertible Bonds (Identified Cost $3,831,937) | 4,033,383 | |||||||
|
| |||||||
| Convertible Bonds — 0.9% | ||||||||
| Energy — 0.9% | ||||||||
| 305,000 | Chesapeake Energy Corp., 2.750%, 11/15/2035 (Identified Cost $291,783) | 305,000 | ||||||
|
| |||||||
Total Bonds and Notes (Identified Cost $4,123,720) | 4,338,383 | |||||||
|
| |||||||
| Shares | ||||||||
| Preferred Stocks — 0.9% | ||||||||
| REITs – Diversified — 0.9% | ||||||||
| 4,847 | Weyerhaeuser Co., Series A, 6.375% (Identified Cost $252,054) | 284,519 | ||||||
|
| |||||||
See accompanying notes to financial statements.
31 |
Table of Contents
Portfolio of Investments – as of November 30, 2014
Loomis Sayles Dividend Income Fund* – (continued)
Principal Amount (‡) | Description | Value (†) | ||||||
| Short-Term Investments — 5.2% | ||||||||
| $ | 1,650,409 | Tri-Party Repurchase Agreement with Fixed Income Clearing Corporation, dated 11/28/2014 at 0.010% to be repurchased at $1,650,410 on 12/01/2014 collateralized by $1,655,000 U.S. Treasury Note, 1.375% due 11/30/2015 valued at $1,686,031 including accrued interest (Note 2 of Notes to Financial Statements) (Identified Cost $1,650,409) | $ | 1,650,409 | ||||
|
| |||||||
Total Investments — 99.6% (Identified Cost $28,180,940)(a) | 31,703,286 | |||||||
| Other assets less liabilities — 0.4% | 126,871 | |||||||
|
| |||||||
| Net Assets — 100.0% | $ | 31,830,157 | ||||||
|
| |||||||
| Shares | ||||||||
| Written Options — (0.0%) | ||||||||
| Options on Securities — (0.0%) | ||||||||
| 2,000 | Bristol-Myers Squibb Co., Call expiring December 20, 2014 at 57.50 | $ | (4,460 | ) | ||||
| 2,500 | Gap, Inc. (The), Put expiring December 20, 2014 at 37.00 | (513 | ) | |||||
| 4,000 | Mattel, Inc., Put expiring December 20, 2014 at 29.00 | (200 | ) | |||||
| 1,000 | PepsiCo, Inc., Call expiring December 20, 2014 at 97.50 | (2,665 | ) | |||||
|
| |||||||
Total Written Options (Premiums Received $4,627) | $ | (7,838 | ) | |||||
|
| |||||||
| * | Formerly Loomis Sayles Capital Income Fund. | |||||||
| (‡) | Principal Amount stated in U.S. dollars unless otherwise noted. | |||||||
| (†) | See Note 2 of Notes to Financial Statements. | |||||||
| (a) | Federal Tax Information: | |||||||
| At November 30, 2014, the net unrealized appreciation on investments based on a cost of $28,219,050 for federal income tax purposes was as follows: | ||||||||
| Aggregate gross unrealized appreciation for all investments in which there is an excess of value over tax cost | $ | 4,080,013 | ||||||
| Aggregate gross unrealized depreciation for all investments in which there is an excess of tax cost over value | (595,777 | ) | ||||||
|
| |||||||
| Net unrealized appreciation | $ | 3,484,236 | ||||||
|
| |||||||
| (b) | All of this security has been designated to cover the Fund’s obligations under open outstanding options. | |||||||
| (c) | A portion of this security has been pledged as collateral for outstanding options. | |||||||
| (d) | Non-income producing security. | |||||||
| (e) | Perpetual bond with no specified maturity date. | |||||||
| (f) | Illiquid security. At November 30, 2014, the value of these securities amounted to $207,000 or 0.7% of net assets. Illiquid securities are deemed to be fair valued pursuant to the Fund’s pricing policies and procedures. | |||||||
See accompanying notes to financial statements.
| 32
Table of Contents
Portfolio of Investments – as of November 30, 2014
Loomis Sayles Dividend Income Fund* – (continued)
| 144A | All or a portion of these securities are exempt from registration under Rule 144A of the Securities Act of 1933. These securities may be resold in transactions exempt from registration, normally to qualified institutional buyers. At November 30, 2014, the value of Rule 144A holdings amounted to $348,000 or 1.1% of net assets. | |||||
| ADR | An American Depositary Receipt is a certificate issued by a custodian bank representing the right to receive securities of the foreign issuer described. The values of ADRs may be significantly influenced by trading on exchanges not located in the United States. | |||||
| MTN | Medium Term Note | |||||
| REITs | Real Estate Investment Trusts | |||||
| AUD | Australian Dollar | |||||
| MXN | Mexican Peso | |||||
Industry Summary at November 30, 2014
Pharmaceuticals | 14.1 | % | ||
Banks | 7.3 | |||
Oil, Gas & Consumable Fuels | 7.1 | |||
Software | 3.8 | |||
Insurance | 3.8 | |||
REITs – Diversified | 3.5 | |||
Chemicals | 3.5 | |||
Electrical Equipment | 3.3 | |||
Media | 2.7 | |||
Banking | 2.3 | |||
Other Investments, less than 2% each | 43.0 | |||
Short-Term Investments | 5.2 | |||
|
| |||
Total Investments | 99.6 | |||
Other assets less liabilities (including open written options) | 0.4 | |||
|
| |||
Net Assets | 100.0 | % | ||
|
|
See accompanying notes to financial statements.
33 |
Table of Contents
Portfolio of Investments – as of November 30, 2014
Loomis Sayles Emerging Markets Opportunities Fund
| Principal Amount (‡) | Description | Value (†) | ||||||
| Bonds and Notes — 86.7% of Net Assets | ||||||||
| Non-Convertible Bonds — 85.8% | ||||||||
| Argentina — 1.0% | ||||||||
| $ | 150,000 | Argentina Bonar Bonds, Series X, 7.000%, 4/17/2017 | $ | 138,546 | ||||
| 200,000 | YPF S.A., 8.750%, 4/04/2024, 144A | 208,000 | ||||||
|
| |||||||
| 346,546 | ||||||||
|
| |||||||
| Barbados — 0.6% | ||||||||
| 200,000 | Columbus International, Inc., 7.375%, 3/30/2021, 144A | 213,000 | ||||||
|
| |||||||
| Brazil — 7.4% | ||||||||
| 135,000 | Banco do Brasil S.A., 6.000%, 1/22/2020, 144A | 146,475 | ||||||
| 250,000 | Banco Nacional de Desenvolvimento Economico e Social, 5.750%, 9/26/2023, 144A(b) | 265,625 | ||||||
| 235,000 | Banco Santander Brasil S.A., 4.625%, 2/13/2017(b) | 245,340 | ||||||
| 250,000 | Braskem Finance Ltd., 6.450%, 2/03/2024(b) | 261,250 | ||||||
| 250,000 | BRF S.A., 5.875%, 6/06/2022(b) | 268,438 | ||||||
| 340,000 | CIMPOR Financial Operations BV, 5.750%, 7/17/2024, 144A | 317,475 | ||||||
| 445,000 | Itau Unibanco Holding S.A., 6.200%, 12/21/2021(b) | 472,812 | ||||||
| 424,397 | Odebrecht Offshore Drilling Finance Ltd., 6.750%, 10/01/2022, 144A(b) | 418,031 | ||||||
| 200,000 | Tupy Overseas S.A., 6.625%, 7/17/2024, 144A | 200,000 | ||||||
|
| |||||||
| 2,595,446 | ||||||||
|
| |||||||
| Chile — 3.2% | ||||||||
| 270,000 | CFR International SpA, 5.125%, 12/06/2022(b) | 294,514 | ||||||
| 260,000 | Corpbanca S.A., 3.125%, 1/15/2018 | 260,828 | ||||||
| 320,000 | GeoPark Latin America Ltd. Agencia en Chile, 7.500%, 2/11/2020 | 321,600 | ||||||
| 240,000 | VTR Finance BV, 6.875%, 1/15/2024 | 252,600 | ||||||
|
| |||||||
| 1,129,542 | ||||||||
|
| |||||||
| China — 7.6% | ||||||||
| 520,000 | Alibaba Group Holding Ltd., 2.500%, 11/28/2019, 144A | 519,235 | ||||||
| 215,000 | Baidu, Inc., 3.500%, 11/28/2022 | 214,349 | ||||||
| 270,000 | Bestgain Real Estate Ltd., 2.625%, 3/13/2018(b) | 264,181 | ||||||
| 250,000 | China Resources Gas Group Ltd., 4.500%, 4/05/2022, 144A(b) | 264,160 | ||||||
| 230,000 | China Shanshui Cement Group Ltd., 10.500%, 4/27/2017(b) | 246,100 | ||||||
| 280,000 | CNOOC Finance 2013 Ltd., 3.000%, 5/09/2023(b) | 268,387 | ||||||
| 255,000 | Country Garden Holdings Co. Ltd., 7.250%, 4/04/2021, 144A(b) | 251,812 | ||||||
| 225,000 | ENN Energy Holdings Ltd., 6.000%, 5/13/2021, 144A(b) | 252,332 | ||||||
| 200,000 | Kaisa Group Holdings Ltd., 8.875%, 3/19/2018, 144A | 203,000 | ||||||
| 200,000 | Tencent Holdings Ltd., 3.375%, 5/02/2019, 144A | 204,103 | ||||||
|
| |||||||
| 2,687,659 | ||||||||
|
| |||||||
| Colombia — 2.8% | ||||||||
| 250,000 | Colombia Telecomunicaciones S.A. E.S.P., 5.375%, 9/27/2022(b) | 251,375 | ||||||
| 230,000 | Ecopetrol S.A., 4.125%, 1/16/2025 | 224,250 | ||||||
| 235,000 | Empresa de Energia de Bogota S.A. E.S.P., 6.125%, 11/10/2021(b) | 251,567 | ||||||
| 260,000 | Oleoducto Central S.A., 4.000%, 5/07/2021, 144A(b) | 258,440 | ||||||
|
| |||||||
| 985,632 | ||||||||
|
| |||||||
See accompanying notes to financial statements.
| 34
Table of Contents
Portfolio of Investments – as of November 30, 2014
Loomis Sayles Emerging Markets Opportunities Fund – (continued)
| Principal Amount (‡) | Description | Value (†) | ||||||
| Croatia — 0.6% | ||||||||
| $ | 200,000 | Agrokor d.d., 8.875%, 2/01/2020 | $ | 216,520 | ||||
|
| |||||||
| Guatemala — 0.7% | ||||||||
| 225,000 | Central American Bottling Corp., 6.750%, 2/09/2022(b) | 238,050 | ||||||
|
| |||||||
| Hong Kong — 1.9% | ||||||||
| 175,000 | Noble Group Ltd., 6.750%, 1/29/2020 | 196,000 | ||||||
| 265,000 | PCCW-HKT Capital No. 5 Ltd., 3.750%, 3/08/2023 | 261,783 | ||||||
| 200,000 | Swire Pacific MTN Financing Ltd., EMTN, 4.500%, 10/09/2023 | 215,120 | ||||||
|
| |||||||
| 672,903 | ||||||||
|
| |||||||
| Hungary — 1.1% | ||||||||
| 400,000 | Magyar Export-Import Bank Zrt, 4.000%, 1/30/2020, 144A | 400,360 | ||||||
|
| |||||||
| India — 4.4% | ||||||||
| 260,000 | Bharti Airtel International BV, 5.350%, 5/20/2024, 144A(b) | 283,418 | ||||||
| 250,000 | Greenko Dutch BV, 8.000%, 8/01/2019, 144A | 235,000 | ||||||
| 325,000 | ICICI Bank Ltd., 3.500%, 3/18/2020, 144A | 330,951 | ||||||
| 440,000 | NTPC Ltd., EMTN, 5.625%, 7/14/2021(b) | 487,521 | ||||||
| 200,000 | Rolta Americas LLC, 8.875%, 7/24/2019, 144A | 196,000 | ||||||
|
| |||||||
| 1,532,890 | ||||||||
|
| |||||||
| Indonesia — 6.2% | ||||||||
| 4,500,000,000 | Indonesia Treasury Bond, 7.000%, 5/15/2027, (IDR) | 339,233 | ||||||
| 200,000 | Listrindo Capital BV, 6.950%, 2/21/2019, 144A | 213,000 | ||||||
| 340,000 | Pelabuhan Indonesia III PT, 4.875%, 10/01/2024, 144A | 350,200 | ||||||
| 435,000 | Pertamina Persero PT, EMTN, 4.300%, 5/20/2023(b) | 429,563 | ||||||
| 385,000 | Perusahaan Gas Negara Persero Tbk PT, 5.125%, 5/16/2024, 144A(b) | 400,881 | ||||||
| 200,000 | TBG Global Pte Ltd., 4.625%, 4/03/2018 | 200,000 | ||||||
| 255,000 | TBG Global Pte Ltd., 4.625%, 4/03/2018, 144A(b) | 255,000 | ||||||
|
| |||||||
| 2,187,877 | ||||||||
|
| |||||||
| Israel — 0.7% | ||||||||
| 230,000 | Israel Electric Corp. Ltd., 5.625%, 6/21/2018, 144A(b) | 246,408 | ||||||
|
| |||||||
| Jamaica — 0.7% | ||||||||
| 250,000 | Digicel Ltd., 6.000%, 4/15/2021, 144A(b) | 245,000 | ||||||
|
| |||||||
| Kenya — 1.1% | ||||||||
| 345,000 | Kenya Government International Bond, 6.875%, 6/24/2024, 144A(b) | 368,805 | ||||||
|
| |||||||
| Korea — 2.9% | ||||||||
| 240,000 | GS Caltex Corp., 3.250%, 10/01/2018, 144A(b) | 246,967 | ||||||
| 230,000 | Korea Gas Corp., 4.250%, 11/02/2020(b) | 250,659 | ||||||
| 200,000 | Lotte Shopping Co. Ltd., 3.375%, 5/09/2017 | 206,653 | ||||||
| 275,000 | Woori Bank, 5.875%, 4/13/2021(b) | 315,609 | ||||||
|
| |||||||
| 1,019,888 | ||||||||
|
| |||||||
| Lithuania — 0.7% | ||||||||
| 210,000 | Lithuania Government International Bond, 6.625%, 2/01/2022(b) | 255,570 | ||||||
|
| |||||||
| Luxembourg — 0.7% | ||||||||
| 240,000 | Altice S.A., 7.750%, 5/15/2022, 144A(b) | 248,100 | ||||||
|
| |||||||
See accompanying notes to financial statements.
35 |
Table of Contents
Portfolio of Investments – as of November 30, 2014
Loomis Sayles Emerging Markets Opportunities Fund – (continued)
| Principal Amount (‡) | Description | Value (†) | ||||||
| Malaysia — 1.0% | ||||||||
| $ | 200,000 | Malayan Banking Bhd, EMTN, (fixed rate to 9/20/2017, variable rate thereafter), 3.250%, 9/20/2022 | $ | 202,447 | ||||
| 100,000 | Petronas Capital Ltd., 7.875%, 5/22/2022, 144A | 132,066 | ||||||
|
| |||||||
| 334,513 | ||||||||
|
| |||||||
| Mexico — 9.1% | ||||||||
| 250,000 | Alfa SAB de CV, 5.250%, 3/25/2024, 144A(b) | 265,000 | ||||||
| 195,000 | Axtel SAB de CV, (Step to 9.000% on 1/31/2015), 8.000%, 1/31/2020, 144A(c) | 193,781 | ||||||
| 225,000 | BBVA Bancomer S.A., 6.750%, 9/30/2022(b) | 252,563 | ||||||
| 270,000 | El Puerto de Liverpool SAB de CV, 3.950%, 10/02/2024, 144A | 265,950 | ||||||
| 290,000 | Elementia SAB de CV, 5.500%, 1/15/2025, 144A | 291,160 | ||||||
| 200,000 | Empresas ICA SAB de CV, 8.875%, 5/29/2024, 144A | 190,000 | ||||||
| 260,000 | Fermaca Enterprises S de RL de CV, 6.375%, 3/30/2038, 144A(b) | 272,350 | ||||||
| 255,000 | Fresnillo PLC, 5.500%, 11/13/2023, 144A(b) | 263,287 | ||||||
| 245,000 | Grupo Idesa S.A. de CV, 7.875%, 12/18/2020, 144A(b) | 260,925 | ||||||
| 250,000 | Grupo KUO SAB de CV, 6.250%, 12/04/2022(b) | 252,908 | ||||||
| 235,000 | Office Depot de Mexico S.A. de CV, 6.875%, 9/20/2020, 144A(b) | 247,925 | ||||||
| 250,000 | Tenedora Nemak S.A. de CV, 5.500%, 2/28/2023, 144A(b) | 255,375 | ||||||
| 200,000 | Unifin Financiera S.A.P.I. de CV SOFOM ENR, 6.250%, 7/22/2019, 144A | 192,500 | ||||||
|
| |||||||
| 3,203,724 | ||||||||
|
| |||||||
| Morocco — 0.7% | ||||||||
| 225,000 | OCP S.A., 5.625%, 4/25/2024, 144A | 238,264 | ||||||
|
| |||||||
| Nigeria — 0.6% | ||||||||
| 210,000 | FBN Finance Co. BV, (fixed rate to 7/23/2019, variable rate thereafter), 8.000%, 7/23/2021, 144A | 199,017 | ||||||
|
| |||||||
| Panama — 0.6% | ||||||||
| 140,000 | Panama Government International Bond, 8.875%, 9/30/2027 | 202,300 | ||||||
|
| |||||||
| Paraguay — 0.7% | ||||||||
| 240,000 | Telefonica Celular del Paraguay, S.A., 6.750%, 12/13/2022 | 254,850 | ||||||
|
| |||||||
| Peru — 2.6% | ||||||||
| 200,000 | Corporacion Financiera de Desarrollo S.A., 4.750%, 2/08/2022 | 209,500 | ||||||
| 345,000 | InRetail Consumer, 5.250%, 10/10/2021, 144A | 346,898 | ||||||
| 350,000 | Union Andina de Cementos SAA, 5.875%, 10/30/2021, 144A | 355,775 | ||||||
|
| |||||||
| 912,173 | ||||||||
|
| |||||||
| Philippines — 1.4% | ||||||||
| 240,000 | Philippine Government International Bond, 4.200%, 1/21/2024(b) | 261,000 | ||||||
| 205,000 | Power Sector Assets and Liabilities Management Corp., 7.250%, 5/27/2019(b) | 245,488 | ||||||
|
| |||||||
| 506,488 | ||||||||
|
| |||||||
| Poland — 0.6% | ||||||||
| 200,000 | PKO Finance AB, 4.630%, 9/26/2022 | 211,000 | ||||||
|
| |||||||
| Qatar — 0.9% | ||||||||
| 285,000 | Ooredoo International Finance Ltd., 4.750%, 2/16/2021, 144A(b) | 309,581 | ||||||
|
| |||||||
See accompanying notes to financial statements.
| 36
Table of Contents
Portfolio of Investments – as of November 30, 2014
Loomis Sayles Emerging Markets Opportunities Fund – (continued)
| Principal Amount (‡) | Description | Value (†) | ||||||
| Russia — 5.2% | ||||||||
| $ | 420,000 | Gazprom OAO Via Gaz Capital S.A., 4.950%, 2/06/2028(b) | $ | 352,229 | ||||
| 300,000 | Russian Foreign Bond-Eurobond, 5.000%, 4/29/2020, 144A(b) | 298,623 | ||||||
| 831,850 | Russian Foreign Bond-Eurobond, 7.500%, 3/31/2030 | 910,876 | ||||||
| 260,000 | VimpelCom Holdings BV, 6.255%, 3/01/2017(b) | 254,069 | ||||||
|
| |||||||
| 1,815,797 | ||||||||
|
| |||||||
| South Africa — 3.4% | ||||||||
| 235,000 | Edcon Pty Ltd., 9.500%, 3/01/2018 | 192,700 | ||||||
| 200,000 | Eskom Holdings SOC Ltd., 6.750%, 8/06/2023, 144A | 216,114 | ||||||
| 320,000 | MTN (Mauritius) Investments Ltd., 4.755%, 11/11/2024, 144A | 321,200 | ||||||
| 175,000 | Standard Bank PLC, GMTN, 8.125%, 12/02/2019 | 200,375 | ||||||
| 275,000 | Transnet SOC Ltd., 4.000%, 7/26/2022 | 263,827 | ||||||
|
| |||||||
| 1,194,216 | ||||||||
|
| |||||||
| Sri Lanka — 0.6% | ||||||||
| 200,000 | Sri Lanka Government International Bond, 5.125%, 4/11/2019, 144A | 205,500 | ||||||
|
| |||||||
| Thailand — 0.6% | ||||||||
| 205,000 | PTT Global Chemical PCL, 4.250%, 9/19/2022 | 211,962 | ||||||
|
| |||||||
| Turkey — 6.1% | ||||||||
| 195,000 | Akbank TAS, 3.875%, 10/24/2017 | 198,727 | ||||||
| 230,000 | Arcelik AS, 5.000%, 4/03/2023, 144A | 221,662 | ||||||
| 240,000 | Coca-Cola Icecek AS, 4.750%, 10/01/2018, 144A(b) | 256,560 | ||||||
| 400,000 | Export Credit Bank of Turkey, 5.000%, 9/23/2021, 144A | 413,435 | ||||||
| 275,000 | TC Ziraat Bankasi AS, 4.250%, 7/03/2019, 144A | 276,320 | ||||||
| 265,000 | Turk Telekomunikasyon AS, 3.750%, 6/19/2019, 144A | 268,644 | ||||||
| 260,000 | Turkiye Is Bankasi, 5.000%, 4/30/2020, 144A | 267,852 | ||||||
| 240,000 | Yasar Holdings, 8.875%, 5/06/2020, 144A | 248,400 | ||||||
|
| |||||||
| 2,151,600 | ||||||||
|
| |||||||
| Ukraine — 0.5% | ||||||||
| 200,000 | Ukraine Government International Bond, 9.250%, 7/24/2017 | 158,000 | ||||||
|
| |||||||
| United Arab Emirates — 3.7% | ||||||||
| 325,000 | Abu Dhabi National Energy Co., 3.625%, 1/12/2023(b) | 327,437 | ||||||
| 275,000 | Dolphin Energy Ltd., 5.500%, 12/15/2021, 144A(b) | 313,148 | ||||||
| 290,000 | DP World Ltd., EMTN, 6.850%, 7/02/2037(b) | 333,500 | ||||||
| 260,000 | Dubai Electricity & Water Authority, 7.375%, 10/21/2020, 144A(b) | 318,500 | ||||||
|
| |||||||
| 1,292,585 | ||||||||
|
| |||||||
| United States — 0.7% | ||||||||
| 260,000 | Kosmos Energy Ltd., 7.875%, 8/01/2021, 144A | 244,400 | ||||||
|
| |||||||
| Venezuela — 1.9% | ||||||||
| 395,000 | Petroleos de Venezuela S.A., 5.500%, 4/12/2037 | 169,455 | ||||||
| 220,000 | Petroleos de Venezuela S.A., 6.000%, 11/15/2026 | 92,400 | ||||||
| 300,000 | Petroleos de Venezuela S.A., Series 2015, 5.000%, 10/28/2015(b) | 254,700 | ||||||
| 240,000 | Venezuela Government International Bond, 12.750%, 8/23/2022 | 162,960 | ||||||
|
| |||||||
| 679,515 | ||||||||
|
| |||||||
See accompanying notes to financial statements.
37 |
Table of Contents
Portfolio of Investments – as of November 30, 2014
Loomis Sayles Emerging Markets Opportunities Fund – (continued)
| Principal Amount (‡) | Description | Value (†) | ||||||
| Zambia — 0.6% | ||||||||
| $ | 200,000 | Zambia Government International Bond, 8.500%, 4/14/2024, 144A | $ | 225,500 | ||||
|
| |||||||
| Total Non-Convertible Bonds (Identified Cost $29,678,141) | 30,141,181 | |||||||
|
| |||||||
| Convertible Bonds — 0.9% | ||||||||
| Argentina — 0.9% | ||||||||
| 255,000 | MercadoLibre, Inc., 2.250%, 7/01/2019, 144A (Identified Cost $255,000) | 324,488 | ||||||
|
| |||||||
Total Bonds and Notes (Identified Cost $29,933,141) | 30,465,669 | |||||||
|
| |||||||
| Senior Loans — 0.6% | ||||||||
| Great Britain — 0.6% | ||||||||
| 202,000 | Sable International Finance Ltd., Senior Unsecured Bridge Loan, 11/06/2016(d) (Identified Cost $198,970) | 199,475 | ||||||
|
| |||||||
| Shares | ||||||||
| Common Stocks — 2.3% | ||||||||
| Cambodia — 0.5% | ||||||||
| 210,000 | NagaCorp Ltd. | 167,825 | ||||||
|
| |||||||
| China — 0.3% | ||||||||
| 6,000 | Tencent Holdings Ltd., ADR, | 95,940 | ||||||
|
| |||||||
| India — 0.5% | ||||||||
| 3,400 | HDFC Bank Ltd., ADR | 181,186 | ||||||
|
| |||||||
| Indonesia — 1.0% | ||||||||
| 89,100 | Indocement Tunggal Prakarsa Tbk PT | 180,903 | ||||||
| 337,000 | Jasa Marga Persero Tbk PT | 186,783 | ||||||
|
| |||||||
| 367,686 | ||||||||
|
| |||||||
| Total Common Stocks (Identified Cost $813,070) | 812,637 | |||||||
|
| |||||||
| Exchange Traded Funds — 2.1% | ||||||||
| 3,665 | iShares® China Large-Cap ETF | 148,799 | ||||||
| 6,000 | iShares® India 50 ETF | 190,020 | ||||||
| 3,893 | iShares® MSCI Frontier 100 ETF | 134,795 | ||||||
| 2,723 | iShares® MSCI South Korea Capped ETF | 154,884 | ||||||
| 7,984 | iShares® MSCI Taiwan ETF | 126,227 | ||||||
|
| |||||||
Total Exchange Traded Funds (Identified Cost $780,111) | 754,725 | |||||||
|
| |||||||
See accompanying notes to financial statements.
| 38
Table of Contents
Portfolio of Investments – as of November 30, 2014
Loomis Sayles Emerging Markets Opportunities Fund – (continued)
| Units of Currency | Description | Value (†) | ||||||
| Purchased Options — 0.0% | ||||||||
| Over-the-Counter Options on Currency — 0.0% | ||||||||
| 750,000 | BRL Call, expiring December 30, 2014 at 2.40(e) (Identified Cost $9,911) | 431 | ||||||
|
| |||||||
| Principal Amount (‡) | ||||||||
| Short-Term Investments — 7.2% | ||||||||
| $ | 2,521,899 | Tri-Party Repurchase Agreement with Fixed Income Clearing Corporation, dated 11/28/2014 at 0.010% to be repurchased at $2,521,901 on 12/01/2014 collateralized by $2,525,000 U.S. Treasury Note, 1.375% due 11/30/2015 valued at $2,572,344 including accrued interest (Note 2 of Notes to Financial Statements) (Identified Cost $2,521,899) | $ | 2,521,899 | ||||
|
| |||||||
| Total Investments — 98.9% (Identified Cost $34,257,102)(a) | 34,754,836 | |||||||
| Other assets less liabilities — 1.1% | 383,435 | |||||||
|
| |||||||
| Net Assets — 100.0% | $ | 35,138,271 | ||||||
|
| |||||||
| (‡) | Principal Amount stated in U.S. dollars unless otherwise noted. | |||||||
| (†) | See Note 2 of Notes to Financial Statements. | |||||||
| (a) | Federal Tax Information: | |||||||
| At November 30, 2014, the net unrealized appreciation on investments based on a cost of $34,332,250 for federal income tax purposes was as follows: | ||||||||
| Aggregate gross unrealized appreciation for all investments in which there is an excess of value over tax cost | $ | 441,966 | ||||||
| Aggregate gross unrealized depreciation for all investments in which there is an excess of tax cost over value | (19,380 | ) | ||||||
|
| |||||||
| Net unrealized appreciation | $ | 422,586 | ||||||
|
| |||||||
| (b) | All of this security has been designated to cover the Fund’s obligations under open forward foreign currency contracts, futures contracts or swap agreements. | |||||||
| (c) | Coupon rate is a fixed rate for an initial period then resets at a specified date and rate. | |||||||
| (d) | Position is unsettled. Contract rate was not determined at November 30, 2014 and does not take effect until settlement date. Maturity date is not finalized until settlement date. | |||||||
| (e) | Counterparty is Bank of America, N.A. | |||||||
| 144A | All or a portion of these securities are exempt from registration under Rule 144A of the Securities Act of 1933. These securities may be resold in transactions exempt from registration, normally to qualified institutional buyers. At November 30, 2014, the value of Rule 144A holdings amounted to $16,441,978 or 46.8% of net assets. | |||||||
| ADR | An American Depositary Receipt is a certificate issued by a custodian bank representing the right to receive securities of the foreign issuer described. The values of ADRs may be significantly influenced by trading on exchanges not located in the United States. | |||||||
| EMTN | Euro Medium Term Note | |||||||
| ETF | Exchange Traded Fund | |||||||
| GMTN | Global Medium Term Note | |||||||
| BRL | Brazilian Real | |||||||
| IDR | Indonesian Rupiah | |||||||
See accompanying notes to financial statements.
39 |
Table of Contents
Portfolio of Investments – as of November 30, 2014
Loomis Sayles Emerging Markets Opportunities Fund – (continued)
At November 30, 2014, the Fund had the following open bilateral credit default swap agreements:
| Counterparty | Reference Obligation | (Pay)/ Receive Fixed Rate | Expiration Date | Implied Credit Spread^ | Notional Value(‡) | Unamortized Up Front Premium Paid/ (Received) | Market Value | Unrealized Appreciation (Depreciation) | Fees Receivable/ (Payable) | |||||||||||||||||||||||
| Sell Protection | ||||||||||||||||||||||||||||||||
| Citibank N.A. | CDX.EM* Series 22, 5-Year | 1.00% | 12/20/2019 | 2.07 | % | $ | 3,700,000 | $ | (270,607 | ) | $ | (286,719 | ) | $ | (16,112 | ) | $ | 7,194 | ||||||||||||||
| Citibank N.A. | CDX.EM* Series 22, 5-Year | 1.00% | 12/20/2019 | 2.07 | % | 600,000 | (45,476 | ) | (46,494 | ) | (1,018 | ) | 1,167 | |||||||||||||||||||
| Citibank N.A. | Republic of Russia | 1.00% | 12/20/2019 | 3.18 | % | 350,000 | (29,735 | ) | (34,237 | ) | (4,502 | ) | 632 | |||||||||||||||||||
|
|
|
|
|
| |||||||||||||||||||||||||||
| Total | $ | (367,450 | ) | $ | (21,632 | ) | $ | 8,993 | ||||||||||||||||||||||||
|
|
|
|
|
| |||||||||||||||||||||||||||
| (‡) | Notional value stated in U.S. dollars unless otherwise noted. |
| ^ | Implied credit spreads, represented in absolute terms, serve as an indicator of the current status of the payment/performance risk and represent the likelihood or risk of default for the credit derivative. The implied credit spread of a particular reference entity reflects the cost of buying/selling protection and may include upfront payments required to be made to enter into the agreement. Wider credit spreads represent a deterioration of the reference entity’s credit soundness and a greater likelihood or risk of default or other credit event occurring as defined under the terms of the agreement. |
| * | CDX.EM is an index composed of emerging market credit default swaps. |
At November 30, 2014, the Fund had the following open forward foreign currency contracts:
| Contract to Buy/Sell | Delivery Date | Currency | Units of Currency | Notional Value | Unrealized Appreciation (Depreciation) | |||||||||||||
| Buy1 | 12/22/2014 | Brazilian Real | 900,000 | $ | 348,958 | $ | (761 | ) | ||||||||||
| Sell1 | 12/22/2014 | Brazilian Real | 900,000 | 348,958 | (1,333 | ) | ||||||||||||
| Buy2 | 12/17/2014 | Euro | 290,000 | 360,875 | (1,210 | ) | ||||||||||||
| Sell2 | 12/17/2014 | Euro | 290,000 | 360,875 | 14,553 | |||||||||||||
| Buy3 | 1/07/2015 | Indonesian Rupiah | 2,000,000,000 | 162,911 | 902 | |||||||||||||
| Buy2 | 1/12/2015 | South African Rand | 5,600,000 | 501,845 | 5,510 | |||||||||||||
| Sell2 | 1/12/2015 | South African Rand | 5,600,000 | 501,845 | (4,386 | ) | ||||||||||||
| Buy2 | 12/29/2014 | Yuan Renminbi | 3,100,000 | 502,889 | 1,194 | |||||||||||||
|
| |||||||||||||||||
| Total | $ | 14,469 | ||||||||||||||||
|
| |||||||||||||||||
1 Counterparty is Credit Suisse International.
2 Counterparty is Barclays Bank PLC.
3 Counterparty is Citibank N.A.
See accompanying notes to financial statements.
| 40
Table of Contents
Portfolio of Investments – as of November 30, 2014
Loomis Sayles Emerging Markets Opportunities Fund – (continued)
At November 30, 2014, open long futures contracts were as follows:
| Financial Futures | Expiration Date | Contracts | Notional Value | Unrealized Appreciation (Depreciation) | ||||||||||
| E-mini MSCI Emerging Markets Index | 12/19/2014 | 9 | $ | 449,235 | $ | (4,289 | ) | |||||||
| 5 Year U.S. Treasury Note | 3/31/2015 | 8 | 955,938 | 4,048 | ||||||||||
| 30 Year U.S. Treasury Bond | 3/20/2015 | 9 | 1,283,625 | 17,851 | ||||||||||
|
| |||||||||||||
| Total | $ | 17,610 | ||||||||||||
|
| |||||||||||||
Industry Summary at November 30, 2014
Banking | 12.0 | % | ||
Foreign Sovereign | 8.3 | |||
Integrated Energy | 5.3 | |||
Oil Field Equipment & Services | 4.3 | |||
Gas Distribution | 4.0 | |||
Telecom – Wireless | 3.7 | |||
Chemicals | 3.5 | |||
Telecom – Integrated & Services | 3.4 | |||
Telecom – Wireline Integrated & Services | 2.9 | |||
Electric – Integrated | 2.9 | |||
Food – Wholesale | 2.8 | |||
Building Materials | 2.6 | |||
Specialty Retail | 2.6 | |||
Agency | 2.6 | |||
Exchange Traded Funds | 2.1 | |||
Diversified Capital Goods | 2.1 | |||
Sovereign | 2.1 | |||
Support – Services | 2.1 | |||
Electric – Generation | 2.0 | |||
Other Investments, less than 2% each | 20.4 | |||
Short-Term Investments | 7.2 | |||
|
| |||
Total Investments | 98.9 | |||
Other assets less liabilities (including swap agreements, forward foreign currency contracts and futures contracts) | 1.1 | |||
|
| |||
Net Assets | 100.0 | % | ||
|
|
See accompanying notes to financial statements.
41 |
Table of Contents
Portfolio of Investments – as of November 30, 2014
Loomis Sayles Senior Floating Rate and Fixed Income Fund
| Principal Amount | Description | Value (†) | ||||||
| Senior Loans — 89.9% of Net Assets | ||||||||
| Aerospace & Defense — 0.6% | ||||||||
| $ | 4,884,306 | LM U.S. Corp. Acquisition, Inc., 1st Lien Term Loan, 4.750%, 10/25/2019(b) | $ | 4,870,874 | ||||
| 193,861 | LM U.S. Corp. Acquisition, Inc., Term Loan Canadian, 4.750%, 10/25/2019(b) | 193,328 | ||||||
| 595,542 | PRV Aerospace LLC, Term Loan B, 6.500%, 5/09/2018(b) | 588,347 | ||||||
| 4,560,029 | Sequa Corp., New Term Loan B, 5.250%, 6/19/2017(b) | 4,446,028 | ||||||
|
| |||||||
| 10,098,577 | ||||||||
|
| |||||||
| Automotive — 3.2% | ||||||||
| 1,700,000 | ABRA, Inc., 1st Lien Term Loan, 4.750%, 9/17/2021(b) | 1,706,375 | ||||||
| 1,700,000 | ABRA, Inc., 2nd Lien Term Loan, 8.250%, 9/19/2022(b) | 1,695,750 | ||||||
| 11,582,057 | American Tire Distributors Holdings, Inc., Term Loan B, 5.750%, 6/01/2018(b) | 11,596,535 | ||||||
| 9,406,000 | Crowne Group LLC, 1st Lien Term Loan, 6.000%, 9/29/2020(b) | 9,264,910 | ||||||
| 5,994,625 | Dayco Products LLC, New Term Loan B, 5.250%, 12/12/2019(b) | 5,969,867 | ||||||
| 7,197,960 | Henniges Automotive Holdings, Inc., Term Loan B, 6.000%, 6/12/2021(b) | 7,233,950 | ||||||
| 8,451,000 | IBC Capital Ltd., 2nd Lien Term Loan, 8.000%, 9/09/2022(b) | 8,435,196 | ||||||
| 3,485,000 | Key Safety Systems, Inc., New 1st Lien Term Loan, 4.750%, 8/29/2021(b) | 3,490,820 | ||||||
|
| |||||||
| 49,393,403 | ||||||||
|
| |||||||
| Banking — 0.9% | ||||||||
| 1,195,377 | Harland Clarke Holdings Corp., Extended Term Loan B2, 5.483%, 6/30/2017(b) | 1,193,883 | ||||||
| 11,451,356 | Harland Clarke Holdings Corp., Term Loan B3, 7.000%, 5/22/2018(b) | 11,555,678 | ||||||
| 2,113,612 | Harland Clarke Holdings Corp., Term Loan B4, 6.000%, 8/04/2019(b) | 2,118,241 | ||||||
|
| |||||||
| 14,867,802 | ||||||||
|
| |||||||
| Building Materials — 3.9% | ||||||||
| 6,413,151 | C.H.I. Overhead Doors, Inc., Term Loan B, 5.503%, 3/18/2019(c) | 6,365,052 | ||||||
| 6,048,438 | Contech Construction Products, Inc., New Term Loan, 6.250%, 4/29/2019(b) | 6,025,756 | ||||||
| 8,351,035 | GYP Holdings III Corp., 1st Lien Term Loan, 4.750%, 4/01/2021(b) | 8,210,153 | ||||||
| 8,136,934 | Jeld-Wen, Inc., Term Loan B, 5.250%, 10/15/2021(b) | 8,111,547 | ||||||
| 4,317,000 | Mannington Mills, Inc., Term Loan B, 4.750%, 10/01/2021(b) | 4,314,324 | ||||||
| 8,416,905 | Munters Corp., Term Loan, 6.250%, 5/05/2021(b) | 8,301,173 | ||||||
| 5,710,516 | PGT, Inc., Term Loan B, 5.250%, 9/22/2021(b) | 5,724,792 | ||||||
| 6,104,100 | Quikrete Holdings, Inc., 2nd Lien Term Loan, 7.000%, 3/26/2021(b) | 6,126,990 | ||||||
| 7,940,492 | Roofing Supply Group LLC, Term Loan, 5.000%, 5/31/2019(b) | 7,841,236 | ||||||
|
| |||||||
| 61,021,023 | ||||||||
|
| |||||||
| Cable Satellite — 0.6% | ||||||||
| 9,552,583 | TWCC Holding Corp., 2nd Lien Term Loan, 7.000%, 6/26/2020(b) | 9,277,946 | ||||||
|
| |||||||
| Chemicals — 3.1% | ||||||||
| 11,000,000 | Arysta LifeScience SPC LLC, 2nd Lien Term Loan, 8.250%, 11/30/2020(b) | 11,041,250 | ||||||
| 4,881,000 | AZ Chem U.S., Inc., 2nd Lien Term Loan, 7.500%, 6/12/2022(b) | 4,846,833 | ||||||
| 4,524,000 | Citadel Plastics Holdings, Inc., 1st Lien Term Loan, 5.250%, 11/05/2020(b) | 4,524,000 | ||||||
| 6,738,000 | ECO Services Operations LLC, Term Loan B, 10/08/2021(d) | 6,738,000 | ||||||
| 3,691,757 | Gemini HDPE LLC, Term Loan B, 4.750%, 8/07/2021(b) | 3,691,757 | ||||||
| 2,433,956 | Nexeo Solutions LLC, Incremental Term Loan, 5.000%, 9/08/2017(b) | 2,413,681 | ||||||
| 2,104,788 | Nexeo Solutions LLC, Term Loan B, 5.000%, 9/08/2017(b) | 2,087,255 | ||||||
| 3,295,100 | Nexeo Solutions LLC, Term Loan B3, 5.000%, 9/08/2017(b) | 3,262,149 | ||||||
| 9,410,001 | Styrolution U.S. Holding LLC, USD Term Loan B, 6.500%, 11/07/2019(b) | 9,398,238 | ||||||
|
| |||||||
| 48,003,163 | ||||||||
|
| |||||||
See accompanying notes to financial statements.
| 42
Table of Contents
Portfolio of Investments – as of November 30, 2014
Loomis Sayles Senior Floating Rate and Fixed Income Fund – (continued)
| Principal Amount | Description | Value (†) | ||||||
| Construction Machinery — 1.2% | ||||||||
| $ | 7,795,621 | Neff Rental LLC, 2nd Lien Term Loan, 7.250%, 6/09/2021(b) | $ | 7,824,854 | ||||
| 10,768,000 | Onsite U.S. Finco LLC, Term Loan, 5.500%, 7/30/2021(b) | 10,673,780 | ||||||
|
| |||||||
| 18,498,634 | ||||||||
|
| |||||||
| Consumer Cyclical Services — 6.7% | ||||||||
| 1,717,000 | Access CIG LLC, 1st Lien Term Loan, 10/18/2021(d) | 1,701,255 | ||||||
| 6,727,000 | Access CIG LLC, 1st Lien Term Loan, 6.000%, 10/18/2021(b) | 6,665,313 | ||||||
| 7,025,640 | Active Network, Inc. (The), 1st Lien Term Loan, 5.500%, 11/13/2020(b) | 6,969,997 | ||||||
| 10,325,000 | AlixPartners LLP, New 2nd Lien Term Loan, 9.000%, 7/10/2021(b) | 10,479,875 | ||||||
| 6,263,000 | DTZ U.S. Borrower LLC, 2nd Lien Term Loan, 9.250%, 11/04/2022(b) | 6,282,603 | ||||||
| 6,639,360 | Inmar Holdings, Inc., 1st Lien Term Loan, 4.250%, 1/27/2021(b) | 6,484,464 | ||||||
| 7,522,000 | Mergermarket USA, Inc., 2nd Lien Term Loan, 7.500%, 2/04/2022(b) | 7,070,680 | ||||||
| 8,818,829 | Miller Heiman, Inc., Term Loan B, 6.750%, 9/30/2019(c) | 8,565,288 | ||||||
| 1,270,782 | SGS Cayman LP, 2014 Term Loan B, 6.000%, 4/23/2021(b) | 1,270,782 | ||||||
| 12,050,000 | SourceHov LLC, 2014 1st Lien Term Loan, 7.750%, 10/31/2019(b) | 11,693,561 | ||||||
| 6,223,403 | Sterling Infosystems, Inc., Term Loan B, 5.500%, 5/13/2021(c) | 6,211,765 | ||||||
| 11,057,579 | STG-Fairway Acquisitions, Inc., Term Loan B, 6.253%, 2/28/2019(c) | 11,029,935 | ||||||
| 5,459,218 | Sutherland Global Services, Inc., Term Loan B, 6.000%, 4/23/2021(b) | 5,459,218 | ||||||
| 5,168,048 | William Morris Endeavor Entertainment LLC, 1st Lien Term Loan, 5.250%, 5/06/2021(b) | 5,037,244 | ||||||
| 10,072,000 | William Morris Endeavor Entertainment LLC, 2nd Lien Term Loan, 8.250%, 5/01/2022(b) | 9,769,840 | ||||||
|
| |||||||
| 104,691,820 | ||||||||
|
| |||||||
| Consumer Products — 2.6% | ||||||||
| 8,003,000 | Advantage Sales & Marketing, Inc., 2014 2nd Lien Term Loan, 7.500%, 7/25/2022(b) | 7,942,978 | ||||||
| 6,732,538 | Affinion Group, Inc., Term Loan B, 6.750%, 4/30/2018(b) | 6,447,482 | ||||||
| 3,179,771 | FGI Operating Co. LLC, Term Loan, 5.500%, 4/19/2019(b) | 3,150,613 | ||||||
| 9,445,490 | NYDJ Apparel LLC, Term Loan, 7.000%, 1/06/2020(b) | 8,406,486 | ||||||
| 5,581,874 | Polyconcept Investments BV, USD 1st Lien Term Loan, 6.000%, 6/27/2019(b) | 5,540,010 | ||||||
| 8,633,000 | Visant Corp., New Term Loan, 7.000%, 9/23/2021(b) | 8,487,361 | ||||||
|
| |||||||
| 39,974,930 | ||||||||
|
| |||||||
| Diversified Manufacturing — 1.1% | ||||||||
| 11,866,000 | Ameriforge Group, Inc., 2nd Lien Term Loan, 8.750%, 12/19/2020(b) | 11,739,983 | ||||||
| 5,107,200 | Electrical Components International, Inc., 2014 Term Loan B, 5.750%, 5/28/2021(b) | 5,158,272 | ||||||
|
| |||||||
| 16,898,255 | ||||||||
|
| |||||||
| Electric — 0.9% | ||||||||
| 2,925,366 | Mirion Technologies, Inc., Term Loan, 5.750%, 3/30/2018(b) | 2,925,366 | ||||||
| 10,624,000 | TPF II Power LLC, Term Loan B, 5.500%, 10/02/2021(b) | 10,697,093 | ||||||
|
| |||||||
| 13,622,459 | ||||||||
|
| |||||||
| Environmental — 1.4% | ||||||||
| 9,489,000 | Allflex Holdings III, Inc., New 2nd Lien Term Loan, 8.000%, 7/19/2021(b) | 9,473,153 | ||||||
| 8,396,955 | EnergySolutions LLC, New Term Loan, 6.750%, 5/29/2020(b) | 8,428,444 | ||||||
| 3,369,000 | WTG Holdings III Corp., 2nd Lien Term Loan, 8.500%, 1/15/2022(b) | 3,312,839 | ||||||
|
| |||||||
| 21,214,436 | ||||||||
|
| |||||||
See accompanying notes to financial statements.
43 |
Table of Contents
Portfolio of Investments – as of November 30, 2014
Loomis Sayles Senior Floating Rate and Fixed Income Fund – (continued)
| Principal Amount | Description | Value (†) | ||||||
| Financial Other — 0.9% | ||||||||
| $ | 7,965,803 | Eze Castle Software, Inc., New 2nd Lien Term Loan, 7.250%, 4/04/2021(b) | $ | 7,813,099 | ||||
| 6,721,155 | Institutional Shareholder Services, Inc., Term Loan, 5.000%, 4/30/2021(b) | 6,653,943 | ||||||
|
| |||||||
| 14,467,042 | ||||||||
|
| |||||||
| Food & Beverage — 2.3% | ||||||||
| 550,000 | CPM Acquisition Corp., 2nd Lien Term Loan, 10.250%, 3/01/2018(b) | 550,000 | ||||||
| 7,412,000 | Del Monte Foods, Inc., 2nd Lien Term Loan, 8.250%, 8/18/2021(b) | 6,399,002 | ||||||
| 3,343,591 | Lineage Logistics Holdings LLC, 2014 Term Loan, 4.500%, 4/07/2021(b) | 3,296,213 | ||||||
| 12,724,779 | New HB Acquisition LLC, Term Loan, 6.750%, 4/09/2020(b) | 12,987,291 | ||||||
| 8,427,000 | Packers Holdings LLC, Term Loan B, 12/02/2021(d) | 8,448,067 | ||||||
| 4,621,158 | Reddy Ice Corp., 1st Lien Term Loan, 6.751%, 5/01/2019(c) | 4,159,042 | ||||||
|
| |||||||
| 35,839,615 | ||||||||
|
| |||||||
| Gaming — 1.4% | ||||||||
| 6,488,000 | Amaya Holdings BV, 1st Lien Term Loan, 5.000%, 8/01/2021(b) | 6,477,879 | ||||||
| 6,818,467 | Amaya Holdings BV, 2nd Lien Term Loan, 8.000%, 8/01/2022(b) | 6,937,790 | ||||||
| 1,600,000 | SGMS Escrow Corp., Incremental Term Loan B2, 10/01/2021(d) | 1,574,400 | ||||||
| 6,625,000 | SGMS Escrow Corp., Incremental Term Loan B2, 6.000%, 10/01/2021(b) | 6,519,000 | ||||||
|
| |||||||
| 21,509,069 | ||||||||
|
| |||||||
| Health Insurance — 0.7% | ||||||||
| 11,057,000 | Sedgwick Claims Management Services, Inc., Incremental 2nd Lien Term Loan, 6.750%, 2/28/2022(b) | 10,799,040 | ||||||
|
| |||||||
| Healthcare — 9.8% | ||||||||
| 2,457,359 | BioScrip, Inc., Delayed Draw Term Loan, 6.500%, 7/31/2020(b) | 2,446,620 | ||||||
| 4,095,598 | BioScrip, Inc., Term Loan B, 6.500%, 7/31/2020(b) | 4,077,701 | ||||||
| 5,138,000 | CareCore National LLC, Term Loan B, 3/05/2021(d) | 5,147,659 | ||||||
| 6,242,630 | CareCore National LLC, Term Loan B, 5.500%, 3/05/2021(b) | 6,254,366 | ||||||
| 7,771,000 | CDRH Parent, Inc., New 1st Lien Term Loan, 5.250%, 7/01/2021(b) | 7,703,004 | ||||||
| 5,570,652 | CHG Healthcare Services, Inc., 2nd Lien Term Loan, 9.000%, 11/19/2020(b) | 5,584,579 | ||||||
| 5,707,868 | CT Technologies Intermediate Holdings, Inc., 1st Lien Term Loan, 5.250%, 10/04/2019(b) | 5,700,733 | ||||||
| 5,063,000 | CT Technologies Intermediate Holdings, Inc., 2014 Term Loan, 12/01/2021(d) | 5,037,685 | ||||||
| 4,406,119 | Edmentum, Inc., 2013 Term Loan, 5.500%, 5/17/2018(b) | 4,273,935 | ||||||
| 11,225,570 | Envision Acquisition Co. LLC, Term Loan, 5.750%, 11/04/2020(b) | 11,225,570 | ||||||
| 6,052,000 | FHC Health Systems, Inc., 2014 Term Loan, 9/30/2021(d) | 6,059,565 | ||||||
| 4,587,856 | Herff Jones, Inc., Term Loan B, 5.500%, 6/25/2019(b) | 4,570,651 | ||||||
| 7,506,280 | Knowledge Universe Education LLC, Term Loan, 5.250%, 3/18/2021(b) | 7,565,730 | ||||||
| 6,717,165 | Learning Care Group (U.S.) No. 2, Inc., New Term Loan, 5.500%, 5/05/2021(b) | 6,759,147 | ||||||
| 8,725,068 | McGraw-Hill School Education Holdings LLC, Term Loan B, 6.250%, 12/18/2019(b) | 8,703,255 | ||||||
| 6,069,375 | MedSolutions Holdings, Inc., Term Loan B, 7.500%, 7/08/2019(b) | 6,039,028 | ||||||
| 8,495,708 | Millennium Laboratories, Inc., Term Loan B, 5.250%, 4/16/2021(b) | 8,522,299 | ||||||
| 4,199,000 | NVA Holdings, Inc., 2nd Lien Term Loan, 8.000%, 8/14/2022(b) | 4,188,503 | ||||||
| 2,025,393 | PLATO, Inc., 2nd Lien Term Loan, 11.250%, 5/17/2019(b) | 1,979,822 | ||||||
| 850,000 | Renaissance Learning, Inc., New 2nd Lien Term Loan, 8.000%, 4/11/2022(b) | 824,500 | ||||||
| 9,373,000 | SkillSoft Corp., 2nd Lien Term Loan, 9.250%, 4/28/2022(b) | 8,927,782 | ||||||
| 2,848,000 | St. Georges University, New Term Loan, 5.750%, 8/07/2021(b) | 2,833,760 | ||||||
See accompanying notes to financial statements.
| 44
Table of Contents
Portfolio of Investments – as of November 30, 2014
Loomis Sayles Senior Floating Rate and Fixed Income Fund – (continued)
| Principal Amount | Description | Value (†) | ||||||
| Healthcare — continued | ||||||||
| $ | 9,956,283 | Steward Health Care System LLC, Term Loan B, 6.750%, 4/12/2020(b) | $ | 9,931,393 | ||||
| 8,526,000 | Surgery Center Holdings, Inc., New 1st Lien Term Loan, 5.250%, 11/03/2020(b) | 8,515,342 | ||||||
| 9,270,000 | Tecomet, Inc., 1st Lien Term Loan, 12/05/2021(d) | 8,991,900 | ||||||
|
| |||||||
| 151,864,529 | ||||||||
|
| |||||||
| Independent Energy — 0.9% | ||||||||
| 5,894,000 | Callon Petroleum Co., 2nd Lien Term Loan, 8.500%, 10/08/2021(b) | 5,746,650 | ||||||
| 8,413,000 | Magnum Hunter Resources, Inc., 2nd Lien Term Loan, 8.500%, 10/17/2019(b) | 8,391,968 | ||||||
|
| |||||||
| 14,138,618 | ||||||||
|
| |||||||
| Industrial Other — 8.2% | ||||||||
| 1,480,946 | API Heat Transfer ThermaSys Corp., Term Loan, 5.257%, 5/03/2019(c) | 1,471,690 | ||||||
| 8,458,354 | Aquilex Holdings LLC, New Term Loan, 5.000%, 12/31/2020(c) | 8,352,624 | ||||||
| 10,251,000 | Brickman Group Ltd. LLC, 2nd Lien Term Loan, 7.500%, 12/17/2021(b) | 10,145,312 | ||||||
| 7,944,069 | Capital Safety North America Holdings, Inc., 2nd Lien Term Loan, 6.500%, 3/28/2022(b) | 7,785,187 | ||||||
| 6,869,000 | Crosby U.S. Acquisition Corp., 2nd Lien Term Loan, 7.000%, 11/22/2021(b) | 6,662,930 | ||||||
| 9,928,325 | Eastman Kodak Co., Exit Term Loan, 7.250%, 9/03/2019(b) | 9,971,811 | ||||||
| 5,321,000 | Element Materials Technology Group Holding CC1 Ltd., Term Loan B, 5.250%, 8/06/2021(b) | 5,281,093 | ||||||
| 5,200,000 | Filtration Group Corp., 2nd Lien Term Loan, 8.250%, 11/21/2021(b) | 5,192,200 | ||||||
| 1,994,987 | Hampton Rubber Co., 1st Lien Term Loan, 3/27/2021(d) | 1,947,606 | ||||||
| 3,685,959 | Hampton Rubber Co., 1st Lien Term Loan, 5.000%, 3/27/2021(b) | 3,598,417 | ||||||
| 7,481,598 | McJunkin Red Man Corp., New Term Loan, 11/08/2019(d) | 7,423,167 | ||||||
| 9,157,734 | NES Global Talent Ltd., 1st Lien Term Loan, 6.500%, 10/03/2019(b) | 9,066,157 | ||||||
| 2,801,029 | North American Lifting Holdings, Inc., 1st Lien Term Loan, 11/27/2020(d) | 2,776,520 | ||||||
| 6,265,973 | North American Lifting Holdings, Inc., 1st Lien Term Loan, 5.500%, 11/27/2020(b) | 6,211,146 | ||||||
| 10,605,544 | Nusil Technology LLC, New Term Loan, 5.250%, 4/07/2017(b) | 10,502,776 | ||||||
| 7,680,000 | Oxbow Carbon LLC, 2nd Lien Term Loan, 8.000%, 1/17/2020(b) | 7,372,800 | ||||||
| 5,757,493 | Redtop Acquisitions Ltd., USD 2nd Lien Term Loan, 8.250%, 6/03/2021(b) | 5,764,689 | ||||||
| 3,861,040 | Syncreon Global Finance (U.S.), Inc., Term Loan B, 5.250%, 10/28/2020(b) | 3,793,472 | ||||||
| 6,998,460 | Trojan Battery Co. LLC, 2013 Term Loan, 5.750%, 6/11/2021(b) | 6,928,475 | ||||||
| 6,737,000 | Zebra Technologies Corp., Term Loan B, 4.750%, 10/27/2021(b) | 6,787,527 | ||||||
|
| |||||||
| 127,035,599 | ||||||||
|
| |||||||
| Leisure — 1.4% | ||||||||
| 8,322,000 | AMF Bowling Centers, Inc., Term Loan B, 7.250%, 9/18/2021(b) | 8,238,780 | ||||||
| 5,063,000 | Great Wolf Resorts, Inc., Term Loan B, 8/06/2020(d) | 5,044,014 | ||||||
| 7,975,978 | World Triathlon Corp., Term Loan, 5.250%, 6/26/2021(b) | 7,906,188 | ||||||
|
| |||||||
| 21,188,982 | ||||||||
|
| |||||||
| Lodging — 1.1% | ||||||||
| 8,485,000 | ESH Hospitality, Inc., Term Loan, 5.000%, 6/24/2019(b) | 8,538,031 | ||||||
| 8,709,556 | Four Seasons Holdings, Inc., 2nd Lien Term Loan, 6.250%, 12/27/2020(b) | 8,753,104 | ||||||
|
| |||||||
| 17,291,135 | ||||||||
|
| |||||||
| Media Entertainment — 5.2% | ||||||||
| 5,033,386 | Advanstar Communications, Inc., New 1st Lien Term Loan, 5.500%, 4/29/2019(b) | 5,020,802 | ||||||
| 5,795,000 | Advanstar Communications, Inc., New 2nd Lien Term Loan, 9.500%, 6/06/2020(b) | 5,823,975 | ||||||
See accompanying notes to financial statements.
45 |
Table of Contents
Portfolio of Investments – as of November 30, 2014
Loomis Sayles Senior Floating Rate and Fixed Income Fund – (continued)
| Principal Amount | Description | Value (†) | ||||||
| Media Entertainment —continued | ||||||||
| $ | 10,244,000 | ALM Media Holdings, Inc., 1st Lien Term Loan, 5.500%, 7/31/2020(b) | $ | 10,039,120 | ||||
| 10,093,616 | Clear Channel Communications, Inc., Term Loan D, 6.904%, 1/30/2019(b) | 9,483,760 | ||||||
| 5,795,638 | Deluxe Entertainment Services Group, Inc., Term Loan 2014, 6.500%, 2/28/2020(b) | 5,317,497 | ||||||
| 1,370,960 | Dex Media West LLC, New Term Loan, 8.000%, 12/30/2016(b) | 1,221,018 | ||||||
| 7,588,000 | Extreme Reach, Inc., 2nd Lien Term Loan, 10.500%, 1/24/2021(b) | 7,606,970 | ||||||
| 3,392,000 | Metro-Goldwyn-Mayer, Inc., 2nd Lien Term Loan, 5.125%, 6/26/2020(b) | 3,385,657 | ||||||
| 5,563,800 | Penton Media, Inc., New 1st Lien Term Loan, 5.500%, 10/03/2019(b) | 5,553,396 | ||||||
| 5,456,000 | Penton Media, Inc., New 2nd Lien Term Loan, 9.000%, 10/02/2020(b) | 5,401,440 | ||||||
| 7,082,000 | ProQuest LLC, New Term Loan B, 10/24/2021(d) | 7,105,583 | ||||||
| 7,623,144 | Springer Science+Business Media Deutschland GmbH, USD Term Loan B3, 4.750%, 8/14/2020(b) | 7,599,360 | ||||||
| 7,139,138 | YP LLC, USD Term Loan B, 8.000%, 6/04/2018(b) | 7,161,484 | ||||||
|
| |||||||
| 80,720,062 | ||||||||
|
| |||||||
| Metals & Mining — 1.1% | ||||||||
| 10,761,471 | Arch Coal, Inc., Term Loan B, 6.250%, 5/16/2018(b) | 9,470,094 | ||||||
| 6,639,550 | Bowie Resource Holdings LLC, 1st Lien Term Loan, 6.750%, 8/14/2020(b) | 6,639,550 | ||||||
| 1,175,120 | Metal Services LLC, Term Loan B, 6.000%, 6/30/2017(b) | 1,168,269 | ||||||
|
| |||||||
| 17,277,913 | ||||||||
|
| |||||||
| Natural Gas — 0.5% | ||||||||
| 8,602,453 | Southcross Holdings Borrower LP, Term Loan B, 6.000%, 8/04/2021(b) | 8,403,564 | ||||||
|
| |||||||
| Oil Field Services — 2.0% | ||||||||
| 4,200,000 | FTS International, Inc., New Term Loan B, 5.750%, 4/16/2021(b) | 3,986,514 | ||||||
| 10,106,670 | KCA Deutag U.S. Finance LLC, Term Loan, 6.250%, 5/13/2020(b) | 8,994,936 | ||||||
| 316,667 | Pinnacle Holdco S.a.r.l., 2nd Lien Term Loan, 10.500%, 7/24/2020(b) | 306,904 | ||||||
| 2,605,387 | Pinnacle Holdco S.a.r.l., Term Loan, 4.750%, 7/30/2019(b) | 2,540,253 | ||||||
| 8,344,159 | Stallion Oilfield Services Ltd., Term Loan B, 8.000%, 6/19/2018(b) | 7,780,928 | ||||||
| 4,574,584 | UTEX Industries, Inc., 1st Lien Term Loan 2014, 5.000%, 5/22/2021(b) | 4,505,965 | ||||||
| 3,501,031 | UTEX Industries, Inc., 2nd Lien Term Loan 2014, 8.250%, 5/22/2022(b) | 3,445,610 | ||||||
|
| |||||||
| 31,561,110 | ||||||||
|
| |||||||
| Other Utility — 0.7% | ||||||||
| 11,973,000 | PowerTeam Services LLC, 2nd Lien Term Loan, 8.250%, 11/06/2020(b) | 11,613,810 | ||||||
|
| |||||||
| Packaging — 1.2% | ||||||||
| 7,112,000 | Hilex Poly Co. LLC, Term Loan, 5.000%, 6/30/2021(b) | 7,065,772 | ||||||
| 7,655,000 | Husky Injection Molding Systems Ltd., 2nd Lien Term Loan, 7.250%, 6/30/2022(b) | 7,492,331 | ||||||
| 3,918,000 | Pro Mach Group, Inc., 2014 1st Lien Term Loan B, 5.500%, 10/22/2021(b) | 3,927,795 | ||||||
|
| |||||||
| 18,485,898 | ||||||||
|
| |||||||
| Pharmaceuticals — 1.1% | ||||||||
| 6,566,555 | eResearchTechnology, Inc., New Term Loan, 6.000%, 5/02/2018(b) | 6,558,347 | ||||||
| 6,074,750 | JLL/Delta Dutch Newco BV, USD Term Loan, 4.250%, 3/11/2021(b) | 5,932,661 | ||||||
| 4,252,000 | QoL meds LLC, Term Loan B, 5.500%, 7/15/2020(b) | 4,230,740 | ||||||
|
| |||||||
| 16,721,748 | ||||||||
|
| |||||||
See accompanying notes to financial statements.
| 46
Table of Contents
Portfolio of Investments – as of November 30, 2014
Loomis Sayles Senior Floating Rate and Fixed Income Fund – (continued)
| Principal Amount | Description | Value (†) | ||||||
| Property & Casualty Insurance — 2.3% | ||||||||
| $ | 1,535,924 | AmWINS Group LLC, New Term Loan, 5.000%, 9/06/2019(b) | $ | 1,537,198 | ||||
| 12,559,969 | Applied Systems, Inc., New 2nd Lien Term Loan, 7.500%, 1/23/2022(b) | 12,544,269 | ||||||
| 9,625,000 | CGSC of Delaware Holding Corp., 2nd Lien Term Loan C, 8.250%, 10/16/2020(b) | 8,470,000 | ||||||
| 2,954,887 | Cunningham Lindsey U.S., Inc., 1st Lien Term Loan, 5.000%, 12/10/2019(b) | 2,879,183 | ||||||
| 701,591 | Cunningham Lindsey U.S., Inc., 2nd Lien Term Loan, 9.250%, 6/10/2020(b) | 684,051 | ||||||
| 9,375,000 | Mitchell International, Inc., New 2nd Lien Term Loan, 8.500%, 10/11/2021(b) | 9,360,938 | ||||||
|
| |||||||
| 35,475,639 | ||||||||
|
| |||||||
| Restaurants — 2.3% | ||||||||
| 589,286 | Brasa Holdings, Inc., 2nd Lien Term Loan, 11.000%, 1/20/2020(b) | 585,603 | ||||||
| 5,972,000 | Portillo’s Holdings LLC, 1st Lien Term Loan, 4.750%, 8/02/2021(b) | 5,945,902 | ||||||
| 7,679,000 | Portillo’s Holdings LLC, 2nd Lien Term Loan, 8.000%, 8/01/2022(b) | 7,650,204 | ||||||
| 8,509,000 | Red Lobster Management LLC, Term Loan B, 6.250%, 7/28/2021(b) | 8,519,636 | ||||||
| 7,703,055 | Sagittarius Restaurants LLC, New Term Loan, 5.536%, 10/01/2018(c) | 7,616,396 | ||||||
| 5,103,000 | TMK Hawk Parent Corp., 1st Lien Term Loan, 5.250%, 10/01/2021(b) | 5,093,457 | ||||||
|
| |||||||
| 35,411,198 | ||||||||
|
| |||||||
| Retailers — 3.6% | ||||||||
| 10,503,675 | BDF Acquisition Corp., 1st Lien Term Loan, 5.250%, 2/12/2021(b) | 10,206,106 | ||||||
| 7,874,000 | BJ’s Wholesale Club, Inc., New 2nd Lien Term Loan, 8.500%, 3/26/2020(b) | 7,879,591 | ||||||
| 4,361,697 | David’s Bridal, Inc., New Term Loan B, 5.000%, 10/11/2019(b) | 4,205,417 | ||||||
| 3,042,000 | Mattress Holdings Corp., 2014 Term Loan, 5.250%, 10/20/2021(b) | 3,043,916 | ||||||
| 2,500,000 | Neiman Marcus Group, Inc. (The), 2020 Term Loan, 10/25/2020(d) | 2,482,950 | ||||||
| 6,700,000 | Neiman Marcus Group, Inc. (The), 2020 Term Loan, 4.250%, 10/25/2020(b) | 6,654,306 | ||||||
| 5,076,884 | PFS Holding Corp., 1st Lien Term Loan, 4.500%, 1/31/2021(b) | 4,274,736 | ||||||
| 7,382,183 | Sportsman’s Warehouse Holdings, Inc., First Out Term Loan, 7.250%, 8/20/2019(b) | 7,382,183 | ||||||
| 5,009,445 | Stuart Weitzman Acquisition Co. LLC, Term Loan, 4.500%, 4/08/2020(b) | 4,890,471 | ||||||
| 997,494 | Talbots, Inc. (The), 1st Lien Term Loan, 4.750%, 3/19/2020(b) | 968,816 | ||||||
| 3,407,000 | Talbots, Inc. (The), 2nd Lien Term Loan, 8.250%, 3/19/2021(b) | 3,338,860 | ||||||
|
| |||||||
| 55,327,352 | ||||||||
|
| |||||||
| Supermarkets — 1.4% | ||||||||
| 8,400,000 | Acosta Holdco, Inc., 2014 Term Loan, 5.000%, 9/26/2021(b) | 8,430,156 | ||||||
| 12,900,000 | Albertson’s Holdings LLC, Term Loan B4, 4.500%, 8/25/2021(b) | 12,932,250 | ||||||
|
| |||||||
| 21,362,406 | ||||||||
|
| |||||||
| Technology — 8.9% | ||||||||
| 8,249,545 | Aptean, Inc., 1st Lien Term Loan, 5.250%, 2/26/2020(b) | 8,043,306 | ||||||
| 3,561,000 | Aptean, Inc., 2nd Lien Term Loan, 8.500%, 2/26/2021(b) | 3,412,613 | ||||||
| 9,975,000 | Aricent Technologies, 1st Lien Term Loan, 5.500%, 4/14/2021(b) | 10,004,127 | ||||||
| 4,450,000 | Blue Coat Systems, Inc., 2nd Lien Term Loan, 9.500%, 6/28/2020(b) | 4,444,437 | ||||||
| 3,979,925 | BMC Foreign Holding Co., USD Term Loan, 5.000%, 9/10/2020(b) | 3,916,684 | ||||||
| 6,754,000 | BMC Software Finance, Inc., USD Term Loan, 5.000%, 9/10/2020(b) | 6,645,463 | ||||||
| 7,204,840 | DataPipe, Inc., 1st Lien Term Loan, 5.250%, 3/15/2019(b) | 7,138,772 | ||||||
| 6,348,627 | DataPipe, Inc., 2nd Lien Term Loan, 8.500%, 9/16/2019(b) | 6,122,489 | ||||||
| 6,395,000 | Deltek, Inc., 2nd Lien Term Loan, 10.000%, 10/10/2019(b) | 6,442,962 | ||||||
| 3,789,720 | Help/Systems LLC, USD Term Loan B, 5.500%, 6/28/2019(b) | 3,747,086 | ||||||
See accompanying notes to financial statements.
47 |
Table of Contents
Portfolio of Investments – as of November 30, 2014
Loomis Sayles Senior Floating Rate and Fixed Income Fund – (continued)
| Principal Amount | Description | Value (†) | ||||||
| Technology — continued | ||||||||
| $ | 8,739,955 | Internap Network Services Corp., Term Loan, 6.000%, 11/26/2019(b) | $ | 8,761,805 | ||||
| 4,191,000 | IQOR U.S., Inc., 2nd Lien Term Loan, 9.750%, 4/01/2022(b) | 3,824,288 | ||||||
| 7,622,095 | IQOR U.S., Inc., Term Loan B, 6.000%, 4/01/2021(b) | 7,221,935 | ||||||
| 8,400,000 | MA FinanceCo. LLC, Term Loan B, 10/07/2021(d) | 8,196,300 | ||||||
| 5,381,374 | MH Sub I LLC, 1st Lien Term Loan, 5.000%, 7/08/2021(b) | 5,352,798 | ||||||
| 4,243,000 | MH Sub I LLC, 2nd Lien Term Loan, 8.500%, 7/08/2022(b) | 4,136,925 | ||||||
| 375,616 | MH Sub I LLC, Delayed Draw Term Loan, 7/08/2021(d)(e) | 373,621 | ||||||
| 4,223,000 | Oberthur Technologies of America Corp., USD Term Loan B2, 4.500%, 10/18/2019(b) | 4,153,658 | ||||||
| 8,119,939 | Openlink International Intermediate, Inc., 2017 Term Loan, 6.250%, 10/28/2017(b) | 8,079,339 | ||||||
| 4,100,000 | Rocket Software, Inc., 2nd Lien Term Loan, 10.250%, 2/08/2019(b) | 4,100,000 | ||||||
| 28,354 | Rocket Software, Inc., New Term Loan, 5.750%, 2/08/2018(b) | 28,354 | ||||||
| 7,029,675 | SafeNet, Inc., New 1st Lien Term Loan, 6.750%, 3/05/2020(b) | 6,994,527 | ||||||
| 418,069 | Sirius Computer Solutions, Inc., Term Loan B, 7.000%, 11/30/2018(b) | 421,205 | ||||||
| 4,040,000 | Telx Group, Inc. (The), 2nd Lien Term Loan, 7.500%, 4/09/2021(b) | 3,965,947 | ||||||
| 3,328,582 | Triple Point Technology, Inc., 1st Lien Term Loan, 5.250%, 7/10/2020(b) | 3,029,010 | ||||||
| 10,350,000 | Websense, Inc., 2nd Lien Term Loan, 8.250%, 12/24/2020(b) | 10,220,625 | ||||||
|
| |||||||
| 138,778,276 | ||||||||
|
| |||||||
| Transportation Services — 2.9% | ||||||||
| 4,205,460 | Alfred Fueling Systems, Inc., 1st Lien Term Loan, 4.750%, 6/20/2021(b) | 4,163,405 | ||||||
| 9,502,078 | FPC Holdings, Inc., 1st Lien Term Loan, 5.250%, 11/19/2019(b) | 9,335,792 | ||||||
| 9,762,364 | OSG Bulk Ships, Inc., Exit Term Loan, 5.250%, 8/05/2019(b) | 9,756,311 | ||||||
| 9,183,260 | OSG International, Inc., Exit Term Loan B, 5.750%, 8/05/2019(b) | 9,137,344 | ||||||
| 5,356,575 | WP Mustang Holdings LLC, 1st Lien Term Loan B, 5.500%, 5/29/2021(b) | 5,373,341 | ||||||
| 7,467,570 | YRC Worldwide, Inc., Term Loan, 8.250%, 2/13/2019(b) | 7,396,031 | ||||||
|
| |||||||
| 45,162,224 | ||||||||
|
| |||||||
| Wireless — 1.1% | ||||||||
| 14,192,000 | Asurion LLC, New 2nd Lien Term Loan, 8.500%, 3/03/2021(b) | 14,289,641 | ||||||
| 3,100,000 | Asurion LLC, New Term Loan B1, 5/24/2019(d) | 3,085,058 | ||||||
|
| |||||||
| 17,374,699 | ||||||||
|
| |||||||
| Wirelines — 2.7% | ||||||||
| 3,635,830 | Fairpoint Communications, Inc., Refi Term Loan, 7.500%, 2/14/2019(b) | 3,651,755 | ||||||
| 4,733,000 | Integra Telecom, Inc., 2nd Lien Term Loan, 9.750%, 2/21/2020(b) | 4,694,568 | ||||||
| 4,057,542 | Level 3 Financing, Inc., Incremental Term Loan B5, 4.500%, 1/31/2022(b) | 4,068,944 | ||||||
| 7,990,473 | LTS Buyer LLC, 2nd Lien Term Loan, 8.000%, 4/12/2021(b) | 8,070,377 | ||||||
| 418,969 | MegaPath Group, Inc., Term Loan B, 10.500%, 12/20/2017(b) | 398,020 | ||||||
| 10,570,508 | Nextgen Networks Pty Ltd., USD Term Loan B, 5.000%, 5/31/2021(b) | 10,187,327 | ||||||
| 3,289,000 | Sable International Finance Ltd., Senior Secured Bridge Loan, 11/06/2016(d) | 3,280,778 | ||||||
| 7,295,966 | U.S. Telepacific Corp., Term Loan, 11/25/2020(d) | 7,241,246 | ||||||
|
| |||||||
| 41,593,015 | ||||||||
|
| |||||||
Total Senior Loans (Identified Cost $1,412,026,838) | 1,396,964,991 | |||||||
|
| |||||||
See accompanying notes to financial statements.
| 48
Table of Contents
Portfolio of Investments – as of November 30, 2014
Loomis Sayles Senior Floating Rate and Fixed Income Fund – (continued)
| Principal Amount | Description | Value (†) | ||||||
| Bonds and Notes — 11.8% | ||||||||
| Building Materials — 0.4% | ||||||||
| $ | 7,340,000 | Atrium Windows & Doors, Inc., 7.750%, 5/01/2019, 144A | $ | 7,009,700 | ||||
|
| |||||||
| Cable Satellite — 0.4% | ||||||||
| 4,292,000 | Intelsat Luxembourg S.A., 7.750%, 6/01/2021 | 4,447,585 | ||||||
| 2,000,000 | WideOpenWest Finance LLC/WideOpenWest Capital Corp., 10.250%, 7/15/2019 | 2,170,000 | ||||||
|
| |||||||
| 6,617,585 | ||||||||
|
| |||||||
| Chemicals — 2.6% | ||||||||
| 8,430,000 | Consolidated Energy Finance S.A., 6.750%, 10/15/2019, 144A | 8,451,075 | ||||||
| 11,660,000 | Hexion U.S. Finance Corp./Hexion Nova Scotia Finance ULC, 8.875%, 2/01/2018 | 11,018,700 | ||||||
| 310,000 | INEOS Group Holdings S.A., 5.875%, 2/15/2019, 144A | 301,475 | ||||||
| 7,510,000 | INEOS Group Holdings S.A., 6.125%, 8/15/2018, 144A | 7,388,713 | ||||||
| 2,297,000 | Nexeo Solutions LLC/Nexeo Solutions Finance Corp., 8.375%, 3/01/2018 | 2,251,060 | ||||||
| 11,075,000 | Perstorp Holding AB, 11.000%, 8/15/2017, 144A | 10,964,250 | ||||||
|
| |||||||
| 40,375,273 | ||||||||
|
| |||||||
| Consumer Cyclical Services — 0.2% | ||||||||
| 2,454,000 | ServiceMaster Co. LLC (The), 7.100%, 3/01/2018 | 2,515,350 | ||||||
|
| |||||||
| Consumer Products — 0.7% | ||||||||
| 8,100,000 | Serta Simmons Holdings LLC, 8.125%, 10/01/2020, 144A | 8,626,500 | ||||||
| 3,100,000 | Visant Corp., 10.000%, 10/01/2017 | 2,774,500 | ||||||
|
| |||||||
| 11,401,000 | ||||||||
|
| |||||||
| Electric — 0.6% | ||||||||
| 8,250,000 | Dynegy Finance I, Inc./Dynegy Finance II, Inc., 6.750%, 11/01/2019, 144A | 8,580,000 | ||||||
|
| |||||||
| Finance Companies — 0.5% | ||||||||
| 7,100,000 | Ladder Capital Finance Holdings LLLP/Ladder Capital Finance Corp., 7.375%, 10/01/2017 | 7,437,250 | ||||||
|
| |||||||
| Financial Other — 0.2% | ||||||||
| 3,335,000 | Rialto Holdings LLC/Rialto Corp., 7.000%, 12/01/2018, 144A | 3,410,038 | ||||||
|
| |||||||
| Food & Beverage — 0.5% | ||||||||
| 4,160,000 | Big Heart Pet Brands, Inc., 7.625%, 2/15/2019 | 4,074,200 | ||||||
| 3,235,000 | Crestview DS Merger Sub II, Inc., 10.000%, 9/01/2021 | 3,817,300 | ||||||
|
| |||||||
| 7,891,500 | ||||||||
|
| |||||||
| Healthcare — 0.2% | ||||||||
| 2,700,000 | Emdeon, Inc., 11.000%, 12/31/2019 | 2,976,750 | ||||||
|
| |||||||
| Home Construction — 0.8% | ||||||||
| 8,795,000 | K. Hovnanian Enterprises, Inc., 7.000%, 1/15/2019, 144A | 8,597,113 | ||||||
| 3,424,000 | K. Hovnanian Enterprises, Inc., 8.000%, 11/01/2019, 144A | 3,424,000 | ||||||
|
| |||||||
| 12,021,113 | ||||||||
|
| |||||||
| Independent Energy — 0.7% | ||||||||
| 2,225,000 | Rex Energy Corp., 8.875%, 12/01/2020 | 2,202,750 | ||||||
| 8,380,000 | Sanchez Energy Corp., 7.750%, 6/15/2021 | 8,254,300 | ||||||
|
| |||||||
| 10,457,050 | ||||||||
|
| |||||||
See accompanying notes to financial statements.
49 |
Table of Contents
Portfolio of Investments – as of November 30, 2014
Loomis Sayles Senior Floating Rate and Fixed Income Fund – (continued)
| Principal Amount | Description | Value (†) | ||||||
| Industrial Other — 0.5% | ||||||||
| $ | 8,205,000 | Permian Holdings, Inc., 10.500%, 1/15/2018, 144A | $ | 7,794,750 | ||||
|
| |||||||
| Metals & Mining — 1.1% | ||||||||
| 10,025,000 | Barminco Finance Pty Ltd., 9.000%, 6/01/2018, 144A | 8,621,500 | ||||||
| 880,000 | Emeco Pty Ltd., 9.875%, 3/15/2019, 144A | 805,200 | ||||||
| 5,100,000 | Rain CII Carbon LLC/CII Carbon Corp., 8.000%, 12/01/2018, 144A | 5,253,000 | ||||||
| 3,000,000 | Ryerson, Inc./Joseph T. Ryerson & Son, Inc., 9.000%, 10/15/2017 | 3,060,000 | ||||||
|
| |||||||
| 17,739,700 | ||||||||
|
| |||||||
| Oil Field Services — 0.7% | ||||||||
| 7,535,000 | FTS International, Inc., 6.250%, 5/01/2022, 144A | 6,178,700 | ||||||
| 7,490,000 | Hercules Offshore, Inc., 10.250%, 4/01/2019, 144A | 4,568,900 | ||||||
|
| |||||||
| 10,747,600 | ||||||||
|
| |||||||
| Packaging — 0.3% | ||||||||
| 4,600,000 | Beverage Packaging Holdings Luxembourg II S.A./Beverage Packaging Holdings II Issuer, Inc., 6.000%, 6/15/2017, 144A | 4,588,500 | ||||||
|
| |||||||
| Retailers — 0.3% | ||||||||
| 4,165,000 | Petco Animal Supplies, Inc., 9.250%, 12/01/2018, 144A | 4,352,425 | ||||||
|
| |||||||
| Technology — 0.3% | ||||||||
| 4,347,000 | Rolta Americas LLC, 8.875%, 7/24/2019, 144A | 4,260,060 | ||||||
|
| |||||||
| Wirelines — 0.8% | ||||||||
| 12,300,000 | FairPoint Communications, Inc., 8.750%, 8/15/2019, 144A | 12,730,500 | ||||||
|
| |||||||
Total Bonds and Notes (Identified Cost $189,218,283) | 182,906,144 | |||||||
|
| |||||||
| Short-Term Investments — 9.2% | ||||||||
| 289,700 | Repurchase Agreement with State Street Bank and Trust Company, dated 11/28/2014 at 0.000% to be repurchased at $289,700 on 12/01/2014 collateralized by $291,100 U.S. Treasury Note, 1.500% due 8/31/2018 valued at $295,539 including accrued interest (Note 2 of Notes to Financial Statements) | 289,700 | ||||||
| 143,515,253 | Tri-Party Repurchase Agreement with Fixed Income Clearing Corporation, dated 11/28/2014 at 0.010% to be repurchased at $143,515,373 on 12/01/2014 collateralized by $143,695,000 U.S. Treasury Note, 1.375% due 11/30/2015 valued at $146,389,281 including accrued interest (Note 2 of Notes to Financial Statements) | 143,515,253 | ||||||
|
| |||||||
Total Short-Term Investments (Identified Cost $143,804,953) | 143,804,953 | |||||||
|
| |||||||
Total Investments — 110.9% (Identified Cost $1,745,050,074)(a) | 1,723,676,088 | |||||||
| Other assets less liabilities — (10.9)% | (169,001,069 | ) | ||||||
|
| |||||||
| Net Assets — 100.0% | $ | 1,554,675,019 | ||||||
|
| |||||||
| (†) | See Note 2 of Notes to Financial Statements. | |||||||
See accompanying notes to financial statements.
| 50
Table of Contents
Portfolio of Investments – as of November 30, 2014
Loomis Sayles Senior Floating Rate and Fixed Income Fund – (continued)
| (a) | Federal Tax Information: | |||||||
| At November 30, 2014, the net unrealized depreciation on investments based on a cost of $1,746,812,269 for federal income tax purposes was as follows: | ||||||||
| Aggregate gross unrealized appreciation for all investments in which there is an excess of value over tax cost | $ | 5,314,204 | ||||||
| Aggregate gross unrealized depreciation for all investments in which there is an excess of tax cost over value | (28,450,385 | ) | ||||||
|
| |||||||
| Net unrealized depreciation | $ | (23,136,181 | ) | |||||
|
| |||||||
| (b) | Variable rate security. Rate as of November 30, 2014 is disclosed. | |||||||
| (c) | Variable rate security. Rate shown represents the weighted average rate of underlying contracts at November 30, 2014. | |||||||
| (d) | Position is unsettled. Contract rate was not determined at November 30, 2014 and does not take effect until settlement date. Maturity date is not finalized until settlement date. | |||||||
| (e) | Unfunded loan commitment. Represents a contractual obligation for future funding at the option of the Borrower. The Fund receives a stated coupon rate until the borrower draws on the loan commitment, at which time the rate will become the stated rate in the loan agreement. | |||||||
| 144A | All or a portion of these securities are exempt from registration under Rule 144A of the Securities Act of 1933. These securities may be resold in transactions exempt from registration, normally to qualified institutional buyers. At November 30, 2014, the value of Rule 144A holdings amounted to $125,906,399 or 8.1% of net assets. | |||||||
| USD | United States Dollar | |||||||
Industry Summary at November 30, 2014
Healthcare | 10.0 | % | ||
Technology | 9.2 | |||
Industrial Other | 8.7 | |||
Consumer Cyclical Services | 6.9 | |||
Chemicals | 5.7 | |||
Media Entertainment | 5.2 | |||
Building Materials | 4.3 | |||
Retailers | 3.9 | |||
Wirelines | 3.5 | |||
Consumer Products | 3.3 | |||
Automotive | 3.2 | |||
Transportation Services | 2.9 | |||
Food & Beverage | 2.8 | |||
Oil Field Services | 2.7 | |||
Property & Casualty Insurance | 2.3 | |||
Restaurants | 2.3 | |||
Metals & Mining | 2.2 | |||
Other Investments, less than 2% each | 22.6 | |||
Short-Term Investments | 9.2 | |||
|
| |||
Total Investments | 110.9 | |||
Other assets less liabilities | (10.9 | ) | ||
|
| |||
Net Assets | 100.0 | % | ||
|
|
See accompanying notes to financial statements.
51 |
Table of Contents
Portfolio of Investments – as of November 30, 2014
Vaughan Nelson Select Fund
| Shares | Description | Value (†) | ||||||
| Common Stocks — 94.6% of Net Assets | ||||||||
| Aerospace & Defense — 12.2% | ||||||||
| 23,075 | General Dynamics Corp. | $ | 3,354,182 | |||||
| 26,400 | Honeywell International, Inc. | 2,615,448 | ||||||
| 9,750 | Precision Castparts Corp. | 2,319,525 | ||||||
|
| |||||||
| 8,289,155 | ||||||||
|
| |||||||
| Banks — 4.5% | ||||||||
| 56,675 | Wells Fargo & Co. | 3,087,654 | ||||||
|
| |||||||
| Beverages — 3.6% | ||||||||
| 20,700 | Anheuser-Busch InBev, Sponsored ADR | 2,421,693 | ||||||
|
| |||||||
| Consumer Finance — 5.9% | ||||||||
| 36,475 | American Express Co. | 3,371,019 | ||||||
| 8,000 | Capital One Financial Corp. | 665,600 | ||||||
|
| |||||||
| 4,036,619 | ||||||||
|
| |||||||
| Diversified Financial Services — 3.9% | ||||||||
| 11,375 | CME Group, Inc. | 962,780 | ||||||
| 16,700 | Moody’s Corp. | 1,686,867 | ||||||
|
| |||||||
| 2,649,647 | ||||||||
|
| |||||||
| Energy Equipment & Services — 3.4% | ||||||||
| 26,950 | Schlumberger Ltd. | 2,316,353 | ||||||
|
| |||||||
| Food & Staples Retailing — 5.0% | ||||||||
| 50,150 | Walgreen Co. | 3,440,792 | ||||||
|
| |||||||
| Health Care Equipment & Supplies — 5.3% | ||||||||
| 48,725 | Medtronic, Inc. | 3,599,316 | ||||||
|
| |||||||
| Health Care Providers & Services — 6.2% | ||||||||
| 42,850 | UnitedHealth Group, Inc. | 4,226,295 | ||||||
|
| |||||||
| Insurance — 4.4% | ||||||||
| 55,075 | American International Group, Inc. | 3,018,110 | ||||||
|
| |||||||
| Internet & Catalog Retail — 4.7% | ||||||||
| 2,775 | Priceline Group, Inc. (The)(b) | 3,219,527 | ||||||
|
| |||||||
| Internet Software & Services — 7.2% | ||||||||
| 24,000 | eBay, Inc.(b) | 1,317,120 | ||||||
| 2,450 | Google, Inc., Class A(b) | 1,345,246 | ||||||
| 4,100 | Google, Inc., Class C(b) | 2,221,503 | ||||||
|
| |||||||
| 4,883,869 | ||||||||
|
| |||||||
| IT Services — 3.9% | ||||||||
| 30,275 | MasterCard, Inc., Class A | 2,642,705 | ||||||
|
| |||||||
| Machinery — 4.3% | ||||||||
| 20,150 | Cummins, Inc. | 2,934,243 | ||||||
|
| |||||||
| Oil, Gas & Consumable Fuels — 2.8% | ||||||||
| 58,825 | Cabot Oil & Gas Corp. | 1,943,578 | ||||||
|
| |||||||
| Pharmaceuticals — 3.7% | ||||||||
| 27,500 | Mallinckrodt PLC(b) | 2,536,050 | ||||||
|
| |||||||
See accompanying notes to financial statements.
| 52
Table of Contents
Portfolio of Investments – as of November 30, 2014
Vaughan Nelson Select Fund – (continued)
| Shares | Description | Value (†) | ||||||
| Semiconductors & Semiconductor Equipment — 3.5% | ||||||||
| 25,350 | Avago Technologies Ltd. | $ | 2,367,690 | |||||
|
| |||||||
| Software — 5.6% | ||||||||
| 80,025 | Microsoft Corp. | 3,825,995 | ||||||
|
| |||||||
| Textiles, Apparel & Luxury Goods — 4.5% | ||||||||
| 27,600 | Fossil Group, Inc.(b) | 3,083,472 | ||||||
|
| |||||||
| Total Common Stocks (Identified Cost $57,619,120) | 64,522,763 | |||||||
|
| |||||||
| Principal Amount | ||||||||
| Short-Term Investments — 4.3% | ||||||||
| $ | 2,955,237 | Tri-Party Repurchase Agreement with Fixed Income Clearing Corporation, dated 11/28/2014 at 0.010% to be repurchased at $2,955,239 on 12/01/2014 collateralized by $2,970,000 U.S. Treasury Note, 2.125% due 9/30/2021 valued at $3,018,263 including accrued interest (Note 2 of Notes to Financial Statements) (Identified Cost $2,955,237) | 2,955,237 | |||||
|
| |||||||
Total Investments — 98.9% (Identified Cost $60,574,357)(a) | 67,478,000 | |||||||
| Other assets less liabilities — 1.1% | 754,031 | |||||||
|
| |||||||
| Net Assets — 100.0% | $ | 68,232,031 | ||||||
|
| |||||||
| (†) | See Note 2 of Notes to Financial Statements. | |||||||
| (a) | Federal Tax Information: | |||||||
| At November 30, 2014, the net unrealized appreciation on investments based on a cost of $60,646,598 for federal income tax purposes was as follows: | ||||||||
| Aggregate gross unrealized appreciation for all investments in which there is an excess of value over tax cost | $ | 7,186,341 | ||||||
| Aggregate gross unrealized depreciation for all investments in which there is an excess of tax cost over value | (354,939 | ) | ||||||
|
| |||||||
| Net unrealized appreciation | $ | 6,831,402 | ||||||
|
| |||||||
| (b) | Non-income producing security. | |||||||
| ADR | An American Depositary Receipt is a certificate issued by a custodian bank representing the right to receive securities of the foreign issuer described. The values of ADRs may be significantly influenced by trading on exchanges not located in the United States. | |||||||
See accompanying notes to financial statements.
53 |
Table of Contents
Portfolio of Investments – as of November 30, 2014
Vaughan Nelson Select Fund – (continued)
Industry Summary at November 30, 2014
Aerospace & Defense | 12.2 | % | ||
Internet Software & Services | 7.2 | |||
Health Care Providers & Services | 6.2 | |||
Consumer Finance | 5.9 | |||
Software | 5.6 | |||
Health Care Equipment & Supplies | 5.3 | |||
Food & Staples Retailing | 5.0 | |||
Internet & Catalog Retail | 4.7 | |||
Banks | 4.5 | |||
Textiles, Apparel & Luxury Goods | 4.5 | |||
Insurance | 4.4 | |||
Machinery | 4.3 | |||
Diversified Financial Services | 3.9 | |||
IT Services | 3.9 | |||
Pharmaceuticals | 3.7 | |||
Beverages | 3.6 | |||
Semiconductors & Semiconductor Equipment | 3.5 | |||
Energy Equipment & Services | 3.4 | |||
Oil, Gas & Consumable Fuels | 2.8 | |||
Short-Term Investments | 4.3 | |||
|
| |||
Total Investments | 98.9 | |||
Other assets less liabilities | 1.1 | |||
|
| |||
Net Assets | 100.0 | % | ||
|
|
See accompanying notes to financial statements.
| 54
Table of Contents
Statements of Assets and Liabilities
November 30, 2014
| Gateway International Fund | Loomis Sayles Dividend Income Fund* | Loomis Sayles Emerging Markets Opportunities Fund | ||||||||||
ASSETS | ||||||||||||
Investments at cost | $ | 16,492,529 | $ | 28,180,940 | $ | 34,257,102 | ||||||
Net unrealized appreciation | 2,808,762 | 3,522,346 | 497,734 | |||||||||
|
|
|
|
|
| |||||||
Investments at value | 19,301,291 | 31,703,286 | 34,754,836 | |||||||||
Cash | — | 4,503 | — | |||||||||
Due from brokers (Note 2) | — | — | 530,000 | |||||||||
Foreign currency at value (identified cost $50,568, $0 and $35,770, respectively) | 50,169 | — | 35,712 | |||||||||
Receivable for Fund shares sold | 50,110 | 27,902 | 8,064 | |||||||||
Receivable from investment adviser (Note 6) | 4,271 | — | 18,617 | |||||||||
Receivable for securities sold | 69,677 | 43,193 | 352,794 | |||||||||
Dividends and interest receivable | 51,653 | 242,135 | 400,740 | |||||||||
Unrealized appreciation on forward foreign currency contracts (Note 2) | — | — | 22,159 | |||||||||
Tax reclaims receivable | 30,701 | 1,766 | — | |||||||||
Fees receivable on swap agreements (Note 2) | — | — | 8,993 | |||||||||
|
|
|
|
|
| |||||||
TOTAL ASSETS | 19,557,872 | 32,022,785 | 36,131,915 | |||||||||
|
|
|
|
|
| |||||||
LIABILITIES | ||||||||||||
Options written, at value (premiums received $169,256, $4,627 and $0, respectively) (Note 2) | 139,507 | 7,838 | — | |||||||||
Payable for securities purchased | 12,031 | 95,606 | 519,867 | |||||||||
Unrealized depreciation on bilateral swap agreements (Note 2) | — | — | 21,632 | |||||||||
Payable for Fund shares redeemed | 51,915 | 250 | — | |||||||||
Unrealized depreciation on forward foreign currency contracts (Note 2) | — | — | 7,690 | |||||||||
Unamortized upfront premiums received on bilateral swap agreements (Note 2) | — | — | 345,818 | |||||||||
Payable for variation margin on futures contracts (Note 2) | — | — | 1,525 | |||||||||
Management fees payable (Note 6) | — | 6,224 | — | |||||||||
Deferred Trustees’ fees (Note 6) | 24,426 | 26,060 | 9,067 | |||||||||
Administrative fees payable (Note 6) | 674 | 1,106 | 1,231 | |||||||||
Payable to distributor (Note 6d) | 73 | 957 | 587 | |||||||||
Other accounts payable and accrued expenses | 70,804 | 54,587 | 86,227 | |||||||||
|
|
|
|
|
| |||||||
TOTAL LIABILITIES | 299,430 | 192,628 | 993,644 | |||||||||
|
|
|
|
|
| |||||||
NET ASSETS | $ | 19,258,442 | $ | 31,830,157 | $ | 35,138,271 | ||||||
|
|
|
|
|
| |||||||
NET ASSETS CONSIST OF: | ||||||||||||
Paid-in capital | $ | 19,854,411 | $ | 25,496,199 | $ | 34,441,446 | ||||||
Undistributed net investment income | 533,347 | 118,390 | 4,977 | |||||||||
Accumulated net realized gain (loss) on investments, futures contracts, options written, swap agreements and foreign currency transactions | (3,963,836 | ) | 2,696,658 | 174,734 | ||||||||
Net unrealized appreciation on investments, futures contracts, options written, swap agreements and foreign currency translations | 2,834,520 | 3,518,910 | 517,114 | |||||||||
|
|
|
|
|
| |||||||
NET ASSETS | $ | 19,258,442 | $ | 31,830,157 | $ | 35,138,271 | ||||||
|
|
|
|
|
| |||||||
See accompanying notes to financial statements.
55 |
Table of Contents
Statements of Assets and Liabilities (continued)
November 30, 2014
| Gateway International Fund | Loomis Sayles Dividend Income Fund* | Loomis Sayles Emerging Markets Opportunities Fund | ||||||||||
COMPUTATION OF NET ASSET VALUE AND OFFERING PRICE: | ||||||||||||
Class A shares: | ||||||||||||
Net assets | $ | 7,716,829 | $ | 7,569,401 | $ | 6,891,987 | ||||||
|
|
|
|
|
| |||||||
Shares of beneficial interest | 800,414 | 581,377 | 668,901 | |||||||||
|
|
|
|
|
| |||||||
Net asset value and redemption price per share | $ | 9.64 | $ | 13.02 | $ | 10.30 | ||||||
|
|
|
|
|
| |||||||
Offering price per share (100/[100-maximum sales charge] of net asset value) (Note 1) | $ | 10.23 | $ | 13.81 | $ | 10.79 | ||||||
|
|
|
|
|
| |||||||
Class C shares: (redemption price per share is equal to net asset value less any applicable contingent deferred sales charge) (Note 1) | ||||||||||||
Net assets | $ | 6,541,889 | $ | 1,716,222 | $ | 32,692 | ||||||
|
|
|
|
|
| |||||||
Shares of beneficial interest | 688,977 | 132,252 | 3,181 | |||||||||
|
|
|
|
|
| |||||||
Net asset value and offering price per share | $ | 9.50 | $ | 12.98 | $ | 10.28 | ||||||
|
|
|
|
|
| |||||||
Class N shares: | ||||||||||||
Net assets | $ | — | $ | — | $ | 1,063 | ||||||
|
|
|
|
|
| |||||||
Shares of beneficial interest | — | — | 103 | |||||||||
|
|
|
|
|
| |||||||
Net asset value, offering and redemption price per share | $ | — | $ | — | $ | 10.30 | ** | |||||
|
|
|
|
|
| |||||||
Class Y shares: | ||||||||||||
Net assets | $ | 4,999,724 | $ | 22,544,534 | $ | 28,212,529 | ||||||
|
|
|
|
|
| |||||||
Shares of beneficial interest | 515,564 | 1,730,395 | 2,739,322 | |||||||||
|
|
|
|
|
| |||||||
Net asset value, offering and redemption price per share | $ | 9.70 | $ | 13.03 | $ | 10.30 | ||||||
|
|
|
|
|
| |||||||
| * | Formerly Loomis Sayles Capital Income Fund. |
| ** | Net asset value calculations reflect fractional share and dollar amounts. |
See accompanying notes to financial statements.
| 56
Table of Contents
Statements of Assets and Liabilities (continued)
November 30, 2014
| Loomis Sayles Senior Floating Rate and Fixed Income Fund | Vaughan Nelson Select Fund | |||||||
ASSETS | ||||||||
Investments at cost | $ | 1,745,050,074 | $ | 60,574,357 | ||||
Net unrealized appreciation (depreciation) | (21,373,986 | ) | 6,903,643 | |||||
|
|
|
| |||||
Investments at value | 1,723,676,088 | 67,478,000 | ||||||
Cash | — | 16,358 | ||||||
Receivable for Fund shares sold | 3,839,969 | 759,828 | ||||||
Receivable for securities sold | 8,482,898 | — | ||||||
Dividends and interest receivable | 14,454,266 | 86,917 | ||||||
Tax reclaims receivable | — | 4,707 | ||||||
|
|
|
| |||||
TOTAL ASSETS | 1,750,453,221 | 68,345,810 | ||||||
|
|
|
| |||||
LIABILITIES | ||||||||
Payable for securities purchased | 92,495,050 | — | ||||||
Loan payable (Note 8) | 100,000,000 | — | ||||||
Payable for Fund shares redeemed | 1,338,761 | — | ||||||
Management fees payable (Note 6) | 681,274 | 38,343 | ||||||
Deferred Trustees’ fees (Note 6) | 48,464 | 22,572 | ||||||
Administrative fees payable (Note 6) | 53,814 | 2,185 | ||||||
Payable to distributor (Note 6d) | 8,323 | 345 | ||||||
Other accounts payable and accrued expenses | 1,152,516 | 50,334 | ||||||
|
|
|
| |||||
TOTAL LIABILITIES | 195,778,202 | 113,779 | ||||||
|
|
|
| |||||
NET ASSETS | $ | 1,554,675,019 | $ | 68,232,031 | ||||
|
|
|
| |||||
NET ASSETS CONSIST OF: | ||||||||
Paid-in capital | $ | 1,579,719,394 | $ | 59,321,603 | ||||
Undistributed (Distributions in excess of) net investment income | 2,301,153 | (2,012 | ) | |||||
Accumulated net realized gain (loss) on investments and foreign currency transactions | (5,971,542 | ) | 2,008,797 | |||||
Net unrealized appreciation (depreciation) on investments | (21,373,986 | ) | 6,903,643 | |||||
|
|
|
| |||||
NET ASSETS | $ | 1,554,675,019 | $ | 68,232,031 | ||||
|
|
|
| |||||
COMPUTATION OF NET ASSET VALUE AND OFFERING PRICE: | ||||||||
Class A shares: | ||||||||
Net assets | $ | 317,293,352 | $ | 11,182,112 | ||||
|
|
|
| |||||
Shares of beneficial interest | 30,501,085 | 756,463 | ||||||
|
|
|
| |||||
Net asset value and redemption price per share | $ | 10.40 | $ | 14.78 | ||||
|
|
|
| |||||
Offering price per share (100/[100-maximum sales charge] of net asset value) (Note 1) | $ | 10.78 | $ | 15.68 | ||||
|
|
|
| |||||
Class C shares: (redemption price per share is equal to net asset value less any applicable contingent deferred sales charge) (Note 1) | ||||||||
Net assets | $ | 215,188,782 | $ | 2,954,941 | ||||
|
|
|
| |||||
Shares of beneficial interest | 20,740,212 | 203,546 | ||||||
|
|
|
| |||||
Net asset value and offering price per share | $ | 10.38 | $ | 14.52 | ||||
|
|
|
| |||||
Class Y shares: | ||||||||
Net assets | $ | 1,022,192,885 | $ | 54,094,978 | ||||
|
|
|
| |||||
Shares of beneficial interest | 98,216,458 | 3,647,065 | ||||||
|
|
|
| |||||
Net asset value, offering and redemption price per share | $ | 10.41 | $ | 14.83 | ||||
|
|
|
| |||||
See accompanying notes to financial statements.
57 |
Table of Contents
Statements of Operations
For the Year Ended November 30, 2014
| Gateway International Fund | Loomis Sayles Dividend Income Fund* | Loomis Sayles Emerging Markets Opportunities Fund(a) | ||||||||||
INVESTMENT INCOME | ||||||||||||
Interest | $ | 9 | $ | 247,896 | $ | 1,204,513 | ||||||
Dividends | 989,491 | (b) | 969,180 | (b) | 17,596 | |||||||
Less net foreign taxes withheld | (57,572 | ) | (4,486 | ) | (7,601 | ) | ||||||
|
|
|
|
|
| |||||||
| 931,928 | 1,212,590 | 1,214,508 | ||||||||||
|
|
|
|
|
| |||||||
Expenses | ||||||||||||
Management fees (Note 6) | 178,175 | 135,460 | 187,488 | |||||||||
Service and distribution fees (Note 6) | 88,253 | 39,422 | 8,293 | |||||||||
Administrative fees (Note 6) | 10,313 | 9,782 | 10,785 | |||||||||
Trustees’ fees and expenses (Note 6) | 18,150 | 18,190 | 15,597 | |||||||||
Transfer agent fees and expenses (Notes 6 and 7) | 15,481 | 13,223 | 6,363 | |||||||||
Audit and tax services fees | 45,024 | 51,361 | 53,766 | |||||||||
Custodian fees and expenses | 74,113 | 18,791 | 24,933 | |||||||||
Interest expense (Note 9) | 1,588 | — | — | |||||||||
Legal fees | 191 | 188 | 226 | |||||||||
Registration fees | 63,503 | 51,847 | 54,387 | |||||||||
Shareholder reporting expenses | 13,276 | 5,739 | 2,672 | |||||||||
Miscellaneous expenses | 24,025 | 15,223 | 10,252 | |||||||||
|
|
|
|
|
| |||||||
Total expenses | 532,092 | 359,226 | 374,762 | |||||||||
Less waiver and/or expense reimbursement (Note 6) | (181,951 | ) | (105,069 | ) | (116,385 | ) | ||||||
|
|
|
|
|
| |||||||
Net expenses | 350,141 | 254,157 | 258,377 | |||||||||
|
|
|
|
|
| |||||||
Net investment income | 581,787 | 958,433 | 956,131 | |||||||||
|
|
|
|
|
| |||||||
NET REALIZED AND UNREALIZED GAIN (LOSS) ON INVESTMENTS, FUTURES CONTRACTS, OPTIONS WRITTEN, SWAP AGREEMENTS AND FOREIGN CURRENCY TRANSACTIONS | ||||||||||||
Net realized gain (loss) on: | ||||||||||||
Investments | 696,511 | 2,612,796 | (15,298 | ) | ||||||||
Futures contracts | — | — | 127,301 | |||||||||
Options written | 214,924 | 19,065 | 1,203 | |||||||||
Swap agreements | — | — | 25,966 | |||||||||
Foreign currency transactions | (22,518 | ) | (355 | ) | 7,955 | |||||||
Increase from payments by affiliates (Note 6) | 10,567 | — | — | |||||||||
Net change in unrealized appreciation (depreciation) on: | ||||||||||||
Investments | (2,429,423 | ) | (507,584 | ) | 497,734 | |||||||
Futures contracts | — | — | 17,610 | |||||||||
Options written | 44,325 | (3,282 | ) | — | ||||||||
Swap agreements | — | — | (12,639 | ) | ||||||||
Foreign currency translations | (3,715 | ) | (217 | ) | 14,409 | |||||||
|
|
|
|
|
| |||||||
Net realized and unrealized gain (loss) on investments, futures contracts, options written, swap agreements and foreign currency transactions | (1,489,329 | ) | 2,120,423 | 664,241 | ||||||||
|
|
|
|
|
| |||||||
NET INCREASE (DECREASE) IN NET ASSETS RESULTING FROM OPERATIONS | $ | (907,542 | ) | $ | 3,078,856 | $ | 1,620,372 | |||||
|
|
|
|
|
| |||||||
| * | Formerly Loomis Sayles Capital Income Fund. |
| (a) | From commencement of operations on February 10, 2014 through November 30, 2014. |
| (b) | Includes non-recurring dividends of $226,122 and $348,055 for Gateway International Fund and Loomis Sayles Dividend Income Fund, respectively. |
See accompanying notes to financial statements.
| 58
Table of Contents
Statements of Operations (continued)
For the Year Ended November 30, 2014
| Loomis Sayles Senior Floating Rate and Fixed Income Fund | Vaughan Nelson Select Fund | |||||||
INVESTMENT INCOME | ||||||||
Interest | $ | 101,396,209 | $ | 37 | ||||
Dividends | 41,201 | 554,163 | ||||||
Less net foreign taxes withheld | — | (7,794 | ) | |||||
|
|
|
| |||||
| 101,437,410 | 546,406 | |||||||
|
|
|
| |||||
Expenses | ||||||||
Management fees (Note 6) | 9,551,870 | 353,995 | ||||||
Service and distribution fees (Note 6) | 3,098,662 | 55,799 | ||||||
Administrative fees (Note 6) | 664,824 | 18,004 | ||||||
Trustees’ fees and expenses (Note 6) | 41,536 | 18,273 | ||||||
Transfer agent fees and expenses (Notes 6 and 7) | 952,175 | 23,216 | ||||||
Audit and tax services fees | 87,483 | 41,187 | ||||||
Custodian fees and expenses | 399,857 | 16,048 | ||||||
Interest expense (Note 9) | 734,557 | — | ||||||
Legal fees | 49,334 | 352 | ||||||
Registration fees | 301,486 | 70,578 | ||||||
Shareholder reporting expenses | 109,670 | 5,443 | ||||||
Miscellaneous expenses | 439,818 | 13,798 | ||||||
|
|
|
| |||||
Total expenses | 16,431,272 | 616,693 | ||||||
Less waiver and/or expense reimbursement (Note 6) | (240,976 | ) | (81,811 | ) | ||||
|
|
|
| |||||
Net expenses | 16,190,296 | 534,882 | ||||||
|
|
|
| |||||
Net investment income | 85,247,114 | 11,524 | ||||||
|
|
|
| |||||
NET REALIZED AND UNREALIZED GAIN (LOSS) ON INVESTMENTS AND FOREIGN CURRENCY TRANSACTIONS | ||||||||
Net realized gain (loss) on: | ||||||||
Investments | 1,394,499 | 2,046,942 | ||||||
Foreign currency transactions | (614 | ) | — | |||||
Net change in unrealized appreciation (depreciation) on: | ||||||||
Investments | (23,608,611 | ) | 3,930,789 | |||||
|
|
|
| |||||
Net realized and unrealized gain (loss) on investments and foreign currency transactions | (22,214,726 | ) | 5,977,731 | |||||
|
|
|
| |||||
NET INCREASE IN NET ASSETS RESULTING FROM OPERATIONS | $ | 63,032,388 | $ | 5,989,255 | ||||
|
|
|
| |||||
See accompanying notes to financial statements.
59 |
Table of Contents
This Page Intentionally Left Blank
| 60
Table of Contents
Statements of Changes in Net Assets
| Gateway International Fund | Loomis Sayles Dividend Income Fund* | |||||||||||||||
| Year Ended November 30, 2014 | Year Ended November 30, 2013 | Year Ended November 30, 2014 | Year Ended November 30, 2013 | |||||||||||||
FROM OPERATIONS: | ||||||||||||||||
Net investment income | $ | 581,787 | $ | 551,088 | $ | 958,433 | $ | 640,577 | ||||||||
Net realized gain (loss) on investments, futures contracts, options written, swap agreements, foreign currency transactions and increase from payments by affiliates | 899,484 | (3,931,470 | ) | 2,631,506 | 1,497,188 | |||||||||||
Net change in unrealized appreciation (depreciation) on investments, futures contracts, options written, swap agreements and foreign currency translations | (2,388,813 | ) | 4,399,596 | (511,083 | ) | 3,189,039 | ||||||||||
|
|
|
|
|
|
|
| |||||||||
Net increase (decrease) in net assets resulting from operations | (907,542 | ) | 1,019,214 | 3,078,856 | 5,326,804 | |||||||||||
|
|
|
|
|
|
|
| |||||||||
FROM DISTRIBUTIONS TO SHAREHOLDERS: | ||||||||||||||||
Net investment income | ||||||||||||||||
Class A | (135,604 | ) | (108,375 | ) | (247,108 | ) | (113,164 | ) | ||||||||
Class C | (64,479 | ) | (7,312 | ) | (76,058 | ) | (21,251 | ) | ||||||||
Class N | — | — | — | — | ||||||||||||
Class Y | (289,639 | ) | (434,389 | ) | (548,134 | ) | (534,440 | ) | ||||||||
Net realized capital gains | ||||||||||||||||
Class A | — | — | (353,619 | ) | (5,207 | ) | ||||||||||
Class C | — | — | (321,318 | ) | (154 | ) | ||||||||||
Class Y | — | — | (836,248 | ) | (33,113 | ) | ||||||||||
|
|
|
|
|
|
|
| |||||||||
Total distributions | (489,722 | ) | (550,076 | ) | (2,382,485 | ) | (707,329 | ) | ||||||||
|
|
|
|
|
|
|
| |||||||||
NET INCREASE (DECREASE) IN NET ASSETS FROM CAPITAL SHARE TRANSACTIONS (NOTE 13) | (12,053,310 | ) | 5,079,814 | 5,978,520 | 838,563 | |||||||||||
|
|
|
|
|
|
|
| |||||||||
Net increase (decrease) in net assets | (13,450,574 | ) | 5,548,952 | 6,674,891 | 5,458,038 | |||||||||||
NET ASSETS | ||||||||||||||||
Beginning of the year | 32,709,016 | 27,160,064 | 25,155,266 | 19,697,228 | ||||||||||||
|
|
|
|
|
|
|
| |||||||||
End of the year | $ | 19,258,442 | $ | 32,709,016 | $ | 31,830,157 | $ | 25,155,266 | ||||||||
|
|
|
|
|
|
|
| |||||||||
UNDISTRIBUTED (DISTRIBUTIONS IN EXCESS OF) NET INVESTMENT INCOME | $ | 533,347 | $ | 463,056 | $ | 118,390 | $ | 93,450 | ||||||||
|
|
|
|
|
|
|
| |||||||||
| * | Formerly Loomis Sayles Capital Income Fund. |
| (a) | From commencement of operations on February 10, 2014 through November 30, 2014. |
See accompanying notes to financial statements.
61 |
Table of Contents
Statements of Changes in Net Assets (continued)
| Loomis Sayles Emerging Markets Opportunities Fund | Loomis Sayles Senior Floating Rate and Fixed Income Fund | Vaughan Nelson Select Fund | ||||||||||||||||
| Period Ended November 30, 2014(a) | Year Ended November 30, 2014 | Year Ended November 30, 2013 | Year Ended November 30, 2014 | Year Ended November 30, 2013 | ||||||||||||||
| $ | 956,131 | $ | 85,247,114 | $ | 38,680,385 | $ | 11,524 | $ | 41,412 | |||||||||
| 147,127 | 1,393,885 | (668,614 | ) | 2,046,942 | 2,579,520 | |||||||||||||
| 517,114 | (23,608,611 | ) | 1,120,957 | 3,930,789 | 2,884,801 | |||||||||||||
|
|
|
|
|
|
|
|
|
| |||||||||
| 1,620,372 | 63,032,388 | 39,132,728 | 5,989,255 | 5,505,733 | ||||||||||||||
|
|
|
|
|
|
|
|
|
| |||||||||
| (113,919 | ) | (22,500,486 | ) | (13,740,965 | ) | (6,348 | ) | — | ||||||||||
| (331 | ) | (10,332,889 | ) | (4,935,510 | ) | — | — | |||||||||||
| (32 | ) | — | — | — | — | |||||||||||||
| (825,391 | ) | (55,152,730 | ) | (22,397,382 | ) | (27,302 | ) | (22,881 | ) | |||||||||
| — | — | (526,071 | ) | (964,875 | ) | (23,743 | ) | |||||||||||
| — | — | (134,855 | ) | (118,489 | ) | (3,873 | ) | |||||||||||
| — | — | (272,651 | ) | (1,439,450 | ) | (236,379 | ) | |||||||||||
|
|
|
|
|
|
|
|
|
| |||||||||
| (939,673 | ) | (87,986,105 | ) | (42,007,434 | ) | (2,556,464 | ) | (286,876 | ) | |||||||||
|
|
|
|
|
|
|
|
|
| |||||||||
| 34,457,572 | 206,911,045 | 1,225,901,010 | 40,001,524 | 11,883,129 | ||||||||||||||
|
|
|
|
|
|
|
|
|
| |||||||||
| 35,138,271 | 181,957,328 | 1,223,026,304 | 43,434,315 | 17,101,986 | ||||||||||||||
| — | 1,372,717,691 | 149,691,387 | 24,797,716 | 7,695,730 | ||||||||||||||
|
|
|
|
|
|
|
|
|
| |||||||||
| $ | 35,138,271 | $ | 1,554,675,019 | $ | 1,372,717,691 | $ | 68,232,031 | $ | 24,797,716 | |||||||||
|
|
|
|
|
|
|
|
|
| |||||||||
| $ | 4,977 | $ | 2,301,153 | $ | 674,221 | $ | (2,012 | ) | $ | 21,434 | ||||||||
|
|
|
|
|
|
|
|
|
| |||||||||
See accompanying notes to financial statements.
| 62
Table of Contents
Financial Highlights
For a share outstanding throughout each period.
| Gateway International Fund—Class A | ||||||||||||
| Year Ended November 30, 2014 | Year Ended November 30, 2013 | Period Ended November 30, 2012* | ||||||||||
Net asset value, beginning of the period | $ | 10.01 | $ | 9.92 | $ | 10.00 | ||||||
|
|
|
|
|
| |||||||
INCOME (LOSS) FROM INVESTMENT OPERATIONS: | ||||||||||||
Net investment income(a) | 0.25 | (b) | 0.17 | 0.09 | ||||||||
Net realized and unrealized gain (loss) | (0.48 | ) | 0.11 | (0.17 | ) | |||||||
|
|
|
|
|
| |||||||
Total from Investment Operations | (0.23 | ) | 0.28 | (0.08 | ) | |||||||
|
|
|
|
|
| |||||||
LESS DISTRIBUTIONS FROM: | ||||||||||||
Net investment income | (0.14 | ) | (0.19 | ) | — | |||||||
Net realized capital gains | — | — | — | |||||||||
|
|
|
|
|
| |||||||
Total Distributions | (0.14 | ) | (0.19 | ) | — | |||||||
|
|
|
|
|
| |||||||
Net asset value, end of the period | $ | 9.64 | $ | 10.01 | $ | 9.92 | ||||||
|
|
|
|
|
| |||||||
Total return(c)(d) | (2.24 | )%(b) | 2.85 | % | (0.80 | )% | ||||||
RATIOS TO AVERAGE NET ASSETS: | ||||||||||||
Net assets, end of the period (000’s) | $ | 7,717 | $ | 9,276 | $ | 5,632 | ||||||
Net expenses(f) | 1.35 | %(h) | 1.35 | % | 1.35 | %(g) | ||||||
Gross expenses | 2.16 | %(e) | 2.17 | % | 2.36 | %(g) | ||||||
Net investment income | 2.56 | %(b) | 1.72 | % | 1.37 | %(g) | ||||||
Portfolio turnover rate | 35 | % | 29 | % | 20 | % | ||||||
| * | From commencement of operations on March 30, 2012 through November 30, 2012. |
| (a) | Per share net investment income has been calculated using the average shares outstanding during the period. |
| (b) | Includes non-recurring dividends. Without these dividends, net investment income per share would have been $0.18, total return would have been (2.95)% and the ratio of net investment income to average net assets would have been 1.84%. |
| (c) | A sales charge for Class A shares is not reflected in total return calculations. |
| (d) | Had certain expenses not been waived/reimbursed during the period, total returns would have been lower. Periods less than one year are not annualized. |
| (e) | Includes interest expense of 0.01%. Without this expense the ratio of gross expenses would have been 2.15%. |
| (f) | The investment adviser agreed to waive its fees and/or reimburse a portion of the Fund’s expenses during the period. Without this waiver/reimbursement, expenses would have been higher. |
| (g) | Computed on an annualized basis for periods less than one year. |
| (h) | The investment adviser voluntarily agreed to reimburse a portion of the Fund’s interest expense during the period. Without this reimbursement, expense would have been higher. |
See accompanying notes to financial statements.
63 |
Table of Contents
Financial Highlights (continued)
For a share outstanding throughout each period.
| Gateway International Fund—Class C | ||||||||||||
| Year Ended November 30, 2014 | Year Ended November 30, 2013 | Period Ended November 30, 2012* | ||||||||||
Net asset value, beginning of the period | $ | 9.91 | $ | 9.88 | $ | 10.00 | ||||||
|
|
|
|
|
| |||||||
INCOME (LOSS) FROM INVESTMENT OPERATIONS: | ||||||||||||
Net investment income(a) | 0.16 | (b) | 0.08 | 0.05 | ||||||||
Net realized and unrealized gain (loss) | (0.46 | ) | 0.13 | (0.17 | ) | |||||||
|
|
|
|
|
| |||||||
Total from Investment Operations | (0.30 | ) | 0.21 | (0.12 | ) | |||||||
|
|
|
|
|
| |||||||
LESS DISTRIBUTIONS FROM: | ||||||||||||
Net investment income | (0.11 | ) | (0.18 | ) | — | |||||||
Net realized capital gains | — | — | — | |||||||||
|
|
|
|
|
| |||||||
Total Distributions | (0.11 | ) | (0.18 | ) | — | |||||||
|
|
|
|
|
| |||||||
Net asset value, end of the period | $ | 9.50 | $ | 9.91 | $ | 9.88 | ||||||
|
|
|
|
|
| |||||||
Total return(c)(d) | (3.03 | )%(b) | 2.13 | % | (1.20 | )% | ||||||
RATIOS TO AVERAGE NET ASSETS: | ||||||||||||
Net assets, end of the period (000’s) | $ | 6,542 | $ | 4,935 | $ | 241 | ||||||
Net expenses(e) | 2.10 | %(h) | 2.10 | % | 2.10 | %(g) | ||||||
Gross expenses | 2.91 | %(f) | 2.78 | % | 3.13 | %(g) | ||||||
Net investment income | 1.64 | %(b) | 0.85 | % | 0.73 | %(g) | ||||||
Portfolio turnover rate | 35 | % | 29 | % | 20 | % | ||||||
| * | From commencement of operations on March 30, 2012 through November 30, 2012. |
| (a) | Per share net investment income has been calculated using the average shares outstanding during the period. |
| (b) | Includes non-recurring dividends. Without these dividends, net investment income per share would have been $0.10, total return would have been (3.75)% and the ratio of net investment income to average net assets would have been 1.01%. |
| (c) | Had certain expenses not been waived/reimbursed during the period, total returns would have been lower. Periods less than one year are not annualized. |
| (d) | A contingent deferred sales charge for Class C shares is not reflected in total return calculations. |
| (e) | The investment adviser agreed to waive its fees and/or reimburse a portion of the Fund’s expenses during the period. Without this waiver/reimbursement, expenses would have been higher. |
| (f) | Includes interest expense of 0.01%. Without this expense the ratio of gross expenses would have been 2.90%. |
| (g) | Computed on an annualized basis for periods less than one year. |
| (h) | The investment adviser voluntarily agreed to reimburse a portion of the Fund’s interest expense during the period. Without this reimbursement, expenses would have been higher. |
See accompanying notes to financial statements.
| 64
Table of Contents
Financial Highlights (continued)
For a share outstanding throughout each period.
| Gateway International Fund—Class Y | ||||||||||||
| Year Ended November 30, 2014 | Year Ended November 30, 2013 | Period Ended November 30, 2012* | ||||||||||
Net asset value, beginning of the period | $ | 10.04 | $ | 9.94 | $ | 10.00 | ||||||
|
|
|
|
|
| |||||||
INCOME (LOSS) FROM INVESTMENT OPERATIONS: | ||||||||||||
Net investment income(a) | 0.29 | (b) | 0.19 | 0.18 | ||||||||
Net realized and unrealized gain (loss) | (0.47 | ) | 0.11 | (0.24 | ) | |||||||
|
| �� |
|
|
|
| ||||||
Total from Investment Operations | (0.18 | ) | 0.30 | (0.06 | ) | |||||||
|
|
|
|
|
| |||||||
LESS DISTRIBUTIONS FROM: | ||||||||||||
Net investment income | (0.16 | ) | (0.20 | ) | — | |||||||
Net realized capital gains | — | — | — | |||||||||
|
|
|
|
|
| |||||||
Total Distributions | (0.16 | ) | (0.20 | ) | — | |||||||
|
|
|
|
|
| |||||||
Net asset value, end of the period | $ | 9.70 | $ | 10.04 | $ | 9.94 | ||||||
|
|
|
|
|
| |||||||
Total return(c) | (1.86 | )%(b) | 3.08 | % | (0.60 | )% | ||||||
RATIOS TO AVERAGE NET ASSETS: | ||||||||||||
Net assets, end of the period (000’s) | $ | 5,000 | $ | 18,497 | $ | 21,287 | ||||||
Net expenses(d) | 1.10 | %(g) | 1.10 | % | 1.10 | %(f) | ||||||
Gross expenses | 1.78 | %(e) | 1.93 | % | 2.36 | %(f) | ||||||
Net investment income | 2.98 | %(b) | 1.96 | % | 2.76 | %(f) | ||||||
Portfolio turnover rate | 35 | % | 29 | % | 20 | % | ||||||
| * | From commencement of operations on March 30, 2012 through November 30, 2012. |
| (a) | Per share net investment income has been calculated using the average shares outstanding during the period. |
| (b) | Includes non-recurring dividends. Without these dividends, net investment income per share would have been $0.15, total return would have been (2.46)% and the ratio of net investment income to average net assets would have been 1.49%. |
| (c) | Had certain expenses not been waived/reimbursed during the period, total returns would have been lower. Periods less than one year are not annualized. |
| (d) | The investment adviser agreed to waive its fees and/or reimburse a portion of the Fund’s expenses during the period. Without this waiver/reimbursement, expenses would have been higher. |
| (e) | Includes interest expense of less than 0.01%. |
| (f) | Computed on an annualized basis for periods less than one year. |
| (g) | The investment adviser voluntarily agreed to reimburse a portion of the Fund’s interest expense during the period. Without this reimbursement, expenses would have been higher. |
See accompanying notes to financial statements.
65 |
Table of Contents
Financial Highlights (continued)
For a share outstanding throughout each period.
| Loomis Sayles Dividend Income Fund*—Class A | ||||||||||||
| Year Ended November 30, 2014 | Year Ended November 30, 2013 | Period Ended November 30, 2012** | ||||||||||
Net asset value, beginning of the period | $ | 12.87 | $ | 10.43 | $ | 10.00 | ||||||
|
|
|
|
|
| |||||||
INCOME (LOSS) FROM INVESTMENT OPERATIONS: | ||||||||||||
Net investment income(a) | 0.51 | (b) | 0.32 | 0.25 | (c) | |||||||
Net realized and unrealized gain (loss) | 0.91 | 2.47 | 0.34 | |||||||||
|
|
|
|
|
| |||||||
Total from Investment Operations | 1.42 | 2.79 | 0.59 | |||||||||
|
|
|
|
|
| |||||||
LESS DISTRIBUTIONS FROM: | ||||||||||||
Net investment income | (0.50 | ) | (0.33 | ) | (0.16 | ) | ||||||
Net realized capital gains | (0.77 | ) | (0.02 | ) | — | |||||||
|
|
|
|
|
| |||||||
Total Distributions | (1.27 | ) | (0.35 | ) | (0.16 | ) | ||||||
|
|
|
|
|
| |||||||
Net asset value, end of the period | $ | 13.02 | $ | 12.87 | $ | 10.43 | ||||||
|
|
|
|
|
| |||||||
Total return(d)(e) | 11.95 | %(b) | 27.35 | % | 6.01 | %(c) | ||||||
RATIOS TO AVERAGE NET ASSETS: | ||||||||||||
Net assets, end of the period (000’s) | $ | 7,569 | $ | 5,978 | $ | 2,691 | ||||||
Net expenses(f) | 1.20 | % | 1.20 | % | 1.20 | %(g) | ||||||
Gross expenses | 1.67 | % | 1.55 | % | 1.74 | %(g) | ||||||
Net investment income | 4.03 | %(b) | 2.70 | % | 3.67 | %(c)(g) | ||||||
Portfolio turnover rate | 65 | % | 45 | % | 14 | % | ||||||
| * | Formerly Loomis Sayles Capital Income Fund. |
| ** | From commencement of operations on March 30, 2012 through November 30, 2012. |
| (a) | Per share net investment income has been calculated using the average shares outstanding during the period. |
| (b) | Includes non-recurring dividends. Without these dividends, net investment income per share would have been $0.33, total return would have been 10.53% and the ratio of net investment income to average net assets would have been 2.63%. |
| (c) | Includes a non-recurring dividend. Without this dividend, net investment income per share would have been $0.23, total return would have been 5.71% and the ratio of net investment income to average net assets would have been 3.31%. |
| (d) | Had certain expenses not been waived/reimbursed during the period, total returns would have been lower. Periods less than one year are not annualized. |
| (e) | A sales charge for Class A shares is not reflected in total return calculations. |
| (f) | The investment adviser agreed to waive its fees and/or reimburse a portion of the Fund’s expenses during the period. Without this waiver/reimbursement, expenses would have been higher. |
| (g) | Computed on an annualized basis for periods less than one year. |
See accompanying notes to financial statements.
| 66
Table of Contents
Financial Highlights (continued)
For a share outstanding throughout each period.
| Loomis Sayles Dividend Income Fund*—Class C | ||||||||||||
| Year Ended November 30, 2014 | Year Ended November 30, 2013 | Period Ended November 30, 2012** | ||||||||||
Net asset value, beginning of the period | $ | 12.81 | $ | 10.42 | $ | 10.00 | ||||||
|
|
|
|
|
| |||||||
INCOME (LOSS) FROM INVESTMENT OPERATIONS: | ||||||||||||
Net investment income(a) | 0.44 | (b) | 0.25 | 0.20 | (c) | |||||||
Net realized and unrealized gain (loss) | 0.89 | 2.45 | 0.34 | |||||||||
|
|
|
|
|
| |||||||
Total from Investment Operations | 1.33 | 2.70 | 0.54 | |||||||||
|
|
|
|
|
| |||||||
LESS DISTRIBUTIONS FROM: | ||||||||||||
Net investment income | (0.39 | ) | (0.29 | ) | (0.12 | ) | ||||||
Net realized capital gains | (0.77 | ) | (0.02 | ) | — | |||||||
|
|
|
|
|
| |||||||
Total Distributions | (1.16 | ) | (0.31 | ) | (0.12 | ) | ||||||
|
|
|
|
|
| |||||||
Net asset value, end of the period | $ | 12.98 | $ | 12.81 | $ | 10.42 | ||||||
|
|
|
|
|
| |||||||
Total return(d)(e) | 11.14 | %(b) | 26.40 | % | 5.44 | %(c) | ||||||
RATIOS TO AVERAGE NET ASSETS: | ||||||||||||
Net assets, end of the period (000’s) | $ | 1,716 | $ | 5,260 | $ | 61 | ||||||
Net expenses(f) | 1.95 | % | 1.95 | % | 1.95 | %(g) | ||||||
Gross expenses | 2.42 | % | 2.21 | % | 2.53 | %(g) | ||||||
Net investment income | 3.54 | %(b) | 2.03 | % | 3.01 | %(c)(g) | ||||||
Portfolio turnover rate | 65 | % | 45 | % | 14 | % | ||||||
| * | Formerly Loomis Sayles Capital Income Fund. |
| ** | From commencement of operations on March 30, 2012 through November 30, 2012. |
| (a) | Per share net investment income has been calculated using the average shares outstanding during the period. |
| (b) | Includes non-recurring dividends. Without these dividends, net investment income per share would have been $0.21, total return would have been 9.71% and the ratio of net investment income to average net assets would have been 1.70%. |
| (c) | Includes a non-recurring dividend. Without this dividend, net investment income per share would have been $0.17, total return would have been 5.14% and the ratio of net investment income to average net assets would have been 2.53%. |
| (d) | Had certain expenses not been waived/reimbursed during the period, total returns would have been lower. Periods less than one year are not annualized. |
| (e) | A contingent deferred sales charge for Class C shares is not reflected in total return calculations. |
| (f) | The investment adviser agreed to waive its fees and/or reimburse a portion of the Fund’s expenses during the period. Without this waiver/reimbursement, expenses would have been higher. |
| (g) | Computed on an annualized basis for periods less than one year. |
See accompanying notes to financial statements.
67 |
Table of Contents
Financial Highlights (continued)
For a share outstanding throughout each period.
| Loomis Sayles Dividend Income Fund*—Class Y | ||||||||||||
| Year Ended November 30, 2014 | Year Ended November 30, 2013 | Period Ended November 30, 2012** | ||||||||||
Net asset value, beginning of the period | $ | 12.88 | $ | 10.44 | $ | 10.00 | ||||||
|
|
|
|
|
| |||||||
INCOME (LOSS) FROM INVESTMENT OPERATIONS: | ||||||||||||
Net investment income(a) | 0.56 | (b) | 0.35 | 0.26 | (c) | |||||||
Net realized and unrealized gain (loss) | 0.90 | 2.47 | 0.35 | |||||||||
|
|
|
|
|
| |||||||
Total from Investment Operations | 1.46 | 2.82 | 0.61 | |||||||||
|
|
|
|
|
| |||||||
LESS DISTRIBUTIONS FROM: | ||||||||||||
Net investment income | (0.54 | ) | (0.36 | ) | (0.17 | ) | ||||||
Net realized capital gains | (0.77 | ) | (0.02 | ) | — | |||||||
|
|
|
|
|
| |||||||
Total Distributions | (1.31 | ) | (0.38 | ) | (0.17 | ) | ||||||
|
|
|
|
|
| |||||||
Net asset value, end of the period | $ | 13.03 | $ | 12.88 | $ | 10.44 | ||||||
|
|
|
|
|
| |||||||
Total return(d) | 12.22 | %(b) | 27.63 | % | 6.19 | %(c) | ||||||
RATIOS TO AVERAGE NET ASSETS: | ||||||||||||
Net assets, end of the period (000’s) | $ | 22,545 | $ | 13,917 | $ | 16,945 | ||||||
Net expenses(e) | 0.95 | % | 0.95 | % | 0.95 | %(f) | ||||||
Gross expenses | 1.41 | % | 1.34 | % | 1.53 | %(f) | ||||||
Net investment income | 4.46 | %(b) | 2.97 | % | 3.88 | %(c)(f) | ||||||
Portfolio turnover rate | 65 | % | 45 | % | 14 | % | ||||||
| * | Formerly Loomis Sayles Capital Income Fund. |
| ** | From commencement of operations on March 30, 2012 through November 30, 2012. |
| (a) | Per share net investment income has been calculated using the average shares outstanding during the period. |
| (b) | Includes non-recurring dividends. Without these dividends, net investment income per share would have been $0.37, total return would have been 10.80% and the ratio of net investment income to average net assets would have been 2.91%. |
| (c) | Includes a non-recurring dividend. Without this dividend, net investment income per share would have been $0.23, total return would have been 5.89%, and the ratio of net investment income to average net assets would have been 3.45%. |
| (d) | Had certain expenses not been waived/reimbursed during the period, total returns would have been lower. Periods less than one year are not annualized. |
| (e) | The investment adviser agreed to waive its fees and/or reimburse a portion of the Fund’s expenses during the period. Without this waiver/reimbursement, expenses would have been higher. |
| (f) | Computed on an annualized basis for periods less than one year. |
See accompanying notes to financial statements.
| 68
Table of Contents
Financial Highlights (continued)
For a share outstanding throughout each period.
| Loomis Sayles Emerging Markets Opportunities Fund—Class A | ||||
| Period Ended November 30, 2014* | ||||
Net asset value, beginning of the period | $ | 10.00 | ||
|
| |||
INCOME (LOSS) FROM INVESTMENT OPERATIONS: | ||||
Net investment income(a) | 0.29 | |||
Net realized and unrealized gain (loss) | 0.31 | |||
|
| |||
Total from Investment Operations | 0.60 | |||
|
| |||
LESS DISTRIBUTIONS FROM: | ||||
Net investment income | (0.30 | ) | ||
Net realized capital gains | — | |||
|
| |||
Total Distributions | (0.30 | ) | ||
|
| |||
Net asset value, end of the period | $ | 10.30 | ||
|
| |||
Total return(b)(c) | 6.00 | % | ||
RATIOS TO AVERAGE NET ASSETS: | ||||
Net assets, end of the period (000’s) | $ | 6,892 | ||
Net expenses(d)(e) | 1.25 | % | ||
Gross expenses(e) | 1.72 | % | ||
Net investment income(e) | 3.52 | % | ||
Portfolio turnover rate | 58 | % | ||
| * | From commencement of operations on February 10, 2014 through November 30, 2014. |
| (a) | Per share net investment income has been calculated using the average shares outstanding during the period. |
| (b) | Had certain expenses not been waived/reimbursed during the period, total returns would have been lower. Periods less than one year are not annualized. |
| (c) | A sales charge for Class A shares is not reflected in total return calculations. |
| (d) | The investment adviser agreed to waive its fees and/or reimburse a portion of the Fund’s expenses during the period. Without this waiver/reimbursement, expenses would have been higher. |
| (e) | Computed on an annualized basis for periods less than one year. |
See accompanying notes to financial statements.
69 |
Table of Contents
Financial Highlights (continued)
For a share outstanding throughout each period.
| Loomis Sayles Emerging Markets Opportunities Fund—Class C | ||||
| Period Ended November 30, 2014* | ||||
Net asset value, beginning of the period | $ | 10.00 | ||
|
| |||
INCOME (LOSS) FROM INVESTMENT OPERATIONS: | ||||
Net investment income(a) | 0.23 | |||
Net realized and unrealized gain (loss) | 0.29 | |||
|
| |||
Total from Investment Operations | 0.52 | |||
|
| |||
LESS DISTRIBUTIONS FROM: | ||||
Net investment income | (0.24 | ) | ||
Net realized capital gains | — | |||
|
| |||
Total Distributions | (0.24 | ) | ||
|
| |||
Net asset value, end of the period | $ | 10.28 | ||
|
| |||
Total return(b)(c) | 5.20 | % | ||
RATIOS TO AVERAGE NET ASSETS: | ||||
Net assets, end of the period (000’s) | $ | 33 | ||
Net expenses(d)(e) | 2.00 | % | ||
Gross expenses(e) | 2.46 | % | ||
Net investment income(e) | 2.82 | % | ||
Portfolio turnover rate | 58 | % | ||
| * | From commencement of operations on February 10, 2014 through November 30, 2014. |
| (a) | Per share net investment income has been calculated using the average shares outstanding during the period. |
| (b) | Had certain expenses not been waived/reimbursed during the period, total returns would have been lower. Periods less than one year are not annualized. |
| (c) | A contingent deferred sales charge for Class C shares is not reflected in total return calculations. |
| (d) | The investment adviser agreed to waive its fees and/or reimburse a portion of the Fund’s expenses during the period. Without this waiver/reimbursement, expenses would have been higher. |
| (e) | Computed on an annualized basis for periods less than one year. |
See accompanying notes to financial statements.
| 70
Table of Contents
Financial Highlights (continued)
For a share outstanding throughout each period.
| Loomis Sayles Emerging Markets Opportunities Fund—Class N | ||||
| Period Ended November 30, 2014* | ||||
Net asset value, beginning of the period | $ | 10.00 | ||
|
| |||
INCOME (LOSS) FROM INVESTMENT OPERATIONS: | ||||
Net investment income(a) | 0.33 | |||
Net realized and unrealized gain (loss) | 0.28 | |||
|
| |||
Total from Investment Operations | 0.61 | |||
|
| |||
LESS DISTRIBUTIONS FROM: | ||||
Net investment income | (0.31 | ) | ||
Net realized capital gains | — | |||
|
| |||
Total Distributions | (0.31 | ) | ||
|
| |||
Net asset value, end of the period | $ | 10.30 | ||
|
| |||
Total return(b) | 6.18 | % | ||
RATIOS TO AVERAGE NET ASSETS: | ||||
Net assets, end of the period (000’s) | $ | 1 | ||
Net expenses(c)(d) | 0.95 | % | ||
Gross expenses(d) | 8.10 | % | ||
Net investment income(d) | 3.97 | % | ||
Portfolio turnover rate | 58 | % | ||
| * | From commencement of operations on February 10, 2014 through November 30, 2014. |
| (a) | Per share net investment income has been calculated using the average shares outstanding during the period. |
| (b) | Had certain expenses not been waived/reimbursed during the period, total returns would have been lower. Periods less than one year are not annualized. |
| (c) | The investment adviser agreed to waive its fees and/or reimburse a portion of the Fund’s expenses during the period. Without this waiver/reimbursement, expenses would have been higher. |
| (d) | Computed on an annualized basis for periods less than one year. |
See accompanying notes to financial statements.
71 |
Table of Contents
Financial Highlights (continued)
For a share outstanding throughout each period.
| Loomis Sayles Emerging Markets Opportunities Fund—Class Y | ||||
| Period Ended November 30, 2014* | ||||
Net asset value, beginning of the period | $ | 10.00 | ||
|
| |||
INCOME (LOSS) FROM INVESTMENT OPERATIONS: | ||||
Net investment income(a) | 0.32 | |||
Net realized and unrealized gain (loss) | 0.29 | |||
|
| |||
Total from Investment Operations | 0.61 | |||
|
| |||
LESS DISTRIBUTIONS FROM: | ||||
Net investment income | (0.31 | ) | ||
Net realized capital gains | — | |||
|
| |||
Total Distributions | (0.31 | ) | ||
|
| |||
Net asset value, end of the period | $ | 10.30 | ||
|
| |||
Total return(b) | 6.18 | % | ||
RATIOS TO AVERAGE NET ASSETS: | ||||
Net assets, end of the period (000’s) | $ | 28,213 | ||
Net expenses(c)(d) | 1.00 | % | ||
Gross expenses(d) | 1.47 | % | ||
Net investment income(d) | 3.87 | % | ||
Portfolio turnover rate | 58 | % | ||
| * | From commencement of operations on February 10, 2014 through November 30, 2014. |
| (a) | Per share net investment income has been calculated using the average shares outstanding during the period. |
| (b) | Had certain expenses not been waived/reimbursed during the period, total returns would have been lower. Periods less than one year are not annualized. |
| (c) | The investment adviser agreed to waive its fees and/or reimburse a portion of the Fund’s expenses during the period. Without this waiver/reimbursement, expenses would have been higher. |
| (d) | Computed on an annualized basis for periods less than one year. |
See accompanying notes to financial statements.
| 72
Table of Contents
Financial Highlights (continued)
For a share outstanding throughout each period.
| Loomis Sayles Senior Floating Rate and Fixed Income Fund—Class A | ||||||||||||||||
| Year Ended November 30, 2014 | Year Ended November 30, 2013 | Year Ended November 30, 2012 | Period Ended November 30, 2011* | |||||||||||||
Net asset value, beginning of the period | $ | 10.56 | $ | 10.56 | $ | 10.02 | $ | 9.83 | ||||||||
|
|
|
|
|
|
|
| |||||||||
INCOME (LOSS) FROM INVESTMENT OPERATIONS: | ||||||||||||||||
Net investment income(a) | 0.58 | 0.56 | 0.68 | 0.12 | ||||||||||||
Net realized and unrealized gain (loss) | (0.14 | ) | 0.10 | 0.49 | 0.17 | |||||||||||
|
|
|
|
|
|
|
| |||||||||
Total from Investment Operations | 0.44 | 0.66 | 1.17 | 0.29 | ||||||||||||
|
|
|
|
|
|
|
| |||||||||
LESS DISTRIBUTIONS FROM: | ||||||||||||||||
Net investment income | (0.60 | ) | (0.60 | ) | (0.61 | ) | (0.10 | ) | ||||||||
Net realized capital gains | — | (0.06 | ) | (0.02 | ) | — | ||||||||||
|
|
|
|
|
|
|
| |||||||||
Total Distributions | (0.60 | ) | (0.66 | ) | (0.63 | ) | (0.10 | ) | ||||||||
|
|
|
|
|
|
|
| |||||||||
Net asset value, end of the period | $ | 10.40 | $ | 10.56 | $ | 10.56 | $ | 10.02 | ||||||||
|
|
|
|
|
|
|
| |||||||||
Total return(b) | 4.22 | %(c) | 6.43 | % | 12.02 | %(c) | 3.00 | %(c) | ||||||||
RATIOS TO AVERAGE NET ASSETS: | ||||||||||||||||
Net assets, end of the period (000’s) | $ | 317,293 | $ | 421,127 | $ | 80,141 | $ | 252 | ||||||||
Net expenses | 1.10 | %(d)(f) | 1.10 | %(e) | 1.10 | %(f) | 1.10 | %(f)(g) | ||||||||
Gross expenses | 1.11 | %(d) | 1.10 | %(e) | 1.48 | % | 7.66 | %(g) | ||||||||
Net investment income | 5.48 | % | 5.30 | % | 6.46 | % | 7.00 | %(g) | ||||||||
Portfolio turnover rate | 107 | % | 82 | % | 90 | % | 17 | % | ||||||||
| * | From commencement of Class operations on September 30, 2011 through November 30, 2011. |
| (a) | Per share net investment income has been calculated using the average shares outstanding during the period. |
| (b) | A sales charge for Class A shares is not reflected in total return calculations. |
| (c) | Had certain expenses not been waived/reimbursed during the period, total returns would have been lower. Periods less than one year are not annualized. |
| (d) | Includes interest expense of 0.05%. Without this expense the ratio of net expenses would have been 1.05% and the ratio of gross expenses would have been 1.06%. |
| (e) | Includes fee/expense recovery of 0.01%. |
| (f) | The investment adviser agreed to waive its fees and/or reimburse a portion of the Fund’s expenses during the period. Without this waiver/reimbursement, expenses would have been higher. |
| (g) | Computed on an annualized basis for periods less than one year. |
See accompanying notes to financial statements.
73 |
Table of Contents
Financial Highlights (continued)
For a share outstanding throughout each period.
| Loomis Sayles Senior Floating Rate and Fixed Income Fund—Class C | ||||||||||||||||
| Year Ended November 30, 2014 | Year Ended November 30, 2013 | Year Ended November 30, 2012 | Period Ended November 30, 2011* | |||||||||||||
Net asset value, beginning of the period | $ | 10.53 | $ | 10.54 | $ | 10.02 | $ | 9.83 | ||||||||
|
|
|
|
|
|
|
| |||||||||
INCOME (LOSS) FROM INVESTMENT OPERATIONS: | ||||||||||||||||
Net investment income(a) | 0.50 | 0.48 | 0.60 | 0.09 | ||||||||||||
Net realized and unrealized gain (loss) | (0.13 | ) | 0.10 | 0.49 | 0.19 | |||||||||||
|
|
|
|
|
|
|
| |||||||||
Total from Investment Operations | 0.37 | 0.58 | 1.09 | 0.28 | ||||||||||||
|
|
|
|
|
|
|
| |||||||||
LESS DISTRIBUTIONS FROM: | ||||||||||||||||
Net investment income | (0.52 | ) | (0.53 | ) | (0.55 | ) | (0.09 | ) | ||||||||
Net realized capital gains | — | (0.06 | ) | (0.02 | ) | — | ||||||||||
|
|
|
|
|
|
|
| |||||||||
Total Distributions | (0.52 | ) | (0.59 | ) | (0.57 | ) | (0.09 | ) | ||||||||
|
|
|
|
|
|
|
| |||||||||
Net asset value, end of the period | $ | 10.38 | $ | 10.53 | $ | 10.54 | $ | 10.02 | ||||||||
|
|
|
|
|
|
|
| |||||||||
Total return(c) | 3.47 | %(b) | 5.70 | % | 11.18 | %(b) | 2.87 | %(b) | ||||||||
RATIOS TO AVERAGE NET ASSETS: | ||||||||||||||||
Net assets, end of the period (000’s) | $ | 215,189 | $ | 190,618 | $ | 22,655 | $ | 1 | ||||||||
Net expenses | 1.85 | %(d)(f) | 1.85 | %(e) | 1.85 | %(f) | 1.85 | %(f)(g) | ||||||||
Gross expenses | 1.87 | %(d) | 1.85 | %(e) | 2.26 | % | 5.00 | %(g) | ||||||||
Net investment income | 4.77 | % | 4.56 | % | 5.75 | % | 5.50 | %(g) | ||||||||
Portfolio turnover rate | 107 | % | 82 | % | 90 | % | 17 | % | ||||||||
| * | From commencement of Class operations on September 30, 2011 through November 30, 2011. |
| (a) | Per share net investment income has been calculated using the average shares outstanding during the period. |
| (b) | Had certain expenses not been waived/reimbursed during the period, total returns would have been lower. Periods less than one year are not annualized. |
| (c) | A contingent deferred sales charge for Class C shares is not reflected in total return calculations. |
| (d) | Includes interest expense of 0.05%. Without this expense the ratio of net expenses would have been 1.80% and the ratio of gross expenses would have been 1.82%. |
| (e) | Includes fee/expense recovery of 0.01%. |
| (f) | The investment adviser agreed to waive its fees and/or reimburse a portion of the Fund’s expenses during the period. Without this waiver/reimbursement, expenses would have been higher. |
| (g) | Computed on an annualized basis for periods less than one year. |
See accompanying notes to financial statements.
| 74
Table of Contents
Financial Highlights (continued)
For a share outstanding throughout each period.
| Loomis Sayles Senior Floating Rate and Fixed Income Fund—Class Y | ||||||||||||||||
| Year Ended November 30, 2014 | Year Ended November 30, 2013 | Year Ended November 30, 2012 | Period Ended November 30, 2011* | |||||||||||||
Net asset value, beginning of the period | $ | 10.56 | $ | 10.57 | $ | 10.02 | $ | 10.00 | ||||||||
|
|
|
|
|
|
|
| |||||||||
INCOME (LOSS) FROM INVESTMENT OPERATIONS: | ||||||||||||||||
Net investment income(a) | 0.61 | 0.59 | 0.79 | 0.11 | ||||||||||||
Net realized and unrealized gain (loss) | (0.13 | ) | 0.09 | 0.41 | 0.02 | |||||||||||
|
|
|
|
|
|
|
| |||||||||
Total from Investment Operations | 0.48 | 0.68 | 1.20 | 0.13 | ||||||||||||
|
|
|
|
|
|
|
| |||||||||
LESS DISTRIBUTIONS FROM: | ||||||||||||||||
Net investment income | (0.63 | ) | (0.63 | ) | (0.63 | ) | (0.11 | ) | ||||||||
Net realized capital gains | — | (0.06 | ) | (0.02 | ) | — | ||||||||||
|
|
|
|
|
|
|
| |||||||||
Total Distributions | (0.63 | ) | (0.69 | ) | (0.65 | ) | (0.11 | ) | ||||||||
|
|
|
|
|
|
|
| |||||||||
Net asset value, end of the period | $ | 10.41 | $ | 10.56 | $ | 10.57 | $ | 10.02 | ||||||||
|
|
|
|
|
|
|
| |||||||||
Total return | 4.49 | %(b) | 6.68 | % | 12.33 | %(b) | 1.29 | %(b)(c) | ||||||||
RATIOS TO AVERAGE NET ASSETS: | ||||||||||||||||
Net assets, end of the period (000’s) | $ | 1,022,193 | $ | 760,972 | $ | 46,895 | $ | 40,636 | ||||||||
Net expenses | 0.85 | %(d)(f) | 0.85 | %(e) | 0.85 | %(d) | 1.01 | %(d)(g)(h) | ||||||||
Gross expenses | 0.87 | %(f) | 0.85 | %(e) | 1.37 | % | 3.60 | %(h) | ||||||||
Net investment income | 5.76 | % | 5.55 | % | 7.57 | % | 5.17 | %(h) | ||||||||
Portfolio turnover rate | 107 | % | 82 | % | 90 | % | 17 | % | ||||||||
| * | From commencement of operations on September 16, 2011 through November 30, 2011. |
| (a) | Per share net investment income has been calculated using the average shares outstanding during the period. |
| (b) | Had certain expenses not been waived/reimbursed during the period, total returns would have been lower. Periods less than one year are not annualized. |
| (c) | For the period September 30, 2011 (the date Class Y shares were first registered under the Securities Act of 1933) through November 30, 2011, the total return for Class Y shares was 3.04%. |
| (d) | The investment adviser agreed to waive its fees and/or reimburse a portion of the Fund’s expenses during the period. Without this waiver/reimbursement, expenses would have been higher. |
| (e) | Includes fee/expense recovery of 0.02%. |
| (f) | Includes interest expense of 0.05%. Without this expense the ratio of net expenses would have been 0.80% and the ratio of gross expenses would have been 0.82%. |
| (g) | Prior to September 30, 2011, there was no expense limitation agreement in place for Class Y. |
| (h) | Computed on an annualized basis for periods less than one year. |
See accompanying notes to financial statements.
75 |
Table of Contents
Financial Highlights (continued)
For a share outstanding throughout each period.
| Vaughan Nelson Select Fund—Class A | ||||||||||||
| Year Ended November 30, 2014 | Year Ended November 30, 2013 | Period Ended November 30, 2012* | ||||||||||
Net asset value, beginning of the period | $ | 14.22 | $ | 10.50 | $ | 10.00 | ||||||
|
|
|
|
|
| |||||||
INCOME (LOSS) FROM INVESTMENT OPERATIONS: | ||||||||||||
Net investment income (loss)(a) | (0.01 | ) | 0.01 | (b) | (0.00 | )(c) | ||||||
Net realized and unrealized gain (loss) | 2.01 | 3.94 | 0.50 | |||||||||
|
|
|
|
|
| |||||||
Total from Investment Operations | 2.00 | 3.95 | 0.50 | |||||||||
|
|
|
|
|
| |||||||
LESS DISTRIBUTIONS FROM: | ||||||||||||
Net investment income | (0.01 | ) | — | — | ||||||||
Net realized capital gains | (1.43 | ) | (0.23 | ) | — | |||||||
|
|
|
|
|
| |||||||
Total Distributions | (1.44 | ) | (0.23 | ) | — | |||||||
|
|
|
|
|
| |||||||
Net asset value, end of the period | $ | 14.78 | $ | 14.22 | $ | 10.50 | ||||||
|
|
|
|
|
| |||||||
Total return(d)(e) | 15.31 | % | 38.44 | %(b) | 5.00 | % | ||||||
RATIOS TO AVERAGE NET ASSETS: | ||||||||||||
Net assets, end of the period (000’s) | $ | 11,182 | $ | 9,468 | $ | 777 | ||||||
Net expenses(f) | 1.40 | % | 1.40 | % | 1.40 | %(g) | ||||||
Gross expenses | 1.62 | % | 1.96 | % | 3.36 | %(g) | ||||||
Net investment income (loss) | (0.08 | )% | 0.05 | %(b) | (0.11 | )%(g) | ||||||
Portfolio turnover rate | 64 | % | 112 | % | 72 | % | ||||||
| * | From commencement of operations on June 29, 2012 through November 30, 2012. |
| (a) | Per share net investment income (loss) has been calculated using the average shares outstanding during the period. |
| (b) | Includes a non-recurring dividend. Without this dividend, net investment loss per share would have been $(0.01), total return would have been 38.24%, and the ratio of net investment loss to average net assets would have been (0.07)%. |
| (c) | Amount rounds to less than $0.01 per share. |
| (d) | Had certain expenses not been waived/reimbursed during the period, total returns would have been lower. Periods less than one year are not annualized. |
| (e) | A sales charge for Class A shares is not reflected in total return calculations. |
| (f) | The investment adviser agreed to waive its fees and/or reimburse a portion of the Fund’s expenses during the period. Without this waiver/reimbursement, expenses would have been higher. |
| (g) | Computed on an annualized basis for periods less than one year. |
See accompanying notes to financial statements.
| 76
Table of Contents
Financial Highlights (continued)
For a share outstanding throughout each period.
| Vaughan Nelson Select Fund—Class C | ||||||||||||
| Year Ended November 30, 2014 | Year Ended November 30, 2013 | Period Ended November 30, 2012* | ||||||||||
Net asset value, beginning of the period | $ | 14.07 | $ | 10.47 | $ | 10.00 | ||||||
|
|
|
|
|
| |||||||
INCOME (LOSS) FROM INVESTMENT OPERATIONS: | ||||||||||||
Net investment loss(a) | (0.11 | ) | (0.08 | )(b) | (0.03 | ) | ||||||
Net realized and unrealized gain (loss) | 1.99 | 3.91 | 0.50 | |||||||||
|
|
|
|
|
| |||||||
Total from Investment Operations | 1.88 | 3.83 | 0.47 | |||||||||
|
|
|
|
|
| |||||||
LESS DISTRIBUTIONS FROM: | ||||||||||||
Net investment income | — | — | — | |||||||||
Net realized capital gains | (1.43 | ) | (0.23 | ) | — | |||||||
|
|
|
|
|
| |||||||
Total Distributions | (1.43 | ) | (0.23 | ) | — | |||||||
|
|
|
|
|
| |||||||
Net asset value, end of the period | $ | 14.52 | $ | 14.07 | $ | 10.47 | ||||||
|
|
|
|
|
| |||||||
Total return(c)(d) | 14.54 | % | 37.38 | %(b) | 4.70 | % | ||||||
RATIOS TO AVERAGE NET ASSETS: | ||||||||||||
Net assets, end of the period (000’s) | $ | 2,955 | $ | 1,118 | $ | 159 | ||||||
Net expenses(e) | 2.15 | % | 2.15 | % | 2.15 | %(f) | ||||||
Gross expenses | 2.35 | % | 2.76 | % | 4.48 | %(f) | ||||||
Net investment loss | (0.84 | )% | (0.62 | )%(b) | (0.78 | )%(f) | ||||||
Portfolio turnover rate | 64 | % | 112 | % | 72 | % | ||||||
| * | From commencement of operations on June 29, 2012 through November 30, 2012. |
| (a) | Per share net investment loss has been calculated using the average shares outstanding during the period. |
| (b) | Includes a non-recurring dividend. Without this dividend, net investment loss per share would have been $(0.09), total return would have been 37.28%, and the ratio of net investment loss to average net assets would have been (0.75)%. |
| (c) | Had certain expenses not been waived/reimbursed during the period, total returns would have been lower. Periods less than one year are not annualized. |
| (d) | A contingent deferred sales charge for Class C shares is not reflected in total return calculations. |
| (e) | The investment adviser agreed to waive its fees and/or reimburse a portion of the Fund’s expenses during the period. Without this waiver/reimbursement, expenses would have been higher. |
| (f) | Computed on an annualized basis for periods less than one year. |
See accompanying notes to financial statements.
77 |
Table of Contents
Financial Highlights (continued)
For a share outstanding throughout each period.
| Vaughan Nelson Select Fund—Class Y | ||||||||||||
| Year Ended November 30, 2014 | Year Ended November 30, 2013 | Period Ended November 30, 2012* | ||||||||||
Net asset value, beginning of the period | $ | 14.24 | $ | 10.51 | $ | 10.00 | ||||||
|
|
|
|
|
| |||||||
INCOME (LOSS) FROM INVESTMENT OPERATIONS: | ||||||||||||
Net investment income (loss)(a) | 0.02 | 0.04 | (b) | (0.00 | )(c) | |||||||
Net realized and unrealized gain (loss) | 2.03 | 3.94 | 0.51 | |||||||||
|
|
|
|
|
| |||||||
Total from Investment Operations | 2.05 | 3.98 | 0.51 | |||||||||
|
|
|
|
|
| |||||||
LESS DISTRIBUTIONS FROM: | ||||||||||||
Net investment income | (0.03 | ) | (0.02 | ) | — | |||||||
Net realized capital gains | (1.43 | ) | (0.23 | ) | — | |||||||
|
|
|
|
|
| |||||||
Total Distributions | (1.46 | ) | (0.25 | ) | — | |||||||
|
|
|
|
|
| |||||||
Net asset value, end of the period | $ | 14.83 | $ | 14.24 | $ | 10.51 | ||||||
|
|
|
|
|
| |||||||
Total return(d) | 15.66 | % | 38.80 | %(b) | 5.10 | % | ||||||
RATIOS TO AVERAGE NET ASSETS: | ||||||||||||
Net assets, end of the period (000’s) | $ | 54,095 | $ | 14,211 | $ | 6,759 | ||||||
Net expenses(e) | 1.15 | % | 1.15 | % | 1.15 | %(f) | ||||||
Gross expenses | 1.33 | % | 1.80 | % | 3.46 | %(f) | ||||||
Net investment income (loss) | 0.16 | % | 0.33 | %(b) | (0.10 | )%(f) | ||||||
Portfolio turnover rate | 64 | % | 112 | % | 72 | % | ||||||
| * | From commencement of operations on June 29, 2012 through November 30, 2012. |
| (a) | Per share net investment income (loss) has been calculated using the average shares outstanding during the period. |
| (b) | Includes a non-recurring dividend. Without this dividend, net investment income per share would have been $0.02, total return would have been 38.61%, and the ratio of net investment income to average net assets would have been 0.15%. |
| (c) | Amount rounds to less than $0.01 per share. |
| (d) | Had certain expenses not been waived/reimbursed during the period, total returns would have been lower. Periods less than one year are not annualized. |
| (e) | The investment adviser agreed to waive its fees and/or reimburse a portion of the Fund’s expenses during the period. Without this waiver/reimbursement, expenses would have been higher. |
| (f) | Computed on an annualized basis for periods less than one year. |
See accompanying notes to financial statements.
| 78
Table of Contents
November 30, 2014
1. Organization. Gateway Trust and Natixis Funds Trust II (the “Trusts” and each a “Trust”) are each organized as a Massachusetts business trust. Each Trust is registered under the Investment Company Act of 1940, as amended (the “1940 Act”), as an open-end management investment company. Each Declaration of Trust permits the Board of Trustees to authorize the issuance of an unlimited number of shares of the Trust in multiple series. The financial statements for certain funds of the Trusts are presented in separate reports. The following funds (individually, a “Fund” and collectively, the “Funds”) are included in this report:
Gateway Trust:
Gateway International Fund
Natixis Funds Trust II:
Loomis Sayles Dividend Income Fund (formerly Loomis Sayles Capital Income Fund) (the “Dividend Income Fund”)
Loomis Sayles Emerging Markets Opportunities Fund (the “Emerging Markets Opportunities Fund”)
Loomis Sayles Senior Floating Rate and Fixed Income Fund (the “Senior Floating Rate and Fixed Income Fund”)
Vaughan Nelson Select Fund (the “Select Fund”)
The Emerging Markets Opportunities Fund commenced operations on February 10, 2014 via contribution to the Fund by Natixis Global Asset Management, L.P. (“Natixis US”) of $25,003,000.
Dividend Income Fund and Gateway International Fund are each a diversified investment company, while Emerging Markets Opportunities Fund, Senior Floating Rate and Fixed Income Fund and Select Fund are each a non-diversified investment company.
Each Fund offers Class A, Class C and Class Y shares. In addition, Emerging Markets Opportunities Fund offers Class N shares. Class A shares are sold with a maximum front-end sales charge of 5.75% for Gateway International Fund, Dividend Income Fund and Select Fund, 4.50% for Emerging Markets Opportunities Fund and 3.50% for Senior Floating Rate and Fixed Income Fund. Class C shares do not pay a front-end sales charge, do not convert to any other class of shares, pay higher Rule 12b-1 fees than Class A shares and may be subject to a contingent deferred sales charge (“CDSC”) of 1.00% if those shares are redeemed within one year of acquisition, except for reinvested distributions. Class N and Class Y shares do not pay a front-end sales charge, a CDSC or Rule 12b-1 fees. Class N shares are offered exclusively through intermediaries and are primarily intended for employer-sponsored retirement plans. Class Y shares are intended for institutional investors with a minimum initial investment of $100,000, though some categories of investors are exempted from the minimum investment amount as outlined in the Funds’ prospectus.
79 |
Table of Contents
Notes to Financial Statements (continued)
November 30, 2014
Most expenses can be directly attributed to a Fund. Expenses which cannot be directly attributed to a Fund are generally apportioned based on the relative net assets of each of the funds in Natixis Funds Trust I, Natixis Funds Trust II, Natixis Funds Trust IV, Gateway Trust (“Natixis Funds Trusts”), Loomis Sayles Funds I and Loomis Sayles Funds II (“Loomis Sayles Funds Trusts”). Expenses of a Fund are borne pro rata by the holders of each class of shares, except that each class bears expenses unique to that class (including the Rule 12b-1 service and distribution fees and, for Emerging Markets Opportunities Fund, transfer agent fees). In addition, each class votes as a class only with respect to its own Rule 12b-1 Plan. Shares of each class would receive their pro rata share of the net assets of a Fund if the Fund were liquidated. The Trustees approve separate distributions from net investment income on each class of shares.
2. Significant Accounting Policies. The following is a summary of significant accounting policies consistently followed by each Fund in the preparation of its financial statements. The Funds’ financial statements follow the accounting and reporting guidelines provided for investment companies and are prepared in accordance with accounting principles generally accepted in the United States of America which require the use of management estimates that affect the reported amounts and disclosures in the financial statements. Actual results could differ from those estimates. Management has evaluated the events and transactions subsequent to year-end through the date the financial statements were issued and has determined that there were no material events that would require disclosure in the Funds’ financial statements.
a. Valuation. Fund securities and other investments are valued at market value based on market quotations obtained or determined by independent pricing services recommended by the adviser and subadviser and approved by the Board of Trustees. Fund securities and other investments for which market quotations are not readily available are valued at fair value as determined in good faith by the adviser or subadviser pursuant to procedures approved by the Board of Trustees, as described below. Market value is determined as follows:
Equity securities (including closed-end investment companies and exchange-traded funds) are valued at the last sale price quoted on the exchange or market where traded most extensively or, if there is no reported sale during the day, the closing bid quotation as reported by an independent pricing service. Securities traded on the NASDAQ Global Select Market, NASDAQ Global Market and NASDAQ Capital Market are valued at the NASDAQ Official Closing Price (“NOCP”), or if lacking an NOCP, at the most recent bid quotations on the applicable NASDAQ Market. In some foreign markets, an official close price and a last sale price may be available from the foreign exchange or market. In those cases, the official close price is used. Debt securities and unlisted equity securities are valued based on evaluated bids furnished to the Fund by an independent pricing service using market information, transactions for comparable securities and various relationships between securities, if available, or bid prices obtained from
| 80
Table of Contents
Notes to Financial Statements (continued)
November 30, 2014
broker-dealers. Senior loans are valued at bid prices supplied by an independent pricing service, if available. Broker-dealer bid prices may be used to value debt and equity securities and senior loans where an independent pricing service is unable to price a security or where an independent pricing service does not provide a reliable price for the security. Domestic exchange-traded single equity option contracts (including options on exchange-traded funds) are valued at the mean of the National Best Bid and Offer quotations. Over-the-counter (“OTC”) options on exchange-traded funds (“ETFs”) are valued at the mid price (between the bid price and the ask price) supplied by an independent pricing service, if available. Options on ETFs not priced through an independent pricing service are valued based on quotations obtained from broker-dealers. Forward foreign currency contracts are valued utilizing interpolated rates determined based on information provided by an independent pricing service. Futures contracts are valued at the current settlement price on the exchange on which the adviser believes that, over time, they are traded most extensively. Centrally cleared credit default swap agreements are valued at settlement prices of the clearinghouse on which the contracts were traded or prices obtained from broker-dealers. Bilateral credit default swaps are valued based on mid prices (between the bid price and the ask price) supplied by an independent pricing service.
Fund securities and other investments for which market quotations are not readily available are valued at fair value as determined in good faith by the adviser or subadviser pursuant to procedures approved by the Board of Trustees. The Fund may also value securities and other investments at fair value in other circumstances such as when extraordinary events occur after the close of a foreign market but prior to the close of the New York Stock Exchange (“NYSE”). This may include situations relating to a single issuer (such as a declaration of bankruptcy or a delisting of the issuer’s security from the primary market on which it has traded) as well as events affecting the securities markets in general (such as market disruptions or closings and significant fluctuations in U.S. and/or foreign markets). When fair valuing its securities or other investments, the Fund may, among other things, use modeling tools or other processes that may take into account factors such as securities or other market activity and/or significant events that occur after the close of the foreign market and before the time the Fund’s Net Asset Value (“NAV”) is calculated. Fair value pricing may require subjective determinations about the value of a security, and fair values used to determine a Fund’s NAV may differ from quoted or published prices, or from prices that are used by others, for the same securities. In addition, the use of fair value pricing may not always result in adjustments to the prices of securities held by the Fund.
As of November 30, 2014, approximately 97% of the market value of Gateway International Fund’s investments and approximately 2% of the market value of Emerging Markets Opportunities Fund’s investments were fair valued pursuant to procedures approved by the Board of Trustees as events occurring after the close of the foreign market were believed to materially affect the value of those securities.
81 |
Table of Contents
Notes to Financial Statements (continued)
November 30, 2014
b. Investment Transactions and Related Investment Income. Investment transactions are accounted for on a trade date plus one day basis for daily NAV calculation. However, for financial reporting purposes, investment transactions are reported on trade date. Dividend income is recorded on ex-dividend date, or in the case of certain foreign securities, as soon as a Fund is notified, and interest income is recorded on an accrual basis. Interest income is increased by the accretion of discount and decreased by the amortization of premium. In determining net gain or loss on securities sold, the cost of securities has been determined on an identified cost basis. Investment income, non-class specific expenses and realized and unrealized gains and losses are allocated on a pro rata basis to each class based on the relative net assets of each class to the total net assets of the Fund.
c. Foreign Currency Translation. The books and records of the Funds are maintained in U.S. dollars. The values of securities, currencies and other assets and liabilities denominated in currencies other than U.S. dollars are translated into U.S. dollars based upon foreign exchange rates prevailing at the end of the period. Purchases and sales of investment securities, income and expenses are translated on the respective dates of such transactions.
Since the values of investment securities are presented at the foreign exchange rates prevailing at the end of the period, it is not practical to isolate that portion of the results of operations arising from changes in exchange rates from fluctuations which arise due to changes in market prices of investment securities. Such changes are included with the net realized and unrealized gain or loss on investments.
Net realized foreign exchange gains or losses arise from sales of foreign currency, currency gains or losses realized between the trade and settlement dates on securities transactions and the difference between the amounts of dividends, interest and foreign withholding taxes recorded on the Funds’ books and the U.S. dollar equivalent of the amounts actually received or paid. Net unrealized foreign exchange gains and losses arise from changes in the value of assets and liabilities, other than investment securities, at the end of the fiscal period, resulting from changes in exchange rates.
Each Fund may use foreign currency exchange contracts to facilitate transactions in foreign-denominated investments. Losses may arise from changes in the value of the foreign currency or if the counterparties do not perform under the contracts’ terms.
d. Forward Foreign Currency Contracts. Certain Funds may enter into forward foreign currency contracts, including forward foreign cross currency contracts to acquire exposure to foreign currencies or to hedge the Funds’ investments against currency fluctuation. A contract can also be used to offset a previous contract. These contracts involve market risk in excess of the unrealized gain or loss reflected in the Funds’ Statements of Assets and Liabilities. The U.S. dollar value of the currencies a Fund has committed to buy or sell represents the aggregate exposure to each currency a Fund has acquired or hedged through currency contracts outstanding at period end. Gains or
| 82
Table of Contents
Notes to Financial Statements (continued)
November 30, 2014
losses are recorded for financial statement purposes as unrealized until settlement date. Contracts are traded over-the-counter directly with a counterparty. Risks may arise upon entering into these contracts from the potential inability of counterparties to meet the terms of their contracts and from unanticipated movements in the value of a foreign currency relative to the U.S. dollar. Certain contracts may require the movement of cash and/or securities as collateral for the Funds’ or counterparty’s net obligations under the contracts.
e. Futures Contracts. Certain Funds may enter into futures contracts. Futures contracts are agreements between two parties to buy and sell a particular instrument or index for a specified price on a specified future date.
When a Fund enters into a futures contract, it is required to deposit with (or for the benefit of) its broker an amount of cash or short-term high-quality securities as “initial margin.” As the value of the contract changes, the value of the futures contract position increases or declines. Subsequent payments, known as “variation margin,” are made or received by a Fund, depending on the price fluctuations in the fair value of the contract and the value of cash or securities on deposit with the broker. The aggregate principal amounts of the contracts are not recorded in the financial statements. Fluctuations in the value of the contracts are recorded in the Statements of Assets and Liabilities as an asset (liability) and in the Statements of Operations as unrealized appreciation (depreciation) until the contracts are closed, when they are recorded as realized gains (losses). Realized gain or loss on a futures position is equal to the difference between the value of the contract at the time it was opened and the value at the time it was closed, minus brokerage commissions. When a Fund enters into a futures contract certain risks may arise, such as illiquidity in the futures market, which may limit a Fund’s ability to close out a futures contract prior to settlement date, and unanticipated movements in the value of securities or interest rates.
Futures contracts are exchange-traded. Exchange-traded futures contracts are standardized and are settled through a clearing house with fulfillment supported by the credit of the exchange. Therefore, counterparty credit risks to the Funds are reduced; however, in the event that a counterparty enters into bankruptcy, the Fund’s claim against initial/variation margin on deposit with the counterparty may be subject to terms of a final settlement in bankruptcy court.
f. Option Contracts. Certain Funds may enter into option contracts. When a Fund purchases an option, it pays a premium and the option is subsequently marked-to-market to reflect current value. Premiums paid for purchasing options which expire are treated as realized losses. Premiums paid for purchasing options which are exercised are added to the cost or deducted from the proceeds on the underlying instrument to determine the realized gain or loss. If the Fund enters into a closing sale transaction, the difference between the premium paid and the proceeds of the closing sale transaction is treated as a realized gain or loss. The risk associated with purchasing options is limited to the premium paid.
83 |
Table of Contents
Notes to Financial Statements (continued)
November 30, 2014
When a Fund writes an option, an amount equal to the net premium received (the premium less commission) is recorded as a liability and is subsequently adjusted to the current value. Net premiums received for written options which expire are treated as realized gains. Net premiums received for written options which are exercised are deducted from the cost or added to the proceeds on the underlying instrument to determine the realized gain or loss. If the Fund enters into a closing purchase transaction, the difference between the net premium received and any amount paid on effecting a closing purchase transaction, including commissions, is treated as a realized gain or, if the net premium received is less than the amount paid, as a realized loss. The Fund, as writer of a written option, bears the risk of an unfavorable change in the market value of the instrument underlying the written option.
Exchange-traded options contracts are standardized and are settled through a clearing house with fulfillment supported by the credit of the exchange. Therefore, counterparty credit risks to the Funds are reduced. OTC options are subject to the risk that the counterparty is unable or unwilling to meet its obligations under the option.
g. Swap Agreements. Certain Funds may enter into credit default swaps. A credit default swap is an agreement between two parties (the “protection buyer” and “protection seller”) to exchange the credit risk of an issuer (“reference obligation”) for a specified time period. The reference obligation may be one or more debt securities or an index of such securities. The Funds may be either the protection buyer or the protection seller. As a protection buyer, the Funds have the ability to hedge the downside risk of an issuer or group of issuers. As a protection seller, the Funds have the ability to gain exposure to an issuer or group of issuers whose bonds are unavailable or in short supply in the cash bond market, as well as realize additional income in the form of fees paid by the protection buyer. The protection buyer is obligated to pay the protection seller a stream of payments (“fees”) over the term of the contract, provided that no credit event, such as a default or a downgrade in credit rating, occurs on the reference obligation. The Funds may also pay or receive upfront premiums. If a credit event occurs, the protection seller must pay the protection buyer the difference between the agreed upon notional value and market value of the reference obligation. Market value in this case is determined by a facilitated auction whereby a minimum number of allowable broker bids, together with a specified valuation method, are used to calculate the value. The maximum potential amount of undiscounted future payments that a Fund as the protection seller could be required to make under a credit default swap agreement would be an amount equal to the notional amount of the agreement.
Implied credit spreads, represented in absolute terms, are disclosed in the Portfolio of Investments for those agreements for which the Fund is the protection seller. Implied credit spreads serve as an indicator of the current status of the payment/performance risk and represent the likelihood or risk of default for the credit derivative. The implied credit spread of a particular reference entity reflects the cost of buying/selling
| 84
Table of Contents
Notes to Financial Statements (continued)
November 30, 2014
protection and may include upfront payments required to be made to enter into the agreement. Wider credit spreads represent a deterioration of the reference entity’s credit soundness and a greater likelihood or risk of default or other credit event occurring as defined under the terms of the agreement.
The notional amounts of swap agreements are not recorded in the financial statements. Swap agreements are valued daily, and fluctuations in value are recorded in the Statements of Operations as change in unrealized appreciation (depreciation) on swap agreements. Fees are accrued in accordance with the terms of the agreement and are recorded in the Statements of Assets and Liabilities as fees receivable or payable. When received or paid, fees are recorded in the Statements of Operations as realized gain or loss. Upfront premiums paid or received by the Funds are recorded on the Statements of Assets and Liabilities as an asset or liability, respectively, and are amortized or accreted over the term of the agreement and recorded as realized gain or loss. Payments made or received by the Funds as a result of a credit event or termination of the agreement are recorded as realized gain or loss.
Swap agreements are privately negotiated in the OTC market and may be entered into as a bilateral contract or centrally cleared (“centrally cleared swaps”). Bilateral swap agreements are traded between counterparties and, as such, are subject to the risk that a party to the agreement will not be able to meet its obligations. In a centrally cleared swap, immediately following execution of the swap agreement, the swap agreement is novated to a central counterparty (the “CCP”) and the Fund faces the CCP through a broker. Upon entering into a centrally cleared swap, the Fund is required to deposit initial margin with the broker in the form of cash or securities in an amount that varies depending on the size and risk profile of the particular swap. Subsequent payments, known as “variation margin,” are made or received by the Fund based on the daily change in the value of the centrally cleared swap agreement. For centrally cleared swaps, the Fund’s counterparty credit risk is reduced as the CCP stands between the Fund and the counterparty. The Funds cover their net obligations under outstanding swap agreements by segregating or earmarking cash or securities.
h. Due from Brokers. Transactions and positions in certain options, futures, forward foreign currency contracts and swap agreements are maintained and cleared by registered U.S. broker/dealers pursuant to customer agreements between the Funds and the various broker/dealers. Due from brokers’ balance in the Statements of Assets and Liabilities for Emerging Markets Opportunities Fund represents cash pledged as collateral for options, forward foreign currency contracts and bilateral swap agreements and as initial margin for futures contracts. In certain circumstances the Fund’s use of cash held at brokers is restricted by regulation or broker mandated limits.
i. Federal and Foreign Income Taxes. The Trusts treat each Fund as a separate entity for federal income tax purposes. Each Fund intends to meet the requirements of the Internal Revenue Code of 1986, as amended, applicable to regulated investment
85 |
Table of Contents
Notes to Financial Statements (continued)
November 30, 2014
companies, and to distribute to its shareholders substantially all of its net investment income and any net realized capital gains at least annually. Management has performed an analysis of each Fund’s tax positions for the open tax years as of November 30, 2014 and has concluded that no provisions for income tax are required. The Funds’ federal tax returns for the prior three fiscal years, where applicable, remain subject to examination by the Internal Revenue Service. Management is not aware of any events that are reasonably possible to occur in the next twelve months that would result in the amounts of any unrecognized tax benefits significantly increasing or decreasing for the Funds. However, management’s conclusions regarding tax positions taken may be subject to review and adjustment at a later date based on factors including, but not limited to, new tax laws and accounting regulations and interpretations thereof.
A Fund may be subject to foreign withholding taxes on investment income and taxes on capital gains on investments that are accrued and paid based upon the Fund’s understanding of the tax rules and regulations that exist in the countries in which the Fund invests. Foreign withholding taxes on dividend and interest income are reflected on the Statements of Operations as a reduction of investment income, net of amounts eligible to be reclaimed. Dividends and interest receivable on the Statements of Assets and Liabilities are net of foreign withholding taxes. Foreign withholding taxes eligible to be reclaimed are reflected on the Statements of Assets and Liabilities as tax reclaims receivable. Capital gains taxes paid are included in net realized gain (loss) on investments in the Statements of Operations. Accrued but unpaid capital gains taxes are reflected as foreign taxes payable on the Statements of Assets and Liabilities, if applicable, and reduce unrealized gains on investments. In the event that realized gains on investments are subsequently offset by realized losses, taxes paid on realized gains may be returned to a Fund. Such amounts, if applicable, are reflected as foreign tax rebates receivable on the Statements of Assets and Liabilities and are recorded as a realized gain when received.
j. Dividends and Distributions to Shareholders. Dividends and distributions are recorded on ex-dividend date. The timing and characterization of certain income and capital gain distributions are determined annually in accordance with federal tax regulations, which may differ from accounting principles generally accepted in the United States of America. Permanent differences are primarily due to differing treatments for book and tax purposes of items such as foreign currency gains and losses, paydown gains and losses, return of capital and capital gain distributions received, deferred Trustees’ fees, contingent payment debt instruments, non-deductible expenses, passive foreign investment company adjustments and premium amortization. Permanent book and tax basis differences relating to shareholder distributions, net investment income, and net realized gains will result in reclassifications to capital accounts. Temporary differences between book and tax distributable earnings are primarily due to deferred Trustees’ fees, wash sales,
| 86
Table of Contents
Notes to Financial Statements (continued)
November 30, 2014
premium amortization, contingent payment debt instruments, futures and forward foreign currency contracts mark-to-market, return of capital distributions received and partnership basis adjustments. Distributions from net investment income and short-term capital gains are considered to be distributed from ordinary income for tax purposes.
The tax characterization of distributions is determined on an annual basis. The tax character of distributions paid to shareholders during the years ended November 30, 2014 and 2013 were as follows:
| 2014 Distributions Paid From: | 2013 Distributions Paid From: | |||||||||||||||||||||||
Fund | Ordinary Income | Long-Term | Total | Ordinary Income | Long-Term | Total | ||||||||||||||||||
Gateway International Fund | $ | 489,722 | $ | — | $ | 489,722 | $ | 550,076 | $ | — | $ | 550,076 | ||||||||||||
Dividend Income Fund | 1,601,456 | 781,029 | 2,382,485 | 698,276 | 9,053 | 707,329 | ||||||||||||||||||
Emerging Markets Opportunities Fund | 939,673 | — | 939,673 | — | — | — | ||||||||||||||||||
Senior Floating Rate and Fixed Income Fund | 87,986,105 | — | 87,986,105 | 42,007,434 | — | 42,007,434 | ||||||||||||||||||
Select Fund | 2,243,055 | 313,409 | 2,556,464 | 286,876 | — | 286,876 | ||||||||||||||||||
Differences between these amounts and those reported in the Statements of Changes in Net Assets are primarily attributable to different book and tax treatment for short-term capital gains.
As of November 30, 2014, the components of distributable earnings on a tax basis were as follows:
Gateway | Dividend | Emerging | Senior | Select Fund | ||||||||||||||||
Undistributed ordinary income | $ | 557,773 | $ | 796,462 | $ | 217,150 | $ | 2,351,692 | $ | 689,013 | ||||||||||
Undistributed long-term capital gains | — | 2,082,756 | 86,947 | — | 1,412,586 | |||||||||||||||
|
|
|
|
|
|
|
|
|
| |||||||||||
Total undistributed earnings | 557,773 | 2,879,218 | 304,097 | 2,351,692 | 2,101,599 | |||||||||||||||
|
|
|
|
|
|
|
|
|
| |||||||||||
87 |
Table of Contents
Notes to Financial Statements (continued)
November 30, 2014
Gateway | Dividend | Emerging | Senior | Select Fund | ||||||||||||||||
Capital loss carryforward: | $ | — | $ | — | $ | — | $ | — | $ | — | ||||||||||
Short-term: | ||||||||||||||||||||
No expiration date | (3,900,053 | )* | — | — | (2,266,544 | ) | — | |||||||||||||
Long-term: | ||||||||||||||||||||
No expiration date | — | — | — | (1,942,803 | ) | — | ||||||||||||||
|
|
|
|
|
|
|
|
|
| |||||||||||
Total capital loss carryforward | (3,900,053 | ) | — | — | (4,209,347 | ) | — | |||||||||||||
|
|
|
|
|
|
|
|
|
| |||||||||||
Unrealized appreciation (depreciation) | 2,770,737 | 3,480,800 | 401,795 | (23,136,181 | ) | 6,831,402 | ||||||||||||||
|
|
|
|
|
|
|
|
|
| |||||||||||
Total accumulated earnings (losses) | $ | (571,543 | ) | $ | 6,360,018 | $ | 705,892 | $ | (24,993,836 | ) | $ | 8,933,001 | ||||||||
|
|
|
|
|
|
|
|
|
| |||||||||||
Capital loss carryforward utilized in the current year | $ | 946,017 | $ | — | $ | — | $ | — | $ | — | ||||||||||
|
|
|
|
|
|
|
|
|
| |||||||||||
| * | Of the $3,900,053 capital loss carry forward (“CLCO”) for the Gateway International Fund, $1,137,699 is unrestricted and can be utilized to offset net realized capital gains in future fiscal years. Utilization of the remaining portion of the CLCO ($2,762,354) is subject to an annual limitation of $1,187,217, pursuant to Section 382 of the Internal Revenue Code. |
k. Repurchase Agreements. Each Fund may enter into repurchase agreements, under the terms of a Master Repurchase Agreement, under which each Fund acquires securities as collateral and agrees to resell the securities at an agreed upon time and at an agreed upon price. It is each Fund’s policy that the market value of the collateral for repurchase agreements be at least equal to 102% of the repurchase price, including interest. Certain repurchase agreements are tri-party arrangements whereby the collateral is held in a segregated account for the benefit of the Fund and on behalf of the counterparty. Repurchase agreements could involve certain risks in the event of default or insolvency of the counterparty, including possible delays or restrictions upon a Fund’s ability to dispose of the underlying securities. As of November 30, 2014, each Fund, as applicable, had investments in repurchase agreements for which the value of the related collateral exceeded the value of the repurchase agreement. The gross value of repurchase agreements is included in the Statements of Assets and Liabilities for financial reporting purposes.
l. Indemnifications. Under the Trusts’ organizational documents, its officers and Trustees are indemnified against certain liabilities arising out of the performance of their duties to the Funds. Additionally, in the normal course of business, the Funds enter into contracts with service providers that contain general indemnification clauses. The
| 88
Table of Contents
Notes to Financial Statements (continued)
November 30, 2014
Funds’ maximum exposure under these arrangements is unknown as this would involve future claims that may be made against the Funds that have not yet occurred. However, based on experience, the Funds expect the risk of loss to be remote.
3. Fair Value Measurements. In accordance with accounting standards related to fair value measurements and disclosures, the Funds have categorized the inputs utilized in determining the value of each Fund’s assets or liabilities. These inputs are summarized in the three broad levels listed below:
| • | Level 1 – quoted prices in active markets for identical assets or liabilities; |
| • | Level 2 – prices determined using other significant inputs that are observable either directly, or indirectly through corroboration with observable market data (which could include quoted prices for similar assets or liabilities, interest rates, credit risk, etc.); and |
| • | Level 3 – prices determined using significant unobservable inputs when quoted prices or observable inputs are unavailable such as when there is little or no market activity for an asset or liability (unobservable inputs reflect each Fund’s own assumptions in determining the fair value of assets or liabilities and would be based on the best information available). |
The inputs or methodology used for valuing securities are not necessarily an indication of the risk associated with investing in those securities.
The following is a summary of the inputs used to value the Funds’ investments as of November 30, 2014, at value:
Gateway International Fund
Asset Valuation Inputs
Description | Level 1 | Level 2 | Level 3 | Total | ||||||||||||
Common Stocks | ||||||||||||||||
Australia | $ | 93,523 | $ | 1,361,071 | $ | — | $ | 1,454,594 | ||||||||
All Other Common Stocks(a) | — | 17,316,632 | — | 17,316,632 | ||||||||||||
|
|
|
|
|
|
|
| |||||||||
Total Common Stocks | 93,523 | 18,677,703 | — | 18,771,226 | ||||||||||||
|
|
|
|
|
|
|
| |||||||||
Purchased Options | 42,183 | — | — | 42,183 | ||||||||||||
Short-Term Investments | — | 487,882 | — | 487,882 | ||||||||||||
|
|
|
|
|
|
|
| |||||||||
Total | $ | 135,706 | $ | 19,165,585 | $ | — | $ | 19,301,291 | ||||||||
|
|
|
|
|
|
|
| |||||||||
| Liability Valuation Inputs | ||||||||||||||||
Description | Level 1 | Level 2 | Level 3 | Total | ||||||||||||
Written Options | $ | — | $ | (139,507 | ) | $ | — | $ | (139,507 | ) | ||||||
|
|
|
|
|
|
|
| |||||||||
| (a) | Details of the major categories of the Fund’s investments are reflected within the Portfolio of Investments. |
89 |
Table of Contents
Notes to Financial Statements (continued)
November 30, 2014
A common stock valued at $84,562 was transferred from Level 1 to Level 2 during the period ended November 30, 2014. At November 30, 2013, this security was valued at the market price in the foreign market in accordance with the Fund’s valuation policies. At November 30, 2014, this security was fair valued pursuant to procedures approved by the Board of Trustees as events occurring after the close of the foreign market were believed to materially affect the value of the security.
A common stock valued at $129,661 was transferred from Level 2 to Level 1 during the period ended November 30, 2014. At November 30, 2013, this security was fair valued pursuant to procedures approved by the Board of Trustees as events occurring after the close of the foreign market were believed to materially affect the value of the security. At November 30, 2014, this security was valued at the market price in the foreign market in accordance with the Fund’s valuation policies.
All transfers are recognized as of the beginning of the reporting period.
Dividend Income Fund
Asset Valuation Inputs
Description | Level 1 | Level 2 | Level 3 | Total | ||||||||||||
Common Stocks(a) | $ | 25,429,975 | $ | — | $ | — | $ | 25,429,975 | ||||||||
Bonds and Notes(a) | — | 4,338,383 | — | 4,338,383 | ||||||||||||
Preferred Stocks(a) | 284,519 | — | — | 284,519 | ||||||||||||
Short-Term Investments | — | 1,650,409 | — | 1,650,409 | ||||||||||||
|
|
|
|
|
|
|
| |||||||||
Total | $ | 25,714,494 | $ | 5,988,792 | $ | — | $ | 31,703,286 | ||||||||
|
|
|
|
|
|
|
| |||||||||
| Liability Valuation Inputs | ||||||||||||||||
Description | Level 1 | Level 2 | Level 3 | Total | ||||||||||||
Written Options(a) | $ | (7,838 | ) | $ | — | $ | — | $ | (7,838 | ) | ||||||
|
|
|
|
|
|
|
| |||||||||
| (a) | Details of the major categories of the Fund’s investments are reflected within the Portfolio of Investments. |
For the year ended November 30, 2014, there were no transfers among Levels 1, 2 and 3.
| 90
Table of Contents
Notes to Financial Statements (continued)
November 30, 2014
Emerging Markets Opportunities Fund
Asset Valuation Inputs
Description | Level 1 | Level 2 | Level 3 | Total | ||||||||||||
Bonds and Notes(a) | $ | — | $ | 30,465,669 | $ | — | $ | 30,465,669 | ||||||||
Senior Loans(a) | — | 199,475 | — | 199,475 | ||||||||||||
Common Stocks | ||||||||||||||||
Cambodia | — | 167,825 | — | 167,825 | ||||||||||||
Indonesia | — | 367,686 | — | 367,686 | ||||||||||||
All Other Common Stocks(a) | 277,126 | — | — | 277,126 | ||||||||||||
|
|
|
|
|
|
|
| |||||||||
Total Common Stocks | 277,126 | 535,511 | — | 812,637 | ||||||||||||
|
|
|
|
|
|
|
| |||||||||
Exchange Traded Funds(a) | 754,725 | — | — | 754,725 | ||||||||||||
Purchased Options(a) | — | 431 | — | 431 | ||||||||||||
Short-Term Investments | — | 2,521,899 | — | 2,521,899 | ||||||||||||
|
|
|
|
|
|
|
| |||||||||
Total Investments | 1,031,851 | 33,722,985 | — | 34,754,836 | ||||||||||||
|
|
|
|
|
|
|
| |||||||||
Forward Foreign Currency Contracts (unrealized appreciation) | — | 22,159 | — | 22,159 | ||||||||||||
Futures Contracts (unrealized appreciation) | 21,899 | — | — | 21,899 | ||||||||||||
|
|
|
|
|
|
|
| |||||||||
Total | $ | 1,053,750 | $ | 33,745,144 | $ | — | $ | 34,798,894 | ||||||||
|
|
|
|
|
|
|
| |||||||||
| Liability Valuation Inputs | ||||||||||||||||
Description | Level 1 | Level 2 | Level 3 | Total | ||||||||||||
Bilateral Credit Default Swap Agreements (unrealized depreciation) | $ | — | $ | (21,632 | ) | $ | — | $ | (21,632 | ) | ||||||
Forward Foreign Currency Contracts (unrealized depreciation) | — | (7,690 | ) | — | (7,690 | ) | ||||||||||
Futures Contracts (unrealized depreciation) | (4,289 | ) | — | — | (4,289 | ) | ||||||||||
|
|
|
|
|
|
|
| |||||||||
Total | $ | (4,289 | ) | $ | (29,322 | ) | $ | — | $ | (33,611 | ) | |||||
|
|
|
|
|
|
|
| |||||||||
| (a) | Details of the major categories of the Fund’s investments are reflected within the Portfolio of Investments. |
For the period ended November 30, 2014, there were no transfers among Levels 1, 2 and 3.
91 |
Table of Contents
Notes to Financial Statements (continued)
November 30, 2014
Senior Floating Rate and Fixed Income Fund
Asset Valuation Inputs
Description | Level 1 | Level 2 | Level 3 | Total | ||||||||||||
Senior Loans(a) | $ | — | $ | 1,396,964,991 | $ | — | $ | 1,396,964,991 | ||||||||
Bonds and Notes(a) | — | 182,906,144 | — | 182,906,144 | ||||||||||||
Short-Term Investments | — | 143,804,953 | — | 143,804,953 | ||||||||||||
|
|
|
|
|
|
|
| |||||||||
Total | $ | — | $ | 1,723,676,088 | $ | — | $ | 1,723,676,088 | ||||||||
|
|
|
|
|
|
|
| |||||||||
| (a) | Details of the major categories of the Fund’s investments are reflected within the Portfolio of Investments. |
For the year ended November 30, 2014, there were no transfers among Levels 1, 2 and 3.
Select Fund
Asset Valuation Inputs
Description | Level 1 | Level 2 | Level 3 | Total | ||||||||||||
Common Stocks(a) | $ | 64,522,763 | $ | — | $ | — | $ | 64,522,763 | ||||||||
Short-Term Investments | — | 2,955,237 | — | 2,955,237 | ||||||||||||
|
|
|
|
|
|
|
| |||||||||
Total | $ | 64,522,763 | $ | 2,955,237 | $ | — | $ | 67,478,000 | ||||||||
|
|
|
|
|
|
|
| |||||||||
| (a) | Details of the major categories of the Fund’s investments are reflected within the Portfolio of Investments. |
For the year ended November 30, 2014, there were no transfers among Levels 1, 2 and 3.
The following is a reconciliation of Level 3 investments for which significant unobservable inputs were used to determine fair values as of November 30, 2013 and/or November 30, 2014:
Senior Floating Rate and Fixed Income Fund
Asset Valuation Inputs
Investments in Securities | Balance as of | Accrued | Realized | Change in | Purchases | |||||||||||||||
Senior Loans | $ | 6,580,930 | $ | — | $ | — | $ | 15,548 | $ | — | ||||||||||
|
|
|
|
|
|
|
|
|
| |||||||||||
Investments in Securities | Sales | Transfers | Transfers Level 3 | Balance as of | Change in | |||||||||||||||
Senior Loans | $ | — | $ | — | $ | (6,596,478 | ) | $ | — | $ | — | |||||||||
|
|
|
|
|
|
|
|
|
| |||||||||||
| 92
Table of Contents
Notes to Financial Statements (continued)
November 30, 2014
4. Derivatives. Derivative instruments are defined as financial instruments whose value and performance are based on the value and performance of another security or financial instrument. Derivative instruments that Gateway International Fund, Dividend Income Fund and Emerging Markets Opportunities Fund used during the period include forward foreign currency contracts, futures contracts, option contracts and swap agreements.
Gateway International Fund seeks to capture the majority of the returns associated with international developed market equity investments, while exposing investors to less risk than such investments generally. To meet this investment goal, the Fund invests in a broadly diversified portfolio of common stocks of non-U.S. companies, including, but not limited to, Australia, the United Kingdom, the Euro Zone, Hong Kong, Japan and Switzerland, while also writing call options and buying put options on one or more non-U.S. equity indices, including options on ETFs that seek to replicate the performance of such indices. Writing call options can reduce the Fund’s volatility, provide a steady cash flow and be an important source of the Fund’s return, although it also may reduce the Fund’s ability to profit from increases in the value of its equity portfolio. Buying put options can protect the Fund from a significant market decline that may occur over a short period of time. The value of a put option generally increases as stock prices (and the value of the index or ETF) decrease and decreases as those stocks (and the index or ETF) increase in price. The Fund typically sells call options and buys put options on market indices or index-tracking ETFs that represent a significant portion of the capitalization in each of the markets in international developed equity markets. The combination of the diversified stock portfolio, the steady cash flow from writing call options and the downside protection from purchased put options is intended to provide the Fund with the majority of the returns associated with international developed equity market investments while exposing investors to less risk than other such investments. During the year ended November 30, 2014, the Fund used written call options and purchased put options in accordance with this objective.
Dividend Income Fund is subject to the risk of unpredictable declines in the value of individual equity securities and periods of below average performance in individual securities or in the equity market as a whole. The Fund may use purchased put options and written call options to hedge against a decline in value of an equity security that it owns and may use written put options to offset the cost of options used for hedging purposes. The Fund may also use purchased call options, written call options and written put options for investment purposes. During the year ended November 30, 2014, the Fund engaged in written call option transactions for hedging purposes and written put and purchased call option transactions for investment purposes.
Emerging Markets Opportunities Fund seeks to provide high total investment return through a combination of high current income and capital appreciation. The Fund pursues its objective by generally obtaining its long investment exposures through direct cash investments and derivatives and short investment exposures substantially through derivatives, including forward foreign currency contracts, futures contracts,
93 |
Table of Contents
Notes to Financial Statements (continued)
November 30, 2014
option contracts and swap agreements. During the period ended November 30, 2014, the Fund used forward foreign currency contracts, futures contracts, option contracts and credit default swap agreements (as a protection seller) to gain investment exposures in accordance with its objective.
Emerging Markets Opportunities Fund is subject to the risk that companies in which the Fund invests will fail financially or otherwise be unwilling or unable to meet their obligations to the Fund. The Fund may use credit default swaps, as a protection buyer, to hedge its credit exposure to issuers of bonds they hold without having to sell the bonds. During the period ended November 30, 2014, the Fund engaged in credit default swap transactions as a protection buyer to hedge its credit exposure.
Emerging Markets Opportunities Fund is subject to the risk that changes in interest rates will affect the value of the Fund’s investments in fixed income securities. The Fund will be subject to increased interest rate risk to the extent that it invests in fixed-income securities with longer maturities or durations, as compared to investing in fixed-income securities with shorter maturities or durations. The Fund may use futures contracts to hedge against changes in interest rates and to manage duration without having to buy or sell portfolio securities. During the period ended November 30, 2014, the Fund engaged in futures contracts to manage duration.
The following is a summary of derivative instruments for Gateway International Fund as of November 30, 2014, as reflected within the Statement of Assets and Liabilities:
Assets | Investments at value1 | |||
Exchange traded/cleared asset derivatives | ||||
Equity contracts | $ | 42,183 | ||
Liabilities | Options written at value | |||
Over-the-counter liability derivatives | ||||
Equity contracts | $ | (139,507 | ) | |
| 1 | Represents purchased options, at value. |
Transactions in derivative instruments for Gateway International Fund during the year ended November 30, 2014, as reflected within the Statement of Operations, were as follows:
Net Realized Gain (Loss) on: | Investments2 | Options written | ||||||
Equity contracts | $ | (479,823 | ) | $ | 214,924 | |||
Net Change in Unrealized Appreciation (Depreciation) on: | Investments2 | Options written | ||||||
Equity contracts | $ | 23,470 | $ | 44,325 | ||||
| 2 | Represents realized loss and change in unrealized appreciation (depreciation), respectively, for purchased options during the period. |
| 94
Table of Contents
Notes to Financial Statements (continued)
November 30, 2014
The following is a summary of derivative instruments for Dividend Income Fund as of November 30, 2014, as reflected within the Statement of Assets and Liabilities:
Liabilities | Options written at value | |||
Exchange traded/cleared liability derivatives | ||||
Equity contracts | $ | (7,838 | ) | |
Transactions in derivative instruments for Dividend Income Fund during the year ended November 30, 2014, as reflected within the Statement of Operations, were as follows:
Net Realized Gain (Loss) on: | Investments2 | Options written | ||||||
Equity contracts | $ | 1,507 | $ | 19,065 | ||||
Net Change in Unrealized Appreciation (Depreciation) on: | Investments2 | Options written | ||||||
Equity contracts | $ | — | $ | (3,282 | ) | |||
| 2 | Represents realized gain and change in unrealized appreciation (depreciation), respectively, for purchased options during the period. |
The following is a summary of derivative instruments for Emerging Markets Opportunities Fund as of November 30, 2014, as reflected within the Statement of Assets and Liabilities:
Investments at value1 | Unrealized appreciation on | Unrealized appreciation on | Swap Agreements at value3 | Total | ||||||||||||||||
Assets | ||||||||||||||||||||
Over-the-counter asset derivatives | ||||||||||||||||||||
Foreign exchange contracts | $ | 431 | $ | 22,159 | $ | — | $ | — | $ | 22,590 | ||||||||||
Exchange traded/cleared asset derivatives | ||||||||||||||||||||
Interest rate contracts | — | — | 21,899 | — | 21,899 | |||||||||||||||
|
|
|
|
|
|
|
|
|
| |||||||||||
Total asset derivatives | $ | 431 | $ | 22,159 | $ | 21,899 | $ | — | $ | 44,489 | ||||||||||
|
|
|
|
|
|
|
|
|
| |||||||||||
95 |
Table of Contents
Notes to Financial Statements (continued)
November 30, 2014
Unrealized depreciation on forward foreign currency contracts | Unrealized depreciation on futures contracts2 | Swap agreements at value3 | Total | |||||||||||||
Liabilities | ||||||||||||||||
Over-the-counter liability derivatives | ||||||||||||||||
Credit contracts | $ | — | $ | — | $ | (367,450 | ) | $ | (367,450 | ) | ||||||
Foreign exchange contracts | (7,690 | ) | — | — | (7,690 | ) | ||||||||||
Exchange traded/cleared liability derivatives | ||||||||||||||||
Equity contracts | — | (4,289 | ) | — | (4,289 | ) | ||||||||||
|
|
|
|
|
|
|
| |||||||||
Total liability derivatives | $ | (7,690 | ) | $ | (4,289 | ) | $ | (367,450 | ) | $ | (379,429 | ) | ||||
|
|
|
|
|
|
|
| |||||||||
| 1 | Represents purchased options, at value. |
| 2 | Represents cumulative unrealized appreciation (depreciation) on futures contracts. Only the current day’s variation margin on futures contracts is reported within the Statement of Assets and Liabilities as receivable or payable for variation margin, as applicable. |
| 3 | Represents swap agreements, at value. Market value of swap agreements is reported in the Portfolio of Investments along with the unamortized upfront premium paid (received), if any, and unrealized appreciation (depreciation) on each individual contract. Unrealized appreciation (depreciation) and upfront premiums paid (received) are reported within the Statement of Assets and Liabilities. |
Transactions in derivative instruments for Emerging Markets Opportunities Fund during the period ended November 30, 2014, as reflected within the Statement of Operations were as follows:
Net Realized Gain (Loss) on: | Investments4 | Futures contracts | Options written | Swap agreements | Foreign currency transactions5 | |||||||||||||||
Equity contracts | $ | (68,642 | ) | $ | (45,087 | ) | $ | — | $ | — | $ | — | ||||||||
Interest rate contracts | — | 172,388 | — | — | — | |||||||||||||||
Foreign exchange contracts | 1,758 | — | 1,203 | — | 15,995 | |||||||||||||||
Credit contracts | — | — | — | 25,966 | — | |||||||||||||||
|
|
|
|
|
|
|
|
|
| |||||||||||
Total | $ | (66,884 | ) | $ | 127,301 | $ | 1,203 | $ | 25,966 | $ | 15,995 | |||||||||
|
|
|
|
|
|
|
|
|
| |||||||||||
| 96
Table of Contents
Notes to Financial Statements (continued)
November 30, 2014
Net Change in Unrealized Appreciation (Depreciation) on: | Investments4 | Futures contracts | Options written | Swap agreements | Foreign currency translations5 | |||||||||||||||
Equity contracts | $ | — | $ | (4,289 | ) | $ | — | $ | — | $ | — | |||||||||
Interest rate contracts | — | 21,899 | — | — | — | |||||||||||||||
Foreign exchange contracts | (9,480 | ) | — | — | — | 14,469 | ||||||||||||||
Credit contracts | — | — | — | (12,639 | ) | — | ||||||||||||||
|
|
|
|
|
|
|
|
|
| |||||||||||
Total | $ | (9,480 | ) | $ | 17,610 | $ | — | $ | (12,639 | ) | $ | 14,469 | ||||||||
|
|
|
|
|
|
|
|
|
| |||||||||||
| 4 | Represents realized loss and change in unrealized appreciation (depreciation), respectively, for purchased options during the period. |
| 5 | Represents realized gain and change in unrealized appreciation (depreciation), respectively, for forward foreign currency contracts during the period. Does not include other foreign currency gains or losses included in the Statement of Operations. |
As the Funds value their derivatives at fair value and recognize changes in fair value through the Statements of Operations, they do not qualify for hedge accounting under authoritative guidance for derivative instruments. The Funds’ investments in derivatives may represent an economic hedge; however, they are considered to be non-hedge transactions for the purpose of these disclosures.
The volume of option contract activity, as a percentage of investments in common stocks, for Gateway International Fund, based on month-end market values of underlying securities, at absolute value, was as follows for the year ended November 30, 2014:
Gateway International Fund* | Call Options | Put Options |
| |||||||
Average Market Value of Underlying Securities | 98.14 | % | 99.19 | % | ||||||
Highest Market Value of Underlying Securities | 98.97 | % | 114.98 | % | ||||||
Lowest Market Value of Underlying Securities | 96.28 | % | 96.28 | % | ||||||
Market Value of Underlying Securities as of November 30, 2014 | 98.01 | % | 114.98 | % | ||||||
| * | Market value of underlying securities is determined by multiplying option shares by the price of the option’s underlying security, as determined by the Fund’s Pricing Policies and Procedures. |
The volume of option contract activity, as a percentage of net assets, for Dividend Income Fund, based on month-end market values of underlying securities, at absolute value, was as follows for the year ended November 30, 2014:
Dividend Income Fund** | Call Options Purchased | Call Options Written | Put Options Written | |||||||||
Average Market Value of Underlying Securities | 0.04 | % | 0.65 | % | 0.82 | % | ||||||
Highest Market Value of Underlying Securities | 0.31 | % | 1.53 | % | 1.36 | % | ||||||
Lowest Market Value of Underlying Securities | 0.00 | % | 0.00 | % | 0.00 | % | ||||||
Market Value of Underlying Securities as of November 30, 2014 | 0.00 | % | 0.69 | % | 0.71 | % | ||||||
97 |
Table of Contents
Notes to Financial Statements (continued)
November 30, 2014
The volume of option contract activity, as a percentage of net assets, for Emerging Markets Opportunities Fund, based on month-end market values of underlying securities, at absolute value, was as follows for the period ended November 30, 2014:
Emerging Markets Opportunities Fund** | Call Options Purchased | Put Options Purchased | Call Options Written | |||||||||
Average Market Value of Underlying Securities | 3.85 | % | 0.43 | % | 0.44 | % | ||||||
Highest Market Value of Underlying Securities | 13.22 | % | 3.83 | % | 4.00 | % | ||||||
Lowest Market Value of Underlying Securities | 0.00 | % | 0.00 | % | 0.00 | % | ||||||
Market Value of Underlying Securities as of November 30, 2014 | 2.00 | % | 0.00 | % | 0.00 | % | ||||||
| ** | Market value of underlying instruments is determined as follows: for securities by multiplying option shares by the price of the option’s underlying security, as determined by the Fund’s Pricing Policies and Procedures and for currencies by multiplying par value by the strike price and dividing by the foreign currency exchange rate. |
The volume of forward foreign currency contract, futures contract and swap agreement activity, as a percentage of net assets, for Emerging Markets Opportunities Fund, based on gross month-end notional amounts outstanding during the period, including long and short positions, at absolute value, was as follows for the period ended November 30, 2014:
Emerging Markets Opportunities Fund | Forwards | Futures | Swaps | |||||||||
Average Notional Amount Outstanding | 6.10 | % | 10.45 | % | 10.40 | % | ||||||
Highest Notional Amount Outstanding | 11.79 | % | 16.83 | % | 16.72 | % | ||||||
Lowest Notional Amount Outstanding | 0.55 | % | 4.53 | % | 6.96 | % | ||||||
Notional Amount Outstanding as of November 30, 2014 | 8.79 | % | 7.65 | % | 13.23 | % | ||||||
The following is a summary of Gateway International Fund’s written option activity:
Gateway International Fund | Number of | Premiums | ||||||
Outstanding at November 30, 2013 | 4,760 | $ | 572,067 | |||||
Options written | 41,600 | 3,572,226 | ||||||
Options terminated in closing purchase transactions | (40,325 | ) | (3,740,095 | ) | ||||
Options expired | (3,160 | ) | (234,942 | ) | ||||
|
|
|
| |||||
Outstanding at November 30, 2014 | 2,875 | $ | 169,256 | |||||
|
|
|
| |||||
The following is a summary of Dividend Income Fund’s written option activity:
Dividend Income Fund | Number of | Premiums | ||||||
Outstanding at November 30, 2013 | 50 | $ | 2,916 | |||||
Options written | 692 | 36,959 | ||||||
Options terminated in closing purchase transactions | (434 | ) | (23,612 | ) | ||||
Options exercised | (45 | ) | (2,867 | ) | ||||
Options expired | (168 | ) | (8,769 | ) | ||||
|
|
|
| |||||
Outstanding at November 30, 2014 | 95 | $ | 4,627 | |||||
|
|
|
| |||||
| 98
Table of Contents
Notes to Financial Statements (continued)
November 30, 2014
The following is a summary of Emerging Markets Opportunities Fund’s foreign currency written option activity:
Emerging Markets Opportunities Fund | Units of | Premiums | ||||||
Outstanding at November 30, 2013 | — | $ | — | |||||
Options written | 1,500,000 | 3,894 | ||||||
Options terminated in closing purchase transactions | (1,500,000 | ) | (3,894 | ) | ||||
|
|
|
| |||||
Outstanding at November 30, 2014 | — | $ | — | |||||
|
|
|
| |||||
OTC derivatives, including forward foreign currency contracts, options and swap agreements, are entered into pursuant to International Swaps and Derivatives Association, Inc. (“ISDA”) agreements negotiated between the Funds and their counterparties. ISDA agreements typically contain, among other things, terms for the posting of collateral and master netting provisions in the event of a default or other termination event. Collateral is posted by a Fund or the counterparty to the extent of the net mark-to-market exposure to the other party of all open contracts under the agreement, subject to minimum transfer requirements. Master netting provisions allow the Funds and the counterparty, in the event of a default or other termination event, to offset amounts owed by each related to derivative contracts, including any posted collateral, to one net amount payable by either the Funds or the counterparty. The Funds’ ISDA agreements typically contain provisions that allow a counterparty to terminate open contracts early if the net asset value of a Fund declines beyond a certain threshold. For financial reporting purposes, the Funds do not offset derivative assets and liabilities, and any related collateral received or pledged, on the Statements of Assets and Liabilities.
As of November 30, 2014, gross amounts of OTC derivative assets and liabilities not offset in the Statements of Assets and Liabilities and the related net amounts after taking into account master netting arrangements, by counterparty, are as follows:
Gateway International Fund
Counterparty | Gross | Offset | Net | Collateral | Net | |||||||||||||||
UBS AG | $ | (139,507 | ) | $ | — | $ | (139,507 | ) | $ | 139,507 | $ | — | ||||||||
|
|
|
|
|
|
|
|
|
| |||||||||||
99 |
Table of Contents
Notes to Financial Statements (continued)
November 30, 2014
Emerging Markets Opportunities Fund
Counterparty | Gross | Offset | Net | Collateral | Net | |||||||||||||||
Bank of America, N.A. | $ | 431 | $ | — | $ | 431 | $ | — | $ | 431 | ||||||||||
Barclays Bank PLC | 21,257 | (5,596 | ) | 15,661 | — | 15,661 | ||||||||||||||
Citibank N.A. | 902 | (902 | ) | — | — | — | ||||||||||||||
|
|
|
|
|
|
|
|
|
| |||||||||||
| $ | 22,590 | $ | (6,498 | ) | $ | 16,092 | $ | — | $ | 16,092 | ||||||||||
|
|
|
|
|
|
|
|
|
| |||||||||||
Counterparty | Gross | Offset | Net | Collateral | Net | |||||||||||||||
Barclays Bank PLC | $ | (5,596 | ) | $ | 5,596 | $ | — | $ | — | $ | — | |||||||||
Citibank N.A. | (367,450 | ) | 902 | (366,548 | ) | 330,000 | (36,548 | ) | ||||||||||||
Credit Suisse International | (2,094 | ) | — | (2,094 | ) | — | (2,094 | ) | ||||||||||||
|
|
|
|
|
|
|
|
|
| |||||||||||
| $ | (375,140 | ) | $ | 6,498 | $ | (368,642 | ) | $ | 330,000 | $ | (38,642 | ) | ||||||||
|
|
|
|
|
|
|
|
|
| |||||||||||
The actual collateral received or pledged, if any, may exceed the amounts shown in the table due to overcollateralization. Timing differences may exist between when contracts under the ISDA agreements are marked-to-market and when collateral moves. The ISDA agreements include tri-party control agreements under which collateral is held for the benefit of the secured party at a third party custodian, State Street Bank.
Counterparty risk is managed based on policies and procedures established by each Fund’s adviser. Such policies and procedures may include, but are not limited to, minimum counterparty credit rating requirements, monitoring of counterparty credit default swap spreads and posting of collateral. A Fund’s risk of loss from counterparty credit risk on OTC derivatives is generally limited to the Fund’s aggregated unrealized gains and the amount of any collateral pledged to the counterparty, which may be offset by any collateral posted to the Fund by the counterparty. ISDA master agreements can help to manage counterparty risk by specifying collateral posting arrangements at pre-arranged exposure levels. Under these ISDA agreements, collateral is routinely transferred if the total net exposure in respect of certain transactions, net of existing collateral already in place, exceeds a specified amount (typically $250,000, depending on the counterparty). With exchange traded derivatives, there is minimal counterparty credit risk to the Fund because the exchange’s clearinghouse, as counterparty to these instruments, stands between the buyer and the seller of the contract. Credit risk still exists in exchange traded derivatives with respect to initial and variation margin that is held in a broker’s customer accounts. While brokers are required to segregate customer margin from their own assets, in the event that a broker becomes insolvent or goes into bankruptcy and at that time there is a shortfall in the aggregate amount of
| 100
Table of Contents
Notes to Financial Statements (continued)
November 30, 2014
margin held by the broker for all its clients, U.S. bankruptcy laws will typically allocate that shortfall on a pro rata basis across all of the broker’s customers, potentially resulting in losses to the Fund. Based on balances reflected on each Fund’s Statement of Assets and Liabilities, the following table shows (i) the maximum amount of loss due to credit risk that, based on the gross fair value of the financial instrument, the applicable Fund would incur if parties to the relevant financial instruments failed completely to perform according to the terms of the contracts and the collateral or other security, if any, for the amount due proved to be of no value to the Fund, and (ii) the amount of loss that the applicable Fund would incur after taking into account master netting provisions pursuant to ISDA agreements, as of November 30, 2014:
Fund | Maximum | Maximum | ||||||
Gateway International Fund | $ | 5,613,259 | $ | 5,473,752 | ||||
Emerging Markets Opportunities Fund | 552,590 | 216,092 | ||||||
5. Purchases and Sales of Securities. For the year ended November 30, 2014, purchases and sales of securities (excluding short-term investments and U.S. Government/Agency securities and including paydowns) were as follows:
Fund | Purchases | Sales | ||||||
Gateway International Fund | $ | 8,037,862 | $ | 20,099,287 | ||||
Dividend Income Fund | 18,013,569 | 14,497,325 | ||||||
Emerging Markets Opportunities Fund | 47,917,634 | 16,203,172 | ||||||
Senior Floating Rate and Fixed Income Fund | 1,919,734,552 | 1,625,525,103 | ||||||
Select Fund | 60,671,469 | 26,088,766 | ||||||
6. Management Fees and Other Transactions with Affiliates.
a. Management Fees. Gateway Investment Advisers, LLC (“Gateway Advisers”) serves as investment adviser to Gateway International Fund. Gateway Advisers is a subsidiary of Natixis US, which is part of Natixis Global Asset Management, an international asset management group based in Paris, France. Under the terms of the management agreement, the Fund pays a management fee at the annual rate of 0.75%, calculated daily and payable monthly, based on the Fund’s average daily net assets.
Loomis Sayles & Company, L.P. (“Loomis Sayles”) serves as investment adviser to Dividend Income Fund, Emerging Markets Opportunities Fund and Senior Floating Rate and Fixed Income Fund. Under the terms of the management agreements, Dividend Income Fund and Senior Floating Rate and Fixed Income Fund pay a management fee at the annual rate of 0.60%, calculated daily and payable monthly, based on Dividend Income Funds’ average daily net assets and Senior Floating Rate and Fixed Income Fund’s average daily managed assets, which include borrowings used for leverage. Emerging Markets Opportunities Fund pays a management fee at the annual rate of 0.75%, calculated daily and payable monthly, based on average daily net assets.
101 |
Table of Contents
Notes to Financial Statements (continued)
November 30, 2014
NGAM Advisors, L.P. (“NGAM Advisors”), serves as investment adviser to the Select Fund. Under the terms of the management agreement, the Fund pays a management fee at the annual rate of 0.85%, calculated daily and payable monthly, based on the Fund’s average daily net assets.
NGAM Advisors has entered into a subadvisory agreement with Vaughan Nelson Investment Management, L.P. (“Vaughan Nelson”). Under the terms of the subadvisory agreement, the Fund pays a subadvisory fee at the annual rate of 0.53%, calculated daily and payable monthly, based on the Fund’s average daily net assets. Payments to NGAM Advisors are reduced by the amount of payments to Vaughan Nelson.
Gateway Advisers, Loomis Sayles and NGAM Advisors have given binding undertakings to the Funds to waive management fees and/or reimburse certain expenses to limit the Funds’ operating expenses, exclusive of acquired fund fees and expenses, brokerage expenses, interest expense, taxes and extraordinary expenses. These undertakings are in effect until March 31, 2015, except for Senior Floating Rate and Fixed Income Fund which is until March 31, 2016 and are reevaluated on an annual basis. Management fees payable, as reflected on the Statements of Assets and Liabilities, is net of waivers and/or expense reimbursements, if any, pursuant to these undertakings.
For the year ended November 30, 2014, the expense limits as a percentage of average daily net assets under the expense limitation agreements were as follows:
| Expense Limit as a Percentage of Average Daily Net Assets | ||||||||||||||||
Fund | Class A | Class C | Class N | Class Y | ||||||||||||
Gateway International Fund | 1.35 | % | 2.10 | % | — | 1.10 | % | |||||||||
Dividend Income Fund | 1.20 | % | 1.95 | % | — | 0.95 | % | |||||||||
Emerging Markets Opportunities Fund | 1.25 | % | 2.00 | % | 0.95 | % | 1.00 | % | ||||||||
Select Fund | 1.40 | % | 2.15 | % | — | 1.15 | % | |||||||||
Effective July 1, 2014, the expense limits as a percentage of average daily net assets under the expense limitation agreement for Senior Floating Rate and Fixed Income Fund were as follows:
Expense Limit as a Percentage of | ||||||||||||
Class A | Class C | Class N | Class Y | |||||||||
1.05% | 1.80% | — | 0.80% | |||||||||
Prior to July 1, 2014, the expense limits as a percentage of average daily net assets under the expense limitation agreement for Senior Floating Rate and Fixed Income Fund were as follows:
Expense Limit as a Percentage of | ||||||||||||
Class A | Class C | Class N | Class Y | |||||||||
1.10% | 1.85% | — | 0.85% | |||||||||
| 102
Table of Contents
Notes to Financial Statements (continued)
November 30, 2014
Gateway Advisers, Loomis Sayles and NGAM Advisors shall be permitted to recover expenses they have borne under the expense limitation agreements (whether through waiver of its management fees or otherwise) on a class by class basis in later periods to the extent the annual operating expenses of a class fall below a class’ expense limits, provided, however, that a class is not obligated to pay such waived/reimbursed fees or expenses more than one year after the end of the fiscal year in which the fees or expenses were waived/reimbursed.
For the year ended November 30, 2014, the management fees and waivers of management fees for each Fund were as follows:
Gross | Contractual | Net | Percentage of Average Daily Net Assets | |||||||||||||||||
Fund | Gross | Net | ||||||||||||||||||
Gateway International Fund | $ | 178,175 | $ | 178,175 | $ | — | 0.75 | % | — | |||||||||||
Dividend Income Fund | 135,460 | 105,069 | 30,391 | 0.60 | % | 0.13 | % | |||||||||||||
Emerging Markets Opportunities Fund | 187,488 | 110,022 | 77,466 | 0.75 | % | 0.31 | % | |||||||||||||
Senior Floating Rate and Fixed Income Fund | 9,551,870 | 240,976 | 9,310,894 | 0.62 | % | 0.61 | % | |||||||||||||
Select Fund | 353,995 | 81,811 | 272,184 | 0.85 | % | 0.65 | % | |||||||||||||
| 1 | Contractual management fee waivers are subject to possible recovery until November 30, 2015. |
For the year ended November 30, 2014, expenses have been reimbursed as follows:
Fund | Contractual | Voluntary (Note 6h) | ||||||
Gateway International Fund | $ | 2,753 | $ | 1,023 | ||||
Emerging Markets Opportunities Fund | 6,363 | — | ||||||
| 2 | Contractual expense reimbursements are subject to possible recovery until November 30, 2015. |
No expenses were recovered for any of the Funds during the year ended November 30, 2014 under the terms of the expense agreements.
Certain officers and employees of Loomis Sayles are also officers or Trustees of the Trusts. Loomis Sayles’ general partner is indirectly owned by Natixis US.
b. Service and Distribution Fees. NGAM Distribution, L.P. (“NGAM Distribution”) has entered into a distribution agreement with the Trusts. Pursuant to this agreement, NGAM Distribution serves as principal underwriter of the Funds of the Trusts.
103 |
Table of Contents
Notes to Financial Statements (continued)
November 30, 2014
Pursuant to Rule 12b-1 under the 1940 Act, the Trusts have adopted a Service Plan relating to each Fund’s Class A shares (the “Class A Plans”) and a Distribution and Service Plan relating to each Fund’s Class C shares (the “Class C Plans”).
Under the Class A Plans, each Fund pays NGAM Distribution a monthly service fee at an annual rate not to exceed 0.25% of the average daily net assets attributable to the Funds’ Class A shares, as reimbursement for expenses incurred by NGAM Distribution in providing personal services to investors in Class A shares and/or the maintenance of shareholder accounts.
Under the Class C Plans, each Fund pays NGAM Distribution a monthly service fee at an annual rate not to exceed 0.25% of the average daily net assets attributable to the Funds’ Class C shares, as compensation for services provided by NGAM Distribution in providing personal services to investors in Class C shares and/or the maintenance of shareholder accounts.
Also under the Class C Plans, each Fund pays NGAM Distribution a monthly distribution fee at the annual rate of 0.75% of the average daily net assets attributable to the Funds’ Class C shares, as compensation for services provided by NGAM Distribution in connection with the marketing or sale of Class C shares.
For the year ended November 30, 2014, the service and distribution fees for each Fund were as follows:
| Service Fees | Distribution Fees | |||||||||||
Fund | Class A | Class C | Class C | |||||||||
Gateway International Fund | $ | 23,444 | $ | 16,202 | $ | 48,607 | ||||||
Dividend Income Fund | 15,934 | 5,872 | 17,616 | |||||||||
Emerging Markets Opportunities Fund | 8,183 | 28 | 82 | |||||||||
Senior Floating Rate and Fixed Income Fund | 1,009,211 | 522,363 | 1,567,088 | |||||||||
Select Fund | 35,991 | 4,952 | 14,856 | |||||||||
c. Administrative Fees. NGAM Advisors provides certain administrative services for the Funds and contracts with State Street Bank and Trust Company (“State Street Bank”) to serve as sub-administrator. Pursuant to an agreement among Natixis Funds Trusts, Loomis Sayles Funds Trust and NGAM Advisors, each Fund pays NGAM Advisors monthly its pro rata portion of fees equal to an annual rate of 0.0575% of the first $15 billion of the average daily net assets of the Natixis Funds Trusts and Loomis Sayles Funds Trusts, 0.0500% of the next $15 billion, 0.0400% of the next $30 billion, 0.0350% of the next $30 billion and 0.0325% of such assets in excess of $90 billion, subject to an annual aggregate minimum fee for the Natixis Funds Trusts and Loomis Sayles Funds Trusts of $10 million, which is reevaluated on an annual basis.
| 104
Table of Contents
Notes to Financial Statements (continued)
November 30, 2014
For the year ended November 30, 2014, the administrative fees for each Fund were as follows:
Fund | Administrative | |||
Gateway International Fund | $ | 10,313 | ||
Dividend Income Fund | 9,782 | |||
Emerging Markets Opportunities Fund | 10,785 | |||
Senior Floating Rate and Fixed Income Fund | 664,824 | |||
Select Fund | 18,004 | |||
Prior to July 1, 2014, each Fund paid NGAM Advisors monthly its pro rata portion of fees equal to an annual rate of 0.0575% of the first $15 billion of the average daily net assets of the Natixis Funds Trusts, Loomis Sayles Funds Trusts and Hansberger International Series, 0.0500% of the next $15 billion, 0.0400% of the next $30 billion and 0.0350% of such assets in excess of $60 billion, subject to an annual aggregate minimum fee for the Natixis Funds Trusts, Loomis Sayles Funds Trusts and Hansberger International Series of $10 million.
d. Sub-Transfer Agent Fees. NGAM Distribution has entered into agreements, which include servicing agreements, with financial intermediaries that provide recordkeeping, processing, shareholder communications and other services to customers of the intermediaries that hold positions in the Funds and has agreed to compensate the intermediaries for providing those services. Intermediaries transact with the Funds primarily through the use of omnibus accounts on behalf of their customers who hold positions in the Funds. These services would have been provided by the Funds’ transfer agent and other service providers if the shareholders’ accounts were maintained directly at the Funds’ transfer agent. Accordingly, the Funds have agreed to reimburse NGAM Distribution for all or a portion of the servicing fees paid to these intermediaries. The reimbursement amounts (sub-transfer agent fees) paid to NGAM Distribution are subject to a current per-account equivalent fee limit approved by the Funds’ Board, which is based on fees for similar services paid to the Funds’ transfer agent and other service providers. Class N shares do not bear such expenses.
For the year ended November 30, 2014, the sub-transfer agent fees (which are reflected in transfer agent fees and expenses in the Statements of Operations) for each Fund were as follows:
Fund | Sub-Transfer Agent | |||
Gateway International Fund | $ | 10,743 | ||
Dividend Income Fund | 11,157 | |||
Emerging Markets Opportunities Fund | 5,790 | |||
Senior Floating Rate and Fixed Income Fund | 849,571 | |||
Select Fund | 19,343 | |||
105 |
Table of Contents
Notes to Financial Statements (continued)
November 30, 2014
As of November 30, 2014, the Funds owe NGAM Distribution the following reimbursements for sub-transfer agent fees (which are reflected in the Statements of Assets and Liabilities as payable to distributor):
Fund | Reimbursements of | |||
Gateway International Fund | $ | 73 | ||
Dividend Income Fund | 957 | |||
Emerging Markets Opportunities Fund | 587 | |||
Senior Floating Rate and Fixed Income Fund | 8,323 | |||
Select Fund | 345 | |||
Sub-transfer agent fees attributable to Class A, Class C and Class Y are allocated on a pro rata basis to each class based on the relative net assets of each class to the total net assets of those classes.
e. Commissions. Commissions (including CDSCs) on Fund shares retained by NGAM Distribution during the year ended November 30, 2014 were as follows:
Fund | Commissions | |||
Gateway International Fund | $ | 19,255 | ||
Dividend Income Fund | 19,913 | |||
Emerging Markets Opportunities Fund | 1,904 | |||
Senior Floating Rate and Fixed Income Fund | 470,342 | |||
Select Fund | 28,880 | |||
f. Trustees Fees and Expenses. The Trusts do not pay any compensation directly to their officers or Trustees who are directors, officers or employees of NGAM Advisors, NGAM Distribution, Natixis US or their affiliates. Effective January 1, 2014, the Chairperson of the Board receives a retainer fee at the annual rate of $300,000. The Chairperson does not receive any meeting attendance fees for Board of Trustees meetings or committee meetings that she attends. Each Independent Trustee (other than the Chairperson) receives, in the aggregate, a retainer fee at the annual rate of $130,000. Each Independent Trustee also receives a meeting attendance fee of $10,000 for each meeting of the Board of Trustees that he or she attends in person and $5,000 for each meeting of the Board of Trustees that he or she attends telephonically. In addition, each committee chairperson (except for the Chairperson of the Governance Committee) receives an additional retainer fee at the annual rate of $17,500. Each Contract Review Committee member is compensated $6,000 for each Committee meeting that he or she attends in person and $3,000 for each meeting that he or she attends telephonically. Each Audit Committee member is compensated $6,000 for each Committee meeting that he or she attends in person and $3,000 for each meeting that he or she attends telephonically. These fees are allocated among the funds in the Natixis
| 106
Table of Contents
Notes to Financial Statements (continued)
November 30, 2014
Funds Trusts and Loomis Sayles Funds Trusts based on a formula that takes into account, among other factors, the relative net assets of each Fund. Trustees are reimbursed for travel expenses in connection with attendance at meetings.
Prior to January 1, 2014, the Chairperson of the Board received a retainer fee at the annual rate of $285,000 and each Independent Trustee (other than the Chairperson) received, in aggregate, a retainer fee at the annual rate of $115,000. All other Trustee fees remained unchanged.
Effective January 1, 2015, the chairperson of the Governance Committee receives an additional retainer fee at the annual rate of $5,000.
A deferred compensation plan (the “Plan”) is available to the Trustees on a voluntary basis. Deferred amounts remain in the Funds until distributed in accordance with the provisions of the Plan. The value of a participating Trustee’s deferral account is based on theoretical investments of deferred amounts, on the normal payment dates, in certain funds of the Natixis Funds Trusts and Loomis Sayles Funds Trusts as designated by the participating Trustees. Changes in the value of participants’ deferral accounts are allocated pro rata among the funds in the Natixis Funds Trusts and Loomis Sayles Funds Trusts, and are normally reflected as Trustees’ fees and expenses in the Statements of Operations. The portions of the accrued obligations allocated to the Funds under the Plan are reflected as Deferred Trustees’ fees in the Statements of Assets and Liabilities.
g. Affiliated Ownership. As of November 30, 2014, Loomis Sayles Employees’ Profit Sharing Retirement Plan (“Retirement Plan”) and Natixis US held shares of the Funds representing the following percentages of net assets:
Fund | Retirement Plan | Natixis | Percentage | |||||||||
Dividend Income Fund | 6.03 | % | — | 6.03 | % | |||||||
Emerging Markets Opportunities Fund | — | 75.55 | % | 75.55 | % | |||||||
Senior Floating Rate and Fixed Income Fund | 0.43 | % | — | 0.43 | % | |||||||
Select Fund | — | 15.34 | % | 15.34 | % | |||||||
Investment activities of affiliated shareholders could have material impacts on the Funds.
h. Payment by Affiliates. For the year ended November 30, 2014, Gateway Advisers and Natixis US reimbursed the Gateway International Fund $1,023 for overdraft charges and $10,567 for transaction costs, respectively, incurred in conjunction with redemptions by affiliates.
107 |
Table of Contents
Notes to Financial Statements (continued)
November 30, 2014
7. Class-Specific Transfer Agent Fees and Expenses. For the period ended November 30, 2014, Emerging Markets Opportunities Fund incurred the following class-specific transfer agent fees and expenses (including sub-transfer agent fees, where applicable):
Class A | Class C | Class N | Class Y | |||||||||||||
Transfer Agent Fees and Expenses | $ | 826 | $ | 3 | $ | 56 | $ | 5,478 | ||||||||
Transfer agent fees and expenses attributable to Class A, Class C and Class Y are allocated on a pro rata basis to each class based on the relative net assets of each class to the total net assets of those classes. Transfer agent fees and expenses attributable to Class N are allocated to Class N.
8. Line of Credit. Each Fund, except the Senior Floating Rate and Fixed Income Fund, together with certain other funds of Natixis Funds Trusts and Loomis Sayles Funds Trusts, participates in a $200,000,000 committed unsecured line of credit provided by State Street Bank, with an individual limit of $125,000,000 for each Fund that participates in the line of credit. Interest is charged to each participating Fund based on its borrowings at a rate per annum equal to the greater of the Federal Funds rate or overnight LIBOR, plus 1.25%. In addition, a commitment fee of 0.10% per annum, payable at the end of each calendar quarter, is accrued and apportioned among the participating funds based on their average daily unused portion of the line of credit.
For the year ended November 30, 2014, none of the Funds had borrowings under this agreement.
Senior Floating Rate and Fixed Income Fund has entered into a committed, secured line of credit with the Bank of Nova Scotia (the “Bank”), under which it may borrow for investment or liquidity purposes. The commitment of the Bank to make loans to the Fund shall not exceed $400,000,000 at any one time. Under the terms of the agreement, the Bank is entitled to a security interest in the assets of the Fund as collateral. Interest is charged to the Fund based upon the terms set forth in the agreement. In addition, a commitment fee of 0.175% per annum (0.125% per annum for dates upon which the loan balance exceeds 50% of the commitment), payable at the end of each calendar quarter, is accrued by the Fund based on the unused portion of the line of credit. Prior to July 30, 2014, the commitment to the Bank to make loans to the Fund was not to exceed $200,000,000 and the commitment fee was 0.20% per annum.
During the year ended November 30, 2014, Senior Floating Rate and Fixed Income Fund had an average daily balance on the line of credit (for those days on which there were borrowings) of $61,204,986 at a weighted average interest rate of 1.21%.
9. Interest Expense. The Funds may incur interest expense on cash overdrafts at the custodian or from use of the line of credit. Interest expense incurred for the year ended November 30, 2014 is reflected on the Statements of Operations.
| 108
Table of Contents
Notes to Financial Statements (continued)
November 30, 2014
10. Brokerage Commission Recapture. Certain Funds have entered into agreements with certain brokers whereby the brokers will rebate a portion of brokerage commissions. All amounts rebated by the brokers are returned to the Funds under such agreements and are included in realized gains on investments on the Statements of Operations. For the year ended November 30, 2014, amounts rebated under these agreements were as follows:
Fund | Rebates | |||
Dividend Income Fund | $ | 999 | ||
11. Concentration of Risk. Each Fund’s investments in foreign securities are subject to foreign currency fluctuations, higher volatility than U.S. securities, varying degrees of regulation and limited liquidity. Greater political, economic, credit and information risks are also associated with foreign securities.
The Senior Floating Rate and Fixed Income Fund, Emerging Markets Opportunities Fund and Select Fund are non-diversified, which means that they are not limited under the 1940 Act to a percentage of assets that they may invest in any one issuer. Because the Funds may invest in the securities of a limited number of issuers, an investment in the Funds may involve a higher degree of risk than would be present in a diversified portfolio.
Emerging markets investments are subject to greater risks arising from political or economic instability, nationalization or confiscatory taxation, currency exchange restrictions and an issuer’s unwillingness or inability to make principal or interest payments on its obligations. Emerging Markets Opportunities Fund’s investments in emerging markets companies, which may be smaller and have shorter operating histories than companies in developed markets, involves risks in addition to, and greater than, those generally associated with investing in companies in developed foreign markets.
The senior loans in which Senior Floating Rate and Fixed Income Fund expects to invest will generally not be rated investment grade by the rating agencies. Economic downturns generally increase non-payment rates and a senior loan could lose a substantial part of its value prior to default. Senior loans are subject to credit risk, and secured loans may not be adequately collateralized. The interest rates of senior loans reset frequently, and thus senior loans are subject to interest rate risk. Senior loans typically have less liquidity than investment grade bonds and there may be less public information available about them as compared to investment grade bonds.
12. Concentration of Ownership. From time to time, a fund may have a concentration of one or more accounts constituting a significant percentage of shares outstanding. Investment activities by holders of such accounts could have material impacts on the funds. As of November 30, 2014, based on management’s evaluation of the shareholder account base, the Funds had accounts representing controlling ownership of more than 5% of the Fund’s total outstanding shares. The number of such accounts, based on
109 |
Table of Contents
Notes to Financial Statements (continued)
November 30, 2014
accounts that represent more than 5% of an individual class of shares, and the aggregate percentage of net assets represented by such holdings were as follows:
Fund | Number of > 5% | Percentage of Non-Affiliated | Percentage of Ownership | Total Percentage of | ||||||||||||
Dividend Income Fund | 2 | 29.56 | % | 6.03 | % | 35.59 | % | |||||||||
Emerging Markets Opportunities Fund | — | — | 75.55 | % | 75.55 | % | ||||||||||
Senior Floating Rate and Fixed Income Fund | 1 | 7.96 | % | 0.43 | % | 8.39 | % | |||||||||
Select Fund | — | — | 15.34 | % | 15.34 | % | ||||||||||
Omnibus shareholder accounts for which NGAM Advisors understands that the intermediary has discretion over the underlying shareholder accounts or investment models where a shareholder account may be invested for a non-discretionary customer are included in the table above. For other omnibus accounts, the Funds do not have information on the individual shareholder accounts underlying omnibus accounts; therefore, there could be other 5% shareholders in addition to those disclosed in the table above
13. Capital Shares. Each Fund may issue an unlimited number of shares of beneficial interest, without par value. Transactions in capital shares were as follows:
| | Year Ended November 30, 2014 | | | Year Ended November 30, 2013 | | |||||||||||
Gateway International Fund | Shares | Amount | Shares | Amount | ||||||||||||
| Class A | ||||||||||||||||
Issued from the sale of shares | 313,476 | $ | 3,078,812 | 564,298 | $ | 5,537,956 | ||||||||||
Issued in connection with the reinvestment of distributions | 13,407 | 132,324 | 11,093 | 108,375 | ||||||||||||
Redeemed | (452,959 | ) | (4,468,973 | ) | (216,840 | ) | (2,112,858 | ) | ||||||||
|
|
|
|
|
|
|
| |||||||||
Net change | (126,076 | ) | $ | (1,257,837 | ) | 358,551 | $ | 3,533,473 | ||||||||
|
|
|
|
|
|
|
| |||||||||
| Class C | ||||||||||||||||
Issued from the sale of shares | 294,150 | $ | 2,871,442 | 479,543 | $ | 4,617,656 | ||||||||||
Issued in connection with the reinvestment of distributions | 6,306 | 61,738 | 732 | 7,131 | ||||||||||||
Redeemed | (109,495 | ) | (1,049,068 | ) | (6,669 | ) | (63,028 | ) | ||||||||
|
|
|
|
|
|
|
| |||||||||
Net change | 190,961 | $ | 1,884,112 | 473,606 | $ | 4,561,759 | ||||||||||
|
|
|
|
|
|
|
| |||||||||
| Class Y | ||||||||||||||||
Issued from the sale of shares | 394,235 | $ | 3,915,985 | 128,900 | $ | 1,249,083 | ||||||||||
Issued in connection with the reinvestment of distributions | 29,200 | 288,495 | 44,266 | 432,920 | ||||||||||||
Redeemed | (1,749,667 | ) | (16,884,065 | ) | (472,557 | ) | (4,697,421 | ) | ||||||||
|
|
|
|
|
|
|
| |||||||||
Net change | (1,326,232 | ) | $ | (12,679,585 | ) | (299,391 | ) | $ | (3,015,418 | ) | ||||||
|
|
|
|
|
|
|
| |||||||||
Increase (decrease) from capital share transactions | (1,261,347 | ) | $ | (12,053,310 | ) | 532,766 | $ | 5,079,814 | ||||||||
|
|
|
|
|
|
|
| |||||||||
| 110
Table of Contents
Notes to Financial Statements (continued)
November 30, 2014
13. Capital Shares (continued).
| | Year Ended November 30, 2014 | | | Year Ended November 30, 2013 | | |||||||||||
Dividend Income Fund | Shares | Amount | Shares | Amount | ||||||||||||
| Class A | ||||||||||||||||
Issued from the sale of shares | 179,861 | $ | 2,266,267 | 272,682 | $ | 3,248,411 | ||||||||||
Issued in connection with the reinvestment of distributions | 48,376 | 591,237 | 10,402 | 118,067 | ||||||||||||
Redeemed | (111,299 | ) | (1,388,398 | ) | (76,573 | ) | (911,223 | ) | ||||||||
|
|
|
|
|
|
|
| |||||||||
Net change | 116,938 | $ | 1,469,106 | 206,511 | $ | 2,455,255 | ||||||||||
|
|
|
|
|
|
|
| |||||||||
| Class C | ||||||||||||||||
Issued from the sale of shares | 124,652 | $ | 1,563,458 | 451,134 | $ | 5,495,013 | ||||||||||
Issued in connection with the reinvestment of distributions | 32,680 | 394,551 | 1,731 | 20,499 | ||||||||||||
Redeemed | (435,659 | ) | (5,233,591 | ) | (48,187 | ) | (579,149 | ) | ||||||||
|
|
|
|
|
|
|
| |||||||||
Net change | (278,327 | ) | $ | (3,275,582 | ) | 404,678 | $ | 4,936,363 | ||||||||
|
|
|
|
|
|
|
| |||||||||
| Class Y | ||||||||||||||||
Issued from the sale of shares | 1,127,135 | $ | 13,806,132 | 232,354 | $ | 2,795,946 | ||||||||||
Issued in connection with the reinvestment of distributions | 113,030 | 1,380,936 | 50,897 | 567,193 | ||||||||||||
Redeemed | (590,262 | ) | (7,402,072 | ) | (825,924 | ) | (9,916,194 | ) | ||||||||
|
|
|
|
|
|
|
| |||||||||
Net change | 649,903 | $ | 7,784,996 | (542,673 | ) | $ | (6,553,055 | ) | ||||||||
|
|
|
|
|
|
|
| |||||||||
Increase (decrease) from capital share transactions | 488,514 | $ | 5,978,520 | 68,516 | $ | 838,563 | ||||||||||
|
|
|
|
|
|
|
| |||||||||
111 |
Table of Contents
Notes to Financial Statements (continued)
November 30, 2014
13. Capital Shares (continued).
| | Period Ended November 30, 2014(a) | | ||||||
Emerging Markets Opportunities Fund | Shares | Amount | ||||||
| Class A | ||||||||
Issued from the sale of shares | 711,823 | $ | 7,411,470 | |||||
Issued in connection with the reinvestment of distributions | 10,837 | 112,651 | ||||||
Redeemed | (53,759 | ) | (556,078 | ) | ||||
|
|
|
| |||||
Net change | 668,901 | $ | 6,968,043 | |||||
|
|
|
| |||||
| Class C | ||||||||
Issued from the sale of shares | 4,275 | $ | 43,749 | |||||
Issued in connection with the reinvestment of distributions | 32 | 331 | ||||||
Redeemed | (1,126 | ) | (11,469 | ) | ||||
|
|
|
| |||||
Net change | 3,181 | $ | 32,611 | |||||
|
|
|
| |||||
| Class N | ||||||||
Issued from the sale of shares | 100 | $ | 1,001 | |||||
Issued in connection with the reinvestment of distributions | 3 | 32 | ||||||
Redeemed | — | — | ||||||
|
|
|
| |||||
Net change | 103 | $ | 1,033 | |||||
|
|
|
| |||||
| Class Y | ||||||||
Issued from the sale of shares | 2,671,508 | $ | 26,759,165 | |||||
Issued in connection with the reinvestment of distributions | 78,820 | 812,043 | ||||||
Redeemed | (11,006 | ) | (115,323 | ) | ||||
|
|
|
| |||||
Net change | 2,739,322 | $ | 27,455,885 | |||||
|
|
|
| |||||
Increase (decrease) from capital share transactions | 3,411,507 | $ | 34,457,572 | |||||
|
|
|
| |||||
| (a) | From commencement of operations on February 10, 2014 through November 30, 2014. |
| 112
Table of Contents
Notes to Financial Statements (continued)
November 30, 2014
13. Capital Shares (continued).
| | Year Ended November 30, 2014 | | | Year Ended November 30, 2013 | | |||||||||||
Senior Floating Rate and Fixed Income Fund | Shares | Amount | Shares | Amount | ||||||||||||
| Class A | ||||||||||||||||
Issued from the sale of shares | 22,625,002 | $ | 239,436,444 | 40,971,441 | $ | 433,135,367 | ||||||||||
Issued in connection with the reinvestment of distributions | 1,698,487 | 17,933,853 | 1,193,068 | 12,581,894 | ||||||||||||
Redeemed | (33,702,577 | ) | (357,095,191 | ) | (9,870,128 | ) | (104,227,061 | ) | ||||||||
|
|
|
|
|
|
|
| |||||||||
Net change | (9,379,088 | ) | $ | (99,724,894 | ) | 32,294,381 | $ | 341,490,200 | ||||||||
|
|
|
|
|
|
|
| |||||||||
| Class C | ||||||||||||||||
Issued from the sale of shares | 8,372,101 | $ | 88,336,125 | 17,056,300 | $ | 179,991,127 | ||||||||||
Issued in connection with the reinvestment of distributions | 580,059 | 6,102,364 | 322,929 | 3,397,992 | ||||||||||||
Redeemed | (6,307,621 | ) | (66,612,203 | ) | (1,432,233 | ) | (15,097,113 | ) | ||||||||
|
|
|
|
|
|
|
| |||||||||
Net change | 2,644,539 | $ | 27,826,286 | 15,946,996 | $ | 168,292,006 | ||||||||||
|
|
|
|
|
|
|
| |||||||||
| Class Y | ||||||||||||||||
Issued from the sale of shares | 83,778,480 | $ | 887,036,447 | 82,968,718 | $ | 878,417,765 | ||||||||||
Issued in connection with the reinvestment of distributions | 3,190,392 | 33,621,437 | 1,274,487 | 13,445,497 | ||||||||||||
Redeemed | (60,786,625 | ) | (641,848,231 | ) | (16,646,969 | ) | (175,744,458 | ) | ||||||||
|
|
|
|
|
|
|
| |||||||||
Net change | 26,182,247 | $ | 278,809,653 | 67,596,236 | $ | 716,118,804 | ||||||||||
|
|
|
|
|
|
|
| |||||||||
Increase (decrease) from capital share transactions | 19,447,698 | $ | 206,911,045 | 115,837,613 | $ | 1,225,901,010 | ||||||||||
|
|
|
|
|
|
|
| |||||||||
113 |
Table of Contents
Notes to Financial Statements (continued)
November 30, 2014
13. Capital Shares (continued).
| | Year Ended November 30, 2014 | | | Year Ended November 30, 2013 | | |||||||||||
Select Fund | Shares | Amount | Shares | Amount | ||||||||||||
| Class A | ||||||||||||||||
Issued from the sale of shares | 1,080,164 | $ | 14,760,927 | 615,495 | $ | 7,736,403 | ||||||||||
Issued in connection with the reinvestment of distributions | 73,027 | 960,306 | 2,007 | 21,581 | ||||||||||||
Redeemed | (1,062,633 | ) | (14,965,696 | ) | (25,578 | ) | (320,636 | ) | ||||||||
|
|
|
|
|
|
|
| |||||||||
Net change | 90,558 | $ | 755,537 | 591,924 | $ | 7,437,348 | ||||||||||
|
|
|
|
|
|
|
| |||||||||
| Class C | ||||||||||||||||
Issued from the sale of shares | 124,505 | $ | 1,698,959 | 64,468 | $ | 854,310 | ||||||||||
Issued in connection with the reinvestment of distributions | 9,036 | 117,470 | 359 | 3,784 | ||||||||||||
Redeemed | (9,427 | ) | (129,599 | ) | (626 | ) | (8,484 | ) | ||||||||
|
|
|
|
|
|
|
| |||||||||
Net change | 124,114 | $ | 1,686,830 | 64,201 | $ | 849,610 | ||||||||||
|
|
|
|
|
|
|
| |||||||||
| Class Y | ||||||||||||||||
Issued from the sale of shares | 2,863,064 | $ | 40,671,827 | 891,911 | $ | 10,500,893 | ||||||||||
Issued in connection with the reinvestment of distributions | 108,470 | 1,427,464 | 23,832 | 250,361 | ||||||||||||
Redeemed | (322,200 | ) | (4,540,134 | ) | (560,996 | ) | (7,155,083 | ) | ||||||||
|
|
|
|
|
|
|
| |||||||||
Net change | 2,649,334 | $ | 37,559,157 | 354,747 | $ | 3,596,171 | ||||||||||
|
|
|
|
|
|
|
| |||||||||
Increase (decrease) from capital share transactions | 2,864,006 | $ | 40,001,524 | 1,010,872 | $ | 11,883,129 | ||||||||||
|
|
|
|
|
|
|
| |||||||||
| 114
Table of Contents
Report of Independent Registered Public Accounting Firm
To the Trustees of Gateway Trust and Natixis Funds Trust II and Shareholders of Gateway International Fund, Loomis Sayles Dividend Income Fund (formerly known as Loomis Sayles Capital Income Fund), Loomis Sayles Emerging Markets Opportunities Fund, Loomis Sayles Senior Floating Rate and Fixed Income Fund and Vaughan Nelson Select Fund:
In our opinion, the accompanying statement of assets and liabilities, including the portfolio of investments, and the related statements of operations and of changes in net assets and the financial highlights present fairly, in all material respects, the financial position of the Gateway International Fund, a series of Gateway Trust; and Loomis Sayles Dividend Income Fund (formerly known as Loomis Sayles Capital Income Fund), Loomis Sayles Emerging Markets Opportunities Fund, Loomis Sayles Senior Floating Rate and Fixed Income Fund and Vaughan Nelson Select Fund, each a series of Natixis Funds Trust II (collectively, the “Funds”), at November 30, 2014, and the results of each of their operations, the changes in each of their net assets and the financial highlights for each of the periods indicated, in conformity with accounting principles generally accepted in the United States of America. These financial statements and financial highlights (hereafter referred to as “financial statements”) are the responsibility of the Funds’ management. Our responsibility is to express an opinion on these financial statements based on our audits. We conducted our audits of these financial statements in accordance with the standards of the Public Company Accounting Oversight Board (United States). Those standards require that we plan and perform the audits to obtain reasonable assurance about whether the financial statements are free of material misstatement. An audit includes examining, on a test basis, evidence supporting the amounts and disclosures in the financial statements, assessing the accounting principles used and significant estimates made by management, and evaluating the overall financial statement presentation. We believe that our audits, which included confirmation of securities at November 30, 2014 by correspondence with the custodian and the application of alternative auditing procedures where securities purchased had not been received, provide a reasonable basis for the opinion expressed above.
PricewaterhouseCoopers LLP
Boston, Massachusetts
January 22, 2015
115 |
Table of Contents
2014 U.S. Tax Distribution Information to
Shareholders (Unaudited)
Corporate Dividends Received Deduction. For the fiscal year ended November 30, 2014, a percentage of dividends distributed by the Funds listed below qualify for the dividends received deduction for corporate shareholders. These percentages are as follows:
Fund | Qualifying | |||
Dividend Income | 30.01 | % | ||
Select | 8.67 | % | ||
Capital Gains Distributions. Pursuant to Internal Revenue Section 852(b), the following Funds paid distributions, which have been designated as capital gains distributions for the fiscal year ended November 30, 2014, unless subsequently determined to be different.
Fund | Amount | |||
Dividend Income | $ | 781,029 | ||
Select | 313,409 | |||
Qualified Dividend Income. For the fiscal year ended November 30, 2014, the Funds below will designate up to the maximum amount allowable pursuant to the Internal Revenue Code as qualified dividend income eligible for reduced tax rates. These lower rates range from 0% to 20% depending on an individual’s tax bracket. If the Funds pay a distribution during calendar year 2014, complete information will be reported in conjunction with Form 1099-DIV.
Fund |
| |
Gateway International | ||
Dividend Income | ||
Select |
Foreign Tax Credit. For the year ended November 30, 2014, the Fund intends to pass through foreign tax credits and have derived gross income from sources within foreign countries amounting to:
Fund | Foreign Tax Credit Pass-Through | Foreign Source Income | ||||||
Gateway International | $ | 54,512 | $ | 788,644 | ||||
| 116
Table of Contents
Trustee and Officer Information
The tables below provide certain information regarding the trustees and officers of Natixis Funds Trust II and Gateway Trust (the “Trusts”). Unless otherwise indicated, the address of all persons below is 399 Boylston Street, Boston, MA 02116. The Funds’ Statements of Additional Information include additional information about the trustees of the Trusts and are available by calling Natixis Funds at 800-225-5478.
Name and Year of Birth | Position(s) Held of Office1 | Principal 5 Years | Number of 5 Years | Experience, Membership | ||||
| INDEPENDENT TRUSTEES | ||||||||
Kenneth A. Drucker (1945) | Trustee since 2008 for Natixis Funds Trust II and Gateway Trust Chairman of the Audit Committee and Governance Committee Member | Retired | 42 None | Significant experience on the Board and on the board of other business organizations (including at investment companies); executive experience (including as treasurer of an aerospace, automotive, and metal manufacturing corporation) | ||||
Edmond J. English (1953) | Trustee since 2013 for Natixis Funds Trust II and Gateway Trust Contract Review Committee Member | Chief Executive Officer of Bob’s Discount Furniture (retail) | 42 Formerly, Director, BJ’s Wholesale Club (retail); formerly, Director, Citizens Financial Group (bank) | Experience on the Board and significant experience on the board of other business organizations (including at a retail company and a bank); executive experience (including at a retail company) | ||||
117 |
Table of Contents
Trustee and Officer Information
Name and Year of Birth | Position(s) Held of Office1 | Principal 5 Years | Number of 5 Years | Experience, Membership | ||||
INDEPENDENT TRUSTEES continued | ||||||||
Richard A. Goglia (1951) | Trustee since 2015 for Natixis Funds Trust II and Gateway Trust Audit Committee Member | Vice President and Treasurer of Raytheon Company (defense) | 42 None | Experience on the Board and executive experience (including his role as vice president and treasurer of a defense company and experience at a financial services company) | ||||
Wendell J. Knox (1948) | Trustee since 2009 for Natixis Funds Trust II and Gateway Trust Audit Committee Member and Governance Committee Member | Director of Abt Associates Inc. (research and consulting) | 42 Director, Eastern Bank (bank); Director, The Hanover Insurance Group (property and casualty insurance) | Significant experience on the Board and on the board of other business organizations (including at a bank and at a property and casualty insurance firm); executive experience (including roles as president and chief executive officer of a research and consulting company) | ||||
| 118
Table of Contents
Trustee and Officer Information
Name and Year of Birth | Position(s) Held of Office1 | Principal 5 Years | Number of 5 Years | Experience, Membership | ||||
INDEPENDENT TRUSTEES continued | ||||||||
| Martin T. Meehan (1956) | Trustee since 2012 for Natixis Funds Trust II and Gateway Trust Contract Review Committee Member | Chancellor and faculty member, University of Massachusetts Lowell | 42 None | Experience on the Board and on the board of other business organizations; experience as Chancellor of the University of Massachusetts Lowell; government experience (including as a member of the U.S. House of Representatives); academic experience | ||||
Sandra O. Moose (1942) | Chairperson of the Board of Trustees since November 2005 Trustee since 1993 for Natixis Funds Trust II and since 2007 for Gateway Trust Ex Officio member of the Audit Committee, the Contract Review Committee and the Governance Committee | President, Strategic Advisory Services (management consulting) | 42 Director, AES Corporation (international power company); formerly, Director, Verizon Communications (telecommunications company) | Significant experience on the Board and on the board of other business organizations (including at a telecommunications company, an international power company and a specialty chemicals corporation); executive experience (including at a management consulting company) | ||||
119 |
Table of Contents
Trustee and Officer Information
Name and Year of Birth | Position(s) Held of Office1 | Principal 5 Years | Number of 5 Years | Experience, Membership | ||||
INDEPENDENT TRUSTEES continued | ||||||||
Erik R. Sirri (1958) | Trustee since 2009 for Natixis Funds Trust II and Gateway Trust Audit Committee Member | Professor of Finance at Babson College | 42 None | Significant experience on the Board; experience as Director of the Division of Trading and Markets at the Securities and Exchange Commission; academic experience; training as an economist | ||||
Peter J. Smail (1952) | Trustee since 2009 for Natixis Funds Trust II and Gateway Trust Chairman of the Contract Review Committee and Governance Committee Member | Retired | 42 None | Significant experience on the Board; mutual fund industry and executive experience (including roles as president and chief executive officer for an investment adviser) | ||||
Cynthia L. Walker (1956) | Trustee since 2005 for Natixis Funds Trust II and since 2007 for Gateway Trust Chairperson of the Governance Committee and Contract Review Committee Member | Deputy Dean for Finance and Administration, Yale University School of Medicine | 42 None | Significant experience on the Board; executive experience in a variety of academic organizations (including roles as dean for finance and administration) | ||||
| 120
Table of Contents
Trustee and Officer Information
Name and Year of Birth | Position(s) Held of Office1 | Principal 5 Years | Number of 5 Years | Experience, Membership | ||||
| INTERESTED TRUSTEES | ||||||||
Robert J. Blanding3 (1947) 555 California Street San Francisco, CA 94104 | Trustee since 2003 for Natixis Funds Trust II and since 2007 for Gateway Trust | Chairman and Chief Executive Officer (formerly, President), Loomis, Sayles & Company, L.P. | 42 None | Significant experience on the Board; continuing service as Chairman and Chief Executive Officer of Loomis, Sayles & Company, L.P. | ||||
David L. Giunta4 (1965) | Trustee since 2011 for Natixis Funds Trust II and Gateway Trust President and Chief Executive Officer of Natixis Funds Trust II and Gateway Trust | President and Chief Executive Officer, NGAM Distribution Corporation, NGAM Advisors, L.P. and NGAM Distribution, L.P. | 42 None | Experience on the Board; continuing experience as President and Chief Executive Officer of NGAM Advisors, L.P. | ||||
John T. Hailer5 (1960) | Trustee since 2000 for Natixis Funds Trust II and since 2007 for Gateway Trust | President and Chief Executive Officer – U.S. and Asia, Natixis Global Asset Management, L.P. | 42 None | Significant experience on the Board; continuing experience as President and Chief Executive Officer – U.S. and Asia, Natixis Global Asset Management, L.P. | ||||
| 1 | Each trustee serves until retirement, resignation or removal from the Board. The current retirement age is 75. The position of Chairperson of the Board is appointed for a three-year term. Ms. Moose was appointed to serve an additional three-year term as the Chairperson of the Board on December 13, 2013. |
| 2 | The trustees of the Trusts serve as trustees of a fund complex that includes all series of the Natixis Funds Trust I, Natixis Funds Trust II, Natixis Funds Trust IV and Gateway Trust (collectively, the “Natixis Funds Trusts”), Loomis Sayles Funds I and Loomis Sayles Funds II (collectively, the “Loomis Sayles Funds Trusts”). |
121 |
Table of Contents
Trustee and Officer Information
| 3 | Mr. Blanding is deemed an “interested person” of the Trusts because he holds the following positions with an affiliated person of the Trusts: Chairman and Chief Executive Officer of Loomis, Sayles & Company, L.P. and Director of Loomis Sayles Investment Asia Pte., Ltd. |
| 4 | Mr. Giunta is deemed an “interested person” of the Trusts because he holds the following positions with an affiliated person of the Trusts: President and Chief Executive Officer of NGAM Distribution Corporation, NGAM Advisors, L.P. and NGAM Distribution, L.P. |
| 5 | Mr. Hailer is deemed an “interested person” of the Trusts because he holds the following positions with an affiliated person of the Trusts: President and Chief Executive Officer – U.S. and Asia, Natixis Global Asset Management, L.P. |
| 122
Table of Contents
Trustee and Officer Information
Name and Year of Birth | Position(s) Held with the Trust(s) | Term of Office1 and Length of Time Served | Principal Occupation(s) During Past 5 Years2 | |||
| OFFICERS OF THE TRUST | ||||||
Coleen Downs Dinneen (1960) | Secretary, Clerk and Chief Legal Officer | Since September 2004 | Executive Vice President, General Counsel, Secretary and Clerk, NGAM Distribution Corporation, NGAM Advisors, L.P. and NGAM Distribution, L.P. | |||
Russell L. Kane (1969) | Chief Compliance Officer, Assistant Secretary and Anti-Money Laundering Officer | Chief Compliance Officer since May 2006; Assistant Secretary since June 2004; and Anti-Money Laundering Officer since April 2007 | Chief Compliance Officer for Mutual Funds, Senior Vice President, Deputy General Counsel, Assistant Secretary and Assistant Clerk, NGAM Distribution Corporation, NGAM Advisors, L.P. and NGAM Distribution, L.P. | |||
Michael C. Kardok (1959) | Treasurer, Principal Financial and Accounting Officer | Since October 2004 | Senior Vice President, NGAM Advisors, L.P. and NGAM Distribution, L.P. | |||
| 1 | Each officer of the Trusts serves for an indefinite term in accordance with the Trusts’ current by-laws until the date his or her successor is elected and qualified, or until he or she sooner dies, retires, is removed or becomes disqualified. |
| 2 | Each person listed above, except as noted, holds the same position(s) with the Fund Complex. Previous positions during the past five years with NGAM Distribution, L.P., NGAM Advisors, L.P. or Loomis, Sayles & Company, L.P. are omitted, if not materially different from a trustee’s or officer’s current position with such entity. |
123 |
Table of Contents
Item 2. Code of Ethics.
The Registrant has adopted a code of ethics that applies to the Registrant’s principal executive officer, principal financial officer and persons performing similar functions. There have been no amendments or waivers of the Registrant’s code of ethics during the period.
Item 3. Audit Committee Financial Expert.
The Board of Trustees of the Registrant has established an audit committee. Mr. Kenneth A. Drucker, Richard Goglia , Mr. Wendell J. Knox and Mr. Erik R. Sirri are members of the audit committee and have been designated as “audit committee financial experts” by the Board of Trustees. Each of these individuals is also an Independent Trustee of the Registrant.
Item 4. Principal Accountant Fees and Services.
Fees billed by the Principal Accountant for services rendered to the Registrant.
The table below sets forth fees billed by the principal accountant, PricewaterhouseCoopers LLP, for the past two fiscal years for professional services rendered in connection with a) the audit of the Registrant’s annual financial statements and services provided in connection with regulatory filings; b) audit-related services (including services that are reasonably related to the performance of the audit of the Registrant’s financial statements but not reported under “Audit Fees”); c) tax compliance, tax advice and tax planning and d) all other fees billed for professional services rendered by the principal accountant to the Registrant, other than the services provided as reported as a part of (a) through (c) of this Item.
| Audit fees | Audit-related fees1 | Tax fees2 | All other fees | |||||||||||||||||||||||||||||
| 12/1/12- 11/30/13 | 12/1/13- 11/30/14 | 12/1/12- 11/30/13 | 12/1/13- 11/30/14 | 12/1/12- 11/30/13 | 12/1/13- 11/30/14 | 12/1/12- 11/30/13 | 12/1/13- 11/30/14 | |||||||||||||||||||||||||
Gateway Trust-Gateway International Fund | $ | 38,570 | $ | 34,722 | $ | 4 | $ | 5 | $ | 9,135 | $ | 9,272 | $ | — | $ | — | ||||||||||||||||
| 1. | Audit-related fees consist of: |
2013 &2014 – Performance of agreed upon procedures related to the Registrants deferred compensation plan.
| 2. | Tax fees consist of: |
2013 & 2014 – review of the Registrant’s tax returns.
Aggregate fees billed to the Registrant for non-audit services during fiscal years 2013 and 2014 were $9,139 and $9,277, respectively.
Fees billed by the Principal Accountant for services rendered to the Adviser and Control Affiliates.
The following table sets forth fees billed by the Registrant’s principal accountant for non-audit services rendered to Gateway Investment Advisers, LLC and entities controlling, controlled by or under common control with Gateway Investment Advisers, LLC (“Control Affiliates”) that provide ongoing services to the Registrant, for engagements that related directly to the operations and financial reporting of the Registrant for the fiscal years 2013 and 2014.
| Audit-related fees | Tax fees | All other fees | ||||||||||||||||||||||
| 12/1/12- 11/30/13 | 12/1/13- 11/30/14 | 12/1/12- 11/30/13 | 12/1/13- 11/30/14 | 12/1/12- 11/30/13 | 12/1/13- 11/30/14 | |||||||||||||||||||
Control Affiliates | $ | — | $ | — | $ | — | $ | — | $ | — | $ | — | ||||||||||||
Table of Contents
The following table sets forth the aggregate fees billed by the Registrant’s principal accountant for non-audit services rendered to Gateway Investment Advisers, LLC and Control Affiliates that provide ongoing services to the Registrant, for the last two fiscal years, including the fees disclosed in the table above.
| Aggregate Non-Audit Fees | ||||||||
| 12/1/12– 11/30/13 | 12/1/13– 11/30/14 | |||||||
Control Affiliates | $ | 2,000 | $ | 90,546 | ||||
None of the services described above were approved pursuant to (c)(7)(i)(C) of Regulation S-X.
Audit Committee Pre Approval Policies.
Annually, the Registrant’s Audit Committee reviews the audit, audit-related, tax and other non-audit services together with the projected fees, for services proposed to be rendered to the Trust and/or other entities for which pre-approval is required during the upcoming year. Any subsequent revisions to already pre-approved services or fees (including fee increases) and requests for pre-approval of new services would be presented for consideration quarterly as needed.
If, in the opinion of management, a proposed engagement by the Registrant’s independent accountants needs to commence before the next regularly scheduled Audit Committee meeting, any member of the Audit Committee who is an independent Board member is authorized to pre-approve the engagement, but only for engagements to provide audit, audit related and tax services. This approval is subject to review of the full Audit Committee at its next quarterly meeting. All other engagements require the approval of all the members of the Audit Committee.
Item 5. Audit Committee of Listed Registrants.
Not applicable.
Item 6. Schedule of Investments.
Included as part of the Report to Shareholders filed as Item 1 herewith.
Item 7. Disclosure of Proxy Voting Policies and Procedures for Closed-End Management Investment Companies.
Not applicable.
Item 8. Portfolio Managers of Closed-End Management Investment Companies.
Not applicable.
Item 9. Purchases of Equity Securities by Closed-End Management Investment Companies and Affiliated Purchasers.
Not applicable.
Item 10. Submission of Matters to a Vote of Securities Holders.
There were no material changes to the procedures by which shareholders may recommend nominees to the Registrant’s Board of Trustees.
Item 11. Controls and Procedures.
The Registrant’s principal executive officer and principal financial officer have concluded that the Registrant’s disclosure controls and procedures are sufficient to ensure that information required to be disclosed by the Registrant in this Form N-CSR was recorded, processed, summarized and reported within the time periods specified in the Securities and Exchange Commission’s rules and forms, based upon such officers’ evaluation of these controls and procedures as of a date within 90 days of the filing date of the report.
Table of Contents
There were no changes in the Registrant’s internal control over financial reporting that occurred during the Registrant’s last fiscal quarter of the period covered by this report that has materially affected, or is reasonably likely to materially affect, the Registrant’s internal control over financial reporting.
Item 12. Exhibits.
| (a) | (1) | Code of Ethics required by Item 2 hereof, filed herewith as Exhibit (a)(1). | ||||
| (a) | (2) | Certifications of Principal Executive Officer and Principal Financial Officer pursuant to Rule 30a-2(a) under the Investment Company Act of 1940 [17 CFR 270.30a-2(a)], filed herewith as Exhibits (a)(2)(1) and (a)(2)(2), respectively. | ||||
| (a) | (3) | Not applicable. | ||||
| (b) | Certifications of Principal Executive Officer and Principal Financial Officer pursuant to Section 906 of Sarbanes-Oxley Act of 2002 are filed herewith as Exhibit (b). | |||||
Table of Contents
SIGNATURES
Pursuant to the requirements of the Securities Exchange Act of 1934 and the Investment Company Act of 1940, the Registrant has duly caused this report to be signed on its behalf by the undersigned, thereunto duly authorized.
| Gateway Trust | ||
| By: | /s/ David L. Giunta | |
| Name: | David L. Giunta | |
| Title: | President and Chief Executive Officer | |
| Date: | January 21, 2015 | |
Pursuant to the requirements of the Securities Exchange Act of 1934 and the Investment Company Act of 1940, this report has been signed by the following persons on behalf of the Registrant and in the capacities and on the dates indicated.
| By: | /s/ David L. Giunta | |
| Name: | David L. Giunta | |
| Title: | President and Chief Executive Officer | |
| Date: | January 21, 2015 | |
| By: | /s/ Michael C. Kardok | |
| Name: | Michael C. Kardok | |
| Title: | Treasurer | |
| Date: | January 21, 2015 | |