Table of Contents
UNITED STATES
SECURITIES AND EXCHANGE COMMISSION
Washington, D.C. 20549
FORM N-CSR
CERTIFIED SHAREHOLDER REPORT OF REGISTERED
MANAGEMENT INVESTMENT COMPANIES
Investment Company Act file number: 811-22099
Gateway Trust
(Exact name of Registrant as specified in charter)
399 Boylston Street, Boston, Massachusetts 02116
(Address of principal executive offices) (Zip code)
Coleen Downs Dinneen, Esq.
NGAM Distribution, L.P.
399 Boylston Street
Boston, Massachusetts 02116
(Name and address of agent for service)
Registrant’s telephone number, including area code: (617) 449-2810
Date of fiscal year end: December 31
Date of reporting period: December 31, 2014
Table of Contents
Item 1. Reports to Stockholders.
The Registrant’s annual report transmitted to shareholders pursuant to Rule 30e-1 under the Investment Company Act of 1940 is as follows:
Table of Contents
ANNUAL REPORT
December 31, 2014

Gateway Fund
Portfolio Review page 1
Portfolio of Investments page 7
Financial Statements page 18
Notes to Financial Statements page 24
Table of Contents
| Managers | Symbols | |
| Michael T. Buckius, CFA® | Class A GATEX | |
| Paul R. Stewart, CFA® | Class C GTECX | |
| Kenneth H. Toft, CFA® | Class Y GTEYX | |
| Gateway Investment Advisers, LLC | ||
Objective
The fund seeks to capture the majority of returns associated with equity market investments, while exposing investors to less risk than other equity investments.
Market Conditions
Over the 12-month period ended December 31, 2014, central bank policy and geopolitical tensions were front and center, but the equity market was driven higher by a positive backdrop of an improving U.S. economy and strong corporate earnings. Anxiety regarding central bank policy and geopolitical events contributed to market choppiness with the S&P 500® Index experiencing five brief but sharp pullbacks with losses ranging from 3.85% to 7.28%. Most of the S&P 500® Index’s return came after October 15th as the 7.28% decline from September 18th to October 15th brought the year-to-date return to just 2.40%. From October 15th to year-end, the S&P 500® Index advanced 11.03%.
Volatility was low in the equity and equity index option markets. For the year, the S&P 500® Index showed a standard deviation, a traditional measure of volatility, of 11.56%, less than its historical average of 14.43% from 1988 to 2014. Equity index option market volatility for 2014, as measured by the Chicago Board Options Exchange Volatility Index (the “VIX”), averaged just 14.17 while falling as low as 10.32 and spending little time above its long-term average of 20. The VIX was relatively elevated in the fourth quarter, with two spikes into the 20s and a quarter average of 16.07.
Performance Results
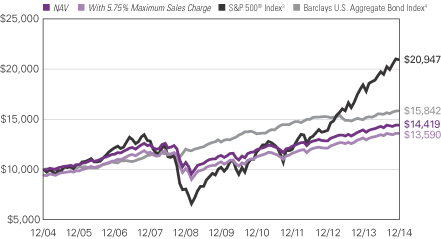
For the 12 months ended December 31, 2014, Class A shares of Gateway Fund returned 3.33% at net asset value. The S&P 500® Index returned 13.69%.
Explanation of Fund Performance
Gateway Fund seeks to generate returns by writing at-the-money index call options, which substitute a less variable option premium for market price appreciation, and uses some of the cash flow to mitigate price declines in the portfolio by purchasing out-of-the-money index put options. Though collecting premiums from writing index call options will allow the fund to generate a return when the index advances, call option positions that expire or are closed out when the index is well above the option’s strike price may generate realized losses. As such, most of the realized losses from index call options occurred during the sharp index advances of the second and fourth quarters. An index option is described as being at-the-money when the price of the underlying index is the same as the option’s strike price. Additionally, an index put option is described as being out-of-the money when the price of the underlying index is above the put option’s strike price.
1 |
Table of Contents
Equity market choppiness combined with below-average VIX levels created challenges for the Fund’s strategy in 2014. Low VIX levels meant less return-generating call premium income was available during periods of market advance, while the periodic market losses were at times large enough to erase a significant portion of the Fund’s year-to-date return despite the downside protection provided by the strategy. For example, during the September to October market decline, the Fund lost 3.43%, which was 3.85 percentage points less than the loss of the S&P 500® Index. However, the Fund’s loss brought its year-to-date return through October 15th to 0.13%. From that point until year-end, the Fund returned 3.19%, a return level consistent with the amount of cashflow available to the strategy in a slightly elevated implied volatility environment, but significantly below the above-average rate of return experienced by the equity market.
Consistent with its objective, the measured risk of the Fund was low relative to the S&P 500® Index, as its standard deviation for 2014 was 5.25%, versus 11.56% for the Index.
Outlook
Looking ahead to the coming year, we anticipate a mix of opportunity and risk. There is meaningful potential for both implied and realized volatility to increase driven by market concern regarding: the Federal Reserve’s moves to normalize monetary policy and raise interest rates; de-synchronization of policies across the world’s central banks with a restrictive Federal Reserve as the most likely outlier, and ongoing geopolitical risks including both Russia and the Middle East.
In the absence of a significant downside event, higher market volatility does not preclude attractive equity returns given reasonable market valuations and continuing domestic economic improvement. In contrast to favorable scenarios for equity market returns, investors appear unlikely to experience attractive returns from fixed-income investments, particularly the high-quality variety, given the very low interest rates.
A sixth straight calendar year of positive returns for most broad market equity indexes and the absence of a 10% correction in the S&P 500® Index since 2011 may be allowing an increasingly large swath of the populace to be comfortable investing in equities. In light of these factors, Gateway’s investment management team continues to maintain a market-agnostic posture, seeking to benefit from return-generating index call option premiums while using index put options to mitigate severe market declines that occur over a short period of time. As investors become more sensitive to the rewards of risk management, we believe they may develop a greater appreciation for the way in which the Fund’s low volatility equity profile aligns with their long-term objectives.
| 2
Table of Contents
GATEWAY FUND
Growth of $10,000 Investment in Class A Shares1,5
December 31, 2004 through December 31, 2014
3 |
Table of Contents
Average Annual Total Returns — December 31, 20145
| 1 Year | 5 Years | 10 Years | ||||||||||
| Class A (Inception 12/07/1977)1 | ||||||||||||
| NAV | 3.33 | % | 4.79 | % | 3.73 | % | ||||||
| With 5.75% Maximum Sales Charge | -2.62 | 3.56 | 3.12 | |||||||||
| Class C (Inception 2/19/2008)1 | ||||||||||||
| NAV | 2.58 | 4.00 | 2.95 | |||||||||
| With CDSC2 | 1.58 | 4.00 | 2.95 | |||||||||
| Class Y (Inception 2/19/2008)1 | ||||||||||||
| NAV | 3.58 | 5.05 | 3.90 | |||||||||
| COMPARATIVE PERFORMANCE | ||||||||||||
| S&P 500® Index3 | 13.69 | 15.45 | 7.67 | |||||||||
| Barclays U.S. Aggregate Bond Index4 | 5.97 | 4.45 | 4.71 | |||||||||
Past performance does not guarantee future results. The table(s) do not reflect taxes shareholders might owe on any fund distributions or when they redeem their shares. Performance for periods less than one year is cumulative, not annualized. Returns reflect changes in share price and reinvestment of dividends and capital gains, if any. Unlike a fund, an index is not managed and does not reflect fees and expenses.
| 1 | As of the close of business on February 15 , 2008, the Fund acquired the assets and liabilities of Gateway Fund (the “Predecessor Fund”), a series of The Gateway Trust, an Ohio business trust. The Fund is the successor to the Predecessor Fund. Prior to 2/15/08 performance of Class A shares is that of the Predecessor Fund, restated to reflect the sales load of Class A shares. Prior to the inception of Class C shares (2/19/08), performance is that of the Predecessor Fund, restated to reflect the higher net expenses and sales loads of Class C shares. Prior to the inception of Class Y shares (2/19/08), performance is that of the Predecessor Fund. |
| 2 | Performance for Class C shares assumes a 1% contingent deferred sales charge (“CDSC”) applied when you sell shares within one year of purchase. |
| 3 | S&P 500® Index is a widely recognized measure of U.S. stock market performance. It is an unmanaged index of 500 common stocks chosen for market size, liquidity, and industry group representation, among other factors. |
| 4 | Barclays U.S. Aggregate Bond Index is an unmanaged index that covers the U.S.-dollar denominated, investment-grade, fixed-rate, taxable bond market of SEC-registered securities. The index includes bonds from the Treasury, government-related, corporate, mortgage-backed securities, asset-backed securities, and collateralized mortgage-backed securities sectors. |
| 5 | Fund performance has been increased by fee waivers and/or expense reimbursements, if any, without which performance would have been lower. |
| 4
Table of Contents
ADDITIONAL INFORMATION
The views expressed in this report reflect those of the portfolio managers as of the dates indicated. The managers’ views are subject to change at any time without notice based on changes in market or other conditions. References to specific securities or industries should not be regarded as investment advice. Because the Fund is actively managed, there is no assurance that they will continue to invest in the securities or industries mentioned.
ADDITIONAL INDEX INFORMATION
This document may contain references to third party copyrights, indexes, and trademarks, each of which is the property of its respective owner. Such owner is not affiliated with Natixis Global Asset Management or any of its related or affiliated companies (collectively “NGAM”) and does not sponsor, endorse or participate in the provision of any NGAM services, funds or other financial products.
The index information contained herein is derived from third parties and is provided on an “as is” basis. The user of this information assumes the entire risk of use of this information. Each of the third party entities involved in compiling, computing or creating index information disclaims all warranties (including, without limitation, any warranties of originality, accuracy, completeness, timeliness, non-infringement, merchantability and fitness for a particular purpose) with respect to such information.
PROXY VOTING INFORMATION
A description of the Fund’s proxy voting policies and procedures is available without charge, upon request, by calling Natixis Funds at 800-225-5478; on the Fund’s website at ngam.natixis.com; and on the Securities and Exchange Commission’s (SEC) website at www.sec.gov. Information regarding how the Fund voted proxies relating to portfolio securities during the 12-months ended June 30, 2014 is available from the Fund’s website and the SEC’s website.
QUARTERLY PORTFOLIO SCHEDULES
The Fund files a complete schedule of portfolio holdings with the SEC for the first and third quarters of each fiscal year on Form N-Q. The fund’s Forms N-Q are available on the SEC’s website at www.sec.gov and may be reviewed and copied at the SEC’s Public Reference Room in Washington, DC. Information on the operation of the Public Reference Room may be obtained by calling 800-SEC-0330.
5 |
Table of Contents
UNDERSTANDING FUND EXPENSES
As a mutual fund shareholder, you incur different types of costs: transaction costs, including sales charges (loads) on purchases and contingent deferred sales charges on redemptions and ongoing costs, including management fees, distribution and/or service fees (12b-1 fees), and other fund expenses. Certain exemptions may apply. These costs are described in more detail in the Fund’s prospectus. The following examples are intended to help you understand the ongoing costs of investing in the Fund and help you compare these with the ongoing costs of investing in other mutual funds.
The first line in the table for each class of Fund shares shows the actual account values and actual Fund expenses you would have paid on a $1,000 investment in the Fund from July 1, 2014 through December 31, 2014. To estimate the expenses you paid over the period, simply divide your account value by $1,000 (for example $8,600 account value divided by $1,000 = 8.60) and multiply the result by the number in the Expenses Paid During Period column as shown below for your class.
The second line in the table for each class of shares provides information about hypothetical account values and hypothetical expenses based on the Fund’s actual expense ratios and an assumed rate of return of 5% per year before expenses, which is not the Fund’s actual return. The hypothetical account values and expenses may not be used to estimate the actual ending account balance or expenses you paid on your investment for the period. You may use this information to compare the ongoing costs of investing in the Fund and other funds. To do so, compare this 5% hypothetical example with the 5% hypothetical examples that appear in the shareholder reports of the other funds.
Please note that the expenses shown reflect ongoing costs only, and do not include any transaction costs, such as sales charges. Therefore, the second line in the table is useful in comparing ongoing costs only, and will not help you determine the relative costs of owning different funds. If transaction costs were included, total costs would be higher.
| GATEWAY FUND | BEGINNING ACCOUNT VALUE 7/1/14 | ENDING ACCOUNT VALUE 12/31/14 | EXPENSES PAID 7/1/14 – 12/31/14 | |||||||||
| Class A | ||||||||||||
| Actual | $1,000.00 | $1,009.00 | $4.76 | |||||||||
| Hypothetical (5% return before expenses) | $1,000.00 | $1,020.47 | $4.79 | |||||||||
| Class C | ||||||||||||
| Actual | $1,000.00 | $1,005.40 | $8.59 | |||||||||
| Hypothetical (5% return before expenses) | $1,000.00 | $1,016.64 | $8.64 | |||||||||
| Class Y | ||||||||||||
| Actual | $1,000.00 | $1,010.40 | $3.55 | |||||||||
| Hypothetical (5% return before expenses) | $1,000.00 | $1,021.68 | $3.57 | |||||||||
| * | Expenses are equal to the Fund’s annualized expense ratio (after waiver/reimbursement): 0.94%, 1.70% and 0.70% for Class A, C and Y, respectively, multiplied by the average account value over the period, multiplied by the number of days in the most recent fiscal half-year (184), divided by 365 (to reflect the half-year period). |
| 6
Table of Contents
Portfolio of Investments – as of December 31, 2014
Gateway Fund
| Shares | Description | Value (†) | ||||||
| Common Stocks — 99.2% of Net Assets | ||||||||
| Aerospace & Defense — 2.2% | ||||||||
| 372,192 | Boeing Co. (The)(b) | $ | 48,377,516 | |||||
| 520,523 | Honeywell International, Inc.(b) | 52,010,658 | ||||||
| 274,963 | Raytheon Co.(b) | 29,742,748 | ||||||
| 421,225 | United Technologies Corp.(b) | 48,440,875 | ||||||
|
| |||||||
| 178,571,797 | ||||||||
|
| |||||||
| Air Freight & Logistics — 0.8% | ||||||||
| 571,206 | United Parcel Service, Inc., Class B(b) | 63,500,971 | ||||||
|
| |||||||
| Airlines — 0.3% | ||||||||
| 239,865 | American Airlines Group, Inc.(b) | 12,863,960 | ||||||
| 204,317 | United Continental Holdings, Inc.(b)(c) | 13,666,764 | ||||||
|
| |||||||
| 26,530,724 | ||||||||
|
| |||||||
| Auto Components — 0.3% | ||||||||
| 179,442 | Cooper Tire & Rubber Co.(b) | 6,217,665 | ||||||
| 169,820 | TRW Automotive Holdings Corp.(b)(c) | 17,465,987 | ||||||
|
| |||||||
| 23,683,652 | ||||||||
|
| |||||||
| Automobiles — 0.5% | ||||||||
| 2,101,689 | Ford Motor Co.(b) | 32,576,179 | ||||||
| 26,631 | Tesla Motors, Inc.(c)(d) | 5,923,001 | ||||||
|
| |||||||
| 38,499,180 | ||||||||
|
| |||||||
| Banks — 5.8% | ||||||||
| 287,346 | Associated Banc-Corp(b) | 5,353,256 | ||||||
| 4,972,402 | Bank of America Corp.(b) | 88,956,272 | ||||||
| 1,496,767 | Citigroup, Inc.(b) | 80,990,062 | ||||||
| 86,171 | FirstMerit Corp. | 1,627,770 | ||||||
| 1,706,024 | JPMorgan Chase & Co.(b) | 106,762,982 | ||||||
| 110,540 | Old National Bancorp | 1,644,835 | ||||||
| 1,207,665 | U.S. Bancorp(b) | 54,284,542 | ||||||
| 2,439,088 | Wells Fargo & Co.(b) | 133,710,804 | ||||||
|
| |||||||
| 473,330,523 | ||||||||
|
| |||||||
| Beverages — 2.3% | ||||||||
| 1,941,819 | Coca-Cola Co. (The)(b) | 81,983,598 | ||||||
| 137,031 | Monster Beverage Corp.(b)(c) | 14,847,309 | ||||||
| 918,488 | PepsiCo, Inc.(b) | 86,852,225 | ||||||
|
| |||||||
| 183,683,132 | ||||||||
|
| |||||||
| Biotechnology — 3.3% | ||||||||
| 114,499 | Alexion Pharmaceuticals, Inc.(b)(c) | 21,185,750 | ||||||
| 393,369 | Amgen, Inc.(d) | 62,659,748 | ||||||
| 122,646 | Biogen Idec, Inc.(b)(c) | 41,632,184 | ||||||
| 452,822 | Celgene Corp.(c)(d) | 50,652,669 | ||||||
| 786,923 | Gilead Sciences, Inc.(b)(c) | 74,175,362 | ||||||
| 137,421 | Vertex Pharmaceuticals, Inc.(c)(d) | 16,325,615 | ||||||
|
| |||||||
| 266,631,328 | ||||||||
|
| |||||||
See accompanying notes to financial statements.
7 |
Table of Contents
Portfolio of Investments – as of December 31, 2014
Gateway Fund – (continued)
| Shares | Description | Value (†) | ||||||
| Capital Markets — 2.2% | ||||||||
| 90,315 | Affiliated Managers Group, Inc.(b)(c) | $ | 19,168,456 | |||||
| 976,184 | Charles Schwab Corp. (The)(b) | 29,470,995 | ||||||
| 323,178 | Eaton Vance Corp.(d) | 13,227,675 | ||||||
| 224,679 | Goldman Sachs Group, Inc. (The)(b) | 43,549,530 | ||||||
| 348,228 | Legg Mason, Inc.(b) | 18,584,928 | ||||||
| 894,591 | Morgan Stanley(d) | 34,710,131 | ||||||
| 354,087 | TD Ameritrade Holding Corp.(b) | 12,669,233 | ||||||
| 135,291 | Waddell & Reed Financial, Inc., Class A(b) | 6,740,198 | ||||||
|
| |||||||
| 178,121,146 | ||||||||
|
| |||||||
| Chemicals — 2.2% | ||||||||
| 674,712 | Dow Chemical Co. (The)(b) | 30,773,614 | ||||||
| 584,976 | E.I. du Pont de Nemours & Co.(b) | 43,253,125 | ||||||
| 213,613 | Eastman Chemical Co.(b) | 16,204,682 | ||||||
| 308,627 | LyondellBasell Industries NV, Class A(b) | 24,501,898 | ||||||
| 332,136 | Monsanto Co.(b) | 39,680,288 | ||||||
| 296,071 | Olin Corp.(d) | 6,741,537 | ||||||
| 111,573 | Potash Corp. of Saskatchewan, Inc.(b) | 3,940,758 | ||||||
| 357,569 | RPM International, Inc.(b) | 18,132,324 | ||||||
|
| |||||||
| 183,228,226 | ||||||||
|
| |||||||
| Commercial Services & Supplies — 0.7% | ||||||||
| 163,755 | ADT Corp. (The)(b) | 5,932,844 | ||||||
| 10,140 | R.R. Donnelley & Sons Co. | 170,403 | ||||||
| 591,916 | Tyco International PLC(b) | 25,961,436 | ||||||
| 451,602 | Waste Management, Inc.(b) | 23,176,214 | ||||||
|
| |||||||
| 55,240,897 | ||||||||
|
| |||||||
| Communications Equipment — 1.8% | ||||||||
| 2,470,813 | Cisco Systems, Inc.(b) | 68,725,664 | ||||||
| 238,994 | Motorola Solutions, Inc.(b) | 16,031,717 | ||||||
| 821,959 | QUALCOMM, Inc.(b) | 61,096,212 | ||||||
| 65,068 | Telefonaktiebolaget LM Ericsson, Sponsored ADR | 787,323 | ||||||
|
| |||||||
| 146,640,916 | ||||||||
|
| |||||||
| Consumer Finance — 1.0% | ||||||||
| 571,384 | American Express Co.(b) | 53,161,568 | ||||||
| 413,525 | Discover Financial Services(b) | 27,081,752 | ||||||
|
| |||||||
| 80,243,320 | ||||||||
|
| |||||||
| Containers & Packaging — 0.4% | ||||||||
| 205,641 | Avery Dennison Corp.(b) | 10,668,655 | ||||||
| 401,958 | MeadWestvaco Corp.(b) | 17,842,916 | ||||||
| 116,207 | Sonoco Products Co.(b) | 5,078,246 | ||||||
|
| |||||||
| 33,589,817 | ||||||||
|
| |||||||
| Distributors — 0.3% | ||||||||
| 257,573 | Genuine Parts Co.(b) | 27,449,555 | ||||||
|
| |||||||
| Diversified Financial Services — 2.4% | ||||||||
| 1,043,489 | Berkshire Hathaway, Inc., Class B(b)(c) | 156,679,873 | ||||||
See accompanying notes to financial statements.
| 8
Table of Contents
Portfolio of Investments – as of December 31, 2014
Gateway Fund – (continued)
| Shares | Description | Value (†) | ||||||
| Diversified Financial Services — (continued) | ||||||||
| 246,268 | CME Group, Inc.(b) | $ | 21,831,658 | |||||
| 129,451 | FNFV Group(c) | 2,037,559 | ||||||
| 83,571 | IntercontinentalExchange, Inc.(b) | 18,326,285 | ||||||
|
| |||||||
| 198,875,375 | ||||||||
|
| |||||||
| Diversified Telecommunication Services — 1.9% | ||||||||
| 1,909,979 | AT&T, Inc.(b) | 64,156,195 | ||||||
| 911,718 | Frontier Communications Corp.(b) | 6,081,159 | ||||||
| 1,810,658 | Verizon Communications, Inc.(b) | 84,702,581 | ||||||
|
| |||||||
| 154,939,935 | ||||||||
|
| |||||||
| Electric Utilities — 1.5% | ||||||||
| 568,271 | American Electric Power Co., Inc.(b) | 34,505,415 | ||||||
| 641,648 | Duke Energy Corp.(d) | 53,603,274 | ||||||
| 96,946 | Hawaiian Electric Industries, Inc. | 3,245,752 | ||||||
| 446,651 | OGE Energy Corp.(b) | 15,847,178 | ||||||
| 465,698 | Pepco Holdings, Inc.(b) | 12,541,247 | ||||||
|
| |||||||
| 119,742,866 | ||||||||
|
| |||||||
| Electrical Equipment — 0.8% | ||||||||
| 317,339 | Eaton Corp. PLC(d) | 21,566,358 | ||||||
| 487,717 | Emerson Electric Co.(b) | 30,106,770 | ||||||
| 94,173 | Hubbell, Inc., Class B(b) | 10,060,502 | ||||||
|
| |||||||
| 61,733,630 | ||||||||
|
| |||||||
| Electronic Equipment, Instruments & Components — 0.5% | ||||||||
| 888,449 | Corning, Inc.(b) | 20,372,135 | ||||||
| 271,907 | TE Connectivity Ltd.(b) | 17,198,118 | ||||||
|
| |||||||
| 37,570,253 | ||||||||
|
| |||||||
| Energy Equipment & Services — 1.6% | ||||||||
| 374,074 | Baker Hughes, Inc.(b) | 20,974,329 | ||||||
| 16,332 | CARBO Ceramics, Inc. | 654,097 | ||||||
| 122,633 | Diamond Offshore Drilling, Inc.(d) | 4,501,857 | ||||||
| 749,817 | Halliburton Co.(d) | 29,490,303 | ||||||
| 256,665 | Patterson-UTI Energy, Inc.(b) | 4,258,072 | ||||||
| 847,306 | Schlumberger Ltd.(b) | 72,368,406 | ||||||
| 70,727 | Seventy Seven Energy, Inc.(c) | 382,633 | ||||||
|
| |||||||
| 132,629,697 | ||||||||
|
| |||||||
| Food & Staples Retailing — 2.3% | ||||||||
| 820,029 | CVS Health Corp.(b) | 78,976,993 | ||||||
| 806,303 | Wal-Mart Stores, Inc.(b) | 69,245,302 | ||||||
| 554,853 | Walgreens Boots Alliance, Inc.(b) | 42,279,798 | ||||||
|
| |||||||
| 190,502,093 | ||||||||
|
| |||||||
| Food Products — 1.2% | ||||||||
| 532,993 | ConAgra Foods, Inc.(b) | 19,336,986 | ||||||
| 505,307 | Kraft Foods Group, Inc.(b) | 31,662,537 | ||||||
| 1,259,935 | Mondelez International, Inc., Class A(b) | 45,767,139 | ||||||
|
| |||||||
| 96,766,662 | ||||||||
|
| |||||||
See accompanying notes to financial statements.
9 |
Table of Contents
Portfolio of Investments – as of December 31, 2014
Gateway Fund – (continued)
| Shares | Description | Value (†) | ||||||
| Gas Utilities — 0.3% | ||||||||
| 81,319 | AGL Resources, Inc.(d) | $ | 4,432,699 | |||||
| 135,628 | National Fuel Gas Co.(b) | 9,430,215 | ||||||
| 44,602 | ONE Gas, Inc. | 1,838,494 | ||||||
| 116,150 | WGL Holdings, Inc.(b) | 6,344,113 | ||||||
|
| |||||||
| 22,045,521 | ||||||||
|
| |||||||
| Health Care Equipment & Supplies — 2.3% | ||||||||
| 953,531 | Abbott Laboratories(b) | 42,927,966 | ||||||
| 343,949 | Baxter International, Inc.(b) | 25,208,022 | ||||||
| 1,326,454 | Boston Scientific Corp.(b)(c) | 17,575,515 | ||||||
| 352,739 | Covidien PLC(b) | 36,078,145 | ||||||
| 23,200 | Intuitive Surgical, Inc.(b)(c) | 12,271,408 | ||||||
| 683,459 | Medtronic, Inc.(b) | 49,345,740 | ||||||
|
| |||||||
| 183,406,796 | ||||||||
|
| |||||||
| Health Care Providers & Services — 2.4% | ||||||||
| 322,863 | Aetna, Inc.(b) | 28,679,920 | ||||||
| 166,500 | Anthem, Inc.(b) | 20,924,055 | ||||||
| 467,008 | Express Scripts Holding Co.(c)(d) | 39,541,567 | ||||||
| 163,629 | HCA Holdings, Inc.(c)(d) | 12,008,732 | ||||||
| 154,641 | Patterson Cos., Inc.(d) | 7,438,232 | ||||||
| 163,767 | Quest Diagnostics, Inc.(d) | 10,982,215 | ||||||
| 557,405 | UnitedHealth Group, Inc.(d) | 56,348,072 | ||||||
| 149,076 | Universal Health Services, Inc., Class B(b) | 16,586,196 | ||||||
|
| |||||||
| 192,508,989 | ||||||||
|
| |||||||
| Hotels, Restaurants & Leisure — 1.1% | ||||||||
| 254,458 | International Game Technology(b) | 4,389,401 | ||||||
| 82,531 | Las Vegas Sands Corp.(b) | 4,800,003 | ||||||
| 656,926 | McDonald’s Corp.(b) | 61,553,966 | ||||||
| 110,718 | Melco Crown Entertainment Ltd., Sponsored ADR(d) | 2,812,237 | ||||||
| 547,003 | MGM Resorts International(c)(d) | 11,694,924 | ||||||
| 69,749 | Restaurant Brands International, Inc.(c) | 2,723,005 | ||||||
| 470,099 | Wendy’s Co. (The) | 4,244,994 | ||||||
|
| |||||||
| 92,218,530 | ||||||||
|
| |||||||
| Household Durables — 0.9% | ||||||||
| 499,849 | Leggett & Platt, Inc.(b) | 21,298,566 | ||||||
| 553,591 | Newell Rubbermaid, Inc.(b) | 21,086,281 | ||||||
| 341,785 | Toll Brothers, Inc.(b)(c) | 11,712,972 | ||||||
| 40,612 | Tupperware Brands Corp.(b) | 2,558,556 | ||||||
| 78,777 | Whirlpool Corp.(b) | 15,262,256 | ||||||
|
| |||||||
| 71,918,631 | ||||||||
|
| |||||||
| Household Products — 2.1% | ||||||||
| 536,232 | Colgate-Palmolive Co.(d) | 37,101,892 | ||||||
| 218,760 | Kimberly-Clark Corp.(b) | 25,275,531 | ||||||
| 1,213,482 | Procter & Gamble Co. (The)(b) | 110,536,075 | ||||||
|
| |||||||
| 172,913,498 | ||||||||
|
| |||||||
See accompanying notes to financial statements.
| 10
Table of Contents
Portfolio of Investments – as of December 31, 2014
Gateway Fund – (continued)
| Shares | Description | Value (†) | ||||||
| Industrial Conglomerates — 2.2% | ||||||||
| 455,525 | 3M Co.(d) | $ | 74,851,868 | |||||
| 4,086,192 | General Electric Co.(b) | 103,258,072 | ||||||
|
| |||||||
| 178,109,940 | ||||||||
|
| |||||||
| Insurance — 3.0% | ||||||||
| 247,214 | Aflac, Inc.(b) | 15,102,303 | ||||||
| 463,021 | Allstate Corp. (The)(b) | 32,527,225 | ||||||
| 728,707 | American International Group, Inc.(d) | 40,814,879 | ||||||
| 251,380 | Aon PLC(b) | 23,838,365 | ||||||
| 226,174 | Arthur J. Gallagher & Co.(b) | 10,648,272 | ||||||
| 269,383 | FNF Group(d) | 9,280,244 | ||||||
| 360,066 | Lincoln National Corp.(b) | 20,765,006 | ||||||
| 660,202 | Marsh & McLennan Cos., Inc.(b) | 37,789,963 | ||||||
| 372,374 | Principal Financial Group, Inc.(b) | 19,341,106 | ||||||
| 230,307 | Travelers Cos., Inc. (The)(b) | 24,377,996 | ||||||
| 264,626 | XL Group PLC(b) | 9,095,196 | ||||||
|
| |||||||
| 243,580,555 | ||||||||
|
| |||||||
| Internet & Catalog Retail — 1.2% | ||||||||
| 193,753 | Amazon.com, Inc.(b)(c) | 60,131,244 | ||||||
| 21,643 | Lands’ End, Inc.(c) | 1,167,856 | ||||||
| 30,519 | Priceline Group, Inc. (The)(b)(c) | 34,798,069 | ||||||
|
| |||||||
| 96,097,169 | ||||||||
|
| |||||||
| Internet Software & Services — 3.9% | ||||||||
| 197,190 | Akamai Technologies, Inc.(b)(c) | 12,415,083 | ||||||
| 26,060 | Baidu, Inc., Sponsored ADR(b)(c) | 5,940,898 | ||||||
| 591,934 | eBay, Inc.(b)(c) | 33,219,336 | ||||||
| 993,541 | Facebook, Inc., Class A(b)(c) | 77,516,069 | ||||||
| 157,770 | Google, Inc., Class A(b)(c) | 83,722,228 | ||||||
| 114,373 | Google, Inc., Class C(b)(c) | 60,205,947 | ||||||
| 23,440 | LinkedIn Corp., Class A(b)(c) | 5,384,403 | ||||||
| 236,066 | VeriSign, Inc.(b)(c) | 13,455,762 | ||||||
| 541,781 | Yahoo!, Inc.(c)(d) | 27,365,358 | ||||||
|
| |||||||
| 319,225,084 | ||||||||
|
| |||||||
| IT Services — 3.2% | ||||||||
| 515,662 | Automatic Data Processing, Inc.(b) | 42,990,741 | ||||||
| 222,366 | Broadridge Financial Solutions, Inc.(b) | 10,268,862 | ||||||
| 448,442 | Cognizant Technology Solutions Corp., Class A(b)(c) | 23,614,956 | ||||||
| 351,538 | Fidelity National Information Services, Inc.(b) | 21,865,664 | ||||||
| 396,793 | International Business Machines Corp.(b) | 63,661,469 | ||||||
| 479,903 | Paychex, Inc.(b) | 22,157,121 | ||||||
| 263,022 | Visa, Inc., Class A(b) | 68,964,368 | ||||||
| 570,921 | Western Union Co. (The)(b) | 10,225,195 | ||||||
|
| |||||||
| 263,748,376 | ||||||||
|
| |||||||
| Leisure Products — 0.1% | ||||||||
| 387,306 | Mattel, Inc.(b) | 11,985,184 | ||||||
|
| |||||||
See accompanying notes to financial statements.
11 |
Table of Contents
Portfolio of Investments – as of December 31, 2014
Gateway Fund – (continued)
| Shares | Description | Value (†) | ||||||
| Life Sciences Tools & Services — 0.1% | ||||||||
| 33,387 | Illumina, Inc.(c)(d) | $ | 6,162,573 | |||||
|
| |||||||
| Machinery — 2.1% | ||||||||
| 383,662 | Caterpillar, Inc.(b) | 35,116,583 | ||||||
| 176,963 | Cummins, Inc.(b) | 25,512,756 | ||||||
| 210,570 | Deere & Co.(b) | 18,629,128 | ||||||
| 179,724 | Parker Hannifin Corp.(b) | 23,175,410 | ||||||
| 212,192 | Pentair PLC(b) | 14,093,793 | ||||||
| 147,037 | Snap-on, Inc.(b) | 20,105,839 | ||||||
| 97,611 | SPX Corp.(b) | 8,386,737 | ||||||
| 224,808 | Stanley Black & Decker, Inc.(b) | 21,599,552 | ||||||
| 121,002 | Timken Co. (The)(d) | 5,164,365 | ||||||
|
| |||||||
| 171,784,163 | ||||||||
|
| |||||||
| Media — 3.7% | ||||||||
| 1,415,214 | Comcast Corp., Class A(b) | 82,096,564 | ||||||
| 102,277 | Liberty Global PLC, Class A(b)(c) | 5,134,817 | ||||||
| 76,955 | Liberty Global PLC, Series C(b)(c) | 3,717,696 | ||||||
| 287,542 | News Corp., Class B(c)(d) | 4,336,133 | ||||||
| 321,456 | Omnicom Group, Inc.(b) | 24,903,196 | ||||||
| 2,945,723 | Sirius XM Holdings, Inc.(c)(d) | 10,310,031 | ||||||
| 191,119 | Time Warner Cable, Inc.(b) | 29,061,555 | ||||||
| 538,543 | Time Warner, Inc.(b) | 46,002,343 | ||||||
| 105,905 | Time, Inc. | 2,606,322 | ||||||
| 1,003,530 | Walt Disney Co. (The)(b) | 94,522,491 | ||||||
|
| |||||||
| 302,691,148 | ||||||||
|
| |||||||
| Metals & Mining — 0.6% | ||||||||
| 616,318 | Freeport-McMoRan, Inc.(b) | 14,397,189 | ||||||
| 393,609 | Nucor Corp.(b) | 19,306,521 | ||||||
| 159,367 | Southern Copper Corp.(d) | 4,494,149 | ||||||
| 479,473 | Steel Dynamics, Inc.(b) | 9,464,797 | ||||||
| 59,633 | TimkenSteel Corp. | 2,208,210 | ||||||
| 86,151 | Worthington Industries, Inc. | 2,592,284 | ||||||
|
| |||||||
| 52,463,150 | ||||||||
|
| |||||||
| Multi-Utilities — 1.5% | ||||||||
| 574,960 | Ameren Corp.(b) | 26,522,905 | ||||||
| 902,825 | CenterPoint Energy, Inc.(b) | 21,153,190 | ||||||
| 505,467 | Consolidated Edison, Inc.(d) | 33,365,877 | ||||||
| 129,514 | Integrys Energy Group, Inc.(d) | 10,082,665 | ||||||
| 792,740 | Public Service Enterprise Group, Inc.(b) | 32,827,363 | ||||||
|
| |||||||
| 123,952,000 | ||||||||
|
| |||||||
| Multiline Retail — 0.9% | ||||||||
| 311,717 | Macy’s, Inc.(b) | 20,495,393 | ||||||
| 279,529 | Nordstrom, Inc.(b) | 22,191,807 | ||||||
| 58,617 | Sears Holdings Corp.(c) | 1,933,188 | ||||||
| 342,103 | Target Corp.(b) | 25,969,039 | ||||||
|
| |||||||
| 70,589,427 | ||||||||
|
| |||||||
See accompanying notes to financial statements.
| 12
Table of Contents
Portfolio of Investments – as of December 31, 2014
Gateway Fund – (continued)
| Shares | Description | Value (†) | ||||||
| Oil, Gas & Consumable Fuels — 6.7% | ||||||||
| 213,950 | California Resources Corp.(c) | $ | 1,178,865 | |||||
| 226,379 | Cheniere Energy, Inc.(b)(c) | 15,937,082 | ||||||
| 1,009,636 | Chevron Corp.(b) | 113,260,966 | ||||||
| 194,954 | Concho Resources, Inc.(b)(c) | 19,446,661 | ||||||
| 909,384 | ConocoPhillips(b) | 62,802,059 | ||||||
| 403,701 | CONSOL Energy, Inc.(b) | 13,649,131 | ||||||
| 433,886 | Continental Resources, Inc.(b)(c) | 16,643,867 | ||||||
| 2,003,418 | Exxon Mobil Corp.(b) | 185,215,994 | ||||||
| 177,911 | Gulfport Energy Corp.(c)(d) | 7,426,005 | ||||||
| 534,875 | Occidental Petroleum Corp.(b) | 43,116,274 | ||||||
| 252,722 | ONEOK, Inc.(b) | 12,583,028 | ||||||
| 520,579 | Phillips 66(b) | 37,325,514 | ||||||
| 602,120 | Southwestern Energy Co.(b)(c) | 16,431,855 | ||||||
| 36,318 | Statoil ASA, Sponsored ADR | 639,560 | ||||||
|
| |||||||
| 545,656,861 | ||||||||
|
| |||||||
| Personal Products — 0.0% | ||||||||
| 42,970 | Herbalife Ltd. | 1,619,969 | ||||||
|
| |||||||
| Pharmaceuticals — 6.1% | ||||||||
| 826,662 | AbbVie, Inc.(b) | 54,096,761 | ||||||
| 161,856 | Actavis PLC(b)(c) | 41,663,353 | ||||||
| 877,680 | Bristol-Myers Squibb Co.(b) | 51,809,450 | ||||||
| 590,932 | Eli Lilly & Co.(b) | 40,768,399 | ||||||
| 17,697 | GlaxoSmithKline PLC, Sponsored ADR(b) | 756,370 | ||||||
| 1,327,433 | Johnson & Johnson(b) | 138,809,669 | ||||||
| 1,374,566 | Merck & Co., Inc.(b) | 78,061,603 | ||||||
| 2,896,610 | Pfizer, Inc.(b) | 90,229,402 | ||||||
|
| |||||||
| 496,195,007 | ||||||||
|
| |||||||
| Professional Services — 0.1% | ||||||||
| 78,180 | Dun & Bradstreet Corp. (The)(d) | 9,456,653 | ||||||
|
| |||||||
| REITs – Diversified — 0.5% | ||||||||
| 1,275,033 | Duke Realty Corp.(b) | 25,755,667 | ||||||
| 436,169 | Liberty Property Trust(b) | 16,413,039 | ||||||
|
| |||||||
| 42,168,706 | ||||||||
|
| |||||||
| REITs – Health Care — 0.7% | ||||||||
| 139,512 | Healthcare Realty Trust, Inc.(b) | 3,811,468 | ||||||
| 725,315 | Senior Housing Properties Trust(d) | 16,036,715 | ||||||
| 502,286 | Ventas, Inc.(d) | 36,013,906 | ||||||
|
| |||||||
| 55,862,089 | ||||||||
|
| |||||||
| REITs – Mortgage — 0.4% | ||||||||
| 637,928 | American Capital Agency Corp.(b) | 13,925,968 | ||||||
| 1,071,072 | Annaly Capital Management, Inc.(b) | 11,578,289 | ||||||
| 296,730 | Hatteras Financial Corp.(b) | 5,468,734 | ||||||
|
| |||||||
| 30,972,991 | ||||||||
|
| |||||||
See accompanying notes to financial statements.
13 |
Table of Contents
Portfolio of Investments – as of December 31, 2014
Gateway Fund – (continued)
| Shares | Description | Value (†) | ||||||
| REITs – Office Property — 0.1% | ||||||||
| 383,149 | Mack-Cali Realty Corp.(b) | $ | 7,302,820 | |||||
|
| |||||||
| Road & Rail — 0.9% | ||||||||
| 139,086 | Avis Budget Group, Inc.(b)(c) | 9,225,574 | ||||||
| 60,437 | Canadian Pacific Railway Ltd.(b) | 11,645,606 | ||||||
| 1,241,580 | CSX Corp.(b) | 44,982,443 | ||||||
| 266,366 | Hertz Global Holdings, Inc.(b)(c) | 6,643,168 | ||||||
|
| |||||||
| 72,496,791 | ||||||||
|
| |||||||
| Semiconductors & Semiconductor Equipment — 2.7% | ||||||||
| 550,339 | Advanced Micro Devices, Inc.(c) | 1,469,405 | ||||||
| 293,513 | Altera Corp.(b) | 10,842,370 | ||||||
| 186,428 | Analog Devices, Inc.(b) | 10,350,483 | ||||||
| 967,327 | Applied Materials, Inc.(b) | 24,105,789 | ||||||
| 2,206,503 | Intel Corp.(b) | 80,073,994 | ||||||
| 308,428 | Linear Technology Corp.(b) | 14,064,317 | ||||||
| 177,644 | Microchip Technology, Inc.(b) | 8,013,521 | ||||||
| 549,741 | Micron Technology, Inc.(b)(c) | 19,246,432 | ||||||
| 421,440 | NVIDIA Corp.(b) | 8,449,872 | ||||||
| 91,552 | Skyworks Solutions, Inc.(b) | 6,656,746 | ||||||
| 560,969 | Texas Instruments, Inc.(b) | 29,992,208 | ||||||
| 238,695 | Xilinx, Inc.(b) | 10,333,106 | ||||||
|
| |||||||
| 223,598,243 | ||||||||
|
| |||||||
| Software — 3.8% | ||||||||
| 214,155 | Activision Blizzard, Inc.(d) | 4,315,223 | ||||||
| 375,834 | Adobe Systems, Inc.(b)(c) | 27,323,132 | ||||||
| 265,524 | Autodesk, Inc.(c)(d) | 15,947,371 | ||||||
| 3,722,230 | Microsoft Corp.(d) | 172,897,584 | ||||||
| 174,900 | Nuance Communications, Inc.(c) | 2,495,823 | ||||||
| 1,536,024 | Oracle Corp.(b) | 69,074,999 | ||||||
| 532,001 | Symantec Corp.(b) | 13,648,486 | ||||||
|
| |||||||
| 305,702,618 | ||||||||
|
| |||||||
| Specialty Retail — 2.6% | ||||||||
| 13,762 | Abercrombie & Fitch Co., Class A | 394,144 | ||||||
| 54,390 | American Eagle Outfitters, Inc. | 754,933 | ||||||
| 216,658 | Foot Locker, Inc.(b) | 12,171,846 | ||||||
| 213,861 | Gap, Inc. (The)(d) | 9,005,687 | ||||||
| 727,291 | Home Depot, Inc. (The)(b) | 76,343,736 | ||||||
| 201,858 | L Brands, Inc.(b) | 17,470,810 | ||||||
| 744,581 | Lowe’s Cos., Inc.(b) | 51,227,173 | ||||||
| 162,648 | Tiffany & Co.(b) | 17,380,565 | ||||||
| 377,457 | TJX Cos., Inc. (The)(d) | 25,886,001 | ||||||
|
| |||||||
| 210,634,895 | ||||||||
|
| |||||||
| Technology Hardware, Storage & Peripherals — 4.6% | ||||||||
| 2,692,572 | Apple, Inc.(b) | 297,206,097 | ||||||
| 984,667 | EMC Corp.(b) | 29,283,997 | ||||||
| 884,571 | Hewlett-Packard Co.(b) | 35,497,834 | ||||||
See accompanying notes to financial statements.
| 14
Table of Contents
Portfolio of Investments – as of December 31, 2014
Gateway Fund – (continued)
| Shares | Description | Value (†) | ||||||
| Technology Hardware, Storage & Peripherals — (continued) | ||||||||
| 207,654 | Seagate Technology PLC(b) | $ | 13,808,991 | |||||
|
| |||||||
| 375,796,919 | ||||||||
|
| |||||||
| Textiles, Apparel & Luxury Goods — 0.2% | ||||||||
| 231,779 | Michael Kors Holdings Ltd.(b)(c) | 17,406,603 | ||||||
|
| |||||||
| Thrifts & Mortgage Finance — 0.1% | ||||||||
| 620,520 | New York Community Bancorp, Inc.(b) | 9,928,320 | ||||||
|
| |||||||
| Tobacco — 1.5% | ||||||||
| 1,128,857 | Altria Group, Inc.(b) | 55,618,784 | ||||||
| 623,315 | Philip Morris International, Inc.(b) | 50,769,007 | ||||||
| 249,023 | Reynolds American, Inc.(b) | 16,004,708 | ||||||
| 132,179 | Vector Group Ltd.(d) | 2,816,735 | ||||||
|
| |||||||
| 125,209,234 | ||||||||
|
| |||||||
| Trading Companies & Distributors — 0.1% | ||||||||
| 107,177 | GATX Corp.(d) | 6,166,965 | ||||||
|
| |||||||
| Wireless Telecommunication Services — 0.2% | ||||||||
| 134,900 | SBA Communications Corp., Class A(c)(d) | 14,941,524 | ||||||
|
| |||||||
| Total Common Stocks (Identified Cost $4,980,761,128) | 8,078,223,637 | |||||||
|
| |||||||
| Contracts | ||||||||
| Purchased Options — 0.4% | ||||||||
| Index Options — 0.4% | ||||||||
| 6,716 | On S&P 500® Index, Put expiring January 17, 2015 at 1800 | 1,158,510 | ||||||
| 6,123 | On S&P 500® Index, Put expiring January 17, 2015 at 1875 | 1,882,822 | ||||||
| 3,661 | On S&P 500® Index, Put expiring January 17, 2015 at 1950 | 2,324,735 | ||||||
| 9,505 | On S&P 500® Index, Put expiring February 20, 2015 at 1825 | 8,602,025 | ||||||
| 6,373 | On S&P 500® Index, Put expiring February 20, 2015 at 1850 | 6,723,515 | ||||||
| 6,522 | On S&P 500® Index, Put expiring March 20, 2015 at 1825 | 10,859,130 | ||||||
|
| |||||||
| Total Purchased Options (Identified Cost $51,364,946) | 31,550,737 | |||||||
|
| |||||||
Principal Amount | ||||||||
| Short-Term Investments — 2.2% | ||||||||
| $ | 184,168,993 | Tri-Party Repurchase Agreement with Fixed Income Clearing Corporation, dated 12/31/2014 at 0.010% to be repurchased at $184,169,095 on 1/02/2015 collateralized by $181,940,000 U.S. Treasury Note, 2.500% due 5/15/2024 valued at $187,853,050 including accrued interest (Note 2 of Notes to Financial Statements) (Identified Cost $184,168,993) | 184,168,993 | |||||
|
| |||||||
| Total Investments — 101.8% (Identified Cost $5,216,295,067)(a) | 8,293,943,367 | |||||||
| Other assets less liabilities — (1.8)% | (149,246,325 | ) | ||||||
| �� |
|
| ||||||
| Net Assets — 100.0% | $ | 8,144,697,042 | ||||||
|
| |||||||
See accompanying notes to financial statements.
15 |
Table of Contents
Portfolio of Investments – as of December 31, 2014
Gateway Fund – (continued)
| Contracts | Description | Value (†) | ||||||
| Written Options — (2.0%) | ||||||||
| Index Options — (2.0%) | ||||||||
| 4,449 | On S&P 500® Index, Call expiring January 02, 2015 at 2060 | $ | (3,270,015 | ) | ||||
| 3,687 | On S&P 500® Index, Call expiring January 09, 2015 at 2090 | (1,677,585 | ) | |||||
| 4,781 | On S&P 500® Index, Call expiring January 17, 2015 at 2000 | (33,275,760 | ) | |||||
| 4,668 | On S&P 500® Index, Call expiring January 17, 2015 at 2025 | (22,826,520 | ) | |||||
| 3,760 | On S&P 500® Index, Call expiring January 17, 2015 at 2050 | (11,430,400 | ) | |||||
| 8,733 | On S&P 500® Index, Call expiring February 20, 2015 at 2025 | (57,113,820 | ) | |||||
| 4,445 | On S&P 500® Index, Call expiring February 20, 2015 at 2050 | (21,469,350 | ) | |||||
| 4,377 | On S&P 500® Index, Call expiring February 20, 2015 at 2075 | (14,619,180 | ) | |||||
|
| |||||||
| Total Written Options (Premiums Received $171,210,559) | $ | (165,682,630 | ) | |||||
|
| |||||||
| (†) | See Note 2 of Notes to Financial Statements. | |||||||
| (a) | Federal Tax Information: | |||||||
| At December 31, 2014, the net unrealized appreciation on investments based on a cost of $5,208,993,567 for federal income tax purposes was as follows: | ||||||||
| Aggregate gross unrealized appreciation for all investments in which there is an excess of value over tax cost | $ | 3,190,338,368 | ||||||
| Aggregate gross unrealized depreciation for all investments in which there is an excess of tax cost over value | (105,388,568 | ) | ||||||
|
| |||||||
| Net unrealized appreciation | $ | 3,084,949,800 | ||||||
|
| |||||||
| (b) | All of this security has been pledged as collateral for outstanding call options. | |||||||
| (c) | Non-income producing security. | |||||||
| (d) | A portion of this security has been pledged as collateral for outstanding call options. | |||||||
| ADR | An American Depositary Receipt is a certificate issued by a custodian bank representing the right to receive securities of the foreign issuer described. The values of ADRs may be significantly influenced by trading on exchanges not located in the United States. | |||||||
| REITs | Real Estate Investment Trusts | |||||||
See accompanying notes to financial statements.
| 16
Table of Contents
Portfolio of Investments – as of December 31, 2014
Gateway Fund – (continued)
Industry Summary at December 31, 2014
Oil, Gas & Consumable Fuels | 6.7 | % | ||
Pharmaceuticals | 6.1 | |||
Banks | 5.8 | |||
Technology Hardware, Storage & Peripherals | 4.6 | |||
Internet Software & Services | 3.9 | |||
Software | 3.8 | |||
Media | 3.7 | |||
Biotechnology | 3.3 | |||
IT Services | 3.2 | |||
Insurance | 3.0 | |||
Semiconductors & Semiconductor Equipment | 2.7 | |||
Specialty Retail | 2.6 | |||
Diversified Financial Services | 2.4 | |||
Health Care Providers & Services | 2.4 | |||
Food & Staples Retailing | 2.3 | |||
Beverages | 2.3 | |||
Health Care Equipment & Supplies | 2.3 | |||
Chemicals | 2.2 | |||
Aerospace & Defense | 2.2 | |||
Capital Markets | 2.2 | |||
Industrial Conglomerates | 2.2 | |||
Household Products | 2.1 | |||
Machinery | 2.1 | |||
Other Investments, less than 2% each | 25.5 | |||
Short-Term Investments | 2.2 | |||
|
| |||
Total Investments | 101.8 | |||
Other assets less liabilities (including open written options) | (1.8 | ) | ||
|
| |||
Net Assets | 100.0 | % | ||
|
|
See accompanying notes to financial statements.
17 |
Table of Contents
Statement of Assets and Liabilities
December 31, 2014
ASSETS | ||||
Investments at cost | $ | 5,216,295,067 | ||
Net unrealized appreciation | 3,077,648,300 | |||
|
| |||
Investments at value | 8,293,943,367 | |||
Cash | 42,340 | |||
Receivable for Fund shares sold | 24,066,619 | |||
Dividends and interest receivable | 11,384,144 | |||
Tax reclaims receivable | 400 | |||
|
| |||
TOTAL ASSETS | 8,329,436,870 | |||
|
| |||
LIABILITIES | ||||
Options written, at value (premiums received $171,210,559) (Note 2) | 165,682,630 | |||
Payable for Fund shares redeemed | 13,885,946 | |||
Management fees payable (Note 6) | 3,861,567 | |||
Deferred Trustees’ fees (Note 6) | 388,276 | |||
Administrative fees payable (Note 6) | 295,140 | |||
Payable to distributor (Note 6d) | 58,255 | |||
Other accounts payable and accrued expenses | 568,014 | |||
|
| |||
TOTAL LIABILITIES | 184,739,828 | |||
|
| |||
NET ASSETS | $ | 8,144,697,042 | ||
|
| |||
NET ASSETS CONSIST OF: | ||||
Paid-in capital | $ | 7,006,478,409 | ||
Undistributed net investment income | 6,386,818 | |||
Accumulated net realized loss on investments, options written and foreign currency transactions | (1,951,344,437 | ) | ||
Net unrealized appreciation on investments, options written and foreign currency translations | 3,083,176,252 | |||
|
| |||
NET ASSETS | $ | 8,144,697,042 | ||
|
| |||
COMPUTATION OF NET ASSET VALUE AND OFFERING PRICE: | ||||
Class A shares: | ||||
Net assets | $ | 1,976,457,363 | ||
|
| |||
Shares of beneficial interest | 66,812,601 | |||
|
| |||
Net asset value and redemption price per share | $ | 29.58 | ||
|
| |||
Offering price per share (100/94.25 of net asset value) (Note 1) | $ | 31.38 | ||
|
| |||
Class C shares: (redemption price per share is equal to net asset value less any applicable contingent deferred sales charge) (Note 1) | ||||
Net assets | $ | 353,339,438 | ||
|
| |||
Shares of beneficial interest | 11,987,545 | |||
|
| |||
Net asset value and offering price per share | $ | 29.48 | ||
|
| |||
Class Y shares: | ||||
Net assets | $ | 5,814,900,241 | ||
|
| |||
Shares of beneficial interest | 196,634,689 | |||
|
| |||
Net asset value, offering and redemption price per share | $ | 29.57 | ||
|
|
See accompanying notes to financial statements.
| 18
Table of Contents
Statement of Operations
For the Year Ended December 31, 2014
INVESTMENT INCOME | ||||
Dividends | $ | 184,964,241 | ||
Interest | 3,899 | |||
Less net foreign taxes withheld | (142,864 | ) | ||
|
| |||
| 184,825,276 | ||||
|
| |||
Expenses | ||||
Management fees (Note 6) | 51,288,047 | |||
Service and distribution fees (Note 6) | 8,953,624 | |||
Administrative fees (Note 6) | 3,514,415 | |||
Trustees’ fees and expenses (Note 6) | 163,710 | |||
Transfer agent fees and expenses (Note 6) | 6,299,270 | |||
Audit and tax services fees | 51,138 | |||
Custodian fees and expenses | 251,924 | |||
Legal fees | 85,555 | |||
Registration fees | 299,809 | |||
Shareholder reporting expenses | 359,517 | |||
Miscellaneous expenses | 168,389 | |||
|
| |||
Total expenses | 71,435,398 | |||
Less waiver and/or expense reimbursement (Note 6) | (5,776,855 | ) | ||
|
| |||
Net expenses | 65,658,543 | |||
|
| |||
Net investment income | 119,166,733 | |||
|
| |||
NET REALIZED AND UNREALIZED GAIN (LOSS) ON INVESTMENTS, OPTIONS WRITTEN AND FOREIGN CURRENCY TRANSACTIONS | ||||
Net realized gain (loss) on: | ||||
Investments | 809,080,568 | |||
Options written | (552,049,724 | ) | ||
Foreign currency transactions | (186 | ) | ||
Net change in unrealized appreciation (depreciation) on: | ||||
Investments | (224,989,472 | ) | ||
Options written | 125,194,219 | |||
Foreign currency translations | 23 | |||
|
| |||
Net realized and unrealized gain on investments, options written and foreign currency transactions | 157,235,428 | |||
|
| |||
NET INCREASE IN NET ASSETS RESULTING FROM OPERATIONS | $ | 276,402,161 | ||
|
|
See accompanying notes to financial statements.
19 |
Table of Contents
Statement of Changes in Net Assets
| Year Ended December 31, 2014 | Year Ended December 31, 2013 | |||||||
FROM OPERATIONS: | ||||||||
Net investment income | $ | 119,166,733 | $ | 128,103,134 | ||||
Net realized gain (loss) on investments, options written and foreign currency transactions | 257,030,658 | (580,142,877 | ) | |||||
Net change in unrealized appreciation (depreciation) on investments, options written and foreign currency translations | (99,795,230 | ) | 1,074,723,913 | |||||
|
|
|
| |||||
Net increase in net assets resulting from operations | 276,402,161 | 622,684,170 | ||||||
|
|
|
| |||||
FROM DISTRIBUTIONS TO SHAREHOLDERS: | ||||||||
Net investment income | ||||||||
Class A | (28,283,705 | ) | (29,673,542 | ) | ||||
Class C | (1,910,281 | ) | (1,877,783 | ) | ||||
Class Y | (86,158,870 | ) | (84,652,953 | ) | ||||
|
|
|
| |||||
Total distributions | (116,352,856 | ) | (116,204,278 | ) | ||||
|
|
|
| |||||
NET INCREASE (DECREASE) IN NET ASSETS FROM CAPITAL SHARE TRANSACTIONS (NOTE 10) | (218,608,215 | ) | 689,098,852 | |||||
|
|
|
| |||||
Net increase (decrease) in net assets | (58,558,910 | ) | 1,195,578,744 | |||||
NET ASSETS | ||||||||
Beginning of the year | 8,203,255,952 | 7,007,677,208 | ||||||
|
|
|
| |||||
End of the year | $ | 8,144,697,042 | $ | 8,203,255,952 | ||||
|
|
|
| |||||
UNDISTRIBUTED NET INVESTMENT INCOME | $ | 6,386,818 | $ | 7,550,491 | ||||
|
|
|
| |||||
See accompanying notes to financial statements.
| 20
Table of Contents
Financial Highlights
For a share outstanding throughout each period.
| Class A | ||||||||||||||||||||
| Year Ended December 31, 2014 | Year Ended December 31, 2013 | Year Ended December 31, 2012 | Year Ended December 31, 2011 | Year Ended December 31, 2010 | ||||||||||||||||
Net asset value, beginning of the period | $ | 29.00 | $ | 27.13 | $ | 26.40 | $ | 26.06 | $ | 25.25 | ||||||||||
|
|
|
|
|
|
|
|
|
| |||||||||||
INCOME (LOSS) FROM INVESTMENT OPERATIONS: | ||||||||||||||||||||
Net investment income(a) | 0.39 | 0.43 | 0.48 | 0.44 | 0.40 | |||||||||||||||
Net realized and unrealized gain (loss) | 0.57 | 1.82 | 0.72 | 0.33 | 0.81 | |||||||||||||||
|
|
|
|
|
|
|
|
|
| |||||||||||
Total from Investment Operations | 0.96 | 2.25 | 1.20 | 0.77 | 1.21 | |||||||||||||||
|
|
|
|
|
|
|
|
|
| |||||||||||
LESS DISTRIBUTIONS FROM: | ||||||||||||||||||||
Net investment income | (0.38 | ) | (0.38 | ) | (0.47 | ) | (0.43 | ) | (0.40 | ) | ||||||||||
Net realized capital gains | — | — | — | — | — | |||||||||||||||
|
|
|
|
|
|
|
|
|
| |||||||||||
Total Distributions | (0.38 | ) | (0.38 | ) | (0.47 | ) | (0.43 | ) | (0.40 | ) | ||||||||||
|
|
|
|
|
|
|
|
|
| |||||||||||
Net asset value, end of the period | $ | 29.58 | $ | 29.00 | $ | 27.13 | $ | 26.40 | $ | 26.06 | ||||||||||
|
|
|
|
|
|
|
|
|
| |||||||||||
Total return(b)(c) | 3.33 | % | 8.39 | % | 4.51 | % | 2.99 | % | 4.83 | % | ||||||||||
RATIOS TO AVERAGE NET ASSETS: | ||||||||||||||||||||
Net assets, end of the period (000’s) | $ | 1,976,457 | $ | 2,351,788 | $ | 2,066,522 | $ | 2,208,167 | $ | 2,403,629 | ||||||||||
Net expenses(d) | 0.94 | % | 0.94 | % | 0.94 | % | 0.94 | % | 0.94 | % | ||||||||||
Gross expenses | 1.02 | % | 1.03 | % | 1.03 | % | 1.04 | % | 1.05 | % | ||||||||||
Net investment income | 1.33 | % | 1.51 | % | 1.79 | % | 1.67 | % | 1.59 | % | ||||||||||
Portfolio turnover rate | 13 | % | 10 | % | 8 | % | 3 | % | 7 | % | ||||||||||
| (a) | Per share net investment income has been calculated using the average shares outstanding during the period. |
| (b) | Had certain expenses not been waived/reimbursed during the period, total returns would have been lower. |
| (c) | A sales charge for Class A shares is not reflected in total return calculations. |
| (d) | The investment adviser agreed to waive its fees and/or reimburse a portion of the Fund’s expenses during the period. Without this waiver/reimbursement, expenses would have been higher. |
See accompanying notes to financial statements.
21 |
Table of Contents
Financial Highlights (continued)
For a share outstanding throughout each period.
| Class C | ||||||||||||||||||||
| Year Ended December 31, 2014 | Year Ended December 31, 2013 | Year Ended December 31, 2012 | Year Ended December 31, 2011 | Year Ended December 31, 2010 | ||||||||||||||||
Net asset value, beginning of the period | $ | 28.90 | $ | 27.04 | $ | 26.32 | $ | 25.98 | $ | 25.18 | ||||||||||
|
|
|
|
|
|
|
|
|
| |||||||||||
INCOME (LOSS) FROM INVESTMENT OPERATIONS: | ||||||||||||||||||||
Net investment income(a) | 0.17 | 0.21 | 0.28 | 0.24 | 0.21 | |||||||||||||||
Net realized and unrealized gain (loss) | 0.57 | 1.82 | 0.71 | 0.33 | 0.80 | |||||||||||||||
|
|
|
|
|
|
|
|
|
| |||||||||||
Total from Investment Operations | 0.74 | 2.03 | 0.99 | 0.57 | 1.01 | |||||||||||||||
|
|
|
|
|
|
|
|
|
| |||||||||||
LESS DISTRIBUTIONS FROM: | ||||||||||||||||||||
Net investment income | (0.16 | ) | (0.17 | ) | (0.27 | ) | (0.23 | ) | (0.21 | ) | ||||||||||
Net realized capital gains | — | — | — | — | — | |||||||||||||||
|
|
|
|
|
|
|
|
|
| |||||||||||
Total Distributions | (0.16 | ) | (0.17 | ) | (0.27 | ) | (0.23 | ) | (0.21 | ) | ||||||||||
|
|
|
|
|
|
|
|
|
| |||||||||||
Net asset value, end of the period | $ | 29.48 | $ | 28.90 | $ | 27.04 | $ | 26.32 | $ | 25.98 | ||||||||||
|
|
|
|
|
|
|
|
|
| |||||||||||
Total return(b)(c) | 2.58 | % | 7.58 | % | 3.71 | % | 2.21 | % | 4.03 | % | ||||||||||
RATIOS TO AVERAGE NET ASSETS: | ||||||||||||||||||||
Net assets, end of the period (000’s) | $ | 353,339 | $ | 331,465 | $ | 286,602 | $ | 258,509 | $ | 273,779 | ||||||||||
Net expenses(d) | 1.70 | % | 1.70 | % | 1.70 | % | 1.70 | % | 1.70 | % | ||||||||||
Gross expenses | 1.77 | % | 1.78 | % | 1.78 | % | 1.79 | % | 1.80 | % | ||||||||||
Net investment income | 0.57 | % | 0.75 | % | 1.04 | % | 0.91 | % | 0.84 | % | ||||||||||
Portfolio turnover rate | 13 | % | 10 | % | 8 | % | 3 | % | 7 | % | ||||||||||
| (a) | Per share net investment income has been calculated using the average shares outstanding during the period. |
| (b) | Had certain expenses not been waived/reimbursed during the period, total returns would have been lower. |
| (c) | A contingent deferred sales charge for Class C shares is not reflected in total return calculations. |
| (d) | The investment adviser agreed to waive its fees and/or reimburse a portion of the Fund’s expenses during the period. Without this waiver/reimbursement, expenses would have been higher. |
See accompanying notes to financial statements.
| 22
Table of Contents
Financial Highlights (continued)
For a share outstanding throughout each period.
| Class Y | ||||||||||||||||||||
| Year Ended December 31, 2014 | Year Ended December 31, 2013 | Year Ended December 31, 2012 | Year Ended December 31, 2011 | Year Ended December 31, 2010 | ||||||||||||||||
Net asset value, beginning of the period | $ | 28.99 | $ | 27.12 | $ | 26.39 | $ | 26.06 | $ | 25.24 | ||||||||||
|
|
|
|
|
|
|
|
|
| |||||||||||
INCOME (LOSS) FROM INVESTMENT OPERATIONS: | ||||||||||||||||||||
Net investment income(a) | 0.46 | 0.50 | 0.56 | 0.50 | 0.47 | |||||||||||||||
Net realized and unrealized gain (loss) | 0.57 | 1.82 | 0.70 | 0.32 | 0.81 | |||||||||||||||
|
|
|
|
|
|
|
|
|
| |||||||||||
Total from Investment Operations | 1.03 | 2.32 | 1.26 | 0.82 | 1.28 | |||||||||||||||
|
|
|
|
|
|
|
|
|
| |||||||||||
LESS DISTRIBUTIONS FROM: | ||||||||||||||||||||
Net investment income | (0.45 | ) | (0.45 | ) | (0.53 | ) | (0.49 | ) | (0.46 | ) | ||||||||||
Net realized capital gains | — | — | — | — | — | |||||||||||||||
|
|
|
|
|
|
|
|
|
| |||||||||||
Total Distributions | (0.45 | ) | (0.45 | ) | (0.53 | ) | (0.49 | ) | (0.46 | ) | ||||||||||
|
|
|
|
|
|
|
|
|
| |||||||||||
Net asset value, end of the period | $ | 29.57 | $ | 28.99 | $ | 27.12 | $ | 26.39 | $ | 26.06 | ||||||||||
|
|
|
|
|
|
|
|
|
| |||||||||||
Total return(b) | 3.58 | % | 8.65 | % | 4.76 | % | 3.20 | % | 5.13 | % | ||||||||||
RATIOS TO AVERAGE NET ASSETS: | ||||||||||||||||||||
Net assets, end of the period (000’s) | $ | 5,814,900 | $ | 5,520,003 | $ | 4,654,553 | $ | 2,915,647 | $ | 2,520,386 | ||||||||||
Net expenses(c) | 0.70 | % | 0.70 | % | 0.70 | % | 0.70 | % | 0.70 | % | ||||||||||
Gross expenses | 0.77 | % | 0.78 | % | 0.78 | % | 0.79 | % | 0.80 | % | ||||||||||
Net investment income | 1.57 | % | 1.76 | % | 2.08 | % | 1.92 | % | 1.86 | % | ||||||||||
Portfolio turnover rate | 13 | % | 10 | % | 8 | % | 3 | % | 7 | % | ||||||||||
| (a) | Per share net investment income has been calculated using the average shares outstanding during the period. |
| (b) | Had certain expenses not been waived/reimbursed during the period, total returns would have been lower. |
| (c) | The investment adviser agreed to waive its fees and/or reimburse a portion of the Fund’s expenses during the period. Without this waiver/reimbursement, expenses would have been higher. |
See accompanying notes to financial statements.
23 |
Table of Contents
December 31, 2014
1. Organization. Gateway Trust (the “Trust”) is organized as a Massachusetts business trust. The Trust is registered under the Investment Company Act of 1940, as amended (the “1940 Act”), as an open-end management investment company. The Declaration of Trust permits the Board of Trustees to authorize the issuance of an unlimited number of shares of the Trust in multiple series. The financial statements for certain funds of the Trust are presented in separate reports. Information presented in these financial statements pertains to Gateway Fund (the “Fund”).
The Fund is a diversified investment company.
The Fund offers Class A, Class C and Class Y shares. Class A shares are sold with a maximum front-end sales charge of 5.75%. Class C shares do not pay a front-end sales charge, pay higher ongoing Rule 12b-1 fees than Class A shares and may be subject to a contingent deferred sales charge (“CDSC”) of 1.00% if those shares are redeemed within one year of acquisition, except for reinvested distributions. Class Y shares do not pay a front-end sales charge, a CDSC or Rule 12b-1 fees. Class Y shares are generally intended for institutional investors with a minimum initial investment of $100,000, though some categories of investors are exempted from the minimum investment amount as outlined in the Fund’s prospectus.
Most expenses can be directly attributed to a Fund. Expenses which cannot be directly attributed to a Fund are generally apportioned based on the relative net assets of each of the funds in Natixis Funds Trust I, Natixis Funds Trust II, Natixis Funds Trust IV, Gateway Trust (“Natixis Funds Trusts”), Loomis Sayles Funds I and Loomis Sayles Funds II (“Loomis Sayles Funds Trusts”). Expenses of the Fund are borne pro rata by the holders of each class of shares, except that each class bears expenses unique to that class (including the Rule 12b-1 service and distribution fees). In addition, each class votes as a class only with respect to its own Rule 12b-1 Plan. Shares of each class would receive their pro rata share of the net assets of the Fund if the Fund were liquidated. The Trustees approve separate distributions from net investment income on each class of shares.
2. Significant Accounting Policies. The following is a summary of significant accounting policies consistently followed by the Fund in the preparation of its financial statements. The Fund’s financial statements follow the accounting and reporting guidelines provided for investment companies and are prepared in accordance with accounting principles generally accepted in the United States of America which require the use of management estimates that affect the reported amounts and disclosures in the financial statements. Actual results could differ from those estimates. Management has evaluated the events and transactions subsequent to year-end through the date the financial statements were issued and has determined that there were no material events that would require disclosure in the Fund’s financial statements.
a. Valuation. Fund securities and other investments are valued at market value based on market quotations obtained or determined by independent pricing services
| 24
Table of Contents
Notes to Financial Statements (continued)
December 31, 2014
recommended by the adviser and approved by the Board of Trustees. Fund securities and other investments for which market quotations are not readily available are valued at fair value as determined in good faith by the adviser pursuant to procedures approved by the Board of Trustees, as described below. Market value is determined as follows:
Equity securities (including closed-end investment companies and exchange-traded funds) are valued at the last sale price quoted on the exchange or market where traded most extensively or, if there is no reported sale during the day, the closing bid quotation as reported by an independent pricing service. Securities traded on the NASDAQ Global Select Market, NASDAQ Global Market and NASDAQ Capital Market are valued at the NASDAQ Official Closing Price (“NOCP”), or if lacking an NOCP, at the most recent bid quotations on the applicable NASDAQ Market. Debt securities and unlisted equity securities are valued based on evaluated bids furnished to the Fund by an independent pricing service using market information, transactions for comparable securities and various relationships between securities, if available, or bid prices obtained from broker-dealers. Broker-dealer bid prices may be used to value debt and equity securities where an independent pricing service is unable to price a security or where an independent pricing service does not provide a reliable price for the security. Exchange-traded index options are valued at the average of the closing bid and ask quotations as of the close of trading on the Chicago Board Options Exchange (“CBOE”).
Fund securities and other investments for which market quotations are not readily available are valued at fair value as determined in good faith by the adviser pursuant to procedures approved by the Board of Trustees. Option contracts for which the average of the closing bid and ask quotations are not considered to reflect option contract values as of the close of the New York Stock Exchange (“NYSE”) are valued at fair value as determined in good faith by the adviser pursuant to procedures approved by the Board of Trustees. On the last business day of the month, the Fund will fair value index options using the closing rotation values, published by the CBOE. The Fund may also value securities and other investments at fair value in other circumstances such as when extraordinary events occur after the close of a foreign market but prior to the close of the NYSE. This may include situations relating to a single issuer (such as a declaration of bankruptcy or a delisting of the issuer’s security from the primary market on which it has traded) as well as events affecting the securities markets in general (such as market disruptions or closings and significant fluctuations in U.S. and/or foreign markets). When fair valuing its securities or other investments, the Fund may, among other things, use modeling tools or other processes that may take into account factors such as securities or other market activity and/or significant events that occur after the close of the foreign market and before the time the Fund’s net asset value (“NAV”) is calculated. Fair value pricing may require subjective determinations about the value of a security, and fair values used to determine the Fund’s NAV may differ from quoted or published prices, or from prices that are used by others, for the same
25 |
Table of Contents
Notes to Financial Statements (continued)
December 31, 2014
securities. In addition, the use of fair value pricing may not always result in adjustments to the prices of securities held by the Fund.
As of December 31, 2014, purchased options were fair valued at $31,550,737 and written options were fair valued at ($165,682,630) using the closing rotation values published by the CBOE.
b. Investment Transactions and Related Investment Income. Investment transactions are accounted for on a trade date plus one day basis for daily NAV calculation. However, for financial reporting purposes, investment transactions are reported on trade date. Dividend income is recorded on ex-dividend date, or in the case of certain foreign securities, as soon as the Fund is notified, and interest income is recorded on an accrual basis. Interest income is increased by the accretion of discount and decreased by the amortization of premium. In determining net gain or loss on securities sold, the cost of securities has been determined on an identified cost basis. Investment income, non-class specific expenses and realized and unrealized gains and losses are allocated on a pro rata basis to each class based on the relative net assets of each class to the total net assets of the Fund.
c. Foreign Currency Translation. The books and records of the Fund are maintained in U.S. dollars. The values of securities, currencies and other assets and liabilities denominated in currencies other than U.S. dollars are translated into U.S. dollars based upon foreign exchange rates prevailing at the end of the period. Purchases and sales of investment securities, income and expenses are translated on the respective dates of such transactions.
Since the values of investment securities are presented at the foreign exchange rates prevailing at the end of the period, it is not practical to isolate that portion of the results of operations arising from changes in exchange rates from fluctuations which arise due to changes in market prices of investment securities. Such changes are included with the net realized and unrealized gain or loss on investments.
Net realized foreign exchange gains or losses arise from sales of foreign currency, currency gains or losses realized between the trade and settlement dates on securities transactions and the difference between the amounts of dividends, interest and foreign withholding taxes recorded on the Fund’s books and the U.S. dollar equivalent of the amounts actually received or paid. Net unrealized foreign exchange gains and losses arise from changes in the value of assets and liabilities, other than investment securities, at the end of the fiscal period, resulting from changes in exchange rates.
The Fund may use foreign currency exchange contracts to facilitate transactions in foreign-denominated investments. Losses may arise from changes in the value of the foreign currency or if the counterparties do not perform under the contracts’ terms.
d. Option Contracts. The Fund’s investment strategy makes use of exchange-traded options. Exchange-traded options are standardized contracts and are settled through a
| 26
Table of Contents
Notes to Financial Statements (continued)
December 31, 2014
clearing house with fulfillment supported by the credit of the exchange. Therefore, counterparty credit risks to the Fund are reduced. The Fund writes (sells) index call options and purchases index put options.
When the Fund writes an index call option, an amount equal to the net premium received (the premium less commission) is recorded as a liability and is subsequently adjusted to the current value until the option expires or the Fund enters into a closing purchase transaction. When an index call option expires or the Fund enters into a closing purchase transaction, the difference between the net premium received and any amount paid at expiration or on effecting a closing purchase transaction, including commission, is treated as a realized gain or, if the net premium received is less than the amount paid, as a realized loss. The Fund, as writer of an index call option, bears the risk of an unfavorable change in the market value of the index underlying the written option.
When the Fund purchases an index put option, it pays a premium and the index put option is subsequently marked-to-market to reflect current value until the option expires or the Fund enters into a closing sale transaction. Premiums paid for purchasing index put options which expire are treated as realized losses. When the Fund enters into a closing sale transaction, the difference between the premium paid and the proceeds of the closing sale transaction is treated as a realized gain or loss. The risk associated with purchasing index put options is limited to the premium paid.
e. Federal and Foreign Income Taxes. The Fund intends to meet the requirements of the Internal Revenue Code of 1986, as amended, applicable to regulated investment companies, and to distribute to its shareholders substantially all of its net investment income and any net realized capital gains at least annually. Management has performed an analysis of the Fund’s tax positions for the open tax years as of December 31, 2014 and has concluded that no provisions for income tax are required. The Fund’s federal tax returns for the prior three fiscal years remain subject to examination by the Internal Revenue Service. Management is not aware of any events that are reasonably possible to occur in the next twelve months that would result in the amounts of any unrecognized tax benefits significantly increasing or decreasing for the Fund. However, management’s conclusions regarding tax positions taken may be subject to review and adjustment at a later date based on factors including, but not limited to, new tax laws and accounting regulations and interpretations thereof.
The Fund may be subject to foreign withholding taxes on investment income and taxes on capital gains on investments that are accrued and paid based upon the Fund’s understanding of the tax rules and regulations that exist in the countries in which the Fund invests. Foreign withholding taxes on dividend and interest income are reflected on the Statement of Operations as a reduction of investment income, net of amounts eligible to be reclaimed. Dividends and interest receivable on the Statement of Assets and Liabilities are net of foreign withholding taxes. Foreign withholding taxes eligible to
27 |
Table of Contents
Notes to Financial Statements (continued)
December 31, 2014
be reclaimed are reflected on the Statement of Assets and Liabilities as tax reclaims receivable. Capital gains taxes paid are included in net realized gain (loss) on investments in the Statement of Operations. Accrued but unpaid capital gains taxes are reflected as foreign taxes payable on the Statement of Assets and Liabilities, if applicable, and reduce unrealized gains on investments. In the event that realized gains on investments are subsequently offset by realized losses, taxes paid on realized gains may be returned to the Fund. Such amounts, if applicable, are reflected as foreign tax rebates receivable on the Statement of Assets and Liabilities and are recorded as a realized gain when received.
f. Dividends and Distributions to Shareholders. Dividends and distributions are recorded on ex-dividend date. The timing and characterization of certain income and capital gain distributions are determined annually in accordance with federal tax regulations, which may differ from accounting principles generally accepted in the United States of America. Permanent differences are primarily due to differing treatments for book and tax purposes of items such as foreign currency transactions, expiring capital loss carryforwards, and return of capital and capital gain distributions received. Permanent book and tax basis differences relating to shareholder distributions, net investment income and net realized gains will result in reclassifications to capital accounts. Temporary differences between book and tax distributable earnings are primarily due to deferred Trustees’ fees, wash sales, return of capital distributions received and option contract mark-to-market. Distributions from net investment income and short-term capital gains are considered to be distributed from ordinary income for tax purposes.
The tax characterization of distributions is determined on an annual basis. The tax character of distributions paid to shareholders during the years ended December 31, 2014 and 2013 was as follows:
2014 Distributions Paid From: | 2013 Distributions Paid From: | |||||||||||||||||||
Ordinary Income | Long-Term | Total | Ordinary | Long-Term | Total | |||||||||||||||
$116,352,856 | $ | — | $ | 116,352,856 | $ | 116,204,278 | $ | — | $ | 116,204,278 | ||||||||||
| 28
Table of Contents
Notes to Financial Statements (continued)
December 31, 2014
As of December 31, 2014, the components of distributable earnings on a tax basis were as follows:
Undistributed ordinary income | $ | 6,775,094 | ||
Undistributed long-term capital gains | — | |||
|
| |||
Total undistributed earnings | 6,775,094 | |||
|
| |||
Capital loss carryforward: | �� | |||
Short-term: | ||||
Expires | ||||
December 31, 2017 | (1,005,056,628 | ) | ||
December 31, 2018 | (393,591,402 | ) | ||
No expiration date | (574,284,187 | ) | ||
|
| |||
Total capital loss carryforward | (1,972,932,217 | ) | ||
Unrealized appreciation | 3,104,764,032 | |||
|
| |||
Total accumulated earnings | $ | 1,138,606,909 | ||
|
| |||
Capital loss carryforward utilized in the current year | $ | 388,548,401 | ||
|
|
The Fund had $75,883,641 of unused capital loss carryforwards expire in the current year.
Capital losses may be utilized to offset future capital gains until expiration. The Regulated Investment Company Modernization Act of 2010 (the “Act”) allows capital loss carryforwards to be carried forward indefinitely. Rules in effect previously limited the carryforward period to eight years. Capital loss carryforwards generated in taxable years beginning after the effective date of the Act must be fully used before capital loss carryforwards generated in years prior to the effective date of the Act; therefore, under certain circumstances, capital loss carryforwards available as of the report date may expire unused.
g. Repurchase Agreements. The Fund may enter into repurchase agreements, under the terms of a Master Repurchase Agreement, under which the Fund acquires securities as collateral and agrees to resell the securities at an agreed upon time and at an agreed upon price. It is the Fund’s policy that the market value of the collateral for repurchase agreements be at least equal to 102% of the repurchase price, including interest. Certain repurchase agreements are tri-party arrangements whereby the collateral is held in a segregated account for the benefit of the Fund and on behalf of the counterparty. Repurchase agreements could involve certain risks in the event of default or insolvency of the counterparty including possible delays or restrictions upon the Fund’s ability to dispose of the underlying securities. As of December 31, 2014, the Fund had an investment in a repurchase agreement for which the value of the related collateral exceeded the value of the repurchase agreement. The gross value of
29 |
Table of Contents
Notes to Financial Statements (continued)
December 31, 2014
repurchase agreements is included in the Statement of Assets and Liabilities for financial reporting purposes.
h. Indemnifications. Under the Trust’s organizational documents, its officers and Trustees are indemnified against certain liabilities arising out of the performance of their duties to the Fund. Additionally, in the normal course of business, the Fund enters into contracts with service providers that contain general indemnification clauses. The Fund’s maximum exposure under these arrangements is unknown as this would involve future claims that may be made against the Fund that have not yet occurred. However, based on experience, the Fund expects the risk of loss to be remote.
3. Fair Value Measurements. In accordance with accounting standards related to fair value measurements and disclosures, the Fund has categorized the inputs utilized in determining the value of the Fund’s assets or liabilities. These inputs are summarized in the three broad levels listed below:
| • | Level 1 – quoted prices in active markets for identical assets or liabilities; |
| • | Level 2 – prices determined using other significant inputs that are observable either directly, or indirectly through corroboration with observable market data (which could include quoted prices for similar assets or liabilities, interest rates, credit risk, etc.); and |
| • | Level 3 – prices determined using significant unobservable inputs when quoted prices or observable inputs are unavailable such as when there is little or no market activity for an asset or liability (unobservable inputs reflect the Fund’s own assumptions in determining the fair value of assets or liabilities and would be based on the best information available). |
The inputs or methodology used for valuing securities are not necessarily an indication of the risk associated with investing in those securities.
The following is a summary of the inputs used to value the Fund’s investments as of December 31, 2014, at value:
Asset Valuation Inputs
Description | Level 1 | Level 2 | Level 3 | Total | ||||||||||||
Common Stocks(a) | $ | 8,078,223,637 | $ | — | $ | — | $ | 8,078,223,637 | ||||||||
Purchased Options(a) | — | 31,550,737 | — | 31,550,737 | ||||||||||||
Short-Term Investments | — | 184,168,993 | — | 184,168,993 | ||||||||||||
|
|
|
|
|
|
|
| |||||||||
Total | $ | 8,078,223,637 | $ | 215,719,730 | $ | — | $ | 8,293,943,367 | ||||||||
|
|
|
|
|
|
|
| |||||||||
| 30
Table of Contents
Notes to Financial Statements (continued)
December 31, 2014
Liability Valuation Inputs
Description | Level 1 | Level 2 | Level 3 | Total | ||||||||||||
Written Options(a) | $ | — | $ | (165,682,630 | ) | $ | — | $ | (165,682,630 | ) | ||||||
|
|
|
|
|
|
|
| |||||||||
| (a) | Details of the major categories of the Fund’s investments are reflected within the Portfolio of Investments. |
For the year ended December 31, 2014, there were no transfers among Levels 1, 2 and 3.
4. Derivatives. Derivative instruments are defined as financial instruments whose value and performance are based on the value and performance of another security or financial instrument. Derivative instruments that the Fund used during the period include written index call options and purchased index put options.
The Fund seeks to capture the majority of the returns associated with equity market investments, while exposing investors to less risk than other equity investments. To meet this investment goal, the Fund invests in a broadly diversified portfolio of common stocks, while also writing index call options and purchasing index put options. Writing index call options can reduce the Fund’s volatility, provide a steady cash flow and be an important source of the Fund’s return, although it also may reduce the Fund’s ability to profit from increases in the value of its equity portfolio. The Fund also buys index put options, which can protect the Fund from a significant market decline that may occur over a short period of time. The value of an index put option generally increases as the prices of stocks constituting the index decrease and decreases as those stocks increase in price. The combination of the diversified stock portfolio, the steady cash flow from writing of index call options and the downside protection from purchased index put options is intended to provide the Fund with the majority of the returns associated with equity market investments while exposing investors to less risk than other equity investments. During the year ended December 31, 2014, written index call options and purchased index put options were used in accordance with this objective.
The following is a summary of derivative instruments for the Fund as of December 31, 2014, as reflected in the Statement of Assets and Liabilities:
Assets | Investments at value1 | |||
Exchange traded/cleared asset derivatives | ||||
Equity contracts | $ | 31,550,737 | ||
Liabilities | Options written at value | |||
Exchange traded/cleared liability derivatives | ||||
Equity contracts | $ | (165,682,630 | ) | |
| 1 | Represents purchased options, at value. |
31 |
Table of Contents
Notes to Financial Statements (continued)
December 31, 2014
Transactions in derivative instruments for the Fund during the year ended December 31, 2014, as reflected in the Statement of Operations were as follows:
Net Realized Gain (Loss) on: | Investments2 | Options written | ||||||
Equity contracts | $ | (178,153,293 | ) | $ | (552,049,724 | ) | ||
Net Change in Unrealized Appreciation (Depreciation) on: | Investments2 | Options written | ||||||
Equity contracts | $ | 4,615,846 | $ | 125,194,219 | ||||
| 2 | Represents realized loss and change in unrealized appreciation (depreciation), respectively, for purchased options during the period. |
As the Fund values its derivatives at fair value and recognizes changes in fair value through the Statement of Operations, it does not qualify for hedge accounting under authoritative guidance for derivative instruments. The Fund’s investments in derivatives may represent an economic hedge; however, they are considered to be non-hedge transactions for the purpose of these disclosures.
The volume of option contract activity as a percentage of investments in common stocks, based on month-end notional amounts outstanding during the period, at absolute value, was as follows for the year ended December 31, 2014:
Call Options | Put Options | |||||||
Average Notional Amount Outstanding | 99.03 | % | 99.03 | % | ||||
Highest Notional Amount Outstanding | 99.23 | % | 99.23 | % | ||||
Lowest Notional Amount Outstanding | 98.75 | % | 98.75 | % | ||||
Notional Amount Outstanding as of December 31, 2014 | 99.14 | % | 99.14 | % | ||||
| * | Notional amounts outstanding are determined by multiplying option contracts by the contract multiplier by the price of the option’s underlying index, the S&P 500® Index. |
Notional amounts outstanding at the end of the prior period are included in the averages above.
The following is a summary of the Fund’s written option activity:
Number of | Premiums | |||||||
Outstanding at December 31, 2013 | 44,166 | $ | 123,112,605 | |||||
Options written | 500,987 | 1,430,625,922 | ||||||
Options terminated in closing purchase transactions | (494,617 | ) | (1,368,232,528 | ) | ||||
Options expired | (11,636 | ) | (14,295,440 | ) | ||||
|
|
|
| |||||
Outstanding at December 31, 2014 | 38,900 | $ | 171,210,559 | |||||
|
|
|
| |||||
| 32
Table of Contents
Notes to Financial Statements (continued)
December 31, 2014
5. Purchases and Sales of Securities. For the year ended December 31, 2014, purchases and sales of securities (excluding short-term investments) were $1,042,998,376 and $1,950,504,286, respectively.
6. Management Fees and Other Transactions with Affiliates.
a. Management Fees. Gateway Investment Advisers, LLC (“Gateway Advisers”) serves as investment adviser to the Fund. Gateway Advisers is a subsidiary of Natixis Global Asset Management, L.P. (“Natixis US”), which is part of Natixis Global Asset Management, an international asset management group based in Paris, France. Under the terms of the management agreement, the Fund pays a management fee at an annual rate of 0.65% for the first $5 billion, 0.60% for the next $5 billion and 0.58% thereafter, calculated daily and payable monthly, based on the Fund’s average daily net assets.
Gateway Advisers has given a binding undertaking to the Fund to waive management fees and/or reimburse certain expenses to limit the Fund’s operating expenses, exclusive of acquired fund fees and expenses, brokerage expenses, interest expense, taxes and extraordinary expenses. This undertaking is in effect until April 30, 2015 and is reevaluated on an annual basis. Management fees payable, as reflected on the Statement of Assets and Liabilities, is net of waivers and/or expense reimbursements, if any, pursuant to these undertakings.
For the year ended December 31, 2014, the expense limits as a percentage of average daily net assets under the expense limitation agreement were as follows:
| Expense Limit as a Percentage of Average Daily Net Assets | ||||
Class A | Class C | Class Y | ||
| 0.94% | 1.70% | 0.70% | ||
Gateway Advisers shall be permitted to recover expenses it has borne under the expense limitation agreement (whether through waiver of its management fee or otherwise) on a class by class basis in later periods to the extent the annual operating expenses of a class fall below a class’ expense limits, provided, however, that a class is not obligated to pay such waived/reimbursed fees or expenses more than one year after the end of the fiscal year in which the fees or expenses were waived/reimbursed.
For the year ended December 31, 2014, the management fees and waiver of management fees for the Fund were as follows:
Gross Management Fees | Waiver of Management Fees1 | Net Management Fees | Percentage of Average Daily Net Assets | |||||
Gross | Net | |||||||
$51,288,047 | $5,556,323 | $45,731,724 | 0.63% | 0.56% | ||||
| 1 | Management fee waiver is subject to possible recovery until December 31, 2015. |
33 |
Table of Contents
Notes to Financial Statements (continued)
December 31, 2014
For the year ended December 31, 2014, Class A expenses have been reimbursed in the amount of $220,532. This expense reimbursement is subject to possible recovery until December 31, 2015.
No expenses were recovered during the year ended December 31, 2014 under the terms of the expense limitation agreement.
Prior to July 1, 2014, the Fund paid a management fee at the annual rate of 0.65% of the first $5 billion of the Fund’s average daily net assets and 0.60% of the Fund’s average daily net assets in excess of $5 billion, calculated daily and payable monthly.
b. Service and Distribution Fees. NGAM Distribution, L.P. (“NGAM Distribution”), which is a wholly-owned subsidiary of Natixis US, has entered into a distribution agreement with the Trust. Pursuant to this agreement, NGAM Distribution serves as principal underwriter of the Fund.
Pursuant to Rule 12b-1 under the 1940 Act, the Trust has adopted a Service Plan relating to the Fund’s Class A shares (the “Class A Plan”) and a Distribution and Service Plan relating to the Fund’s Class C shares (the “Class C Plan”).
Under the Class A Plan, the Fund pays NGAM Distribution a monthly service fee at an annual rate not to exceed 0.25% of the average daily net assets attributable to the Fund’s Class A shares, as reimbursement for expenses incurred by NGAM Distribution in providing personal services to investors in Class A shares and/or the maintenance of shareholder accounts.
Under the Class C Plan, the Fund pays NGAM Distribution a monthly service fee at an annual rate not to exceed 0.25% of the average daily net assets attributable to the Fund’s Class C shares, as compensation for services provided by NGAM Distribution in providing personal services to investors in Class C shares and/or the maintenance of shareholder accounts.
Also under the Class C Plan, the Fund pays NGAM Distribution a monthly distribution fee at an annual rate of 0.75% of the average daily net assets attributable to the Fund’s Class C shares, as compensation for services provided by NGAM Distribution in connection with the marketing or sale of Class C shares.
For the year ended December 31, 2014, the service and distribution fees for the Fund were as follows:
Service Fees | Distribution Fees | |||||
Class A | Class C | Class C | ||||
$5,513,317 | $ | 860,077 | $2,580,230 | |||
c. Administrative Fees. NGAM Advisors provides certain administrative services for the Fund and contracts with State Street Bank and Trust Company (“State Street Bank”) to serve as sub-administrator. Pursuant to an agreement among Natixis Funds
| 34
Table of Contents
Notes to Financial Statements (continued)
December 31, 2014
Trusts, Loomis Sayles Funds Trusts and NGAM Advisors, the Fund pays NGAM Advisors monthly its pro rata portion of fees equal to an annual rate of 0.0575% of the first $15 billion of the average daily net assets of the Natixis Funds Trusts and Loomis Sayles Funds Trusts, 0.0500% of the next $15 billion, 0.0400% of the next $30 billion, 0.0350% of the next $30 billion and 0.0325% of such assets in excess of $90 billion, subject to an annual aggregate minimum fee for the Natixis Funds Trusts and Loomis Sayles Funds Trusts of $10 million, which is reevaluated on an annual basis.
For the year ended December 31, 2014, the administrative fees for the Fund were $3,514,415.
Prior to July 1, 2014, each Fund paid NGAM Advisors monthly its pro rata portion of fees equal to an annual rate of 0.0575% of the first $15 billion of the average daily net assets of the Natixis Funds Trusts, Loomis Sayles Funds Trusts and Hansberger International Series, 0.0500% of the next $15 billion, 0.0400% of the next $30 billion and 0.0350% of such assets in excess of $60 billion, subject to an annual aggregate minimum fee for the Natixis Funds Trusts, Loomis Sayles Funds Trusts and Hansberger International Series of $10 million.
d. Sub-Transfer Agent Fees. NGAM Distribution has entered into agreements, which include servicing agreements, with financial intermediaries that provide recordkeeping, processing, shareholder communications and other services to customers of the intermediaries that hold positions in the Fund and has agreed to compensate the intermediaries for providing those services. Intermediaries transact with the Fund primarily through the use of omnibus accounts on behalf of their customers who hold positions in the Fund. These services would have been provided by the Fund’s transfer agent and other service providers if the shareholders’ accounts were maintained directly at the Fund’s transfer agent. Accordingly, the Fund has agreed to reimburse NGAM Distribution for all or a portion of the servicing fees paid to these intermediaries. The reimbursement amounts (sub-transfer agent fees) paid to NGAM Distribution are subject to a current per-account equivalent fee limit approved by the Fund’s Board, which is based on fees for similar services paid to the Fund’s transfer agent and other service providers.
For the year ended December 31, 2014, the sub-transfer agent fees (which are reflected in transfer agent fees and expenses in the Statement of Operations) for the Fund were $4,451,262.
As of December 31, 2014, the Fund owes NGAM Distribution $58,255 in reimbursements for sub-transfer agent fees (which are reflected in the Statement of Assets and Liabilities as payable to distributor).
e. Commissions. Commissions (including CDSCs) on Fund shares retained by NGAM Distribution during the year ended December 31, 2014 amounted to $808,574.
35 |
Table of Contents
Notes to Financial Statements (continued)
December 31, 2014
f. Trustees Fees and Expenses. The Trust does not pay any compensation directly to its officers or Trustees who are directors, officers or employees of NGAM Advisors, NGAM Distribution, Natixis US or their affiliates. The Chairperson of the Board receives a retainer fee at the annual rate of $300,000. The Chairperson does not receive any meeting attendance fees for Board of Trustees meetings or committee meetings that she attends. Each Independent Trustee (other than the Chairperson) receives, in the aggregate, a retainer fee at the annual rate of $130,000. Each Independent Trustee also receives a meeting attendance fee of $10,000 for each meeting of the Board of Trustees that he or she attends in person and $5,000 for each meeting of the Board of Trustees that he or she attends telephonically. In addition, each committee chairperson (except for the Chairperson of the Governance Committee) receives an additional retainer fee at the annual rate of $17,500. Each Contract Review Committee member is compensated $6,000 for each Committee meeting that he or she attends in person and $3,000 for each meeting that he or she attends telephonically. Each Audit Committee member is compensated $6,000 for each Committee meeting that he or she attends in person and $3,000 for each meeting that he or she attends telephonically. These fees are allocated among the funds in the Natixis Funds Trusts and Loomis Sayles Funds Trusts based on a formula that takes into account, among other factors, the relative net assets of each fund. Trustees are reimbursed for travel expenses in connection with attendance at meetings.
Effective January 1, 2015, the chairperson of the Governance Committee receives an additional retainer fee at the annual rate of $5,000.
A deferred compensation plan (the “Plan”) is available to the Trustees on a voluntary basis. Deferred amounts remain in the Fund until distributed in accordance with the provisions of the Plan. The value of a participating Trustee’s deferral account is based on theoretical investments of deferred amounts, on the normal payment dates, in certain funds of the Natixis Funds Trusts and Loomis Sayles Funds Trusts as designated by the participating Trustees. Changes in the value of participants’ deferral accounts are allocated pro rata among the funds in the Natixis Funds Trusts and Loomis Sayles Funds Trusts, and are normally reflected as Trustees’ fees and expenses in the Statement of Operations. The portions of the accrued obligations allocated to the Fund under the Plan are reflected as Deferred Trustees’ fees in the Statement of Assets and Liabilities.
7. Line of Credit. The Fund, together with certain other funds of Natixis Funds Trusts and Loomis Sayles Funds Trusts, participates in a $200,000,000 committed unsecured line of credit provided by State Street Bank, with an individual limit of $125,000,000 for each fund that participates in the line of credit. Interest is charged to each participating fund based on its borrowings at a rate per annum equal to the greater of the Federal Funds rate or overnight LIBOR, plus 1.25%. In addition, a commitment fee of 0.10% per annum, payable at the end of each calendar quarter, is accrued and apportioned among the participating funds based on their average daily unused portion of the line of credit.
| 36
Table of Contents
Notes to Financial Statements (continued)
December 31, 2014
For the year ended December 31, 2014, the Fund had no borrowings under this agreement.
8. Broker Commission Recapture. The Fund has entered into agreements with certain brokers whereby the brokers will rebate a portion of brokerage commissions. All amounts rebated by the brokers are returned to the Fund under such agreements and are included in realized gains in the Statement of Operations. For the year ended December 31, 2014, $7,662 was rebated under these agreements.
9. Concentration of Ownership. From time to time, the Fund may have a concentration of one or more accounts constituting a significant percentage of shares outstanding. Investment activities by holders of such accounts could have material impacts on the Fund. As of December 31, 2014, based on management’s evaluation of the shareholder account base, the Fund had accounts representing controlling ownership of more than 5% of the Fund’s total outstanding shares. The number of such accounts, based on accounts that represent more than 5% of an individual class of shares, and the aggregate percentage of net assets represented by such holdings were as follows:
Fund | Number of 5% Non-Affiliated Account Holders | Percentage of Non-Affiliated Ownership | ||||||
Gateway Fund | 2 | 25.86 | % | |||||
Omnibus shareholder accounts for which NGAM Advisors understands that the intermediary has discretion over the underlying shareholder accounts or investment models where a shareholder account may be invested for a non-discretionary customer are included in the table above. For other omnibus accounts, the Fund does not have information on the individual shareholder accounts underlying omnibus accounts; therefore, there could be other 5% shareholders in addition to those disclosed in the table above.
37 |
Table of Contents
Notes to Financial Statements (continued)
December 31, 2014
10. Capital Shares. The Fund may issue an unlimited number of shares of beneficial interest, without par value. Transactions in capital shares were as follows:
| | Year Ended December 31, 2014 | | | Year Ended December 31, 2013 | | |||||||||||
| Shares | Amount | Shares | Amount | |||||||||||||
| Class A | ||||||||||||||||
Issued from the sale of shares | 19,526,816 | $ | 570,258,621 | 27,858,414 | $ | 784,790,330 | ||||||||||
Issued in connection with the | 877,005 | 25,694,338 | �� | 965,318 | 27,172,321 | |||||||||||
Redeemed | (34,699,272 | ) | (1,017,930,563 | ) | (23,892,620 | ) | (671,585,130 | ) | ||||||||
|
|
|
|
|
|
|
| |||||||||
Net change | (14,295,451 | ) | $ | (421,977,604 | ) | 4,931,112 | $ | 140,377,521 | ||||||||
|
|
|
|
|
|
|
| |||||||||
| Class C | ||||||||||||||||
Issued from the sale of shares | 2,529,459 | $ | 73,611,116 | 3,073,627 | $ | 86,257,801 | ||||||||||
Issued in connection with the | 48,694 | 1,419,075 | 48,238 | 1,350,393 | ||||||||||||
Redeemed | (2,060,975 | ) | (59,998,261 | ) | (2,250,359 | ) | (63,049,772 | ) | ||||||||
|
|
|
|
|
|
|
| |||||||||
Net change | 517,178 | $ | 15,031,930 | 871,506 | $ | 24,558,422 | ||||||||||
|
|
|
|
|
|
|
| |||||||||
| Class Y | ||||||||||||||||
Issued from the sale of shares | 69,449,619 | $ | 2,032,455,522 | 106,863,222 | $ | 3,001,779,476 | ||||||||||
Issued in connection with the | 1,743,714 | 51,146,687 | 1,590,108 | 44,775,042 | ||||||||||||
Redeemed | (64,987,476 | ) | (1,895,264,750 | ) | (89,656,148 | ) | (2,522,391,609 | ) | ||||||||
|
|
|
|
|
|
|
| |||||||||
Net change | 6,205,857 | $ | 188,337,459 | 18,797,182 | $ | 524,162,909 | ||||||||||
|
|
|
|
|
|
|
| |||||||||
Increase (decrease) from capital share transactions | (7,572,416 | ) | $ | (218,608,215 | ) | 24,599,800 | $ | 689,098,852 | ||||||||
|
|
|
|
|
|
|
| |||||||||
11. Potential Loss Contingency. The Fund has been named as a defendant, along with other financial institutions and individuals, in an action brought by a trustee of a trust created under a bankruptcy plan seeking to recover as fraudulent transfers amounts the Fund, and others, received in connection with a merger involving a company formerly held in the Fund’s portfolio of investments. The Fund received $9,525,600 in connection with the merger. The Fund also is potentially an unnamed member of a putative defendant class in a separate action bought by a different trustee appointed under the same bankruptcy plan seeking to recover the same alleged fraudulent transfers. It is reasonably possible that an outcome unfavorable to the Fund could result from either or both of these cases; however, a reasonable estimate of the amount of potential loss to the Fund cannot be made at this time.
| 38
Table of Contents
Report of Independent Registered Public Accounting Firm
To the Trustees of Gateway Trust and Shareholders of Gateway Fund:
In our opinion, the accompanying statement of assets and liabilities, including the portfolio of investments, and the related statements of operations and of changes in net assets and the financial highlights present fairly, in all material respects, the financial position of the Gateway Fund, a series of Gateway Trust (the “Fund”), at December 31, 2014, and the results of its operations, the changes in its net assets and the financial highlights for each of the periods indicated, in conformity with accounting principles generally accepted in the United States of America. These financial statements and financial highlights (hereafter referred to as “financial statements”) are the responsibility of the Fund’s management; our responsibility is to express an opinion on these financial statements based on our audits. We conducted our audits of these financial statements in accordance with the standards of the Public Company Accounting Oversight Board (United States). Those standards require that we plan and perform the audit to obtain reasonable assurance about whether the financial statements are free of material misstatement. An audit includes examining, on a test basis, evidence supporting the amounts and disclosures in the financial statements, assessing the accounting principles used and significant estimates made by management, and evaluating the overall financial statement presentation. We believe that our audits, which included confirmation of securities at December 31, 2014 by correspondence with the custodian and brokers, provide a reasonable basis for our opinion.
PricewaterhouseCoopers LLP
Boston, Massachusetts
February 23, 2015
39 |
Table of Contents
2014 U.S. Tax Distribution Information to Shareholders (Unaudited)
Qualified Dividend Income. For the fiscal year ended December 31, 2014, 100% of the ordinary income dividends paid by the Gateway Fund are considered qualified dividend income eligible for reduced tax rates. These lower rates range from 0% to 20% depending on an individual’s tax bracket. Complete information will be reported in conjunction with Form 1099-DIV.
Corporate Dividends Received Deduction. For the fiscal year ended December 31, 2014,100% of dividends distributed by the Gateway Fund qualify for the dividends received deduction for corporate shareholders.
| 40
Table of Contents
Trustee and Officer Information
The tables below provide certain information regarding the trustees and officers of Gateway Trust (the “Trust”). Unless otherwise indicated, the address of all persons below is 399 Boylston Street, Boston, MA 02116. The Fund’s Statements of Additional Information include additional information about the trustees of the Trust and are available by calling Natixis Funds at 800-225-5478.
Name and Year of | Position(s) Held | Principal 5 Years | Number of Fund Complex and Other 5 Years | Experience, | ||||
| INDEPENDENT TRUSTEES | ||||||||
Kenneth A. Drucker (1945) | Trustee since 2008 Chairperson of the Audit Committee and Governance Committee Member | Retired | 42 None | Significant experience on the Board and on the boards of other business organizations (including at investment companies); executive experience (including as treasurer of an aerospace, automotive, and metal manufacturing corporation) | ||||
| Edmond J. English (1953) | Trustee since 2013 Contract Review Committee Member | Chief Executive Officer of Bob’s Discount Furniture (retail) | 42 Formerly, Director, BJ’s Wholesale Club (retail); formerly, Director, Citizens Financial Group (bank) | Experience on the Board and significant experience on the boards of other business organizations (including at a retail company and a bank); executive experience (including at a retail company) | ||||
41 |
Table of Contents
Trustee and Officer Information
Name and Year of | Position(s) Held | Principal 5 Years | Number of Fund Complex and Other 5 Years | Experience, | ||||
INDEPENDENT TRUSTEES continued | ||||||||
Richard A. Goglia (1951) | Trustee since 2015 Audit Committee Member | Vice President and Treasurer of Raytheon Company (defense) | 42 None | Experience on the Board and executive experience (including his role as vice president and treasurer of a defense company and experience at a financial services company) | ||||
Wendell J. Knox (1948) | Trustee since 2009 Audit Committee Member and Governance Committee Member | Director of Abt Associates Inc. (research and consulting) | 42 Director, Eastern Bank (bank); Director, The Hanover Insurance Group (property and casualty insurance) | Significant experience on the Board and on the boards of other business organizations (including at a bank and at a property and casualty insurance firm); executive experience (including roles as president and chief executive officer of a research and consulting company) | ||||
| 42
Table of Contents
Trustee and Officer Information
Name and Year of | Position(s) Held | Principal 5 Years | Number of Fund Complex and Other 5 Years | Experience, | ||||
INDEPENDENT TRUSTEES continued | ||||||||
| Martin T. Meehan (1956) | Trustee since 2012 Contract Review Committee Member | Chancellor and faculty member, University of Massachusetts Lowell | 42 None | Experience on the Board and on the boards of other business organizations; experience as Chancellor of the University of Massachusetts Lowell; government experience (including as a member of the U.S. House of Representatives); academic experience | ||||
Sandra O. Moose (1942) | Chairperson of the Board of Trustees since November 2005 Trustee since 2007 Ex Officio member of the Audit Committee, the Contract Review Committee and the Governance Committee | President, Strategic Advisory Services (management consulting) | 42 Director, AES Corporation (international power company); formerly, Director, Verizon Communications (telecommunications company) | Significant experience on the Board and on the boards of other business organizations (including at a telecommunications company, an international power company and a specialty chemicals corporation); executive experience (including at a management consulting company) | ||||
43 |
Table of Contents
Trustee and Officer Information
Name and Year of | Position(s) Held | Principal 5 Years | Number of Fund Complex and Other 5 Years | Experience, | ||||
INDEPENDENT TRUSTEES continued | ||||||||
Erik R. Sirri (1958) | Trustee since 2009 Audit Committee Member | Professor of Finance at Babson College | 42 None | Significant experience on the Board; experience as Director of the Division of Trading and Markets at the Securities and Exchange Commission; academic experience; training as an economist | ||||
Peter J. Smail (1952) | Trustee since 2009 Chairperson of the Contract Review Committee and Governance Committee Member | Retired | 42 None | Significant experience on the Board; mutual fund industry and executive experience (including roles as president and chief executive officer for an investment adviser) | ||||
Cynthia L. Walker (1956) | Trustee since 2005 Chairperson of the Governance Committee and Contract Review Committee Member | Deputy Dean for Finance and Administration, Yale University School of Medicine | 42 None | Significant experience on the Board; executive experience in a variety of academic organizations (including roles as dean for finance and administration) | ||||
| 44
Table of Contents
Trustee and Officer Information
Name and Year of | Position(s) Held | Principal 5 Years | Number of Fund Complex and Other 5 Years | Experience, | ||||
INTERESTED TRUSTEES continued | ||||||||
Robert J. Blanding3 (1947) 555 California Street San Francisco, CA 94104 | Trustee since 2003 | Chairman and Chief Executive Officer (formerly, President), Loomis, Sayles & Company, L.P. | 42 None | Significant experience on the Board; continuing service as Chairman and Chief Executive Officer of Loomis, Sayles & Company, L.P. | ||||
| David L. Giunta4 (1965) | Trustee since 2011 President and Chief Executive Officer since 2008 | President and Chief Executive Officer, NGAM Distribution Corporation, NGAM Advisors, L.P. and NGAM Distribution, L.P. | 42 None | Experience on the Board; continuing experience as President and Chief Executive Officer of NGAM Advisors, L.P. | ||||
John T. Hailer5 (1960) | Trustee since 2000 | President and Chief Executive Officer – U.S. and Asia, Natixis Global Asset Management, L.P. | 42 None | Significant experience on the Board; continuing experience as President and Chief Executive Officer – U.S. and Asia, Natixis Global Asset Management, L.P. | ||||
| 1 | Each trustee serves until retirement, resignation or removal from the Board. The current retirement age is 75. The position of Chairperson of the Board is appointed for a three-year term. Ms. Moose was appointed to serve an additional three-year term as the Chairperson of the Board on December 13, 2013. |
| 2 | The trustees of the Trust serve as trustees of a fund complex that includes all series of the Natixis Funds Trust I, Natixis Funds Trust II, Natixis Funds Trust IV and Gateway Trust (collectively, the “Natixis Funds Trusts”), Loomis Sayles Funds I and Loomis Sayles Funds II (collectively, the “Loomis Sayles Funds Trusts”). |
| 3 | Mr. Blanding is deemed an “interested person” of the Trust because he holds the following positions with an affiliated person of the Trust: Chairman and Chief Executive Officer of Loomis, Sayles & Company, L.P. and Director of Loomis Sayles Investment Asia Pte., Ltd. |
| 4 | Mr. Giunta is deemed an “interested person” of the Trust because he holds the following positions with an affiliated person of the Trust: President and Chief Executive Officer of NGAM Distribution Corporation, NGAM Advisors, L.P. and NGAM Distribution, L.P. |
| 5 | Mr. Hailer is deemed an “interested person” of the Trust because he holds the following positions with an affiliated person of the Trust: President and Chief Executive Officer – U.S. and Asia, Natixis Global Asset Management, L.P. |
45 |
Table of Contents
Trustee and Officer Information
Name and Year of Birth | Position(s) Held | Term of Office1 and | Principal Occupation(s) | |||
| OFFICERS OF THE TRUST | ||||||
Coleen Downs Dinneen (1960) | Secretary, Clerk and Chief Legal Officer | Since September 2004 | Executive Vice President, General Counsel, Secretary and Clerk, NGAM Distribution Corporation, NGAM Advisors, L.P. and NGAM Distribution, L.P. | |||
Russell L. Kane (1969) | Chief Compliance Officer, Assistant Secretary and Anti-Money Laundering Officer | Chief Compliance Officer since May 2006; Assistant Secretary since June 2004; and Anti-Money Laundering Officer since April 2007 | Chief Compliance Officer for Mutual Funds, Senior Vice President, Deputy General Counsel, Assistant Secretary and Assistant Clerk, NGAM Distribution Corporation, NGAM Advisors, L.P. and NGAM Distribution, L.P. | |||
Michael C. Kardok (1959) | Treasurer, Principal Financial and Accounting Officer | Since October 2004 | Senior Vice President, NGAM Advisors, L.P. and NGAM Distribution, L.P. | |||
| 1 | Each officer of the Trust serves for an indefinite term in accordance with the Trust’s current by-laws until the date his or her successor is elected and qualified, or until he or she sooner dies, retires, is removed or becomes disqualified. |
| 2 | Each person listed above, except as noted, holds the same position(s) with the Fund Complex. Previous positions during the past five years with NGAM Distribution, L.P., NGAM Advisors, L.P. or Loomis, Sayles & Company, L.P. are omitted, if not materially different from a trustee’s or officer’s current position with such entity. |
| 46
Table of Contents
ANNUAL REPORT
December 31, 2014

Gateway Equity Call Premium Fund
Loomis Sayles Strategic Alpha Fund
Portfolio Review page 1
Portfolio of Investments page 14
Financial Statements page 47
Notes to Financial Statements page 57
Table of Contents
GATEWAY EQUITY CALL PREMIUM FUND
| Managers | Symbols | |
| Daniel M. Ashcraft, CFA® | Class A GCPAX | |
| Michael T. Buckius, CFA® | Class C GCPCX | |
| Kenneth H. Toft, CFA® | Class Y GCPYX | |
| Gateway Investment Advisors, LLC | ||
Objective
Seeks total return with less risk than U.S. equity markets.
Market Conditions
From the September 30, 2014 inception date of the Gateway Equity Call Premium Fund, through December 31, 2014, the S&P 500® Index returned 4.93%. This period was the most volatile of the year for equity markets, and included two periods of sharp losses followed by quick recoveries as macroeconomic factors remained the key drivers of the market’s ups and downs. The period began with a broad equity market decline that was a continuation and acceleration of the downturn that began in the third week of September. Equity market losses were driven by multiple factors, including fear of a spreading Ebola virus and indications of slowing global growth. The downturn came to an end in mid-October as a recovery was sparked by the European Central Bank’s announcement of a potential quantitative easing (QE) program. The recovery then gained momentum as the Bank of Japan followed suit with a similar announcement.
Equity market gains were extended through November and into December as domestic corporate earnings announcements were strong and a drop in energy prices was seen as consumer-friendly. By early December, however, the decline in oil prices was perceived as an indicator of falling global demand and an increased risk of deflation. This shift in sentiment was the primary driver of a decline in the S&P 500® Index that came to an end on December 16. Reassuring comments from the Federal Reserve (the Fed) regarding interest rates were enough to spark a year-end recovery, and the S&P 500® Index ended the year just below its all-time high. The Chicago Board Options Exchange (“CBOE”) Volatility Index (the “VIX”) tracked this market volatility closely; however, its average of 16.07 for the period was well below its long-term historical average of 20.
The Fund’s benchmark, the CBOE S&P 500® BuyWrite Index (the “BXMSM”), had a return of -0.82% for the September 30-December 31, 2014 period. It is unusual for the BXM to have a negative return over a quarter when the S&P 500® Index is positive. This index call-writing benchmark had significant participation in the losses experienced by the S&P 500® Index, but only partial participation in the period’s largest recovery. This pattern was primarily a result of the BXM’s construction methodology, which dictates when it buys and sells its single monthly index call option. The BXM’s index call option selling happened to be at specific times when the VIX, and therefore the call premiums, were low.
1 |
Table of Contents
Performance Results
From its September 30, 2014 inception date through December 31, 2014, Class A shares of Gateway Equity Call Premium Fund returned 0.00% at net asset value. The Fund outperformed its benchmark, the CBOE S&P 500® BuyWrite Index (BXMSM),, which returned -0.82%.
Explanation of Fund Performance
The Fund seeks to generate returns by selling at- and near-the-money index call options against the full value of its underlying equity portfolio. The steady cash flow from call-option writing is intended to be an important source of the Fund’s return, although it reduces the Fund’s ability to profit from increases in the value of its equity portfolio. The index call options written by the Fund often have similar characteristics to the index call option present in the BXM at any given time. However, unlike the BXM, the Fund employs an active strategy that gives its management team discretion to diversify expiration dates and strike prices across a portfolio of index call options, and to opportunistically pursue attractive call premiums while maintaining a relatively consistent risk profile. Though collecting premiums from writing index call options will allow the Fund to generate a return when the index advances, call option positions that expire or are closed out when the index is well above an option’s strike price may generate realized losses. As such, most of the realized losses from index call options occurred during the sharp index advance in the middle of the fourth quarter. An index option is described as being at-the-money when the price of the underlying index is the same as the option’s strike price.
From the Fund’s inception through December 31, 2014, the active index call writing strategy used by the Fund resulted in higher call premiums received when the VIX was relatively elevated. In addition, the Fund’s management team cautiously adjusted index call strike prices upwards during the market’s strong rally from mid-October to early December. These active decisions helped the Fund outperform the BXM during the market’s declines, as well as deliver a higher return during the market’s strongest advance.
Outlook
The coming year appears to include a mix of opportunity and risk. There is meaningful potential for both implied and realized volatility to increase. Contributors to a potential elevation of VIX levels include market anxiety over the Fed’s moves to normalize monetary policy and raise interest rates; de-synchronization of policies across the world’s central banks, with a restrictive Fed as the most likely outlier; and ongoing geopolitical risks, including both Russia and the Middle East.
In the absence of a significant downside event, higher market volatility does not preclude attractive equity returns given reasonable market valuations and continuing domestic economic improvement. In contrast to favorable scenarios for equity market returns, investors appear unlikely to experience attractive returns from fixed-income investments, particularly the high quality variety, given very low interest rates.
Strong market results, including six straight calendar years of positive returns for most broad market equity indexes and the absence of a 10% correction in the S&P 500® Index
| 2
Table of Contents
GATEWAY EQUITY CALL PREMIUM FUND
since 2011, have made a growing number of investors comfortable with equities. The Fund’s investment management team continues to maintain a market agnostic posture, seeking to benefit from return-generating index call option premiums. As investors become more sensitive to the rewards of risk management, we believe they may develop a greater appreciation for the way in which the Fund’s low volatility equity profile aligns with their long-term objectives.
Total Returns — December 31, 20144
| Life of Fund | ||||
| Class A (Inception 9/30/14) | ||||
| NAV | 0.00 | % | ||
| With 5.75% Maximum Sales Charge | -5.75 | |||
| Class C (Inception 9/30/14) | ||||
| NAV | -0.12 | |||
| With CDSC1 | -1.11 | |||
| Class Y (Inception 9/30/14) | ||||
| NAV | 0.13 | |||
| Comparative Performance | ||||
| CBOE S&P 500 BuyWrite Index (BXMSM)2 | -0.82 | |||
| S&P 500® Index3 | 4.93 | |||
Past performance does not guarantee future results. The table(s) do not reflect taxes shareholders might owe on any fund distributions or when they redeem their shares. Performance for periods less than one year is cumulative, not annualized. Returns reflect changes in share price and reinvestment of dividends and capital gains, if any. Unlike a fund, an index is not managed and does not reflect fees and expenses.
| 1 | Performance for Class C shares assumes a 1% contingent deferred sales charge (“CDSC”) applied when you sell shares within one year of purchase. |
| 2 | The CBOE S&P 500 BuyWrite Index (BXMSM) is a benchmark index designed to track the performance of a hypothetical buy-write strategy on the S&P 500® Index. The BXM is a passive total return index based on (1) buying an S&P 500 stock index portfolio, and (2) “writing” (or selling) the near-term S&P 500 Index (SPXSM) “covered” call option, generally on the third Friday of each month. The SPX call written will have about one month remaining to expiration, with an exercise price just above the prevailing index level (i.e., slightly out of the money). The SPX call is held until expiration and cash settled, at which time a new one-month, near-the-money call is written. |
| 3 | S&P 500® Index is a widely recognized measure of U.S. stock market performance. It is an unmanaged index of 500 common stocks chosen for market size, liquidity, and industry group representation, among other factors. |
| 4 | Fund performance has been increased by fee waivers and/or expense reimbursements, if any, without which performance would have been lower. |
3 |
Table of Contents
LOOMIS SAYLES STRATEGIC ALPHA FUND
| Managers | Symbols | |
| Matthew J. Eagan, CFA® | Class A LABAX | |
| Kevin P. Kearns | Class C LABCX | |
| Todd P. Vandam, CFA® | Class Y LASYX | |
| Loomis, Sayles & Company, L.P. | ||
Objective
Seeks to provide an attractive absolute total return, complemented by prudent investment management designed to manage risks and protect investor capital. The secondary goal of the Fund is to achieve these returns with relatively low volatility.
Market Conditions
U.S. Treasury yields moved steadily lower during the year. The yield on the 10-year Treasury note declined 87 basis points to 2.17%, and the 30-year Treasury bond declined 121 basis points to 2.75%. Improvements in the economy, which led to the end of quantitative easing (QE) in the United States, were offset by geopolitical worries, including events in Ukraine and Iraq and the decline in oil prices. U.S. Treasury volatility, as measured by the Merrill Option Volatility Estimate (MOVE) Index, increased throughout the year.
After experiencing multi-year lows in June, credit spreads (the yield differences between Treasury and non-Treasury bonds of similar maturity) widened through the fourth quarter and finished the year near recent highs. High yield spreads remained elevated following two market volatility spikes late in the year. As yields fell during the year, investment grade corporates were able to outperform high yield corporates, which experienced greater price sensitivity due to their longer duration. Demand for European investment grade corporates strengthened as the year progressed, as spreads priced in the potential for further easing from the European Central Bank (ECB).
The U.S. dollar staged a massive rally during the year, largely driven by diverging growth and interest rate projections for the United States compared with the rest of the world. Increasingly accommodative central bank policies from the Bank of Japan and the ECB caused the yen and euro to fall by approximately 12% each versus the U.S. dollar. Falling oil prices also pressured the currencies of commodity exporters in developed and emerging markets, with the Russian ruble, Colombian peso and Norwegian krone hit the hardest. In addition, political tensions placed increased pressure on Eastern European currencies.
Performance Results
For the 12 months ended December 31, 2014, Class A shares of Loomis Sayles Strategic Alpha Fund returned 2.24% at net asset value. The Fund outperformed its benchmark, the 3-month London Interbank Offered Rate (LIBOR), which returned 0.23%. The Fund follows an absolute return strategy and is not managed to an index.
| 4
Table of Contents
LOOMIS SAYLES STRATEGIC ALPHA FUND
Explanation of Fund Performance
The Fund’s positive performance was diversified across several sectors, with the majority of return generated from securitized credits, investment grade corporates, and currency positioning. In addition, the Fund’s exposure to convertibles and dividend-paying equities supported overall results. Duration management tools were used to shorten the portfolio’s duration and detracted from results as we were expecting higher yields driven by the stronger U.S. economic data.
The Fund’s securitized holdings, particularly non-agency residential mortgage-backed securities (RMBS) and commercial mortgage-backed securities (CMBS), generated positive return in 2014. Despite the slowdown in the U.S. real estate market recovery during the second half of the year, the yield advantage in these asset classes attained earlier in the year benefited return. The Fund’s currency positioning also aided performance, as the U.S. dollar continued to strengthen amid diverging monetary policies. As a result, some of the Fund’s short currency positions, namely in the Mexican peso, Japanese yen and Colombian peso, aided performance. Elsewhere, the Fund’s investment grade corporate bonds lifted performance despite the fact that U.S. spreads widened during the second half of the year. Sustained demand for corporates and flat spreads among euro investment grade securities due to the potential for further ECB easing buoyed return, particularly from selected holdings in the banking, electric, and communication industries. The Fund’s convertible securities also aided performance, benefiting from the uptick in equity markets. Selected holdings in the technology and consumer non-cyclical industries performed well, as did the Fund’s dividend-paying equities, particularly consumer non-cyclical and communication categories.
Meanwhile, in an attempt to protect against downside equity risk, the Fund held short positions in S&P 500® E-mini futures, a hedge for the Fund’s convertible bond and equity positions. These positions weighed on performance. In addition, the Fund’s duration management tools, including the use of interest rate futures and swaptions (options on interest rate swaps), detracted from performance. Short positions on the 10-year Treasury note were the most notable laggards, as the intermediate-to-long end of the U.S. yield curve (a curve that shows the relationship among bond yields across the maturity spectrum) flattened during the year. Credit default swaps (CDS) and credit default swaps on indices (CDX) were used for emerging market, high yield and investment grade exposure. These positions also weighed on return. The Fund used currency forwards to hedge long positions in local currencies or tactically to short specific currencies; both strategies supported results.
Outlook
We continue to temper our assessment of the rate environment. We believe the 10-year U.S. Treasury note will rise slowly in 2015 and reach 3% by year-end. Longer-term, most investors expect the Federal Reserve (the Fed) to raise rates in anticipation of rising wages. The ultimate pace of the Fed’s rate hikes should rest on three factors: the pace of wage growth, significant deviations from their inflation forecasts, and changes in financial conditions as a result of Fed tightening. Furthermore, there is potential for increased rate volatility as the market digests the date and pace of future rate hikes.
5 |
Table of Contents
The United States is in the expansion phase of its credit cycle (a cyclical pattern that follows credit availability and corporate health). U.S. credit spreads have widened from historical tights due to falling oil prices, and perhaps, deteriorating corporate health. As a result, spreads look cheaper with potential for pockets of value. The global bond market remains challenging, as desynchronized recoveries among major economies should extend the global economic recovery and keep inflation low.
Among emerging markets, large economies such as China, Brazil and Russia are facing much slower growth, reversing the improving trends of the past. Geopolitical risks continue to increase with turmoil in the Middle East, Eastern Europe and East Asia. However, improving growth in the developed world should be a positive factor for emerging markets. In addition, slow growth in Europe and the potential for enhanced liquidity measures from the ECB could provide support to the higher-yielding emerging markets.
Regarding currency, we expect the dollar’s strength to continue, given the relative strength of the U.S. economy. We also expect the Mexican peso to appreciate due to the reforms the country is implementing. Finally, as the ECB and Bank of Japan continue to reflate their economies with easy monetary conditions, we believe the euro and yen will depreciate further.
Growth of $10,000 Investment in Class A Shares4
December 15, 2010 (inception) through December 31, 2014
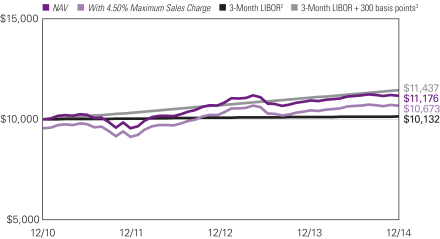
See notes to chart on page 7.
| 6
Table of Contents
LOOMIS SAYLES STRATEGIC ALPHA FUND
Average Annual Total Returns — December 31, 20144
| 1 Year | Life of Fund | |||||||
| Class A (Inception 12/15/10) | ||||||||
| NAV | 2.24 | % | 2.79 | % | ||||
| With 4.50% Maximum Sales Charge | -2.32 | 1.63 | ||||||
| Class C (Inception 12/15/10) | ||||||||
| NAV | 1.47 | 2.00 | ||||||
| With CDSC1 | 0.48 | 2.00 | ||||||
| Class Y (Inception 12/15/10) | ||||||||
| NAV | 2.52 | 3.03 | ||||||
| Comparative Performance | ||||||||
| 3-Month LIBOR2 | 0.23 | 0.32 | ||||||
| 3-Month LIBOR + 300 basis points3 | 3.28 | 3.38 | ||||||
Past performance does not guarantee future results. The table(s) do not reflect taxes shareholders might owe on any fund distributions or when they redeem their shares. Performance for periods less than one year is cumulative, not annualized. Returns reflect changes in share price and reinvestment of dividends and capital gains, if any. Unlike a fund, an index is not managed and does not reflect fees and expenses.
| 1 | Performance for Class C shares assumes a 1% contingent deferred sales charge (“CDSC”) applied when you sell shares within one year of purchase. |
| 2 | 3-Month LIBOR, or the London Interbank Offered Rate, represents the average rate at which a leading bank, for a given currency (in this case U.S. dollars), can obtain unsecured funding, and is representative of short-term interest rates. |
| 3 | 3-Month LIBOR +300 basis points is created by adding 3.00% to the annual percentage change of the 3-Month LIBOR. |
| 4 | Fund performance has been increased by fee waivers and/or expense reimbursements, if any, without which performance would have been lower. |
7 |
Table of Contents
ADDITIONAL INFORMATION
The views expressed in this report reflect those of the portfolio managers as of the dates indicated. The managers’ views are subject to change at any time without notice based on changes in market or other conditions. References to specific securities or industries should not be regarded as investment advice. Because the Funds are actively managed, there is no assurance that they will continue to invest in the securities or industries mentioned.
ADDITIONAL INDEX INFORMATION
This document may contain references to third party copyrights, indexes, and trademarks, each of which is the property of its respective owner. Such owner is not affiliated with Natixis Global Asset Management or any of its related or affiliated companies (collectively “NGAM”) and does not sponsor, endorse or participate in the provision of any NGAM services, funds or other financial products.
The index information contained herein is derived form third parties and is provided on an “as is” basis. The user of this information assumes the entire risk of use of this information. Each of the third party entities involved in compiling, computing or creating index information, disclaims all warranties (including, without limitation, any warranties of originality, accuracy, completeness, timeliness, non-infringement, merchantability and fitness for a particular purpose) with respect to such information.
PROXY VOTING INFORMATION
A description of the Funds’ proxy voting policies and procedures is available without charge, upon request, by calling Natixis Funds at 800-225-5478; on the Funds’ website at ngam.natixis.com; and on the Securities and Exchange Commission’s (SEC) website at www.sec.gov. Information regarding how the Loomis Sayles Strategic Alpha Fund voted proxies relating to portfolio securities during the 12-months ended June 30, 2014 is available on the Fund’s website and the SEC’s website.
QUARTERLY PORTFOLIO SCHEDULES
The Funds file a complete schedule of portfolio holdings with the SEC for the first and third quarters of each fiscal year on Form N-Q. The Funds’ Forms N-Q are available on the SEC’s website at www.sec.gov and may be reviewed and copied at the SEC’s Public Reference Room in Washington, DC. Information on the operation of the Public Reference Room may be obtained by calling 800-SEC-0330.
| 8
Table of Contents
UNDERSTANDING FUND EXPENSES
As a mutual fund shareholder, you incur different types of costs: transaction costs, including sales charges (loads) on purchases, contingent deferred sales charges on redemptions, and ongoing costs, including management fees, distribution and/or service fees (12b-1 fees), and other fund expenses. Certain exemptions may apply. These costs are described in more detail in the Fund’s prospectus. The following examples are intended to help you understand the ongoing costs of investing in the Fund and help you compare these with the ongoing costs of investing in other mutual funds.
The first line in the table for each class shows the actual account values and actual Fund expenses you would have paid on a $1,000 investment in the Fund from July 1, 2014 through December 31, 2014. To estimate the expenses you paid over the period, simply divide your account value by $1,000 (for example, $8,600 account value divided by $1,000 = 8.60) and multiply the result by the number in the Expenses Paid During Period column as shown for your Class.
The second line for the table of each class provides information about hypothetical account values and hypothetical expenses based on the Fund’s actual expense ratios and an assumed rate of return of 5% per year before expenses, which is not the Fund’s actual return. The hypothetical account values and expenses may not be used to estimate the actual ending account balance or expenses you paid on your investment for the period. You may use this information to compare the ongoing costs of investing in the Fund and other funds. To do so, compare this 5% hypothetical example with the 5% hypothetical examples that appear in the shareholder reports of the other funds.
Please note that the expenses shown reflect ongoing costs only, and do not include any transaction costs, such as sales charges. Therefore, the second line in the table of each Fund is useful in comparing ongoing costs only, and will not help you determine the relative costs of owning different funds. If transaction costs were included, total costs would be higher.
9 |
Table of Contents
| GATEWAY EQUITY CALL PREMIUM FUND | BEGINNING ACCOUNT VALUE 7/1/20141 | ENDING ACCOUNT VALUE 12/31/2014 | EXPENSES PAID DURING PERIOD 7/1/20141 – 12/31/2014 | |||||||||
| Class A | ||||||||||||
| Actual | $1,000.00 | $1,000.00 | $3.02 | 1 | ||||||||
| Hypothetical (5% return before expenses) | $1,000.00 | $1,019.16 | $6.11 | * | ||||||||
| Class C | ||||||||||||
| Actual | $1,000.00 | $998.80 | $4.91 | 1 | ||||||||
| Hypothetical (5% return before expenses) | $1,000.00 | $1,015.38 | $9.91 | * | ||||||||
| Class Y | ||||||||||||
| Actual | $1,000.00 | $1,001.30 | $2.40 | 1 | ||||||||
| Hypothetical (5% return before expenses) | $1,000.00 | $1,020.42 | $4.84 | * | ||||||||
| * | Hypothetical expenses are equal to the Fund’s annualized expense ratio (after waiver/reimbursement): 1.20%, 1.95% and 0.95% for Class A, C and Y, respectively, multiplied by the average account value over the period, multiplied by the number of days in the most recent half-year (184), divided by 365 (to reflect the half-year period). |
| 1 | Fund commenced operations on September 30, 2014. Actual expenses are equal to the Fund’s annualized expense ratio (after waiver/reimbursement): 1.20%, 1.95% and 0.95% for Class A, C and Y, respectively, multiplied by the average account value over the period, multiplied by the number of days in the most recent fiscal period (92), divided by 365 (to reflect the partial period). |
| LOOMIS SAYLES STRATEGIC ALPHA FUND | BEGINNING ACCOUNT VALUE 7/1/2014 | ENDING ACCOUNT VALUE 12/31/2014 | EXPENSES PAID DURING PERIOD* 7/1/2014 – 12/31/2014 | |||||||||
| Class A | ||||||||||||
| Actual | $1,000.00 | $1,000.90 | $5.50 | |||||||||
| Hypothetical (5% return before expenses) | $1,000.00 | $1,019.71 | $5.55 | |||||||||
| Class C | ||||||||||||
| Actual | $1,000.00 | $996.90 | $9.31 | |||||||||
| Hypothetical (5% return before expenses) | $1,000.00 | $1,015.88 | $9.40 | |||||||||
| Class Y | ||||||||||||
| Actual | $1,000.00 | $1,002.40 | $4.29 | |||||||||
| Hypothetical (5% return before expenses) | $1,000.00 | $1,020.92 | $4.33 | |||||||||
| * | Expenses are equal to the Fund’s annualized expense ratio: 1.09%, 1.85% and 0.85% for Class A, C and Y, respectively, multiplied by the average account value over the period, multiplied by the number of days in the most recent fiscal half-year (184), divided by 365 (to reflect the half-year period). |
| 10
Table of Contents
BOARD APPROVAL OF THE INITIAL
ADVISORY AGREEMENT
The Investment Company Act of 1940, as amended (the “1940 Act”), requires that both the full Board of Trustees of the Trust and a majority of the Trustees who are not “interested persons” (as defined in the 1940 Act) of the Trust (the “Independent Trustees”), voting separately, initially approve for a two-year term any new investment advisory and sub-advisory agreements for a registered investment company, including newly formed funds such as the Gateway Equity Call Premium Fund (the “Fund”). The Trustees, including the Independent Trustees, unanimously approved the proposed investment advisory agreement (the “Agreement”) for the Fund at an in-person meeting held on September 12, 2014.
In connection with this review, Fund management and other representatives of the Fund’s adviser, Gateway Investment Advisers, LLC (the “Adviser”), distributed to the Trustees materials including, among other items, (i) information on the proposed advisory fees and other expenses to be charged to the Fund, including information comparing the Fund’s expenses to those of peer groups of funds and information on fees charged to other accounts advised or sub-advised by the Adviser and the proposed expense cap, (ii) the Fund’s investment objective and strategies, (iii) the size, education and experience of the Adviser’s investment staff and the investment strategies proposed to be used in managing the Fund, (iv) proposed arrangements for the distribution of the Fund’s shares, (v) the procedures proposed to be employed to determine the value of the Fund’s assets, (vi) the Fund’s investment policies and restrictions, policies on personal securities transactions and other compliance policies, (vii) information about the Adviser’s performance, and (viii) the general economic outlook with particular emphasis on the mutual fund industry. The Trustees also considered the fact that they oversee other funds advised by the Adviser as well as information about the Adviser they had received in connection with their oversight of those other funds. Because the Fund is newly formed and had not commenced operations at the time of the Trustees’ review, certain information, including data relating to Fund performance, was not available, and therefore could not be distributed to the Trustees. Throughout the process, the Trustees were afforded the opportunity to ask questions of, and request additional materials from, the Adviser.
In considering whether to initially approve the Agreement, the Board of Trustees, including the Independent Trustees, did not identify any single factor as determinative. Individual Trustees may have evaluated the information presented differently from one another, giving weight to various factors. Matters considered by the Trustees, including the Independent Trustees, in connection with their approval of the Agreement included, but were not limited to, the factors listed below:
The nature, extent and quality of the services to be provided to the Fund under the Agreement. The Trustees considered the nature, extent and quality of the services to be provided by the Adviser and its affiliates to the Fund, and the resources to be dedicated to the Fund by the Adviser and its affiliates. The Trustees considered their experience with other funds advised by the Adviser, as well as the affiliation between the Adviser and Natixis Global Asset Management, L.P. (“Natixis US”), whose affiliates provide investment advisory services to other funds in the same family of mutual funds. In this regard, the Trustees considered not
11 |
Table of Contents
only the advisory services proposed to be provided by the Adviser to the Fund, but also the monitoring and administrative services proposed to be provided by NGAM Advisors, L.P. (“NGAM Advisors”) and its affiliates to the Fund.
The Trustees also considered the benefits to shareholders of investing in a mutual fund that is part of a family of funds that offers shareholders the right to exchange shares of one type of fund for shares of another type of fund, and provides a variety of fund and shareholder services.
After reviewing these and related factors, the Trustees concluded, within the context of their overall conclusions regarding the Agreement, that the scope of the services to be provided to the Fund under the Agreement seemed consistent with the Fund’s operational requirements, and that the Adviser had the capabilities, resources and personnel necessary to provide the advisory services that would be required by the Fund. The Trustees determined that the nature, extent and quality of services proposed to be provided under the Agreement supported approval of the Agreement.
Investment performance of the Fund and the Adviser. Because the Fund had not yet commenced operations, performance information for the Fund was not considered; however, the Board considered the performance of other funds and accounts managed by the Adviser, including accounts managed in accordance with the Fund’s proposed strategies.
The Trustees also considered the Adviser’s performance and reputation generally, the performance of the fund family generally, and the historical responsiveness of the Adviser to Trustee concerns about performance and the willingness of the Adviser to take steps intended to improve performance.
Based on this and other information, the Trustees concluded, within the context of their overall conclusions regarding the Agreement, that these relevant factors supported approval of the Agreement.
The costs of the services to be provided by the Adviser and its affiliates from its relationship with the Fund. Although the Fund had not yet commenced operations at the time of the Trustees’ review of the Agreement, the Trustees reviewed information comparing the proposed advisory fees and estimated total expenses of the Fund’s share classes with the fees and expenses of comparable share classes of comparable funds identified by the Adviser, as well as information about differences in such fees. In evaluating the fees charged to such comparable accounts, the Trustees considered, among other things, management’s representations about the differences between managing mutual funds as compared to other types of accounts, including the additional resources required to effectively manage, and the greater regulatory costs associated with the management of, mutual fund assets. In evaluating the Fund’s proposed advisory fees, the Trustees also took into account the demands, complexity and quality of the investment management of the Fund and the need for the Adviser to offer competitive compensation. The Trustees also noted that the Fund would have an expense cap in place. In addition, the Trustees considered information regarding the administrative and distribution fees to be paid by the Fund to the Adviser’s affiliates.
Because the Fund had not yet commenced operations, historical profitability information with respect to the Fund was not considered. However, the Trustees noted the information
| 12
Table of Contents
provided in court cases in which adviser profitability was an issue, the estimated expense level of the Fund, and that the Fund would be subject to an expense cap.
After reviewing these and related factors, the Trustees concluded, within the context of their overall conclusions regarding the Agreement, that the advisory fees and expenses proposed to be charged to the Fund were fair and reasonable, and supported the approval of the Agreement.
Economies of scale. The Trustees considered the extent to which the Adviser may realize economies of scale or other efficiencies in managing the Fund, and whether those economies could be shared with the Fund through breakpoints in the advisory fees or other means, such as expense waivers or caps. The Trustees noted that the Fund will be subject to an expense cap. After reviewing these and related factors, the Trustees concluded, within the context of their overall conclusions regarding the Agreement, that the extent to which economies of scale might be shared with the Fund supported the approval of the Agreement.
The Trustees also considered other factors, which included but were not limited to the following:
| · | The compliance-related resources the Adviser and its affiliates would provide to the Fund. |
| · | So-called “fallout benefits” to the Adviser, such as the engagement of affiliates of the Adviser to provide distribution and administrative services to the Fund, the benefits to Natixis US, NGAM Advisors and the Adviser of being able to offer “alternative” products in the Natixis family of funds, and the benefits of research made available to the Adviser by reason of brokerage commissions (if any) generated by the Fund’s securities transactions. The Trustees also considered the benefits to the Natixis organization from the retention of the Adviser. The Trustees considered the possible conflicts of interest associated with these fallout and other benefits, and the reporting, disclosure and other processes in place to disclose and monitor such possible conflicts of interest. |
Based on their evaluation of all factors that they deemed to be material, including those factors described above, and assisted by the advice of independent counsel, the Trustees, including the Independent Trustees, concluded that the Agreement should be approved.
13 |
Table of Contents
Portfolio of Investments – as of December 31, 2014
Gateway Equity Call Premium Fund
| Shares | Description | Value (†) | ||||||
| Common Stocks — 95.1% of Net Assets | ||||||||
| Aerospace & Defense — 2.8% | ||||||||
| 355 | B/E Aerospace, Inc.(b)(c) | $ | 20,597 | |||||
| 895 | Boeing Co. (The)(d) | 116,332 | ||||||
| 634 | General Dynamics Corp.(d) | 87,251 | ||||||
| 1,067 | Honeywell International, Inc.(d) | 106,615 | ||||||
| 292 | KLX, Inc.(b)(c) | 12,045 | ||||||
| 437 | Lockheed Martin Corp.(d) | 84,153 | ||||||
| 163 | Precision Castparts Corp.(c) | 39,263 | ||||||
| 1,043 | United Technologies Corp.(d) | 119,945 | ||||||
|
| |||||||
| 586,201 | ||||||||
|
| |||||||
| Air Freight & Logistics — 1.0% | ||||||||
| 504 | FedEx Corp.(d) | 87,525 | ||||||
| 1,061 | United Parcel Service, Inc., Class B(d) | 117,951 | ||||||
|
| |||||||
| 205,476 | ||||||||
|
| |||||||
| Auto Components — 0.6% | ||||||||
| 1,191 | Johnson Controls, Inc.(d) | 57,573 | ||||||
| 524 | Lear Corp.(d) | 51,394 | ||||||
| 206 | TRW Automotive Holdings Corp.(b)(c) | 21,187 | ||||||
|
| |||||||
| 130,154 | ||||||||
|
| |||||||
| Automobiles — 0.4% | ||||||||
| 2,106 | General Motors Co.(d) | 73,520 | ||||||
|
| |||||||
| Banks — 5.9% | ||||||||
| 1,093 | Banco Santander S.A., Sponsored ADR(c) | 9,105 | ||||||
| 12,476 | Bank of America Corp.(d) | 223,196 | ||||||
| 3,741 | Citigroup, Inc.(d) | 202,425 | ||||||
| 1,107 | Comerica, Inc.(c) | 51,852 | ||||||
| 3,035 | Fifth Third Bancorp(d) | 61,838 | ||||||
| 472 | First Republic Bank(c) | 24,601 | ||||||
| 6,453 | Huntington Bancshares, Inc.(d) | 67,886 | ||||||
| 4,154 | JPMorgan Chase & Co.(d) | 259,957 | ||||||
| 1,358 | SunTrust Banks, Inc.(d) | 56,900 | ||||||
| 5,221 | Wells Fargo & Co.(d) | 286,215 | ||||||
|
| |||||||
| 1,243,975 | ||||||||
|
| |||||||
| Beverages — 1.9% | ||||||||
| 4,818 | Coca-Cola Co. (The)(d) | 203,416 | ||||||
| 1,957 | PepsiCo, Inc.(d) | 185,054 | ||||||
|
| |||||||
| 388,470 | ||||||||
|
| |||||||
| Biotechnology — 2.9% | ||||||||
| 300 | Alexion Pharmaceuticals, Inc.(b)(d) | 55,509 | ||||||
| 948 | Amgen, Inc.(d) | 151,007 | ||||||
| 293 | Biogen Idec, Inc.(b)(d) | 99,459 | ||||||
| 1,114 | Celgene Corp.(b)(d) | 124,612 | ||||||
| 1,884 | Gilead Sciences, Inc.(b)(d) | 177,586 | ||||||
|
| |||||||
| 608,173 | ||||||||
|
| |||||||
See accompanying notes to financial statements.
| 14
Table of Contents
Portfolio of Investments – as of December 31, 2014
Gateway Equity Call Premium Fund – (continued)
| Shares | Description | Value (†) | ||||||
| Building Products — 0.2% | ||||||||
| 789 | Fortune Brands Home & Security, Inc.(c) | $ | 35,718 | |||||
|
| |||||||
| Capital Markets — 2.2% | ||||||||
| 562 | Ameriprise Financial, Inc.(d) | 74,325 | ||||||
| 1,751 | Bank of New York Mellon Corp. (The)(d) | 71,038 | ||||||
| 200 | BlackRock, Inc.(d) | 71,512 | ||||||
| 576 | Goldman Sachs Group, Inc. (The)(d) | 111,646 | ||||||
| 2,133 | Morgan Stanley(d) | 82,760 | ||||||
| 376 | Raymond James Financial, Inc.(c) | 21,541 | ||||||
| 472 | SEI Investments Co.(c) | 18,899 | ||||||
| 530 | TD Ameritrade Holding Corp.(c) | 18,963 | ||||||
|
| |||||||
| 470,684 | ||||||||
|
| |||||||
| Chemicals — 2.3% | ||||||||
| 110 | Agrium, Inc.(c) | 10,419 | ||||||
| 396 | Air Products & Chemicals, Inc.(c) | 57,115 | ||||||
| 295 | Ashland, Inc.(d) | 35,329 | ||||||
| 312 | Celanese Corp., Series A(c) | 18,708 | ||||||
| 1,505 | Huntsman Corp.(d) | 34,284 | ||||||
| 556 | International Flavors & Fragrances, Inc.(d) | 56,356 | ||||||
| 706 | Monsanto Co.(d) | 84,346 | ||||||
| 390 | PPG Industries, Inc.(d) | 90,148 | ||||||
| 591 | Praxair, Inc.(d) | 76,570 | ||||||
| 291 | Rockwood Holdings, Inc.(c) | 22,931 | ||||||
|
| |||||||
| 486,206 | ||||||||
|
| |||||||
| Commercial Services & Supplies — 0.3% | ||||||||
| 1,214 | Waste Management, Inc.(d) | 62,302 | ||||||
|
| |||||||
| Communications Equipment — 1.5% | ||||||||
| 6,234 | Cisco Systems, Inc.(d) | 173,399 | ||||||
| 1,960 | QUALCOMM, Inc.(d) | 145,687 | ||||||
|
| |||||||
| 319,086 | ||||||||
|
| |||||||
| Construction & Engineering — 0.1% | ||||||||
| 488 | Chicago Bridge & Iron Co.(c) | 20,486 | ||||||
|
| |||||||
| Consumer Finance — 1.3% | ||||||||
| 672 | Ally Financial, Inc.(b)(d) | 15,873 | ||||||
| 1,135 | American Express Co.(d) | 105,600 | ||||||
| 749 | Capital One Financial Corp.(d) | 61,830 | ||||||
| 951 | Discover Financial Services(d) | 62,281 | ||||||
| 608 | Synchrony Financial(b)(c) | 18,088 | ||||||
|
| |||||||
| 263,672 | ||||||||
|
| |||||||
| Containers & Packaging — 0.3% | ||||||||
| 627 | Crown Holdings, Inc.(b)(c) | 31,914 | ||||||
| 468 | Packaging Corp. of America(d) | 36,528 | ||||||
|
| |||||||
| 68,442 | ||||||||
|
| |||||||
| Diversified Financial Services — 1.5% | ||||||||
| 2,074 | Berkshire Hathaway, Inc., Class B(b)(d) | 311,411 | ||||||
|
| |||||||
See accompanying notes to financial statements.
15 |
Table of Contents
Portfolio of Investments – as of December 31, 2014
Gateway Equity Call Premium Fund – (continued)
| Shares | Description | Value (†) | ||||||
| Diversified Telecommunication Services — 2.2% | ||||||||
| 5,732 | AT&T, Inc.(d) | $ | 192,538 | |||||
| 1,269 | CenturyLink, Inc.(d) | 50,227 | ||||||
| 4,727 | Verizon Communications, Inc.(d) | 221,129 | ||||||
|
| |||||||
| 463,894 | ||||||||
|
| |||||||
| Electric Utilities — 1.6% | ||||||||
| 1,983 | American Electric Power Co., Inc.(d) | 120,408 | ||||||
| 738 | OGE Energy Corp.(c) | 26,184 | ||||||
| 2,706 | PPL Corp.(d) | 98,309 | ||||||
| 1,727 | Southern Co. (The)(d) | 84,813 | ||||||
|
| |||||||
| 329,714 | ||||||||
|
| |||||||
| Electrical Equipment — 0.7% | ||||||||
| 1,607 | Emerson Electric Co.(d) | 99,200 | ||||||
| 813 | Sensata Technologies Holding NV(b)(d) | 42,609 | ||||||
|
| |||||||
| 141,809 | ||||||||
|
| |||||||
| Electronic Equipment, Instruments & Components — 0.2% | ||||||||
| 680 | Avnet, Inc.(d) | 29,254 | ||||||
| 1,539 | Flextronics International Ltd.(b)(c) | 17,206 | ||||||
|
| |||||||
| 46,460 | ||||||||
|
| |||||||
| Energy Equipment & Services — 0.8% | ||||||||
| 1,371 | National Oilwell Varco, Inc.(d) | 89,842 | ||||||
| 813 | Oceaneering International, Inc.(d) | 47,813 | ||||||
| 2,309 | Seadrill Ltd.(c) | 27,569 | ||||||
|
| |||||||
| 165,224 | ||||||||
|
| |||||||
| Food & Staples Retailing — 2.4% | ||||||||
| 673 | Costco Wholesale Corp.(d) | 95,398 | ||||||
| 1,591 | CVS Health Corp.(d) | 153,229 | ||||||
| 1,018 | Sysco Corp.(c) | 40,404 | ||||||
| 1,510 | Wal-Mart Stores, Inc.(d) | 129,679 | ||||||
| 1,216 | Walgreens Boots Alliance, Inc.(d) | 92,659 | ||||||
|
| |||||||
| 511,369 | ||||||||
|
| |||||||
| Food Products — 1.5% | ||||||||
| 381 | Bunge Ltd.(d) | 34,637 | ||||||
| 1,338 | General Mills, Inc.(d) | 71,356 | ||||||
| 885 | Kellogg Co.(c) | 57,914 | ||||||
| 990 | Kraft Foods Group, Inc.(c) | 62,033 | ||||||
| 2,399 | Mondelez International, Inc., Class A(d) | 87,144 | ||||||
|
| |||||||
| 313,084 | ||||||||
|
| |||||||
| Gas Utilities — 0.3% | ||||||||
| 1,906 | UGI Corp.(d) | 72,390 | ||||||
|
| |||||||
| Health Care Equipment & Supplies — 1.9% | ||||||||
| 2,025 | Abbott Laboratories(d) | 91,166 | ||||||
| 897 | Covidien PLC(d) | 91,745 | ||||||
| 269 | Halyard Health, Inc.(b)(d) | 12,231 | ||||||
| 1,612 | Medtronic, Inc.(c) | 116,386 | ||||||
See accompanying notes to financial statements.
| 16
Table of Contents
Portfolio of Investments – as of December 31, 2014
Gateway Equity Call Premium Fund – (continued)
| Shares | Description | Value (†) | ||||||
| Health Care Equipment & Supplies — continued | ||||||||
| 278 | ResMed, Inc.(c) | $ | 15,585 | |||||
| 657 | Zimmer Holdings, Inc.(d) | 74,517 | ||||||
|
| |||||||
| 401,630 | ||||||||
|
| |||||||
| Health Care Providers & Services — 2.3% | ||||||||
| 852 | Anthem, Inc.(d) | 107,071 | ||||||
| 1,083 | Express Scripts Holding Co.(b)(d) | 91,697 | ||||||
| 403 | McKesson Corp.(d) | 83,655 | ||||||
| 608 | Omnicare, Inc.(d) | 44,341 | ||||||
| 1,585 | UnitedHealth Group, Inc.(d) | 160,228 | ||||||
|
| |||||||
| 486,992 | ||||||||
|
| |||||||
| Hotels, Restaurants & Leisure — 1.5% | ||||||||
| 530 | Las Vegas Sands Corp.(c) | 30,825 | ||||||
| 1,256 | McDonald’s Corp.(d) | 117,687 | ||||||
| 1,172 | Starbucks Corp.(d) | 96,162 | ||||||
| 868 | Yum! Brands, Inc.(d) | 63,234 | ||||||
|
| |||||||
| 307,908 | ||||||||
|
| |||||||
| Household Durables — 0.5% | ||||||||
| 778 | Jarden Corp.(b)(d) | 37,250 | ||||||
| 1,503 | Leggett & Platt, Inc.(d) | 64,043 | ||||||
|
| |||||||
| 101,293 | ||||||||
|
| |||||||
| Household Products — 2.1% | ||||||||
| 370 | Church & Dwight Co., Inc.(c) | 29,160 | ||||||
| 726 | Clorox Co. (The)(d) | 75,656 | ||||||
| 614 | Kimberly-Clark Corp.(d) | 70,942 | ||||||
| 2,843 | Procter & Gamble Co. (The)(d) | 258,969 | ||||||
|
| |||||||
| 434,727 | ||||||||
|
| |||||||
| Industrial Conglomerates — 2.2% | ||||||||
| 1,067 | 3M Co.(d) | 175,329 | ||||||
| 11,058 | General Electric Co.(d) | 279,436 | ||||||
|
| |||||||
| 454,765 | ||||||||
|
| |||||||
| Insurance — 1.9% | ||||||||
| 1,027 | Arch Capital Group Ltd.(b)(c) | 60,696 | ||||||
| 1,108 | Chubb Corp. (The)(d) | 114,645 | ||||||
| 750 | Cincinnati Financial Corp.(c) | 38,873 | ||||||
| 1,378 | Lincoln National Corp.(d) | 79,469 | ||||||
| 1,075 | Prudential Financial, Inc.(d) | 97,244 | ||||||
|
| |||||||
| 390,927 | ||||||||
|
| |||||||
| Internet & Catalog Retail — 1.3% | ||||||||
| 456 | Amazon.com, Inc.(b)(d) | 141,520 | ||||||
| 450 | Liberty Interactive Corp., Class A(b)(c) | 13,239 | ||||||
| 507 | Liberty Ventures, Series A(b)(c) | 19,124 | ||||||
| 78 | Priceline Group, Inc. (The)(b)(d) | 88,936 | ||||||
|
| |||||||
| 262,819 | ||||||||
|
| |||||||
See accompanying notes to financial statements.
17 |
Table of Contents
Portfolio of Investments – as of December 31, 2014
Gateway Equity Call Premium Fund – (continued)
| Shares | Description | Value (†) | ||||||
| Internet Software & Services — 3.1% | ||||||||
| 239 | Alibaba Group Holding Ltd., Sponsored ADR(b)(c) | $ | 24,842 | |||||
| 2,514 | Facebook, Inc., Class A(b)(d) | 196,142 | ||||||
| 430 | Google, Inc., Class A(b)(d) | 228,184 | ||||||
| 228 | Google, Inc., Class C(b)(c) | 120,019 | ||||||
| 1,487 | Yahoo!, Inc.(b)(d) | 75,108 | ||||||
|
| |||||||
| 644,295 | ||||||||
|
| |||||||
| IT Services — 2.8% | ||||||||
| 905 | Accenture PLC, Class A(d) | 80,825 | ||||||
| 1,030 | International Business Machines Corp.(d) | 165,253 | ||||||
| 1,350 | MasterCard, Inc., Class A(d) | 116,316 | ||||||
| 1,475 | Paychex, Inc.(d) | 68,101 | ||||||
| 629 | Visa, Inc., Class A(d) | 164,924 | ||||||
|
| |||||||
| 595,419 | ||||||||
|
| |||||||
| Leisure Products — 0.1% | ||||||||
| 193 | Polaris Industries, Inc.(c) | 29,189 | ||||||
|
| |||||||
| Life Sciences Tools & Services — 0.4% | ||||||||
| 73 | Illumina, Inc.(b)(c) | 13,474 | ||||||
| 599 | Thermo Fisher Scientific, Inc.(d) | 75,049 | ||||||
|
| |||||||
| 88,523 | ||||||||
|
| |||||||
| Machinery — 1.6% | ||||||||
| 1,060 | Caterpillar, Inc.(d) | 97,022 | ||||||
| 630 | Colfax Corp.(b)(c) | 32,489 | ||||||
| 527 | Cummins, Inc.(d) | 75,978 | ||||||
| 1,238 | Ingersoll-Rand PLC(d) | 78,477 | ||||||
| 717 | Trinity Industries, Inc.(d) | 20,083 | ||||||
| 202 | WABCO Holdings, Inc.(b)(c) | 21,165 | ||||||
|
| |||||||
| 325,214 | ||||||||
|
| |||||||
| Media — 3.8% | ||||||||
| 966 | CBS Corp., Class B(c) | 53,458 | ||||||
| 3,050 | Comcast Corp., Class A(d) | 176,931 | ||||||
| 706 | DIRECTV(b)(d) | 61,210 | ||||||
| 449 | Time Warner Cable, Inc.(d) | 68,275 | ||||||
| 1,119 | Time Warner, Inc.(d) | 95,585 | ||||||
| 2,502 | Twenty-First Century Fox, Inc., Class A(d) | 96,089 | ||||||
| 790 | Viacom, Inc., Class B(d) | 59,448 | ||||||
| 1,909 | Walt Disney Co. (The)(d) | 179,809 | ||||||
|
| |||||||
| 790,805 | ||||||||
|
| |||||||
| Metals & Mining — 0.2% | ||||||||
| 1,509 | Freeport-McMoRan, Inc.(c) | 35,250 | ||||||
|
| |||||||
| Multi-Utilities — 1.2% | ||||||||
| 1,249 | Alliant Energy Corp.(d) | 82,959 | ||||||
| 1,439 | PG&E Corp.(d) | 76,612 | ||||||
| 2,072 | Public Service Enterprise Group, Inc.(d) | 85,801 | ||||||
|
| |||||||
| 245,372 | ||||||||
|
| |||||||
See accompanying notes to financial statements.
| 18
Table of Contents
Portfolio of Investments – as of December 31, 2014
Gateway Equity Call Premium Fund – (continued)
| Shares | Description | Value (†) | ||||||
| Multiline Retail — 0.8% | ||||||||
| 943 | Nordstrom, Inc.(d) | $ | 74,865 | |||||
| 1,100 | Target Corp.(d) | 83,501 | ||||||
|
| |||||||
| 158,366 | ||||||||
|
| |||||||
| Oil, Gas & Consumable Fuels — 6.8% | ||||||||
| 849 | Apache Corp.(c) | 53,207 | ||||||
| 1,888 | California Resources Corp.(b)(c) | 10,403 | ||||||
| 948 | Canadian Natural Resources Ltd.(d) | 29,274 | ||||||
| 2,289 | Chevron Corp.(d) | 256,780 | ||||||
| 309 | Concho Resources, Inc.(b)(c) | 30,823 | ||||||
| 868 | Continental Resources, Inc.(b)(d) | 33,296 | ||||||
| 1,146 | Devon Energy Corp.(c) | 70,147 | ||||||
| 2,603 | Encana Corp.(d) | 36,104 | ||||||
| 4,838 | Exxon Mobil Corp.(d) | 447,273 | ||||||
| 703 | HollyFrontier Corp.(c) | 26,348 | ||||||
| 2,121 | Marathon Oil Corp.(d) | 60,003 | ||||||
| 943 | Noble Energy, Inc.(c) | 44,726 | ||||||
| 1,209 | Occidental Petroleum Corp.(d) | 97,458 | ||||||
| 1,250 | Phillips 66(d) | 89,625 | ||||||
| 416 | Pioneer Natural Resources Co.(d) | 61,922 | ||||||
| 1,540 | Spectra Energy Corp.(c) | 55,902 | ||||||
| 436 | Whiting Petroleum Corp.(b)(c) | 14,388 | ||||||
|
| |||||||
| 1,417,679 | ||||||||
|
| |||||||
| Paper & Forest Products — 0.3% | ||||||||
| 1,058 | International Paper Co.(d) | 56,688 | ||||||
|
| |||||||
| Pharmaceuticals — 6.0% | ||||||||
| 2,096 | AbbVie, Inc.(d) | 137,162 | ||||||
| 392 | Actavis PLC(b)(d) | 100,905 | ||||||
| 407 | Allergan, Inc.(d) | 86,524 | ||||||
| 1,974 | Bristol-Myers Squibb Co.(d) | 116,525 | ||||||
| 1,314 | Eli Lilly & Co.(d) | 90,653 | ||||||
| 3,046 | Johnson & Johnson(d) | 318,520 | ||||||
| 3,240 | Merck & Co., Inc.(d) | 184,000 | ||||||
| 6,870 | Pfizer, Inc.(d) | 214,000 | ||||||
|
| |||||||
| 1,248,289 | ||||||||
|
| |||||||
| Professional Services — 0.1% | ||||||||
| 302 | Manpowergroup, Inc.(d) | 20,587 | ||||||
|
| |||||||
| REITs – Apartments — 0.5% | ||||||||
| 310 | Essex Property Trust, Inc.(d) | 64,046 | ||||||
| 1,339 | UDR, Inc.(c) | 41,268 | ||||||
|
| |||||||
| 105,314 | ||||||||
|
| |||||||
| REITs – Diversified — 0.9% | ||||||||
| 802 | American Tower Corp.(d) | 79,278 | ||||||
| 805 | Crown Castle International Corp.(d) | 63,354 | ||||||
| 2,752 | Duke Realty Corp.(d) | 55,590 | ||||||
|
| |||||||
| 198,222 | ||||||||
|
| |||||||
See accompanying notes to financial statements.
19 |
Table of Contents
Portfolio of Investments – as of December 31, 2014
Gateway Equity Call Premium Fund – (continued)
| Shares | Description | Value (†) | ||||||
| REITs – Mortgage — 0.2% | ||||||||
| 1,400 | American Capital Agency Corp.(d) | $ | 30,562 | |||||
| 1,834 | Annaly Capital Management, Inc.(c) | 19,826 | ||||||
|
| |||||||
| 50,388 | ||||||||
|
| |||||||
| REITs – Office Property — 0.2% | ||||||||
| 391 | SL Green Realty Corp.(c) | 46,537 | ||||||
|
| |||||||
| REITs – Shopping Centers — 0.3% | ||||||||
| 3,016 | DDR Corp.(c) | 55,374 | ||||||
|
| |||||||
| REITs – Single Tenant — 0.1% | ||||||||
| 617 | Realty Income Corp.(c) | 29,437 | ||||||
|
| |||||||
| REITs – Storage — 0.2% | ||||||||
| 781 | Extra Space Storage, Inc.(d) | 45,798 | ||||||
|
| |||||||
| Road & Rail — 1.4% | ||||||||
| 2,029 | CSX Corp.(d) | 73,511 | ||||||
| 250 | J.B. Hunt Transport Services, Inc.(c) | 21,062 | ||||||
| 572 | Norfolk Southern Corp.(d) | 62,697 | ||||||
| 1,176 | Union Pacific Corp.(d) | 140,097 | ||||||
|
| |||||||
| 297,367 | ||||||||
|
| |||||||
| Semiconductors & Semiconductor Equipment — 2.5% | ||||||||
| 3,073 | Applied Materials, Inc.(d) | 76,579 | ||||||
| 5,777 | Intel Corp.(d) | 209,647 | ||||||
| 775 | Maxim Integrated Products, Inc.(c) | 24,699 | ||||||
| 1,683 | Micron Technology, Inc.(b)(d) | 58,922 | ||||||
| 458 | NXP Semiconductors NV(b)(d) | 34,991 | ||||||
| 2,076 | Texas Instruments, Inc.(d) | 110,994 | ||||||
|
| |||||||
| 515,832 | ||||||||
|
| |||||||
| Software — 3.7% | ||||||||
| 896 | Adobe Systems, Inc.(b)(d) | 65,139 | ||||||
| 440 | Check Point Software Technologies Ltd.(b)(d) | 34,571 | ||||||
| 9,229 | Microsoft Corp.(d) | 428,687 | ||||||
| 3,711 | Oracle Corp.(d) | 166,884 | ||||||
| 863 | Salesforce.com, Inc.(b)(c) | 51,184 | ||||||
| 207 | ServiceNow, Inc.(b)(d) | 14,045 | ||||||
| 251 | Workday, Inc., Class A(b)(c) | 20,484 | ||||||
|
| |||||||
| 780,994 | ||||||||
|
| |||||||
| Specialty Retail — 2.4% | ||||||||
| 234 | Advance Auto Parts, Inc.(d) | 37,272 | ||||||
| 830 | Foot Locker, Inc.(d) | 46,629 | ||||||
| 1,764 | Home Depot, Inc. (The)(d) | 185,167 | ||||||
| 1,654 | Lowe’s Cos., Inc.(d) | 113,795 | ||||||
| 196 | Signet Jewelers Ltd.(c) | 25,788 | ||||||
| 1,234 | TJX Cos., Inc. (The)(d) | 84,628 | ||||||
| 228 | Williams-Sonoma, Inc.(c) | 17,255 | ||||||
|
| |||||||
| 510,534 | ||||||||
|
| |||||||
See accompanying notes to financial statements.
| 20
Table of Contents
Portfolio of Investments – as of December 31, 2014
Gateway Equity Call Premium Fund – (continued)
| Shares | Description | Value (†) | ||||||
| Technology Hardware, Storage & Peripherals — 4.5% | ||||||||
| 6,581 | Apple, Inc.(d) | $ | 726,411 | |||||
| 2,990 | EMC Corp.(d) | 88,923 | ||||||
| 2,393 | Hewlett-Packard Co.(d) | 96,031 | ||||||
| 674 | NCR Corp.(b)(c) | 19,640 | ||||||
|
| |||||||
| 931,005 | ||||||||
|
| |||||||
| Textiles, Apparel & Luxury Goods — 0.7% | ||||||||
| 359 | Hanesbrands, Inc.(d) | 40,072 | ||||||
| 1,201 | NIKE, Inc., Class B(d) | 115,476 | ||||||
|
| |||||||
| 155,548 | ||||||||
|
| |||||||
| Thrifts & Mortgage Finance — 0.1% | ||||||||
| 1,019 | New York Community Bancorp, Inc.(c) | 16,304 | ||||||
|
| |||||||
| Tobacco — 1.4% | ||||||||
| 3,192 | Altria Group, Inc.(d) | 157,270 | ||||||
| 1,782 | Philip Morris International, Inc.(d) | 145,144 | ||||||
|
| |||||||
| 302,414 | ||||||||
|
| |||||||
| Water Utilities — 0.2% | ||||||||
| 731 | American Water Works Co., Inc.(c) | 38,962 | ||||||
|
| |||||||
| Total Common Stocks (Identified Cost $19,467,927) | 19,894,687 | |||||||
|
| |||||||
| Principal Amount | ||||||||
| Short-Term Investments — 17.4% | ||||||||
| $ | 3,636,299 | Tri-Party Repurchase Agreement with Fixed Income Clearing Corporation, dated 12/31/2014 at 0.010% to be repurchased at $3,636,301 on 1/2/2015 collateralized by $3,765,000 U.S. Treasury Note, 0.750% due 2/28/2018 valued at $3,713,231 including accrued interest (Note 2 of Notes to Financial Statements) (Identified Cost $3,636,299) | 3,636,299 | |||||
|
| |||||||
| Total Investments — 112.5% (Identified Cost $23,104,226)(a) | 23,530,986 | |||||||
| Other assets less liabilities — (12.5)% | (2,619,162 | ) | ||||||
|
| |||||||
| Net Assets — 100.0% | $ | 20,911,824 | ||||||
|
| |||||||
| Contracts | ||||||||
| Written Options — (1.7%) | ||||||||
| Index Options — (1.7%) | ||||||||
| 6 | On S&P 500® Index, Call expiring January 02, 2015 at 2060 | $ | (4,410 | ) | ||||
| 5 | On S&P 500® Index, Call expiring January 09, 2015 at 2090 | (2,275 | ) | |||||
| 6 | On S&P 500® Index, Call expiring January 17, 2015 at 2000 | (41,760 | ) | |||||
| 9 | On S&P 500® Index, Call expiring January 17, 2015 at 2025 | (44,010 | ) | |||||
| 7 | On S&P 500® Index, Call expiring January 17, 2015 at 2050 | (21,280 | ) | |||||
| 11 | On S&P 500® Index, Call expiring January 17, 2015 at 2100 | (6,325 | ) | |||||
| 14 | On S&P 500® Index, Call expiring February 20, 2015 at 2025 | (91,560 | ) | |||||
| 13 | On S&P 500® Index, Call expiring February 20, 2015 at 2050 | (62,790 | ) | |||||
| 25 | On S&P 500® Index, Call expiring February 20, 2015 at 2075 | (83,500 | ) | |||||
|
| |||||||
| Total Written Options (Premiums Received $424,650) | $ | (357,910 | ) | |||||
|
| |||||||
See accompanying notes to financial statements.
21 |
Table of Contents
Portfolio of Investments – as of December 31, 2014
Gateway Equity Call Premium Fund – (continued)
| (†) | See Note 2 of Notes to Financial Statements. | |||||||
| (a) | Federal Tax Information: | |||||||
| At December 31, 2014, the net unrealized appreciation on investments based on a cost of $23,103,863 for federal income tax purposes was as follows: | ||||||||
| Aggregate gross unrealized appreciation for all investments in which there is an excess of value over tax cost | $ | 689,230 | ||||||
| Aggregate gross unrealized depreciation for all investments in which there is an excess of tax cost over value | (262,107 | ) | ||||||
|
| |||||||
| Net unrealized appreciation | $ | 427,123 | ||||||
|
| |||||||
| (b) | Non-income producing security. | |||||||
| (c) | All of this security has been pledged as collateral for outstanding options. | |||||||
| (d) | A portion of this security has been pledged as collateral for outstanding options. | |||||||
| ADR | An American Depositary Receipt is a certificate issued by a custodian bank representing the right to receive securities of the foreign issuer described. The values of ADRs may be significantly influenced by trading on exchanges not located in the United States. | |||||||
| REITs | Real Estate Investment Trusts | |||||||
Industry Summary at December 31, 2014
Oil, Gas & Consumable Fuels | 6.8 | % | ||
Pharmaceuticals | 6.0 | |||
Banks | 5.9 | |||
Technology Hardware, Storage & Peripherals | 4.5 | |||
Media | 3.8 | |||
Software | 3.7 | |||
Internet Software & Services | 3.1 | |||
Biotechnology | 2.9 | |||
IT Services | 2.8 | |||
Aerospace & Defense | 2.8 | |||
Semiconductors & Semiconductor Equipment | 2.5 | |||
Food & Staples Retailing | 2.4 | |||
Specialty Retail | 2.4 | |||
Health Care Providers & Services | 2.3 | |||
Chemicals | 2.3 | |||
Capital Markets | 2.2 | |||
Diversified Telecommunication Services | 2.2 | |||
Industrial Conglomerates | 2.2 | |||
Household Products | 2.1 | |||
Other Investments, less than 2% each | 32.2 | |||
Short-Term Investments | 17.4 | |||
|
| |||
Total Investments | 112.5 | |||
Other assets less liabilities (including open written options) | (12.5 | ) | ||
|
| |||
Net Assets | 100.0 | % | ||
|
|
See accompanying notes to financial statements.
| 22
Table of Contents
Portfolio of Investments – as of December 31, 2014
Loomis Sayles Strategic Alpha Fund
| Principal Amount (‡) | Description | Value (†) | ||||||
| Bonds and Notes — 65.6% of Net Assets | ||||||||
| Non-Convertible Bonds — 62.0% | ||||||||
| ABS Car Loan — 0.5% | ||||||||
| $ | 2,259,000 | AmeriCredit Automobile Receivables Trust, Series 2013-4, Class D, 3.310%, 10/08/2019(b) | $ | 2,295,835 | ||||
| 2,280,000 | Ford Credit Auto Owner Trust, Series 2014-C, Class A3, 1.060%, 5/15/2019 | 2,273,416 | ||||||
| 2,455,000 | Honda Auto Receivables Owner Trust, Series 2014-4, Class A3, 0.990%, 9/17/2018 | 2,448,995 | ||||||
|
| |||||||
| 7,018,246 | ||||||||
|
| |||||||
| ABS Credit Card — 3.5% | ||||||||
| 3,145,000 | American Express Credit Account Master Trust, Series 2013-1, Class A, 0.581%, 2/16/2021(b)(c) | 3,157,809 | ||||||
| 1,860,000 | American Express Credit Account Master Trust, Series 2013-3, Class A, 0.980%, 5/15/2019(b) | 1,859,358 | ||||||
| 1,015,000 | American Express Credit Account Master Trust, Series 2014-3, Class A, 1.490%, 4/15/2020 | 1,015,921 | ||||||
| 2,695,000 | American Express Credit Account Master Trust, Series 2014-4, Class A, 1.430%, 6/15/2020 | 2,689,745 | ||||||
| 2,295,000 | American Express Credit Account Master Trust, Series 2014-5, Class A, 0.451%, 5/15/2020(c) | 2,294,897 | ||||||
| 2,050,000 | BA Credit Card Trust, Series 2014-A1, Class A, 0.541%, 6/15/2021(b)(c) | 2,048,389 | ||||||
| 3,075,000 | Capital One Multi-Asset Execution Trust, Series 2013-A3, Class A3, 0.960%, 9/16/2019(b) | 3,063,675 | ||||||
| 6,600,000 | Chase Issuance Trust, Series 2013-A8, Class A8, 1.010%, 10/15/2018(b) | 6,599,874 | ||||||
| 6,640,000 | Chase Issuance Trust, Series 2014-A7, Class A, 1.380%, 11/15/2019 | 6,613,613 | ||||||
| 3,780,000 | Chase Issuance Trust, Series 2014-A8, Class A, 0.411%, 11/15/2018(c) | 3,780,344 | ||||||
| 3,165,000 | Citibank Credit Card Issuance Trust, Series 2013-A6, Class A6, 1.320%, 9/07/2018(b) | 3,182,547 | ||||||
| 5,825,000 | Citibank Credit Card Issuance Trust, Series 2013-A7, Class A7, 0.592%, 9/10/2020(b)(c) | 5,823,707 | ||||||
| 3,000,000 | Citibank Credit Card Issuance Trust, Series 2014-A4, Class A4, 1.230%, 4/24/2019(b) | 2,995,299 | ||||||
| 3,045,000 | Citibank Credit Card Issuance Trust, Series 2014-A8, Class A8, 1.730%, 4/09/2020 | 3,049,348 | ||||||
|
| |||||||
| 48,174,526 | ||||||||
|
| |||||||
| ABS Home Equity — 11.6% | ||||||||
| 1,044,928 | Adjustable Rate Mortgage Trust, Series 2004-4, Class 3A1, 2.677%, 3/25/2035(b)(c) | 1,016,863 | ||||||
| 1,227,681 | Adjustable Rate Mortgage Trust, Series 2004-5, Class 5A1, 2.582%, 4/25/2035(b)(c) | 1,199,924 | ||||||
| 2,132,410 | Adjustable Rate Mortgage Trust, Series 2004-5, Class 6A1, 2.564%, 4/25/2035(b)(c) | 2,117,300 | ||||||
| 891,249 | Alternative Loan Trust, Series 2003-9T1, Class A7, 5.500%, 7/25/2033(b) | 896,772 | ||||||
| 1,085,303 | Alternative Loan Trust, Series 2003-20CB, Class 2A1, 5.750%, 10/25/2033(b) | 1,120,038 | ||||||
| 652,708 | Alternative Loan Trust, Series 2004-28CB, Class 5A1, 5.750%, 1/25/2035 | 666,524 | ||||||
| 2,241,428 | Alternative Loan Trust, Series 2005-J1, Class 2A1, 5.500%, 2/25/2025(b) | 2,283,685 | ||||||
| 300,000 | American Homes 4 Rent, Series 2014-SFR2, Class D, 5.149%, 10/17/2036, 144A | 306,110 | ||||||
See accompanying notes to financial statements.
23 |
Table of Contents
Portfolio of Investments – as of December 31, 2014
Loomis Sayles Strategic Alpha Fund – (continued)
| Principal Amount (‡) | Description | Value (†) | ||||||
| ABS Home Equity — continued | ||||||||
| $ | 400,000 | American Homes 4 Rent, Series 2014-SFR2, Class E, 6.231%, 10/17/2036, 144A | $ | 399,878 | ||||
| 1,323,400 | Banc of America Alternative Loan Trust, Series 2003-8, Class 1CB1, 5.500%, 10/25/2033(b) | 1,363,045 | ||||||
| 1,453,089 | Banc of America Alternative Loan Trust, Series 2003-10, Class 1A1, 5.500%, 12/25/2033(b) | 1,494,712 | ||||||
| 2,182,020 | Banc of America Alternative Loan Trust, Series 2003-10, Class 3A1, 5.500%, 12/25/2033(b) | 2,238,447 | ||||||
| 1,779,094 | Banc of America Alternative Loan Trust, Series 2005-6, Class CB7, 5.250%, 7/25/2035(b) | 1,599,850 | ||||||
| 806,799 | Banc of America Funding Corp., Series 2008-R4, Class 1A4, 0.620%, 7/25/2037, 144A(c) | 583,201 | ||||||
| 2,097,103 | Banc of America Funding Trust, Series 2004-B, Class 4A2, 2.486%, 11/20/2034(b)(c) | 1,989,629 | ||||||
| 815,888 | Banc of America Funding Trust, Series 2005-5, Class A1, 5.500%, 9/25/2035(b) | 851,415 | ||||||
| 1,617,966 | Banc of America Funding Trust, Series 2005-7, Class 3A1, 5.750%, 11/25/2035(b) | 1,658,743 | ||||||
| 2,880,536 | Bayview Opportunity Master Fund Trust, Series 2014-18NP, Class A, 3.228%, 7/28/2034, 144A(b)(c) | 2,888,157 | ||||||
| 786,966 | Bear Stearns Adjustable Rate Mortgage Trust, Series 2004-6, Class 2A1, 2.663%, 9/25/2034(c) | 747,048 | ||||||
| 1,752,044 | Bear Stearns Adjustable Rate Mortgage Trust, Series 2005-12, Class 11A1, 2.557%, 2/25/2036(c) | 1,365,950 | ||||||
| 1,744,033 | Chase Mortgage Finance Trust, Series 2007-A1, Class 3A1, 2.541%, 2/25/2037(b)(c) | 1,717,326 | ||||||
| 1,639,655 | Citicorp Mortgage Securities Trust, Series 2006-4, Class 1A2, 6.000%, 8/25/2036(b) | 1,663,548 | ||||||
| 971,160 | Citigroup Mortgage Loan Trust, Inc., Series 2005-2, Class 1A4, 2.552%, 5/25/2035(b)(c) | 934,194 | ||||||
| 575,258 | CitiMortgage Alternative Loan Trust, Series 2006-A3, Class 1A7, 6.000%, 7/25/2036 | 516,305 | ||||||
| 2,846,147 | CitiMortgage Alternative Loan Trust, Series 2006-A4, Class 1A1, 6.000%, 9/25/2036(b) | 2,495,906 | ||||||
| 1,085,779 | CitiMortgage Alternative Loan Trust, Series 2007-A6, Class 1A3, 6.000%, 6/25/2037 | 897,375 | ||||||
| 1,997,094 | CitiMortgage Alternative Loan Trust, Series 2007-A6, Class 1A11, 6.000%, 6/25/2037(b) | 1,650,558 | ||||||
| 1,855,000 | Colony American Homes, Series 2014-1A, Class C, 2.100%, 5/17/2031, 144A(b) | 1,805,690 | ||||||
| 1,721,889 | Countrywide Alternative Loan Trust, Series 2003-4CB, Class 1A1, 5.750%, 4/25/2033(b) | 1,755,097 | ||||||
| 1,116,885 | Countrywide Alternative Loan Trust, Series 2004-14T2, Class A11, 5.500%, 8/25/2034(b) | 1,180,862 | ||||||
| 4,116,475 | Countrywide Alternative Loan Trust, Series 2004-27CB, Class A1, 6.000%, 12/25/2034(b) | 4,112,894 | ||||||
| 1,073,055 | Countrywide Alternative Loan Trust, Series 2004-J3, Class 1A1, 5.500%, 4/25/2034(b) | 1,107,175 | ||||||
| 103,368 | Countrywide Alternative Loan Trust, Series 2004-J7, Class 1A5, 5.527%, 8/25/2034(d) | 106,097 | ||||||
See accompanying notes to financial statements.
| 24
Table of Contents
Portfolio of Investments – as of December 31, 2014
Loomis Sayles Strategic Alpha Fund – (continued)
| Principal Amount (‡) | Description | Value (†) | ||||||
| ABS Home Equity — continued | ||||||||
| $ | 1,175,643 | Countrywide Alternative Loan Trust, Series 2005-14, Class 2A1, 0.380%, 5/25/2035(b)(c) | $ | 994,196 | ||||
| 935,304 | Countrywide Alternative Loan Trust, Series 2006-4CB, Class 2A2, 5.500%, 4/25/2036 | 883,878 | ||||||
| 725,473 | Countrywide Alternative Loan Trust, Series 2006-J4, Class 1A3, 6.250%, 7/25/2036 | 489,474 | ||||||
| 817,629 | Countrywide Alternative Loan Trust, Series 2007-4, Class 1A7, 5.750%, 4/25/2037 | 737,348 | ||||||
| 1,444,561 | Countrywide Home Loan Mortgage Pass Through Trust, Series 2004-12, Class 8A1, 2.582%, 8/25/2034(b)(c) | 1,344,645 | ||||||
| 218,752 | Countrywide Home Loan Mortgage Pass Through Trust, Series 2004-HYB4, Class 2A1, 2.396%, 9/20/2034(c) | 208,286 | ||||||
| 491,630 | Countrywide Home Loan Mortgage Pass Through Trust, Series 2005-11, Class 4A1, 0.440%, 4/25/2035(c) | 423,942 | ||||||
| 1,612,219 | Countrywide Home Loan Mortgage Pass Through Trust, Series 2005-21, Class A17, 5.500%, 10/25/2035(b) | 1,509,745 | ||||||
| 1,814,526 | Countrywide Home Loan Mortgage Pass Through Trust, Series 2006-10, Class 1A16, 6.000%, 5/25/2036(b) | 1,661,222 | ||||||
| 887,566 | Credit Suisse First Boston Mortgage Securities Corp., Series 2003-AR26, Class 7A1, 2.515%, 11/25/2033(c) | 854,048 | ||||||
| 702,881 | Credit Suisse First Boston Mortgage Securities Corp., Series 2003-AR28, Class 4A1, 2.544%, 12/25/2033(c) | 680,102 | ||||||
| 2,391,366 | Credit Suisse First Boston Mortgage Securities Corp., Series 2004-AR3, Class 3A1, 2.550%, 5/25/2034(b)(c) | 2,360,661 | ||||||
| 253,829 | Credit Suisse First Boston Mortgage Securities Corp., Series 2005-1, Class 3A4, 5.250%, 5/25/2028 | 256,521 | ||||||
| 1,206,072 | Credit Suisse First Boston Mortgage Securities Corp., Series 2005-10, Class 5A4, 5.500%, 11/25/2035(b) | 1,071,825 | ||||||
| 581,704 | Credit Suisse Mortgage Capital Certificates, Series 2006-8, Class 4A1, 6.500%, 10/25/2021 | 505,420 | ||||||
| 1,115,655 | Deutsche Alternative Mortgage Loan Trust Securities, Inc., Series 2005-3, Class 4A4, 5.250%, 6/25/2035(b) | 1,129,241 | ||||||
| 1,148,665 | Deutsche Alternative Mortgage Loan Trust Securities, Inc., Series 2005-5, Class 1A4, 5.500%, 11/25/2035(b) | 1,086,235 | ||||||
| 1,293,628 | FDIC Trust, Series 2013-N1, Class A, 4.500%, 10/25/2018, 144A(b) | 1,303,675 | ||||||
| 2,015,000 | Federal Home Loan Mortgage Corp., Series 2014-DN1, Class M2, 2.370%, 2/25/2024(c) | 1,980,354 | ||||||
| 1,785,000 | Federal Home Loan Mortgage Corp., Series 2014-DN2, Class M2, 1.820%, 4/25/2024(c) | 1,729,254 | ||||||
| 202,335 | GMAC Mortgage Corp. Loan Trust, Series 2003-J7, Class A7, 5.000%, 11/25/2033 | 203,081 | ||||||
| 2,046,494 | GMAC Mortgage Corp. Loan Trust, Series 2005-AR3, Class 2A1, 2.738%, 6/19/2035(b)(c) | 2,040,352 | ||||||
| 855,067 | GMAC Mortgage Corp. Loan Trust, Series 2005-AR4, Class 3A1, 2.959%, 7/19/2035(c) | 815,826 | ||||||
| 277,314 | GSR Mortgage Loan Trust, Series 2004-14, Class 3A1, 2.757%, 12/25/2034(c) | 265,660 | ||||||
| 1,722,281 | GSR Mortgage Loan Trust, Series 2004-14, Class 5A1, 2.733%, 12/25/2034(b)(c) | 1,710,302 | ||||||
See accompanying notes to financial statements.
25 |
Table of Contents
Portfolio of Investments – as of December 31, 2014
Loomis Sayles Strategic Alpha Fund – (continued)
| Principal Amount (‡) | Description | Value (†) | ||||||
| ABS Home Equity — continued | ||||||||
| $ | 767,123 | GSR Mortgage Loan Trust, Series 2005-AR4, Class 4A1, 2.470%, 7/25/2035(c) | $ | 712,075 | ||||
| 2,653,647 | GSR Mortgage Loan Trust, Series 2005-AR6, Class 4A5, 2.687%, 9/25/2035(b)(c) | 2,668,425 | ||||||
| 1,612,743 | GSR Mortgage Loan Trust, Series 2006-8F, Class 4A17, 6.000%, 9/25/2036(b) | 1,311,627 | ||||||
| 2,408,169 | Impac Secured Assets CMN Owner Trust, Series 2007-2, Class 1A1A, 0.280%, 5/25/2037(b)(c) | 1,731,924 | ||||||
| 1,187,165 | IndyMac Index Mortgage Loan Trust, Series 2004-AR12, Class A1, 0.950%, 12/25/2034(b)(c) | 999,534 | ||||||
| 2,561,935 | IndyMac Index Mortgage Loan Trust, Series 2005-16IP, Class A1, 0.810%, 7/25/2045(b)(c) | 2,250,150 | ||||||
| 3,035,000 | Invitation Homes Trust, Series 2014-SFR1, Class B, 1.662%, 6/17/2031, 144A(b)(c) | 3,004,340 | ||||||
| 2,967,728 | JPMorgan Alternative Loan Trust, Series 2006-A1, Class 3A1, 2.488%, 3/25/2036(b)(c) | 2,569,699 | ||||||
| 1,265,841 | JPMorgan Mortgage Trust, Series 2003-A2, Class 3A1, 1.990%, 11/25/2033(c) | 1,249,311 | ||||||
| 2,690,046 | JPMorgan Mortgage Trust, Series 2005-A2, Class 3A2, 2.408%, 4/25/2035(b)(c) | 2,602,431 | ||||||
| 933,984 | JPMorgan Mortgage Trust, Series 2005-A3, Class 4A1, 2.658%, 6/25/2035(c) | 945,125 | ||||||
| 1,081,766 | JPMorgan Mortgage Trust, Series 2005-A5, Class 1A2, 2.653%, 8/25/2035(b)(c) | 1,076,095 | ||||||
| 2,777,323 | JPMorgan Mortgage Trust, Series 2005-S3, Class 1A9, 6.000%, 1/25/2036(b) | 2,548,080 | ||||||
| �� | 1,853,361 | JPMorgan Mortgage Trust, Series 2006-A1, Class 1A2, 2.408%, 2/25/2036(b)(c) | 1,647,321 | |||||
| 3,371,871 | JPMorgan Mortgage Trust, Series 2006-A7, Class 2A4, 2.695%, 1/25/2037(b)(c) | 3,060,445 | ||||||
| 2,784,021 | JPMorgan Mortgage Trust, Series 2007-S1, Class 2A22, 5.750%, 3/25/2037(b) | 2,409,701 | ||||||
| 2,544,012 | Lehman XS Trust, Series 2006-4N, Class A2A, 0.390%, 4/25/2046(b)(c) | 1,866,893 | ||||||
| 65 | Lehman XS Trust, Series 2006-12N, Class A2A1, 0.320%, 8/25/2046(c)(d) | 63 | ||||||
| 447,945 | MASTR Adjustable Rate Mortgages Trust, Series 2004-4, Class 5A1, 2.542%, 5/25/2034(c)(d) | 434,092 | ||||||
| 3,039,521 | MASTR Adjustable Rate Mortgages Trust, Series 2004-7, Class 3A1, 2.494%, 7/25/2034(b)(c) | 3,054,570 | ||||||
| 685,597 | MASTR Adjustable Rate Mortgages Trust, Series 2006-2, Class 1A1, 2.584%, 4/25/2036(c) | 657,961 | ||||||
| 602,146 | MASTR Adjustable Rate Mortgages Trust, Series 2007-1, Class I2A1, 0.330%, 1/25/2047(c) | 468,304 | ||||||
| 921,172 | MASTR Alternative Loan Trust, Series 2003-9, Class 4A1, 5.250%, 11/25/2033(b) | 954,580 | ||||||
| 999,686 | MASTR Alternative Loan Trust, Series 2004-5, Class 1A1, 5.500%, 6/25/2034(b) | 1,044,434 | ||||||
| 1,126,436 | MASTR Alternative Loan Trust, Series 2004-5, Class 2A1, 6.000%, 6/25/2034(b) | 1,187,565 | ||||||
| 2,536,162 | MASTR Alternative Loan Trust, Series 2004-8, Class 2A1, 6.000%, 9/25/2034(b) | 2,596,490 | ||||||
| 271,341 | MASTR Alternative Loan Trust, Series 2004-12, Class 6A2, 5.250%, 12/25/2034(d) | 271,022 | ||||||
| 1,972,667 | Merrill Lynch Alternative Note Asset Trust, Series 2007-F1, Class 2A7, 6.000%, 3/25/2037(b) | 1,589,180 | ||||||
| 1,820,208 | Merrill Lynch Alternative Note Asset Trust, Series 2007-F1, Class 2A8, 6.000%, 3/25/2037(b) | 1,466,360 | ||||||
See accompanying notes to financial statements.
| 26
Table of Contents
Portfolio of Investments – as of December 31, 2014
Loomis Sayles Strategic Alpha Fund – (continued)
| Principal Amount (‡) | Description | Value (†) | ||||||
| ABS Home Equity — continued | ||||||||
| $ | 386,174 | MLCC Mortgage Investors, Inc., Series 2006-2, Class 2A, 2.120%, 5/25/2036(c) | $ | 383,148 | ||||
| 1,135,983 | Morgan Stanley Mortgage Loan Trust, Series 2005-7, Class 4A2, 5.500%, 11/25/2035(b) | 1,073,099 | ||||||
| 2,423,491 | Morgan Stanley Mortgage Loan Trust, Series 2005-7, Class 7A5, 5.500%, 11/25/2035(b) | 2,463,297 | ||||||
| 772,628 | Provident Funding Mortgage Loan Trust, Series 2005-2, Class 2A1A, 2.396%, 10/25/2035(c) | 752,276 | ||||||
| 2,424,368 | Residential Asset Securitization Trust, Series 2005-A8CB, Class A9, 5.375%, 7/25/2035(b) | 2,121,198 | ||||||
| 926,180 | Residential Funding Mortgage Securities, Series 2006-S1, Class 1A3, 5.750%, 1/25/2036(b) | 942,920 | ||||||
| 1,755,176 | Structured Adjustable Rate Mortgage Loan Trust, Series 2004-6, Class 1A, 2.358%, 6/25/2034(c) | 1,734,897 | ||||||
| 1,140,625 | Structured Adjustable Rate Mortgage Loan Trust, Series 2004-12, Class 6A, 2.630%, 9/25/2034(b)(c) | 1,130,051 | ||||||
| 6,613,040 | Structured Adjustable Rate Mortgage Loan Trust, Series 2004-16, Class 2A, 2.414%, 11/25/2034(b)(c) | 6,549,826 | ||||||
| 706,413 | Structured Adjustable Rate Mortgage Loan Trust, Series 2005-14, Class A1, 0.480%, 7/25/2035(c) | 523,072 | ||||||
| 1,405,554 | Structured Asset Securities Corp. Mortgage Pass Through Certificates, Series 2004-20, Class 8A7, 5.750%, 11/25/2034(b) | 1,477,766 | ||||||
| 736,895 | Structured Asset Securities Corp. Trust, Series 2005-1, Class 7A7, 5.500%, 2/25/2035 | 753,308 | ||||||
| 2,018,370 | WaMu Mortgage Pass Through Certificates, Series 2004-AR14, Class A1, 2.395%, 1/25/2035(b)(c) | 2,026,565 | ||||||
| 709,133 | WaMu Mortgage Pass Through Certificates, Series 2004-CB2, Class 2A, 5.500%, 7/25/2034 | 737,367 | ||||||
| 6,150,000 | WaMu Mortgage Pass Through Certificates, Series 2005-AR7, Class A3, 2.362%, 8/25/2035(c) | 6,042,406 | ||||||
| 1,342,018 | WaMu Mortgage Pass Through Certificates, Series 2006-AR11, Class 2A, 2.163%, 9/25/2046(b)(c) | 1,223,998 | ||||||
| 2,879,562 | WaMu Mortgage Pass Through Certificates, Series 2006-AR19, Class 2A, 1.913%, 1/25/2047(b)(c) | 2,592,236 | ||||||
| 373,702 | Wells Fargo Mortgage Backed Securities Trust, Series 2003-J, Class 1A9, 2.612%, 10/25/2033(c) | 374,956 | ||||||
| 1,283,732 | Wells Fargo Mortgage Backed Securities Trust, Series 2004-A, Class A1, 2.637%, 2/25/2034(b)(c) | 1,286,389 | ||||||
| 492,947 | Wells Fargo Mortgage Backed Securities Trust, Series 2005-11, Class 2A3, 5.500%, 11/25/2035 | 509,908 | ||||||
| 650,014 | Wells Fargo Mortgage Backed Securities Trust, Series 2005-12, Class 1A2, 5.500%, 11/25/2035 | 663,018 | ||||||
| 2,319,860 | Wells Fargo Mortgage Backed Securities Trust, Series 2005-16, Class A18, 6.000%, 1/25/2036(b) | 2,293,901 | ||||||
| 937,268 | Wells Fargo Mortgage Backed Securities Trust, Series 2005-AR10, Class 2A4, 2.614%, 6/25/2035(b)(c) | 940,430 | ||||||
|
| |||||||
| 157,949,440 | ||||||||
|
| |||||||
See accompanying notes to financial statements.
27 |
Table of Contents
Portfolio of Investments – as of December 31, 2014
Loomis Sayles Strategic Alpha Fund – (continued)
| Principal Amount (‡) | Description | Value (†) | ||||||
| ABS Other — 2.3% | ||||||||
| $ | 3,616,204 | Cronos Containers Program I Ltd., 3.270%, 11/18/2029, 144A | $ | 3,613,582 | ||||
| 1,144,082 | Diamond Resorts Owner Trust, Series 2011-1, Class A, 4.000%, 3/20/2023, 144A(b) | 1,161,962 | ||||||
| 3,410,000 | GCA2014 Holdings Ltd., Zero Coupon, 1/05/2030, 144A(d)(e) | 3,100,853 | ||||||
| 2,340,000 | GCA2014 Holdings Ltd., Series 2014-1, Class C, 6.000%, 1/05/2030, 144A(d)(e) | 2,340,000 | ||||||
| 850,000 | GCA2014 Holdings Ltd., Series 2014-1, Class D, 7.500%, 1/05/2030, 144A(d)(e) | 850,000 | ||||||
| 1,495,000 | OneMain Financial Issuance Trust, Series 2014-1A, Class A, 2.430%, 6/18/2024, 144A(b) | 1,494,970 | ||||||
| 1,995,000 | OneMain Financial Issuance Trust, Series 2014-2A, Class A, 2.470%, 9/18/2024, 144A(b) | 2,002,820 | ||||||
| 745,000 | OneMain Financial Issuance Trust, Series 2014-2A, Class B, 3.020%, 9/18/2024, 144A | 745,462 | ||||||
| 6,475,000 | OneMain Financial Issuance Trust, Series 2014-2A, Class D, 5.310%, 9/18/2024, 144A(b) | 6,509,317 | ||||||
| 366,198 | Sierra Timeshare Receivables Funding LLC, Series 2012-1A, Class A, 2.840%, 11/20/2028, 144A | 371,367 | ||||||
| 1,460,806 | Sierra Timeshare Receivables Funding LLC, Series 2013-1A, Class A, 1.590%, 11/20/2029, 144A(b) | 1,457,228 | ||||||
| 3,100,876 | Sierra Timeshare Receivables Funding LLC, Series 2013-3A, Class A, 2.200%, 10/20/2030, 144A(b) | 3,082,132 | ||||||
| 1,895,000 | Springleaf Funding Trust, Series 2014-AA, Class A, 2.410%, 12/15/2022, 144A(b) | 1,893,431 | ||||||
| 3,308,083 | TAL Advantage V LLC, Series 2013-2A, Class A, 3.550%, 11/20/2038, 144A(b) | 3,348,462 | ||||||
|
| |||||||
| 31,971,586 | ||||||||
|
| |||||||
| ABS Student Loan — 0.0% | ||||||||
| 590,000 | SoFi Professional Loan Program LLC, Series 2014-B, Class A1, 1.405%, 8/25/2032, 144A(c) | 590,678 | ||||||
|
| |||||||
| Aerospace & Defense — 1.2% | ||||||||
| 810,000 | Huntington Ingalls Industries, Inc., 5.000%, 12/15/2021, 144A | 824,175 | ||||||
| 2,340,000 | KLX, Inc., 5.875%, 12/01/2022, 144A | 2,363,400 | ||||||
| 6,003,000 | Meccanica Holdings USA, Inc., 6.250%, 1/15/2040, 144A(b) | 5,702,850 | ||||||
| 825,000 | Rockwell Collins, Inc., 0.591%, 12/15/2016(c) | 825,134 | ||||||
| 5,905,000 | Textron Financial Corp., (fixed rate to 2/15/2017, variable rate thereafter), 6.000%, 2/15/2067, 144A(b) | 5,314,500 | ||||||
| 1,035,000 | Textron, Inc., 3.875%, 3/01/2025 | 1,036,823 | ||||||
|
| |||||||
| 16,066,882 | ||||||||
|
| |||||||
| Automotive — 3.3% | ||||||||
| 6,590,000 | Daimler Finance North America LLC, 0.912%, 8/01/2016, 144A(b)(c) | 6,625,105 | ||||||
| 5,250,000 | Ford Motor Credit Co. LLC, 1.482%, 5/09/2016(b)(c) | 5,295,686 | ||||||
| 5,455,000 | General Motors Co., 5.200%, 4/01/2045 | 5,755,025 | ||||||
| 1,000,000 | Nexteer Automotive Group Ltd., 5.875%, 11/15/2021, 144A | 1,000,000 | ||||||
| 5,960,000 | Nissan Motor Acceptance Corp., 0.785%, 3/03/2017, 144A(b)(c) | 5,978,959 | ||||||
| 6,640,000 | Nissan Motor Acceptance Corp., 0.955%, 9/26/2016, 144A(b)(c) | 6,678,333 | ||||||
| 10,650,000 | Toyota Motor Credit Corp., 0.522%, 5/17/2016(b)(c) | 10,670,405 | ||||||
| 3,210,000 | Volkswagen International Finance NV, 0.672%, 11/18/2016, 144A(b)(c) | 3,217,694 | ||||||
|
| |||||||
| 45,221,207 | ||||||||
|
| |||||||
See accompanying notes to financial statements.
| 28
Table of Contents
Portfolio of Investments – as of December 31, 2014
Loomis Sayles Strategic Alpha Fund – (continued)
| Principal Amount (‡) | Description | Value (†) | ||||||
| Banking — 4.6% | ||||||||
| $ | 1,580,000 | Ally Financial, Inc., 8.000%, 3/15/2020 | $ | 1,864,400 | ||||
| 3,310,000 | Bank of America Corp., 1.271%, 1/15/2019(b)(c) | 3,357,025 | ||||||
| 6,825,000 | Bank of America Corp., MTN, 4.200%, 8/26/2024 | 6,952,798 | ||||||
| 12,955,000 | Intesa Sanpaolo SpA, 5.017%, 6/26/2024, 144A(b) | 12,573,022 | ||||||
| 9,280,000 | JPMorgan Chase & Co., 4.250%, 11/02/2018, (NZD)(b) | 7,177,465 | ||||||
| 5,000,000 | Lloyds Banking Group PLC, 4.500%, 11/04/2024 | 5,045,695 | ||||||
| 7,200,000 | Morgan Stanley, 4.350%, 9/08/2026 | 7,243,020 | ||||||
| 11,135,000 | Royal Bank of Scotland Group PLC, 6.125%, 12/15/2022(b) | 12,119,401 | ||||||
| 6,150,000 | Societe Generale S.A., 5.000%, 1/17/2024, 144A(b) | 6,183,708 | ||||||
|
| |||||||
| 62,516,534 | ||||||||
|
| |||||||
| Brokerage — 0.2% | ||||||||
| 3,085,000 | Jefferies Finance LLC/JFIN Co-Issuer Corp., 6.875%, 4/15/2022, 144A | 2,822,775 | ||||||
|
| |||||||
| Building Materials — 0.4% | ||||||||
| 3,660,000 | Atrium Windows & Doors, Inc., 7.750%, 5/01/2019, 144A(b) | 3,074,400 | ||||||
| 3,900,000 | Odebrecht Finance Ltd., 8.250%, 4/25/2018, 144A, (BRL)(b) | 1,239,749 | ||||||
| 1,790,000 | Owens Corning, 4.200%, 12/01/2024 | 1,766,490 | ||||||
|
| |||||||
| 6,080,639 | ||||||||
|
| |||||||
| Cable Satellite — 1.5% | ||||||||
| 1,890,000 | DISH DBS Corp., 5.875%, 7/15/2022 | 1,937,250 | ||||||
| 5,650,000 | DISH DBS Corp., 5.875%, 11/15/2024, 144A | 5,678,250 | ||||||
| 6,020,000 | Time Warner Cable, Inc., 4.500%, 9/15/2042 | 6,188,217 | ||||||
| 6,430,000 | Unitymedia KabelBW GmbH, 6.125%, 1/15/2025, 144A | 6,638,975 | ||||||
|
| |||||||
| 20,442,692 | ||||||||
|
| |||||||
| Chemicals — 0.6% | ||||||||
| 2,596,000 | Albemarle Corp., 4.150%, 12/01/2024 | 2,637,552 | ||||||
| 3,170,000 | Hercules, Inc., 6.500%, 6/30/2029(b) | 2,853,000 | ||||||
| 2,950,000 | Mexichem SAB de CV, 5.875%, 9/17/2044, 144A | 2,787,750 | ||||||
|
| |||||||
| 8,278,302 | ||||||||
|
| |||||||
| Collateralized Mortgage Obligations — 0.4% | ||||||||
| 12,135,613 | Government National Mortgage Association, Series 2012-78, Class IO, 1.047%, 6/16/2052(c)(f) | 806,072 | ||||||
| 72,147,722 | Government National Mortgage Association, Series 2012-135, Class IO, 1.047%, 1/16/2053(b)(c)(f) | 5,272,772 | ||||||
|
| |||||||
| 6,078,844 | ||||||||
|
| |||||||
| Construction Machinery — 1.3% | ||||||||
| 17,660,000 | Caterpillar Financial Services Corp., MTN, 0.474%, 2/26/2016(b)(c) | 17,679,037 | ||||||
|
| |||||||
| Consumer Cyclical Services — 0.9% | ||||||||
| 1,180,000 | IHS, Inc., 5.000%, 11/01/2022, 144A | 1,168,200 | ||||||
| 2,960,000 | Realogy Group LLC/Realogy Co-Issuer Corp., 5.250%, 12/01/2021, 144A | 2,878,600 | ||||||
| 8,260,000 | ServiceMaster Co. LLC (The), 7.000%, 8/15/2020(b) | 8,549,100 | ||||||
|
| |||||||
| 12,595,900 | ||||||||
|
| |||||||
See accompanying notes to financial statements.
29 |
Table of Contents
Portfolio of Investments – as of December 31, 2014
Loomis Sayles Strategic Alpha Fund – (continued)
| Principal Amount (‡) | Description | Value (†) | ||||||
| Electric — 1.5% | ||||||||
| 4,205,000 | Cia de Eletricidade do Estado da Bahia, 11.750%, 4/27/2016, 144A, (BRL)(b) | $ | 1,543,141 | |||||
| 5,600,000 | EDP Finance BV, 4.125%, 1/15/2020, 144A | 5,631,360 | ||||||
| 11,740,000 | Enel SpA, (fixed rate to 9/24/2023, variable rate thereafter), 8.750%, 9/24/2073, 144A(b) | 13,633,075 | ||||||
|
| |||||||
| 20,807,576 | ||||||||
|
| |||||||
| Finance Companies — 2.8% | ||||||||
| 8,365,000 | Air Lease Corp., 4.250%, 9/15/2024 | 8,427,737 | ||||||
| 475,000 | CIT Group, Inc., 5.000%, 8/01/2023 | 488,063 | ||||||
| 4,700,000 | General Electric Capital Corp., Series A, (fixed rate to 6/15/2022, variable rate thereafter), 7.125%(b)(g) | 5,469,625 | ||||||
| 12,535,000 | iStar Financial, Inc., 4.000%, 11/01/2017(b) | 12,190,287 | ||||||
| 11,630,000 | Ladder Capital Finance Holdings LLLP/Ladder Capital Finance Corp., 5.875%, 8/01/2021, 144A(b) | 11,048,500 | ||||||
|
| |||||||
| 37,624,212 | ||||||||
|
| |||||||
| Financial Other — 1.2% | ||||||||
| 630,000 | Corporacion Financiera de Desarrollo S.A., 3.250%, 7/15/2019, 144A | 630,000 | ||||||
| 1,240,000 | Corporacion Financiera de Desarrollo S.A., (fixed rate to 7/15/2024, variable rate thereafter), 5.250%, 7/15/2029, 144A(b) | 1,258,848 | ||||||
| 6,100,000 | Hyundai Capital Services, Inc., 1.043%, 3/18/2017, 144A(b)(c) | 6,087,763 | ||||||
| 8,700,000 | Rialto Holdings LLC/Rialto Corp., 7.000%, 12/01/2018, 144A(b) | 8,830,500 | ||||||
|
| |||||||
| 16,807,111 | ||||||||
|
| |||||||
| Food & Beverage — 0.6% | ||||||||
| 10,800,000 | BRF S.A., 7.750%, 5/22/2018, 144A, (BRL)(b) | 3,514,408 | ||||||
| 2,300,000 | Cosan Luxembourg S.A., 9.500%, 3/14/2018, 144A, (BRL) | 768,339 | ||||||
| 3,500,000 | General Mills, Inc., 0.533%, 1/29/2016(b)(c) | 3,500,858 | ||||||
|
| |||||||
| 7,783,605 | ||||||||
|
| |||||||
| Gaming — 0.8% | ||||||||
| 10,215,000 | MGM Resorts International, 6.000%, 3/15/2023 | 10,266,075 | ||||||
|
| |||||||
| Government Owned - No Guarantee — 1.9% | ||||||||
| 18,670,000,000 | Financiera de Desarrollo Territorial S.A. Findeter, 7.875%, 8/12/2024, 144A, (COP)(b) | 7,941,722 | ||||||
| 12,700,000 | Petrobras Global Finance BV, 5.625%, 5/20/2043 | 10,353,675 | ||||||
| 6,000,000 | Petroleos de Venezuela S.A., 5.500%, 4/12/2037 | 2,064,000 | ||||||
| 700,000(††) | Petroleos Mexicanos, 7.650%, 11/24/2021, 144A, (MXN)(b) | 5,040,617 | ||||||
|
| |||||||
| 25,400,014 | ||||||||
|
| |||||||
| Healthcare — 0.8% | ||||||||
| 1,620,000 | BioScrip, Inc., 8.875%, 2/15/2021, 144A(b) | 1,458,000 | ||||||
| 2,095,000 | Fresenius Medical Care U.S. Finance II, Inc., 4.750%, 10/15/2024, 144A | 2,115,950 | ||||||
| 4,675,000 | HCA, Inc., 4.250%, 10/15/2019 | 4,745,125 | ||||||
| 1,225,000 | Kindred Escrow Corp. II , 8.000%, 1/15/2020, 144A | 1,301,562 | ||||||
| 510,000 | Omnicare, Inc., 4.750%, 12/01/2022 | 516,375 | ||||||
| 420,000 | Omnicare, Inc., 5.000%, 12/01/2024 | 430,500 | ||||||
|
| |||||||
| 10,567,512 | ||||||||
|
| |||||||
See accompanying notes to financial statements.
| 30
Table of Contents
Portfolio of Investments – as of December 31, 2014
Loomis Sayles Strategic Alpha Fund – (continued)
| Principal Amount (‡) | Description | Value (†) | ||||||
| Independent Energy — 2.1% | ||||||||
| $ | 635,000 | Antero Resources Corp., 5.125%, 12/01/2022, 144A | $ | 598,488 | ||||
| 150,000 | Baytex Energy Corp., 5.125%, 6/01/2021, 144A | 127,500 | ||||||
| 155,000 | Baytex Energy Corp., 5.625%, 6/01/2024, 144A | 131,750 | ||||||
| 905,000 | Bonanza Creek Energy, Inc., 5.750%, 2/01/2023 | 714,950 | ||||||
| 240,000 | Bonanza Creek Energy, Inc., 6.750%, 4/15/2021 | 211,200 | ||||||
| 45,000 | California Resources Corp., 5.500%, 9/15/2021, 144A | 38,475 | ||||||
| 2,905,000 | California Resources Corp., 6.000%, 11/15/2024, 144A | 2,454,725 | ||||||
| 2,880,000 | Chesapeake Energy Corp., 4.875%, 4/15/2022 | 2,800,800 | ||||||
| 140,000 | Chesapeake Energy Corp., 6.625%, 8/15/2020 | 148,750 | ||||||
| 2,575,000 | Cimarex Energy Co., 4.375%, 6/01/2024 | 2,459,125 | ||||||
| 365,000 | Concho Resources, Inc., 5.500%, 10/01/2022 | 368,650 | ||||||
| 825,000 | Concho Resources, Inc., 5.500%, 4/01/2023 | 828,877 | ||||||
| 295,000 | Continental Resources, Inc., 3.800%, 6/01/2024 | 263,891 | ||||||
| 210,000 | Continental Resources, Inc., 4.500%, 4/15/2023 | 199,742 | ||||||
| 925,000 | MEG Energy Corp., 6.375%, 1/30/2023, 144A | 825,562 | ||||||
| 180,000 | MEG Energy Corp., 6.500%, 3/15/2021, 144A | 164,250 | ||||||
| 645,000 | MEG Energy Corp., 7.000%, 3/31/2024, 144A | 583,725 | ||||||
| 1,260,000 | Oasis Petroleum, Inc., 6.875%, 3/15/2022 | 1,146,600 | ||||||
| 7,460,000 | OGX Austria GmbH, 8.375%, 4/01/2022, 144A(h) | 73,854 | ||||||
| 4,420,000 | OGX Austria GmbH, 8.500%, 6/01/2018, 144A(h) | 5,481 | ||||||
| 3,325,000 | QEP Resources, Inc., 5.250%, 5/01/2023 | 3,108,875 | ||||||
| 145,000 | Rosetta Resources, Inc., 5.625%, 5/01/2021 | 132,690 | ||||||
| 90,000 | Rosetta Resources, Inc., 5.875%, 6/01/2022 | 81,000 | ||||||
| 310,000 | Rosetta Resources, Inc., 5.875%, 6/01/2024 | 275,900 | ||||||
| 1,440,000 | RSP Permian, Inc., 6.625%, 10/01/2022, 144A | 1,339,200 | ||||||
| 1,238,000 | SM Energy Co., 5.000%, 1/15/2024 | 1,070,870 | ||||||
| 1,662,000 | SM Energy Co., 6.125%, 11/15/2022, 144A | 1,562,280 | ||||||
| 35,000 | SM Energy Co., 6.625%, 2/15/2019 | 34,300 | ||||||
| 575,000 | Ultra Petroleum Corp., 6.125%, 10/01/2024, 144A | 494,500 | ||||||
| 400,000 | Whiting Petroleum Corp., 5.000%, 3/15/2019 | 374,000 | ||||||
| 2,835,000 | Whiting Petroleum Corp., 5.750%, 3/15/2021 | 2,629,462 | ||||||
| 3,255,000 | Whiting Petroleum Corp., 6.500%, 10/01/2018 | 3,141,075 | ||||||
|
| |||||||
| 28,390,547 | ||||||||
|
| |||||||
| Industrial Other — 0.2% | ||||||||
| 2,200,000 | Alfa SAB de CV, 6.875%, 3/25/2044, 144A(b) | 2,400,750 | ||||||
|
| |||||||
| Integrated Energy — 0.7% | ||||||||
| 2,935,000 | BP Capital Markets PLC, 0.652%, 11/07/2016(b)(c) | 2,935,490 | ||||||
| 6,595,000 | Chevron Corp., 0.402%, 11/15/2017(c) | 6,587,310 | ||||||
|
| |||||||
| 9,522,800 | ||||||||
|
| |||||||
| Leisure — 0.1% | ||||||||
| 1,635,000 | 24 Hour Holdings III LLC, 8.000%, 6/01/2022, 144A(b) | 1,308,000 | ||||||
|
| |||||||
| Life Insurance — 1.0% | ||||||||
| 8,600,000 | Assicurazioni Generali SpA, EMTN, (fixed rate to 12/12/2022, variable rate thereafter), 7.750%, 12/12/2042, (EUR)(b) | 13,008,040 | ||||||
|
| |||||||
See accompanying notes to financial statements.
31 |
Table of Contents
Portfolio of Investments – as of December 31, 2014
Loomis Sayles Strategic Alpha Fund – (continued)
| Principal Amount (‡) | Description | Value (†) | ||||||
| Lodging — 0.4% | ||||||||
| $ | 3,565,000 | Choice Hotels International, Inc., 5.750%, 7/01/2022 | $ | 3,823,462 | ||||
| 2,105,000 | Host Hotels & Resorts LP, 5.250%, 3/15/2022(b) | 2,297,216 | ||||||
|
| |||||||
| 6,120,678 | ||||||||
|
| |||||||
| Media Entertainment — 0.6% | ||||||||
| 3,255,000 | CCOH Safari LLC, 5.500%, 12/01/2022 | 3,303,825 | ||||||
| 3,175,000 | CCOH Safari LLC, 5.750%, 12/01/2024 | 3,210,719 | ||||||
| 27,290,000 | Grupo Televisa SAB, EMTN, 7.250%, 5/14/2043, (MXN)(b) | 1,583,993 | ||||||
|
| |||||||
| 8,098,537 | ||||||||
|
| |||||||
| Metals & Mining — 0.5% | ||||||||
| 515,000 | ArcelorMittal, 7.500%, 10/15/2039 | 533,025 | ||||||
| 6,130,000 | Essar Steel Algoma, Inc., 9.500%, 11/15/2019, 144A | 6,175,975 | ||||||
|
| |||||||
| 6,709,000 | ||||||||
|
| |||||||
| Midstream — 0.6% | ||||||||
| 3,225,000 | Regency Energy Partners LP/Regency Energy Finance Corp., 5.750%, 9/01/2020 | 3,233,062 | ||||||
| 2,905,000 | Targa Resources Partners LP/Targa Resources Partners Finance Corp., 4.125%, 11/15/2019, 144A | 2,796,063 | ||||||
| 180,000 | Targa Resources Partners LP/Targa Resources Partners Finance Corp., 4.250%, 11/15/2023 | 163,800 | ||||||
| 690,000 | Targa Resources Partners LP/Targa Resources Partners Finance Corp., 5.250%, 5/01/2023 | 665,850 | ||||||
| 1,120,000 | Targa Resources Partners LP/Targa Resources Partners Finance Corp., 6.375%, 8/01/2022 | 1,134,000 | ||||||
|
| |||||||
| 7,992,775 | ||||||||
|
| |||||||
| Non-Agency Commercial Mortgage-Backed Securities — 4.0% | ||||||||
| 950,000 | Bear Stearns Commercial Mortgage Securities, Series 2003-PWR2, Class E, 6.580%, 5/11/2039, 144A(c) | 974,003 | ||||||
| 1,600,000 | BLCP Hotel Trust, Series 2014-CLRN, Class D, 2.661%, 8/15/2029, 144A(c) | 1,601,584 | ||||||
| 1,600,000 | BLCP Hotel Trust, Series 2014-CLRN, Class E, 3.831%, 8/15/2029, 144A(c) | 1,596,176 | ||||||
| 4,565,000 | CFCRE Commercial Mortgage Trust, Series 2011-C1, Class D, 5.535%, 4/15/2044, 144A(b)(c) | 5,056,801 | ||||||
| 2,765,000 | Citigroup Commercial Mortgage Trust, Series 2013-375P, Class D, 3.518%, 5/10/2035, 144A(b)(c) | 2,670,086 | ||||||
| 2,135,000 | Commercial Mortgage Trust, Series 2014-FL5, Class SV4, 4.303%, 10/15/2031, 144A(c)(e) | 2,140,807 | ||||||
| 850,000 | Commercial Mortgage Trust, Series 2014-SAVA, Class A, 1.311%, 6/15/2034, 144A(c) | 849,544 | ||||||
| 855,000 | Commercial Mortgage Trust, Series 2014-SAVA, Class B, 1.911%, 6/15/2034, 144A(c) | 852,294 | ||||||
| 1,605,000 | Commercial Mortgage Trust, Series 2014-SAVA, Class C, 2.561%, 6/15/2034, 144A(b)(c) | 1,604,324 | ||||||
| 2,552,340 | DBUBS Mortgage Trust, Series 2011-LC1A, Class E, 5.557%, 11/10/2046, 144A(b)(c) | 2,765,241 | ||||||
| 1,300,000 | Del Coronado Trust, Series 2013-HDMZ, Class M, 5.161%, 3/15/2018, 144A(b)(c) | 1,301,040 | ||||||
See accompanying notes to financial statements.
| 32
Table of Contents
Portfolio of Investments – as of December 31, 2014
Loomis Sayles Strategic Alpha Fund – (continued)
| Principal Amount (‡) | Description | Value (†) | ||||||
| Non-Agency Commercial Mortgage-Backed Securities — continued | ||||||||
| $ | 7,430,000 | Extended Stay America Trust, Series 2013-ESH7, Class D7, 5.053%, 12/05/2031, 144A(b)(c) | $ | 7,636,547 | ||||
| 6,295,000 | GS Mortgage Securities Corp. II, Series 2007-GG10, Class AM, 5.796%, 8/10/2045(b)(c) | 6,431,576 | ||||||
| 1,915,000 | Hilton USA Trust, Series 2013-HLT, Class CFX, 3.714%, 11/05/2030, 144A(b) | 1,935,152 | ||||||
| 1,460,000 | Hilton USA Trust, Series 2013-HLT, Class DFX, 4.407%, 11/05/2030, 144A(b) | 1,493,270 | ||||||
| 1,580,000 | Hilton USA Trust, Series 2013-HLT, Class EFX, 5.222%, 11/05/2030, 144A(b)(c) | 1,618,810 | ||||||
| 1,520,000 | JPMorgan Chase Commercial Mortgage Securities Trust, Series 2007-LDPX, Class AM, 5.464%, 1/15/2049(b) | 1,575,544 | ||||||
| 945,264 | JPMorgan Chase Commercial Mortgage Securities Trust, Series 2013-JWMZ, Class M, 6.161%, 4/15/2018, 144A(c) | 945,547 | ||||||
| 1,325,000 | Morgan Stanley Capital I Trust, Series 2007-HQ12, Class AM, 5.592%, 4/12/2049(b)(c) | 1,409,744 | ||||||
| 2,125,000 | Morgan Stanley Capital I Trust, Series 2011-C2, Class E, 5.304%, 6/15/2044, 144A(b)(c) | 2,240,302 | ||||||
| 2,280,000 | SCG Trust, Series 2013-SRP1, Class B, 2.656%, 11/15/2026, 144A(b)(c) | 2,285,835 | ||||||
| 2,200,000 | SCG Trust, Series 2013-SRP1, Class C, 3.411%, 11/15/2026, 144A(b)(c) | 2,207,775 | ||||||
| 2,587,500 | WFRBS Commercial Mortgage Trust, Series 2011-C2, Class D, 5.466%, 2/15/2044, 144A(b)(c) | 2,784,942 | ||||||
|
| |||||||
| 53,976,944 | ||||||||
|
| |||||||
| Oil Field Services — 0.9% | ||||||||
| 9,680,000 | Oceaneering International, Inc., 4.650%, 11/15/2024 | 9,478,201 | ||||||
| 3,310,000 | Shell International Finance BV, 0.442%, 11/15/2016(b)(c) | 3,311,172 | ||||||
|
| |||||||
| 12,789,373 | ||||||||
|
| |||||||
| Pharmaceuticals — 0.5% | ||||||||
| 3,070,000 | Johnson & Johnson, 0.306%, 11/28/2016(b)(c) | 3,072,247 | ||||||
| 3,160,000 | Valeant Pharmaceuticals International, 6.375%, 10/15/2020, 144A | 3,302,200 | ||||||
|
| |||||||
| 6,374,447 | ||||||||
|
| |||||||
| Property & Casualty Insurance — 0.4% | ||||||||
| 5,435,000 | Old Republic International Corp., 4.875%, 10/01/2024 | 5,673,461 | ||||||
|
| |||||||
| Railroads — 0.3% | ||||||||
| 4,700,000 | Canadian National Railway Co., 0.432%, 11/06/2015(b)(c) | 4,701,504 | ||||||
|
| |||||||
| Retailers — 0.1% | ||||||||
| 1,080,000 | Phillips-Van Heusen Corp., 7.750%, 11/15/2023(b) | 1,322,297 | ||||||
|
| |||||||
| Supermarkets — 0.1% | ||||||||
| 935,000 | SUPERVALU, Inc., 7.750%, 11/15/2022 | 916,300 | ||||||
|
| |||||||
| Technology — 2.9% | ||||||||
| 5,785,000 | Equinix, Inc., 5.375%, 1/01/2022 | 5,839,379 | ||||||
| 4,900,000 | Jabil Circuit, Inc., 4.700%, 9/15/2022(b) | 4,875,500 | ||||||
| 10,955,000 | Keysight Technologies, Inc., 4.550%, 10/30/2024, 144A | 10,959,349 | ||||||
| 7,847,000 | KLA-Tencor Corp., 4.650%, 11/01/2024 | 8,123,583 | ||||||
| 2,865,000 | MSCI, Inc., 5.250%, 11/15/2024, 144A | 2,965,275 | ||||||
| 3,030,000 | Rolta Americas LLC, 8.875%, 7/24/2019, 144A(b) | 2,605,800 | ||||||
| 3,730,000 | Sanmina Corp., 4.375%, 6/01/2019, 144A(b) | 3,702,025 | ||||||
|
| |||||||
| 39,070,911 | ||||||||
|
| |||||||
See accompanying notes to financial statements.
33 |
Table of Contents
Portfolio of Investments – as of December 31, 2014
Loomis Sayles Strategic Alpha Fund – (continued)
| Principal Amount (‡) | Description | Value (†) | ||||||
| Treasuries — 3.9% | ||||||||
| 1,475,000 | Brazilian Government International Bond, 12.500%, 1/05/2016, (BRL) | $ | 559,049 | |||||
| 4,271,000(††) | Mexican Fixed Rate Bonds, Series M, 6.500%, 6/10/2021, (MXN)(b) | 30,402,080 | ||||||
| 465,000(††) | Mexican Fixed Rate Bonds, Series M, 6.500%, 6/09/2022, (MXN)(b) | 3,304,525 | ||||||
| 405,000(††) | Mexican Fixed Rate Bonds, Series M, 7.750%, 11/13/2042, (MXN)(b) | 3,160,215 | ||||||
| 1,700,500(††) | Mexican Fixed Rate Bonds, Series M-10, 8.500%, 12/13/2018, (MXN)(b) | 12,987,492 | ||||||
| 130,000(††) | Mexican Fixed Rate Bonds, Series M-20, 8.000%, 12/07/2023, (MXN)(b) | 1,012,660 | ||||||
| 7,091,000 | Republic of Brazil, 8.500%, 1/05/2024, (BRL)(b) | 2,447,518 | ||||||
|
| |||||||
| 53,873,539 | ||||||||
|
| |||||||
| Wireless — 0.3% | ||||||||
| 3,350,000 | Altice S.A., 7.250%, 5/15/2022, 144A, (EUR)(b) | 4,104,339 | ||||||
|
| |||||||
| Wirelines — 0.5% | ||||||||
| 2,875,000 | Level 3 Communications, Inc., 5.750%, 12/01/2022, 144A | 2,892,969 | ||||||
| 10,085,000 | Oi S.A., 9.750%, 9/15/2016, 144A, (BRL) | 3,452,468 | ||||||
|
| |||||||
| 6,345,437 | ||||||||
|
| |||||||
| Total Non-Convertible Bonds (Identified Cost $864,974,956) | 845,443,072 | |||||||
|
| |||||||
| Convertible Bonds — 3.6% | ||||||||
| Automotive — 0.2% | ||||||||
| 755,000 | TRW Automotive, Inc., 3.500%, 12/01/2015(b) | 2,619,850 | ||||||
|
| |||||||
| Consumer Products — 0.3% | ||||||||
| 2,875,000 | Jarden Corp., 1.125%, 3/15/2034, 144A(b) | 3,221,797 | ||||||
|
| |||||||
| Energy — 0.1% | ||||||||
| 425,000 | Chesapeake Energy Corp., 2.750%, 11/15/2035 | 424,469 | ||||||
| 1,430,000 | Peabody Energy Corp., 4.750%, 12/15/2066(b) | 750,750 | ||||||
|
| |||||||
| �� | 1,175,219 | |||||||
|
| |||||||
| Home Construction — 0.1% | ||||||||
| 930,000 | Lennar Corp., 3.250%, 11/15/2021, 144A | 1,804,200 | ||||||
|
| |||||||
| Pharmaceuticals — 1.1% | ||||||||
| 449,000 | BioMarin Pharmaceutical, Inc., 0.750%, 10/15/2018 | 527,856 | ||||||
| 1,168,000 | BioMarin Pharmaceutical, Inc., 1.500%, 10/15/2020(b) | 1,431,530 | ||||||
| 1,600,000 | Emergent Biosolutions, Inc., 2.875%, 1/15/2021, 144A(b) | 1,799,000 | ||||||
| 1,125,000 | Gilead Sciences, Inc., Series D, 1.625%, 5/01/2016(b) | 4,656,094 | ||||||
| 1,670,000 | Mylan, Inc., 3.750%, 9/15/2015(b) | 7,057,837 | ||||||
|
| |||||||
| 15,472,317 | ||||||||
|
| |||||||
| Retailers — 0.5% | ||||||||
| 4,430,000 | Priceline Group, Inc. (The), 0.350%, 6/15/2020(b) | 4,939,450 | ||||||
| 2,295,000 | Priceline Group, Inc. (The), 0.900%, 9/15/2021, 144A | 2,185,987 | ||||||
|
| |||||||
| 7,125,437 | ||||||||
|
| |||||||
| Technology — 1.3% | ||||||||
| 1,810,000 | Ciena Corp., 3.750%, 10/15/2018, 144A(b) | 2,241,006 | ||||||
| 1,080,000 | Finisar Corp., 0.500%, 12/15/2033 | 1,023,300 | ||||||
| 3,815,000 | JDS Uniphase Corp., 0.625%, 8/15/2033(b) | 4,029,594 | ||||||
| 2,045,000 | MercadoLibre, Inc., 2.250%, 7/01/2019, 144A(b) | 2,428,437 | ||||||
See accompanying notes to financial statements.
| 34
Table of Contents
Portfolio of Investments – as of December 31, 2014
Loomis Sayles Strategic Alpha Fund – (continued)
| Principal Amount (‡) | Description | Value (†) | ||||||
| Technology — continued | ||||||||
| $ | 915,000 | Novellus Systems, Inc., 2.625%, 5/15/2041(b) | $ | 2,097,638 | ||||
| 2,360,000 | Nuance Communications, Inc., 2.750%, 11/01/2031(b) | 2,352,625 | ||||||
| 3,145,000 | Palo Alto Networks, Inc., Zero Coupon, 7/01/2019, 144A(b) | 3,972,528 | ||||||
|
| |||||||
| 18,145,128 | ||||||||
|
| |||||||
| Total Convertible Bonds (Identified Cost $41,576,087) | 49,563,948 | |||||||
|
| |||||||
| Total Bonds and Notes (Identified Cost $906,551,043) | 895,007,020 | |||||||
|
| |||||||
| Senior Loans — 15.4% | ||||||||
| Aerospace & Defense — 0.6% | ||||||||
| 2,855,000 | BE Aerospace, Inc., 2014 Term Loan B, 4.000%, 12/16/2021(c) | 2,837,870 | ||||||
| 1,849,062 | Transdigm, Inc., Term Loan C, 3.750%, 2/28/2020(c) | 1,813,394 | ||||||
| 2,997,891 | Transdigm, Inc., Term Loan D, 3.750%, 6/04/2021(c) | 2,940,421 | ||||||
|
| |||||||
| 7,591,685 | ||||||||
|
| |||||||
| Automotive — 0.6% | ||||||||
| 773,088 | American Tire Distributors Holdings, Inc., Term Loan B, 5.750%, 6/01/2018(c) | 771,155 | ||||||
| 901,778 | Dealertrack Technologies, Inc., Term Loan B, 3.250%, 2/28/2021(c) | 882,615 | ||||||
| 2,369,767 | IBC Capital Ltd., 1st Lien Term Loan, 4.750%, 9/09/2021(c) | 2,356,923 | ||||||
| 92,523 | Midas Intermediate Holdco II LLC, Delayed Draw Term Loan, 4.750%, 8/18/2021(c) | 92,022 | ||||||
| 821,138 | Midas Intermediate Holdco II LLC, Term Loan B, 4.750%, 8/18/2021(c) | 816,687 | ||||||
| 3,367,110 | Visteon Corp., Delayed Draw Term Loan B, 3.500%, 4/09/2021(c) | 3,308,186 | ||||||
|
| |||||||
| 8,227,588 | ||||||||
|
| |||||||
| Building Materials — 1.1% | ||||||||
| 3,154,030 | ABC Supply Co., Inc., Term Loan, 3.500%, 4/16/2020(c) | 3,050,546 | ||||||
| 2,408,636 | Continental Building Products LLC, 1st Lien Term Loan, 4.000%, 8/28/2020(c) | 2,362,463 | ||||||
| 3,311,509 | HD Supply, Inc., Term Loan B, 6/28/2018(i) | 3,275,645 | ||||||
| 3,278,963 | Quikrete Holdings, Inc., 1st Lien Term Loan, 4.000%, 9/28/2020(c) | 3,228,139 | ||||||
| 2,790,178 | Wilsonart LLC, Term Loan B, 4.000%, 10/31/2019(c) | 2,702,985 | ||||||
|
| |||||||
| 14,619,778 | ||||||||
|
| |||||||
| Cable Satellite — 0.3% | ||||||||
| 1,057,390 | Charter Communications Operating LLC, Term Loan G, 4.250%, 9/12/2021(c) | 1,063,343 | ||||||
| 3,295,000 | Virgin Media Bristol LLC, USD Term Loan B, 3.500%, 6/07/2020(c) | 3,231,110 | ||||||
|
| |||||||
| 4,294,453 | ||||||||
|
| |||||||
| Chemicals — 0.3% | ||||||||
| 1,603,577 | Arysta LifeScience SPC LLC, 1st Lien Term Loan, 4.500%, 5/29/2020(c) | 1,591,550 | ||||||
| 1,552,186 | Axalta Coating Systems U.S. Holdings, Inc., USD Term Loan, 3.750%, 2/01/2020(c) | 1,508,290 | ||||||
| 441,893 | Emerald Performance Materials LLC, New 1st Lien Term Loan, 4.500%, 8/01/2021(c) | 430,845 | ||||||
| 1,182,000 | MacDermid, Inc., USD 1st Lien Term Loan, 4.000%, 6/07/2020(c) | 1,156,883 | ||||||
|
| |||||||
| 4,687,568 | ||||||||
|
| |||||||
See accompanying notes to financial statements.
35 |
Table of Contents
Portfolio of Investments – as of December 31, 2014
Loomis Sayles Strategic Alpha Fund – (continued)
| Principal Amount (‡) | Description | Value (†) | ||||||
| Consumer Cyclical Services — 0.9% | ||||||||
| $ | 2,516,786 | Creative Artists Agency LLC, Term Loan B, 6.750%, 12/17/2021(c) | $ | 2,516,786 | ||||
| 292,417 | Garda World Security Corp., Delayed Draw Term Loan, 4.000%, 11/06/2020(c) | 284,741 | ||||||
| 1,143,083 | Garda World Security Corp., New Term Loan B, 4.000%, 11/06/2020(c) | 1,113,077 | ||||||
| 3,326,749 | Realogy Corp., New Term Loan B, 3/05/2020(i) | 3,251,897 | ||||||
| 5,160,755 | ServiceMaster Co., 2014 Term Loan B, 4.250%, 7/01/2021(c) | 5,057,540 | ||||||
| 615,228 | Spin Holdco, Inc., New Term Loan B, 4.250%, 11/14/2019(c) | 604,080 | ||||||
|
| |||||||
| 12,828,121 | ||||||||
|
| |||||||
| Consumer Products — 0.4% | ||||||||
| 637,621 | Bauer Performance Sports Ltd., Term Loan B, 4.000%, 4/15/2021(c) | 627,662 | ||||||
| 423,100 | Libbey Glass, Inc., Term Loan B, 3.750%, 4/09/2021(c) | 415,962 | ||||||
| 2,058,791 | SRAM LLC, New Term Loan B, 4.013%, 4/10/2020(j) | 1,991,880 | ||||||
| 2,269,503 | Tempur-Pedic International, Inc., Refi Term Loan B, 3.500%, 3/18/2020(c) | 2,219,868 | ||||||
|
| |||||||
| 5,255,372 | ||||||||
|
| |||||||
| Diversified Manufacturing — 0.1% | ||||||||
| 619,323 | Doncasters Finance U.S. LLC, USD Term Loan, 4.500%, 4/09/2020(c) | 613,520 | ||||||
| 92,368 | WESCO Distribution, Inc., Term Loan B, 3.750%, 12/12/2019(c) | 91,636 | ||||||
|
| |||||||
| 705,156 | ||||||||
|
| |||||||
| Electric — 0.4% | ||||||||
| 1,823,235 | Calpine Construction Finance Co. LP, Original Term Loan B1, 3.000%, 5/03/2020(c) | 1,750,305 | ||||||
| 3,313,070 | Calpine Corp., Term Loan B3, 4.000%, 10/09/2019(c) | 3,265,461 | ||||||
|
| |||||||
| 5,015,766 | ||||||||
|
| |||||||
| Finance Companies — 0.1% | ||||||||
| 1,008,550 | AWAS Finance Luxembourg 2012 S.A., New Term Loan, 3.500%, 7/16/2018(c) | 992,584 | ||||||
|
| |||||||
| Financial Other — 0.3% | ||||||||
| 1,729,999 | American Beacon Advisors, Inc., Term Loan B, 4.750%, 11/22/2019(c) | 1,704,049 | ||||||
| 1,077,600 | Duff & Phelps Investment Management Co., Term Loan B, 4.500%, 4/23/2020(c) | 1,064,130 | ||||||
| 1,232,550 | Grosvenor Capital Management Holdings LLP, New Term Loan B, 3.750%, 1/04/2021(c) | 1,206,346 | ||||||
| 576,177 | Harbourvest Partners LLC, New Term Loan, 3.250%, 2/04/2021(c) | 555,290 | ||||||
|
| |||||||
| 4,529,815 | ||||||||
|
| |||||||
| Food & Beverage — 0.6% | ||||||||
| 2,679,750 | Aramark Services, Inc., USD Term Loan F, 3.250%, 2/24/2021(c) | 2,631,193 | ||||||
| 5,111,375 | Big Heart Pet Brands, New Term Loan, 3.500%, 3/08/2020(c) | 4,881,363 | ||||||
| 821,904 | Reddy Ice Corp., 1st Lien Term Loan, 6.751%, 5/01/2019(j) | 723,276 | ||||||
|
| |||||||
| 8,235,832 | ||||||||
|
| |||||||
| Health Insurance — 0.2% | ||||||||
| 3,001,014 | Sedgwick Claims Management Services, Inc., 1st Lien Term Loan, 3.750%, 3/01/2021(c) | 2,910,984 | ||||||
|
| |||||||
| Healthcare — 0.7% | ||||||||
| 369,164 | Amsurg Corp., 1st Lien Term Loan B, 3.750%, 7/16/2021(c) | 365,472 | ||||||
| 747,836 | Community Health Systems, Inc., Term Loan D, 1/27/2021(i) | 745,188 | ||||||
See accompanying notes to financial statements.
| 36
Table of Contents
Portfolio of Investments – as of December 31, 2014
Loomis Sayles Strategic Alpha Fund – (continued)
| Principal Amount (‡) | Description | Value (†) | ||||||
| Healthcare — continued | ||||||||
| $ | 1,331,654 | DaVita HealthCare Partners, Inc., Term Loan B, 3.500%, 6/24/2021(c) | $ | 1,315,315 | ||||
| 3,044,488 | Millennium Laboratories, Inc., Term Loan B, 5.250%, 4/16/2021(c) | 3,024,181 | ||||||
| 1,492,500 | Ortho-Clinical Diagnostics, Inc., Term Loan B, 4.750%, 6/30/2021(c) | 1,466,008 | ||||||
| 1,430,289 | Planet Fitness Holdings LLC, Term Loan, 4.750%, 3/31/2021(c) | 1,408,835 | ||||||
| 1,716,094 | Renaissance Learning, Inc., New 1st Lien Term Loan, 4.500%, 4/09/2021(c) | 1,671,767 | ||||||
|
| |||||||
| 9,996,766 | ||||||||
|
| |||||||
| Industrial Other — 1.5% | ||||||||
| 1,089,014 | Brickman Group Ltd. LLC, 1st Lien Term Loan, 4.000%, 12/18/2020(c) | 1,055,320 | ||||||
| 2,315,610 | Crosby U.S. Acquisition Corp., 1st Lien Term Loan, 3.750%, 11/23/2020(c) | 2,153,517 | ||||||
| 1,643,880 | Gates Global, Inc., Term Loan B, 4.250%, 7/05/2021(c) | 1,596,619 | ||||||
| 1,733,788 | Generac Power Systems, Inc., Term Loan B, 5/31/2020(i) | 1,677,440 | ||||||
| 2,612,800 | Generac Power Systems, Inc., Term Loan B, 3.250%, 5/31/2020(c) | 2,527,884 | ||||||
| 515,389 | Mirror Bidco Corp., New Term Loan, 4.250%, 12/28/2019(c) | 508,947 | ||||||
| 1,930,485 | Pinnacle Operating Corp., Term Loan, 4.750%, 11/15/2018(c) | 1,906,354 | ||||||
| 6,053,422 | Silver II U.S. Holdings LLC, Term Loan, 4.000%, 12/13/2019(c) | 5,612,673 | ||||||
| 749,541 | Virtuoso U.S. LLC, USD Term Loan, 4.750%, 2/11/2021(c) | 742,360 | ||||||
| 3,317,932 | Zebra Technologies Corp., Term Loan B, 4.750%, 10/27/2021(c) | 3,331,204 | ||||||
|
| |||||||
| 21,112,318 | ||||||||
|
| |||||||
| Leisure — 0.1% | ||||||||
| 1,803,935 | Time, Inc., Term Loan B, 4.250%, 4/26/2021(c) | 1,779,131 | ||||||
|
| |||||||
| Lodging — 0.4% | ||||||||
| 5,820,198 | Hilton Worldwide Finance LLC, USD Term Loan B2, 3.500%, 10/26/2020(c) | 5,745,001 | ||||||
|
| |||||||
| Media Entertainment — 0.5% | ||||||||
| 621,050 | Sinclair Television Group, Inc., Term Loan B, 3.000%, 4/09/2020(c) | 604,363 | ||||||
| 3,145,307 | Springer Science+Business Media Deutschland GmbH, USD Term Loan B3, 4.750%, 8/14/2020(c) | 3,086,993 | ||||||
| 2,609,582 | Tribune Co., 2013 Term Loan, 4.000%, 12/27/2020(c) | 2,565,558 | ||||||
|
| |||||||
| 6,256,914 | ||||||||
|
| |||||||
| Midstream — 0.1% | ||||||||
| 1,930,000 | Energy Transfer Equity LP, New Term Loan, 3.250%, 12/02/2019(c) | 1,855,560 | ||||||
|
| |||||||
| Other Utility — 0.2% | ||||||||
| 3,030,377 | PowerTeam Services LLC, 1st Lien Term Loan, 4.250%, 5/06/2020(c) | 2,944,527 | ||||||
| 160,706 | PowerTeam Services LLC, Delayed Draw Term Loan, 4.250%, 5/06/2020(c) | 156,153 | ||||||
|
| |||||||
| 3,100,680 | ||||||||
|
| |||||||
| Packaging — 0.4% | ||||||||
| 3,741,311 | Ardagh Holdings USA, Inc., Incremental Term Loan, 4.000%, 12/17/2019(c) | 3,661,808 | ||||||
| 1,800,833 | Signode Industrial Group U.S., Inc., USD Term Loan B, 3.750%, 5/01/2021(c) | 1,720,930 | ||||||
|
| |||||||
| 5,382,738 | ||||||||
|
| |||||||
| Pharmaceuticals — 1.4% | ||||||||
| 2,256,398 | Amneal Pharmaceuticals LLC, New Term Loan, 5.001%, 11/01/2019(j) | 2,247,936 | ||||||
| 3,218,678 | Grifols Worldwide Operations USA, Inc., USD Term Loan B, 3.169%, 2/27/2021(c) | 3,170,397 | ||||||
| 986,545 | IMS Health, Inc., New USD Term Loan, 3.500%, 3/17/2021(c) | 961,882 | ||||||
See accompanying notes to financial statements.
37 |
Table of Contents
Portfolio of Investments – as of December 31, 2014
Loomis Sayles Strategic Alpha Fund – (continued)
| Principal Amount (‡) | Description | Value (†) | ||||||
| Pharmaceuticals — continued | ||||||||
| $ | 1,554,190 | JLL/Delta Dutch Newco BV, USD Term Loan, 4.250%, 3/11/2021(c) | $ | 1,505,622 | ||||
| 3,013,230 | Mallinckrodt International Finance S.A., Term Loan B, 3.250%, 3/19/2021(c) | 2,951,459 | ||||||
| 4,539,373 | Quintiles Transnational Corp., Term Loan B3, 3.750%, 6/08/2018(c) | 4,478,863 | ||||||
| 3,400,000 | Valeant Pharmaceuticals International, Inc., Series E Term Loan B, 8/05/2020(i) | 3,363,348 | ||||||
|
| |||||||
| 18,679,507 | ||||||||
|
| |||||||
| Property & Casualty Insurance — 0.5% | ||||||||
| 3,069,803 | Hub International Ltd., Term Loan B, 4.250%, 10/02/2020(c) | 2,966,197 | ||||||
| 3,319,468 | Vertafore, Inc., 1st Lien Term Loan, 4.250%, 10/03/2019(c) | 3,277,974 | ||||||
|
| |||||||
| 6,244,171 | ||||||||
|
| |||||||
| Restaurants — 0.4% | ||||||||
| 5,538,966 | 1011778 B.C. Unlimited Liability Co., 2014 Term Loan B, 4.500%, 12/12/2021(c) | 5,515,204 | ||||||
| 246,429 | Brasa Holdings, Inc., 2nd Lien Term Loan, 11.000%, 1/20/2020(c) | 243,040 | ||||||
|
| |||||||
| 5,758,244 | ||||||||
|
| |||||||
| Retailers — 0.2% | ||||||||
| 322,607 | Hillman Group, Inc. (The), Term Loan B, 4.500%, 6/30/2021(c) | 317,768 | ||||||
| 1,906,161 | Talbots, Inc. (The), 1st Lien Term Loan, 4.750%, 3/19/2020(c) | 1,839,445 | ||||||
|
| |||||||
| 2,157,213 | ||||||||
|
| |||||||
| Supermarkets — 0.1% | ||||||||
| 798,889 | Sprouts Farmers Markets Holdings LLC, New Term Loan, 4.000%, 4/23/2020(c) | 794,895 | ||||||
|
| |||||||
| Technology — 1.7% | ||||||||
| 2,868,325 | Aptean, Inc., 1st Lien Term Loan, 5.250%, 2/26/2020(c) | 2,772,724 | ||||||
| 1,519,314 | BMC Foreign Holding Co., USD Term Loan, 5.000%, 9/10/2020(c) | 1,466,138 | ||||||
| 2,936,958 | BMC Software Finance, Inc., USD Term Loan, 5.000%, 9/10/2020(c) | 2,850,699 | ||||||
| 1,102,117 | Entegris, Inc., Term Loan B, 3.500%, 4/30/2021(c) | 1,075,942 | ||||||
| 3,061,532 | Infor (U.S.), Inc., USD Term Loan B5, 3.750%, 6/03/2020(c) | 2,966,073 | ||||||
| 3,284,388 | IQOR U.S., Inc., Term Loan B, 6.000%, 4/01/2021(c) | 3,021,637 | ||||||
| 1,659,521 | M/A-COM Technology Solutions Holdings, Inc., Term Loan, 4.500%, 5/07/2021(c) | 1,651,223 | ||||||
| 3,619,944 | MA FinanceCo. LLC, Term Loan B, 5.250%, 10/07/2021(c) | 3,495,527 | ||||||
| 760,990 | Microsemi Corp., Incremental Term Loan B2, 3.500%, 2/19/2020(c) | 747,483 | ||||||
| 957,845 | Nuance Communications, Inc., Term Loan C, 2.919%, 8/07/2019(c) | 927,673 | ||||||
| 1,446,688 | NXP BV, Term Loan D, 3.250%, 1/11/2020(c) | 1,421,370 | ||||||
| 1,062,270 | Oberthur Technologies of America Corp., USD Term Loan B2, 4.500%, 10/18/2019(c) | 1,030,402 | ||||||
|
| |||||||
| 23,426,891 | ||||||||
|
| |||||||
| Transportation Services — 0.1% | ||||||||
| 783,130 | FPC Holdings, Inc., 1st Lien Term Loan, 5.250%, 11/19/2019(c) | 766,160 | ||||||
| 520,536 | OSG Bulk Ships, Inc., Exit Term Loan, 5.250%, 8/05/2019(c) | 506,221 | ||||||
|
| |||||||
| 1,272,381 | ||||||||
|
| |||||||
| Wireless — 0.4% | ||||||||
| 3,035,104 | Asurion LLC, New Term Loan B1, 5.000%, 5/24/2019(c) | 2,991,216 | ||||||
| 920,975 | Asurion LLC, New Term Loan B2, 4.250%, 7/08/2020(c) | 888,741 | ||||||
| 1,363,150 | SBA Senior Finance II LLC, Term Loan B1, 3.250%, 3/24/2021(c) | 1,332,193 | ||||||
|
| |||||||
| 5,212,150 | ||||||||
|
| |||||||
See accompanying notes to financial statements.
| 38
Table of Contents
Portfolio of Investments – as of December 31, 2014
Loomis Sayles Strategic Alpha Fund – (continued)
| Principal Amount (‡) | Description | Value (†) | ||||||
| Wirelines — 0.8% | ||||||||
| $ | 2,114,040 | Level 3 Financing, Inc., Incremental Term Loan B5, 4.500%, 1/31/2022(c) | $ | 2,113,385 | ||||
| 2,006,942 | LTS Buyer LLC, 1st Lien Term Loan, 4.000%, 4/13/2020(c) | 1,960,541 | ||||||
| 4,350,000 | Sable International Finance Ltd., Senior Term Loan, 11/06/2016(i) | 4,328,250 | ||||||
| 3,041,283 | Zayo Group LLC, Term Loan B, 4.000%, 7/02/2019(c) | 3,004,483 | ||||||
|
| |||||||
| 11,406,659 | ||||||||
|
| |||||||
| Total Senior Loans (Identified Cost $213,624,792) | 210,075,921 | |||||||
|
| |||||||
| Loan Participations — 0.2% | ||||||||
| ABS Other — 0.2% | ||||||||
| 2,644,688 | Rise Ltd., Series 2014-1, Class A, 4.750%, 2/15/2039(c)(e) (Identified Cost $2,664,523) | 2,657,911 | ||||||
|
| |||||||
| Shares | ||||||||
| Preferred Stocks — 3.9% | ||||||||
| Convertible Preferred Stocks — 2.5% | ||||||||
| Electric — 0.0% | ||||||||
| 9,050 | NextEra Energy, Inc., 5.889% | 605,807 | ||||||
|
| |||||||
| Energy — 0.2% | ||||||||
| 1,977 | Chesapeake Energy Corp., Series A, 5.750%, 144A(b)(d) | 2,023,954 | ||||||
|
| |||||||
| Food Products — 0.5% | ||||||||
| 128,521 | Tyson Foods, Inc., 4.750% | 6,469,747 | ||||||
|
| |||||||
| Metals & Mining — 0.4% | ||||||||
| 74,679 | Alcoa, Inc., Series 1, 5.375% | 3,767,556 | ||||||
| 131,000 | ArcelorMittal, 6.000%(b) | 2,266,300 | ||||||
|
| |||||||
| 6,033,856 | ||||||||
|
| |||||||
| REITs – Diversified — 0.13% | ||||||||
| 223,896 | Weyerhaeuser Co., Series A, 6.375%(b) | 12,918,799 | ||||||
| 50,834 | Crown Castle International Corp., Series A, 4.500%(b) | 5,235,394 | ||||||
|
| |||||||
| 18,154,193 | ||||||||
|
| |||||||
| REITs – Health Care — 0.0% | ||||||||
| 8,000 | Health Care REIT, Inc., Series I, 6.500% | 526,800 | ||||||
|
| |||||||
| REITs – Mortgage — 0.3% | ||||||||
| 67,436 | iStar Financial, Inc., Series J, 4.500%(b)(d) | 3,986,816 | ||||||
|
| |||||||
| Utility Other — 0.2% | ||||||||
| 17,432 | Dominion Resources, Inc., 6.375% | 906,638 | ||||||
| 11,055 | Dominion Resources, Inc., Series A, 6.125% | 663,411 | ||||||
| 9,938 | Dominion Resources, Inc., Series B, 6.000% | 597,473 | ||||||
|
| |||||||
| 2,167,522 | ||||||||
|
| |||||||
| Total Convertible Preferred Stocks (Identified Cost $37,734,185) | 39,968,695 | |||||||
|
| |||||||
See accompanying notes to financial statements.
39 |
Table of Contents
Portfolio of Investments – as of December 31, 2014
Loomis Sayles Strategic Alpha Fund – (continued)
| Shares | Description | Value (†) | ||||||
| Non-Convertible Preferred Stocks — 1.4% | ||||||||
| Banking — 0.5% | ||||||||
| 6,776 | Ally Financial, Inc., Series G, 7.000%, 144A(b) | $ | 6,773,247 | |||||
|
| |||||||
| Cable Satellite — 0.3% | ||||||||
| 4,040,000 | NBCUniversal Enterprise, Inc., 5.250%, 144A(b) | 4,191,500 | ||||||
|
| |||||||
| Property & Casualty Insurance — 0.2% | ||||||||
| 102,000 | Montpelier Re Holdings Ltd., 8.875%(b) | 2,742,780 | ||||||
|
| |||||||
| Total Non-Convertible Preferred Stocks (Identified Cost $13,188,468) | 13,707,527 | |||||||
|
| |||||||
| Total Preferred Stocks (Identified Cost $50,922,653) | 53,676,222 | |||||||
|
| |||||||
| Common Stocks — 3.8% | ||||||||
| Automobiles — 0.4% | ||||||||
| 226,953 | Ford Motor Co. | 3,517,771 | ||||||
| 60,315 | General Motors Co.(b) | 2,105,597 | ||||||
|
| |||||||
| 5,623,368 | ||||||||
|
| |||||||
| Chemicals — 0.1% | ||||||||
| 54,452 | Tronox Ltd., Class A(b) | 1,300,314 | ||||||
|
| |||||||
| Communications Equipment — 0.5% | ||||||||
| 250,172 | Cisco Systems, Inc. | 6,958,534 | ||||||
|
| |||||||
| Food & Staples Retailing — 0.4% | ||||||||
| 35,903 | CVS Health Corp.(b) | 3,457,818 | ||||||
| 25,113 | Wal-Mart Stores, Inc.(b) | 2,156,704 | ||||||
|
| |||||||
| 5,614,522 | ||||||||
|
| |||||||
| Oil, Gas & Consumable Fuels — 0.7% | ||||||||
| 21,550 | Exxon Mobil Corp.(b) | 1,992,298 | ||||||
| 165,139 | Kinder Morgan, Inc. | 6,987,031 | ||||||
|
| |||||||
| 8,979,329 | ||||||||
|
| |||||||
| Pharmaceuticals — 0.7% | ||||||||
| 64,155 | Eli Lilly & Co.(b) | 4,426,054 | ||||||
| 29,105 | Johnson & Johnson(b) | 3,043,510 | ||||||
| 62,096 | Pfizer, Inc.(b) | 1,934,290 | ||||||
|
| |||||||
| 9,403,854 | ||||||||
|
| |||||||
| Semiconductors & Semiconductor Equipment — 0.1% | ||||||||
| 32,227 | Texas Instruments, Inc.(b) | 1,723,016 | ||||||
|
| |||||||
| Specialty Retail — 0.6% | ||||||||
| 39,070 | Home Depot, Inc. (The)(b) | 4,101,178 | ||||||
| 65,673 | Lowe’s Cos., Inc.(b) | 4,518,302 | ||||||
|
| |||||||
| 8,619,480 | ||||||||
|
| |||||||
| Technology Hardware, Storage & Peripherals — 0.2% | ||||||||
| 80,565 | EMC Corp.(b) | 2,396,003 | ||||||
|
| |||||||
See accompanying notes to financial statements.
| 40
Table of Contents
Portfolio of Investments – as of December 31, 2014
Loomis Sayles Strategic Alpha Fund – (continued)
| Shares | Description | Value (†) | ||||||
| Tobacco — 0.1% | ||||||||
| 34,555 | Altria Group, Inc.(b) | $ | 1,702,525 | |||||
|
| |||||||
| Total Common Stocks (Identified Cost $44,078,170) | 52,320,945 | |||||||
|
| |||||||
| Exchange Traded Funds — 0.8% | ||||||||
| 168,671 | iShares® China Large-Cap ETF | 7,020,087 | ||||||
| 23,015 | iShares® Core S&P Mid-Cap ETF | 3,332,572 | ||||||
|
| |||||||
| Total Exchange Traded Funds (Identified Cost $10,255,557) | 10,352,659 | |||||||
|
| |||||||
| Notional Amount/ Shares/ Units of Currency (†††) | ||||||||
| Purchased Options — 0.3% | ||||||||
| Options on Securities — 0.0% | ||||||||
| 2,380,000 | iShares® MSCI Japan ETF, Call, expiring March 20, 2015 at 12 | 249,900 | ||||||
|
| |||||||
| Over-the-Counter Options on Currency — 0.3% | ||||||||
| 45,750,000 | CNH Put, expiring February 03, 2015 at 6.2000(l) | 373,640 | ||||||
| 21,000,000 | COP Put, expiring January 08, 2015 at 2122(m) | 2,248,932 | ||||||
| 35,000,000 | KRW Put, expiring January 08, 2015 at 1095(l) | 181,300 | ||||||
| 35,000,000 | KRW Put, expiring January 08, 2015 at 1175(l) | 140 | ||||||
| 18,000,000 | ZAR Put, expiring January 08, 2015 at 11.3850(l) | 334,602 | ||||||
|
| |||||||
| 3,138,614 | ||||||||
|
| |||||||
| Total Purchased Options (Identified Cost $2,611,732) | 3,388,514 | |||||||
|
| |||||||
| Purchased Swaptions — 0.0% | ||||||||
| Interest Rate Swaptions — 0.0% | ||||||||
| $ | 1,375,000,000 | 1-year Interest Rate Swap Put, expiring 10/16/2015, Pay 28-day TIIE, Receive MXN 4.400%(k) | 270,643 | |||||
| 43,725,000 | 5-year Interest Rate Swap Call, expiring 2/23/2015, Pay 2.0725%, Receive 3-month LIBOR(l) | 84,477 | ||||||
| 15,800,000 | 10-year Interest Rate Swap Call, expiring 2/23/2015, Pay 2.7350%, Receive 3-month LIBOR(l) | 15,863 | ||||||
|
| |||||||
| Total Purchased Swaptions (Identified Cost $1,107,076) | 370,983 | |||||||
|
| |||||||
| Principal Amount (‡) | ||||||||
| Short-Term Investments — 9.5% | ||||||||
| $ | 431,853 | Repurchase Agreement with State Street Bank and Trust Company, dated 12/31/2014 at 0.000% to be repurchased at $431,853 on 1/02/2015 collateralized by $436,200 U.S. Treasury Note, 1.500% due 8/31/2018 valued at $440,518 including accrued interest (Note 2 of Notes to Financial Statements) | 431,853 | |||||
See accompanying notes to financial statements.
41 |
Table of Contents
Portfolio of Investments – as of December 31, 2014
Loomis Sayles Strategic Alpha Fund – (continued)
| Principal Amount (‡) | Description | Value (†) | ||||||
| Short-Term Investments — (continued) | ||||||||
| $ | 119,213,566 | Tri-Party Repurchase Agreement with Fixed Income Clearing Corporation, dated 12/31/2014 at 0.010% to be repurchased at $119,213,632 on 1/02/2015 collateralized by $4,550,000 U.S. Treasury Bond, 3.750% due 11/15/2043 valued at $5,482,750; $17,070,000 U.S. Treasury Note, 1.000% due 9/15/2017 valued at $17,134,013; $72,640,000 U.S. Treasury Note, 0.750% due 3/31/2018 valued at $71,625,655; $26,440,000 U.S. Treasury Inflation Indexed Note, 0.125% due 4/15/2018 valued at $27,034,900; $315,000 U.S. Treasury Note, 2.125% due 6/30/2021 valued at $321,300 including accrued interest (Note 2 of Notes to Financial Statements) | $ | 119,213,566 | ||||
| 9,400,000 | U.S. Treasury Bills, 0.048%, 2/19/2015(n)(o) | 9,399,784 | ||||||
|
| |||||||
| Total Short-Term Investments (Identified Cost $129,044,811) | 129,045,203 | |||||||
|
| |||||||
| Total Investments — 99.5% (Identified Cost $1,360,860,357)(a) | 1,356,895,378 | |||||||
| Other assets less liabilities — 0.5% | 6,979,528 | |||||||
|
| |||||||
| Net Assets — 100.0% | $ | 1,363,874,906 | ||||||
|
| |||||||
| Shares/ Units of Currency (†††) | ||||||||
| Written Options — (0.0%) | ||||||||
| Options on Securities — (0.0%) | ||||||||
| 35,900 | CVS Health Corp., Call, expiring January 17, 2015 at 92.5000 | $ | (148,985 | ) | ||||
| 1,190,000 | iShares® MSCI Japan ETF, Call, expiring March 20, 2015 at 13 | (17,850 | ) | |||||
|
| |||||||
| (166,835 | ) | |||||||
|
| |||||||
| Over-the-Counter Options on Currency — (0.0%) | ||||||||
| 70,000,000 | KRW Put, expiring January 08, 2015 at 1150(l) | (2,240 | ) | |||||
|
| |||||||
| Total Written Options (Premiums Received $443,011) | $ | (169,075 | ) | |||||
|
| |||||||
| (‡) | Principal Amount stated in U.S. dollars unless otherwise noted. | |||||||
| (†) | See Note 2 of Notes to Financial Statements. | |||||||
| (††) | Amount shown represents units. One unit represents a principal amount of 100. | |||||||
| (†††) | Interest rate swaptions are expressed as notional amount. Options on securities are expressed as shares. Options on currency are expressed as units of currency. | |||||||
| (a) | Federal Tax Information: | |||||||
| At December 31, 2014, the net unrealized depreciation on investments based on a cost of $1,361,658,141 for federal income tax purposes was as follows: | ||||||||
| Aggregate gross unrealized appreciation for all investments in which there is an excess of value over tax cost | $ | 39,399,480 | ||||||
| Aggregate gross unrealized depreciation for all investments in which there is an excess of tax cost over value | (44,162,243 | ) | ||||||
|
| |||||||
| Net unrealized depreciation | $ | (4,762,763 | ) | |||||
|
| |||||||
See accompanying notes to financial statements.
| 42
Table of Contents
Portfolio of Investments – as of December 31, 2014
Loomis Sayles Strategic Alpha Fund – (continued)
| (b) | All of this security has been designated to cover the Fund’s obligations under open forward foreign currency contracts, futures contracts, swap agreements or options. | |||||
| (c) | Variable rate security. Rate as of December 31, 2014 is disclosed. | |||||
| (d) | Fair valued by the Fund’s adviser or deemed to be fair valued pursuant to the Fund’s pricing policies and procedures. At December 31, 2014, the value of these securities amounted to $13,112,897 or 1.0% of net assets. | |||||
| (e) | Illiquid security. At December 31, 2014, the value of these securities amounted to $11,089,571 or 0.8% of net assets. Illiquid securities are deemed to be fair valued pursuant to the Fund’s pricing policies and procedures. | |||||
| (f) | Security represents right to receive monthly interest payments on an underlying pool of mortgages. Principal shown is the outstanding par amount of the pool held as of the end of the period. | |||||
| (g) | Perpetual bond with no specified maturity date. | |||||
| (h) | The issuer is in default with respect to interest and/or principal payments. Income is not being accrued. | |||||
| (i) | Position is unsettled. Contract rate was not determined at December 31, 2014 and does not take effect until settlement date. Maturity date is not finalized until settlement date. | |||||
| (j) | Variable rate security. Rate shown represents the weighted average rate of underlying contracts at December 31, 2014. | |||||
| (k) | Counterparty is Bank of America, N.A. | |||||
| (l) | Counterparty is Deutsche Bank AG. | |||||
| (m) | Counterparty is Citibank, N.A. | |||||
| (n) | A portion of this security has been pledged as initial margin for open futures contracts. | |||||
| (o) | Interest rate represents discount rate at time of purchase; not a coupon rate. | |||||
| 144A | All or a portion of these securities are exempt from registration under Rule 144A of the Securities Act of 1933. These securities may be resold in transactions exempt from registration, normally to qualified institutional buyers. At December 31, 2014, the value of Rule 144A holdings amounted to $326,674,284 or 24.0% of net assets. | |||||
| ABS | Asset-Backed Securities | |||||
| EMTN | Euro Medium Term Note | |||||
| ETF | Exchange Traded Fund | |||||
| MTN | Medium Term Note | |||||
| REITs | Real Estate Investment Trusts | |||||
| BRL | Brazilian Real | |||||
| CNH | Chinese Yuan Renminbi Offshore | |||||
| COP | Colombian Peso | |||||
| EUR | Euro | |||||
| KRW | South Korean Won | |||||
| MXN | Mexican Peso | |||||
| NZD | New Zealand Dollar | |||||
| USD | U.S. Dollar | |||||
| ZAR | South African Rand | |||||
See accompanying notes to financial statements.
43 |
Table of Contents
Portfolio of Investments – as of December 31, 2014
Loomis Sayles Strategic Alpha Fund – (continued)
At December 31, 2014, the Fund had the following open bilateral credit default swap agreements:
| Buy Protection | ||||||||||||||||||||||||||||
| Counterparty | Reference Obligation | (Pay)/ Receive Fixed Rate | Expiration Date | Notional Value(‡) | Unamortized Up Front Premium Paid/ (Received) | Market Value | Unrealized Appreciation (Depreciation) | Fees Receivable/ (Payable) | ||||||||||||||||||||
| Bank of America, N.A. | Republic of Brazil | (1.00%) | 12/20/2019 | $ | 5,200,000 | $ | 172,544 | $ | 225,625 | $ | 53,081 | $ | (1,444 | ) | ||||||||||||||
| Bank of America, N.A. | Republic of Brazil | (1.00%) | 12/20/2019 | 1,725,000 | 59,564 | 74,847 | 15,283 | (479 | ) | |||||||||||||||||||
| Bank of America, N.A. | Republic of Brazil | (1.00%) | 12/20/2019 | 2,325,000 | 63,581 | 100,880 | 37,299 | (646 | ) | |||||||||||||||||||
| Bank of America, N.A. | Republic of Venezuela | (5.00%) | 9/20/2019 | 3,000,000 | 653,426 | 1,668,559 | 1,015,133 | (4,167 | ) | |||||||||||||||||||
| Citibank, N.A. | Republic of Brazil | (1.00%) | 12/20/2019 | 3,450,000 | 98,920 | 149,693 | 50,773 | (958 | ) | |||||||||||||||||||
|
|
|
|
|
| |||||||||||||||||||||||
| Total | $ | 2,219,604 | $ | 1,171,569 | $ | (7,694 | ) | |||||||||||||||||||||
|
|
|
|
|
| |||||||||||||||||||||||
| Sell Protection | ||||||||||||||||||||||||||||||||
| Counterparty | Reference Obligation | (Pay)/ Receive Fixed Rate | Expiration Date | Implied Credit Spread^ | Notional Value(‡) | Unamortized Up Front Premium Paid/ (Received) | Market Value | Unrealized Appreciation (Depreciation) | Fees Receivable/ (Payable) | |||||||||||||||||||||||
| Bank of America, N.A. | Transocean, Inc. | 1.00% | 12/20/2019 | 6.47 | % | $ | 1,775,000 | $ | (220,267 | ) | $ | (382,483 | ) | $ | (162,216 | ) | $ | 493 | ||||||||||||||
| Citibank, N.A. | Transocean, Inc. | 1.00% | 12/20/2019 | 6.47 | % | 600,000 | (102,245 | ) | (129,290 | ) | (27,045 | ) | 167 | |||||||||||||||||||
| Citibank, N.A. | Transocean, Inc. | 1.00% | 12/20/2019 | 6.47 | % | 3,150,000 | (390,897 | ) | (678,773 | ) | (287,876 | ) | 875 | |||||||||||||||||||
| Deutsche Bank AG | Transocean, Inc. | 1.00% | 12/20/2019 | 6.47 | % | 2,660,000 | (363,458 | ) | (573,186 | ) | (209,728 | ) | 739 | |||||||||||||||||||
| JPMorgan Chase Bank N.A. | Transocean, Inc. | 1.00% | 12/20/2019 | 6.47 | % | 1,215,000 | (214,048 | ) | (261,812 | ) | (47,764 | ) | 338 | |||||||||||||||||||
| JPMorgan Chase Bank N.A. | Transocean, Inc. | 1.00% | 12/20/2019 | 6.47 | % | 4,075,000 | (650,790 | ) | (878,095 | ) | (227,305 | ) | 1,132 | |||||||||||||||||||
| JPMorgan Chase Bank N.A. | Transocean, Inc. | 1.00% | 12/20/2019 | 6.47 | % | 2,025,000 | (336,933 | ) | (436,354 | ) | (99,421 | ) | 563 | |||||||||||||||||||
| Morgan Stanley Capital Services, Inc. | Transocean, Inc. | 1.00% | 12/20/2019 | 6.47 | % | 810,000 | (144,011 | ) | (174,542 | ) | (30,531 | ) | 225 | |||||||||||||||||||
|
|
|
|
|
| |||||||||||||||||||||||||||
| Total | $ | (3,514,535 | ) | $ | (1,091,886 | ) | $ | 4,532 | ||||||||||||||||||||||||
|
|
|
|
|
| |||||||||||||||||||||||||||
See accompanying notes to financial statements.
| 44
Table of Contents
Portfolio of Investments – as of December 31, 2014
Loomis Sayles Strategic Alpha Fund – (continued)
At December 31, 2014, the Fund had the following open centrally cleared credit default swap agreements:
| Sell Protection | ||||||||||||||||||||||||
Reference Obligation | (Pay)/ Receive Fixed Rate | Expiration Date | Implied Credit Spread^ | Notional Value(‡) | Market Value | Unrealized Appreciation (Depreciation) | Fees Receivable/ (Payable) | |||||||||||||||||
| CDX.NA.HY* Series 23, 5-Year | 5.00% | 12/20/2019 | 3.56 | % | $ | 10,100,000 | $ | 626,210 | $ | 454 | $ | 1,403 | ||||||||||||
| CDX.NA.HY* Series 23, 5-Year | 5.00% | 12/20/2019 | 3.56 | % | 10,100,000 | 626,210 | (6,565 | ) | 1,403 | |||||||||||||||
| CDX.NA.HY* Series 23, 5-Year | 5.00% | 12/20/2019 | 3.56 | % | 13,575,000 | 841,663 | 18,679 | — | ||||||||||||||||
|
|
|
|
|
| |||||||||||||||||||
| Total | $ | 2,094,083 | $ | 12,568 | $ | 2,806 | ||||||||||||||||||
|
|
|
|
|
| |||||||||||||||||||
| (‡) | Notional value stated in U.S. dollars unless otherwise noted. |
| ^ | Implied credit spreads, represented in absolute terms, serve as an indicator of the current status of the payment/performance risk and represent the likelihood or risk of default for the credit derivative. The implied credit spread of a particular reference entity reflects the cost of buying/selling protection and may include upfront payments required to be made to enter into the agreement. Wider credit spreads represent a deterioration of the reference entity’s credit soundness and a greater likelihood or risk of default or other credit event occurring as defined under the terms of the agreement. |
| * | CDX.NA.HY is an index composed of North American high yield credit default swaps. |
At December 31, 2014, the Fund had the following open forward foreign currency contracts:
Contract Buy/Sell | Delivery Date | Currency | Units of Currency | Notional Value | Unrealized Appreciation (Depreciation) | |||||||||||||
| Buy1 | 1/08/2015 | Australian Dollar | 29,625,000 | $ | 24,180,559 | $ | (605,701 | ) | ||||||||||
| Sell1 | 1/26/2015 | Brazilian Real | 35,880,000 | 13,421,581 | 8,573 | |||||||||||||
| Sell2 | 1/15/2015 | Colombian Peso | 18,400,000,000 | 7,740,797 | (70,935 | ) | ||||||||||||
| Buy3 | 1/02/2015 | Euro | 540,000 | 653,427 | (19,579 | ) | ||||||||||||
| Buy1 | 1/02/2015 | Euro | 3,350,000 | 4,053,668 | (22,042 | ) | ||||||||||||
| Buy1 | 1/05/2015 | Euro | 4,900,000 | 5,929,246 | (76,170 | ) | ||||||||||||
| Sell1 | 1/02/2015 | Euro | 3,350,000 | 4,053,668 | 137,269 | |||||||||||||
| Sell3 | 1/02/2015 | Euro | 540,000 | 653,427 | 22,275 | |||||||||||||
| Sell1 | 1/05/2015 | Euro | 4,900,000 | 5,929,246 | 200,816 | |||||||||||||
| Sell1 | 1/22/2015 | Euro | 9,845,000 | 11,915,103 | 179,006 | |||||||||||||
| Sell1 | 1/29/2015 | Euro | 20,800,000 | 25,175,485 | 171,395 | |||||||||||||
| Sell1 | 2/02/2015 | Euro | 3,350,000 | 4,054,878 | 22,025 | |||||||||||||
| Buy2 | 1/20/2015 | Japanese Yen | 3,080,000,000 | 25,716,843 | (415,191 | ) | ||||||||||||
| Sell1 | 1/08/2015 | Malaysian Ringgit | 44,000,000 | 12,580,983 | 140,560 | |||||||||||||
| Buy1 | 1/02/2015 | Mexican Peso | 870,300,000 | 58,988,393 | (63,440 | ) | ||||||||||||
| Sell1 | 1/02/2015 | Mexican Peso | 870,300,000 | 58,988,393 | 4,375,738 | |||||||||||||
| Sell1 | 1/22/2015 | Mexican Peso | 5,362,500 | 363,092 | 5,320 | |||||||||||||
| Sell1 | 2/03/2015 | Mexican Peso | 870,300,000 | 58,884,783 | 54,273 | |||||||||||||
| Sell2 | 1/08/2015 | New Taiwan Dollar | 400,000,000 | 12,657,530 | 220,770 | |||||||||||||
| Sell1 | 1/08/2015 | New Zealand Dollar | 32,800,000 | 25,580,610 | (141,914 | ) | ||||||||||||
| Sell4 | 1/20/2015 | New Zealand Dollar | 8,860,000 | 6,901,740 | (67,844 | ) | ||||||||||||
| Buy1 | 1/05/2015 | Singapore Dollar | 17,000,000 | 12,833,579 | (53,215 | ) | ||||||||||||
| Sell1 | 1/05/2015 | Singapore Dollar | 17,000,000 | 12,833,579 | 117,322 | |||||||||||||
| Buy5 | 1/08/2015 | South Korean Won | 13,500,000,000 | 12,280,272 | 45,362 | |||||||||||||
See accompanying notes to financial statements.
45 |
Table of Contents
Portfolio of Investments – as of December 31, 2014
Loomis Sayles Strategic Alpha Fund – (continued)
Contract Buy/Sell (continued) | Delivery Date | Currency | Units of Currency | Notional Value | Unrealized Appreciation (Depreciation) | |||||||||||||
| Sell5 | 1/08/2015 | South Korean Won | 28,400,000,000 | $ | 25,834,054 | $ | (421,320 | ) | ||||||||||
| Sell1 | 1/12/2015 | Turkish Lira | 27,000,000 | 11,537,929 | 257,615 | |||||||||||||
| Sell2 | 1/12/2015 | Turkish Lira | 17,000,000 | 7,264,622 | 162,851 | |||||||||||||
|
| |||||||||||||||||
| Total | $ | 4,163,819 | ||||||||||||||||
|
| |||||||||||||||||
1 Counterparty is Credit Suisse International.
2 Counterparty is Bank of America, N.A.
3 Counterparty is Deutsche Bank AG.
4 Counterparty is Citibank, N.A.
5 Counterparty is Barclays Bank PLC.
At December 31, 2014, open short futures contracts were as follows:
| Financial Futures | Expiration Date | Contracts | Notional Value | Unrealized Appreciation (Depreciation) | ||||||||||||
E-mini S&P 500® | 3/20/2015 | 774 | $ | 79,427,880 | $ | (3,364,895 | ) | |||||||||
|
| |||||||||||||||
Industry Summary at December 31, 2014
ABS Home Equity | 11.6 | % | ||
Technology | 5.9 | |||
Banking | 5.1 | |||
Automotive | 4.1 | |||
Non-Agency Commercial Mortgage-Backed Securities | 4.0 | |||
Treasuries | 3.9 | |||
Pharmaceuticals | 3.7 | |||
ABS Credit Card | 3.5 | |||
Finance Companies | 2.9 | |||
ABS Other | 2.5 | |||
Cable Satellite | 2.1 | |||
Independent Energy | 2.1 | |||
Other Investments, less than 2% each | 38.6 | |||
Short-Term Investments | 9.5 | |||
|
| |||
Total Investments | 99.5 | |||
Other assets less liabilities (including open written options/swaptions, swap agreements, forward foreign currency contracts and futures contracts) | 0.5 | |||
|
| |||
Net Assets | 100.0 | % | ||
|
|
See accompanying notes to financial statements.
| 46
Table of Contents
Statements of Assets and Liabilities
December 31, 2014
| Gateway Equity Call Premium Fund | Loomis Sayles Strategic Alpha Fund | |||||||
ASSETS | ||||||||
Investments at cost | $ | 19,467,927 | $ | 1,241,214,938 | ||||
Repurchase agreement(s) at cost | 3,636,299 | 119,645,419 | ||||||
Net unrealized appreciation (depreciation) | 426,760 | (3,964,979 | ) | |||||
|
|
|
| |||||
Investments at value | 23,530,986 | 1,356,895,378 | ||||||
Cash | 195 | 21,097 | ||||||
Due from brokers (Note 2) | — | 7,415,000 | ||||||
Foreign currency at value (identified cost $0 and $3,111,502, respectively) | — | 3,085,750 | ||||||
Receivable for Fund shares sold | 135,334 | 8,096,566 | ||||||
Receivable from investment adviser (Note 6) | 26,892 | — | ||||||
Receivable for securities sold | — | 12,122 | ||||||
Collateral received for open forward foreign currency contracts, options/swaptions or swap agreements (Notes 2 and 4) | — | 7,763,447 | ||||||
Dividends and interest receivable | 18,044 | 7,143,821 | ||||||
Unrealized appreciation on bilateral swap agreements (Note 2) | — | 1,171,569 | ||||||
Unrealized appreciation on forward foreign currency contracts (Note 2) | — | 6,121,170 | ||||||
Tax reclaims receivable | — | 20,410 | ||||||
Receivable for variation margin on futures contracts (Note 2) | — | 940,573 | ||||||
Receivable for variation margin on centrally cleared swap agreements (Note 2) | — | 32,803 | ||||||
Unamortized upfront premiums paid on bilateral swap agreements (Note 2) | — | 1,048,035 | ||||||
Fees receivable on swap agreements (Note 2) | — | 7,338 | ||||||
|
|
|
| |||||
TOTAL ASSETS | 23,711,451 | 1,399,775,079 | ||||||
|
|
|
| |||||
LIABILITIES | ||||||||
Options written, at value (premiums received $424,650 and $443,011, respectively) (Note 2) | 357,910 | 169,075 | ||||||
Payable for securities purchased | 2,370,281 | 19,328,138 | ||||||
Unrealized depreciation on bilateral swap agreements (Note 2) | — | 1,091,886 | ||||||
Payable for Fund shares redeemed | — | 2,067,798 | ||||||
Unrealized depreciation on forward foreign currency contracts (Note 2) | — | 1,957,351 | ||||||
Unamortized upfront premiums received on bilateral swap agreements (Note 2) | — | 2,422,649 | ||||||
Due to brokers (Note 2) | — | 7,763,447 | ||||||
Fees payable on swap agreements (Note 2) | — | 7,694 | ||||||
Management fees payable (Note 6) | — | 802,268 | ||||||
Deferred Trustees’ fees (Note 6) | 2,278 | 62,884 | ||||||
Administrative fees payable (Note 6) | 535 | 48,989 | ||||||
Payable to distributor (Note 6d) | 46 | 9,802 | ||||||
Other accounts payable and accrued expenses | 68,577 | 168,192 | ||||||
|
|
|
| |||||
TOTAL LIABILITIES | 2,799,627 | 35,900,173 | ||||||
|
|
|
| |||||
NET ASSETS | $ | 20,911,824 | $ | 1,363,874,906 | ||||
|
|
|
| |||||
NET ASSETS CONSIST OF: | ||||||||
Paid-in capital | $ | 20,927,807 | $ | 1,412,020,378 | ||||
Undistributed (Distributions in excess of) net investment income | (2,278 | ) | 6,428,340 | |||||
Accumulated net realized loss on investments, futures contracts, options/swaptions written, swap agreements and foreign currency transactions | (507,205 | ) | (51,726,907 | ) | ||||
Net unrealized appreciation (depreciation) on investments, futures contracts, options/swaptions written, swap agreements and foreign currency translations | 493,500 | (2,846,905 | ) | |||||
|
|
|
| |||||
NET ASSETS | $ | 20,911,824 | $ | 1,363,874,906 | ||||
|
|
|
| |||||
See accompanying notes to financial statements.
47 |
Table of Contents
Statements of Assets and Liabilities (continued)
December 31, 2014
| Gateway Equity Call Premium Fund | Loomis Sayles Strategic Alpha Fund | |||||||
COMPUTATION OF NET ASSET VALUE AND OFFERING PRICE: | ||||||||
Class A shares: | ||||||||
Net assets | $ | 95,579 | $ | 104,055,520 | ||||
|
|
|
| |||||
Shares of beneficial interest | 9,593 | 10,447,388 | ||||||
|
|
|
| |||||
Net asset value and redemption price per share | $ | 9.96 | $ | 9.96 | ||||
|
|
|
| |||||
Offering price per share (100/[100-maximum sales charge] of net asset value) (Note 1) | $ | 10.57 | $ | 10.43 | ||||
|
|
|
| |||||
Class C shares: (redemption price per share is equal to net asset value less any applicable contingent deferred sales charge) (Note 1) | ||||||||
Net assets | $ | 1,000 | $ | 71,214,856 | ||||
|
|
|
| |||||
Shares of beneficial interest | 100 | 7,174,994 | ||||||
|
|
|
| |||||
Net asset value and offering price per share | $ | 9.97 | * | $ | 9.93 | |||
|
|
|
| |||||
Class Y shares: | ||||||||
Net assets | $ | 20,815,245 | $ | 1,188,604,530 | ||||
|
|
|
| |||||
Shares of beneficial interest | 2,087,634 | 119,472,616 | ||||||
|
|
|
| |||||
Net asset value, offering and redemption price per share | $ | 9.97 | $ | 9.95 | ||||
|
|
|
| |||||
| * | Net asset value calculations reflect fractional share and dollar amounts. |
See accompanying notes to financial statements.
| 48
Table of Contents
Statements of Operations
For the Year Ended December 31, 2014
| Gateway Equity Call Premium Fund (a) | Loomis Sayles Strategic Alpha Fund (b) | |||||||
INVESTMENT INCOME | ||||||||
Interest | $ | 28 | $ | 44,510,335 | ||||
Dividends | 60,612 | 5,631,648 | ||||||
Less net foreign taxes withheld | (27 | ) | (66,968 | ) | ||||
|
|
|
| |||||
| 60,613 | 50,075,015 | |||||||
|
|
|
| |||||
Expenses | ||||||||
Management fees (Note 6) | 20,243 | 8,848,129 | ||||||
Service and distribution fees (Note 6) | 37 | 1,173,852 | ||||||
Administrative fees (Note 6) | 1,333 | 546,169 | ||||||
Trustees’ fees and expenses (Note 6) | 3,722 | 39,710 | ||||||
Transfer agent fees and expenses (Note 6) | 275 | 778,284 | ||||||
Audit and tax services fees | 40,714 | 84,918 | ||||||
Custodian fees and expenses | 16,505 | 195,168 | ||||||
Legal fees | 27 | 9,984 | ||||||
Registration fees | 21,928 | 161,767 | ||||||
Shareholder reporting expenses | 1,768 | 46,295 | ||||||
Miscellaneous expenses | 3,797 | 42,056 | ||||||
|
|
|
| |||||
Total expenses | 110,349 | 11,926,332 | ||||||
Less waiver and/or expense reimbursement (Note 6) | (80,681 | ) | — | |||||
|
|
|
| |||||
Net expenses | 29,668 | 11,926,332 | ||||||
|
|
|
| |||||
Net investment income | 30,945 | 38,148,683 | ||||||
|
|
|
| |||||
NET REALIZED AND UNREALIZED GAIN (LOSS) ON INVESTMENTS, FUTURES CONTRACTS, OPTIONS/SWAPTIONS WRITTEN, SWAP AGREEMENTS AND FOREIGN CURRENCY TRANSACTIONS | ||||||||
Net realized gain (loss) on: | ||||||||
Investments | (112,549 | ) | 14,800,957 | |||||
Futures contracts | — | (23,295,473 | ) | |||||
Options/swaptions written | (395,341 | ) | 3,282,174 | |||||
Swap agreements | — | (5,591,727 | ) | |||||
Foreign currency transactions | — | 9,385,502 | ||||||
Net change in unrealized appreciation (depreciation) on: | ||||||||
Investments | 426,760 | (8,779,112 | ) | |||||
Futures contracts | — | (5,072,552 | ) | |||||
Options/swaptions written | 66,740 | 126,727 | ||||||
Swap agreements | — | 1,921,098 | ||||||
Foreign currency translations | — | 3,821,302 | ||||||
|
|
|
| |||||
Net realized and unrealized loss on investments, futures contracts, options/swaptions written, swap agreements and foreign currency transactions | (14,390 | ) | (9,401,104 | ) | ||||
|
|
|
| |||||
NET INCREASE IN NET ASSETS RESULTING FROM OPERATIONS | $ | 16,555 | $ | 28,747,579 | ||||
|
|
|
| |||||
| (a) | From commencement of operations on September 30, 2014 through December 31, 2014. |
| (b) | Includes a non-recurring dividend of $928,128. |
See accompanying notes to financial statements.
49 |
Table of Contents
Statements of Changes in Net Assets
| Gateway Equity Call Premium Fund | Loomis Sayles Strategic Alpha Fund | |||||||||||
| Period Ended December 31, 2014(a) | Year Ended December 31, 2014 | Year Ended December 31, 2013 | ||||||||||
FROM OPERATIONS: | ||||||||||||
Net investment income | $ | 30,945 | $ | 38,148,683 | $ | 42,429,002 | ||||||
Net realized loss on investments, futures contracts, options/swaptions written, swap agreements and foreign currency transactions | (507,890 | ) | (1,418,567 | ) | (29,265,397 | ) | ||||||
Net change in unrealized appreciation (depreciation) on investments, futures contracts, options/swaptions written, swap agreements and foreign currency translations | 493,500 | (7,982,537 | ) | (11,633,783 | ) | |||||||
|
|
|
|
|
| |||||||
Net increase in net assets resulting from operations | 16,555 | 28,747,579 | 1,529,822 | |||||||||
|
|
|
|
|
| |||||||
FROM DISTRIBUTIONS TO SHAREHOLDERS: | ||||||||||||
Net investment income | ||||||||||||
Class A | (379 | ) | (4,068,797 | ) | (4,183,150 | ) | ||||||
Class C | (2 | ) | (1,878,950 | ) | (1,514,071 | ) | ||||||
Class Y | (54,347 | ) | (37,780,827 | ) | (22,714,766 | ) | ||||||
|
|
|
|
|
| |||||||
Total distributions | (54,728 | ) | (43,728,574 | ) | (28,411,987 | ) | ||||||
|
|
|
|
|
| |||||||
NET INCREASE IN NET ASSETS FROM CAPITAL SHARE TRANSACTIONS (NOTE 10) | 20,949,997 | 139,284,341 | 620,354,079 | |||||||||
|
|
|
|
|
| |||||||
Net increase in net assets | 20,911,824 | 124,303,346 | 593,471,914 | |||||||||
NET ASSETS | ||||||||||||
Beginning of the year | — | 1,239,571,560 | 646,099,646 | |||||||||
|
|
|
|
|
| |||||||
End of the year | $ | 20,911,824 | $ | 1,363,874,906 | $ | 1,239,571,560 | ||||||
|
|
|
|
|
| |||||||
UNDISTRIBUTED (DISTRIBUTIONS IN EXCESS OF) NET INVESTMENT INCOME | $ | (2,278 | ) | $ | 6,428,340 | $ | (569,723 | ) | ||||
|
|
|
|
|
| |||||||
| (a) | From commencement of operations on September 30, 2014 through December 31, 2014. |
See accompanying notes to financial statements.
| 50
Table of Contents
Financial Highlights
For a share outstanding throughout each period.
| Gateway Equity Call Premium Fund—Class A | ||||
| Period Ended December 31, 2014* | ||||
Net asset value, beginning of the period | $ | 10.00 | ||
|
| |||
INCOME (LOSS) FROM INVESTMENT OPERATIONS: | ||||
Net investment income(a) | 0.02 | |||
Net realized and unrealized gain (loss) | (0.02 | ) | ||
|
| |||
Total from Investment Operations | 0.00 | (b) | ||
|
| |||
LESS DISTRIBUTIONS FROM: | ||||
Net investment income | (0.04 | ) | ||
Net realized capital gains | — | |||
|
| |||
Total Distributions | (0.04 | ) | ||
|
| |||
Net asset value, end of the period | $ | 9.96 | ||
|
| |||
Total return(c)(d) | 0.00 | % | ||
RATIOS TO AVERAGE NET ASSETS: | ||||
Net assets, end of the period (000’s) | $ | 96 | ||
Net expenses(e)(f) | 1.20 | % | ||
Gross expenses(f) | 3.69 | % | ||
Net investment income(f) | 0.84 | % | ||
Portfolio turnover rate | 7 | % | ||
| * | From commencement of operations on September 30, 2014 through December 31, 2014. |
| (a) | Per share net investment income has been calculated using the average shares outstanding during the period. |
| (b) | Amount rounds to less than $0.01 per share. |
| (c) | A sales charge for Class A shares is not reflected in total return calculations. |
| (d) | Had certain expenses not been waived/reimbursed during the period, total returns would have been lower. Periods less than one year are not annualized. |
| (e) | The investment adviser agreed to waive its fees and/or reimburse a portion of the Fund’s expenses during the period. Without this waiver/reimbursement, expenses would have been higher. |
| (f) | Computed on an annualized basis for periods less than one year. |
See accompanying notes to financial statements.
51 |
Table of Contents
Financial Highlights (continued)
For a share outstanding throughout each period.
| Gateway Equity Call Premium Fund—Class C | ||||
| Period Ended December 31, 2014* | ||||
Net asset value, beginning of the period | $ | 10.00 | ||
|
| |||
INCOME (LOSS) FROM INVESTMENT OPERATIONS: | ||||
Net investment income(a) | 0.00 | (b) | ||
Net realized and unrealized gain (loss) | (0.01 | ) | ||
|
| |||
Total from Investment Operations | (0.01 | ) | ||
|
| |||
LESS DISTRIBUTIONS FROM: | ||||
Net investment income | (0.02 | ) | ||
Net realized capital gains | — | |||
|
| |||
Total Distributions | (0.02 | ) | ||
|
| |||
Net asset value, end of the period | $ | 9.97 | ||
|
| |||
Total return(c)(d) | (0.12 | )% | ||
RATIOS TO AVERAGE NET ASSETS: | ||||
Net assets, end of the period (000’s) | $ | 1 | ||
Net expenses(e)(f) | 1.95 | % | ||
Gross expenses(f) | 4.37 | % | ||
Net investment income(f) | 0.01 | % | ||
Portfolio turnover rate | 7 | % | ||
| * | From commencement of operations on September 30, 2014 through December 31, 2014. |
| (a) | Per share net investment income has been calculated using the average shares outstanding during the period. |
| (b) | Amount rounds to less than $0.01 per share. |
| (c) | A contingent deferred sales charge for Class C shares is not reflected in total return calculations. |
| (d) | Had certain expenses not been waived/reimbursed during the period, total returns would have been lower. Periods less than one year are not annualized. |
| (e) | The investment adviser agreed to waive its fees and/or reimburse a portion of the Fund’s expenses during the period. Without this waiver/reimbursement, expenses would have been higher. |
| (f) | Computed on an annualized basis for periods less than one year. |
See accompanying notes to financial statements.
| 52
Table of Contents
Financial Highlights (continued)
For a share outstanding throughout each period.
| Gateway Equity Call Premium Fund—Class Y | ||||
| Period Ended December 31, 2014* | ||||
Net asset value, beginning of the period | $ | 10.00 | ||
|
| |||
INCOME (LOSS) FROM INVESTMENT OPERATIONS: | ||||
Net investment income(a) | 0.02 | |||
Net realized and unrealized gain (loss) | (0.01 | ) | ||
|
| |||
Total from Investment Operations | 0.01 | |||
|
| |||
LESS DISTRIBUTIONS FROM: | ||||
Net investment income | (0.04 | ) | ||
Net realized capital gains | — | |||
|
| |||
Total Distributions | (0.04 | ) | ||
|
| |||
Net asset value, end of the period | $ | 9.97 | ||
|
| |||
Total return(b) | 0.13 | % | ||
RATIOS TO AVERAGE NET ASSETS: | ||||
Net assets, end of the period (000’s) | $ | 20,815 | ||
Net expenses(c)(d) | 0.95 | % | ||
Gross expenses(d) | 3.54 | % | ||
Net investment income(d) | 0.99 | % | ||
Portfolio turnover rate | 7 | % | ||
| * | From commencement of operations on September 30, 2014 through December 31, 2014. |
| (a) | Per share net investment income has been calculated using the average shares outstanding during the period. |
| (b) | Had certain expenses not been waived/reimbursed during the period, total returns would have been lower. Periods less than one year are not annualized. |
| (c) | The investment adviser agreed to waive its fees and/or reimburse a portion of the Fund’s expenses during the period. Without this waiver/reimbursement, expenses would have been higher. |
| (d) | Computed on an annualized basis for periods less than one year. |
See accompanying notes to financial statements.
53 |
Table of Contents
Financial Highlights (continued)
For a share outstanding throughout each period.
| Loomis Sayles Strategic Alpha Fund—Class A | ||||||||||||||||||||
| Year Ended December 31, 2014 | Year Ended December 31, 2013 | Year Ended December 31, 2012 | Year Ended December 31, 2011 | Period Ended December 31, 2010* | ||||||||||||||||
Net asset value, beginning of the period | $ | 10.06 | $ | 10.20 | $ | 9.34 | $ | 10.06 | $ | 10.00 | ||||||||||
|
|
|
|
|
|
|
|
|
| |||||||||||
INCOME (LOSS) FROM INVESTMENT OPERATIONS: | ||||||||||||||||||||
Net investment income(a) | 0.29 | (b) | 0.37 | 0.37 | 0.34 | 0.00 | (c) | |||||||||||||
Net realized and unrealized gain (loss) | (0.07 | ) | (0.28 | ) | 0.77 | (0.75 | ) | 0.06 | ||||||||||||
|
|
|
|
|
|
|
|
|
| |||||||||||
Total from Investment Operations | 0.22 | 0.09 | 1.14 | (0.41 | ) | 0.06 | ||||||||||||||
|
|
|
|
|
|
|
|
|
| |||||||||||
LESS DISTRIBUTIONS FROM: | ||||||||||||||||||||
Net investment income | (0.32 | ) | (0.23 | ) | (0.28 | ) | (0.31 | ) | (0.00 | )(c) | ||||||||||
Net realized capital gains | — | — | — | (0.00 | )(c) | — | ||||||||||||||
|
|
|
|
|
|
|
|
|
| |||||||||||
Total Distributions | (0.32 | ) | (0.23 | ) | (0.28 | ) | (0.31 | ) | (0.00 | ) | ||||||||||
|
|
|
|
|
|
|
|
|
| |||||||||||
Net asset value, end of the period | $ | 9.96 | $ | 10.06 | $ | 10.20 | $ | 9.34 | $ | 10.06 | ||||||||||
|
|
|
|
|
|
|
|
|
| |||||||||||
Total return(d) | 2.24 | %(b) | 0.96 | % | 12.24 | % | (3.90 | )% | 0.41 | %(e) | ||||||||||
RATIOS TO AVERAGE NET ASSETS: | ||||||||||||||||||||
Net assets, end of the period (000’s) | $ | 104,056 | $ | 177,339 | $ | 80,704 | $ | 130,662 | $ | 2,465 | ||||||||||
Net expenses | 1.10 | % | 1.11 | % | 1.12 | % | 1.15 | %(f) | 1.30 | %(g)(h) | ||||||||||
Gross expenses | 1.10 | % | 1.11 | % | 1.12 | % | 1.15 | %(f) | 6.98 | %(h) | ||||||||||
Net investment income | 2.90 | %(b) | 3.68 | % | 3.77 | % | 3.50 | % | 0.86 | %(h) | ||||||||||
Portfolio turnover rate | 87 | % | 115 | % | 116 | % | 141 | % | 39 | % | ||||||||||
| * | From commencement of operations on December 15, 2010 through December 31, 2010. |
| (a) | Per share net investment income has been calculated using the average shares outstanding during the period. |
| (b) | Includes a non-recurring dividend. Without this dividend, net investment income per share would have been $0.28, total return would have been 2.14% and the ratio of net investment income to average net assets would have been 2.81%. |
| (c) | Amount rounds to less than $0.01 per share. |
| (d) | A sales charge for Class A shares is not reflected in total return calculations. |
| (e) | Had certain expenses not been waived/reimbursed during the period, total returns would have been lower. Periods less than one year are not annualized. |
| (f) | Includes fee/expense recovery of less than 0.01%. |
| (g) | The investment adviser agreed to waive its fees and/or reimburse a portion of the Fund’s expenses during the period. Without this waiver/reimbursement, expenses would have been higher. |
| (h) | Computed on an annualized basis for periods less than one year. |
See accompanying notes to financial statements.
| 54
Table of Contents
Financial Highlights (continued)
For a share outstanding throughout each period.
| Loomis Sayles Strategic Alpha Fund—Class C | ||||||||||||||||||||
| Year Ended December 31, 2014 | Year Ended December 31, 2013 | Year Ended December 31, 2012 | Year Ended December 31, 2011 | Period Ended December 31, 2010* | ||||||||||||||||
Net asset value, beginning of the period | $ | 10.03 | $ | 10.16 | $ | 9.31 | $ | 10.05 | $ | 10.00 | ||||||||||
|
|
|
|
|
|
|
|
|
| |||||||||||
INCOME (LOSS) FROM INVESTMENT OPERATIONS: | ||||||||||||||||||||
Net investment income(a) | 0.21 | (b) | 0.30 | 0.30 | 0.28 | 0.00 | (c) | |||||||||||||
Net realized and unrealized gain (loss) | (0.06 | ) | (0.28 | ) | 0.76 | (0.77 | ) | 0.05 | ||||||||||||
|
|
|
|
|
|
|
|
|
| |||||||||||
Total from Investment Operations | 0.15 | 0.02 | 1.06 | (0.49 | ) | 0.05 | ||||||||||||||
|
|
|
|
|
|
|
|
|
| |||||||||||
LESS DISTRIBUTIONS FROM: |
| |||||||||||||||||||
Net investment income | (0.25 | ) | (0.15 | ) | (0.21 | ) | (0.25 | ) | (0.00 | )(c) | ||||||||||
Net realized capital gains | — | — | — | (0.00 | )(c) | — | ||||||||||||||
|
|
|
|
|
|
|
|
|
| |||||||||||
Total Distributions | (0.25 | ) | (0.15 | ) | (0.21 | ) | (0.25 | ) | (0.00 | ) | ||||||||||
|
|
|
|
|
|
|
|
|
| |||||||||||
Net asset value, end of the period | $ | 9.93 | $ | 10.03 | $ | 10.16 | $ | 9.31 | $ | 10.05 | ||||||||||
|
|
|
|
|
|
|
|
|
| |||||||||||
Total return(d) | 1.47 | %(b) | 0.22 | % | 11.44 | % | (4.69 | )% | 0.31 | %(e) | ||||||||||
RATIOS TO AVERAGE NET ASSETS: | ||||||||||||||||||||
Net assets, end of the period (000’s) | $ | 71,215 | $ | 91,694 | $ | 67,748 | $ | 77,398 | $ | 563 | ||||||||||
Net expenses | 1.85 | % | 1.86 | % | 1.87 | % | 1.89 | %(f) | 2.05 | %(g)(h) | ||||||||||
Gross expenses | 1.85 | % | 1.86 | % | 1.87 | % | 1.89 | %(f) | 8.68 | %(h) | ||||||||||
Net investment income | 2.13 | %(b) | 2.96 | % | 3.05 | % | 2.82 | % | 0.24 | %(h) | ||||||||||
Portfolio turnover rate | 87 | % | 115 | % | 116 | % | 141 | % | 39 | % | ||||||||||
| * | From commencement of operations on December 15, 2010 through December 31, 2010. |
| (a) | Per share net investment income has been calculated using the average shares outstanding during the period. |
| (b) | Includes a non-recurring dividend. Without this dividend, net investment income per share would have been $0.21, total return would have been 1.37% and the ratio of net investment income to average net assets would have been 2.05%. |
| (c) | Amount rounds to less than $0.01 per share. |
| (d) | A contingent deferred sales charge for Class C shares is not reflected in total return calculations. |
| (e) | Had certain expenses not been waived/reimbursed during the period, total returns would have been lower. Periods less than one year are not annualized. |
| (f) | Includes fee/expense recovery of less than 0.01%. |
| (g) | The investment adviser agreed to waive its fees and/or reimburse a portion of the Fund’s expenses during the period. Without this waiver/reimbursement, expenses would have been higher. |
| (h) | Computed on an annualized basis for periods less than one year. |
See accompanying notes to financial statements.
55 |
Table of Contents
Financial Highlights (continued)
For a share outstanding throughout each period.
| Loomis Sayles Strategic Alpha Fund—Class Y | ||||||||||||||||||||
| Year Ended December 31, 2014 | Year Ended December 31, 2013 | Year Ended December 31, 2012 | Year Ended December 31, 2011 | Period Ended December 31, 2010* | ||||||||||||||||
Net asset value, beginning of the period | $ | 10.05 | $ | 10.19 | $ | 9.33 | $ | 10.05 | $ | 10.00 | ||||||||||
|
|
|
|
|
|
|
|
|
| |||||||||||
INCOME (LOSS) FROM INVESTMENT OPERATIONS: | ||||||||||||||||||||
Net investment income(a) | 0.31 | (b) | 0.40 | 0.41 | 0.37 | 0.00 | (c) | |||||||||||||
Net realized and unrealized gain (loss) | (0.06 | ) | (0.29 | ) | 0.76 | (0.75 | ) | 0.05 | ||||||||||||
|
|
|
|
|
|
|
|
|
| |||||||||||
Total from Investment Operations | 0.25 | 0.11 | 1.17 | (0.38 | ) | 0.05 | ||||||||||||||
|
|
|
|
|
|
|
|
|
| |||||||||||
LESS DISTRIBUTIONS FROM: | ||||||||||||||||||||
Net investment income | (0.35 | ) | (0.25 | ) | (0.31 | ) | (0.34 | ) | (0.00 | )(c) | ||||||||||
Net realized capital gains | — | — | — | (0.00 | )(c) | — | ||||||||||||||
|
|
|
|
|
|
|
|
|
| |||||||||||
Total Distributions | (0.35 | ) | (0.25 | ) | (0.31 | ) | (0.34 | ) | (0.00 | ) | ||||||||||
|
|
|
|
|
|
|
|
|
| |||||||||||
Net asset value, end of the period | $ | 9.95 | $ | 10.05 | $ | 10.19 | $ | 9.33 | $ | 10.05 | ||||||||||
|
|
|
|
|
|
|
|
|
| |||||||||||
Total return | 2.52 | %(b) | 1.19 | % | 12.57 | % | (3.78 | )% | 0.41 | %(d) | ||||||||||
RATIOS TO AVERAGE NET ASSETS: | ||||||||||||||||||||
Net assets, end of the period (000’s) | $ | 1,188,605 | $ | 970,539 | $ | 497,648 | $ | 273,335 | $ | 26,758 | ||||||||||
Net expenses | 0.85 | % | 0.86 | % | 0.87 | % | 0.90 | %(e) | 1.05 | %(f)(g)�� | ||||||||||
Gross expenses | 0.85 | % | 0.86 | % | 0.87 | % | 0.90 | %(e) | 5.37 | %(g) | ||||||||||
Net investment income | 3.10 | %(b) | 3.92 | % | 4.09 | % | 3.81 | % | 0.06 | %(g) | ||||||||||
Portfolio turnover rate | 87 | % | 115 | % | 116 | % | 141 | % | 39 | % | ||||||||||
| * | From commencement of operations on December 15, 2010 through December 31, 2010. |
| (a) | Per share net investment income has been calculated using the average shares outstanding during the period. |
| (b) | Includes a non-recurring dividend. Without this dividend, net investment income per share would have been $0.31, total return would have been 2.42% and the ratio of net investment income to average net assets would have been 3.03%. |
| (c) | Amount rounds to less than $0.01 per share. |
| (d) | Had certain expenses not been waived/reimbursed during the period, total returns would have been lower. Periods less than one year are not annualized. |
| (e) | Includes fee/expense recovery of less than 0.01%. |
| (f) | The investment adviser agreed to waive its fees and/or reimburse a portion of the Fund’s expenses during the period. Without this waiver/reimbursement, expenses would have been higher. |
| (g) | Computed on an annualized basis for periods less than one year. |
See accompanying notes to financial statements.
| 56
Table of Contents
December 31, 2014
1. Organization. Gateway Trust and Natixis Funds Trust II (the “Trusts” and each a “Trust”) are each organized as a Massachusetts business trust. Each Trust is registered under the Investment Company Act of 1940, as amended (the “1940 Act”), as an open-end management investment company. Each Declaration of Trust permits the Board of Trustees to authorize the issuance of an unlimited number of shares of the Trust in multiple series. The financial statements for certain funds of the Trusts are presented in separate reports. The following funds (individually, a “Fund” and collectively, the “Funds”) are included in this report:
Gateway Trust:
Gateway Equity Call Premium Fund
Natixis Funds Trust II:
Loomis Sayles Strategic Alpha Fund (the “Strategic Alpha Fund”)
The Gateway Equity Call Premium Fund commenced operations on September 30, 2014 via contribution to the Fund by Natixis Global Asset Management, L.P. (“Natixis US”) and affiliates of $5,002,000 and by Gateway Investment Advisers, LLC (“Gateway Advisers”) of $5,000,000.
The Gateway Equity Call Premium Fund is a diversified investment company. The Strategic Alpha Fund is a non-diversified investment company.
Each Fund offers Class A, Class C and Class Y shares. Class A shares are sold with a maximum front-end sales charge of 5.75% for Gateway Equity Call Premium Fund and 4.50% for Strategic Alpha Fund. Class C shares do not pay a front-end sales charge, do not convert to any other class of shares, pay higher Rule 12b-1 fees than Class A shares and may be subject to a contingent deferred sales charge (“CDSC”) of 1.00% if those shares are redeemed within one year of acquisition, except for reinvested distributions. Class Y shares do not pay a front-end sales charge, a CDSC or Rule 12b-1 fees. Class Y shares are intended for institutional investors with a minimum initial investment of $100,000, though some categories of investors are exempted from the minimum investment amount as outlined in the Funds’ prospectus.
Most expenses can be directly attributed to a Fund. Expenses which cannot be directly attributed to a Fund are generally apportioned based on the relative net assets of each of the funds in Natixis Funds Trust I, Natixis Funds Trust II, Natixis Funds Trust IV, Gateway Trust (“Natixis Funds Trusts”), Loomis Sayles Funds I and Loomis Sayles Funds II (“Loomis Sayles Funds Trusts”). Expenses of a Fund are borne pro rata by the holders of each class of shares, except that each class bears expenses unique to that class (including the Rule 12b-1 service and distribution fees). In addition, each class votes as a class only with respect to its own Rule 12b-1 Plan. Shares of each class would receive their pro rata share of the net assets of a Fund if the Fund were liquidated. The Trustees approve separate distributions from net investment income on each class of shares.
57 |
Table of Contents
Notes to Financial Statements (continued)
December 31, 2014
2. Significant Accounting Policies. The following is a summary of significant accounting policies consistently followed by each Fund in the preparation of its financial statements. The Funds’ financial statements follow the accounting and reporting guidelines provided for investment companies and are prepared in accordance with accounting principles generally accepted in the United States of America which require the use of management estimates that affect the reported amounts and disclosures in the financial statements. Actual results could differ from those estimates. Management has evaluated the events and transactions subsequent to year-end through the date the financial statements were issued and has determined that there were no material events that would require disclosure in the Funds’ financial statements.
a. Valuation. Fund securities and other investments are valued at market value based on market quotations obtained or determined by independent pricing services recommended by the adviser and approved by the Board of Trustees. Fund securities and other investments for which market quotations are not readily available are valued at fair value as determined in good faith by the adviser pursuant to procedures approved by the Board of Trustees, as described below. Market value is determined as follows:
Equity securities (including closed-end investment companies and exchange-traded funds) are valued at the last sale price quoted on the exchange or market where traded most extensively or, if there is no reported sale during the day, the closing bid quotation as reported by an independent pricing service. Securities traded on the NASDAQ Global Select Market, NASDAQ Global Market and NASDAQ Capital Market are valued at the NASDAQ Official Closing Price (“NOCP”), or if lacking an NOCP, at the most recent bid quotations on the applicable NASDAQ Market. Debt securities and unlisted equity securities are valued based on evaluated bids furnished to the Fund by an independent pricing service using market information, transactions for comparable securities and various relationships between securities, if available, or bid prices obtained from broker-dealers. Senior loans are valued at bid prices supplied by an independent pricing service, if available. Broker-dealer bid prices may be used to value debt and equity securities and senior loans where an independent pricing service is unable to price a security or where an independent pricing service does not provide a reliable price for the security. Forward foreign currency contracts are valued utilizing interpolated rates determined based on information provided by an independent pricing service. Futures contracts are valued at the current settlement price on the exchange on which the adviser believes that, over time, they are traded most extensively. Centrally cleared credit default swap agreements are valued at settlement prices of the clearinghouse on which the contracts were traded or prices obtained from broker-dealers. Bilateral credit default swaps are valued based on mid prices (between the bid price and the ask price) supplied by an independent pricing service. Domestic exchange-traded single equity option contracts are valued at the mean of the National
| 58
Table of Contents
Notes to Financial Statements (continued)
December 31, 2014
Best Bid and Offer quotations. Options on futures contracts are valued using the current settlement price on the exchange on which, over time, they are traded most extensively. Exchange-traded index options are valued at the average of the closing bid and ask quotations as of the close of trading on the Chicago Board Options Exchange (“CBOE”). Other exchange-traded options are valued at the average of the closing bid and ask quotations on the exchange on which, over time, they are traded most extensively. Over-the-counter (“OTC”) currency options and swaptions are valued at mid prices (between the bid and the ask price) supplied by an independent pricing service, if available. Other OTC option contracts (including currency options and swaptions not priced through an independent pricing service) are valued based on prices obtained from broker-dealers.
Fund securities and other investments for which market quotations are not readily available are valued at fair value as determined in good faith by the adviser pursuant to procedures approved by the Board of Trustees. Option contracts for which the average of the closing bid and ask quotations are not considered to reflect option contract values as of the close of the New York Stock Exchange (“NYSE”) are valued at fair value as determined in good faith by the adviser pursuant to procedures approved by the Board of Trustees. On the last business day of the month, the Fund will fair value index options using the closing rotation values, published by the CBOE. The Fund may also value securities and other investments at fair value in other circumstances such as when extraordinary events occur after the close of a foreign market but prior to the close of the NYSE. This may include situations relating to a single issuer (such as a declaration of bankruptcy or a delisting of the issuer’s security from the primary market on which it has traded) as well as events affecting the securities markets in general (such as market disruptions or closings and significant fluctuations in U.S. and/or foreign markets). When fair valuing its securities or other investments, the Fund may, among other things, use modeling tools or other processes that may take into account factors such as securities or other market activity and/or significant events that occur after the close of the foreign market and before the time the Fund’s Net Asset Value (“NAV”) is calculated. Fair value pricing may require subjective determinations about the value of a security, and fair values used to determine the Fund’s NAV may differ from quoted or published prices, or from prices that are used by others, for the same securities. In addition, the use of fair value pricing may not always result in adjustments to the prices of securities held by the Fund.
As of December 31, 2014, written options of Gateway Equity Call Premium Fund were fair valued at $(357,910) using the closing rotation values published by the CBOE.
b. Investment Transactions and Related Investment Income. Investment transactions are accounted for on a trade date plus one day basis for daily NAV calculation. However, for financial reporting purposes, investment transactions are reported on trade date. Dividend income is recorded on ex-dividend date, or in the case of certain foreign securities, as soon as a Fund is notified, and interest income is recorded on an
59 |
Table of Contents
Notes to Financial Statements (continued)
December 31, 2014
accrual basis. Interest income is increased by the accretion of discount and decreased by the amortization of premium. Periodic principal adjustments for inflation-protected securities are recorded to interest income. In determining net gain or loss on securities sold, the cost of securities has been determined on an identified cost basis. Investment income, non-class specific expenses and realized and unrealized gains and losses are allocated on a pro rata basis to each class based on the relative net assets of each class to the total net assets of the Fund.
c. Foreign Currency Translation. The books and records of the Funds are maintained in U.S. dollars. The values of securities, currencies and other assets and liabilities denominated in currencies other than U.S. dollars are translated into U.S. dollars based upon foreign exchange rates prevailing at the end of the period. Purchases and sales of investment securities, income and expenses are translated on the respective dates of such transactions.
Since the values of investment securities are presented at the foreign exchange rates prevailing at the end of the period, it is not practical to isolate that portion of the results of operations arising from changes in exchange rates from fluctuations which arise due to changes in market prices of investment securities. Such changes are included with the net realized and unrealized gain or loss on investments.
Net realized foreign exchange gains or losses arise from sales of foreign currency, currency gains or losses realized between the trade and settlement dates on securities transactions and the difference between the amounts of dividends, interest and foreign withholding taxes recorded on the Funds’ books and the U.S. dollar equivalent of the amounts actually received or paid. Net unrealized foreign exchange gains and losses arise from changes in the value of assets and liabilities, other than investment securities, at the end of the fiscal period, resulting from changes in exchange rates.
Each Fund may use foreign currency exchange contracts to facilitate transactions in foreign-denominated investments. Losses may arise from changes in the value of the foreign currency or if the counterparties do not perform under the contracts’ terms.
d. Forward Foreign Currency Contracts. The Funds may enter into forward foreign currency contracts, including forward foreign cross currency contracts, to acquire exposure to foreign currencies or to hedge the Fund’s investments against currency fluctuation. A contract can also be used to offset a previous contract. These contracts involve market risk in excess of the unrealized gain or loss reflected in the Funds’ Statements of Assets and Liabilities. The U.S. dollar value of the currencies a Fund has committed to buy or sell represents the aggregate exposure to each currency a Fund has acquired or hedged through currency contracts outstanding at period end. Gains or losses are recorded for financial statement purposes as unrealized until settlement date. Contracts are traded over-the-counter directly with a counterparty. Risks may arise upon entering into these contracts from the potential inability of counterparties to meet the terms of their contracts and from unanticipated movements in the value of a
| 60
Table of Contents
Notes to Financial Statements (continued)
December 31, 2014
foreign currency relative to the U.S. dollar. Certain contracts may require the movement of cash and/or securities as collateral for the Fund’s or counterparty’s net obligations under the contracts.
e. Futures Contracts. The Funds may enter into futures contracts. Futures contracts are agreements between two parties to buy and sell a particular instrument or index for a specified price on a specified future date.
When a Fund enters into a futures contract, it is required to deposit with (or for the benefit of) its broker an amount of cash or short-term high-quality securities as “initial margin.” As the value of the contract changes, the value of the futures contract position increases or declines. Subsequent payments, known as “variation margin,” are made or received by a Fund, depending on the price fluctuations in the fair value of the contract and the value of cash or securities on deposit with the broker. The aggregate principal amounts of the contracts are not recorded in the financial statements. Fluctuations in the value of the contracts are recorded in the Statements of Assets and Liabilities as an asset (liability) and in the Statements of Operations as unrealized appreciation (depreciation) until the contracts are closed, when they are recorded as realized gains (losses). Realized gain or loss on a futures position is equal to the difference between the value of the contract at the time it was opened and the value at the time it was closed, minus brokerage commissions. When a Fund enters into a futures contract certain risks may arise, such as illiquidity in the futures market, which may limit a Fund’s ability to close out a futures contract prior to settlement date, and unanticipated movements in the value of securities or interest rates.
Futures contracts are exchange-traded. Exchange-traded futures contracts are standardized and are settled through a clearing house with fulfillment supported by the credit of the exchange. Therefore, counterparty credit risks to the Funds are reduced; however, in the event that a counterparty enters into bankruptcy, a Fund’s claim against initial/variation margin on deposit with the counterparty may be subject to terms of a final settlement in bankruptcy court.
f. Option Contracts. The Funds may enter into option contracts. When a Fund purchases an option, it pays a premium and the option is subsequently marked to market to reflect current value. Premiums paid for purchasing options which expire are treated as realized losses. Premiums paid for purchasing options which are exercised are added to the cost or deducted from the proceeds on the underlying instrument to determine the realized gain or loss. If the Fund enters into a closing sale transaction, the difference between the premium paid and the proceeds of the closing sale transaction is treated as a realized gain or loss. The risk associated with purchasing options is limited to the premium paid.
When a Fund writes an option, an amount equal to the net premium received (the premium less commission) is recorded as a liability and is subsequently adjusted to the current value. Net premiums received for written options which expire are treated as
61 |
Table of Contents
Notes to Financial Statements (continued)
December 31, 2014
realized gains. Net premiums received for written options which are exercised are deducted from the cost or added to the proceeds on the underlying instrument to determine the realized gain or loss. If the Fund enters into a closing purchase transaction, the difference between the net premium received and any amount paid on effecting a closing purchase transaction, including commissions, is treated as a realized gain or, if the net premium received is less than the amount paid, as a realized loss. The Fund, as writer of a written option, bears the risk of an unfavorable change in the market value of the instrument or index underlying the written option.
Exchange-traded options contracts are standardized and are settled through a clearing house with fulfillment supported by the credit of the exchange. Therefore, counterparty credit risks to the Funds are reduced. Over-the-counter options are subject to the risk that the counterparty is unable or unwilling to meet its obligations under the option.
g. Swaptions. The Funds may enter into interest rate swaptions. An interest rate swaption gives the holder the right, but not the obligation, to enter into or cancel an interest rate swap agreement at a future date. Interest rate swaptions may be either purchased or written. The buyer of an interest rate swaption may purchase either the right to receive a fixed rate in the underlying swap (known as a “receiver swaption”) or to pay a fixed rate (known as a “payer swaption”), based on the notional amount of the swap agreement, in exchange for a floating rate. The notional amounts of swaptions are not recorded in the financial statements.
When a Fund purchases an interest rate swaption, it pays a premium and the swaption is subsequently marked to market to reflect current value. Premiums paid for purchasing interest rate swaptions which expire are treated as realized losses. Premiums paid for purchasing interest rate swaptions which are exercised are added to the cost or deducted from the proceeds on the underlying swap to determine the realized gain or loss. If a Fund enters into a closing sale transaction, the difference between the premium paid and the proceeds of the closing sale transaction is treated as a realized gain or loss. The risk associated with purchasing interest rate swaptions is limited to the premium paid.
When a Fund writes an interest rate swaption, an amount equal to the premium received is recorded as a liability and is subsequently adjusted to the current value. Premiums received for written interest rate swaptions which expire are treated as realized gains. Premiums received for written interest rate swaptions which are exercised are deducted from the cost or added to the proceeds on the underlying swap to determine the realized gain or loss. If a Fund enters into a closing purchase transaction, the difference between the premium received and any amount paid on effecting a closing purchase transaction, including commission, is treated as a realized gain or, if the premium received is less than the amount paid, as a realized loss. A Fund, as writer of a written interest rate swaption, bears the risk of an unfavorable change in the market value of the swap underlying the written interest rate swaption.
| 62
Table of Contents
Notes to Financial Statements (continued)
December 31, 2014
OTC interest rate swaptions are subject to the risk that the counterparty is unable or unwilling to meet its obligations under the swaption.
h. Swap Agreements. The Funds may enter into credit default swaps. A credit default swap is an agreement between two parties (the “protection buyer” and “protection seller”) to exchange the credit risk of an issuer (“reference obligation”) for a specified time period. The reference obligation may be one or more debt securities or an index of such securities. The Funds may be either the protection buyer or the protection seller. As a protection buyer, the Funds have the ability to hedge the downside risk of an issuer or group of issuers. As a protection seller, the Funds have the ability to gain exposure to an issuer or group of issuers whose bonds are unavailable or in short supply in the cash bond market, as well as realize additional income in the form of fees paid by the protection buyer. The protection buyer is obligated to pay the protection seller a stream of payments (“fees”) over the term of the contract, provided that no credit event, such as a default or a downgrade in credit rating, occurs on the reference obligation. The Funds may also pay or receive upfront premiums. If a credit event occurs, the protection seller must pay the protection buyer the difference between the agreed upon notional value and market value of the reference obligation. Market value in this case is determined by a facilitated auction whereby a minimum number of allowable broker bids, together with a specified valuation method, are used to calculate the value. The maximum potential amount of undiscounted future payments that a Fund as the protection seller could be required to make under a credit default swap agreement would be an amount equal to the notional amount of the agreement.
Implied credit spreads, represented in absolute terms, are disclosed in the Portfolio of Investments for those agreements for which the Fund is the protection seller. Implied credit spreads serve as an indicator of the current status of the payment/performance risk and represent the likelihood or risk of default for the credit derivative. The implied credit spread of a particular reference entity reflects the cost of buying/selling protection and may include upfront payments required to be made to enter into the agreement. Wider credit spreads represent a deterioration of the reference entity’s credit soundness and a greater likelihood or risk of default or other credit event occurring as defined under the terms of the agreement.
The notional amounts of swap agreements are not recorded in the financial statements. Swap agreements are valued daily, and fluctuations in value are recorded in the Statements of Operations as change in unrealized appreciation (depreciation) on swap agreements. Fees are accrued in accordance with the terms of the agreement and are recorded in the Statements of Assets and Liabilities as fees receivable or payable. When received or paid, fees are recorded in the Statements of Operations as realized gain or loss. Upfront premiums paid or received by the Funds are recorded on the Statements of Assets and Liabilities as an asset or liability, respectively, and are amortized or accreted over the term of the agreement and recorded as realized gain or
63 |
Table of Contents
Notes to Financial Statements (continued)
December 31, 2014
loss. Payments made or received by the Funds as a result of a credit event or termination of the agreement are recorded as realized gain or loss.
Swap agreements are privately negotiated in the over-the-counter market and may be entered into as a bilateral contract or centrally cleared (“centrally cleared swaps”). Bilateral swap agreements are traded between counterparties and, as such, are subject to the risk that a party to the agreement will not be able to meet its obligations. In a centrally cleared swap, immediately following execution of the swap agreement, the swap agreement is novated to a central counterparty (the “CCP”) and the Fund faces the CCP through a broker. Upon entering into a centrally cleared swap, the Fund is required to deposit initial margin with the broker in the form of cash or securities in an amount that varies depending on the size and risk profile of the particular swap. Subsequent payments, known as “variation margin,” are made or received by the Fund based on the daily change in the value of the centrally cleared swap agreement. For centrally cleared swaps, the Fund’s counterparty credit risk is reduced as the CCP stands between the Fund and the counterparty. The Funds cover their net obligations under outstanding swap agreements by segregating or earmarking cash or securities.
i. Due to/from Brokers. Transactions and positions in certain options, futures, forward foreign currency contracts and swap agreements are maintained and cleared by registered U.S. broker/dealers pursuant to customer agreements between the Funds and the various broker/dealers. The due from brokers balance in the Statements of Assets and Liabilities for Strategic Alpha Fund represents cash pledged as collateral for forward foreign currency contracts, options and bilateral swap agreements and as initial margin for futures contracts and centrally cleared swap agreements. The due to brokers balance in the Statements of Assets and Liabilities for Strategic Alpha Fund represents cash and securities received as collateral for forward foreign currency contracts, options, interest rate swaptions and bilateral swap agreements. In certain circumstances the Funds’ use of cash, securities and/or foreign currency held at brokers is restricted by regulation or broker mandated limits.
j. Federal and Foreign Income Taxes. The Trusts treat each Fund as a separate entity for federal income tax purposes. Each Fund intends to meet the requirements of the Internal Revenue Code of 1986, as amended, applicable to regulated investment companies, and to distribute to its shareholders substantially all of its net investment income and any net realized capital gains at least annually. Management has performed an analysis of each Fund’s tax positions for the open tax years as of December 31, 2014 and has concluded that no provisions for income tax are required. The Funds’ federal tax returns for the prior three fiscal years, where applicable, remain subject to examination by the Internal Revenue Service. Management is not aware of any events that are reasonably possible to occur in the next twelve months that would result in the amounts of any unrecognized tax benefits significantly increasing or decreasing for the Funds. However, management’s conclusions regarding tax positions taken may be subject to review and adjustment at a later date based on factors
| 64
Table of Contents
Notes to Financial Statements (continued)
December 31, 2014
including, but not limited to, new tax laws and accounting regulations and interpretations thereof.
A Fund may be subject to foreign withholding taxes on investment income and taxes on capital gains on investments that are accrued and paid based upon the Fund’s understanding of the tax rules and regulations that exist in the countries in which the Fund invests. Foreign withholding taxes on dividend and interest income are reflected on the Statements of Operations as a reduction of investment income, net of amounts eligible to be reclaimed. Dividends and interest receivable on the Statements of Assets and Liabilities are net of foreign withholding taxes. Foreign withholding taxes eligible to be reclaimed are reflected on the Statements of Assets and Liabilities as tax reclaims receivable. Capital gains taxes paid are included in net realized gain (loss) on investments in the Statements of Operations. Accrued but unpaid capital gains taxes are reflected as foreign taxes payable on the Statements of Assets and Liabilities, if applicable, and reduce unrealized gains on investments. In the event that realized gains on investments are subsequently offset by realized losses, taxes paid on realized gains may be returned to a Fund. Such amounts, if applicable, are reflected as foreign tax rebates receivable on the Statements of Assets and Liabilities and are recorded as a realized gain when received.
k. Dividends and Distributions to Shareholders. Dividends and distributions are recorded on ex-dividend date. The timing and characterization of certain income and capital gain distributions are determined annually in accordance with federal tax regulations, which may differ from accounting principles generally accepted in the United States of America. Permanent differences are primarily due to differing treatments for book and tax purposes of items such as paydown gains and losses, return of capital and capital gain distributions received, distributions in excess of income and/or capital gains, non-deductible expenses, foreign currency gains and losses, deferred Trustees’ fees, defaulted bond adjustments, contingent payment debt instruments and premium amortization. Permanent book and tax basis differences relating to shareholder distributions, net investment income and net realized gains will result in reclassifications to capital accounts. Temporary differences between book and tax distributable earnings are primarily due to deferred Trustees’ fees, premium amortization, contingent payment debt instruments, defaulted and/or non-income producing securities, swap payable/receivable, wash sales, return of capital distributions received and forward foreign currency, options and futures contracts mark-to-market. Distributions from net investment income and short-term capital gains are considered to be distributed from ordinary income for tax purposes.
65 |
Table of Contents
Notes to Financial Statements (continued)
December 31, 2014
The tax characterization of distributions is determined on an annual basis. The tax character of distributions paid to shareholders during the years ended December 31, 2014 and 2013 were as follows:
2014 Distributions Paid From: | 2013 Distributions Paid From: | |||||||||||||||||||||||
Fund | Ordinary Income | Long-Term | Total | Ordinary | Long-Term | Total | ||||||||||||||||||
Gateway Equity Call Premium Fund | $ | 54,728 | $ | — | $ | 54,728 | $ | — | $ | — | $ | — | ||||||||||||
Strategic Alpha Fund | 43,728,574 | — | 43,728,574 | 28,411,987 | — | 28,411,987 | ||||||||||||||||||
As of December 31, 2014, the components of distributable earnings on a tax basis were as follows:
Gateway | Strategic | |||||||
Undistributed ordinary income | $ | — | $ | 10,905,507 | ||||
|
|
|
| |||||
Total undistributed earnings | — | 10,905,507 | ||||||
|
|
|
| |||||
Capital loss carryforward: | — | — | ||||||
Short-term: | ||||||||
No expiration date | (243,981 | ) | (36,722,563 | ) | ||||
Long-term: | ||||||||
No expiration date | (196,847 | ) | (17,622,766 | ) | ||||
|
|
|
| |||||
Total capital loss carryforward | (440,828 | ) | (54,345,329 | ) | ||||
|
|
|
| |||||
Unrealized appreciation (depreciation) | 427,123 | (4,132,857 | ) | |||||
|
|
|
| |||||
Total accumulated losses | $ | (13,705 | ) | $ | (47,572,679 | ) | ||
|
|
|
| |||||
l. Loan Participations. Strategic Alpha Fund may invest in loans to corporate, governmental or other borrowers. The Funds’ investments in loans may be in the form of participations in loans or assignments of all or a portion of loans. A loan is often administered by a bank or other financial institution that acts as agent for all holders. The agent administers the terms of the loan, as specified in the loan agreement. When investing in a loan participation, (i) a Fund has the right to receive payments of principal, interest and any fees to which it is entitled only from the party from whom the Fund has purchased the participation and only upon receipt by that party of payments from the borrower and (ii) a Fund generally has no right to enforce compliance by the borrower with the terms of the loan agreement or to vote on matters arising under the loan
| 66
Table of Contents
Notes to Financial Statements (continued)
December 31, 2014
agreement. Thus, a Fund may be subject to credit risk both of the party from whom it purchased the loan participation and the borrower and the Fund may have minimal control over the terms of any loan modification. When a Fund purchase assignments from lenders, it acquires direct rights against the borrower on the loan. Loan agreements and participations outstanding at the end of the year, if any, are listed in each applicable Funds’ Schedule of Investments.
m. Repurchase Agreements. Each Fund may enter into repurchase agreements, under the terms of a Master Repurchase Agreement, under which each Fund acquires securities as collateral and agrees to resell the securities at an agreed upon time and at an agreed upon price. It is each Fund’s policy that the market value of the collateral for repurchase agreements be at least equal to 102% of the repurchase price, including interest. Certain repurchase agreements are tri-party arrangements whereby the collateral is held in a segregated account for the benefit of the Fund and on behalf of the counterparty. Repurchase agreements could involve certain risks in the event of default or insolvency of the counterparty, including possible delays or restrictions upon a Fund’s ability to dispose of the underlying securities. As of December 31, 2014, each Fund, as applicable, had investments in repurchase agreements for which the value of the related collateral exceeded the value of the repurchase agreement. The gross value of repurchase agreements is included in the Statements of Assets and Liabilities for financial reporting purposes.
n. Securities Lending. The Strategic Alpha Fund has entered into an agreement with State Street Bank and Trust Company (“State Street Bank”), as agent of the Fund, to lend securities to certain designated borrowers. The loans are collateralized with cash or securities in an amount equal to at least 105% or 102% of the market value (including accrued interest) of the loaned international or domestic securities, respectively, when the loan is initiated. Thereafter, the value of the collateral must remain at least 102% of the market value (including accrued interest) of loaned securities for U.S. equities and U.S. corporate debt; at least 105% of the market value (including accrued interest) of loaned securities for non-U.S. equities; and at least 100% of the market value (including accrued interest) of loaned securities for U.S. Government securities, sovereign debt issued by non-U.S. Governments and non-U.S. corporate debt. In the event that the market value of the collateral falls below the required percentages described above, the borrower will deliver additional collateral on the next business day. As with other extensions of credit, the Fund may bear the risk of loss with respect to the investment of the collateral. The Fund invests cash collateral in short-term investments, a portion of the income from which is remitted to the borrowers and the remainder allocated between the Fund and State Street Bank as lending agent.
For the year ended December 31, 2014, the Fund did not loan securities under this agreement.
o. Indemnifications. Under the Trusts’ organizational documents, its officers and Trustees are indemnified against certain liabilities arising out of the performance of
67 |
Table of Contents
Notes to Financial Statements (continued)
December 31, 2014
their duties to the Funds. Additionally, in the normal course of business, the Funds enter into contracts with service providers that contain general indemnification clauses. The Funds’ maximum exposure under these arrangements is unknown as this would involve future claims that may be made against the Funds that have not yet occurred. However, based on experience, the Funds expect the risk of loss to be remote.
3. Fair Value Measurements. In accordance with accounting standards related to fair value measurements and disclosures, the Funds have categorized the inputs utilized in determining the value of each Fund’s assets or liabilities. These inputs are summarized in the three broad levels listed below:
| • | Level 1 – quoted prices in active markets for identical assets or liabilities; |
| • | Level 2 – prices determined using other significant inputs that are observable either directly, or indirectly through corroboration with observable market data (which could include quoted prices for similar assets or liabilities, interest rates, credit risk, etc.); and |
| • | Level 3 – prices determined using significant unobservable inputs when quoted prices or observable inputs are unavailable such as when there is little or no market activity for an asset or liability (unobservable inputs reflect each Fund’s own assumptions in determining the fair value of assets or liabilities and would be based on the best information available). |
The inputs or methodology used for valuing securities are not necessarily an indication of the risk associated with investing in those securities.
The following is a summary of the inputs used to value the Funds’ investments as of December 31, 2014, at value:
Gateway Equity Call Premium Fund
Asset Valuation Inputs
Description | Level 1 | Level 2 | Level 3 | Total | ||||||||||||
Common Stocks(a) | $ | 19,894,687 | $ | — | $ | — | $ | 19,894,687 | ||||||||
Short-Term Investments | — | 3,636,299 | — | 3,636,299 | ||||||||||||
|
|
|
|
|
|
|
| |||||||||
Total | $ | 19,894,687 | $ | 3,636,299 | $ | — | $ | 23,530,986 | ||||||||
|
|
|
|
|
|
|
| |||||||||
Liability Valuation Inputs
Description | Level 1 | Level 2 | Level 3 | Total | ||||||||||||
Written Options(a) | $ | — | $ | (357,910 | ) | $ | — | $ | (357,910 | ) | ||||||
|
|
|
|
|
|
|
| |||||||||
| (a) | Details of the major categories of the Fund’s investments are reflected within the Portfolio of Investments. |
For the period ended December 31, 2014, there were no transfers among Levels 1, 2 and 3.
| 68
Table of Contents
Notes to Financial Statements (continued)
December 31, 2014
Strategic Alpha Fund
Asset Valuation Inputs
Description | Level 1 | Level 2 | Level 3 | Total | ||||||||||||
Bonds and Notes | ||||||||||||||||
Non-Convertible Bonds | ||||||||||||||||
ABS Home Equity | $ | — | $ | 157,138,166 | $ | 811,274 | (b) | $ | 157,949,440 | |||||||
ABS Other | — | 11,872,771 | 20,098,815 | (c) | 31,971,586 | |||||||||||
Non-Agency Commercial Mortgage-Backed Securities | — | 49,589,550 | 4,387,394 | (d) | 53,976,944 | |||||||||||
All Other Non-Convertible Bonds(a) | — | 601,545,102 | — | 601,545,102 | ||||||||||||
|
|
|
|
|
|
|
| |||||||||
Total Non-Convertible Bonds | — | 820,145,589 | 25,297,483 | 845,443,072 | ||||||||||||
|
|
|
|
|
|
|
| |||||||||
Convertible Bonds(a) | — | 49,563,948 | — | 49,563,948 | ||||||||||||
|
|
|
|
|
|
|
| |||||||||
Total Bonds and Notes | — | 869,709,537 | 25,297,483 | 895,007,020 | ||||||||||||
|
|
|
|
|
|
|
| |||||||||
Senior Loans(a) | — | 210,075,921 | — | 210,075,921 | ||||||||||||
Loan Participations(a) | — | — | 2,657,911 | (d) | 2,657,911 | |||||||||||
Preferred Stocks | ||||||||||||||||
Convertible Preferred Stocks | ||||||||||||||||
Energy | — | 2,023,954 | — | 2,023,954 | ||||||||||||
REITs – Mortgage | — | 3,986,816 | — | 3,986,816 | ||||||||||||
All Other Convertible Preferred Stocks(a) | 33,957,925 | — | — | 33,957,925 | ||||||||||||
|
|
|
|
|
|
|
| |||||||||
Total Convertible Preferred Stocks | 33,957,925 | 6,010,770 | — | 39,968,695 | ||||||||||||
|
|
|
|
|
|
|
| |||||||||
Non-Convertible Preferred Stocks | ||||||||||||||||
Cable Satellite | — | 4,191,500 | — | 4,191,500 | ||||||||||||
All Other Non-Convertible Preferred Stocks(a) | 9,516,027 | — | — | 9,516,027 | ||||||||||||
|
|
|
|
|
|
|
| |||||||||
Total Non-Convertible Preferred Stocks | 9,516,027 | 4,191,500 | — | 13,707,527 | ||||||||||||
|
|
|
|
|
|
|
| |||||||||
Total Preferred Stocks | 43,473,952 | 10,202,270 | — | 53,676,222 | ||||||||||||
|
|
|
|
|
|
|
| |||||||||
69 |
Table of Contents
Notes to Financial Statements (continued)
December 31, 2014
Strategic Alpha Fund (continued)
Asset Valuation Inputs (continued)
Description | Level 1 | Level 2 | Level 3 | Total | ||||||||||||
Common Stocks(a) | $ | 52,320,945 | $ | — | $ | — | $ | 52,320,945 | ||||||||
Exchange Traded Funds | 10,352,659 | — | — | 10,352,659 | ||||||||||||
Purchased Swaptions(a) | — | 370,983 | — | 370,983 | ||||||||||||
Purchased Options(a) | 249,900 | 3,138,614 | — | 3,388,514 | ||||||||||||
Short-Term Investments | — | 129,045,203 | — | 129,045,203 | ||||||||||||
|
|
|
|
|
|
|
| |||||||||
Total Investments | 106,397,456 | 1,222,542,528 | 27,955,394 | 1,356,895,378 | ||||||||||||
|
|
|
|
|
|
|
| |||||||||
Bilateral Credit Default Swap Agreements (unrealized appreciation) | — | 1,171,569 | — | 1,171,569 | ||||||||||||
Centrally Cleared Credit Default Swap Agreements (unrealized appreciation) | 19,133 | — | — | 19,133 | ||||||||||||
Forward Foreign Currency Contracts (unrealized appreciation) | — | 6,121,170 | — | 6,121,170 | ||||||||||||
|
|
|
|
|
|
|
| |||||||||
Total | $ | 106,416,589 | $ | 1,229,835,267 | $ | 27,955,394 | $ | 1,364,207,250 | ||||||||
|
|
|
|
|
|
|
| |||||||||
Liability Valuation Inputs
Description | Level 1 | Level 2 | Level 3 | Total | ||||||||||||
Written Options(a) | $ | (166,835 | ) | $ | (2,240 | ) | $ | — | $ | (169,075 | ) | |||||
Bilateral Credit Default Swap Agreements (unrealized depreciation) | — | (1,091,886 | ) | — | (1,091,886 | ) | ||||||||||
Centrally Cleared Credit Default Swap Agreements (unrealized depreciation) | (6,565 | ) | — | — | (6,565 | ) | ||||||||||
Forward Foreign Currency Contracts (unrealized depreciation) | — | (1,957,351 | ) | — | (1,957,351 | ) | ||||||||||
Futures Contracts (unrealized depreciation) | (3,364,895 | ) | — | — | (3,364,895 | ) | ||||||||||
|
|
|
|
|
|
|
| |||||||||
Total | $ | (3,538,295 | ) | $ | (3,051,477 | ) | $ | — | $ | (6,589,772 | ) | |||||
|
|
|
|
|
|
|
| |||||||||
| (a) | Details of the major categories of the Fund’s investments are reflected within the Portfolio of Investments. |
| (b) | Fair valued by the Fund’s adviser. |
| 70
Table of Contents
Notes to Financial Statements (continued)
December 31, 2014
Strategic Alpha Fund (continued)
| (c) | Valued using broker-dealer bid prices ($13,807,962) or fair valued by the Fund’s adviser ($6,290,853). |
| (d) | Valued using broker-dealer bid prices. |
A preferred stock valued at $2,290,849 was transferred from Level 1 to Level 2 during the period ended December 31, 2014. At December 31, 2013, this security was valued at the closing bid quotation in accordance with the Fund’s valuation policies. At December 31, 2014, this security was fair valued on the basis of evaluated bids furnished to the Fund as an independent pricing service did not provide a reliable price for the security.
All transfers are recognized as of the beginning of the reporting period.
The Fund’s pricing policies and procedures are recommended by the adviser and approved by the Board of Trustees. Debt securities are valued based on evaluated bids furnished to the Fund by an independent pricing service. Broker-dealer bid prices may be used if an independent pricing service either is unable to price a security or does not provide a reliable price for a security. Broker-dealer bid prices for which the Fund does not have knowledge of the inputs used by the broker-dealer are categorized in Level 3. All security prices, including those obtained from an independent pricing service and broker-dealer bid prices, are reviewed on a daily basis by the adviser, subject to oversight by Fund management and the Board of Trustees. If the adviser, in good faith, believes that the price provided by an independent pricing service is unreliable, broker-dealer bid prices may be used until the price provided by the independent pricing service is considered to be reliable. Reliability of all security prices, including those obtained from an independent pricing service and broker-dealer bid prices, is tested in a variety of ways, including comparison to recent transaction prices and daily fluctuations, amongst other validation procedures in place. Securities for which market quotations are not readily available are valued at fair value as determined in good faith by the Fund’s adviser pursuant to procedures approved by the Board of Trustees. Fair valued securities may be categorized in Level 3.
71 |
Table of Contents
Notes to Financial Statements (continued)
December 31, 2014
The following is a reconciliation of Level 3 investments for which significant unobservable inputs were used to determine fair value as of December 31, 2013 and/or December 31, 2014:
Strategic Alpha Fund
Asset Valuation Inputs
Investments in Securities | Balance as of | Accrued | Realized | Change in | Purchases | |||||||||||||||
Bonds and Notes | ||||||||||||||||||||
Non-Convertible Bonds | ||||||||||||||||||||
ABS Home Equity | $ | — | $ | — | $ | 13,371 | $ | 269 | $ | 566,931 | ||||||||||
ABS Other | 1,703,269 | — | 3,539 | (14,617 | ) | 18,918,915 | ||||||||||||||
Airlines | 6,428,650 | — | 155,058 | (63,650 | ) | — | ||||||||||||||
Non-Agency Commercial Mortgage-Backed Securities | 2,300,373 | — | (486 | ) | (14,461 | ) | 2,140,816 | |||||||||||||
Loan Participations | — | — | (1,090 | ) | (6,612 | ) | 2,810,925 | |||||||||||||
|
|
|
|
|
|
|
|
|
| |||||||||||
Total | $ | 10,432,292 | $ | — | $ | 170,392 | $ | (99,071 | ) | $ | 24,437,587 | |||||||||
|
|
|
|
|
|
|
|
|
| |||||||||||
Investments in Securities | Sales | Transfers | Transfers | Balance as of | Change in | |||||||||||||||
Bonds and Notes | ||||||||||||||||||||
Non-Convertible Bonds | ||||||||||||||||||||
ABS Home Equity | $ | (642,337 | ) | $ | 873,040 | $ | — | $ | 811,274 | $ | 269 | |||||||||
ABS Other | (512,291 | ) | — | — | 20,098,815 | 3,427 | ||||||||||||||
Airlines | (6,520,058 | ) | — | — | — | — | ||||||||||||||
Non-Agency Commercial Mortgage-Backed Securities | (38,848 | ) | — | — | 4,387,394 | (14,485 | ) | |||||||||||||
Loan Participations | (145,312 | ) | — | — | 2,657,911 | (6,612 | ) | |||||||||||||
|
|
|
|
|
|
|
|
|
| |||||||||||
Total | $ | (7,858,846 | ) | $ | 873,040 | $ | — | $ | 27,955,394 | $ | (17,401 | ) | ||||||||
|
|
|
|
|
|
|
|
|
| |||||||||||
Debt securities valued at $873,040 were transferred from Level 2 to Level 3 during the period ended December 31, 2014. At December 31, 2013, these securities were valued on the basis of evaluated bids furnished to the Fund by an independent pricing service in accordance with the Fund’s valuation policies. At December 31, 2014, these securities
| 72
Table of Contents
Notes to Financial Statements (continued)
December 31, 2014
were valued at fair value as determined in good faith by the Fund’s adviser as an independent pricing service did not provide a reliable price for the securities.
All transfers are recognized as of the beginning of the reporting period.
4. Derivatives. Derivative instruments are defined as financial instruments whose value and performance are based on the value and performance of another security or financial instrument. Derivative instruments that the Funds used during the period include forward foreign currency contracts, futures contracts, option contracts, swaptions and swap agreements.
Gateway Equity Call Premium Fund seeks to capture the majority of the returns associated with equity market investments, while exposing investors to less risk than other equity investments. To meet this investment goal, the Fund invests in a broadly diversified portfolio of common stocks, while also writing index call options. Writing index call options can reduce the Fund’s volatility, provide a steady cash flow and be an important source of the Fund’s return, although it also may reduce the Fund’s ability to profit from increases in the value of its equity portfolio. The combination of the diversified stock portfolio and the steady cash flow from writing of index call options is intended to moderate the volatility of returns relative to an all-equity portfolio. During the period ended December 31, 2014, written index call options were used in accordance with this objective.
Strategic Alpha Fund seeks to achieve positive total returns over a full market cycle. The Fund pursues its objective by utilizing a flexible investment approach that allocates investments across a global range of investment opportunities related to credit, currencies and interest rates, while employing risk management techniques to mitigate downside risk. At times, the Fund expects to gain its investment exposure substantially through the use of derivatives, including forward foreign currency contracts, futures and option contracts, interest rate swaptions and swap agreements. During the year ended December 31, 2014, the Fund used forward foreign currency, futures and options contracts, swaptions and credit default swap agreements (as a protection seller) to gain investment exposures in accordance with its objective.
Strategic Alpha Fund is subject to the risk that changes in interest rates will affect the value of the Fund’s investments in fixed-income securities. The Fund will be subject to increased interest rate risk to the extent that it invests in fixed-income securities with longer maturities or durations, as compared to investing in fixed-income securities with shorter maturities or durations. The Fund may use futures contracts and interest rate swaptions to hedge against changes in interest rates and to manage duration without having to buy or sell portfolio securities. During the year ended December 31, 2014, the Fund engaged in futures contracts and interest rate swaptions to manage duration and also used futures contracts for hedging purposes.
73 |
Table of Contents
Notes to Financial Statements (continued)
December 31, 2014
Strategic Alpha Fund is subject to the risk that changes in foreign currency exchange rates will have an unfavorable effect on the value of Fund assets denominated in foreign currencies. The Fund may enter into forward foreign currency exchange contracts and option contracts for hedging purposes to protect the value of the Fund’s holdings of foreign securities. During the year ended December 31, 2014, the Fund engaged in forward foreign currency and option transactions for hedging purposes.
Strategic Alpha Fund is subject to the risk that companies in which the Fund invests will fail financially or otherwise be unwilling or unable to meet their obligations to the Fund. The Fund may use credit default swaps, as a protection buyer, to hedge its credit exposure to issuers of bonds it holds without having to sell the bonds. During the year ended December 31, 2014, the Fund engaged in credit default swap transactions as a protection buyer to hedge its credit exposure.
Strategic Alpha Fund is subject to the risk of unpredictable declines in the value of individual equity securities and periods of below-average performance in individual securities or in the equity market as a whole. The Fund may use futures contracts, purchased put options and written call options to hedge against a decline in value of an equity security that it owns. The Fund may also write put options to offset the cost of options used for hedging purposes. During the year ended December 31, 2014, the Fund engaged in futures and option transactions for hedging purposes.
The following is a summary of derivative instruments for Gateway Equity Call Premium Fund as of December 31, 2014, as reflected within the Statements of Assets and Liabilities:
Liabilities | Options written at value | |||
| Exchange traded/cleared liability derivatives | ||||
Equity contracts | $ | (357,910 | ) | |
Transactions in derivative instruments for Gateway Equity Call Premium Fund during the period December 31, 2014, as reflected within the Statements of Operations, were as follows:
Net Realized Gain (Loss) on: | Options written | |||
| Equity contracts | $ | (395,341 | ) | |
Net Change in Unrealized Appreciation | Options written | |||
| Equity contracts | $ | 66,740 | ||
| 74
Table of Contents
Notes to Financial Statements (continued)
December 31, 2014
The following is a summary of derivative instruments for Strategic Alpha Fund as of December 31, 2014, as reflected within the Statements of Assets and Liabilities:
Assets | Investments | Unrealized | Unrealized | Swap | Total | |||||||||||||||
Over-the-counter asset derivatives | ||||||||||||||||||||
Interest rate contracts | $ | 370,983 | $ | — | $ | — | $ | — | $ | 370,983 | ||||||||||
Foreign exchange contracts | 3,138,614 | 6,121,170 | — | — | 9,259,784 | |||||||||||||||
Credit contracts | — | — | — | 2,219,604 | 2,219,604 | |||||||||||||||
|
|
|
|
|
|
|
|
|
| |||||||||||
Total over-the-counter asset derivatives | $ | 3,509,597 | $ | 6,121,170 | $ | — | $ | 2,219,604 | $ | 11,850,371 | ||||||||||
|
|
|
|
|
|
|
|
|
| |||||||||||
Exchange traded/ cleared asset derivatives | ||||||||||||||||||||
Equity contracts | $ | 249,900 | $ | — | $ | — | $ | — | $ | 249,900 | ||||||||||
Credit contracts | — | — | — | 2,094,083 | 2,094,083 | |||||||||||||||
|
|
|
|
|
|
|
|
|
| |||||||||||
Total exchange traded/cleared asset derivatives | $ | 249,900 | $ | — | $ | — | $ | 2,094,083 | $ | 2,343,983 | ||||||||||
|
|
|
|
|
|
|
|
|
| |||||||||||
Total asset derivatives | $ | 3,759,497 | $ | 6,121,170 | $ | — | $ | 4,313,687 | $ | 14,194,354 | ||||||||||
|
|
|
|
|
|
|
|
|
| |||||||||||
Liabilities | Options | Unrealized | Unrealized | Swap | Total | |||||||||||||||
Over-the-counter liability derivatives | ||||||||||||||||||||
Foreign exchange contracts | $ | (2,240 | ) | $ | (1,957,351 | ) | $ | — | $ | — | $ | (1,959,591 | ) | |||||||
Credit contracts | — | — | — | (3,514,535 | ) | (3,514,535 | ) | |||||||||||||
|
|
|
|
|
|
|
|
|
| |||||||||||
Total over-the-counter liability derivatives | $ | (2,240 | ) | $ | (1,957,351 | ) | $ | — | $ | (3,514,535 | ) | $ | (5,474,126 | ) | ||||||
|
|
|
|
|
|
|
|
|
| |||||||||||
Exchange traded/cleared liability derivatives | ||||||||||||||||||||
Equity contracts | $ | (166,835 | ) | $ | — | $ | (3,364,895 | ) | $ | — | $ | (3,531,730 | ) | |||||||
|
|
|
|
|
|
|
|
|
| |||||||||||
Total exchange traded/cleared liability derivatives | $ | (166,835 | ) | $ | — | $ | (3,364,895 | ) | $ | — | $ | (3,531,730 | ) | |||||||
|
|
|
|
|
|
|
|
|
| |||||||||||
Total liability derivatives | $ | (169,075 | ) | $ | (1,957,351 | ) | $ | (3,364,895 | ) | $ | (3,514,535 | ) | $ | (9,005,856 | ) | |||||
|
|
|
|
|
|
|
|
|
| |||||||||||
| 1 | Represents purchased options/swaptions, at value. |
| 2 | Represents cumulative unrealized appreciation (depreciation) on futures contracts. Only the current day’s variation margin on futures contracts is reported within the Statements of Assets and Liabilities as receivable or payable for variation margin, as applicable. |
75 |
Table of Contents
Notes to Financial Statements (continued)
December 31, 2014
| 3 | Represents swap agreements, at value. Market value of swap agreements is reported in the Portfolio of Investments along with the unamortized upfront premium paid (received), if any, and unrealized appreciation (depreciation) on each individual contract. Unrealized appreciation (depreciation) and upfront premiums paid (received) are reported within the Statements of Assets and Liabilities. |
Transactions in derivative instruments for Strategic Alpha Fund during the year ended December 31, 2014 as reflected in the Statements of Operations were as follows:
Net Realized Gain (Loss) on: | Investments4 | Futures | Options/ | Swap | Foreign currency | |||||||||||||||
Interest rate contracts | $ | (4,240,210 | ) | $ | (12,548,231 | ) | $ | 3,362,483 | $ | 518,496 | $ | — | ||||||||
Foreign exchange contracts | 4,018,226 | — | — | — | 10,473,689 | |||||||||||||||
Credit contracts | — | — | — | (6,110,223 | ) | — | ||||||||||||||
Equity contracts | 700,052 | (10,747,242 | ) | (80,309 | ) | — | — | |||||||||||||
|
|
|
|
|
|
|
|
|
| |||||||||||
Total | $ | 478,068 | $ | (23,295,473 | ) | $ | 3,282,174 | $ | (5,591,727 | ) | $ | 10,473,689 | ||||||||
|
|
|
|
|
|
|
|
|
| |||||||||||
Net Change in Unrealized | Investments4 | Futures | Options/ | Swap | Foreign currency | |||||||||||||||
Interest rate contracts | $ | (1,121,575 | ) | $ | (3,964,303 | ) | $ | (147,209 | ) | $ | — | $ | — | |||||||
Foreign exchange contracts | 1,634,492 | — | 263,760 | — | 3,803,742 | |||||||||||||||
Credit contracts | — | — | — | 1,921,098 | — | |||||||||||||||
Equity contracts | (857,709 | ) | (1,108,249 | ) | 10,176 | — | — | |||||||||||||
|
|
|
|
|
|
|
|
|
| |||||||||||
Total | $ | (344,792 | ) | $ | (5,072,552 | ) | $ | 126,727 | $ | 1,921,098 | $ | 3,803,742 | ||||||||
|
|
|
|
|
|
|
|
|
| |||||||||||
| 4 | Represents realized gain/loss and change in unrealized appreciation (depreciation), respectively, for purchased options/swaptions during the period. |
| 5 | Represents realized gain and change in unrealized appreciation (depreciation), respectively, for forward foreign currency contracts during the period. Does not include other foreign currency gains or losses included in the Statement of Operations. |
As the Funds value their derivatives at fair value and recognize changes in fair value through the Statements of Operations, they do not qualify for hedge accounting under authoritative guidance for derivative instruments. The Funds’ investments in derivatives may represent an economic hedge; however, they are considered to be non-hedge transactions for the purpose of these disclosures.
The volume of option contract activity, as a percentage of investments in common stocks, for Gateway Equity Call Premium Fund, based on month-end notional amounts outstanding during the period, at absolute value, was as follows for period ended December 31, 2014:
Gateway Equity Call Premium Fund | Call Options | |||
Average Notional Amount Outstanding | 99.30 | % | ||
Highest Notional Amount Outstanding | 99.52 | % | ||
Lowest Notional Amount Outstanding | 98.80 | % | ||
Notional Amount Outstanding as of December 31, 2014 | 99.35 | % | ||
| * | Notional amounts outstanding are determined by multiplying option contracts by the contract multiplier by the price of the option’s underlying index, the S&P 500® Index. |
| 76
Table of Contents
Notes to Financial Statements (continued)
December 31, 2014
The volume of forward foreign currency contract, futures contract and swap agreement activity, as a percentage of net assets for Strategic Alpha Fund, based on gross month-end notional amounts outstanding during the period, including long and short positions at absolute value, was as follows for the year ended December 31, 2014:
Strategic Alpha Fund | Forwards | Futures | Credit Default Swaps | Interest Rate Swaps | ||||||||||||
Average Notional Amount Outstanding | 26.28 | % | 19.07 | % | 6.00 | % | 2.25 | % | ||||||||
Highest Notional Amount Outstanding | 34.62 | % | 26.14 | % | 11.97 | % | 13.99 | % | ||||||||
Lowest Notional Amount Outstanding | 16.45 | % | 5.82 | % | 0.23 | % | 0.00 | % | ||||||||
Notional Amount Outstanding as of December 31, 2014 | 33.07 | % | 5.82 | % | 4.82 | % | 0.00 | % | ||||||||
Notional amounts outstanding at the end of the prior period, if applicable, are included in the averages above.
Unrealized gain and/or loss on open forwards, futures and swaps is recorded in the Statements of Assets and Liabilities. The aggregate notional values of forward, futures and swap contracts are not recorded in the Statements of Assets and Liabilities, and therefore are not included in the Fund’s net assets.
The volume of option contract activity, as a percentage of net assets for Strategic Alpha Fund, based on the month-end market values of instruments underlying purchased and written options, at absolute value, was as follows for the year ended December 31, 2014:
Strategic Alpha Fund | Call Options | Put Options Purchased* | Call Options Written* | Put Options Written* | ||||||||||||
Average Market Value of Underlying Instruments | 2.85 | % | 4.43 | % | 0.72 | % | 1.57 | % | ||||||||
Highest Market Value of Underlying Instruments | 8.05 | % | 18.03 | % | 3.37 | % | 5.37 | % | ||||||||
Lowest Market Value of Underlying Instruments | 0.00 | % | 3.54 | % | 0.00 | % | 0.00 | % | ||||||||
Market Value of Underlying Instruments as of December 31, 2014 | 1.96 | % | 2.74 | % | 1.23 | % | 5.37 | % | ||||||||
| * | Market value of underlying instruments is determined as follows: for securities by multiplying option shares by the price of the option’s underlying security, for currencies by multiplying par value by the strike price and dividing by the foreign currency exchange rate and for futures by multiplying the number of contracts by the contract multiplier by the price of the underlying futures contract. |
77 |
Table of Contents
Notes to Financial Statements (continued)
December 31, 2014
The volume of interest rate swaption activity, as a percentage of net assets for Strategic Alpha Fund, based on average premiums paid or received during the period, including long and short positions at absolute value, was as follows for the year ended December 31, 2014:
Strategic Alpha Fund | Interest Rate Call Written | Interest Rate Put Purchased | Interest Rate Call Purchased | |||||||||
Average Premium Paid/Received | 0.16 | % | 0.02 | % | 0.26 | % | ||||||
Highest Premium Paid/Received | 0.31 | % | 0.03 | % | 0.47 | % | ||||||
Lowest Premium Paid/Received | 0.00 | % | 0.00 | % | 0.00 | % | ||||||
Premium Paid/Received as of December 31, 2014 | 0.00 | % | 0.03 | % | 0.05 | % | ||||||
The following is a summary of Gateway Equity Call Premium Fund’s written option activity:
Gateway Equity Call Premium Fund | Number of Contracts | Premiums | ||||||
Options written | 258 | $ | 933,237 | |||||
Options terminated in closing purchase transactions | (157 | ) | (501,850 | ) | ||||
Options expired | (5 | ) | (6,737 | ) | ||||
|
|
|
| |||||
Outstanding at December 31, 2014 | 96 | $ | 424,650 | |||||
|
|
|
| |||||
The following is a summary of Strategic Alpha Fund’s written option activity (excluding foreign currency options and interest rate swaptions):
Strategic Alpha Fund | Number of | Premiums | ||||||
Outstanding at December 31, 2013 | — | $ | — | |||||
Options written | 37,523 | 1,937,981 | ||||||
Options terminated in closing purchase transactions | (25,264 | ) | (1,760,970 | ) | ||||
|
|
|
| |||||
Outstanding at December 31, 2014 | 12,259 | $ | 177,011 | |||||
|
|
|
| |||||
The following is a summary of Strategic Alpha Fund’s foreign currency written option activity:
Strategic Alpha Fund | Units of | Premiums | ||||||
Outstanding at December 31, 2013 | — | $ | — | |||||
Options written | 70,000,000 | 266,000 | ||||||
Options terminated in closing purchase transactions | — | — | ||||||
|
|
|
| |||||
Outstanding at December 31, 2014 | 70,000,000 | $ | 266,000 | |||||
|
|
|
| |||||
| 78
Table of Contents
Notes to Financial Statements (continued)
December 31, 2014
The following is a summary of Strategic Alpha Fund’s written interest rate swaption activity:
Strategic Alpha Fund | Notional | Premiums | ||||||
Outstanding at December 31, 2013 | $ | 114,500,000 | $ | 3,740,334 | ||||
Swaptions written | — | — | ||||||
Swaptions terminated in closing purchase transactions | (114,500,000 | ) | (3,740,334 | ) | ||||
|
|
|
| |||||
Outstanding at December 31, 2014 | $ | — | $ | — | ||||
|
|
|
| |||||
OTC derivatives, including forward foreign currency contracts, options, interest rate swaptions and swap agreements, are entered into pursuant to International Swaps and Derivatives Association, Inc. (“ISDA”) agreements negotiated between the Funds and their counterparties. ISDA agreements typically contain, among other things, terms for the posting of collateral and master netting provisions in the event of a default or other termination event. Collateral is posted by a Fund or the counterparty to the extent of the net mark-to-market exposure to the other party of all open contracts under the agreement, subject to minimum transfer requirements. Master netting provisions allow the Funds and the counterparty, in the event of a default or other termination event, to offset amounts owed by each related to derivative contracts, including any posted collateral, to one net amount payable by either the Funds or the counterparty. The Funds’ ISDA agreements typically contain provisions that allow a counterparty to terminate open contracts early if the net asset value of a Fund declines beyond a certain threshold. For financial reporting purposes, the Funds do not offset derivative assets and liabilities, and any related collateral received or pledged, on the Statements of Assets and Liabilities.
As of December 31, 2014, gross amounts of OTC derivative assets and liabilities not offset in the Statements of Assets and Liabilities and the related net amounts after taking into account master netting arrangements, by counterparty, are as follows:
Strategic Alpha Fund
Counterparty | Gross Amounts | Offset | Net | Collateral | Net | |||||||||||||||
Bank of America, N.A. | $ | 2,724,175 | $ | (868,609 | ) | $ | 1,855,566 | $ | (1,460,000 | ) | $ | 395,566 | ||||||||
Barclays Bank PLC | 45,362 | (45,362 | ) | — | — | — | ||||||||||||||
Citibank N.A. | 2,398,625 | (875,907 | ) | 1,522,718 | (1,522,718 | ) | — | |||||||||||||
Credit Suisse International | 5,669,912 | (962,482 | ) | 4,707,430 | (4,410,000 | ) | 297,430 | |||||||||||||
Deutsche Bank AG | 1,012,297 | (595,005 | ) | 417,292 | (313,447 | ) | 103,845 | |||||||||||||
|
|
|
|
|
|
|
|
|
| |||||||||||
| $ | 11,850,371 | $ | (3,347,365 | ) | $ | 8,503,006 | $ | (7,706,165 | ) | $ | 796,841 | |||||||||
|
|
|
|
|
|
|
|
|
| |||||||||||
79 |
Table of Contents
Notes to Financial Statements (continued)
December 31, 2014
Strategic Alpha Fund (continued)
Counterparty | Gross Amounts | Offset | Net | Collateral | Net | |||||||||||||||
Bank of America, N.A. | $ | (868,609 | ) | $ | 868,609 | $ | — | $ | — | $ | — | |||||||||
Barclays Bank PLC | (421,320 | ) | 45,362 | (375,958 | ) | 310,000 | (65,958 | ) | ||||||||||||
Citibank N.A. | (875,907 | ) | 875,907 | — | — | — | ||||||||||||||
Credit Suisse International | (962,482 | ) | 962,482 | — | — | — | ||||||||||||||
Deutsche Bank AG | (595,005 | ) | 595,005 | — | — | — | ||||||||||||||
JPMorgan Chase Bank N.A. | (1,576,261 | ) | — | (1,576,261 | ) | 1,576,261 | — | |||||||||||||
Morgan Stanley Capital Services, Inc. | (174,542 | ) | — | (174,542 | ) | — | (174,542 | ) | ||||||||||||
|
|
|
|
|
|
|
|
|
| |||||||||||
| $ | (5,474,126 | ) | $ | 3,347,365 | $ | (2,126,761 | ) | $ | 1,886,261 | $ | (240,500 | ) | ||||||||
|
|
|
|
|
|
|
|
|
| |||||||||||
The actual collateral received or pledged, if any, may exceed the amounts shown in the table due to overcollateralization. Timing differences may exist between when contracts under the ISDA agreements are marked-to-market and when collateral moves. The ISDA agreements include tri-party control agreements under which collateral is held for the benefit of the secured party at a third party custodian, State Street Bank.
Counterparty risk is managed based on policies and procedures established by each Fund’s adviser. Such policies and procedures may include, but are not limited to, minimum counterparty credit rating requirements, monitoring of counterparty credit default swap spreads and posting of collateral. A Fund’s risk of loss from counterparty credit risk on OTC derivatives is generally limited to the Fund’s aggregated unrealized gains and the amount of any collateral pledged to the counterparty, which may be offset by any collateral posted to the Fund by the counterparty. ISDA master agreements can help to manage counterparty risk by specifying collateral posting arrangements at pre-arranged exposure levels. Under these ISDA agreements, collateral is routinely transferred if the total net exposure in respect of certain transactions, net of existing collateral already in place, exceeds a specified amount (typically $250,000, depending on the counterparty). With exchange traded derivatives, there is minimal counterparty credit risk to the Fund because the exchange’s clearinghouse, as counterparty to these instruments, stands between the buyer and the seller of the contract. Credit risk still exists in exchange traded derivatives with respect to initial and variation margin that is held in a broker’s customer accounts. While brokers are required to segregate customer margin from their own assets, in the event that a broker becomes insolvent or goes into bankruptcy and at that time there is a shortfall in the aggregate amount of margin held by the broker for all its clients, U.S. bankruptcy laws will typically allocate that shortfall on a pro rata basis across all of the broker’s customers, potentially resulting in losses to the Fund. Based on balances reflected on each Fund’s Statement
| 80
Table of Contents
Notes to Financial Statements (continued)
December 31, 2014
of Assets and Liabilities, the following table shows (i) the maximum amount of loss due to credit risk that, based on the gross fair value of the financial instrument, the applicable Fund would incur if parties to the relevant financial instruments failed completely to perform according to the terms of the contracts and the collateral or other security, if any, for the amount due proved to be of no value to the Fund, and (ii) the amount of loss that the applicable Fund would incur after taking into account master netting provisions pursuant to ISDA agreements, as of December 31, 2014:
Fund | Maximum Amount of Loss - Gross | Maximum Amount of Loss - Net | ||||||
Strategic Alpha Fund | $ | 24,183,631 | $ | 11,243,840 | ||||
These amounts include cash and U.S. government and agency securities received as collateral of $7,763,447. U.S. government and agency securities received as collateral are valued in accordance with the Fund’s valuation policies and are recorded on the Statements of Assets and Liabilities.
5. Purchases and Sales of Securities. For the year ended December 31, 2014, purchases and sales of securities (excluding short-term investments and U.S. Government/Agency securities and including paydowns) were as follows:
Fund | Purchases | Sales | ||||||
Gateway Equity Call Premium Fund | $ | 20,545,828 | $ | 965,353 | ||||
Strategic Alpha Fund | 1,029,937,591 | 943,694,542 | ||||||
For the year ended December 31, 2014, purchases and sales of U.S. Government/Agency securities (excluding short-term investments and including paydowns) by Strategic Alpha Fund were $36,128,203 and $46,577,958, respectively.
6. Management Fees and Other Transactions with Affiliates.
a. Management Fees. Gateway Investment Advisers, LLC (“Gateway Advisers”) serves as investment adviser to Gateway Equity Call Premium Fund. Gateway Advisers is a subsidiary of Natixis US, which is part of Natixis Global Asset Management, an international asset management group based in Paris, France. Under the terms of the management agreement, the Fund pays a management fee at the annual rate of 0.65%, calculated daily and payable monthly, based on the Fund’s average daily net assets.
Loomis, Sayles & Company, L.P. (“Loomis Sayles”) is the investment adviser to Strategic Alpha Fund. Loomis Sayles’ general partner is indirectly owned by Natixis US. Under the terms of the management agreement, the Fund pays a management fee at the annual rate of 0.70% of the Fund’s average daily net assets, calculated daily and payable monthly.
81 |
Table of Contents
Notes to Financial Statements (continued)
December 31, 2014
Gateway Advisers and Loomis Sayles have given binding undertakings to the Funds to waive management fees and/or reimburse certain expenses to limit the Funds’ operating expenses, exclusive of acquired fund fees and expenses, brokerage expenses, interest expense, taxes and extraordinary expenses. These undertakings are in effect until April 30, 2016 for Gateway Equity Call Premium Fund and April 30, 2015 for Strategic Alpha Fund and are reevaluated on an annual basis. Management fees payable, as reflected on the Statements of Assets and Liabilities, is net of waivers and/or expense reimbursements, if any, pursuant to these undertakings. Waivers/reimbursements that exceed management fees payable are reflected on the Statements of Assets and Liabilities as receivable from investment adviser.
For the year ended December 31, 2014, the expense limits as a percentage of average daily net assets under the expense limitation agreements were as follows:
| Expense Limit as a Percentage of Average Daily Net Assets | ||||||||||||
Fund | Class A | Class C | Class Y | |||||||||
Gateway Equity Call Premium Fund | 1.20 | % | 1.95 | % | 0.95 | % | ||||||
Strategic Alpha Fund | 1.30 | % | 2.05 | % | 1.05 | % | ||||||
Gateway Advisers and Loomis Sayles shall be permitted to recover expenses they have borne under the expense limitation agreements (whether through waiver of its management fees or otherwise) on a class by class basis in later periods to the extent the annual operating expenses of a class fall below a class’ expense limits, provided, however, that a class is not obligated to pay such waived/reimbursed fees or expenses more than one year after the end of the fiscal year in which the fees or expenses were waived/reimbursed.
For the year ended December 31, 2014, the management fees and waivers of management fees for each Fund were as follows:
Fund | Gross Fees | Waivers of Fees1 | Net | Percentage of | ||||||||||||||||
| Gross | Net | |||||||||||||||||||
Gateway Equity Call Premium Fund | $ | 20,243 | $ | 20,243 | $ | — | 0.65 | % | — | |||||||||||
Strategic Alpha Fund | 8,848,129 | — | 8,848,129 | 0.70 | % | 0.70 | % | |||||||||||||
| 1 | Management fee waivers are subject to possible recovery until December 31, 2015. |
In addition, the investment adviser reimbursed non-class-specific expenses of Gateway Equity Call Premium Fund in the amount of $60,438 for the period ended December 31, 2014. This expense reimbursement is subject to possible recovery until December 31, 2015.
| 82
Table of Contents
Notes to Financial Statements (continued)
December 31, 2014
No expenses were recovered for either Fund during the year ended December 31, 2014 under the terms of the expense limitation agreements.
b. Service and Distribution Fees. NGAM Distribution, L.P. (“NGAM Distribution”), which is a wholly-owned subsidiary of Natixis US, has entered into a distribution agreement with the Trusts. Pursuant to this agreement, NGAM Distribution serves as principal underwriter of the Funds of the Trusts.
Pursuant to Rule 12b-1 under the 1940 Act, the Trusts have adopted a Service Plan relating to each Fund’s Class A shares (the “Class A Plans”) and a Distribution and Service Plan relating to each Fund’s Class C shares (the “Class C Plans”).
Under the Class A Plans, each Fund pays NGAM Distribution a monthly service fee at an annual rate not to exceed 0.25% of the average daily net assets attributable to the Funds’ Class A shares, as reimbursement for expenses incurred by NGAM Distribution in providing personal services to investors in Class A shares and/or the maintenance of shareholder accounts.
Under the Class C Plans, each Fund pays NGAM Distribution a monthly service fee at an annual rate not to exceed 0.25% of the average daily net assets attributable to the Funds’ Class C shares, as compensation for services provided by NGAM Distribution in providing personal services to investors in Class C shares and/or the maintenance of shareholder accounts.
Also under the Class C Plans, each Fund pays NGAM Distribution a monthly distribution fee at the annual rate of 0.75% of the average daily net assets attributable to the Funds’ Class C shares, as compensation for services provided by NGAM Distribution in connection with the marketing or sale of Class C shares.
For the year ended December 31, 2014, the service and distribution fees for each Fund were as follows:
| Service Fees | Distribution Fees | |||||||||||
Fund | Class A | Class C | Class C | |||||||||
Gateway Equity Call Premium Fund | $ | 35 | $ | — | (a) | $ | 2 | |||||
Strategic Alpha Fund | 363,790 | 202,516 | 607,546 | |||||||||
| (a) | Amount rounds to less than $1.00. |
c. Administrative Fees. NGAM Advisors provides certain administrative services for the Funds and contracts with State Street Bank to serve as sub-administrator. Pursuant to an agreement among Natixis Funds Trusts, Loomis Sayles Funds Trusts and NGAM Advisors, each Fund pays NGAM Advisors monthly its pro rata portion of fees equal to an annual rate of 0.0575% of the first $15 billion of the average daily net assets of the Natixis Funds Trusts and Loomis Sayles Funds Trusts, 0.0500% of the next $15 billion, 0.0400% of the next $30 billion, 0.0350% of the next $30 billion and 0.0325% of such assets in excess of $90 billion, subject to an annual aggregate minimum fee for the
83 |
Table of Contents
Notes to Financial Statements (continued)
December 31, 2014
Natixis Funds Trusts and Loomis Sayles Funds Trusts of $10 million, which is reevaluated on an annual basis.
For the year ended December 31, 2014, the administrative fees for each Fund were as follows:
Fund | Administrative Fees | |||
Gateway Equity Call Premium Fund | $ | 1,333 | ||
Strategic Alpha Fund | 546,169 | |||
Prior to July 1, 2014, each Fund paid NGAM Advisors monthly its pro rata portion of fees equal to an annual rate of 0.0575% of the first $15 billion of the average daily net assets of the Natixis Funds Trusts, Loomis Sayles Funds Trusts and Hansberger International Series, 0.0500% of the next $15 billion, 0.0400% of the next $30 billion and 0.0350% of such assets in excess of $60 billion, subject to an annual aggregate minimum fee for the Natixis Funds Trusts, Loomis Sayles Funds Trusts and Hansberger International Series of $10 million.
d. Sub-Transfer Agent Fees. NGAM Distribution has entered into agreements, which include servicing agreements, with financial intermediaries that provide recordkeeping, processing, shareholder communications and other services to customers of the intermediaries that hold positions in the Funds and has agreed to compensate the intermediaries for providing those services. Intermediaries transact with the Funds primarily through the use of omnibus accounts on behalf of their customers who hold positions in the Funds. These services would have been provided by the Funds’ transfer agent and other service providers if the shareholders’ accounts were maintained directly at the Funds’ transfer agent. Accordingly, the Funds have agreed to reimburse NGAM Distribution for all or a portion of the servicing fees paid to these intermediaries. The reimbursement amounts (sub-transfer agent fees) paid to NGAM Distribution are subject to a current per-account equivalent fee limit approved by the Funds’ Board, which is based on fees for similar services paid to the Funds’ transfer agent and other service providers.
For the year ended December 31, 2014, the sub-transfer agent fees (which are reflected in transfer agent fees and expenses in the Statements of Operations) for each Fund were as follows:
Fund | Sub-Transfer Agent Fees | |||
Gateway Equity Call Premium Fund | $ | 103 | ||
Strategic Alpha Fund | 741,438 | |||
| 84
Table of Contents
Notes to Financial Statements (continued)
December 31, 2014
As of December 31, 2014, the Funds owe NGAM Distribution the following reimbursements for sub-transfer agent fees (which are reflected in the Statements of Assets and Liabilities as payable to distributor):
Fund | Reimbursements of | |||
Gateway Equity Call Premium Fund | $ | 46 | ||
Strategic Alpha Fund | 9,802 | |||
Sub-transfer agent fees attributable to Class A, Class C and Class Y are allocated on a pro rata basis to each class based on the relative net assets of each class to the total net assets of those classes.
e. Commissions. Commissions (including CDSCs) on Fund shares retained by NGAM Distribution during the year ended December 31, 2014 were as follows:
Fund | Commissions | |||
Strategic Alpha Fund | $ | 58,106 | ||
f. Trustees Fees and Expenses. The Trusts do not pay any compensation directly to their officers or Trustees who are directors, officers or employees of NGAM Advisors, NGAM Distribution, Natixis US or their affiliates. The Chairperson of the Board receives a retainer fee at the annual rate of $300,000. The Chairperson does not receive any meeting attendance fees for Board of Trustees meetings or committee meetings that she attends. Each Independent Trustee (other than the Chairperson) receives, in the aggregate, a retainer fee at the annual rate of $130,000. Each Independent Trustee also receives a meeting attendance fee of $10,000 for each meeting of the Board of Trustees that he or she attends in person and $5,000 for each meeting of the Board of Trustees that he or she attends telephonically. In addition, each committee chairperson (except for the Chairperson of the Governance Committee) receives an additional retainer fee at the annual rate of $17,500. Each Contract Review Committee member is compensated $6,000 for each Committee meeting that he or she attends in person and $3,000 for each meeting that he or she attends telephonically. Each Audit Committee member is compensated $6,000 for each Committee meeting that he or she attends in person and $3,000 for each meeting that he or she attends telephonically. These fees are allocated among the funds in the Natixis Funds Trusts and Loomis Sayles Funds Trusts based on a formula that takes into account, among other factors, the relative net assets of each fund. Trustees are reimbursed for travel expenses in connection with attendance at meetings.
Effective January 1, 2015, the chairperson of the Governance Committee receives an additional retainer fee at the annual rate of $5,000.
A deferred compensation plan (the “Plan”) is available to the Trustees on a voluntary basis. Deferred amounts remain in the Funds until distributed in accordance with the provisions of the Plan. The value of a participating Trustee’s deferral account is based
85 |
Table of Contents
Notes to Financial Statements (continued)
December 31, 2014
on theoretical investments of deferred amounts, on the normal payment dates, in certain funds of the Natixis Funds Trusts and Loomis Sayles Funds Trusts as designated by the participating Trustees. Changes in the value of participants’ deferral accounts are allocated pro rata among the funds in the Natixis Funds Trusts and Loomis Sayles Funds Trusts, and are normally reflected as Trustees’ fees and expenses in the Statements of Operations. The portions of the accrued obligations allocated to the Funds under the Plan are reflected as Deferred Trustees’ fees on the Statements of Assets and Liabilities.
g. Affiliated Ownership. At December 31, 2014, Natixis US and affiliates and Gateway Advisers held shares of Gateway Equity Call Premium Fund representing 9.40% and 23.94% of the Fund’s net assets, respectively. Investment activities of affiliated shareholders could have material impacts on the Funds.
h. Payment by Affiliates. For the year ended December 31, 2014, Loomis Sayles reimbursed Strategic Alpha Fund $5,875 for losses incurred in connection with a trading error.
7. Line of Credit. Each Fund, together with certain other funds of Natixis Funds Trusts and Loomis Sayles Funds Trusts, participates in a $200,000,000 committed unsecured line of credit provided by State Street Bank, with an individual limit of $125,000,000 for each Fund that participates in the line of credit. Interest is charged to each participating Fund based on its borrowings at a rate per annum equal to the greater of the Federal Funds rate or overnight LIBOR, plus 1.25%. In addition, a commitment fee of 0.10% per annum, payable at the end of each calendar quarter, is accrued and apportioned among the participating funds based on their average daily unused portion of the line of credit.
For the year ended December 31, 2014, the Strategic Alpha Fund had no borrowings under this agreement. The agreement became effective for the Equity Call Premium Fund on January 8, 2015.
8. Concentration of Risk. The Funds’ investments in foreign securities are subject to foreign currency fluctuations, higher volatility than U.S. securities, varying degrees of regulation and limited liquidity. Greater political, economic, credit and information risks are also associated with foreign securities.
Strategic Alpha Fund is non-diversified, which means it is not limited under the 1940 Act to a percentage of assets that it may invest in any one issuer. Because the Fund may invest in the securities of a limited number of issuers, an investment in the Fund may involve a higher degree of risk than would be present in a diversified portfolio.
9. Concentration of Ownership. From time to time, a Fund may have a concentration of one or more accounts constituting a significant percentage of shares outstanding. Investment activities by holders of such accounts could have material impacts on the Fund. As of December 31, 2014, based on management’s evaluation of the shareholder account base, the Fund had accounts representing controlling ownership of more than 5% of the Fund’s total outstanding shares. The number of such accounts, based on
| 86
Table of Contents
Notes to Financial Statements (continued)
December 31, 2014
accounts that represent more than 5% of an individual class of shares, and the aggregate percentage of net assets represented by such holdings were as follows:
Fund | Number of >5% | Percentage of Non-Affiliated | Percentage of Ownership (Note 6) | Total Percentage of | ||||||||||||
Gateway Equity Call Premium Fund | 1 | 56.61 | % | 33.34 | % | 89.95 | % | |||||||||
Strategic Alpha Fund | 3 | 41.44 | % | — | 41.44 | % | ||||||||||
Omnibus shareholder accounts for which NGAM Advisors understands that the intermediary has discretion over the underlying shareholder accounts or investment models where a shareholder account may be invested for a non-discretionary customer are included in the table above. For other omnibus accounts, the Fund does not have information on the individual shareholder accounts underlying omnibus accounts; therefore, there could be other 5% shareholders in addition to those disclosed in the table above.
10. Capital Shares. The Fund may issue an unlimited number of shares of beneficial interest, without par value. Transactions in capital shares were as follows:
| | Period Ended December 31, 2014(a) | | ||||||
Gateway Equity Call Premium Fund | Shares | Amount | ||||||
| Class A | ||||||||
Issued from the sale of shares | 9,653 | $ | 95,980 | |||||
Issued in connection with the reinvestment of distributions | 38 | 379 | ||||||
Redeemed | (98 | ) | (980 | ) | ||||
|
|
|
| |||||
Net change | 9,593 | $ | 95,379 | |||||
|
|
|
| |||||
| Class C | ||||||||
Issued from the sale of shares | 101 | $ | 1,011 | |||||
Issued in connection with the reinvestment of distributions | — | (b) | 2 | |||||
Redeemed | (1 | ) | (10 | ) | ||||
|
|
|
| |||||
Net change | 100 | $ | 1,003 | |||||
|
|
|
| |||||
| Class Y | ||||||||
Issued from the sale of shares | 2,437,927 | $ | 24,313,859 | |||||
Issued in connection with the reinvestment of distributions | 4,090 | 40,780 | ||||||
Redeemed | (354,383 | ) | (3,501,024 | ) | ||||
|
|
|
| |||||
Net change | 2,087,634 | $ | 20,853,615 | |||||
|
|
|
| |||||
Increase (decrease) from capital share transactions | 2,097,327 | $ | 20,949,997 | |||||
|
|
|
| |||||
| (a) | From commencement of operations on September 30, 2014 through December 31, 2014. |
| (b) | Amount rounds to less than one share. |
87 |
Table of Contents
Notes to Financial Statements (continued)
December 31, 2014
10. Capital Shares (continued).
| | Year Ended December 31, 2014 | | | Year Ended December 31, 2013 | | |||||||||||
Strategic Alpha Fund | Shares | Amount | Shares | Amount | ||||||||||||
| Class A | ||||||||||||||||
Issued from the sale of shares | 3,289,877 | $ | 33,285,385 | 19,193,046 | $ | 197,179,839 | ||||||||||
Issued in connection with the reinvestment of distributions | 314,559 | 3,151,241 | 355,486 | 3,564,612 | ||||||||||||
Redeemed | (10,780,235 | ) | (109,403,574 | ) | (9,839,761 | ) | (99,155,890 | ) | ||||||||
|
|
|
|
|
|
|
| |||||||||
Net change | (7,175,799 | ) | $ | (72,966,948 | ) | 9,708,771 | $ | 101,588,561 | ||||||||
|
|
|
|
|
|
|
| |||||||||
| Class C | ||||||||||||||||
Issued from the sale of shares | 652,702 | $ | 6,559,344 | 6,543,786 | $ | 67,379,172 | ||||||||||
Issued in connection with the reinvestment of distributions | 120,066 | 1,196,499 | 97,192 | 971,450 | ||||||||||||
Redeemed | (2,740,650 | ) | (27,590,387 | ) | (4,163,033 | ) | (41,773,151 | ) | ||||||||
|
|
|
|
|
|
|
| |||||||||
Net change | (1,967,882 | ) | $ | (19,834,544 | ) | 2,477,945 | $ | 26,577,471 | ||||||||
|
|
|
|
|
|
|
| |||||||||
| Class Y | ||||||||||||||||
Issued from the sale of shares | 53,741,784 | $ | 543,162,597 | 88,033,948 | $ | 900,107,320 | ||||||||||
Issued in connection with the reinvestment of distributions | 2,470,530 | 24,696,717 | 1,447,322 | 14,486,878 | ||||||||||||
Redeemed | (33,268,929 | ) | (335,773,481 | ) | (41,806,087 | ) | (422,406,151 | ) | ||||||||
|
|
|
|
|
|
|
| |||||||||
Net change | 22,943,385 | $ | 232,085,833 | 47,675,183 | $ | 492,188,047 | ||||||||||
|
|
|
|
|
|
|
| |||||||||
Increase (decrease) from capital share transactions | 13,799,704 | $ | 139,284,341 | 59,861,899 | $ | 620,354,079 | ||||||||||
|
|
|
|
|
|
|
| |||||||||
| 88
Table of Contents
Report of Independent Registered Public Accounting Firm
To the Board of Trustees of Gateway Trust and Natixis Funds Trust II and Shareholders of Gateway Equity Call Premium Fund and Loomis Sayles Strategic Alpha Fund:
In our opinion, the accompanying statements of assets and liabilities, including the portfolios of investments, and the related statements of operations and of changes in net assets and the financial highlights present fairly, in all material respects, the financial position of Gateway Equity Call Premium Fund, a series of Gateway Trust; and Loomis Sayles Strategic Alpha Fund, a series of Natixis Funds Trust II (the “Fund”), at December 31, 2014, and the results of each of their operations, the changes in each of their net assets and the financial highlights for each of the periods indicated, in conformity with accounting principles generally accepted in the United States of America. These financial statements and financial highlights (hereafter referred to as “financial statements”) are the responsibility of the Funds’ management; our responsibility is to express an opinion on these financial statements based on our audits. We conducted our audits of these financial statements in accordance with the standards of the Public Company Accounting Oversight Board (United States). Those standards require that we plan and perform the audits to obtain reasonable assurance about whether the financial statements are free of material misstatement. An audit includes examining, on a test basis, evidence supporting the amounts and disclosures in the financial statements, assessing the accounting principles used and significant estimates made by management, and evaluating the overall financial statement presentation. We believe that our audits, which included confirmation of securities at December 31, 2014 by correspondence with the custodian and brokers and the application of alternative auditing procedures where securities purchased had not been received, provide a reasonable basis for the opinion expressed above.
PricewaterhouseCoopers LLP
Boston, Massachusetts
February 23, 2015
89 |
Table of Contents
2014 U.S. Tax Distribution Information to Shareholders (Unaudited)
Corporate Dividends Received Deduction. For the fiscal year ended December 31, 2014, a percentage of dividends distributed by the Funds listed below qualify for the dividends received deduction for corporate shareholders. These percentages are as follows:
Fund | Qualifying | |||
Gateway Equity Call Premium | 100.00 | % | ||
Strategic Alpha | 4.67 | % | ||
Qualified Dividend Income. A percentage of dividends distributed by the Funds during the fiscal year ended December 31, 2014 are considered qualified dividend income, and are eligible for reduced tax rates. These lower rates range from 0% to 20% depending on an individual’s tax bracket. These percentages are noted below:
Fund | Qualifying | |||
Gateway Equity Call Premium | 86.99 | % | ||
Strategic Alpha | 11.32 | % | ||
| 90
Table of Contents
Trustee and Officer Information
The tables below provide certain information regarding the trustees and officers of Natixis Funds Trust II and Gateway Trust (the “Trusts”). Unless otherwise indicated, the address of all persons below is 399 Boylston Street, Boston, MA 02116. The Funds’ Statement of Additional Information includes additional information about the trustees of the Trusts and is available by calling Natixis Funds at 800-225-5478.
Name and Year of Birth | Position(s) Held with the Trusts, Length of Time Served and Term of Office1 | Principal Occupation(s) During Past 5 Years | Number of Portfolios in Fund Complex Overseen2 and Other Directorships Held During Past 5 Years | Experience, Qualifications, Attributes, Skills for Board Membership | ||||
| INDEPENDENT TRUSTEES | ||||||||
Kenneth A. Drucker (1945) | Trustee since 2008 Chairperson of the Audit Committee and Governance Committee Member | Retired | 42 None | Significant experience on the Board and on the boards of other business organizations (including at investment companies); executive experience (including as treasurer of an aerospace, automotive, and metal manufacturing corporation) | ||||
Edmond J. English (1953) | Trustee since 2013 Contract Review Committee Member | Chief Executive Officer of Bob’s Discount Furniture (retail) | 42 Formerly, Director, BJ’s Wholesale Club (retail); formerly, Director, Citizens Financial Group (bank) | Experience on the Board and significant experience on the boards of other business organizations (including at a retail company and a bank); executive experience (including at a retail company) | ||||
91 |
Table of Contents
Trustee and Officer Information
Name and Year of Birth | Position(s) Held with the Trusts, Length of Time Served and Term of Office1 | Principal Occupation(s) During Past 5 Years | Number of Portfolios in Fund Complex Overseen2 and Other Directorships Held During Past 5 Years | Experience, Qualifications, Attributes, Skills for Board Membership | ||||
INDEPENDENT TRUSTEES continued | ||||||||
Richard A. Goglia (1951) | Trustee since 2015 Audit Committee Member | Vice President and Treasurer of Raytheon Company (defense) | 42 None | Experience on the Board and executive experience (including his role as vice president and treasurer of a defense company and experience at a financial services company) | ||||
Wendell J. Knox (1948) | Trustee since 2009 Audit Committee Member and Governance Committee Member | Director of Abt Associates Inc. (research and consulting) | 42 Director, Eastern Bank (bank); Director, The Hanover Insurance Group (property and casualty insurance) | Significant experience on the Board and on the boards of other business organizations (including at a bank and at a property and casualty insurance firm); executive experience (including roles as president and chief executive officer of a research and consulting company) | ||||
| 92
Table of Contents
Trustee and Officer Information
Name and Year of Birth | Position(s) Held with the Trusts, Length of Time Served and Term of Office1 | Principal Occupation(s) During Past 5 Years | Number of Portfolios in Fund Complex Overseen2 and Other Directorships Held During Past 5 Years | Experience, Qualifications, Attributes, Skills for Board Membership | ||||
INDEPENDENT TRUSTEES continued | ||||||||
Martin T. Meehan (1956) | Trustee since 2012 Contract Review Committee Member | Chancellor and faculty member, University of Massachusetts Lowell | 42 None | Experience on the Board and on the boards of other business organizations; experience as Chancellor of the University of Massachusetts Lowell; government experience (including as a member of the U.S. House of Representatives); academic experience | ||||
Sandra O. Moose (1942) | Chairperson of the Board of Trustees since November 2005 Trustee since 1993 for Natixis Funds Trust II and since 2007 for Gateway Trust Ex Officio member of the Audit Committee, the Contract Review Committee and the Governance Committee | President, Strategic Advisory Services (management consulting) | 42 Director, AES Corporation (international power company); formerly, Director, Verizon Communications (telecommunications company) | Significant experience on the Board and on the boards of other business organizations (including at a telecommunications company, an international power company and a specialty chemicals corporation); executive experience (including at a management consulting company) | ||||
93 |
Table of Contents
Trustee and Officer Information
Name and Year of Birth | Position(s) Held with the Trusts, Length of Time Served and Term of Office1 | Principal Occupation(s) During Past 5 Years | Number of Portfolios in Fund Complex Overseen2 and Other Directorships Held During Past 5 Years | Experience, Qualifications, Attributes, Skills for Board Membership | ||||
INDEPENDENT TRUSTEES continued | ||||||||
Erik R. Sirri (1958) | Trustee since 2009 Audit Committee Member | Professor of Finance at Babson College | 42 None | Significant experience on the Board; experience as Director of the Division of Trading and Markets at the Securities and Exchange Commission; academic experience; training as an economist | ||||
Peter J. Smail (1952) | Trustee since 2009 Chairperson of the Contract Review Committee and Governance Committee Member | Retired | 42 None | Significant experience on the Board; mutual fund industry and executive experience (including roles as president and chief executive officer for an investment adviser) | ||||
Cynthia L. Walker (1956) | Trustee since 2005 for Natixis Funds Trust II and since 2007 for Gateway Trust Chairperson of the Governance Committee and Contract Review Committee Member | Deputy Dean for Finance and Administration, Yale University School of Medicine | 42 None | Significant experience on the Board; executive experience in a variety of academic organizations (including roles as dean for finance and administration) | ||||
| 94
Table of Contents
Trustee and Officer Information
Name and Year of Birth | Position(s) Held with the Trusts, Length of Time Served and Term of Office1 | Principal Occupation(s) During Past 5 Years | Number of Portfolios in Fund Complex Overseen2 and Other Directorships Held During Past 5 Years | Experience, Qualifications, Attributes, Skills for Board Membership | ||||
| INTERESTED TRUSTEES | ||||||||
Robert J. Blanding3 (1947) 555 California Street San Francisco, CA 94104 | Trustee since 2003 for Natixis Funds Trust II and since 2007 for Gateway Trust | Chairman and Chief Executive Officer (formerly, President), Loomis, Sayles & Company, L.P. | 42 None | Significant experience on the Board; continuing service as Chairman and Chief Executive Officer of Loomis, Sayles & Company, L.P. | ||||
David L. Giunta4 (1965) | Trustee since 2011 President and Chief Executive Officer since 2008 | President and Chief Executive Officer, NGAM Distribution Corporation, NGAM Advisors, L.P. and NGAM Distribution, L.P. | 42 None | Experience on the Board; continuing service as President and Chief Executive Officer of NGAM Advisors, L.P. | ||||
John T. Hailer5 (1960) | Trustee since 2000 for Natixis Funds Trust II and since 2007 for Gateway Trust | President and Chief Executive Officer – U.S. and Asia, Natixis Global Asset Management, L.P. | 42 None | Significant experience on the Board; continuing service as President and Chief Executive Officer – U.S. and Asia, Natixis Global Asset Management, L.P. | ||||
| 1 | Each trustee serves until retirement, resignation or removal from the Board. The current retirement age is 75. The position of Chairperson of the Board is appointed for a three-year term. Ms. Moose was appointed to serve an additional three-year term as the Chairperson of the Board on December 13, 2013. |
| 2 | The trustees of the Trusts serve as trustees of a fund complex that includes all series of the Natixis Funds Trust I, Natixis Funds Trust II, Natixis Funds Trust IV and Gateway Trust (collectively, the “Natixis Funds Trusts”), Loomis Sayles Funds I and Loomis Sayles Funds II (collectively, the “Loomis Sayles Funds Trusts”). |
| 3 | Mr. Blanding is deemed an “interested person” of the Trusts because he holds the following positions with an affiliated person of the Trusts: Chairman and Chief Executive Officer of Loomis, Sayles & Company, L.P. and Director of Loomis Sayles Investment Asia Pte., Ltd. |
| 4 | Mr. Giunta is deemed an “interested person” of the Trusts because he holds the following positions with an affiliated person of the Trusts: President and Chief Executive Officer of NGAM Distribution Corporation, NGAM Advisors, L.P. and NGAM Distribution, L.P. |
| 5 | Mr. Hailer is deemed an “interested person” of the Trusts because he holds the following positions with an affiliated person of the Trusts: President and Chief Executive Officer – U.S. and Asia, Natixis Global Asset Management, L.P. |
95 |
Table of Contents
Trustee and Officer Information
Name and Year of Birth | Position(s) Held with the Trusts | Term of Office1 and Length of Time Served | Principal Occupation(s) During Past 5 Years2 | |||
| OFFICERS OF THE TRUST | ||||||
Coleen Downs Dinneen (1960) | Secretary, Clerk and Chief Legal Officer | Since September 2004 for Natixis Funds Trust II and since 2007 for Gateway Trust | Executive Vice President, General Counsel, Secretary and Clerk, NGAM Distribution Corporation, NGAM Advisors, L.P. and NGAM Distribution, L.P. | |||
Russell L. Kane (1969) | Chief Compliance Officer, Assistant Secretary and Anti-Money Laundering Officer | Chief Compliance Officer since May 2006; Assistant Secretary since June 2004; and Anti-Money Laundering Officer since April 2007 for Natixis Funds Trust II and since 2007 for Gateway Trust | Chief Compliance Officer for Mutual Funds, Senior Vice President, Deputy General Counsel, Assistant Secretary and Assistant Clerk, NGAM Distribution Corporation, NGAM Advisors, L.P. and NGAM Distribution, L.P. | |||
Michael C. Kardok (1959) | Treasurer, Principal Financial and Accounting Officer | Since October 2004 for Natixis Funds Trust II and since 2007 for Gateway Trust | Senior Vice President, NGAM Advisors, L.P. and NGAM Distribution, L.P. | |||
| 1 | Each officer of the Trusts serves for an indefinite term in accordance with the Trusts’ current by-laws until the date his or her successor is elected and qualified, or until he or she sooner dies, retires, is removed or becomes disqualified. |
| 2 | Each person listed above, except as noted, holds the same position(s) with the Fund Complex. Previous positions during the past five years with NGAM Distribution, L.P., NGAM Advisors, L.P. or Loomis, Sayles & Company, L.P. are omitted, if not materially different from a trustee’s or officer’s current position with such entity. |
| 96
Table of Contents
Item 2. Code of Ethics.
The Registrant has adopted a code of ethics that applies to the Registrant’s principal executive officer, principal financial officer and persons performing similar functions. There have been no amendments or waivers of the Registrant’s code of ethics during the period.
Item 3. Audit Committee Financial Expert.
The Board of Trustees of the Registrant has established an audit committee. Mr. Kenneth A. Drucker, Mr. Richard A. Goglia, Mr. Wendell J. Knox and Mr. Erik R. Sirri are members of the audit committee and have been designated as “audit committee financial experts” by the Board of Trustees. Each of these individuals is also an Independent Trustee of the Registrant.
Item 4. Principal Accountant Fees and Services.
Fees billed by the Principal Accountant for services rendered to the Registrant.
The table below sets forth fees billed by the principal accountant, PricewaterhouseCoopers LLP, for the past two fiscal years for professional services rendered in connection with a) the audit of the Registrant’s annual financial statements and services provided in connection with regulatory filings; b) audit-related services (including services that are reasonably related to the performance of the audit of the Registrant’s financial statements but not reported under “Audit Fees”); c) tax compliance, tax advice and tax planning and d) all other fees billed for professional services rendered by the principal accountant to the Registrant, other than the services provided as reported as a part of (a) through (c) of this Item.
| Audit fees | Audit-related fees1 | Tax fees2 | All other fees | |||||||||||||||||||||||||||||
| 1/1/13- 12/31/13 | 1/1/14- 12/31/14 | 1/1/13- 12/31/13 | 1/1/14- 12/31/14 | 1/1/13- 12/31/13 | 1/1/14- 12/31/14 | 1/1/13- 12/31/13 | 1/1/14- 12/31/14 | |||||||||||||||||||||||||
Gateway Trust | $ | 57,900 | $ | 72,444 | $ | 1,104 | $ | 1,238 | $ | 8,364 | $ | 16,978 | $ | — | $ | — | ||||||||||||||||
| 1. | Audit-related fees consist of: |
2013 & 2014– performance of agreed-upon procedures related to the Registrant’s deferred compensation plan.
| 2. | Tax fees consist of: |
2013 & 2014 – review of the Registrant’s tax returns.
Aggregate fees billed to the Registrant for non-audit services during 2013 and 2014 were $9,468 and $18,216 respectively.
Fees billed by the Principal Accountant for services rendered to the Adviser and Control Affiliates.
The following table sets forth fees billed by the Registrant’s principal accountant for non-audit services rendered to Gateway Investment Advisers, LLC and entities controlling, controlled by or under common control with Gateway Investment Advisers, LLC (“Control Affiliates”) that provide ongoing services to the Registrant, for engagements that related directly to the operations and financial reporting of the Registrant for the last two fiscal years.
| Audit-related fees | Tax fees | All other fees | ||||||||||||||||||||||
| 1/1/13- 12/31/13 | 1/1/14- 12/31/14 | 1/1/13- 12/31/13 | 1/1/14- 12/31/14 | 1/1/13- 12/31/13 | 1/1/14- 12/31/14 | |||||||||||||||||||
Control Affiliates | $ | — | $ | — | $ | — | $ | — | $ | — | $ | — | ||||||||||||
The following table sets forth the aggregate fees billed by the Registrant’s principal accountant for non-audit services rendered to Gateway Investment Advisers, LLC and Control Affiliates that provide ongoing services to the Registrant, for the last two fiscal years, including the fees disclosed in the table above.
Table of Contents
| Aggregate Non-Audit Fees | ||||||||
| 1/1/13- 12/31/13 | 1/1/14- 12/31/14 | |||||||
Control Affiliates | $ | 2,000 | $ | 90,546 | ||||
None of the services described above were approved pursuant to (c)(7)(i)(C) of Regulation S-X.
Audit Committee Pre Approval Policies.
Annually, the Registrant’s Audit Committee reviews the audit, audit-related, tax and other non-audit services together with the projected fees, for services proposed to be rendered to the Trust and/or other entities for which pre-approval is required during the upcoming year. Any subsequent revisions to already pre-approved services or fees (including fee increases) and requests for pre-approval of new services would be presented for consideration quarterly as needed.
If, in the opinion of management, a proposed engagement by the Registrant’s independent accountants needs to commence before the next regularly scheduled Audit Committee meeting, any member of the Audit Committee who is an independent Board member is authorized to pre-approve the engagement, but only for engagements to provide audit, audit related and tax services. This approval is subject to review of the full Audit Committee at its next quarterly meeting. All other engagements require the approval of all the members of the Audit Committee.
Item 5. Audit Committee of Listed Registrants.
Not applicable.
Item 6. Schedule of Investments.
Included as part of the Report to Shareholders filed as Item 1 herewith.
Item 7. Disclosure of Proxy Voting Policies and Procedures for Closed-End Management Investment Companies.
Not applicable.
Item 8. Portfolio Managers of Closed-End Management Investment Companies.
Not applicable.
Item 9. Purchases of Equity Securities by Closed-End Management Investment Companies and Affiliated Purchasers.
Not applicable.
Item 10. Submission of Matters to a Vote of Securities Holders.
There were no material changes to the procedures by which shareholders may recommend nominees to the Registrant’s Board of Trustees.
Item 11. Controls and Procedures.
The Registrant’s principal executive officer and principal financial officer have concluded that the Registrant’s disclosure controls and procedures are sufficient to ensure that information required to be disclosed by the Registrant in this Form N-CSR was recorded, processed, summarized and reported within the time periods specified in the Securities and Exchange Commission’s rules and forms, based upon such officers’ evaluation of these controls and procedures as of a date within 90 days of the filing date of the report.
There were no changes in the Registrant’s internal control over financial reporting that occurred during the Registrant’s last fiscal quarter of the period covered by this report that has materially affected, or is reasonably likely to materially affect, the Registrant’s internal control over financial reporting.
Table of Contents
Item 12. Exhibits.
| (a) | (1) | Code of Ethics required by Item 2 hereof, filed herewith as Exhibit (a)(1). | ||||
| (a) | (2) | Certifications of Principal Executive Officer and Principal Financial Officer pursuant to Rule 30a-2(a) under the Investment Company Act of 1940 [17 CFR 270.30a-2(a)], filed herewith as Exhibits (a)(2)(1) and (a)(2)(2), respectively. | ||||
| (a) | (3) | Not applicable. | ||||
| (b) | Certifications of Principal Executive Officer and Principal Financial Officer pursuant to Section 906 of Sarbanes-Oxley Act of 2002 are filed herewith as Exhibit (b). | |||||
Table of Contents
SIGNATURES
Pursuant to the requirements of the Securities Exchange Act of 1934 and the Investment Company Act of 1940, the Registrant has duly caused this report to be signed on its behalf by the undersigned, thereunto duly authorized.
| Gateway Trust | ||
| By: | /s/ David L. Giunta | |
| Name: | David L. Giunta | |
| Title: | President and Chief Executive Officer | |
| Date: | February 23, 2015 | |
Pursuant to the requirements of the Securities Exchange Act of 1934 and the Investment Company Act of 1940, this report has been signed by the following persons on behalf of the Registrant and in the capacities and on the dates indicated.
| By: | /s/ David L. Giunta | |
| Name: | David L. Giunta | |
| Title: | President and Chief Executive Officer | |
| Date: | February 23, 2015 | |
| By: | /s/ Michael C. Kardok | |
| Name: | Michael C. Kardok | |
| Title: | Treasurer | |
| Date: | February 23, 2015 | |