UNITED STATES
SECURITIES AND EXCHANGE COMMISSION
Washington, D.C. 20549
FORM N-CSR
CERTIFIED SHAREHOLDER REPORT OF REGISTERED
MANAGEMENT INVESTMENT COMPANIES
Investment Company Act file number: 811-22099
Gateway Trust
(Exact name of Registrant as specified in charter)
888 Boylston Street, Suite 800 Boston, Massachusetts 02199-8197
(Address of principal executive offices) (Zip code)
Russell L. Kane, Esq.
Natixis Distribution, L.P.
888 Boylston Street, Suite 800
Boston, Massachusetts 02199-8197
(Name and address of agent for service)
Registrant’s telephone number, including area code: (617) 449-2822
Date of fiscal year end: December 31
Date of reporting period: December 31, 2017
| Item 1. | Reports to Stockholders. |
The Registrant’s annual report transmitted to shareholders pursuant to Rule 30e-1 under the Investment Company Act of 1940 is as follows:
ANNUAL REPORT
December 31, 2017

Gateway Fund
Gateway Equity Call Premium Fund
Mirova Global Green Bond Fund
Mirova Global Sustainable Equity Fund

TABLE OF CONTENTS
Portfolio Review page 1
Portfolio of Investments page 23
Financial Statements page 53
Notes to Financial Statements page 78
| Managers | Symbols | |
| Daniel M. Ashcraft, CFA® | Class A GATEX | |
| Michael T. Buckius, CFA® | Class C GTECX | |
| Paul R. Stewart, CFA® | Class N GTENX | |
| Kenneth H. Toft, CFA® | Class Y GTEYX | |
| Gateway Investment Advisers, LLC | ||
Investment Goal
The fund seeks to capture the majority of returns associated with equity market investments, while exposing investors to less risk than other equity investments.
Management Discussion
The S&P 500® Index returned 21.83% in 2017 with the equity market exhibiting very low volatility throughout the year. In fact, for the first time in its history, the total return of the S&P 500® Index was positive in each month of the calendar year. The market shrugged off a contentious domestic political environment, three major hurricanes, escalating rhetoric between the Trump administration and North Korea, and tightening monetary policy conditions. Actions by the Federal Reserve (the Fed) included three rate hikes and a move toward shrinking the size of its balance sheet after nearly a decade of supporting capital markets with asset purchases. Contributors to the market’s upward momentum included a globally synchronized economic expansion and strong earnings growth for US corporations. The US economy expanded at a 3.2% rate in the third quarter of 2017 and the Fed expects that, once aggregate statistics are compiled, economic growth for 2017 will come in at 2.5%. Trailing 12-month growth in aggregate operating earnings for S&P 500® Index companies came in at nearly 17% as of September 30, and analysts estimate that, once companies report fourth quarter earnings in early 2018, earnings for calendar year 2017 will have grown nearly 18%.
The equity market exhibited historically low volatility in 2017. Realized volatility for the year (as measured by the annualized standard deviation of daily returns for the S&P 500® Index) was just 6.78%, the lowest reading since 1964. Moreover, the largest peak-to-trough decline experienced by the S&P 500® Index for 2017 was a loss of just 2.58% from March 1 through April 13. Implied volatility, as measured by the CBOE Volatility Index® (the VIX®), averaged 11.09 in 2017, well below its long-term average of 19.39 and the lowest annual average in the history of the statistic, which began in 1990. The VIX® also set new all-time records for an intra-day low of 8.56 on November 24, and a closing low of 9.14 on November 3. The VIX® closed below 10 on 52 days in 2017. Prior to 2017, it had closed below 10 just nine times in its history.
Performance Results
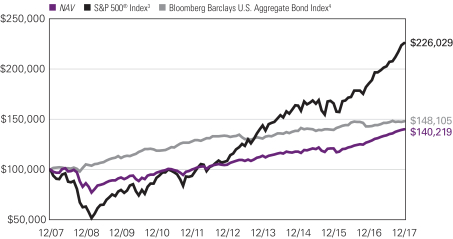
For the 12 months ended December 31, 2017, Class Y shares of Gateway Fund returned 9.93% at net asset value. The Fund’s primary benchmark, the S&P 500® Index, returned
1 |
21.83% for the same period, while its secondary benchmark, the Bloomberg Barclays U.S. Aggregate Bond Index, returned 3.54%.
Explanation of Fund Performance
The Fund invests in a broadly diversified portfolio of common stocks, while also selling index call options and purchasing index put options. The Fund seeks to generate returns by creating cash flow through writing at-the-money index call options against the full value of its underlying equity portfolio. This index call option writing activity exchanges market price appreciation for less variable option premiums and is an important source of the Fund’s return. The Fund uses some of the cash flow from index call option writing to purchase out-of-the-money index put options to mitigate sudden and severe price declines in the equity portfolio. An index option is described as being at-the-money when the price of the underlying index is the same as the option’s strike price. Additionally, an index put option is described as being out-of-the-money when the price of the underlying index is above the put option’s strike price. It is the net premium-to-earn from selling index call options less the price of protective index put options that is a significant factor in determining how much participation the Fund will have in a rising market and how much downside protection is delivered in a declining market. Long term, the combination of the diversified stock portfolio, steady cash flow from the sale of index call options and downside protection from index put options is intended to provide the Fund with the majority of the returns associated with equity market investments while exposing investors to less risk.
The Fund underperformed its primary benchmark for the year, as expected during a period when the equity market advanced at an above-average rate with well below-average volatility. Throughout 2017, the Fund’s two-part option strategy delivered equity market participation during market advances and protection during market declines. Like the S&P 500® Index, the total return of the Fund was positive in each month of the year. In addition, the Fund had two months of outperformance over the course of the year, but underperformed the S&P 500® Index in each of the four quarters. Equity market declines in 2017 were brief, shallow and infrequent, but the Fund delivered downside protection during the market’s largest peak-to-trough decline for the year. Specifically, from March 1 through April 13, the Fund declined 0.49%, delivering 209 basis points (bps) of downside protection relative to the loss of 2.58% for the S&P 500® Index.
The Fund’s equity portfolio returned 22.80% for the year, a performance differential of positive 97 bps versus the S&P 500® Index, which contributed to its return. Consistent with its investment objective, the measured risk of the Fund was low relative to the US equity market, as its standard deviation for 2017 was 3.07% versus 6.78% for the S&P 500® Index.
Outlook
2017 was a continuation of a multi-year period of above-average equity market returns with below-average volatility. Recent fundamental drivers of low volatility include a positive market backdrop featuring expanding global economic growth and strong corporate earnings as well as low correlation across individual stocks. This positive backdrop has
| 2
GATEWAY FUND
helped propel the stock market higher and rising equity markets tend to have lower volatility levels than falling equity markets. While the economy seems to be on increasingly sound footing, it remains to be seen how long these beneficial trends will persist. Volatility is a cyclical phenomenon and the current low phase of the cycle will come to an end at some point. A return to persistently elevated volatility may happen gradually, as the forces keeping volatility low erode, or it could happen suddenly through an external shock to the system. As always, Gateway will avoid incorporating forecasts into its investment approach, and will not attempt to anticipate how events will unfold.
Gateway’s investment philosophy maintains that the US equity market is the most reliable source of attractive long-term returns, despite its high volatility and tendency to periodically deliver significant losses over shorter periods of time. Gateway’s investment philosophy also holds that consistency is the key to long-term investment success and that generating cash flow, rather than seeking to forecast the rise and fall of the market, can be a lower-risk means of participating in equity markets. By staying true to its philosophy and continuing to manage the Gateway Fund consistently with the firm’s historical approach, Gateway will continue to assist investors in managing risk while pursuing long-term return in this positive, yet uncertain, environment.
Hypothetical Growth of $100,000 Investment in Class Y Shares5
December 31, 2007 through December 31, 2017
See notes to chart on page 5.
3 |
Top Ten Holdings as of December 31, 2017
| Security name | % of net assets | |||||
| 1. | Apple, Inc. | 3.87 | % | |||
| 2. | Microsoft Corp. | 2.98 | ||||
| 3. | Alphabet, Inc., Class C | 2.16 | ||||
| 4. | Amazon.com, Inc. | 2.09 | ||||
| 5. | Facebook, Inc., Class A | 2.03 | ||||
| 6. | Berkshire Hathaway, Inc., Class B | 2.00 | ||||
| 7. | JPMorgan Chase & Co. | 1.89 | ||||
| 8. | Johnson & Johnson | 1.70 | ||||
| 9. | Exxon Mobil Corp. | 1.66 | ||||
| 10. | Bank of America Corp. | 1.35 | ||||
The portfolio is actively managed and holdings are subject to change. There is no guarantee the Fund continues to invest in the securities referenced. The holdings listed exclude any temporary cash investments.
| 4
GATEWAY FUND
Average Annual Total Returns — December 31, 20175
| Expense Ratios6 | ||||||||||||||||||||||||
| 1 Year | 5 Years | 10 Years | Life of Class N | Gross | Net | |||||||||||||||||||
| Class Y (Inception 2/19/08)1 | ||||||||||||||||||||||||
| NAV | 9.93 | % | 6.01 | % | 3.44 | % | — | % | 0.77% | 0.70% | ||||||||||||||
| Class A (Inception 12/07/77)1 | ||||||||||||||||||||||||
| NAV | 9.66 | 5.75 | 3.19 | — | 1.02 | 0.94 | ||||||||||||||||||
| With 5.75% Maximum Sales Charge | 3.36 | 4.51 | 2.58 | — | ||||||||||||||||||||
| Class C (Inception 2/19/08)1 | ||||||||||||||||||||||||
| NAV | 8.85 | 4.96 | 2.42 | — | 1.77 | 1.70 | ||||||||||||||||||
| With CDSC2 | 7.85 | 4.96 | 2.42 | — | ||||||||||||||||||||
| Class N (Inception 5/1/17) | ||||||||||||||||||||||||
| NAV | — | — | — | 5.93 | 0.70 | 0.65 | ||||||||||||||||||
| Comparative Performance | ||||||||||||||||||||||||
| S&P 500® Index3 | 21.83 | 15.79 | 8.50 | 13.50 | ||||||||||||||||||||
| Bloomberg Barclays U.S. Aggregate Bond Index4 | 3.54 | 2.10 | 4.01 | 2.14 | ||||||||||||||||||||
Performance data shown represents past performance and is no guarantee of, and not necessarily indicative of, future results. Total return and value will vary, and you may have a gain or loss when shares are sold. Current performance may be lower or higher than quoted. For more recent month-end performance, visit im.natixis.com/performance. Performance for other share classes will be greater or less than shown based on differences in fees and sales charges. You may not invest directly in an index. Performance for periods less than one year is cumulative, not annualized. Returns reflect changes in share price and reinvestment of dividends and capital gains, if any. The table(s) do not reflect taxes shareholders might owe on any fund distributions or when they redeem their shares.
| 1 | As of the close of business on February 15, 2008, the Fund acquired the assets and liabilities of Gateway Fund (the “Predecessor Fund”), a series of The Gateway Trust, an Ohio business trust. The Fund is the successor to the Predecessor Fund. Prior to 2/15/08 performance of Class A shares is that of the Predecessor Fund, restated to reflect the sales load of Class A shares. Prior to the inception of Class C shares (2/19/08), performance is that of the Predecessor Fund, restated to reflect the higher net expenses and sales loads of Class C shares. Prior to the inception of Class Y shares (2/19/08), performance is that of the Predecessor Fund. |
| 2 | Performance for Class C shares assumes a 1% contingent deferred sales charge (“CDSC”) applied when you sell shares within one year of purchase. |
| 3 | S&P 500® Index is a widely recognized measure of U.S. stock market performance. It is an unmanaged index of 500 common stocks chosen for market size, liquidity, and industry group representation, among other factors. It also measures the performance of the large cap segment of the US equities market. |
| 4 | Bloomberg Barclays U.S. Aggregate Bond Index is an unmanaged index that covers the U.S.-dollar denominated, investment-grade, fixed-rate, taxable bond market of SEC-registered securities. The index includes bonds from the Treasury, government-related, corporate, mortgage-backed securities, asset-backed securities, and collateralized mortgage-backed securities sectors. |
| 5 | Fund performance has been increased by fee waivers and/or expense reimbursements, if any, without which performance would have been lower. |
| 6 | Expense ratios are as shown in the Fund’s prospectus in effect as of the date of this report. The expense ratios for the current reporting period can be found in the Financial Highlights section of this report under Ratios to Average Net Assets. Net expenses reflect contractual expense caps set to expire on 4/30/18. When a Fund’s expenses are below the cap, gross and net expense ratios will be the same. See Note 6 of the Notes to Financial Statements for more information about the Fund’s expense caps. |
5 |
GATEWAY EQUITY CALL PREMIUM FUND
| Managers | Symbols | |
| Daniel M. Ashcraft, CFA® | Class A GCPAX | |
| Michael T. Buckius, CFA® | Class C GCPCX | |
| Kenneth H. Toft, CFA® | Class N GCPNX | |
| Gateway Investment Advisers, LLC | Class Y GCPYX |
Investment Goal
The Fund seeks total return with less risk than U.S. equity markets.
Management Discussion
The S&P 500® Index returned 21.83% in 2017 with the equity market exhibiting very low volatility throughout the year. In fact, for the first time in its history, the total return of the S&P 500® Index was positive in each month of the calendar year. The market shrugged off a contentious domestic political environment, three major hurricanes, escalating rhetoric between the Trump administration and North Korea, and tightening monetary policy conditions. Actions by the Federal Reserve (the Fed) included three rate hikes and a move toward shrinking the size of its balance sheet after nearly a decade of supporting capital markets with asset purchases. Contributors to the market’s upward momentum included a globally synchronized economic expansion and strong earnings growth for US corporations. The US economy expanded at a 3.2% rate in the third quarter of 2017 and the Fed expects that, once aggregate statistics are compiled, economic growth for 2017 will come in at 2.5%. Trailing 12-month growth in aggregate operating earnings for S&P 500® Index companies came in at nearly 17% as of September 30, and analysts estimate that, once companies report fourth quarter earnings in early 2018, earnings for calendar year 2017 will have grown nearly 18%.
The equity market exhibited historically low volatility in 2017. Realized volatility for the year (as measured by the annualized standard deviation of daily returns for the S&P 500® Index) was just 6.78%, the lowest reading since 1964. Moreover, the largest peak-to-trough decline experienced by the S&P 500® Index for 2017 was a loss of just 2.58% from March 1 through April 13. Implied volatility, as measured by the CBOE Volatility Index® (the VIX®), averaged 11.09 in 2017, well below its long-term average of 19.39 and the lowest annual average in the history of the statistic, which began in 1990. The VIX® also set new all-time records for an intra-day low, 8.56 on November 24, and a closing low of 9.14 on November 3. The VIX® closed below 10 on 52 days in 2017. Prior to 2017, it had closed below 10 just nine times in its history.
Performance Results
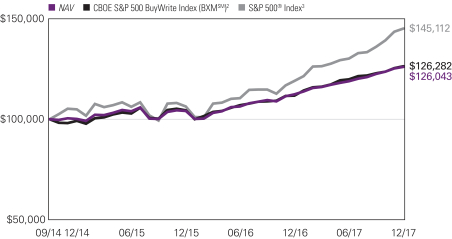
For the 12 months ended December 31, 2017, Class Y shares of Gateway Equity Call Premium Fund returned 12.21% at net asset value. The Fund underperformed its primary benchmark, the CBOE S&P 500 BuyWrite Index (BXMSM), which returned 13.00%, and its secondary benchmark S&P 500® Index, which returned 21.83% for the same period.
| 6
GATEWAY EQUITY CALL PREMIUM FUND
Explanation of Fund Performance
The Fund invests in a diversified stock portfolio designed to support its index option-based risk management strategy as efficiently as possible while seeking to enhance the Fund’s after-tax total return. The Fund seeks to generate returns by writing at- and near-the-money index call options against the full value of its underlying equity portfolio. The steady cash flow from call option writing is intended to be an important source of the Fund’s return, although it reduces the Fund’s ability to profit from increases in the value of its equity portfolio. The index call options written by the Fund often have similar characteristics to the index call option present in the BXMSM at any given time. However, unlike the BXMSM, the Fund employs an active strategy that gives its management team discretion to diversify expiration dates and strike prices across a portfolio of index call options, and to opportunistically pursue attractive call premiums while maintaining a relatively consistent risk profile.
Despite outperforming its benchmark in eight months of the year, the Fund’s total return was less than the BXMSM in 2017 primarily due to relative performance in January, when it underperformed by 93 basis points (bps), and May, when it underperformed by 99 bps. The Fund’s underperformance in January was primarily due to the BXM’sSM index call option having a higher strike price than the weighted-average strike price of the Fund’s index call option portfolio at the beginning of the month, which resulted in the BXMSM having more market exposure and, therefore, more participation in the market’s advance over the first two weeks of the year. The Fund’s underperformance in May was primarily due to the weighted-average strike price of the Fund’s index call option portfolio being higher than the strike price of the BXM’sSM index call option during a brief market pullback that occurred mid-month. The lower strike price of the BXM’sSM index call option resulted in less market exposure and, therefore, less participation in the market decline. In the eight months that the Fund outperformed its benchmark, the active management of its diversified portfolio of written index call options added value over the single-option, hold-to-expiration approach of the BXMSM. The active management of the Fund allowed it to generate higher cash flow during periods of relatively elevated implied volatility and maintain a more consistent amount of market exposure as the equity market advanced.
The Fund’s equity portfolio returned 21.76% for the year, a performance differential of negative 7 bps versus the S&P 500® Index. Though collecting premiums from writing index call options generally allows the Fund to generate a positive return when the S&P 500® Index advances, call option positions that expire or are closed out when the Index is well above the option’s strike price may generate realized losses. Thus, call option positions detracted from the Fund’s return all four quarters of the year. Fund expenses and losses on index call options detracted approximately 9.55 percentage points from overall return for the year. Consistent with its investment objective, the measured risk of the Fund was lower than that of the US equity market and similar to the Fund’s benchmark, as its standard deviation for 2017 was 3.80%, versus 6.78% and 3.75% for the S&P 500® Index and the BXMSM, respectively.
7 |
Outlook
2017 was a continuation of a multi-year period of above-average equity market returns with below-average volatility. Recent fundamental drivers of low volatility include a positive market backdrop featuring expanding global economic growth and strong corporate earnings as well as low correlation across individual stocks. This positive backdrop has helped propel the stock market higher and rising equity markets tend to have lower volatility levels than falling equity markets. While the economy seems to be on increasingly sound footing, it remains to be seen how long these beneficial trends will persist. Volatility is a cyclical phenomenon and the current low phase of the cycle will come to an end at some point. A return to persistently elevated volatility may happen gradually, as the forces keeping volatility low erode, or it could happen suddenly through an external shock to the system. As always, Gateway will avoid incorporating forecasts into its investment approach, and will not attempt to anticipate how events will unfold.
Gateway’s investment philosophy maintains that the US equity market is the most reliable source of attractive long-term returns, despite its high volatility and tendency to periodically deliver significant losses over shorter periods of time. Gateway’s investment philosophy also holds that consistency is the key to long-term investment success and that generating cash flow, rather than seeking to forecast the rise and fall of the market, can be a lower-risk means of participating in equity markets. By staying true to its philosophy and continuing to manage the Gateway Equity Call Premium Fund consistently with the firm’s historical approach, Gateway will continue to assist investors in managing risk while pursuing long-term return in this positive, yet uncertain, environment.
Hypothetical Growth of $100,000 Investment in Class Y Shares4
September 30, 2014 (inception) through December 31, 2017
See notes to chart on page 10.
| 8
GATEWAY EQUITY CALL PREMIUM FUND
Top Ten Holdings as of December 31, 2017
| Security name | % of net assets | |||||
| 1. | Apple, Inc. | 3.95 | % | |||
| 2. | Microsoft Corp. | 2.99 | ||||
| 3. | Amazon.com, Inc. | 2.11 | ||||
| 4. | Facebook, Inc. | 2.02 | ||||
| 5. | JPMorgan Chase & Co. | 1.94 | ||||
| 6. | Berkshire Hathaway, Inc., Class B | 1.91 | ||||
| 7. | Exxon Mobil Corp. | 1.76 | ||||
| 8. | Johnson & Johnson | 1.76 | ||||
| 9. | Alphabet, Inc., Class A | 1.58 | ||||
| 10. | Bank of America Corp. | 1.45 | ||||
The portfolio is actively managed and holdings are subject to change. There is no guarantee the Fund continues to invest in the securities referenced. The holdings listed exclude any temporary cash investments.
9 |
Average Annual Total Returns — December 31, 20174
| Expense Ratios5 | ||||||||||||||||||||
| 1 Year | Life of Class | Gross | Net | |||||||||||||||||
| Class Y (Inception 9/30/14) | Class A/C/Y | Class N | ||||||||||||||||||
| NAV | 12.21 | % | 7.38 | % | — | % | 1.06 | % | 0.95 | % | ||||||||||
| Class A (Inception 9/30/14) | ||||||||||||||||||||
| NAV | 11.80 | 7.09 | — | 1.31 | 1.20 | |||||||||||||||
| With 5.75% Maximum Sales Charge | 5.41 | 5.16 | — | |||||||||||||||||
| Class C (Inception 9/30/14) | ||||||||||||||||||||
| NAV | 10.95 | 6.32 | — | 1.98 | 1.95 | |||||||||||||||
| With CDSC1 | 9.95 | 6.32 | — | |||||||||||||||||
| Class N (Inception 5/1/17) | ||||||||||||||||||||
| NAV | — | — | 7.50 | 1.00 | 0.90 | |||||||||||||||
| Comparative Performance | ||||||||||||||||||||
| CBOE S&P 500 BuyWrite Index (BXMSM)2 | 13.00 | 7.44 | 7.58 | |||||||||||||||||
| S&P 500® Index3 | 21.83 | 12.13 | 13.50 | |||||||||||||||||
Performance data shown represents past performance and is no guarantee of, and not necessarily indicative of, future results. Total return and value will vary, and you may have a gain or loss when shares are sold. Current performance may be lower or higher than quoted. For most recent month-end performance, visit im.natixis.com/performance. Performance for other share classes will be greater or less than shown based on differences in fees and sales charges. You may not invest directly in an index. Performance for periods less than one year is cumulative, not annualized. Returns reflect changes in share price and reinvestment of dividends and capital gains, if any. The table(s) do not reflect taxes shareholders might owe on any fund distributions or when they redeem their shares.
| 1 | Performance for Class C shares assumes a 1% contingent deferred sales charge (“CDSC”) applied when you sell shares within one year of purchase. |
| 2 | The CBOE S&P 500 BuyWrite Index (BXMSM) is a benchmark index designed to track the performance of a hypothetical buy-write strategy on the S&P 500® Index. The BXM is a passive total return index based on (1) buying an S&P 500 stock index portfolio, and (2) “writing” (or selling) the near-term S&P 500® Index (SPXSM) “covered” call option, generally on the third Friday of each month. The SPX call written will have about one month remaining to expiration, with an exercise price just above the prevailing index level (i.e., slightly out of the money). The SPX call is held until expiration and cash settled, at which time a new one-month, near-the-money call is written. |
| 3 | S&P 500® Index is a widely recognized measure of U.S. stock market performance. It is an unmanaged index of 500 common stocks chosen for market size, liquidity, and industry group representation, among other factors. It also measures the performance of the large cap segment of the US equities market. |
| 4 | Fund performance has been increased by fee waivers and/or expense reimbursements, if any, without which performance would have been lower. |
| 5 | Expense ratios are as shown in the Fund’s prospectus in effect as of the date of this report. The expense ratios for the current reporting period can be found in the Financial Highlights section of this report under Ratios to Average Net Assets. Net expenses reflect contractual expense caps set to expire on 4/30/18. When a Fund’s expenses are below the cap, gross and net expense ratios will be the same. See Note 6 of the Notes to Financial Statements for more information about the Fund’s expense caps. |
| 10
MIROVA GLOBAL GREEN BOND FUND
| Managers | Symbols | |
| Christopher Wigley | Class A MGGAX | |
| Marc Briand | Class N MGGNX | |
| Natixis Asset Management U.S., LLC | Class Y MGGYX |
Investment Goal
The Fund seeks to provide total return, through a combination of capital appreciation and current income, by investing in green bonds.
Market Conditions
2017 turned out to be a solid year for fixed income. The US 10-year Treasury yield opened at 2.45% and ranged between 2.63% and 2.04% before closing almost unchanged at 2.41%. After a cautious market start to the year, the key theme throughout most of 2017 was the lack of policy success by the Trump administration. Government bond yields fell as the expected policy stimulus did not arrive and geopolitical tensions increased, particularly in North Korea. When tax reform was eventually delivered at year-end, market attention then turned to the question as to how this would be funded. It appeared that the US Treasury market would have to take the strain, with the result that the national debt would inevitably increase, so putting pressure on US treasury yields. Although the US 10 year US Treasury note yield increased at the end of the year, corporate bonds by comparison had a good year in total with credit spreads opening at the high of 130 basis points (bps) and closing 1 bp off the low at 99 bps (minus 31 bps). Although central banks wanted to remove accommodation, they were very wary of removing it too quickly, so quantitative easing programs, particularly in Europe, provided investors with reassurance. Sustainability was also a key feature of the year as Millennials prioritized personal values alongside financial returns and subjects like gender equality and sexual harassment (the #MeToo movement) became hot topics in Q4.
Performance Results
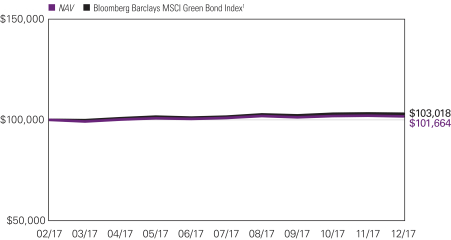
The Mirova Global Green Bond Fund was launched on February 28, 2017. For the ten months ended December 31, 2017, Class Y shares of Mirova Global Green Bond Fund returned 1.66% at net asset value. The Fund underperformed its benchmark, the Bloomberg Barclays MSCI Green Bond Index, which returned 3.02% over the same period.
Explanation of Fund Performance
Security selection is at the heart of the investment process and was the largest positive contributor to performance relative to the benchmark. Duration and term structure were the largest detractors — primarily due to less exposure to US 30-year bonds. Asset allocation contributed +1 bp, although less exposure to sovereign green bonds at the beginning of the year detracted from performance while higher exposure to quasi-governments instead contributed to performance. The team took a cautious view on France
11 |
across all funds approaching the French elections, yet the largest green bond and very long dated French Green OAT rallied soon after launch in January as prospects for a Macron victory dispelled fears of an extreme National Front government.
Security selection contributed to performance in 2017. The poorest performing security was IFC 2.125% 2026. Anglian Water and IFC also contributed negatively. The best performing green bond was EIB 0.5% 2037. Enel 0.5% 2024 and the Province of Ontario also contributed positively. Generally, in such a low volatility environment, the best performing securities were those that benefited most from central bank programs — particularly long dated issues and credit.
Outlook
Our investment thesis is built around the conviction that our society is going through four major transitions: demographics, environmental, technological, and governance, and that each of those transitions will have huge consequences for how our economy is organized. Our ability as a society and an economy to deal with those transitions at a sustainable pace will be the key to success. We believe that these subjects will become increasingly important drivers of investment returns in 2018 and beyond. This has positive and negative implications. Owning the broad market means also owning stocks and bonds negatively exposed to these transitions. Investors will need to be cognizant of these transitions as they build their portfolios. We expect rates on longer-term debt instruments to trend higher in both the US and Europe in 2018, albeit in a continued low inflation scenario. We also expect central banks to continue to increase short-term interest rates (not expected for the European Central Bank in 2018) and reduce their bond repurchase programs. This increased demand that will only be partly offset by higher demand for income generating assets by the retiring Baby Boomer generation.
A major factor currently challenging the markets is the geopolitical risks such as North Korea, Catalonia and any number of small regions in the European Union that may prefer independence. Inflation may rise if the decreased investment in the oil sector eventually sends oil prices up. Finally, the International Monetary Fund has recently increased its forecasts for economic growth in 2017 and 2018, but these developments are often subject to surprises.
We are conservative in our estimates and hold that green bond issuance amounted to $60 billion in 2017. We believe that an additional $50 to $70 billion of green bonds will be issued in 2018. We expect significant issuance in corporate green bonds and probably sovereign green bonds, too. As the market becomes increasingly popular with issuers, a key attraction for investors may be green bonds’ unique impact.
| 12
MIROVA GLOBAL GREEN BOND FUND
Hypothetical Growth of $100,000 Investment in Class Y Shares2
February 28, 2017 (inception) through December 31, 2017
13 |
Total Returns — December 31, 20172
| Expense Ratios3 | ||||||||||||
| Life of Fund | Gross | Net | ||||||||||
| Class Y (Inception 2/28/17) | ||||||||||||
| NAV | 1.66 | % | 1.20 | % | 0.70 | % | ||||||
| Class A (Inception 2/28/17) | ||||||||||||
| NAV | 1.46 | 1.45 | 0.95 | |||||||||
| With 4.25% Maximum Sales Charge | -2.81 | |||||||||||
| Class N (Inception 2/28/17) | ||||||||||||
| NAV | 1.77 | 1.11 | 0.65 | |||||||||
| Comparative Performance | ||||||||||||
| Bloomberg Barclays MSCI Green Bond Index1 | 3.02 | |||||||||||
Performance data shown represents past performance and is no guarantee of, and not necessarily indicative of, future results. Total return and value will vary, and you may have a gain or loss when shares are sold. Current performance may be lower or higher than quoted. For most recent month-end performance, visit im.natixis.com/performance. Performance for other share classes will be greater or less than shown based on differences in fees and sales charges. You may not invest directly in an index. Performance for periods less than one year is cumulative, not annualized. Returns reflect changes in share price and reinvestment of dividends and capital gains, if any. The table(s) do not reflect taxes shareholders might owe on any fund distributions or when they redeem their shares.
| 1 | The Bloomberg Barclays MSCI Green Bond Index provides a broad-based measure of global fixed-income securities issued to fund projects with direct environmental benefits according to MSCI ESG Research’s green bond criteria. The green bonds are primarily investment-grade, or may be classified by other sources when bond ratings are not available. The Index may include green bonds from the corporate, securitized, Treasury, or government-related sectors. |
| 2 | Fund performance has been increased by fee waivers and/or expense reimbursements, if any, without which performance would have been lower. |
| 3 | Expense ratios are as shown in the Fund’s prospectus in effect as of the date of this report. The expense ratios for the current reporting period can be found in the Financial Highlights section of this report under Ratios to Average Net Assets. Net expenses reflect contractual expense caps set to expire on 4/30/18. When a Fund’s expenses are below the cap, gross and net expense ratios will be the same. See Note 6 of the Notes to Financial Statements for more information about the Fund’s expense caps. |
| 14
MIROVA GLOBAL SUSTAINABLE EQUITY FUND
| Managers | Symbols | |
| Jens Peers, CFA® | Class A ESGMX | |
| Suzanne Senellart | Class C ESGCX | |
| Hua Cheng, CFA®, PhD | Class N ESGNX | |
| Natixis Asset Management U.S., LLC | Class Y ESGYX |
Investment Goal
The Fund seeks long-term capital appreciation.
Market Conditions
2017 turned out to be an excellent year for global equity investors. Stable and accelerating economic growth in all major parts of the world, combined with low interest rates, provided the almost perfect backdrop for earnings growth and share price performance. After a more sentiment-driven outperformance by traditional energy-related companies in 2016, primarily at the expense of technology stocks, 2017 saw the complete opposite.
Geopolitical tensions rose during the year, relating primarily to North Korea, Iran and Saudi Arabia. Social and governance issues like gender equality and sexual harassment (the #MeToo movement) and fair tax treatment also became hot topics near the end of the year.
Performance Results
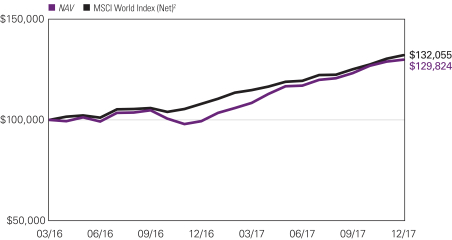
For the 12 months ended December 31, 2017, Class Y Shares of the Mirova Global Sustainable Equity Fund returned 30.75% at net asset value. The Fund outperformed its benchmark, the MSCI World Index (Net), which returned 22.40% over the same period. It is important to note that there are material differences between the Fund and this benchmark.
Explanation of Fund Performance
While the majority of the outperformance can be attributed to individual stocks in the portfolio, the Fund also benefited from its sector selection relative to the benchmark. Most notably, the Fund’s significant overexposure to technology and a lack of exposure to traditional energy companies aided relative returns. Those choices are the result of the investment process, which aims to identify companies whose products and services contribute positively and sustainably to the demographic, environmental, technological and ethical (governance-related) evolution of the world.
Stock selection was the biggest contributor, however, as many companies in the portfolio benefited from better-than-anticipated earnings announcements and/or increased earnings growth expectations. This was notably the case in the tech sector with Tencent and Facebook in the social media area. We also had strong performance in the consumption theme, with Amazon.com confirming its leadership position in the growing e-retail business. The company acquired Whole Foods, which has put pressure on share prices of traditional retailers. We also saw a strong rebound of Illumina and Novo Nordisk after
15 |
their 2016 underperformance. The drive towards natural ingredients pushed share prices higher for Christian Hansen and Novozymes. And finally, as the car manufacturing sector is accelerating the focus on the production of autonomous and electric cars, share prices of Aptiv (the autonomous vehicle division of Delphi) and BYD (a Chinese electric car manufacturer) posted strong returns. On the negative side, United Natural Foods, Acuity Brands, Raffles Medical Group and Alexion Pharmaceuticals were the most significant detractors from performance. The Fund sold out of its positions in United Natural Foods and Alexion Pharmaceuticals during the period.
Outlook
The combination of low interest rates, proactive central policies, accelerating economic growth, and low inflation has provided an almost perfect scenario for equity investors, which we expect to continue in 2018. There is one major difference, however. Interest rates are likely to rise. As higher rates are driven by the anticipation of a more robust global economic recovery, we believe this is on balance still good news for expected 2018 equity returns. Geopolitical risk remains the biggest risk for global markets. In Europe, national elections may intensify the debate around a further break-up of the European Union.
We believe that sustainability will become a more important driver of investment returns in 2018. Recent evidence includes the #MeToo movement and the announcement by Facebook that it will start booking revenues in the countries where they are generated, which should lead to higher tax income for the countries involved.
For 2018, we see good investment opportunities in energy efficiency and renewables, driven by higher oil prices and technological progress. We also expect the providers of industrial water solutions to do well as capex investments are expected to accelerate in 2018. For the technology sector, we believe some investors are underestimating the need for our economy to integrate high-tech solutions in order to be able to compete over the long run. Healthcare stocks finally may also benefit from more attractive valuations after a challenging 2017.
| 16
MIROVA GLOBAL SUSTAINABLE EQUITY FUND
Hypothetical Growth of $100,000 Investment in Class Y Shares3
March 31, 2016 (inception) through December 31, 2017
Top Ten Holdings as of December 31, 2017
| Security name | % of net assets | |||||
| 1 | Alphabet, Inc., Class A | 4.82 | % | |||
| 2 | MasterCard, Inc., Class A | 4.80 | ||||
| 3 | Thermo Fisher Scientific, Inc. | 3.81 | ||||
| 4 | Microsoft Corp. | 3.77 | ||||
| 5 | Novo Nordisk AS, Class B | 3.60 | ||||
| 6 | KBC Groep NV | 3.44 | ||||
| 7 | Essilor International Cie Generale d’Optique S.A. | 3.24 | ||||
| 8 | Ecolab, Inc. | 3.23 | ||||
| 9 | Facebook, Inc., Class A | 3.18 | ||||
| 10 | Danaher Corp. | 3.18 | ||||
The portfolio is actively managed and holdings are subject to change. There is no guarantee the Fund continues to invest in the securities referenced. The holdings listed exclude any temporary cash investments.
17 |
Average Annual Total Returns — December 31, 20173
| Expense Ratios4 | ||||||||||||||||||||
| 1 Year | Life of Class | Gross | Net | |||||||||||||||||
| Class Y (Inception 3/31/16) | Class A/C/Y | Class N | ||||||||||||||||||
| NAV | 30.75 | % | 16.05 | % | — | % | 1.21 | % | 1.05 | % | ||||||||||
| Class A (Inception 3/31/16) | ||||||||||||||||||||
| NAV | 30.44 | 15.80 | — | 1.72 | 1.30 | |||||||||||||||
| With 5.75% Maximum Sales Charge | 22.99 | 11.95 | — | |||||||||||||||||
| Class C (Inception 3/31/16) | ||||||||||||||||||||
| NAV | 29.40 | 14.92 | — | 2.20 | 2.05 | |||||||||||||||
| With CDSC1 | 28.40 | 14.92 | — | |||||||||||||||||
| Class N (Inception 5/1/17) | ||||||||||||||||||||
| NAV | — | 14.81 | 1.20 | 1.00 | ||||||||||||||||
| Comparative Performance | ||||||||||||||||||||
| MSCI World Index (Net)2 | 22.40 | 17.20 | 13.13 | |||||||||||||||||
Performance data shown represents past performance and is no guarantee of, and not necessarily indicative of, future results. Total return and value will vary, and you may have a gain or loss when shares are sold. Current performance may be lower or higher than quoted. For most recent month-end performance, visit im.natixis.com/performance. Performance for other share classes will be greater or less than shown based on differences in fees and sales charges. You may not invest directly in an index. Performance for periods less than one year is cumulative, not annualized. Returns reflect changes in share price and reinvestment of dividends and capital gains, if any. The table(s) do not reflect taxes shareholders might owe on any fund distributions or when they redeem their shares.
| 1 | Performance for Class C shares assumes a 1.00% contingent deferred sales charge (“CDSC”) applied when you sell shares within one year of purchase. |
| 2 | MSCI World Index (Net) is an unmanaged index that is designed to measure the equity market performance of developed markets. It is composed of common stocks of companies representative of the market structure of developed market countries in North America, Europe, and the Asia/Pacific Region. The index is calculated without dividends, with net or with gross dividends reinvested, in both U.S. dollars and local currencies. You may not invest directly in an index. |
| 3 | Fund performance has been increased by fee waivers and/or expense reimbursements, if any, without which performance would have been lower. |
| 4 | Expense ratios are as shown in the Fund’s prospectus in effect as of the date of this report. The expense ratios for the current reporting period can be found in the Financial Highlights section of this report under Ratios to Average Net Assets. Net expenses reflect contractual expense caps set to expire on 4/30/18. When a Fund’s expenses are below the cap, gross and net expense ratios will be the same. See Note 6 of the Notes to Financial Statements for more information about the Fund’s expense caps. |
| 18
ADDITIONAL INFORMATION
The views expressed in this report reflect those of the portfolio managers as of the dates indicated. The managers’ views are subject to change at any time without notice based on changes in market or other conditions. References to specific securities or industries should not be regarded as investment advice. Because the Funds are actively managed, there is no assurance that they will continue to invest in the securities or industries mentioned.
All investing involves risk, including the risk of loss. There is no assurance that any investment will meet its performance objectives or that losses will be avoided.
ADDITIONAL INDEX INFORMATION
This document may contain references to third party copyrights, indexes, and trademarks, each of which is the property of its respective owner. Such owner is not affiliated with Natixis Investment Managers or any of its related or affiliated companies (collectively “Natixis Affiliates”) and does not sponsor, endorse or participate in the provision of any Natixis Affiliates services, funds or other financial products.
The index information contained herein is derived form third parties and is provided on an “as is” basis. The user of this information assumes the entire risk of use of this information. Each of the third party entities involved in compiling, computing or creating index information, disclaims all warranties (including, without limitation, any warranties of originality, accuracy, completeness, timeliness, non-infringement, merchantability and fitness for a particular purpose) with respect to such information.
PROXY VOTING INFORMATION
A description of Natixis Funds’ proxy voting policies and procedures is available without charge, upon request, by calling Natixis Funds at 800-225-5478; on Natixis Funds’ website at im.natixis.com; and on the Securities and Exchange Commission’s (SEC) website at www.sec.gov. Information regarding how Natixis Funds voted proxies relating to portfolio securities during the most recent 12-month period ended June 30 is available on Natixis Funds’ website and the SEC’s website.
QUARTERLY PORTFOLIO SCHEDULES
Natixis Funds file a complete schedule of portfolio holdings with the SEC for the first and third quarters of each fiscal year on Form N-Q. The Funds’ Forms N-Q are available on the SEC’s website at www.sec.gov and may be reviewed and copied at the SEC’s Public Reference Room in Washington, DC. Information on the operation of the Public Reference Room may be obtained by calling 800-SEC-0330.
19 |
UNDERSTANDING FUND EXPENSES
As a mutual fund shareholder, you incur different types of costs: transaction costs, including sales charges (loads) on purchases, contingent deferred sales charges on redemptions, and ongoing costs, including management fees, distribution and/or service fees (12b-1 fees), and other fund expenses. Certain exemptions may apply. These costs are described in more detail in the Fund’s prospectus. The following examples are intended to help you understand the ongoing costs of investing in the Fund and help you compare these with the ongoing costs of investing in other mutual funds.
The first line in the table for each class shows the actual account values and actual Fund expenses you would have paid on a $1,000 investment in the Fund from July 1, 2017 through December 31, 2017. To estimate the expenses you paid over the period, simply divide your account value by $1,000 (for example, $8,600 account value divided by $1,000 = 8.60) and multiply the result by the number in the Expenses Paid During Period column as shown for your Class.
The second line for the table of each class provides information about hypothetical account values and hypothetical expenses based on the Fund’s actual expense ratios and an assumed rate of return of 5% per year before expenses, which is not the Fund’s actual return. The hypothetical account values and expenses may not be used to estimate the actual ending account balance or expenses you paid on your investment for the period. You may use this information to compare the ongoing costs of investing in the Fund and other funds. To do so, compare this 5% hypothetical example with the 5% hypothetical examples that appear in the shareholder reports of the other funds.
Please note that the expenses shown reflect ongoing costs only, and do not include any transaction costs, such as sales charges. Therefore, the second line in the table of each Fund is useful in comparing ongoing costs only, and will not help you determine the relative costs of owning different funds. If transaction costs were included, total costs would be higher.
| 20
| GATEWAY FUND | BEGINNING ACCOUNT VALUE 7/1/2017 | ENDING ACCOUNT VALUE 12/31/2017 | EXPENSES PAID DURING PERIOD* 7/1/2017 – 12/31/2017 | |||||||||
| Class A | ||||||||||||
| Actual | $1,000.00 | $1,044.90 | $4.85 | |||||||||
| Hypothetical (5% return before expenses) | $1,000.00 | $1,020.47 | $4.79 | |||||||||
| Class C | ||||||||||||
| Actual | $1,000.00 | $1,041.20 | $8.75 | |||||||||
| Hypothetical (5% return before expenses) | $1,000.00 | $1,016.64 | $8.64 | |||||||||
| Class N | ||||||||||||
| Actual | $1,000.00 | $1,046.80 | $3.35 | |||||||||
| Hypothetical (5% return before expenses) | $1,000.00 | $1,021.93 | $3.31 | |||||||||
| Class Y | ||||||||||||
| Actual | $1,000.00 | $1,046.50 | $3.61 | |||||||||
| Hypothetical (5% return before expenses) | $1,000.00 | $1,021.68 | $3.57 | |||||||||
| * | Expenses are equal to the Fund’s annualized expense ratio (after waiver/reimbursement): 0.94%, 1.70%, 0.65% and 0.70% for Class A, C, N and Y, respectively, multiplied by the average account value over the period, multiplied by the number of days in the most recent fiscal half-year (184), divided by 365 (to reflect the half-year period). |
| GATEWAY EQUITY CALL PREMIUM FUND | BEGINNING ACCOUNT VALUE 7/1/2017 | ENDING ACCOUNT VALUE 12/31/2017 | EXPENSES PAID DURING PERIOD* 7/1/2017 – 12/31/2017 | |||||||||
| Class A | ||||||||||||
| Actual | $1,000.00 | $1,057.70 | $6.22 | |||||||||
| Hypothetical (5% return before expenses) | $1,000.00 | $1,019.16 | $6.11 | |||||||||
| Class C | ||||||||||||
| Actual | $1,000.00 | $1,053.60 | $10.09 | |||||||||
| Hypothetical (5% return before expenses) | $1,000.00 | $1,015.38 | $9.91 | |||||||||
| Class N | ||||||||||||
| Actual | $1,000.00 | $1,059.80 | $4.67 | |||||||||
| Hypothetical (5% return before expenses) | $1,000.00 | $1,020.67 | $4.58 | |||||||||
| Class Y | ||||||||||||
| Actual | $1,000.00 | $1,060.50 | $4.93 | |||||||||
| Hypothetical (5% return before expenses) | $1,000.00 | $1,020.42 | $4.84 | |||||||||
| * | Expenses are equal to the Fund’s annualized expense ratio (after waiver/reimbursement): 1.20%, 1.95%, 0.90% and 0.95% for Class A, C, N and Y, respectively, multiplied by the average account value over the period, multiplied by the number of days in the most recent fiscal half-year (184), divided by 365 (to reflect the half-year period). |
21 |
| MIROVA GLOBAL GREEN BOND FUND | BEGINNING ACCOUNT VALUE 7/1/2017 | ENDING ACCOUNT VALUE 12/31/2017 | EXPENSES PAID DURING PERIOD* 7/1/2017 – 12/31/2017 | |||||||||
| Class A | ||||||||||||
| Actual | $1,000.00 | $1,011.60 | $4.87 | |||||||||
| Hypothetical (5% return before expenses) | $1,000.00 | $1,020.37 | $4.89 | |||||||||
| Class N | ||||||||||||
| Actual | $1,000.00 | $1,012.70 | $3.35 | |||||||||
| Hypothetical (5% return before expenses) | $1,000.00 | $1,021.88 | $3.36 | |||||||||
| Class Y | ||||||||||||
| Actual | $1,000.00 | $1,012.60 | $3.60 | |||||||||
| Hypothetical (5% return before expenses) | $1,000.00 | $1,021.63 | $3.62 | |||||||||
| * | Expenses are equal to the Fund’s annualized expense ratio (after waiver/reimbursement): 0.96%, 0.66% and 0.71% for Class A, N and Y, respectively, multiplied by the average account value over the period, multiplied by the number of days in the most recent fiscal half-year (184), divided by 365 (to reflect the half-year period). |
| MIROVA GLOBAL SUSTAINABLE EQUITY FUND | BEGINNING ACCOUNT VALUE 7/1/2017 | ENDING ACCOUNT VALUE 12/31/2017 | EXPENSES PAID DURING PERIOD* 7/1/2017 – 12/31/2017 | |||||||||
| Class A | ||||||||||||
| Actual | $1,000.00 | $1,109.50 | $6.86 | |||||||||
| Hypothetical (5% return before expenses) | $1,000.00 | $1,018.70 | $6.56 | |||||||||
| Class C | ||||||||||||
| Actual | $1,000.00 | $1,104.50 | $10.82 | |||||||||
| Hypothetical (5% return before expenses) | $1,000.00 | $1,014.92 | $10.36 | |||||||||
| Class N | ||||||||||||
| Actual | $1,000.00 | $1,110.70 | $5.32 | |||||||||
| Hypothetical (5% return before expenses) | $1,000.00 | $1,020.16 | $5.09 | |||||||||
| Class Y | ||||||||||||
| Actual | $1,000.00 | $1,110.30 | $5.48 | |||||||||
| Hypothetical (5% return before expenses) | $1,000.00 | $1,020.01 | $5.24 | |||||||||
| * | Expenses are equal to the Fund’s annualized expense ratio (after waiver/reimbursement): 1.29%, 2.04%, 1.00% and 1.03% for Class A, C, N and Y, respectively, multiplied by the average account value over the period, multiplied by the number of days in the most recent fiscal half-year (184), divided by 365 (to reflect the half-year period). |
| 22
Portfolio of Investments – as of December 31, 2017
Gateway Fund
| Shares | Description | Value (†) | ||||||
| Common Stocks — 98.9% of Net Assets | ||||||||
| Aerospace & Defense — 2.3% | ||||||||
| 252,587 | Boeing Co. (The)(a) | $ | 74,490,432 | |||||
| 57,682 | Huntington Ingalls Industries, Inc.(a) | 13,595,648 | ||||||
| 244,519 | Raytheon Co.(a) | 45,932,894 | ||||||
| 48,716 | TransDigm Group, Inc.(a) | 13,378,388 | ||||||
| 400,197 | United Technologies Corp.(a) | 51,053,131 | ||||||
|
| |||||||
| 198,450,493 | ||||||||
|
| |||||||
| Air Freight & Logistics — 0.7% | ||||||||
| 460,816 | United Parcel Service, Inc., Class B(a) | 54,906,226 | ||||||
|
| |||||||
| Airlines — 0.5% | ||||||||
| 107,742 | Alaska Air Group, Inc.(a) | 7,920,114 | ||||||
| 330,509 | American Airlines Group, Inc.(a) | 17,196,383 | ||||||
| 266,319 | JetBlue Airways Corp.(a)(b) | 5,949,567 | ||||||
| 224,458 | United Continental Holdings, Inc.(a)(b) | 15,128,469 | ||||||
|
| |||||||
| 46,194,533 | ||||||||
|
| |||||||
| Auto Components — 0.1% | ||||||||
| 41,540 | Adient PLC(a) | 3,269,198 | ||||||
| 45,405 | Autoliv, Inc.(a) | 5,770,067 | ||||||
| 86,236 | Cooper Tire & Rubber Co.(a) | 3,048,443 | ||||||
|
| |||||||
| 12,087,708 | ||||||||
|
| |||||||
| Automobiles — 0.4% | ||||||||
| 2,457,532 | Ford Motor Co.(a) | 30,694,575 | ||||||
| 19,598 | Tesla, Inc.(a)(b) | 6,101,837 | ||||||
|
| |||||||
| 36,796,412 | ||||||||
|
| |||||||
| Banks — 6.7% | ||||||||
| 293,956 | Associated Banc-Corp(a) | 7,466,482 | ||||||
| 3,902,378 | Bank of America Corp.(a) | 115,198,199 | ||||||
| 1,157,194 | Citigroup, Inc.(a) | 86,106,806 | ||||||
| 1,209,783 | Huntington Bancshares, Inc.(a) | 17,614,440 | ||||||
| 1,507,689 | JPMorgan Chase & Co.(a) | 161,232,262 | ||||||
| 332,605 | Old National Bancorp(a) | 5,803,957 | ||||||
| 80,811 | Signature Bank(a)(b) | 11,092,118 | ||||||
| 37,348 | SVB Financial Group(a)(b) | 8,730,842 | ||||||
| 917,756 | U.S. Bancorp(a) | 49,173,366 | ||||||
| 1,820,443 | Wells Fargo & Co.(a) | 110,446,277 | ||||||
|
| |||||||
| 572,864,749 | ||||||||
|
| |||||||
| Beverages — 2.2% | ||||||||
| 1,807,834 | Coca-Cola Co. (The)(a) | 82,943,424 | ||||||
| 241,521 | Monster Beverage Corp.(a)(b) | 15,285,864 | ||||||
| 740,648 | PepsiCo, Inc.(a) | 88,818,508 | ||||||
|
| |||||||
| 187,047,796 | ||||||||
|
| |||||||
| Biotechnology — 3.3% | ||||||||
| 638,345 | AbbVie, Inc.(a) | 61,734,345 | ||||||
| 125,445 | Alexion Pharmaceuticals, Inc.(a)(b) | 15,001,967 | ||||||
See accompanying notes to financial statements.
23 |
Portfolio of Investments – as of December 31, 2017
Gateway Fund – (continued)
| Shares | Description | Value (†) | ||||||
| Biotechnology — continued | ||||||||
| 293,674 | Amgen, Inc.(a) | $ | 51,069,909 | |||||
| 102,495 | Biogen, Inc.(a)(b) | 32,651,832 | ||||||
| 101,415 | Bioverativ, Inc.(a)(b) | 5,468,297 | ||||||
| 364,871 | Celgene Corp.(a)(b) | 38,077,938 | ||||||
| 560,813 | Gilead Sciences, Inc.(a) | 40,176,643 | ||||||
| 59,112 | Seattle Genetics, Inc.(a)(b) | 3,162,492 | ||||||
| 60,249 | Shire PLC, Sponsored ADR(a) | 9,345,825 | ||||||
| 25,386 | TESARO, Inc.(a)(b) | 2,103,738 | ||||||
| 119,292 | Vertex Pharmaceuticals, Inc.(a)(b) | 17,877,099 | ||||||
|
| |||||||
| 276,670,085 | ||||||||
|
| |||||||
| Building Products — 0.5% | ||||||||
| 235,129 | Fortune Brands Home & Security, Inc.(a) | 16,092,229 | ||||||
| 458,586 | Johnson Controls International PLC(a) | 17,476,712 | ||||||
| 39,485 | Lennox International, Inc.(a) | 8,223,146 | ||||||
|
| |||||||
| 41,792,087 | ||||||||
|
| |||||||
| Capital Markets — 2.4% | ||||||||
| 69,674 | Affiliated Managers Group, Inc.(a) | 14,300,589 | ||||||
| 618,850 | Charles Schwab Corp. (The)(a) | 31,790,325 | ||||||
| 162,155 | CME Group, Inc.(a) | 23,682,738 | ||||||
| 109,983 | Eaton Vance Corp.(a) | 6,201,941 | ||||||
| 183,787 | Goldman Sachs Group, Inc. (The)(a) | 46,821,576 | ||||||
| 383,781 | Intercontinental Exchange, Inc.(a) | 27,079,587 | ||||||
| 74,008 | Legg Mason, Inc.(a) | 3,106,856 | ||||||
| 711,425 | Morgan Stanley(a) | 37,328,470 | ||||||
| 68,462 | MSCI, Inc.(a) | 8,663,181 | ||||||
| 130,982 | TD Ameritrade Holding Corp.(a) | 6,697,110 | ||||||
| 67,751 | Waddell & Reed Financial, Inc., Class A(a) | 1,513,557 | ||||||
|
| |||||||
| 207,185,930 | ||||||||
|
| |||||||
| Chemicals — 2.2% | ||||||||
| 17,782 | AdvanSix, Inc.(a)(b) | 748,089 | ||||||
| 121,378 | Ashland Global Holdings, Inc.(a) | 8,642,114 | ||||||
| 74,757 | Celanese Corp., Series A(a) | 8,004,979 | ||||||
| 34,610 | Chemours Co. (The)(a) | 1,732,577 | ||||||
| 1,012,345 | DowDuPont, Inc.(a) | 72,099,211 | ||||||
| 168,176 | Eastman Chemical Co.(a) | 15,579,825 | ||||||
| 36,897 | Ingevity Corp.(a)(b) | 2,600,132 | ||||||
| 220,028 | LyondellBasell Industries NV, Class A(a) | 24,273,489 | ||||||
| 283,899 | Monsanto Co.(a) | 33,153,725 | ||||||
| 88,197 | Olin Corp.(a) | 3,138,049 | ||||||
| 163,753 | RPM International, Inc.(a) | 8,583,932 | ||||||
| 236,738 | Valvoline, Inc.(a) | 5,932,654 | ||||||
|
| |||||||
| 184,488,776 | ||||||||
|
| |||||||
| Commercial Services & Supplies — 0.4% | ||||||||
| 100,997 | Waste Connections, Inc.(a) | 7,164,727 | ||||||
| 317,652 | Waste Management, Inc.(a) | 27,413,368 | ||||||
|
| |||||||
| 34,578,095 | ||||||||
|
| |||||||
See accompanying notes to financial statements.
| 24
Portfolio of Investments – as of December 31, 2017
Gateway Fund – (continued)
| Shares | Description | Value (†) | ||||||
| Communications Equipment — 1.2% | ||||||||
| 24,941 | Arista Networks, Inc.(a)(b) | $ | 5,875,601 | |||||
| 2,061,144 | Cisco Systems, Inc.(a) | 78,941,815 | ||||||
| 115,934 | Motorola Solutions, Inc.(a) | 10,473,478 | ||||||
| 40,643 | Palo Alto Networks, Inc.(a)(b) | 5,890,796 | ||||||
|
| |||||||
| 101,181,690 | ||||||||
|
| |||||||
| Consumer Finance — 0.8% | ||||||||
| 148,984 | Ally Financial, Inc.(a) | 4,344,373 | ||||||
| 457,367 | American Express Co.(a) | 45,421,117 | ||||||
| 273,240 | Discover Financial Services(a) | 21,017,621 | ||||||
|
| |||||||
| 70,783,111 | ||||||||
|
| |||||||
| Containers & Packaging — 0.4% | ||||||||
| 97,938 | Avery Dennison Corp.(a) | 11,249,159 | ||||||
| 123,706 | Sonoco Products Co.(a) | 6,573,737 | ||||||
| 216,203 | WestRock Co.(a) | 13,666,191 | ||||||
|
| |||||||
| 31,489,087 | ||||||||
|
| |||||||
| Distributors — 0.2% | ||||||||
| 139,130 | Genuine Parts Co.(a) | 13,218,741 | ||||||
|
| |||||||
| Diversified Financial Services — 2.0% | ||||||||
| 858,376 | Berkshire Hathaway, Inc., Class B(a)(b) | 170,147,291 | ||||||
|
| |||||||
| Diversified Telecommunication Services — 2.0% | ||||||||
| 2,301,503 | AT&T, Inc.(a) | 89,482,437 | ||||||
| 1,532,583 | Verizon Communications, Inc.(a) | 81,119,618 | ||||||
|
| |||||||
| 170,602,055 | ||||||||
|
| |||||||
| Electric Utilities — 1.6% | ||||||||
| 561,463 | Alliant Energy Corp.(a) | 23,923,938 | ||||||
| 666,189 | American Electric Power Co., Inc.(a) | 49,011,525 | ||||||
| 562,484 | Duke Energy Corp.(a) | 47,310,529 | ||||||
| 87,627 | Hawaiian Electric Industries, Inc.(a) | 3,167,716 | ||||||
| 194,039 | OGE Energy Corp.(a) | 6,385,824 | ||||||
| 135,917 | Westar Energy, Inc.(a) | 7,176,418 | ||||||
|
| |||||||
| 136,975,950 | ||||||||
|
| |||||||
| Electrical Equipment — 0.6% | ||||||||
| 229,541 | Eaton Corp. PLC(a) | 18,136,034 | ||||||
| 341,749 | Emerson Electric Co.(a) | 23,816,488 | ||||||
| 36,487 | Hubbell, Inc.(a) | 4,938,151 | ||||||
|
| |||||||
| 46,890,673 | ||||||||
|
| |||||||
| Electronic Equipment, Instruments & Components — 0.4% | ||||||||
| 608,036 | Corning, Inc.(a) | 19,451,071 | ||||||
| 166,894 | TE Connectivity Ltd.(a) | 15,861,606 | ||||||
|
| |||||||
| 35,312,677 | ||||||||
|
| |||||||
| Energy Equipment & Services — 1.0% | ||||||||
| 284,698 | Baker Hughes, a GE Co.(a) | 9,007,845 | ||||||
| 502,817 | Halliburton Co.(a) | 24,572,667 | ||||||
See accompanying notes to financial statements.
25 |
Portfolio of Investments – as of December 31, 2017
Gateway Fund – (continued)
| Shares | Description | Value (†) | ||||||
| Energy Equipment & Services — continued | ||||||||
| 309,938 | Patterson-UTI Energy, Inc.(a) | $ | 7,131,673 | |||||
| 688,977 | Schlumberger Ltd.(a) | 46,430,160 | ||||||
|
| |||||||
| 87,142,345 | ||||||||
|
| |||||||
| Food & Staples Retailing — 1.7% | ||||||||
| 515,345 | CVS Health Corp.(a) | 37,362,512 | ||||||
| 638,444 | Wal-Mart Stores, Inc.(a) | 63,046,345 | ||||||
| 596,129 | Walgreens Boots Alliance, Inc.(a) | 43,290,888 | ||||||
|
| |||||||
| 143,699,745 | ||||||||
|
| |||||||
| Food Products — 1.2% | ||||||||
| 85,855 | Bunge Ltd.(a) | 5,759,153 | ||||||
| 509,574 | Conagra Brands, Inc.(a) | 19,195,653 | ||||||
| 66,489 | Ingredion, Inc.(a) | 9,295,162 | ||||||
| 313,483 | Kraft Heinz Co. (The)(a) | 24,376,438 | ||||||
| 100,507 | Lamb Weston Holdings, Inc.(a) | 5,673,620 | ||||||
| 840,182 | Mondelez International, Inc., Class A(a) | 35,959,790 | ||||||
|
| |||||||
| 100,259,816 | ||||||||
|
| |||||||
| Gas Utilities — 0.1% | ||||||||
| 90,899 | National Fuel Gas Co.(a) | 4,991,264 | ||||||
| 3,539 | ONE Gas, Inc.(a) | 259,267 | ||||||
| 31,811 | WGL Holdings, Inc.(a) | 2,730,656 | ||||||
|
| |||||||
| 7,981,187 | ||||||||
|
| |||||||
| Health Care Equipment & Supplies — 2.6% | ||||||||
| 681,320 | Abbott Laboratories(a) | 38,882,932 | ||||||
| 50,299 | Align Technology, Inc.(a)(b) | 11,175,935 | ||||||
| 344,421 | Baxter International, Inc.(a) | 22,263,373 | ||||||
| 882,143 | Boston Scientific Corp.(a)(b) | 21,868,325 | ||||||
| 415,791 | Hologic, Inc.(a)(b) | 17,775,065 | ||||||
| 67,471 | Intuitive Surgical, Inc.(a)(b) | 24,622,867 | ||||||
| 861,635 | Medtronic PLC(a) | 69,577,026 | ||||||
| 106,088 | ResMed, Inc.(a) | 8,984,593 | ||||||
| 27,536 | Teleflex, Inc.(a) | 6,851,508 | ||||||
|
| |||||||
| 222,001,624 | ||||||||
|
| |||||||
| Health Care Providers & Services — 2.8% | ||||||||
| 231,278 | Aetna, Inc.(a) | 41,720,238 | ||||||
| 151,540 | Anthem, Inc.(a) | 34,098,015 | ||||||
| 320,125 | Express Scripts Holding Co.(a)(b) | 23,894,130 | ||||||
| 213,130 | HCA Healthcare, Inc.(a)(b) | 18,721,339 | ||||||
| 164,011 | Patterson Cos., Inc.(a) | 5,925,718 | ||||||
| 131,195 | Quest Diagnostics, Inc.(a) | 12,921,396 | ||||||
| 435,594 | UnitedHealth Group, Inc.(a) | 96,031,053 | ||||||
| 71,900 | Universal Health Services, Inc., Class B(a) | 8,149,865 | ||||||
|
| |||||||
| 241,461,754 | ||||||||
|
| |||||||
| Health Care Technology — 0.1% | ||||||||
| 70,651 | Veeva Systems, Inc., Class A(a)(b) | 3,905,587 | ||||||
|
| |||||||
See accompanying notes to financial statements.
| 26
Portfolio of Investments – as of December 31, 2017
Gateway Fund – (continued)
| Shares | Description | Value (†) | ||||||
| Hotels, Restaurants & Leisure — 1.7% | ||||||||
| 41,062 | Domino’s Pizza, Inc.(a) | $ | 7,759,076 | |||||
| 49,280 | Hilton Grand Vacations, Inc.(a)(b) | 2,067,296 | ||||||
| 208,226 | Hilton Worldwide Holdings, Inc.(a) | 16,628,928 | ||||||
| 59,763 | Las Vegas Sands Corp.(a) | 4,152,931 | ||||||
| 421,778 | McDonald’s Corp.(a) | 72,596,429 | ||||||
| 81,428 | Melco Resorts & Entertainment Ltd., Sponsored ADR(a) | 2,364,669 | ||||||
| 389,665 | MGM Resorts International(a) | 13,010,914 | ||||||
| 163,392 | Norwegian Cruise Line Holdings Ltd.(a)(b) | 8,700,624 | ||||||
| 85,273 | Restaurant Brands International, Inc.(a) | 5,242,584 | ||||||
| 39,919 | Vail Resorts, Inc.(a) | 8,481,590 | ||||||
| 401,168 | Wendy’s Co. (The)(a) | 6,587,179 | ||||||
|
| |||||||
| 147,592,220 | ||||||||
|
| |||||||
| Household Durables — 0.5% | ||||||||
| 119,472 | Leggett & Platt, Inc.(a) | 5,702,398 | ||||||
| 292,194 | Newell Brands, Inc.(a) | 9,028,795 | ||||||
| 2,654 | NVR, Inc.(a)(b) | 9,310,816 | ||||||
| 225,136 | Toll Brothers, Inc.(a) | 10,811,031 | ||||||
| 27,819 | Tupperware Brands Corp.(a) | 1,744,251 | ||||||
| 52,559 | Whirlpool Corp.(a) | 8,863,550 | ||||||
|
| |||||||
| 45,460,841 | ||||||||
|
| |||||||
| Household Products — 1.8% | ||||||||
| 303,835 | Church & Dwight Co., Inc.(a) | 15,243,402 | ||||||
| 529,385 | Colgate-Palmolive Co.(a) | 39,942,098 | ||||||
| 1,061,719 | Procter & Gamble Co. (The)(a) | 97,550,742 | ||||||
|
| |||||||
| 152,736,242 | ||||||||
|
| |||||||
| Industrial Conglomerates — 2.3% | ||||||||
| 298,014 | 3M Co.(a) | 70,143,555 | ||||||
| 3,582,568 | General Electric Co.(a) | 62,515,812 | ||||||
| 429,021 | Honeywell International, Inc.(a) | 65,794,660 | ||||||
|
| |||||||
| 198,454,027 | ||||||||
|
| |||||||
| Insurance — 2.4% | ||||||||
| 286,249 | Aflac, Inc.(a) | 25,126,937 | ||||||
| 266,008 | Allstate Corp. (The)(a) | 27,853,698 | ||||||
| 149,909 | American Financial Group, Inc.(a) | 16,271,123 | ||||||
| 484,166 | American International Group, Inc.(a) | 28,846,610 | ||||||
| 180,061 | Aon PLC(a) | 24,128,174 | ||||||
| 161,374 | Arch Capital Group Ltd.(a)(b) | 14,647,918 | ||||||
| 296,125 | Arthur J. Gallagher & Co.(a) | 18,738,790 | ||||||
| 121,715 | FNF Group(a) | 4,776,097 | ||||||
| 184,878 | Lincoln National Corp.(a) | 14,211,572 | ||||||
| 232,774 | Principal Financial Group, Inc.(a) | 16,424,533 | ||||||
| 289,406 | XL Group Ltd.(a) | 10,175,515 | ||||||
|
| |||||||
| 201,200,967 | ||||||||
|
| |||||||
| Internet & Direct Marketing Retail — 2.9% | ||||||||
| 152,347 | Amazon.com, Inc.(a)(b) | 178,165,246 | ||||||
| 173,587 | Netflix, Inc.(a)(b) | 33,321,761 | ||||||
See accompanying notes to financial statements.
27 |
Portfolio of Investments – as of December 31, 2017
Gateway Fund – (continued)
| Shares | Description | Value (†) | ||||||
| Internet & Direct Marketing Retail — continued | ||||||||
| 22,234 | Priceline Group, Inc. (The)(a)(b) | $ | 38,636,911 | |||||
|
| |||||||
| 250,123,918 | ||||||||
|
| |||||||
| Internet Software & Services — 5.3% | ||||||||
| 56,348 | Alphabet, Inc., Class A(a)(b) | 59,356,983 | ||||||
| 175,632 | Alphabet, Inc., Class C(a)(b) | 183,781,325 | ||||||
| 21,160 | Baidu, Inc., Sponsored ADR(a)(b) | 4,955,884 | ||||||
| 462,511 | eBay, Inc.(a)(b) | 17,455,165 | ||||||
| 980,213 | Facebook, Inc., Class A(a)(b) | 172,968,386 | ||||||
| 10,552 | MercadoLibre, Inc.(a) | 3,320,292 | ||||||
| 64,694 | VeriSign, Inc.(a)(b) | 7,403,581 | ||||||
| 73,612 | Zillow Group, Inc., Class C(a)(b) | 3,012,203 | ||||||
|
| |||||||
| 452,253,819 | ||||||||
|
| |||||||
| IT Services — 3.5% | ||||||||
| 208,601 | Automatic Data Processing, Inc.(a) | 24,445,951 | ||||||
| 27,909 | Black Knight, Inc.(a)(b) | 1,232,183 | ||||||
| 46,488 | Broadridge Financial Solutions, Inc.(a) | 4,210,883 | ||||||
| 271,803 | Cognizant Technology Solutions Corp., Class A(a) | 19,303,449 | ||||||
| 257,142 | Fidelity National Information Services, Inc.(a) | 24,194,491 | ||||||
| 33,577 | FleetCor Technologies, Inc.(a)(b) | 6,461,222 | ||||||
| 389,246 | International Business Machines Corp.(a) | 59,718,121 | ||||||
| 205,924 | Paychex, Inc.(a) | 14,019,306 | ||||||
| 469,932 | PayPal Holdings, Inc.(a)(b) | 34,596,394 | ||||||
| 866,216 | Visa, Inc., Class A(a) | 98,765,948 | ||||||
| 461,834 | Western Union Co. (The)(a) | 8,779,464 | ||||||
|
| |||||||
| 295,727,412 | ||||||||
|
| |||||||
| Leisure Products — 0.1% | ||||||||
| 405,813 | Mattel, Inc.(a) | 6,241,404 | ||||||
| 38,286 | Polaris Industries, Inc.(a) | 4,747,081 | ||||||
|
| |||||||
| 10,988,485 | ||||||||
|
| |||||||
| Life Sciences Tools & Services — 0.2% | ||||||||
| 85,067 | Illumina, Inc.(a)(b) | 18,586,289 | ||||||
|
| |||||||
| Machinery — 1.9% | ||||||||
| 286,542 | Caterpillar, Inc.(a) | 45,153,288 | ||||||
| 116,361 | Cummins, Inc.(a) | 20,554,007 | ||||||
| 165,641 | Deere & Co.(a) | 25,924,473 | ||||||
| 108,472 | Parker Hannifin Corp.(a) | 21,648,842 | ||||||
| 180,965 | Pentair PLC(a) | 12,779,748 | ||||||
| 65,179 | Snap-on, Inc.(a) | 11,360,700 | ||||||
| 143,487 | Stanley Black & Decker, Inc.(a) | 24,348,309 | ||||||
| 71,757 | Timken Co. (The)(a) | 3,526,857 | ||||||
|
| |||||||
| 165,296,224 | ||||||||
|
| |||||||
| Media — 2.7% | ||||||||
| 1,918,640 | Comcast Corp., Class A(a) | 76,841,532 | ||||||
| 103,860 | Liberty Broadband Corp., Class C(a)(b) | 8,844,718 | ||||||
| 216,605 | Liberty Global PLC, Series C(a)(b) | 7,329,913 | ||||||
See accompanying notes to financial statements.
| 28
Portfolio of Investments – as of December 31, 2017
Gateway Fund – (continued)
| Shares | Description | Value (†) | ||||||
| Media — continued | ||||||||
| 83,437 | Liberty Global PLC LiLAC, Series C(a)(b) | $ | 1,659,562 | |||||
| 205,665 | News Corp., Class B(a) | 3,414,039 | ||||||
| 182,648 | Omnicom Group, Inc.(a) | 13,302,254 | ||||||
| 2,585,279 | Sirius XM Holdings, Inc.(a) | 13,857,095 | ||||||
| 360,723 | Time Warner, Inc.(a) | 32,995,333 | ||||||
| 62,209 | Time, Inc.(a) | 1,147,756 | ||||||
| 683,388 | Walt Disney Co. (The)(a) | 73,471,044 | ||||||
|
| |||||||
| 232,863,246 | ||||||||
|
| |||||||
| Metals & Mining — 0.2% | ||||||||
| 184,421 | Southern Copper Corp.(a) | 8,750,776 | ||||||
| 164,761 | Steel Dynamics, Inc.(a) | 7,106,142 | ||||||
| 65,675 | Worthington Industries, Inc.(a) | 2,893,641 | ||||||
|
| |||||||
| 18,750,559 | ||||||||
|
| |||||||
| Multi-Utilities — 1.4% | ||||||||
| 401,532 | Ameren Corp.(a) | 23,686,373 | ||||||
| 609,976 | CenterPoint Energy, Inc.(a) | 17,298,919 | ||||||
| 253,530 | Consolidated Edison, Inc.(a) | 21,537,374 | ||||||
| 484,927 | Public Service Enterprise Group, Inc.(a) | 24,973,740 | ||||||
| 462,704 | WEC Energy Group, Inc.(a) | 30,737,427 | ||||||
|
| |||||||
| 118,233,833 | ||||||||
|
| |||||||
| Multiline Retail — 0.4% | ||||||||
| 130,497 | Nordstrom, Inc.(a) | 6,182,948 | ||||||
| 398,543 | Target Corp.(a) | 26,004,931 | ||||||
|
| |||||||
| 32,187,879 | ||||||||
|
| |||||||
| Oil, Gas & Consumable Fuels — 4.9% | ||||||||
| 126,723 | Cheniere Energy, Inc.(a)(b) | 6,822,766 | ||||||
| 795,965 | Chevron Corp.(a) | 99,646,858 | ||||||
| 140,197 | Concho Resources, Inc.(a)(b) | 21,060,393 | ||||||
| 779,769 | ConocoPhillips(a) | 42,801,521 | ||||||
| 260,757 | Continental Resources, Inc.(a)(b) | 13,812,298 | ||||||
| 1,696,701 | Exxon Mobil Corp.(a) | 141,912,072 | ||||||
| 470,790 | Gulfport Energy Corp.(a)(b) | 6,007,281 | ||||||
| 67,828 | HollyFrontier Corp.(a) | 3,474,150 | ||||||
| 482,514 | Occidental Petroleum Corp.(a) | 35,541,981 | ||||||
| 245,897 | ONEOK, Inc.(a) | 13,143,195 | ||||||
| 335,749 | Phillips 66(a) | 33,961,011 | ||||||
|
| |||||||
| 418,183,526 | ||||||||
|
| |||||||
| Personal Products — 0.0% | ||||||||
| 37,688 | Herbalife Ltd.(a)(b) | 2,552,231 | ||||||
|
| |||||||
| Pharmaceuticals — 4.7% | ||||||||
| 180,342 | Allergan PLC(a) | 29,500,344 | ||||||
| 652,140 | Bristol-Myers Squibb Co.(a) | 39,963,139 | ||||||
| 407,447 | Eli Lilly & Co.(a) | 34,412,974 | ||||||
| 52,362 | Jazz Pharmaceuticals PLC(a)(b) | 7,050,543 | ||||||
| 1,037,295 | Johnson & Johnson(a) | 144,930,857 | ||||||
See accompanying notes to financial statements.
29 |
Portfolio of Investments – as of December 31, 2017
Gateway Fund – (continued)
| Shares | Description | Value (†) | ||||||
| Pharmaceuticals — continued | ||||||||
| 1,082,791 | Merck & Co., Inc.(a) | $ | 60,928,650 | |||||
| 2,324,677 | Pfizer, Inc.(a) | 84,199,801 | ||||||
|
| |||||||
| 400,986,308 | ||||||||
|
| |||||||
| Professional Services – 0.4% | ||||||||
| 53,481 | Dun & Bradstreet Corp. (The)(a) | 6,332,685 | ||||||
| 38,349 | ManpowerGroup, Inc.(a) | 4,836,193 | ||||||
| 195,964 | Verisk Analytics, Inc.(a)(b) | 18,812,544 | ||||||
|
| |||||||
| 29,981,422 | ||||||||
|
| |||||||
| REITs – Apartments — 0.5% | ||||||||
| 192,021 | Camden Property Trust(a) | 17,677,453 | ||||||
| 617,097 | UDR, Inc.(a) | 23,770,577 | ||||||
|
| |||||||
| 41,448,030 | ||||||||
|
| |||||||
| REITs – Diversified — 0.6% | ||||||||
| 194,326 | Digital Realty Trust, Inc.(a) | 22,133,731 | ||||||
| 664,704 | Duke Realty Corp.(a) | 18,086,596 | ||||||
| 67,913 | SBA Communications Corp.(a)(b) | 11,094,268 | ||||||
|
| |||||||
| 51,314,595 | ||||||||
|
| |||||||
| REITs – Health Care — 0.4% | ||||||||
| 260,504 | Healthcare Realty Trust, Inc.(a) | 8,367,388 | ||||||
| 206,117 | Sabra Health Care REIT, Inc.(a) | 3,868,816 | ||||||
| 265,800 | Senior Housing Properties Trust(a) | 5,090,070 | ||||||
| 322,756 | Ventas, Inc.(a) | 19,368,588 | ||||||
|
| |||||||
| 36,694,862 | ||||||||
|
| |||||||
| REITs – Hotels — 0.0% | ||||||||
| 104,126 | Park Hotels & Resorts, Inc.(a) | 2,993,623 | ||||||
|
| |||||||
| REITs – Mortgage — 0.3% | ||||||||
| 644,819 | AGNC Investment Corp.(a) | 13,018,895 | ||||||
| 1,234,994 | Annaly Capital Management, Inc.(a) | 14,684,079 | ||||||
|
| |||||||
| 27,702,974 | ||||||||
|
| |||||||
| REITs – Office Property — 0.3% | ||||||||
| 193,780 | Kilroy Realty Corp.(a) | 14,465,677 | ||||||
| 306,600 | Mack-Cali Realty Corp.(a) | 6,610,296 | ||||||
|
| |||||||
| 21,075,973 | ||||||||
|
| |||||||
| REITs – Shopping Centers — 0.3% | ||||||||
| 354,094 | Regency Centers Corp.(a) | 24,496,223 | ||||||
|
| |||||||
| REITs – Storage — 0.2% | ||||||||
| 178,201 | Extra Space Storage, Inc.(a) | 15,583,677 | ||||||
|
| |||||||
| REITs – Warehouse/Industrials — 0.1% | ||||||||
| 271,168 | Liberty Property Trust(a) | 11,662,936 | ||||||
|
| |||||||
| Road & Rail — 0.9% | ||||||||
| 146,168 | Avis Budget Group, Inc.(a)(b) | 6,413,852 | ||||||
| 70,499 | Canadian Pacific Railway Ltd.(a) | 12,884,397 | ||||||
| 640,894 | CSX Corp.(a) | 35,255,579 | ||||||
See accompanying notes to financial statements.
| 30
Portfolio of Investments – as of December 31, 2017
Gateway Fund – (continued)
| Shares | Description | Value (†) | ||||||
| Road & Rail — continued | ||||||||
| 167,459 | Hertz Global Holdings, Inc.(a)(b) | $ | 3,700,844 | |||||
| 110,440 | Old Dominion Freight Line, Inc.(a) | 14,528,382 | ||||||
|
| |||||||
| 72,783,054 | ||||||||
|
| |||||||
| Semiconductors & Semiconductor Equipment — 3.9% | ||||||||
| 577,731 | Advanced Micro Devices, Inc.(a)(b) | 5,939,075 | ||||||
| 203,038 | Analog Devices, Inc.(a) | 18,076,473 | ||||||
| 653,399 | Applied Materials, Inc.(a) | 33,401,757 | ||||||
| 1,911,267 | Intel Corp.(a) | 88,224,085 | ||||||
| 250,237 | Microchip Technology, Inc.(a) | 21,990,827 | ||||||
| 249,568 | NVIDIA Corp.(a) | 48,291,408 | ||||||
| 636,434 | QUALCOMM, Inc.(a) | 40,744,505 | ||||||
| 156,838 | Skyworks Solutions, Inc.(a) | 14,891,768 | ||||||
| 267,055 | Teradyne, Inc.(a) | 11,181,593 | ||||||
| 507,114 | Texas Instruments, Inc.(a) | 52,962,986 | ||||||
|
| |||||||
| 335,704,477 | ||||||||
|
| |||||||
| Software — 5.5% | ||||||||
| 386,332 | Activision Blizzard, Inc.(a) | 24,462,542 | ||||||
| 249,935 | Adobe Systems, Inc.(a)(b) | 43,798,610 | ||||||
| 87,631 | ANSYS, Inc.(a)(b) | 12,933,459 | ||||||
| 383,459 | Cadence Design Systems, Inc.(a)(b) | 16,036,255 | ||||||
| 44,865 | Dell Technologies, Inc., Class V(a)(b) | 3,646,627 | ||||||
| 2,970,402 | Microsoft Corp.(a) | 254,088,187 | ||||||
| 367,409 | Nuance Communications, Inc.(a)(b) | 6,007,137 | ||||||
| 1,305,002 | Oracle Corp.(a) | 61,700,495 | ||||||
| 114,165 | PTC, Inc.(a)(b) | 6,937,807 | ||||||
| 41,728 | ServiceNow, Inc.(a)(b) | 5,440,914 | ||||||
| 352,491 | Symantec Corp.(a) | 9,890,898 | ||||||
| 41,972 | Take-Two Interactive Software, Inc.(a)(b) | 4,607,686 | ||||||
| 76,950 | VMware, Inc., Class A(a)(b) | 9,643,374 | ||||||
| 63,603 | Workday, Inc., Class A(a)(b) | 6,470,969 | ||||||
|
| |||||||
| 465,664,960 | ||||||||
|
| |||||||
| Specialty Retail — 2.4% | ||||||||
| 354,976 | American Eagle Outfitters, Inc.(a) | 6,673,549 | ||||||
| 102,590 | Foot Locker, Inc.(a) | 4,809,419 | ||||||
| 178,688 | Gap, Inc. (The)(a) | 6,086,113 | ||||||
| 520,757 | Home Depot, Inc. (The)(a) | 98,699,074 | ||||||
| 119,254 | L Brands, Inc.(a) | 7,181,476 | ||||||
| 472,528 | Lowe’s Cos., Inc.(a) | 43,916,753 | ||||||
| 104,508 | Tiffany & Co.(a) | 10,863,607 | ||||||
| 375,970 | TJX Cos., Inc. (The)(a) | 28,746,666 | ||||||
|
| |||||||
| 206,976,657 | ||||||||
|
| |||||||
| Technology Hardware, Storage & Peripherals — 3.9% | ||||||||
| 1,950,861 | Apple, Inc.(a) | 330,144,207 | ||||||
|
| |||||||
| Textiles, Apparel & Luxury Goods — 0.4% | ||||||||
| 110,021 | Lululemon Athletica, Inc.(a)(b) | 8,646,550 | ||||||
| 212,485 | Michael Kors Holdings Ltd.(a)(b) | 13,375,931 | ||||||
See accompanying notes to financial statements.
31 |
Portfolio of Investments – as of December 31, 2017
Gateway Fund – (continued)
| Shares | Description | Value (†) | ||||||
| Textiles, Apparel & Luxury Goods — continued | ||||||||
| 681,244 | Under Armour, Inc., Class A(a)(b) | $ | 9,830,351 | |||||
| 108,010 | Under Armour, Inc., Class C(a)(b) | 1,438,693 | ||||||
|
| |||||||
| 33,291,525 | ||||||||
|
| |||||||
| Tobacco — 1.3% | ||||||||
| 721,540 | Altria Group, Inc.(a) | 51,525,172 | ||||||
| 576,065 | Philip Morris International, Inc.(a) | 60,861,267 | ||||||
| 76,584 | Vector Group Ltd.(a) | 1,713,950 | ||||||
|
| |||||||
| 114,100,389 | ||||||||
|
| |||||||
| Trading Companies & Distributors — 0.1% | ||||||||
| 59,515 | GATX Corp.(a) | 3,699,452 | ||||||
|
| |||||||
| Wireless Telecommunication Services — 0.1% | ||||||||
| 187,217 | Sprint Corp.(a)(b) | 1,102,708 | ||||||
| 71,226 | T-Mobile US, Inc.(a)(b) | 4,523,563 | ||||||
|
| |||||||
| 5,626,271 | ||||||||
|
| |||||||
| Total Common Stocks (Identified Cost $5,943,193,154) | 8,429,239,556 | |||||||
|
| |||||||
| Total Purchased Options — 0.1% (Identified Cost $37,415,868) (see detail below) | 13,136,125 | |||||||
|
| |||||||
| Principal Amount | ||||||||
| Short-Term Investments — 2.6% | ||||||||
| $ | 218,118,211 | Tri-Party Repurchase Agreement with Fixed Income Clearing Corporation, dated 12/29/2017 at 0.540% to be repurchased at $218,131,298 on 1/02/2018 collateralized by $8,480,000 Federal Home Loan Bank, 1.000% due 4/27/2018 valued at $8,502,896; $70,185,000 Federal Home Loan Bank, 1.250% due 7/27/2018 valued at $70,448,194; $23,860,000 Federal Agricultural Mortgage Corporation, 1.120% due 8/01/2018 valued at $23,910,201; $54,970,000 Federal Home Loan Discount Note, 0.000% due 5/04/2018 valued at $54,694,875; $25,000,000 Federal Home Loan Mortgage Corp., 1.050% due 6/29/2018 valued at $24,934,500; $10,630,000 U.S. Treasury Note, 1.000% due 8/15/2018 valued at $10,626,152; $30,565,000 U.S. Treasury Note, 1.375% due 6/30/2023 valued at $29,368,747 including accrued interest (Note 2 of Notes to Financial Statements) (Identified Cost $218,118,211) | 218,118,211 | |||||
|
| |||||||
| Total Investments — 101.6% (Identified Cost $6,198,727,233) | 8,660,493,892 | |||||||
| Other assets less liabilities — (1.6)% | (135,428,160 | ) | ||||||
|
| |||||||
| Net Assets — 100.0% | $ | 8,525,065,732 | ||||||
|
| |||||||
See accompanying notes to financial statements.
| 32
Portfolio of Investments – as of December 31, 2017
Gateway Fund – (continued)
| Purchased Options — 0.1% | ||||||||||||||||||||||||
| Description | Expiration Date | Exercise Price | Contracts | Notional Amount | Cost | Value (†) | ||||||||||||||||||
| Index Options — 0.1% | ||||||||||||||||||||||||
| S&P 500® Index, Put | 01/19/2018 | 2,375 | 5,225 | $ | 1,396,961,225 | $ | 5,447,063 | $ | 600,875 | |||||||||||||||
| S&P 500® Index, Put | 01/19/2018 | 2,400 | 3,662 | 979,075,982 | 3,927,495 | 494,370 | ||||||||||||||||||
| S&P 500® Index, Put | 02/16/2018 | 2,325 | 3,061 | 818,392,021 | 3,573,718 | 795,860 | ||||||||||||||||||
| S&P 500® Index, Put | 02/16/2018 | 2,350 | 3,661 | 978,808,621 | 6,049,802 | 1,098,300 | ||||||||||||||||||
| S&P 500® Index, Put | 02/16/2018 | 2,375 | 4,544 | 1,214,888,384 | 5,305,120 | 1,590,400 | ||||||||||||||||||
| S&P 500® Index, Put | 02/16/2018 | 2,400 | 3,674 | 982,284,314 | 3,903,625 | 1,469,600 | ||||||||||||||||||
| S&P 500® Index, Put | 03/16/2018 | 2,400 | 3,691 | 986,829,451 | 4,659,887 | 3,321,900 | ||||||||||||||||||
| S&P 500® Index, Put | 03/16/2018 | 2,425 | 3,691 | 986,829,451 | 4,549,158 | 3,764,820 | ||||||||||||||||||
|
|
|
| |||||||||||||||||||||
| Total | $ | 37,415,868 | $ | 13,136,125 | ||||||||||||||||||||
|
|
|
| |||||||||||||||||||||
| Written Options — (1.8%) | ||||||||||||||||||||||||
| Description | Expiration Date | Exercise Price | Contracts | Notional Amount | Premiums (Received) | Value (†) | ||||||||||||||||||
| Index Options — (1.8%) | ||||||||||||||||||||||||
| S&P 500® Index, Call | 01/05/2018 | 2,650 | (3,415 | ) | $ | (913,037,815 | ) | $ | (7,162,962 | ) | $ | (10,142,550 | ) | |||||||||||
| S&P 500® Index, Call | 01/19/2018 | 2,600 | (3,481 | ) | (930,683,641 | ) | (10,737,144 | ) | (28,874,895 | ) | ||||||||||||||
| S&P 500® Index, Call | 01/19/2018 | 2,650 | (3,534 | ) | (944,853,774 | ) | (15,540,765 | ) | (13,729,590 | ) | ||||||||||||||
| S&P 500® Index, Call | 01/26/2018 | 2,700 | (3,508 | ) | (937,902,388 | ) | (5,253,230 | ) | (3,613,240 | ) | ||||||||||||||
| S&P 500® Index, Call | 02/16/2018 | 2,600 | (3,605 | ) | (963,836,405 | ) | (19,457,987 | ) | (33,111,925 | ) | ||||||||||||||
| S&P 500® Index, Call | 02/16/2018 | 2,625 | (3,560 | ) | (951,805,160 | ) | (19,571,100 | ) | (25,151,400 | ) | ||||||||||||||
| S&P 500® Index, Call | 02/16/2018 | 2,650 | (3,252 | ) | (869,457,972 | ) | (14,951,070 | ) | (16,568,940 | ) | ||||||||||||||
| S&P 500® Index, Call | 02/16/2018 | 2,675 | (3,293 | ) | (880,419,773 | ) | (11,846,568 | ) | (10,949,225 | ) | ||||||||||||||
| S&P 500® Index, Call | 03/16/2018 | 2,700 | (3,561 | ) | (952,072,521 | ) | (16,015,598 | ) | (11,056,905 | ) | ||||||||||||||
|
|
|
| |||||||||||||||||||||
| Total | $ | (120,536,424 | ) | $ | (153,198,670 | ) | ||||||||||||||||||
|
|
|
| |||||||||||||||||||||
| (†) | See Note 2 of Notes to Financial Statements. | |||
| (a) | Security (or a portion thereof) has been pledged as collateral for open derivative contracts. | |||
| (b) | Non-income producing security. | |||
| ADR | An American Depositary Receipt is a certificate issued by a custodian bank representing the right to receive securities of the foreign issuer described. The values of ADRs may be significantly influenced by trading on exchanges not located in the United States. | |||
| REITs | Real Estate Investment Trusts |
See accompanying notes to financial statements.
33 |
Portfolio of Investments – as of December 31, 2017
Gateway Fund – (continued)
Industry Summary at December 31, 2017
Banks | 6.7 | % | ||
Software | 5.5 | |||
Internet Software & Services | 5.3 | |||
Oil, Gas & Consumable Fuels | 4.9 | |||
Pharmaceuticals | 4.7 | |||
Semiconductors & Semiconductor Equipment | 3.9 | |||
Technology Hardware, Storage & Peripherals | 3.9 | |||
IT Services | 3.5 | |||
Biotechnology | 3.3 | |||
Internet & Direct Marketing Retail | 2.9 | |||
Health Care Providers & Services | 2.8 | |||
Media | 2.7 | |||
Health Care Equipment & Supplies | 2.6 | |||
Capital Markets | 2.4 | |||
Specialty Retail | 2.4 | |||
Insurance | 2.4 | |||
Industrial Conglomerates | 2.3 | |||
Aerospace & Defense | 2.3 | |||
Beverages | 2.2 | |||
Chemicals | 2.2 | |||
Diversified Telecommunication Services | 2.0 | |||
Diversified Financial Services | 2.0 | |||
Other Investments, less than 2% each | 26.1 | |||
Short-Term Investments | 2.6 | |||
|
| |||
Total Investments | 101.6 | |||
Other assets less liabilities (including open written options) | (1.6 | ) | ||
|
| |||
Net Assets | 100.0 | % | ||
|
|
See accompanying notes to financial statements.
| 34
Portfolio of Investments – as of December 31, 2017
Gateway Equity Call Premium Fund
| Shares | Description | Value (†) | ||||||
| Common Stocks — 99.3% of Net Assets | ||||||||
| Aerospace & Defense — 2.4% | ||||||||
| 2,472 | Boeing Co. (The)(a) | $ | 729,018 | |||||
| 302 | Huntington Ingalls Industries, Inc.(a) | 71,181 | ||||||
| 890 | KLX, Inc.(b) | 60,742 | ||||||
| 1,513 | Lockheed Martin Corp.(a) | 485,749 | ||||||
| 1,077 | Rockwell Collins, Inc.(a) | 146,063 | ||||||
| 3,684 | United Technologies Corp.(a) | 469,968 | ||||||
|
| |||||||
| 1,962,721 | ||||||||
|
| |||||||
| Air Freight & Logistics — 0.9% | ||||||||
| 1,291 | FedEx Corp.(a) | 322,156 | ||||||
| 3,376 | United Parcel Service, Inc., Class B(a) | 402,251 | ||||||
|
| |||||||
| 724,407 | ||||||||
|
| |||||||
| Airlines — 0.5% | ||||||||
| 655 | Alaska Air Group, Inc.(a) | 48,149 | ||||||
| 4,098 | Delta Air Lines, Inc.(a) | 229,488 | ||||||
| 426 | JetBlue Airways Corp.(b) | 9,517 | ||||||
| 1,724 | United Continental Holdings, Inc.(a)(b) | 116,197 | ||||||
|
| |||||||
| 403,351 | ||||||||
|
| |||||||
| Auto Components — 0.2% | ||||||||
| 623 | Adient PLC(a) | 49,030 | ||||||
| 622 | Lear Corp.(a) | 109,883 | ||||||
|
| |||||||
| 158,913 | ||||||||
|
| |||||||
| Automobiles — 0.4% | ||||||||
| 8,162 | General Motors Co.(a) | 334,560 | ||||||
|
| |||||||
| Banks — 6.6% | ||||||||
| 39,800 | Bank of America Corp.(a) | 1,174,896 | ||||||
| 11,576 | Citigroup, Inc.(a) | 861,370 | ||||||
| 1,574 | Comerica, Inc.(a) | 136,639 | ||||||
| 302 | East West Bancorp, Inc.(a) | 18,371 | ||||||
| 5,380 | Fifth Third Bancorp(a) | 163,229 | ||||||
| 462 | First Republic Bank(a) | 40,028 | ||||||
| 8,896 | Huntington Bancshares, Inc.(a) | 129,526 | ||||||
| 14,726 | JPMorgan Chase & Co.(a) | 1,574,798 | ||||||
| 144 | Signature Bank(b) | 19,765 | ||||||
| 2,717 | SunTrust Banks, Inc.(a) | 175,491 | ||||||
| 126 | SVB Financial Group(a)(b) | 29,455 | ||||||
| 17,106 | Wells Fargo & Co.(a) | 1,037,821 | ||||||
|
| |||||||
| 5,361,389 | ||||||||
|
| |||||||
| Beverages — 2.0% | ||||||||
| 17,615 | Coca-Cola Co. (The)(a) | 808,176 | ||||||
| 6,683 | PepsiCo, Inc.(a) | 801,426 | ||||||
|
| |||||||
| 1,609,602 | ||||||||
|
| |||||||
| Biotechnology — 3.0% | ||||||||
| 6,360 | AbbVie, Inc.(a) | 615,076 | ||||||
See accompanying notes to financial statements.
35 |
Portfolio of Investments – as of December 31, 2017
Gateway Equity Call Premium Fund – (continued)
| Shares | Description | Value (†) | ||||||
| Biotechnology — continued | ||||||||
| 982 | Alexion Pharmaceuticals, Inc.(a)(b) | $ | 117,437 | |||||
| 160 | Alkermes PLC(b) | 8,757 | ||||||
| 309 | Alnylam Pharmaceuticals, Inc.(a)(b) | 39,258 | ||||||
| 2,912 | Amgen, Inc.(a) | 506,397 | ||||||
| 895 | Biogen, Inc.(a)(b) | 285,120 | ||||||
| 264 | BioMarin Pharmaceutical, Inc.(a)(b) | 23,541 | ||||||
| 356 | Bioverativ, Inc.(b) | 19,196 | ||||||
| 3,338 | Celgene Corp.(a)(b) | 348,354 | ||||||
| 5,294 | Gilead Sciences, Inc.(a) | 379,262 | ||||||
| 903 | Incyte Corp.(a)(b) | 85,523 | ||||||
|
| |||||||
| 2,427,921 | ||||||||
|
| |||||||
| Building Products — 0.7% | ||||||||
| 1,956 | A.O. Smith Corp.(a) | 119,864 | ||||||
| 2,300 | Fortune Brands Home & Security, Inc.(a) | 157,412 | ||||||
| 5,286 | Johnson Controls International PLC(a) | 201,449 | ||||||
| 402 | Lennox International, Inc.(a) | 83,721 | ||||||
|
| |||||||
| 562,446 | ||||||||
|
| |||||||
| Capital Markets — 2.2% | ||||||||
| 5,475 | Bank of New York Mellon Corp. (The)(a) | 294,884 | ||||||
| 640 | BlackRock, Inc.(a) | 328,774 | ||||||
| 1,875 | Goldman Sachs Group, Inc. (The)(a) | 477,675 | ||||||
| 8,070 | Morgan Stanley(a) | 423,433 | ||||||
| 396 | MSCI, Inc.(a) | 50,110 | ||||||
| 1,130 | Raymond James Financial, Inc.(a) | 100,909 | ||||||
| 361 | SEI Investments Co. | 25,941 | ||||||
| 1,022 | TD Ameritrade Holding Corp.(a) | 52,255 | ||||||
|
| |||||||
| 1,753,981 | ||||||||
|
| |||||||
| Chemicals — 2.1% | ||||||||
| 536 | AdvanSix, Inc.(a)(b) | 22,549 | ||||||
| 726 | Agrium, Inc.(a) | 83,490 | ||||||
| 1,697 | Air Products & Chemicals, Inc.(a) | 278,444 | ||||||
| 899 | Albemarle Corp.(a) | 114,973 | ||||||
| 943 | Ashland Global Holdings, Inc.(a) | 67,142 | ||||||
| 700 | Celanese Corp., Series A(a) | 74,956 | ||||||
| 2,358 | Huntsman Corp.(a) | 78,498 | ||||||
| 547 | International Flavors & Fragrances, Inc.(a) | 83,478 | ||||||
| 2,380 | Monsanto Co.(a) | 277,936 | ||||||
| 1,978 | PPG Industries, Inc.(a) | 231,070 | ||||||
| 2,500 | Praxair, Inc.(a) | 386,700 | ||||||
| 1,748 | Valvoline, Inc.(a) | 43,805 | ||||||
|
| |||||||
| 1,743,041 | ||||||||
|
| |||||||
| Commercial Services & Supplies — 0.4% | ||||||||
| 810 | Waste Connections, Inc.(a) | 57,461 | ||||||
| 2,825 | Waste Management, Inc.(a) | 243,798 | ||||||
|
| |||||||
| 301,259 | ||||||||
|
| |||||||
See accompanying notes to financial statements.
| 36
Portfolio of Investments – as of December 31, 2017
Gateway Equity Call Premium Fund – (continued)
| Shares | Description | Value (†) | ||||||
| Communications Equipment — 1.2% | ||||||||
| 264 | Arista Networks, Inc.(a)(b) | $ | 62,193 | |||||
| 959 | ARRIS International PLC(b) | 24,637 | ||||||
| 21,317 | Cisco Systems, Inc.(a) | 816,441 | ||||||
| 213 | Palo Alto Networks, Inc.(b) | 30,872 | ||||||
|
| |||||||
| 934,143 | ||||||||
|
| |||||||
| Construction & Engineering — 0.0% | ||||||||
| 781 | Chicago Bridge & Iron Co.(a) | 12,605 | ||||||
|
| |||||||
| Consumer Finance — 1.2% | ||||||||
| 2,148 | Ally Financial, Inc.(a) | 62,636 | ||||||
| 4,605 | American Express Co.(a) | 457,322 | ||||||
| 2,896 | Capital One Financial Corp.(a) | 288,384 | ||||||
| 4,364 | Synchrony Financial(a) | 168,494 | ||||||
|
| |||||||
| 976,836 | ||||||||
|
| |||||||
| Containers & Packaging — 0.4% | ||||||||
| 1,051 | Crown Holdings, Inc.(a)(b) | 59,119 | ||||||
| 3,203 | International Paper Co.(a) | 185,582 | ||||||
| 866 | Packaging Corp. of America(a) | 104,396 | ||||||
|
| |||||||
| 349,097 | ||||||||
|
| |||||||
| Diversified Financial Services — 1.9% | ||||||||
| 7,811 | Berkshire Hathaway, Inc., Class B(a)(b) | 1,548,296 | ||||||
|
| |||||||
| Diversified Telecommunication Services — 2.1% | ||||||||
| 22,795 | AT&T, Inc.(a) | 886,270 | ||||||
| 15,242 | Verizon Communications, Inc.(a) | 806,759 | ||||||
|
| |||||||
| 1,693,029 | ||||||||
|
| |||||||
| Electric Utilities — 2.0% | ||||||||
| 4,965 | Alliant Energy Corp.(a) | 211,559 | ||||||
| 6,907 | American Electric Power Co., Inc.(a) | 508,148 | ||||||
| 3,640 | OGE Energy Corp.(a) | 119,792 | ||||||
| 4,101 | PG&E Corp.(a) | 183,848 | ||||||
| 7,227 | PPL Corp.(a) | 223,676 | ||||||
| 6,090 | Southern Co. (The)(a) | 292,868 | ||||||
| 982 | Westar Energy, Inc.(a) | 51,849 | ||||||
|
| |||||||
| 1,591,740 | ||||||||
|
| |||||||
| Electrical Equipment — 0.4% | ||||||||
| 372 | Acuity Brands, Inc.(a) | 65,472 | ||||||
| 4,281 | Emerson Electric Co.(a) | 298,343 | ||||||
|
| |||||||
| 363,815 | ||||||||
|
| |||||||
| Electronic Equipment, Instruments & Components — 0.3% | ||||||||
| 1,039 | Arrow Electronics, Inc.(a)(b) | 83,546 | ||||||
| 768 | Avnet, Inc. | 30,428 | ||||||
| 5,103 | Flex Ltd.(a)(b) | 91,803 | ||||||
|
| |||||||
| 205,777 | ||||||||
|
| |||||||
See accompanying notes to financial statements.
37 |
Portfolio of Investments – as of December 31, 2017
Gateway Equity Call Premium Fund – (continued)
| Shares | Description | Value (†) | ||||||
| Energy Equipment & Services — 0.9% | ||||||||
| 3,986 | National Oilwell Varco, Inc.(a) | $ | 143,576 | |||||
| 2,188 | Oceaneering International, Inc.(a) | 46,254 | ||||||
| 7,485 | Schlumberger Ltd.(a) | 504,414 | ||||||
|
| |||||||
| 694,244 | ||||||||
|
| |||||||
| Food & Staples Retailing — 2.1% | ||||||||
| 2,038 | Costco Wholesale Corp.(a) | 379,313 | ||||||
| 4,256 | CVS Health Corp.(a) | 308,560 | ||||||
| 2,480 | Sysco Corp.(a) | 150,610 | ||||||
| 5,708 | Wal-Mart Stores, Inc.(a) | 563,665 | ||||||
| 4,078 | Walgreens Boots Alliance, Inc.(a) | 296,144 | ||||||
|
| |||||||
| 1,698,292 | ||||||||
|
| |||||||
| Food Products — 1.0% | ||||||||
| 782 | Hain Celestial Group, Inc. (The)(a)(b) | 33,149 | ||||||
| 457 | Ingredion, Inc.(a) | 63,889 | ||||||
| 3,247 | Kellogg Co.(a) | 220,731 | ||||||
| 8,549 | Mondelez International, Inc., Class A(a) | 365,897 | ||||||
| 830 | Post Holdings, Inc.(a)(b) | 65,761 | ||||||
| 611 | TreeHouse Foods, Inc.(a)(b) | 30,220 | ||||||
|
| |||||||
| 779,647 | ||||||||
|
| |||||||
| Gas Utilities — 0.1% | ||||||||
| 1,158 | UGI Corp.(a) | 54,368 | ||||||
|
| |||||||
| Health Care Equipment & Supplies — 2.4% | ||||||||
| 8,240 | Abbott Laboratories(a) | 470,257 | ||||||
| 682 | Align Technology, Inc.(a)(b) | 151,533 | ||||||
| 591 | Cooper Cos., Inc. (The)(a) | 128,767 | ||||||
| 1,472 | DENTSPLY SIRONA, Inc.(a) | 96,902 | ||||||
| 2,991 | Hologic, Inc.(a)(b) | 127,865 | ||||||
| 797 | IDEXX Laboratories, Inc.(a)(b) | 124,635 | ||||||
| 7,283 | Medtronic PLC(a) | 588,102 | ||||||
| 1,317 | ResMed, Inc.(a) | 111,537 | ||||||
| 745 | STERIS PLC(a) | 65,165 | ||||||
| 341 | Teleflex, Inc.(a) | 84,848 | ||||||
|
| |||||||
| 1,949,611 | ||||||||
|
| |||||||
| Health Care Providers & Services — 2.8% | ||||||||
| 1,943 | Anthem, Inc.(a) | 437,194 | ||||||
| 1,510 | Centene Corp.(a)(b) | 152,329 | ||||||
| 3,644 | Express Scripts Holding Co.(a)(b) | 271,988 | ||||||
| 1,311 | McKesson Corp.(a) | 204,450 | ||||||
| 1,426 | MEDNAX, Inc.(a)(b) | 76,205 | ||||||
| 4,760 | UnitedHealth Group, Inc.(a) | 1,049,390 | ||||||
| 487 | WellCare Health Plans, Inc.(a)(b) | 97,941 | ||||||
|
| |||||||
| 2,289,497 | ||||||||
|
| |||||||
| Health Care Technology — 0.1% | ||||||||
| 827 | Veeva Systems, Inc., Class A(a)(b) | 45,717 | ||||||
|
| |||||||
See accompanying notes to financial statements.
| 38
Portfolio of Investments – as of December 31, 2017
Gateway Equity Call Premium Fund – (continued)
| Shares | Description | Value (†) | ||||||
| Hotels, Restaurants & Leisure — 1.8% | ||||||||
| 116 | Domino’s Pizza, Inc. | $ | 21,919 | |||||
| 505 | Hilton Grand Vacations, Inc.(a)(b) | 21,185 | ||||||
| 2,123 | Hilton Worldwide Holdings, Inc.(a) | 169,543 | ||||||
| 682 | Las Vegas Sands Corp.(a) | 47,392 | ||||||
| 3,389 | McDonald’s Corp.(a) | 583,315 | ||||||
| 4,179 | MGM Resorts International(a) | 139,537 | ||||||
| 5,125 | Starbucks Corp.(a) | 294,329 | ||||||
| 380 | Yum China Holdings, Inc.(a) | 15,207 | ||||||
| 2,266 | Yum! Brands, Inc.(a) | 184,928 | ||||||
|
| |||||||
| 1,477,355 | ||||||||
|
| |||||||
| Household Durables — 0.4% | ||||||||
| 1,794 | Leggett & Platt, Inc.(a) | 85,628 | ||||||
| 3,322 | Newell Brands, Inc.(a) | 102,650 | ||||||
| 3,420 | Toll Brothers, Inc.(a) | 164,228 | ||||||
|
| |||||||
| 352,506 | ||||||||
|
| |||||||
| Household Products — 1.8% | ||||||||
| 2,140 | Church & Dwight Co., Inc.(a) | 107,364 | ||||||
| 865 | Clorox Co. (The)(a) | 128,660 | ||||||
| 1,774 | Kimberly-Clark Corp.(a) | 214,051 | ||||||
| 10,794 | Procter & Gamble Co. (The)(a) | 991,752 | ||||||
|
| |||||||
| 1,441,827 | ||||||||
|
| |||||||
| Industrial Conglomerates — 2.4% | ||||||||
| 2,941 | 3M Co.(a) | 692,223 | ||||||
| 36,349 | General Electric Co.(a) | 634,290 | ||||||
| 3,822 | Honeywell International, Inc.(a) | 586,142 | ||||||
|
| |||||||
| 1,912,655 | ||||||||
|
| |||||||
| Insurance — 2.1% | ||||||||
| 1,397 | American Financial Group, Inc.(a) | 151,631 | ||||||
| 930 | Arch Capital Group Ltd.(a)(b) | 84,416 | ||||||
| 3,084 | Chubb Ltd.(a) | 450,665 | ||||||
| 1,157 | Cincinnati Financial Corp.(a) | 86,740 | ||||||
| 2,118 | Lincoln National Corp.(a) | 162,811 | ||||||
| 3,756 | Prudential Financial, Inc.(a) | 431,865 | ||||||
| 486 | Reinsurance Group of America, Inc.(a) | 75,782 | ||||||
| 692 | RenaissanceRe Holdings Ltd.(a) | 86,908 | ||||||
| 996 | Willis Towers Watson PLC(a) | 150,087 | ||||||
|
| |||||||
| 1,680,905 | ||||||||
|
| |||||||
| Internet & Direct Marketing Retail — 3.0% | ||||||||
| 1,464 | Amazon.com, Inc.(a)(b) | 1,712,104 | ||||||
| 47 | Liberty Expedia Holdings, Inc., Series A(a)(b) | 2,084 | ||||||
| 1,552 | Liberty Interactive Corp./QVC Group, Class A(a)(b) | 37,900 | ||||||
| 628 | Liberty Ventures, Series A(a)(b) | 34,063 | ||||||
| 1,666 | Netflix, Inc.(a)(b) | 319,805 | ||||||
| 202 | Priceline Group, Inc. (The)(a)(b) | 351,023 | ||||||
|
| |||||||
| 2,456,979 | ||||||||
|
| |||||||
See accompanying notes to financial statements.
39 |
Portfolio of Investments – as of December 31, 2017
Gateway Equity Call Premium Fund – (continued)
| Shares | Description | Value (†) | ||||||
| Internet Software & Services — 5.0% | ||||||||
| 358 | Alibaba Group Holding Ltd., Sponsored ADR(a)(b) | $ | 61,730 | |||||
| 1,215 | Alphabet, Inc., Class A(a)(b) | 1,279,881 | ||||||
| 1,001 | Alphabet, Inc., Class C(a)(b) | 1,047,446 | ||||||
| 9,251 | Facebook, Inc., Class A(a)(b) | 1,632,432 | ||||||
|
| |||||||
| 4,021,489 | ||||||||
|
| |||||||
| IT Services — 3.8% | ||||||||
| 2,566 | Accenture PLC, Class A(a) | 392,829 | ||||||
| 12 | Amdocs Ltd. | 786 | ||||||
| 1,500 | DXC Technology Co.(a) | 142,350 | ||||||
| 223 | FleetCor Technologies, Inc.(a)(b) | 42,912 | ||||||
| 532 | Gartner, Inc.(a)(b) | 65,516 | ||||||
| 1,053 | Global Payments, Inc.(a) | 105,553 | ||||||
| 3,640 | International Business Machines Corp.(a) | 558,449 | ||||||
| 4,463 | MasterCard, Inc., Class A(a) | 675,519 | ||||||
| 1,751 | Paychex, Inc.(a) | 119,208 | ||||||
| 8,712 | Visa, Inc., Class A(a) | 993,342 | ||||||
|
| |||||||
| 3,096,464 | ||||||||
|
| |||||||
| Leisure Products — 0.1% | ||||||||
| 590 | Brunswick Corp.(a) | 32,580 | ||||||
| 260 | Polaris Industries, Inc.(a) | 32,237 | ||||||
|
| |||||||
| 64,817 | ||||||||
|
| |||||||
| Life Sciences Tools & Services — 0.6% | ||||||||
| 639 | Illumina, Inc.(a)(b) | 139,615 | ||||||
| 1,846 | Thermo Fisher Scientific, Inc.(a) | 350,519 | ||||||
|
| |||||||
| 490,134 | ||||||||
|
| |||||||
| Machinery — 1.4% | ||||||||
| 897 | AGCO Corp.(a) | 64,073 | ||||||
| 3,318 | Caterpillar, Inc.(a) | 522,850 | ||||||
| 1,271 | Cummins, Inc.(a) | 224,509 | ||||||
| 1,398 | IDEX Corp.(a) | 184,494 | ||||||
| 426 | WABCO Holdings, Inc.(a)(b) | 61,131 | ||||||
| 674 | Wabtec Corp.(a) | 54,884 | ||||||
|
| |||||||
| 1,111,941 | ||||||||
|
| |||||||
| Media — 2.8% | ||||||||
| 984 | AMC Networks, Inc., Class A(a)(b) | 53,215 | ||||||
| 19,368 | Comcast Corp., Class A(a) | 775,688 | ||||||
| 18,692 | Sirius XM Holdings, Inc.(a) | 100,189 | ||||||
| 3,373 | Time Warner, Inc.(a) | 308,528 | ||||||
| 8,044 | Twenty-First Century Fox, Inc., Class A(a) | 277,759 | ||||||
| 6,709 | Walt Disney Co. (The)(a) | 721,285 | ||||||
|
| |||||||
| 2,236,664 | ||||||||
|
| |||||||
| Metals & Mining — 0.2% | ||||||||
| 6,251 | Barrick Gold Corp.(a) | 90,452 | ||||||
| 2,173 | Steel Dynamics, Inc.(a) | 93,721 | ||||||
|
| |||||||
| 184,173 | ||||||||
|
| |||||||
See accompanying notes to financial statements.
| 40
Portfolio of Investments – as of December 31, 2017
Gateway Equity Call Premium Fund – (continued)
| Shares | Description | Value (†) | ||||||
| Multi-Utilities — 0.4% | ||||||||
| 6,757 | Public Service Enterprise Group, Inc.(a) | $ | 347,985 | |||||
|
| |||||||
| Multiline Retail — 0.1% | ||||||||
| 2,043 | Nordstrom, Inc.(a) | 96,797 | ||||||
|
| |||||||
| Oil, Gas & Consumable Fuels — 5.4% | ||||||||
| 1,641 | Cheniere Energy, Inc.(a)(b) | 88,352 | ||||||
| 8,217 | Chevron Corp.(a) | 1,028,686 | ||||||
| 1,828 | Concho Resources, Inc.(a)(b) | 274,602 | ||||||
| 662 | Enbridge, Inc. | 25,891 | ||||||
| 7,263 | Encana Corp.(a) | 96,816 | ||||||
| 1,435 | Energen Corp.(a)(b) | 82,613 | ||||||
| 17,072 | Exxon Mobil Corp.(a) | 1,427,902 | ||||||
| 1,306 | HollyFrontier Corp.(a) | 66,893 | ||||||
| 5,828 | Noble Energy, Inc.(a) | 169,828 | ||||||
| 5,134 | Occidental Petroleum Corp.(a) | 378,171 | ||||||
| 3,420 | Phillips 66(a) | 345,933 | ||||||
| 1,392 | Pioneer Natural Resources Co.(a) | 240,607 | ||||||
| 1,113 | Whiting Petroleum Corp.(a)(b) | 29,472 | ||||||
| 7,085 | WPX Energy, Inc.(a)(b) | 99,686 | ||||||
|
| |||||||
| 4,355,452 | ||||||||
|
| |||||||
| Pharmaceuticals — 4.8% | ||||||||
| 1,391 | Allergan PLC(a) | 227,540 | ||||||
| 6,590 | Bristol-Myers Squibb Co.(a) | 403,835 | ||||||
| 3,965 | Eli Lilly & Co.(a) | 334,884 | ||||||
| 240 | Jazz Pharmaceuticals PLC(a)(b) | 32,316 | ||||||
| 10,190 | Johnson & Johnson(a) | 1,423,747 | ||||||
| 10,679 | Merck & Co., Inc.(a) | 600,907 | ||||||
| 23,721 | Pfizer, Inc.(a) | 859,175 | ||||||
|
| |||||||
| 3,882,404 | ||||||||
|
| |||||||
| Professional Services — 0.2% | ||||||||
| 310 | ManpowerGroup, Inc.(a) | 39,094 | ||||||
| 1,353 | Verisk Analytics, Inc.(a)(b) | 129,888 | ||||||
|
| |||||||
| 168,982 | ||||||||
|
| |||||||
| Real Estate Management & Development — 0.0% | ||||||||
| 221 | Jones Lang LaSalle, Inc.(a) | 32,914 | ||||||
|
| |||||||
| REITs – Apartments — 0.7% | ||||||||
| 890 | American Campus Communities, Inc.(a) | 36,517 | ||||||
| 1,156 | Camden Property Trust(a) | 106,421 | ||||||
| 539 | Essex Property Trust, Inc.(a) | 130,098 | ||||||
| 1,221 | Mid-America Apartment Communities, Inc.(a) | 122,784 | ||||||
| 3,908 | UDR, Inc.(a) | 150,536 | ||||||
|
| |||||||
| 546,356 | ||||||||
|
| |||||||
| REITs – Diversified — 1.0% | ||||||||
| 2,597 | Crown Castle International Corp.(a) | 288,293 | ||||||
| 1,790 | Digital Realty Trust, Inc.(a) | 203,881 | ||||||
See accompanying notes to financial statements.
41 |
Portfolio of Investments – as of December 31, 2017
Gateway Equity Call Premium Fund – (continued)
| Shares | Description | Value (†) | ||||||
| REITs – Diversified — continued | ||||||||
| 6,373 | Duke Realty Corp.(a) | $ | 173,409 | |||||
| 771 | SBA Communications Corp.(a)(b) | 125,951 | ||||||
|
| |||||||
| 791,534 | ||||||||
|
| |||||||
| REITs – Hotels — 0.0% | ||||||||
| 906 | Park Hotels & Resorts, Inc.(a) | 26,048 | ||||||
|
| |||||||
| REITs – Mortgage — 0.2% | ||||||||
| 3,823 | AGNC Investment Corp.(a) | 77,187 | ||||||
| 8,270 | Annaly Capital Management, Inc.(a) | 98,330 | ||||||
|
| |||||||
| 175,517 | ||||||||
|
| |||||||
| REITs – Office Property — 0.2% | ||||||||
| 1,019 | Kilroy Realty Corp.(a) | 76,069 | ||||||
| 1,154 | SL Green Realty Corp.(a) | 116,473 | ||||||
|
| |||||||
| 192,542 | ||||||||
|
| |||||||
| REITs – Shopping Centers — 0.2% | ||||||||
| 6,173 | DDR Corp.(a) | 55,310 | ||||||
| 1,796 | Regency Centers Corp.(a) | 124,247 | ||||||
|
| |||||||
| 179,557 | ||||||||
|
| |||||||
| REITs – Single Tenant — 0.3% | ||||||||
| 1,882 | National Retail Properties, Inc.(a) | 81,170 | ||||||
| 2,937 | Realty Income Corp.(a) | 167,468 | ||||||
|
| |||||||
| 248,638 | ||||||||
|
| |||||||
| REITs – Storage — 0.2% | ||||||||
| 1,517 | Extra Space Storage, Inc.(a) | 132,662 | ||||||
|
| |||||||
| Road & Rail — 0.9% | ||||||||
| 1,536 | Norfolk Southern Corp.(a) | 222,566 | ||||||
| 252 | Old Dominion Freight Line, Inc.(a) | 33,151 | ||||||
| 3,613 | Union Pacific Corp.(a) | 484,503 | ||||||
|
| |||||||
| 740,220 | ||||||||
|
| |||||||
| Semiconductors & Semiconductor Equipment — 3.8% | ||||||||
| 8,059 | Applied Materials, Inc.(a) | 411,976 | ||||||
| 19,255 | Intel Corp.(a) | 888,811 | ||||||
| 2,963 | Maxim Integrated Products, Inc.(a) | 154,906 | ||||||
| 2,607 | NVIDIA Corp.(a) | 504,454 | ||||||
| 663 | NXP Semiconductors NV(a)(b) | 77,631 | ||||||
| 6,229 | QUALCOMM, Inc.(a) | 398,780 | ||||||
| 5,955 | Texas Instruments, Inc.(a) | 621,940 | ||||||
| 981 | Versum Materials, Inc.(a) | 37,131 | ||||||
|
| |||||||
| 3,095,629 | ||||||||
|
| |||||||
| Software — 5.6% | ||||||||
| 3,733 | Activision Blizzard, Inc.(a) | 236,374 | ||||||
| 2,543 | Adobe Systems, Inc.(a)(b) | 445,635 | ||||||
| 560 | ANSYS, Inc.(a)(b) | 82,650 | ||||||
| 1,739 | Cadence Design Systems, Inc.(a)(b) | 72,725 | ||||||
See accompanying notes to financial statements.
| 42
Portfolio of Investments – as of December 31, 2017
Gateway Equity Call Premium Fund – (continued)
| Shares | Description | Value (†) | ||||||
| Software — continued | ||||||||
| 569 | CDK Global, Inc.(a) | $ | 40,558 | |||||
| 384 | Check Point Software Technologies Ltd.(a)(b) | 39,790 | ||||||
| 387 | Dell Technologies, Inc., Class V(a)(b) | 31,455 | ||||||
| 342 | Fortinet, Inc.(a)(b) | 14,942 | ||||||
| 28,324 | Microsoft Corp.(a) | 2,422,835 | ||||||
| 12,346 | Oracle Corp.(a) | 583,719 | ||||||
| 3,192 | salesforce.com, inc.(a)(b) | 326,318 | ||||||
| 373 | ServiceNow, Inc.(a)(b) | 48,636 | ||||||
| 1,052 | Synopsys, Inc.(a)(b) | 89,673 | ||||||
| 597 | Take-Two Interactive Software, Inc.(a)(b) | 65,539 | ||||||
| 87 | Ultimate Software Group, Inc. (The)(b) | 18,986 | ||||||
|
| |||||||
| 4,519,835 | ||||||||
|
| |||||||
| Specialty Retail — 2.6% | ||||||||
| 796 | Advance Auto Parts, Inc.(a) | 79,353 | ||||||
| 961 | Dick’s Sporting Goods, Inc.(a) | 27,619 | ||||||
| 1,982 | Foot Locker, Inc.(a) | 92,916 | ||||||
| 5,394 | Home Depot, Inc. (The)(a) | 1,022,325 | ||||||
| 5,076 | Lowe’s Cos., Inc.(a) | 471,764 | ||||||
| 582 | Signet Jewelers Ltd.(a) | 32,912 | ||||||
| 4,135 | TJX Cos., Inc. (The)(a) | 316,162 | ||||||
| 424 | Ulta Beauty, Inc.(a)(b) | 94,832 | ||||||
| 187 | Williams-Sonoma, Inc. | 9,668 | ||||||
|
| |||||||
| 2,147,551 | ||||||||
|
| |||||||
| Technology Hardware, Storage & Peripherals — 4.4% | ||||||||
| 18,914 | Apple, Inc.(a) | 3,200,816 | ||||||
| 8,231 | Hewlett Packard Enterprise Co.(a) | 118,197 | ||||||
| 10,336 | HP, Inc.(a) | 217,160 | ||||||
|
| |||||||
| 3,536,173 | ||||||||
|
| |||||||
| Textiles, Apparel & Luxury Goods — 0.7% | ||||||||
| 388 | Carter’s, Inc.(a) | 45,586 | ||||||
| 3,829 | Hanesbrands, Inc.(a) | 80,064 | ||||||
| 462 | Lululemon Athletica, Inc.(a)(b) | 36,309 | ||||||
| 6,287 | NIKE, Inc., Class B(a) | 393,252 | ||||||
| 1,029 | Skechers U.S.A., Inc., Class A(a)(b) | 38,937 | ||||||
|
| |||||||
| 594,148 | ||||||||
|
| |||||||
| Thrifts & Mortgage Finance — 0.0% | ||||||||
| 244 | New York Community Bancorp, Inc.(a) | 3,177 | ||||||
|
| |||||||
| Tobacco — 1.6% | ||||||||
| 8,847 | Altria Group, Inc.(a) | 631,764 | ||||||
| 6,523 | Philip Morris International, Inc.(a) | 689,155 | ||||||
|
| |||||||
| 1,320,919 | ||||||||
|
| |||||||
| Water Utilities — 0.3% | ||||||||
| 2,388 | American Water Works Co., Inc.(a) | 218,478 | ||||||
|
| |||||||
See accompanying notes to financial statements.
43 |
Portfolio of Investments – as of December 31, 2017
Gateway Equity Call Premium Fund – (continued)
| Shares | Description | Value (†) | ||||||
| Wireless Telecommunication Services — 0.0% | ||||||||
| 1,342 | Sprint Corp.(b) | $ | 7,904 | |||||
|
| |||||||
| Total Common Stocks (Identified Cost $57,819,939) | 80,419,636 | |||||||
|
| |||||||
| Principal Amount | ||||||||
| Short-Term Investments — 2.7% | ||||||||
| $ | 2,219,220 | Tri-Party Repurchase Agreement with Fixed Income Clearing Corporation, dated 12/29/2017 at 0.540% to be repurchased at $2,219,353 on 1/02/2018 collateralized by $2,255,000 U.S. Treasury Note, 2.250% due 1/31/2024 valued at $2,267,378 including accrued interest (Note 2 of Notes to Financial Statements) (Identified Cost $2,219,220) | 2,219,220 | |||||
|
| |||||||
| Total Investments — 102.0% (Identified Cost $60,039,159) | 82,638,856 | |||||||
| Other assets less liabilities — (2.0)% | (1,650,167 | ) | ||||||
|
| |||||||
| Net Assets — 100.0% | $ | 80,988,689 | ||||||
|
| |||||||
| Written Options — (1.8%) | ||||||||||||||||||||||||
| Description | Expiration Date | Exercise Price | Contracts | Notional Amount | Premiums (Received) | Value (†) | ||||||||||||||||||
| Index Options — (1.8%) | ||||||||||||||||||||||||
| S&P 500® Index, Call | 01/05/2018 | 2,650 | (35 | ) | $ | (9,357,635 | ) | $ | (73,412 | ) | $ | (103,950 | ) | |||||||||||
| S&P 500® Index, Call | 01/19/2018 | 2,600 | (32 | ) | (8,555,552 | ) | (98,704 | ) | (265,440 | ) | ||||||||||||||
| S&P 500® Index, Call | 01/19/2018 | 2,650 | (33 | ) | (8,822,913 | ) | (145,117 | ) | (128,205 | ) | ||||||||||||||
| S&P 500® Index, Call | 01/26/2018 | 2,700 | (32 | ) | (8,555,552 | ) | (47,920 | ) | (32,960 | ) | ||||||||||||||
| S&P 500® Index, Call | 02/16/2018 | 2,600 | (33 | ) | (8,822,913 | ) | (178,118 | ) | (303,105 | ) | ||||||||||||||
| S&P 500® Index, Call | 02/16/2018 | 2,625 | (33 | ) | (8,822,913 | ) | (181,418 | ) | (233,145 | ) | ||||||||||||||
| S&P 500® Index, Call | 02/16/2018 | 2,650 | (32 | ) | (8,555,552 | ) | (147,120 | ) | (163,040 | ) | ||||||||||||||
| S&P 500® Index, Call | 02/16/2018 | 2,675 | (32 | ) | (8,555,552 | ) | (115,120 | ) | (106,400 | ) | ||||||||||||||
| S&P 500® Index, Call | 03/16/2018 | 2,700 | (35 | ) | (9,357,635 | ) | (157,413 | ) | (108,675 | ) | ||||||||||||||
|
|
|
| |||||||||||||||||||||
| Total | $ | (1,144,342 | ) | $ | (1,444,920 | ) | ||||||||||||||||||
|
|
|
| |||||||||||||||||||||
| (†) | See Note 2 of Notes to Financial Statements. | |||
| (a) | Security (or a portion thereof) has been pledged as collateral for open derivative contracts. | |||
| (b) | Non-income producing security. | |||
| ADR | An American Depositary Receipt is a certificate issued by a custodian bank representing the right to receive securities of the foreign issuer described. The values of ADRs may be significantly influenced by trading on exchanges not located in the United States. | |||
| REITs | Real Estate Investment Trusts |
See accompanying notes to financial statements.
| 44
Portfolio of Investments – as of December 31, 2017
Gateway Equity Call Premium Fund – (continued)
Industry Summary at December 31, 2017
Banks | 6.6 | % | ||
Software | 5.6 | |||
Oil, Gas & Consumable Fuels | 5.4 | |||
Internet Software & Services | 5.0 | |||
Pharmaceuticals | 4.8 | |||
Technology Hardware, Storage & Peripherals | 4.4 | |||
IT Services | 3.8 | |||
Semiconductors & Semiconductor Equipment | 3.8 | |||
Internet & Direct Marketing Retail | 3.0 | |||
Biotechnology | 3.0 | |||
Health Care Providers & Services | 2.8 | |||
Media | 2.8 | |||
Specialty Retail | 2.6 | |||
Aerospace & Defense | 2.4 | |||
Health Care Equipment & Supplies | 2.4 | |||
Industrial Conglomerates | 2.4 | |||
Capital Markets | 2.2 | |||
Chemicals | 2.1 | |||
Food & Staples Retailing | 2.1 | |||
Diversified Telecommunication Services | 2.1 | |||
Insurance | 2.1 | |||
Beverages | 2.0 | |||
Electric Utilities | 2.0 | |||
Other Investments, less than 2% each | 23.9 | |||
Short-Term Investments | 2.7 | |||
|
| |||
Total Investments | 102.0 | |||
Other assets less liabilities (including open written options) | (2.0 | ) | ||
|
| |||
Net Assets | 100.0 | % | ||
|
|
See accompanying notes to financial statements.
45 |
Portfolio of Investments – as of December 31, 2017
Mirova Global Green Bond Fund
| Principal Amount (‡) | Description | Value (†) | ||||||
| Bonds and Notes — 94.2% of Net Assets | ||||||||
| Australia — 1.8% | ||||||||
| 400,000 | National Australia Bank Ltd., GMTN, 0.350%, 9/07/2022, (EUR)(a) | $ | 478,330 | |||||
|
| |||||||
| Austria — 1.5% | ||||||||
| 300,000 | Verbund AG, 1.500%, 11/20/2024, (EUR)(a) | 376,665 | ||||||
|
| |||||||
| Canada — 3.0% | ||||||||
| 1,000,000 | Province of Ontario Canada, 1.950%, 1/27/2023, (CAD)(a) | 783,325 | ||||||
|
| |||||||
| Finland — 0.7% | ||||||||
| 200,000 | Municipality Finance PLC, REGS, 1.375%, 9/21/2021(a) | 193,070 | ||||||
|
| |||||||
| France — 14.0% | ||||||||
| 100,000 | Agence Francaise de Developpement, EMTN, 1.375%, 9/17/2024, (EUR)(a) | 127,565 | ||||||
| 400,000 | Electricite de France S.A., EMTN, 1.000%, 10/13/2026, (EUR)(a) | 469,945 | ||||||
| 100,000 | Engie S.A., EMTN, 1.500%, 3/27/2028, (EUR) | 123,384 | ||||||
| 1,350,000 | France Government Bond OAT, 1.750%, 6/25/2039, (EUR)(a) | 1,706,582 | ||||||
| 300,000 | ICADE, 1.500%, 9/13/2027, (EUR) | 361,616 | ||||||
| 100,000 | SNCF Reseau, EMTN, 1.000%, 11/09/2031, (EUR)(a) | 115,768 | ||||||
| 200,000 | SNCF Reseau, EMTN, 1.875%, 3/30/2034, (EUR)(a) | 255,309 | ||||||
| 400,000 | Unibail-Rodamco SE, EMTN, 1.000%, 3/14/2025, (EUR)(a) | 485,861 | ||||||
|
| |||||||
| 3,646,030 | ||||||||
|
| |||||||
| Germany — 8.9% | ||||||||
| 100,000 | Berlin Hyp AG, 0.500%, 9/26/2023, (EUR)(a) | 119,356 | ||||||
| 100,000 | Deutsche Kreditbank AG, Series 100, 0.625%, 6/08/2021, (EUR)(a) | 121,600 | ||||||
| 1,000,000 | Kreditanstalt fuer Wiederaufbau, 1.750%, 10/15/2019(a) | 995,236 | ||||||
| 800,000 | Kreditanstalt fuer Wiederaufbau, 2.000%, 9/29/2022(a) | 787,086 | ||||||
| 370,000 | Kreditanstalt fuer Wiederaufbau, MTN, 2.400%, 7/02/2020, (AUD)(a) | 289,517 | ||||||
|
| |||||||
| 2,312,795 | ||||||||
|
| |||||||
| Italy — 5.0% | ||||||||
| 700,000 | Hera SpA, EMTN, 2.375%, 7/04/2024, (EUR)(a) | 924,035 | ||||||
| 300,000 | Intesa Sanpaolo SpA, EMTN, 0.875%, 6/27/2022, (EUR)(a) | 364,096 | ||||||
|
| |||||||
| 1,288,131 | ||||||||
|
| |||||||
| Japan — 3.2% | ||||||||
| 300,000 | Mizuho Financial Group, Inc., EMTN, 0.956%, 10/16/2024, (EUR) | 359,685 | ||||||
| 400,000 | Sumitomo Mitsui Financial Group, Inc., EMTN, 0.934%, 10/11/2024, (EUR) | 479,145 | ||||||
|
| |||||||
| 838,830 | ||||||||
|
| |||||||
| Netherlands — 12.7% | ||||||||
| 800,000 | Enel Finance International NV, EMTN, 1.000%, 9/16/2024, (EUR)(a) | 973,185 | ||||||
| 600,000 | Iberdrola International BV, EMTN, 1.125%, 4/21/2026, (EUR)(a) | 721,331 | ||||||
| 100,000 | Iberdrola International BV, EMTN, 2.500%, 10/24/2022, (EUR)(a) | 131,914 | ||||||
| 100,000 | Nederlandse Waterschapsbank NV, EMTN, 1.000%, 9/03/2025, (EUR) | 125,778 | ||||||
| 200,000 | TenneT Holding BV, EMTN, 1.250%, 10/24/2033, (EUR)(a) | 230,149 | ||||||
| 300,000 | TenneT Holding BV, EMTN, 1.375%, 6/26/2029, (EUR)(a) | 364,107 | ||||||
| 400,000 | TenneT Holding BV, EMTN, 1.750%, 6/04/2027, (EUR)(a) | 511,004 | ||||||
| 200,000 | TenneT Holding BV, EMTN, 1.875%, 6/13/2036, (EUR) | 246,016 | ||||||
|
| |||||||
| 3,303,484 | ||||||||
|
| |||||||
See accompanying notes to financial statements.
| 46
Portfolio of Investments – as of December 31, 2017
Mirova Global Green Bond Fund – (continued)
| Principal Amount (‡) | Description | Value (†) | ||||||
| Norway — 4.5% | ||||||||
| $ | 1,200,000 | Kommunalbanken AS, MTN, 1.375%, 10/26/2020(a) | $ | 1,173,180 | ||||
|
| |||||||
| Spain — 1.9% | ||||||||
| 400,000 | Adif - Alta Velocidad, 0.800%, 7/05/2023, (EUR) | 481,088 | ||||||
|
| |||||||
| Supranationals — 14.4% | ||||||||
| 100,000 | Asian Development Bank, GMTN, 2.375%, 8/10/2027 | 98,293 | ||||||
| 100,000 | European Investment Bank, 1.500%, 11/15/2047, (EUR)(a) | 123,351 | ||||||
| 400,000 | European Investment Bank, 2.125%, 4/13/2026(a) | 386,213 | ||||||
| 200,000 | European Investment Bank, 2.375%, 5/24/2027(a) | 196,379 | ||||||
| 700,000 | European Investment Bank, 2.500%, 10/15/2024(a) | 699,420 | ||||||
| 600,000 | European Investment Bank, EMTN, 0.500%, 11/13/2037, (EUR)(a) | 639,641 | ||||||
| 100,000 | European Investment Bank, EMTN, 1.250%, 11/13/2026, (EUR) | 128,471 | ||||||
| 200,000 | International Bank for Reconstruction & Development, Series GDIF, 2.125%, 3/03/2025(a) | 195,265 | ||||||
| 600,000 | International Finance Corp., GMTN, 2.000%, 10/24/2022 | 591,499 | ||||||
| 700,000 | International Finance Corp., GMTN, 2.125%, 4/07/2026(a) | 678,163 | ||||||
|
| |||||||
| 3,736,695 | ||||||||
|
| |||||||
| Sweden — 5.4% | ||||||||
| 1,400,000 | Svensk Exportkredit AB, GMTN, 1.875%, 6/23/2020(a) | 1,390,797 | ||||||
|
| |||||||
| United Kingdom — 6.4% | ||||||||
| 500,000 | Anglian Water Services Financing PLC, EMTN, 1.625%, 8/10/2025, (GBP) | 665,107 | ||||||
| 600,000 | SSE PLC, EMTN, 0.875%, 9/06/2025, (EUR) | 711,413 | ||||||
| 200,000 | Transport for London, EMTN, 2.125%, 4/24/2025, (GBP)(a) | 281,836 | ||||||
|
| |||||||
| 1,658,356 | ||||||||
|
| |||||||
| United States — 10.8% | ||||||||
| 900,000 | Apple, Inc., 2.850%, 2/23/2023(a) | 912,192 | ||||||
| 300,000 | Apple, Inc., 3.000%, 6/20/2027 | 298,684 | ||||||
| 400,000 | Digital Realty Trust LP, 3.950%, 7/01/2022(a) | 417,866 | ||||||
| 200,000 | Southern Power Co., 4.150%, 12/01/2025(a) | �� | 210,766 | |||||
| 800,000 | Southern Power Co., Series 2016, 1.000%, 6/20/2022, (EUR)(a) | 976,068 | ||||||
|
| |||||||
| 2,815,576 | ||||||||
|
| |||||||
| Total Bonds and Notes (Identified Cost $23,125,734) | 24,476,352 | |||||||
|
| |||||||
| Short-Term Investments — 2.8% | ||||||||
| 743,602 | Tri-Party Repurchase Agreement with Fixed Income Clearing Corporation, dated 12/29/2017 at 0.540% to be repurchased at $743,647 on 1/02/2018 collateralized by $755,000 U.S. Treasury Note, 2.250% due 1/31/2024 valued at $759,144 including accrued interest (Note 2 of Notes to Financial Statements) (Identified Cost $743,602) | 743,602 | ||||||
|
| |||||||
| Total Investments — 97.0% (Identified Cost $23,869,336) | 25,219,954 | |||||||
| Other assets less liabilities — 3.0% | 768,046 | |||||||
|
| |||||||
| Net Assets — 100.0% | $ | 25,988,000 | ||||||
|
| |||||||
See accompanying notes to financial statements.
47 |
Portfolio of Investments – as of December 31, 2017
Mirova Global Green Bond Fund – (continued)
| (‡) | Principal Amount stated in U.S. dollars unless otherwise noted. | |||||||
| (†) | See Note 2 of Notes to Financial Statements. | |||||||
| (a) | Security (or a portion thereof) has been designated to cover the Fund’s obligations under open derivative contracts. | |||||||
| EMTN | Euro Medium Term Note | |||||||
| GMTN | Global Medium Term Note | |||||||
| MTN | Medium Term Note | |||||||
| AUD | Australian Dollar | |||||||
| CAD | Canadian Dollar | |||||||
| EUR | Euro | |||||||
| GBP | British Pound | |||||||
At December 31, 2017, open long futures contracts were as follows:
| Financial Futures | Expiration Date | Contracts | Notional Amount | Value | Unrealized Appreciation (Depreciation) | |||||||||||||||
10 Year U.S. Treasury Note | 3/20/2018 | 5 | $ | 621,854 | $ | 620,234 | $ | (1,620 | ) | |||||||||||
Euro-Buxl® 30 Year Bond | 3/08/2018 | 1 | 201,240 | 196,607 | (4,633 | ) | ||||||||||||||
German Euro BOBL | 3/08/2018 | 6 | 951,096 | 947,473 | (3,623 | ) | ||||||||||||||
|
| |||||||||||||||||||
Total | $ | (9,876 | ) | |||||||||||||||||
|
| |||||||||||||||||||
At December 31, 2017, open short futures contracts were as follows:
| Financial Futures | Expiration Date | Contracts | Notional Amount | Value | Unrealized Appreciation (Depreciation) | |||||||||||||||
Australian Dollar | 3/19/2018 | 6 | $ | 459,222 | $ | 468,660 | $ | (9,438 | ) | |||||||||||
British Pound | 3/19/2018 | 12 | 1,009,915 | 1,016,775 | (6,860 | ) | ||||||||||||||
Canadian Dollar | 3/20/2018 | 10 | 780,071 | 799,000 | (18,929 | ) | ||||||||||||||
Euro | 3/19/2018 | 90 | 13,388,459 | 13,584,938 | (196,479 | ) | ||||||||||||||
German Euro Bund | 3/08/2018 | 4 | 784,071 | 775,967 | 8,104 | |||||||||||||||
UK Long Gilt | 3/27/2018 | 2 | 334,078 | 337,970 | (3,892 | ) | ||||||||||||||
|
| |||||||||||||||||||
Total | $ | (227,494 | ) | |||||||||||||||||
|
| |||||||||||||||||||
See accompanying notes to financial statements.
| 48
Portfolio of Investments – as of December 31, 2017
Mirova Global Green Bond Fund – (continued)
Industry Summary at December 31, 2017
Utility – Electric | 18.1 | % | ||
Bank | 15.8 | |||
Supra-National | 14.4 | |||
Industrial | 13.4 | |||
Financial | 10.3 | |||
Government Agency | 8.3 | |||
Government National | 6.5 | |||
Government Regional | 3.7 | |||
Special Purpose | 2.6 | |||
Transportation – Rail | 1.1 | |||
Short-Term Investments | 2.8 | |||
|
| |||
Total Investments | 97.0 | |||
Other assets less liabilities (including futures contracts) | 3.0 | |||
|
| |||
Net Assets | 100.0 | % | ||
|
|
Currency Exposure Summary at December 31, 2017
Euro | 51.1 | % | ||
United States Dollar | 38.1 | |||
British Pound | 3.7 | |||
Canadian Dollar | 3.0 | |||
Other, less than 2% each | 1.1 | |||
|
| |||
Total Investments | 97.0 | |||
Other assets less liabilities (including futures contracts) | 3.0 | |||
|
| |||
Net Assets | 100.0 | % | ||
|
|
See accompanying notes to financial statements.
49 |
Portfolio of Investments – as of December 31, 2017
Mirova Global Sustainable Equity Fund
| Shares | Description | Value (†) | ||||||
| Common Stocks — 96.2% of Net Assets | ||||||||
| Belgium — 3.4% | ||||||||
| 27,353 | KBC Groep NV | $ | 2,330,841 | |||||
|
| |||||||
| China — 0.9% | ||||||||
| 66,000 | BYD Co. Ltd. | 573,375 | ||||||
|
| |||||||
| Denmark — 7.5% | ||||||||
| 8,800 | Chr. Hansen Holding AS | 825,021 | ||||||
| 5,826 | Coloplast AS, Series B | 463,170 | ||||||
| 45,389 | Novo Nordisk AS, Class B | 2,439,000 | ||||||
| 10,116 | Novozymes AS | 577,495 | ||||||
| 11,569 | Vestas Wind Systems AS | 799,421 | ||||||
|
| |||||||
| 5,104,107 | ||||||||
|
| |||||||
| France — 4.7% | ||||||||
| 15,921 | Essilor International Cie Generale d’Optique S.A. | 2,192,982 | ||||||
| 13,492 | Valeo S.A. | 1,005,029 | ||||||
|
| |||||||
| 3,198,011 | ||||||||
|
| |||||||
| Germany — 5.4% | ||||||||
| 2,920 | Allianz SE, (Registered) | 668,235 | ||||||
| 33,274 | Deutsche Telekom AG | 588,165 | ||||||
| 8,800 | Fresenius SE & Co. KGaA | 684,391 | ||||||
| 20,055 | Symrise AG | 1,719,494 | ||||||
|
| |||||||
| 3,660,285 | ||||||||
|
| |||||||
| Hong Kong — 4.9% | ||||||||
| 137,737 | AIA Group Ltd. | 1,171,542 | ||||||
| 41,400 | Tencent Holdings Ltd. | 2,142,777 | ||||||
|
| |||||||
| 3,314,319 | ||||||||
|
| |||||||
| Ireland — 2.5% | ||||||||
| 21,500 | Eaton Corp. PLC | 1,698,715 | ||||||
|
| |||||||
| Japan — 5.8% | ||||||||
| 11,100 | Rinnai Corp. | 1,004,285 | ||||||
| 66,000 | Sekisui House Ltd. | 1,190,551 | ||||||
| 26,700 | Toyota Motor Corp. | 1,701,590 | ||||||
|
| |||||||
| 3,896,426 | ||||||||
|
| |||||||
| Netherlands — 3.2% | ||||||||
| 5,132 | ASML Holding NV | 892,240 | ||||||
| 22,892 | Unilever NV | 1,288,887 | ||||||
|
| |||||||
| 2,181,127 | ||||||||
|
| |||||||
| Singapore — 1.4% | ||||||||
| 1,138,700 | Raffles Medical Group Ltd. | 953,564 | ||||||
|
| |||||||
| Switzerland — 2.4% | ||||||||
| 11,471 | Cie Financiere Richemont S.A., (Registered) | 1,038,904 | ||||||
| 1,300 | Geberit AG, (Registered) | 572,216 | ||||||
|
| |||||||
| 1,611,120 | ||||||||
|
| |||||||
See accompanying notes to financial statements.
| 50
Portfolio of Investments – as of December 31, 2017
Mirova Global Sustainable Equity Fund – (continued)
| Shares | Description | Value (†) | ||||||
| United Kingdom — 6.7% | ||||||||
| 15,700 | Aptiv PLC | $ | 1,331,831 | |||||
| 5,233 | Delphi Technologies PLC(a) | 274,576 | ||||||
| 341,943 | Legal & General Group PLC | 1,258,891 | ||||||
| 65,345 | Prudential PLC | 1,673,507 | ||||||
|
| |||||||
| 4,538,805 | ||||||||
|
| |||||||
| United States — 47.4% | ||||||||
| 21,400 | A.O. Smith Corp. | 1,311,392 | ||||||
| 7,500 | Acuity Brands, Inc. | 1,320,000 | ||||||
| 3,101 | Alphabet, Inc., Class A(a) | 3,266,594 | ||||||
| 1,400 | Amazon.com, Inc.(a) | 1,637,258 | ||||||
| 10,174 | American Water Works Co., Inc. | 930,819 | ||||||
| 23,187 | Danaher Corp. | 2,152,217 | ||||||
| 16,300 | Ecolab, Inc. | 2,187,134 | ||||||
| 9,500 | Ellie Mae, Inc.(a) | 849,300 | ||||||
| 12,200 | Facebook, Inc., Class A(a) | 2,152,812 | ||||||
| 8,400 | Gilead Sciences, Inc. | 601,776 | ||||||
| 1,500 | Illumina, Inc.(a) | 327,735 | ||||||
| 4,100 | International Flavors & Fragrances, Inc. | 625,701 | ||||||
| 21,500 | MasterCard, Inc., Class A | 3,254,240 | ||||||
| 29,863 | Microsoft Corp. | 2,554,481 | ||||||
| 6,296 | NextEra Energy, Inc. | 983,372 | ||||||
| 8,000 | Roper Technologies, Inc. | 2,072,000 | ||||||
| 6,500 | Signature Bank(a) | 892,190 | ||||||
| 13,600 | Thermo Fisher Scientific, Inc. | 2,582,368 | ||||||
| 15,400 | Visa, Inc., Class A | 1,755,908 | ||||||
| 8,600 | Watts Water Technologies, Inc., Series A | 653,170 | ||||||
|
| |||||||
| 32,110,467 | ||||||||
|
| |||||||
Total Common Stocks (Identified Cost $52,177,099) | 65,171,162 | |||||||
|
| |||||||
| Principal Amount | ||||||||
| Short-Term Investments — 3.0% | ||||||||
| $ | 2,045,485 | Tri-Party Repurchase Agreement with Fixed Income Clearing Corporation, dated 12/29/2017 at 0.540% to be repurchased at $2,045,607 on 1/02/2018 collateralized by $2,080,000 U.S. Treasury Note, 2.250% due 1/31/2024 valued at $2,091,417 including accrued interest (Note 2 of Notes to Financial Statements) (Identified Cost $2,045,485) | 2,045,485 | |||||
|
| |||||||
| Total Investments — 99.2% (Identified Cost $54,222,584) | 67,216,647 | |||||||
| Other assets less liabilities — 0.8% | 568,508 | |||||||
|
| |||||||
| Net Assets — 100.0% | $ | 67,785,155 | ||||||
|
| |||||||
| (†) | See Note 2 of Notes to Financial Statements. | |||||||
| (a) | Non-income producing security. | |||||||
See accompanying notes to financial statements.
51 |
Portfolio of Investments – as of December 31, 2017
Mirova Global Sustainable Equity Fund – (continued)
Industry Summary at December 31, 2017
Internet Software & Services | 11.2 | % | ||
Chemicals | 8.6 | |||
IT Services | 7.4 | |||
Health Care Equipment & Supplies | 7.1 | |||
Insurance | 7.0 | |||
Electrical Equipment | 5.6 | |||
Software | 5.1 | |||
Banks | 4.7 | |||
Life Sciences Tools & Services | 4.3 | |||
Auto Components | 3.9 | |||
Pharmaceuticals | 3.6 | |||
Automobiles | 3.4 | |||
Household Durables | 3.3 | |||
Industrial Conglomerates | 3.1 | |||
Building Products | 2.8 | |||
Health Care Providers & Services | 2.4 | |||
Internet & Direct Marketing Retail | 2.4 | |||
Other Investments, less than 2% each | 10.3 | |||
Short-Term Investments | 3.0 | |||
|
| |||
Total Investments | 99.2 | |||
Other assets less liabilities | 0.8 | |||
|
| |||
Net Assets | 100.0 | % | ||
|
|
Currency Exposure Summary at December 31, 2017
United States Dollar | 55.3 | % | ||
Euro | 16.7 | |||
Danish Krone | 7.5 | |||
Japanese Yen | 5.8 | |||
Hong Kong Dollar | 5.8 | |||
British Pound | 4.3 | |||
Swiss Franc | 2.4 | |||
Singapore Dollar | 1.4 | |||
|
| |||
Total Investments | 99.2 | |||
Other assets less liabilities | 0.8 | |||
|
| |||
Net Assets | 100.0 | % | ||
|
|
See accompanying notes to financial statements.
| 52
Statements of Assets and Liabilities
December 31, 2017
| Gateway Fund | Gateway Equity Call Premium Fund | Mirova Global Green Bond Fund | ||||||||||
ASSETS | ||||||||||||
Investments at cost | $ | 6,198,727,233 | $ | 60,039,159 | $ | 23,869,336 | ||||||
Net unrealized appreciation | 2,461,766,659 | 22,599,697 | 1,350,618 | |||||||||
|
|
|
|
|
| |||||||
Investments at value | 8,660,493,892 | 82,638,856 | 25,219,954 | |||||||||
Due from brokers (Note 2) | — | — | 489,623 | |||||||||
Foreign currency at value (identified cost $0, $0 and $783,044, respectively) | — | — | 798,889 | |||||||||
Receivable for Fund shares sold | 17,948,740 | 89,074 | 409 | |||||||||
Receivable for securities sold | 180,822,216 | 47,920 | 254,512 | |||||||||
Dividends and interest receivable | 8,469,846 | 82,817 | 133,897 | |||||||||
Unrealized appreciation on futures contracts (Note 2) | — | — | 8,104 | |||||||||
Prepaid expenses (Note 8) | 7,235 | 72 | 32 | |||||||||
|
|
|
|
|
| |||||||
TOTAL ASSETS | 8,867,741,929 | 82,858,739 | 26,905,420 | |||||||||
|
|
|
|
|
| |||||||
LIABILITIES | ||||||||||||
Options written, at value (premiums received $120,536,424, $1,144,342 and $0, respectively) (Note 2) | 153,198,670 | 1,444,920 | — | |||||||||
Payable for securities purchased | 174,953,209 | — | 604,948 | |||||||||
Payable for Fund shares redeemed | 8,949,823 | — | — | |||||||||
Payable to custodian bank (Note 9) | — | 278,480 | — | |||||||||
Unrealized depreciation on futures contracts (Note 2) | — | — | 245,474 | |||||||||
Management fees payable (Note 6) | 4,065,403 | 38,444 | 4,469 | |||||||||
Deferred Trustees’ fees (Note 6) | 651,812 | 29,596 | 3,563 | |||||||||
Administrative fees payable (Note 6) | 321,733 | 3,105 | 992 | |||||||||
Payable to distributor (Note 6d) | 60,343 | 485 | — | |||||||||
Other accounts payable and accrued expenses | 475,204 | 75,020 | 57,974 | |||||||||
|
|
|
|
|
| |||||||
TOTAL LIABILITIES | 342,676,197 | 1,870,050 | 917,420 | |||||||||
|
|
|
|
|
| |||||||
NET ASSETS | $ | 8,525,065,732 | $ | 80,988,689 | $ | 25,988,000 | ||||||
|
|
|
|
|
| |||||||
NET ASSETS CONSIST OF: | ||||||||||||
Paid-in capital | $ | 6,382,336,003 | $ | 67,647,197 | $ | 26,051,162 | ||||||
Undistributed (Distributions in excess of) net investment income | 7,177,681 | (29,596 | ) | 194,112 | ||||||||
Accumulated net realized loss on investments, futures contracts, options written and foreign currency transactions | (293,552,395 | ) | (8,928,031 | ) | (1,379,910 | ) | ||||||
Net unrealized appreciation on investments, futures contracts, options written and foreign currency translations | 2,429,104,443 | 22,299,119 | 1,122,636 | |||||||||
|
|
|
|
|
| |||||||
NET ASSETS | $ | 8,525,065,732 | $ | 80,988,689 | $ | 25,988,000 | ||||||
|
|
|
|
|
| |||||||
See accompanying notes to financial statements.
53 |
Statements of Assets and Liabilities (continued)
December 31, 2017
| Gateway Fund | Gateway Equity Call Premium Fund | Mirova Global Green Bond Fund | ||||||||||
COMPUTATION OF NET ASSET VALUE AND OFFERING PRICE: | ||||||||||||
Class A shares: | ||||||||||||
Net assets | $ | 1,669,272,309 | $ | 7,085,038 | $ | 139,397 | ||||||
|
|
|
|
|
| |||||||
Shares of beneficial interest | 49,870,908 | 586,425 | 14,000 | |||||||||
|
|
|
|
|
| |||||||
Net asset value and redemption price per share | $ | 33.47 | $ | 12.08 | $ | 9.96 | ||||||
|
|
|
|
|
| |||||||
Offering price per share (100/[100-maximum sales charge] of net asset value) (Note 1) | $ | 35.51 | $ | 12.82 | $ | 10.40 | ||||||
|
|
|
|
|
| |||||||
Class C shares: (redemption price per share is equal to net asset value less any applicable contingent deferred sales charge) (Note 1) | ||||||||||||
Net assets | $ | 336,890,619 | $ | 647,536 | $ | — | ||||||
|
|
|
|
|
| |||||||
Shares of beneficial interest | 10,111,353 | 53,716 | — | |||||||||
|
|
|
|
|
| |||||||
Net asset value and offering price per share | $ | 33.32 | $ | 12.05 | $ | — | ||||||
|
|
|
|
|
| |||||||
Class N shares: | ||||||||||||
Net assets | $ | 126,262,459 | $ | 1,076 | $ | 25,805,485 | ||||||
|
|
|
|
|
| |||||||
Shares of beneficial interest | 3,773,222 | 89 | 2,586,809 | |||||||||
|
|
|
|
|
| |||||||
Net asset value, offering and redemption price per share | $ | 33.46 | $ | 12.09 | $ | 9.98 | ||||||
|
|
|
|
|
| |||||||
Class Y shares: | ||||||||||||
Net assets | $ | 6,392,640,345 | $ | 73,255,039 | $ | 43,118 | ||||||
|
|
|
|
|
| |||||||
Shares of beneficial interest | 191,065,099 | 6,061,039 | 4,327 | |||||||||
|
|
|
|
|
| |||||||
Net asset value, offering and redemption price per share | $ | 33.46 | $ | 12.09 | $ | 9.97 | * | |||||
|
|
|
|
|
| |||||||
| * | Net asset value calculations have been determined utilizing fractional share and penny amounts. |
See accompanying notes to financial statements.
| 54
Statements of Assets and Liabilities (continued)
December 31, 2017
| Mirova Global Sustainable Equity Fund | ||||
ASSETS | ||||
Investments at cost | $ | 54,222,584 | ||
Net unrealized appreciation | 12,994,063 | |||
|
| |||
Investments at value | 67,216,647 | |||
Foreign currency at value (identified cost $27,120) | 27,166 | |||
Receivable for Fund shares sold | 596,496 | |||
Receivable for securities sold | 660,072 | |||
Dividends and interest receivable | 14,890 | |||
Tax reclaims receivable | 32,159 | |||
Prepaid expenses (Note 8) | 64 | |||
|
| |||
TOTAL ASSETS | 68,547,494 | |||
|
| |||
LIABILITIES | ||||
Payable for Fund shares redeemed | 108 | |||
Payable to custodian bank (Note 9) | 660,072 | |||
Management fees payable (Note 6) | 37,913 | |||
Deferred Trustees’ fees (Note 6) | 10,665 | |||
Administrative fees payable (Note 6) | 2,518 | |||
Payable to distributor (Note 6d) | 345 | |||
Other accounts payable and accrued expenses | 50,718 | |||
|
| |||
TOTAL LIABILITIES | 762,339 | |||
|
| |||
NET ASSETS | $ | 67,785,155 | ||
|
| |||
NET ASSETS CONSIST OF: | ||||
Paid-in capital | $ | 54,303,201 | ||
Distributions in excess of net investment income | (11,666 | ) | ||
Accumulated net realized gain on investments and foreign currency transactions | 497,802 | |||
Net unrealized appreciation on investments and foreign currency translations | 12,995,818 | |||
|
| |||
NET ASSETS | $ | 67,785,155 | ||
|
| |||
See accompanying notes to financial statements.
55 |
Statements of Assets and Liabilities (continued)
December 31, 2017
| Mirova Global Sustainable Equity Fund | ||||
COMPUTATION OF NET ASSET VALUE AND OFFERING PRICE: | ||||
Class A shares: | ||||
Net assets | $ | 3,260,460 | ||
|
| |||
Shares of beneficial interest | 255,354 | |||
|
| |||
Net asset value and redemption price per share | $ | 12.77 | ||
|
| |||
Offering price per share (100/[100-maximum sales charge] of net asset value) (Note 1) | $ | 13.55 | ||
|
| |||
Class C shares: (redemption price per share is equal to net asset value less any applicable contingent deferred sales charge) (Note 1) | ||||
Net assets | $ | 1,164,399 | ||
|
| |||
Shares of beneficial interest | 92,179 | |||
|
| |||
Net asset value and offering price per share | $ | 12.63 | ||
|
| |||
Class N shares: | ||||
Net assets | $ | 1,149 | ||
|
| |||
Shares of beneficial interest | 90 | |||
|
| |||
Net asset value, offering and redemption price per share | $ | 12.81 | * | |
|
| |||
Class Y shares: | ||||
Net assets | $ | 63,359,147 | ||
|
| |||
Shares of beneficial interest | 4,945,138 | |||
|
| |||
Net asset value, offering and redemption price per share | $ | 12.81 | ||
|
| |||
| * | Net asset value calculations have been determined utilizing fractional share and penny amounts. |
See accompanying notes to financial statements.
| 56
Statements of Operations
For the Year Ended December 31, 2017
| Gateway Fund | Gateway Equity Call Premium Fund | Mirova Global Green Bond Fund(a) | ||||||||||
INVESTMENT INCOME | ||||||||||||
Interest | $ | 434,678 | $ | 3,894 | $ | 303,844 | ||||||
Dividends | 171,654,582 | 1,612,889 | — | |||||||||
Less net foreign taxes withheld | (28,109 | ) | (867 | ) | (391 | ) | ||||||
|
|
|
|
|
| |||||||
| 172,061,151 | 1,615,916 | 303,453 | ||||||||||
|
|
|
|
|
| |||||||
Expenses | ||||||||||||
Management fees (Note 6) | 50,695,230 | 512,391 | 117,442 | |||||||||
Service and distribution fees (Note 6) | 7,812,527 | 27,911 | 75 | |||||||||
Administrative fees (Note 6) | 3,577,170 | 35,101 | 9,509 | |||||||||
Trustees’ fees and expenses (Note 6) | 302,828 | 20,740 | 14,490 | |||||||||
Transfer agent fees and expenses (Notes 6 and 7) | 5,705,737 | 41,423 | 1,610 | |||||||||
Audit and tax services fees | 52,474 | 51,158 | 41,961 | |||||||||
Custodian fees and expenses | 376,656 | 54,432 | 10,881 | |||||||||
Interest expense (Note 12) | — | — | 3,688 | |||||||||
Legal fees | 185,534 | 1,693 | 466 | |||||||||
Registration fees | 233,900 | 93,238 | 14,545 | |||||||||
Shareholder reporting expenses | 552,422 | 4,909 | 10,641 | |||||||||
Miscellaneous expenses (Note 8) | 228,169 | 11,519 | 13,861 | |||||||||
|
|
|
|
|
| |||||||
Total expenses | 69,722,647 | 854,515 | 239,169 | |||||||||
Less waiver and/or expense reimbursement (Note 6) | (5,872,615 | ) | (77,467 | ) | (96,593 | ) | ||||||
|
|
|
|
|
| |||||||
Net expenses | 63,850,032 | 777,048 | 142,576 | |||||||||
|
|
|
|
|
| |||||||
Net investment income | 108,211,119 | 838,868 | 160,877 | |||||||||
|
|
|
|
|
| |||||||
NET REALIZED AND UNREALIZED GAIN (LOSS) ON INVESTMENTS, FUTURES CONTRACTS, OPTIONS WRITTEN AND FOREIGN CURRENCY TRANSACTIONS | ||||||||||||
Net realized gain (loss) on: | ||||||||||||
Investments | 1,459,689,798 | 1,830,668 | 513,342 | |||||||||
Futures contracts | — | — | (1,381,457 | ) | ||||||||
Options written | (562,013,864 | ) | (5,634,939 | ) | — | |||||||
Foreign currency transactions (Note 2c) | 848 | 22 | 18,906 | |||||||||
Net change in unrealized appreciation (depreciation) on: |
| |||||||||||
Investments | (234,657,166 | ) | 12,105,725 | 1,350,618 | ||||||||
Futures contracts | — | — | (237,370 | ) | ||||||||
Options written | (20,438,813 | ) | (159,664 | ) | — | |||||||
Foreign currency translations (Note 2c) | (152 | ) | — | 9,388 | ||||||||
|
|
|
|
|
| |||||||
Net realized and unrealized gain on investments, futures contracts, options written and foreign currency transactions | 642,580,651 | 8,141,812 | 273,427 | |||||||||
|
|
|
|
|
| |||||||
NET INCREASE IN NET ASSETS RESULTING FROM OPERATIONS | $ | 750,791,770 | $ | 8,980,680 | $ | 434,304 | ||||||
|
|
|
|
|
| |||||||
| (a) | From commencement of operations on February 28, 2017 through December 31, 2017. |
See accompanying notes to financial statements.
57 |
Statements of Operations (continued)
For the Year Ended December 31, 2017
| Mirova Global Sustainable Equity Fund | ||||
INVESTMENT INCOME | ||||
Dividends | $ | 834,421 | ||
Interest | 7,420 | |||
Less net foreign taxes withheld | (62,110 | ) | ||
|
| |||
| 779,731 | ||||
|
| |||
Expenses | ||||
Management fees (Note 6) | 480,229 | |||
Service and distribution fees (Note 6) | 5,223 | |||
Administrative fees (Note 6) | 26,726 | |||
Trustees’ fees and expenses (Note 6) | 17,606 | |||
Transfer agent fees and expenses (Notes 6 and 7) | 15,944 | |||
Audit and tax services fees | 43,532 | |||
Custodian fees and expenses | 23,640 | |||
Legal fees | 1,260 | |||
Registration fees | 72,904 | |||
Shareholder reporting expenses | 2,604 | |||
Miscellaneous expenses (Note 8) | 13,700 | |||
|
| |||
Total expenses | 703,368 | |||
Less waiver and/or expense reimbursement (Note 6) | (73,419 | ) | ||
|
| |||
Net expenses | 629,949 | |||
|
| |||
Net investment income | 149,782 | |||
|
| |||
NET REALIZED AND UNREALIZED GAIN ON INVESTMENTS AND FOREIGN CURRENCY TRANSACTIONS | ||||
Net realized gain on: | ||||
Investments | 1,193,195 | |||
Foreign currency transactions (Note 2c) | 4,104 | |||
Net change in unrealized appreciation (depreciation) on: | ||||
Investments | 14,325,525 | |||
Foreign currency translations (Note 2c) | 2,912 | |||
|
| |||
Net realized and unrealized gain on investments and foreign currency transactions | 15,525,736 | |||
|
| |||
NET INCREASE IN NET ASSETS RESULTING FROM OPERATIONS | $ | 15,675,518 | ||
|
| |||
See accompanying notes to financial statements.
| 58
Statements of Changes in Net Assets
| Gateway Fund | ||||||||
| Year Ended December 31, 2017 | Year Ended December 31, 2016 | |||||||
FROM OPERATIONS: | ||||||||
Net investment income | $ | 108,211,119 | $ | 125,507,407 | ||||
Net realized gain on investments, options written and foreign currency transactions | 897,676,782 | 322,163,349 | ||||||
Net change in unrealized appreciation (depreciation) on investments, options written and foreign currency translations | (255,096,131 | ) | (11,608,461 | ) | ||||
|
|
|
| |||||
Net increase in net assets resulting from operations | 750,791,770 | 436,062,295 | ||||||
|
|
|
| |||||
FROM DISTRIBUTIONS TO SHAREHOLDERS: | ||||||||
Net investment income | ||||||||
Class A | (18,006,320 | ) | (25,053,905 | ) | ||||
Class C | (1,226,639 | ) | (2,443,921 | ) | ||||
Class N(a) | (688,888 | ) | — | |||||
Class Y | (76,225,048 | ) | (97,909,866 | ) | ||||
|
|
|
| |||||
Total distributions | (96,146,895 | ) | (125,407,692 | ) | ||||
|
|
|
| |||||
NET INCREASE (DECREASE) IN NET ASSETS FROM CAPITAL SHARE TRANSACTIONS (NOTE 14) | 198,252,858 | (902,825,602 | ) | |||||
|
|
|
| |||||
Net increase (decrease) in net assets | 852,897,733 | (592,170,999 | ) | |||||
NET ASSETS | ||||||||
Beginning of the year | 7,672,167,999 | 8,264,338,998 | ||||||
|
|
|
| |||||
End of the year | $ | 8,525,065,732 | $ | 7,672,167,999 | ||||
|
|
|
| |||||
UNDISTRIBUTED NET INVESTMENT INCOME | $ | 7,177,681 | $ | 2,341,759 | ||||
|
|
|
| |||||
| (a) | From commencement of Class operations on May 1, 2017 through December 31, 2017. |
See accompanying notes to financial statements.
59 |
Statements of Changes in Net Assets (continued)
| Gateway Equity Call Premium Fund | ||||||||
| Year Ended December 31, 2017 | Year Ended December 31, 2016 | |||||||
FROM OPERATIONS: | ||||||||
Net investment income | $ | 838,868 | $ | 804,901 | ||||
Net realized loss on investments, options written and foreign currency transactions | (3,804,249 | ) | (3,388,474 | ) | ||||
Net change in unrealized appreciation (depreciation) on investments and options written | 11,946,061 | 8,047,271 | ||||||
|
|
|
| |||||
Net increase in net assets resulting from operations | 8,980,680 | 5,463,698 | ||||||
|
|
|
| |||||
FROM DISTRIBUTIONS TO SHAREHOLDERS: | ||||||||
Net investment income | ||||||||
Class A | (68,042 | ) | (57,801 | ) | ||||
Class C | (534 | ) | (1,192 | ) | ||||
Class N(a) | (9 | ) | — | |||||
Class Y | (756,852 | ) | (719,110 | ) | ||||
|
|
|
| |||||
Total distributions | (825,437 | ) | (778,103 | ) | ||||
|
|
|
| |||||
NET INCREASE IN NET ASSETS FROM CAPITAL SHARE TRANSACTIONS (NOTE 14) | 2,223,758 | 11,698,686 | ||||||
|
|
|
| |||||
Net increase in net assets | 10,379,001 | 16,384,281 | ||||||
NET ASSETS | ||||||||
Beginning of the year | 70,609,688 | 54,225,407 | ||||||
|
|
|
| |||||
End of the year | $ | 80,988,689 | $ | 70,609,688 | ||||
|
|
|
| |||||
DISTRIBUTIONS IN EXCESS OF NET INVESTMENT INCOME | $ | (29,596 | ) | $ | (21,052 | ) | ||
|
|
|
| |||||
| (a) | From commencement of Class operations on May 1, 2017 through December 31, 2017. |
See accompanying notes to financial statements.
| 60
Statements of Changes in Net Assets (continued)
| Mirova Global Green Bond Fund | ||||
| Period Ended December 31, 2017(a) | ||||
FROM OPERATIONS: | ||||
Net investment income | $ | 160,877 | ||
Net realized loss on investments, futures contracts and foreign currency transactions | (849,209 | ) | ||
Net change in unrealized appreciation (depreciation) on investments, futures contracts and foreign currency translations | 1,122,636 | |||
|
| |||
Net increase in net assets resulting from operations | 434,304 | |||
|
| |||
FROM DISTRIBUTIONS TO SHAREHOLDERS: | ||||
Net investment income | ||||
Class A | (1,938 | ) | ||
Class N | (501,290 | ) | ||
Class Y | (675 | ) | ||
|
| |||
Total distributions | (503,903 | ) | ||
|
| |||
NET INCREASE IN NET ASSETS FROM CAPITAL SHARE TRANSACTIONS (NOTE 14) | 26,057,599 | |||
|
| |||
Net increase in net assets | 25,988,000 | |||
NET ASSETS | ||||
Beginning of the year | — | |||
|
| |||
End of the year | $ | 25,988,000 | ||
|
| |||
UNDISTRIBUTED NET INVESTMENT INCOME | $ | 194,112 | ||
|
| |||
| (a) | From commencement of operations on February 28, 2017 through December 31, 2017. |
See accompanying notes to financial statements.
61 |
Statements of Changes in Net Assets (continued)
| Mirova Global Sustainable Equity Fund | ||||||||
| Year Ended December 31, 2017 | Period Ended December 31, 2016(a) | |||||||
FROM OPERATIONS: | ||||||||
Net investment income | $ | 149,782 | $ | 92,791 | ||||
Net realized gain (loss) on investments and foreign currency transactions | 1,197,299 | (110,685 | ) | |||||
Net change in unrealized appreciation (depreciation) on investments and foreign currency translations | 14,328,437 | (1,332,619 | ) | |||||
|
|
|
| |||||
Net increase (decrease) in net assets resulting from operations | 15,675,518 | (1,350,513 | ) | |||||
|
|
|
| |||||
FROM DISTRIBUTIONS TO SHAREHOLDERS: | ||||||||
Net investment income | ||||||||
Class A | (6,999 | ) | (24 | ) | ||||
Class N(b) | (3 | ) | — | |||||
Class Y | (148,952 | ) | (43,472 | ) | ||||
Net realized capital gains | ||||||||
Class A | (29,257 | ) | (81 | ) | ||||
Class C | (10,251 | ) | (60 | ) | ||||
Class N(b) | (10 | ) | — | |||||
Class Y | (563,786 | ) | (56,464 | ) | ||||
|
|
|
| |||||
Total distributions | (759,258 | ) | (100,101 | ) | ||||
|
|
|
| |||||
NET INCREASE IN NET ASSETS FROM CAPITAL SHARE TRANSACTIONS (NOTE 14) | 3,152,882 | 51,166,627 | ||||||
|
|
|
| |||||
Net increase in net assets | 18,069,142 | 49,716,013 | ||||||
NET ASSETS | ||||||||
Beginning of the year | 49,716,013 | — | ||||||
|
|
|
| |||||
End of the year | $ | 67,785,155 | $ | 49,716,013 | ||||
|
|
|
| |||||
DISTRIBUTIONS IN EXCESS OF NET INVESTMENT INCOME | $ | (11,666 | ) | $ | (9,340 | ) | ||
|
|
|
| |||||
| (a) | From commencement of operations on March 31, 2016 through December 31, 2016. |
| (b) | From commencement of Class operations on May 1, 2017 through December 31, 2017. |
See accompanying notes to financial statements.
| 62
Financial Highlights
For a share outstanding throughout each period.
| Gateway Fund—Class A | ||||||||||||||||||||
| Year Ended December 31, 2017 | Year Ended December 31, 2016 | Year Ended December 31, 2015 | Year Ended December 31, 2014 | Year Ended December 31, 2013 | ||||||||||||||||
Net asset value, beginning of the period | $ | 30.84 | $ | 29.72 | $ | 29.58 | $ | 29.00 | $ | 27.13 | ||||||||||
|
|
|
|
|
|
|
|
|
| |||||||||||
INCOME (LOSS) FROM INVESTMENT OPERATIONS: | ||||||||||||||||||||
Net investment income(a) | 0.39 | 0.41 | 0.57 | (b) | 0.39 | 0.43 | ||||||||||||||
Net realized and unrealized gain (loss) | 2.58 | 1.13 | 0.12 | 0.57 | 1.82 | |||||||||||||||
|
|
|
|
|
|
|
|
|
| |||||||||||
Total from Investment Operations | 2.97 | 1.54 | 0.69 | 0.96 | 2.25 | |||||||||||||||
|
|
|
|
|
|
|
|
|
| |||||||||||
LESS DISTRIBUTIONS FROM: | ||||||||||||||||||||
Net investment income | (0.34 | ) | (0.42 | ) | (0.55 | ) | (0.38 | ) | (0.38 | ) | ||||||||||
|
|
|
|
|
|
|
|
|
| |||||||||||
Net asset value, end of the period | $ | 33.47 | $ | 30.84 | $ | 29.72 | $ | 29.58 | $ | 29.00 | ||||||||||
|
|
|
|
|
|
|
|
|
| |||||||||||
Total return(c)(d) | 9.66 | % | 5.23 | % | 2.34 | % | 3.33 | % | 8.39 | % | ||||||||||
RATIOS TO AVERAGE NET ASSETS: | ||||||||||||||||||||
Net assets, end of the period (000’s) | $ | 1,669,272 | $ | 1,755,576 | $ | 1,864,118 | $ | 1,976,457 | $ | 2,351,788 | ||||||||||
Net expenses(e) | 0.94 | % | 0.94 | % | 0.94 | % | 0.94 | % | 0.94 | % | ||||||||||
Gross expenses | 1.02 | % | 1.02 | % | 1.01 | % | 1.02 | % | 1.03 | % | ||||||||||
Net investment income | 1.20 | % | 1.39 | % | 1.91 | %(b) | 1.33 | % | 1.51 | % | ||||||||||
Portfolio turnover rate | 34 | % | 14 | % | 10 | % | 13 | % | 10 | % | ||||||||||
| (a) | Per share net investment income has been calculated using the average shares outstanding during the period. |
| (b) | Includes a non-recurring dividend. Without this dividend, net investment income per share would have been $0.37, and the ratio of net investment income to average net assets would have been 1.24%. |
| (c) | Had certain expenses not been waived/reimbursed during the period, total returns would have been lower. |
| (d) | A sales charge for Class A shares is not reflected in total return calculations. |
| (e) | The investment adviser agreed to waive its fees and/or reimburse a portion of the Fund’s expenses during the period. Without this waiver/reimbursement, expenses would have been higher. |
See accompanying notes to financial statements.
63 |
Financial Highlights (continued)
For a share outstanding throughout each period.
| Gateway Fund—Class C | ||||||||||||||||||||
| Year Ended December 31, 2017 | Year Ended December 31, 2016 | Year Ended December 31, 2015 | Year Ended December 31, 2014 | Year Ended December 31, 2013 | ||||||||||||||||
Net asset value, beginning of the period | $ | 30.72 | $ | 29.61 | $ | 29.48 | $ | 28.90 | $ | 27.04 | ||||||||||
|
|
|
|
|
|
|
|
|
| |||||||||||
INCOME (LOSS) FROM INVESTMENT OPERATIONS: | ||||||||||||||||||||
Net investment income(a) | 0.14 | 0.19 | 0.34 | (b) | 0.17 | 0.21 | ||||||||||||||
Net realized and unrealized gain (loss) | 2.57 | 1.11 | 0.12 | 0.57 | 1.82 | |||||||||||||||
|
|
|
|
|
|
|
|
|
| |||||||||||
Total from Investment Operations | 2.71 | 1.30 | 0.46 | 0.74 | 2.03 | |||||||||||||||
|
|
|
|
|
|
|
|
|
| |||||||||||
LESS DISTRIBUTIONS FROM: | ||||||||||||||||||||
Net investment income | (0.11 | ) | (0.19 | ) | (0.33 | ) | (0.16 | ) | (0.17 | ) | ||||||||||
|
|
|
|
|
|
|
|
|
| |||||||||||
Net asset value, end of the period | $ | 33.32 | $ | 30.72 | $ | 29.61 | $ | 29.48 | $ | 28.90 | ||||||||||
|
|
|
|
|
|
|
|
|
| |||||||||||
Total return(c)(d) | 8.85 | % | 4.42 | % | 1.54 | % | 2.58 | % | 7.58 | % | ||||||||||
RATIOS TO AVERAGE NET ASSETS: | ||||||||||||||||||||
Net assets, end of the period (000’s) | $ | 336,891 | $ | 366,584 | $ | 387,235 | $ | 353,339 | $ | 331,465 | ||||||||||
Net expenses(e) | 1.70 | % | 1.70 | % | 1.70 | % | 1.70 | % | 1.70 | % | ||||||||||
Gross expenses | 1.77 | % | 1.77 | % | 1.76 | % | 1.77 | % | 1.78 | % | ||||||||||
Net investment income | 0.44 | % | 0.63 | % | 1.15 | %(b) | 0.57 | % | 0.75 | % | ||||||||||
Portfolio turnover rate | 34 | % | 14 | % | 10 | % | 13 | % | 10 | % | ||||||||||
| (a) | Per share net investment income has been calculated using the average shares outstanding during the period. |
| (b) | Includes a non-recurring dividend. Without this dividend, net investment income per share would have been $0.15, and the ratio of net investment income to average net assets would have been 0.51%. |
| (c) | Had certain expenses not been waived/reimbursed during the period, total returns would have been lower. |
| (d) | A contingent deferred sales charge for Class C shares is not reflected in total return calculations. |
| (e) | The investment adviser agreed to waive its fees and/or reimburse a portion of the Fund’s expenses during the period. Without this waiver/reimbursement, expenses would have been higher. |
See accompanying notes to financial statements.
| 64
Financial Highlights (continued)
For a share outstanding throughout each period.
| Gateway Fund—Class N | ||||
| Period Ended December 31, 2017* | ||||
Net asset value, beginning of the period | $ | 31.89 | ||
|
| |||
INCOME (LOSS) FROM INVESTMENT OPERATIONS: | ||||
Net investment income(a) | 0.32 | |||
Net realized and unrealized gain (loss) | 1.56 | |||
|
| |||
Total from Investment Operations | 1.88 | |||
|
| |||
LESS DISTRIBUTIONS FROM: | ||||
Net investment income | (0.31 | ) | ||
|
| |||
Net asset value, end of the period | $ | 33.46 | ||
|
| |||
Total return(b)(c) | 5.93 | % | ||
RATIOS TO AVERAGE NET ASSETS: | ||||
Net assets, end of the period (000’s) | $ | 126,262 | ||
Net expenses(d)(e) | 0.65 | % | ||
Gross expenses(e) | 0.74 | % | ||
Net investment income(e) | 1.42 | % | ||
Portfolio turnover rate(f) | 34 | % | ||
| * | From commencement of Class operations on May 1, 2017 through December 31, 2017. |
| (a) | Per share net investment income has been calculated using the average shares outstanding during the period. |
| (b) | Had certain expenses not been waived/reimbursed during the period, total returns would have been lower. |
| (c) | Periods less than one year are not annualized. |
| (d) | The investment adviser agreed to waive its fees and/or reimburse a portion of the Fund’s expenses during the period. Without this waiver/reimbursement, expenses would have been higher. |
| (e) | Computed on an annualized basis for periods less than one year. |
| (f) | Represents the Fund’s portfolio turnover rate for the year ended December 31, 2017. |
See accompanying notes to financial statements.
65 |
Financial Highlights (continued)
For a share outstanding throughout each period.
| Gateway Fund—Class Y | ||||||||||||||||||||
| Year Ended December 31, 2017 | Year Ended December 31, 2016 | Year Ended December 31, 2015 | Year Ended December 31, 2014 | Year Ended December 31, 2013 | ||||||||||||||||
Net asset value, beginning of the period | $ | 30.83 | $ | 29.71 | $ | 29.57 | $ | 28.99 | $ | 27.12 | ||||||||||
|
|
|
|
|
|
|
|
|
| |||||||||||
INCOME (LOSS) FROM INVESTMENT OPERATIONS: | ||||||||||||||||||||
Net investment income(a) | 0.47 | 0.49 | 0.64 | (b) | 0.46 | 0.50 | ||||||||||||||
Net realized and unrealized gain (loss) | 2.58 | 1.12 | 0.12 | 0.57 | 1.82 | |||||||||||||||
|
|
|
|
|
|
|
|
|
| |||||||||||
Total from Investment Operations | 3.05 | 1.61 | 0.76 | 1.03 | 2.32 | |||||||||||||||
|
|
|
|
|
|
|
|
|
| |||||||||||
LESS DISTRIBUTIONS FROM: | ||||||||||||||||||||
Net investment income | (0.42 | ) | (0.49 | ) | (0.62 | ) | (0.45 | ) | (0.45 | ) | ||||||||||
|
|
|
|
|
|
|
|
|
| |||||||||||
Net asset value, end of the period | $ | 33.46 | $ | 30.83 | $ | 29.71 | $ | 29.57 | $ | 28.99 | ||||||||||
|
|
|
|
|
|
|
|
|
| |||||||||||
Total return(c) | 9.93 | % | 5.48 | % | 2.59 | % | 3.58 | % | 8.65 | % | ||||||||||
RATIOS TO AVERAGE NET ASSETS: | ||||||||||||||||||||
Net assets, end of the period (000’s) | $ | 6,392,640 | $ | 5,550,008 | $ | 6,012,987 | $ | 5,814,900 | $ | 5,520,003 | ||||||||||
Net expenses(d) | 0.70 | % | 0.70 | % | 0.70 | % | 0.70 | % | 0.70 | % | ||||||||||
Gross expenses | 0.77 | % | 0.77 | % | 0.76 | % | 0.77 | % | 0.78 | % | ||||||||||
Net investment income | 1.44 | % | 1.63 | % | 2.16 | %(b) | 1.57 | % | 1.76 | % | ||||||||||
Portfolio turnover rate | 34 | % | 14 | % | 10 | % | 13 | % | 10 | % | ||||||||||
| (a) | Per share net investment income has been calculated using the average shares outstanding during the period. |
| (b) | Includes a non-recurring dividend. Without this dividend, net investment income per share would have been $0.45, and the ratio of net investment income to average net assets would have been 1.51%. |
| (c) | Had certain expenses not been waived/reimbursed during the period, total returns would have been lower. |
| (d) | The investment adviser agreed to waive its fees and/or reimburse a portion of the Fund’s expenses during the period. Without this waiver/reimbursement, expenses would have been higher. |
See accompanying notes to financial statements.
| 66
Financial Highlights (continued)
For a share outstanding throughout each period.
| Gateway Equity Call Premium Fund—Class A | ||||||||||||||||
| Year Ended December 31, 2017 | Year Ended December 31, 2016 | Year Ended December 31, 2015 | Period Ended December 31, 2014* | |||||||||||||
Net asset value, beginning of the period | $ | 10.89 | $ | 10.22 | $ | 9.96 | $ | 10.00 | ||||||||
|
|
|
|
|
|
|
| |||||||||
INCOME (LOSS) FROM INVESTMENT OPERATIONS: | ||||||||||||||||
Net investment income(a) | 0.10 | 0.11 | 0.15 | (b) | 0.02 | |||||||||||
Net realized and unrealized gain (loss) | 1.18 | 0.66 | 0.24 | (0.02 | ) | |||||||||||
|
|
|
|
|
|
|
| |||||||||
Total from Investment Operations | 1.28 | 0.77 | 0.39 | 0.00 | (c) | |||||||||||
|
|
|
|
|
|
|
| |||||||||
LESS DISTRIBUTIONS FROM: | ||||||||||||||||
Net investment income | (0.09 | ) | (0.10 | ) | (0.13 | ) | (0.04 | ) | ||||||||
|
|
|
|
|
|
|
| |||||||||
Net asset value, end of the period | $ | 12.08 | $ | 10.89 | $ | 10.22 | $ | 9.96 | ||||||||
|
|
|
|
|
|
|
| |||||||||
Total return(d)(e) | 11.80 | % | 7.58 | % | 3.90 | % | 0.00 | %(f) | ||||||||
RATIOS TO AVERAGE NET ASSETS: | ||||||||||||||||
Net assets, end of the period (000’s) | $ | 7,085 | $ | 6,507 | $ | 3,855 | $ | 96 | ||||||||
Net expenses(g) | 1.20 | % | 1.20 | % | 1.20 | % | 1.20 | %(h) | ||||||||
Gross expenses | 1.30 | % | 1.31 | % | 1.70 | % | 3.69 | %(h) | ||||||||
Net investment income | 0.85 | % | 1.02 | % | 1.47 | %(b) | 0.84 | %(h) | ||||||||
Portfolio turnover rate | 19 | % | 24 | % | 38 | % | 7 | % | ||||||||
| * | From commencement of operations on September 30, 2014 through December 31, 2014. |
| (a) | Per share net investment income has been calculated using the average shares outstanding during the period. |
| (b) | Includes a non-recurring dividend. Without this dividend, net investment income per share would have been $0.10 and the ratio of net investment income to average net assets would have been 0.98%. |
| (c) | Amount rounds to less than $0.01 per share. |
| (d) | A sales charge for Class A shares is not reflected in total return calculations. |
| (e) | Had certain expenses not been waived/reimbursed during the period, total returns would have been lower. |
| (f) | Periods less than one year are not annualized. |
| (g) | The investment adviser agreed to waive its fees and/or reimburse a portion of the Fund’s expenses during the period. Without this waiver/reimbursement, expenses would have been higher. |
| (h) | Computed on an annualized basis for periods less than one year. |
See accompanying notes to financial statements.
67 |
Financial Highlights (continued)
For a share outstanding throughout each period.
| Gateway Equity Call Premium Fund—Class C | ||||||||||||||||
| Year Ended December 31, 2017 | Year Ended December 31, 2016 | Year Ended December 31, 2015 | Period Ended December 31, 2014* | |||||||||||||
Net asset value, beginning of the period | $ | 10.87 | $ | 10.22 | $ | 9.97 | $ | 10.00 | ||||||||
|
|
|
|
|
|
|
| |||||||||
INCOME (LOSS) FROM INVESTMENT OPERATIONS: | ||||||||||||||||
Net investment income(a) | 0.01 | 0.02 | 0.09 | (b) | 0.00 | (c) | ||||||||||
Net realized and unrealized gain (loss) | 1.18 | 0.68 | 0.22 | (0.01 | ) | |||||||||||
|
|
|
|
|
|
|
| |||||||||
Total from Investment Operations | 1.19 | 0.70 | 0.31 | (0.01 | ) | |||||||||||
|
|
|
|
|
|
|
| |||||||||
LESS DISTRIBUTIONS FROM: | ||||||||||||||||
Net investment income | (0.01 | ) | (0.05 | ) | (0.06 | ) | (0.02 | ) | ||||||||
|
|
|
|
|
|
|
| |||||||||
Net asset value, end of the period | $ | 12.05 | $ | 10.87 | $ | 10.22 | $ | 9.97 | ||||||||
|
|
|
|
|
|
|
| |||||||||
Total return(d)(e) | 10.95 | % | 6.85 | % | 3.07 | % | (0.12 | )%(f) | ||||||||
RATIOS TO AVERAGE NET ASSETS: | ||||||||||||||||
Net assets, end of the period (000’s) | $ | 648 | $ | 524 | $ | 37 | $ | 1 | ||||||||
Net expenses(g) | 1.95 | % | 1.95 | % | 1.95 | % | 1.95 | %(h) | ||||||||
Gross expenses | 2.05 | % | 1.98 | % | 2.40 | % | 4.37 | %(h) | ||||||||
Net investment income | 0.10 | % | 0.23 | % | 0.85 | %(b) | 0.01 | %(h) | ||||||||
Portfolio turnover rate | 19 | % | 24 | % | 38 | % | 7 | % | ||||||||
| * | From commencement of operations on September 30, 2014 through December 31, 2014. |
| (a) | Per share net investment income has been calculated using the average shares outstanding during the period. |
| (b) | Includes a non-recurring dividend. Without this dividend, net investment income per share would have been $0.07 and the ratio of net investment income to average net assets would have been 0.72%. |
| (c) | Amount rounds to less than $0.01 per share. |
| (d) | A contingent deferred sales charge for Class C shares is not reflected in total return calculations. |
| (e) | Had certain expenses not been waived/reimbursed during the period, total returns would have been lower. |
| (f) | Periods less than one year are not annualized. |
| (g) | The investment adviser agreed to waive its fees and/or reimburse a portion of the Fund’s expenses during the period. Without this waiver/reimbursement, expenses would have been higher. |
| (h) | Computed on an annualized basis for periods less than one year. |
See accompanying notes to financial statements.
| 68
Financial Highlights (continued)
For a share outstanding throughout each period.
| Gateway Equity Call Premium Fund—Class N | ||||
| Period Ended December 31, 2017* | ||||
Net asset value, beginning of the period | $ | 11.34 | ||
|
| |||
INCOME (LOSS) FROM INVESTMENT OPERATIONS: | ||||
Net investment income(a) | 0.10 | |||
Net realized and unrealized gain (loss) | 0.75 | |||
|
| |||
Total from Investment Operations | 0.85 | |||
|
| |||
LESS DISTRIBUTIONS FROM: | ||||
Net investment income | (0.10 | ) | ||
|
| |||
Net asset value, end of the period | $ | 12.09 | ||
|
| |||
Total return(b)(c) | 7.50 | % | ||
RATIOS TO AVERAGE NET ASSETS: | ||||
Net assets, end of the period (000’s) | $ | 1 | ||
Net expenses(d)(e) | 0.90 | % | ||
Gross expenses(e) | 14.26 | % | ||
Net investment income(e) | 1.22 | % | ||
Portfolio turnover rate(f) | 19 | % | ||
| * | From commencement of Class operations on May 1, 2017 through December 31, 2017. |
| (a) | Per share net investment income has been calculated using the average shares outstanding during the period. |
| (b) | Had certain expenses not been waived/reimbursed during the period, total returns would have been lower. |
| (c) | Periods less than one year are not annualized. |
| (d) | The investment adviser agreed to waive its fees and/or reimburse a portion of the Fund’s expenses during the period. Without this waiver/reimbursement, expenses would have been higher. |
| (e) | Computed on an annualized basis for periods less than one year. |
| (f) | Represents the Fund’s portfolio turnover rate for the year ended December 31, 2017. |
See accompanying notes to financial statements.
69 |
Financial Highlights (continued)
For a share outstanding throughout each period.
| Gateway Equity Call Premium Fund—Class Y | ||||||||||||||||
| Year Ended December 31, 2017 | Year Ended December 31, 2016 | Year Ended December 31, 2015 | Period Ended December 31, 2014* | |||||||||||||
Net asset value, beginning of the period | $ | 10.89 | $ | 10.22 | $ | 9.97 | $ | 10.00 | ||||||||
|
|
|
|
|
|
|
| |||||||||
INCOME (LOSS) FROM INVESTMENT OPERATIONS: | ||||||||||||||||
Net investment income(a) | 0.13 | 0.13 | 0.16 | (b) | 0.02 | |||||||||||
Net realized and unrealized gain (loss) | 1.19 | 0.67 | 0.24 | (0.01 | ) | |||||||||||
|
|
|
|
|
|
|
| |||||||||
Total from Investment Operations | 1.32 | 0.80 | 0.40 | 0.01 | ||||||||||||
|
|
|
|
|
|
|
| |||||||||
LESS DISTRIBUTIONS FROM: | ||||||||||||||||
Net investment income | (0.12 | ) | (0.13 | ) | (0.15 | ) | (0.04 | ) | ||||||||
|
|
|
|
|
|
|
| |||||||||
Net asset value, end of the period | $ | 12.09 | $ | 10.89 | $ | 10.22 | $ | 9.97 | ||||||||
|
|
|
|
|
|
|
| |||||||||
Total return(c) | 12.21 | % | 7.83 | % | 4.03 | % | 0.13 | %(d) | ||||||||
RATIOS TO AVERAGE NET ASSETS: | ||||||||||||||||
Net assets, end of the period (000’s) | $ | 73,255 | $ | 63,578 | $ | 50,334 | $ | 20,815 | ||||||||
Net expenses(e) | 0.95 | % | 0.95 | % | 0.95 | % | 0.95 | %(f) | ||||||||
Gross expenses | 1.05 | % | 1.06 | % | 1.45 | % | 3.54 | %(f) | ||||||||
Net investment income | 1.10 | % | 1.27 | % | 1.59 | %(b) | 0.99 | %(f) | ||||||||
Portfolio turnover rate | 19 | % | 24 | % | 38 | % | 7 | % | ||||||||
| * | From commencement of operations on September 30, 2014 through December 31, 2014. |
| (a) | Per share net investment income has been calculated using the average shares outstanding during the period. |
| (b) | Includes a non-recurring dividend. Without this dividend, net investment income per share would have been $0.12 and the ratio of net investment income to average net assets would have been 1.20%. |
| (c) | Had certain expenses not been waived/reimbursed during the period, total returns would have been lower. |
| (d) | Periods less than one year are not annualized. |
| (e) | The investment adviser agreed to waive its fees and/or reimburse a portion of the Fund’s expenses during the period. Without this waiver/reimbursement, expenses would have been higher. |
| (f) | Computed on an annualized basis for periods less than one year. |
See accompanying notes to financial statements.
| 70
Financial Highlights (continued)
For a share outstanding throughout each period.
| Mirova Global Green Bond—Class A | ||||
| Period Ended December 31, 2017* | ||||
Net asset value, beginning of the period | $ | 10.00 | ||
|
| |||
INCOME (LOSS) FROM INVESTMENT OPERATIONS: | ||||
Net investment income(a) | 0.04 | |||
Net realized and unrealized gain (loss) | 0.11 | |||
|
| |||
Total from Investment Operations | 0.15 | |||
|
| |||
LESS DISTRIBUTIONS FROM: | ||||
Net investment income | (0.19 | ) | ||
|
| |||
Net asset value, end of the period | $ | 9.96 | ||
|
| |||
Total return(b)(c)(d) | 1.46 | % | ||
RATIOS TO AVERAGE NET ASSETS: | ||||
Net assets, end of the period (000’s) | $ | 139 | ||
Net expenses(e)(f) | 0.96 | %(g) | ||
Gross expenses(f) | 5.23 | %(g) | ||
Net investment income(f) | 0.49 | % | ||
Portfolio turnover rate | 46 | % | ||
| * | From commencement of operations on February 28, 2017 through December 31, 2017. |
| (a) | Per share net investment income has been calculated using the average shares outstanding during the period. |
| (b) | A sales charge for Class A shares is not reflected in total return calculations. |
| (c) | Had certain expenses not been waived/reimbursed during the period, total returns would have been lower. |
| (d) | Periods less than one year are not annualized. |
| (e) | The investment adviser agreed to waive its fees and/or reimburse a portion of the Fund’s expenses during the period. Without this waiver/reimbursement, expenses would have been higher. |
| (f) | Computed on an annualized basis for periods less than one year. |
| (g) | Includes interest expense. Without this expense the ratio of net expenses would have been 0.95% and the ratio of gross expenses would have been 5.22%. |
See accompanying notes to financial statements.
71 |
Financial Highlights (continued)
For a share outstanding throughout each period.
| Mirova Global Green Bond—Class N | ||||
| Period Ended December 31, 2017* | ||||
Net asset value, beginning of the period | $ | 10.00 | ||
|
| |||
INCOME (LOSS) FROM INVESTMENT OPERATIONS: | ||||
Net investment income(a) | 0.06 | |||
Net realized and unrealized gain (loss) | 0.12 | |||
|
| |||
Total from Investment Operations | 0.18 | |||
|
| |||
LESS DISTRIBUTIONS FROM: | ||||
Net investment income | (0.20 | ) | ||
|
| |||
Net asset value, end of the period | $ | 9.98 | ||
|
| |||
Total return(b)(c) | 1.77 | % | ||
RATIOS TO AVERAGE NET ASSETS: | ||||
Net assets, end of the period (000’s) | $ | 25,805 | ||
Net expenses(d)(e) | 0.67 | %(f) | ||
Gross expenses(e) | 1.11 | %(f) | ||
Net investment income(e) | 0.75 | % | ||
Portfolio turnover rate | 46 | % | ||
| * | From commencement of operations on February 28, 2017 through December 31, 2017. |
| (a) | Per share net investment income has been calculated using the average shares outstanding during the period. |
| (b) | Had certain expenses not been waived/reimbursed during the period, total returns would have been lower. |
| (c) | Periods less than one year are not annualized. |
| (d) | The investment adviser agreed to waive its fees and/or reimburse a portion of the Fund’s expenses during the period. Without this waiver/reimbursement, expenses would have been higher. |
| (e) | Computed on an annualized basis for periods less than one year. |
| (f) | Includes interest expense. Without this expense the ratio of net expenses would have been 0.65% and the ratio of gross expenses would have been 1.10%. |
See accompanying notes to financial statements.
| 72
Financial Highlights (continued)
For a share outstanding throughout each period.
| Mirova Global Green Bond—Class Y | ||||
| Period Ended December 31, 2017* | ||||
Net asset value, beginning of the period | $ | 10.00 | ||
|
| |||
INCOME (LOSS) FROM INVESTMENT OPERATIONS: | ||||
Net investment income(a) | 0.06 | |||
Net realized and unrealized gain (loss) | 0.11 | |||
|
| |||
Total from Investment Operations | 0.17 | |||
|
| |||
LESS DISTRIBUTIONS FROM: | ||||
Net investment income | (0.20 | ) | ||
|
| |||
Net asset value, end of the period | $ | 9.97 | ||
|
| |||
Total return(b)(c) | 1.66 | % | ||
RATIOS TO AVERAGE NET ASSETS: | ||||
Net assets, end of the period (000’s) | $ | 43 | ||
Net expenses(d)(e) | 0.71 | %(f) | ||
Gross expenses(e) | 3.62 | %(f) | ||
Net investment income(e) | 0.71 | % | ||
Portfolio turnover rate | 46 | % | ||
| * | From commencement of operations on February 28, 2017 through December 31, 2017. |
| (a) | Per share net investment income has been calculated using the average shares outstanding during the period. |
| (b) | Had certain expenses not been waived/reimbursed during the period, total returns would have been lower. |
| (c) | Periods less than one year are not annualized. |
| (d) | The investment adviser agreed to waive its fees and/or reimburse a portion of the Fund’s expenses during the period. Without this waiver/reimbursement, expenses would have been higher. |
| (e) | Computed on an annualized basis for periods less than one year. |
| (f) | Includes interest expense. Without this expense the ratio of net expenses would have been 0.70% and the ratio of gross expenses would have been 3.62%. |
See accompanying notes to financial statements.
73 |
Financial Highlights (continued)
For a share outstanding throughout each period.
| Mirova Global Sustainable Equity Fund—Class A | ||||||||
| Year Ended December 31, 2017 | Period Ended December 31, 2016* | |||||||
Net asset value, beginning of the period | $ | 9.90 | $ | 10.00 | ||||
|
|
|
| |||||
INCOME (LOSS) FROM INVESTMENT OPERATIONS: | ||||||||
Net investment income (loss)(a) | (0.04 | ) | 0.02 | |||||
Net realized and unrealized gain (loss) | 3.06 | (0.11 | ) | |||||
|
|
|
| |||||
Total from Investment Operations | 3.02 | (0.09 | ) | |||||
|
|
|
| |||||
LESS DISTRIBUTIONS FROM: | ||||||||
Net investment income | (0.03 | ) | (0.00 | )(b) | ||||
Net realized capital gains | (0.12 | ) | (0.01 | ) | ||||
|
|
|
| |||||
Total Distributions | (0.15 | ) | (0.01 | ) | ||||
|
|
|
| |||||
Net asset value, end of the period | $ | 12.77 | $ | 9.90 | ||||
|
|
|
| |||||
Total return(c)(d) | 30.44 | % | (0.85 | )%(e) | ||||
RATIOS TO AVERAGE NET ASSETS: | ||||||||
Net assets, end of the period (000’s) | $ | 3,260 | $ | 71 | ||||
Net expenses(f) | 1.29 | % | 1.30 | %(g) | ||||
Gross expenses | 1.43 | % | 1.72 | %(g) | ||||
Net investment income (loss) | (0.36 | )% | 0.23 | %(g) | ||||
Portfolio turnover rate | 20 | % | 20 | % | ||||
| * | From commencement of operations on March 31, 2016 through December 31, 2016. |
| (a) | Per share net investment income has been calculated using the average shares outstanding during the period. |
| (b) | Amount rounds to less than $0.01 per share. |
| (c) | A sales charge for Class A shares is not reflected in total return calculations. |
| (d) | Had certain expenses not been waived/reimbursed during the period, total returns would have been lower. |
| (e) | Periods less than one year are not annualized. |
| (f) | The investment adviser agreed to waive its fees and/or reimburse a portion of the Fund’s expenses during the period. Without this waiver/reimbursement, expenses would have been higher. |
| (g) | Computed on an annualized basis for periods less than one year. |
See accompanying notes to financial statements.
| 74
Financial Highlights (continued)
For a share outstanding throughout each period.
| Mirova Global Sustainable Equity Fund—Class C | ||||||||
| Year Ended December 31, 2017 | Period Ended December 31, 2016* | |||||||
Net asset value, beginning of the period | $ | 9.85 | $ | 10.00 | ||||
|
|
|
| |||||
INCOME (LOSS) FROM INVESTMENT OPERATIONS: | ||||||||
Net investment loss(a) | (0.12 | ) | (0.06 | ) | ||||
Net realized and unrealized gain (loss) | 3.02 | (0.08 | ) | |||||
|
|
|
| |||||
Total from Investment Operations | 2.90 | (0.14 | ) | |||||
|
|
|
| |||||
LESS DISTRIBUTIONS FROM: | ||||||||
Net realized capital gains | (0.12 | ) | (0.01 | ) | ||||
|
|
|
| |||||
Net asset value, end of the period | $ | 12.63 | $ | 9.85 | ||||
|
|
|
| |||||
Total return(b)(c) | 29.40 | % | (1.39 | )%(d) | ||||
RATIOS TO AVERAGE NET ASSETS: | ||||||||
Net assets, end of the period (000’s) | $ | 1,164 | $ | 52 | ||||
Net expenses(e) | 2.04 | % | 2.05 | %(f) | ||||
Gross expenses | 2.18 | % | 2.20 | %(f) | ||||
Net investment loss | (1.02 | )% | (0.77 | )%(f) | ||||
Portfolio turnover rate | 20 | % | 20 | % | ||||
| * | From commencement of operations on March 31, 2016 through December 31, 2016. |
| (a) | Per share net investment income has been calculated using the average shares outstanding during the period. |
| (b) | A contingent deferred sales charge for Class C shares is not reflected in total return calculations. |
| (c) | Had certain expenses not been waived/reimbursed during the period, total returns would have been lower. |
| (d) | Periods less than one year are not annualized. |
| (e) | The investment adviser agreed to waive its fees and/or reimburse a portion of the Fund’s expenses during the period. Without this waiver/reimbursement, expenses would have been higher. |
| (f) | Computed on an annualized basis for periods less than one year. |
See accompanying notes to financial statements.
75 |
Financial Highlights (continued)
For a share outstanding throughout each period.
| Mirova Global Sustainable Equity Fund—Class N | ||||
| Period Ended December 31, 2017* | ||||
Net asset value, beginning of the period | $ | 11.29 | ||
|
| |||
INCOME (LOSS) FROM INVESTMENT OPERATIONS: | ||||
Net investment income(a) | 0.02 | |||
Net realized and unrealized gain (loss) | 1.66 | |||
|
| |||
Total from Investment Operations | 1.68 | |||
|
| |||
LESS DISTRIBUTIONS FROM: | ||||
Net investment income | (0.04 | ) | ||
Net realized capital gains | (0.12 | ) | ||
|
| |||
Total Distributions | (0.16 | ) | ||
|
| |||
Net asset value, end of the period | $ | 12.81 | ||
|
| |||
Total return(b)(c) | 14.81 | % | ||
RATIOS TO AVERAGE NET ASSETS: | ||||
Net assets, end of the period (000’s) | $ | 1 | ||
Net expenses(d)(e) | 1.00 | % | ||
Gross expenses(e) | 14.30 | % | ||
Net investment income(e) | 0.29 | % | ||
Portfolio turnover rate(f) | 20 | % | ||
| * | From commencement of Class operations on May 1, 2017 through December 31, 2017. |
| (a) | Per share net investment income has been calculated using the average shares outstanding during the period. |
| (b) | Had certain expenses not been waived/reimbursed during the period, total returns would have been lower. |
| (c) | Periods less than one year are not annualized. |
| (d) | The investment adviser agreed to waive its fees and/or reimburse a portion of the Fund’s expenses during the period. Without this waiver/reimbursement, expenses would have been higher. |
| (e) | Computed on an annualized basis for periods less than one year. |
| (f) | Represents the Fund’s portfolio turnover rate for the year ended December 31, 2017. |
See accompanying notes to financial statements.
| 76
Financial Highlights (continued)
For a share outstanding throughout each period.
| Mirova Global Sustainable Equity Fund—Class Y | ||||||||
| Year Ended December 31, 2017 | Period Ended December 31, 2016* | |||||||
Net asset value, beginning of the period | $ | 9.91 | $ | 10.00 | ||||
|
|
|
| |||||
INCOME (LOSS) FROM INVESTMENT OPERATIONS: | ||||||||
Net investment income(a) | 0.03 | 0.03 | ||||||
Net realized and unrealized gain (loss) | 3.02 | (0.10 | ) | |||||
|
|
|
| |||||
Total from Investment Operations | 3.05 | (0.07 | ) | |||||
|
|
|
| |||||
LESS DISTRIBUTIONS FROM: | ||||||||
Net investment income | (0.03 | ) | (0.01 | ) | ||||
Net realized capital gains | (0.12 | ) | (0.01 | ) | ||||
|
|
|
| |||||
Total Distributions | (0.15 | ) | (0.02 | ) | ||||
|
|
|
| |||||
Net asset value, end of the period | $ | 12.81 | $ | 9.91 | ||||
|
|
|
| |||||
Total return(b) | 30.75 | % | (0.70 | )%(c) | ||||
RATIOS TO AVERAGE NET ASSETS: | ||||||||
Net assets, end of the period (000’s) | $ | 63,359 | $ | 49,593 | ||||
Net expenses(d) | 1.04 | % | 1.05 | %(e) | ||||
Gross expenses | 1.16 | % | 1.21 | %(e) | ||||
Net investment income | 0.26 | % | 0.35 | %(e) | ||||
Portfolio turnover rate | 20 | % | 20 | % | ||||
| * | From commencement of operations on March 31, 2016 through December 31, 2016. |
| (a) | Per share net investment income has been calculated using the average shares outstanding during the period. |
| (b) | Had certain expenses not been waived/reimbursed during the period, total returns would have been lower. |
| (c) | Periods less than one year are not annualized. |
| (d) | The investment adviser agreed to waive its fees and/or reimburse a portion of the Fund’s expenses during the period. Without this waiver/reimbursement, expenses would have been higher. |
| (e) | Computed on an annualized basis for periods less than one year. |
See accompanying notes to financial statements.
77 |
December 31, 2017
1. Organization. Gateway Trust and Natixis Funds Trust I (the “Trusts” and each a “Trust”) are each organized as a Massachusetts business trust. Each Trust is registered under the Investment Company Act of 1940, as amended (the “1940 Act”), as an open-end management investment company. Each Declaration of Trust permits the Board of Trustees to authorize the issuance of an unlimited number of shares of the Trust in multiple series. The financial statements for certain funds of the Trusts are presented in separate reports. The following funds (individually, a “Fund” and collectively, the “Funds”) are included in this report:
Gateway Trust:
Gateway Fund
Gateway Equity Call Premium Fund
Natixis Funds Trust I:
Mirova Global Green Bond Fund (the “Global Green Bond Fund”)
Mirova Global Sustainable Equity Fund (the “Global Sustainable Equity Fund”)
Global Green Bond Fund commenced operations on February 28, 2017 via contributions to the Fund by Natixis Investment Managers L.P. (“Natixis”) and Natixis Sustainable Future Funds of $21,210,000 and $3,790,000, respectively. Natixis Sustainable Future Funds is a series of ten affiliated mutual funds that commenced operations on February 28, 2017 via contribution to the Funds by Natixis.
Each Fund is a diversified investment company, except for the Global Green Bond Fund which is a non-diversified investment company.
Each Fund offers Class A, Class N (effective May 1, 2017 for Gateway Fund, Gateway Equity Call Premium Fund and Global Sustainable Equity Fund) and Class Y shares. Gateway Fund, Gateway Equity Call Premium Fund and Global Sustainable Equity Fund also offer Class C shares. Class T shares of Gateway Fund, Gateway Equity Call Premium Fund and Global Sustainable Equity Fund are not are not currently available for purchase.
Class A shares are sold with a maximum front-end sales charge of 5.75% for Gateway Fund, Gateway Equity Call Premium Fund and Global Sustainable Equity Fund and 4.25% for Global Green Bond Fund. Class C shares do not pay a front-end sales charge, do not convert to any other class of shares, pay higher Rule 12b-1 fees than Class A shares and may be subject to a contingent deferred sales charge (“CDSC”) of 1.00% if those shares are redeemed within one year of acquisition, except for reinvested distributions. Class N and Class Y shares do not pay a front-end sales charge, a CDSC or Rule 12b-1 fees. Class N shares are offered with an initial minimum investment of $1,000,000. Class Y shares are offered with an initial minimum investment of $100,000. Certain categories of investors are exempted from the minimum investment amounts for Class N and Class Y as outlined in the relevant Funds’ prospectus.
| 78
Notes to Financial Statements (continued)
December 31, 2017
Most expenses can be directly attributed to a Fund. Expenses which cannot be directly attributed to a Fund are generally apportioned based on the relative net assets of each of the funds in Natixis Funds Trust I, Natixis Funds Trust II, Natixis Funds Trust IV and Gateway Trust (“Natixis Funds Trusts”), Loomis Sayles Funds I and Loomis Sayles Funds II (“Loomis Sayles Funds Trusts”) and Natixis ETF Trust. Expenses of the Fund are borne pro rata by the holders of each class of shares, except that each class bears expenses unique to that class (such as the Rule 12b-1 fees applicable to Class A and Class C), and transfer agent fees are borne collectively for Class A, Class C and Class Y, and individually for Class N. In addition, each class votes as a class only with respect to its own Rule 12b-1 Plan. Shares of each class would receive their pro rata share of the net assets of the Fund if the Fund were liquidated. The Trustees approve separate distributions from net investment income on each class of shares.
2. Significant Accounting Policies. The following is a summary of significant accounting policies consistently followed by each Fund in the preparation of its financial statements. The Funds’ financial statements follow the accounting and reporting guidelines provided for investment companies and are prepared in accordance with accounting principles generally accepted in the United States of America which require the use of management estimates that affect the reported amounts and disclosures in the financial statements. Actual results could differ from those estimates. Management has evaluated the events and transactions subsequent to year-end through the date the financial statements were issued and has determined that there were no material events that would require disclosure in the Funds’ financial statements.
a. Valuation. Fund securities and other investments are valued at market value based on market quotations obtained or determined by independent pricing services recommended by the adviser or subadviser and approved by the Board of Trustees. Fund securities and other investments for which market quotations are not readily available are valued at fair value as determined in good faith by the adviser or subadviser pursuant to procedures approved by the Board of Trustees, as described below. Market value is determined as follows:
Listed equity securities (including shares of closed-end investment companies and exchange-traded funds) are valued at the last sale price quoted on the exchange where they are traded most extensively or, if there is no reported sale during the day, the closing bid quotation as reported by an independent pricing service. Securities traded on the NASDAQ Global Select Market, NASDAQ Global Market and NASDAQ Capital Market are valued at the NASDAQ Official Closing Price (“NOCP”), or if lacking an NOCP, at the most recent bid quotations on the applicable NASDAQ Market. Unlisted equity securities (except unlisted preferred equity securities) are valued at the last sale price quoted in the market where they are traded most extensively or, if there is no reported sale during the day, the closing bid quotation as reported by an
79 |
Notes to Financial Statements (continued)
December 31, 2017
independent pricing service. If there is no last sale price or closing bid quotation available, unlisted equity securities will be valued using evaluated bids furnished by an independent pricing service, if available. In some foreign markets, an official close price and a last sale price may be available from the foreign exchange or market. In those cases, the official close price is used. Debt securities and unlisted preferred equity securities are valued based on evaluated bids furnished to the Fund by an independent pricing service or bid prices obtained from broker-dealers. Broker-dealer bid prices may be used to value debt and unlisted equity securities where an independent pricing service is unable to price a security or where an independent pricing service does not provide a reliable price for the security. Futures contracts are valued at the most recent settlement price on the exchange on which the adviser believes that, over time, they are traded most extensively. Option contracts on domestic indices are valued at the average of the closing bid and ask quotations as of the close of trading on the Chicago Board Options Exchange (“CBOE”).
Fund securities and other investments for which market quotations are not readily available are valued at fair value as determined in good faith by the adviser pursuant to procedures approved by the Board of Trustees. On the last business day of the month, the Funds will fair value S&P 500® Index options using the closing rotation values published by the CBOE. The Funds may also value securities and other investments at fair value in other circumstances such as when extraordinary events occur after the close of a foreign market but prior to the close of the New York Stock Exchange (“NYSE”). This may include situations relating to a single issuer (such as a declaration of bankruptcy or a delisting of the issuer’s security from the primary market on which it has traded) as well as events affecting the securities markets in general (such as market disruptions or closings and significant fluctuations in U.S. and/or foreign markets). When fair valuing its securities or other investments, the Funds may, among other things, use modeling tools or other processes that may take into account factors such as securities or other market activity and/or significant events that occur after the close of the foreign market and before the time the Fund’s net asset value (“NAV”) is calculated. Fair value pricing may require subjective determinations about the value of a security, and fair values used to determine a Fund’s NAV may differ from quoted or published prices, or from prices that are used by others, for the same securities. In addition, the use of fair value pricing may not always result in adjustments to the prices of securities held by a Fund.
As of December 31, 2017 securities held by the Funds were fair valued as follows:
Fund | Equity securities1 | Percentage of Net Assets | ||||||
Global Sustainable Equity Fund | $ | 28,802,009 | 42.5 | % | ||||
| 1 | Certain foreign equity securities were fair valued pursuant to procedures approved by the Board of Trustees as events occurring after the close of the foreign market were believed to materially affect the value of those securities. |
| 80
Notes to Financial Statements (continued)
December 31, 2017
As of December 31, 2017 purchased and written options held by the Funds were fair valued using the closing rotation values published by the CBOE as follows:
Fund | Purchased Options | Percentage of Net Assets | Written Options | Percentage of Net Assets | ||||||||||||
Gateway Fund | $ | 13,136,125 | 0.1 | % | $ | 153,198,670 | 1.8 | % | ||||||||
Gateway Equity Call Premium Fund | — | — | 1,444,920 | 1.8 | % | |||||||||||
b. Investment Transactions and Related Investment Income. Investment transactions are accounted for on a trade date plus one day basis for daily NAV calculation. However, for financial reporting purposes, investment transactions are reported on trade date. Dividend income is recorded on ex-dividend date, or in the case of certain foreign securities, as soon as a Fund is notified, and interest income is recorded on an accrual basis. Interest income is increased by the accretion of discount and decreased by the amortization of premium, if applicable. In determining net gain or loss on securities sold, the cost of securities has been determined on an identified cost basis. Investment income, non-class specific expenses and realized and unrealized gains and losses are allocated on a pro rata basis to each class based on the relative net assets of each class to the total net assets of the Fund.
c. Foreign Currency Translation. The books and records of the Funds are maintained in U.S. dollars. The values of securities, currencies and other assets and liabilities denominated in currencies other than U.S. dollars are translated into U.S. dollars based upon foreign exchange rates prevailing at the end of the period. Purchases and sales of investment securities, income and expenses are translated into U.S. dollars on the respective dates of such transactions.
Net realized foreign exchange gains or losses arise from sales of foreign currency, changes in exchange rates between the trade and settlement dates on securities transactions and the difference between the amounts of dividends, interest and foreign withholding taxes recorded on the Fund’s books and the U.S. dollar equivalent of the amounts actually received or paid. Net unrealized foreign exchange gains or losses arise from changes in the value of assets and liabilities, other than investment securities, as of the end of the fiscal period, resulting from changes in exchange rates. Net realized foreign exchange gains or losses and the net change in unrealized foreign exchange gains or losses are disclosed in the Statements of Operations. For federal income tax purposes, net realized foreign exchange gains or losses are characterized as ordinary income, and may, if the Funds have net losses, reduce the amount of income available to be distributed by the Funds.
The values of investment securities are presented at the foreign exchange rates prevailing at the end of the period for financial reporting purposes. Net realized and unrealized gains or losses on investments reported in the Statements of Operations
81 |
Notes to Financial Statements (continued)
December 31, 2017
reflect gains or losses resulting from changes in exchange rates and fluctuations which arise due to changes in market prices of investment securities. For federal income tax purposes, a portion of the net realized gain or loss on investments arising from changes in exchange rates, which is reflected in the Statements of Operations, may be characterized as ordinary income and may, if the Funds have net losses, reduce the amount of income available to be distributed by the Funds.
The Funds may use foreign currency exchange contracts to facilitate transactions in foreign-denominated investments. Losses may arise from changes in the value of the foreign currency or if the counterparties do not perform under the contracts’ terms.
d. Futures Contracts. Certain Funds may enter into futures contracts. Futures contracts are agreements between two parties to buy and sell a particular instrument or index for a specified price on a specified future date.
When a Fund enters into a futures contract, it is required to deposit with (or for the benefit of) its broker an amount of cash or short-term high-quality securities as “initial margin.” As the value of the contract changes, the value of the futures contract position increases or declines. Subsequent payments, known as “variation margin,” are made or received by a Fund, depending on the price fluctuations in the fair value of the contract and the value of cash or securities on deposit with the broker. The aggregate principal amounts of the contracts are not recorded in the financial statements. Fluctuations in the value of the contracts are recorded in the Statements of Assets and Liabilities as an asset (liability) and in the Statements of Operations as unrealized appreciation (depreciation) until the contracts are closed, when they are recorded as realized gains (losses). Realized gain or loss on a futures position is equal to the difference between the value of the contract at the time it was opened and the value at the time it was closed, minus brokerage commissions. When a Fund enters into a futures contract certain risks may arise, such as illiquidity in the futures market, which may limit a Fund’s ability to close out a futures contract prior to settlement date, and unanticipated movements in the value of securities or interest rates.
Futures contracts are exchange-traded. Exchange-traded futures contracts are standardized and are settled through a clearing house with fulfillment supported by the credit of the exchange. Therefore, counterparty credit risks to the Funds are reduced; however, in the event that a counterparty enters into bankruptcy, a Fund’s claim against initial/variation margin on deposit with the counterparty may be subject to terms of a final settlement in bankruptcy court.
e. Option Contracts. Gateway Fund’s and Gateway Equity Call Premium Fund’s investment strategies make use of exchange-traded options. Exchange-traded options are standardized contracts and are settled through a clearing house with fulfillment supported by the credit of the exchange. Therefore, counterparty credit risks to a Fund are reduced.
| 82
Notes to Financial Statements (continued)
December 31, 2017
When a Fund writes an index call option, an amount equal to the net premium received (the premium less commission) is recorded as a liability and is subsequently adjusted to the current value until the option expires or a Fund enters into a closing purchase transaction. When an index call option expires or a Fund enters into a closing purchase transaction, the difference between the net premium received and any amount paid at expiration or on effecting a closing purchase transaction, including commission, is treated as a realized gain or, if the net premium received is less than the amount paid, as a realized loss. A Fund, as writer of an index call option, bears the risk of an unfavorable change in the market value of the index underlying the written option.
When a Fund purchases an index put option, it pays a premium and the index put option is subsequently marked-to-market to reflect current value until the option expires or a Fund enters into a closing sale transaction. Premiums paid for purchasing index put options which expire are treated as realized losses. When a Fund enters into a closing sale transaction, the difference between the premium paid and the proceeds of the closing sale transaction is treated as a realized gain or loss. The risk associated with purchasing index put options is limited to the premium paid.
f. Due from Brokers. Transactions and positions in certain futures contracts are maintained and cleared by registered U.S. broker/dealers pursuant to customer agreements between a Fund and the various broker/dealers. The due from brokers balance in the Statement of Assets and Liabilities for Global Green Bond Fund represents cash pledged as collateral for futures contracts. In certain circumstances the Fund’s use of cash held at brokers is restricted by regulation or broker mandated limits.
g. Federal and Foreign Income Taxes. The Trusts treat each Fund as a separate entity for federal income tax purposes. Each Fund intends to meet the requirements of the Internal Revenue Code of 1986, as amended, applicable to regulated investment companies, and to distribute to its shareholders substantially all of its net investment income and any net realized capital gains at least annually. Management has performed an analysis of each Fund’s tax positions for the open tax years as of December 31, 2017, as applicable, and has concluded that no provisions for income tax are required. The Funds’ federal tax returns for the prior three fiscal years, where applicable, remain subject to examination by the Internal Revenue Service. Management is not aware of any events that are reasonably possible to occur in the next twelve months that would result in the amounts of any unrecognized tax benefits significantly increasing or decreasing for the Funds. However, management’s conclusions regarding tax positions taken may be subject to review and adjustment at a later date based on factors including, but not limited to, new tax laws and accounting regulations and interpretations thereof.
A Fund may be subject to foreign withholding taxes on investment income and taxes on capital gains on investments that are accrued and paid based upon the Fund’s
83 |
Notes to Financial Statements (continued)
December 31, 2017
understanding of the tax rules and regulations that exist in the countries in which the Fund invests. Foreign withholding taxes on dividend and interest income are reflected on the Statements of Operations as a reduction of investment income, net of amounts eligible to be reclaimed. Dividends and interest receivable on the Statements of Assets and Liabilities are net of foreign withholding taxes. Foreign withholding taxes where reclaims have been or will be filed are reflected on the Statements of Assets and Liabilities as tax reclaims receivable. Capital gains taxes paid are included in net realized gain (loss) on investments in the Statements of Operations. Accrued but unpaid capital gains taxes are reflected as foreign taxes payable on the Statements of Assets and Liabilities, if applicable, and reduce unrealized gains on investments. In the event that realized gains on investments are subsequently offset by realized losses, taxes paid on realized gains may be returned to a Fund. Such amounts, if applicable, are reflected as foreign tax rebates receivable on the Statements of Assets and Liabilities and are recorded as a realized gain when received.
h. Dividends and Distributions to Shareholders. Dividends and distributions are recorded on ex-dividend date. The timing and characterization of certain income and capital gain distributions are determined in accordance with federal tax regulations, which may differ from accounting principles generally accepted in the United States of America. Permanent differences are primarily due to differing treatments for book and tax purposes of items such as foreign currency gains and losses, premium amortization, non-deductible expenses, return of capital and capital gain distributions received, distribution re-designations and distributions in excess of income and/or capital gain. Permanent book and tax basis differences relating to shareholder distributions, net investment income and net realized gains will result in reclassifications to capital accounts reported on the Statements of Assets and Liabilities. Temporary differences between book and tax distributable earnings are primarily due to wash sales, premium amortization, futures contract mark-to-market, return of capital distributions received, deferred trustees’ fees and option contract mark-to-market. Amounts of income and capital gain available to be distributed on a tax basis are determined annually, and at other times during the Funds’ fiscal year as may be necessary to avoid knowingly declaring and paying a return of capital distribution. Distributions from net investment income and short-term capital gains are considered to be distributed from ordinary income for tax purposes.
| 84
Notes to Financial Statements (continued)
December 31, 2017
The tax characterization of distributions is determined on an annual basis. The tax character of distributions paid to shareholders during the years ended December 31, 2017 and 2016 was as follows:
| 2017 Distributions Paid From: | 2016 Distributions Paid From: | |||||||||||||||||||||||
Fund | Ordinary Income | Long-Term Capital Gains | Total | Ordinary Income | Long-Term Capital Gains | Total | ||||||||||||||||||
Gateway Fund | $ | 96,146,895 | $ | — | $ | 96,146,895 | $ | 125,407,692 | $ | — | $ | 125,407,692 | ||||||||||||
Gateway Equity Call Premium Fund | 825,437 | — | 825,437 | 778,103 | — | 778,103 | ||||||||||||||||||
Global Green Bond Fund | 503,903 | — | 503,903 | — | — | — | ||||||||||||||||||
Global Sustainable Equity Fund | 270,696 | 488,562 | 759,258 | 100,101 | — | 100,101 | ||||||||||||||||||
Differences between these amounts and those reported in the Statements of Changes in Net Assets are primarily attributable to different book and tax treatment for short-term capital gains.
As of December 31, 2017, the components of distributable earnings on a tax basis were as follows:
Gateway Fund | Gateway Equity Call Premium Fund | Global Green Bond Fund | Global Sustainable Equity Fund | |||||||||||||
Undistributed ordinary income | $ | 7,829,492 | $ | — | $ | 197,675 | $ | — | ||||||||
Undistributed long-term capital gains | — | — | — | 494,882 | ||||||||||||
|
|
|
|
|
|
|
| |||||||||
Total undistributed earnings | 7,829,492 | — | 197,675 | 494,882 | ||||||||||||
|
|
|
|
|
|
|
| |||||||||
Capital loss carryforward: | ||||||||||||||||
Short-term: | ||||||||||||||||
Expires: | ||||||||||||||||
December 31, 2018 | (359,753,704 | ) | — | — | — | |||||||||||
No expiration date | — | (4,993,709 | ) | (607,978 | ) | — | ||||||||||
Long-term: | ||||||||||||||||
No expiration date | — | (4,236,211 | ) | (971,466 | ) | — | ||||||||||
|
|
|
|
|
|
|
| |||||||||
Total capital loss carryforward | $ | (359,753,704 | ) | $ | (9,229,920 | ) | $ | (1,579,444 | ) | $ | — | |||||
|
|
|
|
|
|
|
| |||||||||
85 |
Notes to Financial Statements (continued)
December 31, 2017
Gateway Fund | Gateway Equity Call Premium Fund | Global Green Bond Fund | Global Sustainable Equity Fund | |||||||||||||
Late-year ordinary and post-October capital loss deferrals* | $ | — | $ | — | $ | — | $ | (1,001 | ) | |||||||
|
|
|
|
|
|
|
| |||||||||
Unrealized appreciation | 2,495,305,753 | 22,601,008 | 1,322,170 | 12,998,738 | ||||||||||||
|
|
|
|
|
|
|
| |||||||||
Total accumulated earnings (losses) | $ | 2,143,381,541 | $ | 13,371,088 | $ | (59,599 | ) | $ | 13,492,619 | |||||||
|
|
|
|
|
|
|
| |||||||||
| * | Under current tax law, capital losses, foreign currency losses, and losses on passive foreign investment companies and contingent payment debt instruments after October 31 or December 31, as applicable, may be deferred and treated as occurring on the first day of the following taxable year. |
Capital losses may be utilized to offset future capital gains until expiration. The Regulated Investment Company Modernization Act of 2010 (the “Act”) allows capital loss carryforwards to be carried forward indefinitely. Rules in effect previously limited the carryforward period to eight years. Capital loss carryforwards generated in taxable years beginning after the effective date of the Act must be fully used before capital loss carryforwards generated in years prior to the effective date of the Act; therefore, under certain circumstances, capital loss carryforwards available as of the report date may expire unused.
As of December 31, 2017, the cost of investments (including derivatives, if applicable) and unrealized appreciation (depreciation) on a federal tax basis were as follows:
Gateway Fund | Gateway Equity Call Premium Fund | Global Green Bond Fund | Global Sustainable Equity Fund | |||||||||||||
Federal tax cost | $ | 6,152,052,044 | $ | 60,037,849 | $ | 23,907,172 | $ | 54,219,664 | ||||||||
|
|
|
|
|
|
|
| |||||||||
Gross tax appreciation | $ | 2,638,614,383 | $ | 23,560,784 | $ | 1,360,640 | $ | 13,561,508 | ||||||||
Gross tax depreciation | (143,308,660 | ) | (959,776 | ) | (47,858 | ) | (564,525 | ) | ||||||||
|
|
|
|
|
|
|
| |||||||||
Net tax appreciation | $ | 2,495,305,723 | $ | 22,601,008 | $ | 1,312,782 | $ | 12,996,983 | ||||||||
|
|
|
|
|
|
|
| |||||||||
Differences between these amounts and those reported in the components of distributable earnings are primarily attributable to foreign currency mark-to-market.
i. Repurchase Agreements. Each Fund may enter into repurchase agreements, under the terms of a Master Repurchase Agreement, under which each Fund acquires securities as collateral and agrees to resell the securities at an agreed upon time and at an agreed upon price. It is each Fund’s policy that the market value of the collateral for repurchase agreements be at least equal to 102% of the repurchase price, including
| 86
Notes to Financial Statements (continued)
December 31, 2017
interest. Certain repurchase agreements are tri-party arrangements whereby the collateral is held in a segregated account for the benefit of the Fund and on behalf of the counterparty. Repurchase agreements could involve certain risks in the event of default or insolvency of the counterparty, including possible delays or restrictions upon a Fund’s ability to dispose of the underlying securities. As of December 31, 2017, each Fund, as applicable, had investments in repurchase agreements for which the value of the related collateral exceeded the value of the repurchase agreement. The gross value of repurchase agreements is included in the Statements of Assets and Liabilities for financial reporting purposes.
j. Indemnifications. Under the Trusts’ organizational documents, its officers and Trustees are indemnified against certain liabilities arising out of the performance of their duties to the Funds. Additionally, in the normal course of business, the Funds enter into contracts with service providers that contain general indemnification clauses. The Funds’ maximum exposure under these arrangements is unknown as this would involve future claims that may be made against the Funds that have not yet occurred. However, based on experience, the Funds expect the risk of loss to be remote.
3. Fair Value Measurements. In accordance with accounting standards related to fair value measurements and disclosures, the Funds have categorized the inputs utilized in determining the value of each Fund’s assets or liabilities. These inputs are summarized in the three broad levels listed below:
| • | Level 1 – quoted prices in active markets for identical assets or liabilities; |
| • | Level 2 – prices determined using other significant inputs that are observable either directly, or indirectly through corroboration with observable market data (which could include quoted prices for similar assets or liabilities, interest rates, credit risk, etc.); and |
| • | Level 3 – prices determined using significant unobservable inputs when quoted prices or observable inputs are unavailable such as when there is little or no market activity for an asset or liability (unobservable inputs reflect each Fund’s own assumptions in determining the fair value of assets or liabilities and would be based on the best information available). |
The inputs or methodology used for valuing securities are not necessarily an indication of the risk associated with investing in those securities.
87 |
Notes to Financial Statements (continued)
December 31, 2017
The following is a summary of the inputs used to value the Funds’ investments as of December 31, 2017, at value:
Gateway Fund
Asset Valuation Inputs
Description | Level 1 | Level 2 | Level 3 | Total | ||||||||||||
Common Stocks(a) | $ | 8,429,239,556 | $ | — | $ | — | $ | 8,429,239,556 | ||||||||
Purchased Options | — | 13,136,125 | — | 13,136,125 | ||||||||||||
Short-Term Investments | — | 218,118,211 | — | 218,118,211 | ||||||||||||
|
|
|
|
|
|
|
| |||||||||
Total | $ | 8,429,239,556 | $ | 231,254,336 | $ | — | $ | 8,660,493,892 | ||||||||
|
|
|
|
|
|
|
| |||||||||
| Liability Valuation Inputs | ||||||||||||||||
Description | Level 1 | Level 2 | Level 3 | Total | ||||||||||||
Written Options | $ | — | $ | (153,198,670 | ) | $ | — | $ | (153,198,670 | ) | ||||||
|
|
|
|
|
|
|
| |||||||||
| (a) | Details of the major categories of the Fund’s investments are reflected within the Portfolio of Investments. |
For the year ended December 31, 2017, there were no transfers among Levels 1, 2 and 3.
Gateway Equity Call Premium Fund
Asset Valuation Inputs
Description | Level 1 | Level 2 | Level 3 | Total | ||||||||||||
Common Stocks(a) | $ | 80,419,636 | $ | — | $ | — | $ | 80,419,636 | ||||||||
Short-Term Investments | — | 2,219,220 | — | 2,219,220 | ||||||||||||
|
|
|
|
|
|
|
| |||||||||
Total | $ | 80,419,636 | $ | 2,219,220 | $ | — | $ | 82,638,856 | ||||||||
|
|
|
|
|
|
|
| |||||||||
| Liability Valuation Inputs | ||||||||||||||||
Description | Level 1 | Level 2 | Level 3 | Total | ||||||||||||
Written Options | $ | — | $ | (1,444,920 | ) | $ | — | $ | (1,444,920 | ) | ||||||
|
|
|
|
|
|
|
| |||||||||
| (a) | Details of the major categories of the Fund’s investments are reflected within the Portfolio of Investments. |
For the year ended December 31, 2017, there were no transfers among Levels 1, 2 and 3.
| 88
Notes to Financial Statements (continued)
December 31, 2017
Global Green Bond Fund
Asset Valuation Inputs
Description | Level 1 | Level 2 | Level 3 | Total | ||||||||||||
Bonds and Notes(a) | $ | — | $ | 24,476,352 | $ | — | $ | 24,476,352 | ||||||||
Short-Term Investments | — | 743,602 | — | 743,602 | ||||||||||||
Futures Contracts (unrealized appreciation) | 8,104 | — | — | 8,104 | ||||||||||||
|
|
|
|
|
|
|
| |||||||||
Total | $ | 8,104 | $ | 25,219,954 | $ | — | $ | 25,228,058 | ||||||||
|
|
|
|
|
|
|
| |||||||||
| Liability Valuation Inputs | ||||||||||||||||
Description | Level 1 | Level 2 | Level 3 | Total | ||||||||||||
Futures Contracts (unrealized depreciation) | $ | (245,474 | ) | $ | — | $ | — | $ | (245,474 | ) | ||||||
|
|
|
|
|
|
|
| |||||||||
| (a) | Details of the major categories of the Fund’s investments are reflected within the Portfolio of Investments. |
For the year ended December 31, 2017, there were no transfers among Levels 1, 2 and 3.
Global Sustainable Equity Fund
Asset Valuation Inputs
Description | Level 1 | Level 2 | Level 3 | Total | ||||||||||||
Common Stocks | ||||||||||||||||
Belgium | $ | — | $ | 2,330,841 | $ | — | $ | 2,330,841 | ||||||||
China | — | 573,375 | — | 573,375 | ||||||||||||
Denmark | — | 5,104,107 | — | 5,104,107 | ||||||||||||
France | — | 3,198,011 | — | 3,198,011 | ||||||||||||
Germany | — | 3,660,285 | — | 3,660,285 | ||||||||||||
Hong Kong | — | 3,314,319 | — | 3,314,319 | ||||||||||||
Japan | — | 3,896,426 | — | 3,896,426 | ||||||||||||
Netherlands | — | 2,181,127 | — | 2,181,127 | ||||||||||||
Switzerland | — | 1,611,120 | — | 1,611,120 | ||||||||||||
United Kingdom | 1,606,407 | 2,932,398 | — | 4,538,805 | ||||||||||||
All Other Common Stocks(a) | 34,762,746 | — | — | 34,762,746 | ||||||||||||
|
|
|
|
|
|
|
| |||||||||
Total Common Stocks | 36,369,153 | 28,802,009 | — | 65,171,162 | ||||||||||||
|
|
|
|
|
|
|
| |||||||||
Short-Term Investments | — | 2,045,485 | — | 2,045,485 | ||||||||||||
|
|
|
|
|
|
|
| |||||||||
Total | $ | 36,369,153 | $ | 30,847,494 | $ | — | $ | 67,216,647 | ||||||||
|
|
|
|
|
|
|
| |||||||||
| (a) | Details of the major categories of the Fund’s investments are reflected within the Portfolio of Investments. |
89 |
Notes to Financial Statements (continued)
December 31, 2017
For the year ended December 31, 2017, there were no transfers among Levels 1, 2 and 3.
4. Derivatives. Derivative instruments are defined as financial instruments whose value and performance are based on the value and performance of an underlying asset, reference rate or index. Derivative instruments that the Funds used during the period include futures contracts, written index call options and purchased index put options.
Gateway Fund and Gateway Equity Call Premium Fund seek to capture the majority of the returns associated with equity market investments, while exposing investors to less risk than other equity investments. To meet this investment goal, the Funds invest in a broadly diversified portfolio of common stocks, while also writing index call options. Writing index call options can reduce the Fund’s volatility, provide a steady cash flow and be an important source of the Fund’s return, although it also may reduce the Funds’ ability to profit from increases in the value of its equity portfolio. The Gateway Fund also buys index put options, which can protect the Fund from a significant market decline that may occur over a short period of time. The value of an index put option generally increases as the prices of stocks constituting the index decrease and decreases as those stocks increase in price. The combination of the diversified stock portfolio, the steady cash flow from writing of index call options and the downside protection from purchased index put options is intended to provide the Funds with the majority of the returns associated with equity market investments while exposing investors to less risk than other equity investments. During the year ended December 31, 2017, Gateway Fund used written index call options and purchased index put options and Gateway Equity Call Premium Fund used written index call options in accordance with this objective.
Global Green Bond Fund seeks to provide total return, through a combination of capital appreciation and current income, by investing in green bonds. The Fund pursues its objective by primarily investing in fixed-income securities. In connection with its principal investment strategies, the Fund may also invest in futures, forwards and foreign currency transactions for hedging and investment purposes and to manage duration. During the period ended December 31, 2017, the Fund used futures contracts to gain yield curve exposure, manage duration and for currency hedging purposes in accordance with its objective.
The following is a summary of derivative instruments for Gateway Fund as of December 31, 2017, as reflected within the Statements of Assets and Liabilities:
Assets | Investments at value1 | |||
Exchange-traded asset derivatives | ||||
Equity contracts | $ | 13,136,125 | ||
| 90
Notes to Financial Statements (continued)
December 31, 2017
Liabilities | Options written at value | |||
Exchange-traded liability derivatives | ||||
Equity contracts | $ | (153,198,670 | ) | |
| 1 | Represents purchased options, at value. |
Transactions in derivative instruments for Gateway Fund during the year ended December 31, 2017, as reflected within the Statements of Operations were as follows:
Net Realized Gain (Loss) on: | Investments2 | Options written | ||||||
Equity contracts | $ | (235,567,627 | ) | $ | (562,013,864 | ) | ||
Net Change in Unrealized Appreciation (Depreciation) on: | Investments2 | Options written | ||||||
Equity contracts | $ | (3,827,388 | ) | $ | (20,438,813 | ) | ||
| 2 | Represents realized loss and change in unrealized appreciation (depreciation), respectively, for purchased options during the period. |
The following is a summary of derivative instruments for Gateway Equity Call Premium Fund as of December 31, 2017, as reflected within the Statements of Assets and Liabilities:
Liabilities | Options written at value | |||
Exchange-traded liability derivatives | ||||
Equity contracts | $ | (1,444,920 | ) | |
Transactions in derivative instruments for Gateway Equity Call Premium Fund during the year ended December 31, 2017, as reflected within the Statements of Operations were as follows:
Net Realized Gain (Loss) on: | Options written | |||
Equity contracts | $ | (5,634,939 | ) | |
Net Change in Unrealized Appreciation (Depreciation) on: | Options written | |||
Equity contracts | $ | (159,664 | ) | |
The following is a summary of derivative instruments for Global Green Bond Fund as of December 31, 2017, as reflected within the Statements of Assets and Liabilities:
Assets | Unrealized appreciation on futures contracts | |||
Exchange-traded asset derivatives | ||||
Interest rate contracts | $ | 8,104 | ||
91 |
Notes to Financial Statements (continued)
December 31, 2017
Liabilities | Unrealized depreciation on futures contracts | |||
Exchange-traded liability derivatives | ||||
Interest rate contracts | $ | (13,768 | ) | |
Foreign exchange contracts | (231,706 | ) | ||
|
| |||
Total exchange-traded liability derivatives | $ | (245,474 | ) | |
|
| |||
Transactions in derivative instruments for Global Green Bond Fund during the period ended December 31, 2017, as reflected within the Statements of Operations were as follows:
Net Realized Gain (Loss) on: | Futures contracts | |||
Interest rate contracts | $ | (71,749 | ) | |
Foreign exchange contracts | (1,309,708 | ) | ||
|
| |||
Total | $ | (1,381,457 | ) | |
|
| |||
Net Change in Unrealized Appreciation (Depreciation) on: | Futures contracts | |||
Interest rate contracts | $ | (5,664 | ) | |
Foreign exchange contracts | (231,706 | ) | ||
|
| |||
Total | $ | (237,370 | ) | |
|
| |||
As the Fund values its derivatives at fair value and recognizes changes in fair value through the Statements of Operations, it does not qualify for hedge accounting under authoritative guidance for derivative instruments. The Fund’s investments in derivatives may represent an economic hedge; however, they are considered to be non-hedge transactions for the purpose of these disclosures.
The volume of option contract activity as a percentage of investments in common stocks, for Gateway Fund based on month-end notional amounts outstanding during the period, at absolute value, was as follows for the year ended December 31, 2017:
Gateway Fund | Call Options Written* | Put Options Purchased* | ||||||
Average Notional Amount Outstanding | 98.99 | % | 98.99 | % | ||||
Highest Notional Amount Outstanding | 99.08 | % | 99.08 | % | ||||
Lowest Notional Amount Outstanding | 98.85 | % | 98.85 | % | ||||
Notional Amount Outstanding as of December 31, 2017 | 98.99 | % | 98.99 | % | ||||
| 92
Notes to Financial Statements (continued)
December 31, 2017
The volume of option contract activity as a percentage of investments in common stocks for Gateway Equity Call Premium Fund, based on month-end notional amounts outstanding during the period, at absolute value, was as follows for the year ended December 31, 2017:
Gateway Equity Call Premium Fund | Call Options Written* | |||
Average Notional Amount Outstanding | 98.97 | % | ||
Highest Notional Amount Outstanding | 99.20 | % | ||
Lowest Notional Amount Outstanding | 98.69 | % | ||
Notional Amount Outstanding as of December 31, 2017 | 98.74 | % | ||
| * | Notional amounts outstanding are determined by multiplying option contracts by the contract multiplier by the price of the option’s underlying index, the S&P 500® Index. |
The volume of futures contract activity as a percentage of net assets, for Global Green Bond Fund based on month-end notional amounts outstanding during the period, at absolute value, was as follows for the period ended December 31, 2017:
Global Green Bond Fund | Futures | |
| Average Notional Amount Outstanding | 75.68% | |
| Highest Notional Amount Outstanding | 84.70% | |
| Lowest Notional Amount Outstanding | 62.16% | |
| Notional Amount Outstanding as of December 31, 2017 | 72.14% |
Notional amounts outstanding at the end of the prior period are included in the averages above.
Counterparty risk is managed based on policies and procedures established by the Fund’s adviser. Such policies and procedures may include, but are not limited to, minimum counterparty credit rating requirements, monitoring of counterparty credit default swap spreads and posting of collateral. With exchange-traded derivatives, there is minimal counterparty credit risk to the Fund because the exchange’s clearinghouse, as counterparty to these instruments, stands between the buyer and the seller of the contract. Credit risk still exists in exchange-traded derivatives with respect to initial and variation margin that is held in a broker’s customer accounts. While brokers are required to segregate customer margin from their own assets, in the event that a broker becomes insolvent or goes into bankruptcy and at that time there is a shortfall in the aggregate amount of margin held by the broker for all its clients, U.S. bankruptcy laws will typically allocate that shortfall on a pro rata basis across all of the broker’s customers, potentially resulting in losses to the Fund. The following table shows the maximum amount of loss due to credit risk that, based on the gross fair value of the financial instrument, the Fund would incur if parties to the relevant financial instruments failed completely to perform according to the terms of the
93 |
Notes to Financial Statements (continued)
December 31, 2017
contracts and the collateral or other security, if any, for the amount due proved to be of no value to the Fund, as of December 31, 2017:
Fund | Maximum Amount of Loss - Gross | Maximum Amount of Loss - Net | ||||||
Global Green Bond Fund | $ | 542,765 | $ | 542,765 | ||||
5. Purchases and Sales of Securities. For the year ended (period ended for Global Green Bond Fund) December 31, 2017, purchases and sales of securities (excluding short-term investments and U.S. Government/Agency securities and option contracts and including paydowns) were as follows:
Fund | Purchases | Sales | ||||||
Gateway Fund | $ | 2,702,274,365 | $ | 3,184,009,390 | ||||
Gateway Equity Call Premium Fund | 15,153,529 | 17,888,018 | ||||||
Global Green Bond Fund | 33,292,042 | 10,656,181 | ||||||
Global Sustainable Equity Fund | 14,415,988 | 11,510,933 | ||||||
6. Management Fees and Other Transactions with Affiliates.
a. Management Fees. Gateway Investment Advisers, LLC (“Gateway Advisers”) serves as investment adviser to the Gateway Fund and Gateway Equity Call Premium Fund. Gateway Advisers is a subsidiary of Natixis, which is part of Natixis Investment Managers, an international asset management group based in Paris, France. Under the terms of the management agreements, each Fund pays a management fee at the following annual rates, calculated daily and payable monthly, based on each Fund’s average daily net assets:
| Percentage of Average Daily Net Assets | ||||||||||||
Fund | First $5 billion | Next $5 billion | Over $10 billion | |||||||||
Gateway Fund | 0.65 | % | 0.60 | % | 0.58 | % | ||||||
Gateway Equity Call Premium Fund | 0.65 | % | 0.65 | % | 0.65 | % | ||||||
Natixis Asset Management U.S., LLC (“Natixis AM US”) serves as investment adviser to the Global Green Bond Fund and Global Sustainable Equity Fund. Under the terms of the management agreements, each Fund pays a management fee at the following annual rates, calculated daily and payable monthly, based on each Fund’s average daily net assets:
Fund | Percentage of Average Daily Net Assets | |||
Global Green Bond Fund | 0.55 | % | ||
Global Sustainable Equity Fund | 0.80 | % | ||
| 94
Notes to Financial Statements (continued)
December 31, 2017
Gateway Advisers and Natixis AM US have given binding undertakings to the Funds to waive management fees and/or reimburse certain expenses to limit the Funds’ operating expenses, exclusive of acquired fund fees and expenses, brokerage expenses, interest expense, taxes, organizational and extraordinary expenses such as litigation and indemnification expenses. These undertakings are in effect until April 30, 2018, may be terminated before then only with the consent of the Funds’ Board of Trustees, and are reevaluated on an annual basis. Management fees payable, as reflected on the Statements of Assets and Liabilities, is net of waivers and/or expense reimbursements, if any, pursuant to these undertakings. Waivers/reimbursements that exceed management fees payable are reflected on the Statements of Assets and Liabilities as receivable from investment adviser.
For the year ended (period ended for Class N and Global Green Bond Fund) December 31, 2017, the expense limits as a percentage of average daily net assets under the expense limitation agreement were as follows:
| Expense Limit as a Percentage of Average Daily Net Assets | ||||||||||||||||
Fund | Class A | Class C | Class N | Class Y | ||||||||||||
Gateway Fund | 0.94 | % | 1.70 | % | 0.65 | % | 0.70 | % | ||||||||
Gateway Equity Call Premium Fund | 1.20 | % | 1.95 | % | 0.90 | % | 0.95 | % | ||||||||
Global Green Bond Fund | 0.95 | % | — | 0.65 | % | 0.70 | % | |||||||||
Global Sustainable Equity Fund | 1.30 | % | 2.05 | % | 1.00 | % | 1.05 | % | ||||||||
Gateway Advisers and Natixis AM US shall be permitted to recover expenses they have borne under the expense limitation agreement (whether through waiver of its management fee or otherwise) on a class by class basis in later periods to the extent the annual operating expenses of a class fall below a class’ expense limits, provided, however, that a class is not obligated to pay such waived/reimbursed fees or expenses more than one year after the end of the fiscal year in which the fees or expenses were waived/reimbursed.
For the year ended (period ended for Global Green Bond Fund) December 31, 2017, the management fees and waiver of management fees for each Fund were as follows:
Fund | Gross Management Fees | Contractual Waivers of Management Fees1 | Voluntary Waivers of Management Fees2 | Net Management Fees | Percentage of Average Daily Net Assets | |||||||||||||||||||
Gross | Net | |||||||||||||||||||||||
Gateway Fund | $ | 50,695,230 | $ | 5,686,948 | $ | — | $ | 45,008,282 | 0.63 | % | 0.56 | % | ||||||||||||
Gateway Equity Call Premium Fund | 512,391 | 77,375 | — | 435,016 | 0.65 | % | 0.55 | % | ||||||||||||||||
95 |
Notes to Financial Statements (continued)
December 31, 2017
Fund | Gross Management Fees | Contractual Waivers of Management Fees1 | Voluntary Waivers of Management Fees2 | Net Management Fees | Percentage of Average Daily Net Assets | |||||||||||||||||||
Gross | Net | |||||||||||||||||||||||
Global Green Bond Fund | $ | 117,442 | $ | 95,290 | $ | — | $ | 22,152 | 0.55 | % | 0.10 | % | ||||||||||||
Global Sustainable Equity Fund | 480,229 | 65,673 | 7,651 | 406,905 | 0.80 | % | 0.68 | % | ||||||||||||||||
| 1 | Management fee waiver is subject to possible recovery until December 31, 2018. |
| 2 | Voluntary management fee waivers are not subject to recovery under the expense limitation agreement described above. |
For the year ended (period ended for Global Green Bond Fund) December 31, 2017, class-specific expenses have been reimbursed as follows:
| Reimbursement | ||||||||||||||||||||
Fund | Class A | Class C | Class N | Class Y | Total | |||||||||||||||
Gateway Fund | $ | 173,713 | $ | — | $ | — | $ | — | $ | 173,713 | ||||||||||
Global Green Bond Fund | 1,148 | — | — | 155 | 1,303 | |||||||||||||||
No expenses were recovered during the year ended (period ended for Global Green Bond Fund) December 31, 2017 under the terms of the expense limitation agreement.
b. Service and Distribution Fees. Natixis Distribution, L.P. (“Natixis Distribution”), which is a wholly-owned subsidiary of Natixis, has entered into a distribution agreement with the Trust. Pursuant to this agreement, Natixis Distribution serves as principal underwriter of the Fund.
Pursuant to Rule 12b-1 under the 1940 Act, the Trust has adopted a Service Plan relating to each Fund’s Class A shares (the “Class A Plan”) and a Distribution and Service Plan relating to each Fund’s Class C shares (the “Class C Plan”).
Under the Class A Plan, each Fund pays Natixis Distribution a monthly service fee at an annual rate not to exceed 0.25% of the average daily net assets attributable to the Fund’s Class A shares, as reimbursement for expenses incurred by Natixis Distribution in providing personal services to investors in Class A shares and/or the maintenance of shareholder accounts.
Under the Class C Plan, if applicable, each Fund pays Natixis Distribution a monthly service fee at an annual rate not to exceed 0.25% of the average daily net assets attributable to the Fund’s Class C shares, as compensation for services provided by Natixis Distribution in providing personal services to investors in Class C shares and/or the maintenance of shareholder accounts.
| 96
Notes to Financial Statements (continued)
December 31, 2017
Also under the Class C Plan, if applicable, each Fund pays Natixis Distribution a monthly distribution fee at an annual rate of 0.75% of the average daily net assets attributable to the Fund’s Class C shares, as compensation for services provided by Natixis Distribution in connection with the marketing or sale of Class C shares.
For the year ended (period ended for Global Green Bond Fund) December 31, 2017, the service and distribution fees for each Fund were as follows:
| Service Fees | Distribution Fees | |||||||||||
Fund | Class A | Class C | Class C | |||||||||
Gateway Fund | $ | 4,342,820 | $ | 867,427 | $ | 2,602,280 | ||||||
Gateway Equity Call Premium Fund | 21,868 | 1,511 | 4,532 | |||||||||
Global Green Bond Fund | 75 | — | — | |||||||||
Global Sustainable Equity Fund | 1,682 | 885 | 2,656 | |||||||||
c. Administrative Fees. Natixis Advisors, L.P. (“Natixis Advisors”) provides certain administrative services for the Funds and contracts with State Street Bank and Trust Company (“State Street Bank”) to serve as sub-administrator. Pursuant to an agreement among Natixis Funds Trusts, Loomis Sayles Funds Trusts, Natixis ETF Trust and Natixis Advisors, the Fund pays Natixis Advisors monthly its pro rata portion of fees equal to an annual rate of 0.0575% of the first $15 billion of the average daily net assets of the Natixis Funds Trusts, Loomis Sayles Funds Trusts and Natixis ETF Trust, 0.0500% of the next $15 billion, 0.0400% of the next $30 billion, 0.0350% of the next $30 billion and 0.0325% of such assets in excess of $90 billion, subject to an annual aggregate minimum fee for the Natixis Funds Trusts, Loomis Sayles Funds Trusts and Natixis ETF Trust of $10 million, which is reevaluated on an annual basis.
For the year ended (period ended for Global Green Bond Fund) December 31, 2017, the administrative fees for each Fund were as follows:
Fund | Administrative Fees | |||
Gateway Fund | $ | 3,577,170 | ||
Gateway Equity Call Premium Fund | 35,101 | |||
Global Green Bond Fund | 9,509 | |||
Global Sustainable Equity Fund | 26,726 | |||
d. Sub-Transfer Agent Fees. Natixis Distribution has entered into agreements, which include servicing agreements, with financial intermediaries that provide recordkeeping, processing, shareholder communications and other services to customers of the intermediaries that hold positions in the Funds and has agreed to compensate the intermediaries for providing those services. Intermediaries transact with the Funds primarily through the use of omnibus accounts on behalf of their customers who hold positions in the Funds. These services would have been provided by the Funds’ transfer agent and other service providers if the shareholders’ accounts were maintained directly
97 |
Notes to Financial Statements (continued)
December 31, 2017
at the Funds’ transfer agent. Accordingly, the Funds have agreed to reimburse Natixis Distribution for all or a portion of the servicing fees paid to these intermediaries. The reimbursement amounts (sub-transfer agent fees) paid to Natixis Distribution are subject to a current per-account equivalent fee limit approved by the Funds’ Board of Trustees, which is based on fees for similar services paid to the Funds’ transfer agent and other service providers. Class N shares do not bear such expenses.
For the year ended (period ended Global Green Bond Fund) December 31, 2017, the sub-transfer agent fees (which are reflected in transfer agent fees and expenses in the Statements of Operations) for each Fund were as follows:
Fund | Sub-Transfer Agent Fees | |||
Gateway Fund | $ | 4,956,035 | ||
Gateway Equity Call Premium Fund | 32,990 | |||
Global Green Bond Fund | 21 | |||
Global Sustainable Equity Fund | 11,922 | |||
As of December 31, 2017, the Funds owe Natixis Distribution the following reimbursements for sub-transfer agent fees (which are reflected in the Statements of Assets and Liabilities as payable to distributor):
Fund | Reimbursements of Sub-Transfer Agent Fees | |||
Gateway Fund | $ | 60,343 | ||
Gateway Equity Call Premium Fund | 485 | |||
Global Sustainable Equity Fund | 345 | |||
Sub-transfer agent fees attributable to Class A, Class C and Class Y are allocated on a pro rata basis to each class based on the relative net assets of each class to the total net assets of those classes.
e. Commissions. Commissions (including CDSCs) on Fund shares retained by Natixis Distribution during the year ended December 31, 2017, were as follows:
Fund | Commissions | |||
Gateway Fund | $ | 207,905 | ||
Gateway Equity Call Premium Fund | 2,921 | |||
Global Sustainable Equity Fund | 3,164 | |||
f. Trustees Fees and Expenses. The Trusts do not pay any compensation directly to its officers or Trustees who are directors, officers or employees of Natixis Advisors, Natixis Distribution, Natixis or their affiliates. The Chairperson of the Board of Trustees receives a retainer fee at the annual rate of $325,000. The Chairperson does not receive
| 98
Notes to Financial Statements (continued)
December 31, 2017
any meeting attendance fees for Board of Trustees meetings or committee meetings that he attends. Each Independent Trustee (other than the Chairperson) receives, in the aggregate, a retainer fee at the annual rate of $155,000. Each Independent Trustee also receives a meeting attendance fee of $10,000 for each meeting of the Board of Trustees that he or she attends in person and $5,000 for each meeting of the Board of Trustees that he or she attends telephonically. In addition, the chairperson of the Contract Review Committee and the chairperson of the Audit Committee each receive an additional retainer fee at the annual rate of $17,500. The chairperson of the Governance Committee receives an additional retainer fee at the annual rate of $10,000. Each Contract Review Committee member is compensated $6,000 for each Committee meeting that he or she attends in person and $3,000 for each meeting that he or she attends telephonically. Each Audit Committee member is compensated $6,000 for each Committee meeting that he or she attends in person and $3,000 for each meeting that he or she attends telephonically. These fees are allocated among the funds in the Natixis Funds Trusts, Loomis Sayles Funds Trusts and Natixis ETF Trust based on a formula that takes into account, among other factors, the relative net assets of each fund. Trustees are reimbursed for travel expenses in connection with attendance at meetings.
Effective January 1, 2018, the Chairperson of the Board will receive a retainer fee at the annual rate of $340,000, each Independent Trustee (other than the Chairperson) will receive, in the aggregate, a retainer fee at the annual rate of $170,000, the chairperson of the Contract Review Committee and Audit Committee each will receive an additional retainer fee at the annual rate of $20,000 and the chairperson of the Governance Committee will receive an additional retainer fee at the annual rate of $12,000. All other Trustee fees will remain unchanged.
A deferred compensation plan (the “Plan”) is available to the Trustees on a voluntary basis. Deferred amounts remain in the Fund until distributed in accordance with the provisions of the Plan. The value of a participating Trustee’s deferral account is based on theoretical investments of deferred amounts, on the normal payment dates, in certain funds of the Natixis Funds Trusts, Loomis Sayles Funds Trusts, and Natixis ETF Trust as designated by the participating Trustees. Changes in the value of participants’ deferral accounts are allocated pro rata among the funds in the Natixis Funds Trusts, Loomis Sayles Funds Trusts and Natixis ETF Trust, and are normally reflected as Trustees’ fees and expenses in the Statements of Operations. The portions of the accrued obligations allocated to the Fund under the Plan are reflected as Deferred Trustees’ fees in the Statements of Assets and Liabilities.
g. Payment by Affiliates. During the period ended December 31, 2017, Natixis AM US reimbursed Global Green Bond Fund $125 in connection with a trading error.
99 |
Notes to Financial Statements (continued)
December 31, 2017
h. Affiliated Ownership. As of December 31, 2017, the percentage of each Fund’s net assets owned by affiliates is as follows:
Gateway Equity Call Premium Fund | Percentage of Net Assets | |
Natixis Advisors | less than 0.01% |
Global Green Bond Fund | Percentage of Net Assets | |||
Natixis Sustainable Future 2015 Fund | 4.62 | % | ||
Natixis Sustainable Future 2020 Fund | 4.15 | % | ||
Natixis Sustainable Future 2025 Fund | 2.66 | % | ||
Natixis Sustainable Future 2030 Fund | 1.68 | % | ||
Natixis Sustainable Future 2035 Fund | 1.19 | % | ||
Natixis Sustainable Future 2040 Fund | 0.67 | % | ||
Natixis Sustainable Future 2045 Fund | 0.41 | % | ||
Natixis Sustainable Future 2050 Fund | 0.28 | % | ||
Natixis Sustainable Future 2055 Fund | 0.30 | % | ||
Natixis Sustainable Future 2060 Fund | 0.31 | % | ||
Natixis and affiliates | 83.07 | % | ||
|
| |||
| 99.34 | % | |||
Global Sustainable Equity Fund | Percentage of Net Assets | |
Natixis Advisors | less than 0.01% | |
Natixis and affiliates | 49.29% |
Investment activities of affiliated shareholders could have material impacts on the Fund.
i. Reimbursement of Transfer Agent Fees and Expenses. Natixis Advisors has given a binding contractual undertaking to Gateway Fund, Gateway Equity Call Premium Fund and Global Sustainable Equity Fund to reimburse any and all transfer agency expenses for the Funds’ Class N shares. This undertaking is in effect through April 30, 2018 and is not subject to recovery under the expense limitation agreement described above.
For the period May 1, 2017 through December 31, 2017, Natixis Advisors reimbursed the Funds for transfer agency expenses as follows:
Fund | Reimbursements of Transfer Agency Expenses Class N | |||
Gateway Fund | $ | 11,954 | ||
Gateway Equity Call Premium Fund | 92 | |||
Global Sustainable Equity Fund | 95 | |||
| 100
Notes to Financial Statements (continued)
December 31, 2017
7. Class-Specific Transfer Agent Fees and Expenses. Transfer agent fees and expenses attributable to Class A, Class C, and Class Y are allocated on a pro rata basis to each class based on the relative net assets of each class to the total net assets of those classes. Transfer agent fees and expenses attributable to Class N are allocated to Class N.
For the period from May 1, 2017 (February 28, 2017 for Global Green Bond Fund), commencement of Class N operations, through December 31, 2017, the Funds incurred the following class-specific transfer agent fees and expenses (including sub-transfer agent fees, where applicable):
| Transfer Agent Fees and Expenses | ||||||||||||||||
Fund | Class A | Class C | Class N | Class Y | ||||||||||||
Gateway Fund | $ | 794,720 | $ | 158,237 | $ | 11,954 | $ | 2,805,281 | ||||||||
Gateway Equity Call Premium Fund | 3,273 | 204 | 92 | 23,451 | ||||||||||||
Global Green Bond Fund | 1,186 | — | 262 | 164 | ||||||||||||
Global Sustainable Equity Fund | 303 | 150 | 95 | 13,177 | ||||||||||||
8. Line of Credit. Each Fund, together with certain other funds of Natixis Funds Trusts and Loomis Sayles Funds Trusts, entered into a 364-day, $400,000,000 syndicated, committed, unsecured line of credit with Citibank, N.A. to be used for temporary or emergency purposes only. Any one Fund may borrow up to the full $400,000,000 under the line of credit (as long as all borrowings by all Funds in the aggregate do not exceed the $400,000,000 limit at any time) subject to each Fund’s investment restrictions. Interest is charged to the Funds at a rate equal to the greater of the eurodollar or the federal funds rate plus 1.00%. In addition, a commitment fee of 0.15% per annum, payable on the last business day of each month, is accrued and apportioned among the participating funds based on their average daily unused portion of the line of credit. The Funds paid an arrangement fee, an upfront fee, and other fees in connection with the new line of credit agreement, which are being amortized over a period of 364 days and are reflected as miscellaneous expenses on the Statements of Operations. The unamortized balance is reflected as prepaid expenses on the Statements of Assets and Liabilities.
Prior to April 13, 2017, the commitment fee was 0.10% per annum based on the average daily unused portion of the line of credit.
For the year ended December 31, 2017, none of the Funds had borrowings under these agreements.
9. Payable to Custodian Bank. The Funds’ custodian bank, State Street Bank, provides overdraft protection to the Funds in the event of a cash shortfall. Cash overdrafts bear
101 |
Notes to Financial Statements (continued)
December 31, 2017
interest at a rate per annum equal to the Federal Funds rate plus 2.00%. At December 31, 2017, the Funds had payables to the custodian bank in connection with these overdrafts as follows:
Payable to Custodian Bank | ||||
Gateway Equity Call Premium Fund | $ | 278,480 | ||
Global Sustainable Equity Fund | 660,072 | |||
10. Broker Commission Recapture. The Gateway Fund has entered into agreements with certain brokers whereby the brokers will rebate a portion of brokerage commissions. All amounts rebated by the brokers are returned to the Fund under such agreements and are included in realized gains in the Statements of Operations.
For the year ended December 31, 2017, the Fund had no amounts rebated under these agreements.
11. Concentration of Risk. The Global Sustainable Equity Fund and Global Green Bond Fund’s investments in foreign securities are subject to foreign currency fluctuations, higher volatility than U.S. securities, varying degrees of regulation and limited liquidity. Greater political, economic, credit and information risks are also associated with foreign securities.
12. Interest Expense. The Funds may incur interest expense on net cash and foreign currency debit balances, if any, for accounts held at brokers. Interest expense incurred for the year ended December 31, 2017 is reflected on the Statements of Operations.
13. Concentration of Ownership. From time to time, a Fund may have a concentration of one or more accounts constituting a significant percentage of shares outstanding. Investment activities by holders of such accounts could have material impacts on the Funds. As of December 31, 2017, based on management’s evaluation of the shareholder account base, the Funds had accounts representing controlling ownership of more than 5% of the Funds’ total outstanding shares. The number of such accounts, based on accounts that represent more than 5% of an individual class of shares, and the aggregate percentage of net assets represented by such holdings were as follows:
Fund | Number of 5% Non-Affiliated Account Holders | Percentage of Non-Affiliated Ownership | Percentage of Affiliated Ownership (Note 6h) | Total Percentage of Ownership | ||||||||||||
Gateway Equity Call Premium Fund | 2 | 75.22 | % | — | 75.22 | % | ||||||||||
Global Green Bond Fund | — | — | 99.34 | % | 99.34 | % | ||||||||||
Global Sustainable Equity Fund | — | — | 49.29 | % | 49.29 | % | ||||||||||
| 102
Notes to Financial Statements (continued)
December 31, 2017
Omnibus shareholder accounts for which Natixis Advisors understands that the intermediary has discretion over the underlying shareholder accounts or investment models where a shareholder account may be invested for a non-discretionary customer are included in the table above. For other omnibus accounts, the Funds do not have information on the individual shareholder accounts underlying the omnibus accounts; therefore, there could be other 5% shareholders in addition to those disclosed in the table above.
14. Capital Shares. Each Fund may issue an unlimited number of shares of beneficial interest, without par value. Transactions in capital shares were as follows:
| | Year Ended December 31, 2017 | | Year Ended December 31, 2016 | |||||||||||||
Gateway Fund | Shares | Amount | Shares | Amount | ||||||||||||
| Class A | ||||||||||||||||
Issued from the sale of shares | 11,877,615 | $ | 380,305,952 | 16,559,714 | $ | 491,042,327 | ||||||||||
Issued in connection with the reinvestment of distributions | 501,051 | 16,214,649 | 754,687 | 22,679,772 | ||||||||||||
Redeemed | (19,432,242 | ) | (625,661,265 | ) | (23,117,116 | ) | (687,596,539 | ) | ||||||||
|
|
|
|
|
|
|
| |||||||||
Net change | (7,053,576 | ) | $ | (229,140,664 | ) | (5,802,715 | ) | $ | (173,874,440 | ) | ||||||
|
|
|
|
|
|
|
| |||||||||
| Class C | ||||||||||||||||
Issued from the sale of shares | 1,324,365 | $ | 42,461,524 | 1,841,324 | $ | 54,446,816 | ||||||||||
Issued in connection with the reinvestment of distributions | 30,037 | 965,515 | 61,318 | 1,830,016 | ||||||||||||
Redeemed | (3,175,268 | ) | (101,409,398 | ) | (3,049,870 | ) | (90,760,674 | ) | ||||||||
|
|
|
|
|
|
|
| |||||||||
Net change | (1,820,866 | ) | $ | (57,982,359 | ) | (1,147,228 | ) | $ | (34,483,842 | ) | ||||||
|
|
|
|
|
|
|
| |||||||||
| Class N(a) | ||||||||||||||||
Issued from the sale of shares | 3,986,733 | $ | 131,101,034 | — | $ | — | ||||||||||
Issued in connection with the reinvestment of distributions | 1,728 | 57,339 | — | — | ||||||||||||
Redeemed | (215,239 | ) | (7,124,210 | ) | — | — | ||||||||||
|
|
|
|
|
|
|
| |||||||||
Net change | 3,773,222 | $ | 124,034,163 | — | $ | — | ||||||||||
|
|
|
|
|
|
|
| |||||||||
| Class Y | ||||||||||||||||
Issued from the sale of shares | 62,338,029 | $ | 2,010,865,299 | 69,770,111 | $ | 2,073,132,056 | ||||||||||
Issued in connection with the reinvestment of distributions | 1,918,062 | 62,178,172 | 2,272,929 | 68,355,689 | ||||||||||||
Redeemed | (53,219,787 | ) | (1,711,701,753 | ) | (94,427,074 | ) | (2,835,955,065 | ) | ||||||||
|
|
|
|
|
|
|
| |||||||||
Net change | 11,036,304 | $ | 361,341,718 | (22,384,034 | ) | $ | (694,467,320 | ) | ||||||||
|
|
|
|
|
|
|
| |||||||||
Increase (decrease) from capital share transactions | 5,935,084 | $ | 198,252,858 | (29,333,977 | ) | $ | (902,825,602 | ) | ||||||||
|
|
|
|
|
|
|
| |||||||||
| (a) | From commencement of Class operations on May 1, 2017 through December 31, 2017. |
103 |
Notes to Financial Statements (continued)
December 31, 2017
14. Capital Shares (continued).
| | Year Ended December 31, 2017 | | Year Ended December 31, 2016 | |||||||||||||
Gateway Equity Call Premium Fund | Shares | Amount | Shares | Amount | ||||||||||||
| Class A | ||||||||||||||||
Issued from the sale of shares | 535,418 | $ | 6,158,261 | 592,010 | $ | 6,121,622 | ||||||||||
Issued in connection with the reinvestment of distributions | 5,824 | 67,504 | 5,121 | 53,868 | ||||||||||||
Redeemed | (552,465 | ) | (6,565,662 | ) | (376,732 | ) | (3,971,403 | ) | ||||||||
|
|
|
|
|
|
|
| |||||||||
Net change | (11,223 | ) | $ | (339,897 | ) | 220,399 | $ | 2,204,087 | ||||||||
|
|
|
|
|
|
|
| |||||||||
| Class C | ||||||||||||||||
Issued from the sale of shares | 10,471 | $ | 117,776 | 45,956 | $ | 492,236 | ||||||||||
Issued in connection with the reinvestment of distributions | 47 | 533 | 111 | 1,192 | ||||||||||||
Redeemed | (5,052 | ) | (57,315 | ) | (1,416 | ) | (14,955 | ) | ||||||||
|
|
|
|
|
|
|
| |||||||||
Net change | 5,466 | $ | 60,994 | 44,651 | $ | 478,473 | ||||||||||
|
|
|
|
|
|
|
| |||||||||
| Class N(a) | ||||||||||||||||
Issued from the sale of shares | 88 | $ | 1,001 | — | $ | — | ||||||||||
Issued in connection with the reinvestment of distributions | 1 | 9 | — | — | ||||||||||||
|
|
|
|
|
|
|
| |||||||||
Net change | 89 | $ | 1,010 | — | $ | — | ||||||||||
|
|
|
|
|
|
|
| |||||||||
| Class Y | ||||||||||||||||
Issued from the sale of shares | 1,249,514 | $ | 14,264,592 | 1,581,610 | $ | 15,844,856 | ||||||||||
Issued in connection with the reinvestment of distributions | 33,652 | 391,063 | 39,283 | 412,824 | ||||||||||||
Redeemed | (1,058,760 | ) | (12,154,004 | ) | (708,332 | ) | (7,241,554 | ) | ||||||||
|
|
|
|
|
|
|
| |||||||||
Net change | 224,406 | $ | 2,501,651 | 912,561 | $ | 9,016,126 | ||||||||||
|
|
|
|
|
|
|
| |||||||||
Increase (decrease) from capital share transactions | 218,738 | $ | 2,223,758 | 1,177,611 | $ | 11,698,686 | ||||||||||
|
|
|
|
|
|
|
| |||||||||
| (a) | From commencement of Class operations on May 1, 2017 through December 31, 2017. |
| 104
Notes to Financial Statements (continued)
December 31, 2017
14. Capital Shares (continued).
| | Period Ended December 31, 2017(a) |
| ||||||
Global Green Bond Fund | Shares | Amount | ||||||
| Class A | ||||||||
Issued from the sale of shares | 14,126 | $ | 142,758 | |||||
Issued in connection with the reinvestment of distributions | 194 | 1,938 | ||||||
Redeemed | (320 | ) | (3,259 | ) | ||||
|
|
|
| |||||
Net change | 14,000 | $ | 141,437 | |||||
|
|
|
| |||||
| Class N | ||||||||
Issued from the sale of shares | 2,537,209 | $ | 25,376,096 | |||||
Issued in connection with the reinvestment of distributions | 50,115 | 501,290 | ||||||
Redeemed | (515 | ) | (5,155 | ) | ||||
|
|
|
| |||||
Net change | 2,586,809 | $ | 25,872,231 | |||||
|
|
|
| |||||
| Class Y | ||||||||
Issued from the sale of shares | 4,283 | $ | 43,491 | |||||
Issued in connection with the reinvestment of distributions | 68 | 675 | ||||||
Redeemed | (24 | ) | (235 | ) | ||||
|
|
|
| |||||
Net change | 4,327 | $ | 43,931 | |||||
|
|
|
| |||||
Increase (decrease) from capital share transactions | 2,605,136 | $ | 26,057,599 | |||||
|
|
|
| |||||
| (a) | From commencement of operations on February 28, 2017 through December 31, 2017. |
105 |
Notes to Financial Statements (continued)
December 31, 2017
14. Capital Shares (continued).
| | Year Ended December 31, 2017 | | Period Ended December 31, 2016(a) | |||||||||||||
Global Sustainable Equity Fund | Shares | Amount | Shares | Amount | ||||||||||||
| Class A | ||||||||||||||||
Issued from the sale of shares | 267,864 | $ | 3,326,306 | 7,436 | $ | 74,105 | ||||||||||
Issued in connection with the reinvestment of distributions | 2,443 | 31,197 | 3 | 30 | ||||||||||||
Redeemed | (22,091 | ) | (265,777 | ) | (301 | ) | (3,007 | ) | ||||||||
|
|
|
|
|
|
|
| |||||||||
Net change | 248,216 | $ | 3,091,726 | 7,138 | $ | 71,128 | ||||||||||
|
|
|
|
|
|
|
| |||||||||
| Class C | ||||||||||||||||
Issued from the sale of shares | 86,492 | $ | 1,050,944 | 5,318 | $ | 52,970 | ||||||||||
Issued in connection with the reinvestment of distributions | 372 | 4,700 | 6 | 60 | ||||||||||||
Redeemed | (6 | ) | (80 | ) | (3 | ) | (33 | ) | ||||||||
|
|
|
|
|
|
|
| |||||||||
Net change | 86,858 | $ | 1,055,564 | 5,321 | $ | 52,997 | ||||||||||
|
|
|
|
|
|
|
| |||||||||
| Class N(b) | ||||||||||||||||
Issued from the sale of shares | 89 | $ | 1,001 | — | $ | — | ||||||||||
Issued in connection with the reinvestment of distributions | 1 | 13 | — | — | ||||||||||||
|
|
|
|
|
|
|
| |||||||||
Net change | 90 | $ | 1,014 | — | $ | — | ||||||||||
|
|
|
|
|
|
|
| |||||||||
| Class Y | ||||||||||||||||
Issued from the sale of shares | 2,401,416 | $ | 29,617,275 | 4,997,044 | $ | 50,979,075 | ||||||||||
Issued in connection with the reinvestment of distributions | 47,449 | 607,824 | 9,961 | 99,208 | ||||||||||||
Redeemed | (2,507,120 | ) | (31,220,521 | ) | (3,612 | ) | (35,781 | ) | ||||||||
|
|
|
|
|
|
|
| |||||||||
Net change | (58,255 | ) | $ | (995,422 | ) | 5,003,393 | $ | 51,042,502 | ||||||||
|
|
|
|
|
|
|
| |||||||||
Increase (decrease) from capital share transactions | 276,909 | $ | 3,152,882 | 5,015,852 | $ | 51,166,627 | ||||||||||
|
|
|
|
|
|
|
| |||||||||
| (a) | From commencement of operations on March 31, 2016 through December 31, 2016. |
| (b) | From commencement of Class operations on May 1, 2017 through December 31, 2017. |
| 106
Report of Independent Registered Public Accounting Firm
To the Board of Trustees of Natixis Funds Trust I and Gateway Trust and Shareholders of Mirova Global Sustainable Equity Fund, Mirova Global Green Bond Fund, Gateway Fund, and Gateway Equity Call Premium Fund
Opinions on the Financial Statements
We have audited the accompanying statements of assets and liabilities, including the portfolios of investments, of Mirova Global Sustainable Equity Fund and Mirova Global Green Bond Fund (two of the funds constituting the Natixis Funds Trust I), and Gateway Fund and Gateway Equity Call Premium Fund (constituting the Gateway Trust) (hereafter collectively referred to as the “Funds”) as of December 31, 2017, the related statements of operations for the year ended December 31, 2017 and for Mirova Global Green Bond Fund for the period February 28, 2017 (commencement of operations) through December 31, 2017 and the statements of changes in net assets for each of the two years in the period ended December 31, 2017 and for Mirova Global Green Bond Fund for the period February 28, 2017 (commencement of operations) through December 31, 2017, including the related notes, and each of the financial highlights for each of the periods indicated therein, (collectively referred to as the “financial statements”). In our opinion, the financial statements present fairly, in all material respects, the financial position of each of the Funds as of December 31, 2017, the results of each of their operations for the year ended December 31, 2017 and for Mirova Global Green Bond Fund for the period February 28, 2017 (commencement of operations) through December 31, 2017 and the changes in each of their net assets for each of the two years in the period ended December 31, 2017 and for Mirova Global Green Bond Fund for the period February 28, 2017 (commencement of operations) through December 31, 2017 and each of the financial highlights for each of the periods indicated therein in conformity with accounting principles generally accepted in the United States of America.
Basis for Opinions
These financial statements are the responsibility of the Funds’ management. Our responsibility is to express an opinion on the Funds’ financial statements based on our audits. We are a public accounting firm registered with the Public Company Accounting Oversight Board (United States) (“PCAOB”) and are required to be independent with respect to the Funds in accordance with the U.S. federal securities laws and the applicable rules and regulations of the Securities and Exchange Commission and the PCAOB.
We conducted our audits of these financial statements in accordance with the standards of the PCAOB. Those standards require that we plan and perform the audit to obtain reasonable assurance about whether the financial statements are free of material misstatement, whether due to error or fraud.
107 |
Report of Independent Registered Public Accounting Firm
Our audits included performing procedures to assess the risks of material misstatement of the financial statements, whether due to error or fraud, and performing procedures that respond to those risks. Such procedures included examining, on a test basis, evidence regarding the amounts and disclosures in the financial statements. Our audits also included evaluating the accounting principles used and significant estimates made by management, as well as evaluating the overall presentation of the financial statements. Our procedures included confirmation of securities owned as of December 31, 2017 by correspondence with the custodian, and brokers; when replies were not received from brokers, we performed other auditing procedures. We believe that our audits provide a reasonable basis for our opinions.
/s/ PricewaterhouseCoopers LLP
Boston, Massachusetts
February 22, 2018
We have served as the auditor of one or more investment companies in the Natixis Investment Company Complex since at least 1995. We have not determined the specific year we began serving as auditor.
| 108
2017 U.S. Tax Distribution Information to Shareholders (Unaudited)
Qualified Dividend Income. For the fiscal year ended December 31, 2017, a percentage of the ordinary income dividends paid by the Funds are considered qualified dividend income eligible for reduced tax rates. These lower rates range from 0% to 20% depending on an individual’s tax bracket. If the Funds paid a distribution during calendar year 2017, complete information will be reported in conjunction with Form 1099-DIV. These percentages are noted below:
Fund | Qualifying Percentage | |||
Gateway Fund | 100.00 | % | ||
Gateway Equity Call Premium Fund | 100.00 | % | ||
Global Sustainable Equity Fund | 100.00 | % | ||
Corporate Dividends Received Deduction. For the fiscal year ended December 31, 2017, a percentage of dividends distributed by the Funds listed below qualify for the dividends received deduction for corporate shareholders. These percentages are as follows:
Fund | Qualifying Percentage | |||
Gateway Fund | 100.00 | % | ||
Gateway Equity Call Premium Fund | 100.00 | % | ||
Global Sustainable Equity Fund | 81.73 | % | ||
Capital Gains Distributions. Pursuant to Internal Revenue Section 852(b), the following Funds paid distributions, which have been designated as capital gains distributions for the fiscal year ended December 31, 2017.
Fund | Amount | |||
Global Sustainable Equity Fund | $ | 488,562 | ||
109 |
Additional Information
Special Meeting of Shareholders. (Unaudited)
A special meeting of shareholders of the Trust was held on December 4, 2017 to consider a proposal to elect thirteen Trustees to the Board of Trustees. The proposal was approved by shareholders of the Trust. The results of the shareholder vote were as follows:
| Gateway | Trust |
Nominee | Voted “For”* | Withheld* | ||||||
Kevin P. Charleston | 233,890,693.096 | 6,209,538.246 | ||||||
Kenneth A. Drucker | 233,707,978.096 | 6,392,253.246 | ||||||
Edmond J. English | 233,858,499.131 | 6,241,732.211 | ||||||
David L. Giunta | 233,857,367.196 | 6,242,864.146 | ||||||
Richard A. Goglia | 233,817,239.203 | 6,282,992.139 | ||||||
Wendell J. Knox | 233,762,076.619 | 6,338,154.723 | ||||||
Martin T. Meehan | 233,773,892.231 | 6,326,339.111 | ||||||
Maureen B. Mitchell | 233,865,538.888 | 6,234,692.454 | ||||||
Sandra O. Moose** | 233,586,124.726 | 6,514,106.616 | ||||||
James P. Palermo | 233,873,514.619 | 6,226,716.723 | ||||||
Erik R. Sirri | 233,815,725.203 | 6,284,506.139 | ||||||
Peter J. Smail | 233,855,335.619 | 6,244,895.723 | ||||||
Cynthia L. Walker | 233,850,990.781 | 6,249,240.561 | ||||||
| Natixis | Funds Trust I |
Nominee | Voted “For”* | Withheld* | ||||||
Kevin P. Charleston | 370,772,225.201 | 2,295,844.378 | ||||||
Kenneth A. Drucker | 370,283,839.168 | 2,784,230.411 | ||||||
Edmond J. English | 370,659,753.916 | 2,408,315.663 | ||||||
David L. Giunta | 370,784,195.912 | 2,283,873.667 | ||||||
Richard A. Goglia | 370,460,463.208 | 2,607,606.371 | ||||||
Wendell J. Knox | 370,534,122.392 | 2,533,947.187 | ||||||
Martin T. Meehan | 370,538,829.643 | 2,529,239.936 | ||||||
Maureen B. Mitchell | 370,919,944.816 | 2,148,124.763 | ||||||
Sandra O. Moose** | 370,426,616.935 | 2,641,452.644 | ||||||
James P. Palermo | 370,643,215.858 | 2,424,853.721 | ||||||
Erik R. Sirri | 370,711,200.752 | 2,356,868.827 | ||||||
Peter J. Smail | 370,588,393.592 | 2,479,675.987 | ||||||
Cynthia L. Walker | 370,711,120.477 | 2,356,949.102 | ||||||
| * | Trust-wide voting results. |
| ** | Ms. Moose retired as a Trustees effective January 1, 2018. |
| 110
Trustee and Officer Information
The tables below provide certain information regarding the trustees and officers of Natixis Funds Trust I and Gateway Trust (the “Trusts”). Unless otherwise indicated, the address of all persons below is 888 Boylston Street, Suite 800, Boston, MA 02199-8197. The Funds’ Statements of Additional Information include additional information about the trustees of the Trusts and are available by calling Natixis Funds at 800-225-5478.
Name and Year of Birth | Position(s) Held with the Trusts, Length of Time Served and Term of Office1 | Principal Occupation(s) During Past 5 Years | Number of Portfolios in Fund Complex Overseen2 and Other Directorships Held During Past 5 Years | Experience, Qualifications, Attributes, Skills for Board Membership | ||||
| INDEPENDENT TRUSTEES | ||||||||
Kenneth A. Drucker (1945) | Chairperson of the Board of Trustees since January 2017 Trustee since 2008 Ex Officio member of Audit Committee, Contract Review Committee and Governance Committee | Retired | 54 None | Significant experience on the Board and on the boards of other business organizations (including at investment companies); executive experience (including as treasurer of an aerospace, automotive, and metal manufacturing corporation) | ||||
Edmond J. English (1953) | Trustee since 2013 Audit Committee Member and Governance Committee Member | Executive Chairman; formerly, Chief Executive Officer of Bob’s Discount Furniture (retail) | 54 Director, Burlington Stores, Inc. (retail) | Significant experience on the Board and significant experience on the boards of other business organizations (including retail companies and a bank); executive experience (including at a retail company) | ||||
111 |
Trustee and Officer Information
Name and Year of Birth | Position(s) Held with the Trusts, Length of Time Served and Term of Office1 | Principal Occupation(s) During Past 5 Years | Number of Portfolios in Fund Complex Overseen2 and Other Directorships Held During Past 5 Years | Experience, Qualifications, Attributes, Skills for Board Membership | ||||
INDEPENDENT TRUSTEES continued | ||||||||
Richard A. Goglia (1951) | Trustee since 2015 Audit Committee Member | Retired; formerly Vice President and Treasurer of Raytheon Company (defense) | 54 None | Experience on the Board and executive experience (including his role as vice president and treasurer of a defense company and experience at a financial services company) | ||||
Wendell J. Knox (1948) | Trustee since 2009 Contract Review Committee Member and Governance Committee Member | Director of Abt Associates Inc. (research and consulting) | 54 Director, Eastern Bank (bank); Director, The Hanover Insurance Group (property and casualty insurance) | Significant experience on the Board and on the boards of other business organizations (including at a bank and at a property and casualty insurance firm); executive experience (including roles as president and chief executive officer of a research and consulting company) | ||||
| 112
Trustee and Officer Information
Name and Year of Birth | Position(s) Held with the Trusts, Length of Time Served and Term of Office1 | Principal Occupation(s) During Past 5 Years | Number of Portfolios in Fund Complex Overseen2 and Other Directorships Held During Past 5 Years | Experience, Qualifications, Attributes, Skills for Board Membership | ||||
INDEPENDENT TRUSTEES continued | ||||||||
Martin T. Meehan (1956) | Trustee since 2012 Audit Committee Member | President, University of Massachusetts; formerly, Chancellor and faculty member, University of Massachusetts Lowell | 54 None | Significant experience on the Board and on the boards of other business organizations; experience as President of the University of Massachusetts; government experience (including as a member of the U.S. House of Representatives); academic experience | ||||
Maureen B. Mitchell3 (1951) | Trustee since 2017 Contract Review Committee Member | Retired; formerly President, Global Sales and Marketing, GE Asset Management, Inc. (financial services) | 54 None | Experience on the Board; financial services industry and executive experience (including role as president of global sales and marketing at a financial services company) | ||||
113 |
Trustee and Officer Information
Name and Year of Birth | Position(s) Held with the Trusts, Length of Time Served and Term of Office1 | Principal Occupation(s) During Past 5 Years | Number of Portfolios in Fund Complex Overseen2 and Other Directorships Held During Past 5 Years | Experience, Qualifications, Attributes, Skills for Board Membership | ||||
INDEPENDENT TRUSTEES continued | ||||||||
James P. Palermo (1955) | Trustee since 2016 Contract Review Committee Member | Founding Partner, Breton Capital Management, LLC (private equity); Partner, STEP Partners, LLC (private equity); formerly, Chief Executive Officer of Global Client Management of The Bank of New York Mellon Corporation | 54 None | Experience on the Board; financial services industry and executive experience (including roles as chief executive officer of client management and asset servicing for a banking and financial services company) | ||||
Erik R. Sirri (1958) | Trustee since 2009 Chairperson of the Audit Committee | Professor of Finance at Babson College | 54 None | Significant experience on the Board; experience as Director of the Division of Trading and Markets at the Securities and Exchange Commission; academic experience; training as an economist | ||||
Peter J. Smail (1952) | Trustee since 2009 Chairperson of the Contract Review Committee and Governance Committee Member | Retired | 54 None | Significant experience on the Board; mutual fund industry and executive experience (including roles as president and chief executive officer for an investment adviser) | ||||
| 114
Trustee and Officer Information
Name and Year of Birth | Position(s) Held with the Trusts, Length of Time Served and Term of Office1 | Principal Occupation(s) During Past 5 Years | Number of Portfolios in Fund Complex Overseen2 and Other Directorships Held During Past 5 Years | Experience, Qualifications, Attributes, Skills for Board Membership | ||||
INDEPENDENT TRUSTEES continued | ||||||||
Cynthia L. Walker (1956) | Trustee since 2005 for Natixis Funds Trust I and since 2007 for Gateway Trust Chairperson of the Governance Committee and Audit Committee Member | Deputy Dean for Finance and Administration, Yale University School of Medicine | 54 None | Significant experience on the Board; executive experience in a variety of academic organizations (including roles as dean for finance and administration) | ||||
| INTERESTED TRUSTEES | ||||||||
Kevin P. Charleston4 (1965) One Financial Center Boston, MA 02111 | Trustee since 2015 | President, Chief Executive Officer and Chairman of the Board of Directors; formerly, Chief Financial Officer, Loomis, Sayles & Company, L.P. | 54 None | Experience on the Board; continuing service as President, Chief Executive Officer and Chairman of the Board of Directors of Loomis, Sayles & Company, L.P. | ||||
David L. Giunta5 (1965) | Trustee since 2011 President and Chief Executive Officer since 2008 | President and Chief Executive Officer, Natixis Advisors, L.P., Natixis Distribution, L.P., Natixis Distribution Corporation and Chairman of the Board of Natixis Distribution Corporation. | 54 None | Significant experience on the Board; experience as President and Chief Executive Officer, Natixis Advisors, L.P., Natixis Distribution, L.P., Natixis Distribution Corporation and Chairman of the Board of Natixis Distribution Corporation. | ||||
115 |
Trustee and Officer Information
| 1 | Each trustee serves until retirement, resignation or removal from the Board. The current retirement age is 75. The position of Chairperson of the Board is appointed for a three-year term. |
| 2 | The trustees of the Trusts serve as trustees of a fund complex that includes all series of the Natixis Funds Trust I, Natixis Funds Trust II, Natixis Funds Trust IV and Gateway Trust (collectively, the “Natixis Funds Trusts”), Loomis Sayles Funds I and Loomis Sayles Funds II (collectively, the “Loomis Sayles Funds Trusts”) and Natixis ETF Trust (collectively, the “Fund Complex”). |
| 3 | Ms. Mitchell was appointed as a Trustee effective July 1, 2017. |
| 4 | Mr. Charleston is deemed an “interested person” of the Trusts because he holds the following positions with an affiliated person of the Trusts: President, Chief Executive Officer and Chairman of the Board of Directors of Loomis, Sayles & Company, L.P. |
| 5 | Mr. Giunta is deemed an “interested person” of the Trusts because he holds the following positions with an affiliated person of the Trusts: President and Chief Executive Officer, Natixis Advisors, L.P., Natixis Distribution, L.P., Natixis Distribution Corporation and Chairman of the Board of Natixis Distribution Corporation. |
| 116
Trustee and Officer Information
Name and Year of Birth | Position(s) Held with the Trusts | Term of Office1 and Length of Time Served | Principal Occupation(s) During Past 5 Years2 | |||
| OFFICERS OF THE TRUSTS | ||||||
| Russell L. Kane (1969) | Secretary, Clerk and Chief Legal Officer | Since July 2016 | Executive Vice President, General Counsel, Secretary and Clerk, Natixis Distribution Corporation, Natixis Advisors, L.P. and Natixis Distribution, L.P.; formerly, Chief Compliance Officer for Mutual Funds, Senior Vice President, Deputy General Counsel, Assistant Secretary and Assistant Clerk, Natixis Distribution Corporation, Natixis Advisors, L.P. and Natixis Distribution, L.P. | |||
| Michael C. Kardok (1959) | Treasurer, Principal Financial and Accounting Officer | Since October 2004 for Natixis Funds Trust I and since May 2007 for Gateway Trust | Senior Vice President, Natixis Advisors, L.P. and Natixis Distribution, L.P. | |||
| Rosa Licea-Mailloux (1976) | Chief Compliance Officer, Assistant Secretary and Anti-Money Laundering Officer | Since July 2016 | Senior Vice President, Deputy General Counsel, Assistant Secretary and Assistant Clerk, Natixis Distribution Corporation, Natixis Advisors, L.P. and Natixis Distribution, L.P.; formerly, Associate General Counsel, Natixis Distribution, L.P. | |||
| 1 | Each officer of the Trusts serves for an indefinite term in accordance with the Trusts’ current by-laws until the date his or her successor is elected and qualified, or until he or she sooner dies, retires, is removed or becomes disqualified. |
| 2 | Each person listed above, except as noted, holds the same position(s) with the Fund Complex. Previous positions during the past five years with Natixis Distribution, L.P., Natixis Advisors, L.P. or Loomis, Sayles & Company, L.P. are omitted, if not materially different from an officer’s current position with such entity. |
117 |
| Item 2. | Code of Ethics. |
The Registrant has adopted a code of ethics that applies to the Registrant’s principal executive officer, principal financial officer and persons performing similar functions. There have been no amendments or waivers of the Registrant’s code of ethics during the period.
| Item 3. | Audit Committee Financial Expert. |
The Board of Trustees of the Registrant has established an audit committee Mr. Edmond J. English, Mr. Richard A. Goglia, Mr. Martin T. Meehan, Mr. Erik R. Sirri and Ms. Cynthia L. Walker are members of the audit committee and have been designated as “audit committee financial experts” by the Board of Trustees. Each of these individuals is also an Independent Trustee of the Registrant.
| Item 4. | Principal Accountant Fees and Services. |
Fees billed by the Principal Accountant for services rendered to the Registrant.
The table below sets forth fees billed by the principal accountant, PricewaterhouseCoopers LLP, for the past two fiscal years for professional services rendered in connection with a) the audit of the Registrant’s annual financial statements and services provided in connection with regulatory filings; b) audit-related services (including services that are reasonably related to the performance of the audit of the Registrant’s financial statements but not reported under “Audit Fees”); c) tax compliance, tax advice and tax planning and d) all other fees billed for professional services rendered by the principal accountant to the Registrant, other than the services provided as reported as a part of (a) through (c) of this Item.
| Audit fees | Audit-related fees1 | Tax fees2 | All other fees | |||||||||||||||||||||||||||||
| 1/1/16-12/31/16 | 1/1/17-12/31/17 | 1/1/16-12/31/16 | 1/1/17-12/31/17 | 1/1/16-12/31/16 | 1/1/17-12/31/17 | 1/1/16-12/31/16 | 1/1/17-12/31/17 | |||||||||||||||||||||||||
Gateway Trust | $ | 81,644 | $ | 82,044 | $ | 1,380 | $ | 3,853 | $ | 17,490 | $ | 17,490 | $ | — | $ | — | ||||||||||||||||
| 1. | Audit-related fees consist of: |
2016 & 2017– performance of agreed-upon procedures related to the Registrant’s deferred compensation plan.
2017 – Prospectus Consent
| 2. | Tax fees consist of: |
2016 & 2017 – review of the Registrant’s tax returns.
Aggregate fees billed to the Registrant for non-audit services during 2016 and 2017 were $18,870 and $21,343 respectively.
Fees billed by the Principal Accountant for services rendered to the Adviser and Control Affiliates.
The following table sets forth fees billed by the Registrant’s principal accountant for non-audit services rendered to Gateway Investment Advisers, LLC and entities controlling, controlled by or under common control with Gateway Investment Advisers, LLC (“Control Affiliates”) that provide ongoing services to the Registrant, for engagements that related directly to the operations and financial reporting of the Registrant for the last two fiscal years.
| Audit-related fees | Tax fees | All other fees | ||||||||||||||||||||||
| 1/1/16-12/31/16 | 1/1/17-12/31/17 | 1/1/16-12/31/16 | 1/1/17-12/31/17 | 1/1/16-12/31/16 | 1/1/17-12/31/17 | |||||||||||||||||||
Control Affiliates | $ | — | $ | — | $ | — | $ | — | $ | — | $ | — | ||||||||||||
The following table sets forth the aggregate fees billed by the Registrant’s principal accountant for non-audit services rendered to Gateway Investment Advisers, LLC and Control Affiliates that provide ongoing services to the Registrant, for the last two fiscal years, including the fees disclosed in the table above.
| Aggregate Non-Audit Fees | ||||||||
| 1/1/16-12/31/16 | 1/1/17-12/31/17 | |||||||
Control Affiliates | $ | 82,978 | $ | 0 | ||||
None of the services described above were approved pursuant to (c)(7)(i)(C) of Regulation S-X.
Audit Committee Pre Approval Policies.
Annually, the Registrant’s Audit Committee reviews the audit, audit-related, tax and other non-audit services together with the projected fees, for services proposed to be rendered to the Trust and/or other entities for which pre-approval is required during the upcoming year. Any subsequent revisions to already pre-approved services or fees (including fee increases) and requests for pre-approval of new services would be presented for consideration quarterly as needed.
If, in the opinion of management, a proposed engagement by the Registrant’s independent accountants needs to commence before the next regularly scheduled Audit Committee meeting, any member of the Audit Committee who is an independent Board member is authorized to pre-approve the engagement, but only for engagements to provide audit, audit related and tax services. This approval is subject to review of the full Audit Committee at its next quarterly meeting. All other engagements require the approval of all the members of the Audit Committee.
| Item 5. | Audit Committee of Listed Registrants. |
Not applicable.
| Item 6. | Schedule of Investments. |
Included as part of the Report to Shareholders filed as Item 1 herewith.
Item 7. Disclosure of Proxy Voting Policies and Procedures for Closed-End Management Investment Companies.
Not applicable.
| Item 8. | Portfolio Managers of Closed-End Management Investment Companies. |
Not applicable.
Item 9. Purchases of Equity Securities by Closed-End Management Investment Companies and Affiliated Purchasers.
Not applicable.
| Item 10. | Submission of Matters to a Vote of Securities Holders. |
There were no material changes to the procedures by which shareholders may recommend nominees to the Registrant’s Board of Trustees.
| Item 11. | Controls and Procedures. |
The Registrant’s principal executive officer and principal financial officer have concluded that the Registrant’s disclosure controls and procedures are sufficient to ensure that information required to be disclosed by the Registrant in this Form N-CSR was recorded, processed, summarized and reported within the time periods specified in the Securities and Exchange Commission’s rules and forms, based upon such officers’ evaluation of these controls and procedures as of a date within 90 days of the filing date of the report.
There were no changes in the Registrant’s internal control over financial reporting that occurred during the Registrant’s last fiscal quarter of the period covered by this report that has materially affected, or is reasonably likely to materially affect, the Registrant’s internal control over financial reporting.
Item 12. Disclosure of Securities Lending Activities for Closed-End Management Investment Companies.
Not applicable.
| Item 13. | Exhibits. |
| (a)(1) | Code of Ethics required by Item 2 hereof, filed herewith as Exhibit (a)(1). | |
| (a)(2) | Certifications of Principal Executive Officer and Principal Financial Officer pursuant to Rule 30a-2(a) under the Investment Company Act of 1940 [17 CFR 270.30a-2(a)], filed herewith as Exhibits (a)(2)(1)and (a)(2)(2), respectively. | |
| (a)(3) | Not applicable. | |
| (b) | Certifications of Principal Executive Officer and Principal Financial Officer pursuant to Section 906 of Sarbanes-Oxley Act of 2002 filed herewith as Exhibit (b). | |
SIGNATURES
Pursuant to the requirements of the Securities Exchange Act of 1934 and the Investment Company Act of 1940, the Registrant has duly caused this report to be signed on its behalf by the undersigned, thereunto duly authorized.
| Gateway Trust | ||
| By: | /s/ David L. Giunta | |
| Name: | David L. Giunta | |
| Title: | President and Chief Executive Officer | |
| Date: | February 21, 2018 | |
Pursuant to the requirements of the Securities Exchange Act of 1934 and the Investment Company Act of 1940, this report has been signed by the following persons on behalf of the Registrant and in the capacities and on the dates indicated.
| By: | /s/ David L. Giunta | |
| Name: | David L. Giunta | |
| Title: | President and Chief Executive Officer | |
| Date: | February 21, 2018 | |
| By: | /s/ Michael C. Kardok | |
| Name: | Michael C. Kardok | |
| Title: | Treasurer | |
| Date: | February 21, 2018 | |