Table of Contents
UNITED STATES
SECURITIES AND EXCHANGE COMMISSION
Washington, D.C. 20549
FORM N-CSR
CERTIFIED SHAREHOLDER REPORT OF REGISTERED
MANAGEMENT INVESTMENT COMPANIES
Investment Company Act file number: 811-22099
Gateway Trust
(Exact name of Registrant as specified in charter)
399 Boylston Street, Boston, Massachusetts 02116
(Address of principal executive offices) (Zip code)
Russell L. Kane, Esq.
NGAM Distribution, L.P.
399 Boylston Street
Boston, Massachusetts 02116
(Name and address of agent for service)
Registrant’s telephone number, including area code: (617) 449-2822
Date of fiscal year end: December 31
Date of reporting period: December 31, 2016
Table of Contents
Item 1. Reports to Stockholders.
The Registrant’s annual report transmitted to shareholders pursuant to Rule 30e-1 under the Investment Company Act of 1940 is as follows:
Table of Contents
ANNUAL REPORT
December 31, 2016

Gateway Fund

Portfolio Review page 1
Portfolio of Investments page 8
Notes to Financial Statements page 25
Table of Contents
| Managers | Symbols | |
| Daniel M. Ashcraft, CFA® | Class A GATEX | |
| Michael T. Buckius, CFA® | Class C GTECX | |
| Paul R. Stewart, CFA® | Class Y GTEYX | |
| Kenneth H. Toft, CFA® | ||
| Gateway Investment Advisers, LLC | ||
Investment Goal
The fund seeks to capture the majority of returns associated with equity market investments, while exposing investors to less risk than other equity investments.
Market Conditions
Surprises were a hallmark of 2016. Surprises in the first half of the year included the S&P 500® Index‘s 10.27% loss through February 11, 2016, and a steady decline in the yield on the 10-year U.S. Treasury Note, despite the Federal Reserve preparing investors for multiple rate hikes in 2016. Though equities had recovered into positive territory by the end of the first quarter, falling interest rates contributed to the bond market’s surprising outperformance of the stock market over the first half of the year. Equity market conditions were calm in the second half of the year despite the United Kingdom (U.K.) voting to leave the European Union and Donald Trump winning the U.S. presidential election. Neither outcome was expected and both were forecast to have a negative impact on capital markets in the unlikely event they came to pass. The S&P 500® Index declined 5.34% in the two days after the U.K. vote, but quickly recovered and advanced until mid-August. The S&P 500® Index declined 4.38% from August 15, 2016, through November 4, 2016 as both the Trump and Clinton campaigns struggled with negative developments. However, the equity market advanced steadily after the election, propelled by anticipation of pro-growth economic policies from the incoming Trump administration and mostly positive quarterly earnings and economic reports. Interest rates rose in the second half of the year, accelerating after the election, and driving the Bloomberg Barclays U.S. Aggregate Bond Index to a loss of 2.53% over the last six months. Fundamentally, seven consecutive quarters of aggregate S&P 500® Index earnings declines came to an end in the third quarter and third quarter GDP growth of 3.5% was the highest rate in two years.
Implied volatility, as measured by the Chicago Board Options Exchange Volatility Index (the VIX), averaged 15.83 for the year, based on the daily closing values. This is well below its long-term average of 19.71 and a somewhat counter-intuitive outcome for an election year that included a great deal of uncertainty and multiple unexpected events. However, below-average volatility is not uncommon in election years and the pattern of volatility in 2016 was similar to typical election years in that the highest volatility readings came early in the year, troughed in the third quarter and rose in October and November.
1 |
Table of Contents
Performance Results
For the 12 months ended December 31, 2016, Class A shares of the Gateway Fund returned 5.23% at net asset value. The Fund underperformed its benchmark, the S&P 500® Index, which returned 11.96% for the same period.
Explanation of Fund Performance
The Fund invests in a broadly diversified portfolio of common stocks, while also selling index call options and purchasing index put options. The Fund seeks to generate returns by writing at-the-money index call options against the full value of its underlying equity portfolio, substituting a less variable option premium for potential market price appreciation. It also uses some of the cash flow to mitigate sudden and severe price declines in the equity portfolio by purchasing out-of-the-money index put options. An index option is described as being at-the-money when the price of the underlying index is the same as the option’s strike price. Additionally, an index put option is described as being out-of-the money when the price of the underlying index is above the put option’s strike price. It is the net premium-to-earn from selling index call options less the price of protective put options that is a significant factor affecting the Fund’s performance. In the long term, the combination of the diversified stock portfolio, the steady cash flow from the sale of index call options and the downside protection from index put options is intended to provide the Fund with the majority of the returns associated with equity market investments while exposing investors to less risk.
Throughout 2016, the Fund’s two-part option strategy delivered protection during equity market declines and participation during market advances. The Fund’s downside protection was consistent throughout the year, delivering shallower losses than the S&P 500® Index in each of the three market drawdowns: from December 31, 2015 to February 11, 2016, the Fund’s -5.28% return held up better by 499 basis points (bps); from June 23, 2016 to June 27, 2016, the Fund’s -2.27% return held up better by 307 bps and from August 15, 2016 to November 4, 2016, the Fund’s -1.10% return held up better by 328 bps. Though collecting premiums from writing index call options generally allows the Fund to generate a positive return when the S&P 500® Index advances, call option positions that expire or are closed out when the Index is well above the option’s strike price may generate realized losses. The consistently low volatility environment during the year produced cash flow from call writing that was insufficient for the Fund to keep pace with the market’s above-average rate of advance. Thus, call option positions detracted from the Fund’s return in three out of four quarters for the year. From February 11th to year-end, the Fund’s return of 11.10% underperformed the S&P 500® Index by 13.67 percentage points. The return of the Fund over this period was in line with expectations in a rapidly rising, low-volatility market environment.
The Fund’s equity portfolio returned 13.31% for the year, a performance differential of positive 135 bps versus the S&P 500® Index, which contributed to its return. Consistent with its investment objective, the measured risk of the Fund was low relative to the U.S. equity market, as its standard deviation for 2016 was 5.98% versus 13.30% for the S&P 500® Index.
| 2
Table of Contents
GATEWAY FUND
Outlook
As we transition from the old year to the new one, we close the books on a year of unexpected events. But with key market elements including interest rates, monetary policy, market volatility and corporate earnings at possible inflection points, 2017 may deliver some significant turning points of its own. As the trends play out, they could contribute significantly either on the positive or negative side for stocks and bonds.
Gateway’s investment philosophy maintains that the U.S. equity market is the most reliable source of attractive long-term returns, despite its high volatility and tendency to periodically deliver significant losses over shorter periods of time. Gateway’s investment philosophy also holds that consistency is the key to long-term investment success and that generating cash flow, rather than seeking to forecast the rise and fall of the market, can be a lower-risk means to participate in equity markets. By staying true to its philosophy and managing the Gateway Fund consistently with the firm’s historical approach, Gateway will continue to help investors manage risk while pursuing long-term return in this challenging and uncertain environment.
3 |
Table of Contents
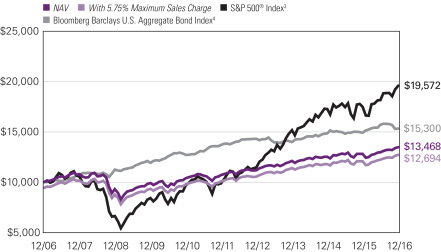
Hypothetical Growth of $10,000 Investment in Class A Shares1,5
December 31, 2006 through December 31, 2016
Top ten holdings as of December 31, 2016
| Security name | % of net assets | |||||
| 1 | Apple, Inc. | 3.17 | % | |||
| 2 | Microsoft Corp. | 2.51 | ||||
| 3 | Exxon Mobil Corp. | 2.01 | ||||
| 4 | JPMorgan Chase & Co. | 1.85 | ||||
| 5 | Berkshire Hathaway, Inc. | 1.84 | ||||
| 6 | Johnson & Johnson | 1.64 | ||||
| 7 | Amazon.com, Inc. | 1.58 | ||||
| 8 | Facebook, Inc. | 1.50 | ||||
| 9 | General Electric Co. | 1.47 | ||||
| 10 | Bank of America Corp. | 1.45 | ||||
The portfolio is actively managed and holdings are subject to change. There is no guarantee the Fund continues to invest in the securities referenced. The holdings listed exclude any temporary cash investments.
See notes to chart on page 5.
| 4
Table of Contents
GATEWAY FUND
Average Annual Total Returns — December 31, 20165
Expense Ratios6 | ||||||||||||||||||||
1 Year | 5 Years | 10 Years | Gross | Net | ||||||||||||||||
Class A (Inception 12/07/77)1 | ||||||||||||||||||||
NAV | 5.23 | % | 4.74 | % | 3.03 | % | 1.01 | % | 0.94 | % | ||||||||||
With 5.75% Maximum Sales Charge | -0.81 | 3.51 | 2.42 | |||||||||||||||||
Class C (Inception 2/19/08)1 | ||||||||||||||||||||
NAV | 4.42 | 3.94 | 2.25 | 1.76 | 1.70 | |||||||||||||||
With CDSC2 | 3.42 | 3.94 | 2.25 | |||||||||||||||||
Class Y (Inception 2/19/08)1 | ||||||||||||||||||||
NAV | 5.48 | 4.99 | 3.25 | 0.76 | 0.70 | |||||||||||||||
Comparative Performance | ||||||||||||||||||||
S&P 500® Index3 | 11.96 | 14.66 | 6.95 | |||||||||||||||||
Bloomberg Barclays U.S. Aggregate Bond Index4 | 2.65 | 2.23 | 4.34 | |||||||||||||||||
Performance data shown represents past performance and is no guarantee of, and not necessarily indicative of, future results. Total return and value will vary, and you may have a gain or loss when shares are sold. Current performance may be lower or higher than quoted. For more recent month-end performance, visit ngam.natixis.com/performance. Performance for other share classes will be greater or less than shown based on differences in fees and sales charges. You may not invest directly in an index. Performance for periods less than one year is cumulative, not annualized. Returns reflect changes in share price and reinvestment of dividends and capital gains, if any. The table(s) do not reflect taxes shareholders might owe on any fund distributions or when they redeem their shares.
| 1 | As of the close of business on February 15, 2008, the Fund acquired the assets and liabilities of Gateway Fund (the “Predecessor Fund”), a series of The Gateway Trust, an Ohio business trust. The Fund is the successor to the Predecessor Fund. Prior to 2/15/08 performance of Class A shares is that of the Predecessor Fund, restated to reflect the sales load of Class A shares. Prior to the inception of Class C shares (2/19/08), performance is that of the Predecessor Fund, restated to reflect the higher net expenses and sales loads of Class C shares. Prior to the inception of Class Y shares (2/19/08), performance is that of the Predecessor Fund. |
| 2 | Performance for Class C shares assumes a 1% contingent deferred sales charge (“CDSC”) applied when you sell shares within one year of purchase. |
| 3 | S&P 500® Index is a widely recognized measure of U.S. stock market performance. It is an unmanaged index of 500 common stocks chosen for market size, liquidity, and industry group representation, among other factors. |
| 4 | Bloomberg Barclays U.S. Aggregate Bond Index is an unmanaged index that covers the U.S.-dollar denominated, investment-grade, fixed-rate, taxable bond market of SEC-registered securities. The index includes bonds from the Treasury, government-related, corporate, mortgage-backed securities, asset-backed securities, and collateralized mortgage-backed securities sectors. |
| 5 | Fund performance has been increased by fee waivers and/or expense reimbursements, if any, without which performance would have been lower. |
| 6 | As of the most recent prospectus, the investment advisor has contractually agreed to waive fees and/or reimburse expenses (with certain exceptions) once the expense cap of the Fund has been exceeded. This agreement is set to expire on 4/30/17. When an expense cap has not been exceeded, the fund may have similar expense ratios. |
5 |
Table of Contents
ADDITIONAL INFORMATION
The views expressed in this report reflect those of the portfolio managers as of the dates indicated. The managers’ views are subject to change at any time without notice based on changes in market or other conditions. References to specific securities or industries should not be regarded as investment advice. Because the Funds are actively managed, there is no assurance that they will continue to invest in the securities or industries mentioned.
All investing involves risk, including the risk of loss. There is no assurance that any investment will meet its performance objectives or that losses will be avoided.
ADDITIONAL INDEX INFORMATION
This document may contain references to third party copyrights, indexes, and trademarks, each of which is the property of its respective owner. Such owner is not affiliated with Natixis Global Asset Management or any of its related or affiliated companies (collectively “NGAM”) and does not sponsor, endorse or participate in the provision of any NGAM services, funds or other financial products.
The index information contained herein is derived from third parties and is provided on an “as is” basis. The user of this information assumes the entire risk of use of this information. Each of the third party entities involved in compiling, computing or creating index information disclaims all warranties (including, without limitation, any warranties of originality, accuracy, completeness, timeliness, non-infringement, merchantability and fitness for a particular purpose) with respect to such information.
PROXY VOTING INFORMATION
A description of the Natixis Funds’ proxy voting policies and procedures is available without charge, upon request, by calling Natixis Funds at 800-225-5478; on Natixis Funds’ website at ngam.natixis.com; and on the Securities and Exchange Commission’s (SEC) website at www.sec.gov. Information regarding how Natixis Funds voted proxies relating to portfolio securities during the most recent 12-month period ended June 30 is available from Natixis Funds’ website and the SEC’s website.
QUARTERLY PORTFOLIO SCHEDULES
Natixis Funds file a complete schedule of portfolio holdings with the SEC for the first and third quarters of each fiscal year on Form N-Q. The Fund’s Forms N-Q are available on the SEC’s website at www.sec.gov and may be reviewed and copied at the SEC’s Public Reference Room in Washington, DC. Information on the operation of the Public Reference Room may be obtained by calling 800-SEC-0330.
| 6
Table of Contents
UNDERSTANDING FUND EXPENSES
As a mutual fund shareholder, you incur different types of costs: transaction costs, including sales charges (loads) on purchases and contingent deferred sales charges on redemptions and ongoing costs, including management fees, distribution and/or service fees (12b-1 fees), and other fund expenses. Certain exemptions may apply. These costs are described in more detail in the Fund’s prospectus. The following examples are intended to help you understand the ongoing costs of investing in the Fund and help you compare these with the ongoing costs of investing in other mutual funds.
The first line in the table for each class of Fund shares shows the actual account values and actual Fund expenses you would have paid on a $1,000 investment in the Fund from July 1, 2016 through December 31, 2016. To estimate the expenses you paid over the period, simply divide your account value by $1,000 (for example $8,600 account value divided by $1,000 = 8.60) and multiply the result by the number in the Expenses Paid During Period column as shown below for your class.
The second line in the table for each class of Fund shares provides information about hypothetical account values and hypothetical expenses based on the Fund’s actual expense ratios and an assumed rate of return of 5% per year before expenses, which is not the Fund’s actual return. The hypothetical account values and expenses may not be used to estimate the actual ending account balance or expenses you paid on your investment for the period. You may use this information to compare the ongoing costs of investing in the Fund and other funds. To do so, compare this 5% hypothetical example with the 5% hypothetical examples that appear in the shareholder reports of the other funds.
Please note that the expenses shown reflect ongoing costs only, and do not include any transaction costs, such as sales charges. Therefore, the second line in the table is useful in comparing ongoing costs only, and will not help you determine the relative costs of owning different funds. If transaction costs were included, total costs would be higher.
| GATEWAY FUND | BEGINNING ACCOUNT VALUE 7/1/2016 | ENDING ACCOUNT VALUE 12/31/2016 | EXPENSES PAID DURING PERIOD* 7/1/2016 – 12/31/2016 | |||||||||
| Class A | ||||||||||||
| Actual | $1,000.00 | $1,039.00 | $4.82 | |||||||||
| Hypothetical (5% return before expenses) | $1,000.00 | $1,020.41 | $4.77 | |||||||||
| Class C | ||||||||||||
| Actual | $1,000.00 | $1,035.20 | $8.70 | |||||||||
| Hypothetical (5% return before expenses) | $1,000.00 | $1,016.59 | $8.62 | |||||||||
| Class Y | ||||||||||||
| Actual | $1,000.00 | $1,040.30 | $3.59 | |||||||||
| Hypothetical (5% return before expenses) | $1,000.00 | $1,021.62 | $3.56 | |||||||||
| * | Expenses are equal to the Fund’s annualized expense ratio (after waiver/reimbursement): 0.94%, 1.70% and 0.70% for Class A, C and Y, respectively, multiplied by the average account value over the period, multiplied by the number of days in the most recent fiscal half-year (184), divided by 366 (to reflect the half-year period). |
7 |
Table of Contents
Portfolio of Investments – as of December 31, 2016
Gateway Fund
| Shares | Description | Value (†) | ||||||
| Common Stocks — 97.1% of Net Assets | ||||||||
| Aerospace & Defense — 1.8% | ||||||||
| 333,048 | Boeing Co. (The)(b) | $ | 51,848,913 | |||||
| 198,576 | Raytheon Co.(b) | 28,197,792 | ||||||
| 47,565 | TransDigm Group, Inc.(b) | 11,841,782 | ||||||
| 439,375 | United Technologies Corp.(b) | 48,164,288 | ||||||
|
| |||||||
| 140,052,775 | ||||||||
|
| |||||||
| Air Freight & Logistics — 0.7% | ||||||||
| 439,597 | United Parcel Service, Inc., Class B(b) | 50,395,400 | ||||||
|
| |||||||
| Airlines — 0.6% | ||||||||
| 112,758 | Alaska Air Group, Inc.(b) | 10,005,017 | ||||||
| 339,779 | American Airlines Group, Inc.(b) | 15,864,282 | ||||||
| 209,953 | JetBlue Airways Corp.(b)(c) | 4,707,146 | ||||||
| 237,587 | United Continental Holdings, Inc.(b)(c) | 17,315,341 | ||||||
|
| |||||||
| 47,891,786 | ||||||||
|
| |||||||
| Auto Components — 0.2% | ||||||||
| 50,247 | Adient PLC(c) | 2,944,474 | ||||||
| 75,907 | Autoliv, Inc.(b) | 8,588,877 | ||||||
| 160,289 | Cooper Tire & Rubber Co.(b) | 6,227,228 | ||||||
|
| |||||||
| 17,760,579 | ||||||||
|
| |||||||
| Automobiles — 0.5% | ||||||||
| 2,669,073 | Ford Motor Co.(b) | 32,375,856 | ||||||
| 28,971 | Tesla Motors, Inc.(b)(c) | 6,190,813 | ||||||
|
| |||||||
| 38,566,669 | ||||||||
|
| |||||||
| Banks — 6.7% | ||||||||
| 299,428 | Associated Banc - Corp(b) | 7,395,872 | ||||||
| 5,025,154 | Bank of America Corp.(b) | 111,055,903 | ||||||
| 1,601,427 | Citigroup, Inc.(b) | 95,172,807 | ||||||
| 1,037,084 | Huntington Bancshares, Inc.(b) | 13,710,250 | ||||||
| 1,646,501 | JPMorgan Chase & Co.(b) | 142,076,571 | ||||||
| 189,753 | Old National Bancorp(b) | 3,444,017 | ||||||
| 782,655 | U.S. Bancorp(b) | 40,204,987 | ||||||
| 1,884,161 | Wells Fargo & Co.(b) | 103,836,113 | ||||||
|
| |||||||
| 516,896,520 | ||||||||
|
| |||||||
| Beverages — 2.0% | ||||||||
| 1,639,418 | Coca-Cola Co. (The)(b) | 67,970,270 | ||||||
| 310,572 | Monster Beverage Corp.(b)(c) | 13,770,763 | ||||||
| 702,457 | PepsiCo, Inc.(b) | 73,498,076 | ||||||
|
| |||||||
| 155,239,109 | ||||||||
|
| |||||||
| Biotechnology — 2.9% | ||||||||
| 647,935 | AbbVie, Inc.(b) | 40,573,690 | ||||||
| 144,748 | Alexion Pharmaceuticals, Inc.(b)(c) | 17,709,918 | ||||||
| 299,292 | Amgen, Inc.(b) | 43,759,483 | ||||||
| 107,014 | Biogen, Inc.(b)(c) | 30,347,030 | ||||||
| 343,133 | Celgene Corp.(b)(c) | 39,717,645 | ||||||
See accompanying notes to financial statements.
| 8
Table of Contents
Portfolio of Investments – as of December 31, 2016
Gateway Fund – (continued)
| Shares | Description | Value (†) | ||||||
| Biotechnology — continued | ||||||||
| 536,749 | Gilead Sciences, Inc.(b) | $ | 38,436,596 | |||||
| 17,121 | Shire PLC, Sponsored ADR | 2,917,076 | ||||||
| 144,295 | Vertex Pharmaceuticals, Inc.(b)(c) | 10,630,212 | ||||||
|
| |||||||
| 224,091,650 | ||||||||
|
| |||||||
| Building Products — 0.5% | ||||||||
| 271,553 | Fortune Brands Home & Security, Inc.(b) | 14,517,224 | ||||||
| 502,475 | Johnson Controls International PLC(b) | 20,696,945 | ||||||
|
| |||||||
| 35,214,169 | ||||||||
|
| |||||||
| Capital Markets — 2.4% | ||||||||
| 120,536 | Affiliated Managers Group, Inc.(b)(c) | 17,513,881 | ||||||
| 775,101 | Charles Schwab Corp. (The)(b) | 30,593,237 | ||||||
| 162,200 | CME Group, Inc.(b) | 18,709,770 | ||||||
| 268,031 | Eaton Vance Corp.(b) | 11,225,138 | ||||||
| 174,018 | Goldman Sachs Group, Inc. (The)(b) | 41,668,610 | ||||||
| 323,643 | Intercontinental Exchange, Inc.(b) | 18,259,938 | ||||||
| 220,119 | Legg Mason, Inc.(b) | 6,583,759 | ||||||
| 746,900 | Morgan Stanley(b) | 31,556,525 | ||||||
| 185,699 | TD Ameritrade Holding Corp.(b) | 8,096,476 | ||||||
| 148,968 | Waddell & Reed Financial, Inc., Class A | 2,906,366 | ||||||
|
| |||||||
| 187,113,700 | ||||||||
|
| |||||||
| Chemicals — 1.9% | ||||||||
| 21,205 | AdvanSix, Inc.(c) | 469,479 | ||||||
| 68,520 | Ashland Global Holdings, Inc.(b) | 7,488,551 | ||||||
| 76,246 | Celanese Corp., Series A(b) | 6,003,610 | ||||||
| 599,063 | Dow Chemical Co. (The)(b) | 34,278,385 | ||||||
| 383,052 | E.I. du Pont de Nemours & Co.(b) | 28,116,017 | ||||||
| 194,173 | Eastman Chemical Co.(b) | 14,603,751 | ||||||
| 51,809 | Ingevity Corp.(c) | 2,842,242 | ||||||
| 213,617 | LyondellBasell Industries NV, Class A(b) | 18,324,066 | ||||||
| 186,277 | Monsanto Co.(b) | 19,598,203 | ||||||
| 123,235 | Olin Corp. | 3,156,048 | ||||||
| 194,640 | RPM International, Inc.(b) | 10,477,471 | ||||||
|
| |||||||
| 145,357,823 | ||||||||
|
| |||||||
| Commercial Services & Supplies — 0.3% | ||||||||
| 268,596 | Waste Management, Inc.(b) | 19,046,142 | ||||||
|
| |||||||
| Communications Equipment — 1.1% | ||||||||
| 2,348,322 | Cisco Systems, Inc.(b) | 70,966,291 | ||||||
| 136,704 | Motorola Solutions, Inc.(b) | 11,331,395 | ||||||
| 39,211 | Palo Alto Networks, Inc.(b)(c) | 4,903,335 | ||||||
|
| |||||||
| 87,201,021 | ||||||||
|
| |||||||
| Consumer Finance — 0.7% | ||||||||
| 135,739 | Ally Financial, Inc. | 2,581,756 | ||||||
| 354,603 | American Express Co.(b) | 26,268,990 | ||||||
| 304,571 | Discover Financial Services(b) | 21,956,523 | ||||||
|
| |||||||
| 50,807,269 | ||||||||
|
| |||||||
See accompanying notes to financial statements.
9 |
Table of Contents
Portfolio of Investments – as of December 31, 2016
Gateway Fund – (continued)
| Shares | Description | Value (†) | ||||||
| Containers & Packaging — 0.4% | ||||||||
| 156,723 | Avery Dennison Corp.(b) | $ | 11,005,089 | |||||
| 137,926 | Sonoco Products Co.(b) | 7,268,700 | ||||||
| 242,621 | WestRock Co.(b) | 12,317,868 | ||||||
|
| |||||||
| 30,591,657 | ||||||||
|
| |||||||
| Distributors — 0.3% | ||||||||
| 209,295 | Genuine Parts Co.(b) | 19,996,044 | ||||||
|
| |||||||
| Diversified Financial Services — 1.8% | ||||||||
| 864,424 | Berkshire Hathaway, Inc., Class B(b)(c) | 140,883,824 | ||||||
|
| |||||||
| Diversified Telecommunication Services — 2.5% | ||||||||
| 2,408,937 | AT&T, Inc.(b) | 102,452,091 | ||||||
| 72,573 | SBA Communications Corp., Class A(c) | 7,493,888 | ||||||
| 1,588,870 | Verizon Communications, Inc.(b) | 84,813,880 | ||||||
|
| |||||||
| 194,759,859 | ||||||||
|
| |||||||
| Electric Utilities — 1.5% | ||||||||
| 461,146 | Alliant Energy Corp.(b) | 17,472,822 | ||||||
| 789,602 | American Electric Power Co., Inc.(b) | 49,713,342 | ||||||
| 492,206 | Duke Energy Corp.(b) | 38,205,029 | ||||||
| 110,798 | Hawaiian Electric Industries, Inc.(b) | 3,664,090 | ||||||
| 271,104 | OGE Energy Corp.(b) | 9,068,429 | ||||||
|
| |||||||
| 118,123,712 | ||||||||
|
| |||||||
| Electrical Equipment — 0.6% | ||||||||
| 280,368 | Eaton Corp. PLC(b) | 18,809,889 | ||||||
| 412,177 | Emerson Electric Co.(b) | 22,978,868 | ||||||
| 40,121 | Hubbell, Inc.(b) | 4,682,121 | ||||||
|
| |||||||
| 46,470,878 | ||||||||
|
| |||||||
| Electronic Equipment, Instruments & Components — 0.5% | ||||||||
| 639,188 | Corning, Inc.(b) | 15,513,093 | ||||||
| 311,816 | TE Connectivity Ltd.(b) | 21,602,612 | ||||||
|
| |||||||
| 37,115,705 | ||||||||
|
| |||||||
| Energy Equipment & Services — 1.5% | ||||||||
| 219,129 | Baker Hughes, Inc.(b) | 14,236,811 | ||||||
| 553,928 | Halliburton Co.(b) | 29,961,966 | ||||||
| 320,999 | Patterson-UTI Energy, Inc.(b) | 8,641,293 | ||||||
| 689,754 | Schlumberger Ltd.(b) | 57,904,848 | ||||||
|
| |||||||
| 110,744,918 | ||||||||
|
| |||||||
| Food & Staples Retailing — 1.7% | ||||||||
| 591,332 | CVS Health Corp.(b) | 46,662,008 | ||||||
| 709,379 | Wal-Mart Stores, Inc.(b) | 49,032,276 | ||||||
| 458,180 | Walgreens Boots Alliance, Inc.(b) | 37,918,977 | ||||||
|
| |||||||
| 133,613,261 | ||||||||
|
| |||||||
| Food Products — 1.4% | ||||||||
| 99,388 | Bunge Ltd.(b) | 7,179,789 | ||||||
| 594,061 | Conagra Brands, Inc.(b) | 23,495,113 | ||||||
See accompanying notes to financial statements.
| 10
Table of Contents
Portfolio of Investments – as of December 31, 2016
Gateway Fund – (continued)
| Shares | Description | Value (†) | ||||||
| Food Products — continued | ||||||||
| 303,613 | Kraft Heinz Co. (The)(b) | $ | 26,511,487 | |||||
| 171,244 | Lamb Weston Holdings, Inc.(b)(c) | 6,481,585 | ||||||
| 1,029,474 | Mondelez International, Inc., Class A(b) | 45,636,583 | ||||||
|
| |||||||
| 109,304,557 | ||||||||
|
| |||||||
| Gas Utilities — 0.2% | ||||||||
| 135,393 | National Fuel Gas Co.(b) | 7,668,660 | ||||||
| 36,602 | ONE Gas, Inc. | 2,341,064 | ||||||
| 74,361 | WGL Holdings, Inc.(b) | 5,672,257 | ||||||
|
| |||||||
| 15,681,981 | ||||||||
|
| |||||||
| Health Care Equipment & Supplies — 2.1% | ||||||||
| 715,714 | Abbott Laboratories(b) | 27,490,575 | ||||||
| 389,539 | Baxter International, Inc.(b) | 17,272,159 | ||||||
| 1,258,452 | Boston Scientific Corp.(b)(c) | 27,220,317 | ||||||
| 336,439 | Hologic, Inc.(b)(c) | 13,497,932 | ||||||
| 31,735 | Intuitive Surgical, Inc.(b)(c) | 20,125,385 | ||||||
| 718,764 | Medtronic PLC(b) | 51,197,560 | ||||||
| 56,543 | ResMed, Inc.(b) | 3,508,493 | ||||||
|
| |||||||
| 160,312,421 | ||||||||
|
| |||||||
| Health Care Providers & Services — 2.7% | ||||||||
| 265,863 | Aetna, Inc.(b) | 32,969,671 | ||||||
| 182,129 | Anthem, Inc.(b) | 26,184,686 | ||||||
| 399,886 | Express Scripts Holding Co.(b)(c) | 27,508,158 | ||||||
| 236,805 | HCA Holdings, Inc.(b)(c) | 17,528,306 | ||||||
| 155,514 | Patterson Cos., Inc.(b) | 6,380,739 | ||||||
| 127,157 | Quest Diagnostics, Inc.(b) | 11,685,728 | ||||||
| 456,919 | UnitedHealth Group, Inc.(b) | 73,125,317 | ||||||
| 123,465 | Universal Health Services, Inc., Class B(b) | 13,134,207 | ||||||
|
| |||||||
| 208,516,812 | ||||||||
|
| |||||||
| Hotels, Restaurants & Leisure — 1.2% | ||||||||
| 52,112 | Domino’s Pizza, Inc.(b) | 8,298,315 | ||||||
| 261,654 | Hilton Worldwide Holdings, Inc.(b) | 7,116,989 | ||||||
| 38,270 | Las Vegas Sands Corp. | 2,044,001 | ||||||
| 421,929 | McDonald’s Corp.(b) | 51,357,198 | ||||||
| 182,685 | Melco Crown Entertainment Ltd., Sponsored ADR | 2,904,692 | ||||||
| 206,550 | MGM Resorts International(b)(c) | 5,954,836 | ||||||
| 155,034 | Norwegian Cruise Line Holdings Ltd.(b)(c) | 6,593,596 | ||||||
| 78,199 | Restaurant Brands International, Inc.(b) | 3,726,964 | ||||||
| 434,122 | Wendy’s Co. (The)(b) | 5,869,329 | ||||||
|
| |||||||
| 93,865,920 | ||||||||
|
| |||||||
| Household Durables — 0.9% | ||||||||
| 261,536 | Leggett & Platt, Inc.(b) | 12,783,880 | ||||||
| 360,064 | Newell Brands, Inc.(b) | 16,076,857 | ||||||
| 577,566 | Toll Brothers, Inc.(b)(c) | 17,904,546 | ||||||
| 63,337 | Tupperware Brands Corp.(b) | 3,332,793 | ||||||
| 83,547 | Whirlpool Corp.(b) | 15,186,338 | ||||||
|
| |||||||
| 65,284,414 | ||||||||
|
| |||||||
See accompanying notes to financial statements.
11 |
Table of Contents
Portfolio of Investments – as of December 31, 2016
Gateway Fund – (continued)
| Shares | Description | Value (†) | ||||||
| Household Products — 1.8% | ||||||||
| 164,245 | Church & Dwight Co., Inc.(b) | $ | 7,257,987 | |||||
| 486,221 | Colgate-Palmolive Co.(b) | 31,818,302 | ||||||
| 172,907 | Kimberly-Clark Corp.(b) | 19,732,147 | ||||||
| 936,340 | Procter & Gamble Co. (The)(b) | 78,727,467 | ||||||
|
| |||||||
| 137,535,903 | ||||||||
|
| |||||||
| Industrial Conglomerates — 3.0% | ||||||||
| 333,360 | 3M Co.(b) | 59,528,095 | ||||||
| 3,566,335 | General Electric Co.(b) | 112,696,186 | ||||||
| 466,215 | Honeywell International, Inc.(b) | 54,011,008 | ||||||
|
| |||||||
| 226,235,289 | ||||||||
|
| |||||||
| Insurance — 2.8% | ||||||||
| 265,611 | Aflac, Inc.(b) | 18,486,526 | ||||||
| 293,814 | Allstate Corp. (The)(b) | 21,777,494 | ||||||
| 514,290 | American International Group, Inc.(b) | 33,588,280 | ||||||
| 179,714 | Aon PLC(b) | 20,043,502 | ||||||
| 114,640 | Arthur J. Gallagher & Co.(b) | 5,956,694 | ||||||
| 191,560 | FNF Group(b) | 6,505,378 | ||||||
| 358,212 | Lincoln National Corp.(b) | 23,738,709 | ||||||
| 394,972 | Marsh & McLennan Cos., Inc.(b) | 26,696,158 | ||||||
| 302,212 | Principal Financial Group, Inc.(b) | 17,485,986 | ||||||
| 259,413 | Travelers Cos., Inc. (The)(b) | 31,757,339 | ||||||
| 302,347 | XL Group Ltd.(b) | 11,265,449 | ||||||
|
| |||||||
| 217,301,515 | ||||||||
|
| |||||||
| Internet & Direct Marketing Retail — 2.3% | ||||||||
| 161,353 | Amazon.com, Inc.(b)(c) | 120,993,774 | ||||||
| 184,751 | Netflix, Inc.(b)(c) | 22,872,174 | ||||||
| 21,195 | Priceline Group, Inc. (The)(b)(c) | 31,073,142 | ||||||
|
| |||||||
| 174,939,090 | ||||||||
|
| |||||||
| Internet Software & Services — 4.6% | ||||||||
| 129,476 | Alphabet, Inc., Class A(b)(c) | 102,603,256 | ||||||
| 110,860 | Alphabet, Inc., Class C(b)(c) | 85,563,965 | ||||||
| 21,117 | Baidu, Inc., Sponsored ADR(b)(c) | 3,471,846 | ||||||
| 613,137 | eBay, Inc.(b)(c) | 18,204,038 | ||||||
| 998,893 | Facebook, Inc., Class A(b)(c) | 114,922,640 | ||||||
| 148,176 | VeriSign, Inc.(b)(c) | 11,271,748 | ||||||
| 421,253 | Yahoo!, Inc.(b)(c) | 16,289,853 | ||||||
|
| |||||||
| 352,327,346 | ||||||||
|
| |||||||
| IT Services — 3.4% | ||||||||
| 270,895 | Automatic Data Processing, Inc.(b) | 27,842,588 | ||||||
| 136,305 | Broadridge Financial Solutions, Inc.(b) | 9,037,021 | ||||||
| 402,460 | Cognizant Technology Solutions Corp., Class A(b)(c) | 22,549,834 | ||||||
| 238,300 | Fidelity National Information Services, Inc.(b) | 18,025,012 | ||||||
| 40,311 | FleetCor Technologies, Inc.(b)(c) | 5,704,813 | ||||||
| 363,173 | International Business Machines Corp.(b) | 60,283,086 | ||||||
| 259,173 | Paychex, Inc.(b) | 15,778,452 | ||||||
See accompanying notes to financial statements.
| 12
Table of Contents
Portfolio of Investments – as of December 31, 2016
Gateway Fund – (continued)
| Shares | Description | Value (†) | ||||||
| IT Services — continued | ||||||||
| 564,099 | PayPal Holdings, Inc.(b)(c) | $ | 22,264,988 | |||||
| 891,906 | Visa, Inc., Class A(b) | 69,586,506 | ||||||
| 394,132 | Western Union Co. (The)(b) | 8,560,547 | ||||||
|
| |||||||
| 259,632,847 | ||||||||
|
| |||||||
| Leisure Products — 0.2% | ||||||||
| 245,637 | Mattel, Inc.(b) | 6,767,300 | ||||||
| 84,926 | Polaris Industries, Inc.(b) | 6,997,053 | ||||||
|
| |||||||
| 13,764,353 | ||||||||
|
| |||||||
| Life Sciences Tools & Services — 0.2% | ||||||||
| 99,001 | Illumina, Inc.(b)(c) | 12,676,088 | ||||||
|
| |||||||
| Machinery — 1.9% | ||||||||
| 381,410 | Caterpillar, Inc.(b) | 35,371,963 | ||||||
| 125,386 | Cummins, Inc.(b) | 17,136,505 | ||||||
| 161,197 | Deere & Co.(b) | 16,609,739 | ||||||
| 189,620 | Parker Hannifin Corp.(b) | 26,546,800 | ||||||
| 171,481 | Pentair PLC(b) | 9,614,940 | ||||||
| 98,027 | Snap-on, Inc.(b) | 16,789,084 | ||||||
| 182,421 | Stanley Black & Decker, Inc.(b) | 20,921,865 | ||||||
| 114,596 | Timken Co. (The)(b) | 4,549,461 | ||||||
|
| |||||||
| 147,540,357 | ||||||||
|
| |||||||
| Media — 3.0% | ||||||||
| 1,042,614 | Comcast Corp., Class A(b) | 71,992,497 | ||||||
| 191,768 | Liberty Global PLC, Series C(b)(c) | 5,695,510 | ||||||
| 95,626 | Liberty Global PLC LiLAC, Series C(c) | 2,024,402 | ||||||
| 288,008 | News Corp., Class B(b) | 3,398,494 | ||||||
| 196,923 | Omnicom Group, Inc.(b) | 16,760,117 | ||||||
| 5,164,830 | Sirius XM Holdings, Inc.(b) | 22,983,493 | ||||||
| 358,707 | Time Warner, Inc.(b) | 34,625,987 | ||||||
| 74,823 | Time, Inc. | 1,335,591 | ||||||
| 712,378 | Walt Disney Co. (The)(b) | 74,244,035 | ||||||
|
| |||||||
| 233,060,126 | ||||||||
|
| |||||||
| Metals & Mining — 0.2% | ||||||||
| 194,251 | Southern Copper Corp.(b) | 6,204,377 | ||||||
| 237,754 | Steel Dynamics, Inc.(b) | 8,459,287 | ||||||
| 70,398 | Worthington Industries, Inc.(b) | 3,339,681 | ||||||
|
| |||||||
| 18,003,345 | ||||||||
|
| |||||||
| Multi-Utilities — 1.5% | ||||||||
| 333,360 | Ameren Corp.(b) | 17,488,066 | ||||||
| 665,565 | CenterPoint Energy, Inc.(b) | 16,399,522 | ||||||
| 286,820 | Consolidated Edison, Inc.(b) | 21,132,897 | ||||||
| 649,303 | Public Service Enterprise Group, Inc.(b) | 28,491,416 | ||||||
| 477,447 | WEC Energy Group, Inc.(b) | 28,002,266 | ||||||
|
| |||||||
| 111,514,167 | ||||||||
|
| |||||||
See accompanying notes to financial statements.
13 |
Table of Contents
Portfolio of Investments – as of December 31, 2016
Gateway Fund – (continued)
| Shares | Description | Value (†) | ||||||
| Multiline Retail — 0.5% | ||||||||
| 182,140 | Nordstrom, Inc.(b) | $ | 8,729,970 | |||||
| 376,175 | Target Corp.(b) | 27,171,120 | ||||||
|
| |||||||
| 35,901,090 | ||||||||
|
| |||||||
| Oil, Gas & Consumable Fuels — 5.9% | ||||||||
| 159,424 | Cheniere Energy, Inc.(b)(c) | 6,604,936 | ||||||
| 841,945 | Chevron Corp.(b) | 99,096,927 | ||||||
| 226,749 | Concho Resources, Inc.(b)(c) | 30,066,917 | ||||||
| 900,918 | ConocoPhillips(b) | 45,172,029 | ||||||
| 196,755 | Continental Resources, Inc.(b)(c) | 10,140,753 | ||||||
| 1,711,465 | Exxon Mobil Corp.(b) | 154,476,831 | ||||||
| 328,183 | Gulfport Energy Corp.(b)(c) | 7,101,880 | ||||||
| 349,548 | HollyFrontier Corp.(b) | 11,451,192 | ||||||
| 532,184 | Occidental Petroleum Corp.(b) | 37,907,466 | ||||||
| 227,919 | ONEOK, Inc.(b) | 13,084,830 | ||||||
| 383,503 | Phillips 66(b) | 33,138,494 | ||||||
|
| |||||||
| 448,242,255 | ||||||||
|
| |||||||
| Personal Products — 0.0% | ||||||||
| 59,847 | Herbalife Ltd.(c) | 2,881,035 | ||||||
|
| |||||||
| Pharmaceuticals — 5.0% | ||||||||
| 190,492 | Allergan PLC(b)(c) | 40,005,225 | ||||||
| 670,365 | Bristol-Myers Squibb Co.(b) | 39,176,131 | ||||||
| 418,737 | Eli Lilly & Co.(b) | 30,798,106 | ||||||
| 62,491 | Jazz Pharmaceuticals PLC(b)(c) | 6,813,394 | ||||||
| 1,090,937 | Johnson & Johnson(b) | 125,686,852 | ||||||
| 1,133,542 | Merck & Co., Inc.(b) | 66,731,617 | ||||||
| 2,294,390 | Pfizer, Inc.(b) | 74,521,787 | ||||||
|
| |||||||
| 383,733,112 | ||||||||
|
| |||||||
| Professional Services — 0.3% | ||||||||
| 74,396 | Dun & Bradstreet Corp. (The)(b) | 9,025,723 | ||||||
| 138,148 | Verisk Analytics, Inc.(b)(c) | 11,213,473 | ||||||
|
| |||||||
| 20,239,196 | ||||||||
|
| |||||||
| REITs – Apartments — 0.3% | ||||||||
| 570,075 | UDR, Inc.(b) | 20,796,336 | ||||||
|
| |||||||
| REITs – Diversified — 0.8% | ||||||||
| 269,981 | Digital Realty Trust, Inc.(b) | 26,528,333 | ||||||
| 943,920 | Duke Realty Corp.(b) | 25,070,515 | ||||||
| 304,696 | Liberty Property Trust(b) | 12,035,492 | ||||||
|
| |||||||
| 63,634,340 | ||||||||
|
| |||||||
| REITs – Health Care — 0.6% | ||||||||
| 170,806 | Care Capital Properties, Inc.(b) | 4,270,150 | ||||||
| 289,444 | Healthcare Realty Trust, Inc.(b) | 8,775,942 | ||||||
| 256,100 | Senior Housing Properties Trust(b) | 4,847,973 | ||||||
| 439,995 | Ventas, Inc.(b) | 27,508,488 | ||||||
|
| |||||||
| 45,402,553 | ||||||||
|
| |||||||
See accompanying notes to financial statements.
| 14
Table of Contents
Portfolio of Investments – as of December 31, 2016
Gateway Fund – (continued)
| Shares | Description | Value (†) | ||||||
| REITs – Mortgage — 0.3% | ||||||||
| 634,597 | AGNC Investment Corp.(b) | $ | 11,505,244 | |||||
| 1,217,765 | Annaly Capital Management, Inc.(b) | 12,141,117 | ||||||
|
| |||||||
| 23,646,361 | ||||||||
|
| |||||||
| REITs – Office Property — 0.0% | ||||||||
| 109,171 | Mack-Cali Realty Corp. | 3,168,142 | ||||||
|
| |||||||
| REITs – Shopping Centers — 0.2% | ||||||||
| 162,802 | Regency Centers Corp.(b) | 11,225,198 | ||||||
|
| |||||||
| REITs – Storage — 0.2% | ||||||||
| 233,190 | Extra Space Storage, Inc.(b) | 18,011,596 | ||||||
|
| |||||||
| Road & Rail — 0.7% | ||||||||
| 146,168 | Avis Budget Group, Inc.(b)(c) | 5,361,442 | ||||||
| 58,999 | Canadian Pacific Railway Ltd.(b) | 8,423,287 | ||||||
| 1,024,576 | CSX Corp.(b) | 36,813,016 | ||||||
| 158,107 | Hertz Global Holdings, Inc.(b)(c) | 3,408,787 | ||||||
|
| |||||||
| 54,006,532 | ||||||||
|
| |||||||
| Semiconductors & Semiconductor Equipment — 3.4% | ||||||||
| 175,038 | Advanced Micro Devices, Inc.(c) | 1,984,931 | ||||||
| 243,846 | Analog Devices, Inc.(b) | 17,708,097 | ||||||
| 724,182 | Applied Materials, Inc.(b) | 23,369,353 | ||||||
| 1,916,735 | Intel Corp.(b) | 69,519,978 | ||||||
| 241,943 | Linear Technology Corp.(b) | 15,085,146 | ||||||
| 200,182 | Microchip Technology, Inc.(b) | 12,841,675 | ||||||
| 278,548 | NVIDIA Corp.(b) | 29,732,214 | ||||||
| 631,881 | QUALCOMM, Inc.(b) | 41,198,641 | ||||||
| 142,510 | Skyworks Solutions, Inc.(b) | 10,639,797 | ||||||
| 512,406 | Texas Instruments, Inc.(b) | 37,390,266 | ||||||
|
| |||||||
| 259,470,098 | ||||||||
|
| |||||||
| Software — 4.3% | ||||||||
| 431,874 | Activision Blizzard, Inc.(b) | 15,594,970 | ||||||
| 321,028 | Adobe Systems, Inc.(b)(c) | 33,049,833 | ||||||
| 100,269 | ANSYS, Inc.(b)(c) | 9,273,880 | ||||||
| 88,935 | Dell Technologies, Inc., Class V(b)(c) | 4,888,757 | ||||||
| 3,103,285 | Microsoft Corp.(b) | 192,838,130 | ||||||
| 341,278 | Nuance Communications, Inc.(b)(c) | 5,085,042 | ||||||
| 1,305,341 | Oracle Corp.(b) | 50,190,361 | ||||||
| 76,669 | ServiceNow, Inc.(b)(c) | 5,699,573 | ||||||
| 390,676 | Symantec Corp.(b) | 9,333,250 | ||||||
| 77,184 | Workday, Inc., Class A(b)(c) | 5,101,091 | ||||||
|
| |||||||
| 331,054,887 | ||||||||
|
| |||||||
| Specialty Retail — 2.5% | ||||||||
| 117,243 | American Eagle Outfitters, Inc. | 1,778,576 | ||||||
| 174,396 | Foot Locker, Inc.(b) | 12,362,933 | ||||||
| 254,552 | Gap, Inc. (The)(b) | 5,712,147 | ||||||
| 656,242 | Home Depot, Inc. (The)(b) | 87,988,927 | ||||||
| 150,116 | L Brands, Inc.(b) | 9,883,637 | ||||||
See accompanying notes to financial statements.
15 |
Table of Contents
Portfolio of Investments – as of December 31, 2016
Gateway Fund – (continued)
| Shares | Description | Value (†) | ||||||
| Specialty Retail — continued | ||||||||
| 567,023 | Lowe’s Cos., Inc.(b) | $ | 40,326,676 | |||||
| 139,355 | Tiffany & Co.(b) | 10,790,258 | ||||||
| 319,557 | TJX Cos., Inc. (The)(b) | 24,008,317 | ||||||
|
| |||||||
| 192,851,471 | ||||||||
|
| |||||||
| Technology Hardware, Storage & Peripherals — 3.2% | ||||||||
| 2,103,114 | Apple, Inc.(b) | 243,582,664 | ||||||
|
| |||||||
| Textiles, Apparel & Luxury Goods — 0.4% | ||||||||
| 93,453 | Lululemon Athletica, Inc.(b)(c) | 6,073,510 | ||||||
| 212,485 | Michael Kors Holdings Ltd.(b)(c) | 9,132,605 | ||||||
| 419,436 | Under Armour, Inc., Class A(b)(c) | 12,184,616 | ||||||
| 92,527 | Under Armour, Inc., Class C(c) | 2,328,905 | ||||||
|
| |||||||
| 29,719,636 | ||||||||
|
| |||||||
| Tobacco — 1.9% | ||||||||
| 899,052 | Altria Group, Inc.(b) | 60,793,896 | ||||||
| 652,072 | Philip Morris International, Inc.(b) | 59,658,067 | ||||||
| 399,880 | Reynolds American, Inc.(b) | 22,409,275 | ||||||
| 158,645 | Vector Group Ltd. | 3,607,588 | ||||||
|
| |||||||
| 146,468,826 | ||||||||
|
| |||||||
| Trading Companies & Distributors — 0.1% | ||||||||
| 101,499 | GATX Corp.(b) | 6,250,308 | ||||||
|
| |||||||
| Wireless Telecommunication Services — 0.0% | ||||||||
| 182,970 | Sprint Corp.(c) | 1,540,607 | ||||||
|
| |||||||
| Total Common Stocks (Identified Cost $4,730,381,064) | 7,447,257,244 | |||||||
|
| |||||||
| Contracts | ||||||||
| Purchased Options — 0.3% | ||||||||
| Index Options — 0.3% | ||||||||
| 4,003 | On S&P 500® Index, Put expiring January 20, 2017 at 2000(c) | 370,277 | ||||||
| 4,718 | On S&P 500® Index, Put expiring January 20, 2017 at 2050(c) | 719,495 | ||||||
| 3,125 | On S&P 500® Index, Put expiring February 17, 2017 at 1975(c) | 1,234,375 | ||||||
| 7,683 | On S&P 500® Index, Put expiring February 17, 2017 at 2025(c) | 4,532,970 | ||||||
| 5,535 | On S&P 500® Index, Put expiring March 17, 2017 at 2000(c) | 6,365,250 | ||||||
| 7,805 | On S&P 500® Index, Put expiring March 17, 2017 at 2075(c) | 14,439,250 | ||||||
|
| |||||||
| Total Purchased Options (Identified Cost $48,113,972) | 27,661,617 | |||||||
|
| |||||||
See accompanying notes to financial statements.
| 16
Table of Contents
Portfolio of Investments – as of December 31, 2016
Gateway Fund – (continued)
| Principal Amount | Description | Value (†) | ||||||
| Short-Term Investments — 4.3% | ||||||||
| $ | 330,108,928 | Tri-Party Repurchase Agreement with Fixed Income Clearing Corporation, dated 12/30/2016 at 0.030% to be repurchased at $330,110,028 on 1/03/2017 collateralized by $44,770,000 Federal Home Loan Bank, 2.790% due 8/08/2036 valued at $40,406,626; $69,000,000 Federal Home Loan Bank, 2.670% due 5/17/2032 valued at $62,725,554; $34,680,000 Federal Home Loan Bank, 2.790% due 8/10/2038 valued at $30,605,551; $29,000,000 Federal Home Loan Bank, 2.570% due 10/06/2031 valued at $27,344,622; $43,000,000 Federal Home Loan Bank, 2.800% due 10/27/2036 valued at $38,782,474; $12,465,000 Federal Farm Credit Bank, 3.120% due 3/14/2031 valued at $12,579,030; $51,080,000 Federal Home Loan Bank, 5.500% due 7/15/2036 valued at $68,022,214; $50,000,000 U.S. Treasury Note, 3.125% due 11/15/2041 valued at $50,650,100; $820,000 U.S. Treasury Note, 3.125% due 2/15/2043 valued at $835,534; $4,500,000 U.S. Treasury Note, 3.375% due 5/15/2044 valued at $4,763,237 including accrued interest (Note 2 of Notes to Financial Statements) (Identified Cost $330,108,928) | $ | 330,108,928 | ||||
|
| |||||||
| Total Investments — 101.7% (Identified Cost $5,108,603,964)(a) | 7,805,027,789 | |||||||
| Other assets less liabilities — (1.7)% | (132,859,790 | ) | ||||||
|
| |||||||
| Net Assets — 100.0% | $ | 7,672,167,999 | ||||||
|
| |||||||
| Contracts | ||||||||
| Written Options — (1.9%) | ||||||||
| Index Options — (1.9%) | ||||||||
| 3,661 | On S&P 500® Index, Call expiring January 06, 2017 at 2200 | $ | (15,998,570 | ) | ||||
| 3,384 | On S&P 500® Index, Call expiring January 13, 2017 at 2260 | (3,299,400 | ) | |||||
| 3,806 | On S&P 500® Index, Call expiring January 20, 2017 at 2175 | (28,183,430 | ) | |||||
| 3,458 | On S&P 500® Index, Call expiring January 20, 2017 at 2200 | (18,361,980 | ) | |||||
| 3,760 | On S&P 500® Index, Call expiring January 20, 2017 at 2250 | (7,031,200 | ) | |||||
| 3,621 | On S&P 500® Index, Call expiring February 17, 2017 at 2200 | (23,808,075 | ) | |||||
| 3,620 | On S&P 500® Index, Call expiring February 17, 2017 at 2225 | (17,412,200 | ) | |||||
| 3,910 | On S&P 500® Index, Call expiring March 17, 2017 at 2250 | (17,810,050 | ) | |||||
| 3,649 | On S&P 500® Index, Call expiring March 17, 2017 at 2275 | (11,768,025 | ) | |||||
|
| |||||||
| Total Written Options (Premiums Received $131,449,497) | $ | (143,672,930 | ) | |||||
|
| |||||||
| (†) | See Note 2 of Notes to Financial Statements. | |||||||
| (a) | Federal Tax Information: | |||||||
| At December 31, 2016, the net unrealized appreciation on investments based on a cost of $5,100,508,143 for federal income tax purposes was as follows: | ||||||||
| Aggregate gross unrealized appreciation for all investments in which there is an excess of value over tax cost | $ | 2,875,408,339 | ||||||
| Aggregate gross unrealized depreciation for all investments in which there is an excess of tax cost over value | (170,888,693 | ) | ||||||
|
| |||||||
| Net unrealized appreciation | $ | 2,704,519,646 | ||||||
|
| |||||||
See accompanying notes to financial statements.
17 |
Table of Contents
Portfolio of Investments – as of December 31, 2016
Gateway Fund – (continued)
| (b) | Security (or a portion thereof) has been pledged as collateral for open derivative contracts. | |||||||
| (c) | Non-income producing security. | |||||||
| ADR | An American Depositary Receipt is a certificate issued by a custodian bank representing the right to receive securities of the foreign issuer described. The values of ADRs may be significantly influenced by trading on exchanges not located in the United States. | |||||||
| REITs | Real Estate Investment Trusts |
Industry Summary at December 31, 2016
Banks | 6.7 | % | ||
Oil, Gas & Consumable Fuels | 5.9 | |||
Pharmaceuticals | 5.0 | |||
Internet Software & Services | 4.6 | |||
Software | 4.3 | |||
IT Services | 3.4 | |||
Semiconductors & Semiconductor Equipment | 3.4 | |||
Technology Hardware, Storage & Peripherals | 3.2 | |||
Media | 3.0 | |||
Industrial Conglomerates | 3.0 | |||
Biotechnology | 2.9 | |||
Insurance | 2.8 | |||
Health Care Providers & Services | 2.7 | |||
Diversified Telecommunication Services | 2.5 | |||
Specialty Retail | 2.5 | |||
Capital Markets | 2.4 | |||
Internet & Direct Marketing Retail | 2.3 | |||
Health Care Equipment & Supplies | 2.1 | |||
Beverages | 2.0 | |||
Other Investments, less than 2% each | 32.7 | |||
Short-Term Investments | 4.3 | |||
|
| |||
Total Investments | 101.7 | |||
Other assets less liabilities (including open written options) | (1.7 | ) | ||
|
| |||
Net Assets | 100.0 | % | ||
|
|
See accompanying notes to financial statements.
| 18
Table of Contents
Statement of Assets and Liabilities
December 31, 2016
ASSETS | ||||
Investments at cost | $ | 5,108,603,964 | ||
Net unrealized appreciation | 2,696,423,825 | |||
|
| |||
Investments at value | 7,805,027,789 | |||
Receivable for Fund shares sold | 24,814,746 | |||
Dividends and interest receivable | 9,811,946 | |||
Prepaid expenses (Note 7) | 18,671 | |||
|
| |||
TOTAL ASSETS | 7,839,673,152 | |||
|
| |||
LIABILITIES | ||||
Options written, at value (premiums received $131,449,497) (Note 2) | 143,672,930 | |||
Payable for Fund shares redeemed | 18,764,175 | |||
Management fees payable (Note 6) | 3,809,728 | |||
Deferred Trustees’ fees (Note 6) | 533,102 | |||
Administrative fees payable (Note 6) | 298,202 | |||
Payable to distributor (Note 6d) | 51,016 | |||
Other accounts payable and accrued expenses | 376,000 | |||
|
| |||
TOTAL LIABILITIES | 167,505,153 | |||
|
| |||
NET ASSETS | $ | 7,672,167,999 | ||
|
| |||
NET ASSETS CONSIST OF: | ||||
Paid-in capital | $ | 6,184,083,145 | ||
Undistributed net investment income | 2,341,759 | |||
Accumulated net realized loss on investments, options written and foreign currency transactions | (1,198,457,479 | ) | ||
Net unrealized appreciation on investments, options written and foreign currency translations | 2,684,200,574 | |||
|
| |||
NET ASSETS | $ | 7,672,167,999 | ||
|
| |||
COMPUTATION OF NET ASSET VALUE AND OFFERING PRICE: | ||||
Class A shares: | ||||
Net assets | $ | 1,755,576,173 | ||
|
| |||
Shares of beneficial interest | 56,924,484 | |||
|
| |||
Net asset value and redemption price per share | $ | 30.84 | ||
|
| |||
Offering price per share (100/94.25 of net asset value) (Note 1) | $ | 32.72 | ||
|
| |||
Class C shares: (redemption price per share is equal to net asset value less any applicable contingent deferred sales charge) (Note 1) | ||||
Net assets | $ | 366,583,671 | ||
|
| |||
Shares of beneficial interest | 11,932,219 | |||
|
| |||
Net asset value and offering price per share | $ | 30.72 | ||
|
| |||
Class Y shares: | ||||
Net assets | $ | 5,550,008,155 | ||
|
| |||
Shares of beneficial interest | 180,028,795 | |||
|
| |||
Net asset value, offering and redemption price per share | $ | 30.83 | ||
|
|
See accompanying notes to financial statements.
19 |
Table of Contents
Statement of Operations
For the Year Ended December 31, 2016
INVESTMENT INCOME | ||||
Dividends | $ | 190,909,819 | ||
Interest | 66,518 | |||
Less net foreign taxes withheld | (23,492 | ) | ||
|
| |||
| 190,952,845 | ||||
|
| |||
Expenses | ||||
Management fees (Note 6) | 51,661,508 | |||
Service and distribution fees (Note 6) | 8,251,574 | |||
Administrative fees (Note 6) | 3,636,241 | |||
Trustees’ fees and expenses (Note 6) | 219,339 | |||
Transfer agent fees and expenses (Note 6) | 5,900,677 | |||
Audit and tax services fees | 51,779 | |||
Custodian fees and expenses | 386,449 | |||
Legal fees | 140,288 | |||
Registration fees | 194,878 | |||
Shareholder reporting expenses | 244,741 | |||
Miscellaneous expenses (Note 7) | 266,565 | |||
|
| |||
Total expenses | 70,954,039 | |||
Less waiver and/or expense reimbursement (Note 6) | (5,508,601 | ) | ||
|
| |||
Net expenses | 65,445,438 | |||
|
| |||
Net investment income | 125,507,407 | |||
|
| |||
NET REALIZED AND UNREALIZED GAIN (LOSS) ON INVESTMENTS, OPTIONS WRITTEN | ||||
Net realized gain (loss) on: | ||||
Investments | 525,855,841 | |||
Options written | (203,691,375 | ) | ||
Foreign currency transactions | (1,117 | ) | ||
Net change in unrealized appreciation (depreciation) on: | ||||
Investments | 98,572,938 | |||
Options written | (110,181,590 | ) | ||
Foreign currency translations | 191 | |||
|
| |||
Net realized and unrealized gain on investments, options written and foreign currency transactions | 310,554,888 | |||
|
| |||
NET INCREASE IN NET ASSETS RESULTING FROM OPERATIONS | $ | 436,062,295 | ||
|
|
See accompanying notes to financial statements.
| 20
Table of Contents
Statement of Changes in Net Assets
| Year Ended December 31, 2016 | Year Ended December 31, 2015 | |||||||
FROM OPERATIONS: | ||||||||
Net investment income | $ | 125,507,407 | $ | 165,793,033 | ||||
Net realized gain on investments, options written and foreign currency transactions | 322,163,349 | 419,952,951 | ||||||
Net change in unrealized appreciation (depreciation) on investments, options written and foreign currency translations | (11,608,461 | ) | (387,367,217 | ) | ||||
|
|
|
| |||||
Net increase in net assets resulting from operations | 436,062,295 | 198,378,767 | ||||||
|
|
|
| |||||
FROM DISTRIBUTIONS TO SHAREHOLDERS: | ||||||||
Net investment income | ||||||||
Class A | (25,053,905 | ) | (34,030,868 | ) | ||||
Class C | (2,443,921 | ) | (3,900,980 | ) | ||||
Class Y | (97,909,866 | ) | (121,203,310 | ) | ||||
|
|
|
| |||||
Total distributions | (125,407,692 | ) | (159,135,158 | ) | ||||
|
|
|
| |||||
NET INCREASE (DECREASE) IN NET ASSETS FROM CAPITAL SHARE TRANSACTIONS (NOTE 9) | (902,825,602 | ) | 80,398,347 | |||||
|
|
|
| |||||
Net increase (decrease) in net assets | (592,170,999 | ) | 119,641,956 | |||||
NET ASSETS | ||||||||
Beginning of the year | 8,264,338,998 | 8,144,697,042 | ||||||
|
|
|
| |||||
End of the year | $ | 7,672,167,999 | $ | 8,264,338,998 | ||||
|
|
|
| |||||
UNDISTRIBUTED NET INVESTMENT INCOME | $ | 2,341,759 | $ | 7,806,629 | ||||
|
|
|
| |||||
See accompanying notes to financial statements.
21 |
Table of Contents
Financial Highlights
For a share outstanding throughout each period.
| Class A | ||||||||||||||||||||
| Year Ended December 31, 2016 | Year Ended December 31, 2015 | Year Ended December 31, 2014 | Year Ended December 31, 2013 | Year Ended December 31, 2012 | ||||||||||||||||
Net asset value, beginning of the period | $ | 29.72 | $ | 29.58 | $ | 29.00 | $ | 27.13 | $ | 26.40 | ||||||||||
|
|
|
|
|
|
|
|
|
| |||||||||||
INCOME (LOSS) FROM INVESTMENT OPERATIONS: | ||||||||||||||||||||
Net investment income(a) | 0.41 | 0.57 | (b) | 0.39 | 0.43 | 0.48 | ||||||||||||||
Net realized and unrealized gain (loss) | 1.13 | 0.12 | 0.57 | 1.82 | 0.72 | |||||||||||||||
|
|
|
|
|
|
|
|
|
| |||||||||||
Total from Investment Operations | 1.54 | 0.69 | 0.96 | 2.25 | 1.20 | |||||||||||||||
|
|
|
|
|
|
|
|
|
| |||||||||||
LESS DISTRIBUTIONS FROM: | ||||||||||||||||||||
Net investment income | (0.42 | ) | (0.55 | ) | (0.38 | ) | (0.38 | ) | (0.47 | ) | ||||||||||
|
|
|
|
|
|
|
|
|
| |||||||||||
Net asset value, end of the period | $ | 30.84 | $ | 29.72 | $ | 29.58 | $ | 29.00 | $ | 27.13 | ||||||||||
|
|
|
|
|
|
|
|
|
| |||||||||||
Total return(c)(d) | 5.23 | % | 2.34 | % | 3.33 | % | 8.39 | % | 4.51 | % | ||||||||||
RATIOS TO AVERAGE NET ASSETS: | ||||||||||||||||||||
Net assets, end of the period (000’s) | $ | 1,755,576 | $ | 1,864,118 | $ | 1,976,457 | $ | 2,351,788 | $ | 2,066,522 | ||||||||||
Net expenses(e) | 0.94 | % | 0.94 | % | 0.94 | % | 0.94 | % | 0.94 | % | ||||||||||
Gross expenses | 1.02 | % | 1.01 | % | 1.02 | % | 1.03 | % | 1.03 | % | ||||||||||
Net investment income | 1.39 | % | 1.91 | %(b) | 1.33 | % | 1.51 | % | 1.79 | % | ||||||||||
Portfolio turnover rate | 14 | % | 10 | % | 13 | % | 10 | % | 8 | % | ||||||||||
| (a) | Per share net investment income has been calculated using the average shares outstanding during the period. |
| (b) | Includes a non-recurring dividend. Without this dividend, net investment income per share would have been $0.37, and the ratio of net investment income to average net assets would have been 1.24%. |
| (c) | Had certain expenses not been waived/reimbursed during the period, total returns would have been lower. |
| (d) | A sales charge for Class A shares is not reflected in total return calculations. |
| (e) | The investment adviser agreed to waive its fees and/or reimburse a portion of the Fund’s expenses during the period. Without this waiver/reimbursement, expenses would have been higher. |
See accompanying notes to financial statements.
| 22
Table of Contents
Financial Highlights (continued)
For a share outstanding throughout each period.
| Class C | ||||||||||||||||||||
| Year Ended December 31, 2016 | Year Ended December 31, 2015 | Year Ended December 31, 2014 | Year Ended December 31, 2013 | Year Ended December 31, 2012 | ||||||||||||||||
Net asset value, beginning of the period | $ | 29.61 | $ | 29.48 | $ | 28.90 | $ | 27.04 | $ | 26.32 | ||||||||||
|
|
|
|
|
|
|
|
|
| |||||||||||
INCOME (LOSS) FROM INVESTMENT OPERATIONS: | ||||||||||||||||||||
Net investment income(a) | 0.19 | 0.34 | (b) | 0.17 | 0.21 | 0.28 | ||||||||||||||
Net realized and unrealized gain (loss) | 1.11 | 0.12 | 0.57 | 1.82 | 0.71 | |||||||||||||||
|
|
|
|
|
|
|
|
|
| |||||||||||
Total from Investment Operations | 1.30 | 0.46 | 0.74 | 2.03 | 0.99 | |||||||||||||||
|
|
|
|
|
|
|
|
|
| |||||||||||
LESS DISTRIBUTIONS FROM: | ||||||||||||||||||||
Net investment income | (0.19 | ) | (0.33 | ) | (0.16 | ) | (0.17 | ) | (0.27 | ) | ||||||||||
|
|
|
|
|
|
|
|
|
| |||||||||||
Net asset value, end of the period | $ | 30.72 | $ | 29.61 | $ | 29.48 | $ | 28.90 | $ | 27.04 | ||||||||||
|
|
|
|
|
|
|
|
|
| |||||||||||
Total return(c)(d) | 4.42 | % | 1.54 | % | 2.58 | % | 7.58 | % | 3.71 | % | ||||||||||
RATIOS TO AVERAGE NET ASSETS: | ||||||||||||||||||||
Net assets, end of the period (000’s) | $ | 366,584 | $ | 387,235 | $ | 353,339 | $ | 331,465 | $ | 286,602 | ||||||||||
Net expenses(e) | 1.70 | % | 1.70 | % | 1.70 | % | 1.70 | % | 1.70 | % | ||||||||||
Gross expenses | 1.77 | % | 1.76 | % | 1.77 | % | 1.78 | % | 1.78 | % | ||||||||||
Net investment income | 0.63 | % | 1.15 | %(b) | 0.57 | % | 0.75 | % | 1.04 | % | ||||||||||
Portfolio turnover rate | 14 | % | 10 | % | 13 | % | 10 | % | 8 | % | ||||||||||
| (a) | Per share net investment income has been calculated using the average shares outstanding during the period. |
| (b) | Includes a non-recurring dividend. Without this dividend, net investment income per share would have been $0.15, and the ratio of net investment income to average net assets would have been 0.51%. |
| (c) | Had certain expenses not been waived/reimbursed during the period, total returns would have been lower. |
| (d) | A contingent deferred sales charge for Class C shares is not reflected in total return calculations. |
| (e) | The investment adviser agreed to waive its fees and/or reimburse a portion of the Fund’s expenses during the period. Without this waiver/reimbursement, expenses would have been higher. |
See accompanying notes to financial statements.
23 |
Table of Contents
Financial Highlights (continued)
For a share outstanding throughout each period.
| Class Y | ||||||||||||||||||||
| Year Ended December 31, 2016 | Year Ended December 31, 2015 | Year Ended December 31, 2014 | Year Ended December 31, 2013 | Year Ended December 31, 2012 | ||||||||||||||||
Net asset value, beginning of the period | $ | 29.71 | $ | 29.57 | $ | 28.99 | $ | 27.12 | $ | 26.39 | ||||||||||
|
|
|
|
|
|
|
|
|
| |||||||||||
INCOME (LOSS) FROM INVESTMENT OPERATIONS: | ||||||||||||||||||||
Net investment income(a) | 0.49 | 0.64 | (b) | 0.46 | 0.50 | 0.56 | ||||||||||||||
Net realized and unrealized gain (loss) | 1.12 | 0.12 | 0.57 | 1.82 | 0.70 | |||||||||||||||
|
|
|
|
|
|
|
|
|
| |||||||||||
Total from Investment Operations | 1.61 | 0.76 | 1.03 | 2.32 | 1.26 | |||||||||||||||
|
|
|
|
|
|
|
|
|
| |||||||||||
LESS DISTRIBUTIONS FROM: | ||||||||||||||||||||
Net investment income | (0.49 | ) | (0.62 | ) | (0.45 | ) | (0.45 | ) | (0.53 | ) | ||||||||||
�� |
|
|
|
|
|
|
|
|
| |||||||||||
Net asset value, end of the period | $ | 30.83 | $ | 29.71 | $ | 29.57 | $ | 28.99 | $ | 27.12 | ||||||||||
|
|
|
|
|
|
|
|
|
| |||||||||||
Total return(c) | 5.48 | % | 2.59 | % | 3.58 | % | 8.65 | % | 4.76 | % | ||||||||||
RATIOS TO AVERAGE NET ASSETS: | ||||||||||||||||||||
Net assets, end of the period (000’s) | $ | 5,550,008 | $ | 6,012,987 | $ | 5,814,900 | $ | 5,520,003 | $ | 4,654,553 | ||||||||||
Net expenses(d) | 0.70 | % | 0.70 | % | 0.70 | % | 0.70 | % | 0.70 | % | ||||||||||
Gross expenses | 0.77 | % | 0.76 | % | 0.77 | % | 0.78 | % | 0.78 | % | ||||||||||
Net investment income | 1.63 | % | 2.16 | %(b) | 1.57 | % | 1.76 | % | 2.08 | % | ||||||||||
Portfolio turnover rate | 14 | % | 10 | % | 13 | % | 10 | % | 8 | % | ||||||||||
| (a) | Per share net investment income has been calculated using the average shares outstanding during the period. |
| (b) | Includes a non-recurring dividend. Without this dividend, net investment income per share would have been $0.45, and the ratio of net investment income to average net assets would have been 1.51%. |
| (c) | Had certain expenses not been waived/reimbursed during the period, total returns would have been lower. |
| (d) | The investment adviser agreed to waive its fees and/or reimburse a portion of the Fund’s expenses during the period. Without this waiver/reimbursement, expenses would have been higher. |
See accompanying notes to financial statements.
| 24
Table of Contents
December 31, 2016
1. Organization. Gateway Trust (the “Trust”) is organized as a Massachusetts business trust. The Trust is registered under the Investment Company Act of 1940, as amended (the “1940 Act”), as an open-end management investment company. The Declaration of Trust permits the Board of Trustees to authorize the issuance of an unlimited number of shares of the Trust in multiple series. The financial statements for certain funds of the Trust are presented in separate reports. Information presented in these financial statements pertains to Gateway Fund (the “Fund”).
The Fund is a diversified investment company.
The Fund offers Class A, Class C and Class Y shares. Class A shares are sold with a maximum front-end sales charge of 5.75%. Class C shares do not pay a front-end sales charge, do not convert to any other class of shares pay higher ongoing Rule 12b-1 fees than Class A shares and may be subject to a contingent deferred sales charge (“CDSC”) of 1.00% if those shares are redeemed within one year of acquisition, except for reinvested distributions. Class Y shares do not pay a front-end sales charge, a CDSC or Rule 12b-1 fees. Class Y shares are generally intended for institutional investors with a minimum initial investment of $100,000, though some categories of investors are exempted from the minimum investment amount as outlined in the Fund’s prospectus.
Most expenses can be directly attributed to a Fund. Expenses which cannot be directly attributed to a Fund are generally apportioned based on the relative net assets of each of the funds in Natixis Funds Trust I, Natixis Funds Trust II, Natixis Funds Trust IV, Gateway Trust and Natixis ETF Trust (“Natixis Funds Trusts”), Loomis Sayles Funds I and Loomis Sayles Funds II (“Loomis Sayles Funds Trusts”). Expenses of the Fund are borne pro rata by the holders of each class of shares, except that each class bears expenses unique to that class (such as the Rule 12b-1 fees applicable to Class A and Class C). In addition, each class votes as a class only with respect to its own Rule 12b-1 Plan. Shares of each class would receive their pro rata share of the net assets of the Fund if the Fund were liquidated. The Trustees approve separate distributions from net investment income on each class of shares.
2. Significant Accounting Policies. The following is a summary of significant accounting policies consistently followed by the Fund in the preparation of its financial statements. The Fund’s financial statements follow the accounting and reporting guidelines provided for investment companies and are prepared in accordance with accounting principles generally accepted in the United States of America which require the use of management estimates that affect the reported amounts and disclosures in the financial statements. Actual results could differ from those estimates. Management has evaluated the events and transactions subsequent to year-end through the date the financial statements were issued and has determined that there were no material events that would require disclosure in the Fund’s financial statements.
25 |
Table of Contents
Notes to Financial Statements (continued)
December 31, 2016
a. Valuation. Fund securities and other investments are valued at market value based on market quotations obtained or determined by independent pricing services recommended by the adviser and approved by the Board of Trustees. Fund securities and other investments for which market quotations are not readily available are valued at fair value as determined in good faith by the adviser pursuant to procedures approved by the Board of Trustees, as described below. Market value is determined as follows:
Listed equity securities (including shares of closed-end investment companies and exchange-traded funds) are valued at the last sale price quoted on the exchange where they are traded most extensively or, if there is no reported sale during the day, the closing bid quotation as reported by an independent pricing service. Securities traded on the NASDAQ Global Select Market, NASDAQ Global Market and NASDAQ Capital Market are valued at the NASDAQ Official Closing Price (“NOCP”), or if lacking an NOCP, at the most recent bid quotations on the applicable NASDAQ Market. Unlisted equity securities (except unlisted preferred equity securities) are valued at the last sale price quoted in the market where they are traded most extensively or, if there is no reported sale during the day, the closing bid quotation as reported by an independent pricing service. If there is no last sale price or closing bid quotation available, unlisted equity securities will be valued using evaluated bids furnished by an independent pricing service, if available. Debt securities and unlisted preferred equity securities are valued based on evaluated bids furnished to the Fund by an independent pricing service or bid prices obtained from broker-dealers. Broker-dealer bid prices may be used to value debt and unlisted equity securities where an independent pricing service is unable to price a security or where an independent pricing service does not provide a reliable price for the security. Option contracts on domestic indices are valued at the average of the closing bid and ask quotations as of the close of trading on the Chicago Board Options Exchange (“CBOE”).
Fund securities and other investments for which market quotations are not readily available are valued at fair value as determined in good faith by the adviser pursuant to procedures approved by the Board of Trustees. Option contracts for which the average of the closing bid and ask quotations are not considered to reflect option contract values as of the close of the New York Stock Exchange (“NYSE”) are valued at fair value as determined in good faith by the adviser pursuant to procedures approved by the Board of Trustees. On the last business day of the month, the Fund will fair value S&P 500® Index options using the closing rotation values published by the CBOE. The Fund may also value securities and other investments at fair value in other circumstances such as when extraordinary events occur after the close of a foreign market but prior to the close of the NYSE. This may include situations relating to a single issuer (such as a declaration of bankruptcy or a delisting of the issuer’s security from the primary market on which it has traded) as well as events affecting the securities markets in general (such as market disruptions or closings and significant
| 26
Table of Contents
Notes to Financial Statements (continued)
December 31, 2016
fluctuations in U.S. and/or foreign markets). When fair valuing its securities or other investments, the Fund may, among other things, use modeling tools or other processes that may take into account factors such as securities or other market activity and/or significant events that occur after the close of the foreign market and before the time the Fund’s net asset value (“NAV”) is calculated. Fair value pricing may require subjective determinations about the value of a security, and fair values used to determine a Fund’s NAV may differ from quoted or published prices, or from prices that are used by others, for the same securities. In addition, the use of fair value pricing may not always result in adjustments to the prices of securities held by the Fund.
As of December 31, 2016, purchased options were fair valued at $27,661,617, representing 0.3% of net assets, and written options were fair valued at $(143,672,930), representing (1.9)% of net assets, using the closing rotation values published by the CBOE.
b. Investment Transactions and Related Investment Income. Investment transactions are accounted for on a trade date plus one day basis for daily NAV calculation. However, for financial reporting purposes, investment transactions are reported on trade date. Dividend income is recorded on ex-dividend date, or in the case of certain foreign securities, as soon as the Fund is notified, and interest income is recorded on an accrual basis. Interest income is increased by the accretion of discount and decreased by the amortization of premium, if applicable. The calendar year-end amounts of ordinary income, capital gains, and return of capital included in distributions received from the Fund’s investments in real estate investment trusts (“REITs”) are reported to the Fund after the end of the fiscal year; accordingly, the Fund estimates these amounts for accounting purposes until the characterization of REIT distributions is reported to the Fund after the end of the fiscal year. Estimates are based on the most recent REIT distribution information available. In determining net gain or loss on securities sold, the cost of securities has been determined on an identified cost basis. Investment income, non-class specific expenses and realized and unrealized gains and losses are allocated on a pro rata basis to each class based on the relative net assets of each class to the total net assets of the Fund.
c. Foreign Currency Translation. The books and records of the Fund are maintained in U.S. dollars. The values of securities, currencies and other assets and liabilities denominated in currencies other than U.S. dollars are translated into U.S. dollars based upon foreign exchange rates prevailing at the end of the period. Purchases and sales of investment securities, income and expenses are translated into U.S. dollars on the respective dates of such transactions.
Net realized foreign exchange gains or losses arise from sales of foreign currency, changes in exchange rates between the trade and settlement dates on securities transactions and the difference between the amounts of dividends, interest and foreign withholding taxes recorded on the Fund’s books and the U.S. dollar equivalent of the amounts actually received or paid. Net unrealized foreign exchange gains or losses
27 |
Table of Contents
Notes to Financial Statements (continued)
December 31, 2016
arise from changes in the value of assets and liabilities, other than investment securities, as of the end of the fiscal period, resulting from changes in exchange rates. Net realized foreign exchange gains or losses and the net change in unrealized foreign exchange gains or losses are disclosed in the Statement of Operations.
The values of investment securities are presented at the foreign exchange rates prevailing at the end of the period for financial reporting purposes. Net realized and unrealized gains or losses on investments reported in the Statement of Operations reflect gains or losses resulting from changes in exchange rates and fluctuations which arise due to changes in market prices of investment securities.
The Fund may use foreign currency exchange contracts to facilitate transactions in foreign-denominated investments. Losses may arise from changes in the value of the foreign currency or if the counterparties do not perform under the contracts’ terms.
d. Option Contracts. The Fund’s investment strategy makes use of exchange-traded options. Exchange-traded options are standardized contracts and are settled through a clearing house with fulfillment supported by the credit of the exchange. Therefore, counterparty credit risks to the Fund are reduced. The Fund writes (sells) index call options and purchases index put options.
When the Fund writes an index call option, an amount equal to the net premium received (the premium less commission) is recorded as a liability and is subsequently adjusted to the current value until the option expires or the Fund enters into a closing purchase transaction. When an index call option expires or the Fund enters into a closing purchase transaction, the difference between the net premium received and any amount paid at expiration or on effecting a closing purchase transaction, including commission, is treated as a realized gain or, if the net premium received is less than the amount paid, as a realized loss. The Fund, as writer of an index call option, bears the risk of an unfavorable change in the market value of the index underlying the written option.
When the Fund purchases an index put option, it pays a premium and the index put option is subsequently marked-to-market to reflect current value until the option expires or the Fund enters into a closing sale transaction. Premiums paid for purchasing index put options which expire are treated as realized losses. When the Fund enters into a closing sale transaction, the difference between the premium paid and the proceeds of the closing sale transaction is treated as a realized gain or loss. The risk associated with purchasing index put options is limited to the premium paid.
e. Federal and Foreign Income Taxes. The Fund intends to meet the requirements of the Internal Revenue Code of 1986, as amended, applicable to regulated investment companies, and to distribute to its shareholders substantially all of its net investment income and any net realized capital gains at least annually. Management has performed an analysis of the Fund’s tax positions for the open tax years as of December 31, 2016 and has concluded that no provisions for income tax are required.
| 28
Table of Contents
Notes to Financial Statements (continued)
December 31, 2016
The Fund’s federal tax returns for the prior three fiscal years remain subject to examination by the Internal Revenue Service. Management is not aware of any events that are reasonably possible to occur in the next twelve months that would result in the amounts of any unrecognized tax benefits significantly increasing or decreasing for the Fund. However, management’s conclusions regarding tax positions taken may be subject to review and adjustment at a later date based on factors including, but not limited to, new tax laws and accounting regulations and interpretations thereof.
The Fund may be subject to foreign withholding taxes on investment income and taxes on capital gains on investments that are accrued and paid based upon the Fund’s understanding of the tax rules and regulations that exist in the countries in which the Fund invests. Foreign withholding taxes on dividend and interest income are reflected on the Statement of Operations as a reduction of investment income, net of amounts eligible to be reclaimed. Dividends and interest receivable on the Statement of Assets and Liabilities are net of foreign withholding taxes. Foreign withholding taxes where reclaims have been or will be filed are reflected on the Statement of Assets and Liabilities as tax reclaims receivable. Capital gains taxes paid are included in net realized gain (loss) on investments in the Statement of Operations. Accrued but unpaid capital gains taxes are reflected as foreign taxes payable on the Statement of Assets and Liabilities, if applicable, and reduce unrealized gains on investments. In the event that realized gains on investments are subsequently offset by realized losses, taxes paid on realized gains may be returned to the Fund. Such amounts, if applicable, are reflected as foreign tax rebates receivable on the Statement of Assets and Liabilities and are recorded as a realized gain when received.
f. Dividends and Distributions to Shareholders. Dividends and distributions are recorded on ex-dividend date. The timing and characterization of certain income and capital gain distributions are determined in accordance with federal tax regulations, which may differ from accounting principles generally accepted in the United States of America. Permanent differences are primarily due to differing treatments for book and tax purposes of items such as foreign currency gains and losses, corporate actions and return of capital and capital gain distributions received. Permanent book and tax basis differences relating to shareholder distributions, net investment income and net realized gains will result in reclassifications to capital accounts reported on the Statements of Assets and Liabilities. Temporary differences between book and tax distributable earnings are primarily due to deferred Trustees’ fees, wash sales, return of capital distributions received and option contract mark-to-market. Amounts of income and capital gain available to be distributed on a tax basis are determined annually, and at other times during the Fund’s fiscal year as may be necessary to avoid knowingly declaring and paying a return of capital distribution. Distributions from net investment income and short-term capital gains are considered to be distributed from ordinary income for tax purposes.
29 |
Table of Contents
Notes to Financial Statements (continued)
December 31, 2016
The tax characterization of distributions is determined on an annual basis. The tax character of distributions paid to shareholders during the years ended December 31, 2016 and 2015 were as follows:
2016 Distributions Paid From: | 2015 Distributions Paid From: | |||||||||||||||||||
Ordinary Income | Long-Term Capital Gains | Total | Ordinary Income | Long-Term Capital Gains | Total | |||||||||||||||
$125,407,692 | $ | — | $ | 125,407,692 | $ | 159,135,158 | $ | — | $ | 159,135,158 | ||||||||||
As of December 31, 2016, the components of distributable earnings on a tax basis were as follows:
Undistributed ordinary income | $ | 2,874,860 | ||
|
| |||
Capital loss carryforward: | ||||
Short-term: | ||||
Expires: | ||||
December 31, 2017 | (845,637,686 | ) | ||
December 31, 2018 | (393,591,402 | ) | ||
|
| |||
Total capital loss carryforward | (1,239,229,088 | ) | ||
|
| |||
Unrealized appreciation | 2,724,972,183 | |||
|
| |||
Total accumulated earnings | $ | 1,488,617,955 | ||
|
| |||
Capital loss carryforward utilized in the current year | $ | 229,379,406 | ||
|
|
Capital losses may be utilized to offset future capital gains until expiration. The Regulated Investment Company Modernization Act of 2010 (the “Act”) allows capital loss carryforwards to be carried forward indefinitely. Rules in effect previously limited the carryforward period to eight years. Capital loss carryforwards generated in taxable years beginning after the effective date of the Act must be fully used before capital loss carryforwards generated in years prior to the effective date of the Act; therefore, under certain circumstances, capital loss carryforwards available as of the report date may expire unused.
g. Repurchase Agreements. The Fund may enter into repurchase agreements, under the terms of a Master Repurchase Agreement, under which the Fund acquires securities as collateral and agrees to resell the securities at an agreed upon time and at an agreed upon price. It is the Fund’s policy that the market value of the collateral for repurchase agreements be at least equal to 102% of the repurchase price, including interest. Certain repurchase agreements are tri-party arrangements whereby the collateral is held in a segregated account for the benefit of the Fund and on behalf of the counterparty. Repurchase agreements could involve certain risks in the event of default or insolvency of the counterparty including possible delays or restrictions upon the Fund’s ability to dispose of the underlying securities. As of December 31, 2016, the
| 30
Table of Contents
Notes to Financial Statements (continued)
December 31, 2016
Fund had an investment in a repurchase agreement for which the value of the related collateral exceeded the value of the repurchase agreement. The gross value of repurchase agreements is included in the Statement of Assets and Liabilities for financial reporting purposes.
h. Indemnifications. Under the Trust’s organizational documents, its officers and Trustees are indemnified against certain liabilities arising out of the performance of their duties to the Fund. Additionally, in the normal course of business, the Fund enters into contracts with service providers that contain general indemnification clauses. The Fund’s maximum exposure under these arrangements is unknown as this would involve future claims that may be made against the Fund that have not yet occurred. However, based on experience, the Fund expects the risk of loss to be remote.
i. New Accounting Pronouncement. In October 2016, the SEC adopted amendments to rules under the Investment Company Act of 1940 (“final rules”) intended to modernize the reporting and disclosures of information by registered investment companies. The final rules amend Regulation S-X and require funds to provide standardized, enhanced derivative disclosures in fund financial statements in a format designed for individual investors. The amendments to Regulation S-X also update the disclosures for other investments, including investments in and advances to affiliates, and amend the rules regarding the general form and content of fund financial statements. The compliance date for the amendments to Regulation S-X is August 1, 2017. Management is currently evaluating the amendments and the impact, if any, on the Fund’s financial statements.
3. Fair Value Measurements. In accordance with accounting standards related to fair value measurements and disclosures, the Fund has categorized the inputs utilized in determining the value of the Fund’s assets or liabilities. These inputs are summarized in the three broad levels listed below:
| • | Level 1 – quoted prices in active markets for identical assets or liabilities; |
| • | Level 2 – prices determined using other significant inputs that are observable either directly, or indirectly through corroboration with observable market data (which could include quoted prices for similar assets or liabilities, interest rates, credit risk, etc.); and |
| • | Level 3 – prices determined using significant unobservable inputs when quoted prices or observable inputs are unavailable such as when there is little or no market activity for an asset or liability (unobservable inputs reflect the Fund’s own assumptions in determining the fair value of assets or liabilities and would be based on the best information available). |
The inputs or methodology used for valuing securities are not necessarily an indication of the risk associated with investing in those securities.
31 |
Table of Contents
Notes to Financial Statements (continued)
December 31, 2016
The following is a summary of the inputs used to value the Fund’s investments as of December 31, 2016, at value:
Asset Valuation Inputs
Description | Level 1 | Level 2 | Level 3 | Total | ||||||||||||
Common Stocks(a) | $ | 7,447,257,244 | $ | — | $ | — | $ | 7,447,257,244 | ||||||||
Purchased Options | — | 27,661,617 | — | 27,661,617 | ||||||||||||
Short-Term Investments | — | 330,108,928 | — | 330,108,928 | ||||||||||||
|
|
|
|
|
|
|
| |||||||||
Total | $ | 7,447,257,244 | $ | 357,770,545 | $ | — | $ | 7,805,027,789 | ||||||||
|
|
|
|
|
|
|
| |||||||||
Liability Valuation Inputs
Description | Level 1 | Level 2 | Level 3 | Total | ||||||||||||
Written Options | $ | — | $ | (143,672,930 | ) | $ | — | $ | (143,672,930 | ) | ||||||
|
|
|
|
|
|
|
| |||||||||
| (a) | Details of the major categories of the Fund’s investments are reflected within the Portfolio of Investments. |
For the year ended December 31, 2016, there were no transfers among Levels 1, 2 and 3.
4. Derivatives. Derivative instruments are defined as financial instruments whose value and performance are based on the value and performance of an underlying asset, reference rate or index. Derivative instruments that the Fund used during the period include written index call options and purchased index put options.
The Fund seeks to capture the majority of the returns associated with equity market investments, while exposing investors to less risk than other equity investments. To meet this investment goal, the Fund invests in a broadly diversified portfolio of common stocks, while also writing index call options and purchasing index put options. Writing index call options can reduce the Fund’s volatility, provide a steady cash flow and be an important source of the Fund’s return, although it also may reduce the Fund’s ability to profit from increases in the value of its equity portfolio. The Fund also buys index put options, which can protect the Fund from a significant market decline that may occur over a short period of time. The value of an index put option generally increases as the prices of stocks constituting the index decrease and decreases as those stocks increase in price. The combination of the diversified stock portfolio, the steady cash flow from writing of index call options and the downside protection from purchased index put options is intended to provide the Fund with the majority of the returns associated with equity market investments while exposing investors to less risk than other equity investments. During the year ended December 31, 2016, written index call options and purchased index put options were used in accordance with this objective.
| 32
Table of Contents
Notes to Financial Statements (continued)
December 31, 2016
The following is a summary of derivative instruments for the Fund as of December 31, 2016, as reflected within the Statement of Assets and Liabilities:
Assets | Investments at value1 | |||
Exchange-traded/cleared asset derivatives | ||||
Equity contracts | $ | 27,661,617 | ||
Liabilities | Options written at value | |||
Exchange-traded/cleared liability derivatives | ||||
Equity contracts | $ | (143,672,930 | ) | |
| 1 | Represents purchased options, at value. |
Transactions in derivative instruments for the Fund during the year ended December 31, 2016, as reflected within the Statement of Operations were as follows:
Net Realized Gain (Loss) on: | Investments2 | Options written | ||||||
Equity contracts | $ | (280,290,260 | ) | $ | (203,691,375 | ) | ||
Net Change in Unrealized | Investments2 | Options written | ||||||
Equity contracts | $ | 12,369,169 | $ | (110,181,590 | ) | |||
| 2 | Represents realized loss and change in unrealized appreciation (depreciation), respectively, for purchased options during the period. |
As the Fund values its derivatives at fair value and recognizes changes in fair value through the Statement of Operations, it does not qualify for hedge accounting under authoritative guidance for derivative instruments. The Fund’s investments in derivatives may represent an economic hedge; however, they are considered to be non-hedge transactions for the purpose of these disclosures.
The volume of option contract activity as a percentage of investments in common stocks, based on month-end notional amounts outstanding during the period, at absolute value, was as follows for the year ended December 31, 2016:
Call Options | Put Options | |||||||
Average Notional Amount Outstanding | 98.97 | % | 98.97 | % | ||||
Highest Notional Amount Outstanding | 99.05 | % | 99.05 | % | ||||
Lowest Notional Amount Outstanding | 98.81 | % | 98.81 | % | ||||
Notional Amount Outstanding as of December 31, 2016 | 98.81 | % | 98.81 | % | ||||
| * | Notional amounts outstanding are determined by multiplying option contracts by the contract multiplier by the price of the option’s underlying index, the S&P 500® Index. |
33 |
Table of Contents
Notes to Financial Statements (continued)
December 31, 2016
Notional amounts outstanding at the end of the prior period are included in the averages above.
The following is a summary of the Fund’s written option activity:
Number of | Premiums | |||||||
Outstanding at December 31, 2015 | 39,150 | $ | 198,677,853 | |||||
Options written | 419,052 | 1,512,243,063 | ||||||
Options terminated in closing purchase transactions | (418,946 | ) | (1,570,031,366 | ) | ||||
Options expired | (6,387 | ) | (9,440,053 | ) | ||||
|
|
|
| |||||
Outstanding at December 31, 2016 | 32,869 | $ | 131,449,497 | |||||
|
|
|
| |||||
5. Purchases and Sales of Securities. For the year ended December 31, 2016, purchases and sales of securities (excluding short-term investments and option contracts) were $1,132,998,110 and $2,649,781,752 respectively.
6. Management Fees and Other Transactions with Affiliates.
a. Management Fees. Gateway Investment Advisers, LLC (“Gateway Advisers”) serves as investment adviser to the Fund. Gateway Advisers is a subsidiary of Natixis Global Asset Management, L.P. (“Natixis US”), which is part of Natixis Global Asset Management, an international asset management group based in Paris, France. Under the terms of the management agreement, the Fund pays a management fee at an annual rate of 0.65% for the first $5 billion, 0.60% for the next $5 billion and 0.58% thereafter, calculated daily and payable monthly, based on the Fund’s average daily net assets.
Gateway Advisers has given a binding undertaking to the Fund to waive management fees and/or reimburse certain expenses to limit the Fund’s operating expenses, exclusive of acquired fund fees and expenses, brokerage expenses, interest expense, taxes, organizational and extraordinary expenses such as litigation and indemnification expenses. This undertaking is in effect until April 30, 2017, may be terminated before then only with the consent of the Fund’s Board of Trustees, and is reevaluated on an annual basis. Management fees payable, as reflected on the Statement of Assets and Liabilities, is net of waivers and/or expense reimbursements, if any, pursuant to these undertakings. Waivers/reimbursements that exceed management fees payable are reflected on the Statement of Assets and Liabilities as receivable from investment adviser.
For the year ended December 31, 2016, the expense limits as a percentage of average daily net assets under the expense limitation agreement were as follows:
Expense Limit as a Percentage of Average | ||||
Class A | Class C | Class Y | ||
0.94% | 1.70% | 0.70% | ||
| 34
Table of Contents
Notes to Financial Statements (continued)
December 31, 2016
Gateway Advisers shall be permitted to recover expenses it has borne under the expense limitation agreement (whether through waiver of its management fee or otherwise) on a class by class basis in later periods to the extent the annual operating expenses of a class fall below a class’ expense limits, provided, however, that a class is not obligated to pay such waived/reimbursed fees or expenses more than one year after the end of the fiscal year in which the fees or expenses were waived/reimbursed.
For the year ended December 31, 2016, the management fees and waiver of management fees for the Fund were as follows:
Gross | Waiver of | Net | Percentage of Average | |||||
Gross | Net | |||||||
| $51,661,508 | $5,329,411 | $46,332,097 | 0.63% | 0.56% | ||||
| 1 | Management fee waiver is subject to possible recovery until December 31, 2017, though actual recovery is unlikely. |
For the year ended December 31, 2016, Class A expenses have been reimbursed in the amount of $179,190. This expense reimbursement is subject to possible recovery until December 31, 2017, though actual recovery is unlikely.
No expenses were recovered during the year ended December 31, 2016 under the terms of the expense limitation agreement.
b. Service and Distribution Fees. NGAM Distribution, L.P. (“NGAM Distribution”), which is a wholly-owned subsidiary of Natixis US, has entered into a distribution agreement with the Trust. Pursuant to this agreement, NGAM Distribution serves as principal underwriter of the Fund.
Pursuant to Rule 12b-1 under the 1940 Act, the Trust has adopted a Service Plan relating to the Fund’s Class A shares (the “Class A Plan”) and a Distribution and Service Plan relating to the Fund’s Class C shares (the “Class C Plan”).
Under the Class A Plan, the Fund pays NGAM Distribution a monthly service fee at an annual rate not to exceed 0.25% of the average daily net assets attributable to the Fund’s Class A shares, as reimbursement for expenses incurred by NGAM Distribution in providing personal services to investors in Class A shares and/or the maintenance of shareholder accounts.
Under the Class C Plan, the Fund pays NGAM Distribution a monthly service fee at an annual rate not to exceed 0.25% of the average daily net assets attributable to the Fund’s Class C shares, as compensation for services provided by NGAM Distribution in providing personal services to investors in Class C shares and/or the maintenance of shareholder accounts.
35 |
Table of Contents
Notes to Financial Statements (continued)
December 31, 2016
Also under the Class C Plan, the Fund pays NGAM Distribution a monthly distribution fee at an annual rate of 0.75% of the average daily net assets attributable to the Fund’s Class C shares, as compensation for services provided by NGAM Distribution in connection with the marketing or sale of Class C shares.
For the year ended December 31, 2016, the service and distribution fees for the Fund were as follows:
Service Fees | Distribution Fees | |||||||
Class A | Class C | Class C | ||||||
$4,479,748 | $ | 942,956 | $ | 2,828,870 | ||||
c. Administrative Fees. NGAM Advisors provides certain administrative services for the Fund and contracts with State Street Bank and Trust Company (“State Street Bank”) to serve as sub-administrator. Pursuant to an agreement among Natixis Funds Trusts, Loomis Sayles Funds Trusts and NGAM Advisors, the Fund pays NGAM Advisors monthly its pro rata portion of fees equal to an annual rate of 0.0575% of the first $15 billion of the average daily net assets of the Natixis Funds Trusts and Loomis Sayles Funds Trusts, 0.0500% of the next $15 billion, 0.0400% of the next $30 billion, 0.0350% of the next $30 billion and 0.0325% of such assets in excess of $90 billion, subject to an annual aggregate minimum fee for the Natixis Funds Trusts and Loomis Sayles Funds Trusts of $10 million, which is reevaluated on an annual basis.
For the year ended December 31, 2016, the administrative fees for the Fund were $3,636,241.
d. Sub-Transfer Agent Fees. NGAM Distribution has entered into agreements, which include servicing agreements, with financial intermediaries that provide recordkeeping, processing, shareholder communications and other services to customers of the intermediaries that hold positions in the Fund and has agreed to compensate the intermediaries for providing those services. Intermediaries transact with the Fund primarily through the use of omnibus accounts on behalf of their customers who hold positions in the Fund. These services would have been provided by the Fund’s transfer agent and other service providers if the shareholders’ accounts were maintained directly at the Fund’s transfer agent. Accordingly, the Fund has agreed to reimburse NGAM Distribution for all or a portion of the servicing fees paid to these intermediaries. The reimbursement amounts (sub-transfer agent fees) paid to NGAM Distribution are subject to a current per-account equivalent fee limit approved by the Fund’s Board of Trustees, which is based on fees for similar services paid to the Fund’s transfer agent and other service providers.
For the year ended December 31, 2016, the sub-transfer agent fees (which are reflected in transfer agent fees and expenses in the Statement of Operations) for the Fund were $4,901,146.
| 36
Table of Contents
Notes to Financial Statements (continued)
December 31, 2016
As of December 31, 2016, the Fund owes NGAM Distribution $51,016 in reimbursements for sub-transfer agent fees (which are reflected in the Statement of Assets and Liabilities as payable to distributor).
e. Commissions. Commissions (including CDSCs) on Fund shares retained by NGAM Distribution during the year ended December 31, 2016 amounted to $187,696.
f. Trustees Fees and Expenses. The Trust does not pay any compensation directly to its officers or Trustees who are directors, officers or employees of NGAM Advisors, NGAM Distribution, Natixis US or their affiliates. The Chairperson of the Board of Trustees receives a retainer fee at the annual rate of $325,000. The Chairperson does not receive any meeting attendance fees for Board of Trustees meetings or committee meetings that she attends. Each Independent Trustee (other than the Chairperson) receives, in the aggregate, a retainer fee at the annual rate of $155,000. Each Independent Trustee also receives a meeting attendance fee of $10,000 for each meeting of the Board of Trustees that he or she attends in person and $5,000 for each meeting of the Board of Trustees that he or she attends telephonically. In addition, the chairperson of the Contract Review Committee and the chairperson of the Audit Committee each receive an additional retainer fee at the annual rate of $17,500. The chairperson of the Governance Committee receives an additional retainer fee at the annual rate of $10,000. Each Contract Review Committee member is compensated $6,000 for each Committee meeting that he or she attends in person and $3,000 for each meeting that he or she attends telephonically. Each Audit Committee member is compensated $6,000 for each Committee meeting that he or she attends in person and $3,000 for each meeting that he or she attends telephonically. These fees are allocated among the funds in the Natixis Funds Trusts and Loomis Sayles Funds Trusts based on a formula that takes into account, among other factors, the relative net assets of each fund. Trustees are reimbursed for travel expenses in connection with attendance at meetings.
A deferred compensation plan (the “Plan”) is available to the Trustees on a voluntary basis. Deferred amounts remain in the Fund until distributed in accordance with the provisions of the Plan. The value of a participating Trustee’s deferral account is based on theoretical investments of deferred amounts, on the normal payment dates, in certain funds of the Natixis Funds Trusts and Loomis Sayles Funds Trusts as designated by the participating Trustees. Changes in the value of participants’ deferral accounts are allocated pro rata among the funds in the Natixis Funds Trusts and Loomis Sayles Funds Trusts, and are normally reflected as Trustees’ fees and expenses in the Statement of Operations. The portions of the accrued obligations allocated to the Fund under the Plan are reflected as Deferred Trustees’ fees in the Statement of Assets and Liabilities.
7. Line of Credit. Effective April 14, 2016, the Fund, together with certain other funds of Natixis Funds Trusts and Loomis Sayles Funds Trusts, entered into a 364-day,
37 |
Table of Contents
Notes to Financial Statements (continued)
December 31, 2016
$400,000,000 syndicated, committed, unsecured line of credit with Citibank, N.A. to be used for temporary or emergency purposes only. Any one Fund may borrow up to the full $400,000,000 under the line of credit (as long as all borrowings by all Funds in the aggregate do not exceed the $400,000,000 limit at any time) subject to each Fund’s investment restrictions. Interest is charged to the Funds at a rate equal to the greater of the eurodollar or the federal funds rate plus 1.00%. In addition, a commitment fee of 0.10% per annum, payable on the last business day of each month, is accrued and apportioned among the participating funds based on their average daily unused portion of the line of credit. The Funds paid an arrangement fee, an upfront fee, and other fees in connection with the new line of credit agreement, which are being amortized over a period of 364 days and are reflected as miscellaneous expenses on the Statement of Operations. The unamortized balance is reflected as prepaid expenses on the Statement of Assets and Liabilities.
Prior to April 14, 2016 the Fund, together with certain other funds of Natixis Funds Trusts and Loomis Sayles Funds Trusts, participated in a $150,000,000 committed unsecured line of credit provided by State Street Bank. Any one Fund was able to borrow up to the full $150,000,000 under the line of credit (as long as all borrowings by all Funds in the aggregate do not exceed the $150,000,000 limit at any time). Interest was charged to each participating Fund based on its borrowings at a rate per annum equal to the greater of the Federal Funds rate or overnight LIBOR, plus 1.25%. In addition, a commitment fee of 0.15% per annum, payable at the end of each calendar quarter, was accrued and apportioned among the participating funds based on their average daily unused portion of
the line of credit.
During the year ended December 31, 2016, the Fund had an average daily balance on the line of credit (for those days on which there were borrowings) of $22,345,615 at a weighted average interest rate of 1.43%.
8. Broker Commission Recapture. The Fund has entered into agreements with certain brokers whereby the brokers will rebate a portion of brokerage commissions. All amounts rebated by the brokers are returned to the Fund under such agreements and are included in realized gains in the Statement of Operations. For the year ended December 31, 2016, $2,371 was rebated under these agreements.
| 38
Table of Contents
Notes to Financial Statements (continued)
December 31, 2016
9. Capital Shares. The Fund may issue an unlimited number of shares of beneficial interest, without par value. Transactions in capital shares were as follows:
| | Year Ended December 31, 2016 | | Year Ended December 31, 2015 | |||||||||||||
| Shares | Amount | Shares | Amount | |||||||||||||
| Class A | ||||||||||||||||
Issued from the sale of shares | 16,559,714 | $ | 491,042,327 | 17,271,312 | $ | 514,256,789 | ||||||||||
Issued in connection with the reinvestment of distributions | 754,687 | 22,679,772 | 1,036,346 | 30,800,314 | ||||||||||||
Redeemed | (23,117,116 | ) | (687,596,539 | ) | (22,393,060 | ) | (667,070,045 | ) | ||||||||
|
|
|
|
|
|
|
| |||||||||
Net change | (5,802,715 | ) | $ | (173,874,440 | ) | (4,085,402 | ) | $ | (122,012,942 | ) | ||||||
|
|
|
|
|
|
|
| |||||||||
| Class C | ||||||||||||||||
Issued from the sale of shares | 1,841,324 | $ | 54,446,816 | 3,110,967 | $ | 92,271,622 | ||||||||||
Issued in connection with the reinvestment of distributions | 61,318 | 1,830,016 | 99,793 | 2,968,203 | ||||||||||||
Redeemed | (3,049,870 | ) | (90,760,674 | ) | (2,118,858 | ) | (62,895,497 | ) | ||||||||
|
|
|
|
|
|
|
| |||||||||
Net change | (1,147,228 | ) | $ | (34,483,842 | ) | 1,091,902 | $ | 32,344,328 | ||||||||
|
|
|
|
|
|
|
| |||||||||
| Class Y | ||||||||||||||||
Issued from the sale of shares | 69,770,111 | $ | 2,073,132,056 | 66,871,753 | $ | 1,991,168,273 | ||||||||||
Issued in connection with the reinvestment of distributions | 2,272,929 | 68,355,689 | 2,623,863 | 77,852,732 | ||||||||||||
Redeemed | (94,427,074 | ) | (2,835,955,065 | ) | (63,717,476 | ) | (1,898,954,044 | ) | ||||||||
|
|
|
|
|
|
|
| |||||||||
Net change | (22,384,034 | ) | $ | (694,467,320 | ) | 5,778,140 | $ | 170,066,961 | ||||||||
|
|
|
|
|
|
|
| |||||||||
Increase (decrease) from capital share transactions | (29,333,977 | ) | $ | (902,825,602 | ) | 2,784,640 | $ | 80,398,347 | ||||||||
|
|
|
|
|
|
|
| |||||||||
10. Potential Loss Contingency. The Fund has been named as a defendant, along with other financial institutions and individuals, in an action brought by a trustee of a trust created under a bankruptcy plan seeking to recover as intentional and constructive fraudulent transfers amounts the Fund, and others, received in connection with a merger involving a company formerly held in the Fund’s portfolio of investments. The Fund received $9,525,600 in connection with the merger. On November 18, 2015, the Bankruptcy Court granted the Fund’s (and other defendants’) motion to dismiss the Plaintiff’s intentional fraudulent transfer claim, dismissing such claim with prejudice. The Bankruptcy Court denied the motion to dismiss Plaintiff’s constructive fraudulent transfer claim. On May 4, 2016, the defendants subsequently filed a motion to dismiss the Plaintiff’s constructive fraudulent transfer claim based on a recent opinion in another similar case rendered by the U.S. Court of Appeals for the Second Circuit. On July 20, 2016, the Bankruptcy Court granted the motion to dismiss, but styled its ruling as a Report and Recommendation to the District Court; accordingly, the dismissal of the Plaintiff’s remaining claim is subject to further review by the District Court. The Fund also is potentially an unnamed member of a putative defendant class in a separate action brought by a different trustee appointed under the same bankruptcy plan
39 |
Table of Contents
Notes to Financial Statements (continued)
December 31, 2016
seeking to recover the same alleged fraudulent transfers as an intentional fraudulent transfer. On November 18, 2015, the Bankruptcy Court granted the Defendants’ motion to dismiss the Plaintiff’s intentional fraudulent transfer claim, dismissing this separate action with prejudice. The Plaintiff appealed the ruling to the District Court, and on July 27, 2016, the District Court reinstated the intentional fraudulent transfer claim and remanded the action to the Bankruptcy Court. The Defendants filed a motion for reconsideration or in the alternative certification of a further appeal to the Second Circuit. On October 6, 2016, the District Court denied the motion and remanded the action to the Bankruptcy Court for further proceedings. The Plaintiff in this separate action had previously moved to certify a defendant class, but the Bankruptcy Court denied that motion without prejudice. It is reasonably possible that an outcome unfavorable to the Fund could result from either or both of these cases. However, a reasonable estimate of the amount of potential loss to the Fund cannot be made at this time.
| 40
Table of Contents
Report of Independent Registered Public Accounting Firm
To the Trustees of Gateway Trust and Shareholders of Gateway Fund:
In our opinion, the accompanying statement of assets and liabilities, including the portfolio of investments, and the related statements of operations and of changes in net assets and the financial highlights present fairly, in all material respects, the financial position of the Gateway Fund, a series of Gateway Trust (the “Fund”) as of December 31, 2016, the results of its operations for the year then ended, the changes in its net assets for each of the two years in the period then ended and the financial highlights for each of the five years in the period then ended, in conformity with accounting principles generally accepted in the United States of America. These financial statements and financial highlights (hereafter referred to as “financial statements”) are the responsibility of the Fund’s management. Our responsibility is to express an opinion on these financial statements based on our audits. We conducted our audits of these financial statements in accordance with the standards of the Public Company Accounting Oversight Board (United States). Those standards require that we plan and perform the audit to obtain reasonable assurance about whether the financial statements are free of material misstatement. An audit includes examining, on a test basis, evidence supporting the amounts and disclosures in the financial statements, assessing the accounting principles used and significant estimates made by management, and evaluating the overall financial statement presentation. We believe that our audits, which included confirmation of securities as of December 31, 2016 by correspondence with the custodian and brokers, provide a reasonable basis for our opinion.
PricewaterhouseCoopers LLP
Boston, Massachusetts
February 22, 2017
41 |
Table of Contents
2016 U.S. Tax Distribution Information to Shareholders (Unaudited)
Qualified Dividend Income. For the fiscal year ended December 31, 2016, 100% of the ordinary income dividends paid by the Gateway Fund are considered qualified dividend income eligible for reduced tax rates. These lower rates range from 0% to 20% depending on an individual’s tax bracket. Complete information will be reported in conjunction with Form 1099-DIV.
Corporate Dividends Received Deduction. For the fiscal year ended December 31, 2016, 100% of dividends distributed by the Gateway Fund qualify for the dividends received deduction for corporate shareholders.
| 42
Table of Contents
Trustee and Officer Information
The tables below provide certain information regarding the trustees and officers of Gateway Trust (the “Trust”). Unless otherwise indicated, the address of all persons below is 399 Boylston Street, Boston, MA 02116. The Fund’s Statement of Additional Information includes additional information about the trustees of the Trust and is available by calling Natixis Funds at 800-225-5478.
Name and Year of Birth | Position(s) Held of Office1 | Principal 5 Years | Number of and Other 5 Years | Experience, Membership | ||||
| INDEPENDENT TRUSTEES | ||||||||
Kenneth A. Drucker (1945) | Chairperson of the Board of Trustees since January 2017 Trustee since 2008 Ex Officio member of the Audit Committee, the Contract Review Committee and the Governance Committee | Retired | 53 None | Significant experience on the Board and on the boards of other business organizations (including at investment companies); executive experience (including as treasurer of an aerospace, automotive, and metal manufacturing corporation) | ||||
| Edmond J. English (1953) | Trustee since 2013 Audit Committee Member | Chief Executive Officer of Bob’s Discount Furniture (retail) | 53 Director, Burlington Stores, Inc. (retail) | Experience on the Board and significant experience on the boards of other business organizations (including retail companies and a bank); executive experience (including at a retail company) | ||||
43 |
Table of Contents
Trustee and Officer Information
Name and Year of Birth | Position(s) Held of Office1 | Principal 5 Years | Number of and Other 5 Years | Experience, Membership | ||||
INDEPENDENT TRUSTEES continued | ||||||||
Richard A. Goglia (1951) | Trustee since 2015 Audit Committee Member | Retired; formerly Vice President and Treasurer of Raytheon Company (defense) | 53 None | Experience on the Board and executive experience (including his role as vice president and treasurer of a defense company and experience at a financial services company) | ||||
Wendell J. Knox (1948) | Trustee since 2009 Contract Review Committee Member and Governance Committee Member | Director of Abt Associates Inc. (research and consulting) | 53 Director, Eastern Bank (bank); Director, The Hanover Insurance Group (property and casualty insurance) | Significant experience on the Board and on the boards of other business organizations (including at a bank and at a property and casualty insurance firm); executive experience (including roles as president and chief executive officer of a research and consulting company) | ||||
| 44
Table of Contents
Trustee and Officer Information
Name and Year of Birth | Position(s) Held of Office1 | Principal 5 Years | Number of and Other 5 Years | Experience, Membership | ||||
INDEPENDENT TRUSTEES continued | ||||||||
| Martin T. Meehan (1956) | Trustee since 2012 Contract Review Committee Member | President, University of Massachusetts; formerly, Chancellor and faculty member, University of Massachusetts Lowell | 53 None | Experience on the Board and on the boards of other business organizations; experience as President of the University of Massachusetts; government experience (including as a member of the U.S. House of Representatives); academic experience | ||||
Sandra O. Moose (1942) | Trustee since 2007 Audit Committee Member and Governance Committee Member | President, Strategic Advisory Services (management consulting) | 53 Formerly, Director, AES Corporation (international power company); formerly, Director, Verizon Communications (telecommunications company) | Significant experience on the Board and on the boards of other business organizations (including at a telecommunications company, an international power company and a specialty chemicals corporation); executive experience (including at a management consulting company) | ||||
45 |
Table of Contents
Trustee and Officer Information
Name and Year of Birth | Position(s) Held of Office1 | Principal 5 Years | Number of and Other 5 Years | Experience, Membership | ||||
INDEPENDENT TRUSTEES continued | ||||||||
James P. Palermo (1955) | Trustee since 2016 Contract Review Committee Member | Founding Partner, Breton Capital Management, LLC (private equity); Partner, STEP Partners, LLC (private equity); formerly, Chief Executive Officer of Global Client Management of The Bank of New York Mellon Corporation | 53 None | Experience on the Board; financial services industry and executive experience (including roles as chief executive officer of client management and asset servicing for a banking and financial services company) | ||||
Erik R. Sirri (1958) | Trustee since 2009 Chairperson of the Audit Committee | Professor of Finance at Babson College | 53 None | Significant experience on the Board; experience as Director of the Division of Trading and Markets at the Securities and Exchange Commission; academic experience; training as an economist | ||||
Peter J. Smail (1952) | Trustee since 2009 Chairperson of the Contract Review Committee and Governance Committee Member | Retired | 53 None | Significant experience on the Board; mutual fund industry and executive experience (including roles as president and chief executive officer for an investment adviser) | ||||
| 46
Table of Contents
Trustee and Officer Information
Name and Year of Birth | Position(s) Held of Office1 | Principal 5 Years | Number of and Other 5 Years | Experience, Membership | ||||
INDEPENDENT TRUSTEES continued | ||||||||
Cynthia L. Walker (1956) | Trustee since 2007 Chairperson of the Contract Review Committee and Governance Committee Member | Deputy Dean for Finance and Administration, Yale University School of Medicine | 53 None | Significant experience on the Board; executive experience in a variety of academic organizations (including roles as dean for finance and administration) | ||||
| INTERESTED TRUSTEES | ||||||||
Kevin P. Charleston3 (1965) One Financial Center Boston, MA 02111 | Trustee since 2015 | President, Chief Executive Officer and Director; formerly, Chief Financial Officer, Loomis, Sayles & Company, L.P. | 53 None | Experience on the Board; continuing service as President, Chief Executive Officer and Director of Loomis, Sayles & Company, L.P. | ||||
David L. Giunta4 (1965) | Trustee since 2011 President and Chief Executive Officer since 2008 | President and Chief Executive Officer, NGAM Distribution Corporation, NGAM Advisors, L.P. and NGAM Distribution, L.P. | 53 None | Significant experience on the Board; continuing experience as President and Chief Executive Officer of NGAM Advisors, L.P. | ||||
| 1 | Each trustee serves until retirement, resignation or removal from the Board. The current retirement age is 75. The position of Chairperson of the Board is appointed for a three-year term. |
| 2 | The trustees of the Trust serve as trustees of a fund complex that includes all series of the Natixis Funds Trust I, Natixis Funds Trust II, Natixis Funds Trust IV and Gateway Trust (collectively, the “Natixis Funds Trusts”), Loomis Sayles Funds I and Loomis Sayles Funds II (collectively, the “Loomis Sayles Funds Trusts”) and Natixis ETF Trust (collectively, the “Fund Complex”). |
| 3 | Mr. Charleston is deemed an “interested person” of the Trust because he holds the following positions with an affiliated person of the Trust: President and Chief Executive Officer of Loomis, Sayles & Company, L.P. |
| 4 | Mr. Giunta is deemed an “interested person” of the Trust because he holds the following positions with an affiliated person of the Trust: President and Chief Executive Officer of NGAM Distribution Corporation, NGAM Advisors, L.P. and NGAM Distribution, L.P. |
47 |
Table of Contents
Trustee and Officer Information
Name and Year of Birth | Position(s) Held with the Trust | Term of Office1 and Length of Time Served | Principal Occupation(s) During Past 5 Years2 | |||
| OFFICERS OF THE TRUST | ||||||
Russell L. Kane (1969) | Secretary, Clerk and Chief Legal Officer | Since July 2016 | Executive Vice President, General Counsel, Secretary and Clerk, NGAM Distribution Corporation, NGAM Advisors, L.P. and NGAM Distribution, L.P.; formerly, Chief Compliance Officer for Mutual Funds, Senior Vice President, Deputy General Counsel, Assistant Secretary and Assistant Clerk, NGAM Distribution Corporation, NGAM Advisors, L.P. and NGAM Distribution, L.P. | |||
Michael C. Kardok (1959) | Treasurer, Principal Financial and Accounting Officer | Since May 2007 | Senior Vice President, NGAM Advisors, L.P. and NGAM Distribution, L.P. | |||
Rosa Licea-Mailloux (1976) | Chief Compliance Officer, Assistant Secretary and Anti-Money Laundering Officer | Since July 2016 | Senior Vice President, Deputy General Counsel, Assistant Secretary and Assistant Clerk, NGAM Distribution Corporation, NGAM Advisors, L.P. and NGAM Distribution, L.P.; formerly, Associate General Counsel, NGAM Distribution, L.P. | |||
| 1 | Each officer of the Trust serves for an indefinite term in accordance with the Trust’s current by-laws until the date his or her successor is elected and qualified, or until he or she sooner dies, retires, is removed or becomes disqualified. |
| 2 | Each person listed above, except as noted, holds the same position(s) with the Fund Complex. Previous positions during the past five years with NGAM Distribution, L.P., NGAM Advisors, L.P. or Loomis, Sayles & Company, L.P. are omitted, if not materially different from a trustee’s or officer’s current position with such entity. |
| 48
Table of Contents
ANNUAL REPORT
December 31, 2016

Gateway Equity Call Premium Fund
Loomis Sayles Strategic Alpha Fund

Portfolio Review page 1
Portfolio of Investments page 13
Financial Statements page 49
Notes to Financial Statements page 59
Table of Contents
GATEWAY EQUITY CALL PREMIUM FUND
| Managers | Symbols | |
| Daniel M. Ashcraft, CFA® | Class A GCPAX | |
| Michael T. Buckius, CFA® | Class C GCPCX | |
| Kenneth H. Toft, CFA® | Class Y GCPYX | |
| Gateway Investment Advisers, LLC | ||
Investment Goal
The Fund seeks total return with less risk than U.S. equity markets.
Market Conditions
Surprises were a hallmark of 2016. Surprises in the first half of the year included the S&P 500® Index’s 10.27% loss through February 11 and a steady decline in the yield on the 10-year U.S. Treasury Note, despite the Federal Reserve preparing investors for multiple rate hikes in 2016. Though equities had recovered to positive territory by the end of the first quarter, falling interest rates contributed to the bond market’s surprising outperformance of the stock market over the first half of the year. Equity market conditions were calm in the second half of the year despite the United Kingdom (U.K.) voting to leave the European Union and Donald Trump winning the U.S. presidential election. Neither outcome was expected and both were forecast to have a negative impact on capital markets in the unlikely event they came to pass. The S&P 500® Index did decline 5.34% in the two days after the U.K. vote, but quickly recovered and advanced until mid-August. The S&P 500® Index declined 4.38% from August 15, 2016 through November 4, 2016 as both the Trump and Clinton campaigns struggled with negative developments. However, the equity market advanced steadily after the election, propelled by anticipation of pro-growth economic policies from the incoming Trump administration and mostly positive quarterly earnings and economic reports. Interest rates rose in the second half of the year, accelerating after the election, and driving the Bloomberg Barclays U.S. Aggregate Bond Index to a loss of 2.53% over the last six months. Fundamentally, seven consecutive quarters of aggregate S&P 500® Index earnings declines came to an end in the third quarter and third quarter GDP growth of 3.5% was the highest rate in two years.
Implied volatility, as measured by the Chicago Board Options Exchange (CBOE) Volatility Index (the VIX), averaged 15.83 for the year, based on the daily closing values. This is well below its long-term average of 19.71 and a somewhat counter-intuitive outcome for an election year that included a great deal of uncertainty and multiple unexpected events. However, below-average volatility is not uncommon in election years and the pattern of volatility in 2016 was similar to typical election years in that the highest volatility readings came early in the year, troughed in the third quarter and rose in October and November.
Performance Results
For the 12 months ended December 31, 2016, Class A shares of Gateway Equity Call Premium Fund returned 7.58% at net asset value. The Fund outperformed its benchmark, the CBOE S&P 500 BuyWriteSM Index (the BXMSM), which returned 7.07% for the same period.
1 |
Table of Contents
Explanation of Fund Performance
The Fund invests in a diversified stock portfolio designed to support its index option-based risk management strategy as efficiently as possible while seeking to enhance the Fund’s total return. The Fund seeks to generate returns by writing at- and near-the-money index call options against the full value of its underlying equity portfolio. The steady cash flow from call option writing is intended to be an important source of the Fund’s return, although it reduces the Fund’s ability to profit from potential increases in the value of its equity portfolio. The index call options written by the Fund often have similar characteristics to the index call option present in the BXMSM at any given time. However, unlike the BXMSM, the Fund employs an active strategy that gives its management team discretion to diversify expiration dates and strike prices across a portfolio of index call options, and to opportunistically pursue attractive call premiums while maintaining a relatively consistent risk profile.
Though collecting premiums from writing index call options generally allows the Fund to generate a positive return when the S&P 500® Index advances, call option positions that expire or are closed out when the Index is well above the option’s strike price may generate realized losses. Thus, call option positions detracted from the Fund’s return in three out of four quarters for the year. Specifically, in the first quarter, index call option positions generated gains as the market declined in January and February but those gains were erased by the strong market rally in March. The steady and modest monthly advances for the market in the second quarter resulted in a slight net gain from call options positions for the quarter. In the second half of the year, as the market trended sideways to down, gains from call options in August, September and October were not large enough to cover the losses from call options during the strong market advances in July, November and December.
Despite slight underperformance relative to the BXMSM in three out of four quarters for the year, the Fund generated a higher total return in 2016 due to 1.10 percentage points of outperformance in the third quarter. The investment management team’s key moves leading to outperformance included increasing the index call option portfolio’s weighted average strike price as the market advanced in July and placing opportunistic trades that took advantage of relatively elevated implied volatility in early September.
The Fund’s equity portfolio returned 13.14% for the year, a performance differential of positive 118 basis points versus the S&P 500® Index, which contributed to the Fund’s return. Index call options detracted approximately 3.90% from overall return for the year. Consistent with its investment objective, the measured risk of the Fund was lower than that of the U.S. equity market and its benchmark, as its standard deviation for 2016 was 8.03% versus 13.30% and 8.65% for the S&P 500® Index and the BXMSM, respectively.
Outlook
As we transition from the old year to the new one, we close the books on a year of unexpected events. But with key market elements including interest rates, monetary policy, market volatility and corporate earnings at possible inflection points, 2017 may deliver some significant turning points of its own. As the trends play out, they could contribute significantly either on the positive or negative side for stocks and bonds.
| 2
Table of Contents
GATEWAY EQUITY CALL PREMIUM FUND
Gateway’s investment philosophy maintains that the U.S. equity market is the most reliable source of attractive long-term returns, despite its high volatility and tendency to periodically deliver significant losses over shorter periods of time. Gateway’s investment philosophy also holds that consistency is the key to long-term investment success and that generating cash flow, rather than seeking to forecast the rise and fall of the market, can be a lower-risk means to participate in equity markets. By staying true to its philosophy and managing the Gateway Equity Call Premium Fund consistently with the firm’s historical approach, Gateway will continue to help investors manage risk while pursuing long-term return in this challenging and uncertain environment.
Hypothetical Growth of $10,000 Investment in Class A Shares4
September 30, 2014 (inception) through December 31, 2016
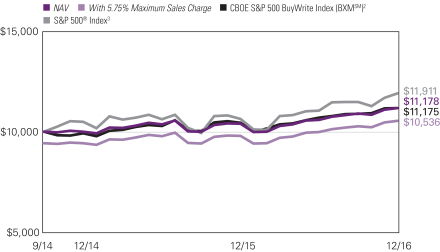
See notes to chart on page 5.
3 |
Table of Contents
Top Ten Holdings as of December 31, 2016
| Security name | % of net assets | |||||
| 1 | Apple, Inc. | 3.32 | % | |||
| 2 | Microsoft Corp. | 2.53 | ||||
| 3 | Exxon Mobil Corp. | 2.08 | ||||
| 4 | JPMorgan Chase & Co. | 1.75 | ||||
| 5 | Johnson & Johnson | 1.67 | ||||
| 6 | General Electric Co. | 1.59 | ||||
| 7 | Berkshire Hathaway, Inc., Class B | 1.53 | ||||
| 8 | Amazon.com, Inc. | 1.52 | ||||
| 9 | Alphabet, Inc., Class A | 1.52 | ||||
| 10 | Facebook, Inc., Class A | 1.43 | ||||
The portfolio is actively managed and holdings are subject to change. There is no guarantee the Fund continues to invest in the securities referenced.
| 4
Table of Contents
GATEWAY EQUITY CALL PREMIUM FUND
Average Annual Total Returns — December 31, 20164
| Expense Ratios5 | ||||||||||||||||
| 1 Year | Life of Fund | Gross | Net | |||||||||||||
| Class A (Inception 9/30/14) | ||||||||||||||||
| NAV | 7.58 | % | 5.07 | % | 1.70 | % | 1.20 | % | ||||||||
| With 5.75% Maximum Sales Charge | 1.43 | 2.34 | ||||||||||||||
| Class C (Inception 9/30/14) | ||||||||||||||||
| NAV | 6.85 | 4.32 | 2.40 | 1.95 | ||||||||||||
| With CDSC1 | 5.85 | 4.32 | ||||||||||||||
| Class Y (Inception 9/30/14) | ||||||||||||||||
| NAV | 7.83 | 5.30 | 1.45 | 0.95 | ||||||||||||
| Comparative Performance | ||||||||||||||||
| CBOE S&P 500 BuyWrite Index (BXMSM)2 | 7.07 | 5.05 | ||||||||||||||
| S&P 500® Index3 | 11.96 | 8.07 | ||||||||||||||
Performance data shown represents past performance and is no guarantee of, and not necessarily indicative of, future results. Total return and value will vary, and you may have a gain or loss when shares are sold. Current performance may be lower or higher than quoted. For most recent month-end performance, visit ngam.natixis.com/performance. Performance for other share classes will be greater or less than shown based on differences in fees and sales charges. You may not invest directly in an index. Performance for periods less than one year is cumulative, not annualized. Returns reflect changes in share price and reinvestment of dividends and capital gains, if any. The table(s) do not reflect taxes shareholders might owe on any fund distributions or when they redeem their shares.
| 1 | Performance for Class C shares assumes a 1% contingent deferred sales charge (“CDSC”) applied when you sell shares within one year of purchase. |
| 2 | The CBOE S&P 500 BuyWrite Index (BXMSM) is a benchmark index designed to track the performance of a hypothetical buy-write strategy on the S&P 500® Index. The BXM is a passive total return index based on (1) buying an S&P 500 stock index portfolio, and (2) “writing” (or selling) the near-term S&P 500® Index (SPXSM) “covered” call option, generally on the third Friday of each month. The SPX call written will have about one month remaining to expiration, with an exercise price just above the prevailing index level (i.e., slightly out of the money). The SPX call is held until expiration and cash settled, at which time a new one-month, near-the-money call is written. |
| 3 | S&P 500® Index is a widely recognized measure of U.S. stock market performance. It is an unmanaged index of 500 common stocks chosen for market size, liquidity, and industry group representation, among other factors. |
| 4 | Fund performance has been increased by fee waivers and/or expense reimbursements, if any, without which performance would have been lower. |
| 5 | As of the most recent prospectus, the investment advisor has contractually agreed to waive fees and/or reimburse expenses (with certain exceptions) once the expense cap of the Fund has been exceeded. This arrangement is set to expire on 4/30/2017. When an expense cap has not been exceeded, the fund may have similar expense ratios. |
5 |
Table of Contents
LOOMIS SAYLES STRATEGIC ALPHA FUND
| Managers | Symbols | |
| Matthew J. Eagan, CFA® | Class A LABAX | |
| Kevin P. Kearns | Class C LABCX | |
| Todd P. Vandam, CFA® | Class Y LASYX | |
| Loomis, Sayles & Company, L.P. | ||
Investment Goal
The Fund seeks to provide an attractive absolute total return, complemented by prudent investment management designed to manage risks and protect investor capital. The secondary goal of the Fund is to achieve these returns with relatively low volatility.
Market Conditions
Investor preferences for riskier assets held up well during the period. U.S. high-yield bonds experienced a sustained rally, and equity markets hit all-time highs following Donald Trump’s presidential win and the surprise Republican sweep of Congress. The Federal Reserve (the Fed) raised interest rates for the second time in a decade, and Brent crude oil surged more than 23% in the face of a strong U.S. dollar rally during the fourth quarter. After experiencing short-term spikes during the bond market sell-off in February and again following the late-June Brexit vote, market volatility decreased to close out the year.
U.S. high-yield bonds represented a bright spot among global fixed-income sectors throughout the year and finished the period with solid returns. The sector benefited from the jump in oil prices, which helped strengthen credit profiles in energy and related industries. Energy-related names tended to lead the broad market in results. Meanwhile, the U.S. dollar hit a 14-year high during the fourth quarter, strengthening relative to most foreign currencies due to a combination of diverging monetary policies and concern about global trade policy following the U.S. election.
Performance Results
For the 12 months ended December 31, 2016, Class A Shares of the Loomis Sayles Strategic Alpha Fund returned 6.57% at net asset value. The Fund outperformed its benchmark, the 3-month London Interbank Offered Rate (LIBOR), which returned 0.66%. The Fund follows an absolute return strategy and is not managed to an index.
Explanation of Fund Performance
Exposure to high-yield and investment-grade corporate bonds primarily generated the Fund’s positive performance. Beyond that, securitized, emerging market and convertible securities contributed to absolute return. Gains from these positions more than offset losses from our currency, global rates and global credit exposures.
High-yield corporate bond spreads (the difference in yield between Treasury and high-yield bonds of similar maturity) consistently tightened following February’s bond market sell-off and finished the period near their tightest levels for the year. Aided by a relatively dovish
| 6
Table of Contents
LOOMIS SAYLES STRATEGIC ALPHA FUND
Fed, positive flows into the asset class, stable oil and metals prices and a general dearth of yield, investors continued to allocate into riskier assets, pushing valuations higher. Individual energy, telecommunication and technology names aided performance the most.
The Fed’s decision to hike rates during the fourth quarter weighed on longer-duration (greater price sensitivity to interest rate changes) issues, including investment-grade corporate bonds. Nevertheless, investment-grade corporates aided overall return as spreads tightened similar to high-yield bonds. Fund flows into corporates from outside the U.S. continued as the search for yield intensified on depressed government rates. Major central banks across the world maintained and even increased their accommodative stance, including the Bank of England, which began buying corporate bonds after the Brexit vote. Most of the positive contribution from investment-grade corporates came from energy, technology and banking names.
Securitized assets, particularly our residential mortgage-backed securities (RMBS), boosted performance during the period, as fundamentals remained stable across all sectors. The weaker spread tightening among asset-backed securities (ABS), commercial mortgage-backed securities (CMBS) and RMBS relative to corporates continued to play out, translating into higher valuations.
Emerging market exposure also lifted the Fund’s return, as credits benefited from spread compression amid the low interest rate environment. Market technical factors also stayed supportive for hard currency assets, as inflows into the asset class remained solid and limited new supply spurred demand. The Fund’s holdings in the energy, capital goods and consumer non-cyclical sectors were leading contributors.
Currency positioning weighed on Fund performance. In particular, currencies of beaten-down commodity exporters rebounded during the period due to the rally in the commodities market. Many of our positions were offset against long pairs, which mitigated the impact. Short positions in the Brazilian real and New Zealand dollar and long positions in the Norwegian krone also weighed on performance. Additionally, the U.S. presidential election had a negative impact on the Mexican peso in December, weakening the Fund’s long position in the currency.
The Fund’s global rates tools, primarily the use of swaps, swaptions (options on interest rate swaps) and interest rate futures, weighed on performance. A short position in a eurodollar future was the primary laggard, as the post-Brexit flight-to-quality rally pushed down Treasury yields. Additionally, short exposure to a euro-bund future diminished performance, as the continuation of accommodative European Central Bank policy caused long maturity German yields to decline during the first half of the period.
Outlook
Growth in the U.S. continues at a moderate rate, while Europe’s pace remains a bit slower. As the Fed works to normalize U.S. interest rates, we expect two rate hikes in 2017 and four additional hikes in 2018. We believe a fiscal stimulus package from the Trump administration could boost GDP growth and inflation, but not until 2018. We expect higher inflation will be primarily responsible for the accelerated pace of tightening in 2018.
7 |
Table of Contents
We believe expectations for tax reform and pro-business policies could prolong the expansion phase of the U.S. credit cycle. Key assumptions include a measured path of rate hikes that do not create significant volatility in risk markets and continued strong foreign demand for corporate bonds. Deteriorating fundamentals remain a concern at this stage of the cycle, as companies reward equity holders at the expense of balance sheets.
Although deteriorating debt fundamentals in the emerging markets have been bottoming out, growth remains weak, and the fiscal picture has not yet improved. External balances remain mixed across countries, as winners and losers are determined by each country’s status as a commodity importer or exporter. Meanwhile, European corporate fundamentals remain solid and notably better than in the U.S., with stable balance sheets and prudent outlooks. Mergers and acquisitions, capital spending and share repurchases remain subdued, with capital spending forecasted to be down again in 2017.
Hypothetical Growth of $10,000 Investment in Class A Shares4
December 15, 2010 (inception) through December 31, 2016
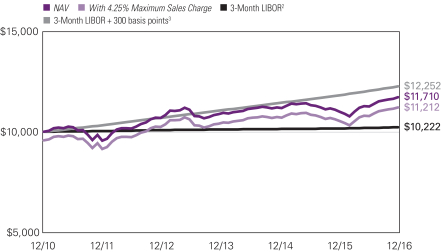
See notes to chart on page 9.
| 8
Table of Contents
LOOMIS SAYLES STRATEGIC ALPHA FUND
Average Annual Total Returns — December 31, 20164
| Expense Ratios5 | ||||||||||||||||||||
| 1 Year | 5 Years | Life of Fund | Gross | Net | ||||||||||||||||
| Class A (Inception 12/15/10) | ||||||||||||||||||||
| NAV | 6.57 | % | 3.95 | % | 2.65 | % | 1.10 | % | 1.10 | % | ||||||||||
| With 4.25% Maximum Sales Charge | 2.03 | 3.06 | 1.92 | |||||||||||||||||
| Class C (Inception 12/15/10) | ||||||||||||||||||||
| NAV | 5.70 | 3.17 | 1.85 | 1.85 | 1.85 | |||||||||||||||
| With CDSC1 | 4.70 | 3.17 | 1.85 | |||||||||||||||||
| Class Y (Inception 12/15/10) | ||||||||||||||||||||
| NAV | 6.86 | 4.23 | 2.90 | 0.85 | 0.85 | |||||||||||||||
| Comparative Performance | ||||||||||||||||||||
| 3-Month LIBOR2 | 0.66 | 0.38 | 0.36 | |||||||||||||||||
| 3-Month LIBOR + 300 basis points3 | 3.73 | 3.44 | 3.42 | |||||||||||||||||
Performance data shown represents past performance and is no guarantee of, and not necessarily indicative of, future results. Total return and value will vary, and you may have a gain or loss when shares are sold. Current performance may be lower or higher than quoted. For most recent month-end performance, visit ngam.natixis.com/performance. Performance for other share classes will be greater or less than shown based on differences in fees and sales charges. You may not invest directly in an index. Performance for periods less than one year is cumulative, not annualized. Returns reflect changes in share price and reinvestment of dividends and capital gains, if any. The table(s) do not reflect taxes shareholders might owe on any fund distributions or when they redeem their shares.
| 1 | Performance for Class C shares assumes a 1% contingent deferred sales charge (“CDSC”) applied when you sell shares within one year of purchase. |
| 2 | 3-Month LIBOR, or the London Interbank Offered Rate, represents the average rate at which a leading bank, for a given currency (in this case U.S. dollars), can obtain unsecured funding, and is representative of short-term interest rates. |
| 3 | 3-Month LIBOR +300 basis points is created by adding 3.00% to the annual return of 3-Month LIBOR. The calculation is performed on a monthly basis and is subject to the effects of compounding. |
| 4 | Fund performance has been increased by fee waivers and/or expense reimbursements, if any, without which performance would have been lower. |
| 5 | As of the most recent prospectus, the investment advisor has contractually agreed to waive fees and/or reimburse expenses (with certain exceptions) once the expense cap of the Fund has been exceeded. This arrangement is set to expire on 4/30/2017. When an expense cap has not been exceeded, the fund may have similar expense ratios. |
9 |
Table of Contents
ADDITIONAL INFORMATION
The views expressed in this report reflect those of the portfolio managers as of the dates indicated. The managers’ views are subject to change at any time without notice based on changes in market or other conditions. References to specific securities or industries should not be regarded as investment advice. Because the Funds are actively managed, there is no assurance that they will continue to invest in the securities or industries mentioned.
All investing involves risk, including the risk of loss. There is no assurance that any investment will meet its performance objectives or that losses will be avoided.
ADDITIONAL INDEX INFORMATION
This document may contain references to third party copyrights, indexes, and trademarks, each of which is the property of its respective owner. Such owner is not affiliated with Natixis Global Asset Management or any of its related or affiliated companies (collectively “NGAM”) and does not sponsor, endorse or participate in the provision of any NGAM services, funds or other financial products.
The index information contained herein is derived form third parties and is provided on an “as is” basis. The user of this information assumes the entire risk of use of this information. Each of the third party entities involved in compiling, computing or creating index information, disclaims all warranties (including, without limitation, any warranties of originality, accuracy, completeness, timeliness, non-infringement, merchantability and fitness for a particular purpose) with respect to such information.
PROXY VOTING INFORMATION
A description of Natixis Funds’ proxy voting policies and procedures is available without charge, upon request, by calling Natixis Funds at 800-225-5478; on Natixis Funds’ website at ngam.natixis.com; and on the Securities and Exchange Commission’s (SEC) website at www.sec.gov. Information regarding how Natixis Funds voted proxies relating to portfolio securities during the most recent 12-month period ended June 30 is available on Natixis Funds’ website and the SEC’s website.
QUARTERLY PORTFOLIO SCHEDULES
Natixis Funds file a complete schedule of portfolio holdings with the SEC for the first and third quarters of each fiscal year on Form N-Q. The Funds’ Forms N-Q are available on the SEC’s website at www.sec.gov and may be reviewed and copied at the SEC’s Public Reference Room in Washington, DC. Information on the operation of the Public Reference Room may be obtained by calling 800-SEC-0330.
| 10
Table of Contents
UNDERSTANDING FUND EXPENSES
As a mutual fund shareholder, you incur different types of costs: transaction costs, including sales charges (loads) on purchases, contingent deferred sales charges on redemptions, and ongoing costs, including management fees, distribution and/or service fees (12b-1 fees), and other fund expenses. Certain exemptions may apply. These costs are described in more detail in the Fund’s prospectus. The following examples are intended to help you understand the ongoing costs of investing in the Fund and help you compare these with the ongoing costs of investing in other mutual funds.
The first line in the table for each class shows the actual account values and actual Fund expenses you would have paid on a $1,000 investment in the Fund from July 1, 2016 through December 31, 2016. To estimate the expenses you paid over the period, simply divide your account value by $1,000 (for example, $8,600 account value divided by $1,000 = 8.60) and multiply the result by the number in the Expenses Paid During Period column as shown for your Class.
The second line for the table of each class provides information about hypothetical account values and hypothetical expenses based on the Fund’s actual expense ratios and an assumed rate of return of 5% per year before expenses, which is not the Fund’s actual return. The hypothetical account values and expenses may not be used to estimate the actual ending account balance or expenses you paid on your investment for the period. You may use this information to compare the ongoing costs of investing in the Fund and other funds. To do so, compare this 5% hypothetical example with the 5% hypothetical examples that appear in the shareholder reports of the other funds.
Please note that the expenses shown reflect ongoing costs only, and do not include any transaction costs, such as sales charges. Therefore, the second line in the table of each Fund is useful in comparing ongoing costs only, and will not help you determine the relative costs of owning different funds. If transaction costs were included, total costs would be higher.
| GATEWAY EQUITY CALL PREMIUM FUND | BEGINNING ACCOUNT VALUE 7/1/2016 | ENDING ACCOUNT VALUE 12/31/2016 | EXPENSES PAID DURING PERIOD* 7/1/2016 – 12/31/2016 | |||||||||
| Class A | ||||||||||||
| Actual | $1,000.00 | $1,055.90 | $6.20 | |||||||||
| Hypothetical (5% return before expenses) | $1,000.00 | $1,019.10 | $6.09 | |||||||||
| Class C | ||||||||||||
| Actual | $1,000.00 | $1,051.50 | $10.06 | |||||||||
| Hypothetical (5% return before expenses) | $1,000.00 | $1,015.33 | $9.88 | |||||||||
| Class Y | ||||||||||||
| Actual | $1,000.00 | $1,056.20 | $4.91 | |||||||||
| Hypothetical (5% return before expenses) | $1,000.00 | $1,020.36 | $4.82 | |||||||||
| * | Expenses are equal to the Fund’s annualized expense ratio (after waiver/reimbursement): 1.20%, 1.95% and 0.95% for Class A, C and Y, respectively, multiplied by the average account value over the period, multiplied by the number of days in the most recent fiscal half-year (184), divided by 366 (to reflect the half-year period). |
11 |
Table of Contents
| LOOMIS SAYLES STRATEGIC ALPHA FUND | BEGINNING ACCOUNT VALUE 7/1/2016 | ENDING ACCOUNT VALUE 12/31/2016 | EXPENSES PAID DURING PERIOD* 7/1/2016 – 12/31/2016 | |||||||||
| Class A | ||||||||||||
| Actual | $1,000.00 | $1,040.20 | $5.64 | |||||||||
| Hypothetical (5% return before expenses) | $1,000.00 | $1,019.61 | $5.58 | |||||||||
| Class C | ||||||||||||
| Actual | $1,000.00 | $1,035.50 | $9.47 | |||||||||
| Hypothetical (5% return before expenses) | $1,000.00 | $1,015.84 | $9.37 | |||||||||
| Class Y | ||||||||||||
| Actual | $1,000.00 | $1,041.60 | $4.36 | |||||||||
| Hypothetical (5% return before expenses) | $1,000.00 | $1,020.86 | $4.32 | |||||||||
| * | Expenses are equal to the Fund’s annualized expense ratio: 1.10%, 1.85% and 0.85% for Class A, C and Y, respectively, multiplied by the average account value over the period, multiplied by the number of days in the most recent fiscal half-year (184), divided by 366 (to reflect the half-year period). |
| 12
Table of Contents
Portfolio of Investments – as of December 31, 2016
Gateway Equity Call Premium Fund
| Shares | Description | Value (†) | ||||||
| Common Stocks — 98.0% of Net Assets | ||||||||
| Aerospace & Defense — 2.2% | ||||||||
| 1,325 | B/E Aerospace, Inc.(b) | $ | 79,752 | |||||
| 2,576 | Boeing Co. (The)(b) | 401,032 | ||||||
| 1,431 | General Dynamics Corp.(b) | 247,076 | ||||||
| 468 | Huntington Ingalls Industries, Inc.(b) | 86,201 | ||||||
| 991 | KLX, Inc.(b)(c) | 44,704 | ||||||
| 1,207 | Lockheed Martin Corp.(b) | 301,678 | ||||||
| 3,296 | United Technologies Corp.(b) | 361,307 | ||||||
|
| |||||||
| 1,521,750 | ||||||||
|
| |||||||
| Air Freight & Logistics — 0.8% | ||||||||
| 1,248 | FedEx Corp.(b) | 232,378 | ||||||
| 3,068 | United Parcel Service, Inc., Class B(b) | 351,715 | ||||||
|
| |||||||
| 584,093 | ||||||||
|
| |||||||
| Airlines — 0.6% | ||||||||
| 821 | Alaska Air Group, Inc.(b) | 72,847 | ||||||
| 3,807 | Delta Air Lines, Inc.(b) | 187,267 | ||||||
| 1,762 | JetBlue Airways Corp.(b)(c) | 39,504 | ||||||
| 1,958 | United Continental Holdings, Inc.(b)(c) | 142,699 | ||||||
|
| |||||||
| 442,317 | ||||||||
|
| |||||||
| Auto Components — 0.2% | ||||||||
| 437 | Adient PLC(b)(c) | 25,608 | ||||||
| 847 | Lear Corp.(b) | 112,118 | ||||||
|
| |||||||
| 137,726 | ||||||||
|
| |||||||
| Automobiles — 0.5% | ||||||||
| 8,226 | General Motors Co.(b) | 286,594 | ||||||
| 208 | Tesla Motors, Inc.(c) | 44,447 | ||||||
|
| |||||||
| 331,041 | ||||||||
|
| |||||||
| Banks — 6.7% | ||||||||
| 38,572 | Bank of America Corp.(b) | 852,441 | ||||||
| 12,292 | Citigroup, Inc.(b) | 730,514 | ||||||
| 2,148 | Comerica, Inc.(b) | 146,300 | ||||||
| 757 | East West Bancorp, Inc.(b) | 38,478 | ||||||
| 7,783 | Fifth Third Bancorp(b) | 209,908 | ||||||
| 888 | First Republic Bank(b) | 81,820 | ||||||
| 16,839 | Huntington Bancshares, Inc.(b) | 222,612 | ||||||
| 14,279 | JPMorgan Chase & Co.(b) | 1,232,135 | ||||||
| 173 | Signature Bank(c) | 25,985 | ||||||
| 3,872 | SunTrust Banks, Inc.(b) | 212,379 | ||||||
| 17,219 | Wells Fargo & Co.(b) | 948,939 | ||||||
|
| |||||||
| 4,701,511 | ||||||||
|
| |||||||
| Beverages — 2.0% | ||||||||
| 16,998 | Coca-Cola Co. (The)(b) | 704,737 | ||||||
| 6,946 | PepsiCo, Inc.(b) | 726,760 | ||||||
|
| |||||||
| 1,431,497 | ||||||||
|
| |||||||
See accompanying notes to financial statements.
13 |
Table of Contents
Portfolio of Investments – as of December 31, 2016
Gateway Equity Call Premium Fund – (continued)
| Shares | Description | Value (†) | ||||||
| Biotechnology — 2.9% | ||||||||
| 6,050 | AbbVie, Inc.(b) | $ | 378,851 | |||||
| 762 | Alexion Pharmaceuticals, Inc.(b)(c) | 93,231 | ||||||
| 984 | Alkermes PLC(b)(c) | 54,691 | ||||||
| 1,001 | Alnylam Pharmaceuticals, Inc.(b)(c) | 37,477 | ||||||
| 2,803 | Amgen, Inc.(b) | 409,827 | ||||||
| 911 | Biogen, Inc.(b)(c) | 258,341 | ||||||
| 611 | BioMarin Pharmaceutical, Inc.(b)(c) | 50,615 | ||||||
| 3,079 | Celgene Corp.(b)(c) | 356,394 | ||||||
| 4,921 | Gilead Sciences, Inc.(b) | 352,393 | ||||||
| 343 | Incyte Corp.(b)(c) | 34,393 | ||||||
|
| |||||||
| 2,026,213 | ||||||||
|
| |||||||
| Building Products — 0.6% | ||||||||
| 1,664 | A.O. Smith Corp.(b) | 78,791 | ||||||
| 2,274 | Fortune Brands Home & Security, Inc.(b) | 121,568 | ||||||
| 4,370 | Johnson Controls International PLC(b) | 180,000 | ||||||
| 258 | Lennox International, Inc. | 39,518 | ||||||
|
| |||||||
| 419,877 | ||||||||
|
| |||||||
| Capital Markets — 2.2% | ||||||||
| 5,475 | Bank of New York Mellon Corp. (The)(b) | 259,405 | ||||||
| 588 | BlackRock, Inc.(b) | 223,758 | ||||||
| 1,883 | Goldman Sachs Group, Inc. (The)(b) | 450,884 | ||||||
| 8,565 | Morgan Stanley(b) | 361,871 | ||||||
| 661 | MSCI, Inc.(b) | 52,074 | ||||||
| 1,178 | Raymond James Financial, Inc.(b) | 81,600 | ||||||
| 930 | SEI Investments Co.(b) | 45,905 | ||||||
| 2,107 | TD Ameritrade Holding Corp.(b) | 91,865 | ||||||
|
| |||||||
| 1,567,362 | ||||||||
|
| |||||||
| Chemicals — 2.1% | ||||||||
| 521 | AdvanSix, Inc.(b)(c) | 11,535 | ||||||
| 651 | Agrium, Inc.(b) | 65,458 | ||||||
| 1,336 | Air Products & Chemicals, Inc.(b) | 192,144 | ||||||
| 1,303 | Albemarle Corp.(b) | 112,162 | ||||||
| 898 | Ashland Global Holdings, Inc.(b) | 98,142 | ||||||
| 1,035 | Celanese Corp., Series A(b) | 81,496 | ||||||
| 4,632 | Huntsman Corp.(b) | 88,379 | ||||||
| 759 | International Flavors & Fragrances, Inc.(b) | 89,433 | ||||||
| 2,095 | Monsanto Co.(b) | 220,415 | ||||||
| 1,665 | PPG Industries, Inc.(b) | 157,775 | ||||||
| 2,271 | Praxair, Inc.(b) | 266,138 | ||||||
| 1,175 | Valspar Corp. (The)(b) | 121,742 | ||||||
|
| |||||||
| 1,504,819 | ||||||||
|
| |||||||
| Commercial Services & Supplies — 0.3% | ||||||||
| 446 | Waste Connections, Inc. | 35,051 | ||||||
| 2,825 | Waste Management, Inc.(b) | 200,321 | ||||||
|
| |||||||
| 235,372 | ||||||||
|
| |||||||
See accompanying notes to financial statements.
| 14
Table of Contents
Portfolio of Investments – as of December 31, 2016
Gateway Equity Call Premium Fund – (continued)
| Shares | Description | Value (†) | ||||||
| Communications Equipment — 1.0% | ||||||||
| 1,668 | ARRIS International PLC(b)(c) | $ | 50,257 | |||||
| 21,120 | Cisco Systems, Inc.(b) | 638,246 | ||||||
| 334 | Palo Alto Networks, Inc.(b)(c) | 41,767 | ||||||
|
| |||||||
| 730,270 | ||||||||
|
| |||||||
| Construction & Engineering — 0.1% | ||||||||
| 1,327 | Chicago Bridge & Iron Co.(b) | 42,132 | ||||||
|
| |||||||
| Consumer Finance — 1.6% | ||||||||
| 3,522 | Ally Financial, Inc.(b) | 66,989 | ||||||
| 4,415 | American Express Co.(b) | 327,063 | ||||||
| 3,429 | Capital One Financial Corp.(b) | 299,146 | ||||||
| 3,486 | Discover Financial Services(b) | 251,306 | ||||||
| 4,319 | Synchrony Financial(b) | 156,650 | ||||||
|
| |||||||
| 1,101,154 | ||||||||
|
| |||||||
| Containers & Packaging — 0.4% | ||||||||
| 1,167 | Crown Holdings, Inc.(b)(c) | 61,349 | ||||||
| 3,932 | International Paper Co.(b) | 208,632 | ||||||
| 532 | Packaging Corp. of America(b) | 45,124 | ||||||
|
| |||||||
| 315,105 | ||||||||
|
| |||||||
| Diversified Financial Services — 1.5% | ||||||||
| 6,612 | Berkshire Hathaway, Inc., Class B(b)(c) | 1,077,624 | ||||||
|
| |||||||
| Diversified Telecommunication Services — 2.6% | ||||||||
| 23,005 | AT&T, Inc.(b) | 978,403 | ||||||
| 552 | SBA Communications Corp., Class A(b)(c) | 56,999 | ||||||
| 15,034 | Verizon Communications, Inc.(b) | 802,515 | ||||||
|
| |||||||
| 1,837,917 | ||||||||
|
| |||||||
| Electric Utilities — 2.1% | ||||||||
| 4,570 | Alliant Energy Corp.(b) | 173,158 | ||||||
| 6,396 | American Electric Power Co., Inc.(b) | 402,692 | ||||||
| 3,656 | PG&E Corp.(b) | 222,175 | ||||||
| 6,885 | PPL Corp.(b) | 234,434 | ||||||
| 5,391 | Southern Co. (The)(b) | 265,183 | ||||||
| 3,073 | Westar Energy, Inc.(b) | 173,164 | ||||||
|
| |||||||
| 1,470,806 | ||||||||
|
| |||||||
| Electrical Equipment — 0.5% | ||||||||
| 299 | Acuity Brands, Inc.(b) | 69,027 | ||||||
| 4,467 | Emerson Electric Co.(b) | 249,035 | ||||||
|
| |||||||
| 318,062 | ||||||||
|
| |||||||
| Electronic Equipment, Instruments & Components — 0.4% | ||||||||
| 1,407 | Arrow Electronics, Inc.(b)(c) | 100,319 | ||||||
| 1,980 | Avnet, Inc.(b) | 94,268 | ||||||
| 6,496 | Flex Ltd.(b)(c) | 93,347 | ||||||
|
| |||||||
| 287,934 | ||||||||
|
| |||||||
See accompanying notes to financial statements.
15 |
Table of Contents
Portfolio of Investments – as of December 31, 2016
Gateway Equity Call Premium Fund – (continued)
| Shares | Description | Value (†) | ||||||
| Energy Equipment & Services — 1.3% | ||||||||
| 4,362 | National Oilwell Varco, Inc.(b) | $ | 163,313 | |||||
| 3,461 | Oceaneering International, Inc.(b) | 97,635 | ||||||
| 7,976 | Schlumberger Ltd.(b) | 669,585 | ||||||
|
| |||||||
| 930,533 | ||||||||
|
| |||||||
| Food & Staples Retailing — 2.0% | ||||||||
| 1,846 | Costco Wholesale Corp.(b) | 295,563 | ||||||
| 3,443 | CVS Health Corp.(b) | 271,687 | ||||||
| 2,488 | Sysco Corp.(b) | 137,761 | ||||||
| 5,468 | Wal-Mart Stores, Inc.(b) | 377,948 | ||||||
| 3,584 | Walgreens Boots Alliance, Inc.(b) | 296,612 | ||||||
|
| |||||||
| 1,379,571 | ||||||||
|
| |||||||
| Food Products — 1.6% | ||||||||
| 3,547 | General Mills, Inc.(b) | 219,098 | ||||||
| 1,632 | Hain Celestial Group, Inc. (The)(b)(c) | 63,697 | ||||||
| 557 | Ingredion, Inc.(b) | 69,603 | ||||||
| 2,622 | Kellogg Co.(b) | 193,268 | ||||||
| 2,225 | Kraft Heinz Co. (The)(b) | 194,287 | ||||||
| 7,367 | Mondelez International, Inc., Class A(b) | 326,579 | ||||||
| 188 | Post Holdings, Inc.(b)(c) | 15,113 | ||||||
| 317 | TreeHouse Foods, Inc.(b)(c) | 22,884 | ||||||
|
| |||||||
| 1,104,529 | ||||||||
|
| |||||||
| Gas Utilities — 0.3% | ||||||||
| 1,722 | Atmos Energy Corp.(b) | 127,686 | ||||||
| 1,999 | UGI Corp.(b) | 92,114 | ||||||
|
| |||||||
| 219,800 | ||||||||
|
| |||||||
| Health Care Equipment & Supplies — 2.1% | ||||||||
| 7,508 | Abbott Laboratories(b) | 288,382 | ||||||
| 624 | Align Technology, Inc.(b)(c) | 59,985 | ||||||
| 389 | Cooper Cos., Inc. (The)(b) | 68,048 | ||||||
| 2,266 | DENTSPLY SIRONA, Inc.(b) | 130,816 | ||||||
| 4,178 | Hologic, Inc.(b)(c) | 167,621 | ||||||
| 825 | IDEXX Laboratories, Inc.(b)(c) | 96,748 | ||||||
| 6,217 | Medtronic PLC(b) | 442,837 | ||||||
| 826 | ResMed, Inc.(b) | 51,253 | ||||||
| 909 | STERIS PLC(b) | 61,258 | ||||||
| 770 | Teleflex, Inc.(b) | 124,086 | ||||||
|
| |||||||
| 1,491,034 | ||||||||
|
| |||||||
| Health Care Providers & Services — 2.6% | ||||||||
| 2,358 | Anthem, Inc.(b) | 339,010 | ||||||
| 2,192 | Centene Corp.(b)(c) | 123,870 | ||||||
| 3,711 | Express Scripts Holding Co.(b)(c) | 255,280 | ||||||
| 1,689 | McKesson Corp.(b) | 237,220 | ||||||
| 1,275 | MEDNAX, Inc.(b)(c) | 84,991 | ||||||
| 4,565 | UnitedHealth Group, Inc.(b) | 730,582 | ||||||
| 508 | WellCare Health Plans, Inc.(b)(c) | 69,637 | ||||||
|
| |||||||
| 1,840,590 | ||||||||
|
| |||||||
See accompanying notes to financial statements.
| 16
Table of Contents
Portfolio of Investments – as of December 31, 2016
Gateway Equity Call Premium Fund – (continued)
| Shares | Description | Value (†) | ||||||
| Hotels, Restaurants & Leisure — 1.6% | ||||||||
| 364 | Domino’s Pizza, Inc.(b) | $ | 57,963 | |||||
| 3,043 | Hilton Worldwide Holdings, Inc.(b) | 82,769 | ||||||
| 1,127 | Las Vegas Sands Corp.(b) | 60,193 | ||||||
| 3,107 | McDonald’s Corp.(b) | 378,184 | ||||||
| 2,601 | MGM Resorts International(b)(c) | 74,987 | ||||||
| 4,988 | Starbucks Corp.(b) | 276,934 | ||||||
| 2,190 | Yum China Holdings, Inc.(b)(c) | 57,203 | ||||||
| 2,190 | Yum! Brands, Inc.(b) | 138,693 | ||||||
|
| |||||||
| 1,126,926 | ||||||||
|
| |||||||
| Household Durables — 0.5% | ||||||||
| 1,633 | Leggett & Platt, Inc.(b) | 79,821 | ||||||
| 3,257 | Newell Brands, Inc.(b) | 145,425 | ||||||
| 3,216 | Toll Brothers, Inc.(b)(c) | 99,696 | ||||||
|
| |||||||
| 324,942 | ||||||||
|
| |||||||
| Household Products — 1.9% | ||||||||
| 1,966 | Church & Dwight Co., Inc.(b) | 86,878 | ||||||
| 1,573 | Clorox Co. (The)(b) | 188,791 | ||||||
| 1,870 | Kimberly-Clark Corp.(b) | 213,404 | ||||||
| 9,945 | Procter & Gamble Co. (The)(b) | 836,176 | ||||||
|
| |||||||
| 1,325,249 | ||||||||
|
| |||||||
| Industrial Conglomerates — 2.9% | ||||||||
| 3,051 | 3M Co.(b) | 544,817 | ||||||
| 35,497 | General Electric Co.(b) | 1,121,705 | ||||||
| 3,488 | Honeywell International, Inc.(b) | 404,085 | ||||||
|
| |||||||
| 2,070,607 | ||||||||
|
| |||||||
| Insurance — 2.2% | ||||||||
| 1,318 | Arch Capital Group Ltd.(b)(c) | 113,730 | ||||||
| 2,827 | Chubb Ltd.(b) | 373,503 | ||||||
| 2,022 | Cincinnati Financial Corp.(b) | 153,167 | ||||||
| 3,703 | Lincoln National Corp.(b) | 245,398 | ||||||
| 4,897 | Prudential Financial, Inc.(b) | 509,582 | ||||||
| 998 | Willis Towers Watson PLC(b) | 122,035 | ||||||
|
| |||||||
| 1,517,415 | ||||||||
|
| |||||||
| Internet & Direct Marketing Retail — 2.4% | ||||||||
| 1,434 | Amazon.com, Inc.(b)(c) | 1,075,314 | ||||||
| 236 | Liberty Expedia Holdings, Inc., Series A(b)(c) | 9,362 | ||||||
| 4,574 | Liberty Interactive Corp./QVC Group, Class A(b)(c) | 91,388 | ||||||
| 486 | Liberty Ventures, Series A(b)(c) | 17,919 | ||||||
| 1,729 | Netflix, Inc.(b)(c) | 214,050 | ||||||
| 201 | Priceline Group, Inc. (The)(b)(c) | 294,678 | ||||||
|
| |||||||
| 1,702,711 | ||||||||
|
| |||||||
| Internet Software & Services — 4.1% | ||||||||
| 307 | Alibaba Group Holding Ltd., Sponsored ADR(b)(c) | 26,958 | ||||||
| 1,352 | Alphabet, Inc., Class A(b)(c) | 1,071,392 | ||||||
| 816 | Alphabet, Inc., Class C(b)(c) | 629,805 | ||||||
See accompanying notes to financial statements.
17 |
Table of Contents
Portfolio of Investments – as of December 31, 2016
Gateway Equity Call Premium Fund – (continued)
| Shares | Description | Value (†) | ||||||
| Internet Software & Services — continued | ||||||||
| 81 | CommerceHub, Inc., Series A(b)(c) | $ | 1,216 | |||||
| 162 | CommerceHub, Inc., Series C(b)(c) | 2,435 | ||||||
| 8,766 | Facebook, Inc., Class A(b)(c) | 1,008,528 | ||||||
| 4,543 | Yahoo!, Inc.(b)(c) | 175,678 | ||||||
|
| |||||||
| 2,916,012 | ||||||||
|
| |||||||
| IT Services — 3.4% | ||||||||
| 2,925 | Accenture PLC, Class A(b) | 342,605 | ||||||
| 655 | Amdocs Ltd.(b) | 38,154 | ||||||
| 1,720 | Computer Sciences Corp.(b) | 102,203 | ||||||
| 360 | FleetCor Technologies, Inc.(b)(c) | 50,947 | ||||||
| 1,181 | Global Payments, Inc.(b) | 81,973 | ||||||
| 3,501 | International Business Machines Corp.(b) | 581,131 | ||||||
| 4,205 | MasterCard, Inc., Class A(b) | 434,166 | ||||||
| 2,951 | Paychex, Inc.(b) | 179,657 | ||||||
| 7,829 | Visa, Inc., Class A(b) | 610,819 | ||||||
|
| |||||||
| 2,421,655 | ||||||||
|
| |||||||
| Leisure Products — 0.2% | ||||||||
| 1,129 | Brunswick Corp.(b) | 61,576 | ||||||
| 586 | Polaris Industries, Inc.(b) | 48,280 | ||||||
|
| |||||||
| 109,856 | ||||||||
|
| |||||||
| Life Sciences Tools & Services — 0.4% | ||||||||
| 708 | Illumina, Inc.(b)(c) | 90,652 | ||||||
| 1,534 | Thermo Fisher Scientific, Inc.(b) | 216,448 | ||||||
|
| |||||||
| 307,100 | ||||||||
|
| |||||||
| Machinery — 1.3% | ||||||||
| 652 | AGCO Corp.(b) | 37,725 | ||||||
| 3,887 | Caterpillar, Inc.(b) | 360,480 | ||||||
| 1,359 | Cummins, Inc.(b) | 185,735 | ||||||
| 2,426 | IDEX Corp.(b) | 218,486 | ||||||
| 581 | WABCO Holdings, Inc.(b)(c) | 61,673 | ||||||
| 964 | Wabtec Corp.(b) | 80,031 | ||||||
|
| |||||||
| 944,130 | ||||||||
|
| |||||||
| Media — 2.9% | ||||||||
| 939 | AMC Networks, Inc., Class A(b)(c) | 49,147 | ||||||
| 9,388 | Comcast Corp., Class A(b) | 648,242 | ||||||
| 36,426 | Sirius XM Holdings, Inc.(b) | 162,096 | ||||||
| 3,313 | Time Warner, Inc.(b) | 319,804 | ||||||
| 9,359 | Twenty-First Century Fox, Inc., Class A(b) | 262,426 | ||||||
| 956 | Twenty-First Century Fox, Inc., Class B(b) | 26,051 | ||||||
| 5,679 | Walt Disney Co. (The)(b) | 591,865 | ||||||
|
| |||||||
| 2,059,631 | ||||||||
|
| |||||||
| Metals & Mining — 0.2% | ||||||||
| 4,474 | Steel Dynamics, Inc.(b) | 159,185 | ||||||
|
| |||||||
See accompanying notes to financial statements.
| 18
Table of Contents
Portfolio of Investments – as of December 31, 2016
Gateway Equity Call Premium Fund – (continued)
| Shares | Description | Value (†) | ||||||
| Multi – Utilities — 0.3% | ||||||||
| 4,966 | Public Service Enterprise Group, Inc.(b) | $ | 217,908 | |||||
|
| |||||||
| Multiline Retail — 0.5% | ||||||||
| 2,844 | Nordstrom, Inc.(b) | 136,313 | ||||||
| 3,466 | Target Corp.(b) | 250,349 | ||||||
|
| |||||||
| 386,662 | ||||||||
|
| |||||||
| Oil, Gas & Consumable Fuels — 6.2% | ||||||||
| 1,770 | Cheniere Energy, Inc.(b)(c) | 73,331 | ||||||
| 7,795 | Chevron Corp.(b) | 917,471 | ||||||
| 2,413 | Concho Resources, Inc.(b)(c) | 319,964 | ||||||
| 16,270 | Exxon Mobil Corp.(b) | 1,468,530 | ||||||
| 3,480 | HollyFrontier Corp.(b) | 114,005 | ||||||
| 6,753 | Noble Energy, Inc.(b) | 257,019 | ||||||
| 5,635 | Occidental Petroleum Corp.(b) | 401,381 | ||||||
| 3,064 | Phillips 66(b) | 264,760 | ||||||
| 1,780 | Pioneer Natural Resources Co.(b) | 320,525 | ||||||
| 4,839 | Spectra Energy Corp.(b) | 198,835 | ||||||
| 6,271 | Whiting Petroleum Corp.(b)(c) | 75,377 | ||||||
|
| |||||||
| 4,411,198 | ||||||||
|
| |||||||
| Pharmaceuticals — 5.1% | ||||||||
| 1,191 | Allergan PLC(b)(c) | 250,122 | ||||||
| 7,282 | Bristol-Myers Squibb Co.(b) | 425,560 | ||||||
| 4,170 | Eli Lilly & Co.(b) | 306,704 | ||||||
| 844 | Jazz Pharmaceuticals PLC(b)(c) | 92,021 | ||||||
| 10,242 | Johnson & Johnson(b) | 1,179,981 | ||||||
| 10,712 | Merck & Co., Inc.(b) | 630,615 | ||||||
| 23,104 | Pfizer, Inc.(b) | 750,418 | ||||||
|
| |||||||
| 3,635,421 | ||||||||
|
| |||||||
| Professional Services — 0.2% | ||||||||
| 578 | Manpowergroup, Inc.(b) | 51,367 | ||||||
| 1,312 | Verisk Analytics, Inc.(b)(c) | 106,495 | ||||||
|
| |||||||
| 157,862 | ||||||||
|
| |||||||
| Real Estate Management & Development — 0.1% | ||||||||
| 559 | Jones Lang LaSalle, Inc.(b) | 56,481 | ||||||
|
| |||||||
| REITs – Apartments — 0.6% | ||||||||
| 823 | American Campus Communities, Inc.(b) | 40,961 | ||||||
| 561 | Essex Property Trust, Inc.(b) | 130,432 | ||||||
| 745 | Mid-America Apartment Communities, Inc.(b) | 72,950 | ||||||
| 4,045 | UDR, Inc.(b) | 147,562 | ||||||
|
| |||||||
| 391,905 | ||||||||
|
| |||||||
| REITs – Diversified — 0.7% | ||||||||
| 1,972 | Crown Castle International Corp.(b) | 171,111 | ||||||
| 1,316 | Digital Realty Trust, Inc.(b) | 129,310 | ||||||
| 7,240 | Duke Realty Corp.(b) | 192,294 | ||||||
|
| |||||||
| 492,715 | ||||||||
|
| |||||||
See accompanying notes to financial statements.
19 |
Table of Contents
Portfolio of Investments – as of December 31, 2016
Gateway Equity Call Premium Fund – (continued)
| Shares | Description | Value (†) | ||||||
| REITs – Mortgage — 0.2% | ||||||||
| 4,847 | AGNC Investment Corp.(b) | $ | 87,876 | |||||
| 8,270 | Annaly Capital Management, Inc.(b) | 82,452 | ||||||
|
| |||||||
| 170,328 | ||||||||
|
| |||||||
| REITs – Office Property — 0.4% | ||||||||
| 1,607 | Kilroy Realty Corp.(b) | 117,665 | ||||||
| 1,517 | SL Green Realty Corp.(b) | 163,153 | ||||||
|
| |||||||
| 280,818 | ||||||||
|
| |||||||
| REITs – Shopping Centers — 0.4% | ||||||||
| 13,092 | DDR Corp.(b) | 199,915 | ||||||
| 1,155 | Regency Centers Corp.(b) | 79,637 | ||||||
|
| |||||||
| 279,552 | ||||||||
|
| |||||||
| REITs – Single Tenant — 0.3% | ||||||||
| 1,430 | National Retail Properties, Inc.(b) | 63,206 | ||||||
| 2,059 | Realty Income Corp.(b) | 118,351 | ||||||
|
| |||||||
| 181,557 | ||||||||
|
| |||||||
| REITs – Storage — 0.2% | ||||||||
| 1,525 | Extra Space Storage, Inc.(b) | 117,791 | ||||||
|
| |||||||
| Road & Rail — 0.9% | ||||||||
| 1,717 | Norfolk Southern Corp.(b) | 185,556 | ||||||
| 915 | Old Dominion Freight Line, Inc.(b)(c) | 78,498 | ||||||
| 3,737 | Union Pacific Corp.(b) | 387,452 | ||||||
|
| |||||||
| 651,506 | ||||||||
|
| |||||||
| Semiconductors & Semiconductor Equipment — 3.0% | ||||||||
| 9,410 | Applied Materials, Inc.(b) | 303,661 | ||||||
| 21,405 | Intel Corp.(b) | 776,359 | ||||||
| 2,220 | Maxim Integrated Products, Inc.(b) | 85,625 | ||||||
| 830 | NXP Semiconductors NV(b)(c) | 81,348 | ||||||
| 6,293 | QUALCOMM, Inc.(b) | 410,304 | ||||||
| 6,106 | Texas Instruments, Inc.(b) | 445,555 | ||||||
| 993 | Versum Materials, Inc.(b)(c) | 27,874 | ||||||
|
| |||||||
| 2,130,726 | ||||||||
|
| |||||||
| Software — 4.6% | ||||||||
| 3,182 | Activision Blizzard, Inc.(b) | 114,902 | ||||||
| 2,439 | Adobe Systems, Inc.(b)(c) | 251,095 | ||||||
| 412 | ANSYS, Inc.(b)(c) | 38,106 | ||||||
| 2,200 | Cadence Design Systems, Inc.(b)(c) | 55,484 | ||||||
| 379 | CDK Global, Inc.(b) | 22,622 | ||||||
| 429 | Check Point Software Technologies Ltd.(c) | 36,233 | ||||||
| 971 | Dell Technologies, Inc., Class V(b)(c) | 53,376 | ||||||
| 1,834 | Fortinet, Inc.(b)(c) | 55,240 | ||||||
| 28,775 | Microsoft Corp.(b) | 1,788,078 | ||||||
| 12,935 | Oracle Corp.(b) | 497,351 | ||||||
| 2,954 | Salesforce.com, Inc.(b)(c) | 202,231 | ||||||
| 652 | ServiceNow, Inc.(b)(c) | 48,470 | ||||||
See accompanying notes to financial statements.
| 20
Table of Contents
Portfolio of Investments – as of December 31, 2016
Gateway Equity Call Premium Fund – (continued)
| Shares | Description | Value (†) | ||||||
| Software — continued | ||||||||
| 406 | Synopsys, Inc.(b)(c) | $ | 23,897 | |||||
| 142 | Ultimate Software Group, Inc. (The)(b)(c) | 25,894 | ||||||
|
| |||||||
| 3,212,979 | ||||||||
|
| |||||||
| Specialty Retail — 2.5% | ||||||||
| 497 | Advance Auto Parts, Inc.(b) | 84,053 | ||||||
| 1,237 | Dick’s Sporting Goods, Inc.(b) | 65,685 | ||||||
| 1,582 | Foot Locker, Inc.(b) | 112,148 | ||||||
| 5,393 | Home Depot, Inc. (The)(b) | 723,093 | ||||||
| 4,459 | Lowe’s Cos., Inc.(b) | 317,124 | ||||||
| 575 | Signet Jewelers Ltd.(b) | 54,199 | ||||||
| 3,067 | TJX Cos., Inc. (The)(b) | 230,424 | ||||||
| 392 | Ulta Salon, Cosmetics & Fragrance, Inc.(b)(c) | 99,936 | ||||||
| 1,007 | Williams-Sonoma, Inc.(b) | 48,729 | ||||||
|
| |||||||
| 1,735,391 | ||||||||
|
| |||||||
| Technology Hardware, Storage & Peripherals — 3.8% | ||||||||
| 20,248 | Apple, Inc.(b) | 2,345,124 | ||||||
| 7,272 | Hewlett Packard Enterprise Co.(b) | 168,274 | ||||||
| 12,056 | HP, Inc.(b) | 178,911 | ||||||
|
| |||||||
| 2,692,309 | ||||||||
|
| |||||||
| Textiles, Apparel & Luxury Goods — 0.7% | ||||||||
| 412 | Carter’s, Inc.(b) | 35,593 | ||||||
| 2,897 | Hanesbrands, Inc.(b) | 62,488 | ||||||
| 743 | Lululemon Athletica, Inc.(b)(c) | 48,287 | ||||||
| 5,923 | NIKE, Inc., Class B(b) | 301,066 | ||||||
| 1,029 | Skechers U.S.A., Inc., Class A(b)(c) | 25,293 | ||||||
|
| |||||||
| 472,727 | ||||||||
|
| |||||||
| Thrifts & Mortgage Finance — 0.0% | ||||||||
| 2,133 | New York Community Bancorp, Inc.(b) | 33,936 | ||||||
|
| |||||||
| Tobacco — 1.7% | ||||||||
| 8,904 | Altria Group, Inc.(b) | 602,089 | ||||||
| 6,535 | Philip Morris International, Inc.(b) | 597,887 | ||||||
|
| |||||||
| 1,199,976 | ||||||||
|
| |||||||
| Water Utilities — 0.3% | ||||||||
| 2,843 | American Water Works Co., Inc.(b) | 205,720 | ||||||
|
| |||||||
| Wireless Telecommunication Services — 0.1% | ||||||||
| 7,863 | Sprint Corp.(b)(c) | 66,206 | ||||||
|
| |||||||
| Total Common Stocks (Identified Cost $58,723,760) | 69,217,732 | |||||||
|
| |||||||
See accompanying notes to financial statements.
21 |
Table of Contents
Portfolio of Investments – as of December 31, 2016
Gateway Equity Call Premium Fund – (continued)
| Principal Amount | Value (†) | |||||||
| Short-Term Investments — 4.0% | ||||||||
| $ | 2,790,351 | Tri-Party Repurchase Agreement with Fixed Income Clearing Corporation, dated 12/30/2016 at 0.030% to be repurchased at $2,790,360 on 1/03/2017 collateralized by $2,930,000 U.S. Treasury Note, 2.000% due 8/15/2025 valued at $2,849,246 including accrued interest (Note 2 of Notes to Financial Statements) (Identified Cost $2,790,351) | $ | 2,790,351 | ||||
|
| |||||||
| Total Investments — 102.0% (Identified Cost $61,514,111)(a) | 72,008,083 | |||||||
| Other assets less liabilities — (2.0)% | (1,398,395 | ) | ||||||
|
| |||||||
| Net Assets — 100.0% | $ | 70,609,688 | ||||||
|
| |||||||
| Contracts | ||||||||
| Written Options — (1.9%) | ||||||||
| Index Options — (1.9%) | ||||||||
| 35 | On S&P 500® Index, Call expiring January 06, 2017 at 2200 | $ | (152,950 | ) | ||||
| 32 | On S&P 500® Index, Call expiring January 13, 2017 at 2260 | (31,200 | ) | |||||
| 38 | On S&P 500® Index, Call expiring January 20, 2017 at 2175 | (281,390 | ) | |||||
| 31 | On S&P 500® Index, Call expiring January 20, 2017 at 2200 | (164,610 | ) | |||||
| 31 | On S&P 500® Index, Call expiring January 20, 2017 at 2250 | (57,970 | ) | |||||
| 36 | On S&P 500® Index, Call expiring February 17, 2017 at 2200 | (236,700 | ) | |||||
| 37 | On S&P 500® Index, Call expiring February 17, 2017 at 2225 | (177,970 | ) | |||||
| 32 | On S&P 500® Index, Call expiring March 17, 2017 at 2250 | (145,760 | ) | |||||
| 34 | On S&P 500® Index, Call expiring March 17, 2017 at 2275 | (109,650 | ) | |||||
|
| |||||||
| Total Written Options (Premiums Received $1,217,286) | $ | (1,358,200 | ) | |||||
|
| |||||||
| (†) | See Note 2 of Notes to Financial Statements. | |||||||
| (a) | Federal Tax Information: | |||||||
| At December 31, 2016, the net unrealized appreciation on investments based on a cost of $61,538,841 for federal income tax purposes was as follows: | ||||||||
| Aggregate gross unrealized appreciation for all investments in which there is an excess of value over tax cost | $ | 11,043,742 | ||||||
| Aggregate gross unrealized depreciation for all investments in which there is an excess of tax cost over value | (574,500 | ) | ||||||
|
| |||||||
| Net unrealized appreciation | $ | 10,469,242 | ||||||
|
| |||||||
| (b) | Security (or a portion thereof) has been pledged as collateral for open derivative contracts. | |||||||
| (c) | Non-income producing security. | |||||||
| ADR | An American Depositary Receipt is a certificate issued by a custodian bank representing the right to receive securities of the foreign issuer described. The values of ADRs may be significantly influenced by trading on exchanges not located in the United States. | |||||||
| REITs | Real Estate Investment Trusts | |||||||
See accompanying notes to financial statements.
| 22
Table of Contents
Portfolio of Investments – as of December 31, 2016
Gateway Equity Call Premium Fund – (continued)
Industry Summary at December 31, 2016
Banks | 6.7 | % | ||
Oil, Gas & Consumable Fuels | 6.2 | |||
Pharmaceuticals | 5.1 | |||
Software | 4.6 | |||
Internet Software & Services | 4.1 | |||
Technology Hardware, Storage & Peripherals | 3.8 | |||
IT Services | 3.4 | |||
Semiconductors & Semiconductor Equipment | 3.0 | |||
Industrial Conglomerates | 2.9 | |||
Media | 2.9 | |||
Biotechnology | 2.9 | |||
Health Care Providers & Services | 2.6 | |||
Diversified Telecommunication Services | 2.6 | |||
Specialty Retail | 2.5 | |||
Internet & Direct Marketing Retail | 2.4 | |||
Capital Markets | 2.2 | |||
Aerospace & Defense | 2.2 | |||
Insurance | 2.2 | |||
Chemicals | 2.1 | |||
Health Care Equipment & Supplies | 2.1 | |||
Electric Utilities | 2.1 | |||
Beverages | 2.0 | |||
Food & Staples Retailing | 2.0 | |||
Other Investments, less than 2% each | 25.4 | |||
Short-Term Investments | 4.0 | |||
|
| |||
Total Investments | 102.0 | |||
Other assets less liabilities (including open written options) | (2.0 | ) | ||
|
| |||
Net Assets | 100.0 | % | ||
|
|
See accompanying notes to financial statements.
23 |
Table of Contents
Portfolio of Investments – as of December 31, 2016
Loomis Sayles Strategic Alpha Fund
| Principal Amount (‡) | Description | Value (†) | ||||||
| Bonds and Notes — 73.9% of Net Assets | ||||||||
| Non-Convertible Bonds — 72.7% | ||||||||
| ABS Car Loan — 6.0% | ||||||||
| $ | 2,135,000 | Ally Auto Receivables Trust, Series 2016-3, Class A3, 1.440%, 8/17/2020(b) | $ | 2,134,852 | ||||
| 1,455,000 | AmeriCredit Automobile Receivables Trust, Series 2015-4, Class D, 3.720%, 12/08/2021(b) | 1,486,663 | ||||||
| 295,000 | AmeriCredit Automobile Receivables Trust, Series 2016-2, Class D, 3.650%, 5/09/2022(b) | 300,645 | ||||||
| 600,000 | CPS Auto Receivables Trust, Series 2014-D, Class C, 4.350%, 11/16/2020, 144A(b) | 603,403 | ||||||
| 3,065,000 | CPS Auto Receivables Trust, Series 2016-B, Class E, 8.140%, 5/15/2023, 144A | 3,183,156 | ||||||
| 2,175,000 | Drive Auto Receivables Trust, Series 2016-CA, Class C, 3.020%, 11/15/2021, 144A(b) | 2,176,336 | ||||||
| 655,000 | DT Auto Owner Trust, Series 2014-3A, Class D, 4.470%, 11/15/2021, 144A(b) | 667,950 | ||||||
| 4,075,000 | DT Auto Owner Trust, Series 2016-1A, Class D, 4.660%, 12/15/2022, 144A(b) | 4,135,716 | ||||||
| 3,045,000 | DT Auto Owner Trust, Series 2016-2A, Class D, 5.430%, 11/15/2022, 144A(b) | 3,144,138 | ||||||
| 270,000 | First Investors Auto Owner Trust, Series 2014-1A, Class D, 3.280%, 4/15/2021, 144A(b) | 270,678 | ||||||
| 440,000 | First Investors Auto Owner Trust, Series 2014-2A, Class D, 3.470%, 2/15/2021, 144A(b) | 442,801 | ||||||
| 345,000 | First Investors Auto Owner Trust, Series 2015-1A, Class D, 3.590%, 1/18/2022, 144A(b) | 345,496 | ||||||
| 1,710,000 | First Investors Auto Owner Trust, Series 2015-2A, Class D, 4.220%, 12/15/2021, 144A(b) | 1,734,493 | ||||||
| 220,000 | First Investors Auto Owner Trust, Series 2016-2A, Class D, 3.350%, 11/15/2022, 144A(b) | 215,460 | ||||||
| 605,000 | Flagship Credit Auto Trust, Series 2015-1, Class C, 3.760%, 6/15/2021, 144A(b) | 603,155 | ||||||
| 2,450,000 | Flagship Credit Auto Trust, Series 2015-2, Class D, 5.980%, 8/15/2022, 144A | 2,437,395 | ||||||
| 2,610,000 | Flagship Credit Auto Trust, Series 2015-3, Class D, 7.120%, 11/15/2022, 144A | 2,658,689 | ||||||
| 650,000 | Flagship Credit Auto Trust, Series 2016-3, Class D, 3.890%, 11/15/2022, 144A(b) | 637,270 | ||||||
| 1,135,000 | Flagship Credit Auto Trust, Series 2016-3, Class E, 6.250%, 10/15/2023, 144A | 1,117,877 | ||||||
| 1,403,699 | Ford Credit Auto Owner Trust, Series 2014-C, Class A3, 1.060%, 5/15/2019(b) | 1,402,873 | ||||||
| 2,446,114 | Ford Credit Auto Owner Trust, Series 2015-A, Class A3, 1.280%, 9/15/2019(b) | 2,447,083 | ||||||
| 1,981,279 | Ford Credit Auto Owner Trust, Series 2015-B, Class A3, 1.160%, 11/15/2019(b) | 1,979,470 | ||||||
| 3,350,000 | Ford Credit Auto Owner Trust, Series 2015-C, Class A3, 1.410%, 2/15/2020(b) | 3,351,148 | ||||||
See accompanying notes to financial statements.
| 24
Table of Contents
Portfolio of Investments – as of December 31, 2016
Loomis Sayles Strategic Alpha Fund – (continued)
| Principal Amount (‡) | Description | Value (†) | ||||||
| ABS Car Loan — continued | ||||||||
| $ | 891,746 | Ford Credit Auto Owner Trust, Series 2016-B, Class A2B, 1.014%, 3/15/2019(b)(c) | $ | 892,233 | ||||
| 10,395,000 | Ford Credit Auto Owner Trust, Series 2016-C, Class A2B, 0.844%, 9/15/2019(b)(c) | 10,395,272 | ||||||
| 1,270,504 | Honda Auto Receivables Owner Trust, Series 2014-4, Class A3, 0.990%, 9/17/2018(b) | 1,269,522 | ||||||
| 3,385,000 | Honda Auto Receivables Owner Trust, Series 2015-3, Class A3, 1.270%, 4/18/2019(b) | 3,383,906 | ||||||
| 2,135,000 | Honda Auto Receivables Owner Trust, Series 2016-2, Class A3, 1.390%, 4/15/2020(b) | 2,131,690 | ||||||
| 5,570,000 | Honda Auto Receivables Owner Trust, Series 2016-4, Class A3, 1.210%, 12/18/2020(b) | 5,525,560 | ||||||
| 970,000 | Nissan Auto Receivables Owner Trust, Series 2016-C, Class A3, 1.180%, 1/15/2021(b) | 960,903 | ||||||
| 3,045,000 | Prestige Auto Receivables Trust, Series 2016-1A, Class D, 5.150%, 11/15/2021, 144A(b) | 3,120,837 | ||||||
| 3,215,000 | Toyota Auto Receivables Owner Trust, Series 2015-C, Class A3, 1.340%, 6/17/2019(b) | 3,215,165 | ||||||
| 795,000 | Toyota Auto Receivables Owner Trust, Series 2016-C, Class A3, 1.140%, 8/17/2020(b) | 789,778 | ||||||
| 1,975,000 | Toyota Auto Receivables Owner Trust, Series 2016-D, Class A2B, 0.834%, 5/15/2019(b)(c) | 1,975,147 | ||||||
| 1,345,000 | USAA Auto Owner Trust, Series 2016-1, Class A3, 1.200%, 6/15/2020(b) | 1,339,577 | ||||||
|
| |||||||
| 72,476,337 | ||||||||
|
| |||||||
| ABS Credit Card — 7.3% | ||||||||
| 3,145,000 | American Express Credit Account Master Trust, Series 2013-1, Class A, 1.124%, 2/16/2021(b)(c) | 3,154,786 | ||||||
| 2,695,000 | American Express Credit Account Master Trust, Series 2014-4, Class A, 1.430%, 6/15/2020(b) | 2,699,465 | ||||||
| 2,295,000 | American Express Credit Account Master Trust, Series 2014-5, Class A, 0.994%, 5/15/2020(b)(c) | 2,297,286 | ||||||
| 4,050,000 | American Express Credit Account Secured Note Trust, Series 2012-4, Class A, 0.944%, 5/15/2020(b)(c) | 4,050,025 | ||||||
| 2,765,000 | American Express Issuance Trust II, Series 2013-2, Class A, 1.134%, 8/15/2019(b)(c) | 2,775,545 | ||||||
| 2,050,000 | BA Credit Card Trust, Series 2014-A1, Class A, 1.084%, 6/15/2021(b)(c) | 2,055,155 | ||||||
| 5,865,000 | Bank of America Credit Card Trust, Series 2015-A1, Class A, 1.034%, 6/15/2020(b)(c) | 5,872,877 | ||||||
| 995,000 | Bank of America Credit Card Trust, Series 2016-A1, Class A, 1.094%, 10/15/2021(b)(c) | 997,904 | ||||||
| 3,600,000 | Capital One Multi-Asset Execution Trust, Series 2004-A7, Class A7, 1.450%, 8/16/2021(b) | 3,592,476 | ||||||
| 5,865,000 | Capital One Multi-Asset Execution Trust, Series 2007-A2, Class A2, 0.784%, 12/16/2019(b)(c) | 5,865,000 | ||||||
| 3,370,000 | Chase Issuance Trust, Series 2007-A12, Class A12, 0.754%, 8/15/2019(b)(c) | 3,368,049 | ||||||
| 6,640,000 | Chase Issuance Trust, Series 2014-A7, Class A, 1.380%, 11/15/2019(b) | 6,645,769 | ||||||
| 3,560,000 | Chase Issuance Trust, Series 2015-A1, Class A, 1.024%, 2/18/2020(b)(c) | 3,564,414 | ||||||
See accompanying notes to financial statements.
25 |
Table of Contents
Portfolio of Investments – as of December 31, 2016
Loomis Sayles Strategic Alpha Fund – (continued)
| Principal Amount (‡) | Description | Value (†) | ||||||
| ABS Credit Card — continued | ||||||||
| $ | 3,500,000 | Chase Issuance Trust, Series 2015-A4, Class A, 1.840%, 4/15/2022(b) | $ | 3,482,971 | ||||
| 6,090,000 | Chase Issuance Trust, Series 2016-A1, Class A, 1.114%, 5/17/2021(b)(c) | 6,109,029 | ||||||
| 3,120,000 | Chase Issuance Trust, Series 2016-A2, Class A, 1.370%, 6/15/2021(b) | 3,089,912 | ||||||
| 2,900,000 | Chase Issuance Trust, Series 2016-A5, Class A5, 1.270%, 7/15/2021(b) | 2,861,328 | ||||||
| 5,825,000 | Citibank Credit Card Issuance Trust, Series 2013-A7, Class A7, 1.094%, 9/10/2020(b)(c) | 5,845,926 | ||||||
| 3,000,000 | Citibank Credit Card Issuance Trust, Series 2014-A4, Class A4, 1.230%, 4/24/2019(b) | 3,001,200 | ||||||
| 3,045,000 | Citibank Credit Card Issuance Trust, Series 2014-A8, Class A8, 1.730%, 4/09/2020(b) | 3,056,668 | ||||||
| 5,800,000 | Citibank Credit Card Issuance Trust, Series 2016-A1, Class A1, 1.750%, 11/19/2021(b) | 5,774,451 | ||||||
| 2,405,000 | Discover Card Execution Note Trust, Series 2013-A1, Class A1, 1.004%, 8/17/2020(b)(c) | 2,406,969 | ||||||
| 990,000 | Discover Card Execution Note Trust, Series 2015-A1, Class A1, 1.054%, 8/17/2020(b)(c) | 991,491 | ||||||
| 3,600,000 | World Financial Network Credit Card Master Trust, Series 2015-C, Class A, 1.260%, 3/15/2021(b) | 3,602,181 | ||||||
|
| |||||||
| 87,160,877 | ||||||||
|
| |||||||
| ABS Home Equity — 12.6% | ||||||||
| 764,379 | Adjustable Rate Mortgage Trust, Series 2004-4, Class 3A1, 3.278%, 3/25/2035(b)(c) | 735,494 | ||||||
| 1,963,530 | Ajax Mortgage Loan Trust, Series 2016-B, Class A, 4.000%, 9/25/2065, 144A(b)(c) | 1,959,574 | ||||||
| 1,519,472 | Ajax Mortgage Loan Trust, Series 2016-C, Class A, 4.000%, 10/25/2057, 144A(b)(c) | 1,522,695 | ||||||
| 4,170,870 | Alliance Bancorp Trust, Series 2007-OA1, Class A1, 0.996%, 7/25/2037(c) | 3,011,615 | ||||||
| 708,655 | Alternative Loan Trust, Series 2003-20CB, Class 2A1, 5.750%, 10/25/2033 | 729,627 | ||||||
| 610,207 | Alternative Loan Trust, Series 2003-9T1, Class A7, 5.500%, 7/25/2033 | 604,142 | ||||||
| 450,120 | Alternative Loan Trust, Series 2004-28CB, Class 5A1, 5.750%, 1/25/2035 | 453,092 | ||||||
| 1,354,215 | Alternative Loan Trust, Series 2005-J1, Class 2A1, 5.500%, 2/25/2025 | 1,379,699 | ||||||
| 1,070,764 | American Home Mortgage Investment Trust, Series 2005-2, Class 1A1, 0.884%, 9/25/2045(c) | 882,632 | ||||||
| 1,500,000 | American Homes 4 Rent, Series 2014-SFR1, Class E, 3.236%, 6/17/2031, 144A(c) | 1,491,339 | ||||||
| 300,000 | American Homes 4 Rent, Series 2014-SFR2, Class D, 5.149%, 10/17/2036, 144A(b) | 314,332 | ||||||
| 1,980,000 | American Homes 4 Rent, Series 2014-SFR2, Class E, 6.231%, 10/17/2036, 144A | 2,067,808 | ||||||
| 1,200,000 | American Homes 4 Rent, Series 2014-SFR3, Class E, 6.418%, 12/17/2036, 144A | 1,267,639 | ||||||
| 863,560 | Banc of America Alternative Loan Trust, Series 2003-8, Class 1CB1, 5.500%, 10/25/2033 | 880,293 | ||||||
| 3,009,423 | Banc of America Alternative Loan Trust, Series 2004-6, Class 2A1, 6.000%, 7/25/2034 | 3,152,115 | ||||||
| 1,098,966 | Banc of America Alternative Loan Trust, Series 2005-6, Class CB7, 5.250%, 7/25/2035 | 1,001,702 | ||||||
See accompanying notes to financial statements.
| 26
Table of Contents
Portfolio of Investments – as of December 31, 2016
Loomis Sayles Strategic Alpha Fund – (continued)
| Principal Amount (‡) | Description | Value (†) | ||||||
| ABS Home Equity — continued | ||||||||
| $ | 810,127 | Banc of America Funding Corp., Series 2007-4, Class 5A1, 5.500%, 11/25/2034 | $ | 803,019 | ||||
| 1,593,970 | Banc of America Funding Trust, Series 2004-B, Class 4A2, 3.231%, 11/20/2034(c) | 1,486,210 | ||||||
| 467,191 | Banc of America Funding Trust, Series 2005-5, Class A1, 5.500%, 9/25/2035(b) | 483,125 | ||||||
| 1,132,807 | Banc of America Funding Trust, Series 2005-7, Class 3A1, 5.750%, 11/25/2035 | 1,160,661 | ||||||
| 648,953 | Bayview Opportunity Master Fund Trust, Series 16-RPL3, Class A1, 3.475%, 7/28/2031, 144A(b)(c) | 645,154 | ||||||
| 1,958,151 | Bayview Opportunity Master Fund Trust, Series 2016-LT1, Class A1, 3.475%, 10/28/2031, 144A(b)(c) | 1,950,416 | ||||||
| 1,002,713 | Bayview Opportunity Master Fund Trust, Series 2016-RN3, Class A1, 3.598%, 9/29/2031, 144A(b)(c) | 998,969 | ||||||
| 1,126,592 | BCAP LLC Trust, Series 2007-AA2, Class 22A1, 6.000%, 3/25/2022 | 1,113,797 | ||||||
| 2,302,178 | Bear Stearns Adjustable Rate Mortgage Trust, Series 2004-6, Class 2A1, 3.322%, 9/25/2034(c) | 2,110,923 | ||||||
| 1,183,677 | Bear Stearns Adjustable Rate Mortgage Trust, Series 2005-12, Class 11A1, 3.177%, 2/25/2036(c) | 999,373 | ||||||
| 612,855 | CAM Mortgage Trust, Series 2016-1, Class A, 4.000%, 1/15/2056, 144A(b)(c) | 609,931 | ||||||
| 2,055,000 | CAM Mortgage Trust, Series 2016-1, Class M, 5.000%, 1/15/2056, 144A(c) | 1,970,435 | ||||||
| 632,204 | Citigroup Mortgage Loan Trust, Inc., Series 2005-2, Class 1A4, 2.967%, 5/25/2035(c) | 587,849 | ||||||
| 2,545,327 | Citigroup Mortgage Loan Trust, Inc., Series 2005-3, Class 2A3, 3.005%, 8/25/2035(c) | 2,190,801 | ||||||
| 2,967,154 | Citigroup Mortgage Loan Trust, Inc., Series 2014-11, Class 2A1, 0.990%, 8/25/2036, 144A(b)(c) | 2,679,422 | ||||||
| 2,665,192 | Citigroup Mortgage Loan Trust, Inc., Series 2015-2, Class 1A1, 0.784%, 6/25/2047, 144A(b)(c) | 2,311,849 | ||||||
| 2,007,498 | CitiMortgage Alternative Loan Trust, Series 2006-A4, Class 1A1, 6.000%, 9/25/2036 | 1,788,886 | ||||||
| 2,200,000 | Colony American Finance Ltd., Series 2015-1, Class D, 5.649%, 10/15/2047, 144A(b) | 2,158,561 | ||||||
| 1,065,000 | Colony American Finance Ltd., Series 2016-1, Class C, 4.638%, 6/15/2048, 144A(b)(c) | 1,065,765 | ||||||
| 400,000 | Colony American Homes, Series 2014-2A, Class E, 3.960%, 7/17/2031, 144A(c) | 401,892 | ||||||
| 812,498 | Countrywide Alternative Loan Trust, Series 2003-22CB, Class 1A1, 5.750%, 12/25/2033(b) | 831,425 | ||||||
| 763,569 | Countrywide Alternative Loan Trust, Series 2004-14T2, Class A11, 5.500%, 8/25/2034 | 795,161 | ||||||
| 1,353,174 | Countrywide Alternative Loan Trust, Series 2004-J10, Class 2CB1, 6.000%, 9/25/2034 | 1,392,993 | ||||||
| 767,580 | Countrywide Alternative Loan Trust, Series 2004-J3, Class 1A1, 5.500%, 4/25/2034(b) | 779,513 | ||||||
| 6,304 | Countrywide Alternative Loan Trust, Series 2004-J7, Class 1A5, 5.188%, 8/25/2034(b)(c)(d) | 6,142 | ||||||
See accompanying notes to financial statements.
27 |
Table of Contents
Portfolio of Investments – as of December 31, 2016
Loomis Sayles Strategic Alpha Fund – (continued)
| Principal Amount (‡) | Description | Value (†) | ||||||
| ABS Home Equity — continued | ||||||||
| $ | 866,469 | Countrywide Alternative Loan Trust, Series 2005-14, Class 2A1, 0.966%, 5/25/2035(c) | $ | 717,884 | ||||
| 827,406 | Countrywide Home Loan Mortgage Pass Through Trust, Series 2004-12, Class 8A1, 3.223%, 8/25/2034(c) | 710,829 | ||||||
| 122,258 | Countrywide Home Loan Mortgage Pass Through Trust, Series 2004-HYB4, Class 2A1, 3.055%, 9/20/2034(b)(c)(d) | 115,254 | ||||||
| 309,580 | Countrywide Home Loan Mortgage Pass Through Trust, Series 2005-11, Class 4A1, 1.026%, 4/25/2035(c) | 241,971 | ||||||
| 946,427 | Countrywide Home Loan Mortgage Pass Through Trust, Series 2005-21, Class A17, 5.500%, 10/25/2035 | 844,467 | ||||||
| 1,849,178 | Credit Suisse First Boston Mortgage Pass Through Certificates, Series 2004-AR3, Class 3A1, 3.085%, 5/25/2034(b)(c) | 1,734,339 | ||||||
| 276,109 | Credit Suisse First Boston Mortgage Securities Corp., Series 2003-27, Class 4A4, 5.750%, 11/25/2033(b) | 288,430 | ||||||
| 698,278 | Credit Suisse First Boston Mortgage Securities Corp., Series 2003-AR26, Class 7A1, 3.145%, 11/25/2033(b)(c) | 672,831 | ||||||
| 521,220 | Credit Suisse First Boston Mortgage Securities Corp., Series 2003-AR28, Class 4A1, 3.253%, 12/25/2033(b)(c)(d) | 505,766 | ||||||
| 871,568 | Credit Suisse First Boston Mortgage Securities Corp., Series 2005-10, Class 5A4, 5.500%, 11/25/2035 | 803,561 | ||||||
| 745,409 | Deutsche Alternative Mortgage Loan Trust Securities, Inc., Series 2005-5, Class 1A4, 5.500%, 11/25/2035(c) | 708,138 | ||||||
| 1,164,090 | Deutsche Mortgage Securities, Inc., Series 2004-4, Class 7AR1, 1.106%, 6/25/2034(c) | 1,057,975 | ||||||
| 789,256 | DSLA Mortgage Loan Trust, Series 2005-AR5, Class 2A1A, 1.066%, 9/19/2045(c) | 586,446 | ||||||
| 2,100,989 | Dukinfield 2 PLC, Series 2, Class A, 1.615%, 12/20/2052, (GBP)(b)(c) | 2,593,386 | ||||||
| 783,543 | Eurosail PLC, Series 2007-2X, Class A3C, 0.527%, 3/13/2045, (GBP)(b)(c) | 933,195 | ||||||
| 500,000 | Freddie Mac Structured Agency Credit Risk Debt Notes, Series 2013-DN2, Class M2, 5.006%, 11/25/2023(c) | 528,083 | ||||||
| 2,015,000 | Freddie Mac Structured Agency Credit Risk Debt Notes, Series 2014-DN1, Class M2, 2.956%, 2/25/2024(b)(c) | 2,061,397 | ||||||
| 1,580,264 | Freddie Mac Structured Agency Credit Risk Debt Notes, Series 2014-DN2, Class M2, 2.406%, 4/25/2024(b)(c) | 1,593,227 | ||||||
| 2,585,000 | Freddie Mac Structured Agency Credit Risk Debt Notes, Series 2015-DNA1, Class M2, 2.606%, 10/25/2027(b)(c) | 2,622,014 | ||||||
| 511,570 | GMAC Mortgage Corp. Loan Trust, Series 2005-AR4, Class 3A1, 3.578%, 7/19/2035(c) | 460,803 | ||||||
| 1,027,503 | GSR Mortgage Loan Trust, Series 2004-14, Class 5A1, 3.202%, 12/25/2034(b)(c) | 1,018,327 | ||||||
| 469,830 | GSR Mortgage Loan Trust, Series 2005-AR4, Class 4A1, 3.118%, 7/25/2035(c) | 415,960 | ||||||
| 1,385,646 | HarborView Mortgage Loan Trust, Series 2006-10, Class 2A1A, 0.916%, 11/19/2036(c) | 1,139,882 | ||||||
| 1,864,227 | IndyMac Index Mortgage Loan Trust, Series 2004-AR12, Class A1, 1.536%, 12/25/2034(c) | 1,529,436 | ||||||
| 1,930,958 | IndyMac Index Mortgage Loan Trust, Series 2005-16IP, Class A1, 1.396%, 7/25/2045(c) | 1,615,274 | ||||||
See accompanying notes to financial statements.
| 28
Table of Contents
Portfolio of Investments – as of December 31, 2016
Loomis Sayles Strategic Alpha Fund – (continued)
| Principal Amount (‡) | Description | Value (†) | ||||||
| ABS Home Equity — continued | ||||||||
| $ | 4,074,600 | IndyMac Index Mortgage Loan Trust, Series 2006-AR2, Class 2A1, 0.966%, 2/25/2046(c) | $ | 3,208,004 | ||||
| 860,000 | Invitation Homes Trust, Series 2015-SFR1, Class E, 4.936%, 3/17/2032, 144A(c) | 862,581 | ||||||
| 2,333,456 | JPMorgan Alternative Loan Trust, Series 2006-A1, Class 3A1, 2.901%, 3/25/2036(c) | 1,910,904 | ||||||
| 663,417 | JPMorgan Mortgage Trust, Series 2003-A2, Class 3A1, 2.770%, 11/25/2033(b)(c) | 629,053 | ||||||
| 2,153,011 | JPMorgan Mortgage Trust, Series 2004-S1, Class 2A1, 6.000%, 9/25/2034 | 2,176,387 | ||||||
| 1,647,076 | JPMorgan Mortgage Trust, Series 2005-A2, Class 3A2, 2.930%, 4/25/2035(b)(c) | 1,635,638 | ||||||
| 577,947 | JPMorgan Mortgage Trust, Series 2005-A3, Class 4A1, 3.077%, 6/25/2035(b)(c) | 580,081 | ||||||
| 2,174,435 | JPMorgan Mortgage Trust, Series 2005-S3, Class 1A9, 6.000%, 1/25/2036 | 1,817,490 | ||||||
| 1,264,471 | JPMorgan Mortgage Trust, Series 2006-A1, Class 1A2, 3.184%, 2/25/2036(c) | 1,116,695 | ||||||
| 2,424,068 | JPMorgan Mortgage Trust, Series 2006-A7, Class 2A4, 3.186%, 1/25/2037(c) | 2,163,641 | ||||||
| 719,402 | Lehman XS Trust, Series 2005-7N, Class 3A1, 1.036%, 12/25/2035(c) | 540,127 | ||||||
| 24 | Lehman XS Trust, Series 2006-12N, Class A2A1, 0.906%, 8/25/2046(c)(d) | 23 | ||||||
| 808,470 | Lehman XS Trust, Series 2006-2N, Class 1A1, 1.016%, 2/25/2046(c) | 596,605 | ||||||
| 577,369 | Ludgate Funding PLC, Series 2007-1, Class A2B, Zero Coupon, 1/01/2061, (EUR)(b)(c) | 568,604 | ||||||
| 2,273,326 | Ludgate Funding PLC, Series 2008-W1X, Class A1, 0.983%, 1/01/2061, (GBP)(b)(c) | 2,663,010 | ||||||
| 360,755 | MASTR Adjustable Rate Mortgages Trust, Series 2004-4, Class 5A1, 3.148%, 5/25/2034(b)(c)(d) | 345,080 | ||||||
| 1,680,359 | MASTR Adjustable Rate Mortgages Trust, Series 2004-7, Class 3A1, 2.854%, 7/25/2034(c) | 1,622,330 | ||||||
| 419,598 | MASTR Adjustable Rate Mortgages Trust, Series 2006-2, Class 1A1, 3.188%, 4/25/2036(c) | 384,948 | ||||||
| 609,292 | MASTR Alternative Loan Trust, Series 2003-9, Class 4A1, 5.250%, 11/25/2033(b) | 629,090 | ||||||
| 658,888 | MASTR Alternative Loan Trust, Series 2004-5, Class 1A1, 5.500%, 6/25/2034(b) | 675,226 | ||||||
| 756,051 | MASTR Alternative Loan Trust, Series 2004-5, Class 2A1, 6.000%, 6/25/2034(b) | 771,179 | ||||||
| 1,964,986 | MASTR Alternative Loan Trust, Series 2004-8, Class 2A1, 6.000%, 9/25/2034 | 2,082,826 | ||||||
| 243,388 | MLCC Mortgage Investors, Inc., Series 2006-2, Class 2A, 2.706%, 5/25/2036(b)(c) | 234,698 | ||||||
| 715,401 | Morgan Stanley Mortgage Loan Trust, Series 2005-7, Class 4A2, 5.500%, 11/25/2035(d) | 681,901 | ||||||
| 1,475,655 | Morgan Stanley Mortgage Loan Trust, Series 2005-7, Class 7A5, 5.500%, 11/25/2035 | 1,517,260 | ||||||
| 1,837,897 | National City Mortgage Capital Trust, Series 2008-1, Class 2A1, 6.000%, 3/25/2038 | 1,907,056 | ||||||
See accompanying notes to financial statements.
29 |
Table of Contents
Portfolio of Investments – as of December 31, 2016
Loomis Sayles Strategic Alpha Fund – (continued)
| Principal Amount (‡) | Description | Value (†) | ||||||
| ABS Home Equity — continued | ||||||||
| 850,123 | Newgate Funding, Series 2007-3X, Class A2B, 0.284%, 12/15/2050, (EUR)(b)(c) | $ | 857,136 | |||||
| 784,810 | NYMT Residential LLC, Series 2016-RP1A, Class A, 4.000%, 3/25/2021, 144A(b)(c) | 778,941 | ||||||
| 1,683,290 | RCO Depositor II LLC, Series 2015-2A, Class A, 4.500%, 11/25/2045, 144A(b)(c) | 1,681,397 | ||||||
| 2,700,000 | RCO Depositor II LLC, Series 2015-2A, Class M, 5.000%, 11/25/2045, 144A(c) | 2,575,456 | ||||||
| 1,135,803 | Residential Accredit Loans, Inc. Trust, Series 2006-QO4, Class 2A1, 0.946%, 4/25/2046(c) | 913,497 | ||||||
| 538,950 | Residential Accredit Loans, Inc. Trust, Series 2006-QO7, Class 3A2, 0.961%, 9/25/2046(c) | 398,121 | ||||||
| 869,934 | Residential Accredit Loans, Inc. Trust, Series 2007-QO4, Class A1A, 0.946%, 5/25/2047(c) | 724,190 | ||||||
| 1,747,514 | Residential Asset Securitization Trust, Series 2005-A8CB, Class A9, 5.375%, 7/25/2035 | 1,532,636 | ||||||
| 594,793 | Residential Funding Mortgage Securities, Series 2006-S1, Class 1A3, 5.750%, 1/25/2036(d) | 577,100 | ||||||
| 267,524 | RMAC PLC, Series 2005-NS3X, Class A2C, 0.042%, 6/12/2043, (EUR)(b)(c) | 265,305 | ||||||
| 475,503 | RMAC Securities No. 1 PLC, Series 2006-NS1X, Class A2C, Zero Coupon, 6/12/2044, (EUR)(b)(c) | 469,050 | ||||||
| 365,968 | RMAC Securities No. 1 PLC, Series 2007-NS1X, Class A2A, 0.526%, 6/12/2044, (GBP)(b)(c) | 419,320 | ||||||
| 671,403 | Structured Adjustable Rate Mortgage Loan Trust, Series 2004-12, Class 6A, 3.039%, 9/25/2034(b)(c) | 660,848 | ||||||
| 891,227 | Structured Adjustable Rate Mortgage Loan Trust, Series 2004-6, Class 1A, 3.096%, 6/25/2034(b)(c) | 880,419 | ||||||
| 4,007,361 | Structured Adjustable Rate Mortgage Loan Trust, Series 2005-14, Class A1, 1.066%, 7/25/2035(c) | 2,930,656 | ||||||
| 814,429 | Structured Asset Securities Corp. Mortgage Pass Through Certificates, Series 2004-20, Class 8A7, 5.750%, 11/25/2034(b) | 823,425 | ||||||
| 451,577 | Structured Asset Securities Corp. Trust, Series 2005-1, Class 7A7, 5.500%, 2/25/2035 | 457,934 | ||||||
| 1,200,000 | Towd Point Mortgage Funding PLC, Series 16-GR1X, Class B, 1.802%, 7/20/2046, (GBP)(b)(c) | 1,478,926 | ||||||
| 902,617 | U.S. Residential Opportunity Fund III Trust, Series 2016-1III, Class A, 3.475%, 7/27/2036, 144A(b)(c) | 898,877 | ||||||
| 2,927,312 | Vericrest Opportunity Loan Transferee, Series 16-NPL8, Class A1, 3.500%, 7/25/2046, 144A(b)(c) | 2,917,314 | ||||||
| 407,415 | Vericrest Opportunity Loan Transferee, Series 2015-NPL7, Class A1, 3.250%, 2/25/2055, 144A(b)(c) | 406,345 | ||||||
| 1,565,000 | VOLT XL LLC, Series 2015-NP14, Class A2, 4.875%, 11/27/2045, 144A(c) | 1,491,433 | ||||||
| 2,472,098 | VOLT XXVI LLC, Series 2014-NPL6, Class A1, 3.125%, 9/25/2043, 144A(b)(c) | 2,468,605 | ||||||
| 452,705 | VOLT XXX LLC, Series 2015-NPL1, Class A1, 3.625%, 10/25/2057, 144A(b)(c) | 452,746 | ||||||
See accompanying notes to financial statements.
| 30
Table of Contents
Portfolio of Investments – as of December 31, 2016
Loomis Sayles Strategic Alpha Fund – (continued)
| Principal Amount (‡) | Description | Value (†) | ||||||
| ABS Home Equity — continued | ||||||||
| $ | 1,401,293 | VOLT XXXI LLC, Series 2015-NPL2, Class A1, 3.375%, 2/25/2055, 144A(b)(c) | $ | 1,404,672 | ||||
| 1,149,527 | VOLT XXXIII LLC, Series 2015-NPL5, Class A1, 3.500%, 3/25/2055, 144A(b)(c) | 1,152,832 | ||||||
| 1,569,097 | VOLT XXXIX LLC, Series 2015-NP13, Class A1, 4.125%, 10/25/2045, 144A(b)(c) | 1,578,544 | ||||||
| 1,320,794 | VOLT XXXV, Series 2016-NPL9, Class A1, 3.500%, 9/25/2046, 144A(b)(c) | 1,317,714 | ||||||
| 440,741 | WaMu Mortgage Pass Through Certificates, Series 2004-CB2, Class 2A, 5.500%, 7/25/2034(b) | 463,044 | ||||||
| 1,160,668 | WaMu Mortgage Pass Through Certificates, Series 2006-AR11, Class 2A, 2.098%, 9/25/2046(c) | 1,107,025 | ||||||
| 2,925,965 | WaMu Mortgage Pass Through Certificates, Series 2006-AR19, Class 2A, 1.848%, 1/25/2047(c) | 2,723,850 | ||||||
| 1,925,629 | WaMu Mortgage Pass Through Certificates, Series 2007-HY5, Class 2A3, 2.400%, 5/25/2037(c) | 1,597,625 | ||||||
| 855,000 | Wedgewood Real Estate Trust, Series 2016-1, Class A2, 5.000%, 7/15/2046, 144A(c) | 852,438 | ||||||
| 385,317 | Wells Fargo Mortgage Backed Securities Trust, Series 2004-O, Class A1, 2.995%, 8/25/2034(b)(c) | 390,570 | ||||||
| 243,764 | Wells Fargo Mortgage Backed Securities Trust, Series 2005-11, Class 2A3, 5.500%, 11/25/2035(d) | 247,995 | ||||||
| 1,070,508 | Wells Fargo Mortgage Backed Securities Trust, Series 2005-16, Class A18, 6.000%, 1/25/2036 | 1,059,043 | ||||||
| 575,067 | Wells Fargo Mortgage Backed Securities Trust, Series 2005-AR10, Class 2A4, 3.010%, 5/01/2035(b)(c) | 591,406 | ||||||
|
| |||||||
| 151,141,817 | ||||||||
|
| |||||||
| ABS Other — 3.8% | ||||||||
| 4,236,607 | AIM Aviation Finance Ltd., Series 2015-1A, Class B1, 5.072%, 2/15/2040, 144A(b)(c) | 4,077,734 | ||||||
| 738,095 | AIM Aviation Finance Ltd., Series 2015-1A, Class C1, 4.750%, 2/15/2040, 144A | 675,357 | ||||||
| 1,240,000 | Blackbird Capital Aircraft Lease Securitization Ltd., Series 2016-1A, Class A, 4.213%, 12/16/2041, 144A(b)(c) | 1,230,700 | ||||||
| 2,805,093 | Cronos Containers Program I Ltd., 3.270%, 11/18/2029, 144A(b) | 2,713,374 | ||||||
| 549,159 | Diamond Resorts Owner Trust, Series 2011-1, Class A, 4.000%, 3/20/2023, 144A(b) | 549,491 | ||||||
| 1,949,544 | GCA2014 Holdings Ltd., Series 2014-1, Class C, 6.000%, 1/05/2030, 144A(d)(e) | 1,239,910 | ||||||
| 761,855 | GCA2014 Holdings Ltd., Series 2014-1, Class D, 7.500%, 1/05/2030, 144A(d)(e) | 219,566 | ||||||
| 3,410,000 | GCA2014 Holdings Ltd., Series 2014-1, Class E, Zero Coupon, 1/05/2030, 144A(d)(e)(f) | 49,445 | ||||||
| 1,317,885 | Global Container Assets Ltd., Series 2015-1A, Class B, 4.500%, 2/05/2030, 144A(e)(g) | 1,266,509 | ||||||
| 3,120,000 | OneMain Financial Issuance Trust, 4.160%, 11/20/2028, 144A(b) | 3,000,087 | ||||||
| 601,471 | OneMain Financial Issuance Trust, Series 2014-1A, Class A, 2.430%, 6/18/2024, 144A(b) | 601,501 | ||||||
See accompanying notes to financial statements.
31 |
Table of Contents
Portfolio of Investments – as of December 31, 2016
Loomis Sayles Strategic Alpha Fund – (continued)
| Principal Amount (‡) | Description | Value (†) | ||||||
| ABS Other — continued | ||||||||
| $ | 443,349 | OneMain Financial Issuance Trust, Series 2014-2A, Class A, 2.470%, 9/18/2024, 144A(b) | $ | 443,531 | ||||
| 745,000 | OneMain Financial Issuance Trust, Series 2014-2A, Class B, 3.020%, 9/18/2024, 144A(b) | 744,699 | ||||||
| 6,475,000 | OneMain Financial Issuance Trust, Series 2014-2A, Class D, 5.310%, 9/18/2024, 144A | 6,502,683 | ||||||
| 1,265,000 | OneMain Financial Issuance Trust, Series 2015-1A, Class A, 3.190%, 3/18/2026, 144A(b) | 1,273,978 | ||||||
| 3,100,000 | OneMain Financial Issuance Trust, Series 2016-1A, Class C, 6.000%, 2/20/2029, 144A | 3,180,594 | ||||||
| 2,685,000 | OneMain Financial Issuance Trust, Series 2016-2A, Class B, 5.940%, 3/20/2028, 144A(b) | 2,827,189 | ||||||
| 4,196,452 | Shenton Aircraft Investment I Ltd., Series 2015-1A, Class A, 4.750%, 10/15/2042, 144A(b) | 4,216,181 | ||||||
| 147,284 | Sierra Timeshare Receivables Funding LLC, Series 2012-1A, Class A, 2.840%, 11/20/2028, 144A(b) | 147,354 | ||||||
| 599,051 | Sierra Timeshare Receivables Funding LLC, Series 2013-1A, Class A, 1.590%, 11/20/2029, 144A(b) | 596,105 | ||||||
| 1,189,602 | Sierra Timeshare Receivables Funding LLC, Series 2013-3A, Class A, 2.200%, 10/20/2030, 144A(b) | 1,189,216 | ||||||
| 598,483 | Springleaf Funding Trust, Series 2014-AA, Class A, 2.410%, 12/15/2022, 144A(b) | 598,703 | ||||||
| 2,566,083 | TAL Advantage V LLC, Series 2013-2A, Class A, 3.550%, 11/20/2038, 144A(b) | 2,490,611 | ||||||
| 5,700,000 | Working Capital Solutions Funding LLC, 7.711%, 8/27/2017, 144A(c)(d)(e) | 5,700,000 | ||||||
|
| |||||||
| 45,534,518 | ||||||||
|
| |||||||
| ABS Student Loan — 0.4% | ||||||||
| 310,338 | SoFi Professional Loan Program LLC, Series 2014-B, Class A1, 2.006%, 8/25/2032, 144A(b)(c) | 312,267 | ||||||
| 1,573,087 | SoFi Professional Loan Program LLC, Series 2015-A, Class A1, 1.792%, 3/25/2033, 144A(b)(c) | 1,580,919 | ||||||
| 3,110,000 | SoFi Professional Loan Program LLC, Series 2016-A, Class B, 3.570%, 1/26/2038, 144A(b) | 3,113,592 | ||||||
|
| |||||||
| 5,006,778 | ||||||||
|
| |||||||
| Aerospace & Defense — 0.7% | ||||||||
| 1,135,000 | Embraer Netherlands Finance BV, 5.050%, 6/15/2025(b) | 1,128,190 | ||||||
| 1,195,000 | Embraer Overseas Ltd., 5.696%, 9/16/2023, 144A(b) | 1,248,775 | ||||||
| 6,003,000 | Meccanica Holdings USA, Inc., 6.250%, 1/15/2040, 144A | 6,078,038 | ||||||
|
| |||||||
| 8,455,003 | ||||||||
|
| |||||||
| Airlines — 1.1% | ||||||||
| 8,093,778 | Air Canada Pass Through Trust, Series 2015-2, Class B, 5.000%, 6/15/2025, 144A(b) | 8,116,116 | ||||||
| 5,641,485 | Latam Airlines Pass Through Trust, Series 2015-1, Class B, 4.500%, 8/15/2025 | 5,444,033 | ||||||
|
| |||||||
| 13,560,149 | ||||||||
|
| |||||||
See accompanying notes to financial statements.
| 32
Table of Contents
Portfolio of Investments – as of December 31, 2016
Loomis Sayles Strategic Alpha Fund – (continued)
| Principal Amount (‡) | Description | Value (†) | ||||||
| Automotive — 2.5% | ||||||||
| $ | 5,875,000 | American Honda Finance Corp., MTN, 1.191%, 11/19/2018(b)(c) | $ | 5,876,586 | ||||
| 3,700,000 | American Honda Finance Corp., Series MTN, 1.447%, 9/20/2017(b)(c) | 3,708,799 | ||||||
| 5,785,000 | BMW U.S. Capital LLC, 1.373%, 9/13/2019, 144A(b)(c) | 5,783,583 | ||||||
| 6,100,000 | Hyundai Capital Services, Inc., 1.793%, 3/18/2017, 144A(b)(c) | 6,101,720 | ||||||
| 5,960,000 | Nissan Motor Acceptance Corp., 1.492%, 3/03/2017, 144A(b)(c) | 5,965,280 | ||||||
| 2,955,000 | Toyota Motor Credit Corp., MTN, 1.322%, 10/18/2019(b)(c) | 2,969,539 | ||||||
|
| |||||||
| 30,405,507 | ||||||||
|
| |||||||
| Banking — 3.4% | ||||||||
| 2,625,000 | Ally Financial, Inc., 4.250%, 4/15/2021 | 2,649,609 | ||||||
| 3,200,000 | Ally Financial, Inc., 5.750%, 11/20/2025 | 3,192,000 | ||||||
| 44,895,000 | Banco Hipotecario S.A., 24.729%, 1/12/2020, 144A, (ARS)(c) | 2,704,314 | ||||||
| 1,334,000 | Bank of America NA, Series BKNT, 1.263%, 6/15/2017(b)(c) | 1,333,272 | ||||||
| 4,603,000 | Citigroup, Inc., 1.630%, 11/24/2017(b)(c) | 4,612,629 | ||||||
| 5,840,000 | Goldman Sachs Group, Inc. (The), MTN, 1.567%, 6/04/2017(b)(c) | 5,849,309 | ||||||
| 5,800,000 | JPMorgan Chase Bank NA, 1.588%, 9/23/2019(b)(c) | 5,804,362 | ||||||
| 12,840,000 | Santander Holdings USA, Inc., 4.500%, 7/17/2025(b) | 12,759,699 | ||||||
| 1,330,000 | Wells Fargo & Co., MTN, 1.234%, 6/02/2017(b)(c) | 1,330,521 | ||||||
|
| |||||||
| 40,235,715 | ||||||||
|
| |||||||
| Building Materials — 0.5% | ||||||||
| 5,500,000 | Cemex SAB de CV, 6.125%, 5/05/2025, 144A | 5,623,750 | ||||||
|
| |||||||
| Cable Satellite — 1.1% | ||||||||
| 1,325,000 | Cablevision S.A., 6.500%, 6/15/2021, 144A | 1,346,531 | ||||||
| 2,865,000 | Cox Communications, Inc., 4.500%, 6/30/2043, 144A(b) | 2,426,048 | ||||||
| 1,575,000 | Cox Communications, Inc., 4.700%, 12/15/2042, 144A(b) | 1,369,535 | ||||||
| 1,740,000 | DISH DBS Corp., 5.875%, 11/15/2024 | 1,790,460 | ||||||
| 1,475,000 | DISH DBS Corp., 7.750%, 7/01/2026 | 1,663,062 | ||||||
| 2,065,000 | Time Warner Cable LLC, 4.500%, 9/15/2042(b) | 1,870,180 | ||||||
| 2,900,000 | Ziggo Secured Finance BV, 5.500%, 1/15/2027, 144A | 2,826,920 | ||||||
|
| |||||||
| 13,292,736 | ||||||||
|
| |||||||
| Collateralized Mortgage Obligations — 0.6% | ||||||||
| 56,697,988 | Government National Mortgage Association, Series 2012-135, Class IO, 0.611%, 1/16/2053(b)(c)(h) | 2,336,025 | ||||||
| 1,316,231 | GSR Mortgage Loan Trust, Series 2005-AR5, Class 4A1, 3.233%, 10/25/2035(c) | 1,235,095 | ||||||
| 541,897 | HarborView Mortgage Loan Trust, Series 2006-7, Class 2A1A, 0.936%, 9/19/2046(c) | 389,241 | ||||||
| 3,062,568 | Merrill Lynch Mortgage Investors Trust, Series 2006-1, Class 1A, 3.014%, 2/25/2036(c) | 2,819,069 | ||||||
|
| |||||||
| 6,779,430 | ||||||||
|
| |||||||
| Construction Machinery — 0.5% | ||||||||
| 5,810,000 | Caterpillar Financial Services Corp., GMTN, 1.620%, 2/23/2018(b)(c) | 5,839,004 | ||||||
|
| |||||||
| Diversified Manufacturing — 0.5% | ||||||||
| 5,915,000 | United Technologies Corp., 1.236%, 11/01/2019(b)(c) | 5,928,427 | ||||||
|
| |||||||
| Electric — 1.6% | ||||||||
| 12,170,000 | Enel SpA, (fixed rate to 9/24/2023, variable rate thereafter), 8.750%, 9/24/2073, 144A(b) | 13,843,375 | ||||||
| 4,800,000 | Pacific Gas & Electric Co., 1.131%, 11/30/2017(b)(c) | 4,801,522 | ||||||
|
| |||||||
| 18,644,897 | ||||||||
|
| |||||||
See accompanying notes to financial statements.
33 |
Table of Contents
Portfolio of Investments – as of December 31, 2016
Loomis Sayles Strategic Alpha Fund – (continued)
| Principal Amount (‡) | Description | Value (†) | ||||||
| Finance Companies — 0.7% | ||||||||
| $ | 3,225,000 | Ladder Capital Finance Holdings LLLP/Ladder Capital Finance Corp., 5.875%, 8/01/2021, 144A | $ | 3,063,750 | ||||
| 5,813,000 | Quicken Loans, Inc., 5.750%, 5/01/2025, 144A | 5,653,143 | ||||||
|
| |||||||
| 8,716,893 | ||||||||
|
| |||||||
| Financial Other — 0.6% | ||||||||
| 6,780,000 | Rialto Holdings LLC/Rialto Corp., 7.000%, 12/01/2018, 144A | 6,864,750 | ||||||
|
| |||||||
| Food & Beverage — 1.5% | ||||||||
| 5,940,000 | BRF GmbH, 4.350%, 9/29/2026, 144A(b) | 5,507,568 | ||||||
| 10,800,000 | BRF S.A., 7.750%, 5/22/2018, 144A, (BRL)(b) | 3,102,590 | ||||||
| 3,225,000 | Cosan Luxembourg S.A., 7.000%, 1/20/2027, 144A | 3,233,063 | ||||||
| 2,300,000 | Cosan Luxembourg S.A., 9.500%, 3/14/2018, 144A, (BRL) | 670,454 | ||||||
| 460,000 | JBS Investments GmbH, 7.250%, 4/03/2024, 144A | 480,700 | ||||||
| 2,090,000 | JBS USA LUX S.A./JBS USA Finance, Inc., 5.750%, 6/15/2025, 144A | 2,116,125 | ||||||
| 145,000 | JBS USA LUX S.A./JBS USA Finance, Inc., 7.250%, 6/01/2021, 144A | 150,076 | ||||||
| 2,900,000 | PepsiCo, Inc., 1.268%, 10/04/2019(b)(c) | 2,903,190 | ||||||
|
| |||||||
| 18,163,766 | ||||||||
|
| |||||||
| Government Owned – No Guarantee — 1.9% | ||||||||
| 18,670,000,000 | Financiera de Desarrollo Territorial S.A. Findeter, 7.875%, 8/12/2024, 144A, (COP)(b) | 5,761,169 | ||||||
| 9,960,000 | Petrobras Global Finance BV, 5.375%, 1/27/2021 | 9,740,880 | ||||||
| 905,000 | Petrobras Global Finance BV, 5.625%, 5/20/2043 | 668,976 | ||||||
| 940,000 | Petrobras Global Finance BV, 8.750%, 5/23/2026 | 1,014,025 | ||||||
| 700,000(††) | Petroleos Mexicanos, 7.650%, 11/24/2021, 144A, (MXN)(b) | 3,100,093 | ||||||
| 1,930,000 | YPF S.A., 26.333%, 7/07/2020, 144A(c) | 2,180,900 | ||||||
|
| |||||||
| 22,466,043 | ||||||||
|
| |||||||
| Health Insurance — 0.5% | ||||||||
| 5,665,000 | Aetna, Inc., 1.601%, 12/08/2017(b)(c) | 5,684,533 | ||||||
|
| |||||||
| Home Construction — 0.2% | ||||||||
| 2,920,000 | PulteGroup, Inc., 5.000%, 1/15/2027 | 2,774,000 | ||||||
|
| |||||||
| Independent Energy — 4.9% | ||||||||
| 150,000 | Baytex Energy Corp., 5.125%, 6/01/2021, 144A | 135,375 | ||||||
| 665,000 | Baytex Energy Corp., 5.625%, 6/01/2024, 144A | 586,863 | ||||||
| 905,000 | Bonanza Creek Energy, Inc., 5.750%, 2/01/2023(f) | 660,650 | ||||||
| 240,000 | Bonanza Creek Energy, Inc., 6.750%, 4/15/2021(f) | 178,800 | ||||||
| 74,000 | California Resources Corp., 5.500%, 9/15/2021 | 58,090 | ||||||
| 448,000 | California Resources Corp., 6.000%, 11/15/2024 | 328,720 | ||||||
| 1,095,000 | California Resources Corp., 8.000%, 12/15/2022, 144A | 974,550 | ||||||
| 3,180,000 | Callon Petroleum Co., 6.125%, 10/01/2024, 144A | 3,275,400 | ||||||
| 245,000 | Canadian Natural Resources Ltd., 3.900%, 2/01/2025(b) | 245,724 | ||||||
| 326,000 | Chesapeake Energy Corp., 4.875%, 4/15/2022 | 297,475 | ||||||
| 13,000 | Chesapeake Energy Corp., 6.125%, 2/15/2021 | 12,675 | ||||||
| 16,000 | Chesapeake Energy Corp., 6.625%, 8/15/2020 | 16,160 | ||||||
| 1,190,000 | Chesapeake Energy Corp., 8.000%, 1/15/2025, 144A | 1,213,800 | ||||||
| 800,000 | Concho Resources, Inc., 5.500%, 10/01/2022 | 829,000 | ||||||
| 3,105,000 | Concho Resources, Inc., 5.500%, 4/01/2023 | 3,217,711 | ||||||
See accompanying notes to financial statements.
| 34
Table of Contents
Portfolio of Investments – as of December 31, 2016
Loomis Sayles Strategic Alpha Fund – (continued)
| Principal Amount (‡) | Description | Value (†) | ||||||
| Independent Energy — continued | ||||||||
| $ | 3,635,000 | Continental Resources, Inc., 3.800%, 6/01/2024 | $ | 3,353,287 | ||||
| 560,000 | Continental Resources, Inc., 4.500%, 4/15/2023 | 548,800 | ||||||
| 11,465,000 | Continental Resources, Inc., 5.000%, 9/15/2022(b) | 11,572,656 | ||||||
| 1,342,000 | Devon Energy Corp., 5.000%, 6/15/2045(b) | 1,318,294 | ||||||
| 1,195,000 | Halcon Resources Corp., 8.625%, 2/01/2020, 144A | 1,242,800 | ||||||
| 4,519,000 | Matador Resources Co., 6.875%, 4/15/2023 | 4,744,950 | ||||||
| 1,265,000 | MEG Energy Corp., 6.375%, 1/30/2023, 144A | 1,125,850 | ||||||
| 180,000 | MEG Energy Corp., 6.500%, 3/15/2021, 144A | 166,500 | ||||||
| 2,055,000 | MEG Energy Corp., 7.000%, 3/31/2024, 144A | 1,859,775 | ||||||
| 2,390,000 | Oasis Petroleum, Inc., 6.875%, 3/15/2022 | 2,449,750 | ||||||
| 7,460,000 | OGX Austria GmbH, 8.375%, 4/01/2022, 144A(d)(e)(i) | — | ||||||
| 4,420,000 | OGX Austria GmbH, 8.500%, 6/01/2018, 144A(d)(e)(i) | — | ||||||
| 2,015,000 | Parsley Energy LLC/Parsley Finance Corp., 6.250%, 6/01/2024, 144A | 2,120,385 | ||||||
| 725,000 | PDC Energy, Inc., 6.125%, 9/15/2024, 144A | 741,313 | ||||||
| 7,565,000 | RSP Permian, Inc., 6.625%, 10/01/2022 | 7,999,987 | ||||||
| 1,055,000 | SM Energy Co., 5.000%, 1/15/2024 | 994,338 | ||||||
| 1,750,000 | SM Energy Co., 6.125%, 11/15/2022 | 1,771,875 | ||||||
| 165,000 | SM Energy Co., 6.500%, 1/01/2023 | 167,681 | ||||||
| 535,000 | SM Energy Co., 6.750%, 9/15/2026 | 551,050 | ||||||
| 400,000 | Whiting Petroleum Corp., 5.000%, 3/15/2019 | 401,564 | ||||||
| 3,255,000 | Whiting Petroleum Corp., 6.500%, 10/01/2018 | 3,238,725 | ||||||
|
| |||||||
| 58,400,573 | ||||||||
|
| |||||||
| Industrial Other — 0.2% | ||||||||
| 2,200,000 | Alfa SAB de CV, 6.875%, 3/25/2044, 144A(b) | 2,139,500 | ||||||
|
| |||||||
| Integrated Energy — 1.1% | ||||||||
| 1,225,000 | BP Capital Markets PLC, 1.327%, 2/13/2018(b)(c) | 1,226,210 | ||||||
| 6,595,000 | Chevron Corp., 1.076%, 11/15/2017(b)(c) | 6,595,923 | ||||||
| 5,795,000 | Shell International Finance BV, 1.303%, 9/12/2019(b)(c) | 5,796,704 | ||||||
|
| |||||||
| 13,618,837 | ||||||||
|
| |||||||
| Life Insurance — 0.5% | ||||||||
| 5,785,000 | Metropolitan Life Global Funding I, 1.299%, 9/14/2018, 144A(b)(c) | 5,790,438 | ||||||
|
| |||||||
| Local Authorities — 0.2% | ||||||||
| 2,900,000 | Provincia de Buenos Aires, 5.750%, 6/15/2019, 144A | 3,023,830 | ||||||
|
| |||||||
| Lodging — 0.1% | ||||||||
| 715,000 | Hilton Grand Vacations Borrower LLC/Hilton Grand Vacations Borrower, Inc., 6.125%, 12/01/2024, 144A | 742,706 | ||||||
|
| |||||||
| Media Entertainment — 0.4% | ||||||||
| 4,150,000 | Clear Channel Worldwide Holdings, Inc., 7.625%, 3/15/2020 | 4,147,385 | ||||||
| 27,290,000 | Grupo Televisa SAB, EMTN, 7.250%, 5/14/2043, (MXN)(b) | 977,545 | ||||||
|
| |||||||
| 5,124,930 | ||||||||
|
| |||||||
| Midstream — 4.5% | ||||||||
| 2,695,000 | AmeriGas Partners LP/AmeriGas Finance Corp., 5.500%, 5/20/2025 | 2,721,950 | ||||||
| 2,340,000 | Crestwood Midstream Partners LP/Crestwood Midstream Finance Corp., 6.125%, 3/01/2022 | 2,398,500 | ||||||
See accompanying notes to financial statements.
35 |
Table of Contents
Portfolio of Investments – as of December 31, 2016
Loomis Sayles Strategic Alpha Fund – (continued)
| Principal Amount (‡) | Description | Value (†) | ||||||
| Midstream — continued | ||||||||
| $ | 410,000 | Energy Transfer Partners LP, 5.150%, 3/15/2045(b) | $ | 393,223 | ||||
| 5,595,000 | Energy Transfer Partners LP, 6.125%, 12/15/2045(b) | 5,952,739 | ||||||
| 1,290,000 | EnLink Midstream Partners LP, 5.050%, 4/01/2045(b) | 1,169,452 | ||||||
| 765,000 | EnLink Midstream Partners LP, 5.600%, 4/01/2044(b) | 736,778 | ||||||
| 1,195,000 | Kinder Morgan Energy Partners LP, 4.700%, 11/01/2042(b) | 1,113,372 | ||||||
| 2,155,000 | Kinder Morgan Energy Partners LP, 5.000%, 8/15/2042(b) | 2,059,574 | ||||||
| 255,000 | Kinder Morgan Energy Partners LP, 5.000%, 3/01/2043(b) | 245,888 | ||||||
| 1,750,000 | Kinder Morgan Energy Partners LP, 5.625%, 9/01/2041(b) | 1,757,667 | ||||||
| 450,000 | MPLX LP, 4.000%, 2/15/2025(b) | 437,402 | ||||||
| 765,000 | MPLX LP, 4.500%, 7/15/2023(b) | 776,946 | ||||||
| 5,395,000 | MPLX LP, 4.875%, 12/01/2024(b) | 5,555,199 | ||||||
| 475,000 | MPLX LP, 4.875%, 6/01/2025(b) | 488,370 | ||||||
| 2,690,000 | NGL Energy Partners LP/NGL Energy Finance Corp., 5.125%, 7/15/2019 | 2,666,462 | ||||||
| 415,000 | NGL Energy Partners LP/NGL Energy Finance Corp., 6.875%, 10/15/2021 | 424,338 | ||||||
| 3,050,000 | NGL Energy Partners LP/NGL Energy Finance Corp., 7.500%, 11/01/2023, 144A | 3,149,125 | ||||||
| 5,055,000 | Sabine Pass Liquefaction LLC, 5.625%, 3/01/2025(b) | 5,408,850 | ||||||
| 180,000 | Targa Resources Partners LP/Targa Resources Partners Finance Corp., 4.250%, 11/15/2023 | 172,125 | ||||||
| 690,000 | Targa Resources Partners LP/Targa Resources Partners Finance Corp., 5.250%, 5/01/2023 | 696,900 | ||||||
| 1,120,000 | Targa Resources Partners LP/Targa Resources Partners Finance Corp., 6.375%, 8/01/2022 | 1,159,200 | ||||||
| 6,015,000 | Targa Resources Partners LP/Targa Resources Partners Finance Corp., 6.750%, 3/15/2024 | 6,451,087 | ||||||
| 1,310,000 | Western Refining Logistics LP/WNRL Finance Corp., 7.500%, 2/15/2023 | 1,414,800 | ||||||
| 3,995,000 | Williams Partners LP, 4.000%, 9/15/2025(b) | 3,950,172 | ||||||
| 965,000 | Williams Partners LP, 5.100%, 9/15/2045(b) | 917,183 | ||||||
| 1,825,000 | Williams Partners LP, 6.300%, 4/15/2040(b) | 1,947,989 | ||||||
|
| |||||||
| 54,165,291 | ||||||||
|
| |||||||
| Non-Agency Commercial Mortgage-Backed Securities — 4.8% | ||||||||
| 1,600,000 | BLCP Hotel Trust, Series 2014-CLRN, Class D, 3.204%, 8/15/2029, 144A(b)(c) | 1,580,900 | ||||||
| 1,600,000 | BLCP Hotel Trust, Series 2014-CLRN, Class E, 4.374%, 8/15/2029, 144A(c) | 1,587,946 | ||||||
| 3,442,048 | BXHTL Mortgage Trust, Series 2015-DRMZ, Class M, 8.849%, 5/15/2020, 144A(c)(e)(g) | 3,349,021 | ||||||
| 4,565,000 | CFCRE Commercial Mortgage Trust, Series 2011-C1, Class D, 6.180%, 4/15/2044, 144A(b)(c) | 4,658,535 | ||||||
| 1,900,000 | Commercial Mortgage Trust, Series 2016-SAVA, Class C, 3.704%, 10/15/2034, 144A(b)(c) | 1,904,485 | ||||||
| 3,700,000 | Credit Suisse Mortgage Capital Certificates, Series 2015-TOWN, Class A, 1.954%, 3/15/2017, 144A(b)(c) | 3,702,255 | ||||||
| 2,552,340 | DBUBS Mortgage Trust, Series 2011-LC1A, Class E, 5.685%, 11/10/2046, 144A(b)(c) | 2,669,814 | ||||||
| 6,505,000 | GS Mortgage Securities Trust, Series 2007-GG10, Class AM, 5.793%, 8/10/2045(c) | 6,425,764 | ||||||
| 4,429 | Hilton USA Trust, Series 2013-HLT, Class DFX, 4.407%, 11/05/2030, 144A | 4,411 | ||||||
See accompanying notes to financial statements.
| 36
Table of Contents
Portfolio of Investments – as of December 31, 2016
Loomis Sayles Strategic Alpha Fund – (continued)
| Principal Amount (‡) | Description | Value (†) | ||||||
| Non-Agency Commercial Mortgage-Backed Securities — continued | ||||||||
| $ | 1,580,000 | Hilton USA Trust, Series 2013-HLT, Class EFX, 4.453%, 11/05/2030, 144A(b)(c) | $ | 1,582,358 | ||||
| 1,520,000 | JPMorgan Chase Commercial Mortgage Securities Trust, Series 2007-LDPX, Class AM, 5.464%, 1/15/2049(b)(c) | 1,506,868 | ||||||
| 3,090,000 | JPMorgan Chase Commercial Mortgage Securities Trust, Series 2015-SGP, Class D, 5.204%, 7/15/2036, 144A(b)(c) | 3,109,298 | ||||||
| 1,225,881 | Morgan Stanley Capital I Trust, Series 2007-HQ12, Class AM, 5.775%, 4/12/2049(b)(c) | 1,225,664 | ||||||
| 1,570,000 | Morgan Stanley Capital I Trust, Series 2011-C2, Class D, 5.473%, 6/15/2044, 144A(b)(c) | 1,617,485 | ||||||
| 2,125,000 | Morgan Stanley Capital I Trust, Series 2011-C2, Class E, 5.473%, 6/15/2044, 144A(b)(c) | 2,173,355 | ||||||
| 9,814,029 | Motel 6 Trust, Series 2015-M6MZ, Class M, 8.230%, 2/05/2020, 144A(e)(g) | 9,906,035 | ||||||
| 2,280,000 | SCG Trust, Series 2013-SRP1, Class B, 3.204%, 11/15/2026, 144A(b)(c) | 2,178,052 | ||||||
| 2,200,000 | SCG Trust, Series 2013-SRP1, Class C, 3.954%, 11/15/2026, 144A(b)(c) | 2,140,529 | ||||||
| 3,165,000 | SCG Trust, Series 2013-SRP1, Class D, 4.048%, 11/15/2026, 144A(b)(c) | 3,034,671 | ||||||
| 2,587,500 | WFRBS Commercial Mortgage Trust, Series 2011-C2, Class D, 5.602%, 2/15/2044, 144A(b)(c) | 2,648,840 | ||||||
|
| |||||||
| 57,006,286 | ||||||||
|
| |||||||
| Oil Field Services — 0.6% | ||||||||
| 3,490,000 | Noble Holding International Ltd., 5.250%, 3/15/2042 | 2,303,400 | ||||||
| 3,015,000 | Noble Holding International Ltd., 7.750%, 1/15/2024 | 2,835,909 | ||||||
| 2,040,000 | Transocean Proteus Ltd., 6.250%, 12/01/2024, 144A | 2,059,135 | ||||||
|
| |||||||
| 7,198,444 | ||||||||
|
| |||||||
| Pharmaceuticals — 1.0% | ||||||||
| 5,570,000 | Merck & Co., Inc., 1.007%, 2/10/2017(b)(c) | 5,571,242 | ||||||
| 3,175,000 | Valeant Pharmaceuticals International, Inc., 5.500%, 3/01/2023, 144A | 2,381,250 | ||||||
| 5,356,000 | Valeant Pharmaceuticals International, Inc., 5.875%, 5/15/2023, 144A | 4,043,780 | ||||||
|
| |||||||
| 11,996,272 | ||||||||
|
| |||||||
| Refining — 0.2% | ||||||||
| 2,090,000 | Ultrapar International S.A., 5.250%, 10/06/2026, 144A | 2,047,991 | ||||||
|
| |||||||
| REITs – Mortgage — 0.1% | ||||||||
| 775,000 | Starwood Property Trust, Inc., 5.000%, 12/15/2021, 144A | 785,385 | ||||||
|
| |||||||
| Retailers — 0.1% | ||||||||
| 1,080,000 | PVH Corp., 7.750%, 11/15/2023(b) | 1,255,500 | ||||||
|
| |||||||
| Technology — 3.0% | ||||||||
| 4,770,000 | Alcatel-Lucent USA, Inc., 6.450%, 3/15/2029 | 4,972,725 | ||||||
| 1,542,000 | Alcatel-Lucent USA, Inc., 6.500%, 1/15/2028 | 1,592,115 | ||||||
| 6,955,000 | Cisco Systems, Inc., 1.337%, 9/20/2019(b)(c) | 6,972,165 | ||||||
| 11,255,000 | Diamond 1 Finance Corp./Diamond 2 Finance Corp., 6.020%, 6/15/2026, 144A(b) | 12,192,496 | ||||||
| 3,310,000 | Donnelley Financial Solutions, Inc., 8.250%, 10/15/2024, 144A | 3,367,925 | ||||||
| 6,695,000 | Open Text Corp., 5.875%, 6/01/2026, 144A | 7,063,225 | ||||||
|
| |||||||
| 36,160,651 | ||||||||
|
| |||||||
See accompanying notes to financial statements.
37 |
Table of Contents
Portfolio of Investments – as of December 31, 2016
Loomis Sayles Strategic Alpha Fund – (continued)
| Principal Amount (‡) | Description | Value (†) | ||||||
| Treasuries — 2.3% | ||||||||
| 42,200(†††) | Brazil Letras do Tesouro Nacional, Zero Coupon, 7/01/2017, (BRL) | $ | 12,240,904 | |||||
| 1,115,000(††) | Mexican Fixed Rate Bonds, Series M, 5.750%, 3/05/2026, (MXN)(b) | 4,772,517 | ||||||
| 43,850,000 | Poland Government International Bond, 4.750%, 4/25/2017, (PLN)(b) | 10,579,370 | ||||||
|
| |||||||
| 27,592,791 | ||||||||
|
| |||||||
| Wirelines — 0.7% | ||||||||
| 1,880,000 | Communications Sales & Leasing, Inc./CSL Capital LLC, 7.125%, 12/15/2024, 144A | 1,898,800 | ||||||
| 10,085,000 | Oi S.A., 9.750%, 9/15/2016, 144A, (BRL)(i) | 654,578 | ||||||
| 5,685,000 | Verizon Communications, Inc., 2.709%, 9/14/2018(b)(c) | 5,811,901 | ||||||
|
| |||||||
| 8,365,279 | ||||||||
|
| |||||||
| Total Non-Convertible Bonds (Identified Cost $888,183,803) | 870,169,634 | |||||||
|
| |||||||
| Convertible Bonds — 1.2% | ||||||||
| Building Materials — 0.0% | ||||||||
| 335,000 | CalAtlantic Group, Inc., 0.250%, 6/01/2019 | 311,969 | ||||||
|
| |||||||
| Diversified Operations — 0.1% | ||||||||
| 775,000 | RWT Holdings, Inc., 5.625%, 11/15/2019 | 780,812 | ||||||
|
| |||||||
| Healthcare — 0.2% | ||||||||
| 1,180,000 | Brookdale Senior Living, Inc., 2.750%, 6/15/2018 | 1,148,287 | ||||||
| 615,000 | Evolent Health, Inc., 2.000%, 12/01/2021, 144A | 590,016 | ||||||
|
| |||||||
| 1,738,303 | ||||||||
|
| |||||||
| Media Entertainment — 0.1% | ||||||||
| 885,000 | Liberty Media Corp., 2.250%, 9/30/2046, 144A | 932,569 | ||||||
|
| |||||||
| Pharmaceuticals — 0.6% | ||||||||
| 1,250,000 | Horizon Pharma Investment Ltd., 2.500%, 3/15/2022 | 1,189,063 | ||||||
| 4,110,000 | Impax Laboratories, Inc., 2.000%, 6/15/2022 | 3,244,331 | ||||||
| 2,770,000 | Ionis Pharmaceuticals, Inc., 1.000%, 11/15/2021 | 2,792,506 | ||||||
|
| |||||||
| 7,225,900 | ||||||||
|
| |||||||
| Technology — 0.2% | ||||||||
| 420,000 | CalAmp Corp., 1.625%, 5/15/2020 | 404,775 | ||||||
| 740,000 | Cypress Semiconductor Corp., 4.500%, 1/15/2022, 144A | 832,038 | ||||||
| 1,578,000 | Viavi Solutions, Inc., 0.625%, 8/15/2033 | 1,631,257 | ||||||
|
| |||||||
| 2,868,070 | ||||||||
|
| |||||||
| Total Convertible Bonds (Identified Cost $13,411,536) | 13,857,623 | |||||||
|
| |||||||
| Total Bonds and Notes (Identified Cost $901,595,339) | 884,027,257 | |||||||
|
| |||||||
| Senior Loans — 7.5% | ||||||||
| Aerospace & Defense — 0.3% | ||||||||
| 1,184,548 | Engility Corp., Term Loan B2, 5.807%, 8/12/2023(j) | 1,201,428 | ||||||
| 335,444 | TransDigm, Inc., 2015 Term Loan E, 3.845%, 5/14/2022(j) | 338,111 | ||||||
See accompanying notes to financial statements.
| 38
Table of Contents
Portfolio of Investments – as of December 31, 2016
Loomis Sayles Strategic Alpha Fund – (continued)
| Principal Amount (‡) | Description | Value (†) | ||||||
| Aerospace & Defense — continued | ||||||||
| $ | 2,398,221 | TransDigm, Inc., 2016 Extended Term Loan F, 3.770%, 6/09/2023(c) | $ | 2,421,004 | ||||
|
| |||||||
| 3,960,543 | ||||||||
|
| |||||||
| Automotive — 0.1% | ||||||||
| 1,587,537 | Gates Global, Inc., Term Loan B, 4.250%, 7/06/2021(c) | 1,587,537 | ||||||
|
| |||||||
| Building Materials — 0.6% | ||||||||
| 1,596,000 | HD Supply, Inc., Incremental Term Loan B2, 3.748%, 10/17/2023(c) | 1,606,645 | ||||||
| 2,112,508 | Headwaters, Inc., 2016 Term Loan B, 4.000%, 3/24/2022(c) | 2,122,416 | ||||||
| 865,996 | Ply Gem Industries, Inc., Term Loan, 4.000%, 2/01/2021(c) | 872,855 | ||||||
| 335,000 | Quikrete Holdings, Inc., 2016 1st Lien Term Loan, 11/15/2023(k) | 338,072 | ||||||
| 2,035,000 | Quikrete Holdings, Inc., 2016 1st Lien Term Loan, 4.000%, 11/15/2023(c) | 2,053,661 | ||||||
|
| |||||||
| 6,993,649 | ||||||||
|
| |||||||
| Cable Satellite — 0.4% | ||||||||
| 282,710 | Altice U.S. Finance I Corp., 2016 Term Loan B, 3.882%, 1/15/2025(c) | 285,537 | ||||||
| 205,000 | CSC Holdings LLC, 2016 Term Loan, 3.876%, 10/11/2024(c) | 207,007 | ||||||
| 2,575,000 | Virgin Media Investment Holdings Ltd., USD Term Loan I, 3.486%, 1/31/2025(c) | 2,584,991 | ||||||
| 1,684,803 | Ziggo Financing Partnership, USD Term Loan B1, 3.500%, 1/15/2022(c) | 1,691,829 | ||||||
| 309,719 | Ziggo Financing Partnership, USD Term Loan B2A, 3.500%, 1/15/2022(c) | 311,011 | ||||||
| 96,238 | Ziggo Financing Partnership, USD Term Loan B3, 3.701%, 1/15/2022(c) | 96,639 | ||||||
|
| |||||||
| 5,177,014 | ||||||||
|
| |||||||
| Consumer Cyclical Services — 0.4% | ||||||||
| 1,175,000 | Conduent, Inc., USD Term Loan B, 12/07/2023(k) | 1,188,219 | ||||||
| 3,885,000 | Conduent, Inc., USD Term Loan B, 6.250%, 12/07/2023(c) | 3,928,706 | ||||||
|
| |||||||
| 5,116,925 | ||||||||
|
| |||||||
| Consumer Products — 0.3% | ||||||||
| 3,119,292 | Serta Simmons Bedding LLC, 1st Lien Term Loan, 4.500%, 11/08/2023(c) | 3,151,452 | ||||||
|
| |||||||
| Environmental — 0.1% | ||||||||
| 753,113 | GFL Environmental, Inc., USD Term Loan B, 3.750%, 9/29/2023(c) | 754,679 | ||||||
|
| |||||||
| Gaming — 0.1% | ||||||||
| 741,258 | Boyd Gaming Corp., Term Loan B2, 3.756%, 9/15/2023(c) | 749,331 | ||||||
|
| |||||||
| Healthcare — 0.1% | ||||||||
| 905,000 | Envision Healthcare Corp., 2016 Term Loan B, 4.000%, 12/01/2023(c) | 913,489 | ||||||
|
| |||||||
| Independent Energy — 0.5% | ||||||||
| 3,385,000 | California Resources Corp., Second Out Term Loan, 11.375%, 12/31/2021(c) | 3,751,697 | ||||||
| 2,649,896 | Chesapeake Energy Corp., Term Loan, 8.500%, 8/23/2021(c) | 2,880,649 | ||||||
|
| |||||||
| 6,632,346 | ||||||||
|
| |||||||
| Industrial Other — 0.4% | ||||||||
| 1,891,188 | Pinnacle Operating Corp., Term Loan, 4.750%, 11/15/2018(c) | 1,555,502 | ||||||
| 2,940,300 | USAGM HoldCo LLC, 2015 Term Loan, 4.750%, 7/28/2022(c) | 2,950,415 | ||||||
|
| |||||||
| 4,505,917 | ||||||||
|
| |||||||
| Leisure — 0.0% | ||||||||
| 310,000 | AMC Entertainment, Inc., New Term Loan B, 3.511%, 12/15/2023(c) | 312,867 | ||||||
|
| |||||||
See accompanying notes to financial statements.
39 |
Table of Contents
Portfolio of Investments – as of December 31, 2016
Loomis Sayles Strategic Alpha Fund – (continued)
| Principal Amount (‡) | Description | Value (†) | ||||||
| Media Entertainment — 0.3% | ||||||||
| $ | 1,511,213 | Camelot UK Holdco Ltd., Term Loan B, 4.750%, 10/03/2023(c) | $ | 1,527,896 | ||||
| 1,050,566 | CBS Radio, Inc., Term Loan B, 4.500%, 10/17/2023(c) | 1,059,758 | ||||||
| 1,092,857 | Donnelley Financial Solutions, Inc., Term Loan B, 5.000%, 9/30/2023(c) | 1,102,879 | ||||||
|
| |||||||
| 3,690,533 | ||||||||
|
| |||||||
| Midstream — 0.2% | ||||||||
| 1,002,817 | Energy Transfer Equity LP, 2015 Term Loan, 4.137%, 12/02/2019(c) | 1,007,209 | ||||||
| 1,598,385 | Energy Transfer Equity LP, New Term Loan, 3.387%, 12/02/2019(c) | 1,598,385 | ||||||
|
| |||||||
| 2,605,594 | ||||||||
|
| |||||||
| Natural Gas — 0.1% | ||||||||
| 955,402 | Southcross Energy Partners LP, 1st Lien Term Loan, 5.250%, 8/04/2021(c) | 749,991 | ||||||
|
| |||||||
| Other Utility — 0.3% | ||||||||
| 3,129,569 | PowerTeam Services LLC, 1st Lien Term Loan, 4.250%, 5/06/2020(c) | 3,125,657 | ||||||
|
| |||||||
| Packaging — 0.3% | ||||||||
| 3,075,000 | Flex Acquisition Company, Inc., Unsecured Bridge Loan, 8.000%, 12/06/2017(c) | 3,067,312 | ||||||
| 282,625 | Signode Industrial Group U.S., Inc., USD Term Loan B, 4.000%, 5/01/2021(c) | 284,745 | ||||||
|
| |||||||
| 3,352,057 | ||||||||
|
| |||||||
| Pharmaceuticals — 0.5% | ||||||||
| 5,430,000 | inVentiv Health, Inc., 2016 Term Loan B, 4.750%, 11/09/2023(c) | 5,474,580 | ||||||
|
| |||||||
| Property & Casualty Insurance — 0.1% | ||||||||
| 1,467,650 | Hyperion Insurance Group Ltd., 2015 Term Loan B, 5.500%, 4/29/2022(c) | 1,469,485 | ||||||
|
| |||||||
| Retailers — 0.8% | ||||||||
| 2,400,000 | Bass Pro Group LLC, Term Loan B, 5.970%, 12/16/2023(c) | 2,376,000 | ||||||
| 1,353,634 | Harbor Freight Tools USA, Inc., 2016 Term Loan B, 3.887%, 8/19/2023(c) | 1,371,678 | ||||||
| 1,173,660 | Men’s Wearhouse, Inc. (The), Term Loan B, 4.500%, 6/18/2021(c) | 1,172,193 | ||||||
| 2,827,822 | PetSmart, Inc., Term Loan B2, 4.000%, 3/11/2022(c) | 2,834,892 | ||||||
| 1,867,273 | Talbots, Inc. (The), 1st Lien Term Loan, 5.500%, 3/19/2020(c) | 1,812,189 | ||||||
|
| |||||||
| 9,566,952 | ||||||||
|
| |||||||
| Supermarkets — 0.3% | ||||||||
| 3,560,000 | Albertsons LLC, USD 2016 Term Loan B4, 8/22/2021(k) | 3,599,302 | ||||||
|
| |||||||
| Technology — 0.4% | ||||||||
| 857,850 | Cavium, Inc., Term Loan B, 3.750%, 8/16/2022(c) | 865,356 | ||||||
| 284,288 | NXP BV, Term Loan F, 3.270%, 12/07/2020(c) | 285,567 | ||||||
| 990,000 | Rackspace Hosting, Inc., 1st Lien Term Loan, 11/03/2023(k) | 1,001,959 | ||||||
| 2,130,531 | Western Digital Corp., USD 2016 Term Loan B1, 4.520%, 4/29/2023(c) | 2,163,149 | ||||||
|
| |||||||
| 4,316,031 | ||||||||
|
| |||||||
| Transportation Services — 0.2% | ||||||||
| 2,992,500 | Uber Technologies, Term Loan B, 5.000%, 7/13/2023(c) | 2,996,241 | ||||||
|
| |||||||
| Wireless — 0.3% | ||||||||
| 632,000 | GTT Communications, Inc., USD 2016 Term Loan B, 9/12/2023(k) | 640,690 | ||||||
| 2,965,000 | Lonestar Intermediate Super Holdings LLC, PIK Term Loan B, 10.000%, 8/31/2021(c) | 3,046,537 | ||||||
|
| |||||||
| 3,687,227 | ||||||||
|
| |||||||
See accompanying notes to financial statements.
| 40
Table of Contents
Portfolio of Investments – as of December 31, 2016
Loomis Sayles Strategic Alpha Fund – (continued)
| Principal Amount (‡) | Description | Value (†) | ||||||
| Wirelines — 0.4% | ||||||||
| $ | 1,160,000 | Consolidated Communications, Inc., Term Loan B2, 10/05/2023(k) | $ | 1,165,800 | ||||
| 3,478,050 | Integra Telecom, Inc., 2015 1st Lien Term Loan, 5.250%, 8/14/2020(c) | 3,484,137 | ||||||
|
| |||||||
| 4,649,937 | ||||||||
|
| |||||||
| Total Senior Loans (Identified Cost $88,183,118) | 89,139,336 | |||||||
|
| |||||||
| Loan Participations — 0.2% | ||||||||
| ABS Other — 0.2% | ||||||||
| 2,302,766 | Rise Ltd., Series 2014-1, Class A, 4.750%, 2/15/2039(c)(e)(g) (Identified Cost $2,320,036) | 2,256,710 | ||||||
|
| |||||||
| Shares | ||||||||
| Preferred Stocks — 0.9% | ||||||||
| Convertible Preferred Stocks — 0.6% | ||||||||
| Food & Beverage — 0.2% | ||||||||
| 25,620 | Bunge Ltd., 4.875% | 2,616,058 | ||||||
|
| |||||||
| Pharmaceuticals — 0.2% | ||||||||
| 521 | Allergan PLC, Series A, 5.500% | 397,242 | ||||||
| 2,057 | Teva Pharmaceutical Industries Ltd., 7.000% | 1,331,496 | ||||||
|
| |||||||
| 1,728,738 | ||||||||
|
| |||||||
| Technology — 0.2% | ||||||||
| 24,910 | Belden, Inc., 6.750% | 2,632,240 | ||||||
|
| |||||||
| Total Convertible Preferred Stocks (Identified Cost $7,080,603) | 6,977,036 | |||||||
|
| |||||||
| Non-Convertible Preferred Stock — 0.3% | ||||||||
| Cable Satellite — 0.3% | ||||||||
| 4,040,000 | NBCUniversal Enterprise, Inc., 5.250%, 144A(b) (Identified Cost $4,040,000) | 4,242,000 | ||||||
|
| |||||||
| Total Preferred Stocks (Identified Cost $11,120,603) | 11,219,036 | |||||||
|
| |||||||
| Common Stocks — 1.7% | ||||||||
| Energy Equipment & Services — 0.1% | ||||||||
| 35,206 | Halliburton Co. | 1,904,292 | ||||||
|
| |||||||
| Oil, Gas & Consumable Fuels — 1.4% | ||||||||
| 188,463 | OGX Petroleo e Gas S.A., Sponsored ADR | 116,847 | ||||||
| 50,446 | Pacific Exploration and Production Corp.(f) | 2,206,602 | ||||||
| 1,172,928 | Whiting Petroleum Corp.(f) | 14,098,589 | ||||||
|
| |||||||
| 16,422,038 | ||||||||
|
| |||||||
| Pharmaceuticals — 0.2% | ||||||||
| 38,880 | Bristol-Myers Squibb Co. | 2,272,147 | ||||||
|
| |||||||
| Total Common Stocks (Identified Cost $22,973,310) | 20,598,477 | |||||||
|
| |||||||
See accompanying notes to financial statements.
41 |
Table of Contents
Portfolio of Investments – as of December 31, 2016
Loomis Sayles Strategic Alpha Fund – (continued)
| Shares | Description | Value (†) | ||||||
| Other Investments — 0.7% | ||||||||
| Aircraft ABS — 0.7% | ||||||||
| 900 | ECAF I Blocker Ltd.(d)(e) (Identified Cost $9,000,000) | $ | 8,840,043 | |||||
|
| |||||||
| Units of Currency(††††) | ||||||||
| Purchased Options — 0.1% | ||||||||
| Over-the-Counter Options on Currency — 0.1% | ||||||||
| 41,652,000 | TRY Call, expiring January 20, 2017 at 3.4000(f)(l) | 2,499 | ||||||
| 39,990,000 | TWD Put, expiring January 17, 2017 at 31.7800(f)(m) | 870,942 | ||||||
|
| |||||||
| 873,441 | ||||||||
|
| |||||||
| Total Purchased Options (Identified Cost $1,622,400) | 873,441 | |||||||
|
| |||||||
| Principal Amount (‡) | ||||||||
| Short-Term Investments — 13.3% | ||||||||
| $ | 22,195,000(††) | Mexican Federal Treasury Certificates, 4.480%, 1/05/2017, (MXN)(b)(n) | 10,702,603 | |||||
| 189,022 | Repurchase Agreement with State Street Bank and Trust Company, dated 12/30/2016 at 0.000% to be repurchased at $189,022 on 1/03/2017 collateralized by $190,700 U.S. Treasury Note, 1.500% due 8/31/2018 valued at $192,848 including accrued interest (Note 2 of Notes to Financial Statements) | 189,022 | ||||||
| 53,915,596 | Tri-Party Repurchase Agreement with Fixed Income Clearing Corporation, dated 12/30/2016 at 0.030% to be repurchased at $53,915,776 on 1/03/2017 collateralized by $2,810,000 U.S. Treasury Note, 3.625% due 2/15/2020 valued at $ 3,027,025; $53,445,000 U.S. Treasury Note, 2.000% due 8/15/2025 valued at $51,972,002 including accrued interest (Note 2 of Notes to Financial Statements) | 53,915,596 | ||||||
| 35,700,000 | U.S. Treasury Bills, 0.318%, 1/05/2017(b)(n) | 35,699,286 | ||||||
| 5,400,000 | U.S. Treasury Bills, 0.381%, 1/12/2017(b)(n)(o) | 5,399,460 | ||||||
| 35,700,000 | U.S. Treasury Bills, 0.466%, 4/06/2017(b)(n) | 35,651,412 | ||||||
| 17,610,000 | U.S. Treasury Bills, 0.583%, 5/25/2017(b)(n) | 17,567,807 | ||||||
|
| |||||||
| Total Short-Term Investments (Identified Cost $160,047,307) | 159,125,186 | |||||||
|
| |||||||
| Total Investments — 98.3% (Identified Cost $1,196,862,113)(a) | 1,176,079,486 | |||||||
| Other assets less liabilities — 1.7% | 20,867,537 | |||||||
|
| |||||||
| Net Assets — 100.0% | $ | 1,196,947,023 | ||||||
|
| |||||||
| (‡) | Principal Amount stated in U.S. dollars unless otherwise noted. | |||||||
| (†) | See Note 2 of Notes to Financial Statements. | |||||||
| (††) | Amount shown represents units. One unit represents a principal amount of 100. | |||||||
| (†††) | Amount shown represents units. One unit represents a principal amount of 1,000. | |||||||
| (††††) | Options on currency are expressed as units of currency. | |||||||
See accompanying notes to financial statements.
| 42
Table of Contents
Portfolio of Investments – as of December 31, 2016
Loomis Sayles Strategic Alpha Fund – (continued)
| (a) | Federal Tax Information: | |||||||
| At December 31, 2016, the net unrealized depreciation on investments based on a cost of $1,197,195,311 for federal income tax purposes was as follows: | ||||||||
| Aggregate gross unrealized appreciation for all investments in which there is an excess of value over tax cost | $ | 26,072,731 | ||||||
| Aggregate gross unrealized depreciation for all investments in which there is an excess of tax cost over value | (47,188,556 | ) | ||||||
|
| |||||||
| Net unrealized depreciation | $ | (21,115,825) | ||||||
|
| |||||||
| (b) | Security (or a portion thereof) has been designated to cover the Fund’s obligations under open derivative contracts. | |||||||
| (c) | Variable rate security. Rate as of December 31, 2016 is disclosed. | |||||||
| (d) | Fair valued by the Fund’s adviser. At December 31, 2016, the value of these securities amounted to $18,528,225 or 1.5% of net assets. See Note 2 of Notes to Financial Statements. | |||||||
| (e) | Illiquid security. (Unaudited) | |||||||
| (f) | Non-income producing security. | |||||||
| (g) | Securities classified as fair valued pursuant to the Fund’s pricing policies and procedures. At December 31, 2016, the value of these securities amounted to $16,778,275 or 1.4% of net assets. See Note 2 of Notes to Financial Statements. | |||||||
| (h) | Security represents right to receive monthly interest payments on an underlying pool of mortgages. Principal shown is the outstanding par amount of the pool held as of the end of the period. | |||||||
| (i) | The issuer is in default with respect to interest and/or principal payments. Income is not being accrued. | |||||||
| (j) | Variable rate security. Rate shown represents the weighted average rate of underlying contracts at December 31, 2016. | |||||||
| (k) | Position is unsettled. Contract rate was not determined at December 31, 2016 and does not take effect until settlement date. Maturity date is not finalized until settlement date. | |||||||
| (l) | Counterparty is Deutsche Bank AG. | |||||||
| (m) | Counterparty is Bank of America, N.A. | |||||||
| (n) | Interest rate represents discount rate at time of purchase; not a coupon rate. | |||||||
| (o) | Security (or a portion thereof) has been pledged as collateral for open derivative contracts. | |||||||
| 144A | All or a portion of these securities are exempt from registration under Rule 144A of the Securities Act of 1933. These securities may be resold in transactions exempt from registration, normally to qualified institutional buyers. At December 31, 2016, the value of Rule 144A holdings amounted to $346,837,576 or 29.0% of net assets. | |||||||
| ABS | Asset-Backed Securities | |||||||
| ADR | An American Depositary Receipt is a certificate issued by a custodian bank representing the right to receive securities of the foreign issuer described. The values of ADRs may be significantly influenced by trading on exchanges not located in the United States. | |||||||
| EMTN | Euro Medium Term Note | |||||||
| GMTN | Global Medium Term Note | |||||||
| JIBAR | Johannesburg Interbank Agreed Rate | |||||||
| LIBOR | London Interbank Offered Rate | |||||||
| MTN | Medium Term Note | |||||||
| PIK | Payment-in-Kind | |||||||
| REITs | Real Estate Investment Trusts | |||||||
See accompanying notes to financial statements.
43 |
Table of Contents
Portfolio of Investments – as of December 31, 2016
Loomis Sayles Strategic Alpha Fund – (continued)
| PRIBOR | Prague Interbank Offered Rate | |||||||
| SAFEX | South African Futures Exchange | |||||||
| TIIE | Equilibrium Interbank Interest Rate (Tasa de Interes de Equilibrio) | |||||||
| ARS | Argentine Peso | |||||||
| BRL | Brazilian Real | |||||||
| COP | Colombian Peso | |||||||
| CZK | Czech Koruna | |||||||
| EUR | Euro | |||||||
| GBP | British Pound | |||||||
| MXN | Mexican Peso | |||||||
| PLN | Polish Zloty | |||||||
| TRY | Turkish Lira | |||||||
| TWD | New Taiwan Dollar | |||||||
| USD | U.S. Dollar | |||||||
| ZAR | South African Rand |
At December 31, 2016, the Fund had the following open bilateral credit default swap agreements:
| Buy Protection | ||||||||||||||||||||||||
| Counterparty | Reference Obligation | (Pay)/ Receive Fixed Rate | Expiration Date | Notional Value(‡) | Unamortized Up Front Premium Paid/ (Received) | Market Value | Unrealized Appreciation (Depreciation) | |||||||||||||||||
| Bank of America, N.A. | Republic of Turkey | (1.00%) | 12/20/2021 | 12,000,000 | $ | 921,372 | $ | 939,786 | $ | 18,414 | ||||||||||||||
| Barclays Bank PLC | Enel SpA | (1.00%) | 12/20/2021 | 5,500,000 | EUR | 30,951 | (20,481 | ) | (51,432 | ) | ||||||||||||||
| Barclays Bank PLC | Markit iTraxx Asia ex-Japan Index Series 25, 5-Year | (1.00%) | 6/20/2021 | 4,370,000 | 76,230 | 6,968 | (69,262 | ) | ||||||||||||||||
| Deutsche Bank AG | Republic of China | (1.00%) | 6/20/2021 | 5,900,000 | 27,412 | 20,049 | (7,363 | ) | ||||||||||||||||
| JPMorgan Chase Bank, N.A. | Enel SpA | (1.00%) | 12/20/2021 | 5,500,000 | EUR | 33,733 | (20,481 | ) | (54,214 | ) | ||||||||||||||
| JPMorgan Chase Bank, N.A. | Intesa Sanpaolo SpA | (1.00%) | 12/20/2021 | 5,500,000 | EUR | 189,491 | 110,362 | (79,129 | ) | |||||||||||||||
| JPMorgan Chase Bank, N.A. | Intesa Sanpaolo SpA | (1.00%) | 12/20/2021 | 5,500,000 | EUR | 205,345 | 110,362 | (94,983 | ) | |||||||||||||||
| Morgan Stanley Capital Services, Inc. | Markit iTraxx Asia ex-Japan Index Series 25, 5-Year | (1.00%) | 6/20/2021 | 8,910,000 | 160,874 | 14,207 | (146,667 | ) | ||||||||||||||||
|
|
|
| |||||||||||||||||||||
| Total | $ | 1,160,772 | $ | (484,636 | ) | |||||||||||||||||||
|
|
|
| |||||||||||||||||||||
See accompanying notes to financial statements.
| 44
Table of Contents
Portfolio of Investments – as of December 31, 2016
Loomis Sayles Strategic Alpha Fund – (continued)
At December 31, 2016, the Fund had the following open centrally cleared credit default swap agreements:
| Buy Protection | ||||||||||||||||
| Reference Obligation | (Pay)/ Receive Fixed Rate | Expiration Date | Notional Value(‡) | Market Value | Unrealized Appreciation (Depreciation) | |||||||||||
| CDX.HY Series 27, 5-Year | (5.00%) | 12/20/2021 | 35,600,000 | $ | (2,203,925 | ) | $ | (850,080 | ) | |||||||
| CDX.HY Series 27, 5-Year | (5.00%) | 12/20/2021 | 12,000,000 | (742,896 | ) | (286,544 | ) | |||||||||
| CDX.HY Series 27, 5-Year | (5.00%) | 12/20/2021 | 11,750,000 | (727,419 | ) | (280,574 | ) | |||||||||
|
|
|
| |||||||||||||
| Total | $ | (3,674,240 | ) | $ | (1,417,198 | ) | ||||||||||
|
|
|
| |||||||||||||
At December 31, 2016, the Fund had the following open centrally cleared interest rate swap agreements:
| Notional Value | Currency | Expiration Date | Fund Pays | Fund Receives | Market Value1 | |||||||||||||||||
| 76,950,000 | GBP | 7/21/2018 | 6-month LIBOR | 0.526% | $ | (82,251 | ) | |||||||||||||||
| 76,950,000 | GBP | 7/22/2018 | 6-month LIBOR | 0.499% | (121,655 | ) | ||||||||||||||||
| 19,195,200 | USD | 7/18/2026 | 1.410% | 3-month LIBOR | 1,548,618 | |||||||||||||||||
| 25,650,000 | GBP | 7/21/2021 | 0.621% | 6-month LIBOR | 293,889 | |||||||||||||||||
| 25,650,000 | GBP | 7/22/2021 | 0.594% | 6-month LIBOR | 332,029 | |||||||||||||||||
|
| |||||||||||||||||||||
| Total | $ | 1,970,630 | ||||||||||||||||||||
|
| |||||||||||||||||||||
| At December 31, 2016, the Fund had the following open bilateral interest rate swap agreements: | ||||||||||||||||||||||
| Counterparty | Notional Value | Currency | Expiration Date | Fund Pays | Fund Receives | Market Value1 | ||||||||||||||||
Bank of America, N.A. | 36,000,000 | ZAR | 5/8/2025 | 7.950% | 3-month SAFEX-JIBAR | $ | 40,717 | |||||||||||||||
Bank of America, N.A. | 330,558,000 | MXN | 7/3/2026 | 28-day TIIE | 6.130% | (1,925,781 | ) | |||||||||||||||
Bank of America, N.A. | 2,874,300,000 | CZK | 8/3/2018 | 6-month PRIBOR | 0.300% | 102,541 | ||||||||||||||||
Bank of America, N.A. | 862,000,000 | CZK | 8/3/2021 | 0.350% | 6-month PRIBOR | 178,643 | ||||||||||||||||
Bank of America, N.A. | 344,900,000 | CZK | 8/4/2018 | 6-month PRIBOR | 0.305% | 13,327 | ||||||||||||||||
Bank of America, N.A. | 143,600,000 | CZK | 8/4/2021 | 0.355% | 6-month PRIBOR | 28,597 | ||||||||||||||||
Bank of America, N.A. | 1,741,000,000 | CZK | 7/29/2018 | 6-month PRIBOR | 0.320% | 83,705 | ||||||||||||||||
Bank of America, N.A. | 698,000,000 | CZK | 7/29/2021 | 0.370% | 6-month PRIBOR | 117,013 | ||||||||||||||||
Barclays Bank PLC | 291,000,000 | ZAR | 5/5/2025 | 7.950% | 3-month SAFEX-JIBAR | 327,908 | ||||||||||||||||
Deutsche Bank AG | 670,000,000 | CZK | 7/29/2021 | 0.375% | 6-month PRIBOR | 106,298 | ||||||||||||||||
Deutsche Bank AG | 104,000,000 | MXN | 7/3/2026 | 28-day TIIE | 6.135% | (604,184 | ) | |||||||||||||||
Deutsche Bank AG | 1,710,000,000 | CZK | 7/29/2018 | 6-month PRIBOR | 0.325% | 87,537 | ||||||||||||||||
JPMorgan Chase Bank, N.A. | 57,120,000 | ZAR | 4/17/2025 | 7.720% | 3-month SAFEX-JIBAR | 120,759 | ||||||||||||||||
|
| |||||||||||||||||||||
Total | $ | (1,322,920 | ) | |||||||||||||||||||
|
| |||||||||||||||||||||
| (‡) | Notional value stated in U.S. dollars unless otherwise noted. |
| 1 | There are no up front payments on interest rate swap agreements; therefore unrealized appreciation (depreciation) is equal to market value. |
See accompanying notes to financial statements.
45 |
Table of Contents
Portfolio of Investments – as of December 31, 2016
Loomis Sayles Strategic Alpha Fund – (continued)
At December 31, 2016, the Fund had the following open forward foreign currency contracts:
| Contract to Buy/Sell | Delivery Date | Currency | Units of Currency | Notional Value | Unrealized Appreciation (Depreciation) | |||||||||||||
| Buy1 | 1/05/2017 | Brazilian Real | 37,900,000 | $ | 11,641,224 | $ | 180,686 | |||||||||||
| Sell1 | 1/05/2017 | Brazilian Real | 37,900,000 | 11,641,224 | (378,222 | ) | ||||||||||||
| Sell2 | 1/17/2017 | Brazilian Real | 23,300,000 | 7,131,992 | (263,901 | ) | ||||||||||||
| Sell1 | 7/06/2017 | Brazilian Real | 37,900,000 | 11,101,026 | (164,653 | ) | ||||||||||||
| Sell3 | 1/12/2017 | British Pound | 5,095,000 | 6,280,905 | 138,795 | |||||||||||||
| Sell1 | 2/09/2017 | British Pound | 1,225,000 | 1,511,108 | 9,191 | |||||||||||||
| Sell1 | 1/27/2017 | Canadian Dollar | 39,200,000 | 29,204,830 | (274,001 | ) | ||||||||||||
| Sell1 | 1/30/2017 | Canadian Dollar | 31,300,000 | 23,320,009 | (122,624 | ) | ||||||||||||
| Sell4 | 1/27/2017 | Colombian Peso | 18,400,000,000 | 6,102,411 | (351,063 | ) | ||||||||||||
| Sell2 | 1/10/2017 | Euro | 15,950,000 | 16,797,293 | 306,530 | |||||||||||||
| Sell3 | 1/17/2017 | Euro | 2,000,000 | 2,106,950 | 28,670 | |||||||||||||
| Sell2 | 1/30/2017 | Euro | 32,550,000 | 34,309,971 | (190,735 | ) | ||||||||||||
| Buy2 | 1/10/2017 | Hungarian Forint | 4,962,600,000 | 16,896,504 | (16,741 | ) | ||||||||||||
| Sell4 | 2/23/2017 | Indonesian Rupiah | 196,800,000,000 | 14,499,431 | (243,727 | ) | ||||||||||||
| Buy1 | 1/30/2017 | Mexican Peso | 445,000,000 | 21,388,261 | 74,163 | |||||||||||||
| Sell1 | 1/09/2017 | Mexican Peso | 219,200,000 | 10,566,252 | 776,665 | |||||||||||||
| Sell2 | 1/17/2017 | Mexican Peso | 92,400,000 | 4,449,006 | 80,406 | |||||||||||||
| Sell1 | 1/27/2017 | Mexican Peso | 11,230,986 | 540,023 | (552 | ) | ||||||||||||
| Sell5 | 1/17/2017 | New Zealand Dollar | 28,200,000 | 19,582,266 | 591,027 | |||||||||||||
| Buy1 | 1/27/2017 | Norwegian Krone | 147,430,000 | 17,076,862 | 195,804 | |||||||||||||
| Buy1 | 1/30/2017 | Norwegian Krone | 253,000,000 | 29,305,596 | 233,156 | |||||||||||||
| Sell3 | 4/28/2017 | Polish Zloty | 45,000,000 | 10,733,819 | 947,666 | |||||||||||||
| Sell2 | 1/17/2017 | South Korean Won | 25,000,000,000 | 20,698,791 | 645,015 | |||||||||||||
| Buy1 | 1/17/2017 | Swedish Krona | 161,100,000 | 17,699,818 | 139,115 | |||||||||||||
| Buy2 | 9/19/2017 | Yuan Renminbi | 235,000,000 | 33,575,400 | 245,848 | |||||||||||||
| Sell2 | 9/19/2017 | Yuan Renminbi | 235,000,000 | 33,575,400 | 653,717 | |||||||||||||
|
| |||||||||||||||||
| Total | $ | 3,240,235 | ||||||||||||||||
|
| |||||||||||||||||
1 Counterparty is Morgan Stanley Capital Services, Inc.
2 Counterparty is Bank of America, N.A.
3 Counterparty is Deutsche Bank AG
4 Counterparty is Credit Suisse International
5 Counterparty is Commonwealth Bank of Australia Sydney
At December 31, 2016, open long futures contracts were as follows:
| Financial Futures | Expiration Date | Contracts | Notional Value | Unrealized Appreciation (Depreciation) | ||||||||||||
CBOE SPX Volatility Index | 2/15/2017 | 166 | $ | 2,751,450 | $ | (168,848 | ) | |||||||||
|
| |||||||||||||||
See accompanying notes to financial statements.
| 46
Table of Contents
Portfolio of Investments – as of December 31, 2016
Loomis Sayles Strategic Alpha Fund – (continued)
At December 31, 2016, open short futures contracts were as follows:
| Financial Futures | Expiration Date | Contracts | Notional Value | Unrealized Appreciation (Depreciation) | ||||||||||||
Ultra Long U.S. Treasury Bond | 3/22/2017 | 76 | $ | 12,179,000 | $ | 168,932 | ||||||||||
Ultra 10 Year U.S. Treasury Note | 3/22/2017 | 236 | 31,638,750 | 226,727 | ||||||||||||
5 Year U.S. Treasury Note | 3/31/2017 | 578 | 68,009,828 | (561,024 | ) | |||||||||||
10 Year U.S. Treasury Note | 3/22/2017 | 720 | 89,482,500 | 494,171 | ||||||||||||
|
| |||||||||||||||
Total |
| $ | 328,806 | |||||||||||||
|
| |||||||||||||||
Industry Summary at December 31, 2016
ABS Home Equity | 12.6 | % | ||
ABS Credit Card | 7.3 | |||
ABS Car Loan | 6.0 | |||
Independent Energy | 5.4 | |||
Non-Agency Commercial Mortgage-Backed Securities | 4.8 | |||
Midstream | 4.7 | |||
ABS Other | 4.0 | |||
Technology | 3.8 | |||
Banking | 3.4 | |||
Automotive | 2.6 | |||
Pharmaceuticals | 2.5 | |||
Treasuries | 2.3 | |||
Other Investments, less than 2% each | 25.6 | |||
Short-Term Investments | 13.3 | |||
|
| |||
Total Investments | 98.3 | |||
Other assets less liabilities (including swap agreements, forward foreign currency and futures contracts) | 1.7 | |||
|
| |||
Net Assets | 100.0 | % | ||
|
|
See accompanying notes to financial statements.
47 |
Table of Contents
This Page Intentionally Left Blank
| 48
Table of Contents
Statements of Assets and Liabilities
December 31, 2016
| Gateway Equity Call Premium Fund | Loomis Sayles Strategic Alpha Fund | |||||||
ASSETS |
| |||||||
Investments at cost | $ | 61,514,111 | $ | 1,196,862,113 | ||||
Net unrealized appreciation (depreciation) | 10,493,972 | (20,782,627 | ) | |||||
|
|
|
| |||||
Investments at value | 72,008,083 | 1,176,079,486 | ||||||
Cash | — | 1,078,123 | ||||||
Due from brokers (Note 2) | — | 11,725,674 | ||||||
Foreign currency at value (identified cost $0 and $4,059,048, respectively) | — | 3,728,098 | ||||||
Receivable for Fund shares sold | 230,017 | 5,072,114 | ||||||
Receivable for securities sold | — | 83,502 | ||||||
Collateral received for open forward foreign currency contracts, options or swap agreements (Notes 2 and 4) | — | 4,099,630 | ||||||
Dividends and interest receivable | 92,056 | 6,262,980 | ||||||
Unrealized appreciation on bilateral swap agreements (Note 2) | — | 1,225,459 | ||||||
Unrealized appreciation on forward foreign currency contracts (Note 2) | — | 5,246,454 | ||||||
Tax reclaims receivable | — | 9,277 | ||||||
Unamortized upfront premiums paid on bilateral swap agreements (Note 2) | — | 1,645,408 | ||||||
Fees receivable on swap agreements (Note 2) | — | 822,207 | ||||||
Prepaid expenses (Note 7) | 138 | 2,778 | ||||||
|
|
|
| |||||
TOTAL ASSETS | 72,330,294 | 1,217,081,190 | ||||||
|
|
|
| |||||
LIABILITIES |
| |||||||
Options written, at value (premiums received $1,217,286 and $0, respectively) (Note 2) | 1,358,200 | — | ||||||
Payable for securities purchased | — | 7,842,203 | ||||||
Unrealized depreciation on bilateral swap agreements (Note 2) | — | 3,033,015 | ||||||
Payable for Fund shares redeemed | 234,201 | 606,086 | ||||||
Unrealized depreciation on forward foreign currency contracts (Note 2) | — | 2,006,219 | ||||||
Payable for variation margin on centrally cleared swap agreements (Note 2) | — | 131,251 | ||||||
Due to brokers (Note 2) | — | 4,099,630 | ||||||
Payable for variation margin on futures contracts (Note 2) | — | 520,090 | ||||||
Fees payable on swap agreements (Note 2) | — | 919,264 | ||||||
Management fees payable (Note 6) | 48,504 | 701,369 | ||||||
Deferred Trustees’ fees (Note 6) | 22,450 | 92,209 | ||||||
Administrative fees payable (Note 6) | 2,676 | 45,163 | ||||||
Payable to distributor (Note 6d) | 393 | 9,984 | ||||||
Other accounts payable and accrued expenses | 54,182 | 127,684 | ||||||
|
|
|
| |||||
TOTAL LIABILITIES | 1,720,606 | 20,134,167 | ||||||
|
|
|
| |||||
NET ASSETS | $ | 70,609,688 | $ | 1,196,947,023 | ||||
|
|
|
| |||||
NET ASSETS CONSIST OF: |
| |||||||
Paid-in capital | $ | 65,426,731 | $ | 1,273,001,223 | ||||
Distributions in excess of net investment income | (21,052 | ) | (1,669,570 | ) | ||||
Accumulated net realized loss on investments, futures contracts, options/swaptions written, swap agreements and foreign currency transactions | (5,149,049 | ) | (55,020,455 | ) | ||||
Net unrealized appreciation (depreciation) on investments, futures contracts, options/swaptions written, swap agreements and foreign currency translations | 10,353,058 | (19,364,175 | ) | |||||
|
|
|
| |||||
NET ASSETS | $ | 70,609,688 | $ | 1,196,947,023 | ||||
|
|
|
| |||||
See accompanying notes to financial statements.
49 |
Table of Contents
Statements of Assets and Liabilities (continued)
December 31, 2016
| Gateway Equity Call Premium Fund | Loomis Sayles Strategic Alpha Fund | |||||||
COMPUTATION OF NET ASSET VALUE AND OFFERING PRICE: | ||||||||
Class A shares: |
| |||||||
Net assets | $ | 6,507,245 | $ | 67,746,118 | ||||
|
|
|
| |||||
Shares of beneficial interest | 597,648 | 6,871,861 | ||||||
|
|
|
| |||||
Net asset value and redemption price per share | $ | 10.89 | $ | 9.86 | ||||
|
|
|
| |||||
Offering price per share (100/[100-maximum sales charge] of net asset value) (Note 1) | $ | 11.55 | $ | 10.30 | ||||
|
|
|
| |||||
Class C shares: (redemption price per share is equal to net asset value less any applicable contingent deferred sales charge) (Note 1) | ||||||||
Net assets | $ | 524,292 | $ | 45,674,260 | ||||
|
|
|
| |||||
Shares of beneficial interest | 48,250 | 4,649,398 | ||||||
|
|
|
| |||||
Net asset value and offering price per share | $ | 10.87 | $ | 9.82 | ||||
|
|
|
| |||||
Class Y shares: |
| |||||||
Net assets | $ | 63,578,151 | $ | 1,083,526,645 | ||||
|
|
|
| |||||
Shares of beneficial interest | 5,836,633 | 110,039,832 | ||||||
|
|
|
| |||||
Net asset value, offering and redemption price per share | $ | 10.89 | $ | 9.85 | ||||
|
|
|
| |||||
See accompanying notes to financial statements.
| 50
Table of Contents
Statements of Operations
For the Year Ended December 31, 2016
| Gateway Equity Call Premium Fund | Loomis Sayles Strategic Alpha Fund | |||||||
INVESTMENT INCOME |
| |||||||
Interest | $ | 640 | $ | 49,631,562 | ||||
Dividends | 1,434,866 | 1,869,517 | ||||||
Less net foreign taxes withheld | (388 | ) | (15,281 | ) | ||||
|
|
|
| |||||
| 1,435,118 | 51,485,798 | |||||||
|
|
|
| |||||
Expenses |
| |||||||
Management fees (Note 6) | 420,410 | 8,505,759 | ||||||
Service and distribution fees (Note 6) | 15,770 | 713,430 | ||||||
Administrative fees (Note 6) | 28,710 | 539,257 | ||||||
Trustees’ fees and expenses (Note 6) | 20,524 | 48,169 | ||||||
Transfer agent fees and expenses (Note 6) | 35,691 | 839,782 | ||||||
Audit and tax services fees | 50,094 | 82,509 | ||||||
Custodian fees and expenses | 54,542 | 145,457 | ||||||
Legal fees | 1,081 | 17,358 | ||||||
Registration fees | 59,523 | 70,668 | ||||||
Shareholder reporting expenses | 3,048 | 33,650 | ||||||
Miscellaneous expenses (Note 7) | 10,792 | 57,242 | ||||||
|
|
|
| |||||
Total expenses | 700,185 | 11,053,281 | ||||||
Less waiver and/or expense reimbursement (Note 6) | (69,968 | ) | — | |||||
|
|
|
| |||||
Net expenses | 630,217 | 11,053,281 | ||||||
|
|
|
| |||||
Net investment income | 804,901 | 40,432,517 | ||||||
|
|
|
| |||||
NET REALIZED AND UNREALIZED GAIN (LOSS) ON INVESTMENTS, FUTURES CONTRACTS, OPTIONS/SWAPTIONS WRITTEN, SWAP AGREEMENTS AND FOREIGN CURRENCY TRANSACTIONS | ||||||||
Net realized gain (loss) on: |
| |||||||
Investments | (1,708,951 | ) | 188,180 | |||||
Futures contracts | — | (4,680,774 | ) | |||||
Options/swaptions written | (1,679,523 | ) | (78,106 | ) | ||||
Swap agreements | — | (1,940,585 | ) | |||||
Foreign currency transactions | — | (14,117,611 | ) | |||||
Net change in unrealized appreciation (depreciation) on: |
| |||||||
Investments | 8,823,220 | 55,962,458 | ||||||
Futures contracts | — | 1,359,156 | ||||||
Options/swaptions written | (775,949 | ) | (1,204,936 | ) | ||||
Swap agreements | — | (3,624,488 | ) | |||||
Foreign currency translations | — | 4,331,047 | ||||||
|
|
|
| |||||
Net realized and unrealized gain on investments, futures contracts, options/swaptions written, swap agreements and foreign currency transactions | 4,658,797 | 36,194,341 | ||||||
|
|
|
| |||||
NET INCREASE IN NET ASSETS RESULTING FROM OPERATIONS | $ | 5,463,698 | $ | 76,626,858 | ||||
|
|
|
| |||||
See accompanying notes to financial statements.
51 |
Table of Contents
Statements of Changes in Net Assets
| Gateway Equity Call Premium Fund | Loomis Sayles Strategic Alpha Fund | |||||||||||||||
| Year Ended December 31, 2016 | Year Ended December 31, 2015 | Year Ended December 31, 2016 | Year Ended December 31, 2015 | |||||||||||||
FROM OPERATIONS: | ||||||||||||||||
Net investment income | $ | 804,901 | $ | 565,577 | $ | 40,432,517 | $ | 40,768,224 | ||||||||
Net realized gain (loss) on investments, futures contracts, options/swaptions written, swap agreements and foreign currency transactions | (3,388,474 | ) | (1,305,010 | ) | (20,628,896 | ) | 9,367,111 | |||||||||
Net change in unrealized appreciation (depreciation) on investments, futures contracts, options/swaptions written, swap agreements and foreign currency translations | 8,047,271 | 1,812,287 | 56,823,237 | (73,340,507 | ) | |||||||||||
|
|
|
|
|
|
|
| |||||||||
Net increase (decrease) in net assets resulting from operations | 5,463,698 | 1,072,854 | 76,626,858 | (23,205,172 | ) | |||||||||||
|
|
|
|
|
|
|
| |||||||||
FROM DISTRIBUTIONS TO SHAREHOLDERS: | ||||||||||||||||
Net investment income | ||||||||||||||||
Class A | (57,801 | ) | (39,013 | ) | (1,492,404 | ) | (4,059,682 | ) | ||||||||
Class C | (1,192 | ) | (187 | ) | (703,920 | ) | (1,842,482 | ) | ||||||||
Class Y | (719,110 | ) | (520,001 | ) | (25,810,102 | ) | (47,419,979 | ) | ||||||||
|
|
|
|
|
|
|
| |||||||||
Total distributions | (778,103 | ) | (559,201 | ) | (28,006,426 | ) | (53,322,143 | ) | ||||||||
|
|
|
|
|
|
|
| |||||||||
NET INCREASE (DECREASE) IN NET ASSETS FROM CAPITAL SHARE TRANSACTIONS (NOTE 10) | 11,698,686 | 32,799,930 | (213,904,671 | ) | 74,883,671 | |||||||||||
|
|
|
|
|
|
|
| |||||||||
Net increase (decrease) in net assets | 16,384,281 | 33,313,583 | (165,284,239 | ) | (1,643,644 | ) | ||||||||||
NET ASSETS | ||||||||||||||||
Beginning of the year | 54,225,407 | 20,911,824 | 1,362,231,262 | 1,363,874,906 | ||||||||||||
|
|
|
|
|
|
|
| |||||||||
End of the year | $ | 70,609,688 | $ | 54,225,407 | $ | 1,196,947,023 | $ | 1,362,231,262 | ||||||||
|
|
|
|
|
|
|
| |||||||||
UNDISTRIBUTED (DISTRIBUTIONS IN EXCESS OF) NET INVESTMENT INCOME | $ | (21,052 | ) | $ | (7,362 | ) | $ | (1,669,570 | ) | $ | 517,945 | |||||
|
|
|
|
|
|
|
| |||||||||
See accompanying notes to financial statements.
| 52
Table of Contents
Financial Highlights
For a share outstanding throughout each period.
| Gateway Equity Call Premium Fund—Class A | ||||||||||||
| Year Ended December 31, 2016 | Year Ended December 31, 2015 | Period Ended December 31, 2014* | ||||||||||
Net asset value, beginning of the period | $ | 10.22 | $ | 9.96 | $ | 10.00 | ||||||
|
|
|
|
|
| |||||||
INCOME (LOSS) FROM INVESTMENT OPERATIONS: |
| |||||||||||
Net investment income(a) | 0.11 | 0.15 | (b) | 0.02 | ||||||||
Net realized and unrealized gain (loss) | 0.66 | 0.24 | (0.02 | ) | ||||||||
|
|
|
|
|
| |||||||
Total from Investment Operations | 0.77 | 0.39 | 0.00 | (c) | ||||||||
|
|
|
|
|
| |||||||
LESS DISTRIBUTIONS FROM: |
| |||||||||||
Net investment income | (0.10 | ) | (0.13 | ) | (0.04 | ) | ||||||
|
|
|
|
|
| |||||||
Net asset value, end of the period | $ | 10.89 | $ | 10.22 | $ | 9.96 | ||||||
|
|
|
|
|
| |||||||
Total return(d)(e) | 7.58 | % | 3.90 | % | 0.00 | %(f) | ||||||
RATIOS TO AVERAGE NET ASSETS: |
| |||||||||||
Net assets, end of the period (000’s) | $ | 6,507 | $ | 3,855 | $ | 96 | ||||||
Net expenses(g) | 1.20 | % | 1.20 | % | 1.20 | %(h) | ||||||
Gross expenses | 1.31 | % | 1.70 | % | 3.69 | %(h) | ||||||
Net investment income | 1.02 | % | 1.47 | %(b) | 0.84 | %(h) | ||||||
Portfolio turnover rate | 24 | % | 38 | % | 7 | % | ||||||
| * | From commencement of operations on September 30, 2014 through December 31, 2014. |
| (a) | Per share net investment income has been calculated using the average shares outstanding during the period. |
| (b) | Includes a non-recurring dividend. Without this dividend, net investment income per share would have been $0.10 and the ratio of net investment income to average net assets would have been 0.98%. |
| (c) | Amount rounds to less than $0.01 per share. |
| (d) | A sales charge for Class A shares is not reflected in total return calculations. |
| (e) | Had certain expenses not been waived/reimbursed during the period, total returns would have been lower. |
| (f) | Periods less than one year are not annualized. |
| (g) | The investment adviser agreed to waive its fees and/or reimburse a portion of the Fund’s expenses during the period. Without this waiver/reimbursement, expenses would have been higher. |
| (h) | Computed on an annualized basis for periods less than one year. |
See accompanying notes to financial statements.
53 |
Table of Contents
Financial Highlights (continued)
For a share outstanding throughout each period.
| Gateway Equity Call Premium Fund—Class C | ||||||||||||
| Year Ended December 31, 2016 | Year Ended December 31, 2015 | Period Ended December 31, 2014* | ||||||||||
Net asset value, beginning of the period | $ | 10.22 | $ | 9.97 | $ | 10.00 | ||||||
|
|
|
|
|
| |||||||
INCOME (LOSS) FROM INVESTMENT OPERATIONS: |
| |||||||||||
Net investment income(a) | 0.02 | 0.09 | (b) | 0.00 | (c) | |||||||
Net realized and unrealized gain (loss) | 0.68 | 0.22 | (0.01 | ) | ||||||||
|
|
|
|
|
| |||||||
Total from Investment Operations | 0.70 | 0.31 | (0.01 | ) | ||||||||
|
|
|
|
|
| |||||||
LESS DISTRIBUTIONS FROM: |
| |||||||||||
Net investment income | (0.05 | ) | (0.06 | ) | (0.02 | ) | ||||||
|
|
|
|
|
| |||||||
Net asset value, end of the period | $ | 10.87 | $ | 10.22 | $ | 9.97 | ||||||
|
|
|
|
|
| |||||||
Total return(d)(e) | 6.85 | % | 3.07 | % | (0.12 | )%(f) | ||||||
RATIOS TO AVERAGE NET ASSETS: |
| |||||||||||
Net assets, end of the period (000’s) | $ | 524 | $ | 37 | $ | 1 | ||||||
Net expenses(g) | 1.95 | % | 1.95 | % | 1.95 | %(h) | ||||||
Gross expenses | 1.98 | % | 2.40 | % | 4.37 | %(h) | ||||||
Net investment income | 0.23 | % | 0.85 | %(b) | 0.01 | %(h) | ||||||
Portfolio turnover rate | 24 | % | 38 | % | 7 | % | ||||||
| * | From commencement of operations on September 30, 2014 through December 31, 2014. |
| (a) | Per share net investment income has been calculated using the average shares outstanding during the period. |
| (b) | Includes a non-recurring dividend. Without this dividend, net investment income per share would have been $0.07 and the ratio of net investment income to average net assets would have been 0.72%. |
| (c) | Amount rounds to less than $0.01 per share. |
| (d) | A contingent deferred sales charge for Class C shares is not reflected in total return calculations. |
| (e) | Had certain expenses not been waived/reimbursed during the period, total returns would have been lower. |
| (f) | Periods less than one year are not annualized. |
| (g) | The investment adviser agreed to waive its fees and/or reimburse a portion of the Fund’s expenses during the period. Without this waiver/reimbursement, expenses would have been higher. |
| (h) | Computed on an annualized basis for periods less than one year. |
See accompanying notes to financial statements.
| 54
Table of Contents
Financial Highlights (continued)
For a share outstanding throughout each period.
| Gateway Equity Call Premium Fund—Class Y | ||||||||||||
| Year Ended December 31, 2016 | Year Ended December 31, 2015 | Period Ended December 31, 2014* | ||||||||||
Net asset value, beginning of the period | $ | 10.22 | $ | 9.97 | $ | 10.00 | ||||||
|
|
|
|
|
| |||||||
INCOME (LOSS) FROM INVESTMENT OPERATIONS: |
| |||||||||||
Net investment income(a) | 0.13 | 0.16 | (b) | 0.02 | ||||||||
Net realized and unrealized gain (loss) | 0.67 | 0.24 | (0.01 | ) | ||||||||
|
|
|
|
|
| |||||||
Total from Investment Operations | 0.80 | 0.40 | 0.01 | |||||||||
|
|
|
|
|
| |||||||
LESS DISTRIBUTIONS FROM: |
| |||||||||||
Net investment income | (0.13 | ) | (0.15 | ) | (0.04 | ) | ||||||
|
|
|
|
|
| |||||||
Net asset value, end of the period | $ | 10.89 | $ | 10.22 | $ | 9.97 | ||||||
|
|
|
|
|
| |||||||
Total return(c) | 7.83 | % | 4.03 | % | 0.13 | %(d) | ||||||
RATIOS TO AVERAGE NET ASSETS: |
| |||||||||||
Net assets, end of the period (000’s) | $ | 63,578 | $ | 50,334 | $ | 20,815 | ||||||
Net expenses(e) | 0.95 | % | 0.95 | % | 0.95 | %(f) | ||||||
Gross expenses | 1.06 | % | 1.45 | % | 3.54 | %(f) | ||||||
Net investment income | 1.27 | % | 1.59 | %(b) | 0.99 | %(f) | ||||||
Portfolio turnover rate | 24 | % | 38 | % | 7 | % | ||||||
| * | From commencement of operations on September 30, 2014 through December 31, 2014. |
| (a) | Per share net investment income has been calculated using the average shares outstanding during the period. |
| (b) | Includes a non-recurring dividend. Without this dividend, net investment income per share would have been $0.12 and the ratio of net investment income to average net assets would have been 1.20%. |
| (c) | Had certain expenses not been waived/reimbursed during the period, total returns would have been lower. |
| (d) | Periods less than one year are not annualized. |
| (e) | The investment adviser agreed to waive its fees and/or reimburse a portion of the Fund’s expenses during the period. Without this waiver/reimbursement, expenses would have been higher. |
| (f) | Computed on an annualized basis for periods less than one year. |
See accompanying notes to financial statements.
55 |
Table of Contents
Financial Highlights (continued)
For a share outstanding throughout each period.
| Loomis Sayles Strategic Alpha Fund—Class A | ||||||||||||||||||||
| Year Ended December 31, 2016 | Year Ended December 31, 2015 | Year Ended December 31, 2014 | Year Ended December 31, 2013 | Year Ended December 31, 2012 | ||||||||||||||||
Net asset value, beginning of the period | $ | 9.45 | $ | 9.96 | $ | 10.06 | $ | 10.20 | $ | 9.34 | ||||||||||
|
|
|
|
|
|
|
|
|
| |||||||||||
INCOME (LOSS) FROM INVESTMENT OPERATIONS: | ||||||||||||||||||||
Net investment income(a) | 0.30 | 0.26 | 0.29 | (b) | 0.37 | 0.37 | ||||||||||||||
Net realized and unrealized gain (loss) | 0.31 | (0.42 | ) | (0.07 | ) | (0.28 | ) | 0.77 | ||||||||||||
|
|
|
|
|
|
|
|
|
| |||||||||||
Total from Investment Operations | 0.61 | (0.16 | ) | 0.22 | 0.09 | 1.14 | ||||||||||||||
|
|
|
|
|
|
|
|
|
| |||||||||||
LESS DISTRIBUTIONS FROM: | ||||||||||||||||||||
Net investment income | (0.20 | ) | (0.35 | ) | (0.32 | ) | (0.23 | ) | (0.28 | ) | ||||||||||
|
|
|
|
|
|
|
|
|
| |||||||||||
Net asset value, end of the period | $ | 9.86 | $ | 9.45 | $ | 9.96 | $ | 10.06 | $ | 10.20 | ||||||||||
|
|
|
|
|
|
|
|
|
| |||||||||||
Total return(c) | 6.57 | % | (1.68 | )% | 2.24 | %(b) | 0.96 | % | 12.24 | % | ||||||||||
RATIOS TO AVERAGE NET ASSETS: | ||||||||||||||||||||
Net assets, end of the period (000’s) | $ | 67,746 | $ | 116,055 | $ | 104,056 | $ | 177,339 | $ | 80,704 | ||||||||||
Net expenses | 1.10 | % | 1.10 | % | 1.10 | % | 1.11 | % | 1.12 | % | ||||||||||
Gross expenses | 1.10 | % | 1.10 | % | 1.10 | % | 1.11 | % | 1.12 | % | ||||||||||
Net investment income | 3.14 | % | 2.66 | % | 2.90 | %(b) | 3.68 | % | 3.77 | % | ||||||||||
Portfolio turnover rate | 72 | % | 72 | % | 87 | % | 115 | % | 116 | % | ||||||||||
| (a) | Per share net investment income has been calculated using the average shares outstanding during the period. |
| (b) | Includes a non-recurring dividend. Without this dividend, net investment income per share would have been $0.28, total return would have been 2.14% and the ratio of net investment income to average net assets would have been 2.81%. |
| (c) | A sales charge for Class A shares is not reflected in total return calculations. |
See accompanying notes to financial statements.
| 56
Table of Contents
Financial Highlights (continued)
For a share outstanding throughout each period.
| Loomis Sayles Strategic Alpha Fund—Class C | ||||||||||||||||||||
| Year Ended December 31, 2016 | Year Ended December 31, 2015 | Year Ended December 31, 2014 | Year Ended December 31, 2013 | Year Ended December 31, 2012 | ||||||||||||||||
Net asset value, beginning of the period | $ | 9.42 | $ | 9.93 | $ | 10.03 | $ | 10.16 | $ | 9.31 | ||||||||||
|
|
|
|
|
|
|
|
|
| |||||||||||
INCOME (LOSS) FROM INVESTMENT OPERATIONS: | ||||||||||||||||||||
Net investment income(a) | 0.23 | 0.19 | 0.21 | (b) | 0.30 | 0.30 | ||||||||||||||
Net realized and unrealized gain (loss) | 0.30 | (0.43 | ) | (0.06 | ) | (0.28 | ) | 0.76 | ||||||||||||
|
|
|
|
|
|
|
|
|
| |||||||||||
Total from Investment Operations | 0.53 | (0.24 | ) | 0.15 | 0.02 | 1.06 | ||||||||||||||
|
|
|
|
|
|
|
|
|
| |||||||||||
LESS DISTRIBUTIONS FROM: | ||||||||||||||||||||
Net investment income | (0.13 | ) | (0.27 | ) | (0.25 | ) | (0.15 | ) | (0.21 | ) | ||||||||||
|
|
|
|
|
|
|
|
|
| |||||||||||
Net asset value, end of the period | $ | 9.82 | $ | 9.42 | $ | 9.93 | $ | 10.03 | $ | 10.16 | ||||||||||
|
|
|
|
|
|
|
|
|
| |||||||||||
Total return(c) | 5.70 | % | (2.44 | )% | 1.47 | %(b) | 0.22 | % | 11.44 | % | ||||||||||
RATIOS TO AVERAGE NET ASSETS: | ||||||||||||||||||||
Net assets, end of the period (000’s) | $ | 45,674 | $ | 62,453 | $ | 71,215 | $ | 91,694 | $ | 67,748 | ||||||||||
Net expenses | 1.85 | % | 1.85 | % | 1.85 | % | 1.86 | % | 1.87 | % | ||||||||||
Gross expenses | 1.85 | % | 1.85 | % | 1.85 | % | 1.86 | % | 1.87 | % | ||||||||||
Net investment income | 2.40 | % | 1.91 | % | 2.13 | %(b) | 2.96 | % | 3.05 | % | ||||||||||
Portfolio turnover rate | 72 | % | 72 | % | 87 | % | 115 | % | 116 | % | ||||||||||
| (a) | Per share net investment income has been calculated using the average shares outstanding during the period. |
| (b) | Includes a non-recurring dividend. Without this dividend, net investment income per share would have been $0.21, total return would have been 1.37% and the ratio of net investment income to average net assets would have been 2.05%. |
| (c) | A contingent deferred sales charge for Class C shares is not reflected in total return calculations. |
See accompanying notes to financial statements.
57 |
Table of Contents
Financial Highlights (continued)
For a share outstanding throughout each period.
| Loomis Sayles Strategic Alpha Fund—Class Y | ||||||||||||||||||||
| Year Ended December 31, 2016 | Year Ended December 31, 2015 | Year Ended December 31, 2014 | Year Ended December 31, 2013 | Year Ended December 31, 2012 | ||||||||||||||||
Net asset value, beginning of the period | $ | 9.44 | $ | 9.95 | $ | 10.05 | $ | 10.19 | $ | 9.33 | ||||||||||
|
|
|
|
|
|
|
|
|
| |||||||||||
INCOME (LOSS) FROM INVESTMENT OPERATIONS: | ||||||||||||||||||||
Net investment income(a) | 0.32 | 0.29 | 0.31 | (b) | 0.40 | 0.41 | ||||||||||||||
Net realized and unrealized gain (loss) | 0.32 | (0.43 | ) | (0.06 | ) | (0.29 | ) | 0.76 | ||||||||||||
|
|
|
|
|
|
|
|
|
| |||||||||||
Total from Investment Operations | 0.64 | (0.14 | ) | 0.25 | 0.11 | 1.17 | ||||||||||||||
|
|
|
|
|
|
|
|
|
| |||||||||||
LESS DISTRIBUTIONS FROM: | ||||||||||||||||||||
Net investment income | (0.23 | ) | (0.37 | ) | (0.35 | ) | (0.25 | ) | (0.31 | ) | ||||||||||
|
|
|
|
|
|
|
|
|
| |||||||||||
Net asset value, end of the period | $ | 9.85 | $ | 9.44 | $ | 9.95 | $ | 10.05 | $ | 10.19 | ||||||||||
|
|
|
|
|
|
|
|
|
| |||||||||||
Total return | 6.86 | % | (1.43 | )% | 2.52 | %(b) | 1.19 | % | 12.57 | % | ||||||||||
RATIOS TO AVERAGE NET ASSETS: | ||||||||||||||||||||
Net assets, end of the period (000’s) | $ | 1,083,527 | $ | 1,183,723 | $ | 1,188,605 | $ | 970,539 | $ | 497,648 | ||||||||||
Net expenses | 0.85 | % | 0.85 | % | 0.85 | % | 0.86 | % | 0.87 | % | ||||||||||
Gross expenses | 0.85 | % | 0.85 | % | 0.85 | % | 0.86 | % | 0.87 | % | ||||||||||
Net investment income | 3.39 | % | 2.91 | % | 3.10 | %(b) | 3.92 | % | 4.09 | % | ||||||||||
Portfolio turnover rate | 72 | % | 72 | % | 87 | % | 115 | % | 116 | % | ||||||||||
| (a) | Per share net investment income has been calculated using the average shares outstanding during the period. |
| (b) | Includes a non-recurring dividend. Without this dividend, net investment income per share would have been $0.31, total return would have been 2.42% and the ratio of net investment income to average net assets would have been 3.03%. |
See accompanying notes to financial statements.
| 58
Table of Contents
December 31, 2016
1. Organization. Gateway Trust and Natixis Funds Trust II (the “Trusts” and each a “Trust”) are each organized as a Massachusetts business trust. Each Trust is registered under the Investment Company Act of 1940, as amended (the “1940 Act”), as an open-end management investment company. Each Declaration of Trust permits the Board of Trustees to authorize the issuance of an unlimited number of shares of the Trust in multiple series. The financial statements for certain funds of the Trusts are presented in separate reports. The following funds (individually, a “Fund” and collectively, the “Funds”) are included in this report:
Gateway Trust:
Gateway Equity Call Premium Fund
Natixis Funds Trust II:
Loomis Sayles Strategic Alpha Fund (the “Strategic Alpha Fund”)
The Gateway Equity Call Premium Fund is a diversified investment company. The Strategic Alpha Fund is a non-diversified investment company.
Each Fund offers Class A, Class C and Class Y shares. Class A shares are sold with a maximum front-end sales charge of 5.75% for Gateway Equity Call Premium Fund and 4.25% for Strategic Alpha Fund. Class C shares do not pay a front-end sales charge, do not convert to any other class of shares, pay higher Rule 12b-1 fees than Class A shares and may be subject to a contingent deferred sales charge (“CDSC”) of 1.00% if those shares are redeemed within one year of acquisition, except for reinvested distributions. Class Y shares do not pay a front-end sales charge, a CDSC or Rule 12b-1 fees. Class Y shares are intended for institutional investors with a minimum initial investment of $100,000, though some categories of investors are exempted from the minimum investment amount as outlined in the Funds’ prospectus.
Most expenses can be directly attributed to a Fund. Expenses which cannot be directly attributed to a Fund are generally apportioned based on the relative net assets of each of the funds in Natixis Funds Trust I, Natixis Funds Trust II, Natixis Funds Trust IV, Gateway Trust and Natixis ETF Trust (“Natixis Funds Trusts”), Loomis Sayles Funds I and Loomis Sayles Funds II (“Loomis Sayles Funds Trusts”). Expenses of a Fund are borne pro rata by the holders of each class of shares, except that each class bears expenses unique to that class (including the Rule 12b-1 fees applicable to class A and Class C). In addition, each class votes as a class only with respect to its own Rule 12b-1 Plan. Shares of each class would receive their pro rata share of the net assets of a Fund if the Fund were liquidated. The Trustees approve separate distributions from net investment income on each class of shares.
2. Significant Accounting Policies. The following is a summary of significant accounting policies consistently followed by each Fund in the preparation of its financial statements. The Funds’ financial statements follow the accounting and reporting guidelines provided for investment companies and are prepared in accordance with
59 |
Table of Contents
Notes to Financial Statements (continued)
December 31, 2016
accounting principles generally accepted in the United States of America which require the use of management estimates that affect the reported amounts and disclosures in the financial statements. Actual results could differ from those estimates. Management has evaluated the events and transactions subsequent to year-end through the date the financial statements were issued and has determined that there were no material events that would require disclosure in the Funds’ financial statements.
a. Valuation. Fund securities and other investments are valued at market value based on market quotations obtained or determined by independent pricing services recommended by the adviser and approved by the Board of Trustees. Fund securities and other investments for which market quotations are not readily available are valued at fair value as determined in good faith by the adviser pursuant to procedures approved by the Board of Trustees, as described below. Market value is determined as follows:
Listed equity securities (including shares of closed-end investment companies and exchange-traded funds) are valued at the last sale price quoted on the exchange where they are traded most extensively or, if there is no reported sale during the day, the closing bid quotation as reported by an independent pricing service. Securities traded on the NASDAQ Global Select Market, NASDAQ Global Market and NASDAQ Capital Market are valued at the NASDAQ Official Closing Price (“NOCP”), or if lacking an NOCP, at the most recent bid quotations on the applicable NASDAQ Market. Unlisted equity securities (except unlisted preferred equity securities) are valued at the last sale price quoted in the market where they are traded most extensively or, if there is no reported sale during the day, the closing bid quotation as reported by an independent pricing service. If there is no last sale price or closing bid quotation available, unlisted equity securities will be valued using evaluated bids furnished by an independent pricing service, if available. In some foreign markets, an official close price and a last sale price may be available from the foreign exchange or market. In those cases, the official close price is used. Debt securities and unlisted preferred equity securities are valued based on evaluated bids furnished to the Fund by an independent pricing service or bid prices obtained from broker-dealers. Senior loans are valued at bid prices supplied by an independent pricing service, if available. Broker-dealer bid prices may be used to value debt and unlisted equity securities and senior loans where an independent pricing service is unable to price a security or where an independent pricing service does not provide a reliable price for the security. Forward foreign currency contracts are valued utilizing interpolated rates determined based on information provided by an independent pricing service. Futures contracts are valued at the most recent settlement price on the exchange on which the adviser believes that, over time, they are traded most extensively. Centrally cleared swap agreements are valued at settlement prices of the clearinghouse on which the contracts were traded or prices obtained from broker-dealers. Bilateral credit default swaps are valued based on mid prices (between the bid price and the ask price)
| 60
Table of Contents
Notes to Financial Statements (continued)
December 31, 2016
supplied by an independent pricing service. Bilateral interest rate swaps are valued based on prices supplied by an independent pricing source. Domestic exchange-traded single name equity option contracts are valued at the mean of the National Best Bid and Offer quotations. Options on futures contracts are valued using the current settlement price on the exchange on which, over time, they are traded most extensively. Option contracts on domestic indices are valued at the average of the closing bid and ask quotations as of the close of trading on the Chicago Board Options Exchange (“CBOE”). Option contracts on foreign indices are priced at the most recent settlement price. Other exchange-traded options are valued at the average of the closing bid and ask quotations on the exchange on which, over time, they are traded most extensively. Over-the-counter (“OTC”) currency options and swaptions are valued at mid prices (between the bid and the ask price) supplied by an independent pricing service, if available. Other OTC option contracts (including currency options and swaptions not priced through an independent pricing service) are valued based on quotations obtained from broker-dealers.
Fund securities and other investments for which market quotations are not readily available are valued at fair value as determined in good faith by the adviser pursuant to procedures approved by the Board of Trustees. Option contracts for which the average of the closing bid and ask quotations are not considered to reflect option contract values as of the close of the New York Stock Exchange (“NYSE”) are valued at fair value as determined in good faith by the adviser pursuant to procedures approved by the Board of Trustees. On the last business day of the month, the Fund will fair value S&P 500® Index options using the closing rotation values published by the CBOE. The Fund may also value securities and other investments at fair value in other circumstances such as when extraordinary events occur after the close of a foreign market but prior to the close of the NYSE. This may include situations relating to a single issuer (such as a declaration of bankruptcy or a delisting of the issuer’s security from the primary market on which it has traded) as well as events affecting the securities markets in general (such as market disruptions or closings and significant fluctuations in U.S. and/or foreign markets). When fair valuing its securities or other investments, the Fund may, among other things, use modeling tools or other processes that may take into account factors such as securities or other market activity and/or significant events that occur after the close of the foreign market and before the time the Fund’s net asset value (“NAV”) is calculated. Fair value pricing may require subjective determinations about the value of a security, and fair values used to determine the Fund’s NAV may differ from quoted or published prices, or from prices that are used by others, for the same securities. In addition, the use of fair value pricing may not always result in adjustments to the prices of securities held by the Fund.
Illiquid securities for which market quotations are readily available and have been evaluated by the adviser are considered and classified as fair valued securities.
61 |
Table of Contents
Notes to Financial Statements (continued)
December 31, 2016
As of December 31, 2016, written options held by Gateway Equity Call Premium Fund were fair valued at $(1,358,200), representing (1.9)% of net assets, using the closing rotation values published by the CBOE.
As of December 31, 2016, securities held by Strategic Alpha Fund were fair valued as follows:
Securities classified | Percentage of Net Assets | Securities fair valued | Percentage of Net Assets | |||
$16,778,275 | 1.4% | $18,528,225 | 1.5% |
b. Investment Transactions and Related Investment Income. Investment transactions are accounted for on a trade date plus one day basis for daily NAV calculation. However, for financial reporting purposes, investment transactions are reported on trade date. Dividend income is recorded on ex-dividend date, or in the case of certain foreign securities, as soon as a Fund is notified, and interest income is recorded on an accrual basis. Interest income is increased by the accretion of discount and decreased by the amortization of premium, if applicable. Periodic principal adjustments for inflation-protected securities are recorded to interest income. The calendar year-end amounts of ordinary income, capital gains, and return of capital included in distributions received from the Funds’ investments in real estate investment trusts (“REITs”) are reported to the Funds after the end of the fiscal year; accordingly, the Funds estimate these amounts for accounting purposes until the characterization of REIT distributions is reported to the Funds after the end of the fiscal year. Estimates are based on the most recent REIT distribution information available. In determining net gain or loss on securities sold, the cost of securities has been determined on an identified cost basis. Investment income, non-class specific expenses and realized and unrealized gains and losses are allocated on a pro rata basis to each class based on the relative net assets of each class to the total net assets of the Fund.
c. Foreign Currency Translation. The books and records of the Funds are maintained in U.S. dollars. The values of securities, currencies and other assets and liabilities denominated in currencies other than U.S. dollars are translated into U.S. dollars based upon foreign exchange rates prevailing at the end of the period. Purchases and sales of investment securities, income and expenses are translated into U.S. dollars on the respective dates of such transactions.
Net realized foreign exchange gains or losses arise from sales of foreign currency, changes in exchange rates between the trade and settlement dates on securities transactions and the difference between the amounts of dividends, interest and foreign withholding taxes recorded on the Fund’s books and the U.S. dollar equivalent of the amounts actually received or paid. Net unrealized foreign exchange gains or losses arise from changes in the value of assets and liabilities, other than investment securities, as of the end of the fiscal period, resulting from changes in exchange rates.
| 62
Table of Contents
Notes to Financial Statements (continued)
December 31, 2016
Net realized foreign exchange gains or losses and the net change in unrealized foreign exchange gains or losses are disclosed in the Statements of Operations. For federal income tax purposes, net realized foreign exchange gains or losses are characterized as ordinary income, and may, if the Funds have net losses, reduce the amount of income available to be distributed by the Funds.
The values of investment securities are presented at the foreign exchange rates prevailing at the end of the period for financial reporting purposes. Net realized and unrealized gains or losses on investments reported in the Statements of Operations reflect gains or losses resulting from changes in exchange rates and fluctuations which arise due to changes in market prices of investment securities. For federal income tax purposes, a portion of Strategic Alpha Fund’s net realized gain or loss on investments arising from changes in exchange rates, which is reflected in the Statements of Operations, may be characterized as ordinary income and may, if the Fund has net losses, reduce the amount of income available to be distributed by the Fund.
For the year ended December 31, 2016, the amount of income available to be distributed by Strategic Alpha Fund has been reduced by $11,833,779 as a result of losses arising from changes in exchange rates.
The Funds may use foreign currency exchange contracts to facilitate transactions in foreign-denominated investments. Losses may arise from changes in the value of the foreign currency or if the counterparties do not perform under the contracts’ terms.
d. Forward Foreign Currency Contracts. The Funds may enter into forward foreign currency contracts, including forward foreign cross currency contracts, to acquire exposure to foreign currencies or to hedge the Fund’s investments against currency fluctuation. A contract can also be used to offset a previous contract. These contracts involve market risk in excess of the unrealized gain or loss reflected in the Funds’ Statements of Assets and Liabilities. The U.S. dollar value of the currencies a Fund has committed to buy or sell represents the aggregate exposure to each currency a Fund has acquired or hedged through currency contracts outstanding at period end. Gains or losses are recorded for financial statement purposes as unrealized until settlement date. Contracts are traded over-the-counter directly with a counterparty. Risks may arise upon entering into these contracts from the potential inability of counterparties to meet the terms of their contracts and from unanticipated movements in the value of a foreign currency relative to the U.S. dollar. Certain contracts may require the movement of cash and/or securities as collateral for the Fund’s or counterparty’s net obligations under the contracts.
e. Futures Contracts. The Funds may enter into futures contracts. Futures contracts are agreements between two parties to buy and sell a particular instrument or index for a specified price on a specified future date.
63 |
Table of Contents
Notes to Financial Statements (continued)
December 31, 2016
When a Fund enters into a futures contract, it is required to deposit with (or for the benefit of) its broker an amount of cash or short-term high-quality securities as “initial margin.” As the value of the contract changes, the value of the futures contract position increases or declines. Subsequent payments, known as “variation margin,” are made or received by a Fund, depending on the price fluctuations in the fair value of the contract and the value of cash or securities on deposit with the broker. The aggregate principal amounts of the contracts are not recorded in the financial statements. Fluctuations in the value of the contracts are recorded in the Statements of Assets and Liabilities as an asset (liability) and in the Statements of Operations as unrealized appreciation (depreciation) until the contracts are closed, when they are recorded as realized gains (losses). Realized gain or loss on a futures position is equal to the difference between the value of the contract at the time it was opened and the value at the time it was closed, minus brokerage commissions. When a Fund enters into a futures contract certain risks may arise, such as illiquidity in the futures market, which may limit a Fund’s ability to close out a futures contract prior to settlement date, and unanticipated movements in the value of securities or interest rates.
Futures contracts are exchange-traded. Exchange-traded futures contracts are standardized and are settled through a clearing house with fulfillment supported by the credit of the exchange. Therefore, counterparty credit risks to the Funds are reduced; however, in the event that a counterparty enters into bankruptcy, a Fund’s claim against initial/variation margin on deposit with the counterparty may be subject to terms of a final settlement in bankruptcy court.
f. Option Contracts. The Funds may enter into option contracts. When a Fund purchases an option, it pays a premium and the option is subsequently marked-to-market to reflect current value. Premiums paid for purchasing options which expire are treated as realized losses. Premiums paid for purchasing options which are exercised are added to the cost or deducted from the proceeds on the underlying instrument to determine the realized gain or loss. If the Fund enters into a closing sale transaction, the difference between the premium paid and the proceeds of the closing sale transaction is treated as a realized gain or loss. The risk associated with purchasing options is limited to the premium paid.
When a Fund writes an option, an amount equal to the net premium received (the premium less commission) is recorded as a liability and is subsequently adjusted to the current value. Net premiums received for written options which expire are treated as realized gains. Net premiums received for written options which are exercised are deducted from the cost or added to the proceeds on the underlying instrument to determine the realized gain or loss. If the Fund enters into a closing purchase transaction, the difference between the net premium received and any amount paid on effecting a closing purchase transaction, including commissions, is treated as a realized gain or, if the net premium received is less than the amount paid, as a realized
| 64
Table of Contents
Notes to Financial Statements (continued)
December 31, 2016
loss. The Fund, as writer of a written option, bears the risk of an unfavorable change in the market value of the instrument or index underlying the written option.
Exchange-traded options contracts are standardized and are settled through a clearing house with fulfillment supported by the credit of the exchange. Therefore, counterparty credit risks to the Funds are reduced. OTC options are subject to the risk that the counterparty is unable or unwilling to meet its obligations under the option.
g. Swaptions. The Funds may enter into interest rate swaptions. An interest rate swaption gives the holder the right, but not the obligation, to enter into or cancel an interest rate swap agreement at a future date. Interest rate swaptions may be either purchased or written. The buyer of an interest rate swaption may purchase either the right to receive a fixed rate in the underlying swap (known as a “receiver swaption”) or to pay a fixed rate (known as a “payer swaption”), based on the notional amount of the swap agreement, in exchange for a floating rate. The notional amounts of swaptions are not recorded in the financial statements.
When a Fund purchases an interest rate swaption, it pays a premium and the swaption is subsequently marked-to-market to reflect current value. Premiums paid for purchasing interest rate swaptions which expire are treated as realized losses. Premiums paid for purchasing interest rate swaptions which are exercised are added to the cost or deducted from the proceeds on the underlying swap to determine the realized gain or loss. If a Fund enters into a closing sale transaction, the difference between the premium paid and the proceeds of the closing sale transaction is treated as a realized gain or loss. The risk associated with purchasing interest rate swaptions is limited to the premium paid.
When a Fund writes an interest rate swaption, an amount equal to the premium received is recorded as a liability and is subsequently adjusted to the current value. Premiums received for written interest rate swaptions which expire are treated as realized gains. Premiums received for written interest rate swaptions which are exercised are deducted from the cost or added to the proceeds on the underlying swap to determine the realized gain or loss. If a Fund enters into a closing purchase transaction, the difference between the premium received and any amount paid on effecting a closing purchase transaction, including commission, is treated as a realized gain or, if the premium received is less than the amount paid, as a realized loss. A Fund, as writer of a written interest rate swaption, bears the risk of an unfavorable change in the market value of the swap underlying the written interest rate swaption.
OTC interest rate swaptions are subject to the risk that the counterparty is unable or unwilling to meet its obligations under the swaption.
h. Swap Agreements. The Funds may enter into credit default and interest rate swaps. A credit default swap is an agreement between two parties (the “protection buyer” and “protection seller”) to exchange the credit risk of an issuer (“reference obligation”) for a
65 |
Table of Contents
Notes to Financial Statements (continued)
December 31, 2016
specified time period. The reference obligation may be one or more debt securities or an index of such securities. The Funds may be either the protection buyer or the protection seller. As a protection buyer, the Funds have the ability to hedge the downside risk of an issuer or group of issuers. As a protection seller, the Funds have the ability to gain exposure to an issuer or group of issuers whose bonds are unavailable or in short supply in the cash bond market, as well as realize additional income in the form of fees paid by the protection buyer. The protection buyer is obligated to pay the protection seller a stream of payments (“fees”) over the term of the contract, provided that no credit event, such as a default or a downgrade in credit rating, occurs on the reference obligation. The Funds may also pay or receive upfront premiums. If a credit event occurs, the protection seller must pay the protection buyer the difference between the agreed upon notional value and market value of the reference obligation. Market value in this case is determined by a facilitated auction whereby a minimum number of allowable broker bids, together with a specified valuation method, are used to calculate the value. The maximum potential amount of undiscounted future payments that a Fund as the protection seller could be required to make under a credit default swap agreement would be an amount equal to the notional amount of the agreement.
Implied credit spreads, represented in absolute terms, are disclosed in the Portfolio of Investments for those agreements for which the Fund is the protection seller. Implied credit spreads serve as an indicator of the current status of the payment/performance risk and represent the likelihood or risk of default for the credit derivative. The implied credit spread of a particular reference entity reflects the cost of buying/selling protection and may include upfront payments required to be made to enter into the agreement. Wider credit spreads represent a deterioration of the reference entity’s credit soundness and a greater likelihood or risk of default or other credit event occurring as defined under the terms of the agreement.
An interest rate swap is an agreement with another party to receive or pay interest (e.g., an exchange of fixed rate payments for floating rate payments) to protect themselves from interest rate fluctuations. This type of swap is an agreement that obligates two parties to exchange a series of cash flows at specified intervals based upon or calculated by reference to a specified interest rate(s) for a specified notional amount. The payment flows are usually netted against each other, with the difference being paid by one party to the other.
The notional amounts of swap agreements are not recorded in the financial statements. Swap agreements are valued daily, and fluctuations in value are recorded in the Statements of Operations as change in unrealized appreciation (depreciation) on swap agreements. Fees are accrued in accordance with the terms of the agreement and are recorded in the Statements of Assets and Liabilities as fees receivable or payable. When received or paid, fees are recorded in the Statements of Operations as realized gain or loss. Upfront premiums paid or received by the Funds are recorded on the Statements of Assets and Liabilities as an asset or liability, respectively, and are
| 66
Table of Contents
Notes to Financial Statements (continued)
December 31, 2016
amortized or accreted over the term of the agreement and recorded as realized gain or loss. Payments made or received by the Funds as a result of a credit event or termination of the agreement are recorded as realized gain or loss.
Swap agreements are privately negotiated in the OTC market and may be entered into as a bilateral contract or centrally cleared (“centrally cleared swaps”). Bilateral swap agreements are traded between counterparties and, as such, are subject to the risk that a party to the agreement will not be able to meet its obligations. In a centrally cleared swap, immediately following execution of the swap agreement, the swap agreement is novated to a central counterparty (the “CCP”) and the Funds face the CCP through a broker. Upon entering into a centrally cleared swap, the Funds are required to deposit initial margin with the broker in the form of cash or securities in an amount that varies depending on the size and risk profile of the particular swap. Subsequent payments, known as “variation margin,” are made or received by the Funds based on the daily change in the value of the centrally cleared swap agreement. For centrally cleared swaps, the Funds’ counterparty credit risk is reduced as the CCP stands between the Funds and the counterparty. The Funds cover their net obligations under outstanding swap agreements by segregating or earmarking cash or securities.
i. Due to/from Brokers. Transactions and positions in certain options, swaptions, futures, forward foreign currency contracts and swap agreements are maintained and cleared by registered U.S. broker/dealers pursuant to customer agreements between the Funds and the various broker/dealers. The due from brokers balance in the Statements of Assets and Liabilities for Strategic Alpha Fund represents cash pledged as collateral for forward foreign currency contracts, options and bilateral swap agreements and as initial margin for futures contracts and centrally cleared swap agreements. The due to brokers balance in the Statements of Assets and Liabilities for Strategic Alpha Fund represents cash and securities received as collateral for forward foreign currency contracts, options and bilateral swap agreements. In certain circumstances the Funds’ use of cash, securities and/or foreign currency held at brokers is restricted by regulation or broker mandated limits.
j. Federal and Foreign Income Taxes. The Trusts treat each Fund as a separate entity for federal income tax purposes. Each Fund intends to meet the requirements of the Internal Revenue Code of 1986, as amended, applicable to regulated investment companies, and to distribute to its shareholders substantially all of its net investment income and any net realized capital gains at least annually. Management has performed an analysis of each Fund’s tax positions for the open tax years as of December 31, 2016 and has concluded that no provisions for income tax are required. The Funds’ federal tax returns for the prior three fiscal years, where applicable, remain subject to examination by the Internal Revenue Service. Management is not aware of any events that are reasonably possible to occur in the next twelve months that would result in the amounts of any unrecognized tax benefits significantly increasing or decreasing for the Funds. However, management’s conclusions regarding tax positions
67 |
Table of Contents
Notes to Financial Statements (continued)
December 31, 2016
taken may be subject to review and adjustment at a later date based on factors including, but not limited to, new tax laws and accounting regulations and interpretations thereof.
A Fund may be subject to foreign withholding taxes on investment income and taxes on capital gains on investments that are accrued and paid based upon the Fund’s understanding of the tax rules and regulations that exist in the countries in which the Fund invests. Foreign withholding taxes on dividend and interest income are reflected on the Statements of Operations as a reduction of investment income, net of amounts eligible to be reclaimed. Dividends and interest receivable on the Statements of Assets and Liabilities are net of foreign withholding taxes. Foreign withholding taxes where reclaims have been or will be filed are reflected on the Statements of Assets and Liabilities as tax reclaims receivable. Capital gains taxes paid are included in net realized gain (loss) on investments in the Statements of Operations. Accrued but unpaid capital gains taxes are reflected as foreign taxes payable on the Statements of Assets and Liabilities, if applicable, and reduce unrealized gains on investments. In the event that realized gains on investments are subsequently offset by realized losses, taxes paid on realized gains may be returned to a Fund. Such amounts, if applicable, are reflected as foreign tax rebates receivable on the Statements of Assets and Liabilities and are recorded as a realized gain when received.
k. Dividends and Distributions to Shareholders. Dividends and distributions are recorded on ex-dividend date. The timing and characterization of certain income and capital gain distributions are determined in accordance with federal tax regulations, which may differ from accounting principles generally accepted in the United States of America. Permanent differences are primarily due to differing treatments for book and tax purposes of items such as paydown gains and losses, return of capital and capital gain distributions received, swap adjustments, treasury inflation-protected bonds, foreign currency gains and losses, convertible bonds, deferred Trustees’ fees, defaulted and/or non-income producing securities, contingent payment debt instruments and premium amortization. Permanent book and tax basis differences relating to shareholder distributions, net investment income and net realized gains will result in reclassifications to capital accounts reported on the Statements of Assets and Liabilities. Temporary differences between book and tax distributable earnings are primarily due to deferred Trustees’ fees, premium amortization, defaulted and/or non-income producing securities, swap adjustments, wash sales, return of capital distributions received, convertible bonds, forward foreign currency, options and futures contracts mark-to-market and straddle deferrals. Amounts of income and capital gain available to be distributed on a tax basis are determined annually, and at other times during the Funds’ fiscal year as may be necessary to avoid knowingly declaring and paying a return of capital distribution. Distributions from net investment income and short-term capital gains are considered to be distributed from ordinary income for tax purposes.
| 68
Table of Contents
Notes to Financial Statements (continued)
December 31, 2016
The tax characterization of distributions is determined on an annual basis. The tax character of distributions paid to shareholders during the years ended December 31, 2016 and 2015 were as follows:
| 2016 Distributions Paid From: | 2015 Distributions Paid From: | |||||||||||||||||||||||
Fund | Ordinary | Long-Term | Total | Ordinary | Long-Term | Total | ||||||||||||||||||
Gateway Equity Call Premium Fund | $ | 778,103 | $ | — | $ | 778,103 | $ | 559,201 | $ | — | $ | 559,201 | ||||||||||||
Strategic Alpha Fund | 28,006,426 | — | 28,006,426 | 53,322,143 | — | 53,322,143 | ||||||||||||||||||
As of December 31, 2016, the components of distributable earnings on a tax basis were as follows:
Gateway | Strategic | |||||||
Undistributed ordinary income | $ | 1,399 | $ | 2,538,801 | ||||
|
|
|
| |||||
Total undistributed earnings | 1,399 | 2,538,801 | ||||||
|
|
|
| |||||
Capital loss carryforward: | ||||||||
Short-term: | ||||||||
No expiration date | (3,203,687 | ) | (37,730,155 | ) | ||||
Long-term: | ||||||||
No expiration date | (2,061,547 | ) | (17,520,479 | ) | ||||
|
|
|
| |||||
Total capital loss carryforward | (5,265,234 | ) | (55,250,634 | ) | ||||
|
|
|
| |||||
Unrealized appreciation (depreciation) | 10,469,243 | (22,660,525 | ) | |||||
|
|
|
| |||||
Total accumulated earnings (losses) | $ | 5,205,408 | $ | (75,372,358 | ) | |||
|
|
|
| |||||
As of December 31, 2016, unrealized appreciation (depreciation) on a tax basis was as follows:
Gateway | Strategic | |||||||
Unrealized appreciation (depreciation) | ||||||||
Investments | $ | 10,469,243 | $ | (8,431,064 | ) | |||
Foreign currency translations | — | (14,229,461 | ) | |||||
|
|
|
| |||||
Total unrealized appreciation (depreciation) | $ | 10,469,243 | $ | (22,660,525 | ) | |||
|
|
|
| |||||
69 |
Table of Contents
Notes to Financial Statements (continued)
December 31, 2016
l. Loan Participations. Strategic Alpha Fund may invest in loans to corporate, governmental or other borrowers. The Fund’s investments in loans may be in the form of participations in loans or assignments of all or a portion of loans. A loan is often administered by a bank or other financial institution that acts as agent for all holders. The agent administers the terms of the loan, as specified in the loan agreement. When investing in a loan participation, (i) a Fund has the right to receive payments of principal, interest and any fees to which it is entitled only from the party from whom the Fund has purchased the participation and only upon receipt by that party of payments from the borrower and (ii) a Fund generally has no right to enforce compliance by the borrower with the terms of the loan agreement or to vote on matters arising under the loan agreement. Thus, a Fund may be subject to credit risk both of the party from whom it purchased the loan participation and the borrower and the Fund may have minimal control over the terms of any loan modification. When a Fund purchases assignments from lenders, it acquires direct rights against the borrower on the loan. Loan agreements and participations outstanding at the end of the period, if any, are listed in each applicable Fund’s Schedule of Investments.
m. Repurchase Agreements. Each Fund may enter into repurchase agreements, under the terms of a Master Repurchase Agreement, under which each Fund acquires securities as collateral and agrees to resell the securities at an agreed upon time and at an agreed upon price. It is each Fund’s policy that the market value of the collateral for repurchase agreements be at least equal to 102% of the repurchase price, including interest. Certain repurchase agreements are tri-party arrangements whereby the collateral is held in a segregated account for the benefit of the Fund and on behalf of the counterparty. Repurchase agreements could involve certain risks in the event of default or insolvency of the counterparty, including possible delays or restrictions upon a Fund’s ability to dispose of the underlying securities. As of December 31, 2016, each Fund, as applicable, had investments in repurchase agreements for which the value of the related collateral exceeded the value of the repurchase agreement. The gross value of repurchase agreements is included in the Statements of Assets and Liabilities for financial reporting purposes.
n. When-Issued and Delayed Delivery Transactions. The Funds may enter into when-issued or delayed delivery transactions. When-issued refers to transactions made conditionally because a security, although authorized, has not been issued. Delayed delivery refers to transactions for which delivery or payment will occur at a later date, beyond the normal settlement period. The price of when-issued and delayed delivery securities and the date when the securities will be delivered and paid for are fixed at the time the transaction is negotiated. The security and the obligation to pay for it are recorded by the Funds at the time the commitment is entered into. The value of the security may vary with market fluctuations during the time before the Funds take delivery of the security. No interest accrues to the Funds until the transaction settles.
| 70
Table of Contents
Notes to Financial Statements (continued)
December 31, 2016
Delayed delivery transactions include those designated as To Be Announced (“TBAs”) in the Portfolios of Investments. For TBAs, the actual security that will be delivered to fulfill the transaction is not designated at the time of the trade. The security is “to be announced” 48 hours prior to the established trade settlement date. Certain transactions require the Funds or counterparty to post cash and/or securities as collateral for the net mark-to-market exposure to the other party. The Funds cover their net obligations under outstanding delayed delivery commitments by segregating or earmarking cash or securities at the custodian.
Purchases of when-issued or delayed delivery securities may have a similar effect on the Funds’ NAV as if the Funds’ had created a degree of leverage in the portfolio. Risks may arise upon entering into such transactions from the potential inability of counterparties to meet their obligations under the transactions. Additionally, losses may arise due to changes in the value of the underlying securities.
There were no when-issued or delayed delivery securities held by the Funds as of December 31, 2016.
o. Securities Lending. The Strategic Alpha Fund has entered into an agreement with State Street Bank and Trust Company (“State Street Bank”), as agent of the Fund, to lend securities to certain designated borrowers. The loans are collateralized with cash or securities in an amount equal to at least 105% or 102% of the market value (including accrued interest) of the loaned international or domestic securities, respectively, when the loan is initiated. Thereafter, the value of the collateral must remain at least 102% of the market value (including accrued interest) of loaned securities for U.S. equities and U.S. corporate debt; at least 105% of the market value (including accrued interest) of loaned securities for non-U.S. equities; and at least 100% of the market value (including accrued interest) of loaned securities for U.S. Government securities, sovereign debt issued by non-U.S. Governments and non-U.S. corporate debt. In the event that the market value of the collateral falls below the required percentages described above, the borrower will deliver additional collateral on the next business day. As with other extensions of credit, the Fund may bear the risk of loss with respect to the investment of the collateral. The Fund invests cash collateral in short-term investments, a portion of the income from which is remitted to the borrowers and the remainder allocated between the Fund and State Street Bank as lending agent.
For the year ended December 31, 2016, the Fund did not loan securities under this agreement.
p. Indemnifications. Under the Trusts’ organizational documents, its officers and Trustees are indemnified against certain liabilities arising out of the performance of their duties to the Funds. Additionally, in the normal course of business, the Funds enter into contracts with service providers that contain general indemnification clauses. The Funds’ maximum exposure under these arrangements is unknown as this would involve
71 |
Table of Contents
Notes to Financial Statements (continued)
December 31, 2016
future claims that may be made against the Funds that have not yet occurred. However, based on experience, the Funds expect the risk of loss to be remote.
q. New Accounting Pronouncement. In October 2016, the SEC adopted amendments to rules under the Investment Company Act of 1940 (“final rules”) intended to modernize the reporting and disclosure of information by registered investment companies. The final rules amend Regulation S-X and require funds to provide standardized, enhanced derivative disclosures in fund financial statements in a format designed for individual investors. The amendments to Regulation S-X also update the disclosures for other investments, including investments in and advances to affiliates, and amend the rules regarding the general form and content of fund financial statements. The compliance date for the amendments to Regulation S-X is August 1, 2017. Management is currently evaluating the amendments and the impact, if any, on the Fund’s financial statements.
3. Fair Value Measurements. In accordance with accounting standards related to fair value measurements and disclosures, the Funds have categorized the inputs utilized in determining the value of each Fund’s assets or liabilities. These inputs are summarized in the three broad levels listed below:
| • | Level 1 – quoted prices in active markets for identical assets or liabilities; |
| • | Level 2 – prices determined using other significant inputs that are observable either directly, or indirectly through corroboration with observable market data (which could include quoted prices for similar assets or liabilities, interest rates, credit risk, etc.); and |
| • | Level 3 – prices determined using significant unobservable inputs when quoted prices or observable inputs are unavailable such as when there is little or no market activity for an asset or liability (unobservable inputs reflect each Fund’s own assumptions in determining the fair value of assets or liabilities and would be based on the best information available). |
The inputs or methodology used for valuing securities are not necessarily an indication of the risk associated with investing in those securities.
The Fund’s pricing policies and procedures are recommended by the adviser and approved by the Board of Trustees. Debt securities are valued based on evaluated bids furnished to the Fund by an independent pricing service. Broker-dealer bid prices may be used if an independent pricing service either is unable to price a security or does not provide a reliable price for a security. Broker-dealer bid prices for which the Fund does not have knowledge of the inputs used by the broker-dealer are categorized in Level 3. All security prices, including those obtained from an independent pricing service and broker-dealer bid prices, are reviewed on a daily basis by the adviser, subject to oversight by Fund management and the Board of Trustees. If the adviser, in good faith, believes that the price provided by an independent pricing service is unreliable, broker-dealer bid
| 72
Table of Contents
Notes to Financial Statements (continued)
December 31, 2016
prices may be used until the price provided by the independent pricing service is considered to be reliable. Reliability of all security prices, including those obtained from an independent pricing service and broker-dealer bid prices, is tested in a variety of ways, including comparison to recent transaction prices and daily fluctuations, amongst other validation procedures in place. Securities for which market quotations are not readily available are valued at fair value as determined in good faith by the Fund’s adviser pursuant to procedures approved by the Board of Trustees. Fair valued securities may be categorized in Level 3.
The following is a summary of the inputs used to value the Funds’ investments as of December 31, 2016, at value:
Gateway Equity Call Premium Fund
Asset Valuation Inputs
Description | Level 1 | Level 2 | Level 3 | Total | ||||||||||||
Common Stocks(a) | $ | 69,217,732 | $ | — | $ | — | $ | 69,217,732 | ||||||||
Short-Term Investments | — | 2,790,351 | — | 2,790,351 | ||||||||||||
|
|
|
|
|
|
|
| |||||||||
Total | $ | 69,217,732 | $ | 2,790,351 | $ | — | $ | 72,008,083 | ||||||||
|
|
|
|
|
|
|
| |||||||||
| Liability Valuation Inputs | ||||||||||||||||
Description | Level 1 | Level 2 | Level 3 | Total | ||||||||||||
Written Options | $ | — | $ | (1,358,200 | ) | $ | — | $ | (1,358,200 | ) | ||||||
|
|
|
|
|
|
|
| |||||||||
| (a) | Details of the major categories of the Fund’s investments are reflected within the Portfolio of Investments. |
For the year ended December 31, 2016, there were no transfers among Levels 1, 2 and 3.
73 |
Table of Contents
Notes to Financial Statements (continued)
December 31, 2016
Strategic Alpha Fund
Asset Valuation Inputs
Description | Level 1 | Level 2 | Level 3 | Total | ||||||||||||
Bonds and Notes | ||||||||||||||||
Non-Convertible Bonds | ||||||||||||||||
ABS Home Equity | $ | — | $ | 147,954,418 | $ | 3,187,399 | (b) | $ | 151,141,817 | |||||||
ABS Other | — | 33,698,372 | 11,836,146 | (c) | 45,534,518 | |||||||||||
Banking | — | 37,531,401 | 2,704,314 | (d) | 40,235,715 | |||||||||||
Government Owned - No Guarantee | — | 20,285,143 | 2,180,900 | (d) | 22,466,043 | |||||||||||
Independent Energy | — | 58,400,573 | — | (e) | 58,400,573 | |||||||||||
Non-Agency Commercial Mortgage-Backed Securities | — | 53,657,265 | 3,349,021 | (d) | 57,006,286 | |||||||||||
All Other Non-Convertible Bonds(a) | — | 495,384,682 | — | 495,384,682 | ||||||||||||
|
|
|
|
|
|
|
| |||||||||
Total Non-Convertible Bonds | — | 846,911,854 | 23,257,780 | 870,169,634 | ||||||||||||
|
|
|
|
|
|
|
| |||||||||
Convertible Bonds(a) | — | 13,857,623 | — | 13,857,623 | ||||||||||||
|
|
|
|
|
|
|
| |||||||||
Total Bonds and Notes | — | 860,769,477 | 23,257,780 | 884,027,257 | ||||||||||||
|
|
|
|
|
|
|
| |||||||||
Senior Loans | ||||||||||||||||
Wirelines | — | 3,484,137 | 1,165,800 | (d) | 4,649,937 | |||||||||||
All Other Senior Loans(a) | — | 84,489,399 | — | 84,489,399 | ||||||||||||
|
|
|
|
|
|
|
| |||||||||
Total Senior Loans | — | 87,973,536 | 1,165,800 | 89,139,336 | ||||||||||||
|
|
|
|
|
|
|
| |||||||||
Loan Participations(a) | — | — | 2,256,710 | (d) | 2,256,710 | |||||||||||
Preferred Stocks | ||||||||||||||||
Convertible Preferred Stocks | ||||||||||||||||
Pharmaceuticals | 397,242 | 1,331,496 | — | 1,728,738 | ||||||||||||
All Other Convertible Preferred Stocks(a) | 5,248,298 | — | — | 5,248,298 | ||||||||||||
|
|
|
|
|
|
|
| |||||||||
Total Convertible Preferred Stocks | 5,645,540 | 1,331,496 | — | 6,977,036 | ||||||||||||
|
|
|
|
|
|
|
| |||||||||
Non-Convertible Preferred Stock(a) | — | 4,242,000 | — | 4,242,000 | ||||||||||||
|
|
|
|
|
|
|
| |||||||||
Total Preferred Stocks | 5,645,540 | 5,573,496 | — | 11,219,036 | ||||||||||||
|
|
|
|
|
|
|
| |||||||||
| 74
Table of Contents
Notes to Financial Statements (continued)
December 31, 2016
Strategic Alpha Fund (continued)
Asset Valuation Inputs (continued)
Description | Level 1 | Level 2 | Level 3 | Total | ||||||||||||
Common Stocks(a) | $ | 20,598,477 | $ | — | $ | — | $ | 20,598,477 | ||||||||
Other Investments(a) | — | — | 8,840,043 | (f) | 8,840,043 | |||||||||||
Purchased Options(a) | — | 873,441 | — | 873,441 | ||||||||||||
Short-Term Investments | — | 159,125,186 | — | 159,125,186 | ||||||||||||
|
|
|
|
|
|
|
| |||||||||
Total Investments | 26,244,017 | 1,114,315,136 | 35,520,333 | 1,176,079,486 | ||||||||||||
|
|
|
|
|
|
|
| |||||||||
Bilateral Credit Default Swap Agreements (unrealized appreciation) | — | 18,414 | — | 18,414 | ||||||||||||
Centrally Cleared Interest Rate Swap Agreements (unrealized appreciation) | — | 2,174,536 | — | 2,174,536 | ||||||||||||
Bilateral Interest Rate Swap Agreements (unrealized appreciation) | — | 1,207,045 | — | 1,207,045 | ||||||||||||
Forward Foreign Currency Contracts (unrealized appreciation) | — | 5,246,454 | — | 5,246,454 | ||||||||||||
Futures Contracts (unrealized appreciation) | 889,830 | — | — | 889,830 | ||||||||||||
|
|
|
|
|
|
|
| |||||||||
Total | $ | 27,133,847 | $ | 1,122,961,585 | $ | 35,520,333 | $ | 1,185,615,765 | ||||||||
|
|
|
|
|
|
|
| |||||||||
| Liability Valuation Inputs | ||||||||||||||||
Description | Level 1 | Level 2 | Level 3 | Total | ||||||||||||
Bilateral Credit Default Swap Agreements (unrealized depreciation) | $ | — | $ | (503,050 | ) | $ | — | $ | (503,050 | ) | ||||||
Centrally Cleared Credit Default Swap Agreements (unrealized depreciation) | — | (1,417,198 | ) | — | (1,417,198 | ) | ||||||||||
Centrally Cleared Interest Rate Swap Agreements (unrealized depreciation) | — | (203,906 | ) | — | (203,906 | ) | ||||||||||
Bilateral Interest Rate Swap Agreements (unrealized depreciation) | — | (2,529,965 | ) | — | (2,529,965 | ) | ||||||||||
Forward Foreign Currency Contracts (unrealized depreciation) | — | (2,006,219 | ) | — | (2,006,219 | ) | ||||||||||
Futures Contracts (unrealized depreciation) | (729,872 | ) | — | — | (729,872 | ) | ||||||||||
|
|
|
|
|
|
|
| |||||||||
Total | $ | (729,872 | ) | $ | (6,660,338 | ) | $ | — | $ | (7,390,210 | ) | |||||
|
|
|
|
|
|
|
| |||||||||
75 |
Table of Contents
Notes to Financial Statements (continued)
December 31, 2016
| (a) | Details of the major categories of the Fund’s investments are reflected within the Portfolio of Investments. |
| (b) | Valued using broker-dealer bid prices ($708,138) or fair valued by the Fund’s adviser ($2,479,261). |
| (c) | Valued using broker-dealer bid prices ($4,627,225) or fair valued by the Fund’s adviser using broker-dealer bid prices for which the inputs are unobservable to the Fund ($7,208,921). |
| (d) | Valued using broker-dealer bid prices. |
| (e) | Fair valued at zero using level 3 inputs. |
| (f) | Fair valued by the Fund’s adviser using broker-dealer bid prices for which the inputs are unobservable to the Fund. |
The following is a reconciliation of Level 3 investments for which significant unobservable inputs were used to determine fair value as of December 31, 2015 and/or December 31, 2016:
Strategic Alpha Fund
Asset Valuation Inputs
Investments in Securities | Balance as of | Accrued | Realized | Change in | Purchases | |||||||||||||||
Bonds and Notes | ||||||||||||||||||||
Non-Convertible Bonds | ||||||||||||||||||||
ABS Home Equity | $ | 1,961,377 | $ | — | $ | 33,522 | $ | (31,816 | ) | $ | — | |||||||||
ABS Other | 13,438,737 | — | 1,779 | (3,032,386 | ) | 5,792,930 | ||||||||||||||
Banking | — | (153,258 | ) | — | (96,863 | ) | 2,954,435 | |||||||||||||
Government Owned - No Guarantee | — | — | — | 250,900 | 1,930,000 | |||||||||||||||
Independent Energy | — | (a) | 310,422 | (310,422 | ) | — | ||||||||||||||
Non-Agency Commercial Mortgage-Backed Securities | 16,593,700 | — | (9,066 | ) | (77,676 | ) | — | |||||||||||||
Senior Loans | ||||||||||||||||||||
Wirelines | — | 5 | — | 11,595 | 1,154,200 | |||||||||||||||
Loan Participations | 2,445,609 | — | (1,257 | ) | (20,095 | ) | — | |||||||||||||
Common Stocks | ||||||||||||||||||||
Oil, Gas & Consumable Fuels | — | (a) | — | — | — | — | ||||||||||||||
Other Investments | ||||||||||||||||||||
Aircraft ABS | 8,820,000 | — | — | 20,043 | — | |||||||||||||||
|
|
|
|
|
|
|
|
|
| |||||||||||
Total | $ | 43,259,423 | $ | 157,169 | $ | 24,978 | $ | (3,286,720 | ) | $ | 11,831,565 | |||||||||
|
|
|
|
|
|
|
|
|
| |||||||||||
| 76
Table of Contents
Notes to Financial Statements (continued)
December 31, 2016
Strategic Alpha Fund (continued)
Asset Valuation Inputs (continued)
Investments in Securities | Sales | Transfers | Transfers | Balance as of | Change in | |||||||||||||||
Bonds and Notes | ||||||||||||||||||||
Non-Convertible Bonds | ||||||||||||||||||||
ABS Home Equity | $ | (951,246 | ) | $ | 2,175,562 | $ | — | $ | 3,187,399 | $ | (31,692 | ) | ||||||||
ABS Other | (6,519,178 | ) | 5,267,400 | (3,113,136 | ) | 11,836,146 | (3,091,389 | ) | ||||||||||||
Banking | — | — | — | 2,704,314 | (96,863 | ) | ||||||||||||||
Government Owned - No Guarantee | — | — | — | 2,180,900 | 250,900 | |||||||||||||||
Independent Energy | — | — | — | — | (a) | (310,422 | ) | |||||||||||||
Non-Agency Commercial Mortgage-Backed Securities | (3,435,000 | ) | — | (9,722,937 | ) | 3,349,021 | (93,027 | ) | ||||||||||||
Senior Loans | ||||||||||||||||||||
Wirelines | — | — | — | 1,165,800 | 11,595 | |||||||||||||||
Loan Participations | (167,547 | ) | — | — | 2,256,710 | (23,028 | ) | |||||||||||||
Common Stocks | ||||||||||||||||||||
Oil, Gas & Consumable Fuels | — | — | — | — | — | |||||||||||||||
Other Investments | ||||||||||||||||||||
Aircraft ABS | — | — | — | 8,840,043 | 20,043 | |||||||||||||||
|
|
|
|
|
|
|
|
|
| |||||||||||
Total | $ | (11,072,971 | ) | $ | 7,442,962 | $ | (12,836,073 | ) | $ | 35,520,333 | $ | (3,363,883 | ) | |||||||
|
|
|
|
|
|
|
|
|
| |||||||||||
| (a) | Fair valued at zero. |
Debt securities valued at $1,308,689 were transferred from Level 2 to Level 3 during the period ended December 31, 2016. At December 31, 2015, these securities were valued on the basis of evaluated bids furnished to the Fund by an independent pricing service in accordance with the Fund’s valuation policies. At December 31, 2016, these securities were valued at fair value as determined in good faith by the Fund’s adviser as an independent pricing service did not provide a reliable price for the securities.
Debt securities valued at $6,134,273 were transferred from Level 2 to Level 3 during the period ended December 31, 2016. At December 31, 2015, these securities were valued
77 |
Table of Contents
Notes to Financial Statements (continued)
December 31, 2016
on the basis of evaluated bids furnished to the Fund by an independent pricing service in accordance with the Fund’s valuation policies. At December 31, 2016, these securities were valued using broker-dealer bid prices based on inputs unobservable to the Fund as an independent pricing service was unable to price the securities.
Debt securities valued at $12,836,073 were transferred from Level 3 to Level 2 during the period ended December 31, 2016. At December 31, 2015, these securities were valued using broker-dealer bid prices based on inputs unobservable to the Fund as an independent pricing service was unable to price the securities. At December 31, 2016, these securities were valued on the basis of evaluated bids furnished to the Fund by an independent pricing service in accordance with the Fund’s valuation policies.
All transfers are recognized as of the beginning of the reporting period.
4. Derivatives. Derivative instruments are defined as financial instruments whose value and performance are based on the value and performance of an underlying asset, reference rate or index. Derivative instruments that the Funds used during the period include forward foreign currency contracts, futures contracts, option contracts, swaptions and swap agreements.
Gateway Equity Call Premium Fund seeks to capture the majority of the returns associated with equity market investments, while exposing investors to less risk than other equity investments. To meet this investment goal, the Fund invests in a broadly diversified portfolio of common stocks, while also writing index call options. Writing index call options can reduce the Fund’s volatility, provide a steady cash flow and be an important source of the Fund’s return, although it also may reduce the Fund’s ability to profit from increases in the value of its equity portfolio. The combination of the diversified stock portfolio and the steady cash flow from writing of index call options is intended to moderate the volatility of returns relative to an all-equity portfolio. During the year ended December 31, 2016, written index call options were used in accordance with this objective.
Strategic Alpha Fund seeks to achieve positive total returns over a full market cycle. The Fund pursues its objective by utilizing a flexible investment approach that allocates investments across a global range of investment opportunities related to credit, currencies and interest rates, while employing risk management techniques to mitigate downside risk. At times, the Fund expects to gain its investment exposure substantially through the use of derivatives, including forward foreign currency contracts, futures and option contracts, interest rate swaptions and swap agreements. During the year ended December 31, 2016, the Fund used futures, forward foreign currency and option contracts, swaptions, interest rate swap agreements and credit default swap agreements (as a protection seller) to gain investment exposures in accordance with its objective.
Strategic Alpha Fund is subject to the risk that changes in foreign currency exchange rates will have an unfavorable effect on the value of Fund assets denominated in
| 78
Table of Contents
Notes to Financial Statements (continued)
December 31, 2016
foreign currencies. The Fund may enter into forward foreign currency exchange contracts and option contracts for hedging purposes to protect the value of the Fund’s holdings of foreign securities. During the year ended December 31, 2016, the Fund engaged in forward foreign currency and option contracts for hedging purposes.
Strategic Alpha Fund is subject to the risk that companies in which the Fund invests will fail financially or otherwise be unwilling or unable to meet their obligations to the Fund. The Fund may use credit default swaps, as a protection buyer, to hedge its credit exposure to issuers of bonds it holds without having to sell the bonds. During the year ended December 31, 2016, the Fund engaged in credit default swap transactions (as a protection buyer) to hedge its credit exposure.
Strategic Alpha Fund is subject to the risk of unpredictable declines in the value of individual equity securities and periods of below-average performance in individual securities or in the equity market as a whole. The Fund may use futures contracts, purchased put options and written call options to hedge against a decline in value of an equity security that it owns. The Fund may also write put options to offset the cost of options used for hedging purposes. During the year ended December 31, 2016, the Fund engaged in futures and option contracts for hedging purposes.
The following is a summary of derivative instruments for Gateway Equity Call Premium Fund as of December 31, 2016, as reflected within the Statements of Assets and Liabilities:
Liabilities | Options written | |
Exchange-traded/cleared liability derivatives | ||
Equity contracts | $(1,358,200) |
Transactions in derivative instruments for Gateway Equity Call Premium Fund during the year ended December 31, 2016, as reflected within the Statements of Operations, were as follows:
Net Realized Gain (Loss) on: | Options written | |
Equity contracts | $(1,679,523) |
Net Change in Unrealized Appreciation | Options written | |
Equity contracts | $(775,949) |
79 |
Table of Contents
Notes to Financial Statements (continued)
December 31, 2016
The following is a summary of derivative instruments for Strategic Alpha Fund as of December 31, 2016, as reflected within the Statements of Assets and Liabilities:
Assets | Investments | Unrealized | Swap | Unrealized | Total | |||||||||||||||
Over-the-counter asset derivatives | ||||||||||||||||||||
Interest rate contracts | $ | — | $ | — | $ | 1,207,045 | $ | — | $ | 1,207,045 | ||||||||||
Foreign exchange contracts | 873,441 | 5,246,454 | — | — | 6,119,895 | |||||||||||||||
Credit contracts | — | — | 1,201,734 | — | 1,201,734 | |||||||||||||||
|
|
|
|
|
|
|
|
|
| |||||||||||
Total over-the-counter asset derivatives | $ | 873,441 | $ | 5,246,454 | $ | 2,408,779 | $ | — | $ | 8,528,674 | ||||||||||
|
|
|
|
|
|
|
|
|
| |||||||||||
Exchange-traded/ cleared asset derivatives | ||||||||||||||||||||
Interest rate contracts | $ | — | $ | — | $ | 2,174,536 | $ | 889,830 | $ | 3,064,366 | ||||||||||
|
|
|
|
|
|
|
|
|
| |||||||||||
Total exchange-traded/cleared asset derivatives | $ | — | $ | — | $ | 2,174,536 | $ | 889,830 | $ | 3,064,366 | ||||||||||
|
|
|
|
|
|
|
|
|
| |||||||||||
Total asset derivatives | $ | 873,441 | $ | 5,246,454 | $ | 4,583,315 | $ | 889,830 | $ | 11,593,040 | ||||||||||
|
|
|
|
|
|
|
|
|
| |||||||||||
Liabilities | Unrealized | Swap | Unrealized | Total | ||||||||||||
Over-the-counter liability derivatives | ||||||||||||||||
Interest rate contracts | $ | — | $ | (2,529,965 | ) | $ | — | $ | (2,529,965 | ) | ||||||
Foreign exchange contracts | (2,006,219 | ) | — | — | (2,006,219 | ) | ||||||||||
Credit contracts | — | (40,962 | ) | — | (40,962 | ) | ||||||||||
|
|
|
|
|
|
|
| |||||||||
Total over-the-counter liability derivatives | $ | (2,006,219 | ) | $ | (2,570,927 | ) | $ | — | $ | (4,577,146 | ) | |||||
|
|
|
|
|
|
|
| |||||||||
Exchange-traded/cleared liability derivatives | ||||||||||||||||
Interest rate contracts | $ | — | $ | (203,906 | ) | $ | (561,024 | ) | $ | (764,930 | ) | |||||
Credit contracts | — | (3,674,240 | ) | — | (3,674,240 | ) | ||||||||||
Equity contracts | — | — | (168,848 | ) | (168,848 | ) | ||||||||||
|
|
|
|
|
|
|
| |||||||||
Total exchange-traded/cleared liability derivatives | $ | — | $ | (3,878,146 | ) | $ | (729,872 | ) | $ | (4,608,018 | ) | |||||
|
|
|
|
|
|
|
| |||||||||
Total liability derivatives | $ | (2,006,219 | ) | $ | (6,449,073 | ) | $ | (729,872 | ) | $ | (9,185,164 | ) | ||||
|
|
|
|
|
|
|
| |||||||||
| 1 | Represents purchased options, at value. |
| 80
Table of Contents
Notes to Financial Statements (continued)
December 31, 2016
| 2 | Represents swap agreements, at value. Market value of swap agreements is reported in the Portfolio of Investments along with the unamortized upfront premium paid (received), if any, and unrealized appreciation (depreciation) on each individual contract. Unrealized appreciation (depreciation) and upfront premiums paid (received) are reported within the Statements of Assets and Liabilities. |
| 3 | Represents cumulative unrealized appreciation (depreciation) on futures contracts. Only the current day’s variation margin on futures contracts is reported within the Statements of Assets and Liabilities as receivable or payable for variation margin, as applicable. |
Transactions in derivative instruments for Strategic Alpha Fund during the year ended December 31, 2016, as reflected in the Statements of Operations were as follows:
Net Realized Gain | Investments4 | Futures | Options/ | Swap | Foreign | |||||||||||||||
Interest rate contracts | $ | (4,113,923 | ) | $ | (5,136,751 | ) | $ | 1,783,740 | $ | 2,199,856 | $ | — | ||||||||
Foreign exchange contracts | 293,631 | — | — | — | (14,451,328 | ) | ||||||||||||||
Credit contracts | — | — | — | (4,140,441 | ) | — | ||||||||||||||
Equity contracts | (86,169 | ) | 455,977 | (1,861,846 | ) | — | — | |||||||||||||
|
|
|
|
|
|
|
|
|
| |||||||||||
Total | $ | (3,906,461 | ) | $ | (4,680,774 | ) | $ | (78,106 | ) | $ | (1,940,585 | ) | $ | (14,451,328 | ) | |||||
|
|
|
|
|
|
|
|
|
| |||||||||||
Net Change in | Investments4 | Futures | Options/ | Swap | Foreign | |||||||||||||||
Interest rate contracts | $ | 2,067,739 | $ | 1,052,822 | $ | (1,204,936 | ) | $ | (2,310,678 | ) | $ | — | ||||||||
Foreign exchange contracts | (585,760 | ) | — | — | — | 4,378,363 | ||||||||||||||
Credit contracts | — | — | — | (1,313,810 | ) | — | ||||||||||||||
Equity contracts | 26,553 | 306,334 | — | — | — | |||||||||||||||
|
|
|
|
|
|
|
|
|
| |||||||||||
Total | $ | 1,508,532 | $ | 1,359,156 | $ | (1,204,936 | ) | $ | (3,624,488 | ) | $ | 4,378,363 | ||||||||
|
|
|
|
|
|
|
|
|
| |||||||||||
| 4 | Represents realized gain (loss) and change in unrealized appreciation (depreciation), respectively, for purchased options/swaptions during the period. |
| 5 | Represents realized loss and change in unrealized appreciation (depreciation), respectively, for forward foreign currency contracts during the period. Does not include other foreign currency gains or losses included in the Statement of Operations. |
As the Funds value their derivatives at fair value and recognize changes in fair value through the Statements of Operations, they do not qualify for hedge accounting under authoritative guidance for derivative instruments. The Funds’ investments in derivatives may represent an economic hedge; however, they are considered to be non-hedge transactions for the purpose of these disclosures.
81 |
Table of Contents
Notes to Financial Statements (continued)
December 31, 2016
The volume of option contract activity, as a percentage of investments in common stocks, for Gateway Equity Call Premium Fund, based on month-end notional amounts outstanding during the period, at absolute value, was as follows for the year ended December 31, 2016:
Gateway Equity Call Premium Fund | Call Options | |||
Average Notional Amount Outstanding | 98.95 | % | ||
Highest Notional Amount Outstanding | 99.15 | % | ||
Lowest Notional Amount Outstanding | 98.70 | % | ||
Notional Amount Outstanding as of December 31, 2016 | 98.97 | % | ||
| * | Notional amounts outstanding are determined by multiplying option contracts by the contract multiplier by the price of the option’s underlying index, the S&P 500® Index. |
The volume of forward foreign currency contract, futures contract and swap agreement activity, as a percentage of net assets for Strategic Alpha Fund, based on gross month-end notional amounts outstanding during the period, including long and short positions at absolute value, was as follows for the year ended December 31, 2016:
Strategic Alpha Fund | Forwards | Futures | Credit | Interest | ||||||||||||
Average Notional Amount Outstanding | 37.88 | % | 61.42 | % | 6.59 | % | 41.37 | % | ||||||||
Highest Notional Amount Outstanding | 59.34 | % | 99.15 | % | 11.73 | % | 101.50 | % | ||||||||
Lowest Notional Amount Outstanding | 27.73 | % | 11.63 | % | 1.66 | % | 1.85 | % | ||||||||
Notional Amount Outstanding as of December 31, 2016 | 34.40 | % | 17.05 | % | 9.50 | % | 56.25 | % | ||||||||
Notional amounts outstanding at the end of the prior period, if applicable, are included in the averages above.
Unrealized gain and/or loss on open forwards, futures and swaps is recorded in the Statements of Assets and Liabilities. The aggregate notional values of forward, futures and swap contracts are not recorded in the Statements of Assets and Liabilities, and therefore are not included in the Fund’s net assets.
| 82
Table of Contents
Notes to Financial Statements (continued)
December 31, 2016
The volume of option contract activity, as a percentage of net assets for Strategic Alpha Fund, based on the month-end market values of instruments underlying purchased and written options, at absolute value, was as follows for the year ended December 31, 2016:
Strategic Alpha Fund | Call | Put | Call | Put | ||||||||||||
Average Market Value of Underlying Instruments | 4.78 | % | 3.27 | % | 2.08 | % | 0.38 | % | ||||||||
Highest Market Value of Underlying Instruments | 12.05 | % | 7.24 | % | 11.06 | % | 4.84 | % | ||||||||
Lowest Market Value of Underlying Instruments | 0.00 | % | 2.11 | % | 0.00 | % | 0.00 | % | ||||||||
Market Value of Underlying Instruments as of December 31, 2016 | 3.35 | % | 3.29 | % | 0.00 | % | 0.00 | % | ||||||||
| * | Market value of underlying instruments is determined as follows: for securities by multiplying option shares by the price of the option’s underlying security, for currencies by multiplying par value by the strike price and dividing by the foreign currency exchange rate and for foreign indices by multiplying the number of contracts by the contract multiplier by the price of the underlying index and dividing by the foreign currency exchange rate. |
The volume of interest rate swaption activity, as a percentage of net assets for Strategic Alpha Fund, based on average premiums paid or received during the period, including long and short positions at absolute value, was as follows for the year ended December 31, 2016:
Strategic Alpha Fund | Interest | Interest | Interest | |||||||||
Average Premium Paid/Received | 0.07 | % | 0.23 | % | 0.10 | % | ||||||
Highest Premium Paid/Received | 0.14 | % | 0.34 | % | 0.15 | % | ||||||
Lowest Premium Paid/Received | 0.00 | % | 0.00 | % | 0.00 | % | ||||||
Premium Paid/Received as of December 31, 2016 | 0.00 | % | 0.00 | % | 0.00 | % | ||||||
83 |
Table of Contents
Notes to Financial Statements (continued)
December 31, 2016
The following is a summary of Gateway Equity Call Premium Fund’s written option activity:
Gateway Equity Call Premium Fund | Number of | Premiums | ||||||
Outstanding at December 31, 2015 | 252 | $ | 1,260,695 | |||||
Options written | 3,252 | 11,725,016 | ||||||
Options terminated in closing purchase transactions | (3,151 | ) | (11,702,746 | ) | ||||
Options expired | (47 | ) | (65,679 | ) | ||||
|
|
|
| |||||
Outstanding at December 31, 2016 | 306 | $ | 1,217,286 | |||||
|
|
|
| |||||
The following is a summary of Strategic Alpha Fund’s written option activity:
Strategic Alpha Fund | Number of | Premiums | ||||||
Outstanding at December 31, 2015 | — | $ | — | |||||
Options written | 18,167 | 3,041,285 | ||||||
Options terminated in closing purchase transactions | (8,928 | ) | (2,713,469 | ) | ||||
Options expired | (9,239 | ) | (327,816 | ) | ||||
Options assigned | — | — | ||||||
|
|
|
| |||||
Outstanding at December 31, 2016 | — | $ | — | |||||
|
|
|
| |||||
The following is a summary of Strategic Alpha Fund’s written interest rate swaption activity:
Strategic Alpha Fund | Notional | Premiums | ||||||
Outstanding at December 31, 2015 | $ | 130,200,000 | $ | 1,783,740 | ||||
Swaptions expired | (130,200,000 | ) | (1,783,740 | ) | ||||
Swaptions terminated in closing purchase transactions | — | — | ||||||
|
|
|
| |||||
Outstanding at December 31, 2016 | $ | — | $ | — | ||||
|
|
|
| |||||
OTC derivatives, including forward foreign currency contracts, options, interest rate swaptions and swap agreements, are entered into pursuant to International Swaps and Derivatives Association, Inc. (“ISDA”) agreements negotiated between the Funds and their counterparties. ISDA agreements typically contain, among other things, terms for the posting of collateral and master netting provisions in the event of a default or other termination event. Collateral is posted by a Fund or the counterparty to the extent of the net mark-to-market exposure to the other party of all open contracts under the agreement, subject to minimum transfer requirements. Master netting provisions allow
| 84
Table of Contents
Notes to Financial Statements (continued)
December 31, 2016
the Funds and the counterparty, in the event of a default or other termination event, to offset amounts owed by each related to derivative contracts, including any posted collateral, to one net amount payable by either the Funds or the counterparty. The Funds’ ISDA agreements typically contain provisions that allow a counterparty to terminate open contracts early if the NAV of a Fund declines beyond a certain threshold. For financial reporting purposes, the Funds do not offset derivative assets and liabilities, and any related collateral received or pledged, on the Statements of Assets and Liabilities.
As of December 31, 2016, gross amounts of OTC derivative assets and liabilities not offset in the Statements of Assets and Liabilities and the related net amounts after taking into account master netting arrangements, by counterparty, are as follows:
Strategic Alpha Fund
Counterparty | Gross Amounts | Offset | Net | Collateral | Net | |||||||||||||||
Bank of America, N.A. | $ | 4,306,787 | $ | (2,397,158 | ) | $ | 1,909,629 | $ | (1,909,629 | ) | $ | — | ||||||||
Barclays Bank PLC | 334,876 | (20,481 | ) | 314,395 | (289,630 | ) | 24,765 | |||||||||||||
Commonwealth Bank of Australia Sydney | 591,027 | — | 591,027 | — | 591,027 | |||||||||||||||
Deutsche Bank AG | 1,331,514 | (604,184 | ) | 727,330 | (727,330 | ) | — | |||||||||||||
JPMorgan Chase Bank, N.A. | 341,483 | (20,481 | ) | 321,002 | (321,002 | ) | — | |||||||||||||
Morgan Stanley Capital Services, Inc. | 1,622,987 | (940,052 | ) | 682,935 | — | 682,935 | ||||||||||||||
|
|
|
|
|
|
|
|
|
| |||||||||||
| $ | 8,528,674 | $ | (3,982,356 | ) | $ | 4,546,318 | $ | (3,247,591 | ) | $ | 1,298,727 | |||||||||
|
|
|
|
|
|
|
|
|
| |||||||||||
Counterparty | Gross Amounts | Offset | Net | Collateral | Net | |||||||||||||||
Bank of America, N.A. | $ | (2,397,158 | ) | $ | 2,397,158 | $ | — | $ | — | $ | — | |||||||||
Barclays Bank PLC | (20,481 | ) | 20,481 | — | — | — | ||||||||||||||
Credit Suisse International | (594,790 | ) | — | (594,790 | ) | 594,790 | — | |||||||||||||
Deutsche Bank AG | (604,184 | ) | 604,184 | — | — | — | ||||||||||||||
JPMorgan Chase Bank, N.A. | (20,481 | ) | 20,481 | — | — | — | ||||||||||||||
Morgan Stanley Capital Services, Inc. | (940,052 | ) | 940,052 | — | — | — | ||||||||||||||
|
|
|
|
|
|
|
|
|
| |||||||||||
| $ | (4,577,146 | ) | $ | 3,982,356 | $ | (594,790 | ) | $ | 594,790 | $ | — | |||||||||
|
|
|
|
|
|
|
|
|
| |||||||||||
85 |
Table of Contents
Notes to Financial Statements (continued)
December 31, 2016
The actual collateral received or pledged, if any, may exceed the amounts shown in the table due to overcollateralization. Timing differences may exist between when contracts under the ISDA agreements are marked-to-market and when collateral moves. The ISDA agreements include tri-party control agreements under which collateral is held for the benefit of the secured party at a third party custodian, State Street Bank.
Counterparty risk is managed based on policies and procedures established by each Fund’s adviser. Such policies and procedures may include, but are not limited to, minimum counterparty credit rating requirements, monitoring of counterparty credit default swap spreads and posting of collateral. A Fund’s risk of loss from counterparty credit risk on OTC derivatives is generally limited to the Fund’s aggregated unrealized gains and the amount of any collateral pledged to the counterparty, which may be offset by any collateral posted to the Fund by the counterparty. ISDA master agreements can help to manage counterparty risk by specifying collateral posting arrangements at pre-arranged exposure levels. Under these ISDA agreements, collateral is routinely transferred if the total net exposure in respect of certain transactions, net of existing collateral already in place, exceeds a specified amount (typically $250,000, depending on the counterparty). With exchange-traded derivatives, there is minimal counterparty credit risk to the Fund because the exchange’s clearinghouse, as counterparty to these instruments, stands between the buyer and the seller of the contract. Credit risk still exists in exchange-traded derivatives with respect to initial and variation margin that is held in a broker’s customer accounts. While brokers are required to segregate customer margin from their own assets, in the event that a broker becomes insolvent or goes into bankruptcy and at that time there is a shortfall in the aggregate amount of margin held by the broker for all its clients, U.S. bankruptcy laws will typically allocate that shortfall on a pro rata basis across all of the broker’s customers, potentially resulting in losses to the Fund. Based on balances reflected on each Fund’s Statement of Assets and Liabilities, the following table shows (i) the maximum amount of loss due to credit risk that, based on the gross fair value of the financial instrument, the applicable Fund would incur if parties (including OTC derivative counterparties and brokers holding margin for exchange-traded derivatives) to the relevant financial instruments failed completely to perform according to the terms of the contracts and the collateral or other security, if any, for the amount due proved to be of no value to the Fund, and (ii) the amount of loss that the applicable Fund would incur after taking into account master netting provisions pursuant to ISDA agreements, as of December 31, 2016:
Fund | Maximum Amount of Loss - Gross | Maximum Amount of Loss - Net | ||||||
Strategic Alpha Fund | $ | 24,052,794 | $ | 16,228,057 | ||||
| 86
Table of Contents
Notes to Financial Statements (continued)
December 31, 2016
These amounts include cash and U.S. government and agency securities received as collateral of $4,099,630. U.S. government and agency securities received as collateral are valued in accordance with the Fund’s valuation policies and are recorded on the Statements of Assets and Liabilities.
5. Purchases and Sales of Securities. For the year ended December 31, 2016, purchases and sales of securities (excluding short-term investments and option/swaption contracts and including paydowns) were as follows:
| U.S. Government/ Agency Securities | Other Securities | |||||||||||||||
Fund | Purchases | Sales | Purchases | Sales | ||||||||||||
Gateway Equity Call Premium Fund | $ | — | $ | — | $ | 25,694,211 | $ | 15,577,838 | ||||||||
Strategic Alpha Fund | — | 82,315,731 | 769,661,876 | 1,100,921,610 | ||||||||||||
6. Management Fees and Other Transactions with Affiliates.
a. Management Fees. Gateway Investment Advisers, LLC (“Gateway Advisers”) serves as investment adviser to Gateway Equity Call Premium Fund. Gateway Advisers is a subsidiary of Natixis Global Asset Management, L.P. (“Natixis US”), which is part of Natixis Global Asset Management, an international asset management group based in Paris, France. Under the terms of the management agreement, the Fund pays a management fee at the annual rate of 0.65%, calculated daily and payable monthly, based on the Fund’s average daily net assets.
Loomis, Sayles & Company, L.P. (“Loomis Sayles”) is the investment adviser to Strategic Alpha Fund. Loomis Sayles’ general partner is indirectly owned by Natixis US. Under the terms of the management agreement, the Fund pays a management fee at the annual rate of 0.70% of the Fund’s average daily net assets, calculated daily and payable monthly.
Gateway Advisers and Loomis Sayles have given binding undertakings to the Funds to waive management fees and/or reimburse certain expenses to limit the Funds’ operating expenses, exclusive of acquired fund fees and expenses, brokerage expenses, interest expense, taxes, organizational and extraordinary expenses such as litigation and indemnification expenses. These undertakings are in effect until April 30, 2017, may be terminated before then only with the consent of the Funds’ Board of Trustees, and are reevaluated on an annual basis. Management fees payable, as reflected on the Statements of Assets and Liabilities, is net of waivers and/or expense reimbursements, if any, pursuant to these undertakings. Waivers/reimbursements that exceed management fees payable are reflected on the Statements of Assets and Liabilities as receivable from investment adviser.
87 |
Table of Contents
Notes to Financial Statements (continued)
December 31, 2016
For the year ended December 31, 2016, the expense limits as a percentage of average daily net assets under the expense limitation agreements were as follows:
| Expense Limit as a Percentage of Average Daily Net Assets | ||||||||||||
Fund | Class A | Class C | Class Y | |||||||||
Gateway Equity Call Premium Fund | 1.20 | % | 1.95 | % | 0.95 | % | ||||||
Strategic Alpha Fund | 1.30 | % | 2.05 | % | 1.05 | % | ||||||
Gateway Advisers and Loomis Sayles shall be permitted to recover expenses they have borne under the expense limitation agreements (whether through waiver of its management fees or otherwise) on a class by class basis in later periods to the extent the annual operating expenses of a class fall below a class’ expense limits, provided, however, that a class is not obligated to pay such waived/reimbursed fees or expenses more than one year after the end of the fiscal year in which the fees or expenses were waived/reimbursed.
For the year ended December 31, 2016, the management fees and waivers of management fees for each Fund were as follows:
Gross | Waivers of | Net | Percentage of Average Daily Net Assets | |||||||||||||||||
Fund | Gross | Net | ||||||||||||||||||
Gateway Equity Call Premium Fund | $ | 420,410 | $ | 69,968 | $ | 350,442 | 0.65 | % | 0.54 | % | ||||||||||
Strategic Alpha Fund | 8,505,759 | — | 8,505,759 | 0.70 | % | 0.70 | % | |||||||||||||
| 1 | Management fee waivers are subject to possible recovery until December 31, 2017. |
No expenses were recovered for either Fund during the year ended December 31, 2016 under the terms of the expense limitation agreements.
b. Service and Distribution Fees. NGAM Distribution, L.P. (“NGAM Distribution”), which is a wholly-owned subsidiary of Natixis US, has entered into a distribution agreement with the Trusts. Pursuant to this agreement, NGAM Distribution serves as principal underwriter of the Funds of the Trusts.
Pursuant to Rule 12b-1 under the 1940 Act, the Trusts have adopted a Service Plan relating to each Fund’s Class A shares (the “Class A Plans”) and a Distribution and Service Plan relating to each Fund’s Class C shares (the “Class C Plans”).
Under the Class A Plans, each Fund pays NGAM Distribution a monthly service fee at an annual rate not to exceed 0.25% of the average daily net assets attributable to the
| 88
Table of Contents
Notes to Financial Statements (continued)
December 31, 2016
Fund’s Class A shares, as reimbursement for expenses incurred by NGAM Distribution in providing personal services to investors in Class A shares and/or the maintenance of shareholder accounts.
Under the Class C Plans, each Fund pays NGAM Distribution a monthly service fee at an annual rate not to exceed 0.25% of the average daily net assets attributable to the Fund’s Class C shares, as compensation for services provided by NGAM Distribution in providing personal services to investors in Class C shares and/or the maintenance of shareholder accounts.
Also under the Class C Plans, each Fund pays NGAM Distribution a monthly distribution fee at the annual rate of 0.75% of the average daily net assets attributable to the Fund’s Class C shares, as compensation for services provided by NGAM Distribution in connection with the marketing or sale of Class C shares.
For the year ended December 31, 2016, the service and distribution fees for each Fund were as follows:
| Service Fees | Distribution Fees | |||||||||||
Fund | Class A | Class C | Class C | |||||||||
Gateway Equity Call Premium Fund | $ | 14,469 | $ | 325 | $ | 976 | ||||||
Strategic Alpha Fund | 189,156 | 131,069 | 393,205 | |||||||||
c. Administrative Fees. NGAM Advisors provides certain administrative services for the Funds and contracts with State Street Bank to serve as sub-administrator. Pursuant to an agreement among Natixis Funds Trusts, Loomis Sayles Funds Trusts and NGAM Advisors, each Fund pays NGAM Advisors monthly its pro rata portion of fees equal to an annual rate of 0.0575% of the first $15 billion of the average daily net assets of the Natixis Funds Trusts and Loomis Sayles Funds Trusts, 0.0500% of the next $15 billion, 0.0400% of the next $30 billion, 0.0350% of the next $30 billion and 0.0325% of such assets in excess of $90 billion, subject to an annual aggregate minimum fee for the Natixis Funds Trusts and Loomis Sayles Funds Trusts of $10 million, which is reevaluated on an annual basis.
For the year ended December 31, 2016, the administrative fees for each Fund were as follows:
Fund | Administrative | |||
Gateway Equity Call Premium Fund | $ | 28,710 | ||
Strategic Alpha Fund | 539,257 | |||
d. Sub-Transfer Agent Fees. NGAM Distribution has entered into agreements, which include servicing agreements, with financial intermediaries that provide recordkeeping, processing, shareholder communications and other services to customers of the intermediaries that hold positions in the Funds and has agreed to
89 |
Table of Contents
Notes to Financial Statements (continued)
December 31, 2016
compensate the intermediaries for providing those services. Intermediaries transact with the Funds primarily through the use of omnibus accounts on behalf of their customers who hold positions in the Funds. These services would have been provided by the Funds’ transfer agent and other service providers if the shareholders’ accounts were maintained directly at the Funds’ transfer agent. Accordingly, the Funds have agreed to reimburse NGAM Distribution for all or a portion of the servicing fees paid to these intermediaries. The reimbursement amounts (sub-transfer agent fees) paid to NGAM Distribution are subject to a current per-account equivalent fee limit approved by the Funds’ Board of Trustees, which is based on fees for similar services paid to the Funds’ transfer agent and other service providers.
For the year ended December 31, 2016, the sub-transfer agent fees (which are reflected in transfer agent fees and expenses in the Statements of Operations) for each Fund were as follows:
Fund | Sub-Transfer | |||
Gateway Equity Call Premium Fund | $ | 28,321 | ||
Strategic Alpha Fund | 810,293 | |||
As of December 31, 2016, the Funds owe NGAM Distribution the following reimbursements for sub-transfer agent fees (which are reflected in the Statements of Assets and Liabilities as payable to distributor):
Fund | Reimbursements | |||
Gateway Equity Call Premium Fund | $ | 393 | ||
Strategic Alpha Fund | 9,984 | |||
e. Commissions. Commissions (including CDSCs) on Fund shares retained by NGAM Distribution during the year ended December 31, 2016 were as follows:
Fund | Commissions | |||
Strategic Alpha Fund | $ | 5,542 | ||
f. Trustees Fees and Expenses. The Trusts do not pay any compensation directly to their officers or Trustees who are directors, officers or employees of NGAM Advisors, NGAM Distribution, Natixis US or their affiliates. The Chairperson of the Board of Trustees receives a retainer fee at the annual rate of $325,000. The Chairperson does not receive any meeting attendance fees for Board of Trustees meetings or committee meetings that she attends. Each Independent Trustee (other than the Chairperson) receives, in the aggregate, a retainer fee at the annual rate of $155,000. Each Independent Trustee also receives a meeting attendance fee of $10,000 for each meeting of the Board of Trustees
| 90
Table of Contents
Notes to Financial Statements (continued)
December 31, 2016
that he or she attends in person and $5,000 for each meeting of the Board of Trustees that he or she attends telephonically. In addition, the chairperson of the Contract Review Committee and the chairperson of the Audit Committee each receive an additional retainer fee at the annual rate of $17,500. The chairperson of the Governance Committee receives an additional retainer fee at the annual rate of $10,000. Each Contract Review Committee member is compensated $6,000 for each Committee meeting that he or she attends in person and $3,000 for each meeting that he or she attends telephonically. Each Audit Committee member is compensated $6,000 for each Committee meeting that he or she attends in person and $3,000 for each meeting that he or she attends telephonically. These fees are allocated among the funds in the Natixis Funds Trusts and Loomis Sayles Funds Trusts based on a formula that takes into account, among other factors, the relative net assets of each fund. Trustees are reimbursed for travel expenses in connection with attendance at meetings.
A deferred compensation plan (the “Plan”) is available to the Trustees on a voluntary basis. Deferred amounts remain in the Funds until distributed in accordance with the provisions of the Plan. The value of a participating Trustee’s deferral account is based on theoretical investments of deferred amounts, on the normal payment dates, in certain funds of the Natixis Funds Trusts and Loomis Sayles Funds Trusts as designated by the participating Trustees. Changes in the value of participants’ deferral accounts are allocated pro rata among the funds in the Natixis Funds Trusts and Loomis Sayles Funds Trusts, and are normally reflected as Trustees’ fees and expenses in the Statements of Operations. The portions of the accrued obligations allocated to the Funds under the Plan are reflected as Deferred Trustees’ fees in the Statements of Assets and Liabilities.
g. Affiliated Ownership. As of December 31, 2016, Loomis Sayles Employees’ Profit Sharing Retirement Plan held shares of Strategic Alpha Fund representing 0.10% of the Fund’s net assets.
7. Line of Credit. Effective April 14, 2016, each Fund, together with certain other funds of Natixis Funds Trusts and Loomis Sayles Funds Trusts, entered into a 364-day, $400,000,000 syndicated, committed, unsecured line of credit with Citibank, N.A. to be used for temporary or emergency purposes only. Any one Fund may borrow up to the full $400,000,000 under the line of credit (as long as all borrowings by all Funds in the aggregate do not exceed the $400,000,000 limit at any time), subject to each Fund’s investment restrictions. Interest is charged to the Funds at a rate equal to the greater of the eurodollar or the federal funds rate plus 1.00%. In addition, a commitment fee of 0.10% per annum, payable on the last business day of each month, is accrued and apportioned among the participating funds based on their average daily unused portion of the line of credit. The Funds paid an arrangement fee, an upfront fee, and other fees in connection with the new line of credit agreement, which are being amortized over a period of 364 days and are reflected as miscellaneous expenses on the Statements of Operations. The unamortized balance is reflected as prepaid expenses on the Statements of Assets and Liabilities.
91 |
Table of Contents
Notes to Financial Statements (continued)
December 31, 2016
Prior to April 14, 2016 each Fund, together with certain other funds of Natixis Funds Trusts and Loomis Sayles Funds Trusts, participated in a $150,000,000 committed unsecured line of credit provided by State Street Bank. Any one Fund was able to borrow up to the full $150,000,000 under the line of credit (as long as all borrowings by all Funds in the aggregate do not exceed the $150,000,000 limit at any time). Interest was charged to each participating Fund based on its borrowings at a rate per annum equal to the greater of the Federal Funds rate or overnight LIBOR, plus 1.25%. In addition, a commitment fee of 0.15% per annum, payable at the end of each calendar quarter, was accrued and apportioned among the participating funds based on their average daily unused portion of the line of credit.
For the year ended December 31, 2016, none of the Funds had borrowings under these agreements.
8. Concentration of Risk. The Funds’ investments in foreign securities are subject to foreign currency fluctuations, higher volatility than U.S. securities, varying degrees of regulation and limited liquidity. Greater political, economic, credit and information risks are also associated with foreign securities.
Strategic Alpha Fund is non-diversified, which means it is not limited under the 1940 Act to a percentage of assets that it may invest in any one issuer. Because the Fund may invest in the securities of a limited number of issuers, an investment in the Fund may involve a higher degree of risk than would be present in a diversified portfolio.
9. Concentration of Ownership. From time to time, a Fund may have a concentration of one or more accounts constituting a significant percentage of shares outstanding. Investment activities by holders of such accounts could have material impacts on the Funds. As of December 31, 2016, based on management’s evaluation of the shareholder account base, the Funds had accounts representing controlling ownership of more than 5% of the Fund’s total outstanding shares. The number of such accounts, based on accounts that represent more than 5% of an individual class of shares, and the aggregate percentage of net assets represented by such holdings were as follows:
Fund | Number of 5% Non-Affiliated Account Holders | Percentage of | ||||||
Gateway Equity Call Premium Fund | 3 | 79.61 | % | |||||
Strategic Alpha Fund | 3 | 41.49 | % | |||||
Omnibus shareholder accounts for which NGAM Advisors understands that the intermediary has discretion over the underlying shareholder accounts or investment models where a shareholder account may be invested for a non-discretionary customer are included in the table above. For other omnibus accounts, the Funds do not have information on the individual shareholder
| 92
Table of Contents
Notes to Financial Statements (continued)
December 31, 2016
10. Capital Shares. The Fund may issue an unlimited number of shares of beneficial interest, without par value. Transactions in capital shares were as follows:
| | Year Ended December 31, 2016 | | | Year Ended December 31, 2015 | | |||||||||||
Gateway Equity Call Premium Fund | Shares | Amount | Shares | Amount | ||||||||||||
| Class A | ||||||||||||||||
Issued from the sale of shares | 592,010 | $ | 6,121,622 | 449,589 | $ | 4,570,382 | ||||||||||
Issued in connection with the reinvestment of distributions | 5,121 | 53,868 | 3,514 | 35,722 | ||||||||||||
Redeemed | (376,732 | ) | (3,971,403 | ) | (85,447 | ) | (858,858 | ) | ||||||||
|
|
|
|
|
|
|
| |||||||||
Net change | 220,399 | $ | 2,204,087 | 367,656 | $ | 3,747,246 | ||||||||||
|
|
|
|
|
|
|
| |||||||||
| Class C | ||||||||||||||||
Issued from the sale of shares | 45,956 | $ | 492,236 | 3,581 | $ | 36,310 | ||||||||||
Issued in connection with the reinvestment of distributions | 111 | 1,192 | 18 | 187 | ||||||||||||
Redeemed | (1,416 | ) | (14,955 | ) | (100 | ) | (1,028 | ) | ||||||||
|
|
|
|
|
|
|
| |||||||||
Net change | 44,651 | $ | 478,473 | 3,499 | $ | 35,469 | ||||||||||
|
|
|
|
|
|
|
| |||||||||
| Class Y | ||||||||||||||||
Issued from the sale of shares | 1,581,610 | $ | 15,844,856 | 4,210,869 | $ | 43,166,037 | ||||||||||
Issued in connection with the reinvestment of distributions | 39,283 | 412,824 | 27,812 | 281,744 | ||||||||||||
Redeemed | (708,332 | ) | (7,241,554 | ) | (1,402,243 | ) | (14,430,566 | ) | ||||||||
|
|
|
|
|
|
|
| |||||||||
Net change | 912,561 | $ | 9,016,126 | 2,836,438 | $ | 29,017,215 | ||||||||||
|
|
|
|
|
|
|
| |||||||||
Increase (decrease) from capital share transactions | 1,177,611 | $ | 11,698,686 | 3,207,593 | $ | 32,799,930 | ||||||||||
|
|
|
|
|
|
|
| |||||||||
93 |
Table of Contents
Notes to Financial Statements (continued)
December 31, 2016
10. Capital Shares (continued).
| | Year Ended December 31, 2016 | | Year Ended December 31, 2015 | |||||||||||||
Loomis Sayles Strategic Alpha Fund | Shares | Amount | Shares | Amount | ||||||||||||
| Class A | ||||||||||||||||
Issued from the sale of shares | 2,073,679 | $ | 19,966,508 | 6,366,120 | $ | 62,543,457 | ||||||||||
Issued in connection with the reinvestment of distributions | 102,020 | 979,713 | 318,954 | 3,111,420 | ||||||||||||
Redeemed | (7,583,445 | ) | (71,672,383 | ) | (4,852,855 | ) | (47,380,866 | ) | ||||||||
|
|
|
|
|
|
|
| |||||||||
Net change | (5,407,746 | ) | $ | (50,726,162 | ) | 1,832,219 | $ | 18,274,011 | ||||||||
|
|
|
|
|
|
|
| |||||||||
| Class C | ||||||||||||||||
Issued from the sale of shares | 285,547 | $ | 2,782,194 | 1,290,714 | $ | 12,573,109 | ||||||||||
Issued in connection with the reinvestment of distributions | 45,145 | 430,682 | 122,269 | 1,191,265 | ||||||||||||
Redeemed | (2,312,367 | ) | (22,078,378 | ) | (1,956,904 | ) | (19,229,282 | ) | ||||||||
|
|
|
|
|
|
|
| |||||||||
Net change | (1,981,675 | ) | $ | (18,865,502 | ) | (543,921 | ) | $ | (5,464,908 | ) | ||||||
|
|
|
|
|
|
|
| |||||||||
| Class Y | ||||||||||||||||
Issued from the sale of shares | 28,064,358 | $ | 270,266,593 | 44,468,853 | $ | 439,028,093 | ||||||||||
Issued in connection with the reinvestment of distributions | 1,876,898 | 18,017,506 | 3,252,297 | 31,686,738 | ||||||||||||
Redeemed | (45,303,829 | ) | (432,597,106 | ) | (41,791,361 | ) | (408,640,263 | ) | ||||||||
|
|
|
|
|
|
|
| |||||||||
Net change | (15,362,573 | ) | $ | (144,313,007 | ) | 5,929,789 | $ | 62,074,568 | ||||||||
|
|
|
|
|
|
|
| |||||||||
Increase (decrease) from capital share transactions | (22,751,994 | ) | $ | (213,904,671 | ) | 7,218,087 | $ | 74,883,671 | ||||||||
|
|
|
|
|
|
|
| |||||||||
| 94
Table of Contents
Report of Independent Registered Public Accounting Firm
To the Trustees of Gateway Trust and Natixis Funds Trust II and Shareholders of Gateway Equity Call Premium Fund and Loomis Sayles Strategic Alpha Fund:
In our opinion, the accompanying statements of assets and liabilities, including the portfolios of investments, and the related statements of operations and of changes in net assets and the financial highlights present fairly, in all material respects, the financial position of the Gateway Equity Call Premium Fund, a series of Gateway Trust, and Loomis Sayles Strategic Alpha Fund, a series of Natixis Funds Trust II (collectively, the “Funds”) as of December 31, 2016, and the results of each of their operations, the changes in each of their net assets and the financial highlights for each of the periods indicated, in conformity with accounting principles generally accepted in the United States of America. These financial statements and financial highlights (hereafter referred to as “financial statements”) are the responsibility of the Funds’ management. Our responsibility is to express an opinion on these financial statements based on our audits. We conducted our audits of these financial statements in accordance with the standards of the Public Company Accounting Oversight Board (United States). Those standards require that we plan and perform the audit to obtain reasonable assurance about whether the financial statements are free of material misstatement. An audit includes examining, on a test basis, evidence supporting the amounts and disclosures in the financial statements, assessing the accounting principles used and significant estimates made by management, and evaluating the overall financial statement presentation. We believe that our audits, which included confirmation of securities at December 31, 2016 by correspondence with the custodian, agent banks and brokers, provide a reasonable basis for our opinion.
PricewaterhouseCoopers LLP
Boston, Massachusetts
February 22, 2017
95 |
Table of Contents
2016 U.S. Tax Distribution Information to Shareholders (Unaudited)
Corporate Dividends Received Deduction. For the fiscal year ended December 31, 2016, a percentage of dividends distributed by the Funds listed below qualify for the dividends received deduction for corporate shareholders. These percentages are as follows:
Fund | Qualifying | |||
Gateway Equity Call Premium | 100.00 | % | ||
Strategic Alpha | 0.61 | % | ||
Qualified Dividend Income. A percentage of dividends distributed by the Funds during the fiscal year ended December 31, 2016 are considered qualified dividend income, and are eligible for reduced tax rates. These lower rates range from 0% to 20% depending on an individual’s tax bracket. These percentages are noted below:
Fund | Qualifying | |||
Gateway Equity Call Premium | 100.00 | % | ||
Strategic Alpha | 0.78 | % | ||
| 96
Table of Contents
Trustee and Officer Information
The tables below provide certain information regarding the trustees and officers of Natixis Funds Trust II and Gateway Trust (the “Trusts”). Unless otherwise indicated, the address of all persons below is 399 Boylston Street, Boston, MA 02116. The Funds’ Statement of Additional Information includes additional information about the trustees of the Trust and is available by calling Natixis Funds at 800-225-5478.
Name and Year of Birth | Position(s) Held of Office1 | Principal 5 Years | Number of and Other 5 Years | Experience, Membership | ||||
| INDEPENDENT TRUSTEES | ||||||||
Kenneth A. Drucker (1945) | Chairperson of the Board of Trustees since January 2017 Trustee since 2008 Ex Officio member of the Audit Committee, the Contract Review Committee and the Governance Committee | Retired | 53 None | Significant experience on the Board and on the boards of other business organizations (including at investment companies); executive experience (including as treasurer of an aerospace, automotive, and metal manufacturing corporation) | ||||
| Edmond J. English (1953) | Trustee since 2013 Audit Committee Member | Chief Executive Officer of Bob’s Discount Furniture (retail) | 53 Director, Burlington Stores, Inc. (retail) | Experience on the Board and significant experience on the boards of other business organizations (including retail companies and a bank); executive experience (including at a retail company) | ||||
97 |
Table of Contents
Trustee and Officer Information
Name and Year of Birth | Position(s) Held of Office1 | Principal 5 Years | Number of and Other 5 Years | Experience, Membership | ||||
| INDEPENDENT TRUSTEES continued | ||||||||
Richard A. Goglia (1951) | Trustee since 2015 Audit Committee Member | Retired; formerly Vice President and Treasurer of Raytheon Company (defense) | 53 None | Experience on the Board and executive experience (including his role as vice president and treasurer of a defense company and experience at a financial services company) | ||||
Wendell J. Knox (1948) | Trustee since 2009 Contract Review Committee Member and Governance Committee Member | Director of Abt Associates Inc. (research and consulting) | 53 Director, Eastern Bank (bank); Director, The Hanover Insurance Group (property and casualty insurance) | Significant experience on the Board and on the boards of other business organizations (including at a bank and at a property and casualty insurance firm); executive experience (including roles as president and chief executive officer of a research and consulting company) | ||||
| 98
Table of Contents
Trustee and Officer Information
Name and Year of Birth | Position(s) Held of Office1 | Principal 5 Years | Number of and Other 5 Years | Experience, Membership | ||||
| INDEPENDENT TRUSTEES continued | ||||||||
| Martin T. Meehan (1956) | Trustee since 2012 Contract Review Committee Member | President, University of Massachusetts; formerly, Chancellor and faculty member, University of Massachusetts Lowell | 53 None | Experience on the Board and on the boards of other business organizations; experience as President of the University of Massachusetts; government experience (including as a member of the U.S. House of Representatives); academic experience | ||||
Sandra O. Moose (1942) | Trustee since 1993 for Natixis Funds Trust II and since 2007 for Gateway Trust Audit Committee Member and Governance Committee Member | President, Strategic Advisory Services (management consulting) | 53 Formerly, Director, AES Corporation (international power company); formerly, Director, Verizon Communications (telecommunications company) | Significant experience on the Board and on the boards of other business organizations (including at a telecommunications company, an international power company and a specialty chemicals corporation); executive experience (including at a management consulting company) | ||||
99 |
Table of Contents
Trustee and Officer Information
Name and Year of Birth | Position(s) Held of Office1 | Principal 5 Years | Number of and Other 5 Years | Experience, Membership | ||||
| INDEPENDENT TRUSTEES continued | ||||||||
James P. Palermo (1955) | Trustee since 2016 Contract Review Committee Member | Founding Partner, Breton Capital Management, LLC (private equity); Partner, STEP Partners, LLC (private equity); formerly, Chief Executive Officer of Global Client Management of The Bank of New York Mellon Corporation | 53 None | Experience on the Board; financial services industry and executive experience (including roles as chief executive officer of client management and asset servicing for a banking and financial services company) | ||||
Erik R. Sirri (1958) | Trustee since 2009 Chairperson of the Audit Committee | Professor of Finance at Babson College | 53 None | Significant experience on the Board; experience as Director of the Division of Trading and Markets at the Securities and Exchange Commission; academic experience; training as an economist | ||||
Peter J. Smail (1952) | Trustee since 2009 Chairperson of the Contract Review Committee and Governance Committee Member | Retired | 53 None | Significant experience on the Board; mutual fund industry and executive experience (including roles as president and chief executive officer for an investment adviser) | ||||
| 100
Table of Contents
Trustee and Officer Information
Name and Year of Birth | Position(s) Held of Office1 | Principal 5 Years | Number of and Other 5 Years | Experience, Membership | ||||
| INDEPENDENT TRUSTEES continued | ||||||||
Cynthia L. Walker (1956) | Trustee since 2005 for Natixis Funds Trust II and since 2007 for Gateway Trust Chairperson of the Governance Committee and Audit Committee Member | Deputy Dean for Finance and Administration, Yale University School of Medicine | 53 None | Significant experience on the Board; executive experience in a variety of academic organizations (including roles as dean for finance and administration) | ||||
| INTERESTED TRUSTEES | ||||||||
Kevin P. Charleston3 (1965) One Financial Center Boston, MA 02111 | Trustee since 2015 | President, Chief Executive Officer and Director; formerly, Chief Financial Officer, Loomis, Sayles & Company, L.P. | 53 None | Experience on the Board; continuing service as President, Chief Executive Officer and Director of Loomis, Sayles & Company, L.P. | ||||
David L. Giunta4 (1965) | Trustee since 2011 President and Chief Executive Officer since 2008 | President and Chief Executive Officer, NGAM Distribution Corporation, NGAM Advisors, L.P. and NGAM Distribution, L.P. | 53 None | Significant experience on the Board; continuing experience as President and Chief Executive Officer of NGAM Advisors, L.P. | ||||
| 1 | Each trustee serves until retirement, resignation or removal from the Board. The current retirement age is 75. The position of Chairperson of the Board is appointed for a three-year term. |
| 2 | The trustees of the Trusts serve as trustees of a fund complex that includes all series of the Natixis Funds Trust I, Natixis Funds Trust II, Natixis Funds Trust IV and Gateway Trust (collectively, the “Natixis Funds Trusts”), Loomis Sayles Funds I and Loomis Sayles Funds II (collectively, the “Loomis Sayles Funds Trusts”) and Natixis ETF Trust (collectively, the “Fund Complex”). |
| 3 | Mr. Charleston is deemed an “interested person” of the Trusts because he holds the following positions with an affiliated person of the Trusts: President and Chief Executive Officer of Loomis, Sayles & Company, L.P. |
| 4 | Mr. Giunta is deemed an “interested person” of the Trusts because he holds the following positions with an affiliated person of the Trusts: President and Chief Executive Officer of NGAM Distribution Corporation, NGAM Advisors, L.P. and NGAM Distribution, L.P. |
101 |
Table of Contents
Trustee and Officer Information
Name and Year of Birth | Position(s) Held with the Trust | Term of Office1 and Length of Time Served | Principal Occupation(s) During Past 5 Years2 | |||
| OFFICERS OF THE TRUST | ||||||
Russell L. Kane (1969) | Secretary, Clerk and Chief Legal Officer | Since July 2016 | Executive Vice President, General Counsel, Secretary and Clerk, NGAM Distribution Corporation, NGAM Advisors, L.P. and NGAM Distribution, L.P.; formerly, Chief Compliance Officer for Mutual Funds, Senior Vice President, Deputy General Counsel, Assistant Secretary and Assistant Clerk, NGAM Distribution Corporation, NGAM Advisors, L.P. and NGAM Distribution, L.P. | |||
Michael C. Kardok (1959) | Treasurer, Principal Financial and Accounting Officer | Since October 2004 for Natixis Funds Trust II and since May 2007 for Gateway Trust | Senior Vice President, NGAM Advisors, L.P. and NGAM Distribution, L.P. | |||
Rosa Licea-Mailloux (1976) | Chief Compliance Officer, Assistant Secretary and Anti-Money Laundering Officer | Since July 2016 | Senior Vice President, Deputy General Counsel, Assistant Secretary and Assistant Clerk, NGAM Distribution Corporation, NGAM Advisors, L.P. and NGAM Distribution, L.P.; formerly, Associate General Counsel, NGAM Distribution, L.P. | |||
| 1 | Each officer of the Trusts serves for an indefinite term in accordance with the Trusts’ current by-laws until the date his or her successor is elected and qualified, or until he or she sooner dies, retires, is removed or becomes disqualified. |
| 2 | Each person listed above, except as noted, holds the same position(s) with the Fund Complex. Previous positions during the past five years with NGAM Distribution, L.P., NGAM Advisors, L.P. or Loomis, Sayles & Company, L.P. are omitted, if not materially different from a trustee’s or officer’s current position with such entity. |
| 102
Table of Contents
Item 2. Code of Ethics.
The Registrant has adopted a code of ethics that applies to the Registrant’s principal executive officer, principal financial officer and persons performing similar functions. There have been no amendments or waivers of the Registrant’s code of ethics during the period.
Item 3. Audit Committee Financial Expert.
The Board of Trustees of the Registrant has established an audit committee. Mr. Kenneth A. Drucker, Mr. Edmond J. English, Mr. Richard A. Goglia, Ms. Sandra O. Moose, Mr. Erik R. Sirri and Ms. Cynthia L. Walker are members of the audit committee and have been designated as “audit committee financial experts” by the Board of Trustees. Each of these individuals is also an Independent Trustee of the Registrant.
Item 4. Principal Accountant Fees and Services.
Fees billed by the Principal Accountant for services rendered to the Registrant.
The table below sets forth fees billed by the principal accountant, PricewaterhouseCoopers LLP, for the past two fiscal years for professional services rendered in connection with a) the audit of the Registrant’s annual financial statements and services provided in connection with regulatory filings; b) audit-related services (including services that are reasonably related to the performance of the audit of the Registrant’s financial statements but not reported under “Audit Fees”); c) tax compliance, tax advice and tax planning and d) all other fees billed for professional services rendered by the principal accountant to the Registrant, other than the services provided as reported as a part of (a) through (c) of this Item.
| Audit fees | Audit-related fees1 | Tax fees2 | All other fees | |||||||||||||||||||||||||||||
| 1/1/15- 12/31/15 | 1/1/16- 12/31/16 | 1/1/15- 12/31/15 | 1/1/16- 12/31/16 | 1/1/15- 12/31/15 | 1/1/16- 12/31/16 | 1/1/15- 12/31/15 | 1/1/16- 12/31/16 | |||||||||||||||||||||||||
Gateway Trust | $ | 80,438 | $ | 81,644 | $ | 1,050 | $ | 1,380 | $ | 17,232 | $ | 17,490 | $ | — | $ | — | ||||||||||||||||
| 1. | Audit-related fees consist of: |
2015 & 2016– performance of agreed-upon procedures related to the Registrant’s deferred compensation plan.
| 2. | Tax fees consist of: |
2015 & 2016 – review of the Registrant’s tax returns.
Aggregate fees billed to the Registrant for non-audit services during 2015 and 2016 were $18,282 and $18,870 respectively.
Fees billed by the Principal Accountant for services rendered to the Adviser and Control Affiliates.
The following table sets forth fees billed by the Registrant’s principal accountant for non-audit services rendered to Gateway Investment Advisers, LLC and entities controlling, controlled by or under common control with Gateway Investment Advisers, LLC (“Control Affiliates”) that provide ongoing services to the Registrant, for engagements that related directly to the operations and financial reporting of the Registrant for the last two fiscal years.
| Audit-related fees | Tax fees | All other fees | ||||||||||||||||||||||
| 1/1/15- 12/31/15 | 1/1/16- 12/31/16 | 1/1/15- 12/31/15 | 1/1/16- 12/31/16 | 1/1/15- 12/31/15 | 1/1/16- 12/31/16 | |||||||||||||||||||
Control Affiliates | $ | — | $ | — | $ | — | $ | — | $ | — | $ | — | ||||||||||||
The following table sets forth the aggregate fees billed by the Registrant’s principal accountant for non-audit services rendered to Gateway Investment Advisers, LLC and Control Affiliates that provide ongoing services to the Registrant, for the last two fiscal years, including the fees disclosed in the table above.
Table of Contents
| Aggregate Non-Audit Fees | ||||||||
| 1/1/15- 12/31/15 | 1/1/16- 12/31/16 | |||||||
Control Affiliates | $ | 41,200 | $ | 82,978 | ||||
None of the services described above were approved pursuant to (c)(7)(i)(C) of Regulation S-X.
Audit Committee Pre Approval Policies.
Annually, the Registrant’s Audit Committee reviews the audit, audit-related, tax and other non-audit services together with the projected fees, for services proposed to be rendered to the Trust and/or other entities for which pre-approval is required during the upcoming year. Any subsequent revisions to already pre-approved services or fees (including fee increases) and requests for pre-approval of new services would be presented for consideration quarterly as needed.
If, in the opinion of management, a proposed engagement by the Registrant’s independent accountants needs to commence before the next regularly scheduled Audit Committee meeting, any member of the Audit Committee who is an independent Board member is authorized to pre-approve the engagement, but only for engagements to provide audit, audit related and tax services. This approval is subject to review of the full Audit Committee at its next quarterly meeting. All other engagements require the approval of all the members of the Audit Committee.
Item 5. Audit Committee of Listed Registrants.
Not applicable.
Item 6. Schedule of Investments.
Included as part of the Report to Shareholders filed as Item 1 herewith.
Item 7. Disclosure of Proxy Voting Policies and Procedures for Closed-End Management Investment Companies.
Not applicable.
Item 8. Portfolio Managers of Closed-End Management Investment Companies.
Not applicable.
Item 9. Purchases of Equity Securities by Closed-End Management Investment Companies and Affiliated Purchasers.
Not applicable.
Item 10. Submission of Matters to a Vote of Securities Holders.
There were no material changes to the procedures by which shareholders may recommend nominees to the Registrant’s Board of Trustees.
Item 11. Controls and Procedures.
The Registrant’s principal executive officer and principal financial officer have concluded that the Registrant’s disclosure controls and procedures are sufficient to ensure that information required to be disclosed by the Registrant in this Form N-CSR was recorded, processed, summarized and reported within the time periods specified in the Securities and Exchange Commission’s rules and forms, based upon such officers’ evaluation of these controls and procedures as of a date within 90 days of the filing date of the report.
There were no changes in the Registrant’s internal control over financial reporting that occurred during the Registrant’s last fiscal quarter of the period covered by this report that has materially affected, or is reasonably likely to materially affect, the Registrant’s internal control over financial reporting.
Table of Contents
Item 12. Exhibits.
| (a) | (1) | Code of Ethics required by Item 2 hereof, filed herewith as Exhibit (a)(1). | ||
| (a) | (2) | Certifications of Principal Executive Officer and Principal Financial Officer pursuant to Rule 30a-2(a) under the Investment Company Act of 1940 [17 CFR 270.30a-2(a)], filed herewith as Exhibits (a)(2)(1) and (a)(2)(2), respectively. | ||
| (a) | (3) | Not applicable. | ||
| (b) | Certifications of Principal Executive Officer and Principal Financial Officer pursuant to Section 906 of Sarbanes-Oxley Act of 2002 are filed herewith as Exhibit (b). | |||
Table of Contents
SIGNATURES
Pursuant to the requirements of the Securities Exchange Act of 1934 and the Investment Company Act of 1940, the Registrant has duly caused this report to be signed on its behalf by the undersigned, thereunto duly authorized.
| Gateway Trust | ||
| By: | /s/ David L. Giunta | |
| Name: | David L. Giunta | |
| Title: | President and Chief Executive Officer | |
| Date: | February 22, 2017 | |
Pursuant to the requirements of the Securities Exchange Act of 1934 and the Investment Company Act of 1940, this report has been signed by the following persons on behalf of the Registrant and in the capacities and on the dates indicated.
| By: | /s/ David L. Giunta | |
| Name: | David L. Giunta | |
| Title: | President and Chief Executive Officer | |
| Date: | February 22, 2017 | |
| By: | /s/ Michael C. Kardok | |
| Name: | Michael C. Kardok | |
| Title: | Treasurer | |
| Date: | February 22, 2017 | |