Exhibit 99.1
| HeaderBackground.jpgvisionLogoRev.pngSevenHills912-334.jpgPRO_1714.jpgextended waterdrop.jpgiStock_000013707527_Large.jpgForestar Investor Conference December 11, 2012 Building Momentum By Accelerating Value Realization, Optimizing Transparency and Growing Net Asset Value |
| Fore_logo.epsCommunityDevHeader.jpgNotice To Investors This presentation contains “forward-looking statements” within the meaning of the federal securities laws. These statements reflect management’s current views with respect to future events and are subject to risk and uncertainties. We note that a variety of factors and uncertainties could cause our actual results to differ significantly from the results discussed in the forward-looking statements. Factors and uncertainties that might cause such differences include but are not limited to general economic, market, or business conditions; the opportunities (or lack thereof) that may be presented to us and that we may pursue; fluctuations in commodity prices, particularly oil and gas, and in costs and expenses including development costs; demand for new housing, including impacts from mortgage credit availability; lengthy and uncertain entitlement processes; cyclicality of our businesses; accuracy of accounting assumptions; competitive actions by other companies; changes in laws or regulations; and other factors, many of which are beyond our control. Except as required by law, we expressly disclaim any obligation to publicly revise any forward- looking statements contained in this presentation to reflect the occurrence of events after the date of this presentation. This presentation includes Non-GAAP financial measures. The required reconciliation to GAAP financial measures can be found as an exhibit to this presentation and on our website at www.forestargroup.com. 2 |
| Fore_logo.epsHeaderBackground.jpgForestar Investor Conference visionLogoRev.pngJim DeCosmo – President & Chief Executive Officer Building Momentum By Accelerating Value Realization, Optimizing Transparency and Growing Net Asset Value 3 SevenHills912-334.jpgPRO_1714.jpgextended waterdrop.jpgiStock_000013707527_Large.jpg Fore_logo.epsRedheadedOilpump.jpgInvestor Conference Agenda Time Topic Presenter 8:30 am Strategy & Vision Jim DeCosmo President & CEO 9:00 am Oil & Gas Flavious Smith Chief Oil & Gas Officer 10:00 am Break 10:15 am Real Estate Bruce Dickson Chief Real Estate Officer Community Development Michael Quinley EVP Real Estate Eastern Region Tom Burleson EVP Real Estate Western Region Community Development Multifamily Phil Weber EVP Real Estate 11:15 am Water Resources Phil Weber EVP Real Estate 11:30 am Financial Review Chris Nines Chief Financial Officer 11:50 am Closing Comments Jim DeCosmo President & CEO 4 |
| Fore_logo.epsRedheadedOilpump.jpgShort History Focused on Strengthening Balance Sheet and Positioning Business For Growth Year Strategic Initiative Accomplishments 2008 Became a public company following spin-off from Temple-Inland 2009 Announced Strategic Initiatives: •Sell 175,000 acres of Timberland •Reduce Debt by $150 Million •Repurchase up to 20% of the Stock .Sold 113,200 acres of timberland - $205 million* .Reduced debt over $120 million 2010 .Sold 29,800 acres of timberland - $59 million* .Repurchased one million shares .Reduced debt over $22 million** 2011 .Sold 74,300 acres of timberland - $128 million* .Completed timberland sales initiatives .Repurchased almost one million shares * Note: Includes retail land sales ** Excluding $26.5 million non-recourse debt associated with the acquisition of multifamily project in Q4 2010 5 |
| Fore_logo.epsRedheadedOilpump.jpg$150 Million Debt Reduction Initiative Positioned Forestar for Growth ($ in millions) Q1 2009 Q2 2012 Total Assets $834 $778 Total Consolidated Debt $349 $202 Total Debt/Capital 44% 28% Total Liquidity* $176 $189 * Represents cash plus available liquidity under senior credit facility Execution of Strategic Initiatives Positioned Forestar with Strong Balance Sheet, Ample Liquidity and Assets Best Positioned To Generate Earnings and Cash Flow Going Forward 6 |
| Fore_logo.epsRedheadedOilpump.jpgExecution of Initiatives and Strategic Acquisitions Positions Forestar With Stronger Portfolio of Assets Assets and Resources at Q3 2012 Real Estate •Land - 143,000 acres of low basis land •Projects - 96 (8 states and 12 markets) •Significant Commercial Assets – 4 Mineral Resources •Fee and Leasehold Interests - 735,000 net acres* •Producing Wells – 924** Water Resources • Water Interests - 1.6 million acres*** Note: includes ventures * Includes 142,000 net acres of leasehold interest associated with the acquisition of Credo Petroleum **Includes working interest and royalty interest wells; excludes 1,181 wells with overriding royalty interest ***Includes a 45% non-participating royalty interest in 1.38 million acres 7 |
| Fore_logo.epsCommunityDevHeader.jpgFocused on Value Creation and Realization 8 Recognizing and responsibly delivering the greatest value from every acre Growing through strategic and disciplined investments REAL ESTATE OIL AND GAS Maximizing Long-Term Shareholder Value STRATEGY 8 |

| Fore_logo.epsRedheadedOilpump.jpgTriple in FOR Initiatives Focused on Accelerating Value Realization and Growing Net Asset Value Focus on Accelerating Value Realization Triple Total Segment EBITDA - Residential Lot Sales and Oil & Gas Production Optimize Transparency & Disclosure Expand Reported Disclosure - Oil and Gas Resource Potential & Water Interests Raise NAV Through Strategic and Disciplined Investments Invest in Growth Opportunities - Prove Up NAV and Exceed Return Requirements Forestar is committed to maximizing long-term shareholder value through execution of Triple in FOR strategic initiatives 9 Fore_logo.epsRedheadedOilpump.jpgAccelerating Value Realization Through Increased Oil Production 0 300,000 600,000 900,000 2010 2011 Est. 2012 Triple In FOR Avg. Oil Production (Bbls) FOR Oil Production Credo Oil Production Forestar’s Share of Total Oil Production 2010 – 2012 Est.* Minerals Resources Initiatives Establish operating platform: .Acquired Credo Petroleum - providing foundation for future growth and investment .Improves ability to report additional reserve categories Grow production and reserves through increased working interest investments Accelerate marketing and promotion of minerals through development of prospects 10 *Note: Est. 2012 Includes full year Credo production |
| Fore_logo.epsCommunityDevHeader.jpgAccelerating Value Realization Through Increased Residential Lot Sales 804 2,200 2008 2009 2010 2011 2012 Est. Triple in FOR Avg. Forestar Lot Sales Avg. Lot Margin U.S. Single-Family Starts Residential Lot Sales & Average Margin FOR Peak Annual Lot Sales = 3,600 Community Development Initiatives Continue increasing market share in Texas Execute opportunistic acquisitions and invest in well located communities Reposition non-core real estate assets 11 |
| Fore_logo.eps($20) $0 $20 $40 $60 $80 $100 $120 $140 2008 2009 2010 2011 2012 Est. Total Segment EBITDA ($ in millions) Working Interests Royalty Interests Lease Bonus Multifamily Income Producing Commercial Tract Residential Tract Residential Lots RedheadedOilpump.jpgGrowing Total Segment EBITDA Through Triple in FOR Initiatives Accelerating Value Realization + Credo Acquisition $120 million (Average) $34 million Note: EBITDA = Total segment earnings + depreciation + depletion and amortization EBITDA is a Non-GAAP financial measure. The reconciliation between GAAP and Non-GAAP financial measures is included in the appendix to this presentation and provided on the company’s investor relations website. 12 2012 - 2015 |
| Fore_logo.epsRedheadedOilpump.jpgOptimize Transparency Through Disclosure of Oil and Gas Resource Potential Proved Developed Proved Behind Pipe Proved Undeveloped Probable Possible Resource Proven Reserves Forestar YE 2011 Reserves (MMboe) Credo Fiscal YE 2011 Reserves (MMboe) 3.0 1.7 ? 0.3 ? 2.1 ? ? ? ? ? ? Unproven Significant Opportunity for Additional Disclosure 13 |
| Fore_logo.epsWaterDroplet.jpgExpand Reported Disclosure of Water Resources •Forestar has interests in almost 1.6 million acres of water rights •Focused on improving transparency and disclosures •Acres by aquifer •Sustainable production levels (acre feet of annual production) •Other water resource sales or market transactions •Permits •Purchase and Sale Agreements 14 |
| Fore_logo.epsRedheadedOilpump.jpgInvest in Growth Opportunities Which Prove Up Net Asset Value and Exceed Return Requirements Single_Family.aiGrowth Strategy Founded on Disciplined Financial Management and Maintaining Balance Sheet Flexibility Single-Family / Community Development •Strategic acquisitions in “A” locations that generate near-term earnings and cash flow and exceed return requirements Oil & Gas •Lower-risk working interest investments •Acquisitions which prove-up the value of our resources and improve transparency Multifamily •Acquisition of additional development sites •20-25% equity co-investment in development projects 15 |

| Fore_logo.epsTimberlandHeader.jpgForestar Well Positioned To Accelerate Value Realization, Optimize Transparency and Grow NAV Increasing oil production and proven reserves Growing lot sales and increasing market share Realizing value from stabilized commercial assets Capitalizing on growth opportunities and investments to generate near-term cash flow and earnings Building Momentum By Accelerating Value Realization, Optimizing Transparency and Growing NAV Single_Family.ai2011 Strategy-Six Symbols.ai16 |
| HeaderBackground.jpgOil & Gas visionLogoRev.png6_a.jpgFlavious Smith - Chief Oil & Gas Officer Building Momentum By Driving Leasing and Exploration to Increase Production and Reserves 17 |
| Fore_logo.epsRedheadedOilpump.jpg Oil & Gas Presentation Outline •Oil & Gas Market Conditions •Forestar Minerals – Leveraging our ownership in East Texas & Louisiana •Becoming an Operator – Credo Acquisition Benefits •Credo Acquisition – “Pulling Back the Curtain” •Bakken / Three Forks •Kansas & Nebraska Exploration Opportunities •Oil & Gas Operating and Investment Strategy •Realizing the Greatest Value From Every Mineral Acre in 2013 and Beyond 18 |
| RedheadedOilpump.jpgCrude Oil Pricing Torn Between Weakening Demand Fundamentals and Geopolitical Risk •Limited OPEC spare capacity and moderate inventory levels •North American supply growth •Shale resource developments provide strong growth in supply •US production set to almost double from 2009 - 2020 •U.S. anticipated to be energy self- sufficient by 2030 19 Global Oil Balance Supply, demand and OPEC spare capacity - 1 2 3 4 5 83 85 87 89 91 2008 2009 2010 2011 2012 2013 OPEC Spare Capacity Supply Demand OPEC spare capacity (right hand scale) Million Bbls / day Million Bbls / day $20 $40 $60 $80 $100 $120 Apr-12 Jun-12 Aug-12 Oct-12 Dec-12 Feb-13 Apr-13 Jun-13 Aug-13 Oct-13 Dec-13 Oil Oil NYMEX Forward Curve – Crude Oil USD / Barrel Oil Price |

| RedheadedOilpump.jpgU.S. Natural Gas Markets Saturated, But Positioned For Rebound •Natural gas inventories and production levels remain high •Weak supply response to depressed prices driven by highly productive resource plays •However, current natural gas inventory returning to balance •Demand levels relatively flat, power sector provides growth potential •Natural gas displacing coal •Natural gas pricing increases over time from increased demand and reduced levels of production - 500 1,000 1,500 2,000 - 300 600 900 1,200 1,500 Jan-07 Jan-08 Jan-09 Jan-10 Jan-11 Jan-12 Oil Rigs Natural Gas Rigs Gas Production U.S. Natural Gas Production vs. Rigs Bcf Rigs $2.00 $3.00 $4.00 $5.00 Apr-12 Jun-12 Aug-12 Oct-12 Dec-12 Feb-13 Apr-13 Jun-13 Aug-13 Oct-13 Dec-13 Natural Gas Price Natural Gas NYMEX Natural Gas Price Expectations Natural Gas Price Trend line 20 Source: Energy Information Administration |
| HeaderBackground.jpgForestar Minerals – Leveraging Our Ownership in East Texas & Louisiana visionLogoRev.png6_a.jpgFlavious Smith - Chief Oil & Gas Officer Building Momentum By Driving Leasing and Exploration to Increase Production and Reserves 21 |
| RedheadedOilpump.jpgVALUE CREATION & REALIZATION Minerals Greatest Value Production - Reserves Lease - Bonus Explore / Seismic Market - Promote Recognizing and Responsibly Delivering the Greatest Value From Our Mineral Resources Recognize and Deliver the Greatest Value from Every Mineral Acre Acres* 38,000 37,000 52,000 466,000 593,000 * Acres as of Q3 2012; excludes approximately 142,000 net acres of leasehold mineral interests associated with acquisition of Credo Petroleum 22 |

| RedheadedOilpump.jpgStrategic Initiatives Focused on Realizing the Greatest Value From Minerals Strategy Initiatives Growing Production, Reserves and Value .Establish operating and investment platform .Increasing transparency and disclosure •Marketing and promoting prospects •Maximizing lease bonus, negotiating drilling requirements, royalty and additional interest in production •Investing in lower-risk non-operating working interests 23 |

| RedheadedOilpump.jpgAccelerating Value Realization of Minerals Through Production and Reserve Growth 0 50,000 100,000 150,000 200,000 250,000 2010 2011 Est. 2012 Oil Production (Bbls) 45% CAGR Forestar Share of Annual Oil Production 2010 – 2012 Forestar Reserves PV-10* 2009 - 2011 ($ in millions) *PV-10 represents present value of estimated future oil and gas revenues, net of estimated direct expenses, discounted at an annual discount rate of 10%, before income taxes. PV-10 is a Non-GAAP financial measure. The reconciliation between GAAP and Non-GAAP financial measures is provided in the appendix to this presentation and on the company’s investor relations website. $34 $81 $0.0 $30.0 $60.0 $90.0 2009 2010 2011 Oil Natural Gas 74% Oil 24 50% CAGR Note: information excludes acquisition of Credo Petroleum RedheadedOilpump.jpgC:\Users\fsmith\AppData\Local\Microsoft\Windows\Temporary Internet Files\Content.Outlook\R0MFCOCI\TX_LA_Lease_Activity_2011.jpgRodessa ~24,000 acres Oil / NGL’s / Natural Gas Target Specific Zones and Formations For Prospect Generation Pettet ~2,000 acres Oil / NGL’s / Natural Gas Glen Rose ~33,000 acres Oil / NGL’s / Natural Gas Bossier ~10,700 acres Natural Gas Austin Chalk ~50,000 acres Oil / NGL’s Tuscaloosa Marine Shale ~17,500 acres Oil / NGL’s / Natural Gas Bossier-Haynesville Shale and James Lime ~22,000 acres Natural Gas Wilcox ~60,000 Acres Oil / NGL’s / Natural Gas Targeting Over 220,000 Acres For Oil and Natural Gas Prospects Bossier-Haynesville Shale Natural Gas James Lime Oil / NGL’s / Natural Gas ~22,000 acres 25 |
| Mineral Activity (2010 - Q3 2012) RedheadedOilpump.jpgNote: Wells owned by third-party lessee / operator Leasing: .28,900 acres leased .$479 / acre Seismic Agreements: .33,600 acres .> 26,000 acres of 3-D seismic received to generate prospects Exploration Agreements: .18,000 net mineral acres Lease Structure Benefits: .Drilling requirements .Horizontal and vertical Pugh clause .Working interest options Available For Lease Acres Leased Held By Production Over 81,000 net mineral acres “put in play” in Louisiana & Texas* Significant Operators – Texas & Louisiana DevonEl PasoGoodrich Petroleumhttp://www.swiftenergy.com/INVESTOR-RELATIONS/Current-Corporate-Presentations/SFY-current-slide.jpg* Includes leases, seismic and exploration agreements Promoting Louisiana Exploration and Production Activity 2010 - 2012 26 TEXAS TEXAS Chesapeake logohttp://www.cabotog.com/images/topbar.jpgEOG Resources, Inc. logo Value Components % of Well Economics Capital Q3 2012 Wells Operating 50 – 100% Moderate -- Working Interest 10 – 50% Low to Moderate 10 Royalties 20 – 25% None 542 Leases < 5% None -- Total 100% 542* Value Creation & Realization * FOR may have a working interest and royalty interest in same well Enhancing Minerals Value Creation and Realization RedheadedOilpump.jpgEnhancing Minerals Value Creation and Realization Through Operating Platform 27 Note: Excludes approximately 382 gross wells associated with the acquisition of Credo Petroleum |
| HeaderBackground.jpgAcquisition of Credo Petroleum visionLogoRev.png6_a.jpgFlavious Smith - Chief Oil & Gas Officer Building Momentum By Driving Leasing and Exploration to Increase Production and Reserves 28 |
| •Acquisition of CREDO Petroleum (NASDAQ:CRED) for $14.50 per share •Oil focused E&P operator headquartered in Denver, CO •Total equity value $146 million - all cash •Consistent with Strategy and Triple in FOR initiatives Strategic acquisition consistent with Triple in FOR initiatives - accelerate value realization, optimize transparency and grow net asset value through strategic and disciplined investments RedheadedOilpump.jpgStrategic Acquisition to Accelerate Value Realization, Optimize Transparency and Grow Net Asset Value 29 |
| * Note: Includes approximately 8,000 net mineral acres located in various states related to overriding royalty interests 30 Credo Acquisition Benefits Increased Scale Doubles Production & Reserves Meaningful Interests In Prolific Basins 142,000 net acres in oil-rich basins* •6,000 net acres / 77,000 gross acres in Bakken / Three Forks Disclosure Benefits Expands ability to report oil and gas reserve categories RedheadedOilpump.jpgAcquisition Provides Meaningful Scale and Solid Platform For Future Growth and Investment http://www.theepochtimes.com/n2/images/stories/large/2012/06/21/141677015.jpg30 |
| RedheadedOilpump.jpg 20,000 40,000 60,000 80,000 Q1 2010 Q2 2010 Q3 2010 Q4 2010 Q1 2011 Q2 2011 Q3 2011 Q4 2011 Q1 2012 Q2 2012 Q3 2012 Barrels CREDO PV-10* Fiscal 2008 –2011 ($ in millions) Credo Oil Production Growth Accelerating Timely acquisition as production and reserve growth increasing $0.0 $10.0 $20.0 $30.0 $40.0 $50.0 $60.0 $70.0 2008 2009 2010 2011 PV-10 25% CAGR *PV-10 represents present value of estimated future oil and gas revenues, net of estimated direct expenses, discounted at an annual discount rate of 10%, before income taxes. Future Net Cash flows represents an undiscounted value based upon estimate of future net cash flows from proved developed reserves after deducting estimated severance and ad valorem taxes, operating expenses and capital costs, but before deducting estimates of future income taxes These are Non-GAAP financial measures. The reconciliation between GAAP and Non-GAAP financial measures is provided in the appendix to this presentation and on the company’s investor relations website. 31 CREDO Quarterly Oil Production Fiscal Q1 2010 – Q3 2012 31 Annual Oil Production Forestar Oil & Gas Highlights •735,000 net mineral acres* •924 gross wells** •382 working interest •542 royalty interest •~900,000 BOE of annual production*** •Oil = 475,000 Bbls •Natural Gas = 2.5 Bcfe 0 300,000 600,000 900,000 2008 2009 2010 2011 Est. 2012 Triple in FOR Avg. Oil Production (Bbls) Forestar Credo Petroleum * Includes owned mineral interests, leasehold interests and overriding royalty interests ** Excludes 1,181 wells with overriding royalty interest *** Based upon trailing twelve months production for Forestar and Credo RedheadedOilpump.jpgAcquisition Essentially Doubles Production and Positions Forestar For Meaningful Growth 32 Note: Est. 2012 Includes full year Credo production |
| Combined Mineral Interests* State Owned Leased Total Texas 252,000 3,000 255,000 Georgia / Alabama 195,000 - 195,000 Louisiana 144,000 - 144,000 Nebraska / Kansas - 101,000 101,000 North Dakota - 6,000 6,000 Other** 2,000 32,000 34,000 Total 593,000 142,000 735,000 * Note: As of third quarter 2012; includes both fee and leasehold interests ** Includes approximately 8,000 net mineral acres located in various states related to overriding royalty interests 33 RedheadedOilpump.jpgAcquisition Provides Meaningful Scale With Operations in Prolific Oil and Gas Basins 33 |
| Fore_logo.epsRedheadedOilpump.jpgOptimize Transparency Through Disclosure of Oil and Gas Resource Potential Proved Developed Proved Behind Pipe Proved Undeveloped Probable Possible Resource Proven Reserves Forestar YE 2011 Reserves (MMboe) Credo Fiscal YE 2011 Reserves (MMboe) 3.0 1.7 ? 0.3 ? 2.1 ? ? ? ? ? ? Unproven Significant Opportunity for Additional Disclosure 34 |
| HeaderBackground.jpgCredo Acquisition – “Pulling Back The Curtain” visionLogoRev.png6_a.jpgFlavious Smith - Chief Oil & Gas Officer Building Momentum By Driving Leasing and Exploration to Increase Production and Reserves 35 |
| Credo Leasehold Interests Acquired – Q3 2012 State Net Acres Net Acres HBP* Basins Formations North Dakota 6,000 2,000 Williston Bakken & Three Forks Kansas 46,000 3,000 Central Uplift Lansing – Kansas City Nebraska 55,000 2,000 Denver – Julesburg Central Uplift Lansing – Kansas City Oklahoma 17,000 17,000 Anadarko Morrow Texas 3,000 2,000 Anadarko Tonkawa & Cleveland Other 15,000 10,000 Total 142,000 36,000 Note: acres are approximate; includes approximately 8,000 net mineral acres of overriding royalty interests *HBP represents Held By Production RedheadedOilpump.jpgAttractive Leasehold Interests In Prolific Oil and Gas Basins 36 |
| RedheadedOilpump.jpgBakken / Three Forks Formations Represent Significant Driver of Future Value Realization Bakken Shale Formation: •Principally located in Western North Dakota and Eastern Montana in the Williston Basin •Continuous oil field of significant magnitude •~14,700 square miles •Largest ever assessed by U.S. Geological Survey •Oil discovered in Bakken play in 1951 •Acceleration in exploration activity driven by horizontal drilling and hydraulic fracturing technology and higher oil prices •U.S. geological survey estimates Bakken formation may yield 4.3 billion BOE with estimates as high as 40.0 billion BOE 37 Bakken Shale Locator Map |
| RedheadedOilpump.jpg Bakken: The Crude of Choice •True Oil Play – 85% Crude Oil •Over-pressured, basin centered oil field •Premium crude - refiner’s crude oil of choice •Superior in quality to benchmark WTI •Lighter weight and lower sulfur content •Requires less downstream processing Natural Gas 15% Crude Oil 85% Average Bakken Well Production Mix 38 RedheadedOilpump.jpgBakken Shale – King of Tight Oil Fields Play Bakken Eagle Ford Woodford Fairway Size (sq. miles) 14,700 5,000 3,300 Depth 8,000’ – 11,500’ 7,000’ – 12,000’ 8,000’ – 16,000’ Thickness 100’ - 250’ 100’ – 250’ 150’ – 400’ Total Organic Carbon 5% - 20% 3% - 7% 6% - 12% Porosity 5% - 10% 6% - 9% 5% - 8% Original Oil in Place (MMBo / section) 60 - 70 42 - 49 45 - 47 Note: Data from public oil and gas companies 39 |
| RedheadedOilpump.jpg Williston Basin – Stacked Oil Plays Type Log Middle Bakken Three Forks 40 •Dual-zone operator development plan •Additional Three Forks potential Bakken & Three Forks Development Plan Source: Data from public oil and gas operators |
| RedheadedOilpump.jpgBakken Production Growth Accelerating •Activity continues to increase •>4,100 horizontal wells, up over 65% vs. 2011 •>200 active rigs •Deeper intervals and tighter spacing Bakken Shale Production Growth Illustration 41 Source: Energy Information Administration RedheadedOilpump.jpgBakken Takeaway Capacity Improving From Increased Rail Availability, Resulting in Reduced Price Differential Rail 1% Pipe 99% Bakken Transportation YE 2009 Bakken Transportation Sep. 2012 Rail 56% Pipe 44% ($30) ($20) ($10) $0 $10 Jan-12 Feb-12 Mar-12 Apr-12 May-12 Jun-12 Jul-12 Aug-12 Sep-12 Oct-12 $ / Bbl Differential Between Bakken and WTI •Bakken discount to WTI reduced in 2012 due to new rail terminals in North Dakota and refining centers in Midwest •Rail capacity expected to be up >280% at YE 2012 vs. YE 2011 42 Bakken Price Differential to WTI Source: Bloomberg Financial Markets |
| McKenzie RedheadedOilpump.jpgBakken Provides Significant Value Creation Potential USGS general Williston slide.tiffFORT BERTHOLD RESERVATION PARSHALL FIELD Bakken / Three Forks Locator Map Leasehold Mineral Interests Locations 43 NORTH DAKOTA Forestar owns leasehold interests in approximately 6,000 net / 77,000 gross mineral acres in core of Bakken and Three Forks Formations Leasehold Interests |
| Leasehold Interests Drilling Locations Units Bakken Vertical Wells Historical Production Three Forks Vertical Well Bakken Horizontal Well Three Forks Horizontal Well Bakken Base.tifLeasehold Mineral Interests Locations Drilling Rig.bmpRedheadedOilpump.jpgBakken Provides Significant Value Creation Potential 6,000 net mineral acres in core of Bakken & Three Forks Bakken / Three Forks Interest Net mineral acres leased 6,000 Average working interest 8.0% Units 50 Total potential wells up to 400 http://upload.wikimedia.org/wikipedia/en/b/bc/XTO_Logo.pnghttp://t2.gstatic.com/images?q=tbn:ANd9GcQV8QCmSObPu1sYSzHd-HO58Ro4wUuldpjDr-aIa1QC4ZuARg4SFJTIPfLYhttp://insightemissions.com/i/logos/enerplus_logo_medium.gifQEP Logohttps://www.acsmeetings.org/2008/images/petro-hunt-platinum.gifBakken Operators* 44 *Major operators in Fort Berthold Indian reservation |
| RedheadedOilpump.jpg Illustrative Bakken Well Economics Bakken Single-Well Economics Completed Well Cost $10.0 Well Production > 500 Mboe Total Well Revenues* $39.0 Net Well Cash Flow* $19.9 Well PV-10* $11.1 FOR Share of Bakken Well Economics Avg. Working Interest 8% Well Cost $0.8 Well Revenues* $2.6 Net Cash Flow* $1.1 Well PV-10* $0.6 ($ in millions) ($ in millions) * Assuming $90 oil and $3 natural gas average price over life of well Note: Actual results may vary from illustrations 45 0 100 200 300 400 500 600 0 20 40 60 80 100 120 140 160 Year 1 Year 3 Year 5 Year 7 Year 9 Year 11 Year 13 Year 15 Year 17 Year 19 Year 21 Year 23 Year 25 Annual Oil Production Cumulative Oil Production Rate of Return (IRR) Cumulative Oil Prod. (Mboe) Bakken Well Type Curve 0% 10% 20% 30% 40% 50% 60% 70% 80% $50 $60 $70 $80 $90 $100 $110 $120 Bakken Returns at Various Oil Prices Annual Oil Prod. (Mboe) Oil Price ($ / Bbl) Single Well Cost = $10.0MM 500 MBoe EUR |
| RedheadedOilpump.jpgForestar Participation in Bakken Drilling Activity Accelerating 0 5 10 15 20 25 30 35 Feb-10 Apr-10 Jun-10 Aug-10 Oct-10 Dec-10 Feb-11 Apr-11 Jun-11 Aug-11 Oct-11 Dec-11 Feb-12 Apr-12 Jun-12 Aug-12 Oct-12 Wells Bakken / Three Forks Drilling Activity Accelerating Production and Reserve Growth Bakken Activity Wells Avg. WI Producing 31 8.9% Drilling & Completing 11 2.8% Scheduled for Drilling 9 9.4% Total Bakken Wells 52 7.5% 46 Proved Developed Producing Bakken Wells Note: Information as of November 2012 |
| RedheadedOilpump.jpg Forestar’s Bakken Resource Potential Note: Data is for illustrative purposes only and is based on management assumptions. EUR refers to management’s internal estimates of reserves potentially recoverable from successful drilling of wells. Actual results may vary from illustrations. Assumes equal number of Bakken and Three Forks wells. Prime Bakken Acreage Provides Forestar Net Resource Potential of 8 – 22 MMBOE 47 Assumptions Number of Wells / Unit 4 6 8 Number of Spacing Units 50 50 50 Number of Drilling Locations 200 300 400 Forestar’s Bakken Resource Potential (BOE) 500 EUR / Well with 8% Avg. Working Interest 8,000,000 12,000,000 16,000,000 700 EUR / Well with 8% Avg. Working Interest 11,200,000 16,800,000 22,400,000 |
| RedheadedOilpump.jpgKansas and Nebraska Represent Scalable Exploration Model with Solid Returns Kansas & Nebraska Leasehold Mineral Interests •101,000 net acres of leasehold interest •Nebraska – 55,000 net acres •Kansas – 46,000 net acres •Target formation: Lansing - Kansas City •Lower acreage acquisition costs •Drilling costs: ~$500,000 / well •Attractive exploration success rate: ~40% •Meaningful reserves: 40,000 - 50,000+ BOE / well •Scalable exploration model http://curriculum.kcdistancelearning.com/courses/AMHISTx-HS-A08/a/unit5/images/HIS02-69.24584.jpgKansas & Nebraska Highlights Nebraska Kansas 48 Nebraska Activity • 11 Producing Wells • 44% Exploration Success Rate Kansas Activity • 51 Producing Wells • 39% Exploration Success Rate |
| RedheadedOilpump.jpgLeveraging Seismic and Engineering in Kansas and Nebraska to Create Value 49 Stacking of Shoals Results in Multiple Pay Zones Seaward Landward Pay Zone Seismic Bump Shale Cycles Separate Pay Zones Stacking of Shoals Results in Multiple Pay Zones Source: B. Jackson, 2012 Source: Aften Ball, 1966 |
| RedheadedOilpump.jpgIllustrative Kansas / Nebraska Well Economics Single-Well Economics Risked Completed Well Cost* $0.8 Well Production (BOE) 40,000 - 50,000 Total Well Revenues** $3.1 Net Well Cash Flow $1.6 PV-10 $1.1 Returns > 100% ($ in millions) * Represents 1.5 dry hole costs @ $200,000 + 1.0 completed well cost at $500,000 for a 40% success rate ** Revenues assume $88 average oil price over life of the well 50 Note: Actual results may vary from illustrations 0 10,000 20,000 30,000 40,000 50,000 0 500 1,000 1,500 2,000 2,500 1 13 25 37 49 61 73 85 97 109 121 133 145 Months Kansas-Nebraska Type Curve Bbls/Month Cum Cumulative Production (Barrels) Monthly Oil Production Cumulative Production 50 Rate of Return 0% 50% 100% 150% 200% 250% 300% 350% 400% $50 $60 $70 $80 $90 $100 $110 $120 Well Returns at Various Oil Prices Oil Price ($ / Bbl) Single Well Cost = $0.8MM 41 MBoe EUR |
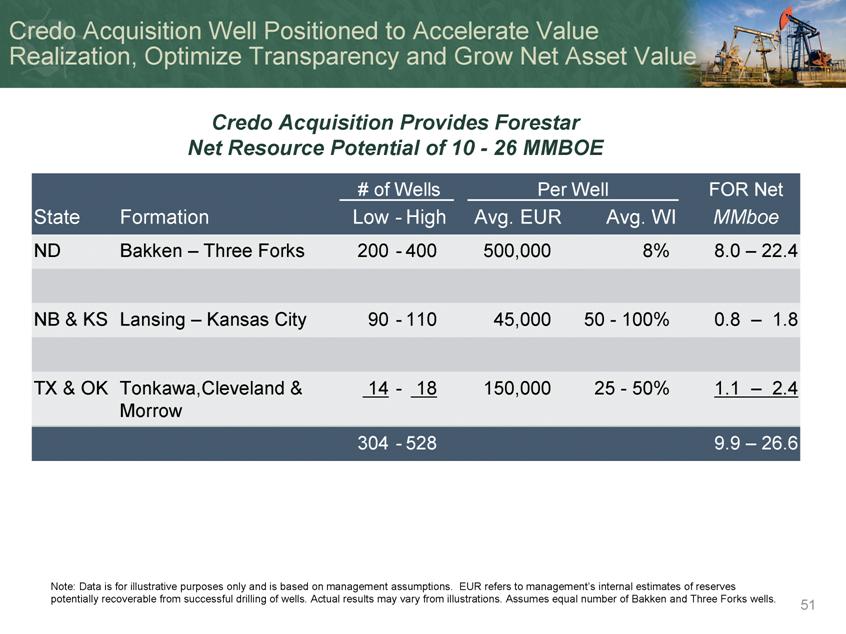
| RedheadedOilpump.jpgCredo Acquisition Well Positioned to Accelerate Value Realization, Optimize Transparency and Grow Net Asset Value # of Wells Per Well FOR Net State Formation Low - High Avg. EUR Avg. WI Mboe ND Bakken – Three Forks 200 - 400 500,000 8% 8.0 – 22.4 NB & KS Lansing – Kansas City 90 - 110 45,000 50 - 100% 0.8 – 1.8 TX & OK Tonkawa, Cleveland & Morrow 14 - 18 150,000 25 - 50% 1.1 – 2.4 304 - 528 9.9 – 26.6 51 Note: Data is for illustrative purposes only and is based on management assumptions. EUR refers to management’s internal estimates of reserves potentially recoverable from successful drilling of wells. Actual results may vary from illustrations. Assumes equal number of Bakken and Three Forks wells. Credo Acquisition Provides Forestar Net Resource Potential of 10 - 26 MMBOE |
| HeaderBackground.jpgOil & Gas Operating & Investment Strategy visionLogoRev.png6_a.jpgFlavious Smith- Chief Oil & Gas Officer Building Momentum By Driving Leasing and Exploration to Increase Production and Reserves 52 |
| RedheadedOilpump.jpgOil & Gas Investment Guidelines and Operating Principles Generate the greatest value from every acre and resource by economically increasing production and reserves focusing on oil and liquid rich natural gas 53 |
| RedheadedOilpump.jpgOperating Principles Focused on Leveraging Experienced Team and Low-Basis Mineral Ownership Keys to Success: •Experienced oil and gas team with proven track record •Grow and expand knowledge through collaborative ventures •Leader in smaller, lower profile conventional plays •High success rate – laser focused, targeted and precise •Employ and utilize best practices – geology, engineering and operations •Leverage investments in technology, systems and data •Exploit mineral ownership to drive low-cost, high-return business 54 |
| RedheadedOilpump.jpgOver 200 years of combined oil and gas experience Dynamic and Experienced Oil and Gas Team Over 200 years of combined oil and gas experience 55 Sarah Deering Director Geophysics & Operations Geology Tony Gossett Operations and Production Mgr Flavious Smith Chief Oil and Gas Officer Rick Dollins Vice President Oil & Gas Land Management Mike O’Donnell Exploration Manager http://www.forestargroup.com/Assets/Bio/3/Smith.jpghttp://www.forestargroup.com/Assets/Bio/13/Rick%20Dollins%20(2).jpghttp://www.forestargroup.com/Assets/Bio/17/ODonnell.jpghttp://www.forestargroup.com/Assets/Bio/19/Gossett.jpghttp://www.forestargroup.com/Assets/Bio/18/Deering.jpgTorie Vandevan Exploration Manager Ken DeFehr Engineering Manager Land Geology Operations Engineering Peter Dallas Vice President Oil & Gas Reporting, Reserves, Budgeting & Forecasting Kevin Donohue Land Manager Brett Barnes Land Manager Jack Renfro Operations and Production Mgr |
| RedheadedOilpump.jpgOil & Gas Investment Guidelines Principally Focused on Lower-Cost, Lower-Risk Opportunities Manage risk through a disciplined and balanced approach to exploration and development investments: •Diversity of prospects across basins and hydrocarbons •Focused on developing low to moderate cost, low to moderate risk opportunities •Less participation in higher-cost, higher-risk opportunities •Utilize joint-ventures to mitigate high-risk prospects and operations •Invest strategically and with discipline •Target risk adjusted rate of return > 20% 56 |
| Fore_logo.epsRedheadedOilpump.jpgOil & Gas Investments - Prospect Generation Parameter Target Prospect Generation = 80% internally generated Working Interest 50% - 100% Well Costs = $5MM gross / = $2MM net Geographic Focus Kansas, Nebraska, Texas, Louisiana Geological Focus 70% oil / 30% gas Long-life reserves Risk Profile 70% low to moderate risk Target Return = 20% http://click4corp.com/c/eccodrilling.com/website/web8/images/edi%20rig%205%20u36%20on%20location%20drilling.jpg57 |
| Credo Acquisition Well Positioned to Accelerate Value Realization, Optimize Transparency and Grow Net Asset Value Credo Acquisition Provides Forestar Net Resource Potential of 10 - 26 MMBOE # of Wells Per Well FOR Net State Formation Low - High Avg. EUR Avg. WI MMboe ND Bakken – Three Forks 200 - 400 500,000 8% 8.0 – 22.4 NB & KS Lansing – Kansas City 90 - 110 45,000 50 - 100% 0.8 – 1.8 TX & OK Tonkawa, Cleveland & Morrow 14 - 18 150,000 25 - 50% 1.1 – 2.4 304 - 528 9.9 – 26.6 Note: Data is for illustrative purposes only and is based on management assumptions. EUR refers to management’s internal estimates of reserves potentially recoverable from successful drilling of wells. Actual results may vary from illustrations. Assumes equal number of Bakken and Three Forks wells. |
| Fore_logo.epsRedheadedOilpump.jpgDrilling Activity Accelerating Following Acquisition State Formation Operation Wells Q4 2012 Investment North Dakota Bakken / Three Forks Non-Operated 13 $8.1 Kansas Lansing – Kansas City Operated & Non-Operated 8 1.5 Nebraska Lansing – Kansas City Operated 4 0.6 Texas Cleveland / Rodessa Operated 1 1.3 Total 26 $11.5 59 Target Return on Capital > 20% ($ in millions) Fourth Quarter 2012 Exploration & Production Investment 59 Note: Exploration and production investment excludes lease acquisition and geological and geophysical expenses |
| Fore_logo.epsRedheadedOilpump.jpgBakken / Three Forks Production and Reserve Growth Accelerating - 9 30 40 0 25 50 YE 2010 YE 2011 Q3 2012 YE 2012 Est. Wells Bakken / Three Forks PDP Wells in Reserves * Note: 2008 – 2011 pricing based upon SEC reporting guidelines. Est. Q3 2012 based upon internal reserves analysis as of Q3 2012 using September 7, 2012 NYMEX strip oil and gas prices, and represent only proven reserves $62 $88 $0 $25 $50 $75 $100 2008 2009 2010 2011 Q3 2012 Est. PV-10 Credo PV-10 Reserve Value* ($ in millions) 60 Note: PV-10 represents present value of estimated future oil and gas revenues, net of estimated direct expenses, discounted at an annual discount rate of 10%, before income taxes. Future Net Cash flows represents an undiscounted value based upon estimate of future net cash flows from proved developed reserves after deducting estimated severance and ad valorem taxes, operating expenses and capital costs, but before deducting estimates of future income taxes These are Non-GAAP financial measures. The reconciliation between GAAP and Non-GAAP financial measures is provided in the appendix to this presentation and on the company’s investor relations website. |

| Fore_logo.epsRedheadedOilpump.jpgPreliminary 2013 Capital Investment and Drilling Program Type State Formation Operation Wells Capital Exploration & Development North Dakota Bakken / Three Forks Non-Operated 19 $21.0 Kansas Lansing – Kansas City Operated & Non-Operated 31 5.8 Nebraska Lansing – Kansas City Operated 18 3.6 Texas & Other Cleveland / Rodessa / Glenrose / James Lime Operated & Non-operated 7 11.1 Total Exploration & Drilling 75 $41.5 Generating Production and Reserve Growth By Accelerating Investment in Bakken Wells ($ in millions) 61 Note: Exploration and production investment excludes lease acquisition and geological and geophysical expenses |
| Fore_logo.eps2.4 3.0 FY 2010 FY 2011 Combined MMBOE Forestar Proven Reserves* (MMBOE) RedheadedOilpump.jpgDrilling Activity Driving Increased Production and Reserves - 9 30 40 YE 2010 YE 2011 Q3 2012 YE 2012 Est. YE 2013 Est. Wells Bakken / Three Forks PDP Wells 62 *Note: Combined includes acquisition of Credo Petroleum on September 28, 2012. |
| Fore_logo.epsRedheadedOilpump.jpgAccelerating Value Realization and Growing Net Asset Value Building Momentum By Accelerating Value Realization and Growing Net Asset Value Increasing oil production and proven reserves Focused on integration and execution of Credo acquisition Capitalizing on investments to accelerate earnings and cash flow 63 - 250 500 750 1,000 2010 2011 Est. 2012 Est. 2013 MBOE Total Annual Production* (BOE) *Note: Est. 2012 production only includes Credo results for Q4 2012 Est. 2013 production includes full year benefit of Credo acquisition |
| Fore_logo.epsHeaderBackground.jpgOil & Gas visionLogoRev.png6_a.jpgFlavious Smith - Chief Oil & Gas Officer Building Momentum By Driving Leasing and Exploration to Increase Production and Reserves 64 |
| Fore_logo.epshttp://static1.businessinsider.com/image/4f578607eab8eab65500009d-900/recent-advancements-in-fracking-allow-operators-to-go-deeper-more-precisely-than-ever-before.jpgRedheadedOilpump.jpg Horizontal Drilling Animation 65 INSERT NEW PICTURE Video Forthcoming! Horizontal Drilling Animation 65 |
| HeaderBackground.jpgCCA_0308.jpgReal Estate visionLogoRev.pngBruce Dickson - Chief Real Estate Officer Building Momentum By Accelerating Lot Sales and Growing Net Asset Value through Strategic and Disciplined Investments 66 |
| Fore_logo.epsCommunityDevHeader.jpgHousing Market Conditions Despite renewed macro concerns, housing and land development data indicate steady improvement in housing •Declining inventory levels support home price appreciation •Builder appetite for land growing amid impending lot shortage •Housing starts exceeding lot deliveries •Distressed sales as percent of total home sales slowing However •New home “Distressing Gap” still exists •A lack of confidence, job growth and macro economic headwinds persist 67 67 |
| Fore_logo.eps0.00.51.01.52.02.53.03.54.0 - 20,000 40,000 60,000 80,000 100,000 120,000 140,0004Q023Q032Q041Q054Q053Q062Q071Q084Q083Q092Q101Q114Q113Q12NATIONAL DETACHED HOUSING MARKETFinished Vacant Inventory & Months of SupplyFinished VacantFV MOSMonths of SupplyInventoryCommunityDevHeader.jpg68 New Home Inventories Declining Source: MetroStudy Inventory Equilibrium Top 40 U.S. Housing Markets (Detached) 68 |
| Fore_logo.epsStarts Exceeding Deliveries 020,00040,00060,00080,000100,000120,000140,000160,000180,000200,0004Q023Q032Q041Q054Q053Q062Q071Q084Q083Q092Q101Q114Q113Q12NATINAL DETACHED HOUSING MARKET Quarterly Lot Delivery & Quarterly Starts HistoryQuarterly Lot DeliveryQuarterly StartsCommunityDevHeader.jpgHousing Starts Exceeding Lot Deliveries Top 40 U.S. Housing Markets Top 40 U.S. Housing Markets (Detached) Source: MetroStudy Quarterly Lot Delivery Quarterly Starts 69 |
| Fore_logo.epsCommunityDevHeader.jpgSource: NAR Decline in Distressed Sales Activity Beginning To Benefit Home Prices 70 Distressed Sales Down Significantly From Peak 49% 24% 20% 30% 40% 50% Oct-08 Jan-09 Apr-09 Jul-09 Oct-09 Jan-10 Apr-10 Jul-10 Oct-10 Jan-11 Apr-11 Jul-11 Oct-11 Jan-12 Apr-12 Jul-12 Oct-12 Distressed Sales as a % of Total Home Sales 70 |
| Fore_logo.epsCommunityDevHeader.jpg“The Distressing Gap” 71 0% 2% 4% 6% 8% 10% 12% 14% 16% 18% Jan-05 May-05 Sep-05 Jan-06 May-06 Sep-06 Jan-07 May-07 Sep-07 Jan-08 May-08 Sep-08 Jan-09 May-09 Sep-09 Jan-10 May-10 Sep-10 Jan-11 May-11 Sep-11 Jan-12 May-12 Sep-12 New Home Share of Total Single Family Home Sales Historical Average = 15% The Distressing Gap 71 Source: NAR |
| Fore_logo.epsCommunityDevHeader.jpgTexas Markets and High Quality Lots Dominate U.S. Housing Markets Vacant Developed Lot Classification Sources: MetroStudy Top 40 U.S. Housing Markets; John Burns Real Estate Annual Ranking of Master Planned Communities, 2012 Class Starts /Month A 4+ B 3 – 4 C 2 – 3 D 1 – 2 F < 1 72 Top 40 U.S. Housing Markets 50 Top-Selling Master Planned Communities By Region A 10% B 14% C 22% D 23% F 18% F- 13% 72 Northeast 20% Texas 40% California 8% Florida 8% Southeast 12% Southwest 24% |

| Fore_logo.epsCommunityDevHeader.jpgNote: MSA performance based on Employment, Gross Metropolitan Product (GMP) and House Price Index Source: Brookings Institute- September 2012 Salt Lake City 1 - $1 Oakland 1 - $9 Strongest Quartile Weakest Quartile Los Angeles 2 - $15 Kansas City 1 - $3 Tampa 3 - $3 Atlanta 33 - $87 San Antonio 4 - $89 Projects and investment as of Q3 2012; includes ventures TEXAS 49 - $374 Texas Markets Represent Over 70% of our Investment in Real Estate Denver 5 - $24 Austin 16 - $120 Dallas/Ft. Worth 14 - $78 Gulf Coast 4 - $34 Houston 11 - $53 Nashville 1 - $12 73 Note: $ in millions Fore_logo.epsCommunityDevHeader.jpgCREATION REALIZATION Real Estate Greatest Value Development Entitled Entitle Timberland Pipeline (Acres) 1 Activity – Uses Financials 2 2,000 53 projects 961 residential acres - 2,614 lots 792 commercial acres $50K per lot $90K per acre (avg sales price) 13,000 27 projects Approved uses, ready for development High Value Creation 28,000 16 projects Planned Lifestyle Communities (1st and 2nd move-up focus) Low Basis Low Cost 100,000 Timberland Sales Fiber Sales Recreational Leases $2K per acre (avg sales price) 143,000 Total Real Estate Acres - 96 Projects 1 Net acres as of Q3 2012 as presented in real estate pipeline; Includes ventures. 2 Based on historical sales activity. Delivering The Greatest Value From Every Acre 74 |

| Fore_logo.epsCommunityDevHeader.jpgEntitlement & Development Entitlement - value creation process required to obtain approvals to develop property according to a plan •Annexation •Zoning •Density / use permits •Access to roads and utilities •Creation of financing districts Our Objectives: •Flexible Zoning •Annexation •Special financing districts Development - realization of entitlement value through investment in infrastructure necessary for sale of real estate to end users •Disciplined return criteria •Focus on markets that support sales •Inventory management 75 |
| Fore_logo.epsCommunityDevHeader.jpgDynamic and Experienced Real Estate Team Over 125 years of combined real estate experience Mary Cowser Senior Vice President – Real Estate Market Research and Investment Tom Burleson Executive Vice President – Real Estate West Region Bruce Dickson Chief Real Estate Officer John Pierret Executive Vice President – Real Estate Acquisitions Michael Quinley Executive Vice President – Real Estate East Region 76 Fore_logo.epsCommunityDevHeader.jpgForestarMark-Bullet Point.aiForestarMark-Bullet Point.aiForestarMark-Bullet Point.ai1 Costs include pro forma interest carry. Note: For illustrative purposes only and not a guarantee of future performance. Investment Cash Flow Cumulative Cash Flow Time Real estate acquisition and development activity driven by Return on Cost (ROC) discipline, Targeted at 35% (including imputed interest) which equates to a 20 - 25% IRR ForestarMark-Bullet Point.aiForestarMark-Bullet Point.aiForestarMark-Bullet Point.aiLong-term economic health Business climate Population and job growth Education/talent Inventory condition Income levels Market underwriting focused on: Disciplined Investing 77 |
| Fore_logo.epsCommunityDevHeader.jpgNote: For illustrative purposes only and not a guarantee of future performance. ($ in millions) Total Per Acre Per Lot Revenues Lot Sales $38.6 $134,000 $47,100 Costs Land Costs $4.4 $15,300 $5,400 Development: Lot development $17.0 Amenities 2.5 Lot selling costs 1.3 Operating expenses 1.0 Total Development Costs 21.8 $75,700 $26,600 Imputed Interest 2.2 7,600 2,700 Total Costs $28.4 $98,600 $34,700 Profit $10.3 $35,400 $12,400 Return on Cost 36% IRR 22% DEVELOPMENT EXAMPLE: 288 ACRES, 819 LOTS; 7-YEAR INVESTMENT Primary Development and Operating Activities: Lot Development •Roads •Water •Utilities •Wastewater •Drainage Amenities •Entrance landscaping •Amenity center •Retaining wall Lot Sales Costs •Management fees and closing costs Operating Expenses •Legal and marketing •Homeowner’s Association •Property taxes Acquisition and Development Example 78 |
| Fore_logo.epsCommunityDevHeader.jpgGrow Market Share •Increase lot sales •Capitalize on residential tract sales •Increase commercial sales Reposition Non-Core, Non-Performing Assets Invest In Opportunities That: •Focus on well-located, right-scale communities •Generate near-term cash flow and earnings, and •Meet or exceed return requirements Accelerating Real Estate Value Realization Through Community Development Initiatives 79 |
| Fore_logo.epsCommunityDevHeader.jpgNote: Includes consolidated ventures Forestar Real Estate Sales Activity (Excluding Timberland Sales) $10 $12 $14 $16 $18 $20 $0 $30 $60 $90 $120 $150 2010 2011 Est. 2012 Est. 2013 Average Lot Margin ($ in 000’s) Total Revenues ($ in millions) Residential Lots Income Producing Residential Tracts Commercial Tracts Avg. Lot Margin Residential Lots •Lots sold to builders Income Producing •Radisson and multifamily income until project stabilized and sold Residential Tracts •Builders take out remainder of phase or community pre-development Commercial Tracts •Typically increase sales as markets recover and communities become established Community Development Initiatives Core Real Estate Business Strengthening 80 |
| Fore_logo.epsCommunityDevHeader.jpghttp://forestarsp.real.local/_layouts/images/blank.gifhttp://forestarsp.real.local/_layouts/images/blank.gifhttp://forestarsp.real.local/_layouts/images/blank.gifhttp://forestarsp.real.local/_layouts/images/blank.gifhttp://forestarsp.real.local/_layouts/images/blank.gifhttp://forestarsp.real.local/_layouts/images/blank.gifhttp://forestarsp.real.local/_layouts/images/blank.gifhttp://forestarsp.real.local/_layouts/images/blank.gifhttp://forestarsp.real.local/_layouts/images/blank.gifhttp://forestarsp.real.local/_layouts/images/blank.gifhttp://forestarsp.real.local/_layouts/images/blank.gifhttp://forestarsp.real.local/_layouts/images/blank.gifhttp://forestarsp.real.local/_layouts/images/blank.gifFilterhttp://forestarsp.real.local/_layouts/images/blank.gifhttp://forestarsp.real.local/_layouts/images/blank.gifhttp://forestarsp.real.local/_layouts/images/blank.gifhttp://forestarsp.real.local/_layouts/images/blank.gifFilterFilterFilterhttp://forestarsp.real.local/_layouts/images/blank.gifhttp://forestarsp.real.local/_layouts/images/blank.gifhttp://forestarsp.real.local/_layouts/images/blank.gifhttp://forestarsp.real.local/_layouts/images/blank.gifhttp://forestarsp.real.local/_layouts/images/blank.gifhttp://forestarsp.real.local/_layouts/images/blank.gifhttp://forestarsp.real.local/_layouts/images/blank.gifhttp://forestarsp.real.local/_layouts/images/blank.gifhttp://forestarsp.real.local/_layouts/images/blank.gifhttp://forestarsp.real.local/_layouts/images/blank.gifhttp://forestarsp.real.local/_layouts/images/blank.gifKingwood 81 Successfully Repositioned Over $60 Million in Non-Earning Assets $52 million Date Project Activity April 2012 Light Farms FOR / RPG Land Company sold 800 acres from proposed residential community near Dallas, TX for $56 million in total consideration FOR received $25 million in cash proceeds and reduced consolidated debt by $31 million Sale eliminated over $2 million in annual carrying costs June 2012 River Plantation Sold 109 remaining residential lots for $2.1 million July 2012 Harbor Mist Sold 1,034 acres for $3.1 million 81 Fore_logo.epsDiscovery at Spring Trails (now Harmony): Acquired non-performing bank loan for $21mm in Q2 2011 Secured by first lien on Discovery at Spring Trails community Previous owner investment - $49mm Principal balance of loan set at $33.8mm 2012 Est. cash flow = $4.6mm 2012 Est. earnings = $3.3mm Barrington Kingwood Acquired 180 developed lots (Q3 2011) for $9 million Includes $4 million in reimbursement rights 2012 Est. Sales Activity: >40 lots sold - $99,600 / lot $50,400 / lot avg. margin 2012 Est. Gross Profit = $1.8mm CommunityDevHeader.jpghttp://forestarsp.real.local/_layouts/images/blank.gifhttp://forestarsp.real.local/_layouts/images/blank.gifhttp://forestarsp.real.local/_layouts/images/blank.gifhttp://forestarsp.real.local/_layouts/images/blank.gifhttp://forestarsp.real.local/_layouts/images/blank.gifhttp://forestarsp.real.local/_layouts/images/blank.gifhttp://forestarsp.real.local/_layouts/images/blank.gifhttp://forestarsp.real.local/_layouts/images/blank.gifhttp://forestarsp.real.local/_layouts/images/blank.gifhttp://forestarsp.real.local/_layouts/images/blank.gifhttp://forestarsp.real.local/_layouts/images/blank.gifhttp://forestarsp.real.local/_layouts/images/blank.gifhttp://forestarsp.real.local/_layouts/images/blank.gifFilterhttp://forestarsp.real.local/_layouts/images/blank.gifhttp://forestarsp.real.local/_layouts/images/blank.gifhttp://forestarsp.real.local/_layouts/images/blank.gifhttp://forestarsp.real.local/_layouts/images/blank.gifFilterFilterFilterhttp://forestarsp.real.local/_layouts/images/blank.gifhttp://forestarsp.real.local/_layouts/images/blank.gifhttp://forestarsp.real.local/_layouts/images/blank.gifhttp://forestarsp.real.local/_layouts/images/blank.gifhttp://forestarsp.real.local/_layouts/images/blank.gifhttp://forestarsp.real.local/_layouts/images/blank.gifhttp://forestarsp.real.local/_layouts/images/blank.gifhttp://forestarsp.real.local/_layouts/images/blank.gifhttp://forestarsp.real.local/_layouts/images/blank.gifhttp://forestarsp.real.local/_layouts/images/blank.gifhttp://forestarsp.real.local/_layouts/images/blank.gifHouston, Texas Campus Harper's Preserve Home PageExxonMobil - Taking on the world's toughest energy challenges.$30 million in acquisitions estimated to generate $5.1 million in earnings in 2012 Strategic Acquisition in Early Recovery logo82 |
| Fore_logo.epsCommunityDevHeader.jpgWillow Creek Farms II 202 acre tract located in west Katy, near Houston 558 planned single-family lots on a phased basis Projected average revenue of $50,000 per lot Projected margin of $28,000 per lot* Expected return exceeds target Cumulative potential cash flow >$10 million over project life Forestar invests 90% of total equity, partner co-invest 10% http://forestarsp.real.local/_layouts/images/blank.gifhttp://forestarsp.real.local/_layouts/images/blank.gifhttp://forestarsp.real.local/_layouts/images/blank.gifhttp://forestarsp.real.local/_layouts/images/blank.gifhttp://forestarsp.real.local/_layouts/images/blank.gifhttp://forestarsp.real.local/_layouts/images/blank.gifhttp://forestarsp.real.local/_layouts/images/blank.gifhttp://forestarsp.real.local/_layouts/images/blank.gifhttp://forestarsp.real.local/_layouts/images/blank.gifhttp://forestarsp.real.local/_layouts/images/blank.gifhttp://forestarsp.real.local/_layouts/images/blank.gifhttp://forestarsp.real.local/_layouts/images/blank.gifhttp://forestarsp.real.local/_layouts/images/blank.gifFilterhttp://forestarsp.real.local/_layouts/images/blank.gifhttp://forestarsp.real.local/_layouts/images/blank.gifhttp://forestarsp.real.local/_layouts/images/blank.gifhttp://forestarsp.real.local/_layouts/images/blank.gifFilterFilterFilterhttp://forestarsp.real.local/_layouts/images/blank.gifhttp://forestarsp.real.local/_layouts/images/blank.gifhttp://forestarsp.real.local/_layouts/images/blank.gifhttp://forestarsp.real.local/_layouts/images/blank.gifhttp://forestarsp.real.local/_layouts/images/blank.gifhttp://forestarsp.real.local/_layouts/images/blank.gifhttp://forestarsp.real.local/_layouts/images/blank.gifhttp://forestarsp.real.local/_layouts/images/blank.gifhttp://forestarsp.real.local/_layouts/images/blank.gifhttp://forestarsp.real.local/_layouts/images/blank.gifhttp://forestarsp.real.local/_layouts/images/blank.gif83 Focus on Smaller Scale Investments as Recovery Builds * Including projected municipal utility district reimbursements 83 |
| Fore_logo.epsCommunityDevHeader.jpg2011 - 2012 Strategic and Disciplined Investments ($ in millions) Year 1 Community Ownership Market Original Invest. Cash Flow Earnings Galo Tract 100% San Antonio $7.9 $7.9 $1.4 Discovery Spring Trails 100% Houston 21.1 4.6 3.3 Barrington-Kingwood 100% Houston 9.0 2.0 1.8 CL Realty & TEMCO 100% Texas / GA 23.5 4.0 1.4 Willow Creek Farms 90% Houston 4.5 - - Total Acquisitions $66.0 $18.5 $7.9 84 84 |
| Fore_logo.epsCommunityDevHeader.jpgMaximizing Long-Term Shareholder Value Growing real estate revenues and increasing market share Reposition non-core and non-earning assets Capitalizing on growth opportunities and investments to generate near-term cash flow and earnings Focused on Accelerating Value Realization and Growing Net Asset Value 85 Non-core projects located in non-strategic markets / sub markets or project type Non-earning projects represent assets with no sales activity over last 12 months 85 |
| HeaderBackground.jpgCCA_0308.jpgReal Estate visionLogoRev.pngBruce Dickson - Chief Real Estate Officer Building Momentum By Accelerating Lot Sales and Growing Net Asset Value through Strategic and Disciplined Investments 86 |
| HeaderBackground.jpgSevenHills912-345.jpgReal Estate – Community Development visionLogoRev.pngMichael Quinley - Executive Vice President, Eastern Region Real Estate Investment and Development Building Momentum By Accelerating Lot Sales and Growing Net Asset Value through Strategic and Disciplined Investments 87 |
| Fore_logo.epsCommunityDevHeader.jpgAtlanta Housing Distress Continues Atlanta New Home Market – Vital Signs Housing distress continues in Atlanta, but improving from market trough Atlanta Year-over-Year Percent Change in Job Growth -7% -5% -3% -1% 1% 3% 5% Jan-02 Sep-02 May-03 Jan-04 Sep-04 May-05 Jan-06 Sep-06 May-07 Jan-08 Sep-08 May-09 Jan-10 Sep-10 May-11 Jan-12 Sep-12 Atlanta U.S. Source: Metrostudy Lost 181,400 jobs from 2008-2010 Recent job growth has been trending higher than national average Market Peak Market Trough Current Annual Starts 58,541 4,449 7,214 Annual Closings 54,424 7,657 8,138 Vacant Developed Lots 34,574 151,907 136,347 VDL Months Supply 13.8 406.8 226.8 Source: Bureau of Labor Statistics 88 |
| Fore_logo.epsCommunityDevHeader.jpgBut Atlanta Building Base for Recovery 0 10000 20000 30000 40000 50000 60000 70000 80000 90000 4Q00 3Q01 2Q02 1Q03 4Q03 3Q04 2Q05 1Q06 4Q06 3Q07 2Q08 1Q09 4Q09 3Q10 2Q11 1Q12 AnnDeliv AnnStarts AnnClosings 0 1 2 3 4 5 6 7 8 9 10 0 5000 10000 15000 20000 25000 4Q00 3Q01 2Q02 1Q03 4Q03 3Q04 2Q05 1Q06 4Q06 3Q07 2Q08 1Q09 4Q09 3Q10 2Q11 1Q12 FinVacant (FV) FVMos Atlanta Starts, Closings & Lot Deliveries Permit activity and starts improving from trough Closings exceeding deliveries Atlanta Finished Vacant Housing Inventory and MoS Months of supply declining Submarkets to the north exhibiting improvement Equilibrium Source: Metrostudy MoS Equilibrium 89 |
| Fore_logo.epsCommunityDevHeader.jpgCREATION REALIZATION Real Estate Greatest Value Development Entitled Entitle Timberland Georgia Pipeline (Acres) 1 Activity – Uses Financials 2 1,000 6 projects 900 residential acres - 680 lots 113 commercial acres $50K per lot $90K per acre (avg sales price) 6,000 16 projects 4,100 acres – 8,172 lots 883 commercial acres High Value Creation 23,000 12 projects Planned Lifestyle Communities (1st and 2nd move-up focus) Low Basis Low Cost 73,000 Mitigation Timberland Sales Fiber Sales Recreational Leases Ventures $2K per acre (avg sales price) 103,000 Total Real Estate Acres - 34 Projects 1 Represents Gross Acres as of Q3 2012; Includes ventures. 2 Based on historical sales activity. Delivering The Greatest Value From Every Acre in Georgia 90 Fore_logo.epsCommunityDevHeader.jpgRecurring Cash Flows from Timberlands $6.50 $7.00 $7.50 $8.00 $8.50 $9.00 2008 2009 2010 2011 2012 Est. $ / Acre Recreational Lease Pricing / Acre Lease Revenues $2.1 $2.0 $1.7 $1.5 $1.1 Timberland Acres and Annual Harvest ($ in millions) - 200,000 400,000 600,000 800,000 1,000,000 1,200,000 - 100,000 200,000 300,000 400,000 500,000 2008 2009 2010 2011 2012 Est. Fiber Sales (Tons) Timberland Acres Fiber Sales Timberland Acres 91 |
| Fore_logo.epsCommunityDevHeader.jpgGenerating The Greatest Value From Every Acre Atlanta, GA •9th largest metropolitan statistical area in U.S. •Population of 5 million, will double from 2005 to 2025 •A historical leader in new building permit activity •Home to 12 Fortune 500 companies •Top 5 in centers of higher learning •World’s busiest airport and growing Entitlement Activity: 12 Projects in Entitlement – 23,000 Acres 15 Entitled Projects – 7,323 Acres 92 |
| Fore_logo.epsCommunityDevHeader.jpgPine Hills Entitlement (formerly known as Wolf Creek) Focused On Recruiting The Right Economic Anchor •12,230 acres strategically located 23 miles west of Atlanta’s International airport •Engaged with the Governor’s Office and the State’s Economic Development Office •Various destination resorts and the PGA tour have expressed interest a0041-000424Location Map DSC0581293 Fore_logo.epsCommunityDevHeader.jpgTowne West – Master Planned, Mixed-Use Community Entitled and Positioned For Recovery Site Plan •Project entitled •1,024 acre mixed-use development •Located near I-75 in Bartow County, GA, approximately 60 miles north of Atlanta •Hwy 140 four lane widening through site scheduled to be completed by 2017 Entitlements Acres Development Residential 650 2,674 lots Retail / Office / Industrial 121 900,000 ft2 Greenspace and Recreation 253 Location Map Note: Site plan subject to change 94 Fore_logo.epsCommunityDevHeader.jpghttp://forestarsp.real.local/_layouts/images/blank.gifhttp://forestarsp.real.local/_layouts/images/blank.gifhttp://forestarsp.real.local/_layouts/images/blank.gifhttp://forestarsp.real.local/_layouts/images/blank.gifhttp://forestarsp.real.local/_layouts/images/blank.gifhttp://forestarsp.real.local/_layouts/images/blank.gifhttp://forestarsp.real.local/_layouts/images/blank.gifhttp://forestarsp.real.local/_layouts/images/blank.gifhttp://forestarsp.real.local/_layouts/images/blank.gifhttp://forestarsp.real.local/_layouts/images/blank.gifhttp://forestarsp.real.local/_layouts/images/blank.gifhttp://forestarsp.real.local/_layouts/images/blank.gifhttp://forestarsp.real.local/_layouts/images/blank.gifFilterhttp://forestarsp.real.local/_layouts/images/blank.gifhttp://forestarsp.real.local/_layouts/images/blank.gifhttp://forestarsp.real.local/_layouts/images/blank.gifhttp://forestarsp.real.local/_layouts/images/blank.gifFilterFilterFilterhttp://forestarsp.real.local/_layouts/images/blank.gifhttp://forestarsp.real.local/_layouts/images/blank.gifhttp://forestarsp.real.local/_layouts/images/blank.gifhttp://forestarsp.real.local/_layouts/images/blank.gifhttp://forestarsp.real.local/_layouts/images/blank.gifhttp://forestarsp.real.local/_layouts/images/blank.gifhttp://forestarsp.real.local/_layouts/images/blank.gifhttp://forestarsp.real.local/_layouts/images/blank.gifhttp://forestarsp.real.local/_layouts/images/blank.gifhttp://forestarsp.real.local/_layouts/images/blank.gifhttp://forestarsp.real.local/_layouts/images/blank.gifKingwood Note: TEMCO and CL Realty continue to own 5,800 acres of undeveloped land in Paulding County, GA, Bentwater Golf Course, 12-acre tract on Padre Island, TX and mineral leases at Summer Creek Ranch Residential Lot & Commercial Inventory of Projects Acquired* * FOR acquired 100% of ventures’ interest in these real estate assets $23.5 million net investment FOR acquired 100% of ventures’ interest in 17 residential and mixed-use communities in CL Realty & TEMCO Tax benefits to FOR = ~$11 million Closed first quarter 2012 Georgia Assets Acquired: Project Level Inventory Market Projects Developed Lots Planned Lots Total Lots Commercial Acres Georgia 5 528 1,092 1,620 113 Florida 3 158 38 196 0 Texas Houston 4 293 2,118 2,411 282 Dallas 4 272 1,540 1,812 81 San Antonio 1 2 106 108 - Total Texas 9 567 3,764 4,331 363 Total All Markets 17 1,253 4,894 6,147 476 Net Interest 546 2,117 2,663 159 Atlanta Developments- Low Basis Project Vacant Developed Lots (VDL’s) Basis / VDL Seven Hills 259 $10,000 The Georgian 258 $6,000 Harris Place 9 $29,000 Westpark Undeveloped 95 Strategic and Disciplined Investment Acquired Remaining Interest in 17 Real Estate Projects |
| Fore_logo.epsCommunityDevHeader.jpgKey Forestar Developments Surrounding Atlanta 96 |

| Fore_logo.epsCommunityDevHeader.jpgBentwater – A Success Story •Award-winning, master planned community with golf, pool and tennis •Entry, 1st and 2nd move-up and custom homes •1,676 planned lots •Home prices ranged $190,000 - $1 million •Majority of community sold out by 2006 Bentwater – Project Summary Revenue $73 million Project Costs $55 million Project Cash Flow $18 million Average price per lot $43,000 Return on Cost 35% IRR 24% Note: Summary as of November 2012 97 |
| Fore_logo.epsBENTWATER VIRTUAL TOUR 11 98 CommunityDevHeader.jpgBentwater Virtual Tour |
| Fore_logo.epsCommunityDevHeader.jpgBel-Aire: Opportunistic Acquisition •Acquired from lender in Q2 2012 for $545,000 •38 acre active adult community •78 residential lots -10 sold* •68 remaining lots - 26 developed •Average lot prices $39,000 / lot Plus 16% of home price > $243,000 •Expected lot margin > $15,000/lot (38% gross margin) •Average home price $200,000 - $250,000+ Bel-Aire - Lot Sales Velocity 0 2 4 6 8 10 12 14 16 18 2012 Est. 2013 Est. *Note: Information as of Q3 2012 99 |
| Fore_logo.epsCommunityDevHeader.jpgBel-Aire Virtual Tour Virtual Tour Bel-Aire bell-air siteplan.jpg100 |
| Fore_logo.epsCommunityDevHeader.jpgAtlanta Housing Distress Continues Atlanta New Home Market – Vital Signs Housing distress continues in Atlanta, but improving from market trough Atlanta Year-over-Year Percent Change in Job Growth -7% -5% -3% -1% 1% 3% 5% Jan-02 Sep-02 May-03 Jan-04 Sep-04 May-05 Jan-06 Sep-06 May-07 Jan-08 Sep-08 May-09 Jan-10 Sep-10 May-11 Jan-12 Sep-12 Atlanta U.S. Source: Metrostudy Lost 181,400 jobs from 2008-2010 Recent job growth has been trending higher than national average Market Peak Market Trough Current Annual Starts 58,541 4,449 7,214 Annual Closings 54,424 7,657 8,138 Vacant Developed Lots 34,574 151,907 136,347 VDL Months Supply 13.8 406.8 226.8 Source: Bureau of Labor Statistics 88 |
| Fore_logo.epsCommunityDevHeader.jpgBut Atlanta Building Base for Recovery 0 10000 20000 30000 40000 50000 60000 70000 80000 90000 4Q00 3Q01 2Q02 1Q03 4Q03 3Q04 2Q05 1Q06 4Q06 3Q07 2Q08 1Q09 4Q09 3Q10 2Q11 1Q12 AnnDeliv AnnStarts AnnClosings 0 1 2 3 4 5 6 7 8 9 10 0 5000 10000 15000 20000 25000 4Q00 3Q01 2Q02 1Q03 4Q03 3Q04 2Q05 1Q06 4Q06 3Q07 2Q08 1Q09 4Q09 3Q10 2Q11 1Q12 FinVacant (FV) FVMos Atlanta Starts, Closings & Lot Deliveries Permit activity and starts improving from trough Closings exceeding deliveries Atlanta Finished Vacant Housing Inventory and MoS Months of supply declining Submarkets to the north exhibiting improvement Equilibrium Source: Metrostudy MoS Equilibrium 89 |
| Fore_logo.epsCommunityDevHeader.jpgCREATION REALIZATION Real Estate Greatest Value Development Entitled Entitle Timberland Georgia Pipeline (Acres) 1 Activity – Uses Financials 2 1,000 6 projects 900 residential acres - 680 lots 113 commercial acres $50K per lot $90K per acre (avg sales price) 6,000 16 projects 4,100 acres – 8,172 lots 883 commercial acres High Value Creation 23,000 12 projects Planned Lifestyle Communities (1st and 2nd move-up focus) Low Basis Low Cost 73,000 Mitigation Timberland Sales Fiber Sales Recreational Leases Ventures $2K per acre (avg sales price) 103,000 Total Real Estate Acres - 34 Projects 1 Represents Gross Acres as of Q3 2012; Includes ventures. 2 Based on historical sales activity. Delivering The Greatest Value From Every Acre in Georgia 90 Fore_logo.epsCommunityDevHeader.jpgRecurring Cash Flows from Timberlands $6.50 $7.00 $7.50 $8.00 $8.50 $9.00 2008 2009 2010 2011 2012 Est. $ / Acre Recreational Lease Pricing / Acre Lease Revenues $2.1 $2.0 $1.7 $1.5 $1.1 Timberland Acres and Annual Harvest ($ in millions) - 200,000 400,000 600,000 800,000 1,000,000 1,200,000 - 100,000 200,000 300,000 400,000 500,000 2008 2009 2010 2011 2012 Est. Fiber Sales (Tons) Timberland Acres Fiber Sales Timberland Acres 91 |
| Fore_logo.epsCommunityDevHeader.jpgGenerating The Greatest Value From Every Acre Atlanta, GA •9th largest metropolitan statistical area in U.S. •Population of 5 million, will double from 2005 to 2025 •A historical leader in new building permit activity •Home to 12 Fortune 500 companies •Top 5 in centers of higher learning •World’s busiest airport and growing Entitlement Activity: 12 Projects in Entitlement – 23,000 Acres 15 Entitled Projects – 7,323 Acres 92 |
| Fore_logo.epsCommunityDevHeader.jpgPine Hills Entitlement (formerly known as Wolf Creek) Focused On Recruiting The Right Economic Anchor •12,230 acres strategically located 23 miles west of Atlanta’s International airport •Engaged with the Governor’s Office and the State’s Economic Development Office •Various destination resorts and the PGA tour have expressed interest a0041-000424Location Map DSC0581293 Fore_logo.epsCommunityDevHeader.jpgTowne West – Master Planned, Mixed-Use Community Entitled and Positioned For Recovery Site Plan •Project entitled •1,024 acre mixed-use development •Located near I-75 in Bartow County, GA, approximately 60 miles north of Atlanta •Hwy 140 four lane widening through site scheduled to be completed by 2017 Entitlements Acres Development Residential 650 2,674 lots Retail / Office / Industrial 121 900,000 ft2 Greenspace and Recreation 253 Location Map Note: Site plan subject to change 94 Fore_logo.epsCommunityDevHeader.jpghttp://forestarsp.real.local/_layouts/images/blank.gifhttp://forestarsp.real.local/_layouts/images/blank.gifhttp://forestarsp.real.local/_layouts/images/blank.gifhttp://forestarsp.real.local/_layouts/images/blank.gifhttp://forestarsp.real.local/_layouts/images/blank.gifhttp://forestarsp.real.local/_layouts/images/blank.gifhttp://forestarsp.real.local/_layouts/images/blank.gifhttp://forestarsp.real.local/_layouts/images/blank.gifhttp://forestarsp.real.local/_layouts/images/blank.gifhttp://forestarsp.real.local/_layouts/images/blank.gifhttp://forestarsp.real.local/_layouts/images/blank.gifhttp://forestarsp.real.local/_layouts/images/blank.gifhttp://forestarsp.real.local/_layouts/images/blank.gifFilterhttp://forestarsp.real.local/_layouts/images/blank.gifhttp://forestarsp.real.local/_layouts/images/blank.gifhttp://forestarsp.real.local/_layouts/images/blank.gifhttp://forestarsp.real.local/_layouts/images/blank.gifFilterFilterFilterhttp://forestarsp.real.local/_layouts/images/blank.gifhttp://forestarsp.real.local/_layouts/images/blank.gifhttp://forestarsp.real.local/_layouts/images/blank.gifhttp://forestarsp.real.local/_layouts/images/blank.gifhttp://forestarsp.real.local/_layouts/images/blank.gifhttp://forestarsp.real.local/_layouts/images/blank.gifhttp://forestarsp.real.local/_layouts/images/blank.gifhttp://forestarsp.real.local/_layouts/images/blank.gifhttp://forestarsp.real.local/_layouts/images/blank.gifhttp://forestarsp.real.local/_layouts/images/blank.gifhttp://forestarsp.real.local/_layouts/images/blank.gifKingwood Note: TEMCO and CL Realty continue to own 5,800 acres of undeveloped land in Paulding County, GA, Bentwater Golf Course, 12-acre tract on Padre Island, TX and mineral leases at Summer Creek Ranch Residential Lot & Commercial Inventory of Projects Acquired* * FOR acquired 100% of ventures’ interest in these real estate assets $23.5 million net investment FOR acquired 100% of ventures’ interest in 17 residential and mixed-use communities in CL Realty & TEMCO Tax benefits to FOR = ~$11 million Closed first quarter 2012 Georgia Assets Acquired: Project Level Inventory Market Projects Developed Lots Planned Lots Total Lots Commercial Acres Georgia 5 528 1,092 1,620 113 Florida 3 158 38 196 0 Texas Houston 4 293 2,118 2,411 282 Dallas 4 272 1,540 1,812 81 San Antonio 1 2 106 108 - Total Texas 9 567 3,764 4,331 363 Total All Markets 17 1,253 4,894 6,147 476 Net Interest 546 2,117 2,663 159 Atlanta Developments- Low Basis Project Vacant Developed Lots (VDL’s) Basis / VDL Seven Hills 259 $10,000 The Georgian 258 $6,000 Harris Place 9 $29,000 Westpark Undeveloped 95 Strategic and Disciplined Investment Acquired Remaining Interest in 17 Real Estate Projects |
| Fore_logo.epsCommunityDevHeader.jpgKey Forestar Developments Surrounding Atlanta 96 |
| Fore_logo.epsCommunityDevHeader.jpgBentwater – A Success Story •Award-winning, master planned community with golf, pool and tennis •Entry, 1st and 2nd move-up and custom homes •1,676 planned lots •Home prices ranged $190,000 - $1 million •Majority of community sold out by 2006 Bentwater – Project Summary Revenue $73 million Project Costs $55 million Project Cash Flow $18 million Average price per lot $43,000 Return on Cost 35% IRR 24% Note: Summary as of November 2012 97 |
| Fore_logo.epsBENTWATER VIRTUAL TOUR 11 98 CommunityDevHeader.jpgBentwater Virtual Tour |
| Fore_logo.epsCommunityDevHeader.jpgBel-Aire: Opportunistic Acquisition •Acquired from lender in Q2 2012 for $545,000 •38 acre active adult community •78 residential lots -10 sold* •68 remaining lots - 26 developed •Average lot prices $39,000 / lot Plus 16% of home price > $243,000 •Expected lot margin > $15,000/lot (38% gross margin) •Average home price $200,000 - $250,000+ Bel-Aire - Lot Sales Velocity 0 2 4 6 8 10 12 14 16 18 2012 Est. 2013 Est. *Note: Information as of Q3 2012 99 |
| Fore_logo.epsCommunityDevHeader.jpgBel-Aire Virtual Tour Virtual Tour Bel-Aire bell-air siteplan.jpg100 |
| Fore_logo.epsCommunityDevHeader.jpgSeven Hills - A Destination of a Lifetime •1,950 acre master planned community –1,087 residential lots - 646 sold –139 commercial acres - 26 sold –441 remaining lots - 258 developed –113 remaining commercial acres •Entry, 1st & 2nd move-up, custom & active adult homes –Home prices range from $170,000 - $700,000 –Lot prices $20,000 - $60,000 –Developed lot basis of $10,000/lot •Wide range of amenities and activities •Strong local and regional builders Seven Hills – Cumulative Cash Flows 101 ($15) ($10) ($5) $0 $5 2002 2004 2006 2008 2010 2012 Cumulative Cash Flow |
| Fore_logo.epsCommunityDevHeader.jpgSeven Hills Virtual Tour Virtual Tour Seven Hills 102 |
| Fore_logo.epsCommunityDevHeader.jpgForestar Well Positioned For Atlanta Recovery •Low basis land •Recurring cash flow from fiber •Retail sales of higher better use tracts •Desirable master planned communities •Opportunistic acquisitions generating near-term cash flow and earnings image001Retail Land for Sale Website 103 |
| Fore_logo.epsHeaderBackground.jpgSevenHills912-345.jpgReal Estate – Community Development visionLogoRev.pngMichael Quinley - Executive Vice President, Eastern Region Real Estate Investment and Development Building Momentum By Accelerating Lot Sales and Growing Net Asset Value through Strategic and Disciplined Investments 104 |

| HeaderBackground.jpgValero2012_149.jpgReal Estate – Community Development visionLogoRev.pngTom Burleson - Executive Vice President, Western Region Real Estate Investment and Development Building Momentum By Accelerating Lot Sales and Growing Net Asset Value through Strategic and Disciplined Investments 105 106 CommunityDevHeader.jpgWell Located Communities in Texas .16 Projects .$120 invested .4 Projects .$89MM invested .11 Projects .$53MM invested .4 Projects .$35MM invested .14 Projects .$78MM invested Note: Includes ventures and commercial projects 106 CommunityDevHeader.jpgCREATION REALIZATION Real Estate Greatest Value Development Entitled Entitle Timberland Pipeline (Acres) 1 Activity – Uses Financials 2 1,000 37 projects 1,837 lots - developed & under development - 1,146 under contract 300 commercial acres $50K per lot $90K per acre (avg sales price) 6,000 3 projects 4,500 acres – 7,351 lots 600 commercial acres High Value Creation 4,000 2 projects Planned Lifestyle Communities (1st and 2nd move-up focus) Low Basis Low Cost 29,000 Mitigation Timberland Sales Fiber Sales Recreational Leases Ventures $2K per acre (avg sales price) 40,000 Total Real Estate Acres - 42 Projects 1 Acres as of Q3 2012; Includes ventures. 2 Based on historical sales activity. Delivering The Greatest Value From Every Acre in Texas 107 |
| Fore_logo.epsCommunityDevHeader.jpgForestar Houston Projects Note: Includes ventures and excludes commercial projects 108 Fore_logo.epsCommunityDevHeader.jpgHouston Employment Well Above U.S. Average Houston vs. U.S. Year-over-Year Percent Change in Job Growth Source: Bureau of Labor Statistics Houston #2 market in U.S. for new job growth + 95,800 jobs created in last 12 months Houston starts rank #1 in U.S. Lot supply below equilibrium of 24 months -6% -4% -2% 0% 2% 4% 6% Jan-02 Aug-02 Mar-03 Oct-03 May-04 Dec-04 Jul-05 Feb-06 Sep-06 Apr-07 Nov-07 Jun-08 Jan-09 Aug-09 Mar-10 Oct-10 May-11 Dec-11 Jul-12 U.S. Houston Market Peak Market Trough Current Q3 2012 Annual Starts 50,166 16,658 22,371 Annual Closings 48,371 18,199 20,867 Vacant Developed Lots 34,449 72,940 44,426 VDL Months Supply 14.2 43.8 23.8 Houston New Home Market – Vital Signs Source: Metrostudy, Texas A&M Real Estate Center 109 |
| Fore_logo.epsCommunityDevHeader.jpgHouston Housing Markets Recovering Houston Starts and Lot Deliveries Houston Finished Vacant Housing Inventory and MoS Months of supply declining below equilibrium levels 0 10000 20000 30000 40000 50000 60000 4Q00 3Q01 2Q02 1Q03 4Q03 3Q04 2Q05 1Q06 4Q06 3Q07 2Q08 1Q09 4Q09 3Q10 2Q11 1Q12 AnnDeliv AnnStarts Housing starts exceeding lot deliveries, further reducing supply and creating favorable inventory imbalance Metrostudy estimates + 24,000 starts in 2013 and 15,000 - 18,000 lot deliveries 0 0.5 1 1.5 2 2.5 3 3.5 0 2000 4000 6000 8000 10000 12000 4Q00 3Q01 2Q02 1Q03 4Q03 3Q04 2Q05 1Q06 4Q06 3Q07 2Q08 1Q09 4Q09 3Q10 2Q11 1Q12 FinVacant (FV) FVMos Equilibrium Source: Metrostudy MoS Equilibrium 110 |
| Fore_logo.epsCommunityDevHeader.jpgHarper’s Preserve - Well Located Near The Woodlands •Opportunistic acquisition from lender, project facing significant environmental permitting hurdles •842 acre master planned community –1,725 planned residential lots – 176 sold –1,549 remaining lots - 29 developed –72 commercial acres available –Initial lot prices range $30,000 - $40,000 •1st and 2nd move-up housing •Home prices range from $190,000 - $400,000 •Builders include Highland, Darling & MHI •Venture with First Continental Opportunity Fund 0 50 100 150 2011 2012 Est. 2013 Est. Lot Sales Velocity 111 |

| Fore_logo.epsCommunityDevHeader.jpgHarper’s Preserve Virtual Tour Virtual Tour Harper’s Preserve 112 |
| Fore_logo.epsCommunityDevHeader.jpgForestar Dallas / Fort Worth Development Projects Note: Includes ventures, excludes commercial projects 113 |
| Fore_logo.epsCommunityDevHeader.jpgDFW Employment Well Above U.S. Average DFW vs. U.S. Year-over-Year Percent Change in Job Growth Source: Bureau of Labor Statistics DFW #4 market in U.S. for new job growth +66,300 jobs created in last 12 months Housing starts rank #2 in U.S. Vacant developed lot inventory at lowest level since Q4 2000 Market Peak Market Trough Current Annual Starts 51,888 13,507 16,373 Annual Closings 47,159 14,603 15,781 Vacant Developed Lots 53,418 92,899 53,418 VDL Months Supply 19.8 73.5 39.2 DFW New Home Market – Vital Signs -5% -3% -1% 1% 3% 5% Jan-02 Sep-02 May-03 Jan-04 Sep-04 May-05 Jan-06 Sep-06 May-07 Jan-08 Sep-08 May-09 Jan-10 Sep-10 May-11 Jan-12 Sep-12 DFW U.S. Source: Metrostudy, Texas A&M Real Estate Center 114 |
| Fore_logo.epsCommunityDevHeader.jpgDFW Housing Markets Early In Recovery DFW Starts and Lot Deliveries DFW Finished Vacant Housing Inventory and MoS Months of supply below equilibrium levels Finished home inventory at lowest level since Q4 2000 Housing starts exceeding lot deliveries further reducing supply and creating favorable inventory imbalance Metrostudy estimates + 20,000 starts in 2013 and 12,000 – 15,000 lot deliveries 0 10000 20000 30000 40000 50000 60000 4Q00 3Q01 2Q02 1Q03 4Q03 3Q04 2Q05 1Q06 4Q06 3Q07 2Q08 1Q09 4Q09 3Q10 2Q11 1Q12 AnnDeliv AnnStarts 0 0.5 1 1.5 2 2.5 3 3.5 4 0 2000 4000 6000 8000 10000 12000 14000 4Q00 3Q01 2Q02 1Q03 4Q03 3Q04 2Q05 1Q06 4Q06 3Q07 2Q08 1Q09 4Q09 3Q10 2Q11 1Q12 FinVacant (FV) FVMos Equilibrium Source: Metrostudy MoS Equilibrium 115 |
| Fore_logo.epsCommunityDevHeader.jpgLantana - Award Winning Top Selling DFW Community •~1,700 acre master planned community –4,226 planned residential lots – 2,817 lots sold –1,409 residential lots remaining – 227 developed –72 planned commercial acres – 30 acres sold –42 commercial acres remaining •Amenities- golf, 2 recreation centers, 5 swimming pools, 300 acres of open space, 4 miles of hike & bike trails •Education– 2 elementary, 1 middle school & day care •New home prices: $170,000 - $900,000 on multiple lot sizes •Builders - American Legend, Highland, Lionsgate, Darling, Standard Pacific, Ashton Woods, Newport & Huntington •Partner - Republic Properties Group (RPG) $0 $25,000 $50,000 $75,000 $100,000 0 50 100 150 200 250 300 350 2006 2007 2008 2009 2010 2011 2012 Est. 2013 Est. Average Lot Prices Annual Lot Sales Lot Sales Avg. Lot Prices Lantana- Lot Sales Velocity 116 |
| Fore_logo.epsCommunityDevHeader.jpgLantana Virtual Tour Virtual Tour Lantana 117 Fore_logo.epsCommunityDevHeader.jpgSan Antonio Job Growth Accelerating San Antonio vs. U.S. Year-over-Year Percent Change in Job Growth Source: Bureau of Labor Statistics Housing starts improving Lot supply near equilibrium Market Peak Market Trough Current Annual Starts 19,818 6,772 7,783 Annual Closings 17,787 6,958 7,289 Vacant Developed Lots 10,824 27,918 16,941 VDL Months Supply 12.7 42.5 26.1 San Antonio New Home Market – Vital Signs -6% -5% -4% -3% -2% -1% 0% 1% 2% 3% 4% 5% 6% Jan-02 Sep-02 May-03 Jan-04 Sep-04 May-05 Jan-06 Sep-06 May-07 Jan-08 Sep-08 May-09 Jan-10 Sep-10 May-11 Jan-12 Sep-12 San Antonio U.S. Source: Metrostudy, Texas A&M Real Estate Center 118 San Antonio ranked #16 market in U.S. for job growth with 23,300 jobs created over last 12 months |
| Fore_logo.epsCommunityDevHeader.jpgSan Antonio Markets Improving San Antonio Starts and Lot Deliveries San Antonio Finished Vacant Housing Inventory and MoS Months of supply below equilibrium levels 0 5000 10000 15000 20000 25000 30000 4Q00 3Q01 2Q02 1Q03 4Q03 3Q04 2Q05 1Q06 4Q06 3Q07 2Q08 1Q09 4Q09 3Q10 2Q11 1Q12 AnnDeliv AnnStarts 0 0.5 1 1.5 2 2.5 3 0 500 1000 1500 2000 2500 3000 3500 4Q00 3Q01 2Q02 1Q03 4Q03 3Q04 2Q05 1Q06 4Q06 3Q07 2Q08 1Q09 4Q09 3Q10 2Q11 1Q12 FinVacant (FV) FVMos Equilibrium Source: Metrostudy MoS Equilibrium Housing starts exceeding lot deliveries further reducing supply and creating favorable inventory imbalance 119 |
| Fore_logo.epsCommunityDevHeader.jpgCibolo Canyons – Generating the Greatest Value From Every Acre Cibolo Canyons - Lot Sales Velocity 0 50 100 150 200 2005 2006 2007 2008 2009 2010 2011 2012E 2013E •2,800 acre master planned community •762 residential lots remaining – 153 developed •82 remaining commercial acres •Lot products include: •Traditional single-family detached •Semi-custom & custom •Age targeted – active adult •Lot prices range from $75,000 - $250,000 •Homes ranging between $200,000 - $1 million •Builders include Brohn, Highland, Imagine, Sitterle, Custom Builders Front%20Entrance%20photo%20-%20twilight120 |
| Fore_logo.epsCommunityDevHeader.jpgCash Flows Stabilizing From Resort To Cibolo Canyons Special Improvement District Cibolo Canyons Special Improvement District Payments to Forestar 2009 – Q3 2012 Total Receipts ($ in millions) Ad Valorem Tax $23.1 HOT & Sales / Use Tax 9.8 $32.9 Note: Forestar Investment in Resort = $33.4 million at Q3 2012 (excluding interest) CCSID Quarterly Hotel Occupancy Tax & Sales Tax Collections JW Marriott Hill Country Resort & Spa Ad Valorem HOT & Sales Estimated Cumulative District Payments to Forestar** 2011 2034 **Actual results may vary. ($ in millions) $0.00 $0.50 $1.00 $1.50 Q2 2010 Q3 2010 Q4 2010 Q1 2011 Q2 2011 Q3 2011 Q4 2011 Q1 2012 Q2 2012 Q3 2012 HOT Receipts Sales Tax Receipts 121 |
| Fore_logo.epsCommunityDevHeader.jpghttp://forestarsp.real.local/_layouts/images/blank.gifhttp://forestarsp.real.local/_layouts/images/blank.gifhttp://forestarsp.real.local/_layouts/images/blank.gifhttp://forestarsp.real.local/_layouts/images/blank.gifhttp://forestarsp.real.local/_layouts/images/blank.gifhttp://forestarsp.real.local/_layouts/images/blank.gifhttp://forestarsp.real.local/_layouts/images/blank.gifhttp://forestarsp.real.local/_layouts/images/blank.gifhttp://forestarsp.real.local/_layouts/images/blank.gifhttp://forestarsp.real.local/_layouts/images/blank.gifhttp://forestarsp.real.local/_layouts/images/blank.gifhttp://forestarsp.real.local/_layouts/images/blank.gifhttp://forestarsp.real.local/_layouts/images/blank.gifFilterhttp://forestarsp.real.local/_layouts/images/blank.gifhttp://forestarsp.real.local/_layouts/images/blank.gifhttp://forestarsp.real.local/_layouts/images/blank.gifhttp://forestarsp.real.local/_layouts/images/blank.gifFilterFilterFilterhttp://forestarsp.real.local/_layouts/images/blank.gifhttp://forestarsp.real.local/_layouts/images/blank.gifhttp://forestarsp.real.local/_layouts/images/blank.gifhttp://forestarsp.real.local/_layouts/images/blank.gifhttp://forestarsp.real.local/_layouts/images/blank.gifhttp://forestarsp.real.local/_layouts/images/blank.gifhttp://forestarsp.real.local/_layouts/images/blank.gifhttp://forestarsp.real.local/_layouts/images/blank.gifhttp://forestarsp.real.local/_layouts/images/blank.gifhttp://forestarsp.real.local/_layouts/images/blank.gifhttp://forestarsp.real.local/_layouts/images/blank.gifKingwood Note: TEMCO and CL Realty continue to own 5,800 acres of undeveloped land in Paulding County, GA, Bentwater Golf Course, 12-acre tract on Padre Island, TX and mineral leases at Summer Creek Ranch Residential Lot & Commercial Inventory of Projects Acquired* * FOR acquired 100% of ventures’ interest in these real estate assets $23.5 million net investment FOR acquired 100% of ventures’ interest in 17 residential and mixed-use communities in CL Realty & TEMCO Tax benefits to FOR = ~$11 million Closed first quarter 2012 Texas assets acquired (Cousins interest in): 9 real estate communities 3,764 planned lots – 567 developed 363 commercial acres Project Level Inventory Market Projects Developed Lots Planned Lots Total Lots Commercial Acres Georgia 5 528 1,092 1,620 113 Florida 3 158 38 196 0 Texas Houston 4 293 2,118 2,411 282 Dallas 4 272 1,540 1,812 81 San Antonio 1 2 106 108 - Total Texas 9 567 3,764 4,331 363 Total All Markets 17 1,253 4,894 6,147 476 Net Interest 546 2,117 2,663 159 122 Strategic and Disciplined Investment Acquired Remaining Interest in 17 Real Estate Projects |

| Fore_logo.epsCommunityDevHeader.jpgForestar Well Positioned For Texas Recovery Developments well located in areas of favorable job growth and housing demand Lot supplies continue to decline, creating favorable inventory imbalance for well capitalized developers Actively developing existing projects and investing in strategic acquisitions which generate near-term cash flow and earnings •CL / TEMCO •Discovery at Spring Trails •Barrington •Willow Creek F:\Website\1_b.jpg123 |
| HeaderBackground.jpgValero2012_149.jpgReal Estate – Community Development visionLogoRev.pngTom Burleson - Executive Vice President, Western Region Real Estate Investment and Development Building Momentum By Accelerating Lot Sales and Growing Net Asset Value through Strategic and Disciplined Investments 124 HeaderBackground.jpgPRO_1714.jpgReal Estate - Multifamily visionLogoRev.pngPhil Weber - Executive Vice President, Real Estate Building Momentum By Delivering Multifamily Communities that Allow Residents to “Live with Purpose” 125 |
| multifamilyHeader.jpgMultifamily Markets Leading Recovery Key Drivers of Multifamily Markets -Demographics -Propensity to rent -Limited supply -Employment and income growth 126 |
| Fore_logo.epsmultifamilyHeader.jpgSeveral Drivers Supporting Multifamily Growth 127 Multifamily Starts: Historical and Projected (Units in Thousands) -Multifamily supply below long-term average due to capital constraints -Single family inventory and vacant and foreclosed homes located in more remote areas -Multifamily living offers wide range of amenities and conveniences -Current multifamily starts are 0.4% of inventory -Mobility and flexibility 0 500 1000 1500 2000 2500 3000 3500 4000 0 100 200 300 400 500 600 700 800 900 1,000 1964 1966 1968 1970 1972 1974 1976 1978 1980 1982 1984 1986 1988 1990 1992 1994 1996 1998 2000 2002 2004 2006 2008 2010 2012 Household Formation Source: US Census Bureau 127 |
| Fore_logo.epsmultifamilyHeader.jpgDemographics Support Multifamily Demand 128 54 56 58 60 62 64 66 68 1990 1992 1994 1996 1998 2000 2002 2004 2006 2008 2010 2012 2014 Population 20-34 (millions) Echo Boomers Population Growth -Strong demand from echo-boomers with high propensity to rent -Pent-up demand from young adults living at home and with room- mates -Shift in perception towards job mobility and home “rentership” -Higher credit scores and down payments required for home ownership Forecast Over 60% of 20-34 age group have increased propensity to rent Source: Witten and Associates, Q3 2012 128 |
| Fore_logo.epsmultifamilyHeader.jpgFavorable Job Growth in Target Markets 129 Source: Bureau of Labor Statistics Metro Year Over Year Job Growth % – October 2012 Focused on Urban Infill Markets with Favorable Job Growth 0.0% 0.5% 1.0% 1.5% 2.0% 2.5% 3.0% 3.5% 4.0% St. Louis Philly Charlotte Chicago Tampa Minneapolis Atlanta DC U.S. Avg. NYC Detroit Orlando LA DFW Denver Raleigh San Antonio Phoenix Austin Seattle Houston Forestar Target Market 129 |
| Fore_logo.epsmultifamilyHeader.jpgOccupancy Rates Remain High Source: Witten and Associates, Q3 2012 US Occupancy and Rent Growth -5% 0% 5% 10% 85% 90% 95% 100% 1Q 1995 4Q 1995 3Q 1996 2Q 1997 1Q 1998 4Q 1998 3Q 1999 2Q 2000 1Q 2001 4Q 2001 3Q 2002 2Q 2003 1Q 2004 4Q2004 3Q2005 2Q2006 1Q 2007 4Q 2007 3Q 2008 2Q 2009 1Q 2010 4Q 2010 3Q 2011 2Q 2012 Est. 1Q 2013 Est. 4Q 2013 Year-Year Effective Rent Growth Occupancy Occupancy Rent Growth 130 Fore_logo.epsmultifamilyHeader.jpgDeveloping A Low Capital, High-Return Multifamily Business Financing $21 million Leverage Forestar sites and resources with third-party capital and financing Multifamily Development Insert Site Map Example Project Economics FOR Investment $4 Cash proceeds to FOR $10 Cash Multiple* 2.5x Equity Investment * $4 million Third-Party Equity Investment $7 million Multi-Family Biz Model.ai* Includes Forestar’s land basis 3401110497_1672580Cash Proceeds $10 million 3401110497_1672580Project Economics Example G:\Forestar\Asset Management\360 - Denver\Photos\Peakview_final_site_opt.c.jpg131 Fore_logo.epsmultifamilyHeader.jpgStrong Multifamily Team Multifamily team has over 200 years experience developing > 30,000 units Shelly Rosales Senior Vice President – Asset Management Wayne MacDonald Senior Vice President – Multifamily Acquisitions Bob Buzbee Senior Vice President – Multifamily Business Development Tom Etheredge Executive Vice President – Multifamily Operations Phil Weber Executive Vice President – Real Estate 132 |
| Fore_logo.epsSelling 2 stabilized assets: .Broadstone – Houston, TX .Las Brisas – Round Rock, TX Developing 4 new communities: .Promesa – Austin, TX .Eleven – Austin, TX .360° – Denver, CO •Cedar Hill – Dallas, TX Acquiring 3 development sites: .Nashville, TN .Charlotte, NC •Three sites in due diligence multifamilyHeader.jpgExecuting Multifamily Plan 2 4 3 Multifamily Value Realization 133 |
| Fore_logo.epsmultifamilyHeader.jpgAccelerating Value Realization of Stabilized Multifamily Communities 2012 Multifamily Sales Key Metrics ($ in millions) Development Cost $87 FOR Equity $31 Project Debt $55 Net Operating Income (NOI)* $5.7 Sales Price @ 5.9% cap rate $97 Forestar Cash From Sales $40 Forestar Equity 31 Net Cash Flows - Life of Projects 13 GAAP Net Income - Life of Projects $13 IRR 17% http://www.forestargroup.com/Assets/Property/594/clubhouse%20-%20exterior%20-%20evening%20-%20131_131-huge.jpg*Based upon annualized YTD Q2 2012 results Las Brisas – Austin, TX Broadstone Memorial – Houston, TX 134 |
| Fore_logo.epsmultifamilyHeader.jpgC:\Users\cnines\Desktop\Promesa Pics\PRO_1143.jpgPromesa - Leasing Activity Building Momentum 289-unit Class A multifamily property located in Northwest Austin Development completed; received certificate of occupancy Nov 2012 70% leased; 60% occupied Total investment = $32 million Targeting stabilization and sale in 1st half 2013 Austin multifamily occupancy rates >96% 135 |
| Fore_logo.epsmultifamilyHeader.jpgPromesa Video 136 136 |
| Fore_logo.epsmultifamilyHeader.jpgEleven - Multifamily Venture with Canyon-Johnson 137 137 257-unit Class A multifamily property Designed for certification under Austin Energy Green Building program Construction commenced in June FOR investment = $4.1 million 25% ownership Developer fees Promoted interests 137 137 |
| Fore_logo.epsmultifamilyHeader.jpgEleven - Premier Location in Strong Market Located adjacent to downtown Austin Austin multifamily market remains strong: Occupancy rates: 95.6% Annual Rent Growth: 6.1% Job Growth: 3.3% Preferred Location: Close proximity to 30,000 jobs in downtown Austin, 24,000 jobs and over 50,000 University of Texas students, and 69,000 State of Texas employees High visibility Convenient access to cultural and entertainment offerings Downtown Austin University of Texas http://www.austinpost.org/files/articles/600px-I-35_(TX).svg.pngEleven SiteProject Status: •10% complete •First unit deliveries expected Q3 2013 C:\Users\atorma\Pictures\7-November 2012-Eleven #3.jpg138 |
| Fore_logo.epsmultifamilyHeader.jpgG:\Forestar\Asset Management\360 - Denver\Photos\Peakview_final_site_opt.c.jpg304-unit Class A multifamily property Designed to obtain Energy Star certification Construction commenced in July FOR investment = $2.1 million 20% ownership Developer fees Promoted interests 360° - Multifamily Venture with Guggenheim Real Estate 139 |
| Fore_logo.epsmultifamilyHeader.jpgDenver Tech Center submarket Multifamily market remains strong: Occupancy rates: 95.4% Rent Growth: 5.7% Job Growth: 2.0% Preferred Location Close proximity to 30 million sq.ft. of office space and 150,000 employees Convenient access to I-25 and Arapahoe Light Rail station Near Denver cultural and entertainment venues 360°- Excellent Location in Strong Multifamily Market Project Status: •5% complete •Site work underway •First unit deliveries expected Q3 2013 C:\Users\atorma\Pictures\8-November 2012-360 #3.jpgMultifamily Development Site 140 |
| Fore_logo.epsmultifamilyHeader.jpgBuilding Solid Pipeline of Development Properties (Proforma) Proforma Project Cash Flows Proforma Forestar Cash Flows Project Date Sale Price Cost Cash From Sale Total Debt FOR Equity FOR Total Cash Cash Multiple* WHOLLY-OWNED Promesa - Austin 2013 $40 – 45 ($33) $7 – 12 $20 $13 $23 1.8x VENTURES Eleven - Austin 2015 55 – 60 (40) 15 – 20 24 4 12 3.0x 360 - Denver 2015 65 – 70 (49) 16 – 21 32 4 11 2.8x Total Estimate $160 – 175 ($122) $38 – 53 $76 $21 $46 2.2x ($ in millions) * Cash multiples include fees Developing A Low Capital, High-Return Multifamily Business 141 |

| Fore_logo.epsmultifamilyHeader.jpgMultifamily Initiatives Developing Long-Term, Sustainable Business Model to Take Advantage of Multifamily Markets •Stabilize and monetize Promesa •Developing Eleven and 360° •Establish ventures and begin construction in Nashville and Charlotte •Continue to acquire well located development sites Developing a capital efficient multifamily business which generates sustainable cash flows, solid investment returns, and provides meaningful contributions 142 |
| Fore_logo.epsHeaderBackground.jpgPRO_1714.jpgReal Estate - Multifamily visionLogoRev.pngPhil Weber - Executive Vice President, Real Estate Building Momentum By Delivering Multifamily Communities that Allow Residents to “Live with Purpose” 143 |
| HeaderBackground.jpgextended waterdrop.jpgWater visionLogoRev.pngPhil Weber- EVP Real Estate Building Momentum By Delivering Economic and Sustainable Water Solutions 144 Fore_logo.epsWaterDroplet.jpgTexas Faces a Significant Water Challenge Source: Texas Water Development Board chart.jpg Drought of Record 1955-56 1940 - 1975 •Significant reservoir development 1940 - 2010 •Population growth = 17 million 2010 + •Virtually no water infrastructure development since 1975 Historically, water politics, legislation and investment driven by droughts / shortages 145 |
| Fore_logo.epsWaterDroplet.jpgTexas Surface Water Facts Texas Surface Water Key Facts •188 Reservoirs •15 major river basins •Provides 40% annual water in TX http://www.hydrosphere.com/projects/planning_mgmt/images/water_mansfield.jpgLake Travis – June 2006 Mansfield Dam Lake Travis – October 2011 Minimal Investment in Water Infrastructure in 40 Yrs •1940 - 1970 = 170 reservoirs constructed •1970 - 2010 = only 18 reservoirs constructed 146 Fore_logo.epsWaterDroplet.jpg Texas Faces a Significant Water Challenge •Texas had new drought of record in 2011 •75% of state was in severe drought status http://t0.gstatic.com/images?q=tbn:ANd9GcRtJZqdAY8N7GShDNDZnhkcAFnGzNwLVarMeTAVnymrrxHeMuUYwA“Plan confirms there is not enough water to meet demand during times of drought. Without sufficient water, Texas could lose 1.1 million jobs and $116 billion in income by 2060. Approximately $231.2 billion needs to be invested in water infrastructure over next 50 years in the state of Texas.” 2012 State of Texas Water Plan Melanie Callahan, Executive Director of TX Water Development Board 147 Fore_logo.epsWaterDroplet.jpgTexas Groundwater Resources TX Groundwater Facts: •9 major & 21 minor aquifers •8.1 million acre feet annual supply •Declining to 5.7 million acre feet annual supply in 2060 •Provides 60% of total annual water used in state •80% of groundwater usage for crop irrigation •Municipalities used 15% of all groundwater (mostly San Antonio, Houston, Panhandle counties) Forestar Water Interests Principally Located in Recharging Aquifers Location of Forestar Texas Water Interests Groundwater resources significantly reduce negative impact of evaporation, sedimentation and potential environmental issues associated with surface water 148 |
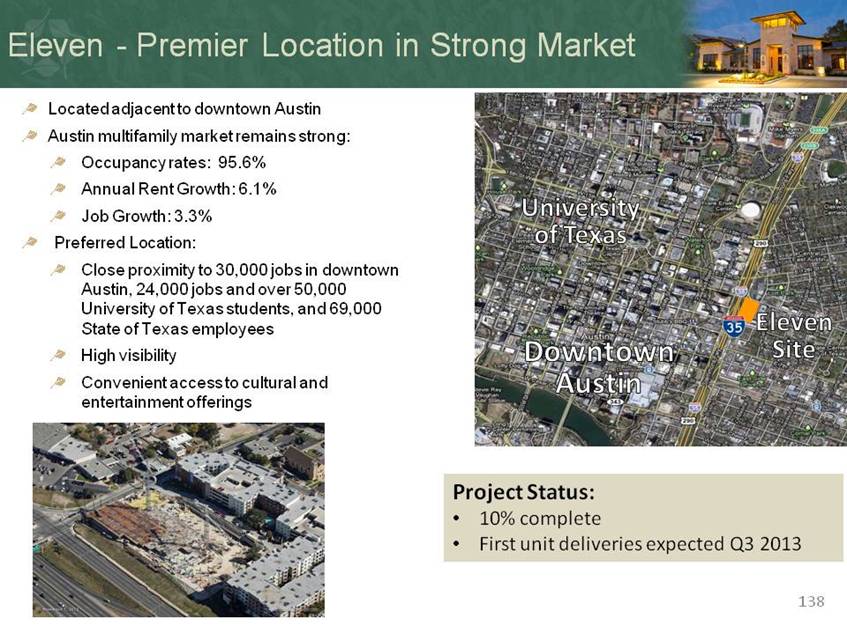
| Fore_logo.epsWaterDroplet.jpgRecharge How A Recharging Aquifer Works 149 Fore_logo.epsWaterDroplet.jpgDelivering Value with Water Resources Requires Withdrawal Permits, Transportation and Demand Buyer Permits Transportation Water Districts/Authorities Entitlements Infrastructure Municipalities Sustainable Production Pipeline Corporations & Utilities Prove Reserves Capital / Financing Focus - Securing Sales Contract and Permits / Managing Local Stakeholders ForestarMark-Bullet Point.aiForestarMark-Bullet Point.aiTop Priorities: Sale Agreements Withdrawal Permits ForestarMark-Bullet Point.aiForestarMark-Bullet Point.ai150 |
| Fore_logo.epsWaterDroplet.jpgTargeted Withdrawal Permits Forestar Water Districts Central Texas Lost Pines (50) East Texas Anderson County UWCD (1) Pineywoods GCD (68) Neches/Trinity Valley GCD (60) Southeast Texas GCD (85) Lower Trinity GCD (51) Permit Requirements: •Reputation •Credibility •Sustainable •Fair Economics 151 |
| Fore_logo.epsWaterDroplet.jpgSignificant Water Initiatives & Resources Estimated FOR Water Resources (Acres & Acre Feet in 000’s) Forestar Water Initiatives (Acres & Acre Feet in 000’s) Market Surface Acres Production Acre Feet / Yr Target Buyer Acre Feet Amount Potential Terms Central Texas 18 45 Water Districts Municipalities 45 Reservation Fee Annual Escalator A East Texas* 100 50 – 100 Municipalities 50 – 100 TBD 300 - 500 300 Municipalities Industrial Users 50 – 150 Reservation Fee Annual escalator Georgia 0.5 (2 wells) 11 Municipalities 1.7 Purchase contract Denver** 12 Municipalities 12 Sale * Represents a 45% non-participating royalty interest **Denver water assets represent sale of Ditch shares (16 units) Note: Based on preliminary estimates. Water withdrawal or usage may be subject to state and local laws, regulations or permit requirements, and there is no assurance that all interests or rights will be available for withdrawal or use. 152 |
| Fore_logo.epsWaterDroplet.jpgCentral Texas Water Opportunity Initiative Sell 45,000 acre feet annual production Target •Water Districts •Municipalities Projected Economics •45,000 acre feet •Reservation fee •Annual price escalator Central Texas Water Authority Service Area 153 |
| Fore_logo.epsWaterDroplet.jpgEast Texas Water Initiatives Initiative Sell 50,000 – 150,000 acre feet annual production from 75,000 – 275,000 acres of land Targets Municipalities – 50,000 acre feet Industrial Users – 150,000 acre feet Potential Economics 50,000 - 150,000 acre feet Reservation fee Annual price escalator 50,000 ac ft 50,000 ac ft 50,000 ac ft 150,000 ac ft 150,000 ac ft Dallas Houston Industrial 154 |
| Fore_logo.epsWaterDroplet.jpgForestar Committed to Providing Economic Solutions Cost Per Acre-Foot per Year $0 $500 $1,000 $1,500 $2,000 $2,500 Houston (Allens Creek Reservoir) Navajo-Gallup Water Supply Project (NM) Forestar (Phase 1) Orange County, CA Dallas (Toledo Bend) Metropolitan Water District - Future San Antonio (Seawater Desal) Estimated Cost for New Water Supplies ($ per acre foot) Source: 2011 South Central Texas Regional Water Plan, Integrated Resource Plan 2010 Update Note: Assumes Forestar (Phase 1) represents Central Texas delivered cost 155 |
| Fore_logo.epsWaterDroplet.jpgWater Resources Lease Transactions $0 $100 $200 $300 $400 $500 $600 $700 NM OR CA UT WA AZ TX ID CO WY NV MT ($ / acre foot) TX Reservation Fees = $25 – 75 / ac ft •Sabine River Authority •Brazos River Authority •Lower Colorado River Authority •Canadian Resources Lease Rate ($ / Acre Foot) Source: Data from the Water Strategist 156 |
| Fore_logo.epsWaterDroplet.jpgExperienced Water Team Forestar Fully Engaged in Water Resource Initiatives Bill Goodrum Vice President – Water Resources Tavia McCuean Vice President – Stewardship and Conservation Brent Covert Senior Vice President – Water Resources Phil Weber Executive Vice President – Real Estate 157 |
| Fore_logo.epsWaterDroplet.jpgDemand and potential value of water expected to grow Significant Forestar Water Resources - Gaining Recognition Capitalizing on water will require leadership, creativity, patience and ultimately capital Forestar Water Resources - Timely and Well Positioned http://forestarwater.com/images/banner_01.jpghttp://forestarwater.com/images/logo_top.jpgwww.forestarwaterresources.com 158 |
| Fore_logo.epsHeaderBackground.jpgextended waterdrop.jpgWater visionLogoRev.pngPhil Weber - EVP Real Estate Building Momentum By Delivering Economic and Sustainable Water Solutions 159 |
| HeaderBackground.jpgPRO_1714.jpgFinancial Review visionLogoRev.pngChris Nines - Chief Financial Officer Building Momentum By Maintaining Financial Flexibility and Ample Liquidity While Managing Growth 160 |
| CommunityDevHeader.jpgGenerating Significant Free Cash Flow and Debt Reduction By Accelerating Real Estate Value Realization Generating Significant Free Cash Flow and Debt Reduction By Accelerating Real Estate Value Realization YTD 2012 Significant Transactions: ($ in millions) Timing Cash Debt Palisades West Venture – sale of 25% interest Q1 2012 $32 $ -- Light Farms Venture – sale of 800 acres Q2 2012 25 (31) Multifamily Ventures – reimbursements Q2 2012 11 -- Multifamily – sale of Broadstone Memorial Q3 2012 30 (26) Multifamily – sale of Las Brisas Q4 2012 10 (29)* Total $108 ($86) Accelerating value realization from sale of stabilized income producing properties and entitled real estate has generated almost $110 million in cash and over $86 million in debt reduction * * Represents unconsolidated venture debt 161 |
| RedheadedOilpump.jpgMaintain Financial Strength and Ample Liquidity While Managing Growth •Maintain balance sheet strength with target leverage of 30-35%* •Increase senior credit facility borrowing base through acquisitions and reserve additions to maximize liquidity •Reposition non-core real estate assets for reinvestment and debt reduction •Maintain sufficient liquidity for growth and investment •No significant near-term debt maturities * Leverage measured as Total Consolidated Debt / Total Consolidated Debt + Total Shareholders Equity ** Other consolidated debt principally non-recourse to Forestar *** Represents total consolidated debt, based on Q3 2012 outstanding. Assumes revolving credit facility maturity is extended one year under existing extension option. ($ in Millions) Q3 2012 Credit Facility Borrowings $227 Other Consolidated Debt** 50 Total Debt $277 Total Debt / Total Capital 35% Available Liquidity $176 $0 $50 $100 $150 $200 $250 2012 2013 2014 2015 2016 2017 Forestar Leverage & Liquidity Forestar Debt Maturity Schedule*** 162 |
| RedheadedOilpump.jpgCapital Allocation Driven By Rates of Return Across Investment Opportunities Opportunity Investment Focus Target Returns Oil & Gas Exploration and development of existing mineral acreage > 20% Return on Capital Investments focused on high-return, oil / liquid rich basins Community Development Development of existing communities in good locations with improving market conditions > 35% Return on Cost Execute opportunistic acquisitions in “A” locations Multifamily Develop solid backlog of development opportunities 2 - 3x Cash Multiple Capital efficient investment model Share Repurchases Opportunistic investment in share repurchases - Repurchased almost 2 million shares in 2010 - 2011 Repurchased almost 100,000 shares in Q4 2012 Committed to maintaining financial strength and liquidity while managing growth 163 |
| RedheadedOilpump.jpgOptimizing Transparency & Disclosure Initiative Accomplishments Optimize Transparency & Disclosure .Quarterly conference calls and webcasts .New corporate web site Q2 2012 •Excel based quarterly financials and key performance metrics available for download on website at YE 2012 •Additional historical segment data available for download to assist in evaluating FOR at YE 2012 164 |
| RedheadedOilpump.jpgOptimizing Transparency – Timberland and Land In Entitlement Historical Sales Activity 2008 - 2012 Q3 2012 Sales Activity (2008 – Q3 2012) State County Market Ownership Acres Investment ($ in millions) Low High ($ per acre) Timberland Georgia & Alabama Various Various 100% 64,300 $37.1 $1,500 - $14,900 Texas Various Various 100% 28,800 6.7 1,200 - 12,000 Ironstob Venture* Paulding Atlanta 58% 16,000 1.6** 2,600 - 15,300 Total Timberland 109,100 $45.4 $ 1,200 - $ 15,300 Land in Entitlement California Los Angeles Los Angeles 100% 730 $15.0 n/a - n/a Georgia Various Atlanta 100% 23,000 19.8 $4,900 - $8,500 Texas Various Houston 100% 3,850 2.9 n/a - n/a Total Land in Entitlement 27,580 $37.7 $4,900 - $8,500 * Represents low-cost option to acquire approximately 16,000 acres ** Investment associated with approximately 1,200 acres 165 |
| RedheadedOilpump.jpgOptimizing Transparency – Residential Real Estate Historical Sales Activity 2008 - 2012 (2008 – 2012) YE 2012 Lot Sales Activity State Market Ownership Total Acres Investment Basis VDL’s* Lots To Be Developed Low High Wholly-Owned Colorado Denver 100% 802 $21.5 Texas Austin 100% 2,076 60.8 Dallas 100% 1,182 44.7 Houston 100% 301 15.1 San Antonio 100% 902 83.5 4,461 $204.1 Georgia Atlanta 100% 6,070 $22.1 Florida Tampa 100% 449 3.3 Missouri & Utah 100% 107 3.4 Total 11,889 $254.4 * Represents vacant developed lots 166 FORTHCOMING YE 2012 |
| RedheadedOilpump.jpgOptimizing Transparency – Commercial and Income Producing Properties Multifamily Projects & Ventures YE 2012 Market Ownership Status Units Q3 2012 FOR Investment Basis Leased Trailing 12 Month NOI Remaining FOR Capital Commit. Total Project Budget Total Project Debt at Completion Promesa Austin 100% In Construction - $30.0 75% Eleven Austin 20% In Construction - 4.1 Cedar Hill Dallas 100% Site - 3.5 Peakview Denver 15% In Construction - 2.1 Nashville Nashville 100% Site - 11.6 Total Multifamily - $51.3 Other Significant Commercial Projects Q3 2012 Assets State Market Ownership Units Investment Basis Trailing 12 Month NOI Radisson Hotel Texas Austin 100% 413 $20.0 $4.7 Total Other Commercial Projects 413 $20.0 $4.7 167 FORTHCOMING YE 2012 |
| RedheadedOilpump.jpgYE 2011 Reserves* Oil (MBO) Gas (Bcf) MBOE ($ in millions) PV-10** Proven Reserves Proved Developed Producing 1,650 18.2 4,680 $114.7 Proved Developed Non-Producing 120 1.1 299 7.2 Proved Undeveloped 1,258 5.0 2,094 22.3 Total Proven Reserves 3,028 24.3 7,073 $144.2 *Note: Based on Credo Form 10-K for the year ended 10/31/11 and Forestar Form 10-K for the year ended 12/31/11, before income taxes **Represent Non-GAAP financial measures. Forestar’s required reconciliation to GAAP financial measures can be found on our website at www.forestargroup.com Optimizing Transparency – Oil & Gas Properties 168 |
| RedheadedOilpump.jpgFinancial Summary Balance sheet well positioned with ample liquidity for strategic growth opportunities and investment Triple in FOR initiatives will improve earnings, cash flow, and grow net asset value Transparency and disclosure initiatives focused on providing additional segment metrics and tools to better understand and evaluate the value of Forestar and its prospects 169 |
| HeaderBackground.jpgvisionLogoRev.pngSevenHills912-334.jpgPRO_1714.jpgextended waterdrop.jpgiStock_000013707527_Large.jpgForestar Investor Conference December 11, 2012 Building Momentum By Accelerating Value Realization, Optimizing Transparency and Growing Net Asset Value 170 |
| TimberlandHeader.jpgForestar Well Positioned To Maximize Long-Term Value For Shareholders Executing Triple in FOR Strategic Initiatives To Accelerate Value Realization, Improve Transparency and Disclosure and Grow Net Asset Value Dynamic and experienced leadership team committed to maximizing long-term shareholder value Strong portfolio of well located real estate and oil and gas resources Balance sheet and liquidity positioned for growth and reinvestment Building Momentum By Accelerating Value Realization, Optimizing Transparency and Growing NAV 171 |
| HeaderBackground.jpgvisionLogoRev.pngSevenHills912-334.jpgPRO_1714.jpgextended waterdrop.jpgiStock_000013707527_Large.jpgForestar Investor Conference December 11, 2012 Building Momentum By Accelerating Value Realization, Optimizing Transparency and Growing Net Asset Value 172 |
| HeaderBackground.jpgvisionLogoRev.pngSevenHills912-334.jpgPRO_1714.jpgextended waterdrop.jpgiStock_000013707527_Large.jpgForestar Investor Conference Appendix December 11, 2012 Building Momentum By Accelerating Value Realization, Optimizing Transparency and Growing Net Asset Value 173 |
| TimberlandHeader.jpg174 In our full year and fourth quarter 2011 earnings release and conference call presentation materials furnished to the Securities and Exchange Commission on Form 8-K on February 22, 2012, we used certain non-GAAP financial measures. The non-GAAP financial measures should not be relied upon to the exclusion of GAAP financial measures. These non-GAAP financial measures reflect an additional way of viewing aspects of our operations that, when viewed with our GAAP financial statements and the accompanying reconciliations to corresponding GAAP financial measures, may provide a more complete understanding of our business. We strongly encourage investors to review our consolidated financial statements and publicly filed reports in their entirety. Reconciliation of Non-GAAP Financial Measures (Unaudited) The following table shows a reconciliation of PV-10 (discounted future net cash flows before income taxes) to the standardized measure of discounted future net cash flows (the most directly comparable measure calculated and presented in accordance with generally accepted accounting principles, or GAAP). PV-10 is an estimate of the present value of future net cash flows from proved developed reserves after deducting estimated severance and ad valorem taxes, but before deducting any estimates of future income taxes. The estimated future net cash flows are discounted at an annual rate of 10%. A reconciliation of PV-10 to the standardized measure of discounted future net cash flows as computed under GAAP is illustrated below: ($ in 000’s) Year-End 2011* Year-End 2010* PV – 10 (discounted future net cash flows before income taxes) $81,919 $45,267 Less: discounted future income taxes (effective tax rate of 38%) (25,713) (14,130) Standardized measure of discounted future net cash flows $56,206 $31,137 The undiscounted value represents an estimate of future net cash flows from proved developed reserves after deducting estimated severance and ad valorem taxes, but before deducting estimates of future income taxes. A reconciliation of undiscounted future net cash flows before income taxes to the undiscounted future net cash flows after income taxes is illustrated below: ($ in 000’s) Year-End 2011* Year-End 2010* Undiscounted future net cash flows before income taxes $133,729 $77,464 Less: undiscounted future income taxes (effective tax rate of 38%) (41,835) (24,112) Undiscounted future net cash flows after income taxes $91,894 $53,352 We believe both PV-10 and undiscounted values are important for evaluating the relative significance of our oil and gas interests and that the presentation of the non-GAAP financial measures provides useful information to investors because they are widely used by professional analysts and sophisticated investors in evaluating oil and gas companies. Because there are many unique factors that can impact an individual company when estimating the amount of future income taxes to be paid, we believe the use of a pre-tax measure is valuable for evaluating our mineral assets. * Includes our share of proved developed reserves in equity-method ventures Reconciliation of Non-GAAP Financial Measures Forestar Group PV-10 (Unaudited) |
| TimberlandHeader.jpg175 Reconciliation of Non-GAAP Financial Measures As Presented In Credo’s Historical Form 10-K’s (Unaudited) The following table shows a reconciliation of PV-10 (discounted future net cash flows before income taxes) to the standardized measure of discounted future net cash flows (the most directly comparable measure calculated and presented in accordance with generally accepted accounting principles, or GAAP). PV-10 is an estimate of the present value of future net cash flows from proved reserves after deducting estimated severance and ad valorem taxes, operating expenses, and capital costs, but before deducting any estimates of future income taxes. The estimated future net cash flows are discounted at an annual rate of 10%. A reconciliation of PV-10 to the standardized measure of discounted future net cash flows as computed under GAAP is illustrated below: ($ in 000’s) Est. Q3 2012* YE 2011 YE 2010 YE 2009 YE 2008 PV – 10 (discounted future net cash flows before income taxes) $88,338 $62,348 $38,730 $40,434 $32,330 Less: discounted future income taxes (17,668) (12,251) (7,800) (7,834) (4,711) Standardized measure of discounted future net cash flows $70,670 $50,097 $30,930 $32,600 $27,619 The undiscounted value represents an estimate of future net cash flows from proved reserves after deducting estimated severance and ad valorem taxes, operating expenses, and capital costs, but before deducting estimates of future income taxes. A reconciliation of undiscounted future net cash flows before income taxes to the undiscounted future net cash flows after income taxes is illustrated below: ($ in 000’s) Est. Q3 2012* YE 2011 YE 2010 YE 2009 YE 2008 Undiscounted future net cash flows before income taxes $152,889 $116,317 $69,865 $71,863 $53,655 Less: undiscounted future income taxes (32,107) (23,867) (14,898) (15,119) (9,119) Undiscounted future net cash flows after income taxes $120,782 $92,450 $54,967 $56,744 $44,536 We believe both PV-10 and undiscounted values are important for evaluating the relative significance of our oil and gas interests and that the presentation of the non-GAAP financial measures provides useful information to investors because they are widely used by professional analysts and sophisticated investors in evaluating oil and gas companies. Because there are many unique factors that can impact an individual company when estimating the amount of future income taxes to be paid, we believe the use of a pre-tax measure is valuable for evaluating our mineral assets. *Estimated Q3 2012 PV-10 represents proved reserves only based upon internal estimated reserve analysis using September 7, 2012 NYMEX strip oil and natural gas prices. Reconciliation of Non-GAAP Financial Measures Credo Petroleum PV-10 (Unaudited) |
| TimberlandHeader.jpgReconciliation of Non-GAAP Financial Measures Forestar Group Total Segment EBITDA (Unaudited) 176 Forestar’s Total Segment EBITDA for the years 2008 through estimated 2012 are non-GAAP financial measures within the meaning of Regulation G of the Securities and Exchange Commission. Non-GAAP financial measures are not in accordance with, or an alternative to, U.S. Generally Accepted Accounting Principles (GAAP). The company believes presenting non-GAAP Total Segment EBITDA is helpful to analyze financial performance without the impact of items that may obscure trends in the company’s underlying performance. A detailed reconciliation is provided below outlining the differences between these non-GAAP measures and the directly related GAAP measures. Full Year Estimate Actual ($ in millions) 2012 2011 2010 2009 2008 Total Segment Earnings (loss), in accordance with GAAP $70.8 ($7.8) $23.2 $45.2 $62.0 Add Back: Depreciation, Depletion and Amortization Expense 8.5 6.1 3.5 2.4 2.1 Total Segment EBITDA $79.3 ($1.7) $26.7 $47.6 $64.1 |
| HeaderBackground.jpgvisionLogoRev.pngSevenHills912-334.jpgPRO_1714.jpgextended waterdrop.jpgiStock_000013707527_Large.jpgForestar Investor Conference December 11, 2012 Building Momentum By Accelerating Value Realization, Optimizing Transparency and Growing Net Asset Value 177 |
| RedheadedOilpump.jpgOptimizing Transparency – Commercial and Income Producing Properties Multifamily Projects & Ventures YE 2012 Market Ownership Status Units Q3 2012 FOR Investment Basis Leased Trailing 12 Month NOI Remaining FOR Capital Commit. Total Project Budget Total Project Debt at Completion Promesa Austin 100% In Construction - $30.0 75% Eleven Austin 20% In Construction - 4.1 Cedar Hill Dallas 100% Site - 3.5 Peakview Denver 15% In Construction - 2.1 Nashville Nashville 100% Site - 11.6 Total Multifamily - $51.3 Other Significant Commercial Projects Q3 2012 Assets State Market Ownership Units Investment Basis Trailing 12 Month NOI Radisson Hotel Texas Austin 100% 413 $20.0 $4.7 Total Other Commercial Projects 413 $20.0 $4.7 167 FORTHCOMING YE 2012 |
| RedheadedOilpump.jpgYE 2011 Reserves* Oil (MBO) Gas (Bcf) MBOE ($ in millions) PV-10** Proven Reserves Proved Developed Producing 1,650 18.2 4,680 $114.7 Proved Developed Non-Producing 120 1.1 299 7.2 Proved Undeveloped 1,258 5.0 2,094 22.3 Total Proven Reserves 3,028 24.3 7,073 $144.2 *Note: Based on Credo Form 10-K for the year ended 10/31/11 and Forestar Form 10-K for the year ended 12/31/11, before income taxes **Represent Non-GAAP financial measures. Forestar’s required reconciliation to GAAP financial measures can be found on our website at www.forestargroup.com Optimizing Transparency – Oil & Gas Properties 168 |

| RedheadedOilpump.jpgFinancial Summary Balance sheet well positioned with ample liquidity for strategic growth opportunities and investment Triple in FOR initiatives will improve earnings, cash flow, and grow net asset value Transparency and disclosure initiatives focused on providing additional segment metrics and tools to better understand and evaluate the value of Forestar and its prospects 169 |

| HeaderBackground.jpgvisionLogoRev.pngSevenHills912-334.jpgPRO_1714.jpgextended waterdrop.jpgiStock_000013707527_Large.jpgForestar Investor Conference December 11, 2012 Building Momentum By Accelerating Value Realization, Optimizing Transparency and Growing Net Asset Value 170 |

| TimberlandHeader.jpgForestar Well Positioned To Maximize Long-Term Value For Shareholders Executing Triple in FOR Strategic Initiatives To Accelerate Value Realization, Improve Transparency and Disclosure and Grow Net Asset Value Dynamic and experienced leadership team committed to maximizing long-term shareholder value Strong portfolio of well located real estate and oil and gas resources Balance sheet and liquidity positioned for growth and reinvestment Building Momentum By Accelerating Value Realization, Optimizing Transparency and Growing NAV 171 |
| HeaderBackground.jpgvisionLogoRev.pngSevenHills912-334.jpgPRO_1714.jpgextended waterdrop.jpgiStock_000013707527_Large.jpgForestar Investor Conference December 11, 2012 Building Momentum By Accelerating Value Realization, Optimizing Transparency and Growing Net Asset Value 172 |

| HeaderBackground.jpgvisionLogoRev.pngSevenHills912-334.jpgPRO_1714.jpgextended waterdrop.jpgiStock_000013707527_Large.jpgForestar Investor Conference Appendix December 11, 2012 Building Momentum By Accelerating Value Realization, Optimizing Transparency and Growing Net Asset Value 173 |
| TimberlandHeader.jpg174 In our full year and fourth quarter 2011 earnings release and conference call presentation materials furnished to the Securities and Exchange Commission on Form 8-K on February 22, 2012, we used certain non-GAAP financial measures. The non-GAAP financial measures should not be relied upon to the exclusion of GAAP financial measures. These non-GAAP financial measures reflect an additional way of viewing aspects of our operations that, when viewed with our GAAP financial statements and the accompanying reconciliations to corresponding GAAP financial measures, may provide a more complete understanding of our business. We strongly encourage investors to review our consolidated financial statements and publicly filed reports in their entirety. Reconciliation of Non-GAAP Financial Measures (Unaudited) The following table shows a reconciliation of PV-10 (discounted future net cash flows before income taxes) to the standardized measure of discounted future net cash flows (the most directly comparable measure calculated and presented in accordance with generally accepted accounting principles, or GAAP). PV-10 is an estimate of the present value of future net cash flows from proved developed reserves after deducting estimated severance and ad valorem taxes, but before deducting any estimates of future income taxes. The estimated future net cash flows are discounted at an annual rate of 10%. A reconciliation of PV-10 to the standardized measure of discounted future net cash flows as computed under GAAP is illustrated below: ($ in 000’s) Year-End 2011* Year-End 2010* PV – 10 (discounted future net cash flows before income taxes) $81,919 $45,267 Less: discounted future income taxes (effective tax rate of 38%) (25,713) (14,130) Standardized measure of discounted future net cash flows $56,206 $31,137 The undiscounted value represents an estimate of future net cash flows from proved developed reserves after deducting estimated severance and ad valorem taxes, but before deducting estimates of future income taxes. A reconciliation of undiscounted future net cash flows before income taxes to the undiscounted future net cash flows after income taxes is illustrated below: ($ in 000’s) Year-End 2011* Year-End 2010* Undiscounted future net cash flows before income taxes $133,729 $77,464 Less: undiscounted future income taxes (effective tax rate of 38%) (41,835) (24,112) Undiscounted future net cash flows after income taxes $91,894 $53,352 We believe both PV-10 and undiscounted values are important for evaluating the relative significance of our oil and gas interests and that the presentation of the non-GAAP financial measures provides useful information to investors because they are widely used by professional analysts and sophisticated investors in evaluating oil and gas companies. Because there are many unique factors that can impact an individual company when estimating the amount of future income taxes to be paid, we believe the use of a pre-tax measure is valuable for evaluating our mineral assets. * Includes our share of proved developed reserves in equity-method ventures Reconciliation of Non-GAAP Financial Measures Forestar Group PV-10 (Unaudited) |
| TimberlandHeader.jpg175 Reconciliation of Non-GAAP Financial Measures As Presented In Credo’s Historical Form 10-K’s (Unaudited) The following table shows a reconciliation of PV-10 (discounted future net cash flows before income taxes) to the standardized measure of discounted future net cash flows (the most directly comparable measure calculated and presented in accordance with generally accepted accounting principles, or GAAP). PV-10 is an estimate of the present value of future net cash flows from proved reserves after deducting estimated severance and ad valorem taxes, operating expenses, and capital costs, but before deducting any estimates of future income taxes. The estimated future net cash flows are discounted at an annual rate of 10%. A reconciliation of PV-10 to the standardized measure of discounted future net cash flows as computed under GAAP is illustrated below: ($ in 000’s) Est. Q3 2012* YE 2011 YE 2010 YE 2009 YE 2008 PV – 10 (discounted future net cash flows before income taxes) $88,338 $62,348 $38,730 $40,434 $32,330 Less: discounted future income taxes (17,668) (12,251) (7,800) (7,834) (4,711) Standardized measure of discounted future net cash flows $70,670 $50,097 $30,930 $32,600 $27,619 The undiscounted value represents an estimate of future net cash flows from proved reserves after deducting estimated severance and ad valorem taxes, operating expenses, and capital costs, but before deducting estimates of future income taxes. A reconciliation of undiscounted future net cash flows before income taxes to the undiscounted future net cash flows after income taxes is illustrated below: ($ in 000’s) Est. Q3 2012* YE 2011 YE 2010 YE 2009 YE 2008 Undiscounted future net cash flows before income taxes $152,889 $116,317 $69,865 $71,863 $53,655 Less: undiscounted future income taxes (32,107) (23,867) (14,898) (15,119) (9,119) Undiscounted future net cash flows after income taxes $120,782 $92,450 $54,967 $56,744 $44,536 We believe both PV-10 and undiscounted values are important for evaluating the relative significance of our oil and gas interests and that the presentation of the non-GAAP financial measures provides useful information to investors because they are widely used by professional analysts and sophisticated investors in evaluating oil and gas companies. Because there are many unique factors that can impact an individual company when estimating the amount of future income taxes to be paid, we believe the use of a pre-tax measure is valuable for evaluating our mineral assets. *Estimated Q3 2012 PV-10 represents proved reserves only based upon internal estimated reserve analysis using September 7, 2012 NYMEX strip oil and natural gas prices. Reconciliation of Non-GAAP Financial Measures Credo Petroleum PV-10 (Unaudited) |
| TimberlandHeader.jpgReconciliation of Non-GAAP Financial Measures Forestar Group Total Segment EBITDA (Unaudited) 176 Forestar’s Total Segment EBITDA for the years 2008 through estimated 2012 are non-GAAP financial measures within the meaning of Regulation G of the Securities and Exchange Commission. Non-GAAP financial measures are not in accordance with, or an alternative to, U.S. Generally Accepted Accounting Principles (GAAP). The company believes presenting non-GAAP Total Segment EBITDA is helpful to analyze financial performance without the impact of items that may obscure trends in the company’s underlying performance. A detailed reconciliation is provided below outlining the differences between these non-GAAP measures and the directly related GAAP measures. Full Year Estimate Actual ($ in millions) 2012 2011 2010 2009 2008 Total Segment Earnings (loss), in accordance with GAAP $70.8 ($7.8) $23.2 $45.2 $62.0 Add Back: Depreciation, Depletion and Amortization Expense 8.5 6.1 3.5 2.4 2.1 Total Segment EBITDA $79.3 ($1.7) $26.7 $47.6 $64.1 |
| HeaderBackground.jpgvisionLogoRev.pngSevenHills912-334.jpgPRO_1714.jpgextended waterdrop.jpgiStock_000013707527_Large.jpgForestar Investor Conference December 11, 2012 Building Momentum By Accelerating Value Realization, Optimizing Transparency and Growing Net Asset Value 177 |