
Quarterly Report | May 31, 2020
2020 2nd Quarter Report
Closed-End Funds

| |
| |
| |
| |
| Tortoise |
| 2020 2nd Quarter Report to Stockholders |
| |
This combined report provides you with a comprehensive review of our funds that span essential assets.
| |
| Table of contents |
| |
| Closed-end Fund Comparison | | 1 | | TPZ: Fund Focus | | 17 | |
| Letter to Stockholders | | 2 | | TEAF: Fund Focus | | 20 | |
| TYG: Fund Focus | | 5 | | Financial Statements | | 24 | |
| NTG: Fund Focus | | 8 | | Notes to Financial Statements | | 64 | |
| TTP: Fund Focus | | 11 | | Additional Information | | 85 | |
| NDP: Fund Focus | | 14 | | | | | |
|
TTP and TPZ distribution policies |
Tortoise Pipeline & Energy Fund, Inc. (“TTP”) and Tortoise Power and Energy Infrastructure Fund, Inc. (“TPZ”) are relying on exemptive relief permitting them to make long-term capital gain distributions throughout the year. Each of TTP and TPZ, with approval of its Board of Directors (the “Board”), has adopted a distribution policy (the “Policy”) with the purpose of distributing over the course of each year, through periodic distributions as nearly equal as practicable and any required special distributions, an amount closely approximating the total taxable income of TTP and TPZ during such year and, if so determined by the Board, all or a portion of the return of capital paid by portfolio companies to TTP and TPZ during such year. In accordance with its Policy, TTP distributes a fixed amount per common share, currently $0.16, each quarter to its common shareholders. Prior to May 2020, the quarterly distribution rate was $0.285. TPZ distributes a fixed amount per common share, currently $0.125, each month to its common shareholders. These amounts are subject to change from time to time at the discretion of the Board. Although the level of distributions is independent of TTP’s and TPZ’s performance, TTP and TPZ expect such distributions to correlate with its performance over time. Each quarterly and monthly distribution to shareholders is expected to be at the fixed amount established by the Board, except for extraordinary distributions in light of TTP’s and TPZ’s performance for the entire calendar year and to enable TTP and TPZ to comply with the distribution requirements imposed by the Internal Revenue Code. The Board may amend, suspend or terminate the Policy without prior notice to shareholders if it deems such action to be in the best interests of TTP, TPZ and their respective shareholders. For example, the Board might take such action if the Policy had the effect of shrinking TTP’s or TPZ’s assets to a level that was determined to be detrimental to TTP or TPZ shareholders. The suspension or termination of the Policy could have the effect of creating a trading discount (if TTP’s or TPZ’s stock is trading at or above net asset value), widening an existing trading discount, or decreasing an existing premium. You should not draw any conclusions about TTP’s or TPZ’s investment performance from the amount of the distribution or from the terms of TTP’s or TPZ’s distribution policy. Each of TTP and TPZ estimates that it has distributed more than its income and net realized capital gains; therefore, a portion of your distribution may be a return of capital. A return of capital may occur, for example, when some or all of the money that you invested in TTP or TPZ is paid back to you. A return of capital distribution does not necessarily reflect TTP’s or TPZ’s investment performance and should not be confused with “yield” or “income.” The amounts and sources of distributions reported are only estimates and are not being provided for tax reporting purposes. The actual amounts and sources of the amounts for tax reporting purposes will depend upon TTP’s and TPZ’s investment experience during the remainder of their fiscal year and may be subject to changes based on tax regulations. TTP and TPZ will send you a Form 1099-DIV for the calendar year that will tell you how to report these distributions for federal income tax purposes.
| |
| |
| 2020 2nd Quarter Report | May 31, 2020 |
| Closed-end Fund Comparison |
| Name/Ticker | | Primary
focus | | Structure | | Total assets
($ millions)1 | | Portfolio mix
by asset type2 | | Portfolio mix
by structure2 |
 | Tortoise Energy Infrastructure Corp. NYSE: TYG
Inception: 2/2004 | | Midstream MLPs | | C-corp | | $467.0 | | 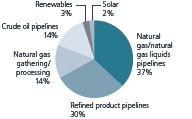 | | 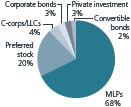 |
Tortoise Midstream Energy Fund, Inc. NYSE: NTG
Inception: 7/2010 | | Natural gas infrastructure MLPs | | C-corp | | $226.2 | | 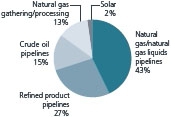 | | 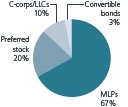 |
Tortoise Pipeline & Energy Fund, Inc. NYSE: TTP
Inception: 10/2011 | | North American pipeline companies | | Regulated investment company | | $72.1 | | 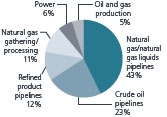 | | 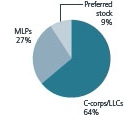 |
 | Tortoise Energy Independence Fund, Inc. NYSE: NDP
Inception: 7/2012 | | North American oil & gas producers | | Regulated investment company | | $33.0 | | 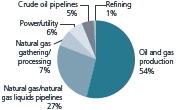 | | 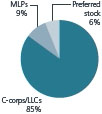 |
 | Tortoise Power and Energy Infrastructure Fund, Inc. NYSE: TPZ
Inception: 7/2009 | | Power & energy infrastructure companies (Fixed income & equity) | | Regulated investment company | | $108.3 | |  | |  |
 | Tortoise Essential Assets Income Term Fund NYSE: TEAF
Inception: 3/2019 | | Essential assets | | Regulated investment company | | $236.4 | |  | |  |
| 1 | As of 6/30/2020 |
| 2 | As of 5/31/2020 |
| |
| |
| |
| |
| Tortoise |
| Second Quarter 2020 Report to closed-end fund stockholders |
| |
Dear stockholder,
The second fiscal quarter ending in May certainly had its highs and lows. When the period started, COVID-19 was just starting to become a serious concern in the U.S. and many other countries across the globe. There weren’t yet shelter-at-home orders and basic shutdowns of countries and economies. By the end of the period, some parts of the world, including the U.S. began to emerge from several months of quarantine-induced economic slumber. While the virus is still gaining momentum in some parts of the globe, it is slowing in others and we are seeing more indicators that life is slowly making the first hesitant steps back towards normalcy. This has taken the form of direct data showing the narrowing gaps between oil and gas supply/ demand, as well as untraditional metrics showing more people out on the roads requesting driving directions.
Energy infrastructure
During the period, the broad equity markets were driven by hopes and possibilities that the world could be closer to a COVID-19 vaccine. Markets vacillated as each drug saw successes or failures during trials. Energy markets improved throughout the period as oil inventories declined with transportation demand increases and supply cuts, and the market saw signs that we are getting closer to balance. The broader energy sector, as represented by the S&P Energy Select Sector® Index, faced headwinds, returning -13.6% in the second fiscal quarter ending May 31, 2020.
Rarely have we seen a sector experience two consecutive months with more extremes than energy did in April and May. In April, oil prices plummeted to negative $37 around expiration of the front-month futures contract. May’s front-month futures contract expiration did not result in similar theatrics. The massively oversupplied global oil market in April that resulted in higher inventories subsided, resulting in higher prices. In fact, oil prices had the largest monthly gain in history in May. Crude oil spot prices, represented by West Texas Intermediate (WTI), began the fiscal period at $44.76 per barrel, troughed at -$37.63 on April 20 and ended the period at $35.49.
Indications are that China oil demand is approaching pre-COVID levels. U.S. demand appears to be increasing as well. Increased demand from two of the largest energy consumers in the world are helping balance the global oil supply and demand equation. Meanwhile, on the supply side, Saudi Arabia, Russia, and other OPEC nations are cutting production along with the U.S. In fact, the U.S. rig count is at its lowest level since 2009, indicating further production declines. According to Energy Information Administration (EIA) estimates, U.S. crude oil production fell from a record 12.9 million barrels per day (b/d) in November 2019 to 11.4 million b/d in May 2020. Baker Hughes reported that the U.S. had the fewest active drilling wells on record dating back to 1987. EIA forecasts that U.S. crude oil production will average 11.6 million b/d in 2020, and 10.8 million b/d in 2021, which would mark the first annual decline since 2016.1
While oil dominated the headlines, natural gas has continued to provide a cleaner burning energy source. As a result, we continue to see natural gas as a critical source of energy supply going forward. A reduction in natural gas demand caused by COVID-19 has resulted in the convergence of global natural gas prices. Natural gas prices, represented by Henry Hub, opened the fiscal quarter at $1.79 per million British Thermal Units (mmbtu), bottomed at $1.50 on April 3 and then peaked on May 5 at $1.93 before ending the fiscal quarter close to where it began at $1.70.
In the short term, the convergence of gas prices restricts the global liquefied natural gas (LNG) trade. It was reported that potentially 35-45 U.S. LNG cargoes scheduled for July loading could be canceled. However, low natural gas prices encourage coal-to-gas switching. We expect low natural gas prices in Europe to result in coal-to-gas fuel switching for electricity generation in countries like Germany this summer. Also, South Korea and Japan are expected to switch to natural gas from coal due to low prices as well. Clearly, more natural gas and less coal will reduce carbon emissions. According to the EIA, U.S. dry natural gas production averaged 92.2 billion cubic feet per day (Bcf/d) in 2019, setting a new record. EIA forecasts dry natural gas production will average 89.7 Bcf/d in 2020 and 85.4 Bcf/d in 2021 before production is expected to begin rising in the second quarter of 2021 in response to higher prices.1
On the demand side, EIA expects U.S. LNG exports to decline through the end of the summer as a result of reduced global demand for natural gas. COVID-19 has reduced global energy consumption, thereby reducing CO2 emissions significantly in 2020, and a further increase of natural gas usage and less coal will accelerate CO2 emissions reductions.
Longer term, lower natural gas prices are causing deferrals and cancellations of several LNG projects. Therefore, the global LNG market is expected to balance faster than analysts expected and there will likely be fewer players in the global LNG market. Existing LNG providers with stable cash flows backed by long-term contracts, will likely benefit from fewer market participants as LNG demand and commodity prices rise in the future.
Midstream energy was on par with broad energy in the second fiscal quarter with the Tortoise North American Pipeline IndexSM return of -14.0% and the Tortoise MLP Index® return of -13.9% during the period. In general, first quarter earnings for midstream companies were treated as a non-event, with an exclusive focus on company outlooks. Conditions appear to be improving, but are still far from normal. Full year guidance is now 8% lower on average. Companies with significant natural gas businesses and/or take or pay contracts reaffirmed guidance, whereas others with cash flows tied to wellhead volumes provided a wider range of outcomes. This falls in line with the sensitivity analysis we’ve conducted. Management teams are seeking to insulate and improve their balance sheets while investor focus has remained on their sustainability of cash flows and ultimately, the dividends. Companies continued to reduce spending to better align activity with the new environment and we estimate capex at the end of the fiscal quarter is 25% lower than original 2020 plans. Although in most cases these projects did shift out of 2020 capital budgets, we believe many of these projects will be necessary when demand stabilizes and may reappear in 2021 capital programs or beyond.
| |
| |
| 2020 2nd Quarter Report | May 31, 2020 |
| |
| |
| |
Capital markets activity was driven solely by debt issuance with midstream companies raising approximately $11.9 billion of debt during the second fiscal quarter of 2020, down from the first fiscal quarter. Merger and acquisition activity was minimal with less than $600 million for the period. The largest deal was Plains All American (PAA) selling its natural gas liquids (NGL) terminal assets to Crestwood Equity Partners (CEQP) totaling approximately $160 million.
On the regulatory front, New York regulators denied a water permit for William’s proposed Northeast Supply Enhancement natural gas pipeline. Now, it is unlikely that Williams will pursue this project, which would have resulted in lower heating bills for certain New York residents. The project cancellation would immediately improve Williams’ free cash flow. And as we are emphasizing a free cash flow focus to management teams, we consequently view this and other project cancellations and deferrals favorably.
Sustainable infrastructure
Renewables and utilities have seen fairly modest overall impacts to fundamentals and valuations throughout the pandemic. The sector has remained highly defensive while maintaining its overall growth outlook. In terms of short-term impact across regions, the primary issue is intense disruptions from ‘stay in place’ policies. Europe has proved to be the most impacted, with short-run electricity demand falling in a range of 5% to 20% versus last year, which relates to a more significant short-term disruption in manufacturing and industrial activity versus other regions. We expect these declines to recover sharply over the next few months, consistent with a gradual relaxation of lockdowns, which will favor essential business activities. Regarding renewables, growth continues unabated. Renewable power generation technologies are the cheapest options globally, accounting for 72% of all new capacity additions in 2019.2
In the U.S. we have seen far more limited impacts, with electricity demand flat to down 5% broadly year-over-year, in part because U.S. industrial and commercial activity has been less disrupted. In China, which experienced an earlier disruption and recovery cycle, we are seeing signs of not only full power demand recovery, but also the potential for annualized power demand to continue to be higher year-over-year for the rest of 2020. Unsurprisingly, residential usage appears to have increased compared to last year, almost everywhere. ‘‘Stay in place” has fueled more usage of appliances, lighting, computers and general activity in the home that relies on ever more plug-in nodes. And importantly, residential mix tends to be more profitable for utility companies. Our views before the crisis and now, are consistent: we expect power demand to remain relatively well underpinned, outperforming overall economic impacts during the economic downturn and to see gradual recovery as manufacturing activity bottoms and re-starts, especially in Europe. General sentiment from the International Energy Agency (IEA) concurs that renewables are growing and will continue to grow despite the generally weak economic environment and the decline in overall energy consumption in 2020.3
Social Infrastructure
Education
COVID-19 has required almost every industry to rethink how they do business and provide services, and education is no exception. Schools have had to rely exclusively on virtual learning, putting a strain on teachers and parents. It is our belief that education inside of facilities is imperative. Parents and children need brick and mortar facilities not only for education, but also for face-to-face social interaction, security, discipline, and in many cases, for a reliable meal. There are some full-time virtual charter schools, but data shows that in a given year full-time virtual charter school students overall make no gains in math and less than half the gains in reading realized by their peers in traditional schools.4
With regard to funding, for K-12 public education, it has proven extremely reliable over time. State level public school funding increased every year from 1985 through 2017, including during the recessions of the late 80’s and late 90’s. The only exception of positive state level growth was due to the recession in 2009 and 2010. Even in 2009, when state level funding declined, the federal stimulus kicked in and continued to demonstrate positive year-over-year growth for total funding (state and federal) in that year. Public school funding growth year-over-year in 2010 was negative for the first time with a nearly 2% decline. Since then, year-over-year growth has been positive. State level funding grew every year since 2011 with the exception of the stimulus pull back in 2012 due to the funding rebound at the state levels.5
To reach full enrollment, we typically need less than 3% of the age-based population in a catchment area. In the event that there is a population shift in a given area or a broad change in parent sentiment regarding allowing their children back into a school building, our underwriting strategy should allow for quite a bit of attrition before showing signs of weakness. For funding, there is a buffer in the revenue side of our underwriting in that we underestimate projected enrollment, funding per pupil, and the year-over-year growth of the revenue per child. In addition, we have cushion in debt service coverage. We think the expertise of our underwriting strategy is a key advantage of working with a strong and experienced team.
Senior Living
The key to handling any crisis is communication. In the case of COVID-19, and its effect on senior living facilities, over communication, being open and very honest with families and employees through not only written communication, but also through webinars and meetings has been essential. It is important to be very clear about the protocols in place to give families, residents and employees comfort that it is a safe environment. Another effect of the pandemic has been the increased expense of personal protective equipment, disinfectant supplies, and staffing. Facilities have always had these items on hand but not at current levels. Cleaning products and anything related to sanitation have increased in price and quantity needed. Many facilities will be tracking four categories of PPEs in key performance indicator formats and will be breaking out the surge pay for those differentials. Additional staff has been hired in some facilities to help maintain distancing of residents. For example, additional staff has been
transporting meals three times a day to each room. If outside staffing agencies are utilized, some are now charging $35 - $40 an hour for a nurse’s aide that is typically paid $14.
Fortunately, there has been access to financial support through the government initiatives in the form of Paycheck Protection Program loans. It is required that 75% of those funds go toward payroll, which can be used for the additional hazard pay. The majority of our investments have received PPP to help offset additional payroll and PPE expenses.
We believe that the spectrum of senior living options will see different levels of demand in the near future. After COVID-19, because of the strict visitation restrictions in place, some families may want to modify their homes to accommodate their aging parents in lieu of senior living facilities, but it’s very hard to provide the level of care and socialization that residents thrive on. There will be little to no change in the tremendous need for memory care because of the specific nature of the care. The need for independent living facilities may slow down a bit because it can be considered discretionary depending on the healthcare needs of the individual.
From an investment standpoint, we believe that cap rates may increase. Evaluations may change somewhat because of the perceived risk, particularly with institutional investors. Facilities that are successful should not have trouble accessing capital or refinancing. We continue to be bullish on the senior living sector and believe that there will continue to be a strong need once our communities bounce back, which will take some time.
Project Finance
The COVID-19 pandemic and related economic shutdown impacted the project finance sector late in the first quarter and throughout the second quarter. However, the impact did not hit each sub-sector equally. The sub-sectors hardest hit include recycling and liquid fuels. Demand for recycled content, such as plastics and metals, plummeted across several sub-sectors, as many new-product production facilities were temporarily shuttered or operated at significantly reduced capacities. Demand for liquid fuels, including ethanol, renewable diesel, and renewable jet fuel, also plummeted, due to the contraction of the transportation sector. Demand reduction was exacerbated by the hardship-based switch to lower-cost virgin raw materials (instead of recycled content) and fossil fuels (instead of biomass-based fuels). Finally, many planned or under-construction facilities were paused until economic re-openings bolster the demand for finished products. We expect the recovery in these sectors to follow the general recovery of the overall economy in general and the transportation sector in particular.
The renewable natural gas (RNG) sector was relatively unaffected during the crisis, with the landfill gas, wastewater treatment plant, and anaerobic digester sub-sectors performing particularly well. From a supply perspective, the production of methane at landfills and water treatment facilities, the collection of manure at farms, and the production of food processing waste remained relatively consistent. From a demand perspective, RNG production is typically contracted and benefits from various tax credits, such as the federal Renewable Identification Number (RIN) and California’s Low Carbon Fuel Standard (LCFS). Pricing for RINs and LCFS has held steady during the crisis, which helped insulate RNG-producing facilities from economic hardship. We expect these sectors to receive further underlying support as other states pass LCFS mandates similar to California’s standard.
Concluding thoughts
Despite the ripple effect that the COVID-19 crisis has had on the economy, we remain optimistic about the recovery potential as the world works hard to return to a new version of normal. We believe that energy markets will continue to improve and the energy demand and usage mix will continue to transition to natural gas and renewables. Our social infrastructure investments continued to be secure and are using the opportunity to plan for the future through this difficult experience. We believe that the need for these essential assets will prevail.
The S&P Energy Select Sector® Index is a capitalization-weighted index of S&P 500® Index companies in the energy sector involved in the development or production of energy products. The Tortoise North American Oil and Gas Producers IndexSM is a float-adjusted, capitalization-weighted index of North American energy companies engaged primarily in the production of crude oil, condensate, natural gas or natural gas liquids (NGLs). The Tortoise North American Pipeline IndexSM is a float adjusted, capitalization-weighted index of energy pipeline companies domiciled in the United States and Canada. The Tortoise MLP Index® is a float-adjusted, capitalization-weighted index of energy master limited partnerships.
The Tortoise indices are the exclusive property of Tortoise Index Solutions, LLC, which has contracted with S&P Opco, LLC (a subsidiary of S&P Dow Jones Indices LLC) to calculate and maintain the Tortoise MLP Index®, Tortoise North American Pipeline IndexSM and Tortoise North American Oil and Gas Producers IndexSM (the “Indices”). The Indices are not sponsored by S&P Dow Jones Indices or its affiliates or its third party licensors (collectively, “S&P Dow Jones Indices LLC”). S&P Dow Jones Indices will not be liable for any errors or omission in calculating the Indices. “Calculated by S&P Dow Jones Indices” and its related stylized mark(s) are service marks of S&P Dow Jones Indices and have been licensed for use by Tortoise Index Solutions, LLC and its affiliates. S&P® is a registered trademark of Standard & Poor’s Financial Services LLC (“SPFS”), and Dow Jones® is a registered trademark of Dow Jones Trademark Holdings LLC (“Dow Jones”).
It is not possible to invest directly in an index.
Performance data quoted represent past performance; past performance does not guarantee future results. Like any other stock, total return and market value will fluctuate so that an investment, when sold, may be worth more or less than its original cost.
| 1. | EIA, June 2020 STEO |
| 2. | The International Renewable Energy Agency: Renewable Power Generation Costs in 2019 |
| 3. | IEA Renewable Energy Market Update, Outlook for 2020 and 2021 |
| 4. | NWEA, The COVID-19 Slide: What summer learning loss can tell us about the potential on student academic achievement, April 2020 |
| 5. | BMO Capital Markets, The Education Industry: 2018 |
| |
| |
| 2020 2nd Quarter Report | May 31, 2020 |
| |
| Tortoise |
| Energy Infrastructure Corp. (TYG) |
| |
Fund description
TYG seeks a high level of total return with an emphasis on current distributions paid to stockholders. TYG invests primarily in equity securities of master limited partnerships (MLPs) and their affiliates that transport, gather, process or store natural gas, natural gas liquids (NGLs), crude oil and refined petroleum products.
Fund performance review
Midstream energy was on par with broad energy in the second fiscal quarter with the Tortoise MLP Index® returning -13.9% during the period. In general, first quarter earnings for midstream companies were treated as a non-event, with an exclusive focus on company outlooks. Conditions appear to be improving, but are still far from normal. Full year guidance is now 8% lower on average. Companies with significant natural gas businesses and/or take or pay contracts reaffirmed guidance, whereas others with cash flows tied to wellhead volumes provided a wider range of outcomes. The average coverage ratio for the fund’s portfolio companies was 2.7x in 1Q20 while average leverage was 3.9x. Since the fund’s inception, it has paid out more than $144 in cumulative distributions to stockholders. The fund’s market-based and NAV-based returns for the fiscal quarter ending May 31, 2020 were -63.0% and -57.5%, respectively (including the reinvestment of distributions).
| Second fiscal quarter highlights | | |
| Distributions paid per share | | None |
| Distribution rate (as of 5/31/2020) | | 0.0% |
| Quarter-over-quarter distribution increase (decrease) | | (100.0)% |
| Year-over-year distribution increase (decrease) | | (100.0)% |
| Cumulative distributions paid per share to | | |
| stockholders since inception in February 2004 | | $144.3900 |
| Market-based total return | | (63.0)% |
| NAV-based total return | | (57.5)% |
| Premium (discount) to NAV (as of 5/31/2020) | | (25.4)% |
| Key asset performance drivers |
| |
| Top five contributors | | Company type | | Performance driver |
Crestwood Equity
Partners LP, 9.250% | | Natural gas pipeline company | | Preferred structure provided downside protection |
Noble Midstream
Partners LP | | Gathering and processing MLP | | Relatively strong counterparty amid market volatility |
Targa Resources Corp.,
9.500% | | Gathering and processing company | | Convertible debt structure provided downside protection |
BP Midstream
Partners LP | | Crude oil pipelines MLP | | Combination of steady outlook for Gulf of Mexico crude oil production and minimum volume commitments |
Altus Midstream
Company Preferred | | Natural gas pipeline company | | Sponsor (Apache) reducing drilling activity |
| Bottom five contributors | | Company type | | Performance driver |
| Targa Resources Corp. | | Gathering and processing company | | Relatively high leverage |
| Energy Transfer LP | | Natural gas/natural gas liquids pipeline MLP | | Relatively high leverage |
| ONEOK, Inc. | | Natural gas/natural gas liquids pipeline company | | Concern about declining crude oil volumes negatively impacting natural gas and natural gas liquids (NGL) volumes |
Enterprise Products
Partners L.P. | | Natural gas/natural gas liquids pipeline MLP | | Concerns regarding U.S. crude oil and natural gas liquids (NGL) production volumes |
Magellan Midstream
Partners, L.P. | | Refined product pipeline MLP | | Concerns regarding reduced refined product demand and Permian crude oil volumes |
Unlike the fund return, index return is pre-expenses and taxes.
Performance data quoted represent past performance; past performance does not guarantee future results. Like any other stock, total return and market value will fluctuate so that an investment, when sold, may be worth more or less than its original cost. Portfolio composition is subject to change due to ongoing management of the fund. References to specific securities or sectors should not be construed as a recommendation by the fund or its adviser. See Schedule of Investments for portfolio weighting at the end of the fiscal quarter.
| |
| |
| |
| |
| Tortoise |
| Energy Infrastructure Corp. (TYG) (continued) |
| |
Fund structure and distribution policy
The fund is structured as a corporation and is subject to federal and state income tax on its taxable income. The fund has adopted a distribution policy in which the Board of Directors considers many factors in determining distributions to stockholders, including NAV performance and distributable cash flow (DCF). The fund’s Board of Directors reviews the distribution rate at least quarterly, and may adjust the quarterly distribution throughout the year. Although the level of distributions is independent of the funds’ performance in the short term, the fund expects such distributions to correlate with its performance over time.
Distributable cash flow and distributions
DCF is distributions received from investments less expenses. The total distributions received from investments include the amount received as cash distributions from investments, paid-in-kind distributions, and dividend and interest payments. Income also includes the premiums received from sales of covered call options, net of amounts paid to buy back out-of-the-money options. The total expenses include current or anticipated operating expenses, leverage costs and current income taxes. Current income taxes include taxes paid on net investment income, in addition to foreign taxes, if any. Taxes incurred from realized gains on the sale of investments, expected tax benefits and deferred taxes are not included in DCF.
Income from investments decreased approximately 74% as compared to 1st quarter 2020 primarily due to trading activity within the fund’s portfolio to fund leverage reductions. Operating expenses, consisting primarily of fund advisory fees, decreased approximately 63% during the quarter due mainly to lower asset-based fees. Overall leverage costs decreased approximately 42% as compared to 1st quarter 2020 as the fund materially reduced leverage during the quarter. As a result of the changes in income and expenses, DCF decreased approximately 81% as compared to 1st quarter 2020. The fund announced the temporary suspension of distributions during the quarter and did not pay any distributions during the 2nd quarter. Subsequent to quarter-end, the fund announced reinstatement of the distribution at a lower level in the 3rd quarter 2020. The fund has paid cumulative distributions to stockholders of $144.39 per share since its inception in Feb. 2004.
The Key Financial Data table discloses the calculation of DCF and should be read in conjunction with this discussion. The difference between distributions received from investments in the DCF calculation and total investment income as reported in the Statement of Operations, is reconciled as follows: the Statement of Operations, in conformity with U.S. generally accepted accounting principles (GAAP), recognizes distribution income from MLPs and other investments on their ex-dates, whereas the DCF calculation may reflect distribution income on their pay dates; GAAP recognizes that a significant portion of the cash distributions received from MLPs and other investments are characterized as a return of capital and therefore excluded from investment income, whereas the DCF calculation includes the return of capital (net of any distributions deemed to be return of principal); and distributions received from investments in the DCF calculation include the value of dividends paid-in-kind (additional stock or MLP units), whereas such amounts may not be included as income for GAAP purposes and includes distributions related to direct investments when the purchase price is reduced in lieu of receiving cash distributions. Net premiums on options written (premiums received less amounts paid to buy back out-of-the-money options) with expiration dates during the fiscal quarter are included in the DCF calculation, whereas GAAP recognizes the net effect of options written as realized and unrealized gains (losses). Income for DCF purposes is reduced by amortizing the cost of certain investments that may not have a residual value after a known time period and by distributions received from investments deemed to be return of principal. The treatment of expenses in the DCF calculation also differs from what is reported in the Statement of Operations. In addition to the total operating expenses, including fee waiver, as disclosed in the Statement of Operations, the DCF calculation reflects interest expense, realized and unrealized gains (losses) on interest rate swap settlements, distributions to preferred stockholders, other recurring leverage expenses, as well as taxes paid on net investment income.
“Net Investment Income (Loss), before Income Taxes” on the Statement of Operations is adjusted as follows to reconcile to DCF for YTD and 2nd quarter 2020 (in thousands):
| | YTD 2020 | | 2nd Qtr 2020 |
| Net Investment Loss, | | | | | | | | |
| before Income Taxes | | $ | (11,524 | ) | | $ | (7,990 | ) |
| Adjustments to reconcile to DCF: | | | | | | | | |
| Distributions characterized as | | | | | | | | |
| return of capital, net | | | 44,577 | | | | 10,102 | |
| Premiums on redemption of | | | | | | | | |
| senior notes and MRP stock | | | 3,659 | | | | 3,659 | |
| Other | | | 262 | | | | 55 | |
| DCF | | $ | 36,974 | | | $ | 5,826 | |
Leverage
The fund’s leverage utilization decreased $436.2 million during 2nd quarter 2020 and represented 25.4% of total assets at May 31, 2020. The fund was not in compliance with its applicable coverage ratios at March 31, 2020 and took action to materially reduce leverage outstanding. At quarter-end, the fund was in compliance with applicable coverage ratios. At quarter-end, 100% of the leverage cost was fixed, the weighted-average maturity was 3.5 years and the weighted-average annual rate on leverage was 4.50%. These rates will vary in the future as a result of changing floating rates, utilization of the fund’s credit facility and as leverage and swaps mature or are redeemed. During the quarter, $233.2 million of Senior Notes and $132.7 million of MRP stock was redeemed. A prepayment premium of 1% was paid upon redemption of the Senior Notes and MRP stock.
Income taxes
During 2nd quarter 2020, due primarily to a decrease in the value of its investment portfolio, the fund’s deferred tax liability was reduced to zero. The fund had net realized losses of approximately $572 million during the quarter. To the extent that the fund has taxable income, it will owe federal and state income taxes. Tax payments can be funded from investment earnings, fund assets, or borrowings.
Please see the Financial Statements and Notes to Financial Statements for additional detail regarding critical accounting policies, results of operations, leverage, taxes and other important fund information.
For further information regarding the calculation of distributable cash flow and distributions to stockholders, as well as a discussion of the tax impact on distributions, please visit www.tortoiseadvisors.com.
| |
| |
| 2020 2nd Quarter Report | May 31, 2020 |
| |
| TYG Key Financial Data (supplemental unaudited information) |
| (dollar amounts in thousands unless otherwise indicated) |
| |
The information presented below regarding Distributable Cash Flow and Selected Financial Information is supplemental non-GAAP financial information, which the fund believes is meaningful to understanding operating performance. The Distributable Cash Flow Ratios include the functional equivalent of EBITDA for non-investment companies, and the fund believes they are an important supplemental measure of performance and promote comparisons from period-to-period. This information is supplemental, is not inclusive of required financial disclosures (e.g. Total Expense Ratio), and should be read in conjunction with the full financial statements.
| | 2019 | | | | 2020 |
| | Q2(1) | | | | Q3(1) | | | | Q4(1) | | | | Q1(1) | | | | Q2(1) |
| Total Income from Investments | | | | | | | | | | | | | | | | | | | | | | | | | |
| Distributions and dividends from investments | | $ | 44,564 | | | | $ | 42,910 | | | | $ | 44,074 | | | | $ | 40,436 | | | | $ | 10,138 | | |
| Dividends paid in kind | | | 117 | | | | | 269 | | | | | 300 | | | | | 178 | | | | | 179 | | |
| Interest earned on corporate bonds | | | — | | | | | 119 | | | | | 348 | | | | | 712 | | | | | 604 | | |
| Premiums on options written | | | 1,092 | | | | | 668 | | | | | 714 | | | | | 250 | | | | | — | | |
| Total from investments | | | 45,773 | | | | | 43,966 | | | | | 45,436 | | | | | 41,576 | | | | | 10,921 | | |
| Operating Expenses Before Leverage | | | | | | | | | | | | | | | | | | | | | | | | | |
| Costs and Current Taxes | | | | | | | | | | | | | | | | | | | | | | | | | |
| Advisory fees | | | 5,215 | | | | | 4,979 | | | | | 4,479 | | | | | 4,143 | | | | | 1,373 | | |
| Other operating expenses | | | 420 | | | | | 407 | | | | | 382 | | | | | 407 | | | | | 313 | | |
| | | 5,635 | | | | | 5,386 | | | | | 4,861 | | | | | 4,550 | | | | | 1,686 | | |
| Distributable cash flow before leverage costs and current taxes | | | 40,138 | | | | | 38,580 | | | | | 40,575 | | | | | 37,026 | | | | | 9,235 | | |
| Leverage costs(2) | | | 6,637 | | | | | 6,607 | | | | | 6,347 | | | | | 5,878 | | | | | 3,409 | | |
| Current income tax expense(3) | | | — | | | | | — | | | | | — | | | | | — | | | | | — | | |
| Distributable Cash Flow(4) | | $ | 33,501 | | | | $ | 31,973 | | | | $ | 34,228 | | | | $ | 31,148 | | | | $ | 5,826 | | |
| | | | | | | | | | | | | | | | | | | | | | | | | | |
| Net realized gain (loss), net of income taxes, | | | | | | | | | | | | | | | | | | | | | | | | | |
| for the period | | $ | 10,905 | | | | $ | 34,895 | | | | $ | (6,537 | ) | | | $ | (17,195 | ) | | | $ | (572,057 | ) | |
| As a percent of average total assets(5) | | | | | | | | | | | | | | | | | | | | | | | | | |
| Total from investments | | | 8.42 | | % | | | 8.38 | | % | | | 9.71 | | % | | | 10.04 | | % | | | 5.58 | | % |
| Operating expenses before leverage costs and current taxes | | | 1.04 | | % | | | 1.03 | | % | | | 1.04 | | % | | | 1.10 | | % | | | 0.86 | | % |
| Distributable cash flow before leverage costs and current taxes | | | 7.38 | | % | | | 7.35 | | % | | | 8.67 | | % | | | 8.94 | | % | | | 4.72 | | % |
| As a percent of average net assets(5) | | | | | | | | | | | | | | | | | | | | | | | | | |
| Total from investments | | | 14.01 | | % | | | 14.41 | | % | | | 17.12 | | % | | | 16.87 | | % | | | 14.35 | | % |
| Operating expenses before leverage costs and current taxes | | | 1.72 | | % | | | 1.77 | | % | | | 1.83 | | % | | | 1.85 | | % | | | 2.22 | | % |
| Leverage costs and current taxes | | | 2.03 | | % | | | 2.17 | | % | | | 2.39 | | % | | | 2.38 | | % | | | 4.48 | | % |
| Distributable cash flow | | | 10.26 | | % | | | 10.47 | | % | | | 12.90 | | % | | | 12.64 | | % | | | 7.65 | | % |
| | | | | | | | | | | | | | | | | | | | | | | | | | |
| Selected Financial Information | | | | | | | | | | | | | | | | | | | | | | | | | |
| Distributions paid on common stock | | $ | 35,131 | | | | $ | 35,131 | | | | $ | 35,195 | | | | $ | 21,224 | | | | $ | — | | |
| Distributions paid on common stock per share(7) | | | 2.6200 | | | | | 2.6200 | | | | | 2.6200 | | | | | 1.5800 | | | | | — | | |
| Total assets, end of period(6) | | | 2,110,273 | | | | | 1,951,035 | | | | | 1,680,775 | | | | | 1,416,246 | | | | | 508,235 | | |
| Average total assets during period(6)(8) | | | 2,157,919 | | | | | 2,080,591 | | | | | 1,876,534 | | | | | 1,665,499 | | | | | 778,359 | | |
| Leverage(9) | | | 683,700 | | | | | 688,900 | | | | | 623,900 | | | | | 565,300 | | | | | 129,100 | | |
| Leverage as a percent of total assets | | | 32.4 | | % | | | 35.3 | | % | | | 37.1 | | % | | | 39.9 | | % | | | 25.4 | | % |
| Net unrealized depreciation, end of period | | | (300,530 | ) | | | | (421,920 | ) | | | | (543,310 | ) | | | | (662,820 | ) | | | | (526,684 | ) | |
| Net assets, end of period | | | 1,220,946 | | | | | 1,097,489 | | | | | 930,286 | | | | | 769,227 | | | | | 334,413 | | |
| Average net assets during period(10) | | | 1,296,336 | | | | | 1,210,078 | | | | | 1,064,735 | | | | | 991,440 | | | | | 302,755 | | |
| Net asset value per common share(7) | | | 91.04 | | | | | 81.72 | | | | | 69.24 | | | | | 57.28 | | | | | 25.08 | | |
| Market value per share(7) | | | 87.60 | | | | | 81.56 | | | | | 67.28 | | | | | 50.60 | | | | | 18.70 | | |
| Shares outstanding (000’s) | | | 53,635 | | | | | 53,732 | | | | | 53,732 | | | | | 53,732 | | | | | 13,334 | | |
| (1) | Q1 is the period from December through February. Q2 is the period from March through May. Q3 is the period from June through August. Q4 is the period from September through November. |
| (2) | Leverage costs include interest expense, distributions to preferred stockholders, interest rate swap expenses and other recurring leverage expenses. |
| (3) | Includes taxes paid on net investment income and foreign taxes, if any. Taxes related to realized gains are excluded from the calculation of Distributable Cash Flow (“DCF”). |
| (4) | “Net investment income (loss), before income taxes” on the Statement of Operations is adjusted as follows to reconcile to DCF: increased by the return of capital on distributions, the dividends paid in stock and increased liquidation value, the premium on dividends paid in kind, the net premiums on options written and amortization of debt issuance costs; and decreased by realized and unrealized gains (losses) on interest rate swap settlements, distributions received that are excluded for DCF purposes and amortization on certain investments. |
| (5) | Annualized. |
| (6) | Includes deferred issuance and offering costs on senior notes and preferred stock. |
| (7) | Adjusted to reflect 1 for 4 reverse stock split effective May 1, 2020. |
| (8) | Computed by averaging month-end values within each period. |
| (9) | Leverage consists of senior notes, preferred stock and outstanding borrowings under credit facilities. |
| (10) | Computed by averaging daily net assets within each period. |
| |
| |
| |
| |
| Tortoise |
| Midstream Energy Fund, Inc. (NTG) |
| |
Fund description
NTG seeks to provide stockholders with a high level of total return with an emphasis on current distributions. NTG invests primarily in midstream energy equities that own and operate a network of pipeline and energy related logistical infrastructure assets with an emphasis on those that transport, gather, process and store natural gas and natural gas liquids (NGLs). NTG targets midstream energy equities, including MLPs benefiting from U.S. natural gas production and consumption expansion, with minimal direct commodity exposure.
Fund performance review
Midstream energy was on par with broad energy in the second fiscal quarter with the Tortoise MLP Index® returning -13.9% during the period. In general, first quarter earnings for midstream companies were treated as a non-event, with an exclusive focus on company outlooks. Conditions appear to be improving, but are still far from normal. Full year guidance is now 8% lower on average. Companies with significant natural gas businesses and/or take or pay contracts reaffirmed guidance, whereas others with cash flows tied to wellhead volumes provided a wider range of outcomes. The average coverage ratio for the fund’s portfolio companies was 2.6x in 1Q20 while average leverage was 3.9x. The fund’s market-based and NAV-based returns for the fiscal quarter ending May 31, 2020 were -73.1% and -70.8%, respectively (including the reinvestment of distributions).
| Second fiscal quarter highlights |
| Distributions paid per share | | None |
| Distribution rate (as of 5/31/2020) | | 0.0% |
| Quarter-over-quarter distribution increase (decrease) | | (100.0)% |
| Year-over-year distribution increase (decrease) | | (100.0)% |
| Cumulative distributions paid per share to | | |
| stockholders since inception in July 2010 | | $156.9500 |
| Market-based total return | | (73.1)% |
| NAV-based total return | | (70.8)% |
| Premium (discount) to NAV (as of 5/31/2020) | | (18.5)% |
Key asset performance drivers
| Top five contributors | | Company type | | Performance driver |
| Crestwood Equity Partners LP, 9.250% | | Natural gas pipeline company | | Preferred structure provided downside protection |
| MPLX LP | | Refined products pipeline MLP | | Protection from minimum volume commitments and business diversification with Northeast midstream business |
| Noble Midstream Partners LP | | Gathering and processing MLP | | Relatively strong counterparty amid market volatility |
| Targa Resources Corp., 9.500% | | Gathering and processing company | | Convertible debt structure provided downside protection |
| DCP Midstream, LP | | Natural gas pipeline MLP | | Aggressive cost cutting initiative amid energy market volatility |
| Bottom five contributors | | Company type | | Performance driver |
| Energy Transfer LP | | Natural gas pipeline company | | Relatively high leverage |
| Targa Resources Corp. | | Gathering and processing company | | Relatively high leverage |
| Enterprise Products Partners L.P. | | Natural gas pipeline MLP | | Concerns regarding U.S. crude oil and natural gas liquids (NGL) production volumes |
| ONEOK, Inc. | | Natural gas pipeline company | | Concern about declining crude oil volumes negatively impacting natural gas and natural gas liquids (NGL) volumes |
| Holly Energy Partners, L.P. | | Refined products pipeline MLP | | Reduced distribution following lower refined product demand |
Unlike the fund return, index return is pre-expenses and taxes.
Performance data quoted represent past performance; past performance does not guarantee future results. Like any other stock, total return and market value will fluctuate so that an investment, when sold, may be worth more or less than its original cost. Portfolio composition is subject to change due to ongoing management of the fund. References to specific securities or sectors should not be construed as a recommendation by the fund or its adviser. See Schedule of Investments for portfolio weighting at the end of the fiscal quarter.
| |
| |
| 2020 2nd Quarter Report | May 31, 2020 |
| |
| |
| |
| |
Fund structure and distribution policy
The fund is structured as a corporation and is subject to federal and state income tax on its taxable income. The fund has adopted a distribution policy in which the Board of Directors considers many factors in determining distributions to stockholders, including NAV performance and distributable cash flow (DCF). The fund’s Board of Directors reviews the distribution rate at least quarterly, and may adjust the quarterly distribution throughout the year. Although the level of distributions is independent of the funds’ performance in the short term, the fund expects such distributions to correlate with its performance over time.
Distributable cash flow and distributions
DCF is distributions received from investments less expenses. The total distributions received from investments include the amount received as cash distributions from MLPs, paid-in-kind distributions, and dividend and interest payments. Income also includes the premiums received from sales of covered call options, net of amounts paid to buy back out-of-the-money options. The total expenses include current or anticipated operating expenses, leverage costs and current income taxes. Current income taxes include taxes paid on net investment income in addition to foreign taxes, if any. Taxes incurred from realized gains on the sale of investments, expected tax benefits and deferred taxes are not included in DCF.
Income from investments decreased approximately 79% as compared to 1st quarter 2020 primarily due to trading activity within the fund’s portfolio to fund leverage reductions. Operating expenses, consisting primarily of fund advisory fees, decreased approximately 75% during the quarter due primarily to lower asset-based fees. Leverage costs decreased approximately 54% as compared to 1st quarter 2020 as the fund materially reduced leverage during the quarter. As a result of the changes in income and expenses, DCF decreased approximately 86% as compared to 1st quarter 2020. The fund announced the temporary suspension of distributions during the quarter and did not pay any distributions during the 2nd quarter. Subsequent to quarter-end, the fund announced reinstatement of the distribution at a lower level in the 3rd quarter 2020. The fund has paid cumulative distributions to stockholders of $156.95 per share since its inception in July 2010.
The Key Financial Data table discloses the calculation of DCF and should be read in conjunction with this discussion. The difference between distributions received from investments in the DCF calculation and total investment income as reported in the Statement of Operations, is reconciled as follows: the Statement of Operations, in conformity with U.S. generally accepted accounting principles (GAAP), recognizes distribution income from MLPs, common stock and other investments on their ex-dates, whereas the DCF calculation may reflect distribution income on their pay dates; GAAP recognizes that a significant portion of the cash distributions received from MLPs, common stock and other investments are characterized as a return of capital and therefore excluded from investment income, whereas the DCF calculation includes the return of capital; and distributions received from investments in the DCF calculation include the value of dividends paid-in-kind (additional stock or MLP units), whereas such amounts may not be included as income for GAAP purposes, and includes distributions related to direct investments when the purchase price is reduced in lieu of receiving cash distributions. Net premiums on options written (premiums received less amounts paid to buy back out-of-the-money options) with expiration dates during the fiscal quarter are included in the DCF calculation, whereas GAAP recognizes the net effect of options written as realized and unrealized gains (losses). The treatment of expenses in the DCF calculation also differs from what is reported in the Statement of Operations. In addition to the total operating expenses, including fee waiver, as disclosed in the Statement of Operations, the DCF calculation reflects interest expense, distributions to preferred stockholders, other recurring leverage expenses, as well as taxes paid on net investment income.
“Net Investment Income (Loss), before Income Taxes” on the Statement of Operations is adjusted as follows to reconcile to DCF for YTD and 2nd quarter 2020 (in thousands):
| | YTD 2020 | | 2nd Qtr 2020 |
| Net Investment Loss, | | | | | | | | |
| before Income Taxes | | $ | (7,754 | ) | | $ | (3,615 | ) |
| Adjustments to reconcile to DCF: | | | | | | | | |
| Distributions characterized as | | | | | | | | |
| return of capital (ROC) | | | 30,164 | | | | 25,303 | |
| Premiums on redemption of | | | | | | | | |
| senior notes and MRP stock | | | 4,081 | | | | 4,081 | |
| Prior year ROC re-class | | | (1,606 | ) | | | (1,606 | ) |
| Other | | | 461 | | | | 128 | |
| DCF | | $ | 25,346 | | | $ | 3,325 | |
Leverage
The fund’s leverage utilization decreased by $358.6 million during 2nd quarter 2020 and represented 21.2% of total assets at May 31, 2020. The fund was not in compliance with its applicable coverage ratios at March 31, 2020 and took action to materially reduce leverage outstanding. At quarter-end, the fund was in compliance with applicable coverage ratios. At quarter-end, 100% of the leverage cost was fixed, the weighted-average maturity was 2.1 years and the weighted-average annual rate on leverage was 5.25%. These rates will vary in the future as a result of changing floating rates, utilization of the fund’s credit facility and as leverage matures or is redeemed. During the quarter, $218.8 million of Senior Notes and $119.3 million of MRP stock was redeemed. Prepayment premiums of approximately 1.3% and 1% were paid upon redemption of the Senior Notes and MRP stock, respectfully.
Income taxes
During 2nd quarter 2020, the fund’s deferred tax asset was reduced to zero, primarily due to application of a valuation allowance as a result of the decrease in value of its investment portfolio. The fund had net realized losses of approximately $520 million during the quarter. As of November 30, 2019, the fund had net operating losses of $1.3 million and capital loss carryforwards of $26.9 million for federal income tax purposes. To the extent that the fund has taxable income in the future that is not offset by net operating losses, it will owe federal and state income taxes. Tax payments can be funded from investment earnings, fund assets, or borrowings.
Please see the Financial Statements and Notes to Financial Statements for additional detail regarding critical accounting policies, results of operations, leverage, taxes and other important fund information.
For further information regarding the calculation of distributable cash flow and distributions to stockholders, as well as a discussion of the tax impact on distributions, please visit www.tortoiseadvisors.com.
| |
| |
| |
| |
| NTG Key Financial Data (supplemental unaudited information) |
| (dollar amounts in thousands unless otherwise indicated) |
| |
The information presented below regarding Distributable Cash Flow and Selected Financial Information is supplemental non-GAAP financial information, which the fund believes is meaningful to understanding operating performance. The Distributable Cash Flow Ratios include the functional equivalent of EBITDA for non-investment companies, and the fund believes they are an important supplemental measure of performance and promote comparisons from period-to-period. This information is supplemental, is not inclusive of required financial disclosures (e.g. Total Expense Ratio), and should be read in conjunction with the full financial statements.
| | 2019 | | | | 2020 |
| | Q2(1) | | | | Q3(1) | | | | Q4(1) | | | | Q1(1) | | | | Q2(1) |
| Total Income from Investments | | | | | | | | | | | | | | | | | | | | | | | | | |
| Distributions and dividends from investments | | $ | 31,824 | | | | $ | 31,244 | | | | $ | 31,315 | | | | $ | 28,806 | | | | $ | 6,309 | | |
| Dividends paid in kind | | | 70 | | | | | 179 | | | | | 200 | | | | | 127 | | | | | 130 | | |
| Interest earned on corporate bonds | | | — | | | | | 85 | | | | | 230 | | | | | 489 | | | | | 317 | | |
| Premiums on options written | | | 890 | | | | | 927 | | | | | 941 | | | | | 216 | | | | | — | | |
| Total from investments | | | 32,784 | | | | | 32,435 | | | | | 32,686 | | | | | 29,638 | | | | | 6,756 | | |
| Operating Expenses Before Leverage | | | | | | | | | | | | | | | | | | | | | | | | | |
| Costs and Current Taxes | | | | | | | | | | | | | | | | | | | | | | | | | |
| Advisory fees, net of fees waived | | | 3,715 | | | | | 3,526 | | | | | 3,145 | | | | | 2,868 | | | | | 873 | | |
| Other operating expenses | | | 324 | | | | | 312 | | | | | 301 | | | | | 321 | | | | | 156 | | |
| | | 4,039 | | | | | 3,838 | | | | | 3,446 | | | | | 3,189 | | | | | 1,029 | | |
| Distributable cash flow before leverage costs and current taxes | | | 28,745 | | | | | 28,597 | | | | | 29,240 | | | | | 26,449 | | | | | 5,727 | | |
| Leverage costs(2) | | | 5,175 | | | | | 5,088 | | | | | 4,859 | | | | | 4,428 | | | | | 2,402 | | |
| Current income tax expense(3) | | | — | | | | | — | | | | | — | | | | | — | | | | | — | | |
| Distributable Cash Flow(4) | | $ | 23,570 | | | | $ | 23,509 | | | | $ | 24,381 | | | | $ | 22,021 | | | | $ | 3,325 | | |
| | | | | | | | | | | | | | | | | | | | | | | | | | |
| Net realized gain (loss), net of income taxes, | | | | | | | | | | | | | | | | | | | | | | | | | |
| for the period | | $ | (6,278 | ) | | | $ | 9,631 | | | | $ | (8,640 | ) | | | $ | (6,917 | ) | | | $ | (518,170 | ) | |
| As a percent of average total assets(5) | | | | | | | | | | | | | | | | | | | | | | | | | |
| Total from investments | | | 8.46 | | % | | | 8.73 | | % | | | 9.96 | | % | | | 10.37 | | % | | | 5.77 | | % |
| Operating expenses before leverage costs and current taxes | | | 1.04 | | % | | | 1.03 | | % | | | 1.05 | | % | | | 1.12 | | % | | | 0.88 | | % |
| Distributable cash flow before leverage costs and current taxes | | | 7.42 | | % | | | 7.70 | | % | | | 8.91 | | % | | | 9.25 | | % | | | 4.89 | | % |
| As a percent of average net assets(5) | | | | | | | | | | | | | | | | | | | | | | | | | |
| Total from investments | | | 13.79 | | % | | | 14.70 | | % | | | 17.18 | | % | | | 16.80 | | % | | | 16.18 | | % |
| Operating expenses before leverage costs and current taxes | | | 1.70 | | % | | | 1.74 | | % | | | 1.81 | | % | | | 1.81 | | % | | | 2.46 | | % |
| Leverage costs and current taxes | | | 2.18 | | % | | | 2.31 | | % | | | 2.55 | | % | | | 2.51 | | % | | | 5.75 | | % |
| Distributable cash flow | | | 9.91 | | % | | | 10.65 | | % | | | 12.82 | | % | | | 12.48 | | % | | | 7.97 | | % |
| | | | | | | | | | | | | | | | | | | | | | | | | | |
| Selected Financial Information | | | | | | | | | | | | | | | | | | | | | | | | | |
| Distributions paid on common stock | | $ | 26,705 | | | | $ | 26,706 | | | | $ | 26,705 | | | | $ | 14,854 | | | | $ | — | | |
| Distributions paid on common stock per share(7) | | | 4.2250 | | | | | 4.2250 | | | | | 4.2250 | | | | | 2.3500 | | | | | — | | |
| Total assets, end of period(6) | | | 1,498,278 | | | | | 1,380,446 | | | | | 1,163,500 | | | | | 964,276 | | | | | 239,673 | | |
| Average total assets during period(6)(8) | | | 1,536,794 | | | | | 1,473,596 | | | | | 1,316,053 | | | | | 1,149,464 | | | | | 466,040 | | |
| Leverage(9) | | | 527,300 | | | | | 528,100 | | | | | 462,600 | | | | | 409,500 | | | | | 50,900 | | |
| Leverage as a percent of total assets | | | 35.2 | | % | | | 38.3 | | % | | | 39.8 | | % | | | 42.5 | | % | | | 21.2 | | % |
| Net unrealized appreciation (depreciation), end of period | | | 93,595 | | | | | 15,163 | | | | | (64,329 | ) | | | | (157,875 | ) | | | | (22,960 | ) | |
| Net assets, end of period | | | 886,270 | | | | | 786,294 | | | | | 667,708 | | | | | 549,293 | | | | | 162,369 | | |
| Average net assets during period(10) | | | 943,080 | | | | | 875,555 | | | | | 762,956 | | | | | 709,609 | | | | | 166,096 | | |
| Net asset value per common share(7) | | | 140.20 | | | | | 124.40 | | | | | 105.60 | | | | | 86.90 | | | | | 25.69 | | |
| Market value per common share(7) | | | 132.10 | | | | | 120.30 | | | | | 98.80 | | | | | 78.00 | | | | | 20.95 | | |
| Shares outstanding (000’s) | | | 63,208 | | | | | 63,208 | | | | | 63,208 | | | | | 63,208 | | | | | 6,321 | | |
| (1) | Q1 is the period from December through February. Q2 is the period from March through May. Q3 is the period from June through August. Q4 is the period from September through November. |
| (2) | Leverage costs include interest expense, distributions to preferred stockholders and other recurring leverage expenses. |
| (3) | Includes taxes paid on net investment income and foreign taxes, if any. Taxes related to realized gains are excluded from the calculation of Distributable Cash Flow (“DCF”). |
| (4) | “Net investment income (loss), before income taxes” on the Statement of Operations is adjusted as follows to reconcile to DCF: increased by the return of capital on distributions, the dividends paid in stock and increased liquidation value, the premium on dividends paid in kind and amortization of debt issuance costs. |
| (5) | Annualized. |
| (6) | Includes deferred issuance and offering costs on senior notes and preferred stock. |
| (7) | Adjusted to reflect 1 for 10 reverse stock split effective May 1, 2020. |
| (8) | Computed by averaging month-end values within each period. |
| (9) | Leverage consists of senior notes, preferred stock and outstanding borrowings under the credit facility. |
| (10) | Computed by averaging daily net assets within each period. |
| |
| |
| 2020 2nd Quarter Report | May 31, 2020 |
| |
| Tortoise |
| Pipeline & Energy Fund, Inc. (TTP) |
| |
Fund description
TTP seeks a high level of total return with an emphasis on current distributions paid to stockholders. TTP invests primarily in equity securities of North American pipeline companies that transport natural gas, natural gas liquids (NGLs), crude oil and refined products and, to a lesser extent, in other energy infrastructure companies.
Fund performance review
Midstream energy was on par with broad energy in the second fiscal quarter with the Tortoise North American Pipeline IndexSM returning -14.0%. In general, first quarter earnings for midstream companies were treated as a non-event, with an exclusive focus on company outlooks. Conditions appear to be improving, but are still far from normal. Full year guidance is now 8% lower on average. Companies with significant natural gas businesses and/or take or pay contracts reaffirmed guidance, whereas others with cash flows tied to wellhead volumes provided a wider range of outcomes. The fund’s market-based and NAV-based returns for the fiscal quarter ending May 31, 2020 were -56.6% and -53.8%, respectively (including the reinvestment of distributions).
| Second fiscal quarter highlights | | |
| Distributions paid per share | | $0.1600 |
| Distribution rate (as of 5/31/2020) | | 3.8% |
| Quarter-over-quarter distribution increase (decrease) | | (86.0)% |
| Year-over-year distribution increase (decrease) | | (90.2)% |
Cumulative distributions paid per share to
stockholders since inception in October 2011 | | $53.7500 |
| Market-based total return | | (56.6)% |
| NAV-based total return | | (53.8)% |
| Premium (discount) to NAV (as of 5/31/2020) | | (16.2)% |
Please refer to the inside front cover of the report for important information about the fund’s distribution policy.
The fund utilizes a covered call strategy when appropriate, which seeks to generate income while reducing overall volatility. No covered calls were written during the quarter.
Key asset performance drivers
| Top five contributors | | Company type | | Performance driver |
| Equitrans Midstream Corporation | | Gathering and processing company | | Relatively steady natural gas outlook amid market volatility |
| Cabot Oil & Gas Corporation | | Natural gas producing company | | View of natural gas prices being a beneficiary of lower crude oil production |
| Noble Midstream Partners LP | | Gathering and processing MLP | | Relatively strong counterparty amid market volatility |
| Targa Resources Corp., 9.500% | | Gathering and processing company | | Convertible debt structure provided downside protection |
| Cimarex Energy Co. | | Oil and gas producing company | | Diversified production provided more stability in volatile market |
| Bottom five contributors | | Company type | | Performance driver |
| ONEOK, Inc. | | Natural gas pipeline company | | Concern about declining crude oil volumes negatively impacting natural gas and natural gas liquids (NGL) volumes |
| Targa Resources Corp. | | Gathering and processing company | | Relatively high leverage |
| Energy Transfer LP | | Natural gas pipeline MLP | | Relatively high leverage |
| Plains GP Holdings, L.P. | | Crude oil pipeline company | | Reduced crude oil volume outlook |
| Inter Pipeline Ltd. | | Crude oil pipeline company | | Relatively high leverage due to growth capex spend |
Unlike the fund return, index return is pre-expenses.
Performance data quoted represent past performance; past performance does not guarantee future results. Like any other stock, total return and market value will fluctuate so that an investment, when sold, may be worth more or less than its original cost. Portfolio composition is subject to change due to ongoing management of the fund. References to specific securities or sectors should not be construed as a recommendation by the fund or its adviser. See Schedule of Investments for portfolio weighting at the end of the fiscal quarter.
| |
| |
| |
| |
| Tortoise |
| Pipeline & Energy Fund, Inc. (TTP) (continued) |
| |
Fund structure and distribution policy
The fund is structured to qualify as a Regulated Investment Company (RIC) allowing it to pass-through to shareholders income and capital gains earned, thus avoiding double-taxation. To qualify as a RIC, the fund must meet specific income, diversification and distribution requirements. Regarding income, at least 90 percent of the fund’s gross income must be from dividends, interest and capital gains. The fund must meet quarterly diversification requirements including the requirement that at least 50 percent of the assets be in cash, cash equivalents or other securities with each single issuer of other securities not greater than 5 percent of total assets. No more than 25 percent of total assets can be invested in any one issuer other than government securities or other RIC’s. The fund must also distribute at least 90 percent of its investment company income. RIC’s are also subject to excise tax rules which require RIC’s to distribute approximately 98 percent of net income and net capital gains to avoid a 4 percent excise tax.
The fund has adopted a distribution policy which is included on the inside front cover of this report. To summarize, the fund intends to distribute an amount closely approximating the total taxable income for the year and, if so determined by the Board, distribute all or a portion of the return of capital paid by portfolio companies during the year. The fund may designate a portion of its distributions as capital gains and may also distribute additional capital gains in the last calendar quarter of the year to meet annual excise distribution requirements. Distribution amounts are subject to change from time to time at the discretion of the Board. Although the level of distributions is independent of the funds’ performance in the short term, the fund expects such distributions to correlate with its performance over time.
Distributable cash flow and distributions
Distributable cash flow (DCF) is income from investments less expenses. Income from investments includes the amount received as cash or paid-in-kind distributions from common stock, master limited partnerships (MLPs), affiliates of MLPs, and pipeline and other energy companies in which the fund invests, and dividend payments on short-term investments. Income also includes the premiums received from sales of covered call options, net of amounts paid to buy back out-of-the-money options. The total expenses include current or anticipated operating expenses and leverage costs.
Income from investments decreased approximately 64% as compared to 1st quarter 2020, primarily due to trading activity within the fund’s portfolio to fund leverage reductions. Operating expenses, consisting primarily of fund advisory fees, decreased approximately 47% during the quarter, primarily due to lower asset-based fees. Leverage costs decreased approximately 30% as compared to 1st quarter 2020 as the fund materially reduced leverage during the quarter. As a result of the changes in income and expenses, DCF decreased approximately 74% as compared to 1st quarter 2020. In addition, the fund had net realized losses on investments of $86.7 million during 2nd quarter 2020. The fund paid a quarterly distribution of $0.16 per share, a decrease of approximately 86% from the distribution paid in the prior quarter and a decrease of approximately 90% from the 2nd quarter 2020. The fund has paid cumulative distributions to stockholders of $53.75 per share since its inception in October 2011.
The Key Financial Data table discloses the calculation of DCF and should be read in conjunction with this discussion. The difference between income from investments in the DCF calculation and total investment income as reported in the Statement of Operations, is reconciled as follows: (1) the Statement of Operations, in conformity with U.S. generally accepted accounting principles (GAAP), recognizes distributions and dividend income from MLPs, common stock and other investments on their ex-dates, whereas the DCF calculation may reflect distributions and dividend income on their pay dates; (2) GAAP recognizes that a significant portion of the cash distributions received from MLPs, common stock and other investments are characterized as a return of capital and therefore excluded from investment income, whereas the DCF calculation includes the return of capital; (3) income from investments in the DCF calculation includes the value of dividends paid-in-kind (additional stock or units), whereas such amounts may not be included as income for GAAP purposes; and (4) net premiums on options written (premiums received less amounts paid to buy back out-of-the-money options) with expiration dates during the fiscal quarter are included in the DCF calculation, whereas GAAP recognizes the net effect of options written as realized and unrealized gains (losses).
“Net Investment Income (Loss)” on the Statement of Operations is adjusted as follows to reconcile to DCF for YTD and 2nd quarter 2020 (in thousands):
| | YTD 2020 | | 2nd Qtr 2020 |
| Net Investment Income (loss) | | $ | 52 | | | $ | 99 | |
| Adjustments to reconcile to DCF: | | | | | | | | |
| Net premiums on options written | | | 747 | | | | 208 | |
Distributions characterized as
return of capital | | | 3,321 | | | | 849 | |
Premiums on redemption of
senior notes and MRP stock | | | 195 | | | | 195 | |
| Prior year ROC re-class | | | (580 | ) | | | (580 | ) |
| Other | | | 63 | | | | 15 | |
| DCF | | $ | 3,798 | | | $ | 786 | |
Leverage
The fund’s leverage utilization decreased by $33.5 million during 2nd quarter 2020 and represented 32.4% of total assets at May 31, 2020. The fund was not in compliance with its applicable coverage ratios at March 31, 2020 and took action to materially reduce leverage outstanding. At quarter-end, the fund was in compliance with applicable coverage ratios. At quarter-end, 100% of the leverage cost was fixed, the weighted-average maturity was 2.6 years and the weighted-average annual rate on leverage was 4.72%. These rates will vary in the future as a result of changing floating rates, utilization of the fund’s credit facility and as leverage matures or is redeemed. During the quarter, $15.6 million of Senior Notes and $9.9 million of MRP stock was redeemed. Prepayment premiums of approximately 0.6% and 1% were paid upon redemption of the Senior Notes and MRP stock, respectfully.
Please see the Financial Statements and Notes to Financial Statements for additional detail regarding critical accounting policies, results of operations, leverage and other important fund information.
For further information regarding the calculation of distributable cash flow and distributions to stockholders, as well as a discussion of the tax impact on distributions, please visit www.tortoiseadvisors.com.
| |
| |
| 2020 2nd Quarter Report | May 31, 2020 |
| |
| TTP Key Financial Data (supplemental unaudited information) |
| (dollar amounts in thousands unless otherwise indicated) |
| |
The information presented below regarding Distributable Cash Flow and Selected Financial Information is supplemental non-GAAP financial information, which the fund believes is meaningful to understanding operating performance. The Distributable Cash Flow Ratios include the functional equivalent of EBITDA for non-investment companies, and the fund believes they are an important supplemental measure of performance and promote comparisons from period-to-period. This information is supplemental, is not inclusive of required financial disclosures (e.g. Total Expense Ratio), and should be read in conjunction with the full financial statements.
| | 2019 | | 2020 |
| | Q2(1) | | Q3(1) | | Q4(1) | | Q1(1) | | Q2(1) |
| Total Income from Investments | | | | | | | | | | | | | | | | | | | | |
Dividends and distributions from investments,
net of foreign taxes withheld | | $ | 4,032 | | | $ | 3,905 | | | $ | 3,890 | | | $ | 3,744 | | | $ | 1,349 | |
| Dividends paid in kind | | | 54 | | | | 62 | | | | 68 | | | | 9 | | | | 10 | |
| Net premiums on options written | | | 1,039 | | | | 967 | | | | 483 | | | | 539 | | | | 208 | |
| Total from investments | | | 5,125 | | | | 4,934 | | | | 4,441 | | | | 4,292 | | | | 1,567 | |
| Operating Expenses Before Leverage Costs | | | | | | | | | | | | | | | | | | | | |
| Advisory fees, net of fees waived | | | 643 | | | | 602 | | | | 563 | | | | 548 | | | | 235 | |
| Other operating expenses | | | 149 | | | | 138 | | | | 116 | | | | 147 | | | | 137 | |
| | | 792 | | | | 740 | | | | 679 | | | | 695 | | | | 372 | |
| Distributable cash flow before leverage costs | | | 4,333 | | | | 4,194 | | | | 3,762 | | | | 3,597 | | | | 1,195 | |
| Leverage costs(2) | | | 633 | | | | 626 | | | | 609 | | | | 585 | | | | 409 | |
| Distributable Cash Flow(3) | | $ | 3,700 | | | $ | 3,568 | | | $ | 3,153 | | | $ | 3,012 | | | $ | 786 | |
Net realized loss on investments and foreign
currency translation, for the period | | $ | (5,479 | ) | | $ | (2,745 | ) | | $ | (1,524 | ) | | $ | (5,807 | ) | | $ | (86,692 | ) |
| As a percent of average total assets(4) | | | | | | | | | | | | | | | | | | | | |
| Total from investments | | | 8.84 | % | | | 8.96 | % | | | 8.74 | % | | | 8.96 | % | | | 5.82 | % |
| Operating expenses before leverage costs | | | 1.37 | % | | | 1.34 | % | | | 1.34 | % | | | 1.45 | % | | | 1.38 | % |
| Distributable cash flow before leverage costs | | | 7.47 | % | | | 7.62 | % | | | 7.40 | % | | | 7.51 | % | | | 4.44 | % |
| As a percent of average net assets(4) | | | | | | | | | | | | | | | | | | | | |
| Total from investments | | | 11.97 | % | | | 12.63 | % | | | 12.46 | % | | | 12.31 | % | | | 12.85 | % |
| Operating expenses before leverage costs | | | 1.85 | % | | | 1.89 | % | | | 1.91 | % | | | 1.99 | % | | | 3.05 | % |
| Leverage costs | | | 1.48 | % | | | 1.60 | % | | | 1.71 | % | | | 1.68 | % | | | 3.35 | % |
| Distributable cash flow | | | 8.64 | % | | | 9.14 | % | | | 8.84 | % | | | 8.64 | % | | | 6.45 | % |
| | | | | | | | | | | | | | | | | | | | | |
| Selected Financial Information | | | | | | | | | | | | | | | | | | | | |
| Distributions paid on common stock | | $ | 4,081 | | | $ | 2,855 | | | $ | 2,855 | | | $ | 2,855 | | | $ | 401 | |
| Distributions paid on common stock per share(5) | | | 1.6300 | | | | 1.1400 | | | | 1.1400 | | | | 1.1400 | | | | 0.1600 | |
| Total assets, end of period(6) | | | 222,673 | | | | 207,072 | | | | 192,751 | | | | 169,680 | | | | 75,700 | |
| Average total assets during period(6)(7) | | | 229,950 | | | | 218,436 | | | | 203,852 | | | | 192,750 | | | | 107,094 | |
| Leverage(8) | | | 63,100 | | | | 61,500 | | | | 61,800 | | | | 58,000 | | | | 24,500 | |
| Leverage as a percent of total assets | | | 28.3 | % | | | 29.7 | % | | | 32.1 | % | | | 34.2 | % | | | 32.4 | % |
| Net unrealized depreciation, end of period | | | (19,404 | ) | | | (28,190 | ) | | | (37,569 | ) | | | (48,038 | ) | | | (20,652 | ) |
| Net assets, end of period | | | 157,061 | | | | 143,463 | | | | 129,887 | | | | 110,707 | | | | 50,721 | |
| Average net assets during period(9) | | | 169,837 | | | | 155,032 | | | | 142,932 | | | | 140,195 | | | | 48,522 | |
| Net asset value per common share(5) | | | 62.72 | | | | 57.28 | | | | 51.88 | | | | 44.20 | | | | 20.26 | |
| Market value per common share(5) | | | 56.08 | | | | 51.36 | | | | 46.08 | | | | 39.44 | | | | 16.98 | |
| Shares outstanding (000’s) | | | 10,016 | | | | 10,016 | | | | 10,016 | | | | 10,016 | | | | 2,504 | |
| (1) | Q1 is the period from December through February. Q2 is the period from March through May. Q3 is the period from June through August. Q4 is the period from September through November. |
| (2) | Leverage costs include interest expense, distributions to preferred stockholders and other recurring leverage expenses. |
| (3) | “Net investment income (loss)” on the Statement of Operations is adjusted as follows to reconcile to Distributable Cash Flow (“DCF”): increased by net premiums on options written, the return of capital on distributions, the dividends paid in stock and increased liquidation value, the premium on dividends paid in kind and amortization of debt issuance costs. |
| (4) | Annualized. |
| (5) | Adjusted to reflect 1 for 4 reverse stock split effective May 1, 2020. |
| (6) | Includes deferred issuance and offering costs on senior notes and preferred stock. |
| (7) | Computed by averaging month-end values within each period. |
| (8) | Leverage consists of senior notes, preferred stock and outstanding borrowings under the revolving credit facility. |
| (9) | Computed by averaging daily net assets within each period. |
| |
| |
| |
| |
| Tortoise |
| Energy Independence Fund, Inc. (NDP) |
| |
Fund description
NDP seeks a high level of total return with an emphasis on current distributions paid to stockholders. NDP invests primarily in equity securities of upstream North American energy companies that engage in the exploration and production of crude oil, condensate, natural gas and natural gas liquids that generally have a significant presence in North American oil and gas fields, including shale reservoirs.
Fund performance review
Rarely have we seen a sector experience two consecutive months with more extremes than energy did in April and May. In April, oil prices plummeted to -$37 around expiration of the front-month futures contract. May’s front-month futures contract expiration did not result in similar theatrics. The massively oversupplied global oil market in April that resulted in higher inventories subsided, resulting in higher prices. In fact, oil prices had the largest monthly gain in history in May. Crude oil spot prices, represented by West Texas Intermediate (WTI), began the fiscal period at $44.76 per barrel, troughed at -$37.63 on April 20 and ended the period at $35.49. The fund’s market-based and NAV-based returns for the fiscal quarter ending May 31, 2020 were -44.8% and -34.1%, respectively (including the reinvestment of distributions).
| Second fiscal quarter highlights | | |
| Distributions paid per share | | None |
| Distribution rate (as of 5/31/2020) | | 0.0% |
| Quarter-over-quarter distribution increase (decrease) | | (100.0)% |
| Year-over-year distribution increase (decrease) | | (100.0)% |
Cumulative distributions paid per share to
stockholders since inception in July 2012 | | $96.9000 |
| Market-based total return | | (44.8)% |
| NAV-based total return | | (34.1)% |
| Premium (discount) to NAV (as of 5/31/2020) | | (25.0)% |
The fund utilizes a covered call strategy when appropriate, which seeks to generate income while reducing overall volatility. No covered calls were written during the quarter.
Key asset performance drivers
| Top five contributors | | Company type | | Performance driver |
| Chevron Corporation | | Oil and natural gas producing company | | Diversified business expected to prove more stable amid volatile energy environment |
| ConocoPhillips | | Liquids producing company | | Relatively low leverage amid volatile energy environment |
| EQT Corporation | | Natural gas producing company | | View of natural gas prices being a beneficiary of lower crude oil production |
| Kinder Morgan Inc. | | Natural gas pipeline company | | Diversified midstream business offers greater stability amid volatile energy environment |
| TC Energy Corporation | | Natural gas pipeline company | | Stability of regulated business model benefitted during volatile commodity prices |
| Bottom five contributors | | Company type | | Performance driver |
| Marathon Petroleum Corp. | | Refining company | | Concerns about global refined product (gasoline, diesel, and jet fuel) demand declines |
| Noble Energy Inc. | | Natural gas producing company | | Lower crude oil prices negatively impacting cash flow |
| Parsley Energy, Inc. | | Oil and gas producing company | | Lower crude oil prices negatively impacting cash flow |
| WPX Energy Inc. | | Oil and gas producing company | | Lower crude oil prices negatively impacting cash flow |
| Pioneer Natural Resources Company | | Oil and gas producing company | | Lower crude oil prices negatively impacting cash flow |
Unlike the fund return, index return is pre-expenses.
Performance data quoted represent past performance: past performance does not guarantee future results. Like any other stock, total return and market value will fluctuate so that an investment, when sold, may be worth more or less than its original cost. Portfolio composition is subject to change due to ongoing management of the fund. References to specific securities or sectors should not be construed as a recommendation by the fund or its adviser. See Schedule of Investments for portfolio weighting at the end of the fiscal quarter.
| |
| |
| 2020 2nd Quarter Report | May 31, 2020 |
| |
| |
| |
Fund structure and distribution policy
The fund is structured to qualify as a Regulated Investment Company (RIC) allowing it to pass-through to shareholders income and capital gains earned, thus avoiding double-taxation. To qualify as a RIC, the fund must meet specific income, diversification and distribution requirements. Regarding income, at least 90 percent of the fund’s gross income must be from dividends, interest and capital gains. The fund must meet quarterly diversification requirements including the requirement that at least 50 percent of the assets be in cash, cash equivalents or other securities with each single issuer of other securities not greater than 5 percent of total assets. No more than 25 percent of total assets can be invested in any one issuer other than government securities or other RIC’s. The fund must also distribute at least 90 percent of its investment company income. RIC’s are also subject to excise tax rules which require RIC’s to distribute approximately 98 percent of net income and net capital gains to avoid a 4 percent excise tax.
The fund has adopted a distribution policy which intends to distribute an amount closely approximating the total taxable income for the year and, if so determined by the Board, distribute all or a portion of the return of capital paid by portfolio companies during the year. The fund may designate a portion of its distributions as capital gains and may also distribute additional capital gains in the last calendar quarter of the year to meet annual excise distribution requirements. Distribution amounts are subject to change from time to time at the discretion of the Board. Although the level of distributions is independent of the funds’ performance in the short term, the fund expects such distributions to correlate with its performance over time.
Distributable cash flow and distributions
Distributable cash flow (DCF) is income from investments less expenses. Income from investments includes the amount received as cash or paid-in-kind distributions from investments and dividend payments on short-term investments. Income also includes the premiums received from sales of covered call options, net of amounts paid to buy back out-of-the-money options. The total expenses include current or anticipated operating expenses and leverage costs.
Income from investments decreased approximately 53% as compared to 1st quarter 2020, primarily due to decreased premiums received on written covered call options. Operating expenses, consisting primarily of fund advisory fees, decreased approximately 42% during the quarter, as primarily due to lower asset-based fees. Total leverage costs decreased approximately 84% as compared to 1st quarter 2020 as the fund materially reduced leverage during the quarter. As a result of the changes in income and expenses, DCF decreased by approximately 52% as compared to 1st quarter 2020. In addition, the fund had net realized losses on investments of $44.8 million during 2nd quarter 2020.
The fund announced the temporary suspension of distributions during the quarter and did not pay any distributions during the 2nd quarter. The fund has paid cumulative distributions to stockholders of $96.90 per share since its inception in July 2012.
The Key Financial Data table discloses the calculation of DCF and should be read in conjunction with this discussion. The difference between income from investments in the DCF calculation and total investment income as reported in the Statement of Operations, is reconciled as follows: (1) the Statement of Operations, in conformity with U.S. generally accepted accounting principles (GAAP), recognizes distributions and dividend income from MLPs, common stock and other investments on their ex-dates, whereas the DCF calculation may reflect distributions and dividend income on their pay dates; (2) GAAP recognizes that a significant portion of the cash distributions received from MLPs, common stock and other investments are characterized as a return of capital and therefore excluded from investment income, whereas the DCF calculation includes the return of capital; (3) income from investments in the DCF calculation includes the value of dividends paid-in-kind (additional stock or units), whereas such amounts may not be included as income for GAAP purposes; and (4) net premiums on options written (premiums received less amounts paid to buy back out-of-the-money options) with expiration dates during fiscal quarter are included in the DCF calculation, whereas GAAP recognizes the net effect of options written as realized and unrealized gains (losses).
“Net Investment Income (Loss)” on the Statement of Operations is adjusted as follows to reconcile to DCF for YTD and 2nd quarter 2020 (in thousands):
| | YTD 2020 | | 2nd Qtr 2020 |
| Net Investment Income (loss) | | $ | (28 | ) | | | $ | 37 | | |
| Adjustments to reconcile to DCF: | | | | | | | | | | |
| Net premiums on options written | | | 1,734 | | | | | 459 | | |
| Distributions characterized as | | | | | | | | | | |
| return of capital | | | 337 | | | | | 174 | | |
| Other | | | (10 | ) | | | | (10 | ) | |
| DCF | | $ | 2,033 | | | | $ | 660 | | |
Leverage
The fund’s leverage utilization decreased $16.3 million as compared to 1st quarter 2020. The fund utilizes all floating rate leverage that had an interest rate of 1.18% and represented 12.1% of total assets at quarter-end. During the period, the fund maintained compliance with its applicable coverage ratios. The interest rate on the fund’s leverage will vary in the future along with changing floating rates.
Please see the Financial Statements and Notes to Financial Statements for additional detail regarding critical accounting policies, results of operations, leverage and other important fund information.
For further information regarding the calculation of distributable cash flow and distributions to stockholders, as well as a discussion of the tax impact on distributions, please visit www.tortoiseadvisors.com.
| |
| |
| |
| |
| NDP Key Financial Data (supplemental unaudited information) |
| (dollar amounts in thousands unless otherwise indicated) |
| |
The information presented below regarding Distributable Cash Flow and Selected Financial Information is supplemental non-GAAP financial information, which the fund believes is meaningful to understanding operating performance. The Distributable Cash Flow Ratios include the functional equivalent of EBITDA for non-investment companies, and the fund believes they are an important supplemental measure of performance and promote comparisons from period-to-period. This information is supplemental, is not inclusive of required financial disclosures (e.g. Total Expense Ratio), and should be read in conjunction with the full financial statements.
| | 2019 | | | 2020 |
| | Q2(1) | | | Q3(1) | | | Q4(1) | | | Q1(1) | | | Q2(1) |
| Total Income from Investments | | | | | | | | | | | | | | | | | | | | |
Distributions and dividends from investments,
net of foreign taxes withheld | | $ | 394 | | | $ | 538 | | | $ | 789 | | | $ | 657 | | | $ | 448 | |
| Dividends paid in stock | | | — | | | | — | | | | — | | | | — | | | | — | |
| Net premiums on options written | | | 5,279 | | | | 5,085 | | | | 1,771 | | | | 1,275 | | | | 459 | |
| Total from investments | | | 5,673 | | | | 5,623 | | | | 2,560 | | | | 1,932 | | | | 907 | |
| Operating Expenses Before Leverage Costs | | | | | | | | | | | | | | | | | | | | |
| Advisory fees, net of fees waived | | | 421 | | | | 315 | | | | 261 | | | | 247 | | | | 93 | |
| Other operating expenses | | | 133 | | | | 110 | | | | 100 | | | | 128 | | | | 124 | |
| | | 554 | | | | 425 | | | | 361 | | | | 375 | | | | 217 | |
| Distributable cash flow before leverage costs | | | 5,119 | | | | 5,198 | | | | 2,199 | | | | 1,557 | | | | 690 | |
| Leverage costs(2) | | | 350 | | | | 292 | | | | 216 | | | | 184 | | | | 30 | |
| Distributable Cash Flow(3) | | $ | 4,769 | | | $ | 4,906 | | | $ | 1,983 | | | $ | 1,373 | | | $ | 660 | |
Net realized loss on investments and foreign
currency translation, for the period | | $ | (17,350 | ) | | $ | (31,152 | ) | | $ | (2,264 | ) | | $ | (3,945 | ) | | $ | (44,750 | ) |
| As a percent of average total assets(4) | | | | | | | | | | | | | | | | | | | | |
| Total from investments | | | 15.12 | % | | | 19.20 | % | | | 10.92 | % | | | 9.16 | % | | | 8.52 | % |
| Operating expenses before leverage costs | | | 1.48 | % | | | 1.45 | % | | | 1.54 | % | | | 1.78 | % | | | 2.04 | % |
| Distributable cash flow before leverage costs | | | 13.64 | % | | | 17.75 | % | | | 9.38 | % | | | 7.38 | % | | | 6.48 | % |
| As a percent of average net assets(4) | | | | | | | | | | | | | | | | | | | | |
| Total from investments | | | 20.05 | % | | | 28.01 | % | | | 15.34 | % | | | 12.10 | % | | | 13.19 | % |
| Operating expenses before leverage costs | | | 1.96 | % | | | 2.12 | % | | | 2.16 | % | | | 2.35 | % | | | 3.15 | % |
| Leverage costs | | | 1.24 | % | | | 1.45 | % | | | 1.29 | % | | | 1.15 | % | | | 0.44 | % |
| Distributable cash flow | | | 16.85 | % | | | 24.44 | % | | | 11.89 | % | | | 8.60 | % | | | 9.60 | % |
| | | | | | | | | | | | | | | | | | | | | |
| Selected Financial Information | | | | | | | | | | | | | | | | | | | | |
| Distributions paid on common stock | | $ | 6,445 | | | $ | 1,477 | | | $ | 1,477 | | | $ | 1,477 | | | $ | — | |
| Distributions paid on common stock per share(5) | | | 3.5000 | | | | 0.8000 | | | | 0.8000 | | | | 0.8000 | | | | — | |
| Total assets, end of period | | | 123,229 | | | | 95,078 | | | | 88,684 | | | | 66,439 | | | | 33,895 | |
| Average total assets during period(6) | | | 148,821 | | | | 116,182 | | | | 94,064 | | | | 84,873 | | | | 42,362 | |
| Leverage(7) | | | 34,600 | | | | 28,700 | | | | 26,500 | | | | 20,400 | | | | 4,100 | |
| Leverage as a percent of total assets | | | 28.1 | % | | | 30.2 | % | | | 29.9 | % | | | 30.7 | % | | | 12.1 | % |
| Net unrealized depreciation, end of period | | | (27,092 | ) | | | (21,503 | ) | | | (21,026 | ) | | | (32,908 | ) | | | (4,249 | ) |
| Net assets, end of period | | | 87,720 | | | | 65,322 | | | | 61,550 | | | | 45,253 | | | | 29,566 | |
| Average net assets during period(8) | | | 112,274 | | | | 79,655 | | | | 66,948 | | | | 64,239 | | | | 27,364 | |
| Net asset value per common share(5) | | | 47.52 | | | | 35.36 | | | | 33.36 | | | | 24.48 | | | | 16.20 | |
| Market value per common share(5) | | | 59.20 | | | | 31.92 | | | | 29.04 | | | | 21.76 | | | | 12.01 | |
| Shares outstanding (000’s) | | | 14,768 | | | | 14,768 | | | | 14,768 | | | | 14,768 | | | | 1,846 | |
| (1) | Q1 is the period from December through February. Q2 is the period from March through May. Q3 is the period from June through August. Q4 is the period from September through November. |
| (2) | Leverage costs include interest expense and other recurring leverage expenses. |
| (3) | “Net investment income (loss)” on the Statement of Operations is adjusted as follows to reconcile to Distributable Cash Flow (“DCF”): increased by net premiums on options written, the return of capital on distributions the distributions paid in stock and the premium on dividends paid in kind. |
| (4) | Annualized. |
| (5) | Adjusted to reflect 1 for 8 reverse stock split effective May 1, 2020. |
| (6) | Computed by averaging month-end values within each period. |
| (7) | Leverage consists of outstanding borrowings under the revolving credit facility. |
| (8) | Computed by averaging daily net assets within each period. |
| |
| |
| 2020 2nd Quarter Report | May 31, 2020 |
| |
| Tortoise |
| Power and Energy Infrastructure Fund, Inc. (TPZ) |
| |
Fund description
TPZ seeks to provide a high level of current income to stockholders, with a secondary objective of capital appreciation. TPZ seeks to invest primarily in fixed income and dividend-paying equity securities of power and energy infrastructure companies that provide stable and defensive characteristics throughout economic cycles.
Fund performance review
Midstream energy was on par with broad energy in the second fiscal quarter with the Tortoise North American Pipeline IndexSM returning -14.0%. In general, first quarter earnings for midstream companies were treated as a non-event, with an exclusive focus on company outlooks. Conditions appear to be improving, but are still far from normal. Full year guidance is now 8% lower on average. Companies with significant natural gas businesses and/or take or pay contracts reaffirmed guidance, whereas others with cash flows tied to wellhead volumes provided a wider range of outcomes. The fund’s market-based and NAV-based returns for the fiscal quarter ending May 31, 2020 were -30.6% and -21.5%, respectively (including the reinvestment of distributions). Comparatively, the TPZ Benchmark Composite* returned -3.1% for the same period. The fund’s fixed income holdings outperformed its equity holdings on a total return basis.
| Second fiscal quarter highlights | | | |
| Monthly distributions paid per share | | $ | 0.1250 |
| Distribution rate (as of 5/31/2020) | | | 15.3% |
| Quarter-over-quarter distribution increase (decrease) | | | 0.0% |
| Year-over-year distribution increase (decrease) | | | 0.0% |
| Cumulative distribution to stockholders | | | |
| since inception in July 2009 | | $ | 17.5250 |
| Market-based total return | | | (30.6)% |
| NAV-based total return | | | (21.5)% |
| Premium (discount) to NAV (as of 5/31/2020) | | | (19.4)% |
| * | The TPZ Benchmark Composite includes the BofA Merrill Lynch U.S. Energy Index (CIEN), the BofA Merrill Lynch U.S. Electricity Index (CUEL) and the Tortoise MLP Index® (TMLP). It is comprised of a blend of 70% fixed income and 30% equity securities issued by companies in the power and energy infrastructure sectors. |
Please refer to the inside front cover of the report for important information about the fund’s distribution policy.
Key asset performance drivers
| Top five contributors | | Company type | | Performance driver |
Blue Racer Midstream
LLC, 6.625%,
07/15/2026 | | Gathering and processing company | | Relatively steady natural gas outlook amid market volatility |
Ascent Resources Utica
Holdings, LLC, 7.000%,
11/01/2026 | | Oil and gas producing company | | View of natural gas prices being a beneficiary of lower crude oil production |
Antero Midstream
Partners, LP, 5.750%,
03/01/2027 | | Gathering and processing company | | Relatively steady natural gas outlook amid market volatility |
Hess Corporation,
5.625%, 02/15/2026 | | Gathering and processing company | | Relatively strong counterparty and minimum volume commitment protections amid market volatility |
Cheniere Corp.,
7.000%, 06/30/2024 | | Natural gas pipeline company | | Long-term take or pay contracts provide visibility to stable cash flow |
| Bottom five contributors | | Company type | | Performance driver |
| Targa Resources Corp. | | Gathering and processing company | | Relatively high leverage |
| Energy Transfer LP | | Natural gas pipeline MLP | | Relatively high leverage |
TransCanada
Corporation,
5.625%, 05/20/2075 | | Natural gas pipeline company | | Relatively high leverage |
| ONEOK, Inc. | | Natural gas pipeline company | | Concern about declining crude oil volumes negatively impacting natural gas and natural gas liquids (NGL) volumes |
| Plains GP Holdings, L.P. | | Crude oil pipeline company | | Reduced crude oil volume outlook |
Unlike the fund return, index return is pre-expenses.
Performance data quoted represent past performance; past performance does not guarantee future results. Like any other stock, total return and market value will fluctuate so that an investment, when sold, may be worth more or less than its original cost. Portfolio composition is subject to change due to ongoing management of the fund. References to specific securities or sectors should not be construed as a recommendation by the fund or its adviser. See Schedule of Investments for portfolio weighting at the end of the fiscal quarter.
| |
| |
| |
| |
| Tortoise |
| Power and Energy Infrastructure Fund, Inc. (TPZ) (continued) |
| |
Fund structure and distribution policy
The fund is structured to qualify as a Regulated Investment Company (RIC) allowing it to pass-through to shareholders income and capital gains earned, thus avoiding double-taxation. To qualify as a RIC, the fund must meet specific income, diversification and distribution requirements. Regarding income, at least 90 percent of the fund gross income must be from dividends, interest and capital gains. The fund must meet quarterly diversification requirements including the requirement that at least 50 percent of the assets be in cash, cash equivalents or other securities with each single issuer of other securities not greater than 5 percent of total assets. No more than 25 percent of total assets can be invested in any one issuer other than government securities or other RIC’s. The fund must also distribute at least 90 percent of its investment company income. RIC’s are also subject to excise tax rules which require RIC’s to distribute approximately 98 percent of net income and net capital gains to avoid a 4 percent excise tax.
The fund has adopted a distribution policy which is included on the inside front cover of this report. To summarize, the fund intends to distribute an amount closely approximating the total taxable income for the year and, if so determined by the Board, distribute all or a portion of the return of capital paid by portfolio companies during the year. The fund may designate a portion of its distributions as capital gains and may also distribute additional capital gains in the last calendar quarter of the year to meet annual excise distribution requirements. Distribution amounts are subject to change from time to time at the discretion of the Board. Although the level of distributions is independent of the funds’ performance in the short term, the fund expects such distributions to correlate with its performance over time.
Distributable cash flow and distributions
Distributable cash flow (DCF) is income from investments less expenses. Income from investments includes the accrued interest from corporate bonds, cash distributions and paid-in-kind distributions from master limited partnerships (MLPs) and other equity investments and dividends earned from short-term investments. The total expenses include current or anticipated operating expenses and leverage costs.
Income from investments decreased approximately 41% as compared to 1st quarter 2020 due primarily to trading activity within the fund’s portfolio to fund leverage reductions. Operating expenses, consisting primarily of fund advisory fees, decreased approximately 35% during the quarter, primarily due to lower asset-based fees. Total leverage costs decreased approximately 36% as compared to 1st quarter 2020 as the fund materially reduced leverage during the quarter. As a result of the changes in income and expenses, DCF decreased approximately 43% as compared to 1st quarter 2020. In addition, the fund had net realized losses on investments of $28.0 million during 2nd quarter 2020.
The fund paid monthly distributions of $0.125 per share during 2nd quarter 2020, which was unchanged over the prior quarter and 2nd quarter 2020. The fund’s Board of Directors has announced monthly distributions of $0.05 per share are expected to be paid during 3rd quarter 2020. The fund has paid cumulative distributions to stockholders of $17.525 per share since its inception in July 2009.
The Key Financial Data table discloses the calculation of DCF and should be read in conjunction with this discussion. The difference between income from investments in the DCF calculation and total investment income as reported in the Statement of Operations, is reconciled as follows: (1) U.S. generally accepted accounting principles (GAAP), recognizes distribution income from MLPs, common stock and other investments on their ex-dates, whereas the DCF calculation may reflect distribution income on their pay dates; (2) GAAP recognizes that a significant portion of the cash distributions received from MLPs, common stock and other investments are characterized as a return of capital and therefore excluded from investment income, whereas the DCF calculation includes the return of capital; (3) income from investments in the DCF calculation includes the value of dividends paid-in-kind (additional stock or units), whereas such amounts may not be included as income for GAAP purposes; and (4) amortization of premium or discount for all securities is calculated using the yield to worst methodology for GAAP purposes while yield to call is used in calculating amortization for long-dated hybrid securities in the DCF calculation. The treatment of expenses in the DCF calculation also differs from what is reported in the Statement of Operations. In addition to the total operating expenses, including fee waiver, as disclosed in the Statement of Operations, the DCF calculation reflects interest expense and realized and unrealized gains (losses) on interest rate swap settlements as leverage costs.
“Net Investment Income (Loss)” on the Statement of Operations is adjusted as follows to reconcile to DCF for YTD and 2nd quarter 2020 (in thousands):
| | YTD 2020 | | 2nd Qtr 2020 |
| Net Investment Income | | $ | 1,338 | | | $ | 630 | |
| Adjustments to reconcile to DCF: | | | | | | | | |
| Distributions characterized as | | | | | | | | |
| return of capital | | | 2,230 | | | | 659 | |
| Other | | | 60 | | | | 30 | |
| DCF | | $ | 3,628 | | | $ | 1,319 | |
Leverage
The fund’s leverage utilization decreased $28.0 million as compared to 1st quarter 2020 and represented 22.7% of total assets at May 31, 2020. During the period, the fund maintained compliance with its applicable coverage ratios. At quarter-end, including the impact of interest rate swaps, approximately 97% of the leverage cost was fixed, the weighted-average maturity was 3.2 years and the weighted-average annual rate on leverage was 3.36%. These rates will vary in the future as a result of changing floating rates and as swaps mature or are redeemed.
Please see the Financial Statements and Notes to Financial Statements for additional detail regarding critical accounting policies, results of operations, leverage and other important fund information.
For further information regarding the calculation of distributable cash flow and distributions to stockholders, as well as a discussion of the tax impact on distributions, please visit www.tortoiseadvisors.com.
| |
| |
| 2020 2nd Quarter Report | May 31, 2020 |
| |
| TPZ Key Financial Data (supplemental unaudited information) |
| (dollar amounts in thousands unless otherwise indicated) |
| |
The information presented below regarding Distributable Cash Flow and Selected Financial Information is supplemental non-GAAP financial information, which the fund believes is meaningful to understanding operating performance. The Distributable Cash Flow Ratios include the functional equivalent of EBITDA for non-investment companies, and the fund believes they are an important supplemental measure of performance and promote comparisons from period-to-period. This information is supplemental, is not inclusive of required financial disclosures (e.g. Total Expense Ratio), and should be read in conjunction with the full financial statements.
| | 2019 | | | | 2020 |
| | Q2(1) | | | | Q3(1) | | | | Q4(1) | | | | Q1(1) | | | | Q2(1) |
| Total Income from Investments | | | | | | | | | | | | | | | | | | | | | | | | | |
| Interest earned on corporate bonds | | $ | 1,381 | | | | $ | 1,368 | | | | $ | 1,331 | | | | $ | 1,311 | | | | $ | 1,116 | | |
| Distributions and dividends from investments, | | | | | | | | | | | | | | | | | | | | | | | | | |
| net of foreign taxes withheld | | | 1,909 | | | | | 1,907 | | | | | 1,975 | | | | | 1,924 | | | | | 800 | | |
| Dividends paid in kind | | | 40 | | | | | 47 | | | | | 49 | | | | | 8 | | | | | 8 | | |
| Total from investments | | | 3,330 | | | | | 3,322 | | | | | 3,355 | | | | | 3,243 | | | | | 1,924 | | |
| Operating Expenses Before Leverage Costs | | | | | | | | | | | | | | | | | | | | | | | | | |
| Advisory fees | | | 476 | | | | | 462 | | | | | 440 | | | | | 426 | | | | | 251 | | |
| Other operating expenses | | | 141 | | | | | 131 | | | | | 109 | | | | | 141 | | | | | 120 | | |
| | | 617 | | | | | 593 | | | | | 549 | | | | | 567 | | | | | 371 | | |
| Distributable cash flow before leverage costs | | | 2,713 | | | | | 2,729 | | | | | 2,806 | | | | | 2,676 | | | | | 1,553 | | |
| Leverage costs(2) | | | 435 | | | | | 410 | | | | | 382 | | | | | 367 | | | | | 234 | | |
| Distributable Cash Flow(3) | | $ | 2,278 | | | | $ | 2,319 | | | | $ | 2,424 | | | | $ | 2,309 | | | | $ | 1,319 | | |
| Net realized gain (loss) on investments and foreign | | | | | | | | | | | | | | | | | | | | | | | | | |
| currency translation, for the period | | $ | 878 | | | | $ | 94 | | | | $ | 4,288 | | | | $ | 1,376 | | | | $ | (27,995 | ) | |
| As a percent of average total assets(4) | | | | | | | | | | | | | | | | | | | | | | | | | |
| Total from investments | | | 6.66 | | % | | | 6.78 | | % | | | 7.23 | | % | | | 7.35 | | % | | | 6.59 | | % |
| Operating expenses before leverage costs | | | 1.23 | | % | | | 1.21 | | % | | | 1.18 | | % | | | 1.28 | | % | | | 1.27 | | % |
| Distributable cash flow before leverage costs | | | 5.43 | | % | | | 5.57 | | % | | | 6.05 | | % | | | 6.07 | | % | | | 5.32 | | % |
| As a percent of average net assets(4) | | | | | | | | | | | | | | | | | | | | | | | | | |
| Total from investments | | | 9.20 | | % | | | 9.53 | | % | | | 10.25 | | % | | | 10.18 | | % | | | 10.12 | | % |
| Operating expenses before leverage costs | | | 1.70 | | % | | | 1.70 | | % | | | 1.68 | | % | | | 1.78 | | % | | | 1.95 | | % |
| Leverage costs | | | 1.20 | | % | | | 1.18 | | % | | | 1.17 | | % | | | 1.15 | | % | | | 1.23 | | % |
| Distributable cash flow | | | 6.30 | | % | | | 6.65 | | % | | | 7.40 | | % | | | 7.25 | | % | | | 6.94 | | % |
| | | | | | | | | | | | | | | | | | | | | | | | | | |
| Selected Financial Information | | | | | | | | | | | | | | | | | | | | | | | | | |
| Distributions paid on common stock | | $ | 2,607 | | | | $ | 2,606 | | | | $ | 2,607 | | | | $ | 2,607 | | | | $ | 2,607 | | |
| Distributions paid on common stock per share | | | 0.3750 | | | | | 0.3750 | | | | | 0.3750 | | | | | 0.3750 | | | | | 0.3750 | | |
| Total assets, end of period | | | 197,731 | | | | | 190,032 | | | | | 177,843 | | | | | 165,718 | | | | | 109,703 | | |
| Average total assets during period(5) | | | 198,360 | | | | | 194,528 | | | | | 186,087 | | | | | 177,506 | | | | | 116,136 | | |
| Leverage(6) | | | 56,600 | | | | | 56,100 | | | | | 54,100 | | | | | 52,900 | | | | | 24,900 | | |
| Leverage as a percent of total assets | | | 28.6 | | % | | | 29.5 | | % | | | 30.4 | | % | | | 31.9 | | % | | | 22.7 | | % |
| Net unrealized appreciation (depreciation), end of period | | | 9,939 | | | | | 5,062 | | | | | (7,471 | ) | | | | (17,866 | ) | | | | (15,664 | ) | |
| Net assets, end of period | | | 139,785 | | | | | 133,107 | | | | | 123,015 | | | | | 112,095 | | | | | 84,322 | | |
| Average net assets during period(7) | | | 143,596 | | | | | 138,251 | | | | | 131,313 | | | | | 128,167 | | | | | 75,647 | | |
| Net asset value per common share | | | 20.11 | | | | | 19.15 | | | | | 17.70 | | | | | 16.13 | | | | | 12.13 | | |
| Market value per common share | | | 18.25 | | | | | 18.17 | | | | | 15.57 | | | | | 14.71 | | | | | 9.78 | | |
| Shares outstanding (000’s) | | | 6,951 | | | | | 6,951 | | | | | 6,951 | | | | | 6,951 | | | | | 6,951 | | |
| (1) | Q1 is the period from December through February. Q2 is the period from March through May. Q3 is the period from June through August. Q4 is the period from September through November. |
| (2) | Leverage costs include interest expense, interest rate swap expenses and other recurring leverage expenses. |
| (3) | “Net investment income (loss)” on the Statement of Operations is adjusted as follows to reconcile to Distributable Cash Flow (“DCF”): increased by the return of capital on distributions, the dividends paid in stock and increased liquidation value and the premium on dividends paid in kind; and decreased by realized and unrealized gains (losses) on interest rate swap settlements. |
| (4) | Annualized. |
| (5) | Computed by averaging month-end values within each period. |
| (6) | Leverage consists of outstanding borrowings under the revolving credit facility. |
| (7) | Computed by averaging daily net assets within each period. |
| |
| |
| |
| |
| Tortoise |
| Essential Assets Income Term Fund (TEAF) |
| |
Fund description
TEAF seeks to provide a high level of total return with an emphasis on current distributions. TEAF provides investors access to a combination of public and direct investments in essential assets that are making an impact on clients and communities.
Fund performance
Performance of the portfolio during the second fiscal quarter was impacted by uncertainty around COVID-19, which created an overhang for commodity prices and resulted in broader equity market volatility. The portfolio’s negative performance during the period was primarily driven by the fund’s energy infrastructure allocation. The downward pressure on commodity prices, as a result of COVID-19 and OPEC’s decision in early March, negatively impacted the fund’s energy infrastructure holdings. Energy infrastructure did rebound in April and May as commodity prices recovered from the lows, however is still down materially from fair value, in our view. Both the sustainable and social infrastructure sleeves held up relatively well during the COVID-19 driven market volatility. The direct and public sustainable portfolios outperformed broader equity markets, due to the regulated nature and contract structures of those companies and projects. The social infrastructure portfolio also performed relatively well in the second fiscal quarter as the portfolio saw minimal disruption as a result of COVID-19.
Despite the challenging market environment, we continue to have conviction in TEAF’s investment strategy. True to the underlying investment thesis of the portfolio, the essential assets we own are critical to a successfully functioning society and we believe as market uncertainty around COVID-19 subsides, the value of our investments will be recognized in the market.
We have made progress in transitioning the portfolio to the targeted allocation of 60% direct investments. As of May 31, 2020, TEAF’s total direct investment commitments were approximately $90 million or approximately 43% of the portfolio. Additionally, we are very pleased to have completed the fund’s allocation to direct sustainable and energy infrastructure investments. The fund anticipates reaching the targeted allocation for direct investments in the next three to four months.
Public Energy Infrastructure
| ● | As mentioned above, the negative impact to global energy demand due to COVID-19 and the lack of an agreement between OPEC and Russia in early March put significant downward pressure on commodity prices. As a result, the energy infrastructure equities in the portfolio faced a significant drawdown in value. |
| ● | The sell-off in the equities was driven largely by the decrease in commodity prices, but also several unknowns in the market regarding the pace of recovery in global energy demand and the resulting impact on U.S. energy supply, which our portfolio companies transport, store and export on a daily basis. |
| ● | We do believe global energy demand will recover as the global economies emerge from COVID-19 driven shut-downs, which we have already started to see in several countries around the world. As energy demand recovers, we expect U.S. energy production to increase benefitting the holdings in the portfolio. |
| ● | Importantly, we believe the drawdown in energy infrastructure equities is overdone and have confidence long-term energy demand will rebound from depressed levels driving the need for energy infrastructure companies to transport supply to demand markets. |
| ● | Lastly, despite our expectation for near-term volatility, we believe current valuations present upside in the energy infrastructure equities, which we believe will be recognized over time. |
Private Energy Infrastructure
| ● | TEAF rolled its previously announced convertible notes investment in Sunnova Energy International Inc. to a new issuance. The coupon on the new convertible notes increased to 9.75%. |
Public Sustainable Infrastructure
| ● | Listed sustainable infrastructure equities demonstrated solid defensive characteristics during the March 2020 downfall in global equity markets. Utilities resisted better than broad equity indices thanks to a good proportion of regulated business models, largely immune from short-term economic fluctuations. The stocks that suffered most in the fund were those with industrial exposure. |
| ● | April witnessed aggressive moves in commodity markets and bullish rallies in equities. Longer term government bond yields traded in a tight range, finishing the month almost flat in the US (10-year Treasury yield closed at 0.6%) and some 10bps lower in the UK and across northern Europe, despite grim economic data everywhere. Utilities underperformed other infrastructure shares for the first time in a while but both participated in the equity market rebound, as did the fund overall. We slightly adjusted the holdings to lighten industrial exposure and focus on those names where we anticipated the most solid dividend cover and growth prospects. |
| ● | In May, rallies took hold in many equity markets as lockdowns began to be eased and further massive stimulus measures raised hopes for the recovery phase. Growth became a critical driving factor behind equities’ performance. Interestingly, the MSCI World Utilities Index (+4.3%) kept pace with the MSCI World Index (+4.9%). The fund’s dominant exposure to names that benefit from renewable energy’s secular growth trends allowed us to capture significant upside. With companies gradually updating their guidance, we became increasingly confident that our investment universe and portfolio holdings would prove resilient in the global context. Dividend prospects notably looked solid. |
| |
| |
| 2020 2nd Quarter Report | May 31, 2020 |
| |
| |
| |
| |
| ● | Overall, the fund appears well positioned to both resist the economic downturn and participate in the equity markets’ recovery, thanks to limited exposure to short-term economic cycles, secular growth trends related to the development of renewables worldwide and sustainable dividend flows. |
Private Sustainable Infrastructure
| ● | TEAF did not invest in any additional private sustainable infrastructure projects during the quarter as the fund previously reached its target allocation in private sustainable deals. |
| ● | To date, the fund has invested approximately $49 million in three entities. |
| ● | Operating assets held at TEAF continued to operate as expected with cash flow generation profiles driven by long term contracted cash flows. |
| ● | Projects that remained under construction did not have to make any material changes to their construction plans or cash flow profiles that would impact the expected returns to be generated by TEAF. |
Social Infrastructure
| ● | TEAF completed a debt investment in Pioneer Technology & Arts Academy (PTAA). PTAA is an open enrollment charter school currently operating three campuses around the Dallas, TX area. Proceeds from the financing were used to fund the acquisition of PTAA’s fourth campus. The campus will enroll will enroll students in kindergarten through eighth grade beginning in 2020-2021 and expand by one grade level each year until reaching K-12 in the school year 2024-2025. PTAA has a three-year track record, achieving an “A” rating by the Texas Education Agency in each of its first two years, with the third year not yet available. |
| ● | TEAF completed a debt investment in C2NC Holdings (C2NC), also known as Carbon Cycle North Carolina. C2NC is constructing a biomethane-producing waste-to-energy anaerobic digester plant in North Carolina. The project will convert waste from local animal processing plants and food processing operations into renewable natural gas. The facility will help local energy companies meet a state level mandate under which a portion of their fuel must be obtained from animal sources. This mandate is in place because of the significant waste generated by pork and poultry production in North Carolina. |
| ● | So far, the fund has seen limited and manageable exposure to COVID-19. In terms of senior living facilities, TEAF has focused on independent and assisted living facilities rather than nursing homes. Nursing homes house individuals with more acute health risks that are more susceptible to the risks of COVID-19. These nursing homes are not part of TEAF’s portfolio. That being said we continue to carefully monitor the situation with routine interaction and are taking proactive measures to ensure the facilities in which TEAF has invested practice all proper precautions. |
| ● | While education facilities have seen significant operational changes in the short term, we expect the investment profile of charter schools to remain relatively unchanged moving forward. While schools may move towards a blended classroom and online experience, having a safe and reliable school building is expected to remain very important to the long term value proposition of schooling. We also believe this shift could provide additional investment opportunities for TEAF. |
| ● | The backlog of opportunities in Social Infrastructure remains robust and the team believes it is on track to achieve its allocation target over the next three to four months. |
| Second fiscal quarter highlights |
| Monthly distributions paid per share | | $0.1085 |
| Distribution rate (as of 5/31/2020) | | 12.1% |
| Quarter-over-quarter distribution increase (decrease) | | 0.0% |
| Year-over-year distribution increase (decrease) | | 0.0% |
| Cumulative distributions paid per share | | |
| to stockholders since inception in March 2019 | | $1.4105 |
| Market-based total return | | (27.9)% |
| NAV-based total return | | (11.5)% |
| Premium (discount) to NAV (as of 5/31/2020) | | (26.3)% |
Performance data quoted represent past performance; past performance does not guarantee future results. Like any other stock, total return and market value will fluctuate so that an investment, when sold, may be worth more or less than its original cost. Portfolio composition is subject to change due to ongoing management of the fund. References to specific securities or sectors should not be construed as a recommendation by the fund or its adviser. See Schedule of Investments for portfolio weighting at the end of the fiscal quarter.
| |
| |
| |
| |
| Tortoise |
| Essential Assets Income Term Fund (TEAF) (continued) |
| |
Fund structure and distribution policy
The fund is structured to qualify as a Regulated Investment Company (RIC) allowing it to pass-through to shareholders income and capital gains earned, thus avoiding double-taxation. To qualify as a RIC, the fund must meet specific income, diversification and distribution requirements. Regarding income, at least 90 percent of the fund gross income must be from dividends, interest and capital gains. The fund must meet quarterly diversification requirements including the requirement that at least 50 percent of the assets be in cash, cash equivalents or other securities with each single issuer of other securities not greater than 5 percent of total assets. No more than 25 percent of total assets can be invested in any one issuer other than government securities or other RIC’s. The fund must also distribute at least 90 percent of its investment company income. RIC’s are also subject to excise tax rules which require RIC’s to distribute approximately 98 percent of net income and net capital gains to avoid a 4 percent excise tax.
The fund has adopted a distribution policy which intends to distribute an amount closely approximating the total taxable income for the year and, if so determined by the Board, distribute all or a portion of the return of capital paid by portfolio companies during the year. The fund may designate a portion of its distributions as capital gains and may also distribute additional capital gains in the last calendar quarter of the year to meet annual excise distribution requirements. Distribution amounts are subject to change from time to time at the discretion of the Board. Although the level of distributions is independent of the funds’ performance in the short term, the fund expects such distributions to correlate with its performance over time.
Distributable cash flow and distributions
DCF is income from investments less expenses. Income from investments includes the accrued interest from bonds, the amount received as cash or paid-in-kind distributions from investments and dividend payments on short-term investments. Income also includes the premiums received from sales of covered call options, net of amounts paid to buy back out-of-the-money options. The total expenses include current or anticipated operating expenses and leverage costs.
Income from investments decreased approximately 14% as compared to 1st quarter 2020 due primarily due to decreased premiums received on written covered call options. Operating expenses, consisting primarily of fund advisory fees, decreased approximately 12% during the quarter, primarily due to lower asset-based fees. Total leverage costs decreased approximately 55% as compared to 1st quarter 2020, primarily due to lower interest rates during the quarter. As a result of the changes in income and expenses, DCF decreased approximately 13% as compared to 1st quarter 2020. In addition, the fund had net realized losses on investments of $37.4 million during 2nd quarter 2020.
The fund paid monthly distributions of $0.1085 per share during 2nd quarter 2020. The fund’s Board of Directors has declared monthly distributions of $0.075 per share to be paid during 3rd quarter 2020. The fund has paid cumulative distributions to stockholders of $1.4105 per share since its inception in March 2019.
The Key Financial Data table discloses the calculation of DCF and should be read in conjunction with this discussion. The difference between income from investments in the DCF calculation and total investment income as reported in the Statement of Operations, is reconciled as follows: (1) the Statement of Operations, in conformity with U.S. generally accepted accounting principles (GAAP), recognizes distributions and dividend income from MLPs, common stock and other investments on their ex-dates, whereas the DCF calculation may reflect distributions and dividend income on their pay dates; (2) GAAP recognizes that a significant portion of the cash distributions received from MLPs, common stock and other investments are characterized as a return of capital and therefore excluded from investment income, whereas the DCF calculation includes the return of capital; (3) income from investments in the DCF calculation includes the value of dividends paid-in-kind (additional stock or units), whereas such amounts may not be included as income for GAAP purposes; and (4) net premiums on options written (premiums received less amounts paid to buy back out-of-the-money options) with expiration dates during fiscal quarter are included in the DCF calculation, whereas GAAP recognizes the net effect of options written as realized and unrealized gains (losses).
“Net Investment Income (Loss)” on the Statement of Operations is adjusted as follows to reconcile to DCF for YTD and 2nd quarter 2020 (in thousands):
| | YTD 2020 | | 2nd Qtr 2020 |
| Net Investment Income, before | | | | | | | | |
| income taxes | | $ | 8,851 | | | $ | 7,585 | |
| Adjustments to reconcile to DCF: | | | | | | | | |
| Distributions characterized as | | | | | | | | |
| return of capital | | | 2,627 | | | | 1,018 | |
| Net premiums on options written | | | 1,589 | | | | 372 | |
| Return of principal excluded | | | | | | | | |
| for DCF purposes | | | (5,194 | ) | | | (5,194 | ) |
| Amortization on certain investments | | | (536 | ) | | | (268 | ) |
| Other | | | (172 | ) | | | (172 | ) |
| DCF | | $ | 7,165 | | | $ | 3,341 | |
Leverage
The fund’s leverage utilization decreased $3.7 million as compared to 1st quarter 2020. The fund utilizes all floating rate leverage that had an interest rate of 1.18% and represented 13.2% of total assets at quarter-end. During the period, the fund maintained compliance with its applicable coverage ratios. The interest rate on the fund’s leverage will vary in the future along with changing floating rates.
Please see the Financial Statements and Notes to Financial Statements for additional detail regarding critical accounting policies, results of operations, leverage and other important fund information.
For further information regarding the calculation of distributable cash flow and distributions to stockholders, as well as a discussion of the tax impact on distributions, please visit www.tortoiseadvisors.com.
| |
| |
2020 2nd Quarter Report | May 31, 2020 |
| |
| TEAF Key Financial Data (supplemental unaudited information) |
| (dollar amounts in thousands unless otherwise indicated) |
| |
The information presented below regarding Distributable Cash Flow and Selected Financial Information is supplemental non-GAAP financial information, which the fund believes is meaningful to understanding operating performance. The Distributable Cash Flow Ratios include the functional equivalent of EBITDA for non-investment companies, and the fund believes they are an important supplemental measure of performance and promote comparisons from period-to-period. This information is supplemental, is not inclusive of required financial disclosures (e.g. Total Expense Ratio), and should be read in conjunction with the full financial statements.
| | 2019 | | 2020 |
| | Q2(1) | | Q3(2) | | Q4(2) | | Q1(2) | | Q2(2) |
| Total Income from Investments | | | | | | | | | | | | | | | | | | | | | | | | | |
| Interest earned on bonds and notes | | $ | 548 | | | | $ | 1,164 | | | | $ | 1,397 | | | | $ | 1,488 | | | | $ | 1,571 | | |
| Distributions and dividends from investments, | | | | | | | | | | | | | | | | | | | | | | | | | |
| net of foreign taxes withheld | | | 3,805 | | | | | 3,576 | | | | | 2,235 | | | | | 2,216 | | | | | 2,257 | | |
| Distributions paid in kind | | | — | | | | | 62 | | | | | 144 | | | | | 74 | | | | | 75 | | |
| Net premiums on options written | | | 1,137 | | | | | 1,428 | | | | | 1,400 | | | | | 1,217 | | | | | 372 | | |
| Total from investments | | | 5,490 | | | | | 6,230 | | | | | 5,176 | | | | | 4,995 | | | | | 4,275 | | |
| |
| Operating Expenses Before Leverage Costs | | | | | | | | | | | | | | | | | | | | | | | | | |
| Advisory fees | | | 546 | | | | | 792 | | | | | 761 | | | | | 772 | | | | | 679 | | |
| Other operating expenses | | | 102 | | | | | 165 | | | | | 203 | | | | | 177 | | | | | 155 | | |
| | | | 648 | | | | | 957 | | | | | 964 | | | | | 949 | | | | | 834 | | |
| Distributable cash flow before leverage costs | | | 4,842 | | | | | 5,273 | | | | | 4,212 | | | | | 4,046 | | | | | 3,441 | | |
| Leverage costs(3) | | | 139 | | | | | 252 | | | | | 229 | | | | | 222 | | | | | 100 | | |
| Distributable Cash Flow(4) | | $ | 4,703 | | | | $ | 5,021 | | | | $ | 3,983 | | | | $ | 3,824 | | | | $ | 3,341 | | |
| |
| Net realized loss on investments and foreign currency | | | | | | | | | | | | | | | | | | | | | | | | | |
| translation, for the period | | $ | (71 | ) | | | $ | (3,168 | ) | | | $ | (9,697 | ) | | | $ | (1,758 | ) | | | $ | (37,365 | ) | |
| As a percent of average total assets(5) | | | | | | | | | | | | | | | | | | | | | | | | | |
| Total from investments | | | 11.25 | | % | | | 8.65 | | % | | | 7.46 | | % | | | 7.24 | | % | | | 7.57 | | % |
| Operating expenses before leverage costs | | | 1.33 | | % | | | 1.33 | | % | | | 1.39 | | % | | | 1.38 | | % | | | 1.48 | | % |
| Distributable cash flow before leverage costs | | | 9.92 | | % | | | 7.32 | | % | | | 6.07 | | % | | | 5.86 | | % | | | 6.09 | | % |
| As a percent of average net assets(5) | | | | | | | | | | | | | | | | | | | | | | | | | |
| Total from investments | | | 12.01 | | % | | | 9.73 | | % | | | 8.49 | | % | | | 8.13 | | % | | | 9.18 | | % |
| Operating expenses before leverage costs | | | 1.42 | | % | | | 1.50 | | % | | | 1.58 | | % | | | 1.55 | | % | | | 1.79 | | % |
| Leverage costs | | | 0.30 | | % | | | 0.39 | | % | | | 0.38 | | % | | | 0.36 | | % | | | 0.21 | | % |
| Distributable cash flow | | | 10.29 | | % | | | 7.84 | | % | | | 6.53 | | % | | | 6.22 | | % | | | 7.18 | | % |
| |
| Selected Financial Information | | | | | | | | | | | | | | | | | | | | | | | | | |
| Distributions paid on common stock | | $ | 1,464 | | | | $ | 4,391 | | | | $ | 4,392 | | | | $ | 4,391 | | | | $ | 4,392 | | |
| Distributions paid on common stock per share | | | 0.1085 | | | | | 0.3255 | | | | | 0.3255 | | | | | 0.3255 | | | | | 0.3255 | | |
| Total assets, end of period | | | 288,040 | | | | | 276,736 | | | | | 271,915 | | | | | 264,801 | | | | | 234,072 | | |
| Average total assets during period(6) | | | 278,413 | | | | | 285,731 | | | | | 278,477 | | | | | 277,296 | | | | | 224,806 | | |
| Leverage(7) | | | 31,500 | | | | | 31,500 | | | | | 32,000 | | | | | 34,600 | | | | | 30,900 | | |
| Leverage as a percent of total assets | | | 10.9 | | % | | | 11.4 | | % | | | 11.8 | | % | | | 13.1 | | % | | | 13.2 | | % |
| Net unrealized depreciation, end of period | | | (15,131 | ) | | | | (22,549 | ) | | | | (15,821 | ) | | | | (19,861 | ) | | | | (18,369 | ) | |
| Net assets, end of period | | | 255,534 | | | | | 243,882 | | | | | 237,461 | | | | | 228,885 | | | | | 196,262 | | |
| Average net assets during period(8) | | | 260,772 | | | | | 253,916 | | | | | 244,483 | | | | | 247,031 | | | | | 185,254 | | |
| Net asset value per common share | | | 18.94 | | | | | 18.08 | | | | | 17.60 | | | | | 16.97 | | | | | 14.55 | | |
| Market value per common share | | | 18.45 | | | | | 16.25 | | | | | 15.60 | | | | | 15.32 | | | | | 10.73 | | |
| Shares outstanding (000’s) | | | 13,491 | | | | | 13,491 | | | | | 13,491 | | | | | 13,491 | | | | | 13,491 | | |
| (1) | Represents the period from March 29, 2019 (commencement of operations) through May 31, 2019. |
| (2) | Q1 represents the period from December through February. Q2 represents the period from March through May. Q3 represents the period from June through August. Q4 represents the period from September through November. |
| (3) | Leverage costs include interest expense and other recurring leverage expenses. |
| (4) | “Net investment income (loss)” on the Statement of Operations is adjusted as follows to reconcile to Distributable Cash Flow (“DCF”): increased by the return of capital on distributions and the net premiums on options written and decreased by amortization on certain investments. |
| (5) | Annualized. |
| (6) | Computed by averaging month-end values within each period. |
| (7) | Leverage consists of outstanding borrowings under the margin loan facility. |
| (8) | Computed by averaging daily net assets within each period. |
| |
| |
| |
| |
| TYG Consolidated Schedule of Investments (unaudited) |
| May 31, 2020 |
| |
| | Shares | | Fair Value |
| Master Limited Partnerships — 80.4%(1) | | | |
| Crude Oil Pipelines — 16.8%(1) | | | | | |
| United States — 16.8%(1) | | | | | |
| BP Midstream Partners LP | | 491,507 | | $ | 6,148,753 |
| Genesis Energy L.P. | | 1 | | | 8 |
| NuStar Energy L.P. | | 1,333,371 | | | 23,160,654 |
| Plains All American Pipeline, L.P. | | 1,043,898 | | | 10,125,811 |
| Shell Midstream Partners, L.P. | | 1,227,662 | | | 16,561,160 |
| | | | | | 55,996,386 |
| Natural Gas/Natural Gas Liquids Pipelines — 22.3%(1) | | | |
| United States — 22.3%(1) | | | | | |
| DCP Midstream, LP | | 1,744,339 | | | 19,187,729 |
| Energy Transfer LP | | 3,031,919 | | | 24,740,459 |
| Enterprise Products Partners L.P. | | 1,611,573 | | | 30,781,044 |
| | | | | | 74,709,232 |
| Natural Gas Gathering/Processing — 9.8%(1) | | | |
| United States — 9.8%(1) | | | | | |
| CNX Midstream Partners LP | | 432,137 | | | 3,137,315 |
| Enable Midstream Partners LP | | 704,768 | | | 2,931,835 |
| EQM Midstream Partners, LP | | 508,946 | | | 10,000,789 |
| Noble Midstream Partners LP | | 352,663 | | | 3,410,251 |
| Western Midstream Partners, LP | | 1,415,815 | | | 13,223,712 |
| | | | | | 32,703,902 |
| Other — 0.2%(1) | | | | | |
| United States — 0.2%(1) | | | | | |
| Westlake Chemical Partners LP | | 29,130 | | | 597,165 |
| Refined Product Pipelines — 31.3%(1) | | | | | |
| United States — 31.3%(1) | | | | | |
| Holly Energy Partners, L.P. | | 365,340 | | | 5,903,894 |
| Magellan Midstream Partners, L.P.(2) | | 796,082 | | | 36,094,358 |
| MPLX LP | | 1,652,635 | | | 31,383,539 |
| Phillips 66 Partners LP | | 701,792 | | | 31,356,067 |
| | | | | | 104,737,858 |
| Total Master Limited Partnerships | | | | | |
| (Cost $379,050,337) | | | | | 268,744,543 |
| | | | | | |
| Common Stock — 4.4%(1) | | | | | |
| Natural Gas/Natural Gas Liquids Pipelines — 4.4%(1) | | | |
| United States — 4.4%(1) | | | | | |
| ONEOK, Inc. | | 181,842 | | | 6,671,783 |
| The Williams Companies, Inc. | | 398,197 | | | 8,135,165 |
| | | | | | 14,806,948 |
| Total Common Stock | | | | | |
| (Cost $11,062,056) | | | | | 14,806,948 |
| |
| Preferred Stock — 23.0%(1) | | | | | |
| Natural Gas/Natural Gas Liquids Pipelines — 16.7%(1) | | | |
| United States — 16.7%(1) | | | | | |
| Altus Midstream Company, 7.000%(3)(4)(5) | | 10,427 | | | 9,981,054 |
| Crestwood Equity Partners LP, 9.250% | | 6,938,277 | | | 46,000,777 |
| | | | | | 55,981,831 |
| Natural Gas Gathering/Processing — 6.3%(1) | | | |
| United States — 6.3%(1) | | | | | |
| Targa Resources Corp., 9.500%(3)(4) | | 21,758 | | | 21,083,720 |
| Total Preferred Stock | | | | | |
| (Cost $94,487,720) | | | | | 77,065,551 |
| See accompanying Notes to Financial Statements. | |
| | |
| 24 | Tortoise |
| |
| |
| 2020 2nd Quarter Report | May 31, 2020 |
| |
| TYG Consolidated Schedule of Investments (unaudited) (continued) |
| May 31, 2020 |
| |
| | | Principal Amount | | Fair Value |
| Corporate Bonds — 3.7%(1) | | | | | | | |
| Refined Product Pipelines — 3.3%(1) | | | | |
| United States — 3.3%(1) | | | | | | | |
| Buckeye Partners, | | | | | | | |
| 5.850%, 11/15/2043 | | $ | 11,950,000 | | $ | 9,963,313 | |
| Buckeye Partners, | | | | | | | |
| 6.370%, 01/22/2078 | | | 1,200,000 | | | 852,000 | |
| | | | | | 10,815,313 | |
| Natural Gas Gathering/Processing — 0.4%(1) | | | | |
| United States — 0.4%(1) | | | | | | | |
| EnLink Midstream Partners, | | | | | | | |
| 6.000%, Perpetual | | | 5,100,000 | | | 1,428,000 | |
| Total Corporate Bonds | | | | | | | |
| (Cost $15,103,988) | | | | | | 12,243,313 | |
| | |
| Convertible Bonds — 2.3%(1) | | | | | | | |
| Solar — 2.3%(1) | | | | | | | |
| Grand Cayman — 2.3%(1) | | | | | | | |
| Sunnova Energy Intl Inc., | | | | | | | |
| 9.750%, 04/30/2025(3)(4) | | | 7,838,000 | | | 7,838,000 | |
| Total Convertible Bonds | | | | | | | |
| (Cost $7,838,000) | | | | | | 7,838,000 | |
| | |
| Private Investments — 3.3%(1) | | | | | | | |
| Renewables — 3.3%(1) | | | | | | | |
| United States — 3.3%(1) | | | | | | | |
| TK NYS Solar Holdco, LLC(3)(4)(6) | | | | | | | |
| (Cost $53,206,470) | | | N/A | | | 11,127,975 | |
| | | | | | | | |
| | | Shares | | Fair Value |
| Short-Term Investment — 18.8%(1) | | | | |
| United States Investment Company — 18.8%(1) | | | | |
| Invesco Government & Agency Portfolio — Institutional Class, | |
| 0.10%(7) (Cost $62,701,013) | | | 62,701,013 | | $ | 62,701,013 | |
| Total Investments — 135.9%(1) | | | | |
| (Cost $623,449,584) | | | | | | 454,527,343 | |
| Interest Rate Swap Contracts — (0.1)%(1) | | | | |
| $10,000,000 notional — net unrealized depreciation(8) | | | (301,653 | ) |
| Other Assets and Liabilities — 2.8%(1) | | | 9,287,616 | |
| Senior Notes — (28.9)%(1) | | | | | | (96,800,000 | ) |
| Mandatory Redeemable Preferred Stock | | | | |
| at Liquidation Value — (9.7)%(1) | | | (32,300,000 | ) |
| Total Net Assets Applicable to | | | | |
| Common Stockholders — 100.0%(1) | | $ | 334,413,306 | |
| (1) | Calculated as a percentage of net assets applicable to common stockholders. |
| (2) | A portion of the security is segregated as collateral for the unrealized depreciation of interest rate swap contracts of $301,653. |
| (3) | Restricted securities have a total fair value of $50,030,749, which represents 15.0% of net assets. See Note 6 to the financial statements for further disclosure. |
| (4) | Securities have been valued by using significant unobservable inputs in accordance with fair value procedures and are categorized as level 3 investments, as more fully described in Note 2 to the financial statements. |
| (5) | Security distributions are paid-in-kind. Cash value of the 7.0% coupon is paid in the form of additional shares. |
| (6) | Deemed to be an affiliate of the fund. See Affiliated Company Transactions Note 7 and Basis For Consolidation Note 13 to the financial statements for further disclosure. |
| (7) | Rate indicated is the current yield as of May 31, 2020. |
| (8) | See Schedule of Interest Rate Swap Contracts and Note 12 to the financial statements for further disclosure. |
| See accompanying Notes to Financial Statements. | |
| | |
| Tortoise | 25 |
| |
| |
| |
| |
| NTG Schedule of Investments (unaudited) |
| May 31, 2020 |
| |
| | Shares | | Fair Value |
| Master Limited Partnerships — 91.3%(1) | | | | |
| Crude Oil Pipelines — 20.0%(1) | | | | | | |
| United States — 20.0%(1) | | | | | | |
| BP Midstream Partners LP | | 522,549 | | $ | 6,537,088 | |
| NuStar Energy L.P. | | 554,816 | | | 9,637,154 | |
| Plains All American Pipeline, L.P. | | 713,456 | | | 6,920,523 | |
| Shell Midstream Partners, L.P. | | 697,987 | | | 9,415,845 | |
| | | | | | 32,510,610 | |
| Natural Gas/Natural Gas Liquids Pipelines — 24.5%(1) | | | | |
| United States — 24.5%(1) | | | | | | |
| DCP Midstream, LP | | 995,915 | | | 10,955,065 | |
| Energy Transfer LP | | 1,462,141 | | | 11,931,071 | |
| Enterprise Products Partners L.P. | | 885,878 | | | 16,920,270 | |
| | | | | | 39,806,406 | |
| Natural Gas Gathering/Processing — 10.0%(1) | | | | |
| United States — 10.0%(1) | | | | | | |
| EQM Midstream Partners, LP | | 289,853 | | | 5,695,611 | |
| Hess Midstream LP | | 45,146 | | | 876,735 | |
| Noble Midstream Partners LP | | 302,100 | | | 2,921,307 | |
| Western Midstream Partners, LP | | 719,131 | | | 6,716,684 | |
| | | | | | 16,210,337 | |
| Refined Product Pipelines — 36.8%(1) | | | | | | |
| United States — 36.8%(1) | | | | | | |
| Magellan Midstream Partners, L.P. | | 414,420 | | | 18,789,803 | |
| MPLX LP | | 1,427,364 | | | 27,105,642 | |
| Phillips 66 Partners LP | | 310,490 | | | 13,872,693 | |
| | | | | | 59,768,138 | |
| Total Master Limited Partnerships | | | | | | |
| (Cost $228,053,296) | | | | | 148,295,491 | |
| | |
| Common Stock — 13.1%(1) | | | | | | |
| Natural Gas/Natural Gas Liquids Pipelines — 13.1%(1) | | | | |
| United States — 13.1%(1) | | | | | | |
| Kinder Morgan Inc. | | 387,852 | | | 6,128,062 | |
| ONEOK, Inc. | | 241,722 | | | 8,868,780 | |
| The Williams Companies, Inc. | | 304,271 | | | 6,216,257 | |
| | | | | | 21,213,099 | |
| Total Common Stock | | | | | | |
| (Cost $18,553,353) | | | | | 21,213,099 | |
| | | | | | | |
| | Principal
Amount/Shares | | Fair Value |
| Preferred Stock — 27.5%(1) | | | | | | |
| Natural Gas Gathering/Processing — 7.3%(1) | | | | |
| United States — 7.3%(1) | | | | | | |
| Targa Resources Corp., 9.500%(2)(3) | | 12,252 | | $ | 11,872,311 | |
| Natural Gas/Natural Gas Liquids Pipelines — 20.2%(1) | | | | |
| United States — 20.2%(1) | | | | | | |
| Altus Midstream Company, 7.000%(2)(3)(4) | 7,456 | | | 7,136,696 | |
| Crestwood Equity Partners LP, 9.250% | | 3,882,318 | | | 25,739,768 | |
| | | | | 32,876,464 | |
| Total Preferred Stock | | | | | | |
| (Cost $54,722,308) | | | | | 44,748,775 | |
| |
| Corporate Bonds — 0.6%(1) | | | | | | |
| Natural Gas Gathering/Processing — 0.6%(1) | | | | |
| United States — 0.6%(1) | | | | | | |
| EnLink Midstream Partners, | | | | | | |
| 6.000%, Perpetual | | 3,400,000 | | | 952,000 | |
| Total Corporate Bonds | | | | | | |
| (Cost $2,454,162) | | | | | 952,000 | |
| |
| Convertible Bonds — 3.4%(1) | | | | | | |
| Solar — 3.4%(1) | | | | | | |
| Grand Cayman — 3.4%(1) | | | | | | |
| Sunnova Energy Intl Inc., | | | | | | |
| 9.750%, 04/30/2025(2)(3) | | 5,458,000 | | | 5,458,000 | |
| Total Convertible Bonds | | | | | | |
| (Cost $5,458,000) | | | | | 5,458,000 | |
| |
| Short-Term Investment — 11.2%(1) | | | | |
| United States Investment Company — 11.2%(1) | | | | |
| First American Government Obligations Fund, | | | | |
| 0.08%(5) (Cost $18,201,446) | 18,201,446 | | | 18,201,446 | |
| Total Investments — 147.1%(1) | | | | | | |
| (Cost $327,442,565) | | | | | 238,868,811 | |
| Other Assets and Liabilities — (15.8)%(1) | | | (25,599,988 | ) |
| Senior Notes — (23.5)%(1) | | | | | (38,200,000 | ) |
| Mandatory Redeemable Preferred Stock | | | | |
| at Liquidation Value — (7.8)%(1) | | | | | (12,700,000 | ) |
| Total Net Assets Applicable to Common | | | | |
| Stockholders — 100.0%(1) | | | | $ | 162,368,823 | |
| (1) | Calculated as a percentage of net assets applicable to common stockholders. |
| (2) | Restricted securities have a total fair value of $24,467,007, which represents 15.1% of net assets. See Note 6 to the financial statements for further disclosure. |
| (3) | Securities have been valued by using significant unobservable inputs in accordance with fair value procedures and are categorized as level 3 investments, as more fully described in Note 2 to the financial statements. |
| (4) | Security distributions are paid-in-kind. Cash value of the 7.0% coupon is paid in the form of additional shares. |
| (5) | Rate indicated is the current yield as of May 31, 2020. |
| See accompanying Notes to Financial Statements. | |
| | |
| 26 | Tortoise |
| |
| |
| 2020 2nd Quarter Report | May 31, 2020 |
| |
| TTP Schedule of Investments (unaudited) |
| May 31, 2020 |
| |
| | Shares | | Fair Value |
|
| Common Stock — 84.3%(1) | | | | | |
| Crude Oil Pipelines — 25.2%(1) | | | | | |
| Canada — 19.6%(1) | | | | | |
| Gibson Energy Inc | | 50,815 | | $ | 786,113 |
| Enbridge Inc. | | 175,500 | | | 5,694,975 |
| Inter Pipeline Ltd. | | 93,257 | | | 854,102 |
| Pembina Pipeline Corporation | | 103,966 | | | 2,597,545 |
| United States — 5.6%(1) | | | | | |
| Plains GP Holdings, L.P. | | 285,424 | | | 2,851,386 |
| | | | | 12,784,121 |
| Natural Gas Gathering/Processing — 7.6%(1) | | | |
| United States — 7.6%(1) | | | | | |
| Equitrans Midstream Corporation | | 264,845 | | | 2,142,596 |
| Hess Midstream LP | | 78,784 | | | 1,529,985 |
| Rattler Midstream LP | | 13 | | | 109 |
| Targa Resources Corp. | | 11,747 | | | 210,154 |
| | | | | 3,882,844 |
| Natural Gas/Natural Gas Liquids Pipelines — 42.6%(1) | |
| Canada — 12.4%(1) | | | | | |
| Keyera Corp. | | 73,152 | | | 1,159,296 |
| TC Energy Corporation | | 113,623 | | | 5,114,171 |
| United States — 30.2%(1) | | | | | |
| Kinder Morgan Inc. | | 389,508 | | | 6,154,226 |
| ONEOK, Inc. | | 73,007 | | | 2,678,627 |
| The Williams Companies, Inc. | | 317,849 | | | 6,493,655 |
| | | | | 21,599,975 |
| Oil and Gas Production — 6.6%(1) | | | | | |
| United States — 6.6%(1) | | | | | |
| Cabot Oil & Gas Corporation | | 37,800 | | | 749,952 |
| Cimarex Energy Co. | | 6,350 | | | 166,878 |
| Concho Resources Inc. | | 3,850 | | | 209,902 |
| Continental Resources, Inc.(2) | | 9,850 | | | 120,466 |
| Diamondback Energy, Inc.(2) | | 3,100 | | | 131,998 |
| EOG Resources, Inc. | | 7,400 | | | 377,178 |
| Noble Energy, Inc. | | 26,900 | | | 234,837 |
| Parsley Energy, Inc. | | 17,500 | | | 159,950 |
| Pioneer Natural Resources Company | | 4,750 | | | 435,100 |
| Viper Energy Partners LP | | 44,800 | | | 469,952 |
| WPX Energy, Inc.(2) | | 49,400 | | | 280,098 |
| | | | | 3,336,311 |
| Power — 2.3%(1) | | | | | |
| United States — 2.3%(1) | | | | | |
| NextEra Energy Partners, LP | | 22,396 | | | 1,144,660 |
| Total Common Stock | | | | | |
| (Cost $58,541,309) | | | | | 42,747,911 |
| | | | |
| Master Limited Partnerships — 35.8%(1) | | | |
| Crude Oil Pipelines — 5.3%(1) | | | | | |
| United States — 5.3%(1) | | | | | |
| BP Midstream Partners LP | | 14,840 | | | 185,648 |
| NuStar Energy L.P. | | 32,670 | | | 567,478 |
| PBF Logistics LP | | 24,710 | | | 256,984 |
| Shell Midstream Partners, L.P. | | 124,825 | | | 1,683,889 |
| | | | | 2,693,999 |
| Natural Gas/Natural Gas Liquids Pipelines — 12.1%(1) | | | |
| United States — 12.1%(1) | | | | | |
| DCP Midstream, LP | | 39,058 | | | 429,638 |
| Energy Transfer LP | | 317,787 | | | 2,593,142 |
| Enterprise Products Partners L.P. | | 163,236 | | | 3,117,808 |
| | | | | 6,140,588 |
| Natural Gas Gathering/Processing — 2.0%(1) | | | |
| United States — 2.0%(1) | | | | | |
| CNX Midstream Partners LP | | 2,353 | | | 17,083 |
| Noble Midstream Partners LP | | 24,065 | | | 232,709 |
| Western Midstream Partners, LP | | 79,732 | | | 744,697 |
| | | | | 994,489 |
| Other — 0.2%(1) | | | | | |
| United States — 0.2%(1) | | | | | |
| Westlake Chemical Partners LP | | 4,940 | | | 101,270 |
| Refined Product Pipelines — 16.2%(1) | | | | | |
| United States — 16.2%(1) | | | | | |
| Holly Energy Partners, L.P. | | 41,962 | | | 678,106 |
| Magellan Midstream Partners, L.P. | | 53,071 | | | 2,406,239 |
| MPLX LP | | 160,097 | | | 3,040,242 |
| Phillips 66 Partners LP | | 47,041 | | | 2,101,792 |
| | | | | 8,226,379 |
| Total Master Limited Partnerships | | | | | |
| (Cost $23,354,281) | | | | | 18,156,725 |
| See accompanying Notes to Financial Statements. | |
| | |
| Tortoise | 27 |
| |
| |
|
| |
| TTP Schedule of Investments (unaudited) (continued) |
| May 31, 2020 |
| |
| | | Shares | | Fair Value |
| |
| Preferred Stock — 11.0%(1) | | | | | | |
| Natural Gas/Natural Gas Liquids Pipelines — 1.0%(1) | | | | |
| United States — 1.0%(1) | | | | | | |
| Altus Midstream Company, 7.000%(3)(4)(5) | | 554 | | $ | 530,218 | |
| Natural Gas Gathering/Processing — 4.0%(1) | | | | |
| United States — 4.0%(1) | | | | | | |
| Targa Resources Corp., 9.500%(3)(4) | | 2,108 | | | 2,042,673 | |
| Power — 6.0%(1) | | | | | | |
| United States — 6.0%(1) | | | | | | |
| Sempra Energy, 6.000%, 01/15/2021 | | 28,811 | | | 3,023,714 | |
| Total Preferred Stock | | | | | | |
| (Cost $5,260,216) | | | | | 5,596,605 | |
| | | | | |
| Short-Term Investment — 17.6%(1) | | | | |
| United States Investment Company — 17.6%(1) | | | | |
| Invesco Government & Agency Portfolio — Institutional Class, | |
| 0.10%(6) (Cost $8,925,978) | | 8,925,978 | | | 8,925,978 | |
| Total Investments — 148.7%(1) | | | | |
| (Cost $96,081,784) | | | | | 75,427,219 | |
| Other Assets and Liabilities — (0.4)%(1) | | | (206,104 | ) |
| Senior Notes — (36.3)%(1) | | | | | (18,400,000 | ) |
| Mandatory Redeemable Preferred Stock | | | | |
| at Liquidation Value — (12.0)%(1) | | | (6,100,000 | ) |
| Total Net Assets Applicable to | | | | |
| Common Stockholders — 100.0%(1) | | $ | 50,721,115 | |
| (1) | Calculated as a percentage of net assets applicable to common stockholders. |
| (2) | Non-income producing security. |
| (3) | Restricted securities have a total fair value of $2,572,891, which represents 5.0% of net assets. See Note 6 to the financial statements for further disclosure. |
| (4) | Securities have been valued by using significant unobservable inputs in accordance with fair value procedures and are categorized as level 3 investments, as more fully described in Note 2 to the financial statements. |
| (5) | Security distributions are paid-in-kind. Cash value of the 7.0% coupon is paid in the form of additional shares. |
| (6) | Rate indicated is the current yield as of May 31, 2020. |
| See accompanying Notes to Financial Statements. | |
| | |
| 28 | Tortoise |
| |
| |
| 2020 2nd Quarter Report | May 31, 2020 |
| |
| NDP Schedule of Investments (unaudited) |
| May 31, 2020 |
| |
| | Shares | | Fair Value |
| |
| Common Stock — 95.7%(1) | | | | | | |
| Crude Oil Pipelines — 5.2%(1) | | | | | | |
| Canada — 5.2%(1) | | | | | | |
| Enbridge Inc. | | 47,200 | | $ | 1,531,640 | |
| Natural Gas/Natural Gas Liquids Pipelines — 23.1%(1) | | |
| United States — 23.1%(1) | | | | | | |
| Cheniere Energy, Inc.(2) | | 38,900 | | | 1,725,215 | |
| Kinder Morgan Inc. | | 104,400 | | | 1,649,520 | |
| TC Energy Corporation | | 28,748 | | | 1,293,947 | |
| The Williams Companies, Inc. | | 105,500 | | | 2,155,365 | |
| | | | | 6,824,047 | |
| Oil and Gas Production — 60.9%(1) | | | | | | |
| United States — 60.9%(1) | | | | | | |
| BP PLC | | 39,283 | | | 909,009 | |
| Cabot Oil & Gas Corporation | | 125,700 | | | 2,493,888 | |
| Chevron Corporation | | 27,300 | | | 2,503,410 | |
| Concho Resources Inc. | | 26,566 | | | 1,448,378 | |
| ConocoPhillips | | 35,594 | | | 1,501,355 | |
| Diamondback Energy, Inc. | | 39,717 | | | 1,691,150 | |
| EOG Resources, Inc. | | 33,000 | | | 1,682,010 | |
| EQT Corporation(2) | | 123,800 | | | 1,651,492 | |
| Parsley Energy, Inc. | | 67,606 | | | 617,919 | |
| Pioneer Natural Resources Company | | 18,700 | | | 1,712,920 | |
| Royal Dutch Shell PLC | | 56,700 | | | 1,811,565 | |
| | | | | 18,023,096 | |
| Power/Utility — 6.5%(1) | | | | | | |
| United States — 6.5%(1) | | | | | | |
| NextEra Energy, Inc. | | 3,800 | | | 971,128 | |
| Sempra Energy | | 7,500 | | | 947,325 | |
| | | | | 1,918,453 | |
| Total Common Stock | | | | | | |
| (Cost $31,452,170) | | | | | 28,297,236 | |
| | | | | |
| Master Limited Partnerships — 10.8%(1) | | | | |
| Natural Gas/Natural Gas Liquids Pipelines — 7.8%(1) | | |
| United States — 7.8%(1) | | | | | | |
| Energy Transfer LP | | 116,900 | | | 953,904 | |
| Enterprise Products Partners L.P. | | 71,100 | | | 1,358,010 | |
| | | | | 2,311,914 | |
| Natural Gas Gathering/Processing — 1.2%(1) | | | | |
| United States — 1.2%(1) | | | | | | |
| Noble Midstream Partners LP | | 37,208 | | | 359,801 | |
| Refined Product Pipelines — 1.8%(1) | | | | | | |
| United States — 1.8%(1) | | | | | | |
| Magellan Midstream Partners, L.P. | | 11,423 | | | 517,919 | |
| Total Master Limited Partnerships | | | | | | |
| (Cost $4,531,118) | | | | | 3,189,634 | |
| | | | | | | |
| Preferred Stock — 6.5%(1) | | | | | | |
| Natural Gas Gathering/Processing — 6.5%(1) | | | | |
| United States — 6.5%(1) | | | | | | |
| Targa Resources Corp., 9.500%(3)(4) | | | | | | |
| (Cost $1,688,542) | | 1,997 | | | 1,935,113 | |
| | | | | | | |
| Short-Term Investment — 1.0%(1) | | | | | | |
| United States Investment Company — 1.0%(1) | | | | |
| Invesco Government & Agency Portfolio — Institutional Class, | |
| 0.10%(5) (Cost $283,325) | | 283,325 | | | 283,325 | |
| Total Investments — 114.0%(1) | | | | | | |
| (Cost $37,955,156) | | | | | 33,705,308 | |
| Other Assets and Liabilities — (0.1)%(1) | | | | | (38,818 | ) |
| Credit Facility Borrowings — (13.9)%(1) | | | | | (4,100,000 | ) |
| Total Net Assets Applicable to | | | | | | |
| Common Stockholders — 100.0%(1) | | $ | 29,566,490 | |
| (1) | Calculated as a percentage of net assets applicable to common stockholders. |
| (2) | Non-income producing security. |
| (3) | Restricted securities have a total fair value of $1,935,113, which represents 6.5% of net assets. See Note 6 to the financial statements for further disclosure. |
| (4) | Securities have been valued by using significant unobservable inputs in accordance with fair value procedures and are categorized as level 3 investments, as more fully described in Note 2 to the financial statements. |
| (5) | Rate indicated is the current yield as of May 31, 2020. |
| See accompanying Notes to Financial Statements. | |
| | |
| Tortoise | 29 |
| |
| |
|
| |
| TPZ Schedule of Investments (unaudited) |
| May 31, 2020 |
| |
| | Principal Amount | | Fair Value |
| Corporate Bonds — 82.5%(1) | | | | | | |
| Crude Oil Pipelines — 7.7%(1) | | | | | | |
| Canada — 7.7%(1) | | | | | | |
| Enbridge Inc., | | | | | | |
| 5.500%, 07/15/2077 | | $ | 7,042,000 | | $ | 6,491,386 |
| Natural Gas/Natural Gas Liquids Pipelines — 29.2%(1) | | | |
| United States — 29.2%(1) | | | | | | |
| Cheniere Corp., | | | | | | |
| 7.000%, 06/30/2024 | | | 4,000,000 | | | 4,447,398 |
| Cheniere Corp., | | | | | | |
| 5.875%, 03/31/2025 | | | 2,000,000 | | | 2,189,149 |
| Florida Gas Transmission Co., LLC, | | | | | | |
| 5.450%, 07/15/2020(2) | | | 1,500,000 | | | 1,505,047 |
| ONEOK, Inc., | | | | | | |
| 4.250%, 02/01/2022 | | | 4,500,000 | | | 4,623,701 |
| ONEOK, Inc., | | | | | | |
| 7.500%, 09/01/2023 | | | 2,000,000 | | | 2,242,661 |
| Rockies Express Pipeline LLC, | | | | | | |
| 4.950%, 07/15/2029(2) | | | 3,000,000 | | | 2,781,900 |
| Ruby Pipeline, LLC, | | | | | | |
| 6.000%, 04/01/2022(2) | | | 1,022,727 | | | 957,295 |
| Southern Star Central Corp., | | | | | | |
| 5.125%, 07/15/2022(2) | | | 3,000,000 | | | 3,000,870 |
| Tallgrass Energy LP, | | | | | | |
| 5.500%, 01/15/2028(2) | | | 3,250,000 | | | 2,906,118 |
| | | | | | 24,654,139 |
| Natural Gas Gathering/Processing — 25.9%(1) | | | |
| United States — 25.9%(1) | | | | | | |
| Antero Midstream Partners LP, | | | | | | |
| 5.750%, 03/01/2027 | | | 2,000,000 | | | 1,575,000 |
| Blue Racer Midstream, LLC, | | | | | | |
| 6.625%, 07/15/2026(2) | | | 5,900,000 | | | 5,265,750 |
| EnLink Midstream LLC, | | | | | | |
| 5.375%, 06/01/2029 | | | 3,000,000 | | | 2,322,570 |
| Hess Corporation, | | | | | | |
| 5.625%, 02/15/2026(2) | | | 4,160,000 | | ` | 4,014,400 |
| The Williams Companies, Inc., | | | | | | |
| 7.875%, 09/01/2021 | | | 5,000,000 | | | 5,386,948 |
| The Williams Companies, Inc., | | | | | | |
| 4.550%, 06/24/2024 | | | 3,000,000 | | | 3,257,168 |
| | | | | | 21,821,836 |
| Oil and Gas Production — 3.0%(1) | | | | |
| United States — 3.0%(1) | | | | | | |
| Ascent Resources Utica Holdings, LLC, | | | | |
| 10.000%, 04/01/2022(2) | | | 1,302,000 | | | 1,139,250 |
| Ascent Resources Utica Holdings, LLC, | | | | |
| 7.000%, 11/01/2026 | | | 2,000,000 | | | 1,354,040 |
| | | | | | 2,493,290 |
| Power/Utility — 12.7%(1) | | | | | | |
| United States — 12.7%(1) | | | | | | |
| Duquesne Light Holdings, Inc., | | | | | | |
| 6.400%, 09/15/2020(2) | | | 3,000,000 | | | 3,048,560 |
| Duquesne Light Holdings, Inc., | | | | | | |
| 5.900%, 12/01/2021(2) | | | 2,000,000 | | | 2,097,924 |
| NextEra Energy, Inc., | | | | | | |
| 4.800%, 12/01/2077 | | | 4,500,000 | | | 4,578,750 |
| NV Energy Inc., | | | | | | |
| 6.250%, 11/15/2020 | | | 1,000,000 | | | 1,023,704 |
| | | | | | 10,748,938 |
| Refined Product Pipelines — 4.0%(1) | | | | |
| United States — 4.0%(1) | | | | | | |
| Buckeye Partners, | | | | | | |
| 5.600%, 10/15/2044 | | | 2,000,000 | | | 1,660,000 |
| Buckeye Partners, | | | | | | |
| 5.850%, 11/15/2043 | | | 2,000,000 | | | 1,667,500 |
| | | | | | 3,327,500 |
| Total Corporate Bonds | | | | | | |
| (Cost $71,529,973) | | | | | | 69,537,089 |
| |
| Convertible Bonds — 1.9%(1) | | | | |
| Solar — 1.9%(1) | | | | | | |
| Grand Cayman — 1.9(1) | | | | | | |
| Sunnova Energy Intl Inc., | | | | | | |
| 9.750%, 04/30/2025(2)(3) | | | 1,570,000 | | | 1,570,000 |
| Total Convertible Bonds | | | | | | |
| (Cost $1,570,000) | | | | | | 1,570,000 |
| See accompanying Notes to Financial Statements. | |
| | |
| 30 | Tortoise |
| |
| |
2020 2nd Quarter Report | May 31, 2020 |
| |
| TPZ Schedule of Investments (unaudited) (continued) |
| May 31, 2020 |
| |
| | Shares | | Fair Value |
| Master Limited Partnerships — 24.3%(1) | | | | | |
| Crude Oil Pipelines — 4.3%(1) | | | | | |
| United States — 4.3%(1) | | | | | |
| BP Midstream Partners LP | | 21,729 | | $ | 271,830 |
| NuStar Energy L.P. | | 88,934 | | | 1,544,784 |
| PBF Logistics LP | | 74,599 | | | 775,830 |
| Shell Midstream Partners, L.P. | | 77,365 | | | 1,043,654 |
| | | | | 3,636,098 |
| Natural Gas/Natural Gas Liquids Pipelines — 5.7%(1) | | | | | |
| United States — 5.7%(1) | | | | | |
| DCP Midstream, LP | | 84,184 | | | 926,024 |
| Energy Transfer LP | | 206,736 | | | 1,686,966 |
| Enterprise Products Partners L.P. | | 113,252 | | | 2,163,113 |
| | | | | 4,776,103 |
| Natural Gas Gathering/Processing — 3.7%(1) | | | | | |
| United States — 3.7%(1) | | | | | |
| CNX Midstream Partners, LP | | 27,028 | | | 196,223 |
| Hess Midstream LP | | 66,901 | | | 1,299,217 |
| Noble Midstream Partners LP | | 21,975 | | | 212,498 |
| Western Midstream Partners, LP | | 154,434 | | | 1,442,414 |
| | | | | 3,150,352 |
| Other — 0.2%(1) | | | | | |
| United States — 0.2%(1) | | | | | |
| Westlake Chemical Partners LP | | 8,074 | | | 165,517 |
| Refined Product Pipelines — 10.4%(1) | | | | | |
| United States — 10.4%(1) | | | | | |
| Holly Energy Partners, L.P. | | 93,991 | | | 1,518,895 |
| Magellan Midstream Partners, L.P. | | 48,777 | | | 2,211,549 |
| MPLX LP(4) | | 159,604 | | | 3,030,880 |
| Phillips 66 Partners LP | | 44,325 | | | 1,980,441 |
| | | | | 8,741,765 |
| Total Master Limited Partnerships | | | | | |
| (Cost $31,166,736) | | | | | 20,469,835 |
| | | | | | |
| Common Stock — 12.1%(1) | | | | | |
| Crude Oil Pipelines — 3.7%(1) | | | | | |
| United States — 3.7%(1) | | | | | |
| Enbridge Inc. | | 41,683 | | | 1,352,613 |
| Plains GP Holdings, L.P. | | 173,099 | | | 1,729,259 |
| | | | | 3,081,872 |
| Natural Gas/Natural Gas Liquids Pipelines — 6.1%(1) | | | | | |
| Canada — 2.0%(1) | | | | | |
| TC Energy Corporation | | 37,541 | | | 1,689,720 |
| United States — 4.1%(1) | | | | | |
| Kinder Morgan Inc. | | 120,619 | | | 1,905,780 |
| ONEOK, Inc. | | 5,606 | | | 205,684 |
| The Williams Companies, Inc. | | 66,658 | | | 1,361,823 |
| | | | | 5,163,007 |
| Natural Gas Gathering/Processing — 1.3%(1) | | | | | |
| United States — 1.3%(1) | | | | | |
| EnLink Midstream LLC | | 90,964 | | | 214,675 |
| Equitrans Midstream Corporation | | 108,596 | | | 878,542 |
| | | | | 1,093,217 |
| Power/Utility — 1.0%(1) | | | | | |
| United States — 1.0%(1) | | | | | |
| DTE Energy Company | | 8,116 | | | 873,038 |
| Total Common Stock | | | | | |
| (Cost $13,427,880) | | | | | 10,211,134 |
| See accompanying Notes to Financial Statements. | |
| | |
| Tortoise | 31 |
| |
| |
| |
| |
| TPZ Schedule of Investments (unaudited) (continued) |
| May 31, 2020 |
| |
| | Shares | | Fair Value |
| Preferred Stock — 5.1%(1) | | | | | | |
| Natural Gas Gathering/Processing — 1.9%(1) | | | | | | |
| United States — 1.9%(1) | | | | | | |
| Targa Resources Corp., 9.500%(2)(3) | | 1,685 | | $ | 1,632,782 | |
| Natural Gas/Natural Gas Liquids Pipelines — 0.6%(1) | | | | | | |
| United States — 0.6%(1) | | | | | | |
| Altus Midstream Company, 7.000%(2)(3)(5) | | 483 | | | 462,422 | |
| Power/Utility — 2.6%(1) | | | | | | |
| United States — 2.6%(1) | | | | | | |
| Sempra Energy, | | | | | | |
| 6.000%, 01/15/2021 | | 21,189 | | | 2,223,786 | |
| Total Preferred Stock | | | | | | |
| (Cost $4,058,191) | | | | | 4,318,990 | |
| | | | | | | |
| Term Loan — 2.3%(1) | | | | | | |
| Other — 2.3%(1) | | | | | | |
| United States — 2.3%(1) | | | | | | |
| New Fortress Energy, | | | | | | |
| 7.8534%, 1/10/2023 | | 2,000,000 | | | 1,950,000 | |
| Total Term Loan | | | | | | |
| (Cost $1,955,049) | | | | | 1,950,000 | |
| | | | | | | |
| Short-Term Investment — 0.1%(1) | | | | | | |
| United States Investment Company — 0.1%(1) | | | | | | |
| Invesco Government & Agency Portfolio — Institutional Class, | | | | | | |
| 0.10%(6) (Cost $120,079) | | 120,079 | | | 120,079 | |
| Total Investments — 128.3%(1) | | | | | | |
| (Cost $123,827,908) | | | | | 108,177,127 | |
| Interest Rate Swap Contracts — (0.0)%(1) | | | | | | |
| $3,000,000 notional — net unrealized depreciation(7) | | | | | (13,292 | ) |
| Other Assets and Liabilities — 1.2%(1) | | | | | 1,058,380 | |
| Credit Facility Borrowings — (29.5)%(1) | | | | | (24,900,000 | ) |
| Total Net Assets Applicable to | | | | | | |
| Common Stockholders — 100.0%(1) | | | | $ | 84,322,215 | |
| (1) | Calculated as a percentage of net assets applicable to common stockholders. |
| (2) | Restricted securities have a total fair value of $30,382,318 which represents 36.0% of net assets. See Note 6 to the financial statements for further disclosure. |
| (3) | Securities have been valued by using significant unobservable inputs in accordance with fair value procedures and are categorized as level 3 investments, as more fully described in Note 2 to the financial statements. |
| (4) | A portion of the security is segregated as collateral for the unrealized depreciation of interest rate swap contracts of $13,292. |
| (5) | Security distributions are paid-in-kind. Cash value of the 7.0% coupon is paid in the form of additional shares. |
| (6) | Rate indicated is the current yield as of May 31, 2020. |
| (7) | See Schedule of Interest Rate Swap Contracts and Note 12 to the financial statements for further disclosure. |
| See accompanying Notes to Financial Statements. | |
| | |
| 32 | Tortoise |
| |
| |
2020 2nd Quarter Report | May 31, 2020 |
| |
| TEAF Consolidated Schedule of Investments (unaudited) |
| May 31, 2020 |
| |
| | Shares | | Fair Value |
| Common Stock — 33.6%(1) | | | | | |
| Natural Gas/Natural Gas Liquids Pipelines — 5.1%(1) | | | | | |
| Italy — 1.6%(1) | | | | | |
| Snam SpA(4) | | 693,360 | | $ | 3,220,276 |
| United States — 3.5%(1) | | | | | |
| Cheniere Energy Inc.(3) | | 41,400 | | | 1,836,090 |
| ONEOK, Inc.(4) | | 46,732 | | | 1,714,597 |
| The Williams Companies, Inc.(4) | | 158,992 | | | 3,248,207 |
| | | | | 10,019,170 |
| Natural Gas Gathering/Processing — 2.6%(1) | | | | | |
| United States — 2.6%(1) | | | | | |
| Targa Resources Corp. | | 286,321 | | | 5,122,283 |
| Other — 1.7%(1) | | | | | |
| Australia — 1.7%(1) | | | | | |
| Spark Infrastructure Group(4) | | 2,368,315 | | | 3,330,852 |
| Power — 16.9%(1) | | | | | |
| Australia — 0.8%(1) | | | | | |
| APA Group(4) | | 203,451 | | | 1,574,438 |
| Canada — 1.4%(1) | | | | | |
| Algonquin Power & Utilities Corp(4) | | 201,460 | | | 2,821,040 |
| Italy — 2.5%(1) | | | | | |
| Enel SpA(4) | | 631,186 | | | 4,835,174 |
| Portugal — 2.7%(1) | | | | | |
| EDP — Energias de Portugal SA(4) | | 1,148,526 | | | 5,383,995 |
| Spain — 3.8%(1) | | | | | |
| Endesa SA | | 177,950 | | | 4,217,340 |
| Iberdrola SA (2) | | 302,443 | | | 3,252,523 |
| United States — 2.5%(1) | | | | | |
| Covanta Holding Corp (4) | | 272,775 | | | 2,454,975 |
| FirstEnergy Corp | | 58,374 | | | 2,466,885 |
| United Kingdom — 3.2%(1) | | | | | |
| National Grid PLC (2) | | 343,450 | | | 3,927,712 |
| SSE PLC(4) | | 149,189 | | | 2,287,434 |
| | | | | 33,221,516 |
| Other — 0.8%(1) | | | | | |
| Spain — 0.8%(1) | | | | | |
| Ferrovial SA | | 61,350 | | | 1,663,041 |
| Renewables — 4.4%(1) | | | | | |
| Canada — 3.6%(1) | | | | | |
| Innergex Renewable Energy Inc(4) | | 254,620 | | | 3,502,562 |
| TransAlta Renewables Inc(4) | | 335,743 | | | 3,494,351 |
| United States — 0.8%(1) | | | | | |
| TerraForm Power Inc | | 87,743 | | | 1,612,716 |
| | | | | 8,609,629 |
| Water Infrastructure — 1.8%(1) | | | | | |
| United Kingdom — 1.8%(1) | | | | | |
| Pennon Group PLC(4) | | 252,172 | | | 3,550,315 |
| Water Utilities — 0.3%(1) | | | | | |
| United States — 0.3%(1) | | | | | |
| Essential Utilities, Inc.(4) | | 11,571 | | | 506,347 |
| Total Common Stock | | | | | |
| (Cost $67,829,911) | | | | | 66,023,153 |
| | | | | | |
| Master Limited Partnerships — 19.6%(1) | | | | | |
| Natural Gas/Natural Gas Liquids Pipelines — 8.2%(1) | | | | | |
| United States — 8.2%(1) | | | | | |
| Energy Transfer LP(4) | | 851,747 | | | 6,950,256 |
| Enterprise Products Partners L.P.(4) | | 473,867 | | | 9,050,856 |
| | | | | 16,001,112 |
| Natural Gas Gathering/Processing — 6.8%(1) | | | | | |
| United States — 6.8%(1) | | | | | |
| EQM Midstream Partners, LP(4) | | 217,570 | | | 4,275,251 |
| Hess Midstream LP | | 207,677 | | | 4,033,087 |
| Noble Midstream Partners LP | | 132,540 | | | 1,281,662 |
| Western Midstream Partners, LP | | 410,567 | | | 3,834,696 |
| | | | | 13,424,696 |
| Refined Product Pipelines — 2.6%(1) | | | | | |
| United States — 2.6%(1) | | | | | |
| MPLX LP | | 272,600 | | | 5,176,674 |
| Renewables — 2.0%(1) | | | | | |
| Canada — 2.0%(1) | | | | | |
| Brookfield Renewable Partners LP(4) | | 80,092 | | | 3,920,689 |
| Total Master Limited Partnerships | | | | | |
| (Cost $41,403,447) | | | | | 38,523,171 |
| See accompanying Notes to Financial Statements. | |
| | |
| Tortoise | 33 |
| |
| |
| |
| |
| TEAF Consolidated Schedule of Investments (unaudited) (continued) |
| May 31, 2020 |
| |
| | Principal | | | |
| | Amount | | Fair Value |
| Corporate Bonds — 14.7%(1) | | | | | | |
| Education — 0.4%(1) | | | | | | |
| United States — 0.4%(1) | | | | | | |
| Village Charter School Inc, | | | | | | |
| 10.000%, 12/15/2021 | | $ | 800,000 | | $ | 767,000 |
| Healthcare — 2.8%(1) | | | | | | |
| United States — 2.8%(1) | | | | | | |
| Grace Commons Property, | | | | | | |
| 15.000%, 10/31/2023(5) | | | 1,825,000 | | | 1,825,000 |
| Grace Commons Property, | | | | | | |
| 8.000%, 10/31/2021(5) | | | 3,650,000 | | | 3,650,000 |
| | | | | | 5,475,000 |
| Natural Gas/Natural Gas Liquids Pipelines — 0.9%(1) | | | | | | |
| United States — 0.9%(1) | | | | | | |
| EQM Midstream Partners LP, | | | | | | |
| 4.750%, 07/15/2023 | | | 1,750,000 | | | 1,731,783 |
| Natural Gas Gathering/Processing — 2.9%(1) | | | | | | |
| United States — 2.9%(1) | | | | | | |
| Antero Midstream Partners LP, | | | | | | |
| 5.750%, 01/15/2028(4)(5) | | | 3,750,000 | | | 2,931,750 |
| Blue Racer Midstream, LLC, | | | | | | |
| 6.625%, 07/15/2026(4)(5) | | | 3,000,000 | | | 2,677,500 |
| | | | | | 5,609,250 |
| Oil and Gas Production — 1.2%(1) | | | | | | |
| United States — 1.2%(1) | | | | | | |
| Ascent Resources Utica Holdings, LLC, | | | | | | |
| 7.000%, 11/01/2026(4) | | | 3,500,000 | | | 2,369,570 |
| Project Finance — 5.4%(1) | | | | | | |
| United States — 5.4%(1) | | | | | | |
| C2NC Holdings, LLC, | | | | | | |
| 13.000%, 05/01/2027(6) | | | 10,715,000 | | | 10,715,000 |
| Senior Living — 1.1%(1) | | | | | | |
| United States — 1.1%(1) | | | | | | |
| Realco Perry Hall MD LLC/OPCO, | | | | | | |
| 10.000%, 10/01/2024(5) | | | 2,280,000 | | | 2,134,842 |
| Total Corporate Bonds | | | | | | |
| (Cost $30,525,803) | | | | | | 28,802,445 |
| | | | | | | |
| | Principal | | | |
| | Amount/Shares | | Fair Value |
| Preferred Bonds — 4.3%(1) | | | | | | |
| Natural Gas Gathering/Processing — 2.0%(1) | | | | | | |
| United States — 2.0%(1) | | | | | | |
| DCP Midstream LP, | | | | | | |
| 7.375% Perpetuity(4) | | $ | 5,000,000 | | $ | 3,038,150 |
| EnLink Midstream Partners LP, | | | | | | |
| 6.000%, Perpetuity(4) | | | 3,000,000 | | | 840,000 |
| | | | | | 3,878,150 |
| Natural Gas/Natural Gas Liquids Pipelines — 2.3%(1) | | | | | | |
| United States — 2.3%(1) | | | | | | |
| Energy Transfer Operating LP, | | | | | | |
| 6.250%, Perpetuity(4) | | | 6,000,000 | | | 4,560,000 |
| Total Preferred Bonds | | | | | | |
| (Cost $13,264,486) | | | | | | 8,438,150 |
| | | | | | |
| Preferred Stock — 7.7%(1) | | | | | | |
| Natural Gas Gathering/Processing — 2.0%(1) | | | | | | |
| United States — 2.0%(1) | | | | | | |
| Targa Resources Corp., 9.500%(5)(6) | | | 4,000 | | | 3,876,040 |
| Natural Gas/Natural Gas Liquids Pipelines — 3.8%(1) | | | | | | |
| United States — 3.8%(1) | | | | | | |
| Altus Midstream Company, 7.000%(5)(6)(7) | | | 4,294 | | | 4,110,203 |
| Crestwood Equity Partners LP, 9.250%(4) | | | 512,909 | | | 3,400,587 |
| | | | | | 7,510,790 |
| Renewables — 0.6%(1) | | | | | | |
| United States — 0.6%(1) | | | | | | |
| NextEra Energy, Inc. | | | 25,380 | | | 1,287,781 |
| Water Utilities — 1.3%(1) | | | | | | |
| United States — 1.3%(1) | | | | | | |
| Essential Utilities, Inc.(4) | | | 43,148 | | | 2,515,097 |
| Total Preferred Stock | | | | | | |
| (Cost $15,498,186) | | | | | | 15,189,708 |
| | | | | | | |
| Private Investments — 20.5%(1) | | | | | | |
| Natural Gas/Natural Gas Liquids Pipelines – 1.0%(1) | | | | | | |
| Mexico – 1.0%(1) | | | | | | |
| Mexico Pacific Limited LLC (MPL) | | | | | | |
| Series A(5)(6) | | | 88,889 | | | 2,000,000 |
| Renewables — 19.5%(1) | | | | | | |
| United States — 19.5%(1) | | | | | | |
| Renewable Holdco, LLC(5)(6)(8) | | | N/A | | | 8,391,651 |
| Renewable Holdco I, LLC(5)(6)(8) | | | N/A | | | 24,889,493 |
| Renewable Holdco II, LLC(5)(6)(8) | | | N/A | | | 5,035,303 |
| | | | | | 38,316,447 |
| Total Private Investments | | | | | | |
| (Cost $46,452,523) | | | | | | 40,316,447 |
| See accompanying Notes to Financial Statements. | |
| | |
| 34 | Tortoise |
| |
| |
| 2020 2nd Quarter Report | May 31, 2020 |
| |
| TEAF Consolidated Schedule of Investments (unaudited) (continued) |
| May 31, 2020 |
| |
| | Principal | | | | |
| | Amount/Shares | | Fair Value |
| Municipal Bonds — 6.8%(1) | | | | | | | |
| Education — 5.3%(1) | | | | | | | |
| United States — 0.3%(1) | | | | | | | |
| Pioneer Technology & Arts Academy | | | | | | | |
| Project — Series B, | | | | | | | |
| 10.000%, 01/01/2026 | | $ | 410,000 | | $ | 387,352 | |
| Public Finance Authority Educational | | | | | | | |
| Facility Revenue, | | | | | | | |
| 12.000%, 10/01/2029 | | | 185,000 | | | 174,044 | |
| Florida — 0.5%(1) | | | | | | | |
| Florida Development Finance Corp, | | | | | | | |
| 10.000%, 07/01/2025 | | | 445,000 | | | 438,788 | |
| Florida Development Finance Corp, | | | | | | | |
| 10.000%, 02/15/2028 | | | 595,000 | | | 563,786 | |
| Wisconsin — 4.5%(1) | | | | | | | |
| Public Finance Authority, | | | | | | | |
| 9.000%, 06/01/2029 | | | 8,925,000 | | | 8,788,894 | |
| | | | | | | 10,352,864 | |
| Other — 1.5%(1) | | | | | | | |
| Pennsylvania — 1.5%(1) | | | | | | | |
| Philadelphia Authority for | | | | | | | |
| Industrial Development, | | | | | | | |
| 10.000%, 06/15/2030 | | | 3,135,000 | | | 3,049,258 | |
| Total Municipal Bonds | | | | | | | |
| (Cost $13,695,000) | | | | | | 13,402,122 | |
| | |
| Construction Note — 1.8%(1) | | | | | | | |
| Renewables — 1.8%(1) | | | | | | | |
| Bermuda — 1.8%(1) | | | | | | | |
| Saturn Solar Bermuda 1 Ltd., | | | | | | | |
| 6.000%, 06/30/2020 | | | | | | | |
| (Cost $3,770,670)(5)(6)(8) | | | 3,510,000 | | | 3,516,669 | |
| | | | | | |
| Convertible Bonds — 2.9%(1) | | | | | |
| Solar — 2.9%(1) | | | | | | | |
| Grand Cayman — 2.9%(1) | | | | | | | |
| Sunnova Energy Intl Inc., | | | | | | | |
| 9.750%, 04/30/2025(5) | | | 5,589,000 | | | 5,589,000 | |
| Total Convertible Bonds | | | | | | | |
| (Cost $5,589,000) | | | | | | 5,589,000 | |
| |
| Term Loan — 2.5%(1) | | | | | | | |
| Other — 2.5%(1) | | | | | | | |
| United States — 2.5%(1) | | | | | | | |
| New Fortress Energy, | | | | | | | |
| 7.8534%, 01/10/2023 | | | 5,000,000 | | | 4,875,000 | |
| Total Term Loan | | | | | | | |
| (Cost $4,887,622) | | | | | | 4,875,000 | |
| |
| Short-Term Investment — 0.3%(1) | | | | | |
| United States Investment Company — 0.3%(1) | | | | |
| First American Government Obligations Fund, | | | | |
| 0.08%(9) (Cost $491,999) | | | 491,999 | | | 491,999 | |
| Total Investments — 114.7%(1) | | | | | |
| (Cost $243,416,882) | | | | | | 225,167,864 | |
| Total Value of Options Written | | | | | |
| (Premiums received $61,913)(10) — (0.1)%(1) | | | (184,656 | ) |
| Deferred Tax Asset — 0.2%(1) | | | | | | 372,212 | |
| Other Assets and Liabilities — 0.9%(1) | | | | 1,807,063 | |
| Credit Facility Borrowings — (15.7)%(1) | | | (30,900,000 | ) |
| Total Net Assets Applicable to | | | | | |
| Common Stockholders — 100.0%(1) | | $ | 196,262,483 | |
| (1) | Calculated as a percentage of net assets applicable to common stockholders. |
| (2) | All or a portion of the security represents cover for outstanding call option contracts written. |
| (3) | Non-income producing security. |
| (4) | All or a portion of the security is segregated as collateral for the margin borrowing facility. See Note 11 to the financial statements for further disclosure. |
| (5) | Restricted securities have a total fair value of $70,627,451 which represents 36.0% of net assets. See Note 7 to the financial statements for further disclosure. |
| (6) | Securities have been valued by using significant unobservable inputs in accordance with fair value procedures and are categorized as level 3 investments, as more fully described in Note 2 to the financial statements. |
| (7) | Security distributions are paid-in-kind. Cash value of the 7.0% coupon is paid in the form of additional shares. |
| (8) | Deemed to be an affiliate of the fund. See Affiliated Company Transactions Note 7 and Basis For Consolidation Note 13 to the financial statements for further disclosure. |
| (9) | Rate indicated is the current yield as of May 31, 2020. |
| (10) | See Schedule of Options Written and Note 12 to the financial statements for further disclosure. |
| See accompanying Notes to Financial Statements. | |
| | |
| Tortoise | 35 |
| |
| |
| |
| |
| Schedule of Interest Rate Swap Contracts (unaudited) |
| May 31, 2020 |
| |
| TYG | | | | | | | | | | | | | |
| | | | | | | Fixed Rate | | Floating Rate | | | | |
| | Maturity | | Notional | | Paid by | | Received by | | Unrealized |
| Counterparty | | Date | | Amount | | TYG | | TYG | | Depreciation |
| The Bank of Nova Scotia | | 09/02/2021 | | $ | 10,000,000 | | 2.381% | | 1-month U.S. Dollar LIBOR | | $ | (301,653 | ) |
| |
| TPZ | | | | | | | | | | | | | |
| | | | | | | Fixed Rate | | Floating Rate | | | | |
| | Maturity | | Notional | | Paid by | | Received by | | Unrealized |
| Counterparty | | Date | | Amount | | TPZ | | TPZ | | Depreciation |
| Wells Fargo Bank, N.A. | | 08/06/2020 | | $ | 3,000,000 | | 2.180% | | 3-month U.S. Dollar LIBOR | | $ | (13,292 | ) |
| See accompanying Notes to Financial Statements. | |
| | |
| 36 | Tortoise |
| |
| |
| 2020 2nd Quarter Report | May 31, 2020 |
| |
| Schedule of Options Written (unaudited) |
| May 31, 2020 |
| |
| TEAF | | | | | | | | | | | | | | | | |
| Call Options Written | | Expiration Date | | Strike Price | | Contracts | | Notional Value | | Fair Value |
| Iberdrola SA | | June 2020 | | $ | 9.25 | | EUR | | 1,000 | | $ | 1,026,797 | | $ | (59,943 | ) |
| Iberdrola SA | | June 2020 | | | 9.50 | | EUR | | 1,000 | | | 1,054,548 | | | (39,962 | ) |
| National Grid PLC | | June 2020 | | | 9.50 | | GBP | | 450 | | | 5,279,603 | | | (84,751 | ) |
| Total Value of Call Options Written (Premiums received $61,913) | | $ | 7,360,947 | | $ | (184,656 | ) |
| See accompanying Notes to Financial Statements. | |
| | |
| Tortoise | 37 |
| |
| |
| |
| |
| Statements of Assets & Liabilities (unaudited) |
| May 31, 2020 |
| |
| | | | Tortoise Energy | | Tortoise |
| | | | Infrastructure | | Midstream Energy |
| | | | Corp.(1) | | Fund, Inc. |
| Assets | | | | | | | | |
| Investments in unaffiliated securities at fair value(2) | | $ | 443,399,368 | | | $ | 238,868,811 | |
| Investments in affiliated securities at fair value(3) | | | 11,127,975 | | | | — | |
| Cash | | | — | | | | — | |
| Receivable for investments sold | | | 109,724 | | | | 62,017 | |
| Receivable for premiums on options written | | | — | | | | — | |
| Dividends, distributions and interest receivable from investments | | | 736,922 | | | | 423,846 | |
| Tax reclaims receivable | | | — | | | | — | |
| Deferred tax asset | | | — | | | | — | |
| Income tax receivable | | | 52,052,354 | | | | — | |
| Prepaid expenses and other assets | | | 808,786 | | | | 317,934 | |
| Total assets | | | 508,235,129 | | | | 239,672,608 | |
| Liabilities | | | | | | | | |
| Call options written, at fair value(4) | | | — | | | | — | |
| Payable to Adviser | | | 648,494 | | | | 366,528 | |
| Accrued directors’ fees and expenses | | | 30,655 | | | | 27,385 | |
| Payable for investments purchased | | | 68,121 | | | | 38,490 | |
| Accrued expenses and other liabilities | | | 2,392,320 | | | | 779,164 | |
| Unrealized depreciation of interest rate swap contracts | | | 301,653 | | | | — | |
| Current tax liability | | | 42,363,620 | | | | 25,657,857 | |
| Credit facility borrowings | | | — | | | | — | |
| Senior notes, net(5) | | | 96,450,041 | | | | 38,077,718 | |
| Mandatory redeemable preferred stock, net(6) | | | 31,566,919 | | | | 12,356,643 | |
| Total liabilities | | | 173,821,823 | | | | 77,303,785 | |
| Net assets applicable to common stockholders | | $ | 334,413,306 | | | $ | 162,368,823 | |
| Net Assets Applicable to Common Stockholders Consist of: | | | | | | | | |
| Capital stock, $0.001 par value per share | | $ | 13,334 | | | $ | 6,321 | |
| Additional paid-in capital | | | 674,038,915 | | | | 580,071,293 | |
| Total distributable earnings loss | | | (339,638,943 | ) | | | (417,708,791 | ) |
| Net assets applicable to common stockholders | | $ | 334,413,306 | | | $ | 162,368,823 | |
| Capital shares: | | | | | | | | |
| Authorized | | | 100,000,000 | | | | 100,000,000 | |
| Outstanding | | | 13,334,239 | | | | 6,320,839 | |
| Net Asset Value per common share outstanding (net assets applicable | | | | | | | | |
| to common stock, divided by common shares outstanding) | | $ | 25.08 | | | $ | 25.69 | |
| |
| (1) | | Consolidated Statement of Assets and Liabilities
(See Note 13 to the financial statements for further disclosure). | | | | | | | | |
| (2) | | Investments in unaffiliated securities at cost | | $ | 570,243,114 | | | $ | 327,442,565 | |
| (3) | | Investments in affiliated securities at cost | | $ | 53,206,470 | | | $ | — | |
| (4) | | Call options written, premiums received | | $ | — | | | $ | — | |
| (5) | | Deferred debt issuance and offering costs | | $ | 349,959 | | | $ | 122,282 | |
| (6) | | Deferred offering costs | | $ | 733,081 | | | $ | 343,357 | |
| See accompanying Notes to Financial Statements. | |
| | |
| 38 | Tortoise |
| |
| |
| 2020 2nd Quarter Report | May 31, 2020 |
| |
| |
| |
| |
| | | | | | | | Tortoise Power | | Tortoise | |
| Tortoise Pipeline | | Tortoise Energy | | and Energy | | Essential Assets | |
| & Energy | | Independence | | Infrastructure | | Income Term | |
| Fund, Inc. | | Fund, Inc. | | Fund, Inc. | | Fund(1) | |
| | | | | | | | | | | | | | | | |
| $ | 75,427,219 | | | $ | 33,705,308 | | | $ | 108,177,127 | | | $ | 186,851,417 | | |
| — | | | | — | | | | — | | | | 38,316,447 | | |
| — | | | | — | | | | — | | | | 5,836 | | |
| — | | | | — | | | | — | | | | 6,025,236 | | |
| — | | | | — | | | | — | | | | 63,218 | | |
| 161,830 | | | | 151,428 | | | | 1,485,377 | | | | 2,130,538 | | |
| — | | | | 2,712 | | | | 14,633 | | | | 267,619 | | |
| — | | | | — | | | | — | | | | 372,212 | | |
| — | | | | — | | | | — | | | | — | | |
| 110,649 | | | | 35,745 | | | | 26,267 | | | | 39,004 | | |
| 75,699,698 | | | | 33,895,193 | | | | 109,703,404 | | | | 234,071,527 | | |
| | | | | | | | | | | | | | | | |
| — | | | | — | | | | — | | | | 184,656 | | |
| 132,829 | | | | 57,498 | | | | 156,637 | | | | 464,582 | | |
| 19,103 | | | | 17,614 | | | | 19,258 | | | | 23,333 | | |
| — | | | | — | | | | — | | | | 6,039,074 | | |
| 455,280 | | | | 153,591 | | | | 292,002 | | | | 197,399 | | |
| — | | | | — | | | | 13,292 | | | | — | | |
| — | | | | — | | | | — | | | | — | | |
| — | | | | 4,100,000 | | | | 24,900,000 | | | | 30,900,000 | | |
| 18,341,863 | | | | — | | | | — | | | | — | | |
| 6,029,508 | | | | — | | | | — | | | | — | | |
| 24,978,583 | | | | 4,328,703 | | | | 25,381,189 | | | | 37,809,044 | | |
| $ | 50,721,115 | | | $ | 29,566,490 | | | $ | 84,322,215 | | | $ | 196,262,483 | | |
| | | | | | | | | | | | | | | | |
| $ | 2,504 | | | $ | 1,846 | | | $ | 6,951 | | | $ | 13,491 | | |
| 188,323,894 | | | | 221,128,808 | | | | 126,833,340 | | | | 261,794,436 | | |
| (137,605,283 | ) | | | (191,564,164 | ) | | | (42,518,076 | ) | | | (65,545,444 | ) | |
| $ | 50,721,115 | | | $ | 29,566,490 | | | $ | 84,322,215 | | | $ | 196,262,483 | | |
| | | | | | | | | | | | | | | | |
| 100,000,000 | | | | 100,000,000 | | | | 100,000,000 | | | | 100,000,000 | | |
| 2,504,104 | | | | 1,845,997 | | | | 6,951,333 | | | | 13,491,127 | | |
| | | | | | | | | | | | | | | | |
| $ | 20.26 | | | $ | 16.02 | | | $ | 12.13 | | | $ | 14.55 | | |
| | | | | | | | | | | | | | | | |
| | | | | | | | | | | | | | | | |
| | | | | | | | | | | | | | | | |
| $ | 96,081,784 | | | $ | 37,955,156 | | | $ | 123,827,908 | | | $ | 198,964,359 | | |
| $ | — | | | $ | — | | | $ | — | | | $ | 44,452,523 | | |
| $ | — | | | $ | — | | | $ | — | | | $ | 61,913 | | |
| $ | 58,137 | | | $ | — | | | $ | — | | | $ | — | | |
| $ | 70,492 | | | $ | — | | | $ | — | | | $ | — | | |
| See accompanying Notes to Financial Statements. | |
| | |
| Tortoise | 39 |
| |
| |
| |
| |
| Statements of Operations (unaudited) |
| Period from December 1, 2019 through May 31, 2020 |
| |
| | | | | |
| | Tortoise Energy | | Tortoise |
| | Infrastructure | | Midstream Energy |
| | Corp.(1) | | Fund, Inc. |
| Investment Income | | | | | | | | |
| Distributions from master limited partnerships | | $ | 38,258,486 | | | $ | 26,455,364 | |
| Dividends and distributions from common stock | | | 7,954,141 | | | | 7,760,100 | |
| Dividends and distributions from preferred stock | | | 4,358,797 | | | | 2,730,797 | |
| Dividends and distributions from private investments | | | 275,000 | | | | — | |
| Less return of capital on distributions(2) | | | (44,577,427 | ) | | | (30,164,381 | ) |
| Less foreign taxes withheld | | | (32,347 | ) | | | (27,044 | ) |
| Net dividends and distributions from investments | | | 6,236,650 | | | | 6,754,836 | |
| Interest income | | | 1,334,817 | | | | 818,077 | |
| Total Investment Income | | | 7,571,467 | | | | 7,572,913 | |
| Operating Expenses | | | | | | | | |
| Advisory fees | | | 5,515,825 | | | | 3,741,740 | |
| Administrator fees | | | 165,024 | | | | 90,511 | |
| Professional fees | | | 207,710 | | | | 131,553 | |
| Directors’ fees | | | 83,160 | | | | 75,731 | |
| Stockholder communication expenses | | | 91,480 | | | | 59,851 | |
| Custodian fees and expenses | | | 23,365 | | | | 15,680 | |
| Fund accounting fees | | | 35,619 | | | | 27,946 | |
| Registration fees | | | 24,585 | | | | 31,406 | |
| Swap breakage fees | | | — | | | | — | |
| Stock transfer agent fees | | | 11,000 | | | | 11,000 | |
| Franchise fees | | | 1,925 | | | | — | |
| Other operating expenses | | | 76,146 | | | | 33,816 | |
| Total Operating Expenses | | | 6,235,839 | | | | 4,219,234 | |
| Leverage Expenses | | | | | | | | |
| Interest expense | | | 5,844,096 | | | | 4,533,289 | |
| Distributions to mandatory redeemable preferred stockholders | | | 2,979,603 | | | | 2,217,251 | |
| Amortization of debt issuance costs | | | 220,476 | | | | 196,939 | |
| Premium on redemption of senior notes | | | 2,332,000 | | | | 2,888,000 | |
| Premium on redemption of mandatory redeemable preferred stock | | | 1,327,000 | | | | 1,193,000 | |
| Other leverage expenses | | | 156,102 | | | | 79,186 | |
| Total Leverage Expenses | | | 12,859,277 | | | | 11,107,665 | |
| Total Expenses | | | 19,095,116 | | | | 15,326,899 | |
| Less fees waived by Adviser (Note 4) | | | — | | | | — | |
| Net Expenses | | | 19,095,116 | | | | 15,326,899 | |
| Net Investment Income (Loss), before Income Taxes | | | (11,523,649 | ) | | | (7,753,986 | ) |
| Deferred tax benefit (expense) | | | 1,652,913 | | | | 986,648 | |
| Net Investment Income (Loss) | | | (9,870,736 | ) | | | (6,767,338 | ) |
| (1) | Consolidated Statement of Operations (See Note 13 to the financial statements for further disclosure). |
| (2) | Return of Capital may be in excess of current year distributions due to prior year adjustments. See Note 2 to the financial statements for further disclosure. |
| See accompanying Notes to Financial Statements. | |
| | |
| 40 | Tortoise |
| |
| |
| 2020 2nd Quarter Report | May 31, 2020 |
| |
| |
| |
| |
| | | | | | | | Tortoise Power | | Tortoise | |
| Tortoise Pipeline | | Tortoise Energy | | and Energy | | Essential Assets | |
| & Energy | | Independence | | Infrastructure | | Income Term | |
| Fund, Inc. | | Fund, Inc. | | Fund, Inc. | | Fund(1) | |
| | | | | | | | | | | | | | | | |
| $ | 1,724,074 | | | $ | 222,293 | | | $ | 1,628,014 | | | $ | 2,249,706 | | |
| 3,995,014 | | | | 803,958 | | | | 1,316,800 | | | | 2,220,108 | | |
| 81,600 | | | | 94,858 | | | | 103,411 | | | | 583,687 | | |
| — | | | | — | | | | — | | | | 5,694,453 | | |
| (3,321,238 | ) | | | (337,208 | ) | | | (2,229,639 | ) | | | (2,626,950 | ) | |
| (148,240 | ) | | | (7,168 | ) | | | (7,979 | ) | | | (233,818 | ) | |
| 2,331,210 | | | | 776,733 | | | | 810,607 | | | | 7,887,186 | | |
| 2,265 | | | | 1,515 | | | | 2,428,745 | | | | 3,068,751 | | |
| 2,333,475 | | | | 778,248 | | | | 3,239,352 | | | | 10,955,937 | | |
| | | | | | | | | | | | | | | |
| 783,300 | | | | 340,223 | | | | 677,235 | | | | 1,663,298 | | |
| 25,889 | | | | 17,375 | | | | 31,411 | | | | 49,487 | | |
| 92,111 | | | | 80,756 | | | | 88,582 | | | | 170,955 | | |
| 66,441 | | | | 64,898 | | | | 58,412 | | | | 53,281 | | |
| 30,226 | | | | 20,634 | | | | 39,130 | | | | 21,836 | | |
| 2,850 | | | | 5,447 | | | | 2,852 | | | | 4,320 | | |
| 16,837 | | | | 13,754 | | | | 13,132 | | | | 16,078 | | |
| 12,168 | | | | 12,457 | | | | 12,225 | | | | (3,007 | ) | |
| — | | | | — | | | | 370,000 | | | | — | | |
| 23,088 | | | | 22,413 | | | | 6,989 | | | | 7,625 | | |
| — | | | | — | | | | — | | | | — | | |
| 14,577 | | | | 13,914 | | | | 8,555 | | | | 20,723 | | |
| 1,067,487 | | | | 591,871 | | | | 1,308,523 | | | | 2,004,596 | | |
| | | | | | | | | | | | | | | | |
| 642,055 | | | | 213,995 | | | | 592,604 | | | | 312,928 | | |
| 339,703 | | | | — | | | | — | | | | — | | |
| 25,324 | | | | — | | | | — | | | | — | | |
| 96,000 | | | | — | | | | — | | | | — | | |
| 99,000 | | | | — | | | | — | | | | — | | |
| 11,695 | | | | — | | | | — | | | | — | | |
| 1,213,777 | | | | 213,995 | | | | 592,604 | | | | 312,928 | | |
| 2,281,264 | | | | 805,866 | | | | 1,901,127 | | | | 2,317,524 | | |
| — | | | | — | | | | — | | | | (212,695 | ) | |
| 2,281,264 | | | | 805,866 | | | | 1,901,127 | | | | 2,104,829 | | |
| 52,211 | | | | (27,618 | ) | | | 1,338,225 | | | | 8,851,108 | | |
| — | | | | — | | | | — | | | | (46,758 | ) | |
| 52,211 | | | | (27,618 | ) | | | 1,338,225 | | | | 8,804,350 | | |
| See accompanying Notes to Financial Statements. | |
| | |
| Tortoise | 41 |
| |
| |
| |
| |
| Statements of Operations (unaudited) (continued) |
| Period from December 1, 2019 through May 31, 2020 |
| |
| | | | | |
| | Tortoise Energy | | Tortoise |
| | Infrastructure | | Midstream Energy |
| | Corp.(1) | | Fund, Inc. |
| Realized and Unrealized Loss on Investments and Foreign Currency | | | | | | | | |
| Net realized loss on investments in unaffiliated securities | | $ | (697,924,441 | ) | | $ | (536,315,612 | ) |
| Net realized gain (loss) on options | | | 220,140 | | | | 82,132 | |
| Net realized loss on interest rate swap settlements | | | (40,635 | ) | | | — | |
| Net realized loss on currency futures | | | — | | | | — | |
| Net realized gain (loss) on foreign currency and translation of other assets | | | | | | | | |
| and liabilities denominated in foreign currency | | | 804 | | | | — | |
| Net realized loss, before income taxes | | | (697,744,132 | ) | | | (536,233,480 | ) |
| Current tax expense | | | (1,654,939 | ) | | | (28,149,444 | ) |
| Deferred tax benefit | | | 119,880,152 | | | | 39,296,244 | |
| Income tax benefit, net | | | 118,225,213 | | | | 11,146,800 | |
| Net realized loss | | | (579,518,919 | ) | | | (525,086,680 | ) |
| Net unrealized appreciation (depreciation) of investments in unaffiliated securities | | | 24,581,846 | | | | 53,829,638 | |
| Net unrealized depreciation of investments in affiliated securities | | | (2,690,116 | ) | | | — | |
| Net unrealized depreciation of options | | | (63,848 | ) | | | (69,929 | ) |
| Net unrealized depreciation of interest rate swap contracts | | | (139,813 | ) | | | — | |
| Net unrealized appreciation of forward currency contracts | | | — | | | | — | |
| Net unrealized appreciation (depreciation) of other assets and liabilities due | | | | | | | | |
| to foreign currency translation | | | (793 | ) | | | (663 | ) |
| Net unrealized appreciation (depreciation), before income taxes | | | 21,687,276 | | | | 53,759,046 | |
| Deferred tax expense | | | (5,060,908 | ) | | | (12,390,407 | ) |
| Net unrealized appreciation (depreciation) | | | 16,626,368 | | | | 41,368,639 | |
| Net Realized and Unrealized Loss | | | (562,892,551 | ) | | | (483,718,041 | ) |
| Net Decrease in Net Assets Applicable to Common Stockholders Resulting from Operations | | $ | (572,763,287 | ) | | $ | (490,485,379 | ) |
| (1) | Consolidated Statement of Operations (See Note 13 to the financial statements for further disclosure). |
| (2) | Return of Capital may be in excess of current year distributions due to prior year adjustments. See Note 2 to the financial statements for further disclosure. |
| See accompanying Notes to Financial Statements. | |
| | |
| 42 | Tortoise |
| |
| |
| 2020 2nd Quarter Report | May 31, 2020 |
| |
| |
| |
| |
| | | | | | | | Tortoise Power | | Tortoise | |
| Tortoise Pipeline | | Tortoise Energy | | and Energy | | Essential Assets | |
| & Energy | | Independence | | Infrastructure | | Income Term | |
| Fund, Inc. | | Fund, Inc. | | Fund, Inc. | | Fund (1) | |
| | | | | | | | | | | | | | | | |
| $ | (92,438,448 | ) | | $ | (48,695,205 | ) | | $ | (26,618,775 | ) | | $ | (39,056,241 | ) | |
| (379,817 | ) | | | 1,438,785 | | | | — | | | | 986,278 | | |
| — | | | | — | | | | (5,403 | ) | | | — | | |
| — | | | | — | | | | — | | | | (534,591 | ) | |
| | | | | | | | | | | | | | | | |
| (60,921 | ) | | | 138 | | | | (404 | ) | | | (67,054 | ) | |
| (92,879,186 | ) | | | (47,256,282 | ) | | | (26,624,582 | ) | | | (38,671,608 | ) | |
| — | | | | — | | | | — | | | | — | | |
| — | | | | — | | | | — | | | | — | | |
| — | | | | — | | | | — | | | | — | | |
| (92,879,186 | ) | | | (47,256,282 | ) | | | (26,624,582 | ) | | | (38,671,608 | ) | |
| 17,056,187 | | | | 17,130,959 | | | | (8,188,699 | ) | | | 3,272,814 | | |
| — | | | | — | | | | — | | | | (5,743,478 | ) | |
| (142,140 | ) | | | (354,660 | ) | | | — | | | | (404,791 | ) | |
| — | | | | — | | | | (4,703 | ) | | | — | | |
| — | | | | — | | | | — | | | | 320,491 | | |
| | | | | | | | | | | | | | | | |
| 2,816 | | | | 553 | | | | 544 | | | | 6,751 | | |
| 16,916,863 | | | | 16,776,852 | | | | (8,192,858 | ) | | | (2,548,213 | ) | |
| — | | | | — | | | | — | | | | — | | |
| 16,916,863 | | | | 16,776,852 | | | | (8,192,858 | ) | | | (2,548,213 | ) | |
| (75,962,323 | ) | | | (30,479,430 | ) | | | (34,817,440 | ) | | | (41,219,821 | ) | |
| $ | (75,910,112 | ) | | $ | (30,507,048 | ) | | $ | (33,479,215 | ) | | $ | (32,415,471 | ) | |
| See accompanying Notes to Financial Statements. | |
| | |
| Tortoise | 43 |
| |
| |
| |
| |
| Statements of Changes in Net Assets |
| |
| | | | | |
| | Tortoise Energy Infrastructure Corp.(1) |
| | Period from | | | | |
| | December 1, 2019 | | Year Ended |
| | through | | November 30, |
| | May 31, 2020 | | 2019 |
| | (unaudited) | | | | |
| Operations | | | | | | | | | |
| Net investment income (loss) | | $ | (9,870,736 | ) | | | $ | (16,044,174 | ) |
| Net realized gain (loss) | | | (579,518,919 | ) | | | | 29,052,706 | |
| Net unrealized appreciation (depreciation) | | | 16,626,368 | | | | | (204,418,240 | ) |
| Net decrease in net assets applicable to common stockholders resulting from operations | | | (572,763,287 | ) | | | | (191,409,708 | ) |
| Distributions to Common Stockholders | | | | | | | | | |
| From distributable earnings | | | — | | | | | — | |
| From return of capital | | | (21,224,322 | ) | | | | (140,587,568 | ) |
| Total distributions to common stockholders | | | (21,224,322 | ) | | | | (140,587,568 | ) |
| Capital Stock Transactions | | | | | | | | | |
| Repurchases of common stock | | | (1,884,610 | ) | (3) | | | | |
| Underwriting discounts and offering expenses associated with the issuance of common stock | | | — | | | | | (6,953 | ) |
| Issuance of common shares from reinvestment of distributions to stockholders | | | — | | | | | 1,990,050 | |
| Net increase (decrease) in net assets applicable to common stockholders | | | | | | | | | |
| from capital stock transactions | | | (1,884,610 | ) | | | | 1,983,097 | |
| Total increase (decrease) in net assets applicable to common stockholders | | | (595,872,219 | ) | | | | (330,014,179 | ) |
| Net Assets | | | | | | | | | |
| Beginning of period | | | 930,285,525 | | | | | 1,260,299,704 | |
| End of period | | $ | 334,413,306 | | | | $ | 930,285,525 | |
| | | | | | | | | | |
| Transactions in common shares | | | | | | | | | |
| Shares outstanding at beginning of period | | | 53,732,462 | | | | | 53,635,054 | |
| Net share reduction due to reverse stock splits (See Note 14) | | | (40,299,345 | ) | | | | — | |
| Shares repurchased | | | (98,878 | ) | | | | — | |
| Shares issued through offerings | | | — | | | | | — | |
| Shares issued through reinvestment of distributions | | | — | | | | | 97,408 | |
| Shares outstanding at end of period | | | 13,334,239 | | | | | 53,732,462 | |
| (1) | Consolidated Statement of Changes in Net Assets (See Note 13 to the financial statements for further disclosure). |
| (2) | Commencement of operations. |
| (3) | Weighted-average discount to NAV of 22.8%. |
| See accompanying Notes to Financial Statements. | |
| | |
| 44 | Tortoise |
| |
| |
| 2020 2nd Quarter Report | May 31, 2020 |
| |
| |
| |
| |
| | | | | | | | |
| Tortoise Midstream Energy Fund, Inc. | | Tortoise Pipeline & Energy Fund, Inc. | |
| Period from | | | | | | Period from | | | | | |
| December 1, 2019 | | Year Ended | | December 1, 2019 | | Year Ended | |
| through | | November 30, | | through | | November 30, | |
| May 31, 2020 | | 2019 | | May 31, 2020 | | 2019 | |
| (unaudited) | | | | | | (unaudited) | | | | | |
| | | | | | | | | | | | | | | | |
| $ | (6,767,338 | ) | | $ | (17,549,941 | ) | | $ | 52,211 | | | $ | (1,235,742 | ) | |
| (525,086,680 | ) | | | (35,175,815 | ) | | | (92,879,186 | ) | | | (15,534,668 | ) | |
| 41,368,639 | | | | (87,752,183 | ) | | | 16,916,863 | | | | (2,671,988 | ) | |
| (490,485,379 | ) | | | (140,477,939 | ) | | | (75,910,112 | ) | | | (19,442,398 | ) | |
| | | | | | | | | | | | | | | | |
| — | | | | — | | | | (99,500 | ) | | | | | |
| (14,853,969 | ) | | | (106,822,149 | ) | | | (3,155,834 | ) | | | (13,872,732 | ) | |
| (14,853,969 | ) | | | (106,822,149 | ) | | | (3,255,334 | ) | | | (13,872,732 | ) | |
| | | | | | | | | | | | | | | | |
| | | | | | | | | | | | | | | | |
| — | | | | (24,715 | ) | | | — | | | | — | | |
| — | | | | — | | | | — | | | | — | | |
| | | | | | | | | | | | | | | | |
| — | | | | (24,715 | ) | | | — | | | | — | | |
| (505,339,348 | ) | | | (247,324,803 | ) | | | (79,165,446 | ) | | | (33,315,130 | ) | |
| | | | | | | | | | | | | | | | |
| 667,708,171 | | | | 915,032,974 | | | | 129,886,561 | | | | 163,201,691 | | |
| $ | 162,368,823 | | | $ | 667,708,171 | | | $ | 50,721,115 | | | $ | 129,886,561 | | |
| | | | | | | | | | | | | | | | |
| | | | | | | | | | | | | | | | |
| 63,208,377 | | | | 63,208,377 | | | | 10,016,413 | | | | 10,016,413 | | |
| (56,887,538 | ) | | | — | | | | (7,512,309 | ) | | | — | | |
| — | | | | — | | | | — | | | | — | | |
| — | | | | — | | | | — | | | | — | | |
| — | | | | — | | | | — | | | | — | | |
| 6,320,839 | | | | 63,208,377 | | | | 2,504,104 | | | | 10,016,413 | | |
| See accompanying Notes to Financial Statements. | |
| | |
| Tortoise | 45 |
| |
| |
| |
| |
| Statements of Changes in Net Assets (continued) |
| |
| | | |
| | Tortoise Energy Independence Fund, Inc. |
| | Period from | | | | |
| | December 1, 2019 | | Year Ended |
| | through | | November 30, |
| | May 31, 2020 | | 2019 |
| | (unaudited) | | | | |
| Operations | | | | | | | | |
| Net investment income (loss) | | $ | (27,618 | ) | | $ | (1,490,748 | ) |
| Net realized gain (loss) | | | (47,256,282 | ) | | | (83,448,293 | ) |
| Net unrealized appreciation (depreciation) | | | 16,776,852 | | | | 29,302,069 | |
| Net decrease in net assets applicable to common stockholders resulting from operations | | | (30,507,048 | ) | | | (55,636,972 | ) |
| Distributions to Common Stockholders | | | | | | | | |
| From distributable earnings | | | — | | | | — | |
| From return of capital | | | (1,476,797 | ) | | | (15,828,822 | ) |
| Total distributions to common stockholders | | | (1,476,797 | ) | | | (15,828,822 | ) |
| Capital Stock Transactions | | | | | | | | |
| Repurchases of common stock | | | — | | | | — | |
| Underwriting discounts and offering expenses associated with the issuance of common stock | | | — | | | | — | |
| Issuance of common shares from reinvestment of distributions to stockholders | | | — | | | | 527,895 | |
| Net increase (decrease) in net assets applicable to common stockholders | | | | | | | | |
| from capital stock transactions | | | — | | | | 527,895 | |
| Total increase (decrease) in net assets applicable to common stockholders | | | (31,983,845 | ) | | | (70,937,899 | ) |
| Net Assets | | | | | | | | |
| Beginning of period | | | 61,550,335 | | | | 132,488,234 | |
| End of period | | $ | 29,566,490 | | | $ | 61,550,335 | |
| | | | | | | | | |
| Transactions in common shares | | | | | | | | |
| Shares outstanding at beginning of period | | | 14,767,968 | | | | 14,696,260 | |
| Net share reduction due to reverse stock splits (See Note) | | | (12,921,971 | ) | | | — | |
| Shares repurchased | | | — | | | | — | |
| Shares issued through offerings | | | — | | | | — | |
| Shares issued through reinvestment of distributions | | | — | | | | 71,708 | |
| Shares outstanding at end of period | | | 1,845,997 | | | | 14,767,968 | |
| (1) | Consolidated Statement of Changes in Net Assets (See Note 13 to the financial statements for further disclosure). |
| (2) | Commencement of operations. |
| See accompanying Notes to Financial Statements. | |
| | |
| 46 | Tortoise |
| |
| |
| 2020 2nd Quarter Report | May 31, 2020 |
| |
| |
| |
| Tortoise Power and Energy | | | | | | | | | |
| Infrastructure Fund, Inc. | | Tortoise Essential Assets Income Term Fund(1) | |
| Period from | | | | | | Period from | | Period from | |
| December 1, 2019 | | Year Ended | | December 1, 2019 | | March 29, 2019(2) | |
| through | | November 30, | | through | | through | |
| May 31, 2020 | | 2019 | | May 31, 2020 | | November 30, 2019 | |
| (unaudited) | | | | | | (unaudited) | | | | | |
| | |
| $ | 1,338,225 | | | $ | 2,722,077 | | | $ | 8,804,350 | | | $ | 4,144,381 | | |
| (26,624,582 | ) | | | 4,821,830 | | | | (38,671,608 | ) | | | (10,438,827 | ) | |
| (8,192,858 | ) | | | (11,426,405 | ) | | | (2,548,213 | ) | | | (15,820,905 | ) | |
| (33,479,215 | ) | | | (3,882,498 | ) | | | (32,415,471 | ) | | | (22,115,351 | ) | |
| | |
| (3,770,290 | ) | | | (9,729,252 | ) | | | (6,468,915 | ) | | | (4,545,707 | ) | |
| (1,443,210 | ) | | | (697,748 | ) | | | (2,313,809 | ) | | | (5,700,804 | ) | |
| (5,213,500 | ) | | | (10,427,000 | ) | | | (8,782,724 | ) | | | (10,246,511 | ) | |
| | |
| — | | | | — | | | | — | | | | — | | |
| — | | | | — | | | | — | | | | — | | |
| — | | | | — | | | | — | | | | — | | |
| | |
| — | | | | — | | | | — | | | | 269,722,540 | | |
| (38,692,715 | ) | | | (14,309,498 | ) | | | (41,198,195 | ) | | | 237,360,678 | | |
| | |
| 123,014,930 | | | | 137,324,428 | | | | 237,460,678 | | | | 100,000 | | |
| $ | 84,322,215 | | | $ | 123,014,930 | | | $ | 196,262,483 | | | $ | 237,460,678 | | |
| | |
| | |
| 6,951,333 | | | | 6,951,333 | | | | 13,491,127 | | | | 5,000 | | |
| — | | | | — | | | | — | | | | — | | |
| — | | | | — | | | | — | | | | — | | |
| — | | | | — | | | | — | | | | 13,486,127 | | |
| — | | | | — | | | | — | | | | — | | |
| 6,951,333 | | | | 6,951,333 | | | | 13,491,127 | | | | 13,491,127 | | |
| See accompanying Notes to Financial Statements. | |
| | |
| Tortoise | 47 |
| |
| |
| |
| |
| Statements of Cash Flows (unaudited) |
| Period from December 1, 2019 through May 31, 2020 |
| | | | | | | |
| | | Tortoise Energy | | | | |
| | Infrastructure | | Tortoise Midstream |
| | Corp.(1) | | Energy Fund, Inc. |
| Cash Flows From Operating Activities | | | | | | | | |
| Dividends, distributions and interest received from investments | | $ | 51,944,896 | | | $ | 35,911,389 | |
| Purchases of long-term investments | | | (153,523,161 | ) | | | (117,731,757 | ) |
| Proceeds from sales of long-term investments | | | 708,258,030 | | | | 546,352,928 | |
| Sales (purchases) of short-term investments, net | | | (62,479,416 | ) | | | (17,900,493 | ) |
| Proceeds from litigation settlement | | | 1,834 | | | | — | |
| Proceeds from funds held in escrow | | | 814,669 | | | | — | |
| Call options written, net | | | (66,903 | ) | | | (29,401 | ) |
| Payments on interest rate swap contracts, net | | | (40,635 | ) | | | — | |
| Payments on forward currency contracts, net | | | — | | | | — | |
| Interest received on securities sold, net | | | — | | | | — | |
| Interest expense paid | | | (9,235,257 | ) | | | (6,603,165 | ) |
| Distributions to mandatory redeemable preferred stockholders | | | (5,382,139 | ) | | | (3,150,341 | ) |
| Other leverage expenses paid | | | (4,300 | ) | | | (7,326 | ) |
| Income taxes paid | | | (205,459 | ) | | | (171,854 | ) |
| Premium on redemption of senior notes | | | (2,332,000 | ) | | | (2,888,000 | ) |
| Premium on redemption of mandatory redeemable preferred stock | | | (1,327,000 | ) | | | (1,193,000 | ) |
| Operating expenses paid | | | (8,514,227 | ) | | | (6,035,011 | ) |
| Net cash provided by operating activities | | | 517,908,932 | | | | 426,553,969 | |
| Cash Flows From Financing Activities | | | | | | | | |
| Payments on credit facilities, net | | | (93,900,000 | ) | | | (53,600,000 | ) |
| Redemption of mandatory redeemable preferred stock | | | (132,700,000 | ) | | | (119,300,000 | ) |
| Repayment of senior notes | | | (268,200,000 | ) | | | (238,800,000 | ) |
| Redemption of common stock | | | (1,884,610 | ) | | | — | |
| Distributions paid to common stockholders | | | (21,224,322 | ) | | | (14,853,969 | ) |
| Net cash used in financing activities | | | (517,908,932 | ) | | | (426,553,969 | ) |
| Net change in cash | | | — | | | | — | |
| Cash — beginning of period | | | — | | | | — | |
| Cash — end of period | | $ | — | | | $ | — | |
| | | | | | | | |
| (1) | Consolidated Statement of Cash Flows (See Note 13 to the financial statements for further disclosure). |
| See accompanying Notes to Financial Statements. | |
| | |
| 48 | Tortoise |
| |
| |
| 2020 2nd Quarter Report | May 31, 2020 |
| |
| |
| |
| | | | | | | | Tortoise Power | | Tortoise | |
| Tortoise Pipeline | | Tortoise Energy | | and Energy | | Essential Assets | |
| & Energy | | Independence | | Infrastructure | | Income Term | |
| Fund, Inc. | | Fund, Inc. | | Fund, Inc. | | Fund(1) | |
| | |
| $ | 5,228,189 | | | $ | 1,188,485 | | | $ | 5,081,297 | | | $ | 13,194,105 | | |
| (29,127,284 | ) | | | (32,717,511 | ) | | | (23,959,286 | ) | | | (99,942,145 | ) | |
| 75,970,836 | | | | 55,534,592 | | | | 54,867,688 | | | | 98,733,070 | | |
| (8,689,376 | ) | | | 15,836 | | | | 124,503 | | | | (81,872 | ) | |
| — | | | | — | | | | — | | | | — | | |
| — | | | | — | | | | — | | | | — | | |
| (38,578 | ) | | | 915,534 | | | | — | | | | 368,586 | | |
| — | | | | — | | | | (5,403 | ) | | | — | | |
| — | | | | — | | | | — | | | | (534,591 | ) | |
| — | | | | — | | | | 479,801 | | | | — | | |
| (859,789 | ) | | | (340,078 | ) | | | (725,897 | ) | | | (363,482 | ) | |
| (414,539 | ) | | | — | | | | — | | | | — | | |
| — | | | | — | | | | — | | | | — | | |
| — | | | | — | | | | — | | | | — | | |
| (96,000 | ) | | | — | | | | — | | | | — | | |
| (99,000 | ) | | | — | | | | — | | | | — | | |
| (1,319,125 | ) | | | (720,061 | ) | | | (1,461,826 | ) | | | (1,863,553 | ) | |
| 40,555,334 | | | | 23,876,797 | | | | 34,400,877 | | | | 9,510,118 | | |
| | |
| (11,800,000 | ) | | | (22,400,000 | ) | | | (29,200,000 | ) | | | (1,100,000 | ) | |
| (9,900,000 | ) | | | — | | | | — | | | | — | | |
| (15,600,000 | ) | | | — | | | | — | | | | — | | |
| — | | | | — | | | | — | | | | — | | |
| (3,255,334 | ) | | | (1,476,797 | ) | | | (5,213,500 | ) | | | (8,782,724 | ) | |
| (40,555,334 | ) | | | (23,876,797 | ) | | | (34,413,500 | ) | | | (9,882,724 | ) | |
| — | | | | — | | | | (12,623 | ) | | | (372,606 | ) | |
| — | | | | — | | | | 12,623 | | | | 378,442 | | |
| $ | — | | | $ | — | | | $ | — | | | $ | 5,836 | | |
| See accompanying Notes to Financial Statements. | |
| | |
| Tortoise | 49 |
| |
| |
| |
| |
| Statements of Cash Flows (unaudited) (continued) |
| Period from December 1, 2019 through May 31, 2020 |
| | | | | | |
| | | Tortoise Energy | | Tortoise | |
| | Infrastructure | | Midstream Energy |
| | Corp.(1) | | Fund, Inc. |
| Reconciliation of net decrease in net assets applicable to common stockholders | | | | | | | | |
| resulting from operations to net cash provided by operating activities | | | | | | | | |
| Net decrease in net assets applicable to common stockholders resulting from operations | | $ | (572,763,287 | ) | | $ | (490,485,379 | ) |
| Adjustments to reconcile net decrease in net assets applicable to common stockholders | | | | | | | | |
| resulting from operations to net cash provided by operating activities: | | | | | | | | |
| Purchases of long-term investments | | | (153,591,282 | ) | | | (117,770,247 | ) |
| Proceeds from sales of long-term investments | | | 706,022,829 | | | | 544,123,509 | |
| Sales (purchases) of short-term investments, net | | | (62,479,416 | ) | | | (17,900,493 | ) |
| Proceeds from litigation settlement | | | 1,834 | | | | — | |
| Call options written, net | | | (66,903 | ) | | | (29,401 | ) |
| Return of capital on distributions received | | | 44,577,427 | | | | 30,164,381 | |
| Deferred tax benefit | | | (116,472,157 | ) | | | (27,892,485 | ) |
| Net unrealized (appreciation) depreciation | | | (21,687,276 | ) | | | (53,759,046 | ) |
| Amortization (accretion) of market premium (discount), net | | | (254,923 | ) | | | (190,065 | ) |
| Net realized loss | | | 697,704,301 | | | | 536,233,480 | |
| Amortization of debt issuance costs | | | 220,476 | | | | 196,939 | |
| Changes in operating assets and liabilities: | | | | | | | | |
| (Increase) decrease in dividends, distributions and interest receivable from investments | | | 50,925 | | | | (1,635,840 | ) |
| Decrease in escrow receivable | | | 814,669 | | | | — | |
| Decrease in current tax asset | | | 11,138,214 | | | | 2,319,733 | |
| Increase in income tax receivable | | | (52,052,354 | ) | | | — | |
| (Increase) decrease in receivable for investments sold | | | 2,235,201 | | | | 2,229,419 | |
| Decrease in receivable for premiums on options written | | | — | | | | — | |
| (Increase) decrease in prepaid expenses and other assets | | | 34,424 | | | | (92 | ) |
| Increase in payable for investments purchased | | | 68,121 | | | | 38,490 | |
| Decrease in payable to Adviser, net of fees waived | | | (2,284,789 | ) | | | (1,687,857 | ) |
| Increase in current tax liability | | | 42,363,620 | | | | 25,657,857 | |
| Decrease in accrued expenses and other liabilities | | | (5,670,722 | ) | | | (3,058,934 | ) |
| Total adjustments | | | 1,090,672,219 | | | | 917,039,348 | |
| Net cash provided by operating activities | | $ | 517,908,932 | | | $ | 426,553,969 | |
| (1) | Consolidated Statement of Cash Flows (See Note 13 to the financial statements for further disclosure). |
| See accompanying Notes to Financial Statements. | |
| | |
| 50 | Tortoise |
| |
| |
| 2020 2nd Quarter Report | May 31, 2020 |
| |
| |
| |
| |
| | | | | | | | Tortoise Power | | Tortoise | |
| Tortoise Pipeline | | Tortoise Energy | | and Energy | | Essential Assets | |
| & Energy | | Independence | | Infrastructure | | Income Term | |
| Fund, Inc. | | Fund, Inc. | | Fund, Inc. | | Fund(1) | |
| | |
| | |
| $ | (75,910,112 | ) | | $ | (30,507,048 | ) | | $ | (33,479,215 | ) | | $ | (32,415,471 | ) | |
| | |
| | |
| (29,127,284 | ) | | | (32,717,511 | ) | | | (23,959,286 | ) | | | (105,040,358 | ) | |
| 75,970,836 | | | | 55,534,592 | | | | 54,867,688 | | | | 104,758,306 | | |
| (8,689,376 | ) | | | 15,836 | | | | 124,503 | | | | (81,872 | ) | |
| — | | | | — | | | | — | | | | — | | |
| (38,578 | ) | | | 915,534 | | | | — | | | | 365,069 | | |
| 3,321,238 | | | | 337,208 | | | | 2,229,639 | | | | 2,626,950 | | |
| — | | | | — | | | | — | | | | 46,758 | | |
| (16,916,863 | ) | | | (16,776,852 | ) | | | 8,192,858 | | | | 2,548,213 | | |
| — | | | | — | | | | 146,498 | | | | (223,641 | ) | |
| 92,879,186 | | | | 47,256,282 | | | | 26,619,179 | | | | 38,137,017 | | |
| 25,324 | | | | — | | | | — | | | | — | | |
| | |
| (426,524 | ) | | | 73,029 | | | | (54,391 | ) | | | (165,141 | ) | |
| — | | | | — | | | | — | | | | — | | |
| — | | | | — | | | | — | | | | — | | |
| — | | | | — | | | | — | | | | — | | |
| — | | | | — | | | | — | | | | (6,025,236 | ) | |
| — | | | | — | | | | — | | | | 3,517 | | |
| (16,139 | ) | | | (26,122 | ) | | | (20,365 | ) | | | (35,383 | ) | |
| — | | | | — | | | | — | | | | 5,098,213 | | |
| (238,716 | ) | | | (115,405 | ) | | | (135,282 | ) | | | (43,191 | ) | |
| — | | | | — | | | | — | | | | — | | |
| (277,658 | ) | | | (112,746 | ) | | | (130,949 | ) | | | (43,632 | ) | |
| 116,465,446 | | | | 54,383,845 | | | | 67,880,092 | | | | 41,925,589 | | |
| $ | 40,555,334 | | | $ | 23,876,797 | | | $ | 34,400,877 | | | $ | 9,510,118 | | |
| See accompanying Notes to Financial Statements. | |
| | |
| Tortoise | 51 |
| | Period from | | | | | | | | | | | | | | | | | | | | |
| | December 1, 2019 | | Year Ended | | Year Ended | | Year Ended | | Year Ended | | Year Ended |
| | through | | November 30, | | November 30, | | November 30, | | November 30, | | November 30, |
| | May 31, 2020 | | 2019 | | 2018 | | 2017 | | 2016 | | 2015 |
| | (unaudited) | | | | | | | | | | | | | | | | | | | | |
| Per Common Share Data(1)(2) | | | | | | | | | | | | | | | | | | | | | | | | |
| Net Asset Value, beginning of period | | $ | 69.24 | | | $ | 94.00 | | | $ | 95.72 | | | $ | 115.32 | | | $ | 117.12 | | | $ | 197.36 | |
| Income (Loss) from Investment Operations | | | | | | | | | | | | | | | | | | | | | | | | |
| Net investment loss(3) | | | (0.21 | ) | | | (1.20 | ) | | | (1.96 | ) | | | (2.60 | ) | | | (3.12 | ) | | | (2.48 | ) |
| Net realized and unrealized gain (loss)(1) | | | (42.37 | ) | | | (13.08 | ) | | | 10.36 | | | | (6.56 | ) | | | 11.76 | | | | (67.40 | ) |
| Total income (loss) from investment | | | | | | | | | | | | | | | | | | | | | | | | |
| operations | | | (42.58 | ) | | | (14.28 | ) | | | 8.40 | | | | (9.16 | ) | | | 8.64 | | | | (69.88 | ) |
| Distributions to Common Stockholders | | | | | | | | | | | | | | | | | | | | | | | | |
| From return of capital | | | (1.58 | ) | | | (10.48 | ) | | | (10.48 | ) | | | (10.48 | ) | | | (10.48 | ) | | | (10.36 | ) |
| Capital Stock Transactions | | | | | | | | | | | | | | | | | | | | | | | | |
| Premiums less underwriting discounts | | | | | | | | | | | | | | | | | | | | | | | | |
| and offering costs on issuance of | | | | | | | | | | | | | | | | | | | | | | | | |
| common stock(4) | | | — | | | | (0.00 | ) | | | 0.36 | | | | 0.04 | | | | 0.04 | | | | (0.00 | ) |
| Net Asset Value, end of period | | $ | 25.08 | | | $ | 69.24 | | | $ | 94.00 | | | $ | 95.72 | | | $ | 115.32 | | | $ | 117.12 | |
| |
| Per common share market value, | | | | | | | | | | | | | | | | | | | | | | | | |
| end of period | | $ | 18.70 | | | $ | 67.28 | | | $ | 90.36 | | | $ | 103.44 | | | $ | 122.52 | | | $ | 106.28 | |
| Total investment return based on | | | | | | | | | | | | | | | | | | | | | | | | |
| market value(5)(6) | | | (71.34 | )% | | | (15.46 | )% | | | (3.42 | )% | | | (7.49 | )% | | | 26.21 | % | | | (37.86 | )% |
| |
| Supplemental Data and Ratios | | | | | | | | | | | | | | | | | | | | | | | | |
| Net assets applicable to common | | | | | | | | | | | | | | | | | | | | | | | | |
| stockholders, end of period (000’s) | | $ | 334,413 | | | $ | 930,286 | | | $ | 1,260,300 | | | $ | 1,181,528 | | | $ | 1,412,274 | | | $ | 1,405,733 | |
| Average net assets (000’s) | | $ | 645,216 | | | $ | 1,203,943 | | | $ | 1,388,683 | | | $ | 1,406,724 | | | $ | 1,345,764 | | | $ | 1,974,038 | |
| Ratio of Expenses to Average Net Assets(7) | | | | | | | | | | | | | | | | | | | | | | | | |
| Advisory fees | | | 1.71 | % | | | 1.62 | % | | | 1.58 | % | | | 1.74 | % | | | 1.74 | % | | | 1.76 | % |
| Other operating expenses | | | 0.22 | | | | 0.14 | | | | 0.13 | | | | 0.12 | | | | 0.12 | | | | 0.10 | |
| Total operating expenses, | | | | | | | | | | | | | | | | | | | | | | | | |
| before fee waiver | | | 1.93 | | | | 1.76 | | | | 1.71 | | | | 1.86 | | | | 1.86 | | | | 1.86 | |
| Fee waiver(8) | | | — | | | | (0.00 | ) | | | (0.04 | ) | | | (0.00 | ) | | | (0.01 | ) | | | — | |
| Total operating expenses | | | 1.93 | | | | 1.76 | | | | 1.67 | | | | 1.86 | | | | 1.85 | | | | 1.86 | |
| Leverage expenses | | | 3.99 | | | | 2.15 | | | | 1.87 | | | | 1.78 | | | | 2.29 | | | | 1.75 | |
| Income tax expense (benefit)(9) | | | (35.59 | ) | | | (5.49 | ) | | | (11.02 | ) | | | (5.28 | ) | | | 4.64 | | | | (24.50 | ) |
| Total expenses | | | (29.67 | )% | | | (1.58 | )% | | | (7.48 | )% | | | (1.64 | )% | | | 8.78 | % | | | (20.89 | )% |
| See accompanying Notes to Financial Statements. | |
| | |
| 52 | Tortoise |
| |
| |
| 2020 2nd Quarter Report | May 31, 2020 |
| |
| |
| |
| |
| | Period from | | | | | | | | | | | | | | | | | | | | | | | | | |
| | December 1, 2019 | | Year Ended | | Year Ended | | Year Ended | | Year Ended | | Year Ended |
| | through | | November 30, | | November 30, | | November 30, | | November 30, | | November 30, |
| | May 31, 2020 | | 2019 | | 2018 | | 2017 | | 2016 | | 2015 |
| | (unaudited) | | | | | | | | | | | | | | | | | | | | | | | | | |
| Ratio of net investment loss to average | | | | | | | | | | | | | | | | | | | | | | | | | | | | | | |
| net assets before fee waiver(7) | | | (3.06 | ) | % | | | (1.33 | ) | % | | | (1.89 | ) | % | | | (2.27 | ) | % | | | (2.83 | ) | % | | | (1.50 | ) | % |
| Ratio of net investment loss to average | | | | | | | | | | | | | | | | | | | | | | | | | | | | | | |
| net assets after fee waiver(7) | | | (3.06 | ) | % | | | (1.33 | ) | % | | | (1.85 | ) | % | | | (2.27 | ) | % | | | (2.82 | ) | % | | | (1.50 | ) | % |
| Portfolio turnover rate(5) | | | 14.16 | | % | | | 26.35 | | % | | | 17.96 | | % | | | 20.38 | | % | | | 24.23 | | % | | | 12.94 | | % |
| Credit facility borrowings, | | | | | | | | | | | | | | | | | | | | | | | | | | | | | | |
| end of period (000’s) | | $ | — | | | | $ | 93,900 | | | | $ | 107,100 | | | | $ | 112,700 | | | | $ | 109,300 | | | | $ | 66,000 | | |
| Senior notes, end of period (000’s) | | $ | 96,800 | | | | $ | 365,000 | | | | $ | 380,000 | | | | $ | 412,500 | | | | $ | 442,500 | | | | $ | 545,000 | | |
| Preferred stock, end of period (000’s) | | $ | 32,300 | | | | $ | 165,000 | | | | $ | 165,000 | | | | $ | 165,000 | | | | $ | 165,000 | | | | $ | 295,000 | | |
| Per common share amount of senior | | | | | | | | | | | | | | | | | | | | | | | | | | | | | | |
| notes outstanding, end of period | | $ | 7.26 | | | | $ | 27.17 | | | | $ | 28.34 | | | | $ | 33.41 | | | | $ | 36.12 | | | | $ | 45.40 | | |
| Per common share amount of net assets, | | | | | | | | | | | | | | | | | | | | | | | | | | | | | | |
| excluding senior notes, end of period | | $ | 32.34 | | | | $ | 96.41 | | | | $ | 122.34 | | | | $ | 129.13 | | | | $ | 151.44 | | | | $ | 162.52 | | |
| Asset coverage, per $1,000 of principal | | | | | | | | | | | | | | | | | | | | | | | | | | | | | | |
| amount of senior notes and credit | | | | | | | | | | | | | | | | | | | | | | | | | | | | | | |
| facility borrowings(10) | | $ | 4,788 | | | | $ | 3,387 | | | | $ | 3,926 | | | | $ | 3,564 | | | | $ | 3,858 | | | | $ | 3,784 | | |
| Asset coverage ratio of senior notes | | | | | | | | | | | | | | | | | | | | | | | | | | | | | | |
| and credit facility borrowings(10) | | | 479 | | % | | | 339 | | % | | | 393 | | % | | | 356 | | % | | | 386 | | % | | | 378 | | % |
| Asset coverage, per $10 liquidation value | | | | | | | | | | | | | | | | | | | | | | | | | | | | | | |
| per share of mandatory redeemable | | | | | | | | | | | | | | | | | | | | | | | | | | | | | | |
| preferred stock(11) | | $ | 36 | | | | $ | 25 | | | | $ | 29 | | | | $ | 27 | | | | $ | 30 | | | | $ | 26 | | |
| Asset coverage ratio of preferred stock(11) | | | 359 | | % | | | 249 | | % | | | 293 | | % | | | 271 | | % | | | 297 | | % | | | 255 | | % |
| (1) | Information presented relates to a share of common stock outstanding for the entire period. |
| (2) | During the period from December 1, 2019 through May 31, 2020, the Fund effected the following reverse stock split: May 1, 2020, 1 for 4. All historical per share information has been retroactively adjusted to reflect this reverse stock split. |
| (3) | The per common share data for the years ended November 30, 2019, 2018, 2017, 2016, and 2015 do not reflect the change in estimate of investment income and return of capital, for the respective year. See Note 2C to the financial statements for further disclosure. |
| (4) | Represents underwriting and offering costs of less than $0.01 for the year ended November 30, 2019. Represents premium on shelf offerings of $0.40 per share, less the underwriting and offering costs of $0.04 per share, for the year ended November 30, 2018. Represents the premium on the shelf offerings of $0.04 per share, less the underwriting and offering costs of less than $0.01 per share for the year ended November 30, 2017. Represents the premium on the shelf offerings of $0.04 per share, less the underwriting and offering costs of less than $0.01 per share for the year ended November 30, 2016. Represents underwriting and offering costs of less than $0.01 per share for the year ended November 30, 2015. |
| (5) | Not annualized for periods less than one full year. |
| (6) | Total investment return is calculated assuming a purchase of common stock at the beginning of the period and a sale at the closing price on the last day of the period reported (excluding brokerage commissions). The calculation also assumes reinvestment of distributions at actual prices pursuant to TYG’s dividend reinvestment plan. |
| (7) | Annualized for periods less than one full year. |
| (8) | Less than 0.01% for the years ended November 30, 2019 and 2017. |
| (9) | For the period from December 1, 2019 through May 31, 2020, TYG accrued $116,472,157 for net deferred income tax benefit and $1,654,939 for current income tax expense. For the year ended November 30, 2019, TYG accrued $73,090,370 for net deferred income tax benefit and $7,034,755 for current income tax expense. For the year ended November 30, 2018, TYG accrued $152,516,725 for net deferred income tax benefit, which included a deferred tax benefit of $125,271,378 due to the impact from the federal tax rate reduction related to the Tax Cuts and Jobs Act. For the year ended November 30, 2017, TYG accrued $35,365,364 for current income tax expense and $109,662,030 for net deferred income tax benefit. For the year ended November 30, 2016, TYG accrued $57,075,786 for current income tax expense and $5,303,392 for net deferred income tax expense. For the year ended November 30, 2015, TYG accrued $66,785,732 for net current income tax expense and $550,449,662 for net deferred income tax benefit. |
| (10) | Represents value of total assets less all liabilities and indebtedness not represented by senior notes, credit facility borrowings and preferred stock at the end of the year divided by senior notes and credit facility borrowings outstanding at the end of the period. |
| (11) | Represents value of total assets less all liabilities and indebtedness not represented by senior notes, credit facility borrowings and preferred stock at the end of the year divided by senior notes, credit facility borrowings and preferred stock outstanding at the end of the period. |
| See accompanying Notes to Financial Statements. | |
| | |
| Tortoise | 53 |
| | Period from | | | | | | | | | | | | | | | | | | | | | | | | | |
| | December 1, 2019 | | Year Ended | | Year Ended | | Year Ended | | Year Ended | | Year Ended |
| | through | | November 30, | | November 30, | | November 30, | | November 30, | | November 30, |
| | May 31, 2020 | | 2019 | | 2018 | | 2017 | | 2016 | | 2015 |
| | (unaudited) | | | | | | | | | | | | | | | | | | | | | | | | | |
| Per Common Share Data(1)(2) | | | | | | | | | | | | | | | | | | | | | | | | | | | | | | |
| Net Asset Value, beginning of period | | $ | 105.60 | | | | $ | 144.80 | | | | $ | 159.60 | | | | $ | 192.20 | | | | $ | 186.50 | | | | $ | 298.30 | | |
| Income (Loss) from Investment Operation | | | | | | | | | | | | | | | | | | | | | | | | | | | | | | |
| Net investment loss(3) | | | (0.13 | ) | | | | (2.80 | ) | | | | (4.30 | ) | | | | (4.20 | ) | | | | (4.60 | ) | | | | (3.20 | ) | |
| Net realized and unrealized gain (loss)(3) | | | (77.43 | ) | | | | (19.50 | ) | | | | 13.60 | | | | | (11.50 | ) | | | | 27.20 | | | | | (91.70 | ) | |
| Total income (loss) from investment | | | | | | | | | | | | | | | | | | | | | | | | | | | | | | |
| operations | | | (77.56 | ) | | | | (22.30 | ) | | | | 9.30 | | | | | (15.70 | ) | | | | 22.60 | | | | | (94.90 | ) | |
| Distributions to Common Stockholders | | | | | | | | | | | | | | | | | | | | | | | | | | | | | | |
| From return of capital | | | (2.35 | ) | | | | (16.90 | ) | | | | (16.90 | ) | | | | (16.90 | ) | | | | (16.90 | ) | | | | (16.90 | ) | |
| Capital stock transactions | | | | | | | | | | | | | | | | | | | | | | | | | | | | | | |
| Premiums less underwriting discounts | | | | | | | | | | | | | | | | | | | | | | | | | | | | | | |
| and offering costs on issuance of | | | | | | | | | | | | | | | | | | | | | | | | | | | | | | |
| common stock(4) | | | — | | | | | (0.00 | ) | | | | (7.19 | ) | | | | — | | | | | (0.01 | ) | | | | (0.00 | ) | |
| Net Asset Value, end of period | | $ | 25.69 | | | | $ | 105.60 | | | | $ | 144.81 | | | | $ | 159.60 | | | | $ | 192.19 | | | | $ | 186.50 | | |
| | |
| Per common share market value, | | | | | | | | | | | | | | | | | | | | | | | | | | | | | | |
| end of period | | $ | 20.95 | | | | $ | 98.80 | | | | $ | 137.20 | | | | $ | 159.00 | | | | $ | 189.00 | | | | $ | 161.80 | | |
| Total investment return based on | | | | | | | | | | | | | | | | | | | | | | | | | | | | | | |
| market value(5)(6) | | | (77.85 | ) | % | | | (17.63 | ) | % | | | (4.10 | ) | % | | | (7.67 | ) | % | | | 27.99 | | % | | | (37.08 | ) | % |
| | |
| Supplemental Data and Ratios | | | | | | | | | | | | | | | | | | | | | | | | | | | | | | |
| Net assets applicable to common | | | | | | | | | | | | | | | | | | | | | | | | | | | | | | |
| stockholders, end of period (000’s) | | $ | 162,369 | | | | $ | 667,708 | | | | $ | 915,033 | | | | $ | 754,085 | | | | $ | 904,866 | | | | $ | 876,409 | | |
| Average net assets (000’s) | | $ | 436,368 | | | | $ | 871,496 | | | | $ | 887,014 | | | | $ | 892,196 | | | | $ | 862,527 | | | | $ | 1,174,085 | | |
| Ratio of Expenses to Average Net Assets(7) | | | | | | | | | | | | | | | | | | | | | | | | | | | | | | |
| Advisory fees | | | 1.71 | | % | | | 1.59 | | % | | | 1.54 | | % | | | 1.61 | | % | | | 1.56 | | % | | | 1.56 | | % |
| Other operating expenses | | | 0.22 | | | | | 0.14 | | | | | 0.15 | | | | | 0.14 | | | | | 0.16 | | | | | 0.12 | | |
| Total operating expenses, | | | | | | | | | | | | | | | | | | | | | | | | | | | | | | |
| before fee waiver | | | 1.93 | | | | | 1.73 | | | | | 1.69 | | | | | 1.75 | | | | | 1.72 | | | | | 1.68 | | |
| Fee waiver | | | — | | | | | (0.03 | ) | | | | (0.09 | ) | | | | — | | | | | (0.01 | ) | | | | (0.09 | ) | |
| Total operating expenses | | | 1.93 | | | | | 1.70 | | | | | 1.60 | | | | | 1.75 | | | | | 1.71 | | | | | 1.59 | | |
| Leverage expenses | | | 5.09 | | | | | 2.34 | | | | | 1.98 | | | | | 1.89 | | | | | 1.95 | | | | | 1.42 | | |
| Income tax expense (benefit)(8) | | | 0.12 | | | | | (4.80 | ) | | | | (6.09 | ) | | | | (4.33 | ) | | | | 7.25 | | | | | (21.92 | ) | |
| Total expenses | | | 7.14 | | % | | | (0.76 | ) | % | | | (2.51 | ) | % | | | (0.69 | ) | % | | | 10.91 | | % | | | (18.91 | ) | % |
| See accompanying Notes to Financial Statements. | |
| | |
| 54 | Tortoise |
| |
| |
| 2020 2nd Quarter Report | May 31, 2020 |
| |
| |
| |
| | Period from | | | | | | | | | | | | | | | | | | | | | | | | | |
| | December 1, 2019 | | Year Ended | | Year Ended | | Year Ended | | Year Ended | | Year Ended |
| | through | | November 30, | | November 30, | | November 30, | | November 30, | | November 30, |
| | May 31, 2020 | | 2019 | | 2018 | | 2017 | | 2016 | | 2015 |
| | (unaudited) | | | | | | | | | | | | | | | | | | | | | | | | | |
| Ratio of net investment loss to average | | | | | | | | | | | | | | | | | | | | | | | | | | | | | | |
| net assets before fee waiver(7) | | | (3.10 | ) | % | | | (2.05 | ) | % | | | (2.65 | ) | % | | | (2.22 | ) | % | | | (2.53 | ) | % | | | (1.36 | ) | % |
| Ratio of net investment loss to average | | | | | | | | | | | | | | | | | | | | | | | | | | | | | | |
| net assets after fee waiver(7) | | | (3.10 | ) | % | | | (2.02 | ) | % | | | (2.56 | ) | % | | | (2.22 | ) | % | | | (2.52 | ) | % | | | (1.27 | ) | % |
| Portfolio turnover rate(4) | | | 16.04 | | % | | | 29.21 | | % | | | 13.67 | | % | | | 20.94 | | % | | | 35.47 | | % | | | 17.54 | | % |
| Credit facility borrowings, | | | | | | | | | | | | | | | | | | | | | | | | | | | | | | |
| end of period (000’s) | | $ | — | | | | $ | 53,600 | | | | $ | 73,100 | | | | $ | 49,800 | | | | $ | 46,800 | | | | $ | 62,800 | | |
| Senior notes, end of period (000’s) | | $ | 38,200 | | | | $ | 277,000 | | | | $ | 312,000 | | | | $ | 284,000 | | | | $ | 284,000 | | | | $ | 348,000 | | |
| Preferred stock, end of period (000’s) | | $ | 12,700 | | | | $ | 132,000 | | | | $ | 132,000 | | | | $ | 110,000 | | | | $ | 110,000 | | | | $ | 90,000 | | |
| Per common share amount of senior | | | | | | | | | | | | | | | | | | | | | | | | | | | | | | |
| notes outstanding, end of period | | $ | 6.04 | | | | $ | 43.82 | | | | $ | 49.36 | | | | $ | 60.11 | | | | $ | 60.30 | | | | $ | 74.00 | | |
| Per common share amount of net assets, | | | | | | | | | | | | | | | | | | | | | | | | | | | | | | |
| excluding senior notes, end of period | | $ | 31.73 | | | | $ | 149.42 | | | | $ | 194.17 | | | | $ | 219.71 | | | | $ | 252.49 | | | | $ | 260.50 | | |
| Asset coverage, per $1,000 of principal | | | | | | | | | | | | | | | | | | | | | | | | | | | | | | |
| amount of senior notes and credit | | | | | | | | | | | | | | | | | | | | | | | | | | | | | | |
| facility borrowings(7) | | $ | 5,583 | | | | $ | 3,419 | | | | $ | 3,719 | | | | $ | 3,589 | | | | $ | 4,068 | | | | $ | 3,353 | | |
| Asset coverage ratio of senior notes and | | | | | | | | | | | | | | | | | | | | | | | | | | | | | | |
| credit facility borrowings(9) | | | 558 | | % | | | 342 | | % | | | 372 | | % | | | 359 | | % | | | 407 | | % | | | 335 | | % |
| Asset coverage, per $25 liquidation value | | | | | | | | | | | | | | | | | | | | | | | | | | | | | | |
| per share of mandatory redeemable | | | | | | | | | | | | | | | | | | | | | | | | | | | | | | |
| preferred stock(10) | | $ | 105 | | | | $ | 61 | | | | $ | 69 | | | | $ | 67 | | | | $ | 76 | | | | $ | 69 | | |
| Asset coverage ratio of preferred stock(10) | | | 419 | | % | | | 244 | | % | | | 277 | | % | | | 270 | | % | | | 305 | | % | | | 275 | | % |
| (1) | Information presented relates to a share of common stock outstanding for the entire period. |
| (2) | During the period from December 1, 2019 through May 31, 2020, the Fund effected the following reverse stock split: May 1, 2020, 1 for 10. All historical per share information has been retroactively adjusted to reflect this reverse stock split. |
| (3) | The per common share data for the years ended November 30, 2019, 2018, 2017, 2016, and 2015 do not reflect the change in estimate of investment income and return of capital, for the respective year. See Note 2C to the financial statements for further disclosure. |
| (4) | Represents underwriting and offering costs of less than $0.01 for the years ending November 30, 2019 and 2015. Represents the discounts on shares issued through rights offerings of $5.50, plus the underwriting and offering costs of $1.69 per share for the year ended November 30, 2018. Represents underwriting and offering costs of $0.01 for the year ending November 30, 2016. |
| (5) | Not annualized for periods less than one full year. |
| (6) | Total investment return is calculated assuming a purchase of common stock at the beginning of the period and a sale at the closing price on the last day of the period reported (excluding brokerage commissions). This calculation also assumes reinvestment of distributions at actual prices pursuant to NTG’s dividend reinvestment plan. |
| (7) | Annualized for periods less than one full year. |
| (8) | For the period from December 1, 2019 to May 31, 2020, NTG accrued $27,892,485 for net deferred income tax benefit and $28,149,444 for current tax expense. For the year ended November 30, 2019, NTG accrued $40,282,948 for net deferred income tax benefit and $1,510,530 for current tax benefit. For the year ended November 30, 2018, NTG accrued $54,197,357 for net deferred income tax benefit, which included a deferred tax benefit of $47,436,124 due to the impact from the federal tax rate reduction related to the Tax Cuts and Jobs Act. For the year ended November 30, 2017, NTG accrued $440,504 for current income tax expense and $39,035,257 for net deferred income tax benefit. For the year ended November 30, 2016, NTG accrued $1,891,670 for current income tax expense and $60,652,872 for net deferred income tax expense. For the year ended November 30, 2015, NTG accrued $200,550 for current income tax expense and $257,585,058 for net deferred income tax benefit. |
| (9) | Represents value of total assets less all liabilities and indebtedness not represented by senior notes, credit facility borrowings and preferred stock at the end of the period divided by senior notes and credit facility borrowings outstanding at the end of the period. |
| (10) | Represents value of total assets less all liabilities and indebtedness not represented by senior notes, credit facility borrowings and preferred stock at the end of the period divided by senior notes, credit facility borrowings and preferred stock outstanding at the end of the period. |
| See accompanying Notes to Financial Statements. | |
| | |
| Tortoise | 55 |
| | Period from | | | | | | | | | | | | | | | | | | | | | | | | | |
| | December 1, 2019 | | Year Ended | | Year Ended | | Year Ended | | Year Ended | | Year Ended |
| | through | | November 30, | | November 30, | | November 30, | | November 30, | | November 30, |
| | May 31, 2020 | | 2019 | | 2018 | | 2017 | | 2016 | | 2015 |
| | (unaudited) | | | | | | | | | | | | | | | | | | | | | | | | | |
| Per Common Share Data(1)(2) | | | | | | | | | | | | | | | | | | | | | | | | | | | | | | |
| Net Asset Value, beginning of period | | $ | 51.88 | | | | $ | 65.16 | | | | $ | 75.28 | | | | $ | 93.68 | | | | $ | 78.84 | | | | $ | 140.16 | | |
| Income (Loss) from Investment Operations | | | | | | | | | | | | | | | | | | | | | | | | | | | | | | |
| Net investment income (loss)(3) | | | 0.01 | | | | | (0.48 | ) | | | | (0.60 | ) | | | | (0.20 | ) | | | | 0.16 | | | | | 0.88 | | |
| Net realized and unrealized gain (loss)(3) | | | (30.33 | ) | | | | (7.24 | ) | | | | (3.00 | ) | | | | (11.68 | ) | | | | 21.20 | | | | | (54.40 | ) | |
| Total income (loss) from investment | | | | | | | | | | | | | | | | | | | | | | | | | | | | | | |
| operations | | | (30.32 | ) | | | | (7.72 | ) | | | | (3.60 | ) | | | | (11.88 | ) | | | | 21.36 | | | | | (53.52 | ) | |
| Distributions to Common Stockholders | | | | | | | | | | | | | | | | | | | | | | | | | | | | | | |
| From net investment income | | | (0.04 | ) | | | | — | | | | | (0.16 | ) | | | | (0.20 | ) | | | | (1.52 | ) | | | | (1.36 | ) | |
| From net realized gains from | | | | | | | | | | | | | | | | | | | | | | | | | | | | | | |
| investment transactions | | | — | | | | | — | | | | | — | | | | | (1.00 | ) | | | | (5.00 | ) | | | | (6.44 | ) | |
| From return of capital | | | (1.26 | ) | | | | (5.56 | ) | | | | (6.36 | ) | | | | (5.32 | ) | | | | — | | | | | — | | |
| Total distributions to common | | | | | | | | | | | | | | | | | | | | | | | | | | | | | | |
| stockholders | | | (1.30 | ) | | | | (5.56 | ) | | | | (6.52 | ) | | | | (6.52 | ) | | | | (6.52 | ) | | | | (7.80 | ) | |
| Net Asset Value, end of period | | $ | 20.26 | | | | $ | 51.88 | | | | $ | 65.16 | | | | $ | 75.28 | | | | $ | 93.68 | | | | $ | 78.84 | | |
| | |
| Per common share market value, | | | | | | | | | | | | | | | | | | | | | | | | | | | | | | |
| end of period | | $ | 16.98 | | | | $ | 46.08 | | | | $ | 57.32 | | | | $ | 68.04 | | | | $ | 86.20 | | | | $ | 69.88 | | |
| Total investment return based on | | | | | | | | | | | | | | | | | | | | | | | | | | | | | | |
| market value(4)(5) | | | (61.25 | ) | % | | | (11.10 | ) | % | | | (7.03 | ) | % | | | (14.18 | ) | % | | | 34.89 | | % | | | (41.19 | ) | % |
| Supplemental Data and Ratios | | | | | | | | | | | | | | | | | | | | | | | | | | | | | | |
| Net assets applicable to common | | | | | | | | | | | | | | | | | | | | | | | | | | | | | | |
| stockholders, end of period (000’s) | | $ | 50,721 | | | | $ | 129,887 | | | | $ | 163,202 | | | | $ | 188,517 | | | | $ | 234,539 | | | | $ | 197,443 | | |
| Average net assets (000’s) | | $ | 94,108 | | | | $ | 157,017 | | | | $ | 188,518 | | | | $ | 219,359 | | | | $ | 192,888 | | | | $ | 292,473 | | |
| Ratio of Expenses to Average Net Assets(6) | | | | | | | | | | | | | | | | | | | | | | | | | | | | | | |
| Advisory fees | | | 1.67 | | % | | | 1.54 | | % | | | 1.51 | | % | | | 1.43 | | % | | | 1.48 | | % | | | 1.44 | | % |
| Other operating expenses | | | 0.60 | | | | | 0.35 | | | | | 0.32 | | | | | 0.26 | | | | | 0.29 | | | | | 0.22 | | |
| Total operating expenses, | | | | | | | | | | | | | | | | | | | | | | | | | | | | | | |
| before fee waiver | | | 2.27 | | | | | 1.89 | | | | | 1.83 | | | | | 1.69 | | | | | 1.77 | | | | | 1.66 | | |
| Fee waiver | | | — | | | | | — | | | | | — | | | | | (0.00 | ) | | | | (0.07 | ) | | | | (0.14 | ) | |
| Total operating expenses | | | 2.27 | | | | | 1.89 | | | | | 1.83 | | | | | 1.69 | | | | | 1.70 | | | | | 1.52 | | |
| Leverage expenses | | | 2.58 | | | | | 1.62 | | | | | 1.40 | | | | | 1.06 | | | | | 1.23 | | | | | 0.93 | | |
| Total expenses | | | 4.85 | | % | | | 3.51 | | % | | | 3.23 | | % | | | 2.75 | | % | | | 2.93 | | % | | | 2.45 | | % |
| See accompanying Notes to Financial Statements. | |
| | |
| 56 | Tortoise |
| |
| |
| 2020 2nd Quarter Report | May 31, 2020 |
| |
| |
| |
| | Period from | | | | | | | | | | | | | | | | | | | | | | | |
| | December 1, 2019 | | Year Ended | | Year Ended | | Year Ended | | Year Ended | | Year Ended |
| | through | | November 30, | | November 30, | | November 30, | | November 30, | | November 30, |
| | May 31, 2020 | | 2019 | | 2018 | | 2017 | | 2016 | | 2015 |
| | (unaudited) | | | | | | | | | | | | | | | | | | | | | | | |
| Ratio of net investment income (loss) to | | | | | | | | | | | | | | | | | | | | | | | | | | | |
| average net assets before fee waiver(6) | | | 0.11 | % | | | (0.79 | ) | % | | | (0.80 | ) | % | | | (0.21 | ) | % | | | 0.12 | % | | | 0.60 | % |
| Ratio of net investment income (loss) to | | | | | | | | | | | | | | | | | | | | | | | | | | | |
| average net assets after fee waiver(6) | | | 0.11 | % | | | (0.79 | ) | % | | | (0.80 | ) | % | | | (0.21 | ) | % | | | 0.19 | % | | | 0.74 | % |
| Portfolio turnover rate(4) | | | 21.57 | % | | | 21.31 | | % | | | 14.27 | | % | | | 24.23 | | % | | | 90.22 | % | | | 18.84 | % |
| Credit facility borrowings, | | | | | | | | | | | | | | | | | | | | | | | | | | | |
| end of period (000’s) | | $ | — | | | $ | 11,800 | | | | $ | 19,800 | | | | $ | 19,300 | | | | $ | 16,600 | | | $ | 16,900 | |
| Senior notes, end of period (000’s) | | $ | 18,400 | | | $ | 34,000 | | | | $ | 34,000 | | | | $ | 34,000 | | | | $ | 34,000 | | | $ | 54,000 | |
| Preferred stock, end of period (000’s) | | $ | 6,100 | | | $ | 16,000 | | | | $ | 16,000 | | | | $ | 16,000 | | | | $ | 16,000 | | | $ | 16,000 | |
| Per common share amount of senior | | | | | | | | | | | | | | | | | | | | | | | | | | | |
| notes outstanding, end of period | | $ | 7.35 | | | $ | 13.58 | | | | $ | 13.58 | | | | $ | 13.58 | | | | $ | 13.56 | | | $ | 21.56 | |
| Per common share amount of net assets, | | | | | | | | | | | | | | | | | | | | | | | | | | | |
| excluding senior notes, end of period | | $ | 27.61 | | | $ | 65.46 | | | | $ | 78.74 | | | | $ | 88.86 | | | | $ | 107.24 | | | $ | 100.40 | |
| Asset coverage, per $1,000 of principal | | | | | | | | | | | | | | | | | | | | | | | | | | | |
| amount of senior notes and credit | | | | | | | | | | | | | | | | | | | | | | | | | | | |
| facility borrowings(5) | | $ | 4,088 | | | $ | 4,185 | | | | $ | 4,331 | | | | $ | 4,837 | | | | $ | 5,951 | | | $ | 4,010 | |
| Asset coverage ratio of senior notes and | | | | | | | | | | | | | | | | | | | | | | | | | | | |
| credit facility borrowings(7) | | | 409 | % | | | 419 | | % | | | 433 | | % | | | 484 | | % | | | 595 | % | | | 401 | % |
| Asset coverage, per $25 liquidation value | | | | | | | | | | | | | | | | | | | | | | | | | | | |
| per share of mandatory redeemable | | | | | | | | | | | | | | | | | | | | | | | | | | | |
| preferred stock(8) | | $ | 77 | | | $ | 78 | | | | $ | 83 | | | | $ | 93 | | | | $ | 113 | | | $ | 82 | |
| Asset coverage ratio of preferred stock(8) | | | 307 | % | | | 310 | | % | | | 334 | | % | | | 372 | | % | | | 452 | % | | | 327 | % |
| (1) | Information presented relates to a share of common stock outstanding for the entire period. |
| (2) | During the period from December 1, 2019 through May 31, 2020, the Fund effected the following reverse stock split: May 1, 2020, 1 for 4. All historical per share information has been retroactively adjusted to reflect this reverse stock split. |
| (3) | The per common share data for the years ended November 30, 2019, 2018, 2017, 2016, and 2015, do not reflect the change in estimate of investment income and return of capital, for the respective year. See Note 2C to the financial statements for further disclosure. |
| (4) | Not annualized for periods less than one full year. |
| (5) | Total investment return is calculated assuming a purchase of common stock at the beginning of the period and a sale at the closing price on the last day of the period reported (excluding brokerage commissions). The calculation also assumes reinvestment of distributions at actual prices pursuant to TTP’s dividend reinvestment plan. |
| (6) | Annualized for periods less than one full year. |
| (7) | Represents value of total assets less all liabilities and indebtedness not represented by senior notes, credit facility borrowings and preferred stock at the end of the period divided by senior notes and credit facility borrowings outstanding at the end of the period. |
| (8) | Represents value of total assets less all liabilities and indebtedness not represented by senior notes, credit facility borrowings and preferred stock at the end of the period divided by senior notes, credit facility borrowings and preferred stock outstanding at the end of the period. |
| See accompanying Notes to Financial Statements. | |
| | |
| Tortoise | 57 |
| | Period from | | | | | | | | | | | | | | | | | | | | | | | | | |
| | December 1, 2019 | | Year Ended | | Year Ended | | Year Ended | | Year Ended | | Year Ended |
| | through | | November 30, | | November 30, | | November 30, | | November 30, | | November 30, |
| | May 31, 2020 | | 2019 | | 2018 | | 2017 | | 2016 | | 2015 |
| | (unaudited) | | | | | | | | | | | | | | | | | | | | | | | | | |
| Per Common Share Data(1)(2) | | | | | | | | | | | | | | | | | | | | | | | | | | | | | | |
| Net Asset Value, beginning of period | | $ | 33.36 | | | | $ | 72.16 | | | | $ | 103.04 | | | | $ | 135.60 | | | | $ | 124.24 | | | | $ | 182.08 | | |
| Income (Loss) from Investment Operations | | | | | | | | | | | | | | | | | | | | | | | | | | | | | | |
| Net investment loss(3) | | | — | | | | | (0.80 | ) | | | | (2.32 | ) | | | | (1.60 | ) | | | | (0.96 | ) | | | | (0.80 | ) | |
| Net realized and unrealized gain (loss)(3) | | | (16.54 | ) | | | | (29.36 | ) | | | | (14.56 | ) | | | | (16.96 | ) | | | | 26.32 | | | | | (43.04 | ) | |
| Total income (loss) from investment | | | | | | | | | | | | | | | | | | | | | | | | | | | | | | |
| operations | | | (16.54 | ) | | | | (30.16 | ) | | | | (16.88 | ) | | | | (18.56 | ) | | | | 25.36 | | | | | (43.84 | ) | |
| Distributions to Common Stockholders | | | | | | | | | | | | | | | | | | | | | | | | | | | | | | |
| From net investment income(4) | | | — | | | | | — | | | | | — | | | | | — | | | | | — | | | | | (0.00 | ) | |
| From net realized gains from | | | | | | | | | | | | | | | | | | | | | | | | | | | | | | |
| investment transactions | | | — | | | | | — | | | | | — | | | | | — | | | | | — | | | | | — | | |
| From return of capital | | | (0.80 | ) | | | | (8.64 | ) | | | | (14.00 | ) | | | | (14.00 | ) | | | | (14.00 | ) | | | | (14.00 | ) | |
| Total distributions to common | | | | | | | | | | | | | | | | | | | | | | | | | | | | | | |
| stockholders | | | (0.80 | ) | | | | (8.64 | ) | | | | (14.00 | ) | | | | (14.00 | ) | | | | (14.00 | ) | | | | (14.00 | ) | |
| Net Asset Value, end of period | | $ | 16.02 | | | | $ | 33.36 | | | | $ | 72.16 | | | | $ | 103.04 | | | | $ | 135.60 | | | | $ | 124.24 | | |
| Per common share market value, | | | | | | | | | | | | | | | | | | | | | | | | | | | | | | |
| end of period | | $ | 12.01 | | | | $ | 29.04 | | | | $ | 72.00 | | | | $ | 99.12 | | | | $ | 126.80 | | | | $ | 105.44 | | |
| Total investment return based on | | | | | | | | | | | | | | | | | | | | | | | | | | | | | | |
| market value(5)(6) | | | (57.10 | ) | % | | | (52.35 | ) | % | | | (15.10 | ) | % | | | (11.04 | ) | % | | | 36.27 | | % | | | (31.05 | ) | % |
| | |
| Supplemental Data and Ratios | | | | | | | | | | | | | | | | | | | | | | | | | | | | | | |
| Net assets applicable to common | | | | | | | | | | | | | | | | | | | | | | | | | | | | | | |
| stockholders, end of period (000’s) | | $ | 29,566 | | | | $ | 61,550 | | | | $ | 132,488 | | | | $ | 187,889 | | | | $ | 246,088 | | | | $ | 225,410 | | |
| Average net assets (000’s) | | $ | 45,701 | | | | $ | 94,144 | | | | $ | 176,481 | | | | $ | 209,940 | | | | $ | 212,528 | | | | $ | 288,672 | | |
| �� Ratio of Expenses to Average Net Assets(7) | | | | | | | | | | | | | | | | | | | | | | | | | | | | | | |
| Advisory fees | | | 1.49 | | % | | | 1.52 | | % | | | 1.50 | | % | | | 1.43 | | % | | | 1.42 | | % | | | 1.33 | | % |
| Other operating expenses | | | 1.10 | | | | | 0.51 | | | | | 0.32 | | | | | 0.26 | | | | | 0.29 | | | | | 0.21 | | |
| Total operating expenses, | | | | | | | | | | | | | | | | | | | | | | | | | | | | | | |
| before fee waiver | | | 2.59 | | | | | 2.03 | | | | | 1.82 | | | | | 1.69 | | | | | 1.71 | | | | | 1.54 | | |
| Fee waiver | | | — | | | | | — | | | | | — | | | | | (0.01 | ) | | | | (0.13 | ) | | | | (0.13 | ) | |
| Total operating expenses | | | 2.59 | | | | | 2.03 | | | | | 1.82 | | | | | 1.68 | | | | | 1.58 | | | | | 1.41 | | |
| Leverage expenses | | | 0.94 | | | | | 1.30 | | | | | 0.99 | | | | | 0.56 | | | | | 0.37 | | | | | 0.21 | | |
| Total expenses | | | 3.53 | | % | | | 3.33 | | % | | | 2.81 | | % | | | 2.24 | | % | | | 1.95 | | % | | | 1.62 | | % |
| See accompanying Notes to Financial Statements. | |
| | |
| 58 | Tortoise |
| |
| |
| 2020 2nd Quarter Report | May 31, 2020 |
| |
| |
| |
| |
| | Period from | | | | | | | | | | | | | | | | | | | | | | | | | |
| | December 1, 2019 | | Year Ended | | Year Ended | | Year Ended | | Year Ended | | Year Ended |
| | through | | November 30, | | November 30, | | November 30, | | November 30, | | November 30, |
| | May 31, 2020 | | 2019 | | 2018 | | 2017 | | 2016 | | 2015 |
| | (unaudited) | | | | | | | | | | | | | | | | | | | | | | | | | |
| Ratio of net investment loss to average | | | | | | | | | | | | | | | | | | | | | | | | | | | | | | |
| net assets before fee waiver(7) | | | (0.12 | ) | % | | | (1.58 | ) | % | | | (2.40 | ) | % | | | (1.41 | ) | % | | | (0.98 | ) | % | | | (0.61 | ) | % |
| Ratio of net investment loss to average | | | | | | | | | | | | | | | | | | | | | | | | | | | | | | |
| net assets after fee waiver(7) | | | (0.12 | ) | % | | | (1.58 | ) | % | | | (2.40 | ) | % | | | (1.40 | ) | % | | | (0.85 | ) | % | | | (0.48 | ) | % |
| Portfolio turnover rate(5) | | | 53.37 | | % | | | 182.52 | | % | | | 143.77 | | % | | | 64.88 | | % | | | 47.03 | | % | | | 15.63 | | % |
| Credit facility borrowings, | | | | | | | | | | | | | | | | | | | | | | | | | | | | | | |
| end of period (000’s) | | $ | 4,100 | | | | $ | 26,500 | | | | $ | 57,100 | | | | $ | 64,500 | | | | $ | 63,800 | | | | $ | 61,800 | | |
| Asset coverage, per $1,000 of principal | | | | | | | | | | | | | | | | | | | | | | | | | | | | | | |
| amount of credit facility borrowings(8) | | $ | 8,211 | | | | $ | 3,323 | | | | $ | 3,320 | | | | $ | 3,913 | | | | $ | 4,857 | | | | $ | 4,647 | | |
| Asset coverage ratio of credit | | | | | | | | | | | | | | | | | | | | | | | | | | | | | | |
| facility borrowings(8) | | | 821 | | % | | | 332 | | % | | | 332 | | % | | | 391 | | % | | | 486 | | % | | | 465 | | % |
| (1) | Information presented relates to a share of common stock outstanding for the entire year. |
| (2) | During the period from December 1, 2019 through May 31, 2020, the Fund effected the following reverse stock split: May 1, 2020, 1 for 8. All historical per share information has been retroactively adjusted to reflect this reverse stock split. |
| (3) | The per common share data for the years ended November 30, 2019, 2018, 2017, 2016, and 2015 do not reflect the change in estimate of investment income and return of capital, for the respective year. See Note 2C to the financial statements for further disclosure. |
| (4) | Less than $0.01 for the year ended November 30, 2015. |
| (5) | Not annualized for periods less than one full year. |
| (6) | Total investment return is calculated assuming a purchase of common stock at the beginning of the year and a sale at the closing price on the last day of the year reported (excluding brokerage commissions). The calculation also assumes reinvestment of distributions at actual prices pursuant to NDP’s dividend reinvestment plan. |
| (7) | Annualized for periods less than one full year. |
| (8) | Represents value of total assets less all liabilities and indebtedness not represented by credit facility borrowings at the end of the period divided by credit facility borrowings outstanding at the end of the period. |
| See accompanying Notes to Financial Statements. | |
| | |
| Tortoise | 59 |
| | Period from | | | | | | | | | | | | | | | | | | | | | | | | | |
| | December 1, 2019 | | Year Ended | | Year Ended | | Year Ended | | Year Ended | | Year Ended |
| | through | | November 30, | | November 30, | | November 30, | | November 30, | | November 30, |
| | May 31, 2020 | | 2019 | | 2018 | | 2017 | | 2016 | | 2015 |
| | (unaudited) | | | | | | | | | | | | | | | | | | | | | | | | | |
| Per Common Share Data(1) | | | | | | | | | | | | | | | | | | | | | | | | | | | | | | |
| Net Asset Value, beginning of period | | $ | 17.70 | | | | $ | 19.76 | | | | $ | 21.33 | | | | $ | 23.89 | | | | $ | 21.23 | | | | $ | 31.08 | | |
| Income (loss) from Investment Operations | | | | | | | | | | | | | | | | | | | | | | | | | | | | | | |
| Net investment income(2) | | | 0.19 | | | | | 0.39 | | | | | 0.24 | | | | | 0.59 | | | | | 0.71 | | | | | 0.88 | | |
| Net realized and unrealized gain (loss)(2) | | | (5.01 | ) | | | | (0.95 | ) | | | | (0.31 | ) | | | | (1.65 | ) | | | | 3.49 | | | | | (7.87 | ) | |
| Total income (loss) from investment | | | | | | | | | | | | | | | | | | | | | | | | | | | | | | |
| operations | | | (4.82 | ) | | | | (0.56 | ) | | | | (0.07 | ) | | | | (1.06 | ) | | | | 4.20 | | | | | (6.99 | ) | |
| Distributions to Common Stockholders | | | | | | | | | | | | | | | | | | | | | | | | | | | | | | |
| From net investment income | | | (0.54 | ) | | | | (1.40 | ) | | | | (1.50 | ) | | | | (1.04 | ) | | | | (1.29 | ) | | | | (0.91 | ) | |
| From net realized gains from | | | | | | | | | | | | | | | | | | | | | | | | | | | | | | |
| investment transactions | | | — | | | | | — | | | | | — | | | | | (0.36 | ) | | | | (0.25 | ) | | | | (1.95 | ) | |
| From return of capital | | | (0.21 | ) | | | | (0.10 | ) | | | | (0.36 | ) | | | | (0.10 | ) | | | | — | | | | | — | | |
| Total distributions to common | | | | | | | | | | | | | | | | | | | | | | | | | | | | | | |
| stockholders | | | (0.75 | ) | | | | (1.50 | ) | | | | (1.86 | ) | | | | (1.50 | ) | | | | (1.54 | ) | | | | (2.86 | ) | |
| Net Asset Value, end of period | | $ | 12.13 | | | | $ | 17.70 | | | | $ | 19.40 | | | | $ | 21.33 | | | | $ | 23.89 | | | | $ | 21.23 | | |
| Per common share market value, | | | | | | | | | | | | | | | | | | | | | | | | | | | | | | |
| end of period | | $ | 9.78 | | | | $ | 15.57 | | | | $ | 17.17 | | | | $ | 19.94 | | | | $ | 21.43 | | | | $ | 18.53 | | |
| Total investment return based on | | | | | | | | | | | | | | | | | | | | | | | | | | | | | | |
| market value(3)(4) | | | (32.92 | ) | % | | | (1.38 | ) | % | | | (6.82 | ) | % | | | (0.27 | ) | % | | | 25.57 | | % | | | (22.54 | ) | % |
| Total investment return based on net | | | | | | | | | | | | | | | | | | | | | | | | | | | | | | |
| asset value(3)(5) | | | (26.81 | ) | % | | | (2.59 | ) | % | | | 0.24 | | % | | | (4.31 | ) | % | | | 22.18 | | % | | | (23.19 | ) | % |
| |
| Supplemental Data and Ratios | | | | | | | | | | | | | | | | | | | | | | | | | | | | | | |
| Net assets applicable to common | | | | | | | | | | | | | | | | | | | | | | | | | | | | | | |
| stockholders, end of period (000’s) | | $ | 84,322 | | | | $ | 123,015 | | | | $ | 137,324 | | | | $ | 148,243 | | | | $ | 166,073 | | | | $ | 147,563 | | |
| Average net assets (000’s) | | $ | 101,763 | | | | $ | 137,701 | | | | $ | 147,616 | | | | $ | 162,708 | | | | $ | 146,274 | | | | $ | 187,752 | | |
| Ratio of Expenses to Average Net Assets(6) | | | | | | | | | | | | | | | | | | | | | | | | | | | | | | |
| Advisory fees | | | 1.33 | | % | | | 1.32 | | % | | | 1.29 | | % | | | 1.25 | | % | | | 1.27 | | % | | | 1.20 | | % |
| Other operating expenses | | | 1.24 | | | | | 0.38 | | | | | 0.37 | | | | | 0.31 | | | | | 0.39 | | | | | 0.31 | | |
| Total operating expenses, | | | | | | | | | | | | | | | | | | | | | | | | | | | | | | |
| before fee waiver | | | 2.57 | | | | | 1.70 | | | | | 1.66 | | | | | 1.56 | | | | | 1.66 | | | | | 1.51 | | |
| Fee waiver | | | — | | | | | — | | | | | — | | | | | — | | | | | — | | | | | (0.01 | ) | |
| Total operating expenses | | | 2.57 | | | | | 1.70 | | | | | 1.66 | | | | | 1.56 | | | | | 1.66 | | | | | 1.50 | | |
| Leverage expenses | | | 1.17 | | | | | 1.25 | | | | | 0.98 | | | | | 0.59 | | | | | 0.44 | | | | | 0.26 | | |
| Current foreign tax expense(7) | | | — | | | | | — | | | | | — | | | | | — | | | | | — | | | | | — | | |
| Total expenses | | | 3.74 | | % | | | 2.95 | | % | | | 2.64 | | % | | | 2.15 | | % | | | 2.10 | | % | | | 1.76 | | % |
| See accompanying Notes to Financial Statements. | |
| | |
| 60 | Tortoise |
| |
| |
| 2020 2nd Quarter Report | May 31, 2020 |
| |
| |
| |
| |
| | Period from | | | | | | | | | | | | | | | | | | | | | | | | | |
| | December 1, 2019 | | Year Ended | | Year Ended | | Year Ended | | Year Ended | | Year Ended |
| | through | | November 30, | | November 30, | | November 30, | | November 30, | | November 30, |
| | May 31, 2020 | | 2019 | | 2018 | | 2017 | | 2016 | | 2015 |
| | (unaudited) | | | | | | | | | | | | | | | | | | | | | | | | | |
| Ratio of net investment income to | | | | | | | | | | | | | | | | | | | | | | | | | | | | | | |
| average net assets before fee waiver(6) | | | 2.63 | | % | | | 1.98 | | % | | | 1.14 | | % | | | 2.51 | | % | | | 3.39 | | % | | | 3.25 | | % |
| Ratio of net investment income to | | | | | | | | | | | | | | | | | | | | | | | | | | | | | | |
| average net assets after fee waiver(6) | | | 2.63 | | % | | | 1.98 | | % | | | 1.14 | | % | | | 2.51 | | % | | | 3.39 | | % | | | 3.26 | | % |
| Portfolio turnover rate(3) | | | 16.88 | | % | | | 25.27 | | % | | | 31.41 | | % | | | 30.86 | | % | | | 40.61 | | % | | | 30.99 | | % |
| Credit facility borrowings, | | | | | | | | | | | | | | | | | | | | | | | | | | | | | | |
| end of period (000’s) | | $ | 24,900 | | | | $ | 54,100 | | | | $ | 53,400 | | | | $ | 53,400 | | | | $ | 50,600 | | | | $ | 49,900 | | |
| Asset coverage, per $1,000 of principal | | | | | | | | | | | | | | | | | | | | | | | | | | | | | | |
| amount of senior notes and credit | | | | | | | | | | | | | | | | | | | | | | | | | | | | | | |
| facility borrowings(7) | | $ | 4,386 | | | | $ | 3,274 | | | | $ | 3,572 | | | | $ | 3,776 | | | | $ | 4,282 | | | | $ | 3,957 | | |
| Asset coverage ratio of senior notes | | | | | | | | | | | | | | | | | | | | | | | | | | | | | | |
| and credit facility borrowings(7) | | | 439 | | % | | | 327 | | % | | | 357 | | % | | | 378 | | % | | | 428 | | % | | | 396 | | % |
| (1) | Information presented relates to a share of common stock outstanding for the entire period. |
| (2) | The per common share data for the years ended November 30, 2019, 2018, 2017, 2016 and 2015 do not reflect the change in estimate of investment income and return of capital, for the respective year. See Note 2C to the financial statements for further disclosure. |
| (3) | Not annualized for periods less than one full year. |
| (4) | Total investment return is calculated assuming a purchase of common stock at the beginning of the period and a sale at the closing price on the last day of the period reported (excluding brokerage commissions). The calculation also assumes reinvestment of distributions at actual prices pursuant to TPZ’s dividend reinvestment plan. |
| (5) | Total investment return is calculated assuming a purchase of common stock at the beginning of the period and a sale at net asset value on the last day of the period reported. The calculation also assumes reinvestment of distributions at actual prices pursuant to TPZ’s dividend reinvestment plan. |
| (6) | Annualized for periods less than one full year. |
| (7) | Represents value of total assets less all liabilities and indebtedness not represented by credit facility borrowings at the end of the period divided by credit facility borrowings outstanding at the end of the period. |
| See accompanying Notes to Financial Statements. | |
| | |
| Tortoise | 61 |
| |
| |
| |
| |
| TEAF Financial Highlights |
| |
| |
| | Period From | | Period From |
| | December 1, 2019 | | March 29, 2019(1) |
| | through | | through |
| | May 31, 2020 | | November 30, 2019 |
| | (unaudited) | | | | | |
| Per Common Share Data(2) | | | | | | | | | | |
| Net Asset Value, beginning of period | | $ | 17.60 | | | | $ | 20.00 | | |
| Income (loss) from Investment Operations | | | | | | | | | | |
| Net investment income | | | 0.65 | | | | | 0.31 | | |
| Net realized and unrealized loss | | | (3.05 | ) | | | | (1.95 | ) | |
| Total loss from investment operations | | | (2.40 | ) | | | | (1.64 | ) | |
| Distributions to Common Stockholders | | | | | | | | | | |
| From net investment income | | | (0.29 | ) | | | | (0.34 | ) | |
| From return of capital | | | (0.36 | ) | | | | (0.42 | ) | |
| Total distributions to common stockholders | | | (0.65 | ) | | | | (0.76 | ) | |
| Net Asset Value, end of period | | $ | 14.55 | | | | $ | 17.60 | | |
| Per common share market value, end of period | | $ | 10.73 | | | | $ | 15.60 | | |
| Total investment return based on market value(3)(4) | | | (27.74 | ) | % | | | (18.45 | ) | % |
| |
| Supplemental Data and Ratios | | | | | | | | | | |
| Net assets applicable to common stockholders, end of period (000’s) | | $ | 196,262 | | | | $ | 237,461 | | |
| Average net assets (000’s) | | $ | 215,974 | | | | $ | 252,217 | | |
| Ratio of Expenses to Average Net Assets(5) | | | | | | | | | | |
| Advisory fees | | | 1.54 | | % | | | 1.51 | | % |
| Other operating expenses | | | 0.32 | | | | | 0.81 | | |
| Total operating expenses, before fee waiver | | | 1.86 | | | | | 2.32 | | |
| Fee waiver | | | (0.20 | ) | | | | (0.28 | ) | |
| Total operating expenses | | | 1.66 | | | | | 2.04 | | |
| Leverage expenses | | | 0.29 | | | | | 0.36 | | |
| Income tax expense (benefit)(6) | | | 0.04 | | | | | (0.24 | ) | |
| Total expenses | | | 1.99 | | % | | | 2.16 | | % |
| See accompanying Notes to Financial Statements. | |
| | |
| 62 | Tortoise |
| |
| |
| 2020 2nd Quarter Report | May 31, 2020 |
| |
| |
| |
| | Period From | | Period From |
| | December 1, 2019 | | March 29, 2019(1) |
| | through | | through |
| | May 31, 2020 | | November 30, 2019 |
| | (unaudited) | | | | |
| Ratio of net investment income to average net assets before fee waiver(5) | | | 7.95 | % | | | 2.15 | % |
| Ratio of net investment income to average net assets after fee waiver(5) | | | 8.15 | % | | | 2.43 | % |
| Portfolio turnover rate(3) | | | 42.79 | % | | | 50.44 | % |
| Credit facility borrowings, end of period (000’s) | | $ | 30,900 | | | $ | 32,000 | |
| Asset coverage, per $1,000 of principal amount of senior notes and credit facility borrowings(7) | | $ | 7,352 | | | $ | 8,421 | |
| Asset coverage ratio of senior notes and credit facility borrowings(7) | | | 735 | % | | | 842 | % |
| (1) | Commencement of operations. |
| (2) | Information presented relates to a share of common stock outstanding for the entire period. |
| (3) | Not annualized. |
| (4) | Total investment return is calculated assuming a purchase of common stock at the beginning of the period and a sale at the closing price on the last day of the period reported (excluding brokerage commissions). The calculation also assumes reinvestment of distributions at actual prices pursuant to TEAF’s dividend reinvestment plan. |
| (5) | Annualized. |
| (6) | For the period from December 1, 2019 to May 31, 2020, TEAF accrued $46,758 for net deferred income tax expense. For the period ended November 30, 2019, TEAF accrued $418,970 for net deferred income tax benefit. |
| (7) | Represents value of total assets less all liabilities and indebtedness not represented by margin facility borrowings at the end of the period divided by margin facility borrowings outstanding at the end of the period. |
| See accompanying Notes to Financial Statements. | |
| | |
| Tortoise | 63 |
| |
| |
| |
| |
| Notes to Financial Statements (unaudited) |
| May 31, 2020 |
1. General Organization
This report covers the following companies, each of which is listed on the New York Stock Exchange (“NYSE”): Tortoise Energy Infrastructure Corp. (“TYG”), Tortoise Midstream Energy Fund, Inc. (“NTG”) (formerly Tortoise MLP Fund, Inc.), Tortoise Pipeline & Energy Fund, Inc. (“TTP”), Tortoise Energy Independence Fund, Inc. (“NDP”), Tortoise Power and Energy Infrastructure Fund, Inc. (“TPZ”), and Tortoise Essential Assets Income Term Fund (“TEAF”). These companies are individually referred to as a “Fund” or by their respective NYSE symbols, or collectively as the “Funds”, and each is a non-diversified, closed-end management investment company under the Investment Company Act of 1940, as amended (the “1940 Act”). Each of TYG, NTG, TTP, NDP and TEAF has a primary investment objective to seek a high level of total return with an emphasis on current distributions. TPZ has a primary investment objective to provide a high level of current income, with a secondary objective of capital appreciation. TEAF commenced operations on March 29, 2019.
2. Significant Accounting Policies
The Funds follow accounting and reporting guidance applicable to investment companies under U.S. generally accepted accounting principles (“GAAP”).
A. Use of Estimates
The preparation of financial statements in conformity with GAAP requires management to make estimates and assumptions that affect the reported amount of assets and liabilities and disclosure of contingent assets and liabilities as of the date of the financial statements, and the amount of income and expenses during the period reported. Actual results could differ from those estimates.
B. Security Valuation
In general, and where applicable, the Funds use readily available market quotations based upon the last updated sales price from the principal market to determine fair value. The Funds primarily own securities that are listed on a securities exchange or are traded in the over-the-counter market. The Funds value those securities at their last sale price on that exchange or over-the-counter market on the valuation date. If the security is listed on more than one exchange, the Funds use the price from the exchange that it considers to be the principal exchange on which the security is traded. If there has been no sale on such exchange or over-the-counter market on such day, the security is valued at the mean between the last bid price and last ask price on such day. Securities listed on the NASDAQ are valued at the NASDAQ Official Closing Price, which may not necessarily represent the last sale price. These securities are categorized as Level 1 in the fair value hierarchy.
Restricted securities are subject to statutory or contractual restrictions on their public resale, which may make it more difficult to obtain a valuation and may limit a Fund’s ability to dispose of them. Investments in private placement securities and other securities for which market quotations are not readily available are valued in good faith by using fair value procedures. Such fair value procedures consider factors such as discounts to publicly traded issues, time until conversion date, securities with similar yields, quality, type of issue, coupon, duration and rating. If events occur that affect the value of a Fund’s portfolio securities before the net asset value has been calculated (a “significant event”), the portfolio securities so affected are generally priced using fair value procedures.
An equity security of a publicly traded company acquired in a private placement transaction without registration under the Securities Act of 1933, as amended (the “1933 Act”), is subject to restrictions on resale that can affect the security’s liquidity and fair value. If such a security is convertible into publicly traded common shares, the security generally will be valued at the common share market price adjusted by a percentage discount due to the restrictions and categorized as Level 2 in the fair value hierarchy. To the extent that such securities are convertible or otherwise become freely tradable within a time frame that may be reasonably determined, an amortization schedule may be used to determine the discount. If the security has characteristics that are dissimilar to the class of security that trades on the open market, the security will generally be valued and categorized as Level 3 in the fair value hierarchy.
Unobservable inputs are used to measure fair value to the extent that observable inputs are not available, thereby allowing for situations in which there is little, if any, market activity. Unobservable inputs reflect the Funds’ own beliefs about the assumptions that market participants would use in pricing the asset or liability (including assumptions about risk). Unobservable inputs are developed based on the best information available in the circumstances, which might include the Fund’s own data. The Fund’s own data are adjusted if information is reasonably available without undue cost and effort that indicates that market participants would use different assumptions. Due to the inherent uncertainty of valuations of such investments, the fair values may differ significantly from the values that would have been used had an active market existed.
Options (including options on futures contracts) and futures contracts shall be valued using readily available market quotations. Exchange-traded options are valued at the last reported sale price on any exchange on which they trade. If there are no sales reported on any exchange, exchange-traded options shall be valued at the mean between the last highest bid and last lowest asked prices obtained as of the closing of the exchanges on which the option is traded. Exchange-traded domestic futures contracts are valued at the last reported sale price on the Chicago Mercantile Exchange. Exchange-traded foreign futures contracts are valued at the last reported sale price on the primary foreign exchange on which they principally trade. The value of Flexible Exchange Options (FLEX Options) are determined (i) by an evaluated price as determined by a third-party valuation service; or (ii) by using a quotation provided by a broker-dealer.
The Funds generally value debt securities at evaluated prices obtained from an independent third-party valuation service that utilizes a pricing matrix based upon yield data for securities with similar characteristics, or based on a direct written broker-dealer quotation from a dealer who has made a market in the security. Debt securities with 60 days or less to maturity at time of purchase are valued on the basis of amortized cost, which approximates fair value. The securities are categorized as level 2 in the fair value hierarchy.
| |
| |
| 2020 2nd Quarter Report | May 31, 2020 |
| |
| Notes to Financial Statements (unaudited) (continued) |
| |
Interest rate swap contracts are valued by using industry-accepted models, which discount the estimated future cash flows based on a forward rate curve and the stated terms of the interest rate swap agreement by using interest rates currently available in the market, or based on dealer quotations, if available, and are categorized as Level 2 in the fair value hierarchy.
Various inputs are used in determining the fair value of the Funds’ investments and financial instruments. These inputs are summarized in the three broad levels listed below:
Level 1 — quoted prices in active markets for identical investments
Level 2 — other significant observable inputs (including quoted prices for similar investments, market corroborated inputs, etc.)
Level 3 — significant unobservable inputs (including a Fund’s own assumptions in determining the fair value of investments)
The inputs or methodologies used for valuing securities are not necessarily an indication of the risk associated with investing in those securities.
The following tables provide the fair value measurements of applicable assets and liabilities by level within the fair value hierarchy as of May 31, 2020. These assets and liabilities are measured on a recurring basis.
| TYG: | | | | | | | | | | | | |
| Description | | Level 1 | | Level 2 | | Level 3 | | Total |
| Assets | | | | | | | | | | | | |
| Investments: | | | | | | | | | | | | |
| Master Limited Partnerships(a) | | $ | 268,744,543 | | $ | — | | $ | — | | $ | 268,744,543 |
| Common Stock(a) | | | 14,806,948 | | | — | | | — | | | 14,806,948 |
| Preferred Stock(a) | | | 46,000,777 | | | — | | | 31,064,774 | | | 77,065,551 |
| Corporate Bonds(a) | | | — | | | 12,243,313 | | | — | | | 12,243,313 |
| Convertible Bonds(a) | | | — | | | — | | | 7,838,000 | | | 7,838,000 |
| Private Investments(a) | | | — | | | — | | | 11,127,975 | | | 11,127,975 |
| Short-Term Investment(b) | | | 62,701,013 | | | — | | | — | | | 62,701,013 |
| Total Assets | | $ | 392,253,281 | | $ | 12,243,313 | | $ | 50,030,749 | | $ | 454,527,343 |
| | | | | | | | | | | | | |
| Liabilities | | | | | | | | | | | | |
| Interest Rate Swap Contracts | | $ | — | | $ | 301,653 | | $ | — | | $ | 301,653 |
| |
| NTG: | | | | | | | | | | | | |
| Description | | Level 1 | | Level 2 | | Level 3 | | Total |
| Assets | | | | | | | | | | | | |
| Investments: | | | | | | | | | | | | |
| Master Limited Partnerships(a) | | $ | 148,295,491 | | $ | — | | $ | — | | $ | 148,295,491 |
| Common Stock(a) | | | 21,213,099 | | | — | | | — | | | 21,213,099 |
| Preferred Stock(a) | | | 25,739,768 | | | — | | | 19,009,007 | | | 44,748,775 |
| Corporate Bonds(a) | | | — | | | 952,000 | | | — | | | 952,000 |
| Convertible Bonds(a) | | | — | | | — | | | 5,458,000 | | | 5,458,000 |
| Short-Term Investment(b) | | | 18,201,446 | | | — | | | — | | | 18,201,446 |
| Total Assets | | $ | 213,449,804 | | $ | 952,000 | | $ | 24,467,007 | | $ | 238,868,811 |
| |
| TTP: | | | | | | | | | | | | |
| Description | | Level 1 | | Level 2 | | Level 3 | | Total |
| Assets | | | | | | | | | | | | |
| Investments: | | | | | | | | | | | | |
| Common Stock(a) | | $ | 42,747,911 | | $ | — | | $ | — | | $ | 42,747,911 |
| Master Limited Partnerships(a) | | | 18,156,725 | | | — | | | — | | | 18,156,725 |
| Preferred Stock(a) | | | 3,023,714 | | | — | | | 2,572,891 | | | 5,596,605 |
| Short-Term Investment(b) | | | 8,925,978 | | | — | | | — | | | 8,925,978 |
| Total Assets | | $ | 72,854,328 | | $ | — | | $ | 2,572,891 | | $ | 75,427,219 |
| |
| |
| |
| |
| Notes to Financial Statements (unaudited) (continued) |
| |
| NDP: | | | | | | | | | | | | |
| Description | | Level 1 | | Level 2 | | Level 3 | | Total |
| Assets | | | | | | | | | | | | |
| Investments: | | | | | | | | | | | | |
| Common Stock(a) | | $ | 28,297,236 | | $ | — | | $ | — | | $ | 28,297,236 |
| Master Limited Partnerships(a) | | | 3,189,634 | | | — | | | — | | | 3,189,634 |
| Preferred Stock(a) | | | — | | | — | | | 1,935,113 | | | 1,935,113 |
| Short-Term Investment(b) | | | 283,325 | | | — | | | — | | | 283,325 |
| Total Assets | | $ | 31,770,195 | | $ | — | | $ | 1,935,113 | | $ | 33,705,308 |
| |
| TPZ: | | | | | | | | | | | | |
| Description | | Level 1 | | Level 2 | | Level 3 | | Total |
| Assets | | | | | | | | | | | | |
| Investments: | | | | | | | | | | | | |
| Corporate Bonds(a) | | $ | — | | $ | 69,537,089 | | $ | — | | $ | 69,537,089 |
| Convertible Bonds(a) | | | — | | | — | | | 1,570,000 | | | 1,570,000 |
| Master Limited Partnerships(a) | | | 20,469,835 | | | — | | | — | | | 20,469,835 |
| Common Stock(a) | | | 10,211,134 | | | — | | | — | | | 10,211,134 |
| Preferred Stock(a) | | | 2,223,786 | | | — | | | 2,095,204 | | | 4,318,990 |
| Term Loan(a) | | | — | | | 1,950,000 | | | — | | | 1,950,000 |
| Short-Term Investment(b) | | | 120,079 | | | — | | | — | | | 120,079 |
| Total Assets | | $ | 33,024,834 | | $ | 71,487,089 | | $ | 3,665,204 | | $ | 108,177,127 |
| | | | | | | | | | | | | |
| Liabilities | | | | | | | | | | | | |
| Interest Rate Swap Contracts | | $ | — | | $ | 13,292 | | $ | — | | $ | 13,292 |
| |
| TEAF: | | | | | | | | | | | | |
| Description | | Level 1 | | Level 2 | | Level 3 | | Total |
| Assets | | | | | | | | | | | | |
| Investments: | | | | | | | | | | | | |
| Common Stock(a) | | $ | 66,023,153 | | $ | — | | $ | — | | $ | 66,023,153 |
| Master Limited Partnerships(a) | | | 38,523,171 | | | — | | | — | | | 38,523,171 |
| Corporate Bonds(a) | | | — | | | 18,087,445 | | | 10,715,000 | | | 28,802,445 |
| Preferred Bonds(a) | | | — | | | 8,438,150 | | | — | | | 8,438,150 |
| Preferred Stock(a) | | | 7,203,465 | | | — | | | 7,986,243 | | | 15,189,708 |
| Private Investments(a) | | | — | | | — | | | 40,316,447 | | | 40,316,447 |
| Municipal Bonds(a) | | | — | | | 13,402,122 | | | — | | | 13,402,122 |
| Construction Note(a) | | | — | | | — | | | 3,516,669 | | | 3,516,669 |
| Convertible Bonds(a) | | | — | | | — | | | 5,589,000 | | | 5,589,000 |
| Term Loan(a) | | | — | | | 4,875,000 | | | — | | | 4,875,000 |
| Short-Term Investment(b) | | | 491,999 | | | — | | | — | | | 491,999 |
| Total Assets | | $ | 112,241,788 | | $ | 44,802,717 | | $ | 68,123,359 | | $ | 225,167,864 |
| | | | | | | | | | | | | |
| Liabilities | | | | | | | | | | | | |
| Written Call Options | | $ | 184,656 | | $ | — | | $ | — | | $ | 184,656 |
| (a) | All other industry classifications are identified in the Schedule of Investments. |
| (b) | Short-term investment is a sweep investment for cash balances. |
| |
| |
| 2020 2nd Quarter Report | May 31, 2020 |
| |
| Notes to Financial Statements (unaudited) (continued) |
| |
The following tables present each Fund’s assets measured at fair value on a recurring basis using significant unobservable inputs (Level 3) for the period ended May 31, 2020:
| Preferred Stock | | TYG | | NTG | | TTP | | NDP | | TPZ | | TEAF |
| Balance — beginning of period | | $ | 40,613,580 | | | $ | 24,705,787 | | | $ | 5,990,475 | | | $ | 2,133,275 | | | $ | 4,629,781 | | | $ | 8,564,680 | |
| Purchases | | | 355,596 | | | | 254,260 | | | | 18,890 | | | | — | | | | 16,475 | | | | 146,434 | |
| Return of capital | | | — | | | | — | | | | — | | | | — | | | | — | | | | — | |
| Sales | | | (7,222,467 | ) | | | (4,329,758 | ) | | | (3,310,291 | ) | | | — | | | | (2,439,257 | ) | | | — | |
| Total realized gain (loss) | | | 945,467 | | | | 566,758 | | | | 433,391 | | | | — | | | | 319,257 | | | | — | |
| Change in unrealized gain (loss) | | | (3,627,402 | ) | | | (2,188,040 | ) | | | (559,574 | ) | | | (198,162 | ) | | | (431,052 | ) | | | (724,871 | ) |
| Balance — end of period | | $ | 31,064,774 | | | $ | 19,009,007 | | | $ | 2,572,891 | | | $ | 1,935,113 | | | $ | 2,095,204 | | | $ | 7,986,243 | |
| | | | | | | | | | | | | | | | | | | | | | | | | |
| Private Investments | | TYG | | NTG | | TTP | | NDP | | TPZ | | TEAF |
| Balance — beginning of period | | $ | 14,093,091 | | | $ | — | | | $ | — | | | $ | — | | | $ | — | | | $ | 40,885,774 | |
| Purchases | | | — | | | | — | | | | — | | | | — | | | | — | | | | 5,182,385 | |
| Return of capital | | | (275,000 | ) | | | — | | | | — | | | | — | | | | — | | | | — | |
| Sales | | | — | | | | — | | | | — | | | | — | | | | — | | | | — | |
| Total realized gain (loss) | | | — | | | | — | | | | — | | | | — | | | | — | | | | — | |
| Change in unrealized gain (loss) | | | (2,690,116 | ) | | | — | | | | — | | | | — | | | | — | | | | (5,751,712 | ) |
| Balance — end of period | | $ | 11,127,975 | | | $ | — | | | $ | — | | | $ | — | | | $ | — | | | $ | 40,316,447 | |
| | | | | | | | | | | | | | | | | | | | | | | | | |
| Construction Note | | TYG | | NTG | | TTP | | NDP | | TPZ | | TEAF |
| Balance — beginning of period | | $ | — | | | $ | — | | | $ | — | | | $ | — | | | $ | — | | | $ | 3,516,669 | |
| Purchases | | | — | | | | — | | | | — | | | | — | | | | — | | | | 8,234 | |
| Return of capital | | | — | | | | — | | | | — | | | | — | | | | — | | | | — | |
| Sales | | | — | | | | — | | | | — | | | | — | | | | — | | | | — | |
| Total realized gain (loss) | | | — | | | | — | | | | — | | | | — | | | | — | | | | — | |
| Change in unrealized gain (loss) | | | — | | | | — | | | | — | | | | — | | | | — | | | | (8,234 | ) |
| Balance — end of period | | $ | — | | | $ | — | | | $ | — | | | $ | — | | | $ | — | | | $ | 3,516,669 | |
| | | | | | | | | | | | | | | | | | | | | | | | | |
| Convertible Bond | | TYG | | NTG | | TTP | | NDP | | TPZ | | TEAF |
| Balance — beginning of period | | $ | — | | | $ | — | | | $ | — | | | $ | — | | | $ | — | | | $ | — | |
| Purchases | | | 15,284,100 | | | | 10,643,100 | | | | — | | | | — | | | | 3,061,500 | | | | 10,898,550 | |
| Return of capital | | | — | | | | — | | | | — | | | | — | | | | — | | | | — | |
| Sales | | | (7,838,000 | ) | | | (5,458,000 | ) | | | — | | | | — | | | | (1,570,000 | ) | | | (5,589,000 | ) |
| Total realized gain (loss) | | | 391,900 | | | | 272,900 | | | | — | | | | — | | | | 78,500 | | | | 279,450 | |
| Change in unrealized gain (loss) | | | — | | | | — | | | | — | | | | — | | | | — | | | | — | |
| Balance — end of period | | $ | 7,838,000 | | | $ | 5,458,000 | | | $ | — | | | $ | — | | | $ | 1,570,000 | | | $ | 5,589,000 | |
| | | | | | | | | | | | | | | | | | | | | | | | | |
| Corporate Bonds | | TYG | | NTG | | TTP | | NDP | | TPZ | | TEAF |
| Balance — beginning of period | | $ | — | | | $ | — | | | $ | — | | | $ | — | | | $ | — | | | $ | — | |
| Purchases | | | — | | | | — | | | | — | | | | — | | | | — | | | | 10,715,000 | |
| Return of capital | | | — | | | | — | | | | — | | | | — | | | | — | | | | — | |
| Sales | | | — | | | | — | | | | — | | | | — | | | | — | | | | — | |
| Total realized gain (loss) | | | — | | | | — | | | | — | | | | — | | | | — | | | | — | |
| Change in unrealized gain (loss) | | | — | | | | — | | | | — | | | | — | | | | — | | | | — | |
| Balance — end of period | | $ | — | | | $ | — | | | $ | — | | | $ | — | | | $ | — | | | $ | 10,715,000 | |
| | | | | | | | | | | | | | | | | | | | | | | | | |
| | TYG | | NTG | | TTP | | NDP | | TPZ | | TEAF |
| Change in unrealized | | | | | | | | | | | | | | | | | | | | | | | | |
| gain (loss) on investments | | | | | | | | | | | | | | | | | | | | | | | | |
| still held at May 31, 2020 | | $ | (5,645,546 | ) | | $ | (1,785,200 | ) | | $ | (251,483 | ) | | $ | (198,162 | ) | | $ | (410,086 | ) | | $ | (6,444,982 | ) |
TYG, NTG, TTP, NDP and TPZ own units of preferred stock of Targa Resources Corp. (“TRGP Pfd”) that were issued in a private placement transaction that closed on March 16, 2016. TEAF owns units of TRGP Pfd that were purchased in a private placement transaction that closed on November 18, 2019. The preferred stock provides the purchaser an option to convert into common stock after 12 years. In addition, the preferred stock can be repurchased by the issuer at a price of $1,100 per share after five years and $1,050 per share after six years.
| |
| |
| |
| |
| Notes to Financial Statements (unaudited) (continued) |
| |
TYG, NTG, TTP, TPZ and TEAF own units of preferred stock of Altus Midstream Company (“ALTM Pfd”) that were issued in a private placement transaction that closed on June 12, 2019. The preferred stock carries a conversion option into common stock after the 7th anniversary of issuance (June 12, 2026) with a conversion rate determined as the quotient of Altus’ common unit price divided by a 6% discount to the prior 20-Day Volume Weighted Average Price (“VWAP”). Alternately, Altus can force conversion into common stock at a value determined by a minimum rate of return: before 5 years: greater of 1.3x Multiple on Invested Capital (“MOIC”) or 11.5% Internal Rate of Return (“IRR”), and after 5 years: greater of 1.3x MOIC or 13.75% IRR.
TYG, NTG, TPZ and TEAF purchased units of a convertible bond in Sunnova Energy International Inc. (“NOVA”) on May 13, 2020. As of May 31, 2020, the investment was valued using the purchase price.
TEAF owns units of Mexico Pacific Limited LLC (“MPL”), which was issued in a private transaction that closed on October 23, 2019. As of May 31, 2020, the investment in MPL was valued using the purchase price.
On April 30, 2020, TEAF purchased a directly-originated corporate bond in C2NC Holdings, LLC, a company in the project finance sector. As of May 31, 2020, the investment was valued using the purchase price.
A lattice model prepared by an independent third party is being utilized to determine fair value of the level 3 TRGP Pfd securities. Unobservable inputs used to determine the discount rate include a debt discount rate that generally reflects the credit worthiness of the company. An increase (decrease) in the debt discount rate would lead to a corresponding decrease (increase) in fair value of the preferred stock. An increase (decrease) in estimated future volatility would lead to a corresponding increase (decrease) in fair value of the preferred stock.
A discounted cash flow model prepared by an independent third party is being used to determine fair value of the level 3 ALTM Pfd securities. Unobservable inputs used to determine the discount rate include a debt discount rate that generally reflects the credit worthiness of the company. An increase (decrease) in the debt discount rate would lead to a corresponding decrease (increase) in fair value of the preferred stock.
A discounted cash flows model is being utilized to determine fair value of the construction note. Unobservable inputs used to determine the discount rate include a risk spread based on similar projects and an illiquidity spread due to the note being issued in the private market. An increase (decrease) in the risk spread or illiquidity spread would lead to a corresponding decrease (increase) in fair value of the note.
The following tables summarize the fair value and significant unobservable inputs that each Fund used to value its portfolio investments categorized as Level 3 as of May 31, 2020:
| Assets at Fair Value | | TYG | | NTG | | TTP | | NDP | | TPZ | | TEAF |
| Construction Note | | $ | — | | $ | — | | $ | — | | $ | — | | $ | — | | $ | 3,516,669 |
| Convertible Bond | | $ | 7,838,000 | | $ | 5,458,000 | | $ | — | | $ | — | | $ | 1,570,000 | | $ | 5,589,000 |
| Preferred Stock | | $ | 31,064,774 | | $ | 19,007,007 | | $ | 2,572,891 | | $ | 1,935,113 | | $ | 2,095,204 | | $ | 7,986,243 |
| Private Investments | | $ | 11,127,975 | | $ | — | | $ | — | | $ | — | | $ | — | | $ | 40,316,447 |
| Corporate Bonds | | $ | — | | $ | — | | $ | — | | $ | — | | $ | — | | $ | 10,715,000 |
| | | | | | | | | | | | | | | | | | | |
| Assets at Fair Value | | | Valuation Technique | | | Unobservable Inputs | | Input |
| Preferred Stock (ALTM Pfd) | | | Discounted cash flow model | | | Debt discount rate | | | 14.50% |
| Preferred Stock (TRGP Pfd) | | | Lattice model | | | Debt discount rate | | | 10.74% |
| Convertible Bond (NOVA) | | | Recent transaction | | | Purchase price | | | $ 100 |
| Private Investment (TK NYS Solar Holdco, LLC) | | | Discounted cash flow model | | | Post-contracted weighted average cost of capital | | | 8.50% |
| Private Investment (Mexico Pacific Limited) | | | Recent transaction | | | Purchase price | | $ | 2,000,000 |
| Private Investment (Renewable Holdco, LLC) | | | Recent transaction | | | Purchase price | | $ | 8,391,651 |
| Private Investment (Renewable Holdco I, LLC) | | | Discounted cash flow model | | | Post-contracted weighted average cost of capital | | | 7.50% |
| Private Investment (Renewable Holdco II, LLC) | | | Discounted cash flow model | | | Post-contracted weighted average cost of capital | | | 8.50% |
| Construction Note | | | Discounted cash flow model | | | Risk spread | | | 1.7500% |
| Construction Note | | | Discounted cash flow model | | | Illiquidity spread | | | 1.7255% |
| Corporate Bond (C2NC Holdings, LLC) | | | Recent transaction | | | Purchase price | | | $ 100 |
C. Securities Transactions and Investment Income
Securities transactions are accounted for on the date the securities are purchased or sold (trade date). Realized gains and losses are reported on an identified cost basis. Interest income is recognized on the accrual basis, including amortization of premiums and accretion of discounts. Dividend income and distributions are recorded on the ex-dividend date. Distributions received from investments generally are comprised of ordinary income and return of capital. The Funds estimate the allocation of distributions between investment income and return of capital at the time such distributions are received based on historical information or regulatory filings. These estimates may subsequently be revised based on actual allocations received from the portfolio companies after their tax reporting periods are concluded, as the actual character of these distributions is not known until after the fiscal year-end of the Funds.
| |
| |
| 2020 2nd Quarter Report | May 31, 2020 |
| |
| Notes to Financial Statements (unaudited) (continued) |
| |
Subsequent to November 30, 2019, the Funds reallocated the amount of return of capital recognized for the period from December 1, 2018 through November 30, 2019 based on the 2019 tax reporting information received. The impact of this adjustment is as follows:
| | Estimated Return | | Revised Return | | Increase/(Decrease) |
| | of Capital % | | of Capital % | | in Return of Capital |
| TYG | | 88% | | 89% | | | $ | 2,235,694 | | |
| NTG | | 90% | | 88% | | | $ | (1,725,051 | ) | |
| TTP | | 68% | | 65% | | | $ | (552,237 | ) | |
| NDP | | 39% | | 40% | | | $ | 13,518 | | |
| TPZ | | 82% | | 78% | | | $ | (280,903 | ) | |
| TEAF | | 52% | | 50% | | | $ | (185,184 | ) | |
In addition, the Funds may be subject to withholding taxes on foreign-sourced income. The Funds accrue such taxes when the related income is earned.
D. Foreign Currency Translation
For foreign currency, investments in foreign securities, and other assets and liabilities denominated in a foreign currency, the Funds translate these amounts into U.S. dollars on the following basis: (i) market value of investment securities, assets and liabilities at the current rate of exchange on the valuation date, and (ii) purchases and sales of investment securities, income and expenses at the relevant rates of exchange on the respective dates of such transactions. The Funds do not isolate the portion of gains and losses on investments that is due to changes in the foreign exchange rates from that which is due to changes in market prices of securities.
E. Federal and State Income Taxation
Each of TYG and NTG, as corporations, are obligated to pay federal and state income tax on its taxable income. Currently, the federal income tax rate for corporations is 21%.
TTP, NDP, TPZ and TEAF each qualify as a regulated investment company (“RIC”) under the Internal Revenue Code (“IRC”). As a result, TTP, NDP, TPZ and TEAF generally will not be subject to U.S. federal income tax on income and gains that they distribute each taxable year to stockholders if they meet certain minimum distribution requirements. However, TEAF’s taxable subsidiary, created to hold certain investments is generally subject to federal and state income taxes on its income. RICs are required to distribute substantially all of their income, in addition to meeting certain asset diversification requirements, and are subject to a 4% non-deductible U.S. federal excise tax on certain undistributed income unless the fund makes sufficient distributions to satisfy the excise tax avoidance requirement.
The Funds invest in master limited partnerships (“MLPs”), which generally are treated as partnerships for federal income tax purposes. As a limited partner in the MLPs, each Fund reports its allocable share of the MLP’s taxable income in computing its own taxable income. The Funds’ tax expense or benefit, if applicable, is included in the Statements of Operations based on the component of income or gains (losses) to which such expense or benefit relates. For TYG and NTG, deferred income taxes reflect the net tax effects of temporary differences between the carrying amounts of assets and liabilities for financial reporting purposes and the amounts used for income tax purposes. A valuation allowance is recognized if, based on the weight of available evidence, it is more likely than not that some portion or all of the deferred income tax asset will not be realized.
The Funds recognize the tax benefits of uncertain tax positions only when the position is “more likely than not” to be sustained upon examination by the tax authorities based on the technical merits of the tax position. The Funds’ policy is to record interest and penalties on uncertain tax positions as part of tax expense. As of May 31, 2020, the Funds had no uncertain tax positions and no penalties or interest was accrued. The Funds do not expect any change in their unrecognized tax positions in the next twelve months. The tax years ended on the following dates remain open to examination by federal and state tax authorities:
TYG — November 30, 2016 through 2019
NTG — November 30, 2013 through 2019
TTP, NDP and TPZ — November 30, 2016 through 2019
TEAF — November 30, 2019
F. Distributions to Stockholders
Distributions to common stockholders are recorded on the ex-dividend date. The Funds may not declare or pay distributions to its common stockholders if it does not meet asset coverage ratios required under the 1940 Act or the rating agency guidelines for its debt and preferred stock following such distribution. The amount of any distributions will be determined by the Board of Directors. The character of distributions to common stockholders made during the year may differ from their ultimate characterization for federal income tax purposes.
As RICs, TTP, NDP, TPZ and TEAF each intend to make cash distributions of its investment company taxable income and capital gains to common stockholders. In addition, on an annual basis, TTP, NDP, TPZ and TEAF each may distribute additional capital gains in the last calendar quarter if necessary to meet minimum distribution requirements and thus avoid being subject to excise taxes. Distributions paid to stockholders in excess of investment company taxable income and net realized gains will be treated as return of capital to stockholders.
| |
| |
| |
| |
| Notes to Financial Statements (unaudited) (continued) |
| |
Distributions to mandatory redeemable preferred (“MRP”) stockholders are accrued daily based on applicable distribution rates for each series and paid periodically according to the terms of the agreements. The Funds may not declare or pay distributions to its preferred stockholders if it does not meet a 200% asset coverage ratio for its debt or the rating agency basic maintenance amount for the debt following such distribution. The character of distributions to preferred stockholders made during the year may differ from their ultimate characterization for federal income tax purposes.
For tax purposes, distributions to stockholders for the year ended November 30, 2019 were characterized as follows:
| | TYG | | NTG | | TTP | | NDP | | TPZ | | TEAF |
| | Common | | Preferred | | Common | | Preferred | | Common | | Preferred | | Common | | Common | | Common |
| Qualified dividend income | | | 21 | % | | | | 100% | | | | — | | | | — | | | | — | | | | 50 | % | | | | — | | | | 10 | % | | | | 29 | % | |
| Ordinary dividend income | | | — | | | | — | | | | — | | | | — | | | | — | | | — | | | | — | | | | 64 | % | | | | 15 | % | |
| Return of capital | | | 79 | % | | | | — | | | | 100 | % | | | | 100 | % | | | | 100 | % | | | | 50 | % | | | | 100 | % | | | | 7 | % | | | | 56 | % | |
| Long-term capital gain | | | — | | | | — | | | | — | | | | — | | | | — | | | — | | | | — | | | | 19 | % | | | | — | |
| * | For Federal income tax purposes, distributions of short-term capital gains are included in qualified dividend income. |
G. Offering and Debt Issuance Costs
Offering costs related to the issuance of common stock are charged to additional paid-in capital when the stock is issued. Debt issuance costs related to senior notes and MRP Stock are deferred and amortized over the period the debt or MRP Stock is outstanding.
There were no offering or debt issuance costs recorded during the period December 1, 2019 through May 31, 2020, for TYG, NTG, TTP, NDP, TPZ or TEAF.
H. Derivative Financial Instruments
The Funds have established policies and procedures for risk assessment and the approval, reporting and monitoring of derivative financial instrument activities. The Funds do not hold or issue derivative financial instruments for speculative purposes. All derivative financial instruments are recorded at fair value with changes in fair value during the reporting period, and amounts accrued under the agreements, included as unrealized gains or losses in the accompanying Statements of Operations. Derivative instruments that are subject to an enforceable master netting arrangement allow a Fund and the counterparty to the instrument to offset any exposure to the other party with amounts owed to the other party. The fair value of derivative financial instruments in a loss position are offset against the fair value of derivative financial instruments in a gain position, with the net fair value appropriately reflected as an asset or liability within the accompanying Statements of Assets & Liabilities.
TYG and TPZ use interest rate swap contracts in an attempt to manage interest rate risk. Cash settlements under the terms of the interest rate swap contracts and the termination of such contracts are recorded as realized gains or losses in the accompanying Statements of Operations.
TYG, NTG, TTP, NDP and TEAF seek to provide current income from gains earned through an option strategy that normally consists of writing (selling) call options on selected equity securities held in the portfolio (“covered calls”). The premium received on a written call option is initially recorded as a liability and subsequently adjusted to the then current fair value of the option written. Premiums received from writing call options that expire unexercised are recorded as a realized gain on the expiration date. Premiums received from writing call options that are exercised are added to the proceeds from the sale of the underlying security to calculate the realized gain (loss). If a written call option is repurchased prior to its exercise, the realized gain (loss) is the difference between the premium received and the amount paid to repurchase the option.
TEAF has entered into forward currency contracts, which represent agreements to exchange currencies on specific future dates at predetermined rates. TEAF uses forward currency contracts to manage exposure to changes in exchange rates. On a daily basis, TEAF’s investment adviser values forward currency contracts and records unrealized appreciation or depreciation for open forward currency contracts in the Statements of Assets & Liabilities. Realized gains or losses are recorded at the time the forward currency contracts are closed.
I. Indemnifications
Under each of the Funds’ organizational documents, its officers and directors are indemnified against certain liabilities arising out of the performance of their duties to the Funds. In addition, in the normal course of business, the Funds may enter into contracts that provide general indemnification to other parties. A Fund’s maximum exposure under these arrangements is unknown, as this would involve future claims that may be made against the Funds that have not yet occurred, and may not occur. However, the Funds have not had prior claims or losses pursuant to these contracts and expect the risk of loss to be remote.
J. Cash and Cash Equivalents
Cash and cash equivalents include short-term, liquid investments with an original maturity of three months or less and money market fund accounts.
K. Recent Accounting and Regulatory Updates
In August 2018, the FASB issued ASU No. 2018-13 (“ASU 2018-13”), Fair Value Measurement (Topic 820): Disclosure Framework which modifies the disclosure requirements on fair value measurements. ASU 2018-13 is effective for fiscal years, and interim periods within those fiscal years, beginning after December 15, 2019, early adoption is permitted. Management is currently evaluating this guidance to determine the impact on the financial statements.
| |
| |
| 2020 2nd Quarter Report | May 31, 2020 |
| |
| Notes to Financial Statements (unaudited) (continued) |
| |
3. Concentration Risk
TYG, NTG, TTP, NDP and TPZ concentrate their investments in the energy sector. TEAF concentrates its investments in issuers operating in essential asset sectors. Funds that primarily invest in a particular sector may experience greater volatility than companies investing in a broad range of industry sectors. A Fund may, for defensive purposes, temporarily invest all or a significant portion of its assets in investment grade securities, short-term debt securities and cash or cash equivalents. To the extent a Fund uses this strategy, it may not achieve its investment objective.
4. Agreements
The Funds have each entered into an Investment Advisory Agreement with Tortoise Capital Advisors, L.L.C. (the “Adviser”). The Funds each pay the Adviser a fee based on the Fund’s average monthly total assets (including any assets attributable to leverage and excluding any net deferred tax asset) minus accrued liabilities (other than net deferred tax liability, debt entered into for purposes of leverage and the aggregate liquidation preference of outstanding preferred stock) (“Managed Assets”), in exchange for the investment advisory services provided. Average monthly Managed Assets is the sum of the daily Managed Assets for the month divided by the number of days in the month. Accrued liabilities are expenses incurred in the normal course of each Fund’s operations. Waived fees are not subject to recapture by the Adviser. The annual fee rates paid to the Adviser as of May 31, 2020 are as follows:
TYG — 0.95% up to $2,500,000,000, 0.90% between $2,500,000,000 and $3,500,000,000, and 0.85% above $3,500,000,000.
NTG — 0.95%.
TTP — 1.10%.
NDP — 1.10%.
TPZ — 0.95%.
TEAF — 1.35%, less a fee waiver of 0.25% for one year following March 29, 2019.
U.S. Bancorp Fund Services, LLC d/b/a U.S. Bank Global Fund Services serves as each Fund’s administrator. Each Fund pays the administrator a monthly fee computed at an annual rate of 0.04% of the first $1,000,000,000 of the Fund’s Managed Assets, 0.01% on the next $500,000,000 of Managed Assets and 0.005% on the balance of the Fund’s Managed Assets.
U.S. Bank, N.A. serves as the Funds’ custodian. Each Fund pays the custodian a monthly fee computed at an annual rate of 0.004% of the Fund’s U.S. Dollar-denominated assets and 0.015% of the Fund’s Canadian Dollar-denominated assets, plus portfolio transaction fees.
5. Income Taxes
TYG and NTG:
Deferred income taxes reflect the net tax effect of temporary differences between the carrying amount of assets and liabilities for financial reporting and tax purposes. Components of TYG’s and NTG’s deferred tax assets and liabilities as of May 31, 2020 are as follows:
| | TYG | | NTG |
| Deferred tax assets: | | | | | | | | |
| Net operating loss carryforwards | | $ | — | | | $ | 53,647 | |
| Capital loss carryforwards | | | 79,352,279 | | | | 114,615,973 | |
| Net unrealized loss on investment securities | | | 39,446,274 | | | | 20,389,831 | |
| Less: Valuation Allowance | | | (56,707,731 | ) | | | (112,444,511 | ) |
| | | 62,090,822 | | | | 22,614,940 | |
| Deferred tax liabilities: | | | | | | | | |
| Basis reduction of investments | | | 62,090,822 | | | | 22,614,940 | |
| | | 62,090,822 | | | | 22,614,940 | |
| Total net deferred tax liability (asset) | | $ | — | | | $ | — | |
At May 31, 2020, a valuation allowance on deferred tax assets was necessary because each of TYG and NTG believe that it is not more likely than not that there is an ability to realize its deferred tax assets through future taxable income. TYG and NTG have recorded valuation allowances of $56,707,731 and $112,444,511 respectively. Any adjustments to TYG’s or NTG’s estimates of future taxable income will be made in the period such determination is made.
| |
| |
| |
| |
| Notes to Financial Statements (unaudited) (continued) |
| |
Total income tax expense for each of TYG and NTG differs from the amount computed by applying the federal statutory income tax rate of 21% to net investment loss and net realized and unrealized gains (losses) on investments for the period ended May 31, 2020, as follows:
| | TYG | | NTG |
| Application of statutory income tax rate | | $ | (144,392,032 | ) | | $ | (102,947,968 | ) |
| State income taxes, net of federal tax effect | | | (15,883,123 | ) | | | (9,902,614 | ) |
| Permanent differences | | | 854,210 | | | | 663,030 | |
| Rate change on capital loss carryback | | | (12,104,004 | ) | | | — | |
| Change in valuation allowance | | | 56,707,731 | | | | 112,444,511 | |
| Total income tax expense (benefit) | | $ | (114,817,218 | ) | | $ | 256,959 | |
Total income taxes are being calculated by applying the federal rate plus a blended state income tax rate.
For the period ended May 31, 2020, the components of income tax expense for TYG and NTG include the following:
| | TYG | | NTG |
| Current tax expense (benefit) | | | | | | | | |
| Federal | | $ | (5,082,206 | ) | | $ | 24,865,837 | |
| State | | | 6,737,145 | | | | 3,283,607 | |
| Total current tax expense (benefit) | | | 1,654,939 | | | | 28,149,444 | |
| Deferred tax (benefit) | | | | | | | | |
| Federal | | | (104,929,869 | ) | | | (25,444,925 | ) |
| State (net of federal tax effect) | | | (11,542,288 | ) | | | (2,447,560 | ) |
| Total deferred tax (benefit) | | | (116,472,157 | ) | | | (27,892,485 | ) |
| Total income tax expense (benefit), net | | $ | (114,817,218 | ) | | $ | 256,959 | |
As of November 30, 2019, NTG had net operating losses for federal income tax purposes of approximately $1,300,000, which may be carried forward for 20 years. If not utilized, these losses will expire in the years ending November 30, 2033 through 2038. As of November 30, 2019, NTG had capital loss carryforwards of approximately $26,900,000, which may be carried forward for 5 years. If not utilized, these capital losses will expire in the year ending November 30, 2024. Such estimate is subject to revision upon receipt of the 2019 tax reporting information from the individual MLPs. For corporations, capital losses can only be used to offset capital gains and cannot be used to offset ordinary income. The amount of deferred tax asset for net operating losses and capital loss carryforwards at May 31, 2020 includes amounts for the period from December 1, 2019 through May 31, 2020. As of November 30, 2019, NTG had $1,412,445 of AMT credits available, which may be utilized against future tax liabilities. AMT credit carryovers may be eligible for a partial refund in 2018, 2019 or 2020 and any remaining unused credit will be fully refundable in 2021. NTG is estimating it will utilize all AMT credits against its current tax liability.
TTP, NDP, TPZ and TEAF:
It is the intention of TTP, NDP, TPZ and TEAF to qualify as RICs under Subchapter M of the IRC and distribute all of its taxable income. Accordingly, no provision for federal income taxes is required in the financial statements. However, TEAF’s taxable subsidiary created to make and hold certain investments is generally subject to federal and state income taxes on its income.
As of May 31, 2020, TEAF consolidated the balance of a deferred tax expense of $46,758 related to the investment activities of its taxable subsidiary. Total income taxes are computed by applying the federal statutory rate plus a blended state income tax rate totaling 26.17%.
At May 31, 2020, a valuation allowance on deferred tax assets was not deemed necessary because TEAF believes it is more likely than not that its able to realize its deferred tax assets through future taxable income. Any adjustments to TEAF’s estimates of future taxable income will be made in the period such determination is made.
Total income tax expense for TEAF’s taxable subsidiary differs from the amount computed by applying the federal statutory income tax rate of 21% to net income for the period ended May 31, 2020, as follows:
| Application of Statutory Income tax rate | | $ | 33,131 |
| State Income taxes, net of federal tax effect | | | 8,163 |
| Permanent differences | | | 5,464 |
| Other | | | — |
| Total income tax expense (benefit) | | $ | 46,758 |
| |
| |
| 2020 2nd Quarter Report | May 31, 2020 |
| |
| Notes to Financial Statements (unaudited) (continued) |
| |
The amount and character of income and capital gain distributions to be paid, if any, are determined in accordance with federal income tax regulations, which may differ from U.S. generally accepted accounting principles. These differences are primarily due to return of capital distributions from underlying investments, wash sales, straddles, swaps, differences in the timing of recognition of gains or losses on investments and distributions in excess of current earnings. These reclassifications have no impact on net assets or results of operations. Permanent book and tax basis differences, if any, may result in reclassifications of undistributed (accumulated) net investment income (loss), undistributed (accumulated) net realized gain (loss) and additional paid-in capital.
As of November 30, 2019, the components of accumulated earnings (deficit) on a tax basis were as follows
| | TTP | | NDP | | TPZ | | TEAF |
| Unrealized appreciation (depreciation) | | $ | (40,841,708 | ) | | | $ | (49,544,380 | ) | | | $ | (5,257,348 | ) | | $ | (18,827,811 | ) | |
| Capital loss carryforwards | | | (20,597,807 | ) | | | | (110,941,585 | ) | | | | — | | | | (7,332,247 | ) | |
| Undistributed ordinary income | | | — | | | | | — | | | | | — | | | | — | | |
| Other temporary differences | | | (156,156 | ) | (1) | | | (571,151 | ) | (2) | | | (11,223 | ) | | | (501,000 | ) | (3) |
| Accumulated earnings (deficit) | | $ | (61,595,671 | ) | | | $ | (161,057,116 | ) | | | $ | (5,268,571 | ) | | $ | (26,661,058 | ) | |
| (1) | Primarily related to losses deferred under straddle regulations per IRC Sec. 1092 and dividends payable. |
| (2) | Primarily related to late year loss deferral. |
| (3) | Primarily related to expenses of TEAF’s taxable subsidiary and losses deferred under straddle regulations per IRC Sec. 1092. |
As of November 30, 2019, TTP, NDP and TEAF had short-term capital loss carryforwards of approximately $780,000, $30,750,000 and $7,350,000 respectively, and TTP and NDP had long-term capital loss carryforwards of approximately $19,820,000 and $80,200,000 respectively, which may be carried forward for an unlimited period under the Regulated Investment Company Modernization Act of 2010. To the extent future net capital gains are realized, those gains will be offset by any unused capital loss carryforwards. Capital loss carryforwards will retain their character as either short-term or long-term capital losses. Thus, such losses must be used first to offset gains of the same character; for example, long-term loss carryforwards will first offset long-term gains, before they can be used to offset short-term gains.
In order to meet certain excise tax distribution requirements, TTP, NDP, TPZ and TEAF are required to measure and distribute annually net capital gains realized during a twelve month period ending October 31 and net investment income earned during a twelve month period ending December 31. In connection with this, TTP, NDP, TPZ and TEAF are permitted for tax purposes to defer into their next fiscal year qualified late year losses. Qualified late year ordinary losses are any net or ordinary losses incured between January 1 and the end of their fiscal year, November 30, 2019. For the taxable year ended November 30, 2019, TTP, TPZ and TEAF do not plan to defer any losses. NDP plans to defer, on a tax basis, late year ordinary losses of approximately $571,000.
As of May 31, 2020, the aggregate cost of investments, aggregate gross unrealized appreciation and aggregate gross unrealized depreciation on a federal income tax basis were as follows:
| | TYG | | NTG | | TTP | | NDP | | TPZ | | TEAF |
| Tax cost of investments | | $ | 377,395,188 | | | $ | 220,800,770 | | | $ | 95,329,180 | | | $ | 45,529,139 | | | $ | 118,583,427 | | | $ | 241,876,021 | |
| Gross unrealized appreciation | | | | | | | | | | | | | | | | | | | | | | | | |
| of investments | | $ | 135,509,488 | | | $ | 44,343,375 | | | $ | 3,404,912 | | | $ | 2,916,068 | | | $ | 4,516,234 | | | $ | 10,654,330 | |
| Gross unrealized depreciation | | | | | | | | | | | | | | | | | | | | | | | | |
| of investments | | | (58,678,986 | ) | | | (26,275,334 | ) | | | (23,306,873 | ) | | | (14,739,899 | ) | | | (14,935,826 | ) | | | (27,485,230 | ) |
| Net unrealized appreciation | | | | | | | | | | | | | | | | | | | | | | | | |
| (depreciation) of investments | | $ | 76,830,502 | | | $ | 18,068,041 | | | $ | (19,901,961 | ) | | $ | (11,823,831 | ) | | $ | (10,419,592 | ) | | $ | (16,830,900 | ) |
| |
| |
| |
| |
| Notes to Financial Statements (unaudited) (continued) |
| |
6. Restricted Securities
Certain of the Funds’ investments are restricted and are valued as determined in accordance with fair value procedures, as more fully described in Note 2. The following table shows the principal amount or shares, acquisition date(s), acquisition cost, fair value and the percent of net assets which the securities comprise at May 31, 2020.
| TYG: | | | | | | | | | | | | | | | | | | | | |
| | | | | | | | | | | | | | | | | Fair Value |
| | | | Principal | | | | | | | | | | as Percent |
| Investment Security | | Investment Type | | Amount/Shares | | Acquisition Date(s) | | Acquisition Cost | | Fair Value | | of Net Assets |
| Sunnova Energy Intl Inc., | | | | | | | | | | | | | | | | | | | | |
| 9.750% | | Convertible Bond | | | $ | 7,838,000 | | | 5/14/20 | | $ | 7,838,000 | | $ | 7,838,000 | | | 2.4 | % | |
| Altus Midstream Company, | | | | | | | | | | | | | | | | | | | | |
| 7.000% | | Preferred Stock | | | | 10,427 | | | 06/12/19-5/14/20 | | | 10,427,244 | | | 9,981,054 | | | 3.0 | | |
| Targa Resources Corp., | | | | | | | | | | | | | | | | | | | | |
| 9.500% | | Preferred Stock | | | | 21,758 | | | 03/16/16 | | | 18,397,248 | | | 21,083,720 | | | 6.3 | | |
| TK NYS Solar Holdco, LLC | | Private Investment | | | | N/A | | | 08/18/17-08/19/19 | | | 53,481,470 | | | 11,127,975 | | | 3.3 | | |
| | | | | | | | | | | $ | 89,868,961 | | $ | 50,030,749 | | | 15.0 | % | |
| | | | | | | | | | | | | | | | | | | | | |
| NTG: | | | | | | | | | | | | | | | | | | | | |
| | | | | | | | | | | | | | | | | Fair Value |
| | | | Principal | | | | | | | | | | as Percent |
| Investment Security | | Investment Type | | Amount/Shares | | Acquisition Date(s) | | Acquisition Cost | | Fair Value | | of Net Assets |
| Sunnova Energy Intl Inc., | | | | | | | | | | | | | | | | | | | | |
| 9.750% | | Convertible Bond | | | $ | 5,458,000 | | | 5/14/20 | | $ | 5,458,000 | | $ | 5,458,000 | | | 3.4 | % | |
| Altus Midstream Company, | | | | | | | | | | | | | | | | | | | | |
| 7.000% | | Preferred Stock | | | | 7,456 | | | 06/12/19-5/14/20 | | | 7,455,805 | | | 7,136,696 | | | 4.4 | | |
| Targa Resources Corp., | | | | | | | | | | | | | | | | | | | | |
| 9.500% | | Preferred Stock | | | | 12,252 | | | 03/16/16 | | | 10,359,550 | | | 11,872,311 | | | 7.3 | | |
| | | | | | | | | | | $ | 23,273,355 | | $ | 24,467,007 | | | 15.1 | % | |
| | | | | | | | | | | | | | | | | | | | | |
| TTP: | | | | | | | | | | | | | | | | | | | | |
| | | | | | | | | | | | | | | | | Fair Value |
| | | | | | | | | | | | | | | | | as Percent |
| Investment Security | | Investment Type | | Shares | | Acquisition Date(s) | | Acquisition Cost | | Fair Value | | of Net Assets |
| Altus Midstream Company, | | | | | | | | | | | | | | | | | | | | |
| 7.000% | | Preferred Stock | | | | 544 | | | 06/12/19-5/14/20 | | $ | 553,926 | | $ | 530,218 | | | 1.0 | % | |
| Targa Resources Corp., | | | | | | | | | | | | | | | | | | | | |
| 9.500% | | Preferred Stock | | | | 2,108 | | | 03/16/16 | | | 1,866,506 | | | 2,042,673 | | | 4.0 | | |
| | | | | | | | | | | $ | 2,420,432 | | $ | 2,572,891 | | | 5.0 | % | |
| | | | | | | | | | | | | | | | | | | | | |
| NDP: | | | | | | | | | | | | | | | | | | | | |
| | | | | | | | | | | | | | | | | Fair Value |
| | | | | | | | | | | | | | | | | as Percent |
| Investment Security | | Investment Type | | Shares | | Acquisition Date | | Acquisition Cost | | Fair Value | | of Net Assets |
| Targa Resources Corp., | | | | | | | | | | | | | | | | | | | | |
| 9.500% | | Preferred Stock | | | | 1,997 | | | 03/16/16 | | $ | 1,768,223 | | $ | 1,935,113 | | | 6.5 | % | |
| | | | | | | | | | | | | | | | | | | | | |
| TPZ: | | | | | | | | | | | | | | | | | | | | |
| | | | | | | | | | | | | | | | | Fair Value |
| | | | Principal | | | | | | | | | | as Percent |
| Investment Security | | Investment Type | | Amount/Shares | | Acquisition Date(s) | | Acquisition Cost | | Fair Value | | of Net Assets |
| Ascent Resources Utica | | | | | | | | | | | | | | | | | | | | |
| Holdings, LLC, | | | | | | | | | | | | | | | | | | | | |
| 10.000%, 04/01/2022* | | Corporate Bond | | | $ | 1,302,000 | | | 08/27/18 | | $ | 1,445,220 | | $ | 1,139,250 | | | 1.3 | % | |
| Blue Racer Midstream, LLC, | | | | | | | | | | | | | | | | | | | | |
| 6.625%, 07/15/2026* | | Corporate Bond | | | $ | 5,900,000 | | | 6/18/18-02/05/19 | | | 5,936,250 | | | 5,265,750 | | | 6.2 | | |
| Duquesne Light Holdings, Inc., | | | | | | | | | | | | | | | | | | | | |
| 6.400%, 09/15/2020* | | Corporate Bond | | | $ | 3,000,000 | | | 11/30/11 | | | 3,180,330 | | | 3,048,560 | | | 3.6 | | |
| |
| |
| 2020 2nd Quarter Report | May 31, 2020 |
| |
| Notes to Financial Statements (unaudited) (continued) |
| |
| TPZ: (continued) | | | | | | | | | | | | | | | | | | | | | | | | |
| | | | | | | | | | | | | | | | | | | | | Fair Value |
| | | | Principal | | | | | | | | | | | | | | as Percent |
| Investment Security | | Investment Type | | Amount/Shares | | Acquisition Date(s) | | Acquisition Cost | | Fair Value | | of Net Assets |
| Duquesne Light Holdings, Inc., | | | | | | | | | | | | | | | | | | | | | | | | |
| 5.900%, 12/01/2021* | | Corporate Bond | | | $ | 2,000,000 | | | | 11/18/11-12/05/11 | | | | $ | 2,074,420 | | | $ | 2,097,924 | | | 2.5 | % | |
| Florida Gas Transmission Co., LLC, | | | | | | | | | | | | | | | | | | | | | | | | |
| 5.450%, 07/15/2020* | | Corporate Bond | | | $ | 1,500,000 | | | | 07/08/10-01/04/11 | | | | | 1,551,220 | | | | 1,505,047 | | | 1.8 | | |
| Hess Corporation, | | | | | | | | | | | | | | | | | | | | | | | | |
| 5.625%, 02/15/2026* | | Corporate Bond | | | $ | 4,160,000 | | | | 07/19/18-08/06/18 | | | | | 4,196,600 | | | | 4,014,400 | | | 4.8 | | |
| Rockies Express Pipeline LLC, | | | | | | | | | | | | | | | | | | | | | | | | |
| 4.950%, 07/15/2029* | | Corporate Bond | | | $ | 3,000,000 | | | | 04/12/19 | | | | | 3,002,670 | | | | 2,781,900 | | | 3.3 | | |
| Ruby Pipeline, LLC, | | | | | | | | | | | | | | | | | | | | | | | | |
| 6.000%, 04/01/2022* | | Corporate Bond | | | $ | 1,022,727 | | | | 09/17/12 | | | | | 1,041,087 | | | | 957,295 | | | 1.1 | | |
| Southern Star Central Corp., | | | | | | | | | | | | | | | | | | | | | | | | |
| 5.125%, 07/15/2022* | | Corporate Bond | | | $ | 3,000,000 | | | | 06/17/14 | | | | | 3,041,250 | | | | 3,000,870 | | | 3.6 | | |
| Tallgrass Energy LP, | | | | | | | | | | | | | | | | | | | | | | | | |
| 5.500%, 01/15/2028* | | Corporate Bond | | | $ | 3,250,000 | | | | 09/24/18-02/06/19 | | | | | 3,261,250 | | | | 2,906,118 | | | 3.4 | | |
| Sunnova Energy Intl Inc., | | | | | | | | | | | | | | | | | | | | | | | | |
| 9.750%, 04/30/2025 | | Convertible Bond | | | $ | 1,570,000 | | | | 05/14/20 | | | | | 1,570,000 | | | | 1,570,000 | | | 1.9 | | |
| Altus Midstream Company, | | | | | | | | | | | | | | | | | | | | | | | | |
| 7.000% | | Preferred Stock | | | | 483 | | | | 06/12/19-05/14/20 | | | | | 483,100 | | | | 462,422 | | | 0.6 | | |
| Targa Resources Corp., | | | | | | | | | | | | | | | | | | | | | | | | |
| 9.500% | | Preferred Stock | | | | 1,685 | | | | 03/16/16 | | | | | 1,424,734 | | | | 1,632,782 | | | 1.9 | | |
| | | | | | | | | | | | | | $ | 31,779,269 | | | $ | 30,382,318 | | | 36.0 | % | |
| | | | | | | | | | | | | | | | | | | | | | | | | |
| TEAF: | | | | | | | | | | | | | | | | | | | | | | | | |
| | | | | | | | | | | | | | | | | | | | | Fair Value |
| | | | Principal | | | | | | | | | | | | | | as Percent |
| Investment Security | | Investment Type | | Amount/Shares | | Acquisition Date | | Acquisition Cost | | Fair Value | | of Net Assets |
| Antero Midstream Partners LP, | | | | | | | | | | | | | | | | | | | | | | | | |
| 5.750%, 01/15/2028* | | Corporate Bond | | | $ | 3,750,000 | | | | 10/31/19-11/19/19 | | | | $ | 3,093,750 | | | $ | 2,931,750 | | | 1.5 | % | |
| Blue Racer Midstream, LLC, | | | | | | | | | | | | | | | | | | | | | | | | |
| 6.625%, 07/15/2026* | | Corporate Bond | | | $ | 3,000,000 | | | | 03/29/19 | | | | | 3,075,000 | | | | 2,677,500 | | | 1.4 | | |
| Grace Commons Property, | | | | | | | | | | | | | | | | | | | | | | | | |
| 15.000%, 10/31/2023* | | Corporate Bond | | | $ | 1,825,000 | | | | 06/17/19 | | | | | 1,825,000 | | | | 1,825,000 | | | 0.9 | | |
| Grace Commons Property, | | | | | | | | | | | | | | | | | | | | | | | | |
| 8.000%, 10/31/2021* | | Corporate Bond | | | $ | 3,650,000 | | | | 06/17/19 | | | | | 3,650,000 | | | | 3,650,000 | | | 1.9 | | |
| Realco Perry Hall MD LLC/OPCO, | | | | | | | | | | | | | | | | | | | | | | | | |
| 10.000%, 10/01/2024* | | Corporate Bond | | | $ | 2,280,000 | | | | 01/01/19 | | | | | 2,280,000 | | | | 2,134,842 | | | 1.1 | | |
| Targa Resources Corp., | | | | | | | | | | | | | | | | | | | | | | | | |
| 9.500% | | Preferred Stock | | | | 4,000 | | | | 03/16/16 | | | | | 4,300,000 | | | | 3,876,040 | | | 2.0 | | |
| Altus Midstream Company, | | | | | | | | | | | | | | | | | | | | | | | | |
| 7.000% | | Preferred Stock | | | | 4,294 | | | | 06/12/19-05/14/20 | | | | | 4,293,985 | | | | 4,110,203 | | | 2.0 | | |
| Mexico Pacific Limited LLC (MPL) | | | | | | | | | | | | | | | | | | | | | | | | |
| Series A | | Private Investment | | | | 88,889 | | | | 10/23/19 | | | | | 2,000,000 | | | | 2,000,000 | | | 1.0 | | |
| Renewable Holdco, LLC | | Private Investment | | | | N/A | | | | 07/25/19-5/31/20 | | | | | 13,056,957 | | | | 8,391,651 | | | 4.3 | | |
| Renewable Holdco I, LLC | | Private Investment | | | | N/A | | | | 09/09/19 | | | | | 26,526,218 | | | | 24,889,493 | | | 12.7 | | |
| Renewable Holdco II, LLC | | Private Investment | | | | N/A | | | | 10/15/19-03/06/20 | | | | | 4,869,348 | | | | 5,035,303 | | | 2.5 | | |
| Saturn Solar Bermuda1 Ltd., | | | | | | | | | | | | | | | | | | | | | | | | |
| 6.000%, 06/30/2020 | | Construction Note | | | $ | 3,510,000 | | | | 05/24/19-07/03/19 | | | | | 3,770,670 | | | | 3,516,669 | | | 1.8 | | |
| Sunnova Energy Intl Inc., | | | | | | | | | | | | | | | | | | | | | | | | |
| 9.750%, 04/30/2025 | | Convertible Bond | | | $ | 5,589,000 | | | | 05/14/20 | | | | | 5,589,000 | | | | 5,589,000 | | | 2.9 | | |
| | | | | | | | | | | | | | $ | 78,329,928 | | | $ | 70,627,451 | | | 36.0 | % | |
| * | Security is eligible for resale under Rule 144A under the 1933 Act. |
| |
| |
| |
| |
| Notes to Financial Statements (unaudited) (continued) |
| |
7. Affiliated Company Transactions
A summary of the transactions in affiliated companies during the period ended May 31, 2020 is as follows:
TYG: | | | | | | | | | | | | | | | | | | | | | | |
| | | | | | | | | | | | | | | 5/31/20 | | | | | Net Change |
| | 11/30/19 | | Gross | | Gross | | Realized | | Distributions | | | Share | | 5/31/20 | | in Unrealized |
| Investment Security | | Share Balance | | Additions | | Reductions | | Gain/(Loss) | | Received | | | Balance | | Value | | Depreciation |
| TK NYS Solar Holdco, LLC | | N/A | | $ — | | $ — | | $ — | | $275,000 | | | N/A | | $ 11,127,975 | | $(2,790,116) |
| | | | | | | | | | | | | | | | | | | | | | | |
| TEAF: | | | | | | | | | | | | | | | | | | | | | | |
| | | | | | | | | | | | | | | | | | | | | Net Change |
| | | | | | | | | | | | | | | 5/31/20 | | | | | in Unrealized |
| | 11/30/19 | | Gross | | Gross | | Realized | | Distributions | | Share | | 5/31/20 | | Appreciation |
| Investment Security | | Share Balance | | Additions | | Reductions | | Gain/(Loss) | | Received | | Balance | | Value | | (Depreciation) |
| Renewable Holdco, LLC | | N/A | | $ | 1,225,388 | | $ — | | $ — | | $ | 5,194,453 | | | N/A | | $ | 8,391,651 | | $ | (5,331,548 | ) |
| Renewable Holdco I, LLC | | N/A | | $ | — | | $ — | | $ — | | $ | 500,000 | | | N/A | | $ | 24,889,493 | | $ | (510,579 | ) |
| Renewable Holdco II, LLC | | N/A | | $ | 3,948,762 | | $ — | | $ — | | $ | — | | | N/A | | $ | 5,035,303 | | $ | 98,634 | |
| Total | | N/A | | $ | 5,174,150 | | $ — | | $ — | | $ | 5,694,453 | | | N/A | | $ | 38,316,447 | | $ | (5,743,493 | ) |
8. Investment Transactions
For the period ended May 31, 2020, the amount of security transactions (other than U.S. government securities and short-term investments), is as follows:
| | TYG | | NTG | | TTP | | NDP | | TPZ | | TEAF |
| Purchases | | $ | 153,591,282 | | $ | 117,770,247 | | $ | 29,127,284 | | $ | 32,717,511 | | $ | 23,959,286 | | $ | 105,040,358 |
| Sales | | $ | 706,022,829 | | $ | 544,123,509 | | $ | 75,970,836 | | $ | 55,534,592 | | $ | 54,867,688 | | $ | 104,758,306 |
| |
| |
| 2020 2nd Quarter Report | May 31, 2020 |
| |
| Notes to Financial Statements (unaudited) (continued) |
| |
9. Senior Notes
TYG, NTG and TTP each have issued private senior notes (collectively, the “Notes”), which are unsecured obligations and, upon liquidation, dissolution or winding up of a Fund, will rank: (1) senior to all of the Fund’s outstanding preferred shares, if any; (2) senior to all of the Fund’s outstanding common shares; (3) on parity with any unsecured creditors of the Fund and any unsecured senior securities representing indebtedness of the Fund and (4) junior to any secured creditors of the Fund. Holders of the Notes are entitled to receive periodic cash interest payments until maturity. The Notes are not listed on any exchange or automated quotation system.
The Notes are redeemable in certain circumstances at the option of a Fund, subject to payment of any applicable make-whole amounts or early redemption premiums. The Notes for a Fund are also subject to a mandatory redemption if the Fund fails to meet asset coverage ratios required under the 1940 Act or the rating agency guidelines if such failure is not waived or cured. At May 31, 2020, each of TYG, NTG and TTP were in compliance with asset coverage covenants and basic maintenance covenants for its senior notes.
Details of each Fund’s outstanding Notes, including estimated fair value, as of May 31, 2020 are included below. The estimated fair value of each series of fixed-rate Notes was calculated, for disclosure purposes, by discounting future cash flows by a rate equal to the current U.S. Treasury rate with an equivalent maturity date, plus either 1) the spread between the interest rate on recently issued debt and the U.S. Treasury rate with a similar maturity date or 2) if there has not been a recent debt issuance, the spread between the AAA corporate finance debt rate and the U.S. Treasury rate with an equivalent maturity date plus the spread between the fixed rates of the Notes and the AAA corporate finance debt rate. The estimated fair value of floating rate Notes approximates the carrying amount because the interest rate fluctuates with changes in interest rates available in the current market. The estimated fair values in the following tables are Level 2 valuations within the fair value hierarchy.
| TYG: | | | | | | | | | | | | | |
| | | | | | | | | Notional | | Estimated |
| Series | | Maturity Date | | Interest Rate | | Payment Frequency | | Amount | | Fair Value |
| Series Y | | June 14, 2020 | | 2.77 | % | | Semi-Annual | | $ | 4,033,333 | | $ | 4,087,704 |
| Series O | | September 27, 2020 | | 3.78 | % | | Semi-Annual | | | 4,840,000 | | | 4,915,859 |
| Series Z | | June 14, 2021 | | 2.98 | % | | Semi-Annual | | | 4,033,333 | | | 4,171,935 |
| Series R | | January 22, 2022 | | 3.77 | % | | Semi-Annual | | | 8,066,667 | | | 8,541,822 |
| Series DD | | September 27, 2022 | | 4.21 | % | | Semi-Annual | | | 4,194,667 | | | 4,536,012 |
| Series II | | December 18, 2022 | | 3.22 | % | | Semi-Annual | | | 3,226,667 | | | 3,454,752 |
| Series K | | December 19, 2022 | | 3.87 | % | | Semi-Annual | | | 3,226,667 | | | 3,516,502 |
| Series S | | January 22, 2023 | | 3.99 | % | | Semi-Annual | | | 3,226,667 | | | 3,524,558 |
| Series P | | September 27, 2023 | | 4.39 | % | | Semi-Annual | | | 3,872,000 | | | 4,327,547 |
| Series FF | | November 20, 2023 | | 4.16 | % | | Semi-Annual | | | 3,266,667 | | | 3,574,442 |
| Series JJ | | December 18, 2023 | | 3.34 | % | | Semi-Annual | | | 6,453,333 | | | 7,069,099 |
| Series T | | January 22, 2024 | | 4.16 | % | | Semi-Annual | | | 8,066,667 | | | 9,085,963 |
| Series L | | December 19, 2024 | | 3.99 | % | | Semi-Annual | | | 6,453,333 | | | 7,400,629 |
| Series AA | | June 14, 2025 | | 3.48 | % | | Semi-Annual | | | 3,226,667 | | | 3,652,645 |
| Series NN | | June 14, 2025 | | 3.20 | % | | Semi-Annual | | | 9,680,000 | | | 10,814,090 |
| Series KK | | December 18, 2025 | | 3.53 | % | | Semi-Annual | | | 3,226,667 | | | 3,688,769 |
| Series OO | | April 9, 2026 | | 3.27 | % | | Semi-Annual | | | 9,680,000 | | | 10,863,592 |
| Series PP | | September 25, 2027 | | 3.33 | % | | Semi-Annual | | | 8,066,667 | | | 9,249,940 |
| | | | | | | | | $ | 96,800,000 | | $ | 106,475,860 |
TYG’s Series LL Notes, with a notional amount of $20,000,000 and a floating rate based on 3-month LIBOR plus 1.20% were prepaid in full on December 4, 2019.
On April 13, 2020, TYG prepaid $8,466,667 of Series Y Notes, $10,160,000 of Series O Notes, $8,466,667 of Series Z Notes, $16,933,333 of Series R Notes, $8,805,333 of Series DD Notes, $6,773,333 of Series II Notes, $6,773,333 of Series K Notes, $6,773,333 of Series S Notes, $8,128,000 of Series P Notes, $6,773,333 of Series FF Notes, $13,546,667 of Series JJ Notes, $16,933,333 of Series T Notes, $13,546,667 of Series L Notes, $6,773,333 of Series AA Notes, $20,320,000 of Series NN Notes, $6,773,333 of Series KK Notes, $20,320,000 of Series OO Notes and $16,933,333 of Series PP Notes subject to a 1% prepayment premium.
| |
| |
| |
| |
| Notes to Financial Statements (unaudited) (continued) |
| |
| NTG: | | | | | | | | | | | | | | |
| | | | | | | | | | Notional | | Estimated |
| Series | | Maturity Date | | Interest Rate | | Payment Frequency | | Amount | | Fair Value |
| Series D | | December 15, 2020 | | 4.29% | | | Quarterly | | | $ | 22,879,144 | | $ | 23,491,083 |
| Series J | | April 17, 2021 | | 3.72% | | | Semi-Annual | | | | 6,128,342 | | | 6,303,179 |
| Series M | | April 17, 2021 | | 3.06% | | | Semi-Annual | | | | 2,042,781 | | | 2,087,473 |
| Series P | | October 16, 2023 | | 3.79% | | | Semi-Annual | | | | 2,979,055 | | | 3,266,074 |
| Series Q | | October 16, 2025 | | 3.97% | | | Semi-Annual | | | | 2,234,291 | | | 2,574,150 |
| Series R | | October 16, 2026 | | 4.02% | | | Semi-Annual | | | | 1,936,386 | | | 2,276,223 |
| | | | | | | | | | $ | 38,200,000 | | $ | 39,998,182 |
NTG’s Series L Notes, with a notional amount of $20,000,000 and a floating rate based on 3-month LIBOR plus 1.45% were prepaid in full on December 4, 2019.
On March 31, 2020, NTG prepaid $5,416,667 of Series P Notes, $4,062,500 of Series Q Notes, $3,520,833 of Series R Notes, $32,000,000 of Series N Notes and $25,000,000 of Series O Notes subject to a 2% prepayment premium.
On April 14, 2020, NTG prepaid $89,120,856 of Series D Notes, $23,871,658 of Series J Notes, $7,957,219 of Series M Notes, $11,604,278 of Series P Notes, $8,703,209 of Series Q Notes and $7,542,781 of Series R Notes subject to a 1% prepayment premium.
TTP:
| | | | | | | | Notional | | Estimated |
| Series | | Maturity Date | | Interest Rate | | Payment Frequency | | Amount | | Fair Value |
| Series F | | December 12, 2020 | | 3.01% | | Semi-Annual | | $ | 3,942,857 | | $ | 4,041,167 |
| Series D | | December 15, 2021 | | 4.08% | | Semi-Annual | | | 10,514,286 | | | 11,102,629 |
| Series H | | December 13, 2024 | | 3.97% | | Semi-Annual | | | 3,942,857 | | | 4,518,485 |
| | | | | | | | $ | 18,400,000 | | $ | 19,662,281 |
On March 30, 2020, TTP prepaid $6,000,000 of Series G Notes at par.
On April 14, 2020, TTP prepaid $2,057,143 of Series F Notes, $5,485,714 of Series D Notes and $2,057,143 of Series H Notes subject to a 1% prepayment premium.
10. Mandatory Redeemable Preferred Stock
TYG, NTG and TTP each have issued and outstanding MRP Stock at May 31, 2020. The MRP Stock has rights determined by the Board of Directors. Except as otherwise indicated in the Funds’ Charter or Bylaws, or as otherwise required by law, the holders of MRP Stock have voting rights equal to the holders of common stock (one vote per MRP share) and will vote together with the holders of shares of common stock as a single class except on matters affecting only the holders of preferred stock or the holders of common stock. The 1940 Act requires that the holders of any preferred stock (including MRP Stock), voting separately as a single class, have the right to elect at least two directors at all times.
Under the 1940 Act, a fund may not declare dividends or make other distributions on shares of common stock or purchases of such shares if, at the time of the declaration, distribution or purchase, asset coverage with respect to the outstanding MRP Stock would be less than 200%. The MRP Stock is also subject to a mandatory redemption if a Fund fails to meet an asset coverage ratio of at least 225% as determined in accordance with the 1940 Act or a rating agency basic maintenance amount if such failure is not waived or cured. At May 31, 2020, each of TYG, NTG and TTP were in compliance with asset coverage covenants and basic maintenance covenants for its MRP Stock.
| |
| |
| 2020 2nd Quarter Report | May 31, 2020 |
| |
| Notes to Financial Statements (unaudited) (continued) |
| |
Details of each Fund’s outstanding MRP Stock, including estimated fair value, as of May 31, 2020 is included below. The estimated fair value of each series of TYG, NTG and TTP MRP Stock was calculated for disclosure purposes by discounting future cash flows at a rate equal to the current U.S. Treasury rate with an equivalent maturity date, plus either 1) the spread between the interest rate on recently issued preferred stock and the U.S. Treasury rate with a similar maturity date or 2) if there has not been a recent preferred stock issuance, the spread between the AA corporate finance debt rate and the U.S. Treasury rate with an equivalent maturity date plus the spread between the fixed rates of the MRP Stock and the AA corporate finance debt rate. The estimated fair values of each series of the TYG, NTG and TTP MRP Stock are Level 2 valuations within the fair value hierarchy.
TYG:
TYG has 65,000,000 shares of preferred stock authorized and 3,230,000 shares of MRP Stock outstanding at May 31, 2020. TYG’s MRP Stock has a liquidation value of $10.00 per share plus any accumulated but unpaid distributions, whether or not declared. Holders of the MRP D Stock and MRP E Stock are entitled to receive cash interest payments semi-annually at a fixed rate until maturity. On April 9, 2020, TYG redeemed 6,836,061 of Series D MRP Shares and 6,433,939 of Series E MRP Shares for a total liquidation preference amount of $132,700,000. TYG paid a 1% premium upon redemption. The TYG MRP Stock is not listed on any exchange or automated quotation system.
| | | | | | | | | | | | Aggregate Liquidation | | Estimated Fair |
| Series | | Mandatory Redemption Date | | Fixed Rate | | Shares Outstanding | | Preference | | Value |
| Series D | | December 17, 2021 | | | 6.01% | | | | 1,663,939 | | | | $ | 16,639,390 | | | $ | 18,212,415 |
| Series E | | December 17, 2024 | | | 6.34% | | | | 1,566,061 | | | | | 15,660,610 | | | | 19,339,960 |
| | | | | | | | | 3,230,000 | | | | $ | 32,300,000 | | | $ | 37,552,375 |
TYG’s MRP Stock is redeemable in certain circumstances at the option of TYG, subject to payment of any applicable make-whole amounts.
NTG:
NTG has 10,000,000 shares of preferred stock authorized and 508,000 shares of MRP Stock outstanding at May 31, 2020. NTG’s MRP Stock has a liquidation value of $25.00 per share plus any accumulated but unpaid distributions, whether or not declared. Holders of NTG MRP Stock are entitled to receive cash interest payments each quarter at a fixed rate until maturity. On April 10, 2020, NTG redeemed 180,757 of Series C MRP Shares, 1,446,061 of Series D MRP Shares, 1,446,061 of Series E MRP Shares, 903,788 of Series F MRP Shares and 795,333 of Series G MRP Shares for a total liquidation preference amount of $119,300,000. NTG paid a 1% premium upon redemption. The NTG MRP Stock is not listed on any exchange or automated quotation system.
| | | | | | | | | | | | | | Aggregate Liquidation | | Estimated Fair |
| Series | | Mandatory Redemption Date | | Fixed Rate | | Shares Outstanding | | Preference | | Value |
| Series C | | | December 8, 2020 | | | | 5.73% | | | | 19,243 | | | | $ | 481,075 | | | $ | 497,188 |
| Series D | | | December 8, 2022 | | | | 6.19% | | | | 153,939 | | | | | 3,848,475 | | | | 4,335,666 |
| Series G | | | October 16, 2023 | | | | 6.39% | | | | 84,667 | | | | | 2,116,675 | | | | 2,462,613 |
| Series E | | | December 13, 2024 | | | | 5.78% | | | | 153,939 | | | | | 3,848,475 | | | | 4,580,585 |
| Series F | | | December 13, 2027 | | | | 6.07% | | | | 96,212 | | | | | 2,405,300 | | | | 3,135,806 |
| | | | | | | | | | | 508,000 | | | | $ | 12,700,000 | | | $ | 15,011,858 |
NTG’s MRP Stock is redeemable in certain circumstances at the option of NTG, subject to payment of any applicable make-whole amounts.
TTP:
TTP has 10,000,000 shares of preferred stock authorized and 244,000 shares of MRP Stock outstanding at May 31, 2020. TTP’s MRP Stock has a liquidation value of $25.00 per share plus any accumulated but unpaid distributions, whether or not declared. Holders of TTP MRP Stock are entitled to receive cash interest payments each quarter at a fixed rate until maturity. On April 10, 2020, TTP redeemed 396,000 of Series B MRP Shares for a total liquidation preference amount of $9,900,000. TTP paid a 1% premium upon redemption. The TTP MRP Stock is not listed on any exchange or automated quotation system.
| | | | | | | | | | | | Aggregate Liquidation | | Estimated Fair |
| Series | | Mandatory Redemption Date | | Fixed Rate | | Shares Outstanding | | Preference | | Value |
| Series B | | December 13, 2024 | | | 6.57% | | | | 244,000 | | | | $ | 6,100,000 | | | $ | 7,480,890 |
TTP’s MRP Stock is redeemable in certain circumstances at the option of TTP, subject to payment of any applicable make-whole amounts.
| |
| |
| |
| |
| Notes to Financial Statements (unaudited) (continued) |
| |
11. Credit Facilities
The following table shows key terms, average borrowing activity and interest rates for the period during which the facility was utilized during the period from December 1, 2019 through May 31, 2020 as well as the principal balance and interest rate in effect at May 31, 2020 for each of the Funds’ credit facilities:
| | TYG | | NTG | | TTP | | NDP | | TPZ | | TEAF |
| Lending syndicate | | | | Bank of America, | | The Bank | | The Bank | | The Bank | | The Bank |
| agent | | U.S. Bank, N.A. | | N.A. | | of Nova Scotia | | of Nova Scotia | | of Nova Scotia | | of Nova Scotia |
| | Unsecured, | | Unsecured, | | Unsecured, | | Secured, | | Secured, | | |
| | revolving credit | | revolving credit | | revolving credit | | revolving credit | | revolving credit | | Margin loan |
| Type of facility | | facility | | facility | | facility | | facility | | facility | | facility |
| Borrowing | | | | | | | | | | | | |
| capacity | | $130,000,000 | | $140,000,000 | | $20,000,000 | | $12,000,000 | | $30,000,000 | | $45,000,000 |
| | | | | | 364-day rolling | | 179-day rolling | | 179-day rolling | | |
| Maturity date | | June 12, 2021 | | June 12, 2021 | | evergreen | | evergreen | | evergreen | | N/A |
| | 1-month LIBOR | | 1-month LIBOR | | 1-month LIBOR | | 1-month LIBOR | | 1-month LIBOR | | 1-month LIBOR |
| Interest rate | | plus 1.10% | | plus 1.10% | | plus 1.125% | | plus 0.80% | | plus 0.80% | | plus 0.80% |
| Non-usage fee | | 0.15%-0.25%(1) | | 0.15%-0.25%(2) | | 0.15% | | 0.20%(3) | | 0.20%(4) | | 0.20%(5) |
| | | | | | | | | | | | | |
| For the period ended May 31, 2020: | | | | | | | | | | |
| Average principal | | | | | | | | | | | | |
| balance | | $63,600,000 | | $67,100,000 | | $9,600,000 | | $16,000,000 | | $40,600,000 | | $30,400,000 |
| Average | | | | | | | | | | | | |
| interest rate | | 2.79% | | 2.73% | | 2.74% | | 1.95% | | 2.86% | | 1.95% |
| | | | | | | | | | | | | |
| As of May 31, 2020: | | | | | | | | | | | | |
| Principal balance | | | | | | | | | | | | |
| outstanding | | $ — | | $ — | | $ — | | $4,100,000 | | $24,900,000(6) | | $30,900,000 |
| Interest rate | | N/A | | N/A | | N/A | | 0.98% | | 0.98% | | 0.98% |
| (1) | Non-use fees are equal to a rate of 0.25% when the outstanding balance is below $65,000,000 and 0.15% when the outstanding balance is at least $65,000,000, but below $91,000,000. The outstanding balance will not be subject to the non-use fee when the amount outstanding is at least $91,000,000. |
| (2) | Non-use fees are equal to a rate of 0.25% when the outstanding balance is below $70,000,000 and 0.15% when the outstanding balance is at least $70,000,000, but below $98,000,000. The outstanding balance will not be subject to the non-use fee when the amount outstanding is at least $98,000,000. |
| (3) | Non-usage fee is waived if the outstanding balance on the facility is at least $8,400,000. |
| (4) | Non-usage fee is waived if the outstanding balance on the facility is at least $21,000,000. |
| (5) | Non-usage fee is waived if the outstanding balance on the facility is at least $31,500,000. |
| (6) | TPZ’s credit facility allows for interest rates to be fixed on all or a portion of the outstanding balance. Amounts reflect activity on the credit facility for the period from December 1, 2019 through May 31, 2020 and include $9,000,000 of the outstanding principal balance that has a fixed rate of 3.03% through June 30, 2023 and $15,000,000 of the outstanding principal balance that has a fixed rate of 3.04% through June 30, 2024. |
For the period from December 1, 2019 through April 2, 2020 (the date the agreement was terminated), TYG had a revolving credit facility with The Bank of Nova Scotia. The terms of the agreement provided for a $90,000,000 facility. Outstanding balances accrued interest at a variable rate equal to one-month LIBOR plus 1.20%. The average principal balance and interest rate during which this credit facility was utilized was approximately $62,200,000 and 2.83%, respectively.
Under the terms of the credit and margin facilities, the Funds must maintain asset coverage required under the 1940 Act. If a Fund fails to maintain the required coverage, it may be required to repay a portion of an outstanding balance until the coverage requirement has been met. At May 31, 2020, each Fund was in compliance with facility terms.
| |
| |
| 2020 2nd Quarter Report | May 31, 2020 |
| |
| Notes to Financial Statements (unaudited) (continued) |
| |
12. Derivative Financial Instruments
The Funds have adopted the disclosure provisions of FASB Accounting Standard Codification 815, Derivatives and Hedging (“ASC 815”). ASC 815 requires enhanced disclosures about the Funds’ use of and accounting for derivative instruments and the effect of derivative instruments on the Funds’ results of operations and financial position. Tabular disclosure regarding derivative fair value and gain/loss by contract type (e.g., interest rate contracts, foreign exchange contracts, credit contracts, etc.) is required and derivatives accounted for as hedging instruments under ASC 815 must be disclosed separately from those that do not qualify for hedge accounting. Even though the Funds may use derivatives in an attempt to achieve an economic hedge, the Funds’ derivatives are not accounted for as hedging instruments under ASC 815 because investment companies account for their derivatives at fair value and record any changes in fair value in current period earnings.
Forward Currency Contracts
TEAF invests in derivative instruments for hedging or risk management purposes, and for short-term purposes such as maintaining market exposure pending investment of the proceeds of an offering or transitioning its portfolio between different asset classes. The Fund’s use of derivatives could enhance or decrease the cash available to the Fund for payment of distributions or interest, as the case may be. Derivatives can be illiquid, may disproportionately increase losses and have a potentially large negative impact on the Fund’s performance. Derivative transactions, including options on securities and securities indices and other transactions in which the Fund may engage (such as forward currency transactions, futures contracts and options thereon and total return swaps), may subject the Fund to increased risk of principal loss due to unexpected movements in stock prices, changes in stock volatility levels, interest rates and foreign currency exchange rates and imperfect correlations between the Fund’s securities holdings and indices upon which derivative transactions are based. The Fund also will be subject to credit risk with respect to the counterparties to any OTC derivatives contracts the Fund enters into.
Interest Rate Swap Contracts
TYG and TPZ have each entered into interest rate swap contracts in an attempt to protect it from increasing interest expense on its leverage resulting from increasing interest rates. A decline in interest rates may result in a decline in the value of the swap contracts, which may result in a decline in the net assets of TYG and TPZ. At the time the interest rate swap contracts reach their scheduled termination, there is a risk that TYG and TPZ will not be able to obtain a replacement transaction, or that the terms of the replacement would not be as favorable as on the expiring transaction. In addition, if TYG or TPZ is required to terminate any swap contract early due to a decline in net assets below a threshold amount or failing to maintain a required 300% asset coverage of the liquidation value of the outstanding debt, then TYG or TPZ could be required to make a payment to the extent of any net unrealized depreciation of the terminated swaps, in addition to redeeming all or some of its outstanding debt. TYG and TPZ each segregate a portion of its assets as collateral for the amount of any net liability of its interest rate swap contracts.
TYG and TPZ are exposed to credit risk on the interest rate swap contracts if the counterparty should fail to perform under the terms of the interest rate swap contracts. The amount of credit risk is limited to the net appreciation of the interest rate swap contracts, if any, as no collateral is pledged by the counterparty. In addition, if the counterparty to the interest rate swap contracts defaults, the Fund would incur a loss in the amount of the receivable and would not receive amounts due from the counterparty to offset the interest payments on the Fund’s leverage.
The average notional amount of all open swap agreements for TYG and TPZ for the period from December 1, 2019 through May 31, 2020 was $10,000,000 and $3,000,000, respectively.
The following table presents TYG’s and TPZ’s interest rate swap contracts, each of which is subject to a netting agreement, on a gross and a net basis at May 31, 2020:
| | | | | | | | | | | | | | | | | Gross Amounts Not Offset in the | | | | | |
| | | | | | | | | | | | | | | | | Statement of Assets & Liabilities | | | | | |
| | | | | | | Gross Amounts | | Net Amounts of | | | | | | | | | | | |
| | Gross Amounts | | Offset in the | | Liabilities Presented in | | | | | | | | | | | |
| | of Recognized | | Statements of | | the Statements of | | Financial | | Cash Collateral | | | | | |
| Description | | Liabilities | | Assets & Liabilities | | Assets & Liabilities | | Instruments | | Received | | Net Amount |
| TYG: Interest Rate Swap Contracts | | | $ | 301,653 | | | | $ | — | | | | $ | 301,653 | | | $ | — | | $ | — | | | $ | 301,653 | |
| TPZ: Interest Rate Swap Contracts | | | $ | 13,292 | | | | $ | — | | | | $ | 13,292 | | | $ | — | | $ | — | | | $ | 13,292 | |
| |
| |
| |
| |
| Notes to Financial Statements (unaudited) (continued) |
| |
Written Call Options
Transactions in written option contracts for TYG, NTG, TTP, NDP and TEAF for the period from December 1, 2019 through May 31, 2020 are as follows:
| | TYG | | NTG | | TTP |
| | Number of | | | | | | Number of | | | | | | Number of | | | | |
| | Contracts | | Premium | | Contracts | | Premium | | Contracts | | Premium |
| Options outstanding at November 30, 2019 | | 3,700 | | | $ | 127,576 | | | 3,600 | | | $ | 115,174 | | | 5,043 | | | $ | 225,578 | |
| Options written | | 14,750 | | | | 122,200 | | | 12,380 | | | | 100,832 | | | 14,214 | | | | 544,579 | |
| Options closed* | | (1,053 | ) | | | (37,877 | ) | | (725 | ) | | | (26,079 | ) | | (13,940 | ) | | | (527,297 | ) |
| Options exercised | | (1,197 | ) | | | (52,056 | ) | | (825 | ) | | | (35,875 | ) | | (1,079 | ) | | | (52,886 | ) |
| Options expired | | (16,200 | ) | | | (159,843 | ) | | (14,430 | ) | | | (154,052 | ) | | (4,238 | ) | | | (189,974 | ) |
| Options outstanding at May 31, 2020 | | — | | | $ | — | | | — | | | $ | — | | | — | | | $ | — | |
| | | | | | | | | | | | | | | | | | | | | | |
| | NDP | | TEAF | | | | | | | |
| | Number of | | | | | | Number of | | | | | | | | | | | |
| | Contracts | | Premium | | Contracts | | Premium | | | | | | | |
| Options outstanding at November 30, 2019 | | 24,139 | | | $ | 534,008 | | | 17,184 | | | $ | 570,114 | | | | | | | | |
| Options written | | 82,077 | | | | 1,394,004 | | | 43,959 | | | | 1,179,049 | | | | | | | | |
| Options closed* | | (70,988 | ) | | | (1,390,773 | ) | | (28,767 | ) | | | (902,384 | ) | | | | | | | |
| Options exercised | | (16,616 | ) | | | (284,531 | ) | | (12,871 | ) | | | (231,091 | ) | | | | | | | |
| Options expired | | (18,612 | ) | | | (252,708 | ) | | (17,055 | ) | | | (553,775 | ) | | | | | | | |
| Options outstanding at May 31, 2020 | | — | | | $ | — | | | 2,450 | | | $ | 61,913 | | | | | | | | |
| * | The aggregate cost of closing written option contracts was $489,005 for TYG, $137,047 for NTG, $530,270 for TTP, $193,939 for NDP, and $583,202 for TEAF, resulting in net realized gain (loss) of $(99,170), $(68,280), $(2,974), $1,196,834 and $319,495 for TYG, NTG, TTP, NDP and TEAF, respectively. |
The following table presents the types and fair value of derivatives by location as presented on the Statements of Assets & Liabilities at May 31, 2020:
| | Assets/(Liabilities) | | | | |
| Derivatives not accounted for | | | | | | | | | | |
| as hedging instruments under ASC 815 | | Location | | Fair Value | | | | |
| TYG: Interest rate swap contracts | | Interest rate swap contracts | | $ | (301,653 | ) | | | | |
| TPZ: Interest rate swap contracts | | Interest rate swap contracts | | $ | (13,292 | ) | | | | |
| TEAF: Written equity call options | | Options written, at fair value | | $ | (184,656 | ) | | | | |
| | | | | | | |
| The following table presents the effect of derivatives on the Statements of Operations for the period ended May 31, 2020: |
| | | | | | | |
| | | | | | Net Unrealized |
| | | | Net Realized | | Appreciation |
| Derivatives not accounted for | | Location of Gains (Losses) | | Gain (Loss) on | | (Depreciation) |
| as hedging instruments under ASC 815 | | on Derivatives | | Derivatives | | of Derivatives |
| TYG: Interest rate swap contracts | | Interest rate swaps | | $ | (40,635 | ) | | $ | (139,813 | ) |
| TYG: Written equity call options | | Options | | $ | 220,140 | | | $ | (63,848 | ) |
| NTG: Written equity call options | | Options | | $ | 82,132 | | | $ | (69,929 | ) |
| TTP: Written equity call options | | Options | | $ | (379,817 | ) | | $ | (142,140 | ) |
| NDP: Written equity call options | | Options | | $ | 1,438,785 | | | $ | (354,660 | ) |
| TPZ: Interest rate swap contracts | | Interest rate swaps | | $ | (5,403 | ) | | $ | (4,703 | ) |
| TEAF: Written equity call options | | Options | | $ | 986,278 | | | $ | (404,791 | ) |
| |
| |
| 2020 2nd Quarter Report | May 31, 2020 |
| |
| Notes to Financial Statements (unaudited) (continued) |
| |
13. Basis For Consolidation
As of May 31, 2020, TYG has committed a total of $55,256,470 of equity funding to Tortoise Holdco II, LLC, a wholly-owned investment of TYG. Tortoise Holdco II, LLC wholly owns TK NYS Solar Holdco, LLC, which owns and operates renewable energy assets. TK NYS Solar Holdco, LLC acquired the commercial and industrial solar portfolio between August 2017 and November 2019. Fair value of TK NYS Solar Holdco, LLC is net of tax benefits.
TYG’s consolidated schedule of investments includes the portfolio holdings of the Fund and its subsidiary, Tortoise Holdco II, LLC. All inter-company transactions and balances have been eliminated.
As of May 31, 2020, TEAF has committed $44,452,523 to TEAF Solar Holdco, LLC, a wholly-owned investment of TEAF. TEAF Solar Holdco, LLC wholly owns each of Renewable Holdco, LLC and Renewable Holdco I, LLC, which owns and operates renewable energy assets. TEAF Solar Holdco, LLC owns a majority partnership interest in Renewable Holdco II, LLC. Renewable Holdco, LLC and Renewable Holdco II, LLC’s acquisition of the commercial and industrial solar portfolio is ongoing. Renewable Holdco I, LLC acquired the commercial and industrial solar portfolio in September 2019.
As of May 31, 2020, TEAF has provided $3,770,670 to TEAF Solar Holdco I, LLC, a wholly-owned investment of TEAF. TEAF Solar Holdco I, LLC has committed to $6,667,100 of debt funding to Saturn Solar Bermuda 1, Ltd. through a construction note. Under the terms of the note Tortoise Solar Holdco I, LLC receives cash payments monthly at an annual rate of 6%. As of May 31, 2020, $3,510,000 of the construction note had been funded.
TEAF’s consolidated schedule of investments includes the portfolio holdings of the Fund and its subsidiaries, TEAF Solar Holdco, LLC and TEAF Solar Holdco I, LLC. All inter-company transactions and balances have been eliminated.
14. Reverse Stock Split
On May 1, 2020, TYG, NTG, TTP, and NDP’s shares were adjusted to reflect a reverse stock split. The effect of this reverse stock split was to reduce the number of shares outstanding in the Funds, while maintaining each Fund’s and each stockholder’s aggregate net asset value. All historical per share information has been retroactively adjusted to reflect this reverse stock split. Set forth below are details regarding the reverse stock splits:
| | | | Net Asset Value | | Net Asset Value | | Shares Outstanding | | Shares Outstanding |
| Fund | | Rate | | Before Split | | After Split | | Before Split | | After Split |
| TYG | | 1-for-4 | | $5.64 | | $22.56 | | 53,732,462 | | | 13,433,117 | |
| NTG | | 1-for-10 | | $2.32 | | $23.20 | | 63,208,377 | | | 6,320,839 | |
| TTP | | 1-for-4 | | $4.77 | | $19.08 | | 10,016,413 | | | 2,504,104 | |
| NDP | | 1-for-8 | | $1.98 | | $15.84 | | 14,767,968 | | | 1,845,997 | |
15. Subsequent Events
As of the date these financial statements were issued, the outbreak of the novel coronavirus (“COVID-19”) in many countries continues to adversely impact global commercial activity, and has contributed to significant volatility in financial markets. The global impact of the outbreak has been rapidly evolving, and as cases of the virus have continued to be identified in additional countries, many countries have reacted by instituting quarantines and restrictions on travel. Such measures, as well as the general uncertainty surrounding the dangers and impact of COVID-19, are creating significant disruption in supply chains and economic activity. The outbreak could have a continued adverse impact on economic and market conditions. The rapid development and fluidity of this situation precludes any prediction as to the ultimate adverse impact of COVID-19. Nevertheless, COVID-19 presents material uncertainty and risk with respect to our and our portfolio companies performance and financial results.
TYG:
On June 12, 2020, TYG entered into an amendment to its credit agreement, reducing the capacity of the facility to $90,000,000.
TYG has performed an evaluation of subsequent events through the date the financial statements were issued and has determined that no additional items require recognition or disclosure.
NTG:
On June 22, 2020, NTG entered into an amendment to its credit agreement, reducing the capacity of the facility to $65,000,000.
NTG has performed an evaluation of subsequent events through the date the financial statements were issued and has determined that no additional items require recognition or disclosure.
| |
| |
| |
| |
| Notes to Financial Statements (unaudited) (continued) |
| |
TTP:
TTP has performed an evaluation of subsequent events through the date the financial statements were issued and has determined that no items require recognition or disclosure.
NDP:
NDP has performed an evaluation of subsequent events through the date the financial statements were issued and has determined that no items require recognition or disclosure.
TPZ:
On June 30, 2020, TPZ paid a distribution in the amount of $0.05 per common share, for a total of $347,567. Of this total, the dividend reinvestment amounted to $3,900.
TPZ has performed an evaluation of subsequent events through the date the financial statements were issued and has determined that no additional items require recognition or disclosure.
TEAF:
On June 30, 2020, TEAF paid a distribution in the amount of $0.075 per common share, for a total of $1,011,835. Of this total, the dividend reinvestment amounted to $68,123.
TEAF has performed an evaluation of subsequent events through the date the financial statements were issued and has determined that no additional items require recognition or disclosure.
| |
| |
| 2020 2nd Quarter Report | May 31, 2020 |
| |
| Additional Information (unaudited) |
| |
Director and Officer Compensation
The Funds do not compensate any of its directors who are “interested persons,” as defined in Section 2(a)(19) of the 1940 Act, nor any of its officers. For the period from December 1, 2019 through May 31, 2020, the aggregate compensation paid by the Funds to the independent directors was as follows:
| TYG | | NTG | | TTP | | NDP | | TPZ | | TEAF |
| $77,667 | | $73,067 | | $58,067 | | $57,067 | | $55,067 | | $43,067 |
The Funds did not pay any special compensation to any of its directors or officers.
Forward-Looking Statements
This report contains “forward-looking statements” within the meaning of the 1933 Act and the Securities Exchange Act of 1934, as amended. By their nature, all forward-looking statements involve risks and uncertainties, and actual results could differ materially from those contemplated by the forward-looking statements. Several factors that could materially affect each Fund’s actual results are the performance of the portfolio of investments held by it, the conditions in the U.S. and international financial, petroleum and other markets, the price at which shares of each Fund will trade in the public markets and other factors discussed in filings with the Securities and Exchange Commission (SEC).
Proxy Voting Policies
A description of the policies and procedures that each Fund uses to determine how to vote proxies relating to portfolio securities owned by the Fund and information regarding how each Fund voted proxies relating to the portfolio of securities during the 12-month period ended June 30, 2019 are available to stockholders (i) without charge, upon request by calling the Adviser at (913) 981-1020 or toll-free at (866) 362-9331 and on or through the Adviser’s Web site at www.tortoiseadvisors.com; and (ii) on the SEC’s Web site at www.sec.gov.
Form N-PORT
Each Fund files its complete schedule of portfolio holdings for the first and third quarters of each fiscal year with the SEC on Form N-PORT. Each Fund’s Part F of Form N-PORT is available without charge upon request by calling the Adviser at (866) 362-9331 or by visiting the SEC’s Web site at www.sec.gov.
Each Fund’s Part F of Form N-PORT is also available through the Adviser’s Web site at www.tortoiseadvisors.com.
Statement of Additional Information
The Statement of Additional Information (“SAI”) includes additional information about each Fund’s directors and is available upon request without charge by calling the Adviser at (866) 362-9331 or by visiting the SEC’s Web site at www.sec.gov.
Certifications
Each Fund’s Chief Executive Officer has submitted to the New York Stock Exchange the annual CEO certification as required by Section 303A.12(a) of the NYSE Listed Company Manual.
Each Fund has filed with the SEC, as an exhibit to its most recently filed Form N-CSR, the certification of its Chief Executive Officer and Principal Financial Officer required by Section 302 of the Sarbanes-Oxley Act.
Privacy Policy
In order to conduct its business, each Fund collects and maintains certain nonpublic personal information about its stockholders of record with respect to their transactions in shares of each Fund’s securities. This information includes the stockholder’s address, tax identification or Social Security number, share balances, and distribution elections. We do not collect or maintain personal information about stockholders whose share balances of our securities are held in “street name” by a financial institution such as a bank or broker.
We do not disclose any nonpublic personal information about you, the Funds’ other stockholders or the Funds’ former stockholders to third parties unless necessary to process a transaction, service an account, or as otherwise permitted by law.
To protect your personal information internally, we restrict access to nonpublic personal information about the Funds’ stockholders to those employees who need to know that information to provide services to our stockholders. We also maintain certain other safeguards to protect your nonpublic personal information.
Repurchase Disclosure
Notice is hereby given in accordance with Section 23(c) of the 1940 Act, that each Fund may from time to time purchase shares of its common stock in the open market.
Office of the Company
and of the Investment Adviser
Tortoise Capital Advisors, L.L.C.
5100 W. 115th Place
Leawood, Kan. 66211
(913) 981-1020
(913) 981-1021 (fax)
www.tortoiseadvisors.com Board of Directors of
Tortoise Energy Infrastructure Corp.
Tortoise Midstream Energy Fund, Inc.
Tortoise Pipeline & Energy Fund, Inc.
Tortoise Energy Independence Fund, Inc.
Tortoise Power and Energy Infrastructure Fund, Inc.
Tortoise Essential Assets Income Term Fund H. Kevin Birzer, Chairman
Tortoise Capital Advisors, L.L.C. Rand C. Berney
Independent Conrad S. Ciccotello
Independent Alexandra Herger
Independent Jennifer Paquette
Independent | | Administrator
U.S. Bancorp Fund Services, LLC
615 East Michigan St.
Milwaukee, Wis. 53202 Custodian
U.S. Bank, N.A.
1555 North Rivercenter Drive, Suite 302
Milwaukee, Wis. 53212 Transfer, Dividend Disbursing
and Reinvestment Agent
Computershare Trust Company, N.A. /
Computershare Inc.
P.O. Box 30170
College Station, Tex. 77842-3170
(800) 426-5523
www.computershare.com Legal Counsel
Husch Blackwell LLP
4801 Main St.
Kansas City, Mo. 64112 Investor Relations
(866) 362-9331
info@tortoiseadvisors.com Stock Symbols
Listed NYSE Symbols: TYG, NTG, TTP, NDP, TPZ, TEAF This report is for stockholder information. This is not a prospectus intended for use in the purchase or sale of fund shares. Past performance is no guarantee of future results and your investment may be worth more or less at the time you sell. |
 |
| |
5100 W. 115th Place |
Leawood, KS 66211 |
| |
www.tortoiseadvisors.com |
Not applicable for semi-annual reports.
Not applicable for semi-annual reports.
Not applicable for semi-annual reports.
Not applicable for semi-annual reports.
Not applicable for semi-annual reports.
Effective March 20, 2020, Brett Jergens and Adam Peltzer are no longer portfolio managers for the Registrant. There have been no other changes to the portfolio managers identified in response to this Item in the Registrant’s most recent annual report on Form N-CSR.
None.
(a) The Registrant’s Chief Executive Officer, Principal Financial Officer and Treasurer has concluded that the Registrant's disclosure controls and procedures (as defined in Rule 30a-3(c) under the Investment Company Act of 1940 (the “1940 Act”)) are effective as of a date within 90 days of the filing date of this report, based on the evaluation of these controls and procedures required by Rule 30a-3(b) under the 1940 Act and Rules 13a-15(b) or 15d-15(b) under the Securities Exchange Act of 1934, as amended.
(b) There were no changes in the Registrant’s internal control over financial reporting (as defined in Rule 30a-3(d) under the 1940 Act) that occurred during the period covered by this report that have materially affected, or are reasonably likely to materially affect, the Registrant’s internal control over financial reporting.
The Registrant does not participate in securities lending activities.
Pursuant to the requirements of the Securities Exchange Act of 1934 and the Investment Company Act of 1940, the Registrant has duly caused this report to be signed on its behalf by the undersigned, thereunto duly authorized.
Pursuant to the requirements of the Securities Exchange Act of 1934 and the Investment Company Act of 1940, this report has been signed below by the following persons on behalf of the Registrant and in the capacities and on the dates indicated.