UNITED STATES
SECURITIES AND EXCHANGE COMMISSION
Washington, D.C. 20549
FORM N-CSR
CERTIFIED SHAREHOLDER REPORT OF REGISTERED
MANAGEMENT INVESTMENT COMPANIES
Investment Company Act file number 811-22106
Tortoise Power and Energy Infrastructure Fund, Inc.
(Exact name of registrant as specified in charter)
6363 College Boulevard, Suite 100A, Overland Park, KS 66211
(Address of principal executive offices) (Zip code)
P. Bradley Adams
Diane Bono
6363 College Boulevard, Suite 100A, Overland Park, KS 66211
(Name and address of agent for service)
913-981-1020
Registrant's telephone number, including area code
Date of fiscal year end: November 30
Date of reporting period: May 31, 2022
Item 1. Report to Stockholders.
(a) The report to Shareholders is attached herewithin.

Semi-Annual Report | May 31, 2022
2022 Semi-Annual Report
Closed-End Funds

| |
| |
| |
| |
| Tortoise |
| 2022 Semi-Annual Report to Stockholders |
| |
This combined report provides you with a comprehensive review of our funds that span essential assets.
| | | | | | | |
| Table of contents |
| | | | | | | |
| Closed-end Fund Comparison | 1 | | TPZ: | Fund Focus | 18 | |
| Letter to Stockholders | 2 | | TEAF: | Fund Focus | 21 | |
| TYG: | Fund Focus | 6 | | Financial Statements | 25 | |
| NTG: | Fund Focus | 9 | | Notes to Financial Statements | 62 | |
| TTP: | Fund Focus | 12 | | Additional Information | 79 | |
| NDP: | Fund Focus | 15 | | | | | |
| |
| TTP and TPZ distribution policies |
Tortoise Pipeline & Energy Fund, Inc. (“TTP”) and Tortoise Power and Energy Infrastructure Fund, Inc. (“TPZ”) are relying on exemptive relief permitting them to make long-term capital gain distributions throughout the year. Each of TTP and TPZ, with approval of its Board of Directors (the “Board”), has adopted a managed distribution policy (the “Policy”). Annual distribution amounts are expected to fall in the range of 7% to 10% of the average week-ending net asset value (“NAV”) per share for the prior fiscal semi-annual period. In accordance with its Policy, TTP distributes a fixed amount per common share, currently $.59, each quarter to its common shareholders. TPZ distributes a fixed amount per common share, currently $.105, each month to its common shareholders. Prior to February 2022, the monthly distribution rate was $.06. These amounts are subject to change from time to time at the discretion of the Board. Although the level of distributions is independent of TTP’s and TPZ’s performance, TTP and TPZ expect such distributions to correlate with its performance over time. Each quarterly and monthly distribution to shareholders is expected to be at the fixed amount established by the Board, except for extraordinary distributions in light of TTP’s and TPZ’s performance for the entire calendar year and to enable TTP and TPZ to comply with the distribution requirements imposed by the Internal Revenue Code. The Board may amend, suspend or terminate the Policy without prior notice to shareholders if it deems such action to be in the best interests of TTP, TPZ and their respective shareholders. For example, the Board might take such action if the Policy had the effect of shrinking TTP’s or TPZ’s assets to a level that was determined to be detrimental to TTP or TPZ shareholders. The suspension or termination of the Policy could have the effect of creating a trading discount (if TTP’s or TPZ’s stock is trading at or above net asset value), widening an existing trading discount, or decreasing an existing premium. You should not draw any conclusions about TTP’s or TPZ’s investment performance from the amount of the distribution or from the terms of TTP’s or TPZ’s distribution policy. Each of TTP and TPZ estimates that it has distributed more than its income and net realized capital gains; therefore, a portion of your distribution may be a return of capital. A return of capital may occur, for example, when some or all of the money that you invested in TTP or TPZ is paid back to you. A return of capital distribution does not necessarily reflect TTP’s or TPZ’s investment performance and should not be confused with “yield” or “income.” The amounts and sources of distributions reported are only estimates and are not being provided for tax reporting purposes. The actual amounts and sources of the amounts for tax reporting purposes will depend upon TTP’s and TPZ’s investment experience during their fiscal year and may be subject to changes based on tax regulations. TTP and TPZ will send you a Form 1099-DIV for the calendar year that will tell you how to report these distributions for federal income tax purposes.
| |
| |
| 2022 Semi-Annual Report | May 31, 2022 |
| |
| Closed-end Fund Comparison |
| | Name/Ticker | | Primary
focus | | Structure | | Total assets
($ millions)1 | | Portfolio mix
by asset type(1) | | Portfolio mix
by structure1 |
 | | Tortoise Energy
Infrastructure Corp. NYSE: TYG
Inception: 2/2004 | | Energy
Infrastructure | | C-corp(2) | | $640.3 | | 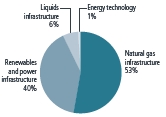 | | 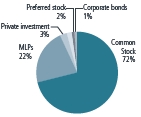 |
| Tortoise Midstream
Energy Fund, Inc. NYSE: NTG
Inception: 7/2010 | | Natural Gas
Infrastructure | | C-corp(2) | | $328.5 | | 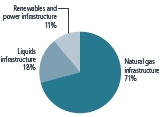 | | 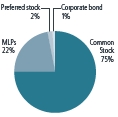 |
| | Tortoise Pipeline
& Energy Fund, Inc. NYSE: TTP
Inception: 10/2011 | | North
American
pipeline
companies | | Regulated
investment
company | | $100.9 | | 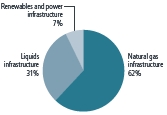 | | 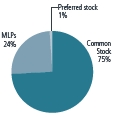 |
 | | Tortoise Energy
Independence
Fund, Inc.NYSE: NDP
Inception: 7/2012 | | North
American
oil & gas
producers | | Regulated
investment
company | | $75.3 | | 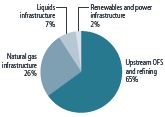 | | 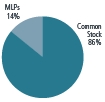 |
 | | Tortoise Power
and Energy
Infrastructure
Fund, Inc. NYSE: TPZ
Inception: 7/2009 | | Power
& energy
infrastructure
companies
(Fixed income
& equity) | | Regulated
investment
company | | $132.9 | | 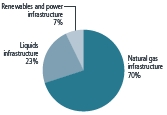 | | 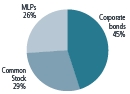 |
 | | Ecofin Sustainable
and Social Impact
Term Fund NYSE: TEAF
Inception: 3/2019 | | Essential
assets | | Regulated
investment
company | | $264.3 | |  | |  |
| (1) | As of 5/31/2022 |
| (2) | TYG and NTG intend to qualify as regulated investment companies. See Note 2.E. to the financial statements for further disclosure. |
| |
| |
| |
| |
| Tortoise |
| 2022 Semi-Annual Report to closed-end fund stockholders |
| |
Dear stockholder
The first half of the 2022 fiscal year has proven to be a volatile environment with numerous headwinds for the broad market, including the renewable energy sector. Headwinds included recessionary concerns, rising inflation, as well as the anticipation of higher interest rates. The broad energy sector was an outlier with continued positive performance during the six-month period, although the sector pulled back significantly in June, following the fiscal period. Our social impact investments continued to improve post-COVID with educational facilities providing a stable environment for the first time since lockdown and senior living facilities seeing a recovery in occupancy rates.
Energy and power infrastructure
The broad energy sector, as represented by the S&P Energy Select Sector® Index returned 63.5% for the fiscal semi-annual period. After a strong start to the year, energy sold off along with the broader market on concerns about a looming recession. Concerns around energy security persisted, exacerbated by the impacts of the war in Ukraine and tightening global energy supply as demand rebounds post-COVID. Global underinvestment resulting from environmental, social and governance (ESG) commitments and energy transition is likely to keep global stock balances extremely tight for the foreseeable future, a dynamic that presents higher, but perhaps more volatile prices.
Despite higher commodity prices, global supply has not responded. OPEC+ production has continually undershot pledged production due to prolonged oil and gas underinvestment and rapidly shut-in production in 2020. The lack of supply coming to market is complicating assessments over the actual amount of OPEC spare capacity. Spare capacity is critical as it guards against prices rapidly rising should a market exogenous event occur. In addition to OPEC’s troubles, sanctions around exports of Russian energy started to take effect during the quarter. Russian volumes are projected to decline and/or face longer transit times to their end market. Given these disruptions, the focus has remained on the supply side of the equation. On the demand side, the scarcity of commodities comes at a time when the world is entering summer, or peak demand season. Global inventories continued to draw and are well below their 5-year averages to be drawn upon.
Global supply scarcity has created a renewed opportunity for short-cycle North American energy. U.S. oil production crossed 12 million (mm) barrels per day (b/d), a level not seen since April 2020. For 2022, the Energy Information Agency (EIA) forecasts that production will increase 1 mm b/d to 12.6 mm b/d, up from 11.6 mm b/d at the end of 2021. By the end of 2023, the EIA forecasts U.S. production growing to 13.4 mm b/d. The Permian, America’s biggest oil field, is expected to be the primary driver of production growth. During the second quarter, production within the basin surged to all-time highs of 5.2 mm b/d. Private operators continue to increase activity while major integrated energy companies have announced intentions to increase their production by 10-25%.
Transitioning to natural gas, the Russia-Ukraine conflict presents a large opportunity for U.S. liquefied natural gas (LNG). Entering 2022, Russian natural gas exports to Europe accounted for 13-15 billion cubic feet per day (Bcf/d) or 35-40% of the EU’s gas supply. With energy security a higher priority and low natural gas inventories, Europe has turned to U.S. LNG. During the first four months of 2022, the European Union (EU) accounted for 74% of total U.S. LNG exports per the EIA. The U.S. LNG market, while young, has grown from zero market share to the top export market in just over seven years. Throughout 2022, LNG exporters have contracted almost 5 Bcf/d of new contracts, signing 15-25-year contracts with European and Asian counterparties.
The midstream energy sector, represented by the Tortoise North American Pipeline IndexSM, returned 30.6% for the period. Investor sentiment rebounded with positive retail flows coupled with companies buying back stock in the open market. Beyond the constructive technical setup, we believe midstream serves as a hedge to many current risks investors face. Rising rates, inflation, higher commodity prices, and energy security all are key macro factors which could drive the global economy into recession.
It is important to note that a recession does not necessarily equate to a dip in energy demand. While there were several recessions in the last 40 years, energy demand increased in 38 out of the last 40 years (excluding 2008 and 2020). If any sector were to hold up in a near-term recession, we believe it would be energy. The world remains undersupplied in energy, we believe sector balance sheets are in much better shape than in past recessions including 2001, 2008, and 2020 and in our opinion, energy is the one part of the market where earnings have grown at an accelerated rate.
With inflation surging to 40-year highs, midstream can provide inflation protection. Pipelines typically have long-term contracts with inflation protection from regulated tariff escalators. Additionally, tariffs on regulated liquid pipelines often include an inflation escalator aligned with the Producer Price Index (PPI). Federal Energy Regulatory Commission (FERC) indexing could be a material driver of cash flows with rates potentially increasing over 13% next summer on top of an 8.7% increase already going into effect July 1, 2022.
Interest rates rose significantly in the first half of 2022 as the Federal Reserve took a more hawkish approach and started raising the Fed Funds rate. Midstream energy has displayed strong historical returns in rising rate environments. In the 15 time periods of rising rates since 2001, midstream energy, represented by the Tortoise North American Pipeline IndexSM, returned an average return of 8.5%, compared to a S&P 500 average return of 7.4%, and bond return of -1.9% represented by the Bloomberg Barclays U.S. Aggregate Bond Index.
Higher commodity prices are positive as midstream companies should expect more volumes flowing through pipeline systems. We expect the balanced return of capital story to continue for investors via debt reduction, share buybacks and increased distributions. The other use of capital has been mergers and acquisitions (M&A). In the first half
| |
| |
| 2022 Semi-Annual Report | May 31, 2022 |
| |
| |
| |
of 2022, there were several accretive bolt-on acquisitions of private assets completed by larger energy infrastructure companies. These assets expand the footprint of company existing assets and help operators keep volumes on systems across their value chains.
With energy supply short and energy security concerns emerging globally, investors are reminded how critical energy infrastructure is to daily life. Even before the Ukraine conflict, U.S. LNG cargoes were rapidly replenishing Europe’s low gas storage levels via LNG tankers. LPGs (liquid petroleum gases) were being exported to India and China, where demand is driven by global population growth and improvements in living standards. Whether it’s LNG, LPG, or crude oil, U.S. energy infrastructure companies have been signing long-term contracts and exporting energy all around the world.
On the regulatory front, it was a mixed quarter of news flow. Demand for low-cost U.S. natural gas created a need for additional natural gas pipelines and LNG export terminals. In the northeast Marcellus Basin, pipeline infrastructure is constrained. Despite this need, the one major pipeline which continues to be under construction is the Mountain Valley Pipeline (MVP). During the first half of 2022, the U.S. Court of Appeals for the Fourth Circuit overturned federal approval of a forest-crossing permit. Seeing the setback with MVP, companies are doing what they can to avoid the red-tape that comes with building new pipelines. For example, one company announced that its pipeline expansion will increase the mainline capacity from 2 billion cubic feet per day (Bcf/d) to 2.5 Bcf/d through the planned installation of three new compressor stations. Adding compression stations, for example, can help avoid the exhaustive permitting process affiliated with building new pipelines.
Sustainable infrastructure
Renewable energy
The beginning of the year has proven to be a volatile environment with numerous headwinds for the renewable sector. Europe’s accelerated pace in reducing fossil fuel generation, led by Germany’s decision to phase out nuclear and coal power plants, left the market highly dependent on Russian gas. In addition, French nuclear plants have faced unscheduled stops due to cracks and hydroelectric plants have been forced to operate at reduced levels due to poor hydro resources. The European power market was therefore tight. The Russian invasion of Ukraine then added geopolitical uncertainties to gas supply. Putting all these issues together, power prices across Europe have risen multiple times in the past 12 months. Supply constraints in global LNG and coal have had a spilling effect on power prices across the world as well.
Companies participating in the energy transition tend to benefit at the margin from higher power prices in the short-term. More importantly, higher fossil-fuel power prices highlight the imbedded value in operating renewables assets as well as in the renewables development pipeline providing affordable and stable power prices. On balance, we expect the events surrounding the invasion of Ukraine to result in a material acceleration of the energy transition.
High inflation and higher interest rates expectations, first in the U.S. and then in Europe, unnerved investors. As such, the companies in our investment universe couldn’t escape these fears even if their secular growth remains intact. However, unlike the broader market, earnings expectations for the majority of our portfolio companies have been revised up as a consequence of rising power prices and better renewables resources. In short, if anything, the fundamentals for the portfolio improved but concerns at the macro level and potential political intervention in some energy markets have been powerful headwinds.
In the midst of turbulence relating to supply chains, inflation, interest rates and geopolitics, the investment team remains focused on identifying long-term beneficiaries of the secular trends within the four master themes of the investment universe. In the medium term, inflation means higher electricity prices which is a material positive tailwind for the renewables sector. We would expect increased demand for renewable power purchase agreements (PPAs) at higher prices and longer tenors than we have seen in the past years.
We also expect an acceleration in renewables development activity as countries and companies want to ensure their security of supply at a predictable price. The macro environment remains a source of potential stress as inflation, interest rates, supply chain disruption and geopolitical tensions create a much tougher asset development environment for the companies we invest in. It is a supply issue and not a demand issue: as much as demand for renewables is strong and developers have pricing power, the industry is experiencing delays coming from bottlenecks (slow permitting process, equipment availability, shipping disruption). In the near-term, the elevated merchant power prices, higher contract prices and better generation volumes should more than offset all these issues and we expect 2022 to be a record year for most companies. At a time when the broader economy is affected by growth concerns and margin pressure, the secular growth in renewables and visibility on cash flows they provide become more sought-after attributes.
Waste transition
While the number of new projects under development in the waste transition sector continues to grow, bringing these projects to a financial closing remained challenging during the six-month period, largely due to continuing inflationary pressures and supply chain constraints. The result is an unusually large number of projects being delayed as developers re-evaluate elevated project construction budgets and their impact on pro-forma operating profitability.
The inflationary and supply chain impacts are three-fold. First, an increase in raw material prices for items such as steel has ballooned cost estimates for these capital-intensive projects. Second, the availability of critical equipment and systems components has been limited by supply-chain constraints, which has caused both price increases and delivery-time delays. Third, contractors that guarantee on-time and on-budget construction are demanding higher
premiums to offset against the potential for further price inflation and delivery-time delays. The combination of these issues — inflation, scarcity, and uncertainty — are leading to project cost increases of 25% or more in many cases.
In addition, development of renewable fuels projects was also adversely impacted by declining fuel credit prices, which generate a substantial portion of the pro-forma revenues for renewable fuels projects. In particular, projects being developed to produce renewable natural gas, renewable diesel, and sustainable aviation fuel saw significant declines in Federal Renewable Identification Number (or RIN) pricing and California Low Carbon Fuel Standard (or LCFS) pricing.
Regarding RIN pricing, D3 RINs, which support projects that convert cellulosic waste into renewable fuels, declined from $3.72 at end of 2021 to $3.30 at the end of the first quarter of 2022, a decline of more than 11%. During the same period, LCFS credits declined from $150 to $121, a decline of more than 19%. Fuel credit prices are expected to stabilize as the U.S. economy continues to recover toward full capacity, which would include higher demand for transportation fuels, and therefore higher demand for offset credits.
Finally, a milestone achievement in terms of recycling efforts occurred in early March 2022, when 175 member-states of the United Nations Environment Assembly signed a resolution to establish a legally-binding treaty on the design, production, and disposal of petroleum-based plastics by the end of 2024. The so called Global Plastics Treaty is intended to dramatically reduce the amount of plastics waste for a more circular economy, and is being hailed as the most significant multilateral agreement since the Paris Agreement on Climate Change in 2015. Absent any coordinated effort, the production of plastics is expected to double by 2040, after already doubling since 2000.
Despite the challenging environment in terms of rising construction costs and lower fuel credit prices, the number of new projects planned or under development in the waste transition sector continues to grow and is at all-time high levels in many sub-sectors, as the demand for renewable or recycled content remains strong.
Social impact
Education
The public bond market for new issuance of K-12 charter school and private school revenue bonds in Q1 2022 was $532,995,000, a 6.1% decrease from the same period in 2021.1 One of the primary factors driving the 28.4% market growth for K-12 charter school and private school bonds in 2021 were more than $60 billion in municipal bond fund inflows, the most ever in a single year.
Robust new issuance in first quarter, despite municipal bond fund outflows exceeding $30 billion and an increase of 96 bps in the 30-yr Municipal Market Data tax-exempt bond benchmark, is a clear indicator that schools’ demand for reliable facility finance remains high, even in the face of significant market headwinds.2
The beginning of the calendar year provided students, parents and schools with a degree of stability and normalcy not seen since widespread lockdowns were put into place in March 2020. Fears the COVID-19 Omicron variant would surge, overwhelm schools and then force a return to remote learning proved unfounded. In January, more than 60% of the nation’s K-12 school districts mandated the use of masks for all students & teachers. By the end of March, that number had fallen to less than 5%. Schools not offering in-person instruction peaked at 7,463 on January 10th, falling to 345 by March 28, 2022.3
Not all of the news from the K-12 sector was as positive. The Brookings Institution reported in March that “schools have faced severe staff shortages, high rates of absenteeism and quarantines, and rolling school closures. Furthermore, students and educators continue to struggle with mental health challenges, higher rates of violence and misbehavior, and concerns about lost instructional time.”4 A recent working paper published by the Annenberg Institute stated drops in academic achievement “are significantly larger than estimated impacts from other large-school disruptions, such as after Hurricane Katrina.” It also noted, “income-based (academic achievement) gaps have indeed expanded substantively during the COVID-19 pandemic.”5
While achieving the unprecedented highs of 2021 seems unlikely, Ecofin believes the market for K-12 charter school and private school revenue bonds will remain strong. Rising interest rates and the likelihood of resulting municipal bond fund outflows should increase the number and quality of school facility funding opportunities available to investors highly focused on this segment of the market.
Senior Living
In the first quarter of 2022, the senior living industry continued its occupancy rebound after having established a “bottom” in occupancy deterioration about a year ago. Statistically, nationwide occupancy for independent living and assisted living is 83.1% and 77.9%, respectively. Occupancy has increased 1.4% for independent and 3.7% for assisted living from pandemic lows.6 Moreover, absorption is robust after Q3 2021 set the highest level ever recorded at more than 4 times the pace of absorption pre-pandemic. While there’s clearly ground to cover, it’s revitalizing to see the industry making strides to get back to pre-pandemic levels of 89.7% and 84.6% for independent and assisted living, respectively.
| |
| |
| 2022 Semi-Annual Report | May 31, 2022 |
| |
| |
| |
According to a recent NIC Lending Trends Report, construction lending dramatically increased in the third quarter of 2021, up 45% quarter over quarter on a same store basis. After over a year of slowing construction starts, this shows a significant reversal and renewed developer optimism especially in the face of rising construction costs and material shortages. That said, the pandemic related slowdown in new construction should help existing communities regain occupancy with the lowest inventory growth recorded since 2013.
From now until 2030, an average of 10,000 baby boomers will turn 65 every day.7 With the combination of occupancy on the rise, we remain confident in the senior living industry’s ability to rebound and prepare for the upcoming “Silver Tsunami” as the population continues to age.
Concluding thoughts
A renewed focus on energy security and independence should be a tailwind for the broad energy sector, particularly energy infrastructure as investors are reminded of its critical place in their daily lives and this should also benefit much of the energy transition universe. We expect improvement in renewables as 2021 was affected by poor wind speed hydro resources across the globe and many companies’ generation volumes were below normal. These renewables resources tend to normalize to long-term averages over time and we are seeing stronger volumes of electricity generation in the first few months of the year that we expect to continue. Our opportunities for investing in social impact projects are expanding for many reasons, primarily as our sectors continue to see robust growth and competing financing providers are forced to scale back allocations.
The S&P Energy Select Sector® Index is a capitalization-weighted index of S&P 500® Index companies in the energy sector involved in the development or production of energy products. The Tortoise North American Pipeline IndexSM is a float adjusted, capitalization-weighted index of energy pipeline companies domiciled in the United States and Canada. The Tortoise MLP Index® is a float-adjusted, capitalization-weighted index of energy master limited partnerships.
The Tortoise indices are the exclusive property of Tortoise Index Solutions, LLC, which has contracted with S&P Opco, LLC (a subsidiary of S&P Dow Jones Indices LLC) to calculate and maintain the Tortoise MLP Index® and Tortoise North American Pipeline IndexSM (the “Indices”). The Indices are not sponsored by S&P Dow Jones Indices or its affiliates or its third party licensors (collectively, “S&P Dow Jones Indices LLC”). S&P Dow Jones Indices will not be liable for any errors or omission in calculating the Indices. “Calculated by S&P Dow Jones Indices” and its related stylized mark(s) are service marks of S&P Dow Jones Indices and have been licensed for use by Tortoise Index Solutions, LLC and its affiliates. S&P® is a registered trademark of Standard & Poor’s Financial Services LLC (“SPFS”), and Dow Jones® is a registered trademark of Dow Jones Trademark Holdings LLC (“Dow Jones”).
It is not possible to invest directly in an index.
Performance data quoted represent past performance; past performance does not guarantee future results. Like any other stock, total return and market value will fluctuate so that an investment, when sold, may be worth more or less than its original cost.
| 1 | EMMA & MuniOS |
| 2 | Bloomberg |
| 3 | https://about.burbio.com/school-mask-policies-by-state/ |
| 4 | https://www.brookings.edu/blog/brown-center-chalkboard/2022/03/03/ the-pandemic-has-had-devastating-impacts-on-learning-what-will-it-taketo-help-students-catch-up/ |
| 5 | https://edworkingpapers.com/sites/default/files/ai22-521.pdf |
| 6 | NIC |
| 7 | census.gov |
| |
| |
| |
| |
| Tortoise |
| Energy Infrastructure Corp. (TYG) |
| |
Fund description
TYG seeks a high level of total return with an emphasis on current distributions paid to stockholders. TYG invests primarily in equity securities in energy infrastructure companies. The fund is positioned to benefit from growing energy demand and accelerated efforts to reduce global CO2 emissions in energy production. Energy infrastructure companies generate, transport and distribute electricity, as well as process, store, distribute and market natural gas, natural gas liquids, refined products and crude oil.
Management’s discussion of fund performance
The midstream energy sector had strong performance for the period. Investor sentiment rebounded with positive retail flows coupled with companies buying back stock in the open market. Beyond the constructive technical setup, we believe midstream serves as a hedge to many current risks investors face. Rising rates, inflation, higher commodity prices, and energy security all are key macro factors that could drive the global economy into recession. Since the fund’s inception, it has paid out more than $147 in cumulative distributions to stockholders. The fund’s market-based and NAV-based returns for the fiscal period ending May 31, 2022 were 26.5 and 20.9%, respectively (including the reinvestment of distributions). The Tortoise MLP Index® returned 31.8% during the same period.
| 2022 mid-fiscal year summary | | |
| Distributions paid per share | | $0.7100 |
| Distribution rate (as of 5/31/2022) | | 8.4% |
| Quarter-over-quarter distribution increase (decrease) | | 0.0% |
| Year-over-year distribution increase (decrease) | | 93.2% |
| Cumulative distributions paid per share to | | |
| stockholders since inception in February 2004 | | $39.5875(1) |
| Market-based total return | | 29.5% |
| NAV-based total return | | 23.8% |
| Premium (discount) to NAV (as of 5/31/2022) | | (18.0)% |
| (1) | Distribution per share is unadjusted for the impact of reverse stock split. |
Key asset performance drivers
| Top five contributors | | Company type |
| Williams Companies, Inc. | | Natural gas pipelines company |
| Targa Resources Corp. | | Natural gas pipeline company |
| Energy Transfer LP | | Natural gas pipeline company |
| Western Midstream Partners LP | | Gathering & processing company |
| American Electric Power Company Inc. | | Power company |
| | | |
| Bottom five contributors | | Company type |
| NextEra Energy Partners | | Diversified infrastructure company |
| Atlantica Sustainable Infrastructure PLC | | Power company |
| ESS Tech Inc. | | Energy storage company |
| Clearway Energy, Inc. | | Diversified infrastructure company |
| NextEra Energy Inc. | | Diversified infrastructure company |
Unlike the fund return, index return is pre-expenses and taxes.
Performance data quoted represent past performance; past performance does not guarantee future results. Like any other stock, total return and market value will fluctuate so that an investment, when sold, may be worth more or less than its original cost. Portfolio composition is subject to change due to ongoing management of the fund. References to specific securities or sectors should not be construed as a recommendation by the fund or its adviser. See Schedule of Investments for portfolio weighting at the end of the fiscal quarter.
| |
| |
| 2022 Semi-Annual Report | May 31, 2022 |
| |
| Tortoise |
| Energy Infrastructure Corp. (TYG) (continued) |
| |
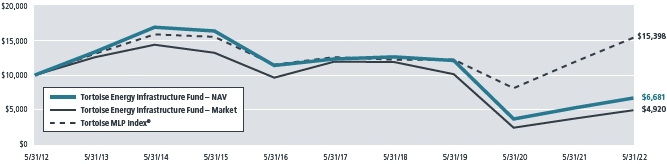
Value of $10,000 vs. Tortoise Energy Infrastructure Fund – Market (unaudited)
From May 31, 2012 through May 31, 2022
The chart assumes an initial investment of $10,000. Performance reflects waivers of fee and operating expenses in effect. In the absence of such waivers, total return would be reduced. Performance data quoted represents past performance and does not guarantee future results. Investment returns and principal value will fluctuate, and when sold, may be worth more or less than their original cost. Performance current to the most recent month-end may be lower or higher than the performance quoted and can be obtained by calling 866-362-9331. Performance assumes the reinvestment of capital gains and income distributions. The performance does not reflect the deduction of taxes that a shareholder would pay on Fund distributions or the redemption of Fund shares.
Annualized Rates of Return as of May 31, 2022
| | 1-Year | | 3-Year | | 5-Year | | 10-Year | | Since Inception(1) |
| Tortoise Energy Infrastructure Fund – NAV | | 29.35% | | -17.08% | | -10.95% | | -3.64% | | 2.80% |
| Tortoise Energy Infrastructure Fund – Market | | 33.46% | | -21.38% | | -16.24% | | -6.85% | | 1.43% |
| Tortoise MLP Index® | | 30.22% | | 7.96% | | 4.10% | | 4.41% | | 8.50% |
| (1) | Inception date of the Fund was February 25, 2004. |
Fund structure and distribution policy
The fund intends to qualify as a Regulated Investment Company (RIC) allowing it to pass-through to shareholders income and capital gains earned, thus avoiding double-taxation. To qualify as a RIC, the fund must meet specific income, diversification and distribution requirements. See Note 2E to the financial statements for further disclosure.
The fund has adopted a managed distribution policy (“MDP”). Annual distribution amounts are expected to fall in the range of 7% to 10% of the average week-ending net asset value (“NAV”) per share for the prior fiscal semi-annual period. Distribution amounts will be reset both up and down to provide a consistent return on trailing NAV. Under the MDP, distribution amounts will normally be reset in February and August, with no changes in distribution amounts in May and November.
Leverage
The fund’s leverage utilization increased $9.6 million during the six months ended Q2 2022, compared to the six months ended Q4 2021, and represented 22.6% of total assets at May 31, 2022. During the period, the fund maintained compliance with its applicable coverage ratios. 83.8% of the leverage cost was fixed, the weighted-average maturity was 2.8 years and the weighted-average annual rate on leverage was 3.39%. These rates will vary in the future as a result of changing floating rates, utilization of the fund’s credit facility and as leverage and swaps mature or are redeemed. During the six month period ended May 31, 2022, $8.0 million of Senior Notes and $16.6 million in preferred stock were paid in full upon maturity. In December 2021, the fund issued $10.0 million in Senior Note principal and $20.0 million in preferred stock.
Income taxes
As of May 31, 2022, the fund’s deferred tax asset was zero. The fund had capital loss carryforwards of $179.0 million for federal income tax purposes, which can be used to offset future capital gains.
Please see the Financial Statements and Notes to Financial Statements for additional detail regarding critical accounting policies, results of operations, leverage, taxes and other important fund information.
For further information regarding the calculation of distributable cash flow and distributions to stockholders, as well as a discussion of the tax impact on distributions, please visit www.tortoiseecofin.com.
| |
| |
| |
| |
| TYG Key Financial Data (supplemental unaudited information) |
| (dollar amounts in thousands unless otherwise indicated) |
| |
The information presented below is supplemental non-GAAP financial information, is not inclusive of required financial disclosures (e.g. Total Expense Ratio), and should be read in conjunction with the full financial statements.
| | 2021 | | 2022 |
| | | Q1(1) | | | | Q2(1) | | | | Q3(1) | | | | Q4(1) | | | | Q1(1) | | | | Q2(1) | |
| Selected Financial Information | | | | | | | | | | | | | | | | | | | | | | | | |
| Distributions paid on common stock | | $ | 3,757 | | | $ | 4,056 | | | $ | 4,353 | | | $ | 5,368 | | | $ | 8,469 | | | $ | 8,469 | |
Distributions paid on common stock
per share(2) | | | 0.3150 | | | | 0.3400 | | | | 0.3650 | | | | 0.4500 | | | | 0.7100 | | | | 0.7100 | |
| Total assets, end of period(3) | | | 523,106 | | | | 581,461 | | | | 555,604 | | | | 569,245 | | | | 607,077 | | | | 640,253 | |
| Average total assets during period(3)(4) | | | 479,525 | | | | 553,147 | | | | 576,902 | | | | 570,749 | | | | 584,250 | | | | 624,786 | |
| Leverage(5) | | | 154,427 | | | | 152,127 | | | | 140,293 | | | | 135,393 | | | | 146,087 | | | | 144,987 | |
| Leverage as a percent of total assets | | | 29.5 | % | | | 26.2 | % | | | 25.3 | % | | | 23.8 | % | | | 24.1 | % | | | 22.6 | % |
Operating expenses before leverage
costs and current taxes(6) | | | 1.10 | % | | | 1.05 | % | | | 1.06 | % | | | 1.11 | % | | | 1.12 | % | | | 1.07 | % |
| Net unrealized depreciation, end of period | | | (418,329 | ) | | | (353,117 | ) | | | (357,262 | ) | | | (358,544 | ) | | | (317,454 | ) | | | (268,736 | ) |
| Net assets, end of period | | | 357,783 | | | | 409,216 | | | | 400,314 | | | | 414,945 | | | | 451,671 | | | | 492,282 | |
| Average net assets during period(7) | | | 345,122 | | | | 391,953 | | | | 419,744 | | | | 432,282 | | | | 428,235 | | | | 482,183 | |
| Net asset value per common share(2) | | | 30.00 | | | | 34.31 | | | | 33.56 | | | | 34.79 | | | | 37.87 | | | | 41.27 | |
| Market value per share(2) | | | 25.25 | | | | 27.26 | | | | 26.81 | | | | 27.27 | | | | 30.25 | | | | 33.84 | |
| Shares outstanding (000's) | | | 11,928 | | | | 11,928 | | | | 11,928 | | | | 11,928 | | | | 11,928 | | | | 11,928 | |
| (1) | Q1 is the period from December through February. Q2 is the period from March through May. Q3 is the period from June through August. Q4 is the period from September through November. |
| (2) | Adjusted to reflect 1 for 4 reverse stock split effective May 1, 2020. |
| (3) | Includes deferred issuance and offering costs on senior notes and preferred stock. |
| (4) | Computed by averaging month-end values within each period. |
| (5) | Leverage consists of senior notes, preferred stock and outstanding borrowings under credit facilities. |
| (6) | As a percent of total assets. |
| (7) | Computed by averaging daily net assets within each period. |
| |
| |
| 2022 Semi-Annual Report | May 31, 2022 |
| |
Tortoise
Midstream Energy Fund, Inc. (NTG) |
|
| |
Fund description
NTG seeks to provide stockholders with a high level of total return with an emphasis on current distributions. NTG invests primarily in midstream energy equities that own and operate a network of pipeline and energy related logistical infrastructure assets with an emphasis on those that transport, gather, process and store natural gas and natural gas liquids (NGLs). NTG targets midstream energy equities, including MLPs benefiting from U.S. natural gas production and consumption expansion, with minimal direct commodity exposure.
Management’s discussion of fund performance
The midstream energy sector had strong performance for the period. Investor sentiment rebounded with positive retail flows coupled with companies buying back stock in the open market. Beyond the constructive technical setup, we believe midstream serves as a hedge to many current risks investors face. Rising rates, inflation, higher commodity prices, and energy security all are key macro factors that could drive the global economy into recession. The fund’s market-based and NAV-based returns for the fiscal period ending May 31, 2022 were 29.8% and 28.5%, respectively (including the reinvestment of distributions). The Tortoise MLP Index® returned 31.8% during the same period.
| 2022 mid-fiscal year summary | | | | |
| Distributions paid per share | | | $0.7700 |
| Distribution rate (as of 5/31/2022) | | | 8.1 | % |
| Quarter-over-quarter distribution increase (decrease) | | | 0.0 | % |
| Year-over-year distribution increase (decrease) | | | 87.2 | % |
Cumulative distributions paid per share to
stockholders since inception in July 2010 | | $ | 19.5000 | (1) |
| Market-based total return | | | 30.6 | % |
| NAV-based total return | | | 29.4 | % |
| Premium (discount) to NAV (as of 5/31/2022) | | | (17.8 | )% |
| (1) | Distribution per share is unadjusted for the impact of reverse stock split. |
Key asset performance drivers
| Top five contributors | | Company type |
| Williams Companies, Inc. | | Natural gas pipelines company |
| Targa Resources Corp. | | Natural gas pipeline company |
| Kinder Morgan Inc. | | Natural gas pipeline company |
| Energy Transfer LP | | Natural gas pipeline company |
| Pembina Pipeline Corporation | | Crude oil pipeline company |
| | | |
| Bottom five contributors | | Company type |
| NextEra Energy Partners | | Diversified infrastructure
company |
Atlantica Sustainable
Infrastructure PLC | | Power company |
| Clearway Energy, Inc. | | Diversified infrastructure
company |
| ESS Tech Inc. | | Energy storage company |
| Altus Midstream Company | | Natural gas pipeline company |
Unlike the fund return, index return is pre-expenses and taxes.
Performance data quoted represent past performance; past performance does not guarantee future results. Like any other stock, total return and market value will fluctuate so that an investment, when sold, may be worth more or less than its original cost. Portfolio composition is subject to change due to ongoing management of the fund. References to specific securities or sectors should not be construed as a recommendation by the fund or its adviser. See Schedule of Investments for portfolio weighting at the end of the fiscal quarter.
(unaudited)
| |
| |
| |
| |
Tortoise
Midstream Energy Fund, Inc. (NTG) (continued) |
|
| |
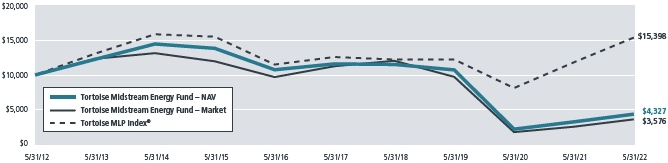
Value of $10,000 vs. Tortoise Midstream Energy Fund – Market (unaudited)
From May 31, 2012 through May 31, 2022
The chart assumes an initial investment of $10,000. Performance reflects waivers of fee and operating expenses in effect. In the absence of such waivers, total return would be reduced. Performance data quoted represents past performance and does not guarantee future results. Investment returns and principal value will fluctuate, and when sold, may be worth more or less than their original cost. Performance current to the most recent month-end may be lower or higher than the performance quoted and can be obtained by calling 866-362-9331. Performance assumes the reinvestment of capital gains and income distributions. The performance does not reflect the deduction of taxes that a shareholder would pay on Fund distributions or the redemption of Fund shares.
Annualized Rates of Return as of May 31, 2022
| | 1-Year | | 3-Year | | 5-Year | | 10-Year | | Since Inception(1) |
| Tortoise Midstream Energy Fund – NAV | | 36.04 | % | | -25.01 | % | | -17.15 | % | | -7.63 | % | | -5.68 | % |
| Tortoise Midstream Energy Fund – Market | | 42.33 | % | | -28.36 | % | | -20.50 | % | | -9.77 | % | | -7.59 | % |
| Tortoise MLP Index® | | 30.22 | % | | 7.96 | % | | 4.10 | % | | 4.41 | % | | 5.78 | % |
| (1) | Inception date of the Fund was July 27, 2010. |
Fund structure and distribution policy
The fund intends to qualify as a Regulated Investment Company (RIC) allowing it to pass-through to shareholders income and capital gains earned, thus avoiding double-taxation. To qualify as a RIC, the fund must meet specific income, diversification and distribution requirements. See Note 2E to the financial statements for further disclosure.
The fund has adopted a managed distribution policy (“MDP”). Annual distribution amounts are expected to fall in the range of 7% to 10% of the average week-ending net asset value (“NAV”) per share for the prior fiscal semi-annual period. Distribution amounts will be reset both up and down to provide a consistent return on trailing NAV. Under the MDP, distribution amounts will normally be reset in February and August, with no changes in distribution amounts in May and November.
Leverage
The fund’s leverage utilization increased approximately $6.1 million during the six months ended Q2 2022 compared to the six months ended Q4 2021, and represented 20.2% of total assets at May 31, 2022. During the period, the fund maintained compliance with its applicable coverage ratios. 78.2% of the leverage cost was fixed, the weighted-average maturity was 4.0 years and the weighted-average annual rate on leverage was 3.17%. These rates will vary in the future as a result of changing floating rates, utilization of the fund’s credit facility and as leverage matures or is redeemed. During the six month period ended May 31, 2022, the fund issued $25.0 million in Senior Note principal and $7.5 million in preferred stock.
Income taxes
As of May 31, 2022, the fund’s deferred tax asset was zero. The fund had capital loss carryforwards of $459.0 million for federal income tax purposes, which can be used to offset future capital gains.
Please see the Financial Statements and Notes to Financial Statements for additional detail regarding critical accounting policies, results of operations, leverage, taxes and other important fund information.
For further information regarding the calculation of distributable cash flow and distributions to stockholders, as well as a discussion of the tax impact on distributions, please visit www.tortoiseecofin.com.
| |
| |
| 2022 Semi-Annual Report | May 31, 2022 |
| |
| NTG Key Financial Data (supplemental unaudited information) |
| (dollar amounts in thousands unless otherwise indicated) |
| |
The information presented below is supplemental non-GAAP financial information, is not inclusive of required financial disclosures (e.g. Total Expense Ratio), and should be read in conjunction with the full financial statements.
| | 2021 | | 2022 |
| | | Q1(1) | | | | Q2(1) | | | | Q3(1) | | | | Q4(1) | | | | Q1(1) | | | | Q2(1) | |
| Selected Financial Information | | | | | | | | | | | | | | | | | | | | | | | | |
| Distributions paid on common stock | | $ | 1,862 | | | $ | 2,032 | | | $ | 2,172 | | | $ | 3,217 | | | $ | 4,345 | | | $ | 4,345 | |
Distributions paid on common stock
per share(2) | | | 0.3300 | | | | 0.3600 | | | | 0.3850 | | | | 0.5700 | | | | 0.7700 | | | | 0.7700 | |
| Total assets, end of period(3) | | | 257,953 | | | | 287,686 | | | | 277,673 | | | | 279,404 | | | | 307,035 | | | | 328,526 | |
| Average total assets during period(3)(4) | | | 237,709 | | | | 271,839 | | | | 287,464 | | | | 281,278 | | | | 289,590 | | | | 317,967 | |
| Leverage(5) | | | 68,640 | | | | 71,869 | | | | 67,969 | | | | 60,269 | | | | 63,069 | | | | 66,369 | |
| Leverage as a percent of total assets | | | 26.6 | % | | | 25.0 | % | | | 24.5 | % | | | 21.6 | % | | | 20.5 | % | | | 20.2 | % |
Operating expenses before leverage
costs and current taxes(6) | | | 1.28 | % | | | 1.10 | % | | | 1.21 | % | | | 1.25 | % | | | 1.22 | % | | | 1.07 | % |
Net unrealized appreciation (depreciation),
end of period | | | 44,946 | | | | 82,670 | | | | 81,302 | | | | 93,436 | | | | 129,068 | | | | 154,849 | |
| Net assets, end of period | | | 176,826 | | | | 206,310 | | | | 202,684 | | | | 210,018 | | | | 241,033 | | | | 260,924 | |
| Average net assets during period(7) | | | 171,201 | | | | 221,422 | | | | 213,041 | | | | 221,422 | | | | 221,176 | | | | 254,706 | |
| Net asset value per common share(2) | | | 31.34 | | | | 36.56 | | | | 35.92 | | | | 37.22 | | | | 42.71 | | | | 46.24 | |
| Market value per common share(2) | | | 27.00 | | | | 28.71 | | | | 28.55 | | | | 30.31 | | | | 34.81 | | | | 37.99 | |
| Shares outstanding (000's) | | | 5,643 | | | | 5,643 | | | | 5,643 | | | | 5,643 | | | | 5,643 | | | | 5,643 | |
| (1) | Q1 is the period from December through February. Q2 is the period from March through May. Q3 is the period from June through August. Q4 is the period from September through November. |
| (2) | Adjusted to reflect 1 for 10 reverse stock split effective May 1, 2020. |
| (3) | Includes deferred issuance and offering costs on senior notes and preferred stock. |
| (4) | Computed by averaging month-end values within each period. |
| (5) | Leverage consists of senior notes, preferred stock and outstanding borrowings under the credit facility. |
| (6) | Computed as a percent of total assets. |
| (7) | Computed by averaging daily net assets within each period. |
| |
| |
| |
| |
Tortoise
Pipeline & Energy Fund, Inc. (TTP) |
|
| |
Fund description
TTP seeks a high level of total return with an emphasis on current distributions paid to stockholders. TTP invests primarily in equity securities of North American pipeline companies that transport natural gas, natural gas liquids (NGLs), crude oil and refined products and, to a lesser extent, in other energy infrastructure companies.
Management’s discussion of fund performance
The midstream energy sector had strong performance for the period. Investor sentiment rebounded with positive retail flows coupled with companies buying back stock in the open market. Beyond the constructive technical setup, we believe midstream serves as a hedge to many current risks investors face. Rising rates, inflation, higher commodity prices, and energy security all are key macro factors that could drive the global economy into recession. The fund’s market-based and NAV-based returns for the fiscal period ending May 31, 2021 were 35.7% and 29.8%, respectively (including the reinvestment of distributions). The Tortoise North American Pipeline IndexSM returned 30.6% for the same period.
2022 mid-fiscal year summary
| Distributions paid per share | | | $0.5900 |
| Distribution rate (as of 5/31/2022) | | | 7.9 | % |
| Quarter-over-quarter distribution increase (decrease) | | | 0.0 | % |
| Year-over-year distribution increase (decrease) | | | 122.6 | % |
Cumulative distributions paid per share to
stockholders since inception in October 2011 | | $ | 16.1175 | (1) |
| Market-based total return | | | 33.8 | % |
| NAV-based total return | | | 32.9 | % |
| Premium (discount) to NAV (as of 5/31/2022) | | | (16.5 | )% |
| (1) | Distribution per share is unadjusted for the impact of reverse stock split. |
Please refer to the inside front cover of the report for important information about the fund’s distribution policy.
The fund utilizes a covered call strategy when appropriate, which seeks to generate income while reducing overall volatility. No covered calls were written during the period.
Key asset performance drivers
| Top five contributors | | Company type |
| Williams Companies, Inc. | | Natural gas pipeline company |
| Enbridge Inc. | | Crude oil pipeline company |
| Kinder Morgan Inc. | | Natural gas pipeline company |
| Pembina Pipeline Corporation | | Crude oil pipeline company |
| TC Energy Corp. | | Natural gas pipeline company |
| | | |
| Bottom five contributors | | Company type |
| Equitrans Midstream | | Gathering & processing |
| Corporation | | company |
| NextEra Energy Partners | | Diversified infrastructure
company |
| ESS Tech Inc. | | Energy storage company |
| Clearway Energy, Inc. | | Diversified infrastructure
company |
| Altus Midstream Company | | Natural gas pipeline company |
Unlike the fund return, index return is pre-expenses.
Performance data quoted represent past performance; past performance does not guarantee future results. Like any other stock, total return and market value will fluctuate so that an investment, when sold, may be worth more or less than its original cost. Portfolio composition is subject to change due to ongoing management of the fund. References to specific securities or sectors should not be construed as a recommendation by the fund or its adviser. See Schedule of Investments for portfolio weighting at the end of the fiscal quarter.
(unaudited)
| |
| |
| 2022 Semi-Annual Report | May 31, 2022 |
| |
| Tortoise |
Pipeline & Energy Fund, Inc. (TTP) (continued) |
| |
Value of $10,000 vs. Tortoise Pipeline and Energy Fund – Market (unaudited)
From May 31, 2012 through May 31, 2022
The chart assumes an initial investment of $10,000. Performance reflects waivers of fee and operating expenses in effect. In the absence of such waivers, total return would be reduced. Performance data quoted represents past performance and does not guarantee future results. Investment returns and principal value will fluctuate, and when sold, may be worth more or less than their original cost. Performance current to the most recent month-end may be lower or higher than the performance quoted and can be obtained by calling 866-362-9331. Performance assumes the reinvestment of capital gains and income distributions. The performance does not reflect the deduction of taxes that a shareholder would pay on Fund distributions or the redemption of Fund shares.
Annualized Rates of Return as of May 31, 2022
| | 1-Year | | 3-Year | | 5-Year | | 10-Year | | Since Inception(1) |
| Tortoise Pipeline and Energy Fund – NAV | | | 32.38 | % | | | | -11.35 | % | | | | -8.68 | % | | | | -2.15 | % | | | | -1.76 | % | |
| Tortoise Pipeline and Energy Fund – Market | | | 40.97 | % | | | | -13.37 | % | | | | -11.06 | % | | | | -3.69 | % | | | | -3.85 | % | |
| Tortoise North American Pipeline Index | | | 30.64 | % | | | | 12.12 | % | | | | 9.15 | % | | | | 8.72 | % | | | | 8.68 | % | |
(1) | Inception date of the Fund was October 26, 2011. |
Fund structure and distribution policy
The fund is structured to qualify as a Regulated Investment Company (RIC) allowing it to pass-through to shareholders income and capital gains earned, thus avoiding double-taxation. To qualify as a RIC, the fund must meet specific income, diversification and distribution requirements. Regarding income, at least 90 percent of the fund’s gross income must be from dividends, interest and capital gains. The fund must meet quarterly diversification requirements including the requirement that at least 50 percent of the assets be in cash, cash equivalents or other securities with each single issuer of other securities not greater than 5 percent of total assets. No more than 25 percent of total assets can be invested in any one issuer other than government securities or other RIC’s. The fund must also distribute at least 90 percent of its investment company income. RIC’s are also subject to excise tax rules which require RIC’s to distribute approximately 98 percent of net income and net capital gains to avoid a 4 percent excise tax.
The fund has adopted a distribution policy which is included on the inside front cover of this report. To summarize, the fund has adopted a managed distribution policy (“MDP”). Annual distribution amounts are expected to fall in the range of 7% to 10% of the average week-ending net asset value (“NAV”) per share for the prior fiscal semi-annual period. Distribution amounts will be reset both up and down to provide a consistent return on trailing NAV. Under the MDP, distribution amounts will normally be reset in February and August, with no changes in distribution amounts in May and November. The fund may designate a portion of its distributions as capital gains and may also distribute additional capital gains in the last quarter of the year to meet annual excise distribution requirements. Distribution amounts are subject to change from time to time at the discretion of the Board.
Leverage
The fund’s leverage utilization increased approximately $2.8 million during the six months ended Q2 2022, compared to the six months ended Q4 2021, and represented 20.6% of total assets at May 31, 2022. During the period, the fund maintained compliance with its applicable coverage ratios. 48.0% of the leverage cost was fixed, the weighted-average maturity was 1.5 years and the weighted-average annual rate on leverage was 3.86%. These rates will vary in the future as a result of changing floating rates, utilization of the fund’s credit facility and as leverage matures or is redeemed.
Please see the Financial Statements and Notes to Financial Statements for additional detail regarding critical accounting policies, results of operations, leverage and other important fund information.
For further information regarding the calculation of distributable cash flow and distributions to stockholders, as well as a discussion of the tax impact on distributions, please visit www.tortoiseecofin.com.
| |
| |
| |
| |
| TTP Key Financial Data (supplemental unaudited information) |
| (dollar amounts in thousands unless otherwise indicated) |
| |
The information presented below is supplemental non-GAAP financial information, is not inclusive of required financial disclosures (e.g. Total Expense Ratio), and should be read in conjunction with the full financial statements.
| | | 2021 | | 2022 |
| | Q1(1) | | Q2(1) | | Q3(1) | | Q4(1) | | Q1(1) | | Q2(1) |
| Selected Financial Information | | | | | | | | | | | | | | | | | | | | | | | | |
| Distributions paid on common stock | | $ | 371 | | | $ | 365 | | | $ | 831 | | | $ | 824 | | | $ | 1,314 | | | $ | 1,314 | |
| Distributions paid on common stock | | | | | | | | | | | | | | | | | | | | | | | | |
| per share(2) | | | 0.1600 | | | | 0.1600 | | | | 0.3700 | | | | 0.3700 | | | | 0.5900 | | | | 0.5900 | |
| Total assets, end of period(3) | | | 75,473 | | | | 88,149 | | | | 83,133 | | | | 80,898 | | | | 92,230 | | | | 100,901 | |
| Average total assets during period(3)(4) | | | 71,333 | | | | 81,731 | | | | 86,656 | | | | 84,993 | | | | 86,730 | | | | 96,706 | |
| Leverage(5) | | | 20,557 | | | | 20,557 | | | | 20,557 | | | | 18,143 | | | | 20,143 | | | | 20,943 | |
| Leverage as a percent of total assets | | | 27.2 | % | | | 23.3 | % | | | 24.7 | % | | | 22.4 | % | | | 21.8 | % | | | 20.8 | % |
| Operating expenses before leverage costs(6) | | | 1.78 | % | | | 1.66 | % | | | 1.60 | % | | | 1.03 | % | | | 1.57 | % | | | 1.44 | % |
| Net unrealized appreciation (depreciation), | | | | | | | | | | | | | | | | | | | | | | | | |
| end of period | | | (11,507 | ) | | | 1,568 | | | | (313 | ) | | | 1,003 | | | | 11,927 | | | | 20,208 | |
| Net assets, end of period | | | 53,891 | | | | 66,024 | | | | 62,043 | | | | 62,289 | | | | 71,653 | | | | 79,443 | |
| Average net assets during period(7) | | | 52,929 | | | | 61,405 | | | | 66,284 | | | | 67,014 | | | | 66,721 | | | | 76,749 | |
| Net asset value per common share(2) | | | 23.35 | | | | 28.96 | | | | 27.70 | | | | 27.96 | | | | 32.16 | | | | 35.66 | |
| Market value per common share(2) | | | 21.32 | | | | 22.69 | | | | 23.05 | | | | 23.16 | | | | 26.44 | | | | 29.76 | |
| Shares outstanding (000's) | | | 2,308 | | | | 2,279 | | | | 2,239 | | | | 2,228 | | | | 2,228 | | | | 2,228 | |
| (1) | Q1 is the period from December through February. Q2 is the period from March through May. Q3 is the period from June through August. Q4 is the period from September through November. |
| (2) | Adjusted to reflect 1 for 4 reverse stock split effective May 1, 2020. |
| (3) | Includes deferred issuance and offering costs on senior notes and preferred stock. |
| (4) | Computed by averaging month-end values within each period. |
| (5) | Leverage consists of senior notes, preferred stock and outstanding borrowings under the revolving credit facility. |
| (6) | Computed as a percent of total assets. |
| (7) | Computed by averaging daily net assets within each period. |
| |
| |
| 2022 Semi-Annual Report | May 31, 2022 |
| |
| Tortoise |
Energy Independence Fund, Inc. (NDP) |
| |
Fund description
NDP seeks a high level of total return with an emphasis on current distributions paid to stockholders. NDP invests primarily in equity securities of upstream North American energy companies that engage in the exploration and production of crude oil, condensate, natural gas and natural gas liquids that generally have a significant presence in North American oil and gas fields, including shale reservoirs.
Management’s discussion of fund performance
Concerns around energy security persisted, exacerbated by the impacts of the war in Ukraine and tightening global energy supply as demand rebounds post-COVID. Despite higher commodity prices, global supply has not responded. OPEC+ production has continually undershot pledged production due to prolonged oil and gas underinvestment and rapidly shut-in production in 2020. Global underinvestment resulting from environmental, social and governance (ESG) commitments and energy transition is likely to keep global stock balances extremely tight for the foreseeable future, a dynamic that presents higher, but perhaps more volatile prices. The fund’s market-based and NAV-based returns for the fiscal period ending May 31, 2022 were 51.3% and 55.5%, respectively (including the reinvestment of distributions).
| 2022 mid-fiscal year summary | | | | |
| Distributions paid per share | | | $0.4800 |
| Distribution rate (as of 5/31/2022) | | | 5.9 | % |
| Quarter-over-quarter distribution increase (decrease) | | | 0.0 | % |
| Year-over-year distribution increase (decrease) | | | 209.7 | % |
| Cumulative distributions paid per share to | | | | |
| stockholders since inception in July 2012 | | $ | 13.6925 | (1) |
| Market-based total return | | | 50.6 | % |
| NAV-based total return | | | 58.8 | % |
| Premium (discount) to NAV (as of 5/31/2022) | | | (16.1 | )% |
(1) | Distribution per share is unadjusted for the impact of reverse stock split. |
The fund utilizes a covered call strategy when appropriate, which seeks to generate income while reducing overall volatility. No covered calls were written during the period.
Key asset performance drivers
| Top five contributors | | Company type |
| EQT Corp. | | Oil & gas production company |
| Devon Energy Corporation | | Oil & gas production company |
| Pioneer Natural Resources Co. | | Oil & gas production company |
| Occidental Petroleum Corp. | | Oil & gas production company |
| EOG Resources Inc. | | Oil & gas production company |
| | | |
| Bottom five contributors | | Company type |
| ESS Tech Inc. | | Energy storage company |
| Denbury Inc. | | Independent energy company |
| NextEra Energy Inc. | | Diversified infrastructure |
| | company |
| Clean Energy Fuels Corp. | | Renewables and power |
| | infrastructure company |
| Archaea Energy Inc. | | Renewables and power |
| | infrastructure company |
Unlike the fund return, index return is pre-expenses.
Performance data quoted represent past performance: past performance does not guarantee future results. Like any other stock, total return and market value will fluctuate so that an investment, when sold, may be worth more or less than its original cost. Portfolio composition is subject to change due to ongoing management of the fund. References to specific securities or sectors should not be construed as a recommendation by the fund or its adviser. See Schedule of Investments for portfolio weighting at the end of the fiscal quarter.
| |
| |
| |
| |
| Tortoise |
Energy Independence Fund, Inc. (NDP) (continued) |
| |
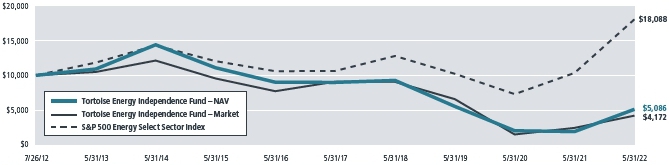
Value of $10,000 vs. Tortoise Energy Independence Fund – Market (unaudited)
Since inception on July 26, 2012 through May 31, 2022
The chart assumes an initial investment of $10,000. Performance reflects waivers of fee and operating expenses in effect. In the absence of such waivers, total return would be reduced. Performance data quoted represents past performance and does not guarantee future results. Investment returns and principal value will fluctuate, and when sold, may be worth more or less than their original cost. Performance current to the most recent month-end may be lower or higher than the performance quoted and can be obtained by calling 866-362-9331. Performance assumes the reinvestment of capital gains and income distributions. The performance does not reflect the deduction of taxes that a shareholder would pay on Fund distributions or the redemption of Fund shares.
Annualized Rates of Return as of May 31, 2022 |
| | | | | | | | | | | | | | | | | | | |
| | 1-Year | | 3-Year | | 5-Year | | Since Inception(1) |
| Tortoise Energy Independence Fund - NAV | | | 78.28 | % | | | | -1.87 | % | | | | -10.33 | % | | | | -6.42 | % | |
| Tortoise Energy Independence Fund - Market | | | 73.55 | % | | | | -13.99 | % | | | | -14.40 | % | | | | -8.50 | % | |
| S&P 500 Energy Select Sector Index | | | 74.76 | % | | | | 20.96 | % | | | | 11.20 | % | | | | 6.20 | % | |
(1) | Inception date of the Fund was July 26, 2012. |
Fund structure and distribution policy
The fund is structured to qualify as a Regulated Investment Company (RIC) allowing it to pass-through to shareholders income and capital gains earned, thus avoiding double-taxation. To qualify as a RIC, the fund must meet specific income, diversification and distribution requirements. Regarding income, at least 90 percent of the fund’s gross income must be from dividends, interest and capital gains. The fund must meet quarterly diversification requirements including the requirement that at least 50 percent of the assets be in cash, cash equivalents or other securities with each single issuer of other securities not greater than 5 percent of total assets. No more than 25 percent of total assets can be invested in any one issuer other than government securities or other RIC’s. The fund must also distribute at least 90 percent of its investment company income. RIC’s are also subject to excise tax rules which require RIC’s to distribute approximately 98 percent of net income and net capital gains to avoid a 4 percent excise tax.
The fund has adopted a managed distribution policy (“MDP”). Annual distribution amounts are expected to fall in the range of 7% to 10% of the average week-ending net asset value (“NAV”) per share for the prior fiscal semi-annual period. Distribution amounts will be reset both up and down to provide a consistent return on trailing NAV. Under the MDP, distribution amounts will normally be reset in February and August, with no changes in distribution amounts in May and November. The fund may designate a portion of its distributions as capital gains and may also distribute additional capital gains in the last quarter of the year to meet annual excise distribution requirements. Distribution amounts are subject to change from time to time at the discretion of the Board.
Leverage
The fund’s leverage utilization increased $0.9 million during the six months ended Q2 2022 as compared to the six months ended Q4 2021. The fund utilizes all floating rate leverage that had an interest rate of 2.22% and represented 4.8% of total assets at year-end. During the period, the fund maintained compliance with its applicable coverage ratios. The interest rate on the fund’s leverage will vary in the future along with changing floating rates.
Please see the Financial Statements and Notes to Financial Statements for additional detail regarding critical accounting policies, results of operations, leverage and other important fund information.
For further information regarding the calculation of distributable cash flow and distributions to stockholders, as well as a discussion of the tax impact on distributions, please visit www.tortoiseecofin.com.
| |
| |
| 2022 Semi-Annual Report | May 31, 2022 |
| |
| NDP Key Financial Data (supplemental unaudited information) |
(dollar amounts in thousands unless otherwise indicated) |
| |
The information presented below is supplemental non-GAAP financial information, is not inclusive of required financial disclosures (e.g. Total Expense Ratio), and should be read in conjunction with the full financial statements.
| | 2021 | | 2022 |
| | Q1(1) | | Q2(1) | | Q3(1) | | Q4(1) | | Q1(1) | | Q2(1) |
| Selected Financial Information | | | | | | | | | | | | | | | | | | | | | | | | |
| Distributions paid on common stock | | $ | — | | | $ | — | | | $ | 572 | | | $ | 572 | | | $ | 886 | | | $ | 886 | |
| Distributions paid on common stock | | | | | | | | | | | | | | | | | | | | | | | | |
| per share(2) | | | — | | | | — | | | | 0.3100 | | | | 0.3100 | | | | 0.4800 | | | | 0.4800 | |
| Total assets, end of period | | | 43,206 | | | | 46,930 | | | | 43,973 | | | | 51,135 | | | | 62,500 | | | | 75,288 | |
| Average total assets during period(3) | | | 37,831 | | | | 44,909 | | | | 45,851 | | | | 49,036 | | | | 55,216 | | | | 67,737 | |
| Leverage(4) | | | 4,400 | | | | 3,600 | | | | 3,100 | | | | 2,700 | | | | 3,200 | | | | 3,600 | |
| Leverage as a percent of total assets | | | 10.2 | % | | | 7.7 | % | | | 7.0 | % | | | 5.3 | % | | | 5.1 | % | | | 4.8 | % |
| Operating expenses before leverage | | | | | | | | | | | | | | | | | | | | | | | | |
| costs as a percent of total assets | | | 2.27 | % | | | 2.02 | % | | | 2.12 | % | | | 1.30 | % | | | 1.80 | % | | | 1.49 | % |
| Net unrealized appreciation (depreciation), | | | | | | | | | | | | | | | | | | | | | | | | |
| end of period | | | 2,902 | | | | 7,043 | | | | 5,595 | | | | 9,327 | | | | 22,097 | | | | 32,340 | |
| Net assets, end of period | | | 38,160 | | | | 42,560 | | | | 40,604 | | | | 46,398 | | | | 58,650 | | | | 71,407 | |
| Average net assets during period(5) | | | 34,528 | | | | 41,089 | | | | 42,801 | | | | 46,787 | | | | 51,521 | | | | 64,733 | |
| Net asset value per common share(2) | | | 20.67 | | | | 23.06 | | | | 22.00 | | | | 25.13 | | | | 31.77 | | | | 38.68 | |
| Market value per common share(2) | | | 17.74 | | | | 19.88 | | | | 19.49 | | | | 22.24 | | | | 27.59 | | | | 32.47 | |
| Shares outstanding (000's) | | | 1,846 | | | | 1,846 | | | | 1,846 | | | | 1,846 | | | | 1,846 | | | | 1,846 | |
| (1) | Q1 is the period from December through February. Q2 is the period from March through May. Q3 is the period from June through August. Q4 is the period from September through November. |
| (2) | Adjusted to reflect 1 for 8 reverse stock split effective May 1, 2020. |
| (3) | Computed by averaging month-end values within each period. |
| (4) | Leverage consists of outstanding borrowings under the revolving credit facility. |
| (5) | Computed by averaging daily net assets within each period. |
| |
| |
| |
| |
| Tortoise |
| Power and Energy Infrastructure Fund, Inc. (TPZ) |
| |
Fund description
TPZ seeks to provide a high level of current income to stockholders, with a secondary objective of capital appreciation. TPZ seeks to invest primarily in fixed income and dividend-paying equity securities of power and energy infrastructure companies that provide stable and defensive characteristics throughout economic cycles.
Management’s discussion of fund performance
The midstream energy sector had strong performance for the period. Investor sentiment rebounded with positive retail flows coupled with companies buying back stock in the open market. Beyond the constructive technical setup, we believe midstream serves as a hedge to many current risks investors face. Rising rates, inflation, higher commodity prices, and energy security all are key macro factors that could drive the global economy into recession. The fund’s market-based and NAV-based returns for the fiscal period ending May 31, 2022 were 7.4% and 9.9%, respectively (including the reinvestment of distributions). Comparatively, the TPZ Benchmark Composite* returned -1.3% for the same period. The fund’s equity holdings outperformed its fixed income holdings for the period on a total return basis.
| 2022 mid-fiscal year summary | | |
| Distributions paid per share | | $0.3150 |
| Monthly distributions paid per share | | $0.105 |
| Distribution rate (as of 5/31/2022) | | 8.9% |
| Quarter-over-quarter distribution increase (decrease) | | 40.0% |
| Year-over-year distribution increase (decrease) | | 96.9% |
| Cumulative distribution to stockholders | | |
| since inception in July 2009 | | $19.005 |
| Market-based total return | | 13.7% |
| NAV-based total return | | 12.6% |
| Premium (discount) to NAV (as of 5/31/2022) | | (13.5)% |
| * | The TPZ Benchmark Composite includes the BofA Merrill Lynch U.S. Energy Index (CIEN), the BofA Merrill Lynch U.S. Electricity Index (CUEL) and the Tortoise MLP Index® (TMLP). It is comprised of a blend of 70% fixed income and 30% equity securities issued by companies in the power and energy infrastructure sectors. |
Please refer to the inside front cover of the report for important information about the fund’s distribution policy.
Key asset performance drivers
| Top five contributors | | Company type |
| Williams Companies, Inc. | | Natural gas pipelines company |
| Enterprise Products Partners | | Natural gas pipeline company |
| Energy Transfer LP | | Natural gas pipeline company |
| Western Midstream Partners LP | | Gathering & processing
company |
| | |
| DCP Midstream LP | | Natural gas pipeline company |
| | | |
| Bottom five contributors | | Company type |
| NextEra Energy, Inc. | | Diversified infrastructure |
| 4.800% Due 12/1/2077 | | company |
| Enbridge Inc. | | Crude oil pipeline company |
| 5.500% Due 7/15/2077 | | |
| ONEOK Inc. | | Natural gas pipeline company |
| 6.350% Due 1/15/2031 | | |
| Buckeye Partners LP | | Refined products pipeline |
| 5.850% Due 11/15/2043 | | company |
| ESS Tech Inc | | Energy storage company |
Unlike the fund return, index return is pre-expenses.
Performance data quoted represent past performance; past performance does not guarantee future results. Like any other stock, total return and market value will fluctuate so that an investment, when sold, may be worth more or less than its original cost. Portfolio composition is subject to change due to ongoing management of the fund. References to specific securities or sectors should not be construed as a recommendation by the fund or its adviser. See Schedule of Investments for portfolio weighting at the end of the fiscal quarter.
| |
| |
| 2022 Semi-Annual Report | May 31, 2022 |
| |
| Tortoise |
| Power and Energy Infrastructure Fund, Inc. (TPZ) (continued) |
| |
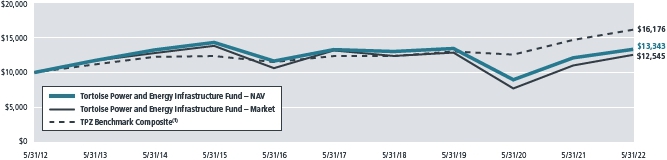
| Value of $10,000 vs. Tortoise Power and Energy Infrastructure Fund – Market (unaudited) |
| From May 31, 2012 through May 31, 2022 |
The chart assumes an initial investment of $10,000. Performance reflects waivers of fee and operating expenses in effect. In the absence of such waivers, total return would be reduced. Performance data quoted represents past performance and does not guarantee future results. Investment returns and principal value will fluctuate, and when sold, may be worth more or less than their original cost. Performance current to the most recent month-end may be lower or higher than the performance quoted and can be obtained by calling 866-362-9331. Performance assumes the reinvestment of capital gains and income distributions. The performance does not reflect the deduction of taxes that a shareholder would pay on Fund distributions or the redemption of Fund shares.
Annualized Rates of Return as of May 31, 2022
| | 1-Year | | 3-Year | | 5-Year | | 10-Year | | Since Inception(2) |
| Tortoise Power and Energy Infrastructure Fund – NAV | | 11.01 | % | | 0.75 | % | | 0.69 | % | | 3.25 | % | | | 5.93 | % | |
| Tortoise Power and Energy Infrastructure Fund – Market | | 13.94 | % | | -0.85 | % | | -0.98 | % | | 2.29 | % | | | 4.74 | % | |
| TPZ Benchmark Composite(1) | | 10.02 | % | | 7.45 | % | | 5.51 | % | | 4.92 | % | | | 6.86 | % | |
| (1) | The TPZ Benchmark Composite includes the BofA Merrill Lynch U.S. Energy Index (CIEN), the BofA Merrill Lynch U.S. Electricity Index (CUEL) and the Tortoise MLP Index® (TMLP). |
| (2) | Inception date of the Fund was July 29, 2009. |
Fund structure and distribution policy
The fund is structured to qualify as a Regulated Investment Company (RIC) allowing it to pass-through to shareholders income and capital gains earned, thus avoiding double-taxation. To qualify as a RIC, the fund must meet specific income, diversification and distribution requirements. Regarding income, at least 90 percent of the fund gross income must be from dividends, interest and capital gains. The fund must meet quarterly diversification requirements including the requirement that at least 50 percent of the assets be in cash, cash equivalents or other securities with each single issuer of other securities not greater than 5 percent of total assets. No more than 25 percent of total assets can be invested in any one issuer other than government securities or other RIC’s. The fund must also distribute at least 90 percent of its investment company income. RIC’s are also subject to excise tax rules which require RIC’s to distribute approximately 98 percent of net income and net capital gains to avoid a 4 percent excise tax.
The fund has adopted a distribution policy which is included on the inside front cover of this report. To summarize, the fund has adopted a managed distribution policy (“MDP”). Annual distribution amounts are expected to fall in the range of 7% to 10% of the average week-ending net asset value (“NAV”) per share for the prior fiscal semi-annual period. Distribution amounts will be reset both up and down to provide a consistent return on trailing NAV. Under the MDP, distribution amounts will normally be reset in February and August, with no changes in distribution amounts in May and November. The fund may designate a portion of its distributions as capital gains and may also distribute additional capital gains in the last quarter of the year to meet annual excise distribution requirements. Distribution amounts are subject to change from time to time at the discretion of the Board.
Leverage
The fund’s leverage utilization increased $1.6 million during the six months ended Q2 2022 as compared to the six months ended Q4 2021, and represented 19.3% of total assets at May 31, 2022. During the period, the fund maintained compliance with its applicable coverage ratios. At year-end, including the impact of interest rate swaps, approximately 93.8% of the leverage cost was fixed, the weighted-average maturity was 1.6 years and the weighted-average annual rate on leverage was 3.26%. These rates will vary in the future as a result of changing floating rates and as swaps mature or are redeemed.
Please see the Financial Statements and Notes to Financial Statements for additional detail regarding critical accounting policies, results of operations, leverage and other important fund information.
For further information regarding the calculation of distributable cash flow and distributions to stockholders, as well as a discussion of the tax impact on distributions, please visit www.tortoiseecofin.com.
| |
| |
| |
| |
| TPZ Key Financial Data (supplemental unaudited information) |
| (dollar amounts in thousands unless otherwise indicated) |
| |
The information presented below is supplemental non-GAAP financial information, is not inclusive of required financial disclosures (e.g. Total Expense Ratio), and should be read in conjunction with the full financial statements.
| 2021 | | 2022 |
| Q1(1) | | Q2(1) | | Q3(1) | | Q4(1) | | Q1(1) | | Q2(1) |
| Selected Financial Information | | | | | | | | | | | | | | | | | | | | | | | |
| Distributions paid on common stock | $ | 1,015 | | | $ | 999 | | | $ | 1,050 | | | $ | 1,175 | | | $ | 1,468 | | | $ | 2,056 | |
| Distributions paid on common stock | | | | | | | | | | | | | | | | | | | | | | | |
| per share | | 0.1500 | | | | 0.1500 | | | | 0.1600 | | | | 0.1800 | | | | 0.2250 | | | | 0.3150 | |
| Total assets, end of period | | 122,293 | | | | 129,169 | | | | 124,958 | | | | 123,000 | | | | 128,994 | | | | 132,902 | |
| Average total assets during period(2) | | 118,439 | | | | 125,330 | | | | 127,825 | | | | 125,633 | | | | 126,282 | | | | 131,028 | |
| Leverage(3) | | 24,000 | | | | 24,000 | | | | 24,000 | | | | 24,000 | | | | 24,000 | | | | 25,600 | |
| Leverage as a percent of total assets | | 19.6 | % | | | 18.6 | % | | | 19.2 | % | | | 19.5 | % | | | 18.6 | % | | | 19.3 | % |
| Operating expenses before leverage | | | | | | | | | | | | | | | | | | | | | | | |
| costs as a percent of total assets | | 1.38 | % | | | 1.30 | % | | | 1.32 | % | | | 1.35 | % | | | 1.30 | % | | | 1.19 | % |
| Net unrealized appreciation (depreciation), | | | | | | | | | | | | | | | | | | | | | | | |
| end of period | | (2,769 | ) | | | 5,384 | | | | 3,749 | | | | 2,356 | | | | 10,439 | | | | 14,292 | |
| Net assets, end of period | | 96,962 | | | | 103,878 | | | | 100,388 | | | | 98,462 | | | | 104,493 | | | | 106,782 | |
| Average net assets during period(4) | | 95,458 | | | | 101,010 | | | | 103,705 | | | | 103,148 | | | | 101,888 | | | | 105,651 | |
| Net asset value per common share | | 14.44 | | | | 15.70 | | | | 15.38 | | | | 15.09 | | | | 16.01 | | | | 16.36 | |
| Market value per common share | | 12.19 | | | | 13.23 | | | | 13.00 | | | | 12.92 | | | | 14.08 | | | | 14.15 | |
| Shares outstanding (000's) | | 6,715 | | | | 6,617 | | | | 6,526 | | | | 6,526 | | | | 6,526 | | | | 6,526 | |
| (1) | Q1 is the period from December through February. Q2 is the period from March through May. Q3 is the period from June through August. Q4 is the period from September through November. |
| (2) | Computed by averaging month-end values within each period. |
| (3) | Leverage consists of outstanding borrowings under the revolving credit facility. |
| (4) | Computed by averaging daily net assets within each period. |
| |
| |
| 2022 Semi-Annual Report | May 31, 2022 |
| |
| Ecofin |
| Sustainable and Social Impact Term Fund (TEAF) |
| |
Fund description
TEAF seeks to provide a high level of total return with an emphasis on current distributions. TEAF provides investors access to a combination of public and direct investments in essential assets that are making an impact on clients and communities.
Management’s discussion of fund performance
Despite broader equity market volatility, TEAF generated positive NAV performance in the first fiscal half of 2022. North American energy infrastructure companies performed extremely well during the period. The strong performance was driven by elevated commodity prices and a renewed focus on energy security following Russia’s invasion of Ukraine. Listed sustainable infrastructure companies also performed extremely well relative to broader equity markets during the period. The defensive nature of regulated utility business models combined with tactical allocations to those companies benefitting from the volatile commodity price backdrop in Europe resulted in positive performance for the portfolio. Additionally, we believe an acceleration in renewable energy infrastructure investment in Europe is likely as countries look to diversify away from Russian energy. Those tailwinds also supported European renewable infrastructure companies during the period. TEAF’s private investments (Social and Sustainable Infrastructure) performed in-line with our expectations during the period.
Despite macroeconomic uncertainty, we hold a constructive outlook for the underlying assets in the TEAF portfolio entering the second half of 2022. We believe TEAF’s current portfolio is largely invested in sectors that will provide stability during the current equity market volatility and are uniquely positioned to benefit from secular tailwinds as a result of COVID-19 and Russia’s invasion of Ukraine. Additionally, we believe a majority of TEAF’s listed investments provide inflation protection for investors. Energy infrastructure equities are likely net beneficiaries of inflation through contractual protections and higher natural gas prices. Renewable and utility equities should be well protected through contractual provisions and hedging programs.
As mentioned, TEAF’s private assets continued to perform in-line with our expectations generating stable current income for investors. TEAF has experienced a delay in one solar project in the private sustainable infrastructure portfolio. While the project is mechanically complete, it has experienced a minor delay in the interconnection with the local utility delaying in-service of the asset. We now expect that project to be online over the coming months at which point all assets will be fully operational.
We continue to progress on transitioning the portfolio to the targeted allocation of 60% direct investments. As of May 31, 2022, TEAF’s total direct investment commitments were approximately $122 million or approximately 50% of the portfolio. As previously mentioned, we have completed the fund’s allocation to direct sustainable and energy infrastructure investments.
Listed Energy Infrastructure
| ● | Listed energy infrastructure equities were the strongest driver of performance in the TEAF portfolio during the first half of 2022. The positive performance during the period was largely driven by a healthy fundamental outlook for North American energy infrastructure. |
| ● | In late February, energy security became the top priority following the war in Ukraine driving actions to reduce dependency on Russia’s energy complex. As a result, we expect U.S. energy infrastructure (pipelines and LNG export facilities) to be critical in supplying low cost natural gas to demand centers around the world over the long-term. |
| ● | As a reminder, TEAF’s energy infrastructure allocation is levered to U.S. natural gas pipeline and LNG export facility operators. We expect the valuation of companies in our portfolio to be rewarded in equity markets as the critical nature of the infrastructure assets they operate are even more critical in today’s energy market backdrop. |
Listed Sustainable Infrastructure
| ● | The six-month period was dominated by the secular trends of inflation, supply chain disruptions and regulatory responses to such issues. This created significant dispersion across the industry as companies that can capitalize on the inflationary environment significantly outperformed those that face restrictive regulatory responses. |
| ● | Equity market flows favored defensive utility-like business models and global clean energy companies, while North American clean energy flows suffered from the disruption associated with the US Department of Commerce announcing an investigation into solar panel supply chains in Asia and their compliance with current US tariff laws. |
| |
| |
| |
| |
| Ecofin |
| Sustainable and Social Impact Term Fund (TEAF) (continued) |
| |
| ● | In such context, TEAF’s sustainable listed infrastructure sleeve performed relatively well due to diversification of risk across sub-segments within sustainable infrastructure sub-sectors and a well-timed rotation out of cyclical sectors and into defensive business models as recession fears grew. The positions taking advantage of this rotation were partially offset by positions exposed to the growing uncertainty around renewable development supply chains. |
| ● | The US treasury curve moved higher throughout the period as the Federal Reserve began increasing the federal funds target rate, moving the upper bound from 0.25% to 1.00% by the end of May, and since increasing the rate by an additional 0.75%. We expect this trend to continue as the Federal Reserve has clearly stated its intention to increase interest rates with the goal of curbing inflation. We expect defensive sectors such as utilities to continue to outperform in this environment as recession risk continues to increase. |
Social Infrastructure
| ● | TEAF completed one direct investment in the Social Infrastructure portfolio during the period. |
| ● | In May 2022, TEAF completed a ~$3.9 million debt investment in a senior care facility located in Galloway, New Jersey. The 130-unit senior living facility called Arbor Village will consist of Assisted Living and Memory Care units. |
Private Energy Infrastructure
| ● | No deals were completed in the Private Energy Infrastructure portfolio during the period. |
Private Sustainable Infrastructure
| ● | TEAF did not invest in any additional private sustainable infrastructure projects during the first half of 2022, as the fund previously reached its targeted allocation. |
| ● | Operating assets held at TEAF continue to operate as expected with stable cash flow generation profiles driven by long-term contracts with highly-rated counterparties. |
| ● | TEAF expects the final solar project awaiting interconnection to be fully online in 3Q 2022. |
| 2022 mid-fiscal year summary | | |
| Distributions paid per share | | $0.2700 |
| Monthly distributions paid per share | | $0.09 |
| Distribution rate (as of 5/31/2022) | | 7.4% |
| Quarter-over-quarter distribution increase (decrease) | | 12.5% |
| Year-over-year distribution increase (decrease) | | 20.0% |
| Cumulative distribution to stockholders | | |
| since inception in July 2009 | | $3.2705 |
| Market-based total return | | 2.8% |
| NAV-based total return | | 4.1% |
| Premium (discount) to NAV (as of 5/31/2022) | | (15.6)% |
Performance data quoted represent past performance; past performance does not guarantee future results. Like any other stock, total return and market value will fluctuate so that an investment, when sold, may be worth more or less than its original cost. Portfolio composition is subject to change due to ongoing management of the fund. References to specific securities or sectors should not be construed as a recommendation by the fund or its adviser. See Schedule of Investments for portfolio weighting at the end of the fiscal quarter.
| |
| |
| 2022 Semi-Annual Report | May 31, 2022 |
| |
| Ecofin |
| Sustainable and Social Impact Term Fund (TEAF) (continued) |
| |
Value of $10,000 vs. Ecofin Sustainable and Social Impact Term Fund – Market (unaudited)
Since inception on March 29, 2019 through May 31, 2022
The chart assumes an initial investment of $10,000. Performance reflects waivers of fee and operating expenses in effect. In the absence of such waivers, total return would be reduced. Performance data quoted represents past performance and does not guarantee future results. Investment returns and principal value will fluctuate, and when sold, may be worth more or less than their original cost. Performance current to the most recent month-end may be lower or higher than the performance quoted and can be obtained by calling 866-362-9331. Performance assumes the reinvestment of capital gains and income distributions. The performance does not reflect the deduction of taxes that a shareholder would pay on Fund distributions or the redemption of Fund shares.
Annualized Rates of Return as of May 31, 2022
| | 1-Year | | 3-Year | | Since Inception(1) |
| Ecofin Sustainable and Social Impact Term Fund – NAV | | 9.16% | | 4.42% | | 2.59% |
| Ecofin Sustainable and Social Impact Term Fund – Market | | 5.18% | | -0.46% | | -2.75% |
| S&P Real Assets Index | | 2.93% | | 7.32% | | 6.54% |
| (1) | Inception date of the Fund was March 29, 2019. |
Fund structure and distribution policy
The fund is structured to qualify as a Regulated Investment Company (RIC) allowing it to pass-through to shareholders income and capital gains earned, thus avoiding double-taxation. To qualify as a RIC, the fund must meet specific income, diversification and distribution requirements. Regarding income, at least 90 percent of the fund gross income must be from dividends, interest and capital gains. The fund must meet quarterly diversification requirements including the requirement that at least 50 percent of the assets be in cash, cash equivalents or other securities with each single issuer of other securities not greater than 5 percent of total assets. No more than 25 percent of total assets can be invested in any one issuer other than government securities or other RIC’s. The fund must also distribute at least 90 percent of its investment company income. RIC’s are also subject to excise tax rules which require RIC’s to distribute approximately 98 percent of net income and net capital gains to avoid a 4 percent excise tax.
The fund has adopted a managed distribution policy (“MDP”). Annual distribution amounts are expected to fall in the range of 6% to 8% of the average week-ending net asset value (“NAV”) per share for the prior fiscal semi-annual period. Distribution amounts will be reset both up and down to provide a consistent return on trailing NAV. Under the MDP, distribution amounts will normally be reset in February and August, with no changes in distribution amounts in May and November. The fund may designate a portion of its distributions as capital gains and may also distribute additional capital gains in the last quarter of the year to meet annual excise distribution requirements. Distribution amounts are subject to change from time to time at the discretion of the Board.
Leverage
The fund’s leverage utilization increased $8.8 million during the six months ended Q2 2022, as compared to six months ended Q4 2021. The fund utilizes all floating rate leverage that had an interest rate of 1.92% and represented 11.5% of total assets at year-end. During the period, the fund maintained compliance with its applicable coverage ratios. The interest rate on the fund’s leverage will vary in the future along with changing floating rates.
Please see the Financial Statements and Notes to Financial Statements for additional detail regarding critical accounting policies, results of operations, leverage and other important fund information.
For further information regarding the calculation of distributable cash flow and distributions to stockholders, as well as a discussion of the tax impact on distributions, please visit www.tortoiseecofin.com.
| |
| |
| |
| |
| TEAF Key Financial Data (supplemental unaudited information) |
| (dollar amounts in thousands unless otherwise indicated) |
| |
The information presented below regarding Distributable Cash Flow and Selected Financial Information is supplemental non-GAAP financial information, which the fund believes is meaningful to understanding operating performance. The Distributable Cash Flow Ratios include the functional equivalent of EBITDA for non-investment companies, and the fund believes they are an important supplemental measure of performance and promote comparisons from period-to-period. This information is supplemental, is not inclusive of required financial disclosures (e.g. Total Expense Ratio), and should be read in conjunction with the full financial statements.
| | 2021 | | 2022 |
| | Q1(1) | | Q2(1) | | Q3(1) | | Q4(1) | | Q1(1) | | Q2(1) |
| Selected Financial Information | | | | | | | | | | | | | | | | | | | | | | | | | |
| Distributions paid on common stock | | $ | 3,035 | | | | $ | 3,035 | | | $ | 3,036 | | | $ | 3,036 | | | $ | 3,238 | | | $ | 3,642 | |
| Distributions paid on common stock | | | | | | | | | | | | | | | | | | | | | | | | | |
| per share | | | 0.2250 | | | | | 0.2250 | | | | 0.2250 | | | | 0.2250 | | | | 0.2400 | | | | 0.2700 | |
| Total assets, end of period | | | 263,959 | | | | | 259,311 | | | | 262,769 | | | | 260,153 | | | | 255,662 | | | | 264,262 | |
| Average total assets during period(2) | | | 253,187 | | | | | 261,033 | | | | 260,599 | | | | 262,969 | | | | 257,415 | | | | 260,960 | |
| Leverage(3) | | | 42,800 | | | | | 30,400 | | | | 29,700 | | | | 21,600 | | | | 22,900 | | | | 30,400 | |
| Leverage as a percent of total assets | | | 16.2 | % | | | | 11.7 | % | | | 11.3 | % | | | 8.3 | % | | | 9.0 | % | | | 11.5 | % |
| Operating expenses before leverage | | | | | | | | | | | | | | | | | | | | | | | | | |
| costs as a percent of total assets | | | 1.57 | % | | | | 1.54 | % | | | 1.71 | % | | | 1.72 | % | | | 2.01 | % | | | 0.69 | % |
| Net unrealized appreciation (depreciation), | | | | | | | | | | | | | | | | | | | | | | | | | |
| end of period | | | (1,352 | ) | | | | 13,357 | | | | 16,157 | | | | 12,165 | | | | 11,274 | | | | 8,712 | |
| Net assets, end of period | | | 218,560 | | | | | 227,356 | | | | 231,658 | | | | 231,382 | | | | 231,553 | | | | 232,699 | |
| Average net assets during period(4) | | | 224,328 | | | | | 235,252 | | | | 229,497 | | | | 235,252 | | | | 230,747 | | | | 233,287 | |
| Net asset value per common share | | | 16.20 | | | | | 16.85 | | | | 17.17 | | | | 17.15 | | | | 17.16 | | | | 17.25 | |
| Market value per common share | | | 13.89 | | | | | 14.76 | | | | 14.40 | | | | 14.64 | | | | 15.00 | | | | 14.55 | |
| Shares outstanding (000's) | | | 13,491 | | | | | 13,491 | | | | 13,491 | | | | 13,491 | | | | 13,491 | | | | 13,491 | |
| (1) | Q1 represents the period from December through February. Q2 represents the period from March through May. Q3 represents the period from June through August. Q4 represents the period from September through November. |
| (2) | Computed by averaging month-end values within each period. |
| (3) | Leverage consists of outstanding borrowings under the margin loan facility. |
| (4) | Computed by averaging daily net assets within each period. |
| |
| |
| 2022 Semi-Annual Report | May 31, 2022 |
| |
| TYG Consolidated Schedule of Investments (unaudited) |
| May 31, 2022 |
| |
| | Principal | | | |
| | Amount/Shares | | Fair Value |
| Common Stock — 93.7%(1) | | | | | |
| | | | | | |
| Energy Technology — 0.8%(1) | | | | | |
| United States — 0.8%(1) | | | | | |
| ESS Tech, Inc.(2) | | 317,850 | | $ | 1,312,721 |
| Fluence Energy, Inc.(2) | | 114,174 | | | 1,118,905 |
| Stem, Inc.(2) | | 166,675 | | | 1,440,072 |
| | | | | 3,871,698 |
| | | | | | |
| Natural Gas Gathering/Processing — 10.5%(1) | | | | | |
| United States — 10.5%(1) | | | | | |
| Hess Midstream Partners LP | | 134,630 | | | 4,387,592 |
| Targa Resources Corp. | | 658,190 | | | 47,402,844 |
| | | | | 51,790,436 |
| Natural Gas/Natural Gas Liquids Pipelines — 34.3%(1) | | | | | |
| United States — 34.3%(1) | | | | | |
| Cheniere Energy, Inc. | | 142,849 | | | 19,537,457 |
| Excelerate Energy, Inc.(2) | | 57,737 | | | 1,538,691 |
| Kinder Morgan Inc. | | 1,443,949 | | | 28,431,356 |
| Kinetik Holdings, Inc. | | 27,462 | | | 2,307,906 |
| ONEOK, Inc. | | 685,180 | | | 45,119,103 |
| The Williams Companies, Inc. | | 1,933,782 | | | 71,665,961 |
| | | | | 168,600,474 |
| | | | | | |
| Renewables and Power Infrastructure — 48.1%(1) | | | | | |
| United States — 48.1%(1) | | | | | |
| AES Corp. | | 1,078,820 | | | 23,777,193 |
| Alliant Energy Corp. | | 312,938 | | | 19,971,703 |
| Ameren Corp. | | 169,722 | | | 16,155,837 |
| American Electric Power Co, Inc. | | 316,996 | | | 32,343,102 |
| Archaea Energy, Inc.(2) | | 316,715 | | | 6,315,297 |
| Atlantica Sustainable | | | | | |
| Infrastructure PLC | | 473,463 | | | 15,458,567 |
| Clearway Energy Inc. | | 868,595 | | | 30,444,255 |
| DTE Energy Company | | 195,824 | | | 25,987,803 |
| NextEra Energy, Inc. | | 121,028 | | | 9,160,609 |
| NextEra Energy Partners, LP | | 379,423 | | | 27,185,658 |
| Sempra Energy | | 183,331 | | | 30,040,618 |
| | | | | 236,840,642 |
| Total Common Stock | | | | | |
| (Cost $357,776,891) | | | | | 461,103,250 |
| | | | | | |
| Master Limited Partnerships — 29.1%(1) | | | | | |
| Natural Gas Gathering/Processing — 5.5%(1) | | | | | |
| United States — 5.5%(1) | | | | | |
| Western Midstream Partners, LP | | 971,673 | | | 26,866,758 |
| | | | | | |
| Natural Gas/Natural Gas Liquids Pipelines — 15.1%(1) | | | | | |
| United States — 15.1%(1) | | | | | |
| DCP Midstream, LP | | 631,505 | | | 22,677,345 |
| Energy Transfer LP | | 2,703,132 | | | 31,518,519 |
| Enterprise Products Partners LP | | 742,362 | | | 20,355,566 |
| | | | | 74,551,430 |
| | | | | | |
| Refined Product Pipelines — 8.5%(1) | | | | | |
| United States — 8.5%(1) | | | | | |
| Magellan Midstream Partners LP | | 280,362 | | | 14,494,715 |
| MPLX LP | | 824,471 | | | 27,166,320 |
| | | | | 41,661,035 |
| Total Master Limited Partnerships | | | | | |
| (Cost $109,153,868) | | | | | 143,079,223 |
| | | | | |
| Preferred Stock — 2.6%(1) | | | | | |
| Natural Gas/Natural Gas Liquids Pipelines — 1.9%(1) | | | | | |
| United States — 1.9%(1) | | | | | |
| Altus Midstream Company 7.000%(3)(4) | | 7,508 | | | 9,425,827 |
| | | | | | |
| Renewable Infrastructure — 0.7%(1) | | | | | |
| NextEra Energy, Inc. | | 72,016 | | | 3,532,385 |
| Total Preferred Stock | | | | | |
| (Cost $11,007,665) | | | | | 12,958,212 |
| See accompanying Notes to Financial Statements. | |
| | |
| Tortoise | 25 |
| |
| |
| |
| |
| TYG Consolidated Schedule of Investments (unaudited) (continued) |
| May 31, 2022 |
| |
| | Principal | | | | |
| | Amount/Shares | | Fair Value |
| Private Investment — 3.4%(1) | | | | | | | |
| Renewables — 3.4%(1) | | | | | | | |
| United States — 3.4%(1) | | | | | | | |
| TK NYS Solar Holdco, LLC(3)(4)(5) | | | | | | | |
| (Cost $50,141,470) | | | 68,144,782 | | $ | 16,849,615 | |
| | | | | | | | |
| Corporate Bond — 0.7%(1) | | | | | | | |
| Natural Gas Gathering/Processing — 0.7%(1) | | | | | | | |
| United States — 0.7%(1) | | | | | | | |
| EnLink Midstream Partners | | | | | | | |
| 6.000%, Perpetual | | | | | | | |
| (Cost $4,739,445) | | $ | 5,100,000 | | | 3,593,766 | |
| | | | | | | | |
| Warrant — 0.0%(1) | | | | | | | |
| Energy Technology — 0.0%(1) | | | | | | | |
| EVgo, Inc. Warrant(2) | | | | | | | |
| (Cost $1) | | | 1 | | | 1 | |
| | | | | | | | |
| Short-Term Investment — 0.2%(1) | | | | | | | |
| United States Investment Company — 0.2%(1) | | | | | | | |
| Invesco Government & Agency Portfolio — Institutional Class, | | | | | | | |
| 0.675%(6) (Cost $832,651) | | | 832,651 | | | 832,651 | |
| | | | | | | | |
| Total Investments — 129.7%(1) | | | | | | | |
| (Cost $533,651,991) | | | | | | 638,416,718 | |
| Liabilities in Excess of Other Assets —(0.2)%(1) | | | | | | (1,147,922 | ) |
| Senior Notes — (17.4)%(1) | | | | | | (85,826,667 | ) |
| Line of Credit — (4.8)%(1) | | | | | | (23,500,000 | ) |
| Mandatory Redeemable Preferred Stock | | | | | | | |
| at Liquidation Value — (7.3)%(1) | | | | | | (35,660,610 | ) |
| Total Net Assets Applicable to | | | | | | | |
| Common Stockholders — 100.0%(1) | | | | | $ | 492,281,519 | |
| (1) | Calculated as a percentage of net assets applicable to common stockholders. |
| (2) | Non-income producing security. |
| (3) | Restricted securities have a total fair value of $26,275,442 which represents 5.3% of net assets. See Note 6 to the financial statements for further disclosure. |
| (4) | Securities have been valued by using significant unobservable inputs in accordance with fair value procedures and are categorized as level 3 investments. |
| (5) | Deemed to be an affiliate of the fund. See Note 7 to the financial statements for further disclosure. |
| (6) | Rate indicated is the current yield as of May 31, 2022. |
| See accompanying Notes to Financial Statements. | |
| | |
| 26 | Tortoise |
| |
| |
| 2022 Semi-Annual Report | May 31, 2022 |
| |
| NTG Schedule of Investments (unaudited) |
| May 31, 2022 |
| |
| | Principal | | | | |
| | Amount/Shares | | Fair Value |
| Common Stock — 93.4%(1) | | | | | | | |
| Crude Oil Pipelines — 15.3%(1) | | | | | | | |
| Canada — 11.1%(1) | | | | | | | |
| Enbridge Inc. | | | 275,100 | | $ | 12,695,865 | |
| Pembina Pipeline Corp. | | | 402,120 | | | 16,181,309 | |
| | | | | | 28,877,174 | |
| | | | | | | | |
| United States — 4.2%(1) | | | | | | | |
| Plains GP Holdings LP | | | 916,535 | | | 10,961,758 | |
| | | | | | | | |
| Natural Gas Gathering/Processing — 14.7%(1) | | | | | | | |
| United States — 14.7%(1) | | | | | | | |
| Hess Midstream Partners LP | | | 105,729 | | | 3,445,708 | |
| Targa Resources Corp. | | | 485,236 | | | 34,946,697 | |
| | | | | | 38,392,405 | |
| | | | | | | | |
| Natural Gas/Natural Gas Liquids Pipelines — 50.9%(1) | | | | | | | |
| United States — 50.9%(1) | | | | | | | |
| Cheniere Energy, Inc. | | | 114,752 | | | 15,694,631 | |
| DT Midstream, Inc. | | | 185,323 | | | 10,767,267 | |
| Excelerate Energy, Inc.(2) | | | 29,332 | | | 781,698 | |
| Kinder Morgan Inc. | | | 1,550,051 | | | 30,520,504 | |
| Kinetik Holdings, Inc. | | | 13,846 | | | 1,163,618 | |
| ONEOK, Inc. | | | 432,038 | | | 28,449,702 | |
| TC Energy Corporation | | | 128,700 | | | 7,444,008 | |
| The Williams Companies, Inc. | | | 1,027,603 | | | 38,082,967 | |
| | | | | | | 132,904,395 | |
| | | | | | | | |
| Renewables and Power Infrastructure — 12.5%(1) | | | | | | | |
| United States — 12.5%(1) | | | | | | | |
| Archaea Energy, Inc.(2) | | | 143,839 | | | 2,868,149 | |
| Atlantica Sustainable | | | | | | | |
| Infrastructure PLC | | | 222,743 | | | 7,272,559 | |
| Clearway Energy Inc. | | | 305,876 | | | 10,720,954 | |
| NextEra Energy Partners, LP | | | 163,701 | | | 11,729,177 | |
| | | | | | 32,590,839 | |
| Total Common Stock | | | | | | | |
| (Cost $164,155,558) | | | | | | 243,726,571 | |
| | | | | | | | |
| Master Limited Partnerships — 27.3%(1) | | | | | | | |
| Natural Gas Gathering/Processing — 5.1%(1) | | | | | | | |
| United States — 5.1%(1) | | | | | | | |
| Western Midstream Partners, LP | | | 479,491 | | | 13,257,926 | |
| | | | | | | | |
| Natural Gas/Natural Gas Liquids Pipelines — 15.0%(1) | | | | | | | |
| United States — 15.0(1) | | | | | | | |
| DCP Midstream, LP | | | 326,064 | | | 11,708,958 | |
| Energy Transfer LP | | | 1,361,998 | | | 15,880,897 | |
| Enterprise Products Partners L.P. | | | 422,068 | | | 11,573,104 | |
| | | | | | 39,162,959 | |
| Refined Product Pipelines — 7.2%(1) | | | | | | | |
| United States — 7.2%(1) | | | | | | | |
| Magellan Midstream Partners L.P. | | | 104,343 | | | 5,394,533 | |
| MPLX LP | | | 406,542 | | | 13,395,559 | |
| | | | | | 18,790,092 | |
| Total Master Limited Partnerships | | | | | | | |
| (Cost $50,458,402) | | | | | | 71,210,977 | |
| | | | | | | | |
| Preferred Stock — 3.3%(1) | | | | | | | |
| Natural Gas/Natural Gas Liquids Pipelines — 2.6%(1) | | | | | | | |
| United States — 2.6%(1) | | | | | | | |
| Altus Midstream Companys, 7.000%(3)(4) | | | 5,368 | | | 6,739,696 | |
| | | | | | | | |
| Renewable Infrastructure — 0.7%(1) | | | | | | | |
| United States — 0.7%(1) | | | | | | | |
| NextEra Energy, Inc. | | | 39,095 | | | 1,917,610 | |
| Total Preferred Stock | | | | | | | |
| (Cost $7,268,196) | | | | | | 8,657,306 | |
| | | | | | | | |
| Corporate Bond — 0.9%(1) | | | | | | | |
| Natural Gas Gathering/Processing — 0.9%(1) | | | | | | | |
| United States — 0.9%(1) | | | | | | | |
| EnLink Midstream Partners | | | | | | | |
| 6.000%, Perpetual | | | | | | | |
| (Cost $3,158,822) | | $ | 3,400,000 | | | 2,395,844 | |
| | | | | | | | |
| Short-Term Investment — 0.3%(1) | | | | | | | |
| United States Investment Company — 0.3%(1) | | | | | | | |
| First American Government Obligations Fund, Class X, | | | | | | | |
| 0.658%(5) (Cost $683,125) | | | 683,125 | | | 683,125 | |
| | | | | | | | |
| Total Investments — 125.2%(1) | | | | | | | |
| (Cost $225,724,103) | | | | | | 326,673,823 | |
| Assets in Excess of Other Liabilities — 0.2%(1) | | | | | | 618,758 | |
| Credit Facility Borrowings — (5.6)% | | | | | | (14,500,000 | ) |
| Senior Notes — (12.3)%(1) | | | | | | (32,149,733 | ) |
| Mandatory Redeemable Preferred Stock | | | | | | | |
| at Liquidation Value — (7.5)% | | | | | | (19,718,925 | ) |
| Total Net Assets Applicable to | | | | | | | |
| Common Stockholders — 100.0%(1) | | | | | $ | 260,923,923 | |
| (1) | Calculated as a percentage of net assets applicable to common stockholders. |
| (2) | Non-income producing security. |
| (3) | Restricted securities have a total fair value of $6,739,696, which represents 2.6% of net assets. See Note 6 to the financial statements for further disclosure. |
| (4) | Securities have been valued by using significant unobservable inputs in accordance with fair value procedures and are categorized as level 3 investments. |
| (5) | Rate indicated is the current yield as of May 31, 2022. |
| See accompanying Notes to Financial Statements. | |
| | |
| Tortoise | 27 |
| |
| |
| |
| |
| TTP Schedule of Investments (unaudited) |
| May 31, 2022 |
| |
| | Shares | | Fair Value |
| Common Stock — 95.2%(1) | | | | | | |
| Crude Oil Pipelines — 26.7%(1) | | | | | | |
| Canada — 18.8%(1) | | | | | | |
| Enbridge Inc. | | 197,300 | | $ | 9,105,395 | |
| Gibson Energy, Inc. | | 50,815 | | | 1,076,281 | |
| Pembina Pipeline Corp. | | 118,304 | | | 4,770,134 | |
| | | | | | 14,951,810 | |
| | |
| United States — 8.0%(1) | | | | | | |
| Plains GP Holdings LP | | 523,256 | | | 6,258,142 | |
| | |
| Energy Technology — 0.1%(1) | | | | | | |
| United States — 0.1%(1) | | | | | | |
| ESS Tech, Inc.(2) | | 20,820 | | | 85,986 | |
| | |
| Natural Gas Gathering/Processing — 11.3%(1) | | | | |
| United States — 11.3%(1) | | | | | | |
| Antero Midstream Corp. | | 101,317 | | | 1,100,303 | |
| Equitrans Midstream Corp. | | 307,343 | | | 2,418,789 | |
| Hess Midstream Partners LP | | 78,784 | | | 2,567,571 | |
| Targa Resources Corp. | | 39,905 | | | 2,873,958 | |
| | | | | 8,960,621 | |
| | |
| Natural Gas/Natural Gas Liquids Pipelines — 48.3%(1) | | | | |
| Canada — 10.7%(1) | | | | | | |
| Keyera Corp. | | 73,152 | | | 1,949,602 | |
| TC Energy Corporation | | 113,623 | | | 6,571,954 | |
| | | | | | 8,521,556 | |
| | |
| United States — 37.6%(1) | | | | | | |
| Cheniere Energy, Inc. | | 26,342 | | | 3,602,795 | |
| Excelerate Energy, Inc.(2) | | 8,917 | | | 237,638 | |
| Kinder Morgan Inc. | | 389,508 | | | 7,669,413 | |
| Kinetik Holdings, Inc. | | 4,157 | | | 349,354 | |
| ONEOK, Inc. | | 125,406 | | | 8,257,985 | |
| The Williams Companies, Inc. | | 263,979 | | | 9,783,062 | |
| | | | | | 29,900,247 | |
| | |
| Renewables and Power Infrastructure — 8.7%(1) | | | | |
| United States — 8.7%(1) | | | | | | |
| Archaea Energy, Inc.(2) | | 14,797 | | | 295,052 | |
| Clearway Energy Inc. | | 22,000 | | | 771,100 | |
| NextEra Energy Partners, LP | | 29,030 | | | 2,080,000 | |
| Sempra Energy | | 23,017 | | | 3,771,566 | |
| | | | | | 6,917,718 | |
| Total Common Stock | | | | | | |
| (Cost $62,486,658) | | | | | 75,596,080 | |
| | |
| Master Limited Partnerships — 30.4%(1) | | | | |
| Crude Oil Pipelines — 3.0%(1) | | | | | | |
| United States — 3.0%(1) | | | | | | |
| NuStar Energy LP | | 40,806 | | | 654,936 | |
| Shell Midstream Partners LP | | 124,825 | | | 1,765,026 | |
| | | | | | 2,419,962 | |
| Natural Gas Gathering/Processing — 3.2%(1) | | | | | | |
| United States — 3.2%(1) | | | | | | |
| Western Midstream Partners, LP | | 92,848 | | | 2,567,247 | |
| |
| Natural Gas/Natural Gas Liquids Pipelines — 14.7%(1) | | | | |
| United States — 14.7%(1) | | | | | | |
| DCP Midstream, LP | | 74,374 | | | 2,670,771 | |
| Energy Transfer LP | | 386,197 | | | 4,503,057 | |
| Enterprise Products Partners LP | | 163,236 | | | 4,475,931 | |
| | | | | | 11,649,759 | |
| |
| Other — 0.2%(1) | | | | | | |
| United States — 0.2%(1) | | | | | | |
| Westlake Chemical Partners LP | | 4,940 | | | 130,910 | |
| |
| Refined Product Pipelines — 9.3%(1) | | | | | | |
| United States — 9.3%(1) | | | | | | |
| Magellan Midstream Partners LP | | 56,630 | | | 2,927,771 | |
| MPLX LP | | 134,271 | | | 4,424,229 | |
| | | | | | 7,352,000 | |
| Total Master Limited Partnerships | | | | | | |
| (Cost $17,126,163) | | | | | 24,119,878 | |
| |
| Preferred Stock — 0.6%(1) | | | | | | |
| Natural Gas/Natural Gas Liquids Pipelines — 0.6%(1) | | | | |
| United States — 0.6%(1) | | | | | | |
| Altus Midstream Company | | | | | | |
| 7.000%(3)(4) (Cost $398,827) | | 399 | | | 500,723 | |
| |
| Short-Term Investment — 0.5%(1) | | | | | | |
| United States Investment Company — 0.5%(1) | | | | | | |
| First American Government Obligations Fund, Class X, | | | | |
| 0.658%(5) (Cost $385,681) | | 385,681 | | | 385,681 | |
| |
| Total Investments — 126.7%(1) | | | | | | |
| (Cost $80,397,329) | | | | | 100,602,362 | |
| Liabilities in Excess of Other Assets — (0.3)%(1) | | | (216,376 | ) |
| Credit Facility Borrowings — (13.7)%(1) | | | | | (10,900,000 | ) |
| Senior Notes — (5.0)%(1) | | | | | (3,942,857 | ) |
| Mandatory Redeemable Preferred Stock | | | | | | |
| at Liquidation Value — (7.7)%(1) | | | | | (6,100,000 | ) |
| Total Net Assets Applicable to | | | | | | |
| Common Stockholders — 100.0%(1) | | | | $ | 79,443,129 | |
| (1) | Calculated as a percentage of net assets applicable to common stockholders. |
| (2) | Non-income producing security. |
| (3) | Restricted securities have a total fair value of $500,723, which represents 0.6% of net assets. See Note 6 to the financial statements for further disclosure. |
| (4) | Securities have been valued by using significant unobservable inputs in accordance with fair value procedures and are categorized as level 3 investments. |
| (5) | Rate indicated is the current yield as of May 31, 2022. |
| See accompanying Notes to Financial Statements. | |
| | |
| 28 | Tortoise |
| |
| |
| 2022 Semi-Annual Report | May 31, 2022 |
| |
| NDP Schedule of Investments (unaudited) |
| May 31, 2022 |
| |
| | Shares | | Fair Value |
| Common Stock — 90.1%(1) | | | | | | |
| Crude Oil Pipelines — 1.5%(1) | | | | | | |
| Canada — 1.5%(1) | | | | | | |
| Enbridge Inc. | | 23,865 | | $ | 1,101,370 | |
| | |
| Energy Technology — 0.1%(1) | | | | | | |
| United States — 0.1%(1) | | | | | | |
| ESS Tech, Inc.(2) | | 11,194 | | | 46,231 | |
| | |
| Natural Gas Gathering/Processing — 4.9%(1) | | | | |
| United States — 4.9%(1) | | | | | | |
| Baker Hughes Co. | | 38,763 | | | 1,394,693 | |
| Targa Resources Corp. | | 28,897 | | | 2,081,162 | |
| | | | | | 3,475,855 | |
| | |
| Natural Gas/Natural Gas Liquids Pipelines — 14.0%(1) | | |
| Canada — 1.6%(1) | | | | | | |
| TC Energy Corporation | | 19,745 | | | 1,142,051 | |
| United States — 12.4%(1) | | | | | | |
| Cheniere Energy, Inc. | | 43,921 | | | 6,007,075 | |
| Excelerate Energy, Inc.(2) | | 6,209 | | | 165,470 | |
| Kinder Morgan Inc. | | 56,165 | | | 1,105,889 | |
| Kinetik Holdings, Inc. | | 2,839 | | | 238,590 | |
| The Williams Companies, Inc. | | 36,175 | | | 1,340,645 | |
| | | | | | 8,857,669 | |
| | |
| Oil and Gas Production — 66.4%(1) | | | | | | |
| Canada — 2.3%(1) | | | | | | |
| Suncor Energy, Inc. | | 40,528 | | | 1,636,521 | |
| United States — 64.1%(1) | | | | | | |
| Chevron Corp. | | 19,314 | | | 3,373,383 | |
| ConocoPhillips | | 21,747 | | | 2,443,493 | |
| Continental Resources, Inc. | | 15,751 | | | 1,072,171 | |
| Coterra Energy, Inc. | | 21,071 | | | 723,367 | |
| Devon Energy Corp. | | 90,404 | | | 6,771,260 | |
| Diamondback Energy, Inc. | | 37,179 | | | 5,651,952 | |
| EOG Resources, Inc. | | 34,587 | | | 4,737,035 | |
| EQT Corp. | | 117,402 | | | 5,602,423 | |
| Exxon Mobil Corp. | | 22,357 | | | 2,146,272 | |
| Occidental Petroleum Corp. | | 53,183 | | | 3,686,114 | |
| Marathon Oil Corp. | | 81,694 | | | 2,567,642 | |
| PDC Energy, Inc. | | 9,914 | | | 784,594 | |
| Pioneer Natural Resources Company | | 22,350 | | | 6,211,959 | |
| | | | | | 45,771,665 | |
| | |
| Other — 1.7%(1) | | | | | | |
| United States — 1.7%(1) | | | | | | |
| Darling Ingredients, Inc.(2) | | 1,957 | | | 156,697 | |
| Denbury, Inc.(2) | | 15,079 | | | 1,102,878 | |
| | | | | | 1,259,575 | |
| Renewables and Power Infrastructure — 1.5%(1) | | | | |
| United States — 1.5%(1) | | | | | | |
| American Electric Power Co, Inc. | | 2,921 | | | 298,030 | |
| Archaea Energy, Inc.(2) | | 7,593 | | | 151,404 | |
| Clean Energy Fuels Corp.(2) | | 29,780 | | | 164,683 | |
| NextEra Energy, Inc. | | 6,065 | | | 459,060 | |
| | | | | 1,073,177 | |
| Total Common Stock | | | | | | |
| (Cost $34,391,036) | | | | | 64,364,114 | |
| |
| Master Limited Partnerships — 14.5%(1) | | | | |
| Crude Oil Pipelines — 3.0%(1) | | | | | | |
| United States — 3.0%(1) | | | | | | |
| Plains All American Pipeline, L.P. | | 189,849 | | | 2,162,380 | |
| |
| Natural Gas Gathering/Processing — 1.9%(1) | | | | |
| United States — 1.9%(1) | | | | | | |
| Western Midstream Partners, LP | | 48,607 | | | 1,343,984 | |
| |
| Natural Gas/Natural Gas Liquids Pipelines — 8.2%(1) | | | | |
| United States — 8.2%(1) | | | | | | |
| DCP Midstream, LP | | 50,351 | | | 1,808,104 | |
| Energy Transfer LP | | 241,059 | | | 2,810,748 | |
| Enterprise Products Partners L.P. | | 43,433 | | | 1,190,933 | |
| | | | | | 5,809,785 | |
| Refined Product Pipelines — 1.4%(1) | | | | | | |
| United States — 1.4%(1) | | | | | | |
| Magellan Midstream Partners L.P. | | 19,323 | | | 998,999 | |
| Total Master Limited Partnerships | | | | | | |
| (Cost $7,948,810) | | | | | 10,315,148 | |
| |
| Warrants — 0.0%(1) | | | | | | |
| Energy Technology — 0.0%(1) | | | | | | |
| United States — 0.0%(1) | | | | | | |
| EVgo, Inc. Warrant(2) | | | | | | |
| (Cost $1) | | 1 | | | 1 | |
| |
| Short-Term Investment — 0.4%(1) | | | | | | |
| United States Investment Company — 0.4%(1) | | | | |
| First American Government Obligations Fund, Class X, | | | | |
| 0.658%(3) (Cost $312,313) | | 312,313 | | | 312,313 | |
| |
| Total Investments — 105.0%(1) | | | | | | |
| (Cost $42,652,160) | | | | | 74,991,576 | |
| Assets in Excess of Other Liabilities — 0.0%(1) | | | 15,596 | |
| Credit Facility Borrowings — (5.0%)(1) | | | | | (3,600,000 | ) |
| Total Net Assets Applicable to | | | | | | |
| Common Stockholders — 100.0%(1) | | $ | 71,407,172 | |
| (1) | Calculated as a percentage of net assets. |
| (2) | Non-income producing security. |
| (3) | Rate indicated is the current yield as of May 31, 2022. |
| See accompanying Notes to Financial Statements. | |
| | |
| Tortoise | 29 |
| |
| |
| |
| |
| TPZ Schedule of Investments (unaudited) |
| May 31, 2022 |
| |
| | Principal | | | |
| | Amount/Shares | | Fair Value |
| Corporate Bonds — 54.5%(1) | | | | | | |
| Crude Oil Pipelines — 5.9%(1) | | | | | | |
| United States — 5.9%(1) | | | | | | |
| Enbridge Inc., | | | | | | |
| 5.500%, 07/15/2077 | | $ | 7,042,000 | | $ | 6,353,891 |
| |
| Natural Gas Gathering/Processing — 19.5%(1) | | | |
| United States — 19.5%(1) | | | | | | |
| Antero Midstream Partners LP | | | | | | |
| 5.750%, 03/01/2027(3) | | | 3,800,000 | | | 3,809,652 |
| Blue Racer Midstream, LLC | | | | | | |
| 6.625%, 07/15/2026(3) | | | 5,900,000 | | | 5,796,750 |
| EnLink Midstream LLC | | | | | | |
| 5.375%, 06/01/2029 | | | 4,000,000 | | | 3,873,520 |
| Hess Corporation | | | | | | |
| 5.625%, 02/15/2026(3) | | | 4,160,000 | | | 4,247,360 |
| The Williams Companies, Inc. | | | | | | |
| 4.550%, 06/24/2024 | | | 3,000,000 | | | 3,049,877 |
| | | | | | 20,777,159 |
| |
| Natural Gas/Natural Gas Liquids Pipelines — 19.4%(1) | | | |
| United States — 19.4%(1) | | | | | | |
| Cheniere Corp. | | | | | | |
| 7.000%, 06/30/2024 | | | 4,000,000 | | | 4,199,592 |
| Cheniere Corp. | | | | | | |
| 5.875%, 03/31/2025 | | | 2,000,000 | | | 2,080,722 |
| DT Midstream, Inc. | | | | | | |
| 4.375%, 06/15/2031(3) | | | 2,000,000 | | | 1,868,955 |
| NGPL PipeCo LLC | | | | | | |
| 3.250%, 07/15/2031(3) | | | 1,500,000 | | | 1,305,226 |
| ONEOK, Inc. | | | | | | |
| 7.500%, 09/01/2023 | | | 2,000,000 | | | 2,083,898 |
| ONEOK, Inc. | | | | | | |
| 6.350%, 01/15/2031 | | | 3,000,000 | | | 3,270,418 |
| Rockies Express Pipeline LLC | | | | | | |
| 4.950%, 07/15/2029(3) | | | 3,000,000 | | | 2,841,015 |
| Tallgrass Energy LP | | | | | | |
| 5.500%, 01/15/2028(3) | | | 3,250,000 | | | 3,015,805 |
| | | | | | 20,665,631 |
| |
| Renewables and Power Infrastructure — 3.7%(1) | | | |
| United States — 3.7%(1) | | | | | | |
| NextEra Energy, Inc. | | | | | | |
| 6.500%, 09/30/2026 | | | 4,500,000 | | | 3,978,860 |
| |
| Refined Product Pipelines — 1.5%(1) | | | |
| United States — 1.5%(1) | | | | | | |
| Buckeye Partners LP | | | | | | |
| 5.850%, 11/15/2043 | | | 2,000,000 | | | 1,559,676 |
| |
| Other — 4.5%(1) | | | | | | |
| United States — 4.5%(1) | | | | | | |
| New Fortress Energy, Inc. | | | | | | |
| 6.500%, 09/30/2026(3) | | | 5,000,000 | | | 4,859,000 |
| Total Corporate Bonds | | | | | | |
| (Cost $60,288,694) | | | | | | 58,194,217 |
| | | | | | | |
| Common Stock — 36.0%(1) | | | | | | |
| Crude Oil Pipelines — 6.7%(1) | | | | | | |
| Canada — 2.3%(1) | | | | | | |
| Enbridge Inc. | | | 53,741 | | | 2,480,147 |
| |
| United States — 4.4%(1) | | | | | | |
| Plains GP Holdings LP | | | 389,094 | | | 4,653,565 |
| |
| Energy Technology — 0.1%(1) | | | | | | |
| United States — 0.1%(1) | | | | | | |
| ESS Tech, Inc.(2) | | | 31,987 | | | 132,106 |
| |
| Natural Gas Gathering/Processing — 8.1%(1) | | | |
| United States — 8.1%(1) | | | | | | |
| EnLink Midstream LLC | | | 90,965 | | | 1,037,001 |
| Equitrans Midstream Corp. | | | 108,596 | | | 854,650 |
| Hess Midstream Partners LP | | | 66,901 | | | 2,180,304 |
| Targa Resources Corp. | | | 62,837 | | | 4,525,521 |
| | | | | | 8,597,476 |
| |
| Natural Gas/Natural Gas Liquids Pipelines — 16.0%(1) | | | |
| United States — 16.0%(1) | | | | | | |
| DT Midstream, Inc. | | | 24,885 | | | 1,445,819 |
| Excelerate Energy, Inc.(2) | | | 11,787 | | | 314,124 |
| Kinder Morgan Inc. | | | 214,709 | | | 4,227,620 |
| Kinetik Holdings, Inc. | | | 5,707 | | | 479,616 |
| ONEOK, Inc. | | | 42,252 | | | 2,782,294 |
| TC Energy Corporation | | | 48,667 | | | 2,814,899 |
| The Williams Companies, Inc. | | | 135,347 | | | 5,015,960 |
| | | | | | 17,080,332 |
| |
| Renewables and Power Infrastructure — 5.1%(1) | | | |
| United States — 5.1%(1) | | | | | | |
| Archaea Energy, Inc.(2) | | | 26,704 | | | 532,478 |
| Atlantica Sustainable | | | | | | |
| Infrastructure PLC | | | 16,523 | | | 539,476 |
| DTE Energy Company | | | 8,116 | | | 1,077,074 |
| NextEra Energy Partners, LP | | | 8,013 | | | 574,132 |
| Sempra Energy | | | 16,927 | | | 2,773,658 |
| | | | | | 5,496,818 |
| Total Common Stock | | | | | | |
| (Cost $30,609,335) | | | | | | 38,440,444 |
| See accompanying Notes to Financial Statements. | |
| | |
| 30 | Tortoise |
| |
| |
| 2022 Semi-Annual Report | May 31, 2022 |
| |
| TPZ Schedule of Investments (unaudited) (continued) |
| May 31, 2022 |
| |
| | Principal | | | | |
| | Amount/Shares | | Fair Value |
| Master Limited Partnerships — 32.1%(1) | | | | |
| Crude Oil Pipelines — 2.9%(1) | | | | | | |
| United States — 2.9%(1) | | | | | | |
| NuStar Energy LP | | 90,687 | | $ | 1,455,526 | |
| PBF Logistics LP | | 30,650 | | | 498,982 | |
| Shell Midstream Partners LP | | 77,365 | | | 1,093,941 | |
| | | | | | 3,048,449 | |
| Natural Gas Gathering/Processing — 4.0%(1) | | | | |
| United States — 4.0%(1) | | | | | | |
| Western Midstream Partners, LP | | 154,434 | | | 4,270,100 | |
| Natural Gas/Natural Gas Liquids Pipelines — 13.6%(1) | | | | |
| United States — 13.6%(1) | | | | | | |
| DCP Midstream, LP | | 110,091 | | | 3,953,368 | |
| Energy Transfer LP | | 407,632 | | | 4,752,989 | |
| Enterprise Products Partners LP | | 213,683 | | | 5,859,188 | |
| | | | | | 14,565,545 | |
| Other — 0.2%(1) | | | | | | |
| United States — 0.2%(1) | | | | | | |
| Westlake Chemical Partners LP | | 8,074 | | | 213,961 | |
| Refined Product Pipelines — 11.4%(1) | | | | |
| United States — 11.4%(1) | | | | | | |
| Holly Energy Partners LP | | 30,993 | | | 588,867 | |
| Magellan Midstream Partners LP | | 78,332 | | | 4,049,764 | |
| MPLX LP | | 226,804 | | | 7,473,192 | |
| | | | | | 12,111,823 | |
| Total Master Limited Partnerships | | | | | | |
| (Cost $25,748,656) | | | | | 34,209,878 | |
| |
| Preferred Stock — 0.4%(1) | | | | | | |
| Natural Gas/Natural Gas Liquids Pipelines — 0.4%(1) | | |
| United States — 0.4%(1) | | | | | | |
| Altus Midstream Company | | | | | | |
| 7.000%, 06/12/2029(3)(4) | | | | | | |
| (Cost $347,832) | | 348 | | | 436,699 | |
| |
| Warrant — 0.0%(1) | | | | | | |
| Energy Technology — 0.0%(1) | | | | | | |
| EVgo, Inc. Warrant(2) | | | | | | |
| (Cost $0) | | 1 | | | 1 | |
| |
| Short-Term Investment — 0.3%(1) | | | | |
| United States Investment Company — 0.3%(1) | | | | |
| First American Government Obligations Fund, Class X, | | | | |
| 0.658%(5) (Cost $315,503) | | 315,503 | | | 315,503 | |
| |
| Total Investments — 123.3%(1) | | | | | | |
| (Cost $117,310,020) | | | | | 131,596,742 | |
| Assets in Excess of Other Liabilities — 0.7%(1) | | | 785,739 | |
| Credit Facility Borrowings — (24.0)%(1) | | | (25,600,000 | ) |
| Total Net Assets Applicable to | | | | | | |
| Common Stockholders — 100.0%(1) | | $ | 106,782,481 | |
| (1) | Calculated as a percentage of net assets. |
| (2) | Non-income producing security. |
| (3) | Restricted securities have a total fair value of $28,180,462, which represents 26.4% of net assets. See Note 6 to the financial statements for further disclosure. |
| (4) | Value determined using significant unobservable inputs. |
| (5) | Rate indicated is the current yield as of May 31, 2022. |
| See accompanying Notes to Financial Statements. | |
| | |
| Tortoise | 31 |
| |
| |
| |
| |
| TEAF Consolidated Schedule of Investments (unaudited) |
| May 31, 2022 |
| |
| | Principal | | | |
| | Amount/Shares | | Fair Value |
| Common Stock — 51.2%(1) | | | | | |
| Natural Gas/Natural Gas Liquids Pipelines — 7.1%(1) | |
| Australia — 1.9%(1) | | | | | |
| APA Group(2) | | 536,889 | | $ | 4,384,686 |
| |
| United States — 5.2%(1) | | | | | |
| Cheniere Energy, Inc.(2)(3) | | 30,700 | | | 4,198,839 |
| Excelerate Energy, Inc.(4) | | 13,710 | | | 365,371 |
| ONEOK, Inc. | | 15,140 | | | 996,969 |
| The Williams Companies, Inc.(2) | | 171,824 | | | 6,367,797 |
| | | | | 11,928,976 |
| |
| Natural Gas Gathering/Processing — 3.4%(1) | | | |
| United States — 3.4%(1) | | | | | |
| Hess Midstream Partners LP | | 38,675 | | | 1,260,418 |
| Targa Resources Corp.(2) | | 92,500 | | | 6,661,850 |
| | | | | 7,922,268 |
| |
| Other — 3.5%(1) | | | | | |
| Australia — 2.2%(1) | | | | | |
| Atlas Arteria Ltd.(2) | | 992,726 | | | 5,122,359 |
| Spain — 1.3%(1) | | | | | |
| Ferrovial SA(2) | | 121,999 | | | 3,144,635 |
| |
| Power — 24.5%(1) | | | | | |
| Canada — 1.0%(1) | | | | | |
| Algonquin Power & Utilities Corp.(2)(4) | | 166,889 | | | 2,427,764 |
| Germany — 1.3%(1) | | | | | |
| RWE AG | | 68,204 | | | 3,002,033 |
| Italy — 5.6%(1) | | | | | |
| ENAV SpA(2)(4) | | 544,452 | | | 2,516,839 |
| Enel SpA | | 1,099,196 | | | 7,132,165 |
| Terna SpA(2) | | 409,102 | | | 3,465,217 |
| | | | | 13,114,221 |
| Portugal — 2.6%(1) | | | | | |
| EDP — Energias de Portugal SA(2) | | 1,209,999 | | | 6,068,897 |
| Spain — 4.7%(1) | | | | | |
| Endesa SA | | 299,775 | | | 6,639,210 |
| Iberdrola SA(2) | | 371,053 | | | 4,395,721 |
| | | | | 11,034,931 |
| United Kingdom — 5.9%(1) | | | | | |
| National Grid Plc | | 335,962 | | | 4,957,365 |
| SSE PLC(2) | | 390,560 | | | 8,720,779 |
| | | | | 13,678,144 |
| United States — 3.4%(1) | | | | | |
| American Electric Power Co, Inc.(2) | | 53,287 | | | 5,436,873 |
| Atlantica Sustainable | | | | | |
| Infrastructure PLC | | 75,263 | | | 2,457,337 |
| | | | | 7,894,210 |
| |
| Renewable Infrastructure — 2.0%(1) | | | | | |
| United Kingdom — 2.0%(1) | | | | | |
| Greencoat UK Wind PLC | | 2,415,956 | | | 4,566,507 |
| United States — 0.0%(1) | | | | | |
| Archaea Energy, Inc.(4) | | 27 | | | 538 |
| |
| Renewables — 5.1%(1) | | | | | |
| United States — 5.1%(1) | | | | | |
| Innergex Renewable Energy, Inc.(2) | | 294,405 | | | 3,970,865 |
| TransAlta Renewables, Inc.(2)(4) | | 381,927 | | | 5,235,889 |
| Transition SA(4) | | 250,000 | | | 2,610,066 |
| | | | | 11,816,820 |
| |
| Solar — 0.7%(1) | | | | | |
| United States — 0.7%(1) | | | | | |
| Sunnova Energy International, Inc.(2)(4) | | 82,766 | | | 1,655,320 |
| |
| Transportation/Storage — 1.9%(1) | | | | | |
| Hong Kong — 1.9%(1) | | | | | |
| China Suntien Green Energy Corp Ltd. | | 7,408,484 | | | 4,323,945 |
| Utilities — 3.0%(1) | | | | | |
| United States — 3.0%(1) | | | | | |
| Ameren Corp. | | 20,040 | | | 1,907,608 |
| Essential Utilities, Inc.(2) | | 58,349 | | | 2,699,225 |
| Public Service Enterprise Group, Inc. | | 35,419 | | | 2,427,618 |
| | | | | 7,034,451 |
| Total Common Stock | | | | | |
| (Cost $113,676,061) | | | | | 119,120,705 |
| |
| Private Investments — 19.5%(1) | | | | | |
| Natural Gas/Natural Gas Liquids Pipelines — 0.9%(1) | | | |
| Mexico Pacific Limited LLC(MLP) | | | | | |
| Series A(5)(6) | | 99,451 | | | 2,182,353 |
| |
| Renewables — 18.6%(1) | | | | | |
| United States — 18.6%(1) | | | | | |
| Renewable Holdco, LLC(5)(6)(7) | | N/A | | | 6,387,342 |
| Renewable Holdco I, LLC(5)(6)(7) | | N/A | | | 23,088,987 |
| Renewable Holdco II, LLC(5)(6)(7) | | N/A | | | 13,684,789 |
| | | | | 43,161,118 |
| Total Private Investments | | | | | |
| (Cost $45,258,469) | | | | | 45,343,471 |
| See accompanying Notes to Financial Statements. | |
| | |
| 32 | Tortoise |
| |
| |
| 2022 Semi-Annual Report | May 31, 2022 |
| |
| TEAF Consolidated Schedule of Investments (unaudited) (continued) |
| May 31, 2022 |
| |
| | Principal | | | |
| | Amount/Shares | | Fair Value |
| Corporate Bonds — 17.1%(1) | | | | | | |
| Education — 0.3%(1) | | | | | | |
| United States — 0.3%(1) | | | | | | |
| Village Charter School, Inc. | | | | | | |
| 10.000%, 06/30/2022(9) | | $ | 800,000 | | $ | 600,000 |
| | | | | | | |
| Healthcare — 1.5%(1) | | | | | | |
| United States — 1.5%(1) | | | | | | |
| 315/333 West Dawson Associates | | | | | | |
| SUB 144A NT, | | | | | | |
| 11.000%, 01/31/2026(6) | | | 3,770,000 | | | 3,555,355 |
| | | | | | | |
| Project Finance — 7.9%(1) | | | | | | |
| United States — 7.9%(1) | | | | | | |
| C2NC Holdings | | | | | | |
| 13.000%, 05/01/2027 | | | 10,715,000 | | | 10,537,453 |
| Dynamic BC Holdings LLC | | | | | | |
| 13.500%, 04/01/2028(6) | | | 8,110,000 | | | 7,925,368 |
| | | | | | 18,462,821 |
| | | | | | | |
| Senior Living — 7.0%(1) | | | | | | |
| United States — 7.0%(1) | | | | | | |
| Contour Propco 1735 S MISSION | | | | | | |
| SUB 144A NT, | | | | | | |
| 11.000%, 10/01/2025(6) | | | 5,715,000 | | | 5,616,919 |
| Dove Mountain Residences, LLC | | | | | | |
| 11.000%, 02/01/2026(6) | | | 1,050,000 | | | 1,031,927 |
| Dove Mountain Residences, LLC | | | | | | |
| 16.000%, 02/01/2026(6) | | | 820,622 | | | 807,157 |
| Drumlin Reserve Property LLC | | | | | | |
| 10.000%, 10/02/2025(6) | | | 1,705,311 | | | 1,684,562 |
| Drumlin Reserve Property LLC | | | | | | |
| 16.000%, 10/02/2025(6) | | | 1,218,000 | | | 1,205,020 |
| JW Living Smithville Urban Ren Sub | | | | | | |
| Global 144A 27 | | | | | | |
| 11.750%, 06/01/2027(6) | | | 3,890,000 | | | 3,890,000 |
| Realco Perry Hall MD LLC/OPCO | | | | | | |
| Sub 144A NT | | | | | | |
| 10.000%, 10/01/2024(6) | | | 2,256,000 | | | 2,065,772 |
| | | | | | 16,301,357 |
| Other — 0.4%(1) | | | | | | |
| United States — 0.4%(1) | | | | | | |
| Vonore Fiber Products LLC | | | | | | |
| 16.000%, 07/10/2022(6) | | | 955,414 | | | 955,414 |
| Total Corporate Bonds | | | | | | |
| (Cost $40,859,241) | | | | | | 39,874,947 |
| | | | | | | |
| Master Limited Partnerships — 10.7%(1) | | | | | | |
| Natural Gas Gathering/Processing — 0.5%(1) | | | | | | |
| United States — 0.5%(1) | | | | | | |
| Western Midstream Partners, LP(2)(3) | | | 39,385 | | | 1,088,995 |
| | | | | | | |
| Natural Gas/Natural Gas Liquids Pipelines — 5.1%(1) | | | | | | |
| United States — 5.1%(1) | | | | | | |
| DCP Midstream, LP | | | 93,735 | | | 3,366,024 |
| Energy Transfer LP(2)(3) | | | 424,800 | | | 4,953,168 |
| Enterprise Products Partners LP(2) | | | 128,400 | | | 3,520,728 |
| | | | | | 11,839,920 |
| | | | | | |
| Refined Product Pipelines — 2.9%(1) | | | | | | |
| United States — 2.9%(1) | | | | | | |
| MPLX LP(2) | | | 206,200 | | | 6,794,290 |
| | | | | | |
| Renewables — 2.2%(1) | | | | | | |
| United States — 2.2%(1) | | | | | | |
| Enviva Partners LP(2) | | | 66,900 | | | 5,210,841 |
| Total Master Limited Partnerships | | | | | | |
| (Cost $20,152,604) | | | | | | 24,934,046 |
| | | | | | |
| Construction Notes — 4.8%(1) | | | | | | |
| Bermuda — 1.5%(1) | | | | | | |
| Saturn Solar Bermuda 1 Ltd.(5)(6) | | | | | | |
| 8.000%, 07/31/2022 | | | 3,510,000 | | | 3,529,656 |
| | | | | | |
| Water Equipment & Services — 3.3%(1) | | | | | | |
| EF WWW Holdings, LLC(5)(6) | | | | | | |
| 10.500%, 09/30/2026 | | | 7,268,888 | | | 7,549,503 |
| Total Construction Notes | | | | | | |
| (Cost $11,047,792) | | | | | $ | 11,079,159 |
| See accompanying Notes to Financial Statements. | |
| | |
| Tortoise | 33 |
| |
| |
| |
| |
| TEAF Consolidated Schedule of Investments (unaudited) (continued) |
| May 31, 2022 |
| |
| | Principal | | | | |
| | Amount/Shares | | Fair Value |
| Municipal Bonds — 4.5%(1) | | | | | | | |
| Arizona — 0.2%(1) | | | | | | | |
| La Paz County Industrial | | | | | | | |
| Development Authority | | | | | | | |
| 10.042%, 01/01/2026 | | $ | 410,000 | | $ | 401,800 | |
| | | | | | | |
| Florida — 0.2%(1) | | | | | | | |
| Florida Development Finance Corp. | | | | | | | |
| 5.720%, 07/01/2025(9) | | | 445,000 | | | 422,750 | |
| | | | | | | |
| Wisconsin — 4.1%(1) | | | | | | | |
| Public Finance Authority | | | | | | | |
| 9.000%, 06/01/2029 | | | 8,925,000 | | | 8,925,000 | |
| Public Finance Authority | | | | | | | |
| 12.000%, 10/01/2029 | | | 185,000 | | | 181,984 | |
| Public Finance Authority | | | | | | | |
| 10.000%, 09/01/2031 | | | 525,000 | | | 468,563 | |
| | | | | | 9,575,547 | |
| Total Municipal Bonds | | | | | | | |
| (Cost $10,459,748) | | | | | | 10,400,097 | |
| | | | | | | |
| Preferred Stock — 4.4%(1) | | | | | | | |
| Natural Gas/Natural Gas Liquids Pipelines — 3.7%(1) | | | | | | | |
| United States — 3.7%(1) | | | | | | | |
| Altus Midstream Company, | | | | | | | |
| 7.000%(5)(6) | | | 3,092 | | | 3,881,560 | |
| Enterprise Products Partners LP, | | | | | | | |
| 7.250%(5)(6) | | | 5,000 | | | 4,680,800 | |
| | | | | | 8,562,360 | |
| | | | | | | |
| Renewables — 0.7%(1) | | | | | | | |
| United States — 0.7%(1) | | | | | | | |
| NextEra Energy Partners LP | | | 28,900 | | | 1,605,684 | |
| Total Preferred Stock | | | | | | | |
| (Cost $10,853,810) | | | | | | 10,168,044 | |
| | | | | | | |
| Special Purpose Acquisition Company Warrant — 0.0%(1) | | | | | | | |
| Renewables — 0.0%(1) | | | | | | | |
| Transition SA Warrant(4) | | | | | | | |
| (Cost $0) | | | 250,000 | | | 67,164 | |
| | | | | | | | |
| Short-Term Investment — 0.4%(1) | | | | | | | |
| United States Investment Company — 0.4%(1) | | | | | | | |
| First American Government Obligations Fund, Class X, | | | | | | | |
| 0.658%(10) (Cost $947,428) | | | 947,428 | | | 947,428 | |
| | | | | | | |
| Total Investments — 112.6%(1) | | | | | | | |
| (Cost $253,255,153) | | | | | | 261,935,061 | |
| Total Value of Options Written | | | | | | | |
| (Premiums received $60,262)(8) — (0.0)%(1) | | | | | | (58,139 | ) |
| Other Assets in Excess of Liabilities — 0.5%(1) | | | | | | 1,221,875 | |
| Credit Facility Borrowings — (13.1)%(1) | | | | | | (30,400,000 | ) |
| Total Net Assets Applicable to | | | | | | | |
| Common Stockholders — 100.0%(1) | | | | | $ | 232,698,797 | |
| (1) | Calculated as a percentage of net assets applicable to common stockholders. |
| (2) | All or a portion of the security is segregated as collateral for the margin borrowing facility. |
| (3) | All or a portion of the security represents cover for outstanding call option contracts written. |
| (4) | Non-income producing security. |
| (5) | Securities have been valued by using significant unobservable inputs in accordance with fair value procedures and are categorized as level 3 investments. |
| (6) | Restricted securities have a total fair value of $93,722,484 which represents 40.3% of net assets. See Note 6 to financial statements for further disclosure. |
| (7) | Deemed to be an affiliate of the fund. See Note 7 to financial statements for further disclosure. |
| (8) | See Schedule of Options Written for further disclosure. |
| (9) | Security in forebearance at May 31, 2022. |
| (10) | Rate indicated is the current yield as of May 31, 2022. |
| See accompanying Notes to Financial Statements. | |
| | |
| 34 | Tortoise |
| |
| |
| 2022 Semi-Annual Report | May 31, 2022 |
| |
| Schedule of Options Written (unaudited) |
| May 31, 2022 |
| |
| TEAF | | | | | | | | | | | | | | | | | | |
| Call Options Written | | Expiration Date | | Strike Price | | Contracts | | Notional Value | | Fair Value |
| Cheniere Energy Inc. | | Jun 2022 | | | $ | 150.00 | | | | 153 | | | $ | 2,295,000 | | $ | (7,650 | ) |
| Cheniere Energy Inc. | | Jun 2022 | | | $ | 155.00 | | | | 154 | | | | 2,387,000 | | | (4,004 | ) |
| Energy Transfer LP | | Jun 2022 | | | $ | 12.50 | | | | 4,248 | | | | 5,310,000 | | | (38,232 | ) |
| Western Midstream Partners LP | | Jun 2022 | | | $ | 30.00 | | | | 393 | | | | 1,179,000 | | | (8,253 | ) |
| Total Value of Call Options Written (Premiums received $60,262) | | | | | | | | | | | | | $ | 11,171,000 | | $ | (58,139 | ) |
| See accompanying Notes to Financial Statements. | |
| | |
| Tortoise | 35 |
| |
| |
| |
| |
| Statements of Assets & Liabilities (unaudited) |
| May 31, 2022 |
| |
| | | | | | |
| | | Tortoise Energy | | Tortoise |
| | | Infrastructure | | Midstream Energy |
| | | Corp.(1) | | Fund, Inc. |
| Assets | | | | | | | | |
| Investments in unaffiliated securities at fair value(2) | | $ | 621,567,103 | | | $ | 326,673,823 | |
| Investments in affiliated securities at fair value(3) | | | 16,849,615 | | | | — | |
| Cash at broker | | | — | | | | — | |
| Cash(7) | | | — | | | | — | |
| Dividends, distributions and interest receivable from investments | | | 901,178 | | | | 558,121 | |
| Accrued Interest Receivable | | | 225,498 | | | | 157,933 | |
| Accrued Current Tax Receivable | | | — | | | | 922,651 | |
| Tax reclaims receivable | | | — | | | | — | |
| Expense Reimbursement Receivable | | | — | | | | — | |
| Prepaid expenses and other assets | | | 709,403 | | | | 213,478 | |
| Total assets | | | 640,252,797 | | | | 328,526,006 | |
| Liabilities | | | | | | | | |
| Call options written, at fair value(4) | | | — | | | | — | |
| Payable to Adviser | | | 995,518 | | | | 510,661 | |
| Accrued directors' fees and expenses | | | — | | | | — | |
| Payable for investments purchased | | | �� | | | | — | |
| Accrued expenses and other liabilities | | | 2,114,858 | | | | 815,429 | |
| Current tax liability | | | 58,627 | | | | — | |
| Deferred tax liability | | | — | | | | — | |
| Credit facility borrowings | | | 23,500,000 | | | | 14,500,000 | |
| Senior notes, net(5) | | | 85,739,035 | | | | 32,091,970 | |
| Mandatory redeemable preferred stock, net(6) | | | 35,563,240 | | | | 19,684,023 | |
| Total liabilities | | | 147,971,278 | | | | 67,602,083 | |
| Net assets applicable to common stockholders | | $ | 492,281,519 | | | $ | 260,923,923 | |
| Net Assets Applicable to Common Stockholders Consist of: | | | | | | | | |
| Capital stock, $0.001 par value per share | | $ | 11,928 | | | $ | 5,643 | |
| Additional paid-in capital | | | 606,880,922 | | | | 545,815,246 | |
| Total distributable accumulated losses | | | (114,611,331 | ) | | | (284,896,966 | ) |
| Net assets applicable to common stockholders | | $ | 492,281,519 | | | $ | 260,923,923 | |
| Capital shares: | | | | | | | | |
| Authorized | | | 100,000,000 | | | | 100,000,000 | |
| Outstanding | | | 11,927,903 | | | | 5,642,991 | |
| Net Asset Value per common share outstanding (net assets applicable | | | | | | | | |
| to common stock, divided by common shares outstanding) | | $ | 41.27 | | | $ | 46.24 | |
| | | | | | | | | |
| (1) | Consolidated Statement of Assets and Liabilities | | | | | | | | |
| (See Note 13 to the financial statements for further disclosure). | | | | | | | | |
| (2) | Investments in unaffiliated securities at cost | | $ | 483,510,521 | | | $ | 225,724,103 | |
| (3) | Investments in affiliated securities at cost | | $ | 50,141,470 | | | $ | — | |
| (4) | Call options written, premiums received | | $ | — | | | $ | — | |
| (5) | Deferred debt issuance and offering costs | | $ | 87,632 | | | $ | 57,763 | |
| (6) | Deferred offering costs | | $ | 97,370 | | | $ | 34,902 | |
| See accompanying Notes to Financial Statements. | |
| | |
| 36 | Tortoise |
| |
| |
| 2022 Semi-Annual Report | May 31, 2022 |
| |
| |
| |
| |
| | | | | | | | | Tortoise Power | | | | Ecofin | |
| Tortoise Pipeline | | | | Tortoise Energy | | | | and Energy | | | | Sustainable | |
| & Energy | | | | Independence | | | | Infrastructure | | | | and Social Impact | |
| Fund, Inc. | | Fund, Inc. | | Fund, Inc. | | Term Fund(1) |
| | | | | | | | | | | | | | | |
| $ | 100,602,362 | | | $ | 74,991,576 | | | $ | 131,596,742 | | | $ | 218,773,943 | |
| — | | | | — | | | | — | | | | 43,161,118 | |
| — | | | | — | | | | — | | | | 133,951 | |
| — | | | | — | | | | — | | | | 40,208 | |
| 156,004 | | | | 265,165 | | | | 1,266,276 | | | | 195,397 | |
| 4,916 | | | | 158 | | | | | | | | 1,782,870 | |
| — | | | | — | | | | — | | | | — | |
| — | | | | — | | | | — | | | | 109,283 | |
| 12,475 | | | | 10,451 | | | | — | | | | — | |
| 125,630 | | | | 20,548 | | | | 38,968 | | | | 64,749 | |
| 100,901,387 | | | | 75,287,898 | | | | 132,901,986 | | | | 264,261,519 | |
| | | | | | | | | | | | | | |
| — | | | | — | | | | — | | | | 58,139 | |
| 180,221 | | | | 127,050 | | | | 208,004 | | | | 586,305 | |
| 8,364 | | | | 8,325 | | | | — | | | | — | |
| — | | | | — | | | | — | | | | — | |
| 355,667 | | | | 145,351 | | | | 311,501 | | | | 277,745 | |
| — | | | | — | | | | — | | | | — | |
| — | | | | — | | | | — | | | | 240,533 | |
| 10,900,000 | | | | 3,600,000 | | | | 25,600,000 | | | | 30,400,000 | |
| 3,929,024 | | | | — | | | | — | | | | — | |
| 6,084,982 | | | | — | | | | — | | | | — | |
| 21,458,258 | | | | 3,880,726 | | | | 26,119,505 | | | | 31,562,722 | |
| $ | 79,443,129 | | | $ | 71,407,172 | | | $ | 106,782,481 | | | $ | 232,698,797 | |
| | | | | | | | | | | | | | |
| $ | 2,228 | | | $ | 1,846 | | | $ | 6,526 | | | $ | 13,491 | |
| 177,316,389 | | | | 219,268,771 | | | | 114,642,537 | | | | 247,569,771 | |
| (97,875,488 | ) | | | (147,863,445 | ) | | | (7,866,582 | ) | | | (14,884,465 | ) |
| $ | 79,443,129 | | | $ | 71,407,172 | | | $ | 106,782,481 | | | $ | 232,698,797 | |
| | | | | | | | | | | | | | |
| 100,000,000 | | | | 100,000,000 | | | | 100,000,000 | | | | 100,000,000 | |
| 2,227,773 | | | | 1,845,997 | | | | 6,526,499 | | | | 13,491,127 | |
| | | | | | | | | | | | | | |
| $ | 35.66 | | | $ | 38.68 | | | $ | 16.36 | | | $ | 17.25 | |
| | | | | | | | | | | | | | |
| | | | | | | | | | | | | | |
| | | | | | | | | | | | | | |
| $ | 80,397,329 | | | $ | 42,652,160 | | | $ | 117,310,020 | | | $ | 210,024,884 | |
| $ | — | | | $ | — | | | $ | — | | | $ | 43,230,269 | |
| $ | — | | | $ | — | | | $ | — | | | $ | 60,262 | |
| $ | 13,833 | | | $ | — | | | $ | — | | | $ | — | |
| $ | 15,018 | | | $ | — | | | $ | — | | | $ | — | |
| See accompanying Notes to Financial Statements. | |
| | |
| Tortoise | 37 |
| |
| |
| |
| |
| Statements of Operations (unaudited) |
| Period from December 1, 2021 through May 31, 2022 |
| |
| | | | | |
| | Tortoise Energy | | Tortoise |
| | Infrastructure | | Midstream Energy |
| | Corp.(1) | | Fund, Inc. |
| Investment Income | | | | | | | | |
| Distributions from master limited partnerships | | $ | 5,154,663 | | | $ | 2,424,395 | |
| Dividends and distributions from common stock | | | 7,973,712 | | | | 5,295,246 | |
| Dividends and distributions from preferred stock | | | 308,348 | | | | 220,476 | |
| Dividends and distributions from affiliated investments | | | 340,000 | | | | — | |
| Less return of capital on distributions(2) | | | (7,101,916 | ) | | | (4,383,314 | ) |
| Less foreign taxes withheld | | | — | | | | (142,152 | ) |
| Net dividends and distributions from investments | | | 6,674,807 | | | | 3,414,651 | |
| Interest income | | | 471,197 | | | | 301,630 | |
| Other income | | | — | | | | — | |
| Total Investment Income | | | 7,146,004 | | | | 3,716,281 | |
| Operating Expenses | | | | | | | | |
| Advisory fees | | | 2,822,429 | | | | 1,426,451 | |
| Administrator fees | | | 125,160 | | | | 66,458 | |
| Professional fees | | | 170,033 | | | | 93,313 | |
| Directors fees | | | 32,675 | | | | 39,040 | |
| Stockholder communication expenses | | | 50,058 | | | | 31,600 | |
| Custodian fees and expenses | | | 18,586 | | | | 9,853 | |
| Fund accounting fees | | | 32,889 | | | | 24,195 | |
| Registration fees | | | (6,668 | ) | | | 11,273 | |
| Stock transfer agent fees | | | 28,356 | | | | 28,356 | |
| Other operating expenses | | | 57,434 | | | | 17,422 | |
| Total Operating Expenses | | | 3,330,952 | | | | 1,747,961 | |
| Leverage Expenses | | | | | | | | |
| Interest expense | | | 1,747,694 | | | | 608,059 | |
| Distributions to mandatory redeemable preferred stockholders | | | 619,158 | | | | 348,457 | |
| Amortization of debt issuance costs | | | 30,495 | | | | 12,236 | |
| Other leverage expenses | | | 78,674 | | | | 61,287 | |
| Total Leverage Expenses | | | 2,476,021 | | | | 1,030,039 | |
| Total Expenses | | | 5,806,973 | | | | 2,778,000 | |
| Less expense reimbursement by Adviser (Note 4) | | | — | | | | — | |
| Net Expenses | | | 5,806,973 | | | | 2,778,000 | |
| Net Investment Income (Loss), before Income Taxes | | | 1,339,031 | | | | 938,281 | |
| Deferred tax benefit (expense) | | | — | | | | — | |
| Net Investment Income (Loss) | | $ | 1,339,031 | | | $ | 938,281 | |
| (1) | Consolidated Statement of Operations (See Note 13 to the financial statements for further disclosure). |
| (2) | Return of Capital may be in excess of current year distributions due to prior year adjustments. See Note 2.C. to the financial statements for further disclosure. |
| See accompanying Notes to Financial Statements. | |
| | |
| 38 | Tortoise |
| |
| |
| 2022 Semi-Annual Report | May 31, 2022 |
| |
| |
| |
| |
| | | | | | | | Tortoise Power | | Ecofin | |
| Tortoise Pipeline | | Tortoise Energy | | and Energy | | Sustainable | |
| & Energy | | Independence | | Infrastructure | | and Social Impact | |
| Fund, Inc. | | Fund, Inc. | | Fund, Inc. | | Term Fund(1) | |
| | |
| $ | 925,552 | | | $ | 316,622 | | | $ | 1,276,112 | | | $ | 782,553 | | |
| 1,864,490 | | | | 1,182,737 | | | | 860,416 | | | | 2,208,548 | | |
| 16,380 | | | | — | | | | 14,286 | | | | 308,228 | | |
| — | | | | — | | | | — | | | | 800,000 | | |
| (1,460,895 | ) | | | (377,510 | ) | | | (1,652,953 | ) | | | (1,813,590 | ) | |
| (95,537 | ) | | | (13,263 | ) | | | (20,995 | ) | | | (207,536 | ) | |
| 1,249,990 | | | | 1,108,586 | | | | 476,866 | | | | 2,078,203 | | |
| 45 | | | | 316 | | | | 1,630,248 | | | | 2,913,075 | | |
| — | | | | — | | | | — | | | | 1,901 | | |
| 1,250,035 | | | | 1,108,902 | | | | 2,107,114 | | | | 4,993,179 | | |
| | |
| 501,947 | | | | 333,687 | | | | 607,514 | | | | 1,732,537 | | |
| 24,875 | | | | 21,569 | | | | 32,324 | | | | 60,091 | | |
| 64,763 | | | | 50,749 | | | | 63,676 | | | | 112,228 | | |
| 38,509 | | | | 38,529 | | | | 39,355 | | | | 39,520 | | |
| 17,901 | | | | 14,779 | | | | 24,352 | | | | 14,944 | | |
| 6,263 | | | | 4,042 | | | | 5,908 | | | | 30,429 | | |
| 14,130 | | | | 11,032 | | | | 14,779 | | | | 16,941 | | |
| 4,948 | | | | 5,101 | | | | 5,169 | | | | (2,670 | ) | |
| 6,049 | | | | 5,723 | | | | 6,355 | | | | 4,284 | | |
| 13,953 | | | | 12,789 | | | | 7,184 | | | | 117,812 | | |
| 693,338 | | | | 498,000 | | | | 806,616 | | | | 2,126,116 | | |
| | |
| 158,049 | | | | 32,370 | | | | 412,891 | | | | 172,797 | | |
| 200,385 | | | | — | | | | — | | | | — | | |
| 5,671 | | | | — | | | | — | | | | — | | |
| 2,307 | | | | — | | | | — | | | | — | | |
| 366,412 | | | | 32,370 | | | | 412,891 | | | | 172,797 | | |
| 1,059,750 | | | | 530,370 | | | | 1,219,507 | | | | 2,298,913 | | |
| (12,101 | ) | | | (78,008 | ) | | | — | | | | — | | |
| 1,047,649 | | | | 452,362 | | | | 1,219,507 | | | | 2,298,913 | | |
| 202,386 | | | | 656,540 | | | | 887,607 | | | | 2,694,266 | | |
| — | | | | — | | | | — | | | | (131,850 | ) | |
| $ | 202,386 | | | $ | 656,540 | | | $ | 887,607 | | | $ | 2,562,416 | | |
| See accompanying Notes to Financial Statements. | |
| | |
| Tortoise | 39 |
| |
| |
| |
| |
| Statements of Operations (unaudited) (continued) |
| Period from December 1, 2021 through May 31, 2022 |
| |
| | | | | |
| | Tortoise Energy | | Tortoise |
| | Infrastructure | | Midstream Energy |
| | Corp.(1) | | Fund, Inc. |
| Realized and Unrealized Loss on Investments and Foreign Currency | | | | | | | | |
| Net realized gain (loss) on investments in unaffiliated securities | | $ | 6,380,993 | | | $ | (100,784 | ) |
| Net realized gain on written options | | | — | | | | — | |
| Net realized gain (loss) on foreign currency and translation of other assets and liabilities | | | | | | | | |
| denominated in foreign currency | | | — | | | | (3,465 | ) |
| Net realized gain (loss), before income taxes | | | 6,380,993 | | | | (104,249 | ) |
| Current tax expense | | | (3,253,810 | ) | | | (2,651,478 | ) |
| Income tax expense, net | | | (3,253,810 | ) | | | (2,651,478 | ) |
| Net realized gain (loss) | | | 3,127,183 | | | | (2,755,727 | ) |
| Change in net unrealized appreciation (depreciation) of investments in unaffiliated securities | | | 84,363,239 | | | | 61,408,082 | |
| Change in net unrealized appreciation (depreciation) of investments in affiliated securities | | | 5,444,794 | | | | — | |
| Change in net unrealized appreciation (depreciation) of options | | | — | | | | — | |
| Change in net unrealized appreciation (depreciation) of other assets and liabilities | | | | | | | | |
| due to foreign currency translation | | | 223 | | | | 5,479 | |
| Net unrealized appreciation (depreciation) | | | 89,808,256 | | | | 61,413,561 | |
| Net Realized and Unrealized Gain | | | 92,935,439 | | | | 58,657,834 | |
| Net Increase in Net Assets Applicable to Common Stockholders Resulting from Operations | | $ | 94,274,470 | | | $ | 59,596,115 | |
| (1) | Consolidated Statement of Operations (See Note 13 to the financial statements for further disclosure). |
| (2) | Return of Capital may be in excess of current year distributions due to prior year adjustments. See Note 2 to the financial statements for further disclosure. |
| See accompanying Notes to Financial Statements. | |
| | |
| 40 | Tortoise |
| |
| |
| 2022 Semi-Annual Report | May 31, 2022 |
| |
| |
| |
| |
| | | | | | | | Tortoise Power | | Ecofin | |
| Tortoise Pipeline | | Tortoise Energy | | and Energy | | Sustainable | |
| & Energy | | Independence | | Infrastructure | | and Social Impact | |
| Fund, Inc. | | Fund, Inc. | | Fund, Inc. | | Term Fund(1) | |
| | | | | | | | |
| $ | 380,658 | | | $ | 3,112,492 | | | $ | (977,791 | ) | | $ | 8,976,414 | | |
| — | | | | — | | | | — | | | | 82,732 | | |
| | |
| (5,230 | ) | | | (370 | ) | | | (1,137 | ) | | | (134,691 | ) | |
| 375,428 | | | | 3,112,122 | | | | (978,928 | ) | | | 8,924,455 | | |
| — | | | | — | | | | — | | | | — | | |
| — | | | | — | | | | — | | | | — | | |
| 375,428 | | | | 3,112,122 | | | | (978,928 | ) | | | 8,924,455 | | |
| 19,199,869 | | | | 23,011,889 | | | | 11,934,805 | | | | (2,874,515 | ) | |
| — | | | | — | | | | — | | | | (401,866 | ) | |
| — | | | | — | | | | — | | | | (7,341 | ) | |
| | |
| 5,205 | | | | 569 | | | | 1,282 | | | | (5,893 | ) | |
| 19,205,074 | | | | 23,012,458 | | | | 11,936,087 | | | | (3,289,615 | ) | |
| 19,580,502 | | | | 26,124,580 | | | | 10,957,159 | | | | 5,634,840 | | |
| $ | 19,782,888 | | | $ | 26,781,120 | | | $ | 11,844,766 | | | $ | 8,197,256 | | |
| See accompanying Notes to Financial Statements. | |
| | |
| Tortoise | 41 |
| |
| |
| |
| |
| Statements of Changes in Net Assets |
| |
| |
| | Tortoise Energy Infrastructure Corp.(1) |
| | Six Months | | Year Ended |
| | Ended May 31, | | November 30, |
| | 2022 | | 2021 |
| | (Unaudited) | | | | |
| Operations | | | | | | | | |
| Net investment income (loss) | | $ | 1,339,031 | | | $ | (5,428,479 | ) |
| Net realized gain (loss) | | | 3,127,183 | | | | 24,355,356 | |
| Net unrealized appreciation (depreciation) | | | 89,808,256 | | | | 114,812,859 | |
| Net increase (decrease) in net assets applicable to common stockholders | | | | | | | | |
| resulting from operations | | | 94,274,470 | | | | 133,739,736 | |
| Distributions to Common Stockholders | | | | | | | | |
| From distributable earnings | | | — | | | | — | |
| From return of capital | | | (16,937,622 | ) | | | (17,534,017 | ) |
| Total distributions to common stockholders | | | (16,937,622 | ) | | | (17,534,017 | ) |
| Capital Stock Transactions | | | | | | | | |
| Repurchases of common stock | | | — | | | | (6,888,558 | ) |
| Net increase (decrease) in net assets applicable to common stockholders | | | | | | | | |
| from capital stock transactions | | | — | | | | (6,888,558 | ) |
| Total increase (decrease) in net assets applicable to common stockholders | | | 77,336,848 | | | | 109,317,161 | |
| Net Assets | | | | | | | | |
| Beginning of period | | | 414,944,671 | | | | 305,627,510 | |
| End of period | | $ | 492,281,519 | | | $ | 414,944,671 | |
| Transactions in common shares | | | | | | | | |
| Shares outstanding at beginning of period | | | 11,927,903 | | | | 12,249,839 | |
| Shares repurchased (See Note 14) | | | — | | | | (321,936 | ) |
| Shares outstanding at end of period | | | 11,927,903 | | | | 11,927,903 | |
| (1) | Consolidated Statement of Changes in Net Assets (See Note 13 to the financial statements for further disclosure). |
| See accompanying Notes to Financial Statements. | |
| | |
| 42 | Tortoise |
| |
| |
| 2022 Semi-Annual Report | May 31, 2022 |
| |
| |
| |
| |
| Tortoise Midstream Energy Fund, Inc. | | Tortoise Pipeline & Energy Fund, Inc. | |
| Six Months | | Year Ended | | Six Months | | Year Ended | |
| Ended May 31, | | November 30, | | Ended May 31, | | November 30, | |
| 2022 | | 2021 | | 2022 | | 2021 | |
| (Unaudited) | | | | (Unaudited) | | | |
| | | | | | | | | | | | | | | | |
| $ | 938,281 | | | $ | (2,341,930 | ) | | $ | 202,386 | | | $ | (514,695 | ) | |
| (2,755,727 | ) | | | (1,788,609 | ) | | | 375,428 | | | | 2,088,332 | | |
| 61,413,561 | | | | 78,473,655 | | | | 19,205,074 | | | | 18,641,552 | | |
| | |
| 59,596,115 | | | | 74,343,116 | | | | 19,782,888 | | | | 20,215,189 | | |
| | |
| — | | | | — | | | | — | | | | — | | |
| (8,690,206 | ) | | | (9,282,720 | ) | | | (2,628,772 | ) | | | (2,390,182 | ) | |
| (8,690,206 | ) | | | (9,282,720 | ) | | | (2,628,772 | ) | | | (2,390,182 | ) | |
| | |
| — | | | | (4,449,789 | ) | | | — | | | | (3,644,330 | ) | |
| | |
| — | | | | (4,449,789 | ) | | | — | | | | (3,644,330 | ) | |
| 50,905,909 | | | | 60,610,607 | | | | 17,154,116 | | | | 14,180,677 | | |
| | |
| 210,018,014 | | | | 149,407,407 | | | | 62,289,013 | | | | 48,108,336 | | |
| $ | 260,923,923 | | | $ | 210,018,014 | | | $ | 79,443,129 | | | $ | 62,289,013 | | |
| | |
| 5,642,991 | | | | 5,845,517 | | | | 2,227,773 | | | | 2,409,128 | | |
| — | | | | (202,526 | ) | | | — | | | | (181,355 | ) | |
| 5,642,991 | | | | 5,642,991 | | | | 2,227,773 | | | | 2,227,773 | | |
| See accompanying Notes to Financial Statements. | |
| | |
| Tortoise | 43 |
| |
| |
| |
| |
| Statements of Changes in Net Assets (continued) |
| |
| |
| | Tortoise Energy Independence Fund, Inc. |
| | Six Months | | Year Ended |
| | Ended May 31, | | November 30, |
| | 2022 | | 2021 |
| | (Unaudited) | | |
| Operations | | | | | | | | |
| Net investment income (loss) | | $ | 656,540 | | | $ | 239,254 | |
| Net realized gain (loss) | | | 3,112,122 | | | | 4,100,658 | |
| Net unrealized appreciation (depreciation) | | | 23,012,458 | | | | 12,895,868 | |
| Net increase (decrease) in net assets applicable to common stockholders | | | | | | | | |
| resulting from operations | | | 26,781,120 | | | | 17,235,780 | |
| Distributions to Common Stockholders | | | | | | | | |
| From distributable earnings | | | — | | | | (86,163 | ) |
| From return of capital | | | (1,772,157 | ) | | | (1,058,355 | ) |
| Total distributions to common stockholders | | | (1,772,157 | ) | | | (1,144,518 | ) |
| Capital Stock Transactions | | | | | | | | |
| Repurchases of common stock | | | — | | | | — | |
| Net increase (decrease) in net assets applicable to common stockholders | | | | | | | | |
| from capital stock transactions | | | — | | | | — | |
| Total increase (decrease) in net assets applicable to common stockholders | | | 25,008,963 | | | | 16,091,262 | |
| Net Assets | | | | | | | | |
| Beginning of period | | | 46,398,209 | | | | 30,306,947 | |
| End of period | | $ | 71,407,172 | | | $ | 46,398,209 | |
| | | | | | | | | |
| Transactions in common shares | | | | | | | | |
| Shares outstanding at beginning of period | | | 1,845,997 | | | | 1,845,997 | |
| Shares repurchased (See Note 14) | | | — | | | | — | |
| Shares outstanding at end of period | | | 1,845,997 | | | | 1,845,997 | |
| (1) | Consolidated Statement of Changes in Net Assets (See Note 13 to the financial statements for further disclosure). |
| See accompanying Notes to Financial Statements. | |
| | |
| 44 | Tortoise |
| |
| |
| 2022 Semi-Annual Report | May 31, 2022 |
| |
| |
| |
| |
| Tortoise Power and Energy | | Ecofin Sustainable and Social | |
| Infrastructure Fund, Inc. | | Impact Term Fund(1) | |
| Six Months | | Year Ended | | Six Months | | Year Ended | |
| Ended May 31, | | November 30, | | Ended May 31, | | November 30, | |
| 2022 | | 2021 | | 2022 | | 2021 | |
| (Unaudited) | | | | (Unaudited) | | | |
| | | | | | | | |
| $ | 887,607 | | | $ | 1,496,314 | | | $ | 2,562,416 | | | $ | 7,302,786 | | |
| (978,928 | ) | | | 3,971,192 | | | | 8,924,455 | | | | 15,490,050 | | |
| 11,936,087 | | | | 12,050,342 | | | | (3,289,615 | ) | | | 6,906,199 | | |
| | |
| 11,844,766 | | | | 17,517,848 | | | | 8,197,256 | | | | 29,699,035 | | |
| | |
| — | | | | (1,880,757 | ) | | | (3,730,552 | ) | | | (8,628,909 | ) | |
| (3,523,848 | ) | | | (2,356,876 | ) | | | (3,149,923 | ) | | | (3,513,105 | ) | |
| (3,523,848 | ) | | | (4,237,633 | ) | | | (6,880,475 | ) | | | (12,142,014 | ) | |
| | |
| — | | | | (4,244,594 | ) | | | — | | | | — | | |
| | |
| — | | | | (4,244,594 | ) | | | — | | | | — | | |
| 8,320,918 | | | | 9,035,621 | | | | 1,316,781 | | | | 17,557,021 | | |
| | |
| 98,461,563 | | | | 89,425,942 | | | | 231,382,016 | | | | 213,824,995 | | |
| $ | 106,782,481 | | | $ | 98,461,563 | | | $ | 232,698,797 | | | $ | 231,382,016 | | |
| | |
| | |
| 6,526,499 | | | | 6,873,127 | | | | 13,491,127 | | | | 13,491,127 | | |
| — | | | | (346,628 | ) | | | — | | | | — | | |
| 6,526,499 | | | | 6,526,499 | | | | 13,491,127 | | | | 13,491,127 | | |
| See accompanying Notes to Financial Statements. | |
| | |
| Tortoise | 45 |
| |
| |
| |
| |
| Statements of Cash Flows (unaudited) |
| Period from December 1, 2021 through May 31, 2022 |
| |
| | | | | |
| | Tortoise Energy | | |
| | Infrastructure | | Tortoise Midstream |
| | Corp.(1) | | Energy Fund, Inc. |
| Cash Flows From Operating Activities | | | | | | | | |
| Dividends, distributions and interest received from investments | | $ | 13,983,676 | | | $ | 7,673,784 | |
| Purchases of long-term investments | | | (66,361,754 | ) | | | (11,357,581 | ) |
| Proceeds from sales of long-term investments | | | 75,598,352 | | | | 14,250,677 | |
| Sales (purchases) of short-term investments, net | | | (349,592 | ) | | | (270,654 | ) |
| Call options written, net | | | — | | | | — | |
| Interest received on securities sold, net | | | 30,235 | | | | 15,541 | |
| Interest expense paid | | | (1,733,177 | ) | | | (306,299 | ) |
| Distributions to mandatory redeemable preferred stockholders | | | (677,321 | ) | | | (248,770 | ) |
| Other leverage expenses paid | | | (24,168 | ) | | | (33,560 | ) |
| Net income tax refunds received (income taxes paid) | | | (9,684,963 | ) | | | (5,314,676 | ) |
| Operating expenses paid | | | (3,349,886 | ) | | | (1,737,237 | ) |
| Net cash provided by (used in) operating activities | | | 7,431,402 | | | | 2,671,225 | |
| Cash Flows From Financing Activities | | | | | | | | |
| Advances (payments) on credit facilities, net | | | 4,300,000 | | | | (26,400,000 | ) |
| Issuance of mandatory redeemable preferred stock | | | 20,000,000 | | | | 7,500,000 | |
| Redemption of mandatory redeemable preferred stock | | | (16,639,390 | ) | | | — | |
| Issuance of senior notes | | | 10,000,000 | | | | 25,000,000 | |
| Repayment of senior notes | | | (8,066,666 | ) | | | — | |
| Debt issuance costs | | | (87,724 | ) | | | (81,019 | ) |
| Distributions paid to common stockholders | | | (16,937,622 | ) | | | (8,690,206 | ) |
| Net cash provided by (used in) financing activities | | | (7,431,402 | ) | | | (2,671,225 | ) |
| Net change in cash | | | — | | | | — | |
| Cash — beginning of period | | | — | | | | — | |
| Cash — end of period | | $ | — | | | $ | — | |
| (1) | Consolidated Statement of Cash Flows (See Note 13 to the financial statements for further disclosure). |
| See accompanying Notes to Financial Statements. | |
| | |
| 46 | Tortoise |
| |
| |
| 2022 Semi-Annual Report | May 31, 2022 |
| |
| |
| |
| |
| | | | | | Tortoise Power | | Ecofin | |
| Tortoise Pipeline | | Tortoise Energy | | and Energy | | Sustainable | |
| & Energy | | Independence | | Infrastructure | | and Social Impact | |
| Fund, Inc. | | Fund, Inc. | | Fund, Inc. | | Term Fund(1) | |
| | |
| $ | 2,698,569 | | | $ | 1,431,867 | | | $ | 3,859,889 | | | $ | 6,802,539 | | |
| (6,280,443 | ) | | | (9,444,944 | ) | | | (4,976,298 | ) | | | (42,384,457 | ) | |
| 4,362,887 | | | | 9,177,897 | | | | 2,410,809 | | | | 39,728,345 | | |
| 16,683 | | | | 102,158 | | | | 1,900,262 | | | | (947,427 | ) | |
| — | | | | — | | | | — | | | | 138,636 | | |
| 1,155 | | | | — | | | | 1,007 | | | | 161,852 | | |
| (132,504 | ) | | | (28,987 | ) | | | (409,925 | ) | | | (150,026 | ) | |
| (200,385 | ) | | | — | | | | — | | | | — | | |
| — | | | | — | | | | — | | | | — | | |
| — | | | | — | | | | — | | | | — | | |
| (637,190 | ) | | | (365,834 | ) | | | (861,896 | ) | | | (2,186,197 | ) | |
| (171,228 | ) | | | 872,157 | | | | 1,923,848 | | | | 1,165,166 | | |
| | |
| 2,800,000 | | | | 900,000 | | | | 1,600,000 | | | | 8,800,000 | | |
| — | | | | — | | | | — | | | | — | | |
| — | | | | — | | | | — | | | | — | | |
| — | | | | — | | | | — | | | | — | | |
| — | | | | — | | | | — | | | | — | | |
| — | | | | — | | | | — | | | | — | | |
| (2,628,772 | ) | | | (1,772,157 | ) | | | (3,523,848 | ) | | | (6,880,475 | ) | |
| 171,228 | | | | (872,157 | ) | | | (1,923,848 | ) | | | 1,919,525 | | |
| — | | | | — | | | | — | | | | 3,084,691 | | |
| — | | | | — | | | | — | | | | (2,910,532 | ) | |
| $ | — | | | $ | — | | | $ | — | | | $ | 174,159 | | |
| See accompanying Notes to Financial Statements. | |
| | |
| Tortoise | 47 |
| |
| |
| |
| |
| Statements of Cash Flows (continued) |
| Period from December 1, 2021 through May 31, 2022 |
| |
| | | | | | |
| | Tortoise Energy | | | Tortoise |
| | Infrastructure | | | Midstream Energy |
| | Corp.(1) | | | Fund, Inc. |
| Reconciliation of net increase in net assets applicable to common stockholders | | | | | | | | |
| resulting from operations to net cash provided by (used in) operating activities | | | | | | | | |
| Net increase in net assets applicable to common stockholders resulting from operations | | $ | 94,274,470 | | | $ | 59,596,115 | |
| Adjustments to reconcile net increase in net assets applicable to common stockholders | | | | | | | | |
| resulting from operations to net cash provided by (used in) operating activities: | | | | | | | | |
| Purchases of long-term investments | | | (57,096,770 | ) | | | (4,913,997 | ) |
| Proceeds from sales of long-term investments | | | 68,370,360 | | | | 8,870,666 | |
| Sales (purchases) of short-term investments, net | | | (349,592 | ) | | | (270,654 | ) |
| Call options written, net | | | — | | | | — | |
| Return of capital on distributions received | | | 7,101,916 | | | | 4,383,314 | |
| Net unrealized (appreciation) depreciation | | | (89,808,256 | ) | | | (61,413,561 | ) |
| Amortization (accretion) of market premium (discount), net | | | (303,345 | ) | | | (202,826 | ) |
| Net realized loss | | | (6,380,993 | ) | | | 104,249 | |
| Amortization of debt issuance costs | | | 30,495 | | | | 12,236 | |
| Changes in operating assets and liabilities: | | | | | | | | |
| (Increase) decrease in dividends, distributions and interest receivable from investments | | | 68,350 | | | | (207,444 | ) |
| (Increase) decrease in receivable for investments sold | | | 7,227,992 | | | | 5,380,011 | |
| (Increase) decrease in prepaid expenses and other assets | | | 161,973 | | | | 131,322 | |
| Increase (decrease) in payable for investments purchased | | | (9,264,984 | ) | | | (6,443,584 | ) |
| Increase (decrease) in payable to Adviser, net of fees waived | | | 89,560 | | | | 48,492 | |
| Decrease in current tax liability | | | (6,626,253 | ) | | | (1,878,651 | ) |
| Decrease in deferred tax liability | | | — | | | | — | |
| Increase (decrease) in accrued expenses and other liabilities | | | (63,521 | ) | | | (524,463 | ) |
| Total adjustments | | | (86,843,068 | ) | | | (56,924,890 | ) |
| Net cash provided by (used in) operating activities | | $ | 7,431,402 | | | $ | 2,671,225 | |
| (1) | Consolidated Statement of Cash Flows (See Note 13 to the financial statements for further disclosure). |
| See accompanying Notes to Financial Statements. | |
| | |
| 48 | Tortoise |
| |
| |
| 2022 Semi-Annual Report | May 31, 2022 |
| |
| |
| |
| |
| | | | | | | | Tortoise Power | | Ecofin | | |
| Tortoise Pipeline | | Tortoise Energy | | and Energy | | Sustainable | | |
| & Energy | | Independence | | Infrastructure | | and Social Impact | | |
| Fund, Inc. | | Fund, Inc. | | Fund, Inc. | | Term Fund(1) | | |
| | | |
| | | |
| $ | 19,782,888 | | | $ | 26,781,120 | | | $ | 11,844,766 | | | $ | 8,197,256 | | | |
| | | |
| | | |
| (6,280,443 | ) | | | (7,666,046 | ) | | | (4,976,298 | ) | | | (39,661,951 | ) | | |
| 4,362,887 | | | | 7,406,800 | | | | 2,410,809 | | | | 37,012,421 | | | |
| 16,683 | | | | 102,158 | | | | 1,900,262 | | | | (947,427 | ) | | |
| — | | | | — | | | | — | | | | 138,636 | | | |
| 1,460,895 | | | | 377,510 | | | | 1,652,953 | | | | 1,813,590 | | | |
| (19,205,074 | ) | | | (23,012,458 | ) | | | (11,936,087 | ) | | | 3,289,615 | | | |
| — | | | | — | | | | 90,780 | | | | 199,074 | | | |
| (375,428 | ) | | | (3,112,122 | ) | | | 978,928 | | | | (8,924,455 | ) | | |
| 5,671 | | | | — | | | | — | | | | — | | | |
| | | |
| (11,206 | ) | | | (54,545 | ) | | | 10,049 | | | | (39,551 | ) | | |
| — | | | | 1,771,097 | | | | — | | | | 2,715,924 | | | |
| (43,770 | ) | | | (12,458 | ) | | | (33,019 | ) | | | (24,309 | ) | | |
| — | | | | (1,778,898 | ) | | | — | | | | (2,722,506 | ) | | |
| 88,960 | | | | 77,747 | | | | 4,123 | | | | (11,977 | ) | | |
| — | | | | — | | | | — | | | | — | | | |
| — | | | | — | | | | — | | | | (131,850 | ) | | |
| 26,709 | | | | (7,748 | ) | | | (23,418 | ) | | | 130,826 | | | |
| (19,954,116 | ) | | | (25,908,963 | ) | | | (9,920,918 | ) | | | (7,032,090 | ) | | |
| $ | (171,228 | ) | | $ | 872,157 | | | $ | 1,923,848 | | | $ | 1,165,166 | | | |
| See accompanying Notes to Financial Statements. | |
| | |
| Tortoise | 49 |
| | Six Months | | Year Ended | | | Year Ended | | Year Ended | | Year Ended |
| | Ended May 31, | | November 30, | | | November 30, | | November 30, | | November 30, |
| | 2022 | | 2021 | | | 2020 | | 2019 | | 2018 |
| | (unaudited) | | | | | | | | | | | | | | | | |
| Per Common Share Data(1)(2) | | | | | | | | | | | | | | | | | | | | |
| Net Asset Value, beginning of period | | $ | 34.79 | | | $ | 24.95 | | | $ | 69.24 | | | $ | 94.00 | | | $ | 95.72 | |
| Income (Loss) from Investment Operations | | | | | | | | | | | | | | | | | | | | |
| Net investment income (loss)(3) | | | 0.11 | | | | (0.45 | ) | | | (0.44 | ) | | | (1.20 | ) | | | (1.96 | ) |
| Net realized and unrealized gain (loss)(3) | | | 7.79 | | | | 11.76 | | | | (41.67 | ) | | | (13.08 | ) | | | 10.36 | |
| Total income (loss) from investment operations | | | 7.90 | | | | 11.31 | | | | (42.11 | ) | | | (14.28 | ) | | | 8.40 | |
| Distributions to Common Stockholders | | | | | | | | | | | | | | | | | | | | |
| From return of capital | | | (1.42 | ) | | | (1.47 | ) | | | (2.18 | ) | | | (10.48 | ) | | | (10.48 | ) |
| Capital Stock Transactions | | | | | | | | | | | | | | | | | | | | |
| Premiums less underwriting discounts and offering | | | | | | | | | | | | | | | | | | | | |
| costs on issuance of common stock(4) | | | — | | | | — | | | | — | | | | (0.00 | ) | | | 0.36 | |
| Net Asset Value, end of period | | $ | 41.27 | | | $ | 34.79 | | | $ | 24.95 | | | $ | 69.24 | | | $ | 94.00 | |
| Per common share market value, end of period | | $ | 33.84 | | | $ | 27.27 | | | $ | 19.16 | | | $ | 67.28 | | | $ | 90.36 | |
| Total investment return based on market value(5)(6) | | | 29.51 | % | | | 50.27 | % | | | (69.69 | )% | | | (15.46 | )% | | | (3.42 | )% |
| |
| Supplemental Data and Ratios | | | | | | | | | | | | | | | | | | | | |
| Net assets applicable to common stockholders, | | | | | | | | | | | | | | | | | | | | |
| end of period (000's) | | $ | 492,282 | | | $ | 414,945 | | | $ | 305,628 | | | $ | 930,286 | | | $ | 1,260,300 | |
| Average net assets (000's) | | $ | 455,506 | | | $ | 397,453 | | | $ | 468,705 | | | $ | 1,203,943 | | | $ | 1,388,683 | |
| Ratio of Expenses to Average Net Assets(7) | | | | | | | | | | | | | | | | | | | | |
| Advisory fees | | | 0.62 | % | | | 1.19 | % | | | 1.55 | % | | | 1.62 | % | | | 1.58 | % |
| Other operating expenses | | | 0.11 | | | | 0.30 | | | | 0.28 | | | | 0.14 | | | | 0.13 | |
| Total operating expenses, before fee waiver | | | 0.73 | | | | 1.49 | | | | 1.83 | | | | 1.76 | | | | 1.71 | |
| Fee waiver(8) | | | — | | | | — | | | | — | | | | (0.00 | ) | | | (0.04 | ) |
| Total operating expenses | | | 0.73 | | | | 1.49 | | | | 1.83 | | | | 1.76 | | | | 1.67 | |
| Leverage expenses | | | 0.54 | | | | 1.34 | | | | 3.52 | | | | 2.15 | | | | 1.87 | |
| Income tax expense (benefit)(9) | | | 0.71 | | | | 4.07 | | | | (23.19 | ) | | | (5.49 | ) | | | (11.02 | ) |
| Total expenses | | | 1.98 | % | | | 6.90 | % | | | (17.85 | )% | | | (1.58 | )% | | | (7.48 | )% |
| See accompanying Notes to Financial Statements. | |
| | |
| 50 | Tortoise |
| |
| |
| 2022 Semi-Annual Report | May 31, 2022 |
| |
| |
| |
| |
| | Six Months | | Year Ended | | Year Ended | | Year Ended | | Year Ended |
| | Ended May 31, | | November 30, | | November 30, | | November 30, | | November 30, |
| | 2022 | | 2021 | | 2020 | | 2019 | | 2018 |
| | (unaudited) | | | | | | | | | | | | | | | | |
| Ratio of net investment income (loss) to average | | | | | | | | | | | | | | | | | | | | |
| net assets before fee waiver(7) | | | 0.29 | % | | | (1.37 | )% | | | (2.83 | )% | | | (1.33 | )% | | | (1.89 | )% |
| Ratio of net investment income (loss) to average | | | | | | | | | | | | | | | | | | | | |
| net assets after fee waiver(7) | | | 0.29 | % | | | (1.37 | )% | | | (2.83 | )% | | | (1.33 | )% | | | (1.85 | )% |
| Portfolio turnover rate(5) | | | 9.51 | % | | | 65.30 | % | | | 36.79 | % | | | 26.35 | % | | | 17.96 | % |
| Credit facility borrowings, end of period (000's) | | $ | 23,500 | | | $ | 19,200 | | | $ | 13,200 | | | $ | 93,900 | | | $ | 107,100 | |
| Senior notes, end of period (000's) | | $ | 85,827 | | | $ | 83,893 | | | $ | 87,927 | | | $ | 365,000 | | | $ | 380,000 | |
| Preferred stock, end of period (000's) | | $ | 35,661 | | | $ | 32,300 | | | $ | 32,300 | | | $ | 165,000 | | | $ | 165,000 | |
| Per common share amount of senior notes | | | | | | | | | | | | | | | | | | | | |
| outstanding, end of period | | $ | 7.20 | | | $ | 7.03 | | | $ | 7.18 | | | $ | 27.17 | | | $ | 28.34 | |
| Per common share amount of net assets, | | | | | | | | | | | | | | | | | | | | |
| excluding senior notes, end of period | | $ | 48.47 | | | $ | 41.82 | | | $ | 32.13 | | | $ | 96.41 | | | $ | 122.34 | |
| Asset coverage, per $1,000 of principal amount | | | | | | | | | | | | | | | | | | | | |
| of senior notes and credit facility borrowings(10) | | $ | 5,829 | | | $ | 5,338 | | | $ | 4,342 | | | $ | 3,387 | | | $ | 3,926 | |
| Asset coverage ratio of senior notes and | | | | | | | | | | | | | | | | | | | | |
| credit facility borrowings(10) | | | 583 | % | | | 534 | % | | | 434 | % | | | 339 | % | | | 393 | % |
| Asset coverage, per $10 liquidation value per share | | | | | | | | | | | | | | | | | | | | |
| of mandatory redeemable preferred stock(11) | | $ | 44 | | | $ | 41 | | | $ | 33 | | | $ | 25 | | | $ | 29 | |
| Asset coverage ratio of preferred stock(11) | | | 440 | % | | | 406 | % | | | 329 | % | | | 249 | % | | | 293 | % |
| (1) | Information presented relates to a share of common stock outstanding for the entire period. |
| (2) | During the year ended November 30, 2020, the Fund effected the following reverse stock split: May 1, 2020, 1 for 4. All historical per share information has been retroactively adjusted to reflect this reverse stock split. |
| (3) | The per common share data for the years ended November 30, 2021, 2020, 2019, and 2018 do not reflect the change in estimate of investment income and return of capital, for the respective year. See Note 2C to the financial statements for further disclosure. |
| (4) | Represents underwriting and offering costs of less than $0.01 for the year ended November 30, 2019. Represents premium on shelf offerings of $0.40 per share, less the underwriting and offering costs of $0.04 per share, for the year ended November 30, 2018. |
| (5) | Not annualized for periods less than one full year. |
| (6) | Total investment return is calculated assuming a purchase of common stock at the beginning of the period and a sale at the closing price on the last day of the period reported (excluding brokerage commissions). The calculation also assumes reinvestment of distributions at actual prices pursuant to TYG’s dividend reinvestment plan. |
| (7) | Annualized for periods less than one full year. |
| (8) | Less than 0.01% for the year ended November 30, 2019. |
| (9) | For the period from December 1, 2021 through May 31, 2022, TYG accrued $3,253,810 for current tax expense. For the year ended November 30, 2021, TYG accrued $16,186,960 for current income tax expense. For the year ended November 30, 2020, TYG accrued $116,472,157 for net deferred income tax benefit and $7,747,729 for current income tax expense. For the year ended November 30, 2019, TYG accrued $73,090,370 for net deferred income tax benefit and $7,034,755 for current income tax expense. For the year ended November 30, 2018, TYG accrued $152,516,725 for net deferred income tax benefit, which included a deferred tax benefit of $125,271,378 due to the impact from the federal tax rate reduction related to the Tax Cuts and Jobs Act. |
| (10) | Represents value of total assets less all liabilities and indebtedness not represented by senior notes, credit facility borrowings and preferred stock at the end of the year divided by senior notes and credit facility borrowings outstanding at the end of the period. |
| (11) | Represents value of total assets less all liabilities and indebtedness not represented by senior notes, credit facility borrowings and preferred stock at the end of the year divided by senior notes, credit facility borrowings and preferred stock outstanding at the end of the period. |
| See accompanying Notes to Financial Statements. | |
| | |
| Tortoise | 51 |
| | Six Months | | Year Ended | | Year Ended | | Year Ended | | Year Ended |
| | Ended May 31, | | November 30, | | November 30, | | November 30, | | November 30, |
| | 2022 | | 2021 | | 2020 | | 2019 | | 2018 |
| | (unaudited) | | | | | | | | | | | | | | | | |
| Per Common Share Data(1)(2) | | | | | | | | | | | | | | | | | | | | |
| Net Asset Value, beginning of period | | $ | 37.22 | | | $ | 25.56 | | | $ | 105.60 | | | $ | 144.80 | | | $ | 159.60 | |
| Income (Loss) from Investment Operations | | | | | | | | | | | | | | | | | | | | |
| Net investment income (loss)(3) | | | 0.17 | | | | (0.41 | ) | | | (0.30 | ) | | | (2.80 | ) | | | (4.30 | ) |
| Net realized and unrealized gain (loss)(3) | | | 10.39 | | | | 13.72 | | | | (76.77 | ) | | | (19.50 | ) | | | 13.60 | |
| Total income (loss) from investment operations | | | 10.56 | | | | 13.31 | | | | (77.07 | ) | | | (22.30 | ) | | | 9.30 | |
| Distributions to Common Stockholders | | | | | | | | | | | | | | | | | | | | |
| From return of capital | | | (1.54 | ) | | | (1.65 | ) | | | (2.97 | ) | | | (16.90 | ) | | | (16.90 | ) |
| Capital stock transactions | | | | | | | | | | | | | | | | | | | | |
| Premiums less underwriting discounts and offering | | | | | | | | | | | | | | | | | | | | |
| costs on issuance of common stock(4) | | | — | | | | — | | | | — | | | | — | | | | (7.19 | ) |
| Net Asset Value, end of period | | $ | 46.24 | | | $ | 37.22 | | | $ | 25.56 | | | $ | 105.60 | | | $ | 144.80 | |
| Per common share market value, end of period | | $ | 37.99 | | | $ | 30.31 | | | $ | 19.46 | | | $ | 98.80 | | | $ | 137.20 | |
| Total investment return based on market value(5)(6) | | | 30.57 | % | | | 64.86 | % | | | (78.77 | )% | | | (17.63 | )% | | | (4.10 | )% |
| |
| Supplemental Data and Ratios | | | | | | | | | | | | | | | | | | | | |
| Net assets applicable to common stockholders, | | | | | | | | | | | | | | | | | | | | |
| end of period (000's) | | $ | 260,924 | | | $ | 210,018 | | | $ | 149,407 | | | $ | 667,708 | | | $ | 915,033 | |
| Average net assets (000's) | | $ | 238,125 | | | $ | 200,484 | | | $ | 289,147 | | | $ | 871,496 | | | $ | 887,014 | |
| Ratio of Expenses to Average Net Assets(7) | | | | | | | | | | | | | | | | | | | | |
| Advisory fees | | | 0.60 | % | | | 1.28 | % | | | 1.61 | % | | | 1.59 | % | | | 1.54 | % |
| Other operating expenses | | | 0.14 | | | | 0.37 | | | | 0.33 | | | | 0.14 | | | | 0.15 | |
| Total operating expenses, before fee waiver | | | 0.74 | | | | 1.65 | | | | 1.94 | | | | 1.73 | | | | 1.69 | |
| Fee waiver | | | — | | | | — | | | | — | | | | (0.03 | ) | | | (0.09 | ) |
| Total operating expenses | | | 0.74 | | | | 1.65 | | | | 1.94 | | | | 1.70 | | | | 1.60 | |
| Leverage expenses | | | 0.43 | | | | 0.84 | | | | 4.43 | | | | 2.34 | | | | 1.98 | |
| Income tax expense (benefit)(8) | | | 1.11 | | | | 4.25 | | | | 2.19 | | | | (4.80 | ) | | | (6.09 | ) |
| Total expenses | | | 2.28 | % | | | 6.74 | % | | | 8.56 | % | | | (0.76 | )% | | | (2.51 | )% |
| See accompanying Notes to Financial Statements. | |
| | |
| 52 | Tortoise |
| |
| |
| 2022 Semi-Annual Report | May 31, 2022 |
| |
| |
| |
| |
| | Six Months | | Year Ended | | Year Ended | | Year Ended | | Year Ended |
| | Ended May 31, | | November 30, | | November 30, | | November 30, | | November 30, |
| | 2022 | | 2021 | | 2020 | | 2019 | | 2018 |
| | (unaudited) | | | | | | | | | | | | | | | | |
| Ratio of net investment income (loss) to average | | | | | | | | | | | | | | | | | | | | |
| net assets before fee waiver(7) | | | 0.39 | % | | | (1.17 | )% | | | (3.11 | )% | | | (2.05 | )% | | | (2.65 | )% |
| Ratio of net investment income (loss) to average | | | | | | | | | | | | | | | | | | | | |
| net assets after fee waiver(7) | | | 0.39 | % | | | (1.17 | )% | | | (3.11 | )% | | | (2.02 | )% | | | (2.56 | )% |
| Portfolio turnover rate(5) | | | 1.64 | % | | | 58.40 | % | | | 38.08 | % | | | 29.21 | % | | | 13.67 | % |
| Credit facility borrowings, end of period (000's) | | $ | 14,500 | | | $ | 40,900 | | | $ | 40,000 | | | $ | 53,600 | | | $ | 73,100 | |
| Senior notes, end of period (000's) | | $ | 32,150 | | | $ | 7,150 | | | $ | 15,321 | | | $ | 277,000 | | | $ | 312,000 | |
| Preferred stock, end of period (000's) | | $ | 19,719 | | | $ | 12,219 | | | $ | 12,700 | | | $ | 132,000 | | | $ | 132,000 | |
| Per common share amount of senior notes | | | | | | | | | | | | | | | | | | | | |
| outstanding, end of period | | $ | 5.70 | | | $ | 1.27 | | | $ | 2.62 | | | $ | 43.82 | | | $ | 49.36 | |
| Per common share amount of net assets, excluding | | | | | | | | | | | | | | | | | | | | |
| senior notes, end of period | | $ | 51.94 | | | $ | 38.49 | | | $ | 28.18 | | | $ | 149.42 | | | $ | 194.17 | |
| Asset coverage, per $1,000 of principal amount | | | | | | | | | | | | | | | | | | | | |
| of senior notes and credit facility borrowings(9) | | $ | 7,016 | | | $ | 5,625 | | | $ | 3,930 | | | $ | 3,419 | | | $ | 3,719 | |
| Asset coverage ratio of senior notes and credit | | | | | | | | | | | | | | | | | | | | |
| facility borrowings(9) | | | 702 | % | | | 563 | % | | | 393 | % | | | 342 | % | | | 372 | % |
| Asset coverage, per $25 liquidation value per share | | | | | | | | | | | | | | | | | | | | |
| of mandatory redeemable preferred stock(10) | | $ | 123 | | | $ | 112 | | | $ | 80 | | | $ | 61 | | | $ | 69 | |
| Asset coverage ratio of preferred stock(10) | | | 493 | % | | | 448 | % | | | 320 | % | | | 244 | % | | | 277 | % |
| (1) | Information presented relates to a share of common stock outstanding for the entire period. |
| (2) | During the year ended November 30, 2020, the Fund effected the following reverse stock split: May 1, 2020, 1 for 10. All historical per share information has been retroactively adjusted to reflect this reverse stock split. |
| (3) | The per common share data for the years ended November 30, 2021, 2020, 2019, and 2018 do not reflect the change in estimate of investment income and return of capital, for the respective year. See Note 2C to the financial statements for further disclosure. |
| (4) | Represents underwriting and offering costs of less than $0.01 for the year ending November 30, 2019. Represents the discounts on shares issued through rights offerings of $5.50, plus the underwriting and offering costs of $1.69 per share for the year ended November 30, 2018. |
| (5) | Not annualized for periods less than one full year. |
| (6) | Total investment return is calculated assuming a purchase of common stock at the beginning of the period and a sale at the closing price on the last day of the period reported (excluding brokerage commissions). This calculation also assumes reinvestment of distributions at actual prices pursuant to NTG’s dividend reinvestment plan. |
| (7) | Annualized for periods less than one full year. |
| (8) | For the period from December 1, 2021 through May 31, 2022, NTG accrued $2,651,478 for current tax expense. For the year ended November 30, 2021, NTG accrued $8,514,650 for current income tax expense. For the year ended November 30, 2020, NTG accrued $27,892,485 for net deferred income tax benefit and $34,222,098 for current tax expense. For the year ended November 30, 2019, NTG accrued $40,282,948 for net deferred income tax benefit and $1,510,530 for current tax benefit. For the year ended November 30, 2018, NTG accrued $54,197,357 for net deferred income tax benefit, which included a deferred tax benefit of $47,436,124 due to the impact from the federal tax rate reduction related to the Tax Cuts and Jobs Act. |
| (9) | Represents value of total assets less all liabilities and indebtedness not represented by senior notes, credit facility borrowings and preferred stock at the end of the year divided by senior notes and credit facility borrowings outstanding at the end of the period. |
| (10) | Represents value of total assets less all liabilities and indebtedness not represented by senior notes, credit facility borrowings and preferred stock at the end of the year divided by senior notes, credit facility borrowings and preferred stock outstanding at the end of the period. |
See accompanying Notes to Financial Statements.
| | | | Six Months | | Year Ended | | Year Ended | | Year Ended | | Year Ended |
| | | Ended May 31, | | November 30, | | November 30, | | November 30, | | November 30, |
| | | 2022 | | 2021 | | 2020 | | 2019 | | 2018 |
| | | (unaudited) | | | | | | | | | | | | | | | | |
| Per Common Share Data(1)(2) | | | | | | | | | | | | | | | | | | | | |
| Net Asset Value, beginning of period | | $ | 27.96 | | | $ | 19.97 | | | $ | 51.88 | | | $ | 65.16 | | | $ | 75.28 | |
| Income (Loss) from Investment Operations | | | | | | | | | | | | | | | | | | | | |
| Net investment income (loss)(3) | | | 0.09 | | | | (0.23 | ) | | | (0.12 | ) | | | (0.48 | ) | | | (0.60 | ) |
| Net realized and unrealized gain (loss)(3) | | | 8.79 | | | | 9.28 | | | | (30.17 | ) | | | (7.24 | ) | | | (3.00 | ) |
| Total income (loss) from investment operations | | | 8.88 | | | | 9.05 | | | | (30.29 | ) | | | (7.72 | ) | | | (3.60 | ) |
| Distributions to Common Stockholders | | | | | | | | | | | | | | | | | | | | |
| From net investment income | | | — | | | | — | | | | — | | | | — | | | | (0.16 | ) |
| From net realized gains from | | | | | | | | | | | | | | | | | | | | |
| investment transactions | | | — | | | | — | | | | — | | | | — | | | | — | |
| From return of capital | | | (1.18 | ) | | | (1.06 | ) | | | (1.62 | ) | | | (5.56 | ) | | | (6.36 | ) |
| Total distributions to common stockholders | | | (1.18 | ) | | | (1.06 | ) | | | (1.62 | ) | | | (5.56 | ) | | | (6.52 | ) |
| Net Asset Value, end of period | | $ | 35.66 | | | $ | 27.96 | | | $ | 19.97 | | | $ | 51.88 | | | $ | 65.16 | |
| Per common share market value, end of period | | $ | 29.76 | | | $ | 23.16 | | | $ | 15.15 | | | $ | 46.08 | | | $ | 57.32 | |
| Total investment return based on market value(4)(5) | | | 33.82 | % | | | 60.09 | % | | | (64.69 | )% | | | (11.10 | )% | | | (7.03 | )% |
| | | | | | | | | | | | | | | | | | | | | |
| Supplemental Data and Ratios | | | | | | | | | | | | | | | | | | | | |
| Net assets applicable to common stockholders, | | | | | | | | | | | | | | | | | | | | |
| end of period (000's) | | $ | 79,443 | | | $ | 62,289 | | | $ | 48,108 | | | $ | 129,887 | | | $ | 163,202 | |
| Average net assets (000's) | | $ | 71,790 | | | $ | 61,943 | | | $ | 70,052 | | | $ | 157,017 | | | $ | 188,518 | |
| Ratio of Expenses to Average Net Assets(6) | | | | | | | | | | | | | | | | | | | | |
| Advisory fees | | | 0.70 | % | | | 1.46 | % | | | 1.67 | % | | | 1.54 | % | | | 1.51 | % |
| Other operating expenses | | | 0.27 | | | | 0.74 | | | | 0.75 | | | | 0.35 | | | | 0.32 | |
| Total operating expenses, before fee waiver | | | 0.97 | | | | 2.20 | | | | 2.42 | | | | 1.89 | | | | 1.83 | |
| Fee waiver | | | (0.02 | ) | | | (0.21 | ) | | | — | | | | — | | | | — | |
| Total operating expenses | | | 0.95 | | | | 1.99 | | | | 2.42 | | | | 1.89 | | | | 1.83 | |
| Leverage expenses | | | 0.51 | | | | 1.67 | | | | 2.66 | | | | 1.62 | | | | 1.40 | |
| Total expenses | | | 1.46 | % | | | 3.66 | % | | | 5.08 | % | | | 3.51 | % | | | 3.23 | % |
See accompanying Notes to Financial Statements.
| |
| |
| 2022 Semi-Annual Report | May 31, 2022 |
| |
| |
| |
| |
| | Six Months | | Year Ended | | Year Ended | | Year Ended | | Year Ended |
| | Ended May 31, | | November 30, | | November 30, | | November 30, | | November 30, |
| | 2022 | | 2021 | | 2020 | | 2019 | | 2018 |
| | (unaudited) | | | | | | | | | | | | | | | | |
| Ratio of net investment income (loss) to average | | | | | | | | | | | | | | | | | | | | |
| net assets before fee waiver(6) | | | 0.27 | % | | | (1.04 | )% | | | (0.97 | )% | | | (0.79 | )% | | | (0.80 | )% |
| Ratio of net investment income (loss) to average | | | | | | | | | | | | | | | | | | | | |
| net assets after fee waiver(6) | | | 0.28 | % | | | (0.83 | )% | | | (0.97 | )% | | | (0.79 | )% | | | (0.80 | )% |
| Portfolio turnover rate(4) | | | 4.81 | % | | | 14.77 | % | | | 35.61 | % | | | 21.31 | % | | | 14.27 | % |
| Credit facility borrowings, end of period (000's) | | $ | 10,900 | | | $ | 8,100 | | | $ | — | | | $ | 11,800 | | | $ | 19,800 | |
| Senior notes, end of period (000's) | | $ | 3,943 | | | $ | 3,943 | | | $ | 14,457 | | | $ | 34,000 | | | $ | 34,000 | |
| Preferred stock, end of period (000's) | | $ | 6,100 | | | $ | 6,100 | | | $ | 6,100 | | | $ | 16,000 | | | $ | 16,000 | |
| Per common share amount of senior notes | | | | | | | | | | | | | | | | | | | | |
| outstanding, end of period | | $ | 1.77 | | | $ | 1.77 | | | $ | 6.00 | | | $ | 13.58 | | | $ | 13.58 | |
| Per common share amount of net assets, excluding | | | | | | | | | | | | | | | | | | | | |
| senior notes, end of period | | $ | 37.43 | | | $ | 29.73 | | | $ | 25.97 | | | $ | 65.46 | | | $ | 78.74 | |
| Asset coverage, per $1,000 of principal amount | | | | | | | | | | | | | | | | | | | | |
| of senior notes and credit facility borrowings(7) | | $ | 6,763 | | | $ | 6,679 | | | $ | 4,750 | | | $ | 4,185 | | | $ | 4,331 | |
| Asset coverage ratio of senior notes and credit | | | | | | | | | | | | | | | | | | | | |
| facility borrowings(7) | | | 676 | % | | | 668 | % | | | 475 | % | | | 419 | % | | | 433 | % |
| Asset coverage, per $25 liquidation value per share | | | | | | | | | | | | | | | | | | | | |
| of mandatory redeemable preferred stock(8) | | $ | 120 | | | $ | 111 | | | $ | 84 | | | $ | 78 | | | $ | 83 | |
| Asset coverage ratio of preferred stock(8) | | | 479 | % | | | 443 | % | | | 334 | % | | | 310 | % | | | 334 | % |
| (1) | Information presented relates to a share of common stock outstanding for the entire period. |
| (2) | During the year ended November 30, 2020, the Fund effected the following reverse stock split: May 1, 2020, 1 for 4. All historical per share information has been retroactively adjusted to reflect this reverse stock split. |
| (3) | The per common share data for the years ended November 30, 2021, 2020, 2019, and 2018 do not reflect the change in estimate of investment income and return of capital, for the respective year. See Note 2C to the financial statements for further disclosure. |
| (4) | Not annualized for years less than one full year. |
| (5) | Total investment return is calculated assuming a purchase of common stock at the beginning of the period and a sale at the closing price on the last day of the period reported (excluding brokerage commissions). The calculation also assumes reinvestment of distributions at actual prices pursuant to TTP’s dividend reinvestment plan. |
| (6) | Annualized for years less than one full year. |
| (7) | Represents value of total assets less all liabilities and indebtedness not represented by senior notes, credit facility borrowings and preferred stock at the end of the year divided by senior notes and credit facility borrowings outstanding at the end of the period. |
| (8) | Represents value of total assets less all liabilities and indebtedness not represented by senior notes, credit facility borrowings and preferred stock at the end of the year divided by senior notes, credit facility borrowings and preferred stock outstanding at the end of the period. |
See accompanying Notes to Financial Statements.
| | | | Six Months | | Year Ended | | Year Ended | | Year Ended | | Year Ended |
| | | Ended May 31, | | November 30, | | November 30, | | November 30, | | November 30, |
| | | 2022 | | 2021 | | 2020 | | 2019 | | 2018 |
| | | (unaudited) | | | | | | | | | | | | | | | | |
| Per Common Share Data(1)(2) | | | | | | | | | | | | | | | | | | | | |
| Net Asset Value, beginning of period | | $ | 25.13 | | | $ | 16.42 | | | $ | 33.36 | | | $ | 72.16 | | | $ | 103.04 | |
| Income (Loss) from Investment Operations | | | | | | | | | | | | | | | | | | | | |
| Net investment income (loss)(3) | | | 0.36 | | | | 0.13 | | | | — | | | | (0.80 | ) | | | (2.32 | ) |
| Net realized and unrealized gain (loss)(3) | | | 14.15 | | | | 9.20 | | | | (16.14 | ) | | | (29.36 | ) | | | (14.56 | ) |
| Total income (loss) from investment operations | | | 14.51 | | | | 9.33 | | | | (16.14 | ) | | | (30.16 | ) | | | (16.88 | ) |
| Distributions to Common Stockholders | | | | | | | | | | | | | | | | | | | | |
| From net investment income | | | — | | | | (0.05 | ) | | | — | | | | — | | | | — | |
| From return of capital | | | (0.96 | ) | | | (0.57 | ) | | | (0.80 | ) | | | (8.64 | ) | | | (14.00 | ) |
| Total distributions to common stockholders | | | (0.96 | ) | | | (0.62 | ) | | | (0.80 | ) | | | (8.64 | ) | | | (14.00 | ) |
| Net Asset Value, end of period | | $ | 38.68 | | | $ | 25.13 | | | $ | 16.42 | | | $ | 33.36 | | | $ | 72.16 | |
| Per common share market value, end of period | | $ | 32.47 | | | $ | 22.24 | | | $ | 12.63 | | | $ | 29.04 | | | $ | 72.00 | |
| Total investment return based on market value(4)(5) | | | 50.62 | % | | | 81.36 | % | | | (54.88 | )% | | | (52.35 | )% | | | (15.10 | )% |
| | | | | | | | | | | | | | | | | | | | | | |
| Supplemental Data and Ratios | | | | | | | | | | | | | | | | | | | | |
| Net assets applicable to common stockholders, | | | | | | | | | | | | | | | | | | | | |
| end of period (000's) | | $ | 71,407 | | | $ | 46,398 | | | $ | 30,307 | | | $ | 61,550 | | | $ | 132,488 | |
| Average net assets (000's) | | $ | 58,200 | | | $ | 41,323 | | | $ | 37,057 | | | $ | 94,144 | | | $ | 176,481 | |
| Ratio of Expenses to Average Net Assets(6) | | | | | | | | | | | | | | | | | | | | |
| Advisory fees | | | 0.57 | % | | | 1.20 | % | | | 1.40 | % | | | 1.52 | % | | | 1.50 | % |
| Other operating expenses | | | 0.28 | | | | 1.04 | | | | 1.18 | | | | 0.51 | | | | 0.32 | |
| Total operating expenses, before fee waiver | | | 0.85 | | | | 2.24 | | | | 2.58 | | | | 2.03 | | | | 1.82 | |
| Fee waiver | | | (0.13 | ) | | | (0.22 | ) | | | — | | | | — | | | | — | |
| Total operating expenses | | | 0.72 | | | | 2.02 | | | | 2.58 | | | | 2.03 | | | | 1.82 | |
| Leverage expenses | | | 0.06 | | | | 0.16 | | | | 0.66 | | | | 1.30 | | | | 0.99 | |
| Total expenses | | | 0.78 | % | | | 2.18 | % | | | 3.24 | % | | | 3.33 | % | | | 2.81 | % |
See accompanying Notes to Financial Statements.
| |
| |
| 2022 Semi-Annual Report | May 31, 2022 |
| |
| |
| |
| |
| | Six Months | | Year Ended | | Year Ended | | Year Ended | | Year Ended |
| | Ended May 31, | | November 30, | | November 30, | | November 30, | | November 30, |
| | 2022 | | 2021 | | 2020 | | 2019 | | 2018 |
| | (unaudited) | | | | | | | | | | | | | | | | |
| Ratio of net investment income (loss) to average | | | | | | | | | | | | | | | | | | | | |
| net assets before fee waiver(6) | | | 0.99 | % | | | 0.36 | % | | | 0.03 | % | | | (1.58 | )% | | | (2.40 | )% |
| Ratio of net investment income (loss) to average | | | | | | | | | | | | | | | | | | | | |
| net assets after fee waiver(6) | | | 1.13 | % | | | 0.58 | % | | | 0.03 | % | | | (1.58 | )% | | | (2.40 | )% |
| Portfolio turnover rate(4) | | | 12.26 | % | | | 53.15 | % | | | 72.19 | % | | | 182.52 | % | | | 143.77 | % |
| Credit facility borrowings, end of period (000's) | | $ | 3,600 | | | $ | 2,700 | | | $ | 5,000 | | | $ | 26,500 | | | $ | 57,100 | |
| Asset coverage, per $1,000 of principal amount | | | | | | | | | | | | | | | | | | | | |
| of credit facility borrowings(7) | | $ | 20,835 | | | $ | 18,185 | | | $ | 7,061 | | | $ | 3,323 | | | $ | 3,320 | |
| Asset coverage ratio of credit facility borrowings(7) | | | 2,084 | % | | | 1,818 | % | | | 706 | % | | | 332 | % | | | 332 | % |
| (1) | Information presented relates to a share of common stock outstanding for the entire period. |
| (2) | During the year ended November 30, 2020, the Fund effected the following reverse stock split: May 1, 2020, 1 for 8. All historical per share information has been retroactively adjusted to reflect this reverse stock split. |
| (3) | The per common share data for the years ended November 30, 2021, 2020, 2019, and 2018 do not reflect the change in estimate of investment income and return of capital, for the respective year. See Note 2C to the financial statements for further disclosure. |
| (4) | Not annualized for year less than one full year. |
| (5) | Total investment return is calculated assuming a purchase of common stock at the beginning of the period and a sale at the closing price on the last day of the period reported (excluding brokerage commissions). The calculation also assumes reinvestment of distributions at actual prices pursuant to NDP’s dividend reinvestment plan. |
| (6) | Annualized for year less than one full year. |
| (7) | Represents value of total assets less all liabilities and indebtedness not represented by credit facility borrowings at the end of the year divided by credit facility borrowings outstanding at the end of the period. |
See accompanying Notes to Financial Statements.
| | Six Months | | Year Ended | | Year Ended | | Year Ended | | Year Ended |
| | Ended May 31, | | November 30, | | November 30, | | November 30, | | November 30, |
| | 2022 | | 2021 | | 2020 | | 2019 | | 2018 |
| | (unaudited) | | | | | | | | |
| Per Common Share Data(1) | | | | | | | | | | | | | | | | | | | | |
| Net Asset Value, beginning of period | | $ | 15.09 | | | $ | 13.01 | | | $ | 17.70 | | | $ | 19.76 | | | $ | 21.33 | |
| Income (loss) from Investment Operations | | | | | | | | | | | | | | | | | | | | |
| Net investment income(2) | | | 0.14 | | | | 0.23 | | | | 0.35 | | | | 0.39 | | | | 0.24 | |
| Net realized and unrealized gain (loss)(2) | | | 1.67 | | | | 2.49 | | | | (3.99 | ) | | | (0.95 | ) | | | (0.31 | ) |
| Total income (loss) from investment operations | | | 1.81 | | | | 2.72 | | | | (3.64 | ) | | | (0.56 | ) | | | (0.07 | ) |
| Distributions to Common Stockholders | | | | | | | | | | | | | | | | | | | | |
| From net investment income | | | — | | | | (0.28 | ) | | | (0.60 | ) | | | (1.12 | ) | | | (0.57 | ) |
| From net realized gains from | | | | | | | | | | | | | | | | | | | | |
| investment transactions | | | — | | | | — | | | | — | | | | (0.28 | ) | | | (0.93 | ) |
| From return of capital | | | (0.54 | ) | | | (0.36 | ) | | | (0.45 | ) | | | (0.10 | ) | | | — | |
| Total distributions to common stockholders | | | (0.54 | ) | | | (0.64 | ) | | | (1.05 | ) | | | (1.50 | ) | | | (1.50 | ) |
| Net Asset Value, end of period | | $ | 16.36 | | | $ | 15.09 | | | $ | 13.01 | | | $ | 17.70 | | | $ | 19.76 | |
| Per common share market value, end of period | | $ | 14.15 | | | $ | 12.92 | | | $ | 9.99 | | | $ | 15.57 | | | $ | 17.17 | |
| Total investment return based on market value(3)(4) | | | 13.72 | % | | | 35.99 | % | | | (29.23 | )% | | | (1.38 | )% | | | (6.82 | )% |
| | | | | | | | | | | | | | | | | | | | | |
| Supplemental Data and Ratios | | | | | | | | | | | | | | | | | | | | |
| Net assets applicable to common stockholders, | | | | | | | | | | | | | | | | | | | | |
| end of period (000's) | | $ | 106,782 | | | $ | 98,462 | | | $ | 89,426 | | | $ | 123,015 | | | $ | 137,324 | |
| Average net assets (000's) | | $ | 103,790 | | | $ | 100,853 | | | $ | 93,027 | | | $ | 137,701 | | | $ | 147,616 | |
| Ratio of Expenses to Average Net Assets(5) | | | | | | | | | | | | | | | | | | | | |
| Advisory fees | | | 0.59 | % | | | 1.18 | % | | | 1.28 | % | | | 1.32 | % | | | 1.29 | % |
| Other operating expenses | | | 0.19 | | | | 0.47 | | | | 0.94 | | | | 0.38 | | | | 0.37 | |
| Total operating expenses, before fee waiver | | | 0.78 | | | | 1.65 | | | | 2.22 | | | | 1.70 | | | | 1.66 | |
| Fee waiver | | | — | | | | — | | | | — | | | | — | | | | — | |
| Total operating expenses | | | 0.78 | | | | 1.65 | | | | 2.22 | | | | 1.70 | | | | 1.66 | |
| Leverage expenses | | | 0.40 | | | | 0.82 | | | | 1.04 | | | | 1.25 | | | | 0.98 | |
| Total expenses | | | 1.18 | % | | | 2.47 | % | | | 3.26 | % | | | 2.95 | % | | | 2.64 | % |
| See accompanying Notes to Financial Statements. | |
| | |
| 58 | Tortoise |
| |
| |
| 2022 Semi-Annual Report | May 31, 2022 |
| |
| |
| |
| |
| | Six Months | | Year Ended | | Year Ended | | Year Ended | | Year Ended |
| | Ended May 31, | | November 30, | | November 30, | | November 30, | | November 30, |
| | 2022 | | 2021 | | 2020 | | 2019 | | 2018 |
| | (unaudited) | | | | | | | | |
| Ratio of net investment income to average | | | | | | | | | | | | | | | | | | | | |
| net assets before fee waiver(5) | | | 0.86 | % | | | 1.48 | % | | | 2.61 | % | | | 1.98 | % | | | 1.14 | % |
| Ratio of net investment income to average | | | | | | | | | | | | | | | | | | | | |
| net assets after fee waiver(5) | | | 0.86 | % | | | 1.48 | % | | | 2.61 | % | | | 1.98 | % | | | 1.14 | % |
| Portfolio turnover rate(3) | | | 3.93 | % | | | 26.70 | % | | | 29.95 | % | | | 25.27 | % | | | 31.41 | % |
| Credit facility borrowings, end of period (000's) | | $ | 25,600 | | | $ | 24,000 | | | $ | 26,200 | | | $ | 54,100 | | | $ | 53,400 | |
| Asset coverage, per $1,000 of principal amount | | | | | | | | | | | | | | | | | | | | |
| of senior notes and credit facility borrowings(6) | | $ | 5,171 | | | $ | 5,103 | | | $ | 4,413 | | | $ | 3,274 | | | $ | 3,572 | |
| Asset coverage ratio of senior notes and credit | | | | | | | | | | | | | | | | | | | | |
| facility borrowings(6) | | | 517 | % | | | 510 | % | | | 441 | % | | | 327 | % | | | 357 | % |
| (1) | Information presented relates to a share of common stock outstanding for the entire year. |
| (2) | The per common share data for the years ended November 30, 2021, 2020, 2019, and 2018 do not reflect the change in estimate of investment income and return of capital, for the respective year. See Note 2C to the financial statements for further disclosure. |
| (3) | Not annualized for periods less than one full year. |
| (4) | Total investment return is calculated assuming a purchase of common stock at the beginning of the year and a sale at the closing price on the last day of the year reported (excluding brokerage commissions). The calculation also assumes reinvestment of distributions at actual prices pursuant to TPZ’s dividend reinvestment plan. |
| (5) | Annualized for periods less than one full year. |
| (6) | Represents value of total assets less all liabilities and indebtedness not represented by credit facility borrowings at the end of the period divided by credit facility borrowings outstanding at the end of the year. |
| See accompanying Notes to Financial Statements. | |
| | |
| Tortoise | 59 |
| |
| |
| |
| |
| TEAF Financial Highlights |
| |
| |
| | | | | | | | | | | | | | Period From |
| | | | | | | | | | | | | | March 29, 2019(1) |
| | Six Months | | Year Ended | | Year Ended | | through |
| | Ended May 31, | | November 30, | | November 30, | | November 30, |
| | 2022 | | 2021 | | 2020 | | 2019 |
| | (unaudited) | | | | | | |
| Per Common Share Data(2) | | | | | | | | | | | | | | | | |
| Net Asset Value, beginning of period | | $ | 17.15 | | | $ | 15.85 | | | $ | 17.60 | | | $ | 20.00 | |
| Income (loss) from Investment Operations | | | | | | | | | | | | | | | | |
| Net investment income | | | 0.19 | | | | 0.54 | | | | 0.51 | | | | 0.31 | |
| Net realized and unrealized gain (loss) | | | 0.42 | | | | 1.66 | | | | (1.16 | ) | | | (1.95 | ) |
| Total income (loss) from investment operations | | | 0.61 | | | | 2.20 | | | | (0.65 | ) | | | (1.64 | ) |
| Distributions to Common Stockholders | | | | | | | | | | | | | | | | |
| From net investment income | | | (0.28 | ) | | | (0.64 | ) | | | (0.46 | ) | | | (0.34 | ) |
| From return of capital | | | (0.23 | ) | | | (0.26 | ) | | | (0.64 | ) | | | (0.42 | ) |
| Total distributions to common stockholders | | | (0.51 | ) | | | (0.90 | ) | | | (1.10 | ) | | | (0.76 | ) |
| Net Asset Value, end of period | | $ | 17.25 | | | $ | 17.15 | | | $ | 15.85 | | | $ | 17.60 | |
| Per common share market value, end of period | | $ | 14.55 | | | $ | 14.64 | | | $ | 13.04 | | | $ | 15.60 | |
| Total investment return based on market value(3)(4) | | | 2.82 | % | | | 19.50 | % | | | (8.66 | )% | | | (18.45 | )% |
| | | | | | | | | | | | | | | | | |
| Supplemental Data and Ratios | | | | | | | | | | | | | | | | |
| Net assets applicable to common stockholders, end of period (000's) | | $ | 232,699 | | | $ | 231,382 | | | $ | 213,825 | | | $ | 237,461 | |
| Average net assets (000's) | | $ | 232,031 | | | $ | 228,533 | | | $ | 210,055 | | | $ | 252,217 | |
| Ratio of Expenses to Average Net Assets(5) | | | | | | | | | | | | | | | | |
| Advisory fees | | | 0.75 | % | | | 1.53 | % | | | 1.55 | % | | | 1.51 | % |
| Other operating expenses | | | 0.17 | | | | 0.33 | | | | 0.37 | | | | 0.81 | |
| Total operating expenses, before fee waiver | | | 0.92 | | | | 1.86 | | | | 1.92 | | | | 2.32 | |
| Fee waiver | | | — | | | | — | | | | (0.10 | ) | | | (0.28 | ) |
| Total operating expenses | | | 0.92 | | | | 1.86 | | | | 1.82 | | | | 2.04 | |
| Leverage expenses | | | 0.07 | | | | 0.13 | | | | 0.23 | | | | 0.36 | |
| Income tax expense (benefit)(6) | | | 0.06 | | | | (0.03 | ) | | | 0.28 | | | | (0.24 | ) |
| Total expenses | | | 1.05 | % | | | 1.96 | % | | | 2.33 | % | | | 2.16 | % |
| See accompanying Notes to Financial Statements. | |
| | |
| 60 | Tortoise |
| |
| |
| 2022 Semi-Annual Report | May 31, 2022 |
| |
| |
| |
| |
| | | | | | | | | | | | | | Period From |
| | | | | | | | | | | | | | March 29, 2019(1) |
| | Six Months | | Year Ended | | Year Ended | | through |
| | Ended May 31, | | November 30, | | November 30, | | November 30, |
| | 2022 | | 2021 | | 2020 | | 2019 |
| | (unaudited) | | | | | | |
| Ratio of net investment income to average net assets | | | | | | | | | | | | | | | | |
| before fee waiver(5) | | | 1.10 | % | | | 3.20 | % | | | 3.16 | % | | | 2.15 | % |
| Ratio of net investment income to average net assets | | | | | | | | | | | | | | | | |
| after fee waiver(5) | | | 1.10 | % | | | 3.20 | % | | | 3.26 | % | | | 2.43 | % |
| Portfolio turnover rate(3) | | | 14.47 | % | | | 68.31 | % | | | 73.22 | % | | | 50.44 | % |
| Credit facility borrowings, end of period (000's) | | $ | 30,400 | | | $ | 21,600 | | | $ | 31,100 | | | $ | 32,000 | |
| Asset coverage, per $1,000 of principal amount of senior notes | | | | | | | | | | | | | | | | |
| and credit facility borrowings(7) | | $ | 8,655 | | | $ | 11,712 | | | $ | 7,875 | | | $ | 8,421 | |
| Asset coverage ratio of senior notes and credit facility borrowings(7) | | | 865 | % | | | 1,171 | % | | | 788 | % | | | 842 | % |
| (1) | Commencement of operations. |
| (2) | Information presented relates to a share of common stock outstanding for the entire period. |
| (3) | Not annualized for period less than one year. |
| (4) | Total investment return is calculated assuming a purchase of common stock at the beginning of the period and a sale at the closing price on the last day of the period reported (excluding brokerage commissions). The calculation also assumes reinvestment of distributions at actual prices pursuant to TEAF’s dividend reinvestment plan. |
| (5) | Annualized for period less than one year. |
| (6) | For the period December 1, 2021 through May 31, 2022 TEAF accrued $131,850 for net deferred income tax expense. For the year ended November 31, 2021, TEAF accrued $67,015 for net deferred income tax expense. For the year ended November 30, 2020, TEAF accrued $594,668 for net deferred income tax expense. For the period ended November 30, 2019, TEAF accrued $418,970 for net deferred income tax benefit. |
| (7) | Represents value of total assets less all liabilities and indebtedness not represented by margin facility borrowings at the end of the period divided by margin facility borrowings outstanding at the end of the period. |
| See accompanying Notes to Financial Statements. | |
| | |
| Tortoise | 61 |
| |
| |
| |
| |
| Notes to Financial Statements (unaudited) |
| May 31, 2022 |
1. General Organization
This report covers the following companies, each of which is listed on the New York Stock Exchange (“NYSE”): Tortoise Energy Infrastructure Corp. (“TYG”), Tortoise Midstream Energy Fund, Inc. (“NTG”), Tortoise Pipeline & Energy Fund, Inc. (“TTP”), Tortoise Energy Independence Fund, Inc. (“NDP”), Tortoise Power and Energy Infrastructure Fund, Inc. (“TPZ”), and Ecofin Sustainable and Social Impact Term Fund (“TEAF”) These companies are individually referred to as a “Fund” or by their respective NYSE symbols, or collectively as the “Funds”, and each is a non-diversified, closed-end management investment company under the Investment Company Act of 1940, as amended (the “1940 Act”). Each of TYG, NTG, TTP, NDP and TEAF has a primary investment objective to seek a high level of total return with an emphasis on current distributions. TPZ has a primary investment objective to provide a high level of current income, with a secondary objective of capital appreciation.
2. Significant Accounting Policies
The Funds follow accounting and reporting guidance applicable to investment companies under U.S. generally accepted accounting principles (“GAAP”).
A. Use of Estimates
The preparation of financial statements in conformity with GAAP requires management to make estimates and assumptions that affect the reported amount of assets and liabilities and disclosure of contingent assets and liabilities as of the date of the financial statements, and the amount of income and expenses during the period reported. Actual results could differ from those estimates.
B. Security Valuation
In general, and where applicable, the Funds use readily available market quotations based upon the last updated sales price from the principal market to determine fair value. The Funds primarily own securities that are listed on a securities exchange or are traded in the over-the-counter market. The Funds value those securities at their last sale price on that exchange or over-the-counter market on the valuation date. If the security is listed on more than one exchange, the Funds use the price from the exchange that it considers to be the principal exchange on which the security is traded. If there has been no sale on such exchange or over-the-counter market on such day, the security is valued at the mean between the last bid price and last ask price on such day. Securities listed on the NASDAQ are valued at the NASDAQ Official Closing Price, which may not necessarily represent the last sale price. These securities are categorized as Level 1 in the fair value hierarchy.
Restricted securities are subject to statutory or contractual restrictions on their public resale, which may make it more difficult to obtain a valuation and may limit a Fund’s ability to dispose of them. Investments in private placement securities and other securities for which market quotations are not readily available are valued in good faith by using fair value procedures. Such fair value procedures consider factors such as discounts to publicly traded issues, time until conversion date, securities with similar yields, quality, type of issue, coupon, duration and rating. If events occur that affect the value of a Fund’s portfolio securities before the net asset value has been calculated (a “significant event”), the portfolio securities so affected are generally priced using fair value procedures.
An equity security of a publicly traded company acquired in a private placement transaction without registration under the Securities Act of 1933, as amended (the “1933 Act”), is subject to restrictions on resale that can affect the security’s liquidity and fair value. If such a security is convertible into publicly traded common shares, the security generally will be valued at the common share market price adjusted by a percentage discount due to the restrictions and categorized as Level 2 in the fair value hierarchy. To the extent that such securities are convertible or otherwise become freely tradable within a time frame that may be reasonably determined, an amortization schedule may be used to determine the discount. If the security has characteristics that are dissimilar to the class of security that trades on the open market, the security will generally be valued and categorized as Level 3 in the fair value hierarchy.
Unobservable inputs are used to measure fair value to the extent that observable inputs are not available, thereby allowing for situations in which there is little, if any, market activity. Unobservable inputs reflect the Funds’ own beliefs about the assumptions that market participants would use in pricing the asset or liability (including assumptions about risk). Unobservable inputs are developed based on the best information available in the circumstances, which might include the Fund’s own data. The Fund’s own data are adjusted if information is reasonably available without undue cost and effort that indicates that market participants would use different assumptions. Due to the inherent uncertainty of valuations of such investments, the fair values may differ significantly from the values that would have been used had an active market existed.
Options (including options on futures contracts) and futures contracts are valued using readily available market quotations. Exchange-traded options are valued at the last reported sale price on any exchange on which they trade. If there are no sales reported on any exchange, exchange-traded options shall be valued at the mean between the last highest bid and last lowest asked prices obtained as of the closing of the exchanges on which the option is traded. Exchange-traded domestic futures contracts are valued at the last reported sale price on the Chicago Mercantile Exchange. Exchange-traded foreign futures contracts are valued at the last reported sale price on the primary foreign exchange on which they principally trade. The value of Flexible Exchange Options (FLEX Options) are determined (i) by an evaluated price as determined by a third-party valuation service; or (ii) by using a quotation provided by a broker-dealer.
| |
| |
| 2022 Semi-Annual Report | May 31, 2022 |
| |
| Notes to Financial Statements (unaudited) (continued) |
| |
| |
The Funds generally value debt securities at evaluated prices obtained from an independent third-party valuation service that utilizes a pricing matrix based upon yield data for securities with similar characteristics, or based on a direct written broker-dealer quotation from a dealer who has made a market in the security. Debt securities with 60 days or less to maturity at time of purchase are valued on the basis of amortized cost, which approximates fair value. The securities are categorized as level 2 in the fair value hierarchy.
Interest rate swap contracts are valued by using industry-accepted models, which discount the estimated future cash flows based on a forward rate curve and the stated terms of the interest rate swap agreement by using interest rates currently available in the market, or based on dealer quotations, if available, and are categorized as Level 2 in the fair value hierarchy.
Various inputs are used in determining the fair value of the Funds’ investments and financial instruments. These inputs are summarized in the three broad levels listed below:
Level 1 — quoted prices in active markets for identical investments
Level 2 — other significant observable inputs (including quoted prices for similar investments, market corroborated inputs, etc.)
Level 3 — significant unobservable inputs (including a Fund’s own assumptions in determining the fair value of investments)
The inputs or methodologies used for valuing securities are not necessarily an indication of the risk associated with investing in those securities.
The following tables provide the fair value measurements of applicable assets and liabilities by level within the fair value hierarchy as of May 31, 2022. These assets and liabilities are measured on a recurring basis.
TYG:
| Description | | Level 1 | | Level 2 | | Level 3 | | Total |
| Assets | | | | | | | | | | | | |
| Investments: | | | | | | | | | | | | |
| Common Stock(a) | | $ | 461,103,250 | | $ | — | | $ | — | | $ | 461,103,250 |
| Master Limited Partnerships(a) | | | 143,079,223 | | | — | | | — | | | 143,079,223 |
| Preferred Stock(a) | | | 3,532,385 | | | — | | | 9,425,827 | | | 12,958,212 |
| Private Investment(a) | | | — | | | — | | | 16,849,615 | | | 16,849,615 |
| Corporate Bonds(a) | | | — | | | 3,593,766 | | | — | | | 3,593,766 |
| Warrants(a) | | | 1 | | | — | | | — | | | 1 |
| Short-Term Investment(b) | | | 832,651 | | | — | | | — | | | 832,651 |
| Total Assets | | $ | 608,547,510 | | $ | 3,593,766 | | $ | 26,275,442 | | $ | 638,416,718 |
| | | | | | | | | | | | |
| NTG: | | | | | | | | | | | | |
| Description | | | Level 1 | | | Level 2 | | | Level 3 | | | Total |
| Assets | | | | | | | | | | | | |
| Investments: | | | | | | | | | | | | |
| Common Stock(a) | | $ | 243,726,571 | | $ | — | | $ | — | | $ | 243,726,571 |
| Master Limited Partnerships(a) | | | 71,210,977 | | | — | | | — | | | 71,210,977 |
| Preferred Stock(a) | | | 1,917,610 | | | — | | | 6,739,696 | | | 8,657,306 |
| Corporate Bonds(a) | | | — | | | 2,395,844 | | | — | | | 2,395,844 |
| Short-Term Investment(b) | | | 683,125 | | | — | | | — | | | 683,125 |
| Total Assets | | $ | 317,538,283 | | $ | 2,395,844 | | $ | 6,739,696 | | $ | 326,673,823 |
| | | | | | | | | | | | |
| TTP: | | | | | | | | | | | | |
| Description | | | Level 1 | | | Level 2 | | | Level 3 | | | Total |
| Assets | | | | | | | | | | | | |
| Investments: | | | | | | | | | | | | |
| Common Stock(a) | | $ | 75,596,080 | | $ | — | | $ | — | | $ | 75,596,080 |
| Master Limited Partnerships(a) | | | 24,119,878 | | | — | | | — | | | 24,119,878 |
| Preferred Stock(a) | | | — | | | — | | | 500,723 | | | 500,723 |
| Short-Term Investment(b) | | | 385,681 | | | — | | | — | | | 385,681 |
| Total Assets | | $ | 100,101,639 | | $ | — | | $ | 500,723 | | $ | 100,602,362 |
| |
| |
| |
| |
| Notes to Financial Statements (unaudited) (continued) |
| |
| |
| NDP: | | | | | | | | | | | | |
| Description | | Level 1 | | Level 2 | | Level 3 | | Total |
| Assets | | | | | | | | | | | | |
| Investments: | | | | | | | | | | | | |
| Common Stock(a) | | $ | 64,364,114 | | $ | — | | $ | — | | $ | 64,364,114 |
| Master Limited Partnerships(a) | | | 10,315,148 | | | — | | | — | | | 10,315,148 |
| Warrants(a) | | | 1 | | | — | | | — | | | 1 |
| Short-Term Investment(b) | | | 312,313 | | | — | | | — | | | 312,313 |
| Total Assets | | $ | 74,991,576 | | $ | — | | $ | — | | $ | 74,991,576 |
| | | | | | | | | | | | |
| TPZ: | | | | | | | | | | | | |
| Description | | Level 1 | | | Level 2 | | Level 3 | | | Total |
| Assets | | | | | | | | | | | | |
| Investments: | | | | | | | | | | | | |
| Corporate Bonds(a) | | $ | — | | $ | 58,194,217 | | $ | — | | $ | 58,194,217 |
| Common Stock(a) | | | 38,440,444 | | | — | | | — | | | 38,440,444 |
| Master Limited Partnerships(a) | | | 34,209,878 | | | — | | | — | | | 34,209,878 |
| Preferred Stock(a) | | | — | | | — | | | 436,699 | | | 436,699 |
| Warrant(a) | | | 1 | | | — | | | — | | | 1 |
| Short-Term Investment(b) | | | 315,503 | | | — | | | — | | | 315,503 |
| Total Assets | | $ | 72,965,826 | | $ | 58,194,217 | | $ | 436,699 | | $ | 131,596,742 |
| | | | | | | | | | | | |
| TEAF: | | | | | | | | | | | | |
| Description | | Level 1 | | Level 2 | | Level 3 | | Total |
| Assets | | | | | | | | | | | | |
| Investments: | | | | | | | | | | | | |
| Common Stock(a) | | $ | 116,510,639 | | $ | 2,610,066 | | $ | — | | $ | 119,120,705 |
| Private Investments(a) | | | — | | | — | | | 45,343,471 | | | 45,343,471 |
| Corporate Bonds(a) | | | — | | | 39,874,947 | | | — | | | 39,874,947 |
| Master Limited Partnerships(a) | | | 24,934,046 | | | — | | | — | | | 24,934,046 |
| Preferred Stock(a) | | | 1,605,684 | | | — | | | 8,562,360 | | | 10,168,044 |
| Construction Notes(a) | | | — | | | — | | | 11,079,159 | | | 11,079,159 |
| Municipal Bonds(a) | | | — | | | 10,400,097 | | | — | | | 10,400,097 |
| Special Purpose Acquisition Company Warrant(a) | | | — | | | 67,164 | | | — | | | 67,164 |
| Short-Term Investment(b) | | | 947,428 | | | — | | | — | | | 947,428 |
| Total Assets | | $ | 143,997,797 | | $ | 52,952,274 | | $ | 64,984,990 | | $ | 261,935,061 |
| Liabilities | | | | | | | | | | | | |
| Written Call Options | | $ | 58,139 | | $ | — | | $ | — | | $ | 58,139 |
| (a) | All other industry classifications are identified in the Schedule of Investments. |
| (b) | Short-term investment is a sweep investment for cash balances. |
The following tables present each Fund’s assets measured at fair value on a recurring basis using significant unobservable inputs (Level 3) for the period ended May 31, 2022:
| Preferred Stock | | TYG | | NTG | | TTP | | NDP | | TPZ | | TEAF |
| Balance — beginning of period | | $ | 13,302,893 | | | $ | 9,511,892 | | | $ | 706,682 | | | $ | — | | $ | 616,324 | | | $ | 10,484,287 | |
| Purchases | | | — | | | | — | | | | — | | | | — | | | — | | | | — | |
| Return of capital | | | — | | | | — | | | | — | | | | — | | | — | | | | — | |
| Sales | | | (3,358,094 | ) | | | (2,401,119 | ) | | | (178,390 | ) | | | — | | | (155,581 | ) | | | (1,382,865 | ) |
| Total realized gain/loss | | | 438,438 | | | | 313,494 | | | | 23,291 | | | | — | | | 20,313 | | | | 180,549 | |
| Change in unrealized gain/loss | | | (957,410 | ) | | | (684,571 | ) | | | (50,860 | ) | | | — | | | (44,357 | ) | | | (719,611 | ) |
| Balance — end of period | | $ | 9,425,827 | | | $ | 6,739,696 | | | $ | 500,723 | | | $ | — | | $ | 436,699 | | | $ | 8,562,360 | |
| |
| |
| 2022 Semi-Annual Report | May 31, 2022 |
| |
| Notes to Financial Statements (unaudited) (continued) |
| |
| |
| Private Investments | | TYG | | NTG | | TTP | | NDP | | TPZ | | TEAF |
| Balance — beginning of period | | $ | 11,744,821 | | | $ | — | | | $ | — | | | $ | — | | $ | — | | | $ | 45,931,077 | |
| Purchases | | | — | | | | — | | | | — | | | | — | | | — | | | | 550,259 | |
| Return of capital | | | (340,000 | ) | | | — | | | | — | | | | — | | | — | | | | (736,000 | ) |
| Sales | | | — | | | | — | | | | — | | | | — | | | — | | | | — | |
| Total realized gain/loss | | | — | | | | — | | | | — | | | | — | | | — | | | | — | |
| Change in unrealized gain/loss | | | 5,444,794 | | | | — | | | | — | | | | — | | | — | | | | (401,865 | ) |
| Balance — end of period | | $ | 16,849,615 | | | $ | — | | | $ | — | | | $ | — | | $ | — | | | $ | 45,343,471 | |
| | | | | | | | | | | | | | | | | | | | | | | |
| Construction Notes | | TYG | | NTG | | TTP | | NDP | | TPZ | | TEAF |
| Balance — beginning of period | | $ | — | | | $ | — | | | $ | — | | | $ | — | | $ | — | | | $ | 3,522,987 | |
| Purchases | | | — | | | | — | | | | — | | | | — | | | — | | | | 7,268,888 | |
| Return of capital | | | — | | | | — | | | | — | | | | — | | | — | | | | — | |
| Sales | | | — | | | | — | | | | — | | | | — | | | — | | | | — | |
| Total realized gain/loss | | | — | | | | — | | | | — | | | | — | | | — | | | | — | |
| Change in unrealized gain/loss | | | — | | | | — | | | | — | | | | — | | | — | | | | 287,284 | |
| Balance — end of period | | $ | — | | | $ | — | | | $ | — | | | $ | — | | $ | — | | | $ | 11,079,159 | |
| | | | | | | | | | | | | | | | | | | | | | | |
| | TYG | | NTG | | TTP | | NDP | | TPZ | | TEAF |
| Change in unrealized gain/loss | | | | | | | | | | | | | | | | | | | | | | | |
| on investments still held | | | | | | | | | | | | | | | | | | | | | | | |
| at May 31, 2022 | | $ | 4,487,384 | | | $ | (684,571 | ) | | $ | (50,860 | ) | | $ | — | | $ | (44,357 | ) | | $ | (834,192 | ) |
TYG, NTG, TTP, TPZ and TEAF own units of preferred stock of Altus Midstream Company (“ALTM Pfd”) that were issued in a private placement transaction that closed on June 12, 2019. The preferred stock carries a conversion option into common stock after the 7th anniversary of issuance (June 12, 2026) with a conversion rate determined as the quotient of Altus’ common unit price divided by a 6% discount to the prior 20-Day Volume Weighted Average Price (“VWAP”). Alternately, Altus can force conversion into common stock at a value determined by a minimum rate of return: before 5 years: greater of 1.3x Multiple on Invested Capital (“MOIC”) or 11.5% Internal Rate of Return (“IRR”), and after 5 years: greater of 1.3x MOIC or 13.75% IRR. A discounted cash flow model prepared by an independent third party is being used to determine fair value of the level 3 ALTM Pfd securities. Unobservable inputs used to determine the discount rate include a debt discount rate that generally reflects the credit worthiness of the company. An increase (decrease) in the debt discount rate would lead to a corresponding decrease (increase) in fair value of the preferred stock.
TEAF owns units of preferred stock of Enterprise Products Partners L.P. (“EPD Pfd”) that were issued in a transaction that closed on September 30, 2020. The preferred stock carries a conversion option into common stock after the 5th anniversary of the Closing Date (September 30, 2025) with a conversion rate determined as the quotient equal to 100% of the Stated Series A Liquidation Preference plus accrued and unpaid distributions up to the applicable conversion date, divided by a 7.50% discount to the prior 5-Day VWAP of EPD’s common unit price. The issuer has an option to force conversion before the 2nd anniversary at 110%, after the 2nd anniversary and prior to the 4th anniversary at 107%, thereafter, prior to the 5th anniversary at 103%, thereafter, prior to the 6th anniversary at 101% and any time on or after the 6th anniversary at par. A discounted cash flow model prepared by an independent third party is being used to determine fair value of the EPD Pfd security. Unobservable inputs used to determine the discount rate include a debt discount rate that generally reflects the credit worthiness of the company. An increase (decrease) in the debt discount rate would lead to a corresponding decrease (increase) in fair value of the preferred stock.
TEAF owns units of Mexico Pacific Limited LLC (“MPL”), which was issued in a private transaction that closed on October 23, 2019. As of May 31, 2022, the investment in MPL was valued at the most recent transaction price, which was a capital raise that closed on September 30, 2021, as the company is still in development with no day to day operations.
TEAF owns a construction note in Saturn Solar Bermuda 1, Ltd (“Saturn”). Under the terms of the note, Saturn pays interest monthly at an annual rate of 9%. A discounted cash flows model is being utilized to determine fair value of the construction note. Unobservable inputs used to determine the discount rate include a risk spread based on similar projects and an illiquidity spread due to the note being issued in the private market. An increase (decrease) in the risk spread or illiquidity spread would lead to a corresponding decrease (increase) in fair value of the note.
TEAF owns a note in EF WWW Holdings, LLC, for debt funding o World Water Works Holdings, Inc. Under the terms of the note, EF WWW Holdings pays interest monthly at an annual rate of 10.50%. A discounted cash flows model is being utilized to determine fair value of the construction note. Unobservable inputs used to determine the discount rate include a risk spread based on similar projects and an illiquidity spread due to the note being issued in the private market. An increase (decrease) in the risk spread or illiquidity spread would lead to a corresponding decrease (increase) in fair value of the note.
| |
| |
| |
| |
| Notes to Financial Statements (unaudited) (continued) |
| |
| |
TYG wholly-owns private investments in TK NYS Solar Holdco, LLC and TEAF wholly-owns private investments in Renewable Holdco, LLC, Renewable Holdco I, LLC, and Renewable Holdco II, LLC. Discounted cash flow models are being utilized to determine the fair value of these holdings. Unobservable inputs used within the discounted cash flow models include weighted average cost of capital. An increase (decrease) in the weighted average cost of capital would lead to a corresponding decrease (increase) in the fair value of the private investment.
The following tables summarize the fair value and significant unobservable inputs that each Fund used to value its portfolio investments categorized as Level 3 as of May 31, 2022:
| Assets at Fair Value | | TYG | | NTG | | TTP | | NDP | | TPZ | | TEAF |
| Construction Note | | $ | — | | $ | — | | $ | — | | $ | — | | $ | — | | $ | 11,079,159 |
| Preferred Stock | | $ | 9,425,827 | | $ | 6,739,696 | | $ | 500,723 | | $ | — | | $ | 436,699 | | $ | 8,562,360 |
| Private Investments | | $ | 16,849,615 | | $ | — | | $ | — | | $ | — | | $ | — | | $ | 45,343,471 |
| | | | | | | | | | | | | | | | | | | |
| Assets at Fair Value | | Valuation Technique | | Unobservable Inputs | | Input |
| Preferred Stock (ALTM Pfd) | | Discounted cash flow model | | Debt discount rate | | | Between |
| | | | | | 9.23% - 9.57% |
| Preferred Stock (EPD Pfd) | | Lattice model | | Debt discount rate | | | 7.53% |
| Private Investment (TK NYS Solar Holdco, LLC) | | Discounted cash flow model | | Post-contracted weighted average cost of capital | | | 7.00% |
| Private Investment (Mexico Pacific Limited) | | Recent transaction | | Purchase price | | $ | 21.94 |
| Private Investment (Renewable Holdco, LLC) | | Recent transaction | | Purchase price | | $ | 6,387,342 |
| Private Investment (Renewable Holdco I, LLC) | | Discounted cash flow model | | Contracted weighted average cost of capital | | | 7.00% |
| Private Investment (Renewable Holdco I, LLC) | | Discounted cash flow model | | Post-contracted weighted average cost of capital | | | 8.50% |
| Private Investment (Renewable Holdco II, LLC) | | Discounted cash flow model | | Contracted weighted average cost of capital | | | 6.00% |
| Private Investment (Renewable Holdco II, LLC) | | Discounted cash flow model | | Post-contracted weighted average cost of capital | | | 7.50% |
| Saturn Bermuda Note | | Discounted cash flow model | | Risk spread | | | 1.7500% |
| Saturn Bermuda Note | | Discounted cash flow model | | Illiquidity spread | | | 1.7255% |
| EF WWW Holdings Note | | Discounted cash flow model | | Risk spread | | | 3.0000% |
| EF WWW Holdings Note | | Discounted cash flow model | | Illiquidity spread | | | 2.6482% |
C. Securities Transactions and Investment Income
Securities transactions are accounted for on the date the securities are purchased or sold (trade date). Realized gains and losses are reported on an identified cost basis. Interest income is recognized on the accrual basis, including amortization of premiums and accretion of discounts. Discounts and premiums on fixed income securities are amortized or accreted over the life of the respective securities using the effective interest method. Dividend income and distributions are recorded on the ex-dividend date. Distributions received from investments generally are comprised of ordinary income and return of capital. The Funds estimate the allocation of distributions between investment income and return of capital at the time such distributions are received based on historical information or regulatory filings. These estimates may subsequently be revised based on actual allocations received from the portfolio companies after their tax reporting periods are concluded, as the actual character of these distributions is not known until after the fiscal year-end of the Funds.
Subsequent to November 30, 2021, the Funds reallocated the amount of return of capital recognized for the period from December 1, 2020 through November 30, 2021 based on the 2021 tax reporting information received. The impact of this reclass is as follows:
| | Estimated Return | | Revised Return | | Increase/(Decrease) |
| | of Capital % | | of Capital % | | in Return of Capital |
| TYG | | 85% | | 83% | | | $ | (897,180 | ) | |
| NTG | | 87% | | 85% | | | $ | (416,935 | ) | |
| TTP | | 62% | | 60% | | | $ | (158,047 | ) | |
| NDP | | 33% | | 33% | | | $ | 3,819 | | |
| TPZ | | 90% | | 88% | | | $ | (66,625 | ) | |
| TEAF | | 68% | | 68% | | | $ | 39,717 | | |
In addition, the Funds may be subject to withholding taxes on foreign-sourced income. The Funds accrue such taxes when the related income is earned in accordance with the Funds’ understanding of the applicable country’s tax rules and rates.
D. Foreign Currency Translation
For foreign currency, investments in foreign securities, and other assets and liabilities denominated in a foreign currency, the Funds translate these amounts into U.S. dollars on the following basis: (i) market value of investment securities, assets and liabilities at the current rate of exchange on the valuation date, and (ii) purchases and sales of investment securities, income and expenses at the relevant rates of exchange on the respective dates of such transactions. The Funds do not isolate the portion of gains and losses on investments that is due to changes in the foreign exchange rates from that which is due to changes in market prices of securities.
| |
| |
| 2022 Semi-Annual Report | May 31, 2022 |
| |
| Notes to Financial Statements (unaudited) (continued) |
| |
| |
E. Federal and State Income Taxation
Each of TYG and NTG, was previously taxed and, as such, was obligated to pay federal and state income tax on its taxable income. Beginning with the fiscal year ending November 30, 2022, TYG and NTG intend to qualify each year for special tax treatment afforded to a regulated investment company (“RIC”) under Subchapter M of the Internal Revenue Code (“IRC”). In order to qualify as a RIC, TYG and NTG must satisfy income, asset diversification and minimum distribution requirements. As long as it so qualifies, TYG and NTG will not be subject to U.S. federal income tax. TYG and NTG intend to distribute at least annually substantially all of its income and gains. Undistributed income and gains are subject to a 4% U.S. federal excise tax unless sufficient distributions have been made to satisfy the excise tax avoidance requirement.
TTP, NDP, TPZ and TEAF each qualify as a regulated investment company (“RIC”) under the Internal Revenue Code (“IRC”). As a result, TTP, NDP, TPZ and TEAF generally will not be subject to U.S. federal income tax on income and gains that they distribute each taxable year to stockholders if they meet certain minimum distribution requirements. However, TEAF’s taxable subsidiary, created to hold certain investments is generally subject to federal and state income taxes on its income. RICs are required to distribute substantially all of their income, in addition to meeting certain asset diversification requirements, and are subject to a 4% non-deductible U.S. federal excise tax on certain undistributed income unless the fund makes sufficient distributions to satisfy the excise tax avoidance requirement.
The Funds recognize the tax benefits of uncertain tax positions only when the position is “more likely than not” to be sustained upon examination by the tax authorities based on the technical merits of the tax position. The Funds’ policy is to record interest and penalties on uncertain tax positions as part of tax expense. As of May 31, 2022, the Funds had no uncertain tax positions and no penalties or interest was accrued. The Funds do not expect any change in their unrecognized tax positions in the next twelve months. The tax years ended on the following dates remain open to examination by federal and state tax authorities:
TYG and NTG — November 30, 2018 through 2021
TTP, NDP and TPZ — November 30 ,2018 through 2021
TEAF — November 30, 2019 through 2021
F. Distributions to Stockholders
Distributions to common stockholders are recorded on the ex-dividend date. The Funds may not declare or pay distributions to its common stockholders if it does not meet asset coverage ratios required under the 1940 Act or the rating agency guidelines for its debt and preferred stock following such distribution. The amount of any distributions will be determined by the Board of Directors. The character of distributions to common stockholders made during the year may differ from their ultimate characterization for federal income tax purposes.
With the intent to qualify as a RIC, TYG and NTG each intend to make cash distributions of its investment company taxable income and capital gains to common stockholders. As RICs, TTP, NDP, TPZ and TEAF each intend to make cash distributions of its investment company taxable income and capital gains to common stockholders. In addition, on an annual basis, TYG, NTG, TTP, NDP, TPZ and TEAF each may distribute additional capital gains in the last calendar quarter if necessary to meet minimum distribution requirements and thus avoid being subject to excise taxes. Distributions paid to stockholders in excess of investment company taxable income and net realized gains will be treated as return of capital to stockholders.
Distributions to mandatory redeemable preferred (“MRP”) stockholders are accrued daily based on applicable distribution rates for each series and paid periodically according to the terms of the agreements. The Funds may not declare or pay distributions to its preferred stockholders if it does not meet a 200% asset coverage ratio for its debt or the rating agency basic maintenance amount for the debt following such distribution. The character of distributions to preferred stockholders made during the year may differ from their ultimate characterization for federal income tax purposes.
For tax purposes, distributions to stockholders for the year ended November 30, 2021 were characterized as follows:
| | TYG | | NTG | | TTP | | NDP | | TPZ | | TEAF |
| | Common | | Preferred | | Common | | Preferred | | Common | | Preferred | | Common | | Common | | Common |
| Qualified dividend income | | | 100% | | | | 100% | | | | 100% | | | | 100% | | | | — | | | | 43% | | | | 8% | | | | 16% | | | | 39% | |
| Ordinary dividend income | | | — | | | | — | | | | — | | | | — | | | | — | | | | — | | | | — | | | | 28% | | | | 32% | |
| Return of capital | | | — | | | | — | | | | — | | | | — | | | | 100% | | | | 57% | | | | 92% | | | | 56% | | | | 29% | |
| Long-term capital gain | | | — | | | | — | | | | — | | | | — | | | | — | | | | — | | | | — | | | | — | | | | — | |
| * | For Federal income tax purposes, distributions of short-term capital gains are included in qualified dividend income. |
| |
| |
| |
| |
| Notes to Financial Statements (unaudited) (continued) |
| |
| |
G. Offering and Debt Issuance Costs
Offering costs related to the issuance of common stock are charged to additional paid-in capital when the stock is issued. Debt issuance costs related to senior notes and MRP Stock are deferred and amortized over the period the debt or MRP Stock is outstanding.
There were no offering or debt issuance costs recorded during the period December 1, 2021 through May 31, 2022 for TTP, NDP, TPZ or TEAF. For TYG, $87,724 in debt issuance costs were recorded for the period. For NTG, $81,019 in debt issuance costs were recorded for the period.
H. Derivative Financial Instruments
The Funds have established policies and procedures for risk assessment and the approval, reporting and monitoring of derivative financial instrument activities. The Funds do not hold or issue derivative financial instruments for speculative purposes. All derivative financial instruments are recorded at fair value with changes in fair value during the reporting period, and amounts accrued under the agreements, included as unrealized gains or losses in the accompanying Statements of Operations. Derivative instruments that are subject to an enforceable master netting arrangement allow a Fund and the counterparty to the instrument to offset any exposure to the other party with amounts owed to the other party. The fair value of derivative financial instruments in a loss position are offset against the fair value of derivative financial instruments in a gain position, with the net fair value appropriately reflected as an asset or liability within the accompanying Statements of Assets & Liabilities.
TYG utilizes interest rate swap contracts in an attempt to manage interest rate risk. Cash settlements under the terms of the interest rate swap contracts and the termination of such contracts are recorded as realized gains or losses in the accompanying Statements of Operations.
TYG, NTG, TTP, NDP and TEAF may seek to provide current income from gains earned through an option strategy that normally consists of writing (selling) call options on selected equity securities held in the portfolio (“covered calls”). The premium received on a written call option is initially recorded as a liability and subsequently adjusted to the then current fair value of the option written. Premiums received from writing call options that expire unexercised are recorded as a realized gain on the expiration date. Premiums received from writing call options that are exercised are added to the proceeds from the sale of the underlying security to calculate the realized gain (loss). If a written call option is repurchased prior to its exercise, the realized gain (loss) is the difference between the premium received and the amount paid to repurchase the option.
TEAF may enter into forward currency contracts, which represent agreements to exchange currencies on specific future dates at predetermined rates. TEAF uses forward currency contracts to manage exposure to changes in exchange rates. On a daily basis, TEAF’s investment adviser values forward currency contracts and records unrealized appreciation or depreciation for open forward currency contracts in the Statements of Assets & Liabilities. Realized gains or losses are recorded at the time the forward currency contracts are closed.
I. Indemnifications
Under each of the Funds’ organizational documents, its officers and directors are indemnified against certain liabilities arising out of the performance of their duties to the Funds. In addition, in the normal course of business, the Funds may enter into contracts that provide general indemnification to other parties. A Fund’s maximum exposure under these arrangements is unknown, as this would involve future claims that may be made against the Funds that have not yet occurred, and may not occur. However, the Funds have not had prior claims or losses pursuant to these contracts and expect the risk of loss to be remote.
J. Cash and Cash Equivalents
Cash and cash equivalents include short-term, liquid investments with an original maturity of three months or less and money market fund accounts.
K. Recent Accounting and Regulatory Updates
In March 2020, the Financial Accounting Standards Board (“FASB”) issued Accounting Standards Update (“ASU”) No. 2020-04 Reference Rate Reform (Topic 848); Facilitation of the Effects of Reference Rate Reform on Financial Reporting, which provides optional guidance for a limited period of time to ease the potential burden in accounting for (or recognizing the effects of) reference rate reform. The guidance is applicable to contracts referencing London Interbank Offered Rate (“LIBOR”) or another reference rate that is expected to be discontinued due to reference rate reform. The original guidance and the scope clarification become effective upon issuance in March 2020 and January 2021, respectively. However, the guidance in ASC 848 is temporary in nature and generally cannot be applied to contract modifications that occur after December 31, 2022 or hedging relationships entered into or evaluated after that date. Management is evaluating the underlying securities referencing LIBOR or another reference rate that is expected to be discontinued as a reference rate over the period of time the ASU is effective.
In October 2020, the SEC adopted new regulations governing the use of derivatives by registered investment companies (“Rule 18f-4”). Rule 18f-4 will impose limits on the amount of derivatives a Fund can enter into, eliminate the asset segregation framework currently used by funds to comply with Section 18 of the 1940 Act, and require funds whose use of derivatives is greater than a limited specified amount to establish and maintain a comprehensive derivatives risk management program and appoint a derivatives risk manager. Funds will be required to comply with Rule 18f-4 by August 19, 2022. It is not currently clear what impact, if any, Rule 18f-4 will have on the availability, liquidity or performance of derivatives. Management is currently evaluating the potential impact of Rule 18f-4 on the Fund(s). When fully implemented, Rule 18f-4 may require changes in how a Fund uses derivatives, adversely affect the Fund’s performance and increase costs related to the Fund’s use of derivatives.
In December 2020, the SEC adopted a new rule providing a framework for fund valuation practices (“Rule 2a-5”). Rule 2a-5 establishes requirements for determining fair value in good faith for purposes of the 1940 Act. Rule 2a-5 will permit fund boards to designate certain
| |
| |
| 2022 Semi-Annual Report | May 31, 2022 |
| |
| Notes to Financial Statements (unaudited) (continued) |
| |
| |
parties to perform fair value determinations, subject to board oversight and certain other conditions. Rule 2a-5 also defines when market quotations are “readily available” for purposes of the 1940 Act and the threshold for determining whether a fund must fair value a security. In connection with Rule 2a-5, the SEC also adopted related recordkeeping requirements and is rescinding previously issued guidance, including with respect to the role of a board in determining fair value and the accounting and auditing of fund investments. The Funds will be required to comply with the rules by September 8, 2022. Management is currently assessing the potential impact of the new rules on the Funds’ financial statements.
The FASB issued final guidance (ASU No. 2022-08) to clarify that a contractual restriction on the sale of an equity security is not considered part of the unit of account of the equity security and, therefore, is not considered when measuring fair value. Recognizing a contractual restriction on the sale of an equity security as a separate unit of account is not permitted. The guidance applies to all entities that have investments in equity securities measured at fair value that are subject to contractual sale restrictions. Entities that hold equity securities subject to contractual sale restrictions are required to make additional disclosures. The guidance will be applied prospectively, with special transition provisions for entities that qualify as investment companies under ASC 946. For public business entities, the guidance is effective for fiscal years beginning after 15 December 2023, and interim periods within those fiscal years. Management is currently assessing the potential impact of the new guidance on the Funds’ financial statements.
3. Risks and Uncertainties
TYG, NTG, TTP, NDP and TPZ concentrate their investments in the energy sector. TEAF concentrates its investments in issuers operating in essential asset sectors. Funds that primarily invest in a particular sector may experience greater volatility than companies investing in a broad range of industry sectors. A Fund may, for defensive purposes, temporarily invest all or a significant portion of its assets in investment grade securities, short-term debt securities and cash or cash equivalents. To the extent a Fund uses this strategy, it may not achieve its investment objective.
The World Health Organization declared the COVID-19 outbreak to be a pandemic in March 2020, and has had a significant impact on global and local economic activities. Despite significant corrections and heightened volatility in the financial markets during the year, COVID-19 continues to present material uncertainty and risk with respect to the performance and financial results of our portfolio companies.
In February 2022, a number of countries (including the US, UK and EU) imposed sanctions against certain entities and individuals in Russia as a result of the official recognition of the Donetsk People Republic and Lugansk People Republic by the Russian Federation. Announcements of potential additional sanctions have been made following military operations initiated by Russia against the Ukraine on 24 February 2022. The situation, together with growing turmoil from fluctuations in commodity prices and foreign exchange rates, and the potential to adversely impact global economies, has driven a sharp increase in volatility across markets. The Advisor continues to monitor the evolving situation and its impact on the financial position of the funds
4. Agreements
The Funds have each entered into an Investment Advisory Agreement with Tortoise Capital Advisors, L.L.C. (the “Adviser”). The Funds each pay the Adviser a fee based on the Fund’s average monthly total assets (including any assets attributable to leverage and excluding any net deferred tax asset) minus accrued liabilities (other than net deferred tax liability, debt entered into for purposes of leverage and the aggregate liquidation preference of outstanding preferred stock) (“Managed Assets”), in exchange for the investment advisory services provided. Average monthly Managed Assets is the sum of the daily Managed Assets for the month divided by the number of days in the month. Accrued liabilities are expenses incurred in the normal course of each Fund’s operations. Waived fees are not subject to recapture by the Adviser. The annual fee rates paid to the Adviser as of May 31, 2022 are as follows:
TYG — 0.95% up to $2,500,000,000, 0.90% between $2,500,000,000 and $3,500,000,000, and 0.85% above $3,500,000,000.
NTG — 0.95%.
TTP — 1.10%.
NDP — 1.10%.
TPZ — 0.95%.
TEAF — 1.35%.
On August 9, 2021, the Adviser voluntarily agreed to reimburse TTP and NDP for their Operating Expenses in order to ensure that Operating Expenses do not exceed 1.35% of average daily managed assets, effective September 1, 2021. In its sole discretion and at any time, the Adviser may elect to extend, terminate or modify the temporary expense reimbursement upon written notice.
U.S. Bancorp Fund Services, LLC d/b/a U.S. Bank Global Fund Services serves as each Fund’s administrator. Each Fund pays the administrator a monthly fee computed at an annual rate of 0.04% of the first $1,000,000,000 of the Fund’s Managed Assets, 0.01% on the next $500,000,000 of Managed Assets and 0.005% on the balance of the Fund’s Managed Assets.
U.S. Bank, N.A. serves as the Funds’ custodian. Each Fund pays the custodian a monthly fee computed at an annual rate of 0.004% of the Fund’s U.S. Dollar-denominated assets and 0.015% of the Fund’s Canadian Dollar-denominated assets, plus portfolio transaction fees.
| |
| |
| |
| |
| Notes to Financial Statements (unaudited) (continued) |
| |
| |
5. Income Taxes
TYG and NTG:
TYG and NTG intend to change their tax status from a taxable C corporation to a RIC under the Internal Revenue Code effective December 1, 2021. The change in tax status requires TYG and NTG to satisfy certain periodic income and asset composition requirements as well as certain distribution requirements in order to permit it to be subject to tax as a RIC. Management has determined that it is more likely than not TYG and NTG will be able to qualify and elect to be subject to tax as a RIC, effective as of its fiscal year ending November 30, 2022.
TYG and NTG intend to elect to be subject to tax as a RIC in connection with the filing of its taxable year ending November 30, 2022 federal income tax return, and such election would be effective December 1, 2021. If TYG and NTG satisfy the required qualification tests and timely elects to be subject to tax as a RIC, it generally will not be subject to federal income or excise taxes on any income and gains timely distributed to their shareholders.
As of May 31, 2022, TYG and NTG have tax expense of $3,253,810 and $2,651,478 respectively, relating to a prior period in which they were C corporations. The tax expense is subject to change upon the completion of the C Corporation tax returns for the period ending November 30, 2021. TYG and NTG are not expected to be subject to federal income or excise taxes during its fiscal year ending November 30, 2022.
As of November 30, 2021, for federal income tax purposes, TYG and NTG had capital loss carryforwards of approximately $179,000,000 and $459,000,000 respectively, which may be carried forward for 5 years. If not utilized, these capital losses will expire in the year ending November 30, 2025.
TTP, NDP, TPZ and TEAF:
It is the intention of TTP, NDP, TPZ and TEAF to qualify as RICs under Subchapter M of the IRC and distribute all of its taxable income. Accordingly, no provision for federal income taxes is required in the financial statements. However, TEAF’s taxable subsidiary created to make and hold certain investments is generally subject to federal and state income taxes on its income.
As of May 31, 2022, TEAF consolidated the balance of a deferred tax expense of $131,850 related to the investment activities of its taxable subsidiary. Total income taxes are computed by applying the federal statutory rate plus a blended state income tax rate totaling 25.35%.
At May 31, 2022, a valuation allowance on deferred tax assets was not deemed necessary because TEAF believes it is more likely than not that its able to realize its deferred tax assets through future taxable income. Any adjustments to TEAF’s estimates of future taxable income will be made in the period such determination is made.
Total income tax expense for TEAF’s taxable subsidiary differs from the amount computed by applying the federal statutory income tax rate of 21% to net income for the period ended May 31, 2022, as follows:
| Application of Statutory Income tax rate | | $ | 82,340 |
| State Income taxes, net of federal tax effect | | | 17,061 |
| Permanent differences | | | 32,449 |
| Investment Tax Credits | | | — |
| Other | | | — |
| Total income tax expense | | $ | 131,850 |
The amount and character of income and capital gain distributions to be paid, if any, are determined in accordance with federal income tax regulations, which may differ from U.S. generally accepted accounting principles. These differences are primarily due to return of capital distributions and book/tax differences from underlying investments.
As of November 30, 2021, the components of accumulated earnings (deficit) on a tax basis were as follows:
| | TTP | | | NDP | | TPZ | | TEAF | |
| Unrealized appreciation (depreciation) | | $ | (21,653,355 | ) | | | $ | 3,644,547 | | | $ | (6,403,500 | ) | | $ | 12,780,492 | | |
| Capital loss carryforwards | | | (95,917,759 | ) | | | | (178,289,112 | ) | | | (13,301,437 | ) | | | (31,794,782 | ) | |
| Undistributed ordinary income | | | — | | | | | — | | | | — | | | | — | | |
| Other temporary differences | | | (87,262 | ) | (1) | | | — | | | | (6,411 | ) | | | (336,879 | ) | (2) |
| Accumulated earnings (deficit) | | $ | (117,658,376 | ) | | | $ | (174,644,565 | ) | | $ | (19,711,348 | ) | | $ | (19,351,169 | ) | |
| (1) | Primarily related to losses deferred under straddle regulations per IRC Sec. 1092 and dividends payable. |
| (2) | Primarily related to expenses of TEAF’s taxable subsidiary and losses deferred under straddle regulations per IRC Sec. 1092. |
As of November 30, 2021, TTP, NDP and TEAF had short-term capital loss carryforwards of approximately $15,400,000, $70,753,000 and $31,800,000 respectively, and TTP, NDP and TPZ had long-term capital loss carryforwards of approximately $80,500,000, $107,536,000 and $13,300,000 respectively, which may be carried forward for an unlimited period under the Regulated Investment Company Modernization Act of 2010. To the extent future net capital gains are realized, those gains will be offset by any unused capital loss carryforwards. Capital loss carryforwards will retain their character as either short-term or long-term capital losses. Thus, such losses must be used first to offset gains of the same character; for example, long-term loss carryforwards will first offset long-term gains, before they can be used to offset short-term gains.
| |
| |
| 2022 Semi-Annual Report | May 31, 2022 |
| |
| Notes to Financial Statements (unaudited) (continued) |
| |
| |
In order to meet certain excise tax distribution requirements, TTP, NDP, TPZ and TEAF are required to measure and distribute annually net capital gains realized during a twelve month period ending October 31 and net investment income earned during a twelve month period ending December 31. In connection with this, TTP, NDP, TPZ and TEAF are permitted for tax purposes to defer into their next fiscal year, qualified late year losses. Qualified late year ordinary losses are any net ordinary losses incurred between January 1 and the end of their fiscal year, November 30, 2021. For the taxable year ended November 30, 2021, TTP, NDP, TPZ and TEAF do not plan to defer any losses.
As of May 31, 2022, the aggregate cost of investments, aggregate gross unrealized appreciation and aggregate gross unrealized depreciation on a federal income tax basis were as follows:
| | TYG | | NTG | | TTP | | NDP | | TPZ | | TEAF |
| Tax cost of investments | | $ | 547,905,816 | | | $ | 268,795,432 | | | $ | 77,483,906 | | | $ | 46,168,579 | | | $ | 109,133,615 | | | $ | 249,555,942 | |
| Gross unrealized appreciation | | | | | | | | | | | | | | | | | | | | | | | | |
| of investments | | $ | 110,134,629 | | | $ | 62,025,551 | | | $ | 29,262,071 | | | $ | 28,973,124 | | | $ | 27,707,161 | | | $ | 21,797,563 | |
| Gross unrealized depreciation | | | | | | | | | | | | | | | | | | | | | | | | |
| of investments | | | (19,623,727 | ) | | | (4,147,160 | ) | | | (6,143,615 | ) | | | (150,127 | ) | | | (5,244,034 | ) | | | (9,416,321 | ) |
| Net unrealized appreciation | | | | | | | | | | | | | | | | | | | | | | | | |
| (depreciation) of investments | | $ | 90,510,902 | | | $ | 57,878,391 | | | $ | 23,118,456 | | | $ | 28,822,997 | | | $ | 22,463,127 | | | $ | 12,381,242 | |
6. Restricted Securities
Certain of the Funds’ investments are restricted and are valued as determined in accordance with fair value procedures, as more fully described in Note 2. The following table shows the principal amount or shares, acquisition date(s), acquisition cost, fair value and the percent of net assets which the securities comprise at May 31, 2022.
| TYG: | | | | | | | | | | | | | | | | | | |
| | | | | | | | | | | | | | | Fair Value |
| | | | | | | | | | | | | | | as Percent |
| Investment Security | | Investment Type | | Shares | | Acquisition Date(s) | | Acquisition Cost | | Fair Value | | of Net Assets |
| Altus Midstream Company, | | | | | | | | | | | | | | | | | | |
| 7.000% | | Preferred Stock | | | 7,508 | | 06/12/19-05/14/20 | | $ | 7,507,688 | | $ | 9,245,827 | | | 1.9 | % | |
| TK NYS Solar Holdco, LLC | | Private Investment | | | N/A | | 08/18/17-08/19/19 | | | 50,141,470 | | | 16,849,615 | | | 3.4 | | |
| | | | | | | | | $ | 57,649,158 | | $ | 26,275,442 | | | 5.3 | % | |
| | |
| NTG: | | | | | | | | | | | | | | | | | | |
| | | | | | | | | | | | | | | Fair Value |
| | | | | | | | | | | | | | | as Percent |
| Investment Security | | Investment Type | | Shares | | Acquisition Date(s) | | Acquisition Cost | | Fair Value | | of Net Assets |
| Altus Midstream Company, | | | | | | | | | | | | | | | | | | |
| 7.000% | | Preferred Stock | | | 5,368 | | 06/12/19-05/14/20 | | $ | 5,368,179 | | $ | 6,739,696 | | | 2.6 | % | |
| | | | | | | | | $ | 5,368,179 | | $ | 6,739,696 | | | 2.6 | % | |
| | |
| TTP: | | | | | | | | | | | | | | | | | | |
| | | | | | | | | | | | | | | Fair Value |
| | | | | | | | | | | | | | | as Percent |
| Investment Security | | Investment Type | | Shares | | Acquisition Date(s) | | Acquisition Cost | | Fair Value | | of Net Assets |
| Altus Midstream Company, | | | | | | | | | | | | | | | | | | |
| 7.000% | | Preferred Stock | | | 399 | | 06/12/19-05/14/20 | | $ | 398,827 | | $ | 500,723 | | | 0.6 | % | |
| | | | | | | | | | $ | 398,827 | | $ | 500,723 | | | 0.6 | % | |
| | |
| TPZ: | | | | | | | | | | | | | | | | | | |
| | | | | | | | | | | | | | | Fair Value |
| | | | Principal | | | | | | | | | | as Percent |
| Investment Security | | Investment Type | | Amount/Shares | | Acquisition Date(s) | | Acquisition Cost | | Fair Value | | of Net Assets |
| Antero Midstream Partners LP, | | | | | | | | | | | | | | | | | | |
| 5.750%, 03/01/2027* | | Corporate Bond | | $ | 3,800,000 | | 04/04/19-09/07/21 | | $ | 3,858,609 | | $ | 3,809,652 | | | 3.6 | % | |
| Blue Racer Midstream, LLC, | | | | | | | | | | | | | | | | | | |
| 6.625%, 07/15/2026* | | Corporate Bond | | $ | 5,900,000 | | 06/18/18-02/05/19 | | | 5,909,693 | | | 5,796,750 | | | 5.4 | | |
| DT Midstream, Inc., | | | | | | | | | | | | | | | | | | |
| 4.375%, 06/15/2031* | | Corporate Bond | | $ | 2,000,000 | | 09/03/21-09/07/21 | | | 2,078,128 | | | 1,868,955 | | | 1.7 | | |
| Hess Corporation, | | | | | | | | | | | | | | | | | | |
| 5.625%, 02/15/2026* | | Corporate Bond | | $ | 4,160,000 | | 07/19/18-08/06/18 | | | 4,172,567 | | | 4,247,360 | | | 4.0 | | |
| |
| |
| |
| |
| Notes to Financial Statements (unaudited) (continued) |
| |
| |
| TPZ: (continued) | | | | | | | | | | | | | | | | | | |
| | | | | | | | | | | | | | | Fair Value |
| | | | Principal | | | | | | | | | | as Percent |
| Investment Security | | Investment Type | | Amount/Shares | | Acquisition Date(s) | | Acquisition Cost | | Fair Value | | of Net Assets |
| New Fortress Energy, Inc., | | | | | | | | | | | | | | | | | | |
| 6.500%, 09/30/2026* | | Corporate Bond | | $ | 5,000,000 | | 03/26/21-10/07/21 | | $ | 4,995,144 | | $ | 4,859,000 | | | 4.6 | % | |
| NGPL Pipe Co, | | | | | | | | | | | | | | | | | | |
| 3.250%, 07/15/2031* | | Corporate Bond | | $ | 1,500,000 | | 11/09/21 | | | 1,548,453 | | | 1,305,226 | | | 1.2 | | |
| Rockies Express Pipeline LLC, | | | | | | | | | | | | | | | | | | |
| 4.950%, 07/15/2029* | | Corporate Bond | | $ | 3,000,000 | | 04/12/19 | | | 3,002,113 | | | 2,841,015 | | | 2.7 | | |
| Tallgrass Energy LP, | | | | | | | | | | | | | | | | | | |
| 5.500%, 01/15/2028* | | Corporate Bond | | $ | 3,250,000 | | 09/24/18-02/06/19 | | | 3,248,394 | | | 3,015,805 | | | 2.8 | | |
| Altus Midstream Company, | | | | | | | | | | | | | | | | | | |
| 7.000% | | Preferred Stock | | | 348 | | 06/12/19-05/14/20 | | | 347,832 | | | 436,699 | | | 0.4 | | |
| | | | | | | | | $ | 29,160,933 | | $ | 28,180,462 | | | 26.4 | % | |
| | |
| TEAF: | | | | | | | | | | | | | | | | | | |
| | | | | | | | | | | | | | | Fair Value |
| | | | Principal | | | | | | | | | | as Percent |
| Investment Security | | Investment Type | | Amount/Shares | | Acquisition Date(s) | | Acquisition Cost | | Fair Value | | of Net Assets |
| 315/333 West Dawson Associates, | | | | | | | | | | | | | | | | | | |
| 11.000%, 01/31/26* | | Corporate Bond | | $ | 3,770,000 | | 03/30/21 | | $ | 3,623,894 | | $ | 3,555,355 | | | 1.5 | % | |
| Contour Propco, | | | | | | | | | | | | | | | | | | |
| 11.000%, 10/01/25 | | Corporate Bond | | $ | 5,715,000 | | 09/30/21 | | | 5,715,000 | | | 5,616,919 | | | 2.4 | | |
| Dove Mountain Residences, LLC | | | | | | | | | | | | | | | | | | |
| 11.000%, 02/01/2026* | | Corporate Bond | | $ | 1,050,000 | | 12/02/21 | | | 1,050,000 | | | 1,031,927 | | | 0.4 | | |
| Dove Mountain Residences, LLC | | | | | | | | | | | | | | | | | | |
| 16.000%, 02/01/2026* | | Corporate Bond | | $ | 820,622 | | 12/02/21 | | | 800,000 | | | 807,157 | | | 0.4 | | |
| Drumlin Reserve Property LLC, | | | | | | | | | | | | | | | | | | |
| 16.000%, 10/02/2025* | | Corporate Bond | | $ | 1,218,000 | | 09/30/20 | | | 1,218,000 | | | 1,205,020 | | | 0.5 | | |
| Drumlin Reserve Property LLC, | | | | | | | | | | | | | | | | | | |
| 10.000%, 10/02/2025* | | Corporate Bond | | $ | 1,705,311 | | 09/30/20 | | | 1,705,311 | | | 1,684,562 | | | 0.7 | | |
| JW Living Smithville Urban | | | | | | | | | | | | | | | | | | |
| Ren Sub Global 144A 27 | | | | | | | | | | | | | | | | | | |
| 11.750%, 06/01/2027 | | Corporate Bond | | $ | 3,890,000 | | 05/24/22 | | | 3,890,000 | | | 3,890,000 | | | 1.7 | | |
| Dynamic BC Holdings LLC, | | | | | | | | | | | | | | | | | | |
| 13.500%, 04/01/28* | | Corporate Bond | | $ | 8,110,000 | | 04/14/21 | | | 8,110,000 | | | 7,925,368 | | | 3.4 | | |
| Realco Perry Hall MD LLC/OPCO, | | | | | | | | | | | | | | | | | | |
| 10.000%, 10/01/2024* | | Corporate Bond | | $ | 2,256,000 | | 10/01/19 | | | 2,256,000 | | | 2,065,772 | | | 0.9 | | |
| Vonore Fiber Products LLC | | | | | | | | | | | | | | | | | | |
| 16.000%, 07/10/2022* | | Corporate Bond | | $ | 955,414 | | 05/07/22 | | | 955,414 | | | 955,414 | | | 0.4 | | |
| Altus Midstream Company, | | | | | | | | | | | | | | | | | | |
| 7.000% | | Preferred Stock | | | 3,092 | | 06/12/19-05/14/20 | | | 3,091,669 | | | 3,881,560 | | | 1.7 | | |
| Enterprise Products Partners LP, | | | | | | | | | | | | | | | | | | |
| 7.250% | | Preferred Stock | | | 5,000 | | 09/30/20 | | | 6,986,282 | | | 4,680,800 | | | 2.0 | | |
| Mexico Pacific Limited LLC (MPL) | | | | | | | | | | | | | | | | | | |
| Series A | | Private Investment | | | 99,451 | | 10/23/19-08/26/21 | | | 2,028,201 | | | 2,182,353 | | | 1.0 | | |
| Renewable Holdco, LLC | | Private Investment | | | N/A | | 07/25/19-11/2/20 | | | 6,891,811 | | | 6,387,342 | | | 2.7 | | |
| Renewable Holdco I, LLC | | Private Investment | | | N/A | | 09/09/19 | | | 23,168,876 | | | 23,088,987 | | | 9.9 | | |
| Renewable Holdco II, LLC | | Private Investment | | | N/A | | 11/15/16-12/22/21 | | | 13,169,581 | | | 13,684,789 | | | 5.9 | | |
| Saturn Solar Bermuda1 Ltd., | | | | | | | | | | | | | | | | | | |
| 8.000%, 07/31/2022 | | Construction Note | | $ | 3,510,000 | | 05/24/19-07/03/19 | | | 3,778,904 | | | 3,529,656 | | | 1.5 | | |
| EF WWW Holdings, LLC, | | | | | | | | | | | | | | | | | | |
| 10.500%, 09/30/2026 | | Construction Note | | $ | 7,268,888 | | 12/06/2021 | | | 7,268,888 | | | 7,549,503 | | | 3.3 | | |
| | | | | | | | | $ | 95,706,831 | | $ | 93,722,484 | | | 40.3 | % | |
| * | Security is eligible for resale under Rule 144A under the 1933 Act. |
| |
| |
| 2022 Semi-Annual Report | May 31, 2022 |
| |
| Notes to Financial Statements (unaudited) (continued) |
| |
| |
7. Affiliated Company Transactions
A summary of the transactions in affiliated companies during the period ended May 31, 2022 is as follows:
| TYG: | | | | | | | | | | | | | | | | | | | | | | | | | | |
| 11/30/21 | | | | | | | | | | | | | | 5/31/22 | | | | | Net Change |
| Share | | Gross | | Gross | | Realized | | Distributions | | Share | | 5/31/22 | | in Unrealized |
| Investment Security | Balance | | Additions | | Reductions | | Gain/(Loss) | | Received | | Balance | | Value | | Depreciation |
| TK NYS Solar Holdco, LLC | | N/A | | | $ | — | | $ | — | | $ | — | | $ | 340,000 | | | N/A | | | $ | 16,849,615 | | $ | 5,444,794 | |
| |
| TEAF: | | | | | | | | | | | | | | | | | | | | | | | | | | |
| 11/30/21 | | | | | | | | | | | | | | 5/31/22 | | | | | Net Change in |
| Share | | Gross | | Gross | | Realized | | Distributions | | Share | | 5/31/22 | | Unrealized |
| Investment Security | Balance | | Additions | | Reductions | | Gain/(Loss) | | Received | | Balance | | Value | | Depreciation |
| Renewable Holdco, LLC | | N/A | | | $ | 550,259 | | $ | — | | $ | — | | $ | — | | | N/A | | | $ | 6,387,342 | | $ | 500,311 | |
| Renewable Holdco I, LLC | | N/A | | | $ | — | | $ | — | | $ | — | | $ | 400,000 | | | N/A | | | $ | 23,088,987 | | $ | (390,790 | ) |
| Renewable Holdco II, LLC | | N/A | | | $ | — | | $ | — | | $ | — | | $ | 400,000 | | | N/A | | | $ | 13,684,789 | | $ | (511,386 | ) |
| Total | | N/A | | | $ | 550,259 | | $ | — | | $ | — | | $ | 800,000 | | | N/A | | | $ | 43,161,118 | | $ | (401,865 | ) |
8. Investment Transactions
For the period ended May 31, 2022, the amount of security transactions (other than U.S. government securities and short-term investments), is as follows:
| | | TYG | | NTG | | TTP | | NDP | | TPZ | | TEAF |
| Purchases | | $ | 57,096,770 | | $ | 4,913,997 | | $ | 6,280,443 | | $ | 7,666,046 | | $ | 4,976,298 | | $ | 39,661,951 |
| Sales | | $ | 68,370,360 | | $ | 8,870,666 | | $ | 4,362,887 | | $ | 7,406,800 | | $ | 2,410,809 | | $ | 37,012,421 |
9. Senior Notes
TYG, NTG and TTP each have issued private senior notes (collectively, the “Notes”), which are unsecured obligations and, upon liquidation, dissolution or winding up of a Fund, will rank: (1) senior to all of the Fund’s outstanding preferred shares, if any; (2) senior to all of the Fund’s outstanding common shares; (3) on parity with any unsecured creditors of the Fund and any unsecured senior securities representing indebtedness of the Fund and (4) junior to any secured creditors of the Fund. Holders of the Notes are entitled to receive periodic cash interest payments until maturity. The Notes are not listed on any exchange or automated quotation system.
The Notes are redeemable in certain circumstances at the option of a Fund, subject to payment of any applicable make-whole amounts or early redemption premiums. The Notes for a Fund are also subject to a mandatory redemption if the Fund fails to meet asset coverage ratios required under the 1940 Act or the rating agency guidelines if such failure is not waived or cured. At May 31, 2022, each of TYG, NTG and TTP were in compliance with asset coverage covenants and basic maintenance covenants for its senior notes.
Details of each Fund’s outstanding Notes, including estimated fair value, as of May 31, 2022 are included below. The estimated fair value of each series of fixed-rate Notes was calculated, for disclosure purposes, by discounting future cash flows by a rate equal to the current U.S. Treasury rate with an equivalent maturity date, plus either 1) the spread between the interest rate on recently issued debt and the U.S. Treasury rate with a similar maturity date or 2) if there has not been a recent debt issuance, the spread between the AAA corporate finance debt rate and the U.S. Treasury rate with an equivalent maturity date plus the spread between the fixed rates of the Notes and the AAA corporate finance debt rate. The estimated fair value of floating rate Notes approximates the carrying amount because the interest rate fluctuates with changes in interest rates available in the current market. The estimated fair values in the following tables are Level 2 valuations within the fair value hierarchy.
TYG:
| | | | | | | | | | | Estimated |
| Series | | Maturity Date | | Interest Rate | | Payment Frequency | | Notional Amount | | Fair Value |
| Series DD | | September 27, 2022 | | 4.21% | | Semi-Annual | | $ | 4,194,667 | | $ | 4,251,487 |
| Series II | | December 18, 2022 | | 3.22% | | Semi-Annual | | | 3,226,667 | | | 3,283,793 |
| Series K | | December 19, 2022 | | 3.87% | | Semi-Annual | | | 3,226,667 | | | 3,304,083 |
| Series S | | January 22, 2023 | | 3.99% | | Semi-Annual | | | 3,226,667 | | | 3,298,024 |
| Series P | | September 27, 2023 | | 4.39% | | Semi-Annual | | | 3,872,000 | | | 3,958,362 |
| Series FF | | November 20, 2023 | | 4.16% | | Semi-Annual | | | 3,266,667 | | | 3,268,575 |
| |
| |
| |
| |
| Notes to Financial Statements (unaudited) (continued) |
| |
| |
TYG: (continued)
| | | | | | | | | | | Estimated |
| Series | | Maturity Date | | Interest Rate | | Payment Frequency | | Notional Amount | | Fair Value |
| Series JJ | | December 18, 2023 | | 3.34% | | Semi-Annual | | $ | 6,453,333 | | $ | 6,549,488 |
| Series T | | January 22, 2024 | | 4.16% | | Semi-Annual | | | 8,066,667 | | | 8,284,130 |
| Series L | | December 19, 2024 | | 3.99% | | Semi-Annual | | | 6,453,333 | | | 6,620,031 |
| Series AA | | June 14, 2025 | | 3.48% | | Semi-Annual | | | 3,226,667 | | | 3,255,041 |
| Series NN | | June 14, 2025 | | 3.20% | | Semi-Annual | | | 9,680,000 | | | 9,676,622 |
| Series KK | | December 18, 2025 | | 3.53% | | Semi-Annual | | | 3,226,666 | | | 3,253,658 |
| Series OO | | April 9, 2026 | | 3.27% | | Semi-Annual | | | 9,680,000 | | | 9,549,496 |
| Series PP | | September 25, 2027 | | 3.33% | | Semi-Annual | | | 8,066,666 | | | 7,919,418 |
| Series QQ | | December 17, 2028 | | 2.50% | | Semi-Annual | | | 10,000,000 | | | 9,796,292 |
| | | | | | | | $ | 85,826,667 | | $ | 86,268,500 |
On December 17, 2021, TYG issued $10,000,000 Series QQ Senior Notes which carry a fixed interest rate of 2.50% and mature on December 17, 2028.
On December 22, 2021, TYG Series R Senior Notes with a notional value of $8,066,667 and fixed rate of 3.77% were paid in full upon maturity.
NTG:
| | | | | | | | | | | Estimated |
| Series | | Maturity Date | | Interest Rate | | Payment Frequency | | Notional Amount | | Fair Value |
| Series P | | October 16, 2023 | | 3.79% | | Semi-Annual | | $ | 2,979,055 | | $ | 3,012,930 |
| Series Q | | October 16, 2025 | | 3.97% | | Semi-Annual | | | 2,234,292 | | | 2,259,981 |
| Series R | | October 16, 2026 | | 4.02% | | Semi-Annual | | | 1,936,386 | | | 1,962,796 |
| Series S | | December 17, 2028 | | 2.50% | | Semi-Annual | | | 25,000,000 | | | 23,323,529 |
| | | | | | | | $ | 32,149,733 | | $ | 30,559,236 |
On December 17, 2021, NTG issued $25,000,000 Series S Senior Notes which carry a fixed interest rate of 2.50% and mature on December 17, 2028.
| TTP: | | | | | | | | | | | | |
| | | | | | | | | | | Estimated |
| Series | | Maturity Date | | Interest Rate | | Payment Frequency | | Notional Amount | | Fair Value |
| Series H | | December 13, 2024 | | 3.97% | | Semi-Annual | | $ | 3,942,857 | | $ | 4,045,137 |
10. Mandatory Redeemable Preferred Stock
TYG, NTG and TTP each have issued and outstanding MRP Stock at May 31, 2022. The MRP Stock has rights determined by the Board of Directors. Except as otherwise indicated in the Funds’ Charter or Bylaws, or as otherwise required by law, the holders of MRP Stock have voting rights equal to the holders of common stock (one vote per MRP share) and will vote together with the holders of shares of common stock as a single class except on matters affecting only the holders of preferred stock or the holders of common stock. The 1940 Act requires that the holders of any preferred stock (including MRP Stock), voting separately as a single class, have the right to elect at least two directors at all times.
Under the 1940 Act, a Fund may not declare dividends or make other distributions on shares of common stock or purchases of such shares if, at the time of the declaration, distribution or purchase, asset coverage with respect to the outstanding MRP Stock would be less than 200%. The MRP Stock is also subject to a mandatory redemption if a Fund fails to meet an asset coverage ratio of at least 225% as determined in accordance with the 1940 Act or a rating agency basic maintenance amount if such failure is not waived or cured. At May 31, 2022, each of TYG, NTG and TTP were in compliance with asset coverage covenants and basic maintenance covenants for its MRP Stock.
Details of each Fund’s outstanding MRP Stock, including estimated fair value, as of May 31, 2022 is included below. The estimated fair value of each series of TYG, NTG and TTP MRP Stock was calculated for disclosure purposes by discounting future cash flows at a rate equal to the current U.S. Treasury rate with an equivalent maturity date, plus either 1) the spread between the interest rate on recently issued preferred stock and the U.S. Treasury rate with a similar maturity date or 2) if there has not been a recent preferred stock issuance, the spread between the AA corporate finance debt rate and the U.S. Treasury rate with an equivalent maturity date plus the spread between the fixed rates of the MRP Stock and the AA corporate finance debt rate. The estimated fair values of each series of the TYG, NTG and TTP MRP Stock are Level 2 valuations within the fair value hierarchy.
| |
| |
| 2022 Semi-Annual Report | May 31, 2022 |
| |
| Notes to Financial Statements (unaudited) (continued) |
| |
| |
TYG:
TYG has 65,000,000 shares of preferred stock authorized and 3,566,061 shares of MRP Stock outstanding at May 31, 2022. TYG’s MRP Stock has a liquidation value of $10.00 per share plus any accumulated but unpaid distributions, whether or not declared. Holders of the MRP E Stock and MRP F Stock are entitled to receive cash interest payments semi-annually at a fixed rate until maturity. The TYG MRP Stock is not listed on any exchange or automated quotation system.
| | Mandatory | | | | | | | | Aggregate Liquidation | | Estimated |
| Series | | Redemption Date | | Fixed Rate | | Shares Outstanding | | Preference | | Fair Value |
| Series E | | December 17, 2024 | | 4.34% | | | 1,566,061 | | | | $ | 15,660,610 | | | $ | 16,063,172 |
| Series F | | December 17, 2026 | | 2.67% | | | 2,000,000 | | | | | 20,000,000 | | | | 18,845,260 |
| | | | | | | 3,566,061 | | | | $ | 35,660,610 | | | $ | 34,908,432 |
TYG’s MRP Stock is redeemable in certain circumstances at the option of TYG, subject to payment of any applicable make-whole amounts.
On December 17, 2021, TYG Series D Mandatory Redeemable Preferred Shares with aggregate liquidation preference of $16,639,390 and fixed rate of 6.01% were paid in full upon maturity.
On December 17, 2021, TYG issued 2,000,000 Series F Mandatory Redeemable Preferred Shares (aggregate liquidation preference $20,000,000) which carry a fixed rate of 2.67% and mandatory redemption date of December 17, 2026.
NTG:
NTG has 10,000,000 shares of preferred stock authorized and 788,757 shares of MRP Stock outstanding at May 31, 2022. NTG’s MRP Stock has a liquidation value of $25.00 per share plus any accumulated but unpaid distributions, whether or not declared. Holders of NTG MRP Stock are entitled to receive cash interest payments each quarter at a fixed rate until maturity. The NTG MRP Stock is not listed on any exchange or automated quotation system.
| | Mandatory | | | | | | | | Aggregate Liquidation | | Estimated |
| Series | | Redemption Date | | Fixed Rate | | Shares Outstanding | | Preference | | Fair Value |
| Series D | | December 8, 2022 | | 4.19% | | | 153,939 | | | | $ | 3,848,475 | | | $ | 3,900,512 |
| Series G | | October 16, 2023 | | 4.39% | | | 84,667 | | | | | 2,116,675 | | | | 2,144,263 |
| Series E | | December 13, 2024 | | 3.78% | | | 153,939 | | | | | 3,848,475 | | | | 3,843,502 |
| Series F | | December 13, 2027 | | 4.07% | | | 96,212 | | | | | 2,405,300 | | | | 2,398,214 |
| Series H | | December 17, 2027 | | 2.90% | | | 300,000 | | | | | 7,500,000 | | | | 7,069,070 |
| | | | | | | 788,757 | | | | $ | 19,718,925 | | | $ | 19,355,561 |
NTG’s MRP Stock is redeemable in certain circumstances at the option of NTG, subject to payment of any applicable make-whole amounts.
On December 17, 2021, NTG issued 300,000 Series H Mandatory Redeemable Preferred Shares (aggregate liquidation preference $7,500,000) which carry a fixed rate of 2.90% and mandatory redemption date of December 17, 2026.
TTP:
TTP has 10,000,000 shares of preferred stock authorized and 244,000 shares of MRP Stock outstanding at May 31, 2022. TTP’s MRP Stock has a liquidation value of $25.00 per share plus any accumulated but unpaid distributions, whether or not declared. Holders of TTP MRP Stock are entitled to receive cash interest payments each quarter at a fixed rate until maturity. The TTP MRP Stock is not listed on any exchange or automated quotation system.
| | Mandatory | | | | | | Aggregate Liquidation | | Estimated |
| Series | | Redemption Date | | Fixed Rate | | Shares Outstanding | | Preference | | Fair Value |
| Series B | | December 13, 2024 | | 6.57% | | 244,000 | | $ 6,100,000 | | $ | 6,537,161 |
TTP’s MRP Stock is redeemable in certain circumstances at the option of TTP, subject to payment of any applicable make-whole amounts.
| |
| |
| |
| |
| Notes to Financial Statements (unaudited) (continued) |
| |
| |
11. Credit Facilities
The following table shows key terms, average borrowing activity and interest rates for the period during which the facility was utilized during the period from December 1, 2021 through May 31, 2022 as well as the principal balance and interest rate in effect at May 31, 2022 for each of the Funds’ credit facilities:
| | TYG | | NTG | | TTP | | NDP | | TPZ | | TEAF |
| | U.S. Bank, | | Bank of America, | | The Bank | | The Bank | | The Bank | | The Bank |
| Lending syndicate agent | | N.A. | | N.A. | | of Nova Scotia | | of Nova Scotia | | of Nova Scotia | | of Nova Scotia |
| | Unsecured, | | Unsecured, | | Unsecured, | | Secured, | | Secured, | | |
| | revolving credit | | revolving credit | | revolving credit | | revolving credit | | revolving credit | | Margin loan |
| Type of facility | | facility | | facility | | facility | | facility | | facility | | facility |
| Borrowing capacity | | $90,000,000 | | $80,000,000 | | $15,000,000 | | $12,000,000 | | $30,000,000 | | $45,000,000 |
| | | | | | | December 28, | | December 28, | | December 28, | | 179-day rolling |
| Maturity date | | June 12, 2023 | | June 12, 2023 | | 2022 | | 2022 | | 2022 | | evergreen |
| | 1-month LIBOR | | 1-month LIBOR | | 1-month LIBOR | | 1-month LIBOR | | 1-month LIBOR | | 1-month LIBOR |
| Interest rate | | plus 1.10% | | plus 1.10% | | plus 1.125% | | plus 1.10% | | plus 1.10% | | plus 0.80% |
| Non-usage fee | | 0.15%-0.25%(1) | | 0.15%-0.25%(2) | | 0.15%-0.30%(3) | | 0.15%-0.25%(4) | | 0.15%-0.25%(5) | | 0.20%(7) |
| |
| For the period ended May 31, 2022: | | | | | | | | | | |
| Average principal balance | | $19,200,000 | | $14,000,000 | | $9,700,000 | | $2,700,000 | | $24,500,000 | | $25,300,000 |
| Average interest rate | | 1.49% | | 1.49% | | 1.51% | | 1.49% | | 3.31% | | 1.19% |
| |
| As of May 31, 2022: | | | | | | | | | | | | |
| Principal balance | | | | | | | | | | | | |
| outstanding | | $23,500,000 | | $14,500,000 | | $10,900,000 | | $3,600,000 | | $25,600,000(6) | | $30,400,000 |
| Interest rate | | 2.22% | | 2.22% | | 2.24% | | 2.22% | | 3.26% | | 1.92% |
| (1) | Non-use fees are equal to a rate of 0.25% when the outstanding balance is below $45,000,000 and 0.15% when the outstanding balance is at least $45,000,000, but below $63,000,000. The outstanding balance will not be subject to the non-use fee when the amount outstanding is at least $63,000,000. |
| (2) | Non-use fees are equal to a rate of 0.25% when the outstanding balance is below $40,000,000 and 0.15% when the outstanding balance is at least $40,000,000, but below $56,000,000. The outstanding balance will not be subject to the non-use fee when the amount outstanding is at least $56,000,000. |
| (3) | Non-use fee is 0.00% when the amount outstanding is at least $13,500,000, and 0.15% when the amount outstanding is less than $13,500,000 and greater than or equal to $10,500,000, and .20% when the amount outstanding is less than $10,500,000 and greater than or equal to $7,500,000, and 0.30% when the amount outstanding is less than $7,500,000 |
| (4) | Non-use fees are 0.15% when amount outstanding is at least $9,000,000, but 0.25% when the amount outstanding is below $9,000,000. |
| (5) | Non-use fee is 0.15% when the amount outstanding is at least $22,500,000 and 0.25% when the amount outstanding is below $22,500,000. |
| (6) | TPZ’s credit facility allows for interest rates to be fixed on all or a portion of the outstanding balance. Amounts reflect activity on the credit facility for the period from December 1, 2021 through May 31, 2022 and include $9,000,000 of the outstanding principal balance that has a fixed rate of 3.33% through June 30, 2023 and $15,000,000 of the outstanding principal balance that has a fixed rate of 3.34% through June 30, 2024. |
| (7) | Non-use fees are waived when amount outstanding is at least $31,500,000. |
Under the terms of the credit and margin facilities, the Funds must maintain asset coverage required under the 1940 Act. If a Fund fails to maintain the required coverage, it may be required to repay a portion of an outstanding balance until the coverage requirement has been met. At May 31, 2022, each Fund was in compliance with facility terms.
12. Derivative Financial Instruments
The Funds have adopted the disclosure provisions of FASB Accounting Standard Codification 815, Derivatives and Hedging (“ASC 815”). ASC 815 requires enhanced disclosures about the Funds’ use of and accounting for derivative instruments and the effect of derivative instruments on the Funds’ results of operations and financial position. Tabular disclosure regarding derivative fair value and gain/loss by contract type (e.g., interest rate contracts, foreign exchange contracts, credit contracts, etc.) is required and derivatives accounted for as hedging instruments under ASC 815 must be disclosed separately from those that do not qualify for hedge accounting. Even though the Funds may use derivatives in an attempt to achieve an economic hedge, the Funds’ derivatives are not accounted for as hedging instruments under ASC 815 because investment companies account for their derivatives at fair value and record any changes in fair value in current period earnings.
| |
| |
| 2022 Semi-Annual Report | May 31, 2022 |
| |
| Notes to Financial Statements (unaudited) (continued) |
| |
| |
Forward Currency Contracts
TEAF invests in derivative instruments for hedging or risk management purposes, and for short-term purposes such as maintaining market exposure pending investment of the proceeds of an offering or transitioning its portfolio between different asset classes. The Fund’s use of derivatives could enhance or decrease the cash available to the Fund for payment of distributions or interest, as the case may be. Derivatives can be illiquid, may disproportionately increase losses and have a potentially large negative impact on the Fund’s performance. Derivative transactions, including options on securities and securities indices and other transactions in which the Fund may engage (such as forward currency transactions, futures contracts and options thereon and total return swaps), may subject the Fund to increased risk of principal loss due to unexpected movements in stock prices, changes in stock volatility levels, interest rates and foreign currency exchange rates and imperfect correlations between the Fund’s securities holdings and indices upon which derivative transactions are based. The Fund also will be subject to credit risk with respect to the counterparties to any OTC derivatives contracts the Fund enters into.
Interest Rate Swap Contracts
TYG has entered into interest rate swap contracts in an attempt to protect it from increasing interest expense on its leverage resulting from increasing interest rates. A decline in interest rates may result in a decline in the value of the swap contracts, which may result in a decline in the net assets of TYG. At the time the interest rate swap contracts reach their scheduled termination, there is a risk that TYG will not be able to obtain a replacement transaction, or that the terms of the replacement would not be as favorable as on the expiring transaction. In addition, if TYG is required to terminate any swap contract early due to a decline in net assets below a threshold amount or failing to maintain a required 300% asset coverage of the liquidation value of the outstanding debt, then TYG could be required to make a payment to the extent of any net unrealized depreciation of the terminated swaps, in addition to redeeming all or some of its outstanding debt. TYG segregates a portion of its assets as collateral for the amount of any net liability of its interest rate swap contracts.
TYG is exposed to credit risk on the interest rate swap contracts if the counterparty should fail to perform under the terms of the interest rate swap contracts. The amount of credit risk is limited to the net appreciation of the interest rate swap contracts, if any, as no collateral is pledged by the counterparty. In addition, if the counterparty to the interest rate swap contracts defaults, the Fund would incur a loss in the amount of the receivable and would not receive amounts due from the counterparty to offset the interest payments on the Fund’s leverage.
As of May 31, 2022, TYG held no interest rate swap contracts.
Written Call Options
Transactions in written option contracts for TYG, NTG, TTP, NDP and TEAF for the period from December 1, 2021 through May 31, 2022 are as follows:
| | TEAF |
| | Number of | | | | |
| | Contracts | | Premium |
| Options outstanding at November 30, 2021 | | 3,079 | | | $ | 51,214 | |
| Options written | | 10,104 | | | | 216,610 | |
| Options closed* | | (2,430 | ) | | | (48,232 | ) |
| Options exercised | | (343 | ) | | | (29,742 | ) |
| Options expired | | (5,462 | ) | | | (129,588 | ) |
| Options outstanding at May 31, 2022 | | 4,948 | | | $ | 60,262 | |
| * | The aggregate cost of closing written option contracts for TEAF was $95,088, resulting in net realized loss of $46,856. |
The following table presents the types and fair value of derivatives by location as presented on the Statements of Assets & Liabilities at May 31, 2022:
| | Assets/(Liabilities) |
| Derivatives not accounted for | | | | | | |
| as hedging instruments under ASC 815 | | Location | | Fair Value |
| TEAF: Written equity call options | | Options written, at fair value | | $ | (58,139 | ) |
The following table presents the effect of derivatives on the Statements of Operations for the period ended May 31, 2022:
| | | | | | | Net Unrealized |
| | | | Net Realized | | Appreciation |
| Derivatives not accounted for | | Location of Gains (Losses) | | Gain (Loss) on | | (Depreciation) |
| as hedging instruments under ASC 815 | | on Derivatives | | Derivatives | | of Derivatives |
| TEAF: Written equity call options | | Options | | $ | 82,732 | | $ | (7,341 | ) |
| |
| |
| |
| |
| Notes to Financial Statements (unaudited) (continued) |
| |
| |
13. Basis For Consolidation
As of May 31, 2022, TYG has committed a total of $55,256,470 of equity funding to Tortoise Holdco II, LLC, a wholly-owned investment of TYG. Tortoise Holdco II, LLC wholly owns TK NYS Solar Holdco, LLC, which owns and operates renewable energy assets. TK NYS Solar Holdco, LLC acquired the commercial and industrial solar portfolio between August 2017 and November 2019. Fair value of TK NYS Solar Holdco, LLC is net of tax benefits.
TYG’s consolidated schedule of investments includes the portfolio holdings of the Fund and its subsidiary, Tortoise Holdco II, LLC. All inter-company transactions and balances have been eliminated.
As of May 31, 2022, TEAF has committed $63,444,315 to TEAF Solar Holdco, LLC, a wholly-owned investment of TEAF. TEAF Solar Holdco, LLC wholly owns each of Renewable Holdco, LLC and Renewable Holdco I, LLC, which owns and operates renewable energy assets. TEAF Solar Holdco, LLC owns a majority partnership interest in Renewable Holdco II, LLC. Renewable Holdco, LLC and Renewable Holdco II, LLC’s acquisition of the commercial and industrial solar portfolio is ongoing. Renewable Holdco I, LLC acquired the commercial and industrial solar portfolio in September 2019.
As of May 31, 2022, TEAF has provided $3,770,670 to TEAF Solar Holdco I, LLC, a wholly-owned investment of TEAF. TEAF Solar Holdco I, LLC has committed to $6,667,100 of debt funding to Saturn Solar Bermuda 1, Ltd. through a construction note. Under the terms of the note Tortoise Solar Holdco I, LLC receives cash payments monthly at an annual rate of 9%. As of May 31, 2021, $3,510,000 of the construction note had been funded.
As of May 31, 2022, TEAF has provided $7,268,888 to EF WWW Holdings, LLC., a wholly-owned investment of TEAF. EF WWW Holdings, LLC has committed to $8,606,385 of debt funding to World Water Works, Inc. through a senior secured convertible note. Under the terms of the note TEAF receives cash payments monthly at an annual rate of 10.50%.
TEAF’s consolidated schedule of investments includes the portfolio holdings of the Fund and its subsidiaries, TEAF Solar Holdco, LLC and TEAF Solar Holdco I, LLC. All inter-company transactions and balances have been eliminated.
14. Subsequent Events
TYG:
TYG has performed an evaluation of subsequent events through the date the financial statements were issued and has determined that no additional items require recognition or disclosure.
NTG:
NTG has performed an evaluation of subsequent events through the date the financial statements were issued and has determined that no additional items require recognition or disclosure.
TTP:
TTP has performed an evaluation of subsequent events through the date the financial statements were issued and has determined that no additional items require recognition or disclosure.
NDP:
NDP has performed an evaluation of subsequent events through the date the financial statements were issued and has determined that no items require recognition or disclosure.
TPZ:
On June 30, 2022, TPZ paid a distribution in the amount of $0.105 per common share, for a total of $685,282. Of this total the dividend reinvestment amounted to $5,271.
TPZ has performed an evaluation of subsequent events through the date the financial statements were issued and has determined that no additional items require recognition or disclosure.
TEAF:
On June 30, 2022, TEAF paid a distribution in the amount of $0.09 per common share, for a total of $1,214,201. Of this total the dividend reinvestment amounted to $22,367.
TEAF has performed an evaluation of subsequent events through the date the financial statements were issued and has determined that no additional items require recognition or disclosure.
| |
| |
| 2022 Semi-Annual Report | May 31, 2022 |
| |
| Additional Information (unaudited) |
| |
| |
Director and Officer Compensation
The Funds do not compensate any of its directors who are “interested persons,” as defined in Section 2(a)(19) of the 1940 Act, nor any of its officers. For the period from December 1, 2021 through May 31, 2022, the aggregate compensation paid by the Funds to the independent directors was as follows:
| TYG | | NTG | | TTP | | NDP | | TPZ | | TEAF |
| $41,800 | | $41,800 | | $33,000 | | $33,000 | | $41,800 | | $41,800 |
The Funds did not pay any special compensation to any of its directors or officers.
Forward-Looking Statements
This report contains “forward-looking statements” within the meaning of the 1933 Act and the Securities Exchange Act of 1934, as amended. By their nature, all forward-looking statements involve risks and uncertainties, and actual results could differ materially from those contemplated by the forward-looking statements. Several factors that could materially affect each Fund’s actual results are the performance of the portfolio of investments held by it, the conditions in the U.S. and international financial, petroleum and other markets, the price at which shares of each Fund will trade in the public markets and other factors discussed in filings with the Securities and Exchange Commission (SEC).
Proxy Voting Policies
A description of the policies and procedures that each Fund uses to determine how to vote proxies relating to portfolio securities owned by the Fund and information regarding how each Fund voted proxies relating to the portfolio of securities during the 12-month period ended June 30, 2021 are available to stockholders (i) without charge, upon request by calling the Adviser at (913) 981-1020 or toll-free at (866) 362-9331 and on or through the Adviser’s Web site at www.tortoiseecofin.com; and (ii) on the SEC’s Web site at www.sec.gov.
Form N-PORT
Each Fund files its complete schedule of portfolio holdings for the first and third quarters of each fiscal year with the SEC on Part F of Form N-PORT. Each Fund’s Form Part F of Form N-PORT are available without charge upon request by calling the Adviser at (866) 362-9331 or by visiting the SEC’s Web site at www.sec.gov.
Each Fund’s N-PORTs are also available through the Adviser’s Web site at www.tortoiseecofin.com.
Statement of Additional Information
The Statement of Additional Information (“SAI”) includes additional information about each Fund’s directors and is available upon request without charge by calling the Adviser at (866) 362-9331 or by visiting the SEC’s Web site at www.sec.gov.
Certifications
Each Fund’s Chief Executive Officer has submitted to the New York Stock Exchange the annual CEO certification as required by Section 303A.12(a) of the NYSE Listed Company Manual.
Each Fund has filed with the SEC, as an exhibit to its most recently filed Form N-CSR, the certification of its Chief Executive Officer and Principal Financial Officer required by Section 302 of the Sarbanes-Oxley Act.
Privacy Policy
In order to conduct its business, each Fund collects and maintains certain nonpublic personal information about its stockholders of record with respect to their transactions in shares of each Fund’s securities. This information includes the stockholder’s address, tax identification or Social Security number, share balances, and distribution elections. We do not collect or maintain personal information about stockholders whose share balances of our securities are held in “street name” by a financial institution such as a bank or broker.
We do not disclose any nonpublic personal information about you, the Funds’ other stockholders or the Funds’ former stockholders to third parties unless necessary to process a transaction, service an account, or as otherwise permitted by law.
To protect your personal information internally, we restrict access to nonpublic personal information about the Funds’ stockholders to those employees who need to know that information to provide services to our stockholders. We also maintain certain other safeguards to protect your nonpublic personal information.
Repurchase Disclosure
Notice is hereby given in accordance with Section 23(c) of the 1940 Act, that each Fund may from time to time purchase shares of its common stock in the open market.
| |
| |
| |
| |
| Additional Information (unaudited) (continued) |
| |
| |
Automatic Dividend Reinvestment
Each of NTG, TTP, NDP and TPZ have an Automatic Dividend Reinvestment Plan and TYG has an Automatic Dividend Reinvestment and Cash Purchase Plan (each, a “Plan”). Each Plan allows participating common stockholders to reinvest distributions, including dividends, capital gains and return of capital in additional shares of the Fund’s common stock and TYG’s Plan also allows registered holders of the TYG’s common stock to make optional cash investments, in accordance with TYG’s Plan, on a monthly basis.
If a stockholder’s shares are registered directly with the Fund or with a brokerage firm that participates in the Fund’s Plan, all distributions are automatically reinvested for stockholders by the Agent in additional shares of common stock of the Fund (unless a stockholder is ineligible or elects otherwise). Stockholders holding shares that participate in the Plan in a brokerage account may not be able to transfer the shares to another broker and continue to participate in the Plan. Stockholders who elect not to participate in the Plan will receive all distributions payable in cash paid by check mailed directly to the stockholder of record (or, if the shares are held in street or other nominee name, then to such nominee) by Computershare, as dividend paying agent. Distributions subject to tax (if any) are taxable whether or not shares are reinvested.
Any single investment pursuant to the cash purchase option under TYG’s Plan must be in an amount of at least $100 and may not exceed $5,000 per month unless a request for waiver has been granted. A request for waiver should be directed to TYG at 1-866-362-9331 and TYG has the sole discretion to grant any requested waiver. Optional cash investments may be delivered to the Agent by personal check, by automatic or electronic bank account transfer or by online access at www.computershare.com. TYG reserves the right to reject any purchase order. Stockholders who hold shares in street or other nominee name who want to participate in optional cash investments should contact their broker, bank or other nominee and follow their instructions. There is no obligation to make an optional cash investment at any time, and the amount of such investments may vary from time to time. Optional cash investments must be received by the Agent no later than two business days prior to the monthly investment date (the “payment date”) for purchase of common shares on the next succeeding purchase date under TYG’s Plan. Scheduled optional cash purchases may be cancelled or refunded upon a participant’s written request received by the Agent at least two business days prior to the purchase date. Participants will not be able to instruct the Agent to purchase common shares at a specific time or at a specific price.
If on the distribution payment date or, for TYG, the purchase date for optional cash investments, the net asset value per share of the common stock is equal to or less than the market price per share of common stock plus estimated brokerage commissions, the Fund will issue additional shares of common stock to participants. The number of shares will be determined by the greater of the net asset value per share or 95 percent of the market price. Otherwise, shares generally will be purchased on the open market by the Agent as soon as possible following the payment date or purchase date, but in no event later than 30 days after such date except as necessary to comply with applicable law. There are no brokerage charges with respect to shares issued directly by the Fund as a result of distributions payable either in shares or in cash or, for TYG, as a result of optional cash investments. However, each participant will pay a pro rata share of brokerage commissions incurred with respect to the Agent’s open-market purchases in connection with the reinvestment of distributions or optional cash investments. If a participant elects to have the Agent sell part or all of his or her common stock and remit the proceeds, such participant will be charged a transaction fee of $15.00 plus his or her pro rata share of brokerage commissions on the shares sold.
Participation is completely voluntary. Stockholders may elect not to participate in the Plan, and participation may be terminated or resumed at any time without penalty, by giving notice in writing, by telephone or Internet to Computershare, the Plan Agent, at the address set forth below. Such termination will be effective with respect to a particular distribution if notice is received prior to such record date.
Additional information about the Plan may be obtained by writing to Computershare Trust Company, N.A, P.O. Box 30170, College Station, TX 77842-3170. You may also contact Computershare by phone at (800) 426-5523 or visit their Web site at www.computershare.com.

Office of the Company
and of the Investment Adviser
Tortoise Capital Advisors, L.L.C.
6363 College Boulevard, Suite 100A
Overland Park, KS 66211
(913) 981-1020
(913) 981-1021 (fax)
www.tortoiseecofin.com Board of Directors of
Tortoise Energy Infrastructure Corp.
Tortoise Midstream Energy Fund, Inc.
Tortoise Pipeline & Energy Fund, Inc.
Tortoise Energy Independence Fund, Inc.
Tortoise Power and Energy Infrastructure Fund, Inc.
Ecofin Sustainable and Social Impact Term Fund H. Kevin Birzer, Chairman
Tortoise Capital Advisors, L.L.C. Rand C. Berney
Independent Conrad S. Ciccotello
Independent Alexandra Herger
Independent Jennifer Paquette
Independent | Administrator
U.S. Bancorp Fund Services, LLC
615 East Michigan St.
Milwaukee, Wis. 53202 Custodian
U.S. Bank, N.A.
1555 North Rivercenter Drive, Suite 302
Milwaukee, Wis. 53212 Transfer, Dividend Disbursing
and Reinvestment Agent
Computershare Trust Company, N.A. /
Computershare Inc.
P.O. Box 30170
College Station, Tex. 77842-3170
(800) 426-5523
www.computershare.com Legal Counsel
Husch Blackwell LLP
4801 Main St.
Kansas City, Mo. 64112 Investor Relations
(866) 362-9331
info@tortoiseecofin.com Stock Symbols
Listed NYSE Symbols: TYG, NTG, TTP, NDP, TPZ, TEAF This report is for stockholder information. This is not a prospectus intended for use in the purchase or sale of fund shares. Past performance is no guarantee of future results and your investment may be worth more or less at the time you sell. |
 |
| |
6363 College Boulevard, Suite 100A |
Overland Park, KS 66211 |
| |
www.tortoiseecofin.com |
(b) Not applicable.
Item 2. Code of Ethics.
Not applicable for semi-annual reports.
Item 3. Audit Committee Financial Expert.
Not applicable for semi-annual reports.
Item 4. Principal Accountant Fees and Services.
Not applicable for semi-annual reports.
Item 5. Audit Committee of Listed Registrants.
Not applicable for semi-annual reports.
Item 6. Investments.
(a) Schedule of Investments is included as part of the report to shareholders filed under Item 1.
(b) Not applicable.
Item 7. Disclosure of Proxy Voting Policies and Procedures for Closed-End Management Investment Companies.
Not applicable for semi-annual reports.
Item 8. Portfolio Managers of Closed-End Management Investment Companies.
Effective July 30, 2022, Nicholas S. Holmes is no longer a portfolio manager for the Registrant. There have been no other changes to the portfolio managers identified in the response to this Item in the Registrant’s most recent annual report on Form N-CSR.
Item 9. Purchases of Equity Securities by Closed-End Management Investment Company and Affiliated Purchasers.
| | | | (d) |
| | | (c) | Maximum Number (or |
| | | Total Number of | Approximate Dollar |
| | (a) | | Shares (or Units) | Value) of Shares (or |
| Total Number of | (b) | Purchased as Part of | Units) that May Yet |
| | Shares (or Units) | Average Price Paid | Publicly Announced | Be Purchased Under |
| Period | Purchased | per Share (or Unit) | Plans or Programs | the Plans or Programs |
| Month #1 | 0 | $0 | 0 | $0 |
| 12/1/21-12/31/21 | | | | |
| Month #2 | 0 | $0 | 0 | $0 |
| 1/1/22-1/31/22 | | | | |
| Month #3 | 0 | $0 | 0 | $0 |
| 2/1/22-2/28/22 | | | | |
| Month #4 | 0 | $0 | 0 | $0 |
| 3/1/22-3/31/22 | | | | |
| Month #5 | 0 | $0 | 0 | $0 |
| 4/1/22-4/30/22 | | | | |
| Month #6 | 0 | $0 | 0 | $0 |
| 5/1/22-5/31/22 | | | | |
| Total | 0 | $0 | 0 | $0 |
Item 10. Submission of Matters to a Vote of Security Holders.
None.
Item 11. Controls and Procedures.
(a) The Registrant’s Chief Executive Officer, and its Principal Financial Officer and Treasurer have concluded that the Registrant's disclosure controls and procedures (as defined in Rule 30a-3(c) under the Investment Company Act of 1940 (the “1940 Act”)) are effective as of a date within 90 days of the filing date of this report, based on the evaluation of these controls and procedures required by Rule 30a-3(b) under the 1940 Act and Rules 13a-15(b) or 15d-15(b) under the Securities Exchange Act of 1934, as amended.
(b) There were no changes in the Registrant’s internal control over financial reporting (as defined in Rule 30a-3(d) under the 1940 Act) that occurred during the period covered by this report that have materially affected, or are reasonably likely to materially affect, the Registrant’s internal control over financial reporting.
Item 12. Disclosure of Securities Lending Activities For Closed-End Management Investment Companies.
The Registrant does not participate in securities lending activities.
Item 13. Exhibits.
(a)(1) Any code of ethics or amendment thereto, that is the subject of the disclosure required by Item 2, to the extent that the Registrant intends to satisfy Item 2 requirements through filing of an exhibit.
Not applicable for semi-annual reports.
(2) Certifications pursuant to Section 302 of the Sarbanes-Oxley Act of 2002. Filed herewith.
(3) Any written solicitation to purchase securities under Rule 23c-1 under the Act sent or given during the period covered by the report by or on behalf of the Registrant to 10 or more persons. None.
(b) Certification pursuant to Section 906 of the Sarbanes-Oxley Act of 2002. Furnished herewith.
(c) Section 19(s) Notification of Sources of Distribution. Furnished herewith.
SIGNATURES
Pursuant to the requirements of the Securities Exchange Act of 1934 and the Investment Company Act of 1940, the Registrant has duly caused this report to be signed on its behalf by the undersigned, thereunto duly authorized.
| (Registrant) | Tortoise Power and Energy Infrastructure Fund, Inc. |
| | |
| By (Signature and Title) | /s/ P. Bradley Adams |
| P. Bradley Adams, Chief Executive Officer |
| |
| Date August 5, 2022 |
Pursuant to the requirements of the Securities Exchange Act of 1934 and the Investment Company Act of 1940, this report has been signed below by the following persons on behalf of the Registrant and in the capacities and on the dates indicated.
| By (Signature and Title) | /s/ P. Bradley Adams |
| P. Bradley Adams, Chief Executive Officer |
| |
| Date August 5, 2022 |
| By (Signature and Title) | /s/ Courtney Gengler |
| Courtney Gengler, Principal Financial Officer and Treasurer |
| |
| Date August 5, 2022 |