Washington, D.C. 20549
For the fiscal ended December 31, 2009.
For the transition period from ______________ to ______________.
FIRST GUARANTY BANCSHARES, INC.
Indicate by check mark if the registrant is a well-known seasoned issuer, as defined in Rule 405 of the Securities Act.
Indicate by check mark whether the Registrant (1) has filed all reports required to be filed by Section 13 or 15(d) of the Securities Exchange Act of 1934 during the preceding 12 months (or for such shorter period that the registrant
The aggregate market value of the voting stock held by non-affiliates of the registrant as of June 30, 2009 was $49,077,538 based upon the price from the last trade which occurred on June 19, 2009 in which 1,184 shares were traded at a price of $17.00 per share. The common stock is not quoted or traded on an exchange and there is no established or liquid market for the common stock.
As of March 30, 2010, there were issued and outstanding 5,559,644 shares of the Registrant’s Common Stock.
First Guaranty Bancshares, Inc.
(references to “our,” “we” or similar terms under this subheading refer to First Guaranty Bancshares, Inc.)
A portion of our loan portfolio is secured by real estate. If the economy deteriorated and depressed real estate values beyond a certain point, that collateral value of the portfolio and the revenue stream from those loans could come under stress and possibly require additional provision to the allowance for loan losses. Our ability to dispose of foreclosed real estate at prices above the respective carrying values could also be impinged, causing additional losses.
Disruptions in the global financial markets could adversely affect our results of operations and financial condition.
Since mid-2007, global financial markets have suffered substantial disruption, illiquidity and volatility. These circumstances resulted in significant government assistance to a number of major financial institutions. These events have significantly diminished overall confidence in the financial markets and in financial institutions and have increased the uncertainty we face in managing our business. If these disruptions continue or other disruptions in the financial markets or the global or our regional economic environment arise, they could have an adverse effect on our future results of operations and financial condition, including our liquidity position, and may affect our ability to access capital.
Difficult market conditions have adversely affected the industry in which we operate.
The capital and credit markets have been experiencing volatility and disruption for more than twelve months. The volatility and disruption has reached unprecedented levels. Dramatic declines in the housing market over the past year, with falling home prices and increasing foreclosures, unemployment and under-employment, have negatively impacted the credit performance of mortgage loans and resulted in significant write-downs of asset values by financial institutions, including government-sponsored entities as well as major commercial and investment banks. These write-downs have caused many financial institutions to seek additional capital, to merge with larger and stronger institutions and, in some cases, to fail. Reflecting concern about the stability of the financial markets generally and the strength of counterparties, many lenders and institutional i nvestors have reduced or ceased providing funding to borrowers, including to other financial institutions. This market turmoil and tightening of credit have led to an increased level of commercial and consumer delinquencies, lack of consumer confidence, increased market volatility and widespread reduction of business activity generally. We do not expect that the difficult conditions in the financial markets are likely to improve in the near future. A worsening of these conditions would likely exacerbate the adverse effects of these difficult market conditions on us and others in the financial institution industry. In particular, we may face the following risks in connection with these events:
There can be no assurance that the Emergency Economic Stabilization Act of 2008 will help stabilize the U.S. Financial System.
On October 3, 2008, President Bush signed into law the Emergency Economic Stabilization Act of 2008 (EESA) in response to the current crisis in the financial sector. The U.S. Department of the Treasury and banking regulators are implementing a number of programs under this legislation to address capital and liquidity issues in the banking system. There can be no assurance, however, as to the actual impact that the EESA will have on the financial markets, including the extreme levels of volatility and limited credit availability currently being experienced. The failure of the EESA to help stabilize the financial markets and a continuation or worsening of current financial market conditions could materially and adversely affect our business, financial condition, results of operations, access to credit or the trading price of our common stock.
Certain changes in interest rates, inflation, deflation, or the financial markets could affect demand for our products and our ability to deliver products efficiently.
Loan originations, and potentially loan revenues, could be adversely impacted by sharply rising interest rates. Conversely, sharply falling rates could increase prepayments within our securities portfolio lowering interest earnings from those investments. An underperforming stock market could reduce brokerage transactions, therefore reducing investment brokerage revenues; in addition, wealth management fees associated with managed securities portfolios could also be adversely affected. An unanticipated increase in inflation could cause our operating costs related to salaries & benefits, technology, and supplies to increase at a faster pace than revenues.
The fair market value of our securities portfolio and the investment income from these securities also fluctuate depending on general economic and market conditions. In addition, actual net investment income and/or cash flows from investments that carry prepayment risk, such as mortgage-backed and other asset-backed securities, may differ from those anticipated at the time of investment as a result of interest rate fluctuations.
Changes in the policies of monetary authorities and other government action could adversely affect our profitability.
The results of operations are affected by credit policies of monetary authorities, particularly the Federal Reserve Board. The instruments of monetary policy employed by the Federal Reserve Board include open market operations in U.S. government securities, changes in the discount rate or the federal funds rate on bank borrowings and changes in reserve requirements against bank deposits. In view of changing conditions in the national economy and in the money markets, particularly in light of the continuing threat of terrorist attacks and the current military operations in the Middle East, we cannot predict possible future changes in interest rates, deposit levels, loan demand or our business and earnings. Furthermore, the actions of the United States government and other governments in responding to such terrorist attacks or the military operations in t he Middle East may result in currency fluctuations, exchange controls, market disruption and other adverse effects.
We engage in acquisitions of other businesses from time to time.
On occasion, we will engage in acquisitions of other businesses. Inability to successfully integrate acquired businesses can pose varied risks to us, including customer and employee turnover, thus increasing the cost of operating the new businesses. The acquired companies may also have legal contingencies, beyond those that we are aware of, that could result in unexpected costs. Moreover, there can be no assurance that acquired businesses will achieve prior or planned results of operations.
We may not be able to successfully maintain and manage our growth.
Our loan portfolio consists of a high percentage of loans secured by non-farm non-residential real estate. These loans are riskier than loans secured by one- to four-family properties.
Emphasis on the origination of short-term loans could expose us to increased lending risks.
Hurricane Activity in Louisiana can have an adverse impact on our market area.
If the allowance for loan losses is not sufficient to cover actual loan losses, earnings could decrease.
Adverse events in Louisiana, where our business is concentrated, could adversely affect our results and future growth.
Our continued pace of growth may require us to raise additional capital in the future, but that capital may not be available when it is needed and could result in dilution of shareholders’ ownership.
We rely on our Management team for the successful implementation of our business strategy.
There is no assurance that we will be able to successfully compete with others for business.
We depend primarily on net interest income for our earnings rather than noninterest income.
Fluctuations in interest rates could reduce our profitability.
We expect to incur additional expenses in connection with our compliance with Sarbanes-Oxley.
The Company’s expenses may increase as a result of increases in FDIC insurance premiums.
Future legislative or regulatory actions responding to perceived financial and market problems could impair the Company’s rights against borrowers.
Continued or further declines in the value of certain investment securities could require write-downs, which would reduce the Company’s earnings.
We operate in a highly regulated environment and may be adversely affected by changes in federal, state and local laws and regulations.
We are subject to extensive regulation, supervision and examination by federal and state banking authorities. Any change in applicable regulations or federal, state or local legislation could have a substantial impact on us and our operations. Additional legislation and regulations that could significantly affect our powers, authority and operations may be enacted or adopted in the future, which could have a material adverse effect on our financial condition and results of operations. Further, regulators have significant discretion and authority to prevent or remedy unsafe or unsound practices or violations of laws by banks and bank holding companies in the performance of their supervisory and enforcement duties. The exercise of regulatory authority may have a negative impact on our results of operations and financial condition. Like other bank holding companies and financial institutions, we must comply with significant anti-money laundering and anti-terrorism laws. Under these laws, we are required, among other things, to enforce a customer identification program and file currency transaction and suspicious activity reports with the federal government. Government agencies have substantial discretion to impose significant monetary penalties on institutions which fail to comply with these laws or make required reports.
We hold certain intangible assets that could be classified as impaired in the future. If these assets are considered to be either partially or fully impaired in the future, our earnings and the book values of these assets would decrease.
Pursuant to FASB ASC 350, Intangibles – Goodwill and Other (SFAS No. 142), we are required to test our goodwill and core deposit intangible assets for impairment on a periodic basis. The impairment testing process considers a variety of factors, including the current market price of our common shares, the estimated net present value of our assets and liabilities and information concerning the terminal valuation of similarly situated insured depository institutions. The market price for our common shares was above our tangible book value at October 1, 2009, the date of our impairment testing, and at December 31, 2009. If there is a decline in the market value of our common shares and a decline in the market pri ces of the common shares of similarly situated insured depository institutions during future reporting periods it is possible that future impairment testing could result in a partial or full impairment of the value of our goodwill or core deposit intangible assets, or both. If an impairment determination is made in a future reporting period, our earnings and the book value of these intangible assets will be reduced by the amount of the impairment. If an impairment loss is recorded, it will have little or no impact on the tangible book value of our common shares or our regulatory capital levels.
If we were unable to borrow funds through access to capital markets, we may not be able to meet the cash flow requirements of our depositors and borrowers, or the operating cash needs to fund corporate expansion and other corporate activities.
Liquidity is the ability to meet cash flow needs on a timely basis at a reasonable cost. The liquidity of our Company is used to make loans and leases to repay deposit liabilities as they become due or are demanded by customers. Liquidity policies and limits are established by the board of directors. Management and the Investment Committee regularly monitor the overall liquidity position of the Company to ensure that various alternative strategies exist to cover unanticipated events that could affect liquidity. Management and the Investment Committee also establish policies and monitor guidelines to diversify the banks’ funding sources. Funding sources include Federal funds purchased, securities sold under repurchase agreements, non-core deposits, and shor t- and long-term debt. We are also members of the Federal Home Loan Bank (“FHLB”) System, which provides funding through advances to members that are collateralized with certain loans.
We maintain a portfolio of securities that can be used as a secondary source of liquidity. There are other sources of liquidity available to us should they be needed. These sources include sales of loans, additional collateralized borrowings such as FHLB advances, unsecured borrowing lines with other financial institutions, the issuance and sale of debt securities, and the issuance and sale of preferred or common securities. We can also borrow from the Federal Reserve’s discount window.
Amounts available under our existing credit facilities as of December 31, 2009, consist of $92.9 million available at the Federal Home Loan Bank and $63.2 million in the form of federal funds and/or other lines of credit.
If we were unable to access any of these funding sources when needed, we might be unable to meet customers’ needs, which could adversely impact our financial condition, results of operations, cash flows, and level of regulatory-qualifying capital.
Risk Associated with an Investment in our Common Stock
The market price of our common stock is established between a buyer and seller.
First Guaranty Bank acts as the transfer agent for First Guaranty Bancshares, Inc. All shares traded are agreed upon by mutual buyers and sellers. First Guaranty Bancshares, Inc. is not traded on an exchange, therefore liquidation and/or purchases of stock may not be readily available.
Our Management controls a substantial percentage of our common stock and therefore has the ability to exercise substantial control over our affairs.
As of December 31, 2009, our directors and executive officers (and their affiliates) beneficially owned 2,348,110 shares or approximately 42.2% of our common stock. Because of the large percentage of common stock held by our directors and executive officers, such persons could significantly influence the outcome of any matter submitted to a vote of our shareholders even if other shareholders were in favor of a different result.
Our participation in the U.S. Treasury’s Capital Purchase Program imposes restrictions on us that limit our ability to perform certain equity transactions, including the payment of dividends and common stock purchases.
On August 28, 2009, we issued and sold $20.7 million in Fixed Rate Cumulative Perpetual Preferred Stock, Series A and a warrant to purchase shares of the Company’s Fixed Rate Cumulative Preferred Stock, Series B to the Treasury Department as part of the Capital Purchase Program. The Series A preferred shares will pay a cumulative dividend rate of five percent (5%) per annum for the first five years and will reset to a rate of nine percent (9%) per annum after year five. Immediately following the issuance of the Series A Preferred Stock and the Warrant, the Treasury Department exercised its rights under the Warrant to acquire shares of the Series B Preferred Stock through a cashless exercise. The Series B Preferred Stock pays cumulative dividends at a rate of nine percent (9%) per annum. The Series B Preferred Stock genera lly has the same rights and privileges as the Series A Preferred Stock. The dividends and potential increase in dividends if we do not redeem the preferred stock may significantly impact our operating results, liquidity, and capital position.
Pursuant to the Purchase Agreement, prior to August 28, 2012, unless the Company has redeemed the Series A Preferred Stock and the Series B Preferred Stock or the Treasury Department has transferred the Series A Preferred Stock and the Series B Preferred Stock to a third party, the ability of the Company to declare or pay any dividend or make any distribution on its capital stock or other equity securities of any kind of the Company will be subject to restriction, including a restriction against (1) increasing the quarterly cash dividend per share to an amount larger than the last quarterly cash dividend paid on the common stock prior to November 17, 2008, $0.16 per share, or (2) redeeming, purchasing or acquiring any shares of its common stock or other equity or capital securities, other than in connection with benefit plans consistent w ith past practice and certain circumstances specified in the Purchase Agreement. In addition, prior to August 28, 2012, the Company may not redeem any of the Series A Preferred Stock or Series B Preferred Stock except with the proceeds of a qualified equity offering.
Following August 28, 2012 and until August 28, 2019 (unless the Series A Preferred Stock and Series B Preferred Stock has been redeemed or transferred to a third party), the Company may not, without the consent of the Treasury Department, pay any dividends on its capital stock that are in the aggregate greater than 103% of any dividends in the prior fiscal quarter. In addition, prior to August 28, 2019 (unless the Series A Preferred Stock and Series B Preferred Stock has been redeemed or transferred to a third party) the Company may not repurchase or acquire any equity security of the Company without the consent of the Treasury Department other than in certain circumstances specified in the Purchase Agreement. Following August 28, 2019, the Company may not pay any dividend or repurchase any equity securities without the consent of the Treasury Department unless the Series A Preferred Stock and the Series B Preferred Stock have been redeemed or the United States Treasury has transferred the securities. In addition, no shares of the Series B Preferred Stock may be redeemed unless all the shares of Series A Preferred Stock have been redeemed.
In addition, under the Articles of Amendment for the Series A Preferred Stock and the Series B Preferred Stock, the Company’s ability to declare or pay dividends or repurchase its common stock or other equity or capital securities will be subject to restrictions in the event that it fails to declare and pay or set aside for payment full dividends on the Series A Preferred Stock and the Series B Preferred Stock, respectively.
None.
The Company does not directly own any real estate, but it does own real estate indirectly through its subsidiary. The Bank operates 17 retail-banking centers. The following table sets forth certain information relating to each office. The net book value of our properties at December 31, 2009 was $9.0 million.
Location | | Use of Facilities | | Year Facility Opened or Acquired | | Owned/ Leased |
First Guaranty Square 400 East Thomas Street Hammond, LA 70401 | | Bank’s Main Office | | 1975 | | Owned |
2111 West Thomas Street Hammond, LA 70401 | | Guaranty West Banking Center | | 1974 | | Owned |
100 East Oak Street Amite, LA 70422 | | Amite Banking Center | | 1970 | | Owned |
455 Railroad Avenue Independence, LA 70443 | | Independence Banking Center | | 1979 | | Owned |
301 Avenue F Kentwood, LA 70444 | | Kentwood Banking Center | | 1975 | | Owned |
170 West Hickory Ponchatoula, LA 70454 | | Ponchatoula Banking Center1 | | 1960 | | Owned |
196 Burt Blvd Benton, LA 71006 | | Benton Banking Center2 | | 1999 | | Owned |
126 South Hwy. 1 Oil City, LA 71061 | | Oil City Banking Center | | 1999 | | Owned |
401 North 2nd Street Homer, LA 71040 | | Homer Main Banking Center | | 1999 | | Owned |
10065 Hwy 79 Haynesville, LA 71038 | | Haynesville Banking Center | | 1999 | | Owned |
117 East Hico Street Dubach, LA 71235 | | Dubach Banking Center | | 1999 | | Owned |
102 East Louisiana Avenue Vivian, LA 71082 | | Vivian Banking Center | | 1999 | | Owned |
500 North Cary Jennings, LA 70546 | | Jennings Banking Center | | 1999 | | Owned |
799 West Summers Drive Abbeville, LA 70510 | | Abbeville Banking Center | | 1999 | | Owned |
105 Berryland Ponchatoula, LA 70454 | | Berryland Banking Center | | 2004 | | Leased |
2231 S. Range Avenue Denham Springs, LA 70726 | | Denham Springs Banking Center | | 2005 | | Owned |
North 6th Street Ponchatoula, LA 70454 | | Ponchatoula Banking Center | | 2007 | | Owned |
29815 Walker Rd S Walker, LA 70785 | | Walker Banking Center | | 2007 | | Owned |
1 This banking facility was closed on March 14, 2008 and consolidated with the Ponchatoula Banking Center.
2 This banking facility was sold on January 27, 2010 and a new facility was opened at 189 Burt Boulevard, Benton, LA.
The Bank also owns four additional properties which are currently not being used as banking facilities. One of the properties is a banking center location previously owned and operated by Homestead Bank in Amite, Louisiana but was closed at the time of the merger. The Bank also acquired, in the Homestead Bank merger, a banking facility located in Ponchatoula, Louisiana. This facility was closed in March 2008 and currently is vacant. Management’s intentions are to sell these two properties. In addition, the Bank owns two parcels of raw land, located in Amite and Bossier City Louisiana, on which it intends to build de nevo banking center locations. During 2009, the Bank opened a stand-alone ATM on the Amite parcel of land.
On December 30, 2008, the Company purchased raw land located at 182 Burt Boulevard, Benton, Louisiana and began construction of a new banking facility. This purchase was to facilitate the sale of the existing Benton banking center, located at 196 Burt Boulevard, Benton, Louisiana, to the Law Enforcement District of Bossier. As of December 31, 2009, the Bank had a binding contract to sell the property located at 196 Burt Boulevard, Benton, Louisiana. The sale was consummated on January 27, 2010 and the new Benton banking center, located at 182 Burt Boulevard, Benton, Louisiana, was opened. The cost of the new Benton banking center, including land, building, furniture and equipment totaled approximately $1.5 million. See Note 24 to the Consolidated Financial Statements.
The Company is subject to various legal proceedings in the normal course of its business. It is Management’s belief that the ultimate resolution of such claims will not have a material adverse effect on the financial position or results of operations. At December 31, 2009, we were not involved in any material legal proceedings.
[Reserved]
PART II
There is no liquid or active market for our common stock. The Company’s shares of common stock are not traded on a stock exchange or in any established over-the-counter market. Trades occur primarily between individuals at a price mutually agreed upon by the buyer and seller. Trading in the Company’s common stock has been infrequent and such trades cannot be characterized as constituting an active trading market.
The following table sets forth the high and low bid quotations for First Guaranty Bancshares, Inc.’s common stock for the periods indicated. These quotations represent trades of which we are aware and do not include retail markups, markdowns, or commissions and do not necessarily reflect actual transactions. As of December 31, 2009, there were 5,559,644 shares of First Guaranty Bancshares, Inc. common stock issued and outstanding. At December 31, 2009, First Guaranty Bancshares, Inc. had 1,356 shareholders of record.
| | | 2009 | | | 2008 | |
| Quarter Ended: | | High | | | Low | | | Dividend | | | High | | | Low | | | Dividend | |
| March | | $ | 25.00 | | | $ | 17.00 | | | $ | 0.16 | | | $ | 25.00 | | | $ | 24.30 | | | $ | 0.16 | |
| June | | | 17.00 | | | | 17.00 | | | | 0.16 | | | | 25.00 | | | | 25.00 | | | | 0.16 | |
| September | | | 17.00 | | | | 15.00 | | | | 0.16 | | | | 25.00 | | | | 25.00 | | | | 0.16 | |
| December | | | 17.00 | | | | 12.00 | | | | 0.16 | | | | 25.00 | | | | 25.00 | | | | 0.16 | |
Our stockholders are entitled to receive dividends when, and if declared by the Board of Directors, out of funds legally available for dividends. We have paid consecutive quarterly cash dividends on our common stock for each of the last ten years and the Board of Directors intends to continue to pay regular quarterly cash dividends. The ability to pay dividends in the future will depend on earnings and financial condition, liquidity and capital requirements, regulatory restrictions, the general economic and regulatory climate and ability to service any equity or debt obligations senior to common stock.
There are legal restrictions on the ability of First Guaranty Bank to pay cash dividends to First Guaranty Bancshares, Inc. Under federal and state law, we are required to maintain certain surplus and capital levels and may not distribute dividends in cash or in kind, if after such distribution we would fall below such levels. Specifically, an insured depository institution is prohibited from making any capital distribution to its shareholders, including by way of dividend, if after making such distribution, the depository institution fails to meet the required minimum level for any relevant capital measure including the risk-based capital adequacy and leverage standards.
Additionally, under the Louisiana Business Corporation Act, First Guaranty Bancshares, Inc. is prohibited from paying any cash dividends to shareholders if, after the payment of such dividend, if its total assets would be less than its total liabilities or where net assets are less than the liquidation value of shares that have a preferential right to participate in First Guaranty Bancshares, Inc.’s assets in the event First Guaranty Bancshares, Inc. were to be liquidated.
First Guaranty Bancshares, Inc. must seek prior approval from the Federal Reserve Bank before paying dividends to its shareholders.
We have not repurchased any shares of our outstanding common stock during the past year.
Stock Performance Graph
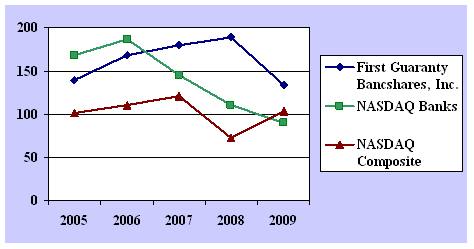
The line graph below compares the cumulative total return for the Company’s common stock with the cumulative total return of both the NASDAQ Stock Market Index for U.S. companies and the NASDAQ Index for bank stocks for the period December 31, 2004 through December 31, 2009. The total return assumes the reinvestment of all dividends and is based on a $100 investment on December 31, 2004. It also reflects the stock price on December 31st of each year shown, although this price reflects only a small number of transactions involving a small number of directors of the Company or affiliates or associates and cannot be taken as an accurate indicator of the market value of the Company’s common stock.
Performance Graph
Cumulative Total Return of First Guaranty Bancshares, Inc. Compared to NASDAQ Bank Index
and NASDAQ Composite Index
| | Total Returns for the Year | |
| | 2005 | 2006 | 2007 | 2008 | 2009 | |
| First Guaranty Bancshares, Inc. | $139 | $168 | $179 | $189 | $133 | |
| NASDAQ Index | $168 | $186 | $145 | $110 | $ 90 | |
| NASDAQ Composite | $101 | $110 | $121 | $ 72 | $103 | |
We have no equity based benefit plans.
The following selected financial data should be read in conjunction with the financial statements, including the related notes, and “Management’s Discussion and Analysis of Financial Condition and Results of Operations,” which are included elsewhere in this Form 10-K. Except for the data under “Performance Ratios,” “Capital Ratios” and “Asset Quality Ratios,” the income statement data and share and per share data for the years ended December 31, 2009, 2008 and 2007 and the balance sheet data as of December 31, 2009 and 2008 are derived from the audited financial statements and related notes which are included elsewhere in this Form 10-K, and the income statement data and share and per share data for the years ended December 31, 2006 and 2005 and the balance sheet data as of December 31, 2 007, 2006 and 2005 are derived from the audited financial statements and related notes that are not included in this Form 10-K.
| | | At or For the Years Ended December 31, | |
| | | 2009 | | | 2008 | | | 2007 | | | 2006 | | | 2005 | |
| | | | | | | | | | | | | | | | |
| | | | | | | | | | | | | | | | |
| Year End Balance Sheet Data: | | | | | | | | | | | | | | | |
| (dollars in thousands) | | | | | | | | | | | | | | | |
| Securities | | $ | 261,829 | | | $ | 139,162 | | | $ | 142,068 | | | $ | 158,352 | | | $ | 175,200 | |
| Federal funds sold | | | 13,279 | | | | 838 | | | | 35,869 | | | | 6,793 | | | | 1,786 | |
| Loans, net of unearned income | | | 589,902 | | | | 606,369 | | | | 575,256 | | | | 507,195 | | | | 491,582 | |
| Allowance for loan losses | | | 7,919 | | | | 6,482 | | | | 6,193 | | | | 6,675 | | | | 7,597 | |
Total assets(1) | | | 930,847 | | | | 871,233 | | | | 807,994 | | | | 715,216 | | | | 713,544 | |
| Total deposits | | | 799,746 | | | | 780,372 | | | | 723,094 | | | | 626,293 | | | | 632,908 | |
| Borrowings | | | 31,929 | | | | 18,122 | | | | 13,494 | | | | 24,568 | | | | 22,132 | |
Stockholders' equity(1) | | | 94,935 | | | | 65,487 | | | | 66,355 | | | | 59,471 | | | | 53,923 | |
Common Stockholders' equity(1) | | | 74,165 | | | | 65,487 | | | | 66,355 | | | | 59,471 | | | | 53,923 | |
| | | | | | | | | | | | | | | | | | | | | |
| Average Balance Sheet Data: | | | | | | | | | | | | | | | | | | | | |
| (dollars in thousands) | | | | | | | | | | | | | | | | | | | | |
| Securities | | $ | 245,952 | | | $ | 127,586 | | | $ | 152,990 | | | $ | 178,419 | | | $ | 109,236 | |
| Federal funds sold | | | 24,662 | | | | 17,247 | | | | 8,083 | | | | 3,115 | | | | 6,028 | |
| Loans, net of unearned income | | | 599,609 | | | | 600,854 | | | | 543,946 | | | | 505,623 | | | | 476,144 | |
| Total earning assets | | | 906,158 | | | | 752,093 | | | | 712,212 | | | | 690,057 | | | | 595,141 | |
| Total assets | | | 948,556 | | | | 797,024 | | | | 751,237 | | | | 726,593 | | | | 631,554 | |
| Total deposits | | | 842,274 | | | | 707,114 | | | | 658,456 | | | | 622,869 | | | | 526,995 | |
| Borrowings | | | 22,907 | | | | 16,287 | | | | 23,450 | | | | 42,435 | | | | 45,732 | |
| Stockholders' equity | | | 77,135 | | | | 67,769 | | | | 63,564 | | | | 56,640 | | | | 54,901 | |
| Stockholders' common equity | | | 70,055 | | | | 67,769 | | | | 63,564 | | | | 56,640 | | | | 54,901 | |
| | | | | | | | | | | | | | | | | | | | | |
| Performance Ratios: | | | | | | | | | | | | | | | | | | | | |
| Return on average assets | | | 0.80 | % | | | 0.69 | % | | | 1.30 | % | | | 1.16 | % | | | 0.95 | % |
| Return on average common equity | | | 10.84 | % | | | 8.13 | % | | | 15.37 | % | | | 14.88 | % | | | 10.89 | % |
Return on average tangible assets(2) | | | 0.80 | % | | | 0.69 | % | | | 1.30 | % | | | 1.16 | % | | | 0.96 | % |
Return on average tangible common equity(3) | | | 11.14 | % | | | 8.77 | % | | | 16.47 | % | | | 15.73 | % | | | 11.24 | % |
| Net interest margin | | | 3.57 | % | | | 4.25 | % | | | 4.79 | % | | | 4.60 | % | | | 4.71 | % |
| Average loans to average deposits | | | 71.19 | % | | | 84.97 | % | | | 82.61 | % | | | 81.18 | % | �� | | 90.35 | % |
Efficiency ratio (1) | | | 60.80 | % | | | 70.73 | % | | | 55.80 | % | | | 51.80 | % | | | 55.44 | % |
| Efficiency ratio (excluding amortization of | | | | | | | | | | | | | |
intangibles and securities transactions) (1) | | | 61.99 | % | | | 61.20 | % | | | 54.59 | % | | | 49.90 | % | | | 53.66 | % |
| Full time equivalent employees (year end) | | | 230 | | | | 225 | | | | 222 | | | | 196 | | | | 189 | |
(1) For the years ended 2006, 2007 and 2008 amounts have been restated to reflect prior period adjustments. See Note 2 to the Consolidated Financial Statements for additional information.
(2) Average tangible assets represent average assets less average core deposit intangibles.
(3) Average tangible equity represents average equity less average core deposit intangibles.
| | | At or For the Years Ended December 31, | |
| | | 2009 | | | 2008 | | | 2007 | | | 2006 | | | 2005 | |
| | | | | | | | | | | | | | | | |
| | | | | | | | | | | | | | | | |
| Capital Ratios: | | | | | | | | | | | | | | | |
| Average stockholders' equity to average assets | | | 8.13 | % | | | 8.50 | % | | | 8.46 | % | | | 7.80 | % | | | 8.69 | % |
Average tangible equity to average tangible assets(1),(2) | | | 7.95 | % | | | 8.25 | % | | | 8.31 | % | | | 7.71 | % | | | 8.51 | % |
Stockholders' equity to total assets(3) | | | 7.97 | % | | | 7.52 | % | | | 8.21 | % | | | 8.32 | % | | | 7.56 | % |
Tier 1 leverage capital(3) | | | 9.58 | % | | | 7.88 | % | | | 7.38 | % | | | 8.11 | % | | | 7.67 | % |
Tier 1 capital(3) | | | 11.90 | % | | | 9.19 | % | | | 10.13 | % | | | 9.85 | % | | | 8.80 | % |
Total risk-based capital(3) | | | 12.97 | % | | | 10.11 | % | | | 11.09 | % | | | 10.96 | % | | | 10.05 | % |
| | | | | | | | | | | | | | | | | | | | | |
| Income Data: | | | | | | | | | | | | | | | | | | | | |
| (dollars in thousands) | | | | | | | | | | | | | | | | | | | | |
| Interest income | | $ | 47,191 | | | $ | 47,661 | | | $ | 55,480 | | | $ | 50,937 | | | $ | 40,329 | |
Interest expense(3) | | | 14,844 | | | | 15,881 | | | | 21,934 | | | | 19,769 | | | | 12,435 | |
Net interest income(3) | | | 32,347 | | | | 31,780 | | | | 33,546 | | | | 31,100 | | | | 27,962 | |
| Provision for loan losses | | | 4,155 | | | | 1,634 | | | | 1,918 | | | | 4,419 | | | | 5,621 | |
| Noninterest income (excluding securities transactions) | | | 5,909 | | | | 5,689 | | | | 5,176 | | | | 4,601 | | | | 5,221 | |
| Securities (losses) gains | | | 2,056 | | | | (1 | ) | | | (478 | ) | | | (234 | ) | | | 7 | |
| Loss on securities impairment | | | (829 | ) | | | (4,611 | ) | | | - | | | | - | | | | - | |
Noninterest expense(3) | | | 24,007 | | | | 23,241 | | | | 21,341 | | | | 18,373 | | | | 18,399 | |
Earnings before income taxes(3) | | | 11,321 | | | | 7,982 | | | | 14,985 | | | | 12,676 | | | | 9,170 | |
Net income(3) | | | 7,595 | | | | 5,512 | | | | 9,772 | | | | 8,431 | | | | 5,979 | |
Net income available to common shareholders(3) | | | 7,001 | | | | 5,512 | | | | 9,772 | | | | 8,431 | | | | 5,979 | |
| | | | | | | | | | | | | | | | | | | | | |
Per Common Share Data:(4) | | | | | | | | | | | | | | | | | | | | |
Net earnings(3) | | $ | 1.26 | | | $ | 0.99 | | | $ | 1.76 | | | $ | 1.52 | | | $ | 1.08 | |
| Cash dividends paid | | | 0.64 | | | | 0.64 | | | | 0.63 | | | | 0.60 | | | | 0.57 | |
Book value(3) | | | 13.34 | | | | 11.78 | | | | 11.94 | | | | 10.70 | | | | 9.70 | |
Dividend payout ratio(3) | | | 50.82 | % | | | 64.53 | % | | | 35.85 | % | | | 39.56 | % | | | 53.07 | % |
| Weighted average number of shares outstanding | | | 5,559,644 | | | | 5,559,644 | | | | 5,559,644 | | | | 5,559,644 | | | | 5,559,644 | |
| Number of shares outstanding (year end) | | | 5,559,644 | | | | 5,559,644 | | | | 5,559,644 | | | | 5,559,644 | | | | 5,559,644 | |
| Market data: | | | | | | | | | | | | | | | | | | | | |
| High | | $ | 25.00 | | | $ | 25.00 | | | $ | 24.30 | | | $ | 23.42 | | | $ | 20.00 | |
| Low | | $ | 12.00 | | | $ | 24.30 | | | $ | 23.42 | | | $ | 18.57 | | | $ | 15.27 | |
| Trading Volume | | | 165,386 | | | | 368,454 | | | | 924,692 | | | | 535,264 | | | | 279,503 | |
| Stockholders of record | | | 1,356 | | | | 1,343 | | | | 1,293 | | | | 1,181 | | | | 1,141 | |
| | | | | | | | | | | | | | | | | | | | | |
| Asset Quality Ratios: | | | | | | | | | | | | | | | | | | | | |
| Nonperforming assets to total assets | | | 1.68 | % | | | 1.14 | % | | | 1.39 | % | | | 1.86 | % | | | 3.08 | % |
| Nonperforming assets to loans | | | 2.65 | % | | | 1.63 | % | | | 1.95 | % | | | 2.62 | % | | | 4.48 | % |
| Loan loss reserve to nonperforming assets | | | 50.68 | % | | | 65.46 | % | | | 55.26 | % | | | 51.53 | % | | | 34.92 | % |
| Net charge-offs to average loans | | | 0.45 | % | | | 0.22 | % | | | 0.50 | % | | | 1.06 | % | | | 0.83 | % |
| Provision for loan loss to average loans | | | 0.69 | % | | | 0.27 | % | | | 0.35 | % | | | 0.87 | % | | | 1.18 | % |
| Allowance for loan loss to total loans | | | 1.34 | % | | | 1.07 | % | | | 1.08 | % | | | 1.32 | % | | | 1.55 | % |
(1) Average tangible assets represents average assets less average core deposit intangibles.
(2) Average tangible equity represents average equity less average core deposit intangibles.
(3) For the years ended 2006, 2007 and 2008 amounts have been restated to reflect prior period adjustments. See Note 2 to the Consolidated Financial Statements for additional information.
(4) For the year ended 2005 amounts have been restated to reflect a stock dividend of one-third of a share of $1 par value common stock for each share of $1 and $5 par value common stock outstanding, accounted for as a four-
for-three stock split, effective and payable to stockholders of record as of October 20, 2005.
First Guaranty Bancshares, Inc. became the holding company for First Guaranty Bank on July 27, 2007 in a corporate reorganization. Prior to becoming the holding company of First Guaranty Bank, First Guaranty Bancshares, Inc. had no assets, liabilities or operations.
This discussion and analysis reflects our financial statements and other relevant statistical data, and is intended to enhance your understanding of our financial condition and results of operations. Reference should be made to those financial statements of this Form 10-K and the selected financial data (above) presented in this report in order to obtain a better understanding of the commentary which follows.
Special Note Regarding Forward-Looking Statements
Congress passed the Private Securities Litigation Act of 1995 in an effort to encourage corporations to provide information about a company’s anticipated future financial performance. This act provides a safe harbor for such disclosure, which protects us from unwarranted litigation, if actual results are different from Management’s expectations. This discussion and analysis contains forward-looking statements and reflects Management’s current views and estimates of future economic circumstances, industry conditions, company performance and financial results. The words “may,” “should,” “expect,” “anticipate,” “intend,” “plan,” “continue,” “believe,” “seek,” “estimate” and similar expressions are intended to identify forward-looking statements. These forward-looking statements are subject to a number of factors and uncertainties, which could cause our actual results and experience to differ from the anticipated results and expectations, expressed in such forward-looking statements.
Application of Critical Accounting Policies
The accounting and reporting policies of the Company conform to generally accepted accounting principles in the United States of America and to predominant accounting practices within the banking industry. Certain critical accounting policies require judgment and estimates which are used in the preparation of the financial statements.
Other-Than-Temporary Impairment of Investment Securities. Securities are evaluated periodically to determine whether a decline in their value is other-than-temporary. The term “other-than-temporary” is not intended to indicate a permanent decline in value. Rather, it means that the prospects for near term recovery of value are not necessarily favorable, or that there is a lack of evidence to support fair values equal to, or greater than, the carrying value of the investment. Management reviews criteria such as the magnitude and duration of the decline, the reasons for the decline, and the performance and valuation of the underlying collateral, when applicable, to predict whether the loss in value is other-than-temporary. Once a decline in value is determined to be other-than-temporary, the carrying value of the security is reduced to its fair value and a corresponding charge to earnings is recognized.
Allowance for Loan Losses. The Company’s most critical accounting policy relates to its allowance for loan losses. The allowance for loan losses is established through a provision for loan losses charged to expense. Loans are charged against the allowance for loan losses when Management believes that the collectability of the principal is unlikely. The allowance, which is based on the evaluation of the collectability of loans and prior loan loss experience, is an amount Management believes will be adequate to reflect the risks inherent in the existing loan portfolio and that exist at the reporting date. The evaluations take into consideration a number of subjective factors including changes in the natu re and volume of the loan portfolio, overall portfolio quality, review of specific problem loans, current economic conditions that may affect a borrower’s ability to pay, adequacy of loan collateral and other relevant factors.
Changes in such estimates may have a significant impact on the financial statements. For further discussion of the allowance for loan losses, see the “Allowance for Loan Losses” section of this analysis and Note 1 to the Consolidated Financial Statements.
Valuation of Goodwill, Intangible Assets and Other Purchase Accounting Adjustments. The Company accounts for goodwill and intangible assets in accordance with FASB ASC 350, Intangibles – Goodwill and Other (SFAS No. 142). Under FASB ASC 350, goodwill and intangible assets deemed to have indefinite lives are no longer amortized, but are subject to annual impairment tests in accordance with the provision of FASB ASC 350. The Company’s goodwill is tested for impairment on an annual basis, or more often if events or circumstances indicate that there may be impairment. A goodwill impairment test includes two steps. Step one, used to identify potential impairment, compares the estimated fair value of a reporting unit with its carrying amount, including goodwill. If the estimated fair value of a reporting unit exceeds its carrying amount, goodwill of the reporting unit is considered not impaired. If the carrying amount of a reporting unit exceeds its estimated fair value, the second step of the goodwill impairment test is performed to measure the amount of impairment loss, if any. Step two of the goodwill impairment test compares the implied estimated fair value of reporting unit goodwill with the carrying amount of that goodwill. If the carrying amount of goodwill for that reporting unit exceeds the implied fair value of that unit’s goodwill, an impairment loss is recognized in an amount equal to that excess. Based on Management’s goodwill impairment tests, there was no impairment of goodwill at December 31, 2009. For additional information on goodwill and intangible assets, see Note 7 to the Consolidated Financial Statements.
Financial Condition
Assets. Total assets at December 31, 2009 were $930.8 million, an increase of $59.6 million, or 6.8%, from $871.2 million at December 31, 2008. Federal funds sold increased $12.4 million from December 31, 2008 to December 31, 2009 and loans for the same period decreased $16.5 million. Cash and due from banks decreased $43.7 from 2008 to 2009. Additionally, total investment securities increased $122.7 million to $261.8 million from December 31, 2008 to December 31, 2009. Total deposits increased by $19.4 million or 2.5% from 2008 to 2009. At December 31, 2009, long-term borrowings were $20.0 million, an increase of $11.6 million or 139.4%, from $8.4 million at December 31, 2008.
Cash and Cash Equivalents. Cash and cash equivalents at December 31, 2009 totaled $46.7 million, a decrease of $31.3 million compared to $78.0 million at December 31, 2008. Cash and due from banks decreased $43.7 million, and federal funds sold increased $12.4 million. The decrease in cash and cash equivalents reflects Management’s decision to increase its investment in higher yielding investment securities.
Investment Securities. The securities portfolio consisted principally of U.S. Government agency securities, mortgage-backed obligations, asset-backed securities, corporate debt securities and mutual funds or other equity securities. The securities portfolio provides us with a relatively stable source of income and provides a balance to interest rate and credit risks as compared to other categories of assets.
The securities portfolio totaled $261.8 million at December 31, 2009, representing an increase of $122.7 million from December 31, 2008. The primary changes in the portfolio consisted of $1.4 billion in purchases, sales totaling $21.8 million, calls and maturities of $1.3 billion. An other-than-temporary impairment charge totaling $0.8 million was taken on six securities during 2009. See Note 4 to the Consolidated Financial Statements for additional information.
At December 31, 2009 approximately 3.5% of the securities portfolio (excluding Federal Home Loan Bank stock) matures in less than one year while securities with maturity dates over 10 years totaled 25.2% of the portfolio. At December 31, 2009, the average maturity of the securities portfolio was 6.3 years, compared to the average maturity at December 31, 2008 of 3.7 years.
At December 31, 2009, securities totaling $249.5 million were classified as available for sale and $12.3 million were classified as held to maturity as compared to $114.4 million and $24.8 million, respectively at December 31, 2008.
Securities classified as available for sale are measured at fair market value. For these securities, the Company obtains fair value measurements from an independent pricing service. The fair value measurements consider observable data that may include dealer quotes, market spreads, cash flows, market yield curves, prepayment speeds, credit information and the instrument’s contractual terms and conditions, among other things. Securities classified as held to maturity are measured at book value. See Note 4 and Note 20 to the Consolidated Financial Statements for additional information.
The book yields on securities available for sale ranged from 0.8% to 19.9% at December 31, 2009, exclusive of the effect of changes in fair value reflected as a component of stockholders’ equity. The book yields on held to maturity securities ranged from 3.6% to 5.3%.
Securities classified as available for sale had gross unrealized losses totaling $2.8 million at December 31, 2009. These losses include $1.6 million in unrealized losses on U.S. Government agency securities, which have been in a loss position for less than 12 months. The Company believes that it will collect all amounts contractually due and has the intent and the ability to hold these securities until the fair value is at least equal to the carrying value. At December 31, 2008, securities classified as available for sale had gross unrealized losses totaling $5.7 million. See Note 4 to the Consolidated Financial Statements for additional information.
Average securities as a percentage of average interest-earning assets were 27.1% and 17.0% at December 31, 2009 and 2008, respectively. This increase reflected, in part, Management’s decision to display a certain amount of funds into investment securities, rather than loans, to manage out interest rate risk, in a low interest rate environment in 2009. At December 31, 2009, $163.6 million of the total securities portfolio did not qualify as pledgeable securities to collateralize repurchase agreements and public funds compared to $54.1 million in securities held at December 31, 2008. At December 31, 2009 and 2008, $154.5 million and $85.4 million in securities were pledged, respectively.
Mortgage Loans Held for Sale. The Company did not hold any mortgage loans for sale at December 31, 2009 or December 31, 2008.
Loans. The origination of loans is the primary use of our financial resources and represents the largest component of earning assets. At December 31, 2009, the loan portfolio (loans, net of unearned income) totaled $589.9 million, a decrease of approximately $16.5 million, or 2.7%, from the December 31, 2008 level of $606.4 million. The decrease in net loans primarily includes a reduction of $13.3 million in real estate construction and land development loans and a reduction of $23.2 million in commercial and industrial loans, partially offset with an increase of $38.9 million in non-farm non-residential loans secured by real estate.
Loans to related parties are included in total loans. Related parties include the Company’s executive officers, directors and certain business organizations and individuals with which such persons are associated. At December 31, 2009 and 2008, loans to related parties totaled $23.3 million and $22.5 million, respectively. See Note 14 to the Consolidated Financial Statements for additional information.
Loans represented 73.8% of deposits at December 31, 2009, compared to 77.7% of deposits at December 31, 2008. Loans secured by real estate increased $11.9 million to $477.1 million at December 31, 2009. Commercial and industrial loans decreased $23.2 million to $82.3 million at December 31, 2009. Real estate and related loans comprised 80.9% of the portfolio in 2009 as compared to 76.7% in 2008. Commercial and industrial loans comprised 14.0% of the portfolio in 2009 as compared to 17.4% in 2008.
Loan charge-offs taken during 2009 totaled $2.9 million, compared to charge-offs of $1.6 million in 2008. Of the loan charge-offs in 2009, approximately $1.6 million were loans secured by real estate, $0.7 million were commercial and industrial loans and $0.6 million were consumer and other loans. In 2009, recoveries of $0.2 million were recognized on loans previously charged off as compared to $0.3 million in 2008.
Nonperforming Assets. Nonperforming assets were $15.6 million, or 1.7% of total assets at December 31, 2009, compared to $9.9 million, or 1.1% of total assets at December 31, 2008. The increase resulted from a $5.1 million, or 55.4%, increase in nonaccrual loans, an increase of $0.6 million in 90 days past due loans and an increase of $0.1 million in other real estate. The increase in nonaccrual loans was primarily in construction and land development, one-to-four family residential, non-farm non-residential and commercial and industrial loans. The increase in other real estate was primarily the result of an increase in non-farm nonresidential properties.
Deposits. Total deposits increased by $19.4 million or 2.5%, to $799.7 million at December 31, 2009 from $780.4 million at December 31, 2008. In 2009, noninterest-bearing demand deposits increased $13.6 million, interest-bearing demand deposits increased $8.0 million and savings deposits decreased $1.1 million. Time deposits decreased $1.1 million, or 0.3% which includes brokered deposits totaling $10.1 million in reciprocal time deposits acquired from the Certificate of Deposit Account Registry Service (CDARS). The increase in deposits was due to a $23.3 million decrease in individual and business deposits offset with a $42.7 million increase in public fund deposits. The increase in public fund deposits was the primary result of three municipalities’ elevated deposit balan ces.
Public fund deposits totaled $268.5 million or 33.6% of total deposits at December 31, 2009. At December 31, 2008, public fund deposits represented 28.9% of total deposits with a balance of $225.8 million.
Borrowings. Short-term borrowings increased $2.2 million in 2009 to $11.9 million at December 31, 2009 from $9.8 million at December 31, 2008. Short-term borrowings are used to manage liquidity on a daily or otherwise short-term basis. The short-term borrowings at December 31, 2009 and 2008, respectively was solely comprised of repurchase agreements. Overnight repurchase agreement balances are monitored daily for sufficient collateralization.
Long-term borrowings increased $11.6 million to $20.0 million at December 31, 2009, compared to $8.4 million at December 31, 2008. At December 31, 2009, two long-term advances were outstanding at FHLB, one totaling $10.0 million with a rate of 0.9% and a maturity date of December 1, 2010 and the other totaling $10.0 million with a rate of 0.5% and a maturity date of December 20, 2010. At December 31, 2008, there was one long-term advance outstanding at FHLB totaling $8.4 million.
Stockholders’ Equity. Total stockholders’ equity increased $29.4 million or 45.0% to $94.9 million at December 31, 2009 from $65.5 million at December 31, 2008. The increase in stockholders’ equity includes $19.6 million and $1.1 million of preferred stock, Series A and Series B respectively, issued in August 2009 to the Treasury Department. See Note 11 to the Consolidated Financial Statements for additional information. In addition, stockholders’ equity reflected consolidated net income of $7.6 million during 2009 and changes in unrealized losses on available for sale securities totaling $5.2 million, offset by common stock dividends paid totaling $3.6 million and preferred stock dividends paid totaling $0.6. See N ote 4 to the Consolidated Financial Statements for additional information.
Loan Portfolio Composition. The following table sets forth the composition of our loan portfolio, excluding loans held for sale, by type of loan at the dates indicated.
| | | December 31, |
| | | 2009 | | 2008 | | 2007 |
| | | | | | As % of | | | | | As % of | | | | | As % of |
| | | Balance | | | Category | | Balance | | | Category | | Balance | | | Category |
| | | (dollars in thousands) |
| Real estate | | | | | | | | | | | | | | | | | | |
| Construction & land development | | $ | 78,686 | | | | 13.3 | % | | $ | 92,029 | | | | 15.2 | % | | $ | 98,127 | | | | 17.0 | % |
| Farmland | | | 11,352 | | | | 1.9 | % | | | 16,403 | | | | 2.7 | % | | | 23,065 | | | | 4.0 | % |
| 1-4 Family | | | 77,470 | | | | 13.1 | % | | | 79,285 | | | | 13.1 | % | | | 84,640 | | | | 14.7 | % |
| Multifamily | | | 8,927 | | | | 1.5 | % | | | 15,707 | | | | 2.6 | % | | | 13,061 | | | | 2.3 | % |
| Non-farm non-residential | | | 300,673 | | | | 51.0 | % | | | 261,744 | | | | 43.0 | % | | | 236,474 | | | | 41.1 | % |
| Total real estate | | | 477,108 | | | | 80.8 | % | | | 465,168 | | | | 76.6 | % | | | 455,367 | | | | 79.1 | % |
| | | | | | | | | | | | | | | | | | | | | | | | | |
| Agricultural | | | 14,017 | | | | 2.4 | % | | | 18,536 | | | | 3.0 | % | | | 16,816 | | | | 2.9 | % |
| Commercial and industrial | | | 82,348 | | | | 13.9 | % | | | 105,555 | | | | 17.4 | % | | | 81,073 | | | | 14.1 | % |
| Consumer and other | | | 17,226 | | | | 2.9 | % | | | 17,926 | | | | 3.0 | % | | | 22,517 | | | | 3.9 | % |
| Total loans before unearned income | | | 590,699 | | | | 100.0 | % | | | 607,185 | | | | 100.0 | % | | | 575,773 | | | | 100.0 | % |
| Less: unearned income | | | (797 | ) | | | | | | | (816 | ) | | | | | | | (517 | ) | | | | |
| Total loans net of unearned income | | $ | 589,902 | | | | | | | $ | 606,369 | | | | | | | $ | 575,256 | | | | | |
| | | | | | | | | | | | | | | | | | | | | | | | | |
| | | | | | | | | | | | | | | | | | | | | | | | | |
| | | December 31, | | | | | | | | |
| | | 2006 | | 2005 | | | | | | | | |
| | | | | | | As % of | | | | | | As % of | | | | | | | | |
| | | Balance | | | Category | | Balance | | | Category | | | | | | | | |
| | | (dollars in thousands) | | | | | | | | |
| Real estate | | | | | | | | | | | | | | | | | | | | | | | | |
| Construction & land development | | $ | 49,837 | | | | 9.9 | % | | $ | 67,099 | | | | 13.6 | % | | | | | | | | |
| Farmland | | | 25,582 | | | | 5.0 | % | | | 24,903 | | | | 5.1 | % | | | | | | | | |
| 1-4 Family | | | 67,022 | | | | 13.2 | % | | | 78,789 | | | | 16.0 | % | | | | | | | | |
| Multifamily | | | 14,702 | | | | 2.9 | % | | | 11,125 | | | | 2.3 | % | | | | | | | | |
| Non-farm non-residential | | | 256,176 | | | | 50.5 | % | | | 223,622 | | | | 45.5 | % | | | | | | | | |
| Total real estate | | | 413,319 | | | | 81.5 | % | | | 405,538 | | | | 82.5 | % | | | | | | | | |
| | | | | | | | | | | | | | | | | | | | | | | | | |
| Agricultural | | | 16,359 | | | | 3.2 | % | | | 11,490 | | | | 2.3 | % | | | | | | | | |
| Commercial and industrial | | | 59,072 | | | | 11.6 | % | | | 54,740 | | | | 11.1 | % | | | | | | | | |
| Consumer and other | | | 18,880 | | | | 3.7 | % | | | 20,078 | | | | 4.1 | % | | | | | | | | |
| Total loans before unearned income | | | 507,630 | | | | 100.0 | % | | | 491,846 | | | | 100.0 | % | | | | | | | | |
| Less: unearned income | | | (435 | ) | | | | | | | (264 | ) | | | | | | | | | | | | |
| Total loans net of unearned income | | $ | 507,195 | | | | | | | $ | 491,582 | | | | | | | | | | | | | |
| | | | | | | | | | | | | | | | | | | | | | | | | |
The four most significant categories of our loan portfolio are construction and land development real estate loans, 1-4 family residential loans, non-farm non-residential real estate loans and commercial and industrial loans.
The Company’s credit policy dictates specific loan-to-value and debt service coverage requirements. The Company generally requires a maximum loan-to-value of 85% and a debt service coverage ratio of 1.25x to 1.0x for non-farm non-residential real estate loans. In addition, personal guarantees of borrowers are required as well as applicable hazard, title and flood insurance. Loans may have a maximum maturity of five years and a maximum amortization of 25 years. The Company may require additional real estate or non-real estate collateral when deemed appropriate to secure the loan.
The Company generally requires all one- to four- family residential loans to be underwritten based on the Fannie Mae guidelines provided through Desktop Underwriter. These guidelines include the evaluation of risk and eligibility, verification and approval of conditions, credit and liabilities, employment and income, assets, property and appraisal information. It is required that all borrowers have proper hazard, flood and title insurance prior to a loan closing. Appraisals and Desktop Underwriter approvals are good for six months. The Company has an in-house underwriter review the final package for compliance to these guidelines.
The Company generally requires a maximum loan-to value of 75% and a debt service coverage ratio of 1.25x to 1.0x for construction land development loans. In addition, detailed construction cost breakdowns, personal guarantees of borrowers and applicable hazard, title and flood insurance are required. Loans may have a maximum maturity of 12 months for the construction phase and a maximum maturity of 24 months for the sell-out phase. The Company may require additional real estate or non-real estate collateral when deemed appropriate to secure the loan.
The Company has specific guidelines for the underwriting of commercial and industrial loans that is specific for the collateral type and the business type. Commercial and industrial loans are secured by non-real estate collateral such as equipment, inventory or accounts receivable. Each of these collateral types has maximum loan to value ratios. Commercial and industrial loans have the same debt service coverage ratio requirements as other loans, which is 1.25x to 1.0x.
The Company will allow exceptions to each of the above policies with appropriate mitigating circumstances and approvals. The Company has a defined credit underwriting process for all loan requests. The Company actively monitors loan concentrations by industry type and will make adjustments to underwriting standards as deemed necessary. The Company has a loan review department that monitors the performance and credit quality of loans. The Company has a special assets department that manages loans that have become delinquent or have serious credit issues associated with them.
For new loan originations, appraisals and evaluations on all properties shall be valid for a period not to exceed two calendar years from the effective appraisal date for non-residential properties and one calendar year from the effective appraisal date for residential properties. However, an appraisal may be valid longer if there has been no material decline in the property condition or market condition that would negatively affect the bank’s collateral position. This must be supported with a “Validity Check Memorandum”.
For renewals with or without new money, any commercial appraisal greater than two years or greater than one year for residential appraisals must be updated with a Validity Check Memorandum. Any renewal loan request, in which new money will be disbursed, whether commercial or residential, and the appraisal is older than five years a new appraisal must be obtained.
The Company does not require new appraisals between renewals unless the loan becomes impaired and is considered collateral dependent. At this time, an appraisal may be ordered in accordance with the Company’s Allowance for Loan Losses policy.
The Company does not mitigate risk using products such as credit default agreements and/or credit derivatives. These, accordingly, have no impact on our financial statements.
The Company does not offer loan products with established loan-funded interest reserves.
Loan Maturities by Type. The following table summarizes the scheduled repayments of our loan portfolio at December 31, 2009. Loans having no stated repayment schedule or maturity and overdraft loans are reported as being due in one year or less. Maturities are based on the final contractual payment date and do not reflect the effect of prepayments and scheduled principal amortization.
| | | One Year | | | One Through | | | After | | | | |
| | | or Less | | | Five Years | | | Five Years | | | Total | |
| | | (in thousands) | |
| Real estate: | | | | | | | | | | | | |
| Construction and land development | | $ | 48,386 | | | $ | 30,233 | | | $ | 67 | | | $ | 78,686 | |
| Farmland | | | 8,038 | | | | 1,370 | | | | 1,944 | | | | 11,352 | |
| 1-4 Family | | | 26,479 | | | | 23,465 | | | | 27,526 | | | | 77,470 | |
| Multifamily | | | 1,991 | | | | 5,611 | | | | 1,325 | | | | 8,927 | |
| Non-farm non-residential | | | 167,092 | | | | 126,397 | | | | 7,184 | | | | 300,673 | |
| Total real estate | | | 251,986 | | | | 187,076 | | | | 38,046 | | | | 477,108 | |
| | | | | | | | | | | | | | | | | |
| Agricultural | | | 7,369 | | | | 3,422 | | | | 3,226 | | | | 14,017 | |
| Commercial and industrial | | | 48,169 | | | | 34,144 | | | | 35 | | | | 82,348 | |
| Consumer and other | | | 10,070 | | | | 7,042 | | | | 114 | | | | 17,226 | |
| Total loans before unearned income | | $ | 317,594 | | | $ | 231,684 | | | $ | 41,421 | | | $ | 590,699 | |
| Less: unearned income | | | | | | | | | | | | | | | (797 | ) |
| Total loans net of unearned income | | | | | | | | | | | $ | 589,902 | |
| | | | | | | | | | | | | | | | | |
The following table sets forth the scheduled contractual maturities at December 31, 2009 of fixed- and floating-rate loans excluding non-accrual loans.
| | | December 31, 2009 | |
| | | Fixed | | | Floating | | | Total | |
| | | (in thousands) | |
| | | | | | | | | | |
| One year or less | | $ | 224,963 | | | $ | 77,651 | | | $ | 302,614 | |
| One to five years | | | 229,276 | | | | 2,408 | | | | 231,684 | |
| Five to 15 years | | | 25,122 | | | | - | | | | 25,122 | |
| Over 15 years | | | 16,299 | | | | - | | | | 16,299 | |
| Subtotal | | | 495,660 | | | | 80,059 | | | | 575,719 | |
| Nonaccrual loans | | | | | | | | | | | 14,183 | |
| Total loans net of unearned income | | $ | 495,660 | | | $ | 80,059 | | | $ | 589,902 | |
| | | | | | | | | | | | | |
At December 31, 2009, total loans include $273.1 million in loans maturing after December 31, 2010. At December 31, 2009, fixed rate loans totaled $495.7 million or 84.0% of total loans, an increase from 51.0% of total loans for the same period in 2008. Throughout 2009, Management added floors to floating rate loans, primarily tied to prime rate. If the floor is higher than the current indexed loan rate, then the loan is classified as a fixed rate loan until such time as the floor equals the indexed loan rate.
Non-Performing Assets. The table below sets forth the amounts and categories of our non-performing assets at the dates indicated.
| | | At December 31, | |
| | | 2009 | | | 2008 | | | 2007 | | | 2006 | | | 2005 | |
| | | (dollars in thousands) | |
| Non-accrual loans: | | | | | | | | | | | | | | | |
| Real estate loans: | | | | | | | | | | | | | | | |
| Construction and land development | | $ | 2,841 | | | $ | 1,644 | | | $ | 1,841 | | | $ | 2,676 | | | $ | 16,376 | |
| Farmland | | | 54 | | | | 182 | | | | 419 | | | | 33 | | | | - | |
| 1 - 4 family residential | | | 2,814 | | | | 1,445 | | | | 1,819 | | | | 3,202 | | | | 3,548 | |
| Multifamily | | | - | | | | - | | | | 2 | | | | - | | | | - | |
| Non-farm non-residential | | | 7,439 | | | | 5,263 | | | | 4,950 | | | | 3,882 | | | | 153 | |
| Non-real estate loans: | | | | | | | | | | | | | | | | | | | | |
| Agricultural | | | - | | | | - | | | | - | | | | - | | | | - | |
| Commercial and industrial | | | 830 | | | | 275 | | | | 978 | | | | 267 | | | | 358 | |
| Consumer and other | | | 205 | | | | 320 | | | | 279 | | | | 302 | | | | 655 | |
| Total non-accrual loans | | | 14,183 | | | | 9,129 | | | | 10,288 | | | | 10,362 | | | | 21,090 | |
| | | | | | | | | | | | | | | | | | | | | |
| Loans 90 days and greater delinquent | | | | | | | | | | | | | | | | | |
| and still accruing: | | | | | | | | | | | | | | | | | | | | |
| Real estate loans: | | | | | | | | | | | | | | | | | | | | |
| Construction and land development | | | - | | | | - | | | | - | | | | - | | | | - | |
| Farmland | | | - | | | | - | | | | - | | | | - | | | | - | |
| 1 - 4 family residential | | | 757 | | | | 185 | | | | 544 | | | | 334 | | | | 248 | |
| Multifamily | | | - | | | | - | | | | - | | | | - | | | | - | |
| Non-farm non-residential | | | - | | | | - | | | | - | | | | - | | | | - | |
| Non-real estate loans: | | | | | | | | | | | | | | | | | | | | |
| Agricultural | | | - | | | | - | | | | - | | | | - | | | | - | |
| Commercial and industrial | | | - | | | | 17 | | | | - | | | | - | | | | - | |
| Consumer and other | | | 28 | | | | 3 | | | | 3 | | | | - | | | | - | |
| Total loans 90 days greater | | | | | | | | | | | | | | | | | | | | |
| delinquent and still accruing | | | 785 | | | | 205 | | | | 547 | | | | 334 | | | | 248 | |
| | | | | | | | | | | | | | | | | | | | | |
| Restructured loans | | | - | | | | - | | | | - | | | | 51 | | | | 121 | |
| | | | | | | | | | | | | | | | | | | | | |
| Total non-performing loans | | | 14,968 | | | | 9,334 | | | | 10,835 | | | | 10,747 | | | | 21,459 | |
| | | | | | | | | | | | | | | | | | | | | |
| Real estate owned: | | | | | | | | | | | | | | | | | | | | |
| Construction and land development | | | - | | | | 89 | | | | 84 | | | | 2,217 | | | | - | |
| Farmland | | | - | | | | - | | | | - | | | | - | | | | 144 | |
| 1 - 4 family residential | | | 292 | | | | 223 | | | | 170 | | | | 78 | | | | 81 | |
| Multifamily | | | - | | | | - | | | | - | | | | - | | | | - | |
| Non-farm non-residential | | | 366 | | | | 256 | | | | 119 | | | | 245 | | | | 321 | |
| Non-real estate loans: | | | | | | | | | | | | | | | | | | | | |
| Agricultural | | | - | | | | - | | | | - | | | | - | | | | - | |
| Commercial and industrial | | | - | | | | - | | | | - | | | | - | | | | - | |
| Consumer and other | | | - | | | | - | | | | - | | | | - | | | | - | |
| Total real estate owned | | | 658 | | | | 568 | | | | 373 | | | | 2,540 | | | | 546 | |
| | | | | | | | | | | | | | | | | | | | | |
| Total non-performing assets | | $ | 15,626 | | | $ | 9,902 | | | $ | 11,208 | | | $ | 13,287 | | | $ | 22,005 | |
| | | | | | | | | | | | | | | | | | | | | |
| Ratios: | | | | | | | | | | | | | | | | | | | | |
| Non-performing assets to total loans | | | 2.65 | % | | | 1.63 | % | | | 1.95 | % | | | 2.62 | % | | | 4.48 | % |
| Non-performing assets to total assets | | | 1.68 | % | | | 1.14 | % | | | 1.39 | % | | | 1.86 | % | | | 3.08 | % |
For the years ended December 31, 2009 and 2008, gross interest income that would have been recorded had our non-accruing loans been current in accordance with their original terms was $0.4 million and $0.5 million, respectively. Interest income recognized on such loans for 2009 was $1.1 million.
Nonperforming assets totaled $15.6 million or 1.7% of total assets at December 31, 2009, an increase of $5.7 million from December 31, 2008. Management has not identified additional information on any loans not already included in impaired loans or the nonperforming asset total that indicates possible credit problems that could cause doubt as to the ability of borrowers to comply with the loan repayment terms in the future.
Nonaccrual loans increased $5.1 million from December 31, 2008 to December 31, 2009. There were increases in construction and land development nonaccrual loans, one- to four- family nonaccrual loans, nonfarm nonresidential nonaccrual loans and commercial and industrial nonaccrual loans.
During 2009, there was a $1.2 million increase in construction and land development nonaccrual loans. The increase in nonaccrual construction and land development loans is partially related to one loan for $522,000 secured by a subdivision development consisting of 17 remaining lots and 6.32 acres of excess land. The loan to value is 58% and the property was appraised for $896,000 in February 2005. The Company is currently in foreclosure and Management does not anticipate any loss. In addition, there is a townhome development in which the Company has four of the units financed totaling approximately $600,000. This loan had a loan to value of 83%. In the fourth quarter of 2007, the properties securing this loan were appraised at $180,000 each. The Company asked the borrower to pay the loans in full but the borrower was unable to do so. The Company has filed suit to repossess the property and is currently awaiting the foreclosure sale. Also included in nonaccrual construction and land development loans are two loans which account for a significant portion of the total. One is in the amount of $1.7 million which we are the participant of approximately $800,000. The collateral is a subdivision development in a neighboring parish and the lead bank has filed suit to foreclose on the property. Since the beginning of 2009, approximately $1.4 million in construction and land development nonaccrual loans have been removed through foreclosures and payoffs.
There was a $1.4 million increase in one- to four- family residential nonaccrual loans during 2009. The increase in nonaccrual one- to four- family residential loans resulted from a loan in the amount of $578,000 secured by several rental houses in the Baton Rouge area. The borrower has filed Chapter 11 bankruptcy and the Company is waiting for a plan of repayment to be filed with the bankruptcy court. The Company has not been able to determine the level of exposure, if any, it will experience as a result of the bankruptcy of the borrower. The Company is now receiving adequate protection payments from the bankruptcy court. Also, we have added a loan in the amount of $800,000 which is secured by two townhomes and five lots in a golf course community. One of the townhomes was sold in October 2009. The borrower is continuing to attempt to liquidate the remaining collateral to pay down the loan. Also included in this category are two loans in the amounts of $194,000 and $120,000 that are properties which were flooded during Hurricane Katrina. The borrowers have received commitments from the state to assist in funding the rebuilding of the properties.
Non-farm non-residential nonaccrual loans increased $2.2 million from December 31, 2008 to December 31, 2009. The increase is primarily from a $4.4 million loan secured by a hotel in Hattiesburg, Mississippi. We are currently negotiating with the borrower on a possible workout scenario. The primary cause of this loan moving into nonacccrual relates to the borrower’s health, which has resulted in poor management, as well as a decline in the hotel industry. The increase was primarily offset by a $2.6 million loan secured by a church and various other real estate properties, which began performing to its terms, therefore was removed from non-accrual loans.
Non-real estate commercial and industrial nonaccrual loans increased $0.6 million during 2009. The largest loan in this category totals $454,000 and is unsecured. The borrower is in Chapter 11 bankruptcy and has reflected a net worth in excess of $20 million on the bankruptcy schedules. A plan is being developed to allocate cash from one of the borrower’s partnerships to pay the unsecured creditors. Although this loan is unsecured, the Company currently anticipates receiving 100% payment. Another loan in this category totals $178,000 and is secured by dental equipment. We are in the process of obtaining a judgment on this credit. There are also some smaller loans included in this nonaccrual category. One is in the amount of $86,000 and the Company is in the process of taking a mortgage on the guarantor’s home to pay down a portion of the debt and renew the balance.
Allowance for Loan Losses. The allowance for loan losses is maintained at a level considered sufficient to absorb potential losses embedded in the loan portfolio. The allowance is increased by the provision for anticipated loan losses as well as recoveries of previously charged off loans and is decreased by loan charge-offs. The provision is the necessary charge to current expense to provide for current loan losses and to maintain the allowance at an adequate level commensurate with Management’s evaluation of the risks inherent in the loan portfolio. Various factors are taken into consideration when determining the amount of the provision and the adequacy of the allowance. These factors include but are not limited to:
· past due and nonperforming assets;
· specific internal analysis of loans requiring special attention;
· the current level of regulatory classified and criticized assets and the associated risk factors with each;
· changes in underwriting standards or lending procedures and policies;
· charge-off and recovery practices;
· national and local economic and business conditions;
· nature and volume of loans;
· overall portfolio quality;
· adequacy of loan collateral;
· quality of loan review system and degree of oversight by its Board of Directors;
· competition and legal and regulatory requirements on borrowers;
· examinations and review by our internal loan review department and independent accountants; and
· examinations of the loan portfolio by federal and state regulatory agencies.
The data collected from all sources in determining the adequacy of the allowance is evaluated on a regular basis by Management with regard to current national and local economic trends, prior loss history, underlying collateral values, credit concentrations and industry risks. An estimate of potential loss on specific loans is developed in conjunction with an overall risk evaluation of the total loan portfolio. This evaluation is inherently subjective as it requires estimates that are susceptible to significant revision as new information becomes available.
The allowance consists of specific, general and unallocated components. The specific component relates to loans that are classified as doubtful, substandard or special mention. For such loans that are also classified as impaired, an allowance is established when the discounted cash flows (or collateral value or observable market price) of the impaired loan is lower than the carrying value of that loan. The general component covers non-classified loans and is based on historical loss experience adjusted for qualitative factors. An unallocated component is maintained to cover uncertainties that could affect the estimate of probable losses. The unallocated component of the allowance reflects the margin of imprecision inherent in the underlying assumptions used in the methodologies for estimating specific and general losses in the portfolio.
Allocation of Allowance for Loan Losses. In prior years, the Company used an internal method to calculate the allowance for loan losses which categorized loans by risk rather than by type. We do not have the ability to accurately and efficiently provide the allocation of the allowance for loan losses by loan type for a five-year historical period. Beginning in 2008, the Company modified the allowance calculation to segregate loans by category and allocate the allowance for loan losses accordingly.
The allowance for loan losses calculation considers both qualitative and quantitative risk factors. The quantitative risk factors include, but are not limited to, past due and nonperforming assets, adequacy of collateral, changes in underwriting standings or lending procedures and policies, specific internal analysis of loans requiring special attention and the nature and volume of loans. Qualitative risk factors include, but are not limited to, local and regional business conditions and other economic factors.
The following table shows the allocation of the allowance for loan losses by loan type as of December 31, 2009 and 2008.
| | | At December 31, | |
| | | 2009 | | | 2008 | |
| | | | | | Percent of | | | | | | Percent of | |
| | | Allowance | | | loans in each | | | Allowance | | | Loans in Each | |
| | | for Loan | | | category to | | | for Loan | | | Category to | |
| | | Losses | | | total loans | | | Losses | | | Total Loans | |
| | | (dollars in thousands) | |
| Real estate loans: | | | | | | | | | | | | |
| Construction and land development | | $ | 1,176 | | | | 13.3 | % | | $ | 315 | | | | 15.2 | % |
| Farmland | | | 56 | | | | 1.9 | % | | | 39 | | | | 2.7 | % |
| 1 - 4 family residential | | | 2,466 | | | | 13.1 | % | | | 1,712 | | | | 13.1 | % |
| Multifamily | | | 128 | | | | 1.5 | % | | | 227 | | | | 2.6 | % |
| Non-farm non-residential | | | 2,727 | | | | 51.0 | % | | | 2,572 | | | | 43.0 | % |
| Non-real estate loans: | | | | | | | | | | | | | | | | |
| Agricultural | | | 82 | | | | 2.4 | % | | | 92 | | | | 3.0 | % |
| Commercial and industrial | | | 1,031 | | | | 13.9 | % | | | 1,119 | | | | 17.4 | % |
| Consumer and other | | | 246 | | | | 2.9 | % | | | 355 | | | | 3.0 | % |
| Unallocated | | | 7 | | | | N/A | | | | 51 | | | | N/A | |
| Total | | $ | 7,919 | | | | 100.0 | % | | $ | 6,482 | | | | 100.0 | % |
| | | | | | | | | | | | | | | | | |
The following table sets forth activity in our allowance for loan losses for the periods indicated.
| | | At or For the Years Ended December 31, | |
| | | 2009 | | | 2008 | | | 2007 | | | 2006 | | | 2005 | |
| | | (dollars in thousands) | |
| | | | | | | | | | | | | | | | |
| Balance at beginning of period | | $ | 6,482 | | | $ | 6,193 | | | $ | 6,675 | | | $ | 7,597 | | | $ | 5,910 | |
| | | | | | | | | | | | | | | | | | | | | |
| Charge-offs: | | | | | | | | | | | | | | | | | | | | |
| Real estate loans: | | | | | | | | | | | | | | | | | | | | |
| Construction and land development | | | (448 | ) | | | (166 | ) | | | (386 | ) | | | (5,008 | ) | | | - | |
| Farmland | | | - | | | | (10 | ) | | | (123 | ) | | | - | | | | - | |
| 1 - 4 family residential | | | (564 | ) | | | (260 | ) | | | (639 | ) | | | (59 | ) | | | (2,001 | ) |
| Multifamily | | | - | | | | - | | | | - | | | | - | | | | - | |
| Non-farm non-residential | | | (586 | ) | | | (256 | ) | | | (1,901 | ) | | | (208 | ) | | | - | |
| Commercial and industrial loans | | | (678 | ) | | | (561 | ) | | | (273 | ) | | | (301 | ) | | | (1,649 | ) |
| Consumer and other | | | (603 | ) | | | (360 | ) | | | (563 | ) | | | (312 | ) | | | (512 | ) |
| Total charge-offs | | | (2,879 | ) | | | (1,613 | ) | | | (3,885 | ) | | | (5,888 | ) | | | (4,162 | ) |
| | | | | | | | | | | | | | | | | | | | | |
| Recoveries: | | | | | | | | | | | | | | | | | | | | |
| Real estate loans: | | | | | | | | | | | | | | | | | | | | |
| Construction and land development | | | 1 | | | | 2 | | | | 779 | | | | 39 | | | | - | |
| Farmland | | | 1 | | | | - | | | | 14 | | | | - | | | | - | |
| 1 - 4 family residential | | | 15 | | | | 10 | | | | 14 | | | | 25 | | | | 5 | |
| Multifamily | | | - | | | | - | | | | - | | | | - | | | | - | |
| Non-farm non-residential | | | - | | | | 57 | | | | 4 | | | | 40 | | | | - | |
| Commercial and industrial loans | | | 28 | | | | 10 | | | | 148 | | | | 304 | | | | 86 | |
| Consumer and other | | | 116 | | | | 189 | | | | 201 | | | | 139 | | | | 137 | |
| Total recoveries | | | 161 | | | | 268 | | | | 1,160 | | | | 547 | | | | 228 | |
| | | | | | | | | | | | | | | | | | | | | |
| Net charge-offs | | | (2,718 | ) | | | (1,345 | ) | | | (2,725 | ) | | | (5,341 | ) | | | (3,934 | ) |
| Provision for loan losses | | | 4,155 | | | | 1,634 | | | | 1,918 | | | | 4,419 | | | | 5,621 | |
| Additional provision from acquisition | | | - | | | | - | | | | 325 | | | | - | | | | - | |
| | | | | | | | | | | | | | | | | | | | | |
| Balance at end of period | | $ | 7,919 | | | $ | 6,482 | | | $ | 6,193 | | | $ | 6,675 | | | $ | 7,597 | |
| | | | | | | | | | | | | | | | | | | | | |
| Ratios: | | | | | | | | | | | | | | | | | | | | |
| Net loan charge-offs to average loans | | | 0.45 | % | | | 0.22 | % | | | 0.50 | % | | | 1.06 | % | | | 0.83 | % |
| Net loan charge-offs to loans at end of period | | | 0.46 | % | | | 0.22 | % | | | 0.47 | % | | | 1.05 | % | | | 0.80 | % |
| Allowance for loan losses to loans at end of period | | | 1.34 | % | | | 1.07 | % | | | 1.08 | % | | | 1.32 | % | | | 1.55 | % |
| Net loan charge-offs to allowance for loan losses | | | 34.32 | % | | | 20.75 | % | | | 44.00 | % | | | 80.01 | % | | | 51.78 | % |
| Net loan charge-offs to provision charged to expense | | | 65.42 | % | | | 82.32 | % | | | 142.04 | % | | | 120.86 | % | | | 69.99 | % |
Investment Securities Portfolio. The securities portfolio totaled $261.8 million at December 31, 2009 and consisted principally of U.S. Government agency securities, mortgage-backed obligations, asset-backed securities, corporate debt securities, mutual funds or other equity securities and municipal bonds. The portfolio provides us with a relatively stable source of income and provides a balance to interest rate and credit risks as compared to other categories of the balance sheet.
U.S. Government Agency, also known as Government Sponsored Enterprises (GSEs), are privately owned but federally chartered companies. While they enjoy certain competitive advantages as a result of their government charters, their debt obligations are unsecured and are not direct obligations of the U.S. Government. However, debt securities issued by GSEs are considered to be of high credit quality and the senior debt of GSEs is AAA rated. GSEs raise funds through a variety of debt issuance programs, including:
· Federal Home Loan Mortgage Corporation (Freddie Mac)
· Federal National Mortgage Association (Fannie Mae)
· Federal Home Loan Bank (FHLB)
· Federal Farm Credit Bank System (FFCB)
With the variety of GSE-issued debt securities and programs available, investors may benefit from a unique combination of high credit quality, liquidity, pricing transparency and cash flows that can be customized to closely match their objectives.
Mortgage-backed securities (MBS) represent an investment in mortgage loans. An MBS investor owns an interest in a pool of mortgages, which serves as the underlying assets and source of cash flow for the security. The loans backing the MBS are issued by a national network of lenders consisting of mortgage bankers, savings and loan associations, commercial banks and other lending institutions. MBS are issued by Government National Mortgage Association (GNMA or Ginnie Mae), Federal Home Loan Mortgage Corporation (FHLMC or Freddie MAC) and Federal National Mortgage Association (FNMA or Fannie Mae). Mortgage-backed securities typically carry some of the highest yields of any government or agency security. The secondary market is generally large and liquid, with activ e trading by dealers and investors.
The risks associated with MBS include interest rate risk (refinancing risk), prepayment risk and extension risk.
Asset-backed securities (ABS) are securities whose value and income payments are derived from and collateralized (or "backed") by a specified pool of underlying assets. The pool of assets is typically a group of small and illiquid assets that are unable to be sold individually. Pooling the assets allows them to be sold to general investors, a process called securitization, and allows the risk of investing in the underlying assets to be diversified because each security will represent a fraction of the total value of the diverse pool of underlying assets. The pools of underlying assets can include common payments from credit cards, auto loans, and mortgage loans, to esoteric cash flows from aircraft leases, royalty payments and movie revenues.
As with all fixed-income securities, the prices of ABS fluctuate in response to changing interest rates in the general economy. When interest rates fall, prices rise, and vice versa. Prices of ABS with floating rates are much less affected because the index against which the ABS rate adjusts reflects external interest-rate changes. Some ABS are subject to another type of interest rate risk—the risk that a change in rates may influence the pace of prepayments of the underlying loans, which, in turn, affects yields. Most revolving ABS are also subject to early-amortization events—also known as payout events or early calls. Another risk, is the risk of default. This is most often thought of as a borrower’s failure to make timely interest and princ ipal payments when due, but default may result from a borrower’s failure to meet other obligations as well.
Corporate bonds are fully taxable debt obligations issued by corporations. These bonds fund capital improvements, expansions, debt refinancing or acquisitions that require more capital than would ordinarily be available from a single lender. Corporate bond rates are set according to prevailing interest rates at the time of the issue, the credit rating of the issuer, the length of the maturity and the other terms of the bond, such as a call feature. Corporate bonds have historically been one of the highest yielding of all taxable debt securities. Interest can be paid monthly, quarterly or semi-annually. There are five main sectors of corporate bonds: industrials, banks/finance, public utilities, transportation, and Yankee and Canadian bonds.
The secondary market for corporate bonds is fairly liquid. Therefore, an investor who wishes to sell a corporate bond will often be able to find a buyer for the security at market prices. However, the market price of a bond might be significantly higher or lower than its face value due to fluctuations in interest rates and other price determining factors. Other factors include credit risk, market risk, even risk, call risk, make-whole call risk and inflation risk.
Mutual funds are a professionally managed type of collective investment scheme that pools money from many investors and invests it in stocks, bonds, short-term money market instruments, and/or other securities. The mutual fund will have a fund manager that trades the pooled money on a regular basis. Mutual funds allow investors spread their investment around widely. That makes it much less risky than investing in one or two stocks.
An equity security is a share in the capital stock of a company (typically common stock, although preferred equity is also a form of capital stock). The holder of an equity security is a shareholder, owning a share, or fractional part of the issuer. Unlike debt securities, which typically require regular payments (interest) to the holder, equity securities are not entitled to any payment. In bankruptcy, they share only in the residual interest of the issuer after all obligations have been paid out to creditors. However, equity generally entitles the holder to a pro rata portion of control of the company, meaning that a holder of a majority of the equity is usually entitled to control the issuer. Equity also enjoys the right to profits and capital gain, whereas holders of debt securities receive only interest and repayment of principal regardless of how well the issuer performs financially. Furthermore, debt securities do not have voting rights outside of bankruptcy. In other words, equity holders are entitled to the "upside" of the business and to control the business.
Equity securities may include, but not be limited to: bank stock, bank holding company stock, listed stock, savings and loan association stock, savings and loan association holding company stock, subsidiary structured as limited liability company, subsidiary structured as limited partnership, limited liability company and unlisted stock. Equity securities are generally traded on either one of the listed stock exchanges, including NASDAQ or an over-the-counter market. The market value of equity shares is influence by prevailing economic conditions such as the company’s performance (ie. earnings) supply and demand and interest rates.
A municipal bond is a bond issued by a city or other local government, or their agencies. Potential issuers of municipal bonds include cities, counties, redevelopment agencies, special-purpose districts, school districts, public utility districts, publicly owned airports and seaports, and any other governmental entity (or group of governments) below the state level. Municipal bonds may be general obligations of the issuer or secured by specified revenues. Interest income received by holders of municipal bonds is often exempt from the federal income tax and from the income tax of the state in which they are issued, although municipal bonds issued for certain purposes may not be tax exempt.
At December 31, 2009, $9.1 million or 3.5% of our securities (excluding Federal Home Loan Bank of Dallas stock) were scheduled to mature in less than one year and securities with maturity dates 10 years and over totaled 24.5% of the total portfolio. The average maturity of the securities portfolio was 6.3 years.
At December 31, 2009, securities totaling $249.5 million were classified as available for sale and $12.3 million were classified as held to maturity, compared to $114.4 million classified as available for sale and $24.8 million classified as held to maturity at December 31, 2008. |
During the fourth quarter of 2009, three agency securities with a par value of $10.0 million were transferred from available for sale to held to maturity. These three securities had a fair market value totaling $9.8 and an average maturity of approximately 14 years. The unrealized loss of $224,000 was recorded as a component of other comprehensive loss and will be amortized over the life of the securities or until the security is called. |
Securities classified as available for sale are measured at fair market value and securities classified as held to maturity are measured at book value. The Company obtains fair value measurements from an independent pricing service to value securities classified as available for sale. The fair value measurements consider observable data that may include dealer quotes, market spreads, cash flows, market yield curves, prepayment speeds, credit information and the instrument’s contractual terms and conditions, among other things. For more information on securities and fair market value see Notes 4 and 19 to the Consolidated Financial Statements. |
Total net securities gains were $3.5 million of which net AFS gains totaled $3.4 million and net HTM gains totaled $0.1 million at December 31, 2009. Securities classified as available for sale had gross unrealized gains totaling $6.2 million at December 31, 2009, which includes $0.4 million in unrealized gains on agency securities, $104,000 in unrealized gains on mortgage-backed securities, $8,000 in unrealized gains on asset-backed securities, $5.6 million in unrealized gains on corporate bonds and $82,000 in unrealized gains on mutual funds or other equity securities. Securities classified as available for sale had gross unrealized losses totaling $2.8 million at December 31, 2009, which includes $1.6 million in unrealized losses on agency securities, $0.8 million in unrealized losses on corporate bonds and $0.5 million in unrealized l osses on mutual funds or other equity securities. Securities classified as held to maturity for sale had gross unrealized gains totaling $113,000 at December 31, 2009, of which unrealized gains on agency securities and unrealized gains on mortgage-backed securities totaled $52,000 and $61,000, respectively. There were no held to maturity securities with unrealized losses as of December 31, 2009. |
All agency securities have been in a loss position for less than 12 months. The majority of the corporate debt securities and mutual funds or other equity securities with unrealized losses have been in a loss position for more than 12 months. The Company believes that it will collect all amounts contractually due and has the intent and the ability to hold these securities until the fair value is at least equal to the carrying value. At December 31, 2008, securities classified as available for sale had gross unrealized losses totaling $5.7 million. Management periodically assesses the quality of our investment holdings using procedures similar to those used in assessing the credit risks inherent in the loan portfolio. During the third quarter 2008, Management identified 12 securities that were other-than-temporarily impaired. |
At December 31, 2009, it is Management’s opinion that we held no investment securities which bear a greater than the normal amount of credit risk as compared to similar investments and that no securities had an amortized cost greater than their recoverable value. See Notes 4 and 19 to the Consolidated Financial Statements for additional information. |
Average securities as a percentage of average interest-earning assets were 27.1% for the year December 31, 2009 and 17.0% for the year ended December 31, 2008. All securities held at December 31, 2009 qualified as pledgeable securities, except $92.1 million of debt securities and $6.1 million of equity securities. Securities pledged at December 31, 2009 totaled $154.5 million.
The following tables set forth the composition of our investment securities portfolio (excluding Federal Home Loan Bank of Dallas stock) at the dates indicated.
| | | December 31, 2009 | | | December 31, 2008 | | | December 31, 2007 | |
| | | | | | Gross | | | Gross | | | | | | | | | Gross | | | Gross | | | | | | | | | Gross | | | Gross | | | | |
| | | Amortized | | | Unrealized | | | Unrealized | | | Fair | | | Amortized | | | Unrealized | | | Unrealized | | | Fair | | | Amortized | | | Unrealized | | | Unrealized | | | Fair | |
| | | Cost | | | Gains | | | Losses | | | Value | | | Cost | | | Gains | | | Losses | | | Value | | | Cost | | | Gains | | | Losses | | | Value | |
| | | (in thousands) | |
| Available for sale: | | | | | | | | | | | | | | | | | | | | | | | | | | | | | | | | | | | | |
| U.S. Government Agencies | | $ | 140,843 | | | $ | 382 | | | $ | (1,562 | ) | | $ | 139,663 | | | $ | 58,389 | | | $ | 132 | | | $ | - | | | $ | 58,521 | | | $ | 92,962 | | | $ | 26 | | | $ | (25 | ) | | $ | 92,963 | |
| Mortgage-backed obligations | | | 1,472 | | | | 104 | | | | - | | | | 1,576 | | | | 1,701 | | | | 82 | | | | (5 | ) | | | 1,778 | | | | 2,016 | | | | 43 | | | | (23 | ) | | | 2,036 | |
| Asset-backed securities | | | - | | | | 8 | | | | - | | | | 8 | | | | 532 | | | | - | | | | (439 | ) | | | 93 | | | | 1,340 | | | | - | | | | (95 | ) | | | 1,245 | |
| Corporate debt securities | | | 87,238 | | | | 5,627 | | | | (776 | ) | | | 92,089 | | | | 57,773 | | | | 644 | | | | (5,077 | ) | | | 53,340 | | | | 5,954 | | | | 50 | | | | (214 | ) | | | 5,790 | |
| Mutual funds or other equity securities | | | 6,556 | | | | 83 | | | | (495 | ) | | | 6,144 | | | | 795 | | | | 26 | | | | (147 | ) | | | 674 | | | | 3,805 | | | | 22 | | | | (291 | ) | | | 3,536 | |
| Municipal bonds | | | 10,000 | | | | - | | | | - | | | | 10,000 | | | | - | | | | - | | | | - | | | | - | | | | - | | | | - | | | | - | | | | - | |
| Total available for sale securities | | $ | 246,109 | | | $ | 6,204 | | | $ | (2,833 | ) | | $ | 249,480 | | | $ | 119,190 | | | $ | 884 | | | $ | (5,668 | ) | | $ | 114,406 | | | $ | 106,077 | | | $ | 141 | | | $ | (648 | ) | | $ | 105,570 | |
| | | | | | | | | | | | | | | | | | | | | | | | | | | | | | | | | | | | | | | | | | | | | | | | | |
| | | | | | | | | | | | | | | | | | | | | | | | | | | | | | | | | | | | | | | | | | | | | | | | | |
| Held to maturity: | | | | | | | | | | | | | | | | | | | | | | | | | | | | | | | | | | | | | | | | | | | | | | | | |
| U.S. Government Agencies | | $ | 10,721 | | | $ | 52 | | | $ | - | | | $ | 10,773 | | | $ | 22,680 | | | $ | 160 | | | $ | - | | | $ | 22,840 | | | $ | 33,984 | | | $ | 24 | | | $ | (281 | ) | | $ | 33,727 | |
| Mortgage-backed obligations | | | 1,628 | | | | 61 | | | | - | | | | 1,689 | | | | 2,076 | | | | 21 | | | | (1 | ) | | | 2,096 | | | | 2,514 | | | | - | | | | (35 | ) | | | 2,479 | |
| Total held to maturity securities | | $ | 12,349 | | | $ | 113 | | | $ | - | | | $ | 12,462 | | | $ | 24,756 | | | $ | 181 | | | $ | (1 | ) | | $ | 24,936 | | | $ | 36,498 | | | $ | 24 | | | $ | (316 | ) | | $ | 36,206 | |
| | | | | | | | | | | | | | | | | | | | | | | | | | | | | | | | | | | | | | | | | | | | | | | | | |
During 2009, the evaluation of securities with continuous unrealized losses indicated that there was a credit loss evident on one corporate bond and it was determined that this investment was other-than-temporarily impaired. In addition, three asset-backed securities were deemed to be other-than-temporarily impaired. The Company recorded other-than-temporary impairment charges on these securities totaling $829,000 before tax, $547,000 after tax, for the year ended December 31, 2009. An other-than-temporary impairment charge was taken on these 12 securities totaling $4.6 million in 2008. |
The Company did not recognize any other impairment charges in 2009 other than those stated above.
In 2008, the Company recorded a non-cash other-than-temporary impairment (“OTTI”) on certain investments totaling $4,611,000. The impairment writedown consisted of three preferred stocks of Fannie Mae and Freddie Mac totaling $1,991,000 and $1,010,000, respectively, debt securities totaling $873,000 and asset-backed securities totaling $753,000.
Investment Portfolio Maturities and Yields. The composition and maturities of the investment securities portfolio at December 31, 2009 are summarized in the following table. Maturities are based on the final contractual payment dates, and do not reflect the impact of prepayments or early redemptions that may occur.
| | | | | | More than One Year | | | More than Five Years | | | | |
| | | One Year or Less | | | through Five Years | | | through Ten Years | | | More than Ten Years | |
| | | | | | Weighted | | | | | | Weighted | | | | | | Weighted | | | | | | Weighted | |
| | | Amortized | | | Average | | | Amortized | | | Average | | | Amortized | | | Average | | | Amortized | | | Average | |
| | | Cost | | | Yield | | | Cost | | | Yield | | | Cost | | | Yield | | | Cost | | | Yield | |
| | | (dollars in thousands) | |
| Held to maturity: | | | | | | | | | | | | | | | | | | | | | | | | |
| U.S. Government agencies | | $ | - | | | | - | | | $ | - | | | | - | | | $ | 946 | | | | 4.79 | % | | $ | 9,775 | | | | 5.30 | % |
| Mortgage-backed obligations | | | - | | | | - | | | | 171 | | | | 3.61 | % | | | 574 | | | | 4.41 | % | | | 883 | | | | 4.77 | % |
| Total held to maturity securities | | $ | - | | | | - | | | $ | 171 | | | | 3.61 | % | | $ | 1,520 | | | | 4.65 | % | | $ | 10,658 | | | | 5.25 | % |
| | | | | | | | | | | | | | | | | | | | | | | | | | | | | | | | | |
| Available for sale: | | | | | | | | | | | | | | | | | | | | | | | | | | | | | | | | |
| U.S. Government agencies | | $ | - | | | | - | | | $ | 9,996 | | | | 3.27 | % | | $ | 94,599 | | | | 4.01 | % | | $ | 36,248 | | | | 4.58 | % |
| Mortgage-backed obligations | | | - | | | | - | | | | - | | | | - | | | | - | | | | - | | | | 1,472 | | | | 5.34 | % |
| Asset-backed securities | | | - | | | | - | | | | - | | | | - | | | | - | | | | - | | | | - | | | | - | |
| Corporate debt securities | | | 8,924 | | | | 6.88 | % | | | 62,129 | | | | 6.64 | % | | | 15,963 | | | | 7.00 | % | | | 222 | | | | 6.43 | % |
| Mutual funds or other equity securities | | | - | | | | - | | | | - | | | | - | | | | - | | | | - | | | | 6,556 | | | | 6.78 | % |
| Municipal bonds | | | - | | | | - | | | | - | | | | - | | | | - | | | | - | | | | 10,000 | | | | 1.40 | % |
| Total available for sale securities | | $ | 8,924 | | | | 6.88 | % | | $ | 72,125 | | | | 6.17 | % | | $ | 110,562 | | | | 4.44 | % | | $ | 54,498 | | | | 4.29 | % |
| | | | | | | | | | | | | | | | | | | | | | | | | | | | | | | | | |
| | | | | | | | | | | | | | | | | | | | | | | | | | | | | | | | | |
| | | Total Securities | | | | | | | | | | | | | | | | | | | | | |
| | | | | | | | Weighted | | | | | | | | | | | | | | | | | | | | | |
| | | Amortized | | | | | Average | | | | | | | | | | | | | | | | | | | | | |
| | | Cost | | | Fair Value | | Yield | | | | | | | | | | | | | | | | | | | | | |
| | | (dollars in thousands) | | | | | | | | | | | | | | | | | | | | | |
| Held to maturity: | | | | | | | | | | | | | | | | | | | | | | | | | | | | | |
| U.S. Government agencies | | $ | 10,721 | | | $ | 10,773 | | | | 5.25 | % | | | | | | | | | | | | | | | | | | | | |
| Mortgage-backed obligations | | | 1,628 | | | | 1,689 | | | | 4.52 | % | | | | | | | | | | | | | | | | | | | | |
| Total held to maturity securities | | $ | 12,349 | | | $ | 12,462 | | | | 5.15 | % | | | | | | | | | | | | | | | | | | | | |
| | | | | | | | | | | | | | | | | | | | | | | | | | | | | | | | | |
| Available for sale: | | | | | | | | | | | | | | | | | | | | | | | | | | | | | |
| U.S. Government agencies | | $ | 140,843 | | | $ | 139,663 | | | | 4.10 | % | | | | | | | | | | | | | | | | | | | | |
| Mortgage-backed obligations | | | 1,472 | | | | 1,576 | | | | 5.34 | % | | | | | | | | | | | | | | | | | | | | |
| Asset-backed securities | | | - | | | | 8 | | | | 0.00 | % | | | | | | | | | | | | | | | | | | | | |
| Corporate debt securities | | | 87,238 | | | | 92,089 | | | | 6.73 | % | | | | | | | | | | | | | | | | | | | | |
| Mutual funds or other equity securities | | | 6,556 | | | | 6,144 | | | | 6.78 | % | | | | | | | | | | | | | | | | | | | | |
| Municipal bonds | | | 10,000 | | | | 10,000 | | | | 1.40 | % | | | | | | | | | | | | | | | | | | | | |
| Total available for sale securities | | $ | 246,109 | | | $ | 249,480 | | | | 5.00 | % | | | | | | | | | | | | | | | | | | | | |
| | | | | | | | | | | | | | | | | | | | | | | | | | | | | | | | | |
Deposits. The following table sets forth the distribution of our total deposit accounts, by account type, for the periods indicated.
| | | December 31, | |
| | | 2009 | | | 2008 | | | 2007 | |
| | | (dollars in thousands) | |
| | | | | | | | | | | | | | | | | | | | | | | | | | | | |
| | | Balance | | | As % of Total | | | Wtd Avg Rate | | Balance | | | As % of Total | | | Wtd Avg Rate | | Balance | | | As % of Total | | | Wtd Avg Rate | |
| Noninterest-bearing demand | | $ | 131,818 | | | | 16.5 | % | | | 0.0 | % | | $ | 118,255 | | | | 15.2 | % | | | 0.0 | % | | $ | 120,740 | | | | 16.7 | % | | | 0.0 | % |
| Interest-bearing demand | | | 188,252 | | | | 23.5 | % | | | 0.6 | % | | | 180,230 | | | | 23.1 | % | | | 1.4 | % | | | 223,142 | | | | 30.9 | % | | | 3.4 | % |
| Savings | | | 40,272 | | | | 5.0 | % | | | 0.2 | % | | | 41,357 | | | | 5.3 | % | | | 0.4 | % | | | 45,044 | | | | 6.2 | % | | | 0.5 | % |
| Time | | | 439,404 | | | | 55.0 | % | | | 2.8 | % | | | 440,530 | | | | 56.4 | % | | | 3.6 | % | | | 334,168 | | | | 46.2 | % | | | 4.6 | % |
| Total deposits | | $ | 799,746 | | | | 100.0 | % | | | | | | $ | 780,372 | | | | 100.0 | % | | | | | | $ | 723,094 | | | | 100.0 | % | | | | |
| | | | | | | | | | | | | | | | | | | | | | | | | | | | | | | | | | | | | |
As of December 31, 2009, the aggregate amount of outstanding certificates of deposit in amounts greater than or equal to $100,000 was approximately $271.2 million. The following table sets forth the maturity of those certificates as of December 31, 2009, 2008 and 2007.
| | | December 31, | |
| | | 2009 | | | 2008 | | | 2007 | |
| | | | | | Weighted | | | | | | Weighted | | | | | | Weighted | |
| | | | | | Average | | | | | | Average | | | | | | Average | |
| | | Balance | | | Rate | | | Balance | | | Rate | | | Balance | | | Rate | |
| | | (dollars in thousands) | |
| | | | | | | | | | | | | | | | | | | |
| Due in one year or less | | $ | 234,685 | | | | 1.71 | % | | $ | 163,375 | | | | 2.10 | % | | $ | 140,052 | | | | 4.43 | % |
| Due after one year through three years | | | 19,930 | | | | 3.89 | % | | | 57,431 | | | | 4.04 | % | | | 20,207 | | | | 4.39 | % |
| Due after three years | | | 16,577 | | | | 4.91 | % | | | 26,944 | | | | 4.19 | % | | | 7,083 | | | | 5.14 | % |
| Total | | $ | 271,192 | | | | 2.06 | % | | $ | 247,750 | | | | 2.78 | % | | $ | 167,342 | | | | 4.46 | % |
| | | | | | | | | | | | | | | | | | | | | | | | | |
Borrowings. The following table sets forth information concerning balances and interest rates on all of our short-term borrowings at the dates and for the periods indicated.
| | | December 31, | |
| | | 2009 | | | 2008 | | | 2007 | |
| | | (dollars in thousands) | |
| | | | | | | | | | |
| Outstanding at year end | | $ | 11,929 | | | $ | 9,767 | | | $ | 10,401 | |
| Maximum month-end outstanding | | | 26,372 | | | | 41,321 | | | | 45,766 | |
| Average daily outstanding | | | 18,233 | | | | 11,379 | | | | 16,655 | |
| Weighted average rate during the year | | | 0.81 | % | | | 2.16 | % | | | 5.18 | % |
| Average rate at year end | | | 0.23 | % | | | 0.19 | % | | | 3.50 | % |
At December 31, 2009, long-term debt consisted of two advances from the Federal Home Loan Bank. In November 2009, the Company recorded an original $10.0 million amortizing one year advance at a rate of 0.861%. The Company makes monthly principal and interest payments. In December 2009, the Company recorded a $10.0 million interest only bullet advance with a one year maturity at a rate of 0.480%. The Company makes monthly interest payments with the balloon note due in December 2010. The outstanding balance on the long-term debt was $20.0 million at December 31, 2009.
At December 31, 2008, the Company had $8.4 million in long-term borrowings that consisted of an amortizing one year advance from the Federal Home Loan Bank at a rate of 3.140%. The Company made monthly principal and interest payments until this advance matured in October 2009.
During the first quarter of 2009, the Company borrowed $6.0 million on its available line of credit with JP Morgan Chase at a variable interest rate of prime less 100 basis points. The Company injected the cash into the Bank to strengthen its capital. This debt was repaid in 2009.
Stockholders’ Equity and Return on Equity and Assets. Stockholders’ equity provides a source of permanent funding, allows for future growth and the ability to absorb unforeseen adverse developments. At December 31, 2009, stockholders’ equity totaled $94.9 million compared to $65.5 million at December 31, 2008.
Information regarding performance and equity ratios is as follows:
| | December 31, |
| | 2009 | 2008 | 2007 |
| | | | |
| Return on average assets | 0.80% | 0.69% | 1.30% |
| Return on average common equity | 10.84% | 8.13% | 15.37% |
| Dividend payout ratio | 50.82% | 64.53% | 35.85% |
On August 28, 2009, the Company entered into a Letter Agreement, which includes a Securities Purchase Agreement and a Side Letter Agreement (together, the “Purchase Agreement”), with the United States Department of the Treasury (“Treasury Department”) pursuant to which the Company has issued and sold to the Treasury Department 2,069.9 shares of the Company’s Fixed Rate Cumulative Perpetual Preferred Stock, Series A, par value $1,000 per share for a total purchase price of $20.7 million. In addition to the issuance of the Series A Stock, as a part of the transaction, the Company issued to the Treasury Department a warrant to purchase 114.44444 shares of the Company’s Fixed Rate Cumulative Preferred Stock, Series B, and immediately following the issuance of the Series A stock, the Treasury Department exer cised its rights and acquired 103 of the Series B shares through a cashless exercise. See Note 11 to the Consolidated Financial Statements for additional information.
On July 8, 2009, the Company committed to the Federal Reserve Bank (the “FRB”) and the Louisiana Office of Financial Institution (the “OFI”) to inject $10 million in capital by September 15, 2009. The issuance of preferred stock to the Treasury Department satisfied the $10 million capital injection commitment made to the FRB and OFI.
The Company anticipates First Guaranty Bank maintaining a well capitalized status as defined by regulatory standards.
Results of Operations for the Years Ended December 31, 2009 and 2008
Net Income. Net income for the year ended December 31, 2009 was $7.6 million, an increase of $2.1 million or 37.8%, from $5.5 million for the year ended December 31, 2008. Net income available to common shareholders for the year ended December 31, 2009 was $7.0 million, an increase of $1.5 million from the $5.5 million for the year ended December 31, 2008. The largest increase in net income resulted from an increase in securities interest income due to an increase in volume of securities owned. The second largest increase resulted from a $3.8 million decline in the amount of other-than-temporary impairment charges recorded on the securities portfolio. The 2009 other-than-temporary impairment charge was $0.8 million compared to a $4.6 million other-than-temporary i mpairment charge in 2008 (see Notes 4 and 19 to the Consolidated Financial Statements). In addition, net gains on sales of securities totaled $2.1 million for the period ended December 31, 2009 compared to net losses of $1,000 realized during the same period in 2008. Net interest income increased by $0.6 million and the provision for loan losses increased $2.5 million. Noninterest expense increased $0.8 million primarily from increased regulatory assessments but was offset by reduced legal and marketing expenses.
Earnings per common share for the year ended December 31, 2009 was $1.26 per common share, an increase of 27.0% or $0.27 per common share from $0.99 per common share for the year ended December 31, 2008.
Net Interest Income. Net interest income is the largest component of our earnings. It is calculated by subtracting the cost of interest-bearing liabilities from the income earned on interest-earning assets and represents the earnings from our primary business of gathering deposits and making loans and investments. Our long-term objective is to manage this income to provide the largest possible amount of income while balancing interest rate, credit and liquidity risks.
A financial institution’s asset and liability structure is substantially different from that of an industrial company, in that virtually all assets and liabilities are monetary in nature. Accordingly, changes in interest rates, which are generally impacted by inflation rates, may have a significant impact on a financial institution’s performance. The impact of interest rate changes depends on the sensitivity to change of our interest-earning assets and interest-bearing liabilities. The effects of the changing interest rate environment in recent years and our interest sensitivity position are discussed below.
Net interest income in 2009 was $32.3 million, an increase of $0.6 million or 1.8%, when compared to $31.8 million in 2008. Although the net interest margin declined from 2008 to 2009, increased volumes in interest-earning assets offset the decline in margins therefore increasing net interest income. Loans are our largest interest-earning asset, and 53.7% of our total loans are floating rate loans which are primarily tied to the prime lending rate. After the prime rate dropped 400 basis points in 2008, Management began adding floors to floating rate loans. Loans which have floors greater than the rate due under the variable rate provision are considered fixed rate loans until such time that the floors equals the rate due under the variable rate provision. The loan floors were the first step to managing the net interest income. Although the yield on securities also declined from 2008 to 2009, interest income was enhanced by increased volumes of securities. Management’s next focus was on the cost of funds. The cost of our interest-bearing liabilities was positively impacted by the reduction all cost of funds paid on interest-bearing liabilities. As of December 31, 2009, time deposits represented 54.9% of our total deposits, which is a decrease from 56.5% of total deposits at December 31, 2008.
Comparing 2009 to 2008, the average yield on interest-earning assets decreased by 110 basis points and the average rate paid on interest-bearing liabilities decreased by 60 basis points. The net yield on interest-earning assets was 3.6% for the year ended December 31, 2009, compared to 4.2% for 2008.
During the first quarter of 2009, the Company borrowed $6.0 million on its available line of credit at a variable interest rate of prime less 100 basis points. This debt was paid in its entirety during 2009.
The net interest income yield shown below in the average balance sheet is calculated by dividing net interest income by average interest-earning assets and is a measure of the efficiency of the earnings from balance sheet activities. It is affected by changes in the difference between interest on interest-earning assets and interest-bearing liabilities and the percentage of interest-earning assets funded by interest-bearing liabilities (leverage). The leverage for the year ending December 31, 2009 and 2008 was 82.5% and 80.3%, respectively.
The following tables set forth average balance sheets, average yields and costs, and certain other information for the periods indicated. No tax-equivalent yield adjustments were made, as the effect thereof was not material. All average balances are daily average balances. Non-accrual loans were included in the computation of average balances, but have been reflected in the table as loans carrying a zero yield. The yields set forth below include the effect of deferred fees, discounts and premiums that are amortized or accreted to interest income or expense.
| | Years Ended December 31, |
| | 2009 | | 2008 | | 2007 |
| | Average | | Yield/ | | Average | | Yield/ | | Average | | Yield/ |
| | Balance | Interest | Rate | | Balance | Interest | Rate | | Balance | Interest | Rate |
| | (dollars in thousands) |
| Assets | | | | | | | | | | | |
| Interest-earning assets: | | | | | | | | | | | |
| Interest-bearing deposits with banks | $ 35,800 | $ 388 | 1.1% | | $ 5,725 | $ 224 | 3.9% | | $ 1,977 | $ 87 | 4.4% |
| Securities (including FHLB stock) | 245,952 | 11,085 | 4.5% | | 127,586 | 6,594 | 5.2% | | 152,990 | 8,381 | 5.5% |
| Federal funds sold | 24,662 | 34 | 0.1% | | 17,247 | 392 | 2.3% | | 8,083 | 400 | 4.9% |
| Loans held for sale | 135 | 7 | 5.1% | | 681 | 45 | 6.6% | | 5,216 | 142 | 2.7% |
| Loans, net of unearned income | 599,609 | 35,677 | 6.0% | | 600,854 | 40,406 | 6.7% | | 543,946 | 46,470 | 8.5% |
| Total interest-earning assets | 906,158 | 47,191 | 5.2% | | 752,093 | 47,661 | 6.3% | | 712,212 | 55,480 | 7.8% |
| | | | | | | | | | | | |
| Noninterest-earning assets: | | | | | | | | | | |
| Cash and due from banks | 17,775 | | | | 22,468 | | | | 19,569 | | |
| Premises and equipment, net | 16,175 | | | | 15,960 | | | | 14,812 | | |
| Other assets | 8,448 | | | | 6,503 | | | | 4,644 | | |
| Total | $ 948,556 | $ 47,191 | | | $ 797,024 | $ 47,661 | | | $ 751,237 | $ 55,480 | |
| | | | | | | | | | | | |
| Liabilities and Stockholders' Equity | | | | | | | | | |
| Interest-bearing liabilities: | | | | | | | | | | |
| Demand deposits | $ 203,467 | $ 1,179 | 0.6% | | $ 197,822 | $ 2,798 | 1.4% | | $ 196,805 | $ 6,688 | 3.4% |
| Savings deposits | 41,747 | 98 | 0.2% | | 43,631 | 193 | 0.4% | | 42,564 | 228 | 0.5% |
| Time deposits | 479,255 | 13,310 | 2.8% | | 346,282 | 12,432 | 3.6% | | 297,193 | 13,673 | 4.6% |
| Borrowings | 22,907 | 257 | 1.1% | | 16,287 | 458 | 2.8% | | 23,450 | 1,345 | 5.7% |
| Total interest-bearing liabilities | 747,376 | 14,844 | 2.0% | | 604,022 | 15,881 | 2.6% | | 560,012 | 21,934 | 3.9% |
| | | | | | | | | | | | |
| Noninterest-bearing liabilities: | | | | | | | | | | |
| Demand deposits | 117,805 | | | | 119,379 | | | | 121,894 | | |
| Other | 6,240 | | | | 5,854 | | | | 5,767 | | |
| Total liabilities | 871,421 | 14,844 | | | 729,255 | 15,881 | | | 687,673 | 21,934 | |
| Stockholders' equity | 77,135 | | | | 67,769 | | | | 63,564 | | |
| Total | $ 948,556 | 14,844 | | | $ 797,024 | 15,881 | | | $ 751,237 | 21,934 | |
| Net interest income | | $ 32,347 | | | | $ 31,780 | | | | $ 33,546 | |
Net interest rate spread (1) | | 3.2% | | | | 3.7% | | | | 3.9% |
Net interest-earning assets (2) | $ 158,782 | | | | $ 148,071 | | | | $ 152,200 | | |
Net interest margin (3) | | | 3.6% | | | | 4.2% | | | | 4.7% |
| | | | | | | | | | | | |
| Average interest-earning assets to | | | | | | | | | |
| interest-bearing liabilities | | 121.2% | | | | 124.5% | | | | 127.2% |
(1) Net interest rate spread represents the difference between the yield on average interest-earning assets and the cost of average interest-bearing liabilities.
(2) Net interest-earning assets represents total interest-earning assets less total interest-bearing liabilities.
(3) Net interest margin represents net interest income divided by average total interest-earning assets.
Rate/Volume Analysis. The following table presents the dollar amount of changes in interest income and interest expense for major components of interest-earning assets and interest-bearing liabilities for the periods indicated. The table distinguishes between (i) changes attributable to rate (change in rate multiplied by the prior period’s volume), (ii) changes attributable to volume (changes in volume multiplied by the prior period’s rate), (iii) mixed changes (changes that are not attributable to either rate of volume) and (iv) total increase (decrease) (the sum of the previous columns).
| | Years Ended December 31, |
| | 2009 Compared to 2008 | | 2008 Compared to 2007 |
| | Increase (Decrease) Due To | | Increase (Decrease) Due To |
| | | | Rate/ | Increase/ | | | Rate/ | Increase/ |
| | Volume | Rate | Volume | Decrease | Volume | Rate | Volume | Decrease |
| | | | | (in thousands) | | | |
| Interest earned on: | | | | | | | | | |
| Interest-bearing deposits with banks | $ 1,177 | $ (162) | $ (851) | $ 164 | | $ 165 | $ (10) | $ (18) | $ 137 |
| Securities (including FHLB stock) | 6,118 | (844) | (783) | 4,491 | | (1,392) | (474) | 79 | (1,787) |
| Federal funds sold | 169 | (368) | (159) | (358) | | 453 | (216) | (245) | (8) |
| Loans held for sale | (36) | (10) | 8 | (38) | | (123) | 204 | (178) | (97) |
| Loans, net of unearned income | (84) | (4,655) | 10 | (4,729) | | 4,862 | (9,892) | (1,034) | (6,064) |
| Total interest income | 7,344 | (6,039) | (1,775) | (470) | | 3,965 | (10,388) | (1,396) | (7,819) |
| | | | | | | | | | |
| Interest paid on: | | | | | | | | | |
| Demand deposits | 80 | (1,652) | (47) | (1,619) | | 32 | (3,904) | (18) | (3,890) |
| Savings deposits | (8) | (91) | 4 | (95) | | 6 | (40) | (1) | (35) |
| Time deposits | 4,774 | (2,816) | (1,080) | 878 | | 2,258 | (3,003) | (496) | (1,241) |
| Borrowings | 186 | (275) | (112) | (201) | | (411) | (685) | 209 | (887) |
| Total interest expense | 5,032 | (4,834) | (1,235) | (1,037) | | 1,885 | (7,632) | (306) | (6,053) |
| Change in net interest income | $ 2,312 | $ (1,205) | $ (540) | $ 567 | | $ 2,080 | $ (2,756) | $ (1,090) | $ (1,766) |
| | | | | | | | | | |
Provision for Loan Losses. The provision for loan losses was $4.2 million and $1.6 million in 2009 and 2008, respectively. The increased 2009 provisions were attributable to $2.7 million in net loan charge-offs during 2009 compared to $1.3 million in net loan charge-offs during 2008. Of the loan charge-offs in 2009, approximately $1.6 million were loans secured by real estate of which $0.4 million were construction and land development, $0.6 million were commercial real estate and approximately $0.6 million were residential properties. In 2009, recoveries of $0.2 million were recognized on loans previously charged off as compared to $0.3 million in 2008. Of the loan charge-offs during 2008, approximately $0.7 million were loans secured by real estate of which $0.3 million were commercial real estate and approximately $0.4 million were residential properties. The allowance for loan losses at December 31, 2009 was $7.9 million, compared to $6.5 million at December 31, 2008, and was 1.34% and 1.07% of total loans, respectively. Management believes that the current level of the allowance is adequate to cover losses in the loan portfolio given the current economic conditions, expected net charge-offs and nonperforming asset levels.
Noninterest Income. Noninterest income totaled $7.1 million in 2009, an increase of $6.1 million when compared to $1.1 million in 2008. Service charges, commissions and fees totaled $4.1 million and $4.0 million for the years ended December 31, 2009 and 2008, respectively. Net securities gain were $2.1 million in 2009 compared to $1,000 in net securities losses in 2008. Other-than-temporary impairment charges totaling $0.8 million were taken on securities in 2009 compared to a charge of $4.6 million in 2008 (see Notes 4 and 19 to the Consolidated Financial Statements). Net gains on sale of loans were $422,000 in 2009 and $210,000 in 2008. Other noninterest income decreased $148,000 to $1.3 million in 2009 fr om $1.5 million in 2008.
Noninterest Expense. Noninterest expense totaled $24.0 million in 2009 and $23.2 million in 2008. Salaries and benefits remained relatively flat at $10.8 million in 2009 compared to $10.7 million in 2008. At December 31, 2009, 248 employees represented 230 full-time equivalent staff members as compared to 224.5 full-time equivalent staff members in 2008. Occupancy and equipment expense totaled $2.9 million in 2009 and 2008, respectively. Regulatory assessment expense totaled $2.0 million in 2009 compared to $0.8 million in 2008. During the second quarter of 2009, a special assessment was imposed on all financial institutions. The 2009 special assessment for the Company totaled $444,000. The net cost of other real estate and repossessions increased $150,000 in 2009 to $399,000, when compared to $249,000 in 2008. Other noninterest expense totaled $7.9 million in 2009, a decrease of $0.7 million or 8.1% when compared to $8.6 million in 2008.
The following is a summary of the significant components of other noninterest expense:
| | | Years Ended December 31, | |
| | | 2009 | | | 2008 | | | 2007 | |
| | | (in thousands) | |
| | | | | | | | | | |
| Other noninterest expense: | | | | | | | | | |
| Legal and professional fees | | $ | 1,254 | | | $ | 1,496 | | | $ | 1,610 | |
| Operating supplies | | | 537 | | | | 572 | | | | 615 | |
| Marketing and public relations | | | 809 | | | | 1,131 | | | | 842 | |
| Data processing | | | 1,067 | | | | 1,063 | | | | 955 | |
| Travel and lodging | | | 398 | | | | 416 | | | | 439 | |
| Taxes - sales and capital | | | 529 | | | | 571 | | | | 628 | |
| Telephone | | | 192 | | | | 185 | | | | 211 | |
| Amortization of core deposit intangibles | | | 291 | | | | 311 | | | | 203 | |
| Other | | | 2,839 | | | | 2,864 | | | | 2,826 | |
| Total other expense | | $ | 7,916 | | | $ | 8,609 | | | $ | 8,329 | |
| | | | | | | | | | | | | |
Total noninterest expense includes expenses paid to related parties. Related parties include the Company’s executive officers, directors and certain business organizations and individuals with which such persons are associated. During the years ended 2008 and 2009, the Company paid approximately $2.1 million and $2.2 million, respectively, for goods and services from related parties. See Note 14 to the Consolidated Financial Statements for additional information.
Income Taxes. The provision for income taxes for the years ended December 31, 2009 and 2008 was $3.7 million and $2.5 million, respectively. The increased provision for income taxes in 2009 resulted from higher income recognized during 2009 when compared to 2008, which resulted from various tax credit taken. The Company’s effective tax rate amounted to 32.9% and 30.9% during 2009 and 2008, respectively. The difference between the effective tax rate and the statutory tax rate primarily relates to variances in items that are non-taxable or non-deductible and various tax credits.
Results of Operations for the Years Ended December 31, 2008 and 2007
Net Income. Net income for the year ended December 31, 2008 was $5.5 million, a decrease of $4.3 million or 43.6%, from $9.8 million for the year ended December 31, 2007. The largest decrease in net income resulted from a $4.6 million other-than-temporary impairment charge recorded on the securities portfolio in the third quarter of 2008, resulting in a $3.0 million net of tax decrease in net income (see Notes 4 and 19 to the Consolidated Financial Statements). Net interest income decreased by $1.8 million due to market pressure placed on our net interest margin with the decline in market interest rates. In addition, noninterest expense increased due to additional costs related to enhancement of the internal audit and control process, costs associated with educati on and training of existing and new personnel, and the addition of staff.
Earnings per share for the year ended December 31, 2008 was $.99 per share, a decrease of 43.6% or $0.77 per share from $1.76 per share for the year ended December 31, 2007.
Net Interest Income. Net interest income is the largest component of our earnings. It is calculated by subtracting the cost of interest-bearing liabilities from the income earned on interest-earning assets and represents the earnings from our primary business of gathering deposits and making loans and investments. Our long-term objective is to manage this income to provide the largest possible amount of income while balancing interest rate, credit and liquidity risks.
A financial institution’s asset and liability structure is substantially different from that of an industrial company, in that virtually all assets and liabilities are monetary in nature. Accordingly, changes in interest rates, which are generally impacted by inflation rates, may have a significant impact on a financial institution’s performance. The impact of interest rate changes depends on the sensitivity to change of our interest-earning assets and interest-bearing liabilities. The effects of the changing interest rate environment in recent years and our interest sensitivity position are discussed below.
Net interest income in 2008 was $31.8 million, a decrease of $1.8 million or 5.3%, when compared to $33.6 million in 2007. The decrease in net interest income reflected a decrease in net interest spread and net interest margin as the yield on our interest-earning assets decreased more than the cost of our interest-bearing liabilities. Loans are our largest interest-earning asset, and 47.4% of our total loans are floating rate loans which are primarily tied to the prime lending rate. During 2008, the prime lending rate decreased 400 basis points which adversely impacted the yield on our interest-earning assets. The cost of our interest-bearing liabilities was adversely impacted by the $106.4 million increase in time deposits, which is currently our most costly interest-bearing liability. As of December 31, 2008, time deposits re presented 56.5% of our total deposits, which is an increase from 46.2% of total deposits at December 31, 2007.
Comparing 2008 to 2007, the average yield on interest-earning assets decreased by 150 basis points and the average rate paid on interest-bearing liabilities decreased by 130 basis points. The net yield on interest-earning assets was 4.2% for the year ended December 31, 2008, compared to 4.7% for 2007.
The net interest income yield shown below in the average balance sheet is calculated by dividing net interest income by average interest-earning assets and is a measure of the efficiency of the earnings from balance sheet activities. It is affected by changes in the difference between interest on interest-earning assets and interest-bearing liabilities and the percentage of interest-earning assets funded by interest-bearing liabilities (leverage). The leverage for the year ending December 31, 2008 and 2007 was 80.3% and 78.6%, respectively.
Provision for Loan Losses. The provision for loan losses was $1.6 million and $1.9 million in 2008 and 2007, respectively. The decreased 2008 provisions were attributable to $1.3 million in net loan charge-offs during 2008 compared to $2.7 million in net loan charge-offs during 2007. Of the loan charge-offs in 2008, approximately $0.7 million were loans secured by real estate of which $0.3 million were commercial real estate and approximately $0.4 million were residential properties. In 2008, recoveries of $0.3 million were recognized on loans previously charged off as compared to $1.2 million in 2007. Of the loan charge-offs during 2007, approximately $3.0 million were loans secured by real estate of which $2.2 million were commercial real estate and approximatel y $0.8 million were residential properties. The allowance for loan losses at December 31, 2008 was $6.5 million, compared to $6.2 million at December 31, 2007, and was 1.07% and 1.08% of total loans, respectively. Management believes that the current level of the allowance is adequate to cover losses in the loan portfolio given the current economic conditions, expected net charge-offs and nonperforming asset levels.
Noninterest Income. Noninterest income totaled $1.1 million in 2008, a decrease of $3.6 million when compared to $4.7 million in 2007. Service charges, commissions and fees totaled $4.0 million and $3.8 million for the years ended December 31, 2008 and 2007, respectively. Net securities losses were $1,000 in 2008, compared to $478,000 in 2007. Other-than-temporary impairment charges totaling $4.6 million were taken on securities in 2008 (see Notes 4 and 19 to the Consolidated Financial Statements). Net gains on sale of loans were $210,000 in 2008 and $272,000 in 2007. Other noninterest income increased $407,000 to $1.5 million in 2008 from $1.1 million in 2007.
Noninterest Expense. Noninterest expense totaled $23.2 million in 2008 and $21.3 million in 2007. Salaries and benefits increased $1.0 million in 2008 to $10.7 million from $9.7 million in 2007. The increase in salaries resulted from the additional key management personnel including an Internal Audit manager and a chief credit officer. At December 31, 2008, 241 employees represented 224.5 full-time equivalent staff members as compared to 222 full-time equivalent staff members in 2007. Occupancy and equipment expense totaled $2.9 million in 2008 and $2.6 million in 2007. Regulatory assessment expense in 2008 totaled $0.8 million compared to $381,000 in 2007. The net cost of other real estate and repossessions decreased $147,000 in 2008 to $249,000, when compared to $396,000 in 2007. Other noninterest expense totaled $8.6 million in 2008, an increase of $281,000 or 3.4% when compared to $8.3 million in 2007.
Total noninterest expense includes expenses paid to related parties. Related parties include the Company’s executive officers, directors and certain business organizations and individuals with which such persons are associated. During the years ended 2006, 2007 and 2008, the Company paid approximately $2.0 million, $2.2 million and $2.1 million, respectively, for goods and services from related parties. See Note 14 to the Consolidated Financial Statements for additional information.
Income Taxes. The provision for income taxes for the years ended December 31, 2008 and 2007 was $2.5 million and $5.2 million, respectively. The decreased provision for income taxes in 2008 resulted from lower income recognized during 2008 when compared to 2007, which resulted from decreases in net interest income, decreases in noninterest income and increases in noninterest expense. The Company’s effective tax rate amounted to 30.9% and 34.8% during 2008 and 2007, respectively. The difference between the effective tax rate and the statutory tax rate primarily relates to variances in items that are non-taxable or non-deductible and various tax credits.
Asset/Liability Management and Market Risk
Asset/LiabilityManagement. Our asset/liability management (ALM) process consists of quantifying, analyzing and controlling interest rate risk (IRR) to maintain reasonably stable net interest income levels under various interest rate environments. The principal objective of ALM is to maximize net interest income while operating within acceptable limits established for interest rate risk and maintain adequate levels of liquidity.
The majority of our assets and liabilities are monetary in nature. Consequently, one of our most significant forms of market risk is interest rate risk. Our assets, consisting primarily of loans secured by real estate, have longer maturities than our liabilities, consisting primarily of deposits. As a result, a principal part of our business strategy is to manage interest rate risk and reduce the exposure of our net interest income to changes in market interest rates. Accordingly, our Board of Directors has established an Asset/Liability Committee which is responsible for evaluating the interest rate risk inherent in our assets and liabilities, for determining the level of risk that is appropriate given our business strategy, operating environment, capital, liquidity and performance objectives, and for managing this risk consistent with t he guidelines approved by the Board of Directors. Senior Management monitors the level of interest rate risk on a regular basis and the Asset/Liability Committee, which consists of executive Management and other bank personnel operating under a policy adopted by the Board of Directors, meets as needed to review our asset/liability policies and interest rate risk position.
The interest spread and liability funding discussed below are directly related to changes in asset and liability mixes, volumes, maturities and repricing opportunities for interest-earning assets and interest-bearing liabilities. Interest-sensitive assets and liabilities are those which are subject to being repriced in the near term, including both floating or adjustable rate instruments and instruments approaching maturity. The interest sensitivity gap is the difference between total interest-sensitive assets and total interest-sensitive liabilities. Interest rates on our various asset and liability categories do not respond uniformly to changing market conditions. Interest rate risk is the degree to which interest rate fluctuations in the marketplace can affect net interest income.
To maximize our margin, we attempt to be somewhat more asset sensitive during periods of rising rates and more liability sensitive during periods of falling rates. The need for interest sensitivity gap Management is most critical in times of rapid changes in overall interest rates. We generally seek to limit our exposure to interest rate fluctuations by maintaining a relatively balanced mix of rate sensitive assets and liabilities on a one-year time horizon. The mix is relatively difficult to manage. Because of the significant impact on net interest margin from mismatches in repricing opportunities, the asset-liability mix is monitored periodically depending upon Management’s assessment of current business conditions and the interest rate outlook. Exposure to interest rate fluctuations is maintained within prudent levels by the use of varying investment strategies.
We monitor interest rate risk using an interest sensitivity analysis set forth on the following table. This analysis, which we prepare monthly, reflects the maturity and repricing characteristics of assets and liabilities over various time periods. The gap indicates whether more assets or liabilities are subject to repricing over a given time period. The interest sensitivity analysis at December 31, 2009 shown below reflects a liability-sensitive position with a negative cumulative gap on a one-year basis.
| | | Interest Sensitivity Within | |
| | | 3 Months | | | Over 3 Months | | | Total | | | Over | | | | |
| | | Or Less | | | thru 12 Months | | | One Year | | | One Year | | | Total | |
| | | (dollars in thousands) | |
| Earning Assets: | | | | | | | | | | | | | | | |
| Loans (including loans held for sale) | | $ | 198,160 | | | $ | 118,637 | | | $ | 316,797 | | | $ | 273,105 | | | $ | 589,902 | |
| Securities (including FHLB stock) | | | 3,927 | | | | 7,703 | | | | 11,630 | | | | 252,746 | | | | 264,376 | |
| Federal Funds Sold | | | 13,279 | | | | - | | | | 13,279 | | | | - | | | | 13,279 | |
| Other earning assets | | | 14 | | | | - | | | | 14 | | | | - | | | | 14 | |
| Total earning assets | | | 215,380 | | | | 126,340 | | | | 341,720 | | | | 525,851 | | | $ | 867,571 | |
| | | | | | | | | | | | | | | | | | | | | |
| Source of Funds: | | | | | | | | | | | | | | | | | | | | |
| Interest-bearing accounts: | | | | | | | | | | | | | | | | | | | | |
| Demand deposits | | | 138,774 | | | | - | | | | 138,774 | | | | 49,478 | | | | 188,252 | |
| Savings deposits | | | 10,067 | | | | - | | | | 10,067 | | | | 30,205 | | | | 40,272 | |
| Time deposits | | | 159,239 | | | | 190,480 | | | | 349,719 | | | | 89,685 | | | | 439,404 | |
| Short-term borrowings | | | 11,929 | | | | - | | | | 11,929 | | | | - | | | | 11,929 | |
| Long-term borrowings | | | - | | | | 20,000 | | | | 20,000 | | | | - | | | | 20,000 | |
| Noninterest-bearing, net | | | - | | | | | | | | - | | | | 167,714 | | | | 167,714 | |
| Total source of funds | | | 320,009 | | | | 210,480 | | | | 530,489 | | | | 337,082 | | | $ | 867,571 | |
| Period gap | | | (104,629 | ) | | | (84,140 | ) | | | (188,769 | ) | | | 188,769 | | | | | |
| Cumulative gap | | $ | (104,629 | ) | | $ | (188,769 | ) | | $ | (188,769 | ) | | $ | - | | | | | |
| | | | | | | | | | | | | | | | | | | | | |
| Cumulative gap as a | | | | | | | | | | | | | | | | | | | | |
| percent of earning assets | | | -12.06 | % | | | -21.76 | % | | | -21.76 | % | | | | | | | | |
| | | | | | | | | | | | | | | | | | | | | |
Net Interest Income at Risk. Net interest income (NII) at risk measures the risk of a decline in earnings due to changes in interest rates. The table below presents an analysis of our interest rate risk as measured by the estimated changes in net interest income resulting from an instantaneous and sustained parallel shift in the yield curve at December 31, 2009. Shifts are measured in 100 basis point increments (+ 200 through - 200 basis points,) from base case. Base case encompasses key assumptions for asset/liability mix, loan and deposit growth, pricing, prepayment speeds, deposit decay rates, securities portfolio cash flows and reinvestment strategy and the market value of ce rtain assets under the various interest rate scenarios. The base case scenario assumes that the current interest rate environment is held constant throughout the forecast period; the instantaneous shocks are performed against that yield curve.
Change in Interest Rates | | Estimated Increase (Decrease) in NII December 31, 2009 | | |
| (basis points) | | | | | |
| | | | | | |
| -200 | | | -17.18% | | |
| -100 | | | -7.47% | | |
| Stable | | | 0.0% | | |
| +100 | | | 3.41% | | |
| +200 | | | 6.19% | | |
The increasing rate scenarios shows higher levels of net interest income while the decreasing scenarios show higher levels of volatility and subsequently lower levels of NII. These scenarios are instantaneous shocks that assume balance sheet Management will mirror base case. Should the yield curve begin to rise or fall, Management has several strategies available to maximize earnings opportunities or offset the negative impact to earnings. For example, in a falling rate environment, deposit pricing strategies could be adjusted to further sway customer behavior to non-contractual or short-term (less than 12 months) contractual deposit products which would reset downward with the changes in the yield curve and prevailing market rates. Another opportunity at the start of such a cycle would be reinvesting the securiti es portfolio cash flows into longer term, non-callable bonds that would lock in higher yields.
Even if interest rates change in the designated amounts, there can be no assurance that our assets and liabilities would perform as anticipated. Additionally, a change in the U.S. Treasury rates in the designated amounts accompanied by a change in the shape of the U.S. Treasury yield curve would cause significantly different changes to NII than indicated above. Strategic management of our balance sheet and earnings would be adjusted to accommodate these movements. As with any method of measuring IRR, certain shortcomings are inherent in the methods of analysis presented above. For example, although certain assets and liabilities may have similar maturities or periods to repricing, they may react in different degrees to changes in market interest rates. Also, the interest rates on certain types of assets and liabil ities may fluctuate in advance of changes in market interest rates, while interest rates on other types may lag behind changes in market rates. Also, the ability of many borrowers to service their debt may decrease in the event of an interest rate increase. We consider all of these factors in monitoring its exposure to interest rate risk.
Liquidity and Capital Resources
Liquidity and Capital Resources. Liquidity refers to the ability or flexibility to manage future cash flows to meet the needs of depositors and borrowers and fund operations. Maintaining appropriate levels of liquidity allows us to have sufficient funds available to meet customer demand for loans, withdrawal of deposit balances and maturities of deposits and other liabilities. Liquid assets include cash and due from banks, interest-earning demand deposits with banks, federal funds sold and available for sale investment securities. Including securities pledged to collateralize public fund deposits, these assets represent 31.8%, 22.1% and 20.3% of the total liquidity base at December 31, 2009, 2008 and 2007, r espectively. In addition, we maintained borrowing availability with the Federal Home Loan Bank of Dallas, or FHLB, approximating $92.9 million and $63.1 million at December 31, 2009 and December 31, 2008, respectively. We also maintain federal funds lines of credit totaling $63.2 million at three other correspondent banks, of which $63.2 was available at December 31, 2009, and $63.2 million was available at December 31, 2008. Management believes there is sufficient liquidity to satisfy current operating needs.
Regulatory Capital. Risk-based capital regulations adopted by the FDIC require banks to achieve and maintain specified ratios of capital to risk-weighted assets. Similar capital regulations apply to bank holding companies. The risk-based capital rules are designed to measure “Tier 1” capital (consisting of common equity, retained earnings and a limited amount of qualifying perpetual preferred stock and trust preferred securities, net of goodwill and other intangible assets and accumulated other comprehensive income) and total capital in relation to the credit risk of both on- and off- balance sheet items. Under the g uidelines, one of its risk weights is applied to the different on balance sheet items. Off-balance sheet items, such as loan commitments, are also subject to risk weighting. All bank holding companies and banks must maintain a minimum total capital to total risk weighted assets ratio of 8.00%, at least half of which must be in the form of core or Tier 1 capital. These guidelines also specify that bank holding companies that are experiencing internal growth or making acquisitions will be expected to maintain capital positions substantially above the minimum supervisory levels.
At December 31, 2009, we satisfied the minimum regulatory capital requirements and were well capitalized within the meaning of federal regulatory requirements.
Off-Balance Sheet Arrangements
We had $140.0 million, $155.0 million and $105.0 million in letters of credit issued by the FHLB of Dallas at December 31, 2009, 2008, and 2007, respectively, which was used as collateral for public fund deposits.
Contractual Obligations
The following table summarizes our significant fixed and determinable contractual obligations and other funding needs by payment date at December 31, 2009. The payment amounts represent those amounts due to the recipient and do not include any unamortized premiums or discounts or other similar carrying amount adjustments.
At of December 31, 2009, our contractual obligations were as follows:
| | | Payments Due by Period | |
| | | One Year | | | One Through | | | Over Three | | | | |
| | | or Less | | | Three Years | | | Years | | | Total | |
| | | (in thousands) | |
| | | | | | | | | | | | | |
| Operating leases | | $ | 11 | | | $ | 21 | | | $ | 74 | | | $ | 106 | |
| Time deposits | | | 349,719 | | | | 50,529 | | | | 39,156 | | | | 439,404 | |
| Short-term borrowings | | | 11,929 | | | | - | | | | - | | | | 11,929 | |
| Long-term borrowings | | | 20,000 | | | | - | | | | - | | | | 20,000 | |
| Total | | $ | 381,659 | | | $ | 50,550 | | | $ | 39,230 | | | $ | 471,439 | |
| | | | | | | | | | | | | | | | | |
Impact of Inflation and Changing Prices
The consolidated financial statements and related financial data presented herein have been prepared in accordance with generally accepted accounting principles, which generally require the measurement of financial position and operating results in terms of historical dollars, without considering changes in relative purchasing power over time due to inflation. Unlike most industrial companies, the majority of the Company’s assets and liabilities are monetary in nature. As a result, interest rates generally have a more significant impact on the Company’s performance than does the effect of inflation. Although fluctuations in interest rates are neither completely predictable or controllable, the Company regularly monitors its interest rate position and oversees its financial risk Management by establishing policies and operating limits (see “Asset/Liability Management and Market Risk” section). Interest rates do not necessarily move in the same direction or in the same magnitude as the prices of goods and services, since such prices are affected by inflation to a larger extent than interest rates. Although not as critical to the banking industry as to other industries, inflationary factors may have some impact on the Company’s growth, earnings, total assets and capital levels. Management does not expect inflation to be a significant factor in 2010.
For discussion on this matter, see the “Asset/Liability Management and Market Risk” section of this analysis.
Report of Castaing, Hussey & Lolan, LLC
Independent Registered Accounting Firm
To the Stockholders and Board of Directors
First Guaranty Bancshares, Inc.
We have audited the accompanying consolidated balance sheets of First Guaranty Bancshares, Inc. as of December 31, 2009 and 2008, and the related consolidated statements of income, changes in stockholders’ equity and cash flows for each of the years in the three-year period ended December 31, 2009. These financial statements are the responsibility of the Company's management. Our responsibility is to express an opinion on these financial statements based on our audits.
We conducted our audits in accordance with the standards of the Public Company Accounting Oversight Board (United States). Those standards require that we plan and perform the audit to obtain reasonable assurance about whether the financial statements are free of material misstatement. The Company is not required to have, nor were we engaged to perform, an audit of its internal control over financial reporting. Our audit included consideration of internal control over financial reporting as a basis for designing audit procedures that are appropriate in the circumstances, but not for the purpose of expressing an opinion on the effectiveness of the Company’s internal control over financial reporting. Accordingly, we express no such opinion. An audit includes examining, on a test basis, evidence supporting the amounts and disclosures in the financial statements. An audit also includes assessing the accounting principles used and significant estimates made by management, as well as evaluating the overall financial statement presentation. We believe that our audits provide a reasonable basis for our opinion.
In our opinion, the financial statements referred to above present fairly, in all material respects, the consolidated financial position of First Guaranty Bancshares, Inc. as of December 31, 2009 and 2008, and the consolidated results of its operations and its cash flows for each of the years in the three-year period ended December 31, 2009 in conformity with accounting principles generally accepted in the United States of America.
/s/ Castaing, Hussey & Lolan, LLC
Castaing, Hussey & Lolan, LLC
New Iberia, Louisiana
March 31, 2010
| FIRST GUARANTY BANCSHARES, INC. AND SUBSIDIARY |
| CONSOLIDATED BALANCE SHEETS |
| (dollars in thousands, except share data) |
| | | | | | | |
| | | | | | | |
| | | December 31, | |
| | | 2009 | | | 2008 | |
| Assets | | | | | | |
| Cash and cash equivalents: | | | | | | |
| Cash and due from banks | | $ | 33,425 | | | $ | 77,159 | |
| Interest-earning demand deposits with banks | | | 14 | | | | 20 | |
| Federal funds sold | | | 13,279 | | | | 838 | |
| Cash and cash equivalents | | | 46,718 | | | | 78,017 | |
| | | | | | | | | |
| Interest-earning time deposits with banks | | | - | | | | 21,481 | |
| | | | | | | | | |
| Investment securities: | | | | | | | | |
| Available for sale, at fair value | | | 249,480 | | | | 114,406 | |
| Held to maturity, at cost (estimated fair value of | | | | | | | | |
| $12,462 and $24,936, respectively) | | | 12,349 | | | | 24,756 | |
| Investment securities | | | 261,829 | | | | 139,162 | |
| | | | | | | | | |
| Federal Home Loan Bank stock, at cost | | | 2,547 | | | | 944 | |
| Loans held for sale | | | - | | | | - | |
| | | | | | | | | |
| Loans, net of unearned income | | | 589,902 | | | | 606,369 | |
| Less: allowance for loan losses | | | 7,919 | | | | 6,482 | |
| Net loans | | | 581,983 | | | | 599,887 | |
| | | | | | | | | |
| Premises and equipment, net | | | 16,704 | | | | 16,141 | |
| Goodwill | | | 1,999 | | | | 1,980 | |
| Intangible assets, net | | | 1,893 | | | | 2,078 | |
| Other real estate, net | | | 658 | | | | 568 | |
| Accrued interest receivable | | | 5,807 | | | | 4,611 | |
| Other assets | | | 10,709 | | | | 6,364 | |
| Total Assets | | $ | 930,847 | | | $ | 871,233 | |
| | | | | | | | | |
| Liabilities and Stockholders' Equity | | | | | | | | |
| Deposits: | | | | | | | | |
| Noninterest-bearing demand | | $ | 131,818 | | | $ | 118,255 | |
| Interest-bearing demand | | | 188,252 | | | | 180,230 | |
| Savings | | | 40,272 | | | | 41,357 | |
| Time | | | 439,404 | | | | 440,530 | |
| Total deposits | | | 799,746 | | | | 780,372 | |
| | | | | | | | | |
| Short-term borrowings | | | 11,929 | | | | 9,767 | |
| Accrued interest payable | | | 2,519 | | | | 3,033 | |
| Long-term borrowings | | | 20,000 | | | | 8,355 | |
| Other liabilities | | | 1,718 | | | | 4,219 | |
| Total Liabilities | | | 835,912 | | | | 805,746 | |
| | | | | | | | | |
| Stockholders' Equity | | | | | | | | |
| Preferred stock: | | | | | | | | |
| Series A - $1,000 par value - authorized 5,000 shares; issued | | | | | |
and outstanding 2,069.9 shares | | | 19,630 | | | | - | |
| Series B - $1,000 par value - authorized 5,000 shares; issued | | | | | |
and outstanding 103 shares | | | 1,140 | | | | - | |
| Common stock: | | | | | | | | |
| $1 par value - authorized 100,600,000 shares; issued and | | | | | |
| outstanding 5,559,644 shares | | | 5,560 | | | | 5,560 | |
| Surplus | | | 26,459 | | | | 26,459 | |
| Retained earnings | | | 40,069 | | | | 36,626 | |
| Accumulated other comprehensive income (loss) | | | 2,077 | | | | (3,158 | ) |
| Total Stockholders' Equity | | | 94,935 | | | | 65,487 | |
| Total Liabilities and Stockholders' Equity | | $ | 930,847 | | | $ | 871,233 | |
| | | | | | | | | |
See Notes to Consolidated Financial Statements.
| FIRST GUARANTY BANCSHARES, INC. AND SUBSIDIARY | |
| CONSOLIDATED STATEMENTS OF INCOME | |
| (dollars in thousands, except share data) | |
| | | | | | | | | | |
| | | Years Ended December 31, | |
| | | 2009 | | | 2008 | | | 2007 | |
| Interest Income: | | | | | | | | | |
| Loans (including fees) | | $ | 35,677 | | | $ | 40,406 | | | $ | 46,470 | |
| Loans held for sale | | | 7 | | | | 45 | | | | 142 | |
| Deposits with other banks | | | 388 | | | | 224 | | | | 87 | |
| Securities (including FHLB stock) | | | 11,085 | | | | 6,594 | | | | 8,381 | |
| Federal funds sold | | | 34 | | | | 392 | | | | 400 | |
| Total Interest Income | | | 47,191 | | | | 47,661 | | | | 55,480 | |
| | | | | | | | | | | | | |
| Interest Expense: | | | | | | | | | | | | |
| Demand deposits | | | 1,179 | | | | 2,798 | | | | 6,688 | |
| Savings deposits | | | 98 | | | | 193 | | | | 228 | |
| Time deposits | | | 13,310 | | | | 12,432 | | | | 13,673 | |
| Borrowings | | | 257 | | | | 458 | | | | 1,345 | |
| Total Interest Expense | | | 14,844 | | | | 15,881 | | | | 21,934 | |
| | | | | | | | | | | | | |
| Net Interest Income | | | 32,347 | | | | 31,780 | | | | 33,546 | |
| Provision for loan losses | | | 4,155 | | | | 1,634 | | | | 1,918 | |
| Net Interest Income after Provision for Loan Losses | | | 28,192 | | | | 30,146 | | | | 31,628 | |
| | | | | | | | | | | | | |
| Noninterest Income: | | | | | | | | | |
| Service charges, commissions and fees | | | 4,146 | | | | 3,990 | | | | 3,822 | |
| Net gains (losses) on sale of securities | | | 2,056 | | | | (1 | ) | | | (478 | ) |
| Loss on securities impairment | | | (829 | ) | | | (4,611 | ) | | | - | |
| Net gains on sale of loans | | | 422 | | | | 210 | | | | 272 | |
| Other | | | 1,341 | | | | 1,489 | | | | 1,082 | |
| Total Noninterest Income | | | 7,136 | | | | 1,077 | | | | 4,698 | |
| | | | | | | | | | | | | |
| Noninterest Expense: | | | | | | | | | |
| Salaries and employee benefits | | | 10,752 | | | | 10,653 | | | | 9,662 | |
| Occupancy and equipment expense | | | 2,891 | | | | 2,903 | | | | 2,573 | |
| Regulatory assessment expense | | | 2,049 | | | | 827 | | | | 381 | |
| Net cost of other real estate and repossessions | | | 399 | | | | 249 | | | | 396 | |
| Other | | | 7,916 | | | | 8,609 | | | | 8,329 | |
| Total Noninterest Expense | | | 24,007 | | | | 23,241 | | | | 21,341 | |
| | | | | | | | | | | | | |
| Income Before Income Taxes | | | 11,321 | | | | 7,982 | | | | 14,985 | |
| Provision for income taxes | | | 3,726 | | | | 2,470 | | | | 5,213 | |
| Net Income | | | 7,595 | | | | 5,512 | | | | 9,772 | |
| Preferred Stock Dividends | | | (594 | ) | | | - | | | | - | |
| Income Available to Common Shareholders | | $ | 7,001 | | | $ | 5,512 | | | $ | 9,772 | |
| | | | | | | | | | | | | |
| Per Common Share: | | | | | | | | | |
| Earnings | | $ | 1.26 | | | $ | 0.99 | | | $ | 1.76 | |
| Cash dividends paid | | $ | 0.64 | | | $ | 0.64 | | | $ | 0.63 | |
| | | | | | | | | | | | | |
| Average Common Shares Outstanding | | | 5,559,644 | | | | 5,559,644 | | | | 5,559,644 | |
| | | | | | | | | | | | | |
See Notes to Consolidated Financial Statements.
| FIRST GUARANTY BANCSHARES, INC. AND SUBSIDIARY | |
| CONSOLIDATED STATEMENTS OF CHANGES IN STOCKHOLDERS' EQUITY | |
| (in thousands) | |
| | | | | | | | | | | | | | | | | | | | | | |
| | | Series A | | | Series B | | | | | | | | | | | | Accumulated | | | | |
| | | Preferred | | | Preferred | | | Common | | | | | | | | | Other | | | | |
| | | Stock | | | Stock | | | Stock | | | | | | Retained | | | Comprehensive | | | | |
| | | $1,000 Par | | | $1,000 Par | | | $1 Par | | | Surplus | | | Earnings | | | Income/(Loss) | | | Total | |
| | | | | | | | | | | | | | | | | | | | | | |
| Balance December 31, 2006 as previously reported | | $ | - | | | $ | - | | | $ | 5,560 | | | $ | 26,459 | | | $ | 28,818 | | | $ | (905 | ) | | $ | 59,932 | |
| Correction of an error | | | - | | | | - | | | | - | | | | - | | | | (416 | ) | | | - | | | | (416 | ) |
| Balance December 31, 2006 as restated | | | - | | | | - | | | | 5,560 | | | | 26,459 | | | | 28,402 | | | | (905 | ) | | | 59,516 | |
| Net income | | | - | | | | - | | | | - | | | | - | | | | 9,772 | | | | - | | | | 9,772 | |
| Change in unrealized loss on | | | | | | | | | | | | | | | | | | | | | | | | | | | | |
| available for sale securities, | | | | | | | | | | | | | | | | | | | | | | | | | | | | |
| net of reclassification adjustments, and taxes | | | - | | | | - | | | | - | | | | - | | | | - | | | | 570 | | | | 570 | |
| Comprehensive income | | | | | | | | | | | | | | | | | | | | | | | | | | | 10,342 | |
| Cash dividends on common stock ($0.63 per share) | | | | | | | | | | | | | | | | | | | (3,503 | ) | | | | | | | (3,503 | ) |
| Balance December 31, 2007 | | | - | | | | - | | | | 5,560 | | | | 26,459 | | | | 34,671 | | | | (335 | ) | | | 66,355 | |
| Net income | | | - | | | | - | | | | - | | | | - | | | | 5,512 | | | | - | | | | 5,512 | |
| Change in unrealized loss on | | | | | | | | | | | | | | | | | | | | | | | | | | | | |
| available for sale securities, | | | | | | | | | | | | | | | | | | | | | | | | | | | | |
| net of reclassification adjustments, and taxes | | | - | | | | - | | | | - | | | | - | | | | - | | | | (2,823 | ) | | | (2,823 | ) |
| Comprehensive income | | | | | | | | | | | | | | | | | | | | | | | | | | | 2,689 | |
| Cash dividends on common stock ($0.64 per share) | | | - | | | | - | | | | - | | | | - | | | | (3,557 | ) | | | - | | | | (3,557 | ) |
| Balance December 31, 2008 | | | - | | | | - | | | | 5,560 | | | | 26,459 | | | | 36,626 | | | | (3,158 | ) | | | 65,487 | |
| Preferred stock issued | | | 19,551 | | | | 1,148 | | | | | | | | | | | | | | | | | | | | 20,699 | |
| Net income | | | - | | | | - | | | | - | | | | - | | | | 7,595 | | | | - | | | | 7,595 | |
| Change in unrealized loss on | | | | | | | | | | | | | | | | | | | | | | | | | | | | |
| available for sale securities, | | | | | | | | | | | | | | | | | | | | | | | | | | | | |
| net of reclassification adjustments, and taxes | | | - | | | | - | | | | - | | | | - | | | | - | | | | 5,235 | | | | 5,235 | |
| Comprehensive income | | | | | | | | | | | | | | | | | | | | | | | | | | | 12,830 | |
| Cash dividends on common stock ($0.64 per share) | | | - | | | | - | | | | - | | | | - | | | | (3,558 | ) | | | - | | | | (3,558 | ) |
| Preferred stock dividend, amortization and accretion | | | 79 | | | | (8 | ) | | | - | | | | - | | | | (594 | ) | | | - | | | | (523 | ) |
| Balance December 31, 2009 | | $ | 19,630 | | | $ | 1,140 | | | $ | 5,560 | | | $ | 26,459 | | | $ | 40,069 | | | $ | 2,077 | | | $ | 94,935 | |
| | | | | | | | | | | | | | | | | | | | | | | | | | | | | |
See Notes to Consolidated Financial Statements.
| FIRST GUARANTY BANCSHARES, INC. AND SUBSIDIARY | |
| CONSOLIDATED STATEMENTS OF CASH FLOWS | |
| (in thousands) | |
| | | | | | | | | | |
| | | | | | | | | | |
| | | Years Ended December 31, | |
| | | 2009 | | | 2008 | | | 2007 | |
| Cash Flows From Operating Activities | | | | | | | | | |
| Net income | | $ | 7,595 | | | $ | 5,512 | | | $ | 9,772 | |
| Adjustments to reconcile net income to net cash | | | | | | | | | | | | |
| provided by operating activities: | | | | | | | | | | | | |
| Provision for loan losses | | | 4,155 | | | | 1,634 | | | | 1,918 | |
| Depreciation and amortization | | | 1,413 | | | | 1,451 | | | | 1,238 | |
| Amortization of premium/discount on investments | | | (768 | ) | | | (807 | ) | | | (1,011 | ) |
| (Gain) Loss on call / sale of securities | | | (2,066 | ) | | | 1 | | | | 478 | |
| Gain on sale of assets | | | (385 | ) | | | (211 | ) | | | (272 | ) |
| Other than temporary impairment charge on securities | | | 829 | | | | 4,611 | | | | - | |
| ORE writedowns and loss on disposition | | | 270 | | | | 113 | | | | 180 | |
| FHLB stock dividends | | | (3 | ) | | | (32 | ) | | | (134 | ) |
| Net decrease in loans held for sale | | | - | | | | 3,959 | | | | 31,090 | |
| Change in other assets and liabilities, net | | | (8,514 | ) | | | 3,326 | | | | (779 | ) |
| Net Cash Provided By Operating Activities | | | 2,526 | | | | 19,557 | | | | 42,480 | |
| | | | | | | | | | | | | |
| Cash Flows From Investing Activities | | | | | | | | | | | | |
| Proceeds from maturities and calls of HTM securities | | | 22,187 | | | | 11,740 | | | | 10,493 | |
| Proceeds from maturities, calls and sales of AFS securities | | | 1,281,594 | | | | 756,642 | | | | 627,001 | |
| Funds invested in AFS securities | | | (1,419,358 | ) | | | (773,772 | ) | | | (575,534 | ) |
| Proceeds from sale of Federal Home Loan Bank stock | | | - | | | | 1,900 | | | | 4,175 | |
| Funds invested in Federal Home Loan Bank stock | | | (1,599 | ) | | | (1,857 | ) | | | (639 | ) |
| Proceeds from maturities of time deposits with banks | | | 35,094 | | | | 2,923 | | | | - | |
| Funds invested in time deposits with banks | | | (13,613 | ) | | | (22,216 | ) | | | - | |
| Net decrease (increase) in loans | | | 12,620 | | | | (33,196 | ) | | | (31,222 | ) |
| Proceeds from sale of mortgage servicing rights | | | - | | | | - | | | | 583 | |
| Purchase of premises and equipment | | | (1,631 | ) | | | (1,017 | ) | | | (801 | ) |
| Proceeds from sales of premises and equipment | | | 24 | | | | - | | | | - | |
| Proceeds from sales of other real estate owned | | | 768 | | | | 443 | | | | 3,103 | |
| Cash paid in excess of cash received in acquisition | | | - | | | | (72 | ) | | | (10,646 | ) |
| Net Cash (Used In) Provided By Investing Activities | | | (83,914 | ) | | | (58,482 | ) | | | 26,513 | |
| | | | | | | | | | | | | |
| Cash Flows From Financing Activities | | | | | | | | | | | | |
| Net increase in deposits | | | 19,382 | | | | 57,194 | | | | 29,355 | |
| Net increase (decrease) in federal funds purchased and short-term borrowings | | | 2,162 | | | | (634 | ) | | | 3,817 | |
| Proceeds from long-term borrowings | | | 20,000 | | | | 10,000 | | | | - | |
| Repayment of long-term borrowings | | | (8,355 | ) | | | (4,738 | ) | | | (64,802 | ) |
| Proceeds from issuance of preferred stock | | | 20,699 | | | | - | | | | - | |
| Dividends paid | | | (3,799 | ) | | | (3,557 | ) | | | (3,503 | ) |
| Net Cash Provided By (Used In) Financing Activities | | | 50,089 | | | | 58,265 | | | | (35,133 | ) |
| | | | | | | | | | | | | |
| Net (Decrease) Increase In Cash and Cash Equivalents | | | (31,299 | ) | | | 19,340 | | | | 33,860 | |
| Cash and Cash Equivalents at the Beginning of the Period | | | 78,017 | | | | 58,677 | | | | 24,817 | |
| Cash and Cash Equivalents at the End of the Period | | $ | 46,718 | | | $ | 78,017 | | | $ | 58,677 | |
| | | | | | | | | | | | | |
| Noncash Activities: | | | | | | | | | | | | |
| Loans transferred to foreclosed assets | | $ | 1,129 | | | $ | 751 | | | $ | 1,118 | |
| Cash Paid During The Period: | | | | | | | | | | | | |
| Interest on deposits and borrowed funds | | $ | 15,357 | | | $ | 15,804 | | | $ | 22,048 | |
| Income taxes | | $ | 4,300 | | | $ | 1,200 | | | $ | 6,015 | |
| | | | | | | | | | | | | |
See Notes to Consolidated Financial Statements.
NOTES TO CONSOLIDATED FINANCIAL STATEMENTS
Note 1. Business and Summary of Significant Accounting Policies
Business
First Guaranty Bancshares, Inc. (the “Company”) is a Louisiana corporation. On July 27, 2007 the Company became the parent of First Guaranty Bank. The Company owns all of the outstanding shares of common stock of First Guaranty Bank. First Guaranty Bank (the “Bank”) is a Louisiana state-chartered commercial bank that provides a diversified range of financial services to consumers and businesses in the communities in which it operates. These services include consumer and commercial lending, mortgage loan origination, the issuance of credit cards and retail banking services. The Bank has 17 banking offices and 25 automated teller machines (ATMs) in northern and southern of Louisiana.
Summary of significant accounting policies
The accounting and reporting policies of the Company conform to generally accepted accounting principles and to predominant accounting practices within the banking industry. The more significant accounting and reporting policies are as follows:
Consolidation
The consolidated financial statements include the accounts of First Guaranty Bancshares, Inc. (the “Company”), and its wholly owned subsidiary, First Guaranty Bank (the “Bank”). All significant intercompany balances and transactions have been eliminated in consolidation.
Use of estimates
The preparation of financial statements in conformity with generally accepted accounting principles requires Management to make estimates and assumptions that affect the reported amounts of assets and liabilities and disclosure of contingent assets and liabilities at the dates of the financial statements and the reported amounts of revenue and expense during the reporting periods. Actual results could differ from those estimates.
Material estimates that are particularly susceptible to significant change in the near-term economic environment and market conditions relate to the determination of the allowance for loan losses and the valuation of real estate acquired in connection with foreclosures or in satisfaction of loans. In connection with the determination of the allowance for loan losses and real estate owned, the Company obtains independent appraisals for significant properties.
Available for sale investment securities are stated at estimated fair value, with the unrealized gains and losses determined on a specific identification basis. Such unrealized gains and losses, net of tax, are reported as a separate component of stockholders’ equity and included in other comprehensive income (loss). The Company utilizes an independent third party as its principal pricing source for determining fair value. For investment securities traded in an active market, fair values are measured on a recurring basis obtained from an independent pricing service and based on quoted market prices if available. If quoted market prices are not available, fair values are based on quoted market prices of comparable securities, broker quotes or comprehensive interest rate tables and pricing matrices. For investment securities traded in a market that is not active, fair value is determined using unobservable inputs or value drivers and is generally determined using expected cash flows and appropriate risk-adjusted discount rates. Expected cash flows are based primarily on the contractual cash flows of the instrument.
Any security that has experienced a decline in value, which Management believes is deemed other than temporary, is reduced to its estimated fair value by a charge to operations. In estimating other-than-temporary impairment losses, Management considers (1) the length of time and the extent to which the fair value has been less than cost, (2) the financial condition and near-term prospects of the issuer, and (3) the intent and ability of the Company to retain its investment in the issuer for a period of time sufficient to allow for any anticipated recovery in fair value. Realized gains and losses on security transactions are computed using the specific identification method. Amortization of premiums and discounts is included in interest and dividend income. Discounts and premiums related to debt securities are amortized using the effective interest rate method. The Company did not have any derivative financial instruments as of December 31, 2009 or 2008.
Cash and cash equivalents
For purposes of reporting cash flows, cash and cash equivalents are defined as cash, due from banks, interest-bearing demand deposits with banks and federal funds sold with maturities of three months or less.
Securities
The Company reviews its financial position, liquidity and future plans in evaluating the criteria for classifying investment securities. At December 31, 2009, the securities portfolio contained two classifications of securities - held to maturity and available for sale. At December 31, 2009, $249.5 million were classified as available for sale and $12.3 million were classified as held to maturity.
Debt securities that Management has the ability and intent to hold to maturity are classified as held to maturity and carried at cost, adjusted for amortization of premiums and accretion of discounts using methods approximating the interest method. Securities available for sale are stated at fair value. The unrealized difference, if any, between amortized cost and fair value of these securities is excluded from income and is reported, net of deferred taxes, as a component of stockholders' equity. Realized gains and losses on securities are computed based on the specific identification method and are reported as a separate component of other income.
Management evaluates securities for other-than-temporary impairment at least quarterly and more frequently when economic or market conditions warrant such evaluation. Consideration is given to (1) the length of time and the extent to which the fair value has been less than cost, (2) the financial condition and near-term prospects of the issuer (3) the recovery of contractual principal and interest and (4) the intent and ability of the Company to retain its investment in the issuer for a period of time sufficient to allow for any anticipated recovery in fair value.
The Company has a required investment in Federal Home Loan Bank stock that is carried at cost that approximates fair value. This stock must be maintained by the Company.
Loans held for sale
Mortgage loans originated and intended for sale in the secondary market are carried at the lower of cost or estimated fair value in the aggregate. Net unrealized losses, if any, are recognized through a valuation allowance by charges to income. Loans held for sale have primarily been fixed rate single-family residential mortgage loans under contract to be sold in the secondary market. In most cases, loans in this category are sold within thirty days. Buyers generally have recourse to return a purchased loan under limited circumstances. Recourse conditions may include early payment default, breach of representations or warranties and documentation deficiencies.
Mortgage loans held for sale are generally sold with the mortgage servicing rights released. Gains or losses on sales of mortgage loans are recognized based on the differences between the selling price and the carrying value of the related mortgage loans sold.
Loans
Loans are stated at the principal amounts outstanding, net of unearned income and deferred loan fees. In addition to loans issued in the normal course of business, overdrafts on customer deposit accounts are considered to be loans and reclassified as such. At December 31, 2009 and 2008, $116,000 and $161,000, respectively, in overdrafts have been reclassified to loans. Interest income on all classifications of loans is calculated using the simple interest method on daily balances of the principal amount outstanding.
Accrual of interest is discontinued on a loan when Management believes, after considering economic and business conditions and collection efforts, the borrower’s financial condition is such that reasonable doubt exists as to the full and timely collection of principal and interest. This evaluation is made for all loans that are 90 days or more contractually past due. When a loan is placed in non-accrual status, all interest previously accrued but not collected is reversed against current period interest income. Income on such loans is then recognized only to the extent that cash is received and where the future collection of interest and principal is probable. Loans are returned to accrual status when, in the judgment of Management, all principal and interest amounts contractually due are reasonably assured of repayment within a rea sonable time frame and when the borrower has demonstrated payment performance of cash or cash equivalents for a minimum of six months.
All loans, except mortgage loans, are considered past due if it is past due 30 days. Mortgage loans are considered past due when two consecutive payments have been missed. Loans that are past due 90-120 days and deemed uncollectible are charged off. The loan charge off is a reduction of the allowance for loan losses.
Loan fees and costs
Nonrefundable loan origination and commitment fees and direct costs associated with originating loans are deferred and recognized over the lives of the related loans as an adjustment to the loans' yield using the level yield method.
Allowance for loan losses
The allowance for loan losses is established through a provision for loan losses charged to expense. Loans are charged against the allowance for loan losses when Management believes that the collectability of the principal is unlikely. The allowance, which is based on evaluation of the collectability of loans and prior loan loss experience, is an amount that Management believes will be adequate to reflect the risks inherent in the existing loan portfolio and exist at the reporting date. The evaluations take into consideration a number of subjective factors including changes in the nature and volume of the loan portfolio, overall portfolio quality, review of specific problem loans, current economic conditions that may affect a borrower’s ability to pay, adequacy of loan collateral and other relevant factors. In addition, regulatory a gencies, as an integral part of their examination process, periodically review the estimated losses on loans. Such agencies may require additional recognition of losses based on their judgments about information available to them at the time of their examination.
Although Management uses available information to recognize losses on loans, because of uncertainties associated with local economic conditions, collateral values and future cash flows on impaired loans, it is reasonably possible that a material change could occur in the allowance for loan losses in the near term. However, the amount of the change that is reasonably possible cannot be estimated.
The evaluation of the adequacy of loan collateral is often based upon estimates and appraisals. Because of changing economic conditions, the valuations determined from such estimates and appraisals may also change. Accordingly, the Company may ultimately incur losses that vary from Management's current estimates. Adjustments to the allowance for loan losses will be reported in the period such adjustments become known or can be reasonably estimated. All loan losses are charged to the allowance for loan losses when the loss actually occurs or when Management believes that the collectability of the principal is unlikely. Recoveries are credited to the allowance at the time of recovery.
The allowance consists of specific, general and unallocated components. The specific component relates to loans that are classified as doubtful, substandard or special mention. For such loans that are also classified as impaired, an allowance is established when the discounted cash flows (or collateral value or observable market price) of the impaired loan is lower than the carrying value of that loan. The general component covers non-classified loans and is based on historical loss experience adjusted for qualitative factors. An unallocated component is maintained to cover uncertainties that could affect Management’s estimate of probable losses. The unallocated component of the allowance reflects the margin of imprecision inherent in the underlying assumptions used in the methodologies for estimating specific and general losses in the portfolio.
A loan is considered impaired when, based on current information and events, it is probable that the Company will be unable to collect the scheduled payments of principal or interest when due according to the contractual terms of the loan agreement. Factors considered by Management in determining impairment include payment status, collateral value and the probability of collecting scheduled principal and interest payments when due. Loans that experience insignificant payment delays and payment shortfalls generally are not classified as impaired. Management determines the significance of payment delays and payment shortfalls on a case-by-case basis, taking into consideration all of the circumstances surrounding the loan and the borrower, including the length of the delay, the reasons for the delay, the borrower’s prior payment record and the amount of the shortfall in relation to the principal and interest owed. Impairment is measured on a loan-by-loan basis for commercial and construction loans by either the present value of expected future cash flows discounted at the loan’s effective interest rate, the loan’s obtainable market price or the fair value of the collateral if the loan is collateral dependent.
Large groups of smaller balance homogeneous loans are collectively evaluated for impairment. Accordingly, individual consumer and residential loans are not separately identified for impairment disclosures, unless such loans are the subject of a restructuring agreement.
Goodwill and Intangible assets
Intangible assets are comprised of goodwill and core deposit intangibles. Goodwill is accounted for in accordance with FASB ASC 350, Intangibles – Goodwill and Other (SFAS No. 142). Under FASB ASC 350, goodwill and intangible assets deemed to have indefinite lives are no longer amortized, but are subject to annual impairment tests in accordance with the provision of FASB ASC 350. The Company’s goodwill is tested for impairment on an annual basis, or more often if events or circumstances indicate that there may be impairment. Adverse changes in the economic environment, declining operations, or other factors could result in a decline in the implied fair value of goodwill. If the implied fair value is less than the carrying amount, a loss would be recognized in other non-interest expense to reduce the carrying amount to implied fair value of goodwill. A goodwill impairment test includes two steps. Step one, used to identify potential impairment, compares the estimated fair value of a reporting unit with its carrying amount, including goodwill. If the estimated fair value of a reporting unit exceeds its carrying amount, goodwill of the reporting unit is considered not impaired. If the carrying amount of a reporting unit exceeds its estimated fair value, the second step of the goodwill impairment test is performed to measure the amount of impairment loss, if any. Step two of the goodwill impairment test compares the implied estimated fair value of reporting unit goodwill with the carrying amount of that goodwill. If the carrying amount of goodwill for that reporting unit exceeds the implied fair value of that unit’s goodwill, an impairment loss is recognized in an amount equal to that excess. The Company did not record goodwill impairment charges in 2009 or 200 8.
Identifiable intangible assets are acquired assets that lack physical substance but can be distinguished from goodwill because of contractual or legal rights or because the assets are capable of being sold or exchanged either on their own on in combination with related contract, asset or liability. The Company’s intangible assets primarily relate to core deposits. These core deposit intangibles are amortized on a straight-line basis over terms ranging from seven to 15 years. Management periodically evaluates whether events or circumstances have occurred that would result in impairment of value.
Premises and equipment
Premises and equipment are stated at cost, less accumulated depreciation. Depreciation is computed for financial reporting purposes using the straight-line method over the estimated useful lives of the respective assets as follows:
Buildings and improvements 10-40 years
Equipment, fixtures and automobiles 3-10 years
Expenditures for renewals and betterments are capitalized and depreciated over their estimated useful lives. Repairs, maintenance and minor improvements are charged to operating expense as incurred. Gains or losses on disposition, if any, are recorded in the Statements of Income.
Other real estate
Other real estate includes properties acquired through foreclosure or acceptance of deeds in lieu of foreclosure. These properties are recorded at the lower of the recorded investment in the property or its fair value less the estimated cost of disposition. Any valuation adjustments required prior to foreclosure are charged to the allowance for loan losses. Subsequent to foreclosure, losses on the periodic revaluation of the property are charged to current period earnings as other real estate expense. Costs of operating and maintaining the properties are charged to other real estate expense as incurred. Any subsequent gains or losses on dispositions are credited or charged to income in the period of disposition.
Off-balance sheet financial instruments
The Company accounts for its guarantees in accordance with the provisions of ASC Topic 460 (formerly Financial Accounting Standards Board (“FASB”) Interpretation No. 45, Guarantor’s Accounting and Disclosure Requirements for Guarantees). In the ordinary course of business, the Company has entered into commitments to extend credit, including commitments under credit card arrangements, commitments to fund commercial real estate, construction and land development loans secured by real estate, and performance standby letters of credit. Such financial instruments are recorded when they are funded.
Income taxes
The Company and all subsidiaries file a consolidated federal income tax return on a calendar year basis. In lieu of Louisiana state income tax, the Bank is subject to the Louisiana bank shares tax, which is included in noninterest expense in the Company’s consolidated financial statements. With few exceptions, the Company is no longer subject to U.S. federal, state or local income tax examinations for years before 2006.
Deferred tax assets and liabilities are recognized for the future tax consequences attributable to differences between the financial statement carrying amounts of existing assets and liabilities and their respective tax basis. Deferred tax assets and liabilities are measured using enacted tax rates expected to apply to taxable income in the years in which the deferred tax assets or liabilities are expected to be settled or realized. Valuation allowances are established when necessary to reduce deferred tax assets to the amount expected to be utilized.
Comprehensive income
Accounting principles generally require that recognized revenue, expenses, gains and losses be included in net income. Although certain changes in assets and liabilities, such as unrealized gains and losses on available for sale securities, are reported as a separate component of the equity section of the balance sheet, such items along with net income, are components of comprehensive income. The components of other comprehensive income and related tax effects are presented in the Statements of Changes in Stockholders’ Equity and Note 17 of the Consolidated Notes to the Financial Statements.
Earnings per common share
Earnings per share represents income available to common shareholders divided by the weighted average number of common shares outstanding during the period. No convertible shares or other agreements to issue common stock are outstanding.
Transfers of Financial Assets
Transfers of financial assets are accounted for as sales, when control over the assets has been surrendered. Control over transferred assets is deemed to be surrendered when (i) the assets have been isolated from the Company, (ii) the transferee obtains the right (free of conditions that constrain it from taking advantage of that right) to pledge or exchange the transferred assets, and (iii) the Company does not maintain effective control over the transferred assets through an agreement to repurchase them before their maturity.
Recent Accounting Pronouncements
In June 2009, the Financial Accounting Standards Board (“FASB”) issued an update to ASC Topic 105, Generally Accepted Accounting Principles (Statement No. 168, “The FASB Accounting Standards Codification” and the Hierarchy of Generally Accepted Accounting Principles – a replacement of FASB Statement No. 162). ASC 105 states that the FASB Accounting Standards Codification (Codification) will become the source of authoritative nongovernmental U.S. Generally Accepted Accounting Principles (U.S. GAAP). The Codification does not change current U.S. GAAP but is intended to simplify user access to all authoritative U.S. GAAP by providing all the authoritative literature related to a particular topic in one place. All existing accounting standard documents will be superseded and all other accounting literature not included in the Codification will be considered nonauthoritative. The Codification is effective for interim and annual periods ending after September 15, 2009. The Codification became effective for the Company during its interim period ending September 30, 2009 and did not have an impact on its financial condition or results of operations.
On June 12, 2009, the FASB issued updates to ASC Topic 860, Transfers and Servicing (SFAS No. 166, Accounting for Transfers of Financial Assets), and FASB ASC 810, (SFAS No.167, Amendments to FASB Interpretation No. 46(R)), which change the way entities account for securitizations and special-purpose entities.
The update to ASC Topic 860 will require more information about transfers of financial assets, including securitization transactions, and where companies have continuing exposure to the risks related to transferred financial assets. The update also eliminates the concept of a “qualifying special-purpose entity”, changes the requirements for derecognizing financial assets and requires additional disclosures.
The update to FASB ASC Topic 810 changes how a company determines when an entity that is insufficiently capitalized or is not controlled through voting (or similar rights) should be consolidated. The determination of whether a company is required to consolidate an entity is based on, among other things, an entity’s purpose and design and a company’s ability to direct the activities of the entity that most significantly impact the entity’s economic performance.
The update to both ASC Topic 860 and ASC Topic 810 will be effective as of the beginning of each reporting entity’s first annual reporting period that begins after November 15, 2009, for interim periods within that first annual reporting period and for interim and annual reporting periods thereafter. Earlier application is prohibited. The recognition and measurement provisions of ASC Topic 860 shall be applied to transfers that occur on or after the effective date. Management has not determined the impact adoption may have on the Company’s consolidated financial statements.
In May 2009, the FASB issued an update to ASC Topic 855, Subsequent Events (SFAS No. 165, Subsequent Events). ASC Topic 855 establishes general standards of accounting for and disclosures of events that occur after the balance sheet date but before financial statements are issued or are available to be issued. It requires entities to disclose the date through which it has evaluated subsequent events and the basis for that date. ASC Topic 855 is effective for interim and annual periods ending after June 15, 2009. ASC Topic 855 was effective for the Company as of June 30, 2009. The adoption of ASC Topic 855 did not have a material impact on our financial condition, results of operations, or disclosures.
In May 2009, FASB issued an update to ASC Topic 855, Subsequent Events with the objective to establish general standards of accounting for and disclosure of events that occur after the balance sheet date but before financial statements are issued or are available to be issued. ASC Topic 855 sets forth: (i) the period after the balance sheet date during which management of a reporting entity should evaluate events or transactions that may occur for potential recognition or disclosure in the financial statements; (ii) the circumstances under which an entity should recognize events or transactions occurring after the balance sheet date in its financial statements; and (iii) the disclosures that an entity should make about events or transactions that occur red after the balance sheet date. ASC Topic 855 is effective for interim and annual financial periods ending after June 15, 2009. The adoption of ASC Topic 855 on June 30, 2009, did not have an impact on the Company’s consolidated financial statements.
In April 2009, the FASB issued an update to ASC Topic 820-10-65-4, Transition Related to FASB Staff Position FAS 157-4. This ASC update affirms that the objective of fair value when the market for an asset is not active is the price that would be received to sell the asset in an orderly transaction; includes additional factors for determining whether there has been a significant decrease in market activity for an asset when the market is inactive; eliminates the presumption that all transactions are distressed unless proven otherwise requiring an entity to base its conclusion on the weight of evidence; and requires an entity to disclose a change in valuation technique resulting from application of the FSP and to quantify its effects, if practicable. ASC Topic 820-10-65-4 is effectiv e for interim and annual periods ending after June 15, 2009 with early adoption permitted for periods ending after March 15, 2009. The Company adopted this ASC in the second quarter. The adoption had no material effect on the results of operations or financial position.
In April 2009, the FASB issued an update to ASC Topic 320-10-65-1, Transition Related to FSP FAS 115-2 and FAS 124-2. This ASC update changes existing guidance for determining whether an impairment is other-than-temporary to debt securities; replaces the existing requirement that the entity’s management assert it has both the intent and ability to hold an impaired security until recovery with a requirement that management assert: (a) it does not have the intent to sell the security and (b) it is more likely than not it will not have to sell the security before recovery of its cost basis; requires that an entity recognize noncredit losses on held-to-maturity debt securities in other comprehensive income and amortize the amount over the remaining life of the security in a prospe ctive manner by offsetting the recorded value of the asset unless the security is subsequently sold or there are credit losses; requires an entity to present the total other-than-temporary impairment in the statement of earnings with an offset for the amount recognized in other comprehensive income; and at adoption, requires an entity to record a cumulative-effect adjustment as of the beginning of the period of adoption to reclassify the noncredit component of a previously recognized other-than-temporary impairment from retained earnings to accumulated other comprehensive income if the entity does not intend to sell the security and it is more likely than not that the entity will be required to sell the security before recovery. ASC Topic 320-10-65-1 is effective for interim and annual periods ending after June 15, 2009 with early adoption permitted for periods ending after March 15, 2009. The Company adopted this ASC in the second quarter. The adoption had no material effect on the results of ope rations or financial position.
In April 2009, the FASB issued an update to ASC Topic 825-10-65-1, Transition Related to FSP FAS 107-1 and APB 28-1.FSP 107-1 and APB 28-1. Under this updated ASC, a publicly traded company shall include disclosures about the fair value of its financial instruments whenever it issues summarized financial information for interim reporting periods. In addition, an entity shall disclose in the body or in the accompanying notes of its summarized financial information for interim reporting periods and in its financial statements for annual reporting periods the fair value of all financial instruments for which it is practicable to estimate that value, whether recognized or not recognized in the statement of financial position. FASB ASC 825-10-65-1 is effective for interim periods ending after June 15, 2009 with early adoption permitted for periods ending after March 15, 2009. The Company adopted this ASC in the second quarter. The adoption had no material effect on the results of operations or financial position.
In December 2007, the FASB issued an update to ASC Topic 805, Business Combinations (SFAS No. 141). ASC Topic 805 establishes principles and requirements for recognition and measurement of assets, liabilities and any noncontrolling interest acquired due to a business combination. This update expands the definitions of a business and a business combination, resulting in an increased number of transactions or other events that will qualify as business combinations. Under ASC Topic 805 the entity that acquires the business (the “acquirer”) will record 100 percent of all assets and liabilities of the acquired business, including goodwill, generally at their fair values. As such, an acquirer will not be permitted to recognize the allowance for loan losses of the acquiree. ASC Topic 805 requires the acquirer to recognize goodwill as of the acquisition date, measured as a residual. In most business combinations, goodwill will be recognized to the extent that the consideration transferred plus the fair value of any noncontrolling interests in the acquiree at the acquisition date exceeds the fair values of the identifiable net assets acquired. Under ASC Topic 805, acquisition-related transaction and restructuring costs will be expensed as incurred rather than treated as part of the cost of the acquisition and included in the amount recorded for assets acquired. ASC Topic 805 is effective for fiscal years beginning after December 15, 2008. The impact on the Company’s financial condition or results of operations is dependent on the extent of future business combinations.
Reclassifications
Certain reclassifications have been made to prior year financial statements in order to conform to the classification adopted for reporting in 2009.
Note 2. Correction of an Error
During 2009, the Company discovered errors related to the calculation of interest expense and prepaid assets for the years ending 2008, 2007 and 2006. As a result, the 2008 adjustments include a reduction of $199,000 in other assets, an increase of $944,000 in other liabilities and a reduction of retained earnings totaling $1,143,000. The 2007 adjustments include a reduction of other assets totaling $66,000, an increase of $842,000 in other liabilities and a reduction of retained earnings totaling $907,000. The portion of the error attributable to years prior to December 31, 2007, was recorded as a decrease to retained earnings at December 31, 2006, of $416,000.
Net income previously reported for 2008 totaled $5.7 million compared to restated net income which totaled $5.5 million, a net decrease of $0.2 million. Net income previously reported for 2007 totaled $10.3 million compared to restated net income which totaled $9.8 million, a net decrease of $0.5 million.
Below depicts changes as currently reported (restated) compared to information previously reported.
| | | Restated | | | Previously Reported | | | Changes | |
| | | For the Years Ended | | | For the Years Ended | | | For the Years Ended | |
| | | 2008 | | | 2007 | | | 2008 | | | 2007 | | | 2008 | | | 2007 | |
| | | (in thousands except per share data) | |
| | | | | | | | | | | | | | | | | | | |
| Other assets | | $ | 6,364 | | | $ | 5,051 | | | $ | 6,563 | | | $ | 5,117 | | | $ | (199 | ) | | $ | (66 | ) |
| Total assets | | | 871,233 | | | | 807,994 | | | | 871,432 | | | | 808,060 | | | | (199 | ) | | | (66 | ) |
| Other liabilities | | | 4,219 | | | | 2,096 | | | | 3,275 | | | | 1,254 | | | | 944 | | | | 842 | |
| Total liabilities | | | 805,746 | | | | 741,640 | | | | 804,802 | | | | 740,798 | | | | 944 | | | | 842 | |
| Retained earnings | | | 36,626 | | | | 34,671 | | | | 37,769 | | | | 35,578 | | | | (1,143 | ) | | | (907 | ) |
| Total stockholders' equity | | | 65,487 | | | | 66,355 | | | | 66,630 | | | | 67,262 | | | | (1,143 | ) | | | (907 | ) |
| | | | | | | | | | | | | | | | | | | | | | | | | |
| Interest expense | | $ | 15,881 | | | $ | 21,934 | | | $ | 15,733 | | | $ | 21,398 | | | $ | 148 | | | $ | 536 | |
| Noninterest expense | | | 23,241 | | | | 21,341 | | | | 23,032 | | | | 21,133 | | | | 209 | | | | 208 | |
| Provision for income taxes | | | 2,470 | | | | 5,213 | | | | 2,591 | | | | 5,466 | | | | (121 | ) | | | (253 | ) |
| Net income | | | 5,512 | | | | 9,772 | | | | 5,748 | | | | 10,263 | | | | (236 | ) | | | (491 | ) |
| | | | | | | | | | | | | | | | | | | | | | | | | |
| Earnings per common share | | $ | 0.99 | | | $ | 1.76 | | | $ | 1.03 | | | $ | 1.85 | | | $ | (0.04 | ) | | $ | (0.09 | ) |
Note 3. Cash and Due from Banks
Certain reserves are required to be maintained at the Federal Reserve Bank. The requirement as of December 31, 2009 and 2008 was $13.7 million and $14.1 million, respectively. The Company has accounts at various correspondent banks, excluding the Federal Reserve Bank, which exceeded the FDIC insured limit of $250,000 by $9.0 million at December 31, 2009. This balance was held at JPMorgan Chase, the correspondent bank which is used to clear cash letters.
Note 4. Securities
A summary comparison of securities by type at December 31, 2009 and 2008 is shown below.
| | | December 31, 2009 | | | December 31, 2008 | |
| | | | | | Gross | | | Gross | | | | | | | | | Gross | | | Gross | | | | |
| | | Amortized | | | Unrealized | | | Unrealized | | | Fair | | | Amortized | | | Unrealized | | | Unrealized | | | Fair | |
| | | Cost | | | Gains | | | Losses | | | Value | | | Cost | | | Gains | | | Losses | | | Value | |
| | | (in thousands) | |
| Available for sale: | | | | | | | | | | | | | | | | | | | | | | | | |
| U.S. Government Agencies | | $ | 140,843 | | | $ | 382 | | | $ | (1,562 | ) | | $ | 139,663 | | | $ | 58,389 | | | $ | 132 | | | $ | - | | | $ | 58,521 | |
| Mortgage-backed obligations | | | 1,472 | | | | 104 | | | | - | | | | 1,576 | | | | 1,701 | | | | 82 | | | | (5 | ) | | | 1,778 | |
| Asset-backed securities | | | - | | | | 8 | | | | - | | | | 8 | | | | 532 | | | | - | | | | (439 | ) | | | 93 | |
| Corporate debt securities | | | 87,238 | | | | 5,627 | | | | (776 | ) | | | 92,089 | | | | 57,773 | | | | 644 | | | | (5,077 | ) | | | 53,340 | |
| Mutual funds or other equity securities | | | 6,556 | | | | 83 | | | | (495 | ) | | | 6,144 | | | | 795 | | | | 26 | | | | (147 | ) | | | 674 | |
| Municipal bonds | | | 10,000 | | | | - | | | | - | | | | 10,000 | | | | - | | | | - | | | | - | | | | - | |
| Total available for sale securities | | $ | 246,109 | | | $ | 6,204 | | | $ | (2,833 | ) | | $ | 249,480 | | | $ | 119,190 | | | $ | 884 | | | $ | (5,668 | ) | | $ | 114,406 | |
| | | | | | | | | | | | | | | | | | | | | | | | | | | | | | | | | |
| | | | | | | | | | | | | | | | | | | | | | | | | | | | | | | | | |
| Held to maturity: | | | | | | | | | | | | | | | | | | | | | | | | | | | | | | | | |
| U.S. Government Agencies | | $ | 10,721 | | | $ | 52 | | | $ | - | | | $ | 10,773 | | | $ | 22,680 | | | $ | 160 | | | $ | - | | | $ | 22,840 | |
| Mortgage-backed obligations | | | 1,628 | | | | 61 | | | | - | | | | 1,689 | | | | 2,076 | | | | 21 | | | | (1 | ) | | | 2,096 | |
| Total held to maturity securities | | $ | 12,349 | | | $ | 113 | | | $ | - | | | $ | 12,462 | | | $ | 24,756 | | | $ | 181 | | | $ | (1 | ) | | $ | 24,936 | |
| | | | | | | | | | | | | | | | | | | | | | | | | | | | | | | | | |
The scheduled maturities of securities at December 31, 2009, by contractual maturity, are shown below. Expected maturities may differ from contractual maturities because borrowers may have the right to call or prepay obligations with or without call or prepayment penalties.
| | | December 31, 2009 | |
| | | Amortized | | | Fair | |
| | | Cost | | | Value | |
| | | (in thousands) | |
| Available For Sale: | | | | | | |
| Due in one year or less | | $ | 8,924 | | | $ | 9,083 | |
| Due after one year through five years | | | 72,125 | | | | 76,441 | |
| Due after five years through 10 years | | | 110,562 | | | | 110,415 | |
| Over 10 years | | | 54,498 | | | | 53,541 | |
| Total available for sale securities | | $ | 246,109 | | | $ | 249,480 | |
| | | | | | | | | |
| Held to Maturity: | | | | | | | | |
| Due in one year or less | | $ | - | | | $ | - | |
| Due after one year through five years | | | 171 | | | | 174 | |
| Due after five years through 10 years | | | 1,520 | | | | 1,597 | |
| Over 10 years | | | 10,658 | | | | 10,691 | |
| Total held to maturity securities | | $ | 12,349 | | | $ | 12,462 | |
| | | | | | | | | |
At December 31, 2009 and 2008, approximately $154.5 million and $85.4 million, respectively, in securities were pledged to secure public fund deposits, and for other purposes required or permitted by law. Gross realized gains were $2.1 million, $4,000 and $0 for the years ended December 31, 2009, 2008 and 2007, respectively. Gross realized losses were $61,000, $5,000 and $478,000 for the years ended December 31, 2009, 2008 and 2007. The tax (benefit) provision applicable to these realized net (losses)/gains amounted to $0.7 million, $0, and $(163,000), respectively. Proceeds from sales of securities classified as available for sale amounted to $22.1 million, $0.2 million and $65.2 million for the years ended December 31, 2009, 2008 and 2007, respectively.
The following is a summary of the fair value of securities with gross unrealized losses and an aging of those gross unrealized losses at December 31, 2009.
| | | Less Than 12 Months | | | 12 Months or More | | | Total | |
| | | | | | Gross | | | | | | Gross | | | | | | Gross | |
| | | | | | Unrealized | | | | | | Unrealized | | | | | | Unrealized | |
| | | Fair Value | | | Losses | | | Fair Value | | | Losses | | | Fair Value | | | Losses | |
| | | (in thousands) | |
| Available for sale: | | | | | | | | | | | | | | | | | | |
| U.S. Treasury and U.S. | | | | | | | | | | | | | | | | | | |
| Government agencies | | $ | 74,460 | | | $ | 1,562 | | | $ | 0 | | | $ | 0 | | | $ | 74,460 | | | $ | 1,562 | |
| Mortgage-backed obligations | | | - | | | | - | | | | - | | | | - | | | | - | | | | - | |
| Asset-backed securities | | | - | | | | - | | | | - | | | | - | | | | - | | | | - | |
| Corporate debt securities | | | 1,874 | | | | 55 | | | | 4,735 | | | | 721 | | | | 6,609 | | | | 776 | |
| Mutual funds or other equity securites | | | 498 | | | | 2 | | | | 3,724 | | | | 493 | | | | 4,222 | | | | 495 | |
| Total available for sale securities | | $ | 76,832 | | | $ | 1,619 | | | $ | 8,459 | | | $ | 1,214 | | | $ | 85,291 | | | $ | 2,833 | |
| | | | | | | | | | | | | | | | | | | | | | | | | |
| | | | | | | | | | | | | | | | | | | | | | | | | |
| Held to maturity: | | | | | | | | | | | | | | | | | | | | | | | | |
| U.S. Treasury and U.S. | | | | | | | | | | | | | | | | | | | | | | | | |
| Government agencies | | $ | 9,776 | | | $ | 224 | | | $ | - | | | $ | - | | | $ | 9,776 | | | $ | 224 | |
| Mortgage-backed obligations | | | - | | | | - | | | | - | | | | - | | | | - | | | | - | |
| Total held to maturity securities | | $ | 9,776 | | | $ | 224 | | | $ | - | | | $ | - | | | $ | 9,776 | | | $ | 224 | |
| | | | | | | | | | | | | | | | | | | | | | | | | |
At December 31, 2009, 59 debt securities and 17 equity securities have unrealized losses of $3.1 million or 3.1% of amortized cost. The gross unrealized losses in the portfolio resulted from increases in market interest rates, illiquidity, and declines in net income and other financial indicators caused by the national economy in the market and not from deterioration in the creditworthiness of the issuer. The Company believes that it will collect all amounts contractually due and has the intent and the ability to hold these securities until the fair value is at least equal to the carrying value. The Company had 30 U.S. Government agency securities and nine debt securities that had gross unrealized losses for less than 12 months. The Company had 20 corporate debt securities and 17 equity securities which have been in a continuous unrealized loss position for 12 months or longer. All securities with unrealized losses, greater than 12 months, were classified as available for sale. All securities with unrealized losses, less than 12 months, were classified as available for sale except $9.8 million in agency securities. These securities with unrealized losses resulted from increases in interest rates and illiquidity in the market and not from deterioration in the creditworthiness of the issuer.
During the fourth quarter of 2009, three agency securities with a par value of $10.0 million were transferred from available for sale to held to maturity. These three securities had a fair market value totaling $9.8 and an average maturity of approximately 14 years. The unrealized loss of $224,000 was recorded as a component of other comprehensive loss and will be amortized over the life of the securities or until the security is called. |
Irrespective of the classification, accounting and reporting treatment as AFS or HTM securities, if any decline in the market value of a security is deemed to be other than temporary, then the security’s carrying value shall be written down to fair value and the amount of the write down reflected in earnings. Management evaluates securities for other-than-temporary impairment at least quarterly and more frequently when economic or market conditions warrant such evaluation. Consideration is given to (i) the length of time and the extent to which the fair value has been less than cost, (ii) the financial condition and near-term prospects of the issuer, (iii) the recovery of contractual principal and interest and (iv) the intent and ability of the Company to retain its investment in the issuer for a period of time sufficient to allow for any anticipat ed recovery in fair value. In analyzing an issuer’s financial condition, Management considers whether the securities are issued by the federal government or its agencies, whether downgrades by bond rating agencies have occurred and industry reports.
The amount of investment securities issued by government agencies, mortgage-backed and asset-backed securities with unrealized losses and the amount of unrealized losses on those investment securities are primarily the result of market interest rates and illiquidity in the market. The company has the ability and intent to hold these securities until recovery, which may be until maturity.
The corporate debt securities consist primarily of corporate bonds issued by financial institutions, insurance and real estate companies. Also included in corporate debt securities are trust preferred capital securities, many issued by national and global financial services firms. The market values of corporate bonds have declined over the last several months due to larger credit spreads on financial sector debt as well as the real estate markets. The Company believes that the each of the issuers will be able to fulfill the obligations of these securities. The Company has the ability and intent to hold these securities until they recover, which could be at their maturity dates.
Other than the corporate debt securities, the Company attributes the unrealized losses mainly to increases in market interest rates over the yield available at the time the underlying securities were purchased and does not expect to incur a loss unless the securities are sold prior to maturity.
Overall market declines, particularly in the banking and financial institutions, as well as the real estate market, are a result of significant stress throughout the regional and national economy. Securities with unrealized losses, in which the Company has not already taken an OTTI charge, are currently performing according to their contractual terms. Management has the intent and ability to hold these securities for the foreseeable future. The fair value is expected to recover as the securities approach their maturity or repricing date or if market yields for such investments decline. As a result of uncertainties in the market place affecting companies in the financial services industry, it is at least reasonably possible that a change in the estimate will occur in the near term.
Securities that are other-than-temporarily impaired are evaluated at least quarterly. The evaluation includes performance indications of the underlying assets in the security, loan to collateral value, third-party guarantees, current levels of subordination, geographic concentrations, industry analysts reports, sector credit ratings, volatility of the securities fair value, liquidity, leverage and capital ratios, the company’s ability to continue as a going concern. If the company is in bankruptcy, the status and potential out come is also considered.
The Company believes that the securities with unrealized losses reflect impairment that is temporary and that there are currently no securities with other-than-temporary impairment.
During 2009, the Company recorded an impairment writedown totaling $829,000. The impairment writedown consisted of one corporate debt security totaling $243,000 issued by Colonial Bank which had an unrealized loss of $233,000, three asset backed securities totaling $381,000 issued by ALESCO which had unrealized losses of $377,000 and two asset backed securities totaling $205,000 issued by TRAPEZA which had unrealized losses of $200,000.
During 2008 the Company recorded an impairment writedown totaling $4,611,000. The impairment writedown consisted of three preferred stocks of Fannie Mae and Freddie Mac totaling $3,046,000, on a cost basis, which had unrealized losses of $1,991,000 and $1,010,000, respectively, debt securities totaling $727,000 and $240,000 issued by Lehman Brothers and Washington Mutual which had unrealized losses of $634,000 and $239,000, respectively. The Company also recorded an impairment writedown on $510,000 and $739,000 in asset backed securities issued by TRAPEZA and ALESCO (CDOs) which had unrealized losses of $344,000 and $409,000, respectively.
At December 31, 2009, the Company’s exposure to four investment security issuers exceeded 10% of stockholders’ equity as follows:
| | | Amortized | | | Fair | |
| | | Cost | | | Value | |
| | | (in thousands) | |
| | | | | | | |
| Federal Home Loan Bank (FHLB) | | $ | 52,513 | | | $ | 52,021 | |
| Federal Home Loan Mortgage Corporation (Freddie Mac) | | | 35,017 | | | | 34,981 | |
| Federal National Mortgage Association (Fannie Mae) | | | 48,849 | | | | 48,359 | |
| Federal Farm Credit Bank (FFCB) | | | 18,230 | | | | 18,050 | |
| Total | | $ | 154,609 | | | $ | 153,411 | |
| | | | | | | | | |
Note 5. Loans and Allowance for Loan Losses
The following table summarizes the components of the Company's loan portfolio as of December 31, 2009 and 2008:
| | | December 31, | |
| | | 2009 | | | 2008 | |
| | | | | | As % of | | | | | | As % of | |
| | | Balance | | | Category | | | Balance | | | Category | |
| | | (dollars in thousands) | |
| Real estate | | | | | | | | | | | | |
| Construction & land development | | $ | 78,686 | | | | 13.3 | % | | $ | 92,029 | | | | 15.2 | % |
| Farmland | | | 11,352 | | | | 1.9 | % | | | 16,403 | | | | 2.7 | % |
| 1-4 Family | | | 77,470 | | | | 13.1 | % | | | 79,285 | | | | 13.1 | % |
| Multifamily | | | 8,927 | | | | 1.5 | % | | | 15,707 | | | | 2.6 | % |
| Non-farm non-residential | | | 300,673 | | | | 51.0 | % | | | 261,744 | | | | 43.0 | % |
| Total real estate | | | 477,108 | | | | 80.8 | % | | | 465,168 | | | | 76.6 | % |
| | | | | | | | | | | | | | | | | |
| Agricultural | | | 14,017 | | | | 2.4 | % | | | 18,536 | | | | 3.0 | % |
| Commercial and industrial | | | 82,348 | | | | 13.9 | % | | | 105,555 | | | | 17.4 | % |
| Consumer and other | | | 17,226 | | | | 2.9 | % | | | 17,926 | | | | 3.0 | % |
| Total loans before unearned income | | | 590,699 | | | | 100.0 | % | | | 607,185 | | | | 100.0 | % |
| Less: unearned income | | | (797 | ) | | | | | | | (816 | ) | | | | |
| Total loans net of unearned income | | $ | 589,902 | | | | | | | $ | 606,369 | | | | | |
| | | | | | | | | | | | | | | | | |
The following table summarizes fixed and floating rate loans by maturity and repricing frequencies as of December 31, 2009:
| | | December 31, 2009 | |
| | | Fixed | | | Floating | | | Total | |
| | | (in thousands) | |
| | | | | | | | | | |
| One year or less | | $ | 224,963 | | | $ | 77,651 | | | $ | 302,614 | |
| One to five years | | | 229,276 | | | | 2,408 | | | | 231,684 | |
| Five to 15 years | | | 25,122 | | | | - | | | | 25,122 | |
| Over 15 years | | | 16,299 | | | | - | | | | 16,299 | |
| Subtotal | | | 495,660 | | | | 80,059 | | | | 575,719 | |
| Nonaccrual loans | | | | | | | | | | | 14,183 | |
| Total loans net of unearned income | | $ | 495,660 | | | $ | 80,059 | | | $ | 589,902 | |
| | | | | | | | | | | | | |
Changes in the allowance for loan losses are as follows:
| | | Years Ended December 31, | |
| | | 2009 | | | 2008 | | | 2007 | |
| | | (in thousands) | |
| | | | | | | | | | |
| Balance, beginning of year | | $ | 6,482 | | | $ | 6,193 | | | $ | 6,675 | |
| Additional provision from acquisition | | | - | | | | - | | | | 325 | |
| Provision charged to expense | | | 4,155 | | | | 1,634 | | | | 1,918 | |
| Loans charged off | | | (2,879 | ) | | | (1,613 | ) | | | (3,885 | ) |
| Recoveries | | | 161 | | | | 268 | | | | 1,160 | |
| Balance, end of year | | $ | 7,919 | | | $ | 6,482 | | | $ | 6,193 | |
| | | | | | | | | | | | | |
As of December 31, 2009, 2008 and 2007, the Company had loans totaling $14.2 million, $9.1 million and $10.3 million, respectively, on which the accrual of interest had been discontinued. As of December 31, 2009, 2008 and 2007, the Company had loans past due 90 days or more and still accruing interest totaling $0.8 million, $205,000 and $547,000, respectively.
The average amount of non-accrual loans in 2009 was $10.6 million compared to $9.9 million in 2008. Had these loans performed in accordance with their original terms, the Company's interest income would have been increased by approximately $0.4 million and $0.5 million for the years ended December 31, 2009 and 2008, respectively. Impaired loans at December 31, 2009 and 2008, including non-accrual loans, amounted to $33.4 million and $11.4 million, respectively. The portion of the allowance for loan losses allocated to all impaired loans amounted to $2.7 million and $1.4 million at December 31, 2009 and 2008, respectively. As of December 31, 2009, the Company has no outstanding commitments to advance additional funds in connection with impaired loans.
The following is a summary of information pertaining to impaired loans as of December 31:
| | | 2009 | | | 2008 | | | | |
| | | (in thousands) | | | | |
| | | | | | | | | | |
| Impaired loans without a valuation allowance | | $ | 5,853 | | | $ | 6,084 | | | | |
| Impaired loans with a valuation allowance | | | 28,080 | | | | 5,267 | | | | |
| Total impaired loans | | $ | 33,933 | | | $ | 11,351 | | | | |
| | | | | | | | | | | | |
| Valuation allowance related to impaired loans | | $ | 2,967 | | | $ | 1,353 | | | | |
| Total nonaccrual loans | | $ | 14,183 | | | $ | 9,129 | | | | |
| Total loans past due ninety days and still accruing | | $ | 785 | | | $ | 205 | | | | |
| | | | | | | | | | | | |
| | | | 2009 | | | | 2008 | | | | 2007 | |
| | | (in thousands) | |
| | | | | | | | | | | | | |
| Average investment in impaired loans | | $ | 8,979 | | | $ | 9,027 | | | $ | 7,571 | |
| Interest income recognized on impaired loans | | $ | 184 | | | $ | 1,049 | | | $ | 764 | |
| Interest income recognized on a cash basis on impaired loans | | $ | 565 | | | $ | 283 | | | $ | 182 | |
Note 6. Premises and Equipment
The major categories comprising premises and equipment at December 31, 2009 and 2008 are as follows:
| | | December 31, | |
| | | 2009 | | | 2008 | |
| | | (in thousands) | |
| | | | | | | |
| Land | | $ | 4,514 | | | $ | 4,693 | |
| Bank premises | | | 16,608 | | | | 15,333 | |
| Furniture and equipment | | | 14,264 | | | | 13,763 | |
| Acquired value | | | 35,386 | | | | 33,789 | |
| Less: accumulated depreciation | | | 18,682 | | | | 17,648 | |
| Net book value | | $ | 16,704 | | | $ | 16,141 | |
| | | | | | | | | |
Depreciation expense amounted to approximately $1.0 million, $1.0 million and $0.9 million for 2009, 2008 and 2007, respectively.
Note 7. Goodwill and Other Intangible Assets
The Company accounts for goodwill and intangible assets in accordance with FASB ASC 350, Intangibles – Goodwill and Other (SFAS No. 142). Under FASB ASC 350, goodwill and intangible assets deemed to have indefinite lives are no longer amortized, but are subject to annual impairment tests in accordance with the provision of FASB ASC 350. Other intangible assets continue to be amortized over their useful lives. Goodwill for the year ended December 31, 2009 was $2.0 million and was acquired in the Homestead acquisition in 2007. No impairment charges were recognized during 2009.
Mortgage servicing rights totaled $136,000 at December 31, 2009 and $29,000 at December 31, 2008.
Other intangible assets recorded include core deposit intangibles, which are subject to amortization. The core deposits reflect the value of deposit relationships, including the beneficial rates, which arose from the purchase of other financial institutions and the purchase of various banking center locations from one single financial institution. The following table summarizes the Company’s purchased accounting intangible assets subject to amortization.
| | | December 31, | |
| | | 2009 | | | 2008 | |
| | | Gross Carrying | | | Accumulated | | | Net Carrying | | | Gross Carrying | | | Accumulated | | | Net Carrying | |
| | | Amount | | | Amortization | | | Amount | | | Amount | | | Amortization | | | Amount | |
| | | (in thousands) | |
| | | | | | | | | | | | | | | | | | | |
| Core deposit intangibles | | $ | 7,997 | | | $ | 6,240 | | | $ | 1,757 | | | $ | 7,997 | | | $ | 5,948 | | | $ | 2,049 | |
| Mortgage Servicing Rights | | | 157 | | | | 21 | | | | 136 | | | | 32 | | | | 3 | | | | 29 | |
| Total | | $ | 8,154 | | | $ | 6,261 | | | $ | 1,893 | | | $ | 8,029 | | | $ | 5,951 | | | $ | 2,078 | |
| | | | | | | | | | | | | | | | | | | | | | | | | |
Amortization expense relating to purchase accounting intangibles totaled $291,000, $311,000, and $203,000 for the year ended December 31, 2009, 2008, and 2007, respectively. The weighted average amortization period of these assets is 9.3 years. Estimated future amortization expense is as follows:
| For the Years Ended December 31, | | | Estimated Amortization Expense |
| (in thousands) |
| 2010 | | | $ | 218 | |
| 2011 | | | | 218 | |
| 2012 | | | | 216 | |
| 2013 | | | | 185 | |
| 2014 | | | | 185 | |
These estimates do not assume the addition of any new intangible assets that may be acquired in the future nor any writedowns resulting from impairment.
Note 8. Other Real Estate
As of December 31, 2009 and 2008 other real estate, net, (ORE) totaled $0.7 million and $0.6 million. ORE consisted of $292,000 of 1-4 family residential properties and $366,000 non-farm non-residential properties at December 31, 2009. At December 31, 2008, ORE consisted of $89,000 of construction, land development and other loans, $223,000 of 1-4 family residential properties and $256,000 of non-farm nonresidential properties.
Note 9. Deposits
The aggregate amount of jumbo time deposits, each with a minimum denomination of $100,000, was approximately $271.2 million and $247.8 million at December 31, 2009 and 2008, respectively.
At December 31, 2009, the scheduled maturities of time deposits are as follows:
| | | December 31, 2009 | |
| | | (in thousands) | |
| | | | |
| Due in one year or less | | $ | 349,719 | |
| Due after one year through three years | | | 50,529 | |
| Due after three years | | | 39,156 | |
| Total | | $ | 439,404 | |
| | | | | |
The table above includes brokered deposits totaling $10.1 million in reciprocal time deposits acquired from the Certificate of Deposit Account Registry Service (CDARS). At December 31, 2008, the Company had $13.0 million in brokered deposits.
Note 10. Borrowings
Short-term borrowings are summarized as follows:
| | | December 31, | |
| | | 2009 | | | 2008 | |
| | | (in thousands) | |
| | | | | | | |
| Securities sold under agreements to repurchase | | $ | 11,929 | | | $ | 9,767 | |
| Total short-term borrowings | | $ | 11,929 | | | $ | 9,767 | |
| | | | | | | | | |
The Company’s available lines of credit with correspondent banks, including the Federal Home Loan Bank, totaled $156.1 million at December 31, 2009 and $140.4 million at December 31, 2008.
At December 31, 2009, the Company had $142.6 million in blanket lien availability (primarily secured by commercial real estate loans) and $110.3 million in custody status availability (primarily secured by commercial real estate loans and 1-4 family mortgage loans). Total gross availability at the FHLB was $252.9 million at December 31, 2009 but was reduced by its outstanding long-term advance totaling $20.0 million and letters of credit totaling $140.0 million. Net availability with the FHLB at December 31, 2009 was $92.9 million. The Company also had lines available with other correspondent banks totaling $63.2 million at December 31, 2009.
With the exception of the FHLB, no other lines were outstanding with any other correspondent bank at December 31, 2009.
The following schedule provides certain information about the Company’s short-term borrowings during the periods indicated:
| | | December 31, | |
| | | 2009 | | | 2008 | | | 2007 | |
| | | (dollars in thousands) | |
| | | | | | | | | | |
| Outstanding at year end | | $ | 11,929 | | | $ | 9,767 | | | $ | 10,401 | |
| Maximum month-end outstanding | | | 26,372 | | | | 41,321 | | | | 45,766 | |
| Average daily outstanding | | | 18,233 | | | | 11,379 | | | | 16,655 | |
| Weighted average rate during the year | | | 0.81 | % | | | 2.16 | % | | | 5.18 | % |
| Average rate at year end | | | 0.23 | % | | | 0.19 | % | | | 3.50 | % |
At December 31, 2009, long-term debt consisted of two advances from the Federal Home Loan Bank. In November 2009, the Company obtained an original $10.0 million amortizing one year advance at a rate of 0.861%. The Company makes monthly principal and interest payments. In December 2009, the Company obtained a $10.0 million interest only advance with a one year maturity at a rate of 0.480%. The Company makes monthly interest payments with the balloon note due in December 2010. The outstanding balance on the long-term debt was $20.0 million at December 31, 2009.
At December 31, 2008, one long-term advance was outstanding at the FHLB totaling $8.4 million with a rate of 3.14% and a maturity date of October 1, 2009.
At December 31, 2009, letters of credit issued by the FHLB totaling $140.0 million were outstanding and carried as off-balance sheet items, all of which expire in 2010. At December 31, 2008, letters of credit issued by the FHLB totaling $155.0 million were outstanding and carried as off-balance sheet items, all of which expire in 2009. The letters of credit are solely used for pledging towards public fund deposits. See Note 18 to the Consolidated Financial Statements for additional information.
Note 11. Issuance of Preferred Stock
On August 28, 2009, the Company entered into a Letter Agreement, which includes a Securities Purchase Agreement and a Side Letter Agreement (together, the “Purchase Agreement”), with the United States Department of the Treasury (“Treasury Department”) pursuant to which the Company has issued and sold to the Treasury Department 2,069.9 shares of the Company’s Fixed Rate Cumulative Perpetual Preferred Stock, Series A, par value $1,000 per share for a total purchase price of $20.7 million. In addition to the issuance of the Series A Stock, as a part of the transaction, the Company issued to the Treasury Department a warrant to purchase 114.44444 shares of the Company’s Fixed Rate Cumulative Preferred Stock, Series B, and immediately following the issuance of the Series A stock, the Treasury Department exer cised its rights and acquired 103 of the Series B shares through a cashless exercise. The newly issued Series A Stock, generally non-voting stock, pays cumulative dividends of 5% for five years, and a rate of 9% dividends, per annum, thereafter. The newly issued Series B Stock, generally non-voting, pays cumulative dividends at a rate of 9% per annum. Both the Series A Stock and the Series B Stock were issued in a private placement.
Note 12. Minimum Capital Requirements
The Company and the Bank are subject to various regulatory capital requirements administered by the federal and state banking agencies. Failure to meet minimum capital requirements can initiate certain mandatory and possibly additional discretionary actions by regulators that, if undertaken, could have a direct material effect on the Company’s financial statements. Under capital adequacy guidelines and the regulatory framework for prompt corrective action, the Company and the Bank must meet specific capital guidelines that involve quantitative measures of their assets, liabilities and certain off-balance sheet items as calculated under regulatory accounting practices. The capital amounts and classification are also subject to qualitative judgments by the regulators about components, risk weightings and other factors. Prompt correcti ve action provisions are not applicable to bank holding companies.
Quantitative measures established by regulation to ensure capital adequacy require the Company and the Bank to maintain minimum amounts and ratios of total and Tier 1 capital to risk-weighted assets and of Tier 1 capital to average assets. Management believes, as of December 31, 2009 and 2008, that the Company and the Bank met all capital adequacy requirements to which they were subject.
As of December 31, 2009, the most recent notification from the Federal Deposit Insurance Corporation categorized the Bank as well capitalized under the regulatory framework for prompt corrective action. To be categorized as well capitalized, an institution must maintain minimum total risk-based, Tier 1 risk-based and Tier 1 leverage ratios as set forth in the following table. There are no conditions or events since the notification that Management believes have changed the Bank’s category. The Company’s and the Bank’s actual capital amounts and ratios as of December 31, 2009 and 2008 are presented in the following table.
| | | | | | | | Minimum |
| | | | | | | | To Be Well |
| | | | | | | | Capitalized Under |
| | | | | Minimum Capital | | Prompt Corrective |
| | Actual | | Requirements | | Action Provisions |
| | Amount | Ratio | | Amount | Ratio | | Amount | Ratio |
| | (dollars in thousands) |
| December 31, 2009 | | | | | | | | |
| Total risk-based capital: | | | | | | | | |
| First Guaranty Bancshares, Inc. | $96,514 | 12.97% | | $59,536 | 8.00% | | N/A | N/A |
| First Guaranty Bank | 91,388 | 12.22% | | 59,834 | 8.00% | | 74,793 | 10.00% |
| Tier 1 capital: | | | | | | | | |
| First Guaranty Bancshares, Inc. | 88,595 | 11.90% | | 29,768 | 4.00% | | N/A | N/A |
| First Guaranty Bank | 83,469 | 11.16% | | 29,917 | 4.00% | | 44,876 | 6.00% |
| Tier 1 leverage capital: | | | | | | | | |
| First Guaranty Bancshares, Inc. | 88,595 | 9.58% | | 36,979 | 4.00% | | N/A | N/A |
| First Guaranty Bank | 83,469 | 9.03% | | 36,985 | 4.00% | | 46,231 | 5.00% |
| | | | | | | | | |
| December 31, 2008 | | | | | | | | |
| Total risk-based capital: | | | | | | | | |
| First Guaranty Bancshares, Inc. | $71,097 | 10.11% | | $56,242 | 8.00% | | N/A | N/A |
| First Guaranty Bank | 70,441 | 9.87% | | 56,190 | 8.00% | | 70,237 | 10.00% |
| Tier 1 capital: | | | | | | | | |
| First Guaranty Bancshares, Inc. | 64,606 | 9.19% | | 28,121 | 4.00% | | N/A | N/A |
| First Guaranty Bank | 63,950 | 8.96% | | 28,095 | 4.00% | | 42,142 | 6.00% |
| Tier 1 leverage capital: | | | | | | | | |
| First Guaranty Bancshares, Inc. | 64,606 | 7.88% | | 32,783 | 4.00% | | N/A | N/A |
| First Guaranty Bank | 63,950 | 7.81% | | 32,754 | 4.00% | | 40,942 | 5.00% |
The Federal Reserve Bank has stated that generally, a bank holding company, should not maintain a rate of distributions to shareholders unless its available net income has been sufficient to fully fund the distributions, and the prospective rate of earnings retention appears consistent with the bank holding company’s capital needs, asset quality and overall financial condition. As a Louisiana corporation, the Company is restricted under the Louisiana corporate law from paying dividends under certain conditions. The Company is currently required to obtain prior written approval from the FRB before declaring or paying any corporate dividend.
First Guaranty Bank may not pay dividends or distribute capital assets if it is in default on any assessment due to the FDIC. First Guaranty Bank is also subject to regulations that impose minimum regulatory capital and minimum state law earnings requirements that affect the amount of cash available for distribution. In addition, under the Louisiana Banking Law, dividends may not be paid if it would reduce the unimpaired surplus below 50% of outstanding capital stock in any year.
The Bank is restricted under applicable laws in the payment of dividends to an amount equal to current year earnings plus undistributed earnings for the immediately preceding year, unless prior permission is received from the Commissioner of Financial Institutions for the State of Louisiana. Dividends payable by the Bank in 2010 without permission will be limited to 2010 earnings.
Accordingly, at January 1, 2010, $89,399,000 of the Company’s equity in the net assets of the Bank was restricted. Funds available for loans or advances by the Bank to the Company amounted to $9,139,000. In addition, dividends paid by the Bank to the Company would be prohibited if the effect thereof would cause the Bank’s capital to be reduced below applicable minimum capital requirements.
Note 14. Related Party Transactions
In the normal course of business, the Company has loans, deposits and other transactions with its executive officers, directors and certain business organizations and individuals with which such persons are associated. An analysis of the activity of loans made to such borrowers during the year ended December 31, 2009 follows:
| | | December 31, | |
| | | 2009 | | | 2008 | |
| | | (in thousands) | |
| | | | | | | |
| Balance, beginning of year | | $ | 22,457 | | | $ | 19,120 | |
| New loans | | | 16,098 | | | | 18,947 | |
| Repayments | | | (15,215 | ) | | | (15,610 | ) |
| Balance, end of year | | $ | 23,340 | | | $ | 22,457 | |
| | | | | | | | | |
Unfunded commitments to the Company’s directors and executive officers totaled $7.7 million and $12.4 million at December 31, 2009 and 2008, respectively. At December 31, 2009 there were no participations in loans purchased from affiliated financial institutions included in the Company’s loan portfolio. During 2008, there were no participations in loans purchased from affiliated financial institutions. Participations sold to affiliated financial institutions totaled $2.4 million and $10.4 million at December 31, 2009 and 2008, respectively.
During the years ended 2009, 2008 and 2007, the Company paid approximately $551,000, $504,000 and $715,000, respectively, for printing services and supplies and office furniture and equipment to Champion Graphic Communications (or subsidiary companies of Champion Industries, Inc.), of which Mr. Marshall T. Reynolds, the Chairman of the Company’s Board of Directors, is President, Chief Executive Officer, Chairman of the Board of Directors and holder of 41.8% of the capital stock as of January 15, 2010; approximately $1.4 million, $1.3 million and $1.1 million, respectively, to participate in the Champion Industries, Inc. employee medical benefit plan; and approximately $154,000, $183,000 and $245,000, respectively, to Sabre Transportation, Inc. for travel expenses of the Chairman and other directors. These ex penses include, but are not limited to, the utilization of an aircraft, fuel, air crew, ramp fees and other expenses attendant to the Company’s use. The Harrah and Reynolds Corporation, of which Mr. Reynolds is President and Chief Executive Officer and sole shareholder, has controlling interest in Sabre Transportation, Inc.
During the years ended 2009, 2008 and 2007, the Company paid approximately $66,000, $30,000 and $3,000, respectively, to subsidiaries of Hood Automotive Group, of which Mr. Hood is the President. Expenses include the purchases of new Company vehicles and services on Company owned vehicles.
During the year ended 2009, 2008 and 2007 the Company engaged the services of Cashe, Lewis, Coudrain and Sandage, attorneys-at-law, of which Mr. Alton Lewis, a director of the Company, was a partner, to represent the Company with certain legal matters. Mr. Lewis had a 25% ownership interest in the law firm. In October 2009, Mr. Lewis joined the Company as the Chief Executive Officer. As of that date, Mr. Lewis was no longer a partner in the law firm Cashe, Lewis, Coudrain and Sandage. The fees paid to Cashe, Lewis, Coudrain and Sandage for legal services totaled $114,000 for the year period ended September 30, 2009. The fees paid for these legal services totaled $162,000 and $178,000 for the years ended 2008 and 2007.
Note 15. Employee Benefit Plans
The Company has an employee savings plan to which employees, who meet certain service requirements, may defer one to 20 percent of their base salaries, six percent of which may be matched up to 100%, at its sole discretion. Contributions to the savings plan were $64,000, $64,000 and $115,000 in 2009, 2008 and 2007, respectively.
An Employee Stock Ownership Plan (“ESOP”) benefits all eligible employees. Full-time employees who have been credited with at least 1,000 hours of service during a 12 consecutive month period and who have attained age 21 are eligible to participate in the ESOP. The plan document has been approved by the Internal Revenue Service. Contributions to the ESOP are at the sole discretion of the Company.
Voluntary contributions of $100,000 to the ESOP were made in 2009, 2008, and 2007 for the purchase of shares from third parties at market value. As of December 31, 2009, the ESOP held 21,652 shares.
Note 16. Income Taxes
The following is a summary of the provision for income taxes included in the Statements of Income:
| | | Years Ended December 31, | |
| | | 2009 | | | 2008 | | | 2007 | |
| | | (in thousands) | |
| | | | | | | | | | |
| Current | | $ | 3,705 | | | $ | 5,423 | | | $ | 4,632 | |
| Deferred | | | 67 | | | | (2,848 | ) | | | (40 | ) |
| Tax credits | | | (46 | ) | | | (105 | ) | | | (81 | ) |
| Tax benefits attributable to items charged to goodwill | | | - | | | | - | | | | 726 | |
| Benefit of operating loss carryforward | | | - | | | | - | | | | (24 | ) |
| Total | | $ | 3,726 | | | $ | 2,470 | | | $ | 5,213 | |
| | | | | | | | | | | | | |
The difference between income taxes computed by applying the statutory federal income tax rate and the provision for income taxes in the financial statements is reconciled as follows:
| | | Years Ended December 31, | |
| | | 2009 | | | 2008 | | | 2007 | |
| | | (dollars in thousands) | |
| | | | | | | | | | |
| Statutory tax rate | | | 34.0 | % | | | 34.3 | % | | | 34.2 | % |
| Federal income taxes at statutory rate | | $ | 3,854 | | | $ | 2,739 | | | $ | 5,126 | |
| Tax credits | | | (46 | ) | | | (105 | ) | | | (81 | ) |
| Other | | | (82 | ) | | | (164 | ) | | | 168 | |
| Total | | $ | 3,726 | | | $ | 2,470 | | | $ | 5,213 | |
| | | | | | | | | | | | | |
Deferred taxes are recorded based upon differences between the financial statement and tax basis of assets and liabilities, and available tax credit carryforwards. Temporary differences between the financial statement and tax values of assets and liabilities give rise to deferred tax assets (liabilities). The significant components of deferred tax assets and liabilities at December 31, 2009 and 2008 are as follows:
| | | Years Ended December 31, | |
| | | 2009 | | | 2008 | |
| | | (in thousands) | |
| Deferred tax assets: | | | | | | |
| Allowance for loan losses | | $ | 2,692 | | | $ | 2,204 | |
| Other real estate owned | | | 36 | | | | 45 | |
| Impairment writedown on securities | | | 1,236 | | | | 1,568 | |
| Unrealized loss on available for sale securities | | | - | | | | 1,627 | |
| Other | | | 145 | | | | 91 | |
| Gross deferred tax assets | | $ | 4,109 | | | $ | 5,535 | |
| | | | | | | | | |
| Deferred tax liabilities: | | | | | | | | |
| Depreciation and amortization | | | (1,238 | ) | | | (1,018 | ) |
| Unrealized gains on avalable for sale securities | | | (1,070 | ) | | | - | |
| Other | | | (817 | ) | | | (754 | ) |
| Gross deferred tax liabilities | | | (3,125 | ) | | | (1,772 | ) |
| Net deferred tax assets | | $ | 984 | | | $ | 3,763 | |
| | | | | | | | | |
The FASB ASC 740-10, Income Taxes (FASB Interpretation No. 48, Accounting for Uncertainty in Income Taxes an interpretation of FASB Statement No. 109), clarifies the accounting for uncertainty in income taxes and prescribes a recognition threshold and measurement attribute for the consolidated financial statements recognition and measurement of a tax position taken or expected to be taken in a tax return. The company does not believe it has any unrecognized tax benefits included in its consolidated financial statements. The Company has not had any settlements in the current period with taxing authorities, nor has it recognized tax benefits as a result of a lapse of the applicable statue of limitations.
The Company recognizes interest and penalties accrued related to unrecognized tax benefits, if applicable, in noninterest expense. During the years ended December 31, 2009, 2008, and 2007, the Company did not recognize any interest or penalties in its consolidated financial statements, nor has it recorded an accrued liability for interest or penalty payments.
Note 17. Comprehensive Income
The following is a summary of the components of other comprehensive income as presented in the Statements of Changes in Stockholders’ Equity:
| | | December 31, | |
| | | 2009 | | | 2008 | | | 2007 | |
| | | (in thousands) | |
| | | | | | | | | | |
| Unrealized gain (loss) on available for sale securities, net | | $ | 9,382 | | | $ | (8,889 | ) | | $ | 387 | |
| Unrealized loss on held to maturity securities, net | | | (224 | ) | | | - | | | | - | |
| Reclassification for OTTI losses | | | 829 | | | | 4,612 | | | | - | |
| Reclassification adjustments for net losses, realized net income | | | (2,056 | ) | | | 1 | | | | 478 | |
| Other comprehensive income (loss) | | | 7,931 | | | | (4,277 | ) | | | 865 | |
| Income tax (provision) benefit related to other comprehensive income | | | (2,696 | ) | | | 1,454 | | | | (295 | ) |
| Other comprehensive income (loss), net of income taxes | | $ | 5,235 | | | $ | (2,823 | ) | | $ | 570 | |
| | | | | | | | | | | | | |
The Company is a party to financial instruments with off-balance sheet risk in the normal course of business to meet the financing needs of its customers and to reduce its own exposure to fluctuations in interest rates. These financial instruments include commitments to extend credit and standby and commercial letters of credit. Those instruments involve, to varying degrees, elements of credit and interest rate risk in excess of the amount recognized in the Consolidated Balance Sheets. The contract or notional amounts of those instruments reflect the extent of the involvement in particular classes of financial instruments.
The exposure to credit loss in the event of nonperformance by the other party to the financial instrument for commitments to extend credit and standby and commercial letters of credit is represented by the contractual notional amount of those instruments. The same credit policies are used in making commitments and conditional obligations as it does for on-balance sheet instruments.
Unless otherwise noted, collateral or other security is not required to support financial instruments with credit risk.
Commitments to extend credit are agreements to lend to a customer as long as there is no violation of any condition established in the contract. Commitments generally have fixed expiration dates or other termination clauses and may require payment of a fee. Since commitments may expire without being drawn upon, the total commitment amounts do not necessarily represent future cash requirements. Each customer's creditworthiness is evaluated on a case-by-case basis. The amount of collateral obtained, if deemed necessary upon extension of credit, is based on Management's credit evaluation of the counterpart. Collateral requirements vary but may include accounts receivable, inventory, property, plant and equipment, residential real estate and commercial properties.
Standby and commercial letters of credit are conditional commitments to guarantee the performance of a customer to a third party. These guarantees are primarily issued to support public and private borrowing arrangements, including commercial paper, bond financing and similar transactions. The majority of these guarantees are short-term, one year or less; however, some guarantees extend for up to three years. The credit risk involved in issuing letters of credit is essentially the same as that involved in extending loan facilities to customers. Collateral requirements are the same as on-balance sheet instruments and commitments to extend credit.
There were no losses incurred on any commitments in 2009 or 2008.
A summary of the notional amounts of the financial instruments with off-balance sheet risk at December 31, 2009 and 2008 follows:
| | | December 31, | |
| | | 2009 | | | 2008 | |
| | | (in thousands) | |
| Financial instruments whose contract | | | | | | |
| amounts represent credit risk: | | | | | | |
| Commitments to extend credit | | $ | 51,132 | | | $ | 90,938 | |
| Standby letters of credit | | | 7,091 | | | | 7,647 | |
Note 19. Fair Value Measurements
Effective January 1, 2008, the Company adopted the provisions of FASB ASC 820-10-65, Fair Value Measurements and Disclosures (SFAS No. 157), for financial assets and liabilities. FASB ASC 820-1-65 defines fair value as the price that would be received to sell an asset or paid to transfer a liability in an orderly transaction between market participants. A fair value measurement assumes that the transaction to sell the asset or transfer the liability occurs in the principal market for the asset or liability or, in the absence of a principal market, the most advantageous market for the asset or liability. Valuation techniques use certain inputs to arrive at fair value. Inputs to valuation techniques are the assumptions that market participants would use in pricing the asset or liabili ty. They may be observable or unobservable. FASB ASC 820-1-65 establishes a fair value hierarchy for valuation inputs that gives the highest priority to quoted prices in active markets for identical assets or liabilities and the lowest priority to unobservable inputs. The fair value hierarchy is as follows:
Level 1 Inputs – Unadjusted quoted market prices in active markets for identical assets or liabilities that the reporting entity has the ability to access at the measurement date.
Level 2 Inputs – Inputs other than quoted prices included in Level 1 that are observable for the asset or liability, either directly or indirectly. These might include quoted prices for similar assets or liabilities in active markets,
quoted prices for identical or similar assets or liabilities in markets that are not active, inputs other than quoted prices that are observable for the asset or liability (such as interest rates, volatilities, prepayment speeds or credit
risks) or inputs that are derived principally from or corroborated by market data by correlation or other means.
Level 3 Inputs – Unobservable inputs for determining the fair values of assets or liabilities that reflect an entity’s own assumptions about the assumptions that market participants would use in pricing the assets or liabilities.
The following table summarizes financial assets measured at fair value on a recurring basis as of December 31, 2009, segregated by the level of the valuation inputs within the fair value hierarchy utilized to measure fair value:
| | | | Fair Value Measurements at |
| | | | December 31, 2009, Using |
| | | | Quoted | | |
| | | | Prices In | | |
| | | | Active | | |
| | | | Markets | Significant | |
| | Assets/Liabilities | | For | Other | Significant |
| | Measured at Fair | | Identical | Observable | Unobservable |
| | Value | | Assets | Inputs | Inputs |
| (in thousands) | December 31, 2009 | | (Level 1) | (Level 2) | (Level 3) |
| | | | | | |
| Securities available for sale | $ 249,480 | | $ 16,943 | $ 223,537 | $ 9,000 |
Securities Available for Sale. Securities classified as available for sale are reported at fair value utilizing Level 1, Level 2 and Level 3 inputs. For these securities, the Company obtains fair value measurements from an independent pricing service. The fair value measurements consider observable data that may include dealer quotes, market spreads, cash flows, market yield curves, prepayment speeds, credit information and the instrument’s contractual terms and conditions, among other things. Cash flow valuations were performed on Level 3 securities. Level 3 securities consist of 2 municipal bonds from the same issuer that were purchased in 2009 for $9.0 million. There has been no gain or loss recognized in 2009 on the securitites valued utilizing Level 3 inputs. C ash flow valuations were done on these securities to facilitate in the calculation of the other-than-temporary impairment charge taken on those securities in 2008 (see Note 4 to the Consolidated Financial Statements).
Impaired Loans. Certain financial assets such as impaired loans are measured at fair value on a nonrecurring basis; that is, the instruments are not measured at fair value on an ongoing basis but are subject to fair value adjustments in certain circumstances, such as when there is evidence of impairment. The fair value of impaired loans was $31.3 million at December 31, 2009. The fair value of impaired loans is measured by either the fair value of the collateral as determined by appraisals or independent valuation (Level 2), or the present value of expected future cash flows discounted at the effective interest rate of the loan (Level 3).
Certain non-financial assets and non-financial liabilities are measured at fair value on a non-recurring basis including assets and liabilities related to reporting units measured at fair value in the testing of goodwill impairment, as well as intangible assets and other non-financial long-lived assets measured at fair value for impairment assessment.
Note 20. Financial Instruments
Fair value estimates are generally subjective in nature and are dependent upon a number of significant assumptions associated with each instrument or group of similar instruments, including estimates of discount rates, risks associated with specific financial instruments, estimates of future cash flows and relevant available market information. Fair value information is intended to represent an estimate of an amount at which a financial instrument could be exchanged in a current transaction between a willing buyer and seller engaging in an exchange transaction. However, since there are no established trading markets for a significant portion of the Company’s financial instruments, the Company may not be able to immediately settle financial instruments; as such, the fair values are not necessarily indicative of the amounts that could be realized through immediate settlement. In addition, the majority of the financial instruments, such as loans and deposits, are held to maturity and are realized or paid according to the contractual agreement with the customer.
Quoted market prices are used to estimate fair values when available. However, due to the nature of the financial instruments, in many instances quoted market prices are not available. Accordingly, estimated fair values have been estimated based on other valuation techniques, such as discounting estimated future cash flows using a rate commensurate with the risks involved or other acceptable methods. Fair values are estimated without regard to any premium or discount that may result from concentrations of ownership of financial instruments, possible income tax ramifications or estimated transaction costs. The fair value estimates are subjective in nature and involve matters of significant judgment and, therefore, cannot be determined with precision. Fair values are also estimated at a specific point in time and are based on interest rates and other assumptions at that date. As events change the assumptions underlying these estimates, the fair values of financial instruments will change.
Disclosure of fair values is not required for certain items such as lease financing, investments accounted for under the equity method of accounting, obligations of pension and other postretirement benefits, premises and equipment, other real estate, prepaid expenses, the value of long-term relationships with depositors (core deposit intangibles) and other customer relationships, other intangible assets and income tax assets and liabilities. Fair value estimates are presented for existing on- and off-balance sheet financial instruments without attempting to estimate the value of anticipated future business and the value of assets and liabilities that are not considered financial instruments. In addition, the tax ramifications related to the realization of the unrealized gains and losses have not been considered in the estimates. According ly, the aggregate fair value amounts presented do not purport to represent and should not be considered representative of the underlying market or franchise value of the Company.
Because the standard permits many alternative calculation techniques and because numerous assumptions have been used to estimate the fair values, reasonable comparison of the fair value information with other financial institutions' fair value information cannot necessarily be made.
The methods and assumptions used to estimate the fair values of each class of financial instruments, that are not disclosed above, are as follows:
Cash and due from banks, interest-bearing deposits with banks, federal funds sold and federal funds purchased. These items are generally short-term in nature and, accordingly, the carrying amounts reported in the Statements of Condition are reasonable approximations of their fair values.
Interest-bearing time deposits with banks. Time deposits are purchased from other financial institutions for investment purposes. Time deposits with banks do not have a balance greater than $250,000. Interest earned is paid monthly and not reinvested as principal. The carrying amount of interest-bearing time deposits with banks approximates its fair value.
Investment Securities. Fair values are principally based on quoted market prices. If quoted market prices are not available, fair values are based on quoted market prices of comparable instruments or the use of discounted cash flow analyses.
Loans Held for Sale. Fair values of mortgage loans held for sale are based on commitments on hand from investors or prevailing market prices.
Loans, net. Market values are computed present values using net present value formulas. The present value is the sum of the present value of all projected cash flows on an item at a specified discount rate. The discount rate is set as an appropriate rate index, plus or minus an appropriate spread.
Accrued interest receivable. The carrying amount of accrued interest receivable approximates its fair value.
Deposits. Market values are actually computed present values using net present value formulas. The present value is the sum of the present value of all projected cash flows on an item at a specified discount rate. The discount rate is set as an appropriate rate index, plus or minus an appropriate spread.
Accrued interest payable. The carrying amount of accrued interest payable approximates its fair value.
Borrowings. The carrying amount of federal funds purchased and other short-term borrowings approximate their fair values. The fair value of the Company’s long-term borrowings is actually computed present values using net present value formulas. The present value is the sum of the present value of all projected cash flows on a item at a specified discount rate. The discount rate is set as an appropriate rate index, plus or minus an appropriate spread.
Other unrecognized financial instruments. The fair value of commitments to extend credit is estimated using the fees charged to enter into similar legally binding agreements, taking into account the remaining terms of the agreements and customers' credit ratings. For fixed-rate loan commitments, fair value also considers the difference between current levels of interest rates and the committed rates. The fair values of letters of credit are based on fees charged for similar agreements or on estimated cost to terminate them or otherwise settle the obligations with the counterparties at the reporting date. At December 31, 2009 and 2008 the fair value of guarantees under commercial and standby letters of credit was immaterial.
The estimated fair values and carrying values of the financial instruments at December 31, 2009 and 2008 are presented in the following table:
| | | December 31, | |
| | | 2009 | | | 2008 | |
| | | | | | Estimated | | | | | | Estimated | |
| | | Carrying | | | Fair | | | Carrying | | | Fair | |
| | | Value | | | Value | | | Value | | | Value | |
| | | (in thousands) | |
| Assets | | | | | | | | | | | | |
| Cash and cash equivalents | | $ | 46,718 | | | $ | 46,718 | | | $ | 78,017 | | | $ | 78,017 | |
| Interest-bearing time deposits with banks | | | - | | | | - | | | | 21,481 | | | | 21,578 | |
| Securities, available for sale | | | 249,480 | | | | 249,480 | | | | 114,406 | | | | 114,406 | |
| Securities, held to maturity | | | 12,349 | | | | 12,462 | | | | 24,756 | | | | 24,936 | |
| Federal Home Loan Bank stock | | | 2,547 | | | | 2,547 | | | | 944 | | | | 944 | |
| Loans, net | | | 581,983 | | | | 584,248 | | | | 599,887 | | | | 606,486 | |
| Accrued interest receivable | | | 5,807 | | | | 5,807 | | | | 4,611 | | | | 4,611 | |
| | | | | | | | | | | | | | | | | |
| Liabilities | | | | | | | | | | | | | | | | |
| Deposits | | $ | 799,746 | | | $ | 802,183 | | | $ | 780,372 | | | $ | 786,928 | |
| Borrowings | | | 31,929 | | | | 31,918 | | | | 18,122 | | | | 18,224 | |
| Accrued interest payable | | | 2,519 | | | | 2,519 | | | | 3,033 | | | | 3,033 | |
There is no material difference between the contract amount and the estimated fair value of off-balance sheet items that are primarily comprised of short-term unfunded loan commitments that are generally priced at market.
Note 21. Concentrations of Credit and Other Risks
Personal, commercial and residential loans are granted to customers, most of who reside in northern and southern areas of Louisiana. Although we have a diversified loan portfolio, significant portions of the loans are collateralized by real estate located in Tangipahoa Parish and surrounding parishes in southeast Louisiana. Declines in the Louisiana economy could result in lower real estate values which could, under certain circumstances, result in losses to the Company.
The distribution of commitments to extend credit approximates the distribution of loans outstanding. Commercial and standby letters of credit were granted primarily to commercial borrowers. Generally, credit is not extended in excess of $8.0 million to any single borrower or group of related borrowers.
Approximately 33.6% of the Company’s deposits are derived from local governmental agencies. These governmental depositing authorities are generally long-term customers. A number of the depositing authorities are under contractual obligation to maintain their operating funds exclusively with us. In most cases, the Company is required to pledge securities or letters of credit issued by the Federal Home Loan Bank to the depositing authorities to collateralize their deposits. Under certain circumstances, the withdrawal of all of, or a significant portion of, the deposits of one or more of the depositing authorities may result in a temporary reduction in liquidity, depending primarily on the maturities and/or classifications of the securities pledged against such deposits and the ability to replace such deposits with either new deposits or other borrowings.
Note 22. Litigation
The Company is subject to various legal proceedings in the normal course of its business. It is Management’s belief that the ultimate resolution of such claims will not have a material adverse effect on the Company’s financial position or results of operations.
Note 23. Commitments and Contingencies
In the ordinary course of business, various outstanding commitments and contingent liabilities arise that are not reflected in the accompanying financial statements. Included among these contingent liabilities are certain provisions in agreements, entered into with outside third parties, to sell loans that may require the Company to repurchase if it becomes delinquent within a specified period of time.
Note 24. Subsequent Events
On January 27, 2010, the Company sold its Benton banking center located at 196 Burt Boulevard to the Law Enforcement District of Bossier for a sale price of $1.8 million. The Law Enforcement District of Bossier paid $1.1 million and the remainder was donated by the Company. A new Benton banking center was opened at 189 Burt Boulevard, Benton, Louisiana. The cost of the new banking center, including land, building, furniture and equipment totaled approximately $1.5 million.
Note 25. Condensed Parent Company Information
The following condensed financial information reflects the accounts and transactions of First Guaranty Bancshares, Inc. (parent company only) for the dates indicated:
| First Guaranty Bancshares, Inc. | |
| Condensed Balance Sheet | |
| (in thousands) | |
| | | | | | | |
| | | December 31, | |
| Assets | | 2009 | | | 2008 | |
| Cash | | $ | 5,547 | | | $ | 93 | |
| Investment in bank subsidiary | | | 89,363 | | | | 64,917 | |
| Other assets | | | 409 | | | | 662 | |
| Total Assets | | $ | 95,319 | | | $ | 65,672 | |
| | | | | | | | | |
| Liabilities and Stockholders' Equity | | | | | | | | |
| Junior subordinated debentures | | | - | | | | - | |
| Other liabilities | | | 384 | | | | 185 | |
| Stockholders' Equity | | | 94,935 | | | | 65,487 | |
| Total Liabilities and Stockholders' Equity | | $ | 95,319 | | | $ | 65,672 | |
| | | | | | | | | |
| First Guaranty Bancshares, Inc. | |
| Condensed Statement of Income | |
| (in thousands) | |
| | | | | | | | | | |
| | | | | | | | | | |
| | | Years ended December 31, | |
| Operating Income | | 2009 | | | 2008 | | | 2007 | |
| Dividends received from bank subsidiary | | $ | 5,109 | | | $ | 7,200 | | | $ | 19,630 | |
| Other income | | | 4 | | | | 143 | | | | 4 | |
| Total operating income | | | 5,113 | | | | 7,343 | | | | 19,634 | |
| | | | | | | | | | | | | |
| Operating Expenses | | | | | | | | | | | | |
| Interest expense | | | 114 | | | | 152 | | | | 233 | |
| Other expenses | | | 501 | | | | 703 | | | | 448 | |
| Total operating expenses | | | 615 | | | | 855 | | | | 681 | |
| | | | | | | | | | | | | |
| Income before income tax expense and increase in equity in undistributed | | | | |
| earnings of subsidiary | | | 4,498 | | | | 6,488 | | | | 18,953 | |
| Income tax benefit | | | 214 | | | | 289 | | | | 220 | |
| Income before increase in equity in undistributed earnings of subdisiary | | | 4,712 | | | | 6,777 | | | | 19,173 | |
| Decrease in equity in undistributed earnings of subsidiary | | | 2,883 | | | | (1,265 | ) | | | (15,713 | ) |
| Net Income | | $ | 7,595 | | | $ | 5,512 | | | $ | 3,460 | |
| Less preferred stock dividends | | | (594 | ) | | | - | | | | - | |
| Net income available to common shareholders | | $ | 7,001 | | | $ | 5,512 | | | $ | 3,460 | |
| | | | | | | | | | | | | |
| | | | | | | | | | |
| First Guaranty Bancshares, Inc. | |
| Condensed Statement of Cash Flow | |
| | | | | | | | | | |
| | | Years ended December 31, | |
| | | 2009 | | | 2008 | | | 2007 | |
| | | (in thousands) | |
| | | | | | | | | | |
| Cash Flows From Operating Activities | | | | | | | | | |
| Net income | | $ | 7,595 | | | $ | 5,512 | | | $ | 3,460 | |
| Adjustments to reconcile net income to net cash | | | | | | | | | | | | |
| provided by operating activities: | | | | | | | | | | | | |
| Provision for deferred income taxes | | | - | | | | (16 | ) | | | - | |
| (Increase) Decrease in equity in undistributed earnings of subsidiary | | | (2,883 | ) | | | 1,265 | | | | 15,713 | |
| Net change in other liabilities | | | (83 | ) | | | 65 | | | | (17 | ) |
| Net change in other assets | | | 275 | | | | (132 | ) | | | (49 | ) |
| Net Cash Provided By Operating Activities | | | 4,904 | | | | 6,694 | | | | 19,107 | |
| | | | | | | | | | | | | |
| Cash Flows From Investing Activities | | | | | | | | | | | | |
| Payments for investments in and advances to subsidiary | | | (16,350 | ) | | | - | | | | (5,489 | ) |
| Cash paid in excess of cash received in acquisition | | | - | | | | - | | | | (11,790 | ) |
| Net Cash Used in Investing Activities | | | (16,350 | ) | | | - | | | | (17,279 | ) |
| | | | | | | | | | | | | |
| Cash Flows From Financing Activities | | | | | | | | | | | | |
| Proceeds from purchased funds and other short-term borrowings | | | - | | | | - | | | | 17,640 | |
| Repayments of purchased funds and other short-term borrowings | | | - | | | | - | | | | (17,640 | ) |
| Repayment of long-term debt | | | - | | | | (3,093 | ) | | | - | |
| Proceeds from issuance of preferred stock | | | 20,699 | | | | - | | | | - | |
| Dividends paid | | | (3,799 | ) | | | (3,557 | ) | | | (1,779 | ) |
| Net Cash Provided by (Used In) Financing Activities | | | 16,900 | | | | (6,650 | ) | | | (1,779 | ) |
| | | | | | | | | | | | | |
| Net Increase In Cash and Cash Equivalents | | | 5,454 | | | | 44 | | | | 49 | |
| Cash and Cash Equivalents at the Beginning of the Period | | | 93 | | | | 49 | | | | - | |
| Cash and Cash Equivalents at the End of the Period | | $ | 5,547 | | | $ | 93 | | | $ | 49 | |
| | | | | | | | | | | | | |
There were no changes in or disagreements with accountants on accounting and financial disclosures for the year ended December 31, 2009.
Evaluation of Disclosure Controls and Procedures
As defined by the Securities and Exchange Commission in Exchange Act Rules 13a-14(c) and 15d-14(c), a company’s “disclosure controls and procedures” means controls and other procedures of an issuer that are designed to ensure that information required to be disclosed by the issuer in the reports that it files or submits under the Exchange Act is recorded, processed, summarized and reported, within time periods specified in the Commission’s rules and forms. The Company maintains such controls designed to ensure this material information is communicated to Management, including the Chief Executive officer (“CEO”) and Chief Financial Officer (“CFO”), as appropriate, to allow timely decision regarding required disclosure.
Management, with the participation of the CEO and CFO, have evaluated the effectiveness of our disclosure controls and procedures as of the end of the period covered by this annual report on Form 10-K. Based on that evaluation, the CEO and CFO have concluded that the disclosure controls and procedures as of the end of the period covered by this annual report are effective. There were no changes in the Company’s internal control over financial reporting during the last fiscal quarter in the period covered by this annual report that have materially affected, or are reasonably likely to materially affect, the Company’s internal control over financial reporting.
This annual report does not include an attestation report of the Company’s registered public accounting firm regarding internal controls over financial reporting. Management’s report was not subject to attestation by the Company’s registered public accounting firm pursuant to temporary rules of the Securities and Exchange Commission that permit the Company to provide only Management’s report in this annual report.
Management’s Annual Report on Internal Control over Financial Reporting
The Management of First Guaranty Bancshares, Inc. has prepared the consolidated financial statements and other information in our Annual Report in accordance with accounting principles generally accepted in the United States of America and is responsible for its accuracy. The financial statements necessarily include amounts that are based on Management’s best estimates and judgments. In meeting its responsibility, Management relies on internal accounting and related control systems. The internal control systems are designed to ensure that transactions are properly authorized and recorded in our financial records and to safeguard our assets from material loss or misuse. Such assurance cannot be absolute because of inherent limitations in any internal control system.
Management is responsible for establishing and maintaining the adequate internal control over financial reporting, as such term is defined in the Exchange Act Rules 13 – 15(f). Under the supervision and with the participation of Management, including our principal executive officers and principal financial officer, we conducted an evaluation of the effectiveness of internal control over financial reporting based on the framework in Internal Control – Integrated Framework issued by the Committee of Sponsoring Organizations of the Treadway Commission. This section relates to Management’s evaluation of internal control over financial reporting including controls over the preparation of the schedules equivalent to the basic financial statements and compliance with laws and regulations. Our evaluation included a review of the documentation of controls, evaluations of the design of the internal control system and tests of the effectiveness of internal controls.
Based on our evaluation under the framework in Internal Control – Integrated Framework, Management concluded that internal control over financial reporting was effective as of December 31, 2009.
None
Item 10 – Directors, Executive Officers and Corporate Governance
Pursuant to General Instruction G (3), information on directors and executive officers of the Registrant will be incorporated by reference from the Company’s 2010 Definitive Proxy Statement.
Item 11 - Executive Compensation
Pursuant to General Instruction G (3), information on directors and executive officers of the Registrant will be incorporated by reference from the Company’s 2010 Definitive Proxy Statement.
Item 12 - Security Ownership of Certain Beneficial Owners, Management and Related Stockholder Matters
Pursuant to General Instruction G (3), information on directors and executive officers of the Registrant will be incorporated by reference from the Company’s 2010 Definitive Proxy Statement.
Item 13 - Certain Relationships and Related Transactions and Director Independence
Pursuant to General Instruction G (3), information on directors and executive officers of the Registrant will be incorporated by reference from the Company’s 2010 Definitive Proxy Statement.
Item 14 - Principal Accountant Fees and Services
Pursuant to General Instruction G (3), information on directors and executive officers of the Registrant will be incorporated by reference from the Company’s 2010 Definitive Proxy Statement.
Part IV
| (a) | 1 | Consolidated Financial Statements | |
| | | | |
| | | Item | Page |
| | | First Guaranty Bancshares, Inc. and Subsidiary | |
| | | Report of Independent Registered Accounting Firm | 50 |
| | | Consolidated Balance Sheets - December 31, 2009 and 2008 | 51 |
| | | Consolidated Statements of Income – Years Ended December 31, 2009, 2008 and 2007 | 52 |
| | | Consolidated Statements of Changes in Stockholders’ Equity - December 31, 2009, 2008 and 2007 | 53 |
| | | Consolidated Statements of Cash Flows - Years Ended December 31, 2009, 2008 and 2007 | 54 |
| | | Notes to Consolidated Financial Statements | 55 |
| | | | |
| | 2 | Consolidated Financial Statement Schedules | |
| | | All schedules to the consolidated financial statements of First Guaranty Bancshares, Inc. and its subsidiary have been omitted because they are not required under the related instructions or are inapplicable, or because the required information has been provided in the consolidated financial statements or the notes thereto. | |
| | | | |
| | 3 | Exhibits | |
| | | | |
| | | The exhibits required by Regulation S-K are set forth in the following list and are filed either by incorporation by reference from previous filings with the Securities and Exchange Commission or by attachment to this Annual Report on Form 10-K as indicated below. | |
Exhibit Number | | Exhibit | |
3.1 | | Restatement of Articles of Incorporation of First Guaranty Banchshares, Inc. dated July 27, 2007 (filed as Exhibit 3.1 on Form 8-K12G3 dated August 2, 2007 and incorporated herein by reference). | |
| 3.2 | | Bylaws of First Guaranty Bancshares, Inc. dated January 4, 2007 (filed as Exhibit 3.2 on Form 8-K12G3 dated August 2, 2007 and incorporated herein by reference). | |
| 3.3 | | Amendment to Bylaws of First Guaranty Bancshares, Inc., dated May 17, 2007 (filed as exhibit 3.3 on Form 8-K12G3 dated August 2, 2007 and incorporated herein by reference). | |
| 11 | | Statement Regarding Computation of Earnings Per Share | |
| 12 | | Statement Regarding Computation of Ratios | |
| 14.1 | | First Guaranty Bancshares, Inc. and Subsidiary Code of Conduct and Ethics for Employees, Officers and Directors adopted March 20, 2009 (filed at Exhibit 14.3 on the Company’s Form 10-K dated March 31, 2009 and incorporated herein by reference) | |
| 14.2 | | First Guaranty Bancshares, Inc. Code of Ethics for Senior Financial Officers adopted March 20, 2009 (filed at Exhibit 14.4 on the Company’s Form 10-K dated March 31, 2009 and incorporated herein by reference). | |
| 14.3 | | First Guaranty Bancshares, Inc. and Subsidiary Code of Conduct and Ethics for Employees, Officers and Directors adopted March 18, 2010. | |
| 14.4 | | First Guaranty Bancshares, Inc. Code of Ethics for Senior Financial Officers adopted March 18, 2010. | |
| 21 | | Subsidiaries of the First Guaranty Bancshares, Inc. (filed as Exhibit 21 on the Company’s Form 8-K dated November 8, 2007 and incorporated herein by reference). | |
| 24 | | Power of attorney | |
| 31.1 | | Certification of principal executive officer pursuant to Exchange Act Rule 13a-14(a) or 15d-14(a), pursuant to Section 302 of the Sarbanes-Oxley Act of 2002. | |
| 31.2 | | Certification of principal financial officer pursuant to Exchange Act Rule 13a-14(a) or 15d-14(a), pursuant to Section 302 of the Sarbanes-Oxley Act of 2002. | |
| 32.1 | | Certification of principal executive officer pursuant to 18 U.S.C. Section 1350, as adopted pursuant to Section 906 of the Sarbanes-Oxley Act of 2002. | |
| 32.2 | | Certification of principal financial officer pursuant to 18 U.S.C. Section 1350, as adopted pursuant to Section 906 of the Sarbanes-Oxley Act of 2002. | |
| 99.1 | | Chief Executive Officer TARP Certification | |
| 99.2 | | Chief Financial Officer TARP Certification | |
SIGNATURES
Pursuant to the requirements of Section 13 or 15(d) of the Securities Exchange Act of 1934, the Bank has duly caused this report to be signed on its behalf by the undersigned, thereunto duly authorized.
FIRST GUARANTY BANCSHARES, INC.
Dated: March 31, 2010
Pursuant to the requirements of the Securities and Exchange Act of 1934, this report has been signed below by the following persons on behalf of the Company and in the capacities and on the dates indicated.
/s/ Alton B. Lewis Alton B. Lewis | Chief Executive Officer and Director | March 31, 2010 |
| | | |
| | | |
/s/ Michele E. LoBianco Michele E. LoBianco | Chief Financial Officer, Secretary and Treasurer (Principal Financial and Accounting Officer) | March 31, 2010 |
| | | |
| | | |
*___________________________ Marshall T. Reynolds | Chairman of the Board | March 31, 2010 | |
| | | |
| | | |
*___________________________ William K. Hood | Director | March 31, 2010 |
| | | |
| | | | |
*By: /s/ Alton B. Lewis
Alton B. Lewis
Under Power of Attorney