UNITED STATES
SECURITIES AND EXCHANGE COMMISSION
Washington, D.C. 20549
FORM N-CSR
CERTIFIED SHAREHOLDER REPORT
OF
REGISTERED MANAGEMENT INVESTMENT COMPANIES
Investment Company Act file number: 811-22114
Name of Registrant: Vanguard Montgomery Funds
Address of Registrant:
P.O. Box 2600
Valley Forge, PA 19482
Name and address of agent for service:
Heidi Stam, Esquire
P.O. Box 876
Valley Forge, PA 19482
Registrant’s telephone number, including area code: (610) 669-1000
Date of fiscal year end: March 31
Date of reporting period: April 1, 2008–September 30, 2008
Item 1: Reports to Shareholders

> For the six months ended September 30, 2008, Vanguard Market Neutral Fund returned –1.9%, outpacing the peer-group average, but trailing the return of its Treasury-bill benchmark.
> Subpar stock selection in the industrials and materials sectors more than offset excellent stock picking in financials.
> The fund’s advisors succeeded in neutralizing much of the portfolio’s exposure to the stock market’s downturn.
Contents | |
| |
Your Fund’s Total Returns | 1 |
President’s Letter | 2 |
Advisors’ Report | 5 |
Fund Profile | 8 |
Performance Summary | 10 |
Financial Statements | 11 |
About Your Fund’s Expenses | 26 |
Glossary | 28 |
Please note: The opinions expressed in this report are just that—informed opinions. They should not be considered promises or advice. Also, please keep in mind that the information and opinions cover the period through the date on the front of this report. Of course, the risks of investing in your fund are spelled out in the prospectus.
Your Fund’s Total Returns
Six Months Ended September 30, 2008 | | |
| Ticker | Total |
| Symbol | Returns |
Vanguard Market Neutral Fund | | |
Investor Shares | VMNFX | –1.9% |
Institutional Shares1 | VMNIX | –1.9 |
Citigroup 3-Month Treasury Bill Index | | 0.8 |
Average Equity Market Neutral Fund2 | | –2.8 |
Your Fund’s Performance at a Glance |
March 31, 2008–September 30, 2008 |
| | | Distributions Per Share |
| Starting | Ending | Income | Capital |
| Share Price | Share Price | Dividends | Gains |
Vanguard Market Neutral Fund | | | | |
Investor Shares | $12.45 | $12.14 | $0.040 | $0.040 |
Institutional Shares | 12.39 | 12.08 | 0.038 | 0.040 |
1 This class of shares carries lower expenses and is available for a minimum initial investment of $5 million.
2 Derived from data provided by Lipper Inc.
1

President’s Letter
Dear Shareholder,
For the six months ended September 30, 2008, Vanguard Market Neutral Fund returned –1.9%, as the negative returns of the stocks it held offset the profits earned on stocks it sold short. This mismatch was most significant in the industrials sector.
Compared with a turbulent stock market, the fund’s six-month return was strong. The fund’s goal, however, is to minimize its exposure to the broad stock market while using skillful stock selection to produce a return a bit higher than that available from low-risk U.S. Treasury bills. By that standard, the fund’s six-month performance fell short.
Credit market turbulence weighed heavily on stock prices
Troubles simmering in the credit markets for much of the past year came to a boil at the end of the six-month period, producing several high-profile bankruptcies and putting severe pressure on stock prices around the world. The broad U.S. stock market returned –10.1%, a continuation of the slide that began before the start of the period. International stock markets were also disappointing, returning –22.5% for the six months.
Policymakers and elected officials, both in the United States and abroad, responded to the upheavals with dramatic new programs designed to help stabilize the credit markets. As participants struggled to make sense of the markets’ fast-changing dynamics, stock
2
prices were exceptionally volatile, with daily ups and downs of 2 percentage points or more becoming commonplace.
U.S. Treasuries rallied in a nervous market
Nervousness in the stock market was echoed, and even amplified, in the bond market. For the six months, the broad U.S. bond market returned –1.5%, as weakness in corporate bonds offset strong returns from Treasuries—investors’ security of choice in times of duress.
The U.S. Federal Reserve Board sought to defuse the turmoil with new lending facilities for market participants and additional cuts in short-term interest rates, reducing its target for the federal funds rate to 2.00% by the end of September.
On October 8, shortly after the close of the fiscal half-year, the Fed cut rates again, to 1.50%. The move was made in coordination with rate cuts by several other central banks.
Modest missteps restrained six-month returns
Vanguard Market Neutral Fund seeks to capture some of the gains available from skillful stock selection while minimizing the portfolio’s exposure to the broad stock market’s ups and downs. Our benchmark for the fund is the 3-month U.S. Treasury bill, a low-risk asset with no stock market exposure, and a reasonable proxy for the returns earned on the cash proceeds from the fund’s short sales.
Market Barometer | | | |
| | | Total Returns |
| Periods Ended September 30, 2008 |
| Six Months | One Year | Five Years1 |
Stocks | | | |
Russell 1000 Index (Large-caps) | –11.1% | –22.1% | 5.5% |
Russell 2000 Index (Small-caps) | –0.5 | –14.5 | 8.1 |
Dow Jones Wilshire 5000 Index (Entire market) | –10.1 | –21.2 | 6.0 |
MSCI All Country World Index ex USA (International) | –22.5 | –30.0 | 11.8 |
| | | |
| | | |
Bonds | | | |
Lehman U.S. Aggregate Bond Index (Broad taxable market) | –1.5% | 3.7% | 3.8% |
Lehman Municipal Bond Index | –2.6 | –1.9 | 2.8 |
Citigroup 3-Month Treasury Bill Index | 0.8 | 2.6 | 3.1 |
| | | |
| | | |
CPI | | | |
Consumer Price Index | 2.5% | 4.9% | 3.4% |
| | | |
| | | |
| | | |
| | | |
1 Annualized. | | | |
3
For the six-month period, the fund returned –1.9%—superior to the average –2.8% return of its peers—but a few steps behind the 0.8% return of 3-month T-bills. The shortfall largely reflected subpar stock selection in the materials and industrials sectors. In both cases, the fund’s holdings underperformed the stocks that the advisors sold short, leading to losses of more than 2 percentage points. The consumer staples sector was also a weak spot. The fund’s long positions declined in value, while those it sold short rose modestly.
The fund’s most notable success during the six months was financial stocks, the sector hit hardest in most long-only portfolios. The advisors’ decisions about which stocks to hold and which ones to sell short added almost 2 percentage points of return. Short sales included investment banks, commercial banks, and insurance giant AIG, which lost most of its value during the period. Long positions included some of the period’s best-performing banks, such as JPMorgan Chase and Bank of America. The advisors’ selections in the utilities sector were another source of strength.
The fund’s advisors, Vanguard Quantitative Equity Group and AXA Rosenberg Investment Management LLC, provide more details about their portfolio decisions on page 5.
A sophisticated tool for diversified portfolios
Although it didn’t quite meet its objective during the past six months, Vanguard Market Neutral Fund demonstrated its value as a diversification vehicle. It neutralized most of the stock market’s volatility, registering a modest negative return as the market posted a double-digit decline. We have great confidence that, over time, the advisors’ disciplined stock-selection methodologies can provide excess returns to complement the fund’s powerful diversification properties.
The fund can play an important role in a well-diversified portfolio. Its strategies are more complex than those in a traditional long-only stock portfolio, however, so due diligence is key to ensure that your expectations are consistent with the fund’s objective.
Thank you for investing with Vanguard.
Sincerely,

F. William McNabb III
President and Chief Executive Officer
October 16, 2008
4
Advisors’ Report
For the fiscal half-year ended September 30, 2008, Vanguard Market Neutral Fund returned –1.9%. This performance reflects the combined efforts of your fund’s two independent advisors. The use of two advisors provides exposure to distinct, yet complementary, investment approaches, enhancing the fund’s diversification.
The advisors, the percentage and amount of fund assets each manages, and brief descriptions of their investment strategies are presented in the table below. Each advisor has also prepared a discussion of the investment environment and of how the portfolio’s positioning reflects this assessment. This report was prepared on October 17, 2008.
AXA Rosenberg Investment
Management LLC
Portfolio Manager:
William E. Ricks, Americas Chief Executive and Chief Investment Officer
It is our firm belief that earnings—both long-term cumulative earnings and near-term changes in earnings—drive stock prices. Our fundamentally driven investment process evaluates each stock’s intrinsic value and earnings prospects, and we focus on attractively valued companies with superior year-ahead earnings.
As the credit storm swept over capital markets during the past six months, our portfolio benefited from being underexposed to companies with high leverage,
Vanguard Market Neutral Fund Investment Advisors |
| | | |
| Fund Assets Managed | |
Investment Advisor | % | $ Million | Investment Strategy |
AXA Rosenberg Investment Management LLC | 51 | 54 | Builds a portfolio based on fundamental analysis using a two-part quantitative |
| | | model that considers valuations |
| | | and earnings forecasts. |
Vanguard Quantitative Equity Group | 47 | 50 | Conducts quantitative management using models that assess valuation, |
| | | marketplace sentiment, and balance- |
| | | sheet characteristics of companies as compared with their peers. |
Cash Investments1 | 2 | 2 | — |
1 The fund’s daily cash balance may be invested in one or more Vanguard CMT Funds, which are very low-cost money market funds. Each advisor may also maintain a modest cash position.
5
and was short in financial stocks such as AIG, Fannie Mae, and Washington Mutual, all of which were rescued by regulators or taken over after asset write-downs, capital shortages, and severe impairments to their business models. Stock selection was mixed among the global cyclicals—while short positions in consumer discretionary stocks such as Starwood Hotels and MGM Mirage and in oil distributors and drillers such as Valero and Nabors were helpful, long positions in select metals and machinery stocks declined amid heightened fears of a slowdown in global growth.
While the financial sector overall remains unsettled, valuation is becoming more appealing, and earnings expectations within the sector are showing increased differentiation. As a result, we recently increased our positions in high-quality stocks such as JPMorgan Chase, Bank of America, and Wells Fargo that are likely to come through the crises with strength. We also initiated long positions in select materials stocks such as Monsanto, 3M, and International Paper as their valuations have become more attractive.
Vanguard Quantitative Equity Group
Portfolio Manager:
James D. Troyer, CFA, Principal
During the first half of the fiscal year, the Russell 1000 Index of large-capitalization companies, from which we select our stocks, dropped more than 11%.
Quantitative management, as we implement it, is similar to traditional stock selection, although we use computer models to make our choices. We attempt to identify attributes that will indicate whether a stock’s market price is too high or too low relative to the company’s fundamentals. Overall, we are trying to find several hundred stocks that individually, and as a group, will outperform their peers. This aspect of our strategy differs from a traditional stock-picking approach, which generally tries to spot a small number of stocks that will outperform.
Our long holdings typically exhibit growth rates similar to the market average but were purchased at price/earnings ratios below the market average. Conversely, our short positions trade at higher earnings multiples and offer slightly lower growth. Our investment judgment tells us that selling a lower growth rate at a higher price in order to buy a higher growth rate at a lower price is an attractive proposition, over the long run.
Our specific quantitative approach uses computer models to assess stocks in terms of three components: market sentiment, valuation, and earnings quality.
Our research indicates that each of these models individually has the ability to identify a group of stocks that will outperform their industry peers over the long term. By combining the results from the three
6
models, we benefit from their relatively low correlation with one another, which diversifies the risk in our portfolio. Just as adding bonds and international stocks to a domestic stock portfolio can help to reduce risk through diversification, using multiple models to pick stocks should improve our overall ability to add value consistently. Our three-component approach doesn’t work every year, but over the long run we are confident in the power of its stock-selection capability and in the diversification it provides.
Our final step is to assemble a portfolio that is relatively neutral with regard to various market risk factors, such as market capitalization and industry. We do not want to have a long portfolio made up of only small-cap stocks while our short portfolio is entirely composed of large-cap stocks. That would put us at risk in an environment in which small-caps underperformed large-caps. Our research does not indicate that we are able to add value through such strategies.
For the six months, financial stocks dominated returns, and our short positions in AIG and Freddie Mac were particularly successful. East West Bancorp and MF Global were our best long financial holdings. Our long position in Morgan Stanley and our short position in Zion Bancorp detracted from performance.
Energy stocks were also volatile during the first half of the fiscal year. Our long positions in Chesapeake Energy and National Oilwell Varco helped performance, as did our short holdings of Range Resources and Foundation Coal. Our short position in Patriot Coal hurt performance, as did our long holding of Superior Energy Services.
We are confident that our focus on value and sentiment will reward patience. We thank you for entrusting us with your investment dollars, and look forward to the remainder of the fiscal year.
7
Fund Profile
As of September 30, 2008
Portfolio Characteristics | | |
| | |
Yield1 | | |
Investor Shares | | 3.2% |
Institutional Shares | | 3.3% |
Short-Term Reserves | | 2.1% |
Investment Characteristics |
| Long | Short |
| Portfolio | Portfolio |
Number of Stocks | 287 | 270 |
Median Market Cap | $35.2B | $28.0B |
Price/Earnings Ratio | 13.4x | 19.1x |
Price/Book Ratio | 2.0x | 2.1x |
Return on Equity | 19.1% | 18.6% |
Earnings Growth Rate | 18.0% | 19.6% |
Foreign Holdings | 0.9% | 0.3% |
Turnover Rate | 212%2 | — |
Estimated Expense Ratios3 | | |
| Investor | Institutional |
| Shares | Shares |
Management and | | |
Administrative Expenses | 0.50% | 0.40% |
Dividend Expense on | | |
Securities Sold Short | 1.50 | 1.50 |
Total | 2.00% | 1.90% |
Sector Diversification (% of equity exposure) |
| Long | Short |
| Portfolio | Portfolio |
Consumer Discretionary | 12.3% | 16.5% |
Consumer Staples | 6.6 | 10.0 |
Energy | 8.9 | 9.2 |
Financials | 10.1 | 4.6 |
Health Care | 12.6 | 13.6 |
Industrials | 14.6 | 12.1 |
Information Technology | 16.9 | 19.3 |
Materials | 7.2 | 4.8 |
Telecommunication Services | 4.6 | 2.9 |
Utilities | 6.2 | 7.0 |
Volatility Measures4 | |
| Fund Versus |
| S&P 500 Index |
R-Squared | 0.01 |
Beta | 0.04 |
1 30-day SEC yield for the fund. See the Glossary.
2 Annualized.
3 The fund expense ratios shown are from the prospectuses dated July 25, 2008, and were based on estimated expenses. For the six months ended September 30, 2008, the annualized expense ratios were: for Investor Shares, 2.03% (0.51% management and administrative expenses plus 1.52% dividend expense on securities sold short); for Institutional Shares, 1.93% (0.41% management and administrative expenses plus 1.52% dividend expense on securities sold short).
4 For an explanation of R-squared, beta, and other terms used here, see the Glossary.
8
Ten Largest Holdings1 (% of total net assets) |
Long Portfolio | | |
| | |
Verizon | integrated | |
Communications Inc. | telecommunication | |
| services | 1.8% |
Pfizer Inc. | pharmaceuticals | 1.7 |
AT&T Inc. | integrated | |
| telecommunication | |
| services | 1.5 |
International Business | | |
Machines Corp. | computer hardware | 1.4 |
Apple Inc. | computer hardware | 1.2 |
JPMorgan Chase & Co. | diversified | |
| financial services | 1.2 |
QUALCOMM Inc. | communications | |
| equipment | 1.2 |
Monsanto Co. | fertilizers and | |
| agricultural | |
| chemicals | 1.1 |
Bank of America Corp. | diversified | |
| financial services | 1.1 |
3M Co. | industrial | |
| conglomerates | 1.1 |
Top Ten | | 13.3% |
Ten Largest Holdings1 | (% of total net assets) |
Short Portfolio | | |
| | |
Google Inc. | internet software | |
| and services | 1.8% |
Cisco Systems, Inc. | communications | |
| equipment | 1.7 |
PepsiCo, Inc. | soft drinks | 1.6 |
The Procter & Gamble Co. | houshold products | 1.6 |
Intel Corp. | semiconductors | 1.5 |
United Parcel Service, Inc. | air freight and logistics | 1.1 |
Stryker Corp. | health care | |
| equipment | 1.0 |
Medtronic, Inc. | health care | |
| equipment | 1.0 |
Comcast Corp. Class A | cable and satellite | 1.0 |
Exelon Corp. | electric utilities | 1.0 |
Top Ten | | 13.3% |
1 The holdings listed exclude any temporary cash investments and equity index products. See the Glossary.
9
Performance Summary
All of the returns in this report represent past performance, which is not a guarantee of future results that may be achieved by the fund. (Current performance may be lower or higher than the performance data cited. For performance data current to the most recent month-end, visit our website at www.vanguard.com/performance.) Note, too, that both investment returns and principal value can fluctuate widely, so an investor’s shares, when sold, could be worth more or less than their original cost. The returns shown do not reflect taxes that a shareholder would pay on fund distributions or on the sale of fund shares.
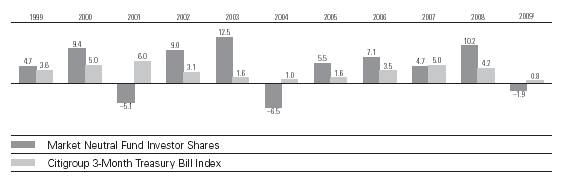
Fiscal-Year Total Returns (%): November 11, 1998–September 30, 2008
Average Annual Total Returns: Periods Ended September 30, 2008 |
| | | | Since |
| Inception Date | One Year | Five Years | Inception |
Investor Shares2 | 11/11/1998 | 4.33% | 5.39% | 4.83% |
Institutional Shares2 | 10/19/1998 | 4.44 | 5.67 | 5.13 |
1 Six months ended September 30, 2008.
2 Total returns do not reflect the 2% fee assessed until November 30, 2007, on redemptions of shares purchased within 30 days or the 1% fee assessed beginning December 1, 2007, on redemptions of shares held less than one year.
Note: See Financial Highlights tables for dividend and capital gains information.
10
Financial Statements (unaudited)
Statement of Net Assets
As of September 30, 2008
The fund provides a complete list of its holdings four times in each fiscal year, at the quarter-ends. For the second and fourth fiscal quarters, the lists appear in the fund’s semiannual and annual reports to shareholders. For the first and third fiscal quarters, the fund files the lists with the Securities and Exchange Commission on Form N-Q. Shareholders can look up the fund’s Forms N-Q on the SEC’s website at www.sec.gov. Forms N-Q may also be reviewed and copied at the SEC’s Public Reference Room (see the back cover of this report for further information).
| | Market |
| | Value• |
| Shares | ($000) |
Common Stocks—Long Positions (91.4%)1 |
Consumer Discretionary (11.3%) | | |
† Johnson Controls, Inc. | 30,000 | 910 |
† Time Warner, Inc. | 66,900 | 877 |
† TJX Cos., Inc. | 20,700 | 632 |
† NIKE, Inc. Class B | 7,100 | 475 |
† H & R Block, Inc. | 19,700 | 444 |
*† DISH Network Corp. | 16,600 | 349 |
*† AutoZone Inc. | 2,800 | 345 |
† NVR, Inc. | 500 | 286 |
† Polo Ralph Lauren Corp. | 4,200 | 280 |
† Jones Apparel Group, Inc. | 14,100 | 261 |
† Ross Stores, Inc. | 7,100 | 261 |
† RadioShack Corp. | 15,000 | 259 |
† Comcast Corp. Class A | 13,200 | 259 |
† Advance Auto Parts, Inc. | 6,500 | 258 |
† Wyndham Worldwide Corp. | 16,400 | 258 |
† Macy’s Inc. | 14,300 | 257 |
† Tiffany & Co. | 7,100 | 252 |
† Warner Music Group Corp. | 32,900 | 250 |
† International Speedway Corp. | 6,400 | 249 |
† The Gap, Inc. | 13,900 | 247 |
† Burger King Holdings Inc. | 10,000 | 246 |
† Hillenbrand Inc. | 12,200 | 246 |
*† Viacom Inc. Class B | 9,900 | 246 |
† Pulte Homes, Inc. | 17,400 | 243 |
† Big Lots Inc. | 8,700 | 242 |
† Interval Leisure Group, Inc. | 23,200 | 241 |
† Service Corp. International | 28,700 | 240 |
† Urban Outfitters, Inc. | 7,500 | 239 |
† Home Depot, Inc. | 9,200 | 238 |
† Whirlpool Corp. | 3,000 | 238 |
† WABCO Holdings Inc. | 6,700 | 238 |
† Boyd Gaming Corp. | 25,300 | 237 |
† News Corp., Class A | 19,800 | 237 |
† Federal-Mogul Corp. | 18,800 | 236 |
† Hanesbrands Inc. | 10,700 | 233 |
† Family Dollar Stores, Inc. | 9,600 | 228 |
† AutoNation, Inc. | 20,100 | 226 |
Yum! Brands, Inc. | 5,400 | 176 |
Limited Brands, Inc. | 9,100 | 158 |
* | Discovery | | |
| Communications Inc. | | |
| Class A | 7,550 | 108 |
* | Discovery | | |
| Communications Inc. | | |
| Class C | 4,300 | 61 |
* | Ascent Media Corporation | 430 | 11 |
| | | 11,977 |
Consumer Staples (6.0%) | | |
† | Kellogg Co. | 13,520 | 758 |
† | Colgate-Palmolive Co. | 9,600 | 723 |
† | Bunge Ltd. | 9,240 | 584 |
† | Avon Products, Inc. | 12,700 | 528 |
| Sara Lee Corp. | 22,000 | 278 |
† | Dr. Pepper | | |
| Snapple Group, Inc. | 10,400 | 275 |
| The Clorox Co. | 4,300 | 270 |
† | The Procter & Gamble Co. | 3,800 | 265 |
† | Dean Foods Co. | 11,200 | 262 |
† | NBTY, Inc. | 8,800 | 260 |
† | Central European | | |
| Distribution Corp. | 5,700 | 259 |
† | General Mills, Inc. | 3,700 | 254 |
† | Altria Group, Inc. | 12,800 | 254 |
† | ConAgra Foods, Inc. | 13,000 | 253 |
† | SuperValu Inc. | 11,300 | 245 |
† | Herbalife Ltd. | 6,200 | 245 |
† | The Estee Lauder Cos. Inc. | | |
| Class A | 4,400 | 220 |
† | Campbell Soup Co. | 5,500 | 212 |
* | Constellation Brands, Inc. | | |
| Class A | 7,840 | 168 |
| Wal-Mart Stores, Inc. | 700 | 42 |
| | | 6,355 |
Energy (8.1%) | | |
† | Apache Corp. | 6,500 | 678 |
| ExxonMobil Corp. | 6,800 | 528 |
† | Chevron Corp. | 6,300 | 520 |
† | Murphy Oil Corp. | 7,300 | 468 |
† | Cimarex Energy Co. | 8,400 | 411 |
† | Pioneer Natural Resources Co. | 7,340 | 384 |
11
| | | Market | |
| | | Value• | |
| | Shares | ($000) | |
*† | Plains Exploration & | | |
| Production Co. | 10,100 | 355 |
† | Massey Energy Co. | 8,600 | 307 |
† | Helmerich & Payne, Inc. | 6,960 | 301 |
*† | Pride International, Inc. | 9,300 | 275 |
† | ConocoPhillips Co. | 3,500 | 256 |
† | Frontline Ltd. | 5,200 | 250 |
† | ENSCO International, Inc. | 4,200 | 242 |
† | Unit Corp. | 4,800 | 239 |
† | Hess Corp. | 2,900 | 238 |
† | Teekay Shipping Corp. | 9,000 | 237 |
† | Overseas | | |
| Shipholding Group Inc. | 4,000 | 233 |
† | Occidental Petroleum Corp. | 3,300 | 232 |
† | Continental Resources, Inc. | 5,900 | 231 |
† | Oil States International, Inc. | 6,500 | 230 |
† | Superior Energy Services, Inc. | 7,200 | 224 |
† | W&T Offshore, Inc. | 8,200 | 224 |
† | Mariner Energy Inc. | 10,600 | 217 |
| Peabody Energy Corp. | 4,800 | 216 |
| Arch Coal, Inc. | 6,300 | 207 |
| Smith International, Inc. | 3,000 | 176 |
† | Diamond Offshore Drilling, Inc. | 1,370 | 141 |
* | Forest Oil Corp. | 2,800 | 139 |
| BJ Services Co. | 6,400 | 122 |
* | Newfield Exploration Co. | 3,700 | 118 |
| Patriot Coal Corp. | 3,600 | 105 |
† | Schlumberger Ltd. | 1,100 | 86 |
* | Cameron International Corp. | 1,200 | 46 |
| | | 8,636 |
Financials (9.2%) | | | |
† | JPMorgan Chase & Co. | 27,600 | 1,289 | |
† | Bank of America Corp. | 33,400 | 1,169 | |
† | Wells Fargo & Co. | 26,100 | 980 | |
† | SunTrust Banks, Inc. | 13,890 | 625 | |
† | Hudson City Bancorp, Inc. | 31,793 | 587 | |
| U.S. Bancorp | 16,000 | 576 | |
† | Unum Group | 22,600 | 567 | |
| State Street Corp. | 9,900 | 563 | |
† | Ameriprise Financial, Inc. | 13,100 | 500 | |
| The Principal | | | |
| Financial Group, Inc. | 9,100 | 396 | |
| MetLife, Inc. | 7,001 | 392 | |
| Aon Corp. | 8,700 | 391 | |
| Prudential Financial, Inc. | 5,300 | 382 | |
† | Everest Re Group, Ltd. | 4,100 | 355 |
| The Allstate Corp. | 5,900 | 272 |
| Assurant, Inc. | 3,800 | 209 |
| Axis Capital Holdings Ltd. | 6,300 | 200 |
| The Hartford Financial | | |
| Services Group Inc. | 4,500 | 184 |
| The Travelers Cos., Inc. | 2,100 | 95 |
| Genworth Financial Inc. | 2,511 | 22 |
| The Goldman Sachs Group, Inc. | 59 | 8 |
| | | 9,762 |
Health Care (11.5%) | | |
† | Pfizer Inc. | 100,163 | 1,847 |
† | Bristol-Myers Squibb Co. | 49,800 | 1,038 |
| | | | | | |
*† | Amgen, Inc. | 12,700 | 753 |
* | Genzyme Corp. | 7,800 | 631 |
† | CIGNA Corp. | 15,800 | 537 |
*† | Express Scripts Inc. | 7,200 | 532 |
*† | Forest Laboratories, Inc. | 18,600 | 526 |
*† | Gilead Sciences, Inc. | 11,400 | 520 |
| Aetna Inc. | 13,920 | 503 |
*† | Cephalon, Inc. | 5,500 | 426 |
*† | Waters Corp. | 6,493 | 378 |
| Johnson & Johnson | 5,000 | 346 |
*† | Hologic, Inc. | 17,600 | 340 |
† | LifePoint Hospitals, Inc. | 8,400 | 270 |
† | Perrigo Co. | 6,900 | 265 |
† | St. Jude Medical, Inc. | 5,900 | 257 |
† | McKesson Corp. | 4,700 | 253 |
† | Covidien Ltd. | 4,700 | 253 |
† | Invitrogen Corp. | 6,600 | 249 |
† | Abbott Laboratories | 4,300 | 248 |
† | Watson Pharmaceuticals, Inc. | 8,700 | 248 |
† | Omnicare, Inc. | 8,600 | 247 |
† | Medtronic, Inc. | 4,900 | 245 |
† | Lincare Holdings, Inc. | 8,100 | 244 |
† | Quest Diagnostics, Inc. | 4,600 | 238 |
† | Universal Health Services | | |
| Class B | 4,200 | 235 |
† | Varian Medical Systems, Inc. | 4,100 | 234 |
* | DaVita, Inc. | 2,500 | 143 |
† | Charles River | | |
| Laboratories, Inc. | 2,200 | 122 |
*† | Intuitive Surgical, Inc. | 400 | 96 |
| | | 12,224 |
Industrials (13.4%) | | |
† | 3M Co. | 17,000 | 1,161 |
† | Tyco International, Ltd. | 21,000 | 735 |
† | Honeywell International Inc. | 17,300 | 719 |
† | Cummins Inc. | 15,700 | 686 |
† | L-3 Communications | | |
| Holdings, Inc. | 6,300 | 619 |
† | Lockheed Martin Corp. | 5,500 | 603 |
† | Fluor Corp. | 9,800 | 546 |
† | R.R. Donnelley & Sons Co. | 22,100 | 542 |
† | Parker Hannifin Corp. | 9,500 | 504 |
† | Fastenal Co. | 8,900 | 440 |
*† | AGCO Corp. | 7,930 | 338 |
* | Shaw Group, Inc. | 10,230 | 314 |
† | Rockwell Automation, Inc. | 7,970 | 298 |
*† | First Solar, Inc. | 1,390 | 263 |
† | GATX Corp. | 6,600 | 261 |
† | The Timken Co. | 9,000 | 255 |
† | The Dun & Bradstreet Corp. | 2,700 | 255 |
† | Ryder System, Inc. | 4,100 | 254 |
† | Copa Holdings SA Class A | 7,800 | 254 |
| | | | |
12
| | | Market |
| | | Value• |
| | Shares | ($000) |
† | CSX Corp. | 4,500 | 246 |
† | United Rentals, Inc. | 16,055 | 245 |
† | The Brink’s Co. | 4,000 | 244 |
† | Dover Corp. | 6,000 | 243 |
† | Northrop Grumman Corp. | 4,000 | 242 |
† | Waste Management, Inc. | 7,700 | 242 |
† | Goodrich Corp. | 5,800 | 241 |
† | Burlington Northern | | |
| Santa Fe Corp. | 2,600 | 240 |
† | Kirby Corp. | 6,300 | 239 |
† | Caterpillar, Inc. | 4,000 | 238 |
† | Gardner Denver Inc. | 6,800 | 236 |
† | Hubbell Inc. Class B | 6,700 | 235 |
† | Lennox International Inc. | 6,800 | 226 |
| Bucyrus International, Inc. | 5,000 | 223 |
† | The Manitowoc Co., Inc. | 14,200 | 221 |
† | Aecom Technology Corp. | 9,000 | 220 |
† | Trinity Industries, Inc. | 8,300 | 214 |
† | W.W. Grainger, Inc. | 2,450 | 213 |
*† | Terex Corp. | 6,600 | 201 |
| Cooper Industries, Inc. Class A | 4,500 | 180 |
| Flowserve Corp. | 2,000 | 178 |
† | SPX Corp. | 1,900 | 146 |
† | Manpower Inc. | 3,300 | 142 |
* | Jacobs Engineering Group Inc. | 1,201 | 65 |
| The Corporate | | |
| Executive Board Co. | 1,400 | 44 |
| General Dynamics Corp. | 100 | 7 |
| | | 14,218 |
Information Technology (15.4%) | | |
† | International Business | | |
| Machines Corp. | 12,339 | 1,443 |
*† | Apple Inc. | 11,500 | 1,307 |
† | QUALCOMM Inc. | 29,700 | 1,276 |
† | Accenture Ltd. | 24,200 | 920 |
*† | Intuit, Inc. | 19,900 | 629 |
*† | Computer Sciences Corp. | 11,000 | 441 |
† | Harris Corp. | 8,500 | 393 |
*† | Agilent Technologies, Inc. | 13,000 | 386 |
*† | VeriSign, Inc. | 12,700 | 331 |
† | Amphenol Corp. | 7,470 | 300 |
† | Oracle Corp. | 13,500 | 274 |
† | FLIR Systems, Inc. | 7,000 | 269 |
*† | Activision Blizzard, Inc. | 17,400 | 268 |
† | Microsoft Corp. | 10,000 | 267 |
† | Lexmark International, Inc. | 8,000 | 261 |
† | SAIC, Inc. | 12,900 | 261 |
*† | Affiliated Computer | | |
| Services, Inc. Class A | 5,130 | 260 |
*† | Alliance Data Systems Corp. | 4,100 | 260 |
† | Xilinx, Inc. | 11,000 | 258 |
† | Symantec Corp. | 13,100 | 257 |
† | Western Digital Corp. | 12,000 | 256 |
† | Intel Corp. | 13,600 | 255 |
† | Convergys Corp. | 17,200 | 254 |
† | Lender Processing | | |
| Services, Inc. | 8,300 | 253 |
† | Diebold, Inc. | 7,600 | 252 |
† | LSI Corp. | 46,700 | 250 |
† | Compuware Corp. | 25,700 | 249 |
† | MEMC Electronic | | |
| Materials, Inc. | 8,800 | 249 |
† | Tyco Electronics Ltd. | 9,000 | 249 |
† | Corning, Inc. | 15,700 | 246 |
† | ON Semiconductor Corp. | 36,400 | 246 |
† | Avnet, Inc. | 9,900 | 244 |
† | Teradyne, Inc. | 31,100 | 243 |
*† | McAfee Inc. | 7,100 | 241 |
*† | BMC Software, Inc. | 8,400 | 241 |
† | Integrated Device | | |
| Technology Inc. | 30,800 | 240 |
† | Sohu.com Inc. | 4,300 | 240 |
† | Hewitt Associates, Inc. | 6,500 | 237 |
| WebMD Health Corp. Class A | 7,900 | 235 |
† | QLogic Corp. | 15,200 | 233 |
† | Dolby Laboratories Inc. | 6,600 | 232 |
† | Arrow Electronics, Inc. | 8,800 | 231 |
† | Marvell | | |
| Technology Group Ltd. | 24,800 | 231 |
† | EchoStar Corp. | 9,400 | 227 |
† | Metavante Technologies | 11,800 | 227 |
* | Sun Microsystems, Inc. | 24,000 | 182 |
| MasterCard, Inc. Class A | 380 | 67 |
| | | 16,371 |
Materials (6.6%) | | |
† | Monsanto Co. | 12,200 | 1,208 |
† | International Paper Co. | 25,200 | 660 |
† | PPG Industries, Inc. | 9,200 | 537 |
† | The Mosaic Co. | 7,890 | 537 |
† | Freeport-McMoRan | | |
| Copper & Gold, Inc. Class B | 7,280 | 414 |
† | Terra Industries, Inc. | 12,900 | 379 |
† | CF Industries Holdings, Inc. | 3,900 | 357 |
† | Celanese Corp. Series A | 12,450 | 347 |
*† | Owens-Illinois, Inc. | 9,800 | 288 |
† | Greif Inc. Class A | 4,100 | 269 |
† | Airgas, Inc. | 5,000 | 248 |
† | MeadWestvaco Corp. | 10,400 | 242 |
† | Alcoa Inc. | 9,900 | 224 |
† | Reliance Steel & Aluminum Co. | 5,800 | 220 |
† | AK Steel Holding Corp. | 8,400 | 218 |
† | United States Steel Corp. | 2,700 | 210 |
† | Schnitzer Steel Industries, Inc. | | |
| Class A | 5,000 | 196 |
| Cleveland-Cliffs Inc. | 3,500 | 185 |
| Eastman Chemical Co. | 2,500 | 138 |
| FMC Corp. | 1,000 | 51 |
| Allegheny Technologies Inc. | 1,470 | 43 |
| | | 6,971 |
Telecommunication Services (4.2%) | | |
† | Verizon Communications Inc. | 58,228 | 1,869 |
† | AT&T Inc. | 57,000 | 1,591 |
13
| | | Market |
| | | Value• |
| | Shares | ($000) |
† | Telephone & | | |
| Data Systems, Inc. | 7,100 | 254 |
† | Embarq Corp. | 6,100 | 247 |
† | Windstream Corp. | 22,400 | 245 |
† | Level 3 Communications, Inc. | 84,700 | 229 |
| Qwest Communications | | |
| International Inc. | 6,600 | 21 |
| | | 4,456 |
Utilities (5.7%) | | |
† | PG&E Corp. | 16,900 | 633 |
*† | AES Corp. | 40,200 | 470 |
† | MDU Resources Group, Inc. | 14,900 | 432 |
† | DTE Energy Co. | 10,040 | 403 |
† | Pepco Holdings, Inc. | 13,100 | 300 |
| Xcel Energy, Inc. | 13,500 | 270 |
† | Edison International | 6,600 | 263 |
† | Atmos Energy Corp. | 9,800 | 261 |
† | CenterPoint Energy Inc. | 17,800 | 259 |
† | American | | |
| Electric Power Co., Inc. | 6,900 | 256 |
† | Progress Energy, Inc. | 5,900 | 254 |
† | Consolidated Edison Inc. | 5,900 | 253 |
† | CMS Energy Corp. | 20,100 | 251 |
† | Pinnacle West Capital Corp. | 7,300 | 251 |
† | Duke Energy Corp. | 14,400 | 251 |
† | Sempra Energy | 4,900 | 247 |
† | ONEOK, Inc. | 6,900 | 237 |
† | Questar Corp. | 5,800 | 237 |
† | TECO Energy, Inc. | 14,100 | 222 |
| UGI Corp. Holding Co. | 6,800 | 175 |
| NiSource, Inc. | 7,290 | 108 |
| | | 6,033 |
Total Common Stocks—Long Positions | |
(Cost $106,141) | 97,003 |
Common Stocks Sold Short (–81.6%) | |
Consumer Discretionary (–13.4%) | |
| Comcast Corp. Class A | (53,500) | (1,050) |
* | Starbucks Corp. | (59,400) | (883) |
| Fortune Brands, Inc. | (13,970) | (801) |
| Mattel, Inc. | (36,200) | (653) |
| The McGraw-Hill Cos., Inc. | (18,747) | (593) |
* | Liberty Global, Inc. Class A | (19,100) | (579) |
| International | | |
| Game Technology | (30,200) | (519) |
| Starwood Hotels & | | |
| Resorts Worldwide, Inc. | (16,950) | (477) |
* | Bed Bath & Beyond, Inc. | (14,800) | (465) |
| Newell Rubbermaid, Inc. | (17,494) | (302) |
| Centex Corp. | (17,200) | (279) |
| Eastman Kodak Co. | (17,300) | (266) |
| Office Depot, Inc. | (45,500) | (265) |
| DIRECTV Group, Inc. | (10,100) | (264) |
| KB Home | (13,200) | (260) |
| Lowe’s Cos., Inc. | (10,800) | (256) |
| Marriott International, Inc. | | |
| Class A | (9,800) | (256) |
| Amazon.com, Inc. | (3,500) | (255) |
| PetSmart, Inc. | (10,300) | (255) |
| Weight Watchers | | |
| International, Inc. | (6,900) | (253) |
| American Eagle | | |
| Outfitters, Inc. | (16,600) | (253) |
| Johnson Controls, Inc. | (8,300) | (252) |
| Staples, Inc. | (11,200) | (252) |
| Best Buy Co., Inc. | (6,700) | (251) |
| Gannett Co., Inc. | (14,700) | (249) |
| BorgWarner, Inc. | (7,500) | (246) |
| O’Reilly Automotive, Inc. | (9,200) | (246) |
| Virgin Media Inc. | (31,000) | (245) |
| Dick’s Sporting Goods, Inc. | (12,000) | (235) |
| The Stanley Works | (5,600) | (234) |
| DeVry, Inc. | (4,700) | (233) |
| Scripps Networks Interactive | (6,400) | (232) |
| Harley-Davidson, Inc. | (6,200) | (231) |
| Penn National Gaming, Inc. | (8,700) | (231) |
| Washington Post Co. | | |
| Class B | (400) | (223) |
| Gentex Corp. | (15,100) | (216) |
| OfficeMax, Inc. | (23,000) | (204) |
| Whirlpool Corp. | (2,400) | (190) |
| Career Education Corp. | (10,800) | (177) |
| Home Depot, Inc. | (6,330) | (164) |
| J.C. Penney Co., Inc. | | |
| (Holding Co.) | (4,800) | (160) |
* | GameStop Corp. Class A | (4,000) | (137) |
| Nordstrom, Inc. | (4,600) | (133) |
* | Ford Motor Co. | (19,192) | (100) |
| Toll Brothers, Inc. | (2,900) | (73) |
* | Discovery | | |
| Communications Inc. | | |
| Class C | (3,250) | (46) |
* | Viacom Inc. Class B | (1,520) | (38) |
| Macy’s Inc. | (1,900) | (34) |
| Hasbro, Inc. | (760) | (26) |
* | Ascent Media Corporation | (325) | (8) |
| | | (14,250) |
Consumer Staples (–8.2%) | | |
| PepsiCo, Inc. | (24,200) | (1,725) |
| The Procter & Gamble Co. | (24,100) | (1,680) |
| Kraft Foods Inc. | (31,700) | (1,038) |
| Archer-Daniels-Midland Co. | (27,200) | (596) |
| The Hershey Co. | (12,000) | (474) |
| The Kroger Co. | (16,200) | (445) |
| The Coca-Cola Co. | (5,000) | (264) |
| Colgate-Palmolive Co. | (3,500) | (264) |
| Hormel Foods Corp. | (7,200) | (261) |
| Kellogg Co. | (4,600) | (258) |
| The Clorox Co. | (4,100) | (257) |
| CVS/Caremark Corp. | (7,500) | (252) |
14
| | | Market |
| | | Value• |
| | Shares | ($000) |
| Molson Coors | | |
| Brewing Co. Class B | (5,400) | (252) |
| Coca-Cola Enterprises, Inc. | (14,800) | (248) |
| Sara Lee Corp. | (19,500) | (246) |
| Energizer Holdings, Inc. | (2,900) | (234) |
| Brown-Forman Corp. Class B | (1,700) | (122) |
| Sysco Corp. | (1,200) | (37) |
| | | (8,653) |
Energy (–7.5%) | | |
| Valero Energy Corp. | (28,600) | (867) |
| XTO Energy, Inc. | (17,300) | (805) |
| Spectra Energy Corp. | (26,100) | (621) |
| Chesapeake Energy Corp. | (13,200) | (473) |
| Sunoco, Inc. | (11,240) | (400) |
* | Nabors Industries, Inc. | (12,580) | (313) |
| Rowan Cos., Inc. | (8,000) | (244) |
| Frontier Oil Corp. | (12,900) | (238) |
| Baker Hughes, Inc. | (3,900) | (236) |
| National Oilwell Varco Inc. | (4,700) | (236) |
| Halliburton Co. | (7,200) | (233) |
| Noble Energy, Inc. | (4,200) | (233) |
| CNX Gas Corp. | (10,300) | (231) |
| Oceaneering | | |
| International, Inc. | (4,300) | (229) |
| BJ Services Co. | (11,900) | (228) |
| Cabot Oil & Gas Corp. | (6,300) | (228) |
| Hercules Offshore, Inc. | (15,000) | (227) |
* | Cameron International Corp. | (5,800) | (224) |
| Range Resources Corp. | (5,100) | (219) |
| Exterran Holdings, Inc. | (6,800) | (217) |
| Global Industries Ltd. | (31,000) | (215) |
| Quicksilver Resources, Inc. | (10,800) | (212) |
* | Newfield Exploration Co. | (6,500) | (208) |
| CONSOL Energy, Inc. | (4,500) | (206) |
| SandRidge Energy, Inc. | (10,500) | (206) |
| Southern Union Co. | (8,000) | (165) |
| Tesoro Corp. | (3,451) | (57) |
| Anadarko Petroleum Corp. | (500) | (24) |
| | | (7,995) |
Financials (–3.7%) | | |
| Marsh & McLennan Cos., Inc. | (25,638) | (814) |
| Progressive Corp. of Ohio | (26,900) | (468) |
| American Express Co. | (12,400) | (439) |
| Moody’s Corp. | (9,400) | (320) |
| MSCI, Inc.-Class A Shares | (10,200) | (245) |
| Brown & Brown, Inc. | (11,300) | (244) |
* | SLM Corp. | (19,786) | (244) |
| Arthur J. Gallagher & Co. | (9,300) | (239) |
* | Nasdaq Stock Market Inc. | (6,300) | (193) |
| Tree.com, Inc. | (35,300) | (170) |
| CME Group, Inc. | (400) | (149) |
| Legg Mason Inc. | (3,800) | (145) |
* | IntercontinentalExchange Inc. | (1,800) | (145) |
| KeyCorp | (10,700) | (128) |
| | | (3,943) |
Health Care (–11.1%) | | |
| Stryker Corp. | (17,500) | (1,090) |
| Medtronic, Inc. | (21,500) | (1,077) |
| Allergan, Inc. | (19,580) | (1,008) |
* | Zimmer Holdings, Inc. | (15,600) | (1,007) |
| Abbott Laboratories | (12,400) | (714) |
| Merck & Co., Inc. | (18,700) | (590) |
| Wyeth | (15,900) | (587) |
* | Laboratory Corp. of | | |
| America Holdings | (6,900) | (480) |
* | DaVita, Inc. | (7,023) | (400) |
| Vertex Pharmaceuticals, Inc. | (9,300) | (309) |
* | Waters Corp. | (4,600) | (268) |
| Pediatrix Medical Group, Inc. | (4,900) | (264) |
* | Gilead Sciences, Inc. | (5,700) | (260) |
| Schering-Plough Corp. | (14,000) | (259) |
| Cardinal Health, Inc. | (5,200) | (256) |
| Millipore Corp. | (3,700) | (255) |
| Celgene Corp. | (4,000) | (253) |
* | Hologic, Inc. | (13,000) | (251) |
| C.R. Bard, Inc. | (2,600) | (247) |
| Cooper Cos., Inc. | (7,100) | (247) |
| Inverness Medical | | |
| Innovations, Inc. | (8,200) | (246) |
| PerkinElmer, Inc. | (9,800) | (245) |
| Gen-Probe Inc. | (4,600) | (244) |
| VCA Antech, Inc. | (8,100) | (239) |
| IDEXX Laboratories Corp. | (4,300) | (236) |
| IMS Health, Inc. | (12,200) | (231) |
| Eli Lilly & Co. | (2,600) | (114) |
| DENTSPLY International Inc. | (2,200) | (83) |
| ResMed Inc. | (1,900) | (82) |
* | Intuitive Surgical, Inc. | (300) | (72) |
| Teleflex Inc. | (1,000) | (63) |
| Quest Diagnostics, Inc. | (800) | (41) |
* | Amylin Pharmaceuticals, Inc. | (800) | (16) |
| | | (11,734) |
Industrials (–9.9%) | | |
| United Parcel Service, Inc. | (18,400) | (1,157) |
| FedEx Corp. | (9,900) | (782) |
* | Iron Mountain, Inc. | (21,500) | (525) |
| The Boeing Co. | (7,200) | (413) |
| Expeditors International | | |
| of Washington, Inc. | (10,300) | (359) |
| Oshkosh Truck Corp. | (22,200) | (292) |
| Precision Castparts Corp. | (3,700) | (291) |
| Masco Corp. | (14,600) | (262) |
| Cintas Corp. | (8,900) | (256) |
| Pall Corp. | (7,400) | (254) |
| Graco, Inc. | (7,100) | (253) |
| Owens Corning Inc. | (10,600) | (253) |
| 3M Co. | (3,700) | (253) |
| W.W. Grainger, Inc. | (2,900) | (252) |
| Roper Industries Inc. | (4,400) | (251) |
| Danaher Corp. | (3,600) | (250) |
| Ametek, Inc. | (6,100) | (249) |
15
| | | Market |
| | | Value• |
| | Shares | ($000) |
| Avery Dennison Corp. | (5,600) | (249) |
| Continental Airlines, Inc. | | |
| Class B | (14,700) | (245) |
| IDEX Corp. | (7,900) | (245) |
| Illinois Tool Works, Inc. | (5,500) | (244) |
| Donaldson Co., Inc. | (5,800) | (243) |
| Robert Half International, Inc. | (9,800) | (243) |
| Spirit | | |
| Aerosystems Holdings Inc. | (15,100) | (243) |
| General Cable Corp. | (6,800) | (242) |
| URS Corp. | (6,600) | (242) |
| Raytheon Co. | (4,500) | (241) |
| Harsco Corp. | (6,300) | (234) |
| KBR Inc. | (14,900) | (228) |
| Kennametal, Inc. | (8,100) | (220) |
| McDermott International, Inc. | (8,600) | (220) |
| Delta Air Lines Inc. | (28,700) | (214) |
| PACCAR, Inc. | (5,000) | (191) |
| Quanta Services, Inc. | (6,400) | (173) |
* | Foster Wheeler Ltd. | (3,900) | (141) |
| UTI Worldwide, Inc. | (4,800) | (82) |
| | | (10,492) |
Information Technology (–15.8%) | | |
* | Google Inc. | (4,660) | (1,866) |
* | Cisco Systems, Inc. | (81,000) | (1,827) |
| Intel Corp. | (86,900) | (1,628) |
| Paychex, Inc. | (26,900) | (889) |
| Applied Materials, Inc. | (49,900) | (755) |
* | eBay Inc. | (20,700) | (463) |
* | NetApp, Inc. | (23,300) | (425) |
| Linear Technology Corp. | (13,600) | (417) |
* | NVIDIA Corp. | (37,900) | (406) |
| KLA-Tencor Corp. | (12,800) | (405) |
* | Citrix Systems, Inc. | (14,400) | (364) |
* | VeriSign, Inc. | (10,100) | (263) |
| Tellabs, Inc. | (64,300) | (261) |
| LAM Research Corp. | (8,200) | (258) |
| Accenture Ltd. | (6,800) | (258) |
* | Broadcom Corp. | (13,700) | (255) |
| Micron Technology, Inc. | (62,100) | (251) |
| EMC Corp. | (20,900) | (250) |
* | Sun Microsystems, Inc. | (32,700) | (249) |
| Brocade Communications | | |
| Systems, Inc. | (42,500) | (247) |
| Vishay Intertechnology, Inc. | (37,300) | (247) |
| Motorola, Inc. | (34,400) | (246) |
| Varian Semiconductor | | |
| Equipment Associates, Inc. | (9,700) | (244) |
| Ingram Micro, Inc. Class A | (15,100) | (243) |
* | Agilent Technologies, Inc. | (8,200) | (243) |
| ANSYS, Inc. | (6,400) | (242) |
| Fidelity National | | |
| Information Services, Inc. | (13,100) | (242) |
| Cadence Design Systems, Inc. | (35,700) | (241) |
| Cognizant Technology | | |
| Solutions Corp. | (10,200) | (233) |
| Electronic Arts Inc. | (6,300) | (233) |
| Yahoo! Inc. | (13,400) | (232) |
| SanDisk Corp. | (11,700) | (229) |
| Trimble Navigation Ltd. | (8,800) | (228) |
| Unisys Corp. | (81,200) | (223) |
| Juniper Networks, Inc. | (10,500) | (221) |
| Rambus Inc. | (17,100) | (220) |
| Red Hat, Inc. | (14,200) | (214) |
* | Fiserv, Inc. | (4,100) | (194) |
| Microchip Technology, Inc. | (6,600) | (194) |
| SunPower Corp. Class B | (2,687) | (186) |
* | salesforce.com, inc. | (2,900) | (140) |
* | Alliance Data Systems Corp. | (2,100) | (133) |
| FactSet Research Systems Inc. | (1,700) | (89) |
| Cypress Semiconductor Corp. | (9,800) | (51) |
| Altera Corp. | (1,200) | (25) |
| | | (16,730) |
Materials (–3.9%) | | |
| Weyerhaeuser Co. | (9,700) | (588) |
| Ecolab, Inc. | (5,300) | (257) |
| Packaging Corp. of America | (10,900) | (253) |
| Sealed Air Corp. | (11,400) | (251) |
| Pactiv Corp. | (10,000) | (248) |
| Nalco Holding Co. | (13,300) | (247) |
| Sigma-Aldrich Corp. | (4,700) | (246) |
| Newmont Mining Corp. | | |
| (Holding Co.) | (6,300) | (244) |
| Scotts Miracle-Gro Co. | (10,300) | (243) |
| Air Products & Chemicals, Inc. | (3,500) | (240) |
| PPG Industries, Inc. | (4,100) | (239) |
| International Flavors & | | |
| Fragrances, Inc. | (6,000) | (237) |
| Dow Chemical Co. | (7,400) | (235) |
| Chemtura Corp. | (50,700) | (231) |
| Smurfit-Stone Container Corp. | (43,000) | (202) |
* | Owens-Illinois, Inc. | (4,600) | (135) |
| Praxair, Inc. | (500) | (36) |
| | | (4,132) |
Telecommunication Services (–2.4%) | | |
* | American Tower Corp. | | |
| Class A | (19,600) | (705) |
| Sprint Nextel Corp. | (100,400) | (612) |
| U.S. Cellular Corp. | (5,500) | (258) |
| SBA Communications Corp. | (9,200) | (238) |
| MetroPCS | | |
| Communications Inc. | (16,900) | (236) |
| Leap Wireless | | |
| International, Inc. | (6,100) | (232) |
| Windstream Corp. | (11,100) | (121) |
* | NII Holdings Inc. | (1,900) | (72) |
* | Crown Castle | | |
| International Corp. | (1,600) | (46) |
| CenturyTel, Inc. | (600) | (22) |
| | | (2,542) |
Utilities (–5.7%) | | |
| Exelon Corp. | (16,700) | (1,046) |
| FirstEnergy Corp. | (10,943) | (733) |
16
| | Market | |
| | Value• | |
| Shares | ($000) | |
PPL Corp. | (15,800) | (585) | |
* Mirant Corp. | (21,700) | (397) | |
Equitable Resources, Inc. | (9,500) | (349) | |
Pepco Holdings, Inc. | (11,300) | (259) | |
Vectren Corp. | (9,200) | (256) | |
Ameren Corp. | (6,500) | (254) | |
Great Plains Energy, Inc. | (11,400) | (252) | |
Xcel Energy, Inc. | (12,600) | (252) | |
Entergy Corp. | (2,800) | (249) | |
AGL Resources Inc. | (7,800) | (245) | |
Public Service | | | |
Enterprise Group, Inc. | (7,400) | (243) | |
NRG Energy, Inc. | (9,200) | (228) | |
Dynegy, Inc. | (63,800) | (228) | |
* Reliant Energy, Inc. | (27,000) | (198) | |
Northeast Utilities | (6,400) | (164) | |
Allegheny Energy, Inc. | (3,100) | (114) | |
| | (6,052) | |
Total Common Stocks Sold Short | |
(Proceeds $93,940) | | (86,523) | |
Temporary Cash Investment (2.4%)1 | |
2 Vanguard Market | | | |
Liquidity Fund, 2.296% | | | |
(Cost $2,488) | 2,487,541 | 2,488 | |
†Other Assets and | | | |
Liabilities—Net (87.8%) | | 93,121 | |
Net Assets (100%) | | 106,089 | |
| | | |
| | | |
Statement of Assets and Liabilities | |
Assets | | | |
Investment in Securities, | | | |
Long Positions at Value | | 99,491 | |
Cash Deposited with Broker | | | |
for Short Positions | | 94,016 | |
Receivables for Capital | | | |
Shares Issued | | 48 | |
Other Assets | | 274 | |
Total Assets | | 193,829 | |
| Market |
| Value• |
| ($000) |
Liabilities | |
Securities Sold Short, at Value | 86,523 |
Payables for Investment | |
Securities Purchased | 35 |
Other Liabilities | 1,182 |
Total Liabilities | 87,740 |
Net Assets (100%) | 106,089 |
At September 30, 2008, net assets consisted of: |
| Amount |
| ($000) |
Paid-in Capital | 107,329 |
Undistributed Net Investment Income | 627 |
Overdistributed Net Realized Gains | (142) |
Unrealized Appreciation (Depreciation) | |
Investment Securities—Long Positions | (9,138) |
Investment Securities Sold Short | 7,417 |
Futures Contracts | (4) |
Net Assets | 106,089 |
| |
| |
Investor Shares—Net Assets | |
Applicable to 7,120,141 outstanding | |
$.001 par value shares of beneficial | |
interest (unlimited authorization) | 86,421 |
Net Asset Value Per Share— | |
Investor Shares | $12.14 |
| |
| |
Institutional Shares—Net Assets | |
Applicable to 1,628,313 outstanding | |
$.001 par value shares of beneficial | |
interest (unlimited authorization) | 19,668 |
Net Asset Value Per Share— | |
Institutional Shares | $12.08 |
• See Note A in Notes to Financial Statements.
* Non-income-producing security.
† Long security positions with a value of $67,100,000 and cash of $94,016,000 have been segregated in connection with securities sold short.
1 The fund invests a portion of its cash reserves in equity markets through the use of index futures contracts. After giving effect to futures investments, the fund’s effective long common stock and temporary cash investment positions represent 91.7% and 2.1%, respectively, of net assets.
2 Affiliated money market fund available only to Vanguard funds and certain trusts and accounts managed by Vanguard. Rate shown is the 7-day yield.
See accompanying Notes, which are an integral part of the Financial Statements.
17
Statement of Operations
| Six Months Ended |
| September 30, 2008 |
| ($000) |
Investment Income | |
Income | |
Dividends | 747 |
Interest1 | 820 |
Total Income | 1,567 |
Expenses | |
Investment Advisory Fees—Note B | 129 |
The Vanguard Group—Note C | |
Management and Administrative—Investor Shares | 56 |
Management and Administrative—Institutional Shares | 6 |
Marketing and Distribution—Investor Shares | 4 |
Marketing and Distribution—Institutional Shares | 1 |
Custodian Fees | 21 |
Shareholders’ Reports—Investor Shares | 2 |
Shareholders’ Reports—Institutional Shares | — |
Dividend Expense on Securities Sold Short | 684 |
Total Expenses | 903 |
Net Investment Income | 664 |
Realized Net Gain (Loss) | |
Investment Securities—Long Positions | (5,475) |
Investment Securities Sold Short | 5,102 |
Futures Contracts | 631 |
Realized Net Gain (Loss) | 258 |
Change in Unrealized Appreciation (Depreciation) | |
Investment Securities—Long Positions | (8,285) |
Investment Securities Sold Short | 5,249 |
Futures Contracts | (4) |
Change in Unrealized Appreciation (Depreciation) | (3,040) |
Net Increase (Decrease) in Net Assets Resulting from Operations | (2,118) |
1 Interest income from an affiliated company of the fund was $88,000.
See accompanying Notes, which are an integral part of the Financial Statements.
18
Statement of Changes in Net Assets
| Six Months Ended | | Year Ended |
| September 30, | | March 31, |
| 2008 | | 2008 |
| ($000) | | ($000) |
Increase (Decrease) in Net Assets | | | |
Operations | | | |
Net Investment Income | 664 | | 638 |
Realized Net Gain (Loss) | 258 | | 2,059 |
Change in Unrealized Appreciation (Depreciation) | (3,040) | | (1,291) |
Net Increase (Decrease) in Net Assets Resulting from Operations | (2,118) | | 1,406 |
Distributions | | | |
Net Investment Income | | | |
Investor Shares | (243) | | (344) |
Institutional Shares | (38) | | (206) |
Realized Capital Gain1 | | | |
Investor Shares | (243) | | (200) |
Institutional Shares | (40) | | (112) |
Total Distributions | (564) | | (862) |
Capital Share Transactions | | | |
Investor Shares | 43,894 | | 35,479 |
Institutional Shares | 7,827 | | 1,704 |
Net Increase (Decrease) from Capital Share Transactions | 51,721 | | 37,183 |
Total Increase (Decrease) | 49,039 | | 37,727 |
Net Assets | | | |
Beginning of Period | 57,050 | | 19,323 |
End of Period2 | 106,089 | | 57,050 |
1 Includes fiscal 2009 and 2008 short-term gain distributions totaling $240,000 and $0, respectively. Short-term gain distributions are treated as ordinary income dividends for tax purposes.
2 Net Assets—End of Period includes undistributed net investment income of $627,000 and $244,000. See accompanying Notes, which are an integral part of the Financial Statements.
19
Financial Highlights
Investor Shares | | | | | | |
| | | | | | |
| Six Months | | | | | |
| Ended | |
For a Share Outstanding | September 30, | Year Ended March 31, |
Throughout Each Period | 2008 | 20081 | 2007 | 2006 | 2005 | 2004 |
Net Asset Value, Beginning of Period | $12.45 | $12.19 | $12.12 | $11.46 | $10.86 | $11.61 |
Investment Operations | | | | | | |
Net Investment Income (Loss) | .0922 | .3112 | .500 | .220 | (.040)2 | (.100)2 |
Net Realized and Unrealized Gain (Loss) on Investments | | | | | | |
(.322) | .909 | .060 | .590 | .640 | (.650) |
Total from Investment Operations | (.230) | 1.220 | .560 | .810 | .600 | (.750) |
Distributions | | | | | | |
Dividends from Net Investment Income | (.040) | (.607) | (.490) | (.150) | — | — |
Distributions from Realized Capital Gains | (.040) | (.353) | — | — | — | — |
Total Distributions | (.080) | (.960) | (.490) | (.150) | — | — |
Net Asset Value, End of Period | $12.14 | $12.45 | $12.19 | $12.12 | $11.46 | $10.86 |
| | | | | | |
| | | | | | |
Total Return3 | –1.87% | 10.15% | 4.68% | 7.09% | 5.52% | –6.46% |
| | | | | | |
| | | | | | |
Ratios/Supplemental Data | | | | | | |
Net Assets, End of Period (Millions) | $86 | $45 | $9 | $12 | $13 | $9 |
Ratio of Expenses to Average Net Assets | | | | | | |
| | | | | |
Based on Total Expenses | 2.03%4 | 3.09% | 3.46% | 3.31% | 3.55% | 3.51% |
Net of Expenses Waived/Reimbursed1 | 2.03%4 | 2.79% | 2.98% | 3.02% | 3.26% | 3.12% |
Net of Expenses Waived/Reimbursed and Dividend Expense on Securities Sold Short | | | | | | |
| | | | | |
0.51%4 | 1.16% | 1.54% | 1.59% | 1.61% | 1.55% |
Ratio of Net Investment Income (Loss) to Average Net Assets—Net of Expenses Waived/Reimbursed | | | | | | |
| | | | | |
1.46%4 | 2.69% | 3.40% | 2.14% | (0.33%) | (0.93%) |
Portfolio Turnover Rate | 212%4 | 214% | 169% | 213% | 180% | 189% |
1 Laudus Rosenberg U.S. Large/Mid Capitalization Long/Short Equity Fund reorganized into Vanguard Market Neutral Fund effective
December 1, 2007. For periods prior to December 1, 2007, the fund’s advisor and other service providers had agreed to waive or reimburse certain of the fund’s expenses.
2 Calculated based on average shares outstanding.
3 Total returns do not reflect the 2% fee assessed until November 30, 2007, on redemptions of shares purchased within 30 days; the 1% fee assessed beginning December 1, 2007, on redemptions of shares held less than one year; or the account service fee that may be applicable to certain accounts with balances below $10,000.
4 Annualized.
See accompanying Notes, which are an integral part of the Financial Statements.
20
Institutional Shares | | | | | | |
| | | | | | |
| Six Months | | | | | |
| Ended | | | | |
For a Share Outstanding | September 30, | Year Ended March 31, |
Throughout Each Period | 2008 | 20081 | 2007 | 2006 | 2005 | 2004 |
Net Asset Value, Beginning of Period | $12.39 | $12.14 | $12.08 | $11.44 | $10.80 | $11.51 |
Investment Operations | | | | | | |
Net Investment Income (Loss) | .1032 | .3902 | .600 | .250 | (.010)2 | (.060)2 |
Net Realized and Unrealized Gain (Loss) on Investments | | | | | | |
(.335) | .864 | — | .580 | .650 | (.650) |
Total from Investment Operations | (.232) | 1.254 | .600 | .830 | .640 | (.710) |
Distributions | | | | | | |
Dividends from Net Investment Income | (.038) | (.651) | (.540) | (.190) | — | — |
Distributions from Realized Capital Gains | (.040) | (.353) | — | — | — | — |
Total Distributions | (.078) | (1.004) | (.540) | (.190) | — | — |
Net Asset Value, End of Period | $12.08 | $12.39 | $12.14 | $12.08 | $11.44 | $10.80 |
| | | | | | |
| | | | | | |
Total Return3 | –1.89% | 10.49% | 4.98% | 7.29% | 5.93% | –6.17% |
| | | | | | |
| | | | | | |
Ratios/Supplemental Data | | | | | | |
Net Assets, End of Period (Millions) | $20 | $12 | $10 | $20 | $12 | $20 |
Ratio of Expenses to | | | | | | |
Average Net Assets | | | | | | |
Based on Total Expenses | 1.93%4 | 2.97% | 3.07% | 3.01% | 3.23% | 3.22% |
Net of Expenses Waived/Reimbursed1 | 1.93%4 | 2.56% | 2.67% | 2.71% | 2.94% | 2.82% |
Net of Expenses Waived/Reimbursed | | | | | | |
and Dividend Expense on | | | | | | |
Securities Sold Short | 0.41%4 | 0.93% | 1.24% | 1.24% | 1.24% | 1.25% |
Ratio of Net Investment Income (Loss) to Average Net Assets—Net of Expenses Waived/Reimbursed | | | | | | |
| | | | | |
1.56%4 | 2.92% | 3.68% | 2.50% | (0.13%) | (0.57%) |
Portfolio Turnover Rate | 212%4 | 214% | 169% | 213% | 180% | 189% |
1 Laudus Rosenberg U.S. Large/Mid Capitalization Long/Short Equity Fund reorganized into Vanguard Market Neutral Fund effective
December 1, 2007. For periods prior to December 1, 2007, the fund’s advisor and other service providers had agreed to waive or reimburse certain of the fund’s expenses.
2 Calculated based on average shares outstanding.
3 Total returns do not reflect the 2% fee assessed until November 30, 2007, on redemptions of shares purchased within 30 days or the 1% fee assessed beginning December 1, 2007, on redemptions of shares held less than one year.
4 Net Income Ratio decreased mostly as a result of a decrease in Interest Income, as rates declined. Interest Income down 55%. See accompanying Notes, which are an integral part of the Financial Statements.
21
Notes to Financial Statements
Vanguard Market Neutral Fund is registered under the Investment Company Act of 1940 as an open-end investment company, or mutual fund. The fund offers two classes of shares, Investor Shares and Institutional Shares. Investor Shares are available to any investor who meets the fund’s minimum purchase requirements. Institutional Shares are designed for investors who meet certain administrative and service criteria and invest a minimum of $5 million.
In September 2008, the fund’s board of trustees approved changing the fund’s fiscal year-end from March 31 to December 31, effective December 31, 2008.
A. The following significant accounting policies conform to generally accepted accounting principles for U.S. mutual funds. The fund consistently follows such policies in preparing its financial statements.
1. Security Valuation: Securities are valued as of the close of trading on the New York Stock Exchange (generally 4 p.m., Eastern time) on the valuation date. Equity securities are valued at the latest quoted sales prices or official closing prices taken from the primary market in which each security trades; such securities not traded on the valuation date are valued at the mean of the latest quoted bid and asked prices. Securities for which market quotations are not readily available, or whose values have been affected by events occurring before the fund’s pricing time but after the close of the securities’ primary markets, are valued at their fair values calculated according to procedures adopted by the board of trustees. These procedures include obtaining quotations from an independent pricing service, monitoring news to identify significant market- or security-specific events, and evaluating changes in the values of foreign market proxies (for example, ADRs, futures contracts, or exchange-traded funds), between the time the foreign markets close and the fund’s pricing time. When fair-value pricing is employed, the prices of securities used by a fund to calculate its net asset value may differ from quoted or published prices for the same securities. Investments in Vanguard Market Liquidity Fund are valued at that fund’s net asset value.
2. Short Sales: Short sales are the sales of securities that the fund does not own. The fund may sell a security it does not own in anticipation of a decline in the value of that security. In order to deliver the security to the purchaser, the fund borrows the security from a broker-dealer. The fund must segregate, as collateral for its obligation to return the borrowed security, an amount of cash and long security positions at least equal to the market value of the security sold short. The fund later closes out the position by returning the security to the lender, typically by purchasing the security in the open market. A gain, limited to the price at which the fund sold the security short, or a loss, theoretically unlimited in size, is recognized upon the termination of the short sale. Dividends on securities sold short are reported as an expense in the Statement of Operations.
Cash collateral segregated for securities sold short is recorded as an asset in the Statement of Assets and Liabilities. Long security positions segregated as collateral are shown in the Statement of Net Assets.
3. Futures Contracts: The fund uses index futures contracts to a limited extent, with the objective of maintaining full exposure to the stock market while maintaining liquidity. The fund may purchase or sell futures contracts to achieve a desired level of investment, whether to accommodate portfolio turnover or cash flows from capital share transactions. The primary risks associated with the use of futures contracts are imperfect correlation between changes in market values of stocks held by the fund and the prices of futures contracts, and the possibility of an illiquid market.
22
Futures contracts are valued at their quoted daily settlement prices. The aggregate principal amounts of the contracts are not recorded in the Statement of Net Assets. Fluctuations in the value of the contracts are recorded in the Statement of Net Assets as an asset (liability) and in the Statement of Operations as unrealized appreciation (depreciation) until the contracts are closed, when they are recorded as realized futures gains (losses).
4. Federal Income Taxes: The fund intends to continue to qualify as a regulated investment company and distribute all of its taxable income. Management has analyzed the fund’s tax positions taken on federal income tax returns for all open tax years (tax years ended March 31, 2005–2008) and for the period ended September 30, 2008, and has concluded that no provision for federal income tax is required in the fund’s financial statements.
5. Distributions: Distributions to shareholders are recorded on the ex-dividend date.
6. Other: Dividend income (or dividend expense on short positions) is recorded on the ex-dividend date. Interest income includes income distributions received from Vanguard Market Liquidity Fund and is accrued daily. Security transactions are accounted for on the date securities are bought or sold. Costs used to determine realized gains (losses) on the sale of investment securities are those of the specific securities sold. Fees assessed on redemptions of capital shares are credited to paid-in capital.
Each class of shares has equal rights as to assets and earnings, except that each class separately bears certain class-specific expenses related to maintenance of shareholder accounts (included in Management and Administrative expenses) and shareholder reporting. Marketing and distribution expenses are allocated to each class of shares based on a method approved by the board of trustees. Income, other non-class-specific expenses, and gains and losses on investments are allocated to each class of shares based on its relative net assets.
B. AXA Rosenberg Investment Management LLC provides investment advisory services to a portion of the fund for a fee calculated at an annual percentage rate of average net assets managed by the advisor. In accordance with the advisory contract entered into with AXA Rosenberg Investment Management LLC in December 2007, beginning October 1, 2008, the investment advisory fee will be subject to quarterly adjustments based on performance since December 31, 2007, relative to the Citigroup 3-Month Treasury Bill Index.
The Vanguard Group provides investment advisory services to a portion of the fund on an at-cost basis; the fund paid Vanguard advisory fees of $18,000 for the six months ended September 30, 2008.
For the six months ended September 30, 2008, the aggregate investment advisory fee represented an effective annual rate of 0.29% of the fund’s average net assets.
C. The Vanguard Group furnishes at cost corporate management, administrative, marketing, and distribution services. The costs of such services are allocated to the fund under methods approved by the board of trustees. The fund has committed to provide up to 0.40% of its net assets in capital contributions to Vanguard. At September 30, 2008, the fund had contributed capital of $10,000 to Vanguard (included in Other Assets), representing 0.01% of the fund’s net assets and 0.01% of Vanguard’s capitalization. The fund’s trustees and officers are also directors and officers of Vanguard.
D. Distributions are determined on a tax basis and may differ from net investment income and realized capital gains for financial reporting purposes. Differences may be permanent or temporary. Permanent differences are reclassified among capital accounts in the financial statements to reflect their tax character. Temporary differences arise when certain items of income, expense, gain, or loss are recognized in
23
different periods for financial statement and tax purposes; these differences will reverse at some time in the future. Differences in classification may also result from the treatment of short-term gains as ordinary income for tax purposes. The fund’s tax basis capital gains and losses are determined only at the end of each fiscal year.
At September 30, 2008, the cost of long security positions for tax purposes was $108,725,000. Net unrealized depreciation of long security positions for tax purposes was $9,234,000, consisting of unrealized gains of $1,880,000 on securities that had risen in value since their purchase and $11,114,000 in unrealized losses on securities that had fallen in value since their purchase. Tax-basis net unrealized appreciation on securities sold short was $7,355,000, consisting of unrealized gains of $8,278,000 on securities that had fallen in value since their sale and $923,000 in unrealized losses on securities that had risen in value since their sale.
At September 30, 2008, the aggregate settlement value of open futures contracts expiring in December 2008 and the related unrealized appreciation (depreciation) were:
| | | ($000) |
| Number of | Aggregate | Unrealized |
| Long (Short) | Settlement | Appreciation |
Futures Contracts | Contracts | Value | (Depreciation) |
E-mini S&P 500 Index | 4 | 234 | (4) |
Unrealized appreciation (depreciation) on open futures contracts is required to be treated as realized gain (loss) for tax purposes.
E. During the six months ended September 30, 2008, the fund purchased $143,365,000 of investment securities and sold $85,017,000 of investment securities, other than temporary cash investments. The proceeds of short sales and the cost of purchases to cover short sales were $180,651,000 and $131,203,000 respectively.
F. Capital share transactions for each class of shares were:
| Six Months Ended | Year Ended |
| September 30, 2008 | March 31, 2008 |
| Amount | Shares | | Amount | Shares |
| ($000) | (000) | | ($000) | (000) |
Investor Shares | | | | | |
Issued | 51,676 | 4,163 | | 42,479 | 3,395 |
Issued in Lieu of Cash Distributions | 469 | 38 | | 436 | 36 |
Redeemed1 | (8,251) | (669) | | (7,436) | (593) |
Net Increase (Decrease)—Investor Shares | 43,894 | 3,532 | | 35,479 | 2,838 |
Institutional Shares | | | | | |
Issued | 8,208 | 661 | | 9,106 | 742 |
Issued in Lieu of Cash Distributions | 78 | 6 | | 318 | 26 |
Redeemed1 | (459) | (37) | | (7,720) | (608) |
Net Increase (Decrease)—Institutional Shares | 7,827 | 630 | | 1,704 | 160 |
1 Net of redemption fees of $5,000 and $4,000 (fund totals).
24
G. In September 2006, the Financial Accounting Standards Board issued Statement of Financial Accounting Standards No. 157 (“FAS 157”), “Fair Value Measurements.” FAS 157 establishes a framework for measuring fair value and expands disclosures about fair value measurements in financial statements.
The various inputs that may be used to determine the value of the fund’s investments are summarized in three broad levels. The inputs or methodologies used for valuing securities are not necessarily an indication of the risk associated with investing in those securities.
Level 1—Quoted prices in active markets for identical securities.
Level 2—Other significant observable inputs (including quoted prices for similar securities, interest rates, prepayment speeds, credit risk, etc.).
Level 3—Significant unobservable inputs (including the fund’s own assumptions used to determine the fair value of investments).
At September 30, 2008, 100% of the fund’s investments were valued based on Level 1 inputs.
25
About Your Fund’s Expenses
As a shareholder of the fund, you incur ongoing costs, which include costs for portfolio management, administrative services, and shareholder reports (like this one), among others. Operating expenses, which are deducted from a fund’s gross income, directly reduce the investment return of the fund.
A fund’s expenses are expressed as a percentage of its average net assets. This figure is known as the expense ratio. The following examples are intended to help you understand the ongoing costs (in dollars) of investing in your fund and to compare these costs with those of other mutual funds. The examples are based on an investment of $1,000 made at the beginning of the period shown and held for the entire period.
The accompanying table illustrates your fund’s costs in two ways:
• Based on actual fund return. This section helps you to estimate the actual expenses that you paid over the period. The “Ending Account Value” shown is derived from the fund’s actual return, and the third column shows the dollar amount that would have been paid by an investor who started with $1,000 in the fund. You may use the information here, together with the amount you invested, to estimate the expenses that you paid over the period.
To do so, simply divide your account value by $1,000 (for example, an $8,600 account value divided by $1,000 = 8.6), then multiply the result by the number given for your fund under the heading “Expenses Paid During Period.”
• Based on hypothetical 5% yearly return. This section is intended to help you compare your fund’s costs with those of other mutual funds. It assumes that the fund had a yearly return of 5% before expenses, but that the expense ratio is unchanged. In this case—because the return used is not the fund’s actual return—the results do not apply to your investment. The example is useful in making comparisons because the Securities and Exchange Commission requires all mutual funds to calculate expenses based on a 5% return. You can assess your fund’s costs by comparing this hypothetical example with the hypothetical examples that appear in shareholder reports of other funds.
Six Months Ended September 30, 2008 | | | |
| Beginning | Ending | Expenses |
| Account Value | Account Value | Paid During |
Market Neutral Fund | 3/31/2008 | 9/30/2008 | Period1 |
Based on Actual Fund Return | | | |
Investor Shares | $1,000.00 | $981.34 | $10.08 |
Institutional Shares | 1,000.00 | 981.09 | 9.58 |
Based on Hypothetical 5% Yearly Return | | | |
Investor Shares | $1,000.00 | $1,014.89 | $10.25 |
Institutional Shares | 1,000.00 | 1,015.39 | 9.75 |
1 | The calculations are based on expenses incurred in the most recent six-month period. The fund’s annualized six-month expense ratios for that period are 2.03% for Investor Shares and 1.93% for Institutional Shares. The dollar amounts shown as “Expenses Paid” are equal to the annualized expense ratio multiplied by the average account value over the period, multiplied by the number of days in the most recent six-month period, then divided by the number of days in the most recent 12-month period. | |
| | | | | |
26
Note that the expenses shown in the table are meant to highlight and help you compare ongoing costs only and do not reflect transaction costs incurred by the fund for buying and selling securities. Further, the expenses do not include the 1% fee assessed on redemptions of shares held for less than one year.
The calculations assume no shares were bought or sold during the period. Your actual costs may have been higher or lower, depending on the amount of your investment and the timing of any purchases or redemptions.
You can find more information about the fund’s expenses, including annual expense ratios, in the Financial Statements section of this report. For additional information on operating expenses and other shareholder costs, please refer to your fund’s current prospectus.
27
Glossary
Beta. A measure of the magnitude of a fund’s past share-price fluctuations in relation to the ups and downs of a given market index. The index is assigned a beta of 1.00. Compared with a given index, a fund with a beta of 1.20 typically would have seen its share price rise or fall by 12% when the index rose or fell by 10%. For this report, beta is based on returns over the past 36 months for both the fund and the index. Note that a fund’s beta should be reviewed in conjunction with its R-squared (see definition). The lower the R-squared, the less correlation there is between the fund and the index, and the less reliable beta is as an indicator of volatility.
Earnings Growth Rate. The average annual rate of growth in earnings over the past five years for the stocks now in a fund.
Equity Exposure. A measure that reflects a fund’s investments in stocks and stock futures. Any holdings in short-term reserves are excluded.
Expense Ratio. The percentage of a fund’s average net assets used to pay its annual administrative and advisory expenses. These expenses directly reduce returns to investors.
Foreign Holdings. The percentage of a fund represented by stocks or depositary receipts of companies based outside the United States.
Inception Date. The date on which the assets of a fund (or one of its share classes) are first invested in accordance with the fund’s investment objective. For funds with a subscription period, the inception date is the day after that period ends. Investment performance is measured from the inception date.
Median Market Cap. An indicator of the size of companies in which a fund invests; the midpoint of market capitalization (market price x shares outstanding) of a fund’s stocks, weighted by the proportion of the fund’s assets invested in each stock. Stocks representing half of the fund’s assets have market capitalizations above the median, and the rest are below it.
Price/Book Ratio. The share price of a stock divided by its net worth, or book value, per share. For a fund, the weighted average price/book ratio of the stocks it holds.
Price/Earnings Ratio. The ratio of a stock’s current price to its per-share earnings over the past year. For a fund, the weighted average P/E of the stock
s it holds. P/E is an indicator of market expectations about corporate prospects; the higher the P/E, the greater the expectations for a company’s future growth.
R-Squared. A measure of how much of a fund’s past returns can be explained by the returns from the market in general, as measured by a given index. If a fund’s total returns were precisely synchronized with an index’s returns, its R-squared would be 1.00. If the fund’s returns bore no relationship to the index’s returns, its R-squared would be 0. For this report, R-squared is based on returns over the past 36 months for both the fund and the index.
Return on Equity. The annual average rate of return generated by a company during the past five years for each dollar of shareholder’s equity (net income divided by shareholder’s equity). For a fund, the weighted average return on equity for the companies whose stocks it holds.
Short-Term Reserves. The percentage of a fund invested in highly liquid, short-term securities that can be readily converted to cash.
28
Turnover Rate. An indication of the fund’s trading activity. Funds with high turnover rates incur higher transaction costs and may be more likely to distribute capital gains (which may be taxable to investors). The turnover rate excludes in-kind transactions, which have minimal impact on costs.
Yield. A fund’s 30-day SEC yield is derived using a formula specified by the U.S. Securities and Exchange Commission. Under the formula, data related to the fund’s security holdings in the previous 30 days are used to calculate the fund’s hypothetical net income for that period, which is then annualized and divided by the fund’s estimated average net assets over the calculation period. For the purposes of this calculation, a security’s income is based on its current market yield to maturity (in the case of bonds) or its projected dividend yield (for stocks). Because the SEC yield represents hypothetical annualized income, it will differ—at times significantly—from the fund’s actual experience. As a result, the fund’s income distributions may be higher or lower than implied by the SEC yield.
29
This page intentionally left blank.
This page intentionally left blank.
The People Who Govern Your Fund
The trustees of your mutual fund are there to see that the fund is operated and managed in your best interests since, as a shareholder, you are a part owner of the fund. Your fund’s trustees also serve on the board of directors of The Vanguard Group, Inc., which is owned by the Vanguard funds and provides services to them on an at-cost basis.
A majority of Vanguard’s board members are independent, meaning that they have no affiliation with Vanguard or the funds they oversee, apart from the sizable personal investments they have made as private individuals.
Our independent board members bring distinguished backgrounds in business, academia, and public service to their task of working with Vanguard officers to establish the policies and oversee the activities of the funds. Among board members’ responsibilities are selecting investment advisors for the funds; monitoring fund operations, performance, and costs; reviewing contracts; nominating and selecting new trustees/directors; and electing Vanguard officers.
Each trustee serves a fund until its termination; or until the trustee’s retirement, resignation, or death; or otherwise as specified in the fund’s organizational documents. Any trustee may be removed at a shareholders’ meeting by a vote representing two-thirds of the net asset value of all shares of the fund together with shares of other Vanguard funds organized within the same trust. The table on these two pages shows information for each trustee and executive officer of the fund. The mailing address of the trustees and officers is P.O. Box 876, Valley Forge, PA 19482.
Chairman of the Board and Trustee
John J. Brennan1
Born 1954 Principal Occupation(s) During the Past Five Years: Chairman of the Board and Director/ Trustee Since May 1987; Trustee of The Vanguard Group, Inc., and of each of the investment companies served Chairman of the Board by The Vanguard Group; Chief Executive Officer and President of The Vanguard Group 156 Vanguard Funds Overseen and of each of the investment companies served by The Vanguard Group (1996–2008).
Independent Trustees
Charles D. Ellis
Born 1937 Principal Occupation(s) During the Past Five Years: Applecore Partners (pro bono ventures Trustee Since January 2001 in education); Senior Advisor to Greenwich Associates (international business strategy 156 Vanguard Funds Overseen consulting); Successor Trustee of Yale University; Overseer of the Stern School of Business at New York University; Trustee of the Whitehead Institute for Biomedical Research.
Emerson U. Fullwood
Born 1948 Principal Occupation(s) During the Past Five Years: Executive Chief Staff and Marketing Trustee Since January 2008 Officer for North America since 2004 and Corporate Vice President of Xerox Corporation 156 Vanguard Funds Overseen (photocopiers and printers); Director of SPX Corporation (multi-industry manufacturing), of the United Way of Rochester, and of the Boy Scouts of America.
Rajiv L. Gupta
Born 1945 Principal Occupation(s) During the Past Five Years: Chairman, President, and Trustee Since December 20012 Chief Executive Officer of Rohm and Haas Co. (chemicals); Board Member of 156 Vanguard Funds Overseen the American Chemistry Council; Director of Tyco International, Ltd. (diversified manufacturing and services) since 2005.
Amy Gutmann
Born 1949 Principal Occupation(s) During the Past Five Years: President of the University of
Trustee Since June 2006 Pennsylvania since 2004; Professor in the School of Arts and Sciences, Annenberg School 156 Vanguard Funds Overseen for Communication, and Graduate School of Education of the University of Pennsylvania since 2004; Provost (2001–2004) and Laurance S. Rockefeller Professor of Politics and the University Center for Human Values (1990–2004), Princeton University; Director of Carnegie Corporation of New York since 2005 and of Schuylkill River Development Corporation and Greater Philadelphia Chamber of Commerce since 2004; Trustee of the National Constitution Center since 2007.
JoAnn Heffernan Heisen
Born 1950 Principal Occupation(s) During the Past Five Years: Corporate Vice President and Trustee Since July 1998 Chief Global Diversity Officer since 2006, Vice President and Chief Information 156 Vanguard Funds Overseen Officer (1997–2005), and Member of the Executive Committee of Johnson & Johnson (pharmaceuticals/consumer products); Director of the University Medical Center at Princeton and Women’s Research and Education Institute.
André F. Perold
Born 1952 Principal Occupation(s) During the Past Five Years: George Gund Professor of Finance Trustee Since December 2004 and Banking, Harvard Business School; Senior Associate Dean and Director of Faculty 156 Vanguard Funds Overseen Recruiting, Harvard Business School; Director and Chairman of UNX, Inc. (equities trading firm); Chair of the Investment Committee of HighVista Strategies LLC (private investment firm) since 2005.
Alfred M. Rankin, Jr.
Born 1941 Principal Occupation(s) During the Past Five Years: Chairman, President, Chief Executive Trustee Since January 1993 Officer, and Director of NACCO Industries, Inc. (forklift trucks/housewares/lignite); Director 156 Vanguard Funds Overseen of Goodrich Corporation (industrial products/aircraft systems and services).
J. Lawrence Wilson
Born 1936 Principal Occupation(s) During the Past Five Years: Retired Chairman and Chief Executive Trustee Since April 1985 Officer of Rohm and Haas Co. (chemicals); Director of Cummins Inc. (diesel engines) and 156 Vanguard Funds Overseen AmerisourceBergen Corp. (pharmaceutical distribution); Trustee of Vanderbilt University and of Culver Educational Foundation.
Executive Officers1
Thomas J. Higgins
Born 1957 Principal Occupation(s) During the Past Five Years: Principal of The Vanguard Group, Inc.; Chief Financial Officer Treasurer of each of the investment companies served by The Vanguard Group; Chief Since September 2008 Financial Officer of each of the investment companies served by The Vanguard Treasurer Since July 1998 Group since 2008. 156 Vanguard Funds Overseen
F. William McNabb III
Born 1957 Principal Occupation(s) During the Past Five Years: Chief Executive Officer, Director, Chief Executive Officer and President of The Vanguard Group, Inc., since 2008; Chief Executive Officer and Since August 31, 2008 President of each of the investment companies served by The Vanguard Group since President Since March 2008 2008; Director of Vanguard Marketing Corporation; Managing Director of The Vanguard 156 Vanguard Funds Overseen Group (1995–2008).
Heidi Stam
Born 1956 Principal Occupation(s) During the Past Five Years: Managing Director of The Vanguard Secretary Since July 2005 Group, Inc., since 2006; General Counsel of The Vanguard Group since 2005; Secretary of 156 Vanguard Funds Overseen The Vanguard Group and of each of the investment companies served by The Vanguard Group since 2005; Director and Senior Vice President of Vanguard Marketing Corporation since 2005; Principal of The Vanguard Group (1997–2006).
Vanguard Senior Management Team | | |
| | | |
R. Gregory Barton | Kathleen C. Gubanich | Michael S. Miller | Glenn W. Reed |
Mortimer J. Buckley | Paul A. Heller | Ralph K. Packard | George U. Sauter |
Founder
John C. Bogle
Chairman and Chief Executive Officer, 1974–1996
1 These individuals are “interested persons” as defined in the Investment Company Act of 1940.
2 December 2002 for Vanguard Equity Income Fund, Vanguard Growth Equity Fund, the Vanguard Municipal Bond Funds, and the Vanguard State Tax-Exempt Funds.
More information about the trustees is in the Statement of Additional Information, available from The Vanguard Group.

P.O. Box 2600
Valley Forge, PA 19482-2600
Connect with Vanguard® > www.vanguard.com
Fund Information > 800-662-7447 | All comparative mutual fund data are from Lipper Inc. |
| or Morningstar, Inc., unless otherwise noted. |
Direct Investor Account Services > 800-662-2739 | |
| You can obtain a free copy of Vanguard’s proxy voting |
Institutional Investor Services > 800-523-1036 | guidelines by visiting our website, www.vanguard.com, |
| and searching for “proxy voting guidelines,” or by |
Text Telephone for People | calling Vanguard at 800-662-2739. The guidelines are |
With Hearing Impairment > 800-952-3335 | also available from the SEC’s website, www.sec.gov. |
| In addition, you may obtain a free report on how your |
| fund voted the proxies for securities it owned during |
| the 12 months ended June 30. To get the report, visit |
This material may be used in conjunction | either www.vanguard.com or www.sec.gov. |
with the offering of shares of any Vanguard | |
fund only if preceded or accompanied by | You can review and copy information about your fund |
the fund’s current prospectus. | at the SEC’s Public Reference Room in Washington, D.C. |
| To find out more about this public service, call the SEC |
| at 202-551-8090. Information about your fund is also |
| available on the SEC’s website, and you can receive |
| copies of this information, for a fee, by sending a |
The funds or securities referred to herein are not | request in either of two ways: via e-mail addressed to |
sponsored, endorsed, or promoted by MSCI, and MSCI | publicinfo@sec.gov or via regular mail addressed to the |
bears no liability with respect to any such funds or | Public Reference Section, Securities and Exchange |
securities. For any such funds or securities, the | Commission, Washington, DC 20549-0102. |
prospectus or the Statement of Additional Information | |
contains a more detailed description of the limited | |
relationship MSCI has with The Vanguard Group and | |
any related funds. | |
| |
CFA® is a trademark owned by CFA Institute. | |
| |
Russell is a trademark of The Frank Russell Company. | |
| |
Standard & Poor’s®, S&P®, S&P 500®, Standard & | |
Poor’s 500, and 500 are trademarks of The McGraw-Hill | |
Companies, Inc., and have been licensed for use by The | |
Vanguard Group, Inc. Vanguard mutual funds are not | |
sponsored, endorsed, sold, or promoted by Standard & | |
Poor’s, and Standard & Poor’s makes no representation | |
regarding the advisability of investing in the funds. | |
| |
| © 2008 The Vanguard Group, Inc. |
| All rights reserved. |
| Vanguard Marketing Corporation, Distributor. |
| |
| Q6342 112008 |
Item 2: Not Applicable.
Item 3: Not Applicable.
Item 4: Not Applicable.
Item 5: Not Applicable.
Item 6: Not Applicable.
Item 7: Not Applicable.
Item 8: Not Applicable.
Item 9: Not Applicable.
Item 10: Not Applicable.
Item 11: Controls and Procedures.
(a) Disclosure Controls and Procedures. The Principal Executive and Financial Officers concluded that the Registrant's Disclosure Controls and Procedures are effective based on their evaluation of the Disclosure Controls and Procedures as of a date within 90 days of the filing date of this report.
(b) Internal Control Over Financial Reporting. There were no significant changes in Registrant’s Internal Control Over Financial Reporting or in other factors that could significantly affect this control subsequent to the date of the evaluation, including any corrective actions with regard to significant deficiencies and material weaknesses.
Item 12: Exhibits.
Pursuant to the requirements of the Securities Exchange Act of 1934 and the Investment Company Act of 1940, the registrant has duly caused this report to be signed on its behalf by the undersigned, thereunto duly authorized.
| VANGUARD MONTGOMERY FUNDS |
| |
BY: | /s/ F. WILLIAM MCNABB III* |
| F. WILLIAM MCNABB III |
| CHIEF EXECUTIVE OFFICER |
Date: November 18, 2008
Pursuant to the requirements of the Securities Exchange Act of 1934 and the Investment Company Act of 1940, this report has been signed below by the following persons on behalf of the registrant and in the capacities and on the dates indicated.
| VANGUARD MONTGOMERY FUNDS |
| |
BY: | /s/ F. WILLIAM MCNABB III* |
| F. WILLIAM MCNABB III |
| CHIEF EXECUTIVE OFFICER |
Date: November 18, 2008
| VANGUARD MONTGOMERY FUNDS |
| |
BY: | /s/ THOMAS J. HIGGINS * |
| THOMAS J. HIGGINS |
| CHIEF FINANCIAL OFFICER |
Date: November 18, 2008
* By: /s/ Heidi Stam
Heidi Stam, pursuant to a Power of Attorney filed on January 18, 2008, see file Number 2-29601, Incorporated by Reference; and pursuant to a Power of Attorney filed on September 26, 2008, see File Number 2-47371, Incorporated by Reference.