> | Vanguard Market Neutral Fund had a disappointing return of less than –9% in the first half of 2009. |
> | The fund significantly trailed its peers and its 3-month U.S. Treasury bill benchmark. The fund also lagged the gains of the broad U.S. stock market, as can be expected during market rallies. |
> | Stock selection within the financial and energy sectors, and a net short position in energy during a period of rising oil and stock prices, detracted from fund performance. |
Contents | |
| |
Your Fund’s Total Returns | 1 |
President’s Letter | 2 |
Advisors’ Report | 6 |
Fund Profile | 9 |
Performance Summary | 11 |
Financial Statements | 12 |
About Your Fund’s Expenses | 28 |
Trustees Approve Advisory Arrangements | 30 |
Glossary | 32 |
Please note: The opinions expressed in this report are just that—informed opinions. They should not be considered promises or advice. Also, please keep in mind that the information and opinions cover the period through the date on the front of this report. Of course, the risks of investing in your fund are spelled out in the prospectus.
Your Fund’s Total Returns
Six Months Ended June 30, 2009 | | |
| Ticker | Total |
| Symbol | Returns |
Vanguard Market Neutral Fund | | |
Investor Shares | VMNFX | –9.37% |
Institutional Shares1 | VMNIX | –9.29 |
Citigroup 3-Month Treasury Bill Index | | 0.10 |
Average Equity Market Neutral Fund2 | | 0.66 |
Your Fund’s Performance at a Glance | | | | |
December 31, 2008–June 30, 2009 | | | | |
| | | Distributions Per Share |
| Starting | Ending | Income | Capital |
| Share Price | Share Price | Dividends | Gains |
Vanguard Market Neutral Fund | | | | |
Investor Shares | $10.97 | $9.93 | $0.012 | $0.000 |
Institutional Shares | 10.90 | 9.88 | 0.008 | 0.000 |
1 This class of shares carries lower expenses and is available for a minimum initial investment of $5 million.
2 Derived from data provided by Lipper Inc.
1

President’s Letter
Dear Shareholder,
A robust stock market rally began in March, led by companies that had been beaten down during the market’s descent. As investors became less risk-averse, the rebound in lower-quality stocks worked against the advisors’ stock-selection strategies. In the first half of 2009, Vanguard Market Neutral Fund returned about –9%, a disappointing performance relative to the 0.10% return of its benchmark, the Citigroup 3-Month Treasury Bill Index.
The fund’s advisors, AXA Rosenberg Investment Management and Vanguard Quantitative Equity Group, aim for a portfolio that is neutral with respect to general stock market risk. At times, however, the fund may have net long or short positions in certain sectors of the market—as it did during the first half. The advisors strive to increase portfolio returns through stock selection, by purchasing stocks that appear to be undervalued in the marketplace and selling short stocks that appear overvalued. (To engage in short selling, an advisor sells stocks it does not own but has “borrowed” for a fee.)
In the first half, disappointing selection among financial and energy stocks, coupled with a net short position in energy stocks—many of which rose along with rising oil prices—detracted from fund performance. As a result, the fund did not meet its goal of minimizing its exposure to U.S. stock market risk and outperforming the return on U.S. Treasury bills.
2
Stock gains petered out by the end of the period
For the six months ended June 30, the broad U.S. stock market returned 5%. The stock market began the period in negative territory, but then rallied through much of the spring. While the second quarter was the strongest quarter for U.S. stocks since 2003, equity gains fizzled in mid-June as investors were taken aback by a drop in consumer confidence, a decline in home prices, and a larger-than-expected rise in the unemployment rate.
International stocks registered a stronger showing, returning about 14% for the half-year. Emerging markets posted the best results as investors poured money into countries with strong growth prospects.
Higher commodity prices and a slight rebound in manufacturing orders helped reverse steep declines in international stocks from earlier in the period.
Still, pockets of the developed and developing markets, particularly in Europe, continued to struggle amid the global recession. After three consecutive monthly gains, the MSCI All Country World Index ex USA returned –1.07% for June, perhaps signaling a bumpy road ahead.
Bond investors grew confident, sought out higher yields
As the fiscal half-year began, investors who were panicked by the credit-market crisis sought shelter in U.S. Treasury bonds, considered the safest of all
Market Barometer | | | |
| | | Total Returns |
| | Periods Ended June 30, 2009 |
| Six Months | One Year | Five Years1 |
Stocks | | | |
Russell 1000 Index (Large-caps) | 4.32% | –26.69% | –1.85% |
Russell 2000 Index (Small-caps) | 2.64 | –25.01 | –1.71 |
Dow Jones U.S. Total Stock Market Index | 5.00 | –26.11 | –1.47 |
MSCI All Country World Index ex USA (International) | 14.35 | –30.54 | 4.95 |
| | | |
Bonds | | | |
Barclays Capital U.S. Aggregate Bond Index | | | |
(Broad taxable market) | 1.90% | 6.05% | 5.01% |
Barclays Capital Municipal Bond Index | 6.43 | 3.77 | 4.14 |
Citigroup 3-Month Treasury Bill Index | 0.10 | 0.78 | 3.02 |
| | | |
CPI | | | |
Consumer Price Index | 2.60% | –1.43% | 2.60% |
1 Annualized.
3
securities. The difference between the yields of Treasuries and those of corporate bonds surged to levels not seen since the 1930s.
By mid-March, investors had gained confidence from the federal government’s efforts to thaw the credit market and stimulate the economy. Bond investors were more optimistic and more willing to take on risk; they shifted their focus away from Treasuries to higher-yielding corporate bonds. For the six months, the Barclays Capital U.S. Aggregate Bond Index returned about 2%, while high-yield bonds, as measured by the Barclays Capital U.S. Corporate High Yield Bond Index, returned about 30%.
Despite some murmurs in the market about longer-term inflation risks, the Federal Reserve in recent months unveiled plans to purchase Treasury and mortgage-backed securities. The Fed hoped to drive up the securities’ prices and push down yields, and thus keep borrowing costs, such as mortgage rates, low. Government initiatives also helped bring down municipal bond yields, which earlier in the period were higher than those of Treasuries, a reversal in the traditional relationship between taxable and tax-exempt yields. For the six months, the tax-exempt bond market returned more than 6%.
The Fed kept the target for short-term interest rates at an all-time low of 0% to 0.25% throughout the period.
Long holdings lagged short-sale portfolio
The Market Neutral Fund has two portfolios: stocks the fund’s advisors hold because of their potential for capital appreciation and stocks sold short because they appear to be overvalued. When equities began to bounce back from the depths reached in 2008 and early 2009, the stocks chosen for the long portfolio in the Market Neutral Fund underperformed the stocks sold short. This performance mismatch was especially evident in the financial and energy sectors.
Although the dollar value of the fund’s long and short holdings in the financial sector was nearly in balance, the long holdings posted a double-digit loss while the stocks sold short had a positive return. This reflected, in part, the advisors’ preference for high-quality securities. As credit markets began to ease, investor assessments of many financial companies—especially those that were able to shore up their capital structures—improved. The shift in sentiment ignited a rally in the stocks of relatively weak companies with lower credit ratings and higher risk, which tend to be stocks that the advisors sell short.
In energy, the fund’s long positions advanced only about half as much as the stocks that were sold short. The fund’s net short position in the energy sector also detracted from performance, especially when oil prices rose significantly during the second quarter. Some oil field
4
equipment and services providers represented in the short portfolio benefited from higher prices that signaled a pickup in exploration and production activity.
Bright spots included the fund’s sizable holdings of information technology and consumer discretionary stocks, which were among the broad market’s best performers as consumers gained confidence that the worst of the economic recession may be over.
For more discussion of each advisor’s approach, please see the Advisors’ Report that follows.
Diversification pays off in the long run
Stocks and bonds have tested investor confidence, and patience, in recent times, as they have throughout history. That’s one reason some investor portfolios include “alternative investments”—for example, commodities, real estate, and strategies such as market-neutral investing—that offer the potential for returns independent of traditional stock and bond markets.
As with any active investment strategy, success with alternative investments can be highly dependent on manager skill. For market-neutral funds—which seek to generate positive returns regardless of stock market results—success depends not only on the selection and performance of the stocks held in the portfolio but also the stocks sold short. When stock prices are on the upswing, the fund’s short positions are likely to lose money and hold back fund performance compared with the long-only marketplace. This is the trade-off for trying to achieve some downside protection when markets are falling.
Given the markets’ inevitable swings, investors should evaluate the performance of any investment over the long run, not based on whether short-term results are rewarding or discouraging. And Vanguard always counsels you to focus on the time-tested principles of balance and diversification, both within and across asset classes, in developing a portfolio consistent with your goals, time horizon, and tolerance for risk. When included in such a portfolio, Vanguard Market Neutral Fund—managed by two experienced advisors, each with distinct stock-selection strategies—can help improve the overall portfolio’s risk-return profile.
Thank you for entrusting your assets to Vanguard.
Sincerely,

F. William McNabb III
President and Chief Executive Officer
July 20, 2009
5
Advisors’ Report
In the first six months of 2009, Vanguard Market Neutral Fund returned about –9%. Your fund is managed by two independent advisors. The use of multiple advisors provides exposure to distinct, yet complementary, investment approaches, enhancing the fund’s diversification. It is not uncommon for different advisors to have different views about individual securities or the broader investment environment.
The advisors, the amount and percentage of fund assets each manages, and brief descriptions of their investment strategies are presented in the table below. Each advisor has also prepared a discussion of the investment environment and of how the portfolio’s positioning reflected this assessment. This report was prepared on July 21, 2009.
AXA Rosenberg Investment Management LLC
Portfolio Manager:
William E. Ricks
Americas Chief Investment Officer
The significant reversal in equity market performance and the sudden shift in investor sentiment, from risk-averse to risk-embracing, presented a challenging market environment for our investment process during the first six months of 2009.
The biggest performance driver during this period was the extraordinary returns of stocks with low trailing momentum (as measured by our Relative Strength risk-exposure indicator). The outperformance
Vanguard Market Neutral Fund Investment Advisors |
| | | |
| Fund Assets Managed | |
Investment Advisor | % | $ Million | Investment Strategy |
AXA Rosenberg | 48 | 38 | Builds a portfolio based on fundamental analysis using |
Investment Management | | | a two-part quantitative model that considers valuations |
LLC | | | and earnings forecasts. |
Vanguard Quantitative | 46 | 38 | Conducts quantitative management using models that |
Equity Group | | | assess valuation, marketplace sentiment, and balance- |
| | | sheet characteristics of companies as compared with |
| | | their peers. |
Cash Investments | 6 | 5 | The fund’s daily cash balance may be invested in one |
| | | or more Vanguard CMT Funds, which are very low-cost |
| | | money market funds. Each advisor may also maintain |
| | | a modest cash position. |
| | | | |
6
of these beaten-down stocks was at a level virtually unseen in the last few decades. These stocks historically have poor fundamentals—a weak earnings yield and negative change in forward earnings—and tend not to be favored by our investment process. Our exposure along this dimension was fairly modest, yet the impact on overall portfolio performance was pronounced given these stocks’ outsized returns.
The uncertain earnings environment prompted us to maintain a modestly more defensive posture. This strategy favored select companies in health care, consumer staples, and information technology with favorable valuations and stable earnings, but these holdings trailed the more speculative, more volatile stocks that led the March rally. In financials, we maintained a consistent net long exposure with mixed results at the individual stock level. While long positions in JPMorgan Chase and State Street contributed to performance, they were more than offset by the weak showings of Wells Fargo, U.S. Bancorp, and PNC Financial Services Group, which detracted from performance as they failed to maintain their positive trend and succumbed to renewed worries about the economy.
We increased our active weights in technology, which helped our portfolio. Positive contributors included Hewlett-Packard, Oracle, and IBM, as the market expected companies to increase their spending on technology in order to replace and upgrade aging equipment.
In contrast, we decreased active weights in oil exploration and production, integrated oil, and biotechnology companies. Unfortunately, our consistent net short exposure to oil-related sectors was a drag on performance. A net short position in oil services companies, specifically Schlumberger, impaired the strategy’s performance as stock prices increased over the period despite their negative earnings trends.
We believe our focus on earnings will serve us well in the coming months. In most market environments, investors actively reconcile the earnings generated by stocks with the price paid to participate in those earnings. Our focus on creating an earnings advantage in the portfolio should keep us in good standing as the market works through the challenges that appear on the horizon.
7
Vanguard Quantitative Equity Group
Portfolio Manager:
James D. Troyer, CFA, Principal
We build our portfolio from the pool of stocks in the Russell 1000 Index, which returned 4.32% in the first half of 2009. After returning –10.45% in the first quarter, the index rebounded with a 16.50% return in the second quarter. Within the overall market, growth stocks continued to outperform more value-oriented names: The Russell 1000 Growth Index returned 11.53% for the six months compared with –2.87% for the Russell 1000 Value Index. For our value-oriented process, this created a head-wind that has been difficult to overcome, although the second quarter was more favorable as the growth and value indexes had similar returns. Reflecting the market’s shift, our model’s performance improved in the second quarter.
Our best-performing holdings were Ford Motor (which more than doubled during the time we held it), Temple-Inland (+150%) and Health Management Associates (up 150%). Offsetting these successes, our portfolio was short Sun Microsystems and Prudential, which both then had significant price gains.
The magnitude of these individual stock returns—each at least 150%—compared with our disheartening overall performance highlights the fact that a quantitative strategy such as ours is not about specific stocks. Rather, it is about the results that come from averaging the returns of a large number of stocks. Ford’s rise was stellar, yet—since our goal is to take many small stakes—our average position in Ford was slightly less than 0.3%, yielding a modest positive contribution to our portfolio’s return. At the same time, our small short position in Sun Microsystems, whose stock price then rose by 150%, generated a loss. The net effect of these two positions was a very slight gain for our portfolio.
This example illustrates that we seek to minimize the effects of individual stocks on the portfolio; instead, we attempt to capture the average return of a large basket of names. We designed our process to exploit the tendency of stocks that have attractive growth prospects and are trading at low valuations to—on average—outperform other stocks over longer-term time horizons. We are confident that this tendency will reassert itself in the market and will reward patient investors in the coming years.
8
Market Neutral Fund
Fund Profile
As of June 30, 2009
Portfolio Characteristics | |
| |
Turnover Rate1 | 136% |
Short-Term Reserves | 36.1% |
Investment Characteristics | | |
| Long | Short |
| Portfolio | Portfolio |
Number of Stocks | 277 | 267 |
Median Market Cap | $8.5B | $10.9B |
Price/Earnings Ratio | 14.4x | 50.4x |
Price/Book Ratio | 2.0x | 2.0x |
Return on Equity | 20.5% | 19.2% |
Earnings Growth Rate | 14.4% | 13.5% |
Foreign Holdings | 0.2% | 0.2% |
Expense Ratios2 | | |
| Investor | Institutional |
| Shares | Shares |
Management and | | |
Administrative Expenses | 0.50% | 0.40% |
Dividend Expense on | | |
Securities Sold Short3 | 1.67 | 1.67 |
Total | 2.17% | 2.07% |
Sector Diversification (% of equity exposure) |
| Long | Short |
| Portfolio | Portfolio |
Consumer Discretionary | 14.4% | 10.6% |
Consumer Staples | 10.3 | 7.0 |
Energy | 5.2 | 12.5 |
Financials | 14.3 | 13.7 |
Health Care | 13.1 | 10.4 |
Industrials | 13.2 | 14.4 |
Information Technology | 20.1 | 16.6 |
Materials | 4.4 | 8.7 |
Telecommunication Services | 0.8 | 1.3 |
Utilities | 4.2 | 4.8 |
Volatility Measures4 | |
| Fund Versus |
| S&P 500 Index |
R-Squared | 0.01 |
Beta | 0.04 |
1 Annualized.
2 The expense ratios shown are from the prospectus dated April 28, 2009, and were based on expenses incurred during the fund’s most recent fiscal year. For the six months ended June 30, 2009, the annualized expense ratios were: for Investor Shares, 2.84% (0.41% management and administrative expenses plus 1.57% dividend expense on securities sold short plus 0.86% borrowing expense on securities sold short); for Institutional Shares, 2.74% (0.31% management and administrative expenses plus 1.57% dividend expense on securities sold short plus 0.86% borrowing expense on securities sold short).
3 When a cash dividend is declared on a stock the fund has sold short, the fund is required to pay an amount equal to that dividend to the lender of the stock. Although the payment of the dividend amount reduces the return of the short sale transaction, SEC rules call for the inclusion of such payments in the fund’s operating expenses.
4 For an explanation of R-squared, beta, and other terms used here, see the Glossary.
9
Market Neutral Fund
Ten Largest Holdings1 (% of total net assets) |
Long Portfolio | | |
| | |
Bristol-Myers Squibb Co. | pharmaceuticals | 1.7% |
International Business | | |
Machines Corp. | computer hardware | 1.7 |
Oracle Corp. | systems software | 1.6 |
Hewlett-Packard Co. | computer hardware | 1.6 |
Gilead Sciences, Inc. | biotechnology | 1.6 |
Microsoft Corp. | systems software | 1.5 |
The Walt Disney Co. | movies and | |
| entertainment | 1.3 |
Lockheed Martin Corp. | aerospace | |
| and defense | 1.2 |
JPMorgan Chase & Co. | other diversified | |
| financial services | 1.2 |
Baxter International, Inc. | health care | |
| equipment | 1.1 |
Top Ten | | 14.5% |
Ten Largest Holdings1 (% of total net assets) |
Short Portfolio | | |
| | |
Citigroup Inc. | other diversified | |
| financial services | 2.3% |
Google Inc. | internet software | |
| and services | 1.7 |
The Procter & Gamble Co. | household products | 1.6 |
Schlumberger Ltd. | oil and gas | |
| equipment | |
| and services | 1.6 |
Intel Corp. | semiconductors | 1.5 |
News Corp., Class A | movies and | |
| entertainment | 1.4 |
ExxonMobil Corp. | integrated oil | |
| and gas | 1.2 |
3M Co. | industrial | |
| conglomerates | 1.2 |
Eli Lilly & Co. | pharmaceuticals | 1.1 |
Devon Energy Corp. | oil and gas | |
| exploration | |
| and production | 1.1 |
Top Ten | | 14.7% |
1 The holdings listed exclude any temporary cash investments and equity index products. See the Glossary.
10
Market Neutral Fund
Performance Summary
All of the returns in this report represent past performance, which is not a guarantee of future results that may be achieved by the fund. (Current performance may be lower or higher than the performance data cited. For performance data current to the most recent month-end, visit our website at www.vanguard.com/performance.) Note, too, that both investment returns and principal value can fluctuate widely, so an investor’s shares, when sold, could be worth more or less than their original cost. The returns shown do not reflect taxes that a shareholder would pay on fund distributions or on the sale of fund shares.
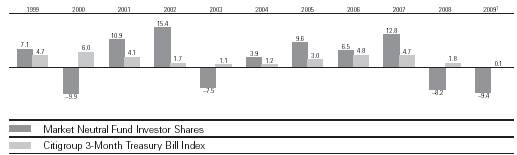
Fiscal-Year Total Returns (%): December 31, 1998–June 30, 2009
Average Annual Total Returns: Periods Ended June 30, 2009 |
| | | | |
| Inception Date | One Year | Five Years | Ten Years |
Investor Shares2 | 11/11/1998 | –15.99% | 2.78% | 3.00% |
Institutional Shares2 | 10/19/1998 | –15.91 | 3.00 | 3.26 |
1 Six months ended June 30, 2009.
2 Total returns do not reflect the 2% fee assessed until November 30, 2007, on redemptions of shares purchased within 30 days or the 1% fee assessed beginning December 1, 2007, on redemptions of shares held less than one year.
Note: See Financial Highlights tables for dividend and capital gains information.
11
Market Neutral Fund
Financial Statements (unaudited)
Statement of Net Assets
As of June 30, 2009
The fund provides a complete list of its holdings four times in each fiscal year, at the quarter-ends. For the second and fourth fiscal quarters, the lists appear in the fund’s semiannual and annual reports to shareholders. For the first and third fiscal quarters, the fund files the lists with the Securities and Exchange Commission on Form N-Q. Shareholders can look up the fund’s Forms N-Q on the SEC’s website at www.sec.gov. Forms N-Q may also be reviewed and copied at the SEC’s Public Reference Room (see the back cover of this report for further information).
| | | Market |
| | | Value• |
| | Shares | ($000) |
Common Stocks—Long Positions (84.1%) | | |
Consumer Discretionary (12.1%) | | |
† | The Walt Disney Co. | 45,400 | 1,059 |
* † | Amazon.com, Inc. | 8,400 | 703 |
* † | AutoZone Inc. | 4,100 | 620 |
† | Darden Restaurants Inc. | 11,500 | 379 |
† | Sherwin-Williams Co. | 6,000 | 322 |
* † | DISH Network Corp. | 18,500 | 300 |
† | Limited Brands, Inc. | 22,900 | 274 |
| Coach, Inc. | 8,900 | 239 |
† | The Gap, Inc. | 13,600 | 223 |
† | WABCO Holdings Inc. | 12,600 | 223 |
† | Ross Stores, Inc. | 5,700 | 220 |
† | Wyndham Worldwide Corp. | 17,600 | 213 |
† | McDonald’s Corp. | 3,700 | 213 |
* † | Jarden Corp. | 11,100 | 208 |
† | Advance Auto Parts, Inc. | 5,000 | 207 |
† | Phillips-Van Heusen Corp. | 7,200 | 207 |
† | Home Depot, Inc. | 8,400 | 198 |
* † | Ford Motor Co. | 32,600 | 198 |
† | Whirlpool Corp. | 4,600 | 196 |
† | RadioShack Corp. | 14,000 | 195 |
* † | Apollo Group, Inc. Class A | 2,700 | 192 |
† | Snap-On Inc. | 6,600 | 190 |
† | H & R Block, Inc. | 10,800 | 186 |
* † | Interpublic Group | | |
| of Cos., Inc. | 36,700 | 185 |
† | Comcast Corp. Class A | 12,500 | 181 |
* † | Priceline.com, Inc. | 1,600 | 178 |
* † | Big Lots Inc. | 8,100 | 170 |
† | Pulte Homes, Inc. | 19,000 | 168 |
† | Family Dollar Stores, Inc. | 5,900 | 167 |
* † | Dollar Tree, Inc. | 3,600 | 152 |
† | Foot Locker, Inc. | 13,200 | 138 |
* † | GameStop Corp. Class A | 5,900 | 130 |
† | MDC Holdings, Inc. | 4,000 | 120 |
† | Weight Watchers | | |
| International, Inc. | 4,500 | 116 |
† | International Speedway Corp. | 4,300 | 110 |
| | | Market |
| | | Value• |
| | Shares | ($000) |
* † | Discovery | | |
| Communications Inc. | | |
| Class A | 4,600 | 104 |
* † | Warner Music Group Corp. | 16,600 | 97 |
* | Expedia, Inc. | 6,000 | 91 |
† | PetSmart, Inc. | 4,200 | 90 |
| Hasbro, Inc. | 3,600 | 87 |
† | Macy’s Inc. | 7,300 | 86 |
| Newell Rubbermaid, Inc. | 7,500 | 78 |
† | D. R. Horton, Inc. | 8,000 | 75 |
† | Yum! Brands, Inc. | 2,200 | 73 |
† | Centex Corp. | 7,600 | 64 |
| Brinker International, Inc. | 2,500 | 43 |
† | Meredith Corp. | 1,500 | 38 |
* † | Federal-Mogul Corp. | 3,700 | 35 |
† | The McGraw-Hill Cos., Inc. | 900 | 27 |
* | Chipotle Mexican Grill, Inc. | 300 | 24 |
| KB Home | 1,300 | 18 |
† | John Wiley & Sons Class A | 500 | 17 |
| Carnival Corp. | 200 | 5 |
| | | 9,832 |
Consumer Staples (8.6%) | | |
† | Walgreen Co. | 24,000 | 706 |
† | Colgate-Palmolive Co. | 9,600 | 679 |
† | Kellogg Co. | 13,520 | 630 |
† | ConAgra Foods, Inc. | 26,200 | 499 |
† | The Clorox Co. | 6,300 | 352 |
† | H.J. Heinz Co. | 9,700 | 346 |
† | Lorillard, Inc. | 4,800 | 325 |
† | Kimberly-Clark Corp. | 6,000 | 315 |
* † | Dean Foods Co. | 14,700 | 282 |
† | Del Monte Foods Co. | 26,600 | 250 |
† | Avon Products, Inc. | 8,300 | 214 |
† | Alberto-Culver Co. | 8,000 | 203 |
† | Archer-Daniels-Midland Co. | 7,500 | 201 |
† | Sara Lee Corp. | 20,200 | 197 |
* † | Dr. Pepper Snapple | | |
| Group, Inc. | 9,000 | 191 |
† | The Pepsi Bottling Group, Inc. | 5,600 | 189 |
† | The Hershey Co. | 4,900 | 176 |
12
Market Neutral Fund
| | | Market |
| | | Value• |
| | Shares | ($000) |
† | Campbell Soup Co. | 5,900 | 174 |
* † | Energizer Holdings, Inc. | 3,300 | 172 |
† | The Estee Lauder | | |
| Cos. Inc. Class A | 4,400 | 144 |
† | Tyson Foods, Inc. | 10,700 | 135 |
* † | Ralcorp Holdings, Inc. | 2,200 | 134 |
† | CVS Caremark Corp. | 4,200 | 134 |
† | The Kroger Co. | 4,900 | 108 |
* † | BJ’s Wholesale Club, Inc. | 3,100 | 100 |
* † | Bare Escentuals, Inc. | 10,200 | 90 |
† | Philip Morris International Inc. | 1,600 | 70 |
† | Wal-Mart Stores, Inc. | 300 | 15 |
| | | 7,031 |
Energy (4.3%) | | |
† | Chevron Corp. | 10,700 | 709 |
* † | Southwestern Energy Co. | 11,900 | 462 |
* † | Pride International, Inc. | 8,400 | 211 |
† | Marathon Oil Corp. | 6,800 | 205 |
† | Teekay Shipping Corp. | 9,600 | 202 |
* † | Oil States International, Inc. | 7,800 | 189 |
† | ENSCO International, Inc. | 5,400 | 188 |
† | Overseas | | |
| Shipholding Group Inc. | 5,200 | 177 |
* † | SEACOR Holdings Inc. | 2,300 | 173 |
† | Helmerich & Payne, Inc. | 5,200 | 161 |
† | Sunoco, Inc. | 6,900 | 160 |
† | Peabody Energy Corp. | 5,300 | 160 |
| Diamond Offshore | | |
| Drilling, Inc. | 1,900 | 158 |
† | Tesoro Corp. | 12,000 | 153 |
† | CONSOL Energy, Inc. | 4,200 | 143 |
* | Plains Exploration & | | |
| Production Co. | 2,900 | 79 |
| | | 3,530 |
Financials (10.1%) | | |
† | JPMorgan Chase & Co. | 29,300 | 999 |
† | The Travelers Cos., Inc. | 20,900 | 858 |
† | State Street Corp. | 14,600 | 689 |
† | Wells Fargo & Co. | 24,400 | 592 |
† | U.S. Bancorp | 19,100 | 342 |
† | Everest Re Group, Ltd. | 4,100 | 293 |
† | Northern Trust Corp. | 5,400 | 290 |
* † | TD Ameritrade Holding Corp. | 12,500 | 219 |
† | The Hanover | | |
| Insurance Group Inc. | 5,700 | 217 |
† | Ameriprise Financial, Inc. | 8,758 | 213 |
† | American Financial Group, Inc. | 9,800 | 211 |
† | The Chubb Corp. | 5,300 | 211 |
† | Torchmark Corp. | 5,700 | 211 |
† | Hudson City Bancorp, Inc. | 15,800 | 210 |
† | Federated Investors, Inc. | 8,500 | 205 |
* † | Progressive Corp. of Ohio | 13,500 | 204 |
† | Bank of New York | | |
| Mellon Corp. | 6,900 | 202 |
† | AFLAC Inc. | 6,500 | 202 |
| | | | Market |
| | | | Value• |
| | | Shares | ($000) |
| † | Bank of Hawaii Corp. | 5,500 | 197 |
| † | Unum Group | 12,300 | 195 |
| † | PNC Financial | | |
| | Services Group | 4,500 | 175 |
| † | Moody’s Corp. | 6,500 | 171 |
| † | Raymond James | | |
| | Financial, Inc. | 8,700 | 150 |
| † | PartnerRe Ltd. | 2,200 | 143 |
| † | Willis Group Holdings Ltd. | 5,200 | 134 |
| † | The Goldman Sachs Group, Inc. | 900 | 133 |
| † | BB&T Corp. | 4,900 | 108 |
| † | New York | | |
| | Community Bancorp, Inc. | 8,000 | 86 |
| † | Allied World Assurance | | |
| | Holdings, Ltd. | 1,700 | 69 |
| † | MGIC Investment Corp. | 15,300 | 67 |
* | | Jefferies Group, Inc. | 2,400 | 51 |
| † | Lincoln National Corp. | 2,500 | 43 |
* | | MBIA, Inc. | 6,400 | 28 |
| † | Cullen/Frost Bankers, Inc. | 500 | 23 |
| † | Axis Capital Holdings Ltd. | 800 | 21 |
| † | Capital One Financial Corp. | 800 | 18 |
* | † | Nasdaq OMX Group, Inc. | 700 | 15 |
* | | Conseco, Inc. | 3,900 | 9 |
| | | | 8,204 |
Health Care (11.0%) | | |
| † | Bristol-Myers Squibb Co. | 68,100 | 1,383 |
* | † | Gilead Sciences, Inc. | 27,200 | 1,274 |
| † | Baxter International, Inc. | 16,400 | 869 |
* | † | Express Scripts Inc. | 11,500 | 791 |
| † | Pfizer Inc. | 24,000 | 360 |
| † | Cardinal Health, Inc. | 10,800 | 330 |
| † | Omnicare, Inc. | 12,300 | 317 |
* | † | Mylan Inc. | 19,100 | 249 |
* | † | Watson Pharmaceuticals, Inc. | 7,100 | 239 |
* | † | DaVita, Inc. | 4,800 | 237 |
| † | Quest Diagnostics, Inc. | 4,200 | 237 |
* | † | Forest Laboratories, Inc. | 9,400 | 236 |
* | † | Mettler-Toledo | | |
| | International Inc. | 2,900 | 224 |
| † | AmerisourceBergen Corp. | 12,000 | 213 |
* | † | Lincare Holdings, Inc. | 9,000 | 212 |
* | † | LifePoint Hospitals, Inc. | 7,800 | 205 |
* | † | Community Health | | |
| | Systems, Inc. | 8,000 | 202 |
* | † | Millipore Corp. | 2,800 | 197 |
* | † | Biogen Idec Inc. | 4,300 | 194 |
| † | The Cooper Companies, Inc. | 7,500 | 185 |
| † | IMS Health, Inc. | 14,100 | 179 |
* | † | Health Management | | |
| | Associates Class A | 34,400 | 170 |
| † | Beckman Coulter, Inc. | 2,600 | 149 |
* | † | Amgen Inc. | 2,600 | 138 |
* | † | Sepracor Inc. | 3,900 | 68 |
13
Market Neutral Fund
| | | Market |
| | | Value• |
| | Shares | ($000) |
* † | Endo Pharmaceuticals | | |
| Holdings, Inc. | 3,700 | 66 |
* | Hospira, Inc. | 1,000 | 39 |
† | Techne Corp. | 200 | 13 |
| | | 8,976 |
Industrials (11.1%) | | |
† | Lockheed Martin Corp. | 12,400 | 1,000 |
† | General Dynamics Corp. | 14,200 | 787 |
† | Raytheon Co. | 17,500 | 778 |
† | Waste Management, Inc. | 22,200 | 625 |
† | L-3 Communications | | |
| Holdings, Inc. | 7,700 | 534 |
† | Goodrich Corp. | 8,800 | 440 |
† | Dover Corp. | 12,500 | 414 |
† | C.H. Robinson Worldwide Inc. | 7,500 | 391 |
† | Pitney Bowes, Inc. | 15,000 | 329 |
† | Equifax, Inc. | 10,600 | 277 |
† | W.W. Grainger, Inc. | 2,900 | 237 |
* † | AGCO Corp. | 7,700 | 224 |
† | Union Pacific Corp. | 4,200 | 219 |
† | Fluor Corp. | 4,200 | 215 |
† | The Dun & Bradstreet Corp. | 2,600 | 211 |
† | Norfolk Southern Corp. | 5,600 | 211 |
† | J.B. Hunt Transport | | |
| Services, Inc. | 6,900 | 211 |
† | Joy Global Inc. | 5,400 | 193 |
† | Flowserve Corp. | 2,700 | 188 |
† | Northrop Grumman Corp. | 4,000 | 183 |
* † | Delta Air Lines Inc. | 28,400 | 164 |
† | GATX Corp. | 6,200 | 159 |
* † | URS Corp. | 3,000 | 149 |
† | The Brink’s Co. | 5,000 | 145 |
† | ITT Industries, Inc. | 3,200 | 142 |
† | Ryder System, Inc. | 3,500 | 98 |
| Masco Corp. | 9,800 | 94 |
| Manpower Inc. | 2,200 | 93 |
† | Rockwell Collins, Inc. | 2,100 | 88 |
* † | Kirby Corp. | 2,600 | 83 |
* | Hertz Global Holdings Inc. | 7,900 | 63 |
† | Copa Holdings SA Class A | 1,300 | 53 |
* † | Corrections Corp. of America | 2,500 | 42 |
| | | 9,040 |
Information Technology (17.1%) | | |
† | International Business | | |
| Machines Corp. | 13,000 | 1,357 |
† | Oracle Corp. | 61,400 | 1,315 |
† | Hewlett-Packard Co. | 34,000 | 1,314 |
† | Microsoft Corp. | 51,900 | 1,234 |
† | Visa Inc. | 10,500 | 654 |
* † | Computer Sciences Corp. | 14,200 | 629 |
† | CA, Inc. | 19,100 | 333 |
† | QUALCOMM Inc. | 7,100 | 321 |
* † | Fiserv, Inc. | 6,500 | 297 |
* † | BMC Software, Inc. | 8,400 | 284 |
† | Harris Corp. | 8,500 | 241 |
| | | Market |
| | | Value• |
| | Shares | ($000) |
* † | Genpact, Ltd. | 19,900 | 234 |
* † | Tech Data Corp. | 7,100 | 232 |
† | Intel Corp. | 13,600 | 225 |
* † | Ingram Micro, Inc. Class A | 12,700 | 222 |
† | Accenture Ltd. | 6,600 | 221 |
* † | SAIC, Inc. | 11,900 | 221 |
* † | Teradata Corp. | 9,400 | 220 |
† | Xilinx, Inc. | 10,500 | 215 |
† | Diebold, Inc. | 8,000 | 211 |
* † | Marvell Technology | | |
| Group Ltd. | 18,000 | 210 |
* † | Cisco Systems, Inc. | 11,200 | 209 |
* † | Dolby Laboratories Inc. | 5,600 | 209 |
* † | Sohu.com Inc. | 3,300 | 207 |
* † | NCR Corp. | 17,500 | 207 |
† | Altera Corp. | 12,400 | 202 |
* † | QLogic Corp. | 15,700 | 199 |
† | Xerox Corp. | 29,900 | 194 |
* † | Hewitt Associates, Inc. | 6,500 | 194 |
* † | Alliance Data Systems Corp. | 4,600 | 189 |
* † | Lexmark International, Inc. | 11,300 | 179 |
* † | Compuware Corp. | 25,700 | 176 |
† | Broadridge Financial | | |
| Solutions LLC | 10,500 | 174 |
* † | Affiliated Computer | | |
| Services, Inc. Class A | 3,400 | 151 |
* † | Amdocs Ltd. | 7,000 | 150 |
* † | Symantec Corp. | 9,600 | 149 |
| Maxim Integrated | | |
| Products, Inc. | 8,700 | 136 |
† | Seagate Technology | 11,800 | 123 |
* † | Broadcom Corp. | 4,500 | 112 |
* † | Synopsys, Inc. | 5,500 | 107 |
* † | Micron Technology, Inc. | 20,400 | 103 |
* † | Metavante Technologies | 3,800 | 98 |
* | SanDisk Corp. | 6,300 | 93 |
* | Avnet, Inc. | 4,000 | 84 |
* † | FLIR Systems, Inc. | 1,700 | 38 |
* † | Harris Stratex | | |
| Networks, Inc. Class A | 2,111 | 14 |
| | | 13,887 |
Materials (3.7%) | | |
† | Dow Chemical Co. | 24,500 | 395 |
† | Airgas, Inc. | 8,300 | 336 |
† | FMC Corp. | 6,800 | 322 |
† | Ball Corp. | 5,100 | 230 |
† | Greif Inc. Class A | 4,600 | 203 |
| PPG Industries, Inc. | 4,600 | 202 |
† | United States Steel Corp. | 5,400 | 193 |
† | Celanese Corp. Series A | 8,000 | 190 |
* † | Pactiv Corp. | 8,600 | 187 |
† | Monsanto Co. | 2,400 | 178 |
† | Eastman Chemical Co. | 4,300 | 163 |
† | Cliffs Natural Resources Inc. | 5,600 | 137 |
| E.I. du Pont de Nemours & Co. | 4,100 | 105 |
14
Market Neutral Fund
| | | Market |
| | | Value• |
| | Shares | ($000) |
† | Bemis Co., Inc. | 3,400 | 86 |
| International Paper Co. | 3,500 | 53 |
| | | 2,980 |
Other (2.0%) | | |
1 | Miscellaneous Securities | | 1,597 |
| | | |
Telecommunication Services (0.6%) | | |
† | CenturyTel, Inc. | 4,100 | 126 |
† | Windstream Corp. | 14,800 | 124 |
| Telephone & | | |
| Data Systems, Inc. | 3,000 | 85 |
† | Qwest Communications | | |
| International Inc. | 15,300 | 63 |
* † | Sprint Nextel Corp. | 12,800 | 62 |
* † | Level 3 Communications, Inc. | 39,300 | 59 |
* | U.S. Cellular Corp. | 100 | 4 |
| | | 523 |
Utilities (3.5%) | | |
† | PG&E Corp. | 16,900 | 650 |
† | Sempra Energy | 4,600 | 228 |
† | NiSource, Inc. | 18,900 | 220 |
† | CMS Energy Corp. | 18,000 | 217 |
† | American Electric | | |
| Power Co., Inc. | 7,500 | 217 |
† | Atmos Energy Corp. | 8,600 | 215 |
* † | Mirant Corp. | 13,100 | 206 |
† | Exelon Corp. | 4,000 | 205 |
† | UGI Corp. Holding Co. | 7,400 | 189 |
† | FirstEnergy Corp. | 4,800 | 186 |
† | DTE Energy Co. | 5,800 | 186 |
* | AES Corp. | 12,500 | 145 |
| DPL Inc. | 900 | 21 |
| | | 2,885 |
Total Common Stocks—Long Positions | | |
(Cost $66,995) | | 68,485 |
Common Stocks Sold Short (–75.6%) | | |
Consumer Discretionary (–8.0%) | | |
| News Corp., Class A | (125,000) | (1,139) |
* | Bed Bath & Beyond, Inc. | (7,300) | (224) |
| Johnson Controls, Inc. | (10,200) | (222) |
| Mattel, Inc. | (13,700) | (220) |
* | O’Reilly Automotive, Inc. | (5,700) | (217) |
* | Starbucks Corp. | (15,400) | (214) |
| Staples, Inc. | (10,500) | (212) |
* | LKQ Corp. | (12,800) | (211) |
| Target Corp. | (5,200) | (205) |
| American Eagle | | |
| Outfitters, Inc. | (14,300) | (203) |
| Marriott International, Inc. | | |
| Class A | (9,133) | (202) |
| McDonald’s Corp. | (3,400) | (195) |
| Harman International | | |
| Industries, Inc. | (10,100) | (190) |
| Williams-Sonoma, Inc. | (15,900) | (189) |
| | | Market |
| | | Value• |
| | Shares | ($000) |
| Fortune Brands, Inc. | (5,200) | (181) |
* | Dick’s Sporting Goods, Inc. | (10,400) | (179) |
| Best Buy Co., Inc. | (5,300) | (177) |
| Time Warner Inc. | (6,933) | (175) |
| The Walt Disney Co. | (7,300) | (170) |
* | Ascent Media Corp. | (6,400) | (170) |
* | Urban Outfitters, Inc. | (7,700) | (161) |
* | Mohawk Industries, Inc. | (4,500) | (161) |
| Scripps Networks Interactive | (5,200) | (145) |
| International Game | | |
| Technology | (7,000) | (111) |
| Washington Post Co. Class B | (300) | (106) |
| Abercrombie & Fitch Co. | (4,000) | (102) |
| The Stanley Works | (3,000) | (102) |
* | ITT Educational Services, Inc. | (900) | (91) |
| DeVry, Inc. | (1,700) | (85) |
* | Scientific Games Corp. | (4,700) | (74) |
* | Brink’s Home | | |
| Security Holdings, Inc. | (2,600) | (74) |
| Garmin Ltd. | (2,800) | (67) |
| Newell Rubbermaid, Inc. | (5,900) | (61) |
| Tim Hortons, Inc. | (2,500) | (61) |
* | Expedia, Inc. | (3,600) | (54) |
* | NVR, Inc. | (100) | (50) |
* | Toll Brothers, Inc. | (2,900) | (49) |
| Gentex Corp. | (3,500) | (41) |
* | The Goodyear Tire & | | |
| Rubber Co. | (1,500) | (17) |
| | | (6,507) |
Consumer Staples (–5.3%) | | |
| The Procter & Gamble Co. | (25,500) | (1,303) |
| J.M. Smucker Co. | (5,100) | (248) |
* | NBTY, Inc. | (8,100) | (228) |
| Sara Lee Corp. | (23,200) | (226) |
| Hormel Foods Corp. | (6,500) | (224) |
| The Coca-Cola Co. | (4,600) | (221) |
| The Estee Lauder Cos. Inc. | | |
| Class A | (6,600) | (216) |
| Tyson Foods, Inc. | (16,700) | (211) |
| Church & Dwight, Inc. | (3,600) | (196) |
| Altria Group, Inc. | (11,200) | (184) |
| Kimberly-Clark Corp. | (3,400) | (178) |
| Bunge Ltd. | (2,900) | (175) |
| Kellogg Co. | (3,400) | (158) |
| SUPERVALU Inc. | (9,600) | (124) |
| Molson Coors Brewing Co. | | |
| Class B | (2,700) | (114) |
| Walgreen Co. | (3,300) | (97) |
| PepsiCo, Inc. | (1,400) | (77) |
| McCormick & Co., Inc. | (1,700) | (55) |
| Reynolds American Inc. | (1,200) | (46) |
| Costco Wholesale Corp. | (900) | (41) |
| | | (4,322) |
Energy (–9.5%) | | |
| Schlumberger Ltd. | (24,000) | (1,299) |
| ExxonMobil Corp. | (14,200) | (993) |
15
Market Neutral Fund
| | | Market |
| | | Value• |
| | Shares | ($000) |
| Devon Energy Corp. | (16,100) | (877) |
| Apache Corp. | (8,900) | (642) |
| Hess Corp. | (11,200) | (602) |
| Occidental Petroleum Corp. | (7,200) | (474) |
| Spectra Energy Corp. | (21,100) | (357) |
* | Newfield Exploration Co. | (10,600) | (346) |
| El Paso Corp. | (21,500) | (198) |
| Range Resources Corp. | (4,700) | (195) |
| Pioneer Natural Resources Co. | (7,600) | (194) |
* | Petrohawk Energy Corp. | (8,600) | (192) |
| Cabot Oil & Gas Corp. | (6,200) | (190) |
| BJ Services Co. | (13,500) | (184) |
* | CNX Gas Corp. | (7,000) | (184) |
| Smith International, Inc. | (7,000) | (180) |
| Peabody Energy Corp. | (5,700) | (172) |
* | Ultra Petroleum Corp. | (4,400) | (172) |
* | SandRidge Energy, Inc. | (9,800) | (83) |
| Murphy Oil Corp. | (1,500) | (81) |
* | Forest Oil Corp. | (5,100) | (76) |
| | | (7,691) |
Financials (–10.4%) | | |
| Citigroup Inc. | (625,000) | (1,856) |
| American Express Co. | (20,400) | (474) |
* | IntercontinentalExchange Inc. | (3,800) | (434) |
| T. Rowe Price Group Inc. | (8,800) | (367) |
| AFLAC Inc. | (10,800) | (336) |
| MetLife, Inc. | (10,400) | (312) |
* | Leucadia National Corp. | (14,400) | (304) |
| Franklin Resources, Inc. | (3,300) | (238) |
| Legg Mason Inc. | (9,300) | (227) |
| CNA Financial Corp. | (14,300) | (221) |
| Invesco, Ltd. | (12,200) | (217) |
| Mercury General Corp. | (6,500) | (217) |
| Waddell & Reed | | |
| Financial, Inc. | (8,200) | (216) |
| Fidelity National | | |
| Financial, Inc. Class A | (15,900) | (215) |
| BlackRock, Inc. | (1,200) | (210) |
| RenaissanceRe Holdings Ltd. | (4,500) | (209) |
| Wesco Financial Corp. | (700) | (204) |
| Loews Corp. | (7,400) | (203) |
| Old Republic | | |
| International Corp. | (20,500) | (202) |
* | Markel Corp. | (700) | (197) |
| Lazard Ltd. Class A | (6,700) | (180) |
| Comerica, Inc. | (8,500) | (180) |
| Fulton Financial Corp. | (30,100) | (157) |
| Whitney Holdings Corp. | (14,500) | (133) |
* | SLM Corp. | (10,700) | (110) |
| Arthur J. Gallagher & Co. | (4,900) | (105) |
| American National | | |
| Insurance Co. | (1,300) | (98) |
| W.R. Berkley Corp. | (4,500) | (97) |
| Cincinnati Financial Corp. | (3,500) | (78) |
| OCH-Ziff Capital | | |
| Management Group | (8,200) | (73) |
| | | Market |
| | | Value• |
| | Shares | ($000) |
| Discover Financial Services | (6,700) | (69) |
| KeyCorp | (12,000) | (63) |
| Commerce Bancshares, Inc. | (1,900) | (60) |
| Eaton Vance Corp. | (1,900) | (51) |
| Erie Indemnity Co. Class A | (1,300) | (46) |
| People’s United | | |
| Financial Inc. | (2,400) | (36) |
| Brown & Brown, Inc. | (900) | (18) |
| Washington Federal Inc. | (1,200) | (16) |
| Wilmington Trust Corp. | (700) | (10) |
| Prudential Financial, Inc. | (200) | (7) |
| Astoria Financial Corp. | (700) | (6) |
| | | (8,452) |
Health Care (–7.8%) | | |
| Eli Lilly & Co. | (25,800) | (894) |
* | Celgene Corp. | (14,000) | (670) |
| Medtronic, Inc. | (13,400) | (468) |
* | Boston Scientific Corp. | (24,000) | (243) |
* | Vertex Pharmaceuticals, Inc. | (6,800) | (242) |
* | St. Jude Medical, Inc. | (5,800) | (238) |
* | VCA Antech, Inc. | (8,500) | (227) |
* | Covance, Inc. | (4,600) | (226) |
| Stryker Corp. | (5,500) | (219) |
* | Patterson Companies, Inc. | (9,900) | (215) |
* | Health Net Inc. | (13,700) | (213) |
| DENTSPLY International Inc. | (6,900) | (211) |
* | Zimmer Holdings, Inc. | (4,900) | (209) |
* | King Pharmaceuticals, Inc. | (21,200) | (204) |
| Allergan, Inc. | (4,200) | (200) |
* | Intuitive Surgical, Inc. | (1,200) | (196) |
| Cardinal Health, Inc. | (6,200) | (189) |
* | BioMarin Pharmaceutical Inc. | (11,700) | (183) |
* | Coventry Health Care Inc. | (9,600) | (180) |
* | Genzyme Corp. | (3,100) | (173) |
* | Abraxis BioScience | (3,400) | (125) |
* | Gilead Sciences, Inc. | (2,600) | (122) |
| Perrigo Co. (U.S.Shares) | (3,800) | (106) |
* | Kinetic Concepts, Inc. | (3,600) | (98) |
| PerkinElmer, Inc. | (5,100) | (89) |
* | Edwards Lifesciences Corp. | (1,300) | (88) |
* | Alexion Pharmaceuticals, Inc. | (1,900) | (78) |
* | Myriad Genetics, Inc. | (2,100) | (75) |
* | Myriad Pharmaceuticals Inc. | (525) | (2) |
| | | (6,383) |
Industrials (–10.9%) | | |
| 3M Co. | (15,800) | (950) |
| United Parcel Service, Inc. | (17,500) | (875) |
| The Boeing Co. | (20,500) | (871) |
| Caterpillar, Inc. | (23,200) | (767) |
| Eaton Corp. | (9,100) | (406) |
| Deere & Co. | (9,500) | (380) |
| Robert Half | | |
| International, Inc. | (13,700) | (324) |
| Con-way, Inc. | (6,700) | (237) |
| Illinois Tool Works, Inc. | (6,000) | (224) |
16
Market Neutral Fund
| | | Market |
| | | Value• |
| | Shares | ($000) |
| Republic Services, Inc. | | |
| Class A | (8,900) | (217) |
| Danaher Corp. | (3,500) | (216) |
| Fluor Corp. | (4,200) | (215) |
| IDEX Corp. | (8,600) | (211) |
* | FTI Consulting, Inc. | (4,000) | (203) |
| Landstar System, Inc. | (5,600) | (201) |
| FedEx Corp. | (3,600) | (200) |
* | Kansas City Southern | (12,200) | (197) |
| Graco, Inc. | (8,900) | (196) |
* | McDermott | | |
| International, Inc. | (9,400) | (191) |
* | BE Aerospace, Inc. | (12,900) | (185) |
| Southwest Airlines Co. | (26,900) | (181) |
| Ingersoll-Rand Co. | (8,100) | (169) |
| Masco Corp. | (15,300) | (147) |
| Flowserve Corp. | (1,900) | (133) |
| Roper Industries Inc. | (2,900) | (131) |
* | Monster Worldwide Inc. | (9,700) | (115) |
* | Stericycle, Inc. | (2,000) | (103) |
| The Corporate | | |
| Executive Board Co. | (4,900) | (102) |
* | Terex Corp. | (8,400) | (101) |
| Cintas Corp. | (4,200) | (96) |
| Avery Dennison Corp. | (3,600) | (92) |
| Alexander & Baldwin, Inc. | (3,100) | (73) |
| Steelcase Inc. | (12,200) | (71) |
* | Copart, Inc. | (900) | (31) |
* | Iron Mountain, Inc. | (800) | (23) |
| | | (8,834) |
Information Technology (–12.5%) | | |
* | Google Inc. | (3,340) | (1,408) |
| Intel Corp. | (72,700) | (1,203) |
* | Yahoo! Inc. | (50,900) | (797) |
* | Apple Inc. | (5,100) | (726) |
| Corning, Inc. | (43,200) | (694) |
* | Dell Inc. | (17,000) | (233) |
* | Cognizant Technology | | |
| Solutions Corp. | (8,400) | (224) |
* | Intuit, Inc. | (7,900) | (222) |
| QUALCOMM Inc. | (4,900) | (221) |
* | Electronic Arts Inc. | (10,100) | (219) |
| National Instruments Corp. | (9,700) | (219) |
* | Activision Blizzard, Inc. | (17,300) | (218) |
* | Citrix Systems, Inc. | (6,800) | (217) |
* | NVIDIA Corp. | (19,000) | (214) |
* | Tyco Electronics Ltd. | (11,300) | (210) |
* | Cadence Design | | |
| Systems, Inc. | (35,500) | (209) |
* | Agilent Technologies, Inc. | (10,000) | (203) |
* | LAM Research Corp. | (7,800) | (203) |
| Molex, Inc. | (13,000) | (202) |
| Paychex, Inc. | (7,900) | (199) |
| KLA-Tencor Corp. | (7,700) | (194) |
| Applied Materials, Inc. | (17,500) | (192) |
* | Ciena Corp. | (18,200) | (188) |
| | | Market |
| | | Value• |
| | Shares | ($000) |
| Global Payments Inc. | (5,000) | (187) |
* | CommScope, Inc. | (6,700) | (176) |
| Texas Instruments, Inc. | (6,300) | (134) |
* | SanDisk Corp. | (8,900) | (131) |
* | EchoStar Corp. | (8,100) | (129) |
* | salesforce.com, inc. | (3,300) | (126) |
* | Akamai Technologies, Inc. | (6,400) | (123) |
* | Cisco Systems, Inc. | (6,300) | (117) |
* | FLIR Systems, Inc. | (4,500) | (102) |
* | MEMC Electronic | | |
| Materials, Inc. | (5,400) | (96) |
* | Itron, Inc. | (1,300) | (72) |
* | Novellus Systems, Inc. | (3,300) | (55) |
| MasterCard, Inc. Class A | (300) | (50) |
* | ANSYS, Inc. | (1,500) | (47) |
* | Teradyne, Inc. | (4,900) | (34) |
* | Varian Semiconductor | | |
| Equipment Associates, Inc. | (700) | (17) |
| | | (10,211) |
Materials (–6.6%) | | |
| Freeport-McMoRan | | |
| Copper & Gold, Inc. | | |
| Class B | (16,800) | (842) |
| Monsanto Co. | (9,700) | (721) |
| Cliffs Natural Resources Inc. | (29,000) | (710) |
| Nucor Corp. | (11,300) | (502) |
| Alcoa Inc. | (46,300) | (478) |
| Weyerhaeuser Co. | (13,400) | (408) |
| Packaging Corp. of America | (13,100) | (212) |
| Air Products & | | |
| Chemicals, Inc. | (3,200) | (207) |
| Commercial Metals Co. | (12,500) | (200) |
| MeadWestvaco Corp. | (11,200) | (184) |
| The Mosaic Co. | (3,700) | (164) |
| PPG Industries, Inc. | (3,300) | (145) |
| Southern Copper Corp. | | |
| (U.S. Shares) | (6,500) | (133) |
* | Crown Holdings, Inc. | (5,300) | (128) |
| Allegheny Technologies Inc. | (2,300) | (80) |
| Martin Marietta Materials, Inc. | (1,000) | (79) |
| Newmont Mining Corp. | | |
| (Holding Co.) | (1,800) | (74) |
| RPM International, Inc. | (4,500) | (63) |
* | Century Aluminum Co. | (2,400) | (15) |
| | | (5,345) |
Telecommunication Services (–1.0%) | |
* | American Tower Corp. | | |
| Class A | (9,100) | (287) |
| Telephone & | | |
| Data Systems, Inc. | (6,300) | (178) |
* | Leap Wireless | | |
| International, Inc. | (4,300) | (142) |
| Windstream Corp. | (10,600) | (89) |
* | NII Holdings Inc. | (3,700) | (71) |
* | SBA Communications Corp. | (1,100) | (27) |
17
Market Neutral Fund
| | | Market |
| | | Value• |
| | Shares | ($000) |
* | Crown Castle | | |
| International Corp. | (1,000) | (24) |
| AT&T Inc. | (100) | (2) |
| | | (820) |
Utilities (–3.6%) | | |
| Dominion Resources, Inc. | (11,800) | (394) |
| EQT Corp. | (9,600) | (335) |
| Alliant Energy Corp. | (9,000) | (235) |
| MDU Resources Group, Inc. | (11,600) | (220) |
| Southern Co. | (7,000) | (218) |
| Constellation | | |
| Energy Group, Inc. | (7,800) | (207) |
| Northeast Utilities | (8,800) | (196) |
| Integrys Energy Group, Inc. | (6,200) | (186) |
| Allegheny Energy, Inc. | (7,200) | (185) |
| Pinnacle West Capital Corp. | (6,000) | (181) |
| Questar Corp. | (5,000) | (155) |
| Wisconsin Energy Corp. | (3,100) | (126) |
| Energen Corp. | (2,900) | (116) |
| NSTAR | (2,900) | (93) |
| CenterPoint Energy Inc. | (7,900) | (88) |
| National Fuel Gas Co. | (900) | (32) |
| | | (2,967) |
Total Common Stocks Sold Short | | |
(Proceeds $58,106) | | (61,532) |
Temporary Cash Investment (32.4%) | | |
Money Market Fund (32.4%) | | |
2 | Vanguard Market Liquidity | | |
| Fund, 0.395% | | |
| (Cost $26,319) | 26,318,571 | 26,319 |
† Other Assets and Liabilities— | | |
Net (59.1%) | | 48,077 |
Net Assets (100%) | | 81,349 |
At June 30, 2009, net assets consisted of: | |
| Amount |
| ($000) |
Paid-in Capital | 100,558 |
Accumulated Net Investment Losses | (553) |
Accumulated Net Realized Losses | (16,720) |
Unrealized Appreciation (Depreciation) | |
Investment Securities—Long Positions | 1,490 |
Investment Securities Sold Short | (3,426) |
Net Assets | 81,349 |
| |
Investor Shares—Net Assets | |
Applicable to 6,762,588 outstanding | |
$.001 par value shares of beneficial | |
interest (unlimited authorization) | 67,169 |
Net Asset Value Per Share— | |
Investor Shares | $9.93 |
| |
Institutional Shares—Net Assets | |
Applicable to 1,435,375 outstanding | |
$.001 par value shares of beneficial | |
interest (unlimited authorization) | 14,180 |
Net Asset Value Per Share— | |
Institutional Shares | $9.88 |
• | See Note A in Notes to Financial Statements. |
* | Non-income-producing security. |
† Long security positions with a value of $65,387,000 and cash of $42,287,000 have been segregated in connection with securities sold short.
1 Securities representing up to 5% of the market value of unaffiliated securities are permitted to be combined and reported as “miscellaneous securities” provided that they have been held for less than one year and not previously reported by name.
2 Affiliated money market fund available only to Vanguard funds and certain trusts and accounts managed by Vanguard. Rate shown is the 7-day yield.
See accompanying Notes, which are an integral part of the Financial Statements.
18
Market Neutral Fund
Statement of Assets and Liabilities
As of June 30, 2009
| Market Value |
| ($000) |
Assets | |
Investment in Securities, Long Positions at Value | |
Common Stocks | 68,485 |
Temporary Cash Investments | 26,319 |
Cash Deposited with Broker for Short Positions | 42,287 |
Receivables for Capital Shares Issued | 1,511 |
Other Assets | 4,418 |
Total Assets | 143,020 |
Liabilities | |
Securities Sold Short, at Value | 61,532 |
Other Liabilities | 139 |
Total Liabilities | 61,671 |
Net Assets (100%) | 81,349 |
See accompanying Notes, which are an integral part of the Financial Statements.
19
Market Neutral Fund
Statement of Operations
| Six Months Ended |
| June 30, 2009 |
| ($000) |
Investment Income | |
Income | |
Dividends | 802 |
Interest1 | 49 |
Total Income | 851 |
Expenses | |
Investment Advisory Fees—Note B | |
Basic Fee | 98 |
Performance Adjustment | (32) |
The Vanguard Group—Note C | |
Management and Administrative—Investor Shares | 37 |
Management and Administrative—Institutional Shares | — |
Marketing and Distribution—Investor Shares | 12 |
Marketing and Distribution—Institutional Shares | 3 |
Custodian Fees | 42 |
Auditing Fees | 1 |
Shareholders’ Reports and Proxies—Investor Shares | 1 |
Shareholders’ Reports and Proxies—Institutional Shares | — |
Dividend Expense on Securities Sold Short | 647 |
Borrowing Expense on Securities Sold Short | 559 |
Total Expenses | 1.368 |
Net Investment Income (Loss) | (517) |
Realized Net Gain (Loss) | |
Investment Securities—Long Positions | (14,924) |
Investment Securities Sold Short | 3,972 |
Futures Contracts | (23) |
Realized Net Gain (Loss) | (10,975) |
Change in Unrealized Appreciation (Depreciation) | |
Investment Securities—Long Positions | 18,696 |
Investment Securities Sold Short | (15,485) |
Futures Contracts | 5 |
Change in Unrealized Appreciation (Depreciation) | 3,216 |
Net Increase (Decrease) in Net Assets Resulting from Operations | (8,276) |
1 Interest income from an affiliated company of the fund was $49,000.
See accompanying Notes, which are an integral part of the Financial Statements.
20
Market Neutral Fund
Statement of Changes in Net Assets
| | April 1, | |
| Six Months Ended | 2008, to | Year Ended |
| June 30, | December 31, | March 31, |
| 2009 | 20081 | 2008 |
| ($000) | ($000) | ($000) |
Increase (Decrease) in Net Assets | | | |
Operations | | | |
Net Investment Income (Loss) | (517) | 797 | 638 |
Realized Net Gain (Loss) | (10,975) | (1,034) | 2,059 |
Change in Unrealized Appreciation (Depreciation) | 3,216 | (6,467) | (1,291) |
Net Increase (Decrease) in Net Assets | | | |
Resulting from Operations | (8,276) | (6,704) | 1,406 |
Distributions | | | |
Net Investment Income | | | |
Investor Shares | (76) | (819) | (344) |
Institutional Shares | (12) | (187) | (206) |
Realized Capital Gain2 | | | |
Investor Shares | — | (3,716) | (200) |
Institutional Shares | — | (861) | (112) |
Total Distributions | (88) | (5,583) | (862) |
Capital Share Transactions | | | |
Investor Shares | 1,422 | 37,746 | 35,479 |
Institutional Shares | (1,489) | 7,271 | 1,704 |
Net Increase (Decrease) from Capital Share Transactions | (67) | 45,017 | 37,183 |
Total Increase (Decrease) | (8,431) | 32,730 | 37,727 |
Net Assets | | | |
Beginning of Period | 89,780 | 57,050 | 19,323 |
End of Period3 | 81,349 | 89,780 | 57,050 |
| | | | |
1 The fund’s fiscal year-end changed from March 31 to December 31, effective December 31, 2008.
2 Includes short-term gain distributions totaling $0, $4,163,000, and $0, for fiscal periods ended June 30, 2009, December 31, 2008, and March 31, 2008, respectively. Short-term gain distributions are treated as ordinary income dividends for tax purposes.
3 Net Assets—End of Period includes undistributed (overdistributed) net investment income of ($553,000), $52,000, and $244,000.
See accompanying Notes, which are an integral part of the Financial Statements.
21
Market Neutral Fund
Financial Highlights
Investor Shares | | | | | | | |
| Six Months | April 1, | | | | | |
| Ended | 2008, to | | | | | |
For a Share Outstanding | June 30, | Dec. 31, | Year Ended March 31, |
Throughout Each Period | 2009 | 20081 | 20082 | 2007 | 2006 | 2005 | 2004 |
Net Asset Value, | | | | | | | |
Beginning of Period | $10.97 | $12.45 | $12.19 | $12.12 | $11.46 | $10.86 | $11.61 |
Investment Operations | | | | | | | |
Net Investment Income (Loss) | (.063) | .084 | .3113 | .500 | .220 | (.040)3 | (.100)3 |
Net Realized and | | | | | | | |
Unrealized Gain (Loss) | | | | | | | |
on Investments | (.965) | (.838) | .909 | .060 | .590 | .640 | (.650) |
Total from | | | | | | | |
Investment Operations | (1.028) | (.754) | 1.220 | .560 | .810 | .600 | (.750) |
Distributions | | | | | | | |
Dividends from | | | | | | | |
Net Investment Income | (.012) | (.132) | (.607) | (.490) | (.150) | — | — |
Distributions from | | | | | | | |
Realized Capital Gains | — | (.594) | (.353) | — | — | — | — |
Total Distributions | (.012) | (.726) | (.960) | (.490) | (.150) | — | — |
Net Asset Value, | | | | | | | |
End of Period | $9.93 | $10.97 | $12.45 | $12.19 | $12.12 | $11.46 | $10.86 |
| | | | | | | |
Total Return4 | –9.37% | –6.11% | 10.15% | 4.68% | 7.09% | 5.52% | –6.46% |
| | | | | | | |
Ratios/Supplemental Data | | | | | | | |
Net Assets, | | | | | | | |
End of Period (Millions) | $67 | $73 | $45 | $9 | $12 | $13 | $9 |
Ratio of Expenses to | | | | | | | |
Average Net Assets | | | | | | | |
Based on Total Expenses | 2.84%5 | 2.13%5 | 3.09% | 3.46% | 3.31% | 3.55% | 3.51% |
Net of Expenses | | | | | | | |
Waived/Reimbursed2 | 2.84%5 | 2.13%5 | 2.79% | 2.98% | 3.02% | 3.26% | 3.12% |
Net of Expenses | | | | | | | |
Waived/Reimbursed and | | | | | | | |
Dividend and Borrowing | | | | | | | |
Expense on Securities | | | | | | | |
Sold Short | 0.41%5 | 0.46%5 | 1.16% | 1.54% | 1.59% | 1.61% | 1.55% |
Ratio of Net Investment | | | | | | | |
Income (Loss) to | | | | | | | |
Average Net Assets | (0.77%)5 | 1.15%5 | 2.69% | 3.40% | 2.14% | (0.33%) | (0.93%) |
Portfolio Turnover Rate | 136%5 | 161% | 214% | 169% | 213% | 180% | 189% |
1 The fund’s fiscal year-end changed from March 31 to December 31, effective December 31, 2008.
2 Laudus Rosenberg U.S. Large/Mid Capitalization Long/Short Equity Fund reorganized into Vanguard Market Neutral Fund effective December 1, 2007. For periods prior to December 1, 2007, the fund’s advisor and other service providers had agreed to waive or reimburse certain of the fund’s expenses.
3 Calculated based on average shares outstanding.
4 Total returns do not reflect the 2% fee assessed until November 30, 2007, on redemptions of shares purchased within 30 days; the 1% fee assessed beginning December 1, 2007, on redemptions of shares held less than one year; or the account service fee that may be applicable to certain accounts with balances below $10,000.
5 Annualized.
See accompanying Notes, which are an integral part of the Financial Statements.
22
Market Neutral Fund
Financial Highlights
Institutional Shares | | | | | | | |
| Six Months | April 1, | | | | | |
| Ended | 2008, to | | | | | |
For a Share Outstanding | June 30, | Dec. 31, | Year Ended March 31, |
Throughout Each Period | 2009 | 20081 | 20082 | 2007 | 2006 | 2005 | 2004 |
Net Asset Value, | | | | | | | |
Beginning of Period | $10.90 | $12.39 | $12.14 | $12.08 | $11.44 | $10.80 | $11.51 |
Investment Operations | | | | | | | |
Net Investment Income (Loss) | (.058) | .085 | .3903 | .600 | .250 | (.010)3 | (.060)3 |
Net Realized and | | | | | | | |
Unrealized Gain (Loss) | | | | | | | |
on Investments | (.954) | (.846) | .864 | — | .580 | .650 | (.650) |
Total from | | | | | | | |
Investment Operations | (1.012) | (.761) | 1.254 | .600 | .830 | .640 | (.710) |
Distributions | | | | | | | |
Dividends from | | | | | | | |
Net Investment Income | (.008) | (.138) | (.651) | (.540) | (.190) | — | — |
Distributions from | | | | | | | |
Realized Capital Gains | — | (.591) | (.353) | — | — | — | — |
Total Distributions | (.008) | (.729) | (1.004) | (.540) | (.190) | — | — |
Net Asset Value, | | | | | | | |
End of Period | $9.88 | $10.90 | $12.39 | $12.14 | $12.08 | $11.44 | $10.80 |
| | | | | | | |
Total Return4 | –9.29% | –6.20% | 10.49% | 4.98% | 7.29% | 5.93% | –6.17% |
| | | | | | | |
Ratios/Supplemental Data | | | | | | | |
Net Assets, | | | | | | | |
End of Period (Millions) | $14 | $17 | $12 | $10 | $20 | $12 | $20 |
Ratio of Expenses to | | | | | | | |
Average Net Assets | | | | | | | |
Based on Total Expenses | 2.74%5 | 2.08%5 | 2.97% | 3.07% | 3.01% | 3.23% | 3.22% |
Net of Expenses | | | | | | | |
Waived/Reimbursed2 | 2.74%5 | 2.08%5 | 2.56% | 2.67% | 2.71% | 2.94% | 2.82% |
Net of Expenses | | | | | | | |
Waived/Reimbursed and | | | | | | | |
Dividend and Borrowing | | | | | | | |
Expense on Securities | | | | | | | |
Sold Short | 0.31%5 | 0.41%5 | 0.93% | 1.24% | 1.24% | 1.24% | 1.25% |
Ratio of Net Investment | | | | | | | |
Income (Loss) to | | | | | | | |
Average Net Assets | (0.67%)5 | 1.20%5 | 2.92% | 3.68% | 2.50% | (0.13%) | (0.57%) |
Portfolio Turnover Rate | 136%5 | 161% | 214% | 169% | 213% | 180% | 189% |
1 The fund’s fiscal year-end changed from March 31 to December 31, effective December 31, 2008.
2 Laudus Rosenberg U.S. Large/Mid Capitalization Long/Short Equity Fund reorganized into Vanguard Market Neutral Fund effective December 1, 2007. For periods prior to December 1, 2007, the fund’s advisor and other service providers had agreed to waive or reimburse certain of the fund’s expenses.
3 Calculated based on average shares outstanding.
4 Total returns do not reflect the 2% fee assessed until November 30, 2007, on redemptions of shares purchased within 30 days or the 1% fee assessed beginning December 1, 2007, on redemptions of shares held less than one year.
5 Annualized.
See accompanying Notes, which are an integral part of the Financial Statements.
23
Market Neutral Fund
Notes to Financial Statements
Vanguard Market Neutral Fund is registered under the Investment Company Act of 1940 as an open-end investment company, or mutual fund. The fund offers two classes of shares, Investor Shares and Institutional Shares. Investor Shares are available to any investor who meets the fund’s minimum purchase requirements. Institutional Shares are designed for investors who meet certain administrative and service criteria and invest a minimum of $5 million.
A. The following significant accounting policies conform to generally accepted accounting principles for U.S. mutual funds. The fund consistently follows such policies in preparing its financial statements.
1. Security Valuation: Securities are valued as of the close of trading on the New York Stock Exchange (generally 4 p.m., Eastern time) on the valuation date. Equity securities are valued at the latest quoted sales prices or official closing prices taken from the primary market in which each security trades; such securities not traded on the valuation date are valued at the mean of the latest quoted bid and asked prices. Securities for which market quotations are not readily available, or whose values have been affected by events occurring before the fund’s pricing time but after the close of the securities’ primary markets, are valued at their fair values calculated according to procedures adopted by the board of trustees. These procedures include obtaining quotations from an independent pricing service, monitoring news to identify significant market- or security-specific events, and evaluating changes in the values of foreign market proxies (for example, ADRs, futures contracts, or exchange-traded funds), between the time the foreign markets close and the fund’s pricing time. When fair-value pricing is employed, the prices of securities used by a fund to calculate its net asset value may differ from quoted or published prices for the same securities. Investments in Vanguard Market Liquidity Fund are valued at that fund’s net asset value. Temporary cash investments acquired over 60 days to maturity are valued using the latest bid prices or using valuations based on a matrix system (which considers such factors as security prices, yields, maturities, and ratings), both as furnished by independent pricing services. Other temporary cash investments are valued at amortized cost, which approximates market value.
2. Short Sales: Short sales are the sales of securities that the fund does not own. The fund may sell a security it does not own in anticipation of a decline in the value of that security. In order to deliver the security to the purchaser, the fund borrows the security from a broker-dealer. The fund must segregate, as collateral for its obligation to return the borrowed security, an amount of cash and long security positions at least equal to the market value of the security sold short. The fund later closes out the position by returning the security to the lender, typically by purchasing the security in the open market. A gain, limited to the price at which the fund sold the security short, or a loss, theoretically unlimited in size, is recognized upon the termination of the short sale. The fund may receive a portion of the income from the investment of collateral, or be charged a fee on borrowed securities, based on the market value of each borrowed security and a variable rate that is dependent upon the availability of such security. The net amounts of income or fees are recorded as interest income (for net income received) or borrowing expense on securities sold short (for net fees charged) on the Statement of Operations. Dividends on securities sold short are reported as an expense in the Statement of Operations.
Cash collateral segregated for securities sold short is recorded as an asset in the Statement of Assets and Liabilities. Long security positions segregated as collateral are shown in the Statement of Net Assets.
24
Market Neutral Fund
3. Futures Contracts: The fund uses index futures contracts to a limited extent, with the objective of limiting exposure to general stock market risk while maintaining liquidity. The fund may purchase or sell futures contracts to achieve a desired level of investment, whether to accommodate portfolio turnover or cash flows from capital share transactions. The primary risks associated with the use of futures contracts are imperfect correlation between changes in market values of stocks held by the fund and the prices of futures contracts, and the possibility of an illiquid market.
Futures contracts are valued at their quoted daily settlement prices. The aggregate principal amounts of the contracts are not recorded in the Statement of Net Assets. Fluctuations in the value of the contracts are recorded in the Statement of Net Assets as an asset (liability) and in the Statement of Operations as unrealized appreciation (depreciation) until the contracts are closed, when they are recorded as realized futures gains (losses).
4. Federal Income Taxes: The fund intends to continue to qualify as a regulated investment company and distribute all of its taxable income. Management has analyzed the fund’s tax positions taken on federal income tax returns for all open tax years (tax years ended March 31, 2005–December 31, 2008) and for the period ended June 30, 2009, and has concluded that no provision for federal income tax is required in the fund’s financial statements.
5. Distributions: Distributions to shareholders are recorded on the ex-dividend date.
6. Other: Dividend income (or dividend expense on short positions) is recorded on the ex-dividend date. Interest income includes income distributions received from Vanguard Market Liquidity Fund and is accrued daily. Security transactions are accounted for on the date securities are bought or sold. Costs used to determine realized gains (losses) on the sale of investment securities are those of the specific securities sold. Fees assessed on redemptions of capital shares are credited to paid-in capital.
Each class of shares has equal rights as to assets and earnings, except that each class separately bears certain class-specific expenses related to maintenance of shareholder accounts (included in Management and Administrative expenses), shareholder reporting, and proxies. Marketing and distribution expenses are allocated to each class of shares based on a method approved by the board of trustees. Income, other non-class-specific expenses, and gains and losses on investments are allocated to each class of shares based on its relative net assets.
B. AXA Rosenberg Investment Management LLC (AXA) provides investment advisory services to a portion of the fund for a fee calculated at an annual percentage rate of average net assets managed by the advisor. The basic fee for AXA is subject to quarterly adjustments based on performance since December 31, 2007, relative to the Citigroup 3-Month Treasury Bill Index.
The Vanguard Group provides investment advisory services to a portion of the fund on an at-cost basis.
For the six months ended June 30, 2009, the aggregate investment advisory fee represented an effective annual basic rate of 0.24% of the fund’s average net assets, before a decrease of $32,000 (0.08%) based on performance.
25
Market Neutral Fund
C. The Vanguard Group furnishes at cost corporate management, administrative, marketing, and distribution services. The costs of such services are allocated to the fund under methods approved by the board of trustees. The fund has committed to provide up to 0.40% of its net assets in capital contributions to Vanguard. At June 30, 2009, the fund had contributed capital of $19,000 to Vanguard (included in Other Assets), representing 0.02% of the fund’s net assets and 0.01% of Vanguard’s capitalization. The fund’s trustees and officers are also directors and officers of Vanguard.
D. Various inputs may be used to determine the value of the fund’s investments. These inputs are summarized in three broad levels for financial statement purposes. The inputs or methodologies used to value securities are not necessarily an indication of the risk associated with investing in those securities.
Level 1—Quoted prices in active markets for identical securities.
Level 2—Other significant observable inputs (including quoted prices for similar securities, interest rates, prepayment speeds, credit risk, etc.).
Level 3—Significant unobservable inputs (including the fund’s own assumptions used to determine the fair value of investments).
At June 30, 2009, 100% of the fund’s investments were valued based on Level 1 inputs.
E. Distributions are determined on a tax basis and may differ from net investment income and realized capital gains for financial reporting purposes. Differences may be permanent or temporary. Permanent differences are reclassified among capital accounts in the financial statements to reflect their tax character. Temporary differences arise when certain items of income, expense, gain, or loss are recognized in different periods for financial statement and tax purposes; these differences will reverse at some time in the future. Differences in classification may also result from the treatment of short-term gains as ordinary income for tax purposes.
The fund’s tax-basis capital gains and losses are determined only at the end of each fiscal year. For tax purposes, at December 31, 2008, the fund had available realized losses of $3,175,000 to offset future net capital gains through December 31, 2017. The fund will use these capital losses to offset net taxable capital gains, if any, realized during the year ending December 31, 2009; should the fund realize net capital losses for the year, the losses will be added to the loss carryforward balance above.
The fund had realized losses totaling $2,452,000 through December 31, 2008, which are deferred for tax purposes and reduce the amount of unrealized appreciation on investment securities for tax purposes.
At June 30, 2009, the cost of long security positions for tax purposes was $95,409,000. Net unrealized depreciation of long security positions for tax purposes was $605,000, consisting of unrealized gains of $6,455,000 on securities that had risen in value since their purchase and $7,060,000 in unrealized losses on securities that had fallen in value since their purchase. Tax-basis net unrealized depreciation on securities sold short was $4,074,000, consisting of unrealized gains of $4,364,000 on securities that had fallen in value since their sale and $8,438,000 in unrealized losses on securities that had risen in value since their sale.
26
F. During the six months ended June 30, 2009, the fund purchased $52,253,000 of investment securities and sold $71,909,000 of investment securities, other than temporary cash investments. The proceeds of short sales and the cost of purchases to cover short sales were $59,553,000 and $88,849,000, respectively.
G. Capital share transactions for each class of shares were:
| Six Months Ended | April 1, 2008, to | Year Ended |
| June 30, 2009 | December 31, 20081 | March 31, 2008 |
| Amount | Shares | Amount | Shares | Amount | Shares |
| ($000) | (000) | ($000) | (000) | ($000) | (000) |
Investor Shares | | | | | | |
Issued | 24,629 | 2,422 | 63,080 | 5,143 | 42,479 | 3,395 |
Issued in Lieu of Cash Distributions | 68 | 7 | 4,119 | 370 | 436 | 36 |
Redeemed2 | (23,275) | (2,279) | (29,453) | (2,488) | (7,436) | (593) |
Net Increase (Decrease)— | | | | | | |
Investor Shares | 1,422 | 150 | 37,746 | 3,025 | 35,479 | 2,838 |
Institutional Shares | | | | | | |
Issued | 1,915 | 191 | 8,972 | 726 | 9,106 | 742 |
Issued in Lieu of Cash Distributions | 12 | 1 | 1,046 | 95 | 318 | 26 |
Redeemed2 | (3,416) | (341) | (2,747) | (235) | (7,720) | (608) |
Net Increase (Decrease)— | | | | | | |
Institutional Shares | (1,489) | (149) | 7,271 | 586 | 1,704 | 160 |
1 The fund’s fiscal year-end changed from March 31 to December 31, effective December 31, 2008. |
2 Net of redemption fees of $50,000, $5,000, and $4,000 (fund totals). |
H. In preparing the financial statements as of June 30, 2009, management considered the impact of subsequent events occurring through August 5, 2009, for potential recognition or disclosure in these financial statements. In July 2009, three Vanguard Managed Payout Funds redeemed $14.2 million of their investment in Vanguard Market Neutral Fund, representing approximately 18% of the fund’s net assets as of the redemption date.
27
About Your Fund’s Expenses
As a shareholder of the fund, you incur ongoing costs, which include costs for portfolio management, administrative services, and shareholder reports (like this one), among others. Operating expenses, which are deducted from a fund’s gross income, directly reduce the investment return of the fund.
A fund’s expenses are expressed as a percentage of its average net assets. This figure is known as the expense ratio. The following examples are intended to help you understand the ongoing costs (in dollars) of investing in your fund and to compare these costs with those of other mutual funds. The examples are based on an investment of $1,000 made at the beginning of the period shown and held for the entire period.
The accompanying table illustrates your fund’s costs in two ways:
• Based on actual fund return. This section helps you to estimate the actual expenses that you paid over the period. The “Ending Account Value” shown is derived from the fund’s actual return, and the third column shows the dollar amount that would have been paid by an investor who started with $1,000 in the fund. You may use the information here, together with the amount you invested, to estimate the expenses that you paid over the period.
To do so, simply divide your account value by $1,000 (for example, an $8,600 account value divided by $1,000 = 8.6), then multiply the result by the number given for your fund under the heading “Expenses Paid During Period.”
• Based on hypothetical 5% yearly return. This section is intended to help you compare your fund’s costs with those of other mutual funds. It assumes that the fund had a yearly return of 5% before expenses, but that the expense ratio is unchanged. In this case—because the return used is not the fund’s actual return—the results do not apply to your investment. The example is useful in making comparisons because the Securities and Exchange Commission requires all mutual funds to calculate expenses based on a 5% return. You can assess your fund’s costs by comparing this hypothetical example with the hypothetical examples that appear in shareholder reports of other funds.
Six Months Ended June 30, 2009 | | | |
| Beginning | Ending | Expenses |
| Account Value | Account Value | Paid During |
Market Neutral Fund | 12/31/2008 | 6/30/2009 | Period1 |
Based on Actual Fund Return | | | |
Investor Shares | $1,000.00 | $906.26 | $13.42 |
Institutional Shares | 1,000.00 | 907.14 | 12.96 |
Based on Hypothetical 5% Yearly Return | | | |
Investor Shares | $1,000.00 | $1,010.71 | $14.16 |
Institutional Shares | 1,000.00 | 1,011.21 | 13.66 |
1 The calculations are based on expenses incurred in the most recent six-month period. The fund’s annualized six-month expense ratios for that period are 2.84% for Investor Shares and 2.74% for Institutional Shares. The dollar amounts shown as “Expenses Paid” are equal to the annualized expense ratio multiplied by the average account value over the period, multiplied by the number of days in the most recent six-month period, then divided by the number of days in the most recent 12-month period.
28
Note that the expenses shown in the table are meant to highlight and help you compare ongoing costs only and do not reflect transaction costs incurred by the fund for buying and selling securities. Further, the expenses do not include the 1% fee assessed on redemptions of shares held for less than one year.
The calculations assume no shares were bought or sold during the period. Your actual costs may have been higher or lower, depending on the amount of your investment and the timing of any purchases or redemptions.
You can find more information about the fund’s expenses, including annual expense ratios, in the Financial Statements section of this report. For additional information on operating expenses and other shareholder costs, please refer to your fund’s current prospectus.
29
Trustees Approve Advisory Arrangements
The board of trustees of Vanguard Market Neutral Fund has renewed the fund’s investment advisory arrangements with AXA Rosenberg Investment Management LLC and The Vanguard Group, Inc. (through its Quantitative Equity Group). The board determined that the retention of the advisors was in the best interests of the fund and its shareholders.
The board based its decision upon an evaluation of each advisor’s investment staff, portfolio management process, and performance. The trustees considered the factors discussed below, among others. However, no single factor determined whether the board approved the arrangements. Rather, it was the totality of the circumstances that drove the board’s decision.
Nature, extent, and quality of services
The board considered the quality of the fund’s investment management over both the short and long term, and took into account the organizational depth and stability of each advisor. The board noted the following:
AXA Rosenberg Investment Management LLC. Founded in 1985, AXA Rosenberg is an independently operated subsidiary of the AXA Group. The firm employs an investment philosophy grounded in fundamental analysis using a two-part quantitative model: a valuation model and an earnings forecast model. The valuation model compares the current stock price with its fair value calculated through an independent asset appraisal. The earnings forecast model uses a mix of fundamental indicators and market data to identify companies that are likely to have superior year-ahead earnings. The two models are combined to develop an individual predicted return for each company. This process results in an optimized portfolio with little exposure to equity market risk, long positions in companies that are expected to outperform, and short positions in companies that are expected to underperform. AXA Rosenberg has advised the fund since 1998.
The Vanguard Group, Inc. Vanguard has been managing investments for more than three decades. The Quantitative Equity Group adheres to a sound, disciplined investment management process; the team has considerable experience, stability, and depth. Vanguard has managed a portion of the fund since 2007.
The board concluded that each advisor’s experience, stability, depth, and performance, among other factors, warranted continuation of the advisory arrangements.
Investment performance
The board considered the short- and long-term performance of the fund, including any periods of outperformance or underperformance of a relevant benchmark and peer group. The board concluded that the advisors have carried out the fund’s investment strategy in disciplined fashion; however, the fund’s results versus its average peer fund and its benchmark, Citigroup 3-Month Treasury Bill Index, have been less favorable over the last 12 months. Information about the fund’s most recent performance can be found in the Performance Summary section of this report.
Cost
The board concluded that the fund’s expense ratio was reasonable compared with the average expense ratio charged by funds in its peer group. The board noted that the fund’s advisory fee rate was well below the peer-group average. Information about the fund’s expense ratio appears in the About Your Fund’s Expenses section of this report as well as in the Financial Statements section, which also includes information about the advisory fee rate.
30
The board did not consider profitability of AXA Rosenberg in determining whether to approve the advisory fee, because AXA Rosenberg is independent of Vanguard, and the advisory fee is the result of arm’slength negotiations. The board does not conduct a profitability analysis of Vanguard, because of Vanguard’s unique “at-cost” structure. Unlike most other mutual fund management companies, Vanguard is owned by the funds it oversees, and produces “profits” only in the form of reduced expenses of fund shareholders.
The benefit of economies of scale
The board concluded that the fund’s shareholders benefit from economies of scale because of breakpoints in the advisory fee schedule for AXA Rosenberg. The breakpoints reduce the effective rate of the fee as the fund’s assets managed by AXA Rosenberg increase.
The board also concluded that the fund’s low-cost arrangement with Vanguard ensures that the fund will realize economies of scale as it grows, with the cost to shareholders declining as the fund’s assets managed by Vanguard increase.
The board will consider whether to renew the advisory arrangements again after a one-year period.
31
Glossary
Beta. A measure of the magnitude of a fund’s past share-price fluctuations in relation to the ups and downs of a given market index. The index is assigned a beta of 1.00. Compared with a given index, a fund with a beta of 1.20 typically would have seen its share price rise or fall by 12% when the index rose or fell by 10%. For this report, beta is based on returns over the past 36 months for both the fund and the index. Note that a fund’s beta should be reviewed in conjunction with its R-squared (see definition below). The lower the R-squared, the less correlation there is between the fund and the index, and the less reliable beta is as an indicator of volatility.
Earnings Growth Rate. The average annual rate of growth in earnings over the past five years for the stocks now in a fund.
Equity Exposure. A measure that reflects a fund’s investments in stocks and stock futures. Any holdings in short-term reserves are excluded.
Expense Ratio. The percentage of a fund’s average net assets used to pay its annual administrative and advisory expenses. These expenses directly reduce returns to investors.
Foreign Holdings. The percentage of a fund represented by stocks or depositary receipts of companies based outside the United States.
Inception Date. The date on which the assets of a fund (or one of its share classes) are first invested in accordance with the fund’s investment objective. For funds with a subscription period, the inception date is the day after that period ends. Investment performance is measured from the inception date.
Median Market Cap. An indicator of the size of companies in which a fund invests; the midpoint of market capitalization (market price x shares outstanding) of a fund’s stocks, weighted by the proportion of the fund’s assets invested in each stock. Stocks representing half of the fund’s assets have market capitalizations above the median, and the rest are below it.
Price/Book Ratio. The share price of a stock divided by its net worth, or book value, per share. For a fund, the weighted average price/book ratio of the stocks it holds.
Price/Earnings Ratio. The ratio of a stock’s current price to its per-share earnings over the past year. For a fund, the weighted average P/E of the stocks it holds. P/E is an indicator of market expectations about corporate prospects; the higher the P/E, the greater the expectations for a company’s future growth.
R-Squared. A measure of how much of a fund’s past returns can be explained by the returns from the market in general, as measured by a given index. If a fund’s total returns were precisely synchronized with an index’s returns, its R-squared would be 1.00. If the fund’s returns bore no relationship to the index’s returns, its R-squared would be 0. For this report, R-squared is based on returns over the past 36 months for both the fund and the index.
Return on Equity. The annual average rate of return generated by a company during the past five years for each dollar of shareholder’s equity (net income divided by shareholder’s equity). For a fund, the weighted average return on equity for the companies whose stocks it holds.
32
Short-Term Reserves. The percentage of a fund invested in highly liquid, short-term securities that can be readily converted to cash.
Turnover Rate. An indication of the fund’s trading activity. Funds with high turnover rates incur higher transaction costs and may be more likely to distribute capital gains (which may be taxable to investors). The turnover rate excludes in-kind transactions, which have minimal impact on costs.
33
This page intentionally left blank.
This page intentionally left blank.
The People Who Govern Your Fund
The trustees of your mutual fund are there to see that the fund is operated and managed in your best interests since, as a shareholder, you are a part owner of the fund. Your fund’s trustees also serve on the board of directors of The Vanguard Group, Inc., which is owned by the Vanguard funds and provides services to them on an at-cost basis.
A majority of Vanguard’s board members are independent, meaning that they have no affiliation with Vanguard or the funds they oversee, apart from the sizable personal investments they have made as private individuals. The independent board members have distinguished backgrounds in business, academia, and public service. Each of the trustees and executive officers oversees 157 Vanguard funds.
The following table provides information for each trustee and executive officer of the fund. More information about the trustees is in the Statement of Additional Information, which can be obtained, without charge, by contacting Vanguard at 800-662-7447, or online at www.vanguard.com.
Interested Trustees | Emerson U. Fullwood |
| Born 1948. Trustee Since January 2008. Principal |
| Occupation(s) During the Past Five Years: Retired |
John J. Brennan1 | Executive Chief Staff and Marketing Officer for North |
Born 1954. Trustee Since May 1987. Chairman of | America and Corporate Vice President of Xerox |
the Board. Principal Occupation(s) During the Past | Corporation (photocopiers and printers); Director of |
Five Years: Chairman of the Board and Director/Trustee | SPX Corporation (multi-industry manufacturing), the |
of The Vanguard Group, Inc., and of each of the | United Way of Rochester, the Boy Scouts of America, |
investment companies served by The Vanguard Group; | Amerigroup Corporation (direct health and medical |
Chief Executive Officer and President of The Vanguard | insurance carriers), and Monroe Community College |
Group and of each of the investment companies served | Foundation. |
by The Vanguard Group (1996–2008); Chairman of | |
the Financial Accounting Foundation; Governor of | |
the Financial Industry Regulatory Authority (FINRA); | Rajiv L. Gupta |
Director of United Way of Southeastern Pennsylvania. | Born 1945. Trustee Since December 2001.2 Principal |
| Occupation(s) During the Past Five Years: Retired |
| Chairman and Chief Executive Officer of Rohm and |
F. William McNabb III1 | Haas Co. (chemicals); President of Rohm and Haas Co. |
Born 1957. Trustee Since July 2009. Principal | (2006–2008); Board Member of American Chemistry |
Occupation(s) During the Past Five Years: Director of | Council; Director of Tyco International, Ltd. (diversified |
The Vanguard Group, Inc., since 2008; Chief Executive | manufacturing and services) and Hewlett-Packard Co. |
Officer and President of The Vanguard Group and of | (electronic computer manufacturing); Trustee of The |
each of the investment companies served by The | Conference Board. |
Vanguard Group since 2008; Director of Vanguard | |
Marketing Corporation; Managing Director of The | |
Vanguard Group (1995–2008). | Amy Gutmann |
| Born 1949. Trustee Since June 2006. Principal |
| Occupation(s) During the Past Five Years: President of |
Independent Trustees | the University of Pennsylvania; Christopher H. Browne |
| Distinguished Professor of Political Science in the School |
| of Arts and Sciences with Secondary Appointments |
Charles D. Ellis | at the Annenberg School for Communication and the |
Born 1937. Trustee Since January 2001. Principal | Graduate School of Education of the University of |
Occupation(s) During the Past Five Years: Applecore | Pennsylvania; Director of Carnegie Corporation of |
Partners (pro bono ventures in education); Senior | New York, Schuylkill River Development Corporation, |
Advisor to Greenwich Associates (international business | and Greater Philadelphia Chamber of Commerce; |
strategy consulting); Successor Trustee of Yale University; | Trustee of the National Constitution Center. |
Overseer of the Stern School of Business at New York | |
University; Trustee of the Whitehead Institute for | |
Biomedical Research. | |
JoAnn Heffernan Heisen | Executive Officers | |
Born 1950. Trustee Since July 1998. Principal | | |
Occupation(s) During the Past Five Years: Retired | | |
Corporate Vice President, Chief Global Diversity Officer, | Thomas J. Higgins1 | |
and Member of the Executive Committee of Johnson | Born 1957. Chief Financial Officer Since September |
& Johnson (pharmaceuticals/consumer products); | 2008. Principal Occupation(s) During the Past Five |
Vice President and Chief Information Officer of Johnson | Years: Principal of The Vanguard Group, Inc.; Chief |
& Johnson (1997–2005); Director of the University | Financial Officer of each of the investment companies |
Medical Center at Princeton and Women’s Research | served by The Vanguard Group since 2008; Treasurer |
and Education Institute. | of each of the investment companies served by The |
| Vanguard Group (1998–2008). |
| |
André F. Perold | |
Born 1952. Trustee Since December 2004. Principal | Kathryn J. Hyatt1 |
Occupation(s) During the Past Five Years: George Gund | Born 1955. Treasurer Since November 2008. Principal |
Professor of Finance and Banking, Harvard Business | Occupation(s) During the Past Five Years: Principal of |
School; Director and Chairman of UNX, Inc. (equities | The Vanguard Group, Inc.; Treasurer of each of the |
trading firm); Chair of the Investment Committee of | investment companies served by The Vanguard |
HighVista Strategies LLC (private investment firm). | Group since 2008; Assistant Treasurer of each of the |
| investment companies served by The Vanguard Group |
| (1988–2008). | |
Alfred M. Rankin, Jr. | | |
Born 1941. Trustee Since January 1993. Principal | | |
Occupation(s) During the Past Five Years: Chairman, | Heidi Stam1 | |
President, Chief Executive Officer, and Director of | Born 1956. Secretary Since July 2005. Principal |
NACCO Industries, Inc. (forklift trucks/housewares/ | Occupation(s) During the Past Five Years: Managing |
lignite); Director of Goodrich Corporation (industrial | Director of The Vanguard Group, Inc., since 2006; |
products/aircraft systems and services). | General Counsel of The Vanguard Group since 2005; |
| Secretary of The Vanguard Group and of each of the |
| investment companies served by The Vanguard Group |
Peter F. Volanakis | since 2005; Director and Senior Vice President of |
Born 1955. Trustee Since July 2009. Principal | Vanguard Marketing Corporation since 2005; Principal |
Occupations During the Past Five Years: President | of The Vanguard Group (1997–2006). |
since 2007 and Chief Operating Officer since 2005 | | |
of Corning Incorporated (communications equipment); | | |
President of Corning Technologies (2001–2005); Director | Vanguard Senior Management Team |
of Corning Incorporated and Dow Corning; Trustee of | | |
the Corning Incorporated Foundation and the Corning | | |
Museum of Glass; Overseer of the Amos Tuck School | R. Gregory Barton | Michael S. Miller |
of Business Administration at Dartmouth College. | Mortimer J. Buckley | James M. Norris |
| Kathleen C. Gubanich | Glenn W. Reed |
| Paul A. Heller | George U. Sauter |
| | |
| | |
| Founder | |
| | |
| John C. Bogle | |
| Chairman and Chief Executive Officer, 1974–1996 |
1 These individuals are “interested persons” as defined in the Investment Company Act of 1940.
2 December 2002 for Vanguard Equity Income Fund, Vanguard Growth Equity Fund, the Vanguard Municipal Bond Funds, and the Vanguard State Tax-Exempt Funds.
| 
|
| P.O. Box 2600 |
| Valley Forge, PA 19482-2600 |
Connect with Vanguard® > www.vanguard.com
Fund Information > 800-662-7447 | All comparative mutual fund data are from Lipper Inc. |
| or Morningstar, Inc., unless otherwise noted. |
Direct Investor Account Services > 800-662-2739 | |
| |
Institutional Investor Services > 800-523-1036 | You can obtain a free copy of Vanguard’s proxy voting |
| guidelines by visiting our website, www.vanguard.com, |
Text Telephone for People | and searching for “proxy voting guidelines,” or by |
With Hearing Impairment > 800-952-3335 | calling Vanguard at 800-662-2739. The guidelines are |
| also available from the SEC’s website, www.sec.gov. |
| In addition, you may obtain a free report on how your |
This material may be used in conjunction | fund voted the proxies for securities it owned during |
with the offering of shares of any Vanguard | the 12 months ended June 30. To get the report, visit |
fund only if preceded or accompanied by | either www.vanguard.com or www.sec.gov. |
the fund’s current prospectus. | |
| |
| You can review and copy information about your fund |
| at the SEC’s Public Reference Room in Washington, D.C. |
| To find out more about this public service, call the SEC |
| at 202-551-8090. Information about your fund is also |
| available on the SEC’s website, and you can receive |
| copies of this information, for a fee, by sending a |
| request in either of two ways: via e-mail addressed to |
| publicinfo@sec.gov or via regular mail addressed to the |
| Public Reference Section, Securities and Exchange |
| Commission, Washington, DC 20549-0102. |
| |
| |
| |
| |
| |
| |
| |
| |
| |
| |
| |
| |
| © 2009 The Vanguard Group, Inc. |
| All rights reserved. |
| Vanguard Marketing Corporation, Distributor. |
| |
| Q6342 082009 |
(a) Disclosure Controls and Procedures. The Principal Executive and Financial Officers concluded that the Registrant's Disclosure Controls and Procedures are effective based on their evaluation of the Disclosure Controls and Procedures as of a date within 90 days of the filing date of this report.
(b) Internal Control Over Financial Reporting. There were no significant changes in Registrant’s Internal Control Over Financial Reporting or in other factors that could significantly affect this control subsequent to the date of the evaluation, including any corrective actions with regard to significant deficiencies and material weaknesses.
Pursuant to the requirements of the Securities Exchange Act of 1934 and the Investment Company Act of 1940, the registrant has duly caused this report to be signed on its behalf by the undersigned, thereunto duly authorized.
Pursuant to the requirements of the Securities Exchange Act of 1934 and the Investment Company Act of 1940, this report has been signed below by the following persons on behalf of the registrant and in the capacities and on the dates indicated.
Heidi Stam, pursuant to a Power of Attorney filed on July 24, 2009, see file Number
2-88373, Incorporated by Reference.