UNITED STATES
SECURITIES AND EXCHANGE COMMISSION
Washington, D.C. 20549
FORM N-CSR
CERTIFIED SHAREHOLDER REPORT
OF
REGISTERED MANAGEMENT INVESTMENT COMPANIES
Investment Company Act file number: 811-22114
Name of Registrant: Vanguard Montgomery Funds
Address of Registrant:
P.O. Box 2600
Valley Forge, PA 19482
Name and address of agent for service:
Anne E. Robinson, Esquire
P.O. Box 876
Valley Forge, PA 19482
Registrant’s telephone number, including area code: (610) 669-1000
Date of fiscal year end: December 31
Date of reporting period: January 1, 2018—June 30, 2018
Item 1: Reports to Shareholders
| Semiannual Report | June 30, 2018 |
| Vanguard Market Neutral Fund |
Vanguard’s Principles for Investing Success
We want to give you the best chance of investment success. These principles, grounded in Vanguard’s research and experience, can put you on the right path.
Goals. Create clear, appropriate investment goals.
Balance. Develop a suitable asset allocation using broadly diversified funds. Cost. Minimize cost.
Discipline. Maintain perspective and long-term discipline.
A single theme unites these principles: Focus on the things you can control.
We believe there is no wiser course for any investor.
| Contents | |
| Your Fund’s Performance at a Glance. | 1 |
| CEO’s Perspective. | 2 |
| Advisor’s Report. | 4 |
| Fund Profile. | 6 |
| Performance Summary. | 8 |
| Financial Statements. | 9 |
| About Your Fund’s Expenses. | 26 |
| Trustees Approve Advisory Arrangement. | 28 |
| Glossary. | 30 |
Please note: The opinions expressed in this report are just that—informed opinions. They should not be considered promises or advice. Also, please keep in mind that the information and opinions cover the period through the date on the front of this report. Of course, the risks of investing in your fund are spelled out in the prospectus.
See the Glossary for definitions of investment terms used in this report.
About the cover: Nautical images have been part of Vanguard’s rich heritage since its start in 1975. For an incoming ship, a lighthouse offers a beacon and safe path to shore. You can similarly depend on Vanguard to put you first––and light the way––as you strive to meet your financial goals. Our client focus and low costs, stemming from our unique ownership structure, assure that your interests are paramount.
Your Fund’s Performance at a Glance
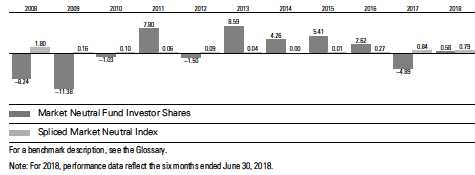
• For the six months ended June 30, 2018, Vanguard Market Neutral Fund returned 0.58% for Investor Shares, underperforming its mandate of beating the returns of 3-month U.S. Treasury bills, which gained 0.79%. The fund exceeded its market neutral peers, which returned an average of –1.16%.
• The fund’s stock selection model focuses on five signals that rank a universe of stocks.
Three of those signals—sentiment, growth, and management decisions—contributed to performance. The quality and valuation signals hurt results; valuation detracted as most growth stocks outpaced value.
• Stock selection was negative in six of 11 sectors, with financials and health care detracting the most. Financials were held back by uncertainty amid U.S.-China trade tensions, reduced market volatility at the end of the period, and a flattening yield curve.
• Poorly performing short positions also muted gains from the fund’s long positions.
| Total Returns: Six Months Ended June 30, 2018 | |
| Total | |
| Returns | |
| Vanguard Market Neutral Fund | |
| Investor Shares | 0.58% |
| Institutional Shares | 0.60 |
| FTSE Three-Month U.S. Treasury Bill Index (Daily) | 0.79 |
| Alternative Equity Market Neutral Funds Average | -1.16 |
Alternative Equity Market Neutral Funds Average: Derived from data provided by Lipper, a Thomson Reuters Company.
Institutional Shares are available to certain institutional investors who meet specific administrative, service, and account-size criteria.
1
CEO’s Perspective

Tim Buckley
President and Chief Executive Officer
Dear Shareholder,
I feel extremely fortunate to have the chance to lead a company filled with people who come to work every day passionate about Vanguard’s core purpose: to take a stand for all investors, to treat them fairly, and to give them the best chance for investment success.
When I joined Vanguard in 1991, I found a mission-driven team focused on improving lives—helping people retire more comfortably, put their children through college, and achieve financial security. I also found a company with purpose in an industry ripe for improvement.
It was clear, even early in my career, that the cards were stacked against most investors. Hidden fees, performance-chasing, and poor advice were relentlessly eroding investors’ dreams.
We knew Vanguard could be different and, as a result, could make a real difference. We have lowered the costs of investing for our shareholders significantly. And we’re proud of the performance of our funds.
Vanguard is built for Vanguard investors—we focus solely on you, our fund shareholders. Everything we do is designed to give our clients the best chance for investment success. In my role as CEO, I’ll keep this priority
2
front and center. We’re proud of what we’ve achieved, but we’re even more excited about what’s to come.
Steady, time-tested guidance
Our guidance for investors, as always, is to stay the course, tune out the hyperbolic headlines, and focus on your goals and what you can control, such as costs and how much you save. This time-tested advice has served our clients well over the decades.
Regardless of how the markets perform in the short term, I’m incredibly optimistic about the future for our investors. We have a dedicated team serving you, and we will never stop striving to make Vanguard the best place for you to invest through our high-quality funds and services, advice and guidance to help you meet your financial goals, and an experience that makes you feel good about entrusting us with your hard-earned savings.
Thank you for your continued loyalty.
Sincerely,

Mortimer J. Buckley
President and Chief Executive Officer
July 13, 2018
| Market Barometer | |||
| Total Returns | |||
| Periods Ended June 30, 2018 | |||
| Six | One | Five Years | |
| Months | Year | (Annualized) | |
| Stocks | |||
| Russell 1000 Index (Large-caps) | 2.85% | 14.54% | 13.37% |
| Russell 2000 Index (Small-caps) | 7.66 | 17.57 | 12.46 |
| Russell 3000 Index (Broad U.S. market) | 3.22 | 14.78 | 13.29 |
| FTSE All-World ex US Index (International) | -3.83 | 7.28 | 6.35 |
| Bonds | |||
| Bloomberg Barclays U.S. Aggregate Bond Index | |||
| (Broad taxable market) | -1.62% | -0.40% | 2.27% |
| Bloomberg Barclays Municipal Bond Index | |||
| (Broad tax-exempt market) | -0.25 | 1.56 | 3.53 |
| FTSE Three-Month U. S. Treasury Bill Index | 0.78 | 1.33 | 0.38 |
| CPI | |||
| Consumer Price Index | 2.22% | 2.87% | 1.54% |
3
Advisor’s Report
Stock markets in the United States and abroad posted positive results for the six months ended June 30, 2018, despite a spike in volatility earlier in the period and uncertainty triggered by escalating trade tensions. The Standard & Poor’s 500 Index returned 2.65% and the MSCI World Index a more muted 0.76%.
U.S. equities’ advance was driven by exceptionally robust corporate earnings and economic conditions. Companies were largely upbeat about U.S. growth prospects but cited rising wages, commodity prices, and logistics costs as potential impediments to earnings. Despite the economy’s underlying strength, there were concerns about the sustainability of growth in light of broader macroeconomic risks, including rising interest rates; signs of slowing global growth, especially in Europe; trade tensions; and political disruptions in the euro zone.
As widely anticipated, the Federal Reserve twice raised its benchmark interest rate during the period by a quarter percentage point, to 1.75%–2%, and it signaled the potential for more increases in 2018. The Fed lifted its growth forecast for 2018 to 2.8% and lowered its unemployment expectation to 3.6%, from 3.8% in March.
U.S. small-capitalization stocks, which being domestically based are less vulnerable to global trade tensions, outperformed large-caps. Growth stocks, aided by the strength of a few large technology companies, significantly outperformed value stocks.
International equity markets lost ground given higher volatility. The FTSE Global All Cap ex US Index returned –3.69%. Concerns about monetary policy and the impact of trade tariffs and rising oil prices countered strong job reports and decent corporate earnings. Emerging markets lagged developed markets, and U.K. stocks trailed those of broader Europe. Stocks throughout the Pacific region performed well in early 2018, but escalating U.S.-China trade rhetoric led the share prices of many export-heavy companies in that region to retreat.
Against that backdrop, Vanguard Market Neutral Fund returned 0.58% for Investor Shares. It fell short of its mandate of exceeding the return of 3-month U.S. Treasury bills, which posted 0.79% and benefited from the rising-rate environment. Please note that the fund’s long-term record still achieves that mandate and that the fund does not try to outperform the equity market.
4
Although it’s important to understand how our overall performance is affected by the broader macroeconomic and market factors we’ve described, our approach to investing focuses on specific stock fundamentals and how companies rank relative to their industry peers.
Our model uses five themes to evaluate companies—growth, quality, management decisions, sentiment, and valuation—to generate a composite expected return for all the stocks in our investment universe. We seek to capitalize on investor biases by taking long positions in the stocks that our model ranks high and by shorting those that score the lowest. We aim to keep your fund’s sector exposures neutral, because our research has shown that sector bets do not add value over the long term.
In the current investment environment, our stock selection was mixed, as five of the 11 industry sectors helped results. Energy, information technology, and consumer staples produced the strongest relative performance, while financials, health care, and real estate hurt the most.
Three of our signals—sentiment, growth, and management decisions—contributed to relative results. The quality and valuation signals detracted, but we still believe that exposure to these signals offers a compelling investment opportunity.
Our long positions in consumer discretionary companies Weight Watchers International, World Wrestling Entertainment, and RH added to performance, as did energy holding California Resources and consumer staples company Medifast. Short positions in health care companies AveXis, Ultragenyx, and DexCom were among the biggest detractors, as were consumer discretionary holdings Wayfair and TripAdvisor.
We remain committed to our investment philosophy and process of identifying companies with strong, consistent fundamental growth at attractive valuations. We believe these remain the tenets of long-term investment success.
Portfolio Managers: James P. Stetler Binbin Guo, Principal, Head of Alpha Strategies Vanguard Quantitative Equity Group July 24, 2018
5
Market Neutral Fund
Fund Profile
As of June 30, 2018
| Share-Class Characteristics | ||
| Investor | Institutional | |
| Shares | Shares | |
| Ticker Symbol | VMNFX | VMNIX |
| Total Expense Ratio 1 | 1.54% | 1.46% |
| Management Expenses | 0.19% | 0.13% |
| Dividend Expenses on | ||
| Securities Sold Short 2 | 1.32% | 1.32% |
| Borrowing Expenses on | ||
| Securities Sold Short 2 | 0.00% | 0.00% |
| Other Expenses | 0.03% | 0.01% |
| Portfolio Characteristics | ||
| Long | Short | |
| Portfolio | Portfolio | |
| Number of Stocks | 277 | 263 |
| Median Market Cap | $4.2B | $4.0B |
| Price/Earnings Ratio | 14.8x | 24.6x |
| Price/Book Ratio | 2.7x | 1.9x |
| Return on Equity | 9.2% | 7.8% |
| Earnings Growth Rate | 8.6% | 7.1% |
| Foreign Holdings | 0.0% | 0.7% |
| Fund Characteristics | ||
| Turnover Rate (Annualized) | 100% | |
| Short-Term Reserves | 5.8% | |
| Volatility Measures | ||
| Spliced | DJ | |
| Market | U.S. Total | |
| Neutral | Market | |
| Index | FA Index | |
| R-Squared | 0.02 | 0.00 |
| Beta | -5.52 | -0.02 |
These measures show the degree and timing of the fund’s fluctuations compared with the index over 36 months.
| Sector Diversification (% of equity exposure) | ||
| Long | Short | |
| Portfolio | Portfolio | |
| Consumer Discretionary | 12.7% | 12.6% |
| Consumer Staples | 4.2 | 4.4 |
| Energy | 7.0 | 6.8 |
| Financials | 15.9 | 15.7 |
| Health Care | 10.6 | 10.6 |
| Industrials | 16.0 | 16.0 |
| Information Technology | 15.5 | 15.6 |
| Materials | 8.3 | 8.5 |
| Real Estate | 5.7 | 5.5 |
| Telecommunication Services | 0.8 | 0.8 |
| Utilities | 3.3 | 3.5 |
Sector categories are based on the Global Industry Classification Standard (“GICS”), except for the “Other” category (if applicable), which includes securities that have not been provided a GICS classification as of the effective reporting period.
1 The total expense ratios shown are from the prospectus dated April 26, 2018, and represent estimated costs for the current fiscal year. For the six months ended June 30, 2018, the annualized expense ratios were 1.73% for Investor Shares and 1.66% for Institutional Shares.
2 In connection with a short sale, the fund may receive income or be charged a fee based on the market value of the borrowed stock. When a cash dividend is declared on a stock the fund has sold short, the fund is required to pay an amount equal to that dividend to the party from which the fund borrowed the stock and to record the payment of the dividend as an expense.
6
Market Neutral Fund
Ten Largest Holdings1 (% of total net assets) Long Portfolio
| Etsy Inc. | Internet Software & | |
| Services | 0.7% | |
| TriNet Group Inc. | Human Resource & | |
| Employment | ||
| Services | 0.7 | |
| Medifast Inc. | Personal Products | 0.7 |
| California Resources | Oil & Gas Exploration | |
| Corp. | & Production | 0.7 |
| Square Inc. | Data Processing & | |
| Outsourced Services | 0.7 | |
| Boston Beer Co. Inc. | Brewers | 0.7 |
| World Wrestling | Movies & | |
| Entertainment Inc. | Entertainment | 0.7 |
| Weight Watchers | Specialized | |
| International Inc. | Consumer Services | 0.7 |
| Booz Allen Hamilton | IT Consulting & | |
| Holding Corp. | Other Services | 0.7 |
| ConocoPhillips | Oil & Gas Exploration | |
| & Production | 0.7 | |
| Top Ten | 7.0% |
Ten Largest Holdings1 (% of total net assets) Short Portfolio
| Wayfair Inc. | Internet & Direct | |
| Marketing Retail | 0.7% | |
| Ensco plc | Oil & Gas Drilling | 0.7 |
| Gentherm Inc. | Auto Parts & | |
| Equipment | 0.7 | |
| j2 Global Inc. | Internet Software & | |
| Services | 0.7 | |
| Ultragenyx | ||
| Pharmaceutical Inc. | Biotechnology | 0.7 |
| LendingClub Corp. | Consumer Finance | 0.7 |
| Wabtec Corp. | Construction | |
| Machinery & Heavy | ||
| Trucks | 0.7 | |
| Aerie Pharmaceuticals | ||
| Inc. | Pharmaceuticals | 0.6 |
| TripAdvisor Inc. | Internet & Direct | |
| Marketing Retail | 0.6 | |
| Ellie Mae Inc. | Application | |
| Software | 0.6 | |
| Top Ten | 6.7% |
1 The holdings listed exclude any temporary cash investments and equity index products.
7
Market Neutral Fund
Performance Summary
All of the returns in this report represent past performance, which is not a guarantee of future results that may be achieved by the fund. (Current performance may be lower or higher than the performance data cited. For performance data current to the most recent month-end, visit our website at vanguard.com/performance.) Note, too, that both investment returns and principal value can fluctuate widely, so an investor’s shares, when sold, could be worth more or less than their original cost. The returns shown do not reflect taxes that a shareholder would pay on fund distributions or on the sale of fund shares.
Fiscal-Year Total Returns (%): December 31, 2007, Through June 30, 2018
| Average Annual Total Returns: Periods Ended June 30, 2018 | ||||
| Inception | One | Five | Ten | |
| Date | Year | Years | Years | |
| Investor Shares | 11/11/1998 | 0.10% | 2.28% | 0.11% |
| Institutional Shares | 10/19/1998 | 0.19 | 2.36 | 0.20 |
See Financial Highlights for dividend and capital gains information.
8
Market Neutral Fund
Financial Statements (unaudited)
Statement of Net Assets
As of June 30, 2018
The fund reports a complete list of its holdings in regulatory filings four times in each fiscal year, at the quarter-ends. For the second and fourth fiscal quarters, the lists appear in the fund’s semiannual and annual reports to shareholders. For the first and third fiscal quarters, the fund files the lists with the Securities and Exchange Commission on Form N-Q. Shareholders can look up the fund’s Forms N-Q on the SEC’s website at sec.gov. Forms N-Q may also be reviewed and copied at the SEC’s Public Reference Room (see the back cover of this report for further information).
| Market | |||
| Value• | |||
| Shares | ($000) | ||
| Common Stocks—Long Positions (98.4%) | |||
| Consumer Discretionary (12.5%) | |||
| † | World Wrestling | ||
| Entertainment Inc. | |||
| Class A | 145,785 | 10,616 | |
| *,† | Weight Watchers | ||
| International Inc. | 104,596 | 10,575 | |
| *,† | Deckers Outdoor Corp. | 89,489 | 10,102 |
| *,^,† RH | 71,540 | 9,994 | |
| † | Lear Corp. | 49,968 | 9,285 |
| † | Ralph Lauren Corp. | ||
| Class A | 72,898 | 9,165 | |
| *,† | Crocs Inc. | 519,894 | 9,155 |
| † | Best Buy Co. Inc. | 121,784 | 9,083 |
| *,^,† Conn’s Inc. | 268,271 | 8,853 | |
| *,† | Liberty Media Corp- | ||
| Liberty SiriusXM A | 194,890 | 8,780 | |
| † | Tailored Brands Inc. | 308,534 | 7,874 |
| † | Bloomin’ Brands Inc. | 390,708 | 7,853 |
| * | Urban Outfitters Inc. | 174,430 | 7,771 |
| † | H&R Block Inc. | 340,905 | 7,766 |
| † | Abercrombie & Fitch Co. | 314,292 | 7,694 |
| † | Winnebago Industries | ||
| Inc. | 185,055 | 7,513 | |
| ^,† | PetMed Express Inc. | 168,078 | 7,404 |
| *,† | Sleep Number Corp. | 197,776 | 5,739 |
| † | News Corp. Class B | 280,450 | 4,445 |
| Hyatt Hotels Corp. | |||
| Class A | 55,430 | 4,276 | |
| *,† | Burlington Stores Inc. | 27,588 | 4,153 |
| † | New York Times Co. | ||
| Class A | 159,177 | 4,123 | |
| Gannett Co. Inc. | 372,812 | 3,989 | |
| John Wiley & Sons Inc. | |||
| Class A | 60,108 | 3,751 | |
| *,† | Penn National Gaming Inc. | 107,627 | 3,615 |
| † | Hilton Worldwide | ||
| Holdings Inc. | 43,302 | 3,428 | |
| BJ’s Restaurants Inc. | 31,190 | 1,871 | |
| Market | |||
| Value• | |||
| Shares | ($000) | ||
| Dana Inc. | 86,246 | 1,741 | |
| * | Career Education Corp. | 98,273 | 1,589 |
| * | Stoneridge Inc. | 45,196 | 1,588 |
| *,† | MSG Networks Inc. | 62,538 | 1,498 |
| Lions Gate Entertainment | |||
| Corp. Class A | 54,101 | 1,343 | |
| New Media Investment | |||
| Group Inc. | 48,958 | 905 | |
| *,† | Cooper-Standard | ||
| Holdings Inc. | 6,643 | 868 | |
| *,† | Michael Kors Holdings | ||
| Ltd. | 12,087 | 805 | |
| 199,210 | |||
| Consumer Staples (4.1%) | |||
| † | Medifast Inc. | 66,914 | 10,717 |
| *,† | Boston Beer Co. Inc. | ||
| Class A | 35,440 | 10,621 | |
| Kroger Co. | 273,881 | 7,792 | |
| *,† | National Beverage Corp. | 67,588 | 7,225 |
| Lamb Weston Holdings | |||
| Inc. | 93,969 | 6,438 | |
| * | Cal-Maine Foods Inc. | 120,455 | 5,523 |
| * | US Foods Holding Corp. | 145,363 | 5,498 |
| † | Costco Wholesale Corp. | 21,237 | 4,438 |
| MGP Ingredients Inc. | 39,500 | 3,508 | |
| * | USANA Health Sciences | ||
| Inc. | 17,227 | 1,986 | |
| * | Darling Ingredients Inc. | 93,736 | 1,864 |
| 65,610 | |||
| Energy (6.9%) | |||
| *,† | California Resources | ||
| Corp. | 234,534 | 10,657 | |
| † | ConocoPhillips | 150,260 | 10,461 |
| *,† | Denbury Resources Inc. | 2,116,574 | 10,181 |
| † | HollyFrontier Corp. | 147,592 | 10,100 |
| † | PBF Energy Inc. Class A | 239,296 | 10,034 |
| † | Valero Energy Corp. | 89,319 | 9,899 |
| ^,† | CVR Energy Inc. | 240,525 | 8,897 |
| * | Whiting Petroleum Corp. | 148,427 | 7,825 |
9
| Market Neutral Fund | |||
| Market | |||
| Value• | |||
| Shares | ($000) | ||
| *,† | Laredo Petroleum Inc. | 664,441 | 6,392 |
| *,† | ProPetro Holding Corp. | 404,817 | 6,347 |
| *,† | Unit Corp. | 236,800 | 6,053 |
| * | W&T Offshore Inc. | 717,679 | 5,131 |
| * | CONSOL Energy Inc. | 71,646 | 2,748 |
| * | Northern Oil and Gas | ||
| Inc. | 549,848 | 1,732 | |
| † | Delek US Holdings Inc. | 32,044 | 1,608 |
| Peabody Energy Corp. | 21,878 | 995 | |
| Arch Coal Inc. Class A | 9,668 | 758 | |
| 109,818 | |||
| Financials (15.6%) | |||
| † | Universal Insurance | ||
| Holdings Inc. | 297,662 | 10,448 | |
| † | Walker & Dunlop Inc. | 184,770 | 10,282 |
| *,† | Green Dot Corp. | ||
| Class A | 134,474 | 9,869 | |
| † | Primerica Inc. | 89,726 | 8,937 |
| † | TCF Financial Corp. | 361,765 | 8,907 |
| † | Zions Bancorporation | 167,494 | 8,825 |
| † | American Equity | ||
| Investment Life | |||
| Holding Co. | 244,594 | 8,805 | |
| † | Aflac Inc. | 204,134 | 8,782 |
| † | SunTrust Banks Inc. | 132,296 | 8,734 |
| † | BankUnited Inc. | 211,415 | 8,636 |
| † | Comerica Inc. | 94,677 | 8,608 |
| † | Regions Financial Corp. | 475,846 | 8,461 |
| † | Torchmark Corp. | 99,605 | 8,109 |
| *,† | BofI Holding Inc. | 194,047 | 7,938 |
| † | Fifth Third Bancorp | 274,639 | 7,882 |
| † | Citizens Financial Group | ||
| Inc. | 198,839 | 7,735 | |
| † | Nelnet Inc. Class A | 121,751 | 7,111 |
| Kemper Corp. | 92,985 | 7,034 | |
| † | Allstate Corp. | 69,257 | 6,321 |
| † | First American Financial | ||
| Corp. | 115,808 | 5,990 | |
| † | Bank of NT Butterfield | ||
| & Son Ltd. | 127,358 | 5,823 | |
| Umpqua Holdings Corp. | 235,481 | 5,320 | |
| † | Washington Federal Inc. | 155,517 | 5,085 |
| † | JPMorgan Chase & Co. | 48,083 | 5,010 |
| *,† | MGIC Investment Corp. | 441,702 | 4,735 |
| * | Western Alliance | ||
| Bancorp | 80,897 | 4,580 | |
| † | Unum Group | 114,713 | 4,243 |
| *,^,† Credit Acceptance Corp. | 11,214 | 3,963 | |
| Virtu Financial Inc. | |||
| Class A | 145,114 | 3,853 | |
| * | NMI Holdings Inc. | ||
| Class A | 195,132 | 3,181 | |
| First Citizens | |||
| BancShares Inc. Class A | 7,625 | 3,075 | |
| † | Synovus Financial Corp. | 55,081 | 2,910 |
| CenterState Bank Corp. | 94,696 | 2,824 | |
| Santander Consumer | |||
| USA Holdings Inc. | 131,774 | 2,516 | |
| FNF Group | 59,412 | 2,235 | |
| † | CNO Financial Group Inc. | 106,897 | 2,035 |
| BB&T Corp. | 35,757 | 1,804 | |
| Assured Guaranty Ltd. | 48,645 | 1,738 | |
| * | Enova International Inc. | 45,080 | 1,648 |
| * | Ambac Financial Group | ||
| Inc. | 80,745 | 1,603 | |
| LPL Financial Holdings | |||
| Inc. | 24,373 | 1,597 | |
| Enterprise Financial | |||
| Services Corp. | 29,415 | 1,587 | |
| * | SVB Financial Group | 5,493 | 1,586 |
| * | First BanCorp | 206,640 | 1,581 |
| * | Encore Capital Group Inc. | 43,181 | 1,580 |
| International | |||
| Bancshares Corp. | 36,870 | 1,578 | |
| Ally Financial Inc. | 48,312 | 1,269 | |
| Preferred Bank | 19,880 | 1,222 | |
| S&T Bancorp Inc. | 19,019 | 822 | |
| 248,417 | |||
| Health Care (10.5%) | |||
| *,† | Medpace Holdings Inc. | 242,576 | 10,431 |
| *,† | Align Technology Inc. | 30,133 | 10,310 |
| *,† | Haemonetics Corp. | 114,359 | 10,256 |
| † | Chemed Corp. | 30,278 | 9,744 |
| *,† | Myriad Genetics Inc. | 254,053 | 9,494 |
| *,† | Charles River | ||
| Laboratories | |||
| International Inc. | 82,014 | 9,207 | |
| *,† | Centene Corp. | 73,327 | 9,035 |
| *,† | Loxo Oncology Inc. | 50,839 | 8,819 |
| † | Humana Inc. | 27,088 | 8,062 |
| *,† | Tivity Health Inc. | 222,192 | 7,821 |
| *,† | Tenet Healthcare Corp. | 231,574 | 7,774 |
| *,† | Halozyme Therapeutics | ||
| Inc. | 453,279 | 7,647 | |
| † | Anthem Inc. | 31,648 | 7,533 |
| † | Bruker Corp. | 235,027 | 6,825 |
| * | Spectrum | ||
| Pharmaceuticals Inc. | 242,524 | 5,083 | |
| *,† | Sangamo Therapeutics | ||
| Inc. | 311,452 | 4,423 | |
| * | Immunomedics Inc. | 185,978 | 4,402 |
| UnitedHealth Group Inc. | 15,217 | 3,733 | |
| * | Madrigal | ||
| Pharmaceuticals Inc. | 12,245 | 3,425 | |
| * | Enanta Pharmaceuticals | ||
| Inc. | 26,631 | 3,086 | |
| † | Cigna Corp. | 16,412 | 2,789 |
| * | CytomX Therapeutics | ||
| Inc. | 116,783 | 2,670 | |
| * | MacroGenics Inc. | 102,418 | 2,115 |
10
| Market Neutral Fund | |||
| Market | |||
| Value• | |||
| Shares | ($000) | ||
| *,† | Corcept Therapeutics | ||
| Inc. | 128,091 | 2,014 | |
| * | STAAR Surgical Co. | 53,504 | 1,659 |
| *,† | PRA Health Sciences | ||
| Inc. | 17,262 | 1,611 | |
| * | Cerus Corp. | 240,040 | 1,601 |
| CONMED Corp. | 21,682 | 1,587 | |
| * | Triple-S Management | ||
| Corp. Class B | 39,198 | 1,531 | |
| * | Providence Service Corp. | 17,329 | 1,361 |
| 166,048 | |||
| Industrials (15.8%) | |||
| *,† | TriNet Group Inc. | 192,559 | 10,772 |
| *,† | Continental Building | ||
| Products Inc. | 322,799 | 10,184 | |
| *,† | Harsco Corp. | 443,520 | 9,802 |
| † | Terex Corp. | 231,229 | 9,756 |
| † | Old Dominion Freight | ||
| Line Inc. | 63,759 | 9,498 | |
| † | WW Grainger Inc. | 28,850 | 8,897 |
| † | SkyWest Inc. | 166,419 | 8,637 |
| † | Boeing Co. | 25,604 | 8,590 |
| † | Allison Transmission | ||
| Holdings Inc. | 210,740 | 8,533 | |
| *,† | Meritor Inc. | 397,200 | 8,170 |
| *,† | Generac Holdings Inc. | 157,881 | 8,167 |
| * | HD Supply Holdings Inc. | 183,961 | 7,890 |
| † | ArcBest Corp. | 170,580 | 7,796 |
| † | GATX Corp. | 104,812 | 7,780 |
| *,† | Rush Enterprises Inc. | ||
| Class A | 178,458 | 7,742 | |
| † | Caterpillar Inc. | 56,721 | 7,695 |
| *,† | Cimpress NV | 52,733 | 7,644 |
| *,† | United Rentals Inc. | 50,804 | 7,500 |
| † | Triton International Ltd. | 242,152 | 7,424 |
| *,† | XPO Logistics Inc. | 65,406 | 6,552 |
| *,† | FTI Consulting Inc. | 103,372 | 6,252 |
| † | Quad/Graphics Inc. | 295,976 | 6,165 |
| † | Oshkosh Corp. | 84,788 | 5,962 |
| *,† | Avis Budget Group Inc. | 174,163 | 5,660 |
| † | Copa Holdings SA | ||
| Class A | 59,645 | 5,644 | |
| *,† | TrueBlue Inc. | 179,922 | 4,849 |
| Insperity Inc. | 49,105 | 4,677 | |
| H&E Equipment | |||
| Services Inc. | 121,188 | 4,558 | |
| * | Axon Enterprise Inc. | 67,842 | 4,286 |
| * | Herc Holdings Inc. | 69,270 | 3,903 |
| * | PGT Innovations Inc. | 172,849 | 3,604 |
| * | Echo Global Logistics | ||
| Inc. | 111,402 | 3,259 | |
| Harris Corp. | 17,274 | 2,497 | |
| † | Greenbrier Cos. Inc. | 46,200 | 2,437 |
| McGrath RentCorp | 37,084 | 2,346 | |
| Manitowoc Co. Inc. | 79,411 | 2,054 | |
| Werner Enterprises Inc. | 43,935 | 1,650 | |
| * | SPX FLOW Inc. | 37,650 | 1,648 |
| Korn/Ferry International | 26,349 | 1,632 | |
| Kforce Inc. | 46,875 | 1,608 | |
| * | Textainer Group | ||
| Holdings Ltd. | 94,035 | 1,495 | |
| * | SPX Corp. | 35,600 | 1,248 |
| * | Atlas Air Worldwide | ||
| Holdings Inc. | 13,527 | 970 | |
| ICF International Inc. | 13,504 | 959 | |
| * | Casella Waste Systems | ||
| Inc. Class A | 34,611 | 886 | |
| Pentair plc | 17,720 | 746 | |
| † | Spirit AeroSystems | ||
| Holdings Inc. Class A | 6,310 | 542 | |
| 250,566 | |||
| Information Technology (15.2%) | |||
| *,† | Etsy Inc. | 255,539 | 10,781 |
| *,† | Square Inc. | 172,588 | 10,638 |
| † | Booz Allen Hamilton | ||
| Holding Corp. Class A | 239,940 | 10,493 | |
| *,† | CACI International Inc. | ||
| Class A | 61,402 | 10,349 | |
| *,† | Five9 Inc. | 294,911 | 10,195 |
| *,† | RingCentral Inc. Class A | 140,487 | 9,883 |
| † | CDW Corp. | 118,575 | 9,580 |
| † | HP Inc. | 398,588 | 9,044 |
| *,† | Micron Technology Inc. | 167,153 | 8,765 |
| *,^,† Match Group Inc. | 223,943 | 8,676 | |
| *,† | Hortonworks Inc. | 466,339 | 8,497 |
| *,† | ON Semiconductor | ||
| Corp. | 374,711 | 8,332 | |
| *,† | Dell Technologies Inc. | ||
| Class V | 96,870 | 8,193 | |
| *,† | Zebra Technologies | ||
| Corp. | 56,226 | 8,054 | |
| *,† | Appfolio Inc. | 121,216 | 7,412 |
| *,† | VMware Inc. Class A | 48,729 | 7,162 |
| *,† | Apptio Inc. Class A | 193,717 | 7,013 |
| *,† | SMART Global | ||
| Holdings Inc. | 207,333 | 6,608 | |
| *,† | First Solar Inc. | 117,884 | 6,208 |
| *,† | Sykes Enterprises Inc. | 207,895 | 5,983 |
| † | Hewlett Packard | ||
| Enterprise Co. | 401,196 | 5,861 | |
| *,† | Electro Scientific | ||
| Industries Inc. | 367,756 | 5,800 | |
| *,† | KEMET Corp. | 219,110 | 5,292 |
| † | TTEC Holdings Inc. | 133,173 | 4,601 |
| * | Syntel Inc. | 142,607 | 4,576 |
| *,† | TTM Technologies Inc. | 259,490 | 4,575 |
| Avnet Inc. | 94,847 | 4,068 | |
| *,† | Amkor Technology Inc. | 418,788 | 3,597 |
| Science Applications | |||
| International Corp. | 40,007 | 3,238 | |
11
| Market Neutral Fund | |||
| Market | |||
| Value• | |||
| Shares | ($000) | ||
| * | Virtusa Corp. | 63,426 | 3,088 |
| ManTech International | |||
| Corp. Class A | 53,566 | 2,873 | |
| * | Altair Engineering Inc. | ||
| Class A | 83,382 | 2,850 | |
| *,† | Extreme Networks Inc. | 340,399 | 2,710 |
| Switch Inc. | 183,542 | 2,234 | |
| *,† | Anixter International Inc. | 30,672 | 1,942 |
| † | CSG Systems | ||
| International Inc. | 42,134 | 1,722 | |
| * | Glu Mobile Inc. | 262,579 | 1,683 |
| * | Infinera Corp. | 166,394 | 1,652 |
| * | F5 Networks Inc. | 9,326 | 1,608 |
| Plantronics Inc. | 20,726 | 1,580 | |
| * | New Relic Inc. | 13,441 | 1,352 |
| *,† | Pure Storage Inc. | ||
| Class A | 54,161 | 1,293 | |
| * | Teradata Corp. | 27,058 | 1,086 |
| * | Cree Inc. | 21,750 | 904 |
| 242,051 | |||
| Materials (8.2%) | |||
| † | CF Industries | ||
| Holdings Inc. | 224,528 | 9,969 | |
| † | Boise Cascade Co. | 220,873 | 9,873 |
| † | Warrior Met Coal Inc. | 349,121 | 9,625 |
| † | Freeport-McMoRan Inc. | 533,667 | 9,211 |
| † | Westlake Chemical Corp. | 84,041 | 9,045 |
| *,† | Alcoa Corp. | 185,407 | 8,692 |
| † | Louisiana-Pacific Corp. | 317,879 | 8,653 |
| † | Huntsman Corp. | 286,737 | 8,373 |
| † | Kronos Worldwide Inc. | 370,070 | 8,338 |
| † | Greif Inc. Class A | 154,003 | 8,145 |
| † | Schnitzer Steel | ||
| Industries Inc. | 236,053 | 7,955 | |
| † | Chemours Co. | 174,463 | 7,739 |
| † | United States Steel Corp. | 208,949 | 7,261 |
| † | Tronox Ltd. Class A | 287,462 | 5,657 |
| *,† | AdvanSix Inc. | 147,599 | 5,407 |
| Domtar Corp. | 69,860 | 3,335 | |
| Materion Corp. | 25,284 | 1,369 | |
| * | SunCoke Energy Inc. | 70,963 | 951 |
| 129,598 | |||
| Real Estate (5.6%) | |||
| † | Xenia Hotels & Resorts | ||
| Inc. | 419,873 | 10,228 | |
| † | Pebblebrook Hotel Trust | 253,271 | 9,827 |
| † | Gaming and Leisure | ||
| Properties Inc. | 244,795 | 8,764 | |
| *,† | CBRE Group Inc. Class A | 180,314 | 8,608 |
| † | Jones Lang LaSalle Inc. | 49,027 | 8,138 |
| *,† | SBA Communications | ||
| Corp. Class A | 49,088 | 8,105 | |
| † | Lexington Realty Trust | 915,674 | 7,994 |
| † | Ryman Hospitality | ||
| Properties Inc. | 74,936 | 6,231 | |
| † | Hospitality Properties | ||
| Trust | 202,378 | 5,790 | |
| Spirit Realty Capital Inc. | 532,675 | 4,277 | |
| † | Select Income REIT | 172,009 | 3,865 |
| Rayonier Inc. | 93,820 | 3,630 | |
| Getty Realty Corp. | 92,825 | 2,615 | |
| Extra Space Storage Inc. | 9,990 | 997 | |
| 89,069 | |||
| Telecommunication Services (0.8%) | |||
| *,† | Boingo Wireless Inc. | 341,430 | 7,713 |
| Telephone & Data | |||
| Systems Inc. | 89,011 | 2,441 | |
| * | Vonage Holdings Corp. | 171,497 | 2,210 |
| * | United States Cellular | ||
| Corp. | 20,952 | 776 | |
| 13,140 | |||
| Utilities (3.2%) | |||
| † | FirstEnergy Corp. | 283,772 | 10,190 |
| † | Exelon Corp. | 235,341 | 10,026 |
| † | NRG Energy Inc. | 301,483 | 9,256 |
| *,† | Vistra Energy Corp. | 355,233 | 8,405 |
| AES Corp. | 370,995 | 4,975 | |
| † | National Fuel Gas Co. | 92,116 | 4,878 |
| † | Entergy Corp. | 42,821 | 3,459 |
| 51,189 | |||
| Total Common Stocks—Long Positions | |||
| (Cost $1,285,560) | 1,564,716 | ||
| Common Stocks Sold Short (-98.5%) | |||
| Consumer Discretionary (-12.4%) | |||
| * | Wayfair Inc. | (92,669) | (11,005) |
| * | Gentherm Inc. | (270,036) | (10,612) |
| * | TripAdvisor Inc. | (184,510) | (10,279) |
| Core-Mark Holding Co. | |||
| Inc. | (423,391) | (9,611) | |
| Monro Inc. | (153,950) | (8,944) | |
| Genuine Parts Co. | (95,811) | (8,794) | |
| Tapestry Inc. | (184,326) | (8,610) | |
| * | Liberty Media Corp- | ||
| Liberty Formula One | (218,721) | (8,121) | |
| * | Caesars Entertainment | ||
| Corp. | (746,037) | (7,983) | |
| * | Liberty Broadband Corp. | (105,340) | (7,976) |
| * | Fiesta Restaurant Group | ||
| Inc. | (276,921) | (7,948) | |
| * | GCI Liberty Inc. - | ||
| Class A | (175,862) | (7,928) | |
| Jack in the Box Inc. | (89,422) | (7,612) | |
| * | DISH Network Corp. | ||
| Class A | (192,175) | (6,459) | |
| Aramark | (172,054) | (6,383) | |
| Bed Bath & Beyond Inc. | (316,373) | (6,304) | |
| LCI Industries | (65,292) | (5,886) | |
| Hasbro Inc. | (59,411) | (5,484) | |
| L Brands Inc. | (127,596) | (4,706) | |
12
| Market Neutral Fund | |||
| Market | |||
| Value• | |||
| Shares | ($000) | ||
| Whirlpool Corp. | (31,056) | (4,541) | |
| * | Tempur Sealy | ||
| International Inc. | (91,786) | (4,410) | |
| * | Under Armour Inc. | (183,435) | (3,867) |
| * | Houghton Mifflin | ||
| Harcourt Co. | (500,420) | (3,828) | |
| Office Depot Inc. | (1,484,188) | (3,785) | |
| Nutrisystem Inc. | (91,399) | (3,519) | |
| NIKE Inc. Class B | (41,080) | (3,273) | |
| Meredith Corp. | (62,055) | (3,165) | |
| * | Fox Factory Holding | ||
| Corp. | (56,749) | (2,642) | |
| * | IMAX Corp. | (105,809) | (2,344) |
| EW Scripps Co. Class A | (170,499) | (2,283) | |
| * | Eldorado Resorts Inc. | (46,514) | (1,819) |
| * | Belmond Ltd. Class A | (159,019) | (1,773) |
| Adient plc | (35,217) | (1,732) | |
| * | Liberty TripAdvisor | ||
| Holdings Inc. Class A | (105,033) | (1,691) | |
| Newell Brands Inc. | (61,212) | (1,579) | |
| * | Liberty Broadband Corp. | ||
| Class A | (9,216) | (697) | |
| (197,593) | |||
| Consumer Staples (-4.4%) | |||
| Universal Corp. | (141,434) | (9,342) | |
| PriceSmart Inc. | (90,802) | (8,217) | |
| Campbell Soup Co. | (199,180) | (8,075) | |
| Casey’s General Stores | |||
| Inc. | (74,502) | (7,829) | |
| Church & Dwight Co. | |||
| Inc. | (142,803) | (7,591) | |
| Coty Inc. Class A | (470,332) | (6,632) | |
| Altria Group Inc. | (107,222) | (6,089) | |
| Molson Coors Brewing | |||
| Co. Class B | (64,052) | (4,358) | |
| Kraft Heinz Co. | (69,035) | (4,337) | |
| Bunge Ltd. | (54,014) | (3,765) | |
| * | Hain Celestial Group Inc. | (79,291) | (2,363) |
| Dean Foods Co. | (96,033) | (1,009) | |
| (69,607) | |||
| Energy (-6.7%) | |||
| Ensco plc Class A | (1,465,090) | (10,637) | |
| SemGroup Corp. | |||
| Class A | (389,182) | (9,885) | |
| Baker Hughes a GE Co. | (292,224) | (9,652) | |
| * | Weatherford | ||
| International plc | (2,832,459) | (9,319) | |
| EQT Corp. | (161,727) | (8,924) | |
| World Fuel Services | |||
| Corp. | (272,011) | (5,552) | |
| * | Centennial Resource | ||
| Development Inc. | |||
| Class A | (307,327) | (5,550) | |
| Nabors Industries Ltd. | (815,256) | (5,226) | |
| * | Extraction Oil & Gas Inc. | (343,503) | (5,046) |
| Scorpio Tankers Inc. | (1,764,102) | (4,957) | ||
| * | Forum Energy | |||
| Technologies Inc. | (389,022) | (4,804) | ||
| Oceaneering | ||||
| International Inc. | (178,949) | (4,556) | ||
| Range Resources Corp. | (272,003) | (4,551) | ||
| ONEOK Inc. | (57,314) | (4,002) | ||
| Green Plains Inc. | (199,814) | (3,657) | ||
| Patterson-UTI Energy | ||||
| Inc. | (148,705) | (2,677) | ||
| * | Dril-Quip Inc. | (45,891) | (2,359) | |
| * | Select Energy Services | |||
| Inc. Class A | (155,850) | (2,264) | ||
| Targa Resources Corp. | (43,816) | (2,168) | ||
| (105,786) | ||||
| Financials (-15.4%) | ||||
| * | LendingClub Corp. | (2,732,509) | (10,356) | |
| First Republic Bank | (98,722) | (9,555) | ||
| Aspen Insurance | ||||
| Holdings Ltd. | (234,290) | (9,536) | ||
| United Bankshares Inc. | (255,784) | (9,311) | ||
| MarketAxess Holdings | ||||
| Inc. | (45,612) | (9,025) | ||
| Renasant Corp. | (197,328) | (8,982) | ||
| Popular Inc. | (198,197) | (8,960) | ||
| Wells Fargo & Co. | (156,218) | (8,661) | ||
| * | Enstar Group Ltd. | (41,481) | (8,599) | |
| Willis Towers Watson plc | (55,482) | (8,411) | ||
| IBERIABANK Corp. | (110,901) | (8,406) | ||
| Home BancShares Inc. | (371,064) | (8,371) | ||
| * | Signature Bank | (63,839) | (8,164) | |
| * | Markel Corp. | (7,485) | (8,116) | |
| First Horizon National | ||||
| Corp. | (453,054) | (8,082) | ||
| * | Arch Capital Group Ltd. | (302,448) | (8,003) | |
| Chubb Ltd. | (60,879) | (7,733) | ||
| Axis Capital Holdings Ltd. | (131,548) | (7,317) | ||
| South State Corp. | (80,887) | (6,976) | ||
| Community Bank | ||||
| System Inc. | (117,721) | (6,954) | ||
| Valley National Bancorp | (562,537) | (6,840) | ||
| Mercury General Corp. | (128,195) | (5,841) | ||
| First Midwest Bancorp | ||||
| Inc. | (217,793) | (5,547) | ||
| Banner Corp. | (86,811) | (5,220) | ||
| Investors Bancorp Inc. | (394,628) | (5,047) | ||
| Old National Bancorp | (267,914) | (4,983) | ||
| Citigroup Inc. | (73,933) | (4,948) | ||
| Jefferies Financial Group | ||||
| Inc. | (202,799) | (4,612) | ||
| James River Group | ||||
| Holdings Ltd. | (114,486) | (4,498) | ||
| * | Brighthouse Financial Inc. | (108,192) | (4,335) | |
| RenaissanceRe Holdings | ||||
| Ltd. | (30,847) | (3,712) | ||
13
| Market Neutral Fund | |||
| Market | |||
| Value• | |||
| Shares | ($000) | ||
| Pinnacle Financial | |||
| Partners Inc. | (51,041) | (3,131) | |
| * | PRA Group Inc. | (74,241) | (2,862) |
| Hope Bancorp Inc. | (136,441) | (2,433) | |
| Midland States | |||
| Bancorp Inc. | (42,262) | (1,448) | |
| * | INTL. FCStone Inc. | (24,311) | (1,257) |
| Sterling Bancorp | (51,795) | (1,217) | |
| PJT Partners Inc. | (21,703) | (1,159) | |
| WisdomTree | |||
| Investments Inc. | (126,067) | (1,145) | |
| Kearny Financial Corp. | (82,355) | (1,108) | |
| Artisan Partners Asset | |||
| Management Inc. | |||
| Class A | (32,108) | (968) | |
| Columbia Banking | |||
| System Inc. | (22,864) | (935) | |
| * | Pacific Premier Bancorp | ||
| Inc. | (23,509) | (897) | |
| First Hawaiian Inc. | (29,582) | (858) | |
| Beneficial Bancorp Inc. | (52,885) | (857) | |
| (245,376) | |||
| Health Care (-10.4%) | |||
| * | Ultragenyx | ||
| Pharmaceutical Inc. | (136,157) | (10,466) | |
| * | Aerie Pharmaceuticals | ||
| Inc. | (152,456) | (10,298) | |
| * | Natus Medical Inc. | (271,833) | (9,378) |
| Owens & Minor Inc. | (543,791) | (9,087) | |
| Becton Dickinson and Co. | (37,928) | (9,086) | |
| * | Nevro Corp. | (112,796) | (9,007) |
| * | Portola Pharmaceuticals | ||
| Inc. | (224,663) | (8,486) | |
| * | Acceleron Pharma Inc. | (170,794) | (8,287) |
| * | Clovis Oncology Inc. | (177,311) | (8,062) |
| * | Hologic Inc. | (202,016) | (8,030) |
| Medtronic plc | (92,166) | (7,890) | |
| * | Brookdale Senior Living | ||
| Inc. | (865,941) | (7,872) | |
| Abbott Laboratories | (128,673) | (7,848) | |
| * | Bluebird Bio Inc. | (47,879) | (7,515) |
| * | TESARO Inc. | (166,564) | (7,407) |
| Dentsply Sirona Inc. | (161,166) | (7,054) | |
| * | Spark Therapeutics Inc. | (76,241) | (6,310) |
| * | Seattle Genetics Inc. | (90,607) | (6,015) |
| * | Sarepta Therapeutics Inc. | (43,477) | (5,747) |
| * | NuVasive Inc. | (82,144) | (4,281) |
| * | Glaukos Corp. | (48,353) | (1,965) |
| * | BioTelemetry Inc. | (43,336) | (1,950) |
| * | Deciphera | ||
| Pharmaceuticals Inc. | (42,421) | (1,669) | |
| * | Insmed Inc. | (47,299) | (1,119) |
| * | Pacira Pharmaceuticals Inc.) | (23,735 | (761) |
| (165,590) | |||
| Industrials (-15.7%) | |||
| Wabtec Corp. | (104,968) | (10,348) | |
| Tennant Co. | (124,749) | (9,855) | |
| Cubic Corp. | (151,192) | (9,707) | |
| Macquarie | |||
| Infrastructure Corp. | (224,406) | (9,470) | |
| * | NOW Inc. | (707,510) | (9,431) |
| Healthcare Services | |||
| Group Inc. | (216,202) | (9,338) | |
| * | Kirby Corp. | (110,442) | (9,233) |
| United Parcel Service | |||
| Inc. Class B | (81,542) | (8,662) | |
| General Electric Co. | (634,244) | (8,632) | |
| Flowserve Corp. | (212,329) | (8,578) | |
| * | WageWorks Inc. | (168,154) | (8,408) |
| * | Esterline Technologies | ||
| Corp. | (112,972) | (8,337) | |
| * | Spirit Airlines Inc. | (224,443) | (8,158) |
| Nielsen Holdings plc | (263,077) | (8,137) | |
| * | Mercury Systems Inc. | (212,328) | (8,081) |
| Knight-Swift | |||
| Transportation | |||
| Holdings Inc. | (208,077) | (7,951) | |
| ABM Industries Inc. | (272,378) | (7,948) | |
| * | Middleby Corp. | (75,154) | (7,848) |
| Hubbell Inc. Class B | (71,979) | (7,611) | |
| * | SiteOne Landscape | ||
| Supply Inc. | (87,225) | (7,324) | |
| Allegiant Travel Co. | |||
| Class A | (51,531) | (7,160) | |
| * | MRC Global Inc. | (319,891) | (6,932) |
| Johnson Controls | |||
| International plc | (201,537) | (6,741) | |
| * | Beacon Roofing Supply | ||
| Inc. | (131,729) | (5,614) | |
| REV Group Inc. | (291,269) | (4,954) | |
| Astec Industries Inc. | (80,303) | (4,802) | |
| * | Team Inc. | (194,363) | (4,490) |
| Acuity Brands Inc. | (36,243) | (4,199) | |
| * | JELD-WEN Holding Inc. | (139,493) | (3,988) |
| * | American Woodmark | ||
| Corp. | (35,071) | (3,211) | |
| Cintas Corp. | (14,987) | (2,774) | |
| Multi-Color Corp. | (42,160) | (2,726) | |
| John Bean Technologies | |||
| Corp. | (27,944) | (2,484) | |
| * | Evoqua Water | ||
| Technologies Corp. | (119,597) | (2,452) | |
| * | Clean Harbors Inc. | (38,670) | (2,148) |
| Apogee Enterprises Inc. | (42,637) | (2,054) | |
| 3M Co. | (9,133) | (1,797) | |
| CIRCOR International Inc. | (45,845) | (1,694) | |
| Carlisle Cos. Inc. | (14,800) | (1,603) | |
14
| Market Neutral Fund | |||
| Market | |||
| Value• | |||
| Shares | ($000) | ||
| Actuant Corp. Class A | (52,160) | (1,531) | |
| * | Welbilt Inc. | (61,895) | (1,381) |
| * | Hub Group Inc. Class A | (20,055) | (999) |
| AZZ Inc. | (18,221) | (792) | |
| (249,583) | |||
| Information Technology (-15.4%) | |||
| j2 Global Inc. | (121,004) | (10,480) | |
| * | Ellie Mae Inc. | (97,904) | (10,166) |
| * | Guidewire Software Inc. | (114,189) | (10,138) |
| * | Electronics For Imaging | ||
| Inc. | (309,312) | (10,071) | |
| * | NetScout Systems Inc. | (328,834) | (9,766) |
| * | Gartner Inc. | (73,211) | (9,730) |
| CA Inc. | (264,854) | (9,442) | |
| * | Finisar Corp. | (520,993) | (9,378) |
| * | 8x8 Inc. | (459,571) | (9,214) |
| * | Black Knight Inc. | (171,344) | (9,176) |
| Analog Devices Inc. | (94,789) | (9,092) | |
| * | Inphi Corp. | (270,105) | (8,808) |
| * | Tyler Technologies Inc. | (39,138) | (8,693) |
| * | Ultimate Software | ||
| Group Inc. | (33,460) | (8,610) | |
| * | Coherent Inc. | (53,107) | (8,307) |
| LogMeIn Inc. | (79,453) | (8,204) | |
| Corning Inc. | (297,630) | (8,188) | |
| Cognex Corp. | (181,648) | (8,103) | |
| * | Nuance Communications | ||
| Inc. | (574,497) | (7,977) | |
| * | ViaSat Inc. | (116,003) | (7,624) |
| SS&C Technologies | |||
| Holdings Inc. | (137,930) | (7,159) | |
| Symantec Corp. | (322,468) | (6,659) | |
| * | Zillow Group Inc. | (104,911) | (6,196) |
| * | Cloudera Inc. | (395,600) | (5,396) |
| AVX Corp. | (321,946) | (5,045) | |
| * | Veeco Instruments Inc. | (293,070) | (4,176) |
| * | ForeScout Technologies | ||
| Inc. | (117,163) | (4,014) | |
| Xperi Corp. | (242,167) | (3,899) | |
| * | Integrated Device | ||
| Technology Inc. | (104,201) | (3,322) | |
| TiVo Corp. | (244,527) | (3,289) | |
| * | Qorvo Inc. | (35,346) | (2,834) |
| * | Worldpay Inc. Class A | (30,254) | (2,474) |
| * | MaxLinear Inc. | (142,588) | (2,223) |
| * | SailPoint Technologies | ||
| Holding Inc. | (67,923) | (1,667) | |
| * | Cardtronics plc Class A | (64,649) | (1,563) |
| Broadcom Inc. | (6,431) | (1,560) | |
| * | MicroStrategy Inc. | ||
| Class A | (12,027) | (1,536) | |
| * | Shutterstock Inc. | (15,220) | (722) |
| (244,901) | |||
| Materials (-8.4%) | |||
| Mosaic Co. | (348,102) | (9,764) | |
| Martin Marietta | |||
| Materials Inc. | (41,932) | (9,365) | |
| Vulcan Materials Co. | (71,477) | (9,225) | |
| DowDuPont Inc. | (131,455) | (8,666) | |
| Compass Minerals | |||
| International Inc. | (128,901) | (8,475) | |
| Tahoe Resources Inc. | (1,641,590) | (8,077) | |
| * | AK Steel Holding Corp. | (1,827,460) | (7,931) |
| Albemarle Corp. | (83,439) | (7,871) | |
| * | Axalta Coating Systems | ||
| Ltd. | (255,509) | (7,744) | |
| NewMarket Corp. | (18,889) | (7,641) | |
| Hecla Mining Co. | (1,999,001) | (6,957) | |
| * | Coeur Mining Inc. | (843,013) | (6,407) |
| International Flavors & | |||
| Fragrances Inc. | (47,886) | (5,936) | |
| HB Fuller Co. | (107,742) | (5,784) | |
| * | Platform Specialty | ||
| Products Corp. | (468,214) | (5,431) | |
| * | US Concrete Inc. | (100,425) | (5,272) |
| Valvoline Inc. | (228,648) | (4,932) | |
| Nucor Corp. | (58,293) | (3,643) | |
| * | Century Aluminum Co. | (149,490) | (2,354) |
| Worthington Industries | |||
| Inc. | (46,544) | (1,953) | |
| (133,428) | |||
| Real Estate (-5.5%) | |||
| American Campus | |||
| Communities Inc. | (234,134) | (10,040) | |
| Colony Capital Inc. | (1,471,122) | (9,180) | |
| Vornado Realty Trust | (121,699) | (8,996) | |
| Healthcare Trust of | |||
| America Inc. Class A | (299,033) | (8,062) | |
| American Homes 4 | |||
| Rent Class A | (362,243) | (8,035) | |
| * | Equity Commonwealth | (250,523) | (7,891) |
| Physicians Realty Trust | (478,109) | (7,621) | |
| Acadia Realty Trust | (236,100) | (6,462) | |
| Federal Realty | |||
| Investment Trust | (46,426) | (5,875) | |
| Mid-America Apartment | |||
| Communities Inc. | (46,161) | (4,647) | |
| Realogy Holdings Corp. | (157,594) | (3,593) | |
| Boston Properties Inc. | (24,718) | (3,100) | |
| QTS Realty Trust Inc. | |||
| Class A | (40,943) | (1,617) | |
| Empire State Realty | |||
| Trust Inc. | (93,428) | (1,598) | |
| (86,717) | |||
15
| Market Neutral Fund | ||
| Market | ||
| Value• | ||
| Shares | ($000) | |
| Telecommunication Services (-0.8%) | ||
| Consolidated | ||
| Communications | ||
| Holdings Inc. | (607,016) | (7,503) |
| CenturyLink Inc. | (302,597) | (5,640) |
| (13,143) | ||
| Utilities (-3.4%) | ||
| Pattern Energy Group | ||
| Inc. Class A | (481,474) | (9,028) |
| PPL Corp. | (305,550) | (8,724) |
| Sempra Energy | (72,733) | (8,445) |
| Edison International | (130,305) | (8,244) |
| Aqua America Inc. | (144,027) | (5,067) |
| NiSource Inc. | (191,276) | (5,027) |
| Ormat Technologies Inc. | (92,619) | (4,926) |
| Southern Co. | (100,454) | (4,652) |
| (54,113) | ||
| Total Common Stocks Sold Short | ||
| (Proceeds $1,517,457) | (1,565,837) | |
| Temporary Cash Investment (6.6%) | ||
| Money Market Fund (6.6%) | ||
| 1,2 Vanguard Market | ||
| Liquidity Fund, 2.122% | ||
| (Cost $104,038) | 1,040,313 | 104,042 |
| †,2Other Assets and Liabilities— | ||
| Net (93.5%) | 1,486,958 | |
| Net Assets (100%) | 1,589,879 | |
| Amount | |
| ($000) | |
| Statement of Assets and Liabilities | |
| Assets | |
| Investments in Securities, | |
| Long Positions, at Value | |
| Unaffiliated Issuers | 1,564,716 |
| Affiliated Vanguard Funds | 104,042 |
| Total Long Positions | 1,668,758 |
| Investment in Vanguard | 88 |
| †Cash Segregated for Short Positions | 1,501,343 |
| Receivables for Investment | |
| Securities Sold | 214,358 |
| Receivables for Accrued Income | 1,575 |
| Receivables for Capital Shares Issued | 5,789 |
| Other Assets | 138 |
| Total Assets | 3,392,049 |
| Liabilities | |
| Securities Sold Short, at Value | 1,565,837 |
| Payables for Investment | |
| Securities Purchased | 218,850 |
| Collateral for Securities on Loan | 12,867 |
| Payables for Capital Shares Redeemed | 2,110 |
| Payables to Vanguard | 418 |
| Accrued Dividend Expense on | |
| Securities Sold Short | 2,088 |
| Total Liabilities | 1,802,170 |
| Net Assets | 1,589,879 |
16
Market Neutral Fund
| At June 30, 2018, net assets consisted of: | |
| Amount | |
| ($000) | |
| Paid-in Capital | 1,633,374 |
| Undistributed Net Investment Income | 4,867 |
| Accumulated Net Realized Losses | (279,142) |
| Unrealized Appreciation (Depreciation) | |
| Investment Securities—Long Positions | 279,160 |
| Investment Securities Sold Short | (48,380) |
| Net Assets | 1,589,879 |
| Investor Shares—Net Assets | |
| Applicable to 108,376,855 outstanding | |
| $.001 par value shares of beneficial | |
| interest (unlimited authorization) | 1,269,852 |
| Net Asset Value Per Share— | |
| Investor Shares | $11.72 |
| Institutional Shares—Net Assets | |
| Applicable to 27,425,274 outstanding | |
| $.001 par value shares of beneficial | |
| interest (unlimited authorization) | 320,027 |
| Net Asset Value Per Share— | |
| Institutional Shares | $11.67 |
• See Note A in Notes to Financial Statements.
† Long security positions with a value of $976,756,000 and cash of $1,501,343,000 are held in a segregated account at the fund’s custodian bank and pledged to a broker-dealer as collateral for the fund’s obligation to return borrowed securities. For so long as such obligations continue, the fund’s access to these assets is subject to authorization from the broker-dealer.
* Non-income-producing security.
^ Includes partial security positions on loan to broker-dealers. The total value of securities on loan is $12,584,000.
1 Affiliated money market fund available only to Vanguard funds and certain trusts and accounts managed by Vanguard. Rate shown is the 7-day yield.
2 Includes $12,867,000 of collateral received for securities on loan.
REIT—Real Estate Investment Trust.
See accompanying Notes, which are an integral part of the Financial Statements.
17
| Market Neutral Fund | |
| Statement of Operations | |
| Six Months Ended | |
| June30,2018 | |
| ($000) | |
| Investment Income | |
| Income | |
| Dividends | 9,475 |
| Interest1 | 9,706 |
| Securities Lending—Net | 180 |
| Total Income | 19,361 |
| Expenses | |
| The Vanguard Group—Note B | |
| Investment Advisory Services | 577 |
| Management and Administrative—Investor Shares | 733 |
| Management and Administrative—Institutional Shares | 96 |
| Marketing and Distribution—Investor Shares | 147 |
| Marketing and Distribution—Institutional Shares | 4 |
| Custodian Fees | 60 |
| Shareholders’ Reports—Investor Shares | 14 |
| Shareholders’ Reports—Institutional Shares | — |
| Trustees’ Fees and Expenses | 1 |
| Dividend Expense on Securities Sold Short | 12,515 |
| Total Expenses | 14,147 |
| Net Investment Income (Loss) | 5,214 |
| Realized Net Gain (Loss) | |
| Investment Securities—Long Positions1 | 150,831 |
| Investment Securities Sold Short | (147,029) |
| Realized Net Gain (Loss) | 3,802 |
| Change in Unrealized Appreciation (Depreciation) | |
| Investment Securities—Long Positions1 | (59,852) |
| Investment Securities Sold Short | 61,504 |
| Change in Unrealized Appreciation (Depreciation) of Investment Securities | 1,652 |
| Net Increase (Decrease) in Net Assets Resulting from Operations | 10,668 |
1 Interest income, realized net gain (loss), and change in unrealized appreciation (depreciation) from an affiliated company of the fund were $363,000, $10,000 and ($1,000), respectively. Purchases and sales are for temporary cash investment purposes.
See accompanying Notes, which are an integral part of the Financial Statements.
18
| Market Neutral Fund | ||
| Statement of Changes in Net Assets | ||
| Six Months Ended | Year Ended | |
| June 30, | December 31, | |
| 2018 | 2017 | |
| ($000) | ($000) | |
| Increase (Decrease) in Net Assets | ||
| Operations | ||
| Net Investment Income | 5,214 | 19,150 |
| Realized Net Gain (Loss) | 3,802 | (207,185) |
| Change in Unrealized Appreciation (Depreciation) | 1,652 | 82,731 |
| Net Increase (Decrease) in Net Assets Resulting from Operations | 10,668 | (105,304) |
| Distributions | ||
| Net Investment Income | ||
| Investor Shares | (842) | (14,751) |
| Institutional Shares | (259) | (3,657) |
| Realized Capital Gain | ||
| Investor Shares | — | — |
| Institutional Shares | — | — |
| Total Distributions | (1,101) | (18,408) |
| Capital Share Transactions | ||
| Investor Shares | (105,930) | (289,113) |
| Institutional Shares | (13,889) | 14,828 |
| Net Increase (Decrease) from Capital Share Transactions | (119,819) | (274,285) |
| Total Increase (Decrease) | (110,252) | (397,997) |
| Net Assets | ||
| Beginning of Period | 1,700,131 | 2,098,128 |
| End of Period1 | 1,589,879 | 1,700,131 |
1 Net Assets—End of Period includes undistributed (overdistributed) net investment income of $4,867,000 and $726,000.
See accompanying Notes, which are an integral part of the Financial Statements.
19
| Market Neutral Fund | ||||||
| Financial Highlights | ||||||
| Investor Shares | ||||||
| Six Months | ||||||
| Ended | ||||||
| For a Share Outstanding | June 30, | Year Ended December 31, | ||||
| Throughout Each Period | 2018 | 2017 | 2016 | 2015 | 2014 | 2013 |
| Net Asset Value, Beginning of Period | $11.66 | $12.39 | $12.12 | $11.50 | $11.03 | $10.16 |
| Investment Operations | ||||||
| Net Investment Income (Loss) | . 0361 | .1111 | .050 | .0021 | (. 032) | (. 007) |
| Net Realized and Unrealized Gain (Loss) | ||||||
| on Investments | .031 | (.717) | . 267 | .620 | . 502 | .880 |
| Total from Investment Operations | .067 | (.606) | .317 | .622 | .470 | .873 |
| Distributions | ||||||
| Dividends from Net Investment Income | (. 007) | (.124) | (. 047) | (. 002) | — | (. 002) |
| Distributions from Realized Capital Gains | — | — | — | — | — | — |
| Return of Capital | — | — | — | — | — | (.001) |
| Total Distributions | (. 007) | (.124) | (. 047) | (. 002) | — | (. 003) |
| Net Asset Value, End of Period | $11.72 | $11.66 | $12.39 | $12.12 | $11.50 | $11.03 |
| Total Return2 | 0.58% | -4.89% | 2.62% | 5.41% | 4.26% | 8.59% |
| Ratios/Supplemental Data | ||||||
| Net Assets, End of Period (Millions) | $1,270 | $1,368 | $1,760 | $650 | $257 | $174 |
| Ratio of Total Expenses to Average Net Assets | ||||||
| Based on Total Expenses3,4 | 1.73% | 1.54% | 1.60% | 1.46% | 1.64% | 1.57% |
| Net of Dividend and Borrowing Expense | ||||||
| on Securities Sold Short | 0.21% | 0.22% | 0.22% | 0.25% | 0.25% | 0.25% |
| Ratio of Net Investment Income (Loss) | ||||||
| to Average Net Assets | 0.62% | 0.94% | 0.48% | 0.01% | (0.38%) | (0.06%) |
| Portfolio Turnover Rate | 100% | 79% | 64% | 68% | 73% | 68% |
The expense ratio, net investment income ratio, and turnover rate for the current period have been annualized.
1 Calculated based on average shares outstanding.
2 Total returns do not include transaction fees that may have applied in the periods shown. Fund prospectuses provide information
about any applicable transaction fees.
3 Includes dividend expense on securities sold short of 1.52%, 1.32%, 1.38%, 1.06%, 1.21%, and 1.18%, respectively.
4 Includes borrowing expense on securities sold short of 0.00%, 0.00%, 0.00%, 0.15%, 0.18%, and 0.14%, respectively.
See accompanying Notes, which are an integral part of the Financial Statements.
20
| Market Neutral Fund | ||||||
| Financial Highlights | ||||||
| Institutional Shares | ||||||
| Six Months | ||||||
| Ended | ||||||
| For a Share Outstanding | June 30, | Year Ended December 31, | ||||
| Throughout Each Period | 2018 | 2017 | 2016 | 2015 | 2014 | 2013 |
| Net Asset Value, Beginning of Period | $11.61 | $12.34 | $12.07 | $11.45 | $10.97 | $10.10 |
| Investment Operations | ||||||
| Net Investment Income (Loss) | . 0411 | .1231 | .061 | .0111 | (. 023) | . 006 |
| Net Realized and Unrealized Gain (Loss) | ||||||
| on Investments | .029 | (.719) | .265 | .621 | .503 | .868 |
| Total from Investment Operations | .070 | (.596) | .326 | .632 | .480 | .874 |
| Distributions | ||||||
| Dividends from Net Investment Income | (. 010) | (.134) | (. 056) | (. 012) | — | (. 003) |
| Distributions from Realized Capital Gains | — | — | — | — | — | — |
| Return of Capital | — | — | — | — | — | (.001) |
| Total Distributions | (. 010) | (.134) | (. 056) | (. 012) | — | (. 004) |
| Net Asset Value, End of Period | $11.67 | $11.61 | $12.34 | $12.07 | $11.45 | $10.97 |
| Total Return2 | 0.60% | -4.83% | 2.70% | 5.52% | 4.38% | 8.66% |
| Ratios/Supplemental Data | ||||||
| Net Assets, End of Period (Millions) | $320 | $332 | $338 | $102 | $55 | $35 |
| Ratio of Total Expenses to Average Net Assets | ||||||
| Based on Total Expenses3,4 | 1.66% | 1.46% | 1.52% | 1.36% | 1.54% | 1.47% |
| Net of Dividend and Borrowing Expense | ||||||
| on Securities Sold Short | 0.14% | 0.14% | 0.14% | 0.15% | 0.15% | 0.15% |
| Ratio of Net Investment Income (Loss) | ||||||
| to Average Net Assets | 0.69% | 1.02% | 0.56% | 0.11% | (0.28%) | 0.04% |
| Portfolio Turnover Rate | 100% | 79% | 64% | 68% | 73% | 68% |
The expense ratio, net investment income ratio, and turnover rate for the current period have been annualized.
1 Calculated based on average shares outstanding.
2 Total returns do not include transaction fees that may have applied in the periods shown. Fund prospectuses provide information
about any applicable transaction fees.
3 Includes dividend expense on securities sold short of 1.52%, 1.32%, 1.38%, 1.06%, 1.21%, and 1.18%, respectively.
4 Includes borrowing expense on securities sold short of 0.00%, 0.00%, 0.00%, 0.15%, 0.18%, and 0.14%, respectively.
See accompanying Notes, which are an integral part of the Financial Statements.
21
Market Neutral Fund
Notes to Financial Statements
Vanguard Market Neutral Fund is registered under the Investment Company Act of 1940 as an open-end investment company, or mutual fund. The fund offers two classes of shares: Investor Shares and Institutional Shares. Investor Shares are available to any investor who meets the fund’s minimum purchase requirements. Institutional Shares are designed for investors who meet certain administrative, service, and account-size criteria.
A. The following significant accounting policies conform to generally accepted accounting principles for U.S. investment companies. The fund consistently follows such policies in preparing its financial statements.
1. Security Valuation: Securities are valued as of the close of trading on the New York Stock Exchange (generally 4 p.m., Eastern time) on the valuation date. Equity securities are valued at the latest quoted sales prices or official closing prices taken from the primary market in which each security trades; such securities not traded on the valuation date are valued at the mean of the latest quoted bid and asked prices. Securities for which market quotations are not readily available, or whose values have been materially affected by events occurring before the fund’s pricing time but after the close of the securities’ primary markets, are valued by methods deemed by the board of trustees to represent fair value. Investments in Vanguard Market Liquidity Fund are valued at that fund’s net asset value.
2. Short Sales: Short sales are the sales of securities that the fund does not own. The fund sells a security it does not own in anticipation of a decline in the value of that security. In order to deliver the security to the purchaser, the fund borrows the security from a broker-dealer. The fund must segregate, as collateral for its obligation to return the borrowed security, an amount of cash and long security positions at least equal to the market value of the security sold short. In the absence of a default, the collateral segregated by the fund cannot be repledged, resold or rehypothecated. This results in the fund holding a significant portion of its assets in cash. The fund later closes out the position by returning the security to the lender, typically by purchasing the security in the open market. A gain, limited to the price at which the fund sold the security short, or a loss, theoretically unlimited in size, is recognized upon the termination of the short sale. The fund may receive a portion of the income from the investment of collateral, or be charged a fee on borrowed securities, based on the market value of each borrowed security and a variable rate that is dependent upon the availability of such security. The net amounts of income or fees are recorded as interest income (for net income received) or borrowing expense on securities sold short (for net fees charged) on the Statement of Operations. Dividends on securities sold short are reported as an expense in the Statement of Operations.
Cash collateral segregated for securities sold short is recorded as an asset in the Statement of Assets and Liabilities. Long security positions segregated as collateral are shown in the Statement of Net Assets.
3. Federal Income Taxes: The fund intends to continue to qualify as a regulated investment company and distribute all of its taxable income. Management has analyzed the fund’s tax positions taken for all open federal income tax years (December 31, 2014–2017), and for the period ended June 30, 2018, and has concluded that no provision for federal income tax is required in the fund’s financial statements.
4. Distributions: Distributions to shareholders are recorded on the ex-dividend date.
5. Securities Lending: To earn additional income, the fund lends its securities to qualified institutional borrowers. Security loans are subject to termination by the fund at any time, and are required to be secured at all times by collateral in an amount at least equal to the market value of securities loaned.
22
Market Neutral Fund
Daily market fluctuations could cause the value of loaned securities to be more or less than the value of the collateral received. When this occurs, the collateral is adjusted and settled before the opening of the market on the next business day. The fund further mitigates its counterparty risk by entering into securities lending transactions only with a diverse group of prequalified counterparties, monitoring their financial strength, and entering into master securities lending agreements with its counterparties. The master securities lending agreements provide that, in the event of a counterparty’s default (including bankruptcy), the fund may terminate any loans with that borrower, determine the net amount owed, and sell or retain the collateral up to the net amount owed to the fund; however, such actions may be subject to legal proceedings. While collateral mitigates counterparty risk, in the event of a default, the fund may experience delays and costs in recovering the securities loaned. The fund invests cash collateral received in Vanguard Market Liquidity Fund, and records a liability in the Statement of Assets and Liabilities for the return of the collateral, during the period the securities are on loan. Securities lending income represents fees charged to borrowers plus income earned on invested cash collateral, less expenses associated with the loan. During the term of the loan, the fund is entitled to all distributions made on or in respect of the loaned securities.
6. Credit Facility: The fund and certain other funds managed by The Vanguard Group (“Vanguard”) participate in a $3.1 billion committed credit facility provided by a syndicate of lenders pursuant to a credit agreement that may be renewed annually; each fund is individually liable for its borrowings, if any, under the credit facility. Borrowings may be utilized for temporary and emergency purposes, and are subject to the fund’s regulatory and contractual borrowing restrictions. The participating funds are charged administrative fees and an annual commitment fee of 0.10% of the undrawn amount of the facility; these fees are allocated to the funds based on a method approved by the fund’s board of trustees and included in Management and Administrative expenses on the fund’s Statement of Operations. Any borrowings under this facility bear interest at a rate based upon the higher of the one-month London Interbank Offered Rate, federal funds effective rate, or overnight bank funding rate plus an agreed-upon spread.
The fund had no borrowings outstanding at June 30, 2018, or at any time during the period then ended.
7. Other: Dividend income is recorded on the ex-dividend date. Interest income includes income distributions received from Vanguard Market Liquidity Fund and is accrued daily. Premiums and discounts on debt securities purchased are amortized and accreted, respectively, to interest income over the lives of the respective securities. Security transactions are accounted for on the date securities are bought or sold. Costs used to determine realized gains (losses) on the sale of investment securities are those of the specific securities sold.
Each class of shares has equal rights as to assets and earnings, except that each class separately bears certain class-specific expenses related to maintenance of shareholder accounts (included in Management and Administrative expenses), shareholder reporting, and the proxy. Marketing and distribution expenses are allocated to each class of shares based on a method approved by the board of trustees. Income, other non-class-specific expenses, and gains and losses on investments are allocated to each class of shares based on its relative net assets.
B. In accordance with the terms of a Funds’ Service Agreement (the “FSA”) between Vanguard and the fund, Vanguard furnishes to the fund investment advisory, corporate management, administrative, marketing, and distribution services at Vanguard’s cost of operations (as defined by the FSA). These costs of operations are allocated to the fund based on methods and guidelines approved by the board of trustees. Vanguard does not require reimbursement in the current period
23
Market Neutral Fund
for certain costs of operations (such as deferred compensation/benefits and risk/insurance costs); the fund’s liability for these costs of operations is included in Payables to Vanguard on the Statement of Assets and Liabilities. All other costs of operations payable to Vanguard are generally settled twice a month.
Upon the request of Vanguard, the fund may invest up to 0.40% of its net assets as capital in Vanguard. At June 30, 2018, the fund had contributed to Vanguard capital in the amount of $88,000 representing 0.01% of the fund’s net assets and 0.04% of Vanguard’s capitalization. The fund’s trustees and officers are also directors and employees, respectively, of Vanguard.
C. Various inputs may be used to determine the value of the fund’s investments. These inputs are summarized in three broad levels for financial statement purposes. The inputs or methodologies used to value securities are not necessarily an indication of the risk associated with investing in those securities.
Level 1—Quoted prices in active markets for identical securities.
Level 2—Other significant observable inputs (including quoted prices for similar securities, interest rates, prepayment speeds, credit risk, etc.).
Level 3—Significant unobservable inputs (including the fund’s own assumptions used to determine the fair value of investments). Any investments valued with significant unobservable inputs are noted on the Statement of Net Assets.
At June 30, 2018, 100% of the market value of the fund’s investments was determined based on Level 1 inputs.
D. Distributions are determined on a tax basis and may differ from net investment income and realized capital gains for financial reporting purposes. Differences may be permanent or temporary. Permanent differences are reclassified among capital accounts in the financial statements to reflect their tax character. Temporary differences arise when certain items of income, expense, gain, or loss are recognized in different periods for financial statement and tax purposes. These differences will reverse at some time in the future. Differences in classification may also result from the treatment of short-term gains as ordinary income for tax purposes.
The fund’s tax-basis capital gains and losses are determined only at the end of each fiscal year. For tax purposes, at December 31, 2017, the fund had available capital losses totaling $282,442,000 to offset future net capital gains. Of this amount, $4,871,000 is subject to expiration on December 31, 2018. Capital losses of $277,571,000 realized beginning in fiscal 2011 may be carried forward indefinitely under the Regulated Investment Company Modernization Act of 2010, but must be used before any expiring loss carryforwards. The fund will use these capital losses to offset net taxable capital gains, if any, realized during the year ending December 31, 2018; should the fund realize net capital losses for the year, the losses will be added to the loss carryforward balance above.
At June 30, 2018, the cost of long security positions for tax purposes was $1,389,598,000. Net unrealized appreciation of long security positions for tax purposes was $279,160,000, consisting of unrealized gains of $314,663,000 on securities that had risen in value since their purchase and $35,503,000 in unrealized losses on securities that had fallen in value since their purchase. Tax-basis net unrealized depreciation on securities sold short was $48,380,000, consisting of unrealized gains of $90,497,000 on securities that had fallen in value since their purchase and $138,877,000 in unrealized losses on securities that had risen in value since their sale.
24
Market Neutral Fund
E. During the six months ended June 30, 2018, the fund purchased $1,540,629,000 of investment securities and sold $2,218,583,000 of investment securities, other than temporary cash investments. The proceeds of short sales and the cost of purchases to cover short sales were $978,879,000 and $1,164,162,000, respectively.
| F. Capital share transactions for each class of shares were: | ||||
| Six Months Ended | Year Ended | |||
| June 30, 2018 | December 31, 2017 | |||
| Amount | Shares | Amount | Shares | |
| ($000) | (000) | ($000) | (000) | |
| Investor Shares | ||||
| Issued | 206,281 | 17,471 | 591,027 | 49,285 |
| Issued in Lieu of Cash Distributions | 714 | 60 | 12,597 | 1,078 |
| Redeemed | (312,925) | (26,470) | (892,737) | (75,101) |
| Net Increase (Decrease)—Investor Shares | (105,930) | (8,939) | (289,113) | (24,738) |
| Institutional Shares | ||||
| Issued | 69,460 | 5,903 | 103,508 | 8,699 |
| Issued in Lieu of Cash Distributions | 220 | 19 | 2,924 | 251 |
| Redeemed | (83,569) | (7,115) | (91,604) | (7,730) |
| Net Increase (Decrease)—Institutional Shares | (13,889) | (1,193) | 14,828 | 1,220 |
At June 30, 2018, one shareholder was the record or beneficial owner of 28% of the fund’s net assets. If the shareholder were to redeem its investment in the fund, the redemption might result in an increase in the fund’s expense ratio, cause the fund to incur higher transaction costs, or lead to the realization of taxable capital gains.
G. Management has determined that no events or transactions occurred subsequent to June 30, 2018, that would require recognition or disclosure in these financial statements.
25
About Your Fund’s Expenses
As a shareholder of the fund, you incur ongoing costs, which include costs for portfolio management, administrative services, and shareholder reports (like this one), among others. Operating expenses, which are deducted from a fund’s gross income, directly reduce the investment return of the fund.
A fund’s expenses are expressed as a percentage of its average net assets. This figure is known as the expense ratio. The following examples are intended to help you understand the ongoing costs (in dollars) of investing in your fund and to compare these costs with those of other mutual funds. The examples are based on an investment of $1,000 made at the beginning of the period shown and held for the entire period.
The accompanying table illustrates your fund’s costs in two ways:
• Based on actual fund return. This section helps you to estimate the actual expenses that you paid over the period. The ”Ending Account Value“ shown is derived from the fund‘s actual return, and the third column shows the dollar amount that would have been paid by an investor who started with $1,000 in the fund. You may use the information here, together with the amount you invested, to estimate the expenses that you paid over the period.
To do so, simply divide your account value by $1,000 (for example, an $8,600 account value divided by $1,000 = 8.6), then multiply the result by the number given for your fund under the heading ”Expenses Paid During Period.“
• Based on hypothetical 5% yearly return. This section is intended to help you compare your fund‘s costs with those of other mutual funds. It assumes that the fund had a yearly return of 5% before expenses, but that the expense ratio is unchanged. In this case—because the return used is not the fund’s actual return—the results do not apply to your investment. The example is useful in making comparisons because the Securities and Exchange Commission requires all mutual funds to calculate expenses based on a 5% return. You can assess your fund’s costs by comparing this hypothetical example with the hypothetical examples that appear in shareholder reports of other funds.
Note that the expenses shown in the table are meant to highlight and help you compare ongoing costs only and do not reflect transaction costs incurred by the fund for buying and selling securities. Further, the expenses do not include any purchase, redemption, or account service fees described in the fund prospectus. If such fees were applied to your account, your costs would be higher. Your fund does not carry a “sales load.”
The calculations assume no shares were bought or sold during the period. Your actual costs may have been higher or lower, depending on the amount of your investment and the timing of any purchases or redemptions.
You can find more information about the fund’s expenses, including annual expense ratios, in the Financial Statements section of this report. For additional information on operating expenses and other shareholder costs, please refer to your fund’s current prospectus.
26
| Six Months Ended June 30, 2018 | |||
| Beginning | Ending | Expenses | |
| Account Value | Account Value | Paid During | |
| Market Neutral Fund | 12/31/2017 | 6/30/2018 | Period |
| Based on Actual Fund Return | |||
| Investor Shares | $1,000.00 | $1,005.77 | $8.60 |
| Institutional Shares | 1,000.00 | 1,006.00 | 8.24 |
| Based on Hypothetical 5% Yearly Return | |||
| Investor Shares | $1,000.00 | $1,016.22 | $8.64 |
| Institutional Shares | 1,000.00 | 1,016.58 | 8.28 |
The calculations are based on expenses incurred in the most recent six-month period. The fund’s annualized six-month expense ratios for that period are 1.73% for Investor Shares and 1.66% for Institutional Shares. The dollar amounts shown as “Expenses Paid” are equal to the annualized expense ratio multiplied by the average account value over the period, multiplied by the number of days in the most recent six-month period, then divided by the number of days in the most recent 12-month period (181/365).
27
Trustees Approve Advisory Arrangement
The board of trustees of Vanguard Market Neutral Fund has renewed the fund’s investment advisory arrangement with The Vanguard Group, Inc. (Vanguard), through its Quantitative Equity Group. The board determined that continuing the fund’s internalized management structure was in the best interests of the fund and its shareholders.
The board based its decision upon an evaluation of the advisor’s investment staff, portfolio management process, and performance. This evaluation included information provided to the board by Vanguard’s Portfolio Review Department, which is responsible for fund and advisor oversight and product management. The Portfolio Review Department met regularly with the advisor and made monthly presentations to the board during the fiscal year that directed the board’s focus to relevant information and topics.
The board, or an investment committee made up of board members, also received information throughout the year during advisor presentations. For each advisor presentation, the board was provided with letters and reports that included information about, among other things, the advisory firm and the advisor’s assessment of the investment environment, portfolio performance, and portfolio characteristics.
In addition, the board received monthly reports, which included a Market and Economic Report, a Fund Dashboard Monthly Summary, and a Fund Performance Report.
Prior to their meeting, the trustees were provided with a memo and materials that summarized the information they received over the course of the year. They also considered the factors discussed below, among others. However, no single factor determined whether the board approved the arrangement. Rather, it was the totality of the circumstances that drove the board’s decision.
Nature, extent, and quality of services
The board reviewed the quality of the fund’s investment management services over both the short and long term and took into account the organizational depth and stability of the advisor. The board considered that Vanguard has been managing investments for more than four decades. The Quantitative Equity Group adheres to a sound, disciplined investment management process; the team has considerable experience, stability, and depth.
The board concluded that Vanguard’s experience, stability, depth, and performance, among other factors, warranted continuation of the advisory arrangement.
Investment performance
The board considered the short- and long-term performance of the fund, including any periods of outperformance or underperformance compared with a relevant benchmark index and peer group. The board concluded that the performance was such that the advisory arrangement should continue. Information about the fund’s most recent performance can be found in the Performance Summary section of this report.
28
Cost
The board concluded that the fund’s expense ratio was reasonable compared with the average expense ratio charged by funds in its peer group and that the fund’s advisory expenses were well below the peer-group average. Information about the fund’s expenses appears in the About Your Fund’s Expenses section of this report as well as in the Financial Statements section.
The board does not conduct a profitability analysis of Vanguard because of Vanguard’s unique “at-cost” structure. Unlike most other mutual fund management companies, Vanguard is owned by the funds it oversees and produces “profits” only in the form of reduced expenses for fund shareholders.
The benefit of economies of scale
The board concluded that the fund’s at-cost arrangement with Vanguard ensures that the fund will realize economies of scale as it grows, with the cost to shareholders declining as the fund’s assets increase.
The board will consider whether to renew the advisory arrangement again after a one-year period.
29
Glossary
Beta. A measure of the magnitude of a fund’s past share-price fluctuations in relation to the ups and downs of a given market index. The index is assigned a beta of 1.00. Compared with a given index, a fund with a beta of 1.20 typically would have seen its share price rise or fall by 12% when the index rose or fell by 10%. For this report, beta is based on returns over the past 36 months for both the fund and the index. Note that a fund’s beta should be reviewed in conjunction with its R-squared (see definition). The lower the R-squared, the less correlation there is between the fund and the index, and the less reliable beta is as an indicator of volatility.
Earnings Growth Rate. The average annual rate of growth in earnings over the past five years for the stocks now in a fund.
Equity Exposure. A measure that reflects a fund’s investments in stocks and stock futures. Any holdings in short-term reserves are excluded.
Expense Ratio. The percentage of a fund’s average net assets used to pay its annual administrative and advisory expenses. These expenses directly reduce returns to investors.
Foreign Holdings. The percentage of a fund represented by securities or depositary receipts of companies based outside the United States.
Inception Date. The date on which the assets of a fund (or one of its share classes) are first invested in accordance with the fund’s investment objective. For funds with a subscription period, the inception date is the day after that period ends. Investment performance is measured from the inception date.
Median Market Cap. An indicator of the size of companies in which a fund invests; the midpoint of market capitalization (market price x shares outstanding) of a fund’s stocks, weighted by the proportion of the fund’s assets invested in each stock. Stocks representing half of the fund’s assets have market capitalizations above the median, and the rest are below it.
Price/Book Ratio. The share price of a stock divided by its net worth, or book value, per share. For a fund, the weighted average price/book ratio of the stocks it holds.
Price/Earnings Ratio. The ratio of a stock’s current price to its per-share earnings over the past year. For a fund, the weighted average P/E of the stocks it holds. P/E is an indicator of market expectations about corporate prospects; the higher the P/E, the greater the expectations for a company’s future growth.
R-Squared. A measure of how much of a fund’s past returns can be explained by the returns from the market in general, as measured by a given index. If a fund’s total returns were precisely synchronized with an index’s returns, its R-squared would be 1.00. If the fund’s returns bore no relationship to the index’s returns, its R-squared would be 0. For this report, R-squared is based on returns over the past 36 months for both the fund and the index.
Return on Equity. The annual average rate of return generated by a company during the past five years for each dollar of shareholder’s equity (net income divided by shareholder’s equity). For a fund, the weighted average return on equity for the companies whose stocks it holds.
Short-Term Reserves. The percentage of a fund invested in highly liquid, short-term securities that can be readily converted to cash.
30
Turnover Rate. An indication of the fund’s trading activity. Funds with high turnover rates incur higher transaction costs and may be more likely to distribute capital gains (which may be taxable to investors). The turnover rate excludes in-kind transactions, which have minimal impact on costs.
Benchmark Information
Spliced Market Neutral Index: Citigroup 3-Month U.S. Treasury Bill Index through March 31, 2016; FTSE 3-Month U.S. Treasury Bill Index (Daily) thereafter.
31
The Global Industry Classification Standard (“GICS”) was developed by and is the exclusive property and a service mark of MSCI Inc. (“MSCI”) and Standard and Poor’s, a division of McGraw-Hill Companies, Inc. (“S&P”), and is licensed for use by Vanguard. Neither MSCI, S&P nor any third party involved in making or compiling the GICS or any GICS classification makes any express or implied warranties or representations with respect to such standard or classification (or the results to be obtained by the use thereof), and all such parties hereby expressly disclaim all warranties of originality, accuracy, completeness, merchantability or fitness for a particular purpose with respect to any such standard or classification. Without limiting any of the foregoing, in no event shall MSCI, S&P, any of its affiliates or any third party involved in making or compiling the GICS or any GICS classification have any liability for any direct, indirect, special, punitive, consequential or any other damages (including lost profits) even if notified of the possibility of such damages.
32
This page intentionally left blank.
This page intentionally left blank.
The People Who Govern Your Fund
The trustees of your mutual fund are there to see that the fund is operated and managed in your best interests since, as a shareholder, you are a part owner of the fund. Your fund’s trustees also serve on the board of directors of The Vanguard Group, Inc., which is owned by the Vanguard funds and provides services to them on an at-cost basis.
A majority of Vanguard’s board members are independent, meaning that they have no affiliation with Vanguard or the funds they oversee, apart from the sizable personal investments they have made as private individuals. The independent board members have distinguished backgrounds in business, academia, and public service. Each of the trustees and executive officers oversees 208 Vanguard funds.
Information for each trustee and executive officer of the fund appears below. The mailing address of the trustees and officers is P.O. Box 876, Valley Forge, PA 19482. More information about the trustees is in the Statement of Additional Information, which can be obtained, without charge, by contacting Vanguard at 800-662-7447, or online at vanguard.com.
Interested Trustees1
F. William McNabb III
Born in 1957. Trustee since July 2009. Principal occupation(s) during the past five years and other experience: chairman of the board (January 2010–present) of Vanguard and of each of the investment companies served by Vanguard, trustee (2009–present) of each of the investment companies served by Vanguard, and director (2008–present) of Vanguard. Chief executive officer and president (2008–2017) of Vanguard and each of the investment companies served by Vanguard, managing director (1995–2008) of Vanguard, and director (1997–2018) of Vanguard Marketing Corporation. Director (2018–present) of UnitedHealth Group.
Mortimer J. Buckley
Born in 1969. Trustee since January 2018. Principal occupation(s) during the past five years and other experience: chief executive officer (January 2018–present) of Vanguard; chief executive officer, president, and trustee (January 2018–present) of each of the investment companies served by Vanguard; president and director (2017–present) of Vanguard; and president (February 2018–present) of Vanguard Marketing Corporation. Chief investment officer (2013–2017), managing director (2002–2017), head of the Retail Investor Group (2006–2012), and chief information officer (2001–2006) of Vanguard. Chairman of the board (2011–2017) of the Children’s Hospital of Philadelphia.
Independent Trustees
Emerson U. Fullwood
Born in 1948. Trustee since January 2008. Principal occupation(s) during the past five years and other experience: executive chief staff and marketing officer for North America and corporate vice president (retired 2008) of Xerox Corporation (document management products and services). Former president of the Worldwide Channels Group, Latin America, and Worldwide Customer Service and executive chief staff officer of Developing Markets of Xerox. Executive in residence and 2009–2010 Distinguished Minett Professor at the Rochester Institute of Technology. Lead director of SPX FLOW, Inc. (multi-industry manufacturing). Director of the University of Rochester Medical Center, the Monroe Community College Foundation, the United Way of Rochester, North Carolina A&T University, and Roberts Wesleyan College. Trustee of the University of Rochester.
Amy Gutmann
Born in 1949. Trustee since June 2006. Principal occupation(s) during the past five years and other experience: president (2004–present) of the University of Pennsylvania. Christopher H. Browne Distinguished Professor of Political Science, School of Arts and Sciences, and professor of communication, Annenberg School for Communication, with secondary faculty appointments in the Department of Philosophy, School of Arts and Sciences, and at the Graduate School of Education, University of Pennsylvania. Trustee of the National Constitution Center.
1 Mr. McNabb and Mr. Buckley are considered “interested persons,” as defined in the Investment Company Act of 1940, because they are officers of the Vanguard funds.
JoAnn Heffernan Heisen
Born in 1950. Trustee since July 1998. Principal occupation(s) during the past five years and other experience: corporate vice president of Johnson & Johnson (pharmaceuticals/medical devices/consumer products) and member of its executive committee (1997–2008). Chief global diversity officer (retired 2008), vice president and chief information officer (1997–2006), controller (1995–1997), treasurer (1991–1995), and assistant treasurer (1989–1991) of Johnson & Johnson. Director of Skytop Lodge Corporation (hotels) and the Robert Wood Johnson Foundation. Member of the advisory board of the Institute for Women’s Leadership at Rutgers University.
F. Joseph Loughrey
Born in 1949. Trustee since October 2009. Principal occupation(s) during the past five years and other experience: president and chief operating officer (retired 2009) and vice chairman of the board (2008–2009) of Cummins Inc. (industrial machinery). Chairman of the board of Hillenbrand, Inc. (specialized consumer services), Oxfam America, and the Lumina Foundation for Education. Director of the V Foundation for Cancer Research. Member of the advisory council for the College of Arts and Letters and chair of the advisory board to the Kellogg Institute for International Studies, both at the University of Notre Dame.
Mark Loughridge
Born in 1953. Trustee since March 2012. Principal occupation(s) during the past five years and other experience: senior vice president and chief financial officer (retired 2013) of IBM (information technology services). Fiduciary member of IBM’s Retirement Plan Committee (2004–2013), senior vice president and general manager (2002–2004) of IBM Global Financing, vice president and controller (1998–2002) of IBM, and a variety of other prior management roles at IBM. Member of the Council on Chicago Booth.
Scott C. Malpass
Born in 1962. Trustee since March 2012. Principal occupation(s) during the past five years and other experience: chief investment officer (1989–present) and vice president (1996–present) of the University of Notre Dame. Assistant professor of finance at the Mendoza College of Business, University of Notre Dame, and member of the Notre Dame 403(b) Investment Committee. Chairman of the board of TIFF Advisory Services, Inc. Member of the board of Catholic Investment Services, Inc. (investment advisors), the board of advisors for Spruceview Capital Partners, and the board of superintendence of the Institute for the Works of Religion.
Deanna Mulligan
Born in 1963. Trustee since January 2018. Principal occupation(s) during the past five years and other experience: president (2010–present) and chief executive officer (2011–present) of The Guardian Life Insurance Company of America. Chief operating officer (2010–2011) and executive vice president (2008–2010) of Individual Life and Disability of The Guardian Life Insurance Company of America. Member of the board of The Guardian Life Insurance Company of America, the American Council of Life Insurers, the Partnership for New York City (business leadership), and the Committee Encouraging Corporate Philanthropy. Trustee of the Economic Club of New York and the Bruce Museum (arts and science). Member of the Advisory Council for the Stanford Graduate School of Business.
André F. Perold
Born in 1952. Trustee since December 2004. Principal occupation(s) during the past five years and other experience: George Gund Professor of Finance and Banking, Emeritus at the Harvard Business School (retired 2011). Chief investment officer and co-managing partner of HighVista Strategies LLC (private investment firm). Overseer of the Museum of Fine Arts Boston.
Sarah Bloom Raskin
Born in 1961. Trustee since January 2018. Principal occupation(s) during the past five years and other experience: deputy secretary (2014–2017) of the United States Department of the Treasury. Governor (2010–2014) of the Federal Reserve Board. Commissioner (2007–2010) of financial regulation for the State of Maryland. Member of the board of directors (2012–2014) of Neighborhood Reinvestment Corporation. Director of i(x) Investments, LLC.
Peter F. Volanakis
Born in 1955. Trustee since July 2009. Principal occupation(s) during the past five years and other experience: president and chief operating officer (retired 2010) of Corning Incorporated (communications equipment) and director of Corning Incorporated (2000–2010) and Dow Corning (2001–2010). Director (2012) of SPX Corporation (multi-industry manufacturing). Overseer of the Amos Tuck School of Business Administration, Dartmouth College (2001–2013). Chairman of the board of trustees of Colby-Sawyer College. Member of the Board of Hypertherm Inc. (industrial cutting systems, software, and consumables).
Executive Officers
Glenn Booraem
Born in 1967. Principal occupation(s) during the past five years and other experience: principal of Vanguard. Investment stewardship officer (2017–present), treasurer (2015–2017), controller (2010–2015), and assistant controller (2001–2010) of each of the investment companies served by Vanguard.
Christine M. Buchanan
Born in 1970. Principal occupation(s) during the past five years and other experience: principal of Vanguard and global head of Fund Administration at Vanguard. Treasurer (2017–present) of each of the investment companies served by Vanguard. Partner (2005–2017) at KPMG LLP (audit, tax, and advisory services).
Brian Dvorak
Born in 1973. Principal occupation(s) during the past five years and other experience: principal of Vanguard. Chief compliance officer (2017–present) of Vanguard and each of the investment companies served by Vanguard. Assistant vice president (2017–present) of Vanguard Marketing Corporation. Vice president and director of Enterprise Risk Management (2011–2013) at Oppenheimer Funds, Inc.
Thomas J. Higgins
Born in 1957. Principal occupation(s) during the past five years and other experience: principal of Vanguard. Chief financial officer (2008–present) and treasurer (1998–2008) of each of the investment companies served by Vanguard.
Peter Mahoney
Born in 1974. Principal occupation(s) during the past five years and other experience: principal of Vanguard. Controller (2015–present) of each of the investment companies served by Vanguard. Head of International Fund Services (2008–2014) at Vanguard.
Anne E. Robinson
Born in 1970. Principal occupation(s) during the past five years and other experience: general counsel (2016–present) of Vanguard. Secretary (2016–present) of Vanguard and of each of the investment companies served by Vanguard. Managing director (2016–present) of Vanguard. Director and senior vice president (2016–2018) of Vanguard Marketing Corporation. Managing director and general counsel of Global Cards and Consumer Services (2014–2016) at Citigroup. Counsel (2003–2014) at American Express.
Michael Rollings
Born in 1963. Principal occupation(s) during the past five years and other experience: finance director (2017–present) and treasurer (2017) of each of the investment companies served by Vanguard. Managing director (2016–present) of Vanguard. Chief financial officer (2016–present) of Vanguard. Director (2016–present) of Vanguard Marketing Corporation. Executive vice president and chief financial officer (2006–2016) of MassMutual Financial Group.
| Vanguard Senior Management Team | |
| Mortimer J. Buckley | James M. Norris |
| Gregory Davis | Thomas M. Rampulla |
| John James | Karin A. Risi |
| Martha G. King | Anne E. Robinson |
| John T. Marcante | Michael Rollings |
| Chris D. McIsaac | |
| Chairman Emeritus and Senior Advisor | |
| John J. Brennan | |
| Chairman, 1996–2009 | |
| Chief Executive Officer and President, 1996–2008 | |
| Founder | |
| John C. Bogle | |
| Chairman and Chief Executive Officer, 1974–1996 | |
 | |
P.O. Box 2600 | |
Connect with Vanguard® > vanguard.com | |
| Fund Information > 800-662-7447 | Source for Bloomberg Barclays indexes: Bloomberg |
| Direct Investor Account Services > 800-662-2739 | Index Services Limited. Copyright 2018, Bloomberg. |
| All rights reserved. | |
| Institutional Investor Services > 800-523-1036 | |
| Text Telephone for People | |
| Who Are Deaf or Hard of Hearing > 800-749-7273 | |
| This material may be used in conjunction | |
| with the offering of shares of any Vanguard | |
| fund only if preceded or accompanied by | |
| the fund’s current prospectus. | |
| All comparative mutual fund data are from Lipper, a | |
| Thomson Reuters Company, or Morningstar, Inc., unless | |
| otherwise noted. | |
| You can obtain a free copy of Vanguard’s proxy voting | |
| guidelines by visiting vanguard.com/proxyreporting or by | |
| calling Vanguard at 800-662-2739. The guidelines are | |
| also available from the SEC’s website, sec.gov. In | |
| addition, you may obtain a free report on how your fund | |
| voted the proxies for securities it owned during the 12 | |
| months ended June 30. To get the report, visit either | |
| vanguard.com/proxyreporting or sec.gov. | |
| You can review and copy information about your fund at | |
| the SEC’s Public Reference Room in Washington, D.C. To | |
| find out more about this public service, call the SEC at | |
| 202-551-8090. Information about your fund is also | |
| available on the SEC’s website, and you can receive | |
| copies of this information, for a fee, by sending a | |
| request in either of two ways: via email addressed to | |
| publicinfo@sec.gov or via regular mail addressed to the | |
| Public Reference Section, Securities and Exchange | |
| Commission, Washington, DC 20549-1520. | |
| © 2018 The Vanguard Group, Inc. | |
| All rights reserved. | |
| Vanguard Marketing Corporation, Distributor. | |
| Q6342 082018 | |
Item 2: Code of Ethics.
Not Applicable.
Item 3: Audit Committee Financial Expert.
Not Applicable.
Item 4: Principal Accountant Fees and Services.
(a) Audit Fees.
Not Applicable.
Item 5: Audit Committee of Listed Registrants.
Not Applicable.
Item 6: Investments.
Not Applicable.
Item 7: Disclosure of Proxy Voting Policies and Procedures for Closed-End Management Investment Companies.
Not Applicable.
Item 8: Portfolio Managers of Closed-End Management Investment Companies.
Not Applicable.
Item 9: Purchase of Equity Securities by Closed-End Management Investment Company and Affiliated Purchasers.
Not Applicable.
Item 10: Submission of Matters to a Vote of Security Holders.
Not Applicable.
Item 11: Controls and Procedures.
(a) Disclosure Controls and Procedures. The Principal Executive and Financial Officers concluded that the Registrant’s Disclosure Controls and Procedures are effective based on their evaluation of the Disclosure Controls and Procedures as of a date within 90 days of the filing date of this report.
(b) Internal Control Over Financial Reporting. There were no significant changes in Registrant’s Internal Control Over Financial Reporting or in other factors that could significantly affect this control subsequent to the date of the evaluation, including any corrective actions with regard to significant deficiencies and material weaknesses.
Item 12: Disclosure of Securities Lending Activities for Closed-End Management Investment Companies.
Not Applicable.
Item 13: Exhibits.
(a) Certifications.
Pursuant to the requirements of the Securities Exchange Act of 1934 and the Investment Company Act of 1940, the registrant has duly caused this report to be signed on its behalf by the undersigned, thereunto duly authorized.
| VANGUARD MONTGOMERY FUNDS | |
| By: | /s/ MORTIMER J. BUCKLEY* |
| MORTIMER J. BUCKLEY | |
| CHIEF EXECUTIVE OFFICER | |
| Date: August 20, 2018 | |
Pursuant to the requirements of the Securities Exchange Act of 1934 and the Investment Company Act of 1940, this report has been signed below by the following persons on behalf of the registrant and in the capacities and on the dates indicated.
| VANGUARD MONTGOMERY FUNDS | |
| By: | /s/ MORTIMER J. BUCKLEY* |
| MORTIMER J. BUCKLEY | |
| CHIEF EXECUTIVE OFFICER | |
| Date: August 20, 2018 | |
| VANGUARD MONTGOMERY FUNDS | |
| By: | /s/ THOMAS J. HIGGINS* |
| THOMAS J. HIGGINS | |
| CHIEF FINANCIAL OFFICER | |
| Date: August 20, 2018 | |
* By: /s/ Anne E. Robinson
Anne E. Robinson, pursuant to a Power of Attorney filed on January 18, 2018; see file Number 33-32216,
Incorporated by Reference.