
American Realty Capital Trust, Inc. NASDAQ: ARCT NASDAQ: “ARCT” May 2012
Introductory Notes The data and other information described in these slides speaks as of the date of the slides or an earlier date indicated. Future performance may not be consistent with past performance, and is subject to change and inherent risks and uncertainties. This presentation contains certain statements that are the Company’s and its management’s hopes, intentions, beliefs, expectations, or projections of the future and might be considered to be forward-looking statements under Federal Securities laws. Prospective investors are cautioned that any such forward-looking statements are not guarantees of future performance, and involve risks and uncertainties. The Company’s actual future results may differ significantly from the matters discussed in these forward-looking statements, and we may not release revisions to these forward-looking statements to reflect changes after we’ve made the statements. Factors and risks that could cause actual results to differ materially from expectations are disclosed from time to time in greater detail in the Company’s filings with the Securities and Exchange Commission (the “SEC”) including, but not limited to, the Company’s Annual Report on Form 10-K, [the Company’s Quarterly Report on Form 10-Q to be filed with the SEC,] as well as the Company press releases. May 2012 2
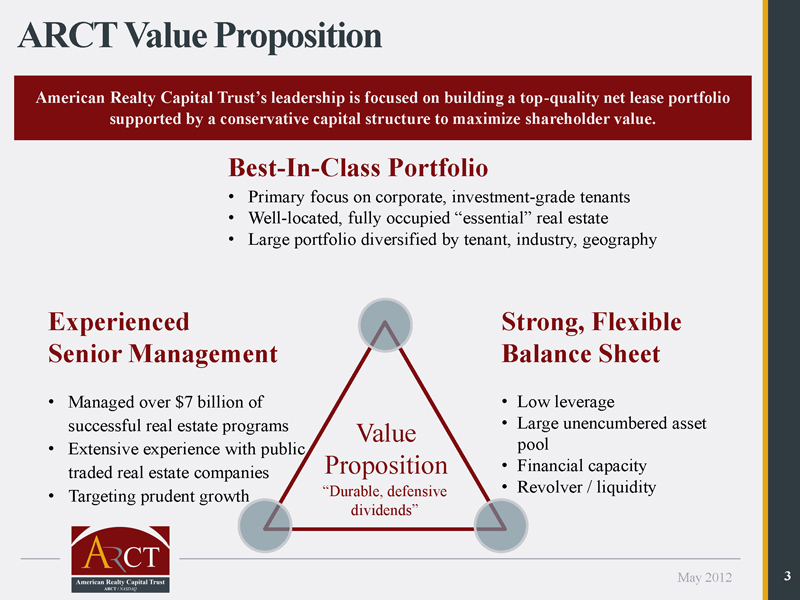
ARCT Value Proposition American Realty Capital Trust’s -quality net lease portfolioleadership is supported by a conservative capital structure to maximize shareholder value. Best-In-Class Portfolio Primary focus on corporate, investment-grade tenants Well-located, fully occupied Large portfolio diversified by tenant, industry, geography Experienced Strong, Flexible Senior Management Balance Sheet Managed over $7 billion of Low leverage successful real estate programs Value Large unencumbered asset Extensive experience with public pool traded real estate companies Proposition Financial capacity “Durable, defensive Revolver / liquidity Targeting prudent growth dividends” May 2012 3

Overview of Recent Events High Quality Portfolio Proven, Focused Business Plan Conservative Capital Structure May 2012 4

Operating Performance In Line With Projections Three Months Ended March 31, 2012 (1) Funds From Operations: $25.6 million, or $0.144 per share, compared to $5.2 million, or $0.029 per share in 2011 Annualized $123.6 million, or $0.780 per share, excluding $100 million projected acquisitions, previously included in earnings guidance Adjusted Funds From Operations: $25.7 million, or $0.144 per share, compared to $12.1 million, or $0.068 per share in 2011 Annualized $124.4 million, or $0.785 per share, excluding $100 million projected purposes only and is not an offer to acquisitions, previously included in earnings guidance informational of an offer to sell any shares. Total Revenue: $45.6 million, up 118% over 2011, $182.4 million annualized solicitation Net Operating Income: $42.9 million, up 108% over 2011, $171.7 million annualized Net (Loss) To Common Shareholders: ($28.1) million, or ($6.0) million excluding costs buy or the for the listing, internalization of management and prepayment of debt Operating Expenses: $53.3 million, or $31.2 million excluding one-time items and This slide show is for acquisition-related costs and including depreciation expense of $26.1 million (1) Annualized amounts generally reflect March 2012 operations on an annualized basis. Management May 2012 5 believes this best reflects -administered publicly traded REIT.the Company’s operations as
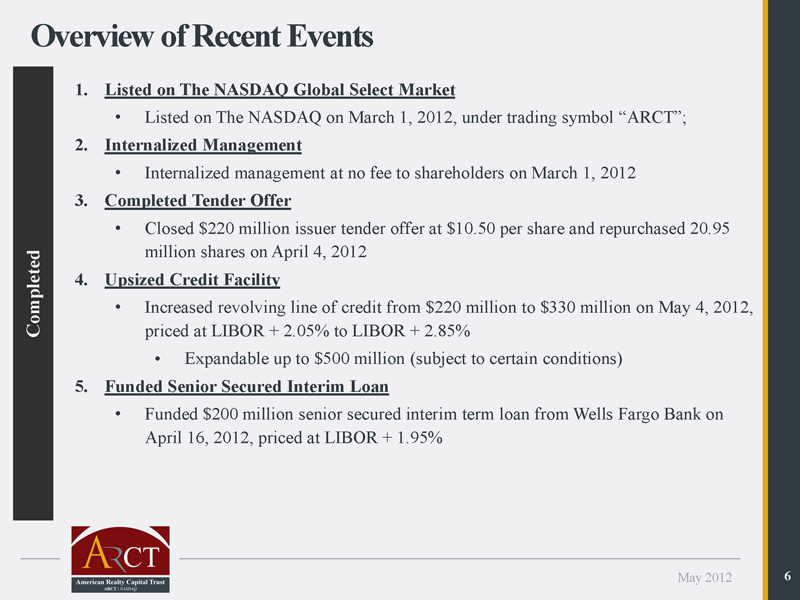
Overview of Recent Events 1. Listed on The NASDAQ Global Select Market Listed on The NASDAQ on March 1, 2012, under 2. Internalized Management Internalized management at no fee to shareholders on March 1, 2012 3. Completed Tender Offer Closed $220 million issuer tender offer at $10.50 per share and repurchased 20.95 million shares on April 4, 2012 Completed 4. Upsized Credit Facility Increased revolving line of credit from $220 million to $330 million on May 4, 2012, priced at LIBOR + 2.05% to LIBOR + 2.85% Expandable up to $500 million (subject to certain conditions) 5. Funded Senior Secured Interim Loan Funded $200 million senior secured interim term loan from Wells Fargo Bank on April 16, 2012, priced at LIBOR + 1.95% May 2012 6
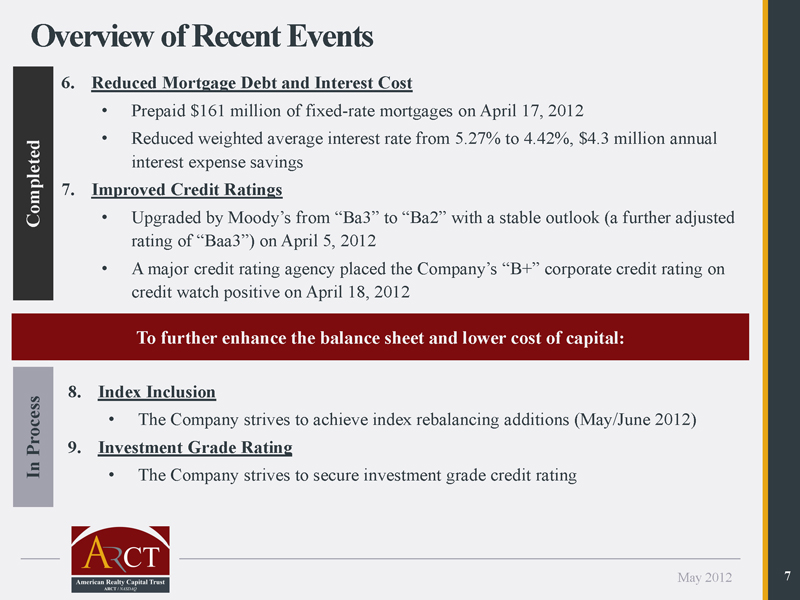
Overview of Recent Events 6. Reduced Mortgage Debt and Interest Cost Prepaid $161 million of fixed-rate mortgages on April 17, 2012 Reduced weighted average interest rate from 5.27% to 4.42%, $4.3 million annual Completed interest expense savings 7. Improved Credit Ratings Upgraded by Moody’s from “Ba3” to “Ba2” rating of “Baa3”) on April 5, 2012 A major credit rating agency placed the credit watch positive on April 18, 2012 To further enhance the balance sheet and lower cost of capital: 8. Index Inclusion Process The Company strives to achieve index rebalancing additions (May/June 2012) 9. Investment Grade Rating In The Company strives to secure investment grade credit rating May 2012 7
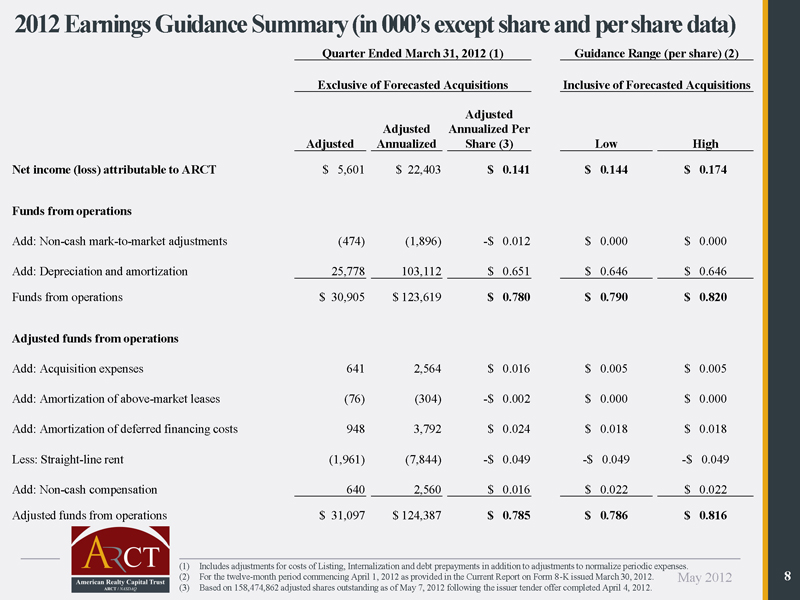
2012 Earnings Guidance Summary (in Quarter Ended March 31, 2012 (1) Guidance Range (per share) (2) Exclusive of Forecasted Acquisitions Inclusive of Forecasted Acquisitions Adjusted Adjusted Annualized Per Adjusted Annualized Share (3) Low High Net income (loss) attributable to ARCT $ 5,601 $ 22,403 $ 0.141 $ 0.144 $ 0.174 Funds from operations Add: Non-cash mark-to-market adjustments (474) (1,896) -$ 0.012 $ 0.000 $ 0.000 Add: Depreciation and amortization 25,778 103,112 $ 0.651 $ 0.646 $ 0.646 Funds from operations $ 30,905 $ 123,619 $ 0.780 $ 0.790 $ 0.820 Adjusted funds from operations Add: Acquisition expenses 641 2,564 $ 0.016 $ 0.005 $ 0.005 Add: Amortization of above-market leases (76) (304) -$ 0.002 $ 0.000 $ 0.000 Add: Amortization of deferred financing costs 948 3,792 $ 0.024 $ 0.018 $ 0.018 Less: Straight-line rent (1,961) (7,844) -$ 0.049 -$ 0.049 -$ 0.049 Add: Non-cash compensation 640 2,560 $ 0.016 $ 0.022 $ 0.022 Adjusted funds from operations $ 31,097 $ 124,387 $ 0.785 $ 0.786 $ 0.816 (1) Includes adjustments for costs of Listing, Internalization and debt prepayments in addition to adjustments to normalize periodic expenses. (2) For the twelve-month period commencing April 1, 2012 as provided in the Current Report on Form 8-K issued March 30, 2012. May 2012 8 (3) Based on 158,474,862 adjusted shares outstanding as of May 7, 2012 following the issuer tender offer completed April 4, 2012.

Overview of Recent Events High Quality Portfolio Proven, Focused Business Plan Conservative Capital Structure May 2012 9
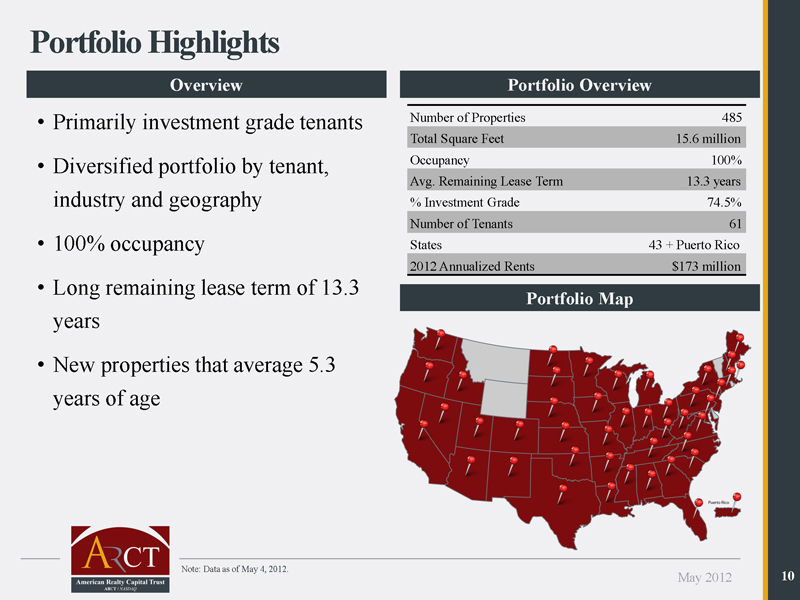
Portfolio Highlights Overview Portfolio Overview Primarily investment grade tenants Number of Properties 485 Total Square Feet 15.6 million Diversified portfolio by tenant, Occupancy 100% Avg. Remaining Lease Term 13.3 years industry and geography % Investment Grade 74.5% Number of Tenants 61 100% occupancy States 43 + Puerto Rico 2012 Annualized Rents $173 million Long remaining lease term of 13.3 Portfolio Map years New properties that average 5.3 years of age Note: Data as of May 4, 2012. May 2012 10
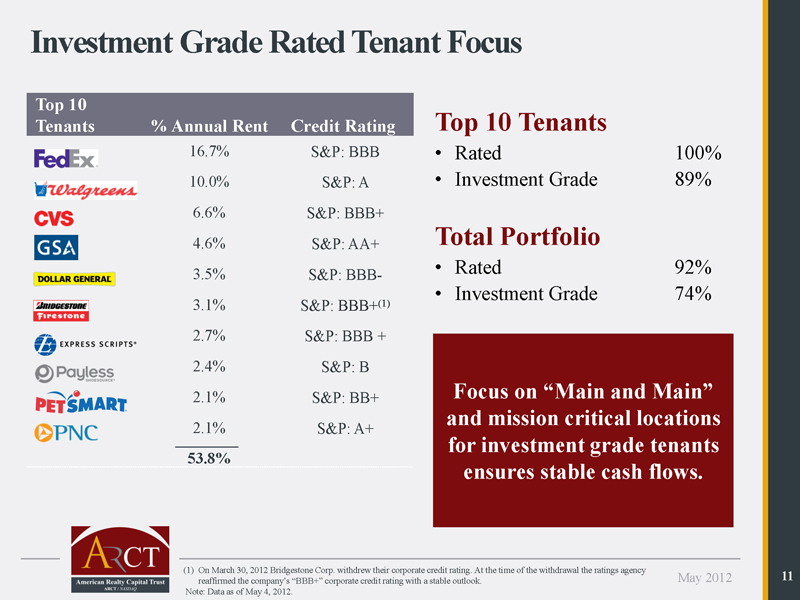
Investment Grade Rated Tenant Focus Top 10 Tenants % Annual Rent Credit Rating Top 10 Tenants 16.7% S&P: BBB Rated 100% 10.0% S&P: A Investment Grade 89% 6.6% S&P: BBB+ 4.6% S&P: AA+ Total Portfolio 3.5% S&P: BBB- Rated 92% Investment Grade 74% 3.1% S&P: BBB+(1) 2.7% S&P: BBB + 2.4% S&P: B 2.1% S&P: BB+ Focus on “Main and mission critical locations 2.1% S&P: A+ for investment grade tenants 53.8% ensures stable cash flows. (1) On March 30, 2012 Bridgestone Corp. withdrew their corporate credit rating. At the time of the withdrawal the ratings agency 11 reaffirmed the company’s “BBB+” corporate credit rating with a stable May 2012 Note: Data as of May 4, 2012.
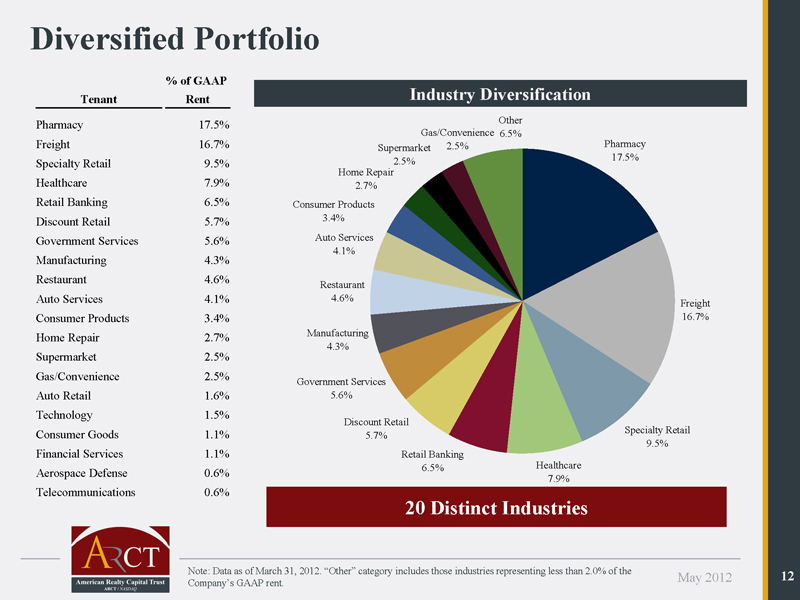
Diversified Portfolio % of GAAP Tenant Rent Industry Diversification Pharmacy 17.5% Other Gas/Convenience 6.5% Freight 16.7% Supermarket 2.5% Pharmacy 2.5% 17.5% Specialty Retail 9.5% Home Repair Healthcare 7.9% 2.7% Retail Banking 6.5% Consumer Products Discount Retail 5.7% 3.4% Government Services 5.6% Auto Services 4.1% Manufacturing 4.3% Restaurant 4.6% Restaurant Auto Services 4.1% 4.6% Freight Consumer Products 3.4% 16.7% Home Repair 2.7% Manufacturing 4.3% Supermarket 2.5% Gas/Convenience 2.5% Government Services Auto Retail 1.6% 5.6% Technology 1.5% Discount Retail Consumer Goods 1.1% Specialty Retail 5.7% 9.5% Financial Services 1.1% Retail Banking 6.5% Healthcare Aerospace Defense 0.6% 7.9% Telecommunications 0.6% 20 Distinct Industries Note: Data as of March 31, 2012. “Other” category includes 12 Company’s GAAP rent. May 2012
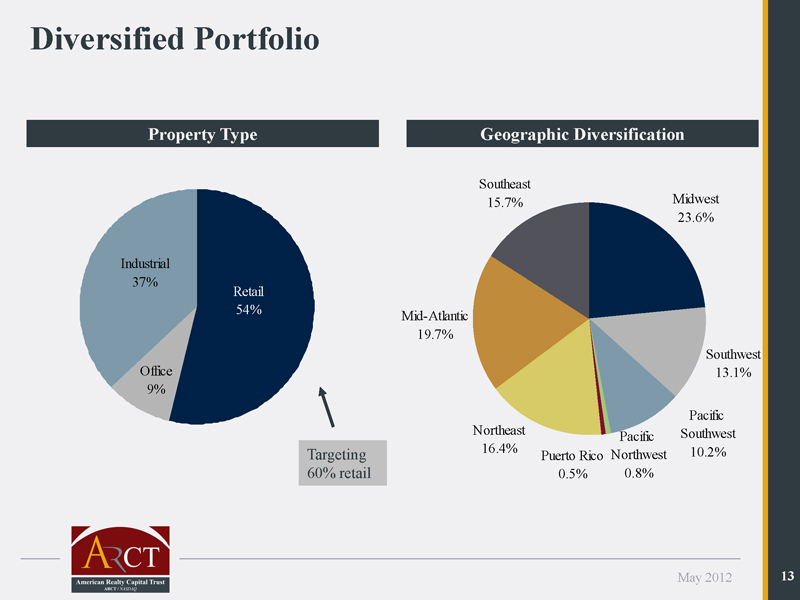
Diversified Portfolio Property Type Geographic Diversification Southeast 15.7% Midwest 23.6% Industrial 37% Retail 54% Mid-Atlantic 19.7% Southwest Office 13.1% 9% Pacific Northeast Southwest Pacific 16.4% 10.2% Targeting Puerto Rico Northwest 60% retail 0.5% 0.8% May 2012 13
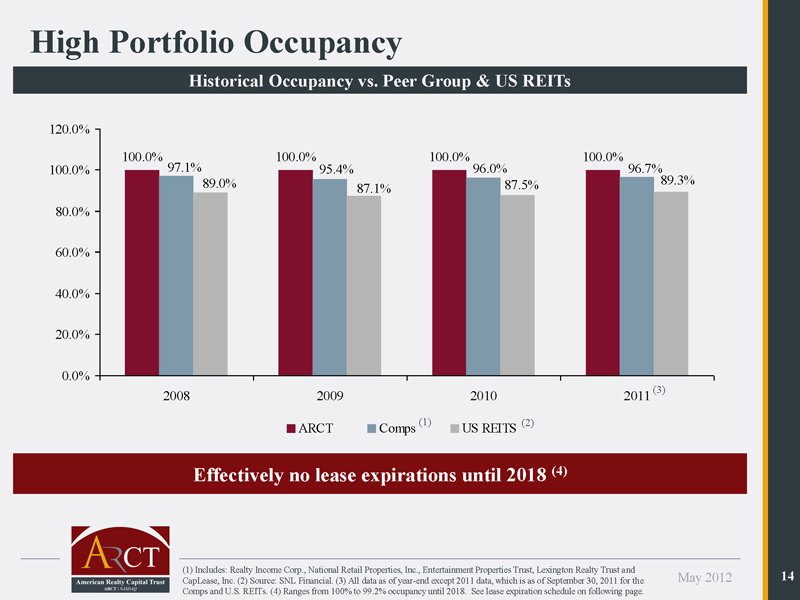
High Portfolio Occupancy Historical Occupancy vs. Peer Group & US REITs 120.0% 100.0% 100.0% 100.0% 100.0% 100.0% 97.1% 95.4% 96.0% 96.7% 89.0% 87.5% 89.3% 87.1% 80.0% 60.0% 40.0% 20.0% 0.0% (3) 2008 2009 2010 2011 (1) (2) ARCT Comps US REITS Effectively no lease expirations until 2018 (4) (1) Includes: Realty Income Corp., National Retail Properties, Inc., Entertainment Properties Trust, Lexington Realty Trust and 14 CapLease, Inc. (2) Source: SNL Financial. (3) All data as of year-end except 2011 data, which is as of September 30, 2011 for the May 2012 Comps and U.S. REITs. (4) Ranges from 100% to 99.2% occupancy until 2018. See lease expiration schedule on following page.
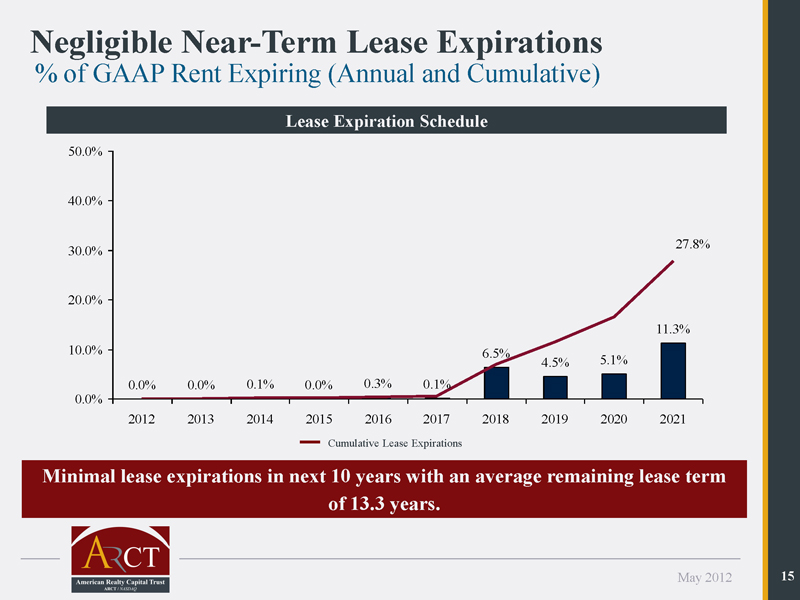
Negligible Near-Term Lease Expirations % of GAAP Rent Expiring (Annual and Cumulative) Lease Expiration Schedule 50.0% 40.0% 27.8% 30.0% 20.0% 11.3% 10.0% 6.5% 4.5% 5.1% 0.0% 0.0% 0.1% 0.0% 0.3% 0.1% 0.0% 2012 2013 2014 2015 2016 2017 2018 2019 2020 2021 Cumulative Lease Expirations Minimal lease expirations in next 10 years with an average remaining lease term of 13.3 years. May 2012 15
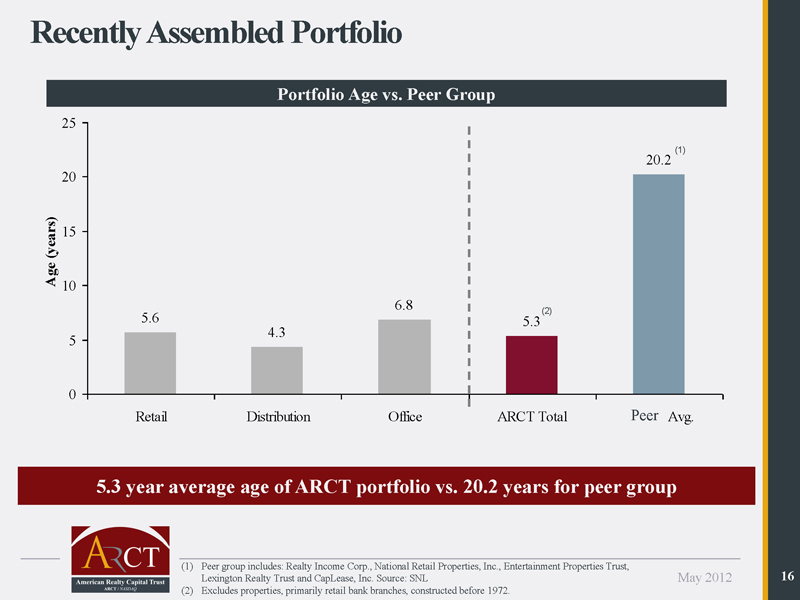
Recently Assembled Portfolio Portfolio Age vs. Peer Group 25 (1) 20.2 20 (years) 15 Age 10 6.8 (2) 5.6 5.3 4.3 5 0 Retail Distribution Office ARCT Total Comps Avg. Peer 5.3 year average age of ARCT portfolio vs. 20.2 years for peer group (1) Peer group includes: Realty Income Corp., National Retail Properties, Inc., Entertainment Properties Trust, Lexington Realty Trust and CapLease, Inc. Source: SNL May 2012 16 (2) Excludes properties, primarily retail bank branches, constructed before 1972.

Overview of Recent Events High Quality Portfolio Proven, Focused Business Plan Conservative Capital Structure May 2012 17
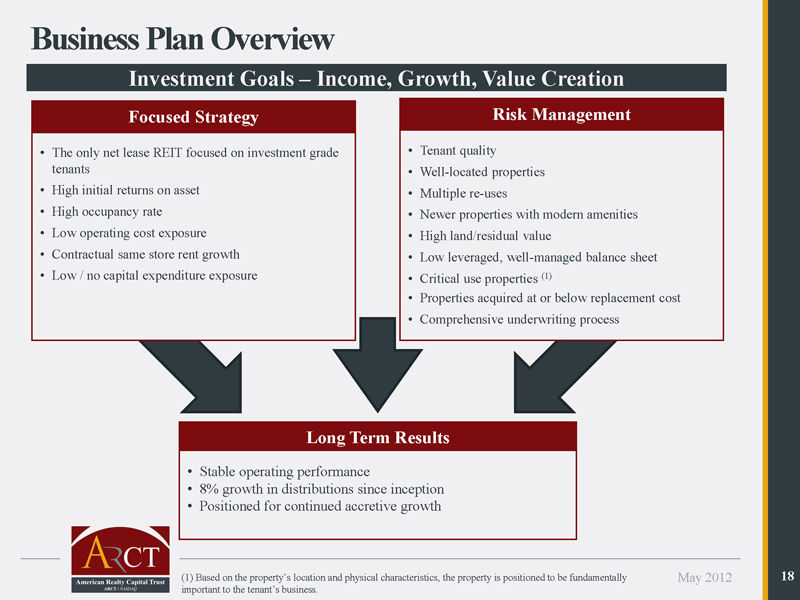
Business Plan Overview Investment Goals Income, Growth, Value Creation Focused Strategy Risk Management The only net lease REIT focused on investment grade Tenant quality tenants Well-located properties High initial returns on asset Multiple re-uses High occupancy rate Newer properties with modern amenities Low operating cost exposure High land/residual value Contractual same store rent growth Low leveraged, well-managed balance sheet Low / no capital expenditure exposure Critical use properties (1) Properties acquired at or below replacement cost Comprehensive underwriting process Long Term Results Stable operating performance 8% growth in distributions since inception Positioned for continued accretive growth (1) Based on the property’s location and physical characteristics, May 2012 18 important to the tenant’s business.
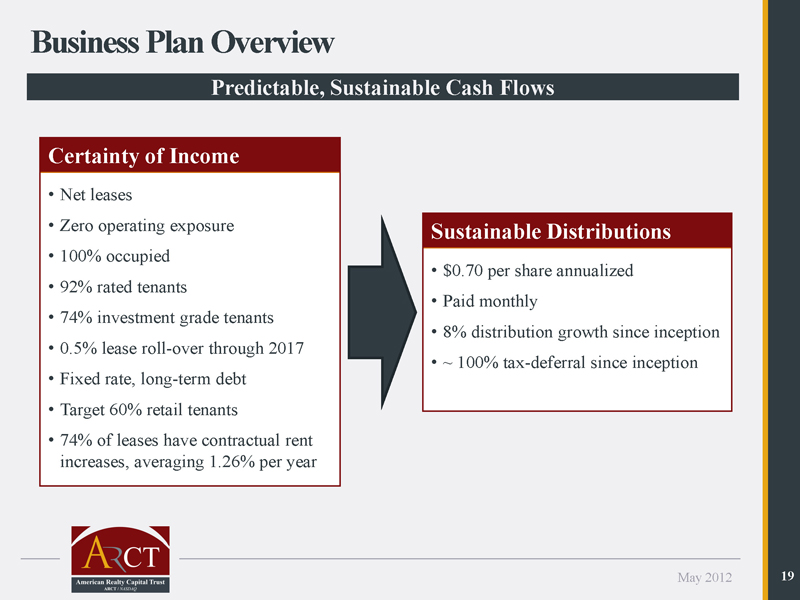
Business Plan Overview Predictable, Sustainable Cash Flows Certainty of Income Net leases Zero operating exposure Sustainable Distributions 100% occupied $0.70 per share annualized 92% rated tenants Paid monthly 74% investment grade tenants 8% distribution growth since inception 0.5% lease roll-over through 2017 ~ 100% tax-deferral since inception Fixed rate, long-term debt Target 60% retail tenants 74% of leases have contractual rent increases, averaging 1.26% per year May 2012 19

Overview of Recent Events High Quality Portfolio Proven, Focused Business Plan Conservative Capital Structure May 2012 20
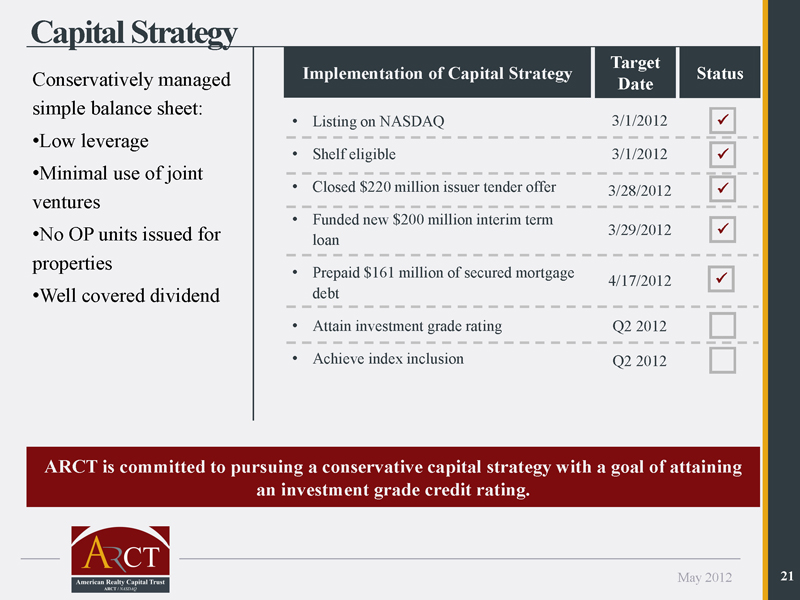
Capital Strategy Target Conservatively managed Implementation of Capital Strategy Status Date simple balance sheet: Listing on NASDAQ 3/1/2012u Low leverage Shelf eligible 3/1/2012u Minimal use of joint Closed $220 million issuer tender offer 3/28/2012u ventures Funded new $200 million interim term No OP units issued for 3/29/2012u loan properties Prepaid $161 million of secured mortgage 4/17/2012u Well covered dividend debt Attain investment grade rating Q2 2012 Achieve index inclusion Q2 2012 ARCT is committed to pursuing a conservative capital strategy with a goal of attaining an investment grade credit rating. May 2012 21
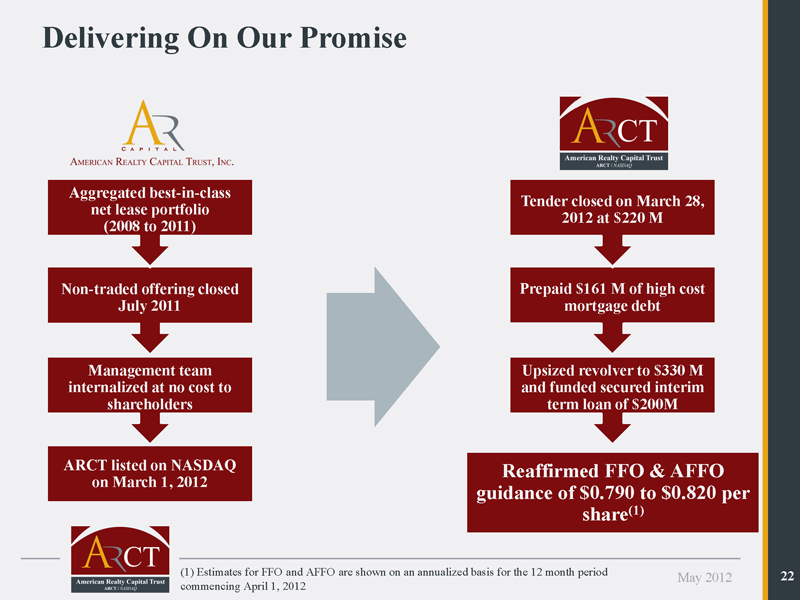
Delivering On Our Promise Aggregated best-in-class Tender closed on March 28, net lease portfolio 2012 at $220 M (2008 to 2011) Non-traded offering closed Prepaid $161 M of high cost July 2011 mortgage debt Management team Upsized revolver to $330 M internalized at no cost to and funded secured interim shareholders term loan of $200M ARCT listed on NASDAQ Reaffirmed FFO & AFFO on March 1, 2012 guidance of $0.790 to $0.820 per share(1) (1) Estimates for FFO and AFFO are shown on an annualized basis for the 12 month period May 2012 22 commencing April 1, 2012