
Exhibit 99.1 KBS Real Estate Investment Trust II Portfolio Update Meeting August 23, 2019 1

The information contained herein should be read in conjunction with, and is qualified by, the information in KBS Real Estate Investment Trust II’s (the “Company” or “KBS REIT II”) Important Annual Report on Form 10-K for the year ended December 31, 2018 (the “Annual Report”) and Quarterly Report on Form 10-Q for the period ended June 30, 2019 (the “Quarterly Disclosures Report”), including the “Risk Factors” contained therein. For a full description of the limitations, methodologies and assumptions used to value KBS REIT II’s assets and liabilities in connection with the calculation of KBS REIT II’s estimated value per share, see KBS REIT II’s Current Report on From 8-K, filed with the SEC on June 14, 2019, and Current Report on Form 8-K, filed with the SEC on December 7, 2018. Forward-Looking Statements Certain statements contained herein may be deemed to be forward-looking statements within the meaning of the Federal Private Securities Litigation Reform Act of 1995. The Company intends that such forward-looking statements be subject to the safe harbors created by Section 21E of the Securities Exchange Act of 1934, as amended. These statements include statements regarding the intent, belief or current expectations of the Company and members of its management team, as well as the assumptions on which such statements are based, and generally are identified by the use of words such as “may,” “will,” “seeks,” “anticipates,” “believes,” “estimates,” “expects,” “plans,” “intends,” “should” or similar expressions. Readers are cautioned not to place undue reliance on these forward-looking statements, which speak only as of the date they are made. The Company undertakes no obligation to update or revise forward-looking statements to reflect changed assumptions, the occurrence of unanticipated events or changes to future operating results over time, unless required by law. Such statements are subject to known and unknown risks and uncertainties which could cause actual results to differ materially from those contemplated by such forward-looking statements. The Company makes no representation or warranty (express or implied) about the accuracy of any such forward- looking statements. These statements are based on a number of assumptions involving the judgment of management. The Company may fund distributions from any source including, without limitation, from borrowings. Distributions paid through June 30, 2019 have been funded in part with cash flow from operating activities, debt financing, proceeds from the sales of real estate properties and the repayment or sale of real estate loans receivables. There are no guarantees that the Company will continue to pay distributions or that distributions at the current rate are sustainable. Actual events may cause the value and returns on the Company’s investments to be less than that used for purposes of the Company’s estimated NAV per share. With respect to the estimated NAV per share, the appraisal methodology used for the appraised properties assumes the properties realize the projected net operating income and expected exit cap rates and that investors would be willing to invest in such properties at yields equal to the expected discount rates. Though the appraisals of the appraised properties, with respect to CBRE, and the valuation estimates used in calculating the estimated value per share, with respect to the Company’s advisor and the Company, are the respective party’s best estimates as of September 30, 2018 or December 3, 2018, as applicable, the Company can give no assurance in this regard. Even small changes to these assumptions could result in significant differences in the appraised values of the appraised properties and the estimated value per share. Moreover, the updated estimate value per share, effective June 17, 2019, is based solely on subtracting the special distribution in the amount of $0.45 per share, with a record date of June 17, 2019, from the December 3, 2018 estimated value per share. REIT II can give no assurance that it will be able to successfully carry out any or all of its stated areas of focus in 2019, including its ability to successfully lease and/or sell certain assets and pay special distributions to stockholders. The statements herein also depend on factors such as: future economic, competitive and market conditions; the Company’s ability to maintain occupancy levels and rental rates at its real estate properties; and other risks identified in Part I, Item IA of the Company’s Annual Report and in Part II, Item 1A of the Company’s Quarterly Report. 2
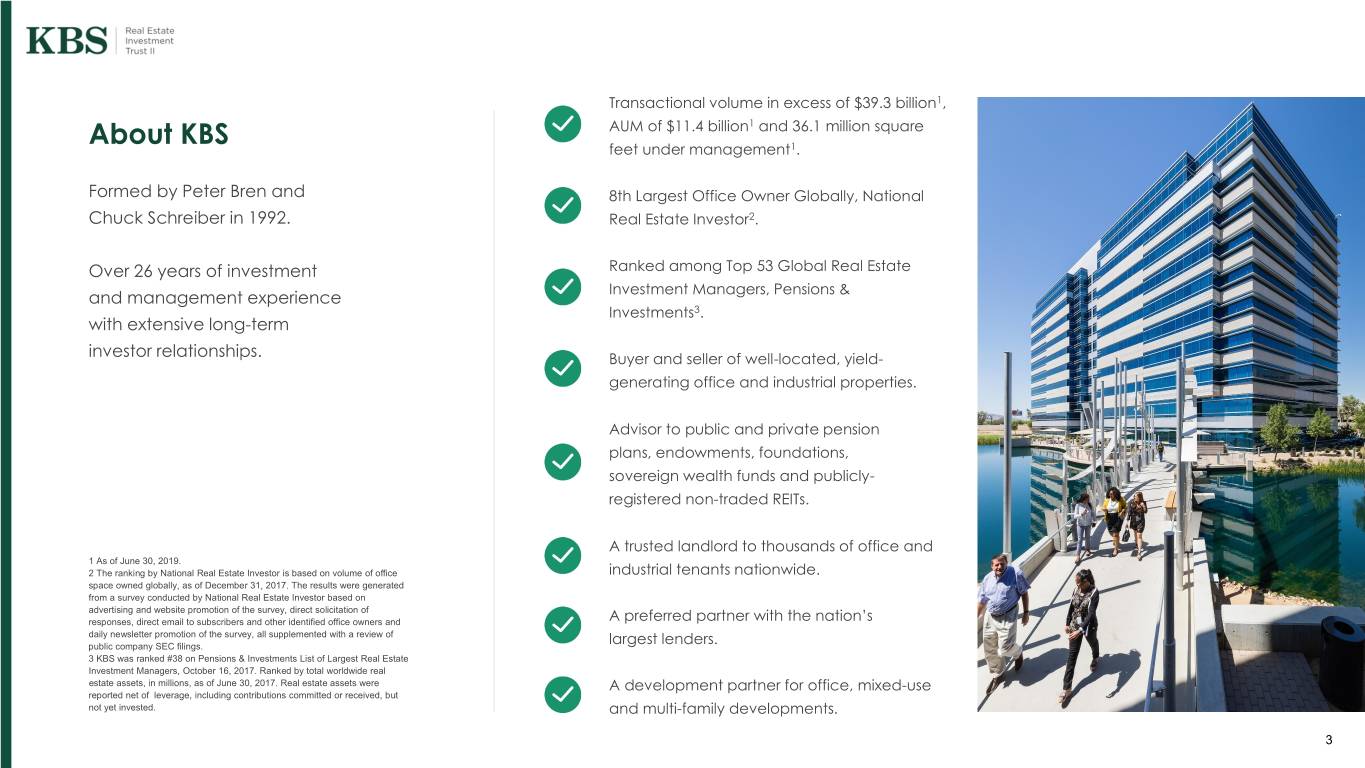
Transactional volume in excess of $39.3 billion1, About KBS AUM of $11.4 billion1 and 36.1 million square feet under management1. Formed by Peter Bren and 8th Largest Office Owner Globally, National Chuck Schreiber in 1992. Real Estate Investor2. Over 26 years of investment Ranked among Top 53 Global Real Estate Investment Managers, Pensions & and management experience Investments3. with extensive long-term investor relationships. Buyer and seller of well-located, yield- generating office and industrial properties. Advisor to public and private pension plans, endowments, foundations, sovereign wealth funds and publicly- registered non-traded REITs. A trusted landlord to thousands of office and 1 As of June 30, 2019. 2 The ranking by National Real Estate Investor is based on volume of office industrial tenants nationwide. space owned globally, as of December 31, 2017. The results were generated from a survey conducted by National Real Estate Investor based on advertising and website promotion of the survey, direct solicitation of responses, direct email to subscribers and other identified office owners and A preferred partner with the nation’s daily newsletter promotion of the survey, all supplemented with a review of public company SEC filings. largest lenders. 3 KBS was ranked #38 on Pensions & Investments List of Largest Real Estate Investment Managers, October 16, 2017. Ranked by total worldwide real estate assets, in millions, as of June 30, 2017. Real estate assets were A development partner for office, mixed-use reported net of leverage, including contributions committed or received, but not yet invested. and multi-family developments. 3

KBS REIT II Asset Map Current Equity Assets Sold and Liquidated Assets (Equity & Debt) 4
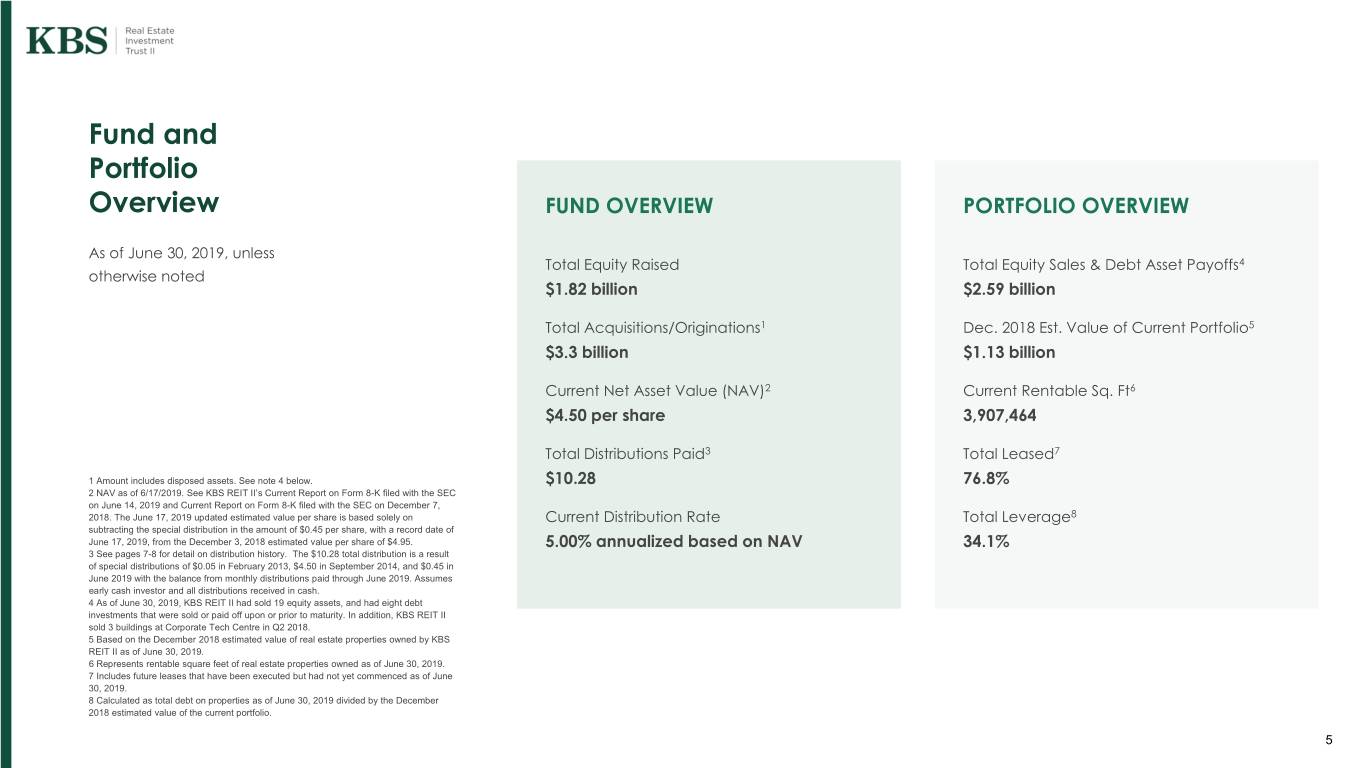
Fund and Portfolio Overview FUND OVERVIEW PORTFOLIO OVERVIEW As of June 30, 2019, unless Total Equity Raised Total Equity Sales & Debt Asset Payoffs4 otherwise noted $1.82 billion $2.59 billion Total Acquisitions/Originations1 Dec. 2018 Est. Value of Current Portfolio5 $3.3 billion $1.13 billion Current Net Asset Value (NAV)2 Current Rentable Sq. Ft6 $4.50 per share 3,907,464 Total Distributions Paid3 Total Leased7 1 Amount includes disposed assets. See note 4 below. $10.28 76.8% 2 NAV as of 6/17/2019. See KBS REIT II’s Current Report on Form 8-K filed with the SEC on June 14, 2019 and Current Report on Form 8-K filed with the SEC on December 7, 2018. The June 17, 2019 updated estimated value per share is based solely on Current Distribution Rate Total Leverage8 subtracting the special distribution in the amount of $0.45 per share, with a record date of June 17, 2019, from the December 3, 2018 estimated value per share of $4.95. 5.00% annualized based on NAV 34.1% 3 See pages 7-8 for detail on distribution history. The $10.28 total distribution is a result of special distributions of $0.05 in February 2013, $4.50 in September 2014, and $0.45 in June 2019 with the balance from monthly distributions paid through June 2019. Assumes early cash investor and all distributions received in cash. 4 As of June 30, 2019, KBS REIT II had sold 19 equity assets, and had eight debt investments that were sold or paid off upon or prior to maturity. In addition, KBS REIT II sold 3 buildings at Corporate Tech Centre in Q2 2018. 5 Based on the December 2018 estimated value of real estate properties owned by KBS REIT II as of June 30, 2019. 6 Represents rentable square feet of real estate properties owned as of June 30, 2019. 7 Includes future leases that have been executed but had not yet commenced as of June 30, 2019. 8 Calculated as total debt on properties as of June 30, 2019 divided by the December 2018 estimated value of the current portfolio. 5
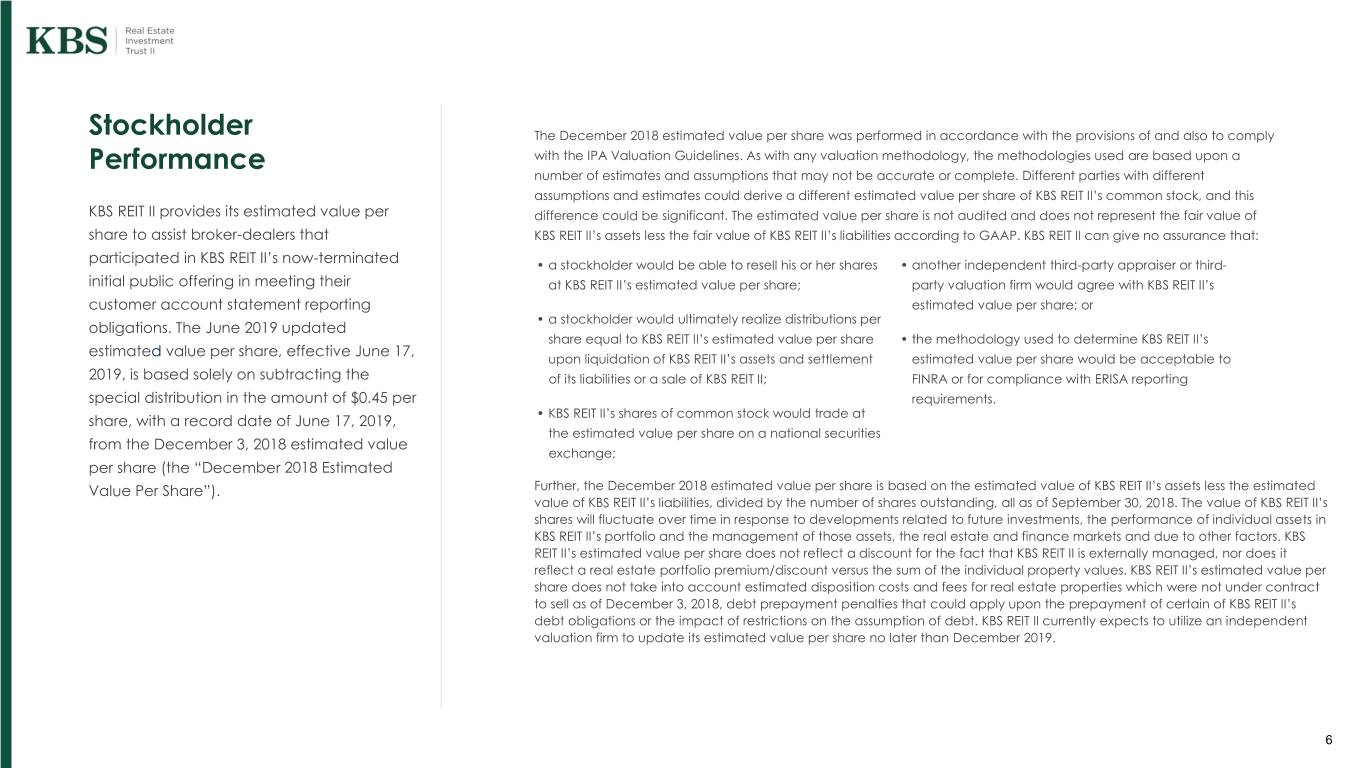
Stockholder The December 2018 estimated value per share was performed in accordance with the provisions of and also to comply Performance with the IPA Valuation Guidelines. As with any valuation methodology, the methodologies used are based upon a number of estimates and assumptions that may not be accurate or complete. Different parties with different assumptions and estimates could derive a different estimated value per share of KBS REIT II’s common stock, and this KBS REIT II provides its estimated value per difference could be significant. The estimated value per share is not audited and does not represent the fair value of share to assist broker-dealers that KBS REIT II’s assets less the fair value of KBS REIT II’s liabilities according to GAAP. KBS REIT II can give no assurance that: participated in KBS REIT II’s now-terminated • a stockholder would be able to resell his or her shares • another independent third-party appraiser or third- initial public offering in meeting their at KBS REIT II’s estimated value per share; party valuation firm would agree with KBS REIT II’s customer account statement reporting estimated value per share; or • a stockholder would ultimately realize distributions per obligations. The June 2019 updated share equal to KBS REIT II’s estimated value per share • the methodology used to determine KBS REIT II’s estimated value per share, effective June 17, upon liquidation of KBS REIT II’s assets and settlement estimated value per share would be acceptable to 2019, is based solely on subtracting the of its liabilities or a sale of KBS REIT II; FINRA or for compliance with ERISA reporting special distribution in the amount of $0.45 per requirements. • KBS REIT II’s shares of common stock would trade at share, with a record date of June 17, 2019, the estimated value per share on a national securities from the December 3, 2018 estimated value exchange; per share (the “December 2018 Estimated Value Per Share”). Further, the December 2018 estimated value per share is based on the estimated value of KBS REIT II’s assets less the estimated value of KBS REIT II’s liabilities, divided by the number of shares outstanding, all as of September 30, 2018. The value of KBS REIT II’s shares will fluctuate over time in response to developments related to future investments, the performance of individual assets in KBS REIT II’s portfolio and the management of those assets, the real estate and finance markets and due to other factors. KBS REIT II’s estimated value per share does not reflect a discount for the fact that KBS REIT II is externally managed, nor does it reflect a real estate portfolio premium/discount versus the sum of the individual property values. KBS REIT II’s estimated value per share does not take into account estimated disposition costs and fees for real estate properties which were not under contract to sell as of December 3, 2018, debt prepayment penalties that could apply upon the prepayment of certain of KBS REIT II’s debt obligations or the impact of restrictions on the assumption of debt. KBS REIT II currently expects to utilize an independent valuation firm to update its estimated value per share no later than December 2019. 6

Stockholder Performance Hypothetical Performance of Early and Late Investors $14.78 Total value1 for early cash investors $13.21 Total value1 for late cash investors Assumes all distributions received in cash through June 2019 Breakdown of Early Cash Investor Value Breakdown of Late Cash Investor Value $14.78 $13.80 $14.55 $14.46 $14.52 $14.67 $14.35 $14.66 $13.10 $12.27 $13.21 2 $12.99 $12.90 $12.96 $13.11 $13.09 $4.95 $4.50 $12.24 $12.79 $10.00 $6.05 $5.86 $5.62 $5.49 $4.89 $11.59 $10.76 $10.00 $4.502 $10.29 $6.05 $5.86 $5.62 $5.49 $4.89 $4.95 $10.11 $10.29 $4.55 $4.55 $4.55 $5.00 $4.55 $4.55 $4.55 $10.29 $10.29 $5.00 $4.55 $4.55 $4.55 $10.11 $4.55 $4.55 $4.55 $0.05 $4.05 $4.63 $4.91 $5.16 $5.28 $0.05 $3.46 $3.95 $4.35 $3.35 $3.59 $3.71 $2.16 $2.81 $1.90 $2.38 $2.49 $2.79 $3.07 $0.65 $1.30 Estimated Value Estimated Value Regular Distributions Special Distributions Regular Distributions Special Distributions Per Share Per Share 1 Total value equals (i) cumulative distributions through June 30, 2019 plus (ii) the June 2019 estimated value per share of $4.50. 2 The June 17, 2019 updated estimated value per share is based solely on subtracting the special distribution in the amount of $0.45 per share, with a record date of June 17, 2019, from the December 3, 2018 estimated value per share of $4.95. “Cumulative distributions” for an early cash investor and a late cash investor assumes all distributions received in cash and no share redemptions, and reflect the cash payment amounts (all distributions paid since investment) per share for a hypothetical investor who invested on June 24, 2008 and December 31, 2010, respectively. The “offering price” of $10.00 reflects the price most investors paid to purchase shares in the primary initial public offering. For estimated value per share information, see KBS REIT II’s Current Reports on Form 8-K filed with the SEC on December 21, 2011, December 19, 2012, December 19, 2013, December 4, 2014, December 9, 2015, December 15, 2016, December 11, 2017, December 7, 2018 and June 14, 2019. 7

History of Distribution Payments $10.28/share of total distributions paid from August 2008 through June 2019 August 2008 – September 2014 • $0.20 / share distributions, on an annualized basis, for record dates from July 16, 2008 to August 15, 2008 (74 Monthly Payments) • $0.65 / share distributions, on an annualized basis, for record dates from August 16, 2008 through August 31, 2014 February 2013 (1 Payment) • $0.05416667 / share special 13th distribution funded from 2012 MFFO in excess of 2012 distributions declared • $4.50 / share special distribution funded from the proceeds from dispositions of real estate properties between May 2014 and September 2014 (1 Payment) August 2014, as well as cash on hand resulting primarily from the repayment or sale of real estate loans • $0.13328082 / share total distributions paid from October 2014 through January 2015. (If converted to a daily distribution amount October 2014 to January 2015 for the period and annualized, then this period’s $0.13328082/share distributions would equal a 7.25% annualized rate based on a (4 Payments) $10.00 purchase price less $4.50 special distribution or 6.80% annualized rate based on the December 2014 estimated value per share of $5.86) • $0.26811507 / share total distributions paid from February 2015 through December 2015 (if converted to a daily distribution February 2015 to December 2015 amount for the period and annualized, then this period’s $0.26811507/share would equal a 5.00% annualized rate based on the (11 Payments) December 2014 estimated value per share of $5.86 or a 5.2% annualized rate based on the December 2015 estimated value per share of $5.62) • $0.28208442 / share total distributions paid from January 2016 through December 2016 (if converted to a daily distribution amount January 2016 to December 2016 (12 Payments) for the period and annualized, then this period’s $0.28208442/share would equal a 5.0% annualized rate based on the December 2015 estimated value per share of $5.62 or a 5.1% annualized rate based on the December 2016 estimated value per share of $5.49) • $0.27505204 / share total distributions paid from January 2017 through December 2017 (if converted to a daily distribution amount January 2017 to December 2017 (12 Payments) for the period and annualized, then this period’s $0.27505204/share would equal a 5.0% annualized rate based on the December 2016 estimated value per share of $5.49 or a 5.6% annualized rate based on the December 2017 estimated value per share of $4.89) • $0.24704792 / share total distributions paid from January 2018 through December 2018 (if converted to a daily distribution amount January 2018 to December 2018 for the period and annualized, then this period’s $0.24704792/share would equal a 5.0% annualized rate based on the December 2017 (12 Payments) estimated value per share of $4.89 or a 5.0% annualized rate based on the December 2018 estimated value per share of $4.95) • $0.12389075 / share total distributions paid from January 2019 through June 2019 (if converted to a daily distribution amount for January 2019 to June 2019 (6 Payments) the period and annualized, then this period’s $0.12389075/share would equal a 5.0% annualized rate based on the December 2018 estimated value per share of $4.95) June 2019 • $0.45 / share special distribution funded from the proceeds from dispositions of real estate properties in May 2019 (1 Payment) 8
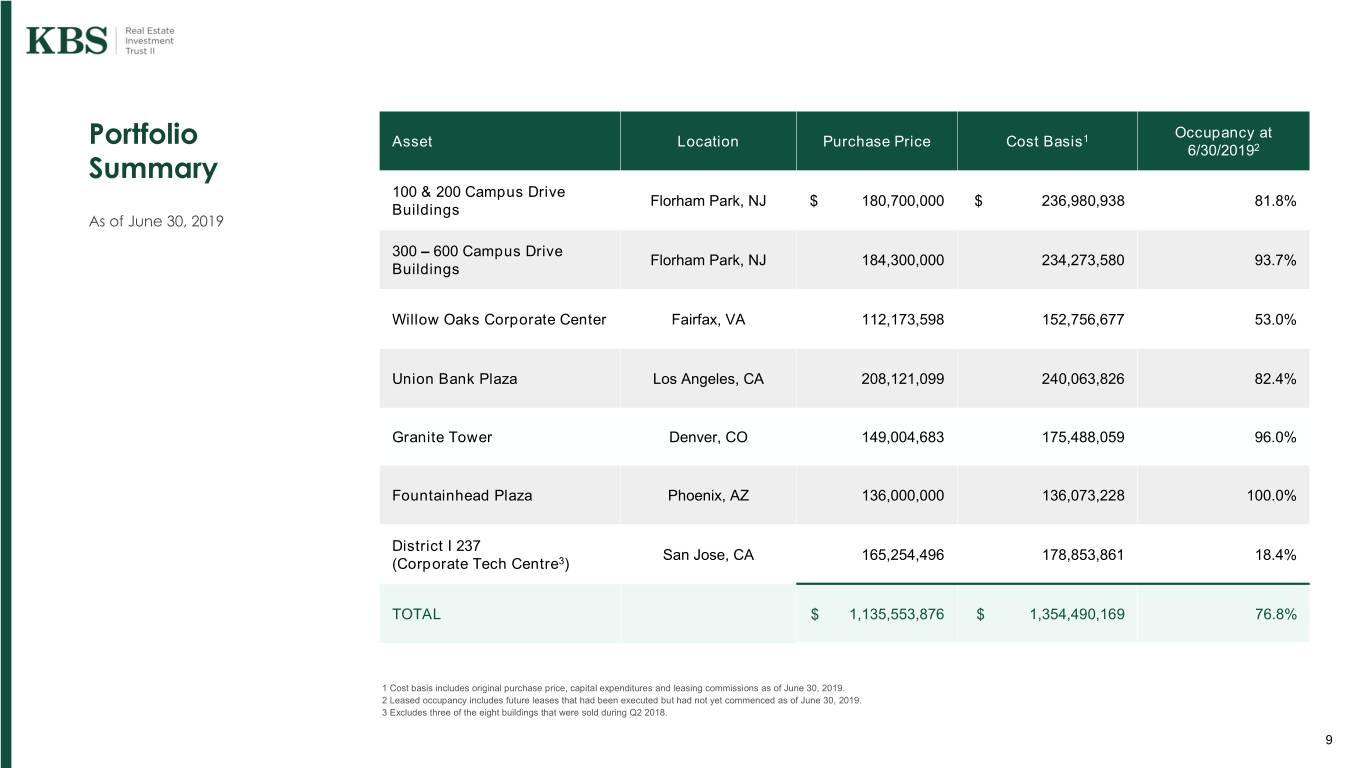
Occupancy at Portfolio Asset Location Purchase Price Cost Basis1 6/30/20192 Summary 100 & 200 Campus Drive Florham Park, NJ $ 180,700,000 $ 236,980,938 81.8% Buildings As of June 30, 2019 300 – 600 Campus Drive Florham Park, NJ 184,300,000 234,273,580 93.7% Buildings Willow Oaks Corporate Center Fairfax, VA 112,173,598 152,756,677 53.0% Union Bank Plaza Los Angeles, CA 208,121,099 240,063,826 82.4% Granite Tower Denver, CO 149,004,683 175,488,059 96.0% Fountainhead Plaza Phoenix, AZ 136,000,000 136,073,228 100.0% District I 237 San Jose, CA 165,254,496 178,853,861 18.4% (Corporate Tech Centre3) TOTAL $ 1,135,553,876 $ 1,354,490,169 76.8% 1 Cost basis includes original purchase price, capital expenditures and leasing commissions as of June 30, 2019. 2 Leased occupancy includes future leases that had been executed but had not yet commenced as of June 30, 2019. 3 Excludes three of the eight buildings that were sold during Q2 2018. 9
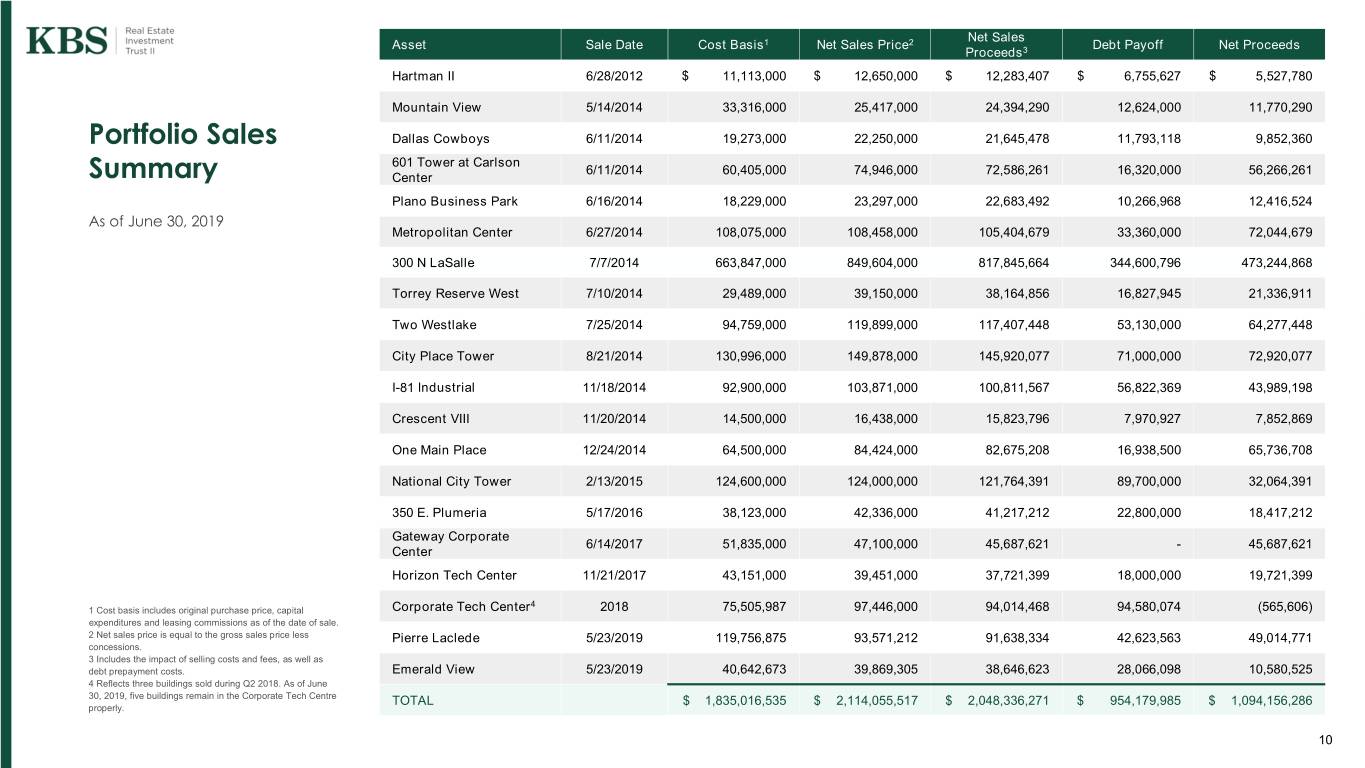
Net Sales Asset Sale Date Cost Basis1 Net Sales Price2 Debt Payoff Net Proceeds Proceeds3 Hartman II 6/28/2012 $ 11,113,000 $ 12,650,000 $ 12,283,407 $ 6,755,627 $ 5,527,780 Mountain View 5/14/2014 33,316,000 25,417,000 24,394,290 12,624,000 11,770,290 Portfolio Sales Dallas Cowboys 6/11/2014 19,273,000 22,250,000 21,645,478 11,793,118 9,852,360 601 Tower at Carlson 6/11/2014 60,405,000 74,946,000 72,586,261 16,320,000 56,266,261 Summary Center Plano Business Park 6/16/2014 18,229,000 23,297,000 22,683,492 10,266,968 12,416,524 As of June 30, 2019 Metropolitan Center 6/27/2014 108,075,000 108,458,000 105,404,679 33,360,000 72,044,679 300 N LaSalle 7/7/2014 663,847,000 849,604,000 817,845,664 344,600,796 473,244,868 Torrey Reserve West 7/10/2014 29,489,000 39,150,000 38,164,856 16,827,945 21,336,911 Two Westlake 7/25/2014 94,759,000 119,899,000 117,407,448 53,130,000 64,277,448 City Place Tower 8/21/2014 130,996,000 149,878,000 145,920,077 71,000,000 72,920,077 I-81 Industrial 11/18/2014 92,900,000 103,871,000 100,811,567 56,822,369 43,989,198 Crescent VIII 11/20/2014 14,500,000 16,438,000 15,823,796 7,970,927 7,852,869 One Main Place 12/24/2014 64,500,000 84,424,000 82,675,208 16,938,500 65,736,708 National City Tower 2/13/2015 124,600,000 124,000,000 121,764,391 89,700,000 32,064,391 350 E. Plumeria 5/17/2016 38,123,000 42,336,000 41,217,212 22,800,000 18,417,212 Gateway Corporate 6/14/2017 51,835,000 47,100,000 45,687,621 - 45,687,621 Center Horizon Tech Center 11/21/2017 43,151,000 39,451,000 37,721,399 18,000,000 19,721,399 4 1 Cost basis includes original purchase price, capital Corporate Tech Center 2018 75,505,987 97,446,000 94,014,468 94,580,074 (565,606) expenditures and leasing commissions as of the date of sale. 2 Net sales price is equal to the gross sales price less Pierre Laclede 5/23/2019 119,756,875 93,571,212 91,638,334 42,623,563 49,014,771 concessions. 3 Includes the impact of selling costs and fees, as well as debt prepayment costs. Emerald View 5/23/2019 40,642,673 39,869,305 38,646,623 28,066,098 10,580,525 4 Reflects three buildings sold during Q2 2018. As of June 30, 2019, five buildings remain in the Corporate Tech Centre TOTAL $ 1,835,016,535 $ 2,114,055,517 $ 2,048,336,271 $ 954,179,985 $ 1,094,156,286 properly. 10

Purchase / Sale / Payoff Sale / Repayment Debt Sales Debt Asset Origination Debt Payoff Net Proceeds Date Proceeds Summary Amount Northern Trust A & B 6/27/2012 $ 59,428,000 $ 84,932,000 $ - $ 84,932,000 Notes As of June 30, 2019 One Liberty Plaza 10/11/2013 66,700,000 113,091,000 - 113,091,000 One Kendall Square 12/4/2013 87,500,000 87,500,000 - 87,500,000 Tuscan Inn 2/7/2014 20,200,000 20,200,000 12,216,074 7,983,926 Chase Tower 2/14/2014 59,200,000 64,117,000 35,747,036 28,369,964 Pappas Commerce 6/9/2014 32,673,000 32,673,000 19,325,428 13,347,572 Summit I & II 8/4/2015 58,750,000 59,624,000 - 59,624,000 Sheraton Charlotte 6/1/2018 14,500,000 14,500,000 8,711,462 5,788,538 Airport Hotel TOTAL $ 398,951,000 $ 476,637,000 $ 76,000,000 $ 400,637,000 11

Portfolio Overview As of June 30, 2019 Geographic Diversification2 Key Statistics VA No. of Assets 7 9% Total Rentable Sq. Ft. 3,907,464 AZ NJ 16% 36% Wtd. Avg. Lease Term 6.0 years Economic Occupancy 70.4% CO Leased Occupancy1 76.8% 19% CA No. of Tenants 110 20% Leverage 34.1% Leased Occupancy1 Lease Expirations2 100.0% 90.0% 100% 96% 80.0% 94% 700000. 70.0% 82% 82% 600000. 60.0% 19% 18% 50.0% 53% 500000. 17% 40.0% 30.0% 400000. 20.0% 18% 300000. 10.0% 8% 8% 0.0% 200000. 5% 4% 5% Occupied SF Expiring 3% 3% 4% 100000. 2% 2% 2% 0. 1 Leased occupancy includes future leases that had been executed but had not yet commenced as of June 30, 2019. 12 2 Based on occupied square feet as of June 30, 2019.
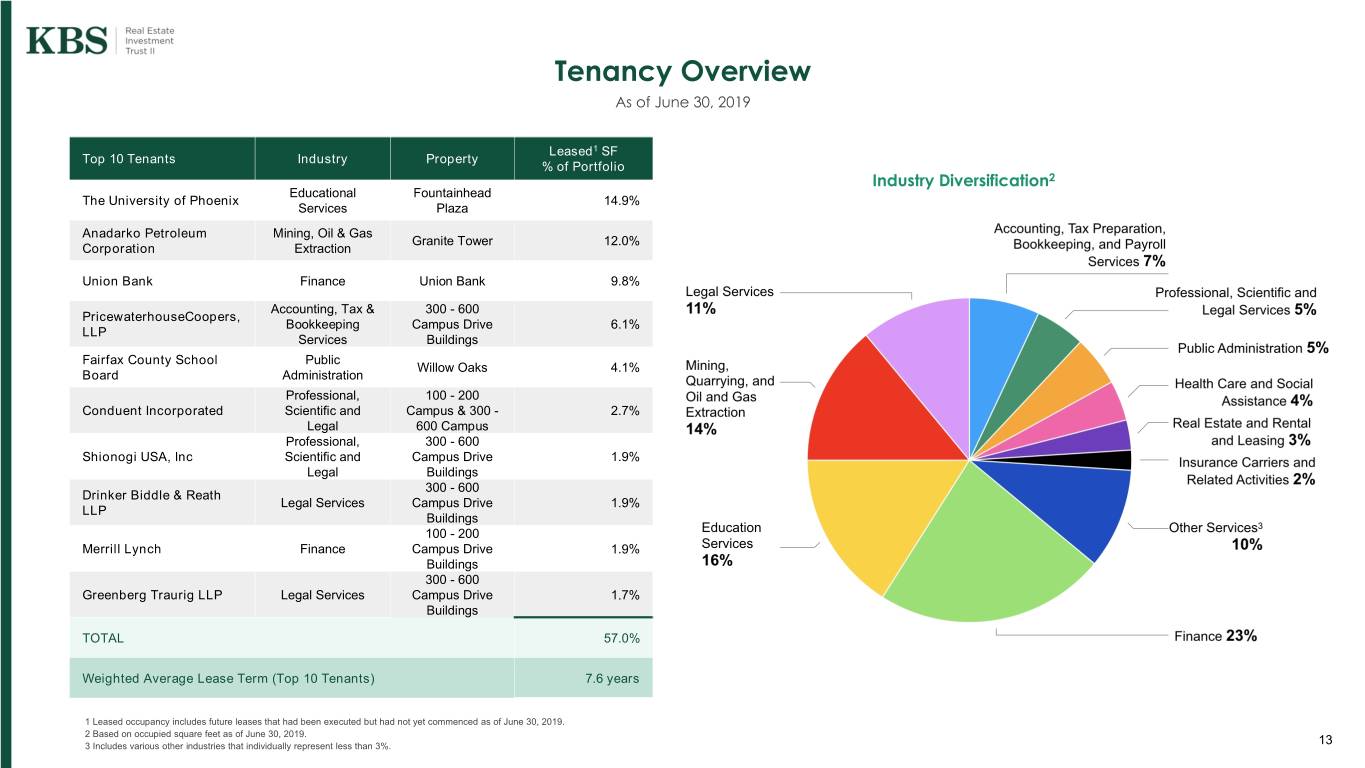
Tenancy Overview As of June 30, 2019 Leased1 SF Top 10 Tenants Industry Property % of Portfolio Industry Diversification2 Educational Fountainhead The University of Phoenix 14.9% Services Plaza Anadarko Petroleum Mining, Oil & Gas Granite Tower 12.0% Corporation Extraction Union Bank Finance Union Bank 9.8% Accounting, Tax & 300 - 600 PricewaterhouseCoopers, Bookkeeping Campus Drive 6.1% LLP Services Buildings Fairfax County School Public Willow Oaks 4.1% Board Administration Professional, 100 - 200 Conduent Incorporated Scientific and Campus & 300 - 2.7% Legal 600 Campus Professional, 300 - 600 Shionogi USA, Inc Scientific and Campus Drive 1.9% Legal Buildings 300 - 600 Drinker Biddle & Reath Legal Services Campus Drive 1.9% LLP Buildings 100 - 200 Merrill Lynch Finance Campus Drive 1.9% Buildings 300 - 600 Greenberg Traurig LLP Legal Services Campus Drive 1.7% Buildings TOTAL 57.0% Weighted Average Lease Term (Top 10 Tenants) 7.6 years 1 Leased occupancy includes future leases that had been executed but had not yet commenced as of June 30, 2019. 2 Based on occupied square feet as of June 30, 2019. 3 Includes various other industries that individually represent less than 3%. 13
Property Updates 14

District | 237 (formerly Corporate Tech Centre) - Job growth in the San Jose metropolitan statistical area (MSA) continued in the 2nd quarter of 2019 with an increase of 2.3% or 25,700 non-farm jobs year-over- year (YoY), despite the market being at full employment. After another solid performance in the 1st quarter of 2019, the 2nd quarter had gross absorption of 3 million square feet (msf), up from 1.7 msf in the 1st quarter. This was primarily attributable to significant preleasing for occupancy in the second half of 2019 and early 2020.1 - New speculative product under construction across the region currently stands at 4.4 msf, however, 3.2 msf has already been preleased. Of the remaining 1.2 msf available and under construction, only 360,000 SF will be completed in 2019. Tenant requirements remained strong at 11.3 msf in the second quarter of 2019. As such, we expect to see continued strong demand in the Silicon Valley office market. - 350 Holger Way has undergone extensive renovation and is serving as a model for the potential at the other four buildings. The renovations include all new open creative office space, an updated lobby and common areas, a new tenant lounge, gym and a private outdoor amenity area. - We executed a full building lease for 76,000 SF at 250 Holger in Q1 2019. - We have agreed to terms on another full building lease for 95,500 SF at 350 Holger. - We are currently negotiating a lease with a large company for 143,800 SF, which covers both the 100 Headquarters Drive and 200 Holger Way buildings. - If the aforementioned leases are completed, the leased occupancy would jump 350 Holger Way up to approximately 76%. San Jose, CA 1 The 2nd quarter net absorption was actually a negative 448,000 SF, but that’s because net absorption is based on occupancy date and doesn’t yet reflect the preleased deals. 15
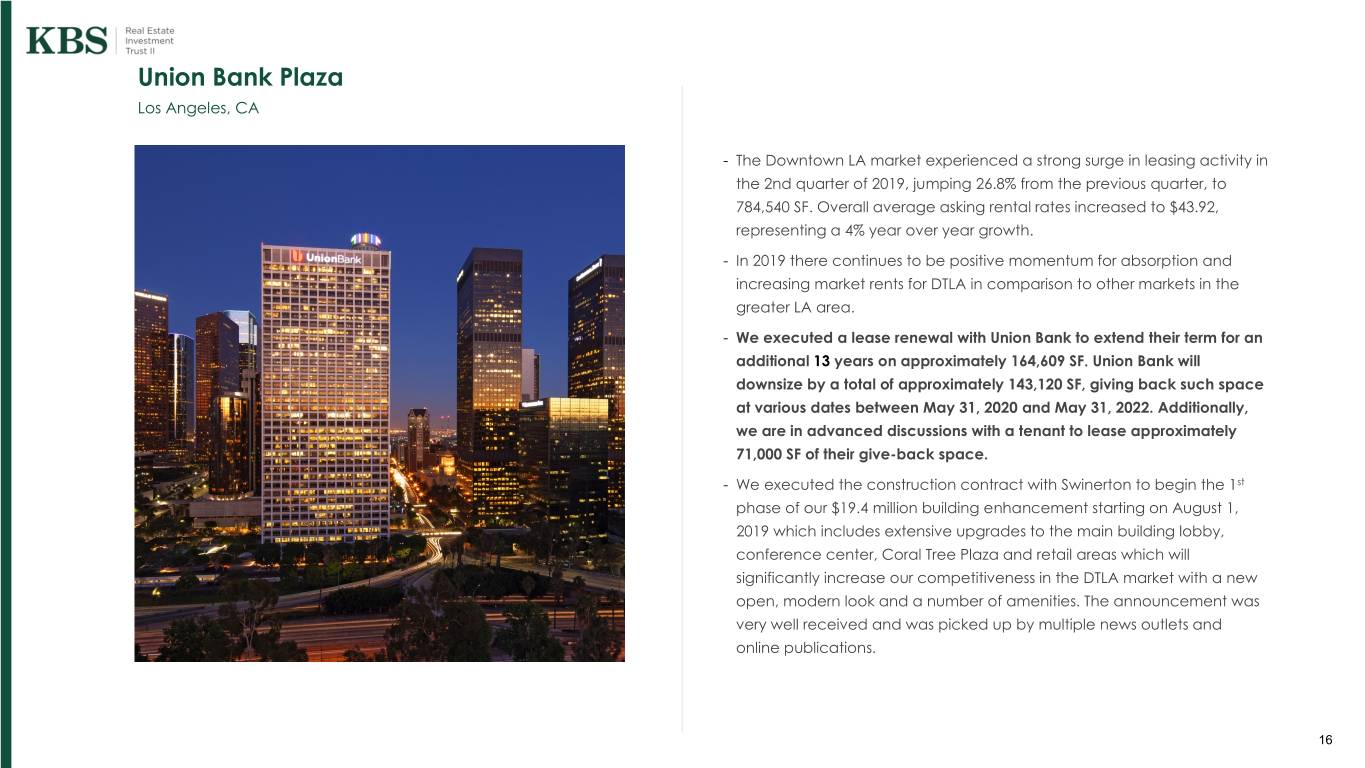
Union Bank Plaza Los Angeles, CA - The Downtown LA market experienced a strong surge in leasing activity in the 2nd quarter of 2019, jumping 26.8% from the previous quarter, to 784,540 SF. Overall average asking rental rates increased to $43.92, representing a 4% year over year growth. - In 2019 there continues to be positive momentum for absorption and increasing market rents for DTLA in comparison to other markets in the greater LA area. - We executed a lease renewal with Union Bank to extend their term for an additional 13 years on approximately 164,609 SF. Union Bank will downsize by a total of approximately 143,120 SF, giving back such space at various dates between May 31, 2020 and May 31, 2022. Additionally, we are in advanced discussions with a tenant to lease approximately 71,000 SF of their give-back space. - We executed the construction contract with Swinerton to begin the 1st phase of our $19.4 million building enhancement starting on August 1, 2019 which includes extensive upgrades to the main building lobby, conference center, Coral Tree Plaza and retail areas which will significantly increase our competitiveness in the DTLA market with a new open, modern look and a number of amenities. The announcement was very well received and was picked up by multiple news outlets and online publications. 16

Willow Oaks Fairfax, VA - Northern Virginia has 2.9 million square feet of office space under construction as of the 2nd quarter of 2019, excluding renovations and owner-occupied buildings. This year will be a slower year for deliveries; paired with a continued increase in demand, the office market is expected to continue to see declining vacancy rates. Deliveries will pick back up in 2020, when 9 buildings currently under construction are set to deliver, totaling 2.0 million square feet. - We are in lease negotiations with OrthoVirginia for a new lease to take the full 7th floor of 27,549 SF in the Willow Oaks III building. The term would be for 15 years. Their targeted commencement date is August 1, 2020. OrthoVirginia is the state’s largest provider of expert orthopedic and therapy care. - We are in lease negotiations with Fairfax Radiological Consultants to expand into 5,115 SF of space on their current floor in the Willow Oaks II building. It would be for a 10-year and 8 month term, and would commence March 1, 2020. Fairfax Radiological Consultants currently occupies 20,095 SF. - We have invested significant capital in recent years to enhance and add to the on-site amenities including a conference center, fitness center and two shuttles offering tenants continuous transport to and from Metro, Mosaic District, Tricare and INOVA Hospital. We continue to add to the amenity base with the construction of a new tenant lounge, which is estimated to be completed by the 4th quarter of 2019. 17
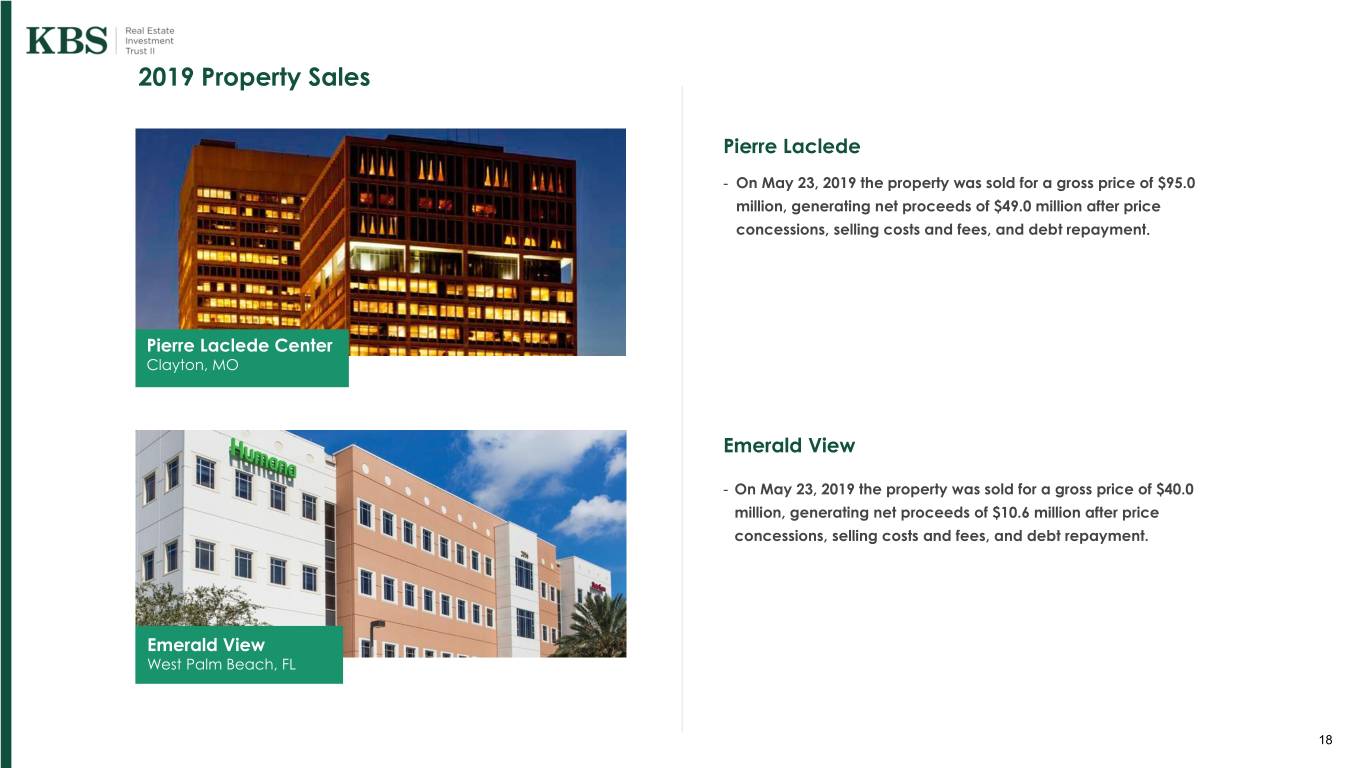
2019 Property Sales Pierre Laclede - On May 23, 2019 the property was sold for a gross price of $95.0 million, generating net proceeds of $49.0 million after price concessions, selling costs and fees, and debt repayment. Pierre Laclede Center Clayton, MO Emerald View - On May 23, 2019 the property was sold for a gross price of $40.0 million, generating net proceeds of $10.6 million after price concessions, selling costs and fees, and debt repayment. Emerald View West Palm Beach, FL 18
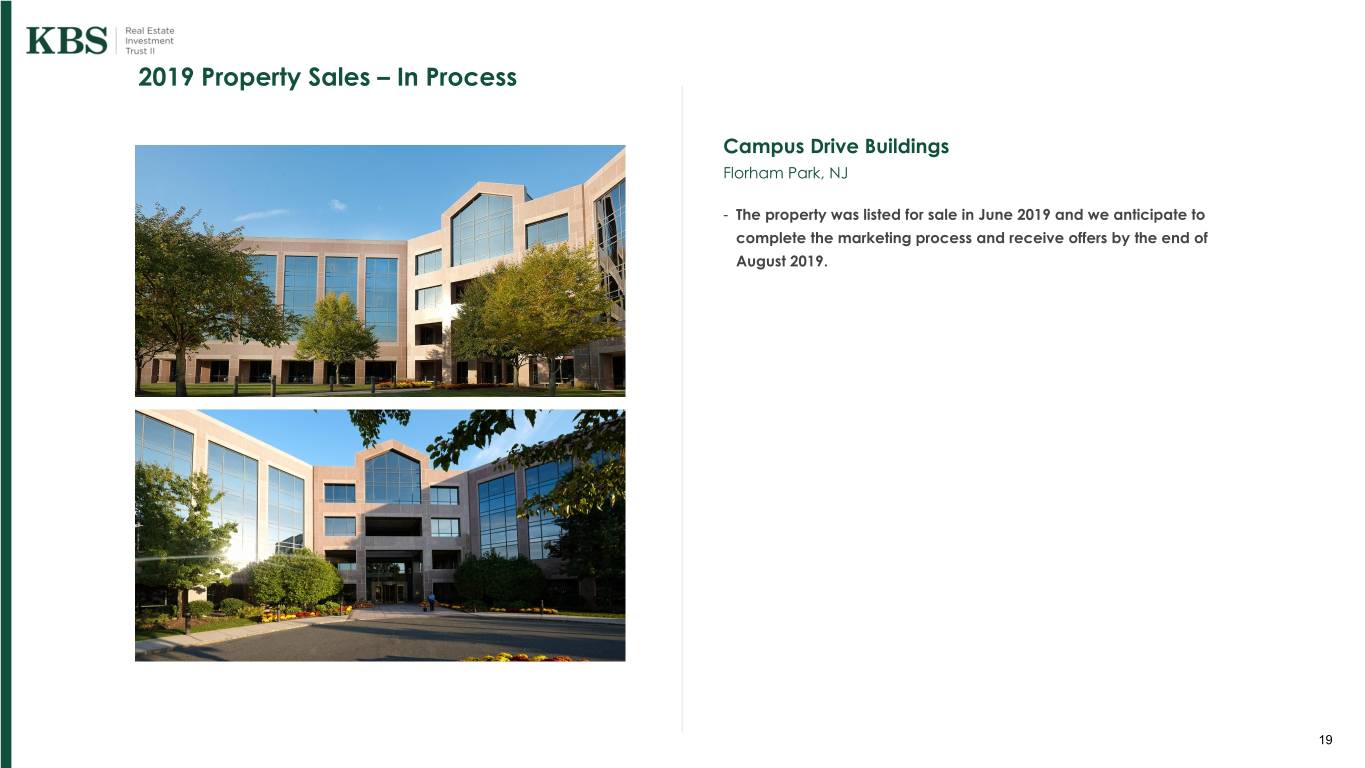
2019 Property Sales – In Process Campus Drive Buildings Florham Park, NJ - The property was listed for sale in June 2019 and we anticipate to complete the marketing process and receive offers by the end of August 2019. 19
June 2019 On June 12, 2019, KBS REIT II’s board of directors declared a special distribution in the amount of Special $0.45 per share of common stock to stockholders Distribution of record as of the close of business on June 17, 2019 (the “Special Distribution”). The Special Distribution was funded primarily from the Company’s net proceeds from the sales of Pierre Laclede Center and Emerald View on May 23, 2019 and was paid on June 21, 2019. As a result of the special distribution, the NAV was reduced from $4.95 to $4.50. 20

REIT II Goals & Objectives Continue to strategically sell assets and pay special distributions Negotiate lease renewals or new leases that facilitate the sales process and enhance property stability for prospective buyers Complete capital projects, such as renovations or amenity enhancements, to attract quality buyers Complete strategic alternatives assessment and finalize the liquidation plan 2119

Q&A For additional questions, contact KBS Capital Markets Group Investor Relations (866) 527-4264 22 20


