UNITED STATES
SECURITIES AND EXCHANGE COMMISSION
450 Fifth Street, N.W.
Washington, D.C. 20549
FORM 10-K
x | Annual Report Pursuant to Section 13 or 15(d) of the Securities Exchange Act of 1934 |
For the Year Ended December 31, 2013
OR
¨ | Transition Report Pursuant to Section 13 or 15(d) of the Securities Exchange Act of 1934 |
For the transition period from to
Commission File No. 001-33934
Cape Bancorp, Inc.
(Exact name of registrant as specified in its charter)
| | |
Maryland | | 26-1294270 |
(State or other jurisdiction of incorporation or organization) | | (I.R.S. Employer Identification Number) |
225 North Main Street, Cape May Court House, New Jersey | | 08210 |
(Address of Principal Executive Offices) | | Zip Code |
(609) 465-5600
(Registrant’s telephone number)
Securities Registered Pursuant to Section 12(b) of the Act:
| | | | | | |
| Title of each class | | | | Name of each exchange on which registered | |
Common Stock, $0.01 par value | | The NASDAQ Stock Market, LLC |
Securities Registered Pursuant to Section 12(g) of the Act: None
Indicate by check mark if the registrant is a well-known seasoned issuer, as defined in Rule 405 of the Securities Act. YES ¨ NO x
Indicate by check mark if the registrant is not required to file reports pursuant to Section 13 or Section 15(d) of the Act. YES ¨ NO x
Indicate by check mark whether the Registrant (1) has filed all reports required to be filed by Section 13 or 15(d) of the Securities Exchange Act of 1934 during the preceding twelve months (or for such shorter period that the Registrant was required to file such reports) and (2) has been subject to such requirements for the past 90 days. YES x NO ¨
Indicate by check mark if disclosure of delinquent filers pursuant to Item 405 of Regulation S-K (§229.405) is not contained herein, and will not be contained, to the best of Registrant’s knowledge, in definitive proxy or information statements incorporated by reference in Part III of this Form 10-K or any amendment to this Form 10-K. x
Indicate by check mark whether the registrant has submitted electronically and posted on its corporate Web site, if any, every Interactive Data File required to be submitted and posted pursuant to Rule 405 of Regulation S-T during the preceding 12 months (or for such shorter period that the registrant was required to submit and post such files). Yes x No ¨
Indicate by check mark whether the registrant is a large accelerated filer, an accelerated filer, a non-accelerated filer or a smaller reporting company, as defined in Rule 12b-2 of the Exchange Act).
| | | | | | |
Large accelerated filer | | ¨ | | Accelerated filer | | x |
| | | |
Non-accelerated filer | | ¨ | | Smaller reporting company | | ¨ |
Indicate by check mark whether the Registrant is a shell company (as defined in Rule 12b-2 of the Exchange Act). YES ¨ NO x
As of March 10, 2014 there were 11,881,985 shares of the Registrant’s common stock, par value $0.01 per share, outstanding.
The aggregate market value of the voting and non-voting common equity held by non-affiliates of the Registrant, computed by reference to the last sale price on June 30, 2013, was $114,015,000.
DOCUMENTS INCORPORATED BY REFERENCE
1. Proxy Statement for the 2014 Annual Meeting of Shareholders (Part III).
TABLE OF CONTENTS
PART I
Forward Looking Statements
Certain statements contained herein are “forward-looking statements” within the meaning of Section 27A of the Securities Act of 1933 and Section 21E of the Securities Exchange Act of 1934. Such forward-looking statements may be identified by reference to a future period or periods, or by the use of forward-looking terminology, such as “may,” “will,” “believe,” “expect,” “estimate,” “anticipate,” “continue,” or similar terms or variations on those terms, or the negative of those terms. Forward-looking statements are subject to numerous risks and uncertainties, including, but not limited to, those related to the economic environment, particularly in the market areas in which the Company operates, competitive products and pricing, fiscal and monetary policies of the U.S. Government, changes in government regulations affecting financial institutions, including regulatory fees and capital requirements, changes in prevailing interest rates, acquisitions and the integration of acquired businesses, credit risk management, asset-liability management, the financial and securities markets and the availability of, and costs associated with, sources of liquidity.
Cape Bancorp wishes to caution readers not to place undue reliance on any such forward-looking statements, which speak only as of the date made. The Company wishes to advise readers that the factors listed above could affect the Company’s financial performance and could cause the Company’s actual results for future periods to differ materially from any opinions or statements expressed with respect to future periods in any current statements.
Overview
Cape Bancorp, Inc. (“Cape Bancorp” or the “Company”) is a Maryland corporation that was incorporated on September 14, 2007 for the purpose of becoming the holding company of Cape Bank (“the Bank”).
At December 31, 2013, the Company had total assets of $1.093 billion compared to $1.041 billion at December 31, 2012. For the years ended December 31, 2013 and 2012, the Company had total revenues of $47.0 million and $51.5 million, respectively. Net income for the year ended December 31, 2013 totaled $5.6 million compared to $4.6 million for the year ended December 31, 2012. At December 31, 2013, the Company had total deposits of $798.4 million and total stockholders’ equity of $140.4 million, compared to total deposits of $784.6 million and total stockholders’ equity of $150.8 million at December 31, 2012.
Cape Bank
General
Cape Bank is a New Jersey chartered savings bank originally founded in 1923. We are a community bank focused on providing deposit and loan products to retail customers and to small and mid-sized businesses from our fourteen full service branch offices, located in Atlantic and Cape May Counties, New Jersey, including our main office located at 225 North Main Street, Cape May Court House, New Jersey 08210, one drive-up teller/ATM operation in Atlantic County and our two market development offices (“MDOs”) located in Burlington County, New Jersey and in Radnor, Pennsylvania, which services the five county Philadelphia market area. We attract deposits from the general public and use those funds to originate a variety of loans, including commercial mortgages, commercial business loans, residential mortgage loans, home equity loans and lines of credit (“HELOC”) and construction loans. Effective December 31, 2013, the Company exited the residential mortgage loan origination business which will allow for more resources to be focused on commercial lending. Our retail and business banking deposit products include checking accounts, money market accounts, savings accounts, and certificates of deposit with terms ranging from 30 days to 60 months. At December 31, 2013, 91.7% of our loan portfolio was secured by real estate and 61.5% of our portfolio was commercial related loans. We also maintain an investment portfolio.
We offer banking services to individuals and businesses predominantly located in our primary market area of Cape May and Atlantic Counties, New Jersey and through our MDOs. Our business and results of operations are significantly affected by local and national economic conditions, as well as market interest rates. With the local and national economic conditions continuing to improve through 2013, the Bank experienced significant declines in its level of non-performing assets as well as make progress in improving its credit quality ratios. Non-performing loans as a percentage of total gross loans decreased to 0.93% at December 31, 2013 from 2.67% at December 31, 2012. The Company’s Adversely Classified Asset Ratio (Classified Assets/Tier I Capital plus the allowance for loan losses) at December 31, 2013 was 26% compared to 30% at December 31, 2012. Non-performing assets (non-performing loans, other real estate owned and non-accruing investment securities) as a percentage of total assets decreased to 1.35% at December 31, 2013 from 2.61% at December 31, 2012. For the periods ended, and as of December 31, 2013 and December 31, 2012, loans held for sale (“HFS”) are excluded from delinquencies, non-performing loans, non-performing assets, impaired loans and all related ratio calculations. The ratio of our allowance for loan losses to total loans decreased to 1.18% at December 31, 2013, from 1.36% at December 31, 2012, while the ratio of our allowance for loan losses to non-performing loans increased to 127.05% at
3
December 31, 2013 from 50.86% at December 31, 2012. For the year ended December 31, 2013, loan charge-offs and write-downs on loans transferred to HFS totaled $2.8 million compared to loan charge-offs of $7.5 million for the year ended December 31, 2012. Our total loan portfolio increased $65.3 million to $789.8 million at December 31, 2013 from $724.5 million at December 31, 2012. Commercial loans increased $44.6 million, net of $6.5 million of commercial loans transferred to OREO throughout the year and $2.8 million of charge-offs and write-downs on loans transferred to HFS, residential mortgage loans increased $22.7 million and consumer loans declined $2.1 million. The increase in mortgage loans resulted from the Bank retaining approximately 68% of originations made during the year, partially offset by normal amortizations and payoffs. We believe our existing loan underwriting practices are appropriate in the current market environment while continuing to address the local credit needs. Total deposits increased $13.8 million from $784.6 million at December 31, 2012 to $798.4 million at December 31, 2013. Increases in certificates of deposit of $30.6 million were partially offset by a decrease in interest-bearing checking and money market deposits of $12.8 million and a decrease in non-interest bearing checking accounts totaling $3.8 million. Savings accounts declined $131,000.
Our principal business is acquiring deposits from individuals and businesses in the communities surrounding our offices and using these deposits to fund loans and other investments. We currently offer personal and business checking accounts, commercial mortgage loans, construction loans, home equity loans and lines of credit and other types of commercial and consumer loans.
Our website address is www.capebanknj.com. Information on our website is not and should not be considered a part of this Annual Report on Form 10-K. Our website contains a direct link to our filings with the Securities and Exchange Commission, including copies of Annual Reports on Form 10-K, Quarterly Reports on Form 10-Q, Current Reports on Form 8-K, and amendments to these filings, if any. Copies may also be obtained, without charge, by written request to Investor Relations, 225 Main Street, Cape May Court House, New Jersey 08210. The telephone number at our main office is (609) 465-5600.
Market Area
Our primary market area consists of Cape May and Atlantic Counties, which includes communities along the barrier islands of the southern New Jersey shore and the mainland areas. While the economies along the New Jersey shore are more seasonal in nature, the mainland areas are comprised of year-round communities. The economy of our market area is impacted by the gaming industry, a variety of service businesses, vacation-related businesses concentrated along the coastal areas and, to a lesser degree, commercial fishing. In addition, nearby Atlantic City is a major tourist destination, centered around its large gaming industry, and is an important regional economic hub. The severe national and local economic recession that began in late 2007 has had a significant negative impact on our market area. Unemployment rates in both Atlantic and Cape May Counties have remained elevated compared to the State of New Jersey and National levels. However, both Atlantic and Cape May Counties had significant declines in their unemployment rates from 14.3% and 16.2%, respectively, at December 2012 to 10.4% and 13.0%, respectively, at December 31, 2013, which was consistent with the decrease in unemployment rates at state and national levels. Both residential and commercial real estate values have declined during this recession. Residential real estate median sales prices remained flat year-over-year in Atlantic County and declined in Cape May County by 2.7%. When comparing 2013 to 2012, the number of closed sales and the number of days on the market increased in both counties. Additionally, both the number and dollar amount of residential building permits issued in 2013 increased from 2012 levels in Atlantic County and Cape May County. Commercial real estate (industrial, office and retail) values remain depressed on a national level compared to 2007 levels, commercial real estate rents have declined since 2007 and commercial real estate vacancy rates have increased since 2007. However, the improvement in the commercial real estate market (industrial, office and retail) that began in 2011 continued through 2013 with improving values, rents and occupancy rates consistent with improvements within the economy. The Company believes that this information, both nationally and regionally, is consistent with the Atlantic City metropolitan area.
The gaming industry is a significant economic force in our market and has already suffered a serious decline in revenues due to the economy and increased regional competition. The Atlantic City casino industry has experienced mixed results through the first three quarters of 2013.
Gross operating profit declined 37% for the nine month period ended September 30, 2013 compared to the same period in 2012;
Ten casinos had revenue declines during the period;
Occupancy rate in the casino hotels declined to 79.7% for the nine months ended September 30, 2013 compared to 86.2% for the same period ended September 30, 2012.
Competition from neighboring states has played an important role in this decline. Pennsylvania now has 14 operating casinos representing an addition of three from the previous year. Twelve of these casinos offer both table games and slots. Delaware has only three casinos, but in 2012 began offering table games in addition to their historic slot offerings. In an attempt to revitalize Atlantic City, the State of New Jersey has worked on several initiatives:
The Tourism District Law led to a $30 million marketing plan and realigned State gaming agencies to reduce bureaucracy.
4
In 2011, a second casino related law was passed with a comprehensive overhaul of casino regulations. This was the first major revision since 1977.
In February 2013, the State passed a law permitting online gaming in the state if the customer registers with an existing casino. Actual online gaming started in November of 2013.
Notwithstanding the recession, the year-round residency has remained relatively unchanged in both Cape May and Atlantic Counties from 2010 to 2013. Median household income has remained relatively stable in each county during the past three years, and was $54,978 for Atlantic County and $56,235 for Cape May County during 2013. For the State of New Jersey, median household income during 2013 was $68,482.
Competition
We face significant competition in attracting deposits and originating loans. Our most direct competition for deposits historically has come from the many financial institutions operating in our market area, including commercial banks, savings banks, savings and loan associations and credit unions, and, to a lesser extent, from other financial service companies such as brokerage firms and insurance companies. Several large holding companies operate banks in our market area, and these institutions are significantly larger than Cape Bank and, therefore, have significantly greater resources. We also face competition for investors’ funds from money market funds, mutual funds and other corporate and government securities. At June 30, 2013, which is the most recent date for which data is available from the Federal Deposit Insurance Corporation (“FDIC”), we held approximately 13.3% of the deposits in Cape May County, which was the 2nd largest market share out of the 14 financial institutions with offices in Cape May County, and we held approximately 8.4% of the deposits in Atlantic County, which was the 6th largest market share of the 16 financial institutions with offices in Atlantic County. On a combined market basis we held approximately 10.1% of the deposits which was the 4th largest market share of 21 financial institutions.
Our competition for loans comes primarily from financial institutions in our market area and, to a lesser extent, from other financial service providers. Our market area has a large number of competitors offering real estate lending products. Data is not available to determine our competitive position among this group. Competition for deposits and the origination of loans could limit our growth in the future.
Lending Activities
We currently offer a variety of loans, including commercial mortgages, commercial loans, home equity loans and lines of credit, and construction loans. Our commercial mortgage loan portfolio at December 31, 2013, comprised 53.0% of our total loan portfolio, which was greater than any other loan category.
Loans are presented in Management’s Discussion and analysis according to type of loan utilized for management reporting purposes, whereas certain disclosures within Note 4 – Loans Receivable are presented in accordance with FASB issued ASU No. 2010-20, “Disclosures about the Credit Quality of Financing Receivables and the Allowance for Credit Losses”.
Loan Portfolio Composition. The following table sets forth the composition of our loan portfolio, excluding loans held for sale, by type of loan at the dates indicated.
| At December 31, | | |
| 2013 | | | 2012 | | | 2011 | | | 2010 | | | 2009 | | |
| Amount | | | Percent | | | Amount | | | Percent | | | Amount | | | Percent | | | Amount | | | Percent | | | Amount | | | Percent | | |
| (dollars in thousands) | | |
Real estate loans: | | | | | | | | | | | | | | | | | | | | | | | | | | | | | | | | | | | | | | | | |
Commercial mortgage | $ | 419,554 | | | | 53.0 | % | | $ | 383,650 | | | | 53.0 | % | | $ | 374,252 | | | | 51.4 | % | | $ | 413,487 | | | | 52.7 | % | | $ | 412,475 | | | | 51.3 | % | |
Residential mortgage | | 250,698 | | | | 31.8 | % | | | 235,921 | | | | 32.6 | % | | | 252,513 | | | | 34.6 | % | | | 258,047 | | | | 32.9 | % | | | 244,897 | | | | 30.5 | % | |
Construction | | 10,852 | | | | 1.4 | % | | | 1,765 | | | | 0.2 | % | | | 12,378 | | | | 1.7 | % | | | 15,191 | | | | 1.9 | % | | | 28,839 | | | | 3.6 | % | |
Home equity loans and lines of credit | | 43,468 | | | | 5.5 | % | | | 45,258 | | | | 6.2 | % | | | 47,237 | | | | 6.5 | % | | | 47,875 | | | | 6.1 | % | | | 52,806 | | | | 6.6 | % | |
Commercial business loans | | 64,250 | | | | 8.2 | % | | | 56,589 | | | | 7.8 | % | | | 41,827 | | | | 5.7 | % | | | 48,223 | | | | 6.1 | % | | | 62,685 | | | | 7.8 | % | |
Other consumer loans | | 977 | | | | 0.1 | % | | | 1,317 | | | | 0.2 | % | | | 1,023 | | | | 0.1 | % | | | 2,207 | | | | 0.3 | % | | | 1,284 | | | | 0.2 | % | |
Total loans | $ | 789,799 | | | | 100.0 | % | | $ | 724,500 | | | | 100.0 | % | | $ | 729,230 | | | | 100.0 | % | | $ | 785,030 | | | | 100.0 | % | | $ | 802,986 | | | | 100.0 | % | |
| | | | | | | | | | | | | | | | | | | | | | | | | | | | | | | | | | | | | | | | |
Less: | | | | | | | | | | | | | | | | | | | | | | | | | | | | | | | | | | | | | | | | |
Allowance for loan losses | | 9,330 | | | | | | | | 9,852 | | | | | | | | 12,653 | | | | | | | | 12,538 | | | | | | | | 13,311 | | | | | | |
Deferred loan fees, net | | 342 | | | | | | | | 252 | | | | | | | | 236 | | | | | | | | 174 | | | | | | | | 202 | | | | | | |
Total loans, net | $ | 780,127 | | | | | | | $ | 714,396 | | | | | | | $ | 716,341 | | | | | | | $ | 772,318 | | | | | | | $ | 789,473 | | | | | | |
5
Loan Portfolio Maturities and Yields. The following tables summarize the scheduled maturities of our loan portfolio at December 31, 2013 and December 31, 2012. Demand loans, loans having no stated repayment schedule at maturity and overdraft loans are reported as being due in one year or less. Maturities are based on final contractual payment date and do not reflect the effect of prepayments and scheduled principal amortization.
| | Commercial
Mortgage Loans | | | Residential Mortgage
Loans | | | Construction Loans | | | Home Equity Loans
and Lines of Credit | |
At December 31, 2013 | | Amount | | | Weighted
Average
Rate | | | Amount | | | Weighted
Average
Rate | | | Amount | | | Weighted
Average
Rate | | | Amount | | | Weighted
Average
Rate | |
| | (dollars in thousands) | |
Due During the Years | | | | | | | | | | | | | | | | | | | | | | | | | | | | | | | | |
Ending December 31, | | | | | | | | | | | | | | | | | | | | | | | | | | | | | | | | |
2014 | | $ | 13,987 | | | | 6.26 | % | | $ | 944 | | | | 4.68 | % | | $ | 10,744 | | | | 4.12 | % | | $ | 226 | | | | 3.73 | % |
2015 | | | 744 | | | | 5.94 | % | | | 233 | | | | 5.28 | % | | | - | | | | 0.00 | % | | | 424 | | | | 4.29 | % |
2016 | | | 18,436 | | | | 4.53 | % | | | 361 | | | | 5.99 | % | | | - | | | | 0.00 | % | | | 395 | | | | 5.31 | % |
2017 to 2018 | | | 110,424 | | | | 4.69 | % | | | 5,089 | | | | 5.09 | % | | | - | | | | 0.00 | % | | | 2,561 | | | | 4.58 | % |
2019 to 2023 | | | 79,233 | | | | 4.63 | % | | | 9,258 | | | | 5.04 | % | | | 108 | | | | 4.50 | % | | | 12,001 | | | | 5.25 | % |
2024 to 2028 | | | 42,946 | | | | 5.76 | % | | | 36,730 | | | | 4.06 | % | | | - | | | | 0.00 | % | | | 25,439 | | | | 3.96 | % |
2029 to 2031 | | | 28,936 | | | | 5.48 | % | | | 13,672 | | | | 4.97 | % | | | - | | | | 0.00 | % | | | 1,006 | | | | 4.19 | % |
2032 to 2034 | | | 40,499 | | | | 5.68 | % | | | 17,344 | | | | 4.70 | % | | | - | | | | 0.00 | % | | | 1,196 | | | | 4.46 | % |
2035 to 2036 | | | 17,166 | | | | 6.53 | % | | | 13,675 | | | | 4.88 | % | | | - | | | | 0.00 | % | | | 220 | | | | 5.50 | % |
2037 to 2038 | | | 26,883 | | | | 6.07 | % | | | 19,923 | | | | 4.98 | % | | | - | | | | 0.00 | % | | | - | | | | 0.00 | % |
2039 to 2041 | | | 37,338 | | | | 5.17 | % | | | 43,442 | | | | 4.80 | % | | | - | | | | 0.00 | % | | | - | | | | 0.00 | % |
2042 and beyond | | | 2,962 | | | | 4.75 | % | | | 90,027 | | | | 3.93 | % | | | - | | | | 0.00 | % | | | - | | | | 0.00 | % |
Total | | $ | 419,554 | | | | 5.19 | % | | $ | 250,698 | | | | 4.42 | % | | $ | 10,852 | | | | 4.12 | % | | $ | 43,468 | | | | 4.39 | % |
| | Commercial Business Loans | | | Other Consumer Loans (1) | | | Total | |
| | Amount | | | Weighted
Average
Rate | | | Amount | | | Weighted
Average
Rate | | | Amount | | | Weighted
Average
Rate | |
| | (dollars in thousands) | |
Due During the Years | | | | | | | | | | | | | | | | | | | | | | | | |
Ending December 31, | | | | | | | | | | | | | | | | | | | | | | | | |
2014 | | $ | 38,611 | | | | 4.63 | % | | $ | 264 | | | | 0.38 | % | | $ | 64,776 | | | | 4.88 | % |
2015 | | | 1,943 | | | | 4.62 | % | | | - | | | | 0.00 | % | | | 3,344 | | | | 4.92 | % |
2016 | | | 4,007 | | | | 5.66 | % | | | - | | | | 0.00 | % | | | 23,199 | | | | 4.76 | % |
2017 to 2018 | | | 10,321 | | | | 4.90 | % | | | - | | | | 0.00 | % | | | 128,395 | | | | 4.72 | % |
2019 to 2023 | | | 8,104 | | | | 3.94 | % | | | - | | | | 0.00 | % | | | 108,704 | | | | 4.68 | % |
2024 to 2028 | | | 558 | | | | 4.27 | % | | | 713 | | | | 3.55 | % | | | 106,386 | | | | 4.72 | % |
2029 to 2031 | | | - | | | | 0.00 | % | | | - | | | | 0.00 | % | | | 43,614 | | | | 5.29 | % |
2032 to 2034 | | | 528 | | | | 4.23 | % | | | - | | | | 0.00 | % | | | 59,567 | | | | 5.36 | % |
2035 to 2036 | | | 178 | | | | 7.25 | % | | | - | | | | 0.00 | % | | | 31,239 | | | | 5.80 | % |
2037 to 2038 | | | - | | | | 0.00 | % | | | - | | | | 0.00 | % | | | 46,806 | | | | 5.61 | % |
2039 to 2041 | | | - | | | | 0.00 | % | | | - | | | | 0.00 | % | | | 80,780 | | | | 4.97 | % |
2042 and beyond | | | - | | | | 0.00 | % | | | - | | | | 0.00 | % | | | 92,989 | | | | 3.96 | % |
Total | | $ | 64,250 | | | | 4.65 | % | | $ | 977 | | | | 2.69 | % | | $ | 789,799 | | | | 4.84 | % |
(1) | Includes overdrawn DDA accounts. |
6
| | Commercial Mortgage
Loans | | | Residential Mortgage
Loans | | | Construction Loans | | | Home Equity Loans
and Lines of Credit | |
At December 31, 2012 | | Amount | | | Weighted
Average
Rate | | | Amount | | | Weighted
Average
Rate | | | Amount | | | Weighted
Average
Rate | | | Amount | | | Weighted
Average
Rate | |
| | (dollars in thousands) | |
Due During the Years | | | | | | | | | | | | | | | | | | | | | | | | | | | | | | | | |
Ending December 31, | | | | | | | | | | | | | | | | | | | | | | | | | | | | | | | | |
2013 | | $ | 11,768 | | | | 6.83 | % | | $ | 1,144 | | | | 4.60 | % | | $ | 1,765 | | | | 4.29 | % | | $ | 184 | | | | 4.66 | % |
2014 | | | 6,812 | | | | 6.57 | % | | | 219 | | | | 5.55 | % | | | - | | | | 0.00 | % | | | 334 | | | | 4.72 | % |
2015 | | | 1,086 | | | | 6.19 | % | | | 415 | | | | 5.20 | % | | | - | | | | 0.00 | % | | | 610 | | | | 4.49 | % |
2016 to 2017 | | | 64,953 | | | | 5.21 | % | | | 2,582 | | | | 5.89 | % | | | - | | | | 0.00 | % | | | 1,932 | | | | 5.02 | % |
2018 to 2022 | | | 40,488 | | | | 4.98 | % | | | 14,067 | | | | 5.02 | % | | | - | | | | 0.00 | % | | | 12,073 | | | | 5.50 | % |
2023 to 2027 | | | 49,677 | | | | 5.95 | % | | | 40,240 | | | | 4.34 | % | | | - | | | | 0.00 | % | | | 28,841 | | | | 4.09 | % |
2028 to 2030 | | | 27,976 | | | | 6.13 | % | | | 15,611 | | | | 5.04 | % | | | - | | | | 0.00 | % | | | - | | | | 0.00 | % |
2031 to 2033 | | | 52,488 | | | | 6.02 | % | | | 10,755 | | | | 5.34 | % | | | - | | | | 0.00 | % | | | 1,284 | | | | 4.34 | % |
2034 to 2035 | | | 22,979 | | | | 6.76 | % | | | 21,073 | | | | 4.88 | % | | | - | | | | 0.00 | % | | | - | | | | 0.00 | % |
2036 to 2037 | | | 21,133 | | | | 6.35 | % | | | 8,361 | | | | 5.68 | % | | | - | | | | 0.00 | % | | | - | | | | 0.00 | % |
2038 to 2040 | | | 84,290 | | | | 6.00 | % | | | 53,246 | | | | 4.90 | % | | | - | | | | 0.00 | % | | | - | | | | 0.00 | % |
2041 and beyond | | | - | | | | 0.00 | % | | | 68,208 | | | | 4.37 | % | | | - | | | | 0.00 | % | | | - | | | | 0.00 | % |
Total | | $ | 383,650 | | | | 5.87 | % | | $ | 235,921 | | | | 4.72 | % | | $ | 1,765 | | | | 4.29 | % | | $ | 45,258 | | | | 4.53 | % |
| | Commercial Business Loans | | | Other Consumer Loans (1) | | | Total | |
| | Amount | | | Weighted
Average
Rate | | | Amount | | | Weighted
Average
Rate | | | Amount | | | Weighted
Average
Rate | |
| | (dollars in thousands) | |
Due During the Years | | | | | | | | | | | | | | | | | | | | | | | | |
Ending December 31, | | | | | | | | | | | | | | | | | | | | | | | | |
2013 | | $ | 32,926 | | | | 4.97 | % | | $ | 119 | | | | 0.69 | % | | $ | 47,906 | | | | 5.38 | % |
2014 | | | 1,046 | | | | 6.33 | % | | | 7 | | | | 13.50 | % | | | 8,418 | | | | 6.45 | % |
2015 | | | 1,886 | | | | 5.45 | % | | | - | | | | 0.00 | % | | | 3,997 | | | | 5.48 | % |
2016 to 2017 | | | 13,250 | | | | 5.18 | % | | | - | | | | 0.00 | % | | | 82,717 | | | | 5.22 | % |
2018 to 2022 | | | 6,015 | | | | 4.51 | % | | | - | | | | 0.00 | % | | | 72,643 | | | | 5.04 | % |
2023 to 2027 | | | 183 | | | | 5.58 | % | | | 1,191 | | | | 3.56 | % | | | 120,132 | | | | 4.94 | % |
2028 to 2030 | | | 542 | | | | 4.00 | % | | | - | | | | 0.00 | % | | | 44,129 | | | | 5.72 | % |
2031 to 2033 | | | 559 | | | | 5.37 | % | | | - | | | | 0.00 | % | | | 65,086 | | | | 5.87 | % |
2034 to 2035 | | | 182 | | | | 7.25 | % | | | - | | | | 0.00 | % | | | 44,234 | | | | 5.87 | % |
2036 to 2037 | | | - | | | | 0.00 | % | | | - | | | | 0.00 | % | | | 29,494 | | | | 6.16 | % |
2038 to 2040 | | | - | | | | 0.00 | % | | | - | | | | 0.00 | % | | | 137,536 | | | | 5.57 | % |
2041 and beyond | | | - | | | | 0.00 | % | | | - | | | | 0.00 | % | | | 68,208 | | | | 4.37 | % |
Total | | $ | 56,589 | | | | 5.02 | % | | $ | 1,317 | | | | 3.35 | % | | $ | 724,500 | | | | 5.34 | % |
(1) | Includes overdrawn DDA accounts. |
7
The following table sets forth the scheduled repayments of fixed and adjustable rate loans at December 31, 2013 and December 31, 2012 that are contractually due within one year and after one year.
| At December 31, 2013 | |
| Fixed Rate | | | Adjustable Rate | | | | | |
| Due Within | | | Due After | | | | | | | Due Within | | | Due After | | | | | | | Total | |
| One Year | | | One Year | | | Total | | | One Year | | | One Year | | | Total | | | Loans | |
| (in thousands) | |
Real estate loans: | | | | | | | | | | | | | | | | | | | | | | | | | | | |
Commercial mortgage | $ | 6,124 | | | $ | 28,018 | | | $ | 34,142 | | | $ | 7,863 | | | $ | 377,549 | | | $ | 385,412 | | | $ | 419,554 | |
Residential mortgage | | 944 | | | | 213,050 | | | | 213,994 | | | | - | | | | 36,704 | | | | 36,704 | | | | 250,698 | |
Construction | | 8,977 | | | | - | | | | 8,977 | | | | 1,767 | | | | 108 | | | | 1,875 | | | | 10,852 | |
Home equity loans and lines of credit | | 73 | | | | 15,660 | | | | 15,733 | | | | 153 | | | | 27,582 | | | | 27,735 | | | | 43,468 | |
Commercial business loans | | 2,513 | | | | 23,794 | | | | 26,307 | | | | 36,098 | | | | 1,845 | | | | 37,943 | | | | 64,250 | |
Other consumer loans | | 258 | | | | - | | | | 258 | | | | 6 | | | | 713 | | | | 719 | | | | 977 | |
Total | $ | 18,889 | | | $ | 280,522 | | | $ | 299,411 | | | $ | 45,887 | | | $ | 444,501 | | | $ | 490,388 | | | $ | 789,799 | |
| At December 31, 2012 | |
| Fixed Rate | | | Adjustable Rate | | | | | |
| Due Within | | | Due After | | | | | | | Due Within | | | Due After | | | | | | | Total | |
| One Year | | | One Year | | | Total | | | One Year | | | One Year | | | Total | | | Loans | |
| (in thousands) | |
Real estate loans: | | | | | | | | | | | | | | | | | | | | | | | | | | | |
Commercial mortgage | $ | 7,767 | | | $ | 9,399 | | | $ | 17,166 | | | $ | 4,001 | | | $ | 362,483 | | | $ | 366,484 | | | $ | 383,650 | |
Residential mortgage | | 1,142 | | | | 205,494 | | | | 206,636 | | | | - | | | | 29,285 | | | | 29,285 | | | | 235,921 | |
Construction | | 1,341 | | | | - | | | | 1,341 | | | | 424 | | | | - | | | | 424 | | | | 1,765 | |
Home equity loans and lines of credit | | 155 | | | | 16,208 | | | | 16,363 | | | | 29 | | | | 28,866 | | | | 28,895 | | | | 45,258 | |
Commercial business loans | | 2,662 | | | | 22,189 | | | | 24,851 | | | | 30,264 | | | | 1,474 | | | | 31,738 | | | | 56,589 | |
Other consumer loans | | 114 | | | | 7 | | | | 121 | | | | 5 | | | | 1,191 | | | | 1,196 | | | | 1,317 | |
Total | $ | 13,181 | | | $ | 253,297 | | | $ | 266,478 | | | $ | 34,723 | | | $ | 423,299 | | | $ | 458,022 | | | $ | 724,500 | |
8
The following table sets forth fixed and adjustable rate loans at December 31, 2013 and at December 31, 2012 as a percentage of the total loan portfolio.
| Percentage of Total Loan Portfolio | | |
| At December 31, 2013 | | |
| (dollars in thousands) | | |
| | | | | Percent | | | | | | | Percent | | | | | | |
| Fixed | | | of Total | | | Adjustable | | | of Total | | | | | | |
| Rate | | | Loans | | | Rate | | | Loans | | | Total | | |
Real estate loans: | | | | | | | | | | | | | | | | | | | | |
Commercial mortgage | $ | 34,142 | | | | 4.3 | % | | $ | 385,412 | | | | 48.7 | % | | $ | 419,554 | | |
Residential mortgage | | 213,994 | | | | 27.1 | % | | | 36,704 | | | | 4.7 | % | | | 250,698 | | |
Construction | | 8,977 | | | | 1.2 | % | | | 1,875 | | | | 0.2 | % | | | 10,852 | | |
Home equity loans and lines of credit | | 15,733 | | | | 2.0 | % | | | 27,735 | | | | 3.5 | % | | | 43,468 | | |
Commercial business loans | | 26,307 | | | | 3.3 | % | | | 37,943 | | | | 4.9 | % | | | 64,250 | | |
Other consumer loans | | 258 | | | | 0.0 | % | | | 719 | | | | 0.1 | % | | | 977 | | |
Total | $ | 299,411 | | | | 37.9 | % | | $ | 490,388 | | | | 62.1 | % | | $ | 789,799 | | |
| Percentage of Total Loan Portfolio | | |
| At December 31, 2012 | | |
| (dollars in thousands) | | |
| | | | | Percent | | | | | | | Percent | | | | | | |
| Fixed | | | of Total | | | Adjustable | | | of Total | | | | | | |
| Rate | | | Loans | | | Rate | | | Loans | | | Total | | |
Real estate loans: | | | | | | | | | | | | | | | | | | | | |
Commercial mortgage | $ | 17,166 | | | | 2.4 | % | | $ | 366,484 | | | | 50.6 | % | | $ | 383,650 | | |
Residential mortgage | | 206,636 | | | | 28.6 | % | | | 29,285 | | | | 4.0 | % | | | 235,921 | | |
Construction | | 1,341 | | | | 0.1 | % | | | 424 | | | | 0.1 | % | | | 1,765 | | |
Home equity loans and lines of credit | | 16,363 | | | | 2.2 | % | | | 28,895 | | | | 4.0 | % | | | 45,258 | | |
Commercial business loans | | 24,851 | | | | 3.4 | % | | | 31,738 | | | | 4.4 | % | | | 56,589 | | |
Other consumer loans | | 121 | | | | 0.0 | % | | | 1,196 | | | | 0.2 | % | | | 1,317 | | |
Total | $ | 266,478 | | | | 36.7 | % | | $ | 458,022 | | | | 63.3 | % | | $ | 724,500 | | |
The Bank’s fixed rate loans increased as a percentage of total loans to 37.9% at December 31, 2013 from 36.7% at December 31, 2012. The low interest rate environment has resulted in customers selecting fixed rate products, moreso in 2013, than in prior years. During the past two years while market interest rates fell to historically low levels, we were able to maintain a net interest margin of 3.76% and 3.75% for 2013 and 2012, respectively. This increase in net interest margin during 2013 resulted from a decline of 35 basis points in the cost of interest-bearing liabilities partially offset by a 30 basis point decrease in the yield on interest-earning assets. The net interest margin for both 2013 and 2012 benefitted from the previously disclosed debt extinguishment in the second quarter of 2012, and the further restructuring of debt in the third quarter of 2012. Based on our interest rate risk modeling, when market interest rates rise our net interest income will be negatively affected based on the assumptions used in our analysis located in the section within this report entitled “Management’s Discussion and Analysis of Financial Condition and Results of Operations—Management of Market Risk”.
9
The following table sets forth fixed and adjustable rate loans at December 31, 2013 maturing within ten years, twenty years and over twenty years as a percentage of the total loan portfolio.
| | Fixed Rate at December 31, 2013 | | |
| | (dollars in thousands) | | |
| | | | | | Percent | | | Ten to | | | Percent | | | Over | | | Percent | | | | | | |
| | Within | | | of Total | | | Twenty | | | of Total | | | Twenty | | | of Total | | | | | | |
| | Ten Years | | | Loans | | | Years | | | Loans | | | Years | | | Loans | | | Total | | |
Real estate loans: | | | | | | | | | | | | | | | | | | | | | | | | | | | | | |
Commercial mortgage | | $ | 31,333 | | | | 4.0 | % | | $ | 997 | | | | 0.1 | % | | $ | 1,812 | | | | 0.2 | % | | $ | 34,142 | | |
Residential mortgage | | | 15,001 | | | | 1.9 | % | | | 57,758 | | | | 7.3 | % | | | 141,235 | | | | 17.9 | % | | | 213,994 | | |
Construction | | | 8,977 | | | | 1.2 | % | | | - | | | | 0.0 | % | | | - | | | | 0.0 | % | | | 8,977 | | |
Home equity loans and lines of credit | | | 7,984 | | | | 1.0 | % | | | 7,699 | | | | 1.0 | % | | | 50 | | | | 0.0 | % | | | 15,733 | | |
Commercial business loans | | | 25,475 | | | | 3.2 | % | | | 654 | | | | 0.1 | % | | | 178 | | | | 0.0 | % | | | 26,307 | | |
Other consumer loans | | | 258 | | | | 0.0 | % | | | - | | | | 0.0 | % | | | - | | | | 0.0 | % | | | 258 | | |
Total loans | | $ | 89,028 | | | | 11.3 | % | | $ | 67,108 | | | | 8.5 | % | | $ | 143,275 | | | | 18.1 | % | | $ | 299,411 | | |
| | Adjustable Rate at December 31, 2013 | | |
| | (dollars in thousands) | | |
| | | | | | Percent | | | Ten to | | | Percent | | | Over | | | Percent | | | | | | |
| | Within | | | of Total | | | Twenty | | | of Total | | | Twenty | | | of Total | | | | | | |
| | Ten Years | | | Loans | | | Years | | | Loans | | | Years | | | Loans | | | Total | | |
Real estate loans: | | | | | | | | | | | | | | | | | | | | | | | | | | | | | |
Commercial mortgage | | $ | 191,492 | | | | 24.2 | % | | $ | 103,741 | | | | 13.1 | % | | $ | 90,179 | | | | 11.4 | % | | $ | 385,412 | | |
Residential mortgage | | | 826 | | | | 0.1 | % | | | 1,420 | | | | 0.2 | % | | | 34,458 | | | | 4.4 | % | | | 36,704 | | |
Construction | | | 1,875 | | | | 0.2 | % | | | - | | | | 0.0 | % | | | - | | | | 0.0 | % | | | 1,875 | | |
Home equity loans and lines of credit | | | 7,623 | | | | 1.0 | % | | | 19,892 | | | | 2.5 | % | | | 220 | | | | 0.0 | % | | | 27,735 | | |
Commercial business loans | | | 37,512 | | | | 4.8 | % | | | 431 | | | | 0.1 | % | | | - | | | | 0.0 | % | | | 37,943 | | |
Other consumer loans | | | 6 | | | | 0.0 | % | | | 713 | | | | 0.1 | % | | | - | | | | 0.0 | % | | | 719 | | |
Total loans | | $ | 239,334 | | | | 30.3 | % | | $ | 126,197 | | | | 16.0 | % | | $ | 124,857 | | | | 15.8 | % | | $ | 490,388 | | |
| | Total Loans at December 31, 2013 | | |
| | (dollars in thousands) | | |
| | | | | | Percent | | | Ten to | | | Percent | | | Over | | | Percent | | | | | | |
| | Within | | | of Total | | | Twenty | | | of Total | | | Twenty | | | of Total | | | | | | |
| | Ten Years | | | Loans | | | Years | | | Loans | | | Years | | | Loans | | | Total | | |
Real estate loans: | | | | | | | | | | | | | | | | | | | | | | | | | | | | | |
Commercial mortgage | | $ | 222,825 | | | | 28.2 | % | | $ | 104,738 | | | | 13.2 | % | | $ | 91,991 | | | | 11.6 | % | | $ | 419,554 | | |
Residential mortgage | | | 15,827 | | | | 2.0 | % | | | 59,178 | | | | 7.5 | % | | | 175,693 | | | | 22.3 | % | | | 250,698 | | |
Construction | | | 10,852 | | | | 1.4 | % | | | - | | | | 0.0 | % | | | - | | | | 0.0 | % | | | 10,852 | | |
Home equity loans and lines of credit | | | 15,607 | | | | 2.0 | % | | | 27,591 | | | | 3.5 | % | | | 270 | | | | 0.0 | % | | | 43,468 | | |
Commercial business loans | | | 62,987 | | | | 8.0 | % | | | 1,085 | | | | 0.2 | % | | | 178 | | | | 0.0 | % | | | 64,250 | | |
Other consumer loans | | | 264 | | | | 0.0 | % | | | 713 | | | | 0.1 | % | | | - | | | | 0.0 | % | | | 977 | | |
Total loans | | $ | 328,362 | | | | 41.6 | % | | $ | 193,305 | | | | 24.5 | % | | $ | 268,132 | | | | 33.9 | % | | $ | 789,799 | | |
10
The following table sets forth fixed and adjustable rate loans at December 31, 2012 maturing within ten years, twenty years and over twenty years as a percentage of the total loan portfolio.
| | Fixed Rate at December 31, 2012 | | |
| | (dollars in thousands) | | |
| | | | | | Percent | | | Ten to | | | Percent | | | Over | | | Percent | | | | | | |
| | Within | | | of Total | | | Twenty | | | of Total | | | Twenty | | | of Total | | | | | | |
| | Ten Years | | | Loans | | | Years | | | Loans | | | Years | | | Loans | | | Total | | |
Real estate loans: | | | | | | | | | | | | | | | | | | | | | | | | | | | | | |
Commercial mortgage | | $ | 13,947 | | | | 1.9 | % | | $ | 1,557 | | | | 0.2 | % | | $ | 1,662 | | | | 0.3 | % | | $ | 17,166 | | |
Residential mortgage | | | 17,394 | | | | 2.4 | % | | | 58,125 | | | | 8.1 | % | | | 131,117 | | | | 18.1 | % | | | 206,636 | | |
Construction | | | 1,341 | | | | 0.1 | % | | | - | | | | 0.0 | % | | | - | | | | 0.0 | % | | | 1,341 | | |
Home equity loans and lines of credit | | | 8,695 | | | | 1.2 | % | | | 7,668 | | | | 1.0 | % | | | - | | | | 0.0 | % | | | 16,363 | | |
Commercial business loans | | | 23,841 | | | | 3.3 | % | | | 828 | | | | 0.1 | % | | | 182 | | | | 0.0 | % | | | 24,851 | | |
Other consumer loans | | | 121 | | | | 0.0 | % | | | - | | | | 0.0 | % | | | - | | | | 0.0 | % | | | 121 | | |
Total loans | | $ | 65,339 | | | | 8.9 | % | | $ | 68,178 | | | | 9.4 | % | | $ | 132,961 | | | | 18.4 | % | | $ | 266,478 | | |
| | Adjustable Rate at December 31, 2012 | | |
| | (dollars in thousands) | | |
| | | | | | Percent | | | Ten to | | | Percent | | | Over | | | Percent | | | | | | |
| | Within | | | of Total | | | Twenty | | | of Total | | | Twenty | | | of Total | | | | | | |
| | Ten Years | | | Loans | | | Years | | | Loans | | | Years | | | Loans | | | Total | | |
Real estate loans: | | | | | | | | | | | | | | | | | | | | | | | | | | | | | |
Commercial mortgage | | $ | 111,159 | | | | 15.3 | % | | $ | 104,942 | | | | 14.5 | % | | $ | 150,383 | | | | 20.8 | % | | $ | 366,484 | | |
Residential mortgage | | | 1,032 | | | | 0.1 | % | | | 632 | | | | 0.1 | % | | | 27,621 | | | | 3.8 | % | | | 29,285 | | |
Construction | | | 424 | | | | 0.1 | % | | | - | | | | 0.0 | % | | | - | | | | 0.0 | % | | | 424 | | |
Home equity loans and lines of credit | | | 6,438 | | | | 0.9 | % | | | 22,457 | | | | 3.1 | % | | | - | | | | 0.0 | % | | | 28,895 | | |
Commercial business loans | | | 31,282 | | | | 4.3 | % | | | 53 | | | | 0.0 | % | | | 403 | | | | 0.1 | % | | | 31,738 | | |
Other consumer loans | | | 5 | | | | 0.0 | % | | | 1,191 | | | | 0.2 | % | | | - | | | | 0.0 | % | | | 1,196 | | |
Total loans | | $ | 150,340 | | | | 20.7 | % | | $ | 129,275 | | | | 17.9 | % | | $ | 178,407 | | | | 24.7 | % | | $ | 458,022 | | |
| | Total Loans at December 31, 2012 | | |
| | (dollars in thousands) | | |
| | | | | | Percent | | | Ten to | | | Percent | | | Over | | | Percent | | | | | | |
| | Within | | | of Total | | | Twenty | | | of Total | | | Twenty | | | of Total | | | | | | |
| | Ten Years | | | Loans | | | Years | | | Loans | | | Years | | | Loans | | | Total | | |
Real estate loans: | | | | | | | | | | | | | | | | | | | | | | | | | | | | | |
Commercial mortgage | | $ | 125,106 | | | | 17.2 | % | | $ | 106,499 | | | | 14.7 | % | | $ | 152,045 | | | | 21.1 | % | | $ | 383,650 | | |
Residential mortgage | | | 18,426 | | | | 2.5 | % | | | 58,757 | | | | 8.2 | % | | | 158,738 | | | | 21.9 | % | | | 235,921 | | |
Construction | | | 1,765 | | | | 0.2 | % | | | - | | | | 0.0 | % | | | - | | | | 0.0 | % | | | 1,765 | | |
Home equity loans and lines of credit | | | 15,133 | | | | 2.1 | % | | | 30,125 | | | | 4.1 | % | | | - | | | | 0.0 | % | | | 45,258 | | |
Commercial business loans | | | 55,123 | | | | 7.6 | % | | | 881 | | | | 0.1 | % | | | 585 | | | | 0.1 | % | | | 56,589 | | |
Other consumer loans | | | 126 | | | | 0.0 | % | | | 1,191 | | | | 0.2 | % | | | - | | | | 0.0 | % | | | 1,317 | | |
Total loans | | $ | 215,679 | | | | 29.6 | % | | $ | 197,453 | | | | 27.3 | % | | $ | 311,368 | | | | 43.1 | % | | $ | 724,500 | | |
Fixed rate long-term loans present interest rate risk to the Bank and will constrain net income in a rising interest rate environment. The magnitude of this long-term risk associated with fixed rate long-term loans is factored into our Management of Market Risk analysis provided in “Management’s Discussion and Analysis of Financial Condition and Results of Operations—Management of Market Risk” . The Bank’s Cumulative Gap Analysis with assumptions results in the Bank being liability sensitive through 5 years.
11
The following table indicates our commercial loan portfolio concentrations sorted by the North American Industry Classification System (NAICS) code as of December 31, 2013.
Commercial Loan Concentrations
December 31, 2013
Real Estate and Rental and Leasing | | 36.6 | % |
Accommodation and Food Services | | 20.6 | % |
Retail Trade | | 9.6 | % |
Health Care and Social Assistance | | 6.8 | % |
Arts, Entertainment and Recreation | | 5.2 | % |
Other Services | | 4.1 | % |
Agriculture, Forestry, Fishing and Hunting | | 3.8 | % |
Construction | | 2.9 | % |
Professional, Scientific, Technical and Information Services | | 2.9 | % |
Wholesale Trade | | 3.3 | % |
Manufacturing | | 2.0 | % |
Transportation and Warehousing | | 1.0 | % |
Administrative, Educational and Support Services | | 0.8 | % |
Finance and Insurance | | 0.4 | % |
| | 100.0 | % |
Commercial Mortgage Loans. At December 31, 2013, commercial mortgage loans totaled $419.6 million, or 53.0%, of our total loan portfolio, which was greater than any other loan category, including one-to-four family residential mortgage loans. Commercial mortgage loans totaled $383.6 million, or 53.0%, of the total loan portfolio at December 31, 2012.
We offer commercial mortgage loans secured by real estate primarily with interest rates that reset every five years and are generally based on an amortization schedule of up to 25 years. Commercial construction loans also are originated for the acquisition and development of land as part of a full construction project and are typically based upon the prime interest rate as published in The Wall Street Journal with interest rate floors. These loans typically are paid off by permanent mortgages obtained by the buyers; commercial construction loans convert to a commercial mortgage loan once construction is completed. Commercial construction/mortgage loans for the development of non-owner occupied real estate are originated with loan-to-value ratios of up to 75%. Commercial mortgage loans for owner occupied real estate are originated with loan-to-value ratios of up to 80%. The loan-to-value ratio is defined as the lesser of the actual acquisition cost or the estimated value determined by an independent appraisal.
Loans secured by commercial real estate generally have larger balances and involve a greater degree of risk. Of primary concern in commercial mortgage lending is the borrower’s creditworthiness and cash flow. Repayments of loans secured by income-producing properties often depend on the successful operation and management of the properties. As a result, repayment of such loans may be subject to adverse conditions in the real estate market or the economy, to a greater extent than residential mortgage loans. See “Risk Factors—Our Emphasis on Commercial Real Estate and Commercial Business Loans May Continue to Expose the Bank to Increased Lending Risks”. To monitor cash flows on income-producing properties, we require borrowers and loan guarantors, if any, to provide annual financial statements and rent rolls where applicable. In reaching a decision whether to make a commercial mortgage loan, we consider and review a cash flow analysis of the borrower and consider the net operating income of the property, the borrower’s expertise, credit history and profitability, and the value of the underlying property.
An environmental report from a third party, the EDR Environmental Screen, is obtained on all commercial real estate loans up to $1 million. Loans in excess of $1 million may require a Phase I or Phase II analysis when the possibility exists that hazardous materials may have existed on the site, or the site may have been affected by adjoining properties that handled hazardous materials. It is the practice of the Company,that for commercial real estate loans, to obtain appraisals for the collateral securing the loan at origination and when the loan has become 90 days delinquent or if information is obtained indicating insufficient cash flow to support the loan. For these collateral dependent loans an FASB ASC Topic No. 310 Receivables analysis is performed and any resulting collateral shortfall is charged-off to the allowance for loan losses. It is not the Company’s practice to test collateral value to loan balance for loans that are performing consistent with contractual terms, or are less than 90 days delinquent, as the value of collateral does not necessarily affect the repayment capacity of the borrower.
In addition, if loans that are collateralized by real estate become troubled and the value of the real estate has been significantly impaired from the time of origination or the most recent appraisal, then the Company may not be able to recover the full contractual amount of principal and interest that we anticipated at the time we originated the loan. This could cause us to increase the provision for loan losses and adversely affect our operating results and financial condition. The Company’s current practice when originating a
12
commercial real estate loan is to use the commercial real estate as collateral, but, as noted above, the extension of credit is based on many other factors in addition to the value of the collateral. As a matter of practice, loan-to-value ratios on non-owner occupied real estate seldom exceed 75% and seldom exceed 80% on owner occupied real estate. If a loan is in a performing status it is not the practice of this Company to obtain updated appraised values of the collateral. The Company’s practice regarding loans delinquent 90 days or greater is discussed previously within this document.
Delinquencies in the commercial mortgage loan portfolio showed significant improvement at year-end 2013. At December 31, 2013, 16 commercial mortgage loans totaling $6.0 million were 31 days or more delinquent and 10 of such commercial mortgage loans totaling $4.6 million were more than 90 days or more delinquent. By comparison, at December 31, 2012, 29 commercial mortgage loans totaling $9.6 million were 31 days or more delinquent with 25 of such commercial mortgage loans totaling $7.8 million being more than 90 days delinquent.
One-to-Four Family Residential Mortgage Loans. At December 31, 2013, one-to-four family residential mortgage loans totaled $250.7 million, or 31.8%, of our total loan portfolio compared to $235.9 million, or 32.6%, of the total loan portfolio at December 31, 2012.
Effective December 31, 2013, the Company exited the residential mortgage loan origination business. Rising interest rates have underscored the possibility of a steepening of the yield curve in the future and increased extension risk for fixed rate loans. Even the fairly modest increases earlier this year have brought a dramatic reduction in the residential refinance business. In addition, increasing regulations are adding compliance costs particularly as it relates to consumer real estate transactions. As a result of this action, we anticipate residential mortgage loan outstanding balances to decline approximately 10% during 2014, which represents 3.2% of total loans at December 31, 2013. However, we continue to offer home equity loans and lines of credit, discussed later in this section. Our general policy was not to make high loan-to-value loans (defined as loans with a loan-to-value ratio of 80% or more) without mortgage insurance; however, we did offer loans with loan-to-value ratios of up to 95% with mortgage insurance. We required all properties securing residential mortgage loans to be appraised. We adhered to the Appraisal Independence Requirements, as established by the secondary market for appraiser selection and independence. We required title insurance on all first mortgage loans secured by a residence, and borrowers were required to obtain hazard insurance. Additionally, we required flood insurance for loans on properties located in a flood zone.
As a result of our lending standards we did not offer, nor have, any payment option adjustable rate loans or sub-prime loans.
The following table indicates the amount and percent of residential mortgage loans that are single family and multi-family as of December 31, 2013 and 2012.
| | At December 31, | |
| | 2013 | | | 2012 | |
| | Amount | | | Percent | | | Amount | | | Percent | |
| | (dollars in thousands) | |
| | | | | | | | | | | | | | | | |
Single Family Mortgage Loans | | $ | 236,111 | | | | 94.2 | % | | $ | 220,985 | | | | 93.7 | % |
Multi-Family Mortgage Loans | | | 14,587 | | | | 5.8 | % | | | 14,936 | | | | 6.3 | % |
Total | | $ | 250,698 | | | | 100.0 | % | | $ | 235,921 | | | | 100.0 | % |
The following table segregates loans with original loan-to-value ratios greater than 80% and less than 80%.
| At December 31, | |
| 2013 | | | 2012 | |
| Amount | | | Percent | | | Amount | | | Percent | |
| (dollars in thousands) | |
| | | | | | | | | | | | | | | |
Loan to Value greater than 80% (1) | $ | 3,637 | | | | 1.5 | % | | $ | 2,576 | | | | 1.1 | % |
Loan to Value less than or equal to 80% | | 247,061 | | | | 98.5 | % | | | 233,345 | | | | 98.9 | % |
Total Residential Mortgage Loans | $ | 250,698 | | | | 100.0 | % | | $ | 235,921 | | | | 100.0 | % |
(1) | All loans with an original loan-to-value greater than 80% were single family loans for both periods presented. |
Commercial Business Loans. At December 31, 2013, commercial business loans totaled $64.3 million, or 8.2%, of our total loan portfolio compared to $56.6 million, or 7.8%, of the total loan portfolio at December 31, 2012.
13
We offer commercial business loans to professionals, sole proprietorships and small businesses in our market area. We offer lines of credit for working capital and term loans for capital improvements and equipment acquisition. These loans are typically based on a competitive variable rate over a published Wall Street Journal Rate or a fixed market rate. These loans may be secured by business assets other than real estate, such as business equipment and inventory and may be backed by personal guarantees.
When making commercial business loans, we consider the financial statements of the borrower and guarantors, the borrower’s payment history of both corporate and personal debt, the debt service capabilities of the borrower and guarantors, the projected cash flows of the business, the viability of the industry in which the customer operates and the value of the collateral, if any.
Unlike residential mortgage loans, which generally are made on the basis of the borrower’s ability to repay from his or her employment or other income, and which are secured by residential real property, the value of which tends to be more easily ascertainable, commercial business loans have greater risk and typically are made on the basis of the borrower’s ability to repay from the cash flow of the borrower’s business. As a result, the availability of funds for the repayment of commercial business loans may depend substantially on the success of the business itself. Further, any collateral securing such loans may depreciate over time, may be difficult to appraise and may fluctuate in value. We have generally required these loans to have debt service coverage of at least 1.20, and we generally require personal guarantees. See “Risk Factors—Our Emphasis on Commercial Real Estate and Commercial Business Loans May Continue to Expose us to Increased Lending Risks.”
Construction Loans. Construction loans totaled $10.9 million, or 1.4%, of our total loan portfolio at December 31, 2013 compared to $1.8 million, or 0.2%, of the total loan portfolio at December 31, 2012.
Our commercial construction program offers construction/permanent loans. The short-term loans require monthly interest only payments based on the amount of funds disbursed. The construction/permanent loans require interest-only payments during the construction phase, and convert to a fully amortized fixed rate loan at the end of the interest-only period. For commercial construction loans the term is a maximum of 24 months. While providing us with a comparable, and in some cases, higher yield than conventional mortgage loans, construction loans may involve a higher level of risk. With a commercial construction loan, for example, if a project is not completed and the borrower defaults, we may have to hire another contractor to complete the project at a higher cost. Also, a project may be completed, but may not be saleable, resulting in the borrower defaulting and Cape Bank taking title to the property.
Home Equity Loans and Lines of Credit. Home equity loans and lines of credit totaled $43.5 million, or 5.5%, of the total loan portfolio at December 31, 2013 compared to $45.3 million, or 6.2%, of the total loan portfolio at December 31, 2012.
We generally offer home equity loans and lines of credit with a maximum combined loan-to-value ratio of 80%. Home equity loans have fixed rates of interest and are originated with terms of up to 15 to 20 years. Home equity lines of credit have adjustable interest rates and are based upon the prime interest rate as published in The Wall Street Journal, plus a margin, with a floor of 3.75% on lines up to $500,000 on primary residences and second homes. The floor for investment property lines is 3.75% up to $250,000 and 5.5% on lines over $250,000. We hold a first or second mortgage position on the homes that secure our home equity loans and lines of credit.
Other Consumer Loans. Other consumer loans totaled $977,000, or 0.1%, of our total loan portfolio at December 31, 2013 compared to $1.3 million, or 0.2%, of the total loan portfolio at December 31, 2012.
We offer consumer loans secured by certificates of deposit held at Cape Bank, the pricing of which is based upon the rate of the certificate of deposit plus 3%. We will offer such loans up to 90% of the principal balance of the certificate of deposit. For more information on our loan commitments, see “Management’s Discussion and Analysis of Financial Condition and Results of Operations—Management of Market Risk.”
Loan Originations, Sales, Purchases and Participations. Loan originations come from a number of sources, including direct calling on commercial prospects, existing customers, advertising, referrals from customers and walk-in traffic. From time to time, we will participate in loans originated by other banks to supplement our loan portfolio. During 2013, the Bank participated in loans originated by other banks and, at December 31, 2013, the balance of these participations totaled $17.8 million. During 2012, we participated in one loan originated by another bank and, at December 31, 2013, the balance of these participations totaled $879,000. We are permitted to review all of the documentation relating to any loan in which we participate. However, in a purchased participation loan, we do not service the loan and thus are subject to the policies and practices of the lead lender with regard to monitoring delinquencies, pursuing collections and instituting foreclosure proceedings. Cape Bank services loans for other financial institutions, which generally consists of collecting loan payments, disbursing payments to investors and, where necessary, instituting foreclosure proceedings. A loan servicing asset of approximately $104,000 and $26,000 as of December 31, 2013 and December 31, 2012, respectively, was recorded relating to the servicing of loans for others, and is included in other assets on our balance sheet. The increase in the servicing asset results from an increase in Small Business Administration (“SBA”) originations and subsequent sales, with the Bank retaining the servicing.
14
Loan Underwriting. The Company adheres to underwriting guidelines that provide for continuity and completeness of process and are summarized as follows: a comprehensive and thorough review of (i) the financial information of applicant(s) and any guarantor(s), including current and historical balance sheet and income data, (at least two (2) years), balance sheet and income projections, when appropriate, and credit checks; (ii) collateral valuation, including appraisals (based on regulatory requirements) on real estate-based loans; (iii) loan terms, pricing and covenants appropriate to risk; (iv) a review of the character and integrity of the borrower, including interviews with the proposed borrower if warranted, and (v) analysis of relevant industry data. We also review the purpose of a proposed loan which assists the Company in determining the terms of such loan, i.e. short-term notes should not be utilized to finance long-term investments or capital expenditures.
The Company’s general practice is not to make new loans or additional loans to a borrower or related interest of a borrower who is past due in principal or interest more than 90 days. In limited circumstances, the Company could advance an existing borrower new money for operating capital, with expectations that the full amount of the new advance plus reduction of the delinquent outstanding principal and interest would occur within one year of granting the additional funds.
The Company assesses a borrower’s income or cash flow expectations, its collateral position and a borrower’s financial outlook when temporarily restructuring loan terms. Based on that assessment, the Company would then determine its course of action. Generally, in a troubled situation, on a loan with a long-term maturity, the maturity date is more often shortened or left unchanged than it is extended. An exception to this would be when a loan either has matured or is near maturity, the maturity date would be extended, but not for more than twelve months. Because cash flow is often a problem for a struggling borrower, the interest rate is usually reduced for a period of time, typically twelve months. Occasionally, the Company splits the loan into two separate notes: one note structured on terms that are supported by the borrower’s ability to repay, and the other note structured on more lenient terms and/or possibly partially or fully written-down.
Correspondent Lending Relationships. Effective December 31, 2013, the Company exited the residential mortgage loan origination business. Prior to December 31, 2013, Cape Bank had residential correspondent banking relationships with other financial institutions and mortgage banks, which enabled the Bank to generate fee income by selling conforming loans, FHA/VA and USDA loans that we originated on a servicing–released, non-recourse basis that we would normally not retain in our loan portfolio because of interest rate risk or because the loans did not conform to our standard underwriting guidelines. During the year ended December 31, 2013, Cape Bank sold approximately $47.0 million of loans to correspondents. The amount of loans sold varied according to market pricing and the portfolio needs of Cape Bank. Effective December 31, 2013, the Bank no longer maintains these correspondent lending relationships, thus there are no expectations of fee income from this source going forward.
Loan Approval Procedures and Authority. Our lending activities follow written, non-discriminatory, underwriting standards and loan origination procedures recommended by management and reviewed and approved by our Board of Directors and management. The Board of Directors has granted loan approval authority to certain officers or groups of officers up to prescribed limits, based on the type of loan, whether the loan is secured or unsecured and the officer’s position and experience. Individuals have joint authority up to assigned levels. The Management Loan Committee approves loans for borrowing relationships from $1.5 million up to $5 million, the Directors Loan Committee approves loans for borrowing relationships up to $10 million and the Bank’s Board of Directors approves loans for borrowing relationships over $10 million. All loans extended to Regulation O defined parties are approved by the Bank’s Board of Directors.
Loans-to-One Borrower. The maximum amount that we may lend to one borrower and the borrower’s related entities is limited by regulation to generally 15% of our stated capital and reserves. At December 31, 2013, our regulatory limit on loans-to-one borrower was $16.6 million. At that date, our largest lending relationship was $10.4 million, consisting of 6 loans and secured by commercial real estate and residential real estate. At December 31, 2013 these loans were performing in accordance with their terms.
Loan Commitments. The Bank issues commitments to make loans conditioned upon the occurrence of certain events. Generally, our loan commitments expire after 60 days. At December 31, 2013, the reserve for unfunded commitments totaled $89,000.
Non-Performing and Problem Assets
When a loan is 15 days past due, we send the borrower a late charge notice. If the loan delinquency is not corrected, other collection procedures are implemented, including telephone calls and collection letters. We attempt personal, direct contact with the borrower to determine the reason for the delinquency, to ensure that the borrower correctly understands the terms of the loan and to emphasize the importance of making payments on or before the due date. If necessary, subsequent late charges and delinquency notices are issued and the account will be monitored on a regular basis thereafter. By the 90th day of delinquency, we send the borrower a demand for payment. If the account is not made current by the 120th day of delinquency, we may refer the loan to legal counsel. Any of our loan officers can shorten these time frames in consultation with Executive Management.
15
A commercial loan is classified as non-accrual when the loan is 90 days or more delinquent, or when in the opinion of management, the collectability of such loan is in doubt. Commercial loans are returned to accrual status when all the principal and interest amounts contractually due are brought current and future payments are reasonably assured.
Consumer and residential loans are classified as non-accrual when the loan is 90 days or more delinquent with a loan-to-value ratio greater than 60 percent. Consumer and residential loans are returned to accrual status when their delinquency becomes less than 90 days and/or the loan-to-value ratio is less than 60 percent.
All interest accrued, but not received, for loans placed on non-accrual, is reversed against interest income. Interest received on such loans is accounted for as a reduction of the principal balance until qualifying for return to accrual. Payments are generally applied to reduce the principal balance but, in certain situations, the application of payments may vary.
In analyzing whether to restructure a loan that would be designated as a troubled debt restructuring (“TDR”), the Bank comes to an agreement with the borrower that would restructure the repayment terms. The Bank analyzes the borrower’s cash flow to determine what level of debt service the cash flow will support, and the collateral to determine how much equity is in the collateral. If the cash flow supports repaying part of the loan, but not all of it, typically the Bank will write-down the loan to the value supported by the cash flow and the loan will be restructured as a TDR in accordance with the agreed upon terms. Management presents reports to the Board of Directors on a monthly basis on all loans Risk Rated 6 or higher.
Year-end 2013 non-performing loans showed a significant decrease as a result of charge-offs totaling $2.8 million and $6.5 million of loans being transferred to OREO. At December 31, 2013, non-performing loans totaled $7.3 million, or 0.93% of total loans compared to $19.4 million, or 2.67%, of total loans at December 31, 2012.
16
Non-Performing Assets. The table below sets forth the amounts and categories of our non-performing assets at the dates indicated.
| | At December 31, | |
| | 2013 | | | 2012 | | | 2011 | | | 2010 | | | 2009 | |
| | (dollars in thousands) | |
Non-accrual loans: | | | | | | | | | | | | | | | | | | | | |
Real estate loans: (1) | | | | | | | | | | | | | | | | | | | | |
Commercial mortgage | | $ | 5,230 | | | $ | 14,162 | | | $ | 16,506 | | | $ | 27,781 | | | $ | 25,132 | |
Residential mortgage | | | 807 | | | | 2,487 | | | | 2,672 | | | | 2,449 | | | | 2,081 | |
Construction | | | - | | | | - | | | | 4,324 | | | | 3,980 | | | | 1,298 | |
Home equity and line of credit | | | 350 | | | | 413 | | | | 516 | | | | 363 | | | | 398 | |
Commercial business loans | | | 498 | | | | 681 | | | | 1,398 | | | | 6,254 | | | | 3,085 | |
Other consumer loans | | | - | | | | - | | | | - | | | | - | | | | - | |
| | | | | | | | | | | | | | | | | | | | |
Total non-accrual loans | | | 6,885 | | | | 17,743 | | | | 25,416 | | | | 40,827 | | | | 31,994 | |
| | | | | | | | | | | | | | | | | | | | |
Loans greater than 90 days delinquent and still accruing: | | | | | | | | | | | | | | | | | | | | |
Real estate loans: | | | | | | | | | | | | | | | | | | | | |
Commercial mortgage | | | - | | | | - | | | | - | | | | - | | | | - | |
Residential mortgage | | | 347 | | | | 1,056 | | | | 1,866 | | | | 2,207 | | | | 1,170 | |
Construction | | | - | | | | 141 | | | | - | | | | - | | | | - | |
Home equity and line of credit | | | 111 | | | | 429 | | | | 167 | | | | 432 | | | | 84 | |
Commercial business loans | | | - | | | | - | | | | - | | | | - | | | | - | |
Other consumer loans | | | - | | | | - | | | | - | | | | - | | | | - | |
Total loans 90 days and still Accruing | | | 458 | | | | 1,626 | | | | 2,033 | | | | 2,639 | | | | 1,254 | |
| | | | | | | | | | | | | | | | | | | | |
Total non-performing loans | | | 7,343 | | | | 19,369 | | | | 27,449 | | | | 43,466 | | | | 33,248 | |
| | | | | | | | | | | | | | | | | | | | |
Other real estate owned | | | 7,449 | | | | 7,221 | | | | 8,354 | | | | 3,255 | | | | 4,817 | |
| | | | | | | | | | | | | | | | | | | | |
Non-accrual investment securities | | | - | | | | 564 | | | | 393 | | | | 71 | | | | - | |
| | | | | | | | | | | | | | | | | | | | |
Total non-performing assets | | $ | 14,792 | | | $ | 27,154 | | | $ | 36,196 | | | $ | 46,792 | | | $ | 38,065 | |
| | | | | | | | | | | | | | | | | | | | |
Performing TDRs | | $ | 3,452 | | | $ | 3,538 | | | $ | 10,840 | | | $ | 7,732 | | | $ | - | |
| | | | | | | | | | | | | | | | | | | | |
Ratios: | | | | | | | | | | | | | | | | | | | | |
Non-performing loans to total loans | | | 0.93 | % | | | 2.67 | % | | | 3.77 | % | | | 5.54 | % | | | 4.14 | % |
Non-performing assets to total assets | | | 1.35 | % | | | 2.61 | % | | | 3.38 | % | | | 4.41 | % | | | 3.55 | % |
(1) | Non-accrual loans in the table above include $688,000 in commercial mortgage TDRs and $193,000 in residential mortgage TDRs at December 31, 2013 and exclude loans held for sale, of which $1.6 million were on non-accrual status at December 31, 2013. |
For the years ended December 31, 2013, 2012 and 2011, gross interest income that would have been recorded had our non-accruing loans been current in accordance with their original terms was $719,000, $1.3 million and $2.1 million, respectively. Income recorded for such loans was $290,000, $311,000 and $649,000 for the years ended December 31, 2013, 2012 and 2011, respectively.
17
The following table sets forth certain information with respect to our loan portfolio delinquencies at the dates indicated.
| Loans Delinquent For | | | | | | | | | |
| 60-89 Days | | | 90 Days and Over | | | Total | |
| Number | | | Amount | | | Number | | | Amount | | | Number | | | Amount | |
| (dollars in thousands) | | | | | | | | | |
At December 31, 2013 | | | | | | | | | | | | | | | | | | | | | | | |
Real estate loans: | | | | | | | | | | | | | | | | | | | | | | | |
Commercial mortgage | | 6 | | | $ | 1,468 | | | | 10 | | | $ | 4,561 | | | | 16 | | | $ | 6,029 | |
Residential mortgage | | 4 | | | | 589 | | | | 12 | | | | 1,154 | | | | 16 | | | | 1,743 | |
Construction | | - | | | | - | | | | - | | | | - | | | | - | | | | - | |
Home equity loans and lines of credit | | 4 | | | | 192 | | | | 6 | | | | 461 | | | | 10 | | | | 653 | |
Commercial business loans | | - | | | | - | | | | 4 | | | | 498 | | | | 4 | | | | 498 | |
Other consumer loans | | 1 | | | | 7 | | | | - | | | | - | | | | 1 | | | | 7 | |
Total | | 15 | | | $ | 2,256 | | | | 32 | | | $ | 6,674 | | | | 47 | | | $ | 8,930 | |
At December 31, 2012 | | | | | | | | | | | | | | | | | | | | | | | |
Real estate loans: | | | | | | | | | | | | | | | | | | | | | | | |
Commercial mortgage | | 2 | | | $ | 633 | | | | 25 | | | $ | 7,795 | | | | 27 | | | $ | 8,428 | |
Residential mortgage | | 4 | | | | 253 | | | | 26 | | | | 3,543 | | | | 30 | | | | 3,796 | |
Construction | | - | | | | - | | | | 1 | | | | 141 | | | | 1 | | | | 141 | |
Home equity loans and lines of credit | | 3 | | | | 195 | | | | 13 | | | | 842 | | | | 16 | | | | 1,037 | |
Commercial business loans | | 1 | | | | 87 | | | | 5 | | | | 594 | | | | 6 | | | | 681 | |
Other consumer loans | | 2 | | | | 24 | | | | - | | | | - | | | | 2 | | | | 24 | |
Total | | 12 | | | $ | 1,192 | | | | 70 | | | $ | 12,915 | | | | 82 | | | $ | 14,107 | |
At December 31, 2011 | | | | | | | | | | | | | | | | | | | | | | | |
Real estate loans: | | | | | | | | | | | | | | | | | | | | | | | |
Commercial mortgage | | 2 | | | $ | 1,363 | | | | 34 | | | $ | 15,464 | | | | 36 | | | $ | 16,827 | |
Residential mortgage | | 5 | | | | 673 | | | | 33 | | | | 4,538 | | | | 38 | | | | 5,211 | |
Construction | | - | | | | - | | | | 4 | | | | 4,324 | | | | 4 | | | | 4,324 | |
Home equity loans and lines of credit | | 1 | | | | 95 | | | | 12 | | | | 683 | | | | 13 | | | | 778 | |
Commercial business loans | | - | | | | - | | | | 15 | | | | 1,398 | | | | 15 | | | | 1,398 | |
Other consumer loans | | - | | | | - | | | | - | | | | - | | | | - | | | | - | |
Total | | 8 | | | $ | 2,131 | | | | 98 | | | $ | 26,407 | | | | 106 | | | $ | 28,538 | |
At December 31, 2010 | | | | | | | | | | | | | | | | | | | | | | | |
Real estate loans: | | | | | | | | | | | | | | | | | | | | | | | |
Commercial mortgage | | 1 | | | $ | 94 | | | | 46 | | | $ | 18,250 | | | | 47 | | | $ | 18,344 | |
Residential mortgage | | 4 | | | | 477 | | | | 26 | | | | 4,655 | | | | 30 | | | | 5,132 | |
Construction | | - | | | | - | | | | 9 | | | | 3,980 | | | | 9 | | | | 3,980 | |
Home equity loans and lines of credit | | 2 | | | | 103 | | | | 9 | | | | 795 | | | | 11 | | | | 898 | |
Commercial business loans | | - | | | | - | | | | 27 | | | | 4,031 | | | | 27 | | | | 4,031 | |
Other consumer loans | | 2 | | | | 16 | | | | - | | | | - | | | | 2 | | | | 16 | |
Total | | 9 | | | $ | 690 | | | | 117 | | | $ | 31,711 | | | | 126 | | | $ | 32,401 | |
At December 31, 2009 | | | | | | | | | | | | | | | | | | | | | | | |
Real estate loans: | | | | | | | | | | | | | | | | | | | | | | | |
Commercial mortgage | | 4 | | | $ | 802 | | | | 48 | | | $ | 20,592 | | | | 52 | | | $ | 21,394 | |
Residential mortgage | | 3 | | | | 1,551 | | | | 16 | | | | 3,251 | | | | 19 | | | | 4,802 | |
Construction | | - | | | | - | | | | 4 | | | | 1,298 | | | | 4 | | | | 1,298 | |
Home equity loans and lines of credit | | 1 | | | | 50 | | | | 6 | | | | 482 | | | | 7 | | | | 532 | |
Commercial business loans | | 3 | | | | 101 | | | | 12 | | | | 3,085 | | | | 15 | | | | 3,186 | |
Other consumer loans | | - | | | | - | | | | - | | | | - | | | | - | | | | - | |
Total | | 11 | | | $ | 2,504 | | | | 86 | | | $ | 28,708 | | | | 97 | | | $ | 31,212 | |
18
Classification of Loans. The Company categorizes loans, when the loan is initially underwritten, into risk categories based on relevant information about the ability of borrowers to service their debt. The assessment considers numerous factors including, but not limited to, current financial information, historical payment experience, credit documentation, public information, and current economic trends, among other factors. The Company analyzes loans individually by classifying the loans as to credit risk. Annually, this analysis includes loans with an outstanding balance greater than $250,000 and non-homogeneous loans, such as commercial and commercial real estate loans. The Company uses the following definitions for risk ratings:
Risk Rating 1-5—Acceptable credit quality ranging from High Pass (cash or near cash as collateral) to Management Attention/Pass (acceptable risk) with some deficiency in one or more of the following areas: management experience, debt service coverage levels, balance sheet leverage, earnings trends, the industry of the borrower and annual receipt of current borrower financial information.
Risk Rating 6—Special Mention reflects loans that management believes warrant special consideration and may be loans that are delinquent or current in their payments. These loans have potential weakness which increases their risk to the bank and have shown some signs of weakness but have fallen short of being a Substandard loan.
Management believes that the Substandard category is best considered in four discrete classes: RR 7 “performing substandard loans”; RR 8, RR 9, and RR 10.
Risk Rating 7—The class is mostly populated by customers that have a history of repayment (less than 2 delinquencies in the past year) but exhibit a well-defined weakness.
Risk Rating 8—These are loans that share many of the characteristics of the RR 7 loans as they relate to cash flow and/or collateral, but have the further negative of chronic delinquencies. These loans have not yet declined in quality to require a FASB ASC Topic No. 310 Receivables analysis, but nonetheless this class has a greater likelihood of migration to a more negative risk rating.
Risk Rating 9—These loans are impaired loans, are current and accruing, and in some cases are TDRs. They have had a FASB ASC Topic No. 310 Receivables analysis completed.
Risk Rating 10—These loans have undergone a FASB ASC Topic No. 310 Receivables analysis. For those that have a FASB ASC Topic No. 310 Receivables analysis, no general reserve is allowed. More often than not, those loans in this class with specific reserves have had the reserve placed by Management pending information to complete a FASB ASC Topic No. 310 Receivables analysis. Upon completion of the FASB ASC Topic No. 310 Receivables analysis reserves are adjusted or charged-off.
For homogeneous loan pools, such as residential mortgages, home equity lines of credit and term loans, and other consumer loans, the Company uses payment status to identify the credit risk in these loan portfolios. Payment status is reviewed on a daily basis by the Bank’s collection area and on a monthly basis with respect to determining the adequacy of the allowance for loan losses. The payment status of these homogeneous pools at December 31, 2013 and December 31, 2012 is included in the aging of the recorded investment of past due loans table. In addition, the total non-performing portion of these homogeneous loan pools at December 31, 2013 and December 31, 2012 is presented in the recorded investment in nonaccrual loans.
Our classified assets total includes $7.3 million of non-performing loans at December 31, 2013.
Other Real Estate Owned (“OREO”). Real estate acquired as a result of foreclosure or by deed in lieu of foreclosure is classified as other real estate owned and is initially recorded at the estimated fair market value, less the estimated cost to sell, at the date of foreclosure, thereby establishing a new cost basis. If fair value declines subsequent to foreclosure, an OREO write-down is recorded through expense and the OREO balance is lowered to reflect the current fair value. Operating costs after acquisition are expensed. At December 31, 2013, the Company had $7.4 million in OREO compared to $7.2 million at December 31, 2012.
Allowance for Loan Losses
The allowance for loan losses is maintained at an amount management deems appropriate to cover probable incurred losses. In determining the level to be maintained, management considers the losses inherent in our loan portfolio and changes in the type and volume of loan activities, along with the general economic and real estate market conditions. A description of our methodology in establishing our allowance for loan losses is set forth in the section “Management’s Discussion and Analysis of Financial Condition and Results of Operations-Critical Accounting Policies-Allowance for Loan Losses.” The allowance for loan losses as of December 31, 2013 was maintained at a level that represents management’s best estimate of losses inherent in the loan portfolio, and such losses were both probable and reasonably estimable. However, this analysis process is inherently subjective, as it requires us to make estimates that are susceptible to revisions as more information becomes available. Although we believe that we have established the allowance at levels to absorb probable and estimable losses, future additions may be necessary if economic or other conditions in
19
the future differ from the current environment. The economic information located within the Market Area section of this report was considered by management and used as a factor in our analysis of determining the adequacy of our general allowance for loan losses.
In addition, as an integral part of their examination process, the Federal Deposit Insurance Corporation and the New Jersey Department of Banking and Insurance have authority to periodically review our allowance for loan losses. Such agencies may require that we recognize additions to the allowance based on their judgment of information available to them at the time of their examination. The following table sets forth activity in our allowance for loan losses for the periods indicated.
| | At or For the Years ended December 31, | |
| | 2013 | | | 2012 | | | 2011 | | | 2010 | | | 2009 | |
| | (dollars in thousands) | |
| | | | | | | | | | | | | | | | | | | | |
Balance at beginning of year | | $ | 9,852 | | | $ | 12,653 | | | $ | 12,538 | | | $ | 13,311 | | | $ | 11,240 | |
| | | | | | | | | | | | | | | | | | | | |
Charge-offs: | | | | | | | | | | | | | | | | | | | | |
Real estate loans: | | | | | | | | | | | | | | | | | | | | |
Commercial mortgage | | | (2,085 | ) | | | (5,989 | ) | | | (9,143 | ) | | | (4,159 | ) | | | (8,043 | ) |
Residential mortgage | | | (205 | ) | | | (450 | ) | | | (423 | ) | | | (677 | ) | | | (239 | ) |
Construction | | | - | | | | (602 | ) | | | (2,517 | ) | | | (1,160 | ) | | | (2,378 | ) |
Home equity loans and lines of credit | | | (109 | ) | | | (171 | ) | | | (393 | ) | | | - | | | | - | |
Commercial business loans | | | (106 | ) | | | (245 | ) | | | (3,124 | ) | | | (2,751 | ) | | | (872 | ) |
Other consumer loans | | | (40 | ) | | | (33 | ) | | | (62 | ) | | | (90 | ) | | | (124 | ) |
Total charge-offs | | | (2,545 | ) | | | (7,490 | ) | | | (15,662 | ) | | | (8,837 | ) | | | (11,656 | ) |
| | | | | | | | | | | | | | | | | | | | |
Recoveries: | | | | | | | | | | | | | | | | | | | | |
Real estate loans: | | | | | | | | | | | | | | | | | | | | |
Commercial mortgage | | | 205 | | | | 182 | | | | 96 | | | | 436 | | | | 406 | |
Residential mortgage | | | - | | | | - | | | | 23 | | | | - | | | | - | |
Construction | | | - | | | | 11 | | | | 9 | | | | - | | | | 114 | |
Home equity loans and lines of credit | | | 1 | | | | 5 | | | | 8 | | | | | | | | | |
Commercial business loans | | | 19 | | | | 4 | | | | 59 | | | | 103 | | | | 18 | |
Other consumer loans | | | 28 | | | | 26 | | | | 26 | | | | 29 | | | | 30 | |
Total recoveries | | | 253 | | | | 228 | | | | 221 | | | | 568 | | | | 568 | |
| | | | | | | | | | | | | | | | | | | | |
Net (charge-offs) recoveries | | | (2,292 | ) | | | (7,262 | ) | | | (15,441 | ) | | | (8,269 | ) | | | (11,088 | ) |
| | | | | | | | | | | | | | | | | | | | |
Write-downs on transfers to HFS | | | (241 | ) | | | - | | | | (4,051 | ) | | | - | | | | - | |
Provision for loan losses | | | 2,011 | | | | 4,461 | | | | 19,607 | | | | 7,496 | | | | 13,159 | |
| | | | | | | | | | | | | | | | | | | | |
Balance at end of year | | $ | 9,330 | | | $ | 9,852 | | | $ | 12,653 | | | $ | 12,538 | | | $ | 13,311 | |
| | | | | | | | | | | | | | | | | | | | |
Ratios: | | | | | | | | | | | | | | | | | | | | |
Net charge-offs to average loans outstanding | | | 0.34 | % | | | 0.99 | % | | | 2.01 | % | | | 1.05 | % | | | 1.37 | % |
Allowance for loan losses to non- performing loans at end of year | | | 127.05 | % | | | 50.86 | % | | | 46.10 | % | | | 28.84 | % | | | 40.04 | % |
Allowance for loan losses to total loans at end of year | | | 1.18 | % | | | 1.36 | % | | | 1.74 | % | | | 1.60 | % | | | 1.66 | % |
20
Allocation of Allowance for Loan Losses. The following table sets forth the allowance for loan losses allocated by loan category, the total loan balances by category, and the percent of loans in each category to total loans at the dates indicated. The allowance for loan losses allocated to each category is not necessarily indicative of future losses in any particular category and does not restrict the use of the allowance to absorb losses in other categories.
| At December 31, | |
| 2013 | | | 2012 | | | 2011 | |
| | | | | Percent of | | | | | | | Percent of | | | | | | | Percent of | |
| | | | | Loans in | | | | | | | Loans in | | | | | | | Loans in | |
| Allowance for | | | Each Category to | | | Allowance for | | | Each Category to | | | Allowance for | | | Each Category to | |
| Loan Losses | | | Total Loans | | | Loan Losses | | | Total Loans | | | Loan Losses | | | Total Loans | |
| (dollars in thousands) | |
Real estate loans: | | | | | | | | | | | | | | | | | | | | | | | |
Commercial mortgage | $ | 6,744 | | | | 76.4 | % | | $ | 6,691 | | | | 72.6 | % | | $ | 8,208 | | | | 71.3 | % |
Residential mortgage | | 865 | | | | 9.8 | % | | | 1,300 | | | | 14.1 | % | | | 1,909 | | | | 16.5 | % |
Construction | | 227 | | | | 2.6 | % | | | 58 | | | | 0.6 | % | | | 744 | | | | 6.4 | % |
Home equity loans and lines of credit | | 160 | | | | 1.8 | % | | | 249 | | | | 2.7 | % | | | 349 | | | | 3.0 | % |
Commercial business loans | | 830 | | | | 9.4 | % | | | 902 | | | | 9.8 | % | | | 312 | | | | 2.7 | % |
Other consumer loans | | 4 | | | | 0.0 | % | | | 17 | | | | 0.2 | % | | | 16 | | | | 0.1 | % |
Total allocated allowance | | 8,830 | | | | 100.0 | % | | | 9,217 | | | | 100.0 | % | | | 11,538 | | | | 100.0 | % |
Unallocated | | 500 | | | | | | | | 635 | | | | | | | | 1,115 | | | | | |
Total | $ | 9,330 | | | | | | | $ | 9,852 | | | | | | | $ | 12,653 | | | | | |
| At December 31, | | |
| 2010 | | | 2009 | | |
| | | | | Percent of | | | | | | | Percent of | | |
| | | | | Loans in Each | | | | | | | Loans in Each | | |
| Allowance for | | | Category to | | | Allowance for | | | Category to | | |
| Loan Losses | | | Total Loans | | | Loan Losses | | | Total Loans | | |
| (dollars in thousands) | | |
Real estate loans: | | | | | | | | | | | | | | | | |
Commercial mortgage | $ | 9,809 | | | | 82.7 | % | | $ | 9,571 | | | | 71.9 | % | |
Residential mortgage | | 879 | | | | 7.4 | % | | | 2,048 | | | | 15.4 | % | |
Construction | | 736 | | | | 6.2 | % | | | 388 | | | | 2.9 | % | |
Home equity loans and lines of credit | | 195 | | | | 1.6 | % | | | 771 | | | | 5.8 | % | |
Commercial business loans | | 236 | | | | 2.0 | % | | | 492 | | | | 3.7 | % | |
Other consumer loans | | 13 | | | | 0.1 | % | | | 41 | | | | 0.3 | % | |
Total allocated allowance | | 11,868 | | | | 100.0 | % | | | 13,311 | | | | 100.0 | % | |
Unallocated | | 670 | | | | | | | | - | | | | | | |
Total | $ | 12,538 | | | | | | | $ | 13,311 | | | | | | |
Investment Activities
We have authority to invest in various types of liquid assets, including U.S. Treasury obligations, securities of various U.S. Government sponsored enterprises, federal agencies and state and municipal governments, school districts and utility authorities, mortgage-backed securities and certificates of deposit of federally insured institutions. Within certain regulatory limits, we also may invest a portion of our assets in corporate securities (equity as well as debt) and mutual funds. As a member of the Federal Home Loan Bank of New York, we also are required to maintain an investment in Federal Home Loan Bank of New York stock.
At December 31, 2013, our investment portfolio, excluding Federal Home Loan Bank stock, totaled $166.3 million and consisted of mortgage-backed securities (including collateralized mortgage obligations), U.S. Government and agency securities (including securities issued by U.S. Government sponsored enterprises), municipal bonds, corporate bonds, collateralized debt obligations, and equity securities. At December 31, 2013, investment securities consisted of $157.2 million classified as available-for-sale (“AFS”) and $9.1 million classified as held-to-maturity (“HTM”). Investment securities are classified as HTM when management has the positive intent and ability to hold them to maturity. In September 2013, the Bank reclassified a portion of the AFS securities as HTM, as these securities may be particularly susceptible to changes in fair value in the near term as a result of market volatility.
21
Our investment objectives are to provide and maintain liquidity, to establish an acceptable level of interest rate and credit risk, to provide an alternate source of low-risk investments when demand for loans is weak, to generate a favorable return on our investment and to provide pledgeable assets for liquidity management.. Our Board of Directors has the overall responsibility for the investment portfolio, including approval of our investment policy, which is reviewed and approved annually. The Investment Committee (a subcommittee of the Asset Liability Committee (“ALCO”)), meets on a monthly basis and is responsible for implementation of the investment policy and monitoring our investment performance. Our Board of Directors reviews the status of our investment portfolio on a monthly basis.
Municipal Securities. We invest in municipal bonds issued by counties, cities, school districts and utility authorities; primarily general obligation and some revenue bonds. Our policy allows us to purchase such securities rated “A-” or higher. No more than 20% of our investment portfolio can be invested in obligations of local or municipal entities without approval of our Board of Directors. As of December 31, 2013, our municipal securities portfolio consisted of issuers within the State of New Jersey in the amount of $1.6 million and issuers within other states consisted of $13.5 million.
U.S. Government and Federal Agency Obligations. While U.S. Government and federal agency securities generally provide lower yields than other investments in our securities investment portfolio, we maintain these investments, to the extent appropriate, for liquidity purposes, as collateral for borrowings and as an interest rate risk hedge in the event of significant mortgage loan prepayments.
Mortgage-Backed Securities. We invest in mortgage-backed securities insured or guaranteed by Fannie Mae, Freddie Mac and Ginnie Mae. Investment in mortgage-backed securities enables us to achieve positive interest rate spreads with minimal administrative expense, and lower our credit risk as a result of the guarantees provided by Fannie Mae, Freddie Mac and Ginnie Mae.
Mortgage-backed securities are created by pooling mortgages and issuing a security with an interest rate that is less than the interest rate on the underlying mortgages. Mortgage-backed securities typically represent a participation interest in a pool of single family or multi-family mortgages, although we invest primarily in mortgage-backed securities backed by one-to-four family mortgages. The issuers of such securities pool and resell the participation interests in the form of securities to investors such as Cape Bank. Some securities pools are guaranteed as to payment of principal and interest to investors. Mortgage-backed securities generally yield less than the loans that underlie such securities because of the cost of payment guarantees and credit enhancements. In addition, mortgage-backed securities may be used to collateralize our specific liabilities and obligations. Finally, mortgage-backed securities are assigned lower risk weightings for purposes of calculating our risk-based capital level.
Investments in mortgage-backed securities involve a risk that actual payments will be greater or less than the prepayment rate estimated at the time of purchase, which may require adjustments to the amortization of any premium or acceleration of any discount relating to such interests, thereby affecting the net yield on our securities. We periodically review current prepayment speeds to determine whether prepayment estimates require modification that could cause amortization or accretion adjustments. The decline in real estate values over the past five years has created additional risks. Mortgage backed securities may have individual loans in which the outstanding balance due is greater than the current value of the home. This could result in the borrower defaulting.
Collateralized Mortgage Obligations. Collateralized Mortgage Obligations (“CMOs”) are debt securities issued by a special-purpose entity that aggregates pools of mortgages and mortgage-backed securities and creates different classes of securities with varying maturities and amortization schedules, as well as a residual interest, with each class possessing different risk characteristics. The cash flows from the underlying collateral are generally divided into “tranches” or classes that have descending priorities with respect to the distribution of principal and interest cash flows, while cash flows on pass-through mortgage-backed securities are distributed pro rata to all security holders. All of the CMOs are backed by U.S. Government agencies or Government sponsored enterprises. See the Securities Impairment section of Item 7, Management’s Discussion and Analysis of Financial Condition and Result of Operations for information related to the risks associated with non-agency CMOs.
Collateralized Debt Obligations. As of December 31, 2013, we own 11 collateralized debt obligation securities (“CDOs”) that are backed by trust preferred securities, all of which have been principally issued by bank holding companies. All of the CDO securities have below investment grade credit ratings. During 2012, we recorded an $8,000 charge to earnings for the credit-related portion of other-than-temporary impairment (“OTTI”). During 2013, there was no additional OTTI charge to earnings. In December 2013, the Company sold the remaining portion of CDOs that had a book balance of greater than zero. The remaining CDOs have a book balance of zero and, as a result, these securities are not at risk for further OTTI charges. On February 27, 2014, the Company sold the remaining CDOs having a book balance of zero resulting in a pre-tax gain of $1.9 million. See Note 3—Investment Securities of the Notes to Consolidated Financial Statements for more information related to our CDO portfolio.
22
Investment Securities Portfolio. The following tables set forth the composition of our investment securities portfolio.
| At December 31, | |
| 2013 | | | 2012 | | | 2011 | |
| Amortized Cost | | | Fair Value | | | Amortized Cost | | | Fair Value | | | Amortized Cost | | | Fair Value | |
| (in thousands) | |
Investment securities available-for-sale: | | | | | | | | | | | | | | | | | | | | | | | |
Debt securities: | | | | | | | | | | | | | | | | | | | | | | | |
U.S. Government and agency obligations | $ | 53,951 | | | $ | 51,606 | | | $ | 38,982 | | | $ | 39,082 | | | $ | 39,370 | | | $ | 39,746 | |
Corporate bonds | | 6,090 | | | | 6,178 | | | | 14,103 | | | | 14,241 | | | | 22,128 | | | | 22,181 | |
Municipal bonds | | - | | | | - | | | | 20,307 | | | | 20,758 | | | | 21,405 | | | | 21,997 | |
Collateralized debt obligations | | 13,059 | | | | 13,079 | | | | 8,263 | | | | 4,682 | | | | 8,311 | | | | 3,584 | |
Total debt securities | $ | 73,100 | | | $ | 70,863 | | | $ | 81,655 | | | $ | 78,763 | | | $ | 91,214 | | | $ | 87,508 | |
| | | | | | | | | | | | | | | | | | | | | | | |
Equity securities: | | | | | | | | | | | | | | | | | | | | | | | |
CRA Qualified Investment Fund | $ | 5,000 | | | $ | 4,700 | | | $ | 5,000 | | | $ | 4,991 | | | $ | - | | | $ | - | |
Total equity securities | $ | 5,000 | | | $ | 4,700 | | | $ | 5,000 | | | $ | 4,991 | | | $ | - | | | $ | - | |
| | | | | | | | | | | | | | | | | | | | | | | |
Mortgage-backed securities: | | | | | | | | | | | | | | | | | | | | | | | |
GNMA pass-through certificates | $ | 3,424 | | | $ | 3,554 | | | $ | 4,193 | | | $ | 4,430 | | | $ | 4,699 | | | $ | 4,964 | |
FHLMC pass-through certificates | | 5,101 | | | | 5,004 | | | | 5,784 | | | | 5,918 | | | | 4,696 | | | | 4,806 | |
FNMA pass-through certificates | | 14,596 | | | | 14,264 | | | | 17,591 | | | | 18,059 | | | | 11,781 | | | | 12,262 | |
Collateralized mortgage obligations | | 60,686 | | | | 58,781 | | | | 57,764 | | | | 58,696 | | | | 79,894 | | | | 81,174 | |
Total mortgage-backed securities | $ | 83,807 | | | $ | 81,603 | | | $ | 85,332 | | | $ | 87,103 | | | $ | 101,070 | | | $ | 103,206 | |
| | | | | | | | | | | | | | | | | | | | | | | |
Total securities available-for-sale | $ | 161,907 | | | $ | 157,166 | | | $ | 171,987 | | | $ | 170,857 | | | $ | 192,284 | | | $ | 190,714 | |
| | | | | | | | | | | | | | | | | | | | | | | |
Investment securities held-to-maturity | | | | | | | | | | | | | | | | | | | | | | | |
Debt securities | | | | | | | | | | | | | | | | | | | | | | | |
Municipal bonds | $ | 9,102 | | | $ | 8,906 | | | $ | - | | | $ | - | | | $ | - | | | $ | - | |
Total debt securities | $ | 9,102 | | | $ | 8,906 | | | $ | - | | | $ | - | | | $ | - | | | $ | - | |
Total securities held-to-maturity | $ | 9,102 | | | $ | 8,906 | | | $ | - | | | $ | - | | | $ | - | | | $ | - | |
Portfolio Maturities and Yields. The composition and maturities of the investment securities portfolio at December 31, 2013 are summarized in the following table. Maturities are based on the final contractual payment dates, and do not reflect the impact of prepayments or early redemptions that may occur. State and municipal securities yields have not been adjusted to a tax-equivalent basis, which as of December 31, 2013 was 2.21%.
23
| One Year or Less | | | More than One Year
through Five Years | | | More than Five Years
through Ten Years | | | More than Ten Years | | | Total Securities | |
| Amortized
Cost | | | Weighted
Average
Yield | | | Amortized
Cost | | | Weighted
Average
Yield | | | Amortized
Cost | | | Weighted
Average
Yield | | | Amortized
Cost | | | Weighted
Average
Yield | | | Amortized
Cost | | | Fair
Value | | | Weighted
Average
Yield | |
| (dollars in thousands) | |
Investment securities available-for-sale: | | | | | | | | | | | | | | | | | | | | | | | | | | | | | | | | | | | | | | | | | | | |
Debt securities: | | | | | | | | | | | | | | | | | | | | | | | | | | | | | | | | | | | | | | | | | | | |
U.S. Government and agency obligations | $ | - | | | | - | | | $ | 16,968 | | | | 1.43 | % | | $ | 36,983 | | | | 1.71 | % | | $ | - | | | | - | | | $ | 53,951 | | | $ | 51,606 | | | | 1.63 | % |
Corporate bonds | | 3,992 | | | | 1.33 | % | | | 9,067 | | | | 1.26 | % | | | - | | | | - | | | | - | | | | - | | | | 13,059 | | | | 13,079 | | | | 1.28 | % |
Municipal bonds | | 982 | | | | 3.26 | % | | | 5,108 | | | | 2.38 | % | | | - | | | | - | | | | - | | | | - | | | | 6,090 | | | | 6,178 | | | | 2.52 | % |
Collateralized debt obligations | | - | | | | - | | | | - | | | | - | | | | - | | | | - | | | | - | | | | - | | | | - | | | | - | | | | - | |
Mortgage-backed securities: | | | | | | | | | | | | | | | | | | | | | | | | | | - | | | | | | | | | | | | | | | | | |
Ginnie Mae pass-through certificates | | - | | | | - | | | | 71 | | | | 2.95 | % | | | - | | | | - | | | | 3,353 | | | | 4.32 | % | | | 3,424 | | | | 3,554 | | | | 4.29 | % |
Freddie Mac pass-through certificates | | - | | | | - | | | | 2 | | | | 1.75 | % | | | - | | | | - | | | | 5,099 | | | | 2.64 | % | | | 5,101 | | | | 5,004 | | | | 2.64 | % |
Fannie Mae pass-through certificates | | - | | | | - | | | | 175 | | | | 4.86 | % | | | 1 | | | | 2.26 | % | | | 14,420 | | | | 2.93 | % | | | 14,596 | | | | 14,264 | | | | 2.95 | % |
Collateralized mortgage obligations | | - | | | | - | | | | 747 | | | | 2.00 | % | | | 962 | | | | 2.05 | % | | | 58,977 | | | | 1.98 | % | | | 60,686 | | | | 58,781 | | | | 1.98 | % |
Total securities available-for-sale | $ | 4,974 | | | | 1.71 | % | | $ | 32,138 | | | | 1.57 | % | | $ | 37,946 | | | | 1.72 | % | | $ | 81,849 | | | | 2.29 | % | | $ | 156,907 | | | $ | 152,466 | | | | 1.98 | % |
| | | | | | | | | | | | | | | | | | | | | | | | | | | | | | | | | | | | | | | | | | | |
| | | | | | | | | | | | | | | | | | | | | | | | | | | | | | | | | | | | | | | | | | | |
Investment securities held-to-maturity: | | | | | | | | | | | | | | | | | | | | | | | | | | | | | | | | | | | | | | | | | | | |
Municipal bonds | $ | - | | | | - | | | $ | - | | | | - | | | $ | 7,037 | | | | 2.19 | % | | $ | 2,065 | | | | 4.01 | % | | $ | 9,102 | | | $ | 8,906 | | | | 2.60 | % |
Total securities held-to-maturity | $ | - | | | | - | | | $ | - | | | | - | | | $ | 7,037 | | | | 2.19 | % | | $ | 2,065 | | | | 4.01 | % | | $ | 9,102 | | | $ | 8,906 | | | | 2.60 | % |
Deposit Activities and Other Sources of Funds
General. Deposits, borrowings and loan repayments are the major sources of our funds for lending and other investment purposes. Scheduled loan repayments are a relatively stable source of funds, while deposit inflows and outflows and loan prepayments are significantly influenced by general interest rates and money market conditions.
Deposit Accounts. We obtain deposits within our market area primarily by offering a broad selection of deposit accounts, including non-interest-bearing demand deposits (such as checking accounts), interest-bearing checking accounts and money market accounts, savings accounts and certificates of deposit. Included in interest-bearing demand deposits at December 31, 2013 were balances from a variety of local municipal relationships totaling $88.9 million, or 11.1%, of total deposits. At December 31, 2013, we had $31.7 million of brokered deposits, or 4.0%, of our total deposits. Included in the brokered deposits were $8.0 million of reciprocal certificates of deposits offered under the Certificate of Deposit Account Registry Service ® (“CDARS”), a program in which Cape Bank participates. Under CDARS, participating banks are able to match customer’s deposits that would otherwise exceed the limits for FDIC insurance with certificates of deposits offered at other participating banks and thereby provide FDIC insurance to these excess deposits.
We also offer a variety of deposit accounts designed for the businesses operating in our market area. Our business banking deposit products include a commercial checking account, a commercial money market account and a checking account specifically designed for small businesses. We offer bill paying and cash management services through our online banking system. Additionally we offer commercial customers our remote deposit capture product.
24
Deposit account terms vary according to the minimum balance required, the time periods the funds must remain on deposit and the interest rate, among other factors. In determining the terms of our deposit accounts, we consider funding needs, liquidity needs, competition, and alternative sources of funding customer preferences. We generally review our deposit mix and deposit pricing weekly. Our deposit pricing strategy generally has been to offer competitive rates on all types of deposit products, and to periodically offer special rates in order to attract deposits of a specific type or term.
The following table sets forth the distribution of our average total deposit accounts, by account type, for the periods indicated.
| | For the year ended December 31, | | |
| | 2013 | | | 2012 | | |
| | Average Balance | | | Percent | | | Weighted Average Rate | | | Average Balance | | | Percent | | | Weighted Average Rate | | |
| | (dollars in thousands) | | |
| | | | | | | | | | | | | | | | | | | | | | | | | |
Non-interest bearing | | $ | 85,399 | | | | 10.8 | % | | n/a | | | $ | 82,218 | | | | 10.7 | % | | n/a | | |
Savings accounts | | | 96,815 | | | | 12.2 | % | | | 0.07 | % | | | 92,488 | | | | 12.1 | % | | | 0.17 | % | |
Interest-bearing and money market……… | | | 364,206 | | | | 46.0 | % | | | 0.20 | % | | | 332,625 | | | | 43.4 | % | | | 0.37 | % | |
Certificates of deposit | | | 244,922 | | | | 31.0 | % | | | 0.90 | % | | | 259,447 | | | | 33.8 | % | | | 1.19 | % | |
Total deposits | | $ | 791,342 | | | | 100.0 | % | | | 0.38 | % | | $ | 766,778 | | | | 100.0 | % | | | 0.58 | % | |
The following table sets forth certificates of deposit classified by interest rate as of the dates indicated.
| At December 31, | |
| 2013 | | | 2012 | | | 2011 | |
| (in thousands) | |
Interest Rate | | | | | | | | | | | |
Less than 2.00% | $ | 242,589 | | | $ | 194,383 | | | $ | 218,111 | |
2.00% - 2.99% | | 23,941 | | | | 28,700 | | | | 47,270 | |
3.00% - 3.99% | | 2,658 | | | | 5,353 | | | | 6,247 | |
4.00% - 4.99% | | - | | | | 10,186 | | | | 16,398 | |
5.00% - 5.99% | | - | | | | - | | | | 1,079 | |
Total | $ | 269,188 | | | $ | 238,622 | | | $ | 289,105 | |
The following table sets forth the amount and maturities of certificates of deposit at December 31, 2013.
| Period to Maturity at December 31, 2013 | |
| Less Than or
Equal to a
Year | | | More Than
One to Two
Years | | | More Than
Two to Three
Years | | | More Than
Three to Four
Years | | | More Than
Four Years | | | Total | |
| (in thousands) | |
Interest Rate | | | | | | | | | | | | | | | | | | | | | | | |
Less than 2.00% | $ | 203,567 | | | $ | 22,205 | | | $ | 4,044 | | | $ | 7,312 | | | $ | 5,461 | | | $ | 242,589 | |
2.00% - 2.99% | | 2,043 | | | | 9,380 | | | | 12,518 | | | | - | | | | - | | | | 23,941 | |
3.00% - 3.99% | | 2,045 | | | | 613 | | | | - | | | | - | | | | - | | | | 2,658 | |
4.00% - 4.99% | | - | | | | - | | | | - | | | | - | | | | - | | | | - | |
5.00% - 5.99% | | - | | | | - | | | | - | | | | - | | | | - | | | | - | |
Total | $ | 207,655 | | | $ | 32,198 | | | $ | 16,562 | | | $ | 7,312 | | | $ | 5,461 | | | $ | 269,188 | |
25
As of December 31, 2013, the aggregate amount of outstanding certificates of deposit in amounts greater than or equal to $100,000 was approximately $156.1 million. The following table sets forth the maturity of these certificates as of December 31, 2013.
| At December 31, 2013 | |
| (in thousands) | |
Maturities | | | |
Three months or less | $ | 105,252 | |
Over three months through six months | | 12,209 | |
Over six months through one year | | 13,727 | |
Over one year to three years | | 20,327 | |
Over three years | | 4,550 | |
Total | $ | 156,065 | |
Borrowings. We have the ability to borrow from the Federal Home Loan Bank of New York to supplement our investable funds. The Federal Home Loan Bank functions as a central credit bank providing credit for member financial institutions. As a member, we are required to own capital stock in the Federal Home Loan Bank and are authorized to apply for advances on the security of such stock and certain of our mortgage loans and other assets (principally securities which are obligations of, or guaranteed by, the United States), provided certain standards related to creditworthiness have been met. Advances are made under several different programs, each having its own interest rate and range of maturities. Depending on the program, limitations on the amount of advances are based either on a fixed percentage of an institution’s net worth or on the Federal Home Loan Bank’s assessment of the institution’s creditworthiness.
Our borrowings consist of advances from the Federal Home Loan Bank of New York totaling $134.0 million at December 31, 2013. Additionally, we had $9.9 million in repurchase agreements through another party at December 31, 2013. At December 31, 2013, we had access to additional Federal Home Loan Bank advances of up to $99.4 million based on our unused qualifying collateral available to support such advances. Access to these funds in the future assumes that the Federal Home Loan Bank’s evaluation of our creditworthiness will not change. In addition, we have access to funding of $6.6 million through the discount window at the Federal Reserve Bank of Philadelphia based on qualifying collateral that has been pledged to support such borrowings. The following table sets forth information concerning balances and interest rates on all of our borrowings at the dates and for the period indicated.
| | 2013 | |
| | FHLB | | | Repurchase | | | | | |
| | Borrowings | | | Agreements | | | Total | |
| | (dollars in thousands) | |
| | | | | | | | | | | | |
Average daily balance during the year | | $ | 91,602 | | | $ | 9,932 | | | $ | 101,534 | |
Average interest rate during the year | | | 2.04 | % | | | 4.39 | % | | | 2.27 | % |
Maximum month-end balance during the year | | $ | 133,995 | | | $ | 9,940 | | | $ | 143,935 | |
Weighted average interest rate at year-end | | | 1.39 | % | | | 4.15 | % | | | 1.58 | % |
Personnel
As of December 31, 2013, we had 164 full-time employees and 39 part-time employees, or 190 full-time equivalent employees, none of whom is represented by a collective bargaining unit. We believe we have a good relationship with our employees.
SUPERVISION AND REGULATION
General
Federal law allows a state savings bank that qualifies as a “qualified thrift lender” (discussed below), such as Cape Bank, to elect to be treated as a savings association for purposes of the savings and loan holding company provisions of the Home Owners’ Loan Act, as amended (“HOLA”). Such an election results in the Company being regulated as a savings and loan holding company rather than as bank holding company, by the Board of Governors of the Federal Reserve System (the “Federal Reserve Board”). At the time of its mutual-to-stock conversion, Cape Bank elected to be treated as a savings association under the applicable provisions of the HOLA. Accordingly, Cape Bancorp is a savings and loan holding company and is required to file certain reports with, is subject to examination by, and otherwise must comply with the rules and regulations of, the Federal Reserve Board. Cape Bancorp is also subject to the rules and regulations of the Securities and Exchange Commission (the “SEC”) under the federal securities laws.
26
Cape Bank is a New Jersey-chartered savings bank, and its deposit accounts are insured up to applicable limits by the FDIC. Cape Bank is subject to extensive regulation, examination and supervision by the Commissioner of the New Jersey Department of Banking and Insurance (the “Commissioner”) as its chartering authority, and by the FDIC, as the Bank’s deposit insurer and primary federal regulator. Cape Bank must file reports with the Commissioner and the FDIC concerning its activities and financial condition, and it must obtain regulatory approval prior to entering into certain transactions, such as mergers with, or acquisitions of, other depository institutions and opening or acquiring branch offices. The Commissioner and the FDIC conduct periodic examinations to assess Cape Bank’s compliance with various regulatory requirements. This regulation and supervision establishes a comprehensive framework of activities in which a savings bank may engage and is intended primarily for the protection of the deposit insurance fund and depositors. The regulatory structure also gives the regulatory authorities extensive discretion in connection with their supervisory and enforcement activities and examination policies, including policies with respect to the classification of assets and the establishment of adequate loan loss reserves for regulatory purposes.
Any change in these laws or regulations, whether by the New Jersey Department of Banking and Insurance (the “Department”), the FDIC, the Federal Reserve Board, the SEC or the U.S. Congress, could have a material adverse impact on Cape Bancorp, Cape Bank and our operations.
The Dodd-Frank Wall Street Reform and Consumer Protection Act of 2010 (the “Dodd-Frank Act”) made extensive changes in the regulation of depository institutions. The Dodd-Frank Act eliminated the Office of Thrift Supervision (the “OTS”). Responsibility for the supervision and regulation of federal savings banks was transferred to the Office of the Comptroller of the Currency, the agency primarily responsible for the regulation and supervision of national banks. The transfer of regulatory functions took place on July 21, 2011. At the same time, responsibility for the regulation and supervision of savings and loan holding companies, such as Cape Bancorp, was transferred from the OTS to the Federal Reserve Board, which also supervises bank holding companies. Additionally, the Dodd-Frank Act created a new Consumer Financial Protection Bureau (the “CFPB”) as an independent bureau of the Federal Reserve Board. The CFPB has assumed responsibility for the implementation of the federal financial consumer protection and fair lending laws and regulations, a function previously assigned to prudential regulators, and will have authority to impose new requirements. However, institutions of less than $10 billion in assets, such as Cape Bank, will continue to be examined for compliance with consumer protection and fair lending laws and regulations by, and be subject to the primary enforcement authority of, their prudential regulator rather than the CFPB.
In addition to eliminating the OTS and creating the CFPB, the Dodd-Frank Act, among other things, changed the way that institutions are assessed for deposit insurance, mandated the imposition of consolidated capital requirements on savings and loan holding companies, required originators of securitized loans to retain a percentage of the risk for the transferred loans, provided for regulatory rate-setting for certain debit card interchange fees, repealed restrictions on the payment of interest on commercial demand deposits and established a number of reforms related to mortgage originations. Many of the provisions of the Dodd-Frank Act are subject to delayed effective dates and/or require the issuance of implementing regulations. Their impact on operations cannot yet be fully assessed. However, there is significant possibility that the Dodd-Frank Act will, at a minimum, result in increased regulatory burden, compliance costs and interest expense for Cape Bank and Cape Bancorp.
Certain of the regulatory requirements that are, or will be, applicable to Cape Bank and Cape Bancorp are described below. This description of statutes and regulations is not intended to be a complete explanation of such statutes and regulations and their effects on Cape Bank and Cape Bancorp and is qualified in its entirety by reference to the actual statutes and regulations.
New Jersey Banking Regulation
Activities Powers. Cape Bank derives its lending, investment and other powers primarily from the applicable provisions of the New Jersey Banking Act and its related regulations. Under these laws and regulations, New Jersey savings banks, including Cape Bank, generally may invest in: real estate mortgages; consumer and commercial loans; specific types of debt securities, including certain corporate debt securities and obligations of federal, state and local governments and agencies; certain types of corporate equity securities and certain other assets.
A savings bank may also invest pursuant to a “leeway” power that permits investments not otherwise permitted by the New Jersey Banking Act. “Leeway” investments must comply with a number of limitations on the individual and aggregate amounts of “leeway” investments. A savings bank may also exercise trust powers upon approval of the Department. New Jersey savings banks may exercise those powers, rights, benefits or privileges authorized for national banks or out-of-state banks or for federal or out-of-state savings banks or savings associations, provided that prior approval by the Department is required before exercising any such power, right, benefit or privilege. The exercise of these lending, investment and activity powers is further limited by federal law and the related regulations. Cape Bank does not have any investments due to provisions provided under leeway powers. See “—Federal Banking Regulation—Activity Restrictions on State-Chartered Banks” below.
27
Loan-to-One Borrower Limitations. With certain specified exceptions, a New Jersey chartered savings bank may not make loans or extend credit to a single borrower and to entities related to the borrower in an aggregate amount that would exceed 15% of the bank’s capital funds. A savings bank may lend an additional 10% of the bank’s capital funds if secured by collateral meeting the requirements of the New Jersey Banking Act. Cape Bank currently complies with applicable loans-to-one borrower limitations.
Dividends. Under the New Jersey Banking Act, a stock savings bank may declare and pay a dividend on its capital stock only to the extent that the payment of the dividend would not impair the capital stock of the savings bank. In addition, a stock savings bank may not pay a dividend unless the savings bank would, after the payment of the dividend, have a surplus of not less than 50% of its capital stock, or the payment of the dividend would not reduce the surplus. Federal law may also limit the amount of dividends that may be paid by Cape Bank. See “—Federal Banking Regulation—Prompt Corrective Action” below.
Minimum Capital Requirements. Regulations of the Department impose on New Jersey chartered depository institutions, including Cape Bank, minimum capital requirements similar to those imposed by the FDIC on insured state banks. See “—Federal Banking Regulation—Capital Requirements.”
Examination and Enforcement. The Department may examine Cape Bank whenever it deems an examination advisable. The Department examines Cape Bank at least once every two years. The Department may order any savings bank to discontinue any violation of law or unsafe or unsound business practice and may direct any director, officer, attorney or employee of a savings bank engaged in an objectionable activity, after the Department has ordered the activity to be terminated, to show cause at a hearing before the Commissioner of the Department why such person should not be removed. The Department may also appoint a receiver for a savings bank under certain conditions, including insolvency.
Federal Banking Regulation
Banks and their holding companies are subject to regulatory capital requirements administered by federal banking agencies. Capital adequacy guidelines and, additionally for banks, prompt corrective action regulations, involve quantitative measures of assets, liabilities, and certain off-balance-sheet items calculated under regulatory accounting practices. Capital amounts and classifications are also subject to qualitative judgments by regulators. Failure to meet capital requirements can initiate regulatory action. Management believes that as of December 31, 2013, the Company and Bank has met all capital adequacy requirements to which it is subject.
Capital Requirements. FDIC regulations require banks to maintain minimum levels of capital. The FDIC regulations define two tiers, or classes, of capital.
Tier 1 capital is comprised of the sum of:
— | common stockholders’ equity, excluding the unrealized appreciation or depreciation, net of tax, from available-for-sale securities; |
— | non-cumulative perpetual preferred stock, including any related retained earnings; and |
— | minority interests in consolidated subsidiaries minus all intangible assets, other than qualifying servicing rights and any net unrealized loss on marketable equity securities. |
The components of Tier 2 capital currently include:
— | cumulative perpetual preferred stock; |
— | certain perpetual preferred stock for which the dividend rate may be reset periodically; |
— | hybrid capital instruments, including mandatory convertible securities; |
— | intermediate term preferred stock; |
— | allowance for loan losses; and |
— | up to 45% of pre-tax net unrealized holding gains on available-for-sale equity securities with readily determinable fair market values. |
The allowance for loan losses includible in Tier 2 capital is limited to a maximum of 1.25% of risk-weighted assets (as discussed below). Overall, the amount of Tier 2 capital that may be included in total capital cannot exceed 100% of Tier 1 capital.
28
The FDIC regulations establish a minimum leverage capital requirement for banks in the strongest financial and managerial condition, with a rating of 1 (the highest examination rating of the FDIC for banks) under the Uniform Financial Institutions Rating System, of not less than 3% of Tier 1 capital to total assets. For all other banks, the minimum leverage capital requirement is 4%, unless a higher leverage capital ratio is warranted by the particular circumstances or risk profile of the depository institution.
The FDIC regulations also require that banks meet a risk-based capital standard. The risk-based capital standard requires the maintenance of a ratio of total capital, which is defined as the sum of Tier 1 capital and Tier 2 capital, to risk-weighted assets of at least 8% and a ratio of Tier 1 capital to risk-weighted assets of at least 4%. In determining the amount of risk-weighted assets, all assets, plus certain off balance sheet items, are multiplied by a risk-weight of 0% to 100%, based on the risks the FDIC believes are inherent in the type of asset or item.
The federal banking agencies, including the FDIC, have also adopted regulations to require an assessment of an institution’s exposure to declines in the economic value of a bank’s capital due to changes in interest rates when assessing the bank’s capital adequacy. Under such a risk assessment, examiners evaluate a bank’s capital for interest rate risk on a case-by-case basis, with consideration of both quantitative and qualitative factors. According to the agencies, applicable considerations include:
— | the quality of the bank’s interest rate risk management process; |
— | the overall financial condition of the bank; and |
— | the level of other risks at the bank for which capital is needed. Institutions with significant interest rate risk may be required to hold additional capital. The agencies also issued a joint policy statement providing guidance on interest rate risk management, including a discussion of the critical factors affecting the agencies’ evaluation of interest rate risk in connection with capital adequacy. |
As of December 31, 2013, Cape Bank complied with applicable FDIC minimum capital requirements.
In July 2013, the FDIC and the other federal bank regulatory agencies issued a final rule that will revise their leverage and risk-based capital requirements and the method for calculating risk-weighted assets to make them consistent with agreements that were reached by the Basel Committee on Banking Supervision and certain provisions of the Dodd-Frank Act. Among other things, the rule establishes a uniform leverage ratio requirement of 4% of total assets, provides for a new common equity Tier 1 minimum capital requirement (4.5% of risk-weighted assets), increases the minimum Tier 1 capital to risk-based assets requirement (from 4% to 6% of risk-weighted assets) and assigns a higher risk weight (150%) to exposures that are more than 90 days past due or are on nonaccrual status and to certain commercial real estate facilities that finance the acquisition, development or construction of real property. The final rule also requires unrealized gains and losses on certain “available-for-sale” securities holdings to be included for purposes of calculating regulatory capital requirements unless a one-time opt-out is exercised. The rule limits a banking organization’s capital distributions and certain discretionary bonus payments to executive officers if the banking organization does not hold a “capital conservation buffer” consisting of 2.5% of common equity Tier 1 capital to risk-weighted assets in addition to the amount necessary to meet its minimum risk-based capital requirements. The final rule also implements the Dodd-Frank Act’s directive to apply to savings and loan holding companies consolidated capital requirements that are not less stringent than those applicable to their subsidiary institutions. The final rule is effective January 1, 2015. The “capital conservation buffer” will be phased in from January 1, 2016 to January 1, 2019, when the full capital conservation buffer will be effective.
Activity Restrictions on State-Chartered Banks. Federal law and FDIC regulations generally limit the activities and equity investments of state-chartered FDIC insured banks and their subsidiaries to those permissible for national banks and their subsidiaries, unless such activities and investments are specifically exempted by law or consented to by the FDIC.
Before engaging as principal in a new activity that is not permissible for a national bank or otherwise permissible under federal law or FDIC regulations, an insured bank must seek approval from the FDIC. The FDIC will not approve the activity unless the bank meets its minimum capital requirements and the FDIC determines that the activity does not present a significant risk to the FDIC deposit insurance fund. Certain activities of subsidiaries that are engaged in activities permitted for national banks only through a “financial subsidiary” are subject to additional restrictions. Equity investments by state banks are generally limited to those permissible for national banks but bank subsidiaries may seek FDIC approval to engage in a broader range of equity investments.
Federal law permits a state-chartered savings bank to engage, through financial subsidiaries, in any activity in which a national bank may engage through a financial subsidiary and on substantially the same terms and conditions. In general, the law permits a national bank that is well-capitalized and well-managed to conduct, through a financial subsidiary, any activity permitted for a financial holding company other than insurance underwriting, insurance investments, real estate investment or development or merchant banking. The total assets of all such financial subsidiaries may not exceed the lesser of 45% of the bank’s total assets or $50 million. The bank must have policies and procedures to assess the financial subsidiary’s risk and protect the bank from such risk and potential liability, must not consolidate the financial subsidiary’s assets with the bank’s and must exclude from its own assets and
29
equity all equity investments, including retained earnings, in the financial subsidiary. Cape Bank is not currently engaging in such activities and has no plans to do so.
Federal Home Loan Bank System. Cape Bank is a member of the Federal Home Loan Bank System, which consists of 12 regional Federal Home Loan Banks. The Federal Home Loan Bank System provides a central credit facility primarily for member institutions. As a member of the Federal Home Loan Bank of New York, Cape Bank is required to acquire and hold shares of capital stock in the Federal Home Loan Bank in specified amounts. As of December 31, 2013, Cape Bank was in compliance with this requirement.
Enforcement. The FDIC has extensive enforcement authority over insured savings banks, including Cape Bank. This enforcement authority includes, among other things, the ability to assess civil money penalties, issue cease and desist orders and remove directors and officers. In general, these enforcement actions may be initiated in response to violations of laws and regulations and unsafe or unsound practices.
Prompt Corrective Action. The Federal Deposit Improvement Act established a system of prompt corrective action to resolve the problems of undercapitalized institutions. The FDIC, as well as the other federal banking regulators, adopted regulations governing the supervisory actions that may be taken against undercapitalized institutions. The regulations establish five categories, consisting of “well capitalized”, “adequately capitalized”, “undercapitalized”, “significantly undercapitalized” and “critically undercapitalized”. The FDIC’s regulations define the five capital categories as follows:
An institution will be treated as “well-capitalized” if:
— | its ratio of total capital to risk-weighted assets is at least 10%; |
— | its ratio of Tier 1 capital to risk-weighted assets is at least 6%; and |
— | its ratio of Tier 1 capital to total assets is at least 5%, and it is not subject to any order or directive by the FDIC to meet a specific capital level. |
An institution will be treated as “adequately capitalized” if:
— | its ratio of total capital to risk-weighted assets is at least 8%; |
— | its ratio of Tier 1 capital to risk-weighted assets is at least 4%; and |
— | its ratio of Tier 1 capital to total assets is at least 4% (3% if the bank receives the highest rating under the Uniform Financial Institutions Rating System) and it is not a well-capitalized institution. |
An institution will be treated as “undercapitalized” if:
— | its ratio of total capital to risk-based capital is less than 8%; |
— | its ratio of Tier 1 capital to risk-weighted assets is less than 4%; and |
— | its ratio of Tier 1 capital to total assets is less than 4% (or less than 3% if the institution receives the highest rating under the Uniform Financial Institutions Rating System). |
An institution will be treated as “significantly undercapitalized” if:
— | its ratio of total capital to risk-weighted assets is less than 6%; |
— | its ratio of Tier 1 capital to risk-weighted assets is less than 3%; or |
— | its leverage ratio is less than 3%. |
An institution that has a tangible capital to total assets ratio equal to or less than 2% would be deemed to be “critically undercapitalized.”
30
“Undercapitalized” institutions are subject to various restrictions, such as on dividends and growth. They must also file an acceptable capital restoration plan that must be guaranteed by any controlling holding company in an amount up to the lesser of 5% of the institution’s assets or the amount of capital needed to achieve compliance with capital standards. Various other supervisory restrictions may apply. The FDIC is required, with some exceptions, to appoint a receiver or conservator for an insured state bank if that bank is “critically undercapitalized.” For this purpose, “critically undercapitalized” means having a ratio of tangible capital to total assets of less than 2%. The FDIC may also appoint a conservator or receiver for a state bank on the basis of the institution’s financial condition or upon the occurrence of certain events, including:
— | insolvency, or when the assets of the bank are less than its liabilities; |
— | substantial dissipation of assets or earnings through violations of law or unsafe or unsound practices; |
— | existence of an unsafe or unsound condition to transact business; |
— | likelihood that the bank will be unable to meet the demands of its depositors or to pay its obligations in the normal course of business; or |
— | insufficient capital, or the incurring or likely incurring of losses that will deplete substantially all of the institution’s capital with no reasonable prospect of replenishment of capital without federal assistance. |
Cape Bank is classified as “well-capitalized” under the Prompt Corrective Action rules.
The recently adopted final rule that will increase regulatory capital requirements will adjust the prompt corrective action categories accordingly, effective January 1, 2015.
Insurance of Deposit Accounts. Cape Bank is a member of the Deposit Insurance Fund, which is administered by the FDIC. Deposit accounts in Cape Bank are insured up to a maximum of $250,000 for each separately insured depositor.
The FDIC imposes an assessment for deposit insurance on all insured depository institutions. Under the FDIC’s risk-based assessment system, insured institutions are assigned to risk categories based on supervisory evaluations, regulatory capital levels and certain other factors. An institution’s assessment rate depends upon the category to which it is assigned and certain adjustments specified by FDIC regulations, with less risky institutions paying lower rates. Assessment rates (inclusive of possible adjustments) currently range from 2 1 /2 to 45 basis points of each institution’s total assets less tangible capital. The FDIC may increase or decrease the scale uniformly, except that no adjustment can deviate more than two basis points from the base scale without notice and comment rulemaking. The FDIC’s current system represents a change, required by the Dodd-Frank Act, from its prior practice of basing the assessment on an institution’s volume of deposits.
The Dodd-Frank Act increased the minimum target Deposit Insurance Fund ratio from 1.15% of estimated insured deposits to 1.35% of estimated insured deposits. The FDIC must seek to achieve the 1.35% ratio by September 30, 2020. Insured institutions with assets of $10 billion or more are supposed to fund the increase. The Dodd-Frank Act eliminated the 1.5% maximum fund ratio, instead leaving it to the discretion of the FDIC. The FDIC has exercised that discretion by establishing a long-range fund ratio of 2.00%.
The FDIC has authority to increase insurance assessments. A significant increase in insurance premiums would likely have an adverse effect on the operating expenses and results of operations of the Bank. Management cannot predict what insurance assessment rates will be in the future.
Insurance of deposits may be terminated by the FDIC upon a finding that an institution has engaged in unsafe or unsound practices, is in an unsafe or unsound condition to continue operations or has violated any applicable law, regulation, rule, order or condition imposed by the FDIC. We do not currently know of any practice, condition or violation that might lead to termination of our deposit insurance.
In addition to the FDIC assessments, the Financing Corporation (“FICO”) is authorized to impose and collect, with the approval of the FDIC, assessments for anticipated payments, issuance costs and custodial fees on bonds issued by the FICO in the 1980s to recapitalize the former Federal Savings and Loan Insurance Corporation. The bonds issued by the FICO are due to mature in 2017 through 2019. For the quarter ended December 31, 2013, the annualized FICO assessment was equal to 0.64 basis points of an institution’s total assets less tangible equity.
Transactions with Affiliates of Cape Bank. Transactions between an insured bank, such as Cape Bank, and any of its affiliates is governed by Sections 23A and 23B of the Federal Reserve Act and implementing regulations. An affiliate of a bank is any company or entity that controls, is controlled by, or is under common control with the bank. For example, Cape Bancorp is an affiliate of Cape Bank. Generally, a subsidiary of a bank that is not also a depository institution or financial subsidiary is not treated as an affiliate of the bank for purposes of Sections 23A and 23B.
31
Section 23A:
— | limits the extent to which the Bank or its subsidiaries may engage in “covered transactions” with any one affiliate to 10% of such bank’s capital stock and surplus, and limits all such transactions with all affiliates to an amount equal to 20% of such capital stock and surplus; and |
— | requires that all such transactions be on terms that are consistent with safe and sound banking practices. |
The term “covered transaction” includes the making of loans, purchase of assets, issuance of guarantees and other similar types of transactions. Further, most loans by a Bank to any of its affiliates must be secured by collateral ranging from 100 to 130 percent of the loan amount, depending upon the type of collateral. In addition, transactions with Bank affiliates, including covered transactions must be on terms that are substantially the same, or at least as favorable to the Bank, as those that would be provided to a non-affiliate.
Prohibitions Against Tying Arrangements. Banks are prohibited, subject to some exceptions, from extending credit to or offering any other service, or fixing or varying the consideration for such extension of credit or service, on the condition that the customer obtain some additional service from the bank or its affiliates or not obtain services of a competitor of the institution.
Community Reinvestment Act and Fair Lending Laws. All FDIC insured banks have a responsibility under the Community Reinvestment Act and related regulations to help meet the credit needs of their communities, including low and moderate income neighborhoods. In connection with its examination of a state chartered savings bank, the FDIC is required to assess the bank’s record of compliance with the Community Reinvestment Act. In addition, the Equal Credit Opportunity Act and the Fair Housing Act prohibit lenders from discriminating in their lending practices on the basis of characteristics specified in those statutes. A savings bank’s failure to comply with the provisions of the Community Reinvestment Act could, at a minimum, result in denial of certain corporate applications such as branches or mergers, or in restrictions on its activities. The failure to comply with the Equal Credit Opportunity Act and the Fair Housing Act could result in enforcement actions by the FDIC, as well as other federal regulatory agencies and the Department of Justice. Cape Bank received a Community Reinvestment Act rating of “satisfactory” in its most recent federal examination.
Loans to Insiders. A bank’s loans to its executive officers, directors, any owner of 10% or more of its stock (each, an insider) and any of certain entities affiliated with any such person (an insider’s “related interest”) are subject to the conditions and limitations imposed by Sections 22(g) and 22(h) of the Federal Reserve Act and its implementing regulations. Under these restrictions, the aggregate amount of the loans to any insider and the insider’s related interests may not exceed the loans to one borrower limit applicable to national banks, which is comparable to the loans to one borrower limit applicable to Cape Bank. See “—New Jersey Banking Regulation—Loans to One Borrower Limitation”. Aggregate loans by a bank to all insiders and insiders’ related interests may not exceed the bank’s unimpaired capital and unimpaired surplus. With certain exceptions, loans to an executive officer, other than loans for the education of the officer’s children and certain loans secured by the officer’s primary residence, may not exceed $100,000. Federal regulation also requires that any proposed loan to an insider or an insider’s related interest be approved in advance by a majority of the board of directors of the bank, with any interested directors not participating in the voting, if such loan, when aggregated with any existing loans to that insider his or her related interests, would exceed either (i) $500,000 or (ii) the greater of $25,000 or 5% of the bank’s unimpaired capital and surplus. Generally, such loans must be made on substantially the same terms as, and follow credit underwriting procedures that are not less stringent than, those that are prevailing at the time for comparable transactions with non-insiders.
An exception is made for extensions of credit made pursuant to a benefit or compensation plan of a bank that is widely available to employees of the bank and that does not give any preference to insiders of the bank over other employees of the bank.
In addition, federal law prohibits extensions of credit to a bank’s insiders and their related interests by any other institution that has a correspondent banking relationship with the bank, unless such extension of credit is on substantially the same terms as those prevailing at the time for comparable transactions with other persons and does not involve more than the normal risk of repayment or present other unfavorable features.
New Jersey Regulation. Provisions of the New Jersey Banking Act impose conditions and limitations on the liabilities to a savings bank of its directors and executive officers and of corporations and partnerships controlled by such persons that are comparable in many respects to the conditions and limitations imposed on the loans and extensions of credit to insiders and their related interests under federal law, as discussed above. The New Jersey Banking Act also provides that a savings bank that is in compliance with federal law is deemed to be in compliance with such provisions of the New Jersey Banking Act.
32
The USA PATRIOT Act
The USA PATRIOT Act of 2001 (the “PATRIOT Act”) gave the federal government new powers to address terrorist threats through enhanced domestic security measures, expanded surveillance powers, increased information sharing and broadened anti-money laundering requirements. The PATRIOT Act also required the federal banking agencies to take into consideration the effectiveness of controls designed to combat money laundering activities in determining whether to approve a merger or other acquisition application of a member institution. Accordingly, if we engage in a merger or other acquisition, our controls designed to combat money laundering would be considered as part of the application process. We have established policies, procedures and systems designed to comply with these regulations.
Sarbanes-Oxley Act of 2002
The Sarbanes-Oxley Act of 2002 addressed, among other issues, corporate governance, auditing and accounting, executive compensation, and enhanced and timely disclosure of corporate information. As directed by the Sarbanes-Oxley Act, our Chief Executive Officer and Chief Financial Officer are required to certify that our quarterly and annual reports do not contain any untrue statement of a material fact. The rules adopted by the Securities and Exchange Commission under the Sarbanes-Oxley Act have several requirements, including having these officers certify that: they are responsible for establishing, maintaining and regularly evaluating the effectiveness of our internal control over financial reporting; they have made certain disclosures to our auditors and the audit committee of the Board of Directors about our internal control over financial reporting; and they have included information in our quarterly and annual reports about their evaluation and whether there have been changes in our internal control over financial reporting or in other factors that could materially affect internal control over financial reporting. We have policies, procedures and systems designed to ensure compliance with these regulations.
Holding Company Regulation
General. Cape Bancorp is a unitary savings and loan holding company subject to Federal Reserve Board regulations, examinations, supervision, reporting requirements and regulations concerning activities. In addition, the Federal Reserve Board has enforcement authority over Cape Bancorp’s non-savings institution subsidiaries. Among other things, this authority permits the Federal Reserve Board to restrict or prohibit activities that are determined to be a serious risk to Cape Bank.
Pursuant to the Dodd-Frank Act regulatory restructuring, the Federal Reserve Board assumed the Office of Thrift Supervision’s authority over savings and loan holding companies on July 21, 2011.
As a unitary savings and loan holding company, Cape Bancorp is permitted to engage in those activities permissible for financial holding companies (if certain criteria are met) or for multiple savings and loan holding companies. A financial holding company may engage in activities that are financial in nature, including underwriting equity securities and insurance as well as activities that are incidental to financial activities or complementary to a financial activity. A multiple savings and loan holding company is generally limited to activities permissible for bank holding companies under Section 4(c)(8) of the Bank Holding Company Act and certain additional activities authorized by federal regulations, subject to the approval of the Federal Reserve Board.
Federal law requires subsidiary institutions of savings and loan holding companies, such as Cape Bank, to provide prior notice to the Federal Reserve Board of proposed dividends. In the event Cape Bank’s capital fell below its regulatory requirements, or the FDIC notified the Bank that it was in need of increased supervision, Cape Bank’s ability to make capital distributions could be restricted. In addition, the Federal Reserve Board could deny a proposed dividend by any institution if the Federal Reserve Board determines that such dividend would be unsafe or unsound.
Unlike bank holding companies, savings and loan holding companies are not currently subject to specific regulatory capital requirements. The Dodd-Frank Act, however, requires the Federal Reserve Board to promulgate consolidated capital requirements for depository institution holding companies that are no less stringent, both quantitatively and in terms of components of capital, than those applicable to institutions themselves. That would exclude from Tier 1 capital instruments such as trust preferred securities and cumulative preferred stock that are currently permitted for bank holding companies. The previously discussed final rule regarding regulatory capital requirements implements the Dodd-Frank Act as to savings and loan holding companies. Consolidated regulatory capital requirements identical to those applicable to the subsidiary depository institutions will apply to savings and loan holding companies as of January 1, 2015. As is the case with institutions themselves, the capital conservation buffer will be phased in between 2016 and 2019.
The Dodd-Frank Act also extends the “source of strength” doctrine to savings and loan holding companies. The Federal Reserve Board has promulgated regulations implementing the “source of strength” policy that requires holding companies act as a source of strength to their subsidiary depository institutions by providing capital, liquidity and other support in times of financial stress.
33
The Federal Reserve Board has issued a policy statement regarding the payment of dividends and other capital distributions by bank holding companies that it has also made applicable to savings and loan holding companies. In general, the policy provides that dividends should be paid only out of current earnings and only if the prospective rate of earnings retention by the holding company appears consistent with the organization’s capital needs, asset quality and overall financial condition. Regulatory guidance provides for prior regulatory consultation concerning capital distributions in certain circumstances such as where the company’s net income for the past four quarters, net of dividends previously paid over that period, is insufficient to fully fund the dividend or the company’s overall rate of earnings retention is inconsistent with the company’s capital needs and overall financial condition. The ability of a holding company to pay dividends may be restricted if a subsidiary bank becomes undercapitalized. These regulatory policies could affect the ability of Cape Bancorp, Inc. to pay dividends, repurchase shares of common stock or otherwise engage in capital distributions.
Qualified Thrift Lender Test. In order for Cape Bancorp to be regulated as a savings and loan holding company, rather than as a bank holding company by the Federal Reserve Board, Cape Bank must qualify as a “qualified thrift lender” under regulations or satisfy the “domestic building and loan association” test under the Internal Revenue Code. Under the qualified thrift lender test, a savings institution is required to maintain at least 65% of its “portfolio assets” (total assets less: (i) specified liquid assets up to 20% of total assets; (ii) intangible assets, including goodwill; and (iii) the value of property used to conduct business) in certain “qualified thrift investments” (primarily residential mortgages and related investments, including certain mortgage-backed and related securities) in at least nine out of each 12 month period. At December 31, 2013, Cape Bank maintained 69.0% of its portfolio assets in qualified thrift investments. Cape Bank also met the Qualified Thrift Lender test in each of the prior four quarters.
Acquisitions and Control. Federal law prohibits a savings and loan holding company, directly or indirectly, or through one or more subsidiaries, from acquiring control of another savings institution or holding company thereof, without prior written approval of the Federal Reserve Board. It also prohibits the acquisition or retention of, with specified exceptions, more than 5% of the equity securities of any company engaged in activities that are not closely related to banking or financial in nature or acquiring or retaining control of an institution that is not federally insured. In evaluating applications by holding companies to acquire savings institutions, the Federal Reserve Board must consider factors such as the financial and managerial resources and future prospects of the savings institution involved, the effect of the acquisition on the risk to the insurance fund, the convenience and needs of the community, the effectiveness of each parties’ anti-money laundering program and competitive factors.
Under the Federal Change in Bank Control Act, a notice must be submitted to the Federal Reserve Board if any person (including a company), or group acting in concert, seeks to acquire “control” of a savings and loan holding company. An acquisition of “control” can occur upon the acquisition of 10% or more of the voting stock of a savings and loan holding company under certain circumstances, such as where a savings and loan holding company has registered securities under Section 12 of the Securities Exchange Act of 1934, which is the case with Cape Bancorp. Under the Change in Bank Control Act, the Federal Reserve Board has 60 days from the filing of a complete notice to act, taking into consideration certain factors, including the financial and managerial resources of the acquirer and the anti-trust effects of the acquisition. Any company that so acquires control would then be subject to regulation as a savings and loan holding company.
Federal Securities Laws
Cape Bancorp’s common stock is registered with the Securities and Exchange Commission under the Securities Exchange Act of 1934, as amended. Cape Bancorp is subject to the information, proxy solicitation, insider trading restrictions and other requirements under the Securities Exchange Act of 1934.
Cape Bancorp common stock held by persons who are affiliates (generally officers, directors and principal stockholders) of Cape Bancorp may not be resold without registration or unless sold in accordance with certain resale restrictions. If Cape Bancorp meets specified current public information requirements, each affiliate of Cape Bancorp is able to sell in the public market, without registration, a limited number of shares in any three month period.
The risks set forth below, in addition to the other risks described in this Annual Report on Form 10-K, may adversely affect our business, financial condition and operating results. In addition to the risks set forth below and the other risks described in this annual report, there may also be additional risks and uncertainties that are not currently known to us or that we currently deem to be immaterial that could materially and adversely affect our business, financial condition or operating results. As a result, past financial performance may not be a reliable indicator of future performance, and historical trends should not be used to anticipate results or trends in future periods. Further, to the extent that any of the information contained in this Annual Report on Form 10-K constitutes forward-looking statements, the risk factors set forth below also are cautionary statements identifying important factors that could cause our actual results to differ materially from those expressed in any forward-looking statements made by or on behalf of us.
34
Future Changes in Interest Rates Could Reduce Our Profits.
Our ability to make a profit largely depends on our net interest income which could be negatively affected by changes in interest rates. Net interest income is the difference between the interest income earned on our interest-earning assets (such as loans and securities) and the interest expense paid on our interest-bearing liabilities (such as deposits and borrowings).
Short term interest rates have been maintained at very low levels since the recession and the Federal Reserve Open Market Committee (“FOMC”) has consistently communicated their desire to keep these rates low. In addition, through asset purchase programs such as Quantitative Easing, they have also had a significant impact on keeping longer term rates low. Such policies are subject to change should the FOMC believe that the economy has sufficient strength and if there were fears of building inflationary pressure. It would be difficult to predict how rapidly such changes could take place, nor to gauge the potential magnitude of rate increases.
Increased rates could have a significant impact on the Bank’s net interest income. The section, “Net Interest Income Analysis” relays the negative results of a rate increase illustrated under standard financial models. We evaluate interest rate sensitivity by estimating the change in Cape Bank’s net portfolio value over a range of interest rate scenarios. Net portfolio value is the difference of discounted present values of expected cash flows from assets and liabilities. At December 31, 2013, in the event of an immediate 100 basis point increase in interest rates, we would experience a 4.2% decrease in net portfolio value and a $1.5 million decrease in net interest income. Interest rate increases during the last year have been the primary cause of the effective duration of the portfolio increasing from 2.85 years as of December 31, 2012 to 4.15 years as of December 31, 2013.See “Item 7, Management’s Discussion and Analysis of Financial Condition and Results of Operations—Management of Market Risk”.
Changes in interest rates can affect the average life of loans and mortgage-backed and related securities. Historically low residential mortgage rates over the recent past may significantly increase the average life of residential mortgage loans as borrowers would be incented to keep low rate mortgages in a rising interest rate environment. Rising rates may dampen the demand for loans from both the consumer and commercial customer as the economy adjusts to higher interest costs. Rising rates would also reduce the value of securities held in the Bank’s investment portfolio. Generally, the value of fixed income securities moves inversely with changes in interest rates. At December 31, 2013, the fair value of our available for sale investment securities totaled $157.2 million and the amortized cost of such securities was $161.9 million. The fair value of our HTM securities totaled $8.9 million and the amortized cost of such securities was $9.1 million. Decreases in the fair value of securities available for sale in future periods would have an adverse effect on stockholders’ equity.
Should rates rise, management would take steps to mitigate the loss of income by lengthening the term of liabilities and borrowings, and shortening the average life of assets. We would also work to increase higher yielding assets. Such steps could fail through poor execution or inaccurate timing.
Our Emphasis on Commercial Real Estate Loans and Commercial Business Loans May Continue to Expose Us to Increased Credit Risks.
At December 31, 2013, $419.6 million, or 53.0% or our loan portfolio consisted of commercial real estate loans and represented the largest percentage of our loan portfolio. Residential mortgage loans totaled $250.7 million or 31.8% of the total loan portfolio at December 31, 2013. In addition, at December 31, 2013, $64.2 million, or 8.2% of our loan portfolio consisted of commercial business loans. Effective December 31, 2013, the Bank exited the residential mortgage loan origination business.
Commercial real estate loans and commercial business loans generally expose a lender to a greater risk of loss than one-to-four family residential loans. Repayment of commercial real estate and commercial business loans generally depends, in large part, on sufficient income from the property or the borrower’s business to cover operating expenses and debt service. Commercial real estate loans typically involve larger loan balances to single borrowers or groups of related borrowers compared to one-to-four family residential mortgage loans. Changes in economic conditions that are beyond the control of the borrower and lender could affect the value of the security for the loan, the future cash flow of the affected property, or the marketability of a construction project with respect to loans originated for the acquisition and development of property. See “Business—Lending Activities.”
Our Continuing Concentration of Loans in Our Primary Market Area May Increase Our Risk.
Our success depends primarily on the general economic conditions in the counties in which we conduct business, and in the southern New Jersey shore communities in general. Our portfolio primarily consists of loans made to businesses in this area. While our MDOs are helping to diversify this risk, the largest geographic concentration remains in our historic markets. As a result, the local economic conditions have a significant impact on our loans and the ability of the borrowers to repay and on the value of the collateral that may secure these loans. A significant decline in general economic conditions caused by inflation, recession, unemployment, or poor weather for the summer season could adversely affect our financial condition and results of condition. Further, because we have a
35
significant amount of commercial real estate loans, decreases in tenant occupancy may have a negative effect on the ability of many of our borrowers to make timely loan payments thus adversely impacting our earnings.
The gaming industry is a significant economic force in our market and has already suffered a serious decline in revenues due to the economy and increased regional competition. The Atlantic City casino industry has experienced mixed results through the first three quarters of 2013.
Gross operating profit declined 37% for the nine month period ended September 30, 2013 compared to the same period in 2012;
Ten casinos had revenue declines during the period;
Occupancy rate in the casino hotels declined to 79.7% for the nine months ended September 30, 2013 compared to 86.2% for the same period ended September 30, 2012.
Competition from neighboring states has played an important role in this decline. Pennsylvania now has 14 operating casinos representing an addition of three from the previous year. Twelve of these casinos offer both table games and slots. Delaware has only three casinos, but in 2012 began offering table games in addition to their historic slot offerings. In an attempt to revitalize Atlantic City, the State of New Jersey has worked on several initiatives:
The Tourism District Law led to a $30 million marketing plan and realigned State gaming agencies to reduce bureaucracy.
In 2011, a second casino related law was passed with a comprehensive overhaul of casino regulations. This was the first major revision since 1977.
In February 2013, the State passed a law permitting online gaming in the state if the customer registers with an existing casino. Actual online gaming started in November of 2013.
A Breach of Information Security Could Negatively Affect Our Earnings.
Increasingly, we depend upon data processing, communication and information exchange on a variety of computing platforms and networks, and over the internet. We cannot be certain all of our systems are entirely free from vulnerability to attack, despite safeguards we have instituted. In addition, we rely on the services of a variety of vendors to meet our data processing and communication needs. Disruptions to our vendors’ systems may arise from events that are wholly or partially beyond our vendors’ control (including, for example, computer viruses or electrical or telecommunications outages). If information security is breached, despite the controls we have instituted, information can be lost or misappropriated, resulting in financial loss or costs to us or damages to others. Further, such breaches could cause harm to the Bank’s reputation. These costs or losses could materially exceed the amount of insurance coverage, if any, which would adversely affect our earnings.
We Are Subject to Extensive Regulatory Oversight That Could Limit Our Operations, Products and Services, and Make Regulatory Compliance Expensive.
We and our subsidiaries are subject to extensive regulation and supervision. Regulators have intensified their focus on Bank lending criteria and controls, and on the USA PATRIOT Act’s anti-money laundering and Bank Secrecy Act compliance requirements. Under Dodd-Frank, the structure of Bank regulation was changed and the Consumer Financial Protection Bureau (“CFFB”) was created resulting in more extensive regulation over consumer financial products is anticipated. There is also increased scrutiny of our compliance with the rules enforced by the Office of Foreign Assets Control (“OFAC”). In order to comply with regulations, guidelines and examination procedures in the anti-money laundering area, we have been required to adopt new policies and procedures and to install new systems. We cannot be certain that the policies, procedures and systems we have in place meet every aspect of current regulation. Therefore, there is no assurance that in every instance we are in full compliance with these requirements. Our failure to comply with these and other regulatory requirements can lead to, among other remedies, administrative enforcement actions, and legal proceedings. In addition, recently enacted, proposed and future legislation and regulations have had, will continue to have, or may have significant impact on the financial services industry. Regulatory or legislative changes could make regulatory compliance more difficult or expensive for us, and could cause us to change or limit some of our products and services, or the way we operate our business.
36
An Inadequate Allowance for Loan Losses Would Negatively Affect Our Results of Operations.
We are exposed to the risk that our customers will be unable to repay their loans according to their terms and that any collateral securing the payment of their loans will not be sufficient to avoid losses. Credit losses are inherent in the lending business and could have a material adverse effect on our operating results. Volatility and deterioration in the broader economy may also increase our risk of credit losses. The determination of an appropriate level of allowance for loan losses is an inherently uncertain process and is based on numerous assumptions. The amount of future losses is susceptible to changes in economic, operating and other conditions, including changes in interest rates, that may be beyond our control, and charge-offs may exceed current estimates. We evaluate the collectability of our loan portfolio and provide an allowance for loan losses that we believe is appropriate based upon such factors as, including, but not limited to: the risk characteristics of various classifications of loans; previous loan loss experience; specific loans that have loss potential; delinquency trends; the estimated fair market value of the collateral; current economic conditions; the views of our regulators; and geographic and industry loan concentrations. If any of our evaluations are incorrect and borrower defaults result in losses exceeding our allowance for loan losses, our results of operations could be significantly and adversely affected. We cannot be certain that our allowance is appropriate to cover probable loan losses inherent in our portfolio.
The National Economy is Experiencing a Modest/Fragile Recovery
The recession ended in 2009 although its effects continued. The economy has generated growth in GDP of 2.2% in 2012 and 2.8% in 2013. This data points to a modest recovery despite an accommodative Federal Reserve interest rate policy meant to stimulate the economy. The results have been reflected in the employment statistics which have improved during 2013 but still remain at historically elevated levels.
The modest recovery has negatively impacted many segments of the economy including community banking. Higher unemployment strains household income and contributes to delinquent payments. Collateral values have risen, albeit slowly. The Federal Reserve may have achieved the maximum benefit from it strategies and thus have a limited arsenal should the current recovery drift back into recession. Political gridlock further hampers the ability of the government to implement fiscal strategies to head off a recession.
Should a recession re-occur, or should the current modest recovery continue for an extended period, the Bank could face low demand for loans and an increase in credit problems. A deteriorating credit situation might necessitate an increase in loan loss provisions and charge-offs related to declining asset values.
Other-Than-Temporary Impairment (“OTTI”) Could Reduce Our Earnings.
We evaluate our investment securities for OTTI as required by FASB ASC Topic No. 320, “Investments – Debt and Equity Securities”. When a decline in fair value below cost is deemed to be OTTI, the impairment must be recognized as a charge to earnings to the extent it is related to credit losses. In determining whether or not OTTI exists, management considers several factors, including the length of time and extent that fair value has been less than cost, the financial condition and near term prospects of the issuer, adverse changes to projected cash flows, credit rating downgrades, and our intentions with regard to selling the securities or whether it is more likely than not that we will be required to sell the securities prior to the anticipated recovery in fair value.
The Need to Account for Assets at Market Prices May Adversely Affect Our Results of Operations.
We report certain assets, including investments and securities, at fair value. Generally, for assets that are reported at fair value, we use quoted market prices or valuation models that utilize market data inputs to estimate fair value. Because we carry these assets on our books at their fair value, we may incur losses even if the asset in question presents minimal credit risk. Given the continued disruption in the capital markets, we may be required to recognize OTTI in future periods with respect to securities in our portfolio. The amount and timing of any impairment recognized will depend on the severity and duration of the decline in fair value of the securities and our estimation of the anticipated recovery period.
Changes in the Value of Goodwill and Intangible Assets Could Reduce Our Earnings.
We are required by U.S. generally accepted accounting principles to test goodwill and other intangible assets for impairment at least annually. Testing for impairment of goodwill and intangible assets involves the identification of reporting units and the estimation of fair values. The estimation of fair values involves a high degree of judgment and subjectivity in the assumptions used. As of December 31, 2013, if our goodwill and intangible assets were fully impaired and we were required to charge-off all of our goodwill and intangible assets, the pro forma reduction to our net income would be approximately $1.91 per fully diluted share.
37
Our Expenses May Increase as a Result of Possible Increases in Federal Deposit Insurance Corporation (“FDIC”) Premiums.
The FDIC imposes an assessment against financial institutions for deposit insurance. The FDIC has authority to increase insurance assessments. A significant increase in insurance premiums would likely have an adverse effect on the operating expenses and results of operations of the Bank. Management cannot predict what insurance assessment rates will be in the future.
If the Federal Home Loan Bank of New York Stops Paying Dividends, This Will Negatively Affect Our Earnings.
We recorded dividend income of $243,000 on our Federal Home Loan Bank of New York stock in 2013. However, no assurances can be given that these dividends will continue to be paid in the future. The failure of the Federal Home Loan Bank to pay dividends in the future will cause our earnings to decrease.
38
ITEM 1B. | UNRESOLVED STAFF COMMENTS |
None.
The Company currently conducts business from its fourteen full service branch offices located in Atlantic and Cape May Counties, New Jersey, including its main office located at 225 North Main Street, Cape May Court House, New Jersey 08210, one drive-up teller/ATM operation in Atlantic County and two market development offices (“MDOs”) located in Burlington County, New Jersey and in Radnor, Pennsylvania, which services the five county Philadelphia market area. At December 31, 2013, the aggregate net book value of premises and equipment was $20.0 million. With the exception of the potential remodeling of certain facilities to provide for the efficient use of work space and/or to maintain an appropriate appearance, each property is considered reasonably adequate for current and anticipated needs.
Periodically, there have been various claims and lawsuits against us, such as claims to enforce liens, condemnation proceedings on properties in which we hold security interests, claims involving the making and servicing of real property loans and other issues incident to our business. We are not a party to any pending legal proceedings that we believe would have a material adverse effect on our financial condition, results of operations or cash flows.
ITEM 4. | MINE SAFETY DISCLOSURES |
None.
39
PART II
ITEM 5. | MARKET FOR REGISTRANT’S COMMON EQUITY, RELATED STOCKHOLDER MATTERS AND ISSUER PURCHASES OF EQUITY SECURITIES |
(a) No equity securities were sold during the year ended December 31, 2013 that were not registered under the Securities Act.
Stock Performance Graph
The following Performance Graph and related information shall not be deemed “soliciting material” or to be “filed” with the Securities and Exchange Commission, nor shall such information be incorporated by reference into any future filing under the Securities Act of 1933 or Securities Exchange Act of 1934, each as amended, except to the extent that the Company specifically incorporates it by reference into such filing.
Our common stock began trading on the NASDAQ Stock Market under the symbol “CBNJ” on February 1, 2008, and the per share closing price of one share of the Company’s common stock on that date was $10.05. The approximate number of shareholders of the Company’s common stock as of February 28, 2014 was 1,092. In 2013, we declared a quarterly dividend of $0.06. Although we currently pay quarterly cash dividends to our stockholders, stockholders are not entitled to receive dividends. Economic factors could cause our Board of Directors to eliminate or reduce the amount of frequency of cash dividends paid on our common stock.
The following graph represents $100 invested in our common stock at the $10.05 per share closing price on February 1, 2008. The graph illustrates the comparison of the cumulative total returns on the common stock of the Company with (a) the cumulative total return on stocks included in the NASDAQ Composite Index; and (b) the cumulative total return on stocks included in the SNL Mid-Atlantic Thrift Index.
There can be no assurance that our stock performance will continue in the future with the same or similar trend depicted in the graph below. We will not make or endorse any predictions as to future stock performance.
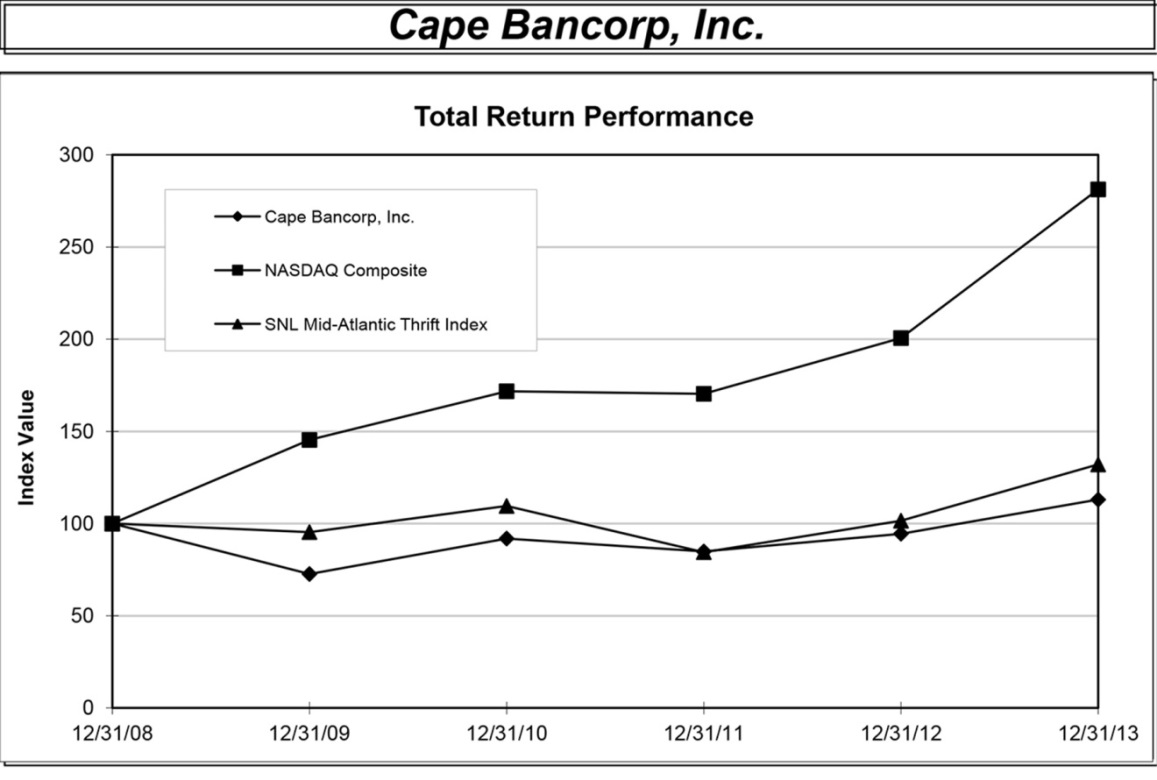
| | Period Ending | |
Index | | 12/31/08 | | | 12/31/09 | | | 12/31/10 | | | 12/31/11 | | | 12/31/12 | | | 12/31/13 | |
Cape Bancorp, Inc. | | | 100.00 | | | | 72.65 | | | | 91.89 | | | | 84.86 | | | | 94.50 | | | | 112.99 | |
NASDAQ Composite | | | 100.00 | | | | 145.36 | | | | 171.74 | | | | 170.38 | | | | 200.63 | | | | 281.22 | |
SNL Mid-Atlantic Thrift Index | | | 100.00 | | | | 95.38 | | | | 109.51 | | | | 84.49 | | | | 101.52 | | | | 132.04 | |
40
The following table sets forth the range of high and low bid information for the Company’s common stock as reported on NASDAQ for the period beginning January 1, 2012. Quotations reflect inter-dealer prices, without retail mark-up, markdown or commissions and may not represent actual transactions. In the fourth quarter of 2012, the Company paid its first cash dividend at $0.05 per common share and paid cash dividends in each subsequent quarter through year-end 2013.
| | 2013 | | | 2012 | |
| | High | | | Low | | | High | | | Low | |
First Quarter | | $ | 9.35 | | | $ | 7.38 | | | $ | 8.99 | | | $ | 7.02 | |
Second Quarter | | $ | 9.69 | | | $ | 7.15 | | | $ | 8.56 | | | $ | 7.25 | |
Third Quarter | | $ | 9.91 | | | $ | 8.36 | | | $ | 9.79 | | | $ | 8.00 | |
Fourth Quarter | | $ | 10.28 | | | $ | 9.00 | | | $ | 9.48 | | | $ | 8.00 | |
(b) Not applicable
(c) (1) | On April 18, 2013, the Company announced that the Board of Directors authorized a stock repurchase plan under which the Company would repurchase up to 5%, or approximately 667,239 shares, of the Company’s issued and outstanding shares. The repurchase plan was completed July 16, 2013. |
(2) | On July 19, 2013, the Company announced that the Board of Directors authorized a second stock repurchase program for the repurchase of up to 5%, or approximately 633,877 shares, of the Company’s issued and outstanding shares. The second stock repurchase plan was completed on October 3, 2013. |
(3) | On December 23, 2013, the Company announced that the Board of Directors authorized a third stock repurchase plan for the repurchase of up to 5%, or approximately 602,989 shares, of the Company’s issued and outstanding shares. |
(d) There were no equity compensation plan share issuances.
PURCHASES OF EQUITY SECURITIES | |
Period | | Total Number of Shares Purchased | | | Average Price Paid per Share | | | Total Number of Shares Purchased as Part of Publicly Announced Plans or Programs (1) (2) (3) | | | Maximum Number of Shares that May Yet Be Purchased Under the Plans or Programs | |
10/1/13-10/31/13 | | | 124,627 | | | $ | 9.27 | | | | 124,627 | | | - | |
11/01/13-11/30/13 | | - | | | - | | | - | | | - | |
12/1/13-12/31/13 | | - | | | - | | | - | | | | 602,389 | |
Total | | | 124,627 | | | $ | 9.27 | | | | 124,627 | | | | | |
ITEM 6. | SELECTED FINANCIAL DATA |
The following information is derived from the audited consolidated financial statements of Cape Bancorp. For additional information, reference is made to “Management’s Discussion and Analysis of Financial Condition and Results of Operations” and the Consolidated Financial Statements of Cape Bancorp and related notes included elsewhere in this Annual Report.
| | At December 31, | |
| | 2013 | | | 2012 | | | 2011 | | | 2010 | | | 2009 | |
| | (in thousands) | |
Selected Financial Condition Data: | | | | | | | | | | | | | | | | | | | | |
Total assets | | $ | 1,092,879 | | | $ | 1,040,798 | | | $ | 1,071,128 | | | $ | 1,061,042 | | | $ | 1,072,821 | |
Cash and cash equivalents | | $ | 24,861 | | | $ | 24,228 | | | $ | 25,475 | | | $ | 14,997 | | | $ | 13,513 | |
Investment securities available for sale, at fair value | | $ | 157,166 | | | $ | 170,857 | | | $ | 190,714 | | | $ | 157,407 | | | $ | 152,815 | |
Investment securities held to maturity | | $ | 9,102 | | | $ | - | | | $ | - | | | $ | - | | | $ | - | |
Loans held for sale | | $ | 1,814 | | | $ | 8,795 | | | $ | 7,657 | | | $ | 1,224 | | | $ | 398 | |
Loans, net | | $ | 780,127 | | | $ | 714,396 | | | $ | 716,341 | | | $ | 772,318 | | | $ | 789,473 | |
Federal Home Loan Bank of New York stock, at cost | | $ | 7,747 | | | $ | 5,775 | | | $ | 7,533 | | | $ | 8,721 | | | $ | 10,275 | |
Bank owned life insurance | | $ | 31,177 | | | $ | 30,226 | | | $ | 29,249 | | | $ | 28,252 | | | $ | 27,210 | |
Deposits | | $ | 798,422 | | | $ | 784,591 | | | $ | 774,403 | | | $ | 753,068 | | | $ | 736,587 | |
Borrowings | | $ | 143,935 | | | $ | 97,965 | | | $ | 144,019 | | | $ | 169,637 | | | $ | 203,981 | |
Total stockholders' equity | | $ | 140,427 | | | $ | 150,826 | | | $ | 145,719 | | | $ | 132,154 | | | $ | 126,548 | |
41
| | Years ended December 31, | |
| | 2013 | | | 2012 | | | 2011 | | | 2010 | | | 2009 | |
| | (in thousands) | |
Selected Operating Data: | | | | | | | | | | | | | | | | | | | | |
Interest income | | $ | 41,041 | | | $ | 43,684 | | | $ | 46,467 | | | $ | 50,269 | | | $ | 54,533 | |
Interest expense | | | 5,292 | | | | 8,204 | | | | 11,611 | | | | 14,539 | | | | 19,028 | |
Net interest income | | | 35,749 | | | | 35,480 | | | | 34,856 | | | | 35,730 | | | | 35,505 | |
Provision for loan losses | | | 2,011 | | | | 4,461 | | | | 19,607 | | | | 7,496 | | | | 13,159 | |
Net interest income after provision for loan losses | | | 33,738 | | | | 31,019 | | | | 15,249 | | | | 28,234 | | | | 22,346 | |
Non-interest income (expense) | | | 5,966 | | | | 7,814 | | | | 5,311 | | | | 2,851 | | | | 932 | |
Non-interest expense | | | 29,922 | | | | 31,622 | | | | 30,928 | | | | 28,534 | | | | 29,168 | |
Income (loss) before income tax expense | | | 9,782 | | | | 7,211 | | | | (10,368 | ) | | | 2,551 | | | | (5,890 | ) |
Income tax expense (benefit) | | | 4,231 | | | | 2,655 | | | | (18,355 | ) | | | (1,490 | ) | | | 12,011 | |
Net income (loss) | | $ | 5,551 | | | $ | 4,556 | | | $ | 7,987 | | | $ | 4,041 | | | $ | (17,901 | ) |
| | At or for the years ended December 31, | |
| | 2013 | | | 2012 | | | 2011 | | | 2010 | | | 2009 | |
Selected Financial Ratios and Other Data: | | | | | | | | | | | | | | | | | | | | |
Performance Ratios: | | | | | | | | | | | | | | | | | | | | |
Return on assets (ratio of net income to average total assets) | | | 0.53 | % | | | 0.43 | % | | | 0.75 | % | | | 0.38 | % | | | (1.64 | %) |
Return on equity (ratio of net income to average equity) | | | 3.80 | % | | | 3.05 | % | | | 5.61 | % | | | 3.06 | % | | | (12.89 | %) |
Earnings (loss) per share - fully diluted | | $ | 0.46 | | | $ | 0.37 | | | $ | 0.64 | | | $ | 0.33 | | | $ | (1.45 | ) |
Average interest rate spread (1) | | | 3.66 | % | | | 3.61 | % | | | 3.42 | % | | | 3.46 | % | | | 3.27 | % |
Net interest margin (2) | | | 3.76 | % | | | 3.75 | % | | | 3.60 | % | | | 3.66 | % | | | 3.54 | % |
Efficiency ratio | | | 70.47 | % | | | 71.68 | % | | | 72.93 | % | | | 68.59 | % | | | 69.19 | % |
Non-interest expense to average total assets | | | 2.85 | % | | | 3.01 | % | | | 2.90 | % | | | 2.68 | % | | | 2.67 | % |
Average interest-earning assets to average interest-bearing liabilities | | | 117.78 | % | | | 116.52 | % | | | 114.71 | % | | | 113.67 | % | | | 114.11 | % |
| | | | | | | | | | | | | | | | | | | | |
Asset Quality Ratios: | | | | | | | | | | | | | | | | | | | | |
Non-performing assets to total assets | | | 1.35 | % | | | 2.61 | % | | | 3.38 | % | | | 4.41 | % | | | 3.55 | % |
Non-performing loans to total loans | | | 0.93 | % | | | 2.67 | % | | | 3.77 | % | | | 5.54 | % | | | 4.14 | % |
Allowance for loan losses to non-performing loans | | | 127.05 | % | | | 50.86 | % | | | 46.10 | % | | | 28.84 | % | | | 40.04 | % |
Allowance for loan losses to total loans | | | 1.18 | % | | | 1.36 | % | | | 1.74 | % | | | 1.60 | % | | | 1.66 | % |
| | | | | | | | | | | | | | | | | | | | |
Capital Ratios: | | | | | | | | | | | | | | | | | | | | |
Total capital (to risk-weighted assets) | | | 9.53 | % | | | 10.35 | % | | | 13.82 | % | | | 13.90 | % | | | 12.71 | % |
Tier I capital (to risk-weighted assets) | | | 13.07 | % | | | 14.11 | % | | | 12.57 | % | | | 12.65 | % | | | 11.45 | % |
Tier I capital (to average assets) | | | 14.29 | % | | | 15.36 | % | | | 9.15 | % | | | 9.96 | % | | | 9.37 | % |
Equity to assets | | | 12.85 | % | | | 14.49 | % | | | 13.60 | % | | | 12.46 | % | | | 11.80 | % |
| | | | | | | | | | | | | | | | | | | | |
Other Data: | | | | | | | | | | | | | | | | | | | | |
Number of full service offices | | | 14 | | | | 15 | | | | 16 | | | | 17 | | | | 18 | |
Full time equivalent employees | | | 190 | | | | 193 | | | | 191 | | | | 205 | | | | 201 | |
(1) | Represents the difference between the weighted average yield on average interest-earning assets and the weighted average cost of interest-bearing liabilities. |
(2) | Represents net interest income as a percent of average earning assets. |
42
ITEM 7. | MANAGEMENT’S DISCUSSION AND ANALYSIS OF FINANCIAL CONDITION AND RESULTS OF OPERATIONS |
Overview/Business Strategy
Cape Bank was organized in 1923. Over the years, we have expanded primarily through internal growth. On January 31, 2008, we completed our mutual-to-stock conversion and initial public stock offering, and our acquisition of Boardwalk Bancorp and Boardwalk Bank. The merger resulted in a well-capitalized community oriented bank with a significant commercial loan presence and an experienced executive management team. For the three years prior to the merger both banks had experienced strong asset quality and financial performance. The severe economic recession affected the merged financial institution as a whole, as well as the loan portfolios of each of the constituent banks to the merger. At December 31, 2013, we had total assets of $1.093 billion.
Our principal business is acquiring deposits from individuals and businesses in the communities surrounding our offices and using these deposits to fund loans and other investments. More specifically, we offer personal and business checking accounts, commercial mortgage loans, construction loans, home equity loans and lines of credit and other types of commercial and consumer loans. Our customers consist primarily of individuals and small and mid-sized businesses. At December 31, 2013, our retail market area primarily included the area surrounding our 15 offices located in Cape May and Atlantic Counties, New Jersey.
During 2014, Cape Bank will focus on the following initiatives:
— | Core deposit gathering , both retail and commercial |
— | Continue building commercial loan relationships |
— | Continue efforts to effectively manage the Bank’s capital |
— | Continue efforts to reduce nonperforming assets |
— | Effectively utilize new core processors functionality with an emphasis on digital delivery |
Core deposit gathering, both retail and commercial:
The Company recognizes the value associated with strong core deposits and has built company-wide incentive programs to achieve this initiative. Both retail and commercial deposits will be focused on through advertising, branch programs, commercial loan calling officers and digital media. Deposit products will be designed to attract new deposit customers and retain existing ones.
Continue building commercial loan relationships:
Cape Bank has had good success in building strong commercial loan relationships during the past several years. This has been the result of building a seasoned group professional and knowledgeable staff combined with market driven products. The Company’s expansion into Burlington County in 2010 and the Philadelphia metro market in 2013 has produced better than anticipated results. Efforts will be made to continue to attract quality commercial lending staff as well as maximizing the efforts of the existing staff, while remaining flexible with product structure to adapt to market conditions.
Continue efforts to effectively manage the Company’s capital:
Despite the Company’s problems with credit since the recession, we were able to maintain a strong capital position. With troubled assets posing a reduced concern, the Company reassessed the level of capital and believed a continued active management would be appropriate. The Company began paying a quarterly cash dividend in the fourth quarter of 2012 and increased that dividend from $.05 per share to $.06 per share in the fourth quarter of 2013. Additionally, during 2013, the Company completed two 5% stock buyback programs and announced a third 5% buyback program in December 2013. On January 20, 2014, the Company, with the approval of the regulators, declared a $0.06 per common share cash dividend to shareholders of record on February 3, 2014. The dividend was paid on February 17, 2014.
Build core earnings:
During the economic downturn, Bank values were often a reflection of the perceived adequacy of equity often through the metric of tangible book value. Uncertainty with the economy in general, and with credit in particular, made capital a handy heuristic to gauge the soundness of a Bank.
43
These macro concerns have been receding as more institutions have gotten on sounder footing. As a result, valuations have begun to focus on earnings as a driver of value. In particular, core earnings are becoming an increasingly important metric.
Management recognizes this development and has made growth in core earnings an integral part of the 2014 Strategic Plan.
Continue efforts to reduce non-performing assets:
Management was able to reduce the level of non-performing assets during 2013 and believes that continued efforts to reduce them further will provide value to the shareholders. Several of the larger troubled credits have moved to OREO as the Bank attempts to move these properties promptly. This area will continue to receive attention in 2014.
Effectively utilize new core processors functionality with an emphasis on digital delivery:
The Bank made a smooth transition to our new core processor, FISERV, in the 4th quarter of 2013. The Bank believes that customers are requiring access to and communication from their financial service providers through a multitude of both physical and electronic delivery channels. During 2014, the Bank will maximize its opportunities to provide products and services via multiple delivery channels offered through FISERV and other available sources.
2014 Outlook
Our market area has been affected by the recession and the modest recovery. There has been a number of economic indicators that have shown improvement in 2013 when compared to 2012. Such as; unemployment in Atlantic and Cape May County was 10.4% and 13.0%, respectively, as of December 2013, an improvement from 2012 levels of 14.3% and 16.2%, respectively. Residential real estate values remained relatively flat in 2013 compared to 2012, in both Atlantic and Cape May Counties. Additionally, the number of residential building permits issued increased in both number and amounts in both Atlantic and Cape May Counties.
Income. Our primary source of income is net interest income. Net interest income is the difference between interest income (which is the income that we earn on our loans and investments) and interest expense (which is the interest that we pay on our deposits and borrowings). Changes in levels of market interest rates affect our net interest income.
The Bank’s net interest margin was 3.76% for 2013. This was achieved through active management of deposit pricing and steps taken to restructure borrowings during 2012.. Throughout the recession and the recovery, FOMC policy has been effective in keeping short term interest rates low while long term rates have been at historically low rates, arguably aided by the FOMC quantitative easing programs. We have taken advantage of these lower rates and have reduced deposit costs on both term deposits and transaction accounts. For the year ended December 31, 2013, the Bank’s cost of deposits was 0.42%, down from 0.65% for the year ended December 31, 2012. We anticipate that 2014 will not see any further reduction in the cost of deposits as the Bank has exhausted these opportunities and has begun to see some pricing pressure given the demand for deposits throughout the industry.
While the yield curve afforded opportunity to dramatically reduce the cost of liabilities, it also had the impact of reducing the yield on earning assets. During 2013, the yield on earning assets declined from 4.61% for the year ended December 31, 2012 to 4.32% for the year ended December 31, 2013. We plan on continuing to grow the Bank’s commercial loan portfolio and thus increasing earning assets in 2014. The very competitive market will lessen our ability to price loans at the levels we would prefer.
The Bank’s non-interest income comes predominately from fees on deposit products. We expect to maintain our current fee structure in 2014 and anticipate a level of income comparable to our 2013 performance.
Allowance for Loan Losses. The amount of the allowance for loan losses is based on management’s judgment of probable losses, and the ultimate losses may vary from such estimates as more information becomes available or conditions change.
Expenses. The non-interest expenses we incur in operating our business consist of salaries and employee benefits expenses, data processing expenses, occupancy expenses, depreciation, amortization and maintenance expenses and other miscellaneous expenses, such as advertising, insurance, professional services and printing and supplies expenses.
Our largest non-interest expense is salaries and employee benefits, which consist primarily of salaries and wages paid to our employees, payroll taxes, and expenses for health insurance, retirement plans and other employee benefits. We will recognize additional annual employee compensation expenses from our employee stock ownership plan, our Equity Incentive Plan and any additional stock-based benefit plans that we may adopt in the future.
44
We anticipate costs savings during 2014, and beyond, as a result of the converting our core processing system to FISERV during Q4 of 2013. Additionally, we will save in compensation expense as a result of closing the residential mortgage loan origination function in Q4 of 2013, which resulted in the reduction of 18 full time equivalents.
Growth and Expansion. In 2014, we have limited plans for expansion, with no new market development offices (“MDOs”) planned at this time. The Bank will be opportunistic if circumstance arise that would be of potential value to the Bank. The Bank has enjoyed success from the opening of a MDO in Burlington County, New Jersey in late 2010. This office has become the customer prototype for MDOs. In addition to our Burlington MDO, we opened an MDO in Radnor, Pennsylvania (March 2013).
Critical Accounting Policies
In the preparation of our consolidated financial statements, we have adopted various accounting policies that govern the application of accounting principles generally accepted in the United States. Our significant accounting policies are described in Note 2 of the Notes to Consolidated Financial Statements.
Certain accounting policies involve significant judgments and assumptions by us that have a material impact on the carrying value of certain assets and liabilities. We consider these accounting policies to be critical accounting policies. The judgments and assumptions we use are based on historical experience and other factors, which we believe to be reasonable under the circumstances. Actual results could differ from these judgments and estimates under different conditions, resulting in a change that could have a material impact on the carrying values of our assets and liabilities and our results of operations.
Allowance for Loan Losses. We consider the allowance for loan losses to be a critical accounting policy. The allowance for loan losses is the amount estimated by management as necessary to cover losses inherent in the loan portfolio at the balance sheet date. The allowance is established through the provision for loan losses, which is charged to income. Determining the amount of the allowance for loan losses necessarily involves a high degree of judgment.
In evaluating the allowance for loan losses, management considers historical loss factors, the mix of the loan portfolio (types of loans and amounts), geographic and industry concentrations, current national and local economic conditions and other factors related to the collectability of the loan portfolio, including underlying collateral values and estimated future cash flows. All of these estimates are susceptible to significant change. Groups of homogenous loans are evaluated in the aggregate under FASB ASC Topic No. 450 Contingencies, using historical loss factors adjusted for economic conditions and other environmental factors. Other environmental factors include trends in delinquencies and classified loans, loan concentrations by loan category and by property type, seasonality of the portfolio, internal and external analysis of credit quality, and single and total credit exposure. Certain loans that indicate underlying credit or collateral concerns may be evaluated individually for impairment in accordance with FASB ASC Topic No. 310 Receivables. If a loan is impaired and repayment is expected solely from the collateral, the difference between the outstanding balance and the value of the collateral will be charged off. For potentially impaired loans where the source of repayment may include other sources of repayment from third parties, the evaluation may include these potential sources of repayment and indicate the need for a specific reserve for any potential shortfall. This evaluation is inherently subjective, as it requires estimates that are susceptible to significant revision as more information becomes available or as projected events change.
Management reviews the level of the allowance quarterly. Although we believe that we use the best information available to establish the allowance for loan losses, future adjustments to the allowance may be necessary if economic conditions differ substantially from the assumptions used in making the evaluation. In addition, the FDIC and the New Jersey Department of Banking and Insurance, as an integral part of their examination process, periodically review our allowance for loan losses. Such agencies may require us to recognize adjustments to the allowance based on judgments about information available to them at the time of their examination. A large loss could deplete the allowance and require increased provisions to replenish the allowance, which would adversely affect earnings. See Note 2 – Summary of Significant Accounting Policies of the Notes to Consolidated Financial Statements.
Securities Impairment. Beginning 2013, the Company’s investment portfolio included twenty-two securities in pooled trust preferred collateralized debt obligations, fourteen of which had been principally issued by bank holding companies, and eight of which had been principally issued by insurance companies.. All of the aforementioned securities had below investment grade credit ratings.
Through December 31, 2012, all fourteen of the bank-issued pooled trust preferred collateralized debt obligation securities had OTTI recognized in earnings due to credit impairment. Of those securities, eleven have been completely written-off and the three remaining bank-issued CDOs had a total book value of $524,000 and a fair value of $564,000 at December 31, 2012. At December 31, 2012, the CDO securities principally issued by insurance companies, none of which have had OTTI charges, had an aggregate book value of $7.7 million and a fair value of $4.1million.
45
In December 2013 the Bank sold all of the CDO securities principally issued by insurance companies as well as the three remaining CDO securities that had been principally issued by bank holding companies. At the time of sale, these securities had an aggregate book value of $8.3 million and the Bank recorded an $851,000 loss on the sale. Additionally, in February 2014, the Bank sold the eleven CDO securities that had been fully written-off for $1.9 million.
Income Taxes. The Company is subject to the income and other tax laws of the United States and the State of New Jersey. These laws are complex and are subject to different interpretations by the taxpayer and the various taxing authorities. In determining the provisions for income and other taxes, management must make judgments and estimates about the application of these inherently complex laws, related regulations and case law. In the process of preparing the Company provision and tax returns, management attempts to make reasonable interpretations of applicable tax laws. These interpretations are subject to challenge by the taxing authorities upon audit or to reinterpretation based on management’s ongoing assessment of facts and evolving case law.
The Company and its subsidiaries file a consolidated federal income tax return and separate entity state income tax returns. The provision for federal and state income taxes is based on income and expenses, as reported in the consolidated financial statements, rather than amounts reported on the Company’s federal and state income tax returns. When income and expenses are recognized in different periods for tax purposes than for book purposes, applicable deferred tax assets and liabilities are recognized for the future tax consequences attributable to the differences between the financial statement carrying amounts of existing assets and liabilities and their respective tax bases. Deferred tax assets and liabilities are measured using enacted tax rates expected to apply to taxable income in the years in which those temporary differences are expected to be recovered or settled. The effect on deferred tax assets and liabilities of a change in tax rates is recognized as income or expense in the period that includes the enactment date.
On a quarterly basis, management assesses the reasonableness of its effective federal and state tax rate based upon its current best estimate of net income and the applicable taxes expected for the full year.
Comparison of Financial Condition at December 31, 2013 and December 31, 2012
The Company’s total assets at December 31, 2013 totaled $1.093 billion, an increase of $52.0 million, or 5.00%, from the December 31, 2012 level of $1.041 billion. The increase was primarily attributable to an increase in net loans of $65.7 million. Investment securities decreased $4.6 million.
Cash and cash equivalents increased $633,000, or 2.61%, to $24.9 million at December 31, 2013 from $24.2 million at December 31, 2012. Interest-bearing time deposits decreased $74,000 or 0.80%, to $9.2 million at December 31, 2013 from $9.3 million at December 31, 2012. The Company invests in time deposits of other banks generally for terms ranging from one to two years and not to exceed $250,000, which is the amount currently insured by the Federal Deposit Insurance Corporation.
Total loans increased $65.2 million, or 9.00%, to $789.5 million at December 31, 2013 from $724.2 million at December 31, 2012. Net loans increased $65.7 million, net of a decrease in the allowance for loan losses of $522,000. Commercial loans increased $44.6 million, or 10.12% and residential mortgage loans increased $22.7 million, or 9.61%, as the Bank retained approximately 68% of originations made during the year. An increase in commercial loan activity within our market resulted in net growth of $44.6 million. Consumer loans declined $2.1 million.
At December 31, 2013, the Company had $7.3 million in non-performing loans, or 0.93% of total loans, compared to $19.4 million, or 2.67% of total loans, at December 31, 2012. Included in non-performing loans are troubled debt restructurings totaling $881,000 at December 31, 2013 and $3.5 million at December 31, 2012, respectively. At December 31, 2013, non-performing loans by loan portfolio category were as follows: $5.2 million of commercial mortgage loans; $1.1 million of residential mortgage loans; $498,000 of commercial business loans; and $461,000 of home equity loans. Loan charge-offs and write-downs on loans transferred to HFS for the year ended December 31, 2013 totaled $2.8 million. Loans transferred to OREO during 2013 totaled $6.5 million. Delinquent loans decreased $6.15 million to $9.83 million or 1.24% of total gross loans at December 31, 2013 from $15.98 million, or 2.20% of total loans at December 31, 2012. Total delinquent loans by portfolio at December 31, 2013 were $6.0 million of commercial mortgages, $2.3 million of residential mortgages, $497,000 of commercial business loans, $1.0 million of home equity loans, and $7,000 of other consumer loans. Delinquent loan balances by number of days delinquent were: 31 to 59 days – $896,000; 60 to 89 days – $2.2 million; and 90 days and greater – $6.7 million.
At December 31, 2013, non-performing commercial loans had collateral type concentrations of $3.4 million (8 loans or 59%) secured by retail stores; $885,000 (5 loans or 16%) secured by residential, duplex and multi-family properties; $563,000 (1 loan or 10%) secured by B&B and hotels; $365,000 (1 loan or 6%) secured by commercial buildings and equipment; $336,000 (1 loan or 6%) secured by restaurant properties; and $198,000 (2 loans or 3%) secured by land and building lots. The three largest relationships in this category of non-performing loans are $1.8 million, $563,000, and $374,000.
46
We believe we have appropriately charged-off, written-down or established adequate loss reserves on problem loans that we have identified. For 2014, we anticipate a gradual decrease in the amount of problem assets as we have disposed of assets collateralizing loans that have gone through foreclosure. We are aggressively managing all loan relationships, and where necessary, we will continue to apply our loan work-out experience to protect our collateral position and actively negotiate with mortgagors to resolve these non-performing loans.
Total investment securities decreased $4.6 million, or 2.68%, to $166.3 million at December 31, 2013 from $170.9 million at December 31, 2012. At December 31, 2013, AFS securities totaled $157.2 million and HTM securities totaled $9.1 million. Investment securities are classified as HTM when management has the positive intent and ability to hold them to maturity. In September 2013, the Bank reclassified a portion of the AFS securities as HTM, as these securities may be particularly susceptible to changes in fair value in the near term as a result of market volatility. At December 31, 2012, all of the Company’s investment securities totaling $170.9 million were classified as AFS. The decrease in the portfolio is primarily a result of investment security sales including the December 2013 sale of the remaining trust preferred CDO securities that had a book balance of greater than zero. The Company also experienced additional OTTI related to its bank-issued CDOs portfolio during the year ended December 31, 2012 and recorded an $8,000 charge to earnings related to the credit loss portion of impairment. There was no additional OTTI recorded for the year 2013. On February 27, 2014, the Company sold its remaining CDO portfolio which had a book balance of zero, and, as a result, recorded a $1.9 million pre-tax gain on the sale.
Total deposits increased $13.8 million, or 1.76%, to $798.4 million at December 31, 2013, from $784.6 million at December 31, 2012. The increase is attributable to a $30.6 million, or 12.81%, increase in certificates of deposit from $238.6 million at December 31, 2012 to $269.2 million at December 31, 2013, partially offset by a decrease of $16.0 million in core deposits. Interest-bearing checking accounts and money market accounts increased $12.8 million, or 3.53%, to $350.7 million at December 31, 2013 from $363.5 million at December 31, 2012. This decrease was attributable to decreases in personal money market deposit accounts of $26.0 million primarily resulting from a decline in interest rates paid and decreases in commercial money market accounts of $11.3 million primarily resulting from fluctuations in large balance accounts, partially offset by increases in municipal interest-bearing checking accounts of $9.6 million, or 12.08%, commercial interest-bearing checking of $8.4 million, or 50.14%, and increases in personal interest bearing checking accounts of $6.5 million, or 7.13%. Non-interest bearing checking accounts decreased $3.0 million, or 3.62%, to $79.7 million at December 31, 2013 from $82.7 million at December 31, 2012. Savings deposit accounts totaled $96.0 million at December 31, 2013 and $96.2 million at December 31, 2012.
Total borrowings increased $46.0 million, or 46.92%, to $143.9 million at December 31, 2013 from $98.0 million at December 31, 2012. This primarily resulted from an increase in the FHLB overnight borrowing of $60.0 million. In June 2012, the Company extinguished $20.0 million in FHLB of NY fixed rate term borrowings which had a weighted average rate of 3.44% and maturity dates ranging from August 2013 through February 2014. The prepayment of these borrowings will be accretive to net interest income through the first quarter of 2014. In addition, in August 2012, the Company restructured an additional $54.0 million in borrowings, significantly lowering the cost of funds. As a result of both restructurings, net interest income is projected to increase by $1.3 million annually and the net interest margin will benefit by 22 basis points annually. At December 31, 2013, our borrowings to assets ratio increased to 13.2% from 9.4% at December 31, 2012 primarily resulting from the previously mentioned increase in the overnight borrowing. Borrowings to total liabilities increased to 15.1% at December 31, 2013 from 11.0% at December 31, 2012.
Stockholders’ equity decreased $10.4 million, or 6.89%, to $140.4 million at December 31, 2013, from $150.8 million at December 31, 2012. The decrease in equity was primarily attributable to $12.0 million decrease related to the Company’s stock repurchase programs and an increase of $2.3 million in the accumulated other comprehensive loss, partially offset by a net increase of $3.1 million (earnings less dividends declared) in retained earnings. At December 31, 2013, stockholders’ equity totaled $140.4 million, or 12.85% of total assets, and tangible equity totaled $117.6 million or 10.99% of total tangible assets.
Comparison of Operating Results for the Years Ended December 31, 2013 and 2012
General. The Company recorded net income of $5.6 million, or $0.47 per common share and $0.46 per fully diluted share for the year ended December 31, 2013 compared to net income of $4.6 million, or $0.37 per common and fully diluted share for the year ended December 31, 2012. Pre-tax income increased $2.6 million year-over-year primarily resulting from a reduction in the loan loss provision of $2.5 million., an increase in net interest income of $265,000, increases in net gains on the sale of loans of $799,000, net gains on the sale of OREO of $341,000, lower OREO expenses of $809,000, lower loan related expenses of $686,000, and a reduction of $485,000 in Federal deposit insurance premiums. In addition, the full year 2012 included a $921,000 prepayment penalty of related to the previously disclosed debt extinguishment in the second quarter of 2012. These positive factors were partially offset by net securities losses of $561,000 in 2013 compared to net securities gains totaling $1.6 million for the same 2012 period, a reduction in the gain on sale of bank premises of $425,000, and an increase in salaries and employee benefits totaling $1.5 million primarily attributable to incentive based compensation programs, the expansion of the commercial loan functions and severance costs related to the exiting of our residential mortgage loan origination business.
47
Interest Income. Interest income decreased $2.6 million, or 6.06%, to $41.0 million for the year ended December 31, 2013, from $43.7 million for the year ended December 31, 2012. The decrease for the year resulted from a $1.8 million, or 4.67%, decrease in interest income on loans. Average loan balances for the year ended December 31, 2013 increased $13.3 million, or 1.80% to $748.7 million from $735.4 million for the year ended December 31, 2012. However, the average yield on loans declined 34 basis points to 4.95% for the year ended December 31, 2013 compared to 5.29% for the year ended December 31, 2012, reflecting a lower interest rate environment and the impact of non-accruing loans on interest income. For the year ended December 31, 2013, loan charge-offs totaled $2.8 million and loans transferred to OREO totaled $6.5 million. The amount of interest income that would have been recorded had our non-accruing loans been current in accordance with their original terms approximated $719,000 for the year ended December 31, 2013 compared to $1.3 million for the year ended December 31, 2012.
The average balance of the investment portfolio increased $4.7 million, or 2.57%, to $187.7 million for the year ended December 31, 2013 from $183.0 million for the year ended December 31, 2012. The average yield on the investment portfolio decreased 49 basis points to 2.06% for the year ended December 31, 2013 from 2.55% for the year ended December 31, 2012. The decrease in the investment portfolio yield was a result of the proceeds from higher yielding securities being reinvested into securities that have lower coupon rates.
Interest Expense. Interest expense decreased $2.9 million, or 35.49%, to $5.3 million for the year ended December 31, 2013, from $8.2 million for the year ended December 31, 2012. The decrease in interest expense resulted from lower rates on interest-bearing deposit products, particularly certificates of deposit and money market accounts, and a lower cost of borrowings.
Interest expense on certificates of deposit decreased $874,000, or 28.36%, to $2.2 million for the year ended December 31, 2013, from $3.1 million for the year ended December 31, 2012. The average rate paid on certificates of deposit decreased 29 basis points to 0.90% for the year ended December 31, 2013, from 1.19% for the year ended December 31, 2012 while the average balance of certificates of deposit decreased $14.5 million, or 5.6% to $244.9 million for the year ended December 31, 2013, from $259.4 million for the year ended December 31, 2012. Interest expense on interest-bearing demand accounts and money market accounts decreased $525,000, or 42.41%, to $713,000 for the year ended December 31, 2013, from $1.2 million for the year ended December 31, 2012. The average rate paid on interest-bearing demand accounts and money market accounts decreased 17 basis points to 0.20% for the year ended December 31, 2013, from 0.37% for the year ended December 31, 2012. The average balance of interest-bearing demand accounts and money market accounts increased $31.6 million, or 8.67%, to $364.2 million for the year ended December 31, 2013, from $332.6 million for the year ended December 31, 2012. Interest expense on savings accounts decreased $90,000 to $64,000 for the year ended December 31, 2013, from $154,000 for the year ended December 31, 2012. The average rate paid on savings deposits decreased 10 basis points to 0.07% for the year ended December 31, 2013, from 0.17% for the year ended December 31, 2012, while the average balance of savings accounts increased $4.3 million, or 4.68% to $96.8 million for the year ended December 31, 2013, from $92.5 million for the year ended December 31, 2012. The average balance of interest-bearing demand accounts and money market accounts includes both indexed priced and fixed rate municipal account relationships for the year ended December 31, 2013, with an average balance of $87.8 million and an average rate of 0.36%, compared to an average balance of $62.8 million and an average rate of 0.61% for the year ended December 31, 2012.
Interest expense on borrowings (primarily Federal Home Loan Bank of New York advances) decreased $1.4 million, or 38.15%, to $2.3 million for the year ended December 31, 2013 from $3.7 million for the year ended December 31, 2012. The average balance of borrowings declined $25.3 million, or 19.95%, to $101.5 million for the year ended December 31, 2013, from $126.8 million for the year ended December 31, 2012. The average rate paid on borrowings decreased 67 basis points to 2.27% for the year ended December 31, 2013, from 2.94% for the year ended December 31, 2012. The decreases in both the average balance and average rate paid on borrowings primarily resulted from the previously mentioned debt extinguishment in the second quarter of 2012 and the further restructuring of debt in the third quarter of 2012.
Net Interest Income. Net interest income increased $265,000, or 0.75%, to $35.7 million for the year ended December 31, 2013, from $35.5 million for the year ended December 31, 2012. The net interest margin increased by 1 basis point to 3.76% for the year ended December 31, 2013, from 3.75% for the year ended December 31, 2012. The yield on interest-earning assets declined 30 basis points to 4.32% for the year ended December 31, 2013 compared to 4.62% for the year ended December 31, 2012, while the cost of interest-bearing liabilities declined 35 basis points to 0.66% for the year ended December 31, 2013 compared to 1.01% for the same period last year. The net interest margin benefited from the previously mentioned debt extinguishment and restructuring of debt. Significant interest expense savings were realized from certificates of deposits and money market accounts as pricing strategies implemented during the year reflected the current interest rate environment and competition. The ratio of average interest earning assets to average interest bearing liabilities increased to 117.78% during the year ended December 31, 2013, from 116.52% for the year ended December 31, 2012.
48
Provision for Loan Losses. In accordance with FASB ASC Topic No. 450 Contingencies, we establish provisions for loan losses which are charged to operations in order to maintain the allowance for loan losses at a level we consider necessary to absorb credit losses incurred in the loan portfolio that are both probable and reasonably estimable at the balance sheet date. In determining the level of the allowance for loan losses, we consider, among other things, past and current loss experience, evaluations of real estate collateral, current economic conditions, volume and type of lending, external factors such as competition and regulations, adverse situations that may affect a borrower’s ability to repay a loan and the levels of delinquent loans.
The amount of the allowance is based on management’s judgment of probable losses, and the ultimate losses may vary from such estimates as more information becomes available or conditions change. We assess the allowance for loan losses and make provisions for loan losses on a quarterly basis.
The Company recorded a provision for loan losses of $2.0 million for the year ended December 31, 2013 compared to $4.5 million for the year ended December 31, 2012 resulting from charge-offs and write-downs of loans transferred to HFS totaling $2.8 million in 2013 compared to charge-offs totaling $7.5 million in 2012. The ratio of the allowance for loan losses to non-performing loans (coverage ratio) increased to 127.05% at December 31, 2013, from 50.86% at December 31, 2012 primarily due a $12.1 million reduction in non-performing loans. Included in the 2013 charge-offs and write-downs of $2.8 million were partial charge-offs totaling $2.0 million. The amount of non-performing loans for which the full loss has been charged-off to total loans is 0.95%. The amount of non-performing loans for which the full loss has been charged-off to total non-performing loans is 10.20%. Loan loss recoveries were $253,000 for the year ended December 31, 2013 compared to $228,000 for the year ended December 31, 2012.
Our allowance for loans losses decreased $522,000 or 5.30%, to $9.3 million at December 31, 2013, from $9.9 million at December 31, 2012. The ratio of our allowance for loan losses to total loans decreased to 1.18% at December 31, 2013, from 1.36% at December 31, 2012.
Non-Interest Income. Non-interest income decreased $1.8 million, or 23.65%, to $6.0 million for the year ended December 31, 2013, from $7.8 million for the year ended December 31, 2012. The decrease resulted from net losses on sales of investment securities totaling $561,000 for the year ended December 31, 2013 compared to net gains on the sale of investment securities totaling $1.6 million for the year ended December 31, 2012.Net gains on the sale of loans totaled $1.2 million for the year ended December 31, 2013 compared to net gains on the sale of loans totaling $423,000 for the year ended December 31, 2012 Included in the twelve month period of 2012 was a gain on the sale of the Company’s merchant card business in the amount of $325,000. The year ended December 31, 2012 included the recognition of a deferred gain related to the sale of bank premises of $425,000 resulting from vacating leased space in the second quarter of 2012 which accelerated the recognition of a portion of the deferred gain. The Company recorded net gains on the sale of OREO of $81,000 for the 2013 twelve month period compared to net losses on OREO sales of $260,000 for the year ended December 31, 2012.
Non-Interest Expense. Non-interest expense decreased $1.7 million or 5.39%, to $29.9million for the year ended December 31, 2013 from $31.6 million for the year ended December 31, 2012. OREO expenses declined $809,000 to $1.2 million for the year ended December 31, 2013 compared to $2.1 million for the twelve month period of 2012. Included in these expenses were OREO write-downs totaling $492,000 compared to $1.1 million for the year ended December 31, 2012. Loan related expenses totaled $1.4 million for the year ended December 31, 2013 compared to $2.1 million for the year ended December 31, 2012 resulting from decreased expenses related to non-performing loans. Year-over-year, Federal deposit insurance premiums decreased $485,000 and advertising expenses decreased $98,000. Salaries and benefits increased $1.5 million primarily attributable to incentive based compensation programs, the expansion of the commercial loan functions and severance costs related to the exiting of our residential mortgage loan origination business. The year ended December 31, 2012 included a prepayment penalty of $921,000 related to the previously disclosed debt extinguishment in the second quarter of 2012.
Income Tax Expense. For the year ended December 31, 2013 income tax expense totaled $4.2 million compared to income tax expense of $2.7 million for the year ended December 31, 2012, resulting in an effective tax rate of 43.2% for 2013 and 36.8% for 2012. Income tax expense for the year ended December 31, 2012 was negatively impacted by approximately $358,000 of deferred tax asset valuation allowance related to the Cape Charitable Foundation and positively impacted by the reversal of a $256,000 FIN 48 reserve. The increase in the effective tax rate for 2013 was primarily due to higher state income taxes combined with a lower amount of tax-exempt and BOLI income compared to total income as well as the expiration of some additional charitable contribution carryforwards offset by the remaining decrease in the valuation allowance.
49
Comparison of Operating Results for the Years Ended December 31, 2012 and 2011
General. The Company recorded net income of $4.6 million, or $0.37 per common and fully diluted share for the year ended December 31, 2012 compared to net income of $8.0 million, or $0.64 per common and fully diluted share for the year ended December 31, 2011. Included in the full year operating results for 2011 were tax benefits totaling $12.2 million representing the reversal of a portion of the deferred tax valuation allowance. Pre-tax income increased $17.6 million year-over-year primarily resulting from a reduction in the loan loss provision of $15.1 million, a reduced year-over-year OTTI charge of $1.4 million, an increase in net gains on the sale of investment securities of $1.5 million, an increase in net interest income of $644,000, lower OREO expenses of $450,000 and lower loan related expenses of $213,000. In addition, the Company recorded net gains on loan sales of $423,000 for the year ended December 31, 2012 compared to net losses of $67,000 for the twelve month period ended December 31, 2011. These positive factors were partially offset by a reduction in the gain on sale of bank premises of $1.4 million, and a $921,000 prepayment penalty of related to the previously disclosed debt extinguishment in the second quarter of 2012.
Interest Income. Interest income decreased $2.8 million, or 5.99%, to $43.7 million for the year ended December 31, 2012, from $46.5 million for the year ended December 31, 2011. The decrease for the year resulted from a $2.7 million, or 6.55%, decrease in interest income on loans. Average loan balances for the year ended December 31, 2012 decreased $32.3 million, or 4.21% to $735.4 million from $767.7 million for the year ended December 31, 2011. Loan demand has not been sufficient to offset monthly principal reductions, pay-offs, charge-offs, and the transfer of loans to OREO. For the year ended December 31, 2012, loan charge-offs totaled $7.5 million and loans transferred to OREO totaled $10.2 million. The average yield on the loan portfolio decreased 13 basis points to 5.29% for the year ended December 31, 2012 from 5.42% for the year ended December 31, 2011, reflecting a lower interest rate environment and the impact of non-accruing loans on interest income. The amount of interest income that would have been recorded had our non-accruing loans been current in accordance with their original terms approximated $1.3 million for the year ended December 31, 2011 compared to $2.1 million for the year ended December 31, 2011.
The average balance of the investment portfolio increased $2.1 million, or 1.16%, to $183.0 million for the year ended December 31, 2012 from $180.9 million for the year ended December 31, 2011. The slight increase in the average balance of investments occurred in conjunction with a reduction in agency securities and an increase in mortgage backed securities. The average yield on the investment portfolio decreased 6 basis points to 2.55% for the year ended December 31, 2012 from 2.61% for the year ended December 31, 2011. The decrease in the investment portfolio yield was a result of the proceeds from higher yielding securities being reinvested into securities that have lower coupon rates.
Interest Expense. Interest expense decreased $3.4 million, or 29.34%, to $8.2 million for the year ended December 31, 2012, from $11.6 million for the year ended December 31, 2011. The decrease in interest expense resulted from lower rates on interest-bearing deposit products, particularly certificates of deposit and money market accounts.
Interest expense on certificates of deposit decreased $1.4 million, or 31.65%, to $3.1 million for the year ended December 31, 2012, from $4.5 million for the year ended December 31, 2011. The average rate paid on certificates of deposit decreased 30 basis points to 1.19% for the year ended December 31, 2012, from 1.49% for the year ended December 31, 2011, while the average balance of certificates of deposit decreased $43.0 million, or 14.21% to $259.4 million for the year ended December 31, 2012, from $302.4 million for the year ended December 31, 2011. Interest expense on NOW (interest-bearing demand accounts) and money market accounts decreased $502,000, or 28.85%, to $1.2 million for the year ended December 31, 2012, from $1.7 million for the year ended December 31, 2011. The average rate paid on NOW and money market accounts decreased 20 basis points to 0.37% for the year ended December 31, 2012, from 0.57% for the year ended December 31, 2011. The average balance of NOW and money market accounts increased $27.6 million, or 9.07%, to $332.6 million for the year ended December 31, 2012, from $305.0 million for the year ended December 31, 2011. Interest expense on savings accounts decreased $61,000 to $154,000 for the year ended December 31, 2012, from $215,000 for the year ended December 31, 2011. The average rate paid on savings deposits decreased 8 basis points to 0.17% for the year ended December 31, 2012, from 0.25% for the year ended December 31, 2011, while the average balance of savings accounts increased $7.1 million, or 3.97% to $92.5 million for the year ended December 31, 2012, from $85.4 million for the year ended December 31, 2011. The average balance of NOW and money market accounts includes both indexed priced and fixed rate municipal account relationships for the year ended December 31, 2012, with an average balance of $62.8 million and an average rate of 0.61%, compared to an average balance of $50.8 million and an average rate of 0.60% for the year ended December 31, 2011. Interest expense on borrowings (primarily Federal Home Loan Bank of New York advances) decreased $1.4 million, or 27.53%, to $3.7 million for the year ended December 31, 2012 from $5.1 million for the year ended December 31, 2011. The average balance of borrowings declined $25.4 million, or 16.66%, to $126.8 million for the year ended December 31, 2012, from $152.2 million for the year ended December 31, 2011. The average rate paid on borrowings decreased 44 basis points to 2.94% for the year ended December 31, 2012, from 3.38% for the year ended December 31, 2011. The decreases in both the average balance and average rate paid on borrowings primarily resulted from the previously mentioned debt extinguishment in the second quarter of 2012 and the further restructuring of debt in the third quarter of 2012.
50
Net Interest Income. Net interest income increased $624,000, or 1.79%, to $35.5 million for the year ended December 31, 2012, from $34.8 million for the year ended December 31, 2011. The net interest margin increased by 15 basis points to 3.75% for the year ended December 31, 2012, from 3.60% for the year ended December 31, 2011. The yield on interest-earning assets declined 17 basis points to 4.62% for the year ended December 31, 2012 compared to 4.79% for the year ended December 31, 2011, while the cost of interest-bearing liabilities declined 36 basis points to 1.01% for the year ended December 31, 2012 compared to 1.37% for the same period last year. The net interest margin benefited from the previously mentioned debt extinguishment and restructuring of debt. Significant interest expense savings were realized from certificates of deposits and money market accounts as pricing strategies implemented during the year reflected the current interest rate environment and competition. The ratio of average interest earning assets to average interest bearing liabilities increased to 116.52% during the year ended December 31, 2012, from 114.71% for the year ended December 31, 2011.
Provision for Loan Losses. In accordance with FASB ASC Topic No. 450 Contingencies, we establish provisions for loan losses which are charged to operations in order to maintain the allowance for loan losses at a level we consider necessary to absorb credit losses incurred in the loan portfolio that are both probable and reasonably estimable at the balance sheet date. In determining the level of the allowance for loan losses, we consider, among other things, past and current loss experience, evaluations of real estate collateral, current economic conditions, volume and type of lending, external factors such as competition and regulations, adverse situations that may affect a borrower’s ability to repay a loan and the levels of delinquent loans.
The amount of the allowance is based on management’s judgment of probable losses, and the ultimate losses may vary from such estimates as more information becomes available or conditions change. We assess the allowance for loan losses and make provisions for loan losses on a quarterly basis.
The Company recorded a provision for loan losses of $4.5 million for the year ended December 31, 2012 compared to $19.6 million for the year ended December 31, 2011 resulting from charge-offs totaling $7.5 million in 2012 compared to charge-offs and write-downs of loans transferred to held for sale totaling $19.7 million in 2011. The ratio of the allowance for loan losses to non-performing loans (coverage ratio) increased to 50.86% at December 31, 2012, from 46.10% at December 31, 2011 primarily due an $8.0 million reduction in non-performing loans. Included in the 2012 charge-offs of $7.5 million were partial charge-offs totaling $6.1 million. The amount of non-performing loans for which the full loss has been charged-off to total loans is 0.19%. The amount of non-performing loans for which the full loss has been charged-off to total non-performing loans is 7.01%. Loan loss recoveries were $228,000 for the year ended December 31, 2012 compared to $221,000 for the year ended December 31, 2011.
Our allowance for loans losses decreased $2.8 million or 22.14%, to $9.9 million at December 31, 2012, from $12.7 million at December 31, 2011. The ratio of our allowance for loan losses to total loans decreased to 1.36% at December 31, 2012, from 1.74% at December 31, 2011.
Non-Interest Income. Non-interest income increased $2.5 million, or 47.13%, to $7.8 million for the year ended December 31, 2012, from $5.3 million for the year ended December 31, 2011. The increase resulted from net gains on sales of investment securities totaling $1.6 million for the year ended December 31, 2012 compared to $149,000 for the year ended December 31, 2011 and the Company recognizing a reduced OTTI charge on investment securities which totaled $8,000 for the year ended December 31, 2012 compared to an OTTI charge of $1.5 million for the year ended December 31, 2011. Net gains on the sale of loans totaled $423,000 for the year ended December 31, 2012 compared to net losses on the sale of loans totaling $67,000 for the year ended December 31, 2011. Included in the twelve month period of 2012 was a gain on the sale of the Company’s merchant card business. The year ended December 31, 2012 included the recognition of a deferred gain related to the sale of bank premises of $425,000 compared to the initial $1.8 million gain recorded in the second quarter of 2011. The additional gain of $425,000 resulted from vacating leased space in the second quarter of 2012 which accelerated the recognition of a portion of the deferred gain. The Company recorded net losses on the sale of OREO of $260,000 for the 2012 twelve month period compared to net losses on OREO sales of $218,000 for the year ended December 31, 2011.
Non-Interest Expense. Non-interest expense increased $694,000, or 2.24%, to $31.6 million for the year ended December 31, 2012 from $30.9 million for the year ended December 31, 2011. The year ended December 31, 2012 included a prepayment penalty of $921,000 related to the previously disclosed debt extinguishment in the second quarter of 2012. OREO expenses declined $450,000 to $2.1 million for the year ended December 31, 2012 compared to $2.5 million for the twelve month period of 2011. Included in these expenses were OREO write-downs totaling $1.1 million compared to $1.8 million for the year ended December 31, 2011. Loan related expenses totaled $2.1 million for the year ended December 31, 2012 compared to $2.4 million for the year ended December 31, 2011 resulting from decreased expenses related to non-performing loans. Year-over-year, advertising expenses increased $137,000 reflecting the Company’s aggressive approach to increase market share and Federal deposit insurance premiums increased $139,000. Telecommunications costs increased $150,000 year-over-year primarily resulting from increased contractual service provider costs and an increase in the transactional volume of our on-line banking solutions. Salaries and benefits declined $68,000. Increases in compensation costs (salaries and incentive compensation) were more than offset by reductions in healthcare costs, stock-based compensation plan expenses and the elimination of the Company’s contributions to the 401K plan in 2012.
51
Income Tax Expense. For the year ended December 31, 2012 income tax expense totaled $2.7 million compared to a tax benefit of $18.4 million for the year ended December 31, 2011. Income tax expense for the year ended December 31, 2012 was negatively impacted by approximately $358,000 of deferred tax asset valuation allowance related to the Cape Charitable Foundation. The 2011 tax benefit is primarily attributable to the reversal of $12.2 million of the deferred tax valuation allowance and a pre-tax loss of $10.4 million. The release of a portion of the valuation allowance was based on a pattern of sustained earnings exhibited by the Company over the most recent 7 quarters through September 30, 2011, projected future taxable income and a tax strategy to facilitate ordinary loss treatment by the Company of certain investment losses when such losses are recognized for tax purposes. Based on these factors management has determined that it is more likely than not that a greater portion of its deferred tax assets are realizable and has adjusted the valuation allowance accordingly.
The following tables set forth average balance sheets, average yields and costs, and certain other information for the periods indicated. All average balances are daily average balances. Non-accrual loans were included in the computation of average balances, but have been reflected in the table as loans carrying a zero yield. The yields set forth below include the effect of deferred fees, discounts and premiums that are amortized or accreted to interest income or expense.
| For the years ended December 31, | |
| | | | | 2013 | | | | | | | | | | | 2012 | | | | | | | | | | | 2011 | | | | | |
| Average
Balance | | | Interest
Income/
Expense | | | Average
Yield | | | Average
Balance | | | Interest
Income/
Expense | | | Average
Yield | | | Average
Balance | | | Interest
Income/
Expense | | | Average
Yield | |
| (dollars in thousands) | |
Assets | | | | | | | | | | | | | | | | | | | | | | | | | | | | | | | | | | | |
Interest-earning deposits | $ | 14,656 | | | $ | 102 | | | | 0.70 | % | | $ | 27,080 | | | $ | 136 | | | | 0.50 | % | | $ | 20,725 | | | $ | 137 | | | | 0.66 | % |
Investments | | 187,715 | | | | 3,876 | | | | 2.06 | % | | | 182,997 | | | | 4,670 | | | | 2.55 | % | | | 180,920 | | | | 4,728 | | | | 2.61 | % |
Loans | | 748,682 | | | | 37,063 | | | | 4.95 | % | | | 735,409 | | | | 38,878 | | | | 5.29 | % | | | 767,695 | | | | 41,602 | | | | 5.42 | % |
Total interest-earning assets | | 951,053 | | | | 41,041 | | | | 4.32 | % | | | 945,486 | | | | 43,684 | | | | 4.62 | % | | | 969,340 | | | | 46,467 | | | | 4.79 | % |
Noninterest-earning assets | | 107,371 | | | | | | | | | | | | 116,283 | | | | | | | | | | | | 113,114 | | | | | | | | | |
Allowance for loan losses | | (9,878 | ) | | | | | | | | | | | (12,411 | ) | | | | | | | | | | | (13,301 | ) | | | | | | | | |
Total assets | $ | 1,048,546 | | | | | | | | | | | $ | 1,049,358 | | | | | | | | | | | $ | 1,069,153 | | | | | | | | | |
| | | | | | | | | | | | | | | | | | | | | | | | | | | | | | | | | | | |
Liabilities and Stockholders' Equity | | | | | | | | | | | | | | | | | | | | | | | | | | | | | | | | | | | |
Interest-bearing demand accounts | $ | 202,391 | | | | 436 | | | | 0.22 | % | | $ | 163,011 | | | | 552 | | | | 0.34 | % | | $ | 141,099 | | | | 472 | | | | 0.33 | % |
Savings accounts | | 96,815 | | | | 64 | | | | 0.07 | % | | | 92,488 | | | | 154 | | | | 0.17 | % | | | 85,409 | | | | 215 | | | | 0.25 | % |
Money market accounts | | 161,815 | | | | 277 | | | | 0.17 | % | | | 169,614 | | | | 686 | | | | 0.40 | % | | | 163,873 | | | | 1,268 | | | | 0.77 | % |
Certificates of deposit | | 244,922 | | | | 2,208 | | | | 0.90 | % | | | 259,447 | | | | 3,082 | | | | 1.19 | % | | | 302,426 | | | | 4,509 | | | | 1.49 | % |
Borrowings | | 101,534 | | | | 2,307 | | | | 2.27 | % | | | 126,843 | | | | 3,730 | | | | 2.94 | % | | | 152,196 | | | | 5,147 | | | | 3.38 | % |
Total interest-bearing liabilities | | 807,477 | | | | 5,292 | | | | 0.66 | % | | | 811,403 | | | | 8,204 | | | | 1.01 | % | | | 845,003 | | | | 11,611 | | | | 1.37 | % |
Noninterest-bearing deposits | | 85,399 | | | | | | | | | | | | 82,218 | | | | | | | | | | | | 75,930 | | | | | | | | | |
Other liabilities | | 9,600 | | | | | | | | | | | | 6,395 | | | | | | | | | | | | 5,965 | | | | | | | | | |
Total liabilities | | 902,476 | | | | | | | | | | | | 900,016 | | | | | | | | | | | | 926,898 | | | | | | | | | |
Stockholders' equity | | 146,071 | | | | | | | | | | | | 149,341 | | | | | | | | | | | | 142,255 | | | | | | | | | |
Total liabilities and stockholders' equity | $ | 1,048,546 | | | | | | | | | | | $ | 1,049,358 | | | | | | | | | | | $ | 1,069,153 | | | | | | | | | |
Net interest income | | | | | $ | 35,749 | | | | | | | | | | | $ | 35,480 | | | | | | | | | | | $ | 34,856 | | | | | |
Net interest spread | | | | | | | | | | 3.66 | % | | | | | | | | | | | 3.61 | % | | | | | | | | | | | 3.42 | % |
Net interest margin | | | | | | | | | | 3.76 | % | | | | | | | | | | | 3.75 | % | | | | | | | | | | | 3.60 | % |
Net interest income and margin (tax equivalent basis) (1) | | | | | $ | 36,023 | | | | 3.79 | % | | | | | | $ | 35,877 | | | | 3.79 | % | | | | | | $ | 35,321 | | | | 3.64 | % |
Ratio of average interest-earning assets to average interest-bearing liabilities | | 117.78 | % | | | | | | | | | | | 116.52 | % | | | | | | | | | | | 114.71 | % | | | | | | | | |
(1) | In order to present pre-tax income and resultant yields on tax-exempt investments on a basis comparable to those on taxable investments, a tax equivalent yield adjustment is made to interest income. The tax equivalent adjustment has been computed using a Federal income tax rate of 35%, and has the effect of increasing interest income by $274,000, $397,000 and $465,000 for the years ended December 31, 2013, 2012 and 2011 respectively. The average yield on investments increased from 2.06% (book basis) to 2.21% (tax-equivalent basis) for the year ended December 31, 2013, increased from 2.55% (book basis) to 2.76% (tax-equivalent basis) for the year ended December 31, 2012, and increased from 2.61% (book basis) to 2.87% (tax-equivalent basis) for the year ended December 31, 2011. |
52
Rate/Volume Analysis
The following table presents the effects of changing rates and volumes on our net interest income for the periods indicated. The rate column shows the effects attributable to changes in rate (changes in rate multiplied by prior volume). The volume column shows the effects attributable to changes in volume (changes in volume multiplied by prior rate). The total column represents the sum of the prior columns. For purposes of this table, changes attributable to both rate and volume, which cannot be segregated, have been allocated proportionately, based on the changes due to rate and the changes due to volume.
| For the year ended December 31, 2013 | | | For the year ended December 31, 2012 | |
| compared to the year ended December 31, 2012 | | | compared to the year ended December 31, 2011 | |
| Increase (decrease) due to changes in: | | | Increase (decrease) due to changes in: | |
| Average | | | Average | | | Net | | | Average | | | Average | | | Net | |
| Volume | | | Rate | | | Change | | | Volume | | | Rate | | | Change | |
| | | | | (in thousands) | | | | | | | | | | | (in thousands) | | | | | |
Interest Earning Assets | | | | | | | | | | | | | | | | | | | | | | | |
Interest-earning deposits | $ | (63 | ) | | $ | 29 | | | $ | (34 | ) | | $ | 42 | | | $ | (43 | ) | | $ | (1 | ) |
Investments | | 118 | | | | (912 | ) | | | (794 | ) | | | 58 | | | | (116 | ) | | | (58 | ) |
Loans | | 678 | | | | (2,493 | ) | | | (1,815 | ) | | | (1,682 | ) | | | (1,042 | ) | | | (2,724 | ) |
Total interest income | | 733 | | | | (3,376 | ) | | | (2,643 | ) | | | (1,582 | ) | | | (1,201 | ) | | | (2,783 | ) |
| | | | | | | | | | | | | | | | | | | | | | | |
Interest-Bearing Liabilities | | | | | | | | | | | | | | | | | | | | | | | |
Interest-bearing demand accounts | | 133 | | | | (249 | ) | | | (116 | ) | | | 75 | | | | 5 | | | | 80 | |
Savings accounts | | 7 | | | | (97 | ) | | | (90 | ) | | | 18 | | | | (77 | ) | | | (61 | ) |
Money market accounts | | (32 | ) | | | (377 | ) | | | (409 | ) | | | 45 | | | | (627 | ) | | | (582 | ) |
Certificates of deposit | | (174 | ) | | | (700 | ) | | | (874 | ) | | | (637 | ) | | | (790 | ) | | | (1,427 | ) |
Borrowings | | (748 | ) | | | (675 | ) | | | (1,423 | ) | | | (852 | ) | | | (565 | ) | | | (1,417 | ) |
Total interest expense | | (814 | ) | | | (2,098 | ) | | | (2,912 | ) | | | (1,351 | ) | | | (2,054 | ) | | | (3,407 | ) |
| | | | | | | | | | | | | | | | | | | | | | | |
Total net interest income | $ | 1,547 | | | $ | (1,278 | ) | | $ | 269 | | | $ | (231 | ) | | $ | 853 | | | $ | 624 | |
Management of Market Risk
General. The majority of our assets and liabilities are monetary in nature. Consequently, interest rate risk is a significant risk to our net interest income and earnings. Our assets, consisting primarily of loans, have longer maturities than our liabilities, consisting primarily of deposits. As a result, a principal part of our business strategy is to manage interest rate risk and limit the exposure of our net interest income to changes in market interest rates. Accordingly, we have an Interest Rate Risk Committee of the Board, which meets quarterly, as well as a management level Asset/Liability Committee which meets monthly. The Interest Rate Risk Committee is responsible for evaluating the interest rate risk inherent in our assets and liabilities, for recommending to our Board of Directors the level of risk that is appropriate, given our business strategy, operating environment, capital, liquidity and performance objectives, and for managing this risk consistent with the guidelines approved by the Board of Directors.
We have sought to manage our interest rate risk in order to minimize the exposure of our earnings and capital to changes in interest rates. As part of our ongoing asset-liability management, we currently use the following strategies to manage our interest rate risk:
— | originating commercial loans that generally tend to have shorter maturity or repricing characteristics; |
— | obtaining general financing through lower cost deposits, brokered deposits and advances from the Federal Home Loan Bank; |
— | lengthening the terms of borrowings and deposits; and |
— | focusing on core deposit growth. |
By shortening the average maturity of our interest-earning assets by increasing our investments in shorter term loans, as well as loans with variable interest rates, it helps to better match the maturities and interest rates of our assets and liabilities, thereby reducing the exposure of our net interest income to changes in market interest rates.
53
Net Portfolio Value Analysis. We compute amounts by which the net present value of our interest-earning assets and interest-bearing liabilities (net portfolio value or “NPV”) would change in the event of a range of assumed changes in market interest rates. Our simulation model uses a discounted cash flow analysis to measure the interest rate sensitivity of net portfolio value. We estimate the economic value of these assets and liabilities under the assumption that interest rates experience an instantaneous and sustained increase of 100 or 200 basis points or decrease of 100 or 200 basis points.
Net Interest Income Analysis. In addition to NPV calculations, we analyze our sensitivity to changes in interest rates through our net interest income model. Net interest income is the difference between the interest income we earn on our interest-earning assets, such as loans and securities, and the interest we pay on our interest-bearing liabilities, such as deposits and borrowings. In our model, we estimate what our net interest income would be for a twelve-month period. We then calculate what the net interest income would be for the same period under the assumption that interest rates experience an instantaneous and sustained increase of 100 or 200 basis points or decrease of 100 or 200 basis points.
The table below sets forth, as of December 31, 2013, our calculation of the estimated changes in our net portfolio value and net interest income that would result from the designated instantaneous and sustained changes in interest rates. Computations of prospective effects of hypothetical interest rate changes are based on numerous assumptions, including relative levels of market interest rates, loan prepayments and deposit decay, and should not be relied upon as indicative of actual results.
| | Net Portfolio Value | | | Net Interest Income | |
Changes in | | | | | | Increase (decrease) in | | | | | | | Increase (decrease) in | |
Interest Rates | | Estimated | | | Estimated NPV | | | Estimated Net | | | Estimated Net Interest Income | |
(basis points) (1) | | NPV (2) | | | Amount | | | Percent | | | Interest Income | | | Amount | | | Percent | |
(dollars in thousands) | |
| | | | | | | | | | | | | | | | | | | | | | | | |
+200 | | $ | 159,454 | | | $ | (20,449 | ) | | | -11.40 | % | | $ | 32,350 | | | $ | (3,219 | ) | | | -9.00 | % |
+100 | | $ | 172,351 | | | $ | (7,552 | ) | | | -4.20 | % | | $ | 34,075 | | | $ | (1,494 | ) | | | -4.20 | % |
0 | | $ | 179,903 | | | | | | | | | | | $ | 35,569 | | | | | | | | | |
-100 | | $ | 166,929 | | | $ | (12,974 | ) | | | -7.20 | % | | $ | 35,346 | | | $ | (223 | ) | | | -0.60 | % |
-200 | | $ | 150,875 | | | $ | (29,028 | ) | | | -16.10 | % | | $ | 35,013 | | | $ | (556 | ) | | | -1.60 | % |
(1) | Assumes an instantaneous and sustained uniform change in interest rates at all maturities. |
(2) | NPV is the discounted present value of expected cash flows from interest-earning assets and interest-bearing liabilities. |
The table above indicates that at December 31, 2013, in the event of a 100 basis point increase in interest rates, we would experience a 4.2% decrease in net portfolio value and a $1.5 million decrease in net interest income. In the event of a 100 basis point decrease in interest rates, we would experience a 7.2% decrease in net portfolio value and a $223,000 decrease in net interest income.
Certain shortcomings are inherent in the methodologies used in determining interest rate risk through changes in net portfolio value and net interest income. Modeling changes require making certain assumptions that may or may not reflect the manner in which actual yields and costs respond to changes in market interest rates. In this regard, the net portfolio value and net interest income information presented assume that the composition of our interest-sensitive assets and liabilities existing at the beginning of a period remains constant over the period being measured, and assume that a particular change in interest rates is reflected uniformly across the yield curve regardless of the duration or repricing of specific assets and liabilities. Accordingly, although interest rate risk calculations provide an indication of our interest rate risk exposure at a particular point in time, such measurements are not intended to and do not provide a precise forecast of the effect of changes in market interest rates on our net interest income and will differ from actual results.
Liquidity and Capital Resources
Liquidity refers to our ability to meet the cash flow requirements of depositors and borrowers as well as our operating cash needs with cost-effective funding. We generate funds to meet these needs primarily through our core deposit base and the maturity or repayment of loans and other interest-earning assets, including investments. Proceeds from the call, maturity, redemption, and return of principal of investment securities totaled $45.4 million during 2013 and were used either for liquidity, to reduce borrowings, or to invest in securities of similar quality as our current investment portfolio. We also have available unused wholesale sources of liquidity, including overnight federal funds and repurchase agreements, advances from the FHLB of New York, borrowings through the discount window at the Federal Reserve Bank of Philadelphia and access to certificates of deposit through brokers. We can also raise cash through the sale of earning assets, such as loans and marketable securities. As of December 31, 2013, the Company’s investment portfolio consisted of AFS securities with a fair market value of $157.2 million and HTM securities at amortized cost of $9.1 million. The Company has no intention to sell these securities, nor is it more likely than not that we will be required to sell any securities prior to their recovery in fair market value.
54
Liquidity risk arises from the possibility that we may not be able to meet our financial obligations and operating cash needs or may become overly reliant upon external funding sources. In order to manage this risk, our Board of Directors has approved a Liquidity Management Policy and Contingency Funding Plan that identifies primary sources of liquidity, establishes procedures for monitoring and measuring liquidity, and quantifies minimum liquidity requirements based on approved limits. This policy designates our Asset/Liability Committee (“ALCO”) as the body responsible for meeting these objectives. The ALCO, which includes members of executive management, reviews liquidity on a periodic basis and approves significant changes in strategies that affect balance sheet or cash flow positions. Liquidity is centrally managed on a daily basis by our Chief Financial Officer and our Treasury function. Liquidity stress testing is performed annually, unless circumstance dictates more frequently, and all testing results are reported to the Board of Directors through the ALCO minutes.
Cape Bank’s long-term liquidity source is a large core deposit base and a strong capital position. Core deposits are the most stable source of liquidity a bank can have due to the long-term relationship with a deposit customer. The level of deposits during any period is sometimes influenced by factors outside of management’s control, such as the level of short-term and long-term market interest rates and yields offered on competing investments, such as money market mutual funds. Deposits increased $13.8 million, or 1.76%, during 2013, and comprised 83.83% of total liabilities at December 31, 2013, as compared to 88.16% at December 31, 2012.
Cape Bank is subject to various regulatory capital requirements, including a risk-based capital measure. The risk-based capital guidelines include both a definition of capital and a framework for calculating risk-weighted assets by assigning balance sheet assets and off-balance sheet items to broad risk categories. At December 31, 2013, Cape Bank exceeded all regulatory capital requirements. Cape Bank is considered “well capitalized” under regulatory guidelines. Capital stress testing is performed quarterly, unless circumstance dictates more frequently, and all testing results are reported to the Board of Directors. See “Supervision and Regulation—Federal Banking Regulation—Capital Requirements” and Note 15, “Regulatory Matters” of the Notes to Consolidated Financial Statements.
Off-Balance Sheet Arrangements and Aggregate Contractual Obligations
Commitments. As a financial services provider, we routinely are a party to various financial instruments with off-balance sheet risks, such as commitments to extend credit and unused lines of credit. While these contractual obligations represent our potential future cash requirements, a significant portion of commitments to extend credit may expire without being drawn upon. Such commitments are subject to the same credit policies and approval process accorded to loans we originate. For additional information, see Note 12, “Financial Instruments with Off-Balance Sheet Risk and Concentrations of Credit Risk” of the Notes to Consolidated Financial Statements.
Contractual Obligations. In the ordinary course of our operations, we enter into certain contractual obligations. Such obligations include operating leases for premises and equipment, agreements with respect to borrowed funds and deposit liabilities and agreements with respect to investments.
The following table summarizes our significant fixed and determinable contractual obligations and other funding needs by payment date at December 31, 2013. The payment amounts represent those amounts due to the recipient and do not include any unamortized premiums or discounts or other similar carrying amount adjustments.
| | Payments Due by Period | |
| | Less Than | | | One to Three | | | Three to Five | | | More than | | | | | |
Contractual Obligations | | One Year | | | Years | | | Years | | | Five Years | | | Total | |
| | (in thousands) | |
| | | | | | | | | | | | | | | | | | | | |
Borrowings | | $ | 60,000 | | | $ | 24,970 | | | $ | 41,050 | | | $ | 17,915 | | | $ | 143,935 | |
Operating leases | | | 234 | | | | 251 | | | | 111 | | | | - | | | | 596 | |
Certificates of deposit | | | 207,655 | | | | 48,760 | | | | 12,773 | | | | - | | | | 269,188 | |
Total | | $ | 267,889 | | | $ | 73,981 | | | $ | 53,934 | | | $ | 17,915 | | | $ | 413,719 | |
| | | | | | | | | | | | | | | | | | | | |
Commitments to extend credit | | $ | 95,805 | | | $ | - | | | $ | - | | | $ | - | | | $ | 95,805 | |
55
Impact of Inflation and Changing Prices
Our consolidated financial statements and related notes have been prepared in accordance with generally accepted accounting principles. Generally accepted accounting principles generally requires the measurement of financial position and operating results in terms of historical dollars without consideration for changes in the relative purchasing power of money over time due to inflation. The impact of inflation is reflected in the increased cost of our operations. Unlike industrial companies, our assets and liabilities are primarily monetary in nature. As a result, changes in market interest rates have a greater impact on our performance than the effects of inflation.
ITEM 7A. | QUANTITATIVE AND QUALITATIVE DISCLOSURE ABOUT MARKET RISK |
For information regarding market risk see Item 7- “Management’s Discussion and Analysis of Financial Condition and Results of Operation”.
ITEM 8. | FINANCIAL STATEMENTS AND SUPPLEMENTARY DATA |
The information required by this item begins on page F-4.
ITEM 9. | CHANGES IN AND DISAGREEMENTS WITH ACCOUNTANTS ON ACCOUNTING AND FINANCIAL DISCLOSURE |
Not applicable.
ITEM 9A. | CONTROLS AND PROCEDURES |
(a) | Evaluation of Disclosure Controls and Procedures |
Under the supervision and with the participation of our management, including our Principal Executive Officer and Principal Financial Officer, we evaluated the effectiveness of the design and operation of our disclosure controls and procedures (as defined in Rule 13a-15(e) and 15d-15(e) under the Exchange Act) as of the end of the fiscal year (the “Evaluation Date”). Based upon that evaluation, the Principal Executive Officer and Principal Financial Officer concluded that, as of the Evaluation Date, our disclosure controls and procedures were effective in timely alerting them to the material information relating to us (or our consolidated subsidiaries) required to be included in our periodic SEC filings.
(b) | Changes in internal controls |
There were no significant changes made in our internal control over financial reporting during the Company’s fourth fiscal quarter that have materially affected, or are reasonably likely to materially affect, the Company’s internal control over financial reporting.
(c) | Management report on internal control over financial reporting |
Management is responsible for establishing and maintaining adequate internal control over financial reporting. Our internal control system is a process designed to provide reasonable assurance to the Company’s management and Board of Directors regarding the preparation and fair presentation of published financial statements.
Our internal control over financial reporting includes policies and procedures that pertain to the maintenance of records that, in reasonable detail, accurately and fairly reflect transactions and dispositions of assets; provide reasonable assurances that transactions are recorded as necessary to permit preparation of financial statements in accordance with U.S. generally accepted accounting principles, and that receipts and expenditures are being made only in accordance with authorizations of management and the Directors of the Company: and provide reasonable assurance regarding prevention or timely detection of unauthorized acquisition, use or disposition of the Company’s assets that could have a material effect on our financial statements.
All internal control systems, no matter how well designed, have inherent limitations. Therefore, even those systems determined to be effective can provide only reasonable assurance with respect to financial statement preparation and presentation. Also, projections of any evaluation of effectiveness to future periods are subject to the risk that controls may become inadequate because of changes in conditions, or that the degree of compliance with the policies or procedures may deteriorate.
56
Cape Bancorp, Inc.’s management assessed the effectiveness of the Company’s internal control over financial reporting as of December 31, 2013. In making this assessment, we used the criteria set forth by the 1992 Committee of Sponsoring Organizations of the Treadway Commission (COSO). Based on our assessment we believe that, as of December 31, 2013, the Company’s internal control over financial reporting is effective based on those criteria.
Cape Bancorp’s independent registered public accounting firm that audited the consolidated financial statements has issued an audit report on the effectiveness of the Company’s internal control over financial reporting as of December 31, 2013. This report appears on page F-1.
The Sarbanes-Oxley Act Section 302 Certifications have been filed with the SEC as exhibit 31.1 and exhibit 31.2 to this Annual Report on Form 10-K.
ITEM 9B. | OTHER INFORMATION |
Not Applicable.
57
PART III
ITEM 10. | DIRECTORS, EXECUTIVE OFFICERS AND CORPORATE GOVERNANCE |
The information required by this item is incorporated by reference from the Proxy Statement, specifically the section captioned “Proposal I—Election of Directors” .
ITEM 11. | EXECUTIVE COMPENSATION |
The information required by this item is incorporated by reference from the Proxy Statement specifically the section captioned “Executive Compensation” .
ITEM 12. | SECURITY OWNERSHIP OF CERTAIN BENEFICIAL OWNERS AND MANAGEMENT AND RELATED STOCKHOLDER MATTERS |
The information required by this item is incorporated by reference from the Proxy Statement, specifically the section captioned “Voting Securities and Principal Holder Thereof” .
ITEM 13. | CERTAIN RELATIONSHIPS AND RELATED TRANSACTIONS, AND DIRECTOR INDEPENDENCE |
The information required by this item is incorporated by reference from the Proxy Statement, specifically the section captioned “Transactions with Certain Related Persons” .
ITEM 14. | PRINCIPAL ACCOUNTANT FEES AND SERVICES |
The information required by this item is incorporated by reference from the Proxy Statement, specifically the section captioned “Proposal II-Ratification of Appointment of Auditors” .
58
PART IV
ITEM 15. | EXHIBITS AND FINANCIAL STATEMENT SCHEDULES |
(a)(1) Financial Statements
The following documents are filed as part of this Form 10-K.
(A) | Reports of Independent Registered Public Accounting Firms |
(B) | Consolidated Balance Sheets as of December 31, 2013 and 2012 |
(C) | Consolidated Statements of Income for the years ended December 31, 2013, 2012 and 2011 |
(D) | Consolidated Statements of Comprehensive Income for the years ended December 31, 2013, 2012 and 2011 |
(E) | Consolidated Statements of Changes in Stockholders’ Equity for the years ended December 31, 2013, 2012 and 2011 |
(F) | Consolidated Statements of Cash Flows for the years ended December 31, 2013, 2012 and 2011 |
(G) | Notes to Consolidated Financial Statements |
(a)(2) Financial Statement Schedules
None.
(a)(3) Exhibits
3.1 | | Articles of Incorporation of Cape Bancorp, Inc. (1) |
3.2 | | Amended and Restated Bylaws of Cape Bancorp, Inc. (2) |
4 | | Form of Common Stock Certificate of Cape Bancorp, Inc. (1) |
10.1 | | Form of Employee Stock Ownership Plan (1) |
10.2 | | Employment Agreement for Michael D. Devlin (5) |
10.3 | | Change in Control Agreement for Guy Hackney (3) |
10.4 | | Change in Control Agreement for James McGowan, Jr. (3) |
10.5 | | Change in Control Agreement for Michele Pollack (3) |
10.6 | | Change in Control Agreement for Charles L. Pinto (4) |
10.7 | | Form of Director Retirement Plan (1) |
10.8 | | 2008 Equity Incentive Plan (6) |
14 | | Code of Ethics (7) |
21 | | Subsidiaries of Registrant |
23.1 | | Consent of Crowe Horwath LLP |
23.2 | | Consent of KPMG LLP |
31.1 | | Certification of Chief Executive Officer pursuant to Section 302 of the Sarbanes-Oxley Act of 2002 |
31.2 | | Certification of Chief Financial Officer pursuant to Section 302 of the Sarbanes-Oxley Act of 2002 |
32 | | Certification of Chief Executive Officer and Chief Financial Officer pursuant to Section 906 of the Sarbanes-Oxley Act of 2002 |
101 | | The following materials from Cape Bancorp, Inc.’s Annual Report on From 10-K for the year ended December 31, 2013 formatted in XBRL (eXtensible Business Reporting Language): (i) the Consolidated Balance Sheets, (ii) the Consolidated Statements of Income, (iii) the Consolidated Statements of Comprehensive Income, (iv) the Consolidated Statements of Changes in Equity, (v) the Consolidated Statements of Cash Flows, and (vi) related notes to these financial statements – Furnished herewith. |
59
(1) | Incorporated by reference to the Registration Statement on Form S-1 of Cape Bancorp, Inc. (file no. 333-146178), originally filed with the Securities and Exchange Commission on September 19, 2007. |
(2) | Incorporated by reference to the Company’s Current Report on Form 8-K filed with the Securities and Exchange Commission on September 17, 2013. |
(3) | Incorporated by reference to the Company’s Current Report on Form 8-K filed on October 6, 2010. |
(4) | Incorporated by reference to the Company’s Current Report on Form 8-K filed with the Securities and Exchange Commission on July 7, 2011. |
(5) | Incorporated by reference to the Company’s Current Report on Form 8-K filed with the Securities and Exchange Commission on September 25, 2012. |
(6) | Incorporated by reference to the Company’s Definitive Proxy Statement filed with the Securities and Exchange Commission on July 16, 2008. |
(7) | Incorporated by reference to the Company’s Annual Report on Form 10-K for the Year ended December 31, 2007 filed with the Securities and Exchange Commission on March 31, 2008. |
60
SIGNATURES
Pursuant to the requirements of Section 13 or 15(d) of the Securities Exchange Act of 1934, the Registrant has duly caused this report to be signed on its behalf by the undersigned, thereunto duly authorized.
| | CAPE BANCORP, INC. |
| | | | |
Date: March 10, 2014 | | By: | | /s/ Michael D. Devlin |
| | | | Michael D. Devlin Chief Executive Officer and President |
| | | | (Duly Authorized Representative) |
Pursuant to the requirements of the Securities Exchange of 1934, this report has been signed below by the following persons on behalf of the Registrant and in the capacities and on the dates indicated.
Signatures | | | | Title | | | | Date | |
/s/ Michael D. Devlin | | Chief Executive Officer and President (Principal Executive Officer) | | March 10, 2014 |
Michael D. Devlin | | | | |
| | | | |
/s/ Guy Hackney | | Chief Financial Officer | | March 10, 2014 |
Guy Hackney | | (Principal Financial and Accounting Officer) | | |
| | | | |
/s/ James J. Lynch | | Director | | March 10, 2014 |
James J. Lynch | | | | |
| | | | |
/s/ Agostino R. Fabietti | | Director | | March 10, 2014 |
Agostino R. Fabietti | | | | |
| | | | |
/s/ Roy Goldberg | | Director | | March 10, 2014 |
Roy Goldberg | | | | |
| | | | |
/s/ Benjamin D. Goldman | | Director | | March 10, 2014 |
Benjamin D. Goldman | | | | |
| | | | |
/s/ Frank J. Glaser | | Director | | March 10, 2014 |
Frank J. Glaser | | | | |
| | | | |
/s/ Althea L.A. Skeels | | Director | | March 10, 2014 |
Althea L.A. Skeels | | | | |
| | | | |
/s/ David C. Ingersoll, Jr. | | Director | | March 10, 2014 |
David C. Ingersoll, Jr. | | | | |
| | | | |
/s/ Matthew J. Reynolds | | Director | | March 10, 2014 |
Matthew J. Reynolds | | | | |
| | | | |
/s/ Thomas K. Ritter | | Director | | March 10, 2014 |
Thomas K. Ritter | | | | |
61
INDEX TO CONSOLIDATED FINANCIAL STATEMENTS OF
CAPE BANCORP, INC. AND SUBSIDIARIES
* * *
62

| |
Crowe Horwath LLP Independent Member Crowe Horwath International |
Report of Independent Registered Public Accounting Firm
We have audited the accompanying consolidated balance sheet of Cape Bancorp, Inc. and subsidiaries’ (the Company) as of December 31, 2013 and the related consolidated statements of income, comprehensive income, changes in stockholders' equity and cash flow for the year then ended. We also have audited the Company’s internal control over financial reporting as of December 31, 2013, based on criteria established in 1992 Internal Control – Integrated Framework issued by the Committee of Sponsoring Organizations of the Treadway Commission (COSO). The Company’s management is responsible for these financial statements, for maintaining effective internal control over financial reporting, and for its assessment of the effectiveness of internal control over financial reporting, included in Management’s Report on Internal Controls Over Financial Reporting located in Item 9A. Our responsibility is to express an opinion on these financial statements and an opinion on the company's internal control over financial reporting based on our audits.
We conducted our audits in accordance with the standards of the Public Company Accounting Oversight Board (United States). Those standards require that we plan and perform the audits to obtain reasonable assurance about whether the financial statements are free of material misstatement and whether effective internal control over financial reporting was maintained in all material respects. Our audit of the financial statements included examining, on a test basis, evidence supporting the amounts and disclosures in the financial statements, assessing the accounting principles used and significant estimates made by management, and evaluating the overall financial statement presentation. Our audit of internal control over financial reporting included obtaining an understanding of internal control over financial reporting, assessing the risk that a material weakness exists, and testing and evaluating the design and operating effectiveness of internal control based on the assessed risk. Our audits also included performing such other procedures as we considered necessary in the circumstances. We believe that our audits provide a reasonable basis for our opinions.
A company's internal control over financial reporting is a process designed to provide reasonable assurance regarding the reliability of financial reporting and the preparation of financial statements for external purposes in accordance with generally accepted accounting principles. A company's internal control over financial reporting includes those policies and procedures that (1) pertain to the maintenance of records that, in reasonable detail, accurately and fairly reflect the transactions and dispositions of the assets of the company; (2) provide reasonable assurance that transactions are recorded as necessary to permit preparation of financial statements in accordance with generally accepted accounting principles, and that receipts and expenditures of the company are being made only in accordance with authorizations of management and directors of the company; and (3) provide reasonable assurance regarding prevention or timely detection of unauthorized acquisition, use, or disposition of the company's assets that could have a material effect on the financial statements.
Because of its inherent limitations, internal control over financial reporting may not prevent or detect misstatements. Also, projections of any evaluation of effectiveness to future periods are subject to the risk that controls may become inadequate because of changes in conditions, or that the degree of compliance with the policies or procedures may deteriorate.
In our opinion, the consolidated financial statements referred to above present fairly, in all material respects, the financial position of the Company as of December 31, 2013, and the results of its operations and its cash flows for the year then ended, in conformity with accounting principles generally accepted in the United States of America. Also in our opinion, the Company maintained, in all material respects, effective internal control over financial reporting as of December 31, 2013, based on criteria established in 1992 Internal Control – Integrated Framework issued by the Committee of Sponsoring Organizations of the Treadway Commission (COSO).
| 
Crowe Horwath LLP | |
Livingston, New Jersey
March 10, 2014
F-1

Report of Independent Registered Public Accounting Firm
The Board of Directors and Stockholders
Cape Bancorp, Inc.:
We have audited the accompanying consolidated balance sheet of Cape Bancorp, Inc. and subsidiaries (the Company) as of December 31, 2012, and the related consolidated statements of income, comprehensive income, changes in stockholders’ equity, and cash flows for the years ended December 31, 2012 and 2011. These consolidated financial statements are the responsibility of the Company’s management. Our responsibility is to express an opinion on these consolidated financial statements based on our audits.
We conducted our audits in accordance with the standards of the Public Company Accounting Oversight Board (United States). Those standards require that we plan and perform the audit to obtain reasonable assurance about whether the financial statements are free of material misstatement. An audit includes examining, on a test basis, evidence supporting the amounts and disclosures in the financial statements. An audit also includes assessing the accounting principles used and significant estimates made by management, as well as evaluating the overall financial statement presentation. We believe that our audits provide a reasonable basis for our opinion.
In our opinion, the consolidated financial statements referred to above present fairly, in all material respects, the financial position of the Company as of December 31, 2012, and the results of their operations and their cash flows for the years ended December 31, 2012 and 2011, in conformity with U.S. generally accepted accounting principles.

March 15, 2013
F-2
CAPE BANCORP, INC. AND SUBSIDIARIES
CONSOLIDATED BALANCE SHEETS
| December 31, | | | December 31, | |
| | 2013 | | | | 2012 | |
| (in thousands) | |
ASSETS | | | | | | | |
Cash & due from financial institutions | $ | 6,940 | | | $ | 6,867 | |
Interest-bearing bank balances | | 17,921 | | | | 17,361 | |
Cash and cash equivalents | | 24,861 | | | | 24,228 | |
Interest-bearing time deposits | | 9,185 | | | | 9,259 | |
Investment securities available for sale, at fair value (amortized cost of $161,907 and $171,987 respectively) | | 157,166 | | | | 170,857 | |
Investment securities held to maturity, at amortized cost (fair value of $8,906 at December 31, 2013) | | 9,102 | | | | - | |
Loans held for sale | | 1,814 | | | | 8,795 | |
Loans, net of allowance of $9,330 and $9,852 respectively | | 780,127 | | | | 714,396 | |
Accrued interest receivable | | 3,235 | | | | 3,091 | |
Premises and equipment, net | | 20,024 | | | | 20,283 | |
Other real estate owned | | 7,449 | | | | 7,221 | |
Federal Home Loan Bank (FHLB) stock, at cost | | 7,747 | | | | 5,775 | |
Prepaid FDIC insurance premium | | - | | | | 635 | |
Deferred income taxes | | 15,628 | | | | 17,639 | |
Bank owned life insurance (BOLI) | | 31,177 | | | | 30,226 | |
Goodwill | | 22,575 | | | | 22,575 | |
Intangible assets, net | | 298 | | | | 264 | |
Assets held for sale | | 10 | | | | 436 | |
Other assets | | 2,481 | | | | 5,118 | |
Total assets | $ | 1,092,879 | | | $ | 1,040,798 | |
| | | | | | | |
LIABILITIES AND STOCKHOLDERS' EQUITY | | | | | | | |
Liabilities | | | | | | | |
Deposits | | | | | | | |
Interest-bearing deposits | $ | 715,934 | | | $ | 698,325 | |
Noninterest-bearing deposits | | 82,488 | | | | 86,266 | |
Federal funds purchased and repurchase agreements | | 9,940 | | | | 9,924 | |
Federal Home Loan Bank borrowings | | 133,995 | | | | 88,041 | |
Advances from borrowers for taxes and insurance | | 768 | | | | 652 | |
Accrued interest payable | | 102 | | | | 148 | |
Other liabilities | | 9,225 | | | | 6,616 | |
Total liabilities | | 952,452 | | | | 889,972 | |
| | | | | | | |
Stockholders' Equity | | | | | | | |
Common stock, $.01 par value: authorized 100,000,000 shares; issued 13,344,776 shares at December 31, | | | | | | | |
2013 and 13,336,776 shares at December 31, 2012; outstanding 12,059,785 shares at December 31, | | | | | | | |
2013 and 13,336,776 shares at December 31, 2012 | | 133 | | | | 133 | |
Additional paid-in capital | | 128,193 | | | | 127,767 | |
Treasury stock at cost: 1,284,991 shares at December 31, 2013 and no shares at December 31, 2012 | | (12,035 | ) | | | - | |
Unearned ESOP shares | | (8,102 | ) | | | (8,528 | ) |
Accumulated other comprehensive loss, net | | (2,951 | ) | | | (679 | ) |
Retained earnings | | 35,189 | | | | 32,133 | |
Total stockholders' equity | | 140,427 | | | | 150,826 | |
Total liabilities & stockholders' equity | $ | 1,092,879 | | | $ | 1,040,798 | |
See accompanying notes to consolidated financial statements.
F-3
CAPE BANCORP, INC. AND SUBSIDIARIES
CONSOLIDATED STATEMENTS OF INCOME
| Years ended December 31, | |
| 2013 | | | 2012 | | | 2011 | |
| (dollars in thousands, except share data) | |
Interest income: | | | | | | | | | | | |
Interest on loans | $ | 37,063 | | | $ | 38,878 | | | $ | 41,602 | |
Interest and dividends on investments | | | | | | | | | | | |
Taxable | | 1,659 | | | | 1,854 | | | | 2,237 | |
Tax-exempt | | 487 | | | | 697 | | | | 930 | |
Interest on mortgage-backed securities | | 1,832 | | | | 2,255 | | | | 1,698 | |
Total interest income | | 41,041 | | | | 43,684 | | | | 46,467 | |
Interest expense: | | | | | | | | | | | |
Interest on deposits | | 2,985 | | | | 4,474 | | | | 6,464 | |
Interest on borrowings | | 2,307 | | | | 3,730 | | | | 5,147 | |
Total interest expense | | 5,292 | | | | 8,204 | | | | 11,611 | |
Net interest income before provision for loan losses | | 35,749 | | | | 35,480 | | | | 34,856 | |
Provision for loan losses | | 2,011 | | | | 4,461 | | | | 19,607 | |
Net interest income after provision for loan losses | | 33,738 | | | | 31,019 | | | | 15,249 | |
Non-interest income: | | | | | | | | | | | |
Service fees | | 3,469 | | | | 3,678 | | | | 3,555 | |
Net gains (losses) on sale of loans | | 1,222 | | | | 423 | | | | (67 | ) |
Net increase from BOLI | | 951 | | | | 977 | | | | 998 | |
Net rental income | | - | | | | - | | | | 157 | |
Gain (loss) on sale of investment securities available for sale, net | | (561 | ) | | | 1,604 | | | | 149 | |
Net gain (loss) on sale of OREO | | 81 | | | | (260 | ) | | | (218 | ) |
Gain on sale of bank premises | | - | | | | 425 | | | | 1,830 | |
Other | | 804 | | | | 975 | | | | 364 | |
Gross other-than-temporary impairment losses | | - | | | | (72 | ) | | | (1,661 | ) |
Less: Portion of loss recognized in other comprehensive income | | - | | | | 64 | | | | 204 | |
Net other-than-temporary impairment losses | | - | | | | (8 | ) | | | (1,457 | ) |
Total non-interest income | | 5,966 | | | | 7,814 | | | | 5,311 | |
Non-interest expense: | | | | | | | | | | | |
Salaries and employee benefits | | 15,893 | | | | 14,363 | | | | 14,431 | |
Occupancy expenses, net | | 1,728 | | | | 1,748 | | | | 1,833 | |
Equipment expenses | | 1,116 | | | | 1,178 | | | | 1,236 | |
Federal insurance premiums | | 928 | | | | 1,413 | | | | 1,274 | |
Data processing | | 1,393 | | | | 1,424 | | | | 1,365 | |
Loan related expenses | | 1,463 | | | | 2,149 | | | | 2,362 | |
Advertising | | 597 | | | | 695 | | | | 558 | |
Telecommunications | | 1,219 | | | | 1,184 | | | | 1,034 | |
Professional services | | 675 | | | | 724 | | | | 784 | |
OREO expenses | | 1,244 | | | | 2,053 | | | | 2,503 | |
Other operating | | 3,666 | | | | 4,691 | | | | 3,548 | |
Total non-interest expense | | 29,922 | | | | 31,622 | | | | 30,928 | |
Income (loss) before income taxes | | 9,782 | | | | 7,211 | | | | (10,368 | ) |
Income tax expense (benefit) | | 4,231 | | | | 2,655 | | | | (18,355 | ) |
Net income | $ | 5,551 | | | $ | 4,556 | | | $ | 7,987 | |
| | | | | | | | | | | |
Earnings per share (see Note 16): | | | | | | | | | | | |
Basic | $ | 0.47 | | | $ | 0.37 | | | $ | 0.64 | |
Diluted | $ | 0.46 | | | $ | 0.37 | | | $ | 0.64 | |
| | | | | | | | | | | |
Weighted average number of shares outstanding: | | | | | | | | | | | |
Basic | | 11,904,369 | | | | 12,441,219 | | | | 12,393,359 | |
Diluted | | 11,950,943 | | | | 12,443,298 | | | | 12,398,178 | |
See accompanying notes to consolidated financial statements.
F-4
CAPE BANCORP, INC. AND SUBSIDIARIES
CONSOLIDATED STATEMENTS OF COMPREHENSIVE INCOME
| | Years ended December 31, | |
| | 2013 | | | 2012 | | | 2011 | |
| | Before
Tax
Amount | | | Tax
Expense
(Benefit) | | | Net of
Tax
Amount | | | Before
Tax
Amount | | | Tax
Expense
(Benefit) | | | Net of
Tax
Amount | | | Before
Tax
Amount | | | Tax
Expense
(Benefit) | | | Net of
Tax
Amount | |
| | (in thousands) | |
| | | | | | | | | | | | | | | | | | | | | | | | | | | | | | | | | | | | |
Net income (loss) | | $ | 9,782 | | | $ | 4,231 | | | $ | 5,551 | | | $ | 7,211 | | | $ | 2,655 | | | $ | 4,556 | | | $ | (10,368 | ) | | $ | (18,355 | ) | | $ | 7,987 | |
Other comprehensive income: | | | | | | | | | | | | | | | | | | | | | | | | | | | | | | | | | | | | |
Unrealized holding gains (losses) arising during the period on AFS securities | | | (4,172 | ) | | | (1,667 | ) | | | (2,505 | ) | | | 2,100 | | | | 841 | | | | 1,259 | | | | 5,796 | | | | 1,811 | | | | 3,985 | |
Amortization of previously unrealized loss on AFS securities transferred to HTM | | | (174 | ) | | | (70 | ) | | | (104 | ) | | | - | | | | - | | | | - | | | | - | | | | - | | | | - | |
Non-credit related unrealized gain (loss) on other-than-temporarily impaired CDOs | | | - | | | | - | | | | - | | | | (64 | ) | | | (26 | ) | | | (38 | ) | | | (204 | ) | | | (81 | ) | | | (123 | ) |
Less reclassification adjustment for (gain) loss on sales of securities realized in net income | | | 561 | | | | 224 | | | | 337 | | | | (1,604 | ) | | | (641 | ) | | | (963 | ) | | | (149 | ) | | | (60 | ) | | | (89 | ) |
Less reclassification adjustment for credit related OTTI realized in net income | | | - | | | | - | | | | - | | | | 8 | | | | 3 | | | | 5 | | | | 1,457 | | | | 582 | | | | 875 | |
Total other comprehensive income (loss) | | | (3,785 | ) | | | (1,513 | ) | | | (2,272 | ) | | | 440 | | | | 177 | | | | 263 | | | | 6,900 | | | | 2,252 | | | | 4,648 | |
| | | | | | | | | | | | | | | | | | | | | | | | | | | | | | | | | | | | |
Total comprehensive income (loss) | | $ | 5,997 | | | $ | 2,718 | | | $ | 3,279 | | | $ | 7,651 | | | $ | 2,832 | | | $ | 4,819 | | | $ | (3,468 | ) | | $ | (16,103 | ) | | $ | 12,635 | |
See accompanying notes to consolidated financial statements.
F-5
CAPE BANCORP, INC. AND SUBSIDIARIES
CONSOLIDATED STATEMENTS OF CHANGES IN STOCKHOLDERS’ EQUITY
Years ended December 31, 2013, 2012 and 2011
| | | | | | | | | | | | | | | | | | | | | | | | | | | | |
| | Common
Stock | | | Additional
Paid-In
Capital | | | Treasury
Stock | | | Unearned
ESOP Shares | | | Accumulated
Other
Comprehensive
Income (Loss) | | | Retained
Earnings | | | Total
Stockholders'
Equity | |
| | (in thousands) | |
| | | | | | | | | | | | | | | | | | | | | | | | | | | | |
Balance, December 31, 2010 | | $ | 133 | | | $ | 126,864 | | | $ | (85 | ) | | $ | (9,380 | ) | | $ | (5,590 | ) | | $ | 20,212 | | | $ | 132,154 | |
Net income | | | - | | | | - | | | | - | | | | - | | | | - | | | | 7,987 | | | | 7,987 | |
Other comprehensive income | | | - | | | | - | | | | - | | | | - | | | | 4,648 | | | | - | | | | 4,648 | |
Stock option compensation expense | | | - | | | | 526 | | | | - | | | | - | | | | - | | | | - | | | | 526 | |
Restricted stock compensation expense | | | - | | | | 17 | | | | - | | | | - | | | | - | | | | - | | | | 17 | |
Issuance of stock for stock options | | | - | | | | - | | | | 4 | | | | - | | | | - | | | | - | | | | 4 | |
ESOP shares earned | | | - | | | | (43 | ) | | | - | | | | 426 | | | | - | | | | - | | | | 383 | |
Balance, December 31, 2011 | | | 133 | | | | 127,364 | | | | (81 | ) | | | (8,954 | ) | | | (942 | ) | | | 28,199 | | | | 145,719 | |
Net income | | | - | | | | - | | | | - | | | | - | | | | - | | | | 4,556 | | | | 4,556 | |
Other comprehensive income | | | - | | | | - | | | | - | | | | - | | | | 263 | | | | - | | | | 263 | |
Stock option compensation expense | | | - | | | | 356 | | | | - | | | | - | | | | - | | | | - | | | | 356 | |
Restricted stock compensation expense | | | - | | | | 10 | | | | - | | | | - | | | | - | | | | - | | | | 10 | |
Issuance of stock for stock options | | | - | | | | 98 | | | | 81 | | | | - | | | | - | | | | - | | | | 179 | |
Cash dividends declared on common stock | | | | | | | | | | | | | | | | | | | | | | | | | | | | |
stock ($0.05 per share) | | | - | | | | - | | | | - | | | | - | | | | - | | | | (622 | ) | | | (622 | ) |
ESOP shares earned | | | - | | | | (61 | ) | | | - | | | | 426 | | | | - | | | | - | | | | 365 | |
Balance, December 31, 2012 | | | 133 | | | | 127,767 | | | | - | | | | (8,528 | ) | | | (679 | ) | | | 32,133 | | | | 150,826 | |
Net income | | | - | | | | - | | | | - | | | | - | | | | - | | | | 5,551 | | | | 5,551 | |
Other comprehensive loss | | | - | | | | - | | | | - | | | | - | | | | (2,272 | ) | | | - | | | | (2,272 | ) |
Stock option compensation expense | | | - | | | | 444 | | | | - | | | | - | | | | - | | | | - | | | | 444 | |
Restricted stock compensation expense | | | - | | | | 17 | | | | - | | | | - | | | | - | | | | - | | | | 17 | |
Issuance of stock for stock options | | | - | | | | 33 | | | | 113 | | | | - | | | | - | | | | - | | | | 146 | |
Issuance of restricted stock | | | | | | | (38 | ) | | | 38 | | | | | | | | | | | | | | | | | |
Cash dividends declared on common stock | | | | | | | | | | | | | | | | | | | | | | | | | | | | |
stock ($0.21 per share) | | | - | | | | - | | | | - | | | | - | | | | - | | | | (2,495 | ) | | | (2,495 | ) |
Common stock repurchased -1,301,116 shares | | | - | | | | - | | | | (12,186 | ) | | | - | | | | - | | | | - | | | | (12,186 | ) |
ESOP shares earned | | | - | | | | (30 | ) | | | - | | | | 426 | | | | - | | | | - | | | | 396 | |
Balance, December 31, 2013 | | $ | 133 | | | $ | 128,193 | | | $ | (12,035 | ) | | $ | (8,102 | ) | | $ | (2,951 | ) | | $ | 35,189 | | | $ | 140,427 | |
See accompanying notes to consolidated financial statements.
F-6
CAPE BANCORP, INC. AND SUBSIDIARIES
CONSOLIDATED STATEMENTS OF CASH FLOWS
| Years ended December 31, | |
| 2013 | | | 2012 | | | 2011 | |
| (in thousands) | |
Cash flows from operating activities | | | | | | | | | | | |
Net income | $ | 5,551 | | | $ | 4,556 | | | $ | 7,987 | |
Adjustments to reconcile net income to net cash provided by operating activities: | | | | | | | | | | | |
Provision for loan losses | | 2,011 | | | | 4,461 | | | | 19,607 | |
Net (gain) loss on the sale of loans | | (1,222 | ) | | | (423 | ) | | | 67 | |
Gain on the sale of bank premises | | - | | | | (425 | ) | | | (1,830 | ) |
Net (gain) loss on the sale of assets held for sale | | (569 | ) | | | - | | | | - | |
Net (gain) loss on the sale of other real estate owned | | (81 | ) | | | 260 | | | | 218 | |
Write-down of other real estate owned | | 492 | | | | 1,062 | | | | 1,848 | |
Prepayment penalty on debt extinguishment | | - | | | | 921 | | | | - | |
Loss on impairment of securities | | - | | | | 8 | | | | 1,457 | |
Net (gain) loss on sale of investments | | 561 | | | | (1,604 | ) | | | (149 | ) |
(Gain) loss on disposal of other assets | | - | | | | - | | | | 24 | |
Gain on the sale of merchant card business | | - | | | | (350 | ) | | | - | |
Earnings on BOLI | | (951 | ) | | | (977 | ) | | | (998 | ) |
Originations of loans held for sale | | (39,294 | ) | | | (49,256 | ) | | | (21,986 | ) |
Proceeds from sales of loans | | 46,994 | | | | 47,612 | | | | 27,206 | |
Depreciation and amortization | | 2,050 | | | | 1,574 | | | | 1,254 | |
ESOP and stock-based compensation expense | | 857 | | | | 731 | | | | 925 | |
Deferred income taxes | | 3,522 | | | | 2,683 | | | | (16,694 | ) |
Changes in assets and liabilities that (used) provided cash: | | | | | | | | | | | |
Accrued interest receivable | | (144 | ) | | | 510 | | | | 428 | |
Other assets | | 3,239 | | | | 3,425 | | | | (1,115 | ) |
Accrued interest payable | | (46 | ) | | | (383 | ) | | | (183 | ) |
Other liabilities | | (1,619 | ) | | | (430 | ) | | | (328 | ) |
Net cash provided by operating activities | | 21,351 | | | | 13,955 | | | | 17,738 | |
Cash flows from investing activities | | | | | | | | | | | |
Proceeds from sales of AFS securities | | 20,927 | | | | 67,419 | | | | 12,441 | |
Proceeds from calls, maturities, and principal repayments of AFS securities | | 43,647 | | | | 55,150 | | | | 107,326 | |
Proceeds from calls, maturities, and principal repayments of HTM securities | | 1,714 | | | | - | | | | - | |
Purchases of AFS securities | | (60,956 | ) | | | (99,274 | ) | | | (147,492 | ) |
Purchases of HTM securities | | (481 | ) | | | - | | | | - | |
Redemption (Purchase) of Federal Home Loan Bank stock | | (1,972 | ) | | | 1,758 | | | | 1,188 | |
Proceeds from the sale of merchant card business | | - | | | | 350 | | | | - | |
Proceeds from the sale of assets held for sale | | 842 | | | | - | | | | - | |
Proceeds from sale of other real estate owned | | 5,826 | | | | 9,969 | | | | 3,316 | |
(Increase) decrease in interest-bearing time deposits | | 74 | | | | 569 | | | | (467 | ) |
(Increase) decrease in loans, net | | (74,003 | ) | | | (12,474 | ) | | | 13,854 | |
Proceeds from sales of premises and equipment | | - | | | | - | | | | 7,078 | |
Purchases of premises and equipment | | (747 | ) | | | (1,146 | ) | | | (275 | ) |
Net cash (used in) provided by investing activities | | (65,129 | ) | | | 22,321 | | | | (3,031 | ) |
Cash flows from financing activities | | | | | | | | | | | |
Net increase in deposits | | 13,831 | | | | 10,188 | | | | 21,339 | |
Increase in advances from borrowers for taxes and insurance | | 116 | | | | 70 | | | | 28 | |
Increase in long-term borrowings | | - | | | | 59,000 | | | | 20,000 | |
Repayments of long-term borrowings | | (15,000 | ) | | | (106,338 | ) | | | (25,000 | ) |
Increase (decrease) in short-term borrowings | | 60,000 | | | | - | | | | (20,600 | ) |
Purchase of Treasury stock | | (12,186 | ) | | | - | | | | - | |
Issuance of Treasury stock for stock plans | | 87 | | | | - | | | | - | |
Proceeds from exercise of shares from stock option | | 58 | | | | 179 | | | | 4 | |
Dividends paid on common stock | | (2,495 | ) | | | (622 | ) | | | - | |
Net cash provided by (used in) financing activities | | 44,411 | | | | (37,523 | ) | | | (4,229 | ) |
Net increase (decrease) in cash and cash equivalents | | 633 | | | | (1,247 | ) | | | 10,478 | |
Cash and cash equivalents at beginning of year | | 24,228 | | | | 25,475 | | | | 14,997 | |
Cash and cash equivalents at end of year | $ | 24,861 | | | $ | 24,228 | | | $ | 25,475 | |
Supplementary disclosure of cash flow information: | | | | | | | | | | | |
Cash paid during period for: | | | | | | | | | | | |
Interest | $ | 5,338 | | | $ | 8,587 | | | $ | 11,794 | |
Income taxes, net of refunds | $ | (1,668 | ) | | $ | (446 | ) | | $ | 1,276 | |
Deferred gain on the sale of bank premises | $ | - | | | $ | - | | | $ | 1,600 | |
Supplementary disclosure of non-cash investing activities: | | | | | | | | | | | |
AFS investment security sales that settle after year-end | $ | 4,189 | | | $ | 281 | | | $ | - | |
AFS investment security purchases that settle after year-end | $ | - | | | $ | 2,000 | | | $ | - | |
Transfers from AFS to HTM investment securities | $ | 10,148 | | | $ | - | | | $ | - | |
Transfers from loans to loans held for sale | $ | 825 | | | $ | - | | | $ | - | |
Transfers from loans to other real estate owned | $ | 6,498 | | | $ | 10,158 | | | $ | 10,480 | |
Transfers from premises and equipment to assets held for sale | $ | - | | | $ | - | | | $ | 477 | |
See accompanying notes to consolidated financial statements.
F-7
NOTES TO AUDITED FINANCIAL STATEMENTS
NOTE 1 — ORGANIZATION
Cape Bancorp Inc., (the “Company”) is a Maryland corporation that was incorporated on September 14, 2007 for the purpose of becoming the holding company of Cape Bank.
Cape Bank (the “Bank”) is a New Jersey-chartered stock savings bank. The Bank provides a complete line of business and personal banking products through its fourteen full service offices located throughout Atlantic and Cape May counties in Southern New Jersey, including its main office located at 225 North Main Street, Cape May Court House, New Jersey, one drive-up teller/ATM operation in Atlantic County, and two market development offices (“MDOs”) located in Burlington County, New Jersey and in Radnor, Pennsylvania, which services the five county Philadelphia market area.
The Bank faces significant competition in attracting deposits and originating loans. Our most direct competition for deposits historically has come from the many financial institutions operating in our market area, including commercial banks, savings banks, savings and loan associations and credit unions, and, to a lesser extent, from other financial service companies, such as brokerage firms and insurance companies. The Bank is subject to regulations of certain state and federal agencies, and accordingly, the Bank is periodically examined by such regulatory authorities. As a consequence of the regulation of commercial banking activities, the Bank’s business is particularly susceptible to future state and federal legislation and regulations.
NOTE 2 — SUMMARY OF SIGNIFICANT ACCOUNTING POLICIES
Basis of Financial Statement Presentation: The accounting and reporting policies of the Company conform to accounting principles generally accepted in the United States of America (US GAAP).
We have prepared the consolidated financial statements included herein pursuant to the rules and regulations of the Securities and Exchange Commission (“SEC”).
The consolidated financial statements include the accounts of Cape Bancorp, Inc. and its subsidiaries, all of which are wholly-owned. Significant intercompany balances and transactions have been eliminated. Certain prior period amounts may have been reclassified to conform to current year presentations. In the opinion of management, all accounting entries and adjustments, including normal recurring accruals, necessary for a fair presentation of the financial position and the results of operations for the periods presented have been made. Events occurring subsequent to the date of the balance sheet have been evaluated for potential recognition or disclosure in the consolidated financial statements through the date of the filing of the consolidated financial statements with the SEC.
Use of Estimates: To prepare financial statements in conformity with GAAP, management makes estimates and assumptions based on available information. These estimates and assumptions affect the amounts reported in the financial statements and the disclosures provided, and actual results could differ. The allowance for loan losses, deferred taxes, evaluation of investment securities for other-than-temporary impairment and fair values of financial instruments are particularly subject to change.
Cash and Cash Equivalents: For purposes of reporting cash flows, cash and cash equivalents include cash on hand, amounts due from banks, overnight deposits, federal funds sold and interest bearing bank balances. The Federal Reserve Bank required reserves of $732,000 as of December 31, 2013, and $515,000 as of December 31, 2012, are included in these balances.
Interest-Bearing Time Deposits: Interest-bearing time deposits are held to maturity, are carried at cost and have original maturities greater than three months.
Investment Securities: The Bank classifies investment securities as either available for sale or held to maturity. Investment securities classified as available for sale are carried at fair value with unrealized gains and losses excluded from earnings and reported in a separate component of equity, net of related income tax effects. Investment securities classified as held to maturity are carried at cost, adjusted for amortization of premium and accretion of discount over the term of the related investments, using the level yield method. Investment securities are classified as held to maturity when management has the positive intent and ability to hold them to maturity. In September 2013, the Bank reclassified a portion of the available for sale securities as held to maturity as these securities may be particularly susceptible to changes in fair value in the near term as a result of market volatility. Gains and losses on sales of investment securities are recognized upon realization utilizing the specific identification method. When the fair value of a debt security has declined below the amortized cost at the measurement date, if an entity intends to sell a security or is more likely than not to sell the security before the recovery of the security’s cost basis, the entity must recognize the other-than-temporary impairment (OTTI) in earnings. For a debt security with a fair value below the amortized cost at the measurement date where it is more likely than not that an entity will not sell the security before the recovery of its cost basis, but an entity does not expect to recover the entire cost
F-8
basis of the security, the security is classified as OTTI. The related OTTI loss on the debt security will be recognized in earnings to the extent of the credit losses, with the remaining impairment loss recognized in accumulated other comprehensive income. In estimating OTTI losses, management considers: the length of time and extent that fair value of the security has been less than the cost of the security, the financial condition and near term prospects of the issuer, cash flow, stress testing analysis on securities, when applicable, and the Company’s ability and intent to hold the security for a period sufficient to allow for any anticipated recovery in fair value.
In December 2013, prompted by the “Volcker Rule”, the Bank sold a portion of its portfolio of bank and insurance trust preferred collateral debt obligation (“CDO”) securities that had a cost basis greater than zero. While a loss of $851,000 was incurred, management believed the timing was right to exit this asset class. On February 27, 2014, the Company sold its remaining portion of CDOs with a book value of zero, resulting in a pre-tax gain of $1.9 million.
Loans Held for Sale (“HFS”): HFS consists of residential mortgage loans originated and intended for sale in the secondary market and, from time to time, certain loans transferred from the loan portfolio to HFS, all of which are carried at the lower of aggregate cost or fair market value. The fair value of residential mortgage loans is based on the price secondary markets are currently offering for similar loans using observable market data. The fair values of loans transferred from the loan portfolio to HFS are based on the amounts offered for these loans in currently pending sales transactions or as determined by outstanding commitments from investors. Write-downs on loans transferred to HFS are charged to the allowance for loan losses. Subsequent declines in fair value, if any, are charged to operating income and the HFS balance is reduced. Gains and losses on sales of loans are based on the difference between the selling price and the carrying value of the related loans sold.
Loans and Allowance for Loan Losses: Loans that management has the intent and ability to hold for the foreseeable future or until maturity or payoff are stated at the amount of unpaid principal, net of unearned interest, deferred loan fees and costs, and reduced by an allowance for loan losses. Interest on loans is accrued and credited to operations based upon the principal amounts outstanding. Loan origination fees and certain direct origination costs are deferred and amortized over the life of the related loans as an adjustment to the yield on loans receivable in a manner which approximates the interest method. The allowance for loan losses is established through a provision for loan losses charged to operations. The allowance for loan losses is comprised of both loan pool valuation allowances and individual valuation allowances. Loans are charged against the allowance for loan losses when management believes that the collectability of the principal is unlikely.
Recognition of interest income is discontinued when, in the opinion of management, the collectability of the loan becomes doubtful. A commercial loan is classified as non-accrual when the loan is 90 days or more delinquent, or when in the opinion of management, the collectability of such loan is in doubt. Consumer and residential loans are classified as non-accrual when the loan is 90 days or more delinquent with a loan to value ratio greater than 60 percent.
All interest accrued, but not received, for loans placed on non-accrual, is reversed against interest income. Interest received on such loans is accounted for as a reduction of the principal balance until qualifying for return to accrual. Commercial loans are returned to accrual status when all the principal and interest amounts contractually due are brought current and future payments are reasonably assured. Payments are generally applied to reduce the principal balance but, in certain situations, the application of payments may vary. Consumer and residential loans are returned to accrual status when their delinquency becomes less than 90 days and/or the loan to value ratio is less than 60 percent.
The allowance for loan losses is maintained at an amount management deems appropriate to cover probable incurred losses. In determining the level to be maintained, management evaluates many factors including historical loss experience, the borrowers’ ability to repay and repayment performance, current economic trends, estimated collateral values, industry experience, industry loan concentrations, changes in loan policies and procedures, changes in loan volume, delinquency and troubled asset trends, loan management and personnel, internal and external loan review, total credit exposure of the individual or entity, and external factors including competition, legal, regulatory and seasonal factors. In the opinion of management, the allowance is appropriate to absorb probable loan losses. While management uses the best information available to make such evaluations, future adjustments to the allowance may be necessary. In addition, various regulatory agencies, as an integral part of their examination process, periodically review the Bank’s allowance for losses on loans. Such agencies may require the Bank to recognize additions to the allowance based on their judgment about information available to them at the time of their examination. Charge-offs to the allowance are made when the loan is transferred to other real estate owned or a determination of loss is made.
A loan is impaired when, based on current information and events, it is probable that a creditor will be unable to collect all amounts due according to the contractual terms of the loan agreement. Loans are individually evaluated for impairment. If a loan is impaired, a portion of the allowance is allocated so that the loan is reported net, at the present value of estimated future cash flows using the loan’s existing rate or at the fair value of collateral if repayment is expected solely from the collateral. Included in the Company’s loan portfolio are modified loans. Per the Financial Accounting Standards Board (‘FASB”) Accounting Standards Codification (“ASC”), Topic 310-40, “Troubled Debt Restructurings by Creditors” (“FASB ASC 310-40”), a loan restructuring is one in which the creditor, for economic or legal reasons related to the debtor’s financial difficulties, grants a concession to the debtor that
F-9
the creditor would not otherwise consider, such as providing for a below market interest rate and/or forgiving principal or previously accrued interest. This restructuring may stem from an agreement or may be imposed by law, and may involve a multiple note structure. Prior to the restructuring, if the loans which are modified as a troubled debt restructuring (“TDR”) are already classified as non-accrual, these loans may only be returned to performing (i.e. accrual status) after considering the borrower’s sustained repayment performance for a reasonable amount of time, generally six months. This sustained repayment performance may include the period of time just prior to the restructuring. At December 31, 2013, TDRs totaled $4.3 million, of which $3.4 million were accruing TDRs and $881,000 were non-accruing TDRs. This compares to $7.0 million of TDRs at December 31, 2012, of which $3.5 million were accruing TDRs and $3.5 million were non-accruing TDRs. (See Note 4 - Loans Receivable).
In determining an appropriate amount for the allowance, the Bank segments and evaluates the loan portfolio based on collateral. The following portfolio classes have been identified:
Commercial Secured by Real Estate: Commercial real estate properties primarily include office and medical buildings, retail space, restaurants, multifamily and warehouse or flex space. Some properties are considered “mixed use” as they are a combination of building types, such as an apartment building that may also have retail space. Multifamily loans are expected to be repaid from the cash flow of the underlying property so the collective amount of rents must be sufficient to cover all operating expenses, property management and maintenance, taxes and debt service. Increases in vacancy rates, interest rates or other changes in general economic conditions can all have an impact on the borrower and their ability to repay the loan. Commercial real estate loans are generally considered to have a higher degree of credit risk than multifamily loans as they may be dependent on the ongoing success and operating viability of a fewer number of tenants who are occupying the property and who may have a greater degree of exposure to economic conditions.
Commercial Term Loans: Commercial term loans are term loans to operating companies for business purposes. These loans are generally secured by real estate or business assets such as accounts receivable, inventory and equipment. These loans are typically repaid first by the cash flow generated by the borrower’s business operation. The primary risk characteristics are specific to the underlying business and its ability to generate sustainable profitability and resulting positive cash flow. Factors that may influence a business’s profitability include, but are not limited to, demand for its products or services, quality and depth of management, degree of competition, regulatory changes, and general economic conditions. Commercial term and lines of credit loans are generally secured by business assets; however, the ability of the Bank to foreclose and realize sufficient value from the assets is often highly uncertain.
Construction: Construction loans are granted to experienced and reputable local builders and developers that have the capital and liquidity to carry a project to completion and stabilization. Construction loans are considered riskier than commercial financing on improved and established commercial real estate and loans for the purchase of existing residential properties. The risk of potential loss increases if the original cost estimates or time to complete are significantly off.
Other Commercial: The Bank provides commercial lines of credit loans to operating companies for business purposes. The loans are generally secured by business assets such as accounts receivable, inventory and equipment. These loans are typically repaid first by the cash flow generated by the borrower’s business operation. The primary risk characteristics are specific to the underlying business and its ability to generate sustainable profitability and resulting positive cash flow. Factors that may influence a business’s profitability include, but are not limited to, demand for its products or services, quality and depth of management, degree of competition, regulatory changes, and general economic conditions. Commercial lines of credit loans are generally secured by business assets; however, the ability of the Bank to foreclose and realize sufficient value from the assets is often highly uncertain.
Residential Mortgage: Effective December 31, 2013, the Bank exited the residential mortgage loan origination business. Prior to December 31, 2013, the Bank originated one-to-four family residential mortgage loans within or near its primary geographic market area. The mortgage loans are secured by first liens on the primary residence or investment property. Primary risk characteristics associated with residential mortgage loans typically involve major living or lifestyle changes to the borrower, including unemployment or other loss of income; unexpected significant expenses, such as for major medical issues or catastrophic events; divorce or death. In addition, residential mortgage loans that have adjustable rates could expose the borrower to higher debt service requirements in a rising interest rate environment. Further, real estate values could drop significantly and cause the value of the property to fall below the loan amount, creating additional potential exposure for the Bank.
Home Equity & Lines of Credit: The Bank provides home equity loans and lines of credit in the form of amortizing home equity loans or revolving home equity lines of credit against one to four family residences within or near its primary geographic market. Primary risk characteristics associated with home equity lines of credit typically involve major living or lifestyle changes to the borrower, including unemployment or other loss of income; unexpected significant expenses, such as for major medical issues or catastrophic events; divorce or death. In addition, home equity lines of credit typically are made with variable or floating interest rates, such as the Prime Rate, which could expose the borrower to higher debt service requirements in a rising interest rate environment. Further, real estate value could drop
F-10
significantly and cause the value of the property to fall below the loan amount, creating additional potential exposure for the Bank.
Other Consumer: These are loans to individuals for household, family and other personal expenditures. This also represents all other loans that cannot be categorized in any of the previous mentioned loan segments.
Other Real Estate Owned (“OREO”): Real estate acquired as a result of foreclosure or by deed in lieu of foreclosure is classified as other real estate owned and is initially recorded at the estimated fair market value, less the estimated cost to sell, at the date of foreclosure, thereby establishing a new cost basis. If fair value declines subsequent to foreclosure, an OREO write-down is recorded through expense and the OREO balance is lowered to reflect the current fair value. Operating costs after acquisition are expensed.
Premises and Equipment: Land is carried at cost. Premises and equipment are stated at cost less accumulated depreciation. Buildings and related components are depreciated using the straight-line method with useful lives ranging from 10 to 39 years. Furniture, fixtures and equipment are depreciated using the straight-line (or accelerated) method with useful lives ranging from 3 to 7 years. (See Note 18 – Sale of Bank Assets).
Federal Home Loan Bank of New York (“FHLB”) Stock: The Bank is a member of the FHLB of New York. Members are required to own a certain amount of stock based on the level of borrowings and other factors. FHLB stock is carried at cost, classified as a restricted security, and periodically evaluated for impairment based on ultimate recovery of par value. Cash dividends are reported as income.
Goodwill and Other Intangible Assets: Goodwill results from business acquisitions and represents the excess of the purchase price over the fair value of acquired tangible assets and liabilities and identifiable intangible assets. Goodwill is assessed at least annually for impairment and any such impairment will be recognized in the period identified. The annual goodwill assessment for 2013 was performed in the fourth quarter at which time there was no impairment to be recognized.
Other intangible assets consist of core deposit and acquired customer relationship intangible assets arising from whole bank acquisitions. They are initially measured at fair value and then are amortized on an accelerated method over their estimated useful lives, which range from 5 to 13 years. Other intangible assets also include loan servicing rights which are amortized on the level yield method over the life of the loan. Other intangible assets are assessed at least annually for impairment and any such impairment will be recognized in the period identified.
Bank Owned Life Insurance (“BOLI”): The Bank has an investment of bank owned life insurance. BOLI involves the purchasing of life insurance by the Bank on a chosen group of employees and directors. The Bank is the owner and beneficiary of the policies and in accordance with FASB ASC Topic 325 “Investments in Insurance Contracts,” the amount recorded is the cash surrender value, which is the amount realizable.
Loan Commitments and Related Financial Instruments: Financial instruments include off-balance sheet credit instruments, such as commitments to make loans and commercial letters of credit, issued to meet customer financing needs. The face amount for these items represents the exposure to loss, before considering customer collateral or ability to repay. Such financial instruments are recorded when they are funded.
Defined Benefit Plan: The Bank participates in the Pentegra Defined Benefit Plan for Financial Institutions (The “Pentegra DB Plan”), a tax-qualified defined benefit pension plan. The Pentegra DB Plan’s Employer Identification Number is 13-5645888 and the Plan Number is 333. The Pentegra DB Plan operates as a multi-employer plan for accounting purposes and as a multiple-employer plan under the Employee Retirement Income Security Act of 1974 and the Internal Revenue Code. There are no collective bargaining agreements in place that require contributions to the Pentegra DB Plan. (See Note 13 – Benefit Plans)
The plan was amended to freeze participation to new employees commencing January 1, 2008. Employees who became eligible to participate prior to January 1, 2008, will continue to accrue a benefit under the plan. The Bank accrues pension costs as incurred. The plan was further amended to freeze benefits as of December 31, 2008 for all employees eligible to participate prior to January 1, 2008.
401(k) Plan: The Bank maintains a tax-qualified defined contribution plan for all salaried employees of Cape Bank who have satisfied the 401(k) Plan’s eligibility requirements. Effective, January 1, 2012, the Bank eliminated the matching contribution formula and replaced it with a discretionary form of matching contribution.
F-11
Employee Stock Ownership Plan (“ESOP”): The cost of shares issued to the ESOP, but not yet earned is shown as a reduction of equity. Compensation expense is based on the market price of shares as they are committed to be released to participant accounts and the shares become outstanding for earnings per share computations. Dividends on allocated ESOP shares reduce retained earnings; dividends on unearned ESOP shares are used to reduce the annual ESOP debt service. As of December 31, 2013, 206,145 shares have been allocated to eligible participants in the Cape Bank Employee Stock Ownership Plan. (See Note 13 – Benefit Plans).
Stock Benefit Plan: The Company has an Equity Incentive Plan (the “Stock Benefit Plan”) under which incentive and non-qualified stock options, stock appreciation rights (SARs) and restricted stock awards (RSAs) may be granted periodically to certain employees and directors. The fair value of the restricted stock is the market value of the stock on the date of grant. Under the fair value method of accounting for stock options, the fair value is measured on the date of grant using the Black-Scholes option pricing model with market assumptions. This amount is amortized as salaries and employee benefits expense on a straight-line basis over the vesting period. Option pricing models require the use of highly subjective assumptions, including expected stock price volatility, which, if changed, can significantly affect fair value estimates.
Income Taxes: Income taxes are accounted for under the asset and liability method. Deferred tax assets and liabilities are recognized for the future tax consequences attributable to differences between the financial statement carrying amounts of existing assets and liabilities and their respective tax bases and operating loss and tax credit carryforwards. The principal types of accounts resulting in differences between assets and liabilities for financial statement and tax purposes are the allowance for loan losses, deferred compensation, deferred loan fees, charitable contributions, depreciation and OTTI charges. Deferred tax assets and liabilities are measured using enacted tax rates expected to apply to taxable income in the years in which those temporary differences are expected to be recovered or settled. The effect on deferred tax assets and liabilities of a change in tax rates is recognized in income in the period that includes the enactment date. A valuation allowance is recorded against net deferred tax assets when management has concluded that it is not more likely than not that a portion or all will be realized. Management considers several factors in determining whether a portion, or all, of the valuation allowance should be reversed such as the level of historical taxable income, projections for future taxable income over the periods in which the deferred tax assets are deductible and tax planning strategies.
Under FASB Interpretation No. 48, Accounting for Uncertainty in Income Taxes, included in FASB ASC Subtopic 740-10—Income Taxes—Overall, the Company recognizes the effect of income tax positions only if those positions are more likely than not of being sustained. Recognized income tax positions are measured at the largest amount that is greater than 50% likely of being realized. Changes in recognition or measurement are reflected in the period in which the change in judgment occurs.
The Company records interest and penalties related to uncertain tax positions as non-interest expense.
Earnings Per Share: Basic earnings per common share is the net income divided by the weighted average number of common shares outstanding during the period. ESOP shares are not considered outstanding for this calculation unless earned. Diluted earnings per share includes the dilutive effect of additional potential common shares issuable under stock option and restricted stock awards, if any.
Comprehensive Income (Loss): Comprehensive income (loss) includes net income as well as certain other items which result in a change to equity during the period. Other comprehensive income includes unrealized gains and losses on securities available for sale which are also recognized as separate components of equity. See the Consolidated Statement of Changes in Comprehensive Income.
Operating Segments: While the chief decision makers monitor the revenue streams of the various products and services, operations are managed and financial performance is evaluated on a Company-wide basis. Operating segments are aggregated into one as operating results for all segments are similar. Accordingly, all of the financial service operations are considered by management to be aggregated in one reportable operating segment.
Treasury Stock: Stock held in the treasury by the Company is accounted for using the cost method, which treats stock held in treasury as a reduction to total stockholders’ equity. As shares of treasury stock are reissued to satisfy stock option exercises, the shares are issued using the average cost basis of the shares in the treasury at the time of issuance.
On April 18, 2013, the Company announced that the Board of Directors authorized a stock repurchase plan under which the Company would repurchase up to 5%, or approximately 667,239 shares, of the Company’s issued and outstanding shares. The repurchase was completed on July 16, 2013. Furthermore, on July 19, 2013, the Company announced that the Board of Directors authorized a second repurchase program for the repurchase of up to 5%, or approximately 633,877 shares, of the Company’s issued and outstanding shares. The second repurchase plan was completed on October 3, 2013. The average repurchase price for both stock repurchase plans was $9.37 per share. On December 23, 2013, the Company announced that the Board of Directors authorized a third
F-12
stock repurchase plan under which the Company would repurchase up to 5%, or approximately 602,989 shares, of the Company’s issued and outstanding shares.
Effect of Newly Issued Accounting Standards: In February 2013, the FASB issued ASU 2013-02, Comprehensive Income, Reporting of Amounts Reclassified Out of Accumulated Other Comprehensive Income (Topic 220): The amendments in this update aim to improve the reporting of reclassifications out of accumulated other comprehensive income. The amendments seek to attain that objective by requiring an entity to report the effect of significant reclassifications out of accumulated other comprehensive income on the respective line items in net income if the amount being reclassified is required under U.S. GAAP to be reclassified in its entirety to net income. For other amounts that are not required under U.S. GAAP to be reclassified in their entirety to net income in the same reporting period, an entity is required to cross-reference other disclosures required under U.S. GAAP that provide additional detail about those amounts. This would be the case when a portion of the amount reclassified out of accumulated other comprehensive income is reclassified to a balance sheet account instead of directly to income or expense in the same reporting period. For public entities, the amendments are effective prospectively for reporting periods beginning after December 15, 2012. The Company adopted the amendments of ASU 2011-12 effective January 1, 2013. Adoption of this update did not have a material impact on the Company’s financial position or results of operations.
NOTE 3 — INVESTMENT SECURITIES
In September 2013, the Bank reclassified a portion of the available for sale securities as held to maturity as these securities may be particularly susceptible to changes in fair value in the near term as a result of market volatility. The amortized cost, gross unrealized gains or losses and the fair value of the Company’s investment securities available-for-sale and held-to-maturity at December 31, 2013 and December 31, 2012 are as follows:
| | Amortized Cost | | | Gross Unrealized Gains | | | Gross Unrealized Losses | | | Fair Value | |
| | (in thousands) | |
December 31, 2013 | | | | | | | | | | | | | | | | |
Investment securities available-for-sale | | | | | | | | | | | | | | | | |
Debt securities | | | | | | | | | | | | | | | | |
U.S. Government and agency obligations | | $ | 53,951 | | | $ | 5 | | | $ | (2,350 | ) | | $ | 51,606 | |
Municipal bonds | | | 6,090 | | | | 116 | | | | (28 | ) | | | 6,178 | |
Collateralized debt obligations | | | - | | | | - | | | | - | | | | - | |
Corporate bonds | | | 13,059 | | | | 44 | | | | (24 | ) | | | 13,079 | |
Total debt securities | | $ | 73,100 | | | $ | 165 | | | $ | (2,402 | ) | | $ | 70,863 | |
| | | | | | | | | | | | | | | | |
Equity securities | | | | | | | | | | | | | | | | |
CRA Qualified Investment Fund | | $ | 5,000 | | | $ | - | | | $ | (300 | ) | | $ | 4,700 | |
Total equity securities | | $ | 5,000 | | | $ | - | | | $ | (300 | ) | | $ | 4,700 | |
| | | | | | | | | | | | | | | | |
Mortgage-backed securities | | | | | | | | | | | | | | | | |
GNMA pass-through certificates | | $ | 3,424 | | | $ | 130 | | | $ | - | | | $ | 3,554 | |
FHLMC pass-through certificates | | | 5,101 | | | | 78 | | | | (175 | ) | | | 5,004 | |
FNMA pass-through certificates | | | 14,596 | | | | 163 | | | | (495 | ) | | | 14,264 | |
Collateralized mortgage obligations | | | 60,686 | | | | 121 | | | | (2,026 | ) | | | 58,781 | |
Total mortgage-backed securities | | $ | 83,807 | | | $ | 492 | | | $ | (2,696 | ) | | $ | 81,603 | |
Total securities available-for-sale | | $ | 161,907 | | | $ | 657 | | | $ | (5,398 | ) | | $ | 157,166 | |
| | | | | | | | | | | | | | | | |
| | | | | | | | | | | | | | | | |
Investment securities held-to-maturity | | | | | | | | | | | | | | | | |
Debt securities | | | | | | | | | | | | | | | | |
Municipal bonds | | $ | 9,102 | | | $ | 42 | | | $ | (238 | ) | | $ | 8,906 | |
Total debt securities | | $ | 9,102 | | | $ | 42 | | | $ | (238 | ) | | $ | 8,906 | |
Total securities held-to-maturity | | $ | 9,102 | | | $ | 42 | | | $ | (238 | ) | | $ | 8,906 | |
F-13
| | Amortized Cost | | | Gross Unrealized Gains | | | Gross Unrealized Losses | | | Fair Value | |
| | (in thousands) | |
December 31, 2012 | | | | | | | | | | | | | | | | |
Investment securities available-for-sale | | | | | | | | | | | | | | | | |
Debt securities | | | | | | | | | | | | | | | | |
U.S. Government and agency obligations | | $ | 38,982 | | | $ | 129 | | | $ | (29 | ) | | $ | 39,082 | |
Municipal bonds | | | 20,307 | | | | 472 | | | | (21 | ) | | | 20,758 | |
Collateralized debt obligations | | | 8,263 | | | | 104 | | | | (3,685 | ) | | | 4,682 | |
Corporate bonds | | | 14,103 | | | | 139 | | | | (1 | ) | | | 14,241 | |
Total debt securities | | $ | 81,655 | | | $ | 844 | | | $ | (3,736 | ) | | $ | 78,763 | |
| | | | | | | | | | | | | | | | |
Equity securities | | | | | | | | | | | | | | | | |
CRA Qualified Investment Fund | | $ | 5,000 | | | $ | - | | | $ | (9 | ) | | $ | 4,991 | |
Total equity securities | | $ | 5,000 | | | $ | - | | | $ | (9 | ) | | $ | 4,991 | |
| | | | | | | | | | | | | | | | |
Mortgage-backed securities | | | | | | | | | | | | | | | | |
GNMA pass-through certificates | | $ | 4,193 | | | $ | 237 | | | $ | - | | | $ | 4,430 | |
FHLMC pass-through certificates | | | 5,784 | | | | 134 | | | | - | | | | 5,918 | |
FNMA pass-through certificates | | | 17,591 | | | | 468 | | | | - | | | | 18,059 | |
Collateralized mortgage obligations | | | 57,764 | | | | 950 | | | | (18 | ) | | | 58,696 | |
Total mortgage-backed securities | | $ | 85,332 | | | $ | 1,789 | | | $ | (18 | ) | | $ | 87,103 | |
Total securities available-for-sale | | $ | 171,987 | | | $ | 2,633 | | | $ | (3,763 | ) | | $ | 170,857 | |
Proceeds from sales of securities available for sale were $20.9 million and $67.4 million for the years ended December 31, 2013 and 2012, respectively. Gross realized gains on sales of investment securities during 2013 were $831,000, compared to $1.7 million during 2012. The Company also realized gross losses of $1.4 million during 2013 compared to $122,000 during 2012 as it sold securities that it viewed as having a greater than acceptable level of potential risk in the future. Included in the gains and losses for the year 2013 were net security losses in the amount of $851,000 related to the Bank selling a portion of its portfolio of bank and insurance trust preferred collateral debt obligation (“CDO”) securities that had a cost basis greater than zero. Proceeds from security calls, maturities, and return of principal were $45.3 million and $55.2 million for the years ended December 31, 2013 and 2012, respectively.
Securities having a fair value of approximately $50.6 million and $28.5 million at December 31, 2013 and December 31, 2012, respectively, were pledged to secure public deposits, Federal Home Loan Bank advances and other borrowings. The Bank did not hold any trading securities during the years ended December 31, 2013 or December 31, 2012.
The table below indicates the length of time individual securities have been in a continuous unrealized loss position at December 31, 2013.
| | Less Than 12 Months | | | 12 Months or Longer | | | Total | |
Description of Securities | | Fair Value | | | Unrealized
Losses | | | Fair Value | | | Unrealized
Losses | | | Fair Value | | | Unrealized
Losses | |
| | | | | | | | | | (in thousands) | | | | | | | | | |
U.S. Government and agency obligations | | $ | 45,771 | | | $ | (2,184 | ) | | $ | 1,834 | | | $ | (166 | ) | | $ | 47,605 | | | $ | (2,350 | ) |
Municipal bonds | | | 7,936 | | | | (244 | ) | | | 1,220 | | | | (22 | ) | | | 9,156 | | | | (266 | ) |
Corporate bonds | | | 4,029 | | | | (24 | ) | | | - | | | | - | | | | 4,029 | | | | (24 | ) |
CRA Qualified Investment Fund | | | - | | | | - | | | | 4,700 | | | | (300 | ) | | | 4,700 | | | | (300 | ) |
Mortgage-backed securities | | | 59,729 | | | | (2,452 | ) | | | 2,569 | | | | (244 | ) | | | 62,298 | | | | (2,696 | ) |
| | | | | | | | | | | | | | | | | | | | | | | | |
Total temporarily impaired investment securities | | $ | 117,465 | | | $ | (4,904 | ) | | $ | 10,323 | | | $ | (732 | ) | | $ | 127,788 | | | $ | (5,636 | ) |
F-14
The table below indicates the length of time individual securities have been in a continuous unrealized loss position at December 31, 2012.
| | Less Than 12 Months | | | 12 Months or Longer | | | Total | |
Description of Securities | | Fair Value | | | Unrealized
Losses | | | Fair Value | | | Unrealized
Losses | | | Fair Value | | | Unrealized
Losses | |
| | (in thousands) | |
U.S. Government and agency obligations | | $ | 6,968 | | | $ | (29 | ) | | $ | - | | | $ | - | | | $ | 6,968 | | | $ | (29 | ) |
Municipal bonds | | | 3,111 | | | | (18 | ) | | | 225 | | | | (3 | ) | | | 3,336 | | | | (21 | ) |
Corporate bonds | | | 1,035 | | | | (1 | ) | | | - | | | | - | | | | 1,035 | | | | (1 | ) |
Collateralized debt obligations | | | - | | | | - | | | | 4,524 | | | | (3,685 | ) | | | 4,524 | | | | (3,685 | ) |
CRA Qualified Investment Fund | | | 4,991 | | | | (9 | ) | | | | | | | | | | | 4,991 | | | | (9 | ) |
Mortgage-backed securities | | | 1,989 | | | | (18 | ) | | | - | | | | - | | | | 1,989 | | | | (18 | ) |
| | | | | | | | | | | | | | | | | | | | | | | | |
Total temporarily impaired investment securities | | $ | 18,094 | | | $ | (75 | ) | | $ | 4,749 | | | $ | (3,688 | ) | | $ | 22,843 | | | $ | (3,763 | ) |
Management evaluates investment securities to determine if they are other-than-temporarily impaired on at least a quarterly basis. The evaluation process applied to each security includes, but is not limited to, the following factors: whether the security is performing according to its contractual terms; a determination if there has been an adverse change in the expected cash flows for investments within the scope of FASB Accounting Standards Codification (ASC) Topic 325, “Investments Other,” the length of time and the extent to which the fair value has been less than cost; whether the Company intends to sell, or would more likely than not be required to sell an impaired debt security before a recovery of its amortized cost basis; credit rating downgrades; the percentage of performing collateral that would need to default or defer to cause a break in yield and/or a temporary interest shortfall; and a review of the underlying issuers. Additionally, and consistent with FDIC regulations, management, prior to acquiring and periodically thereafter, evaluates various factors of corporate securities that may include but is not limited to the following; evaluate that the risk of default is low and consistent with bonds of similar quality, evaluate the capacity to pay, understand applicable market demographics/economics and understand current levels and trends in operating margins, operating efficiency, profitability, return on assets and return on equity.
At December 31, 2013, the Company’s investment securities portfolio consisted of 260 securities, 105 of which were in an unrealized loss position. The securities consist of investments that are backed by the U.S. Government or U.S. sponsored agencies which the government has affirmed its commitment to support, municipal obligations and corporate bonds which had unrealized losses that were caused by changing credit spreads in the market as a result of the current economic environment. Because the Company has no intention to sell these securities, nor is it more likely than not that we will be required to sell these securities, the Company does not consider those investments to be OTTI.
The following table provides additional information related to our pooled trust preferred collateralized debt obligations as of December 31, 2012. The pooled trust preferred collateralized debt obligations were sold in December 2013, thereby leaving a book balance of zero.
Pooled Trust Preferred Collateralized Debt Obligations
(dollars in thousands)
Deal | Number
of
Securities | | Class | | Amortized
Cost | | | Fair
Value | | | Unrealized
Loss | | | Realized
Loss | | | Moody's/
Fitch
Ratings | | Current
Number of
Performing
Issuers | | Amount
of
Deferrals
and
Defaults
as a % of
Current
Collateral | | | Excess
Subordination
as a % of
Current
Performing
Collateral | |
PreTSL II | 2 | | Mezzanine | | $ | 470 | | | $ | 406 | | | $ | (64 | ) | | $ | (643 | ) | | Ca/C | | 14 | | | 47.50 | % | | | 0.00 | % |
PreTSL XIX | 1 | | Mezzanine | | | 54 | | | | 158 | | | | 104 | | | | (1,759 | ) | | C/C | | 47 | | | 26.10 | % | | | 0.00 | % |
I-PreTSL I | 2 | | Mezzanine | | | 1,844 | | | | 1,200 | | | | (644 | ) | | | - | | | NR/CCC | | 15 | | | 16.50 | % | | | 15.68 | % |
I-PreTSL II | 2 | | Mezzanine | | | 2,733 | | | | 1,347 | | | | (1,386 | ) | | | - | | | NR/B | | 23 | | | 12.60 | % | | | 13.79 | % |
I-PreTSL III | 3 | | Mezzanine | | | 2,720 | | | | 1,345 | | | | (1,375 | ) | | | - | | | Ba3/CCC | | 23 | | | 12.20 | % | | | 17.11 | % |
I-PreTSL IV | 1 | | Mezzanine | | | 442 | | | | 226 | | | | (216 | ) | | | - | | | Ba2/CCC | | 24 | | | 19.70 | % | | | 10.43 | % |
Total | 11 | | | | $ | 8,263 | | | $ | 4,682 | | | $ | (3,581 | ) | | $ | (2,402 | ) | | | | | | | | | | | | |
F-15
Lack of liquidity in the market for trust preferred collateralized debt obligations, credit rating downgrades and market uncertainties related to the financial industry are factors contributing to the impairment on these securities. The table above excludes 11 CDO securities which have been completely written-off and, therefore, have no book value. The realized loss associated with these securities is $14.5 million.
On a quarterly basis, we evaluate our investment securities for other-than-temporary impairment. As required by FASB ASC Topic No. 320, “Investments – Debt and Equity Securities”, if we do not intend to sell a debt security, and it is not more likely than not that we will be required to sell the security, an OTTI write-down is separated into a credit loss portion and a portion related to all other factors. The credit loss portion is recognized in earnings as net OTTI losses, and the portion related to all other factors is recognized in accumulated other comprehensive income, net of taxes. The credit loss portion is defined as the difference between the amortized cost of the security and the present value of the expected future cash flows for the security. If the intent is to sell a debt security or if it is more likely than not that we will be required to sell the security, then the security is written down to its fair market value as a net OTTI loss in earnings. The Company has evaluated these securities and determined that the decreases in estimated fair value are temporary with the exception of 14 bank issued pooled trust preferred CDO securities. The Company’s estimate of projected cash flows it expected to receive was less than the securities’ carrying value resulting in a net credit impairment charge to earnings for the year ending December 31, 2012 of $8,000. There was no OTTI recorded for the year ending December 31, 2013.
Our CDOs are beneficial interests in securitized financial assets within the scope of FASB ASC Topic No. 325, “Investments – Other”, and are therefore evaluated for OTTI using management’s estimate of future cash flows. If these estimated cash flows determine that it is probable an adverse change in cash flows has occurred, then OTTI would be recognized in accordance with FASB ASC Topic No. 320. However, in December 2013, the Company sold the remaining portion of its CDOs that had a cost basis of greater than zero.
The amortized cost and fair value of debt, equity, and mortgage-backed securities available for sale at December 31, 2013, by contractual maturities, are shown below. Expected maturities will differ from contractual maturities because borrowers may have the right to call or prepay obligations with or without call or prepayment penalties.
| | Available for Sale | | | Held to Maturity | |
| | Amortized Cost | | | Fair Value | | | Amortized Cost | | | Fair Value | |
| | (in thousands) | | | (in thousands) | |
| | | | | | | | | | | | | | | | |
Due within one year or less | | $ | 4,974 | | | $ | 4,996 | | | $ | - | | | $ | - | |
Due after one year but within five years | | | 31,142 | | | | 31,087 | | | | - | | | | - | |
Due after five years but within ten years | | | 36,984 | | | | 34,780 | | | | 7,037 | | | | 6,810 | |
Due after ten years | | | - | | | | - | | | | 2,065 | | | | 2,096 | |
Equity securities | | | 5,000 | | | | 4,700 | | | | | | | | | |
Mortgage-backed securities | | | 83,807 | | | | 81,603 | | | | - | | | | - | |
Total investment securities | | $ | 161,907 | | | $ | 157,166 | | | $ | 9,102 | | | $ | 8,906 | |
The following table presents a summary of the cumulative credit related OTTI charges recognized as components of earnings for CDO securities still held by the Company at December 31, 2013 and 2012 (in thousands):
| | For the years ended December 31, | |
| | 2013 | | | 2012 | |
Beginning balance of cumulative credit losses on CDO securities | | $ | (18,383 | ) | | $ | (18,375 | ) |
Additional credit losses for which other than temporary impairment was previously recognized | | | - | | | | (8 | ) |
Sale of OTTI securities | | | 3,882 | | | | | |
Credit loss recognized due to change to intent to sell | | | - | | | | - | |
Ending balance of cumulative credit losses on CDO securities | | $ | (14,501 | ) | | $ | (18,383 | ) |
On February 27, 2014, the Company sold its remaining portion of CDOs having a zero book balance resulting in a pre-tax gain of $1.9 million.
F-16
NOTE 4 — LOANS RECEIVABLE
Loans receivable consist of the following:
| December 31, | |
| 2013 | | | 2012 | |
| (in thousands) | |
| | | | | | | |
Commercial secured by real estate | $ | 422,829 | | | $ | 388,048 | |
Commercial term loans | | 23,203 | | | | 19,443 | |
Construction | | 10,852 | | | | 1,765 | |
Other commercial | | 37,772 | | | | 32,748 | |
Residential mortgage | | 250,698 | | | | 235,921 | |
Home equity loans and lines of credit | | 43,468 | | | | 45,258 | |
Other consumer loans | | 977 | | | | 1,317 | |
Loans receivable, gross | | 789,799 | | | | 724,500 | |
| | | | | | | |
Less: | | | | | | | |
Allowance for loan losses | | 9,330 | | | | 9,852 | |
Deferred loan fees | | 342 | | | | 252 | |
Loans receivable, net | $ | 780,127 | | | $ | 714,396 | |
Activity in the allowance for losses is as follows:
| At or for the Years ended December 31, | |
| 2013 | | | 2012 | | | 2011 | |
| (in thousands) | |
| | | | | | | | | | | |
Balance at beginning of year | $ | 9,852 | | | $ | 12,653 | | | $ | 12,538 | |
Provisions charged to operations | | 2,011 | | | | 4,461 | | | | 19,607 | |
Charge-offs | | (2,545 | ) | | | (7,490 | ) | | | (15,662 | ) |
Write-downs on transfers to HFS (1) | | (241 | ) | | | - | | | | (4,051 | ) |
Recoveries | | 253 | | | | 228 | | | | 221 | |
Balance at end of year | $ | 9,330 | | | $ | 9,852 | | | $ | 12,653 | |
(1) | The Company reclassified $825,000 to loans held for sale in the fourth quarter of 2013 and $11.9 million of loans to loans held for sale in the third quarter of 2011. |
F-17
The following summarizes activity related to the allowance for loan losses by category for the years ended December 31, 2013 and 2012:
| | At or for the Year ended December 31, 2013 | |
| | (in thousands) | |
| | Commercial
Secured by
Real Estate | | | Commercial
Term Loans | | | Construction | | | Other
Commercial (1) | | | Residential
Mortgage | | | Home
Equity &
Lines of
Credit | | | Other
Consumer | | | Unallocated | | | Total | |
Balance at beginning of year | | $ | 6,321 | | | $ | 457 | | | $ | 58 | | | $ | 815 | | | $ | 1,300 | | | $ | 249 | | | $ | 17 | | | $ | 635 | | | $ | 9,852 | |
Charge-offs | | | (2,085 | ) | | | - | | | | - | | | | (106 | ) | | | (205 | ) | | | (109 | ) | | | (40 | ) | | | - | | | | (2,545 | ) |
Write-downs on loans transferred to HFS | | | (241 | ) | | | - | | | | - | | | | - | | | | - | | | | - | | | | - | | | | - | | | | (241 | ) |
Recoveries | | | 214 | | | | - | | | | - | | | | 10 | | | | - | | | | 1 | | | | 28 | | | | - | | | | 253 | |
Provision for loan losses | | | 2,345 | | | | (37 | ) | | | 169 | | | | (119 | ) | | | (230 | ) | | | 19 | | | | (1 | ) | | | (135 | ) | | | 2,011 | |
Balance at end of year | | $ | 6,554 | | | $ | 420 | | | $ | 227 | | | $ | 600 | | | $ | 865 | | | $ | 160 | | | $ | 4 | | | $ | 500 | | | $ | 9,330 | |
| | | | | | | | | | | | | | | | | | | | | | | | | | | | | | | | | | | | |
Impairment evaluation | | | | | | | | | | | | | | | | | | | | | | | | | | | | | | | | | | | | |
Allowance for loan losses | | | | | | | | | | | | | | | | | | | | | | | | | | | | | | | | | | | | |
Individually evaluated | | $ | 148 | | | $ | - | | | $ | - | | | $ | 6 | | | $ | 70 | | | $ | 22 | | | $ | - | | | $ | - | | | $ | 246 | |
Collectively evaluated | | | 6,406 | | | | 420 | | | | 227 | | | | 594 | | | | 795 | | | | 138 | | | | 4 | | | | 500 | | | | 9,084 | |
Total allowance for loan losses | | $ | 6,554 | | | $ | 420 | | | $ | 227 | | | $ | 600 | | | $ | 865 | | | $ | 160 | | | $ | 4 | | | $ | 500 | | | $ | 9,330 | |
Loans | | | | | | | | | | | | | | | | | | | | | | | | | | | | | | | | | | | | |
Individually evaluated | | $ | 8,223 | | | $ | - | | | $ | - | | | $ | 303 | | | $ | 2,215 | | | $ | 461 | | | $ | - | | | $ | - | | | $ | 11,202 | |
Collectively evaluated | | | 414,606 | | | | 23,203 | | | | 10,852 | | | | 37,469 | | | | 248,483 | | | | 43,007 | | | | 977 | | | | - | | | | 778,597 | |
Total loans | | $ | 422,829 | | | $ | 23,203 | | | $ | 10,852 | | | $ | 37,772 | | | $ | 250,698 | | | $ | 43,468 | | | $ | 977 | | | $ | - | | | $ | 789,799 | |
(1) | includes commercial lines of credit |
| | At or for the Year ended December 31, 2012 | |
| | (in thousands) | |
| | Commercial
Secured by
Real Estate | | | Commercial
Term Loans | | | Construction | | | Other
Commercial (1) | | | Residential
Mortgage | | | Home
Equity &
Lines of
Credit | | | Other
Consumer | | | Unallocated | | | Total | |
Balance at beginning of year | | $ | 8,058 | | | $ | 124 | | | $ | 744 | | | $ | 338 | | | $ | 1,909 | | | $ | 349 | | | $ | 16 | | | $ | 1,115 | | | $ | 12,653 | |
Charge-offs | | | (6,070 | ) | | | (27 | ) | | | (602 | ) | | | (137 | ) | | | (450 | ) | | | (171 | ) | | | (33 | ) | | | - | | | | (7,490 | ) |
Write-downs on loans transferred to HFS | | | - | | | | - | | | | - | | | | - | | | | - | | | | - | | | | - | | | | - | | | | - | |
Recoveries | | | 182 | | | | - | | | | 11 | | | | 4 | | | | - | | | | 5 | | | | 26 | | | | - | | | | 228 | |
Provision for loan losses | | | 4,151 | | | | 360 | | | | (95 | ) | | | 610 | | | | (159 | ) | | | 66 | | | | 8 | | | | (480 | ) | | | 4,461 | |
Balance at end of year | | $ | 6,321 | | | $ | 457 | | | $ | 58 | | | $ | 815 | | | $ | 1,300 | | | $ | 249 | | | $ | 17 | | | $ | 635 | | | $ | 9,852 | |
| | | | | | | | | | | | | | | | | | | | | | | | | | | | | | | | | | | | |
Impairment evaluation | | | | | | | | | | | | | | | | | | | | | | | | | | | | | | | | | | | | |
Allowance for loan losses | | | | | | | | | | | | | | | | | | | | | | | | | | | | | | | | | | | | |
Individually evaluated | | $ | 550 | | | $ | - | | | $ | - | | | $ | 57 | | | $ | 5 | | | $ | - | | | $ | - | | | $ | - | | | $ | 612 | |
Collectively evaluated | | | 5,771 | | | | 457 | | | | 58 | | | | 758 | | | | 1,295 | | | | 249 | | | | 17 | | | | 635 | | | | 9,240 | |
Total allowance for loan losses | | $ | 6,321 | | | $ | 457 | | | $ | 58 | | | $ | 815 | | | $ | 1,300 | | | $ | 249 | | | $ | 17 | | | $ | 635 | | | $ | 9,852 | |
Loans | | | | | | | | | | | | | | | | | | | | | | | | | | | | | | | | | | | | |
Individually evaluated | | $ | 17,452 | | | $ | - | | | $ | 141 | | | $ | 515 | | | $ | 4,430 | | | $ | 841 | | | $ | - | | | $ | - | | | $ | 23,379 | |
Collectively evaluated | | | 370,596 | | | | 19,443 | | | | 1,624 | | | | 32,233 | | | | 231,491 | | | | 44,417 | | | | 1,317 | | | | - | | | | 701,121 | |
Total loans | | $ | 388,048 | | | $ | 19,443 | | | $ | 1,765 | | | $ | 32,748 | | | $ | 235,921 | | | $ | 45,258 | | | $ | 1,317 | | | $ | - | | | $ | 724,500 | |
(1) | includes commercial lines of credit |
F-18
Impaired loans at December 31, 2013 and 2012 were as follows:
| | December 31, | |
| | 2013 | | | 2012 | |
| | (in thousands) | |
Non-accrual loans (1) | | $ | 6,885 | | | $ | 17,743 | |
Loans delinquent greater than 90 days and still accruing | | | 458 | | | | 1,626 | |
Troubled debt restructured loans | | | 3,452 | | | | 3,538 | |
Loans less than 90 days and still accruing | | | 407 | | | | 472 | |
Total impaired loans | | $ | 11,202 | | | $ | 23,379 | |
(1) | Non-accrual loans in the table above include TDRs totaling $881,000 at December 31, 2013 and $3.5 million at December 31, 2012. Total impaired loans do not include loans held for sale. Loans held for sale include $1.6 million and $911,000 of loans that were on non-accrual status at December 31, 2013 and 2012, respectively. |
| For the years ended December 31, | |
| 2013 | | | 2012 | | | 2011 | |
| (in thousands) | |
Average recorded investment of impaired loans | $ | 9,521 | | | $ | 20,781 | | | $ | 33,254 | |
Interest income recognized during impairment | $ | 290 | | | $ | 311 | | | $ | 649 | |
Cash basis interest income recognized | $ | 130 | | | $ | 208 | | | $ | 176 | |
As of December 31, 2013 and 2012, non-performing loans had a principal balance of approximately $7.3 million and $19.4 million, respectively. Loan balances past due 90 days or more and still accruing interest, but which management expects will eventually be paid in full, amounted to approximately $458,000 and $1.6 million at December 31, 2013 and 2012, respectively. The amount of interest income that would have been recorded had our non-accruing loans been current in accordance with their original terms was $719,000, $1.3 million, and $2.1 million for the years ended December 31, 2013, 2012 and 2011, respectively.
Impaired loans include loans whose contractual terms have been restructured in a manner that grants a concession to a borrower experiencing financial difficulties. In accordance with applicable accounting guidance FASB ASC 310-40 “Receivables”, these modified loans are considered TDRs. See Note 2 of the Notes to Consolidated Financial Statements for further information regarding TDRs.
The following table provides a summary of TDRs by performing status:
| | December 31, 2013 | | | December 31, 2012 | |
Troubled Debt Restructurings | | Non-accruing | | | Accruing | | | Total | | | Non-accruing | | | Accruing | | | Total | |
| | (in thousands) | | | (in thousands) | |
Commercial secured by real estate | | $ | 688 | | | $ | 2,392 | | | $ | 3,080 | | | $ | 3,112 | | | $ | 2,651 | | | $ | 5,763 | |
Residential mortgage | | | 193 | | | | 1,060 | | | | 1,253 | | | | 363 | | | | 887 | | | | 1,250 | |
Total TDRs | | $ | 881 | | | $ | 3,452 | | | $ | 4,333 | | | $ | 3,475 | | | $ | 3,538 | | | $ | 7,013 | |
The following presents new TDRs for the years ended December 31, 2013 and 2012:
| | For the years ended December 31, | |
| | 2013 | | | 2012 | |
Troubled Debt Restructurings | | Number of
Contracts | | | Pre-Modification
Recorded
Investment | | | Post-Modification
Recorded
Investment | | | Number of
Contracts | | | Pre-Modification
Recorded
Investment | | | Post-Modification
Recorded
Investment | |
| | (dollars in thousands) | |
Commercial secured by real estate | | | 3 | | | $ | 2,371 | | | $ | 2,359 | | | | 5 | | | $ | 4,296 | | | $ | 4,073 | |
Residential mortgage | | | 3 | | | | 1,023 | | | | 1,017 | | | | - | | | | - | | | | - | |
Total TDRs | | | 6 | | | $ | 3,394 | | | $ | 3,376 | | | | 5 | | | $ | 4,296 | | | $ | 4,073 | |
F-19
The following tables present, by class of loans, information regarding the types of concessions granted on accruing and non-accruing loans that were restructured during the years ended December 31, 2013 and 2012:
| | Year ended December 31, 2013 | |
| | (dollars in thousands) | |
| | Reductions in Interest Rate and Maturity Date | | | Reductions in Interest Rate and Principal Amount | | | Maturity Date Extension | | | Maturity Date Extension and Interest Rate Reduction | | | Deferral of Principal Amount Due and Shortened Maturity Date | | | Total Concessions Granted | |
| | No. of Loans | | | Amount | | | No. of Loans | | | Amount | | | No. of Loans | | | Amount | | | No. of Loans | | | Amount | | | No. of Loans | | | Amount | | | No. of Loans | | | Amount | |
Accruing TDRs: | | | | | | | | | | | | | | | | | | | | | | | | | | | | | | | | | | | | | | | | | | | | | | | | |
Commercial secured by real estate | | | - | | | $ | - | | | | - | | | $ | - | | | | 1 | | | $ | 54 | | | | 1 | | | $ | 2,194 | | | | - | | | $ | - | | | | 2 | | | $ | 2,248 | |
Residential mortgage | | | - | | | | - | | | | - | | | | - | | | | 2 | | | | 805 | | | | 1 | | | | 212 | | | | - | | | | - | | | | 3 | | | | 1,017 | |
Total accruing TDRs | | | - | | | $ | - | | | | - | | | $ | - | | | | 3 | | | $ | 859 | | | | 2 | | | $ | 2,406 | | | | - | | | $ | - | | | | 5 | | | $ | 3,265 | |
| | | | | | | | | | | | | | | | | | | | | | | | | | | | | | | | | | | | | | | | | | | | | | | | |
Non-accruing TDRs: | | | | | | | | | | | | | | | | | | | | | | | | | | | | | | | | | | | | | | | | | | | | | | | | |
Commercial secured by real estate | | | - | | | $ | - | | | | - | | | $ | - | | | | 1 | | | $ | 111 | | | | - | | | $ | - | | | | - | | | $ | - | | | | 1 | | | $ | 111 | |
Residential mortgage | | | - | | | | - | | | | - | | | | - | | | | - | | | | - | | | | - | | | | - | | | | - | | | | - | | | | - | | | | - | |
Total non-accruing TDRs | | | - | | | $ | - | | | | - | | | $ | - | | | | 1 | | | $ | 111 | | | | - | | | $ | - | | | | - | | | $ | - | | | | 1 | | | $ | 111 | |
| | | | | | | | | | | | | | | | | | | | | | | | | | | | | | | | | | | | | | | | | | | | | | | | |
Total TDRs: | | | | | | | | | | | | | | | | | | | | | | | | | | | | | | | | | | | | | | | | | | | | | | | | |
Commercial secured by real estate | | | - | | | $ | - | | | | - | | | $ | - | | | | 2 | | | $ | 165 | | | | 1 | | | $ | 2,194 | | | | - | | | $ | - | | | | 3 | | | $ | 2,359 | |
Residential mortgage | | | - | | | | - | | | | - | | | | - | | | | 2 | | | | 805 | | | | 1 | | | | 212 | | | | - | | | | - | | | | 3 | | | | 1,017 | |
Total TDRs | | | - | | | $ | - | | | | - | | | $ | - | | | | 4 | | | $ | 970 | | | | 2 | | | $ | 2,406 | | | | - | | | $ | - | | | | 6 | | | $ | 3,376 | |
| | Year ended December 31, 2012 | |
| | (dollars in thousands) | |
| | Reductions in Interest Rate and Maturity Date | | | Reductions in Interest Rate and Principal Amount | | | Maturity Date Extension | | | Maturity Date Extension and Interest Rate Reduction | | | Deferral of Principal Amount Due and Shortened Maturity Date | | | Total Concessions Granted | |
| | No. of Loans | | | Amount | | | No. of Loans | | | Amount | | | No. of Loans | | | Amount | | | No. of Loans | | | Amount | | | No. of Loans | | | Amount | | | No. of Loans | | | Amount | |
Accruing TDRs: | | | | | | | | | | | | | | | | | | | | | | | | | | | | | | | | | | | | | | | | | | | | | | | | |
Commercial secured by real estate | | | 1 | | | $ | 2,207 | | | | - | | | $ | - | | | | - | | | $ | - | | | | 1 | | | $ | 342 | | | | - | | | $ | - | | | | 2 | | | $ | 2,549 | |
Residential mortgage | | | - | | | | - | | | | - | | | | - | | | | - | | | | - | | | | - | | | | - | | | | - | | | | - | | | | - | | | | - | |
Total accruing TDRs | | | 1 | | | $ | 2,207 | | | | - | | | $ | - | | | | - | | | $ | - | | | | 1 | | | $ | 342 | | | | - | | | $ | - | | | | 2 | | | $ | 2,549 | |
| | | | | | | | | | | | | | | | | | | | | | | | | | | | | | | | | | | | | | | | | | | | | | | | |
Non-accruing TDRs: | | | | | | | | | | | | | | | | | | | | | | | | | | | | | | | | | | | | | | | | | | | | | | | | |
Commercial secured by real estate | | | 1 | | | $ | 1,064 | | | | - | | | $ | - | | | | - | | | $ | - | | | | - | | | $ | - | | | | 2 | | | $ | 460 | | | | 3 | | | $ | 1,524 | |
Residential mortgage | | | - | | | | - | | | | - | | | | - | | | | - | | | | - | | | | - | | | | - | | | | - | | | | - | | | | - | | | | - | |
Total non-accruing TDRs | | | 1 | | | $ | 1,064 | | | | - | | | $ | - | | | | - | | | $ | - | | | | - | | | $ | - | | | | 2 | | | $ | 460 | | | | 3 | | | $ | 1,524 | |
| | | | | | | | | | | | | | | | | | | | | | | | | | | | | | | | | | | | | | | | | | | | | | | | |
Total TDRs: | | | | | | | | | | | | | | | | | | | | | | | | | | | | | | | | | | | | | | | | | | | | | | | | |
Commercial secured by real estate | | | 2 | | | $ | 3,271 | | | | - | | | $ | - | | | | - | | | $ | - | | | | 1 | | | $ | 342 | | | | 2 | | | $ | 460 | | | | 5 | | | $ | 4,073 | |
Residential mortgage | | | - | | | | - | | | | - | | | | - | | | | - | | | | - | | | | - | | | | - | | | | - | | | | - | | | | - | | | | - | |
Total TDRs | | | 2 | | | $ | 3,271 | | | | - | | | $ | - | | | | - | | | $ | - | | | | 1 | | | $ | 342 | | | | 2 | | | $ | 460 | | | | 5 | | | $ | 4,073 | |
F-20
The following presents TDRs that subsequently defaulted for the years ended December 31, 2013 and 2012:
| | For the years ended December 31, | |
| | 2013 | | | 2012 | |
Troubled Debt Restructurings That Subsequently Defaulted | | Number of
Contracts | | | Recorded
Investment | | | Number of
Contracts | | | Recorded
Investment | |
| | (dollars in thousands) | |
Commercial secured by real estate | | | 2 | | | $ | 449 | | | | 2 | | | $ | 194 | |
Residential mortgage | | | - | | | | - | | | | 2 | | | | 363 | |
Total | | | 2 | | | $ | 449 | | | | 4 | | | $ | 557 | |
A loan is considered to be in payment default once it is 90 days contractually past due under the modified terms. Some loan modifications classified as TDRs may not ultimately result in the full collection of principal and interest, as modified, and may result in potential incremental losses. These potential incremental losses have been factored into our overall allowance for loan losses estimate. The level of any re-defaults will likely be affected by future economic conditions. Once a loan becomes a TDR, it will continue to be reported as a TDR until it is repaid in full, reclassified to loans held for sale, foreclosed, sold or it meets criteria to be removed from TDR status. At December 31, 2013 and 2012, the allowance for loan losses included an impairment reserve for TDRs in the amount of $127,000 and $79,000, respectively. At December 31, 2013, there are no commitments to extend additional funds to loans that are TDRs.
The following table presents impaired loans at December 31, 2013:
December 31, 2013 (1) | | Recorded
Investment (2) | | | Unpaid
Principal
Balance | | | Related
Allowance | | | Average
Recorded
Investment | | | Interest
Income
Recognized | |
| | (in thousands) |
Impaired loans with a related allowance | | | | | | | | | | | | | | | | | | | | |
Commercial secured by real estate | | $ | 2,773 | | | $ | 3,234 | | | $ | 148 | | | $ | 2,901 | | | $ | 116 | |
Commercial term loans | | | - | | | | - | | | | - | | | | - | | | | - | |
Construction | | | - | | | | - | | | | - | | | | - | | | | - | |
Other commercial | | | 60 | | | | 70 | | | | 6 | | | | 60 | | | | - | |
Residential mortgage | | | 618 | | | | 689 | | | | 70 | | | | 660 | | | | 8 | |
Home equity loans and lines of credit | | | 220 | | | | 232 | | | | 22 | | | | 223 | | | | - | |
Other consumer loans | | | - | | | | - | | | | - | | | | - | | | | - | |
Impaired loans with a related allowance | | $ | 3,671 | | | $ | 4,225 | | | $ | 246 | | | $ | 3,844 | | | $ | 124 | |
| | | | | | | | | | | | | | | | | | | | |
Impaired loans with no related allowance | | | | | | | | | | | | | | | | | | | | |
Commercial secured by real estate | | $ | 5,450 | | | $ | 7,203 | | | $ | - | | | $ | 3,738 | | | $ | 88 | |
Commercial term loans | | | - | | | | - | | | | - | | | | - | | | | - | |
Construction | | | - | | | | - | | | | - | | | | - | | | | - | |
Other commercial | | | 243 | | | | 306 | | | | - | | | | 246 | | | | - | |
Residential mortgage | | | 1,597 | | | | 1,675 | | | | - | | | | 1,536 | | | | 69 | |
Home equity loans and lines of credit | | | 241 | | | | 242 | | | | - | | | | 157 | | | | 9 | |
Other consumer loans | | | - | | | | - | | | | - | | | | - | | | | - | |
Impaired loans with no related allowance | | $ | 7,531 | | | $ | 9,426 | | | $ | - | | | $ | 5,677 | | | $ | 166 | |
| | | | | | | | | | | | | | | | | | | | |
Total impaired loans | | | | | | | | | | | | | | | | | | | | |
Commercial secured by real estate | | $ | 8,223 | | | $ | 10,437 | | | $ | 148 | | | $ | 6,639 | | | $ | 204 | |
Commercial term loans | | | - | | | | - | | | | - | | | | - | | | | - | |
Construction | | | - | | | | - | | | | - | | | | - | | | | - | |
Other commercial | | | 303 | | | | 376 | | | | 6 | | | | 306 | | | | - | |
Residential mortgage | | | 2,215 | | | | 2,364 | | | | 70 | | | | 2,196 | | | | 77 | |
Home equity loans and lines of credit | | | 461 | | | | 474 | | | | 22 | | | | 380 | | | | 9 | |
Other consumer loans | | | - | | | | - | | | | - | | | | - | | | | - | |
Total impaired loans | | $ | 11,202 | | | $ | 13,651 | | | $ | 246 | | | $ | 9,521 | | | $ | 290 | |
(1) | excludes HFS non-accruing loans of $1.6 million. |
(2) | the difference between the recorded investment and unpaid principal balance primarily results from partial charge-offs. |
F-21
The following table presents impaired loans at December 31, 2012:
December 31, 2012 (1) | | Recorded
Investment (2) | | | Unpaid
Principal
Balance | | | Related
Allowance | | | Average
Recorded
Investment | | | Interest
Income
Recognized | |
| | (in thousands) | |
Impaired loans with a related allowance | | | | | | | | | | | | | | | | | | | | |
Commercial secured by real estate | | $ | 6,281 | | | $ | 9,021 | | | $ | 550 | | | $ | 7,106 | | | $ | 149 | |
Commercial term loans | | | - | | | | - | | | | - | | | | - | | | | - | |
Construction | | | - | | | | - | | | | - | | | | - | | | | - | |
Other commercial | | | 116 | | | | 122 | | | | 57 | | | | 128 | | | | - | |
Residential mortgage | | | 47 | | | | 47 | | | | 5 | | | | 47 | | | | - | |
Home equity loans and lines of credit | | | - | | | | - | | | | - | | | | - | | | | - | |
Other consumer loans | | | - | | | | - | | | | - | | | | - | | | | - | |
Impaired loans with a related allowance | | $ | 6,444 | | | $ | 9,190 | | | $ | 612 | | | $ | 7,281 | | | $ | 149 | |
| | | | | | | | | | | | | | | | | | | | |
Impaired loans with no related allowance | | | | | | | | | | | | | | | | | | | | |
Commercial secured by real estate | | $ | 11,171 | | | $ | 16,748 | | | $ | - | | | $ | 8,702 | | | $ | 3 | |
Commercial term loans | | | - | | | | - | | | | - | | | | - | | | | - | |
Construction | | | 141 | | | | 208 | | | | - | | | | 140 | | | | - | |
Other commercial | | | 399 | | | | 436 | | | | - | | | | 361 | | | | - | |
Residential mortgage | | | 4,383 | | | | 4,754 | | | | - | | | | 3,792 | | | | 72 | |
Home equity loans and lines of credit | | | 841 | | | | 901 | | | | - | | | | 505 | | | | 87 | |
Other consumer loans | | | - | | | | - | | | | - | | | | - | | | | - | |
Impaired loans with no related allowance | | $ | 16,935 | | | $ | 23,047 | | | $ | - | | | $ | 13,500 | | | $ | 162 | |
| | | | | | | | | | | | | | | | | | | | |
Total impaired loans | | | | | | | | | | | | | | | | | | | | |
Commercial secured by real estate | | $ | 17,452 | | | $ | 25,769 | | | $ | 550 | | | $ | 15,808 | | | $ | 152 | |
Commercial term loans | | | - | | | | - | | | | - | | | | - | | | | - | |
Construction | | | 141 | | | | 208 | | | | - | | | | 140 | | | | - | |
Other commercial | | | 515 | | | | 558 | | | | 57 | | | | 489 | | | | - | |
Residential mortgage | | | 4,430 | | | | 4,801 | | | | 5 | | | | 3,839 | | | | 72 | |
Home equity loans and lines of credit | | | 841 | | | | 901 | | | | - | | | | 505 | | | | 87 | |
Other consumer loans | | | - | | | | - | | | | - | | | | - | | | | - | |
Total impaired loans | | $ | 23,379 | | | $ | 32,237 | | | $ | 612 | | | $ | 20,781 | | | $ | 311 | |
(1) | excludes HFS non-accruing loans of $911,000. |
(2) | the difference between the recorded investment and unpaid principal balance primarily results from partial charge-offs. |
The following table presents loans by past due status at December 31, 2013:
December 31, 2013 | | 30-59 Days Delinquent | | | 60-89 Days Delinquent | | | 90 Days or More Delinquent and Accruing | | | Total Delinquent and Accruing | | | Non-accrual (1) | | | Current | | | Total Loans | |
| | (in thousands) | |
Commercial secured by real estate | | $ | - | | | $ | 1,272 | | | $ | - | | | $ | 1,272 | | | $ | 5,425 | | | $ | 416,132 | | | $ | 422,829 | |
Commercial term loans | | | - | | | | - | | | | - | | | | - | | | | - | | | | 23,203 | | | | 23,203 | |
Construction | | | - | | | | - | | | | - | | | | - | | | | - | | | | 10,852 | | | | 10,852 | |
Other commercial | | | - | | | | - | | | | - | | | | - | | | | 303 | | | | 37,469 | | | | 37,772 | |
Residential mortgage | | | 504 | | | | 589 | | | | 347 | | | | 1,440 | | | | 807 | | | | 248,451 | | | | 250,698 | |
Home equity loans and lines of
credit | | | 392 | | | | 192 | | | | 111 | | | | 695 | | | | 350 | | | | 42,423 | | | | 43,468 | |
Other consumer loans | | | - | | | | 7 | | | | - | | | | 7 | | | | - | | | | 970 | | | | 977 | |
Total | | $ | 896 | | | $ | 2,060 | | | $ | 458 | | | $ | 3,414 | | | $ | 6,885 | | | $ | 779,500 | | | $ | 789,799 | |
(1) | excludes $1.6 million of loans held for sale. |
F-22
The following table presents loans by past due status at December 31, 2012:
December 31, 2012 | | 30-59 Days Delinquent | | | 60-89 Days Delinquent | | | 90 Days or More Delinquent and Accruing | | | Total Delinquent and Accruing | | | Non-accrual (1) | | | Current | | | Total Loans | |
| | (in thousands) | |
Commercial secured by real estate | | $ | - | | | $ | 517 | | | $ | - | | | $ | 517 | | | $ | 14,329 | | | $ | 373,202 | | | $ | 388,048 | |
Commercial term loans | | | - | | | | - | | | | - | | | | - | | | | - | | | | 19,443 | | | | 19,443 | |
Construction | | | - | | | | - | | | | 141 | | | | 141 | | | | - | | | | 1,624 | | | | 1,765 | |
Other commercial | | | - | | | | - | | | | - | | | | - | | | | 515 | | | | 32,233 | | | | 32,748 | |
Residential mortgage | | | 532 | | | | 253 | | | | 1,056 | | | | 1,841 | | | | 2,487 | | | | 231,593 | | | | 235,921 | |
Home equity loans and lines of credit | | | 87 | | | | 195 | | | | 429 | | | | 711 | | | | 412 | | | | 44,135 | | | | 45,258 | |
Other consumer loans | | | 20 | | | | 24 | | | | - | | | | 44 | | | | - | | | | 1,273 | | | | 1,317 | |
Total | | $ | 639 | | | $ | 989 | | | $ | 1,626 | | | $ | 3,254 | | | $ | 17,743 | | | $ | 703,503 | | | $ | 724,500 | |
(1) | excludes $911,000 of loans held for sale. |
The Company categorizes loans, when the loan is initially under written, into risk categories based on relevant information about the ability of borrowers to service their debt. The assessment considers numerous factors including, but not limited to, current financial information, historical payment experience, credit documentation, public information, and current economic trends, among other factors. The Company analyzes loans individually by classifying the loans as to credit risk. Annually, this analysis includes loans with an outstanding balance greater than $250,000 and non-homogeneous loans, such as commercial and commercial real estate loans. The Company uses the following definitions for risk ratings:
Risk Rating 1-5—Acceptable credit quality ranging from High Pass (cash or near cash as collateral) to Management Attention/Pass (acceptable risk) with some deficiency in one or more of the following areas: management experience, debt service coverage levels, balance sheet leverage, earnings trends, the industry of the borrower and annual receipt of current borrower financial information.
Risk Rating 6— Special Mention reflects loans that management believes warrant special consideration and may be loans that are delinquent or current in their payments. These loans have potential weakness which increases their risk to the bank and have shown some signs of weakness but have fallen short of being a Substandard loan.
Management believes that the Substandard category is best considered in four discrete classes: RR 7; RR 8; RR 9; and RR 10.
Risk Rating 7—The class is mostly populated by customers that have a history of repayment (less than 2 delinquencies in the past year) but exhibit a well-defined weakness.
Risk Rating 8—These are loans that share many of the characteristics of the RR 7 loans as they relate to cash flow and/or collateral, but have the further negative of chronic delinquencies. These loans have not yet declined in quality to require a FASB ASC Topic No. 310 Receivables analysis, but nonetheless this class has a greater likelihood of migration to a more negative risk rating.
Risk Rating 9—These loans are impaired loans, are current and accruing, and in some cases are TDRs. They have had a FASB ASC Topic No. 310 Receivables analysis completed.
Risk Rating 10—These loans have undergone a FASB ASC Topic No. 310 Receivables analysis. For those that have a FASB ASC Topic No. 310 Receivables analysis, no general reserve is allowed. More often than not, those loans in this class with specific reserves have had the reserve placed by Management pending information to complete a FASB ASC Topic No. 310 Receivables analysis. Upon completion of the FASB ASC Topic No. 310 Receivables analysis reserves are adjusted or charged-off.
For homogeneous loan pools, such as residential mortgages, home equity lines of credit and term loans, and other consumer loans, the Company uses payment status to identify the credit risk in these loan portfolios. Payment status is reviewed on a daily basis by the Bank’s collection area and on a monthly basis with respect to determining the adequacy of the allowance for loan losses. The payment status of these homogeneous pools at December 31, 2013 and December 31, 2012 is included in the aging of the recorded investment of past due loans table. In addition, the total non-performing portion of these homogeneous loan pools at December 31, 2013 and December 31, 2012 is presented in the recorded investment in nonaccrual loans.
F-23
The following tables present commercial loans by credit quality indicator:
| | Risk Ratings | |
December 31, 2013 | | Grades 1-5 | | | Grade 6 | | | Grade 7 | | | Grade 8 | | | Grade 9 | | | Grade 10 | | | Non-accrual | | | Total | |
| | (in thousands) | |
Commercial secured by real estate | | $ | 397,398 | | | $ | 10,669 | | | $ | 4,729 | | | $ | 1,809 | | | $ | 2,799 | | | $ | - | | | $ | 5,425 | | | $ | 422,829 | |
Commercial term loans | | | 20,899 | | | | - | | | | 2,304 | | | | - | | | | - | | | | - | | | | - | | | | 23,203 | |
Construction | | | 10,852 | | | | - | | | | - | | | | - | | | | - | | | | - | | | | - | | | | 10,852 | |
Other commercial | | | 35,859 | | | | 510 | | | | 1,100 | | | | - | | | | - | | | | - | | | | 303 | | | | 37,772 | |
| | $ | 465,008 | | | $ | 11,179 | | | $ | 8,133 | | | $ | 1,809 | | | $ | 2,799 | | | $ | - | | | $ | 5,728 | | | $ | 494,656 | |
| | Risk Ratings | |
December 31, 2012 | | Grades 1-5 | | | Grade 6 | | | Grade 7 | | | Grade 8 | | | Grade 9 | | | Grade 10 | | | Non-accrual | | | Total | |
| | (in thousands) | |
Commercial secured by real estate | | $ | 363,460 | | | $ | 3,845 | | | $ | 2,717 | | | $ | 574 | | | $ | 3,123 | | | $ | - | | | $ | 14,329 | | | $ | 388,048 | |
Commercial term loans | | | 19,443 | | | | - | | | | - | | | | - | | | | - | | | | - | | | | - | | | | 19,443 | |
Construction | | | 1,624 | | | | - | | | | - | | | | - | | | | - | | | | 141 | | | | - | | | | 1,765 | |
Other commercial | | | 32,233 | | | | - | | | | - | | | | - | | | | - | | | | - | | | | 515 | | | | 32,748 | |
| | $ | 416,760 | | | $ | 3,845 | | | $ | 2,717 | | | $ | 574 | | | $ | 3,123 | | | $ | 141 | | | $ | 14,844 | | | $ | 442,004 | |
Mortgage loans serviced for others are not reported as assets. The principal balances of these loans at December 31, 2013 and 2012 are as follows:
| December 31, | |
| 2013 | | | 2012 | |
| (in thousands) | |
Mortgage loan portfolios serviced | $ | 1,934 | | | $ | 2,346 | |
Custodial escrow balances maintained in connection with serviced loans were $15,000 and $18,000, respectively at December 31, 2013 and 2012.
Loans to principal officers, directors, and their affiliates were as follows:
| December 31, | |
| 2013 | | | 2012 | |
| (in thousands) | |
| | | | | | | |
Beginning balance | $ | 7,469 | | | $ | 14,424 | |
New loans/advances | | 409 | | | | 6,285 | |
Effect of changes in composition of related parties | | - | | | | (5,960 | ) |
Repayments | | (552 | ) | | | (7,280 | ) |
Ending balance | $ | 7,326 | | | $ | 7,469 | |
NOTE 5 — FAIR VALUE
FASB ASC Topic No. 820, “Fair Value Measurements and Disclosures” establishes a fair value hierarchy which requires an entity to maximize the use of observable inputs and minimize the use of unobservable inputs when measuring fair value. The standard describes three levels of inputs that may be used to measure fair value:
Level 1: Quoted prices (unadjusted) for identical assets or liabilities in active markets that the entity has the ability to access as of the measurement date.
Level 2: Significant other observable inputs other than Level 1 prices such as quoted prices for similar assets or liabilities; quoted prices in markets that are not active; or other inputs that are observable or can be corroborated by observable market data.
F-24
Level 3: Significant unobservable inputs that reflect a reporting entity’s own assumptions about the assumptions that market participants would use in pricing an asset or liability.
Fair value measurement of securities available for sale is based upon quoted prices, if available. If quoted prices are not available, fair values are generally measured using independent pricing models or other model-based valuation techniques that include market inputs, such as benchmark yields, reported trades, broker/dealer quotes, issuer spreads, two-sided markets, benchmark securities, bids, offers, reference data and industry and economic events. Level 1 securities include an investment fund that is traded by dealers or brokers in active over-the-counter markets. Level 2 securities include securities issued by government sponsored agencies, securities issued by certain state and political subdivisions, residential mortgage-backed securities, collateralized mortgage obligations, and corporate bonds.
Collateralized debt obligation securities which are issued by financial institutions and insurance companies were historically priced using Level 3 inputs. The decline in the level of observable inputs and market activity in this class of investments by the measurement date has been significant and resulted in unreliable external pricing. Broker pricing and bid/ask spreads, when available, vary widely. The once active market has become comparatively inactive.
The Company obtained the pricing for collateralized debt obligation securities, which are issued by financial institutions and insurance companies, from an independent third party who prepared the valuations using a market valuation approach. Information such as historical and current performance of the underlying collateral, deferral/default rates, collateral coverage ratios, break in yield calculations, cash flow projections, liquidity and credit premiums required by a market participant, and financial trend analysis with respect to the individual issuing financial institutions and insurance companies, is utilized in determining individual security valuations. Due to current market conditions, as well as the limited trading activity of these securities, the market value of the securities is highly sensitive to assumption changes and market volatility.
Assets and Liabilities Measured on a Recurring Basis
Assets and liabilities measured at fair value on a recurring basis are summarized below:
| Fair Value Measurements at December 31, 2013 | | | Fair Value Measurements at December 31, 2012 | |
| Quoted Prices in Active Markets for Identical Assets (Level 1) | | | Significant Other Observable Inputs (Level 2) | | | Significant Other Observable Inputs (Level 3) | | | Quoted Prices in Active Markets for Identical Assets (Level 1) | | | Significant Other Observable Inputs (Level 2) | | | Significant Other Observable Inputs (Level 3) | |
| (in thousands) | | | (in thousands) | |
Investment securities available for sale: | | | | | | | | | | | | | | | | | | | | | | | |
U.S. Government and agency obligations | $ | - | | | $ | 51,606 | | | $ | - | | | $ | - | | | $ | 39,082 | | | $ | - | |
Municipal bonds | | - | | | | 6,178 | | | | - | | | | - | | | | 20,758 | | | | - | |
Collateralized debt obligations | | - | | | | - | | | | - | | | | - | | | | - | | | | 4,682 | |
Corporate bonds | | - | | | | 13,079 | | | | - | | | | - | | | | 14,241 | | | | - | |
CRA Qualified Investment Fund | | 4,700 | | | | - | | | | - | | | | 4,991 | | | | - | | | | - | |
Mortgage-backed securities | | - | | | | 81,603 | | | | - | | | | - | | | | 87,103 | | | | - | |
Total securities available for sale | $ | 4,700 | | | $ | 152,466 | | | $ | - | | | $ | 4,991 | | | $ | 161,184 | | | $ | 4,682 | |
The fair value of the collateralized debt obligation securities for the period ended December 31, 2012 was determined by utilizing Level 3 inputs. The value was derived from a discounted cash flow model using significant unobservable inputs such as, a discount margin to present value the cash flows, and assumptions about the underlying collateral including default rate, recovery rate for deferring issuers, and prepayment speeds. The discount margin used for each security ranged from 2.2% to 9.5%, while the range for the default rate was 0.25% to 2.00% and a 15% recovery rate for deferring issuers has been assumed. An annual prepayment speed of 1.00% was assumed. Significant increases in any of the rates, with the exception of the recovery rate, would result in a significantly lower fair value measurement. In December 2013, the Company sold its remaining collateralized debt obligation securities that had a cost basis of greater than zero.
F-25
The table below presents a reconciliation and income statement classification of gains and losses for all assets measured at fair value on a recurring basis using significant unobservable inputs (Level 3) for the years ended December 31, 2013 and 2012:
| Fair Value Measurements Using Significant Unobservable Inputs (Level 3) | |
| CDO Securities Available for Sale | |
| Years ended December 31, | |
| 2013 | | | 2012 | |
| (in thousands) | |
Beginning balance | $ | 4,682 | | | $ | 3,584 | |
Accretion of discount | | 27 | | | | 39 | |
Payments received | | - | | | | (182 | ) |
Reduction in Accumulated OTTI on sale | | (2,402 | ) | | | | |
Realized gain (loss) on sale/redemption | | (2,561 | ) | | | 127 | |
Unrealized holding gain (loss) | | 254 | | | | 1,122 | |
Other-than-temporary impairment included in earnings | | - | | | | (8 | ) |
Ending balance | $ | - | | | $ | 4,682 | |
Assets and Liabilities Measured on a Non-Recurring Basis
Assets and liabilities measured at fair value on a non-recurring basis are summarized below:
| Fair Value Measurements at December 31, 2013 | | | Fair Value Measurements at December 31, 2012 | |
| Quoted Prices in Active Markets for Identical Assets (Level 1) | | | Significant Other Observable Inputs (Level 2) | | | Significant Other Unobservable Inputs (Level 3) | | | Quoted Prices in Active Markets for Identical Assets (Level 1) | | | Significant Other Observable Inputs (Level 2) | | | Significant Other Unobservable Inputs (Level 3) | |
| (in thousands) | | | (in thousands) | |
Assets: | | | | | | | | | | | | | | | | | | | | | | | |
Impaired loans (1): | | | | | | | | | | | | | | | | | | | | | | | |
Commercial secured by real estate | $ | - | | | $ | - | | | $ | 2,255 | | | $ | - | | | $ | 8,389 | | | $ | 9,063 | |
Commercial term loans | | - | | | | - | | | | - | | | | - | | | | - | | | | - | |
Construction | | - | | | | - | | | | - | | | | - | | | | 141 | | | | - | |
Other commercial | | - | | | | - | | | | 297 | | | | - | | | | 400 | | | | 115 | |
Residential mortgage | | - | | | | - | | | | 766 | | | | - | | | | 3,133 | | | | 1,297 | |
Home equity loans | | - | | | | - | | | | 198 | | | | - | | | | 841 | | | | - | |
Total impaired loans | $ | - | | | $ | - | | | $ | 3,516 | | | $ | - | | | $ | 12,904 | | | $ | 10,475 | |
Other real estate owned: | | | | | | | | | | | | | | | | | | | | | | | |
Commercial | $ | - | | | $ | 4,893 | | | $ | - | | | $ | - | | | $ | 3,648 | | | $ | - | |
Residential mortgage | | - | | | | 2,556 | | | | - | | | | - | | | | 3,573 | | | | - | |
Total other real estate owned | $ | - | | | $ | 7,449 | | | $ | - | | | $ | - | | | $ | 7,221 | | | $ | - | |
Loans held for sale | $ | - | | | $ | 1,814 | | | $ | - | | | $ | - | | | $ | 8,795 | | | $ | - | |
Assets held for sale | $ | - | | | $ | 10 | | | $ | - | | | $ | - | | | $ | 436 | | | $ | - | |
(1) | Includes non-accrual loans, loans delinquent greater than 90 days and still accruing, loans less than 90 days delinquent and still accruing and troubled debt restructured loans. |
At the time a loan is considered impaired, it is valued at the lower of cost or fair value. This value is generally based on recent real estate appraisals. These appraisals may utilize a single valuation approach or a combination of approaches including comparable sales and the income approach. Adjustments are routinely made in the appraisal process by the appraisers to adjust for differences between the comparable sales and income data available. Such adjustments may relate to location, square footage, condition, amenities, market rate of leases, if any, as well as the timing of comparable sales. The fair value of the loan is compared to the carrying value to determine if any write-down or specific reserve is required. On a quarterly basis, impaired loans are evaluated for additional impairment and adjusted accordingly. Because the Company has a small amount of impaired loans and OREO measured at fair value, the impact of unobservable inputs on the Company’s financial statements is not material.
F-26
On an annual basis, management compares the actual selling price of any collateral that has been sold to the most recent appraised value to determine what additional adjustment should be made to the appraisal value to arrive at the fair value for other properties. The most recent analysis performed in 2013 indicated that a discount up to 7 percent should be applied to appraisals on properties. The discount is determined based on the nature of the underlying properties, aging of appraisal and other factors.
Fair valued impaired loans with allocated allowance for loan losses at December 31, 2013, had a carrying amount of $3.5 million, which is made up of the outstanding balance of $3.6 million, net of a valuation allowance of $119,000. These balances do not include $3.4 million of impaired loans that are measured using the discounted cash flow method and are not collateral dependent.
Other real estate owned properties are recorded at the estimated fair market value, less the estimated cost to sell, at the date of foreclosure. Fair market value is estimated by using professional real estate appraisals subject to similar adjustments previously mentioned and may be subsequently adjusted based upon real estate broker opinions. Often these values are based on contract of sale or offers, which could result in a Level 2 assignment.
As discussed above, the fair value of impaired loans and other real estate owned is generally determined through independent appraisals of the underlying collateral, which may include Level 3 inputs that are not identifiable.
The following disclosure of estimated fair value amounts has been determined by the Company using available market information and appropriate valuation methodologies. However, considerable judgment is required to interpret market data to develop the estimates of fair value. Accordingly, the estimates presented herein are not necessarily indicative of the amounts the Company could realize in a current market exchange. The use of different market assumptions and/or estimation methodologies may have a material effect on the estimated fair value amounts.
| At December 31, 2013 | |
| | | | | Fair Value Measurements | |
| | | | | Quoted Prices | | | | | | | | | |
| | | | | in Active | | | Significant | | | Significant | |
| | | | | Markets | | | Other | | | Other | |
| | | | | for Identical | | | Observable | | | Unobservable | |
| Carrying | | | Assets | | | Inputs | | | Inputs | |
| Amount | | | (Level 1) | | | (Level 2) | | | (Level 3) | |
| (in thousands) | |
Assets | | | | | | | | | | | | | | | |
Cash and cash equivalents | $ | 24,861 | | | $ | 6,940 | | | $ | 17,921 | | | $ | - | |
Interest-bearing time deposits | $ | 9,185 | | | $ | - | | | $ | 9,185 | | | $ | - | |
Loans held for sale | $ | 1,814 | | | $ | - | | | $ | 1,814 | | | $ | - | |
Loans receivable | $ | 780,127 | | | $ | - | | | $ | - | | | $ | 791,262 | |
FHLB Stock | $ | 7,747 | | | n/a | | | n/a | | | n/a | |
Accrued interest receivable | $ | 3,235 | | | $ | - | | | $ | 615 | | | $ | 2,620 | |
| | | | | | | | | | | | | | | |
Liabilities | | | | | | | | | | | | | | | |
Savings deposits | $ | 96,029 | | | $ | - | | | $ | 96,029 | | | $ | - | |
Checking and money market deposits | $ | 433,205 | | | $ | 82,488 | | | $ | 350,717 | | | $ | - | |
Certificates of deposit | $ | 269,188 | | | $ | - | | | $ | 270,371 | | | $ | - | |
Borrowings | $ | 143,935 | | | $ | - | | | $ | 151,287 | | | $ | - | |
Accrued interest payable | $ | 102 | | | $ | - | | | $ | 102 | | | $ | - | |
F-27
| At December 31, 2012 | |
| | | | | Fair Value Measurements | |
| | | | | Quoted Prices | | | | | | | | | |
| | | | | in Active | | | Significant | | | Significant | |
| | | | | Markets | | | Other | | | Other | |
| | | | | for Identical | | | Observable | | | Unobservable | |
| Carrying | | | Assets | | | Inputs | | | Inputs | |
| Amount | | | (Level 1) | | | (Level 2) | | | (Level 3) | |
| (in thousands) | |
Assets | | | | | | | | | | | | | | | |
Cash and cash equivalents | $ | 24,228 | | | $ | 6,867 | | | $ | 17,361 | | | $ | - | |
Interest-bearing time deposits | $ | 9,259 | | | $ | - | | | $ | 9,259 | | | $ | - | |
Loans held for sale | $ | 8,795 | | | $ | - | | | $ | 8,795 | | | $ | - | |
Loans receivable | $ | 714,396 | | | $ | - | | | $ | 12,904 | | | $ | 725,116 | |
FHLB Stock | $ | 5,775 | | | n/a | | | n/a | | | n/a | |
Accrued interest receivable | $ | 3,091 | | | $ | - | | | $ | 627 | | | $ | 2,464 | |
| | | | | | | | | | | | | | | |
Liabilities | | | | | | | | | | | | | | | |
Savings deposits | $ | 96,160 | | | $ | - | | | $ | 96,160 | | | $ | - | |
Checking and money market deposits | $ | 449,809 | | | $ | 86,266 | | | $ | 363,543 | | | $ | - | |
Certificates of deposit | $ | 238,622 | | | $ | - | | | $ | 240,997 | | | $ | - | |
Borrowings | $ | 97,965 | | | $ | - | | | $ | 109,952 | | | $ | - | |
Accrued interest payable | $ | 148 | | | $ | - | | | $ | 148 | | | $ | - | |
The carrying amount is the estimated fair value for cash and cash equivalents, interest bearing deposits, and accrued interest receivable and payable. Noninterest-bearing cash and cash equivalents and noninterest-bearing deposit liabilities are classified as Level 1, whereas interest-bearing cash and cash equivalents and interest-bearing deposit liabilities are classified as Level 2. Accrued interest receivable and payable are classified as either Level 2 or Level 3 based on the classification level of the asset or liability with which the accrued interest is associated.
Loans held for sale — The fair value of residential mortgage loans held for sale is based on the price secondary markets are currently offering for similar loans using observable market data. The fair value is equal to the carrying value, since the time from when a loan is closed and settled is generally not more than two weeks. The fair value of loans transferred from the loan portfolio to loans held for sale is based on the amounts offered for these loans in currently pending sales transactions, outstanding commitments from investors, or current market valuation appraisals. Loans held for sale are not included in non-performing loans.
Loans — The fair value of impaired loans with specific allocations of the allowance for loan losses is generally based on recent real estate appraisals. The fair values of loans not impaired is estimated by discounting the estimated future cash flows using the Company’s interest rates currently offered for loans with similar terms to borrowers of similar credit quality which is not an exit price under FASB ASC Topic No. 820 “Fair Value Measurements and Disclosures.” The carrying value and fair value of loans include the allowance for loan losses.
FHLB stock — It is not practical to determine the fair value of FHLB stock due to restrictions placed on transferability.
Deposits — The fair value of deposits with no stated maturity, such as money market deposit accounts, checking accounts and savings accounts, is equal to the amount payable on demand. The fair value of certificates of deposit is based on the discounted value of contractual cash flows. The discount rate is equivalent to the rate currently offered by the Company for deposits of similar size, type and maturity.
Borrowings — The fair value of borrowings, which includes Federal Home Loan Bank of New York advances and securities sold under agreement to repurchase, is based on the discounted value of contractual cash flows. The discount rate is equivalent to the rate currently offered for borrowings of similar maturity and terms.
F-28
The Company’s unused loan commitments, standby letters of credit and undisbursed loans have no carrying amount and have been estimated to have no realizable fair value. Historically, a majority of the unused loan commitments have not been drawn upon. See Note 12, “Financial Instruments with Off-Balance Sheet Risk and Concentrations of Credit Risk” of Notes to Consolidated Financial Statements, for additional information.
The fair value estimates presented herein are based on pertinent information available to management as of December 31, 2013. Although management is not aware of any factors that would significantly affect the estimated fair value amounts, such amounts have not been comprehensively revalued for purposes of these financial statements since that date; and therefore, current estimates of fair value may differ significantly from the amounts presented herein.
NOTE 6 — OTHER REAL ESTATE OWNED
At December 31, 2013, other real estate owned totaled $7.4 million and consisted of twenty-three residential properties (including fifteen building lots) and eleven commercial properties. At December 31, 2012, other real estate owned totaled $7.2 million and consisted of thirty-five residential properties (including twenty-seven building lots) and thirteen commercial properties.
For the year ended December 31, 2013, the Company added $6.1 million of property to OREO and sold ten commercial OREO properties and twenty-one residential OREO properties with an aggregate carrying value totaling $5.7 million, including two commercial OREO properties and five residential OREO properties with an aggregate carrying value of $895,000 sold in the fourth quarter of 2013. Net gains on the sale of OREO totaled $81,000 for the year ended December 31, 2013, of which $24,000 was recorded in the fourth quarter, compared to net losses on OREO sales of $260,000 for the year ended December 31, 2012.
For the year ended December 31, 2013, net expenses applicable to OREO totaled $1.1 million which included OREO valuation write-downs of $492,000 , taxes and insurance totaling $309,000, net gains on the sale of OREO totaling $81,000 and miscellaneous expenses, net of rental income totaling $388,000. For the year ended December 31, 2012, net expenses applicable to OREO totaled $2.0 million which included OREO valuation write-downs of $1.1 million, taxes and insurance totaling $456,000, net losses on the sale of OREO totaling $260,000 and miscellaneous expenses, net of rental income totaling $241,000.
As of the date of this filing, the Company has agreements of sale for twelve OREO properties, including four residential building lots, with an aggregate carrying value totaling $2.7 million. In 2014, the Company has added one residential property with a carrying value of $56,000. In addition, in 2014, the Company has sold six residential OREO properties (building lots) with an aggregate carrying value of $538,000.
NOTE 7 — PREMISES AND EQUIPMENT
Premises and equipment, summarized by major classification, are as follows:
| | Estimated Useful
Lives | | 2013 | | | 2012 | |
| | | | (in thousands) | |
| | | | | | | | | | |
Land | | | | $ | 8,484 | | | $ | 8,332 | |
Buildings and improvements | | 10 - 39 years | | | 14,971 | | | | 14,727 | |
Furniture and equipment | | 3 - 7 years | | | 8,562 | | | | 8,782 | |
Construction-in-progress | | - | | | 8 | | | | 93 | |
Total | | | | | 32,025 | | | | 31,934 | |
Accumulated depreciation | | | | | (12,001 | ) | | | (11,651 | ) |
Premises and equipment, net | | | | $ | 20,024 | | | $ | 20,283 | |
Depreciation expense for the years ended December 31, 2013, 2012, and 2011 was approximately $946,000, $1.0 million, and $1.2 million, respectively.
NOTE 8 — GOODWILL AND INTANGIBLE ASSETS
The balance for goodwill as of December 31, 2013 and 2012 totaled $22.6 million.
F-29
FASB ASC Topic No. 350-20, “Goodwill” requires a company to perform an impairment test on goodwill annually, or more frequently if events or changes in circumstance indicate that the asset might be impaired, by computing the fair value of such goodwill to its recorded or carrying amount. If the carrying amount of goodwill exceeds the fair value, an impairment charge must be recorded in an amount equal to the excess.
The Company tested goodwill for impairment during the fourth quarter of 2013. The Company has one reporting unit, Community Banking, and as such evaluated goodwill at the Community Banking reporting unit level. This test involved estimating the fair value of the Company using financial data and market prices as of December 31, 2013 and utilizing the control premium approach. The results of this test indicated that goodwill was not impaired. The Company continues to evaluate goodwill on a quarterly basis utilizing the methodology required for an annual goodwill assessment.
Acquired intangible assets at year end are as follows:
| 2013 | | | 2012 | |
| Gross Carrying
Amount | | | Accumulated
Amortization | | | Gross Carrying
Amount | | | Accumulated
Amortization | |
| (in thousands) | | | (in thousands) | |
Amortized acquired intangible assets: | | | | | | | | | | | | | | | |
Core deposit intangibles | $ | 565 | | | $ | 370 | | | $ | 565 | | | $ | 332 | |
Other customer relationship intangibles | | 485 | | | | 485 | | | | 485 | | | | 481 | |
Total | $ | 1,050 | | | $ | 855 | | | $ | 1,050 | | | $ | 813 | |
The aggregate amortization expense for the years ended December 31, 2013, 2012 and 2011 was $43,000, $97,000 and $111,000, respectively.
The estimated amortization expense for each of the next five years and thereafter is as follows:
| (in thousands) | |
2014 | $ | 32 | |
2015 | $ | 31 | |
2016 | $ | 31 | |
2017 | $ | 31 | |
2018 | $ | 31 | |
Thereafter | $ | 39 | |
NOTE 9 — DEPOSITS
Deposits are as follows:
` | December 31, | |
| 2013 | | | 2012 | |
| (in thousands) | |
Savings accounts | $ | 96,029 | | | $ | 96,160 | |
Interest-bearing checking and money market deposits (1) | | 350,717 | | | | 363,543 | |
Non-interest bearing checking | | 82,488 | | | | 86,266 | |
Certificates of deposit of less than $100,000 | | 113,123 | | | | 129,709 | |
Certificates of deposit of $100,000 or more | | 156,065 | | | | 108,913 | |
Total deposits | $ | 798,422 | | | $ | 784,591 | |
(1) | Includes municipal deposit accounts totaling $88.9 million, or 11.1% of total deposits at December 31, 2013 and $79.4 million, or 10.1 % at December 31, 2012. |
F-30
Interest expense by deposit type was as follows:
| For the years ended December 31, | |
| 2013 | | | 2012 | | | 2011 | |
| (in thousands) | |
Savings accounts | $ | 64 | | | $ | 154 | | | $ | 215 | |
Interest-bearing checking and money market deposits | | 713 | | | | 1,238 | | | | 1,740 | |
Certificates of deposit | | 2,208 | | | | 3,082 | | | | 4,509 | |
Total interest expense on deposits | $ | 2,985 | | | $ | 4,474 | | | $ | 6,464 | |
Certificates of deposit were scheduled to mature contractually within the following periods:
| (in thousands) | |
2014 | $ | 207,655 | |
2015 | | 32,198 | |
2016 | | 16,562 | |
2017 | | 7,312 | |
2018 | | 5,461 | |
| $ | 269,188 | |
Deposits held at the Bank by related parties, which include officers, directors, and companies in which directors of the Board have a significant ownership interest, approximated $5.6 million at December 31, 2013 and $6.0 million at December 31, 2012.
NOTE 10 — BORROWINGS
At December 31, 2013, the Bank had available borrowing capacity under a continuing borrowing agreement with the Federal Home Loan Bank of New York (FHLB) to borrow up to 100% of the book value of qualified 1 to 4 family loans secured by residential properties and various commercial loans secured by commercial real estate subject to FHLB approval. At December 31, 2013 and 2012, none of these advances were callable. Interest rates ranges from 1.10% to 2.25% at December 31, 2013, and from 1.10% to 3.85% at December 31, 2012.
In June 2012, the Company extinguished $20.0 million of fixed rate term FHLB borrowings prior to their scheduled maturity. In connection with the early repayment of these borrowings, the Company incurred a charge of $921,000 to extinguish the debt which was recorded as other expense in the consolidated statements of income. In August 2012, the Company restructured $54.0 million in borrowings, lowering the cost of funds. This action represents a continuation of the balance sheet restructuring the Company began in the second quarter of 2012. The replacement borrowings are adjustable rate, non-callable FHLB advances with maturities ranging from 5 years to 7 years. A prepayment penalty of $6.4 million was incurred related to the restructuring of the old debt and is being amortized as an adjustment to interest expense over the terms of the new borrowings using the interest method.
Outstanding borrowings mature as follows:
| December 31, 2013 | |
| FHLB
Borrowings | | | Repurchase
Agreements | | | Total | |
2014 | $ | 60,000 | | | $ | - | | | $ | 60,000 | |
2015 | | 15,000 | | | | - | | | | 15,000 | |
2016 | | 5,000 | | | | 4,970 | | | | 9,970 | |
2017 | | 18,824 | | | | 4,970 | | | | 23,794 | |
2018 | | 17,256 | | | | - | | | | 17,256 | |
Thereafter | | 17,915 | | | | - | | | | 17,915 | |
Principal due | $ | 133,995 | | | $ | 9,940 | | | $ | 143,935 | |
At December 31, 2013 and 2012, the Bank had qualified 1 to 4 family loans and commercial loans of approximately $250.4 million and $242.2 million, respectively, which served as collateral to cover outstanding advances on the Federal Home Loan Bank of New York borrowings.
F-31
Securities sold under agreement to repurchase totaled $9.9 million at December 31, 2013 and December 31, 2012, are fixed rate, and are collateralized by securities with a carrying amount of $13.0 million at December 31, 2013 and 2012. At maturity, the securities underlying the agreement are returned to the Company. At December 31, 2013 and 2012, the repurchase agreements were callable on various dates, at par, by the repurchase agreement counter-party.
The following table sets forth fixed and variable rate FHLB borrowings and the respective weighted average interest rate at December 31, 2013 and 2012:
| FHLB Borrowings | |
| December 31, 2013 | | | December 31, 2012 | |
| Balance | | | Weighted Average
Rate at Year End | | | Balance | | | Weighted
Average Rate
at Year End | |
| (dollars in thousands) | |
Fixed rate advances | $ | 85,000 | | | | 0.78 | % | | $ | 40,000 | | | | 2.13 | % |
Variable rate advances | | 48,995 | | | | 2.36 | % | | | 48,041 | | | | 2.78 | % |
Total | $ | 133,995 | | | | 1.39 | % | | $ | 88,041 | | | | 2.49 | % |
Additional information regarding FHLB Borrowings and securities sold under agreements to repurchase is as follows:
| 2013 | | | 2012 | |
| FHLB
Borrowings | | | Repurchase
Agreements | | | Total | | | FHLB
Borrowings | | | Repurchase
Agreements | | | Total | |
| (dollars in thousands) | |
Average daily balance during the year | $ | 91,602 | | | $ | 9,932 | | | $ | 101,534 | | | $ | 116,930 | | | $ | 9,913 | | | $ | 126,843 | |
Average interest rate during the year | | 2.04 | % | | | 4.39 | % | | | 2.27 | % | | | 2.81 | % | | | 4.45 | % | | | 2.94 | % |
Maximum month-end balance during the
year | $ | 133,995 | | | $ | 9,940 | | | $ | 143,935 | | | $ | 120,408 | | | $ | 37,413 | | | $ | 157,821 | |
Weighted average interest rate at year-end | | 1.39 | % | | | 4.15 | % | | | 1.58 | % | | | 2.49 | % | | | 4.33 | % | | | 2.61 | % |
NOTE 11 — INCOME TAXES
For the year ended December 31, 2013, the Company recorded a net tax expense of $4.2 million compared to a net tax expense of $2.7 million for the year ended December 31, 2012. As of December 31, 2013, the balance of the deferred tax valuation allowance was zero, due to the expiration of the Charitable Contribution carryforward. Management considered several factors, such as the level of historical taxable income, projections for future taxable income over the periods in which the deferred tax assets are deductible and tax planning strategies in determining the amount of the deferred tax asset that was more likely than not realizable.
Income tax benefit for the year ended December 31, 2011 was primarily impacted by the reversal of $12.2 million of the deferred tax asset valuation allowance. There was a deferred tax valuation allowance increase in 2012 in the amount of $358,000. The balance of the valuation allowance remaining was approximately $1.9 million at December 31, 2012, however, in 2013 the valuation allowance was reduced to zero due to the expiration of the charitable contribution carryforward. The release of a portion of the valuation allowance in 2011 was based on a pattern of sustained earnings exhibited by the Company over the most recent 7 quarters through September 30, 2011, projected future taxable income and a tax strategy to facilitate ordinary loss treatment by the Company of certain investment losses when such losses are recognized for tax purposes. Based on these factors management determined that it was more likely than not that a greater portion of its deferred tax assets were realizable and adjusted the valuation allowance accordingly.
F-32
Income tax expense (benefit) was as follows:
| For the years ended December 31, | |
| 2013 | | | 2012 | | | 2011 | |
| (in thousands) | |
Current expense: | | | | | | | | | | | |
Federal | $ | 701 | | | $ | (36 | ) | | $ | (2,201 | ) |
State | | 8 | | | | 8 | | | | 31 | |
Total current | | 709 | | | | (28 | ) | | | (2,170 | ) |
Deferred (benefit): | | | | | | | | | | | |
Federal | | 4,015 | | | | 1,514 | | | | (827 | ) |
State | | 1,441 | | | | 811 | | | | (3,189 | ) |
Total deferred | | 5,456 | | | | 2,325 | | | | (4,016 | ) |
| | | | | | | | | | | |
Change in deferred tax valuation allowance | | (1,934 | ) | | | 358 | | | | (12,169 | ) |
Income tax expense (benefit) | $ | 4,231 | | | $ | 2,655 | | | $ | (18,355 | ) |
Effective tax rate differs from the federal statutory rate of 34% applied to income before income taxes due to the following:
| For the years ended December 31, | |
| 2013 | | | 2012 | | | 2011 | |
Tax statutory rate | | 34.0 | % | | | 34.0 | % | | | (34.0 | %) |
Adjustments resulting from: | | | | | | | | | | | |
State tax benefit, net of federal income tax expense | | 9.8 | | | | 7.5 | | | | (20.1 | ) |
Tax-exempt income | | (1.5 | ) | | | (3.0 | ) | | | (3.0 | ) |
Income on bank owned life insurance | | (3.3 | ) | | | (4.6 | ) | | | (3.3 | ) |
Change in valuation reserve | | (19.8 | ) | | | 5.0 | | | | (117.4 | ) |
Charity expiration | | 20.4 | | | | - | | | | 0.0 | |
Reversal of FIN 48 reserve | | - | | | | (3.5 | ) | | | - | |
Non-deductible expenses | | 1.4 | | | | - | | | | - | |
Other | | 2.2 | | | | 1.4 | | | | 0.8 | |
| | | | | | | | | | | |
Effective tax rate | | 43.2 | % | | | 36.8 | % | | | (177.0 | %) |
F-33
Year-end deferred tax assets and liabilities were due to the following:
| December 31, | |
| 2013 | | | 2012 | |
| (in thousands) | |
Deferred tax assets: | | | | | | | |
Other than temporary impairment | $ | 6,953 | | | $ | 7,915 | |
Allowance for loan losses | | 3,726 | | | | 4,046 | |
Charity carryforward | | 2 | | | | 2,337 | |
Purchase accounting adjustments | | 685 | | | | 834 | |
Non-accrual loan interest income | | 743 | | | | 743 | |
Deferred compensation | | 364 | | | | 445 | |
Net operating losses | | 739 | | | | 2,507 | |
Net unrealized loss on available for sale securities | | 1,963 | | | | 452 | |
Deferred gain | | 54 | | | | 183 | |
AMT credit carryforward | | 1,299 | | | | 716 | |
Other | | 648 | | | | 890 | |
Valuation allowance | - | | | | (1,934 | ) |
| | 17,176 | | | | 19,134 | |
Deferred tax liabilities: | | | | | | | |
Depreciation | | (993 | ) | | | (1,005 | ) |
Deferred loan fees | | (549 | ) | | | (484 | ) |
Other | | (6 | ) | | | (6 | ) |
| | (1,548 | ) | | | (1,495 | ) |
Net deferred tax asset | $ | 15,628 | | | $ | 17,639 | |
In 2009, the Company recorded a significant valuation allowance against the deferred tax asset. At December 31, 2011, based upon the level of historical taxable income, projections for future taxable income over the periods in which the deferred tax assets are deductible and a recent tax strategy to facilitate ordinary loss treatment by the Company of certain investment losses when such losses are recognized for tax purposes, management believes it is more likely than not that the Company will realize the benefits of these deductible differences, net of the existing valuation allowances.
At December 31, 2013 and 2012, the Company had approximately $350,000 and $4.8 million, respectively, of federal net operating losses and $10.4 million and $16.6 million, respectively, of state net operating losses. The federal net operating losses will expire between 2031 and 2032. The state net operating losses will expire between 2015 and 2031. Additionally, for 2013 and 2012, the Company has approximately $1.3 million and $716,000, respectively, of AMT tax credits, which do not expire to offset the difference between regular tax and alternative minimum tax.
Pursuant to FASB ASC Topic No. 740, “Income Taxes” the Company is not required to provide deferred taxes on its tax loan loss reserve as of the base year. The amount of this reserve on which no deferred taxes have been provided was $7,878,000 for 2013 and 2012. This reserve could be recognized as taxable income and create a current and/or deferred tax liability using the income tax rates then in effect if any portion of this tax reserve is subsequently used for purposes other than to absorb loan losses.
F-34
The following is a roll-forward of the Bank’s FASB ASC Topic No. 740 unrecognized tax benefits:
| 2013 | | | 2012 | | | 2011 | |
| (in thousands) | |
Balance at beginning of year | $ | - | | | $ | 256 | | | $ | 353 | |
Additions based on tax positions related to the current year | | - | | | | - | | | | - | |
Additions for tax positions of prior years | | - | | | | - | | | | - | |
Reductions for tax positions of prior years | | - | | | | - | | | | - | |
Reductions due to the statute of limitations | | - | | | | 256 | | | | 97 | |
Settlements | | - | | | | - | | | | - | |
Balance at end of year | $ | - | | | $ | - | | | $ | 256 | |
As of December 31, 2013 and December 31, 2012, the Company did not have any unrecognized tax benefits. As of December 31, 2011, $256,000 represents the amount of unrecognized tax benefits that, if recognized, would favorably affect the effective income tax rate in future periods. The Bank does not expect the total amount of unrecognized tax benefits to significantly increase or decrease in the next twelve months.
The Bank is subject to U.S. federal income tax as well as income tax of the state of New Jersey. The Bank is no longer subject to examination by the Internal Revenue Service (“IRS”) for years before 2011 and by the state of New Jersey for years before 2008. The Bank has currently finalized an examination by the IRS for tax years 2009 and 2010. No significant issues were raised. The statute of limitations for the Federal and New Jersey state income tax returns remains open for years ending on or after December 31, 2010.
NOTE 12 —FINANCIAL INSTRUMENTS WITH OFF-BALANCE SHEET RISK AND CONCENTRATIONS OF CREDIT RISK
The Bank is a party to financial instruments with off-balance sheet risk in the normal course of business to meet the financing needs of its customers. These financial instruments are commitments to extend credit. Those instruments involve, to varying degrees, elements of credit and interest rate risk in excess of the amounts recognized in the balance sheets.
The Bank’s exposure to credit loss in the event of nonperformance by the other party to the financial instrument for commitments to extend credit is represented by the contractual notional amount of those instruments. The Bank uses the same credit policies in making commitments and conditional obligations as it does for on balance sheet instruments.
At December 31, 2013 and 2012, the Bank had outstanding commitments (substantially all of which expire within one year) to originate residential mortgage loans, construction loans, commercial real estate and consumer loans. These commitments were comprised of fixed and variable rate loans.
Standby letters of credit are conditional commitments issued by the Bank to guarantee the performance of a customer to a third party. Those guarantees are primarily issued to support contracts entered into by customers. Most guarantees extend for one year. The credit risk involved in issuing standby letters of credit is essentially the same as that involved in extending loan facilities to customers. At December 31, 2013 the Bank had no letters of credit outstanding to borrowers of non-performing loans. The Bank defines the fair value of these letters of credit as the fees paid by the customer or similar fees collected on similar instruments.
The Bank amortizes the fees collected over the life of the instrument. The Bank generally obtains collateral, such as real estate or liens on customer assets for these types of commitments. The Bank’s potential liability would be reduced by proceeds obtained in liquidation of the collateral held.
F-35
The Bank had the following off-balance sheet financial instruments whose contract amounts represent credit risk:
| | December 31, | |
| | 2013 | | | 2012 | |
| | Fixed Rate | | | Variable Rate | | | Fixed Rate | | | Variable Rate | |
| | (in thousands) | |
Commitments to make loans | | $ | 4,616 | | | $ | 6,738 | | | $ | 21,421 | | | $ | 2,116 | |
Unused lines of credit | | $ | - | | | $ | 69,321 | | | $ | - | | | $ | 71,277 | |
Construction loans in process | | $ | - | | | $ | 10,817 | | | $ | 400 | | | $ | 1,183 | |
Standby letters of credit | | $ | - | | | $ | 4,313 | | | $ | - | | | $ | 4,670 | |
Commitments to make loans are generally made for periods of 60 days or less. The fixed rate loan commitments have interest rates ranging from 3.85% to 4.99% and maturities ranging from one to thirty years.
The Bank provides loans through its branch locations in Atlantic and Cape May Counties, New Jersey and through its MDOs in Burlington County, New Jersey and Radnor, Pennsylvania to borrowers that share similar attributes. A substantial portion of the Bank’s debtors’ ability to honor their contracts is dependent upon the economic conditions of these regions of New Jersey and Pennsylvania.
NOTE 13 — BENEFIT PLANS
Defined Benefit Plan
The Bank participates in the Pentegra Defined Benefit Plan for Financial Institutions (The “Pentegra DB Plan”), a tax-qualified defined benefit pension plan. The Pentegra DB Plan’s Employer Identification Number is 13-5645888 and the Plan Number is 333. The Pentegra DB Plan operates as a multi-employer plan for accounting purposes and as a multiple-employer plan under the Employee Retirement Income Security Act of 1974 and the Internal Revenue Code. There are no collective bargaining agreements in place that require contributions to the Pentegra DB Plan.
The Pentegra DB Plan is a single plan under Internal Revenue Code Section 413(c) and, as a result, all of the assets stand behind all of the liabilities. Accordingly, under the Pentegra DB Plan contributions made by a participating employer may be used to provide benefits to participants of other participating employers. As of July 1, 2013 and 2012, the Cape Bank funded status was 81.53% and 91.99%, respectively.
Total contributions to the Pentegra DB Plan, as reported on Form 5500, totaled $196.5 million and $299.7 million for the plan years ended June 30, 2013 and June 30, 2012, respectively. Contributions to this plan by Cape Bank during the years ended December 31, 2013, 2012 and 2011 were $492,000, $310,000, and $542,000, respectively. Cape Bank’s contributions to the Pentegra DB Plan are not more than 5% of the total contributions to the Pentegra DB Plan. Total compensation expense recorded under the Pentegra DB Plan during the years ended December 31, 2013, 2012 and 2011, was approximately $406,000, $371,000, and $419,000, respectively.
The Pentegra DB Plan was amended to freeze benefits as of December 31, 2008 for all employees eligible to participate prior to January 1, 2008.
401K Plan
The Bank maintains a tax-qualified defined contribution plan for all salaried employees of Cape Bank who have satisfied the 401(k) Plan’s eligibility requirements. Effective, January 1, 2012, the Bank eliminated the matching contribution formula and replaced it with a discretionary form of matching contribution and, as a result, there was no employer contribution to the 401(k) plan for the year ended December 31, 2012. For the year ended December 31, 2013, the Bank made a discretionary contribution and charged approximately $141,000 to employer contribution expense for the 401(k) plan. The Bank charged approximately $287,000 to employer contribution expense for the 401(k) plan for the year ended December 31, 2011.
F-36
Employee Stock Ownership Plan
On January 1, 2008, the Bank adopted an Employee Stock Ownership Plan (“ESOP”). The ESOP borrowed $10.7 million from the Company and used the funds to purchase 1,065,082 shares of the Company. The loan has an interest rate that is determined January 1st of each year and is based on the prime rate as published in The Wall Street Journal on the first business day of the calendar year. The interest rate for 2013, 2012 and 2011 was 3.25% and has an amortization schedule of 25 years. The loan is secured by the shares. Shares purchased are held by the trustee in a loan suspense account and are released from the suspense account on a pro rata basis as the loan is repaid by the Bank over a period not to exceed 25 years. The trustee allocates shares to participants based on compensation as described in the Cape Bank Employee Stock Ownership Plan, in the year of allocation. Employees are eligible to participate in the ESOP after attainment of age 21 and completion of one year of service.
The ESOP recorded dividend income of $179,000 and $45,000 for the years ended December 31, 2013 and 2012, respectively. Since the Company had not declared a dividend prior to 2012, no dividend income was recorded for the year ended December 31, 2011. The Company recorded ESOP compensation expense of $396,000, $365,000 and $383,000 for the years ended December 31, 2013, 2012 and 2011, respectively.
Shares held by the ESOP were as follows
| For the Years ended December 31, | |
| 2013 | | | 2012 | | | 2011 | |
| (dollars in thousands) | |
Number of shares allocated to participants at the beginning of the year | | 181,423 | | | | 153,294 | | | | 118,977 | |
Allocated to participants | | 42,603 | | | | 42,603 | | | | 42,603 | |
Distributed to participants | | (17,881 | ) | | | (14,474 | ) | | | (8,286 | ) |
Number of shares allocated to participants at the end of the year | | 206,145 | | | | 181,423 | | | | 153,294 | |
Unearned shares | | 809,464 | | | | 852,067 | | | | 894,670 | |
Total ESOP shares | | 1,015,609 | | | | 1,033,490 | | | | 1,047,964 | |
Fair value of unearned shares | $ | 8,224 | | | $ | 7,404 | | | $ | 7,023 | |
Director Retirement Plan
The Bank maintains an amended and restated director retirement plan for its directors, represented by individual agreements with the directors. In accordance with each director’s retirement agreement, the director is entitled to a normal retirement benefit upon termination of service on or after the director’s normal retirement age, equal to 2.5% times the director’s years of service with Cape Bank (not to exceed a benefit equal to 50%) of the average of the greatest fees earned by a director during any five consecutive calendar years. This benefit was payable to the director in equal monthly installments for a period of 10 years or the director’s lifetime, whichever is greater. In December 2008, the individual agreements were amended to comply with the final regulations issued under Section 409A of the Internal Revenue Code and to freeze future benefit accruals as of October 31, 2008. In accordance with these amendments, the agreements were modified to require a specified dollar amount to be paid to the director in January 2009, in complete satisfaction of all rights under the director retirement plan. Accordingly, in January 2009, the directors received $8,604 from the plan. In addition, the individual agreements were also modified to specify the total benefit that would be paid to each director and to specify that the total benefit would be paid in 120 monthly installments upon the occurrence of retirement, death or a change in control. The director could elect a lump sum benefit in the event of death or a change in control if such election was made prior to December 31, 2008.
Expense for these plans related to both active and retired participants totaled $35,000, $39,000, and $41,000, for the years ended December 31, 2013, 2012 and 2011, respectively. The total compensation liability for these plans was $757,000 and $864,000 at December 31, 2013 and 2012, respectively. Payments made under the Plan totaled $107,000 and $94,000 for the years ended December 31, 2013 and 2012, respectively.
Equity Incentive Plan
The Company has an Equity Incentive Plan under which incentive and non-qualified stock options, stock appreciation rights (SARs), and restricted stock awards (RSAs) may be granted periodically to certain employees and directors. Generally, stock options are granted with an exercise price equal to the fair market value at the date of grant and expire in 10 years from the date of grant. Generally, stock options granted vest over a five-year period commencing on the first anniversary of the date of grant. Under the plan, 1,331,352 stock options are available to be issued. Forfeited options are returned to the plan and are available for issuance.
F-37
Under the fair value method of accounting for stock options, the fair value for all stock options granted under the Equity Incentive Plan is measured on the date of grant using the Black-Scholes option pricing model with market assumptions. This amount is amortized as salaries and employee benefits expense on a straight-line basis over the vesting period. Option pricing models require the use of highly subjective assumptions, including expected stock price volatility, which, if changed, can significantly affect fair value estimates.
During 2013, the Company issued 48,850 incentive stock options to certain employees and directors at prices ranging from $8.93 per share to $10.30 per share. During 2012, the Company issued 25,000 incentive stock options to certain employees at prices ranging from $8.43 per share to $9.10 per share. The following table presents the weighted average per share fair value of options granted and the assumptions used, based on the Black-Scholes option pricing methodology:
| | December 31, | |
Assumption | | 2013 | | | 2012 | |
Expected average risk-free interest rate | | | 1.81 | % | | | 2.39 | % |
Expected average life (in years) | | | 6.5 | | | | 6.5 | |
Expected volatility | | | 39.08 | % | | | 41.39 | % |
Expected dividend yield | | | 2.19 | % | | | 0.00 | % |
Weighted average per share fair value | | $ | 2.99 | | | $ | 3.39 | |
Stock option activity for the years ended December 31, 2013 and 2012 was as follows:
| | For the Years ended December 31, |
| | 2013 | | 2012 |
| | Number of Options | | | Weighted Average Exercise Price | | | Weighted Average Remaining Contractual Life | | Number of Options | | | Weighted Average Exercise Price | | | Weighted Average Remaining Contractual Life |
Outstanding at the beginning of the year | | | 711,290 | | | $ | 7.64 | | | | | | 833,010 | | | $ | 7.54 | | | |
Granted | | | 48,850 | | | $ | 9.41 | | | | | | 25,000 | | | $ | 8.75 | | | |
Forfeited | | | (29,180 | ) | | $ | 9.14 | | | | | | (122,130 | ) | | $ | 7.28 | | | |
Exercised | | | (20,000 | ) | | $ | 7.27 | | | | | | (24,590 | ) | | $ | 7.28 | | | |
Outstanding at the end of the year (1) | | | 710,960 | | | $ | 7.71 | | | 6.8 years | | | 711,290 | | | $ | 7.64 | | | 7.7 years |
Exercisable at December 31 | | | 380,466 | | | $ | 7.49 | | | 6.5 years | | | 246,516 | | | $ | 7.34 | | | 7.5 years |
| | | | | | | | | | | | | | | | | | | | |
Aggregate Intrinsic Value at December 31 | | $ | 1,015,000 | | | | | | | | | $ | 332,593 | | | | | | | |
(1) | Expected forfeitures are immaterial. |
The expected average risk-free rate is based on the U.S. Treasury yield curve on the day of grant. The expected average life represents the weighted average period of time that options granted are expected to be outstanding giving consideration to vesting schedules and expected option exercise activity. Expected volatility is based on historical volatilities of the Company’s common stock as well as the historical volatility of the stocks of the Company’s peer banks. The expected dividend yield is based on the expected dividend yield over the life of the option and the Company’s historical information.
During 2013, the Company issued 4,125 restricted stock awards to directors at a price of $9.04 per share. The restricted stock awards will vest in five equal annual installments beginning on the first anniversary date of the grant, or September 16, 2014. During 2013 and 2012, 1,650 restricted stock awards and 1,925 restricted stock awards, respectively, vested at a fair value of $7.68 per share. At December 31, 2013, there were 7,425 non-vested restricted stock awards outstanding at a weighted average fair value of $8.44 per share.
F-38
Restricted stock activity for the years ended December 31, 2013 and 2012 was as follows:
| | For the Years ended December 31, | |
| | 2013 | | | 2012 | |
| | Restricted Common Shares | | | Weighted Average Fair Value at Grant Date | | | Restricted Common Shares | | | Weighted Average Fair Value at Grant Date | |
Outstanding at the beginning of the year | | | 4,950 | | | $ | 7.68 | | | | 8,800 | | | $ | 7.68 | |
Granted | | | 4,125 | | | $ | 9.04 | | | | - | | | $ | - | |
Vested | | | (1,650 | ) | | $ | 7.68 | | | | (1,925 | ) | | $ | 7.68 | |
Forfeited | | | - | | | $ | - | | | | (1,925 | ) | | $ | 7.68 | |
Outstanding at the end of the year | | | 7,425 | | | $ | 8.44 | | | | 4,950 | | | $ | 7.68 | |
At December 31, 2013, unrecognized compensation costs on unvested stock options and restricted stock awards was $1.0 million which will be amortized on a straight-line basis over the remaining vesting period.
Stock-based compensation expense and related tax effects recognized for the years ended December 31, 2013, 2012 and 2011 was as follows:
| | For the Years ended December 31, | |
| | 2013 | | | 2012 | | | 2011 | |
| | | | | | (in thousands) | | | | | |
Compensation expense: | | | | | | | | | | | | |
Common stock options | | $ | 444 | | | $ | 356 | | | $ | 526 | |
Restricted common stock | | | 17 | | | | 10 | | | | 17 | |
Total compensation expense | | | 461 | | | | 366 | | | | 543 | |
Tax benefit | | | 9 | | | | 7 | | | | 11 | |
Net income effect | | $ | 452 | | | $ | 359 | | | $ | 532 | |
As of December 31, 2013, 917,450 options were issued, leaving 575,212 options available to be issued. Forfeited options are returned to the plan, available for re-issuance. Based on the option agreements, there were 380,466 incentive stock options exercisable.
NOTE 14 — COMMITMENTS AND CONTINGENCIES
Leases: Lessee – As a result of the sale of the Cape Bank main office complex on May 31, 2011, (See Note 17 – Sale of Bank Premises), the Bank entered into six separate lease agreements, each for a discrete portion of the original complex, all with initial three-year terms ending on May 31, 2014. In accordance with ASC Section 840-40 Sale Leaseback Transactions, the deferred gain on the sale is recognized evenly over the initial three-year lease period as a credit to rent expense. Further, the Bank had the option to exit a certain amount of square footage within the first year of the lease incurring a penalty of three months of lease payments for the space exited. Also, in doing so, the Bank would recognize a portion of the remaining deferred gain proportionate to the amount of space exited. In the second quarter of 2012, the Bank vacated additional leased space, resulting in the recognition of an additional gain of $425,000.
In addition, the Bank leases office space for the Burlington County, New Jersey and Radnor, Pennsylvania MDOs. The Company’s total minimum lease payments for the years 2014 and 2015 total $234,000 and, $85,000, respectively. In addition, total minimum lease payments for the years 2016 through 2018 total $83,000 each year and total $28,000 for the year 2019. Rent expense for the years ended December 31, 2013, 2012 and 2011 approximated $77,000, $90,000 and $28,000, respectively.
Litigation – From time to time, the Bank may be a defendant in legal proceedings arising out of the normal course of business. In management’s opinion, the financial position and results of operations of the Bank would not be affected materially by the outcome of such legal proceedings.
F-39
NOTE 15 — REGULATORY MATTERS
Banks and bank holding companies are subject to regulatory capital requirements administered by federal banking agencies. Capital adequacy guidelines and, additionally for banks, prompt corrective action regulations, involve quantitative measures of assets, liabilities, and certain off-balance sheet items calculated under regulatory accounting practices. Capital amounts and classifications are also subject to qualitative judgments by regulators. Failure to meet capital requirements can initiate regulatory action. Management believes as of December 31, 2013, the Company and Bank meet all capital adequacy requirements to which it is subject.
The Bank is subject to various regulatory capital requirements administered by the federal banking agencies. Failure to meet minimum capital requirements can initiate certain mandatory, and possibly, additional discretionary, actions by regulators that, if undertaken, could have a direct material effect on the Bank’s financial statements. Under capital adequacy guidelines and the regulatory framework for prompt corrective action, the Bank must meet specific capital guidelines that involve quantitative measures of the Bank’s assets, liabilities and certain off-balance sheet items as calculated under regulatory accounting practices. The Bank’s capital amounts and classification are also subject to qualitative judgments by the regulators about components, risk weightings and other factors.
Quantitative measures established by regulation to ensure capital adequacy require the Bank to maintain minimum amounts and ratios (set forth in the table below) of total and Tier I capital (as defined in the regulations) to risk-weighted assets (as defined), and of Tier I capital (as defined) to average assets (as defined).
As of December 31, 2013 and 2012, the Bank was categorized as well-capitalized under the regulatory framework for prompt corrective action. To be categorized as well-capitalized, the Bank must maintain minimum total risk-based, Tier I risk-based, and Tier I leverage ratios as set forth in the table. There are no conditions or events since that notification that management believes have changed the institution’s category.
The actual capital amounts, ratios and minimum regulatory guidelines for Cape Bank are as follows:
| | | | | | | | | Per Regulatory Guidelines | |
| Actual | | | Minimum | | | "Well Capitalized" | |
| Amount | | | Ratio | | | Amount | | | Ratio | | | Amount | | | Ratio | |
| (dollars in thousands) | |
| | | | | | | | | | | | | | | | | | | | | | | |
December 31, 2013 | | | | | | | | | | | | | | | | | | | | | | | |
Risk based capital ratios: | | | | | | | | | | | | | | | | | | | | | | | |
Tier I risk based capital | $ | 101,008 | | | | 13.07 | % | | $ | 30,913 | | | | 4.00 | % | | $ | 46,369 | | | | 6.00 | % |
Total risk based capital | $ | 110,427 | | | | 14.29 | % | | $ | 61,821 | | | | 8.00 | % | | $ | 77,276 | | | | 10.00 | % |
Tier I leverage ratio | $ | 101,008 | | | | 9.53 | % | | $ | 42,396 | | | | 4.00 | % | | $ | 52,995 | | | | 5.00 | % |
| | | | | | | | | | | | | | | | | | | | | | | |
December 31, 2012 | | | | | | | | | | | | | | | | | | | | | | | |
Risk based capital ratios: | | | | | | | | | | | | | | | | | | | | | | | |
Tier I risk based capital | $ | 103,876 | | | | 14.11 | % | | $ | 29,447 | | | | 4.00 | % | | $ | 44,171 | | | | 6.00 | % |
Total risk based capital | $ | 113,090 | | | | 15.36 | % | | $ | 58,901 | | | | 8.00 | % | | $ | 73,626 | | | | 10.00 | % |
Tier I leverage ratio | $ | 103,876 | | | | 10.35 | % | | $ | 40,145 | | | | 4.00 | % | | $ | 50,182 | | | | 5.00 | % |
Management believes that under the current regulations, the Bank will continue to meet its minimum capital requirements in the foreseeable future.
F-40
Regulatory capital levels for Cape Bank differ from its total capital computed in accordance with accounting principles generally accepted in the United States (GAAP), as follows:
| At December 31, | |
| 2013 | | | 2012 | |
| (in thousands) | |
Total capital, computed in accordance with GAAP | $ | 130,735 | | | $ | 140,122 | |
Accumulated other comprehensive loss | | 2,651 | | | | 679 | |
Disallowed deferred tax assets | | (9,504 | ) | | | (14,086 | ) |
Disallowed goodwill and other disallowed intangible assets | | (22,874 | ) | | | (22,839 | ) |
Tier I (tangible) capital | | 101,008 | | | | 103,876 | |
Allowance for loan losses | | 9,419 | | | | 9,214 | |
Total regulatory capital | $ | 110,427 | | | $ | 113,090 | |
NOTE 16 — EARNINGS PER SHARE
Basic earnings per common share is the net income (loss) divided by the weighted average number of common shares outstanding during the period. ESOP shares are not considered outstanding for this calculation unless earned. Diluted earnings per share includes the dilutive effect of additional potential common shares issuable under stock option and restricted stock awards, if any.
The following is the earnings per share calculation for the periods ended December 31, 2013, 2012 and 2011, respectively. At December 31, 2013, options to purchase 710,960 shares were outstanding and dilutive, and accordingly were included in determining diluted earnings per common share. In addition, 7,425 shares of restricted stock were outstanding and dilutive, and accordingly were included in determining diluted earnings per common share. At December 31, 2012, options to purchase 711,290 shares were outstanding and dilutive, and accordingly were included in determining diluted earnings per common share. In addition, 4,950 shares of restricted stock were dilutive, and accordingly were included in determining diluted earnings per common share. At December 31, 2011, options to purchase 833,010 shares were outstanding and dilutive, and accordingly were included in determining diluted earnings per common share. Restricted stock was dilutive and is included in the earnings per share calculation for the period ended December 31, 2011.
| Years ended December 31, | |
| 2013 | | | 2012 | | | 2011 | |
| (in thousands, except share data) | |
| | | | | | | | | | | |
Net income | $ | 5,551 | | | $ | 4,556 | | | $ | 7,987 | |
| | | | | | | | | | | |
Weighted average shares outstanding | | 11,904,369 | | | | 12,441,219 | | | | 12,393,359 | |
Basic earnings per share | $ | 0.47 | | | $ | 0.37 | | | $ | 0.64 | |
Diluted weighted average shares outstanding | | 11,950,943 | | | | 12,443,298 | | | | 12,398,178 | |
Diluted basic earnings per share | $ | 0.46 | | | $ | 0.37 | | | $ | 0.64 | |
NOTE 17 — SALE OF BANK ASSETS
On April 11, 2011, the Company entered into an Agreement of Sale to sell the Cape Bank main office complex and an adjoining vacant lot located in Cape May Court House, NJ. The sale was consummated on May 31, 2011. The selling price of the properties was $7.2 million with net cash proceeds of $6.8 million received at time of sale. The Bank entered into six separate lease agreements, each for a discrete portion of the original complex with initial three year terms, all ending in 2014. The net book value of the property at the time of closing was $3.8 million resulting in a gain of $3.4 million. This gain is being recognized under the full accrual method and as an operating lease in accordance with FASB ASC Topic No.840-40 “Sale Leaseback Transactions” which permits $1.8 million of the gain to be recognized at the time of sale and the remaining portion of the gain, $1.6 million, to be recognized evenly over the initial three-year lease period.
During the second quarter of 2012, the Bank vacated portions of their leased premises. In accordance with FASB ASC Topic No. 840-40 “Sale Leaseback Transactions”, the Bank recognized an additional portion of the deferred gain in the amount of $425,000. At December 31, 2013, the balance of the deferred gain to be recognized totaled $135,000.
F-41
In accordance with FASB ASC Topic No. 360-20 “Plant, Property and Equipment, Real Estate Sales”, the Bank recognized a gain of $569,000 in the third quarter of 2013 related to the sale of a parcel of unused land previously classified as assets held for sale. The cost basis of this asset was $281,000 and was sold on September 4, 2013 for $850,000.
NOTE 18 — CAPE BANCORP (PARENT COMPANY)
The Parent Company’s condensed balance sheets at December 31, 2013 and 2012 and the related condensed statements of income and cash flows for the years ended December 31, 2013, 2012 and 2011 follow:
Condensed Balance Sheets
| December 31, | |
| 2013 | | | 2012 | |
| (in thousands) | |
ASSETS | | | | | | | |
Non-interest bearing balances with bank subsidiary | $ | 746 | | | $ | 1,508 | |
Loans due from bank subsidiary | | 8,846 | | | | 9,179 | |
Investment in bank subsidiary | | 130,735 | | | | 140,122 | |
Other assets | | 261 | | | | 264 | |
Total assets | $ | 140,588 | | | $ | 151,073 | |
| | | | | | | |
LIABILITIES AND STOCKHOLDERS' EQUITY | | | | | | | |
Liabilities | | | | | | | |
Accounts payable and accrued expenses | $ | 161 | | | $ | 247 | |
Total liabilities | | 161 | | | | 247 | |
| | | | | | | |
Stockholders' Equity | | | | | | | |
Common stock | | 133 | | | | 133 | |
Additional paid in capital | | 128,193 | | | | 127,767 | |
Treasury stock at cost - 1,284,991 shares at December 31, 2013 | | (12,035 | ) | | | - | |
Unearned ESOP shares | | (8,102 | ) | | | (8,528 | ) |
Accumulated other comprehensive loss | | (2,951 | ) | | | (679 | ) |
Retained earnings | | 35,189 | | | | 32,133 | |
Total stockholders' equity | | 140,427 | | | | 150,826 | |
Total liabilities and stockholders' equity | $ | 140,588 | | | $ | 151,073 | |
F-42
Condensed Statements of Income
| Years ended December 31, | |
| 2013 | | | 2012 | | | 2011 | |
| (in thousands) | |
Income: | | | | | | | | | | | |
Interest income from bank subsidiary | $ | 298 | | | $ | 310 | | | $ | 319 | |
Dividend Income | | 14,100 | | | | - | | | | - | |
Total income | | 14,398 | | | | 310 | | | | 319 | |
| | | | | | | | | | | |
Expense: | | | | | | | | | | | |
Legal expense | | 69 | | | | 79 | | | | 41 | |
Investor relations expense | | 119 | | | | 120 | | | | 84 | |
Audit and consulting fees | | 427 | | | | 399 | | | | 411 | |
Subscriptions and publications | | 72 | | | | 74 | | | | 72 | |
Other non-interest expenses | | 29 | | | | 22 | | | | 29 | |
Total expense | | 716 | | | | 694 | | | | 637 | |
| | | | | | | | | | | |
Income (loss) before income taxes and equity in undistributed net income of bank subsidiary | | 13,682 | | | | (384 | ) | | | (318 | ) |
Income tax expense (benefit) | | (5 | ) | | | (131 | ) | | | (101 | ) |
Income before equity in undistributed net income (loss) of subsidiaries | | 13,687 | | | | (253 | ) | | | (217 | ) |
Equity in (over distributed)/undistributed net income (loss) of bank subsidiary | | (8,136 | ) | | | 4,809 | | | | 8,204 | |
Net income | $ | 5,551 | | | $ | 4,556 | | | $ | 7,987 | |
Condensed Statements of Cash Flows
| Years ended December 31, | |
| 2013 | | | 2012 | | | 2011 | |
| (in thousands) | |
Cash flows from operating activities: | | | | | | | | | | | |
Net income | $ | 5,551 | | | $ | 4,556 | | | $ | 7,987 | |
Adjustments to reconcile net income to cash provided by operating activities: | | | | | | | | | | | |
Equity in over distributed/(undistributed) net income of bank subsidiary | | 8,136 | | | | (4,809 | ) | | | (8,204 | ) |
Stock-based compensation expense | | 17 | | | | 10 | | | | 17 | |
Changes in assets and liabilities that (used) provided cash | | (86 | ) | | | (162 | ) | | | (108 | ) |
Net cash provided by (used in) operating activities | | 13,618 | | | | (405 | ) | | | (308 | ) |
| | | | | | | | | | | |
Cash flows from investing activities | | | | | | | | | | | |
Repayment of ESOP loan | | 333 | | | | 322 | | | | 313 | |
Net cash (used in) provided by investing activities | | 333 | | | | 322 | | | | 313 | |
| | | | | | | | | | | |
Cash flows from financing activities | | | | | | | | | | | |
Purchase of Treasury Stock | | (12,186 | ) | | | - | | | | - | |
Proceeds from exercise of shares from stock option | | 146 | | | | 179 | | | | 4 | |
Dividends paid on common stock | | (2,673 | ) | | | (667 | ) | | | - | |
Net cash provided by (used in) financing activities | | (14,713 | ) | | | (488 | ) | | | 4 | |
| | | | | | | | | | | |
Net increase (decrease) in cash and cash equivalents | | (762 | ) | | | (571 | ) | | | 9 | |
Cash and cash equivalents at beginning of year | | 1,508 | | | | 2,079 | | | | 2,070 | |
Cash and cash equivalents at end of year | $ | 746 | | | $ | 1,508 | | | $ | 2,079 | |
F-43
Under the New Jersey Banking Act, a stock savings bank may declare and pay a dividend on its capital stock only to the extent that the payment of the dividend would not impair the capital stock of the savings bank. In addition, a stock savings bank may not pay a dividend unless the savings bank would, after the payment of the dividend, have a surplus of not less than 50% of its capital stock, or the payment of the dividend would not reduce the surplus. Federal law may also limit the amount of dividends that may be paid by Cape Bank.
NOTE 19 — SELECTED QUARTERLY DATA (UNAUDITED)
| Year Ended December 31, | | | Year Ended December 31, | |
| 2013 | | | 2012 | |
| Fourth
Quarter | | | Third
Quarter | | | Second
Quarter | | | First
Quarter | | | Fourth
Quarter | | | Third
Quarter | | | Second
Quarter | | | First
Quarter | |
| (in thousands) | | | (in thousands) | |
| | | | | | | | | | | | | | | | | | | | | | | | | | | | | | | |
Interest income | $ | 10,551 | | | $ | 10,289 | | | $ | 10,093 | | | $ | 10,108 | | | $ | 10,511 | | | $ | 10,949 | | | $ | 10,935 | | | $ | 11,289 | |
Interest expense | | 1,227 | | | | 1,274 | | | | 1,342 | | | | 1,449 | | | | 1,617 | | | | 1,897 | | | | 2,221 | | | | 2,469 | |
Net interest income | | 9,324 | | | | 9,015 | | | | 8,751 | | | | 8,659 | | | | 8,894 | | | | 9,052 | | | | 8,714 | | | | 8,820 | |
Provision for loan losses | | 952 | | | | 449 | | | | 313 | | | | 297 | | | | 1,910 | | | | 710 | | | | 1,168 | | | | 673 | |
Net interest income after provision for loan losses | | 8,372 | | | | 8,566 | | | | 8,438 | | | | 8,362 | | | | 6,984 | | | | 8,342 | | | | 7,546 | | | | 8,147 | |
Non-interest income | | 445 | | | | 2,223 | | | | 1,603 | | | | 1,695 | | | | 1,978 | | | | 1,601 | | | | 2,630 | | | | 1,605 | |
Non-interest expense | | 7,371 | | | | 7,523 | | | | 7,455 | | | | 7,573 | | | | 7,507 | | | | 8,011 | | | | 8,674 | | | | 7,430 | |
Income before income taxes | | 1,446 | | | | 3,266 | | | | 2,586 | | | | 2,484 | | | | 1,455 | | | | 1,932 | | | | 1,502 | | | | 2,322 | |
Income tax expense | | 894 | | | | 1,362 | | | | 1,006 | | | | 969 | | | | 995 | | | | 399 | | | | 477 | | | | 784 | |
Net income | $ | 552 | | | $ | 1,904 | | | $ | 1,580 | | | $ | 1,515 | | | $ | 460 | | | $ | 1,533 | | | $ | 1,025 | | | $ | 1,538 | |
F-44
NOTE 20 -- ACCUMULATED OTHER COMPREHENSIVE INCOME (LOSS)
The following is a summary of the accumulated other comprehensive income (loss) balances, net of tax, for the year ended December 31, 2013:
| Balance at December 31, 2012 | | | Other Comprehensive Income Before Reclassifications | | | Amount Reclassified from Accumulated Other Comprehensive Income | | | Amortization HTM Other Comprehensive Income | | | Other Comprehensive Income Year Ended December 31, 2013 | | | Balance at December 31, 2013 | | |
| (in thousands) | | |
| | | | | | | | | | | | | | | | | | | | | | | | |
Net unrealized holding gain (loss) on securities available for sale, net of tax | $ | (679 | ) | | $ | (2,505 | ) | | $ | 337 | | | $ | (104 | ) | | $ | (2,272 | ) | | $ | (2,951 | ) | |
| | | | | | | | | | | | | | | | | | | | | | | | |
Accumulated other comprehensive income (loss) net of tax | $ | (679 | ) | | $ | (2,505 | ) | | $ | 337 | | | $ | (104 | ) | | $ | (2,272 | ) | | $ | (2,951 | ) | |
The following represents the reclassifications out of accumulated other comprehensive income for the twelve months ended December 31, 2013:
| | Year Ended December 31, 2013 | | | Affected Line Item in Statements of Income |
| | (in thousands) | | | | | |
Unrealized gains (losses) on securities available for sale: | | | | | | | | |
Realized gain on securities sales | | $ | 561 | | | Gain (loss) on sale of investment securities, net |
Income tax expense | | | (224 | ) | | Income taxes |
Total reclassifications net of tax | | $ | 337 | | | | | |
F-45
EXHIBIT INDEX
Exhibit No. | | Description |
3.1 | | Articles of Incorporation of Cape Bancorp, Inc. (1) |
3.2 | | Amended and Restated Bylaws of Cape Bancorp, Inc. (2) |
4 | | Form of Common Stock Certificate of Cape Bancorp, Inc. (1) |
10.1 | | Form of Employee Stock Ownership Plan (1) |
10.2 | | Employment Agreement for Michael D. Devlin (5) |
10.3 | | Change in Control Agreement for Guy Hackney (3) |
10.4 | | Change in Control Agreement for James McGowan, Jr. (3) |
10.5 | | Change in Control Agreement for Michele Pollack (3) |
10.6 | | Change in Control Agreement for Charles L. Pinto (4) |
10.7 | | Form of Director Retirement Plan (1) |
10.8 | | 2008 Equity Incentive Plan (6) |
14 | | Code of Ethics (7) |
21 | | Subsidiaries of Registrant |
23.1 | | Consent of Crowe Horwath LLP |
23.2 | | Consent of KPMG LLP |
31.1 | | Certification of Chief Executive Officer pursuant to Section 302 of the Sarbanes-Oxley Act of 2002 |
31.2 | | Certification of Chief Financial Officer pursuant to Section 302 of the Sarbanes-Oxley Act of 2002 |
32 | | Certification of Chief Executive Officer and Chief Financial Officer pursuant to Section 906 of the Sarbanes-Oxley Act of 2002 |
101 | | The following materials from Cape Bancorp, Inc.’s Annual Report on From 10-K for the year ended December 31, 2013 formatted in XBRL (eXtensible Business Reporting Language): (i) the Consolidated Balance Sheets, (ii) the Consolidated Statements of Income, (iii) the Consolidated Statements of Comprehensive Income, (iv) the Consolidated Statements of Changes in Equity, (v) the Consolidated Statements of Cash Flows, and (vi) related notes to these financial statements – Furnished herewith. |
(1) | Incorporated by reference to the Registration Statement on Form S-1 of Cape Bancorp, Inc. (file no. 333-146178), originally filed with the Securities and Exchange Commission on September 19, 2007. |
(2) | Incorporated by reference to the Company’s Current Report on Form 8-K filed with the Securities and Exchange Commission on September 17, 2013. |
(3) | Incorporated by reference to the Company’s Current Report on Form 8-K filed on October 6, 2010. |
(4) | Incorporated by reference to the Company’s Current Report on Form 8-K filed with the Securities and Exchange Commission on July 7, 2011. |
(5) | Incorporated by reference to the Company’s Current Report on Form 8-K filed with the Securities and Exchange Commission on September 25, 2012. |
(6) | Incorporated by reference to the Company’s Definitive Proxy Statement filed with the Securities and Exchange Commission on July 16, 2008. |
(7) | Incorporated by reference to the Company’s Annual Report on Form 10-K for the Year ended December 31, 2007 filed with the Securities and Exchange Commission on March 31, 2008. |