UNITED STATES
SECURITIES AND EXCHANGE COMMISSION
Washington, D.C. 20549
FORM N-CSR
CERTIFIED SHAREHOLDER REPORT OF REGISTERED MANAGEMENT INVESTMENT COMPANIES
Investment Company Act file number 811-22126
Name of Fund: BlackRock Defined Opportunity Credit Trust (BHL)
Fund Address: 100 Bellevue Parkway, Wilmington, DE 19809
Name and address of agent for service: John M. Perlowski, Chief Executive Officer, BlackRock Defined Opportunity Credit Trust, 55 East 52nd Street, New York, NY 10055
Registrant’s telephone number, including area code: (800) 882-0052, Option 4
Date of fiscal year end: 08/31/2014
Date of reporting period: 02/28/2014
Item 1 – Report to Stockholders
FEBRUARY 28, 2014
| SEMI-ANNUAL REPORT (UNAUDITED) | |  |
BlackRock Defined Opportunity Credit Trust (BHL)
BlackRock Floating Rate Income Strategies Fund, Inc. (FRA)
BlackRock Limited Duration Income Trust (BLW)
Not FDIC Insured • May Lose Value • No Bank Guarantee | | | |
Table of Contents
| | | | | Page | |
Dear Shareholder | | | | | 3 | |
Semi-Annual Report:
| | | | | | |
Fund Summaries | | | | | 4 | |
The Benefits and Risks of Leveraging | | | | | 10 | |
Derivative Financial Instruments | | | | | 10 | |
Financial Statements
| | | | | | |
Schedules of Investments | | | | | 11 | |
Statements of Assets and Liabilities | | | | | 52 | |
Statements of Operations | | | | | 53 | |
Statements of Changes in Net Assets | | | | | 54 | |
Statements of Cash Flows | | | | | 57 | |
Financial Highlights | | | | | 58 | |
Notes to Financial Statements | | | | | 61 | |
Officers and Directors | | | | | 74 | |
Additional Information | | | | | 75 | |
| 2 | SEMI-ANNUAL REPORT | FEBRUARY 28, 2014
|
One year ago, US financial markets were improving despite a sluggish global economy, as easy monetary policy gave investors enough conviction to take on more risk in their portfolios. Slow but positive growth in the US was sufficient to support corporate earnings, while uncomfortably high unemployment reinforced expectations that the Federal Reserve would continue its aggressive monetary stimulus programs. International markets were more volatile given uneven growth rates and more direct exposure to macro risks such as the banking crisis in Cyprus and a generally poor outlook for European economies. Emerging markets significantly lagged the rest of the world amid fears over slowing growth and debt problems.
Global financial markets were rattled in May when then-Fed Chairman Bernanke mentioned the possibility of reducing (or “tapering”) the central bank’s asset purchase programs — comments that were widely misinterpreted as signaling an end to the Fed’s zero-interest-rate policy. US Treasury yields rose sharply, triggering a steep sell-off across fixed income markets. (Bond prices move in the opposite direction of yields.) Equity prices also suffered as investors feared the implications of a potential end of a program that had greatly supported the markets. Markets rebounded in late June, however, when the Fed’s tone turned more dovish, and improving economic indicators and better corporate earnings helped extend gains through most of the summer.
Although autumn brought mixed events, it was a surprisingly positive period for most asset classes. Early on, the Fed defied market expectations with its decision to delay tapering, but higher volatility returned in late September when the US Treasury Department warned that the national debt would soon breach its statutory maximum. The ensuing political brinksmanship led to a partial government shutdown, roiling global financial markets through the first half of October. Equities and other so-called “risk assets” managed to resume their rally when politicians engineered a compromise to reopen the government and extend the debt ceiling, at least temporarily.
The remainder of 2013 was generally positive for stock markets in the developed world, although investors continued to grapple with uncertainty about when and how much the Fed would scale back on stimulus. When the long-awaited taper announcement ultimately came in mid-December, the Fed reduced the amount of its monthly asset purchases but at the same time reaffirmed its commitment to maintaining low short-term interest rates. Markets reacted positively, as the taper signaled the Fed’s perception of real improvement in the economy, and investors were finally relieved from the anxiety that had gripped them for quite some time.
The start of the new year brought another turn in sentiment, as heightened volatility in emerging markets and mixed US economic data caused global equities to weaken in January while bond markets found renewed strength. Although these headwinds persisted, equities were back on the rise in February thanks to positive developments in Washington, DC. For one, Congress extended the nation’s debt ceiling through mid-March 2015, thereby reducing some degree of fiscal uncertainty for the next year. Additionally, investors were encouraged by market-friendly comments in new Fed Chair Janet Yellen’s Congressional testimony, giving further assurance that short-term rates would remain low for a prolonged period.
While accommodative monetary policy was the main driver behind positive market performance over the period, it was also a key cause of investor uncertainty. Developed market stocks were the strongest performers for the six- and 12-month periods ended February 28. In contrast, emerging markets were weighed down by uneven growth, high levels of debt and severe currency weakness, in addition to the broader concern about reduced global liquidity. The anticipation of Fed tapering during 2013 pressured US Treasury bonds and other high-quality fixed income sectors, including tax-exempt municipals and investment grade corporate bonds. High yield bonds, to the contrary, benefited from income-oriented investors’ search for yield in the low-rate environment. Short-term interest rates remained near zero, keeping yields on money market securities close to historic lows.
At BlackRock, we believe investors need to think globally, extend their scope across a broad array of asset classes and be prepared to move freely as market conditions change over time. We encourage you to talk with your financial advisor and visit www.blackrock.com for further insight about investing in today’s world.
Sincerely,

Rob Kapito
President, BlackRock Advisors, LLC
| |
| “While accommodative monetary policy was the main driver behind positive market performance over the period, it was also a key cause of investor uncertainty.” |
Rob Kapito
President, BlackRock Advisors, LLC
Total Returns as of February 28, 2014 | | | | 6-month | | 12-month |
US large cap equities (S&P 500® Index) | | | | | 15.07 | % | | | 25.37 | % |
US small cap equities (Russell 2000® Index) | | | | | 17.75 | | | | 31.56 | |
International equities (MSCI Europe, Australasia, Far East Index) | | | | | 15.01 | | | | 19.28 | |
Emerging market equities (MSCI Emerging Markets Index) | | | | | 4.77 | | | | (6.01 | ) |
3-month Treasury bill (BofA Merrill Lynch 3-Month US Treasury
Bill Index) | | | | | 0.03 | | | | 0.08 | |
US Treasury securities (BofA Merrill Lynch
10-Year US Treasury Index) | | | | | 2.61 | | | | (3.65 | ) |
US investment grade bonds (Barclays US Aggregate Bond Index) | | | | | 2.84 | | | | 0.15 | |
Tax-exempt municipal bonds (S&P Municipal Bond Index) | | | | | 6.08 | | | | (0.27 | ) |
US high yield bonds (Barclays US Corporate High Yield 2% Issuer Capped Index) | | | | | 7.46 | | | | 8.36 | |
Past performance is no guarantee of future results. Index performance is shown for illustrative purposes only. You cannot invest directly in an index.
THIS PAGE NOT PART OF YOUR FUND REPORT
| 3 |
| |
| Fund Summary as of February 28, 2014 | BlackRock Defined Opportunity Credit Trust
|
Fund Overview
BlackRock Defined Opportunity Credit Trust’s (BHL) (the “Fund”) primary investment objective is to provide high current income, with a secondary objective of long-term capital appreciation. The Fund seeks to achieve its investment objectives by investing substantially all of its assets in loan and debt instruments and loan-related and debt-related instruments (collectively “credit securities”). The Fund invests, under normal market conditions, at least 80% of its assets in any combination of the following credit securities: (i) senior secured floating rate and fixed rate loans; (ii) second lien or other subordinated or unsecured floating rate and fixed rate loans or debt; (iii) credit securities that are rated below investment grade quality; and (iv) investment grade corporate bonds. The Fund may invest directly in such securities or synthetically through the use of derivatives.
No assurance can be given that the Fund’s investment objectives will be achieved.
Portfolio Management Commentary
How did the Fund perform?
| • | | For the six-month period ended February 28, 2014, the Fund returned 4.22% based on market price and 3.75% based on NAV. For the same period, the closed-end Lipper Loan Participation Funds category posted an average return of 1.71% based on market price and 4.33% based on NAV. All returns reflect reinvestment of dividends. The Fund’s discount to NAV, which narrowed during the period, accounts for the difference between performance based on price and performance based on NAV. The following discussion relates to performance based on NAV. |
What factors influenced performance?
| • | | Security selection among higher quality loan instruments, where the Fund maintained a quality bias, had a positive impact on performance. From an industry perspective, holdings within gaming, wirelines and lodging boosted results. The Fund’s tactical allocation to high yield bonds generated additional gains as the asset class outperformed bank loans during the period. Exposure to high-quality collateralized loan obligations (“CLOs”) also enhanced results. |
| • | | Conversely, security selection in the media non-cable and electric industries detracted from results. The Fund’s limited exposure to lower-rated loan credits represented a missed opportunity for additional gains as this segment performed well during the period. |
Describe recent portfolio activity.
| • | | During the period, the Fund maintained its focus on the higher quality segments of the loan market in terms of loan structure, liquidity and overall credit quality. With the average loan trading recently at or just above par (i.e., with limited or no upside), the Fund has concentrated its investments in strong companies with stable cash flows and high quality collateral, with the ability to meet interest obligations and ultimately return principal. The Fund has been actively participating in the new-issue market, where the more appealing investment opportunities have been emerging. Although we expect modest growth and improving economic conditions, we continue to limit the Fund’s exposure to lower-rated segments of the market given less attractive risk-reward profiles in that space. From an asset allocation perspective, we continued to reduce exposure to higher-quality high yield bonds as valuations in that market also moved closer to fair value. In addition, we tactically added risk in high-quality CLOs. |
Describe portfolio positioning at period end.
| • | | At period end, the Fund held 94% of its total portfolio in floating rate loan interests (bank loans), with the remainder in corporate bonds and other interests. The Fund’s highest-conviction holdings included La Quinta (lodging), Caesars Entertainment Resort Properties LLC (gaming) and Level 3 Financing, Inc. (wirelines). |
| | The views expressed reflect the opinions of BlackRock as of the date of this report and are subject to change based on changes in market, economic or other conditions. These views are not intended to be a forecast of future events and are no guarantee of future results. |
| 4 | SEMI-ANNUAL REPORT | FEBRUARY 28, 2014
|
| |
| | BlackRock Defined Opportunity Credit Trust
|
Fund Information
Symbol on New York Stock Exchange (“NYSE”) | | | | BHL |
Initial Offering Date | | | | January 31, 2008 |
Current Distribution Rate on Closing Market Price as of February 28, 2014 ($13.87)1 | | | | 5.71% |
Current Monthly Distribution per Common Share2 | | | | $0.066 |
Current Annualized Distribution per Common Share2 | | | | $0.792 |
Economic Leverage as of February 28, 20143 | | | | 28% |
| 1 | | Current distribution rate on closing market price is calculated by dividing the current annualized distribution per share by the closing market price. The current distribution rate may consist of income, net realized gains and/or a tax return of capital. Past performance does not guarantee future results. |
| 2 | | The monthly distribution per common share, declared on March 3, 2014, was decreased to $0.0605 per share. The current distribution rate on closing market price, current monthly distribution per common share and current annualized distribution per common share do not reflect the new distribution rate. The new distribution rate is not constant and is subject to change in the future. |
| 3 | | Represents bank borrowings outstanding as a percentage of total managed assets, which is the total assets of the Fund (including any assets attributable to borrowings) minus the sum of liabilities (other than borrowings representing financial leverage). For a discussion of leveraging techniques utilized by the Fund, please see The Benefits and Risks of Leveraging on page 10. |
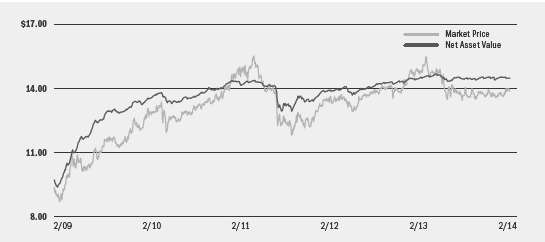
Market Price and Net Asset Value Per Share Summary
|
|
|
| 2/28/14
|
| 8/31/13
|
| Change
|
| High
|
| Low
|
Market Price | | | | $ | 13.87 | | | $ | 13.77 | | | | 0.73 | % | | $ | 14.09 | | | $ | 13.48 | |
Net Asset Value | | | | $ | 14.48 | | | $ | 14.44 | | | | 0.28 | % | | $ | 14.53 | | | $ | 14.39 | |
Market Price and Net Asset Value History For the Past Five Years
Overview of the Fund’s Long-Term Investments
Portfolio Composition
|
|
|
| 2/28/14
|
| 8/31/13
|
Floating Rate Loan Interests | | | | | 94 | % | | | 94 | % |
Corporate Bonds | | | | | 3 | | | | 3 | |
Asset-Backed Securities | | | | | 2 | | | | 2 | |
Common Stocks | | | | | 1 | | | | 1 | |
Corporate Bonds Credit Quality Allocation4
|
|
|
| 2/28/14
|
| 8/31/13
|
BBB/Baa | | | | | 12 | % | | | 11 | % |
BB/Ba | | | | | 18 | | | | 17 | |
B | | | | | 70 | | | | 72 | |
| 4 | | Using the higher of Standard & Poor’s (“S&P”) or Moody’s Investors Service (“Moody’s”) ratings. |
| SEMI-ANNUAL REPORT | FEBRUARY 28, 2014 | 5
|
| |
| Fund Summary as of February 28, 2014 | BlackRock Floating Rate Income Strategies Fund, Inc.
|
Fund Overview
BlackRock Floating Rate Income Strategies Fund, Inc.’s (FRA) (the “Fund”) investment objective is to provide shareholders with high current income and such preservation of capital as is consistent with investment in a diversified, leveraged portfolio consisting primarily of floating rate debt securities and instruments. The Fund seeks to achieve its investment objective by investing, under normal market conditions, at least 80% of its assets in floating rate debt securities, including floating or variable rate debt securities that pay interest at rates that adjust whenever a specified interest rate changes and/or which reset on predetermined dates (such as the last day of a month or calendar quarter). The Fund invests a substantial portion of its investments in floating rate debt securities consisting of secured or unsecured senior floating rate loans that are rated below investment grade. The Fund may invest directly in such securities or synthetically through the use of derivatives.
No assurance can be given that the Fund’s investment objective will be achieved.
Portfolio Management Commentary
How did the Fund perform?
| • | | For the six-month period ended February 28, 2014, the Fund returned 1.47% based on market price and 4.27% based on NAV. For the same period, the closed-end Lipper Loan Participation Funds category posted an average return of 1.71% based on market price and 4.33% based on NAV. All returns reflect reinvestment of dividends. The Fund’s discount to NAV, which widened during the period, accounts for the difference between performance based on price and performance based on NAV. The following discussion relates to performance based on NAV. |
What factors influenced performance?
| • | | Security selection among higher quality loan instruments, where the Fund maintained a quality bias, had a positive impact on performance. From an industry perspective, holdings within gaming, wirelines and lodging boosted results. The Fund’s tactical allocation to high yield bonds generated additional gains as the asset class outperformed bank loans during the period. Exposure to high-quality collateralized loan obligations (“CLOs”) also enhanced results. |
| • | | Conversely, security selection in the media non-cable and electric industries detracted from results. The Fund’s limited exposure to lower-rated loan credits represented a missed opportunity for additional gains as this segment performed well during the period. |
Describe recent portfolio activity.
| • | | During the period, the Fund maintained its focus on the higher quality segments of the loan market in terms of loan structure, liquidity and overall credit quality. With the average loan trading recently at or just above par (i.e., with limited or no upside), the Fund has concentrated its investments in strong companies with stable cash flows and high quality collateral, with the ability to meet interest obligations and ultimately return principal. The Fund has been actively participating in the new-issue market, where the more appealing investment opportunities have been emerging. Although we expect modest growth and improving economic conditions, we continue to limit the Fund’s exposure to lower-rated segments of the market given less attractive risk-reward profiles in that space. From an asset allocation perspective, we continued to reduce exposure to higher-quality high yield bonds as valuations in that market also moved closer to fair value. In addition, we tactically added risk in high-quality CLOs. |
Describe portfolio positioning at period end.
| • | | At period end, the Fund held 93% of its total portfolio in floating rate loan interests (bank loans), with the remainder in corporate bonds and other interests. The Fund’s highest-conviction holdings included La Quinta (lodging), Caesars Entertainment Resort Properties LLC (gaming) and Level 3 Financing, Inc. (wirelines). |
| | The views expressed reflect the opinions of BlackRock as of the date of this report and are subject to change based on changes in market, economic or other conditions. These views are not intended to be a forecast of future events and are no guarantee of future results. |
| 6 | SEMI-ANNUAL REPORT | FEBRUARY 28, 2014
|
| |
| | BlackRock Floating Rate Income Strategies Fund, Inc.
|
Fund Information
Symbol on NYSE | | | | FRA |
Initial Offering Date | | | | October 31, 2003 |
Current Distribution Rate on Closing Market Price as of February 28, 2014 ($14.70)1 | | | | 6.16% |
Current Monthly Distribution per Common Share2 | | | | $0.0755 |
Current Annualized Distribution per Common Share2 | | | | $0.9060 |
Economic Leverage as of February 28, 20143 | | | | 28% |
| 1 | | Current distribution rate on closing market price is calculated by dividing the current annualized distribution per share by the closing market price. The current distribution rate may consist of income, net realized gains and/or a tax return of capital. Past performance does not guarantee future results. |
| 2 | | The monthly distribution per common share, declared on March 3, 2014, was decreased to $0.0700 per share. The current distribution rate on closing market price, current monthly distribution per common share and current annualized distribution per common share do not reflect the new distribution rate. The new distribution rate is not constant and is subject to change in the future. |
| 3 | | Represents bank borrowings outstanding as a percentage of total managed assets, which is the total assets of the Fund (including any assets attributable to borrowings) minus the sum of liabilities (other than borrowings representing financial leverage). For a discussion of leveraging techniques utilized by the Fund, please see The Benefits and Risks of Leveraging on page 10. |
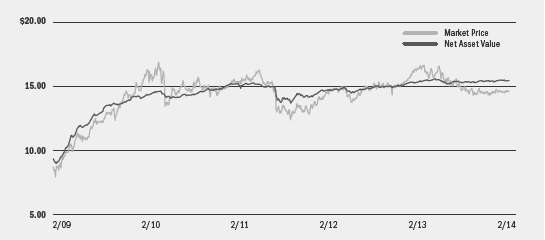
Market Price and Net Asset Value Per Share Summary
|
|
|
| 2/28/14
|
| 8/31/13
|
| Change
|
| High
|
| Low
|
Market Price | | | | $ | 14.70 | | | $ | 14.96 | | | | (1.74 | )% | | $ | 15.02 | | | $ | 14.30 | |
Net Asset Value | | | | $ | 15.51 | | | $ | 15.36 | | | | 0.98 | % | | $ | 15.54 | | | $ | 15.33 | |
Market Price and Net Asset Value History For the Past Five Years
Overview of the Fund’s Long-Term Investments
Portfolio Composition
|
|
|
| 2/28/14
|
| 8/31/13
|
Floating Rate Loan Interests | | | | | 93 | % | | | 92 | % |
Corporate Bonds | | | | | 4 | | | | 4 | |
Asset-Backed Securities | | | | | 2 | | | | 3 | |
Common Stocks | | | | | 1 | | | | 1 | |
Corporate Bonds Credit Quality Allocation4
|
|
|
| 2/28/14
|
| 8/31/13
|
BBB/Baa | | | | | 9 | % | | | 10 | % |
BB/Ba | | | | | 13 | | | | 15 | |
B | | | | | 37 | | | | 57 | |
CCC/Caa | | | | | 24 | | | | 5 | |
Not Rated | | | | | 17 | | | | 13 | |
| 4 | | Using the higher of S&P’s or Moody’s ratings. |
| SEMI-ANNUAL REPORT | FEBRUARY 28, 2014 | 7
|
| |
| Fund Summary as of February 28, 2014 | BlackRock Limited Duration Income Trust
|
Fund Overview
BlackRock Limited Duration Income Trust’s (BLW) (the “Fund”) investment objective is to provide current income and capital appreciation. The Fund seeks to achieve its investment objective by investing primarily in three distinct asset classes:
• | | intermediate duration, investment grade corporate bonds, mortgage-related securities, asset-backed securities and US Government and agency securities; |
• | | senior, secured floating rate loans made to corporate and other business entities; and |
• | | US dollar-denominated securities of US and non-US issuers rated below investment grade and, to a limited extent, non-US dollar denominated securities of non-US issuers rated below investment grade. |
The Fund’s portfolio normally has an average portfolio duration of less than five years (including the effect of anticipated leverage), although it may be longer from time to time depending on market conditions. The Fund may invest directly in such securities or synthetically through the use of derivatives.
No assurance can be given that the Fund’s investment objective will be achieved.
Portfolio Management Commentary
How did the Fund perform?
| • | | For the six-month period ended February 28, 2014, the Fund returned 6.32% based on market price and 7.35% based on NAV. For the same period, the closed-end Lipper High Yield Funds (Leveraged) category posted an average return of 12.50% based on market price and 10.48% based on NAV. All returns reflect reinvestment of dividends. The Fund’s discount to NAV, which widened during the period, accounts for the difference between performance based on price and performance based on NAV. The following discussion relates to performance based on NAV. |
What factors influenced performance?
| • | | Fixed income markets experienced a rally over the six-month period that was only temporarily suspended at the beginning of 2014 due to investors’ concern over softening US economic data, which appeared to be mostly driven by unusually harsh weather conditions. In addition, certain risk assets, including emerging market debt, were negatively impacted by the tightening of global liquidity as the Fed continued to reduce the size of its asset purchase program. |
| • | | The Fund benefited from the generally positive market environment, with positions in corporate credit being the largest contributors to returns. Exposure to securitized assets, including asset-backed securities (“ABS”) and commercial mortgage-backed securities (“CMBS”) also had a positive impact on performance. In addition, positions in non-agency residential mortgage-backed securities (“MBS”) and high yield credit enhanced results. |
| • | | Based on the view that short-term rates would remain low, the Fund maintained its leverage to augment income generation throughout the period. |
| • | | As most fixed income sectors performed well during the period, there were no material detractors from the Fund’s performance. |
Describe recent portfolio activity.
| • | | The Fund’s allocations remained consistent throughout the six-month period, with its largest position in high yield and investment grade corporate credit, followed by allocations to securitized credits, specifically, ABS and CMBS. |
Describe portfolio positioning at period end.
| • | | At period end, the Fund maintained diversified exposure to non-government spread sectors including high yield and investment grade corporate credit, CMBS, ABS and non-agency residential MBS. |
| | The views expressed reflect the opinions of BlackRock as of the date of this report and are subject to change based on changes in market, economic or other conditions. These views are not intended to be a forecast of future events and are no guarantee of future results. |
| 8 | SEMI-ANNUAL REPORT | FEBRUARY 28, 2014
|
| |
| | BlackRock Limited Duration Income Trust
|
Fund Information
Symbol on NYSE | | | | BLW |
Initial Offering Date | | | | July 30, 2003 |
Current Distribution Rate on Closing Market Price as of February 28, 2014 ($17.31)1 | | | | 7.24% |
Current Monthly Distribution per Common Share2 | | | | $0.1045 |
Current Annualized Distribution per Common Share2 | | | | $1.2540 |
Economic Leverage as of February 28, 20143 | | | | 30% |
| 1 | | Current distribution rate on closing market price is calculated by dividing the current annualized distribution per share by the closing market price. The current distribution rate may consist of income, net realized gains and/or a tax return of capital. Past performance does not guarantee future results. |
| 2 | | The monthly distribution per common share, declared on March 3, 2014, was decreased to $0.0995 per share. The current distribution rate on closing market price, current monthly distribution per common share and current annualized distribution per common share do not reflect the new distribution rate. The new distribution rate is not constant and is subject to change in the future. |
| 3 | | Represents reverse repurchase agreements outstanding as a percentage of total managed assets, which is the total assets of the Fund (including any assets attributable to borrowing) minus the sum of liabilities (other than borrowings representing financial leverage). For a discussion of leveraging techniques utilized by the Fund, please see The Benefits and Risks of Leveraging on page 10. |
Market Price and Net Asset Value Per Share Summary
|
|
|
| 2/28/14
|
| 8/31/13
|
| Change
|
| High
|
| Low
|
Market Price | | | | $ | 17.31 | | | $ | 16.89 | | | | 2.49 | % | | $ | 17.62 | | | $ | 16.15 | |
Net Asset Value | | | | $ | 18.15 | | | $ | 17.54 | | | | 3.48 | % | | $ | 18.15 | | | $ | 17.54 | |
Market Price and Net Asset Value History For the Past Five Years |
Overview of the Fund’s Long-Term Investments
Portfolio Composition
|
|
|
| 2/28/14
|
| 8/31/13
|
Corporate Bonds | | | | | 44 | % | | | 44 | % |
Floating Rate Loan Interests | | | | | 36 | | | | 36 | |
Non-Agency Mortgage-Backed Securities | | | | | 8 | | | | 8 | |
Asset-Backed Securities | | | | | 4 | | | | 6 | |
US Government Sponsored Agency Securities | | | | | 4 | | | | 4 | |
Preferred Securities | | | | | 2 | | | | 1 | |
Foreign Agency Obligations | | | | | 1 | | | | - | |
Common Stocks | | | | | 1 | | | | 1 | |
| | | | | | | |
Corporate Bonds Credit Quality Allocation4
|
|
|
| 2/28/14
|
| 8/31/13
|
AAA/Aaa5 | | | | | 9 | % | | | 9 | % |
AA/Aa | | | | | - | | | | 1 | |
A | | | | | 3 | | | | 6 | |
BBB/Baa | | | | | 17 | | | | 17 | |
BB/Ba | | | | | 30 | | | | 25 | |
B | | | | | 33 | | | | 34 | |
CCC/Caa | | | | | 7 | | | | 7 | |
Not Rated | | | | | 1 | | | | 1 | |
| 4 | | Using the higher of S&P’s or Moody’s ratings. |
| 5 | | Includes US Government Sponsored Agency securities and US Treasury Obligations, which were deemed AAA/Aaa by the investment advisor. |
| SEMI-ANNUAL REPORT | FEBRUARY 28, 2014 | 9
|
| |
| The Benefits and Risks of Leveraging |
|
The Funds may utilize leverage to seek to enhance the yield and net asset value (“NAV”) of their common shares (“Common Shares”). However, these objectives cannot be achieved in all interest rate environments.
In general, the concept of leveraging is based on the premise that the financing cost of leverage, which will be based on short-term interest rates, will normally be lower than the income earned by a Fund on its longer-term portfolio investments purchased with the proceeds from leverage. To the extent that the total assets of the Fund (including the assets obtained from leverage) are invested in higher-yielding portfolio investments, the Fund’s shareholders will benefit from the incremental net income. The interest earned on securities purchased with the proceeds from leverage is paid to shareholders in the form of dividends, and the value of these portfolio holdings is reflected in the per share NAV.
To illustrate these concepts, assume a Fund’s capitalization is $100 million and it utilizes leverage for an additional $30 million, creating a total value of $130 million available for investment in longer-term income securities. If prevailing short-term interest rates are 3% and longer-term interest rates are 6%, the yield curve has a strongly positive slope. In this case, the Fund’s financing costs on the $30 million of proceeds obtained from leverage are based on the lower short-term interest rates. At the same time, the securities purchased by the Fund with the proceeds from leverage earn income based on longer-term interest rates. In this case, the Fund’s costs of leverage are significantly lower than the income earned on the Fund’s longer-term investments acquired from leverage proceeds, and therefore the holders of Common Shares (“Common Shareholders”) are the beneficiaries of the incremental net income.
However, in order to benefit shareholders, the return on assets purchased with leverage proceeds must exceed the ongoing costs associated with the leverage. If interest or dividends and other costs of leverage exceed the Fund’s return on assets purchased with leverage proceeds, income to shareholders will be lower than if the Fund had not used leverage. Furthermore, the value of the Fund’s portfolio investments generally varies inversely with the direction of long-term interest rates, although other factors can influence the value of portfolio investments. In contrast, the value of the Fund’s obligations under its leverage arrangement generally does not fluctuate in relation to interest rates. As a result, changes in interest rates can influence the Fund’s NAVs positively or negatively. Changes in the future direction of interest rates are very difficult to predict accurately, and there is no assurance that a Fund’s intended leveraging strategy will be successful.
Leverage also will generally cause greater changes in the Funds’ NAVs, market prices and dividend rates than comparable portfolios without leverage. In a declining market, leverage is likely to cause a greater decline in the net asset value and market price of a Fund’s shares than if the Fund were not leveraged. In addition, the Fund may be required to sell portfolio securities at inopportune times or at distressed values in order to comply with regulatory requirements applicable to the use of leverage or as required by the terms of leverage instruments, which may cause the Fund to incur losses. The use of leverage may limit the Fund’s ability to invest in certain types of securities or use certain types of hedging strategies. The Fund will incur expenses in connection with the use of leverage, all of which are borne by shareholders and may reduce income to the shares.
Each Fund may utilize leverage through a credit facility or reverse repurchase agreements as described in the Notes to Financial Statements.
Under the Investment Company Act of 1940, as amended (the “1940 Act”), each Fund is permitted to issue debt up to 331⁄3% of its total managed assets. A Fund may voluntarily elect to limit its leverage to less than the maximum amount permitted under the 1940 Act. In addition, a Fund may also be subject to certain asset coverage, leverage or portfolio composition requirements imposed by its credit facility, which may be more stringent than those imposed by the 1940 Act.
Derivative Financial Instruments
The Funds may invest in various derivative financial instruments, including financial futures contracts, foreign currency exchange contracts, options and swaps, as specified in Note 4 of the Notes to Financial Statements, which may constitute forms of economic leverage. Such derivative financial instruments are used to obtain exposure to a market without owning or taking physical custody of securities or to hedge market, equity, credit, interest rate and/or foreign currency exchange rate risks. Derivative financial instruments involve risks, including the imperfect correlation between the value of a derivative financial instrument and the underlying asset, possible default of the counterparty to the transaction or illiquidity of the derivative financial instrument. The Funds’ ability to use a derivative financial instrument successfully depends on the investment advisor’s ability to predict pertinent market movements accurately, which cannot be assured. The use of derivative financial instruments may result in losses greater than if they had not been used, may require a Fund to sell or purchase portfolio investments at inopportune times or for distressed values, may limit the amount of appreciation a Fund can realize on an investment, may result in lower dividends paid to shareholders and/or may cause a Fund to hold an investment that it might otherwise sell. The Funds’ investments in these instruments are discussed in detail in the Notes to Financial Statements.
| 10 | SEMI-ANNUAL REPORT | FEBRUARY 28, 2014
|
| |
| Schedule of Investments February 28, 2014 (Unaudited) | BlackRock Defined Opportunity Credit Trust (BHL)
(Percentages shown are based on Net Assets)
|
| Common Stocks (a) | | | | | |
Shares | | Value |
Hotels, Restaurants & Leisure — 0.4% | | | | | | | | | | | | | | |
BLB Worldwide Holdings, Inc. | | | | | | | 21,020 | | | $ | 524,449 | |
Software — 0.4% | | | | | | | | | | | | | | |
HMH Holdings/EduMedia | | | | | | | 24,355 | | | | 470,149 | |
Total Common Stocks — 0.8% | | | | | | | | | | | 994,598 | |
|
Asset-Backed Securities (b)(c) | | | | | | Par
(000) | | |
ALM Loan Funding, Series 2013-7RA, Class C, 3.69%, 4/24/24 | | | | USD | | | 835 | | | | 807,395 | |
Atrium CDO Corp., Series 9A,Class D, 3.73%, 2/28/24 | | | | | | | 250 | | | | 242,219 | |
Carlyle Global Market Strategies CLO Ltd., Series 2012-4A, Class D, 4.74%, 1/20/25 | | | | | | | 250 | | | | 251,422 | |
Figueroa CLO Ltd., Series 2013-1A, Class C, 3.88%, 3/21/24 | | | | | | | 250 | | | | 243,188 | |
Fraser Sullivan CLO VII Ltd., Series 2012-7A, Class C, 4.24%, 4/20/23 | | | | | | | 215 | | | | 214,994 | |
Highbridge Loan Management Ltd., Series 2012-1A, Class C, 5.25%, 9/20/22 | | | | | | | 350 | | | | 352,038 | |
Marea CLO Ltd., Series 2012-1A, Class D, 4.79%, 10/16/23 | | | | | | | 400 | | | | 401,120 | |
Neuberger Berman CLO XV, Series 2013-15A, Class C, 3.09%, 10/15/25 | | | | | | | 500 | | | | 489,415 | |
North End CLO Ltd., Series 2013-1A, Class D, 3.74%, 7/17/25 | | | | | | | 250 | | | | 242,227 | |
Octagon Investment Partners XVII Ltd., Series 2013-1A, Class D, 3.44%, 10/25/25 | | | | | | | 250 | | | | 238,487 | |
Race Point CLO Ltd., Series 2012-6A, Class D, 4.74%, 5/24/23 | | | | | | | 250 | | | | 250,082 | |
Symphony CLO Ltd., Series 2012-10A,
Class D, 5.49%, 7/23/23 | | | | | | | 350 | | | | 351,927 | |
Total Asset-Backed Securities — 3.1% | | | | | | | | | | | 4,084,514 | |
|
Corporate Bonds | | | | | | | | | | | | |
Airlines — 0.7% | | | | | | | | | | | | | | |
American Airlines Pass-Through Trust, Series 2013-2, Class C, 6.00%, 1/15/17 (c) | | | | | | | 250 | | | | 259,375 | |
Delta Air Lines Pass-Through Trust, Series 2009-1, Class B, 9.75%, 6/17/18 | | | | | | | 48 | | | | 54,006 | |
US Airways Pass-Through Trust, Series 2012-2, Class C, 5.45%, 6/03/18 | | | | | | | 590 | | | | 601,800 | |
| | | | | | | | | | | 915,181 | |
Auto Components — 0.2% | | | | | | | | | | | | | | |
Icahn Enterprises LP/Icahn Enterprises Finance Corp., 3.50%, 3/15/17 (c) | | | | | | | 269 | | | | 272,363 | |
Chemicals — 0.1% | | | | | | | | | | | | | | |
INEOS Finance PLC, 8.38%, 2/15/19 (c) | | | | | | | 110 | | | | 121,825 | |
| | | | | | | | | | | | | |
| Corporate Bonds | | | | | | Par
(000) | | Value |
Commercial Services & Supplies — 0.3% | | | | | | | | | | | | | | |
Avis Budget Car Rental LLC/Avis Budget Finance, Inc., 2.99%, 12/01/17 (b)(c) | | | | USD | | | 68 | | | $ | 68,680 | |
AWAS Aviation Capital Ltd., 7.00%, 10/17/16 (c) | | | | | | | 268 | | | | 277,751 | |
United Rentals North America, Inc., 5.75%, 7/15/18 | | | | | | | 80 | | | | 85,800 | |
| | | | | | | | | | | 432,231 | |
Communications Equipment — 0.4% | | | | | | | | | | | | | | |
Avaya, Inc., 7.00%, 4/01/19 (c) | | | | | | | 101 | | | | 100,242 | |
Zayo Group LLC/Zayo Capital, Inc., 8.13%, 1/01/20 | | | | | | | 380 | | | | 418,950 | |
| | | | | | | | | | | 519,192 | |
Diversified Financial Services — 0.3% | | | | | | | | | | | | | | |
Ally Financial, Inc., 2.92%, 7/18/16 (b) | | | | | | | 275 | | | | 280,714 | |
Reynolds Group Issuer, Inc., 7.13%, 4/15/19 | | | | | | | 120 | | | | 127,650 | |
| | | | | | | | | | | 408,364 | |
Diversified Telecommunication Services — 0.3% | | | | | | | | | | | | | | |
Level 3 Financing, Inc. (c): | | | | | | | | | | | | | | |
3.85%, 1/15/18 (b) | | | | | | | 228 | | | | 231,420 | |
6.13%, 1/15/21 | | | | | | | 127 | | | | 134,303 | |
| | | | | | | | | | | 365,723 | |
Health Care Technology — 0.3% | | | | | | | | | | | | | | |
IMS Health, Inc., 12.50%, 3/01/18 (c) | | | | | | | 295 | | | | 339,250 | |
Household Durables — 0.1% | | | | | | | | | | | | | | |
Beazer Homes USA, Inc., 6.63%, 4/15/18 | | | | | | | 180 | | | | 194,400 | |
Independent Power Producers & Energy Traders — 0.8% | | | | | | | |
Calpine Corp., 6.00%, 1/15/22 (c) | | | | | | | 80 | | | | 84,800 | |
Energy Future Intermediate Holding Co. LLC/EFIH Finance, Inc.: | | | | | | | | | | | | | | |
10.00%, 12/01/20 | | | | | | | 700 | | | | 728,000 | |
10.25%, 12/01/20 (c) | | | | | | | 230 | | | | 239,200 | |
| | | | | | | | | | | 1,052,000 | |
Media — 0.1% | | | | | | | | | | | | | | |
NAI Entertainment Holdings/NAI Entertainment Holdings Finance Corp., 5.00%, 8/01/18 (c) | | | | | | | 96 | | | | 100,080 | |
Oil, Gas & Consumable Fuels — 0.1% | | | | | | | | | | | | | | |
EP Energy LLC/Everest Acquisition Finance, Inc., 6.88%, 5/01/19 | | | | | | | 145 | | | | 156,419 | |
Wireless Telecommunication Services — 0.0% | | | | | | | | | | | | | | |
T-Mobile USA, Inc., 6.13%, 1/15/22 | | | | | | | 50 | | | | 52,813 | |
Total Corporate Bonds — 3.7% | | | | | | | | | | | 4,929,841 | |
|
Floating Rate Loan Interests (b) | | | | | | | | | | | | |
Aerospace & Defense — 2.1% | | | | | | | | | | | | | | |
DigitalGlobe, Inc., Term Loan B, 3.75%, 1/31/20 | | | | | | | 511 | | | | 510,499 | |
The SI Organization, Inc., Term Loan B, 5.50%, 11/22/16 | | | | | | | 410 | | | | 401,671 | |
Spirit Aerosystems, Inc., Term Loan B, 3.75%, 4/18/19 | | | | | | | 364 | | | | 364,888 | |
Transdigm, Inc., Term Loan C, 3.75%, 2/28/20 | | | | | | | 223 | | | | 223,585 | |
TransUnion LLC, Term Loan, 4.25%, 2/08/19 | | | | | | | 1,276 | | | | 1,279,733 | |
| | | | | | | | | | | 2,780,376 | |
Portfolio Abbreviations
| CAD
EBITDA
EUR | | Canadian Dollar
Earnings Before Interest, Taxes, Depreciation and Amortization
Euro | | GBP
OTC
PIK
USD | | British Pound
Over-the-Counter
Payment-In-Kind
US Dollar |
See Notes to Financial Statements.
| SEMI-ANNUAL REPORT | FEBRUARY 28, 2014 | 11
|
| |
| Schedule of Investments (continued) | BlackRock Defined Opportunity Credit Trust (BHL)
(Percentages shown are based on Net Assets)
|
| Floating Rate Loan Interests (b) | | | | | | Par
(000) | | Value |
Airlines — 1.0% | | | | | | | | | | | | | | |
Delta Air Lines, Inc.: | | | | | | | | | | | | | | |
Term Loan, 3.49%, 9/16/15 | | | | USD | | | 317 | | | $ | 306,656 | |
Term Loan B1, 3.50%, 10/18/18 | | | | | | | 325 | | | | 326,023 | |
Northwest Airlines, Inc., Term Loan: | | | | | | | | | | | | | | |
2.24%, 3/10/17 | | | | | | | 208 | | | | 201,148 | |
1.62%, 9/10/18 | | | | | | | 273 | | | | 257,513 | |
US Airways Group, Inc., Term Loan B1, 3.50%, 5/23/19 | | | | | | | 260 | | | | 260,081 | |
| | | | | | | | | | | 1,351,421 | |
Auto Components — 4.6% | | | | | | | | | | | | | | |
Affinia Group Intermediate Holdings, Inc., Term Loan B2, 4.75%, 4/27/20 | | | | | | | 358 | | | | 358,497 | |
Armored Autogroup, Inc., Term Loan B, 6.00%, 11/05/16 | | | | | | | 60 | | | | 59,887 | |
Autoparts Holdings Ltd., 1st Lien Term Loan, 6.50%, 7/29/17 | | | | | | | 627 | | | | 627,309 | |
Dayco Products LLC, Term Loan B, 5.25%, 12/12/19 | | | | | | | 360 | | | | 363,150 | |
Federal-Mogul Corp.: | | | | | | | | | | | | | | |
Term Loan B, 2.10%, 12/29/14 | | | | | | | 1,354 | | | | 1,342,640 | |
Term Loan C, 2.10%, 12/28/15 | | | | | | | 1,258 | | | | 1,247,910 | |
The Goodyear Tire & Rubber Co., 2nd Lien Term Loan, 4.75%, 4/30/19 | | | | | | | 1,150 | | | | 1,160,638 | |
Schaeffler AG, Term Loan C, 4.25%, 1/27/17 | | | | | | | 15 | | | | 15,098 | |
Transtar Holding Co., 1st Lien Term Loan, 5.50%, 10/09/18 | | | | | | | 489 | | | | 480,258 | |
UCI International, Inc., Term Loan B, 5.50%, 7/26/17 | | | | | | | 340 | | | | 338,865 | |
| | | | | | | | | | | 5,994,252 | |
Automobiles — 0.1% | | | | | | | | | | | | | | |
Chrysler Group LLC, 2018 Term Loan B, 3.25%, 12/31/18 | | | | | | | 190 | | | | 189,016 | |
Building Products — 2.1% | | | | | | | | | | | | | | |
Armstrong World Industries, Inc., Term Loan B, 3.50%, 3/15/20 | | | | | | | 258 | | | | 258,293 | |
Continental Building Products LLC, 1st Lien Term Loan, 4.75%, 8/28/20 | | | | | | | 269 | | | | 269,212 | |
CPG International, Inc., Term Loan, 4.75%, 9/30/20 | | | | | | | 783 | | | | 783,531 | |
Ply Gem Industries, Inc., Term Loan, 4.00%, 1/16/21 | | | | | | | 200 | | | | 200,334 | |
Quikrete Holdings, Inc., 1st Lien Term Loan, 4.00%, 9/28/20 | | | | | | | 339 | | | | 339,855 | |
Wilsonart LLC: | | | | | | | | | | | | | | |
Incremental Term Loan B2, 4.00%, 10/31/19 | | | | | | | 110 | | | | 109,725 | |
Term Loan B, 4.00%, 10/31/19 | | | | | | | 792 | | | | 791,010 | |
| | | | | | | | | | | 2,751,960 | |
Capital Markets — 0.2% | | | | | | | | | | | | | | |
American Capital Holdings, Inc., 2017 Term Loan, 3.50%, 8/22/17 | | | | | | | 197 | | | | 197,211 | |
KCG Holdings, Inc., Term Loan B, 5.75%, 12/05/17 | | | | | | | 110 | | | | 110,041 | |
| | | | | | | | | | | 307,252 | |
Chemicals — 4.1% | | | | | | | | | | | | | | |
Allnex USA, Inc.: | | | | | | | | | | | | | | |
Term Loan B1, 4.50%, 10/03/19 | | | | | | | 255 | | | | 256,554 | |
Term Loan B2, 4.50%, 10/03/19 | | | | | | | 133 | | | | 133,114 | |
Axalta Coating Systems US Holdings, Inc., Term Loan, 4.00%, 2/01/20 | | | | | | | 729 | | | | 732,092 | |
CeramTec Acquisition Corp., Term Loan B2, 4.25%, 8/28/20 | | | | | | | 27 | | | | 27,005 | |
Chemtura Corp., Term Loan B, 3.50%, 8/27/16 | | | | | | | 324 | | | | 326,003 | |
Chromaflo Technologies Corp.: | | | | | | | | | | | | | | |
1st Lien Term Loan, 4.50%, 12/02/19 | | | | | | | 260 | | | | 260,650 | |
2nd Lien Term Loan, 8.25%, 5/30/20 | | | | | | | 110 | | | | 110,825 | |
Evergreen Acqco 1 LP, Term Loan, 5.00%, 7/09/19 | | | | | | | 478 | | | | 479,404 | |
| | | | | | | | | | | | | |
| Floating Rate Loan Interests (b) | | | | | | Par
(000) | | Value |
Chemicals (concluded) | | | | | | | | | | | | | | |
INEOS Finance LLC: | | | | | | | | | | | | | | |
3 Year Term Loan, 2.15%, 5/04/15 | | | | USD | | | 88 | | | $ | 88,142 | |
6 Year Term Loan, 2.75%, 5/04/18 | | | | | | | 195 | | | | 194,458 | |
MacDermid, Inc., 1st Lien Term Loan, 4.00%, 6/08/20 | | | | | | | 353 | | | | 354,638 | |
Nexeo Solutions LLC, Term Loan B, 5.00%, 9/08/17 | | | | | | | 584 | | | | 579,797 | |
OXEA Finance LLC: | | | | | | | | | | | | | | |
2nd Lien Term Loan, 8.25%, 7/15/20 | | | | | | | 315 | | | | 321,004 | |
Term Loan B2, 4.25%, 1/15/20 | | | | | | | 584 | | | | 587,185 | |
Royal Adhesives and Sealants LLC, 1st Lien Term Loan, 5.50%, 7/31/18 | | | | | | | 159 | | | | 160,875 | |
Tata Chemicals North America, Inc., Term Loan B, 3.75%, 8/07/20 | | | | | | | 134 | | | | 134,661 | |
Tronox Pigments (Netherlands) BV, Term Loan, 4.50%, 3/19/20 | | | | | | | 409 | | | | 409,636 | |
Univar, Inc., Term Loan B, 5.00%, 6/30/17 | | | | | | | 223 | | | | 221,861 | |
| | | | | | | | | | | 5,377,904 | |
Commercial Banks — 0.2% | | | | | | | | | | | | | | |
Redtop Acquisitions Ltd.: | | | | | | | | | | | | | | |
1st Lien Term Loan, 4.50%, 12/03/20 | | | | | | | 190 | | | | 191,108 | |
2nd Lien Term Loan, 8.25%, 6/03/21 | | | | | | | 70 | | | | 71,400 | |
| | | | | | | | | | | 262,508 | |
Commercial Services & Supplies — 4.2% | | | | | | | | | | | | | | |
ADS Waste Holdings, Inc., Term Loan, 3.75%, 10/09/19 | | | | | | | 740 | | | | 739,202 | |
ARAMARK Corp.: | | | | | | | | | | | | | | |
Extended Synthetic Line of Credit 2, 3.65%, 7/26/16 | | | | | | | 14 | | | | 13,860 | |
Extended Synthetic Line of Credit 3, 6.65%, 7/26/16 | | | | | | | 9 | | | | 9,373 | |
AWAS Finance Luxembourg 2012 SA, Term Loan, 3.50%, 7/16/18 | | | | | | | 290 | | | | 290,876 | |
Brand Energy & Infrastructure Services, Inc., Term Loan B, 4.75%, 11/26/20 | | | | | | | 870 | | | | 872,596 | |
Catalent Pharma Solutions, Inc., Term Loan, 6.50%, 12/29/17 | | | | | | | 115 | | | | 116,438 | |
KAR Auction Services, Inc., Term Loan B, 3.75%, 5/19/17 | | | | | | | 555 | | | | 555,490 | |
Livingston International, Inc.: | | | | | | | | | | | | | | |
1st Lien Term Loan, 5.00%, 4/16/19 | | | | | | | 308 | | | | 309,221 | |
2nd Lien Term Loan, 9.00%, 4/20/20 | | | | | | | 200 | | | | 204,373 | |
Progressive Waste Solutions Ltd., Term Loan B, 3.00%, 10/24/19 | | | | | | | 312 | | | | 312,942 | |
Protection One, Inc., Term Loan, 4.25%, 3/21/19 | | | | | | | 471 | | | | 469,371 | |
Spin Holdco, Inc., Term Loan B, 4.25%, 11/14/19 | | | | | | | 928 | | | | 928,970 | |
West Corp., Term Loan B10, 3.25%, 6/30/18 | | | | | | | 681 | | | | 677,103 | |
| | | | | | | | | | | 5,499,815 | |
Communications Equipment — 2.3% | | | | | | | | | | | | | | |
Alcatel-Lucent USA, Inc., Term Loan C, 4.50%, 1/30/19 | | | | | | | 1,206 | | | | 1,215,823 | |
Applied Systems, Inc.: | | | | | | | | | | | | | | |
1st Lien Term Loan, 4.25%, 1/25/21 | | | | | | | 185 | | | | 186,156 | |
2nd Lien Term Loan, 7.50%, 1/22/22 | | | | | | | 85 | | | | 86,764 | |
Avaya, Inc., Extended Term Loan B3, 4.73%, 10/26/17 | | | | | | | 347 | | | | 337,369 | |
Blackboard, Inc., Term Loan B3, 4.75%, 10/04/18 | | | | | | | 115 | | | | 115,685 | |
CommScope, Inc.: | | | | | | | | | | | | | | |
Term Loan B3, 2.65% - 2.73%, 1/21/17 | | | | | | | 158 | | | | 157,483 | |
Term Loan B4, 3.25%, 1/26/18 | | | | | | | 237 | | | | 236,962 | |
Zayo Group LLC/Zayo Capital, Inc., Term Loan B, 4.00%, 7/02/19 | | | | | | | 649 | | | | 650,673 | |
| | | | | | | | | | | 2,986,915 | |
See Notes to Financial Statements.
| 12 | SEMI-ANNUAL REPORT | FEBRUARY 28, 2014
|
| |
| Schedule of Investments (continued) | BlackRock Defined Opportunity Credit Trust (BHL)
(Percentages shown are based on Net Assets)
|
| Floating Rate Loan Interests (b) | | | | | | Par
(000) | | Value |
Construction & Engineering — 1.0% | | | | | | | | | | | | | | |
BakerCorp International, Inc., Term Loan, 4.25%, 2/14/20 | | | | USD | | | 301 | | | $ | 300,759 | |
Centaur Acquisition LLC: | | | | | | | | | | | | | | |
1st Lien Term Loan, 5.25%, 2/20/19 | | | | | | | 504 | | | | 504,554 | |
2nd Lien Term Loan, 8.75%, 2/15/20 | | | | | | | 280 | | | | 285,600 | |
USIC Holdings, Inc., 1st Lien Term Loan, 4.00%, 7/10/20 | | | | | | | 269 | | | | 268,201 | |
| | | | | | | | | | | 1,359,114 | |
Construction Materials — 1.6% | | | | | | | | | | | | | | |
Filtration Group Corp.: | | | | | | | | | | | | | | |
1st Lien Term Loan, 4.50%, 11/21/20 | | | | | | | 220 | | | | 221,742 | |
2nd Lien Term Loan, 8.25%, 11/21/21 | | | | | | | 120 | | | | 122,550 | |
HD Supply, Inc., Term Loan B, 4.00%, 6/28/18 | | | | | | | 1,612 | | | | 1,616,736 | |
McJunkin Red Man Corp., Term Loan, 5.00%, 11/08/19 | | | | | | | 150 | | | | 151,159 | |
| | | | | | | | | | | 2,112,187 | |
Consumer Finance — 0.5% | | | | | | | | | | | | | | |
Springleaf Financial Funding Co., Term Loan B2, 4.75%, 9/25/19 | | | | | | | 700 | | | | 708,050 | |
Containers & Packaging — 1.1% | | | | | | | | | | | | | | |
Ardagh Holdings USA, Inc.: | | | | | | | | | | | | | | |
Incremental Term Loan, 4.00%, 12/17/19 | | | | | | | 210 | | | | 210,788 | |
Term Loan B, 4.25%, 12/17/19 | | | | | | | 290 | | | | 290,725 | |
Berry Plastics Holding Corp., Term Loan E, 3.75%, 1/09/21 | | | | | | | 185 | | | | 184,445 | |
Sealed Air Corp., 2013 Term Loan, 3.00%, 10/03/18 | | | | | | | 331 | | | | 332,584 | |
Tekni-Plex, Inc., Term Loan B, 5.50% – 6.50%, 8/25/19 | | | | | | | 393 | | | | 393,489 | |
| | | | | | | | | | | 1,412,031 | |
Distributors — 1.3% | | | | | | | | | | | | | | |
ABC Supply Co., Inc., Term Loan, 3.50%, 4/16/20 | | | | | | | 1,147 | | | | 1,147,481 | |
Crossmark Holdings, Inc., 1st Lien Term Loan, 4.50%, 12/20/19 | | | | | | | 233 | | | | 231,633 | |
VWR Funding, Inc., Term Loan, 3.45%, 4/03/17 | | | | | | | 277 | | | | 277,200 | |
| | | | | | | | | | | 1,656,314 | |
Diversified Consumer Services — 2.1% | | | | | | | | | | | | | | |
Allied Security Holdings LLC: | | | | | | | | | | | | | | |
1st Lien Term Loan, 4.25%, 2/12/21 | | | | | | | 242 | | | | 241,367 | |
Delayed Draw Term Loan, 0.50%, 2/12/21 | | | | | | | 86 | | | | 85,689 | |
Bright Horizons Family Solutions, Inc., Term Loan B, 4.00%, 1/30/20 | | | | | | | 639 | | | | 639,482 | |
Doncasters Finance US LLC, Term Loan, 5.50%, 4/09/20 | | | | | | | 208 | | | | 210,313 | |
Garda World Securities Corp.: | | | | | | | | | | | | | | |
Delayed Draw Term Loan, 4.00%, 11/06/20 | | | | | | | 69 | | | | 68,860 | |
Term Loan B, 4.00%, 11/06/20 | | | | | | | 269 | | | | 269,180 | |
ROC Finance LLC, Term Loan, 5.00%, 6/20/19 | | | | | | | 249 | | | | 242,829 | |
ServiceMaster Co., Term Loan, 4.25%, 1/31/17 | | | | | | | 467 | | | | 467,397 | |
Weight Watchers International, Inc., Term Loan B2, 4.00%, 4/02/20 | | | | | | | 630 | | | | 481,149 | |
| | | | | | | | | | | 2,706,266 | |
Diversified Financial Services — 2.3% | | | | | | | | | | | | | | |
ION Trading Technologies Sarl: | | | | | | | | | | | | | | |
1st Lien Term Loan, 4.50%, 5/22/20 | | | | | | | 371 | | | | 373,342 | |
2nd Lien Term Loan, 8.25%, 5/21/21 | | | | | | | 80 | | | | 80,800 | |
Kasima LLC, Term Loan B, 3.25%, 5/17/21 | | | | | | | 355 | | | | 354,556 | |
Reynolds Group Holdings, Inc., Dollar Term Loan, 4.00%, 12/01/18 | | | | | | | 749 | | | | 754,173 | |
RPI Finance Trust, Term Loan B3, 3.25%, 11/09/18 | | | | | | | 88 | | | | 88,247 | |
SAM Finance Luxembourg Sarl, Term Loan, 4.25%, 12/17/20 | | | | | | | 595 | | | | 595,994 | |
WMG Acquisition Corp., Term Loan, 3.75%, 7/01/20 | | | | | | | 798 | | | | 796,803 | |
| | | | | | | | | | | 3,043,915 | |
| | | | | | | | | | | | | |
| Floating Rate Loan Interests (b) | | | | | | Par
(000) | | Value |
Diversified Telecommunication Services — 4.4% | | | | | | | | | | | | | | |
Consolidated Communications, Inc., Term Loan B, 4.25%, 12/23/20 | | | | USD | | | 873 | | | $ | 878,422 | |
Hawaiian Telcom Communications, Inc., Term Loan B, 5.00%, 6/06/19 | | | | | | | 523 | | | | 525,515 | |
Integra Telecom, Inc.: | | | | | | | | | | | | | | |
2nd Lien Term Loan, 9.75%, 2/21/20 | | | | | | | 255 | | | | 261,439 | |
Term Loan B, 5.25%, 2/22/19 | | | | | | | 462 | | | | 465,666 | |
Level 3 Financing, Inc.: | | | | | | | | | | | | | | |
2020 Term Loan B, 4.00%, 1/15/20 | | | | | | | 2,160 | | | | 2,165,400 | |
Term Loan, 4.00%, 8/01/19 | | | | | | | 220 | | | | 220,660 | |
Syniverse Holdings, Inc., Term Loan B, 4.00%, 4/23/19 | | | | | | | 446 | | | | 447,514 | |
US Telepacific Corp., Term Loan B, 5.75%, 2/23/17 | | | | | | | 732 | | | | 736,073 | |
| | | | | | | | | | | 5,700,689 | |
Electric Utilities — 0.5% | | | | | | | | | | | | | | |
American Energy – Utica LLC, 2nd Lien Term Loan, 11.00%, 9/30/18 | | | | | | | 325 | | | | 339,738 | |
Sandy Creek Energy Associates LP, Term Loan B, 5.00%, 11/06/20 | | | | | | | 300 | | | | 300,609 | |
| | | | | | | | | | | 640,347 | |
Electrical Equipment — 1.0% | | | | | | | | | | | | | | |
Southwire Co., Term Loan, 3.25%, 2/11/21 | | | | | | | 265 | | | | 264,857 | |
Texas Competitive Electric Holdings Co. LLC, Extended Term Loan, 4.74%, 10/10/17 | | | | | | | 1,505 | | | | 1,048,880 | |
| | | | | | | | | | | 1,313,737 | |
Electronic Equipment, Instruments & Components — 0.4% |
CDW LLC, Term Loan, 3.25%, 4/29/20 | | | | | | | 521 | | | | 518,239 | |
Energy Equipment & Services — 0.7% | | | | | | | | | | | | | | |
Dynegy Holdings, Inc., Term Loan B2, 4.00%, 4/23/20 | | | | | | | 259 | | | | 259,476 | |
MEG Energy Corp., Refinancing Term Loan, 3.75%, 3/31/20 | | | | | | | 360 | | | | 360,880 | |
Seadrill Partners Finco LLC, Term Loan B, 4.00%, 2/21/21 | | | | | | | 115 | | | | 115,312 | |
Unifrax Corp., Term Loan, 4.25%, 11/28/18 | | | | | | | 217 | | | | 217,692 | |
| | | | | | | | | | | 953,360 | |
Food & Staples Retailing — 1.9% | | | | | | | | | | | | | | |
Alliance Boots Holdings Ltd., Term Loan B1, 3.47%, 7/09/15 | | | | GBP | | | 767 | | | | 1,282,968 | |
Rite Aid Corp.: | | | | | | | | | | | | | | |
2nd Lien Term Loan, 5.75%, 8/21/20 | | | | USD | | | 235 | | | | 239,895 | |
Term Loan 6, 4.00%, 2/21/20 | | | | | | | 223 | | | | 224,038 | |
Supervalu, Inc., Refinancing Term Loan B, 4.50%, 3/21/19 | | | | | | | 511 | | | | 512,257 | |
US Foods, Inc., Refinancing Term Loan, 4.50%, 3/29/19 | | | | | | | 199 | | | | 199,995 | |
| | | | | | | | | | | 2,459,153 | |
Food Products — 3.3% | | | | | | | | | | | | | | |
AdvancePierre Foods, Inc., Term Loan, 5.75%, 7/10/17 | | | | | | | 200 | | | | 200,701 | |
CTI Foods Holding Co. LLC, 1st Lien Term Loan, 4.50%, 6/29/20 | | | | | | | 259 | | | | 259,459 | |
Del Monte Foods Co., 1st Lien Term Loan, 4.25%, 11/06/20 | | | | | | | 395 | | | | 395,494 | |
Diamond Foods, Inc., Term Loan, 4.25%, 7/28/18 | | | | | | | 180 | | | | 179,885 | |
Dole Food Co., Inc., Term Loan B, 4.50%, 11/01/18 | | | | | | | 605 | | | | 608,176 | |
GFA Brands, Inc., Term Loan B, 5.00%, 7/09/20 | | | | | | | 109 | | | | 110,088 | |
H.J. Heinz Co., Term Loan B1, 3.25%, 6/07/19 | | | | | | | 75 | | | | 74,939 | |
Michael Foods Group, Inc., Term Loan, 4.25%, 2/23/18 | | | | | | | 165 | | | | 165,513 | |
Performance Food Group Co., 2nd Lien Term Loan, 6.25%, 11/14/19 | | | | | | | 711 | | | | 722,097 | |
Pinnacle Foods Finance LLC: | | | | | | | | | | | | | | |
Incremental Term Loan H, 3.25%, 4/29/20 | | | | | | | 125 | | | | 124,272 | |
Term Loan G, 3.25%, 4/29/20 | | | | | | | 695 | | | | 691,929 | |
See Notes to Financial Statements.
| SEMI-ANNUAL REPORT | FEBRUARY 28, 2014 | 13
|
| |
| Schedule of Investments (continued) | BlackRock Defined Opportunity Credit Trust (BHL)
(Percentages shown are based on Net Assets)
|
| Floating Rate Loan Interests (b) | | | | | | Par
(000) | | Value |
Food Products (concluded) | | | | | | | | | | | | | | |
Reddy Ice Corp.: | | | | | | | | | | | | | | |
1st Lien Term Loan, 6.75% – 7.75%, 5/01/19 | | | | USD | | | 566 | | | $ | 562,897 | |
2nd Lien Term Loan, 10.75%, 11/01/19 | | | | | | | 270 | | | | 261,900 | |
| | | | | | | | | | | 4,357,350 | |
Health Care Equipment & Supplies — 5.5% | | | | | | | | | | | | | | |
Arysta LifeScience Corp.: | | | | | | | | | | | | | | |
1st Lien Term Loan, 4.50%, 5/29/20 | | | | | | | 935 | | | | 938,415 | |
2nd Lien Term Loan, 8.25%, 11/30/20 | | | | | | | 380 | | | | 385,225 | |
Biomet, Inc., Term Loan B2, 3.65% – 3.75%, 7/25/17 | | | | | | | 756 | | | | 757,221 | |
Capital Safety North America Holding, Inc., Term Loan, 4.50%, 1/21/19 | | | | | | | 349 | | | | 348,814 | |
Capsugel Holdings US, Inc., Term Loan B, 3.50%, 8/01/18 | | | | | | | 472 | | | | 471,238 | |
DJO Finance LLC, Term Loan B3, 4.75%, 9/15/17 | | | | | | | 980 | | | | 985,077 | |
Fresenius SE & Co. KGaA: | | | | | | | | | | | | | | |
Incremental Term Loan B, 2.25%, 6/25/19 | | | | EUR | | | 120 | | | | 165,429 | |
Term Loan B, 2.25%, 8/07/19 | | | | USD | | | 618 | | | | 617,504 | |
The Hologic, Inc., Term Loan B, 3.25%, 8/01/19 | | | | | | | 765 | | | | 763,460 | |
Iasis Healthcare LLC, Term Loan B2, 4.50%, 5/03/18 | | | | | | | 95 | | | | 95,715 | |
Immucor, Inc., Refinancing Term Loan B2, 5.00%, 8/17/18 | | | | | | | 807 | | | | 810,604 | |
Kinetic Concepts, Inc., Term Loan E1, 4.00%, 5/04/18 | | | | | | | 120 | | | | 120,048 | |
Leonardo Acquisition Corp., Term Loan, 4.25%, 1/31/21 | | | | | | | 95 | | | | 95,237 | |
LHP Hospital Group, Inc., Term Loan, 9.00%, 7/03/18 | | | | | | | 132 | | | | 128,213 | |
Onex Carestream Finance LP: | | | | | | | | | | | | | | |
1st Lien Term Loan, 5.00%, 6/07/19 | | | | | | | 302 | | | | 305,650 | |
2nd Lien Term Loan, 9.50%, 12/07/19 | | | | | | | 245 | | | | 249,900 | |
| | | | | | | | | | | 7,237,750 | |
Health Care Providers & Services — 6.7% | | | | | | | | | | | | | | |
American Renal Holdings, Inc.: | | | | | | | | | | | | | | |
1st Lien Term Loan, 4.50%, 9/20/19 | | | | | | | 655 | | | | 655,050 | |
2nd Lien Term Loan, 8.50%, 2/14/20 | | | | | | | 410 | | | | 411,025 | |
Ardent Medical Services, Inc., Term Loan, 6.75%, 7/02/18 | | | | | | | 262 | | | | 263,006 | |
CHG Buyer Corp., Term Loan, 4.50%, 11/19/19 | | | | | | | 414 | | | | 415,513 | |
CHS/Community Health Systems, Inc., Term Loan D, 4.25%, 1/27/21 | | | | | | | 1,965 | | | | 1,981,368 | |
ConvaTec, Inc., Term Loan, 4.00%, 12/22/16 | | | | | | | 563 | | | | 565,723 | |
DaVita, Inc.: | | | | | | | | | | | | | | |
Term Loan B, 4.50%, 10/20/16 | | | | | | | 995 | | | | 1,000,143 | |
Term Loan B2, 4.00%, 11/01/19 | | | | | | | 405 | | | | 406,623 | |
Envision Acquisition Co. LLC, 1st Lien Term Loan, 5.75%, 11/04/20 | | | | | | | 239 | | | | 241,196 | |
Envision Healthcare Corp., Term Loan, 4.00%, 5/25/18 | | | | | | | 426 | | | | 427,067 | |
Genesis HealthCare Corp., Term Loan B, 10.00% – 10.75%, 9/25/17 | | | | | | | 276 | | | | 283,410 | |
HCA, Inc., Extended Term Loan B4, 3.00%, 5/01/18 | | | | | | | 234 | | | | 234,150 | |
Ikaria, Inc.: | | | | | | | | | | | | | | |
1st Lien Term Loan, 5.00%, 2/12/21 | | | | | | | 270 | | | | 271,520 | |
2nd Lien Term Loan, 8.75%, 1/17/22 | | | | | | | 70 | | | | 70,992 | |
inVentiv Health, Inc.: | | | | | | | | | | | | | | |
Combined Term Loan, 7.50%, 8/04/16 | | | | | | | 260 | | | | 259,324 | |
Incremental Term Loan B3, 7.75%, 5/15/18 | | | | | | | 219 | | | | 217,161 | |
National Mentor Holdings, Inc., Term Loan B, 4.75%, 1/27/21 | | | | | | | 190 | | | | 191,663 | |
Surgical Care Affiliates, Inc., Class C Incremental Term Loan, 4.25%, 6/29/18 | | | | | | | 423 | | | | 422,524 | |
US Renal Care, Inc., 2013 Term Loan, 4.25%, 7/03/19 | | | | | | | 482 | | | | 484,653 | |
| | | | | | | | | | | 8,802,111 | |
| | | | | | | | | | | | | |
| Floating Rate Loan Interests (b) | | | | | | Par
(000) | | Value |
Health Care Technology — 0.7% | | | | | | | | | | | | | | |
IMS Health, Inc., Term Loan B1, 3.75%, 9/01/17 | | | | USD | | | 744 | | | $ | 743,568 | |
MedAssets, Inc., Term Loan B, 4.00%, 12/13/19 | | | | | | | 182 | | | | 182,913 | |
| | | | | | | | | | | 926,481 | |
Hotels, Restaurants & Leisure — 12.1% | | | | | | | | | | | | | | |
Bally Technologies, Inc., Term Loan B, 4.25%, 11/25/20 | | | | | | | 429 | | | | 431,284 | |
Boyd Gaming Corp., Term Loan B, 4.00%, 8/14/20 | | | | | | | 269 | | | | 269,524 | |
Bronco Midstream Funding LLC, Term Loan B, 5.00%, 8/17/20 | | | | | | | 724 | | | | 730,079 | |
Caesars Entertainment Resort Properties LLC, Term Loan B, 7.00%, 10/12/20 | | | | | | | 2,835 | | | | 2,877,015 | |
Four Seasons Holdings, Inc., 2nd Lien Term Loan, 6.25%, 12/28/20 | | | | | | | 330 | | | | 336,600 | |
Hilton Worldwide Finance LLC, Term Loan B2, 3.75%, 10/26/20 | | | | | | | 2,093 | | | | 2,098,767 | |
Intrawest ULC, Term Loan, 5.50%, 11/26/20 | | | | | | | 370 | | | | 373,237 | |
La Quinta Intermediate Holdings, Term Loan B, 3.00%, 2/19/21 | | | | | | | 2,710 | | | | 2,715,420 | |
Las Vegas Sands LLC, Term Loan B, 3.25%, 12/20/20 | | | | | | | 600 | | | | 599,376 | |
Marina District Finance Co., Inc., Term Loan B, 6.75%, 8/15/18 | | | | | | | 335 | | | | 337,791 | |
MGM Resorts International, Term Loan B, 3.50%, 12/20/19 | | | | | | | 539 | | | | 538,034 | |
OSI Restaurant Partners LLC, Term Loan, 3.50%, 10/25/19 | | | | | | | 230 | | | | 229,866 | |
Pinnacle Entertainment, Inc., Term Loan B2, 3.75%, 8/13/20 | | | | | | | 517 | | | | 517,886 | |
Playa Resorts Holding BV, Term Loan B, 4.75%, 8/06/19 | | | | | | | 409 | | | | 410,509 | |
Sabre, Inc.: | | | | | | | | | | | | | | |
Incremental Term Loan, 4.50%, 2/19/19 | | | | | | | 115 | | | | 114,820 | |
Term Loan B, 4.25%, 2/19/19 | | | | | | | 317 | | | | 316,867 | |
Six Flags Theme Parks, Inc., Term Loan B, 3.50%, 12/20/18 | | | | | | | 303 | | | | 304,232 | |
Station Casinos, Inc., Term Loan B, 5.00%, 3/02/20 | | | | | | | 1,191 | | | | 1,191,369 | |
Travelport LLC: | | | | | | | | | | | | | | |
2nd Lien Term Loan 1, 9.50%, 1/29/16 | | | | | | | 250 | | | | 258,692 | |
Refinancing Term Loan, 6.25%, 6/26/19 | | | | | | | 269 | | | | 275,283 | |
Twin River Management Group, Inc., Term Loan B, 5.25%, 11/09/18 | | | | | | | 566 | | | | 569,982 | |
Wendy’s International, Inc., Term Loan B, 3.25%, 5/15/19 | | | | | | | 370 | | | | 369,467 | |
| | | | | | | | | | | 15,866,100 | |
Household Products — 1.2% | | | | | | | | | | | | | | |
Bass Pro Group LLC, Term Loan, 3.75%, 11/20/19 | | | | | | | 638 | | | | 640,163 | |
Prestige Brands, Inc., Term Loan, 3.75% – 5.00%, 1/31/19 | | | | | | | 311 | | | | 312,034 | |
Spectrum Brands, Inc.: | | | | | | | | | | | | | | |
Term Loan A, 3.00%, 9/07/17 | | | | | | | 231 | | | | 231,007 | |
Term Loan C, 3.50%, 9/04/19 | | | | | | | 342 | | | | 342,035 | |
| | | | | | | | | | | 1,525,239 | |
Independent Power Producers & Energy Traders — 1.8% |
The AES Corp., Refinancing Term Loan B, 3.75%, 6/01/18 | | | | | | | 761 | | | | 762,859 | |
Calpine Corp., Term Loan B1, 4.00%, 4/02/18 | | | | | | | 212 | | | | 212,588 | |
La Frontera Generation LLC, Term Loan, 4.50%, 9/30/20 | | | | | | | 1,009 | | | | 1,010,122 | |
Star West Generation LLC, Term Loan B, 4.25%, 3/13/20 | | | | | | | 352 | | | | 352,805 | |
| | | | | | | | | | | 2,338,374 | |
Industrial Conglomerates — 0.8% | | | | | | | | | | | | | | |
Sequa Corp., Term Loan B, 5.25%, 6/19/17 | | | | | | | 1,045 | | | | 1,028,203 | |
See Notes to Financial Statements.
| 14 | SEMI-ANNUAL REPORT | FEBRUARY 28, 2014
|
| |
| Schedule of Investments (continued) | BlackRock Defined Opportunity Credit Trust (BHL)
(Percentages shown are based on Net Assets)
|
| Floating Rate Loan Interests (b) | | | | | | Par
(000) | | Value |
Insurance — 3.2% | | | | | | | | | | | | | | |
Alliant Holdings I, Inc., Term Loan B, 4.25%, 12/20/19 | | | | USD | | | 421 | | | $ | 423,119 | |
Asurion LLC: | | | | | | | | | | | | | | |
2nd Lien Term Loan, 8.50%, 2/19/21 | | | | | | | 310 | | | | 319,687 | |
Term Loan B1, 4.50%, 5/24/19 | | | | | | | 458 | | | | 458,390 | |
CNO Financial Group, Inc.: | | | | | | | | | | | | | | |
Term Loan B1, 3.00%, 9/28/16 | | | | | | | 308 | | | | 308,462 | |
Term Loan B2, 3.75%, 9/20/18 | | | | | | | 519 | | | | 517,933 | |
Cooper Gay Swett & Crawford Ltd.: | | | | | | | | | | | | | | |
1st Lien Term Loan, 5.00%, 4/16/20 | | | | | | | 418 | | | | 411,285 | |
2nd Lien Term Loan, 8.25%, 10/16/20 | | | | | | | 200 | | | | 192,750 | |
Cunningham Lindsey US, Inc., 1st Lien Term Loan, 5.00%, 12/10/19 | | | | | | | 366 | | | | 364,468 | |
Hub International Ltd., Term Loan B, 4.75%, 10/02/20 | | | | | | | 439 | | | | 442,556 | |
National Financial Partners Corp., Term Loan, 5.25%, 7/01/20 | | | | | | | 129 | | | | 130,482 | |
Sedgwick CMS Holdings, Inc.: | | | | | | | | | | | | | | |
1st Lien Term Loan, 3.75%, 2/11/21 | | | | | | | 345 | | | | 343,189 | |
2nd Lien Term Loan, 6.75%, 12/12/18 | | | | | | | 260 | | | | 262,460 | |
| | | | | | | | | | | 4,174,781 | |
Internet Software & Services — 1.7% | | | | | | | | | | | | | | |
Dealertrack Technologies, Inc., Term Loan B, 3.50%, 2/26/21 | | | | | | | 255 | | | | 256,275 | |
Interactive Data Corp., Term Loan B, 3.75%, 2/11/18 | | | | | | | 871 | | | | 871,442 | |
Open Text Corp., Term Loan B, 3.25%, 1/04/21 | | | | | | | 280 | | | | 279,860 | |
W3 Co.: | | | | | | | | | | | | | | |
1st Lien Term Loan, 5.75%, 3/13/20 | | | | | | | 407 | | | | 407,942 | |
2nd Lien Term Loan, 9.25%, 9/11/20 | | | | | | | 155 | | | | 156,159 | |
Web.com Group, Inc., Term Loan B, 4.50%, 10/27/17 | | | | | | | 281 | | | | 283,923 | |
| | | | | | | | | | | 2,255,601 | |
IT Services — 3.5% | | | | | | | | | | | | | | |
Ceridian Corp., Term Loan B, 4.37% – 4.40%, 5/09/17 | | | | | | | 899 | | | | 901,891 | |
First Data Corp.: | | | | | | | | | | | | | | |
2018 Term Loan, 4.16%, 9/24/18 | | | | | | | 270 | | | | 270,451 | |
Extended 2018 Term Loan B, 4.16%, 3/23/18 | | | | | | | 2,140 | | | | 2,141,650 | |
Genpact International, Inc., Term Loan B, 3.50%, 8/30/19 | | | | | | | 658 | | | | 657,639 | |
InfoGroup, Inc., Term Loan, 8.00%, 5/25/18 | | | | | | | 245 | | | | 213,758 | |
SunGard Data Systems, Inc.: | | | | | | | | | | | | | | |
Term Loan D, 4.50%, 1/31/20 | | | | | | | 262 | | | | 262,678 | |
Term Loan E, 4.00%, 3/09/20 | | | | | | | 144 | | | | 144,495 | |
| | | | | | | | | | | 4,592,562 | |
Leisure Equipment & Products — 0.2% | | | | | | | | | | | | | | |
FGI Operating Co. LLC, Term Loan, 5.50%, 4/19/19 | | | | | | | 205 | | | | 208,273 | |
Life Sciences Tools & Services — 0.5% | | | | | | | | | | | | | | |
Patheon, Inc.: | | | | | | | | | | | | | | |
2nd Lien Term Loan, 6.25%, 1/09/21 | | | | | | | 365 | | | | 363,861 | |
Term Loan, 7.25%, 12/14/18 | | | | | | | 272 | | | | 270,748 | |
| | | | | | | | | | | 634,609 | |
Machinery — 4.4% | | | | | | | | | | | | | | |
Allegion US Holding Co., Inc., Term Loan B, 3.00%, 9/30/20 | | | | | | | 210 | | | | 209,649 | |
Alliance Laundry Systems LLC: | | | | | | | | | | | | | | |
2nd Lien Term Loan, 9.50%, 12/10/19 | | | | | | | 131 | | | | 132,545 | |
Refinancing Term Loan, 4.25%, 12/10/18 | | | | | | | 257 | | | | 257,672 | |
Faenza Acquisition GmbH: | | | | | | | | | | | | | | |
Term Loan B1, 4.25%, 8/31/20 | | | | | | | 274 | | | | 274,255 | |
Term Loan B3, 4.25%, 8/28/20 | | | | | | | 83 | | | | 83,419 | |
Gardner Denver, Inc., Term Loan, 4.25%, 7/30/20 | | | | EUR | | | 886 | | | | 930,473 | |
Generac Power Systems, Inc., Term Loan B, 3.50%, 5/31/20 | | | | USD | | | 781 | | | | 780,934 | |
| | | | | | | | | | | | | |
| Floating Rate Loan Interests (b) | | | | | | Par
(000) | | Value |
Machinery (concluded) | | | | | | | | | | | | | | |
Intelligrated, Inc., 1st Lien Term Loan, 4.50%, 7/30/18 | | | | USD | | | 395 | | | $ | 395,744 | |
Mirror Bidco Corp., Term Loan, 4.25%, 12/27/19 | | | | | | | 564 | | | | 566,885 | |
Navistar International Corp., Term Loan B, 5.75%, 8/17/17 | | | | | | | 206 | | | | 208,319 | |
Pacific Industrial Services US Finance Co. LLC: | | | | | | | | | | | | | | |
1st Lien Term Loan, 5.00%, 10/02/18 | | | | | | | 499 | | | | 504,984 | |
2nd Lien Term Loan, 8.75%, 4/02/19 | | | | | | | 195 | | | | 199,875 | |
Rexnord LLC, 1st Lien Term Loan B, 4.00%, 8/21/20 | | | | | | | 480 | | | | 480,671 | |
Silver II US Holdings LLC, Term Loan, 4.00%, 12/13/19 | | | | | | | 286 | | | | 286,262 | |
STS Operating, Inc., Term Loan, 4.75%, 2/19/21 | | | | | | | 155 | | | | 155,388 | |
Terex Corp., Term Loan, 4.00%, 4/28/17 | | | | EUR | | | 34 | | | | 47,150 | |
Wabash National Corp., Term Loan B, 4.50%, 5/08/19 | | | | USD | | | 288 | | | | 289,628 | |
| | | | | | | | | | | 5,803,853 | |
Marine — 0.4% | | | | | | | | | | | | | | |
HGIM Corp., Term Loan B, 5.50%, 6/18/20 | | | | | | | 517 | | | | 523,090 | |
Media — 13.4% | | | | | | | | | | | | | | |
Acosta, Inc., Term Loan B, 4.25%, 3/02/18 | | | | | | | 45 | | | | 45,157 | |
Activision Blizzard, Inc., Term Loan B, 3.25%, 10/12/20 | | | | | | | 589 | | | | 589,908 | |
Advanstar Communications, Inc., 2nd Lien Term Loan, 9.50%, 6/06/20 | | | | | | | 255 | | | | 255,849 | |
Catalina Marketing Corp., Term Loan B, 5.25%, 10/12/20 | | | | | | | 574 | | | | 576,189 | |
CBS Outdoor Americas Capital LLC, Term Loan B, 3.00%, 1/31/21 | | | | | | | 170 | | | | 169,548 | |
Cengage Learning Acquisitions, Inc.: | | | | | | | | | | | | | | |
Non-Extended Term Loan, 4.75%, 7/03/14 | | | | | | | 226 | | | | 212,603 | |
Tranche 1 Incremental, 9.50%, 7/03/14 | | | | | | | 365 | | | | 339,508 | |
Charter Communications Operating LLC, Term Loan E, 3.00%, 7/01/20 | | | | | | | 463 | | | | 460,246 | |
Clear Channel Communications, Inc.: | | | | | | | | | | | | | | |
Term Loan B, 3.80%, 1/29/16 | | | | | | | 148 | | | | 144,914 | |
Term Loan C, 3.80%, 1/29/16 | | | | | | | 40 | | | | 39,086 | |
Term Loan D, 6.90%, 1/30/19 | | | | | | | 1,564 | | | | 1,534,650 | |
Cumulus Media Holdings, Inc., 2013 Term Loan, 4.25%, 12/23/20 | | | | | | | 559 | | | | 561,740 | |
The E.W. Scripps Co., Term Loan B, 3.25%, 11/26/20 | | | | | | | 350 | | | | 350,735 | |
EMI Music Publishing Ltd., Term Loan B, 4.25%, 6/29/18 | | | | | | | 249 | | | | 249,455 | |
Fender Musical Instruments Corp., Term Loan B, 5.75%, 4/03/19 | | | | | | | 62 | | | | 62,827 | |
Getty Images, Inc., Term Loan B, 4.75%, 10/18/19 | | | | | | | 45 | | | | 42,981 | |
Hemisphere Media Group, Inc., Term Loan, 6.25%, 7/30/20 | | | | | | | 367 | | | | 368,394 | |
Hubbard Radio LLC, Term Loan B, 4.50%, 4/29/19 | | | | | | | 386 | | | | 387,464 | |
Intelsat Jackson Holdings SA, Term Loan B2, 3.75%, 6/30/19 | | | | | | | 1,058 | | | | 1,064,762 | |
Lions Gate Entertainment Corp., 2nd Lien Term Loan, 5.00%, 7/17/20 | | | | | | | 150 | | | | 151,875 | |
Live Nation Entertainment, Inc., 2020 Term Loan B1, 3.50%, 8/17/20 | | | | | | | 115 | | | | 114,856 | |
Media General, Inc., Delayed Draw Term Loan B, 4.25%, 7/31/20 | | | | | | | 420 | | | | 423,415 | |
Mediacom Communications Corp., Term Loan F, 2.63%, 1/31/18 | | | | | | | 255 | | | | 253,406 | |
Mediacom LLC, Term Loan E, 4.50%, 10/23/17 | | | | | | | 483 | | | | 482,900 | |
NEP/NCP Holdco, Inc.: | | | | | | | | | | | | | | |
2nd Lien Term Loan, 9.50%, 7/22/20 | | | | | | | 131 | | | | 134,386 | |
Incremental Term Loan, 4.50%, 1/22/20 | | | | | | | 653 | | | | 653,400 | |
Nielsen Finance LLC, Term Loan E, 2.91%, 5/02/16 | | | | | | | 537 | | | | 536,601 | |
Rentpath, Inc., Term Loan B, 6.25%, 5/29/20 | | | | | | | 537 | | | | 522,524 | |
See Notes to Financial Statements.
| SEMI-ANNUAL REPORT | FEBRUARY 28, 2014 | 15
|
| |
| Schedule of Investments (continued) | BlackRock Defined Opportunity Credit Trust (BHL)
(Percentages shown are based on Net Assets)
|
| Floating Rate Loan Interests (b) | | | | | | Par
(000) | | Value |
Media (concluded) | | | | | | | | | | | | | | |
Salem Communications Corp., Term Loan B, 4.50%, 3/13/20 | | | | USD | | | 388 | | | $ | 389,549 | |
SBA Senior Finance II LLC: | | | | | | | | | | | | | | |
Incremental Delayed Draw Term Loan B, 3.25%, 3/31/21 | | | | | | | 248 | | | | 246,728 | |
Incremental Term Loan B, 3.25%, 3/24/21 | | | | | | | 248 | | | | 246,765 | |
Sinclair Television Group, Inc., Term Loan B, 3.00%, 4/09/20 | | | | | | | 372 | | | | 369,491 | |
Springer Science & Business Media Deutschland GmbH, Term Loan B2, 5.00%, 8/14/20 | | | | | | | 494 | | | | 496,108 | |
Tribune Co., Term Loan, 4.00%, 12/27/20 | | | | | | | 650 | | | | 649,389 | |
TWCC Holding Corp., 2nd Lien Term Loan, 7.00%, 6/26/20 | | | | | | | 465 | | | | 449,887 | |
Univision Communications, Inc., Term Loan C4, 4.00%, 3/01/20 | | | | | | | 525 | | | | 525,938 | |
UPC Financing Partnership, Term Loan AG, 3.98%, 3/31/21 | | | | EUR | | | 281 | | | | 390,405 | |
Virgin Media Investment Holdings Ltd.: | | | | | | | | | | | | | | |
Term Loan B, 3.50%, 6/08/20 | | | | USD | | | 780 | | | | 779,165 | |
Term Loan C, 4.50%, 6/05/20 | | | | GBP | | | 650 | | | | 1,094,521 | |
WideOpenWest Finance LLC, Term Loan B, 4.75%, 4/01/19 | | | | USD | | | 512 | | | | 514,606 | |
Ziggo NV: | | | | | | | | | | | | | | |
Term Loan B1, 3.50%, 1/15/22 | | | | | | | 233 | | | | 231,576 | |
Term Loan B2, 3.50%, 1/15/22 | | | | | | | 150 | | | | 149,251 | |
Term Loan B3, 2.75%, 1/15/22 | | | | | | | 247 | | | | 245,464 | |
| | | | | | | | | | | 17,508,222 | |
Metals & Mining — 3.3% | | | | | | | | | | | | | | |
Ameriforge Group, Inc.: | | | | | | | | | | | | | | |
1st Lien Term Loan, 5.00%, 12/19/19 | | | | | | | 371 | | | | 372,957 | |
2nd Lien Term Loan, 8.75%, 12/19/20 | | | | | | | 185 | | | | 189,163 | |
API Heat Transfer, Inc., Term Loan, 5.25%, 5/03/19 | | | | | | | 370 | | | | 369,850 | |
Constellium Holdco BV, Term Loan B, 6.00%, 3/25/20 | | | | | | | 824 | | | | 840,250 | |
FMG Resources August 2006 Property Ltd., Term Loan B, 4.25%, 6/28/19 | | | | | | | 845 | | | | 853,036 | |
Novelis, Inc., Term Loan, 3.75%, 3/10/17 | | | | | | | 788 | | | | 790,512 | |
SunCoke Energy, Inc., Term Loan B, 4.00%, 7/26/18 | | | | | | | 137 | | | | 136,503 | |
Walter Energy, Inc., Term Loan B, 6.75%, 4/02/18 | | | | | | | 145 | | | | 142,272 | |
Windsor Financing LLC, Term Loan B, 6.25%, 12/05/17 | | | | | | | 607 | | | | 621,952 | |
| | | | | | | | | | | 4,316,495 | |
Multiline Retail — 3.9% | | | | | | | | | | | | | | |
99¢ Only Stores, Term Loan, 4.50%, 1/11/19 | | | | | | | 453 | | | | 457,043 | |
Apex Tool Group LLC, Term Loan B, 4.50%, 1/31/20 | | | | | | | 481 | | | | 475,196 | |
BJ’s Wholesale Club, Inc.: | | | | | | | | | | | | | | |
1st Lien Term Loan, 4.50%, 9/26/19 | | | | | | | 541 | | | | 543,833 | |
2nd Lien Term Loan, 8.50%, 3/26/20 | | | | | | | 200 | | | | 205,188 | |
HEMA Holding BV, Extended 2nd Lien Term Loan, 5.97%, 1/05/18 | | | | EUR | | | 1,800 | | | | 2,236,087 | |
Hudson’s Bay Co., 1st Lien Term Loan, 4.75%, 11/04/20 | | | | USD | | | 430 | | | | 436,241 | |
The Neiman Marcus Group, Inc., Term Loan B, 5.00%, 10/25/20 | | | | | | | 698 | | | | 706,036 | |
| | | | | | | | | | | 5,059,624 | |
Oil, Gas & Consumable Fuels — 5.4% | | | | | | | | | | | | | | |
Arch Coal, Inc., Term Loan B, 5.75%, 5/16/18 | | | | | | | 195 | | | | 192,249 | |
Chesapeake Energy Corp., Unsecured Term Loan, 5.75%, 12/01/17 | | | | | | | 985 | | | | 1,006,463 | |
Drillships Financing Holding, Inc., Term Loan B1, 6.00%, 3/31/21 | | | | | | | 591 | | | | 601,434 | |
EP Energy LLC/Everest Acquisition Finance, Inc., Term Loan B3, 3.50%, 5/24/18 | | | | | | | 440 | | | | 439,670 | |
Fieldwood Energy LLC: | | | | | | | | | | | | | | |
1st Lien Term Loan, 3.88%, 9/28/18 | | | | | | | 314 | | | | 314,863 | |
2nd Lien Term Loan, 8.38%, 9/30/20 | | | | | | | 135 | | | | 139,641 | |
| | | | | | | | | | | | | |
| Floating Rate Loan Interests (b) | | | | | | Par
(000) | | Value |
Oil, Gas & Consumable Fuels (concluded) | | | | | | | | | | | | | | |
Moxie Patriot LLC, Term Loan B1, 6.75%, 12/18/20 | | | | USD | | | 325 | | | $ | 331,500 | |
Obsidian Natural Gas Trust, Term Loan, 7.00%, 11/02/15 | | | | | | | 280 | | | | 283,977 | |
Offshore Group Investment Ltd.: | | | | | | | | | | | | | | |
5.00%, 10/25/17 | | | | | | | 678 | | | | 680,608 | |
5.75%, 3/28/19 | | | | | | | 172 | | | | 174,457 | |
Pacific Drilling SA, Term Loan B, 4.50%, 6/04/18 | | | | | | | 552 | | | | 555,505 | |
Panda Temple II Power LLC, Term Loan B, 7.25%, 4/03/19 | | | | | | | 360 | | | | 367,650 | |
Philadelphia Energy Solutions LLC, Term Loan B, 6.25%, 4/04/18 | | | | | | | 52 | | | | 46,499 | |
Power Buyer, LLC: | | | | | | | | | | | | | | |
1st Lien Term Loan, 4.25%, 5/06/20 | | | | | | | 195 | | | | 193,971 | |
2nd Lien Term Loan, 8.25%, 11/06/20 | | | | | | | 105 | | | | 103,950 | |
Delayed Draw Term Loan, 4.25%, 5/06/20 | | | | | | | 11 | | | | 10,600 | |
Raven Power Finance LLC, Term Loan, 5.25%, 12/19/20 | | | | | | | 240 | | | | 241,500 | |
Ruby Western Pipeline Holdings LLC, Term Loan B, 3.50%, 3/27/20 | | | | | | | 404 | | | | 402,935 | |
Tesoro Corp., Term Loan B, 2.40%, 5/30/16 | | | | | | | 429 | | | | 430,373 | |
Western Refining, Inc., Term Loan B, 4.25%, 11/12/20 | | | | | | | 335 | | | | 337,094 | |
WTG Holdings III Corp.: | | | | | | | | | | | | | | |
1st Lien Term Loan, 4.75%, 1/15/21 | | | | | | | 135 | | | | 135,338 | |
2nd Lien Term Loan, 8.50%, 1/15/22 | | | | | | | 30 | | | | 30,356 | |
| | | | | | | | | | | 7,020,633 | |
Pharmaceuticals — 4.4% | | | | | | | | | | | | | | |
Akorn, Inc., Term Loan B, 3.50%, 8/27/20 | | | | | | | 410 | | | | 412,562 | |
Amneal Pharmaceuticals LLC, Term Loan, 5.75% – 7.00%, 11/01/19 | | | | | | | 279 | | | | 280,697 | |
CCC Information Services, Inc., Term Loan, 4.00%, 12/20/19 | | | | | | | 213 | | | | 213,050 | |
Endo Health Solutions, Inc., Term Loan B, 3.75%, 11/05/20 | | | | | | | 360 | | | | 359,251 | |
Jazz Pharmaceuticals, Inc., Term Loan B, 3.50%, 6/12/18 | | | | | | | 95 | | | | 95,136 | |
Par Pharmaceutical Cos., Inc., Term Loan B, 4.00%, 9/30/19 | | | | | | | 1,240 | | | | 1,241,379 | |
Pharmaceutical Product Development LLC, Term Loan B, 4.00%, 12/05/18 | | | | | | | 916 | | | | 919,724 | |
Quintiles Transnational Corp., Term Loan B3, 3.75%, 6/08/18 | | | | | | | 577 | | | | 577,407 | |
Valeant Pharmaceuticals International, Inc.: | | | | | | | | | | | | | | |
Series C2 Term Loan B, 3.75%, 12/11/19 | | | | | | | 607 | | | | 608,831 | |
Series D2 Term Loan B, 3.75%, 2/13/19 | | | | | | | 657 | | | | 658,906 | |
Series E Term Loan B, 3.75%, 8/05/20 | | | | | | | 378 | | | | 379,743 | |
| | | | | | | | | | | 5,746,686 | |
Professional Services — 1.7% | | | | | | | | | | | | | | |
Emdeon Business Services LLC, Term Loan B2, 3.75%, 11/02/18 | | | | | | | 720 | | | | 721,099 | |
ON Assignment, Inc., Refinancing Term Loan B, 3.50%, 4/30/20 | | | | | | | 170 | | | | 170,585 | |
SIRVA Worldwide, Inc., Term Loan, 7.50%, 3/27/19 | | | | | | | 427 | | | | 434,243 | |
TriNet Group, Inc., Term Loan B2, 5.00%, 8/14/20 | | | | | | | 259 | | | | 260,971 | |
Truven Health Analytics, Inc., Term Loan B, 4.50%, 6/06/19 | | | | | | | 596 | | | | 597,151 | |
| | | | | | | | | | | 2,184,049 | |
Real Estate Investment Trusts (REITs) — 0.5% | | | | | | | | | | | | | | |
iStar Financial, Inc., Term Loan, 4.50%, 10/16/17 | | | | | | | 587 | | | | 587,837 | |
Starwood Property Trust, Inc., Term Loan B, 3.50%, 4/17/20 | | | | | | | 125 | | | | 124,257 | |
| | | | | | | | | | | 712,094 | |
Real Estate Management & Development — 1.4% | | | | | | | | | | | | | | |
CityCenter Holdings LLC, Term Loan B, 5.00%, 10/16/20 | | | | | | | 575 | | | | 580,301 | |
See Notes to Financial Statements.
| 16 | SEMI-ANNUAL REPORT | FEBRUARY 28, 2014
|
| |
| Schedule of Investments (continued) | BlackRock Defined Opportunity Credit Trust (BHL)
(Percentages shown are based on Net Assets)
|
| Floating Rate Loan Interests (b) | | | | | | Par
(000) | | Value |
Real Estate Management & Development (concluded) |
Realogy Corp.: | | | | | | | | | | | | | | |
Extended Letter of Credit, 4.40%, 10/10/16 | | | | USD | | | 87 | | | $ | 87,087 | |
Extended Term Loan, 4.50%, 3/05/20 | | | | | | | 1,194 | | | | 1,196,793 | |
| | | | | | | | | | | 1,864,181 | |
Road & Rail — 0.4% | | | | | | | | | | | | | | |
Genesee & Wyoming, Inc., Term Loan A, 1.90% – 1.91%, 9/29/17 | | | | | | | 236 | | | | 235,989 | |
Road Infrastructure Investment LLC, Term Loan B, 6.25%, 3/30/18 | | | | | | | 229 | | | | 230,212 | |
| | | | | | | | | | | 466,201 | |
Semiconductors & Semiconductor Equipment — 0.8% |
Freescale Semiconductor, Inc.: | | | | | | | | | | | | | | |
Term Loan B4, 5.00%, 2/28/20 | | | | | | | 534 | | | | 536,128 | |
Term Loan B5, 5.00%, 1/15/21 | | | | | | | 165 | | | | 166,439 | |
NXP BV, Term Loan D, 3.25%, 1/11/20 | | | | | | | 329 | | | | 328,846 | |
| | | | | | | | | | | 1,031,413 | |
Software — 4.9% | | | | | | | | | | | | | | |
BMC Software Finance, Inc., Term Loan, 5.00%, 9/10/20 | | | | | | | 560 | | | | 561,282 | |
CompuCom Systems, Inc., Refinancing Term Loan B, 4.25%, 5/11/20 | | | | | | | 139 | | | | 138,890 | |
Evertec Group LLC, Term Loan B, 3.50%, 4/17/20 | | | | | | | 244 | | | | 237,437 | |
GCA Services Group, Inc.: | | | | | | | | | | | | | | |
2nd Lien Term Loan, 9.25%, 10/22/20 | | | | | | | 176 | | | | 177,980 | |
Term Loan B, 4.25% – 5.50%, 11/01/19 | | | | | | | 414 | | | | 416,105 | |
Infor US, Inc., Term Loan B5, 3.75%, 6/03/20 | | | | | | | 924 | | | | 922,271 | |
IQOR US, Inc., Term Loan B, 6.00%, 2/19/21 | | | | | | | 210 | | | | 205,800 | |
Kronos Worldwide, Inc., 2020 Term Loan B, 4.75%, 2/12/20 | | | | | | | 115 | | | | 115,791 | |
Kronos, Inc., 2nd Lien Term Loan, 9.75%, 4/30/20 | | | | | | | 409 | | | | 416,390 | |
Mitchell International, Inc.: | | | | | | | | | | | | | | |
1st Lien Term Loan, 4.50%, 10/12/20 | | | | | | | 310 | | | | 310,775 | |
2nd Lien Term Loan, 8.50%, 10/11/21 | | | | | | | 350 | | | | 356,709 | |
RP Crown Parent LLC, 2013 Term Loan, 6.00%, 12/21/18 | | | | | | | 357 | | | | 357,682 | |
Shield Finance Co. Sarl, Term Loan, 5.00%, 1/27/21 | | | | | | | 155 | | | | 156,356 | |
Sophia LP, Term Loan B, 4.50%, 7/19/18 | | | | | | | 603 | | | | 607,224 | |
SS&C Technologies, Inc.: | | | | | | | | | | | | | | |
Term Loan B1, 3.25%, 6/07/19 | | | | | | | 631 | | | | 633,050 | |
Term Loan B2, 3.25%, 6/07/19 | | �� | | | | | 65 | | | | 65,488 | |
StoneRiver Holdings, Inc.: | | | | | | | | | | | | | | |
1st Lien Term Loan, 4.50%, 11/29/19 | | | | | | | 146 | | | | 146,198 | |
2nd Lien Term Loan, 8.50%, 5/29/20 | | | | | | | 204 | | | | 205,765 | |
Websence, Inc.: | | | | | | | | | | | | | | |
2nd Lien Term Loan, 8.25%, 12/24/20 | | | | | | | 170 | | | | 170,425 | |
Term Loan B, 4.50%, 6/25/20 | | | | | | | 184 | | | | 185,456 | |
| | | | | | | | | | | 6,387,074 | |
Specialty Retail — 4.7% | | | | | | | | | | | | | | |
Academy Ltd., Term Loan, 4.50%, 8/03/18 | | | | | | | 614 | | | | 617,139 | |
Burlington Coat Factory Warehouse Corp., Term Loan B2, 4.25%, 2/23/17 | | | | | | | 146 | | | | 146,643 | |
David’s Bridal, Inc., Term Loan B, 5.00%, 10/11/19 | | | | | | | 846 | | | | 850,520 | |
Equinox Holdings, Inc., Repriced Term Loan B, 4.50% – 5.50%, 1/31/20 | | | | | | | 452 | | | | 455,539 | |
The Gymboree Corp., Initial Term Loan, 5.00%, 2/23/18 | | | | | | | 77 | | | | 70,706 | |
Harbor Freight Tools USA, Inc., 1st Lien Term Loan, 4.75%, 7/26/19 | | | | | | | 454 | | | | 460,055 | |
Jo-Ann Stores, Inc., Term Loan, 4.00%, 3/16/18 | | | | | | | 221 | | | | 220,687 | |
Leslies Poolmart, Inc., Term Loan, 4.25%, 10/16/19 | | | | | | | 554 | | | | 556,305 | |
Michaels Stores, Inc., Term Loan, 3.75%, 1/28/20 | | | | | | | 520 | | | | 521,404 | |
Party City Holdings, Inc., Term Loan, 4.00%, 7/27/19 | | | | | | | 753 | | | | 752,988 | |
Petco Animal Supplies, Inc., Term Loan, 4.00%, 11/24/17 | | | | | | | 779 | | | | 781,781 | |
Sprouts Farmers Markets Holdings LLC, Term Loan, 4.00%, 4/23/20 | | | | | | | 61 | | | | 61,244 | |
| | | | | | | | | | | | | |
| Floating Rate Loan Interests (b) | | | | | | Par
(000) | | Value |
Specialty Retail (concluded) | | | | | | | | | | | | | | |
SRAM LLC, Term Loan B, 4.00% – 5.25%, 4/10/20 | | | | USD | | | 188 | | | $ | 187,810 | |
Things Remembered, Inc., Term Loan B, 8.00%, 5/24/18 | | | | | | | 395 | | | | 393,236 | |
Toys ‘R’ Us-Delaware, Inc., Term Loan B3, 5.25%, 5/25/18 | | | | | | | 37 | | | | 31,274 | |
| | | | | | | | | | | 6,107,331 | |
Textiles, Apparel & Luxury Goods — 1.2% | | | | | | | | | | | | | | |
Ascend Performance Materials LLC, Term Loan B, 6.75%, 4/10/18 | | | | | | | 909 | | | | 881,548 | |
J. Crew Group, Inc., Term Loan B, 4.00%, 2/20/21 | | | | | | | 405 | | | | 403,481 | |
Phillips-Van Heusen Corp., Term Loan B, 3.25%, 2/13/20 | | | | | | | 239 | | | | 239,105 | |
| | | | | | | | | | | 1,524,134 | |
Thrifts & Mortgage Finance — 0.3% | | | | | | | | | | | | | | |
IG Investments Holdings LLC, 1st Lien Term Loan, 5.25%, 10/31/19 | | | | | | | 446 | | | | 446,614 | |
Trading Companies & Distributors — 0.1% | | | | | | | | | | | | | | |
Fly Funding II Sarl, Term Loan B, 4.50%, 8/09/19 | | | | | | | 54 | | | | 55,059 | |
WESCO Distribution, Inc., Term Loan B, 3.75%, 12/12/19 | | | | | | | 127 | | | | 127,477 | |
| | | | | | | | | | | 182,536 | |
Wireless Telecommunication Services — 0.7% | | | | | | | | | | | | | | |
Cricket Communications, Inc., Term Loan, 4.75%, 10/10/19 | | | | | | | 371 | | | | 370,793 | |
Light Tower Fiber LLC, 1st Lien Term Loan, 4.00%, 4/13/20 | | | | | | | 607 | | | | 605,815 | |
| | | | | | | | | | | 976,608 | |
Total Floating Rate Loan Interests — 132.8% | | | | | | | | | | | 173,893,093 | |
|
Non-Agency Mortgage-Backed Securities — 0.2% |
Commercial Mortgage-Backed Securities — 0.2% | | | | | | | | | | | | | | |
Hilton USA Trust, Series 2013-HLT, Class EFX, 4.45%, 11/05/30 (b)(c) | | | | | | | 304 | | | | 312,445 | |
|
Investment Companies | | | | | | | Shares | | | | | |
Capital Markets — 0.0% | | | | | | | | | | | | | | |
Eaton Vance Floating-Rate Income Trust | | | | | | | 12 | | | | 185 | |
Eaton Vance Senior Income Trust | | | | | | | 3,347 | | | | 23,563 | |
Total Investment Companies — 0.0% | | | | | | | | | | | 23,748 | |
|
Warrants (d) — 0.0% |
Software — 0.0% | | | | | | | | | | | | | | |
HMH Holdings/EduMedia (issued/exercisable 3/09/10, 19 Shares for 1 Warrant, Expires 6/22/19, Strike Price $42.27) | | | | | | | 691 | | | | 2,444 | |
Total Long-Term Investments
(Cost — $181,985,573) — 140.6% | | | | | | | | | | | 184,240,683 | |
|
Short-Term Securities |
BlackRock Liquidity Funds, TempFund, Institutional Class, 0.03% (e)(f) | | | | | | | 2,835,510 | | | | 2,835,510 | |
Total Short-Term Securities
(Cost — $2,835,510) — 2.2% | | | | | | | | | | | 2,835,510 | |
Total Investments (Cost — $184,821,083) — 142.8% | | | | | | 187,076,193 | |
Liabilities in Excess of Other Assets — (42.8)% | | | | | | | | | | | (56,105,233 | ) |
Net Assets — 100.0% | | | | | $ | 130,970,960 | |
See Notes to Financial Statements.
| SEMI-ANNUAL REPORT | FEBRUARY 28, 2014 | 17
|
| |
| Schedule of Investments (continued) | BlackRock Defined Opportunity Credit Trust (BHL)
|
Notes to Schedule of Investments
| (a) | | | | Non-income producing security. |
| (b) | | | | Variable rate security. Rate shown is as of report date. |
| (c) | | | | Security exempt from registration pursuant to Rule 144A under the Securities Act of 1933, as amended. These securities may be resold in transactions exempt from registration to qualified institutional investors. |
| (d) | | | | Warrants entitle the Fund to purchase a predetermined number of shares of common stock and are non-income producing. The purchase price and number of shares are subject to adjustment under certain conditions until the expiration date, if any. |
| (e) | | | | Investments in issuers considered to be an affiliate of the Fund during the six months ended February 28, 2014, for purposes of Section 2(a)(3) of the 1940 Act, were as follows: |
Affiliate
| Shares
Held at
August 31, 2013
| Net
Activity
| Shares
Held at
February 28, 2014
| Income
|
|
BlackRock Liquidity Funds, TempFund, Institutional Class | 1,298,269 | 1,537,241 | 2,835,510 | $112 | |
| (f) | | | | Represents the current yield as of report date. |
| • | | | | Foreign currency exchange contracts outstanding as of February 28, 2014 were as follows: |
Currency Purchased
|
| Currency Sold
|
| Counterparty
|
| Settlement
Date
|
|
| Unrealized
Appreciation
(Depreciation)
|
|
EUR | | | | | 120,000 | | | USD | | | 162,968 | | | Citibank N.A. | | 4/22/14 | | $ | 2,665 | |
GBP | | | | | 136,000 | | | USD | | | 224,249 | | | Citibank N.A. | | 4/22/14 | | | 3,407 | |
USD | | | | | 151,295 | | | EUR | | | 110,000 | | | Goldman Sachs Bank USA | | 4/22/14 | | | (535 | ) |
USD | | | | | 164,020 | | | EUR | | | 120,000 | | | JPMorgan Chase Bank N.A. | | 4/22/14 | | | (1,613 | ) |
USD | | | | | 2,749,739 | | | EUR | | | 2,023,468 | | | Royal Bank of Scotland PLC | | 4/22/14 | | | (43,205 | ) |
USD | | | | | 130,389 | | | GBP | | | 80,000 | | | Deutsche Bank AG | | 4/22/14 | | | (3,526 | ) |
USD | | | | | 2,313,367 | | | GBP | | | 1,409,000 | | | JPMorgan Chase Bank N.A. | | 4/22/14 | | | (45,217 | ) |
Total | | | | | | | | | | | | | | | | | | $ | (88,024 | ) |
| • | | | | OTC credit default swaps — sold protection outstanding as of February 28, 2014 were as follows: |
Issuer
|
|
|
| Receive
Fixed
Rate
|
| Counterparty
|
| Expiration
Date
|
| Credit
Rating1
|
| Notional
Amount
(000)2
|
| Market
Value
|
| Premiums
Received
|
| Unrealized
Depreciation
|
|
| | | | | | | | | | | | | | | | | | | | | | | | | | | | | | | | | |
| Caesars Entertainment Operating Co., Inc. | | | | 5.00% | | JPMorgan Chase Bank N.A. | | 12/20/15 | | CCC- | | USD | | 124 | | $ | (28,398 | ) | | $ | (28,003 | ) | | $ | (395 | ) |
| Caesars Entertainment Operating Co., Inc. | | | | 5.00% | | JPMorgan Chase Bank N.A. | | 12/20/15 | | CCC- | | USD | | 34 | | | (7,873 | ) | | | (6,730 | ) | | | (1,143 | ) |
| Caesars Entertainment Operating Co., Inc. | | | | 5.00% | | Goldman Sachs Bank USA | | 3/20/16 | | CCC- | | USD | | 49 | | | (13,138 | ) | | | (9,516 | ) | | | (3,622 | ) |
| Caesars Entertainment Operating Co., Inc. | | | | 5.00% | | Goldman Sachs Bank USA | | 3/20/16 | | CCC- | | USD | | 49 | | | (13,138 | ) | | | (9,516 | ) | | | (3,622 | ) |
| Caesars Entertainment Operating Co., Inc. | | | | 5.00% | | Goldman Sachs Bank USA | | 3/20/16 | | CCC- | | USD | | 143 | | | (38,129 | ) | | | (26,322 | ) | | | (11,807 | ) |
| Caesars Entertainment Operating Co., Inc. | | | | 5.00% | | Goldman Sachs Bank USA | | 6/20/16 | | CCC- | | USD | | 190 | | | (56,729 | ) | | | (37,975 | ) | | | (18,754 | ) |
| Caesars Entertainment Operating Co., Inc. | | | | 5.00% | | Deutsche Bank AG | | 9/20/16 | | CCC- | | USD | | 500 | | | (165,840 | ) | | | (97,671 | ) | | | (68,169 | ) |
| Caesars Entertainment Operating Co., Inc. | | | | 5.00% | | Goldman Sachs Bank USA | | 9/20/16 | | CCC- | | USD | | 473 | | | (156,768 | ) | | | (90,237 | ) | | | (66,531 | ) |
| Caesars Entertainment Operating Co., Inc. | | | | 5.00% | | Goldman Sachs Bank USA | | 3/20/17 | | CCC- | | USD | | 89 | | | (35,635 | ) | | | (21,284 | ) | | | (14,351 | ) |
| Caesars Entertainment Operating Co., Inc. | | | | 5.00% | | Deutsche Bank AG | | 6/20/17 | | CCC- | | USD | | 127 | | | (53,128 | ) | | | (32,555 | ) | | | (20,573 | ) |
| | | | | | | | | | | | | | | | | | | | | | | | | | | | | | | |
Total | | | | | | | | | | | | | | | | $ | (568,776 | ) | | $ | (359,809 | ) | | $ | (208,967 | ) |
| 1 | Using S&P’s rating of the issuer. |
| 2 | The maximum potential amount the Fund may pay should a negative credit event take place as defined under the terms of agreement. |
| • | | | | For Fund compliance purposes, the Fund’s industry classifications refer to any one or more of the industry sub-classifications used by one or more widely recognized market indexes or ratings group indexes, and/or as defined by the investment advisor. These definitions may not apply for purposes of this report, which may combine such industry sub-classifications for reporting ease. |
See Notes to Financial Statements.
| 18 | SEMI-ANNUAL REPORT | FEBRUARY 28, 2014
|
| |
| Schedule of Investments (continued) | BlackRock Defined Opportunity Credit Trust (BHL)
|
| • | | | | Fair Value Measurements — Various inputs are used in determining the fair value of investments and derivative financial instruments. These inputs to valuation techniques are categorized into a disclosure hierarchy consisting of three broad levels for financial statement purposes as follows: |
| • | | | | Level 1 — unadjusted price quotations in active markets/exchanges for identical assets or liabilities that the Fund has the ability to access |
| • | | | | Level 2 — other observable inputs (including, but not limited to, quoted prices for similar assets or liabilities in markets that are active, quoted prices for identical or similar assets or liabilities in markets that are not active, inputs other than quoted prices that are observable for the assets or liabilities (such as interest rates, yield curves, volatilities, prepayment speeds, loss severities, credit risks and default rates) or other market-corroborated inputs) |
| • | | | | Level 3 — unobservable inputs based on the best information available in the circumstances, to the extent observable inputs are not available (including the Fund’s own assumptions used in determining the fair value of investments and derivative financial instruments) |
| | | | | The hierarchy gives the highest priority to unadjusted quoted prices in active markets for identical assets or liabilities (Level 1 measurements) and the lowest priority to unobservable inputs (Level 3 measurements). Accordingly, the degree of judgment exercised in determining fair value is greatest for instruments categorized in Level 3. The inputs used to measure fair value may fall into different levels of the fair value hierarchy. In such cases, for disclosure purposes, the fair value hierarchy classification is determined based on the lowest level input that is significant to the fair value measurement in its entirety. |
| | | | | Changes in valuation techniques may result in transfers into or out of an assigned level within the disclosure hierarchy. In accordance with the Fund’s policy, transfers between different levels of the fair value disclosure hierarchy are deemed to have occurred as of the beginning of the reporting period. The categorization of a value determined for investments and derivative financial instruments is based on the pricing transparency of the investment and derivative financial instruments and is not necessarily an indication of the risks associated with investing in those securities. For information about the Fund’s policy regarding valuation of investments, please refer to Note 2 of the Notes to Financial Statements. |
| | | | | The following tables summarize the Fund’s investments and derivative financial instruments categorized in the disclosure hierarchy as of February 28, 2014: |
|
|
|
| Level 1
|
| Level 2
|
| Level 3
|
| Total
|
Assets:
| | | | | | | | | | | | | | | | | | |
Investments:
| | | | | | | | | | | | | | | | | | |
Long-Term Investments:
| | | | | | | | | | | | | | | | | | |
Asset-Backed Securities | | | | | — | | | $ | 4,084,514 | | | | — | | | $ | 4,084,514 | |
Common Stocks | | | | | — | | | | 994,598 | | | | — | | | | 994,598 | |
Corporate Bonds | | | | | — | | | | 4,929,841 | | | | — | | | | 4,929,841 | |
Floating Rate Loan Interests | | | | | — | | | | 160,957,420 | | | $ | 12,935,673 | | | | 173,893,093 | |
Investment Companies | | | | $ | 23,748 | | | | — | | | | — | | | | 23,748 | |
Non-Agency Mortgage-Backed Securities | | | | | — | | | | 312,445 | | | | — | | | | 312,445 | |
Warrants | | | | | — | | | | 2,444 | | | | — | | | | 2,444 | |
Short-Term Securities | | | | | 2,835,510 | | | | — | | | | — | | | | 2,835,510 | |
Unfunded Loan Commitments | | | | | — | | | | 19 | | | | — | | | | 19 | |
Total
| | | | $ | 2,859,258 | | | $ | 171,281,281 | | | $ | 12,935,673 | | | $ | 187,076,212 | |
| | | | | | | | | | | |
|
|
|
|
|
|
|
|
|
|
|
|
|
|
| Level 1
|
| Level 2
|
| Level 3
|
| Total
|
Derivative Financial Instruments1
|
Assets:
| | | | | | | | | | | | | | | | | | |
Foreign currency exchange contracts | | | | | — | | | $ | 6,072 | | | | — | | | $ | 6,072 | |
Liabilities:
| | | | | | | | | | | | | | | | | | |
Credit contracts | | | | | — | | | | (208,967 | ) | | | — | | | | (208,967 | ) |
Foreign currency exchange contracts | | | | | — | | | | (94,096 | ) | | | — | | | | (94,096 | ) |
Total
| | | | | — | | | $ | (296,991 | ) | | | — | | | $ | (296,991 | ) |
| 1 | | Derivative financial instruments are swaps and foreign currency exchange contracts. Swaps and foreign currency exchange contracts are valued at the unrealized appreciation/depreciation on the instrument. |
The carrying amount for certain of the Fund’s assets and/or liabilities approximates fair value for financial statement purposes. As of February 28, 2014, such assets and/or liabilities are categorized within the disclosure hierarchy as follows: |
|
|
|
| Level 1
|
| Level 2
|
| Level 3
|
| Total
|
Assets:
| | | | | | | | | | | | | | | | | | |
Cash | | | | $ | 182,484 | | | | — | | | | — | | | $ | 182,484 | |
Foreign currency at value | | | | | 171,631 | | | | — | | | | — | | | | 171,631 | |
Liabilities:
| | | | | | | | | | | | | | | | | | |
Bank borrowings payable | | | | | — | | | $ | (52,000,000 | ) | | | — | | | | (52,000,000 | ) |
Total
| | | | $ | 354,115 | | | $ | (52,000,000 | ) | | | — | | | $ | (51,645,885 | ) |
There were no transfers between Level 1 and Level 2 during the six months ended February 28, 2014. |
See Notes to Financial Statements.
| SEMI-ANNUAL REPORT | FEBRUARY 28, 2014 | 19
|
| |
| Schedule of Investments (concluded) | BlackRock Defined Opportunity Credit Trust (BHL)
|
A reconciliation of Level 3 investments is presented when the Fund had a significant amount of Level 3 investments at the beginning and/or end of the period in relation to net assets. The following table is a reconciliation of Level 3 investments for which significant unobservable inputs were used in determining fair value: |
|
|
|
| Asset-Backed
Securities
|
| Floating Rate
Loan Interests
|
| Total
|
Assets:
|
Opening Balance, as of August 31, 2013 | | | | $ | 4,422,403 | | | $ | 21,940,408 | | | $ | 26,362,811 | |
Transfers into Level 31 | | | | | — | | | | 3,663,924 | | | | 3,663,924 | |
Transfers out of Level 32 | | | | | (3,316,503 | ) | | | (12,127,990 | ) | | | (15,444,493 | ) |
Accrued discounts/premiums | | | | | 398 | | | | 19,789 | | | | 20,187 | |
Net realized gain | | | | | 39,182 | | | | 34,456 | | | | 73,638 | |
Net change in unrealized appreciation/ depreciation3,4 | | | | | (38,010 | ) | | | 74,198 | | | | 36,188 | |
Purchases | | | | | — | | | | 4,014,657 | | | | 4,014,657 | |
Sales | | | | | (1,107,470 | ) | | | (4,683,769 | ) | | | (5,791,239 | ) |
Closing Balance, as of February 28, 2014
| | | | | — | | | $ | 12,935,673 | | | $ | 12,935,673 | |
Net change in unrealized appreciation/depreciation on investments
still held at February 28, 20144 | | | | | — | | | $ | 89,436 | | | $ | 89,436 | |
| 1 | | As of August 31, 2013, the Fund used observable inputs in determining the value of certain investments. As of February 28, 2014, the Fund used significant unobservable inputs in determining the value of the same investments. As a result, investments with a beginning of period value of $3,663,924 transferred from Level 2 to Level 3 in the disclosure hierarchy. |
| 2 | | As of August 31, 2013, the Fund used significant unobservable inputs in determining the value of certain investments. As of February 28, 2014, the Fund used observable inputs in determining the value of the same investments. As a result, investments with a beginning of period value of $15,444,493 transferred from Level 3 to Level 2 in the disclosure hierarchy. |
| 3 | | Included in the related net change in unrealized appreciation/depreciation in the Statements of Operations. |
| 4 | | Any difference between Net change in unrealized appreciation/depreciation and Net change in unrealized appreciation/depreciation on investments still held at February 28, 2014 is generally due to investments no longer held or categorized as Level 3 at period end. |
The Fund’s investments that are categorized as Level 3 were valued utilizing third party pricing information without adjustment. Such valuations are based on unobservable inputs. A significant change in third party information inputs could result in a significantly lower or higher value of such Level 3 investments. |
See Notes to Financial Statements.
| 20 | SEMI-ANNUAL REPORT | FEBRUARY 28, 2014
|
| |
Consolidated Schedule of Investments
February 28, 2014 (Unaudited) | BlackRock Floating Rate Income Strategies Fund, Inc. (FRA)
(Percentages shown are based on Net Assets)
|
| Common Stocks | | | | | |
Shares | | Value |
Chemicals — 0.0% | | | | | | | | | | | | | | |
GEO Specialty Chemicals, Inc. (a) | | | | | | | 23,849 | | | $ | 20,033 | |
Diversified Financial Services — 0.2% | | | | | | | | | | | | | | |
Kcad Holdings I Ltd. (a) | | | | | | | 217,833,983 | | | | 849,552 | |
Electrical Equipment — 0.0% | | | | | | | | | | | | | | |
Medis Technologies Ltd. | | | | | | | 260,833 | | | | 3 | |
Paper & Forest Products — 0.5% | | | | | | | | | | | | | | |
Ainsworth Lumber Co., Ltd. (a) | | | | | | | 393,892 | | | | 1,494,036 | |
Ainsworth Lumber Co., Ltd. (a)(b) | | | | | | | 346,000 | | | | 1,312,382 | |
Western Forest Products, Inc. (a) | | | | | | | 84,448 | | | | 192,950 | |
| | | | | | | | | | | 2,999,368 | |
Semiconductors & Semiconductor Equipment — 0.0% |
SunPower Corp. | | | | | | | 1,860 | | | | 61,622 | |
Software — 0.4% | | | | | | | | | | | | | | |
HMH Holdings/EduMedia (a) | | | | | | | 116,627 | | | | 2,251,367 | |
Total Common Stocks — 1.1% | | | | | | | | | | | 6,181,945 | |
|
Asset-Backed Securities (b)(c) | | | | | | Par
(000) | | |
ALM Loan Funding: | | | | | | | | | | | | | | |
Series 2013-7R2A, Class B, 2.84%, 4/24/24 | | | | USD | | | 775 | | | | 759,965 | |
Series 2013-7RA, Class C, 3.69%, 4/24/24 | | | | | | | 2,125 | | | | 2,054,748 | |
Series 2013-7RA, Class D, 5.24%, 4/24/24 | | | | | | | 900 | | | | 852,192 | |
Series 2013-8A, Class B, 2.99%, 1/20/26 | | | | | | | 1,150 | | | | 1,133,091 | |
Atrium CDO Corp., Series 9A, Class D, 3.73%, 2/28/24 | | | | | | | 1,100 | | | | 1,065,763 | |
Carlyle Global Market Strategies CLO Ltd.: | | | | | | | | | | | | | | |
Series 2012-4A, Class D, 4.74%, 1/20/25 | | | | | | | 700 | | | | 703,981 | |
Series 2013-1A, Class C, 4.24%, 2/14/25 | | | | | | | 250 | | | | 250,723 | |
Cavalry CLO II, Series 2A, Class D, 4.24%, 1/17/24 | | | | | | | 500 | | | | 490,738 | |
Cent CLO LP, Series 2013-17A, Class C, 3.74%, 1/30/25 | | | | | | | 500 | | | | 482,420 | |
Figueroa CLO Ltd., Series 2013-1A, Class C, 3.88%, 3/21/24 | | | | | | | 500 | | | | 486,375 | |
Fraser Sullivan CLO VII Ltd., Series 2012-7A, Class C, 4.24%, 4/20/23 | | | | | | | 950 | | | | 949,974 | |
Highbridge Loan Management Ltd., Series 2012-1A, Class C, 5.25%, 9/20/22 | | | | | | | 1,500 | | | | 1,508,736 | |
Madison Park Funding XI Ltd., Series 2013-11A, Class D, 3.80%, 10/23/25 | | | | | | | 370 | | | | 356,655 | |
Marea CLO Ltd., Series 2012-1A, Class D, 4.79%, 10/16/23 | | | | | | | 1,650 | | | | 1,654,621 | |
Neuberger Berman CLO XV, Series 2013-15A, Class C, 3.09%, 10/15/25 | | | | | | | 1,000 | | | | 978,830 | |
North End CLO Ltd., Series 2013-1A, Class D, 3.74%, 7/17/25 | | | | | | | 750 | | | | 726,680 | |
Octagon Investment Partners XVI Ltd., Series 2013-1A, Class D, 3.44%, 10/25/25 | | | | | | | 1,000 | | | | 953,949 | |
OZLM Funding Ltd., Series 2012-2A, Class C, 4.59%, 10/30/23 | | | | | | | 500 | | | | 501,416 | |
Race Point CLO Ltd., Series 2012-6A, Class D, 4.74%, 5/24/23 | | | | | | | 1,075 | | | | 1,075,353 | |
Regatta Funding LP, Series 2013-2A, Class C, 4.24%, 1/15/25 | | | | | | | 500 | | | | 497,120 | |
Symphony CLO Ltd., Series 2012-10A, Class D, 5.49%, 7/23/23 | | | | | | | 1,500 | | | | 1,508,260 | |
Total Asset-Backed Securities — 3.3% | | | | | | | | | | | 18,991,590 | |
|
Corporate Bonds | | | | | | | | | | | | |
Airlines — 0.7% | | | | | | | | | | | | | | |
American Airlines Pass-Through Trust, Series 2013-2, Class C, 6.00%, 1/15/17 (b) | | | | | | | 1,140 | | | | 1,182,750 | |
| | | | | | | | | | | | | |
| Corporate Bonds | | | | | | Par
(000) | | Value |
Airlines (concluded) | | | | | | | | | | | | | | |
Delta Air Lines Pass-Through Trust, Series 2009-1, Class B, 9.75%, 6/17/18 | | | | USD | | | 190 | | | | $216,025 | |
US Airways Pass-Through Trust, Series 2012-2, Class C, 5.45%, 6/03/18 | | | | | | | 2,605 | | | | 2,657,100 | |
| | | | | | | | | | | 4,055,875 | |
Auto Components — 0.2% | | | | | | | | | | | | | | |
Icahn Enterprises LP/Icahn Enterprises Finance Corp., 3.50%, 3/15/17 (b) | | | | | | | 1,177 | | | | 1,191,713 | |
Capital Markets — 0.0% | | | | | | | | | | | | | | |
E*Trade Financial Corp., 0.00%, 8/31/19 (b)(d)(e) | | | | | | | 129 | | | | 280,172 | |
Chemicals — 0.6% | | | | | | | | | | | | | | |
GEO Specialty Chemicals, Inc., 7.50%, 3/31/15 (b) | | | | | | | 1,559 | | | | 3,398,812 | |
Commercial Services & Supplies — 0.3% | | | | | | | | | | | | | | |
Avis Budget Car Rental LLC/Avis Budget Finance, Inc., 2.99%, 12/01/17 (b)(c) | | | | | | | 295 | | | | 297,950 | |
AWAS Aviation Capital Ltd., 7.00%, 10/17/16 (b) | | | | | | | 1,085 | | | | 1,125,779 | |
United Rentals North America, Inc., 5.75%, 7/15/18 | | | | | | | 350 | | | | 375,375 | |
| | | | | | | | | | | 1,799,104 | |
Communications Equipment — 0.3% | | | | | | | | | | | | | | |
Avaya, Inc., 7.00%, 4/01/19 (b) | | | | | | | 390 | | | | 387,075 | |
Zayo Group LLC/Zayo Capital, Inc., 8.13%, 1/01/20 | | | | | | | 1,470 | | | | 1,620,675 | |
| | | | | | | | | | | 2,007,750 | |
Construction & Engineering — 0.1% | | | | | | | | | | | | | | |
Safway Group Holding LLC/Safway Finance Corp., 7.00%, 5/15/18 (b) | | | | | | | 335 | | | | 355,938 | |
Diversified Financial Services — 0.4% | | | | | | | | | | | | | | |
Ally Financial, Inc.: | | | | | | | | | | | | | | |
2.92%, 7/18/16 (c) | | | | | | | 1,375 | | | | 1,403,572 | |
7.50%, 9/15/20 | | | | | | | 160 | | | | 193,600 | |
8.00%, 11/01/31 | | | | | | | 360 | | | | 453,600 | |
| | | | | | | | | | | 2,050,772 | |
Diversified Telecommunication Services — 0.3% | | | | | | | | | | | | | | |
Level 3 Financing, Inc. (b): | | | | | | | | | | | | | | |
3.85%, 1/15/18 (c) | | | | | | | 1,000 | | | | 1,015,000 | |
6.13%, 1/15/21 | | | | | | | 555 | | | | 586,912 | |
| | | | | | | | | | | 1,601,912 | |
Health Care Technology — 0.4% | | | | | | | | | | | | | | |
IMS Health, Inc., 12.50%, 3/01/18 (b) | | | | | | | 1,776 | | | | 2,042,400 | |
Hotels, Restaurants & Leisure — 0.3% | | | | | | | | | | | | | | |
Little Traverse Bay Bands of Odawa Indians, 9.00%, 8/31/20 (b) | | | | | | | 948 | | | | 949,682 | |
Travelport LLC/Travelport Holdings, Inc., 6.36%, 3/01/16 (b)(c) | | | | | | | 668 | | | | 675,935 | |
Tropicana Entertainment LLC/Tropicana Finance Corp., 9.63%, 12/15/14 (a)(f) | | | | | | | 120 | | | | — | |
| | | | | | | | | | | 1,625,617 | |
Household Durables — 0.1% | | | | | | | | | | | | | | |
Beazer Homes USA, Inc., 6.63%, 4/15/18 | | | | | | | 790 | | | | 853,200 | |
Independent Power Producers & Energy Traders — 0.8% |
Calpine Corp., 6.00%, 1/15/22 (b) | | | | | | | 349 | | | | 369,940 | |
Energy Future Intermediate Holding Co. LLC/EFIH Finance, Inc.: | | | | | | | | | | | | | | |
10.00%, 12/01/20 | | | | | | | 2,895 | | | | 3,010,800 | |
10.25%, 12/01/20 (b) | | | | | | | 1,115 | | | | 1,159,600 | |
| | | | | | | | | | | 4,540,340 | |
Media — 0.2% | | | | | | | | | | | | | | |
Checkout Holding Corp., 0.00%, 11/15/15 (b)(d) | | | | | | | 400 | | | | 338,000 | |
NAI Entertainment Holdings/NAI Entertainment Holdings Finance Corp., 5.00%, 8/01/18 (b) | | | | | | | 514 | | | | 535,845 | |
| | | | | | | | | | | 873,845 | |
Oil, Gas & Consumable Fuels — 0.1% | | | | | | | | | | | | | | |
EP Energy LLC/Everest Acquisition Finance, Inc., Series WI, 6.88%, 5/01/19 | | | | | | | 635 | | | | 685,006 | |
See Notes to Financial Statements.
| SEMI-ANNUAL REPORT | FEBRUARY 28, 2014 | 21
|
| |
| Consolidated Schedule of Investments (continued) | BlackRock Floating Rate Income Strategies Fund, Inc. (FRA)
(Percentages shown are based on Net Assets)
|
| Corporate Bonds | | | | | | Par
(000) | | Value |
Wireless Telecommunication Services — 0.0% | | | | | | | | | | | | | | |
T-Mobile USA, Inc., 6.13%, 1/15/22 | | | | USD | | | 225 | | | $ | 237,656 | |
Total Corporate Bonds — 4.8% | | | | | | | | | | | 27,600,112 | |
|
Floating Rate Loan Interests (c)
| | | | | | | | |
Aerospace & Defense — 2.1% | | | | | | | | | | | | | | |
DigitalGlobe, Inc., Term Loan B, 3.75%, 1/31/20 | | | | | | | 2,223 | | | | 2,220,421 | |
The SI Organization, Inc., Term Loan B, 5.50%, 11/22/16 | | | | | | | 1,686 | | | | 1,651,566 | |
Spirit Aerosystems, Inc., Term Loan B, 3.75%, 4/18/19 | | | | | | | 1,572 | | | | 1,577,895 | |
Transdigm, Inc., Term Loan C, 3.75%, 2/28/20 | | | | | | | 891 | | | | 894,341 | |
TransUnion LLC, Term Loan, 4.25%, 2/10/19 | | | | | | | 5,587 | | | | 5,602,539 | |
| | | | | | | | | | | 11,946,762 | |
Airlines — 1.0% | | | | | | | | | | | | | | |
Delta Air Lines, Inc.: | | | | | | | | | | | | | | |
Term Loan, 3.49%, 9/16/15 | | | | | | | 1,373 | | | | 1,328,844 | |
Term Loan B1, 3.50%, 10/18/18 | | | | | | | 1,436 | | | | 1,439,045 | |
Northwest Airlines, Inc., Term Loan: | | | | | | | | | | | | | | |
2.24%, 3/10/17 | | | | | | | 913 | | | | 881,153 | |
1.62%, 9/10/18 | | | | | | | 1,197 | | | | 1,130,849 | |
US Airways Group, Inc., Term Loan B1, 3.50%, 5/23/19 | | | | | | | 1,150 | | | | 1,150,356 | |
| | | | | | | | | | | 5,930,247 | |
Auto Components — 4.8% | | | | | | | | | | | | | | |
Affinia Group Intermediate Holdings, Inc., Term Loan B2, 4.75%, 4/27/20 | | | | | | | 1,572 | | | | 1,573,405 | |
Armored Autogroup, Inc., Term Loan B, 6.00%, 11/04/16 | | | | | | | 253 | | | | 254,519 | |
Autoparts Holdings Ltd., 1st Lien Term Loan, 6.50%, 7/28/17 | | | | | | | 2,797 | | | | 2,798,763 | |
Dayco Products LLC, Term Loan B, 5.25%, 12/12/19 | | | | | | | 1,595 | | | | 1,608,956 | |
Federal-Mogul Corp.: | | | | | | | | | | | | | | |
Term Loan B, 2.10%, 12/29/14 | | | | | | | 5,942 | | | | 5,893,407 | |
Term Loan C, 2.10%, 12/28/15 | | | | | | | 5,482 | | | | 5,436,550 | |
FleetPride Corp., 1st Lien Term Loan, 5.25%, 11/19/19 | | | | | | | 1,559 | | | | 1,536,641 | |
The Goodyear Tire & Rubber Co., 2nd Lien Term Loan, 4.75%, 4/30/19 | | | | | | | 5,015 | | | | 5,061,389 | |
GPX International Tire Corp., Term Loan (a)(f)(g): | | | | | | | | | | | | | | |
PIK, 13.00%, 12/31/49 | | | | | | | 18 | | | | — | |
12.25%, 12/31/49 | | | | | | | 1,097 | | | | — | |
Schaeffler AG, Term Loan C, 4.25%, 1/27/17 | | | | | | | 15 | | | | 15,098 | |
Transtar Holding Co., 1st Lien Term Loan, 5.50%, 10/09/18 | | | | | | | 2,123 | | | | 2,085,970 | |
UCI International, Inc., Term Loan B, 5.50%, 7/26/17 | | | | | | | 1,455 | | | | 1,452,279 | |
| | | | | | | | | | | 27,716,977 | |
Automobiles — 0.1% | | | | | | | | | | | | | | |
Chrysler Group LLC, 2018 Term Loan B, 3.25%, 12/31/18 | | | | | | | 825 | | | | 820,727 | |
Building Products — 2.1% | | | | | | | | | | | | | | |
Armstrong World Industries, Inc., Term Loan B, 3.50%, 3/16/20 | | | | | | | 1,136 | | | | 1,137,481 | |
Continental Building Products LLC, 1st Lien Term Loan, 4.75%, 8/14/20 | | | | | | | 1,177 | | | | 1,176,556 | |
CPG International, Inc., Term Loan, 4.75%, 9/30/20 | | | | | | | 3,436 | | | | 3,438,552 | |
Ply Gem Industries, Inc., Term Loan, 4.00%, 1/16/21 | | | | | | | 895 | | | | 896,495 | |
Quikrete Holdings, Inc., 1st Lien Term Loan, 4.00%, 9/28/20 | | | | | | | 1,481 | | | | 1,484,368 | |
| | | | | | | | | | | | | |
| Floating Rate Loan Interests (c) | | | | | | Par
(000) | | Value |
Building Products (concluded) | | | | | | | | | | | | | | |
Wilsonart LLC: | | | | | | | | | | | | | | |
Incremental Term Loan B2, 4.00%, 10/31/19 | | | | USD | | | 505 | | | $ | 503,737 | |
Term Loan B, 4.00%, 10/31/19 | | | | | | | 3,420 | | | | 3,416,176 | |
| | | | | | | | | | | 12,053,365 | |
Capital Markets — 0.2% | | | | | | | | | | | | | | |
American Capital Holdings, Inc., 2017 Term Loan, 3.50%, 8/22/17 | | | | | | | 879 | | | | 878,829 | |
KCG Holdings, Inc., Term Loan B, 5.75%, 12/05/17 | | | | | | | 479 | | | | 480,638 | |
| | | | | | | | | | | 1,359,467 | |
Chemicals — 4.0% | | | | | | | | | | | | | | |
Allnex USA, Inc.: | | | | | | | | | | | | | | |
Term Loan B1, 4.50%, 10/03/19 | | | | | | | 1,110 | | | | 1,115,025 | |
Term Loan B2, 4.50%, 10/03/19 | | | | | | | 576 | | | | 578,533 | |
Axalta Coating Systems US Holdings, Inc., Term Loan, 4.00%, 2/01/20 | | | | | | | 3,171 | | | | 3,182,358 | |
CeramTec Acquisition Corp., Term Loan B2, 4.25%, 8/28/20 | | | | | | | 117 | | | | 117,489 | |
Chemtura Corp., Term Loan B, 3.50%, 8/27/16 | | | | | | | 1,264 | | | | 1,271,662 | |
Chromaflo Technologies Corp.: | | | | | | | | | | | | | | |
1st Lien Term Loan, 4.50%, 12/02/19 | | | | | | | 1,150 | | | | 1,152,875 | |
2nd Lien Term Loan, 8.25%, 5/30/20 | | | | | | | 490 | | | | 493,675 | |
Evergreen Acqco 1 LP, Term Loan, 5.00%, 7/09/19 | | | | | | | 2,070 | | | | 2,075,765 | |
INEOS Finance LLC: | | | | | | | | | | | | | | |
3 Year Term Loan, 2.15%, 5/04/15 | | | | | | | 382 | | | | 381,948 | |
6 Year Term Loan, 3.75%, 5/04/18 | | | | | | | 865 | | | | 862,595 | |
MacDermid, Inc., 1st Lien Term Loan, 4.00%, 6/08/20 | | | | | | | 1,547 | | | | 1,553,414 | |
Nexeo Solutions LLC, Term Loan B, 5.00%, 9/08/17 | | | | | | | 2,467 | | | | 2,449,696 | |
OXEA Finance LLC: | | | | | | | | | | | | | | |
2nd Lien Term Loan, 8.25%, 7/15/20 | | | | | | | 1,365 | | | | 1,391,017 | |
Term Loan B2, 4.25%, 1/15/20 | | | | | | | 2,544 | | | | 2,559,523 | |
Royal Adhesives and Sealants LLC, 1st Lien Term Loan, 5.50%, 7/31/18 | | | | | | | 694 | | | | 703,830 | |
Tata Chemicals North America, Inc., Term Loan B, 3.75%, 8/07/20 | | | | | | | 587 | | | | 588,517 | |
Tronox Pigments (Netherlands) BV, Term Loan, 4.50%, 3/19/20 | | | | | | | 1,768 | | | | 1,773,173 | |
Univar, Inc., Term Loan B, 5.00%, 6/30/17 | | | | | | | 989 | | | | 982,475 | |
| | | | | | | | | | | 23,233,570 | |
Commercial Banks — 0.2% | | | | | | | | | | | | | | |
Redtop Acquisitions Ltd.: | | | | | | | | | | | | | | |
1st Lien Term Loan, 4.50%, 12/03/20 | | | | | | | 845 | | | | 849,926 | |
2nd Lien Term Loan, 8.25%, 6/03/21 | | | | | | | 310 | | | | 316,200 | |
| | | | | | | | | | | 1,166,126 | |
Commercial Services & Supplies — 4.1% | | | | | | | | | | | | | | |
ADS Waste Holdings, Inc., Term Loan, 3.75%, 10/09/19 | | | | | | | 3,251 | | | | 3,247,654 | |
ARAMARK Corp.: | | | | | | | | | | | | | | |
Extended Synthetic Line of Credit 2, 3.65%, 7/26/16 | | | | | | | 46 | | | | 46,140 | |
Extended Synthetic Line of Credit 3, 3.65%, 7/26/16 | | | | | | | 32 | | | | 32,207 | |
AWAS Finance Luxembourg 2012 SA, Term Loan, 3.50%, 7/16/18 | | | | | | | 1,202 | | | | 1,205,059 | |
Brand Energy & Infrastructure Services, Inc., Term Loan B, 4.75%, 11/26/20 | | | | | | | 3,816 | | | | 3,829,945 | |
Catalent Pharma Solutions, Inc., Term Loan, 6.50%, 12/29/17 | | | | | | | 500 | | | | 506,250 | |
KAR Auction Services, Inc., Term Loan B, 3.75%, 5/19/17 | | | | | | | 2,429 | | | | 2,430,375 | |
Livingston International, Inc.: | | | | | | | | | | | | | | |
1st Lien Term Loan, 5.00%, 4/16/19 | | | | | | | 1,353 | | | | 1,356,583 | |
2nd Lien Term Loan, 9.00%, 4/20/20 | | | | | | | 875 | | | | 892,261 | |
Progressive Waste Solutions Ltd., Term Loan B, 3.00%, 10/24/19 | | | | | | | 1,337 | | | | 1,341,178 | |
Protection One, Inc., Term Loan, 4.25%, 3/21/19 | | | | | | | 2,054 | | | | 2,048,684 | |
See Notes to Financial Statements.
| 22 | SEMI-ANNUAL REPORT | FEBRUARY 28, 2014
|
| |
| Consolidated Schedule of Investments (continued) | BlackRock Floating Rate Income Strategies Fund, Inc. (FRA)
(Percentages shown are based on Net Assets)
|
| Floating Rate Loan Interests (c) | | | | | | Par
(000) | | Value |
Commercial Services & Supplies (concluded) | | | | | | | | | | | | | | |
Spin Holdco, Inc., Term Loan B, 4.25%, 11/14/19 | | | | USD | | | 4,072 | | | $ | 4,075,505 | |
West Corp., Term Loan B10, 3.25%, 6/30/18 | | | | | | | 2,966 | | | | 2,948,834 | |
| | | | | | | | | | | 23,960,675 | |
Communications Equipment — 2.6% | | | | | | | | | | | | | | |
Alcatel-Lucent USA, Inc., Term Loan C, 4.50%, 1/30/19 | | | | | | | 5,170 | | | | 5,213,211 | |
Applied Systems, Inc.: | | | | | | | | | | | | | | |
1st Lien Term Loan, 4.25%, 1/25/21 | | | | | | | 805 | | | | 810,031 | |
2nd Lien Term Loan, 7.50%, 1/24/22 | | | | | | | 380 | | | | 387,885 | |
Avaya, Inc., Extended Term Loan B3, 4.73%, 10/26/17 | | | | | | | 1,524 | | | | 1,482,677 | |
Blackboard, Inc., Term Loan B3, 4.75%, 10/04/18 | | | | | | | 493 | | | | 496,766 | |
CommScope, Inc.: | | | | | | | | | | | | | | |
Term Loan B3, 2.65% – 2.73%, 1/21/17 | | | | | | | 696 | | | | 694,806 | |
Term Loan B4, 3.25%, 1/26/18 | | | | | | | 1,044 | | | | 1,045,467 | |
Telesat Canada, Term Loan A, 4.28%, 3/24/17 | | | | CAD | | | 2,375 | | | | 2,144,857 | |
Zayo Group LLC/Zayo Capital, Inc., Term Loan B, 4.00%, 7/02/19 | | | | USD | | | 2,837 | | | | 2,842,628 | |
| | | | | | | | | | | 15,118,328 | |
Construction & Engineering — 1.0% | | | | | | | | | | | | | | |
BakerCorp International, Inc., Term Loan, 4.25%, 2/14/20 | | | | | | | 1,428 | | | | 1,425,907 | |
Centaur Acquisition LLC: | | | | | | | | | | | | | | |
1st Lien Term Loan, 5.25%, 2/20/19 | | | | | | | 2,210 | | | | 2,212,958 | |
2nd Lien Term Loan, 8.75%, 2/15/20 | | | | | | | 1,230 | | | | 1,254,600 | |
USIC Holdings, Inc., 1st Lien Term Loan, 4.00%, 7/10/20 | | | | | | | 1,169 | | | | 1,167,172 | |
| | | | | | | | | | | 6,060,637 | |
Construction Materials — 1.6% | | | | | | | | | | | | | | |
Filtration Group Corp.: | | | | | | | | | | | | | | |
1st Lien Term Loan, 4.50%, 11/21/20 | | | | | | | 970 | | | | 977,682 | |
2nd Lien Term Loan, 8.25%, 11/21/21 | | | | | | | 525 | | | | 536,156 | |
HD Supply, Inc., Term Loan B, 4.00%, 6/28/18 | | | | | | | 7,226 | | | | 7,246,313 | |
McJunkin Red Man Corp., Term Loan, 5.00%, 11/08/19 | | | | | | | 663 | | | | 670,137 | |
| | | | | | | | | | | 9,430,288 | |
Consumer Finance — 0.5% | | | | | | | | | | | | | | |
Springleaf Financial Funding Co., Term Loan B2, 4.75%, 9/25/19 | | | | | | | 3,060 | | | | 3,095,190 | |
Containers & Packaging — 1.1% | | | | | | | | | | | | | | |
Ardagh Holdings USA, Inc.: | | | | | | | | | | | | | | |
Incremental Term Loan, 4.00%, 12/17/19 | | | | | | | 925 | | | | 928,469 | |
Term Loan B, 4.25%, 12/17/19 | | | | | | | 1,285 | | | | 1,288,212 | |
Berry Plastics Holding Corp., Term Loan E, 3.75%, 1/09/21 | | | | | | | 800 | | | | 797,600 | |
Sealed Air Corp., 2013 Term Loan, 3.00%, 10/03/18 | | | | | | | 1,450 | | | | 1,455,597 | |
Tekni-Plex, Inc., Term Loan B, 5.50%, 8/25/19 | | | | | | | 1,716 | | | | 1,718,407 | |
| | | | | | | | | | | 6,188,285 | |
Distributors — 1.3% | | | | | | | | | | | | | | |
ABC Supply Co., Inc., Term Loan, 3.50%, 4/16/20 | | | | | | | 5,022 | | | | 5,023,969 | |
Crossmark Holdings, Inc., 1st Lien Term Loan, 4.50%, 12/20/19 | | | | | | | 1,020 | | | | 1,015,244 | |
VWR Funding, Inc., Term Loan, 3.45%, 4/03/17 | | | | | | | 1,198 | | | | 1,197,900 | |
| | | | | | | | | | | 7,237,113 | |
Diversified Consumer Services — 2.1% | | | | | | | | | | | | | | |
Allied Security Holdings, LLC: | | | | | | | | | | | | | | |
1st Lien Term Loan, 4.25%, 2/12/21 | | | | | | | 1,067 | | | | 1,065,639 | |
Delayed Draw Term Loan, 0.50%, 2/12/21 | | | | | | | 379 | | | | 378,320 | |
Bright Horizons Family Solutions, Inc., Term Loan B, 4.00%, 1/30/20 | | | | | | | 2,797 | | | | 2,800,833 | |
Doncasters Finance US LLC, Term Loan, 5.50%, 4/09/20 | | | | | | | 908 | | | | 916,365 | |
Garda World Securities Corp.: | | | | | | | | | | | | | | |
Delayed Draw Term Loan, 4.00%, 11/06/20 | | | | | | | 301 | | | | 300,781 | |
Term Loan B, 4.00%, 11/06/20 | | | | | | | 1,175 | | | | 1,175,782 | |
| | | | | | | | | | | | | |
Floating Rate Loan Interests (c) | | | | | | Par
(000) | | Value | Diversified Consumer Services (concluded) | | | | | | | | | | | | | | |
ROC Finance LLC, Term Loan, 5.00%, 6/20/19 | | | | USD | | | 1,077 | | | $ | 1,049,021 | |
ServiceMaster Co., Term Loan, 4.25%, 1/31/17 | | | | | | | 2,047 | | | | 2,046,680 | |
Weight Watchers International, Inc., Term Loan B2, 4.00%, 4/02/20 | | | | | | | 2,819 | | | | 2,151,908 | |
| | | | | | | | | | | 11,885,329 | |
Diversified Financial Services — 2.3% | | | | | | | | | | | | | | |
ION Trading Technologies Sarl: | | | | | | | | | | | | | | |
1st Lien Term Loan, 4.50%, 5/22/20 | | | | | | | 1,636 | | | | 1,644,596 | |
2nd Lien Term Loan, 8.25%, 5/21/21 | | | | | | | 365 | | | | 368,650 | |
Kasima LLC, Term Loan B, 3.25%, 5/17/21 | | | | | | | 1,535 | | | | 1,533,081 | |
Reynolds Group Holdings, Inc., Dollar Term Loan, 4.00%, 12/01/18 | | | | | | | 3,277 | | | | 3,299,545 | |
RPI Finance Trust, Term Loan B3, 3.25%, 11/09/18 | | | | | | | 395 | | | | 397,110 | |
SAM Finance Luxembourg Sarl, Term Loan, 4.25%, 12/17/20 | | | | | | | 2,595 | | | | 2,599,334 | |
WMG Acquisition Corp., Term Loan, 3.75%, 7/01/20 | | | | | | | 3,486 | | | | 3,481,033 | |
| | | | | | | | | | | 13,323,349 | |
Diversified Telecommunication Services — 4.4% | | | | | | | | | | | | | | |
Consolidated Communications, Inc., Term Loan B, 4.25%, 12/23/20 | | | | | | | 3,891 | | | | 3,912,971 | |
Hawaiian Telcom Communications, Inc., Term Loan B, 5.00%, 6/06/19 | | | | | | | 2,731 | | | | 2,741,600 | |
Integra Telecom, Inc.: | | | | | | | | | | | | | | |
2nd Lien Term Loan, 9.75%, 2/21/20 | | | | | | | 1,125 | | | | 1,153,406 | |
Term Loan B, 5.25%, 2/22/19 | | | | | | | 2,025 | | | | 2,042,922 | |
Level 3 Financing, Inc.: | | | | | | | | | | | | | | |
2020 Term Loan B, 4.00%, 1/15/20 | | | | | | | 9,510 | | | | 9,533,775 | |
Term Loan, 4.00%, 8/01/19 | | | | | | | 1,085 | | | | 1,088,255 | |
Syniverse Holdings, Inc., Term Loan B, 4.00%, 4/23/19 | | | | | | | 1,939 | | | | 1,945,713 | |
US Telepacific Corp., Term Loan B, 5.75%, 2/23/17 | | | | | | | 3,072 | | | | 3,091,508 | |
| | | | | | | | | | | 25,510,150 | |
Electric Utilities — 0.5% | | | | | | | | | | | | | | |
American Energy – Utica LLC, 2nd Lien Term Loan, 11.00%, 9/30/18 | | | | | | | 1,423 | | | | 1,486,535 | |
Sandy Creek Energy Associates LP, Term Loan B, 5.00%, 11/06/20 | | | | | | | 1,315 | | | | 1,317,670 | |
| | | | | | | | | | | 2,804,205 | |
Electrical Equipment — 1.0% | | | | | | | | | | | | | | |
Southwire Co., Term Loan, 3.25%, 2/11/21 | | | | | | | 1,180 | | | | 1,179,363 | |
Texas Competitive Electric Holdings Co. LLC, Extended Term Loan, 4.74%, 10/10/17 | | | | | | | 6,610 | | | | 4,606,707 | |
| | | | | | | | | | | 5,786,070 | |
Electronic Equipment, Instruments & Components — 0.4% |
CDW LLC, Term Loan, 3.25%, 4/29/20 | | | | | | | 2,283 | | | | 2,270,381 | |
Energy Equipment & Services — 0.8% |
Dynegy Holdings, Inc., Term Loan B2, 4.00%, 4/23/20 | | | | | | | 1,831 | | | | 1,836,292 | |
MEG Energy Corp., Refinancing Term Loan, 3.75%, 3/31/20 | | | | | | | 1,585 | | | | 1,589,488 | |
Seadrill Partners Finco LLC, Term Loan B, 4.00%, 2/21/21 | | | | | | | 520 | | | | 521,409 | |
Unifrax Corp., Term Loan, 4.25%, 11/28/18 | | | | | | | 952 | | | | 954,879 | |
| | | | | | | | | | | 4,902,068 | |
Food & Staples Retailing — 1.7% | | | | | | | | | | | | | | |
Alliance Boots Holdings Ltd., Term Loan B1, 3.47%, 7/09/15 | | | | GBP | | | 2,769 | | | | 4,632,941 | |
Rite Aid Corp.: | | | | | | | | | | | | | | |
2nd Lien Term Loan, 5.75%, 8/21/20 | | | | USD | | | 1,040 | | | | 1,061,663 | |
Term Loan 6, 4.00%, 2/21/20 | | | | | | | 868 | | | | 871,260 | |
Supervalu, Inc., Refinancing Term Loan B, 4.50%, 3/21/19 | | | | | | | 2,229 | | | | 2,236,198 | |
See Notes to Financial Statements.
| SEMI-ANNUAL REPORT | FEBRUARY 28, 2014 | 23
|
| |
| Consolidated Schedule of Investments (continued) | BlackRock Floating Rate Income Strategies Fund, Inc. (FRA)
(Percentages shown are based on Net Assets)
|
| Floating Rate Loan Interests (c) | | | | | | Par
(000) | | Value |
Food & Staples Retailing (concluded) | | | | | | | | | | | | | | |
US Foods, Inc., Refinancing Term Loan, 4.50%, 3/29/19 | | | | USD | | | 861 | | | $ | 864,978 | |
| | | | | | | | | | | 9,667,040 | |
Food Products — 3.3% | | | | | | | | | | | | | | |
AdvancePierre Foods, Inc., Term Loan, 5.75%, 7/10/17 | | | | | | | 884 | | | | 886,403 | |
CTI Foods Holding Co. LLC, 1st Lien Term Loan, 4.50%, 6/29/20 | | | | | | | 1,132 | | | | 1,132,638 | |
Del Monte Foods Co., 1st Lien Term Loan, 4.25%, 11/06/20 | | | | | | | 1,740 | | | | 1,742,175 | |
Diamond Foods, Inc., Term Loan, 4.25%, 7/28/18 | | | | | | | 785 | | | | 784,498 | |
Dole Food Co., Inc., Term Loan B, 4.50%, 11/01/18 | | | | | | | 2,655 | | | | 2,668,939 | |
GFA Brands, Inc., Term Loan B, 5.00%, 7/09/20 | | | | | | | 493 | | | | 495,396 | |
H.J. Heinz Co., Term Loan B1, 3.25%, 6/07/19 | | | | | | | 313 | | | | 314,744 | |
Michael Foods Group, Inc., Term Loan, 4.25%, 2/23/18 | | | | | | | 635 | | | | 635,765 | |
Performance Food Group Co., 2nd Lien Term Loan, 6.25%, 11/14/19 | | | | | | | 2,945 | | | | 2,989,378 | |
Pinnacle Foods Finance LLC: | | | | | | | | | | | | | | |
Incremental Term Loan H, 3.25%, 4/29/20 | | | | | | | 534 | | | | 531,885 | |
Term Loan G, 3.25%, 4/29/20 | | | | | | | 3,027 | | | | 3,014,835 | |
Reddy Ice Corp.: | | | | | | | | | | | | | | |
1st Lien Term Loan, 6.75% – 7.75%, 5/01/19 | | | | | | | 2,476 | | | | 2,463,906 | |
2nd Lien Term Loan, 10.75%, 11/01/19 | | | | | | | 1,195 | | | | 1,159,150 | |
| | | | | | | | | | | 18,819,712 | |
Health Care Equipment & Supplies — 5.5% | | | | | | | | | | | | | | |
Arysta LifeScience Corp.: | | | | | | | | | | | | | | |
1st Lien Term Loan, 4.50%, 5/29/20 | | | | | | | 4,089 | | | | 4,103,068 | |
2nd Lien Term Loan, 8.25%, 11/30/20 | | | | | | | 1,675 | | | | 1,698,031 | |
Biomet, Inc., Term Loan B2, 3.65% – 3.75%, 7/25/17 | | | | | | | 3,318 | | | | 3,322,805 | |
Capital Safety North America Holding, Inc., Term Loan, 4.50%, 1/21/19 | | | | | | | 1,538 | | | | 1,537,730 | |
Capsugel Holdings US, Inc., Term Loan B, 3.50%, 8/01/18 | | | | | | | 2,072 | | | | 2,069,394 | |
DJO Finance LLC, Term Loan B3, 4.75%, 9/15/17 | | | | | | | 4,293 | | | | 4,314,326 | |
Fresenius SE & Co. KgaA, Term Loan B: | | | | | | | | | | | | | | |
2.47%, 6/30/19 | | | | EUR | | | 530 | | | | 730,645 | |
2.25%, 8/07/19 | | | | USD | | | 2,703 | | | | 2,699,089 | |
The Hologic, Inc., Term Loan B, 3.25%, 8/01/19 | | | | | | | 3,324 | | | | 3,316,127 | |
Iasis Healthcare LLC, Term Loan B2, 4.50%, 5/03/18 | | | | | | | 434 | | | | 435,206 | |
Immucor, Inc., Refinancing Term Loan B2, 5.00%, 8/17/18 | | | | | | | 3,554 | | | | 3,571,571 | |
Kinetic Concepts, Inc., Term Loan E1, 4.00%, 5/04/18 | | | | | | | 529 | | | | 530,213 | |
Leonardo Acquisition Corp., Term Loan, 4.25%, 1/31/21 | | | | | | | 415 | | | | 416,037 | |
LHP Hospital Group, Inc., Term Loan, 9.00%, 7/03/18 | | | | | | | 576 | | | | 560,382 | |
Onex Carestream Finance LP: | | | | | | | | | | | | | | |
1st Lien Term Loan, 5.00%, 6/07/19 | | | | | | | 1,316 | | | | 1,331,058 | |
2nd Lien Term Loan, 9.50%, 12/07/19 | | | | | | | 1,170 | | | | 1,193,400 | |
| | | | | | | | | | | 31,829,082 | |
Health Care Providers & Services — 6.8% | | | | | | | | | | | | | | |
American Renal Holdings, Inc.: | | | | | | | | | | | | | | |
1st Lien Term Loan, 4.50%, 9/20/19 | | | | | | | 2,868 | | | | 2,868,325 | |
2nd Lien Term Loan, 8.50%, 2/14/20 | | | | | | | 1,795 | | | | 1,799,487 | |
Ardent Medical Services, Inc., Term Loan, 6.75%, 7/02/18 | | | | | | | 1,148 | | | | 1,151,271 | |
CHG Buyer Corp., Term Loan, 4.50%, 11/19/19 | | | | | | | 1,778 | | | | 1,785,694 | |
CHS/Community Health Systems, Inc., Term Loan D, 4.25%, 1/27/21 | | | | | | | 8,665 | | | | 8,737,179 | |
ConvaTec, Inc., Term Loan, 4.00%, 12/22/16 | | | | | | | 2,440 | | | | 2,451,466 | |
DaVita, Inc.: | | | | | | | | | | | | | | |
Term Loan B, 4.50%, 10/20/16 | | | | | | | 3,832 | | | | 3,849,962 | |
Term Loan B2, 4.00%, 11/01/19 | | | | | | | 1,765 | | | | 1,770,292 | |
| | | | | | | | | | | | | |
Floating Rate Loan Interests (c) | | | | | | Par
(000) | | Value | Health Care Providers & Services (concluded) | | | | | | | | | | | | | | |
Envision Acquisition Co. LLC, 1st Lien Term Loan, 5.75%, 11/04/20 | | | | USD | | | 1,042 | | | $ | 1,050,205 | |
Envision Healthcare Corp., Term Loan, 4.00%, 5/25/18 | | | | | | | 1,922 | | | | 1,925,059 | |
Genesis HealthCare Corp., Term Loan B, 10.00% – 10.75%, 9/25/17 | | | | | | | 1,242 | | | | 1,276,469 | |
HCA, Inc.: | | | | | | | | | | | | | | |
Extended Term Loan B4, 3.00%, 5/01/18 | | | | | | | 1,136 | | | | 1,134,443 | |
Term Loan B5, 2.90%, 3/31/17 | | | | | | | 825 | | | | 823,810 | |
Ikaria, Inc.: | | | | | | | | | | | | | | |
1st Lien Term Loan, 5.00%, 2/12/21 | | | | | | | 1,215 | | | | 1,221,840 | |
2nd Lien Term Loan, 8.75%, 1/17/22 | | | | | | | 315 | | | | 319,464 | |
inVentiv Health, Inc.: | | | | | | | | | | | | | | |
Combined Term Loan, 7.50%, 8/04/16 | | | | | | | 1,008 | | | | 1,006,016 | |
Incremental Term Loan B3, 7.75%, 5/15/18 | | | | | | | 1,105 | | | | 1,095,907 | |
National Mentor Holdings, Inc., Term Loan B, 4.75%, 1/27/21 | | | | | | | 820 | | | | 827,175 | |
Surgical Care Affiliates, Inc., Class C Incremental Term Loan, 4.25%, 6/29/18 | | | | | | | 1,856 | | | | 1,854,135 | |
US Renal Care, Inc., 2013 Term Loan, 4.25%, 7/03/19 | | | | | | | 2,111 | | | | 2,124,354 | |
| | | | | | | | | | | 39,072,553 | |
Health Care Technology — 0.7% | | | | | | | | | | | | | | |
IMS Health, Inc., Term Loan B1, 3.75%, 9/01/17 | | | | | | | 3,202 | | | | 3,199,914 | |
MedAssets, Inc., Term Loan B, 4.00%, 12/13/19 | | | | | | | 797 | | | | 799,039 | |
| | | | | | | | | | | 3,998,953 | |
Hotels, Restaurants & Leisure — 12.0% | | | | | | | | | | | | | | |
Bally Technologies, Inc., Term Loan B, 4.25%, 11/25/20 | | | | | | | 1,880 | | | | 1,890,629 | |
Boyd Gaming Corp., Term Loan B, 4.00%, 8/14/20 | | | | | | | 1,192 | | | | 1,192,895 | |
Bronco Midstream Funding LLC, Term Loan B, 5.00%, 8/17/20 | | | | | | | 3,167 | | | | 3,192,879 | |
Caesars Entertainment Resort Properties LLC, Term Loan B, 7.00%, 10/12/20 | | | | | | | 12,440 | | | | 12,624,361 | |
Four Seasons Holdings, Inc., 2nd Lien Term Loan, 6.25%, 12/28/20 | | | | | | | 1,435 | | | | 1,463,700 | |
Hilton Worldwide Finance LLC, Term Loan B2, 3.75%, 10/26/20 | | | | | | | 9,195 | | | | 9,222,030 | |
Intrawest ULC, Term Loan, 5.50%, 11/26/20 | | | | | | | 1,620 | | | | 1,634,175 | |
La Quinta Intermediate Holdings, Term Loan B, 4.00%, 2/19/21 | | | | | | | 11,860 | | | | 11,883,720 | |
Las Vegas Sands LLC, Term Loan B, 3.25%, 12/20/20 | | | | | | | 2,500 | | | | 2,497,400 | |
Marina District Finance Co., Inc., Term Loan B, 6.75%, 8/15/18 | | | | | | | 1,475 | | | | 1,487,287 | |
MGM Resorts International, Term Loan B, 3.50%, 12/20/19 | | | | | | | 2,364 | | | | 2,359,489 | |
OSI Restaurant Partners LLC, Term Loan, 3.50%, 10/25/19 | | | | | | | 1,012 | | | | 1,010,453 | |
Pinnacle Entertainment, Inc., Term Loan B2, 3.75%, 8/13/20 | | | | | | | 2,264 | | | | 2,265,753 | |
Playa Resorts Holding BV, Term Loan B, 4.75%, 8/06/19 | | | | | | | 1,776 | | | | 1,782,208 | |
Sabre, Inc.: | | | | | | | | | | | | | | |
Incremental Term Loan, 4.50%, 2/19/19 | | | | | | | 509 | | | | 509,203 | |
Term Loan B, 4.25%, 2/19/19 | | | | | | | 1,396 | | | | 1,396,193 | |
Six Flags Theme Parks, Inc., Term Loan B, 3.50%, 12/20/18 | | | | | | | 1,146 | | | | 1,151,449 | |
Station Casinos, Inc., Term Loan B, 5.00%, 3/02/20 | | | | | | | 5,240 | | | | 5,242,024 | |
Travelport LLC/Travelport Holdings, Inc.: | | | | | | | | | | | | | | |
2nd Lien Term Loan 1, 9.50%, 1/29/16 | | | | | | | 1,057 | | | | 1,095,009 | |
Refinancing Term Loan, 6.25%, 6/26/19 | | | | | | | 1,378 | | | | 1,412,100 | |
Twin River Management Group, Inc., Term Loan B, 5.25%, 11/09/18 | | | | | | | 2,458 | | | | 2,475,349 | |
Wendy’s International, Inc., Term Loan B, 3.25%, 5/15/19 | | | | | | | 1,643 | | | | 1,639,789 | |
| | | | | | | | | | | 69,428,095 | |
See Notes to Financial Statements.
| 24 | SEMI-ANNUAL REPORT | FEBRUARY 28, 2014
|
| |
| Consolidated Schedule of Investments (continued) | BlackRock Floating Rate Income Strategies Fund, Inc. (FRA)
(Percentages shown are based on Net Assets)
|
| Floating Rate Loan Interests (c) | | | | | | Par
(000) | | Value |
Household Products — 1.1% | | | | | | | | | | | | | | |
Bass Pro Group LLC, Term Loan, 3.75%, 11/20/19 | | | | USD | | | 2,769 | | | $ | 2,780,379 | |
Prestige Brands, Inc., Term Loan, 3.75% – 5.00%, 1/31/19 | | | | | | | 1,359 | | | | 1,363,451 | |
Spectrum Brands, Inc.: | | | | | | | | | | | | | | |
Term Loan A, 3.00%, 9/07/17 | | | | | | | 1,021 | | | | 1,022,326 | |
Term Loan C, 3.50%, 9/04/19 | | | | | | | 1,473 | | | | 1,471,039 | |
| | | | | | | | | | | 6,637,195 | |
Independent Power Producers & Energy Traders — 1.7% |
The AES Corp., Refinancing Term Loan B, 3.75%, 6/01/18 | | | | | | | 3,042 | | | | 3,051,437 | |
Calpine Corp., Term Loan B1, 4.00%, 4/02/18 | | | | | | | 921 | | | | 924,508 | |
La Frontera Generation LLC, Term Loan, 4.50%, 9/30/20 | | | | | | | 4,414 | | | | 4,419,284 | |
Star West Generation LLC, Term Loan B, 4.25%, 3/13/20 | | | | | | | 1,537 | | | | 1,540,492 | |
| | | | | | | | | | | 9,935,721 | |
Industrial Conglomerates — 0.8% | | | | | | | | | | | | | | |
Sequa Corp., Term Loan B, 5.25%, 6/19/17 | | | | | | | 4,547 | | | | 4,474,933 | |
Insurance — 3.3% | | | | | | | | | | | | | | |
Alliant Holdings I, Inc., Term Loan B, 4.25%, 12/20/19 | | | | | | | 1,822 | | | | 1,831,856 | |
Asurion LLC: | | | | | | | | | | | | | | |
2nd Lien Term Loan, 8.50%, 2/19/21 | | | | | | | 1,350 | | | | 1,392,187 | |
Term Loan B1, 4.50%, 5/24/19 | | | | | | | 2,774 | | | | 2,778,270 | |
CNO Financial Group, Inc.: | | | | | | | | | | | | | | |
Term Loan B1, 3.00%, 9/28/16 | | | | | | | 1,350 | | | | 1,354,225 | |
Term Loan B2, 3.75%, 9/20/18 | | | | | | | 2,267 | | | | 2,261,333 | |
Cooper Gay Swett & Crawford Ltd.: | | | | | | | | | | | | | | |
1st Lien Term Loan, 5.00%, 4/16/20 | | | | | | | 1,836 | | | | 1,806,715 | |
2nd Lien Term Loan, 8.25%, 10/16/20 | | | | | | | 860 | | | | 828,825 | |
Cunningham Lindsey US, Inc., 1st Lien Term Loan, 5.00%, 12/10/19 | | | | | | | 1,584 | | | | 1,576,080 | |
Hub International Ltd., Term Loan B, 4.75%, 10/02/20 | | | | | | | 1,925 | | | | 1,941,212 | |
National Financial Partners Corp., Term Loan, 5.25%, 7/01/20 | | | | | | | 562 | | | | 567,094 | |
Sedgwick CMS Holdings, Inc.: | | | | | | | | | | | | | | |
1st Lien Term Loan, 3.75%, 2/11/21 | | | | | | | 1,510 | | | | 1,502,072 | |
2nd Lien Term Loan, 6.75%, 12/12/18 | | | | | | | 1,155 | | | | 1,165,926 | |
| | | | | | | | | | | 19,005,795 | |
Internet Software & Services — 1.7% | | | | | | | | | | | | | | |
Dealertrack Technologies, Inc., Term Loan B, 3.50%, 2/26/21 | | | | | | | 1,105 | | | | 1,110,525 | |
Interactive Data Corp., Term Loan B, 3.75%, 2/11/18 | | | | | | | 3,819 | | | | 3,822,491 | |
Open Text Corp., Term Loan B, 3.25%, 1/04/21 | | | | | | | 1,225 | | | | 1,224,388 | |
W3 Co.: | | | | | | | | | | | | | | |
1st Lien Term Loan, 5.75%, 3/13/20 | | | | | | | 1,782 | | | | 1,785,991 | |
2nd Lien Term Loan, 9.25%, 9/11/20 | | | | | | | 693 | | | | 700,195 | |
Web.com Group, Inc., Term Loan B, 4.50%, 10/27/17 | | | | | | | 1,228 | | | | 1,241,515 | |
| | | | | | | | | | | 9,885,105 | |
IT Services — 3.5% | | | | | | | | | | | | | | |
Ceridian Corp., Term Loan B, 4.37% – 4.40%, 5/09/17 | | | | | | | 3,873 | | | | 3,883,918 | |
First Data Corp.: | | | | | | | | | | | | | | |
2018 Term Loan, 4.16%, 9/24/18 | | | | | | | 1,050 | | | | 1,051,753 | |
Extended 2018 Term Loan B, 4.16%, 3/23/18 | | | | | | | 9,424 | | | | 9,433,909 | |
Genpact International, Inc., Term Loan B, 3.50%, 8/30/19 | | | | | | | 2,868 | | | | 2,867,910 | |
InfoGroup, Inc., Term Loan, 8.00%, 5/25/18 | | | | | | | 1,015 | | | | 885,177 | |
SunGard Data Systems, Inc.: | | | | | | | | | | | | | | |
Term Loan D, 4.50%, 1/31/20 | | | | | | | 1,153 | | | | 1,154,792 | |
Term Loan E, 4.00%, 3/09/20 | | | | | | | 645 | | | | 647,738 | |
| | | | | | | | | | | 19,925,197 | |
Leisure Equipment & Products — 0.2% | | | | | | | | | | | | | | |
FGI Operating Co. LLC, Term Loan, 5.50%, 4/19/19 | | | | | | | 884 | | | | 897,505 | |
| | | | | | | | | | | | | |
Floating Rate Loan Interests (c) | | | | | | Par
(000) | | Value | Life Sciences Tools & Services — 0.5% | | | | | | | | | | | | | | |
Patheon, Inc.: | | | | | | | | | | | | | | |
2nd Lien Term Loan, 6.25%, 1/09/21 | | | | USD | | | 1,595 | | | $ | 1,590,024 | |
Term Loan, 7.25%, 12/06/18 | | | | | | | 1,195 | | | | 1,191,290 | |
| | | | | | | | | | | 2,781,314 | |
Machinery — 4.4% | | | | | | | | | | | | | | |
Allegion US Holding Co., Inc., Term Loan B, 3.00%, 9/30/20 | | | | | | | 915 | | | | 913,472 | |
Alliance Laundry Systems LLC: | | | | | | | | | | | | | | |
2nd Lien Term Loan, 9.50%, 12/10/19 | | | | | | | 573 | | | | 579,886 | |
Refinancing Term Loan, 4.25%, 12/10/18 | | | | | | | 1,117 | | | | 1,120,897 | |
Faenza Acquisition GmbH: | | | | | | | | | | | | | | |
Term Loan B1, 4.25%, 8/31/20 | | | | | | | 1,191 | | | | 1,193,188 | |
Term Loan B3, 4.25%, 8/28/20 | | | | | | | 362 | | | | 362,926 | |
Gardner Denver, Inc.: | | | | | | | | | | | | | | |
4.25%, 7/30/20 | | | | | | | 3,321 | | | | 3,305,304 | |
4.75%, 7/30/20 | | | | EUR | | | 548 | | | | 756,942 | |
Generac Power Systems, Inc., Term Loan B, 3.50%, 5/31/20 | | | | USD | | | 3,418 | | | | 3,417,210 | |
Intelligrated, Inc., 1st Lien Term Loan, 4.50%, 7/30/18 | | | | | | | 1,975 | | | | 1,978,721 | |
Mirror Bidco Corp., Term Loan, 4.25%, 12/27/19 | | | | | | | 2,440 | | | | 2,451,527 | |
Navistar International Corp., Term Loan B, 5.75%, 8/17/17 | | | | | | | 904 | | | | 916,022 | |
Pacific Industrial Services US Finance Co. LLC: | | | | | | | | | | | | | | |
1st Lien Term Loan, 5.00%, 10/02/18 | | | | | | | 2,204 | | | | 2,232,031 | |
2nd Lien Term Loan, 8.75%, 4/02/19 | | | | | | | 855 | | | | 876,375 | |
Rexnord LLC, 1st Lien Term Loan B, 4.00%, 8/21/20 | | | | | | | 1,726 | | | | 1,729,466 | |
Silver II US Holdings LLC, Term Loan, 4.00%, 12/13/19 | | | | | | | 1,260 | | | | 1,261,589 | |
STS Operating, Inc., Term Loan, 4.75%, 2/19/21 | | | | | | | 690 | | | | 691,725 | |
Terex Corp., Term Loan, 4.00%, 4/28/17 | | | | EUR | | | 153 | | | | 212,173 | |
Wabash National Corp., Term Loan B, 4.50%, 5/08/19 | | | | USD | | | 1,271 | | | | 1,276,028 | |
| | | | | | | | | | | 25,275,482 | |
Marine — 0.4% | | | | | | | | | | | | | �� | |
HGIM Corp., Term Loan B, 5.50%, 6/18/20 | | | | | | | 2,275 | | | | 2,299,628 | |
Media — 13.0% | | | | | | | | | | | | | | |
Acosta, Inc., Term Loan B, 4.25%, 3/02/18 | | | | | | | 195 | | | | 195,683 | |
Activision Blizzard, Inc., Term Loan B, 3.25%, 10/12/20 | | | | | | | 2,576 | | | | 2,580,316 | |
Advanstar Communications, Inc., 2nd Lien Term Loan, 9.50%, 6/06/20 | | | | | | | 1,125 | | | | 1,128,746 | |
Catalina Marketing Corp., Term Loan B, 5.25%, 10/12/20 | | | | | | | 2,494 | | | | 2,505,171 | |
CBS Outdoor Americas Capital LLC, Term Loan B, 3.00%, 1/31/21 | | | | | | | 750 | | | | 748,005 | |
Cengage Learning Acquisitions, Inc.: | | | | | | | | | | | | | | |
Non-Extended Term Loan, 4.75%, 7/03/14 | | | | | | | 781 | | | | 735,656 | |
Tranche 1 Incremental, 9.50%, 7/03/14 | | | | | | | 1,708 | | | | 1,586,495 | |
Charter Communications Operating LLC, Term Loan E, 3.00%, 7/01/20 | | | | | | | 2,025 | | | | 2,014,195 | |
Clear Channel Communications, Inc.: | | | | | | | | | | | | | | |
Term Loan B, 3.80%, 1/29/16 | | | | | | | 655 | | | | 642,986 | |
Term Loan C, 3.80%, 1/29/16 | | | | | | | 174 | | | | 169,711 | |
Term Loan D, 6.90%, 1/30/19 | | | | | | | 6,875 | | | | 6,745,958 | |
Cumulus Media Holdings, Inc., 2013 Term Loan, 4.25%, 12/23/20 | | | | | | | 2,411 | | | | 2,425,073 | |
The E.W. Scripps Co., Term Loan B, 3.25%, 11/26/20 | | | | | | | 1,540 | | | | 1,543,234 | |
EMI Music Publishing Ltd., Term Loan B, 4.25%, 6/29/18 | | | | | | | 1,097 | | | | 1,097,693 | |
Fender Musical Instruments Corp., 2019 Term Loan B, 5.75%, 4/03/19 | | | | | | | 286 | | | | 287,208 | |
Getty Images, Inc., Term Loan B, 4.75%, 10/18/19 | | | | | | | 196 | | | | 186,676 | |
Hemisphere Media Group, Inc., Term Loan, 6.25%, 7/30/20 | | | | | | | 1,614 | | | | 1,618,010 | |
Hubbard Radio LLC, Term Loan B, 4.50%, 4/29/19 | | | | | | | 1,544 | | | | 1,549,857 | |
See Notes to Financial Statements.
| SEMI-ANNUAL REPORT | FEBRUARY 28, 2014 | 25
|
| |
| Consolidated Schedule of Investments (continued) | BlackRock Floating Rate Income Strategies Fund, Inc. (FRA)
(Percentages shown are based on Net Assets)
|
| Floating Rate Loan Interests (c) | | | | | | Par
(000) | | Value |
Media (concluded) | | | | | | | | | | | | | | |
Intelsat Jackson Holdings SA, Term Loan B2, 3.75%, 6/30/19 | | | | USD | | | 5,188 | | | $ | 5,221,966 | |
Lions Gate Entertainment Corp., 2nd Lien Term Loan, 5.00%, 7/17/20 | | | | | | | 645 | | | | 653,063 | |
Live Nation Entertainment, Inc., 2020 Term Loan B1, 3.50%, 8/17/20 | | | | | | | 499 | | | | 499,373 | |
Media General, Inc., Delayed Draw Term Loan B, 4.25%, 7/31/20 | | | | | | | 1,845 | | | | 1,860,000 | |
Mediacom Communications Corp., Term Loan F, 2.63%, 1/31/18 | | | | | | | 1,120 | | | | 1,113,000 | |
NEP/NCP Holdco, Inc.: | | | | | | | | | | | | | | |
2nd Lien Term Loan, 9.50%, 7/22/20 | | | | | | | 571 | | | | 584,286 | |
Incremental Term Loan, 4.50%, 1/22/20 | | | | | | | 2,871 | | | | 2,871,000 | |
Nielsen Finance LLC, Term Loan E, 2.91%, 5/02/16 | | | | | | | 2,362 | | | | 2,362,030 | |
Rentpath, Inc., Term Loan B, 6.25%, 5/29/20 | | | | | | | 2,353 | | | | 2,288,463 | |
Salem Communications Corp., Term Loan B, 4.50%, 3/13/20 | | | | | | | 1,709 | | | | 1,714,015 | |
SBA Senior Finance II LLC: | | | | | | | | | | | | | | |
Incremental Delayed Draw Term Loan B, 3.25%, 3/31/21 | | | | | | | 1,093 | | | | 1,089,091 | |
Incremental Term Loan B, 3.25%, 3/24/21 | | | | | | | 1,093 | | | | 1,089,255 | |
Sinclair Television Group, Inc., Term Loan B, 3.00%, 4/09/20 | | | | | | | 1,881 | | | | 1,867,161 | |
Springer Science & Business Media Deutschland GmbH, Term Loan B2, 5.00%, 8/14/20 | | | | | | | 2,150 | | | | 2,159,823 | |
Tribune Co., 2013 Term Loan, 4.00%, 12/27/20 | | | | | | | 2,855 | | | | 2,852,316 | |
TWCC Holding Corp., 2nd Lien Term Loan, 7.00%, 6/26/20 | | | | | | | 2,045 | | | | 1,978,538 | |
Univision Communications, Inc., Term Loan C4, 4.00%, 3/01/20 | | | | | | | 2,294 | | | | 2,299,049 | |
UPC Financing Partnership, Term Loan AG, 3.98%, 3/31/21 | | | | EUR | | | 1,272 | | | | 1,768,249 | |
Virgin Media Investment Holdings Ltd.: | | | | | | | | | | | | | | |
Term Loan B, 3.50%, 6/08/20 | | | | USD | | | 3,415 | | | | 3,411,346 | |
Term Loan C, 4.50%, 6/05/20 | | | | GBP | | | 2,840 | | | | 4,782,214 | |
WideOpenWest Finance LLC, Term Loan B, 4.75%, 4/01/19 | | | | USD | | | 2,231 | | | | 2,241,505 | |
Ziggo NV: | | | | | | | | | | | | | | |
Term Loan B1, 3.50%, 1/15/22 | | | | | | | 1,025 | | | | 1,020,535 | |
Term Loan B2, 3.50%, 1/15/22 | | | | | | | 661 | | | | 657,731 | |
Term Loan B3, 2.75%, 1/15/22 | | | | | | | 1,087 | | | | 1,081,734 | |
| | | | | | | | | | | 75,226,416 | |
Metals & Mining — 3.3% | | | | | | | | | | | | | | |
Ameriforge Group, Inc.: | | | | | | | | | | | | | | |
1st Lien Term Loan, 5.00%, 12/19/19 | | | | | | | 1,624 | | | | 1,631,067 | |
2nd Lien Term Loan, 8.75%, 12/19/20 | | | | | | | 815 | | | | 833,337 | |
API Heat Transfer, Inc., Term Loan, 5.25%, 5/03/19 | | | | | | | 1,639 | | | | 1,637,201 | |
Constellium Holdco BV, Term Loan B, 6.00%, 3/25/20 | | | | | | | 3,628 | | | | 3,700,139 | |
FMG Resources August 2006 Property Ltd., Term Loan B, 4.25%, 6/28/19 | | | | | | | 3,719 | | | | 3,752,316 | |
Novelis, Inc., Term Loan, 3.75%, 3/10/17 | | | | | | | 3,418 | | | | 3,429,608 | |
SunCoke Energy, Inc., Term Loan B, 4.00%, 7/26/18 | | | | | | | 576 | | | | 576,346 | |
Walter Energy, Inc., Term Loan B, 6.75%, 4/02/18 | | | | | | | 623 | | | | 611,408 | |
Windsor Financing LLC, Term Loan B, 6.25%, 12/05/17 | | | | | | | 2,633 | | | | 2,698,315 | |
| | | | | | | | | | | 18,869,737 | |
Multiline Retail — 2.7% | | | | | | | | | | | | | | |
99¢ Only Stores, Term Loan, 4.50%, 1/11/19 | | | | | | | 1,979 | | | | 1,995,332 | |
Apex Tool Group LLC, Term Loan B, 4.50%, 1/31/20 | | | | | | | 2,099 | | | | 2,072,248 | |
BJ’s Wholesale Club, Inc.: | | | | | | | | | | | | | | |
1st Lien Term Loan, 4.50%, 9/26/19 | | | | | | | 2,367 | | | | 2,380,002 | |
2nd Lien Term Loan, 8.50%, 3/26/20 | | | | | | | 870 | | | | 892,568 | |
HEMA Holding BV: | | | | | | | | | | | | | | |
Extended 2nd Lien Term Loan, 5.97%, 1/05/18 | | | | EUR | | | 1,400 | | | | 1,739,179 | |
Extended Term Loan B, 4.60%, 12/06/17 | | | | | | | 576 | | | | 782,014 | |
Extended Term Loan C, 4.60%, 12/06/17 | | | | | | | 528 | | | | 716,166 | |
Hudson’s Bay Co., 1st Lien Term Loan, 4.75%, 11/04/20 | | | | USD | | | 1,882 | | | | 1,909,142 | |
| | | | | | | | | | | | | |
Floating Rate Loan Interests (c) | | | | | | Par
(000) | | Value | Multiline Retail (concluded) | | | | | | | | | | | | | | |
The Neiman Marcus Group, Inc., Term Loan B, 5.00%, 10/26/20 | | | | USD | | | 3,057 | | | $ | 3,091,427 | |
| | | | | | | | | | | 15,578,078 | |
Oil, Gas & Consumable Fuels — 5.2% | | | | | | | | | | | | | | |
Arch Coal, Inc., Term Loan B, 5.75%, 5/16/18 | | | | | | | 845 | | | | 833,077 | |
Chesapeake Energy Corp., Unsecured Term Loan, 5.75%, 12/01/17 | | | | | | | 4,285 | | | | 4,378,370 | |
Drillships Financing Holding, Inc., Term Loan B1, 6.00%, 3/31/21 | | | | | | | 2,597 | | | | 2,643,288 | |
EP Energy LLC/Everest Acquisition Finance, Inc., Term Loan B3, 3.50%, 5/24/18 | | | | | | | 1,920 | | | | 1,918,560 | |
Fieldwood Energy LLC: | | | | | | | | | | | | | | |
1st Lien Term Loan, 3.88%, 9/28/18 | | | | | | | 1,367 | | | | 1,369,396 | |
2nd Lien Term Loan, 8.38%, 9/30/20 | | | | | | | 590 | | | | 610,284 | |
Moxie Patriot LLC, Term Loan B1, 6.75%, 12/18/20 | | | | | | | 1,435 | | | | 1,463,700 | |
Obsidian Natural Gas Trust, Term Loan, 7.00%, 11/02/15 | | | | | | | 1,246 | | | | 1,264,780 | |
Offshore Group Investment Ltd.: | | | | | | | | | | | | | | |
5.00%, 10/25/17 | | | | | | | 2,959 | | | | 2,970,493 | |
5.75%, 3/28/19 | | | | | | | 749 | | | | 757,719 | |
Pacific Drilling SA, Term Loan B, 4.50%, 6/04/18 | | | | | | | 2,418 | | | | 2,432,212 | |
Panda Temple II Power LLC, Term Loan B, 7.25%, 4/03/19 | | | | | | | 1,560 | | | | 1,593,150 | |
Philadelphia Energy Solutions LLC, Term Loan B, 6.25%, 4/04/18 | | | | | | | 235 | | | | 211,792 | |
Power Buyer, LLC: | | | | | | | | | | | | | | |
1st Lien Term Loan, 4.25%, 5/06/20 | | | | | | | 840 | | | | 837,601 | |
2nd Lien Term Loan, 8.25%, 11/06/20 | | | | | | | 470 | | | | 465,300 | |
Delayed Draw Term Loan, 4.25%, 5/06/20 | | | | | | | 46 | | | | 45,774 | |
Raven Power Finance LLC, Term Loan, 5.25%, 12/19/20 | | | | | | | 1,025 | | | | 1,031,406 | |
Ruby Western Pipeline Holdings LLC, Term Loan B, 3.50%, 3/27/20 | | | | | | | 1,188 | | | | 1,185,912 | |
Tesoro Corp., Term Loan B, 2.40%, 5/30/16 | | | | | | | 1,880 | | | | 1,884,875 | |
Western Refining, Inc., Term Loan B, 4.25%, 11/12/20 | | | | | | | 1,470 | | | | 1,479,188 | |
WTG Holdings III Corp.: | | | | | | | | | | | | | | |
1st Lien Term Loan, 4.75%, 1/15/21 | | | | | | | 605 | | | | 606,513 | |
2nd Lien Term Loan, 8.50%, 1/15/22 | | | | | | | 140 | | | | 141,663 | |
| | | | | | | | | | | 30,125,053 | |
Pharmaceuticals — 4.4% | | | | | | | | | | | | | | |
Akorn, Inc., Term Loan B, 4.50%, 8/27/20 | | | | | | | 1,790 | | | | 1,801,187 | |
Amneal Pharmaceuticals LLC, Term Loan, 5.75% – 7.00%, 11/01/19 | | | | | | | 1,232 | | | | 1,238,072 | |
CCC Information Services, Inc., Term Loan, 4.00%, 12/20/19 | | | | | | | 921 | | | | 921,565 | |
Endo Health Solutions, Inc., Term Loan B, 3.75%, 11/05/20 | | | | | | | 1,580 | | | | 1,576,714 | |
Jazz Pharmaceuticals, Inc., Term Loan B, 3.50%, 6/12/18 | | | | | | | 425 | | | | 425,608 | |
Par Pharmaceutical Cos., Inc., Term Loan B, 4.00%, 9/30/19 | | | | | | | 5,356 | | | | 5,360,314 | |
Pharmaceutical Product Development LLC, Term Loan B, 4.00%, 12/05/18 | | | | | | | 4,056 | | | | 4,071,443 | |
Quintiles Transnational Corp., Term Loan B3, 3.75%, 6/08/18 | | | | | | | 2,647 | | | | 2,649,280 | |
Valeant Pharmaceuticals International, Inc.: | | | | | | | | | | | | | | |
Series C2 Term Loan B, 3.75%, 12/11/19 | | | | | | | 2,666 | | | | 2,672,916 | |
Series D2 Term Loan B, 3.75%, 2/13/19 | | | | | | | 2,933 | | | | 2,940,830 | |
Series E Term Loan B, 3.75%, 8/05/20 | | | | | | | 1,663 | | | | 1,671,880 | |
| | | | | | | | | | | 25,329,809 | |
Professional Services — 1.7% | | | | | | | | | | | | | | |
Emdeon Business Services LLC, Term Loan B2, 3.75%, 11/02/18 | | | | | | | 3,241 | | | | 3,244,945 | |
ON Assignment, Inc., Refinancing Term Loan B, 3.50%, 4/30/20 | | | | | | | 754 | | | | 754,509 | |
SIRVA Worldwide, Inc., Term Loan, 7.50%, 3/27/19 | | | | | | | 1,846 | | | | 1,878,356 | |
See Notes to Financial Statements.
| 26 | SEMI-ANNUAL REPORT | FEBRUARY 28, 2014
|
| |
| Consolidated Schedule of Investments (continued) | BlackRock Floating Rate Income Strategies Fund, Inc. (FRA)
(Percentages shown are based on Net Assets)
|
| Floating Rate Loan Interests (c) | | | | | | Par
(000) | | Value |
Professional Services (concluded) | | | | | | | | | | | | | | |
TriNet Group, Inc., Term Loan B2, 5.00%, 8/14/20 | | | | USD | | | 1,162 | | | $ | 1,169,350 | |
Truven Health Analytics, Inc., Term Loan B, 4.50%, 6/06/19 | | | | | | | 2,605 | | | | 2,610,685 | |
| | | | | | | | | | | 9,657,845 | |
Real Estate Investment Trusts (REITs) — 0.5% | | | | | | | | | | | | | | |
iStar Financial, Inc., Term Loan, 4.50%, 10/16/17 | | | | | | | 2,513 | | | | 2,517,376 | |
Starwood Property Trust, Inc., Term Loan B, 3.50%, 4/17/20 | | | | | | | 559 | | | | 556,672 | |
| | | | | | | | | | | 3,074,048 | |
Real Estate Management & Development — 1.4% | | | | | | | | | | | | | | |
CityCenter Holdings LLC, Term Loan B, 5.00%, 10/16/20 | | | | | | | 2,525 | | | | 2,548,281 | |
Realogy Corp.: | | | | | | | | | | | | | | |
Extended Letter of Credit, 4.40%, 10/10/16 | | | | | | | 247 | | | | 247,967 | |
Extended Term Loan, 4.50%, 3/05/20 | | | | | | | 5,238 | | | | 5,249,522 | |
| | | | | | | | | | | 8,045,770 | |
Road & Rail — 0.4% | | | | | | | | | | | | | | |
Genesee & Wyoming, Inc., Term Loan A, 1.90% – 1.91%, 9/29/17 | | | | | | | 1,079 | | | | 1,079,430 | |
Road Infrastructure Investment LLC, Term Loan B, 6.25%, 3/30/18 | | | | | | | 1,004 | | | | 1,009,015 | |
| | | | | | | | | | | 2,088,445 | |
Semiconductors & Semiconductor Equipment — 0.8% |
Freescale Semiconductor, Inc.: | | | | | | | | | | | | | | |
Term Loan B4, 5.00%, 2/28/20 | | | | | | | 2,355 | | | | 2,363,088 | |
Term Loan B5, 5.00%, 1/15/21 | | | | | | | 713 | | | | 721,236 | |
NXP BV, Term Loan D, 3.25%, 1/11/20 | | | | | | | 1,426 | | | | 1,424,999 | |
| | | | | | | | | | | 4,509,323 | |
Software — 4.9% | | | | | | | | | | | | | | |
BMC Software Finance, Inc., Term Loan, 5.00%, 9/10/20 | | | | | | | 2,455 | | | | 2,460,622 | |
CompuCom Systems, Inc., Refinancing Term Loan B, 4.25%, 5/11/20 | | | | | | | 611 | | | | 610,134 | |
Evertec Group LLC, Term Loan B, 3.50%, 4/17/20 | | | | | | | 1,065 | | | | 1,036,969 | |
GCA Services Group, Inc.: | | | | | | | | | | | | | | |
2nd Lien Term Loan, 9.25%, 10/22/20 | | | | | | | 780 | | | | 788,775 | |
Term Loan B, 4.25% – 5.50%, 11/01/19 | | | | | | | 1,804 | | | | 1,815,730 | |
Infor US, Inc., Term Loan B5, 3.75%, 6/03/20 | | | | | | | 4,107 | | | | 4,098,720 | |
IQOR US, Inc., Term Loan B, 6.00%, 2/19/21 | | | | | | | 920 | | | | 901,600 | |
Kronos Worldwide, Inc., 2020 Term Loan B, 4.75%, 2/12/20 | | | | | | | 510 | | | | 513,509 | |
Kronos, Inc., 2nd Lien Term Loan, 9.75%, 4/30/20 | | | | | | | 1,787 | | | | 1,817,896 | |
Mitchell International, Inc.: | | | | | | | | | | | | | | |
1st Lien Term Loan, 4.50%, 10/12/20 | | | | | | | 1,380 | | | | 1,383,450 | |
2nd Lien Term Loan, 8.50%, 10/11/21 | | | | | | | 1,600 | | | | 1,630,672 | |
RP Crown Parent LLC, 2013 Term Loan, 6.00%, 12/21/18 | | | | | | | 1,553 | | | | 1,554,924 | |
Shield Finance Co. Sarl, Term Loan, 5.00%, 1/27/21 | | | | | | | 690 | | | | 696,038 | |
Sophia LP, Term Loan B, 4.50%, 7/19/18 | | | | | | | 2,641 | | | | 2,657,774 | |
SS&C Technologies, Inc.: | | | | | | | | | | | | | | |
Term Loan B1, 3.25%, 6/07/19 | | | | | | | 2,762 | | | | 2,770,375 | |
Term Loan B2, 3.25%, 6/07/19 | | | | | | | 286 | | | | 286,591 | |
StoneRiver Holdings, Inc.: | | | | | | | | | | | | | | |
1st Lien Term Loan, 4.50%, 11/29/19 | | | | | | | 635 | | | | 634,594 | |
2nd Lien Term Loan, 8.50%, 5/29/20 | | | | | | | 902 | | | | 908,530 | |
Websence, Inc.: | | | | | | | | | | | | | | |
2nd Lien Term Loan, 8.25%, 12/24/20 | | | | | | | 730 | | | | 731,825 | |
Term Loan B, 4.50%, 6/25/20 | | | | | | | 801 | | | | 806,982 | |
| | | | | | | | | | | 28,105,710 | |
Specialty Retail — 4.7% | | | | | | | | | | | | | | |
Academy Ltd., Term Loan, 4.50%, 8/03/18 | | | | | | | 2,685 | | | | 2,698,728 | |
Burlington Coat Factory Warehouse Corp., Term Loan B2, 4.25%, 2/23/17 | | | | | | | 594 | | | | 597,544 | |
David’s Bridal, Inc., Term Loan B, 5.00%, 10/11/19 | | | | | | | 3,672 | | | | 3,690,566 | |
Equinox Holdings, Inc., Repriced Term Loan B, 4.50% – 5.50%, 1/31/20 | | | | | | | 1,950 | | | | 1,967,327 | |
| | | | | | | | | | | | | |
Floating Rate Loan Interests (c) | | | | | | Par
(000) | | Value | Specialty Retail (concluded) | | | | | | | | | | | | | | |
The Gymboree Corp., Initial Term Loan, 5.00%, 2/23/18 | | | | USD | | | 161 | | | $ | 146,775 | |
Harbor Freight Tools USA, Inc., 1st Lien Term Loan, 4.75%, 7/26/19 | | | | | | | 1,980 | | | | 2,005,238 | |
Jo-Ann Stores, Inc., Term Loan, 4.00%, 3/16/18 | | | | | | | 976 | | | | 975,753 | |
Leslies Poolmart, Inc., Term Loan, 4.25%, 10/16/19 | | | | | | | 2,390 | | | | 2,399,256 | |
Michaels Stores, Inc., Term Loan, 3.75%, 1/28/20 | | | | | | | 2,264 | | | | 2,269,267 | |
Party City Holdings, Inc., Term Loan, 4.00%, 7/27/19 | | | | | | | 3,306 | | | | 3,307,345 | |
Petco Animal Supplies, Inc., Term Loan, 4.00%, 11/24/17 | | | | | | | 3,387 | | | | 3,397,452 | |
Sprouts Farmers Markets Holdings LLC, Term Loan, 4.00%, 4/23/20 | | | | | | | 258 | | | | 258,811 | |
SRAM LLC, Term Loan B, 4.00% – 5.25%, 4/10/20 | | | | | | | 823 | | | | 823,476 | |
Things Remembered, Inc., Term Loan B, 8.00%, 5/24/18 | | | | | | | 1,714 | | | | 1,705,654 | |
Toys ‘R’ Us-Delaware, Inc.: | | | | | | | | | | | | | | |
Incremental Term Loan B2, 5.25%, 5/25/18 | | | | | | | 789 | | | | 660,479 | |
Term Loan B3, 5.25%, 5/25/18 | | | | | | | 164 | | | | 136,798 | |
| | | | | | | | | | | 27,040,469 | |
Textiles, Apparel & Luxury Goods — 1.2% | | | | | | | | | | | | | | |
Ascend Performance Materials LLC, Term Loan B, 6.75%, 4/10/18 | | | | | | | 3,964 | | | | 3,845,456 | |
J. Crew Group, Inc., Term Loan B, 4.00%, 2/20/21 | | | | | | | 1,780 | | | | 1,773,325 | |
Phillips-Van Heusen Corp., Term Loan B, 3.25%, 2/13/20 | | | | | | | 1,123 | | | | 1,123,794 | |
| | | | | | | | | | | 6,742,575 | |
Thrifts & Mortgage Finance — 0.3% | | | | | | | | | | | | | | |
IG Investments Holdings LLC, 1st Lien Term Loan, 5.25%, 10/31/19 | | | | | | | 1,940 | | | | 1,945,251 | |
Trading Companies & Distributors — 0.1% | | | | | | | | | | | | | | |
Fly Funding II Sarl, Term Loan B, 4.50%, 8/09/19 | | | | | | | 242 | | | | 245,264 | |
WESCO Distribution, Inc., Term Loan B, 3.75%, 12/12/19 | | | | | | | 550 | | | | 551,151 | |
| | | | | | | | | | | 796,415 | |
Wireless Telecommunication Services — 0.7% | | | | | | | | | | | | | | |
Cricket Communications, Inc., Term Loan, 4.75%, 10/10/19 | | | | | | | 1,621 | | | | 1,621,640 | |
Light Tower Fiber LLC, 1st Lien Term Loan, 4.00%, 4/13/20 | | | | | | | 2,677 | | | | 2,671,545 | |
| | | | | | | | | | | 4,293,185 | |
Total Floating Rate Loan Interests — 131.1% | | | | | | | | | | | 757,160,748 | |
|
Non-Agency Mortgage-Backed Securities — 0.2% |
Commercial Mortgage-Backed Securities — 0.2% | | | | | | | | | | | | | | |
Hilton USA Trust, Series 2013-HLT, Class EFX, 4.45%, 11/05/30 (b)(c) | | | | | | | 1,336 | | | | 1,373,113 | |
|
Investment Companies
| | | | | | | Shares | | | | | |
Capital Markets — 0.0% | | | | | | | | | | | | | | |
Eaton Vance Floating-Rate Income Trust | | | | | | | 54 | | | | 830 | |
Eaton Vance Senior Income Trust | | | | | | | 13,945 | | | | 98,173 | |
Total Investment Companies — 0.0% | | | | | | | | | | | 99,003 | |
|
Other Interests (h)
| | | | Beneficial
Interest
(000)
| | | | |
Auto Components — 0.0% | | | | | | | | | | | | | �� | |
Intermet Liquidating Trust, Class A | | | | USD | | | 256 | | | | 3 | |
See Notes to Financial Statements.
| SEMI-ANNUAL REPORT | FEBRUARY 28, 2014 | 27
|
| |
| Consolidated Schedule of Investments (continued) | BlackRock Floating Rate Income Strategies Fund, Inc. (FRA)
(Percentages shown are based on Net Assets)
|
| Other Interests (h) | | | | Beneficial
Interest
(000) | | Value |
Diversified Financial Services — 0.1% | | | | | | | | | | | | | | |
J.G. Wentworth LLC Preferred Equity Interests: (135-day lockup), (Acquired 11/18/13, cost $1,177,928) (a)(i) | | | | USD | | | 17 | | | $ | 311,621 | |
(180-day lockup), (Acquired 11/18/13, cost $1,177,928) (a)(i) | | | | | | | 17 | | | | 311,622 | |
| | | | | | | | | | | 623,243 | |
Household Durables — 0.4% | | | | | | | | | | | | | | |
Stanley Martin, Class B Membership Units | | | | | | | 1 | | | | 2,032,500 | |
Total Other Interests — 0.5% | | | | | | | | | | | 2,655,746 | |
|
Preferred Securities
| | | | | | | Shares | | | | | |
Preferred Stocks — 0.0% | | | | | | | | | | | | |
Consumer Finance — 0.0% | | | | | | | | | | | | | | |
Ally Financial, Inc., Series A, 8.50% (c)(j) | | | | | | | 4,976 | | | | 136,094 | |
Trust Preferreds — 0.5% | | | | | | | | | | | | |
Diversified Financial Services — 0.5% | | | | | | | | | | | | | | |
GMAC Capital Trust I, Series 2, 8.13%, 2/15/40 (c) | | | | | | | 95,644 | | | | 2,587,021 | |
Total Preferred Securities—0.5% | | | | | | | | | | | 2,723,115 | |
Warrants (k)
| | | | | | |
Shares | | | | Value | |
Chemicals — 0.0% | | | | | | | | | | | | | | |
GEO Specialty Chemicals, Inc., (Expires 3/31/15) | | | | | | | 143,928 | | | $ | 119,460 | |
Software — 0.0% | | | | | | | | | | | | | | |
HMH Holdings/EduMedia (issued/exercisable 3/09/10, 19 Shares for 1 Warrant, Expires 6/22/19, Strike Price $42.27) | | | | | | | 2,406 | | | | 8,510 | |
Total Warrants — 0.0% | | | | | | | | | | | 127,970 | |
Total Long-Term Investments
(Cost — $814,499,723) — 141.5% | | | | | | | | | | | 816,913,342 | |
|
Short-Term Securities
| | | | | | | | | | | | |
BlackRock Liquidity Funds, TempFund, Institutional Class, 0.03% (l)(m) | | | | | | | 4,239,004 | | | | 4,239,004 | |
Total Short-Term Securities
(Cost — $4,239,004) — 0.7% | | | | | | | | | | | 4,239,004 | |
|
Options Purchased | | | | | | | | | | | | |
(Cost — $43,022) — 0.0% | | | | | | | | | | | — | |
Total Investments (Cost — $818,781,749) — 142.2% | | | | | $ | 821,152,346 | |
Liabilities in Excess of Other Assets — (42.2)% | | | | | | | | | | | (243,791,198 | ) |
Net Assets — 100.0% | | | | | | | | | | $ | 577,361,148 | |
Notes to Consolidated Schedule of Investments
| (a) | | | | Non-income producing security. |
| (b) | | | | Security exempt from registration pursuant to Rule 144A under the Securities Act of 1933, as amended. These securities may be resold in transactions exempt from registration to qualified institutional investors. |
| (c) | | | | Variable rate security. Rate shown is as of report date. |
| (d) | | | | Zero-coupon bond. Rate shown epresents the current yield as of report date. |
| (e) | | | | Convertible security. |
| (f) | | | | Issuer filed for bankruptcy and/or is in default of principal and/or interest payments. |
| (g) | | | | Represents a payment-in-kind security which may pay interest/dividends in additional par/shares and/or in cash. Rates shown are the current rate and possible payment rates. |
| (h) | | | | Other interests represent beneficial interests in liquidation trusts and other reorganization or private entities. |
| (i) | | | | Restricted security as to resale. As of report date the Fund held 0.1% of its net assets, with a current value of $623,243 in this security. |
| (j) | | | | Security is perpetual in nature and has no stated maturity date. |
| (k) | | | | Warrants entitle the Fund to purchase a predetermined number of shares of common stock and are non-income producing. The purchase price and number of shares are subject to adjustment under certain conditions until the expiration date, if any. |
| (l) | | | | Investments in issuers considered to be an affiliate of the Fund during the six months ended February 28, 2014, for purposes of Section 2(a)(3) of the 1940 Act, were as follows: |
Affiliate
|
|
|
| Shares
Held at
August 31, 2013
|
| Net
Activity
|
| Shares
Held at
February 28, 2014
|
| Income
|
BlackRock Liquidity Funds, TempFund, Institutional Class | | | | | 907,643 | | | | 3,331,361 | | | | 4,239,004 | | | $ | 439 | |
| (m) | | | | Represents the current yield as of report date. |
See Notes to Financial Statements.
| 28 | SEMI-ANNUAL REPORT | FEBRUARY 28, 2014
|
| |
| Consolidated Schedule of Investments (continued) | BlackRock Floating Rate Income Strategies Fund, Inc. (FRA)
|
| • | | | | Foreign currency exchange contracts outstanding as of February 28, 2014 were as follows: |
Currency Purchased
|
| Currency Sold
|
| Counterparty
|
| Settlement
Date
|
| Unrealized
Appreciation
(Depreciation)
|
|
CAD | | | | | 7,633 | | | USD | | | 6,912 | | | Deutsche Bank AG | | 4/22/14 | | $ | (27 | ) |
EUR | | | | | 548,283 | | | USD | | | 747,076 | | | Deutsche Bank AG | | 4/22/14 | | | 9,706 | |
GBP | | | | | 490,997 | | | USD | | | 805,149 | | | Deutsche Bank AG | | 4/22/14 | | | 16,752 | |
USD | | | | | 3,130,317 | | | CAD | | | 3,435,000 | | | Barclays Bank PLC | | 4/22/14 | | | 31,839 | |
USD | | | | | 574,141 | | | EUR | | | 425,000 | | | BNP Paribas S.A. | | 4/22/14 | | | (12,476 | ) |
USD | | | | | 728,969 | | | EUR | | | 530,000 | | | Goldman Sachs Bank USA | | 4/22/14 | | | (2,577 | ) |
USD | | | | | 724,424 | | | EUR | | | 530,000 | | | JPMorgan Chase Bank N.A. | | 4/22/14 | | | (7,123 | ) |
USD | | | | | 4,971,754 | | | EUR | | | 3,656,462 | | | Royal Bank of Scotland PLC | | 4/22/14 | | | (75,174 | ) |
USD | | | | | 9,112,268 | | | GBP | | | 5,550,000 | | | JPMorgan Chase Bank N.A. | | 4/22/14 | | | (178,108 | ) |
Total | | | | | | | | | | | | | | | | | | $ | (217,188 | ) |
| • | | | | OTC options purchased as of February 28, 2014 were as follows: |
Description
|
|
|
| Counterparty
|
| Put/
Call
|
| Strike
Price
|
| Expiration
Date
|
| Contracts
|
| Market
Value
|
|
Marsico Parent Superholdco LLC | | | | Goldman Sachs & Co. | | Call | | USD | | 942.86 | | 12/14/19 | | 44 | | — |
| • | | | | OTC credit default swaps — sold protection outstanding as of February 28, 2014 were as follows: |
Issuer
|
|
|
| Receive
Fixed
Rate
|
| Counterparty
|
| Expiration
Date
|
| Credit
Rating1
|
| Notional
Amount
(000)2
|
| Market
Value
|
| Premiums
Received
|
| Unrealized
Depreciation
|
|
Caesars Entertainment Operating Co., Inc. | | | | 5.00% | | Barclays Bank PLC | | 9/20/15 | | CCC- | | USD | | 413 | | $ | (79,580 | ) | | $ | (73,641 | ) | | $ | (5,939 | ) |
Caesars Entertainment Operating Co., Inc. | | | | 5.00% | | JPMorgan Chase Bank N.A. | | 12/20/15 | | CCC- | | USD | | 538 | | | (123,311 | ) | | | (121,598 | ) | | | (1,713 | ) |
Caesars Entertainment Operating Co., Inc. | | | | 5.00% | | JPMorgan Chase Bank N.A. | | 12/20/15 | | CCC- | | USD | | 149 | | | (34,190 | ) | | | (29,227 | ) | | | (4,963 | ) |
Caesars Entertainment Operating Co., Inc. | | | | 5.00% | | Barclays Bank PLC | | 12/20/15 | | CCC- | | USD | | 1,112 | | | (254,556 | ) | | | (192,793 | ) | | | (61,763 | ) |
Caesars Entertainment Operating Co., Inc. | | | | 5.00% | | Goldman Sachs International | | 12/20/15 | | CCC- | | USD | | 339 | | | (77,702 | ) | | | (37,985 | ) | | | (39,717 | ) |
Caesars Entertainment Operating Co., Inc. | | | | 5.00% | | Barclays Bank PLC | | 3/20/16 | | CCC- | | USD | | 2,000 | | | (531,934 | ) | | | (347,486 | ) | | | (184,448 | ) |
Caesars Entertainment Operating Co., Inc. | | | | 5.00% | | JPMorgan Chase Bank N.A. | | 6/20/16 | | CCC- | | USD | | 362 | | | (108,154 | ) | | | (60,571 | ) | | | (47,583 | ) |
Caesars Entertainment Operating Co., Inc. | | | | 5.00% | | Goldman Sachs International | | 9/20/16 | | CCC- | | USD | | 2,092 | | | (693,781 | ) | | | (399,346 | ) | | | (294,435 | ) |
Caesars Entertainment Operating Co., Inc. | | | | 5.00% | | Barclays Bank PLC | | 9/20/16 | | CCC- | | USD | | 302 | | | (100,206 | ) | | | (57,733 | ) | | | (42,473 | ) |
Caesars Entertainment Operating Co., Inc. | | | | 5.00% | | Deutsche Bank AG | | 9/20/16 | | CCC- | | USD | | 800 | | | (265,344 | ) | | | (156,273 | ) | | | (109,071 | ) |
Caesars Entertainment Operating Co., Inc. | | | | 5.00% | | Goldman Sachs International | | 3/20/17 | | CCC- | | USD | | 389 | | | (154,756 | ) | | | (92,433 | ) | | | (62,323 | ) |
Caesars Entertainment Operating Co., Inc. | | | | 5.00% | | Deutsche Bank AG | | 6/20/17 | | CCC- | | USD | | 593 | | | (247,930 | ) | | | (151,923 | ) | | | (96,007 | ) |
| | | | | | | | | | | | | | | | | | | | | | | | | | |
Total | | | | | | | | | | | | | | | | $ | (2,671,444 | ) | | $ | (1,721,009 | ) | | $ | (950,435 | ) |
| 1 | | Using S&P’s rating of the issuer. |
| 2 | | The maximum potential amount the Fund may pay should a negative event take place as defined under the terms of the agreement. |
| • | | | | For Fund compliance purposes, the Fund’s industry classifications refer to any one or more of the industry sub-classifications used by one or more widely recognized market indexes or rating group indexes, and/or as defined by the investment advisor. These definitions may not apply for purposes of this report, which may combine such industry sub-classifications for reporting ease. |
| • | | | | Fair Value Measurements — Various inputs are used in determining the fair value of investments and derivative financial instruments. These inputs to valuation techniques are categorized into a disclosure hierarchy consisting of three broad levels for financial statement purposes as follows: |
| • | | | | Level 1 — unadjusted price quotations in active markets/exchanges for identical assets or liabilities that the Fund has the ability to access |
| • | | | | Level 2 — other observable inputs (including, but not limited to, quoted prices for similar assets or liabilities in markets that are active, quoted prices for identical or similar assets or liabilities in markets that are not active, inputs other than quoted prices that are observable for the assets or liabilities (such as interest rates, yield curves, volatilities, prepayment speeds, loss severities, credit risks and default rates) or other market-corroborated inputs) |
| • | | | | Level 3 — unobservable inputs based on the best information available in the circumstances, to the extent observable inputs are not available (including the Fund’s own assumptions used in determining the fair value of investments and derivative financial instruments) |
| | | | | The hierarchy gives the highest priority to unadjusted quoted prices in active markets for identical assets or liabilities (Level 1 measurements) and the lowest priority to unobservable inputs (Level 3 measurements). Accordingly, the degree of judgment exercised in determining fair value is greatest for instruments categorized in Level 3. The inputs used to measure fair value may fall into different levels of the fair value hierarchy. In such cases, for disclosure purposes, the fair value hierarchy classification is determined based on the lowest level input that is significant to the fair value measurement in its entirety. |
| | | | | Changes in valuation techniques may result in transfers into or out of an assigned level within the disclosure hierarchy. In accordance with the Fund’s policy, transfers between different levels of the fair value disclosure hierarchy are deemed to have occurred as of the beginning of the reporting period. The categorization of a value determined for investments and derivative financial instruments is based on the pricing transparency of the investment and is not necessarily an indication of the risks associated with investing in those securities. For information about the Fund’s policy regarding valuation of investments and derivative financial instruments, please refer to Note 2 of the Notes to Financial Statements. |
See Notes to Financial Statements.
| SEMI-ANNUAL REPORT | FEBRUARY 28, 2014 | 29
|
| |
| Consolidated Schedule of Investments (continued) | BlackRock Floating Rate Income Strategies Fund, Inc. (FRA)
|
The following tables summarize the Fund’s investments and derivative financial instruments categorized in the disclosure hierarchy as of February 28, 2014: |
|
|
|
| Level 1
|
| Level 2
|
| Level 3
|
| Total
|
Assets:
| | | | | | | | | | | | | | | | | | |
Investments:
| | | | | | | | | | | | | | | | | | |
Long-Term Investments:
| | | | | | | | | | | | | | | | | | |
Asset-Backed Securities | | | | | — | | | $ | 18,231,625 | | | $ | 759,965 | | | $ | 18,991,590 | |
Common Stocks | | | | $ | 1,748,608 | | | | 3,563,749 | | | | 869,588 | | | | 6,181,945 | |
Corporate Bonds | | | | | — | | | | 24,201,300 | | | | 3,398,812 | | | | 27,600,112 | |
Floating Rate Loan Interests | | | | | — | | | | 698,273,817 | | | | 58,886,931 | | | | 757,160,748 | |
Investment Companies | | | | | 99,003 | | | | — | | | | — | | | | 99,003 | |
Non-Agency Mortgage-Backed Securities | | | | | — | | | | 1,373,113 | | | | — | | | | 1,373,113 | |
Other Interests | | | | | — | | | | 623,243 | | | | 2,032,503 | | | | 2,655,746 | |
Preferred Securities | | | | | 2,723,115 | | | | — | | | | — | | | | 2,723,115 | |
Warrants | | | | | — | | | | 8,510 | | | | 119,460 | | | | 127,970 | |
Short-Term Securities | | | | | 4,239,004 | | | | — | | | | — | | | | 4,239,004 | |
Unfunded Loan Commitments | | | | | — | | | | 82 | | | | — | | | | 82 | |
Total
| | | | $ | 8,809,730 | | | $ | 746,275,439 | | | $ | 66,067,259 | | | $ | 821,152,428 | |
|
|
|
| Level 1
|
| Level 2
|
| Level 3
|
| Total
|
Derivative Financial Instruments1
| | | | | | | | | | | | | | | | | | |
Assets:
| | | | | | | | | | | | | | | | | | |
Foreign currency exchange contracts | | | | | — | | | $ | 58,297 | | | | — | | | $ | 58,297 | |
Liabilities:
| | | | | | | | | | | | | | | | | | |
Credit contracts | | | | | — | | | | (950,435 | ) | | | — | | | | (950,435 | ) |
Foreign currency exchange contracts | | | | | — | | | | (275,485 | ) | | | — | | | | (275,485 | ) |
Total
| | | | | — | | | $ | (1,167,623 | ) | | | — | | | $ | (1,167,623 | ) |
| 1 | | Derivative financial instruments are swaps and foreign currency exchange contracts. Swaps and foreign currency exchange contracts are valued at the unrealized appreciation/depreciation on the instrument. |
The carrying amount for certain of the Fund’s assets and/or liabilities approximates fair value for financial statement purposes. As of February 28, 2014, such assets and/or liabilities are categorized within the disclosure hierarchy as follows: |
|
|
|
| Level 1
|
| Level 2
|
| Level 3
|
| Total
|
Assets:
| | | | | | | | | | | | | | | | | | |
Cash pledged as collateral for OTC derivatives | | | | $ | 1,560,000 | | | | — | | | | — | | | $ | 1,560,000 | |
Foreign currency at value | | | | | 724,871 | | | | — | | | | — | | | | 724,871 | |
Liabilities:
| | | | | | | | | | | | | | | | | | |
Bank overdraft | | | | | (89,151 | ) | | | — | | | | — | | | | (89,151 | ) |
Bank borrowings payable | | | | | — | | | $ | (224,000,000 | ) | | | — | | | | (224,000,000 | ) |
Total
| | | | $ | 2,195,720 | | | $ | (224,000,000 | ) | | | — | | | $ | (221,804,280 | ) |
There were no transfers between Level 1 and Level 2 during the six months ended February 28, 2014. |
See Notes to Financial Statements.
| 30 | SEMI-ANNUAL REPORT | FEBRUARY 28, 2014
|
| |
| Consolidated Schedule of Investments (concluded) | BlackRock Floating Rate Income Strategies Fund, Inc. (FRA)
|
A reconciliation of Level 3 investments is presented when the Fund had a significant amount of Level 3 investments at the beginning and/or end of the period in relation to net assets. The following table is a reconciliation of Level 3 investments for which significant unobservable inputs were used in determining fair value: |
|
| Common
Stocks
|
| Asset-Backed
Securities
|
| Corporate
Bonds
|
| Floating
Rate Loan
Interests
|
| Other
Interests
|
| Warrants
|
| Total
|
Assets:
| | | | | | | | | | | | | | | | | | | | | | | | | | | | |
| Opening Balance, as of August 31, 2013 | | $ | 1,119,143 | | | $ | 21,081,133 | | | $ | 4,187,534 | | | $ | 86,976,283 | | | $ | 2,150,980 | | | $ | 113,703 | | | $ | 115,628,776 | |
Transfers into Level 31 | | | — | | | | — | | | | — | | | | 18,257,199 | | | | — | | | | — | | | | 18,257,199 | |
Transfers out of Level 32 | | | — | | | | (15,468,197 | ) | | | (929,040 | ) | | | (43,938,814 | ) | | | — | | | | — | | | | (60,336,051 | ) |
| Other | | | — | | | | — | | | | — | | | | — | | | | — | | | | — | | | | — | |
| Accrued discounts/premiums | | | — | | | | 3,548 | | | | 38,185 | | | | 95,812 | | | | — | | | | — | | | | 137,545 | |
| Net realized gain (loss) | | | — | | | | 220,661 | | | | (1,353,448 | ) | | | 150,421 | | | | — | | | | — | | | | (982,366 | ) |
Net change in unrealized appreciation/depreciation3,4 | | | (249,555 | ) | | | (202,589 | ) | | | 1,456,879 | | | | 212,819 | | | | 3,571,107 | | | | 5,757 | | | | 4,794,418 | |
| Purchases | | | — | | | | — | | | | — | | | | 17,689,490 | | | | — | | | | — | | | | 17,689,490 | |
| Sales | | | — | | | | (4,874,591 | ) | | | (1,298 | ) | | | (20,556,279 | ) | | | (3,689,584 | ) | | | — | | | | (29,121,752 | ) |
Closing Balance, as of February 28, 2014
| | $ | 869,588 | | | $ | 759,965 | | | $ | 3,398,812 | | | $ | 58,886,931 | | | $ | 2,032,503 | | | $ | 119,460 | | | $ | 66,067,259 | |
Net change in unrealized appreciation/depreciation
on investments still held at February 28, 20144 | | $ | (249,555 | ) | | $ | 18,547 | | | $ | 102,132 | | | $ | 279,801 | | | $ | 525,000 | | | $ | 5,757 | | | $ | 681,682 | |
| 1 | As of August 31, 2013, the Fund used observable inputs in determining the value of certain investments. As of February 28, 2014, the Fund used significant unobservable inputs in determining the value of the same investments. As a result, investments with a beginning of period value of $18,257,199 transferred from Level 2 to Level 3 in the disclosure hierarchy. |
| 2 | As of August 31, 2013, the Fund used significant unobservable inputs in determining the value of certain investments. As of February 28, 2014, the Fund used observable inputs in determining the value of the same investments. As a result, investments with a beginning of period value of $60,336,051 transferred from Level 3 to Level 2 in the disclosure hierarchy. |
| 3 | Included in the related net change in unrealized appreciation/depreciation in the Consolidated Statements of Operations. |
| 4 | Any difference between Net change in unrealized appreciation/depreciation and Net change in unrealized appreciation/depreciation on investments still held at February 28, 2014 is generally due to investments no longer held or categorized as Level 3 at period end. |
The following table summarizes the valuation techniques used and unobservable inputs utilized by the BlackRock Global Valuation Methodologies Committee (“Global Valuation Committee”) to determine the value of certain of the Fund’s Level 3 investments as of February 28, 2014. The table does not include Level 3 investments with values based upon unadjusted third party pricing information in the amount of $57,941,248. A significant change in such third party pricing information could result in a significantly lower or higher value of such Level 3 investments. |
|
|
|
| Value
|
| Valuation Techniques
|
| Unobservable Inputs
|
| Range of
Unobservable
Inputs Utilized
|
Assets:
| | | | | | | | | | | | | | | | | | |
Common Stocks | | | | $ | 869,585 | | | Market Comparable Companies | | Offshore Last 12 Months
EBITDA Multiple5 | | 6.50x |
| | | | | | | | | | Offshore Current Fiscal Year
EBITDA Multiple5 | | 6.88x |
| | | | | | | | | | Onshore EBITDA Multiple5 | | 4.00x |
| | | | | | | | | | Onshore Current Fiscal Year
EBITDA Multiple5 | | 3.88x |
| | | | | | | | | | Last 12 Months EBITDA Multiple5 | | 6.25x |
| | | | | | | | | | Illiquidity Discount6 | | 17.50% |
Corporate Bonds | | | | | 3,398,812 | | | Market Comparable Companies | | Last 12 Months EBITDA Multiple5 | | 6.25x |
| | | | | | | | | | Illiquidity Discount6 | | 17.50% |
Floating Rate Loan Interests | | | | | 1,705,654 | | | Market Comparable Yield Analysis | | Yield6 | | 8.13% |
Other Interests | | | | | 2,032,500 | | | Discounted Cash Flow | | Perpetuity Growth Rate5 | | 3.50% |
| | | | | | | | | | Specific Risk Premium6 | | 10.00% |
| | | | | | | | | | Weighted Cost of Capital6 | | 17.80% |
| | | | | | | | | | Risk Free Rate6 | | 3.40% |
| | | | | | | | | | Free Cash Flow5 | | $33.5 – 59.57 |
Warrants | | | | | 119,460 | | | Market Comparable Companies | | Last 12 Months EBITDA Multiple5 | | 6.25x |
Total
| | | | $ | 8,126,011 | | | | | | | | | | | | | |
| 5 | Increase in unobservable input may result in a significant increase to value, while a decrease in the unobservable input may result in a significant decrease to value. |
| 6 | Decrease in unobservable input may result in a significant increase to value, while an increase in the unobservable input may result in a significant decrease to value. |
| 7 | Amount is stated in millions. |
See Notes to Financial Statements.
| SEMI-ANNUAL REPORT | FEBRUARY 28, 2014 | 31
|
| |
| Consolidated Schedule of Investments February 28, 2014 (Unaudited) | BlackRock Limited Duration Income Trust (BLW)
(Percentages shown are based on Net Assets)
|
| Common Stocks | | | | | |
Shares | | Value |
Auto Components — 0.0% | | | | | | | | | | | | | | |
Lear Corp. | | | | | | | 807 | | | $ | 65,528 | |
Construction & Engineering — 0.0% | | | | | | | | | | | | | | |
USI United Subcontractors (a) | | | | | | | 6,454 | | | | 70,994 | |
Diversified Financial Services — 0.2% | | | | | | | | | | | | | | |
Kcad Holdings I Ltd. (a) | | | | | | | 384,412,912 | | | | 1,499,210 | |
Hotels, Restaurants & Leisure — 0.2% | | | | | | | | | | | | | | |
BLB Worldwide Holdings, Inc. (a) | | | | | | | 51,947 | | | | 1,296,078 | |
Travelport Worldwide Ltd. (a) | | | | | | | 256,191 | | | | 439,880 | |
| | | | | | | | | | | 1,735,958 | |
Paper & Forest Products — 0.2% | | | | | | | | | | | | | | |
NewPage Holdings, Inc. | | | | | | | 13,780 | | | | 1,143,740 | |
Software — 0.4% | | | | | | | | | | | | | | |
HMH Holdings/EduMedia (a) | | | | | | | 128,441 | | | | 2,479,425 | |
Total Common Stocks — 1.0% | | | | | | | | | | | 6,994,855 | |
|
Asset-Backed Securities | | | | | | Par
(000) | | |
Asset-Backed Securities — 5.7% | | | | | | | | | | | | | | |
321 Henderson Receivables I LLC, Class A (b): | | | | | | | | | | | | | | |
Series 2010-2A, 4.07%, 1/15/48 | | | | USD | | | 1,263 | | | | 1,351,703 | |
Series 2010-3A, 3.82%, 12/15/48 | | | | | | | 3,628 | | | | 3,839,300 | |
ACAS CLO Ltd. (b)(c): | | | | | | | | | | | | | | |
Series 2007-1A, Class A1S, 0.45%, 4/20/21 | | | | | | | 746 | | | | 735,929 | |
Series 2013-1A, Class D, 3.84%, 4/20/25 | | | | | | | 750 | | | | 731,250 | |
Adirondack Park CLO Ltd., Series 2013-1A, Class D, 3.89%, 4/15/24 (b)(c) | | | | | | | 1,750 | | | | 1,708,828 | |
Aircraft Lease Securitisation Ltd., Series 2007-1A, Class G3, 0.42%, 5/10/32 (b)(c) | | | | | | | 722 | | | | 697,173 | |
ALM Loan Funding (b)(c): | | | | | | | | | | | | | | |
Series 2013-7R2A, Class B, 2.84%, 4/24/24 | | | | | | | 865 | | | | 848,219 | |
Series 2013-7RA, Class C, 3.69%, 4/24/24 | | | | | | | 2,410 | | | | 2,330,325 | |
Series 2013-7RA, Class D, 5.24%, 4/24/24 | | | | | | | 1,040 | | | | 984,755 | |
Atrium CDO Corp., Series 9A, Class D, 3.73%, 2/28/24 (b)(c) | | | | | | | 1,100 | | | | 1,065,763 | |
Battalion CLO IV Ltd., Series 2013-4A, Class C, 3.59%, 10/22/25 (b)(c) | | | | | | | 500 | | | | 477,200 | |
Capital One Multi-Asset Execution Trust, Series 4-3C, 6.63%, 4/19/17 | | | | GBP | | | 2,650 | | | | 4,477,134 | |
Carlyle Global Market Strategies CLO Ltd., Series 2013-1A, Class C, 4.24%, 2/14/25 (b)(c) | | | | USD | | | 250 | | | | 250,723 | |
CarMax Auto Owner Trust, Series 2012-3, Class D, 2.29%, 4/15/19 | | | | | | | 2,530 | | | | 2,595,681 | |
Cavalry CLO II, Series 2A, Class D, 4.24%, 1/17/24 (b)(c) | | | | | | | 500 | | | | 490,738 | |
Central Park CLO Ltd., Series 2011-1A, Class D, 3.44%, 7/23/22 (b)(c) | | | | | | | 500 | | | | 492,346 | |
Countrywide Asset-Backed Certificates, Series 2007-7, Class 2A2, 0.32%, 10/25/47 (c) | | | | | | | 1,751 | | | | 1,716,412 | |
Credit Suisse ABS Repackaging Trust, Series 2013-A, Class B, 2.50%, 1/25/30 (b) | | | | | | | 2,763 | | | | 2,604,165 | |
ECP CLO Ltd., Series 2013-5A, Class C, 3.74%, 1/20/25 (b)(c) | | | | | | | 1,500 | | | | 1,443,713 | |
Fraser Sullivan CLO VII Ltd., Series 2012-7A, Class C, 4.24%, 4/20/23 (b)(c) | | | | | | | 1,090 | | | | 1,089,970 | |
GSAA Trust, Series 2007-3, Class 1A2, 0.33%, 3/25/47 (c) | | | | | | | 2,804 | | | | 1,379,899 | |
Halcyon Loan Advisors Funding Ltd., Series 2013-1A, Class C, 3.74%, 4/15/25 (b)(c) | | | | | | | 1,000 | | | | 954,203 | |
Madison Park Funding XI Ltd., Series 2013-11A, Class D, 3.80%, 10/23/25 (b)(c) | | | | | | | 420 | | | | 404,852 | |
Neuberger Berman CLO XV, Series 2013-15A, Class C, 3.09%, 10/15/25 (b)(c) | | | | | | | 1,000 | | | | 978,830 | |
Octagon Investment Partners XVI Ltd., Series 2013-1A, Class D, 3.59%, 7/17/25 (b)(c) | | | | | | | 500 | | | | 482,116 | |
| | | | | | | | | | | | | |
| Asset-Backed Securities | | | | | | Par
(000) | | Value |
Asset-Backed Securities (concluded) | | | | | | | | | | | | | | |
OZLM Funding Ltd., Series 2012-2A, Class C, 4.59%, 10/30/23 (b)(c) | | | | USD | | | 500 | | | $ | 501,416 | |
Regatta Funding LP, Series 2013-2A, Class C, 4.24%, 1/15/25 (b)(c) | | | | | | | 500 | | | | 497,120 | |
Santander Drive Auto Receivables Trust, Series 2011-S2A (b): | | | | | | | | | | | | | | |
Class B, 2.06%, 6/15/17 | | | | | | | 199 | | | | 199,373 | |
Class C, 2.86%, 6/15/17 | | | | | | | 118 | | | | 118,140 | |
SLC Student Loan Trust, Series 2006-A, Class A4, 0.36%, 1/15/19 (c) | | | | | | | 28 | | | | 28,024 | |
World Financial Network Credit Card Master Trust, Series 2012-C, Class B, 3.57%, 8/15/22 | | | | | | | 3,000 | | | | 3,062,325 | |
| | | | | | | | | | | 38,537,625 | |
Interest Only Asset-Backed Securities — 0.2% | | | | | | | | | | | | | | |
Sterling Bank Trust, Series 2004-2, Class Note, 2.08%, 3/30/30 (b) | | | | | | | 8,643 | | | | 618,492 | |
Sterling Coofs Trust, Series 2004-1, Class A, 2.36%, 4/15/29 (b) | | | | | | | 8,875 | | | | 590,748 | |
| | | | | | | | | | | 1,209,240 | |
Total Asset-Backed Securities — 5.9% | | | | | | | | | | | 39,746,865 | |
|
Corporate Bonds | | | | | | | | | | | | |
Aerospace & Defense — 0.3% | | | | | | | | | | | | | | |
DigitalGlobe, Inc., 5.25%, 2/01/21 (d) | | | | | | | 928 | | | | 918,720 | |
Huntington Ingalls Industries, Inc., 7.13%, 3/15/21 (d) | | | | | | | 570 | | | | 634,125 | |
Meccanica Holdings USA, Inc., 6.25%, 7/15/19 (b) | | | | | | | 339 | | | | 359,088 | |
| | | | | | | | | | | 1,911,933 | |
Airlines — 3.0% | | | | | | | | | | | | | | |
Air Canada Pass-Through Trust, Series 2013-1, Class C, 6.63%, 5/15/18 (b) | | | | | | | 651 | | | | 664,020 | |
American Airlines Pass-Through Trust, Series 2013-2 (b): |
Class A, 4.95%, 7/15/24 (d) | | | | | | | 3,749 | | | | 4,011,063 | |
Class B, 5.60%, 1/15/22 | | | | | | | 736 | | | | 765,133 | |
Class C, 6.00%, 1/15/17 (d) | | | | | | | 2,600 | | | | 2,697,500 | |
Continental Airlines Pass-Through Trust, Series 2012-3, Class C, 6.13%, 4/29/18 (d) | | | | | | | 2,090 | | | | 2,212,787 | |
Continental Airlines, Inc., 6.75%, 9/15/15 (b)(d) | | | | | | | 1,350 | | | | 1,377,000 | |
Delta Air Lines Pass-Through Trust, Series 2009-1, Class B, 9.75%, 6/17/18 | | | | | | | 226 | | | | 255,990 | |
United Continental Holdings, Inc., 6.00%, 12/01/20 (d) | | | | | | | 950 | | | | 989,188 | |
US Airways Pass-Through Trust, Class C (d): | | | | | | | | | | | | | | |
Series 2011-1, 10.88%, 10/22/14 | | | | | | | 847 | | | | 880,914 | |
Series 2012-1, 9.13%, 10/01/15 | | | | | | | 2,115 | | | | 2,241,907 | |
Virgin Australia Trust, Series 2013-1 (b): | | | | | | | | | | | | | | |
Class A, 5.00%, 10/23/23 | | | | | | | 800 | | | | 848,000 | |
Class B, 6.00%, 10/23/20 | | | | | | | 1,700 | | | �� | 1,780,750 | |
Class C, 7.13%, 10/23/18 | | | | | | | 1,240 | | | | 1,283,400 | |
| | | | | | | | | | | 20,007,652 | |
Auto Components — 1.6% | | | | | | | | | | | | | | |
Affinia Group, Inc., 7.75%, 5/01/21 (d) | | | | | | | 1,095 | | | | 1,182,600 | |
Autodis SA, 6.50%, 2/01/19 | | | | EUR | | | 100 | | | | 140,031 | |
Brighthouse Group PLC, 7.88%, 5/15/18 | | | | GBP | | | 100 | | | | 176,113 | |
Chrysler Group LLC/CG Co-Issuer, Inc. (b): | | | | | | | | | | | | | | |
8.00%, 6/15/19 (d) | | | | USD | | | 1,087 | | | | 1,195,700 | |
8.25%, 6/15/21 | | | | | | | 1,165 | | | | 1,319,362 | |
Icahn Enterprises LP/Icahn Enterprises Finance Corp., 4.88%, 3/15/19 (b)(d) | | | | | | | 2,058 | | | | 2,099,160 | |
Jaguar Land Rover Automotive PLC, 8.25%, 3/15/20 | | | | GBP | | | 554 | | | | 1,052,941 | |
Pittsburgh Glass Works LLC, 8.00%, 11/15/18 (b) | | | | USD | | | 445 | | | | 485,050 | |
Rhino Bondco SpA, 7.25%, 11/15/20 | | | | EUR | | | 110 | | | | 160,412 | |
Schaeffler Holding Finance BV (e): | | | | | | | | | | | | | | |
6.88%, 8/15/18 | | | | | | | 375 | | | | 552,551 | |
6.88%, 8/15/18 (b)(d) | | | | USD | | | 1,085 | | | | 1,155,525 | |
See Notes to Financial Statements.
| 32 | SEMI-ANNUAL REPORT | FEBRUARY 28, 2014
|
| |
| Consolidated Schedule of Investments (continued) | BlackRock Limited Duration Income Trust (BLW)
(Percentages shown are based on Net Assets)
|
| Corporate Bonds | | | | | | Par
(000) | | Value |
Auto Components (concluded) | | | | | | | | | | | | | | |
Servus Luxembourg Holdings SCA, 7.75%, 6/15/18 | | | | EUR | | | 342 | | | $ | 508,497 | |
Titan International, Inc., 6.88%, 10/01/20 (b) | | | | USD | | | 555 | | | | 586,913 | |
| | | | | | | | | | | 10,614,855 | |
Auto Parts — 0.0% | | | | | | | | | | | | | | |
PetroLogistics LP/PetroLogistics Finance Corp., 6.25%, 4/01/20 | | | | | | | 260 | | | | 263,900 | |
Automobiles — 0.5% | | | | | | | | | | | | | | |
Ford Motor Co., 4.25%, 11/15/16 (f) | | | | | | | 434 | | | | 782,285 | |
General Motors Co., 3.50%, 10/02/18 (b)(d) | | | | | | | 2,478 | | | | 2,558,535 | |
| | | | | | | | | | | 3,340,820 | |
Beverages — 0.0% | | | | | | | | | | | | | | |
Constellation Brands, Inc., 7.25%, 5/15/17 | | | | | | | 82 | | | | 94,915 | |
Building Products — 1.2% | | | | | | | | | | | | | | |
American Builders & Contractors Supply Co., Inc., 5.63%, 4/15/21 (b) | | | | | | | 415 | | | | 426,413 | |
Builders FirstSource, Inc., 7.63%, 6/01/21 (b)(d) | | | | | | | 890 | | | | 952,300 | |
Building Materials Corp. of America (b)(d): | | | | | | | | | | | | | | |
7.00%, 2/15/20 | | | | | | | 1,345 | | | | 1,442,512 | |
6.75%, 5/01/21 | | | | | | | 1,030 | | | | 1,117,550 | |
CPG Merger Sub LLC, 8.00%, 10/01/21 (b)(d) | | | | | | | 1,030 | | | | 1,107,250 | |
Momentive Performance Materials, Inc., 8.88%, 10/15/20 (d) | | | | | | | 530 | | | | 567,100 | |
Ply Gem Industries, Inc., 6.50%, 2/01/22 (b) | | | | | | | 745 | | | | 756,175 | |
USG Corp., 9.75%, 1/15/18 (d) | | | | | | | 1,390 | | | | 1,678,425 | |
| | | | | | | | | | | 8,047,725 | |
Capital Markets — 0.9% | | | | | | | | | | | | | | |
American Capital Ltd., 6.50%, 9/15/18 (b)(d) | | | | | | | 975 | | | | 1,038,375 | |
E*Trade Financial Corp., 0.00%, 8/31/19 (b)(f)(g) | | | | | | | 249 | | | | 540,797 | |
The Goldman Sachs Group, Inc., 3.30%, 5/03/15 (d) | | | | | | | 3,285 | | | | 3,382,206 | |
SteelRiver Transmission Co. LLC, 4.71%, 6/30/17 (b)(d) | | | | | | | 1,079 | | | | 1,141,229 | |
| | | | | | | | | | | 6,102,607 | |
Chemicals — 1.4% | | | | | | | | | | | | | | |
Ashland, Inc., 3.88%, 4/15/18 (d) | | | | | | | 675 | | | | 698,625 | |
Chemtura Corp., 5.75%, 7/15/21 | | | | | | | 200 | | | | 208,000 | |
Huntsman International LLC: | | | | | | | | | | | | | | |
8.63%, 3/15/21 (d) | | | | | | | 655 | | | | 740,150 | |
5.13%, 4/15/21 | | | | EUR | | | 135 | | | | 190,999 | |
INEOS Finance PLC, 7.50%, 5/01/20 (b)(d) | | | | USD | | | 445 | | | | 489,500 | |
INEOS Group Holdings SA: | | | | | | | | | | | | | | |
6.13%, 8/15/18 (b)(d) | | | | | | | 680 | | | | 703,800 | |
6.50%, 8/15/18 | | | | EUR | | | 328 | | | | 478,205 | |
5.75%, 2/15/19 | | | | | | | 340 | | | | 484,554 | |
LSB Industries, Inc., 7.75%, 8/01/19 (b) | | | | USD | | | 301 | | | | 322,823 | |
Nufarm Australia Ltd., 6.38%, 10/15/19 (b)(d) | | | | | | | 320 | | | | 332,000 | |
Orion Engineered Carbons Bondco GmbH, 9.63%, 6/15/18 (b)(d) | | | | | | | 898 | | | | 978,820 | |
Rockwood Specialties Group, Inc., 4.63%, 10/15/20 (d) | | | | | | | 3,175 | | | | 3,294,063 | |
US Coatings Acquisition, Inc./Axalta Coating Systems Dutch Holding BV: | | | | | | | | | | | | | | |
5.75%, 2/01/21 | | | | | | | 200 | | | | 291,934 | |
7.38%, 5/01/21 (b) | | | | | | | 398 | | | | 429,840 | |
| | | | | | | | | | | 9,643,313 | |
Commercial Banks — 0.8% | | | | | | | | | | | | | | |
CIT Group, Inc. (d): | | | | | | | | | | | | | | |
5.00%, 5/15/17 | | | | | | | 890 | | | | 954,525 | |
5.50%, 2/15/19 (b) | | | | | | | 1,370 | | | | 1,489,875 | |
HSBC Holdings PLC, 6.25%, 3/19/18 | | | | EUR | | | 1,000 | | | | 1,612,136 | |
Nordea Bank AB, 4.50%, 3/26/20 | | | | | | | 1,020 | | | | 1,579,167 | |
| | | | | | | | | | | 5,635,703 | |
Commercial Services & Supplies — 1.5% | | | | | | | | | | | | | | |
AA Bond Co., Ltd., 9.50%, 7/31/43 | | | | GBP | | | 306 | | | | 574,876 | |
ACCO Brands Corp., 6.75%, 4/30/20 | | | | USD | | | 100 | | | | 103,000 | |
ADS Waste Holdings, Inc., 8.25%, 10/01/20 | | | | | | | 292 | | | | 316,820 | |
| | | | | | | | | | | | | |
| Corporate Bonds | | | | | | Par
(000) | | Value |
Commercial Services & Supplies (concluded) | | | | | | | | | | | | | | |
ARAMARK Corp., 5.75%, 3/15/20 (b)(d) | | | | USD | | | 712 | | | $ | 751,160 | |
Aviation Capital Group Corp., 4.63%, 1/31/18 (b)(d) | | | | | | | 1,000 | | | | 1,041,921 | |
Bilbao Luxembourg SA, 10.50% (10.50% Cash or 11.25% PIK), 12/01/18 (e) | | | | EUR | | | 100 | | | | 143,634 | |
Brand Energy & Infrastructure Services, Inc., 8.50%, 12/01/21 (b)(d) | | | | USD | | | 617 | | | | 643,223 | |
Catalent Pharma Solutions, Inc., 7.88%, 10/15/18 | | | | | | | 306 | | | | 311,355 | |
Covanta Holding Corp., 6.38%, 10/01/22 | | | | | | | 100 | | | | 105,750 | |
Interactive Data Corp., 10.25%, 8/01/18 (d) | | | | | | | 2,210 | | | | 2,397,850 | |
Mobile Mini, Inc., 7.88%, 12/01/20 (d) | | | | | | | 915 | | | | 1,022,512 | |
United Rentals North America, Inc. (d): | | | | | | | | | | | | | | |
5.75%, 7/15/18 | | | | | | | 494 | | | | 529,815 | |
7.63%, 4/15/22 | | | | | | | 1,518 | | | | 1,724,827 | |
Verisure Holding AB: | | | | | | | | | | | | | | |
8.75%, 9/01/18 | | | | EUR | | | 199 | | | | 299,401 | |
8.75%, 12/01/18 | | | | | | | 111 | | | | 166,236 | |
West Corp., 8.63%, 10/01/18 | | | | USD | | | 165 | | | | 177,788 | |
| | | | | | | | | | | 10,310,168 | |
Communications Equipment — 2.1% | | | | | | | | | | | | | | |
ADC Telecommunications, Inc., 3.50%, 7/15/15 | | | | | | | 6,670 | | | | 6,753,375 | |
Alcatel-Lucent USA, Inc. (b)(d): | | | | | | | | | | | | | | |
4.63%, 7/01/17 | | | | | | | 800 | | | | 825,000 | |
6.75%, 11/15/20 | | | | | | | 1,560 | | | | 1,661,400 | |
Avaya, Inc., 7.00%, 4/01/19 (b) | | | | | | | 437 | | | | 433,723 | |
CommScope Holding Co., Inc., 6.63% (10.50% Cash or 11.25% PIK), 6/01/20 (b)(d)(e) | | | | | | | 605 | | | | 639,787 | |
Zayo Group LLC/Zayo Capital, Inc. (d): | | | | | | | | | | | | | | |
8.13%, 1/01/20 | | | | | | | 1,800 | | | | 1,984,500 | |
10.13%, 7/01/20 | | | | | | | 1,460 | | | | 1,693,600 | |
| | | | | | | | | | | 13,991,385 | |
Construction & Engineering — 0.2% | | | | | | | | | | | | | | |
Astaldi SpA, 7.13%, 12/01/20 | | | | EUR | | | 365 | | | | 536,598 | |
BlueLine Rental Finance Corp., 7.00%, 2/01/19 (b) | | | | USD | | | 165 | | | | 174,281 | |
Safway Group Holding LLC/Safway Finance Corp., 7.00%, 5/15/18 (b) | | | | | | | 258 | | | | 274,125 | |
Weekley Homes LLC/Weekley Finance Corp., 6.00%, 2/01/23 | | | | | | | 320 | | | | 314,400 | |
| | | | | | | | | | | 1,299,404 | |
Construction Materials — 1.3% | | | | | | | | | | | | | | |
Buzzi Unicem SpA, 6.25%, 9/28/18 | | | | EUR | | | 154 | | | | 242,591 | |
HD Supply, Inc. (d): | | | | | | | | | | | | | | |
8.13%, 4/15/19 | | | | USD | | | 4,285 | | | | 4,820,625 | |
11.00%, 4/15/20 | | | | | | | 770 | | | | 941,325 | |
7.50%, 7/15/20 | | | | | | | 2,696 | | | | 2,952,120 | |
| | | | | | | | | | | 8,956,661 | |
Consumer Finance — 0.7% | | | | | | | | | | | | | | |
Ford Motor Credit Co. LLC (d): | | | | | | | | | | | | | | |
3.88%, 1/15/15 | | | | | | | 2,475 | | | | 2,543,354 | |
7.00%, 4/15/15 | | | | | | | 400 | | | | 427,339 | |
Hyundai Capital America, 3.75%, 4/06/16 (b)(d) | | | | | | | 1,285 | | | | 1,349,701 | |
IVS F. SpA, 7.13%, 4/01/20 | | | | EUR | | | 235 | | | | 345,455 | |
Springleaf Finance Corp.: | | | | | | | | | | | | | | |
7.75%, 10/01/21 | | | | USD | | | 52 | | | | 57,590 | |
8.25%, 10/01/23 | | | | | | | 94 | | | | 105,045 | |
| | | | | | | | | | | 4,828,484 | |
Containers & Packaging — 0.4% | | | | | | | | | | | | | | |
Ardagh Packaging Finance PLC/Ardagh Holdings USA, Inc., 7.38%, 10/15/17 | | | | EUR | | | 100 | | | | 147,175 | |
Berry Plastics Corp., 9.75%, 1/15/21 | | | | USD | | | 290 | | | | 336,400 | |
Beverage Packaging Holdings Luxembourg II SA, 6.00%, 6/15/17 (b)(d) | | | | | | | 1,560 | | | | 1,622,400 | |
Crown Americas LLC/Crown Americas Capital Corp. III, 6.25%, 2/01/21 (d) | | | | | | | 144 | | | | 157,680 | |
OI European Group BV, 4.88%, 3/31/21 | | | | EUR | | | 311 | | | | 457,176 | |
| | | | | | | | | | | 2,720,831 | |
See Notes to Financial Statements.
| SEMI-ANNUAL REPORT | FEBRUARY 28, 2014 | 33
|
| |
| Consolidated Schedule of Investments (continued) | BlackRock Limited Duration Income Trust (BLW)
(Percentages shown are based on Net Assets)
|
| Corporate Bonds | | | | | | Par
(000) | | Value |
Distributors — 0.1% | | | | | | | | | | | | | | |
VWR Funding, Inc., 7.25%, 9/15/17 (d) | | | | USD | | | 874 | | | $ | 937,365 | |
Diversified Consumer Services — 0.5% | | | | | | | | | | | | | | |
APX Group, Inc. (d): | | | | | | | | | | | | | | |
6.38%, 12/01/19 | | | | | | | 491 | | | | 506,344 | |
8.75%, 12/01/20 | | | | | | | 1,112 | | | | 1,159,260 | |
Garda World Security Corp., 7.25%, 11/15/21 (b) | | | | | | | 275 | | | | 291,500 | |
Laureate Education, Inc., 9.25%, 9/01/19 (b) | | | | | | | 1,020 | | | | 1,091,400 | |
| | | | | | | | | | | 3,048,504 | |
Diversified Financial Services — 2.8% | | | | | | | | | | | | | | |
Aircastle Ltd., 6.25%, 12/01/19 (d) | | | | | | | 367 | | | | 400,030 | |
Ally Financial, Inc. (d): | | | | | | | | | | | | | | |
8.30%, 2/12/15 | | | | | | | 2,460 | | | | 2,619,900 | |
8.00%, 11/01/31 | | | | | | | 2,766 | | | | 3,471,570 | |
CE Energy AS, 7.00%, 2/01/21 | | | | EUR | | | 150 | | | | 213,772 | |
Co-Operative Group Holdings, 5.63%, 7/08/20 (h) | | | | GBP | | | 190 | | | | 334,076 | |
DPL, Inc.: | | | | | | | | | | | | | | |
6.50%, 10/15/16 | | | | USD | | | 70 | | | | 75,425 | |
Gala Group Finance PLC, 8.88%, 9/01/18 | | | | GBP | | | 700 | | | | 1,255,669 | |
Jefferies Finance LLC/JFIN Co-Issuer Corp., 7.38%, 4/01/20 (b)(d) | | | | USD | | | 585 | | | | 618,638 | |
Jefferies LoanCore LLC/JLC Finance Corp., 6.88%, 6/01/20 (b) | | | | | | | 567 | | | | 578,340 | |
Leucadia National Corp., 8.13%, 9/15/15 (d) | | | | | | | 1,870 | | | | 2,057,000 | |
Macquarie Bank Ltd./London, 10.25%, 6/20/57 (c) | | | | | | | 1,450 | | | | 1,645,750 | |
Reynolds Group Issuer, Inc.: | | | | | | | | | | | | | | |
7.13%, 4/15/19 (d) | | | | | | | 1,294 | | | | 1,376,492 | |
9.00%, 4/15/19 | | | | | | | 180 | | | | 193,500 | |
9.88%, 8/15/19 (d) | | | | | | | 535 | | | | 603,213 | |
5.75%, 10/15/20 (d) | | | | | | | 800 | | | | 836,000 | |
6.88%, 2/15/21 (d) | | | | | | | 820 | | | | 891,750 | |
WMG Acquisition Corp.: | | | | | | | | | | | | | | |
11.50%, 10/01/18 | | | | | | | 753 | | | | 856,537 | |
6.00%, 1/15/21 (b)(d) | | | | | | | 841 | | | | 878,845 | |
| | | | | | | | | | | 18,906,507 | |
Diversified Telecommunication Services — 3.7% | | | | | | | | | | | | | | |
CenturyLink, Inc., Series V, 5.63%, 4/01/20 (d) | | | | | | | 906 | | | | 946,770 | |
Level 3 Communications, Inc., 8.88%, 6/01/19 (d) | | | | | | | 735 | | | | 810,338 | |
Level 3 Financing, Inc.: | | | | | | | | | | | | | | |
3.85%, 1/15/18 (b)(c) | | | | | | | 411 | | | | 417,165 | |
8.13%, 7/01/19 (d) | | | | | | | 3,083 | | | | 3,391,300 | |
7.00%, 6/01/20 | | | | | | | 495 | | | | 539,550 | |
6.13%, 1/15/21 (b)(d) | | | | | | | 1,682 | | | | 1,778,715 | |
Telecom Italia SpA: | | | | | | | | | | | | | | |
6.13%, 11/15/16 (f) | | | | EUR | | | 300 | | | | 470,903 | |
6.38%, 6/24/19 | | | | GBP | | | 200 | | | | 360,162 | |
4.88%, 9/25/20 | | | | EUR | | | 220 | | | | 320,067 | |
4.50%, 1/25/21 | | | | | | | 270 | | | | 384,677 | |
5.88%, 5/19/23 | | | | GBP | | | 450 | | | | 763,603 | |
Telenet Finance V Luxembourg SCA: | | | | | | | | | | | | | | |
6.25%, 8/15/22 | | | | EUR | | | 271 | | | | 409,597 | |
6.75%, 8/15/24 | | | | | | | 397 | | | | 602,733 | |
Verizon Communications, Inc., 3.65%, 9/14/18 (d) | | | | USD | | | 13,000 | | | | 13,852,891 | |
Windstream Corp., 7.75%, 10/15/20 | | | | | | | 46 | | | | 49,450 | |
| | | | | | | | | | | 25,097,921 | |
Electric Utilities — 0.2% | | | | | | | | | | | | | | |
Homer City Generation LP (e): | | | | | | | | | | | | | | |
8.14% (8.14% Cash or 8.64% PIK), 10/01/19 | | | | | | | 345 | | | | 363,975 | |
8.73% (8.73% Cash or 9.23% PIK), 10/01/26 | | | | | | | 495 | | | | 519,750 | |
Mirant Mid Atlantic Pass-Through Trust, Series B, 9.13%, 6/30/17 (d) | | | | | | | 538 | | | | 566,133 | |
| | | | | | | | | | | 1,449,858 | |
Electrical Equipment — 0.2% | | | | | | | | | | | | | | |
Belden, Inc., 5.50%, 4/15/23 | | | | EUR | | | 140 | | | | 195,561 | |
Techem Energy Metering Service GmbH & Co., 7.88%, 10/01/20 | | | | | | | 106 | | | | 165,318 | |
Techem GmbH, 6.13%, 10/01/19 | | | | | | | 300 | | | | 450,406 | |
| | | | | | | | | | | | | |
| Corporate Bonds | | | | | | Par
(000) | | Value |
Electrical Equipment (concluded) | | | | | | | | | | | | | | |
Trionista Holdco GmbH, 5.00%, 4/30/20 | | | | EUR | | | 410 | | | $ | 589,975 | |
Trionista TopCo GmbH, 6.88%, 4/30/21 | | | | | | | 100 | | | | 149,762 | |
| | | | | | | | | | | 1,551,022 | |
Energy Equipment & Services — 1.5% | | | | | | | | | | | | | | |
Calfrac Holdings LP, 7.50%, 12/01/20 (b)(d) | | | | USD | | | 503 | | | | 525,635 | |
CGG SA, 7.75%, 5/15/17 (d) | | | | | | | 330 | | | | 337,425 | |
Gulfmark Offshore, Inc., 6.38%, 3/15/22 (d) | | | | | | | 185 | | | | 190,550 | |
Hornbeck Offshore Services, Inc., 5.88%, 4/01/20 (d) | | | | | | | 375 | | | | 390,000 | |
MEG Energy Corp. (b)(d): | | | | | | | | | | | | | | |
6.50%, 3/15/21 | | | | | | | 358 | | | | 377,690 | |
7.00%, 3/31/24 | | | | | | | 864 | | | | 907,200 | |
Oil States International, Inc. (d): | | | | | | | | | | | | | | |
6.50%, 6/01/19 | | | | | | | 1,614 | | | | 1,706,805 | |
5.13%, 1/15/23 | | | | | | | 908 | | | | 1,020,365 | |
Peabody Energy Corp. (d): | | | | | | | | | | | | | | |
6.00%, 11/15/18 | | | | | | | 1,004 | | | | 1,086,830 | |
6.25%, 11/15/21 | | | | | | | 991 | | | | 1,023,207 | |
Rain CII Carbon LLC/CII Carbon Corp., 8.25%, 1/15/21 (b)(d) | | | | | | | 535 | | | | 551,050 | |
Seadrill Ltd., 5.63%, 9/15/17 (b) | | | | | | | 1,806 | | | | 1,882,755 | |
Transocean, Inc., 6.00%, 3/15/18 (d) | | | | | | | 230 | | | | 259,047 | |
| | | | | | | | | | | 10,258,559 | |
Food & Staples Retailing — 0.8% | | | | | | | | | | | | | | |
Bakkavor Finance 2 PLC: | | | | | | | | | | | | | | |
8.25%, 2/15/18 | | | | GBP | | | 312 | | | | 559,032 | |
8.75%, 6/15/20 | | | | | | | 200 | | | | 367,899 | |
Brakes Capital, 7.13%, 12/15/18 | | | | | | | 1,655 | | | | 2,743,668 | |
R&R Ice Cream PLC, 9.25%, 5/15/18 (e) | | | | EUR | | | 314 | | | | 444,250 | |
Rite Aid Corp., 9.25%, 3/15/20 (d) | | | | USD | | | 1,095 | | | | 1,259,250 | |
| | | | | | | | | | | 5,374,099 | |
Food Products — 0.3% | | | | | | | | | | | | | | |
Findus Bondco SA: | | | | | | | | | | | | | | |
9.13%, 7/01/18 | | | | EUR | | | 187 | | | | 282,637 | |
9.50%, 7/01/18 | | | | GBP | | | 100 | | | | 183,154 | |
Post Holdings, Inc., 6.75%, 12/01/21 (b) | | | | USD | | | 252 | | | | 269,955 | |
Smithfield Foods, Inc.: | | | | | | | | | | | | | | |
5.25%, 8/01/18 (b) | | | | | | | 207 | | | | 217,091 | |
5.88%, 8/01/21 (b) | | | | | | | 193 | | | | 198,790 | |
6.63%, 8/15/22 (d) | | | | | | | 783 | | | | 845,640 | |
Univeg Holding BV, 7.88%, 11/15/20 | | | | EUR | | | 135 | | | | 186,296 | |
| | | | | | | | | | | 2,183,563 | |
Gas Utilities — 0.2% | | | | | | | | | | | | | | |
Targa Resources Partners LP/Targa Resources Partners Finance Corp., 7.88%, 10/15/18 (d) | | | | USD | | | 1,515 | | | | 1,624,838 | |
Health Care Equipment & Supplies — 1.1% | | | | | | | | | | | | | | |
Biomet, Inc. (d): | | | | | | | | | | | | | | |
6.50%, 8/01/20 | | | | | | | 1,720 | | | | 1,855,450 | |
6.50%, 10/01/20 | | | | | | | 418 | | | | 445,693 | |
CareFusion Corp., 5.13%, 8/01/14 (d) | | | | | | | 3,000 | | | | 3,055,440 | |
DJO Finance LLC/DJO Finance Corp., 8.75%, 3/15/18 (d) | | | | | | | 413 | | | | 452,235 | |
IDH Finance PLC, 6.00%, 12/01/18 | | | | GBP | | | 113 | | | | 194,901 | |
Kinetic Concepts, Inc./KCI USA, Inc., 12.50%, 11/01/19 | | | | USD | | | 328 | | | | 377,200 | |
Teleflex, Inc., 6.88%, 6/01/19 (d) | | | | | | | 675 | | | | 717,187 | |
| | | | | | | | | | | 7,098,106 | |
Health Care Providers & Services — 1.8% | | | | | | | | | | | | | | |
Aviv Healthcare Properties LP/Aviv Healthcare Capital Corp.: | | | | | | | | | | | | | | |
7.75%, 2/15/19 (d) | | | | | | | 995 | | | | 1,074,600 | |
6.00%, 10/15/21 | | | | | | | 232 | | | | 241,860 | |
CHS/Community Health Systems, Inc.: | | | | | | | | | | | | | | |
5.13%, 8/15/18 (d) | | | | | | | 490 | | | | 518,788 | |
5.13%, 8/01/21 (b) | | | | | | | 192 | | | | 198,720 | |
6.88%, 2/01/22 (b) | | | | | | | 739 | | | | 786,111 | |
See Notes to Financial Statements.
| 34 | SEMI-ANNUAL REPORT | FEBRUARY 28, 2014
|
| |
| Consolidated Schedule of Investments (continued) | BlackRock Limited Duration Income Trust (BLW)
(Percentages shown are based on Net Assets)
|
| Corporate Bonds | | | | | | Par
(000) | | Value |
Health Care Providers & Services (concluded) | | | | | | | | | | | | | | |
Crown Newco 3 PLC, 7.00%, 2/15/18 | | | | GBP | | | 335 | | | $ | 591,828 | |
HCA, Inc. (d): | | | | | | | | | | | | | | �� |
7.88%, 2/15/20 | | | | USD | | | 1,896 | | | | 2,028,720 | |
7.25%, 9/15/20 | | | | | | | 711 | | | | 773,213 | |
Hologic, Inc., 6.25%, 8/01/20 (d) | | | | | | | 1,289 | | | | 1,369,562 | |
LifePoint Hospitals, Inc., 5.50%, 12/01/21 (b) | | | | | | | 240 | | | | 251,100 | |
Tenet Healthcare Corp.: | | | | | | | | | | | | | | |
6.25%, 11/01/18 (d) | | | | | | | 1,134 | | | | 1,255,905 | |
8.00%, 8/01/20 (d) | | | | | | | 775 | | | | 850,563 | |
6.00%, 10/01/20 (b) | | | | | | | 461 | | | | 495,575 | |
8.13%, 4/01/22 (d) | | | | | | | 898 | | | | 1,005,760 | |
Voyage Care Bondco PLC, 6.50%, 8/01/18 | | | | GBP | | | 355 | | | | 619,730 | |
| | | | | | | | | | | 12,062,035 | |
Health Care Technology — 0.7% | | | | | | | | | | | | | | |
IMS Health, Inc., 12.50%, 3/01/18 (b)(d) | | | | USD | | | 4,300 | | | | 4,945,000 | |
Hotels, Restaurants & Leisure — 4.5% | | | | | | | | | | | | | | |
Cirsa Funding Luxembourg SA, 8.75%, 5/15/18 | | | | EUR | | | 540 | | | | 777,040 | |
Enterprise Funding Ltd., Series ETI, 3.50%, 9/10/20 (f) | | | | GBP | | | 100 | | | | 188,220 | |
Enterprise Inns PLC, 6.50%, 12/06/18 | | | | | | | 926 | | | | 1,624,289 | |
Gategroup Finance Luxembourg SA, 6.75%, 3/01/19 | | | | EUR | | | 290 | | | | 430,309 | |
GLP Capital LP/GLP Financing II, Inc., 4.38%, 11/01/18 (b) | | | | USD | | | 357 | | | | 370,388 | |
Greektown Holdings LLC/Greektown Mothership Corp., 8.88%, 3/15/19 (b)(i) | | | | | | | 980 | | | | 1,009,400 | |
Intralot Finance Luxembourg SA, 9.75%, 8/15/18 | | | | EUR | | | 480 | | | | 752,120 | |
Isle of Capri Casinos, Inc.: | | | | | | | | | | | | | | |
7.75%, 3/15/19 | | | | USD | | | 70 | | | | 76,038 | |
5.88%, 3/15/21 | | | | | | | 294 | | | | 303,555 | |
MCE Finance Ltd., 5.00%, 2/15/21 (b)(d) | | | | | | | 941 | | | | 938,647 | |
PNK Finance Corp., 6.38%, 8/01/21 (b)(d) | | | | | | | 268 | | | | 280,060 | |
PortAventura Entertainment Barcelona BV, 7.25%, 12/01/20 | | | | EUR | | | 100 | | | | 145,277 | |
Six Flags Entertainment Corp., 5.25%, 1/15/21 (b)(d) | | | | USD | | | 576 | | | | 583,200 | |
Snai SpA, 7.63%, 6/15/18 | | | | EUR | | | 205 | | | | 296,402 | |
Spirit Issuer PLC (c): | | | | | | | | | | | | | | |
Series A1, 1.08%, 12/28/28 | | | | GBP | | | 655 | | | | 924,080 | |
Series A2, 3.23%, 12/28/31 | | | | | | | 1,800 | | | | 2,742,915 | |
Series A5, 5.47%, 12/28/34 | | | | | | | 4,500 | | | | 7,121,028 | |
Series A6, 2.33%, 12/28/36 | | | | | | | 2,670 | | | | 4,202,788 | |
Station Casinos LLC, 7.50%, 3/01/21 (d) | | | | USD | | | 2,245 | | | | 2,407,762 | |
Travelport LLC/Travelport Holdings, Inc., 11.88%, 9/01/16 (b) | | | | | | | 78 | | | | 78,792 | |
Tropicana Entertainment LLC/Tropicana Finance Corp., 9.63%, 12/15/14 (a)(j) | | | | | | | 375 | | | | — | |
The Unique Pub Finance Co. PLC: | | | | | | | | | | | | | | |
Series A3, 6.54%, 3/30/21 | | | | GBP | | | 1,364 | | | | 2,400,557 | |
Series A4, 5.66%, 6/30/27 | | | | | | | 811 | | | | 1,365,385 | |
Vougeot Bidco PLC, 7.88%, 7/15/20 | | | | | | | 218 | | | | 396,556 | |
Wynn Macau Ltd., 5.25%, 10/15/21 (b)(d) | | | | USD | | | 428 | | | | 439,770 | |
| | | | | | | | | | | 29,854,578 | |
Household Durables — 1.4% | | | | | | | | | | | | | | |
Algeco Scotsman Global Finance PLC, 9.00%, 10/15/18 | | | | EUR | | | 530 | | | | 799,228 | |
Ashton Woods USA LLC/Ashton Woods Finance Co., 6.88%, 2/15/21 (b)(d) | | | | USD | | | 510 | | | | 508,725 | |
Beazer Homes USA, Inc., 6.63%, 4/15/18 (d) | | | | | | | 910 | | | | 982,800 | |
Berkline/Benchcraft LLC, 11/03/14 (a)(j) | | | | | | | 200 | | | | — | |
Brookfield Residential Properties, Inc., 6.50%, 12/15/20 (b)(d) | | | | | | | 925 | | | | 982,812 | |
Brookfield Residential Properties, Inc./Brookfield Residential US Corp., 6.13%, 7/01/22 (b) | | | | | | | 259 | | | | 266,123 | |
K. Hovnanian Enterprises, Inc., 7.25%, 10/15/20 (b)(d) | | | | | | | 2,130 | | | | 2,332,350 | |
KB Home, 7.25%, 6/15/18 (d) | | | | | | | 880 | | | | 992,200 | |
Libbey Glass, Inc., 6.88%, 5/15/20 (d) | | | | | | | 226 | | | | 244,645 | |
| | | | | | | | | | | | | |
| Corporate Bonds | | | | | | Par
(000) | | Value |
Household Durables (concluded) | | | | | | | | | | | | | | |
Spie BondCo 3 SCA, 11.00%, 8/15/19 | | | | EUR | | | 248 | | | $ | 390,239 | |
Standard Pacific Corp., 8.38%, 1/15/21 (d) | | | | USD | | | 1,000 | | | | 1,192,500 | |
Taylor Morrison Communities, Inc./Monarch Communities, Inc., 5.25%, 4/15/21 (b) | | | | | | | 597 | | | | 591,030 | |
| | | | | | | | | | | 9,282,652 | |
Household Products — 0.2% | | | | | | | | | | | | | | |
Ontex IV SA, 9.00%, 4/15/19 | | | | EUR | | | 353 | | | | 526,226 | |
Spectrum Brands, Inc.: | | | | | | | | | | | | | | |
6.38%, 11/15/20 | | | | USD | | | 250 | | | | 272,500 | |
6.63%, 11/15/22 | | | | | | | 285 | | | | 310,650 | |
| | | | | | | | | | | 1,109,376 | |
Independent Power Producers & Energy Traders — 1.6% |
The AES Corp., 7.75%, 10/15/15 (d) | | | | | | | 972 | | | | 1,069,200 | |
Calpine Corp. (b): | | | | | | | | | | | | | | |
7.50%, 2/15/21 | | | | | | | 147 | | | | 162,067 | |
6.00%, 1/15/22 | | | | | | | 143 | | | | 151,580 | |
5.88%, 1/15/24 | | | | | | | 438 | | | | 448,950 | |
Energy Future Intermediate Holding Co. LLC/EFIH Finance, Inc.: | | | | | | | | | | | | | | |
6.88%, 8/15/17 (b) | | | | | | | 625 | | | | 641,406 | |
10.00%, 12/01/20 | | | | | | | 390 | | | | 405,600 | |
10.25%, 12/01/20 (b) | | | | | | | 2,105 | | | | 2,189,200 | |
12.25%, 3/01/22 (b) | | | | | | | 3,408 | | | | 3,953,280 | |
NRG Energy, Inc., 7.63%, 1/15/18 (d) | | | | | | | 913 | | | | 1,031,690 | |
NRG REMA LLC: | | | | | | | | | | | | | | |
Series B, 9.24%, 7/02/17 | | | | | | | 85 | | | | 84,505 | |
Series C, 9.68%, 7/02/26 (d) | | | | | | | 899 | | | | 872,030 | |
| | | | | | | | | | | 11,009,508 | |
Insurance — 3.0% | | | | | | | | | | | | | | |
Allied World Assurance Co., Ltd., 7.50%, 8/01/16 (d) | | | | | | | 3,000 | | | | 3,427,086 | |
The Allstate Corp., 6.13%, 5/15/67 (c)(d) | | | | | | | 3,000 | | | | 3,138,750 | |
CNO Financial Group, Inc., 6.38%, 10/01/20 (b)(d) | | | | | | | 304 | | | | 323,760 | |
Forethought Financial Group, Inc., 8.63%, 4/15/21 (b)(d) | | | | | | | 750 | | | | 850,466 | |
Galaxy Bidco Ltd., 6.38%, 11/15/20 | | | | GBP | | | 100 | | | | 172,479 | |
Hockey Merger Sub 2, Inc., 7.88%, 10/01/21 (b) | | | | USD | | | 255 | | | | 268,388 | |
ING US, Inc., 5.65%, 5/15/53 (c) | | | | | | | 3,500 | | | | 3,430,000 | |
Liberty Mutual Group, Inc. (b): | | | | | | | | | | | | | | |
7.00%, 3/07/67 (c)(d) | | | | | | | 1,575 | | | | 1,641,937 | |
7.80%, 3/07/87 | | | | | | | 1,500 | | | | 1,627,500 | |
MPL 2 Acquisition Canco, Inc., 9.88%, 8/15/18 (b) | | | | | | | 595 | | | | 635,163 | |
Muenchener Rueckversicherungs AG, 6.00%, 5/26/41 (c) | | | | EUR | | | 400 | | | | 651,926 | |
Prudential Financial, Inc., 5.63%, 6/15/43 (c)(d) | | | | USD | | | 3,250 | | | | 3,355,625 | |
TMF Group Holding BV, 9.88%, 12/01/19 (c) | | | | EUR | | | 310 | | | | 474,961 | |
| | | | | | | | | | | 19,998,041 | |
Internet Software & Services — 0.2% | | | | | | | | | | | | | | |
Cerved Group SpA: | | | | | | | | | | | | | | |
6.38%, 1/15/20 | | | | | | | 100 | | | | 147,692 | |
8.00%, 1/15/21 | | | | | | | 100 | | | | 149,172 | |
Equinix, Inc., 4.88%, 4/01/20 | | | | USD | | | 139 | | | | 141,259 | |
IAC/InterActiveCorp, 4.88%, 11/30/18 (b)(d) | | | | | | | 695 | | | | 724,537 | |
| | | | | | | | | | | 1,162,660 | |
IT Services — 2.1% | | | | | | | | | | | | | | |
Ceridian Corp., 8.88%, 7/15/19 (b)(d) | | | | | | | 1,395 | | | | 1,593,788 | |
Ceridian HCM Holding, Inc., 11.00%, 3/15/21 (b)(d) | | | | | | | 1,004 | | | | 1,148,325 | |
Epicor Software Corp., 8.63%, 5/01/19 (d) | | | | | | | 1,260 | | | | 1,376,550 | |
First Data Corp. (b)(d): | | | | | | | | | | | | | | |
7.38%, 6/15/19 | | | | | | | 1,775 | | | | 1,923,656 | |
6.75%, 11/01/20 | | | | | | | 1,250 | | | | 1,350,000 | |
11.75%, 8/15/21 | | | | | | | 582 | | | | 622,740 | |
SunGard Data Systems, Inc., 6.63%, 11/01/19 (d) | | | | | | | 1,040 | | | | 1,111,500 | |
The Western Union Co., 2.88%, 12/10/17 (d) | | | | | | | 4,000 | | | | 4,115,096 | |
WEX, Inc., 4.75%, 2/01/23 (b)(d) | | | | | | | 550 | | | | 517,000 | |
| | | | | | | | | | | 13,758,655 | |
See Notes to Financial Statements.
| SEMI-ANNUAL REPORT | FEBRUARY 28, 2014 | 35
|
| |
| Consolidated Schedule of Investments (continued) | BlackRock Limited Duration Income Trust (BLW)
(Percentages shown are based on Net Assets)
|
| Corporate Bonds | | | | | | Par
(000) | | Value |
Machinery — 0.0% | | | | | | | | | | | | | | |
Trinseo Materials Operating SCA/Trinseo Materials Finance, Inc., 8.75%, 2/01/19 (b) | | | | USD | | | 167 | | | $ | 173,680 | |
Media — 4.2% | | | | | | | | | | | | | | |
Adria Bidco BV, 7.88%, 11/15/20 | | | | EUR | | | 140 | | | | 200,972 | |
Altice Financing SA, 6.50%, 1/15/22 (b)(d) | | | | USD | | | 850 | | | | 886,125 | |
AMC Networks, Inc., 7.75%, 7/15/21 (d) | | | | | | | 865 | | | | 981,775 | |
CBS Outdoor Americas Capital LLC/CBS Outdoor Americas Capital Corp. (b): | | | | | | | | | | | | | | |
5.25%, 2/15/22 | | | | | | | 105 | | | | 107,625 | |
5.63%, 2/15/24 | | | | | | | 85 | | | | 87,763 | |
Cengage Learning Acquisitions, Inc., 11.50%, 4/15/20 (a)(b)(j) | | | | | | | 509 | | | | 488,640 | |
Checkout Holding Corp., 0.00%, 11/15/15 (b)(g) | | | | | | | 467 | | | | 394,615 | |
Clear Channel Communications, Inc., 9.00%, 3/01/21 (d) | | | | | | | 1,311 | | | | 1,373,272 | |
Clear Channel Worldwide Holdings, Inc.: | | | | | | | | | | | | | | |
7.63%, 3/15/20 | | | | | | | 677 | | | | 732,852 | |
6.50%, 11/15/22 (d) | | | | | | | 965 | | | | 1,020,487 | |
6.50%, 11/15/22 | | | | | | | 213 | | | | 226,845 | |
DIRECTV Holdings LLC/DIRECTV Financing Co., Inc., 3.13%, 2/15/16 (d) | | | | | | | 3,000 | | | | 3,122,721 | |
DISH DBS Corp. (d): | | | | | | | | | | | | | | |
7.13%, 2/01/16 | | | | | | | 200 | | | | 220,000 | |
4.25%, 4/01/18 | | | | | | | 1,330 | | | | 1,383,200 | |
DreamWorks Animation SKG, Inc., 6.88%, 8/15/20 (b) | | | | | | | 305 | | | | 327,113 | |
Gannett Co., Inc. (b): | | | | | | | | | | | | | | |
5.13%, 10/15/19 | | | | | | | 197 | | | | 206,850 | |
5.13%, 7/15/20 | | | | | | | 218 | | | | 224,540 | |
6.38%, 10/15/23 | | | | | | | 304 | | | | 320,720 | |
Gray Television, Inc., 7.50%, 10/01/20 (d) | | | | | | | 428 | | | | 466,520 | |
Intelsat Jackson Holdings SA: | | | | | | | | | | | | | | |
7.25%, 10/15/20 (d) | | | | | | | 1,660 | | | | 1,805,250 | |
5.50%, 8/01/23 (b) | | | | | | | 515 | | | | 509,206 | |
Intelsat Luxembourg SA, 6.75%, 6/01/18 (b) | | | | | | | 800 | | | | 852,000 | |
Lamar Media Corp., 5.38%, 1/15/24 (b) | | | | | | | 240 | | | | 247,800 | |
Live Nation Entertainment, Inc., 7.00%, 9/01/20 (b) | | | | | | | 185 | | | | 203,038 | |
The McClatchy Co., 9.00%, 12/15/22 | | | | | | | 330 | | | | 377,438 | |
MDC Partners, Inc., 6.75%, 4/01/20 (b) | | | | | | | 493 | | | | 526,277 | |
Midcontinent Communications & Midcontinent Finance Corp., 6.25%, 8/01/21 (b) | | | | | | | 245 | | | | 254,800 | |
NAI Entertainment Holdings/NAI Entertainment Holdings Finance Corp., 5.00%, 8/01/18 (b) | | | | | | | 345 | | | | 359,663 | |
Play Finance 2 SA, 5.25%, 2/01/19 | | | | EUR | | | 220 | | | | 313,156 | |
RCN Telecom Services LLC/RCN Capital Corp., 8.50%, 8/15/20 (b) | | | | USD | | | 580 | | | | 609,000 | |
Sirius XM Holdings, Inc. (b): | | | | | | | | | | | | | | |
5.75%, 8/01/21 | | | | | | | 424 | | | | 440,960 | |
4.63%, 5/15/23 | | | | | | | 311 | | | | 292,340 | |
Sterling Entertainment Corp., 9.75%, 12/15/19 (b) | | | | | | | 1,175 | | | | 1,198,500 | |
Townsquare Radio LLC/Townsquare Radio, Inc., 9.00%, 4/01/19 (b)(d) | | | | | | | 789 | | | | 873,817 | |
Unitymedia Hessen GmbH & Co. KG/Unitymedia NRW GmbH: | | | | | | | | | | | | | | |
7.50%, 3/15/19 | | | | | | | 1,440 | | | | 1,566,000 | |
5.63%, 4/15/23 | | | | EUR | | | 104 | | | | 154,332 | |
Univision Communications, Inc., 6.75%, 9/15/22 (b)(d) | | | | USD | | | 286 | | | | 317,460 | |
Virgin Media Secured Finance PLC: | | | | | �� | | | | | | | | | |
6.50%, 1/15/18 (d) | | | | | | | 1,000 | | | | 1,036,250 | |
6.00%, 4/15/21 | | | | GBP | | | 1,274 | | | | 2,245,380 | |
VTR Finance BV, 6.88%, 1/15/24 (b) | | | | USD | | | 512 | | | | 524,267 | |
Ziggo Bond Co. BV, 8.00%, 5/15/18 (b) | | | | EUR | | | 513 | | | | 753,270 | |
Ziggo Finance BV, 6.13%, 11/15/17 | | | | | | | 100 | | | | 142,258 | |
| | | | | | | | | | | 28,375,097 | |
Metals & Mining — 1.7% | | | | | | | | | | | | | | |
APERAM (b): | | | | | | | | | | | | | | |
7.38%, 4/01/16 | | | | USD | | | 150 | | | | 155,250 | |
7.75%, 4/01/18 | | | | | | | 308 | | | | 324,940 | |
| | | | | | | | | | | | | |
| Corporate Bonds | | | | | | Par
(000) | | Value |
Metals & Mining (concluded) | | | | | | | | | | | | | | |
ArcelorMittal: | | | | | | | | | | | | | | |
9.50%, 2/15/15 (d) | | | | USD | | | 1,219 | | | $ | 1,307,377 | |
4.25%, 8/05/15 (d) | | | | | | | 738 | | | | 761,062 | |
5.00%, 2/25/17 | | | | | | | 343 | | | | 366,581 | |
6.13%, 6/01/18 (d) | | | | | | | 498 | | | | 547,800 | |
Eco-Bat Finance PLC, 7.75%, 2/15/17 | | | | EUR | | | 495 | | | | 708,016 | |
Global Brass & Copper, Inc., 9.50%, 6/01/19 (d) | | | | USD | | | 695 | | | | 802,725 | |
Kaiser Aluminum Corp., 8.25%, 6/01/20 (d) | | | | | | | 510 | | | | 577,575 | |
Novelis, Inc., 8.75%, 12/15/20 (d) | | | | | | | 2,375 | | | | 2,671,875 | |
Perstorp Holding AB, 8.75%, 5/15/17 (b) | | | | | | | 290 | | | | 311,388 | |
Steel Dynamics, Inc., 6.38%, 8/15/22 (d) | | | | | | | 555 | | | | 609,113 | |
ThyssenKrupp AG, 3.13%, 10/25/19 | | | | EUR | | | 400 | | | | 554,881 | |
Wise Metals Group LLC/Wise Alloys Finance Corp., 8.75%, 12/15/18 (b)(d) | | | | USD | | | 1,301 | | | | 1,405,080 | |
| | | | | | | | | | | 11,103,663 | |
Multiline Retail — 0.2% | | | | | | | | | | | | | | |
Dufry Finance SCA, 5.50%, 10/15/20 (b)(d) | | | | | | | 557 | | | | 570,925 | |
The Neiman Marcus Group Ltd., 8.00%, 10/15/21 (b)(d) | | | | | | | 856 | | | | 918,060 | |
| | | | | | | | | | | 1,488,985 | |
Oil, Gas & Consumable Fuels — 3.8% | | | | | | | | | | | | | | |
Access Midstream Partners LP/ACMP Finance Corp., 4.88%, 5/15/23 | | | | | | | 455 | | | | 464,100 | |
Alpha Natural Resources, Inc., 6.25%, 6/01/21 | | | | | | | 209 | | | | 176,605 | |
Antero Resources Finance Corp., 5.38%, 11/01/21 (b)(d) | | | | | | | 774 | | | | 791,415 | |
Athlon Holdings LP/Athlon Finance Corp., 7.38%, 4/15/21 (b) | | | | | | | 254 | | | | 269,240 | |
Bonanza Creek Energy, Inc., 6.75%, 4/15/21 | | | | | | | 95 | | | | 102,125 | |
Chaparral Energy, Inc., 7.63%, 11/15/22 | | | | | | | 305 | | | | 330,925 | |
Concho Resources, Inc., 6.50%, 1/15/22 (d) | | | | | | | 221 | | | | 241,719 | |
CONSOL Energy, Inc., 8.25%, 4/01/20 (d) | | | | | | | 1,890 | | | | 2,055,375 | |
El Paso LLC, 7.80%, 8/01/31 | | | | | | | 116 | | | | 122,993 | |
EP Energy LLC/Everest Acquisition Finance, Inc., Series WI, 6.88%, 5/01/19 (d) | | | | | | | 630 | | | | 679,612 | |
Kinder Morgan Finance Co. LLC, 6.00%, 1/15/18 (b)(d) | | | | | | | 1,285 | | | | 1,416,712 | |
Kinder Morgan, Inc., 5.63%, 11/15/23 (b) | | | | | | | 457 | | | | 459,382 | |
Kodiak Oil & Gas Corp., 8.13%, 12/01/19 (d) | | | | | | | 1,470 | | | | 1,635,375 | |
Laredo Petroleum, Inc.: | | | | | | | | | | | | | | |
9.50%, 2/15/19 (d) | | | | | | | 630 | | | | 697,725 | |
7.38%, 5/01/22 | | | | | | | 515 | | | | 571,650 | |
Lightstream Resources Ltd., 8.63%, 2/01/20 (b) | | | | | | | 379 | | | | 387,528 | |
Linn Energy LLC/Linn Energy Finance Corp.: | | | | | | | | | | | | | | |
8.63%, 4/15/20 (d) | | | | | | | 903 | | | | 984,270 | |
7.75%, 2/01/21 | | | | | | | 215 | | | | 232,738 | |
Memorial Production Partners LP/Memorial Production Finance Corp., 7.63%, 5/01/21 | | | | | | | 344 | | | | 362,920 | |
Oasis Petroleum, Inc.: | | | | | | | | | | | | | | |
7.25%, 2/01/19 | | | | | | | 380 | | | | 408,500 | |
6.50%, 11/01/21 | | | | | | | 410 | | | | 442,800 | |
6.88%, 3/15/22 (b) | | | | | | | 479 | | | | 519,715 | |
PBF Holding Co. LLC/PBF Finance Corp., 8.25%, 2/15/20 | | | | | | | 202 | | | | 221,695 | |
Penn Virginia Resource Partners LP/Penn Virginia Resource Finance Corp. II, 8.38%, 6/01/20 | | | | | | | 351 | | | | 392,243 | |
Petrobras Global Finance BV, 3.00%, 1/15/19 (d) | | | | | | | 768 | | | | 732,663 | |
Range Resources Corp.: | | | | | | | | | | | | | | |
6.75%, 8/01/20 (d) | | | | | | | 815 | | | | 886,312 | |
5.75%, 6/01/21 | | | | | | | 161 | | | | 173,075 | |
RKI Exploration & Production LLC/RKI Finance Corp., 8.50%, 8/01/21 (b) | | | | | | | 143 | | | | 153,725 | |
Rosetta Resources, Inc., 5.63%, 5/01/21 | | | | | | | 379 | | | | 390,370 | |
Sabine Pass Liquefaction LLC, 5.63%, 4/15/23 (b)(d) | | | | | | | 754 | | | | 740,805 | |
Sabine Pass LNG LP, 7.50%, 11/30/16 (d) | | | | | | | 3,110 | | | | 3,452,100 | |
See Notes to Financial Statements.
| 36 | SEMI-ANNUAL REPORT | FEBRUARY 28, 2014
|
| |
| Consolidated Schedule of Investments (continued) | BlackRock Limited Duration Income Trust (BLW)
(Percentages shown are based on Net Assets)
|
| Corporate Bonds | | | | | | Par
(000) | | Value |
Oil, Gas & Consumable Fuels (concluded) | | | | | | | | | | | | | | |
SandRidge Energy, Inc.: | | | | | | | | | | | | | | |
8.75%, 1/15/20 | | | | USD | | | 94 | | | $ | 101,755 | |
7.50%, 2/15/23 (d) | | | | | | | 1,096 | | | | 1,156,280 | |
SM Energy Co.: | | | | | | | | | | | | | | |
6.63%, 2/15/19 | | | | | | | 60 | | | | 64,350 | |
6.50%, 11/15/21 (d) | | | | | | | 605 | | | | 656,425 | |
Summit Midstream Holdings LLC/Summit Midstream Finance Corp., 7.50%, 7/01/21 (b) | | | | | | | 636 | | | | 674,160 | |
Tesoro Logistics LP/Tesoro Logistics Finance Corp., 5.88%, 10/01/20 (d) | | | | | | | 176 | | | | 183,920 | |
Ultra Petroleum Corp., 5.75%, 12/15/18 (b) | | | | | | | 425 | | | | 445,187 | |
Whiting Petroleum Corp., 5.00%, 3/15/19 (d) | | | | | | | 1,426 | | | | 1,507,995 | |
| | | | | | | | | | | 25,286,484 | |
Paper & Forest Products — 0.2% | | | | | | | | | | | | | | |
Ainsworth Lumber Co., Ltd., 7.50%, 12/15/17 (b)(d) | | | | | | | 728 | | | | 780,780 | |
NewPage Corp., 11.38%, 12/31/14 (a)(j) | | | | | | | 3,177 | | | | — | |
Sappi Papier Holding GmbH, 8.38%, 6/15/19 (b)(d) | | | | | | | 305 | | | | 338,550 | |
| | | | | | | | | | | 1,119,330 | |
Pharmaceuticals — 1.0% | | | | | | | | | | | | | | |
Capsugel SA, 7.00% (7.00% Cash or 7.75% PIK), 5/15/19 (b)(e) | | | | | | | 156 | | | | 161,850 | |
Endo Finance LLC, 5.75%, 1/15/22 (b) | | | | | | | 517 | | | | 533,803 | |
Forest Laboratories, Inc., 4.38%, 2/01/19 (b) | | | | | | | 585 | | | | 625,950 | |
Salix Pharmaceuticals Ltd., 6.00%, 1/15/21 (b) | | | | | | | 140 | | | | 149,800 | |
Valeant Pharmaceuticals International (b): | | | | | | | | | | | | | | |
6.88%, 12/01/18 (d) | | | | | | | 1,210 | | | | 1,287,137 | |
7.50%, 7/15/21 | | | | | | | 335 | | | | 381,900 | |
Valeant Pharmaceuticals International, Inc. (b): | | | | | | | | | | | | | | |
6.75%, 8/15/18 (d) | | | | | | | 2,214 | | | | 2,440,935 | |
6.38%, 10/15/20 (d) | | | | | | | 613 | | | | 669,702 | |
5.63%, 12/01/21 | | | | | | | 520 | | | | 551,850 | |
| | | | | | | | | | | 6,802,927 | |
Professional Services — 0.1% | | | | | | | | | | | | | | |
Truven Health Analytics, Inc., 10.63%, 6/01/20 (d) | | | | | | | 540 | | | | 611,550 | |
Real Estate Investment Trusts (REITs) — 0.5% | | | | | | | | | | | | | | |
Cantor Commercial Real Estate Co. LP/CCRE Finance Corp., 7.75%, 2/15/18 (b)(d) | | | | | | | 634 | | | | 684,720 | |
Felcor Lodging LP, 6.75%, 6/01/19 (d) | | | | | | | 820 | | | | 881,500 | |
iStar Financial, Inc., 4.88%, 7/01/18 | | | | | | | 449 | | | | 453,490 | |
Ventas Realty LP/Ventas Capital Corp., 4.75%, 6/01/21 (d) | | | | | | | 1,300 | | | | 1,399,120 | |
| | | | | | | | | | | 3,418,830 | |
Real Estate Management & Development — 1.1% | | | | | | | | | | | | | | |
Realogy Corp. (b): | | | | | | | | | | | | | | |
7.88%, 2/15/19 (d) | | | | | | | 1,833 | | | | 1,988,805 | |
7.63%, 1/15/20 (d) | | | | | | | 1,081 | | | | 1,213,422 | |
9.00%, 1/15/20 | | | | | | | 301 | | | | 346,150 | |
The Realogy Group LLC/Sunshine Group Florida Ltd., 3.38%, 5/01/16 (b)(d) | | | | | | | 756 | | | | 763,560 | |
Rialto Holdings LLC/Rialto Corp., 7.00%, 12/01/18 (b) | | | | | | | 220 | | | | 224,400 | |
RPG Byty Sro, 6.75%, 5/01/20 | | | | EUR | | | 220 | | | | 315,813 | |
Shea Homes LP/Shea Homes Funding Corp., 8.63%, 5/15/19 (d) | | | | USD | | | 2,110 | | | | 2,326,275 | |
| | | | | | | | | | | 7,178,425 | |
Road & Rail — 0.9% | | | | | | | | | | | | | | |
Asciano Finance, Ltd., 3.13%, 9/23/15 (b)(d) | | | | | | | 3,400 | | | | 3,494,612 | |
The Hertz Corp.: | | | | | | | | | | | | | | |
7.50%, 10/15/18 (d) | | | | | | | 540 | | | | 577,125 | |
6.75%, 4/15/19 | | | | | | | 405 | | | | 433,856 | |
5.88%, 10/15/20 | | | | | | | 435 | | | | 461,100 | |
7.38%, 1/15/21 (d) | | | | | | | 675 | | | | 742,500 | |
Watco Cos. LLC/Watco Finance Corp., 6.38%, 4/01/23 (b) | | | | | | | 319 | | | | 322,190 | |
| | | | | | | | | | | 6,031,383 | |
| | | | | | | | | | | | | |
| Corporate Bonds | | | | | | Par
(000) | | Value |
Semiconductors & Semiconductor Equipment — 0.3% |
GCS Holdco Finance I SA, 6.50%, 11/15/18 | | | | EUR | | | 100 | | | $ | 147,002 | |
NXP BV/NXP Funding LLC (b)(d): | | | | | | | | | | | | | | |
3.75%, 6/01/18 | | | | USD | | | 950 | | | | 960,687 | |
5.75%, 2/15/21 | | | | | | | 560 | | | | 596,400 | |
| | | | | | | | | | | 1,704,089 | |
Software — 0.7% | | | | | | | | | | | | | | |
Activision Blizzard, Inc. (b): | | | | | | | | | | | | | | |
5.63%, 9/15/21 (d) | | | | | | | 467 | | | | 502,025 | |
6.13%, 9/15/23 | | | | | | | 163 | | | | 176,855 | |
Healthcare Technology Intermediate, Inc., 7.38% (7.38% Cash or 8.13% PIK), 9/01/18 (b)(e) | | | | | | | 298 | | | | 308,430 | |
Infor US, Inc., 9.38%, 4/01/19 (d) | | | | | | | 2,000 | | | | 2,260,000 | |
Nuance Communications, Inc., 5.38%, 8/15/20 (b)(d) | | | | | | | 1,715 | | | | 1,719,287 | |
| | | | | | | | | | | 4,966,597 | |
Specialty Retail — 0.6% | | | | | | | | | | | | | | |
Claire’s Stores, Inc. (b): | | | | | | | | | | | | | | |
9.00%, 3/15/19 (d) | | | | | | | 1,034 | | | | 1,088,285 | |
7.75%, 6/01/20 | | | | | | | 219 | | | | 183,413 | |
Magnolia BC SA, 9.00%, 8/01/20 | | | | EUR | | | 274 | | | | 400,894 | |
Michaels Stores, Inc., 7.75%, 11/01/18 | | | | USD | | | 317 | | | | 339,982 | |
New Academy Finance Co. LLC/New Academy Finance Corp., 8.00% (8.00% Cash or 8.75% PIK), 6/15/18 (b)(e) | | | | | | | 218 | | | | 222,905 | |
New Look Bondco I PLC, 8.75%, 5/14/18 | | | | GBP | | | 100 | | | | 181,270 | |
Party City Holdings, Inc., 8.88%, 8/01/20 (d) | | | | USD | | | 374 | | | | 417,010 | |
PC Nextco Holdings LLC/PC Nextco Finance, Inc.,
8.75% (8.75% Cash or 9.50% PIK), 8/15/19 (b)(e) | | | | | | | 252 | | | | 260,190 | |
QVC, Inc., 7.50%, 10/01/19 (b)(d) | | | | | | | 410 | | | | 438,625 | |
Sally Holdings LLC/Sally Capital, Inc., 5.50%, 11/01/23 (d) | | | | | | | 508 | | | | 515,620 | |
| | | | | | | | | | | 4,048,194 | |
Textiles, Apparel & Luxury Goods — 0.2% | | | | | | | | | | | | | | |
Levi Strauss & Co., 6.88%, 5/01/22 (d) | | | | | | | 380 | | | | 416,100 | |
SIWF Merger Sub, Inc., 6.25%, 6/01/21 (b)(d) | | | | | | | 645 | | | | 661,125 | |
The William Carter Co., 5.25%, 8/15/21 (b) | | | | | | | 346 | | | | 354,650 | |
| | | | | | | | | | | 1,431,875 | |
Trading Companies & Distributors — 0.2% | | | | | | | | | | | | | | |
Ashtead Capital, Inc., 6.50%, 7/15/22 (b)(d) | | | | | | | 1,054 | | | | 1,143,590 | |
Transportation Infrastructure — 1.8% | | | | | | | | | | | | | | |
Aguila 3 SA, 7.88%, 1/31/18 (b) | | | | | | | 848 | | | | 901,000 | |
Federal Express Corp. 2012 Pass-Through Trust, 2.63%, 1/15/18 (b)(d) | | | | | | | 917 | | | | 929,293 | |
Penske Truck Leasing Co. LP/PTL Finance Corp. (b)(d): | | | | | | | | | | | | | | |
3.13%, 5/11/15 | | | | | | | 3,372 | | | | 3,465,934 | |
3.38%, 3/15/18 | | | | | | | 6,155 | | | | 6,470,758 | |
| | | | | | | | | | | 11,766,985 | |
Wireless Telecommunication Services — 2.5% | | | | | | | | | | | | | | |
Crown Castle Towers LLC, 4.52%, 1/15/35 (b)(d) | | | | | | | 3,000 | | | | 3,081,309 | |
Digicel Ltd., 6.00%, 4/15/21 (b)(d) | | | | | | | 2,073 | | | | 2,083,365 | |
The Geo Group, Inc., 5.88%, 1/15/22 | | | | | | | 340 | | | | 346,800 | |
Phones4u Finance PLC, 9.50%, 4/01/18 | | | | GBP | | | 103 | | | | 181,127 | |
Sprint Communications, Inc. (b)(d): | | | | | | | | | | | | | | |
9.00%, 11/15/18 | | | | USD | | | 2,020 | | | | 2,474,500 | |
7.00%, 3/01/20 | | | | | | | 1,361 | | | | 1,571,955 | |
Sprint Corp. (b): | | | | | | | | | | | | | | |
7.88%, 9/15/23 (d) | | | | | | | 2,325 | | | | 2,574,937 | |
7.13%, 6/15/24 | | | | | | | 405 | | | | 425,250 | |
T-Mobile USA, Inc.: | | | | | | | | | | | | | | |
6.63%, 4/28/21 (d) | | | | | | | 1,380 | | | | 1,493,850 | |
6.13%, 1/15/22 | | | | | | | 215 | | | | 227,094 | |
6.73%, 4/28/22 (d) | | | | | | | 1,455 | | | | 1,571,400 | |
6.50%, 1/15/24 | | | | | | | 395 | | | | 418,700 | |
Wind Acquisition Finance SA, 6.50%, 4/30/20 (b) | | | | | | | 311 | | | | 342,878 | |
| | | | | | | | | | | 16,793,165 | |
Total Corporate Bonds — 62.8% | | | | | | | | | | | 421,928,052 | |
See Notes to Financial Statements.
| SEMI-ANNUAL REPORT | FEBRUARY 28, 2014 | 37
|
| |
| Consolidated Schedule of Investments (continued) | BlackRock Limited Duration Income Trust (BLW)
(Percentages shown are based on Net Assets)
|
| Floating Rate Loan Interests (c) | | | | | | Par
(000) | | Value |
Aerospace & Defense — 0.7% | | | | | | | | | | | | | | |
DigitalGlobe, Inc., Term Loan B, 3.75%, 1/31/20 | | | | USD | | | 1,290 | | | $ | 1,288,637 | |
Transdigm, Inc., Term Loan C, 3.75%, 2/28/20 | | | | | | | 653 | | | | 655,850 | |
TransUnion LLC, Term Loan, 4.25%, 2/10/19 | | | | | | | 2,571 | | | | 2,577,617 | |
| | | | | | | | | | | 4,522,104 | |
Airlines — 0.3% | | | | | | | | | | | | | | |
Northwest Airlines, Inc., Term Loan: | | | | | | | | | | | | | | |
2.24%, 3/10/17 | | | | | | | 527 | | | | 508,126 | |
1.62%, 9/10/18 | | | | | | | 690 | | | | 652,050 | |
US Airways Group, Inc., Term Loan B1, 3.50%, 5/23/19 | | | | | | | 665 | | | | 665,206 | |
| | | | | | | | | | | 1,825,382 | |
Auto Components — 2.3% | | | | | | | | | | | | | | |
Affinia Group Intermediate Holdings, Inc., Term Loan B2, 4.75%, 4/27/20 | | | | | | | 905 | | | | 906,202 | |
Autoparts Holdings Ltd.: | | | | | | | | | | | | | | |
1st Lien Term Loan, 6.50%, 7/28/17 | | | | | | | 964 | | | | 965,091 | |
2nd Lien Term Loan, 10.50%, 1/29/18 | | | | | | | 1,500 | | | | 1,430,625 | |
Dayco Products LLC, Term Loan B, 5.25%, 12/12/19 | | | | | | | 860 | | | | 867,525 | |
Federal-Mogul Corp.: | | | | | | | | | | | | | | |
Term Loan B, 2.10%, 12/29/14 | | | | | | | 3,883 | | | | 3,851,304 | |
Term Loan C, 2.10%, 12/28/15 | | | | | | | 3,169 | | | | 3,143,037 | |
The Goodyear Tire & Rubber Co., 2nd Lien Term Loan, 4.75%, 4/30/19 | | | | | | | 2,985 | | | | 3,012,611 | |
Schaeffler AG, Term Loan C, 4.25%, 1/27/17 | | | | | | | 45 | | | | 45,295 | |
Transtar Holding Co., 1st Lien Term Loan, 5.50%, 10/09/18 | | | | | | | 1,269 | | | | 1,246,731 | |
| | | | | | | | | | | 15,468,421 | |
Automobiles — 0.1% | | | | | | | | | | | | | | |
Chrysler Group LLC, 2018 Term Loan B, 3.25%, 12/31/18 | | | | | | | 345 | | | | 343,213 | |
Beverages — 0.0% | | | | | | | | | | | | | | |
Le-Nature’s, Inc., Tranche B Term Loan, 3/01/2011 (a)(j) | | | | | | | 1,000 | | | | 100 | |
Building Products — 0.7% | | | | | | | | | | | | | | |
Continental Building Products LLC, 1st Lien Term Loan, 4.75%, 8/14/20 | | | | | | | 913 | | | | 912,329 | |
CPG International, Inc., Term Loan, 4.75%, 9/30/20 | | | | | | | 1,377 | | | | 1,377,417 | |
Ply Gem Industries, Inc., Term Loan, 4.00%, 1/16/21 | | | | | | | 125 | | | | 125,209 | |
Quikrete Holdings, Inc., 1st Lien Term Loan, 4.00%, 9/28/20 | | | | | | | 549 | | | | 549,766 | |
United Subcontractors, Inc., Term Loan, 4.25%, 6/30/15 | | | | | | | 172 | | | | 167,251 | |
Wilsonart LLC: | | | | | | | | | | | | | | |
Incremental Term Loan B2, 4.00%, 10/31/19 | | | | | | | 770 | | | | 768,075 | |
Term Loan B, 4.00%, 10/31/19 | | | | | | | 812 | | | | 810,786 | |
| | | | | | | | | | | 4,710,833 | |
Capital Markets — 0.1% | | | | | | | | | | | | | | |
American Capital Holdings, Inc., 2017 Term Loan, 3.50%, 8/22/17 | | | | | | | 581 | | | | 581,401 | |
KCG Holdings, Inc., Term Loan B, 5.75%, 12/05/17 | | | | | | | 198 | | | | 198,579 | |
| | | | | | | | | | | 779,980 | |
Chemicals — 1.7% | | | | | | | | | | | | | | |
Allnex USA, Inc.: | | | | | | | | | | | | | | |
Term Loan B1, 4.50%, 10/03/19 | | | | | | | 321 | | | | 322,338 | |
Term Loan B2, 4.50%, 10/03/19 | | | | | | | 167 | | | | 167,246 | |
Axalta Coating Systems US Holdings, Inc., Term Loan, 4.00%, 2/01/20 | | | | | | | 2,094 | | | | 2,101,651 | |
CeramTec Acquisition Corp., Term Loan B2, 4.25%, 8/28/20 | | | | | | | 46 | | | | 45,593 | |
Chemtura Corp., Term Loan B, 3.50%, 8/27/16 | | | | | | | 247 | | | | 248,858 | |
Chromaflo Technologies Corp.: | | | | | | | | | | | | | | |
1st Lien Term Loan, 4.50%, 12/02/19 | | | | | | | 660 | | | | 661,650 | |
2nd Lien Term Loan, 8.25%, 5/30/20 | | | | | | | 560 | | | | 564,200 | |
Evergreen Acqco 1 LP, Term Loan, 5.00%, 7/09/19 | | | | | | | 773 | | | | 775,422 | |
INEOS Finance LLC, 6 Year Term Loan, 3.75%, 5/04/18 | | | | | | | 665 | | | | 663,151 | |
| | | | | | | | | | | | | |
| Floating Rate Loan Interests (c) | | | | | | Par
(000) | | Value |
Chemicals (concluded) | | | | | | | | | | | | | | |
MacDermid, Inc., 1st Lien Term Loan, 4.00%, 6/08/20 | | | | USD | | | 667 | | | $ | 669,317 | |
Nexeo Solutions LLC, Term Loan B, 5.00%, 9/08/17 | | | | | | | 1,264 | | | | 1,255,565 | |
OXEA Finance LLC: | | | | | | | | | | | | | | |
2nd Lien Term Loan, 8.25%, 7/15/20 | | | | | | | 705 | | | | 718,437 | |
Term Loan B2, 4.25%, 1/15/20 | | | | | | | 678 | | | | 682,539 | |
Royal Adhesives and Sealants LLC, 1st Lien Term Loan, 5.50%, 7/31/18 | | | | | | | 789 | | | | 799,350 | |
Tata Chemicals North America, Inc., Term Loan B, 3.75%, 8/07/20 | | | | | | | 662 | | | | 663,329 | |
Tronox Pigments (Netherlands) BV, Term Loan, 4.50%, 3/19/20 | | | | | | | 938 | | | | 940,414 | |
| | | | | | | | | | | 11,279,060 | |
Commercial Banks — 0.1% | | | | | | | | | | | | | | |
Redtop Acquisitions Ltd.: | | | | | | | | | | | | | | |
1st Lien Term Loan, 4.50%, 12/03/20 | | | | | | | 420 | | | | 422,449 | |
2nd Lien Term Loan, 8.25%, 6/03/21 | | | | | | | 355 | | | | 362,100 | |
| | | | | | | | | | | 784,549 | |
Commercial Services & Supplies — 1.6% | | | | | | | | | | | | | | |
ADS Waste Holdings, Inc., Term Loan, 3.75%, 10/09/19 | | | | | | | 1,475 | | | | 1,473,260 | |
AWAS Finance Luxembourg 2012 SA, Term Loan, 3.50%, 7/16/18 | | | | | | | 1,239 | | | | 1,241,996 | |
AWAS Finance Luxembourg Sarl, Term Loan B, 3.50%, 6/10/16 | | | | | | | 584 | | | | 585,258 | |
Brand Energy & Infrastructure Services, Inc., Term Loan B, 4.75%, 11/26/20 | | | | | | | 1,570 | | | | 1,575,410 | |
Catalent Pharma Solutions, Inc., Term Loan, 6.50%, 12/29/17 | | | | | | | 370 | | | | 374,625 | |
KAR Auction Services, Inc., Term Loan B, 3.75%, 5/19/17 | | | | | | | 967 | | | | 966,991 | |
Livingston International, Inc.: | | | | | | | | | | | | | | |
1st Lien Term Loan, 5.00%, 4/16/19 | | | | | | | 776 | | | | 778,040 | |
2nd Lien Term Loan, 9.00%, 4/20/20 | | | | | | | 352 | | | | 358,898 | |
Protection One, Inc., Term Loan, 4.25%, 3/21/19 | | | | | | | 572 | | | | 570,293 | |
Spin Holdco, Inc., Term Loan B, 4.25%, 11/14/19 | | | | | | | 1,787 | | | | 1,788,346 | |
West Corp., Term Loan B10, 3.25%, 6/30/18 | | | | | | | 982 | | | | 976,403 | |
| | | | | | | | | | | 10,689,520 | |
Communications Equipment — 1.6% | | | | | | | | | | | | | | |
Alcatel-Lucent USA, Inc., Term Loan C, 4.50%, 1/30/19 | | | | | | | 4,257 | | | | 4,292,548 | |
Applied Systems, Inc.: | | | | | | | | | | | | | | |
1st Lien Term Loan, 4.25%, 1/25/21 | | | | | | | 330 | | | | 332,062 | |
2nd Lien Term Loan, 7.50%, 1/24/22 | | | | | | | 265 | | | | 270,499 | |
Avaya, Inc., Extended Term Loan B3, 4.73%, 10/26/17 | | | | | | | 765 | | | | 744,241 | |
CommScope, Inc.: | | | | | | | | | | | | | | |
Term Loan B3, 2.65% – 2.73%, 1/21/17 | | | | | | | 436 | | | | 435,590 | |
Term Loan B4, 3.25%, 1/26/18 | | | | | | | 655 | | | | 655,428 | |
Telesat Canada, Term Loan A, 4.28%, 3/24/17 | | | | CAD | | | 1,743 | | | | 1,574,325 | |
Zayo Group LLC/Zayo Capital, Inc., Term Loan B, 4.00%, 7/02/19 | | | | USD | | | 2,295 | | | | 2,299,721 | |
| | | | | | | | | | | 10,604,414 | |
Construction & Engineering — 0.4% | | | | | | | | | | | | | | |
Centaur Acquisition LLC: | | | | | | | | | | | | | | |
1st Lien Term Loan, 5.25%, 2/20/19 | | | | | | | 1,277 | | | | 1,279,089 | |
2nd Lien Term Loan, 8.75%, 2/15/20 | | | | | | | 710 | | | | 724,200 | |
USIC Holdings, Inc., 1st Lien Term Loan, 4.00%, 7/10/20 | | | | | | | 473 | | | | 471,836 | |
| | | | | | | | | | | 2,475,125 | |
Construction Materials — 0.5% | | | | | | | | | | | | | | |
Filtration Group Corp.: | | | | | | | | | | | | | | |
1st Lien Term Loan, 4.50%, 11/21/20 | | | | | | | 505 | | | | 509,000 | |
2nd Lien Term Loan, 8.25%, 11/21/21 | | | | | | | 605 | | | | 617,856 | |
HD Supply, Inc., Term Loan B, 4.00%, 6/28/18 | | | | | | | 1,878 | | | | 1,883,427 | |
McJunkin Red Man Corp., Term Loan, 5.00%, 11/08/19 | | | | | | | 379 | | | | 382,935 | |
| | | | | | | | | | | 3,393,218 | |
See Notes to Financial Statements.
| 38 | SEMI-ANNUAL REPORT | FEBRUARY 28, 2014
|
| |
| Consolidated Schedule of Investments (continued) | BlackRock Limited Duration Income Trust (BLW)
(Percentages shown are based on Net Assets)
|
| Floating Rate Loan Interests (c) | | | | | | Par
(000) | | Value |
Consumer Finance — 0.2% | | | | | | | | | | | | | | |
Springleaf Financial Funding Co., Term Loan B2, 4.75%, 9/25/19 | | | | USD | | | 1,220 | | | $ | 1,234,030 | |
Containers & Packaging — 0.2% | | | | | | | | | | | | | | |
Ardagh Holdings USA, Inc.: | | | | | | | | | | | | | | |
Incremental Term Loan, 4.00%, 12/17/19 | | | | | | | 385 | | | | 386,444 | |
Term Loan B, 4.25%, 12/17/19 | | | | | | | 490 | | | | 491,877 | |
Berry Plastics Holding Corp., Term Loan E, 3.75%, 1/09/21 | | | | | | | 345 | | | | 343,965 | |
Sealed Air Corp., 2013 Term Loan, 3.00%, 10/03/18 | | | | | | | 452 | | | | 453,524 | |
| | | | | | | | | | | 1,675,810 | |
Distributors — 0.4% | | | | | | | | | | | | | | |
ABC Supply Co., Inc., Term Loan, 3.50%, 4/16/20 | | | | | | | 2,100 | | | | 2,100,389 | |
Crossmark Holdings, Inc., 1st Lien Term Loan, 4.50%, 12/20/19 | | | | | | | 381 | | | | 379,484 | |
VWR Funding, Inc., Term Loan, 3.45%, 4/03/17 | | | | | | | 455 | | | | 455,400 | |
| | | | | | | | | | | 2,935,273 | |
Diversified Consumer Services — 0.8% | | | | | | | | | | | | | | |
Allied Security Holdings, LLC: | | | | | | | | | | | | | | |
1st Lien Term Loan, 4.25%, 2/12/21 | | | | | | | 517 | | | | 516,763 | |
Delayed Draw Term Loan, 0.50%, 2/12/21 | | | | | | | 184 | | | | 183,458 | |
Bright Horizons Family Solutions, Inc., Term Loan B, 4.00%, 1/30/20 | | | | | | | 777 | | | | 778,285 | |
Doncasters Finance US LLC, Term Loan, 5.50%, 4/09/20 | | | | | | | 551 | | | | 555,828 | |
Garda World Securities Corp.: | | | | | | | | | | | | | | |
Delayed Draw Term Loan, 4.00%, 11/06/20 | | | | | | | 76 | | | | 76,373 | |
Term Loan B, 4.00%, 11/06/20 | | | | | | | 298 | | | | 298,549 | |
ROC Finance LLC, Term Loan, 5.00%, 6/20/19 | | | | | | | 628 | | | | 611,929 | |
ServiceMaster Co., Term Loan, 4.25%, 1/31/17 | | | | | | | 1,038 | | | | 1,037,737 | |
Weight Watchers International, Inc., Term Loan B2, 4.00%, 4/02/20 | | | | | | | 1,665 | | | | 1,270,980 | |
| | | | | | | | | | | 5,329,902 | |
Diversified Financial Services — 1.0% | | | | | | | | | | | | | | |
ION Trading Technologies Sarl: | | | | | | | | | | | | | | |
1st Lien Term Loan, 4.50%, 5/22/20 | | | | | | | 526 | | | | 529,295 | |
2nd Lien Term Loan, 8.25%, 5/21/21 | | | | | | | 310 | | | | 313,100 | |
Kasima LLC, Term Loan B, 3.25%, 5/17/21 | | | | | | | 740 | | | | 739,075 | |
Reynolds Group Holdings, Inc., Dollar Term Loan, 4.00%, 12/01/18 | | | | | | | 1,517 | | | | 1,527,303 | |
RPI Finance Trust, Term Loan B3, 3.25%, 11/09/18 | | | | | | | 453 | | | | 455,942 | |
SAM Finance Luxembourg Sarl, Term Loan, 4.25%, 12/17/20 | | | | | | | 1,125 | | | | 1,126,879 | |
WMG Acquisition Corp., Term Loan, 3.75%, 7/01/20 | | | | | | | 1,736 | | | | 1,733,047 | |
| | | | | | | | | | | 6,424,641 | |
Diversified Telecommunication Services — 1.9% | | | | | | | | | | | | | | |
Consolidated Communications, Inc., Term Loan B, 4.25%, 12/23/20 | | | | | | | 2,238 | | | | 2,250,956 | |
Hawaiian Telcom Communications, Inc., Term Loan B, 5.00%, 6/06/19 | | | | | | | 1,733 | | | | 1,740,147 | |
Integra Telecom, Inc.: | | | | | | | | | | | | | | |
2nd Lien Term Loan, 9.75%, 2/21/20 | | | | | | | 1,270 | | | | 1,302,068 | |
Term Loan B, 5.25%, 2/22/19 | | | | | | | 1,166 | | | | 1,176,683 | |
Level 3 Financing, Inc., 2020 Term Loan B, 4.00%, 1/15/20 | | | | | | | 4,865 | | | | 4,877,162 | |
Syniverse Holdings, Inc., Term Loan B, 4.00%, 4/23/19 | | | | | | | 509 | | | | 510,750 | |
US Telepacific Corp., Term Loan B, 5.75%, 2/23/17 | | | | | | | 993 | | | | 998,757 | |
| | | | | | | | | | | 12,856,523 | |
Electric Utilities — 0.3% | | | | | | | | | | | | | | |
American Energy — Utica LLC, 2nd Lien Term Loan, 11.00%, 9/30/18 | | | | | | | 965 | | | | 1,008,425 | |
Sandy Creek Energy Associates LP, Term Loan B, 5.00%, 11/06/20 | | | | | | | 855 | | | | 856,736 | |
| | | | | | | | | | | 1,865,161 | |
| | | | | | | | | | | | | |
| Floating Rate Loan Interests (c) | | | | | | Par
(000) | | Value |
Electrical Equipment — 0.9% | | | | | | | | | | | | | | |
Southwire Co., Term Loan, 3.25%, 2/11/21 | | | | USD | | | 455 | | | $ | 454,755 | |
Texas Competitive Electric Holdings Co. LLC, Extended Term Loan, 4.74%, 10/10/17 | | | | | | | 7,640 | | | | 5,324,545 | |
| | | | | | | | | | | 5,779,300 | |
Electronic Equipment, Instruments & Components — 0.1% |
CDW LLC, Term Loan, 3.25%, 4/29/20 | | | | | | | 844 | | | | 839,054 | |
Energy Equipment & Services — 0.4% | | | | | | | | | | | | | | |
Dynegy Holdings, Inc., Term Loan B2, 4.00%, 4/23/20 | | | | | | | 1,104 | | | | 1,107,763 | |
MEG Energy Corp., Refinancing Term Loan, 3.75%, 3/31/20 | | | | | | | 647 | | | | 648,641 | |
Seadrill Partners Finco LLC, Term Loan B, 4.00%, 2/21/21 | | | | | | | 250 | | | | 250,678 | |
Unifrax Corp., Term Loan, 4.25%, 11/28/18 | | | | | | | 548 | | | | 549,179 | |
| | | | | | | | | | | 2,556,261 | |
Food & Staples Retailing — 0.3% | | | | | | | | | | | | | | |
Rite Aid Corp.: | | | | | | | | | | | | | | |
2nd Lien Term Loan, 5.75%, 8/21/20 | | | | | | | 240 | | | | 244,999 | |
Term Loan 6, 4.00%, 2/21/20 | | | | | | | 258 | | | | 258,889 | |
Supervalu, Inc., Refinancing Term Loan B, 4.50%, 3/21/19 | | | | | | | 903 | | | | 906,300 | |
US Foods, Inc., Refinancing Term Loan, 4.50%, 3/29/19 | | | | | | | 299 | | | | 299,993 | |
| | | | | | | | | | | 1,710,181 | |
Food Products — 1.2% | | | | | | | | | | | | | | |
AdvancePierre Foods, Inc., Term Loan, 5.75%, 7/10/17 | | | | | | | 707 | | | | 709,349 | |
CTI Foods Holding Co. LLC, 1st Lien Term Loan, 4.50%, 6/29/20 | | | | | | | 653 | | | | 653,637 | |
Del Monte Foods Co., 1st Lien Term Loan, 4.25%, 11/06/20 | | | | | | | 645 | | | | 645,806 | |
Diamond Foods, Inc., Term Loan, 4.25%, 7/28/18 | | | | | | | 260 | | | | 259,834 | |
Dole Food Co., Inc., Term Loan B, 4.50%, 11/01/18 | | | | | | | 1,065 | | | | 1,070,591 | |
Performance Food Group Co., 2nd Lien Term Loan, 6.25%, 11/14/19 | | | | | | | 1,045 | | | | 1,060,421 | |
Pinnacle Foods Finance LLC, Term Loan G, 3.25%, 4/29/20 | | | | | | | 1,191 | | | | 1,186,165 | |
Reddy Ice Corp.: | | | | | | | | | | | | | | |
1st Lien Term Loan, 6.75% – 7.75%, 5/01/19 | | | | | | | 1,479 | | | | 1,471,431 | |
2nd Lien Term Loan, 10.75%, 11/01/19 | | | | | | | 1,380 | | | | 1,338,600 | |
| | | | | | | | | | | 8,395,834 | |
Health Care Equipment & Supplies — 1.7% | | | | | | | | | | | | | | |
Arysta LifeScience Corp.: | | | | | | | | | | | | | | |
1st Lien Term Loan, 4.50%, 5/29/20 | | | | | | | 1,478 | | | | 1,482,495 | |
2nd Lien Term Loan, 8.25%, 11/30/20 | | | | | | | 530 | | | | 537,287 | |
Biomet, Inc., Term Loan B2, 3.65% – 3.75%, 7/25/17 | | | | | | | 1,239 | | | | 1,240,447 | |
Capital Safety North America Holding, Inc., Term Loan, 4.50%, 1/21/19 | | | | | | | 983 | | | | 982,575 | |
Capsugel Holdings US, Inc., Term Loan B, 3.50%, 8/01/18 | | | | | | | 549 | | | | 548,400 | |
DJO Finance LLC, Term Loan B3, 4.75%, 9/15/17 | | | | | | | 1,705 | | | | 1,713,674 | |
Fresenius SE & Co. KGaA, Incremental Term Loan B, 2.47%, 6/30/19 | | | | EUR | | | 610 | | | | 840,931 | |
The Hologic, Inc., Term Loan B, 3.25%, 8/01/19 | | | | USD | | | 1,317 | | | | 1,313,771 | |
Immucor, Inc., Refinancing Term Loan B2, 5.00%, 8/17/18 | | | | | | | 636 | | | | 639,520 | |
Kinetic Concepts, Inc., Term Loan E1, 4.00%, 5/04/18 | | | | | | | 274 | | | | 275,111 | |
LHP Hospital Group, Inc., Term Loan, 9.00%, 7/03/18 | | | | | | | 532 | | | | 517,689 | |
Onex Carestream Finance LP: | | | | | | | | | | | | | | |
1st Lien Term Loan, 5.00%, 6/07/19 | | | | | | | 834 | | | | 843,003 | |
2nd Lien Term Loan, 9.50%, 12/07/19 | | | | | | | 740 | | | | 754,800 | |
| | | | | | | | | | | 11,689,703 | |
Health Care Providers & Services — 2.4% | | | | | | | | | | | | | | |
American Renal Holdings, Inc.: | | | | | | | | | | | | | | |
1st Lien Term Loan, 4.50%, 9/20/19 | | | | | | | 849 | | | | 848,588 | |
2nd Lien Term Loan, 8.50%, 2/14/20 | | | | | | | 890 | | | | 892,225 | |
See Notes to Financial Statements.
| SEMI-ANNUAL REPORT | FEBRUARY 28, 2014 | 39
|
| |
| Consolidated Schedule of Investments (continued) | BlackRock Limited Duration Income Trust (BLW)
(Percentages shown are based on Net Assets)
|
| Floating Rate Loan Interests (c) | | | | | | Par
(000) | | Value |
Health Care Providers & Services (concluded) | | | | | | | | | | | | | | |
Ardent Medical Services, Inc., Term Loan, 6.75%, 7/02/18 | | | | USD | | | 475 | | | $ | 476,388 | |
CHG Buyer Corp., Term Loan, 4.50%, 11/19/19 | | | | | | | 707 | | | | 710,084 | |
CHS/Community Health Systems, Inc., Term Loan D, 4.25%, 1/27/21 | | | | | | | 4,005 | | | | 4,038,362 | |
ConvaTec, Inc., Term Loan, 4.00%, 12/22/16 | | | | | | | 1,220 | | | | 1,225,733 | |
DaVita, Inc., Term Loan B, 4.50%, 10/20/16 | | | | | | | 1,940 | | | | 1,949,099 | |
Envision Acquisition Co. LLC, 1st Lien Term Loan, 5.75%, 11/04/20 | | | | | | | 903 | | | | 909,508 | |
Envision Healthcare Corp., Term Loan, 4.00%, 5/25/18 | | | | | | | 276 | | | | 276,325 | |
Genesis HealthCare Corp., Term Loan B, 10.00% – 10.75%, 9/25/17 | | | | | | | 1,041 | | | | 1,069,688 | |
Ikaria, Inc.: | | | | | | | | | | | | | | |
1st Lien Term Loan, 5.00%, 2/12/21 | | | | | | | 540 | | | | 543,040 | |
2nd Lien Term Loan, 8.75%, 1/17/22 | | | | | | | 270 | | | | 273,826 | |
inVentiv Health, Inc.: | | | | | | | | | | | | | | |
Combined Term Loan, 7.50%, 8/04/16 | | | | | | | 360 | | | | 359,188 | |
Incremental Term Loan B3, 7.75%, 5/15/18 | | | | | | | 232 | | | | 230,485 | |
National Mentor Holdings, Inc., Term Loan B, 4.75%, 1/27/21 | | | | | | | 580 | | | | 585,075 | |
Surgical Care Affiliates, Inc., Class C Incremental Term Loan, 4.25%, 6/29/18 | | | | | | | 597 | | | | 596,504 | |
US Renal Care, Inc., 2013 Term Loan, 4.25%, 7/03/19 | | | | | | | 1,150 | | | | 1,156,703 | |
| | | | | | | | | | | 16,140,821 | |
Health Care Technology — 0.1% | | | | | | | | | | | | | | |
IMS Health, Inc., Term Loan B1, 3.75%, 9/01/17 | | | | | | | 640 | | | | 639,380 | |
MedAssets, Inc., Term Loan B, 4.00%, 12/13/19 | | | | | | | 234 | | | | 234,256 | |
| | | | | | | | | | | 873,636 | |
Hotels, Restaurants & Leisure — 5.5% | | | | | | | | | | | | | | |
Bally Technologies, Inc., Term Loan B, 4.25%, 11/25/20 | | | | | | | 673 | | | | 677,016 | |
Bronco Midstream Funding LLC, Term Loan B, 5.00%, 8/17/20 | | | | | | | 1,284 | | | | 1,294,673 | |
Caesars Entertainment Resort Properties LLC, Term Loan B, 7.00%, 10/12/20 | | | | | | | 7,775 | | | | 7,890,226 | |
Four Seasons Holdings, Inc., 2nd Lien Term Loan, 6.25%, 12/28/20 | | | | | | | 585 | | | | 596,700 | |
Hilton Worldwide Finance LLC, Term Loan B2, 3.75%, 10/26/20 | | | | | | | 5,205 | | | | 5,220,813 | |
Intrawest ULC, Term Loan, 5.50%, 11/26/20 | | | | | | | 615 | | | | 620,381 | |
La Quinta Intermediate Holdings, Term Loan B, 4.00%, 2/19/21 | | | | | | | 5,085 | | | | 5,095,170 | |
Las Vegas Sands LLC, Term Loan B, 3.25%, 12/20/20 | | | | | | | 650 | | | | 649,324 | |
Marina District Finance Co., Inc., Term Loan B, 6.75%, 8/15/18 | | | | | | | 1,375 | | | | 1,386,454 | |
MGM Resorts International, Term Loan B, 3.50%, 12/20/19 | | | | | | | 1,075 | | | | 1,072,985 | |
OSI Restaurant Partners LLC, Term Loan, 3.50%, 10/25/19 | | | | | | | 580 | | | | 579,454 | |
Pinnacle Entertainment, Inc., Term Loan B2, 3.75%, 8/13/20 | | | | | | | 920 | | | | 921,240 | |
Playa Resorts Holding BV, Term Loan B, 4.75%, 8/06/19 | | | | | | | 723 | | | | 725,899 | |
Sabre, Inc.: | | | | | | | | | | | | | | |
Incremental Term Loan, 4.50%, 2/19/19 | | | | | | | 399 | | | | 399,375 | |
Term Loan B, 4.25%, 2/19/19 | | | | | | | 564 | | | | 564,419 | |
Station Casinos, Inc., Term Loan B, 5.00%, 3/02/20 | | | | | | | 3,260 | | | | 3,261,373 | |
Travelport LLC: | | | | | | | | | | | | | | |
2nd Lien PIK Term Loan 2, 4.00%, 12/01/16 (e) | | | | | | | 1,033 | | | | 1,060,918 | |
2nd Lien Term Loan 1, 9.50%, 1/29/16 | | | | | | | 1,178 | | | | 1,221,171 | |
Refinancing Term Loan, 6.25%, 6/26/19 | | | | | | | 1,577 | | | | 1,616,013 | |
Twin River Management Group, Inc., Term Loan B, 5.25%, 11/09/18 | | | | | | | 1,419 | | | | 1,429,025 | |
Wendy’s International, Inc., Term Loan B, 3.25%, 5/15/19 | | | | | | | 666 | | | | 665,009 | |
| | | | | | | | | | | 36,947,638 | |
| | | | | | | | | | | | | |
| Floating Rate Loan Interests (c) | | | | | | Par
(000) | | Value |
Household Products — 0.4% | | | | | | | | | | | | | | |
Bass Pro Group LLC, Term Loan, 3.75%, 11/20/19 | | | | USD | | | 1,156 | | | $ | 1,160,317 | |
Prestige Brands, Inc., Term Loan, 3.75% – 5.00%, 1/31/19 | | | | | | | 451 | | | | 452,222 | |
Spectrum Brands, Inc.: | | | | | | | | | | | | | | |
Term Loan A, 3.00%, 9/07/17 | | | | | | | 707 | | | | 707,765 | |
Term Loan C, 3.50%, 9/04/19 | | | | | | | 550 | | | | 549,576 | |
| | | | | | | | | | | 2,869,880 | |
Independent Power Producers & Energy Traders — 0.6% |
The AES Corp., Refinancing Term Loan B, 3.75%, 6/01/18 | | | | | | | 380 | | | | 381,430 | |
Calpine Corp., Term Loan B1, 4.00%, 4/02/18 | | | | | | | 1,054 | | | | 1,057,993 | |
La Frontera Generation LLC, Term Loan, 4.50%, 9/30/20 | | | | | | | 1,826 | | | | 1,828,508 | |
Star West Generation LLC, Term Loan B, 4.25%, 3/13/20 | | | | | | | 887 | | | | 889,493 | |
| | | | | | | | | | | 4,157,424 | |
Industrial Conglomerates — 0.3% | | | | | | | | | | | | | | |
Sequa Corp., Term Loan B, 5.25%, 6/19/17 | | | | | | | 1,834 | | | | 1,805,329 | |
Insurance — 1.4% | | | | | | | | | | | | | | |
Alliant Holdings I, Inc., Term Loan B, 4.25%, 12/20/19 | | | | | | | 1,064 | | | | 1,070,242 | |
Asurion LLC: | | | | | | | | | | | | | | |
2nd Lien Term Loan, 8.50%, 2/19/21 | | | | | | | 895 | | | | 922,969 | |
Term Loan B1, 4.50%, 5/24/19 | | | | | | | 1,504 | | | | 1,506,115 | |
CNO Financial Group, Inc., Term Loan B2, 3.75%, 9/20/18 | | | | | | | 1,312 | | | | 1,308,706 | |
Cooper Gay Swett & Crawford Ltd.: | | | | | | | | | | | | | | |
1st Lien Term Loan, 5.00%, 4/16/20 | | | | | | | 1,055 | | | | 1,038,004 | |
2nd Lien Term Loan, 8.25%, 10/16/20 | | | | | | | 500 | | | | 481,875 | |
Cunningham Lindsey US, Inc., 1st Lien Term Loan, 5.00%, 12/10/19 | | | | | | | 921 | | | | 916,096 | |
Hub International Ltd., Term Loan B, 4.75%, 10/02/20 | | | | | | | 778 | | | | 784,531 | |
National Financial Partners Corp., Term Loan, 5.25%, 7/01/20 | | | | | | | 303 | | | | 306,130 | |
Sedgwick CMS Holdings, Inc.: | | | | | | | | | | | | | | |
1st Lien Term Loan, 3.75%, 2/11/21 | | | | | | | 495 | | | | 492,401 | |
2nd Lien Term Loan, 6.75%, 12/12/18 | | | | | | | 665 | | | | 671,291 | |
| | | | | | | | | | | 9,498,360 | |
Internet Software & Services — 0.8% | | | | | | | | | | | | | | |
Dealertrack Technologies, Inc., Term Loan B, 3.50%, 2/26/21 | | | | | | | 550 | | | | 552,750 | |
Interactive Data Corp., Term Loan B, 3.75%, 2/11/18 | | | | | | | 2,116 | | | | 2,117,961 | |
Open Text Corp., Term Loan B, 3.25%, 1/04/21 | | | | | | | 850 | | | | 849,575 | |
W3 Co.: | | | | | | | | | | | | | | |
1st Lien Term Loan, 5.75%, 3/13/20 | | | | | | | 1,032 | | | | 1,034,780 | |
2nd Lien Term Loan, 9.25%, 9/11/20 | | | | | | | 404 | | | | 408,027 | |
Web.com Group, Inc., Term Loan B, 4.50%, 10/27/17 | | | | | | | 510 | | | | 516,223 | |
| | | | | | | | | | | 5,479,316 | |
IT Services — 0.9% | | | | | | | | | | | | | | |
Ceridian Corp., Term Loan B, 4.37% – 4.40%, 5/09/17 | | | | | | | 1,115 | | | | 1,117,700 | |
First Data Corp.: | | | | | | | | | | | | | | |
2018 Term Loan, 4.16%, 9/24/18 | | | | | | | 1,615 | | | | 1,617,697 | |
Extended 2018 Term Loan B, 4.16%, 3/23/18 | | | | | | | 2,169 | | | | 2,171,372 | |
InfoGroup, Inc., Term Loan, 8.00%, 5/25/18 | | | | | | | 754 | | | | 657,716 | |
SunGard Data Systems, Inc.: | | | | | | | | | | | | | | |
Term Loan D, 4.50%, 1/31/20 | | | | | | | 386 | | | | 386,583 | |
Term Loan E, 4.00%, 3/09/20 | | | | | | | 432 | | | | 433,486 | |
| | | | | | | | | | | 6,384,554 | |
Life Sciences Tools & Services — 0.2% | | | | | | | | | | | | | | |
Patheon, Inc., Term Loan: | | | | | | | | | | | | | | |
7.25%, 12/14/18 | | | | | | | 464 | | | | 462,733 | |
4.25%, 1/09/21 | | | | | | | 920 | | | | 917,129 | |
| | | | | | | | | | | 1,379,862 | |
Machinery — 2.0% | | | | | | | | | | | | | | |
Allegion US Holding Co., Inc., Term Loan B, 3.00%, 9/30/20 | | | | | | | 795 | | | | 793,672 | |
See Notes to Financial Statements.
| 40 | SEMI-ANNUAL REPORT | FEBRUARY 28, 2014
|
| |
| Consolidated Schedule of Investments (continued) | BlackRock Limited Duration Income Trust (BLW)
(Percentages shown are based on Net Assets)
|
| Floating Rate Loan Interests (c) | | | | | | Par
(000) | | Value |
Machinery (concluded) | | | | | | | | | | | | | | |
Alliance Laundry Systems LLC, Refinancing Term Loan, 4.25%, 12/10/18 | | | | USD | | | 520 | | | $ | 521,569 | |
Faenza Acquisition GmbH: | | | | | | | | | | | | | | |
Term Loan B1, 4.25%, 8/31/20 | | | | | | | 462 | | | | 463,028 | |
Term Loan B3, 4.25%, 8/28/20 | | | | | | | 141 | | | | 140,837 | |
Gardner Denver, Inc.: | | | | | | | | | | | | | | |
4.25%, 7/30/20 | | | | | | | 1,345 | | | | 1,338,546 | |
4.75%, 7/30/20 | | | | EUR | | | 222 | | | | 307,200 | |
Generac Power Systems, Inc., Term Loan B, 3.50%, 5/31/20 | | | | USD | | | 1,418 | | | | 1,417,620 | |
Intelligrated, Inc., 1st Lien Term Loan, 4.50%, 7/30/18 | | | | | | | 1,086 | | | | 1,088,297 | |
Mirror Bidco Corp., Term Loan, 4.25%, 12/27/19 | | | | | | | 1,431 | | | | 1,437,102 | |
Navistar International Corp., Term Loan B, 5.75%, 8/17/17 | | | | | | | 525 | | | | 531,905 | |
Pacific Industrial Services US Finance Co. LLC: | | | | | | | | | | | | | | |
1st Lien Term Loan, 5.00%, 10/02/18 | | | | | | | 893 | | | | 903,922 | |
2nd Lien Term Loan, 8.75%, 4/02/19 | | | | | | | 730 | | | | 748,250 | |
Rexnord LLC, 1st Lien Term Loan B, 4.00%, 8/21/20 | | | | | | | 1,323 | | | | 1,325,680 | |
Silver II US Holdings LLC, Term Loan, 4.00%, 12/13/19 | | | | | | | 582 | | | | 582,262 | |
STS Operating, Inc., Term Loan, 4.75%, 2/19/21 | | | | | | | 320 | | | | 320,800 | |
Terex Corp., Term Loan, 4.00%, 4/28/17 | | | | EUR | | | 175 | | | | 243,606 | |
Wabash National Corp., Term Loan B, 4.50%, 5/08/19 | | | | USD | | | 998 | | | | 1,002,843 | |
| | | | | | | | | | | 13,167,139 | |
Marine — 0.2% | | | | | | | | | | | | | | |
HGIM Corp., Term Loan B, 5.50%, 6/18/20 | | | | | | | 1,059 | | | | 1,070,395 | |
Media — 5.2% | | | | | | | | | | | | | | |
Activision Blizzard, Inc., Term Loan B, 3.25%, 10/12/20 | | | | | | | 1,170 | | | | 1,171,328 | |
Advanstar Communications, Inc., 2nd Lien Term Loan, 9.50%, 6/06/20 | | | | | | | 465 | | | | 466,548 | |
Catalina Marketing Corp., Term Loan B, 5.25%, 10/12/20 | | | | | | | 1,017 | | | | 1,022,110 | |
CBS Outdoor Americas Capital LLC, Term Loan B, 3.00%, 1/31/21 | | | | | | | 155 | | | | 154,588 | |
Cengage Learning Acquisitions, Inc., Tranche 1 Incremental, 9.50%, 7/03/14 | | | | | | | 2,005 | | | | 1,862,350 | |
Charter Communications Operating LLC, Term Loan E, 3.00%, 7/01/20 | | | | | | | 1,179 | | | | 1,172,885 | |
Clear Channel Communications, Inc.: | | | | | | | | | | | | | | |
Term Loan B, 3.80%, 1/29/16 | | | | | | | 316 | | | | 310,556 | |
Term Loan C, 3.80%, 1/29/16 | | | | | | | 200 | | | | 194,938 | |
Term Loan D, 6.90%, 1/30/19 | | | | | | | 4,063 | | | | 3,986,480 | |
Cumulus Media Holdings, Inc., 2013 Term Loan, 4.25%, 12/23/20 | | | | | | | 1,362 | | | | 1,370,098 | |
The E.W. Scripps Co., Term Loan B, 3.25%, 11/26/20 | | | | | | | 635 | | | | 636,334 | |
EMI Music Publishing Ltd., Term Loan B, 4.25%, 6/29/18 | | | | | | | 727 | | | | 727,461 | |
Fender Musical Instruments Corp., 2019 Term Loan B, 5.75%, 4/03/19 | | | | | | | 245 | | | | 246,819 | |
Getty Images, Inc., Term Loan B, 4.75%, 10/18/19 | | | | | | | 209 | | | | 199,018 | |
Hemisphere Media Group, Inc., Term Loan, 6.25%, 7/30/20 | | | | | | | 891 | | | | 892,751 | |
Hubbard Radio LLC, Term Loan B, 4.50%, 4/29/19 | | | | | | | 695 | | | | 697,436 | |
Intelsat Jackson Holdings SA, Term Loan B2, 3.75%, 6/30/19 | | | | | | | 2,514 | | | | 2,530,563 | |
Lions Gate Entertainment Corp., 2nd Lien Term Loan, 5.00%, 7/17/20 | | | | | | | 395 | | | | 399,938 | |
Live Nation Entertainment, Inc., 2020 Term Loan B1, 3.50%, 8/17/20 | | | | | | | 564 | | | | 564,292 | |
Media General, Inc., Delayed Draw Term Loan B, 4.25%, 7/31/20 | | | | | | | 750 | | | | 756,098 | |
Mediacom Communications Corp., Term Loan F, 2.63%, 1/31/18 | | | | | | | 780 | | | | 775,125 | |
NEP/NCP Holdco, Inc.: | | | | | | | | | | | | | | |
2nd Lien Term Loan, 9.50%, 7/22/20 | | | | | | | 340 | | | | 347,650 | |
Incremental Term Loan, 4.75%, 1/22/20 | | | | | | | 1,663 | | | | 1,663,200 | |
| | | | | | | | | | | | | |
| Floating Rate Loan Interests (c) | | | | | | Par
(000) | | Value |
Media (concluded) | | | | | | | | | | | | | | |
Rentpath, Inc., Term Loan B, 6.25%, 5/29/20 | | | | USD | | | 995 | | | $ | 967,638 | |
Salem Communications Corp., Term Loan B, 4.50%, 3/13/20 | | | | | | | 1,005 | | | | 1,007,958 | |
Springer Science & Business Media Deutschland GmbH, Term Loan B2, 5.00%, 8/14/20 | | | | | | | 988 | | | | 992,216 | |
Tribune Co., 2013 Term Loan, 4.00%, 12/27/20 | | | | | | | 1,175 | | | | 1,173,895 | |
TWCC Holding Corp., 2nd Lien Term Loan, 7.00%, 6/26/20 | | | | | | | 840 | | | | 812,700 | |
Univision Communications, Inc., Term Loan C4, 4.00%, 3/01/20 | | | | | | | 2,436 | | | | 2,441,312 | |
UPC Financing Partnership, Term Loan AG, 3.98%, 3/31/21 | | | | EUR | | | 442 | | | | 614,211 | |
Virgin Media Investment Holdings Ltd.: | | | | | | | | | | | | | | |
Term Loan B, 3.50%, 6/08/20 | | | | USD | | | 410 | | | | 409,561 | |
Term Loan C, 4.50%, 6/05/20 | | | | GBP | | | 2,340 | | | | 3,940,275 | |
WideOpenWest Finance LLC, Term Loan B, 4.75%, 4/01/19 | | | | USD | | | 734 | | | | 737,272 | |
| | | | | | | | | | | 35,245,604 | |
Metals & Mining — 1.7% | | | | | | | | | | | | | | |
Ameriforge Group, Inc.: | | | | | | | | | | | | | | |
1st Lien Term Loan, 5.00%, 12/19/19 | | | | | | | 941 | | | | 944,825 | |
2nd Lien Term Loan, 8.75%, 12/19/20 | | | | | | | 470 | | | | 480,575 | |
API Heat Transfer, Inc., Term Loan, 5.25%, 5/03/19 | | | | | | | 676 | | | | 675,592 | |
Constellium Holdco BV, Term Loan B, 6.00%, 3/25/20 | | | | | | | 1,345 | | | | 1,371,734 | |
FMG Resources August 2006 Property Ltd., Term Loan B, 4.25%, 6/28/19 | | | | | | | 2,233 | | | | 2,252,581 | |
Novelis, Inc., Term Loan, 3.75%, 3/10/17 | | | | | | | 3,851 | | | | 3,863,565 | |
Walter Energy, Inc., Term Loan B, 6.75%, 4/02/18 | | | | | | | 39 | | | | 38,324 | |
Windsor Financing LLC, Term Loan B, 6.25%, 12/05/17 | | | | | | | 1,531 | | | | 1,569,233 | |
| | | | | | | | | | | 11,196,429 | |
Multiline Retail — 1.3% | | | | | | | | | | | | | | |
| 99¢ Only Stores, Term Loan, 4.50%, 1/11/19 | | | | | | | 785 | | | | 791,164 | |
Apex Tool Group LLC, Term Loan B, 4.50%, 1/31/20 | | | | | | | 695 | | | | 685,850 | |
BJ’s Wholesale Club, Inc.: | | | | | | | | | | | | | | |
1st Lien Term Loan, 4.50%, 9/26/19 | | | | | | | 589 | | | | 592,301 | |
2nd Lien Term Loan, 8.50%, 3/26/20 | | | | | | | 575 | | | | 589,916 | |
HEMA Holding BV: | | | | | | | | | | | | | | |
Extended 2nd Lien Term Loan, 5.97%, 1/05/18 | | | | EUR | | | 2,600 | | | | 3,229,903 | |
Extended Term Loan B, 4.60%, 12/06/17 | | | | | | | 323 | | | | 437,928 | |
Extended Term Loan C, 4.60%, 12/06/17 | | | | | | | 295 | | | | 401,053 | |
Hudson’s Bay Co., 1st Lien Term Loan, 4.75%, 11/04/20 | | | | USD | | | 948 | | | | 961,607 | |
The Neiman Marcus Group, Inc., Term Loan B, 5.00%, 10/26/20 | | | | | | | 1,651 | | | | 1,669,270 | |
| | | | | | | | | | | 9,358,992 | |
Oil, Gas & Consumable Fuels — 2.6% | | | | | | | | | | | | | | |
Arch Coal, Inc., Term Loan B, 5.75%, 5/16/18 | | | | | | | 585 | | | | 576,746 | |
Chesapeake Energy Corp., Unsecured Term Loan, 5.75%, 12/01/17 | | | | | | | 2,595 | | | | 2,651,545 | |
Drillships Financing Holding, Inc., Term Loan B1, 6.00%, 3/31/21 | | | | | | | 1,053 | | | | 1,071,470 | |
EP Energy LLC, Term Loan B3, 3.50%, 5/24/18 | | | | | | | 1,127 | | | | 1,125,822 | |
Fieldwood Energy LLC: | | | | | | | | | | | | | | |
1st Lien Term Loan, 3.88%, 9/28/18 | | | | | | | 469 | | | | 469,608 | |
2nd Lien Term Loan, 8.38%, 9/30/20 | | | | | | | 420 | | | | 434,440 | |
Moxie Patriot LLC, Term Loan B1, 6.75%, 12/18/20 | | | | | | | 1,645 | | | | 1,677,900 | |
Obsidian Natural Gas Trust, Term Loan, 7.00%, 11/02/15 | | | | | | | 1,265 | | | | 1,284,235 | |
Offshore Group Investment Ltd.: | | | | | | | | | | | | | | |
5.00%, 10/25/17 | | | | | | | 870 | | | | 873,312 | |
5.75%, 3/28/19 | | | | | | | 729 | | | | 738,300 | |
Pacific Drilling SA, Term Loan B, 4.50%, 6/04/18 | | | | | | | 1,000 | | | | 1,005,915 | |
Panda Temple II Power LLC, Term Loan B, 7.25%, 4/03/19 | | | | | | | 900 | | | | 919,125 | |
See Notes to Financial Statements.
| SEMI-ANNUAL REPORT | FEBRUARY 28, 2014 | 41
|
| |
| Consolidated Schedule of Investments (continued) | BlackRock Limited Duration Income Trust (BLW)
(Percentages shown are based on Net Assets)
|
| Floating Rate Loan Interests (c) | | | | | | Par
(000) | | Value |
Oil, Gas & Consumable Fuels (concluded) | | | | | | | | | | | | | | |
Power Buyer, LLC: | | | | | | | | | | | | | | |
1st Lien Term Loan, 4.25%, 5/06/20 | | | | USD | | | 354 | | | $ | 352,674 | |
2nd Lien Term Loan, 8.25%, 11/06/20 | | | | | | | 275 | | | | 272,250 | |
Delayed Draw Term Loan, 4.25%, 5/06/20 | | | | | | | 19 | | | | 19,273 | |
Raven Power Finance LLC, Term Loan, 5.25%, 12/19/20 | | | | | | | 555 | | | | 558,469 | |
Ruby Western Pipeline Holdings LLC, Term Loan B, 3.50%, 3/27/20 | | | | | | | 688 | | | | 686,821 | |
Tesoro Corp., Term Loan B, 2.40%, 5/30/16 | | | | | | | 1,093 | | | | 1,095,858 | |
Western Refining, Inc., Term Loan B, 4.25%, 11/12/20 | | | | | | | 1,020 | | | | 1,026,375 | |
WTG Holdings III Corp.: | | | | | | | | | | | | | | |
1st Lien Term Loan, 4.75%, 1/15/21 | | | | | | | 300 | | | | 300,750 | |
2nd Lien Term Loan, 8.50%, 1/15/22 | | | | | | | 160 | | | | 161,901 | |
| | | | | | | | | | | 17,421,167 | |
Pharmaceuticals — 1.2% | | | | | | | | | | | | | | |
Akorn, Inc., Term Loan B, 4.50%, 8/27/20 | | | | | | | 885 | | | | 890,531 | |
Amneal Pharmaceuticals LLC, Term Loan, 5.75% – 7.00%, 11/01/19 | | | | | | | 608 | | | | 611,517 | |
CCC Information Services, Inc., Term Loan, 4.00%, 12/20/19 | | | | | | | 307 | | | | 307,188 | |
Endo Health Solutions, Inc., Term Loan B, 3.75%, 11/05/20 | | | | | | | 855 | | | | 853,222 | |
Jazz Pharmaceuticals, Inc., Term Loan B, 3.50%, 6/12/18 | | | | | | | 295 | | | | 295,422 | |
Par Pharmaceutical Cos., Inc., Term Loan B, 4.00%, 9/30/19 | | | | | | | 2,153 | | | | 2,154,259 | |
Pharmaceutical Product Development LLC, Term Loan B, 4.00%, 12/05/18 | | | | | | | 1,399 | | | | 1,404,451 | |
Valeant Pharmaceuticals International, Inc.: | | | | | | | | | | | | | | |
Series C2 Term Loan B, 3.75%, 12/11/19 | | | | | | | 553 | | | | 554,383 | |
Series E Term Loan B, 3.75%, 8/05/20 | | | | | | | 834 | | | | 838,677 | |
| | | | | | | | | | | 7,909,650 | |
Professional Services — 0.6% | | | | | | | | | | | | | | |
Emdeon Business Services LLC, Term Loan B2, 3.75%, 11/02/18 | | | | | | | 610 | | | | 611,038 | |
ON Assignment, Inc., Refinancing Term Loan B, 3.50%, 4/30/20 | | | | | | | 298 | | | | 298,523 | |
SIRVA Worldwide, Inc., Term Loan, 7.50%, 3/27/19 | | | | | | | 1,062 | | | | 1,080,560 | |
TriNet Group, Inc., Term Loan B2, 5.00%, 8/14/20 | | | | | | | 603 | | | | 607,259 | |
Truven Health Analytics, Inc., Term Loan B, 4.50%, 6/06/19 | | | | | | | 1,172 | | | | 1,174,561 | |
| | | | | | | | | | | 3,771,941 | |
Real Estate Investment Trusts (REITs) — 0.5% | | | | | | | | | | | | | | |
iStar Financial, Inc., Term Loan, 4.50%, 10/16/17 | | | | | | | 2,723 | | | | 2,728,464 | |
Starwood Property Trust, Inc., Term Loan B, 3.50%, 4/17/20 | | | | | | | 638 | | | | 636,196 | |
| | | | | | | | | | | 3,364,660 | |
Real Estate Management & Development — 0.5% | | | | | | | | | | | | | | |
CityCenter Holdings LLC, Term Loan B, 5.00%, 10/16/20 | | | | | | | 1,035 | | | | 1,044,543 | |
Realogy Corp.: | | | | | | | | | | | | | | |
Extended Letter of Credit, 4.40%, 10/10/16 | | | | | | | 102 | | | | 101,891 | |
Extended Term Loan, 4.50%, 3/05/20 | | | | | | | 2,112 | | | | 2,116,270 | |
| | | | | | | | | | | 3,262,704 | |
Road & Rail — 0.1% | | | | | | | | | | | | | | |
Road Infrastructure Investment LLC, Term Loan B, 6.25%, 3/30/18 | | | | | | | 629 | | | | 631,859 | |
Semiconductors & Semiconductor Equipment — 0.3% |
Freescale Semiconductor, Inc.: | | | | | | | | | | | | | | |
Term Loan B4, 5.00%, 2/28/20 | | | | | | | 723 | | | | 725,560 | |
Term Loan B5, 5.00%, 1/15/21 | | | | | | | 379 | | | | 383,314 | |
NXP BV, Term Loan D, 3.25%, 1/11/20 | | | | | | | 988 | | | | 986,537 | |
| | | | | | | | | | | 2,095,411 | |
| | | | | | | | | | | | | |
| Floating Rate Loan Interests (c) | | | | | | Par
(000) | | Value |
Software — 2.0% | | | | | | | | | | | | | | |
BMC Software Finance, Inc., Term Loan, 5.00%, 9/10/20 | | | | USD | | | 845 | | | $ | 846,935 | |
CompuCom Systems, Inc., Refinancing Term Loan B, 4.25%, 5/11/20 | | | | | | | 224 | | | | 223,220 | |
Evertec Group LLC, Term Loan B, 3.50%, 4/17/20 | | | | | | | 463 | | | | 450,645 | |
GCA Services Group, Inc.: | | | | | | | | | | | | | | |
2nd Lien Term Loan, 9.25%, 10/22/20 | | | | | | | 560 | | | | 566,300 | |
Term Loan B, 4.25% – 5.50%, 11/01/19 | | | | | | | 561 | | | | 564,289 | |
Infor US, Inc., Term Loan B5, 3.75%, 6/03/20 | | | | | | | 1,138 | | | | 1,135,923 | |
IQOR US, Inc., Term Loan B, 6.00%, 2/19/21 | | | | | | | 630 | | | | 617,400 | |
Kronos Worldwide, Inc., 2020 Term Loan B, 4.75%, 2/12/20 | | | | | | | 235 | | | | 236,617 | |
Kronos, Inc., 2nd Lien Term Loan, 9.75%, 4/30/20 | | | | | | | 1,837 | | | | 1,868,675 | |
Mitchell International, Inc.: | | | | | | | | | | | | | | |
1st Lien Term Loan, 4.50%, 10/12/20 | | | | | | | 635 | | | | 636,588 | |
2nd Lien Term Loan, 8.50%, 10/11/21 | | | | | | | 1,200 | | | | 1,223,004 | |
RP Crown Parent LLC, 2013 Term Loan, 6.00%, 12/21/18 | | | | | | | 913 | | | | 914,077 | |
Shield Finance Co. Sarl, Term Loan, 5.00%, 1/27/21 | | | | | | | 340 | | | | 342,975 | |
Sophia LP, Term Loan B, 4.50%, 7/19/18 | | | | | | | 854 | | | | 859,456 | |
SS&C Technologies, Inc.: | | | | | | | | | | | | | | |
Term Loan B1, 3.25%, 6/07/19 | | | | | | | 950 | | | | 952,708 | |
Term Loan B2, 3.25%, 6/07/19 | | | | | | | 98 | | | | 98,556 | |
StoneRiver Holdings, Inc.: | | | | | | | | | | | | | | |
1st Lien Term Loan, 4.50%, 11/29/19 | | | | | | | 265 | | | | 265,084 | |
2nd Lien Term Loan, 8.50%, 5/29/20 | | | | | | | 255 | | | | 256,414 | |
Websence, Inc.: | | | | | | | | | | | | | | |
2nd Lien Term Loan, 8.25%, 12/24/20 | | | | | | | 835 | | | | 837,088 | |
Term Loan B, 4.50%, 6/25/20 | | | | | | | 418 | | | | 421,034 | |
| | | | | | | | | | | 13,316,988 | |
Specialty Retail — 1.2% | | | | | | | | | | | | | | |
Academy Ltd., Term Loan, 4.50%, 8/03/18 | | | | | | | 1,724 | | | | 1,732,772 | |
Burlington Coat Factory Warehouse Corp., Term Loan B2, 4.25%, 2/23/17 | | | | | | | 191 | | | | 192,581 | |
David’s Bridal, Inc., Term Loan B, 5.00%, 10/11/19 | | | | | | | 945 | | | | 950,177 | |
Equinox Holdings, Inc., Repriced Term Loan B, 4.50% – 5.50%, 1/31/20 | | | | | | | 1,131 | | | | 1,141,350 | |
Harbor Freight Tools USA, Inc., 1st Lien Term Loan, 4.75%, 7/26/19 | | | | | | | 523 | | | | 530,063 | |
Michaels Stores, Inc., Term Loan, 3.75%, 1/28/20 | | | | | | | 471 | | | | 471,761 | |
Party City Holdings, Inc., Term Loan, 4.00%, 7/27/19 | | | | | | | 1,427 | | | | 1,427,442 | |
Petco Animal Supplies, Inc., Term Loan, 4.00%, 11/24/17 | | | | | | | 898 | | | | 900,209 | |
Sprouts Farmers Markets Holdings LLC, Term Loan, 4.00%, 4/23/20 | | | | | | | 110 | | | | 110,308 | |
SRAM LLC, Term Loan B, 4.00% – 5.25%, 4/10/20 | | | | | | | 424 | | | | 423,777 | |
Toys ‘R’ Us-Delaware, Inc., Term Loan B3, 5.25%, 5/25/18 | | | | | | | 243 | | | | 203,267 | |
| | | | | | | | | | | 8,083,707 | |
Textiles, Apparel & Luxury Goods — 0.2% | | | | | | | | | | | | | | |
Ascend Performance Materials LLC, Term Loan B, 6.75%, 4/10/18 | | | | | | | 1,253 | | | | 1,215,107 | |
J. Crew Group, Inc., Term Loan B, 4.00%, 2/20/21 | | | | | | | 475 | | | | 473,219 | |
| | | | | | | | | | | 1,688,326 | |
Thrifts & Mortgage Finance — 0.1% | | | | | | | | | | | | | | |
IG Investments Holdings LLC, 1st Lien Term Loan, 5.25%, 10/31/19 | | | | | | | 861 | | | | 863,453 | |
Trading Companies & Distributors — 0.0% | | | | | | | | | | | | | | |
Fly Funding II Sarl, Term Loan B, 4.50%, 8/09/19 | | | | | | | 138 | | | | 140,151 | |
WESCO Distribution, Inc., Term Loan B, 3.75%, 12/12/19 | | | | | | | 192 | | | | 192,465 | |
| | | | | | | | | | | 332,616 | |
See Notes to Financial Statements.
| 42 | SEMI-ANNUAL REPORT | FEBRUARY 28, 2014
|
| |
| Consolidated Schedule of Investments (continued) | BlackRock Limited Duration Income Trust (BLW)
(Percentages shown are based on Net Assets)
|
| Floating Rate Loan Interests (c) | | | | | | Par
(000) | | Value |
Wireless Telecommunication Services — 0.4% | | | | | | | | | | | | | | |
Cricket Communications, Inc., Term Loan, 4.75%, 10/10/19 | | | | USD | | | 880 | | | $ | 880,030 | |
Light Tower Fiber LLC, 1st Lien Term Loan, 4.00%, 4/13/20 | | | | | | | 1,542 | | | | 1,539,366 | |
| | | | | | | | | | | 2,419,396 | |
Total Floating Rate Loan Interests — 52.2% | | | | | | | | | | | 350,904,849 | |
|
Foreign Agency Obligations |
Iceland Government International Bond, 5.88%, 5/11/22 | | | | | | | 3,030 | | | | 3,238,312 | |
Slovenia Government International Bond: | | | | | | | | | | | | | | |
4.38%, 4/02/14 | | | | EUR | | | 2,550 | | | | 3,529,340 | |
4.13%, 2/18/19 (b) | | | | USD | | | 635 | | | | 652,463 | |
Total Foreign Agency Obligations — 1.1% | | | | | | | | | | | 7,420,115 | |
|
Non-Agency Mortgage-Backed Securities |
Collateralized Mortgage Obligations — 2.1% | | | | | | | | | | | | | | |
Adjustable Rate Mortgage Trust, Series 2007-1, Class 3A21, 3.17%, 3/25/37 (c) | | | | | | | 43 | | | | 42,440 | |
Countrywide Alternative Loan Trust, Series 2005-54CB, Class 3A4, 5.50%, 11/25/35 | | | | | | | 5,531 | | | | 4,802,546 | |
Countrywide Home Loan Mortgage Pass-Through Trust: | | | | | | | | | | | | | | |
Series 2005-17, Class 1A6, 5.50%, 9/25/35 | | | | | | | 1,464 | | | | 1,463,617 | |
Series 2006-17, Class A2, 6.00%, 12/25/36 | | | | | | | 3,157 | | | | 2,863,378 | |
Series 2007-HY5, Class 3A1, 5.32%, 9/25/37 (c) | | | | | | | 2,164 | | | | 2,036,728 | |
GSR Mortgage Loan Trust, Series 2005-AR5, Class 2A3, 2.71%, 10/25/35 (c) | | | | | | | 1,936 | | | | 1,793,801 | |
Morgan Stanley Reremic Trust, Series 2010-R4, Class 4A, REMIC, 0.45%, 2/26/37 (b)(c) | | | | | | | 875 | | | | 868,018 | |
| | | | | | | | | | | 13,870,528 | |
Commercial Mortgage-Backed Securities — 8.3% | | | | | | | | | | | | | | |
Banc of America Commercial Mortgage Trust, Series 2007-4, Class A4, 5.82%, 2/10/51 (c) | | | | | | | 1,712 | | | | 1,920,667 | |
Citigroup/Deutsche Bank Commercial Mortgage Trust, Series 2007-CD4, Class A2B, 5.21%, 12/11/49 | | | | | | | 34 | | | | 33,730 | |
Commercial Mortgage Pass-Through Certificates, Series 2013-LC13, Class D, 5.05%, 8/10/46 (b)(c) | | | | | | | 3,530 | | | | 3,312,379 | |
Commercial Mortgage Trust, Series 2013-LC6: | | | | | | | | | | | | | | |
Class B, 3.74%, 1/10/46 | | | | | | | 1,110 | | | | 1,077,525 | |
Class D, 4.29%, 1/10/46 (b)(c) | | | | | | | 1,330 | | | | 1,185,795 | |
Credit Suisse Commercial Mortgage Trust, Series 2006-C5, Class AM, 5.34%, 12/15/39 | | | | | | | 1,850 | | | | 1,997,464 | |
Credit Suisse Mortgage Capital Certificates (c): | | | | | | | | | | | | | | |
Series 2007-C2, Class A2, 5.45%, 1/15/49 | | | | | | | 5 | | | | 4,986 | |
Series 2007-C4, Class A3, 5.76%, 9/15/39 | | | | | | | 513 | | | | 515,861 | |
Series 2007-C5, Class AAB, 5.62%, 9/15/40 | | | | | | | 1,402 | | | | 1,499,631 | |
Series 2014-SURF, Class E, 3.26%, 2/15/29 (b) | | | | | | | 1,000 | | | | 1,000,125 | |
First Union Commercial Mortgage Securities, Inc., Series 1997-C2, Class G, 7.50%, 11/18/29 (b)(c) | | | | | | | 459 | | | | 466,476 | |
Greenwich Capital Commercial Funding Corp., Series 2006-GG7, Class AM, 5.82%, 7/10/38 (c) | | | | | | | 1,610 | | | | 1,763,916 | |
GS Mortgage Securities Corp. II, Series 2013-GC10, Class B, 3.68%, 2/10/46 (b) | | | | | | | 1,995 | | | | 1,906,965 | |
GS Mortgage Securities Trust, Series 2006-GG6, Class AM, 5.62%, 4/10/38 (c) | | | | | | | 3,680 | | | | 3,971,125 | |
Hilton USA Trust, Series 2013-HLT, Class EFX, 4.45%, 11/05/30 (b)(c) | | | | | | | 4,162 | | | | 4,277,620 | |
JPMorgan Chase Commercial Mortgage Securities Corp.: |
Series 2004-LN2, Class A2, 5.12%, 7/15/41 | | | | | | | 2,011 | | | | 2,025,336 | |
Series 2007-CB18, Class A4, 5.44%, 6/12/47 | | | | | | | 2,110 | | | | 2,324,089 | |
Series 2007-CB19, Class A4, 5.70%, 2/12/49 (c) | | | | | | | 2,140 | | | | 2,391,835 | |
Series 2012-LC9, Class XA, 1.94%, 12/15/47 (c) | | | | | | | 14,880 | | | | 1,541,815 | |
| | | | | | | | | | | | | |
| Non-Agency Mortgage-Backed Securities | | | | | | Par
(000) | | Value |
Commercial Mortgage-Backed Securities (concluded) |
LB-UBS Commercial Mortgage Trust (c): | | | | | | | | | | | | | | |
Series 2007-C2, Class AM, 5.49%, 2/15/40 | | | | USD | | | 2,500 | | | $ | 2,664,720 | |
Series 2007-C6, Class A4, 5.86%, 7/15/40 | | | | | | | 4,715 | | | | 5,086,978 | |
Merrill Lynch Mortgage Trust, Series 2007-C1, Class A1A, 5.84%, 6/12/50 (c) | | | | | | | 1,549 | | | | 1,661,786 | |
Talisman Finance PLC, Series 6, Class A, 0.46%, 10/22/16 (c) | | | | EUR | | | 1,827 | | | | 2,402,930 | |
Titan Europe PLC, Series 2007-1X, Class A, 0.77%, 1/20/17 (c) | | | | GBP | | | 2,548 | | | | 3,925,736 | |
Wachovia Bank Commercial Mortgage Trust, Series 2007-C33, Class A4, 5.93%, 2/15/51 (c) | | | | USD | | | 2,030 | | | | 2,239,928 | |
WF-RBS Commercial Mortgage Trust: | | | | | | | | | | | | | | |
Series 2012-C8, Class B, 4.31%, 8/15/45 | | | | | | | 1,085 | | | | 1,105,415 | |
Series 2012-C8, Class C, 4.88%, 8/15/45 (c) | | | | | | | 1,395 | | | | 1,442,897 | |
Series 2013-C11, Class D, 4.18%, 3/15/45 (b)(c) | | | | | | | 1,400 | | | | 1,266,359 | |
Windermere XI Cmbs PLC, Series XI-X, Class A, 0.78%, 4/24/17 (c) | | | | GBP | | | 681 | | | | 1,132,741 | |
| | | | | | | | | | | 56,146,830 | |
Interest Only Commercial Mortgage-Backed Securities — 0.6% |
Morgan Stanley Capital I Trust, Series 2012-C4, Class XA, 2.66%, 3/15/45 (b)(c) | | | | USD | | | 15,228 | | | | 1,848,996 | |
WF-RBS Commercial Mortgage Trust, Series 2012-C9, Class XA, 2.25%, 11/15/45 (b)(c) | | | | | | | 16,725 | | | | 2,047,705 | |
| | | | | | | | | | | 3,896,701 | |
Total Non-Agency Mortgage-Backed Securities — 11.0% | | | | | | 73,914,059 | |
|
US Government Sponsored Agency Securities | |
Collateralized Mortgage Obligations — 1.0% | | | | | | | | | | | | | | |
Freddie Mac Mortgage-Backed Securities: | | | | | | | | | | | | | | |
Series 3986, Class M, REMIC, 4.50%, 9/15/41 | | | | | | | 2,611 | | | | 2,813,768 | |
Series K032, Class A2, 3.31%, 5/25/23 (c) | | | | | | | 3,500 | | | | 3,558,636 | |
| | | | | | | | | | | 6,372,404 | |
Interest Only Collateralized Mortgage Obligations — 0.9% |
Fannie Mae Mortgage-Backed Securities, Series 2012-M9, Class X1, 4.07%, 12/25/17 (c) | | | | | | | 19,938 | | | | 2,515,002 | |
Freddie Mac Mortgage-Backed Securities, Class X1 (c): |
Series K707, 1.56%, 12/25/18 | | | | | | | 42,927 | | | | 2,765,202 | |
Series K710, 1.78%, 5/25/19 | | | | | | | 13,340 | | | | 1,052,311 | |
| | | | | | | | | | | 6,332,515 | |
Mortgage-Backed Securities — 4.0% | | | | | | | | | | | | | | |
Fannie Mae Mortgage-Backed Securities: | | | | | | | | | | | | | | |
3.50%, 8/01/26 | | | | | | | 8,456 | | | | 8,955,223 | |
5.00%, 7/01/20–8/01/23 | | | | | | | 6,728 | | | | 7,215,980 | |
Freddie Mac Mortgage-Backed Securities, 4.50%, 4/01/25 | | | | | | | 9,957 | | | | 10,746,478 | |
| | | | | | | | | | | 26,917,681 | |
Total US Government Sponsored Agency Securities — 5.9% | | 39,622,600 | |
|
Other Interests (k) | | | | Beneficial
Interest
(000)
| | | |
Auto Components — 0.0% | | | | | | | | | | | | | | |
Lear Corp. Escrow | | | | | | | 1,000 | | | | 8,750 | |
Construction Materials — 0.0% | | | | | | | | | | | | | | |
USI Senior Holdings | | | | | | | 6 | | | | — | |
| | | | | | | | | | | | | |
See Notes to Financial Statements.
| SEMI-ANNUAL REPORT | FEBRUARY 28, 2014 | 43
|
| |
| Consolidated Schedule of Investments (continued) | BlackRock Limited Duration Income Trust (BLW)
(Percentages shown are based on Net Assets)
|
| Other Interests (k) | | | | Beneficial
Interest
(000) | | Value |
Diversified Financial Services — 0.1% | | | | | | | | | | | | | | |
J.G. Wentworth LLC Preferred Equity Interests: | | | | | | | | | | | | | | |
(135-day lockup), (Acquired 11/18/13, cost $969,589) (a)(l) | | | | USD | | | 14 | | | $ | 258,056 | |
(180-day lockup), (Acquired 11/18/13, cost $969,589) (a)(l) | | | | | | | 14 | | | | 258,056 | |
| | | | | | | | | | | 516,112 | |
Household Durables — 0.0% | | | | | | | | | | | | | | |
Berkline Benchcraft Equity LLC | | | | | | | 3,155 | | | | — | |
Total Other Interests — 0.1% | | | | | | | | | | | 524,862 | |
|
Preferred Securities |
Capital Trusts | | | | | | Par
(000) | | |
Chemicals — 0.1% | | | | | | | | | | | | | | |
Solvay Finance SA, 4.20% (c)(m) | | | | EUR | | | 260 | | | | 367,401 | |
Commercial Banks — 0.5% | | | | | | | | | | | | | | |
Wachovia Capital Trust III, 5.57% (c)(d)(m) | | | | USD | | | 3,365 | | | | 3,255,638 | |
Diversified Financial Services — 0.5% | | | | | | | | | | | | | | |
Bank of America Corp., Series U, 5.20% (c)(d)(m) | | | | | | | 1,250 | | | | 1,175,000 | |
Barclays PLC, 8.00% (c)(m) | | | | | | | 600 | | | | 882,012 | |
Citigroup, Inc., 5.95% (c)(d)(m) | | | | | | | 1,370 | | | | 1,352,875 | |
| | | | | | | | | | | 3,409,887 | |
Insurance — 1.4% | | | | | | | | | | | | | | |
AXA SA, 6.46% (b)(c)(d)(m) | | | | | | | 1,625 | | | | 1,694,062 | |
Genworth Holdings, Inc., 6.15%, 11/15/66 (c)(d) | | | | | | | 1,850 | | | | 1,702,703 | |
Hartford Financial Services Group, Inc., 8.13%, 6/15/68 (c) | | | | | | | 2,500 | | | | 2,918,750 | |
Swiss Re Capital I LP, 6.85% (b)(c)(d)(m) | | | | | | | 3,000 | | | | 3,214,500 | |
| | | | | | | | | | | 9,530,015 | |
Total Capital Trusts — 2.5% | | | | | | | | | | | 16,562,941 | |
| Preferred Stocks | | | | | |
Shares | | Value |
Capital Markets — 0.1% | | | | | | | | | | | | | | |
SCE Trust III, 5.75% (c)(m) | | | | | | | 21,200 | | | $ | 535,936 | |
Consumer Finance — 0.0% | | | | | | | | | | | | | | |
Ally Financial, Inc., Series A, 8.50% (c)(m) | | | | | | | 8,657 | | | | 236,769 | |
Total Preferred Stocks — 0.1% | | | | | | | | | | | 772,705 | |
|
Trust Preferreds — 0.7%
| | | | | | | | | | | | |
Diversified Financial Services — 0.7% | | | | | | | | | | | | | | |
GMAC Capital Trust I, Series 2, 8.13%, 2/15/40 (c) | | | | | | | 166,413 | | | | 4,501,212 | |
Total Preferred Securities — 3.3% | | | | | | | | | | | 21,836,858 | |
|
Warrants (n) — 0.0% | |
Software — 0.0% | | | | | | | | | | | | | | |
HMH Holdings/EduMedia (issued/exercisable 3/09/10, 19 Shares for 1 Warrant, Expires 6/22/19, Strike Price $42.27) | | | | | | | 3,100 | | | | 10,964 | |
Total Long-Term Investments
(Cost — $940,371,245) — 143.3% | | | | | | | | | | | 962,904,079 | |
|
Short-Term Securities |
BlackRock Liquidity Funds, TempFund, Institutional Class, 0.03% (o)(p) | | | | | | | 3,052,131 | | | | 3,052,131 | |
Total Short-Term Securities
(Cost — $3,052,131) — 0.5% | | | | | | | | | | | 3,052,131 | |
|
Options Purchased | |
(Cost — $44,978) — 0.0% | | | | | | | | | | | — | |
Total Investments (Cost — $943,468,354) — 143.8% | | | | | | 965,956,210 | |
Liabilities in Excess of Other Assets — (43.8)% | | | | | | | | | | | (294,170,116 | ) |
Net Assets — 100.0% | | | | | | | | | | $ | 671,786,094 | |
Notes to Consolidated Schedule of Investments
| (a) | | | | Non-income producing security. |
| (b) | | | | Security exempt from registration pursuant to Rule 144A under the Securities Act of 1933, as amended. These securities may be resold in transactions exempt from registration to qualified institutional investors. |
| (c) | | | | Variable rate security. Rate shown is as of report date. |
| (d) | | | | All or a portion of security has been pledged as collateral in connection with outstanding reverse repurchase agreements. |
| (e) | | | | Represents a payment-in-kind security which may pay interest/dividends in additional par/shares and/or in cash. Rates shown are the current rate and possible payment rates. |
| (f) | | | | Convertible security. |
| (g) | | | | Zero-coupon bond. |
| (h) | | | | Represents a step-up bond that pays an initial coupon rate for the first period and then a higher coupon rate for the following periods. Rate shown is as of report date. |
| (i) | | | | When-issued security. Unsettled when-issued transactions were as follows: |
Counterparty
|
|
|
| Value
|
| Unrealized
Appreciation
|
Jefferies Co. | | | | $ | 1,009,400 | | | $ | 29,400 | |
| (j) | | | | Issuer filed for bankruptcy and/or is in default of principal and/or interest payments. |
| (k) | | | | Other interests represent beneficial interests in liquidation trusts and other reorganization or private entities. |
| (l) | | | | Restricted security as to resale. As of report date, the Fund held 0.1% of its net assets, with a current value of $516,112 in this security. |
| (m) | | | | Security is perpetual in nature and has no stated maturity date. |
| (n) | | | | Warrants entitle the Fund to purchase a predetermined number of shares of common stock and are non-income producing. The purchase price and number of shares are subject to adjustment under certain conditions until the expiration date, if any. |
See Notes to Financial Statements.
| 44 | SEMI-ANNUAL REPORT | FEBRUARY 28, 2014
|
| |
| Consolidated Schedule of Investments (continued) | BlackRock Limited Duration Income Trust (BLW)
|
| (o) | | | | Investments in issuers considered to be an affiliate of the Fund during the six months ended February 28, 2014, for purposes of Section 2(a)(3) of the 1940 Act, were as follows: |
Affiliate
|
|
|
| Shares
Held at
August 31, 2013
|
| Net
Activity
|
| Shares
Held at
February 28, 2014
|
| Income
|
BlackRock Liquidity Funds, TempFund, Institutional Class | | | | | 1,184,093 | | | | 1,868,038 | | | | 3,052,131 | | | $ | 1,413 | |
| (p) | | | | Represents the current yield as of report date. |
| • | | | | Reverse repurchase agreements outstanding as of February 28, 2014 were as follows: |
Counterparty
|
|
|
| Interest
Rate
|
| Trade
Date
|
| Maturity
Date
|
| Face Value
|
| Face Value
Including
Accrued
Interest
|
UBS Securities LLC | | | | 0.50% | | 1/30/13 | | Open | | $ | 1,862,820 | | | $ | 1,873,040 | |
UBS Securities LLC | | | | 0.65% | | 1/31/13 | | Open | | | 547,200 | | | | 551,093 | |
Barclays Capital, Inc. | | | | 0.60% | | 2/07/13 | | Open | | | 592,144 | | | | 595,953 | |
Barclays Capital, Inc. | | | | 0.60% | | 2/07/13 | | Open | | | 292,304 | | | | 294,184 | |
Barclays Capital, Inc. | | | | 0.60% | | 2/07/13 | | Open | | | 1,000,721 | | | | 1,007,159 | |
Barclays Capital, Inc. | | | | 0.60% | | 2/07/13 | | Open | | | 633,994 | | | | 638,073 | |
Barclays Capital, Inc. | | | | 0.60% | | 2/07/13 | | Open | | | 1,673,438 | | | | 1,684,204 | |
Barclays Capital, Inc. | | | | 0.60% | | 2/07/13 | | Open | | | 507,052 | | | | 510,314 | |
Barclays Capital, Inc. | | | | 0.60% | | 2/07/13 | | Open | | | 662,469 | | | | 666,731 | |
UBS Securities LLC | | | | 0.25% | | 2/07/13 | | Open | | | 1,048,688 | | | | 1,051,499 | |
UBS Securities LLC | | | | 0.34% | | 2/07/13 | | Open | | | 3,334,275 | | | | 3,346,430 | |
UBS Securities LLC | | | | 0.45% | | 2/07/13 | | Open | | | 866,250 | | | | 870,430 | |
UBS Securities LLC | | | | 0.55% | | 2/07/13 | | Open | | | 2,196,563 | | | | 2,209,517 | |
UBS Securities LLC | | | | 0.65% | | 2/07/13 | | Open | | | 356,250 | | | | 358,733 | |
UBS Securities LLC | | | | 0.65% | | 2/07/13 | | Open | | | 843,275 | | | | 849,152 | |
Deutsche Bank Securities, Inc. | | | | 0.58% | | 2/08/13 | | Open | | | 1,170,163 | | | | 1,177,384 | |
Deutsche Bank Securities, Inc. | | | | 0.58% | | 2/08/13 | | Open | | | 483,060 | | | | 486,064 | |
Barclays Capital, Inc. | | | | 0.60% | | 2/15/13 | | Open | | | 291,043 | | | | 292,881 | |
UBS Securities LLC | | | | 0.65% | | 2/19/13 | | Open | | | 166,058 | | | | 167,182 | |
Deutsche Bank Securities, Inc. | | | | 0.55% | | 2/20/13 | | Open | | | 484,000 | | | | 486,766 | |
Deutsche Bank Securities, Inc. | | | | 0.55% | | 2/20/13 | | Open | | | 217,132 | | | | 218,373 | |
Deutsche Bank Securities, Inc. | | | | 0.58% | | 2/20/13 | | Open | | | 2,512,000 | | | | 2,527,096 | |
Deutsche Bank Securities, Inc. | | | | 0.55% | | 2/22/13 | | Open | | | 509,587 | | | | 512,483 | |
Deutsche Bank Securities, Inc. | | | | 0.55% | | 2/22/13 | | Open | | | 509,760 | | | | 512,657 | |
Deutsche Bank Securities, Inc. | | | | 0.55% | | 2/22/13 | | Open | | | 848,076 | | | | 852,896 | |
Deutsche Bank Securities, Inc. | | | | 0.55% | | 2/28/13 | | Open | | | 1,280,181 | | | | 1,287,339 | |
Deutsche Bank Securities, Inc. | | | | 0.55% | | 2/28/13 | | Open | | | 107,112 | | | | 107,711 | |
Deutsche Bank Securities, Inc. | | | | 0.55% | | 2/28/13 | | Open | | | 1,901,900 | | | | 1,912,535 | |
Credit Suisse Securities (USA) LLC | | | | 0.40% | | 3/07/13 | | Open | | | 1,503,125 | | | | 1,509,104 | |
UBS Securities LLC | | | | 0.60% | | 3/12/13 | | Open | | | 3,040,295 | | | | 3,058,233 | |
UBS Securities LLC | | | | 0.35% | | 3/13/13 | | Open | | | 1,560,000 | | | | 1,565,354 | |
UBS Securities LLC | | | | 0.55% | | 3/13/13 | | Open | | | 395,650 | | | | 397,784 | |
Deutsche Bank Securities, Inc. | | | | 0.55% | | 3/14/13 | | Open | | | 760,000 | | | | 764,075 | |
Deutsche Bank Securities, Inc. | | | | 0.70% | | 3/14/13 | | Open | | | 1,523,693 | | | | 1,534,092 | |
Deutsche Bank Securities, Inc. | | | | 0.55% | | 3/19/13 | | Open | | | 972,625 | | | | 977,781 | |
Credit Suisse Securities (USA) LLC | | | | 0.35% | | 3/22/13 | | Open | | | 1,496,075 | | | | 1,501,079 | |
Deutsche Bank Securities, Inc. | | | | 0.40% | | 3/27/13 | | Open | | | 3,022,500 | | | | 3,033,885 | |
Deutsche Bank Securities, Inc. | | | | 0.55% | | 3/27/13 | | Open | | | 1,464,750 | | | | 1,472,336 | |
Deutsche Bank Securities, Inc. | | | | 0.60% | | 3/27/13 | | Open | | | 1,634,000 | | | | 1,643,205 | |
Deutsche Bank Securities, Inc. | | | | 0.60% | | 3/27/13 | | Open | | | 919,000 | | | | 924,177 | |
Deutsche Bank Securities, Inc. | | | | 0.60% | | 3/27/13 | | Open | | | 527,000 | | | | 529,969 | |
Deutsche Bank Securities, Inc. | | | | 0.60% | | 3/27/13 | | Open | | | 579,000 | | | | 582,262 | |
Barclays Capital, Inc. | | | | 0.40% | | 4/02/13 | | Open | | | 3,326,900 | | | | 3,339,173 | |
Barclays Capital, Inc. | | | | 0.60% | | 4/02/13 | | Open | | | 865,247 | | | | 870,035 | |
Barclays Capital, Inc. | | | | 0.60% | | 4/02/13 | | Open | | | 331,500 | | | | 333,334 | |
Deutsche Bank Securities, Inc. | | | | 0.55% | | 4/02/13 | | Open | | | 1,250,330 | | | | 1,256,691 | |
Credit Suisse Securities (USA) LLC | �� | | | 0.35% | | 4/03/13 | | Open | | | 243,800 | | | | 244,585 | |
Credit Suisse Securities (USA) LLC | | | | 0.35% | | 4/03/13 | | Open | | | 5,701,069 | | | | 5,719,415 | |
Credit Suisse Securities (USA) LLC | | | | 0.35% | | 4/03/13 | | Open | | | 1,233,600 | | | | 1,237,570 | |
Credit Suisse Securities (USA) LLC | | | | 0.35% | | 4/03/13 | | Open | | | 1,277,250 | | | | 1,281,360 | |
Credit Suisse Securities (USA) LLC | | | | 0.35% | | 4/03/13 | | Open | | | 2,861,250 | | | | 2,870,458 | |
Credit Suisse Securities (USA) LLC | | | | 0.35% | | 4/03/13 | | Open | | | 3,119,100 | | | | 3,129,137 | |
Credit Suisse Securities (USA) LLC | | | | 0.35% | | 4/03/13 | | Open | | | 2,958,750 | | | | 2,968,271 | |
Credit Suisse Securities (USA) LLC | | | | 0.35% | | 4/03/13 | | Open | | | 3,213,750 | | | | 3,224,092 | |
See Notes to Financial Statements.
| SEMI-ANNUAL REPORT | FEBRUARY 28, 2014 | 45
|
| |
| Consolidated Schedule of Investments (continued) | BlackRock Limited Duration Income Trust (BLW)
|
Reverse repurchase agreements outstanding as of February 28, 2014 were as follows (continued): |
Counterparty
|
|
|
| Interest
Rate
|
| Trade
Date
|
| Maturity
Date
|
| Face Value
|
| Face Value
Including
Accrued
Interest
|
Credit Suisse Securities (USA) LLC | | | | 0.35% | | 4/03/13 | | Open | | $ | 3,695,000 | | | $ | 3,706,891 | |
Deutsche Bank Securities, Inc. | | | | 0.58% | | 4/03/13 | | Open | | | 1,482,188 | | | | 1,490,116 | |
Deutsche Bank Securities, Inc. | | | | 0.58% | | 4/03/13 | | Open | | | 1,624,500 | | | | 1,633,163 | |
UBS Securities LLC | | | | 0.55% | | 4/08/13 | | Open | | | 2,327,500 | | | | 2,339,057 | |
Deutsche Bank Securities, Inc. | | | | 0.55% | | 4/10/13 | | Open | | | 846,000 | | | | 850,201 | |
Deutsche Bank Securities, Inc. | | | | 0.55% | | 4/10/13 | | Open | | | 536,000 | | | | 538,661 | |
Deutsche Bank Securities, Inc. | | | | 0.55% | | 4/10/13 | | Open | | | 489,000 | | | | 491,428 | |
Deutsche Bank Securities, Inc. | | | | 0.55% | | 4/12/13 | | Open | | | 2,054,000 | | | | 2,064,136 | |
Deutsche Bank Securities, Inc. | | | | (0.25)% | | 4/17/13 | | Open | | | 690,206 | | | | 688,706 | |
Barclays Capital, Inc. | | | | 0.60% | | 5/07/13 | | Open | | | 225,152 | | | | 226,270 | |
Deutsche Bank Securities, Inc. | | | | 0.55% | | 5/14/13 | | Open | | | 789,000 | | | | 792,508 | |
Credit Suisse Securities (USA) LLC | | | | 0.75% | | 5/23/13 | | Open | | | 238,810 | | | | 240,213 | |
Credit Suisse Securities (USA) LLC | | | | 0.40% | | 5/30/13 | | Open | | | 720,960 | | | | 723,163 | |
Deutsche Bank Securities, Inc. | | | | 0.55% | | 5/30/13 | | Open | | | 851,000 | | | | 854,575 | |
Deutsche Bank Securities, Inc. | | | | 0.55% | | 5/30/13 | | Open | | | 1,511,000 | | | | 1,517,348 | |
Deutsche Bank Securities, Inc. | | | | 0.55% | | 5/30/13 | | Open | | | 2,137,000 | | | | 2,145,978 | |
Deutsche Bank Securities, Inc. | | | | 0.55% | | 5/31/13 | | Open | | | 586,181 | | | | 588,635 | |
UBS Securities LLC | | | | 0.55% | | 6/03/13 | | Open | | | 808,520 | | | | 811,867 | |
UBS Securities LLC | | | | 0.55% | | 6/12/13 | | Open | | | 864,647 | | | | 868,095 | |
Deutsche Bank Securities, Inc. | | | | 0.55% | | 6/13/13 | | Open | | | 923,000 | | | | 926,680 | |
Deutsche Bank Securities, Inc. | | | | 0.55% | | 6/13/13 | | Open | | | 1,440,000 | | | | 1,445,720 | |
UBS Securities LLC | | | | 0.65% | | 6/20/13 | | Open | | | 743,850 | | | | 747,248 | |
Barclays Capital, Inc. | | | | 0.44% | | 6/21/13 | | Open | | | 1,109,299 | | | | 1,112,729 | |
Barclays Capital, Inc. | | | | 0.60% | | 6/24/13 | | Open | | | 1,731,221 | | | | 1,738,434 | |
Barclays Capital, Inc. | | | | 0.60% | | 6/24/13 | | Open | | | 432,962 | | | | 434,766 | |
Barclays Capital, Inc. | | | | 0.60% | | 6/24/13 | | Open | | | 488,876 | | | | 490,913 | |
Barclays Capital, Inc. | | | | 0.60% | | 6/24/13 | | Open | | | 979,729 | | | | 983,811 | |
Barclays Capital, Inc. | | | | 0.60% | | 6/24/13 | | Open | | | 2,180,349 | | | | 2,189,434 | |
Deutsche Bank Securities, Inc. | | | | 0.55% | | 6/24/13 | | Open | | | 803,000 | | | | 806,067 | |
Deutsche Bank Securities, Inc. | | | | 0.55% | | 6/24/13 | | Open | | | 1,629,700 | | | | 1,635,925 | |
Deutsche Bank Securities, Inc. | | | | 0.57% | | 6/26/13 | | Open | | | 504,000 | | | | 505,971 | |
Deutsche Bank Securities, Inc. | | | | 0.58% | | 6/27/13 | | Open | | | 698,000 | | | | 700,766 | |
Deutsche Bank Securities, Inc. | | | | 0.55% | | 7/18/13 | | Open | | | 871,000 | | | | 874,007 | |
Deutsche Bank Securities, Inc. | | | | 0.55% | | 7/30/13 | | Open | | | 1,095,000 | | | | 1,098,580 | |
Deutsche Bank Securities, Inc. | | | | 0.58% | | 8/12/13 | | Open | | | 2,958,000 | | | | 2,967,579 | |
Deutsche Bank Securities, Inc. | | | | 0.58% | | 8/13/13 | | Open | | | 1,295,000 | | | | 1,299,131 | |
Deutsche Bank Securities, Inc. | | | | 0.58% | | 8/13/13 | | Open | | | 450,000 | | | | 451,435 | |
Deutsche Bank Securities, Inc. | | | | 0.58% | | 8/13/13 | | Open | | | 1,288,000 | | | | 1,292,109 | |
Deutsche Bank Securities, Inc. | | | | 0.58% | | 8/13/13 | | Open | | | 1,009,000 | | | | 1,012,219 | |
Deutsche Bank Securities, Inc. | | | | 0.58% | | 8/13/13 | | Open | | | 137,000 | | | | 137,437 | |
Deutsche Bank Securities, Inc. | | | | 0.58% | | 8/13/13 | | Open | | | 198,000 | | | | 198,632 | |
Deutsche Bank Securities, Inc. | | | | 0.58% | | 8/13/13 | | Open | | | 311,000 | | | | 311,992 | |
Deutsche Bank Securities, Inc. | | | | 0.58% | | 8/13/13 | | Open | | | 3,135,000 | | | | 3,145,001 | |
Deutsche Bank Securities, Inc. | | | | 0.58% | | 8/13/13 | | Open | | | 1,107,000 | | | | 1,110,531 | |
Deutsche Bank Securities, Inc. | | | | 0.58% | | 8/13/13 | | Open | | | 780,000 | | | | 782,488 | |
Deutsche Bank Securities, Inc. | | | | 0.58% | | 8/13/13 | | Open | | | 1,169,000 | | | | 1,172,729 | |
Deutsche Bank Securities, Inc. | | | | 0.58% | | 8/13/13 | | Open | | | 948,000 | | | | 951,024 | |
Deutsche Bank Securities, Inc. | | | | 0.58% | | 8/13/13 | | Open | | | 356,000 | | | | 357,136 | |
Deutsche Bank Securities, Inc. | | | | 0.58% | | 8/14/13 | | Open | | | 703,000 | | | | 705,254 | |
Deutsche Bank Securities, Inc. | | | | 0.58% | | 9/11/13 | | Open | | | 610,000 | | | | 611,681 | |
Deutsche Bank Securities, Inc. | | | | 0.58% | | 9/16/13 | | Open | | | 2,124,000 | | | | 2,129,681 | |
Deutsche Bank Securities, Inc. | | | | 0.58% | | 9/16/13 | | Open | | | 1,480,000 | | | | 1,483,958 | |
Deutsche Bank Securities, Inc. | | | | 0.58% | | 9/16/13 | | Open | | | 1,524,000 | | | | 1,528,076 | |
Deutsche Bank Securities, Inc. | | | | 0.58% | | 9/16/13 | | Open | | | 2,142,000 | | | | 2,147,729 | |
Deutsche Bank Securities, Inc. | | | | 0.58% | | 9/16/13 | | Open | | | 1,309,000 | | | | 1,312,501 | |
Deutsche Bank Securities, Inc. | | | | 0.58% | | 9/16/13 | | Open | | | 1,523,000 | | | | 1,527,073 | |
Deutsche Bank Securities, Inc. | | | | 0.58% | | 9/17/13 | | Open | | | 163,000 | | | | 163,433 | |
BNP Paribas Securities Corp. | | | | 0.34% | | 9/18/13 | | Open | | | 13,065,000 | | | | 13,085,207 | |
Credit Suisse Securities (USA) LLC | | | | 0.75% | | 9/23/13 | | Open | | | 389,825 | | | | 391,116 | |
Deutsche Bank Securities, Inc. | | | | 0.55% | | 9/26/13 | | Open | | | 397,000 | | | | 397,946 | |
Barclays Capital, Inc. | | | | 0.60% | | 9/27/13 | | Open | | | 1,189,125 | | | | 1,192,197 | |
Deutsche Bank Securities, Inc. | | | | 0.60% | | 9/27/13 | | Open | | | 2,219,000 | | | | 2,224,732 | |
Deutsche Bank Securities, Inc. | | | | 0.60% | | 9/27/13 | | Open | | | 2,954,000 | | | | 2,961,631 | |
Deutsche Bank Securities, Inc. | | | | 0.60% | | 9/27/13 | | Open | | | 1,035,000 | | | | 1,037,674 | |
Deutsche Bank Securities, Inc. | | | | 0.60% | | 9/27/13 | | Open | | | 882,000 | | | | 884,278 | |
See Notes to Financial Statements.
| 46 | SEMI-ANNUAL REPORT | FEBRUARY 28, 2014
|
| |
| Consolidated Schedule of Investments (continued) | BlackRock Limited Duration Income Trust (BLW)
|
Reverse repurchase agreements outstanding as of February 28, 2014 were as follows (continued): |
Counterparty
|
|
|
| Interest
Rate
|
| Trade
Date
|
| Maturity
Date
|
| Face Value
|
| Face Value
Including
Accrued
Interest
|
Deutsche Bank Securities, Inc. | | | | 0.56% | | 10/11/13 | | Open | | $ | 1,016,000 | | | $ | 1,018,228 | |
Barclays Capital, Inc. | | | | 0.60% | | 10/15/13 | | Open | | | 628,340 | | | | 629,775 | |
Barclays Capital, Inc. | | | | 0.60% | | 10/15/13 | | Open | | | 893,525 | | | | 895,565 | |
Barclays Capital, Inc. | | | | 0.60% | | 10/15/13 | | Open | | | 919,755 | | | | 921,855 | |
Barclays Capital, Inc. | | | | 0.60% | | 10/15/13 | | Open | | | 497,887 | | | | 499,024 | |
Barclays Capital, Inc. | | | | 0.60% | | 10/16/13 | | Open | | | 803,937 | | | | 805,759 | |
Deutsche Bank Securities, Inc. | | | | 0.58% | | 10/16/13 | | Open | | | 546,562 | | | | 547,760 | |
Deutsche Bank Securities, Inc. | | | | 0.58% | | 10/16/13 | | Open | | | 1,207,500 | | | | 1,210,146 | |
Deutsche Bank Securities, Inc. | | | | 0.58% | | 10/16/13 | | Open | | | 934,313 | | | | 936,360 | |
Barclays Capital, Inc. | | | | 0.60% | | 10/17/13 | | Open | | | 728,012 | | | | 729,650 | |
Barclays Capital, Inc. | | | | 0.60% | | 10/17/13 | | Open | | | 682,594 | | | | 684,130 | |
Barclays Capital, Inc. | | | | 0.60% | | 10/17/13 | | Open | | | 875,600 | | | | 877,570 | |
Barclays Capital, Inc. | | | | 0.60% | | 10/17/13 | | Open | | | 1,215,288 | | | | 1,218,022 | |
Deutsche Bank Securities, Inc. | | | | 0.58% | | 10/17/13 | | Open | | | 770,000 | | | | 771,675 | |
Barclays Capital, Inc. | | | | 0.60% | | 10/21/13 | | Open | | | 676,000 | | | | 677,465 | |
Deutsche Bank Securities, Inc. | | | | 0.59% | | 10/21/13 | | Open | | | 791,000 | | | | 792,698 | |
Deutsche Bank Securities, Inc. | | | | 0.59% | | 10/21/13 | | Open | | | 389,000 | | | | 389,835 | |
Deutsche Bank Securities, Inc. | | | | 0.59% | | 10/21/13 | | Open | | | 803,000 | | | | 804,724 | |
UBS Securities LLC | | | | (0.50)% | | 10/21/13 | | Open | | | 983,281 | | | | 981,506 | |
UBS Securities LLC | | | | 0.65% | | 10/21/13 | | Open | | | 1,601,775 | | | | 1,605,535 | |
UBS Securities LLC | | | | 0.65% | | 10/21/13 | | Open | | | 588,262 | | | | 589,643 | |
Barclays Capital, Inc. | | | | 0.60% | | 10/22/13 | | Open | | | 845,434 | | | | 847,266 | |
Barclays Capital, Inc. | | | | 0.60% | | 10/22/13 | | Open | | | 1,023,231 | | | | 1,025,448 | |
Barclays Capital, Inc. | | | | 0.60% | | 10/22/13 | | Open | | | 755,625 | | | | 757,262 | |
Barclays Capital, Inc. | | | | 0.60% | | 10/22/13 | | Open | | | 851,217 | | | | 853,061 | |
Barclays Capital, Inc. | | | | 0.60% | | 10/22/13 | | Open | | | 788,400 | | | | 790,108 | |
Deutsche Bank Securities, Inc. | | | | 0.55% | | 10/22/13 | | Open | | | 2,441,000 | | | | 2,445,811 | |
Deutsche Bank Securities, Inc. | | | | 0.59% | | 10/25/13 | | Open | | | 707,445 | | | | 708,917 | |
Deutsche Bank Securities, Inc. | | | | 0.59% | | 10/25/13 | | Open | | | 835,450 | | | | 837,189 | |
Barclays Capital, Inc. | | | | 0.60% | | 11/15/13 | | Open | | | 2,067,975 | | | | 2,071,628 | |
Barclays Capital, Inc. | | | | 0.60% | | 11/15/13 | | Open | | | 1,356,788 | | | | 1,359,185 | |
Barclays Capital, Inc. | | | | 0.60% | | 11/15/13 | | Open | | | 1,291,249 | | | | 1,293,530 | |
Barclays Capital, Inc. | | | | 0.60% | | 11/15/13 | | Open | | | 1,283,400 | | | | 1,285,667 | |
Deutsche Bank Securities, Inc. | | | | 0.59% | | 11/15/13 | | Open | | | 424,000 | | | | 424,737 | |
Barclays Capital, Inc. | | | | 0.55% | | 11/18/13 | | Open | | | 1,313,488 | | | | 1,315,555 | |
Deutsche Bank Securities, Inc. | | | | 0.58% | | 11/18/13 | | Open | | | 968,000 | | | | 969,606 | |
Deutsche Bank Securities, Inc. | | | | 0.60% | | 11/27/13 | | Open | | | 1,227,000 | | | | 1,228,881 | |
Deutsche Bank Securities, Inc. | | | | 0.60% | | 11/27/13 | | Open | | | 646,000 | | | | 646,991 | |
Deutsche Bank Securities, Inc. | | | | 0.60% | | 11/27/13 | | Open | | | 1,538,000 | | | | 1,540,358 | |
Deutsche Bank Securities, Inc. | | | | 0.60% | | 11/27/13 | | Open | | | 2,602,000 | | | | 2,605,990 | |
Deutsche Bank Securities, Inc. | | | | 0.60% | | 11/27/13 | | Open | | | 834,000 | | | | 835,279 | |
Deutsche Bank Securities, Inc. | | | | 0.60% | | 11/27/13 | | Open | | | 708,000 | | | | 709,086 | |
Deutsche Bank Securities, Inc. | | | | 0.60% | | 11/27/13 | | Open | | | 772,000 | | | | 773,184 | |
Deutsche Bank Securities, Inc. | | | | 0.60% | | 12/12/13 | | Open | | | 1,230,000 | | | | 1,231,620 | |
Deutsche Bank Securities, Inc. | | | | 0.60% | | 12/12/13 | | Open | | | 723,000 | | | | 723,952 | |
Deutsche Bank Securities, Inc. | | | | 0.60% | | 12/12/13 | | Open | | | 564,000 | | | | 564,743 | |
Deutsche Bank Securities, Inc. | | | | 0.60% | | 12/12/13 | | Open | | | 549,000 | | | | 549,723 | |
Deutsche Bank Securities, Inc. | | | | 0.60% | | 12/12/13 | | Open | | | 727,000 | | | | 727,957 | |
Deutsche Bank Securities, Inc. | | | | 0.60% | | 12/12/13 | | Open | | | 1,323,000 | | | | 1,324,742 | |
Deutsche Bank Securities, Inc. | | | | 0.59% | | 12/16/13 | | Open | | | 412,000 | | | | 412,506 | |
Deutsche Bank Securities, Inc. | | | | 0.58% | | 12/18/13 | | Open | | | 996,000 | | | | 997,155 | |
Deutsche Bank Securities, Inc. | | | | 0.60% | | 12/18/13 | | Open | | | 1,030,000 | | | | 1,031,236 | |
Deutsche Bank Securities, Inc. | | | | 0.60% | | 12/18/13 | | Open | | | 865,000 | | | | 866,038 | |
Deutsche Bank Securities, Inc. | | | | 0.60% | | 12/18/13 | | Open | | | 767,000 | | | | 767,920 | |
Deutsche Bank Securities, Inc. | | | | 0.60% | | 12/18/13 | | Open | | | 1,222,000 | | | | 1,223,466 | |
Deutsche Bank Securities, Inc. | | | | 0.60% | | 12/18/13 | | Open | | | 686,000 | | | | 686,823 | |
RBC Capital Markets, LLC | | | | 0.65% | | 12/18/13 | | Open | | | 453,000 | | | | 453,589 | |
RBC Capital Markets, LLC | | | | 0.65% | | 12/18/13 | | Open | | | 570,000 | | | | 570,741 | |
RBC Capital Markets, LLC | | | | 0.65% | | 12/18/13 | | Open | | | 514,000 | | | | 514,668 | |
RBC Capital Markets, LLC | | | | 0.65% | | 12/18/13 | | Open | | | 566,000 | | | | 566,736 | |
RBC Capital Markets, LLC | | | | 0.65% | | 12/18/13 | | Open | | | 474,000 | | | | 474,616 | |
RBC Capital Markets, LLC | | | | 0.65% | | 12/18/13 | | Open | | | 489,000 | | | | 489,636 | |
RBC Capital Markets, LLC | | | | 0.65% | | 12/18/13 | | Open | | | 520,000 | | | | 520,676 | |
RBC Capital Markets, LLC | | | | 0.65% | | 12/18/13 | | Open | | | 508,000 | | | | 508,660 | |
Deutsche Bank Securities, Inc. | | | | 0.60% | | 12/23/13 | | Open | | | 1,464,000 | | | | 1,465,659 | |
See Notes to Financial Statements.
| SEMI-ANNUAL REPORT | FEBRUARY 28, 2014 | 47
|
| |
| Consolidated Schedule of Investments (continued) | BlackRock Limited Duration Income Trust (BLW)
|
Reverse repurchase agreements outstanding as of February 28, 2014 were as follows (concluded): |
Counterparty
|
|
|
| Interest
Rate
|
| Trade
Date
|
| Maturity
Date
|
| Face Value
|
| Face Value
Including
Accrued
Interest
|
Deutsche Bank Securities, Inc. | | | | (0.63)% | | 12/27/13 | | Open | | $ | 1,680,000 | | | $ | 1,678,221 | |
Deutsche Bank Securities, Inc. | | | | (0.10)% | | 12/27/13 | | Open | | | 1,162,000 | | | | 1,161,803 | |
Deutsche Bank Securities, Inc. | | | | 0.50% | | 12/27/13 | | Open | | | 1,416,000 | | | | 1,417,200 | |
Deutsche Bank Securities, Inc. | | | | 0.55% | | 12/27/13 | | Open | | | 973,000 | | | | 973,907 | |
Deutsche Bank Securities, Inc. | | | | 0.55% | | 12/27/13 | | Open | | | 553,000 | | | | 553,515 | |
Deutsche Bank Securities, Inc. | | | | 0.55% | | 12/27/13 | | Open | | | 296,000 | | | | 296,276 | |
Deutsche Bank Securities, Inc. | | | | 0.58% | | 12/27/13 | | Open | | | 300,000 | | | | 300,295 | |
Deutsche Bank Securities, Inc. | | | | 0.58% | | 12/27/13 | | Open | | | 1,450,000 | | | | 1,451,425 | |
Deutsche Bank Securities, Inc. | | | | 0.58% | | 12/27/13 | | Open | | | 593,000 | | | | 593,583 | |
Deutsche Bank Securities, Inc. | | | | 0.58% | | 12/27/13 | | Open | | | 945,000 | | | | 945,929 | |
Deutsche Bank Securities, Inc. | | | | 0.58% | | 12/27/13 | | Open | | | 357,000 | | | | 357,351 | |
Deutsche Bank Securities, Inc. | | | | 0.58% | | 12/27/13 | | Open | | | 1,228,000 | | | | 1,229,207 | |
Deutsche Bank Securities, Inc. | | | | 0.58% | | 12/27/13 | | Open | | | 4,600,000 | | | | 4,604,521 | |
Deutsche Bank Securities, Inc. | | | | 0.60% | | 12/27/13 | | Open | | | 1,898,000 | | | | 1,899,930 | |
Deutsche Bank Securities, Inc. | | | | 0.60% | | 12/27/13 | | Open | | | 820,000 | | | | 820,834 | |
Deutsche Bank Securities, Inc. | | | | 0.65% | | 12/27/13 | | Open | | | 557,000 | | | | 557,613 | |
Deutsche Bank Securities, Inc. | | | | 0.65% | | 12/27/13 | | Open | | | 909,000 | | | | 910,001 | |
Deutsche Bank Securities, Inc. | | | | 0.58% | | 2/03/14 | | Open | | | 2,254,981 | | | | 2,255,926 | |
Deutsche Bank Securities, Inc. | | | | 0.58% | | 2/03/14 | | Open | | | 1,253,464 | | | | 1,253,989 | |
RBC Capital Markets, LLC | | | | 0.65% | | 2/04/14 | | Open | | | 219,760 | | | | 219,859 | |
Credit Suisse Securities (USA) LLC | | | | 0.12% | | 2/18/14 | | 3/18/14 | | | 26,130,546 | | | | 26,131,417 | |
RBC Capital Markets, LLC | | | | 0.65% | | 2/18/14 | | Open | | | 492,000 | | | | 492,089 | |
RBC Capital Markets, LLC | | | | 0.65% | | 2/18/14 | | Open | | | 334,000 | | | | 334,060 | |
RBC Capital Markets, LLC | | | | 0.65% | | 2/18/14 | | Open | | | 477,000 | | | | 477,086 | |
RBC Capital Markets, LLC | | | | 0.65% | | 2/18/14 | | Open | | | 560,000 | | | | 560,101 | |
HSBC Securities (USA), Inc. | | | | 0.55% | | 2/26/14 | | Open | | | 2,515,741 | | | | 2,515,856 | |
HSBC Securities (USA), Inc. | | | | 0.55% | | 2/26/14 | | Open | | | 1,111,931 | | | | 1,111,982 | |
Barclays Capital, Inc. | | | | 0.35% | | 2/28/14 | | Open | | | 3,109,000 | | | | 3,109,000 | |
Barclays Capital, Inc. | | | | 0.35% | | 2/28/14 | | Open | | | 3,202,000 | | | | 3,202,000 | |
Barclays Capital, Inc. | | | | 0.35% | | 2/28/14 | | Open | | | 1,929,000 | | | | 1,929,000 | |
Barclays Capital, Inc. | | | | 0.60% | | 2/28/14 | | Open | | | 935,000 | | | | 935,000 | |
Deutsche Bank Securities, Inc. | | | | 0.55% | | 2/28/14 | | Open | | | 1,894,000 | | | | 1,894,000 | |
Deutsche Bank Securities, Inc. | | | | 0.55% | | 2/28/14 | | Open | | | 474,000 | | | | 474,000 | |
Deutsche Bank Securities, Inc. | | | | 0.55% | | 2/28/14 | | Open | | | 996,000 | | | | 996,000 | |
Deutsche Bank Securities, Inc. | | | | 0.55% | | 2/28/14 | | Open | | | 2,862,000 | | | | 2,862,000 | |
Deutsche Bank Securities, Inc. | | | | 0.55% | | 2/28/14 | | Open | | | 1,073,000 | | | | 1,073,000 | |
RBC Capital Markets, LLC | | | | 0.40% | | 2/28/14 | | Open | | | 484,000 | | | | 484,000 | |
Total | | | | | | | | | | $ | 291,162,130 | | | $ | 291,897,510 | |
| | | | | | | | | | | | | | | | |
| • | | | | Financial futures contracts outstanding as of February 28, 2014 were as follows: |
Contracts
Purchased/
(Sold)
|
| Issue
|
| Exchange
|
| Expiration
|
| Notional
Value
|
| Unrealized
Appreciation
(Depreciation)
|
6 | | 90-Day Euro-Dollar | | Chicago Mercantile | | March 2014 | | $ | 1,496,475 | | $ | 39,209 | |
(97) | | 10-Year US Treasury Note | | Chicago Board of Trade | | June 2014 | | $ | 12,079,531 | | | (38,828 | ) |
Total
| | | | | | | | | | | $ | 381 | |
| • | | | | Foreign currency exchange contracts outstanding as of February 28, 2014 were as follows: |
| | | | | | | | | | |
Currency Purchased
|
| Currency Sold
|
| Counterparty
|
| Settlement
Date
|
| Unrealized
Appreciation
(Depreciation)
|
|
EUR | | | | | 1,088,000 | | | USD | | | 1,501,016 | | | State Street Bank and Trust Co. | | 4/22/14 | | $ | 725 | |
GBP | | | | | 1,152,000 | | | USD | | | 1,921,812 | | | State Street Bank and Trust Co. | | 4/22/14 | | | 6,568 | |
USD | | | | | 1,601,378 | | | CAD | | | 1,753,000 | | | Barclays Bank PLC | | 4/22/14 | | | 20,117 | |
USD | | | | | 32,851,501 | | | EUR | | | 24,162,000 | | | Barclays Bank PLC | | 4/22/14 | | | (498,732 | ) |
USD | | | | | 395,075 | | | EUR | | | 288,000 | | | BNP Paribas S.A. | | 4/22/14 | | | (2,445 | ) |
USD | | | | | 839,053 | | | EUR | | | 610,000 | | | BNP Paribas S.A. | | 4/22/14 | | | (2,915 | ) |
USD | | | | | 888,937 | | | EUR | | | 650,000 | | | Deutsche Bank AG | | 4/22/14 | | | (8,243 | ) |
USD | | | | | 216,298 | | | EUR | | | 159,374 | | | Goldman Sachs & Co. | | 4/22/14 | | | (3,682 | ) |
USD | | | | | 466,108 | | | EUR | | | 340,000 | | | Royal Bank of Scotland PLC | | 4/22/14 | | | (3,186 | ) |
USD | | | | | 422,592 | | | EUR | | | 310,000 | | | State Street Bank and Trust Co. | | 4/22/14 | | | (5,293 | ) |
USD | | | | | 45,909,756 | | | GBP | | | 27,985,000 | | | Barclays Bank PLC | | 4/22/14 | | | (935,500 | ) |
USD | | | | | 827,755 | | | GBP | | | 500,000 | | | Citibank N.A. | | 4/22/14 | | | (9,216 | ) |
USD | | | | | 1,486,091 | | | GBP | | | 901,000 | | | UBS AG | | 4/22/14 | | | (22,130 | ) |
Total | | | | | | | | | | | | | | | | | | $ | (1,463,932 | ) |
See Notes to Financial Statements.
| 48 | SEMI-ANNUAL REPORT | FEBRUARY 28, 2014
|
| |
| Consolidated Schedule of Investments (continued) | BlackRock Limited Duration Income Trust (BLW)
|
| • | | | | OTC options purchased as of February 28, 2014 were as follows: |
Description
|
|
|
| Counterparty
|
| Put/
Call
|
| Strike
Price
|
| Expiration
Date
|
| Contracts
|
| Market
Value
|
|
Marsico Parent Superholdco LLC | | | | Goldman Sachs & Co. | | Call | | USD | | 942.86 | | 12/14/19 | | 46 | | — | |
| • | | | | OTC credit default swaps – buy protection outstanding as of February 28, 2014 were as follows: |
Issuer
|
|
|
| Pay
Fixed
Rate
|
| Counterparty
|
| Expiration
Date
|
| Notional
Amount
(000)
|
| Market
Value
|
| Premiums
Paid
|
| Unrealized
Depreciation
|
|
Australia & New Zealand Banking Group Ltd. | | | | 1.00% | | Deutsche Bank AG | | 9/20/17 | | USD | | 1 | | $ (8) | | $ | 11 | | | $ | (19 | ) |
Westpac Banking Corp. | | | | 1.00% | | Deutsche Bank AG | | 9/20/17 | | USD | | 1 | | (8) | | | 11 | | | | (19 | ) |
Total | | | | | | | | | | | | | | $(16) | | $ | 22 | | | $ | (38 | ) |
| • | | | | OTC credit default swaps – sold protection outstanding as of February 28, 2014 were as follows: |
Issuer
|
|
|
| Receive
Fixed
Rate
|
| Counterparty
|
| Expiration
Date
|
| Credit
Rating1
|
| Notional
Amount
(000)2
|
| Market
Value
|
| Premiums
Received
|
| Unrealized
Appreciation
(Depreciation)
|
|
| Rosneft Oil Co. | | | | 1.50% | | HSBC Bank PLC | | 6/12/14 | | BBB | | USD | | 3,250 | | $ | (3,828 | ) | | $ | (9,472 | ) | | $ | 5,644 | |
| Caesars Entertainment Operating Co., Inc. | | | | 5.00% | | Barclays Bank PLC | | 9/20/15 | | CCC- | | USD | | 470 | | | (90,463 | ) | | | (83,711 | ) | | | (6,752 | ) |
| Caesars Entertainment Operating Co., Inc. | | | | 5.00% | | JPMorgan Chase Bank N.A. | | 12/20/15 | | CCC- | | USD | | 626 | | | (143,266 | ) | | | (141,275 | ) | | | (1,991 | ) |
| Caesars Entertainment Operating Co., Inc. | | | | 5.00% | | Citibank N.A. | | 12/20/15 | | CCC- | | USD | | 357 | | | (81,819 | ) | | | (72,001 | ) | | | (9,818 | ) |
| Caesars Entertainment Operating Co., Inc. | | | | 5.00% | | JPMorgan Chase Bank N.A. | | 12/20/15 | | CCC- | | USD | | 145 | | | (33,196 | ) | | | (28,377 | ) | | | (4,819 | ) |
| Caesars Entertainment Operating Co., Inc. | | | | 5.00% | | Citibank N.A. | | 12/20/15 | | CCC- | | USD | | 172 | | | (39,389 | ) | | | (31,062 | ) | | | (8,327 | ) |
| Caesars Entertainment Operating Co., Inc. | | | | 5.00% | | UBS AG | | 12/20/15 | | CCC- | | USD | | 840 | | | (192,367 | ) | | | (142,569 | ) | | | (49,798 | ) |
| Caesars Entertainment Operating Co., Inc. | | | | 5.00% | | Goldman Sachs Bank USA | | 12/20/15 | | CCC- | | USD | | 382 | | | (87,591 | ) | | | (42,820 | ) | | | (44,771 | ) |
| Caesars Entertainment Operating Co., Inc. | | | | 5.00% | | Goldman Sachs Bank USA | | 3/20/16 | | CCC- | | USD | | 247 | | | (65,692 | ) | | | (47,580 | ) | | | (18,112 | ) |
| Caesars Entertainment Operating Co., Inc. | | | | 5.00% | | Goldman Sachs Bank USA | | 3/20/16 | | CCC- | | USD | | 247 | | | (65,692 | ) | | | (47,580 | ) | | | (18,112 | ) |
| Caesars Entertainment Operating Co., Inc. | | | | 5.00% | | Goldman Sachs Bank USA | | 3/20/16 | | CCC- | | USD | | 739 | | | (196,666 | ) | | | (135,766 | ) | | | (60,900 | ) |
| Caesars Entertainment Operating Co., Inc. | | | | 5.00% | | Goldman Sachs Bank USA | | 3/20/16 | | CCC- | | USD | | 165 | | | (43,972 | ) | | | (28,865 | ) | | | (15,107 | ) |
| Caesars Entertainment Operating Co., Inc. | | | | 5.00% | | Barclays Bank PLC | | 3/20/16 | | CCC- | | USD | | 75 | | | (19,858 | ) | | | (12,790 | ) | | | (7,068 | ) |
| Caesars Entertainment Operating Co., Inc. | | | | 5.00% | | JPMorgan Chase Bank N.A. | | 3/20/16 | | CCC- | | USD | | 82 | | | (21,863 | ) | | | (13,552 | ) | | | (8,311 | ) |
| Caesars Entertainment Operating Co., Inc. | | | | 5.00% | | Barclays Bank PLC | | 3/20/16 | | CCC- | | USD | | 72 | | | (19,196 | ) | | | (10,976 | ) | | | (8,220 | ) |
| Caesars Entertainment Operating Co., Inc. | | | | 5.00% | | Citibank N.A. | | 3/20/16 | | CCC- | | USD | | 79 | | | (20,882 | ) | | | (12,200 | ) | | | (8,682 | ) |
| Caesars Entertainment Operating Co., Inc. | | | | 5.00% | | Goldman Sachs Bank USA | | 3/20/16 | | CCC- | | USD | | 634 | | | (168,635 | ) | | | (89,391 | ) | | | (79,244 | ) |
| Caesars Entertainment Operating Co., Inc. | | | | 5.00% | | Citibank N.A. | | 3/20/16 | | CCC- | | USD | | 135 | | | (35,811 | ) | | | (19,280 | ) | | | (16,531 | ) |
| Caesars Entertainment Operating Co., Inc. | | | | 5.00% | | Goldman Sachs Bank USA | | 6/20/16 | | CCC- | | USD | | 499 | | | (149,076 | ) | | | (103,044 | ) | | | (46,032 | ) |
| Caesars Entertainment Operating Co., Inc. | | | | 5.00% | | Goldman Sachs Bank USA | | 6/20/16 | | CCC- | | USD | | 970 | | | (289,614 | ) | | | (193,871 | ) | | | (95,743 | ) |
| Caesars Entertainment Operating Co., Inc. | | | | 5.00% | | Barclays Bank PLC | | 6/20/16 | | CCC- | | USD | | 440 | | | (131,371 | ) | | | (69,687 | ) | | | (61,684 | ) |
| Caesars Entertainment Operating Co., Inc. | | | | 5.00% | | JPMorgan Chase Bank N.A. | | 6/20/16 | | CCC- | | USD | | 412 | | | (122,902 | ) | | | (68,831 | ) | | | (54,071 | ) |
| Caesars Entertainment Operating Co., Inc. | | | | 5.00% | | Citibank N.A. | | 9/20/16 | | CCC- | | USD | | 330 | | | (109,455 | ) | | | (94,923 | ) | | | (14,532 | ) |
| Caesars Entertainment Operating Co., Inc. | | | | 5.00% | | Goldman Sachs Bank USA | | 9/20/16 | | CCC- | | USD | | 1,710 | | | (567,032 | ) | | | (326,389 | ) | | | (240,643 | ) |
| Caesars Entertainment Operating Co., Inc. | | | | 5.00% | | Goldman Sachs Bank USA | | 3/20/17 | | CCC- | | USD | | 453 | | | (180,210 | ) | | | (107,636 | ) | | | (72,574 | ) |
| Caesars Entertainment Operating Co., Inc. | | | | 5.00% | | Barclays Bank PLC | | 3/20/17 | | CCC- | | USD | | 72 | | | (28,740 | ) | | | (17,989 | ) | | | (10,751 | ) |
| Caesars Entertainment Operating Co., Inc. | | | | 5.00% | | Goldman Sachs Bank USA | | 3/20/17 | | CCC- | | USD | | 147 | | | (58,516 | ) | | | (37,173 | ) | | | (21,343 | ) |
| Caesars Entertainment Operating Co., Inc. | | | | 5.00% | | Deutsche Bank AG | | 6/20/17 | | CCC- | | USD | | 635 | | | (265,639 | ) | | | (162,774 | ) | | | (102,865 | ) |
| |
Total | | | | | | | | | | | | | | | | $ | (3,232,741 | ) | | $ | (2,151,584 | ) | | $ | (1,081,157 | ) |
| 1 | Using S&P’s rating of the issuer. |
| 2 | The maximum potential amount the Fund may pay should a negative event take place as defined under the terms of the agreement. |
| • | | | | For Fund compliance purposes, the Fund’s industry classifications refer to any one or more of the industry sub-classifications used by one or more widely recognized market indexes or ratings group indexes, and/or as defined by the investment advisor. These definitions may not apply for purposes of this report, which may combine such industry sub-classifications for reporting ease. |
| • | | | | Fair Value Measurements — Various inputs are used in determining the fair value of investments and derivative financial instruments. These inputs to valuation techniques are categorized into a disclosure hierarchy consisting of three broad levels for financial statement purposes as follows: |
| • | | | | Level 1 — unadjusted price quotations in active markets/exchanges for identical assets or liabilities that the Fund has the ability to access |
| • | | | | Level 2 — other observable inputs (including, but not limited to, quoted prices for similar assets or liabilities in markets that are active, quoted prices for identical or similar assets or liabilities in markets that are not active, inputs other than quoted prices that are observable for the assets or liabilities (such as interest rates, yield curves, volatilities, prepayment speeds, loss severities, credit risks and default rates) or other market-corroborated inputs) |
| • | | | | Level 3 — unobservable inputs based on the best information available in the circumstances, to the extent observable inputs are not available (including the Fund’s own assumptions used in determining the fair value of investments and derivative financial instruments) |
See Notes to Financial Statements.
| SEMI-ANNUAL REPORT | FEBRUARY 28, 2014 | 49
|
| |
| Consolidated Schedule of Investments (continued) | BlackRock Limited Duration Income Trust (BLW)
|
The hierarchy gives the highest priority to unadjusted quoted prices in active markets for identical assets or liabilities (Level 1 measurements) and the lowest priority to unobservable inputs (Level 3 measurements). Accordingly, the degree of judgment exercised in determining fair value is greatest for instruments categorized in Level 3. The inputs used to measure fair value may fall into different levels of the fair value hierarchy. In such cases, for disclosure purposes, the fair value hierarchy classification is determined based on the lowest level input that is significant to the fair value measurement in its entirety. |
Changes in valuation techniques may result in transfers into or out of an assigned level within the disclosure hierarchy. In accordance with the Fund’s policy, transfers between different levels of the fair value disclosure hierarchy are deemed to have occurred as of the beginning of the reporting period. The categorization of a value determined for investments and derivative financial instruments is based on the pricing transparency of the investment and derivative financial instrument and is not necessarily an indication of the risks associated with investing in those securities. For information about the Fund’s policy regarding valuation of investments and derivative financial instruments, please refer to Note 2 of the Notes to Financial Statements. |
The following tables summarize the Fund’s investments and derivative financial instruments categorized in the disclosure hierarchy as of February 28, 2014: |
|
|
|
| Level 1
|
| Level 2
|
| Level 3
|
| Total
|
Assets:
| | | | | | | | | | | | | | | | | | |
Investments:
| | | | | | | | | | | | | | | | | | |
Long-Term Investments:
| | | | | | | | | | | | | | | | | | |
Common Stocks | | | | $ | 65,528 | | | $ | 4,215,383 | | | $ | 2,713,944 | | | $ | 6,994,855 | |
Asset-Backed Securities | | | | | — | | | | 33,140,862 | | | | 6,606,003 | | | | 39,746,865 | |
Corporate Bonds | | | | | — | | | | 413,976,177 | | | | 7,951,875 | | | | 421,928,052 | |
Floating Rate Loan Interests | | | | | — | | | | 317,976,382 | | | | 32,928,467 | | | | 350,904,849 | |
Foreign Agency Obligations | | | | | — | | | | 7,420,115 | | | | — | | | | 7,420,115 | |
Non-Agency Mortgage-Backed Securities | | | | | — | | | | 73,914,059 | | | | — | | | | 73,914,059 | |
US Government Sponsored Agency Securities | | | | | — | | | | 39,622,600 | | | | — | | | | 39,622,600 | |
Other Interests | | | | | — | | | | 516,112 | | | | 8,750 | | | | 524,862 | |
Preferred Securities | | | | | 5,273,917 | | | | 16,562,941 | | | | — | | | | 21,836,858 | |
Warrants | | | | | — | | | | 10,964 | | | | — | | | | 10,964 | |
Short-Term Securities | | | | | 3,052,131 | | | | — | | | | — | | | | 3,052,131 | |
Unfunded Loan Commitments | | | | | — | | | | 35 | | | | — | | | | 35 | |
Total
| | | | $ | 8,391,576 | | | $ | 907,355,630 | | | $ | 50,209,039 | | | $ | 965,956,245 | |
| | | | | | | | | | | |
|
|
|
|
|
|
|
|
|
|
|
|
|
|
| Level 1
|
| Level 2
|
| Level 3
|
| Total
|
Derivative Financial Instruments1
| | | | | | | | | | | | | | | | | | |
Assets:
| | | | | | | | | | | | | | | | | | |
Interest rate contracts | | | | $ | 39,209 | | | | — | | | | — | | | $ | 39,209 | |
Foreign currency exchange contracts | | | | | — | | | $ | 27,410 | | | | — | | | | 27,410 | |
Credit contracts | | | | | — | | | | 5,644 | | | | — | | | | 5,644 | |
Liabilities:
| | | | | | | | | | | | | | | | | | |
Interest rate contracts | | | | | (38,828 | ) | | | — | | | | — | | | | (38,828 | ) |
Foreign currency exchange contracts | | | | | — | | | | (1,491,342 | ) | | | — | | | | (1,491,342 | ) |
Credit contracts | | | | | — | | | | (1,086,839 | ) | | | — | | | | (1,086,839 | ) |
Total
| | | | $ | 381 | | | $ | (2,545,127 | ) | | | — | | | $ | (2,544,746 | ) |
| 1 | Derivative financial instruments are swaps, financial futures contracts and foreign currency exchange contracts. Swaps, financial futures contracts and foreign currency exchange contracts are valued at the unrealized appreciation/depreciation on the instrument. |
The carrying amount for certain of the Fund’s assets and/or liabilities approximates fair value for financial statement purposes. As of February 28, 2014, such assets and/or liabilities are categorized within the disclosure hierarchy as follows: |
|
|
|
| Level 1
|
| Level 2
|
| Level 3
|
| Total
|
Assets:
| | | | | | | | | | | | | | | | | | |
Cash | | | | $ | 1,443,512 | | | | — | | | | — | | | $ | 1,443,512 | |
Cash pledged as collateral for OTC derivatives | | | | | 1,810,000 | | | | — | | | | — | | | | 1,810,000 | |
Cash pledged for financial futures contracts | | | | | 171,500 | | | | — | | | | — | | | | 171,500 | |
Foreign currency at value | | | | | 2,348 | | | | — | | | | — | | | | 2,348 | |
Liabilities:
| | | | | | | | | | | | | | | | | | |
Cash received as collateral for reverse repurchase agreements | | | | | — | | | $ | (40,000 | ) | | | — | | | | (40,000 | ) |
Reverse repurchase agreements | | | | | — | | | | (291,897,510 | ) | | | — | | | | (291,897,510 | ) |
Total
| | | | $ | 3,427,360 | | | $ | (291,937,510 | ) | | | — | | | $ | (288,510,150 | ) |
There were no transfers between Level 1 and Level 2 during the six months ended February 28, 2014. |
See Notes to Financial Statements.
| 50 | SEMI-ANNUAL REPORT | FEBRUARY 28, 2014
|
| |
| Consolidated Schedule of Investments (concluded) | BlackRock Limited Duration Income Trust (BLW)
|
| |
A reconciliation of Level 3 investments is presented when the Fund had a significant amount of Level 3 investments at the beginning and/or end of the period in relation to net assets. The following table is a reconciliation of Level 3 investments for which significant unobservable inputs were used in determining fair value: |
| | | | | Common
Stocks | | Asset-Backed
Securities | | Corporate
Bonds | | Floating Rate
Loan Interests | | Other
Interests | | Total | |
|
| Assets: | | | | | | | | | | | | | | | | | | | | | | | | | | | |
| Opening Balance, as of August 31, 2013 | | | | $ | 3,050,139 | | | $ | 26,050,547 | | | $ | 7,930,102 | | | $ | 42,689,763 | | | $ | 537,766 | | | $ | 80,258,317 | | |
| Transfers into Level 31 | | | | | — | | | | — | | | | — | | | | 12,741,262 | | | | — | | | | 12,741,262 | | |
| Transfers out of Level 32 | | | | | — | | | | (12,461,639 | ) | | | — | | | | (22,630,549 | ) | | | — | | | | (35,092,188 | ) | |
| Other | | | | | — | | | | — | | | | — | | | | — | | | | — | | | | — | | |
| Accrued discounts/premiums | | | | | — | | | | (448,833 | ) | | | — | | | | 46,812 | | | | — | | | | (402,021 | ) | |
| Net realized gain (loss) | | | | | — | | | | 59,461 | | | | 1,798 | | | | 83,964 | | | | — | | | | 145,223 | | |
| Net change in unrealized appreciation/depreciation3,4 | | | | | (336,195 | ) | | | 437,476 | | | | 21,773 | | | | 79,059 | | | | 2,508,765 | | | | 2,710,878 | | |
| Purchases | | | | | — | | | | 4,041,500 | | | | — | | | | 10,956,531 | | | | — | | | | 14,998,031 | | |
| Sales | | | | | — | | | | (11,072,509 | ) | | | (1,798 | ) | | | (11,038,375 | ) | | | (3,037,781 | ) | | | (25,150,463 | ) | |
| Closing Balance, as of February 28, 2014 | | | | $ | 2,713,944 | | | $ | 6,606,003 | | | $ | 7,951,875 | | | $ | 32,928,467 | | | $ | 8,750 | | | $ | 50,209,039 | | |
| Net change in unrealized appreciation/depreciation on investments still held at February 28, 20144 | | | | $ | (336,195 | ) | | $ | 447,162 | | | $ | 23,500 | | | $ | 142,257 | | | $ | 3,750 | | | $ | 280,474 | | |
| 1 | | As of August 31, 2013, the Fund used observable inputs in determining the value of certain investments. As of February 28, 2014, the Fund used significant unobservable inputs in determining the value of the same investments. As a result, investments with a beginning of period value of $12,741,262 transferred from Level 2 to Level 3 in the disclosure hierarchy. |
| 2 | | As of August 31, 2013, the Fund used significant unobservable inputs in determining the value of certain investments. As of February 28, 2014, the Fund used observable inputs in determining the value of the same investments. As a result, investments with a beginning of period value of $35,092,188 transferred from Level 3 to Level 2 in the disclosure hierarchy. |
| 3 | | Included in the related net change in unrealized appreciation/depreciation in the Consolidated Statements of Operations. |
| 4 | | Any difference between Net change in unrealized appreciation/depreciation and Net change in unrealized appreciation/depreciation on investments still held at February 28, 2014 is generally due to investments no longer held or categorized as Level 3 at period end. |
| | The Fund’s investments that are categorized as Level 3 were valued utilizing third party pricing information without adjustment. Such valuations are based on unobservable inputs. A significant change in third party information inputs could result in a significantly lower or higher value of such Level 3 investments. |
See Notes to Financial Statements.
| SEMI-ANNUAL REPORT | FEBRUARY 28, 2014 | 51
|
| |
| Statements of Assets and Liabilities |
|
February 28, 2014 (Unaudited)
| | | | BlackRock
Defined
Opportunity
Credit Trust
(BHL) | | BlackRock
Floating Rate
Income
Strategies
Fund, Inc.
(FRA)1 | | BlackRock
Limited
Duration
Income Trust
(BLW)1 |
| |
Assets
|
Investments at value — unaffiliated2 | | | | $ | 184,240,683 | | | $ | 816,913,342 | | | $ | 962,904,079 | |
Investments at value — affiliated3 | | | | | 2,835,510 | | | | 4,239,004 | | | | 3,052,131 | |
Cash | | | | | 182,484 | | | | — | | | | 1,443,512 | |
Cash pledged for financial futures contracts | | | | | — | | | | — | | | | 171,500 | |
Cash pledged as collateral for OTC derivatives | | | | | — | | | | 1,560,000 | | | | 1,810,000 | |
Investments sold receivable | | | | | 4,739,726 | | | | 17,418,298 | | | | 16,821,065 | |
Interest receivable | | | | | 983,520 | | | | 4,397,594 | | | | 10,417,220 | |
Dividends receivable | | | | | — | | | | 3,432 | | | | 11,616 | |
Foreign currency at value4 | | | | | 171,631 | | | | 724,871 | | | | 2,348 | |
Swaps receivable | | | | | 18,044 | | | | 92,155 | | | | 122,774 | |
Unrealized appreciation on foreign currency exchange contracts | | | | | 6,072 | | | | 58,297 | | | | 27,410 | |
Variation margin receivable on financial futures contracts | | | | | — | | | | — | | | | 19,703 | |
Unrealized appreciation on OTC derivatives | | | | | — | | | | — | | | | 5,644 | |
Unrealized appreciation on unfunded loan commitments | | | | | 19 | | | | 82 | | | | 35 | |
Swap premiums paid | | | | | — | | | | — | | | | 22 | |
Prepaid expenses | | | | | 11,752 | | | | 30,273 | | | | 37,437 | |
Other assets | | | | | — | | | | — | | | | 57,632 | |
Total assets | | | | | 193,189,441 | | | | 845,437,348 | | | | 996,904,128 | |
| |
Liabilities
|
Bank overdraft | | | | | — | | | | 89,151 | | | | — | |
Reverse repurchase agreements | | | | | — | | | | — | | | | 291,897,510 | |
Bank borrowings payable | | | | | 52,000,000 | | | | 224,000,000 | | | | — | |
Cash received as collateral for reverse repurchase agreements | | | | | — | | | | — | | | | 40,000 | |
Investments purchased payable | | | | | 9,219,570 | | | | 39,850,810 | | | | 27,500,886 | |
Swap premiums received | | | | | 359,809 | | | | 1,721,009 | | | | 2,151,584 | |
Unrealized depreciation on OTC derivatives | | | | | 208,967 | | | | 950,435 | | | | 1,086,839 | |
Investment advisory fees payable | | | | | 139,119 | | | | 461,543 | | | | 407,229 | |
Unrealized depreciation on foreign currency exchange contracts | | | | | 94,096 | | | | 275,485 | | | | 1,491,342 | |
Income dividends payable | | | | | 70,606 | | | | 114,738 | | | | 84,359 | |
Interest expense payable | | | | | 34,971 | | | | 155,948 | | | | — | |
Officer’s and Directors’ fees payable | | | | | 2,257 | | | | 9,950 | | | | 298,159 | |
Swaps payable | | | | | — | | | | — | | | | 2 | |
Other accrued expenses payable | | | | | 89,086 | | | | 447,131 | | | | 160,124 | |
Total liabilities | | | | | 62,218,481 | | | | 268,076,200 | | | | 325,118,034 | |
Net Assets | | | | $ | 130,970,960 | | | $ | 577,361,148 | | | $ | 671,786,094 | |
| |
Net Assets Consist of
|
Paid-in capital5,6,7 | | | | $ | 128,319,712 | | | $ | 660,069,691 | | | $ | 703,366,312 | |
Undistributed (distributions in excess of) net investment income | | | | | 582,077 | | | | (292,613 | ) | | | 3,096,871 | |
Undistributed net realized gain (accumulated net realized loss) | | | | | 112,510 | | | | (83,531,389 | ) | | | (54,685,655 | ) |
Net unrealized appreciation/depreciation | | | | | 1,956,661 | | | | 1,115,459 | | | | 20,008,566 | |
Net Assets | | | | $ | 130,970,960 | | | $ | 577,361,148 | | | $ | 671,786,094 | |
Net asset value per share | | | | $ | 14.48 | | | $ | 15.51 | | | $ | 18.15 | |
1 Consolidated Statement of Assets and Liabilities
| | | | | | | | | | | | | | |
2 Investments at cost — unaffiliated | | | | $ | 181,985,573 | | | $ | 814,542,745 | | | $ | 940,416,223 | |
3 Investments at cost — affiliated | | | | $ | 2,835,510 | | | $ | 4,239,004 | | | $ | 3,052,131 | |
4 Foreign currency at cost | | | | $ | 170,065 | | | $ | 718,561 | | | $ | 2,323 | |
5 Par value per share | | | | $ | 0.001 | | | $ | 0.10 | | | $ | 0.001 | |
6 Shares outstanding | | | | | 9,044,041 | | | | 37,232,488 | | | | 37,003,854 | |
7 Shares authorized | | | | | unlimited | | | | 200 million | | | | unlimited | |
See Notes to Financial Statements.
| 52 | SEMI-ANNUAL REPORT | FEBRUARY 28, 2014
|
Six Months Ended February 28, 2014 (Unaudited)
| | | | BlackRock
Defined
Opportunity
Credit Trust
(BHL) | | BlackRock
Floating Rate
Income
Strategies
Fund, Inc.
(FRA)1 | | BlackRock
Limited
Duration
Income Trust
(BLW)1 |
| |
Investment Income
|
Interest | | | | $ | 4,649,194 | | | $ | 20,396,281 | | | $ | 25,968,137 | |
Dividends — unaffiliated | | | | | 103,638 | | | | 7,873 | | | | 278,455 | |
Dividends — affiliated | | | | | 112 | | | | 439 | | | | 1,413 | |
Foreign taxes withheld | | | | | — | | | | (1,180 | ) | | | (932 | ) |
Total income | | | | | 4,752,944 | | | | 20,403,413 | | | | 26,247,073 | |
| |
Expenses
|
Investment advisory | | | | | 895,025 | | | | 2,964,423 | | | | 2,620,303 | |
Professional | | | | | 57,276 | | | | 56,461 | | | | 103,021 | |
Custodian | | | | | 41,362 | | | | 126,460 | | | | 95,659 | |
Accounting services | | | | | 16,203 | | | | 52,711 | | | | 45,323 | |
Transfer agent | | | | | 10,049 | | | | 28,284 | | | | 36,374 | |
Officer and Directors | | | | | 6,236 | | | | 27,597 | | | | 51,040 | |
Printing | | | | | 6,028 | | | | 10,538 | | | | 10,529 | |
Registration | | | | | 4,145 | | | | — | | | | 5,836 | |
Miscellaneous | | | | | 7,093 | | | | 48,844 | | | | 53,633 | |
Total expenses excluding interest expense | | | | | 1,043,417 | | | | 3,315,318 | | | | 3,021,718 | |
Interest expense | | | | | 225,145 | | | | 1,007,094 | | | | 708,191 | |
Total expenses | | | | | 1,268,562 | | | | 4,322,412 | | | | 3,729,909 | |
Less fees waived by Manager | | | | | (192 | ) | | | (628 | ) | | | (2,660 | ) |
Less fees paid indirectly | | | | | (33 | ) | | | (288 | ) | | | (60 | ) |
Total expenses after fees waived and paid indirectly | | | | | 1,268,337 | | | | 4,321,496 | | | | 3,727,189 | |
Net investment income | | | | | 3,484,607 | | | | 16,081,917 | | | | 22,519,884 | |
| |
Realized and Unrealized Gain (Loss)
|
Net realized gain (loss) from:
| | | | | | | | | | | | | | |
Investments | | | | | 820,002 | | | | 1,374,278 | | | | 7,790,503 | |
Financial futures contracts | | | | | — | | | | — | | | | (712,868 | ) |
Foreign currency transactions | | | | | (234,748 | ) | | | (728,322 | ) | | | (4,225,759 | ) |
Swaps | | | | | 93,540 | | | | 503,054 | | | | 693,370 | |
| | | | | 678,794 | | | | 1,149,010 | | | | 3,545,246 | |
Net change in unrealized appreciation/depreciation on:
| | | | | | | | | | | | | | |
Investments | | | | | 788,623 | | | | 7,119,318 | | | | 21,784,062 | |
Financial futures contracts | | | | | — | | | | — | | | | (119,889 | ) |
Foreign currency translations | | | | | (101,175 | ) | | | (175,994 | ) | | | (785,934 | ) |
Swaps | | | | | (214,639 | ) | | | (1,028,298 | ) | | | (1,067,093 | ) |
Unfunded loan commitments | | | | | (4,683 | ) | | | (20,594 | ) | | | (8,353 | ) |
| | | | | 468,126 | | | | 5,894,432 | | | | 19,802,793 | |
Total realized and unrealized gain | | | | | 1,146,920 | | | | 7,043,442 | | | | 23,348,039 | |
Net Increase in Net Assets Resulting from Operations | | | | $ | 4,631,527 | | | $ | 23,125,359 | | | $ | 45,867,923 | |
1 Consolidated Statement of Operations.
See Notes to Financial Statements.
| SEMI-ANNUAL REPORT | FEBRUARY 28, 2014 | 53
|
| |
| Statements of Changes in Net Assets | BlackRock Defined Opportunity Credit Trust (BHL)
|
Increase (Decrease) in Net Assets:
| | | | Six Months Ended
February 28,
2014 (Unaudited) | | Year Ended
August 31,
2013 |
| |
Operations
|
Net investment income | | | | $ | 3,484,607 | | | $ | 7,859,267 | |
Net realized gain | | | | | 678,794 | | | | 3,251,344 | |
Net change in unrealized appreciation/depreciation | | | | | 468,126 | | | | (578,700 | ) |
Net increase in net assets resulting from operations | | | | | 4,631,527 | | | | 10,531,911 | |
| |
Dividends to Shareholders From
|
Net investment income | | | | | (4,259,743 | ) | | | (7,633,968 | )1 |
| |
Capital Share Transactions
|
Reinvestment of dividends | | | | | — | | | | 246,640 | |
| |
Net Assets
|
Total increase in net assets | | | | | 371,784 | | | | 3,144,583 | |
Beginning of period | | | | | 130,599,176 | | | | 127,454,593 | |
End of period | | | | $ | 130,970,960 | | | $ | 130,599,176 | |
Undistributed net investment income, end of period | | | | $ | 582,077 | | | $ | 1,357,213 | |
1 Determined in accordance with federal income tax regulations.
See Notes to Financial Statements.
| 54 | SEMI-ANNUAL REPORT | FEBRUARY 28, 2014
|
| |
| Consolidated Statements of Changes in Net Assets | BlackRock Floating Rate Income Strategies Fund, Inc. (FRA)
|
Increase (Decrease) in Net Assets:
| | | | Six Months Ended
February 28,
2014 (Unaudited) | | Year Ended
August 31,
2013 |
| |
Operations
|
Net investment income | | | | $ | 16,081,917 | | | $ | 35,052,895 | |
Net realized gain | | | | | 1,149,010 | | | | 14,417,374 | |
Net change in unrealized appreciation/depreciation | | | | | 5,894,432 | | | | (1,626,772 | ) |
Net increase in net assets resulting from operations | | | | | 23,125,359 | | | | 47,843,497 | |
| |
Dividends to Shareholders From
|
Net investment income | | | | | (17,566,298 | ) | | | (34,814,179 | )1 |
| |
Capital Share Transactions
|
Proceeds issued resulting from reorganization | | | | | — | | | | 280,530,144 | |
Reinvestment of dividends | | | | | — | | | | 1,252,625 | |
Net increase in net assets derived from capital share transactions | | | | | — | | | | 281,782,769 | |
| |
Net Assets
|
Total increase in net assets | | | | | 5,559,061 | | | | 294,812,087 | |
Beginning of period | | | | | 571,802,087 | | | | 276,990,000 | |
End of period | | | | $ | 577,361,148 | | | $ | 571,802,087 | |
Undistributed (distributions in excess of) net investment income, end of period | | | | $ | (292,613 | ) | | $ | 1,191,768 | |
1 Determined in accordance with federal income tax regulations.
See Notes to Financial Statements.
| SEMI-ANNUAL REPORT | FEBRUARY 28, 2014 | 55
|
| |
| Consolidated Statements of Changes in Net Assets | BlackRock Limited Duration Income Trust (BLW)
|
Increase (Decrease) in Net Assets:
| | | | Six Months Ended
February 28,
2014 (Unaudited) | | Year Ended
August 31,
2013 |
| |
Operations
|
Net investment income | | | | $ | 22,519,884 | | | $ | 48,146,073 | |
Net realized gain | | | | | 3,545,246 | | | | 15,966,288 | |
Net change in unrealized appreciation/depreciation | | | | | 19,802,793 | | | | (7,037,223 | ) |
Net increase in net assets resulting from operations | | | | | 45,867,923 | | | | 57,075,138 | |
| |
Dividends to Shareholders From
|
Net investment income | | | | | (23,201,416 | ) | | | (51,220,576 | )1 |
| |
Capital Share Transactions
|
Reinvestment of dividends | | | | | — | | | | 873,743 | |
| |
Net Assets
|
Total increase in net assets | | | | | 22,666,507 | | | | 6,728,305 | |
Beginning of period | | | | | 649,119,587 | | | | 642,391,282 | |
End of period | | | | $ | 671,786,094 | | | $ | 649,119,587 | |
Undistributed net investment income, end of period | | | | $ | 3,096,871 | | | $ | 3,778,403 | |
1Determined in accordance with federal income tax regulations.
See Notes to Financial Statements.
| 56 | SEMI-ANNUAL REPORT | FEBRUARY 28, 2014
|
Six Months Ended February 28, 2014 (Unaudited)
| | | | BlackRock
Defined
Opportunity
Credit Trust
(BHL) | | BlackRock
Floating Rate
Income
Strategies
Fund, Inc.
(FRA)1 | | BlackRock
Limited
Duration
Income Trust
(BLW)1 |
| |
Cash Provided by Operating Activities
|
Net increase in net assets resulting from operations | | | | $ | 4,631,527 | | | $ | 23,125,359 | | | $ | 45,867,923 | |
Adjustments to reconcile net increase in net assets resulting from operations to net cash provided by operating activities:
| | | | | | | | | | | | | | |
(Increase) decrease in interest receivable | | | | | 67,649 | | | | 258,625 | | | | (846,998 | ) |
Increase in swap receivable | | | | | (9,637 | ) | | | (38,052 | ) | | | (34,275 | ) |
Decrease in cash pledged for centrally cleared swaps | | | | | 60,000 | | | | 260,000 | | | | — | |
Increase in cash pledged for financial futures contracts | | | | | — | | | | — | | | | (5,000 | ) |
Decrease in cash received as collateral for reverse repurchase agreements | | | | | — | | | | — | | | | 1,050,000 | |
Increase in cash pledged as collateral for OTC derivatives | | | | | — | | | | (600,000 | ) | | | (1,120,000 | ) |
Decrease in other assets | | | | | — | | | | — | | | | 160,335 | |
Increase in prepaid expenses | | | | | (8,404 | ) | | | (27,418 | ) | | | (19,021 | ) |
Increase in variation margin receivable on financial futures contracts | | | | | — | | | | — | | | | (15,564 | ) |
Increase in dividends receivable — unaffiliated | | | | | — | | | | (3,432 | ) | | | (9,946 | ) |
Decrease in swap premiums paid | | | | | — | | | | — | | | | 4 | |
Decrease in investment advisory fees payable | | | | | (10,657 | ) | | | (33,549 | ) | | | (25,734 | ) |
Increase (decrease) in interest expense payable | | | | | (1,126 | ) | | | (6,057 | ) | | | 282,538 | |
Decrease in other accrued expenses payable | | | | | (47,251 | ) | | | (9,209 | ) | | | (53,520 | ) |
Increase in Officer’s and Directors’ fees payable | | | | | 14 | | | | 256 | | | | 33,713 | |
Increase in swap premiums received | | | | | 150,846 | | | | 471,585 | | | | 80,709 | |
Decrease in variation margin payable on centrally cleared swaps | | | | | (2 | ) | | | (7 | ) | | | — | |
Increase in cash received as collateral for reverse repurchase agreements | | | | | — | | | | — | | | | 40,000 | |
Net realized gain on investments | | | | | (697,187 | ) | | | (704,039 | ) | | | (5,670,836 | ) |
Net unrealized gain (loss) on investments, swaps, foreign currency translations and unfunded loan commitments | | | | | (468,126 | ) | | | (5,974,793 | ) | | | (20,083,017 | ) |
Amortization of premium and accretion of discount on investments | | | | | (239,804 | ) | | | (1,116,829 | ) | | | 725,781 | |
Proceeds from sales of long-term investments | | | | | 44,400,299 | | | | 192,914,778 | | | | 254,156,872 | |
Purchases of long-term investments | | | | | (45,690,263 | ) | | | (200,012,007 | ) | | | (266,375,531 | ) |
Net purchases of short-term securities | | | | | (1,537,241 | ) | | | (3,331,361 | ) | | | (1,868,038 | ) |
Cash provided by operating activities | | | | | 600,637 | | | | 5,173,850 | | | | 6,270,395 | |
| |
Cash Used for Financing Activities
|
Cash receipts from borrowings | | | | | 31,000,000 | | | | 224,000,000 | | | | — | |
Cash payments on borrowings | | | | | (28,000,000 | ) | | | (214,000,000 | ) | | | — | |
Net borrowing of reverse repurchase agreements | | | | | — | | | | — | | | | 18,267,771 | |
Cash dividends paid to shareholders | | | | | (4,254,017 | ) | | | (17,558,667 | ) | | | (23,199,327 | ) |
Increase (decrease) in bank overdraft | | | | | — | | | | 89,151 | | | | (444,474 | ) |
Cash used for financing activities | | | | | (1,254,017 | ) | | | (7,469,516 | ) | | | (5,376,030 | ) |
| |
Cash Impact from Foreign Exchange Fluctuations
|
Cash impact from foreign exchange fluctuations | | | | | 1,970 | | | | 6,330 | | | | 3,909 | |
| |
Cash and Foreign Currency
|
Net increase (decrease) in cash and foreign currency | | | | | (651,410 | ) | | | (2,289,336 | ) | | | 898,274 | |
Cash and foreign currency at beginning of period | | | | | 1,005,525 | | | | 3,014,207 | | | | 547,586 | |
Cash and foreign currency at end of period | | | | $ | 354,115 | | | $ | 724,871 | | | $ | 1,445,860 | |
| |
Supplemental Disclosure of Cash Flow Information
|
Cash paid during the period for interest | | | | $ | 226,271 | | | $ | 1,013,151 | | | $ | 425,653 | |
1 Consolidated Statement of Cash Flows.
See Notes to Financial Statements.
| SEMI-ANNUAL REPORT | FEBRUARY 28, 2014 | 57
|
| |
| Financial Highlights | BlackRock Defined Opportunity Credit Trust (BHL)
|
| | | |
| | | | |
Six Months Ended
February 28,
2014
(Unaudited)
| |
Year Ended March 31,
|
|
| | | | | 2013 | | 2012 | | 2011 | | 2010 | | 2009 | |
| |
Per Share Operating Performance |
Net asset value, beginning of period | | | | $ | 14.44 | | | $ | 14.12 | | | $ | 13.17 | | | $ | 13.55 | | | $ | 12.53 | | | $ | 14.31 | |
| Net investment income1 | | | | | 0.39 | | | | 0.87 | | | | 0.85 | | | | 0.86 | | | | 0.85 | | | | 0.87 | | |
Net realized and unrealized gain (loss) | | | | | 0.12 | | | | 0.30 | | | | 0.90 | | | | (0.45 | ) | | | 0.87 | | | | (1.55 | ) |
Net increase (decrease) from investment operations | | | | | 0.51 | | | | 1.17 | | | | 1.75 | | | | 0.41 | | | | 1.72 | | | | (0.68 | ) |
Dividends and distributions from:
| | | | | | | | | | | | | | | | | | | | | | | | | | |
Net investment income | | | | | (0.47 | ) | | | (0.85 | )2 | | | (0.80 | )2 | | | (0.79 | )2 | | | (0.70 | )2 | | | (1.09 | )2 |
Net realized gain | | | | | — | | | | — | | | | — | | | | — | | | | — | | | | (0.01 | )2 |
Total dividends and distributions | | | | | (0.47 | ) | | | (0.85 | ) | | | (0.80 | ) | | | (0.79 | ) | | | (0.70 | ) | | | (1.10 | ) |
Net asset value, end of period | | | | $ | 14.48 | | | $ | 14.44 | | | $ | 14.12 | | | $ | 13.17 | | | $ | 13.55 | | | $ | 12.53 | |
Market price, end of period | | | | $ | 13.87 | | | $ | 13.77 | | | $ | 13.94 | | | $ | 12.65 | | | $ | 12.86 | | | $ | 11.03 | |
| |
Total Investment Return3
|
Based on net asset value | | | | | 3.75% | 4 | | | 8.52% | | | | 13.94% | | | | 2.93% | | | | 14.39% | | | | (2.16)% |
Based on market price | | | | | 4.22% | 4 | | | 4.82% | | | | 17.12% | | | | 4.17% | | | | 23.33% | | | | (2.65)% |
| |
Ratios to Average Net Assets
|
Total expenses | | | | | 1.95% | 5 | | | 1.92% | | | | 1.91% | | | | 2.02% | | | | 1.91% | | | | 2.39% | |
Total expenses after fees waived and paid indirectly | | | | | 1.95% | 5 | | | 1.92% | | | | 1.91% | | | | 2.02% | | | | 1.90% | | | | 2.39% | |
Total expenses after fees waived and paid indirectly and excluding interest expense | | | | | 1.61% | 5 | | | 1.58% | 6 | | | 1.61% | 6 | | | 1.71% | | | | 1.65% | | | | 1.94% | |
Net investment income | | | | | 5.37% | 5 | | | 6.04% | | | | 6.24% | | | | 6.10% | | | | 6.40% | | | | 8.11% | |
| |
Supplemental Data
|
Net assets, end of period (000) | | | | $ | 130,971 | | | $ | 130,599 | | | $ | 127,455 | | | $ | 118,897 | | | $ | 122,062 | | | $ | 112,862 | |
Borrowings outstanding, end of period (000) | | | | $ | 52,000 | | | $ | 49,000 | | | $ | 55,000 | | | $ | 43,000 | | | $ | 24,000 | | | $ | 27,000 | |
Average borrowings outstanding, during the period (000) | | | | $ | 49,680 | | | $ | 47,384 | | | $ | 39,007 | | | $ | 36,369 | | | $ | 24,633 | | | $ | 31,141 | |
Portfolio turnover | | | | | 25% | | | | 85% | | | | 53% | | | | 91% | | | | 102% | | | | 41% | |
Asset coverage, end of period per $1,000 | | | | $ | 3,519 | | | $ | 3,665 | | | $ | 3,317 | | | $ | 3,765 | | | $ | 6,086 | | | $ | 5,180 | |
| 1 | | Based on average shares outstanding. |
| 2 | | Determined in accordance with federal income tax regulations. |
| 3 | | Total investment returns based on market price, which can be significantly greater or less than the net asset value, may result in substantially different returns. Where applicable, excludes the effects of any sales charges and assumes the reinvestment of dividends and distributions. |
| 4 | | Aggregate total investment return. |
| 6 | | For the years ended August 31, 2013 and August 31, 2012, the total expense ratio after fees waived and paid indirectly and excluding interest expense and borrowing costs was 1.57% and 1.52%, respectively. |
See Notes to Financial Statements.
| 58 | SEMI-ANNUAL REPORT | FEBRUARY 28, 2014
|
| |
| Financial Highlights | BlackRock Floating Rate Income Strategies Fund, Inc. (FRA)
|
| | | |
| | | | | Six Months Ended
February 28,
2014
(Unaudited)1 | |
Year Ended March 31,
|
|
| | | | | 20131 | | 20121 | | 2011 | | 2010 | | 2009 | |
| |
Per Share Operating Performance |
Net asset value, beginning of period | | | | $ | 15.36 | | | $ | 14.98 | | | $ | 14.04 | | | $ | 14.36 | | | $ | 12.93 | | | $ | 16.12 | |
| Net investment income2 | | | | | 0.43 | | | | 0.99 | | | | 0.97 | | | | 0.96 | | | | 0.91 | | | | 1.14 | | |
Net realized and unrealized gain (loss) | | | | | 0.19 | | | | 0.42 | | | | 0.90 | | | | (0.36 | ) | | | 1.48 | | | | (3.04 | ) |
Net increase (decrease) from investment operations | | | | | 0.62 | | | | 1.41 | | | | 1.87 | | | | 0.60 | | | | 2.39 | | | | (1.90 | ) |
Dividends and distributions from:
| | | | | | | | | | | | | | | | | | | | | | | | | | |
Net investment income | | | | | (0.47 | ) | | | (1.03 | )3 | | | (0.93 | )3 | | | (0.86 | )3 | | | (0.94 | )3 | | | (1.29 | )3 |
Net realized gain | | | | | — | | | | — | | | | — | | | | (0.06 | )3 | | | (0.02 | )3 | | | — | |
Total dividends and distributions | | | | | (0.47 | ) | | | (1.03 | ) | | | (0.93 | ) | | | (0.92 | ) | | | (0.96 | ) | | | (1.29 | ) |
Net asset value, end of period | | | | $ | 15.51 | | | $ | 15.36 | | | $ | 14.98 | | | $ | 14.04 | | | $ | 14.36 | | | $ | 12.93 | |
Market price, end of period | | | | $ | 14.70 | | | $ | 14.96 | | | $ | 15.20 | | | $ | 13.33 | | | $ | 14.61 | | | $ | 12.26 | |
| |
Total Investment Return4
|
Based on net asset value | | | | | 4.27% | 5 | | | 9.68% | | | | 13.91% | | | | 4.04% | | | | 18.91% | | | | (8.88)% |
Based on market price | | | | | 1.47% | 5 | | | 5.28% | | | | 21.74% | | | | (2.91)% | | | 27.59% | | | | (3.88)% |
| |
Ratios to Average Net Assets
|
Total expenses | | | | | 1.52% | 6 | | | 1.54% | 7 | | | 1.67% | 9 | | | 1.60% | | | | 1.45% | | | | 1.96% | |
Total expenses after fees waived and paid indirectly | | | | | 1.52% | 6 | | | 1.52% | 7 | | | 1.67% | 9 | | | 1.60% | | | | 1.45% | | | | 1.96% | |
Total expenses after fees waived and paid indirectly and excluding interest expense | | | | | 1.16% | 6 | | | 1.15% | 7,8 | | | 1.35% | 8,9 | | | 1.30% | | | | 1.22% | | | | 1.31% | |
Net investment income | | | | | 5.64% | 6 | | | 6.49% | | | | 6.67% | | | | 6.44% | | | | 6.43% | | | | 10.18% | |
| |
Supplemental Data
|
Net assets, end of period (000) | | | | $ | 577,361 | | | $ | 571,802 | | | $ | 276,990 | | | $ | 259,205 | | | $ | 264,379 | | | $ | 237,160 | |
Borrowings outstanding, end of period (000) | | | | $ | 224,000 | | | $ | 214,000 | | | $ | 117,000 | | | $ | 93,000 | | | $ | 53,000 | | | $ | 38,000 | |
Average borrowings outstanding, during the period (000) | | | | $ | 222,227 | | | $ | 201,830 | | | $ | 88,197 | | | $ | 79,195 | | | $ | 48,258 | | | $ | 50,591 | |
Portfolio turnover | | | | | 25% | | | | 88% | | | | 53% | | | | 91% | | | | 96% | | | | 58% | |
Asset coverage, end of period per $1,000 | | | | $ | 3,578 | | | $ | 3,672 | | | $ | 3,367 | | | $ | 3,787 | | | $ | 5,988 | | | $ | 7,241 | |
| 1 | | Consolidated Financial Highlights. |
| 2 | | Based on average shares outstanding. |
| 3 | | Determined in accordance with federal income tax regulations. |
| 4 | | Total investment returns based on market price, which can be significantly greater or less than the net asset value, may result in substantially different returns. Where applicable, excludes the effects of any sales charges and assumes the reinvestment of dividends and distributions. |
| 5 | | Aggregate total investment return. |
| 7 | | Includes reorganization costs. Without these costs, total expenses, total expenses after fees waived and paid indirectly and total expenses after fees waived and paid indirectly and excluding interest expense would have been 1.52%, 1.52% and 1.15%, respectively. |
| 8 | | For the years ended August 31, 2013 and August 31, 2012, the total expense ratio after fees waived and paid indirectly, excluding interest expense and borrowing costs was 1.14% and 1.26%, respectively. |
| 9 | | Includes reorganization costs. Without these costs, total expenses, total expenses after fees waived and paid indirectly and total expenses after fees waived and paid indirectly and excluding interest expense would have been 1.61%, 1.61% and 1.29%, respectively. |
See Notes to Financial Statements.
| SEMI-ANNUAL REPORT | FEBRUARY 28, 2014 | 59
|
| |
| Financial Highlights | BlackRock Limited Duration Income Trust (BLW)
|
| | | |
| | | | | Six Months Ended
February 28,
2014
(Unaudited)1 | |
Year Ended March 31,
|
|
| | | | | 20131 | | 20121 | | 2011 | | 2010 | | 2009 | |
| |
Per Share Operating Performance |
Net asset value, beginning of period | | | | $ | 17.54 | | | $ | 17.38 | | | $ | 16.52 | | | $ | 16.79 | | | $ | 14.95 | | | $ | 16.71 | |
| Net investment income2 | | | | | 0.61 | | | | 1.30 | | | | 1.31 | | | | 1.34 | | | | 1.12 | | | | 1.01 | | |
Net realized and unrealized gain (loss) | | | | | 0.63 | | | | 0.25 | | | | 0.88 | | | | (0.37 | ) | | | 1.62 | | | | (1.61 | ) |
Net increase (decrease) from investment operations | | | | | 1.24 | | | | 1.55 | | | | 2.19 | | | | 0.97 | | | | 2.74 | | | | (0.60 | ) |
Dividends from net investment income | | | | | (0.63 | ) | | | (1.39 | )3 | | | (1.33 | )3 | | | (1.24 | )3 | | | (0.90 | )3 | | | (1.16 | )3 |
Net asset value, end of period | | | | $ | 18.15 | | | $ | 17.54 | | | $ | 17.38 | | | $ | 16.52 | | | $ | 16.79 | | | $ | 14.95 | |
Market price, end of period | | | | $ | 17.31 | | | $ | 16.89 | | | $ | 18.00 | | | $ | 16.01 | | | $ | 16.76 | | | $ | 14.09 | |
| |
Total Investment Return4
|
Based on net asset value | | | | | 7.35% | 5 | | | 9.13% | | | | 13.86% | | | | 5.85% | | | | 19.00% | | | | (1.57)% |
Based on market price | | | | | 6.32% | 5 | | | 1.47% | | | | 21.68% | | | | 2.77% | | | | 26.04% | | | | 6.40% | |
| |
Ratio to Average Net Assets
|
Total expenses | | | | | 1.14% | 6 | | | 1.12% | | | | 1.05% | | | | 1.01% | | | | 0.82% | | | | 0.72% | |
Total expenses after fees waived and paid indirectly | | | | | 1.14% | 6 | | | 1.12% | | | | 1.05% | | | | 1.00% | | | | 0.81% | | | | 0.71% | |
Total expenses after fees waived and paid indirectly and excluding interest expense | | | | | 0.92% | 6 | | | 0.90% | | | | 0.89% | | | | 0.87% | | | | 0.73% | | | | 0.69% | |
Net investment income | | | | | 6.87% | 6 | | | 7.34% | | | | 7.82% | | | | 7.75% | | | | 6.90% | | | | 7.42% | |
| |
Supplemental Data
|
Net assets, end of period (000) | | | | $ | 671,786 | | | $ | 649,120 | | | $ | 642,391 | | | $ | 609,818 | | | $ | 619,381 | | | $ | 551,505 | |
Borrowings outstanding, end of period (000) | | | | $ | 291,898 | | | $ | 273,347 | | | $ | 296,476 | | | $ | 244,120 | | | $ | 123,233 | | | | — | |
Average borrowings outstanding, during the period (000) | | | | $ | 299,713 | | | $ | 301,214 | | | $ | 242,396 | | | $ | 191,303 | | | $ | 44,160 | | | $ | 11,705 | |
Portfolio turnover | | | | | 28% | | | | 71% | | | | 54% | | | | 106% | 7 | | | 248% | 8 | | | 287%9 |
Asset coverage, end of period $1,000 | | | | $ | 3,301 | | | $ | 3,375 | | | $ | 3,167 | | | $ | 3,498 | | | $ | 6,026 | | | | — | |
| 1 | | Consolidated Financial Highlights. |
| 2 | | Based on average shares outstanding. |
| 3 | | Determined in accordance with federal income tax regulations. |
| 4 | | Total investment returns based on market price, which can be significantly greater or less than the net asset value, may result in substantially different returns. Where applicable, excludes the effects of any sales charges and assumes the reinvestment of dividends and distributions. |
| 5 | | Aggregate total investment return. |
| 7 | | Includes mortgage dollar roll and to-be-announced (“TBA”) transactions. Excluding these transactions, the portfolio turnover rate would have been 87%. |
| 8 | | Includes mortgage dollar roll transactions. Excluding these transactions, the portfolio turnover would have been 113%. |
| 9 | | Includes mortgage dollar roll transactions. Excluding these transactions, the portfolio turnover would have been 79%. |
See Notes to Financial Statements.
| 60 | SEMI-ANNUAL REPORT | FEBRUARY 28, 2014
|
| |
| Notes to Financial Statements (Unaudited) |
|
1. Organization:
BlackRock Defined Opportunity Credit Trust (“BHL”), BlackRock Floating Rate Income Strategies Fund, Inc. (“FRA”) and BlackRock Limited Duration Income Trust (“BLW”) (collectively, the “Funds” or individually as a “Fund”) are registered under the 1940 Act, as diversified, closed-end management investment companies. BHL and BLW are organized as Delaware statutory trusts. FRA is organized as a Maryland corporation. The Board of Directors and the Boards of Trustees of the Funds are collectively referred to throughout this report as the “Board of Directors” or the “Board”, and the directors/trustees thereof are collectively referred to throughout this report as “Directors”. The Funds determine and make available for publication the NAV of their Common Shares on a daily basis.
Reorganization: The Board and shareholders of FRA and the Board and shareholders of each of BlackRock Diversified Strategies Fund, Inc. (“DVF”) and BlackRock Floating Rate Income Strategies Fund II, Inc., (“FRB”) (individually, a “Target Fund” and collectively the “Target Funds”) approved the reorganization of each Target Fund into FRA pursuant to which FRA acquired substantially all of the assets and substantially all of the liabilities of each Target Fund in exchange for an equal aggregate value of newly-issued shares of FRA.
Each shareholder of a Target Fund received shares of FRA in an amount equal to the aggregate net asset value of such shareholder’s Target Fund shares, as determined at the close of business on October 5, 2012, less the costs of the Target Fund’s reorganization. Cash was distributed for any fractional shares.
The reorganizations were accomplished by a tax-free exchange of shares of FRA in the following amounts and at the following conversion ratios:
Target Fund
|
|
|
| Shares Prior to
Reorganization
|
| Conversion
Ratio
|
| Shares of
FRA
|
FRB | | | | | 10,585,281 | | | | 0.91462449 | | | | 9,681,549 | |
DVF | | | | | 12,405,453 | | | | 0.72423797 | | | | 8,984,499 | |
Each Target Fund’s net assets and composition of net assets on October 5, 2012, the business day immediately prior to the effective date of its reorganization, were as follows:
| | | | Target Funds
|
|
|
|
|
| FRB
|
| DVF
|
Net assets | | | | $ | 145,503,247 | | | $ | 135,026,897 | |
Paid-in capital | | | | $ | 199,203,523 | | | $ | 228,382,425 | |
Undistributed (distributions in excess of) net investment income | | | | $ | (164,508 | ) | | $ | (88,960 | ) |
Accumulated net realized loss | | | | $ | (54,909,880 | ) | | $ | (89,378,206 | ) |
Net unrealized appreciation (depreciation) | | | | $ | 1,374,112 | | | $ | (3,888,362 | ) |
For financial reporting purposes, assets received and shares issued by FRA were recorded at fair value. However, the cost basis of the investments received from the Target Funds were carried forward to align ongoing reporting of FRA’s realized and unrealized gains and losses with amounts distributable to shareholders for tax purposes.
The net assets of FRA before the acquisition were $278,016,037. The aggregate net assets of FRA immediately after the acquisition amounted to $558,546,181. Each Target Fund’s fair value and cost of investments prior to the reorganization were as follows:
Target Fund
|
|
|
| Fair Value of
Investments
|
| Cost of
Investments
|
FRB | | | | $ | 220,588,307 | | | $ | 219,010,017 | |
DVF | | | | $ | 206,051,284 | | | $ | 209,710,937 | |
The purpose of these transactions was to combine three funds managed by the Manager with the same or substantially similar (but not identical) investment objectives, investment policies, strategies, risks and restrictions. Each reorganization was a tax-free event and was effective on October 8, 2012.
Assuming the acquisition had been completed on September 1, 2012 the beginning of the fiscal reporting period of FRA, the pro forma results of operations for the year ended August 31, 2013, are as follows:
• | | Net investment income: $36,549,895 |
• | | Net realized and change in unrealized gain/loss on investments: $15,835,377 |
• | | Net increase/decrease in net assets resulting from operations: $52,385,271 |
Because the combined investment portfolios have been managed as a single integrated portfolio since the acquisition was completed, it is not practicable to separate the amounts of revenue and earnings of the Target Funds that have been included in FRA’s Statement of Operations since October 8, 2012.
Reorganization costs incurred in connection with the reorganizations were expensed by FRA. BlackRock Advisors, LLC (the “Manager”) reimbursed FRA $100,000, which was shown as fees reimbursed by Manager in the Statements of Operations.
Basis of Consolidation: The accompanying consolidated financial statements include the accounts of FRA Subsidiary, LLC and BLW Subsidiary, LLC (the “Taxable Subsidiaries”), which are wholly owned taxable subsidiaries of the respective Fund. The Subsidiaries enable the Funds to hold investments in J.G. Wentworth LLC Preferred Equity Interests and Stanley Martin, Class B Membership Units, each an operating company, and satisfy regulated investment company tax requirements. Income earned and gains realized on the investment held by the Taxable Subsidiary are taxable to such subsidiary. A tax provision for income, if any, is shown as income tax in the Consolidated Statements of Operations. A tax provision for realized and unrealized gains, if any, is included as a reduction of realized and/or unrealized gain (loss) in the Consolidated Statement of Operations. Each Fund may invest up to 25% of its total assets in the Taxable Subsidiary. Intercompany accounts and transactions, if any, have been eliminated. The Taxable Subsidiaries are subject to the same investment policies and restrictions that apply to the Funds.
| SEMI-ANNUAL REPORT | FEBRUARY 28, 2014 | 61
|
| |
| Notes to Financial Statements (continued) |
|
2. Significant Accounting Policies:
The Funds’ financial statements are prepared in conformity with accounting principles generally accepted in the United States of America (“US GAAP”), which may require management to make estimates and assumptions that affect the reported amounts of assets and liabilities in the financial statements and the reported amounts of increases and decreases in net assets from operations during the reporting period. Actual results could differ from those estimates. The following is a summary of significant accounting policies followed by the Funds:
Valuation: US GAAP defines fair value as the price the Funds would receive to sell an asset or pay to transfer a liability in an orderly transaction between market participants at the measurement date. The Funds determine the fair values of their financial instruments at market value using independent dealers or pricing services under policies approved by the Board. The BlackRock Global Valuation Methodologies Committee (the “Global Valuation Committee”) is the committee formed by management to develop global pricing policies and procedures and to provide oversight of the pricing function for the Funds for all financial instruments.
The Funds value their bond investments on the basis of last available bid prices or current market quotations provided by dealers or pricing services. Floating rate loan interests are valued at the mean of the bid prices from one or more brokers or dealers as obtained from a pricing service. In determining the value of a particular investment, pricing services may use certain information with respect to transactions in such investments, quotations from dealers, pricing matrixes, market transactions in comparable investments, various relationships observed in the market between investments and calculated yield measures. Asset-backed and mortgage-backed securities are valued by independent pricing services using models that consider estimated cash flows of each tranche of the security, establish a benchmark yield and develop an estimated tranche-specific spread to the benchmark yield based on the unique attributes of the tranche. Financial futures contracts traded on exchanges are valued at their last sale price. Swap agreements are valued utilizing quotes received daily by the Funds’ pricing service or through brokers, which are derived using daily swap curves and models that incorporate a number of market data factors, such as discounted cash flows, trades and values of the underlying reference instruments. Investments in open-end registered investment companies are valued at NAV each business day.
Municipal investments (including commitments to purchase such investments on a “when-issued” basis) are valued on the basis of prices provided by dealers or pricing services. In determining the value of a particular investment, pricing services may use certain information with respect to transactions in such investments, quotations from dealers, pricing matrixes, market transactions in comparable investments and information with respect to various relationships between investments.
Equity investments traded on a recognized securities exchange or the NASDAQ Stock Market (“NASDAQ”) are valued at the last reported sale price that day or the NASDAQ official closing price, if applicable. For equity investments traded on more than one exchange, the last reported sale price on the exchange where the stock is primarily traded is used. Equity investments traded on a recognized exchange for which there were no sales on that day are valued at the last available bid price.
Securities and other assets and liabilities denominated in foreign currencies are translated into US dollars using exchange rates determined as of the close of business on the New York Stock Exchange (“NYSE”). Foreign currency exchange contracts are valued at the mean between the bid and ask prices and are determined as of the close of business on the NYSE. Interpolated values are derived when the settlement date of the contract is an interim date for which quotations are not available.
Exchange-traded options are valued at the mean between the last bid and ask prices at the close of the options market in which the options trade. An exchange-traded option for which there is no mean price is valued at the last bid (long positions) or ask (short positions) price. If no bid or ask price is available, the prior day’s price will be used, unless it is determined that the prior day’s price no longer reflects the fair value of the option. Over-the-counter (“OTC”) options are valued by an independent pricing service using a mathematical model, which incorporates a number of market data factors, such as the trades and prices of the underlying instruments.
In the event that the application of these methods of valuation results in a price for an investment that is deemed not to be representative of the market value of such investment, or if a price is not available, the investment will be valued by the Global Valuation Committee, or its delegate, in accordance with a policy approved by the Board as reflecting fair value (“Fair Value Assets”). When determining the price for Fair Value Assets, the Global Valuation Committee, or its delegate, seeks to determine the price that each Fund might reasonably expect to receive from the current sale of that asset in an arm’s-length transaction. Fair value determinations shall be based upon all available factors that the Global Valuation Committee, or its delegate, deems relevant consistent with the principles of fair value measurement which include the market approach, income approach and/or in the case of recent investments, the cost approach, as appropriate. The market approach generally consists of using comparable market transactions. The income approach generally is used to discount future cash flows to present value and is adjusted for liquidity as appropriate. These factors include but are not limited to: (i) attributes specific to the investment or asset; (ii) the principal market for the investment or asset; (iii) the customary participants in the principal market for the investment or asset; (iv) data assumptions by market participants for the investment or asset, if reasonably available; (v) quoted prices for similar investments or assets in active markets; and (vi) other factors, such as future cash flows, interest rates, yield curves, volatilities, prepayment speeds, loss severities, credit risks, recovery rates, liquidation amounts and/or default rates. Due to the inherent uncertainty of valuations of such investments, the fair values may differ from the values that would have been used had an active market existed. The Global Valuation Committee, or its delegate, employs various methods for calibrating valuation approaches for investments where an active market does not exist, including regular due diligence of the Funds’ pricing vendors, regular reviews of key inputs and assumptions, transactional back-testing or disposition analysis to compare unrealized gains and
| 62 | SEMI-ANNUAL REPORT | FEBRUARY 28, 2014
|
| |
| Notes to Financial Statements (continued) |
|
losses to realized gains and losses, reviews of missing or stale prices and large movements in market values and reviews of any market related activity. The pricing of all Fair Value Assets is subsequently reported to the Board or a committee thereof on a quarterly basis.
Generally, trading in foreign instruments is substantially completed each day at various times prior to the close of business on the NYSE. Occasionally, events affecting the values of such instruments may occur between the foreign market close and the close of business on the NYSE that may not be reflected in the computation of the Fund’s net assets. If events (e.g., a company announcement, market volatility or a natural disaster) occur during such periods that are expected to materially affect the value of such instruments, those instruments may be Fair Value Assets and be valued at their fair value, as determined in good faith by the Global Valuation Committee using a pricing service and/or policies approved by the Board.
Foreign Currency: The Funds’ books and records are maintained in US dollars. Purchases and sales of investment securities are recorded at the rates of exchange prevailing on the respective date of such transactions. Generally, when the US dollar rises in value against a foreign currency, the Funds’ investments denominated in that currency will lose value because that currency is worth fewer US dollars; the opposite effect occurs if the US dollar falls in relative value.
The Funds do not isolate the portion of the results of operations arising as a result of changes in the foreign exchange rates from the changes in the market prices of investments held or sold for financial reporting purposes. Accordingly, the effects of changes in foreign currency exchange rates on investments are not segregated in the Statements of Operations from the effects of changes in market prices of those investments but are included as a component of net realized and unrealized gain (loss) from investments. The Funds report realized currency gains (losses) on foreign currency related transactions as components of net realized gain (loss) for financial reporting purposes, whereas such components are treated as ordinary income for federal income tax purposes.
Segregation and Collateralization: In cases where the Funds enter into certain investments (e.g., financial futures contracts, foreign currency exchange contracts and swaps), or certain borrowings (e.g., reverse repurchase agreements and bank borrowings payable) that would be “senior securities” for 1940 Act purposes, the Funds may segregate or designate on their books and records cash or liquid securities having a market value at least equal to the amount of the Funds’ future obligations under such investments or borrowings. Doing so allows the investments or borrowings to be excluded from treatment as a “senior security”. Furthermore, if required by an exchange or counterparty agreement, the Funds may be required to deliver/deposit cash and/or securities to/with an exchange, or broker-dealer or custodian as collateral for certain investments or obligations.
Investment Transactions and Investment Income: For financial reporting purposes, investment transactions are recorded on the dates the transactions are entered into (the trade dates). Realized gains and losses on investment transactions are determined on the identified cost basis. Dividend income is recorded on the ex-dividend date. Dividends from foreign securities where the ex-dividend date may have passed are subsequently recorded when the Funds are informed of the ex-dividend date. Under the applicable foreign tax laws, a withholding tax at various rates may be imposed on capital gains, dividends and interest. Upon notification from issuers, some of the dividend income received from a real estate investment trust may be redesignated as a reduction of cost of the related investment and/or realized gain. Interest income, including amortization and accretion of premiums and discounts on debt securities, is recognized on the accrual basis.
Dividends and Distributions: Dividends from net investment income are declared and paid monthly. Distributions of capital gains are recorded on the ex-dividend date. The character and timing of dividends and distributions are determined in accordance with federal income tax regulations, which may differ from US GAAP.
Income Taxes: It is the Funds’ policy to comply with the requirements of the Internal Revenue Code of 1986, as amended, applicable to regulated investment companies and to distribute substantially all of their taxable income to their shareholders. Therefore, no federal income tax provision is required, except with respect to any taxes related to the Subsidiaries.
Each Fund files US federal and various state and local tax returns. No income tax returns are currently under examination. The statute of limitations on each Fund’s US federal tax returns remains open for each of the four years ended August 31, 2013. The statutes of limitations on each Fund’s state and local tax returns may remain open for an additional year depending upon the jurisdiction.
Management has analyzed tax laws and regulations and their application to the Funds’ facts and circumstances and does not believe there are any uncertain tax positions that require recognition of a tax liability.
Deferred Compensation Plan: Under the Deferred Compensation Plan (the “Plan”) approved by each Fund’s Board, the independent Directors (“Independent Directors”) may defer a portion of their annual complex-wide compensation. Deferred amounts earn an approximate return as though equivalent dollar amounts had been invested in common shares of certain other BlackRock Closed-End Funds selected by the Independent Directors. This has the same economic effect for the Independent Directors as if the Independent Directors had invested the deferred amounts directly in certain other BlackRock Closed-End Funds.
The Plan is not funded and obligations thereunder represent general unsecured claims against the general assets of each Fund. Deferred compensation liabilities are included in officer’s and directors’ fees payable in the Statements of Assets and Liabilities and will remain as a liability of the Funds until such amounts are distributed in accordance with the Plan.
Other: Expenses directly related to a Fund are charged to that Fund. Other operating expenses shared by several funds are pro rated among those funds on the basis of relative net assets or other appropriate methods.
| SEMI-ANNUAL REPORT | FEBRUARY 28, 2014 | 63
|
| |
| Notes to Financial Statements (continued) |
|
The Funds have an arrangement with the custodian whereby fees may be reduced by credits earned on uninvested cash balances, which, if applicable, are shown as fees paid indirectly in the Statements of Operations. The custodian imposes fees on overdrawn cash balances, which can be offset by accumulated credits earned or may result in additional custody charges.
3. Securities and Other Investments:
Asset-Backed and Mortgage-Backed Securities: The Funds may invest in asset-backed securities. Asset-backed securities are generally issued as pass-through certificates, which represent undivided fractional ownership interests in an underlying pool of assets, or as debt instruments, which are also known as collateralized obligations, and are generally issued as the debt of a special purpose entity organized solely for the purpose of owning such assets and issuing such debt. Asset-backed securities are often backed by a pool of assets representing the obligations of a number of different parties. The yield characteristics of certain asset-backed securities may differ from traditional debt securities. One such major difference is that all or a principal part of the obligations may be prepaid at any time because the underlying assets (i.e., loans) may be prepaid at any time. As a result, a decrease in interest rates in the market may result in increases in the level of prepayments as borrowers, particularly mortgagors, refinance and repay their loans. An increased prepayment rate with respect to an asset-backed security subject to such a prepayment feature will have the effect of shortening the maturity of the security. In addition, the Funds may have to subsequently reinvest the proceeds at lower interest rates. If the Funds have purchased such an asset-backed security at a premium, a faster than anticipated prepayment rate could result in a loss of principal to the extent of the premium paid.
The Funds may purchase certain mortgage pass-through securities. There are a number of important differences among the agencies and instrumentalities of the US government that issue mortgage-related securities and among the securities that they issue. For example, mortgage-related securities guaranteed by Ginnie Mae are guaranteed as to the timely payment of principal and interest by Ginnie Mae and such guarantee is backed by the full faith and credit of the United States. However, mortgage-related securities issued by Freddie Mac and Fannie Mae, including Freddie Mac and Fannie Mae guaranteed mortgage pass-through certificates, which are solely the obligations of Freddie Mac and Fannie Mae, are not backed by or entitled to the full faith and credit of the United States but are supported by the right of the issuer to borrow from the Treasury.
Collateralized Debt Obligations: Certain Funds may invest in collateralized debt obligations (“CDOs”), which include collateralized bond obligations (“CBOs”) and collateralized loan obligations (“CLOs”). CBOs and CLOs are types of asset-backed securities. A CDO is an entity which is backed by a diversified pool of debt securities (CBOs) or syndicated bank loans (CLOs). The cash flows of the CDO can be split into multiple segments, called “tranches”, which will vary in risk profile and yield. The riskiest segment is the subordinated or “equity” tranche. This tranche bears the greatest risk of defaults from the underlying assets in the CDO and serves to protect the other, more senior, tranches from default in all but the most severe circumstances. Since it is shielded from defaults by the more junior tranches, a “senior” tranche will typically have higher credit ratings and lower yields than their underlying securities, and often receive investment grade ratings from one or more of the nationally recognized rating agencies. Despite the protection from the more junior tranches, senior tranches can experience substantial losses due to actual defaults, increased sensitivity to future defaults and the disappearance of one or more protecting tranches as a result of changes in the credit profile of the underlying pool of assets.
Multiple Class Pass-Through Securities: Certain Funds may invest in multiple class pass-through securities, including collateralized mortgage obligations (“CMOs”) and commercial mortgage-backed securities. These multiple class securities may be issued by Ginnie Mae, US government agencies or instrumentalities or by trusts formed by private originators of, or investors in, mortgage loans. In general, CMOs are debt obligations of a legal entity that are collateralized by, and multiple class pass-through securities represent direct ownership interests in, a pool of residential or commercial mortgage loans or mortgage pass-through securities (the “Mortgage Assets”), the payments on which are used to make payments on the CMOs or multiple pass-through securities. Classes of CMOs include interest only (“IOs”), principal only (“POs”), planned amortization classes and targeted amortization classes. IOs and POs are stripped mortgage-backed securities representing interests in a pool of mortgages, the cash flow from which has been separated into interest and principal components. IOs receive the interest portion of the cash flow while POs receive the principal portion. IOs and POs can be extremely volatile in response to changes in interest rates. As interest rates rise and fall, the value of IOs tends to move in the same direction as interest rates. POs perform best when prepayments on the underlying mortgages rise since this increases the rate at which the principal is returned and the yield to maturity on the PO. When payments on mortgages underlying a PO are slower than anticipated, the life of the PO is lengthened and the yield to maturity is reduced. If the underlying Mortgage Assets experience greater than anticipated pre-payments of principal, a Fund may not fully recoup its initial investment in IOs.
Stripped Mortgage-Backed Securities: Certain Funds may invest in stripped mortgage-backed securities issued by the US government, its agencies and instrumentalities. Stripped mortgage-backed securities are usually structured with two classes that receive different proportions of the interest (IOs) and principal (POs) distributions on a pool of Mortgage Assets. The Funds also may invest in stripped mortgage-backed securities that are privately issued.
Zero-Coupon Bonds: The Funds may invest in zero-coupon bonds, which are normally issued at a significant discount from face value and do not provide for periodic interest payments. Zero-coupon bonds may experience greater volatility in market value than similar maturity debt obligations which provide for regular interest payments.
Capital Trusts and Trust Preferred Securities: Certain Funds may invest in capital trusts and/or trust preferred securities. These securities are typically issued by corporations, generally in the form of interest-bearing notes with preferred securities characteristics, or by an affiliated business trust of a corporation, generally in the form of beneficial interests in
| 64 | SEMI-ANNUAL REPORT | FEBRUARY 28, 2014
|
| |
| Notes to Financial Statements (continued) |
|
subordinated debentures or similarly structured securities. The securities can be structured as either fixed or adjustable coupon securities that can have either a perpetual or stated maturity date. For trust preferred securities, the issuing bank or corporation will pay interest to the trust, which will then be distributed to holders of the trust preferred securities as a dividend. Dividends can be deferred without creating an event of default or acceleration, although maturity cannot take place unless all cumulative payment obligations have been met. The deferral of payments does not affect the purchase or sale of these securities in the open market. Payments on these securities are treated as interest rather than dividends for federal income tax purposes. These securities generally are rated below that of the issuing company’s senior debt securities and are freely callable at the issuer’s option.
Preferred Stock: Certain Funds may invest in preferred stock. Preferred stock has a preference over common stock in liquidation (and generally in receiving dividends as well) but is subordinated to the liabilities of the issuer in all respects. As a general rule, the market value of preferred stock with a fixed dividend rate and no conversion element varies inversely with interest rates and perceived credit risk, while the market price of convertible preferred stock generally also reflects some element of conversion value. Because preferred stock is junior to debt securities and other obligations of the issuer, deterioration in the credit quality of the issuer will cause greater changes in the value of a preferred stock than in a more senior debt security with similar stated yield characteristics. Unlike interest payments on debt securities, preferred stock dividends are payable only if declared by the issuer’s board of directors. Preferred stock also may be subject to optional or mandatory redemption provisions.
Floating Rate Loan Interests: The Funds may invest in floating rate loan interests. The floating rate loan interests held by the Funds are typically issued to companies (the “borrower”) by banks, other financial institutions, and privately and publicly offered corporations (the “lender”). Floating rate loan interests are generally non-investment grade, often involve borrowers whose financial condition is troubled or uncertain and companies that are highly leveraged. The Funds may invest in obligations of borrowers who are in bankruptcy proceedings. Floating rate loan interests may include fully funded term loans or revolving lines of credit. Floating rate loan interests are typically senior in the corporate capital structure of the borrower. Floating rate loan interests generally pay interest at rates that are periodically determined by reference to a base lending rate plus a premium. The base lending rates are generally the lending rate offered by one or more European banks, such as the London Interbank Offered Rate (“LIBOR”), the prime rate offered by one or more US banks or the certificate of deposit rate. Floating rate loan interests may involve foreign borrowers, and investments may be denominated in foreign currencies. The Funds consider these investments to be investments in debt securities for purposes of their investment policies.
When the Funds purchase a floating rate loan interest they may receive a facility fee and when they sells a floating rate loan interest they may pay a facility fee. On an ongoing basis, the Funds may receive commitment fees based on the undrawn portion of the underlying line of credit amount of a floating rate loan interest. Facility and commitment fees are typically amortized to income over the term of the loan or term of the commitment, respectively. Consent and amendment fees are recorded to income as earned. Prepayment penalty fees, which may be received by the Funds upon the prepayment of a floating rate loan interest by a borrower, are recorded as realized gains. The Funds may invest in multiple series or tranches of a loan. A different series or tranche may have varying terms and carry different associated risks.
Floating rate loan interests are usually freely callable at the borrower’s option. The Funds may invest in such loans in the form of participations in loans (“Participations”) or assignments (“Assignments”) of all or a portion of loans from third parties. Participations typically will result in the Funds having a contractual relationship only with the lender, not with the borrower. The Funds will have the right to receive payments of principal, interest and any fees to which they are entitled only from the lender selling the Participation and only upon receipt by the lender of the payments from the borrower. In connection with purchasing Participations, the Funds generally will have no right to enforce compliance by the borrower with the terms of the loan agreement, nor any rights of offset against the borrower, and the Funds may not benefit directly from any collateral supporting the loan in which they have purchased the Participation. As a result, the Funds will assume the credit risk of both the borrower and the lender that is selling the Participation. The Funds’ investment in loan participation interests involves the risk of insolvency of the financial intermediaries who are parties to the transactions. In the event of the insolvency of the lender selling the Participation, the Funds may be treated as a general creditor of the lender and may not benefit from any offset between the lender and the borrower. Assignments typically result in the Funds having a direct contractual relationship with the borrower, and the Funds may enforce compliance by the borrower with the terms of the loan agreement.
In connection with floating rate loan interests, the Funds may also enter into unfunded floating rate loan interests (“commitments”). In connection with these commitments, the Funds earn a commitment fee, typically set as a percentage of the commitment amount. Such fee income, which is included in interest income in the Statements of Operations, is recognized ratably over the commitment period. Unfunded floating rate loan interests are marked-to-market daily, and any unrealized appreciation or depreciation is included in the Statements of Assets and Liabilities and Statements of Operations. As of February 28, 2014, the Funds had the following unfunded floating rate loan interests:
|
|
|
| Borrower
|
| Unfunded
Floating Rate
Loan Interest
|
| Value of
Underlying
Floating Rate
Loan Interest
|
| Unrealized
Appreciation
|
BHL | | | | Power Buyer, LLC | | $ | 13,811 | | | $ | 13,768 | | | $ | 19 | |
FRA | | | | Power Buyer, LLC | | $ | 59,638 | | | $ | 59,452 | | | $ | 82 | |
BLW | | | | Power Buyer, LLC | | $ | 25,111 | | | $ | 25,032 | | | $ | 35 | |
Forward Commitments and When-Issued Delayed Delivery Securities: The Funds may purchase securities on a when-issued basis and may purchase or sell securities on a forward commitment basis. Settlement of such transactions normally occurs within a month or more after the purchase or sale commitment is made. The Funds may purchase securities under such conditions with the intention of actually acquiring them, but may enter into a separate agreement to sell the securities before the settlement date.
| SEMI-ANNUAL REPORT | FEBRUARY 28, 2014 | 65
|
| |
| Notes to Financial Statements (continued) |
|
Since the value of securities purchased may fluctuate prior to settlement, the Funds may be required to pay more at settlement than the security is worth. In addition, the Funds are not entitled to any of the interest earned prior to settlement. When purchasing a security on a delayed delivery basis, the Funds assume the rights and risks of ownership of the security, including the risk of price and yield fluctuations. In the event of default by the counterparty, the Funds’ maximum amount of loss is the unrealized appreciation of unsettled when-issued transactions, which is shown in the Schedules of Investments.
Reverse Repurchase Agreements: Certain Funds may enter into reverse repurchase agreements with qualified third party broker-dealers. In a reverse repurchase agreement, the Funds sell securities to a bank or broker-dealer and agrees to repurchase the same securities at a mutually agreed upon date and price. During the term of the reverse repurchase agreement, the Funds continue to receive the principal and interest payments on the securities sold. Certain agreements have no stated maturity and can be terminated by either party at any time. Interest on the value of the reverse repurchase agreements issued and outstanding is based upon competitive market rates determined at the time of issuance. The Funds may utilize reverse repurchase agreements when it is anticipated that the interest income to be earned from the investment of the proceeds of the transaction is greater than the interest expense of the transaction. Reverse repurchase agreements involve leverage risk and also the risk that the market value of the securities that the Funds are obligated to repurchase under the agreement may decline below the repurchase price.
For financial reporting purposes, cash received in exchange for securities delivered plus accrued interest payments to be made to the counterparty is recorded as a liability in the Statements of Assets and Liabilities at face value including accrued interest. Due to the short term nature of the reverse repurchase agreements, face value approximates fair value. Interest payments made by the Funds to the counterparties are recorded as a component of interest expense in the Statements of Operations. In periods of increased demand for the security, the Funds may receive a fee for use of the security by the counterparty, which may result in interest income to the Funds.
Reverse repurchase transactions are entered into by the Funds under Master Repurchase Agreements (“MRA”), which permit the Funds, under certain circumstances including an event of default (such as bankruptcy or insolvency), to offset payables and/or receivables under the MRA with collateral held and/or posted to the counterparty and create one single net payment due to or from the Funds. With reverse repurchase transactions, typically the Funds and the counterparty are permitted to sell, re-pledge, or use the collateral associated with the transaction. However, bankruptcy or insolvency laws of a particular jurisdiction may impose restrictions on or prohibitions against such a right of offset in the event of the MRA counterparty’s bankruptcy or insolvency. Pursuant to the terms of the MRA, the Funds receives or posts securities as collateral with a market value in excess of the repurchase price to be paid or received by the Funds upon the maturity of the transaction. Upon a bankruptcy or insolvency of the MRA counterparty, the Funds are considered an unsecured creditor with respect to excess collateral and, as such, the return of excess collateral may be delayed.
The following table is a summary of BLW’s open reverse repurchase agreements by counterparty which are subject to offset under an MRA on a net basis as of February 28, 2014:
Counterparty
|
|
|
| Reverse
Repurchase
Agreements
|
| Fair Value of
Non-cash
Collateral
Pledged
Including
Accrued
Interest1
|
| Cash
Collateral
Pledged
|
| Net
Amount
|
Barclays Capital, Inc. | | | | $ | 47,313,120 | | | $ | (47,313,120 | ) | | | — | | | | — | |
BNP Paribas Securities Corp. | | | | | 13,085,207 | | | | (13,085,207 | ) | | | — | | | | — | |
Credit Suisse Securities (USA) LLC | | | | | 54,877,871 | | | | (54,877,871 | ) | | | — | | | | — | |
Deutsche Bank Securities, Inc. | | | | | 142,085,559 | | | | (142,085,559 | ) | | | — | | | | — | |
HSBC Securities (USA) Inc. | | | | | 3,627,838 | | | | (3,627,838 | ) | | | — | | | | — | |
RBC Capital Markets LLC | | | | | 6,666,517 | | | | (6,666,517 | ) | | | — | | | | — | |
UBS Securities LLC | | | | | 24,241,398 | | | | (24,241,398 | ) | | | — | | | | — | |
Total
| | | | $ | 291,897,510 | | | $ | (291,897,510 | ) | | | — | | | | — | |
| 1 | | Collateral with a value of $324,783,188 has been pledged in connection with open reverse repurchase agreements. Excess of collateral pledged to the individual counterparty is not shown for financial reporting purposes. |
In the event the buyer of securities under an MRA files for bankruptcy or becomes insolvent, the Fund’s use of the proceeds of the agreement may be restricted while the other party, or its trustee or receiver, determines whether or not to enforce the Fund’s obligation to repurchase the securities.
4. Derivative Financial Instruments:
The Funds engage in various portfolio investment strategies using derivative contracts both to increase the returns of the Funds and/or to economically hedge their exposure to certain risks such as credit risk, equity risk, interest rate risk or foreign currency exchange rate risk. These contracts may be transacted on an exchange or OTC.
Financial Futures Contracts: The Funds purchase and/or sell financial futures contracts and options on financial futures contracts to gain exposure to, or economically hedge against, changes in interest rates (interest rate risk) or changes in the value of equity securities (equity risk). Financial futures contracts are agreements between the Funds and a counterparty to buy or sell a specific quantity of an underlying instrument at a specified price and at a specified date. Depending on the terms of the particular contract, financial futures contracts are settled either through physical delivery of the underlying instrument on the settlement date or by payment of a cash settlement amount on the settlement date.
Upon entering into a financial futures contract, the Funds are required to deposit initial margin with the broker in the form of cash or securities in an amount that varies depending on a contract’s size and risk profile. The initial margin deposit must then be maintained at an established level over the life of the contract. Securities deposited as initial margin are designated on the Schedules of Investments and cash deposited, if any, is recorded on the Statements of Assets and Liabilities as cash pledged for financial futures contracts. Pursuant to the contract, the Funds agree to receive from or pay to the broker an amount of cash equal to the daily
| 66 | SEMI-ANNUAL REPORT | FEBRUARY 28, 2014
|
| |
| Notes to Financial Statements (continued) |
|
fluctuation in value of the contract. Such receipts or payments are known as variation margin. Variation margin is recorded by the Funds as unrealized appreciation or depreciation and, if applicable, as a receivable or payable for variation margin in the Statements of Assets and Liabilities.
When the contract is closed, the Funds record a realized gain or loss equal to the difference between the value of the contract at the time it was opened and the value at the time it was closed. The use of financial futures contracts involves the risk of an imperfect correlation in the movements in the price of financial futures contracts, interest or foreign currency exchange rates and the underlying assets.
Foreign Currency Exchange Contracts: The Funds enter into foreign currency exchange contracts as an economic hedge against either specific transactions or portfolio instruments or to obtain exposure to, or hedge exposure away from, foreign currencies (foreign currency exchange rate risk). A foreign currency exchange contract is an agreement between two parties to buy and sell a currency at a set exchange rate on a future date. Foreign currency exchange contracts, when used by the Funds, help to manage the overall exposure to the currencies in which some of the investments held by the Funds are denominated. The contract is marked-to-market daily and the change in market value is recorded by the Funds as an unrealized gain or loss. When the contract is closed, the Funds record a realized gain or loss equal to the difference between the value at the time it was opened and the value at the time it was closed. The use of foreign currency exchange contracts involves the risk that the value of a foreign currency exchange contract changes unfavorably due to movements in the value of the referenced foreign currencies.
Options: The Funds purchase and write call and put options to increase or decrease their exposure to underlying instruments including equity risk, and/or interest rate risk and/or in the case of options written, to generate gains from options premiums. A call option gives the purchaser (holder) of the option the right (but not the obligation) to buy, and obligates the seller (writer) to sell (when the option is exercised) the underlying instrument at the exercise or strike price at any time or at a specified time during the option period. A put option gives the holder the right to sell and obligates the writer to buy the underlying instrument at the exercise or strike price at any time or at a specified time during the option period. When the Funds purchase (write) an option, an amount equal to the premium paid (received) by the Funds is reflected as an asset (liability). The amount of the asset (liability) is subsequently marked-to-market to reflect the current market value of the option purchased (written). When an instrument is purchased or sold through an exercise of an option, the related premium paid (or received) is added to (or deducted from) the basis of the instrument acquired or deducted from (or added to) the proceeds of the instrument sold. When an option expires (or the Funds enter into a closing transaction), the Funds realize a gain or loss on the option to the extent of the premiums received or paid (or gain or loss to the extent the cost of the closing transaction exceeds the premiums received or paid). When the Funds write a call option, such option is “covered,” meaning that the Funds hold the underlying instrument subject to being called by the option counterparty. When the Funds write a put option, such option is covered by cash in an amount sufficient to cover the obligation.
In purchasing and writing options, the Funds bear the risk of an unfavorable change in the value of the underlying instrument or the risk that the Funds may not be able to enter into a closing transaction due to an illiquid market. Exercise of a written option could result in the Funds purchasing or selling a security when it otherwise would not, or at a price different from the current market value.
Swaps: The Funds enter into swap agreements, in which the Funds and the counterparty agree either to make periodic net payments on a specified notional amount or a net payment upon termination. Swap agreements are privately negotiated in the OTC market and may be entered into as a bilateral contract (“OTC swaps”) or centrally cleared (“centrally cleared swaps”). Swaps are marked-to-market daily and changes in value are recorded as unrealized appreciation (depreciation).
For OTC swaps, any upfront premiums paid are recorded as assets and any upfront fees received are recorded as liabilities and are shown as swap premiums paid and swap premiums received, respectively, in the Statements of Assets and Liabilities and amortized over the term of the OTC swap. Payments received or made by the Funds for OTC swaps are recorded in the Statements of Operations as realized gains or losses, respectively. When an OTC swap is terminated, the Funds will record a realized gain or loss equal to the difference between the proceeds from (or cost of) the closing transaction and the Funds’ basis in the contract, if any. Generally, the basis of the contracts is the premium received or paid.
In a centrally cleared swap, immediately following execution of the swap agreement, the swap agreement is novated to a central counterparty (the “CCP”) and the Fund’s counterparty on the swap agreement becomes the CCP. The Fund is required to interface with the CCP through a broker. Upon entering into a centrally cleared swap, the Funds are required to deposit initial margin with the broker in the form of cash or securities in an amount that varies depending on the size and risk profile of the particular swap. Securities deposited as initial margin are designated on the Schedules of Investments and cash deposited is recorded on the Statements of Assets and Liabilities as cash pledged for centrally cleared swaps. The daily change in valuation of centrally cleared swaps is recorded as a receivable or payable for variation margin in the Statements of Assets and Liabilities. Payments received from (paid to) the counterparty, including at termination, are recorded as realized gain (loss) in the Statements of Operations.
Swap transactions involve, to varying degrees, elements of interest rate, credit and market risk in excess of the amounts recognized in the Statements of Assets and Liabilities. Such risks involve the possibility that there will be no liquid market for these agreements, that the counterparty to the agreements may default on its obligation to perform or disagree as to the meaning of the contractual terms in the agreements, and that there may be unfavorable changes in interest rates and/or market values associated with these transactions.
• | | Credit default swaps — The Funds enter into credit default swaps to manage their exposure to the market or certain sectors of the market, to reduce their risk exposure to defaults of corporate and/or sovereign |
| SEMI-ANNUAL REPORT | FEBRUARY 28, 2014 | 67
|
| |
| Notes to Financial Statements (continued) |
|
issuers or to create exposure to corporate and/or sovereign issuers to which they are not otherwise exposed (credit risk). The Funds may either buy or sell (write) credit default swaps on single-name issuers (corporate or sovereign), a combination or basket of single-name issuers or traded indexes. Credit default swaps on single-name issuers are agreements in which the protection buyer pays fixed periodic payments to the seller in consideration for a guarantee from the protection seller to make a specific payment should a negative credit event take place with respect to the referenced entity (e.g., bankruptcy, failure to pay, obligation accelerators, repudiation, moratorium or restructuring). Credit default swaps on traded indexes are agreements in which the buyer pays fixed periodic payments to the seller in consideration for a guarantee from the seller to make a specific payment should a write-down, principal or interest shortfall or default of all or individual underlying securities included in the index occur. As a buyer, if an underlying credit event occurs, the Funds will either (i) receive from the seller an amount equal to the notional amount of the swap and deliver the referenced security or underlying securities comprising the index, or (ii) receive a net settlement of cash equal to the notional amount of the swap less the recovery value of the security or underlying securities comprising the index. As a seller (writer), if an underlying credit event occurs, the Funds will either pay the buyer an amount equal to the notional amount of the swap and take delivery of the referenced security or underlying securities comprising the index or pay a net settlement of cash equal to the notional amount of the swap less the recovery value of the security or underlying securities comprising the index.
• | | Interest rate swaps — The Funds enter into interest rate swaps to gain or reduce exposure to interest rates or to manage duration, the yield curve or interest rate risk by economically hedging the value of the fixed rate bonds, which may decrease when interest rates rise (interest rate risk). Interest rate swaps are agreements in which one party pays a stream of interest payments, either fixed or floating, for another party’s stream of interest payments, either fixed or floating, on the same notional amount for a specified period of time. |
The following is a summary of the Funds’ derivative financial instruments categorized by risk exposure:
Fair Values of Derivative Financial Instruments as of February 28, 2014
|
|
| | |
| | Derivative Assets
| |
| |
|
| BHL
|
| FRA
|
| BLW
|
| Statements of Assets
and Liabilities Location
|
|
| |
| Interest rate contracts | Net unrealized appreciation/depreciation1; | | | — | | | | — | | | $ | 39,209 | |
| Foreign currency exchange contracts | Unrealized appreciation on foreign
currency exchange contracts | | $ | 6,072 | | | $ | 58,297 | | | | 27,410 | |
| Credit contracts | Unrealized appreciation on OTC swaps;
Swap premiums paid | | | — | | | | — | | | | 5,666 | |
Total
| | | $ | 6,072 | | | $ | 58,297 | | | $ | 72,285 | |
| | | Derivative Liabilities
| |
| | |
|
| BHL
|
| FRA
|
| BLW
|
|
| Statements of Assets
and Liabilities Location
|
|
| |
| Interest rate contracts | | Net unrealized appreciation/depreciation1 | | | — | | | | — | | | $ | (38,828 | ) |
| Foreign currency exchange contracts | | Unrealized depreciation on foreign
currency exchange contracts | | $ | 94,096 | | | $ | (275,485 | ) | | | (1,491,342 | ) |
| Credit contracts | | Unrealized depreciation on OTC swaps;
Swap premiums received | | | 568,776 | | | | (2,671,444 | ) | | | (3,238,423 | ) |
Total
| | | | $ | 662,872 | | | $ | (2,946,929 | ) | | $ | (4,768,593 | ) |
| 1 | | Includes cumulative appreciation/depreciation on financial futures contracts, if any, as reported in the Schedules of Investments. Only current day’s variation margin is reported within the Statements of Assets and Liabilities. |
The Effect of Derivative Financial Instruments in the Statements of Operations
Six Months Ended February 28, 2014
|
|
| |
| | | | Net Realized Gain (Loss) From
|
|
|
|
|
| BHL
|
| FRA
|
| BLW
|
| | | | | | | | | | | | | | |
Interest rate contracts:
| | | | | | | | | | | | | | |
Financial futures contracts | | | | | — | | | | — | | | $ | (712,868 | ) |
Swaps | | | | | — | | | | — | | | | — | |
Foreign currency exchange contracts:
| | | | | | | | | | | | | | |
Foreign currency transactions | | | | $ | (245,371 | ) | | $ | (758,713 | ) | | | (4,331,879 | ) |
Credit contracts:
| | | | | | | | | | | | | | |
Swaps | | | | | 93,540 | | | | 503,054 | | | | 693,370 | |
Total
| | | | $ | (151,831 | ) | | $ | ��(255,659 | ) | | $ | (4,351,377 | ) |
| 68 | SEMI-ANNUAL REPORT | FEBRUARY 28, 2014
|
| |
| Notes to Financial Statements (continued) |
|
| | | | Net Change in Unrealized
Appreciation/Depreciation on
|
|
|
|
|
| BHL
|
| FRA
|
| BLW
|
Interest rate contracts:
| | | | | | | | | | | | | | |
Financial futures contracts | | | | | — | | | | — | | | $ | (119,889 | ) |
Foreign currency exchange contracts:
| | | | | | | | | | | | | | |
Foreign currency translations | | | | $ | (101,342 | ) | | $ | (174,246 | ) | | | (794,807 | ) |
Credit contracts:
| | | | | | | | | | | | | | |
Swaps | | | | | (214,639 | ) | | | (1,028,298 | ) | | | (1,067,093 | ) |
Total
| | | | $ | (315,981 | ) | | $ | (1,202,544 | ) | | $ | (1,981,789 | ) |
For the six months ended February 28, 2014, the average quarterly balances of outstanding derivative financial instruments were as follows:
|
|
|
| BHL
|
| FRA
|
| BLW
|
Financial future contracts:
| | | | | | | | | | | | | | |
Average number of contracts purchased | | | | | — | | | | — | | | | 9 | |
Average number of contracts sold | | | | | — | | | | — | | | | 210 | |
Average notional value of contracts purchased | | | | | — | | | | — | | | $ | 2,244,544 | |
Average notional value of contracts sold | | | | | — | | | | — | | | $ | 25,724,164 | |
Foreign currency exchange contracts:
| | | | | | | | | | | | | | |
Average number of contracts-US dollars purchased | | | | | 4 | | | | 5 | | | | 8 | |
Average number of contracts-US dollars sold | | | | | 1 | | | | 2 | | | | 2 | |
Average US dollar amounts purchased | | | | $ | 5,382,315 | | | $ | 19,021,557 | | | $ | 87,954,777 | |
Average US dollar amounts sold | | | | $ | 193,609 | | | $ | 779,568 | | | $ | 6,248,088 | |
Options:
| | | | | | | | | | | | | | |
Average number of option contracts purchased | | | | | — | | | | 44 | | | | 46 | |
Average notional value of option contracts purchased | | | | | — | | | $ | 4,148,584 | | | $ | 4,337,156 | |
Credit default swaps:
| | | | | | | | | | | | | | |
Average number of contracts-buy protection | | | | | — | | | | — | | | | 2 | |
Average number of contracts-sell protection | | | | | 10 | | | | 12 | | | | 28 | |
Average notional value-buy protection | | | | | — | | | | — | | | $ | 1,000 | |
Average notional value-sell protection | | | | $ | 1,779,719 | | | $ | 9,089,236 | | | $ | 12,759,253 | |
Counterparty Credit Risk: A derivative contract may suffer a mark-to-market loss if the value of the contract decreases due to an unfavorable change in the market rates or values of the underlying instrument. Losses can also occur if the counterparty does not perform under the contract.
A Fund’s risk of loss from counterparty credit risk on OTC derivatives is generally limited to the aggregate unrealized gain netted against any collateral held by such Fund. For OTC options purchased, each Fund bears the risk of loss of the amount of the premiums paid plus the positive change in market values net of any collateral held by such Fund should the counterparty fail to perform under the contracts. Options written by the Funds do not typically give rise to counterparty credit risk, as options written generally obligate the Funds, and not the counterparty, to perform.
With exchange-traded purchased options and futures, there is less counterparty credit risk to the Funds since the exchange or clearinghouse, as counterparty to such instruments, guarantees against a possible default. The clearinghouse stands between the buyer and the seller of the contract; therefore, the credit risk is limited to failure of the clearinghouse. While offset rights may exist under applicable law, the Funds do not have a contractual right of offset against a clearing broker or clearinghouse in the event of a default (including the bankruptcy or insolvency) of the clearing broker or clearinghouse. Additionally, credit risk exists in exchange-traded futures with respect to initial and variation margin that is held in a clearing broker’s customer accounts. While clearing brokers are required to segregate customer margin from their own assets, in the event that a clearing broker becomes insolvent or goes into bankruptcy and at that time there is a shortfall in the aggregate amount of margin held by the clearing broker for all its clients, typically the shortfall would be allocated on a pro rata basis across all the clearing broker’s customers, potentially resulting in losses to the Funds.
In order to better define their contractual rights and to secure rights that will help the Funds mitigate their counterparty risk, the Funds may enter into an International Swaps and Derivatives Association, Inc. Master Agreement (“ISDA Master Agreement”) or similar agreement with their derivative contract counterparties. An ISDA Master Agreement is a bilateral agreement between each Fund and a counterparty that governs certain OTC derivatives and typically contains, among other things, collateral posting terms and netting provisions in the event of a default and/or termination event. Under an ISDA Master Agreement, each Fund may, under certain circumstances, offset with the counterparty certain derivative financial instruments’ payables and/or receivables with collateral held and/or posted and create one single net payment. The provisions of the ISDA Master Agreement typically permit a single net payment in the event of default including the bankruptcy or insolvency of the counterparty. However, bankruptcy or insolvency laws of a particular jurisdiction may impose restrictions on or prohibitions against the right of offset in bankruptcy, insolvency or other events. In addition, certain ISDA Master Agreements allow counterparties to OTC derivatives to terminate derivative contracts prior to maturity in the event the Funds’ net assets decline by a stated percentage or the Funds fail to meet the terms of their ISDA Master Agreements, which would cause the Funds to accelerate payment of any net liability owed to the counterparty.
| SEMI-ANNUAL REPORT | FEBRUARY 28, 2014 | 69
|
| |
| Notes to Financial Statements (continued) |
|
Collateral Requirements: For derivatives traded under an ISDA Master Agreement, the collateral requirements are typically calculated by netting the mark-to-market amount for each transaction under such agreement and comparing that amount to the value of any collateral currently pledged by the Funds and the counterparty.
Cash collateral that has been pledged to cover obligations of the Funds and cash collateral received from the counterparty, if any, is reported separately on the Statements of Assets and Liabilities as cash pledged as collateral and cash received as collateral, respectively. Non-cash collateral pledged by the Funds, if any, is noted in the Schedules of Investments. Generally, the amount of collateral due from or to a party has to exceed a minimum transfer amount threshold (e.g., $500,000) before a transfer is required, which is determined at the close of business of the Funds and any additional required collateral is delivered to/pledged by the Funds on the next business day. Typically, the Funds and counterparties are not permitted to sell, re-pledge or use the collateral they receive. To the extent amounts due to the Funds from its counterparties are not fully collateralized, contractually or otherwise, the Funds bear the risk of loss from counterparty non-performance. Each Fund attempts to mitigate counterparty risk by entering into agreements only with counterparties that it believes have the financial resources to honor their obligations and by monitoring the financial stability of those counterparties.
For financial reporting purposes, the Funds do not offset derivative assets and derivative liabilities that are subject to netting arrangements, if any, in the Statements of Assets and Liabilities.
At February 28, 2014, the Funds’ derivative assets and liabilities (by type) are as follows:
BHL
|
|
|
| Assets
|
| Liabilities
|
Derivative Financial Instruments:
| | | | | | | | | | |
Foreign currency exchange contracts | | | | $ | 6,072 | | | $ | 94,096 | |
OTC swaps1 | | | | | — | | | | 568,776 | |
Total derivative assets and liabilities in the Statement of Assets and Liabilities | | | | | 6,072 | | | | 662,872 | |
Derivatives not subject to a Master Netting Agreement or similar agreement (“MNA”) | | | | | — | | | | — | |
Total derivative assets and liabilities subject to an MNA | | | | $ | 6,072 | | | $ | 662,872 | |
FRA
|
|
|
| Assets
|
| Liabilities
|
Derivative Financial Instruments:
| | | | | | | | | | |
Foreign currency exchange contracts | | | | $ | 58,297 | | | $ | 275,485 | |
OTC swaps1 | | | | | — | | | | 2,671,444 | |
Total derivative assets and liabilities in the Statement of Assets and Liabilities | | | | | 58,297 | | | | 2,946,929 | |
Derivatives not subject to an MNA or similar agreement | | | | | — | | | | — | |
Total derivative assets and liabilities subject to an MNA | | | | $ | 58,297 | | | $ | 2,946,929 | |
BLW
|
|
|
| Assets
|
| Liabilities
|
Derivative Financial Instruments:
| | | | | | | | | | |
Financial futures contracts | | | | $ | 19,703 | | | | — | |
Foreign currency exchange contracts | | | | | 27,410 | | | $ | 1,491,342 | |
OTC swaps1 | | | | | 5,666 | | | | 3,238,423 | |
Total derivative assets and liabilities in the Statement of Assets and Liabilities | | | | | 52,779 | | | | 4,729,765 | |
Derivatives not subject to an MNA or similar agreement | | | | | (19,703 | ) | | | — | |
Total derivative assets and liabilities subject to an MNA | | | | $ | 33,076 | | | $ | 4,729,765 | |
| 1 | | Includes unrealized appreciation/depreciation on OTC swaps and swap premiums paid/received in the Statements of Assets and Liabilities. |
The following tables present the Funds’ derivative assets and liabilities by counterparty net of amounts available for offset under an MNA and net of the related collateral received and pledged by the Funds as of February 28, 2014:
BHL
|
|
Counterparty
|
|
|
| Derivative Assets
Subject to an MNA
by Counterparty
|
| Derivatives
Available for
Offset
|
| Non-cash
Collateral
Received
|
| Cash
Collateral
Received
|
| Net Amount
of Derivative
Assets2
|
Citibank N.A. | | | | $ | 6,072 | | | | — | | | | — | | | | — | | | $ | 6,072 | |
Counterparty
|
|
|
| Derivative Liabilities
Subject to an MNA
by Counterparty
|
| Derivatives
Available
for Offset
|
| Non-cash
Collateral
Pledged
|
| Cash
Collateral
Pledged
|
| Net Amount
of Derivative
Liabilities3
|
Deutsche Bank AG | | | | $ | 222,494 | | | | — | | | | — | | | | — | | | $ | 222,494 | |
Goldman Sachs Bank USA | | | | | 314,072 | | | | — | | | | — | | | | — | | | | 314,072 | |
JPMorgan Chase Bank N.A. | | | | | 83,101 | | | | — | | | | — | | | | — | | | | 83,101 | |
Royal Bank of Scotland PLC | | | | | 43,205 | | | | — | | | | — | | | | — | | | | 43,205 | |
Total
| | | | $ | 662,872 | | | | — | | | | — | | | | — | | | $ | 662,872 | |
| 2 | | Net amount represents the net amount receivable from the counterparty in the event of default. |
| 3 | | Net amount represents the net amount payable due to the counterparty in the event of default. |
| 70 | SEMI-ANNUAL REPORT | FEBRUARY 28, 2014
|
| |
| Notes to Financial Statements (continued) |
|
FRA
|
|
Counterparty
|
|
|
| Derivative Assets
Subject to an MNA
by Counterparty
|
| Derivatives
Available
for Offset1
|
| Non-cash
Collateral
Received
|
| Cash
Collateral
Received
|
| Net Amount
of Derivative
Assets
|
Barclays Bank PLC | | | | | | $(31,839) | | — | | — | | — |
Deutsche Bank AG | | | | | | (26,458) | | — | | — | | — |
Total
| | | | | | $(58,297) | | — | | — | | — |
Counterparty
|
|
|
| Derivative Liabilities
Subject to an MNA
by Counterparty
|
| Derivatives
Available
for Offset1
|
| Non-cash
Collateral
Pledged2
|
| Cash
Collateral
Pledged2
|
| Net Amount
of Derivative
Liabilities3
|
Barclays Bank PLC | | | | $ 966,276 | | $(31,839) | | — | | $(934,437) | | — |
BNP Paribas S.A. | | | | 12,476 | | — | | — | | — | | $ 12,476 |
Deutsche Bank AG | | | | 513,301 | | (26,458) | | — | | (486,843) | | — |
Goldman Sachs International | | | | 926,239 | | — | | $(926,239) | | — | | — |
Goldman Sachs Bank USA | | | | 2,577 | | — | | — | | — | | 2,577 |
JPMorgan Chase Bank N.A. | | | | 450,886 | | — | | — | | — | | 450,886 |
Royal Bank of Scotland PLC | | | | 75,174 | | — | | — | | — | | 75,174 |
Total
| | | | $2,946,929 | | $(58,297) | | $(926,239) | | $(1,421,280) | | $541,113 |
BLW
|
|
Counterparty
|
|
|
| Derivative Assets
Subject to an MNA
by Counterparty
|
| Derivatives
Available
for Offset1
|
| Non-cash
Collateral
Received
|
| Cash
Collateral
Received
|
| Net Amount
of Derivative
Assets4
|
Barclays Bank PLC | | | | $20,117 | | $(20,117) | | — | | — | | — |
Deutsche Bank AG | | | | 22 | | (22) | | — | | — | | — |
HSBC Bank PLC | | | | 5,644 | | (5,644) | | — | | — | | — |
State Street Bank and Trust Co. | | | | 7,293 | | (5,293) | | — | | — | | $2,000 |
Total
| | | | $33,076 | | $(31,076) | | — | | — | | $2,000 |
Counterparty
|
|
|
| Derivative Liabilities
Subject to an MNA
by Counterparty
|
| Derivatives
Available
for Offset1
|
| Non-cash
Collateral
Pledged2
|
| Cash
Collateral
Pledged2
|
| Net Amount
of Derivative
Liabilities3
|
Barclays Bank PLC | | | | $1,723,860 | | $(20,117) | | — | | $ (420,000) | | $1,283,743 |
BNP Paribas S.A. | | | | 5,360 | | — | | — | | — | | 5,360 |
Citibank N.A. | | | | 296,572 | | — | | — | | — | | 296,572 |
Deutsche Bank AG | | | | 273,920 | | (22) | | — | | (273,898) | | — |
Goldman Sachs & Co. | | | | 3,682 | | — | | — | | — | | 3,682 |
Goldman Sachs Bank USA | | | | 1,872,696 | | — | | $(1,237,500) | | (635,196) | | — |
HSBC Bank PLC | | | | 9,472 | | (5,644) | | — | | — | | 3,828 |
JPMorgan Chase Bank N.A. | | | | 321,227 | | — | | — | | — | | 321,227 |
Royal Bank of Scotland PLC | | | | 3,186 | | — | | — | | — | | 3,186 |
State Street Bank and Trust Co. | | | | 5,293 | | (5,293) | | — | | — | | — |
UBS AG | | | | 214,497 | | — | | — | | — | | 214,497 |
Total
| | | | $4,729,765 | | $(31,076) | | $(1,237,500) | | $(1,329,094) | | $2,132,095 |
| 1 | | The amount of derivatives available for offset is limited to the amount of the assets and/or liabilities that are subject to an MNA. |
| 2 | | Excess of the collateral pledged to the individual counterparty may not be shown for financial reporting purposes. |
| 3 | | Net amount represents the net amount payable due to the counterparty in the event of default. |
| 4 | | Net amount represents the net amount receivable from the counterparty in the event of default. |
| SEMI-ANNUAL REPORT | FEBRUARY 28, 2014 | 71
|
| |
| Notes to Financial Statements (continued) |
|
5. Investment Advisory Agreement and Other Transactions with Affiliates:
The PNC Financial Services Group, Inc. is the largest stockholder and an affiliate, for 1940 Act purposes, of BlackRock, Inc. (“BlackRock”).
Each Fund entered into an Investment Advisory Agreement with the Manager, the Funds’ investment advisor, an indirect, wholly owned subsidiary of BlackRock, to provide investment advisory and administration services. The Manager is responsible for the management of each Fund’s portfolio and provides the necessary personnel, facilities, equipment and certain other services necessary to the operations of each Fund. For such services, each Fund pays the Manager a monthly fee based on a percentage of each Fund’s average daily net assets at the following annual rates, plus the proceeds of any outstanding borrowings used for leverage as follows:
BHL | | | | | 1.00 | % |
FRA. | | | | | 0.75 | % |
BLW | | | | | 0.55 | % |
The Manager voluntarily agreed to waive its investment advisory fees by the amount of investment advisory fees each Fund pays to the Manager indirectly through its investment in affiliated money market funds. However, the Manager does not waive its investment advisory fees by the amount of investment advisory fees paid in connection with each Fund’s investment in other affiliated investment companies, if any. These amounts are shown as fees waived by Manager in the Statements of Operations.
The Manager provides investment management and other services to the Subsidiaries. The Manager does not receive separate compensation from the Subsidiaries for providing investment management or administrative services. However, each Fund pays the Manager based on the Fund’s net assets, which includes the assets of the Subsidiaries.
The Manager entered into a sub-advisory agreement with BlackRock Financial Management, Inc. (“BFM”), an affiliate of the Manager. The Manager pays BFM, for services it provides, a monthly fee that is a percentage of the investment advisory fees paid by each Fund to the Manager.
Certain officers and/or Directors of the Funds are officers and/or Directors of BlackRock or its affiliates. The Funds reimburse the Manager for a portion of the compensation paid to the Funds’ Chief Compliance Officer, which is included in officer and directors in the Statements of Operations.
The Funds may purchase securities from, or sell securities to, an affiliated fund provided the affiliation is solely due to having a common investment adviser, common officers, or common directors. For the six months ended February 28, 2014, the purchase and sale transactions with an affiliated fund in compliance with Rule 17a-7 under the 1940 Act were as follows:
|
|
|
| Purchases
|
| Sales
|
BLW | | | | | — | | | $ | 7,253,816 | |
6. Purchases and Sales:
Purchases and sales of investments including paydowns and excluding short-term securities for the six months ended February 28, 2014, were as follows:
|
|
|
| Purchases
|
| Sales
|
BHL | | | | $ | 47,010,052 | | | $ | 46,830,847 | |
FRA | | | | $ | 205,908,691 | | | $ | 200,771,102 | |
BLW | | | | $ | 275,043,119 | | | $ | 267,435,141 | |
7. Income Tax Information:
As of August 31, 2013, the Funds had capital loss carryforwards available to offset future realized capital gains through the indicated expiration dates as follows:
Expires August 31,
|
|
|
| BHL
|
| FRA
|
| BLW
|
2014 | | | | | — | | | $ | 2,237,399 | | | | — | |
2015 | | | | | — | | | | 1,444,704 | | | | — | |
2016 | | | | | — | | | | 20,623,334 | | | $ | 11,256,103 | |
2017 | | | | | — | | | | 30,228,590 | | | | 9,996,868 | |
2018 | | | | $ | 572,418 | | | | 27,716,009 | | | | 37,509,275 | |
2019 | | | | | — | | | | 2,206,081 | | | | — | |
No expiration date1 | | | | | — | | | | 286,162 | | | | — | |
Total
| | | | $ | 572,418 | | | $ | 84,742,279 | | | $ | 58,762,246 | |
| 1 | | Must be utilized prior to losses subject to expiration. |
As of February 28, 2014, gross unrealized appreciation and depreciation based on cost for federal income tax purposes were as follows:
|
|
|
| BHL
|
| FRA
|
| BLW
|
Tax cost | | | | $ | 185,275,365 | | | $ | 820,962,050 | | | $ | 945,359,014 | |
Gross unrealized appreciation | | | | $ | 2,741,544 | | | $ | 15,640,005 | | | $ | 39,715,183 | |
Gross unrealized depreciation | | | | | (940,716 | ) | | | (15,449,709 | ) | | | (19,117,987 | ) |
Net unrealized appreciation | | | | $ | 1,800,828 | | | $ | 190,296 | | | $ | 20,597,196 | |
8. Borrowings:
BHL and FRA were party to a senior committed secured, 360-day rolling line of credit facility and a separate security agreement (the “SSB Agreement”) with State Street Bank and Trust Company (“SSB”). SSB may elect to terminate its commitment upon 360-days written notice to the Funds. The Funds have granted a security interest in substantially all of their assets to SSB.
The SSB Agreement allows for the following maximum commitment amounts:
|
|
|
| Commitment
Amounts
|
BHL | | | | $ | 64,000,000 | |
FRA | | | | $ | 280,000,000 | |
Advances will be made by SSB to the Funds, at the Funds’ option of (a) the higher of (i) 0.80% above the Fed Funds rate and (ii) 0.80% above the Overnight LIBOR or (b) 0.80% above 7-day, 30-day, 60-day or 90-day LIBOR.
| 72 | SEMI-ANNUAL REPORT | FEBRUARY 28, 2014
|
| |
| Notes to Financial Statements (concluded) |
|
In addition, the Funds pay a facility fee and utilization fee (based on the daily unused portion of the commitments). The commitment fees are waived if the Funds meet certain conditions. The fees associated with each of the agreements are included in the Statements of Operations as borrowing costs. Advances to the Funds as of February 28, 2014 are shown in the Statements of Assets and Liabilities as bank borrowings payable. Based on the short-term nature of the borrowings under the line of credit and the variable interest rate, the carrying amount of the borrowings approximates fair value.
The Funds may not declare dividends or make other distributions on shares or purchase any such shares if, at the time of the declaration, distribution or purchase, asset coverage with respect to the outstanding short-term borrowings is less than 300%.
For the six months ended February 28, 2014, the daily weighted average interest rates for Funds with loans under the revolving credit agreements were as follows:
|
|
|
| Daily Weighted
Average
Interest Rate
|
BHL | | | | | 0.91 | % |
FRA | | | | | 0.91 | % |
For the six months ended February 28, 2014, the daily weighted average interest rate for BLW with borrowings from reverse repurchase agreements was 0.48%.
9. Concentration, Market and Credit Risk:
In the normal course of business, the Funds invest in securities and enter into transactions where risks exist due to fluctuations in the market (market risk) or failure of the issuer of a security to meet all its obligations (issuer credit risk). The value of securities held by the Funds may decline in response to certain events, including those directly involving the issuers whose securities are owned by the Funds; conditions affecting the general economy; overall market changes; local, regional or global political, social or economic instability; and currency and interest rate and price fluctuations. Similar to issuer credit risk, the Funds may be exposed to counterparty credit risk, or the risk that an entity with which the Funds have unsettled or open transactions may fail to or be unable to perform on its commitments. The Funds manage counterparty credit risk by entering into transactions only with counterparties that they believe have the financial resources to honor their obligations and by monitoring the financial stability of those counterparties. Financial assets, which potentially expose the Funds to market, issuer and counterparty credit risks, consist principally of financial instruments and receivables due from counterparties. The extent of the Funds’ exposure to market, issuer and counterparty credit risks with respect to these financial assets is generally approximated by their value recorded in Statements of Assets and Liabilities, less any collateral held by the Funds.
The Funds invest a significant portion of their assets in fixed-income securities and/or use derivatives tied to the fixed income markets. See the Schedules of Investments for these securities and/or derivatives. Changes in market interest rates or economic conditions, including the Federal Reserve’s decision in December 2013 to taper its quantitative easing policy, may affect the value and/or liquidity of such investments. Interest rate risk is the risk that prices of bonds and other fixed-income securities will increase as interest rates fall and decrease as interest rates rise. The Funds may be subject to a greater risk of rising interest rates due to the current period of historically low rates.
The Funds invest a significant portion of its assets in securities backed by commercial or residential mortgage loans or in issuers that hold mortgage and other asset-backed securities. Please see the Schedules of Investments for these securities. Changes in economic conditions, including delinquencies and/or defaults on assets underlying these securities, can affect the value, income and/or liquidity of such positions.
10. Capital Share Transactions:
BHL and BLW are authorized to issue an unlimited number of shares, par value $0.001, all of which were initially classified as Common Shares. FRA is authorized to issue 200 million shares, par value $0.10, all of which were initially classified as Common Shares. The Board is authorized, however, to reclassify any unissued Common Shares without approval of Common Shareholders.
For the periods shown, shares issued and outstanding increased by the following amounts as a result of dividend reinvestment:
|
|
|
| Six Months
Ended
February 28,
2014
|
| Year Ended
August 31,
2013
|
BHL | | | | | — | | | | 16,935 | |
FRA | | | | | — | | | | 18,747,801 | 1 |
BLW | | | | | — | | | | 49,145 | |
| 1 | | Includes 18,666,048 shares issued from the reorganization. |
11. Subsequent Events:
Management’s evaluation of the impact of all subsequent events on the Funds’ financial statements was completed through the date the financial statements were issued and the following item was noted:
Each Fund paid a net investment income dividend in the following amounts per share on March 31, 2014 to Common Shareholders of record on March 14, 2014:
|
|
|
| Common Dividend
Per Share
|
BHL | | | | $ | 0.0605 | |
FRA | | | | $ | 0.0700 | |
BLW | | | | $ | 0.0995 | |
Additionally, the Funds declared a net investment income dividend on April 1, 2014 payable to Common Shareholders of record on April 15, 2014 for the same amounts noted above.
| SEMI-ANNUAL REPORT | FEBRUARY 28, 2014 | 73
|
Richard E. Cavanagh, Chairman of the Board and Director
Karen P. Robards, Vice Chairperson of the Board,
Chairperson of the Audit Committee and Director
Paul L. Audet, Director
Michael J. Castellano, Director and Member of the
Audit Committee
Frank J. Fabozzi, Director and Member of the
Audit Committee
Kathleen F. Feldstein, Director
James T. Flynn, Director and Member of the Audit Committee
Henry Gabbay, Director
Jerrold B. Harris, Director
R. Glenn Hubbard, Director
W. Carl Kester, Director and Member of the Audit Committee
John M. Perlowski, President and Chief Executive Officer
Brendan Kyne, Vice President
Robert W. Crothers, Vice President
Neal Andrews, Chief Financial Officer
Jay Fife, Treasurer
Brian Kindelan, Chief Compliance Officer and
Anti-Money Laundering Officer
Janey Ahn, Secretary
Investment Advisor
BlackRock Advisors, LLC
Wilmington, DE 19809
Sub-Advisor
BlackRock Financial Management, Inc.
New York, NY 10055
Custodian and Accounting Agent
State Street Bank and Trust Company
Boston, MA 02110
Transfer Agent
Common Shares
Computershare Trust Company, N.A.
Canton, MA 02021
Independent Registered Public Accounting Firm
Deloitte & Touche LLP
Boston, MA 02116
Legal Counsel
Skadden, Arps, Slate,
Meagher & Flom LLP
New York, NY 10036
Address of the Funds
100 Bellevue Parkway
Wilmington, DE 19809
| 74 | SEMI-ANNUAL REPORT | FEBRUARY 28, 2014
|
Dividend Policy
Each Fund’s dividend policy is to distribute all or a portion of its net investment income to its shareholders on a monthly basis. In order to provide shareholders with a more stable level of dividend distributions, the dividends paid by the Funds for any particular month may be more or less than the amount of net investment income earned by the Funds during such month. The portion of dividend distributions that exceeds a Fund’s current and accumulated earnings and profits, which are measured on a tax basis, will constitute a nontaxable return of capital. Dividend distributions in excess of a Fund’s taxable income and net capital gains, but not in excess of a Fund’s earnings and profits, will be taxable to shareholders as ordinary income and will not constitute a nontaxable return of capital. The Funds’ current accumulated but undistributed net investment income, if any, is disclosed in the Statements of Assets and Liabilities, which comprises part of the financial information included in this report.
| SEMI-ANNUAL REPORT | FEBRUARY 28, 2014 | 75
|
| |
| Additional Information (continued) |
|
General Information
The Funds do not make available copies of their Statements of Additional Information because the Funds’ shares are not continuously offered, which means that the Statement of Additional Information of each Fund has not been updated after completion of the respective Fund’s offerings and the information contained in each Fund’s Statement of Additional Information may have become outdated.
During the period, there were no material changes in the Funds’ investment objectives or policies or to the Funds’ charters or by-laws that would delay or prevent a change of control of the Funds that were not approved by shareholders or in the principal risk factors associated with investment in the Funds. There have been no changes in the persons who are primarily responsible for the day-to-day management of the Funds’ portfolios.
Quarterly performance, semi-annual and annual reports, current net asset value and other information regarding the Funds may be found on BlackRock’s website, which can be accessed at http://www.blackrock.com. This reference to BlackRock’s website is intended to allow investors public access to information regarding the Funds and does not, and is not intended to, incorporate BlackRock’s website in this report.
Electronic Delivery
Electronic copies of most financial reports are available on the Funds’ website or shareholders can sign up for e-mail notifications of quarterly statements, annual and semi-annual reports by enrolling in the Funds’ electronic delivery program.
Shareholders Who Hold Accounts with Investment Advisors, Banks or Brokerages:
Please contact your financial advisor to enroll. Please note that not all investment advisors, banks or brokerages may offer this service.
Householding
The Funds will mail only one copy of shareholder documents, including annual and semi-annual reports and proxy statements, to shareholders with multiple accounts at the same address. This practice is commonly called “householding” and is intended to reduce expenses and eliminate duplicate mailings of shareholder documents. Mailings of your shareholder documents may be householded indefinitely unless you instruct us otherwise. If you do not want the mailing of these documents to be combined with those for other members of your household, please call the Funds at (800) 882-0052.
Availability of Quarterly Schedule of Investments
The Funds files their complete schedule of portfolio holdings with the SEC for the first and third quarters of each fiscal year on Form N-Q. The Funds’ Forms N-Q are available on the SEC’s website at http://www.sec.gov and may also be reviewed and copied at the SEC’s Public Reference Room in Washington, DC. Information on how to access documents on the SEC’s website without charge may be obtained by calling (800) SEC-0330. The Fund’s Forms N-Q may also be obtained upon request and without charge by calling (800) 882-0052.
Availability of Proxy Voting Policies and Procedures
A description of the policies and procedures that the Funds use to determine how to vote proxies relating to portfolio securities is available (1) without charge, upon request, by calling (800) 882-0052; (2) at http://www.blackrock.com; and (3) on the SEC’s website at http://www.sec.gov.
Availability of Proxy Voting Record
Information about how the Funds voted proxies relating to securities held in the Funds’ portfolios during the most recent 12-month period ended June 30 is available upon request and without charge (1) at http://www.blackrock.com or by calling (800) 882-0052 and (2) on the SEC’s website at http://www.sec.gov.
Availability of Fund Updates
BlackRock will update performance and certain other data for the Funds on a monthly basis on its website in the “Closed-end Funds” section of http://www.blackrock.com as well as certain other material information as necessary from time to time. Investors and others are advised to periodically check the website for updated performance information and the release of other material information about the Funds. This reference to BlackRock’s website is intended to allow investors public access to information regarding the Funds and does not, and is not intended to, incorporate BlackRock’s website in this report.
| 76 | SEMI-ANNUAL REPORT | FEBRUARY 28, 2014
|
| |
| Additional Information (concluded) |
|
Shelf Offering Program
From time-to-time, each Fund may seek to raise additional equity capital through an equity shelf program (a “Shelf Offering”). In a Shelf Offering, a Fund may, subject to market conditions, raise additional equity capital by issuing new Common Shares from time to time in varying amounts at a net price at or above the Fund’s net asset value (“NAV”) per Common Share (calculated within 48 hours of pricing). While any such Shelf Offering may allow a Fund to pursue additional investment opportunities without the need to sell existing portfolio investments, it could also entail risks — including that the issuance of additional Common Shares may limit the extent to which the Common Shares are able to trade at a premium to NAV in the secondary market. On March 14, 2014, each of BLW and FRA filed a registration statement with the SEC to issue additional Common Shares through Shelf Offerings, which is not yet effective. BLW and FRA may not sell any Common Shares in a Shelf Offering until the registration statements filed with the SEC are effective. This report is not an offer to sell BLW or FRA Common Shares and is not a solicitation of an offer to buy BLW or FRA Common Shares in any jurisdiction where the offer or sale is not permitted. Investors should consider BLW and FRA’s investment objectives, risks, charges and expenses carefully before investing. The preliminary prospectus contain more complete information about BLW and FRA Shelf Offerings and should be read carefully before investing. The information in the preliminary prospectuses for BLW and FRA is not complete and may be amended or changed. A copy of the final prospectus for BLW and FRA can be obtained from BlackRock at http://www.blackrock.com, when available.
BlackRock Privacy Principles
BlackRock is committed to maintaining the privacy of its current and former fund investors and individual clients (collectively, “Clients”) and to safeguarding their non-public personal information. The following information is provided to help you understand what personal information BlackRock collects, how we protect that information and why in certain cases we share such information with select parties.
If you are located in a jurisdiction where specific laws, rules or regulations require BlackRock to provide you with additional or different privacy-related rights beyond what is set forth below, then BlackRock will comply with those specific laws, rules or regulations.
BlackRock obtains or verifies personal non-public information from and about you from different sources, including the following: (i) information we receive from you or, if applicable, your financial intermediary, on applications, forms or other documents; (ii) information about your transactions with us, our affiliates, or others; (iii) information we receive from a consumer reporting agency; and (iv) from visits to our websites.
BlackRock does not sell or disclose to non-affiliated third parties any non- public personal information about its Clients, except as permitted by law or as is necessary to respond to regulatory requests or to service Client accounts. These non-affiliated third parties are required to protect the confidentiality and security of this information and to use it only for its intended purpose.
We may share information with our affiliates to service your account or to provide you with information about other BlackRock products or services that may be of interest to you. In addition, BlackRock restricts access to non-public personal information about its Clients to those BlackRock employees with a legitimate business need for the information. BlackRock maintains physical, electronic and procedural safeguards that are designed to protect the non-public personal information of its Clients, including procedures relating to the proper storage and disposal of such information.
| SEMI-ANNUAL REPORT | FEBRUARY 28, 2014 | 77
|
[THIS PAGE INTENTIONALLY LEFT BLANK]
[THIS PAGE INTENTIONALLY LEFT BLANK]
This report is transmitted to shareholders only. It is not a prospectus. Past performance results shown in this report should not be considered a representation of future performance. The Funds have leveraged their Common Shares, which creates risks for Common Shareholders, including the likelihood of greater volatility of net asset value and market price of Common Shares, and the risk that fluctuations in short-term interest rates may reduce the Common Shares’ yield. Statements and other information herein are as dated and are subject to change.
CEFT-BK3-2/14-SAR | | | | | 
| |
Item 2 – Code of Ethics – Not Applicable to this semi-annual report
Item 3 – Audit Committee Financial Expert – Not Applicable to this semi-annual report
Item 4 – Principal Accountant Fees and Services – Not Applicable to this semi-annual report
Item 5 – Audit Committee of Listed Registrants – Not Applicable to this semi-annual report
Item 6 – Investments
(a) The registrant’s Schedule of Investments is included as part of the Report to Stockholders filed under Item 1 of this Form.
(b) Not Applicable due to no such divestments during the semi-annual period covered since the previous Form N-CSR filing.
Item 7 – Disclosure of Proxy Voting Policies and Procedures for Closed-End Management Investment Companies – Not Applicable to this semi-annual report
Item 8 – Portfolio Managers of Closed-End Management Investment Companies
(a) Not Applicable to this semi-annual report
(b) As of the date of this filing, there have been no changes in any of the portfolio managers identified in the most recent annual report on Form N-CSR.
Item 9 – Purchases of Equity Securities by Closed-End Management Investment Company and Affiliated Purchasers – Not Applicable
Item 10 – Submission of Matters to a Vote of Security Holders – There have been no material changes to these procedures.
Item 11 – Controls and Procedures
(a) – The registrant’s principal executive and principal financial officers, or persons performing similar functions, have concluded that the registrant’s disclosure controls and procedures (as defined in Rule 30a-3(c) under the Investment Company Act of 1940, as amended (the “1940 Act”)) are effective as of a date within 90 days of the filing of this report based on the evaluation of these controls and procedures required by Rule 30a-3(b) under the 1940 Act and Rule 13a-15(b) under the Securities Exchange Act of 1934, as amended.
(b) – There were no changes in the registrant’s internal control over financial reporting (as defined in Rule 30a-3(d) under the 1940 Act) that occurred during the second fiscal quarter of the period covered by this report that have materially affected, or are reasonably likely to materially affect, the registrant’s internal control over financial reporting.
Item 12 – Exhibits attached hereto
(a)(1) – Code of Ethics – Not Applicable to this semi-annual report
(a)(2) – Certifications – Attached hereto
(a)(3) – Not Applicable
(b) – Certifications – Attached hereto
Pursuant to the requirements of the Securities Exchange Act of 1934 and the Investment Company Act of 1940, the registrant has duly caused this report to be signed on its behalf by the undersigned, thereunto duly authorized.
BlackRock Defined Opportunity Credit Trust
By: /s/ John M. Perlowski
John M. Perlowski
Chief Executive Officer (principal executive officer) of
BlackRock Defined Opportunity Credit Trust
Date: May 1, 2014
Pursuant to the requirements of the Securities Exchange Act of 1934 and the Investment Company Act of 1940, this report has been signed below by the following persons on behalf of the registrant and in the capacities and on the dates indicated.
By: /s/ John M. Perlowski
John M. Perlowski
Chief Executive Officer (principal executive officer) of
BlackRock Defined Opportunity Credit Trust
Date: May 1, 2014
By: /s/ Neal J. Andrews
Neal J. Andrews
Chief Financial Officer (principal financial officer) of
BlackRock Defined Opportunity Credit Trust
Date: May 1, 2014