
| Class | Costs of a $10,000 investment | Costs paid as a percentage of a $10,000 investment |
| Class 1 | $ 42 | 0.82 % |
| Fund net assets | $ 249,438,164 |
| Total number of portfolio holdings | 49 |
| Portfolio turnover for the reporting period | 2% |
| CACI International, Inc., Class A | 3.3% |
| AMETEK, Inc. | 3.2% |
| Trane Technologies PLC | 3.2% |
| Ingersoll Rand, Inc. | 3.1% |
| Marathon Petroleum Corp. | 3.0% |
| ITT, Inc. | 3.0% |
| Corning, Inc. | 2.7% |
| Reinsurance Group of America, Inc. | 2.6% |
| Popular, Inc. | 2.4% |
| Lamar Advertising Co., Class A | 2.3% |


| Class | Costs of a $10,000 investment | Costs paid as a percentage of a $10,000 investment |
| Class 2 | $ 55 | 1.07 % |
| Fund net assets | $ 249,438,164 |
| Total number of portfolio holdings | 49 |
| Portfolio turnover for the reporting period | 2% |
| CACI International, Inc., Class A | 3.3% |
| AMETEK, Inc. | 3.2% |
| Trane Technologies PLC | 3.2% |
| Ingersoll Rand, Inc. | 3.1% |
| Marathon Petroleum Corp. | 3.0% |
| ITT, Inc. | 3.0% |
| Corning, Inc. | 2.7% |
| Reinsurance Group of America, Inc. | 2.6% |
| Popular, Inc. | 2.4% |
| Lamar Advertising Co., Class A | 2.3% |


| Class | Costs of a $10,000 investment | Costs paid as a percentage of a $10,000 investment |
| Class 3 | $ 48 | 0.94 % |
| Fund net assets | $ 249,438,164 |
| Total number of portfolio holdings | 49 |
| Portfolio turnover for the reporting period | 2% |
| CACI International, Inc., Class A | 3.3% |
| AMETEK, Inc. | 3.2% |
| Trane Technologies PLC | 3.2% |
| Ingersoll Rand, Inc. | 3.1% |
| Marathon Petroleum Corp. | 3.0% |
| ITT, Inc. | 3.0% |
| Corning, Inc. | 2.7% |
| Reinsurance Group of America, Inc. | 2.6% |
| Popular, Inc. | 2.4% |
| Lamar Advertising Co., Class A | 2.3% |

Item 2. Code of Ethics.
Not applicable.
Item 3. Audit Committee Financial Expert.
Not applicable.
Item 4. Principal Accountant Fees and Services.
Not applicable.
Item 5. Audit Committee of Listed Registrants.
Not applicable.
Item 6. Investments.
(a) The registrant’s “Schedule I – Investments in securities of unaffiliated issuers” (as set forth in 17 CFR 210.12-12) is included in Item 7 of this Form N-CSR.
(b) Not applicable.
Item 7. Financial Statements and Financial Highlights for Open-End Management Investment Companies.

Not FDIC or NCUA Insured | No Financial Institution Guarantee | May Lose Value |
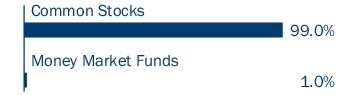
Common Stocks 99.0% | ||
Issuer | Shares | Value ($) |
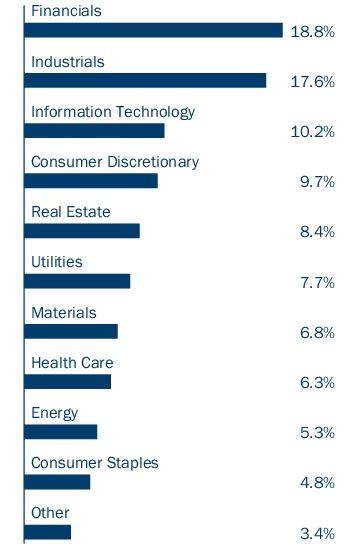
Communication Services 3.4% | ||
Entertainment 1.7% | ||
Take-Two Interactive Software, Inc.(a) | 27,381 | 4,257,472 |
Media 1.7% | ||
Nexstar Media Group, Inc., Class A | 25,721 | 4,269,943 |
Total Communication Services | 8,527,415 | |
Consumer Discretionary 9.7% | ||
Hotels, Restaurants & Leisure 2.2% | ||
Hyatt Hotels Corp., Class A | 35,889 | 5,452,257 |
Household Durables 1.9% | ||
D.R. Horton, Inc. | 34,012 | 4,793,311 |
Leisure Products 1.8% | ||
Hasbro, Inc. | 76,707 | 4,487,359 |
Specialty Retail 3.8% | ||
Burlington Stores, Inc.(a) | 21,217 | 5,092,080 |
O’Reilly Automotive, Inc.(a) | 4,177 | 4,411,163 |
Total | 9,503,243 | |
Total Consumer Discretionary | 24,236,170 | |
Consumer Staples 4.8% | ||
Consumer Staples Distribution & Retail 3.3% | ||
Dollar Tree, Inc.(a) | 33,356 | 3,561,420 |
U.S. Foods Holding Corp.(a) | 89,487 | 4,741,021 |
Total | 8,302,441 | |
Food Products 1.5% | ||
Tyson Foods, Inc., Class A | 63,234 | 3,613,191 |
Total Consumer Staples | 11,915,632 | |
Energy 5.3% | ||
Oil, Gas & Consumable Fuels 5.3% | ||
Devon Energy Corp. | 121,905 | 5,778,297 |
Marathon Petroleum Corp. | 43,168 | 7,488,785 |
Total | 13,267,082 | |
Total Energy | 13,267,082 | |
Common Stocks (continued) | ||
Issuer | Shares | Value ($) |
Financials 18.8% | ||
Banks 4.6% | ||
Popular, Inc. | 68,082 | 6,020,491 |
Regions Financial Corp. | 264,582 | 5,302,224 |
Total | 11,322,715 | |
Capital Markets 2.0% | ||
Carlyle Group, Inc. (The) | 125,347 | 5,032,682 |
Consumer Finance 2.1% | ||
Discover Financial Services | 39,366 | 5,149,467 |
Financial Services 3.9% | ||
Global Payments, Inc. | 48,255 | 4,666,258 |
Voya Financial, Inc. | 72,191 | 5,136,390 |
Total | 9,802,648 | |
Insurance 6.2% | ||
Hanover Insurance Group, Inc. (The) | 42,786 | 5,367,076 |
Kemper Corp. | 62,424 | 3,703,616 |
Reinsurance Group of America, Inc. | 31,187 | 6,401,755 |
Total | 15,472,447 | |
Total Financials | 46,779,959 | |
Health Care 6.3% | ||
Health Care Equipment & Supplies 1.6% | ||
Zimmer Biomet Holdings, Inc. | 37,290 | 4,047,084 |
Health Care Providers & Services 3.1% | ||
Centene Corp.(a) | 54,827 | 3,635,030 |
Quest Diagnostics, Inc. | 30,388 | 4,159,509 |
Total | 7,794,539 | |
Life Sciences Tools & Services 1.6% | ||
Agilent Technologies, Inc. | 29,628 | 3,840,678 |
Total Health Care | 15,682,301 | |
Industrials 17.6% | ||
Building Products 3.2% | ||
Trane Technologies PLC | 24,133 | 7,938,068 |
Electrical Equipment 3.2% | ||
AMETEK, Inc. | 48,189 | 8,033,588 |
Common Stocks (continued) | ||
Issuer | Shares | Value ($) |
Machinery 6.1% | ||
Ingersoll Rand, Inc. | 83,981 | 7,628,834 |
ITT, Inc. | 57,852 | 7,473,321 |
Total | 15,102,155 | |
Passenger Airlines 1.8% | ||
Southwest Airlines Co. | 158,610 | 4,537,832 |
Professional Services 3.3% | ||
CACI International, Inc., Class A(a) | 19,162 | 8,242,151 |
Total Industrials | 43,853,794 | |
Information Technology 10.2% | ||
Communications Equipment 2.3% | ||
Motorola Solutions, Inc. | 14,704 | 5,676,479 |
Electronic Equipment, Instruments & Components 2.7% | ||
Corning, Inc. | 175,635 | 6,823,420 |
Semiconductors & Semiconductor Equipment 5.2% | ||
Marvell Technology, Inc. | 65,894 | 4,605,991 |
ON Semiconductor Corp.(a) | 64,043 | 4,390,148 |
Teradyne, Inc. | 26,943 | 3,995,377 |
Total | 12,991,516 | |
Total Information Technology | 25,491,415 | |
Materials 6.8% | ||
Chemicals 2.9% | ||
Chemours Co. LLC (The) | 178,430 | 4,027,165 |
FMC Corp. | 52,741 | 3,035,245 |
Total | 7,062,410 | |
Metals & Mining 3.9% | ||
ATI, Inc.(a) | 90,524 | 5,019,556 |
Freeport-McMoRan, Inc. | 98,289 | 4,776,845 |
Total | 9,796,401 | |
Total Materials | 16,858,811 | |
Real Estate 8.4% | ||
Health Care REITs 2.1% | ||
Welltower, Inc. | 51,707 | 5,390,455 |
Common Stocks (continued) | ||
Issuer | Shares | Value ($) |
Industrial REITs 2.0% | ||
First Industrial Realty Trust, Inc. | 105,945 | 5,033,447 |
Specialized REITs 4.3% | ||
Gaming and Leisure Properties, Inc. | 106,618 | 4,820,200 |
Lamar Advertising Co., Class A | 48,871 | 5,841,550 |
Total | 10,661,750 | |
Total Real Estate | 21,085,652 | |
Utilities 7.7% | ||
Electric Utilities 4.0% | ||
Entergy Corp. | 54,396 | 5,820,372 |
PG&E Corp. | 242,496 | 4,233,980 |
Total | 10,054,352 | |
Independent Power and Renewable Electricity Producers 1.7% | ||
AES Corp. (The) | 238,809 | 4,195,874 |
Multi-Utilities 2.0% | ||
Ameren Corp. | 68,897 | 4,899,266 |
Total Utilities | 19,149,492 | |
Total Common Stocks (Cost $183,054,085) | 246,847,723 | |
Money Market Funds 1.0% | ||
Shares | Value ($) | |
Columbia Short-Term Cash Fund, 5.547%(b),(c) | 2,567,883 | 2,567,112 |
Total Money Market Funds (Cost $2,567,112) | 2,567,112 | |
Total Investments in Securities (Cost: $185,621,197) | 249,414,835 | |
Other Assets & Liabilities, Net | 23,329 | |
Net Assets | 249,438,164 | |
(a) | Non-income producing investment. |
(b) | The rate shown is the seven-day current annualized yield at June 30, 2024. |
(c) | As defined in the Investment Company Act of 1940, as amended, an affiliated company is one in which the Fund owns 5% or more of the company’s outstanding voting securities, or a company which is under common ownership or control with the Fund. The value of the holdings and transactions in these affiliated companies during the period ended June 30, 2024 are as follows: |
Affiliated issuers | Beginning of period($) | Purchases($) | Sales($) | Net change in unrealized appreciation (depreciation)($) | End of period($) | Realized gain (loss)($) | Dividends($) | End of period shares |
Columbia Short-Term Cash Fund, 5.547% | ||||||||
645,537 | 29,108,586 | (27,186,946 ) | (65 ) | 2,567,112 | (12 ) | 49,243 | 2,567,883 | |
Level 1 ($) | Level 2 ($) | Level 3 ($) | Total ($) | |
Investments in Securities | ||||
Common Stocks | ||||
Communication Services | 8,527,415 | — | — | 8,527,415 |
Consumer Discretionary | 24,236,170 | — | — | 24,236,170 |
Consumer Staples | 11,915,632 | — | — | 11,915,632 |
Energy | 13,267,082 | — | — | 13,267,082 |
Financials | 46,779,959 | — | — | 46,779,959 |
Health Care | 15,682,301 | — | — | 15,682,301 |
Industrials | 43,853,794 | — | — | 43,853,794 |
Level 1 ($) | Level 2 ($) | Level 3 ($) | Total ($) | |
Information Technology | 25,491,415 | — | — | 25,491,415 |
Materials | 16,858,811 | — | — | 16,858,811 |
Real Estate | 21,085,652 | — | — | 21,085,652 |
Utilities | 19,149,492 | — | — | 19,149,492 |
Total Common Stocks | 246,847,723 | — | — | 246,847,723 |
Money Market Funds | 2,567,112 | — | — | 2,567,112 |
Total Investments in Securities | 249,414,835 | — | — | 249,414,835 |
Assets | |
Investments in securities, at value | |
Unaffiliated issuers (cost $183,054,085) | $246,847,723 |
Affiliated issuers (cost $2,567,112) | 2,567,112 |
Receivable for: | |
Capital shares sold | 55,902 |
Dividends | 253,120 |
Expense reimbursement due from Investment Manager | 519 |
Prepaid expenses | 3,345 |
Total assets | 249,727,721 |
Liabilities | |
Payable for: | |
Capital shares redeemed | 158,135 |
Management services fees | 5,568 |
Distribution and/or service fees | 575 |
Service fees | 8,233 |
Compensation of chief compliance officer | 23 |
Accounting services fees | 15,328 |
Compensation of board members | 1,604 |
Other expenses | 8,676 |
Deferred compensation of board members | 91,415 |
Total liabilities | 289,557 |
Net assets applicable to outstanding capital stock | $249,438,164 |
Represented by | |
Trust capital | $249,438,164 |
Total - representing net assets applicable to outstanding capital stock | $249,438,164 |
Class 1 | |
Net assets | $134,080,168 |
Shares outstanding | 3,418,026 |
Net asset value per share | $39.23 |
Class 2 | |
Net assets | $53,742,678 |
Shares outstanding | 1,415,715 |
Net asset value per share | $37.96 |
Class 3 | |
Net assets | $61,615,318 |
Shares outstanding | 1,597,012 |
Net asset value per share | $38.58 |
Net investment income | |
Income: | |
Dividends — unaffiliated issuers | $2,458,646 |
Dividends — affiliated issuers | 49,243 |
Foreign taxes withheld | (13,039 ) |
Total income | 2,494,850 |
Expenses: | |
Management services fees | 1,051,553 |
Distribution and/or service fees | |
Class 2 | 66,293 |
Class 3 | 39,036 |
Service fees | 46,543 |
Custodian fees | 2,790 |
Printing and postage fees | 11,179 |
Accounting services fees | 15,328 |
Legal fees | 6,989 |
Compensation of chief compliance officer | 24 |
Compensation of board members | 6,884 |
Deferred compensation of board members | 12,478 |
Other | 4,918 |
Total expenses | 1,264,015 |
Fees waived or expenses reimbursed by Investment Manager and its affiliates | (106,614 ) |
Total net expenses | 1,157,401 |
Net investment income | 1,337,449 |
Realized and unrealized gain (loss) — net | |
Net realized gain (loss) on: | |
Investments — unaffiliated issuers | 16,454,271 |
Investments — affiliated issuers | (12 ) |
Net realized gain | 16,454,259 |
Net change in unrealized appreciation (depreciation) on: | |
Investments — unaffiliated issuers | (1,689,674 ) |
Investments — affiliated issuers | (65 ) |
Net change in unrealized appreciation (depreciation) | (1,689,739 ) |
Net realized and unrealized gain | 14,764,520 |
Net increase in net assets resulting from operations | $16,101,969 |
Six Months Ended June 30, 2024 (Unaudited) | Year Ended December 31, 2023 | |
Operations | ||
Net investment income | $1,337,449 | $2,914,750 |
Net realized gain | 16,454,259 | 9,805,866 |
Net change in unrealized appreciation (depreciation) | (1,689,739 ) | 14,685,992 |
Net increase in net assets resulting from operations | 16,101,969 | 27,406,608 |
Decrease in net assets from capital stock activity | (37,537,080 ) | (36,737,727 ) |
Total decrease in net assets | (21,435,111 ) | (9,331,119 ) |
Net assets at beginning of period | 270,873,275 | 280,204,394 |
Net assets at end of period | $249,438,164 | $270,873,275 |
Six Months Ended | Year Ended | |||
June 30, 2024 (Unaudited) | December 31, 2023 | |||
Shares | Dollars ($) | Shares | Dollars ($) | |
Capital stock activity | ||||
Class 1 | ||||
Shares sold | 26,047 | 997,142 | 85,975 | 2,872,684 |
Shares redeemed | (853,907 ) | (32,316,568 ) | (824,774 ) | (29,559,785 ) |
Net decrease | (827,860 ) | (31,319,426 ) | (738,799 ) | (26,687,101 ) |
Class 2 | ||||
Shares sold | 51,983 | 1,946,930 | 141,642 | 4,606,760 |
Shares redeemed | (85,014 ) | (3,161,832 ) | (189,724 ) | (6,269,099 ) |
Net decrease | (33,031 ) | (1,214,902 ) | (48,082 ) | (1,662,339 ) |
Class 3 | ||||
Shares sold | 1,919 | 72,523 | 21,753 | 731,789 |
Shares redeemed | (134,427 ) | (5,075,275 ) | (271,920 ) | (9,120,076 ) |
Net decrease | (132,508 ) | (5,002,752 ) | (250,167 ) | (8,388,287 ) |
Total net decrease | (993,399 ) | (37,537,080 ) | (1,037,048 ) | (36,737,727 ) |
Net asset value, beginning of period | Net investment income | Net realized and unrealized gain (loss) | Total from investment operations | |
Class 1 | ||||
Six Months Ended 6/30/2024 (Unaudited) | $36.84 | 0.21 | 2.18 | 2.39 |
Year Ended 12/31/2023 | $33.40 | 0.39 | 3.05 | 3.44 |
Year Ended 12/31/2022 | $36.88 | 0.30 | (3.78 ) | (3.48 ) |
Year Ended 12/31/2021 | $27.87 | 0.22 | 8.79 | 9.01 |
Year Ended 12/31/2020 | $25.93 | 0.23 | 1.71 | 1.94 |
Year Ended 12/31/2019 | $19.70 | 0.29 | 5.94 | 6.23 |
Class 2 | ||||
Six Months Ended 6/30/2024 (Unaudited) | $35.70 | 0.17 | 2.09 | 2.26 |
Year Ended 12/31/2023 | $32.44 | 0.29 | 2.97 | 3.26 |
Year Ended 12/31/2022 | $35.91 | 0.22 | (3.69 ) | (3.47 ) |
Year Ended 12/31/2021 | $27.21 | 0.14 | 8.56 | 8.70 |
Year Ended 12/31/2020 | $25.37 | 0.17 | 1.67 | 1.84 |
Year Ended 12/31/2019 | $19.33 | 0.22 | 5.82 | 6.04 |
Class 3 | ||||
Six Months Ended 6/30/2024 (Unaudited) | $36.26 | 0.19 | 2.13 | 2.32 |
Year Ended 12/31/2023 | $32.91 | 0.34 | 3.01 | 3.35 |
Year Ended 12/31/2022 | $36.39 | 0.26 | (3.74 ) | (3.48 ) |
Year Ended 12/31/2021 | $27.54 | 0.18 | 8.67 | 8.85 |
Year Ended 12/31/2020 | $25.64 | 0.20 | 1.70 | 1.90 |
Year Ended 12/31/2019 | $19.51 | 0.25 | 5.88 | 6.13 |
Notes to Financial Highlights | |
(a) | In addition to the fees and expenses that the Fund bears directly, the Fund indirectly bears a pro rata share of the fees and expenses of any other funds in which it invests. Such indirect expenses are not included in the Fund’s reported expense ratios. |
(b) | Total net expenses include the impact of certain fee waivers/expense reimbursements made by the Investment Manager and certain of its affiliates, if applicable. |
(c) | Ratios include interfund lending expense which is less than 0.01%. |
Net asset value, end of period | Total return | Total gross expense ratio to average net assets(a) | Total net expense ratio to average net assets(a),(b) | Net investment income ratio to average net assets | Portfolio turnover | Net assets, end of period (000’s) | |
Class 1 | |||||||
Six Months Ended 6/30/2024 (Unaudited) | $39.23 | 6.49% | 0.90% | 0.82% | 1.11% | 2% | $134,080 |
Year Ended 12/31/2023 | $36.84 | 10.30% | 0.89% (c) | 0.82% (c) | 1.14% | 17% | $156,439 |
Year Ended 12/31/2022 | $33.40 | (9.44% ) | 0.88% | 0.83% | 0.89% | 24% | $166,488 |
Year Ended 12/31/2021 | $36.88 | 32.33% | 0.88% | 0.82% | 0.68% | 32% | $222,591 |
Year Ended 12/31/2020 | $27.87 | 7.48% | 0.88% | 0.81% | 1.03% | 40% | $237,299 |
Year Ended 12/31/2019 | $25.93 | 31.62% | 0.88% | 0.82% | 1.22% | 31% | $220,919 |
Class 2 | |||||||
Six Months Ended 6/30/2024 (Unaudited) | $37.96 | 6.33% | 1.15% | 1.07% | 0.89% | 2% | $53,743 |
Year Ended 12/31/2023 | $35.70 | 10.05% | 1.14% (c) | 1.07% (c) | 0.89% | 17% | $51,720 |
Year Ended 12/31/2022 | $32.44 | (9.66% ) | 1.13% | 1.08% | 0.66% | 24% | $48,561 |
Year Ended 12/31/2021 | $35.91 | 31.97% | 1.13% | 1.07% | 0.45% | 32% | $49,498 |
Year Ended 12/31/2020 | $27.21 | 7.25% | 1.13% | 1.06% | 0.78% | 40% | $34,497 |
Year Ended 12/31/2019 | $25.37 | 31.25% | 1.13% | 1.07% | 0.97% | 31% | $34,239 |
Class 3 | |||||||
Six Months Ended 6/30/2024 (Unaudited) | $38.58 | 6.40% | 1.03% | 0.94% | 1.01% | 2% | $61,615 |
Year Ended 12/31/2023 | $36.26 | 10.18% | 1.02% (c) | 0.95% (c) | 1.01% | 17% | $62,714 |
Year Ended 12/31/2022 | $32.91 | (9.56% ) | 1.01% | 0.95% | 0.78% | 24% | $65,155 |
Year Ended 12/31/2021 | $36.39 | 32.14% | 1.01% | 0.95% | 0.57% | 32% | $73,390 |
Year Ended 12/31/2020 | $27.54 | 7.41% | 1.01% | 0.94% | 0.91% | 40% | $59,101 |
Year Ended 12/31/2019 | $25.64 | 31.42% | 1.01% | 0.95% | 1.08% | 31% | $68,354 |
Contractual expense cap July 1, 2024 through April 30, 2025 (%) | Voluntary expense cap May 1, 2024 through June 30, 2024 (%) | Contractual expense cap prior to May 1, 2024 (%) | |
Class 1 | 0.82 | 0.82 | 0.82 |
Class 2 | 1.07 | 1.07 | 1.07 |
Class 3 | 0.945 | 0.945 | 0.945 |

Item 8. Changes in and Disagreements with Accountants for Open-End Management Investment Companies.
Not applicable.
Item 9. Proxy Disclosures for Open-End Management Investment Companies.
Not applicable.
Item 10. Remuneration Paid to Directors, Officers, and Others of Open-End Management Investment Companies.
Remuneration Paid to Directors, Officers, and Others of Open-End Management Investment Companies is included in Item 7 of this Form N-CSR.
Item 11. Statement Regarding Basis for Approval of Investment Advisory Contract.
Statement regarding basis for approval of Investment Advisory Contract is included in Item 7 of this Form N-CSR.
Item 12. Disclosure of Proxy Voting Policies and Procedures for Closed-End Management Investment Companies.
Not applicable.
Item 13. Portfolio Managers of Closed-End Management Investment Companies.
Not applicable.
Item 14. Purchases of Equity Securities by Closed-End Management Investment Company and Affiliated Purchasers.
Not applicable.
Item 15. Submission of Matters to a Vote of Security Holders.
There were no material changes to the procedures by which shareholders may recommend nominees to the registrant’s board of directors implemented since the registrant last provided disclosure as to such procedures in response to the requirements of Item 407(c)(2)(iv) of Regulation S-K or Item 15 of Form N-CSR.
Item 16. Controls and Procedures.
(a) The registrant’s principal executive officer and principal financial officer, based on their evaluation of the registrant’s disclosure controls and procedures as of a date within 90 days of the filing of this report, have concluded that such controls and procedures are adequately designed to ensure that information required to be disclosed by the registrant in Form N-CSR is accumulated and communicated to the registrant’s management, including the principal executive officer and principal financial officer, or persons performing similar functions, as appropriate to allow timely decisions regarding required disclosure.
(b) There was no change in the registrant’s internal control over financial reporting that occurred during the period covered by this report that has materially affected, or is reasonably likely to materially affect, the registrant’s internal control over financial reporting.
Item 17. Disclosure of Securities Lending Activities for Closed-End Management Investment Companies.
Not applicable.
Item 18. Recovery of Erroneously Awarded Compensation.
Not applicable.
Item 19. Exhibits.
(a)(1) Not applicable.
SIGNATURES
Pursuant to the requirements of the Securities Exchange Act of 1934 and the Investment Company Act of 1940, the registrant has duly caused this report to be signed on its behalf by the undersigned, thereunto duly authorized.
| (registrant) | Columbia Funds Variable Series Trust II |
| By (Signature and Title) | /s/ Daniel J. Beckman |
| Daniel J. Beckman, President and Principal Executive Officer | |
| Date | August 22, 2024 |
Pursuant to the requirements of the Securities Exchange Act of 1934 and the Investment Company Act of 1940, this report has been signed below by the following persons on behalf of the registrant and in the capacities and on the dates indicated.
| By (Signature and Title) | /s/ Daniel J. Beckman |
| Daniel J. Beckman, President and Principal Executive Officer | |
| Date | August 22, 2024 |
| By (Signature and Title) | /s/ Michael G. Clarke |
| Michael G. Clarke, Chief Financial Officer, | |
| Principal Financial Officer and Senior Vice President | |
| Date | August 22, 2024 |
| By (Signature and Title) | /s/ Charles H. Chiesa |
| Charles H. Chiesa, Treasurer, Chief Accounting | |
| Officer and Principal Financial Officer | |
| Date | August 22, 2024 |