UNITED STATES
SECURITIES AND EXCHANGE COMMISSION
Washington, D.C. 20549
FORM N-CSR
CERTIFIED SHAREHOLDER REPORT OF
REGISTERED MANAGEMENT INVESTMENT COMPANIES
| Investment Company Act file number: | 811-22132 | |
| Exact name of registrant as specified in charter: | abrdn Funds | |
| Address of principal executive offices: | 1900 Market Street, Suite 200 | |
| Philadelphia, PA 19103 | ||
| Name and address of agent for service: | Michael Marsico | |
| abrdn Inc. | ||
| 1900 Market Street, Suite 200 | ||
| Philadelphia, PA 19103 | ||
| Registrant’s telephone number, including area code: | 866-667-9231 | |
| Date of fiscal year end: | October 31 | |
| Date of reporting period: | April 30, 2023 |
Item 1. Reports to Shareholders.
(a) A copy of the report transmitted to shareholders pursuant to Rule 30e-1 under the Investment Company Act of 1940 (the “1940 Act”) is filed herewith.
Equity Series
| Class A - GOPAX ■ | Class C - GOPCX■ | Class R - GOPRX■ | Institutional Class - GOPIX■ | Institutional Service Class - GOPSX |
| Class A - ADAVX ■ | Institutional Class - ADVDX |
| Class A - GLLAX ■ | Class C - GLLCX■ | Class R - GWLRX■ | Institutional Class - GWLIX■ | Institutional Service Class - GLLSX |
| Class A - GEGAX ■ | Class C - GEGCX■ | Class R - GEMRX■ | Institutional Class - ABEMX■ | Institutional Service Class - AEMSX |
| Class A - GIGAX ■ | Class C - GIGCX■ | Class R - GIRRX■ | Institutional Class - GIGIX■ | Institutional Service Class - GIGSX |
| Class A - JETAX ■ | Institutional Class - JETIX |
| Class A - AIAFX ■ | Institutional Class - AIFRX |
| Class A - WVCCX ■ | Class C - CPVCX■ | Class R - WPVAX■ | Institutional Class - ABNIX |
| Class A - BJBIX ■ | Institutional Class - JIEIX |
| Class A - AIAGX ■ | Institutional Class - AIGYX |
| Class A - GSXAX ■ | Class C - GSXCX■ | Class R - GNSRX■ | Institutional Class - GSCIX■ | Institutional Service Class - GSXIX |
| Class A - GXXAX ■ | Class C - GXXCX■ | Institutional Class - GGLIX■ | Institutional Service Class - GXXIX |
| Class A - MLSAX ■ | Class R - GLSRX■ | Institutional Class - GGUIX■ | Institutional Service Class - AELSX |

| Page 1 | |
| Page 4 | |
| Page 9 | |
| Page 12 | |
| Page 16 | |
| Page 20 | |
| Page 24 | |
| Page 28 | |
| Page 32 | |
| Page 36 | |
| Page 40 | |
| Page 43 | |
| Page 46 | |
| Page 49 | |
| Page 52 | |
| Page 104 | |
| Page 131 | |
| Page 133 | |
| Page 135 |
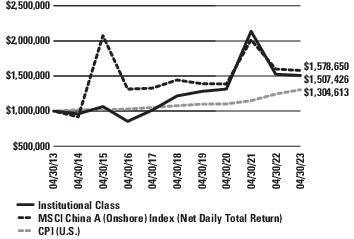
| Average Annual Total Return1 (For the periods ended April 30, 2023) | Six Month2 | 1 Yr. | 5 Yr. | 10 Yr. | |
Class A | w/o SC | 17.59% | (1.47%) | 4.04% | 3.87% |
| w/SC3 | 10.82% | (7.15%) | 2.81% | 3.25% | |
Class C | w/o SC | 17.22% | (2.12%) | 3.34% | 3.15% |
| w/SC4 | 16.22% | (3.10%) | 3.34% | 3.15% | |
Class R5 | w/o SC | 17.43% | (1.75%) | 3.71% | 3.51% |
Institutional Service Class5 | w/o SC | 17.77% | (1.24%) | 4.28% | 4.11% |
Institutional Class5 | w/o SC | 17.84% | (1.13%) | 4.39% | 4.19% |
| 1 | The Fund changed its investment strategies effective June 13, 2019. Performance information for periods prior to June 13, 2019 does not reflect the current investment strategy. In connection with the change in investment strategy, the Fund changed its name from Aberdeen China Opportunities Fund to Aberdeen China A Share Equity Fund. Please consult the Fund’s prospectus for more detail. |
| 2 | Not annualized |
| 3 | A 5.75% front-end sales charge was deducted. |
| 4 | A 1.00% contingent deferred sales charge (CDSC) was deducted from the one year return because it is charged when Class C shares are sold within the first year after purchase. |
| 5 | Not subject to any sales charges. |
| 2023 Semi-Annual Report | 1 |
| Asset Allocation | |
| Common Stocks | 94.9% |
| Short-Term Investment | 3.2% |
| Exchange-Traded Funds | 2.0% |
| Liabilities in Excess of Other Assets | (0.1%) |
| 100.0% |
| Sectors | |
| Consumer Staples | 19.0% |
| Industrials | 18.0% |
| Financials | 16.1% |
| Information Technology | 15.8% |
| Health Care | 11.5% |
| Consumer Discretionary | 9.6% |
| Materials | 3.2% |
| Exchange-Traded Funds | 2.0% |
| Real Estate | 1.7% |
| Energy | -% |
| Short-Term Investment | 3.2% |
| Liabilities in Excess of Other Assets | (0.1%) |
| 100.0% |
| Amounts listed as “–” are 0% or round to 0%. |
| Top Ten Holdings | |
| Kweichow Moutai Co. Ltd. | 7.7% |
| Contemporary Amperex Technology Co. Ltd. | 4.6% |
| China Merchants Bank Co. Ltd. | 4.5% |
| Ping An Insurance Group Co. of China Ltd. | 3.9% |
| Shenzhen Mindray Bio-Medical Electronics Co. Ltd. | 3.6% |
| Aier Eye Hospital Group Co. Ltd. | 3.4% |
| China Tourism Group Duty Free Corp. Ltd. | 3.3% |
| Glodon Co. Ltd. | 3.3% |
| Centre Testing International Group Co. Ltd. | 3.1% |
| Midea Group Co. Ltd. | 2.9% |
| Countries | |
| China | 94.9% |
| United States | 2.0% |
| Short-Term Investment | 3.2% |
| Liabilities in Excess of Other Assets | (0.1%) |
| 100.0% |
| 2 | 2023 Semi-Annual Report |
| Shares | Value | ||
| COMMON STOCKS—94.9% | |||
| CHINA—94.9% | |||
| Consumer Discretionary—9.6% | |||
| China Tourism Group Duty Free Corp. Ltd., A Shares(a)(b)(c) | 12,300 | $ 263,113 | |
| China Tourism Group Duty Free Corp. Ltd., A Shares (Stock Connect)(b) | 56,295 | 1,313,618 | |
| Fuyao Glass Industry Group Co. Ltd., A Shares(b) | 216,741 | 1,063,898 | |
| Midea Group Co. Ltd., A Shares (Stock Connect)(b) | 141,242 | 1,159,465 | |
| 3,800,094 | |||
| Consumer Staples—19.0% | |||
| By-health Co. Ltd., A Shares(b) | 172,488 | 594,781 | |
| Chacha Food Co. Ltd., A Shares(b) | 83,100 | 520,277 | |
| Foshan Haitian Flavouring & Food Co. Ltd., A Shares(b)(c) | 96,193 | 982,601 | |
| Inner Mongolia Yili Industrial Group Co. Ltd., A Shares(b) | 185,400 | 791,810 | |
| Kweichow Moutai Co. Ltd., A Shares (Stock Connect)(b) | 11,963 | 3,045,801 | |
| Proya Cosmetics Co. Ltd., A Shares(b) | 33,367 | 810,043 | |
| Wuliangye Yibin Co. Ltd., A Shares(b) | 29,937 | 731,534 | |
| 7,476,847 | |||
| Energy—0.0% | |||
| G3 Exploration Ltd.(c)(d)(e) | 53,000 | – | |
| Financials—16.1% | |||
| Bank of Ningbo Co. Ltd., A Shares(b) | 288,516 | 1,142,649 | |
| China International Capital Corp. Ltd., A Shares(b) | 100,600 | 613,309 | |
| China International Capital Corp. Ltd., H Shares(a) | 181,200 | 380,749 | |
| China Merchants Bank Co. Ltd., A Shares(b) | 367,232 | 1,787,588 | |
| Ping An Bank Co. Ltd., A Shares(b) | 487,800 | 885,865 | |
| Ping An Insurance Group Co. of China Ltd., A Shares(b) | 207,837 | 1,558,663 | |
| 6,368,823 | |||
| Health Care—11.5% | |||
| Aier Eye Hospital Group Co. Ltd., A Shares(b) | 318,711 | 1,357,043 | |
| Hangzhou Tigermed Consulting Co. Ltd., A Shares(b) | 68,767 | 905,118 | |
| Hangzhou Tigermed Consulting Co. Ltd., H Shares(a) | 14,800 | 123,287 | |
| Jiangsu Hengrui Pharmaceuticals Co. Ltd., A Shares(b) | 105,555 | 742,704 | |
| Shenzhen Mindray Bio-Medical Electronics Co. Ltd., A Shares (Stock Connect)(b) | 31,010 | 1,398,916 | |
| 4,527,068 | |||
| Industrials—18.0% | |||
| Centre Testing International Group Co. Ltd., A Shares(b) | 445,188 | 1,239,423 | |
| Contemporary Amperex Technology Co. Ltd., A Shares(b) | 54,202 | 1,814,027 | |
| Guangzhou Baiyun International Airport Co. Ltd., A Shares(b)(c) | 200,400 | 454,412 | |
| NARI Technology Co. Ltd., A Shares (Stock Connect)(b) | 180,052 | 680,706 | |
| Shanghai International Airport Co. Ltd., A Shares(b)(c) | 32,910 | 255,621 | |
| Shanghai M&G Stationery, Inc., A Shares(b) | 127,280 | 853,012 | |
| Shenzhen Inovance Technology Co. Ltd., A Shares(b) | 60,489 | 540,621 | |
| Shares | Value | ||
| Sungrow Power Supply Co. Ltd., A Shares(b) | 43,678 | $ 713,535 | |
| Zhejiang Weixing New Building Materials Co. Ltd., A Shares(b) | 169,200 | 540,711 | |
| 7,092,068 | |||
| Information Technology—15.8% | |||
| Glodon Co. Ltd., A Shares(b) | 154,289 | 1,293,756 | |
| Hundsun Technologies, Inc., A Shares(b) | 152,495 | 1,090,715 | |
| LONGi Green Energy Technology Co. Ltd., A Shares(b) | 189,788 | 958,850 | |
| Luxshare Precision Industry Co. Ltd., A Shares(b) | 195,370 | 739,008 | |
| Maxscend Microelectronics Co. Ltd., A Shares(b) | 36,180 | 531,839 | |
| SG Micro Corp., A Shares(b) | 19,410 | 348,541 | |
| Venustech Group, Inc., A Shares(b) | 136,000 | 610,633 | |
| Yonyou Network Technology Co. Ltd., A Shares(b) | 214,299 | 670,177 | |
| 6,243,519 | |||
| Materials—3.2% | |||
| Wanhua Chemical Group Co. Ltd., A Shares(b)(c) | 53,917 | 718,908 | |
| Yunnan Energy New Material Co. Ltd., A Shares (Stock Connect)(b) | 37,020 | 557,538 | |
| 1,276,446 | |||
| Real Estate—1.7% | |||
| China Vanke Co. Ltd., A Shares(b) | 309,673 | 677,129 | |
| Total China | 37,461,994 | ||
| Total Common Stocks | 37,461,994 | ||
| EXCHANGE-TRADED FUNDS—2.0% | |||
| KraneShares Bosera MSCI China A 50 Connect Index ETF | 31,521 | 799,845 | |
| Total Exchange-Traded Funds | 799,845 | ||
| SHORT-TERM INVESTMENT—3.2% | |||
| State Street Institutional U.S. Government Money Market Fund, Premier Class, 4.76%(f) | 1,254,482 | 1,254,482 | |
| Total Short-Term Investment | 1,254,482 | ||
| Total Investments (Cost $49,979,721)(g)—100.1% | 39,516,321 | ||
| Liabilities in Excess of Other Assets—(0.1%) | (58,221) | ||
| Net Assets—100.0% | $39,458,100 | ||
| (a) | Denotes a security issued under Regulation S or Rule 144A. |
| (b) | China A Shares. These shares are issued in local currency, traded in the local stock markets and are held through either a Qualified Foreign Institutional Investor (QFII) license or the Shanghai or Shenzhen Hong-Kong Stock Connect program. |
| (c) | Non-income producing security. |
| (d) | Fair Value is determined pursuant to procedures approved by the Fund’s Board of Trustees. Unless otherwise noted, securities are valued by applying valuation factors to the exchange traded price. See Note 2(a) of the accompanying Notes to Financial Statements for inputs used. |
| (e) | The Fund’s adviser has deemed this security to be illiquid based upon procedures approved by the Board of Trustees. Illiquid securities held by the Fund represent 0.00% of net assets as of April 30, 2023. |
| (f) | Registered investment company advised by State Street Global Advisors. The rate shown is the 7 day yield as of April 30, 2023. |
| (g) | See accompanying Notes to Financial Statements for tax unrealized appreciation/(depreciation) of securities. |
| ETF | Exchange-Traded Fund |
| 2023 Semi-Annual Report | 3 |
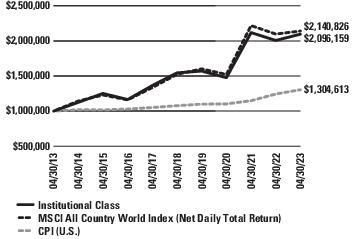
| Average Annual Total Return1 (For the periods ended April 30, 2023) | Six Month2 | 1 Yr. | 5 Yr. | 10 Yr. | |
Class A | w/o SC | 14.14% | 4.21% | 6.08% | 7.42% |
| w/SC3 | 7.54% | (1.83%) | 4.83% | 6.79% | |
Institutional Class4 | w/o SC | 14.28% | 4.48% | 6.29% | 7.68% |
| 1 | Returns prior to May 7, 2018 reflect the performance of a predecessor fund (the “Predecessor Fund”). Returns of the Predecessor Fund have not been adjusted to reflect the expenses applicable to the respective classes. The Fund and the Predecessor Fund have substantially similar investment objectives and strategies. Please consult the Fund’s prospectus for more detail. |
| 2 | Not annualized |
| 3 | A 5.75% front-end sales charge was deducted. |
| 4 | Not subject to any sales charges. |
| 4 | 2023 Semi-Annual Report |
| Asset Allocation | |
| Common Stocks | 98.7% |
| Preferred Stocks | 1.2% |
| Short-Term Investment | 0.4% |
| Liabilities in Excess of Other Assets | (0.3%) |
| 100.0% |
| Sectors | |
| Information Technology | 17.1% |
| Financials | 15.9% |
| Health Care | 13.7% |
| Industrials | 11.0% |
| Consumer Staples | 9.0% |
| Consumer Discretionary | 8.8% |
| Utilities | 6.6% |
| Energy | 6.0% |
| Materials | 4.4% |
| Real Estate | 3.8% |
| Communication Services | 3.6% |
| Short-Term Investment | 0.4% |
| Liabilities in Excess of Other Assets | (0.3%) |
| 100.0% |
| Top Ten Holdings | |
| Apple, Inc. | 3.4% |
| Microsoft Corp. | 2.9% |
| Engie SA | 2.1% |
| RWE AG | 1.6% |
| Broadcom, Inc. | 1.5% |
| BE Semiconductor Industries NV | 1.5% |
| Alphabet, Inc. | 1.5% |
| TotalEnergies SE, ADR | 1.5% |
| Coca-Cola Co. (The) | 1.5% |
| Mondelez International, Inc. | 1.4% |
| Countries | |
| United States | 56.7% |
| France | 8.1% |
| United Kingdom | 7.0% |
| Netherlands | 4.7% |
| Brazil | 2.7% |
| Canada | 2.3% |
| Spain | 2.1% |
| China | 2.0% |
| Other, less than 2% each | 14.3% |
| Short-Term Investment | 0.4% |
| Liabilities in Excess of Other Assets | (0.3%) |
| 100.0% |
| 2023 Semi-Annual Report | 5 |
| Shares | Value | ||
| COMMON STOCKS—98.7% | |||
| AUSTRALIA—0.7% | |||
| Materials—0.7% | |||
| BHP Group Ltd., ADR | 12,800 | $ 755,712 | |
| BRAZIL—2.7% | |||
| Energy—0.9% | |||
| Petroleo Brasileiro SA | 101,146 | 959,875 | |
| Industrials—1.2% | |||
| CCR SA | 478,900 | 1,302,914 | |
| Materials—0.6% | |||
| Vale SA, ADR | 48,100 | 693,121 | |
| Total Brazil | 2,955,910 | ||
| CANADA—2.3% | |||
| Energy—1.3% | |||
| Enbridge, Inc. | 35,200 | 1,399,552 | |
| Materials—1.0% | |||
| Barrick Gold Corp. | 57,400 | 1,092,896 | |
| Total Canada | 2,492,448 | ||
| CHINA—2.0% | |||
| Financials—1.3% | |||
| Ping An Insurance Group Co. of China Ltd., H Shares | 184,000 | 1,342,376 | |
| Real Estate—0.7% | |||
| China Vanke Co. Ltd., H Shares | 498,900 | 779,927 | |
| Total China | 2,122,303 | ||
| DENMARK—1.8% | |||
| Financials—1.1% | |||
| Tryg A/S | 49,300 | 1,165,106 | |
| Industrials—0.7% | |||
| AP Moller - Maersk AS, Class B | 427 | 771,824 | |
| Total Denmark | 1,936,930 | ||
| FINLAND—1.7% | |||
| Financials—1.1% | |||
| Nordea Bank Abp | 105,700 | 1,174,249 | |
| Information Technology—0.6% | |||
| Nokia OYJ | 167,600 | 709,141 | |
| Total Finland | 1,883,390 | ||
| FRANCE—8.1% | |||
| Consumer Discretionary—1.1% | |||
| LVMH Moet Hennessy Louis Vuitton SE | 1,210 | 1,163,876 | |
| Consumer Staples—1.4% | |||
| Danone SA | 22,800 | 1,508,987 | |
| Energy—1.5% | |||
| TotalEnergies SE, ADR | 24,700 | 1,579,071 | |
| Industrials—2.0% | |||
| Alstom SA | 38,322 | 963,207 | |
| Bouygues SA | 7,500 | 274,373 | |
| Teleperformance | 4,650 | 929,329 | |
| 2,166,909 | |||
| Utilities—2.1% | |||
| Engie SA | 143,600 | 2,298,216 | |
| Total France | 8,717,059 | ||
| Shares | Value | ||
| GERMANY—1.6% | |||
| Utilities—1.6% | |||
| RWE AG(a) | 37,900 | $ 1,776,988 | |
| HONG KONG—0.7% | |||
| Financials—0.7% | |||
| Hong Kong Exchanges & Clearing Ltd. | 18,700 | 776,366 | |
| ISRAEL—1.0% | |||
| Industrials—1.0% | |||
| ZIM Integrated Shipping Services Ltd. | 59,800 | 1,020,786 | |
| JAPAN—1.9% | |||
| Financials—1.1% | |||
| Mitsubishi UFJ Financial Group, Inc. | 184,000 | 1,151,754 | |
| Real Estate—0.8% | |||
| GLP J-REIT | 800 | 914,060 | |
| Total Japan | 2,065,814 | ||
| NETHERLANDS—4.7% | |||
| Consumer Staples—1.1% | |||
| Heineken NV | 10,400 | 1,194,182 | |
| Financials—1.0% | |||
| ING Groep NV, Series N | 85,000 | 1,054,195 | |
| Information Technology—2.6% | |||
| ASML Holding NV | 1,900 | 1,205,763 | |
| BE Semiconductor Industries NV | 18,400 | 1,656,251 | |
| 2,862,014 | |||
| Total Netherlands | 5,110,391 | ||
| NORWAY—1.1% | |||
| Communication Services—1.1% | |||
| Telenor ASA | 92,700 | 1,156,724 | |
| SINGAPORE—1.2% | |||
| Financials—1.2% | |||
| Oversea-Chinese Banking Corp. Ltd. | 141,100 | 1,334,931 | |
| SPAIN—2.1% | |||
| Consumer Discretionary—0.9% | |||
| Amadeus IT Group SA(a) | 14,600 | 1,026,161 | |
| Industrials—1.2% | |||
| Ferrovial SA | 40,610 | 1,273,262 | |
| Total Spain | 2,299,423 | ||
| SWITZERLAND—0.3% | |||
| Financials—0.3% | |||
| Swiss Life Holding AG(a) | 400 | 262,594 | |
| TAIWAN—1.1% | |||
| Information Technology—1.1% | |||
| Taiwan Semiconductor Manufacturing Co. Ltd., ADR | 13,700 | 1,154,910 | |
| UNITED KINGDOM—7.0% | |||
| Communication Services—1.0% | |||
| Vodafone Group PLC, ADR | 89,700 | 1,071,915 | |
| Consumer Discretionary—1.1% | |||
| Dowlais Group PLC(a) | 175,666 | 292,739 | |
| Taylor Wimpey PLC | 534,486 | 862,589 | |
| 1,155,328 | |||
| Energy—1.1% | |||
| Capricorn Energy PLC(a) | 439,100 | 1,210,735 | |
| 6 | 2023 Semi-Annual Report |
| Shares | Value | ||
| COMMON STOCKS (continued) | |||
| UNITED KINGDOM (continued) | |||
| Financials—0.3% | |||
| Legal & General Group PLC | 115,479 | $ 340,723 | |
| Health Care—2.7% | |||
| AstraZeneca PLC, ADR | 19,100 | 1,398,502 | |
| Dechra Pharmaceuticals PLC | 32,371 | 1,519,529 | |
| 2,918,031 | |||
| Industrials—0.8% | |||
| Melrose Industries PLC | 175,666 | 904,872 | |
| Total United Kingdom | 7,601,604 | ||
| UNITED STATES—56.7% | |||
| Communication Services—1.5% | |||
| Alphabet, Inc., Class C(a) | 14,600 | 1,580,012 | |
| Consumer Discretionary—5.7% | |||
| Aptiv PLC(a) | 9,300 | 956,598 | |
| Genuine Parts Co. | 7,900 | 1,329,649 | |
| Las Vegas Sands Corp.(a) | 15,100 | 964,135 | |
| Lowe's Cos., Inc. | 6,900 | 1,434,027 | |
| TJX Cos., Inc. (The) | 19,100 | 1,505,462 | |
| 6,189,871 | |||
| Consumer Staples—6.5% | |||
| Coca-Cola Co. (The) | 24,500 | 1,571,675 | |
| Kraft Heinz Co. (The) | 27,300 | 1,072,071 | |
| Mondelez International, Inc., Class A | 20,400 | 1,565,088 | |
| Nestle SA | 11,000 | 1,411,185 | |
| Target Corp. | 8,900 | 1,403,975 | |
| 7,023,994 | |||
| Energy—1.2% | |||
| Williams Cos., Inc. (The) | 43,600 | 1,319,336 | |
| Financials—7.8% | |||
| Bank of America Corp. | 33,900 | 992,592 | |
| Blackstone, Inc., Class A | 9,500 | 848,635 | |
| CME Group, Inc. | 5,800 | 1,077,466 | |
| Fidelity National Information Services, Inc. | 15,200 | 892,544 | |
| Goldman Sachs Group, Inc. (The) | 3,800 | 1,305,072 | |
| Huntington Bancshares, Inc. | 76,400 | 855,680 | |
| Intercontinental Exchange, Inc. | 11,600 | 1,263,588 | |
| JPMorgan Chase & Co. | 8,500 | 1,175,040 | |
| 8,410,617 | |||
| Health Care—11.0% | |||
| AbbVie, Inc. | 9,700 | 1,465,864 | |
| Baxter International, Inc. | 17,400 | 829,632 | |
| Bristol-Myers Squibb Co. | 18,000 | 1,201,860 | |
| CVS Health Corp. | 13,400 | 982,354 | |
| Eli Lilly & Co. | 3,200 | 1,266,752 | |
| Medtronic PLC | 13,600 | 1,236,920 | |
| Merck & Co., Inc. | 10,200 | 1,177,794 | |
| Roche Holding AG | 4,500 | 1,409,131 | |
| Sanofi | 12,767 | 1,375,878 | |
| UnitedHealth Group, Inc. | 2,000 | 984,180 | |
| 11,930,365 | |||
| Industrials—4.1% | |||
| FedEx Corp. | 5,500 | 1,252,790 | |
| Shares | Value | ||
| Norfolk Southern Corp. | 4,400 | $ 893,332 | |
| Schneider Electric SE | 8,500 | 1,482,330 | |
| Stanley Black & Decker, Inc. | 9,600 | 828,864 | |
| 4,457,316 | |||
| Information Technology—11.6% | |||
| Amdocs Ltd. | 15,200 | 1,387,000 | |
| Analog Devices, Inc. | 7,600 | 1,367,088 | |
| Apple, Inc. | 21,500 | 3,648,120 | |
| Broadcom, Inc. | 2,700 | 1,691,550 | |
| Cisco Systems, Inc. | 26,800 | 1,266,300 | |
| Microsoft Corp. | 10,400 | 3,195,504 | |
| 12,555,562 | |||
| Materials—2.1% | |||
| Air Products & Chemicals, Inc. | 3,400 | 1,000,824 | |
| Linde PLC | 3,600 | 1,322,743 | |
| 2,323,567 | |||
| Real Estate—2.3% | |||
| American Tower Corp., REIT | 6,100 | 1,246,779 | |
| Gaming and Leisure Properties, Inc., REIT | 22,800 | 1,185,600 | |
| 2,432,379 | |||
| Utilities—2.9% | |||
| CMS Energy Corp. | 16,800 | 1,045,968 | |
| FirstEnergy Corp. | 25,700 | 1,022,860 | |
| NextEra Energy, Inc. | 13,900 | 1,065,157 | |
| 3,133,985 | |||
| Total United States | 61,357,004 | ||
| Total Common Stocks | 106,781,287 | ||
| PREFERRED STOCKS—1.2% | |||
| SOUTH KOREA—1.2% | |||
| Information Technology—1.2% | |||
| Samsung Electronics Co. Ltd. | 32,000 | 1,337,756 | |
| Total Preferred Stocks | 1,337,756 | ||
| SHORT-TERM INVESTMENT—0.4% | |||
| State Street Institutional U.S. Government Money Market Fund, Premier Class, 4.76%(b) | 456,940 | 456,940 | |
| Total Short-Term Investment | 456,940 | ||
| Total Investments (Cost $89,803,749)(c)—100.3% | 108,575,983 | ||
| Liabilities in Excess of Other Assets—(0.3%) | (342,677) | ||
| Net Assets—100.0% | $108,233,306 | ||
| (a) | Non-income producing security. |
| (b) | Registered investment company advised by State Street Global Advisors. The rate shown is the 7 day yield as of April 30, 2023. |
| (c) | See accompanying Notes to Financial Statements for tax unrealized appreciation/(depreciation) of securities. |
| ADR | American Depositary Receipt |
| EUR | Euro Currency |
| PLC | Public Limited Company |
| REIT | Real Estate Investment Trust |
| USD | U.S. Dollar |
| 2023 Semi-Annual Report | 7 |
| At April 30, 2023, the Fund held the following forward foreign currency contracts: |
| Sale Contracts Settlement Date | Counterparty | Currency Purchased | Amount Purchased | Currency Sold | Amount Sold | Fair Value | Unrealized Appreciation/ (Depreciation) | |
| United States Dollar/Euro | ||||||||
| 07/19/2023 | Citibank N.A. | USD | 8,828,102 | EUR | 8,000,000 | $8,853,217 | $(25,115) | |
| 8 | 2023 Semi-Annual Report |
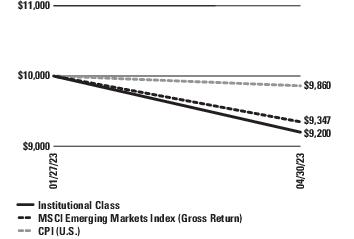
| Average Annual Total Return (For the periods ended April 30, 2023) | Inception1 | |
Institutional Class | (8.00%) | |
| 1 | Fund commenced operations on January 27, 2023. |
| 2023 Semi-Annual Report | 9 |
| Asset Allocation | |
| Common Stocks | 82.9% |
| Preferred Stocks | 16.8% |
| Short-Term Investment | 5.2% |
| Liabilities in Excess of Other Assets | (4.9%) |
| 100.0% |
| Sectors | |
| Information Technology | 24.7% |
| Financials | 22.7% |
| Consumer Staples | 11.6% |
| Materials | 9.6% |
| Consumer Discretionary | 8.0% |
| Industrials | 7.1% |
| Health Care | 5.2% |
| Real Estate | 4.2% |
| Communication Services | 3.6% |
| Energy | 3.0% |
| Short-Term Investment | 5.2% |
| Liabilities in Excess of Other Assets | (4.9%) |
| 100.0% |
| Top Ten Holdings | |
| Samsung Electronics Co. Ltd. | 16.8% |
| LG Chem Ltd. | 6.6% |
| Grupo Financiero Banorte SAB de CV | 6.1% |
| Shenzhen Mindray Bio-Medical Electronics Co. Ltd. | 5.2% |
| Bank Central Asia Tbk PT | 4.9% |
| China Tourism Group Duty Free Corp. Ltd. | 4.4% |
| China Resources Land Ltd. | 4.2% |
| Budweiser Brewing Co. APAC Ltd. | 4.2% |
| Foshan Haitian Flavouring & Food Co. Ltd. | 3.9% |
| Americana Restaurants International PLC | 3.6% |
| Countries | |
| China | 29.7% |
| South Korea | 27.0% |
| Indonesia | 8.5% |
| Brazil | 6.6% |
| Thailand | 6.5% |
| Mexico | 6.1% |
| Hong Kong | 4.2% |
| United Arab Emirates | 3.6% |
| Austria | 3.0% |
| Kazakhstan | 2.5% |
| Taiwan | 2.0% |
| Short-Term Investment | 5.2% |
| Liabilities in Excess of Other Assets | (4.9%) |
| 100.0% |
| 10 | 2023 Semi-Annual Report |
| Shares | Value | ||
| COMMON STOCKS—82.9% | |||
| AUSTRIA—3.0% | |||
| Materials—3.0% | |||
| Mondi PLC | 491 | $ 7,775 | |
| BRAZIL—6.6% | |||
| Consumer Staples—3.5% | |||
| Raia Drogasil SA | 1,732 | 9,126 | |
| Financials—3.1% | |||
| B3 SA - Brasil Bolsa Balcao | 3,427 | 8,025 | |
| Total Brazil | 17,151 | ||
| CHINA—29.7% | |||
| Consumer Discretionary—4.4% | |||
| China Tourism Group Duty Free Corp. Ltd., A Shares (Stock Connect)(a) | 500 | 11,665 | |
| Consumer Staples—3.9% | |||
| Foshan Haitian Flavouring & Food Co. Ltd., A Shares(a)(b) | 1,000 | 10,213 | |
| Financials—2.6% | |||
| China International Capital Corp. Ltd., H Shares(c) | 3,200 | 6,724 | |
| Health Care—5.2% | |||
| Shenzhen Mindray Bio-Medical Electronics Co. Ltd., A Shares (Stock Connect)(a) | 300 | 13,531 | |
| Industrials—3.5% | |||
| NARI Technology Co. Ltd., A Shares (Stock Connect)(a) | 2,400 | 9,072 | |
| Information Technology—5.9% | |||
| Glodon Co. Ltd., A Shares(a) | 1,000 | 8,384 | |
| LONGi Green Energy Technology Co. Ltd., A Shares(a) | 1,400 | 7,072 | |
| 15,456 | |||
| Real Estate—4.2% | |||
| China Resources Land Ltd. | 2,370 | 11,037 | |
| Total China | 77,698 | ||
| HONG KONG—4.2% | |||
| Consumer Staples—4.2% | |||
| Budweiser Brewing Co. APAC Ltd.(c) | 3,800 | 10,979 | |
| INDONESIA—8.5% | |||
| Communication Services—3.6% | |||
| Telkom Indonesia Persero Tbk PT | 32,400 | 9,385 | |
| Financials—4.9% | |||
| Bank Central Asia Tbk PT | 20,800 | 12,872 | |
| Total Indonesia | 22,257 | ||
| KAZAKHSTAN—2.5% | |||
| Financials—2.5% | |||
| Kaspi.KZ JSC, GDR | 78 | 6,435 | |
| MEXICO—6.1% | |||
| Financials—6.1% | |||
| Grupo Financiero Banorte SAB de CV, Class O | 1,847 | 16,007 | |
| SOUTH KOREA—10.2% | |||
| Industrials—3.6% | |||
| Samsung Engineering Co. Ltd.(b) | 429 | 9,364 | |
| Materials—6.6% | |||
| LG Chem Ltd. | 31 | 17,220 | |
| Total South Korea | 26,584 | ||
| Shares | Value | ||
| TAIWAN—2.0% | |||
| Information Technology—2.0% | |||
| MediaTek, Inc. | 247 | $ 5,371 | |
| THAILAND—6.5% | |||
| Energy—3.0% | |||
| PTT Exploration & Production PCL, Foreign Shares | 1,800 | 7,832 | |
| Financials—3.5% | |||
| Kasikornbank PCL, Foreign Shares | 2,500 | 9,178 | |
| Total Thailand | 17,010 | ||
| UNITED ARAB EMIRATES—3.6% | |||
| Consumer Discretionary—3.6% | |||
| Americana Restaurants International PLC | 8,882 | 9,481 | |
| Total Common Stocks | 216,748 | ||
| PREFERRED STOCKS—16.8% | |||
| SOUTH KOREA—16.8% | |||
| Information Technology—16.8% | |||
| Samsung Electronics Co. Ltd. | 1,048 | 43,812 | |
| Total Preferred Stocks | 43,812 | ||
| SHORT-TERM INVESTMENT—5.2% | |||
| State Street Institutional U.S. Government Money Market Fund, Premier Class, 4.76%(d) | 13,544 | 13,544 | |
| Total Short-Term Investment | 13,544 | ||
| Total Investments (Cost $296,608)(e)—104.9% | 274,104 | ||
| Liabilities in Excess of Other Assets—(4.9%) | (12,709) | ||
| Net Assets—100.0% | $261,395 | ||
| (a) | China A Shares. These shares are issued in local currency, traded in the local stock markets and are held through either a Qualified Foreign Institutional Investor (QFII) license or the Shanghai or Shenzhen Hong-Kong Stock Connect program. |
| (b) | Non-income producing security. |
| (c) | Denotes a security issued under Regulation S or Rule 144A. |
| (d) | Registered investment company advised by State Street Global Advisors. The rate shown is the 7 day yield as of April 30, 2023. |
| (e) | See accompanying Notes to Financial Statements for tax unrealized appreciation/(depreciation) of securities. |
| GDR | Global Depositary Receipt |
| PLC | Public Limited Company |
| 2023 Semi-Annual Report | 11 |
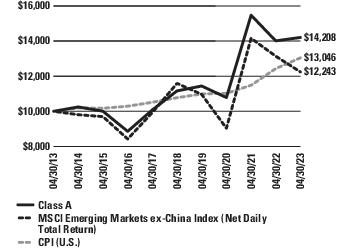
| Average Annual Total Return1 (For the periods ended April 30, 2023) | Six Month2 | 1 Yr. | 5 Yr. | 10 Yr. | |
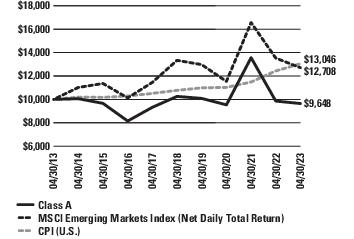
Class A | w/o SC | 11.38% | 1.39% | 4.94% | 4.19% |
| w/SC3 | 4.94% | (4.44%) | 3.71% | 3.57% | |
Class C | w/o SC | 10.99% | 0.69% | 4.27% | 3.52% |
| w/SC4 | 10.15% | (0.07%) | 4.27% | 3.52% | |
Class R5 | w/o SC | 11.25% | 1.05% | 4.57% | 3.83% |
Institutional Service Class5 | w/o SC | 11.40% | 1.53% | 5.20% | 4.49% |
Institutional Class5 | w/o SC | 11.70% | 1.84% | 5.34% | 4.55% |
| 1 | The Fund changed its investment strategies effective February 28, 2022. Performance information for periods prior to February 28, 2022 does not reflect the current investment strategy. In connection with the change in investment strategy, the Fund changed its name from Aberdeen Global Equity Fund to abrdn Emerging Markets ex-China Fund. Please consult the Fund’s prospectus for more detail. |
| 2 | Not annualized |
| 3 | A 5.75% front-end sales charge was deducted. |
| 4 | A 1.00% contingent deferred sales charge (CDSC) was deducted from the one year return because it is charged when Class C shares are sold within the first year after purchase. |
| 5 | Not subject to any sales charges. |
| 12 | 2023 Semi-Annual Report |
| Asset Allocation | |
| Common Stocks | 97.0% |
| Short-Term Investment | 2.0% |
| Preferred Stocks | 1.1% |
| Rights | –% |
| Liabilities in Excess of Other Assets | (0.1%) |
| 100.0% |
| Sectors | |
| Information Technology | 26.2% |
| Semiconductors & Semiconductor Equipment | 12.7% |
| Technology Hardware, Storage & Peripherals | 5.9% |
| Electronic Equipment, Instruments & Components | 5.3% |
| IT Services | 2.3% |
| Financials | 22.5% |
| Consumer Staples | 12.5% |
| Materials | 9.9% |
| Industrials | 7.2% |
| Consumer Discretionary | 6.4% |
| Energy | 6.0% |
| Utilities | 2.6% |
| Health Care | 2.0% |
| Communication Services | 1.7% |
| Real Estate | 1.1% |
| Short-Term Investment | 2.0% |
| Liabilities in Excess of Other Assets | (0.1%) |
| 100.0% |
| Top Ten Holdings | |
| Taiwan Semiconductor Manufacturing Co. Ltd., ADR | 9.0% |
| Samsung Electronics Co. Ltd., GDR | 5.7% |
| Housing Development Finance Corp. Ltd. | 2.8% |
| Saudi Arabian Oil Co. | 2.4% |
| Raia Drogasil SA | 2.3% |
| Hon Hai Precision Industry Co. Ltd. | 2.0% |
| LG Chem Ltd. | 2.0% |
| Coca-Cola HBC AG | 2.0% |
| Grupo Financiero Banorte SAB de CV | 2.0% |
| Power Grid Corp. of India Ltd. | 1.9% |
| Countries | |
| India | 21.4% |
| Taiwan | 17.2% |
| South Korea | 12.3% |
| Brazil | 9.0% |
| Mexico | 5.9% |
| Saudi Arabia | 5.1% |
| Indonesia | 3.6% |
| Thailand | 2.7% |
| Poland | 2.7% |
| South Africa | 2.3% |
| Netherlands | 2.1% |
| Italy | 2.0% |
| Other, less than 2% each | 11.8% |
| Short-Term Investment | 2.0% |
| Liabilities in Excess of Other Assets | (0.1%) |
| 100.0% |
| 2023 Semi-Annual Report | 13 |
| Shares | Value | ||
| COMMON STOCKS—97.0% | |||
| AUSTRALIA—1.3% | |||
| Materials—1.3% | |||
| BHP Group Ltd. | 13,226 | $ 388,077 | |
| AUSTRIA—0.9% | |||
| Materials—0.9% | |||
| Mondi PLC | 17,332 | 274,451 | |
| BRAZIL—8.1% | |||
| Consumer Discretionary—1.2% | |||
| MercadoLibre, Inc.(a) | 273 | 348,755 | |
| Consumer Staples—3.1% | |||
| Raia Drogasil SA | 131,856 | 694,730 | |
| Sendas Distribuidora SA | 93,833 | 231,206 | |
| 925,936 | |||
| Energy—0.8% | |||
| 3R Petroleum Oleo E Gas SA(a) | 40,173 | 255,078 | |
| Financials—1.0% | |||
| B3 SA - Brasil Bolsa Balcao | 132,086 | 309,308 | |
| Industrials—2.0% | |||
| Localiza Rent a Car SA(a) | 24,844 | 288,945 | |
| WEG SA | 40,010 | 329,847 | |
| 618,792 | |||
| Total Brazil | 2,457,869 | ||
| CHILE—1.0% | |||
| Materials—1.0% | |||
| Sociedad Quimica y Minera de Chile SA, ADR | 4,444 | 299,881 | |
| FRANCE—1.9% | |||
| Energy—1.9% | |||
| TotalEnergies SE | 9,019 | 576,313 | |
| INDIA—21.4% | |||
| Consumer Discretionary—0.9% | |||
| Maruti Suzuki India Ltd. | 2,574 | 271,616 | |
| Consumer Staples—3.7% | |||
| Hindustan Unilever Ltd. | 17,820 | 536,529 | |
| ITC Ltd. | 111,630 | 583,013 | |
| 1,119,542 | |||
| Financials—7.1% | |||
| Housing Development Finance Corp. Ltd. | 24,305 | 826,446 | |
| ICICI Bank Ltd. | 26,250 | 296,661 | |
| Kotak Mahindra Bank Ltd. | 17,930 | 425,623 | |
| SBI Life Insurance Co. Ltd.(b) | 41,521 | 580,057 | |
| 2,128,787 | |||
| Health Care—1.3% | |||
| Syngene International Ltd.(b) | 47,008 | 389,378 | |
| Industrials—1.2% | |||
| Larsen & Toubro Ltd. | 12,764 | 369,371 | |
| Information Technology—1.8% | |||
| Infosys Ltd. | 22,306 | 344,218 | |
| Tata Consultancy Services Ltd. | 5,271 | 208,122 | |
| 552,340 | |||
| Materials—1.7% | |||
| Asian Paints Ltd. | 5,720 | 202,980 | |
| UltraTech Cement Ltd. | 3,308 | 305,578 | |
| 508,558 | |||
| Shares | Value | ||
| Real Estate—1.1% | |||
| Godrej Properties Ltd.(a) | 20,914 | $ 337,836 | |
| Utilities—2.6% | |||
| Power Grid Corp. of India Ltd. | 202,745 | 587,306 | |
| ReNew Energy Global PLC, Class A(a) | 39,949 | 204,539 | |
| 791,845 | |||
| Total India | 6,469,273 | ||
| INDONESIA—3.6% | |||
| Communication Services—1.0% | |||
| Telkom Indonesia Persero Tbk PT | 1,058,200 | 306,506 | |
| Financials—2.6% | |||
| Bank Central Asia Tbk PT | 523,300 | 323,845 | |
| Bank Rakyat Indonesia Persero Tbk PT | 1,278,400 | 445,496 | |
| 769,341 | |||
| Total Indonesia | 1,075,847 | ||
| ISRAEL—0.7% | |||
| Information Technology—0.7% | |||
| Nova Ltd.(a) | 2,175 | 198,904 | |
| ITALY—2.0% | |||
| Consumer Staples—2.0% | |||
| Coca-Cola HBC AG(a) | 20,054 | 612,182 | |
| KAZAKHSTAN—1.4% | |||
| Financials—1.4% | |||
| Kaspi.KZ JSC, GDR | 5,048 | 416,460 | |
| MEXICO—5.9% | |||
| Consumer Staples—1.2% | |||
| Fomento Economico Mexicano SAB de CV, ADR | 3,871 | 375,564 | |
| Financials—2.0% | |||
| Grupo Financiero Banorte SAB de CV, Class O | 67,769 | 587,323 | |
| Industrials—1.1% | |||
| Grupo Aeroportuario del Centro Norte SAB de CV, ADR | 3,828 | 334,873 | |
| Materials—1.6% | |||
| Southern Copper Corp. | 6,356 | 488,332 | |
| Total Mexico | 1,786,092 | ||
| NETHERLANDS—2.1% | |||
| Information Technology—2.1% | |||
| ASM International NV | 620 | 225,091 | |
| ASML Holding NV | 631 | 400,440 | |
| 625,531 | |||
| PERU—1.0% | |||
| Financials—1.0% | |||
| Credicorp Ltd. | 2,227 | 301,714 | |
| PHILIPPINES—0.8% | |||
| Financials—0.8% | |||
| Bank of the Philippine Islands | 130,658 | 254,141 | |
| POLAND—2.7% | |||
| Consumer Staples—1.4% | |||
| Dino Polska SA(a)(b) | 4,069 | 414,970 | |
| Industrials—1.3% | |||
| InPost SA(a) | 37,818 | 405,894 | |
| Total Poland | 820,864 | ||
| 14 | 2023 Semi-Annual Report |
| Shares | Value | ||
| COMMON STOCKS (continued) | |||
| SAUDI ARABIA—5.1% | |||
| Energy—2.4% | |||
| Saudi Arabian Oil Co.(b) | 75,078 | $ 723,681 | |
| Financials—2.7% | |||
| Al Rajhi Bank | 22,920 | 473,068 | |
| Saudi Tadawul Group Holding Co. | 7,410 | 332,576 | |
| 805,644 | |||
| Total Saudi Arabia | 1,529,325 | ||
| SOUTH AFRICA—2.3% | |||
| Communication Services—0.7% | |||
| Vodacom Group Ltd. | 28,491 | 195,288 | |
| Financials—0.9% | |||
| Sanlam Ltd. | 89,258 | 275,349 | |
| Materials—0.7% | |||
| Anglo American Platinum Ltd. | 3,579 | 212,193 | |
| Total South Africa | 682,830 | ||
| SOUTH KOREA—12.1% | |||
| Financials—1.0% | |||
| KB Financial Group, Inc., ADR | 7,759 | 289,333 | |
| Health Care—0.7% | |||
| Samsung Biologics Co. Ltd.(a)(b) | 367 | 214,643 | |
| Industrials—1.6% | |||
| Samsung Engineering Co. Ltd.(a) | 21,811 | 476,070 | |
| Information Technology—6.8% | |||
| Samsung Electronics Co. Ltd., GDR | 1,644 | 1,716,156 | |
| Samsung SDI Co. Ltd., GDR(b)(c) | 2,689 | 348,125 | |
| 2,064,281 | |||
| Materials—2.0% | |||
| LG Chem Ltd. | 1,108 | 615,476 | |
| Total South Korea | 3,659,803 | ||
| TAIWAN—17.2% | |||
| Consumer Discretionary—3.1% | |||
| Makalot Industrial Co. Ltd. | 36,000 | 261,459 | |
| momo.com, Inc. | 9,600 | 260,122 | |
| Poya International Co. Ltd. | 21,190 | 396,614 | |
| 918,195 | |||
| Information Technology—14.1% | |||
| Chroma ATE, Inc. | 50,000 | 310,385 | |
| Delta Electronics, Inc. | 37,000 | 362,451 | |
| Hon Hai Precision Industry Co. Ltd. | 181,000 | 616,766 | |
| MediaTek, Inc. | 12,000 | 260,926 | |
| Taiwan Semiconductor Manufacturing Co. Ltd., ADR | 144,200 | 2,714,567 | |
| 4,265,095 | |||
| Total Taiwan | 5,183,290 | ||
| THAILAND—2.7% | |||
| Energy—0.9% | |||
| PTT Exploration & Production PCL, Foreign Shares | 64,400 | 280,208 | |
| Financials—1.1% | |||
| Kasikornbank PCL, Foreign Shares | 94,000 | 345,110 | |
| Materials—0.7% | |||
| SCG Packaging PCL, Foreign Shares | 156,300 | 202,000 | |
| Total Thailand | 827,318 | ||
| Shares | Value | ||
| TURKEY—1.1% | |||
| Consumer Staples—1.1% | |||
| Coca-Cola Icecek AS | 27,105 | $ 328,311 | |
| UNITED ARAB EMIRATES—1.2% | |||
| Consumer Discretionary—1.2% | |||
| Americana Restaurants International PLC | 331,792 | 356,070 | |
| UNITED STATES—0.5% | |||
| Information Technology—0.5% | |||
| Globant SA(a) | 870 | 136,477 | |
| Total Common Stocks | 29,261,023 | ||
| PREFERRED STOCKS—1.1% | |||
| BRAZIL—0.9% | |||
| Financials—0.9% | |||
| Banco Bradesco SA, Preferred Shares, ADR, 1.94% | 98,138 | 274,786 | |
| SOUTH KOREA—0.2% | |||
| Information Technology—0.2% | |||
| Samsung Electronics Co. Ltd. | 615 | 25,710 | |
| Samsung Electronics Co. Ltd., Preferred Shares, GDR | 28 | 29,120 | |
| 54,830 | |||
| Total Preferred Stocks | 329,616 | ||
| RIGHTS—0.0% | |||
| Localiza Rent a Car SA(a) | 111 | 382 | |
| 3R Petroleum Oleo Gas SA(a) | 7,281 | 11,211 | |
| Total Rights | 11,593 | ||
| SHORT-TERM INVESTMENT—2.0% | |||
| State Street Institutional U.S. Government Money Market Fund, Premier Class, 4.76%(d) | 609,967 | 609,967 | |
| Total Short-Term Investment | 609,967 | ||
| Total Investments (Cost $30,010,430)(e)—100.1% | 30,212,199 | ||
| Liabilities in Excess of Other Assets—(0.1%) | (28,516) | ||
| Net Assets—100.0% | $30,183,683 | ||
| (a) | Non-income producing security. |
| (b) | Denotes a security issued under Regulation S or Rule 144A. |
| (c) | Illiquid security. |
| (d) | Registered investment company advised by State Street Global Advisors. The rate shown is the 7 day yield as of April 30, 2023. |
| (e) | See accompanying Notes to Financial Statements for tax unrealized appreciation/(depreciation) of securities. |
| ADR | American Depositary Receipt |
| GDR | Global Depositary Receipt |
| PLC | Public Limited Company |
| 2023 Semi-Annual Report | 15 |
| Average Annual Total Return (For the periods ended April 30, 2023) | Six Month1 | 1 Yr. | 5 Yr. | 10 Yr. | |
Class A | w/o SC | 15.29% | (3.67%) | (0.99%) | 0.22% |
| w/SC2 | 8.65% | (9.18%) | (2.16%) | (0.37%) | |
Class C | w/o SC | 14.87% | (4.14%) | (1.51%) | (0.36%) |
| w/SC3 | 13.87% | (5.10%) | (1.51%) | (0.36%) | |
Class R4 | w/o SC | 15.17% | (3.80%) | (1.15%) | (0.02%) |
Institutional Service Class4 | w/o SC | 15.38% | (3.37%) | (0.64%) | 0.48% |
Institutional Class4 | w/o SC | 15.48% | (3.20%) | (0.52%) | 0.65% |
| 1 | Not annualized |
| 2 | A 5.75% front-end sales charge was deducted. |
| 3 | A 1.00% contingent deferred sales charge (CDSC) was deducted from the one year return because it is charged when Class C shares are sold within the first year after purchase. |
| 4 | Not subject to any sales charges. |

| 16 | 2023 Semi-Annual Report |
| Asset Allocation | |
| Common Stocks | 91.5% |
| Preferred Stocks | 6.7% |
| Short-Term Investment | 1.7% |
| Other Assets in Excess of Liabilities | 0.1% |
| 100.0% |
| Sectors | |
| Financials | 24.4% |
| Information Technology | 22.3% |
| Consumer Discretionary | 14.3% |
| Consumer Staples | 8.8% |
| Materials | 7.2% |
| Communication Services | 7.0% |
| Industrials | 5.1% |
| Energy | 3.6% |
| Health Care | 2.5% |
| Utilities | 1.7% |
| Real Estate | 1.3% |
| Short-Term Investment | 1.7% |
| Assets in Excess of Other Liabilities | 0.1% |
| 100.0% |
| Top Ten Holdings | |
| Taiwan Semiconductor Manufacturing Co. Ltd., ADR | 7.6% |
| Tencent Holdings Ltd. | 6.0% |
| Samsung Electronics Co. Ltd. | 5.6% |
| Housing Development Finance Corp. Ltd. | 4.0% |
| Alibaba Group Holding Ltd. | 3.9% |
| AIA Group Ltd. | 2.6% |
| LG Chem Ltd. | 2.3% |
| SBI Life Insurance Co. Ltd. | 2.3% |
| TotalEnergies SE | 2.1% |
| Bank Rakyat Indonesia Persero Tbk PT | 1.9% |
| Countries | |
| China | 26.7% |
| India | 15.1% |
| Taiwan | 11.2% |
| South Korea | 9.6% |
| Brazil | 6.0% |
| Mexico | 5.8% |
| Hong Kong | 4.9% |
| Indonesia | 4.0% |
| Saudi Arabia | 2.8% |
| South Africa | 2.2% |
| France | 2.1% |
| Other, less than 2% each | 7.8% |
| Short-Term Investment | 1.7% |
| Assets in Excess of Other Liabilities | 0.1% |
| 100.0% |
| 2023 Semi-Annual Report | 17 |
| Shares | Value | ||
| COMMON STOCKS—91.5% | |||
| AUSTRIA—0.8% | |||
| Materials—0.8% | |||
| Mondi PLC | 1,128,442 | $ 17,868,772 | |
| BRAZIL—4.9% | |||
| Consumer Discretionary—1.1% | |||
| MercadoLibre, Inc.(a) | 17,953 | 22,934,778 | |
| Consumer Staples—1.3% | |||
| Raia Drogasil SA | 5,216,242 | 27,483,628 | |
| Financials—1.1% | |||
| B3 SA - Brasil Bolsa Balcao | 10,167,727 | 23,809,907 | |
| Industrials—1.4% | |||
| Rumo SA | 3,943,205 | 15,574,229 | |
| WEG SA | 1,889,467 | 15,576,984 | |
| 31,151,213 | |||
| Total Brazil | 105,379,526 | ||
| CHILE—0.6% | |||
| Materials—0.6% | |||
| Sociedad Quimica y Minera de Chile SA, ADR | 191,207 | 12,902,648 | |
| CHINA—26.7% | |||
| Communication Services—6.0% | |||
| Tencent Holdings Ltd. | 2,888,400 | 128,291,496 | |
| Consumer Discretionary—10.8% | |||
| Alibaba Group Holding Ltd.(a) | 7,935,300 | 83,904,867 | |
| China Tourism Group Duty Free Corp. Ltd., A Shares(a)(b)(c) | 651,500 | 13,936,463 | |
| China Tourism Group Duty Free Corp. Ltd., A Shares (Stock Connect)(c) | 552,803 | 12,897,353 | |
| JD.com, Inc., A Shares(c) | 1,269,119 | 22,651,035 | |
| Li Auto, Inc., A Share(a)(c) | 1,401,400 | 16,597,972 | |
| Meituan, Class B(a)(b) | 1,769,770 | 30,246,163 | |
| Midea Group Co. Ltd., A Shares (Stock Connect)(c) | 4,530,911 | 37,188,665 | |
| Zhongsheng Group Holdings Ltd. | 3,761,000 | 16,065,165 | |
| 233,487,683 | |||
| Consumer Staples—2.8% | |||
| Foshan Haitian Flavouring & Food Co. Ltd., A Shares(a)(c) | 2,549,875 | 26,042,554 | |
| Kweichow Moutai Co. Ltd., A Shares (Stock Connect)(c) | 136,106 | 34,647,327 | |
| 60,689,881 | |||
| Financials—0.7% | |||
| China International Capital Corp. Ltd., H Shares(b) | 7,596,000 | 15,961,184 | |
| Health Care—2.5% | |||
| Shenzhen Mindray Bio-Medical Electronics Co. Ltd., A Shares (Stock Connect)(c) | 726,997 | 32,790,927 | |
| Wuxi Biologics Cayman, Inc.(a)(b) | 3,568,500 | 21,278,381 | |
| 54,069,308 | |||
| Industrials—1.0% | |||
| NARI Technology Co. Ltd., A Shares (Stock Connect)(c) | 5,477,233 | 20,703,978 | |
| Shares | Value | ||
| Information Technology—1.6% | |||
| LONGi Green Energy Technology Co. Ltd., A Shares(c) | 3,693,017 | $ 18,654,957 | |
| Yonyou Network Technology Co. Ltd., A Shares(c) | 5,040,918 | 15,761,942 | |
| 34,416,899 | |||
| Real Estate—1.3% | |||
| China Resources Land Ltd. | 6,084,000 | 28,331,699 | |
| Total China | 575,952,128 | ||
| FRANCE—2.1% | |||
| Energy—2.1% | |||
| TotalEnergies SE | 710,269 | 45,386,126 | |
| HONG KONG—4.9% | |||
| Consumer Staples—1.3% | |||
| Budweiser Brewing Co. APAC Ltd.(b) | 9,876,800 | 28,536,140 | |
| Financials—3.6% | |||
| AIA Group Ltd. | 5,044,600 | 54,920,920 | |
| Hong Kong Exchanges & Clearing Ltd. | 540,265 | 22,430,128 | |
| 77,351,048 | |||
| Total Hong Kong | 105,887,188 | ||
| INDIA—15.1% | |||
| Consumer Discretionary—1.1% | |||
| Maruti Suzuki India Ltd. | 220,994 | 23,319,898 | |
| Consumer Staples—1.7% | |||
| Hindustan Unilever Ltd. | 1,182,172 | 35,593,125 | |
| Financials—8.1% | |||
| Housing Development Finance Corp. Ltd. | 2,537,489 | 86,282,505 | |
| Kotak Mahindra Bank Ltd. | 1,700,830 | 40,374,370 | |
| SBI Life Insurance Co. Ltd.(b) | 3,518,286 | 49,151,191 | |
| 175,808,066 | |||
| Information Technology—1.3% | |||
| Tata Consultancy Services Ltd. | 736,602 | 29,084,344 | |
| Materials—1.2% | |||
| UltraTech Cement Ltd. | 290,020 | 26,790,768 | |
| Utilities—1.7% | |||
| Power Grid Corp. of India Ltd. | 12,517,007 | 36,258,949 | |
| Total India | 326,855,150 | ||
| INDONESIA—4.0% | |||
| Communication Services—1.0% | |||
| Telkom Indonesia Persero Tbk PT | 72,244,000 | 20,925,377 | |
| Financials—3.0% | |||
| Bank Central Asia Tbk PT | 39,039,300 | 24,159,509 | |
| Bank Rakyat Indonesia Persero Tbk PT | 116,405,944 | 40,565,043 | |
| 64,724,552 | |||
| Total Indonesia | 85,649,929 | ||
| KAZAKHSTAN—0.8% | |||
| Financials—0.8% | |||
| Kaspi.KZ JSC, GDR | 205,604 | 16,962,330 | |
| MEXICO—5.8% | |||
| Consumer Staples—1.7% | |||
| Fomento Economico Mexicano SAB de CV, ADR | 382,011 | 37,062,707 | |
| 18 | 2023 Semi-Annual Report |
| Shares | Value | ||
| COMMON STOCKS (continued) | |||
| MEXICO (continued) | |||
| Financials—1.8% | |||
| Grupo Financiero Banorte SAB de CV, Class O | 4,466,126 | $ 38,705,846 | |
| Industrials—1.0% | |||
| Grupo Aeroportuario del Sureste SAB de CV, B Shares | 735,717 | 21,076,546 | |
| Materials—1.3% | |||
| Southern Copper Corp. | 359,751 | 27,639,669 | |
| Total Mexico | 124,484,768 | ||
| NETHERLANDS—1.9% | |||
| Information Technology—1.9% | |||
| ASM International NV | 54,570 | 19,811,607 | |
| ASML Holding NV | 32,882 | 20,867,325 | |
| 40,678,932 | |||
| PERU—0.6% | |||
| Financials—0.6% | |||
| Credicorp Ltd. | 88,980 | 12,055,012 | |
| RUSSIA—0.0% | |||
| Energy—0.0% | |||
| LUKOIL PJSC, ADR(a)(d)(e) | 986,507 | – | |
| Novatek PJSC(d)(e) | 3,278,243 | – | |
| – | |||
| Financials—0.0% | |||
| Sberbank of Russia PJSC(a)(d)(e) | 6,211,074 | – | |
| Total Russia | – | ||
| SAUDI ARABIA—2.8% | |||
| Energy—1.5% | |||
| Saudi Arabian Oil Co.(b) | 3,283,557 | 31,650,397 | |
| Financials—1.3% | |||
| Al Rajhi Bank | 1,413,020 | 29,164,657 | |
| Total Saudi Arabia | 60,815,054 | ||
| SOUTH AFRICA—2.2% | |||
| Financials—1.2% | |||
| Sanlam Ltd. | 8,150,756 | 25,144,030 | |
| Materials—1.0% | |||
| Anglo American Platinum Ltd. | 356,550 | 21,139,301 | |
| Total South Africa | 46,283,331 | ||
| SOUTH KOREA—4.0% | |||
| Industrials—1.7% | |||
| Samsung Engineering Co. Ltd.(a) | 1,672,657 | 36,509,194 | |
| Materials—2.3% | |||
| LG Chem Ltd. | 91,298 | 50,714,508 | |
| Total South Korea | 87,223,702 | ||
| TAIWAN—11.2% | |||
| Information Technology—11.2% | |||
| Delta Electronics, Inc. | 2,326,000 | 22,785,426 | |
| Hon Hai Precision Industry Co. Ltd. | 10,122,000 | 34,491,202 | |
| MediaTek, Inc. | 959,000 | 20,852,342 | |
| Taiwan Semiconductor Manufacturing Co. Ltd., ADR | 10,033,017 | 164,296,608 | |
| 242,425,578 | |||
| Shares | Value | ||
| THAILAND—1.1% | |||
| Financials—1.1% | |||
| Kasikornbank PCL, Foreign Shares | 6,547,800 | $ 24,039,448 | |
| UNITED ARAB EMIRATES—1.3% | |||
| Consumer Discretionary—1.3% | |||
| Americana Restaurants International PLC | 26,614,484 | 28,561,960 | |
| UNITED STATES—0.7% | |||
| Information Technology—0.7% | |||
| Globant SA(a) | 94,025 | 14,749,702 | |
| Total Common Stocks | 1,974,161,284 | ||
| PREFERRED STOCKS—6.7% | |||
| BRAZIL—1.1% | |||
| Financials—1.1% | |||
| Banco Bradesco SA, Preferred Shares, ADR, 1.94% | 8,770,950 | 24,558,660 | |
| SOUTH KOREA—5.6% | |||
| Information Technology—5.6% | |||
| Samsung Electronics Co. Ltd. | 2,888,216 | 120,741,525 | |
| Total Preferred Stocks | 145,300,185 | ||
| SHORT-TERM INVESTMENT—1.7% | |||
| State Street Institutional U.S. Government Money Market Fund, Premier Class, 4.76%(f) | 36,066,663 | 36,066,663 | |
| Total Short-Term Investment | 36,066,663 | ||
| Total Investments (Cost $2,174,939,053)(g)—99.9% | 2,155,528,132 | ||
| Other Assets in Excess of Liabilities—0.1% | 2,892,460 | ||
| Net Assets—100.0% | $2,158,420,592 | ||
| (a) | Non-income producing security. |
| (b) | Denotes a security issued under Regulation S or Rule 144A. |
| (c) | China A Shares. These shares are issued in local currency, traded in the local stock markets and are held through either a Qualified Foreign Institutional Investor (QFII) license or the Shanghai or Shenzhen Hong-Kong Stock Connect program. |
| (d) | Level 3 security. See Note 2(a) of the accompanying Notes to Financial Statements. |
| (e) | The Fund’s adviser has deemed this security to be illiquid based upon procedures approved by the Board of Trustees. Illiquid securities held by the Fund represent 0.00% of net assets as of April 30, 2023. |
| (f) | Registered investment company advised by State Street Global Advisors. The rate shown is the 7 day yield as of April 30, 2023. |
| (g) | See accompanying Notes to Financial Statements for tax unrealized appreciation/(depreciation) of securities. |
| ADR | American Depositary Receipt |
| GDR | Global Depositary Receipt |
| PLC | Public Limited Company |
| 2023 Semi-Annual Report | 19 |
| Average Annual Total Return1 (For the periods ended April 30, 2023) | Six Month2 | 1 Yr. | 5 Yr. | 10 Yr. | |
Class A | w/o SC | 15.65% | (2.14%) | (1.22%) | 0.23% |
| w/SC3 | 9.04% | (7.80%) | (2.38%) | (0.36%) | |
Class C | w/o SC | 15.39% | (2.68%) | (1.82%) | (0.43%) |
| w/SC4 | 14.39% | (3.66%) | (1.82%) | (0.43%) | |
Class R5 | w/o SC | 15.61% | (2.30%) | (1.46%) | (0.03%) |
Institutional Service Class5 | w/o SC | 15.82% | (1.89%) | (0.90%) | 0.52% |
Institutional Class5 | w/o SC | 15.98% | (1.75%) | (0.83%) | 0.60% |
| 1 | The Fund changed its investment strategies effective December 1, 2020. Performance information for periods prior to December 1, 2020 does not reflect the current investment strategy. In connection with the change in investment strategy, the Fund changed its name from Aberdeen International Equity Fund to Aberdeen Emerging Markets Sustainable Leaders Fund. Please consult the Fund’s prospectus for more detail. |
| 2 | Not annualized |
| 3 | A 5.75% front-end sales charge was deducted. |
| 4 | A 1.00% contingent deferred sales charge (CDSC) was deducted from the one year return because it is charged when Class C shares are sold within the first year after purchase. |
| 5 | Not subject to any sales charges. |
| 20 | 2023 Semi-Annual Report |
| Asset Allocation | |
| Common Stocks | 91.8% |
| Preferred Stocks | 7.1% |
| Short-Term Investment | 0.4% |
| Other Assets in Excess of Liabilities | 0.7% |
| 100.0% |
| Sectors | |
| Information Technology | 26.2% |
| Semiconductors & Semiconductor Equipment | 12.5% |
| Technology Hardware, Storage & Peripherals | 6.0% |
| Software | 2.9% |
| Electronic Equipment, Instruments & Components | 2.6% |
| IT Services | 2.2% |
| Financials | 24.7% |
| Consumer Discretionary | 12.2% |
| Consumer Staples | 7.8% |
| Communication Services | 7.1% |
| Industrials | 5.7% |
| Materials | 4.3% |
| Health Care | 4.1% |
| Utilities | 3.7% |
| Real Estate | 3.1% |
| Short-Term Investment | 0.4% |
| Assets in Excess of Other Liabilities | 0.7% |
| 100.0% |
| Top Ten Holdings | |
| Taiwan Semiconductor Manufacturing Co. Ltd., ADR | 8.3% |
| Samsung Electronics Co. Ltd. | 6.0% |
| Tencent Holdings Ltd. | 5.8% |
| Alibaba Group Holding Ltd. | 4.3% |
| Housing Development Finance Corp. Ltd. | 3.9% |
| Grupo Financiero Banorte SAB de CV | 2.8% |
| Power Grid Corp. of India Ltd. | 2.8% |
| LG Chem Ltd. | 2.7% |
| AIA Group Ltd. | 2.5% |
| SBI Life Insurance Co. Ltd. | 2.1% |
| Countries | |
| China | 28.1% |
| India | 15.9% |
| Taiwan | 11.9% |
| South Korea | 8.7% |
| Brazil | 8.2% |
| Hong Kong | 4.8% |
| Mexico | 4.4% |
| Indonesia | 4.3% |
| Netherlands | 2.4% |
| Saudi Arabia | 2.0% |
| Other, less than 2% each | 8.2% |
| Short-Term Investment | 0.4% |
| Assets in Excess of Other Liabilities | 0.7% |
| 100.0% |
| 2023 Semi-Annual Report | 21 |
| Shares | Value | ||
| COMMON STOCKS—91.8% | |||
| AUSTRIA—1.0% | |||
| Materials—1.0% | |||
| Mondi PLC | 48,669 | $ 770,669 | |
| BRAZIL—7.1% | |||
| Consumer Discretionary—1.3% | |||
| MercadoLibre, Inc.(a) | 837 | 1,069,259 | |
| Consumer Staples—3.6% | |||
| Adecoagro SA | 102,134 | 864,054 | |
| Raia Drogasil SA | 270,568 | 1,425,584 | |
| Sendas Distribuidora SA | 249,598 | 615,012 | |
| 2,904,650 | |||
| Industrials—1.1% | |||
| WEG SA | 103,806 | 855,789 | |
| Real Estate—1.1% | |||
| Multiplan Empreendimentos Imobiliarios SA | 163,760 | 850,351 | |
| Total Brazil | 5,680,049 | ||
| CHILE—1.6% | |||
| Financials—1.0% | |||
| Banco Santander Chile, ADR | 43,869 | 840,091 | |
| Materials—0.6% | |||
| Sociedad Quimica y Minera de Chile SA, ADR | 7,151 | 482,550 | |
| Total Chile | 1,322,641 | ||
| CHINA—28.1% | |||
| Communication Services—5.8% | |||
| Tencent Holdings Ltd. | 104,800 | 4,654,808 | |
| Consumer Discretionary—10.9% | |||
| Alibaba Group Holding Ltd.(a) | 325,300 | 3,439,599 | |
| China Tourism Group Duty Free Corp. Ltd., A Shares(a)(b)(c) | 37,700 | 806,454 | |
| JD.com, Inc., A Shares | 60,400 | 1,078,010 | |
| Midea Group Co. Ltd., A Shares (Stock Connect)(c) | 182,029 | 1,494,052 | |
| Tongcheng Travel Holdings Ltd.(a) | 525,600 | 1,118,060 | |
| Zhongsheng Group Holdings Ltd. | 188,500 | 805,180 | |
| 8,741,355 | |||
| Financials—0.7% | |||
| China International Capital Corp. Ltd., H Shares(b) | 281,200 | 590,875 | |
| Health Care—2.8% | |||
| Shenzhen Mindray Bio-Medical Electronics Co. Ltd., A Shares (Stock Connect)(c) | 28,731 | 1,295,901 | |
| Wuxi Biologics Cayman, Inc.(a)(b) | 162,000 | 965,979 | |
| 2,261,880 | |||
| Industrials—3.2% | |||
| Centre Testing International Group Co. Ltd., A Shares(c) | 253,180 | 704,752 | |
| Contemporary Amperex Technology Co. Ltd., A Shares(c) | 36,360 | 1,216,700 | |
| NARI Technology Co. Ltd., A Shares (Stock Connect)(c) | 171,016 | 646,441 | |
| 2,567,893 | |||
| Information Technology—3.7% | |||
| Glodon Co. Ltd., A Shares(c) | 114,040 | 956,106 | |
| Shares | Value | ||
| Hundsun Technologies, Inc., A Shares(c) | 186,926 | $ 1,336,769 | |
| LONGi Green Energy Technology Co. Ltd., A Shares(c) | 135,687 | 685,411 | |
| 2,978,286 | |||
| Real Estate—1.0% | |||
| China Vanke Co. Ltd., H Shares | 496,100 | 775,550 | |
| Total China | 22,570,647 | ||
| HONG KONG—4.8% | |||
| Consumer Staples—1.0% | |||
| Vitasoy International Holdings Ltd. | 440,000 | 778,287 | |
| Financials—3.8% | |||
| AIA Group Ltd. | 186,900 | 2,034,794 | |
| Hong Kong Exchanges & Clearing Ltd. | 25,800 | 1,071,136 | |
| 3,105,930 | |||
| Total Hong Kong | 3,884,217 | ||
| INDIA—15.9% | |||
| Consumer Staples—1.6% | |||
| Hindustan Unilever Ltd. | 43,284 | 1,303,205 | |
| Financials—7.7% | |||
| Housing Development Finance Corp. Ltd. | 92,719 | 3,152,734 | |
| Kotak Mahindra Bank Ltd. | 56,817 | 1,348,724 | |
| SBI Life Insurance Co. Ltd.(b) | 122,037 | 1,704,882 | |
| 6,206,340 | |||
| Health Care—1.3% | |||
| Syngene International Ltd.(b) | 123,780 | 1,025,298 | |
| Information Technology—1.6% | |||
| Tata Consultancy Services Ltd. | 33,244 | 1,312,622 | |
| Utilities—3.7% | |||
| Power Grid Corp. of India Ltd. | 775,135 | 2,245,392 | |
| ReNew Energy Global PLC, Class A(a) | 132,293 | 677,340 | |
| 2,922,732 | |||
| Total India | 12,770,197 | ||
| INDONESIA—4.3% | |||
| Communication Services—1.3% | |||
| Telkom Indonesia Persero Tbk PT(d) | 3,610,000 | 1,045,632 | |
| Financials—3.0% | |||
| Bank Central Asia Tbk PT(d) | 1,446,200 | 894,982 | |
| Bank Rakyat Indonesia Persero Tbk PT | 4,380,500 | 1,526,513 | |
| 2,421,495 | |||
| Total Indonesia | 3,467,127 | ||
| KAZAKHSTAN—1.3% | |||
| Financials—1.3% | |||
| Kaspi.KZ JSC, GDR(b)(d) | 12,728 | 1,051,715 | |
| MEXICO—4.4% | |||
| Consumer Staples—1.6% | |||
| Fomento Economico Mexicano SAB de CV, ADR | 13,273 | 1,287,746 | |
| Financials—2.8% | |||
| Grupo Financiero Banorte SAB de CV, Class O | 261,747 | 2,268,440 | |
| Total Mexico | 3,556,186 | ||
| 22 | 2023 Semi-Annual Report |
| Shares | Value | ||
| COMMON STOCKS (continued) | |||
| NETHERLANDS—2.4% | |||
| Information Technology—2.4% | |||
| ASM International NV | 2,453 | $ 890,560 | |
| ASML Holding NV | 1,609 | 1,021,092 | |
| 1,911,652 | |||
| PHILIPPINES—1.0% | |||
| Real Estate—1.0% | |||
| Ayala Land, Inc. | 1,723,300 | 832,873 | |
| POLAND—1.4% | |||
| Industrials—1.4% | |||
| InPost SA(a) | 101,561 | 1,090,039 | |
| SAUDI ARABIA—2.0% | |||
| Financials—2.0% | |||
| Al Rajhi Bank | 75,968 | 1,567,975 | |
| SOUTH AFRICA—1.3% | |||
| Financials—1.3% | |||
| Sanlam Ltd. | 333,479 | 1,028,740 | |
| SOUTH KOREA—2.7% | |||
| Materials—2.7% | |||
| LG Chem Ltd. | 3,973 | 2,206,935 | |
| TAIWAN—11.9% | |||
| Information Technology—11.9% | |||
| Chroma ATE, Inc. | 146,000 | 906,324 | |
| Hon Hai Precision Industry Co. Ltd. | 346,000 | 1,179,012 | |
| MediaTek, Inc. | 36,000 | 782,778 | |
| Taiwan Semiconductor Manufacturing Co. Ltd., ADR | 407,000 | 6,664,866 | |
| 9,532,980 | |||
| UNITED STATES—0.6% | |||
| Information Technology—0.6% | |||
| Globant SA(a) | 3,119 | 489,278 | |
| Total Common Stocks | 73,733,920 | ||
| PREFERRED STOCKS—7.1% | |||
| BRAZIL—1.1% | |||
| Financials—1.1% | |||
| Banco Bradesco SA, Preferred Shares, ADR, 1.94% | 318,494 | 891,783 | |
| SOUTH KOREA—6.0% | |||
| Information Technology—6.0% | |||
| Samsung Electronics Co. Ltd. | 113,823 | 4,758,357 | |
| Total Preferred Stocks | 5,650,140 | ||
| SHORT-TERM INVESTMENT—0.4% | |||
| State Street Institutional U.S. Government Money Market Fund, Premier Class, 4.76%(e) | 375,921 | 375,921 | |
| Total Short-Term Investment | 375,921 | ||
| Total Investments (Cost $94,287,378)(f)—99.3% | 79,759,981 | ||
| Other Assets in Excess of Liabilities—0.7% | 528,917 | ||
| Net Assets—100.0% | $80,288,898 | ||
| (a) | Non-income producing security. |
| (b) | Denotes a security issued under Regulation S or Rule 144A. |
| (c) | China A Shares. These shares are issued in local currency, traded in the local stock markets and are held through either a Qualified Foreign Institutional Investor (QFII) license or the Shanghai or Shenzhen Hong-Kong Stock Connect program. |
| (d) | Illiquid security. |
| (e) | Registered investment company advised by State Street Global Advisors. The rate shown is the 7 day yield as of April 30, 2023. |
| (f) | See accompanying Notes to Financial Statements for tax unrealized appreciation/(depreciation) of securities. |
| ADR | American Depositary Receipt |
| GDR | Global Depositary Receipt |
| PLC | Public Limited Company |
| 2023 Semi-Annual Report | 23 |
| Average Annual Total Return1 (For the periods ended April 30, 2023)2 | Six Month3 | 1 Yr. | 5 Yr. | 10 Yr. | |
Class A | w/o SC | 14.21% | 3.95% | 5.94% | 4.15% |
| w/SC4 | 7.62% | (2.06%) | 4.70% | 3.53% | |
Institutional Class5 | w/o SC | 14.37% | 4.21% | 6.21% | 4.42% |
| 1 | Returns prior to December 3, 2021 reflect the performance of a predecessor fund (the “Predecessor Fund”). Returns of the Predecessor Fund have not been adjusted to reflect the expenses applicable to the respective classes. The Fund and the Predecessor Fund have substantially similar investment objectives and strategies. Please consult the Fund’s prospectus for more detail. |
| 2 | Performance shown for periods after February 1, 2017 reflect the Fund’s receipt of payment from some European jurisdictions related to prior years in accordance with European Union law under Article 63 of the Treaty on the Functioning of the European Union (the “Article 63 EU Tax Reclaims”). The receipt of these extraordinary payments and accrual of anticipated payments increased the Fund’s performance for all periods that include February 2017, October 2017, August 2018, February 2019, September 2019, June 2022, and October 2022 in a manner that may not recur in the future, and the Fund’s performance was significantly higher than it would have been absent receipt of the Article 63 EU Tax Reclaims. At the time of receipt or accrual of the income and related taxes, including any adjustment in taxes previously estimated for similar payments, those payments and accruals resulted in an increase in net assets of approximately 3.1%, 0.3%, 0.9%, 2.1% and 2.0%, in 2017, 2018, 2019, 2022 and 2023, respectively. Past returns would have been higher had the Fund not originally paid the withholding taxes that relate to the EU reclaims that are now being returned. There can be no assurance that the Fund will receive additional Article 63 EU Tax Reclaim payments or maintain this level of performance in the future. |
| 3 | Not annualized |
| 4 | A 5.75% front-end sales charge was deducted. |
| 5 | Not subject to any sales charges. |

| 24 | 2023 Semi-Annual Report |
| Asset Allocation | |
| Common Stocks | 101.0% |
| Short-Term Investment | 2.1% |
| Liabilities in Excess of Other Assets | (3.1%) |
| 100.0% |
| Sectors | |
| Health Care | 24.7% |
| Industrials | 23.1% |
| Financials | 20.5% |
| Information Technology | 8.8% |
| Utilities | 7.3% |
| Real Estate | 7.1% |
| Materials | 4.0% |
| Consumer Discretionary | 3.4% |
| Consumer Staples | 2.1% |
| Short-Term Investment | 2.1% |
| Liabilities in Excess of Other Assets | (3.1%) |
| 100.0% |
| Top Ten Holdings | |
| AstraZeneca PLC | 5.2% |
| Novo Nordisk AS | 5.0% |
| Housing Development Finance Corp. Ltd. | 4.7% |
| UnitedHealth Group, Inc. | 4.7% |
| Schneider Electric SE | 4.6% |
| Tetra Tech, Inc. | 4.5% |
| AIA Group Ltd. | 4.1% |
| AXA SA | 3.6% |
| Merck & Co., Inc. | 3.6% |
| RELX PLC | 3.3% |
| Countries | |
| United States | 49.3% |
| United Kingdom | 9.8% |
| Denmark | 7.1% |
| India | 5.9% |
| Hong Kong | 4.1% |
| France | 3.6% |
| South Korea | 3.0% |
| Indonesia | 2.9% |
| Netherlands | 2.8% |
| Brazil | 2.3% |
| Other, less than 2% each | 10.2% |
| Short-Term Investment | 2.1% |
| Liabilities in Excess of Other Assets | (3.1%) |
| 100.0% |
| 2023 Semi-Annual Report | 25 |
| Shares | Value | ||
| COMMON STOCKS—101.0% | |||
| BRAZIL—2.3% | |||
| Consumer Discretionary—1.0% | |||
| MercadoLibre, Inc. | 410 | $ 523,771 | |
| Financials—1.3% | |||
| Banco Bradesco SA | 253,049 | 630,111 | |
| Total Brazil | 1,153,882 | ||
| CHINA—1.4% | |||
| Health Care—1.4% | |||
| Wuxi Biologics Cayman, Inc.(a)(b) | 116,000 | 691,689 | |
| DENMARK—7.1% | |||
| Health Care—5.0% | |||
| Novo Nordisk AS, Class B(a) | 15,161 | 2,522,098 | |
| Industrials—1.2% | |||
| Vestas Wind Systems AS | 22,305 | 617,193 | |
| Utilities—0.9% | |||
| Orsted AS | 5,193 | 466,072 | |
| Total Denmark | 3,605,363 | ||
| FRANCE—3.6% | |||
| Financials—3.6% | |||
| AXA SA | 55,962 | 1,826,610 | |
| HONG KONG—4.1% | |||
| Financials—4.1% | |||
| AIA Group Ltd. | 190,100 | 2,069,632 | |
| INDIA—5.9% | |||
| Financials—4.7% | |||
| Housing Development Finance Corp. Ltd. | 69,861 | 2,375,491 | |
| Utilities—1.2% | |||
| ReNew Energy Global PLC, Class A | 120,638 | 617,667 | |
| Total India | 2,993,158 | ||
| INDONESIA—2.9% | |||
| Financials—2.9% | |||
| Bank Rakyat Indonesia Persero Tbk PT | 4,229,095 | 1,473,751 | |
| ISRAEL—0.7% | |||
| Industrials—0.7% | |||
| Kornit Digital Ltd. | 20,754 | 378,968 | |
| JAPAN—1.0% | |||
| Consumer Discretionary—1.0% | |||
| LITALICO, Inc.(b) | 27,400 | 491,005 | |
| MEXICO—1.9% | |||
| Financials—1.9% | |||
| Gentera SAB de CV | 860,428 | 945,636 | |
| NETHERLANDS—2.8% | |||
| Information Technology—2.8% | |||
| ASML Holding NV | 2,257 | 1,432,320 | |
| REPUBLIC OF IRELAND—1.7% | |||
| Industrials—1.7% | |||
| Kingspan Group PLC(b) | 12,572 | 871,236 | |
| SOUTH AFRICA—0.9% | |||
| Consumer Staples—0.9% | |||
| Clicks Group Ltd. | 31,974 | 467,292 | |
| Shares | Value | ||
| SOUTH KOREA—3.0% | |||
| Information Technology—3.0% | |||
| Samsung SDI Co. Ltd. | 2,946 | $ 1,528,891 | |
| SWITZERLAND—1.2% | |||
| Materials—1.2% | |||
| DSM-Firmenich AG(b) | 4,458 | 583,382 | |
| TAIWAN—1.4% | |||
| Industrials—1.4% | |||
| Voltronic Power Technology Corp. | 12,610 | 725,075 | |
| UNITED KINGDOM—9.8% | |||
| Health Care—5.2% | |||
| AstraZeneca PLC | 17,953 | 2,642,016 | |
| Industrials—3.3% | |||
| RELX PLC(b) | 50,161 | 1,671,299 | |
| Utilities—1.3% | |||
| SSE PLC | 27,133 | 626,044 | |
| Total United Kingdom | 4,939,359 | ||
| UNITED STATES—49.3% | |||
| Consumer Discretionary—1.4% | |||
| Coursera, Inc.(b) | 55,147 | 686,029 | |
| Consumer Staples—1.2% | |||
| Darling Ingredients, Inc.(b) | 10,594 | 631,084 | |
| Financials—2.0% | |||
| Hannon Armstrong Sustainable Infrastructure Capital, Inc. | 36,242 | 1,028,548 | |
| Health Care—13.1% | |||
| GSK PLC | 55,827 | 1,006,737 | |
| Insulet Corp.(b) | 4,522 | 1,438,177 | |
| Merck & Co., Inc. | 15,730 | 1,816,343 | |
| UnitedHealth Group, Inc.(b) | 4,821 | 2,372,366 | |
| 6,633,623 | |||
| Industrials—14.8% | |||
| Johnson Controls International PLC | 20,018 | 1,197,877 | |
| Schneider Electric SE(b) | 13,264 | 2,313,133 | |
| Shoals Technologies Group, Inc., Class A(b) | 31,374 | 655,403 | |
| Tetra Tech, Inc. | 16,330 | 2,259,582 | |
| Westinghouse Air Brake Technologies Corp.(a)(b) | 10,704 | 1,045,460 | |
| 7,471,455 | |||
| Information Technology—3.0% | |||
| Analog Devices, Inc. | 8,440 | 1,518,187 | |
| Materials—2.8% | |||
| Crown Holdings, Inc. | 16,273 | 1,395,898 | |
| Real Estate—7.1% | |||
| American Tower Corp., REIT | 5,744 | 1,174,016 | |
| Equinix, Inc., REIT | 1,101 | 797,212 | |
| Prologis, Inc., REIT | 12,746 | 1,596,437 | |
| 3,567,665 | |||
| Utilities—3.9% | |||
| American Water Works Co., Inc. | 6,700 | 993,275 | |
| NextEra Energy, Inc. | 13,030 | 998,489 | |
| 1,991,764 | |||
| Total United States | 24,924,253 | ||
| Total Common Stocks | 51,101,502 | ||
| 26 | 2023 Semi-Annual Report |
| Shares | Value | ||
| SHORT-TERM INVESTMENT—2.1% | |||
| State Street Institutional U.S. Government Money Market Fund, Premier Class, 4.76%(c) | 1,060,220 | $ 1,060,220 | |
| Total Short-Term Investment | 1,060,220 | ||
| Total Investments (Cost $47,402,817)(d)—103.1% | 52,161,722 | ||
| Liabilities in Excess of Other Assets—(3.1%) | (1,575,506) | ||
| Net Assets—100.0% | $50,586,216 | ||
| (a) | Denotes a security issued under Regulation S or Rule 144A. |
| (b) | Non-income producing security. |
| (c) | Registered investment company advised by State Street Global Advisors. The rate shown is the 7 day yield as of April 30, 2023. |
| (d) | See accompanying Notes to Financial Statements for tax unrealized appreciation/(depreciation) of securities. |
| PLC | Public Limited Company |
| REIT | Real Estate Investment Trust |
| 2023 Semi-Annual Report | 27 |
| Average Annual Total Return1 (For the periods ended April 30, 2023) | Six Month2 | 1 Yr. | 5 Yr. | 10 Yr. | |
Class A | w/o SC | 14.43% | 3.34% | 7.30% | 6.46% |
| w/SC3 | 7.84% | (2.62%) | 6.03% | 5.83% | |
Institutional Class4 | w/o SC | 14.55% | 3.60% | 7.57% | 6.73% |
| 1 | Returns prior to May 7, 2018 reflect the performance of a predecessor fund (the “Predecessor Fund”). Returns of the Predecessor Fund have not been adjusted to reflect the expenses applicable to the respective classes. The Fund and the Predecessor Fund have substantially similar investment objectives and strategies. Please consult the Fund’s prospectus for more detail. |
| 2 | Not annualized |
| 3 | A 5.75% front-end sales charge was deducted. |
| 4 | Not subject to any sales charges. |

| 28 | 2023 Semi-Annual Report |
| Asset Allocation | |
| Common Stocks | 98.8% |
| Short-Term Investment | 1.0% |
| Other Assets in Excess of Liabilities | 0.2% |
| 100.0% |
| Sectors | |
| Industrials | 36.6% |
| Transportation Infrastructure | 16.1% |
| Construction & Engineering | 9.4% |
| Ground Transportation | 8.9% |
| Commercial Services & Supplies | 2.2% |
| Utilities | 32.4% |
| Multi-Utilities | 11.4% |
| Electric Utilities | 11.3% |
| Independent Power Producers & Energy Traders | 9.7% |
| Communication Services | 13.5% |
| Energy | 9.9% |
| Real Estate | 3.9% |
| Materials | 2.2% |
| Information Technology | 0.3% |
| Short-Term Investment | 1.0% |
| Assets in Excess of Other Liabilities | 0.2% |
| 100.0% |
| Top Ten Holdings | |
| Ferrovial SA | 3.1% |
| Aena SME SA | 3.1% |
| Vinci SA | 3.0% |
| Engie SA | 3.0% |
| Cellnex Telecom SA | 2.9% |
| CCR SA | 2.9% |
| Enbridge, Inc. | 2.9% |
| Kinder Morgan, Inc. | 2.8% |
| Williams Cos., Inc. (The) | 2.8% |
| RWE AG | 2.8% |
| Countries | |
| United States | 32.3% |
| France | 12.8% |
| Spain | 11.2% |
| Italy | 6.6% |
| Canada | 6.2% |
| Brazil | 5.7% |
| United Kingdom | 5.0% |
| Mexico | 3.5% |
| Germany | 2.8% |
| Philippines | 2.2% |
| Other, less than 2% each | 10.5% |
| Short-Term Investment | 1.0% |
| Assets in Excess of Other Liabilities | 0.2% |
| 100.0% |
| 2023 Semi-Annual Report | 29 |
| Shares | Value | ||
| COMMON STOCKS—98.8% | |||
| ARGENTINA—1.7% | |||
| Industrials—0.8% | |||
| Corp. America Airports SA(a) | 36,800 | $ 393,392 | |
| Materials—0.9% | |||
| Loma Negra Cia Industrial Argentina SA, ADR | 79,600 | 487,152 | |
| Total Argentina | 880,544 | ||
| AUSTRALIA—1.0% | |||
| Industrials—1.0% | |||
| Aurizon Holdings Ltd. | 219,000 | 497,929 | |
| BRAZIL—5.7% | |||
| Industrials—4.6% | |||
| CCR SA | 543,400 | 1,478,395 | |
| Rumo SA | 218,100 | 861,416 | |
| 2,339,811 | |||
| Utilities—1.1% | |||
| Omega Energia SA(a) | 294,907 | 546,321 | |
| Total Brazil | 2,886,132 | ||
| CANADA—6.2% | |||
| Energy—2.9% | |||
| Enbridge, Inc. | 37,000 | 1,471,152 | |
| Industrials—2.2% | |||
| Canadian Pacific Kansas City Ltd. | 14,500 | 1,143,180 | |
| Utilities—1.1% | |||
| Algonquin Power & Utilities Corp. | 63,300 | 538,226 | |
| Total Canada | 3,152,558 | ||
| CHINA—0.3% | |||
| Information Technology—0.3% | |||
| GDS Holdings Ltd., ADR(a) | 10,400 | 161,512 | |
| FRANCE—12.8% | |||
| Industrials—7.5% | |||
| Eiffage SA | 11,000 | 1,309,262 | |
| Getlink SE | 52,900 | 988,661 | |
| Vinci SA | 12,200 | 1,509,033 | |
| 3,806,956 | |||
| Utilities—5.3% | |||
| Engie SA | 93,100 | 1,489,999 | |
| Veolia Environnement SA | 37,000 | 1,171,603 | |
| 2,661,602 | |||
| Total France | 6,468,558 | ||
| GERMANY—2.8% | |||
| Utilities—2.8% | |||
| RWE AG(a) | 30,000 | 1,406,587 | |
| GUATEMALA—0.7% | |||
| Communication Services—0.7% | |||
| Millicom International Cellular SA, SDR(a) | 18,610 | 333,794 | |
| INDONESIA—0.8% | |||
| Communication Services—0.8% | |||
| Sarana Menara Nusantara Tbk PT | 5,845,200 | 409,355 | |
| ITALY—6.6% | |||
| Communication Services—2.5% | |||
| Infrastrutture Wireless Italiane SpA(b) | 92,200 | 1,279,692 | |
| Shares | Value | ||
| Materials—1.3% | |||
| Buzzi Unicem SpA | 26,500 | $ 658,945 | |
| Utilities—2.8% | |||
| Enel SpA | 203,500 | 1,390,335 | |
| Total Italy | 3,328,972 | ||
| LUXEMBOURG—0.7% | |||
| Communication Services—0.7% | |||
| SES SA | 54,800 | 339,904 | |
| MALAYSIA—1.7% | |||
| Industrials—1.7% | |||
| Malaysia Airports Holdings Bhd | 550,100 | 870,640 | |
| MEXICO—3.5% | |||
| Industrials—3.5% | |||
| Grupo Aeroportuario del Centro Norte SAB de CV | 70,900 | 777,792 | |
| Promotora y Operadora de Infraestructura SAB de CV | 96,400 | 1,003,221 | |
| 1,781,013 | |||
| NIGERIA—1.0% | |||
| Communication Services—1.0% | |||
| IHS Holding Ltd.(a) | 51,500 | 496,975 | |
| NORWAY—1.1% | |||
| Communication Services—1.1% | |||
| Telenor ASA | 46,300 | 577,738 | |
| PHILIPPINES—2.2% | |||
| Industrials—2.2% | |||
| International Container Terminal Services, Inc. | 284,600 | 1,116,111 | |
| SPAIN—11.2% | |||
| Communication Services—2.9% | |||
| Cellnex Telecom SA(a)(b) | 35,200 | 1,482,061 | |
| Industrials—6.2% | |||
| Aena SME SA(a)(b) | 9,400 | 1,583,119 | |
| Ferrovial SA | 50,505 | 1,583,504 | |
| 3,166,623 | |||
| Utilities—2.1% | |||
| EDP Renovaveis SA(a) | 47,300 | 1,051,369 | |
| Total Spain | 5,700,053 | ||
| TANZANIA—1.5% | |||
| Communication Services—1.5% | |||
| Helios Towers PLC(a) | 577,600 | 754,990 | |
| UNITED KINGDOM—5.0% | |||
| Communication Services—1.2% | |||
| Vodafone Group PLC | 502,900 | 604,046 | |
| Industrials—0.9% | |||
| National Express Group PLC | 295,500 | 451,614 | |
| Utilities—2.9% | |||
| National Grid PLC, ADR | 11,200 | 802,480 | |
| SSE PLC | 29,396 | 678,259 | |
| 1,480,739 | |||
| Total United Kingdom | 2,536,399 | ||
| 30 | 2023 Semi-Annual Report |
| Shares | Value | ||
| COMMON STOCKS (continued) | |||
| UNITED STATES—32.3% | |||
| Communication Services—1.1% | |||
| DISH Network Corp., Class A(a) | 15,200 | $ 114,152 | |
| Verizon Communications, Inc. | 11,000 | 427,130 | |
| 541,282 | |||
| Energy—7.0% | |||
| Cheniere Energy, Inc. | 4,700 | 719,100 | |
| Kinder Morgan, Inc. | 83,400 | 1,430,310 | |
| Williams Cos., Inc. (The) | 47,000 | 1,422,220 | |
| 3,571,630 | |||
| Industrials—6.0% | |||
| CoreCivic, Inc., REIT(a) | 58,200 | 511,578 | |
| Dycom Industries, Inc.(a) | 4,000 | 370,480 | |
| Norfolk Southern Corp. | 3,400 | 690,302 | |
| Union Pacific Corp. | 4,400 | 861,080 | |
| Waste Connections, Inc. | 4,400 | 612,260 | |
| 3,045,700 | |||
| Real Estate—3.9% | |||
| American Tower Corp., REIT | 5,400 | 1,103,706 | |
| Crown Castle, Inc., REIT | 7,200 | 886,248 | |
| 1,989,954 | |||
| Utilities—14.3% | |||
| American Electric Power Co., Inc. | 8,500 | 785,570 | |
| CenterPoint Energy, Inc. | 27,800 | 847,066 | |
| Clearway Energy, Inc., Class C | 20,600 | 625,622 | |
| CMS Energy Corp. | 14,100 | 877,866 | |
| FirstEnergy Corp. | 22,300 | 887,540 | |
| NextEra Energy Partners LP | 8,800 | 506,088 | |
| NextEra Energy, Inc. | 15,500 | 1,187,765 | |
| PPL Corp. | 26,800 | 769,696 | |
| Vistra Corp. | 32,000 | 763,520 | |
| 7,250,733 | |||
| Total United States | 16,399,299 | ||
| Total Common Stocks | 50,099,063 | ||
| SHORT-TERM INVESTMENT—1.0% | |||
| State Street Institutional U.S. Government Money Market Fund, Premier Class, 4.76%(c) | 494,819 | 494,819 | |
| Total Short-Term Investment | 494,819 | ||
| Total Investments (Cost $42,200,653)(d)—99.8% | 50,593,882 | ||
| Other Assets in Excess of Liabilities—0.2% | 105,518 | ||
| Net Assets—100.0% | $50,699,400 | ||
| (a) | Non-income producing security. |
| (b) | Denotes a security issued under Regulation S or Rule 144A. |
| (c) | Registered investment company advised by State Street Global Advisors. The rate shown is the 7 day yield as of April 30, 2023. |
| (d) | See accompanying Notes to Financial Statements for tax unrealized appreciation/(depreciation) of securities. |
| ADR | American Depositary Receipt |
| PLC | Public Limited Company |
| REIT | Real Estate Investment Trust |
| 2023 Semi-Annual Report | 31 |
| Average Annual Total Return1 (For the periods ended April 30, 2023) | Six Month2 | 1 Yr. | 5 Yr. | 10 Yr. | |
Class A | w/o SC | 15.42% | (3.70%) | 2.88% | 4.89% |
| w/SC3 | 8.78% | (9.24%) | 1.66% | 4.27% | |
Class C | w/o SC | 15.03% | (4.34%) | 2.20% | 4.20% |
| w/SC4 | 14.03% | (5.29%) | 2.20% | 4.20% | |
Class R5 | w/o SC | 15.25% | (3.99%) | 2.57% | 4.58% |
Institutional Class | w/o SC | 15.56% | (3.42%) | 3.23% | 5.24% |
| 1 | The Fund changed its investment strategy effective February 29, 2016. Performance information for periods prior to February 29, 2016 does not reflect the current investment strategy. Please consult the Fund’s prospectus for more detail. |
| 2 | Not annualized |
| 3 | A 5.75% front-end sales charge was deducted. |
| 4 | A 1.00% contingent deferred sales charge (CDSC) was deducted from the one year return because it is charged when Class C shares are sold within the first year after purchase. |
| 5 | Not subject to any sales charges. |

| 32 | 2023 Semi-Annual Report |
| Asset Allocation | |
| Common Stocks | 95.3% |
| Preferred Stocks | 2.0% |
| Short-Term Investment | 1.2% |
| Other Assets in Excess of Liabilities | 1.5% |
| 100.0% |
| Sectors | |
| Industrials | 25.5% |
| Life Sciences Tools & Services | 4.4% |
| Professional Services | 4.0% |
| Trading Companies & Distributors | 3.7% |
| Construction & Engineering | 3.0% |
| Transportation Infrastructure | 2.9% |
| Electrical Equipment | 2.9% |
| Commercial Services & Supplies | 2.5% |
| Marine Transportation | 2.1% |
| Information Technology | 21.7% |
| Health Care | 13.6% |
| Consumer Staples | 9.8% |
| Communication Services | 9.2% |
| Financials | 7.6% |
| Consumer Discretionary | 7.5% |
| Energy | 2.4% |
| Short-Term Investment | 1.2% |
| Assets in Excess of Other Liabilities | 1.5% |
| 100.0% |
| Top Ten Holdings | |
| Dechra Pharmaceuticals PLC | 3.8% |
| Chroma ATE, Inc. | 3.8% |
| CTS Eventim AG & Co. KGaA | 3.5% |
| WNS Holdings Ltd., ADR | 3.3% |
| Steadfast Group Ltd. | 3.3% |
| Interparfums SA | 3.2% |
| TechnoPro Holdings, Inc. | 3.1% |
| SHO-BOND Holdings Co. Ltd. | 3.0% |
| Games Workshop Group PLC | 3.0% |
| Voltronic Power Technology Corp. | 2.9% |
| Countries | |
| Japan | 14.3% |
| United Kingdom | 9.6% |
| Taiwan | 9.5% |
| India | 8.4% |
| Australia | 6.7% |
| France | 5.6% |
| Germany | 5.5% |
| Israel | 5.3% |
| Sweden | 4.6% |
| Mexico | 2.9% |
| Switzerland | 2.8% |
| Canada | 2.7% |
| Belgium | 2.7% |
| Poland | 2.5% |
| Netherlands | 2.2% |
| Vietnam | 2.1% |
| Hong Kong | 2.1% |
| Republic of Ireland | 2.1% |
| Italy | 2.0% |
| Other, less than 2% each | 3.7% |
| Short-Term Investment | 1.2% |
| Assets in Excess of Other Liabilities | 1.5% |
| 100.0% |
| 2023 Semi-Annual Report | 33 |
| Shares | Value | ||
| COMMON STOCKS—95.3% | |||
| AUSTRALIA—6.7% | |||
| Consumer Discretionary—2.5% | |||
| IDP Education Ltd. | 236,987 | $ 4,452,220 | |
| Financials—3.3% | |||
| Steadfast Group Ltd. | 1,474,185 | 5,811,834 | |
| Industrials—0.9% | |||
| IPH Ltd. | 284,404 | 1,538,533 | |
| Total Australia | 11,802,587 | ||
| BELGIUM—2.7% | |||
| Industrials—2.7% | |||
| Azelis Group NV | 198,200 | 4,702,191 | |
| CANADA—2.7% | |||
| Consumer Staples—2.7% | |||
| Jamieson Wellness, Inc.(a) | 193,466 | 4,777,925 | |
| CHINA—0.9% | |||
| Communication Services—0.9% | |||
| Autohome, Inc., ADR | 51,270 | 1,520,155 | |
| FRANCE—5.6% | |||
| Consumer Staples—3.2% | |||
| Interparfums SA | 71,651 | 5,691,448 | |
| Energy—2.4% | |||
| Gaztransport Et Technigaz SA | 38,962 | 4,166,643 | |
| Total France | 9,858,091 | ||
| GERMANY—3.5% | |||
| Communication Services—3.5% | |||
| CTS Eventim AG & Co. KGaA(b) | 92,178 | 6,073,165 | |
| HONG KONG—2.1% | |||
| Industrials—2.1% | |||
| Pacific Basin Shipping Ltd. | 10,636,800 | 3,701,140 | |
| INDIA—8.4% | |||
| Communication Services—2.6% | |||
| Affle India Ltd.(b) | 396,334 | 4,535,742 | |
| Health Care—2.5% | |||
| Syngene International Ltd.(a) | 521,658 | 4,321,012 | |
| Information Technology—3.3% | |||
| WNS Holdings Ltd., ADR(b) | 65,190 | 5,878,182 | |
| Total India | 14,734,936 | ||
| ISRAEL—5.3% | |||
| Information Technology—5.3% | |||
| CyberArk Software Ltd.(b) | 35,336 | 4,402,866 | |
| Nova Ltd.(b) | 52,621 | 4,812,190 | |
| 9,215,056 | |||
| ITALY—2.0% | |||
| Financials—2.0% | |||
| FinecoBank Banca Fineco SpA | 225,477 | 3,417,710 | |
| JAPAN—14.3% | |||
| Consumer Discretionary—2.0% | |||
| Asics Corp. | 122,800 | 3,432,422 | |
| Health Care—1.3% | |||
| Mani, Inc. | 170,800 | 2,235,194 | |
| Industrials—11.0% | |||
| Daiseki Co. Ltd. | 153,000 | 4,377,388 | |
| Shares | Value | ||
| Nabtesco Corp. | 179,900 | $ 4,336,223 | |
| SHO-BOND Holdings Co. Ltd. | 122,100 | 5,218,056 | |
| TechnoPro Holdings, Inc. | 198,300 | 5,410,353 | |
| 19,342,020 | |||
| Total Japan | 25,009,636 | ||
| MEXICO—2.9% | |||
| Industrials—2.9% | |||
| Grupo Aeroportuario del Sureste SAB de CV, B Shares | 174,970 | 5,012,475 | |
| NETHERLANDS—2.2% | |||
| Information Technology—2.2% | |||
| BE Semiconductor Industries NV | 42,107 | 3,790,204 | |
| POLAND—2.5% | |||
| Consumer Staples—2.5% | |||
| Dino Polska SA(a)(b) | 43,561 | 4,442,492 | |
| REPUBLIC OF IRELAND—2.1% | |||
| Information Technology—2.1% | |||
| Keywords Studios PLC | 105,828 | 3,600,144 | |
| ROMANIA—1.4% | |||
| Information Technology—1.4% | |||
| Endava PLC, ADR(b) | 43,911 | 2,527,956 | |
| SOUTH AFRICA—1.4% | |||
| Consumer Staples—1.4% | |||
| Clicks Group Ltd. | 163,182 | 2,384,861 | |
| SWEDEN—4.6% | |||
| Communication Services—1.3% | |||
| Hemnet Group AB | 142,335 | 2,331,757 | |
| Financials—2.3% | |||
| Nordnet AB publ | 249,296 | 3,919,293 | |
| Industrials—1.0% | |||
| AddTech AB, Class B | 90,246 | 1,808,727 | |
| Total Sweden | 8,059,777 | ||
| SWITZERLAND—2.8% | |||
| Health Care—2.8% | |||
| SKAN Group AG | 50,485 | 4,868,610 | |
| TAIWAN—9.5% | |||
| Health Care—1.3% | |||
| Universal Vision Biotechnology Co. Ltd. | 175,000 | 2,291,173 | |
| Industrials—2.9% | |||
| Voltronic Power Technology Corp. | 88,500 | 5,088,753 | |
| Information Technology—5.3% | |||
| Chroma ATE, Inc. | 1,063,000 | 6,598,784 | |
| Sinbon Electronics Co. Ltd. | 240,000 | 2,660,960 | |
| 9,259,744 | |||
| Total Taiwan | 16,639,670 | ||
| UNITED KINGDOM—9.6% | |||
| Communication Services—0.9% | |||
| Future PLC | 114,968 | 1,631,377 | |
| Consumer Discretionary—3.0% | |||
| Games Workshop Group PLC | 41,722 | 5,207,656 | |
| 34 | 2023 Semi-Annual Report |
| Shares | Value | ||
| COMMON STOCKS (continued) | |||
| UNITED KINGDOM (continued) | |||
| Health Care—5.7% | |||
| Dechra Pharmaceuticals PLC | 140,677 | $ 6,603,527 | |
| Genus PLC | 101,720 | 3,439,187 | |
| 10,042,714 | |||
| Total United Kingdom | 16,881,747 | ||
| VIETNAM—2.1% | |||
| Information Technology—2.1% | |||
| FPT Corp. | 1,128,740 | 3,737,126 | |
| Total Common Stocks | 166,757,654 | ||
| PREFERRED STOCKS—2.0% | |||
| GERMANY—2.0% | |||
| Industrials—2.0% | |||
| Jungheinrich AG | 91,537 | 3,547,951 | |
| Total Preferred Stocks | 3,547,951 | ||
| SHORT-TERM INVESTMENT—1.2% | |||
| State Street Institutional U.S. Government Money Market Fund, Premier Class, 4.76%(c) | 2,150,400 | 2,150,400 | |
| Total Short-Term Investment | 2,150,400 | ||
| Total Investments (Cost $179,502,104)(d)—98.5% | 172,456,005 | ||
| Other Assets in Excess of Liabilities—1.5% | 2,592,504 | ||
| Net Assets—100.0% | $175,048,509 | ||
| (a) | Denotes a security issued under Regulation S or Rule 144A. |
| (b) | Non-income producing security. |
| (c) | Registered investment company advised by State Street Global Advisors. The rate shown is the 7 day yield as of April 30, 2023. |
| (d) | See accompanying Notes to Financial Statements for tax unrealized appreciation/(depreciation) of securities. |
| ADR | American Depositary Receipt |
| PLC | Public Limited Company |
| 2023 Semi-Annual Report | 35 |
| Average Annual Total Return1 (For the periods ended April 30, 2023)2 | Six Month3 | 1 Yr. | 5 Yr. | 10 Yr. | |
Class A | w/o SC | 23.16% | 8.05% | 1.45% | 2.06% |
| w/SC4 | 16.09% | 1.85% | 0.25% | 1.46% | |
Institutional Class5 | w/o SC | 23.33% | 8.36% | 1.70% | 2.32% |
| 1 | Returns prior to December 3, 2021 reflect the performance of a predecessor fund (the “Predecessor Fund”). Returns of the Predecessor Fund have not been adjusted to reflect the expenses applicable to the respective classes. The Fund and the Predecessor Fund have substantially similar investment objectives and strategies. Please consult the Fund’s prospectus for more detail. |
| 2 | Performance shown for periods after December 16, 2016 reflect the Fund’s receipt of payment from some European jurisdictions related to prior years in accordance with European Union law under Article 63 of the Treaty on the Functioning of the European Union (the “Article 63 EU Tax Reclaims”). The receipt of these extraordinary payments and accrual of anticipated payments increased the Fund’s performance for all periods that include December 2016, February 2017, July 2017, October 2017, February 2019, March 2019, September 2019, June 2022, and October 2022 in a manner that may not recur in the future, and the Fund’s performance was significantly higher than it would have been absent receipt of the Article 63 EU Tax Reclaims. At the time of receipt or accrual of the income and related taxes, including any adjustments to taxes previously estimated for similar payments, those payments and accruals resulted in an increase in net assets of approximately 5.4%, 2.1%, 1.4% and 1.9%, in 2017, 2019, 2022 and 2023, respectively. Past returns would have been higher had the Fund not originally paid the withholding taxes that relate to the EU reclaims that are now being returned. There can be no assurance that the Fund will receive additional Article 63 EU Tax Reclaim payments or maintain this level of performance in the future. |
| 3 | Not annualized |
| 4 | A 5.75% front-end sales charge was deducted. |
| 5 | Not subject to any sales charges. |
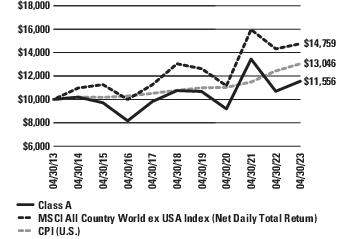
ex USA) (Net Daily Total Return) and the U.S. Consumer Price Index
| 36 | 2023 Semi-Annual Report |
| Asset Allocation | |
| Common Stocks | 100.1% |
| Short-Term Investment | 2.1% |
| Liabilities in Excess of Other Assets | (2.2%) |
| 100.0% |
| Sectors | |
| Financials | 21.9% |
| Health Care | 21.0% |
| Information Technology | 14.9% |
| Industrials | 12.1% |
| Materials | 10.5% |
| Consumer Staples | 10.1% |
| Consumer Discretionary | 4.8% |
| Real Estate | 3.0% |
| Utilities | 1.8% |
| Short-Term Investment | 2.1% |
| Liabilities in Excess of Other Assets | (2.2%) |
| 100.0% |
| Top Ten Holdings | |
| L'Oreal SA | 4.5% |
| Novo Nordisk AS | 4.3% |
| AIA Group Ltd. | 4.2% |
| Wolters Kluwer NV | 4.1% |
| Taiwan Semiconductor Manufacturing Co. Ltd., ADR | 4.0% |
| Housing Development Finance Corp. Ltd. | 4.0% |
| Linde PLC | 3.2% |
| Dechra Pharmaceuticals PLC | 3.1% |
| DSM-Firmenich AG | 3.0% |
| Goodman Group | 3.0% |
| Countries | |
| Denmark | 11.6% |
| United States | 10.3% |
| France | 9.1% |
| Netherlands | 8.9% |
| United Kingdom | 8.4% |
| Japan | 8.4% |
| Australia | 8.0% |
| India | 5.6% |
| Hong Kong | 4.2% |
| Taiwan | 4.0% |
| Switzerland | 3.0% |
| Indonesia | 2.8% |
| Sweden | 2.7% |
| Singapore | 2.7% |
| South Korea | 2.3% |
| Poland | 2.0% |
| Other, less than 2% each | 6.1% |
| Short-Term Investment | 2.1% |
| Liabilities in Excess of Other Assets | (2.2%) |
| 100.0% |
| 2023 Semi-Annual Report | 37 |
| Shares | Value | ||
| COMMON STOCKS—100.1% | |||
| AUSTRALIA—8.0% | |||
| Financials—2.2% | |||
| Steadfast Group Ltd. | 498,201 | $ 1,964,110 | |
| Health Care—2.8% | |||
| Cochlear Ltd. | 14,910 | 2,444,756 | |
| Real Estate—3.0% | |||
| Goodman Group, REIT | 199,791 | 2,575,632 | |
| Total Australia | 6,984,498 | ||
| BELGIUM—0.8% | |||
| Industrials—0.8% | |||
| Azelis Group NV | 29,268 | 694,368 | |
| CANADA—1.1% | |||
| Financials—1.1% | |||
| CI Financial Corp. | 92,906 | 914,763 | |
| CHINA—1.0% | |||
| Health Care—1.0% | |||
| Wuxi Biologics Cayman, Inc.(a)(b) | 144,000 | 858,648 | |
| DENMARK—11.6% | |||
| Financials—2.9% | |||
| Tryg A/S | 108,468 | 2,563,421 | |
| Health Care—6.9% | |||
| Genmab AS(b) | 5,476 | 2,250,442 | |
| Novo Nordisk AS, Class B | 22,845 | 3,800,365 | |
| 6,050,807 | |||
| Utilities—1.8% | |||
| Orsted AS(a) | 17,141 | 1,538,406 | |
| Total Denmark | 10,152,634 | ||
| FRANCE—9.1% | |||
| Consumer Discretionary—2.5% | |||
| LVMH Moet Hennessy Louis Vuitton SE | 2,260 | 2,173,851 | |
| Consumer Staples—4.5% | |||
| L'Oreal SA | 8,195 | 3,916,530 | |
| Information Technology—2.1% | |||
| Dassault Systemes SE | 45,232 | 1,836,222 | |
| Total France | 7,926,603 | ||
| HONG KONG—4.2% | |||
| Financials—4.2% | |||
| AIA Group Ltd. | 339,400 | 3,695,072 | |
| INDIA—5.6% | |||
| Financials—4.0% | |||
| Housing Development Finance Corp. Ltd. | 102,628 | 3,489,671 | |
| Materials—1.6% | |||
| Asian Paints Ltd. | 38,084 | 1,351,448 | |
| Total India | 4,841,119 | ||
| INDONESIA—2.8% | |||
| Financials—2.8% | |||
| Bank Rakyat Indonesia Persero Tbk PT | 6,935,900 | 2,417,016 | |
| JAPAN—8.4% | |||
| Consumer Discretionary—2.3% | |||
| Sony Group Corp. | 22,200 | 2,008,516 | |
| Health Care—2.4% | |||
| Chugai Pharmaceutical Co. Ltd. | 79,100 | 2,041,226 | |
| Shares | Value | ||
| Industrials—1.6% | |||
| SHO-BOND Holdings Co. Ltd. | 32,400 | $ 1,384,644 | |
| Information Technology—2.1% | |||
| Keyence Corp. | 4,100 | 1,848,922 | |
| Total Japan | 7,283,308 | ||
| LATVIA—0.0% | |||
| Financials—0.0% | |||
| Parex Bank(b)(c)(d) | 1,424,182 | – | |
| NETHERLANDS—8.9% | |||
| Financials—2.0% | |||
| Adyen NV(a)(b) | 1,086 | 1,745,041 | |
| Industrials—4.1% | |||
| Wolters Kluwer NV | 26,751 | 3,541,654 | |
| Information Technology—2.8% | |||
| ASML Holding NV | 3,915 | 2,484,508 | |
| Total Netherlands | 7,771,203 | ||
| NEW ZEALAND—1.6% | |||
| Information Technology—1.6% | |||
| Xero Ltd.(b) | 22,072 | 1,377,861 | |
| POLAND—2.0% | |||
| Consumer Staples—2.0% | |||
| Dino Polska SA(a)(b) | 17,213 | 1,755,437 | |
| SINGAPORE—2.7% | |||
| Financials—2.7% | |||
| DBS Group Holdings Ltd. | 96,700 | 2,389,452 | |
| SOUTH AFRICA—1.6% | |||
| Consumer Staples—1.6% | |||
| Clicks Group Ltd. | 94,224 | 1,377,059 | |
| SOUTH KOREA—2.3% | |||
| Information Technology—2.3% | |||
| Samsung SDI Co. Ltd. | 3,797 | 1,970,536 | |
| SWEDEN—2.7% | |||
| Industrials—2.7% | |||
| Atlas Copco AB, A Shares | 165,541 | 2,394,405 | |
| SWITZERLAND—3.0% | |||
| Materials—3.0% | |||
| DSM-Firmenich AG(b) | 19,942 | 2,609,644 | |
| TAIWAN—4.0% | |||
| Information Technology—4.0% | |||
| Taiwan Semiconductor Manufacturing Co. Ltd., ADR | 41,639 | 3,510,168 | |
| UNITED KINGDOM—8.4% | |||
| Health Care—5.7% | |||
| AstraZeneca PLC | 15,437 | 2,271,754 | |
| Dechra Pharmaceuticals PLC | 57,065 | 2,678,692 | |
| 4,950,446 | |||
| Materials—2.7% | |||
| Croda International PLC | 27,344 | 2,402,428 | |
| Total United Kingdom | 7,352,874 | ||
| UNITED STATES—10.3% | |||
| Consumer Staples—2.0% | |||
| Nestle SA | 13,668 | 1,753,462 | |
| 38 | 2023 Semi-Annual Report |
| Shares | Value | ||
| COMMON STOCKS (continued) | |||
| UNITED STATES (continued) | |||
| Health Care—2.2% | |||
| ResMed, Inc. | 7,821 | $ 1,884,548 | |
| Industrials—2.9% | |||
| Schneider Electric SE | 14,586 | 2,543,679 | |
| Materials—3.2% | |||
| Linde PLC | 7,706 | 2,831,405 | |
| Total United States | 9,013,094 | ||
| Total Common Stocks | 87,289,762 | ||
| SHORT-TERM INVESTMENT—2.1% | |||
| State Street Institutional U.S. Government Money Market Fund, Premier Class, 4.76%(e) | 1,828,131 | 1,828,131 | |
| Total Short-Term Investment | 1,828,131 | ||
| Total Investments (Cost $97,683,185)(f)—102.2% | 89,117,893 | ||
| Liabilities in Excess of Other Assets—(2.2%) | (1,949,063) | ||
| Net Assets—100.0% | $87,168,830 | ||
| (a) | Denotes a security issued under Regulation S or Rule 144A. |
| (b) | Non-income producing security. |
| (c) | Level 3 security. See Note 2(a) of the accompanying Notes to Financial Statements. |
| (d) | The Fund’s adviser has deemed this security to be illiquid based upon procedures approved by the Board of Trustees. Illiquid securities held by the Fund represent 0.00% of net assets as of April 30, 2023. |
| (e) | Registered investment company advised by State Street Global Advisors. The rate shown is the 7 day yield as of April 30, 2023. |
| (f) | See accompanying Notes to Financial Statements for tax unrealized appreciation/(depreciation) of securities. |
| ADR | American Depositary Receipt |
| PLC | Public Limited Company |
| REIT | Real Estate Investment Trust |
| 2023 Semi-Annual Report | 39 |
| Average Annual Total Return1 (For the periods ended April 30, 2023) | Six Month2 | 1 Yr. | 5 Yr. | 10 Yr. | |
Class A | w/o SC | 4.69% | (14.20%) | 5.21% | 5.42% |
| w/SC3 | (1.32%) | (19.13%) | 3.97% | 4.80% | |
Institutional Class4 | w/o SC | 4.73% | (14.02%) | 5.47% | 5.68% |
| 1 | Returns prior to May 7, 2018 reflect the performance of a predecessor fund (the “Predecessor Fund”). Returns of the Predecessor Fund have not been adjusted to reflect the expenses applicable to the respective classes. The Fund and the Predecessor Fund have substantially similar investment objectives and strategies. Please consult the Fund’s prospectus for more detail. |
| 2 | Not annualized |
| 3 | A 5.75% front-end sales charge was deducted. |
| 4 | Not subject to any sales charges. |

| 40 | 2023 Semi-Annual Report |
| Asset Allocation | |
| Common Stocks | 99.5% |
| Short-Term Investment | 1.3% |
| Liabilities in Excess of Other Assets | (0.8%) |
| 100.0% |
| Sub-Industries | |
| Retail REITs | 18.2% |
| Industrial REITs | 17.5% |
| Data Center REITs | 11.8% |
| Health Care REITs | 10.7% |
| Self Storage REITs | 9.2% |
| Multi-Family Residential REITs | 8.6% |
| Other Specialized REITs | 8.2% |
| Office REITs | 6.4% |
| Single-Family Residential REITs | 4.2% |
| Hotel & Resort REITs | 3.7% |
| Other, less than 2% each | 1.0% |
| Short-Term Investment | 1.3% |
| Liabilities in Excess of Other Assets | (0.8%) |
| 100.0% |
| Top Ten Holdings | |
| Prologis, Inc., REIT | 13.7% |
| Equinix, Inc., REIT | 8.3% |
| Public Storage | 6.2% |
| Realty Income Corp. | 5.9% |
| Welltower, Inc. | 5.8% |
| VICI Properties, Inc. | 4.9% |
| Digital Realty Trust, Inc. | 3.5% |
| AvalonBay Communities, Inc. | 3.4% |
| Gaming and Leisure Properties, Inc., REIT | 3.3% |
| Extra Space Storage, Inc. | 3.0% |
| Countries | |
| United States | 99.5% |
| Short-Term Investment | 1.3% |
| Liabilities in Excess of Other Assets | (0.8%) |
| 100.0% |
| 2023 Semi-Annual Report | 41 |
| Shares | Value | ||
| COMMON STOCKS—99.5% | |||
| UNITED STATES—99.5% | |||
| Data Center REITs—11.8% | |||
| Digital Realty Trust, Inc. | 14,299 | $ 1,417,746 | |
| Equinix, Inc. | 4,639 | 3,359,007 | |
| 4,776,753 | |||
| Health Care REITs—10.7% | |||
| Omega Healthcare Investors, Inc. | 13,230 | 354,035 | |
| Sabra Health Care REIT, Inc. | 49,920 | 569,088 | |
| Ventas, Inc. | 22,529 | 1,082,518 | |
| Welltower, Inc. | 29,596 | 2,344,595 | |
| 4,350,236 | |||
| Hotel & Resort REITs—3.7% | |||
| DiamondRock Hospitality Co. | 70,304 | 570,165 | |
| Host Hotels & Resorts, Inc. | 58,188 | 940,900 | |
| 1,511,065 | |||
| Industrial REITs—17.5% | |||
| Americold Realty Trust, Inc. | 25,466 | 753,539 | |
| Prologis, Inc. | 44,527 | 5,577,007 | |
| STAG Industrial, Inc. | 22,233 | 753,031 | |
| 7,083,577 | |||
| Multi-Family Residential REITs—8.6% | |||
| AvalonBay Communities, Inc. | 7,726 | 1,393,539 | |
| Equity Residential | 15,257 | 965,005 | |
| Mid-America Apartment Communities, Inc. | 7,393 | 1,137,043 | |
| 3,495,587 | |||
| Office REITs—6.4% | |||
| Alexandria Real Estate Equities, Inc. | 7,868 | 977,048 | |
| Boston Properties, Inc. | 12,321 | 657,449 | |
| Equity Commonwealth | 47,232 | 978,647 | |
| 2,613,144 | |||
| Other Specialized REITs—8.2% | |||
| Gaming and Leisure Properties, Inc. | 25,517 | 1,326,884 | |
| VICI Properties, Inc. | 58,866 | 1,997,912 | |
| 3,324,796 | |||
| Retail REITs—18.2% | |||
| Brixmor Property Group, Inc. | 30,992 | 661,059 | |
| Kimco Realty Corp. | 45,420 | 871,610 | |
| National Retail Properties, Inc. | 25,108 | 1,092,198 | |
| Realty Income Corp. | 37,870 | 2,379,751 | |
| Regency Centers Corp. | 8,165 | 501,576 | |
| Simon Property Group, Inc. | 10,056 | 1,139,546 | |
| Spirit Realty Capital, Inc. | 19,476 | 749,047 | |
| 7,394,787 | |||
| Self Storage REITs—9.2% | |||
| Extra Space Storage, Inc. | 8,128 | 1,235,781 | |
| Public Storage | 8,526 | 2,513,721 | |
| 3,749,502 | |||
| Single-Family Residential REITs—4.2% | |||
| American Homes 4 Rent, Class A | 26,555 | 883,220 | |
| Equity LifeStyle Properties, Inc. | 12,018 | 828,040 | |
| 1,711,260 | |||
| Shares | Value | ||
| Telecom Tower REITs—1.0% | |||
| American Tower Corp. | 1,947 | $ 397,947 | |
| Total United States | 40,408,654 | ||
| Total Common Stocks | 40,408,654 | ||
| SHORT-TERM INVESTMENT—1.3% | |||
| State Street Institutional U.S. Government Money Market Fund, Premier Class, 4.76%(a) | 537,012 | 537,012 | |
| Total Short-Term Investment | 537,012 | ||
| Total Investments (Cost $34,350,164)(b)—100.8% | 40,945,666 | ||
| Liabilities in Excess of Other Assets—(0.8%) | (334,681) | ||
| Net Assets—100.0% | $40,610,985 | ||
| (a) | Registered investment company advised by State Street Global Advisors. The rate shown is the 7 day yield as of April 30, 2023. |
| (b) | See accompanying Notes to Financial Statements for tax unrealized appreciation/(depreciation) of securities. |
| REIT | Real Estate Investment Trust |
| 42 | 2023 Semi-Annual Report |
| Average Annual Total Return (For the periods ended April 30, 2023) | Six Month1 | 1 Yr. | 5 Yr. | 10 Yr. | |
Class A | w/o SC | 2.96% | 0.53% | 7.75% | 10.64% |
| w/SC2 | (2.95%) | (5.26%) | 6.48% | 9.98% | |
Class C | w/o SC | 2.66% | (0.04%) | 7.05% | 9.89% |
| w/SC3 | 1.71% | (0.97%) | 7.05% | 9.89% | |
Class R4 | w/o SC | 2.83% | 0.27% | 7.40% | 10.32% |
Institutional Service Class4 | w/o SC | 3.13% | 0.84% | 8.03% | 10.95% |
Institutional Class4 | w/o SC | 3.19% | 0.96% | 8.12% | 11.00% |
| 1 | Not annualized |
| 2 | A 5.75% front-end sales charge was deducted. |
| 3 | A 1.00% contingent deferred sales charge (CDSC) was deducted from the one year return because it is charged when Class C shares are sold within the first year after purchase. |
| 4 | Not subject to any sales charges. |

| 2023 Semi-Annual Report | 43 |
| Asset Allocation | |
| Common Stocks | 98.2% |
| Short-Term Investment | 1.9% |
| Liabilities in Excess of Other Assets | (0.1%) |
| 100.0% |
| Sectors | |
| Industrials | 23.6% |
| Financials | 17.8% |
| Information Technology | 15.3% |
| Consumer Discretionary | 12.6% |
| Health Care | 8.8% |
| Consumer Staples | 8.5% |
| Materials | 5.1% |
| Real Estate | 2.2% |
| Energy | 1.8% |
| Utilities | 1.4% |
| Communication Services | 1.1% |
| Short-Term Investment | 1.9% |
| Liabilities in Excess of Other Assets | (0.1%) |
| 100.0% |
| Top Ten Holdings | |
| Atkore, Inc. | 3.2% |
| elf Beauty, Inc. | 3.0% |
| ATS Corp. | 2.7% |
| Graphic Packaging Holding Co. | 2.6% |
| WNS Holdings Ltd., ADR | 2.6% |
| Hostess Brands, Inc. | 2.6% |
| Casella Waste Systems, Inc. | 2.6% |
| Stride, Inc. | 2.4% |
| PRA Group, Inc. | 2.4% |
| CyberArk Software Ltd. | 2.3% |
| Countries | |
| United States | 82.4% |
| Canada | 10.9% |
| India | 2.6% |
| Israel | 2.3% |
| Short-Term Investment | 1.9% |
| Liabilities in Excess of Other Assets | (0.1%) |
| 100.0% |
| 44 | 2023 Semi-Annual Report |
| Shares | Value | ||
| COMMON STOCKS—98.2% | |||
| CANADA—10.9% | |||
| Consumer Discretionary—2.1% | |||
| Aritzia, Inc.(a) | 377,719 | $ 12,004,709 | |
| Consumer Staples—2.9% | |||
| Jamieson Wellness, Inc.(b) | 318,750 | 7,871,997 | |
| SunOpta, Inc.(a) | 1,088,977 | 9,256,304 | |
| 17,128,301 | |||
| Financials—3.2% | |||
| CI Financial Corp. | 1,020,688 | 10,049,805 | |
| TMX Group Ltd. | 85,555 | 8,665,060 | |
| 18,714,865 | |||
| Industrials—2.7% | |||
| ATS Corp.(a) | 371,258 | 15,915,168 | |
| Total Canada | 63,763,043 | ||
| INDIA—2.6% | |||
| Information Technology—2.6% | |||
| WNS Holdings Ltd., ADR(a) | 167,369 | 15,091,663 | |
| ISRAEL—2.3% | |||
| Information Technology—2.3% | |||
| CyberArk Software Ltd.(a) | 107,495 | 13,393,877 | |
| UNITED STATES—82.4% | |||
| Communication Services—1.1% | |||
| Cogent Communications Holdings, Inc. | 91,600 | 6,324,064 | |
| Consumer Discretionary—10.5% | |||
| Boot Barn Holdings, Inc.(a) | 2,892 | 209,583 | |
| Dorman Products, Inc.(a) | 145,983 | 12,577,895 | |
| LCI Industries | 80,969 | 9,146,258 | |
| LGI Homes, Inc.(a) | 57,078 | 6,780,866 | |
| Monro, Inc. | 208,261 | 10,179,798 | |
| National Vision Holdings, Inc.(a) | 395,347 | 8,318,101 | |
| Stride, Inc.(a) | 330,539 | 14,199,956 | |
| 61,412,457 | |||
| Consumer Staples—5.6% | |||
| elf Beauty, Inc.(a) | 189,830 | 17,608,631 | |
| Hostess Brands, Inc.(a) | 585,610 | 15,085,314 | |
| 32,693,945 | |||
| Energy—1.8% | |||
| ChampionX Corp. | 381,701 | 10,336,463 | |
| Financials—14.6% | |||
| American Equity Investment Life Holding Co. | 226,924 | 8,745,651 | |
| Banner Corp. | 171,837 | 8,578,103 | |
| Donnelley Financial Solutions, Inc.(a) | 301,041 | 13,020,023 | |
| First Interstate BancSystem, Inc., Class A | 362,080 | 9,265,627 | |
| Hannon Armstrong Sustainable Infrastructure Capital, Inc. | 213,612 | 6,062,309 | |
| PJT Partners, Inc., Class A | 170,300 | 11,711,531 | |
| PRA Group, Inc.(a) | 387,142 | 14,041,640 | |
| Seacoast Banking Corp. of Florida | 304,667 | 6,760,561 | |
| Wintrust Financial Corp. | 102,263 | 6,991,721 | |
| 85,177,166 | |||
| Health Care—8.8% | |||
| CONMED Corp. | 102,418 | 12,860,628 | |
| CryoPort, Inc.(a) | 279,843 | 5,887,897 | |
| Harmony Biosciences Holdings, Inc.(a) | 234,327 | 7,554,702 | |
| Shares | Value | ||
| Integer Holdings Corp.(a) | 134,254 | $ 11,055,817 | |
| Ligand Pharmaceuticals, Inc.(a) | 105,620 | 8,064,087 | |
| OmniAb, Inc.(a) | 116,422 | – | |
| Pacira BioSciences, Inc.(a) | 141,122 | 6,394,238 | |
| 51,817,369 | |||
| Industrials—20.9% | |||
| Ameresco, Inc., Class A(a) | 178,157 | 7,411,331 | |
| ArcBest Corp. | 131,635 | 12,426,344 | |
| Atkore, Inc.(a) | 149,306 | 18,861,827 | |
| AZEK Co., Inc. (The)(a) | 466,032 | 12,648,109 | |
| Brady Corp., Class A | 104,142 | 5,314,366 | |
| Casella Waste Systems, Inc., Class A(a) | 168,000 | 14,952,000 | |
| EnPro Industries, Inc. | 125,852 | 11,864,068 | |
| Parsons Corp.(a) | 243,578 | 10,595,643 | |
| RBC Bearings, Inc.(a) | 28,216 | 6,405,314 | |
| Shyft Group, Inc. (The) | 356,683 | 8,945,610 | |
| Werner Enterprises, Inc. | 285,879 | 12,913,154 | |
| 122,337,766 | |||
| Information Technology—10.4% | |||
| Cohu, Inc.(a) | 364,563 | 12,336,812 | |
| Onto Innovation, Inc.(a) | 144,451 | 11,697,642 | |
| Perficient, Inc.(a) | 189,441 | 12,298,510 | |
| Verint Systems, Inc.(a) | 307,646 | 11,226,003 | |
| Workiva, Inc.(a) | 140,320 | 13,108,694 | |
| 60,667,661 | |||
| Materials—5.1% | |||
| Graphic Packaging Holding Co. | 615,130 | 15,169,106 | |
| Materion Corp. | 106,263 | 11,509,346 | |
| Ranpak Holdings Corp.(a) | 752,727 | 3,071,126 | |
| 29,749,578 | |||
| Real Estate—2.2% | |||
| Terreno Realty Corp., REIT | 208,757 | 12,857,344 | |
| Utilities—1.4% | |||
| ONE Gas, Inc. | 105,513 | 8,119,225 | |
| Total United States | 481,493,038 | ||
| Total Common Stocks | 573,741,621 | ||
| SHORT-TERM INVESTMENT—1.9% | |||
| State Street Institutional U.S. Government Money Market Fund, Premier Class, 4.76%(c) | 11,218,427 | 11,218,427 | |
| Total Short-Term Investment | 11,218,427 | ||
| Total Investments (Cost $610,798,248)(d)—100.1% | 584,960,048 | ||
| Liabilities in Excess of Other Assets—(0.1%) | (475,750) | ||
| Net Assets—100.0% | $584,484,298 | ||
| (a) | Non-income producing security. |
| (b) | Denotes a security issued under Regulation S or Rule 144A. |
| (c) | Registered investment company advised by State Street Global Advisors. The rate shown is the 7 day yield as of April 30, 2023. |
| (d) | See accompanying Notes to Financial Statements for tax unrealized appreciation/(depreciation) of securities. |
| ADR | American Depositary Receipt |
| REIT | Real Estate Investment Trust |
| 2023 Semi-Annual Report | 45 |
| Average Annual Total Return1 (For the periods ended April 30, 2023) | Six Month2 | 1 Yr. | 5 Yr. | 10 Yr. | |
Class A | w/o SC | 7.18% | (4.80%) | 8.65% | 9.39% |
| w/SC3 | 1.04% | (10.24%) | 7.37% | 8.75% | |
Class C | w/o SC | 6.70% | (5.47%) | 7.87% | 8.60% |
| w/SC4 | 5.70% | (6.41%) | 7.87% | 8.60% | |
Institutional Service Class5 | w/o SC | 7.23% | (4.61%) | 8.89% | 9.62% |
Institutional Class5 | w/o SC | 7.26% | (4.49%) | 8.97% | 9.71% |
| 1 | The Fund changed its investment strategies effective December 1, 2020. Performance information for periods prior to December 1, 2020 does not reflect the current investment strategy. In connection with the change in investment strategy, the Fund changed its name from Aberdeen U.S. Multi-Cap Equity Fund to abrdn U.S. Sustainable Leaders Fund. Returns prior to October 9, 2011 reflect the performance of a predecessor fund (the “Predecessor Fund”). Returns of the Predecessor Fund have not been adjusted to reflect the expenses applicable to the respective classes. Please consult the Fund’s prospectus for more detail. |
| 2 | Not annualized |
| 3 | A 5.75% front-end sales charge was deducted. |
| 4 | A 1.00% contingent deferred sales charge (CDSC) was deducted from the one year return because it is charged when Class C shares are sold within the first year after purchase. |
| 5 | Not subject to any sales charges. |

| 46 | 2023 Semi-Annual Report |
| Asset Allocation | |
| Common Stocks | 97.2% |
| Short-Term Investment | 2.9% |
| Liabilities in Excess of Other Assets | (0.1%) |
| 100.0% |
| Sectors | |
| Information Technology | 25.9% |
| Software | 15.9% |
| IT Services | 5.6% |
| Semiconductors & Semiconductor Equipment | 4.4% |
| Industrials | 19.0% |
| Financials | 13.8% |
| Health Care | 13.2% |
| Consumer Staples | 8.7% |
| Consumer Discretionary | 6.1% |
| Utilities | 4.8% |
| Materials | 2.9% |
| Energy | 1.5% |
| Communication Services | 1.3% |
| Short-Term Investment | 2.9% |
| Liabilities in Excess of Other Assets | (0.1%) |
| 100.0% |
| Top Ten Holdings | |
| Microsoft Corp. | 12.2% |
| Mastercard, Inc. | 5.3% |
| Merck & Co., Inc. | 4.7% |
| Tetra Tech, Inc. | 3.8% |
| Nice Ltd., ADR | 3.7% |
| Colgate-Palmolive Co. | 3.7% |
| Integer Holdings Corp. | 3.5% |
| Amdocs Ltd. | 3.5% |
| Canadian National Railway Co. | 3.4% |
| Jamieson Wellness, Inc. | 3.2% |
| Countries | |
| United States | 82.3% |
| Canada | 11.2% |
| Israel | 3.7% |
| Short-Term Investment | 2.9% |
| Liabilities in Excess of Other Assets | (0.1%) |
| 100.0% |
| 2023 Semi-Annual Report | 47 |
| Shares | Value | ||
| COMMON STOCKS—97.2% | |||
| CANADA—11.2% | |||
| Consumer Staples—3.2% | |||
| Jamieson Wellness, Inc.(a) | 446,372 | $ 11,023,808 | |
| Financials—1.8% | |||
| CI Financial Corp. | 619,365 | 6,098,335 | |
| Industrials—6.2% | |||
| ATS Corp.(b) | 223,629 | 9,586,576 | |
| Canadian National Railway Co. | 97,492 | 11,627,871 | |
| 21,214,447 | |||
| Total Canada | 38,336,590 | ||
| ISRAEL—3.7% | |||
| Information Technology—3.7% | |||
| Nice Ltd., ADR(b) | 62,974 | 12,847,326 | |
| UNITED STATES—82.3% | |||
| Communication Services—1.3% | |||
| Cable One, Inc. | 5,903 | 4,476,894 | |
| Consumer Discretionary—6.1% | |||
| Burlington Stores, Inc.(b) | 56,701 | 10,932,520 | |
| Home Depot, Inc. | 33,814 | 10,162,459 | |
| 21,094,979 | |||
| Consumer Staples—5.5% | |||
| Colgate-Palmolive Co. | 159,464 | 12,725,227 | |
| Darling Ingredients, Inc.(b) | 100,656 | 5,996,078 | |
| 18,721,305 | |||
| Energy—1.5% | |||
| New Fortress Energy, Inc. | 174,750 | 5,293,178 | |
| Financials—12.0% | |||
| American Express Co. | 59,275 | 9,563,429 | |
| Hannon Armstrong Sustainable Infrastructure Capital, Inc. | 131,722 | 3,738,270 | |
| LPL Financial Holdings, Inc. | 46,531 | 9,717,534 | |
| Mastercard, Inc., Class A | 48,068 | 18,267,282 | |
| 41,286,515 | |||
| Health Care—13.2% | |||
| CONMED Corp. | 72,886 | 9,152,295 | |
| Danaher Corp. | 32,763 | 7,761,882 | |
| Integer Holdings Corp.(b) | 148,132 | 12,198,670 | |
| Merck & Co., Inc. | 141,297 | 16,315,565 | |
| 45,428,412 | |||
| Industrials—12.8% | |||
| Advanced Drainage Systems, Inc. | 56,770 | 4,866,324 | |
| Atkore, Inc.(b) | 73,564 | 9,293,340 | |
| Chart Industries, Inc.(b) | 35,538 | 4,730,108 | |
| Tetra Tech, Inc. | 93,351 | 12,916,978 | |
| Trex Co., Inc.(b) | 96,789 | 5,290,487 | |
| Vertiv Holdings Co. | 452,749 | 6,755,015 | |
| 43,852,252 | |||
| Information Technology—22.2% | |||
| Accenture PLC, Class A | 25,917 | 7,264,276 | |
| Amdocs Ltd. | 131,744 | 12,021,640 | |
| Marvell Technology, Inc. | 182,423 | 7,202,060 | |
| Microsoft Corp. | 135,549 | 41,648,786 | |
| SolarEdge Technologies, Inc.(b) | 27,696 | 7,910,808 | |
| 76,047,570 | |||
| Shares | Value | ||
| Materials—2.9% | |||
| Crown Holdings, Inc. | 114,143 | $ 9,791,187 | |
| Utilities—4.8% | |||
| American Water Works Co., Inc. | 56,947 | 8,442,393 | |
| CenterPoint Energy, Inc. | 265,126 | 8,078,389 | |
| 16,520,782 | |||
| Total United States | 282,513,074 | ||
| Total Common Stocks | 333,696,990 | ||
| SHORT-TERM INVESTMENT—2.9% | |||
| State Street Institutional U.S. Government Money Market Fund, Premier Class, 4.76%(c) | 9,759,486 | 9,759,486 | |
| Total Short-Term Investment | 9,759,486 | ||
| Total Investments (Cost $330,964,690)(d)—100.1% | 343,456,476 | ||
| Liabilities in Excess of Other Assets—(0.1%) | (219,849) | ||
| Net Assets—100.0% | $343,236,627 | ||
| (a) | Denotes a security issued under Regulation S or Rule 144A. |
| (b) | Non-income producing security. |
| (c) | Registered investment company advised by State Street Global Advisors. The rate shown is the 7 day yield as of April 30, 2023. |
| (d) | See accompanying Notes to Financial Statements for tax unrealized appreciation/(depreciation) of securities. |
| ADR | American Depositary Receipt |
| PLC | Public Limited Company |
| 48 | 2023 Semi-Annual Report |
| Average Annual Total Return1 (For the periods ended April 30, 2023) | Six Month2 | 1 Yr. | 5 Yr. | 10 Yr. | |
Class A | w/o SC | (2.07%) | (5.67%) | 8.77% | 6.41% |
| w/SC3 | (7.65%) | (11.11%) | 7.48% | 5.78% | |
Class R4 | w/o SC | (2.23%) | (5.90%) | 8.45% | 6.05% |
Institutional Service Class4 | w/o SC | (2.11%) | (5.52%) | 8.96% | 6.58% |
Institutional Class4 | w/o SC | (1.87%) | (5.26%) | 9.12% | 6.76% |
| 1 | The Fund changed its investment strategies effective December 1, 2020. Performance information for periods prior to December 1, 2020 does not reflect the curren investment strategy. In connection with the change in investment strategy, the Fund changed its name from Aberdeen Focused U.S. Equity Fund to abrdn U.S. Sustainable Leaders Smaller Companies Fund. The Fund changed its investment strategies effective November 15, 2017. Performance information for periods prior to November 15, 2017 does not reflect the current investment strategy. Please consult the Fund’s prospectus for more detail. |
| 2 | Not annualized |
| 3 | A 5.75% front-end sales charge was deducted. |
| 4 | Not subject to any sales charges. |
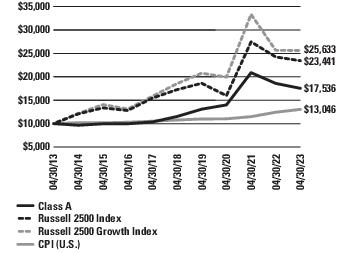
Consumer Price Index (CPI) over a 10-year period ended April 30, 2023. Unlike the Fund, the returns for these unmanaged indexes do
| 2023 Semi-Annual Report | 49 |
| Asset Allocation | |
| Common Stocks | 99.0% |
| Short-Term Investment | 0.4% |
| Other Assets in Excess of Liabilities | 0.6% |
| 100.0% |
| Sectors | |
| Industrials | 27.7% |
| Electrical Equipment | 6.7% |
| Life Sciences Tools & Services | 6.5% |
| Commercial Services & Supplies | 5.7% |
| Building Products | 3.2% |
| Ground Transportation | 2.3% |
| Professional Services | 1.9% |
| Construction & Engineering | 1.4% |
| Information Technology | 19.1% |
| Financials | 14.6% |
| Health Care | 13.4% |
| Consumer Staples | 6.7% |
| Materials | 6.1% |
| Consumer Discretionary | 4.6% |
| Utilities | 3.5% |
| Communication Services | 1.7% |
| Energy | 1.6% |
| Short-Term Investment | 0.4% |
| Assets in Excess of Other Liabilities | 0.6% |
| 100.0% |
| Top Ten Holdings | |
| CONMED Corp. | 4.2% |
| Amdocs Ltd. | 3.7% |
| Atkore, Inc. | 3.5% |
| Essential Utilities, Inc. | 3.5% |
| Vertiv Holdings Co. | 3.2% |
| Crown Holdings, Inc. | 3.1% |
| CyberArk Software Ltd. | 3.1% |
| Integer Holdings Corp. | 3.1% |
| Nice Ltd., ADR | 3.1% |
| Tetra Tech, Inc. | 3.0% |
| Countries | |
| United States | 79.2% |
| Canada | 13.6% |
| Israel | 6.2% |
| Short-Term Investment | 0.4% |
| Assets in Excess of Other Liabilities | 0.6% |
| 100.0% |
| 50 | 2023 Semi-Annual Report |
| Shares | Value | ||
| COMMON STOCKS—99.0% | |||
| CANADA—13.6% | |||
| Consumer Discretionary—2.2% | |||
| Aritzia, Inc.(a) | 9,614 | $ 305,553 | |
| Consumer Staples—4.2% | |||
| Jamieson Wellness, Inc.(b) | 12,332 | 304,557 | |
| SunOpta, Inc.(a) | 32,353 | 275,000 | |
| 579,557 | |||
| Financials—4.8% | |||
| CI Financial Corp. | 34,994 | 344,555 | |
| TMX Group Ltd. | 2,994 | 303,234 | |
| 647,789 | |||
| Industrials—2.4% | |||
| ATS Corp.(a) | 7,607 | 326,099 | |
| Total Canada | 1,858,998 | ||
| ISRAEL—6.2% | |||
| Information Technology—6.2% | |||
| CyberArk Software Ltd.(a) | 3,406 | 424,387 | |
| Nice Ltd., ADR(a) | 2,067 | 421,689 | |
| 846,076 | |||
| UNITED STATES—79.2% | |||
| Communication Services—1.7% | |||
| Cogent Communications Holdings, Inc. | 3,403 | 234,943 | |
| Consumer Discretionary—2.4% | |||
| Burlington Stores, Inc.(a) | 1,722 | 332,019 | |
| Consumer Staples—2.5% | |||
| Darling Ingredients, Inc.(a) | 5,627 | 335,200 | |
| Energy—1.6% | |||
| New Fortress Energy, Inc. | 7,070 | 214,150 | |
| Financials—9.8% | |||
| First Interstate BancSystem, Inc., Class A | 9,327 | 238,678 | |
| Hannon Armstrong Sustainable Infrastructure Capital, Inc. | 8,216 | 233,170 | |
| LPL Financial Holdings, Inc. | 1,530 | 319,525 | |
| PJT Partners, Inc., Class A | 5,464 | 375,759 | |
| Seacoast Banking Corp. of Florida | 7,778 | 172,594 | |
| 1,339,726 | |||
| Health Care—13.4% | |||
| CONMED Corp. | 4,531 | 568,958 | |
| CryoPort, Inc.(a) | 8,871 | 186,646 | |
| ICON PLC(a) | 1,352 | 260,517 | |
| Inmode Ltd.(a) | 10,304 | 383,927 | |
| Integer Holdings Corp.(a) | 5,147 | 423,855 | |
| 1,823,903 | |||
| Industrials—25.3% | |||
| Advanced Drainage Systems, Inc. | 2,238 | 191,841 | |
| Ameresco, Inc., Class A(a) | 4,488 | 186,701 | |
| Atkore, Inc.(a) | 3,800 | 480,054 | |
| Casella Waste Systems, Inc., Class A(a) | 4,103 | 365,167 | |
| Chart Industries, Inc.(a) | 1,730 | 230,263 | |
| JB Hunt Transport Services, Inc. | 1,770 | 310,263 | |
| Paylocity Holding Corp.(a) | 1,356 | 262,101 | |
| Shyft Group, Inc. (The) | 13,356 | 334,969 | |
| Tetra Tech, Inc. | 2,948 | 407,915 | |
| Shares | Value | ||
| Trex Co., Inc.(a) | 4,459 | $ 243,729 | |
| Vertiv Holdings Co. | 29,568 | 441,155 | |
| 3,454,158 | |||
| Information Technology—12.9% | |||
| Amdocs Ltd. | 5,597 | 510,726 | |
| Onto Innovation, Inc.(a) | 4,747 | 384,412 | |
| Perficient, Inc.(a) | 6,138 | 398,479 | |
| SolarEdge Technologies, Inc.(a) | 1,082 | 309,052 | |
| Wolfspeed, Inc.(a) | 3,496 | 162,739 | |
| 1,765,408 | |||
| Materials—6.1% | |||
| Crown Holdings, Inc. | 4,967 | 426,069 | |
| Graphic Packaging Holding Co. | 16,212 | 399,788 | |
| 825,857 | |||
| Utilities—3.5% | |||
| Essential Utilities, Inc. | 11,045 | 471,622 | |
| Total United States | 10,796,986 | ||
| Total Common Stocks | 13,502,060 | ||
| SHORT-TERM INVESTMENT—0.4% | |||
| State Street Institutional U.S. Government Money Market Fund, Premier Class, 4.76%(c) | 45,540 | 45,540 | |
| Total Short-Term Investment | 45,540 | ||
| Total Investments (Cost $15,363,118)(d)—99.4% | 13,547,600 | ||
| Other Assets in Excess of Liabilities—0.6% | 86,540 | ||
| Net Assets—100.0% | $13,634,140 | ||
| (a) | Non-income producing security. |
| (b) | Denotes a security issued under Regulation S or Rule 144A. |
| (c) | Registered investment company advised by State Street Global Advisors. The rate shown is the 7 day yield as of April 30, 2023. |
| (d) | See accompanying Notes to Financial Statements for tax unrealized appreciation/(depreciation) of securities. |
| ADR | American Depositary Receipt |
| PLC | Public Limited Company |
| 2023 Semi-Annual Report | 51 |
| abrdn China A Share Equity Fund | abrdn Dynamic Dividend Fund | abrdn EM SMA Completion Fund | abrdn Emerging Markets ex-China Fund | abrdn Emerging Markets Fund | |||||
| Assets: | |||||||||
| Investments, at value | $38,261,839 | $108,119,043 | $260,560 | $29,602,232 | $2,119,461,469 | ||||
| Short-term investments, at value | 1,254,482 | 456,940 | 13,544 | 609,967 | 36,066,663 | ||||
| Foreign Currency, at value | – | – | 114 | 48,311 | 2,694,923 | ||||
| Cash | – | 164 | – | 13,734 | – | ||||
| Receivable for investments sold | – | 2,085,410 | – | – | 12,488,504 | ||||
| Interest and dividends receivable | 2,674 | 874,709 | 785 | 32,368 | 3,506,583 | ||||
| Receivable for capital shares issued | 51,777 | 47,925 | – | 8,916 | 719,301 | ||||
| Receivable from Adviser | 18,732 | 16,871 | 7,749 | 23,194 | 259,244 | ||||
| Tax reclaim receivable | – | 419,007 | – | 12,774 | 161,791 | ||||
| Prepaid expenses | 32,699 | 19,314 | – | 37,717 | 94,544 | ||||
| Total Assets | 39,622,203 | 112,039,383 | 282,752 | 30,389,213 | 2,175,453,022 | ||||
| Liabilities: | |||||||||
| Due to Custodian | – | 970,968 | – | – | – | ||||
| Payable for investments purchased | – | 2,458,783 | – | 33,874 | 2,621,954 | ||||
| Unrealized depreciation on forward foreign currency exchange contracts | – | 25,115 | – | – | – | ||||
| Payable for capital shares redeemed | – | 169,121 | – | 2,096 | 2,081,653 | ||||
| Accrued foreign capital gains tax | – | – | – | 50,828 | 7,326,253 | ||||
| Accrued expenses and other payables: | |||||||||
| Administration fees | 2,664 | 6,377 | 17 | 1,934 | 145,325 | ||||
| Audit fees | 18,209 | 17,758 | 12,906 | 18,209 | 19,340 | ||||
| Custodian fees | 92,480 | 28,818 | 3,309 | 26,518 | 2,256,606 | ||||
| Distribution fees | 5,442 | 698 | – | 4,717 | 59,668 | ||||
| Fund accounting fees | 1,886 | 4,653 | 3 | 1,103 | 113,737 | ||||
| Interest expense on line of credit | – | 528 | – | – | – | ||||
| Investment advisory fees | 28,305 | 88,803 | – | 21,755 | 1,634,909 | ||||
| Legal fees | 933 | 2,494 | 10 | 676 | 51,146 | ||||
| Printing fees | 4,939 | 4,816 | 1,650 | 7,070 | 138,037 | ||||
| Sub-transfer agent and administrative services fees | 3,964 | 7,080 | – | 2,991 | 525,252 | ||||
| Transfer agent fees | 1,851 | 999 | 883 | 375 | 25,389 | ||||
| Other accrued expenses | 3,430 | 19,066 | 2,579 | 33,384 | 33,161 | ||||
| Total liabilities | 164,103 | 3,806,077 | 21,357 | 205,530 | 17,032,430 | ||||
| Net assets | $39,458,100 | $108,233,306 | $261,395 | $30,183,683 | $2,158,420,592 | ||||
| Cost: | |||||||||
| Investments | 48,725,239 | 89,346,809 | 283,064 | 29,400,463 | 2,138,872,390 | ||||
| Short-Term Investments | 1,254,482 | 456,940 | 13,544 | 609,967 | 36,066,663 | ||||
| Foreign currency | – | – | 114 | 48,437 | 2,693,799 | ||||
| Represented by: | |||||||||
| Paid in capital in excess of par value | $62,753,489 | $90,266,432 | $283,441 | $34,089,288 | $2,278,403,433 | ||||
| Distributable earnings (accumulated loss) | (23,295,389) | 17,966,874 | (22,046) | (3,905,605) | (119,982,841) | ||||
| Net Assets | $39,458,100 | $108,233,306 | $261,395 | $30,183,683 | $2,158,420,592 | ||||
| Net Assets: | |||||||||
| Class A | $11,370,114 | $4,399,068 | $– | $21,390,615 | $64,011,172 | ||||
| Class C | 1,746,570 | – | – | 157,499 | 3,315,261 | ||||
| Class R | 3,610,056 | – | – | 577,156 | 104,872,370 | ||||
| Institutional Service Class | 441,743 | – | – | 40,750 | 527,179,944 | ||||
| Institutional Class | 22,289,617 | 103,834,238 | 261,395 | 8,017,663 | 1,459,041,845 | ||||
| Total | $39,458,100 | $108,233,306 | $261,395 | $30,183,683 | $2,158,420,592 Amounts listed as “–” are $0 or round to $0. See Notes to Financial Statements. |
| 52 | 2023 Semi-Annual Report |
| abrdn China A Share Equity Fund | abrdn Dynamic Dividend Fund | abrdn EM SMA Completion Fund | abrdn Emerging Markets ex-China Fund | abrdn Emerging Markets Fund | |||||
| Shares Outstanding (unlimited number of shares authorized): | |||||||||
| Class A Shares | 425,176 | 1,058,242 | – | 2,005,783 | 4,990,476 | ||||
| Class C Shares | 70,108 | – | – | 16,681 | 261,427 | ||||
| Class R Shares | 139,548 | – | – | 58,674 | 8,303,789 | ||||
| Institutional Service Class Shares | 16,339 | – | – | 3,727 | 41,011,329 | ||||
| Institutional Class Shares | 818,999 | 24,967,544 | 28,411 | 744,770 | 112,852,143 | ||||
| Total Shares Outstanding per Class | 1,470,170 | 26,025,786 | 28,411 | 2,829,635 | 167,419,164 | ||||
| Net Asset Value and Redemption Price Per Share (Net assets by class divided by shares outstanding by class, respectively): | |||||||||
| Class A Shares | $26.74 | $4.16 | $– | $10.66 | $12.83 | ||||
| Class C Shares | 24.91 | – | – | 9.44 | 12.68 | ||||
| Class R Shares | 25.87 | – | – | 9.84 | 12.63 | ||||
| Institutional Service Class Shares | 27.04 | – | – | 10.93 | 12.85 | ||||
| Institutional Class Shares | 27.22 | 4.16 | 9.20 | 10.77 | 12.93 | ||||
| Maximum Offering Price Per Share (100%/(100% - maximum sales charge) of net asset value adjusted to the nearest cent): | |||||||||
| Class A Shares | $28.37 | $4.41 | $– | $11.31 | $13.61 | ||||
| Maximum Sales Charge: | |||||||||
| Class A Shares | 5.75% | 5.75% | –% | 5.75% | 5.75% |
| 2023 Semi-Annual Report | 53 |
| abrdn Emerging Markets Sustainable Leaders Fund | abrdn Global Equity Impact Fund | abrdn Global Infrastructure Fund | abrdn International Small Cap Fund | abrdn International Sustainable Leaders Fund | |||||
| Assets: | |||||||||
| Investments, at value | $79,384,060 | $51,101,502 | $50,099,063 | $170,305,605 | $87,289,762 | ||||
| Short-term investments, at value | 375,921 | 1,060,220 | 494,819 | 2,150,400 | 1,828,131 | ||||
| Foreign Currency, at value | 810,221 | 165,408 | 5 | 81,028 | 77,470 | ||||
| Receivable for investments sold | 184,581 | – | – | 2,653,728 | 3,759,778 | ||||
| Interest and dividends receivable | 152,073 | 571,083 | 186,523 | 591,845 | 1,086,680 | ||||
| Receivable for capital shares issued | 4,650 | 3,061 | 4,794 | 71,388 | 449 | ||||
| Receivable from Adviser | 19,700 | – | 16,846 | 38,413 | – | ||||
| Tax reclaim receivable | 142,216 | 87,877 | 16,180 | 56,324 | 207,768 | ||||
| Prepaid expenses | 38,658 | 59,264 | 16,224 | 27,120 | 59,294 | ||||
| Total Assets | 81,112,080 | 53,048,415 | 50,834,454 | 175,975,851 | 94,309,332 | ||||
| Liabilities: | |||||||||
| Payable for investments purchased | 338,455 | – | – | 414,036 | 3,541,425 | ||||
| Payable for capital shares redeemed | 37,217 | 3,226 | 17,080 | 143,197 | 13,272 | ||||
| Payable to IRS on behalf of shareholders related to Article 63 EU Tax Reclaims (see Note 2(i)) | – | 2,319,738 | – | – | 3,270,217 | ||||
| Accrued foreign capital gains tax | 175,390 | 3,869 | – | – | 88,766 | ||||
| Accrued expenses and other payables: | |||||||||
| Administration fees | 5,356 | 3,316 | 2,943 | 11,560 | 5,636 | ||||
| Audit fees | 18,209 | 18,591 | 19,707 | 19,340 | 18,591 | ||||
| Custodian fees | 143,783 | 58,559 | 25,455 | 123,074 | 90,319 | ||||
| Distribution fees | 3,681 | 6,149 | 1,461 | 13,489 | 15,735 | ||||
| Fund accounting fees | 4,762 | 2,132 | 2,190 | 8,846 | 3,754 | ||||
| Interest expense on line of credit | – | – | – | 323 | – | ||||
| Investment advisory fees | 53,556 | 14,459 | 35,098 | 116,598 | 31,508 | ||||
| Legal fees | 1,884 | 1,170 | 1,171 | 4,037 | 1,958 | ||||
| Printing fees | 10,533 | 7,472 | 5,507 | 21,914 | 10,659 | ||||
| Sub-transfer agent and administrative services fees | 7,486 | 7,503 | 4,487 | 22,373 | 17,638 | ||||
| Transfer agent fees | 7 | 1,671 | 871 | 2,945 | 1,541 | ||||
| Other accrued expenses | 22,863 | 14,344 | 19,084 | 25,610 | 29,483 | ||||
| Total liabilities | 823,182 | 2,462,199 | 135,054 | 927,342 | 7,140,502 | ||||
| Net assets | $80,288,898 | $50,586,216 | $50,699,400 | $175,048,509 | $87,168,830 | ||||
| Cost: | |||||||||
| Investments | 93,911,457 | 46,342,597 | 41,705,834 | 177,351,704 | 95,855,054 | ||||
| Short-Term Investments | 375,921 | 1,060,220 | 494,819 | 2,150,400 | 1,828,131 | ||||
| Foreign currency | 804,065 | 171,354 | 5 | 79,982 | 77,109 | ||||
| Represented by: | |||||||||
| Paid in capital in excess of par value | $126,077,577 | $56,818,079 | $41,369,055 | $217,086,742 | $497,940,323 | ||||
| Distributable earnings (accumulated loss) | (45,788,679) | (6,231,863) | 9,330,345 | (42,038,233) | (410,771,493) | ||||
| Net Assets | $80,288,898 | $50,586,216 | $50,699,400 | $175,048,509 | $87,168,830 | ||||
| Net Assets: | |||||||||
| Class A | $12,096,487 | $30,041,121 | $12,056,399 | $60,232,814 | $77,841,934 | ||||
| Class C | 135,507 | – | – | 396,856 | – | ||||
| Class R | 2,539,407 | – | – | 2,124,453 | – | ||||
| Institutional Service Class | 57,600,516 | – | – | – | – | ||||
| Institutional Class | 7,916,981 | 20,545,095 | 38,643,001 | 112,294,386 | 9,326,896 | ||||
| Total | $80,288,898 | $50,586,216 | $50,699,400 | $175,048,509 | $87,168,830 | ||||
| Shares Outstanding (unlimited number of shares authorized): | |||||||||
| Class A Shares | 1,148,267 | 2,108,167 | 526,205 | 2,229,466 | 3,073,676 | ||||
| Class C Shares | 13,994 | – | – | 16,628 | – | ||||
| Class R Shares | 258,031 | – | – | 84,872 | – | ||||
| Institutional Service Class Shares | 5,309,700 | – | – | – | – | ||||
| Institutional Class Shares | 723,526 | 1,438,588 | 1,682,469 | 4,103,574 | 356,917 | ||||
| Total Shares Outstanding per Class | 7,453,518 | 3,546,755 | 2,208,674 | 6,434,540 | 3,430,593 Amounts listed as “–” are $0 or round to $0. See Notes to Financial Statements. |
| 54 | 2023 Semi-Annual Report |
| abrdn Emerging Markets Sustainable Leaders Fund | abrdn Global Equity Impact Fund | abrdn Global Infrastructure Fund | abrdn International Small Cap Fund | abrdn International Sustainable Leaders Fund | |
| Net Asset Value and Redemption Price Per Share (Net assets by class divided by shares outstanding by class, respectively): | |||||
| Class A Shares | $10.53 | $14.25 | $22.91 | $27.02 | $25.33 |
| Class C Shares | 9.68 | – | – | 23.87 | – |
| Class R Shares | 9.84 | – | – | 25.03 | – |
| Institutional Service Class Shares | 10.85 | – | – | – | – |
| Institutional Class Shares | 10.94 | 14.28 | 22.97 | 27.37 | 26.13 |
| Maximum Offering Price Per Share (100%/(100% - maximum sales charge) of net asset value adjusted to the nearest cent): | |||||
| Class A Shares | $11.17 | $15.12 | $24.31 | $28.67 | $26.88 |
| Maximum Sales Charge: | |||||
| Class A Shares | 5.75% | 5.75% | 5.75% | 5.75% | 5.75% |
| 2023 Semi-Annual Report | 55 |
| abrdn Realty Income & Growth Fund | abrdn U.S. Small Cap Equity Fund | abrdn U.S. Sustainable Leaders Fund | abrdn U.S. Sustainable Leaders Smaller Companies Fund | ||||
| Assets: | |||||||
| Investments, at value | $40,408,654 | $573,741,621 | $333,696,990 | $13,502,060 | |||
| Short-term investments, at value | 537,012 | 11,218,427 | 9,759,486 | 45,540 | |||
| Foreign Currency, at value | 789 | – | – | 3,952 | |||
| Cash | – | – | 150 | – | |||
| Receivable for investments sold | – | 1,390,122 | – | 100,812 | |||
| Interest and dividends receivable | 37,282 | 72,201 | 194,687 | 553 | |||
| Receivable for capital shares issued | 734 | 307,622 | 887 | 259 | |||
| Receivable from Adviser | 18,905 | 81,445 | 54,554 | 12,810 | |||
| Prepaid expenses | 16,951 | 54,709 | 28,446 | 34,959 | |||
| Total Assets | 41,020,327 | 586,866,147 | 343,735,200 | 13,700,945 | |||
| Liabilities: | |||||||
| Payable for investments purchased | – | 1,164,003 | – | – | |||
| Payable for capital shares redeemed | 318,425 | 471,250 | 107,322 | 1,792 | |||
| Accrued expenses and other payables: | |||||||
| Administration fees | 1,942 | 39,521 | 22,191 | 898 | |||
| Audit fees | 19,334 | 18,457 | 17,644 | 19,901 | |||
| Custodian fees | 8,967 | 36,921 | 18,506 | 11,389 | |||
| Distribution fees | 1,063 | 40,350 | 45,836 | 2,486 | |||
| Fund accounting fees | 1,937 | 31,737 | 15,474 | 702 | |||
| Interest expense on line of credit | 69 | 2,142 | – | – | |||
| Investment advisory fees | 33,032 | 407,535 | 208,040 | 8,417 | |||
| Legal fees | 930 | 14,034 | 7,737 | 313 | |||
| Printing fees | 4,376 | 49,141 | 2,386 | 4,083 | |||
| Sub-transfer agent and administrative services fees | 3,114 | 76,611 | 18,030 | 1,743 | |||
| Transfer agent fees | 680 | 11,303 | 20,748 | 1,471 | |||
| Other accrued expenses | 15,473 | 18,844 | 14,659 | 13,610 | |||
| Total liabilities | 409,342 | 2,381,849 | 498,573 | 66,805 | |||
| Net assets | $40,610,985 | $584,484,298 | $343,236,627 | $13,634,140 | |||
| Cost: | |||||||
| Investments | 33,813,152 | 599,579,821 | 321,205,204 | 15,317,578 | |||
| Short-Term Investments | 537,012 | 11,218,427 | 9,759,486 | 45,540 | |||
| Foreign currency | 785 | – | – | 4,015 | |||
| Represented by: | |||||||
| Paid in capital in excess of par value | $32,887,521 | $645,510,140 | $338,175,016 | $16,429,126 | |||
| Distributable earnings (accumulated loss) | 7,723,464 | (61,025,842) | 5,061,611 | (2,794,986) | |||
| Net Assets | $40,610,985 | $584,484,298 | $343,236,627 | $13,634,140 | |||
| Net Assets: | |||||||
| Class A | $350,339 | $103,643,799 | $225,613,627 | $7,584,155 | |||
| Class C | – | 21,262,906 | 285,011 | – | |||
| Class R | – | 3,214,960 | – | 2,260,259 | |||
| Institutional Service Class | – | 33,160,582 | 109,324,257 | 232,215 | |||
| Institutional Class | 40,260,646 | 423,202,051 | 8,013,732 | 3,557,511 | |||
| Total | $40,610,985 | $584,484,298 | $343,236,627 | $13,634,140 | |||
| Shares Outstanding (unlimited number of shares authorized): | |||||||
| Class A Shares | 33,282 | 3,533,287 | 22,547,333 | 1,231,579 | |||
| Class C Shares | – | 991,772 | 39,774 | – | |||
| Class R Shares | – | 129,114 | – | 429,964 | |||
| Institutional Service Class Shares | – | 1,014,948 | 9,689,449 | 35,714 | |||
| Institutional Class Shares | 3,803,850 | 12,900,194 | 704,163 | 520,317 | |||
| Total Shares Outstanding per Class | 3,837,132 | 18,569,315 | 32,980,719 | 2,217,574 Amounts listed as “–” are $0 or round to $0. See Notes to Financial Statements. |
| 56 | 2023 Semi-Annual Report |
| abrdn Realty Income & Growth Fund | abrdn U.S. Small Cap Equity Fund | abrdn U.S. Sustainable Leaders Fund | abrdn U.S. Sustainable Leaders Smaller Companies Fund | |
| Net Asset Value and Redemption Price Per Share (Net assets by class divided by shares outstanding by class, respectively): | ||||
| Class A Shares | $10.53 | $29.33 | $10.01 | $6.16 |
| Class C Shares | – | 21.44 | 7.17 | – |
| Class R Shares | – | 24.90 | – | 5.26 |
| Institutional Service Class Shares | – | 32.67 | 11.28 | 6.50 |
| Institutional Class Shares | 10.58 | 32.81 | 11.38 | 6.84 |
| Maximum Offering Price Per Share (100%/(100% - maximum sales charge) of net asset value adjusted to the nearest cent): | ||||
| Class A Shares | $11.17 | $31.12 | $10.62 | $6.54 |
| Maximum Sales Charge: | ||||
| Class A Shares | 5.75% | 5.75% | 5.75% | 5.75% |
| 2023 Semi-Annual Report | 57 |
| abrdn China A Share Equity Fund | abrdn Dynamic Dividend Fund | abrdn EM SMA Completion Fund | abrdn Emerging Markets ex-China Fund | abrdn Emerging Markets Fund | |||||
| Investment Income: | |||||||||
| Dividend income | $91,622 | $4,278,109 | $1,509 | $336,577 | $30,756,929 | ||||
| Interest income | 31,685 | 24,051 | 160 | 12,347 | 917,420 | ||||
| Securities lending income, net | — | — | — | — | 36,367 | ||||
| Foreign tax withholding | (5,614) | (458,172) | (133) | (49,227) | (3,249,720) | ||||
| Total Income | 117,693 | 3,843,988 | 1,536 | 299,697 | 28,460,996 | ||||
| Expenses | |||||||||
| Investment advisory fees | 170,851 | 531,578 | — | 120,745 | 10,301,092 | ||||
| Trustee fees | 2,479 | 6,230 | 11 | 1,534 | 144,339 | ||||
| Administration fees | 16,080 | 42,526 | 52 | 10,733 | 915,653 | ||||
| Legal fees | 4,823 | 16,076 | 19 | 3,160 | 280,231 | ||||
| Audit fees | 18,209 | 17,758 | 12,906 | 18,209 | 19,340 | ||||
| Printing fees | 4,974 | 7,023 | 1,654 | 8,259 | 129,802 | ||||
| Custodian fees | 22,765 | 16,305 | 3,309 | 22,808 | 959,256 | ||||
| Transfer agent fees | 12,866 | 17,476 | 993 | 19,284 | 139,876 | ||||
| Distribution fees Class A | 14,913 | 5,335 | — | 25,896 | 81,949 | ||||
| Distribution fees Class C | 9,184 | — | — | 699 | 20,217 | ||||
| Distribution fees Class R | 9,215 | — | — | 1,490 | 261,257 | ||||
| Sub-transfer agent and administrative service fees Institutional Class | 7,074 | 34,118 | — | 3,229 | 736,307 | ||||
| Sub-transfer agent and administrative service fees Class A | 6,030 | 1,861 | — | 10,583 | 81,950 | ||||
| Sub-transfer agent and administrative service fees Class C | 639 | — | — | 122 | 2,030 | ||||
| Sub-transfer agent and administrative service fees Class R | 2,302 | — | — | 594 | 78,025 | ||||
| Sub-transfer agent and administrative service fees Institutional Service Class | 246 | — | — | 46 | 398,283 | ||||
| Fund accounting fees | 804 | 2,126 | 3 | 537 | 45,783 | ||||
| Registration and filing fees | 33,266 | — | — | 32,305 | 130,290 | ||||
| Other | 16,367 | 12,994 | 3,917 | 20,404 | 212,428 | ||||
| Total expenses before reimbursed/waived expenses | 353,087 | 711,406 | 22,864 | 300,637 | 14,938,108 | ||||
| Interest expense (Note 9) | — | 1,341 | — | 966 | 27,025 | ||||
| Total operating expenses before reimbursed/waived expenses | 353,087 | 712,747 | 22,864 | 301,603 | 14,965,133 | ||||
| Expenses reimbursed | (112,204) | (41,595) | (22,864) | (113,751) | (1,426,206) | ||||
| Net expenses | 240,883 | 671,152 | — | 187,852 | 13,538,927 | ||||
| Net Investment Income | (123,190) | 3,172,836 | 1,536 | 111,845 | 14,922,069 | ||||
| REALIZED/UNREALIZED GAIN/(LOSS) FROM INVESTMENTS: | |||||||||
| Realized gain/(loss) on investment transactions | (2,365,215) | 1,613,526 | 1,053 | (254,584) | 3,246,164 | ||||
| Realized gain/(loss) on forward foreign currency exchange contracts | — | (436,169) | — | — | — | ||||
| Realized gain/(loss) on foreign currency transactions | (9,702) | 5,392 | (2,123) | (9,220) | (472,667) | ||||
| Net realized gain/(loss) from investments, forward foreign currency exchange contracts and foreign currency transactions | (2,374,917) | 1,182,749 | (1,070) | (263,804) | 2,773,497 | ||||
| Net change in unrealized appreciation/(depreciation) on investment transactions (including $0, $0, $0, $928 and $2,414,252 change in deferred capital gains tax, respectively) | 7,340,572 | 9,785,303 | (22,504) | 2,979,255 | 324,425,778 | ||||
| Net change in unrealized appreciation/(depreciation) on forward foreign currency exchange contracts | — | 12,363 | — | — | — | ||||
| Net change in unrealized appreciation/(depreciation) on translation of assets and liabilities denominated in foreign currencies | — | (83,232) | (8) | 1,550 | 9,839 | ||||
| Net change in unrealized appreciation/(depreciation) from investments, forward foreign currency exchange contracts and translation of assets and liabilities denominated in foreign currencies | 7,340,572 | 9,714,434 | (22,512) | 2,980,805 | 324,435,617 | ||||
| Net realized/unrealized gain/(loss) from investments, forward foreign currency exchange contracts and translation of assets and liabilities denominated in foreign currencies | 4,965,655 | 10,897,183 | (23,582) | 2,717,001 | 327,209,114 | ||||
| CHANGE IN NET ASSETS RESULTING FROM OPERATIONS | $4,842,465 | $14,070,019 | $(22,046) | $2,828,846 | $342,131,183 |
| 58 | 2023 Semi-Annual Report |
| abrdn Emerging Markets Sustainable Leaders Fund | abrdn Global Equity Impact Fund | abrdn Global Infrastructure Fund | abrdn International Small Cap Fund | abrdn International Sustainable Leaders Fund | |||||
| Investment Income: | |||||||||
| Dividend income | $1,138,689 | $488,994 | $861,114 | $1,379,094 | $732,926 | ||||
| Interest income | 19,838 | 21,041 | 11,734 | 22,679 | 105,109 | ||||
| Foreign tax withholding | (127,753) | (345,419) | (70,753) | (90,748) | (447,146) | ||||
| Total Income | 1,030,774 | 164,616 | 802,095 | 1,311,025 | 390,889 | ||||
| Expenses | |||||||||
| Investment advisory fees | 340,471 | 186,908 | 207,057 | 726,882 | 317,777 | ||||
| Trustee fees | 6,117 | 2,886 | 2,912 | 10,979 | 4,974 | ||||
| Administration fees | 34,047 | 19,937 | 19,488 | 72,245 | 33,896 | ||||
| Legal fees | 12,342 | 6,649 | 5,826 | 21,765 | 11,342 | ||||
| Audit fees | 18,209 | 18,591 | 19,707 | 19,340 | 18,591 | ||||
| Printing fees | 10,817 | 7,292 | 6,053 | 19,358 | 10,214 | ||||
| Custodian fees | 54,113 | 13,874 | 12,791 | 58,180 | 21,690 | ||||
| Transfer agent fees | 43,068 | 14,522 | 10,875 | 39,594 | 18,336 | ||||
| Distribution fees Class A | 15,507 | 36,526 | 14,623 | 75,291 | 92,690 | ||||
| Distribution fees Class C | 754 | — | — | 1,837 | — | ||||
| Distribution fees Class R | 6,531 | — | — | 5,024 | — | ||||
| Sub-transfer agent and administrative service fees Institutional Class | 4,194 | 11,323 | 14,851 | 61,539 | 4,425 | ||||
| Sub-transfer agent and administrative service fees Class A | 9,210 | 15,040 | 4,406 | 30,885 | 42,201 | ||||
| Sub-transfer agent and administrative service fees Class C | 117 | — | — | 349 | — | ||||
| Sub-transfer agent and administrative service fees Class R | 1,410 | — | — | 1,093 | — | ||||
| Sub-transfer agent and administrative service fees Institutional Service Class | 18,794 | — | — | — | — | ||||
| Fund accounting fees | 1,702 | 997 | 974 | 3,612 | 1,695 | ||||
| Registration and filing fees | 32,995 | 16,339 | — | 32,679 | 16,791 | ||||
| Other | 27,506 | 42,171 | 10,562 | 31,720 | 46,305 | ||||
| Total expenses before reimbursed/waived expenses | 637,904 | 393,055 | 330,125 | 1,212,372 | 640,927 | ||||
| Interest expense (Note 9) | 4,541 | 80 | — | 2,035 | 2,760 | ||||
| Total operating expenses before reimbursed/waived expenses | 642,445 | 393,135 | 330,125 | 1,214,407 | 643,687 | ||||
| Expenses reimbursed | (117,551) | (110,997) | (74,340) | (204,215) | (145,663) | ||||
| Net expenses | 524,894 | 282,138 | 255,785 | 1,010,192 | 498,024 | ||||
| Net Investment Income | 505,880 | (117,522) | 546,310 | 300,833 | (107,135) | ||||
| REALIZED/UNREALIZED GAIN/(LOSS) FROM INVESTMENTS: | |||||||||
| Realized gain/(loss) on investment transactions | (20,245,833) | 1,821,383 | 1,035,846 | (10,764,642) | 298,997 | ||||
| Realized gain/(loss) on foreign currency transactions | 112,746 | 107,454 | (7,006) | (11,927) | 260,275 | ||||
| Net realized gain/(loss) from investments and foreign currency transactions | (20,133,087) | 1,928,837 | 1,028,840 | (10,776,569) | 559,272 | ||||
| Net change in unrealized appreciation/(depreciation) on investment transactions (including $84,965, $(6,608), $0, $48,477 and $(44,970) change in deferred capital gains tax, respectively) | 32,500,155 | 4,671,125 | 5,046,046 | 36,998,678 | 17,431,314 | ||||
| Net change in unrealized appreciation/(depreciation) on translation of assets and liabilities denominated in foreign currencies | 25,353 | 83,153 | 1,362 | 45,610 | 121,871 | ||||
| Net change in unrealized appreciation/(depreciation) from investments and translation of assets and liabilities denominated in foreign currencies | 32,525,508 | 4,754,278 | 5,047,408 | 37,044,288 | 17,553,185 | ||||
| Net realized/unrealized gain/(loss) from investments and translation of assets and liabilities denominated in foreign currencies | 12,392,421 | 6,683,115 | 6,076,248 | 26,267,719 | 18,112,457 | ||||
| CHANGE IN NET ASSETS RESULTING FROM OPERATIONS | $12,898,301 | $6,565,593 | $6,622,558 | $26,568,552 | $18,005,322 |
| 2023 Semi-Annual Report | 59 |
| abrdn Realty Income & Growth Fund | abrdn U.S. Small Cap Equity Fund | abrdn U.S. Sustainable Leaders Fund | abrdn U.S. Sustainable Leaders Smaller Companies Fund | ||||
| Investment Income: | |||||||
| Dividend income | $1,004,782 | $3,015,816 | $2,417,704 | $93,636 | |||
| Interest income | 12,152 | 219,063 | 111,036 | 3,263 | |||
| Foreign tax withholding | — | (81,588) | (57,710) | (2,633) | |||
| Total Income | 1,016,934 | 3,153,291 | 2,471,030 | 94,266 | |||
| Expenses | |||||||
| Investment advisory fees | 208,301 | 2,721,077 | 1,279,398 | 55,840 | |||
| Trustee fees | 2,532 | 41,519 | 20,378 | 936 | |||
| Administration fees | 16,664 | 264,669 | 136,469 | 5,956 | |||
| Legal fees | 4,948 | 79,147 | 40,735 | 1,826 | |||
| Audit fees | 19,334 | 18,457 | 17,644 | 19,901 | |||
| Printing fees | 4,941 | 49,746 | 10,677 | 4,257 | |||
| Custodian fees | 4,061 | 15,548 | 8,167 | 4,983 | |||
| Transfer agent fees | 10,206 | 80,822 | 98,946 | 10,345 | |||
| Distribution fees Class A | 472 | 133,322 | 280,818 | 10,067 | |||
| Distribution fees Class C | — | 114,413 | 1,521 | — | |||
| Distribution fees Class R | — | 7,984 | — | 5,745 | |||
| Sub-transfer agent and administrative service fees Institutional Class | 14,643 | 264,484 | 2,563 | 3,263 | |||
| Sub-transfer agent and administrative service fees Class A | 202 | 76,371 | 45,966 | 3,531 | |||
| Sub-transfer agent and administrative service fees Class C | — | 12,885 | 165 | — | |||
| Sub-transfer agent and administrative service fees Class R | — | 2,611 | — | 1,623 | |||
| Sub-transfer agent and administrative service fees Institutional Service Class | — | 15,042 | 32,899 | 194 | |||
| Fund accounting fees | 833 | 13,233 | 6,823 | 298 | |||
| Registration and filing fees | — | 42,062 | 28,820 | 29,211 | |||
| Other | 5,829 | 58,709 | 32,506 | 10,542 | |||
| Total expenses before reimbursed/waived expenses | 292,966 | 4,012,101 | 2,044,495 | 168,518 | |||
| Interest expense (Note 9) | 621 | 6,068 | — | 16 | |||
| Total operating expenses before reimbursed/waived expenses | 293,587 | 4,018,169 | 2,044,495 | 168,534 | |||
| Expenses reimbursed | (84,193) | (387,074) | (148,013) | (80,350) | |||
| Net expenses | 209,394 | 3,631,095 | 1,896,482 | 88,184 | |||
| Net Investment Income | 807,540 | (477,804) | 574,548 | 6,082 | |||
| REALIZED/UNREALIZED GAIN/(LOSS) FROM INVESTMENTS: | |||||||
| Realized gain/(loss) on investment transactions | 979,694 | (24,787,628) | (7,918,862) | (561,974) | |||
| Realized gain/(loss) on foreign currency transactions | (2) | (15,669) | 2,501 | (273) | |||
| Net realized gain/(loss) from investments and foreign currency transactions | 979,692 | (24,803,297) | (7,916,361) | (562,247) | |||
| Net change in unrealized appreciation/(depreciation) on investment transactions | 113,697 | 49,982,484 | 30,917,637 | 299,796 | |||
| Net change in unrealized appreciation/(depreciation) on translation of assets and liabilities denominated in foreign currencies | 4 | (1,486) | — | (257) | |||
| Net change in unrealized appreciation/(depreciation) from investments and translation of assets and liabilities denominated in foreign currencies | 113,701 | 49,980,998 | 30,917,637 | 299,539 | |||
| Net realized/unrealized gain/(loss) from investments and translation of assets and liabilities denominated in foreign currencies | 1,093,393 | 25,177,701 | 23,001,276 | (262,708) | |||
| CHANGE IN NET ASSETS RESULTING FROM OPERATIONS | $1,900,933 | $24,699,897 | $23,575,824 | $(256,626) |
| 60 | 2023 Semi-Annual Report |
| abrdn China A Share Equity Fund | abrdn Dynamic Dividend Fund | abrdn EM SMA Completion Fund | |||||||
| Six-Month Period Ended April 30, 2023 (unaudited) | Year Ended October 31, 2022 | Six-Month Period Ended April 30, 2023 (unaudited) | Year Ended October 31, 2022 | Six-Month Period Ended April 30, 2023(a) (unaudited) | |||||
| From Investment Activities: | |||||||||
| Operations: | |||||||||
| Net investment income | $(123,190) | $53,740 | $3,172,836 | $5,548,100 | $1,536 | ||||
| Net realized gain/(loss) from investments, forward foreign currency exchange contracts and foreign currency transactions | (2,374,917) | (10,391,487) | 1,182,749 | (891,228) | (1,070) | ||||
| Net change in unrealized appreciation/(depreciation) from investments, forward foreign currency exchange contracts and translation of assets and liabilities denominated in foreign currencies | 7,340,572 | (17,965,887) | 9,714,434 | (24,590,633) | (22,512) | ||||
| Changes in net assets resulting from operations | 4,842,465 | (28,303,634) | 14,070,019 | (19,933,761) | (22,046) | ||||
| Distributions to Shareholders From: | |||||||||
| Distributable earnings | |||||||||
| Class A | — | (454,659) | (122,094) | (250,310) | — | ||||
| Class C | — | (99,787) | — | — | — | ||||
| Class R | — | (119,125) | — | — | — | ||||
| Institutional Service Class | — | (23,223) | — | — | — | ||||
| Institutional Class | — | (1,556,884) | (3,057,554) | (6,261,044) | — | ||||
| Class A | — | — | — | (6,551) | — | ||||
| Institutional Class | — | — | — | (156,417) | — | ||||
| Change in net assets from shareholder distributions | — | (2,253,678) | (3,179,648) | (6,674,322) | — | ||||
| Change in net assets from capital transactions | 3,854,441 | (26,754,952) | (3,113,493) | (1,087,516) | 283,441 | ||||
| Change in net assets | 8,696,906 | (57,312,264) | 7,776,878 | (27,695,599) | 261,395 | ||||
| Net Assets: | |||||||||
| Beginning of period | 30,761,194 | 88,073,458 | 100,456,428 | 128,152,027 | — | ||||
| End of period | $39,458,100 | $30,761,194 | $108,233,306 | $100,456,428 | $261,395 | ||||
| (a) | For the period from January 27, 2023 (commencement of operations) through April 30, 2023. |
| 2023 Semi-Annual Report | 61 |
| abrdn China A Share Equity Fund | abrdn Dynamic Dividend Fund | abrdn EM SMA Completion Fund | |||||||
| Six-Month Period Ended April 30, 2023 (unaudited) | Year Ended October 31, 2022 | Six-Month Period Ended April 30, 2023 (unaudited) | Year Ended October 31, 2022 | Six-Month Period Ended April 30, 2023 (unaudited) | |||||
| Capital Transactions: | |||||||||
| Class A Shares | |||||||||
| Proceeds from shares issued | $2,674,763 | $3,046,824 | $292,875 | $522,813 | $— | ||||
| Dividends reinvested | — | 376,768 | 93,604 | 184,142 | — | ||||
| Cost of shares redeemed | (2,551,747) | (5,176,897) | (526,082) | (514,849) | — | ||||
| Total Class A | 123,016 | (1,753,305) | (139,603) | 192,106 | — | ||||
| Class C Shares | |||||||||
| Proceeds from shares issued | 57,481 | 317,081 | — | — | — | ||||
| Dividends reinvested | — | 99,579 | — | — | — | ||||
| Cost of shares redeemed | (112,460) | (1,236,375) | — | — | — | ||||
| Total Class C | (54,979) | (819,715) | — | — | — | ||||
| Class R Shares | |||||||||
| Proceeds from shares issued | 2,360,101 | 921,124 | — | — | — | ||||
| Dividends reinvested | — | 119,125 | — | — | — | ||||
| Cost of shares redeemed | (1,352,800) | (1,541,018) | — | — | — | ||||
| Total Class R | 1,007,301 | (500,769) | — | — | — | ||||
| Institutional Service Class Shares | |||||||||
| Proceeds from shares issued | 34,959 | 28,398 | — | — | — | ||||
| Dividends reinvested | — | 23,119 | — | — | — | ||||
| Cost of shares redeemed | (1,142) | (338,939) | — | — | — | ||||
| Total Institutional Service Class | 33,817 | (287,422) | — | — | — | ||||
| Institutional Class Shares | |||||||||
| Proceeds from shares issued | 8,095,474 | 22,647,772 | 3,764,448 | 6,238,774 | 290,982 | ||||
| Dividends reinvested | — | 1,523,305 | 2,637,501 | 5,461,393 | — | ||||
| Cost of shares redeemed | (5,350,188) | (47,564,818) | (9,375,839) | (12,979,789) | (7,541) | ||||
| Total Institutional Class | 2,745,286 | (23,393,741) | (2,973,890) | (1,279,622) | 283,441 | ||||
| Change in net assets from capital transactions: | $3,854,441 | $(26,754,952) | $(3,113,493) | $(1,087,516) | $283,441 | ||||
| 62 | 2023 Semi-Annual Report |
| abrdn China A Share Equity Fund | abrdn Dynamic Dividend Fund | abrdn EM SMA Completion Fund | |||||||
| Six-Month Period Ended April 30, 2023 (unaudited) | Year Ended October 31, 2022 | Six-Month Period Ended April 30, 2023 (unaudited) | Year Ended October 31, 2022 | Six-Month Period Ended April 30, 2023 (unaudited) | |||||
| Share Transactions: | |||||||||
| Class A Shares | |||||||||
| Issued | 93,691 | 96,678 | 73,664 | 120,270 | – | ||||
| Reinvested | – | 10,460 | 23,261 | 43,405 | – | ||||
| Redeemed | (91,098) | (173,865) | (131,439) | (123,273) | – | ||||
| Total Class A Shares | 2,593 | (66,727) | (34,514) | 40,402 | – | ||||
| Class C Shares | |||||||||
| Issued | 2,281 | 10,299 | – | – | – | ||||
| Reinvested | – | 2,941 | – | – | – | ||||
| Redeemed | (4,320) | (47,373) | – | – | – | ||||
| Total Class C Shares | (2,039) | (34,133) | – | – | – | ||||
| Class R Shares | |||||||||
| Issued | 82,004 | 31,381 | – | – | – | ||||
| Reinvested | – | 3,406 | – | – | – | ||||
| Redeemed | (49,409) | (51,990) | – | – | – | ||||
| Total Class R Shares | 32,595 | (17,203) | – | – | – | ||||
| Institutional Service Class Shares | |||||||||
| Issued | 1,199 | 801 | – | – | – | ||||
| Reinvested | – | 637 | – | – | – | ||||
| Redeemed | (42) | (11,455) | – | – | – | ||||
| Total Institutional Service Class Shares | 1,157 | (10,017) | – | – | – | ||||
| Institutional Class Shares | |||||||||
| Issued | 277,359 | 692,817 | 926,861 | 1,464,716 | 29,225 | ||||
| Reinvested | – | 41,746 | 655,051 | 1,284,612 | – | ||||
| Redeemed | (190,597) | (1,579,023) | (2,322,867) | (3,022,528) | (814) | ||||
| Total Institutional Class Shares | 86,762 | (844,460) | (740,955) | (273,200) | 28,411 | ||||
| Total change in shares: | 121,068 | (972,540) | (775,469) | (232,798) | 28,411 | ||||
| 2023 Semi-Annual Report | 63 |
| abrdn Emerging Markets ex-China Fund | abrdn Emerging Markets Fund | abrdn Emerging Markets Sustainable Leaders Fund | |||||||||
| Six-Month Period Ended April 30, 2023 (unaudited) | Year Ended October 31, 2022 | Six-Month Period Ended April 30, 2023 (unaudited) | Year Ended October 31, 2022 | Six-Month Period Ended April 30, 2023 (unaudited) | Year Ended October 31, 2022 | ||||||
| From Investment Activities: | |||||||||||
| Operations: | |||||||||||
| Net investment income | $111,845 | $142,640 | $14,922,069 | $29,581,569 | $505,880 | $949,194 | |||||
| Net realized gain/(loss) from investments and foreign currency transactions | (263,804) | 6,028,790 | 2,773,497 | (75,572,510) | (20,133,087) | (10,768,770) | |||||
| Net change in unrealized appreciation/(depreciation) from investments and translation of assets and liabilities denominated in foreign currencies | 2,980,805 | (13,295,901) | 324,435,617 | (1,565,051,981) | 32,525,508 | (60,620,532) | |||||
| Changes in net assets resulting from operations | 2,828,846 | (7,124,471) | 342,131,183 | (1,611,042,922) | 12,898,301 | (70,440,108) | |||||
| Distributions to Shareholders From: | |||||||||||
| Distributable earnings | |||||||||||
| Class A | (4,756,449) | (2,940,025) | (888,931) | (10,450,111) | (171,618) | (4,773,694) | |||||
| Class C | (32,983) | (22,504) | (21,039) | (982,396) | (42) | (230,068) | |||||
| Class R | (140,910) | (100,452) | (1,335,257) | (13,100,936) | (29,935) | (1,308,584) | |||||
| Institutional Service Class | (55,202) | (35,904) | (9,738,793) | (43,720,503) | (988,508) | (18,601,335) | |||||
| Institutional Class | (974,995) | (161,867) | (28,752,203) | (397,648,559) | (197,328) | (15,010,365) | |||||
| Change in net assets from shareholder distributions | (5,960,539) | (3,260,752) | (40,736,223) | (465,902,505) | (1,387,431) | (39,924,046) | |||||
| Change in net assets from capital transactions | 8,668,850 | 4,193,751 | (404,488,269) | (582,993,591) | (44,554,427) | 7,296,976 | |||||
| Change in net assets | 5,537,157 | (6,191,472) | (103,093,309) | (2,659,939,018) | (33,043,557) | (103,067,178) | |||||
| Net Assets: | |||||||||||
| Beginning of period | 24,646,526 | 30,837,998 | 2,261,513,901 | 4,921,452,919 | 113,332,455 | 216,399,633 | |||||
| End of period | $30,183,683 | $24,646,526 | $2,158,420,592 | $2,261,513,901 | $80,288,898 | $113,332,455 | |||||
| 64 | 2023 Semi-Annual Report |
| abrdn Emerging Markets ex-China Fund | abrdn Emerging Markets Fund | abrdn Emerging Markets Sustainable Leaders Fund | |||||||||
| Six-Month Period Ended April 30, 2023 (unaudited) | Year Ended October 31, 2022 | Six-Month Period Ended April 30, 2023 (unaudited) | Year Ended October 31, 2022 | Six-Month Period Ended April 30, 2023 (unaudited) | Year Ended October 31, 2022 | ||||||
| Capital Transactions: | |||||||||||
| Class A Shares | |||||||||||
| Proceeds from shares issued | $1,219,999 | $3,170,285 | $6,552,623 | $23,429,077 | $571,775 | $1,513,131 | |||||
| Dividends reinvested | 4,454,545 | 2,746,115 | 614,614 | 7,804,763 | 153,121 | 4,278,213 | |||||
| Cost of shares redeemed | (1,703,328) | (4,455,540) | (14,998,596) | (33,776,964) | (1,567,739) | (5,940,123) | |||||
| Total Class A | 3,971,216 | 1,460,860 | (7,831,359) | (2,543,124) | (842,843) | (148,779) | |||||
| Class C Shares | |||||||||||
| Proceeds from shares issued | 14,825 | 1,500 | 272,306 | 603,272 | — | — | |||||
| Dividends reinvested | 32,955 | 22,485 | 17,548 | 783,716 | 42 | 230,068 | |||||
| Cost of shares redeemed | (7,105) | (15,904) | (1,722,826) | (3,495,596) | (96,273) | (671,768) | |||||
| Total Class C | 40,675 | 8,081 | (1,432,972) | (2,108,608) | (96,231) | (441,700) | |||||
| Class R Shares | |||||||||||
| Proceeds from shares issued | 21,551 | 138,335 | 2,318,327 | 16,410,398 | 131,608 | 537,416 | |||||
| Dividends reinvested | 137,915 | 98,734 | 1,333,126 | 13,078,200 | 29,881 | 1,306,259 | |||||
| Cost of shares redeemed | (93,428) | (237,380) | (3,919,825) | (4,699,741) | (322,549) | (2,480,297) | |||||
| Total Class R | 66,038 | (311) | (268,372) | 24,788,857 | (161,060) | (636,622) | |||||
| Institutional Service Class Shares | |||||||||||
| Proceeds from shares issued | 24,891 | 2 | 27,747,330 | 1,105,274,192 | 409,986 | 967,067 | |||||
| Dividends reinvested | 55,202 | 35,904 | 9,735,404 | 43,708,321 | 940,192 | 17,726,195 | |||||
| Cost of shares redeemed | (228,933) | (34,006) | (72,325,603) | (863,152,616) | (3,921,216) | (8,913,971) | |||||
| Total Institutional Service Class | (148,840) | 1,900 | (34,842,869) | 285,829,897 | (2,571,038) | 9,779,291 | |||||
| Institutional Class Shares | |||||||||||
| Proceeds from shares issued | 7,094,216 | 3,049,569 | 126,983,834 | 556,206,945 | 1,279,539 | 8,684,644 | |||||
| Dividends reinvested | 966,643 | 154,472 | 20,681,800 | 292,773,343 | 194,860 | 14,948,995 | |||||
| Cost of shares redeemed | (3,321,098) | (480,820) | (507,778,331) | (1,737,940,901) | (42,357,654) | (24,888,853) | |||||
| Total Institutional Class | 4,739,761 | 2,723,221 | (360,112,697) | (888,960,613) | (40,883,255) | (1,255,214) | |||||
| Change in net assets from capital transactions: | $8,668,850 | $4,193,751 | $(404,488,269) | $(582,993,591) | $(44,554,427) | $7,296,976 | |||||
| 2023 Semi-Annual Report | 65 |
| abrdn Emerging Markets ex-China Fund | abrdn Emerging Markets Fund | abrdn Emerging Markets Sustainable Leaders Fund | |||||||||
| Six-Month Period Ended April 30, 2023 (unaudited) | Year Ended October 31, 2022 | Six-Month Period Ended April 30, 2023 (unaudited) | Year Ended October 31, 2022 | Six-Month Period Ended April 30, 2023 (unaudited) | Year Ended October 31, 2022 | ||||||
| Share Transactions: | |||||||||||
| Class A Shares | |||||||||||
| Issued | 107,903 | 242,682 | 512,518 | 1,594,035 | 55,191 | 114,027 | |||||
| Reinvested | 447,693 | 167,039 | 49,169 | 460,186 | 15,012 | 314,575 | |||||
| Redeemed | (160,673) | (329,568) | (1,174,315) | (2,221,142) | (149,942) | (470,024) | |||||
| Total Class A Shares | 394,923 | 80,153 | (612,628) | (166,921) | (79,739) | (41,422) | |||||
| Class C Shares | |||||||||||
| Issued | 1,548 | 107 | 21,830 | 43,499 | – | – | |||||
| Reinvested | 3,732 | 1,499 | 1,417 | 46,845 | 4 | 18,509 | |||||
| Redeemed | (606) | (1,224) | (137,226) | (250,625) | (10,493) | (59,979) | |||||
| Total Class C Shares | 4,674 | 382 | (113,979) | (160,281) | (10,489) | (41,470) | |||||
| Class R Shares | |||||||||||
| Issued | 2,124 | 10,404 | 185,295 | 1,141,921 | 13,307 | 45,438 | |||||
| Reinvested | 15,007 | 6,395 | 108,208 | 782,189 | 3,135 | 102,693 | |||||
| Redeemed | (9,209) | (18,578) | (306,636) | (330,159) | (32,795) | (216,494) | |||||
| Total Class R Shares | 7,922 | (1,779) | (13,133) | 1,593,951 | (16,353) | (68,363) | |||||
| Institutional Service Class Shares | |||||||||||
| Issued | 2,305 | 1 | 2,316,945 | 83,268,183 | 37,326 | 79,729 | |||||
| Reinvested | 5,412 | 2,141 | 778,210 | 2,572,591 | 89,627 | 1,267,062 | |||||
| Redeemed | (22,634) | (2,028) | (5,721,805) | (65,700,482) | (368,711) | (686,027) | |||||
| Total Institutional Service Class Shares | (14,917) | 114 | (2,626,650) | 20,140,292 | (241,758) | 660,764 | |||||
| Institutional Class Shares | |||||||||||
| Issued | 637,079 | 237,754 | 9,876,260 | 36,388,629 | 121,021 | 679,385 | |||||
| Reinvested | 96,375 | 9,334 | 1,644,022 | 17,171,457 | 18,435 | 1,062,473 | |||||
| Redeemed | (287,800) | (34,618) | (39,652,326) | (118,342,884) | (4,264,064) | (1,603,456) | |||||
| Total Institutional Class Shares | 445,654 | 212,470 | (28,132,044) | (64,782,798) | (4,124,608) | 138,402 | |||||
| Total change in shares: | 838,256 | 291,340 | (31,498,434) | (43,375,757) | (4,472,947) | 647,911 | |||||
| 66 | 2023 Semi-Annual Report |
| abrdn Global Equity Impact Fund | abrdn Global Infrastructure Fund | abrdn International Small Cap Fund | |||||||||
| Six-Month Period Ended April 30, 2023 (unaudited) | Year Ended October 31, 2022 | Six-Month Period Ended April 30, 2023 (unaudited) | Year Ended October 31, 2022 | Six-Month Period Ended April 30, 2023 (unaudited) | Year Ended October 31, 2022 | ||||||
| From Investment Activities: | |||||||||||
| Operations: | |||||||||||
| Net investment income | $(117,522) | $1,487,409 | $546,310 | $1,079,551 | $300,833 | $3,274,152 | |||||
| Net realized gain/(loss) from investments, forward foreign currency exchange contracts and foreign currency transactions | 1,928,837 | 4,430,386 | 1,028,840 | 1,633,848 | (10,776,569) | (24,482,306) | |||||
| Net change in unrealized appreciation/(depreciation) from investments, forward foreign currency exchange contracts and translation of assets and liabilities denominated in foreign currencies | 4,754,278 | (26,795,443) | 5,047,408 | (8,689,667) | 37,044,288 | (118,020,445) | |||||
| Changes in net assets resulting from operations | 6,565,593 | (20,877,648) | 6,622,558 | (5,976,268) | 26,568,552 | (139,228,599) | |||||
| Distributions to Shareholders From: | |||||||||||
| Distributable earnings | |||||||||||
| Class A | (1,341,529) | (10,881) | (338,631) | (550,004) | (937,040) | (7,629,460) | |||||
| Class C | — | — | — | — | (3,288) | (43,299) | |||||
| Class R | — | — | — | — | (32,584) | (178,327) | |||||
| Institutional Class | (1,047,552) | (22,288) | (1,097,552) | (1,854,305) | (2,192,455) | (14,015,543) | |||||
| Change in net assets from shareholder distributions | (2,389,081) | (33,169) | (1,436,183) | (2,404,309) | (3,165,367) | (21,866,629) | |||||
| Change in net assets from capital transactions | 39,408 | (8,089,439) | (1,481,871) | (2,928,005) | (26,837,844) | 32,831,251 | |||||
| Change in net assets | 4,215,920 | (29,000,256) | 3,704,504 | (11,308,582) | (3,434,659) | (128,263,977) | |||||
| Net Assets: | |||||||||||
| Beginning of period | 46,370,296 | 75,370,552 | 46,994,896 | 58,303,478 | 178,483,168 | 306,747,145 | |||||
| End of period | $50,586,216 | $46,370,296 | $50,699,400 | $46,994,896 | $175,048,509 | $178,483,168 | |||||
| 2023 Semi-Annual Report | 67 |
| abrdn Global Equity Impact Fund | abrdn Global Infrastructure Fund | abrdn International Small Cap Fund | |||||||||
| Six-Month Period Ended April 30, 2023 (unaudited) | Year Ended October 31, 2022 | Six-Month Period Ended April 30, 2023 (unaudited) | Year Ended October 31, 2022 | Six-Month Period Ended April 30, 2023 (unaudited) | Year Ended October 31, 2022 | ||||||
| Capital Transactions: | |||||||||||
| Class A Shares | |||||||||||
| Proceeds from shares issued | $700,383 | $1,325,451 | $259,643 | $1,542,589 | $1,622,891 | $9,431,681 | |||||
| Dividends reinvested | 1,269,842 | 10,348 | 281,871 | 459,304 | 901,341 | 7,350,418 | |||||
| Cost of shares redeemed | (1,395,281) | (5,339,224) | (1,078,209) | (1,873,045) | (8,305,496) | (19,537,173) | |||||
| Total Class A | 574,944 | (4,003,425) | (536,695) | 128,848 | (5,781,264) | (2,755,074) | |||||
| Class C Shares | |||||||||||
| Proceeds from shares issued | — | — | — | — | 20,524 | 43,286 | |||||
| Dividends reinvested | — | — | — | — | 3,288 | 43,299 | |||||
| Cost of shares redeemed | — | — | — | — | (23,924) | (19,256) | |||||
| Total Class C | — | — | — | — | (112) | 67,329 | |||||
| Class R Shares | |||||||||||
| Proceeds from shares issued | — | — | — | — | 327,991 | 938,145 | |||||
| Dividends reinvested | — | — | — | — | 32,541 | 178,046 | |||||
| Cost of shares redeemed | — | — | — | — | (407,702) | (478,149) | |||||
| Total Class R | — | — | — | — | (47,170) | 638,042 | |||||
| Institutional Class Shares | |||||||||||
| Proceeds from shares issued | 446,316 | 389,719 | 1,092,559 | 1,658,833 | 8,750,001 | 127,740,123 | |||||
| Dividends reinvested | 928,599 | 19,988 | 1,076,011 | 1,823,311 | 2,174,000 | 13,937,907 | |||||
| Cost of shares redeemed | (1,910,451) | (4,495,721) | (3,113,746) | (6,538,997) | (31,933,299) | (106,797,076) | |||||
| Total Institutional Class | (535,536) | (4,086,014) | (945,176) | (3,056,853) | (21,009,298) | 34,880,954 | |||||
| Change in net assets from capital transactions: | $39,408 | $(8,089,439) | $(1,481,871) | $(2,928,005) | $(26,837,844) | $32,831,251 | |||||
| 68 | 2023 Semi-Annual Report |
| abrdn Global Equity Impact Fund | abrdn Global Infrastructure Fund | abrdn International Small Cap Fund | |||||||||
| Six-Month Period Ended April 30, 2023 (unaudited) | Year Ended October 31, 2022 | Six-Month Period Ended April 30, 2023 (unaudited) | Year Ended October 31, 2022 | Six-Month Period Ended April 30, 2023 (unaudited) | Year Ended October 31, 2022 | ||||||
| Share Transactions: | |||||||||||
| Class A Shares | |||||||||||
| Issued | 49,411 | 85,715 | 12,040 | 64,757 | 62,453 | 263,970 | |||||
| Reinvested | 92,622 | 593 | 13,306 | 20,134 | 35,458 | 192,470 | |||||
| Redeemed | (98,500) | (355,896) | (49,551) | (81,561) | (318,520) | (636,737) | |||||
| Total Class A Shares | 43,533 | (269,588) | (24,205) | 3,330 | (220,609) | (180,297) | |||||
| Class C Shares | |||||||||||
| Issued | – | – | – | – | 865 | 1,398 | |||||
| Reinvested | – | – | – | – | 146 | 1,281 | |||||
| Redeemed | – | – | – | – | (1,030) | (705) | |||||
| Total Class C Shares | – | – | – | – | (19) | 1,974 | |||||
| Class R Shares | |||||||||||
| Issued | – | – | – | – | 13,507 | 34,522 | |||||
| Reinvested | – | – | – | – | 1,381 | 5,013 | |||||
| Redeemed | – | – | – | – | (16,719) | (16,245) | |||||
| Total Class R Shares | – | – | – | – | (1,831) | 23,290 | |||||
| Institutional Class Shares | |||||||||||
| Issued | 30,171 | 26,137 | 49,016 | 70,795 | 332,982 | 3,828,420 | |||||
| Reinvested | 67,633 | 1,142 | 50,690 | 79,817 | 84,526 | 360,992 | |||||
| Redeemed | (136,334) | (298,060) | (142,263) | (286,787) | (1,205,408) | (3,729,923) | |||||
| Total Institutional Class Shares | (38,530) | (270,781) | (42,557) | (136,175) | (787,900) | 459,489 | |||||
| Total change in shares: | 5,003 | (540,369) | (66,762) | (132,845) | (1,010,359) | 304,456 | |||||
| 2023 Semi-Annual Report | 69 |
| abrdn International Sustainable Leaders Fund | abrdn Realty Income & Growth Fund | abrdn U.S. Small Cap Equity Fund | |||||||||
| Six-Month Period Ended April 30, 2023 (unaudited) | Year Ended October 31, 2022 | Six-Month Period Ended April 30, 2023 (unaudited) | Year Ended October 31, 2022 | Six-Month Period Ended April 30, 2023 (unaudited) | Year Ended October 31, 2022 | ||||||
| From Investment Activities: | |||||||||||
| Operations: | |||||||||||
| Net investment income | $(107,135) | $1,372,703 | $807,540 | $778,977 | $(477,804) | $(4,360,618) | |||||
| Net realized gain/(loss) from investments and foreign currency transactions | 559,272 | (8,558,136) | 979,692 | 2,985,249 | (24,803,297) | 37,496,663 | |||||
| Net change in unrealized appreciation/(depreciation) from investments and translation of assets and liabilities denominated in foreign currencies | 17,553,185 | (43,496,780) | 113,701 | (14,020,801) | 49,980,998 | (303,779,602) | |||||
| Changes in net assets resulting from operations | 18,005,322 | (50,682,213) | 1,900,933 | (10,256,575) | 24,699,897 | (270,643,557) | |||||
| Distributions to Shareholders From: | |||||||||||
| Distributable earnings | |||||||||||
| Class A | (5,324,309) | — | (27,808) | (146,200) | (5,913,035) | (33,412,568) | |||||
| Class C | — | — | — | — | (1,721,556) | (10,627,887) | |||||
| Class R | — | — | — | — | (202,505) | (1,193,211) | |||||
| Institutional Service Class | — | — | — | — | (1,601,455) | (7,641,334) | |||||
| Institutional Class | (701,988) | — | (2,984,491) | (8,236,405) | (25,542,201) | (170,135,539) | |||||
| Change in net assets from shareholder distributions | (6,026,297) | — | (3,012,299) | (8,382,605) | (34,980,752) | (223,010,539) | |||||
| Change in net assets from capital transactions | (6,823,680) | (12,636,785) | (266,976) | 2,945,089 | (133,078,779) | 25,650,936 | |||||
| Change in net assets | 5,155,345 | (63,318,998) | (1,378,342) | (15,694,091) | (143,359,634) | (468,003,160) | |||||
| Net Assets: | |||||||||||
| Beginning of period | 82,013,485 | 145,332,483 | 41,989,327 | 57,683,418 | 727,843,932 | 1,195,847,092 | |||||
| End of period | $87,168,830 | $82,013,485 | $40,610,985 | $41,989,327 | $584,484,298 | $727,843,932 | |||||
| 70 | 2023 Semi-Annual Report |
| abrdn International Sustainable Leaders Fund | abrdn Realty Income & Growth Fund | abrdn U.S. Small Cap Equity Fund | |||||||||
| Six-Month Period Ended April 30, 2023 (unaudited) | Year Ended October 31, 2022 | Six-Month Period Ended April 30, 2023 (unaudited) | Year Ended October 31, 2022 | Six-Month Period Ended April 30, 2023 (unaudited) | Year Ended October 31, 2022 | ||||||
| Capital Transactions: | |||||||||||
| Class A Shares | |||||||||||
| Proceeds from shares issued | $316,722 | $712,259 | $13,000 | $185,980 | $8,809,309 | $20,277,259 | |||||
| Dividends reinvested | 5,115,908 | — | 20,699 | 128,002 | 4,786,280 | 26,361,790 | |||||
| Cost of shares redeemed | (5,605,665) | (10,551,412) | (68,115) | (738,916) | (15,095,188) | (39,579,226) | |||||
| Total Class A | (173,035) | (9,839,153) | (34,416) | (424,934) | (1,499,599) | 7,059,823 | |||||
| Class C Shares | |||||||||||
| Proceeds from shares issued | — | — | — | — | 1,336,120 | 2,628,175 | |||||
| Dividends reinvested | — | — | — | — | 1,614,621 | 9,893,910 | |||||
| Cost of shares redeemed | — | — | — | — | (5,691,629) | (11,067,124) | |||||
| Total Class C | — | — | — | — | (2,740,888) | 1,454,961 | |||||
| Class R Shares | |||||||||||
| Proceeds from shares issued | — | — | — | — | 295,209 | 401,183 | |||||
| Dividends reinvested | — | — | — | — | 192,619 | 1,152,789 | |||||
| Cost of shares redeemed | — | — | — | — | (452,610) | (1,200,513) | |||||
| Total Class R | — | — | — | — | 35,218 | 353,459 | |||||
| Institutional Service Class Shares | |||||||||||
| Proceeds from shares issued | — | — | — | — | 2,848,939 | 7,079,316 | |||||
| Dividends reinvested | — | — | — | — | 1,545,659 | 7,333,017 | |||||
| Cost of shares redeemed | — | — | — | — | (2,497,137) | (6,806,129) | |||||
| Total Institutional Service Class | — | — | — | — | 1,897,461 | 7,606,204 | |||||
| Institutional Class Shares | |||||||||||
| Proceeds from shares issued | 154,770 | 475,331 | 163,245 | 1,135,617 | 58,065,228 | 212,922,069 | |||||
| Dividends reinvested | 644,247 | — | 2,910,679 | 8,034,241 | 22,298,024 | 142,349,678 | |||||
| Cost of shares redeemed | (7,449,662) | (3,272,963) | (3,306,484) | (5,799,835) | (211,134,223) | (346,095,258) | |||||
| Total Institutional Class | (6,650,645) | (2,797,632) | (232,560) | 3,370,023 | (130,770,971) | 9,176,489 | |||||
| Change in net assets from capital transactions: | $(6,823,680) | $(12,636,785) | $(266,976) | $2,945,089 | $(133,078,779) | $25,650,936 | |||||
| 2023 Semi-Annual Report | 71 |
| abrdn International Sustainable Leaders Fund | abrdn Realty Income & Growth Fund | abrdn U.S. Small Cap Equity Fund | |||||||||
| Six-Month Period Ended April 30, 2023 (unaudited) | Year Ended October 31, 2022 | Six-Month Period Ended April 30, 2023 (unaudited) | Year Ended October 31, 2022 | Six-Month Period Ended April 30, 2023 (unaudited) | Year Ended October 31, 2022 | ||||||
| Share Transactions: | |||||||||||
| Class A Shares | |||||||||||
| Issued | 12,495 | 26,547 | 1,242 | 13,704 | 291,875 | 567,743 | |||||
| Reinvested | 224,776 | – | 2,036 | 9,053 | 169,726 | 674,560 | |||||
| Redeemed | (233,377) | (394,467) | (6,663) | (55,619) | (508,515) | (1,151,284) | |||||
| Total Class A Shares | 3,894 | (367,920) | (3,385) | (32,862) | (46,914) | 91,019 | |||||
| Class C Shares | |||||||||||
| Issued | – | – | – | – | 61,404 | 99,538 | |||||
| Reinvested | – | – | – | – | 78,152 | 336,528 | |||||
| Redeemed | – | – | – | – | (257,668) | (439,311) | |||||
| Total Class C Shares | – | – | – | – | (118,112) | (3,245) | |||||
| Class R Shares | |||||||||||
| Issued | – | – | – | – | 11,616 | 13,153 | |||||
| Reinvested | – | – | – | – | 8,039 | 34,268 | |||||
| Redeemed | – | – | – | – | (17,349) | (43,323) | |||||
| Total Class R Shares | – | – | – | – | 2,306 | 4,098 | |||||
| Institutional Service Class Shares | |||||||||||
| Issued | – | – | – | – | 86,194 | 193,426 | |||||
| Reinvested | – | – | – | – | 49,256 | 170,021 | |||||
| Redeemed | – | – | – | – | (75,932) | (182,787) | |||||
| Total Institutional Service Class Shares | – | – | – | – | 59,518 | 180,660 | |||||
| Institutional Class Shares | |||||||||||
| Issued | 6,078 | 17,036 | 15,336 | 82,122 | 1,769,963 | 5,454,490 | |||||
| Reinvested | 27,450 | – | 285,019 | 573,732 | 708,099 | 3,292,845 | |||||
| Redeemed | (286,085) | (109,891) | (316,665) | (431,610) | (6,281,427) | (9,375,510) | |||||
| Total Institutional Class Shares | (252,557) | (92,855) | (16,310) | 224,244 | (3,803,365) | (628,175) | |||||
| Total change in shares: | (248,663) | (460,775) | (19,695) | 191,382 | (3,906,567) | (355,643) | |||||
| 72 | 2023 Semi-Annual Report |
| abrdn U.S. Sustainable Leaders Fund | abrdn U.S. Sustainable Leaders Smaller Companies Fund(a) | ||||||
| Six-Month Period Ended April 30, 2023 (unaudited) | Year Ended October 31, 2022 | Six-Month Period Ended April 30, 2023 (unaudited) | Year Ended October 31, 2022 | ||||
| From Investment Activities: | |||||||
| Operations: | |||||||
| Net investment income | $574,548 | $(1,437,727) | $6,082 | $(102,325) | |||
| Net realized gain/(loss) from investments and foreign currency transactions | (7,916,361) | 2,817,747 | (562,247) | (318,550) | |||
| Net change in unrealized appreciation/(depreciation) from investments and translation of assets and liabilities denominated in foreign currencies | 30,917,637 | (135,458,814) | 299,539 | (5,446,133) | |||
| Changes in net assets resulting from operations | 23,575,824 | (134,078,794) | (256,626) | (5,867,008) | |||
| Distributions to Shareholders From: | |||||||
| Distributable earnings | |||||||
| Class A | (963,743) | (86,439,173) | — | (2,703,472) | |||
| Class C | (2,414) | (101,349) | — | (181,578) | |||
| Class R | — | — | — | (775,300) | |||
| Institutional Service Class | (409,828) | (36,416,872) | — | (115,420) | |||
| Institutional Class | (31,379) | (3,524,570) | — | (1,464,436) | |||
| Change in net assets from shareholder distributions | (1,407,364) | (126,481,964) | — | (5,240,206) | |||
| Change in net assets from capital transactions | (16,062,986) | 78,191,306 | (2,073,239) | 7,645,361 | |||
| Change in net assets | 6,105,474 | (182,369,452) | (2,329,865) | (3,461,853) | |||
| Net Assets: | |||||||
| Beginning of period | 337,131,153 | 519,500,605 | 15,964,005 | 19,425,858 | |||
| End of period | $343,236,627 | $337,131,153 | $13,634,140 | $15,964,005 | |||
| (a) | Effective August 18, 2022, the Class C had zero assets. On August 18, 2022, the abrdn U.S. Sustainable Leaders Smaller Companies Fund ceased offering Class C Shares. |
| 2023 Semi-Annual Report | 73 |
| abrdn U.S. Sustainable Leaders Fund | abrdn U.S. Sustainable Leaders Smaller Companies Fund | ||||||
| Six-Month Period Ended April 30, 2023 (unaudited) | Year Ended October 31, 2022 | Six-Month Period Ended April 30, 2023 (unaudited) | Year Ended October 31, 2022 | ||||
| Capital Transactions: | |||||||
| Class A Shares | |||||||
| Proceeds from shares issued | $355,903 | $2,565,716 | $170,035 | $5,226,490 | |||
| Dividends reinvested | 875,365 | 79,023,829 | — | 2,304,020 | |||
| Cost of shares redeemed | (12,317,058) | (29,656,026) | (644,929) | (3,598,106) | |||
| Total Class A | (11,085,790) | 51,933,519 | (474,894) | 3,932,404 | |||
| Class C Shares | |||||||
| Proceeds from shares issued | 214,184 | 75,853 | — | 627,907 | |||
| Dividends reinvested | 2,414 | 101,349 | — | 168,111 | |||
| Cost of shares redeemed | (175,478) | (82,812) | — | (1,058,100) | |||
| Total Class C | 41,120 | 94,390 | — | (262,082) | |||
| Class R Shares | |||||||
| Proceeds from shares issued | — | — | 211,249 | 694,194 | |||
| Dividends reinvested | — | — | — | 775,300 | |||
| Cost of shares redeemed | — | — | (182,814) | (655,043) | |||
| Total Class R | — | — | 28,435 | 814,451 | |||
| Institutional Service Class Shares | |||||||
| Proceeds from shares issued | 513,196 | 2,039,723 | 7,673 | 805,282 | |||
| Dividends reinvested | 404,905 | 35,857,287 | — | 115,420 | |||
| Cost of shares redeemed | (4,756,920) | (12,622,962) | (48,865) | (532,248) | |||
| Total Institutional Service Class | (3,838,819) | 25,274,048 | (41,192) | 388,454 | |||
| Institutional Class Shares | |||||||
| Proceeds from shares issued | 464,935 | 2,378,356 | 143,948 | 3,712,861 | |||
| Dividends reinvested | 30,699 | 3,445,850 | — | 1,429,154 | |||
| Cost of shares redeemed | (1,675,131) | (4,934,857) | (1,729,536) | (2,369,881) | |||
| Total Institutional Class | (1,179,497) | 889,349 | (1,585,588) | 2,772,134 | |||
| Change in net assets from capital transactions: | $(16,062,986) | $78,191,306 | $(2,073,239) | $7,645,361 | |||
| 74 | 2023 Semi-Annual Report |
| abrdn U.S. Sustainable Leaders Fund | abrdn U.S. Sustainable Leaders Smaller Companies Fund | ||||||
| Six-Month Period Ended April 30, 2023 (unaudited) | Year Ended October 31, 2022 | Six-Month Period Ended April 30, 2023 (unaudited) | Year Ended October 31, 2022 | ||||
| Share Transactions: | |||||||
| Class A Shares | |||||||
| Issued | 36,318 | 208,059 | 26,231 | 642,781 | |||
| Reinvested | 90,711 | 6,125,878 | – | 272,343 | |||
| Redeemed | (1,259,865) | (2,606,941) | (101,142) | (513,295) | |||
| Total Class A Shares | (1,132,836) | 3,726,996 | (74,911) | 401,829 | |||
| Class C Shares | |||||||
| Issued | 30,258 | 9,258 | – | 519,347 | |||
| Reinvested | 348 | 10,839 | – | 142,467 | |||
| Redeemed | (24,690) | (10,119) | – | (1,080,502) | |||
| Total Class C Shares | 5,916 | 9,978 | – | (418,688) | |||
| Class R Shares | |||||||
| Issued | – | – | 38,366 | 101,153 | |||
| Reinvested | – | – | – | 106,938 | |||
| Redeemed | – | – | (33,340) | (104,938) | |||
| Total Class R Shares | – | – | 5,026 | 103,153 | |||
| Institutional Service Class Shares | |||||||
| Issued | 46,440 | 163,154 | 1,098 | 89,076 | |||
| Reinvested | 37,216 | 2,472,916 | – | 12,954 | |||
| Redeemed | (435,829) | (978,676) | (7,018) | (74,014) | |||
| Total Institutional Service Class Shares | (352,173) | 1,657,394 | (5,920) | 28,016 | |||
| Institutional Class Shares | |||||||
| Issued | 42,363 | 181,226 | 20,078 | 434,370 | |||
| Reinvested | 2,798 | 235,856 | – | 152,851 | |||
| Redeemed | (152,625) | (391,382) | (242,862) | (297,169) | |||
| Total Institutional Class Shares | (107,464) | 25,700 | (222,784) | 290,052 | |||
| Total change in shares: | (1,586,557) | 5,420,068 | (298,589) | 404,362 | |||
| 2023 Semi-Annual Report | 75 |
| Investment Activities | Distributions | |||||||
| Net Asset Value, Beginning of Period | Net Investment Income (Loss) (a) | Net Realized and Unrealized Gains (Losses) on Investments | Total from Investment Activities | Net Investment Income | Net Realized Gains | Total Distributions | Net Asset Value, End of Period | |
| Class A Shares | ||||||||
| Six-Months Ended April 30, 2023* | $22.74 | $(0.10) | $4.10 | $ 4.00 | $ – | $ – | $ – | $ 26.74 |
| Year Ended October 31, 2022 | 37.76 | 0.01 | (14.09) | (14.08) | – | (0.94) | (0.94) | 22.74 |
| Year Ended October 31, 2021 | 33.90 | (0.11) | 4.50 | 4.39 | – | (0.53) | (0.53) | 37.76 |
| Year Ended October 31, 2020 | 25.61 | 0.08 | 9.29 | 9.37 | –(i) | (1.08) | (1.08) | 33.90 |
| Year Ended October 31, 2019 | 19.86 | 0.07 | 5.72 | 5.79 | (0.04) | – | (0.04) | 25.61 |
| Year Ended October 31, 2018 | 22.48 | 0.06 | (2.45) | (2.39) | (0.23) | – | (0.23) | 19.86 |
| Class C Shares | ||||||||
| Six-Months Ended April 30, 2023* | 21.25 | (0.18) | 3.84 | 3.66 | – | – | – | 24.91 |
| Year Ended October 31, 2022 | 35.58 | (0.22) | (13.17) | (13.39) | – | (0.94) | (0.94) | 21.25 |
| Year Ended October 31, 2021 | 32.18 | (0.31) | 4.24 | 3.93 | – | (0.53) | (0.53) | 35.58 |
| Year Ended October 31, 2020 | 24.52 | (0.09) | 8.83 | 8.74 | – | (1.08) | (1.08) | 32.18 |
| Year Ended October 31, 2019 | 19.12 | (0.21) | 5.61 | 5.40 | – | – | – | 24.52 |
| Year Ended October 31, 2018 | 21.59 | (0.09) | (2.35) | (2.44) | (0.03) | – | (0.03) | 19.12 |
| Class R Shares | ||||||||
| Six-Months Ended April 30, 2023* | 22.03 | (0.14) | 3.98 | 3.84 | – | – | – | 25.87 |
| Year Ended October 31, 2022 | 36.71 | (0.06) | (13.68) | (13.74) | – | (0.94) | (0.94) | 22.03 |
| Year Ended October 31, 2021 | 33.07 | (0.23) | 4.40 | 4.17 | – | (0.53) | (0.53) | 36.71 |
| Year Ended October 31, 2020 | 25.08 | (0.06) | 9.13 | 9.07 | – | (1.08) | (1.08) | 33.07 |
| Year Ended October 31, 2019 | 19.48 | 0.02 | 5.58 | 5.60 | – | – | – | 25.08 |
| Year Ended October 31, 2018 | 22.07 | 0.04 | (2.46) | (2.42) | (0.17) | – | (0.17) | 19.48 |
| Institutional Service Class Shares | ||||||||
| Six-Months Ended April 30, 2023* | 22.96 | (0.07) | 4.15 | 4.08 | – | – | – | 27.04 |
| Year Ended October 31, 2022 | 38.05 | 0.05 | (14.18) | (14.13) | (0.02) | (0.94) | (0.96) | 22.96 |
| Year Ended October 31, 2021 | 34.11 | (0.04) | 4.53 | 4.49 | (0.02) | (0.53) | (0.55) | 38.05 |
| Year Ended October 31, 2020 | 25.75 | 0.15 | 9.34 | 9.49 | (0.05) | (1.08) | (1.13) | 34.11 |
| Year Ended October 31, 2019 | 19.98 | 0.11 | 5.76 | 5.87 | (0.10) | – | (0.10) | 25.75 |
| Year Ended October 31, 2018 | 22.62 | 0.11 | (2.46) | (2.35) | (0.29) | – | (0.29) | 19.98 |
| Institutional Class Shares | ||||||||
| Six-Months Ended April 30, 2023* | 23.10 | (0.06) | 4.18 | 4.12 | – | – | – | 27.22 |
| Year Ended October 31, 2022 | 38.24 | 0.06 | (14.23) | (14.17) | (0.03) | (0.94) | (0.97) | 23.10 |
| Year Ended October 31, 2021 | 34.26 | 0.12 | 4.43 | 4.55 | (0.04) | (0.53) | (0.57) | 38.24 |
| Year Ended October 31, 2020 | 25.85 | 0.05 | 9.51 | 9.56 | (0.07) | (1.08) | (1.15) | 34.26 |
| Year Ended October 31, 2019 | 20.03 | 0.26 | 5.64 | 5.90 | (0.08) | – | (0.08) | 25.85 |
| Year Ended October 31, 2018 | 22.65 | 0.05 | (2.38) | (2.33) | (0.29) | – | (0.29) | 20.03 |
| * | Unaudited |
| (a) | Net investment income/(loss) is based on average shares outstanding during the period. |
| (b) | Excludes sales charge. |
| (c) | Not Annualized for periods less than one year. |
| (d) | Annualized for periods less than one year. |
| (e) | During the period, certain fees were waived and/or reimbursed. If such waivers/reimbursements had not occurred, the ratios would have been as indicated. |
| (f) | Portfolio turnover is calculated on the basis of the Fund as a whole without distinguishing among the classes of shares. |
| (g) | Includes interest expense that amounts to less than 0.01%. |
| (h) | The total return shown above includes the impact of financial statement rounding of the NAV per share and/or financial statement adjustments. |
| (i) | Less than $0.005 per share. |
| 76 | 2023 Semi-Annual Report |
| Ratios/Supplemental Data | |||||
| Total Return (b)(c) | Net Assets at End of Period (000's) | Ratio of Expenses (Net of Reimbursements/ Waivers) to Average Net Assets (d) | Ratio of Expenses (Prior to Reimbursements) to Average Net Assets(d)(e) | Ratio of Net Investment Income (Loss) to Average Net Assets (d) | Portfolio Turnover (c)(f) |
| 17.59% | $ 11,370 | 1.34% | 1.86% | (0.73%) | 15.55% |
| (38.20%) | 9,609 | 1.33%(g) | 1.78%(g) | 0.04% | 23.60% |
| 12.98%(h) | 18,476 | 1.32%(g) | 1.58%(g) | (0.28%) | 45.21% |
| 38.06%(h) | 10,888 | 1.32%(g) | 2.55%(g) | 0.28% | 56.48% |
| 29.21% | 8,685 | 1.60%(g) | 3.19%(g) | 0.30% | 115.09% |
| (10.76%) | 5,978 | 1.95%(g) | 3.01%(g) | 0.27% | 26.13% |
| 17.22% | 1,747 | 1.99% | 2.58% | (1.37%) | 15.55% |
| (38.62%) | 1,533 | 1.99%(g) | 2.51%(g) | (0.76%) | 23.60% |
| 12.23% | 3,782 | 1.99%(g) | 2.33%(g) | (0.86%) | 45.21% |
| 37.13% | 587 | 1.99%(g) | 3.37%(g) | (0.37%) | 56.48% |
| 28.24% | 839 | 2.38%(g) | 3.99%(g) | (0.96%) | 115.09% |
| (11.32%) | 1,568 | 2.62%(g) | 3.81%(g) | (0.42%) | 26.13% |
| 17.43% | 3,610 | 1.61% | 2.13% | (1.06%) | 15.55% |
| (38.37%) | 2,356 | 1.61%(g) | 2.06%(g) | (0.22%) | 23.60% |
| 12.63%(h) | 4,557 | 1.64%(g) | 1.90%(g) | (0.62%) | 45.21% |
| 37.63%(h) | 3,215 | 1.62%(g) | 2.85%(g) | (0.23%) | 56.48% |
| 28.75% | 2,682 | 1.92%(g) | 3.52%(g) | 0.07% | 115.09% |
| (11.07%) | 1,664 | 2.27%(g) | 3.33%(g) | 0.18% | 26.13% |
| 17.77% | 442 | 1.10% | 1.62% | (0.50%) | 15.55% |
| (38.07%) | 349 | 1.10%(g) | 1.55%(g) | 0.15% | 23.60% |
| 13.21% | 959 | 1.08%(g) | 1.34%(g) | (0.10%) | 45.21% |
| 38.37% | 639 | 1.09%(g) | 2.32%(g) | 0.55% | 56.48% |
| 29.52% | 543 | 1.40%(g) | 2.96%(g) | 0.45% | 115.09% |
| (10.57%) | 532 | 1.72%(g) | 2.78%(g) | 0.49% | 26.13% |
| 17.84% | 22,290 | 0.99% | 1.57% | (0.41%) | 15.55% |
| (37.99%) | 16,915 | 0.99%(g) | 1.51%(g) | 0.19% | 23.60% |
| 13.33% | 60,300 | 0.99%(g) | 1.33%(g) | 0.32% | 45.21% |
| 38.55% | 4,919 | 0.99%(g) | 2.34%(g) | 0.20% | 56.48% |
| 29.59% | 1,336 | 1.16%(g) | 2.97%(g) | 1.09% | 115.09% |
| (10.46%) | 299 | 1.62%(g) | 2.78%(g) | 0.21% | 26.13% |
| 2023 Semi-Annual Report | 77 |
| Investment Activities | Distributions | |||||||
| Net Asset Value, Beginning of Period | Net Investment Income (Loss) (a) | Net Realized and Unrealized Gains (Losses) on Investments | Total from Investment Activities | Net Investment Income | Net Realized Gains | Tax Return of Capital | Total Distributions | |
| Class A Shares | ||||||||
| Six-Months Ended April 30, 2023* | $3.75 | $0.11 | $0.41 | $ 0.52 | $ (0.11) | $ – | $ – | $ (0.11) |
| Year Ended October 31, 2022 | 4.74 | 0.20(h) | (0.95) | (0.75) | (0.22) | (0.01) | (0.01) | (0.24) |
| Year Ended October 31, 2021 | 3.68 | 0.23 | 1.06 | 1.29 | (0.23) | – | – | (0.23) |
| Year Ended October 31, 2020 | 3.99 | 0.20 | (0.28) | (0.08) | (0.23) | – | – | (0.23) |
| Year Ended October 31, 2019 | 3.85 | 0.23 | 0.14 | 0.37 | (0.23) | – | – | (0.23) |
| Year Ended October 31, 2018 | 4.04 | 0.17 | (0.13) | 0.04 | (0.23) | –(j) | –(j) | (0.23) |
| Institutional Class Shares | ||||||||
| Six-Months Ended April 30, 2023* | 3.75 | 0.12 | 0.41 | 0.53 | (0.12) | – | – | (0.12) |
| Year Ended October 31, 2022 | 4.74 | 0.21(h) | (0.95) | (0.74) | (0.23) | (0.01) | (0.01) | (0.25) |
| Year Ended October 31, 2021 | 3.69 | 0.24 | 1.05 | 1.29 | (0.24) | – | – | (0.24) |
| Year Ended October 31, 2020 | 4.00 | 0.21 | (0.28) | (0.07) | (0.24) | – | – | (0.24) |
| Year Ended October 31, 2019 | 3.85 | 0.24 | 0.15 | 0.39 | (0.24) | – | – | (0.24) |
| Year Ended October 31, 2018 | 4.04 | 0.18 | (0.13) | 0.05 | (0.24) | –(j) | –(j) | (0.24) |
| * | Unaudited |
| (a) | Net investment income/(loss) is based on average shares outstanding during the period. |
| (b) | Excludes sales charge. |
| (c) | Not Annualized for periods less than one year. |
| (d) | Annualized for periods less than one year. |
| (e) | During the period, certain fees were waived and/or reimbursed. If such waivers/reimbursements had not occurred, the ratios would have been as indicated. |
| (f) | Portfolio turnover is calculated on the basis of the Fund as a whole without distinguishing among the classes of shares. |
| (g) | Includes interest expense that amounts to less than 0.01% and 0.03% for Class A and Institutional Class for the six months ended April 30, 2023 and the year ended October 31, 2018, respectively. |
| (h) | Included within Net Investment Income per share, Total Return, and Ratio of Net Investment Income to Average Net Assets reflects the effects of a liability accrued on February 28, 2022 relating to withholding tax refunds that the Fund previously received and recorded which are being contested by the local tax authority. The accrued liability resulted in a decrease in net assets of approximately 0.87% as of October 31, 2022. (See Note 2i of the Notes to Financial Statements). If such amounts were excluded, the Net Investment Income per share, Total Return, and Ratio of Net Investment Loss to Average Net Assets for Class A Shares would have been $0.24, (15.67%), and 5.49%, respectively. For Institutional Class Shares, these amounts would have been $0.24, (15.45%), and 5.67%, respectively. |
| (i) | The total return shown above includes the impact of financial statement rounding of the NAV per share and/or financial statement adjustments. |
| (j) | Less than $0.005 per share. |
| 78 | 2023 Semi-Annual Report |
| Ratios/Supplemental Data | |||||||
| Redemption Fees | Net Asset Value, End of Period | Total Return (b)(c) | Net Assets at End of Period (000's) | Ratio of Expenses (Net of Reimbursements/ Waivers) to Average Net Assets (d) | Ratio of Expenses (Prior to Reimbursements) to Average Net Assets(d)(e) | Ratio of Net Investment Income (Loss) to Average Net Assets (d) | Portfolio Turnover (c)(f) |
| $ – | $ 4.16 | 14.14% | $ 4,399 | 1.50%(g) | 1.60%(g) | 5.74% | 32.79% |
| – | 3.75 | (16.34%)(h) | 4,094 | 1.50% | 1.61% | 4.62%(h) | 78.51% |
| – | 4.74 | 35.40% | 4,986 | 1.50% | 1.66% | 5.03% | 59.28% |
| – | 3.68 | (2.04%)(i) | 3,885 | 1.50% | 1.60% | 5.20% | 85.01% |
| – | 3.99 | 10.02%(i) | 4,399 | 1.50% | 1.61% | 6.00% | 105.70% |
| –(j) | 3.85 | 0.79% | 4,505 | 1.52%(g) | 1.60%(g) | 4.17% | 66.16% |
| – | 4.16 | 14.28% | 103,834 | 1.25%(g) | 1.33%(g) | 5.98% | 32.79% |
| – | 3.75 | (16.12%)(h) | 96,362 | 1.25% | 1.34% | 4.81%(h) | 78.51% |
| – | 4.74 | 35.36% | 123,166 | 1.25% | 1.39% | 5.26% | 59.28% |
| – | 3.69 | (1.77%) | 100,350 | 1.25% | 1.35% | 5.37% | 85.01% |
| – | 4.00 | 10.60% | 122,197 | 1.25% | 1.33% | 6.21% | 105.70% |
| –(j) | 3.85 | 1.02% | 135,262 | 1.28%(g) | 1.35%(g) | 4.44% | 66.16% |
| 2023 Semi-Annual Report | 79 |
| Investment Activities | Distributions | |||||||
| Net Asset Value, Beginning of Period | Net Investment Income (Loss) (a) | Net Realized and Unrealized Gains (Losses) on Investments | Total from Investment Activities | Net Investment Income | Total Distributions | Net Asset Value, End of Period | Total Return (b)(c) | |
| Institutional Class Shares | ||||||||
| Period Ended April 30, 2023*(f) | $10.00 | $0.05 | $(0.85) | $ (0.80) | $ – | $ – | $ 9.20 | (8.00%) |
| * | Unaudited |
| (a) | Net investment income/(loss) is based on average shares outstanding during the period. |
| (b) | Excludes sales charge. |
| (c) | Not Annualized for periods less than one year. |
| (d) | Annualized for periods less than one year. |
| (e) | During the period, certain fees were waived and/or reimbursed. If such waivers/reimbursements had not occurred, the ratios would have been as indicated. |
| (f) | For the period from January 27, 2023 (commencement of operations) through April 30, 2023. |
| (g) | Amounts listed as “–” are 0% or round to 0% |
| 80 | 2023 Semi-Annual Report |
| Ratios/Supplemental Data | ||||
| Net Assets at End of Period (000's) | Ratio of Expenses (Net of Reimbursements/ Waivers) to Average Net Assets (d) | Ratio of Expenses (Prior to Reimbursements) to Average Net Assets(d)(e) | Ratio of Net Investment Income (Loss) to Average Net Assets (d) | Portfolio Turnover (c) |
| $ 261 | –(g) | 34.90% | 2.34% | 6.26% |
| 2023 Semi-Annual Report | 81 |
| Investment Activities | Distributions | |||||||
| Net Asset Value, Beginning of Period | Net Investment Income (Loss) (a) | Net Realized and Unrealized Gains (Losses) on Investments | Total from Investment Activities | Net Investment Income | Net Realized Gains | Total Distributions | Net Asset Value, End of Period | |
| Class A Shares | ||||||||
| Six-Months Ended April 30, 2023* | $12.38 | $0.04 | $1.16 | $ 1.20 | $ (0.11) | $ (2.81) | $ (2.92) | $ 10.66 |
| Year Ended October 31, 2022 | 18.17 | 0.08 | (3.93) | (3.85) | – | (1.94) | (1.94) | 12.38 |
| Year Ended October 31, 2021 | 13.21 | (0.06) | 5.02 | 4.96 | – | – | – | 18.17 |
| Year Ended October 31, 2020 | 12.87 | (0.01) | 0.77 | 0.76 | (0.08) | (0.34) | (0.42) | 13.21 |
| Year Ended October 31, 2019 | 12.75 | 0.08 | 1.08 | 1.16 | (0.09) | (0.95) | (1.04) | 12.87 |
| Year Ended October 31, 2018 | 14.66 | 0.09 | (0.72) | (0.63) | (0.10) | (1.18) | (1.28) | 12.75 |
| Class C Shares | ||||||||
| Six-Months Ended April 30, 2023* | 11.24 | –(i) | 1.04 | 1.04 | (0.03) | (2.81) | (2.84) | 9.44 |
| Year Ended October 31, 2022 | 16.77 | (0.02) | (3.57) | (3.59) | – | (1.94) | (1.94) | 11.24 |
| Year Ended October 31, 2021 | 12.27 | (0.15) | 4.65 | 4.50 | – | – | – | 16.77 |
| Year Ended October 31, 2020 | 11.98 | (0.08) | 0.71 | 0.63 | – | (0.34) | (0.34) | 12.27 |
| Year Ended October 31, 2019 | 11.93 | 0.01 | 0.99 | 1.00 | – | (0.95) | (0.95) | 11.98 |
| Year Ended October 31, 2018 | 13.78 | –(i) | (0.67) | (0.67) | – | (1.18) | (1.18) | 11.93 |
| Class R Shares | ||||||||
| Six-Months Ended April 30, 2023* | 11.59 | 0.02 | 1.08 | 1.10 | (0.04) | (2.81) | (2.85) | 9.84 |
| Year Ended October 31, 2022 | 17.19 | 0.02 | (3.68) | (3.66) | – | (1.94) | (1.94) | 11.59 |
| Year Ended October 31, 2021 | 12.54 | (0.11) | 4.76 | 4.65 | – | – | – | 17.19 |
| Year Ended October 31, 2020 | 12.21 | (0.05) | 0.73 | 0.68 | (0.01) | (0.34) | (0.35) | 12.54 |
| Year Ended October 31, 2019 | 12.15 | 0.03 | 1.01 | 1.04 | (0.03) | (0.95) | (0.98) | 12.21 |
| Year Ended October 31, 2018 | 14.04 | 0.03 | (0.68) | (0.65) | (0.06) | (1.18) | (1.24) | 12.15 |
| Institutional Service Class Shares | ||||||||
| Six-Months Ended April 30, 2023* | 12.66 | 0.06 | 1.17 | 1.23 | (0.15) | (2.81) | (2.96) | 10.93 |
| Year Ended October 31, 2022 | 18.49 | 0.11 | (4.00) | (3.89) | – | (1.94) | (1.94) | 12.66 |
| Year Ended October 31, 2021 | 13.41 | (0.02) | 5.10 | 5.08 | – | – | – | 18.49 |
| Year Ended October 31, 2020 | 13.05 | 0.02 | 0.80 | 0.82 | (0.12) | (0.34) | (0.46) | 13.41 |
| Year Ended October 31, 2019 | 12.94 | 0.11 | 1.08 | 1.19 | (0.13) | (0.95) | (1.08) | 13.05 |
| Year Ended October 31, 2018 | 14.87 | 0.13 | (0.73) | (0.60) | (0.15) | (1.18) | (1.33) | 12.94 |
| Institutional Class Shares | ||||||||
| Six-Months Ended April 30, 2023* | 12.50 | 0.07 | 1.18 | 1.25 | (0.17) | (2.81) | (2.98) | 10.77 |
| Year Ended October 31, 2022 | 18.27 | 0.08 | (3.91) | (3.83) | – | (1.94) | (1.94) | 12.50 |
| Year Ended October 31, 2021 | 13.24 | –(i) | 5.03 | 5.03 | – | – | – | 18.27 |
| Year Ended October 31, 2020 | 12.88 | 0.03 | 0.79 | 0.82 | (0.12) | (0.34) | (0.46) | 13.24 |
| Year Ended October 31, 2019 | 12.77 | 0.13 | 1.06 | 1.19 | (0.13) | (0.95) | (1.08) | 12.88 |
| Year Ended October 31, 2018 | 14.69 | 0.14 | (0.73) | (0.59) | (0.15) | (1.18) | (1.33) | 12.77 |
| * | Unaudited |
| (a) | Net investment income/(loss) is based on average shares outstanding during the period. |
| (b) | Excludes sales charge. |
| (c) | Not Annualized for periods less than one year. |
| (d) | Annualized for periods less than one year. |
| (e) | During the period, certain fees were waived and/or reimbursed. If such waivers/reimbursements had not occurred, the ratios would have been as indicated. |
| (f) | Portfolio turnover is calculated on the basis of the Fund as a whole without distinguishing among the classes of shares. |
| (g) | Includes interest expense that amounts to 0.01% for Class A and Institutional Class for the six months ended April 30, 2023. Includes interest expense that amounts to less than 0.01%. |
| (h) | The total return shown above includes the impact of financial statement rounding of the NAV per share and/or financial statement adjustments. |
| (i) | Less than $0.005 per share. |
| 82 | 2023 Semi-Annual Report |
| Ratios/Supplemental Data | |||||
| Total Return (b)(c) | Net Assets at End of Period (000's) | Ratio of Expenses (Net of Reimbursements/ Waivers) to Average Net Assets (d) | Ratio of Expenses (Prior to Reimbursements) to Average Net Assets(d)(e) | Ratio of Net Investment Income (Loss) to Average Net Assets (d) | Portfolio Turnover (c)(f) |
| 11.38% | $ 21,391 | 1.46%(g) | 2.28%(g) | 0.75% | 18.82% |
| (23.84%) | 19,947 | 1.48%(g) | 2.17%(g) | 0.55% | 129.38% |
| 37.55% | 27,814 | 1.53% | 2.17% | (0.35%) | 21.98% |
| 5.93%(h) | 22,455 | 1.53%(g) | 2.17%(g) | (0.06%) | 29.04% |
| 10.40%(h) | 26,719 | 1.53%(g) | 2.07%(g) | 0.66% | 32.68% |
| (4.97%) | 27,530 | 1.53% | 1.92% | 0.67% | 22.06% |
| 10.99% | 157 | 2.11%(g) | 3.11%(g) | 0.10% | 18.82% |
| (24.32%) | 135 | 2.14%(g) | 3.05%(g) | (0.12%) | 129.38% |
| 36.67% | 195 | 2.19% | 3.03% | (1.01%) | 21.98% |
| 5.24% | 205 | 2.19%(g) | 3.04%(g) | (0.68%) | 29.04% |
| 9.62% | 638 | 2.19%(g) | 2.95%(g) | 0.05% | 32.68% |
| (5.53%) | 1,713 | 2.19% | 2.77% | 0.02% | 22.06% |
| 11.25% | 577 | 1.81%(g) | 2.63%(g) | 0.37% | 18.82% |
| (24.12%) | 588 | 1.88%(g) | 2.57%(g) | 0.13% | 129.38% |
| 37.08% | 903 | 1.87% | 2.51% | (0.69%) | 21.98% |
| 5.58% | 898 | 1.91%(g) | 2.55%(g) | (0.42%) | 29.04% |
| 9.83% | 1,554 | 1.94%(g) | 2.48%(g) | 0.26% | 32.68% |
| (5.27%) | 2,120 | 1.94% | 2.33% | 0.26% | 22.06% |
| 11.40% | 41 | 1.21%(g) | 2.04%(g) | 0.96% | 18.82% |
| (23.62%) | 236 | 1.23%(g) | 1.92%(g) | 0.78% | 129.38% |
| 37.88% | 343 | 1.29% | 1.93% | (0.12%) | 21.98% |
| 6.25% | 250 | 1.29%(g) | 1.93%(g) | 0.18% | 29.04% |
| 10.56% | 265 | 1.29%(g) | 1.83%(g) | 0.88% | 32.68% |
| (4.65%) | 460 | 1.26% | 1.65% | 0.94% | 22.06% |
| 11.70% | 8,018 | 1.11%(g) | 2.05%(g) | 1.24% | 18.82% |
| (23.57%) | 3,740 | 1.13%(g) | 1.88%(g) | 0.61% | 129.38% |
| 37.99% | 1,583 | 1.19% | 1.88% | (0.02%) | 21.98% |
| 6.39% | 1,409 | 1.19%(g) | 1.88%(g) | 0.27% | 29.04% |
| 10.71% | 1,390 | 1.19%(g) | 1.77%(g) | 1.01% | 32.68% |
| (4.63%) | 2,104 | 1.19% | 1.62% | 1.01% | 22.06% |
| 2023 Semi-Annual Report | 83 |
| Investment Activities | Distributions | |||||||
| Net Asset Value, Beginning of Period | Net Investment Income (Loss) (a) | Net Realized and Unrealized Gains (Losses) on Investments | Total from Investment Activities | Net Investment Income | Net Realized Gains | Total Distributions | Net Asset Value, End of Period | |
| Class A Shares | ||||||||
| Six-Months Ended April 30, 2023* | $11.29 | $0.06 | $1.65 | $ 1.71 | $ (0.17) | $ – | $ (0.17) | $ 12.83 |
| Year Ended October 31, 2022 | 20.15 | 0.06 | (6.98) | (6.92) | (0.02) | (1.92) | (1.94) | 11.29 |
| Year Ended October 31, 2021 | 16.79 | 0.04 | 3.46 | 3.50 | – | (0.14) | (0.14) | 20.15 |
| Year Ended October 31, 2020 | 15.30 | 0.01 | 1.71 | 1.72 | (0.22) | (0.01) | (0.23) | 16.79 |
| Year Ended October 31, 2019 | 13.12 | 0.07 | 2.26 | 2.33 | (0.13) | (0.02) | (0.15) | 15.30 |
| Year Ended October 31, 2018 | 15.74 | 0.07 | (2.53) | (2.46) | (0.16) | – | (0.16) | 13.12 |
| Class C Shares | ||||||||
| Six-Months Ended April 30, 2023* | 11.09 | 0.02 | 1.63 | 1.65 | (0.06) | – | (0.06) | 12.68 |
| Year Ended October 31, 2022 | 19.90 | (0.01) | (6.88) | (6.89) | – | (1.92) | (1.92) | 11.09 |
| Year Ended October 31, 2021 | 16.68 | (0.08) | 3.44 | 3.36 | – | (0.14) | (0.14) | 19.90 |
| Year Ended October 31, 2020 | 15.18 | (0.06) | 1.69 | 1.63 | (0.12) | (0.01) | (0.13) | 16.68 |
| Year Ended October 31, 2019 | 12.97 | –(i) | 2.24 | 2.24 | (0.01) | (0.02) | (0.03) | 15.18 |
| Year Ended October 31, 2018 | 15.55 | –(i) | (2.51) | (2.51) | (0.07) | – | (0.07) | 12.97 |
| Class R Shares | ||||||||
| Six-Months Ended April 30, 2023* | 11.11 | 0.05 | 1.63 | 1.68 | (0.16) | – | (0.16) | 12.63 |
| Year Ended October 31, 2022 | 19.89 | 0.04 | (6.90) | (6.86) | –(i) | (1.92) | (1.92) | 11.11 |
| Year Ended October 31, 2021 | 16.60 | 0.01 | 3.42 | 3.43 | – | (0.14) | (0.14) | 19.89 |
| Year Ended October 31, 2020 | 15.14 | –(i) | 1.68 | 1.68 | (0.21) | (0.01) | (0.22) | 16.60 |
| Year Ended October 31, 2019 | 13.00 | 0.07 | 2.21 | 2.28 | (0.12) | (0.02) | (0.14) | 15.14 |
| Year Ended October 31, 2018 | 15.61 | 0.06 | (2.52) | (2.46) | (0.15) | – | (0.15) | 13.00 |
| Institutional Service Class Shares | ||||||||
| Six-Months Ended April 30, 2023* | 11.34 | 0.08 | 1.66 | 1.74 | (0.23) | – | (0.23) | 12.85 |
| Year Ended October 31, 2022 | 20.26 | 0.11 | (7.01) | (6.90) | (0.10) | (1.92) | (2.02) | 11.34 |
| Year Ended October 31, 2021 | 16.85 | 0.12 | 3.46 | 3.58 | (0.03) | (0.14) | (0.17) | 20.26 |
| Year Ended October 31, 2020 | 15.37 | 0.07 | 1.70 | 1.77 | (0.28) | (0.01) | (0.29) | 16.85 |
| Year Ended October 31, 2019 | 13.19 | 0.23 | 2.16 | 2.39 | (0.19) | (0.02) | (0.21) | 15.37 |
| Year Ended October 31, 2018 | 15.78 | 0.14 | (2.55) | (2.41) | (0.18) | – | (0.18) | 13.19 |
| Institutional Class Shares | ||||||||
| Six-Months Ended April 30, 2023* | 11.40 | 0.09 | 1.67 | 1.76 | (0.23) | – | (0.23) | 12.93 |
| Year Ended October 31, 2022 | 20.34 | 0.14 | (7.05) | (6.91) | (0.11) | (1.92) | (2.03) | 11.40 |
| Year Ended October 31, 2021 | 16.90 | 0.14 | 3.48 | 3.62 | (0.04) | (0.14) | (0.18) | 20.34 |
| Year Ended October 31, 2020 | 15.39 | 0.09 | 1.72 | 1.81 | (0.29) | (0.01) | (0.30) | 16.90 |
| Year Ended October 31, 2019 | 13.20 | 0.13 | 2.27 | 2.40 | (0.19) | (0.02) | (0.21) | 15.39 |
| Year Ended October 31, 2018 | 15.81 | 0.15 | (2.55) | (2.40) | (0.21) | – | (0.21) | 13.20 |
| * | Unaudited |
| (a) | Net investment income is based on average shares outstanding during the period. |
| (b) | Excludes sales charge. |
| (c) | Not Annualized for periods less than one year. |
| (d) | Annualized for periods less than one year. |
| (e) | During the period, certain fees were waived and/or reimbursed. If such waivers/reimbursements had not occurred, the ratios would have been as indicated. |
| (f) | Portfolio turnover is calculated on the basis of the Fund as a whole without distinguishing among the classes of shares. |
| (g) | The total return shown above includes the impact of financial statement rounding of the NAV per share and/or financial statement adjustments. |
| (h) | Includes interest expense that amounts to 0.01% for Class A and Institutional Class for the six months ended April 30, 2023. Includes interest expense that amounts to less than 0.01%. |
| (i) | Less than $0.005 per share. |
| (j) | Amount is less than 0.005%. |
| 84 | 2023 Semi-Annual Report |
| Ratios/Supplemental Data | |||||
| Total Return (b)(c) | Net Assets at End of Period (000's) | Ratio of Expenses (Net of Reimbursements/ Waivers) to Average Net Assets (d) | Ratio of Expenses (Prior to Reimbursements) to Average Net Assets(d)(e) | Ratio of Net Investment Income (Loss) to Average Net Assets (d) | Portfolio Turnover (c)(f) |
| 15.19%(g) | $ 64,011 | 1.60%(h) | 1.66%(h) | 0.90% | 17.39% |
| (37.56%)(g) | 63,232 | 1.60%(h) | 1.63%(h) | 0.39% | 36.82% |
| 20.87% | 116,268 | 1.56%(h) | 1.56%(h) | 0.20% | 37.26% |
| 11.31% | 107,572 | 1.59%(h) | 1.59%(h) | 0.09% | 26.13% |
| 17.89% | 134,382 | 1.59%(h) | 1.59%(h) | 0.46% | 14.86% |
| (15.80%) | 143,297 | 1.59%(h) | 1.59%(h) | 0.49% | 20.39% |
| 14.87% | 3,315 | 2.10%(h) | 2.26%(h) | 0.37% | 17.39% |
| (37.87%) | 4,162 | 2.10%(h) | 2.21%(h) | (0.09%) | 36.82% |
| 20.16% | 10,662 | 2.10%(h) | 2.13%(h) | (0.38%) | 37.26% |
| 10.74% | 11,786 | 2.10%(h) | 2.19%(h) | (0.40%) | 26.13% |
| 17.26% | 15,611 | 2.10%(h) | 2.20%(h) | (0.03%) | 14.86% |
| (16.20%) | 15,886 | 2.10%(h) | 2.21%(h) | –(j) | 20.39% |
| 15.17% | 104,872 | 1.75%(h) | 1.81%(h) | 0.77% | 17.39% |
| (37.71%) | 92,428 | 1.75%(h) | 1.78%(h) | 0.26% | 36.82% |
| 20.68% | 133,696 | 1.72%(h) | 1.72%(h) | 0.04% | 37.26% |
| 11.13% | 113,707 | 1.73%(h) | 1.73%(h) | 0.01% | 26.13% |
| 17.72% | 108,487 | 1.75%(h) | 1.75%(h) | 0.48% | 14.86% |
| (15.93%) | 89,874 | 1.75%(h) | 1.75%(h) | 0.40% | 20.39% |
| 15.38% | 527,180 | 1.25%(h) | 1.31%(h) | 1.26% | 17.39% |
| (37.37%) | 494,873 | 1.25%(h) | 1.28%(h) | 0.79% | 36.82% |
| 21.29% | 476,046 | 1.21%(h) | 1.21%(h) | 0.56% | 37.26% |
| 11.64%(g) | 362,229 | 1.24%(h) | 1.24%(h) | 0.50% | 26.13% |
| 18.38%(g) | 297,466 | 1.24%(h) | 1.24%(h) | 1.55% | 14.86% |
| (15.48%) | 118,917 | 1.16%(h) | 1.16%(h) | 0.89% | 20.39% |
| 15.48% | 1,459,042 | 1.10%(h) | 1.26%(h) | 1.37% | 17.39% |
| (37.26%) | 1,606,819 | 1.10%(h) | 1.22%(h) | 0.90% | 36.82% |
| 21.45% | 4,184,781 | 1.10%(h) | 1.14%(h) | 0.69% | 37.26% |
| 11.86% | 3,414,059 | 1.10%(h) | 1.18%(h) | 0.59% | 26.13% |
| 18.45% | 4,420,838 | 1.10%(h) | 1.16%(h) | 0.91% | 14.86% |
| (15.38%) | 5,511,182 | 1.10%(h) | 1.14%(h) | 1.00% | 20.39% |
| 2023 Semi-Annual Report | 85 |
| Investment Activities | Distributions | ||||||
| Net Asset Value, Beginning of Period | Net Investment Income (Loss) (a) | Net Realized and Unrealized Gains (Losses) on Investments | Total from Investment Activities | Net Investment Income | Net Realized Gains | Total Distributions | |
| Class A Shares | |||||||
| Six-Months Ended April 30, 2023* | $9.24 | $0.05 | $1.38 | $ 1.43 | $ (0.14) | $ – | $ (0.14) |
| Year Ended October 31, 2022 | 18.83 | 0.04 | (5.77) | (5.73) | (0.01) | (3.85) | (3.86) |
| Year Ended October 31, 2021 | 15.74 | 0.02 | 3.07 | 3.09 | –(i) | – | –(i) |
| Year Ended October 31, 2020 | 14.68 | –(i) | 1.21 | 1.21 | (0.15) | – | (0.15) |
| Year Ended October 31, 2019 | 13.28 | 0.12 | 1.57 | 1.69 | (0.29) | – | (0.29) |
| Year Ended October 31, 2018 | 15.04 | 0.15 | (1.78) | (1.63) | (0.13) | – | (0.13) |
| Class C Shares | |||||||
| Six-Months Ended April 30, 2023* | 8.40 | 0.01 | 1.27 | 1.28 | –(i) | – | –(i) |
| Year Ended October 31, 2022 | 17.58 | (0.04) | (5.29) | (5.33) | – | (3.85) | (3.85) |
| Year Ended October 31, 2021 | 14.79 | (0.11) | 2.90 | 2.79 | – | – | – |
| Year Ended October 31, 2020 | 13.76 | (0.08) | 1.12 | 1.04 | (0.01) | – | (0.01) |
| Year Ended October 31, 2019 | 12.44 | 0.03 | 1.48 | 1.51 | (0.19) | – | (0.19) |
| Year Ended October 31, 2018 | 14.09 | 0.04 | (1.66) | (1.62) | (0.03) | – | (0.03) |
| Class R Shares | |||||||
| Six-Months Ended April 30, 2023* | 8.62 | 0.03 | 1.30 | 1.33 | (0.11) | – | (0.11) |
| Year Ended October 31, 2022 | 17.87 | – | (5.40) | (5.40) | – | (3.85) | (3.85) |
| Year Ended October 31, 2021 | 14.98 | (0.02) | 2.91 | 2.89 | – | – | – |
| Year Ended October 31, 2020 | 13.97 | (0.03) | 1.14 | 1.11 | (0.10) | – | (0.10) |
| Year Ended October 31, 2019 | 12.65 | 0.08 | 1.50 | 1.58 | (0.26) | – | (0.26) |
| Year Ended October 31, 2018 | 14.33 | 0.10 | (1.68) | (1.58) | (0.10) | – | (0.10) |
| Institutional Service Class Shares | |||||||
| Six-Months Ended April 30, 2023* | 9.53 | 0.07 | 1.43 | 1.50 | (0.18) | – | (0.18) |
| Year Ended October 31, 2022 | 19.25 | 0.08 | (5.93) | (5.85) | (0.02) | (3.85) | (3.87) |
| Year Ended October 31, 2021 | 16.08 | 0.08 | 3.14 | 3.22 | (0.05) | – | (0.05) |
| Year Ended October 31, 2020 | 15.00 | 0.06 | 1.22 | 1.28 | (0.20) | – | (0.20) |
| Year Ended October 31, 2019 | 13.58 | 0.17 | 1.60 | 1.77 | (0.35) | – | (0.35) |
| Year Ended October 31, 2018 | 15.37 | 0.20 | (1.80) | (1.60) | (0.19) | – | (0.19) |
| Institutional Class Shares | |||||||
| Six-Months Ended April 30, 2023* | 9.59 | 0.08 | 1.44 | 1.52 | (0.17) | – | (0.17) |
| Year Ended October 31, 2022 | 19.34 | 0.09 | (5.97) | (5.88) | (0.02) | (3.85) | (3.87) |
| Year Ended October 31, 2021 | 16.15 | 0.09 | 3.15 | 3.24 | (0.05) | – | (0.05) |
| Year Ended October 31, 2020 | 15.06 | 0.06 | 1.23 | 1.29 | (0.20) | – | (0.20) |
| Year Ended October 31, 2019 | 13.63 | 0.17 | 1.61 | 1.78 | (0.35) | – | (0.35) |
| Year Ended October 31, 2018 | 15.43 | 0.21 | (1.82) | (1.61) | (0.19) | – | (0.19) |
| * | Unaudited |
| (a) | Net investment income/(loss) is based on average shares outstanding during the period. |
| (b) | Excludes sales charge. |
| (c) | Not Annualized for periods less than one year. |
| (d) | Annualized for periods less than one year. |
| (e) | During the period, certain fees were waived and/or reimbursed. If such waivers/reimbursements had not occurred, the ratios would have been as indicated. |
| (f) | Portfolio turnover is calculated on the basis of the Fund as a whole without distinguishing among the classes of shares. |
| (g) | The total return shown above includes the impact of financial statement rounding of the NAV per share and/or financial statement adjustments. |
| (h) | Includes interest expense that amounts to 0.01% for Class A and Institutional Class for the six months ended April 30, 2023. Includes interest expense that amounts to less than 0.01%. |
| (i) | Less than $0.005 per share. |
| (j) | Includes interest expense that amounts to 0.02% for Class C and Institutional class. Includes interest expense that amounts to 0.01% for Class A, Class R and Institutional Service Class. |
| 86 | 2023 Semi-Annual Report |
| Ratios/Supplemental Data | ||||||
| Net Asset Value, End of Period | Total Return (b)(c) | Net Assets at End of Period (000's) | Ratio of Expenses (Net of Reimbursements/ Waivers) to Average Net Assets (d) | Ratio of Expenses (Prior to Reimbursements) to Average Net Assets(d)(e) | Ratio of Net Investment Income (Loss) to Average Net Assets (d) | Portfolio Turnover (c)(f) |
| $ 10.53 | 15.54%(g) | $ 12,096 | 1.51%(h) | 1.78%(h) | 0.90% | 14.97% |
| 9.24 | (37.00%) | 11,345 | 1.48%(h) | 1.63%(h) | 0.33% | 29.36% |
| 18.83 | 19.65% | 23,898 | 1.46%(h) | 1.46%(h) | 0.11% | 120.50% |
| 15.74 | 8.24% | 21,418 | 1.49%(h) | 1.49%(h) | 0.02% | 37.50% |
| 14.68 | 13.13% | 24,719 | 1.52%(j) | 1.52%(j) | 0.89% | 28.30% |
| 13.28 | (10.93%) | 24,957 | 1.38% | 1.38% | 0.99% | 20.75% |
| 9.68 | 15.27%(g) | 136 | 2.11%(h) | 2.54%(h) | 0.30% | 14.97% |
| 8.40 | (37.41%) | 206 | 2.10%(h) | 2.36%(h) | (0.35%) | 29.36% |
| 17.58 | 18.86% | 1,159 | 2.11%(h) | 2.21%(h) | (0.59%) | 120.50% |
| 14.79 | 7.56%(g) | 2,432 | 2.10%(h) | 2.20%(h) | (0.55%) | 37.50% |
| 13.76 | 12.43%(g) | 4,330 | 2.12%(j) | 2.24%(j) | 0.21% | 28.30% |
| 12.44 | (11.54%) | 8,074 | 2.10% | 2.10% | 0.27% | 20.75% |
| 9.84 | 15.49%(g) | 2,539 | 1.72%(h) | 1.99%(h) | 0.69% | 14.97% |
| 8.62 | (37.15%) | 2,365 | 1.76%(h) | 1.91%(h) | 0.02% | 29.36% |
| 17.87 | 19.29% | 6,126 | 1.74%(h) | 1.74%(h) | (0.10%) | 120.50% |
| 14.98 | 7.97% | 3,244 | 1.74%(h) | 1.74%(h) | (0.22%) | 37.50% |
| 13.97 | 12.80% | 3,992 | 1.79%(j) | 1.79%(j) | 0.58% | 28.30% |
| 12.65 | (11.14%) | 5,041 | 1.64% | 1.64% | 0.74% | 20.75% |
| 10.85 | 15.82% | 57,601 | 1.18%(h) | 1.45%(h) | 1.23% | 14.97% |
| 9.53 | (36.80%) | 52,901 | 1.16%(h) | 1.31%(h) | 0.67% | 29.36% |
| 19.25 | 20.02% | 94,132 | 1.16%(h) | 1.16%(h) | 0.41% | 120.50% |
| 16.08 | 8.58%(g) | 83,121 | 1.15%(h) | 1.15%(h) | 0.36% | 37.50% |
| 15.00 | 13.49%(g) | 85,934 | 1.16%(j) | 1.16%(j) | 1.23% | 28.30% |
| 13.58 | (10.58%) | 84,902 | 1.06% | 1.06% | 1.31% | 20.75% |
| 10.94 | 15.87%(g) | 7,917 | 1.11%(h) | 1.45%(h) | 1.42% | 14.97% |
| 9.59 | (36.78%) | 46,516 | 1.10%(h) | 1.31%(h) | 0.70% | 29.36% |
| 19.34 | 20.06% | 91,084 | 1.11%(h) | 1.15%(h) | 0.45% | 120.50% |
| 16.15 | 8.63%(g) | 107,158 | 1.10%(h) | 1.13%(h) | 0.41% | 37.50% |
| 15.06 | 13.55%(g) | 99,475 | 1.12%(j) | 1.13%(j) | 1.21% | 28.30% |
| 13.63 | (10.56%) | 272,152 | 1.02% | 1.02% | 1.37% | 20.75% |
| 2023 Semi-Annual Report | 87 |
| Investment Activities | Distributions | ||||||
| Net Asset Value, Beginning of Period | Net Investment Income (Loss) (a) | Net Realized and Unrealized Gains (Losses) on Investments | Total from Investment Activities | Net Investment Income | Total Distributions | Net Asset Value, End of Period | |
| Class A Shares | |||||||
| Six-Months Ended April 30, 2023* | $13.07 | $(0.04) | $1.88 | $ 1.84 | $ (0.66) | $ (0.66) | $ 14.25 |
| Year Ended October 31, 2022 | 18.45 | 0.39(i) | (5.77) | (5.38) | –(j) | –(j) | 13.07 |
| Year Ended October 31, 2021 | 13.14 | – | 5.37 | 5.37 | (0.06) | (0.06) | 18.45 |
| Year Ended October 31, 2020 | 11.59 | 0.05 | 1.77 | 1.82 | (0.27) | (0.27) | 13.14 |
| Year Ended October 31, 2019 | 10.29 | 0.18(l) | 1.30 | 1.48 | (0.18) | (0.18) | 11.59 |
| Year Ended October 31, 2018 | 11.95 | 0.08 | (1.41) | (1.33) | (0.33) | (0.33) | 10.29 |
| Institutional Class Shares | |||||||
| Six-Months Ended April 30, 2023* | 13.12 | (0.03) | 1.90 | 1.87 | (0.71) | (0.71) | 14.28 |
| Year Ended October 31, 2022 | 18.49 | 0.41(i) | (5.77) | (5.36) | (0.01) | (0.01) | 13.12 |
| Year Ended October 31, 2021 | 13.18 | 0.04 | 5.37 | 5.41 | (0.10) | (0.10) | 18.49 |
| Year Ended October 31, 2020 | 11.62 | 0.08 | 1.79 | 1.87 | (0.31) | (0.31) | 13.18 |
| Year Ended October 31, 2019 | 10.30 | 0.21(l) | 1.30 | 1.51 | (0.19) | (0.19) | 11.62 |
| Year Ended October 31, 2018 | 11.96 | 0.10 | (1.40) | (1.30) | (0.36) | (0.36) | 10.30 |
| * | Unaudited |
| (a) | Net investment income is based on average shares outstanding during the period. |
| (b) | Not Annualized for periods less than one year. |
| (c) | Beginning with the year ended October 31, 2022, income taxes on recovered refunds were included in foreign tax withholding on the Statement of Operations and, as such, are not included within the ratios of expenses to average net assets. Income taxes on recovered refunds for years prior to October 31, 2022 were reflected as expenses on the Statement of Operations and included within the ratios of expenses to average net assets. |
| (d) | Annualized for periods less than one year. |
| (e) | During the period, certain fees were waived and/or reimbursed. If such waivers/reimbursements had not occurred, the ratios would have been as indicated. |
| (f) | Includes interest expense that amounts to 0.01% for Class A and Institutional Class for the six months ended April 30, 2023. Includes interest expense that amounts to less than 0.01%. |
| (g) | Portfolio turnover is calculated on the basis of the Fund as a whole without distinguishing among the classes of shares. |
| (h) | The total return shown above includes the impact of financial statement rounding of the NAV per share and/or financial statement adjustments. |
| (i) | Included within Net Investment Income per share, Total Return, and Ratio of Net Investment Income to Average Net Assets are the effects of withholding tax refunds and income taxes on recovered refunds (See Note 2i of the Notes to Financial Statements). If such amounts were excluded, the Net Investment Income per share, Total Return, and Ratio of Net Investment Loss to Average Net Assets for Class A Shares would have been $0.07, (30.98%) and 0.47%, respectively. For Institutional Class Shares, these amounts would have been $0.07, (30.83%) and 0.49%, respectively. |
| (j) | Less than $0.005 per share. |
| (k) | Included within Total Return is the effect of withholding tax refunds and income taxes on recovered refunds (See Note 2i of the Notes to Financial Statements). If such amounts were excluded, the Total Return for Class A Shares would have been 15.82%. For Institutional Class Shares, this amount would have been 16.12%. |
| (l) | Included within Net Investment Income per share, Total Return, and Ratio of Net Investment Income to Average Net Assets are the effects of withholding tax refunds and income taxes on recovered refunds (See Note 2i of the Notes to Financial Statements). If such amounts were excluded, the Net Investment Income per share, Total Return, and Ratio of Net Investment Loss to Average Net Assets for Class A Shares would have been $0.08, 13.56%, and 0.77%, respectively. For Institutional Class Shares, these amounts would have been $0.11, 13.81%, and 1.03%, respectively. |
| 88 | 2023 Semi-Annual Report |
| Ratios/Supplemental Data | ||||||
| Total Return (b) | Net Assets at End of Period (000's) | Ratio of Expenses (Net of Reimbursements/ Waivers Excluding Accruals for Estimated Tax Due on Foreign Tax Refund Recoveries) to Average Net Assets (c) | Ratio of Expenses (Net of Reimbursements/ Waivers) to Average Net Assets (c)(d)(e)(f) | Ratio of Expenses (Prior to Reimbursements) to Average Net Assets(c)(d)(e)(f) | Ratio of Net Investment Income (Loss) to Average Net Assets (d) | Portfolio Turnover (b)(g) |
| 14.29%(h) | $ 30,041 | 1.24% | 1.24% | 1.68% | (0.55%) | 17.17% |
| (29.14%)(h)(i) | 26,986 | 1.17% | 1.17% | 1.72% | 2.59%(i) | 36.90% |
| 40.95% | 43,059 | 1.38% | 1.38% | 1.73% | 0.02% | 17.40% |
| 15.93%(k) | 32,180 | 1.41% | 1.41% | 1.92% | 0.40% | 32.11% |
| 14.76%(l) | 34,933 | 1.53% | 2.21% | 2.47% | 1.69%(l) | 125.21% |
| (11.48%) | 35,964 | 1.77% | 2.44% | 2.44% | 0.72% | 19.00% |
| 14.45%(h) | 20,545 | 0.98% | 0.98% | 1.43% | (0.36%) | 17.17% |
| (28.99%)(h)(i) | 19,384 | 0.92% | 0.92% | 1.44% | 2.71%(i) | 36.90% |
| 41.23% | 32,312 | 1.13% | 1.13% | 1.45% | 0.24% | 17.40% |
| 16.30%(k) | 27,839 | 1.16% | 1.16% | 1.61% | 0.65% | 32.11% |
| 14.99%(l) | 27,937 | 1.28% | 1.97% | 2.20% | 1.95%(l) | 125.21% |
| (11.23%) | 28,477 | 1.52% | 2.22% | 2.23% | 0.89% | 19.00% |
| 2023 Semi-Annual Report | 89 |
| Investment Activities | Distributions | ||||||||
| Net Asset Value, Beginning of Period | Net Investment Income (Loss) (a) | Net Realized and Unrealized Gains (Losses) on Investments | Total from Investment Activities | Net Investment Income | Net Realized Gains | Tax Return of Capital | Total Distributions | Redemption Fees | |
| Class A Shares | |||||||||
| Six-Months Ended April 30, 2023* | $20.62 | $0.22 | $2.70 | $ 2.92 | $ (0.24) | $ (0.39) | $ – | $ (0.63) | $ – |
| Year Ended October 31, 2022 | 24.18 | 0.41 | (3.00) | (2.59) | (0.71) | (0.26) | – | (0.97) | – |
| Year Ended October 31, 2021 | 19.03 | 0.45 | 5.41 | 5.86 | (0.71) | – | – | (0.71) | – |
| Year Ended October 31, 2020 | 21.93 | 0.53 | (2.59) | (2.06) | (0.56) | (0.14) | (0.14) | (0.84) | – |
| Year Ended October 31, 2019 | 18.82 | 0.30 | 3.48 | 3.78 | (0.64) | (0.03) | – | (0.67) | – |
| Year Ended October 31, 2018 | 20.65 | 0.46 | (1.54) | (1.08) | (0.71) | (0.04) | – | (0.75) | –(g) |
| Institutional Class Shares | |||||||||
| Six-Months Ended April 30, 2023* | 20.66 | 0.25 | 2.71 | 2.96 | (0.26) | (0.39) | – | (0.65) | – |
| Year Ended October 31, 2022 | 24.22 | 0.47 | (3.01) | (2.54) | (0.76) | (0.26) | – | (1.02) | – |
| Year Ended October 31, 2021 | 19.05 | 0.52 | 5.41 | 5.93 | (0.76) | – | – | (0.76) | – |
| Year Ended October 31, 2020 | 21.97 | 0.58 | (2.60) | (2.02) | (0.62) | (0.14) | (0.14) | (0.90) | – |
| Year Ended October 31, 2019 | 18.85 | 0.34 | 3.50 | 3.84 | (0.69) | (0.03) | – | (0.72) | – |
| Year Ended October 31, 2018 | 20.68 | 0.54 | (1.57) | (1.03) | (0.76) | (0.04) | – | (0.80) | –(g) |
| * | Unaudited |
| (a) | Net investment income/(loss) is based on average shares outstanding during the period. |
| (b) | Excludes sales charge. |
| (c) | Not Annualized for periods less than one year. |
| (d) | Annualized for periods less than one year. |
| (e) | During the period, certain fees were waived and/or reimbursed. If such waivers/reimbursements had not occurred, the ratios would have been as indicated. |
| (f) | Portfolio turnover is calculated on the basis of the Fund as a whole without distinguishing among the classes of shares. |
| (g) | Less than $0.005 per share. |
| (h) | The total return shown above includes the impact of financial statement rounding of the NAV per share and/or financial statement adjustments. |
| 90 | 2023 Semi-Annual Report |
| Ratios/Supplemental Data | ||||||
| Net Asset Value, End of Period | Total Return (b)(c) | Net Assets at End of Period (000's) | Ratio of Expenses (Net of Reimbursements/ Waivers) to Average Net Assets (d) | Ratio of Expenses (Prior to Reimbursements) to Average Net Assets(d)(e) | Ratio of Net Investment Income (Loss) to Average Net Assets (d) | Portfolio Turnover (c)(f) |
| $ 22.91 | 14.43% | $ 12,056 | 1.24% | 1.54% | 2.05% | 8.17% |
| 20.62 | (11.04%) | 11,350 | 1.24% | 1.58% | 1.81% | 23.33% |
| 24.18 | 31.09% | 13,227 | 1.24% | 1.63% | 1.95% | 30.75% |
| 19.03 | (9.49%) | 9,206 | 1.33% | 1.55% | 2.61% | 23.76% |
| 21.93 | 20.41% | 12,776 | 1.45% | 1.59% | 1.46% | 31.62% |
| 18.82 | (5.39%) | 12,310 | 1.45% | 1.58% | 2.29% | 48.54% |
| 22.97 | 14.61%(h) | 38,643 | 0.99% | 1.30% | 2.30% | 8.17% |
| 20.66 | (10.82%)(h) | 35,645 | 0.99% | 1.33% | 2.05% | 23.33% |
| 24.22 | 31.43% | 45,076 | 0.99% | 1.38% | 2.25% | 30.75% |
| 19.05 | (9.30%) | 32,640 | 1.08% | 1.27% | 2.90% | 23.76% |
| 21.97 | 20.73% | 87,441 | 1.20% | 1.31% | 1.68% | 31.62% |
| 18.85 | (5.13%) | 95,025 | 1.20% | 1.32% | 2.70% | 48.54% |
| 2023 Semi-Annual Report | 91 |
| Investment Activities | Distributions | |||||||
| Net Asset Value, Beginning of Period | Net Investment Income (Loss) (a) | Net Realized and Unrealized Gains (Losses) on Investments | Total from Investment Activities | Net Investment Income | Net Realized Gains | Total Distributions | Net Asset Value, End of Period | |
| Class A Shares | ||||||||
| Six-Months Ended April 30, 2023* | $23.78 | $0.02 | $3.62 | $ 3.64 | $ (0.40) | $ – | $ (0.40) | $ 27.02 |
| Year Ended October 31, 2022 | 42.73 | 0.28 | (16.37) | (16.09) | – | (2.86) | (2.86) | 23.78 |
| Year Ended October 31, 2021 | 30.18 | (0.20) | 12.75 | 12.55 | – | – | – | 42.73 |
| Year Ended October 31, 2020 | 28.11 | (0.09) | 3.63 | 3.54 | (0.34) | (1.13) | (1.47) | 30.18 |
| Year Ended October 31, 2019 | 29.23 | 0.23 | 3.03 | 3.26 | (0.65) | (3.73) | (4.38) | 28.11 |
| Year Ended October 31, 2018 | 31.35 | 0.47 | (1.56) | (1.09) | (0.17) | (0.86) | (1.03) | 29.23 |
| Class C Shares | ||||||||
| Six-Months Ended April 30, 2023* | 20.94 | (0.06) | 3.20 | 3.14 | (0.21) | – | (0.21) | 23.87 |
| Year Ended October 31, 2022 | 38.21 | 0.09 | (14.50) | (14.41) | – | (2.86) | (2.86) | 20.94 |
| Year Ended October 31, 2021 | 27.16 | (0.39) | 11.44 | 11.05 | – | – | – | 38.21 |
| Year Ended October 31, 2020 | 25.43 | (0.25) | 3.27 | 3.02 | (0.16) | (1.13) | (1.29) | 27.16 |
| Year Ended October 31, 2019 | 26.73 | (0.04) | 2.84 | 2.80 | (0.37) | (3.73) | (4.10) | 25.43 |
| Year Ended October 31, 2018 | 28.78 | 0.20 | (1.39) | (1.19) | – | (0.86) | (0.86) | 26.73 |
| Class R Shares | ||||||||
| Six-Months Ended April 30, 2023* | 22.06 | (0.01) | 3.35 | 3.34 | (0.37) | – | (0.37) | 25.03 |
| Year Ended October 31, 2022 | 39.97 | 0.21 | (15.26) | (15.05) | – | (2.86) | (2.86) | 22.06 |
| Year Ended October 31, 2021 | 28.31 | (0.28) | 11.94 | 11.66 | – | – | – | 39.97 |
| Year Ended October 31, 2020 | 26.46 | (0.15) | 3.40 | 3.25 | (0.27) | (1.13) | (1.40) | 28.31 |
| Year Ended October 31, 2019 | 27.74 | 0.12 | 2.88 | 3.00 | (0.55) | (3.73) | (4.28) | 26.46 |
| Year Ended October 31, 2018 | 29.82 | 0.30 | (1.43) | (1.13) | (0.09) | (0.86) | (0.95) | 27.74 |
| Institutional Class Shares | ||||||||
| Six-Months Ended April 30, 2023* | 24.12 | 0.06 | 3.67 | 3.73 | (0.48) | – | (0.48) | 27.37 |
| Year Ended October 31, 2022 | 43.15 | 0.44 | (16.61) | (16.17) | – | (2.86) | (2.86) | 24.12 |
| Year Ended October 31, 2021 | 30.37 | (0.06) | 12.84 | 12.78 | – | – | – | 43.15 |
| Year Ended October 31, 2020 | 28.25 | 0.01 | 3.65 | 3.66 | (0.41) | (1.13) | (1.54) | 30.37 |
| Year Ended October 31, 2019 | 29.33 | 0.27 | 3.11 | 3.38 | (0.73) | (3.73) | (4.46) | 28.25 |
| Year Ended October 31, 2018 | 31.43 | 0.58 | (1.57) | (0.99) | (0.25) | (0.86) | (1.11) | 29.33 |
| * | Unaudited |
| (a) | Net investment income/(loss) is based on average shares outstanding during the period. |
| (b) | Excludes sales charge. |
| (c) | Not Annualized for periods less than one year. |
| (d) | Annualized for periods less than one year. |
| (e) | During the period, certain fees were waived and/or reimbursed. If such waivers/reimbursements had not occurred, the ratios would have been as indicated. |
| (f) | Portfolio turnover is calculated on the basis of the Fund as a whole without distinguishing among the classes of shares. |
| (g) | Includes interest expense that amounts to less than 0.01%. |
| (h) | The total return shown above includes the impact of financial statement rounding of the NAV per share and/or financial statement adjustments. |
| 92 | 2023 Semi-Annual Report |
| Ratios/Supplemental Data | |||||
| Total Return (b)(c) | Net Assets at End of Period (000's) | Ratio of Expenses (Net of Reimbursements/ Waivers) to Average Net Assets (d) | Ratio of Expenses (Prior to Reimbursements) to Average Net Assets(d)(e) | Ratio of Net Investment Income (Loss) to Average Net Assets (d) | Portfolio Turnover (c)(f) |
| 15.42% | $ 60,233 | 1.34%(g) | 1.50%(g) | 0.12% | 12.83% |
| (40.18%)(h) | 58,262 | 1.35%(g) | 1.43%(g) | 0.91% | 46.90% |
| 41.58%(h) | 112,408 | 1.34%(g) | 1.42%(g) | (0.54%) | 42.63% |
| 13.02% | 90,560 | 1.40% | 1.61% | (0.33%) | 29.65% |
| 13.93% | 75,754 | 1.49%(g) | 1.82%(g) | 0.86% | 35.37% |
| (3.68%) | 49,391 | 1.53%(g) | 1.88%(g) | 1.48% | 18.07% |
| 15.03% | 397 | 1.99%(g) | 2.34%(g) | (0.50%) | 12.83% |
| (40.56%)(h) | 349 | 1.99%(g) | 2.23%(g) | 0.35% | 46.90% |
| 40.68%(h) | 561 | 1.99%(g) | 2.18%(g) | (1.15%) | 42.63% |
| 12.27% | 554 | 2.05% | 2.38% | (1.02%) | 29.65% |
| 13.21% | 829 | 2.15%(g) | 2.59%(g) | (0.17%) | 35.37% |
| (4.31%) | 565 | 2.22%(g) | 2.65%(g) | 0.69% | 18.07% |
| 15.25% | 2,124 | 1.60%(g) | 1.76%(g) | (0.10%) | 12.83% |
| (40.36%) | 1,913 | 1.64%(g) | 1.72%(g) | 0.76% | 46.90% |
| 41.19% | 2,535 | 1.62%(g) | 1.70%(g) | (0.80%) | 42.63% |
| 12.68% | 1,649 | 1.69% | 1.90% | (0.61%) | 29.65% |
| 13.62% | 1,945 | 1.80%(g) | 2.13%(g) | 0.47% | 35.37% |
| (3.98%) | 2,309 | 1.84%(g) | 2.19%(g) | 1.02% | 18.07% |
| 15.61%(h) | 112,294 | 0.99%(g) | 1.25%(g) | 0.45% | 12.83% |
| (39.96%)(h) | 117,960 | 0.99%(g) | 1.18%(g) | 1.44% | 46.90% |
| 42.08%(h) | 191,244 | 0.99%(g) | 1.15%(g) | (0.15%) | 42.63% |
| 13.41% | 46,330 | 1.04% | 1.35% | 0.03% | 29.65% |
| 14.39% | 35,248 | 1.15%(g) | 1.57%(g) | 1.01% | 35.37% |
| (3.34%) | 12,418 | 1.20%(g) | 1.61%(g) | 1.84% | 18.07% |
| 2023 Semi-Annual Report | 93 |
| Investment Activities | Distributions | |||||||
| Net Asset Value, Beginning of Period | Net Investment Income (Loss) (a) | Net Realized and Unrealized Gains (Losses) on Investments | Total from Investment Activities | Net Investment Income | Tax Return of Capital | Total Distributions | Net Asset Value, End of Period | |
| Class A Shares | ||||||||
| Six-Months Ended April 30, 2023* | $22.17 | $(0.03) | $4.96 | $ 4.93 | $ (1.77) | $ – | $ (1.77) | $ 25.33 |
| Year Ended October 31, 2022 | 34.93 | 0.34(h) | (13.10) | (12.76) | – | – | – | 22.17 |
| Year Ended October 31, 2021 | 26.19 | (0.12) | 9.05 | 8.93 | (0.19) | – | (0.19) | 34.93 |
| Year Ended October 31, 2020 | 26.95 | 0.17 | 0.29 | 0.46 | (1.22) | – | (1.22) | 26.19 |
| Year Ended October 31, 2019 | 23.64 | 0.81(k) | 2.70 | 3.51 | (0.20) | – | (0.20) | 26.95 |
| Year Ended October 31, 2018 | 28.01 | 0.01 | (3.20) | (3.19) | (1.15) | (0.03) | (1.18) | 23.64 |
| Institutional Class Shares | ||||||||
| Six-Months Ended April 30, 2023* | 22.88 | (0.02) | 5.14 | 5.12 | (1.87) | – | (1.87) | 26.13 |
| Year Ended October 31, 2022 | 35.96 | 0.42(h) | (13.50) | (13.08) | – | – | – | 22.88 |
| Year Ended October 31, 2021 | 26.98 | (0.04) | 9.32 | 9.28 | (0.30) | – | (0.30) | 35.96 |
| Year Ended October 31, 2020 | 27.74 | 0.24 | 0.30 | 0.54 | (1.30) | – | (1.30) | 26.98 |
| Year Ended October 31, 2019 | 24.27 | 0.91(k) | 2.77 | 3.68 | (0.21) | – | (0.21) | 27.74 |
| Year Ended October 31, 2018 | 28.73 | 0.09 | (3.30) | (3.21) | (1.22) | (0.03) | (1.25) | 24.27 |
| * | Unaudited |
| (a) | Net investment income/(loss) is based on average shares outstanding during the period. |
| (b) | Not Annualized for periods less than one year. |
| (c) | Beginning with the year ended October 31, 2022, income taxes on recovered refunds were included in foreign tax withholding on the Statement of Operations and, as such, are not included within the ratios of expenses to average net assets. Income taxes on recovered refunds for years prior to October 31, 2022 were reflected as expenses on the Statement of Operations and included within the ratios of expenses to average net assets. |
| (d) | Annualized for periods less than one year. |
| (e) | Includes interest expense that amounts to 0.01% for Class A and Institutional Class for the six months ended April 30, 2023. Includes interest expense that amounts to less than 0.01%. |
| (f) | During the period, certain fees were waived and/or reimbursed. If such waivers/reimbursements had not occurred, the ratios would have been as indicated. |
| (g) | Portfolio turnover is calculated on the basis of the Fund as a whole without distinguishing among the classes of shares. |
| (h) | Included within Net Investment Income per share, Total Return, and Ratio of Net Investment Income to Average Net Assets are the effects of withholding tax refunds and income taxes on recovered refunds (See Note 2i of the Notes to Financial Statements). If such amounts were excluded, the Net Investment Income per share, Total Return, and Ratio of Net Investment Loss to Average Net Assets for Class A Shares would have been $0.07, (37.36%), and 0.24%, respectively. For Institutional Class Shares, these amounts would have been $0.08, (37.18%), and 0.29%, respectively. |
| (i) | The total return shown above includes the impact of financial statement rounding of the NAV per share and/or financial statement adjustments. |
| (j) | Included within Total Return is the effect of withholding tax refunds and income taxes on recovered refunds (See Note 2i of the Notes to Financial Statements). If such amounts were excluded, the Total Return for Class A Shares would have been (0.38%). For Institutional Class Shares, this amount would have been (0.11%). |
| (k) | Included within Net Investment Income per share, Total Return, and Ratio of Net Investment Income to Average Net Assets are the effects of withholding tax refunds and income taxes on recovered refunds (See Note 2i of the Notes to Financial Statements). If such amounts were excluded, the Net Investment Income per share, Total Return, and Ratio of Net Investment Loss to Average Net Assets for Class A Shares would have been $0.28, 12.13%, and 1.13%, respectively. For Institutional Class Shares, these amounts would have been $0.37, 12.41%, and 1.42%, respectively. |
| 94 | 2023 Semi-Annual Report |
| Ratios/Supplemental Data | ||||||
| Total Return (b) | Net Assets at End of Period (000's) | Ratio of Expenses (Net of Reimbursements/ Waivers Excluding Accruals for Estimated Tax Due on Foreign Tax Refund Recoveries) to Average Net Assets (c) | Ratio of Expenses (Net of Reimbursements/ Waivers) to Average Net Assets (c)(d)(e) | Ratio of Expenses (Prior to Reimbursements) to Average Net Assets(c)(d)(e)(f) | Ratio of Net Investment Income (Loss) to Average Net Assets (d) | Portfolio Turnover (b)(g) |
| 23.16% | $ 77,842 | 1.21% | 1.21% | 1.56% | (0.27%) | 13.79% |
| (36.53%)(h)(i) | 68,067 | 1.18% | 1.18% | 1.60% | 1.26%(h) | 38.19% |
| 34.20% | 120,080 | 1.38% | 1.38% | 1.62% | (0.36%) | 113.67% |
| 1.63%(j) | 100,780 | 1.38% | 1.38% | 1.71% | 0.67% | 34.20% |
| 15.02%(k) | 120,472 | 1.44% | 2.99% | 3.06% | 3.24%(k) | 131.52% |
| (11.93%) | 126,383 | 1.54% | 2.50% | 2.50% | 0.05% | 19.46% |
| 23.28%(i) | 9,327 | 0.95% | 0.95% | 1.28% | (0.13%) | 13.79% |
| (36.37%)(h)(i) | 13,946 | 0.93% | 0.93% | 1.27% | 1.50%(h) | 38.19% |
| 34.56% | 25,253 | 1.13% | 1.13% | 1.31% | (0.11%) | 113.67% |
| 1.86%(j) | 20,047 | 1.13% | 1.13% | 1.33% | 0.90% | 34.20% |
| 15.34%(k) | 27,390 | 1.18% | 2.77% | 2.82% | 3.53%(k) | 131.52% |
| (11.71%) | 26,633 | 1.30% | 2.22% | 2.23% | 0.33% | 19.46% |
| 2023 Semi-Annual Report | 95 |
| Investment Activities | Distributions | ||||||||
| Net Asset Value, Beginning of Period | Net Investment Income (Loss) (a) | Net Realized and Unrealized Gains (Losses) on Investments | Total from Investment Activities | Net Investment Income | Net Realized Gains | Total Distributions | Redemption Fees | Net Asset Value, End of Period | |
| Class A Shares | |||||||||
| Six-Months Ended April 30, 2023* | $10.84 | $0.19 | $0.28 | $ 0.47 | $ (0.11) | $ (0.67) | $ (0.78) | $ – | $ 10.53 |
| Year Ended October 31, 2022 | 15.68 | 0.15 | (2.72) | (2.57) | (0.31) | (1.96) | (2.27) | – | 10.84 |
| Year Ended October 31, 2021 | 12.40 | 0.11 | 4.84 | 4.95 | (0.13) | (1.54) | (1.67) | – | 15.68 |
| Year Ended October 31, 2020 | 17.98 | 0.25 | (3.17) | (2.92) | (0.60) | (2.06) | (2.66) | – | 12.40 |
| Year Ended October 31, 2019 | 21.38 | 0.32 | 3.28 | 3.60 | (0.52) | (6.48) | (7.00) | – | 17.98 |
| Year Ended October 31, 2018 | 22.93 | 0.47 | (0.74) | (0.27) | (0.69) | (0.59) | (1.28) | –(h) | 21.38 |
| Institutional Class Shares | |||||||||
| Six-Months Ended April 30, 2023* | 10.89 | 0.21 | 0.27 | 0.48 | (0.12) | (0.67) | (0.79) | – | 10.58 |
| Year Ended October 31, 2022 | 15.74 | 0.20 | (2.75) | (2.55) | (0.34) | (1.96) | (2.30) | – | 10.89 |
| Year Ended October 31, 2021 | 12.44 | 0.14 | 4.86 | 5.00 | (0.16) | (1.54) | (1.70) | – | 15.74 |
| Year Ended October 31, 2020 | 18.02 | 0.28 | (3.16) | (2.88) | (0.64) | (2.06) | (2.70) | – | 12.44 |
| Year Ended October 31, 2019 | 21.41 | 0.36 | 3.29 | 3.65 | (0.56) | (6.48) | (7.04) | – | 18.02 |
| Year Ended October 31, 2018 | 22.97 | 0.54 | (0.76) | (0.22) | (0.75) | (0.59) | (1.34) | –(h) | 21.41 |
| * | Unaudited |
| (a) | Net investment income/(loss) is based on average shares outstanding during the period. |
| (b) | Excludes sales charge. |
| (c) | Not Annualized for periods less than one year. |
| (d) | Annualized for periods less than one year. |
| (e) | During the period, certain fees were waived and/or reimbursed. If such waivers/reimbursements had not occurred, the ratios would have been as indicated. |
| (f) | Portfolio turnover is calculated on the basis of the Fund as a whole without distinguishing among the classes of shares. |
| (g) | Includes interest expense that amounts to less than 0.01% for Class A and Institutional Class for the six months ended April 30, 2023. Includes interest expense that amounts to less than 0.01%, 0.01%, 0.05%, 0.03%, and 0.10% for Class A and Institutional Class for the years ended October 31, 2022, October 31, 2021, October 31, 2020, October 31, 2019, and October 31, 2018, respectively. |
| (h) | Less than $0.005 per share. |
| 96 | 2023 Semi-Annual Report |
| Ratios/Supplemental Data | |||||
| Total Return (b)(c) | Net Assets at End of Period (000's) | Ratio of Expenses (Net of Reimbursements/ Waivers) to Average Net Assets (d) | Ratio of Expenses (Prior to Reimbursements) to Average Net Assets(d)(e) | Ratio of Net Investment Income (Loss) to Average Net Assets (d) | Portfolio Turnover (c)(f) |
| 4.69% | $ 350 | 1.25%(g) | 1.69%(g) | 3.64% | 10.29% |
| (19.45%) | 397 | 1.25%(g) | 1.67%(g) | 1.13% | 23.36% |
| 44.07% | 1,090 | 1.26%(g) | 1.72%(g) | 0.80% | 32.52% |
| (18.12%) | 1,971 | 1.30%(g) | 1.71%(g) | 1.84% | 22.61% |
| 25.65% | 2,341 | 1.28%(g) | 1.71%(g) | 1.83% | 20.70% |
| (1.35%) | 1,751 | 1.34%(g) | 1.71%(g) | 2.16% | 42.71% |
| 4.73% | 40,261 | 1.00%(g) | 1.40%(g) | 3.88% | 10.29% |
| (19.24%) | 41,592 | 1.00%(g) | 1.42%(g) | 1.53% | 23.36% |
| 44.41% | 56,593 | 1.01%(g) | 1.47%(g) | 1.01% | 32.52% |
| (17.85%) | 46,235 | 1.05%(g) | 1.48%(g) | 2.05% | 22.61% |
| 25.97% | 75,232 | 1.03%(g) | 1.39%(g) | 2.10% | 20.70% |
| (1.15%) | 83,573 | 1.10%(g) | 1.45%(g) | 2.46% | 42.71% |
| 2023 Semi-Annual Report | 97 |
| Investment Activities | Distributions | |||||||
| Net Asset Value, Beginning of Period | Net Investment Income (Loss) (a) | Net Realized and Unrealized Gains (Losses) on Investments | Total from Investment Activities | Net Investment Income | Net Realized Gains | Total Distributions | Net Asset Value, End of Period | |
| Class A Shares | ||||||||
| Six-Months Ended April 30, 2023* | $30.19 | $(0.06) | $0.89 | $ 0.83 | $ – | $ (1.69) | $ (1.69) | $ 29.33 |
| Year Ended October 31, 2022 | 49.57 | (0.25) | (9.33) | (9.58) | – | (9.80) | (9.80) | 30.19 |
| Year Ended October 31, 2021 | 33.55 | (0.24) | 18.64 | 18.40 | – | (2.38) | (2.38) | 49.57 |
| Year Ended October 31, 2020 | 33.19 | (0.20) | 3.08 | 2.88 | – | (2.52) | (2.52) | 33.55 |
| Year Ended October 31, 2019 | 35.39 | (0.10) | 1.78 | 1.68 | –(h) | (3.88) | (3.88) | 33.19 |
| Year Ended October 31, 2018 | 35.61 | (0.08) | (0.14) | (0.22) | – | – | – | 35.39 |
| Class C Shares | ||||||||
| Six-Months Ended April 30, 2023* | 22.59 | (0.11) | 0.65 | 0.54 | – | (1.69) | (1.69) | 21.44 |
| Year Ended October 31, 2022 | 39.79 | (0.36) | (7.04) | (7.40) | – | (9.80) | (9.80) | 22.59 |
| Year Ended October 31, 2021 | 27.48 | (0.42) | 15.11 | 14.69 | – | (2.38) | (2.38) | 39.79 |
| Year Ended October 31, 2020 | 27.79 | (0.33) | 2.54 | 2.21 | – | (2.52) | (2.52) | 27.48 |
| Year Ended October 31, 2019 | 30.53 | (0.27) | 1.41 | 1.14 | – | (3.88) | (3.88) | 27.79 |
| Year Ended October 31, 2018 | 30.94 | (0.30) | (0.11) | (0.41) | – | – | – | 30.53 |
| Class R Shares | ||||||||
| Six-Months Ended April 30, 2023* | 25.92 | (0.09) | 0.76 | 0.67 | – | (1.69) | (1.69) | 24.90 |
| Year Ended October 31, 2022 | 44.07 | (0.31) | (8.04) | (8.35) | – | (9.80) | (9.80) | 25.92 |
| Year Ended October 31, 2021 | 30.12 | (0.32) | 16.65 | 16.33 | – | (2.38) | (2.38) | 44.07 |
| Year Ended October 31, 2020 | 30.14 | (0.27) | 2.77 | 2.50 | – | (2.52) | (2.52) | 30.12 |
| Year Ended October 31, 2019 | 32.64 | (0.19) | 1.57 | 1.38 | – | (3.88) | (3.88) | 30.14 |
| Year Ended October 31, 2018 | 32.97 | (0.18) | (0.15) | (0.33) | – | – | – | 32.64 |
| Institutional Service Class Shares | ||||||||
| Six-Months Ended April 30, 2023* | 33.38 | (0.02) | 1.00 | 0.98 | – | (1.69) | (1.69) | 32.67 |
| Year Ended October 31, 2022 | 53.65 | (0.19) | (10.28) | (10.47) | – | (9.80) | (9.80) | 33.38 |
| Year Ended October 31, 2021 | 36.06 | (0.15) | 20.12 | 19.97 | – | (2.38) | (2.38) | 53.65 |
| Year Ended October 31, 2020 | 35.41 | (0.12) | 3.29 | 3.17 | – | (2.52) | (2.52) | 36.06 |
| Year Ended October 31, 2019 | 37.39 | (0.01) | 1.93 | 1.92 | (0.02) | (3.88) | (3.90) | 35.41 |
| Year Ended October 31, 2018 | 37.51 | 0.01 | (0.13) | (0.12) | – | – | – | 37.39 |
| Institutional Class Shares | ||||||||
| Six-Months Ended April 30, 2023* | 33.50 | (0.01) | 1.01 | 1.00 | – | (1.69) | (1.69) | 32.81 |
| Year Ended October 31, 2022 | 53.75 | (0.15) | (10.30) | (10.45) | – | (9.80) | (9.80) | 33.50 |
| Year Ended October 31, 2021 | 36.09 | (0.10) | 20.14 | 20.04 | – | (2.38) | (2.38) | 53.75 |
| Year Ended October 31, 2020 | 35.40 | (0.09) | 3.30 | 3.21 | – | (2.52) | (2.52) | 36.09 |
| Year Ended October 31, 2019 | 37.37 | 0.01 | 1.92 | 1.93 | (0.02) | (3.88) | (3.90) | 35.40 |
| Year Ended October 31, 2018 | 37.49 | 0.02 | (0.14) | (0.12) | – | – | – | 37.37 |
| * | Unaudited |
| (a) | Net investment income is based on average shares outstanding during the period. |
| (b) | Excludes sales charge. |
| (c) | Not Annualized for periods less than one year. |
| (d) | Annualized for periods less than one year. |
| (e) | During the period, certain fees were waived and/or reimbursed. If such waivers/reimbursements had not occurred, the ratios would have been as indicated. |
| (f) | Portfolio turnover is calculated on the basis of the Fund as a whole without distinguishing among the classes of shares. |
| (g) | Includes interest expense that amounts to 0.01% for Class A and Institutional Class for the six months ended April 30, 2023. Includes interest expense that amounts to less than 0.01%. |
| (h) | Less than $0.005 per share. |
| 98 | 2023 Semi-Annual Report |
| Ratios/Supplemental Data | |||||
| Total Return (b)(c) | Net Assets at End of Period (000's) | Ratio of Expenses (Net of Reimbursements/ Waivers) to Average Net Assets (d) | Ratio of Expenses (Prior to Reimbursements) to Average Net Assets(d)(e) | Ratio of Net Investment Income (Loss) to Average Net Assets (d) | Portfolio Turnover (c)(f) |
| 2.96% | $ 103,644 | 1.39%(g) | 1.42%(g) | (0.44%) | 10.89% |
| (23.82%) | 108,078 | 1.35%(g) | 1.35%(g) | (0.74%) | 59.08% |
| 56.92% | 172,963 | 1.35% | 1.35% | (0.56%) | 78.38% |
| 8.97% | 124,673 | 1.40%(g) | 1.40%(g) | (0.62%) | 60.67% |
| 7.15% | 159,391 | 1.41%(g) | 1.41%(g) | (0.33%) | 55.00% |
| (0.62%) | 224,804 | 1.35%(g) | 1.35%(g) | (0.23%) | 38.28% |
| 2.66% | 21,263 | 1.99%(g) | 2.14%(g) | (1.04%) | 10.89% |
| (24.30%) | 25,068 | 1.99%(g) | 2.06%(g) | (1.38%) | 59.08% |
| 55.93% | 44,295 | 1.99% | 2.06% | (1.20%) | 78.38% |
| 8.25% | 36,621 | 2.05%(g) | 2.10%(g) | (1.26%) | 60.67% |
| 6.41% | 48,382 | 2.10%(g) | 2.10%(g) | (0.99%) | 55.00% |
| (1.33%) | 75,913 | 2.06%(g) | 2.06%(g) | (0.95%) | 38.28% |
| 2.83% | 3,215 | 1.66%(g) | 1.69%(g) | (0.71%) | 10.89% |
| (24.04%) | 3,286 | 1.65%(g) | 1.65%(g) | (1.03%) | 59.08% |
| 56.50% | 5,408 | 1.63% | 1.63% | (0.84%) | 78.38% |
| 8.59% | 3,554 | 1.75%(g) | 1.75%(g) | (0.96%) | 60.67% |
| 6.78% | 5,272 | 1.75%(g) | 1.75%(g) | (0.65%) | 55.00% |
| (1.00%) | 8,430 | 1.72%(g) | 1.72%(g) | (0.55%) | 38.28% |
| 3.13% | 33,161 | 1.08%(g) | 1.11%(g) | (0.14%) | 10.89% |
| (23.64%) | 31,893 | 1.11%(g) | 1.11%(g) | (0.50%) | 59.08% |
| 57.33% | 41,568 | 1.11% | 1.11% | (0.31%) | 78.38% |
| 9.24% | 31,548 | 1.13%(g) | 1.13%(g) | (0.35%) | 60.67% |
| 7.44% | 40,476 | 1.12%(g) | 1.12%(g) | (0.04%) | 55.00% |
| (0.32%) | 50,163 | 1.08%(g) | 1.08%(g) | 0.03% | 38.28% |
| 3.19% | 423,202 | 0.99%(g) | 1.13%(g) | (0.04%) | 10.89% |
| (23.54%) | 559,518 | 0.99%(g) | 1.07%(g) | (0.38%) | 59.08% |
| 57.48% | 931,614 | 0.99% | 1.06% | (0.21%) | 78.38% |
| 9.37% | 536,973 | 1.04%(g) | 1.10%(g) | (0.27%) | 60.67% |
| 7.48% | 607,103 | 1.11%(g) | 1.11%(g) | 0.03% | 55.00% |
| (0.32%) | 1,263,907 | 1.07%(g) | 1.07%(g) | 0.04% | 38.28% |
| 2023 Semi-Annual Report | 99 |
| Investment Activities | Distributions | |||||||
| Net Asset Value, Beginning of Period | Net Investment Income (Loss) (a) | Net Realized and Unrealized Gains (Losses) on Investments | Total from Investment Activities | Net Investment Income | Net Realized Gains | Total Distributions | Net Asset Value, End of Period | |
| Class A Shares | ||||||||
| Six-Months Ended April 30, 2023* | $9.38 | $0.01 | $0.66 | $ 0.67 | $ – | $ (0.04) | $ (0.04) | $ 10.01 |
| Year Ended October 31, 2022 | 17.32 | (0.05) | (3.52) | (3.57) | – | (4.37) | (4.37) | 9.38 |
| Year Ended October 31, 2021 | 13.79 | (0.05) | 5.31 | 5.26 | – | (1.73) | (1.73) | 17.32 |
| Year Ended October 31, 2020 | 12.95 | (0.03) | 2.17 | 2.14 | (0.01) | (1.29) | (1.30) | 13.79 |
| Year Ended October 31, 2019 | 12.53 | 0.01 | 1.79 | 1.80 | (0.02) | (1.36) | (1.38) | 12.95 |
| Year Ended October 31, 2018 | 13.05 | 0.02 | 0.83 | 0.85 | (0.04) | (1.33) | (1.37) | 12.53 |
| Class C Shares | ||||||||
| Six-Months Ended April 30, 2023* | 6.76 | (0.01) | 0.46 | 0.45 | – | (0.04) | (0.04) | 7.17 |
| Year Ended October 31, 2022 | 13.77 | (0.09) | (2.55) | (2.64) | – | (4.37) | (4.37) | 6.76 |
| Year Ended October 31, 2021 | 11.36 | (0.12) | 4.26 | 4.14 | – | (1.73) | (1.73) | 13.77 |
| Year Ended October 31, 2020 | 10.94 | (0.10) | 1.81 | 1.71 | – | (1.29) | (1.29) | 11.36 |
| Year Ended October 31, 2019 | 10.87 | (0.06) | 1.49 | 1.43 | – | (1.36) | (1.36) | 10.94 |
| Year Ended October 31, 2018 | 11.53 | (0.06) | 0.73 | 0.67 | – | (1.33) | (1.33) | 10.87 |
| Institutional Service Class Shares | ||||||||
| Six-Months Ended April 30, 2023* | 10.56 | 0.03 | 0.73 | 0.76 | – | (0.04) | (0.04) | 11.28 |
| Year Ended October 31, 2022 | 18.91 | (0.03) | (3.95) | (3.98) | – | (4.37) | (4.37) | 10.56 |
| Year Ended October 31, 2021 | 14.89 | (0.02) | 5.77 | 5.75 | – | (1.73) | (1.73) | 18.91 |
| Year Ended October 31, 2020 | 13.88 | (–)(h) | 2.34 | 2.34 | (0.04) | (1.29) | (1.33) | 14.89 |
| Year Ended October 31, 2019 | 13.33 | 0.04 | 1.92 | 1.96 | (0.05) | (1.36) | (1.41) | 13.88 |
| Year Ended October 31, 2018 | 13.79 | 0.05 | 0.88 | 0.93 | (0.06) | (1.33) | (1.39) | 13.33 |
| Institutional Class Shares | ||||||||
| Six-Months Ended April 30, 2023* | 10.65 | 0.03 | 0.74 | 0.77 | – | (0.04) | (0.04) | 11.38 |
| Year Ended October 31, 2022 | 19.03 | (0.02) | (3.99) | (4.01) | – | (4.37) | (4.37) | 10.65 |
| Year Ended October 31, 2021 | 14.96 | (0.01) | 5.81 | 5.80 | – | (1.73) | (1.73) | 19.03 |
| Year Ended October 31, 2020 | 13.93 | 0.01 | 2.35 | 2.36 | (0.04) | (1.29) | (1.33) | 14.96 |
| Year Ended October 31, 2019 | 13.37 | 0.04 | 1.93 | 1.97 | (0.05) | (1.36) | (1.41) | 13.93 |
| Year Ended October 31, 2018 | 13.82 | 0.06 | 0.89 | 0.95 | (0.07) | (1.33) | (1.40) | 13.37 |
| * | Unaudited |
| (a) | Net investment income/(loss) is based on average shares outstanding during the period. |
| (b) | Excludes sales charge. |
| (c) | Not Annualized for periods less than one year. |
| (d) | Annualized for periods less than one year. |
| (e) | During the period, certain fees were waived and/or reimbursed. If such waivers/reimbursements had not occurred, the ratios would have been as indicated. |
| (f) | Portfolio turnover is calculated on the basis of the Fund as a whole without distinguishing among the classes of shares. |
| (g) | Includes interest expense that amounts to 0.01% for Class A and Institutional Class for the six months ended April 30, 2023. Includes interest expense that amounts to less than 0.01%. |
| (h) | Less than $0.005 per share. |
| 100 | 2023 Semi-Annual Report |
| Ratios/Supplemental Data | |||||
| Total Return (b)(c) | Net Assets at End of Period (000's) | Ratio of Expenses (Net of Reimbursements/ Waivers) to Average Net Assets (d) | Ratio of Expenses (Prior to Reimbursements) to Average Net Assets(d)(e) | Ratio of Net Investment Income (Loss) to Average Net Assets (d) | Portfolio Turnover (c)(f) |
| 7.18% | $ 225,614 | 1.19% | 1.28% | 0.26% | 2.39% |
| (27.49%) | 222,190 | 1.19%(g) | 1.24%(g) | (0.43%) | 44.12% |
| 41.35% | 345,638 | 1.19% | 1.23% | (0.33%) | 111.07% |
| 17.50% | 264,977 | 1.19% | 1.26% | (0.24%) | 49.68% |
| 17.60% | 247,926 | 1.19% | 1.27% | 0.06% | 47.13% |
| 6.63% | 233,717 | 1.19%(g) | 1.25%(g) | 0.14% | 38.68% |
| 6.70% | 285 | 1.90% | 2.09% | (0.32%) | 2.39% |
| (27.96%) | 229 | 1.90%(g) | 2.08%(g) | (1.14%) | 44.12% |
| 40.20% | 329 | 1.90% | 2.07% | (1.01%) | 111.07% |
| 16.71% | 1,143 | 1.90% | 2.08% | (0.94%) | 49.68% |
| 16.75% | 1,428 | 1.90% | 2.11% | (0.58%) | 47.13% |
| 5.88% | 2,963 | 1.90%(g) | 2.07%(g) | (0.56%) | 38.68% |
| 7.23% | 109,324 | 0.96% | 1.05% | 0.49% | 2.39% |
| (27.32%) | 106,068 | 0.97%(g) | 1.02%(g) | (0.20%) | 44.12% |
| 41.61% | 158,581 | 0.97% | 1.01% | (0.11%) | 111.07% |
| 17.79% | 121,611 | 0.97% | 1.04% | (0.01%) | 49.68% |
| 17.84% | 113,600 | 0.97% | 1.05% | 0.29% | 47.13% |
| 6.90% | 106,337 | 0.97%(g) | 1.03%(g) | 0.36% | 38.68% |
| 7.26% | 8,014 | 0.90% | 1.05% | 0.54% | 2.39% |
| (27.29%) | 8,644 | 0.90%(g) | 1.01%(g) | (0.14%) | 44.12% |
| 41.77% | 14,953 | 0.90% | 1.00% | (0.05%) | 111.07% |
| 17.89% | 10,982 | 0.90% | 1.01% | 0.05% | 49.68% |
| 17.90% | 8,839 | 0.90% | 1.03% | 0.34% | 47.13% |
| 6.99% | 6,801 | 0.90%(g) | 1.01%(g) | 0.43% | 38.68% |
| 2023 Semi-Annual Report | 101 |
| Investment Activities | Distributions | |||||||
| Net Asset Value, Beginning of Period | Net Investment Income (Loss) (a) | Net Realized and Unrealized Gains (Losses) on Investments | Total from Investment Activities | Net Investment Income | Net Realized Gains | Total Distributions | Net Asset Value, End of Period | |
| Class A Shares | ||||||||
| Six-Months Ended April 30, 2023* | $6.29 | $– | $(0.13) | $ (0.13) | $ – | $ – | $ – | $ 6.16 |
| Year Ended October 31, 2022 | 11.09 | (0.04) | (2.09) | (2.13) | – | (2.67) | (2.67) | 6.29 |
| Year Ended October 31, 2021 | 8.08 | (0.04) | 4.06 | 4.02 | – | (1.01) | (1.01) | 11.09 |
| Year Ended October 31, 2020 | 7.59 | (0.01) | 0.96 | 0.95 | –(j) | (0.46) | (0.46) | 8.08 |
| Year Ended October 31, 2019 | 6.85 | 0.01 | 1.09 | 1.10 | – | (0.36) | (0.36) | 7.59 |
| Year Ended October 31, 2018 | 8.52 | 0.02 | 0.62 | 0.64 | – | (2.31) | (2.31) | 6.85 |
| Class R Shares | ||||||||
| Six-Months Ended April 30, 2023* | 5.38 | (0.01) | (0.11) | (0.12) | – | – | – | 5.26 |
| Year Ended October 31, 2022 | 9.54 | (0.06) | (1.78) | (1.84) | – | (2.32) | (2.32) | 5.38 |
| Year Ended October 31, 2021 | 7.09 | (0.06) | 3.52 | 3.46 | – | (1.01) | (1.01) | 9.54 |
| Year Ended October 31, 2020 | 6.73 | (0.03) | 0.85 | 0.82 | – | (0.46) | (0.46) | 7.09 |
| Year Ended October 31, 2019 | 6.13 | (0.01) | 0.97 | 0.96 | – | (0.36) | (0.36) | 6.73 |
| Year Ended October 31, 2018 | 7.88 | –(j) | 0.56 | 0.56 | – | (2.31) | (2.31) | 6.13 |
| Institutional Service Class Shares | ||||||||
| Six-Months Ended April 30, 2023* | 6.64 | 0.01 | (0.15) | (0.14) | – | – | – | 6.50 |
| Year Ended October 31, 2022 | 11.68 | (0.04) | (2.18) | (2.22) | – | (2.82) | (2.82) | 6.64 |
| Year Ended October 31, 2021 | 8.45 | (0.03) | 4.27 | 4.24 | – | (1.01) | (1.01) | 11.68 |
| Year Ended October 31, 2020 | 7.92 | –(j) | 1.00 | 1.00 | (0.01) | (0.46) | (0.47) | 8.45 |
| Year Ended October 31, 2019 | 7.11 | 0.03 | 1.14 | 1.17 | – | (0.36) | (0.36) | 7.92 |
| Year Ended October 31, 2018 | 8.75 | 0.04 | 0.63 | 0.67 | – | (2.31) | (2.31) | 7.11 |
| Institutional Class Shares | ||||||||
| Six-Months Ended April 30, 2023* | 6.97 | 0.01 | (0.14) | (0.13) | – | – | – | 6.84 |
| Year Ended October 31, 2022 | 12.21 | (0.02) | (2.31) | (2.33) | – | (2.91) | (2.91) | 6.97 |
| Year Ended October 31, 2021 | 8.78 | (0.01) | 4.45 | 4.44 | – | (1.01) | (1.01) | 12.21 |
| Year Ended October 31, 2020 | 8.20 | 0.01 | 1.04 | 1.05 | (0.01) | (0.46) | (0.47) | 8.78 |
| Year Ended October 31, 2019 | 7.34 | 0.04 | 1.18 | 1.22 | – | (0.36) | (0.36) | 8.20 |
| Year Ended October 31, 2018 | 8.95 | 0.05 | 0.65 | 0.70 | – | (2.31) | (2.31) | 7.34 |
| * | Unaudited |
| (a) | Net investment income/(loss) is based on average shares outstanding during the period. |
| (b) | Excludes sales charge. |
| (c) | Not Annualized for periods less than one year. |
| (d) | Annualized for periods less than one year. |
| (e) | During the period, certain fees were waived and/or reimbursed. If such waivers/reimbursements had not occurred, the ratios would have been as indicated. |
| (f) | Dividend expense ratio includes broker related expenses for securities sold short. |
| (g) | Indicates the dividend expense charged for the period to average net assets. |
| (h) | Portfolio turnover is calculated on the basis of the Fund as a whole without distinguishing among the classes of shares. |
| (i) | Includes interest expense that amounts to less than 0.01% for Class A, Class C, Class R, Institutional Service Class and Institutional Class for the six months ended April 30, 2023. Includes interest expense that amounts to less than 0.01% for Class A, Class C, Class R, Institutional Service Class and Institutional Class for the years ended October 31, 2021, October 31, 2020 and October 31, 2018. |
| (j) | Less than $0.005 per share. |
| 102 | 2023 Semi-Annual Report |
| Ratios/Supplemental Data | ||||||
| Total Return (b)(c) | Net Assets at End of Period (000's) | Ratio of Expenses (Net of Reimbursements/ Waivers) to Average Net Assets (d) | Ratio of Expenses (Prior to Reimbursements) to Average Net Assets(d)(e) | Ratio of Net Investment Income (Loss) to Average Net Assets (d) | Dividend Expense (f)(g) | Portfolio Turnover (c)(h) |
| (2.07%) | $ 7,584 | 1.24%(i) | 2.28%(i) | 0.02% | – | 1.92% |
| (25.40%) | 8,220 | 1.24% | 2.34% | (0.59%) | – | 55.89% |
| 53.27% | 10,032 | 1.22%(i) | 2.42%(i) | (0.45%) | – | 157.35% |
| 12.88% | 7,618 | 1.24%(i) | 2.13%(i) | (0.17%) | – | 45.98% |
| 17.62% | 8,481 | 1.25% | 2.09% | 0.20% | – | 54.04% |
| 8.32% | 7,466 | 1.32%(i) | 2.03%(i) | 0.34% | 0.04% | 112.97% |
| (2.23%) | 2,260 | 1.54%(i) | 2.58%(i) | (0.28%) | – | 1.92% |
| (25.57%) | 2,286 | 1.56% | 2.67% | (0.91%) | – | 55.89% |
| 52.76% | 3,071 | 1.55%(i) | 2.75%(i) | (0.78%) | – | 157.35% |
| 12.54% | 1,952 | 1.43%(i) | 2.32%(i) | (0.37%) | – | 45.98% |
| 17.39% | 1,924 | 1.55% | 2.39% | (0.09%) | – | 54.04% |
| 7.89% | 1,895 | 1.69%(i) | 2.40%(i) | (0.04%) | 0.04% | 112.97% |
| (2.11%) | 232 | 1.05%(i) | 2.09%(i) | 0.22% | – | 1.92% |
| (25.16%) | 276 | 1.05% | 2.16% | (0.47%) | – | 55.89% |
| 53.56% | 159 | 1.05%(i) | 2.25%(i) | (0.33%) | – | 157.35% |
| 12.96% | 340 | 1.04%(i) | 1.93%(i) | 0.02% | – | 45.98% |
| 17.96% | 480 | 1.05% | 1.89% | 0.45% | – | 54.04% |
| 8.50% | 679 | 1.07%(i) | 1.79%(i) | 0.55% | 0.04% | 112.97% |
| (1.87%) | 3,558 | 0.90%(i) | 2.09%(i) | 0.38% | – | 1.92% |
| (25.17%) | 5,182 | 0.90% | 2.15% | (0.25%) | – | 55.89% |
| 53.85% | 5,531 | 0.90%(i) | 2.24%(i) | (0.12%) | – | 157.35% |
| 13.14% | 3,451 | 0.90%(i) | 1.94%(i) | 0.17% | – | 45.98% |
| 18.10% | 4,580 | 0.90% | 1.89% | 0.58% | – | 54.04% |
| 8.69% | 5,583 | 0.98%(i) | 1.83%(i) | 0.63% | 0.06% | 112.97% |
| 2023 Semi-Annual Report | 103 |
April 30, 2023
| • | abrdn China A Share Equity Fund ("China A Share Equity Fund") |
| • | abrdn Dynamic Dividend Fund (“Dynamic Dividend Fund”) |
| • | abrdn EM SMA Completion Fund* ("EM SMA Completion Fund") |
| • | abrdn Emerging Markets ex-China Fund (“Emerging Markets ex-China Fund”) |
| • | abrdn Emerging Markets Fund (“Emerging Markets Fund”) |
| • | abrdn Emerging Markets Sustainable Leaders Fund (“Emerging Markets Sustainable Leaders Fund”) |
| • | abrdn Global Equity Impact Fund (“Global Equity Impact Fund”) |
| • | abrdn Global Infrastructure Fund (“Global Infrastructure Fund”) |
| • | abrdn International Small Cap Fund (formerly, (“International Small Cap Fund”) |
| • | abrdn International Sustainable Leaders Fund (“International Sustainable Leaders Fund”) |
| • | abrdn Realty Income & Growth Fund (“Realty Income & Growth Fund”) |
| • | abrdn U.S. Small Cap Equity Fund (“U.S. Small Cap Equity Fund”) |
| • | abrdn U.S. Sustainable Leaders Fund (“U.S. Sustainable Leaders Fund”) |
| • | abrdn U.S. Sustainable Leaders Smaller Companies Fund (“U.S. Sustainable Leaders Smaller Companies Fund”) |
| a. | Security Valuation: |
| The Funds value their securities at current market value or fair value, consistent with regulatory requirements. "Fair value" is defined in the Funds' Valuation and Liquidity Procedures as the price that could be received to sell an asset or paid to transfer a liability in an orderly transaction between willing market participants without a compulsion to transact at the measurement date. Pursuant to Rule 2a-5 under the 1940 Act, the Board of Trustees (the "Board") designated abrdn Inc. ("abrdn" or the "Adviser") as the valuation designee ("Valuation Designee") for the Funds to perform the fair value determinations relating to Fund investments for which market quotations are not readily available. | |
| Equity securities that are traded on an exchange are valued at the last quoted sale price or the official close price on the principal exchange on which the security is traded at the “Valuation Time” subject to application, when appropriate, of the valuation factors described in the paragraph below. Under normal circumstances, the Valuation Time is as of the close of regular trading on the New York Stock Exchange ("NYSE") (usually 4:00 p.m. Eastern Time). In the absence of a sale price, the security is valued at the mean of the bid/ask price quoted at the close on the principal exchange on which the security is traded. Securities traded on NASDAQ are valued at the NASDAQ official closing price. | |
| In accordance with the authoritative guidance on fair value measurements and disclosures under U.S. GAAP, the Funds disclose the fair value of their investments using a three-level hierarchy that classifies the inputs to valuation techniques used to measure the fair value. The hierarchy assigns Level 1, the highest level, measurements to valuations based upon unadjusted quoted prices in active markets for identical assets, Level 2 measurements to valuations based upon other significant observable inputs, including adjusted quoted prices in active markets |
| 104 | 2023 Semi-Annual Report |
April 30, 2023
| for similar assets, and Level 3, the lowest level, measurements to valuations based upon unobservable inputs that are significant to the valuation. Inputs refer broadly to the assumptions that market participants would use in pricing the asset or liability, including assumptions about risk, for example, the risk inherent in a particular valuation technique used to measure fair value including a pricing model and/or the risk inherent in the inputs to the valuation technique. Inputs may be observable or unobservable. Observable inputs are inputs that reflect the assumptions market participants would use in pricing the asset or liability, which are based on market data obtained from sources independent of the reporting entity. Unobservable inputs are inputs that reflect the reporting entity’s own assumptions about the assumptions market participants would use in pricing the asset or liability developed based on the best information available in the circumstances. A financial instrument’s level within the fair value hierarchy is based upon the lowest level of any input that is significant to the fair value measurement. Open-end mutual funds are valued at the respective net asset value (“NAV”) as reported by such company. The prospectuses for the registered open-end management investment companies in which a Fund invests explain the circumstances under which those companies will use fair value pricing and the effects of using fair value pricing. Closed-end funds and exchange-traded funds (“ETFs”) are valued at the market price of the security at the Valuation Time. A security using any of these pricing methodologies is determined to be a Level 1 investment. | |
| Foreign equity securities that are traded on foreign exchanges that close prior to the Valuation Time are valued by applying valuation factors to the last sale price or the mean price as noted above. Valuation factors are provided by an independent pricing service provider. These valuation factors are used when pricing a Fund's portfolio holdings to estimate market movements between the time foreign markets close and the time a Fund values such foreign securities. These valuation factors are based on inputs such as depositary receipts, indices, futures, sector indices/ETFs, exchange rates, and local exchange opening and closing prices of each security. When prices with the application of valuation factors are utilized, the value assigned to the foreign securities may not be the same as quoted or published prices of the securities on their primary markets. A security that applies a valuation factor is determined to be a Level 2 investment because the exchange-traded price has been adjusted. Valuation factors are not utilized if the independent pricing service provider is unable to provide a valuation factor or if the valuation factor falls below a predetermined threshold; in such case, the security is determined to be a Level 1 investment. | |
| Long-term debt and other fixed income securities are valued at the last quoted or evaluated bid price on the valuation date provided by an independent pricing service provider. If there are no current day bids, the security is valued at the previously applied bid. Pricing services generally price debt securities assuming orderly transactions of an institutional “round lot” size, and the strategies employed by the Adviser as Valuation Designee generally trade in round lot sizes. In certain circumstances, fixed income securities may be held or transactions may be conducted in smaller, “odd lot” sizes. Odd lots may trade at lower or occasionally higher prices than institutional round lot trades. Short-term debt securities (such as commercial paper and U.S. treasury bills) having a remaining maturity of 60 days or less are valued at the last quoted or evaluated bid price on the valuation date provided by an independent pricing service, or on the basis of amortized cost if it represents the best approximation for fair value. Debt and other fixed-income securities are generally determined to be Level 2 investments. | |
| Short-term investments are comprised of cash and cash equivalents invested in short-term investment funds which are redeemable daily. The Funds sweep available cash into the State Street Institutional U.S. Government Money Market Fund, which has elected to qualify as a “government money market fund” pursuant to Rule 2a-7 under the 1940 Act, and has an objective, which is not guaranteed, to maintain a $1.00 per share NAV. Registered investment companies are valued at their NAV as reported by such company. Generally, these investment types are categorized as Level 1 investments. | |
| Forward foreign currency contracts are generally valued based on the bid price of the forward rates and the current spot rate. Forward exchange rate quotations are available for scheduled settlement dates, such as 1-, 3-, 6-, 9- and 12-month periods. An interpolated valuation is derived based on the actual settlement dates of the forward contracts held. Futures contracts are valued at the settlement price or at the last bid price if no settlement price is available. Interest rate swaps agreements are generally valued by an approved pricing agent based on the terms of the swap agreement (including future cash flows). | |
| In the event that a security’s market quotations are not readily available or are deemed unreliable (for reasons other than because the foreign exchange on which it trades closes before the Valuation Time), the security is valued at fair value as determined by the Valuation Designee, taking into account the relevant factors and surrounding circumstances using valuation policies and procedures approved by the Board. Under normal circumstances the Valuation Time is as of the close of regular trading on the NYSE (usually 4:00 p.m. Eastern Time). A security that has been fair valued by the Adviser may be classified as Level 2 or Level 3 depending on the nature of the inputs. | |
| The three-level hierarchy of inputs is summarized below: |
| • | Level 1 - quoted prices in active markets for identical investments; |
| • | Level 2 - other significant observable inputs (including valuation factors, quoted prices for similar securities, interest rates, prepayment speeds, and credit risk); or |
| • | Level 3 - significant unobservable inputs (including a Fund’s own assumptions in determining the fair value of investments). |
| 2023 Semi-Annual Report | 105 |
April 30, 2023
| Security Type | Standard Inputs |
| Foreign equities utilizing a fair value factor | Depositary receipts, indices, futures, sector indices/ETFs, exchange rates, and local exchange opening and closing prices of each security. |
| Investments, at Value | Level 1 – Quoted Prices | Level 2 – Other Significant Observable Inputs | Level 3 – Significant Unobservable Inputs | Total |
| China A Share Equity Fund | ||||
| Assets | ||||
| Investments in Securities | ||||
Common Stocks | $– | $37,461,994 | $– | $37,461,994 |
Exchange-Traded Funds | 799,845 | – | – | 799,845 |
Short-Term Investment | 1,254,482 | – | – | 1,254,482 |
Total Investments | $2,054,327 | $37,461,994 | $– | $39,516,321 |
Total Assets | $2,054,327 | $37,461,994 | $– | $39,516,321 |
| Dynamic Dividend Fund | ||||
| Assets | ||||
| Investments in Securities | ||||
Common Stocks | $69,611,208 | $37,170,079 | $– | $106,781,287 |
Preferred Stocks | – | 1,337,756 | – | 1,337,756 |
Short-Term Investment | 456,940 | – | – | 456,940 |
Total Investments | $70,068,148 | $38,507,835 | $– | $108,575,983 |
Total Assets | $70,068,148 | $38,507,835 | $– | $108,575,983 |
| Liabilities | ||||
| Other Financial Instruments | ||||
Foreign Currency Exchange Contracts | $– | $(25,115) | $– | $(25,115) |
Total Liabilities | $– | $(25,115) | $– | $(25,115) |
| EM SMA Completion Fund | ||||
| Assets | ||||
| Investments in Securities | ||||
Common Stocks | $56,849 | $159,899 | $– | $216,748 |
Preferred Stocks | – | 43,812 | – | 43,812 |
Short-Term Investment | 13,544 | – | – | 13,544 |
Total Investments | $70,393 | $203,711 | $– | $274,104 |
Total Assets | $70,393 | $203,711 | $– | $274,104 |
| 106 | 2023 Semi-Annual Report |
April 30, 2023
| Investments, at Value | Level 1 – Quoted Prices | Level 2 – Other Significant Observable Inputs | Level 3 – Significant Unobservable Inputs | Total |
| Emerging Markets ex-China Fund | ||||
| Assets | ||||
| Investments in Securities | ||||
Common Stocks | $6,699,461 | $22,561,562 | $– | $29,261,023 |
Preferred Stocks | 303,906 | 25,710 | – | 329,616 |
Rights | 11,593 | – | – | 11,593 |
Short-Term Investment | 609,967 | – | – | 609,967 |
Total Investments | $7,624,927 | $22,587,272 | $– | $30,212,199 |
Total Assets | $7,624,927 | $22,587,272 | $– | $30,212,199 |
| Emerging Markets Fund | ||||
| Assets | ||||
| Investments in Securities | ||||
Common Stocks | $329,546,788 | $1,644,614,496 | $– | $1,974,161,284 |
Preferred Stocks | 24,558,660 | 120,741,525 | – | 145,300,185 |
Short-Term Investment | 36,066,663 | – | – | 36,066,663 |
Total Investments | $390,172,111 | $1,765,356,021 | $– | $2,155,528,132 |
Total Assets | $390,172,111 | $1,765,356,021 | $– | $2,155,528,132 |
| Emerging Markets Sustainable Leaders Fund | ||||
| Assets | ||||
| Investments in Securities | ||||
Common Stocks | $13,524,903 | $60,209,017 | $– | $73,733,920 |
Preferred Stocks | 891,783 | 4,758,357 | – | 5,650,140 |
Short-Term Investment | 375,921 | – | – | 375,921 |
Total Investments | $14,792,607 | $64,967,374 | $– | $79,759,981 |
Total Assets | $14,792,607 | $64,967,374 | $– | $79,759,981 |
| Global Equity Impact Fund | ||||
| Assets | ||||
| Investments in Securities | ||||
Common Stocks | $25,121,099 | $25,980,403 | $– | $51,101,502 |
Short-Term Investment | 1,060,220 | – | – | 1,060,220 |
Total Investments | $26,181,319 | $25,980,403 | $– | $52,161,722 |
Total Assets | $26,181,319 | $25,980,403 | $– | $52,161,722 |
| Global Infrastructure Fund | ||||
| Assets | ||||
| Investments in Securities | ||||
Common Stocks | $26,560,513 | $23,538,550 | $– | $50,099,063 |
Short-Term Investment | 494,819 | – | – | 494,819 |
Total Investments | $27,055,332 | $23,538,550 | $– | $50,593,882 |
Total Assets | $27,055,332 | $23,538,550 | $– | $50,593,882 |
| 2023 Semi-Annual Report | 107 |
April 30, 2023
| Investments, at Value | Level 1 – Quoted Prices | Level 2 – Other Significant Observable Inputs | Level 3 – Significant Unobservable Inputs | Total |
| International Small Cap Fund | ||||
| Assets | ||||
| Investments in Securities | ||||
Common Stocks | $38,516,977 | $128,240,677 | $– | $166,757,654 |
Preferred Stocks | – | 3,547,951 | – | 3,547,951 |
Short-Term Investment | 2,150,400 | – | – | 2,150,400 |
Total Investments | $40,667,377 | $131,788,628 | $– | $172,456,005 |
Total Assets | $40,667,377 | $131,788,628 | $– | $172,456,005 |
| International Sustainable Leaders Fund | ||||
| Assets | ||||
| Investments in Securities | ||||
Common Stocks | $16,669,241 | $70,620,521 | $– | $87,289,762 |
Short-Term Investment | 1,828,131 | – | – | 1,828,131 |
Total Investments | $18,497,372 | $70,620,521 | $– | $89,117,893 |
Total Assets | $18,497,372 | $70,620,521 | $– | $89,117,893 |
| Realty Income & Growth Fund | ||||
| Assets | ||||
| Investments in Securities | ||||
Common Stocks | $40,408,654 | $– | $– | $40,408,654 |
Short-Term Investment | 537,012 | – | – | 537,012 |
Total Investments | $40,945,666 | $– | $– | $40,945,666 |
Total Assets | $40,945,666 | $– | $– | $40,945,666 |
| U.S. Small Cap Equity Fund | ||||
| Assets | ||||
| Investments in Securities | ||||
Common Stocks | $573,741,621 | $– | $– | $573,741,621 |
Short-Term Investment | 11,218,427 | – | – | 11,218,427 |
Total Investments | $584,960,048 | $– | $– | $584,960,048 |
Total Assets | $584,960,048 | $– | $– | $584,960,048 |
| U.S. Sustainable Leaders Fund | ||||
| Assets | ||||
| Investments in Securities | ||||
Common Stocks | $333,696,990 | $– | $– | $333,696,990 |
Short-Term Investment | 9,759,486 | – | – | 9,759,486 |
Total Investments | $343,456,476 | $– | $– | $343,456,476 |
Total Assets | $343,456,476 | $– | $– | $343,456,476 |
| 108 | 2023 Semi-Annual Report |
April 30, 2023
| Investments, at Value | Level 1 – Quoted Prices | Level 2 – Other Significant Observable Inputs | Level 3 – Significant Unobservable Inputs | Total |
| U.S. Sustainable Leaders Smaller Companies Fund | ||||
| Assets | ||||
| Investments in Securities | ||||
Common Stocks | $13,502,060 | $– | $– | $13,502,060 |
Short-Term Investment | 45,540 | – | – | 45,540 |
Total Investments | $13,547,600 | $– | $– | $13,547,600 |
Total Assets | $13,547,600 | $– | $– | $13,547,600 |
| b. | Restricted Securities: |
| Restricted securities are privately-placed securities whose resale is restricted under U.S. securities laws. The Funds may invest in restricted securities, including unregistered securities eligible for resale without registration pursuant to Rule 144A and privately-placed securities of U.S. and non-U.S. issuers offered outside the U.S. without registration pursuant to Regulation S under the Securities Act of 1933, as amended (the "1933 Act"). Rule 144A securities may be freely traded among certain qualified institutional investors, such as the Funds, but resale of such securities in the U.S. is permitted only in limited circumstances. |
| c. | Foreign Currency Translation: |
| Foreign securities, currencies and other assets and liabilities denominated in foreign currencies are translated into U.S. dollars at the exchange rate of said currencies against the U.S. dollar, as of the Valuation Time, as provided by an independent pricing service. Purchases and sales of securities, and income and expenses are translated at the prevailing rate of exchange on the respective date of these transactions. The Funds do not isolate that portion of the results of operations resulting from changes in foreign exchange rates on investments from fluctuations arising from changes in market prices of securities held. These fluctuations are included with the net realized and unrealized gain or loss from investments and foreign currencies within the Statements of Operations. |
| d. | Rights Issues and Warrants: |
| Rights issues give the right, normally to existing shareholders, to buy a proportional number of additional securities at a given price (generally at a discount) within a fixed period (generally a short-term period) and are offered at the company’s discretion. Warrants are securities that give the holder the right to buy common stock at a specified price for a specified period of time. Rights issues and warrants are speculative and have no value if they are not exercised before the expiration date. Rights issues and warrants are valued at the last sale price on the exchange on which they are traded. |
| e. | Derivative Financial Instruments: |
| Certain Funds are authorized to use derivatives to manage currency risk, credit risk, and interest rate risk and to replicate, or use as a substitute for, physical securities. Losses may arise due to changes in the value of the contract or if the counterparty does not perform under the contract. The use of derivative instruments involves, to varying degrees, elements of market risk in excess of the amount recognized in the Statements of Assets and Liabilities. | |
| Forward Foreign Currency Exchange Contracts: | |
| A forward foreign currency exchange contract ("forward contract") involves an obligation to purchase and sell a specific currency at a future date, which may be any fixed number of days from the date of the contract agreed upon by the parties, at a price set at the time of the contract. Forward contracts are used to manage a Fund's currency exposure in an efficient manner. They are used to sell unwanted currency exposure that comes with holding securities in a market, or to buy currency exposure where the exposure from holding securities is |
| 2023 Semi-Annual Report | 109 |
April 30, 2023
| insufficient to give the desired currency exposure either in absolute terms or relative to a particular benchmark or index. The use of forward contracts allows for the separation of investment decision-making between foreign exchange holdings and their currencies. | |
| The forward contract is marked-to-market daily and the change in market value is recorded by a Fund as unrealized appreciation or depreciation. Forward contracts' prices are received daily from an independent pricing provider. When the forward contract is closed, a Fund records a realized gain or loss equal to the difference between the value at the time it was opened and the value at the time it was closed. These realized and unrealized gains and losses are reported on the Statement of Operations. A Fund could be exposed to risks if the counterparties to the contracts are unable to meet the terms of their contracts or from unanticipated movements in exchange rates. | |
| During the period, the Funds used forward contracts for the purposes of efficient portfolio management and managing active currency risk relative to the benchmark, the latter of which involves both hedging currency risk and adding currency risk in excess of underlying bond positions. | |
| While a Fund may enter into forward contracts to seek to reduce currency exchange rate risks, transactions in such contracts involve certain risks. A Fund could be exposed to risks if the counterparties to the contracts are unable to meet the terms of their contracts and from unanticipated movements in exchange rates. Thus, while a Fund may benefit from such transactions, unanticipated changes in currency prices may result in a poorer overall performance for a Fund than if it had not engaged in any such transactions. Moreover, there may be an imperfect correlation between a Fund’s portfolio holdings or securities quoted or denominated in a particular currency and forward contracts entered into by the Fund. Such imperfect correlation may prevent a Fund from achieving a complete hedge, which will expose the Fund to the risk of foreign exchange loss. | |
| Forward contracts are subject to the risk that the counterparties to such contracts may default on their obligations. Since a forward foreign currency exchange contract is not guaranteed by an exchange or clearing house, a default on the contract would deprive a Fund of unrealized profits, transaction costs or the benefits of a currency hedge or force a Fund to cover its purchase or sale commitments, if any, at the market price at the time of the default. |
| Summary of Derivative Instruments | |
| Certain Funds may use derivatives for various purposes as noted above. The following is a summary of the fair value of derivative instruments, not accounted for as hedging instruments, as of April 30, 2023: | |
| Risk Exposure Category | |||||||
| Interest Rate Contracts | Foreign Currency Contracts | Credit Contracts | Equity Contracts | Commodity Contracts | Other | Total | |
| Dynamic Dividend Fund | |||||||
| Liabilities: | |||||||
| Unrealized depreciation on: | |||||||
| Forward Foreign Currency Exchange Contracts | $– | $25,115 | $– | $– | $– | $– | $25,115 |
Total | $– | $25,115 | $– | $– | $– | $– | $25,115 |
| 110 | 2023 Semi-Annual Report |
April 30, 2023
| Gross Amounts Not Offset in the Statement of Assets and Liabilities | Gross Amounts Not Offset in the Statement of Assets and Liabilities | |||||||
| Gross Amounts of Assets Presented in Statement of Assets and Liabilities | Financial Instruments | Collateral Received | Net Amount | Gross Amounts of Liabilities Presented in Statement of Assets and Liabilities | Financial Instruments | Collateral Pledged | Net Amount | |
| Description | Assets | Liabilities | ||||||
| Dynamic Dividend Fund | ||||||||
| Foreign Currency Exchange Contracts | ||||||||
| Citibank N.A. | $– | $– | $– | $– | $25,115 | $– | $– | $25,115 |
| Risk Exposure Category | ||||||
| Interest Rate Contracts | Foreign Currency Contracts | Credit Contracts | Equity Contracts | Commodity Contracts | Total | |
| Dynamic Dividend Fund | ||||||
| Realized Gain (Loss) on Derivatives Recognized as a Result of Operations: | ||||||
| Net realized gain (loss) on: | ||||||
| Forward Currency Contracts | $– | $(436,169) | $– | $– | $– | $(436,169) |
Total | $– | $(436,169) | $– | $– | $– | $(436,169) |
| Net Change in Unrealized Appreciation (Depreciation) on Derivatives Recognized as a Result of Operations: | ||||||
| Net change in unrealized appreciation (depreciation) of: | ||||||
| Forward Currency Contracts | $– | $12,363 | $– | $– | $– | $12,363 |
Total | $– | $12,363 | $– | $– | $– | $12,363 |
| Derivative | Average Notional Value |
| Dynamic Dividend Fund | |
| Foreign Currency Contracts Sold | $7,627,454 |
| f. | Security Transactions, Investment Income and Expenses: |
| Security transactions are recorded on the trade date. Realized and unrealized gains/(losses) from security and currency transactions are calculated on the identified cost basis. Dividend income and corporate actions are recorded generally on the ex-date, except for certain dividends and corporate actions which may be recorded after the ex-date, as soon as a Fund acquires information regarding such dividends or corporate actions. |
| 2023 Semi-Annual Report | 111 |
April 30, 2023
| Interest income and expenses are recorded on an accrual basis. Expenses directly attributable to a Fund are charged to that Fund. Expenses not directly attributable to a Fund are allocated proportionately among the relevant Funds based on net assets of each Fund as of month-end. For each of the Funds, the method for allocating income, fund level expenses, and realized and unrealized gains or losses to a class is based on the average net asset value of that class’ shares in proportion to the average net assets of the relevant Fund when incurred. Expenses specific to a class (such as Rule 12b-1 and administrative services fees) are charged to that class. |
| g. | Distributions: |
| Distributions from net investment income, if any, are declared and paid annually for all Funds except the Dynamic Dividend Fund, which declares and pays monthly, and the Global Infrastructure Fund and Realty Income & Growth Fund, which declare and pay quarterly. The Funds will also declare and pay distributions at least annually from net realized gains on investment transactions and net realized foreign exchange gains, if any. Dividends and distributions to shareholders are recorded on the ex-dividend date. The Funds will also declare and pay distributions at least annually from net realized gains on investment transactions and net realized foreign exchange gains, if any. Dividends and distributions to shareholders are determined in accordance with federal income tax regulations, which may differ from GAAP. These differences are primarily due to differing treatment for foreign currencies and loss deferrals. |
| h. | Federal Income Taxes: |
| Each Fund intends to continue to qualify as a “regulated investment company” by complying with the provisions available to certain investment companies, as defined in Subchapter M of the Internal Revenue Code of 1986, as amended (the"Code"), and to make distributions of net investment income and net realized capital gains sufficient to relieve the Funds from all federal income taxes. Therefore, no federal income tax provision is required. Management of the Funds has concluded that there are no significant uncertain tax positions that would require recognition in the financial statements. Since tax authorities can examine previously filed tax returns, the Funds' U.S. federal and state tax returns for each of the most recent four fiscal years up to the most recent fiscal year ended October 31, 2022 are subject to such review. |
| i. | Foreign Withholding Tax: |
| Dividend and interest income from non-U.S. sources received by the Fund are generally subject to non-U.S. withholding taxes and are recorded on the Statement of Operations. The Funds file for tax reclaims for the refund of such withholdings taxes according to tax treaties. Tax reclaims that are deemed collectible are booked as tax reclaim receivable on the Statement of Assets and Liabilities. Foreign tax authorities can examine previously filed withholding tax reclaims for various periods of time, depending on the statute of limitations in each foreign jurisdiction. In some cases, amounts that have been refunded by foreign tax authorities and received by the Funds are still subject to such review. | |
| In addition, the Funds may be subject to capital gains tax in certain countries in which they invest. The above taxes may be reduced or eliminated under the terms of applicable U.S. income tax treaties with some of these countries. The Funds accrue such taxes when the related income is earned. | |
| In addition, when the Funds sell securities within certain countries in which they invest, the capital gains realized may be subject to tax. Based on these market requirements and as required under GAAP, the Funds accrue deferred capital gains tax on securities currently held that have unrealized appreciation within these countries. The amount of deferred capital gains tax accrued is reported on the Statement of Operations as part of the Net Change in Unrealized Appreciation/Depreciation on Investments. | |
| The Dynamic Dividend Fund has received requests from the German Federal Tax Office ("GTO") for additional documents and information relating to withholding tax refunds from 2009-2011 that the Fund has previously received and recorded. The tax refunds previously received amount to approximately 1.26% of the Dynamic Dividend Fund's net assets as of October 31, 2022. Of the 1.26%, 0.87% are contested by the GTO. During the period ended April 30, 2023, the Fund reached an agreement with the GTO to repay the contested amount, and repaid EUR 881,176, which was reflected on the October 31, 2022 Statement of Assets and Liabilities as payable for foreign withholding. As of the date of this report, the Fund awaits confirmation from the GTO that the matter is closed. | |
| abrdn Global Equity Impact Fund (“GEI”) and abrdn International Sustainable Leaders Fund (“ISL”). The total return in the financial highlights reflects the receipt of the payment of Article 63 EU Tax Reclaims net of estimated taxes payable to the IRS on behalf of shareholders to the IRS. At the time of receipt, those payments, net of applicable tax, resulted in an increase in net assets approximately 3.1%, 0.3%, 0.9%, 2.1%, and 2.0% in 2017, 2018, 2019, 2022 and 2023, respectively for GEI and an increase in net assets of approximately 5.4%, 2.1%, 1.4% and 1.9% in 2017, 2019, 2022 and 2023, respectively for ISL, based upon the net asset value as of the date of receipt. Without these payments, GEI’s and ISL’s performance would have been lower during each respective period in which the refunds and/or interest was received or recognized under U.S. GAAP. Additionally, past returns would have been higher had each of GEI and ISL's respective Predecessor Fund not originally paid |
| 112 | 2023 Semi-Annual Report |
April 30, 2023
| the withholding taxes that relate to the Article 63 EU reclaims that have been returned. There can be no assurance that either GEI or ISL will receive additional Article 63 EU Tax Reclaim payments or maintain this level of performance in the future. | |
| Consistent with U.S. GAAP accrual requirements, for uncertain tax positions, each fund recognizes Article 63 EU Tax Reclaims when uncertainty relating to these claims, including but not limited to resolution of administrative and judicial proceedings and likelihood of receipt, have been resolved. | |
| In 2023, Article 63 EU Tax reclaims and interest, as applicable, were paid to each of GEI and ISL related to Spanish dividend withholding tax. The net assets of GEI and ISL increased by 2.0% and 1.9%, respectively, based upon the net asset value as of the date of receipt. As of April 30, 2023, GEI and ISL have remaining Article 63 EU Tax Reclaims, primarily related to France and Germany. During the period ended April 30, 2023, based upon evaluation of facts and circumstances related to the outstanding claims, the outstanding reclaims related to France are accrued as a receivable, and are reflected as Article 63 EU Tax Reclaims Receivable on the accompanying Statement of Assets and Liabilities. Additionally, a payable to the IRS on behalf of shareholders related to Article 63 tax reclaims was accrued and is reflected on the accompanying Statement of Assets and Liabilities | |
| Certain of the outstanding Article 63 EU Tax Reclaims related to Germany, Spain and Poland are not deemed to meet the recognition criteria under U.S. GAAP as of April 30,2023, and have not been recorded in each fund’s respective net asset value. As of April 30, 2023, the total amount of outstanding reclaims (before the impact of interest or any tax or additional costs incurred in the pursuit of such reclaims) filed with Germany, Spain and Poland represents 3.2% and 3.2%, respectively, of net assets of GEI or ISL. These amounts net of estimated taxes represent 1.8% and 1.8%, respectively, of net assets of GEI and ISL. Recognition by GEI or ISL of these amounts would have a positive impact on either fund's performance. | |
| The payments received on tax reclaims (including interest payments) within the six-month period ended April 30, 2023 and from prior periods were as follows: | |
| Amount | Percent of Total Net Assets | Received Date Range | |
| Global Equity Impact Fund | |||
| Withholding Tax Refunds Received from Country: | |||
Finland | $500,000 | 0.25%* | 5/21/2015 |
Poland | 4,400,193 | 4.68%** | 2/1/2017-2/24/2017 |
Poland | 380,000 | 0.59%*** | 8/22/2018 |
Poland | 1,011,000 | 1.62%**** | 2/12/2019-9/4/2019 |
Sweden | 150,447 | 0.32%***** | 6/1/2022 |
France | 1,920,555 | 4.14%***** | 6/15/2022 |
Spain | 1,998,256 | 3.95%****** | 1/20/2023 |
| International Sustainable Leaders Fund | |||
Withholding Tax Refunds Received from Country: | |||
Finland | $1,355,000 | 0.35%* | 5/21/2015 |
Poland | 16,452,314 | 7.74%** | 12/26/2016-2/24/2017 |
Poland | 5,504,000 | 3.68%**** | 12/12/2018-9/4/2019 |
Sweden | 210,317 | 0.26%***** | 6/1/2022 |
France | 2,115,068 | 2.58%***** | 6/15/2022 |
Spain | 3,306,910 | 3.79%****** | 1/20/2023 |
| * | As of October 31, 2015 |
| ** | As of October 31, 2017 |
| *** | As of October 31, 2018 |
| **** | As of October 31, 2019 |
| ***** | As of October 31, 2022 |
| ****** | As of April 30, 2023 |
| 2023 Semi-Annual Report | 113 |
April 30, 2023
| j. | Securities Lending: |
| Through an agreement with Securities Finance Trust Company as the Lending Agent and State Street Bank and Trust Company (the Funds’ custodian), the Funds may lend their portfolio securities to brokers, dealers and other financial institutions that pay a negotiated fee in order to generate additional income. The Funds receive non-cash collateral in the form of U.S. Government Securities, with respect to each loan of U.S. securities, typically equal to at least 102% of the value of the portfolio securities loaned, and, with respect to each loan of non-U.S. securities, typically equal to at least 105% of the value of the portfolio securities loaned, and at all times thereafter require the borrower to mark to market such collateral on a daily basis so that the market value of such collateral does not fall below 100% of the market value of the portfolio securities so loaned. | |
| Income generated from securities lending includes the difference between (i) the sum of income received from the investment of collateral received from the borrowers that are counterparties to loans, loan fees received from loans, and fees paid by borrower on loans collateralized with collateral other than cash collateral; and ii) any rebate paid to a borrower, and any other allocable fees and expenses in connection with loans of securities. All income is accrued daily and is apportioned 90% to the Funds and 10% to the Lending Agent. | |
| The Funds continue to own the loaned securities and continue to recognize unrealized gains and losses on the securities on loan. However, securities lending involves certain risks including the event of default or insolvency of the borrower and possible delays or restrictions upon a Fund’s ability to recover the loaned securities or dispose of the collateral for the loan. Securities on loan are noted within the Statement of Investments. Non-cash securities lending collateral held by the Lending Agent on behalf of the Funds cannot be sold or repledged by the Funds and, therefore, this amount is not presented on the Funds’ Statements of Investments. | |
| At April 30, 2023 the Funds did not have any securities on loan. |
| a. | Investment Adviser: |
| Under the Investment Advisory Agreement with the Trust, abrdn manages the Funds in accordance with the policies and procedures established by the Board. |
| 114 | 2023 Semi-Annual Report |
April 30, 2023
| For services provided under the terms of the current Investment Advisory Agreement, each Fund pays the Adviser an annual management fee (as a percentage of its average daily net assets) paid monthly according to the following schedule: | |
| Fund | Fee Schedule | |
China A Share Equity Fund | Up to $500 million | 0.850% |
| $500 million up to $2 billion | 0.800% | |
| On $2 billion and more | 0.750% | |
Dynamic Dividend Fund | Up to $250 million | 1.000% |
| On $250 million and more | 0.950% | |
EM SMA Completion Fund | On all assets | -1 |
Emerging Markets ex-China Fund | Up to $500 million | 0.900% |
| $500 million up to $2 billion | 0.850% | |
| On $2 billion and more | 0.800% | |
Emerging Markets Fund | On all assets | 0.900% |
Emerging Markets Sustainable Leaders Fund | On all assets | 0.800% |
Global Equity Impact Fund | $0 up to $500 million | 0.750% |
| $500 million up to $2 billion | 0.730% | |
| $2 billion and more | 0.700% | |
Global Infrastructure Fund | Up to $250 million | 0.850% |
| $250 million up to $750 million | 0.800% | |
| $750 million to $1 billion | 0.750% | |
| On $1 billion and more | 0.650% | |
International Small Cap Fund | Up to $100 million | 0.850% |
| On $100 million and more | 0.750% | |
International Sustainable Leaders Fund | $0 up to $500 million | 0.750% |
| $500 million up to $2 billion | 0.730% | |
| $2 billion and more | 0.700% | |
Realty Income & Growth Fund | Up to $250 million | 1.000% |
| $250 million up to $750 million | 0.950% | |
| $750 million up to $1 billion | 0.900% | |
| On $1 billion and more | 0.800% | |
U.S. Small Cap Equity Fund | Up to $100 million | 0.950% |
| On $100 million and more | 0.800% | |
U.S. Sustainable Leaders Fund | Up to $500 million | 0.750% |
| $500 million up to $2 billion | 0.700% | |
| On $2 billion and more | 0.650% | |
U.S. Sustainable Leaders Smaller Companies Fund | Up to $500 million | 0.750% |
| $500 million up to $2 billion | 0.700% | |
| On $2 billion and more | 0.650% |
| 1 | None of abrdn Inc. (the “Adviser”), abrdn Asia Limited (“AAL”) or abrdn Investments Limited (formerly known as Aberdeen Asset Managers Limited) (“AIL” and collectively with AAL, the “Sub-advisers”) charges a management fee or sub-advisory fee to the Fund. |
| 2023 Semi-Annual Report | 115 |
April 30, 2023
| Fund | Limit |
China A Share Equity Fund | 0.99% |
Emerging Markets ex-China Fund | 1.10% |
Emerging Markets Fund | 1.10% |
Emerging Markets Sustainable Leaders Fund | 1.10% |
Global Equity Impact Fund | 0.90% |
International Small Cap Fund | 0.99% |
International Sustainable Leaders Fund | 0.90% |
U.S. Small Cap Equity Fund | 0.99% |
U.S. Sustainable Leaders Fund | 0.90% |
U.S. Sustainable Leaders Smaller Companies Fund | 0.90% |
| Fund | Class A Limit | Institutional Class Limit |
Dynamic Dividend Fund | 1.50% | 1.25% |
Global Infrastructure Fund | 1.24% | 0.99% |
Realty Income & Growth Fund | 1.25% | 1.00% |
| Fund | Amount Fiscal Year 2020 (Expires 10/31/23) | Amount Fiscal Year 2021 (Expires 10/31/24) | Amount Fiscal Year 2022 (Expires 10/31/25) | Amount Six Months Ended April 30, 2023 (Expires 4/30/26) | Total* |
China A Share Equity Fund | $194,764 | $244,894 | $299,918 | $112,204 | $851,780 |
Dynamic Dividend Fund | 114,147 | 180,278 | 104,327 | 41,595 | 440,347 |
EM SMA Completion Fund | – | – | – | 22,864 | 22,864 |
Emerging Markets ex-China Fund | 173,186 | 191,740 | 183,875 | 113,751 | 662,552 |
Emerging Markets Fund | 2,887,668 | 1,800,053 | 3,610,371 | 1,426,206 | 9,724,298 |
Emerging Markets Sustainable Leaders Fund | 32,170 | 38,869 | 262,777 | 117,551 | 451,367 |
Global Equity Impact Fund | 288,816 | 240,122 | 300,400 | 110,997 | 940,335 |
Global Infrastructure Fund | 162,223 | 207,420 | 181,503 | 74,340 | 625,486 |
International Small Cap Fund | 291,518 | 261,986 | 386,527 | 204,215 | 1,144,246 |
| 116 | 2023 Semi-Annual Report |
April 30, 2023
| Fund | Amount Fiscal Year 2020 (Expires 10/31/23) | Amount Fiscal Year 2021 (Expires 10/31/24) | Amount Fiscal Year 2022 (Expires 10/31/25) | Amount Six Months Ended April 30, 2023 (Expires 4/30/26) | Total* |
International Sustainable Leaders Fund | $391,729 | $324,735 | $427,265 | $145,663 | $1,289,392 |
Realty Income & Growth Fund | 254,885 | 245,459 | 214,703 | 84,193 | 799,240 |
U.S. Small Cap Equity Fund | 327,286 | 604,829 | 573,835 | 387,074 | 1,893,024 |
U.S. Sustainable Leaders Fund | 257,392 | 216,967 | 209,581 | 148,013 | 831,953 |
U.S. Sustainable Leaders Smaller Companies Fund | 164,571 | 202,597 | 213,043 | 80,350 | 660,561 |
| * | Amounts reported are due to expire throughout the respective 3-year expiration period presented above. |
| b. | Fund Administration: |
| Under the terms of the Fund Administration Agreement, abrdn provides various administrative and accounting services, including daily valuation of the Funds' shares, preparation of financial statements, tax returns, regulatory reports, and presentation of quarterly reports to the Board. For services provided pursuant to the Fund Administration Agreement, the Trust pays abrdn an annual fee of 0.08% based on the Trust’s average daily net assets. The fee is then allocated proportionately among all funds within the Trust (including the Funds) in relation to the average daily net assets of each fund. This asset-based fee is subject to an annual minimum fee based on the number of funds served. Pursuant to a sub-administration agreement with abrdn, State Street Bank and Trust Company ("State Street") provides sub-administration services with respect to the Funds. abrdn pays State Street for providing such services. |
| c. | Distributor and Shareholder Servicing: |
| The Trust and Aberdeen Fund Distributors, LLC (the “Distributor”) are parties to the current Underwriting Agreement (the “Underwriting Agreement”) whereby the Distributor acts as principal underwriter for the Trust’s shares. | |
| The Trust has adopted a Distribution Plan (the “Plan”) pursuant to Rule 12b-1 under the 1940 Act with respect to certain classes of shares. The Plan permits the Funds to compensate the Distributor, for expenses associated with the distribution-related and/or shareholder services provided by such entities. These fees are paid to the Distributor and are either kept or paid to shareholders’ financial advisors or other intermediaries for distribution and shareholder services. Although actual distribution expenses may be more or less, under the Plan, the Funds pay the Distributor an annual fee of the following amounts, based on the total net assets of each, respective class: | |
| Fund | Class A Shares | Class C Shares(a) | Class R Shares(a) |
China A Share Equity Fund | 0.25% | 1.00% | 0.50% |
Dynamic Dividend Fund | 0.25% | – | – |
EM SMA Completion Fund | – | – | – |
Emerging Markets ex-China Fund | 0.25% | 1.00% | 0.50% |
Emerging Markets Fund | 0.25% | 1.00% | 0.50% |
Emerging Markets Sustainable Leaders Fund | 0.25% | 1.00% | 0.50% |
Global Equity Impact Fund | 0.25% | – | – |
Global Infrastructure Fund | 0.25% | – | – |
International Small Cap Fund | 0.25% | 1.00% | 0.50% |
International Sustainable Leaders Fund | 0.25% | – | – |
Realty Income & Growth Fund | 0.25% | – | – |
U.S. Small Cap Equity Fund | 0.25% | 1.00% | 0.50% |
U.S. Sustainable Leaders Fund | 0.25% | 1.00% | – |
| 2023 Semi-Annual Report | 117 |
April 30, 2023
| Fund | Class A Shares | Class C Shares(a) | Class R Shares(a) |
U.S. Sustainable Leaders Smaller Companies Fund | 0.25% | – | 0.50% |
| (a) | 0.25% of which is service fees. |
| Fund | Commissions Retained from Front-End Sales Charges of Class A Shares | Commissions Retained from CDSC Fees of Class C (Certain Class A) Shares |
China A Share Equity Fund | $2,250 | $302 |
Dynamic Dividend Fund | 6,530 | – |
EM SMA Completion Fund | – | – |
Emerging Markets ex-China Fund | 1,878 | – |
Emerging Markets Fund | 2,370 | 585 |
Emerging Markets Sustainable Leaders Fund | 102 | – |
Global Equity Impact Fund | – | – |
Global Infrastructure Fund | 6,900 | – |
International Small Cap Fund | 93 | – |
International Sustainable Leaders Fund | 125 | – |
Realty Income & Growth Fund | – | – |
U.S. Small Cap Equity Fund | 17,863 | 4,332 |
U.S. Sustainable Leaders Fund | 1,590 | – |
U.S. Sustainable Leaders Smaller Companies Fund | 41 | – |
| Total Retained | $39,742 | $ 5,219 |
| d. | Administrative Services Fees/Transfer Agent Out-of-Pocket Expenses: |
| The Funds may pay and/or reimburse administrative services fees/sub-transfer agent expenses to certain broker-dealers and financial intermediaries who provide administrative support services to beneficial shareholders on behalf of the Funds (sometimes referred to as “sub-transfer agency fees”), subject to certain limitations approved by the Board. These fees may be in addition to Rule 12b-1 fees. Sub-transfer agency fees generally include, but are not limited to, costs associated with recordkeeping, networking, sub-transfer agency or other administrative or shareholder services. | |
| Class A, Class R and Institutional Service Class shares of the Funds pay for such services pursuant to an Administrative Services Plan adopted by the Board. Under the Administrative Services Plan, a Fund may pay a broker-dealer or other intermediary a maximum annual administrative services fee of 0.25% for Class A, Class R and Institutional Service Class shares. Under an amendment to the Administrative Services Plan that is in effect until at least February 29, 2024, the administrative service fee for a Fund is limited to a maximum of 0.15% for contracts with fees that are calculated as a percentage of Fund assets and a maximum of $16 per account for contracts with fees that are |
| 118 | 2023 Semi-Annual Report |
April 30, 2023
| calculated on a dollar per account basis; however, many intermediaries do not charge the maximum permitted fee or even a portion thereof. Class C and Institutional Class shares may also pay for the services described above directly, as these classes are not subject to an Administrative Services Plan. | |
| The aggregate amount of sub-transfer agent and administrative service fees paid during the six-month period ended April 30, 2023 was as follows: | |
| Fund | Class A | Class C | Class R | Institutional Service | Institutional |
China A Share Equity Fund | $6,030 | $639 | $2,302 | $246 | $7,074 |
Dynamic Dividend Fund | 1,861 | – | – | – | 34,118 |
EM SMA Completion Fund | – | – | – | – | – |
Emerging Markets ex-China Fund | 10,583 | 122 | 594 | 46 | 3,229 |
Emerging Markets Fund | 81,950 | 2,030 | 78,025 | 398,283 | 736,307 |
Emerging Markets Sustainable Leaders Fund | 9,210 | 117 | 1,410 | 18,794 | 4,194 |
Global Equity Impact Fund | 15,040 | – | – | – | 11,323 |
Global Infrastructure Fund | 4,406 | – | – | – | 14,851 |
International Small Cap Fund | 30,885 | 349 | 1,093 | – | 61,539 |
International Sustainable Leaders Fund | 42,201 | – | – | – | 4,425 |
Realty Income & Growth Fund | 202 | – | – | – | 14,643 |
U.S. Small Cap Equity Fund | 76,371 | 12,885 | 2,611 | 15,042 | 264,484 |
U.S. Sustainable Leaders Fund | 45,966 | 165 | – | 32,899 | 2,563 |
U.S. Sustainable Leaders Smaller Companies Fund | 3,531 | – | 1,623 | 194 | 3,263 |
| e. | Purchase/Sale Transactions Between Affiliates: |
| The Funds are permitted to buy or sell securities with funds that have a common investment adviser (or investment advisers which are affiliates) under specific procedures which have been approved by the Board. The procedures are designed to satisfy the requirements of Rule 17a-7 of the Investment Company Act of 1940 (“Rule 17a-7”). During the six-month period ended April 30, 2023, the Funds did not engage in any of these trades. |
| Fund | Purchase | Sales |
China A Share Equity Fund | $8,700,393 | $5,963,888 |
Dynamic Dividend Fund | 34,773,419 | 35,350,328 |
EM SMA Completion Fund | 99,223 | 16,091 |
Emerging Markets ex-China Fund | 7,879,377 | 5,016,192 |
Emerging Markets Fund | 388,740,110 | 783,544,663 |
Emerging Markets Sustainable Leaders Fund | 13,168,478 | 58,199,632 |
Global Equity Impact Fund | 8,454,138 | 9,010,367 |
Global Infrastructure Fund | 3,957,417 | 6,225,701 |
International Small Cap Fund | 23,006,197 | 55,172,661 |
International Sustainable Leaders Fund | 11,503,867 | 20,964,803 |
Realty Income & Growth Fund | 4,277,455 | 5,422,721 |
U.S. Small Cap Equity Fund | 71,431,005 | 243,355,848 |
U.S. Sustainable Leaders Fund | 8,127,651 | 22,163,104 |
U.S. Sustainable Leaders Smaller Companies Fund | 286,040 | 2,249,603 |
| 2023 Semi-Annual Report | 119 |
April 30, 2023
| a. | Concentration Risk |
| The Global Infrastructure Fund and Realty Income & Growth Fund are subject to concentration risk. Each Fund's strategy of concentrating in companies in a specific industry means that its performance will be closely tied to the performance of a particular market segment. Each Fund’s concentration in these companies may present more risks than if it were broadly diversified over numerous industries and sectors of the economy. A downturn in these companies would have a larger impact on each Fund than on a mutual fund that does not concentrate in such companies. At times, the performance of these companies will lag the performance of other industries or the broader market as a whole. |
| b. | Cybersecurity Risk |
| Cybersecurity incidents may allow an unauthorized party to gain access to Fund assets, customer data (including private shareholder information), or proprietary information, or cause each Fund, the Adviser and/or their service providers (including, but not limited to, Fund accountants, custodians, sub-custodians, transfer agents and financial intermediaries) to suffer data breaches, data corruption or lose operational functionality. |
| c. | Dividend Strategy Risk |
| The Dynamic Dividend Fund and Realty Income & Growth Fund are subject to dividend strategy risk. There is no guarantee that the issuers of the stocks held by the Fund will declare dividends in the future or that, if dividends are declared, they will remain at their current levels or increase over time. The Fund’s emphasis on dividend paying stocks could cause the Fund to underperform similar funds that invest without consideration of a company’s track record of paying dividends or ability to pay dividends in the future. Dividend-paying stocks may not participate in a broad market advance to the same degree as other stocks, and a sharp rise in interest rates or economic downturn could cause a company to unexpectedly reduce or eliminate its dividend. The Fund may hold securities for short periods of time related to the dividend payment periods and may experience loss during these periods. |
| d. | Emerging Markets Risk |
| The risks of investing in emerging markets countries are a magnification of the risks that apply to foreign investments. These risks are greater for securities of companies in emerging markets countries because the countries may have less stable governments, more volatile currencies and less established markets (see “Foreign Securities Risk” below). | |
| Asian Risk. Parts of the Asian region may be subject to a greater degree of economic, political and social instability than is the case in the United States and Europe. Some Asian countries can be characterized as emerging markets or newly industrialized and may experience more volatile economic cycles than developed countries. The developing nature of securities markets in many countries in the Asian region may lead to a lack of liquidity while some countries have restricted the flow of money in and out of the country. Some countries in Asia have historically experienced political uncertainty, corruption, military intervention and social unrest. To the extent a Fund invests heavily in Asian issuers, the Fund may be more volatile than a fund which is broadly diversified geographically. | |
| China Risk. Exposure to China and Hong Kong securities subjects the China A Shares Equity Fund to additional risks, and may make it significantly more volatile than more geographically diverse mutual funds. Additional risks associated with investments in China and Hong Kong include exposure to currency fluctuations, less liquidity, expropriation, confiscatory taxation, nationalization, exchange control regulations (including currency blockage), trading halts, imposition of tariffs, limitations on repatriation and differing legal standards. Any spread of an infectious illness, public health threat or similar issue could reduce consumer demand or economic output, result in market closures, travel restrictions or quarantines, and generally have a significant impact on the Chinese economy, which in turn could adversely affect the Fund’s investments. | |
| China A Shares Risk. Trading in China A Shares through Stock Connect and the QFII Programs involves additional risks. Stock Connect is subject to a daily quota (the “Daily Quota”), which limits the maximum net purchases under Stock Connect each day and, as such, buy orders for China A Shares would be rejected once the Daily Quota is exceeded (although the Fund will be permitted to sell China A Shares regardless of the Daily Quota balance). Further, Stock Connect, which relies on the connectivity of the Shanghai or Shenzhen markets with Hong Kong, is subject to operational risk, regulations that are relatively untested and are subject to change, and extended market closures for holidays or otherwise. During an extended market closure, the Fund’s ability to trade in China A Shares will be impacted which may affect the Fund’s performance. The QFII Programs are subject to the risk that the Adviser may have its QFII Programs license revoked or restricted with respect to the Fund or the Fund may be impacted by the rules, restrictions and quota limitations connected to reliance on a QFII Programs license. |
| 120 | 2023 Semi-Annual Report |
April 30, 2023
| India Risk. The value of a Fund’s assets may be adversely affected by political, economic, social and religious factors, changes in Indian law or regulations and the status of India’s relations with other countries. In addition, the economy of India may differ favorably or unfavorably from the U.S. economy in such respects as the rate of growth of gross domestic product, the rate of inflation, capital reinvestment, resource self-sufficiency and balance of payments position. The Indian government has exercised and continues to exercise significant influence over many aspects of the economy, and the number of public sector enterprises in India is substantial. Accordingly, Indian government actions in the future could have a significant effect on the Indian economy, which could affect private sector companies and a Fund, market conditions, and prices and yields of securities in a Fund’s portfolio. Economic growth in India is constrained by inadequate infrastructure, a cumbersome bureaucracy, corruption, labor market rigidities, regulatory and foreign investment controls, the “reservation” of key products for small-scale industries and high fiscal deficits. Changes in economic policies, or lack of movement toward economic liberalization, could negatively affect the general business and economic conditions in India, which could in turn affect a Fund’s investments. The securities market in India is substantially smaller, less liquid and significantly more volatile than the securities market in the United States. The relatively small market capitalizations of, and trading values on, Indian stock exchanges may cause a Fund’s investments in securities listed on these exchanges to be comparatively less liquid and subject to greater price volatility than comparable U.S. investments. | |
| Russia/Ukraine Risk. In February 2022, Russia commenced a military attack on Ukraine. The outbreak of hostilities between the two countries and the threat of wider spread hostilities could have a severe adverse effect on the region and global economies, including significant negative impacts on the markets for certain securities and commodities, such as oil and natural gas. In addition, sanctions imposed on Russia by the United States and other countries, and any sanctions imposed in the future, could have a significant adverse impact on the Russian economy and related markets. The price and liquidity of investments may fluctuate widely as a result of the conflict and related events. How long the armed conflict and related events will last cannot be predicted. These tensions and any related events could have a significant impact on Fund performance and the value of the Funds’ investments. | |
| The Republic of Korea (South Korea) Risk. Concentrating investments in South Korea subjects the Fund to additional risks, and may make it significantly more volatile than geographically diverse mutual funds. Additional risks associated with investments in South Korea include political, economic and social instability, and the potential for increasing militarization in North Korea. The financial sector in South Korea has been subject to systemic weaknesses and illiquidity, which could be a material risk for any investments in South Korea if exacerbated. South Korea is dependent on. A significant increase in energy prices could have an adverse impact on South Korea’s economy as South Korea is dependent on foreign sources for much of its energy needs. The South Korean government has exercised and continues to exercise significant influence over many aspects of the economy. Accordingly, South Korean government actions in the future could have a significant effect on the South Korean economy, which could affect private sector companies and the Fund, market conditions, and prices and yields of securities in the Fund’s portfolio. |
| e. | Equity Linked Notes |
| The China A Share Equity Fund may invest in equity-linked notes, which are generally subject to the same risks as the foreign equity securities or the basket of foreign securities they are linked to. If the linked security(ies) declines in value, the note may return a lower amount at maturity. The trading price of an equity-linked note also depends on the value of the linked security(ies). |
| f. | Equity Securities Risk |
| The stock or other security of a company may not perform as well as expected, and may decrease in value, because of factors related to the company (such as poorer than expected earnings or certain management decisions), to the industry in which the company is engaged (such as a reduction in the demand for products or services in a particular industry), or to the market as a whole (such as periods of market volatility or instability, or general and prolonged periods of economic decline). |
| g. | Exchange-Traded Fund Risk |
| To the extent that the China A Share Equity Fund invests in ETFs, the Fund may be subject to, among other risks, tracking error risk and passive and, in some cases, active management investment risk. An active secondary market in ETF shares may not develop or be maintained and may be halted or interrupted due to actions by its listing exchange, unusual market conditions or other reasons. There can be no assurance that an ETF’s shares will continue to be listed on an active exchange. In addition, Fund shareholders bear both their proportionate share of the Fund’s expenses and similar expenses incurred through the Fund’s ownership of the ETF. |
| h. | Foreign Currency Exposure Risk |
| The value of foreign currencies relative to the U.S. Dollar fluctuates in response to market, economic, political, regulatory, geopolitical or other conditions. A decline in the value of a foreign currency versus the U.S. Dollar reduces the value in U.S. Dollars of investments |
| 2023 Semi-Annual Report | 121 |
April 30, 2023
| denominated in that foreign currency. This risk may impact a Fund more greatly to the extent the Fund does not hedge its currency risk, or hedging techniques used by the Adviser are unsuccessful. |
| i. | Foreign Securities Risk |
| Foreign countries in which a Fund may invest may have markets that are less liquid, less regulated and more volatile than U.S. markets. The value of a Fund’s investments may decline because of factors such as unfavorable or unsuccessful government actions, reduction of government or central bank support and political or financial instability. To the extent the Fund focuses its investments in a single country or only a few countries in a particular geographic region, economic, political, regulatory or other conditions affecting such country or region may have a greater impact on Fund performance relative to a more geographically diversified fund. | |
| Japan Risk. The Japanese economy is heavily dependent upon international trade and may be subject to considerable degrees of economic, political and social instability, which could negatively affect the Fund. The Japanese yen has fluctuated widely during recent periods and may be affected by currency volatility elsewhere in Asia, especially Southeast Asia. In addition, the yen has had a history of unpredictable and volatile movements against the U.S. dollar. The performance of the global economy could have a major impact upon equity returns in Japan. Since the mid-2000s, Japan's economic growth has remained relatively low. A recent economic recession was likely compounded by an unstable financial sector, low domestic consumption, and certain corporate structural weaknesses, which remain some of the major issues facing the Japanese economy. Japan has also experienced natural disasters, such as earthquakes and tidal waves, of varying degrees of severity, which could negatively affect the Fund. |
| j. | Illiquid Securities Risk |
| Illiquid securities are assets that a Fund reasonably expects cannot be sold or disposed of in current market conditions in seven calendar days or less without the sale or disposition significantly changing the market value of the asset. An inability to sell a portfolio position can adversely affect a Fund’s value or prevent the Fund from being able to take advantage of other investment opportunities. Illiquid securities and relatively less liquid securities may also be difficult to value. | |
| The Adviser employs procedures and tests using third-party and internal data inputs that seek to assess and manage the liquidity of a Fund’s portfolio holdings. These procedures and tests take into account a Fund’s investment strategy and liquidity of portfolio investments during both normal and foreseeable stressed conditions, cash-flow projections during both normal and reasonably foreseeable stressed conditions, relevant market, trading and other factors, and monitor whether liquidity should be adjusted based on changed market conditions. These procedures and tests are designed to assist a Fund in determining its ability to meet redemption requests in various market conditions. In light of the dynamic nature of markets, there can be no assurance that these procedures and tests will enable a Fund to ensure that it has sufficient liquidity to meet redemption requests. |
| k. | Impact of Large Redemptions and Purchases of Fund Shares |
| Occasionally, shareholders may make large redemptions or purchases of Fund shares, which may cause a Fund to have to sell securities or invest additional cash. These transactions may adversely affect the Fund’s performance and increase transaction costs. In addition, large redemption requests may exceed the cash balance of a Fund and result in credit line borrowing fees and/or overdraft charges to a Fund until the sales of portfolio securities necessary to cover the redemption request settle. |
| l. | Impact Investing Risk |
| In implementing the Global Equity Impact Fund’s ESG (Environmental, Social and Governance) investment strategy, the Adviser may select or exclude securities of issuers in certain industries, sectors, regions or countries for reasons other than the issuer’s investment performance. For this reason, the Fund’s ESG strategy could cause it to perform differently compared to funds that do not have such strategy. ESG investing is qualitative and subjective by nature. In addition, the Fund may be required to sell a security when it might otherwise be disadvantageous for it to do so. In evaluating an issuer, the Adviser utilizes, in part, information and data obtained through voluntary or third-party reporting that may be incomplete, inaccurate or unavailable, which could cause the Adviser to incorrectly assess an issuer’s business practices with respect to the environment, social responsibility and corporate governance. Securities of companies with ESG practices may shift into and out of favor depending on market and economic conditions. The definition of “impact investing” will vary according to an investor’s beliefs and values. There is no guarantee that the Adviser’s definition of impact investing, security selection criteria or investment judgment will reflect the beliefs or values of any particular investor. |
| 122 | 2023 Semi-Annual Report |
April 30, 2023
| m. | Infrastructure-Related Investment Risk |
| Because the Global Infrastructure Fund concentrates its investments in infrastructure-related entities, the Fund has greater exposure to the potential adverse economic, regulatory, political and other changes affecting such entities. Infrastructure related entities are subject to a variety of factors that may adversely affect their business or operations, including high interest costs in connection with capital construction programs, costs associated with environmental and other regulations, the effects of economic slowdown and surplus capacity, increased competition from other providers of services, uncertainties concerning the availability of fuel at reasonable prices, the effects of energy conservation policies and other factors. Additionally, infrastructure-related entities may be subject to regulation by various governmental authorities and may also be affected by governmental regulation of rates charged to customers, service interruption due to environmental, operational or other mishaps and the imposition of special tariffs and changes in tax laws, regulatory policies and accounting standards. |
| n. | Issuer Risk |
| The value of a security may decline for reasons directly related to the issuer, such as management performance, financial leverage and reduced demand for the issuer's goods or services. |
| o. | Management Risk |
| Each Fund is subject to the risk that the Adviser or Subadviser (as applicable) may make poor security selections. The Adviser, Subadviser and their portfolio managers apply their own investment techniques and risk analyses in making investment decisions for a Fund and there can be no guarantee that these decisions will achieve the desired results for a Fund. In addition, the Adviser or Subadviser may select securities that underperform the relevant market or other funds with similar investment objectives and strategies. |
| p. | Market Risk |
| Deteriorating market conditions might cause a general weakness in the market that reduces the prices, or yield, of securities in that market. Developments in a particular class of bonds or the stock market could also adversely affect a Fund by reducing the relative attractiveness of bonds or stocks as an investment. Also, to the extent that a Fund emphasizes bonds or stocks from any given industry, it could be hurt if that industry does not do well. Additionally, a Fund could lose value if the individual stocks in which it maintains long positions and/or the overall stock markets on which the stocks trade decline in price. In addition, a Fund that engages in short sales could lose value if the individual stocks which they sell short increase in price. Stocks and stock markets may experience short-term volatility (price fluctuation) as well as extended periods of price decline or increase. Individual stocks are affected by many factors, including: |
| • | corporate earnings; |
| • | production; |
| • | management; |
| • | sales; and |
| • | market trends, including investor demand for a particular type of stock, such as growth or value stocks, small or large stocks, or stocks within a particular industry. |
| 2023 Semi-Annual Report | 123 |
April 30, 2023
| q. | Mid-Cap Securities Risk |
| Securities of medium-sized companies tend to be more volatile and less liquid than securities of larger companies. |
| r. | Non-Diversified Fund Risk |
| The EM SMA Completion Fund and the Realty Income & Growth Fund's performance may be more volatile than a diversified fund because these Funds may invest a greater percentage of their total assets in the securities of a single issuer. |
| s. | Non-U.S. Taxation Risk |
| Income, proceeds and gains received by a Fund from sources within foreign countries may be subject to withholding and other taxes imposed by such countries, which will reduce the return on those investments. Tax treaties between certain countries and the United States may reduce or eliminate such taxes. | |
| If, at the close of its taxable year, more than 50% of the value of a Fund’s total assets consists of securities of foreign corporations, including for this purpose foreign governments, the Fund will be permitted to make an election under the Code that will allow shareholders a deduction or credit for foreign taxes paid by the Fund. In such a case, shareholders will include in gross income from foreign sources their pro rata shares of such taxes. A shareholder’s ability to claim an offsetting foreign tax credit or deduction in respect of such foreign taxes is subject to certain limitations imposed by the Code, which may result in the shareholder’s not receiving a full credit or deduction (if any) for the amount of such taxes. Shareholders who do not itemize on their U.S. federal income tax returns may claim a credit (but not a deduction) for such foreign taxes. If a Fund does not qualify for or chooses not to make such an election, shareholders will not be entitled separately to claim a credit or deduction for U.S. federal income tax purposes with respect to foreign taxes paid by the Fund; in that case the foreign tax will nonetheless reduce the Fund’s taxable income. Even if a Fund elects to pass through to its shareholders foreign tax credits or deductions, tax-exempt shareholders and those who invest in the Fund through tax-advantaged accounts such as IRAs will not benefit from any such tax credit or deduction. |
| 124 | 2023 Semi-Annual Report |
April 30, 2023
| t. | Portfolio Turnover Risk |
| The Dynamic Dividend Fund may engage in active and frequent trading of portfolio securities to achieve its investment objective. High portfolio turnover may result in greater transaction costs which may reduce Fund performance. The sale of Fund portfolio securities may also result in greater realization and/or distribution to shareholders of gains or losses as compared to a Fund with less active trading, which may include short-term gains taxable at ordinary income tax rates. |
| u. | Qualified Dividend Income Tax Risk |
| With respect to the Dynamic Dividend Fund, no assurance can be given as to what percentage of the distributions paid on shares, if any, will consist of tax-advantaged qualified dividend income or long-term capital gains or what the tax rates on various types of income will be in future years. The favorable U.S. federal tax treatment may be adversely affected, changed or repealed by future changes in tax laws at any time. In addition, it may be difficult to obtain information regarding whether distributions by non-U.S. entities in which a Fund invests should be regarded as qualified dividend income. Furthermore, to receive qualified dividend income treatment, a Fund must meet holding period and other requirements with respect to the dividend paying securities in its portfolio, and the shareholder must meet holding period and other requirements with respect to the common shares of a Fund. |
| v. | REIT and Real Estate Risk |
| Investment in real estate investment trusts ("REITs") and real estate involves the risks that are associated with direct ownership of real estate and with the real estate industry in general. These risks include: declines in the value of real estate; risks related to local economic conditions, overbuilding and increased competition; increases in property taxes and operating expenses; changes in zoning laws; casualty or condemnation losses; variations in rental income, neighborhood values or the appeal of properties to tenants; changes in interest rates and changes in general economic and market conditions. REITs’ share prices may decline because of adverse developments affecting the real estate industry including changes in interest rates. The returns from REITs may trail returns from the overall market. Additionally, there is always a risk that a given REIT will fail to qualify for favorable tax treatment. REITs may be leveraged, which increases risk. Certain REITs charge management fees, which may result in layering the management fee paid by the Funds. |
| w. | Sector Risk |
| To the extent that a Fund has a significant portion of its assets invested in securities of companies conducting business in a broadly related group of industries within an economic sector, the Fund may be more vulnerable to unfavorable developments in that economic sector than funds that invest more broadly. | |
| Consumer Staples Sector Risk. Companies in the consumer staples sector may be adversely affected by changes in the global economy, consumer spending, competition, demographics and consumer preferences, and production spending. Companies in the consumer staples sector may also be affected by changes in global economic, environmental and political events, economic conditions, the depletion of resources, and government regulation. For instance, government regulations may affect the permissibility of using various food additives and production methods of companies that make food products, which could affect company profitability. In addition, tobacco companies may be adversely affected by the adoption of proposed legislation and/or by litigation. Companies in the consumer staples sector also may be subject to risks pertaining to the supply of, demand for and prices of raw materials. The prices of raw materials fluctuate in response to a number of factors, including, without limitation, changes in government agricultural support programs, exchange rates, import and export controls, changes in international agricultural and trading policies, and seasonal and weather conditions. Companies in the consumer staples sector may be subject to severe competition, which may also have an adverse impact on their profitability. | |
| Financials Sector Risk. To the extent that the financials sector represents a significant portion of the Fund, the Fund will be sensitive to changes in, and its performance may depend to a greater extent on, factors impacting this sector. Performance of companies in the financials sector may be adversely impacted by many factors, including, among others, government regulations, economic conditions, credit rating downgrades, changes in interest rates, decreased liquidity in credit markets as well as cyber-attacks. | |
| Healthcare Sector Risk. To the extent that the healthcare sector represents a significant portion of the Fund, the Fund will be sensitive to changes in, and its performance may depend to a greater extent on, factors impacting this sector. Healthcare-related companies may be smaller and less seasoned than companies in other sectors, and performance of companies in the healthcare sector may be adversely impacted by many factors, including, among others, government regulation. restrictions on government reimbursement for medical expenses, changes to the costs of medical products and services, pricing pressure, increased emphasis on outpatient services, a limited number of products, industry innovation, changes in technologies, and other market developments. Many healthcare-related companies are dependent on patent protection, and, therefore, the expiration of patents may adversely affect the profitability of healthcare-related companies. |
| 2023 Semi-Annual Report | 125 |
April 30, 2023
| Industrials Sector Risk. To the extent that the industrial sector represents a significant portion of a Fund’s holdings, the Fund will be sensitive to changes in, and its performance may be adversely impacted by issues impacting this sector. The value of securities issued by companies in the industrials sector may be adversely affected by supply and demand related to their specific products or services and industrials sector products in general. The products of manufacturing companies may face obsolescence due to rapid technological developments and frequent new product introduction. Government regulations, world events, economic conditions and exchange rates may adversely affect the performance of companies in the industrials sector. Companies in the industrials sector may be adversely affected by liability for environmental damage and product liability claims. The industrials sector may also be adversely affected by changes or trends in commodity prices, which may be influenced by unpredictable factors. Companies in the industrials sector, particularly aerospace and defense companies, may also be adversely affected by government spending policies because companies involved in this sector rely to a significant extent on government demand for their products and services. | |
| Information Technology Sector Risk. To the extent that the information technology sector represents a significant portion of a Fund, the Fund will be sensitive to changes in, and its performance may depend to a greater extent on, factors impacting this sector. Information technology companies face intense competition, both domestically and internationally, which may have an adverse effect on their profit margins. Like other technology companies, information technology companies may have limited product lines, markets, financial resources or personnel. The products of information technology companies may face obsolescence due to rapid technological developments, frequent new product introduction, unpredictable changes in growth rates and competition for the services of qualified personnel. Companies in the information technology sector are heavily dependent on patent and intellectual property rights. The loss or impairment of these rights may adversely affect the profitability of these companies. | |
| Utilities Sector Risk. To the extent that the utilities sector represents a significant portion of the Fund’s portfolio, the Fund will be sensitive to changes in, and its performance may depend to a greater extent on, factors impacting this sector. Performance of companies in the utilities sector may be adversely impacted by many factors, including, among others, general economic conditions, supply and demand, financing and operating costs, rate caps, interest rates, liabilities arising from governmental or civil actions, consumer confidence and spending, competition, resource conservation and depletion, man-made or natural disasters, geopolitical events, and environmental, and other government regulations. |
| x. | Small-Cap Securities Risk |
| Securities of smaller companies are usually less stable in price and less liquid than those of larger, more established companies. Therefore, they generally involve greater risk. |
| y. | Sustainable Investing Risk |
| A Fund’s “Sustainable Leaders” strategy could cause it to perform differently compared to funds that do not have such strategy. ESG considerations may be linked to long-term rather than short-term returns. The criteria related to a Fund’s Sustainable Leaders strategy ,including the exclusion of securities of companies that engage in certain business activities, may result in the Fund forgoing opportunities to buy certain securities when it might otherwise be advantageous to do so, or selling securities for ESG reasons when it might be otherwise disadvantageous for it to do so. In addition, there is a risk that the companies identified as sustainable leaders by the Adviser do not operate as expected when addressing ESG issues. There are significant differences in interpretations of what it means for a company to have positive ESG characteristics. While the Adviser believes its definitions are reasonable, the portfolio decisions it makes may differ with other investors’ or advisers’ views. |
| z. | Valuation Risk |
| The price that a Fund could receive upon the sale of any particular portfolio investment may differ from the Fund’s valuation of the investment, particularly for securities that trade in thin or volatile markets or that are valued using a fair valuation methodology or a price provided by an independent pricing service. As a result, the price received upon the sale of an investment may be less than the value ascribed by a Fund, and the Fund could realize a greater than expected loss or lesser than expected gain upon the sale of the investment. The ability to value a Fund's investments may also be impacted by technological issues and/or errors by pricing services or other third-party service providers. | |
| Please read the Funds' prospectuses for more detailed information regarding these and other risks. |
| 126 | 2023 Semi-Annual Report |
April 30, 2023
| Tax Cost of Securities | Unrealized Appreciation | Unrealized Depreciation | Net Unrealized Appreciation/ (Depreciation) | |
China A Share Equity Fund | $51,754,612 | $257,245 | $(12,495,536) | $(12,238,291) |
Dynamic Dividend Fund | 91,973,874 | 26,637,101 | (10,034,992) | 16,602,109 |
EM SMA Completion Fund | 296,608 | 5,434 | (27,938) | (22,504) |
Emerging Markets ex-China Fund | 30,065,570 | 2,445,839 | (2,299,210) | 146,629 |
Emerging Markets Fund | 2,248,809,489 | 270,730,529 | (364,011,886) | (93,281,357) |
Emerging Markets Sustainable Leaders Fund | 96,292,265 | 3,508,685 | (20,040,969) | (16,532,284) |
Global Equity Impact Fund | 47,447,612 | 9,132,676 | (4,418,566) | 4,714,110 |
Global Infrastructure Fund | 41,587,877 | 11,318,423 | (2,312,418) | 9,006,005 |
International Small Cap Fund | 179,505,600 | 11,411,171 | (18,460,766) | (7,049,595) |
International Sustainable Leaders Fund | 97,984,491 | 8,095,808 | (16,962,406) | (8,866,598) |
Realty Income & Growth Fund | 34,196,397 | 8,791,663 | (2,042,394) | 6,749,269 |
U.S. Small Cap Equity Fund | 616,948,606 | 56,601,667 | (88,590,225) | (31,988,558) |
U.S. Sustainable Leaders Fund | 330,766,514 | 50,428,614 | (37,738,652) | 12,689,962 |
U.S. Sustainable Leaders Smaller Companies Fund | 15,380,067 | 787,989 | (2,620,456) | (1,832,467) |
| Distributions paid from | ||||||
| Fund | Ordinary Income | Net Long Term Capital Gains | Total Taxable Distributions | Tax Exempt Distributions | Return of Capital | Total Distributions Paid |
China A Share Equity Fund | $42,904 | $2,210,774 | $2,253,678 | $– | $– | $2,253,678 |
Dynamic Dividend Fund | 5,854,531 | 656,823 | 6,511,354 | – | 162,968 | 6,674,322 |
Emerging Markets ex-China Fund | – | 3,260,752 | 3,260,752 | – | – | 3,260,752 |
Emerging Markets Fund | 75,550,719 | 390,351,786 | 465,902,505 | – | – | 465,902,505 |
Emerging Markets Sustainable Leaders Fund | 8,918,774 | 31,005,272 | 39,924,046 | – | – | 39,924,046 |
Global Equity Impact Fund | 33,169 | – | 33,169 | – | – | 33,169 |
Global Infrastructure Fund | 1,233,841 | 1,170,468 | 2,404,309 | – | – | 2,404,309 |
International Small Cap Fund | 3,632,385 | 18,234,244 | 21,866,629 | – | – | 21,866,629 |
International Sustainable Leaders Fund | – | – | – | – | – | – |
Realty Income & Growth Fund | 1,665,695 | 6,716,910 | 8,382,605 | – | – | 8,382,605 |
U.S. Small Cap Equity Fund | 92,274,229 | 130,736,310 | 223,010,539 | – | – | 223,010,539 |
U.S. Sustainable Leaders Fund | 46,765,062 | 79,716,902 | 126,481,964 | – | – | 126,481,964 |
U.S. Sustainable Leaders Smaller Companies Fund | 2,795,644 | 2,444,562 | 5,240,206 | – | – | 5,240,206 |
| 2023 Semi-Annual Report | 127 |
April 30, 2023
| Fund | Undistributed Tax Exempt Income | Undistributed Ordinary Income | Undistributed Long-Term Capital Gains | Accumulated Earnings | Distributions Payable | Late Year Ordinary and Post-October Capital Loss Deferrals | Other Temporary Differences | Unrealized Appreciation/ (Depreciation) | Accumulated Capital and Other Losses | Total Accumulated Earnings/ (Deficit) |
China A Share Equity Fund | $– | $– | $– | $– | $– | $– | $– | $(19,578,864) | $(8,558,990) | $(28,137,854) |
Dynamic Dividend Fund | $– | $– | $– | $– | $– | $– | $– | $7,076,503 | $– | 7,076,503 |
Emerging Markets ex-China Fund | – | 145,461 | 5,716,302 | – | – | – | – | (2,885,060) | (3,750,615) | (773,912) |
Emerging Markets Fund | – | 37,064,337 | – | – | – | – | – | (425,070,895) | (33,371,243) | (421,377,801) |
Emerging Markets Sustainable Leaders Fund | – | 1,214,037 | – | – | – | – | – | (49,235,175) | (9,278,411) | (57,299,549) |
Global Equity Impact Fund | – | 2,319,140 | – | – | – | – | 501,484 | 15,103 | (13,244,102) | (10,408,375) |
Global Infrastructure Fund | – | – | 865,590 | – | – | – | – | 3,278,380 | – | 4,143,970 |
International Small Cap Fund | – | 3,165,365 | – | – | – | – | – | (44,095,948) | (24,510,835) | (65,441,418) |
International Sustainable Leaders Fund | – | 5,102,324 | – | – | – | – | 139,366 | (26,237,572) | (401,754,636) | (422,750,518) |
Realty Income & Growth Fund | – | 68,156 | 2,476,600 | – | – | – | – | 6,290,074 | – | 8,834,830 |
U.S. Small Cap Equity Fund | – | – | 34,980,497 | – | – | (2,905,843) | – | (82,819,641) | – | (50,744,987) |
U.S. Sustainable Leaders Fund | – | 1,407,046 | – | – | – | – | – | (18,513,895) | – | (17,106,849) |
U.S. Sustainable Leaders Smaller Companies Fund | – | – | – | – | – | (72,917) | – | (2,156,104) | (309,339) | (2,538,360) |
| Fund | Amounts | Expires |
China A Share Equity Fund | $1,712,837 | Unlimited (Short—Term) |
China A Share Equity Fund | 6,846,153 | Unlimited (Long—Term) |
Emerging Markets ex-China Fund | 3,750,615 | Unlimited (Long—Term) |
Emerging Markets Fund | 33,371,243 | Unlimited (Short—Term) |
Emerging Markets Sustainable Leaders Fund | 5,587,778 | Unlimited (Short—Term) |
Emerging Markets Sustainable Leaders Fund | 3,690,633 | Unlimited (Long—Term) |
Global Equity Impact Fund | 834,340 | Unlimited (Short—Term) |
Global Equity Impact Fund | 12,409,762 | Unlimited (Long—Term) |
International Small Cap Fund | 24,510,835 | Unlimited (Short—Term) |
International Sustainable Leaders Fund | 8,796,709 | Unlimited (Short—Term) |
International Sustainable Leaders Fund | 392,957,927 | Unlimited (Long—Term) |
U.S. Sustainable Leaders Smaller Companies Fund | 132,648 | Unlimited (Short—Term) |
U.S. Sustainable Leaders Smaller Companies Fund | 176,691 | Unlimited (Long—Term) |
| 128 | 2023 Semi-Annual Report |
April 30, 2023
| Fund | Record Ownership % | Number of Account Owners |
China A Share Equity Fund | 48.9% | 3 |
Dynamic Dividend Fund | 50.3 | 5 |
EM SMA Completion Fund | – | – |
Emerging Markets ex-China Fund | 38.5 | 4 |
Emerging Markets Fund | 69.6 | 5 |
Emerging Markets Sustainable Leaders Fund | 22.7 | 2 |
Global Equity Impact Fund | 21.0 | 2 |
Global Infrastructure Fund | 55.1 | 4 |
International Small Cap Fund | 55.8 | 2 |
International Sustainable Leaders Fund | 48.7 | 1 |
Realty Income & Growth Fund | 52.5 | 3 |
U.S. Small Cap Equity Fund | 40.2 | 5 |
U.S. Sustainable Leaders Fund | 11.9 | 1 |
U.S. Sustainable Leaders Smaller Companies Fund | 46.3 | 4 |
| Fund | Average Outstanding Daily Balance | Average Weighted Interest Rate | Days Utilized |
Dynamic Dividend Fund | $381,890 | 6.02% | 21 |
Emerging Markets ex-China Fund | 329,511 | 5.56% | 19 |
Emerging Markets Fund | 29,333,627 | 5.23% | 6 |
Emerging Markets Sustainable Leaders Fund | 4,396,254 | 5.04% | 17 |
Global Equity Impact Fund | 625,000 | 5.68% | 1 |
International Small Cap Fund | 694,777 | 5.70% | 23 |
International Sustainable Leaders Fund | 3,572,612 | 5.56% | 5 |
Realty Income & Growth Fund | 160,877 | 5.73% | 24 |
U.S. Small Cap Equity Fund | 4,023,214 | 5.88% | 14 |
U.S. Sustainable Leaders Smaller Companies Fund | 100,000 | 5.68% | 1 |
| 2023 Semi-Annual Report | 129 |
April 30, 2023
| 130 | 2023 Semi-Annual Report |
| Beginning Account Value, November 1, 2022 | Actual Ending Account Value, April 30, 2023 | Hypothetical Ending Account Value | Actual Expenses Paid During Period1 | Hypothetical Expenses Paid During Period1,2 | Annualized Expense Ratio** | ||
| China A Share Equity Fund | Class A | $1,000.00 | $1,175.90 | $1,018.15 | $7.23 | $6.71 | 1.34% |
Class C | $1,000.00 | $1,172.20 | $1,014.93 | $10.72 | $9.94 | 1.99% | |
Class R | $1,000.00 | $1,174.30 | $1,016.81 | $8.68 | $8.05 | 1.61% | |
Institutional Service Class | $1,000.00 | $1,177.70 | $1,019.34 | $5.94 | $5.51 | 1.10% | |
Institutional Class | $1,000.00 | $1,178.40 | $1,019.89 | $5.35 | $4.96 | 0.99% | |
| Dynamic Dividend Fund | Class A | $1,000.00 | $1,141.40 | $1,017.36 | $7.96 | $7.50 | 1.50% |
Institutional Class | $1,000.00 | $1,142.80 | $1,018.60 | $6.64 | $6.26 | 1.25% | |
| EM SMA Completion Fund | Institutional Class3 | $1,000.00 | $1,000.00 | $1,024.80 | $ —4 | $ —4 | —% |
| Emerging Markets ex-China Fund | Class A | $1,000.00 | $1,113.80 | $1,017.56 | $7.65 | $7.30 | 1.46% |
Class C | $1,000.00 | $1,109.90 | $1,014.33 | $11.04 | $10.54 | 2.11% | |
Class R | $1,000.00 | $1,112.50 | $1,015.82 | $9.48 | $9.05 | 1.81% | |
Institutional Service Class | $1,000.00 | $1,114.00 | $1,018.79 | $6.34 | $6.06 | 1.21% | |
Institutional Class | $1,000.00 | $1,117.00 | $1,019.29 | $5.83 | $5.56 | 1.11% | |
| Emerging Markets Fund | Class A | $1,000.00 | $1,152.90 | $1,016.86 | $8.54 | $8.00 | 1.60% |
Class C | $1,000.00 | $1,148.70 | $1,014.38 | $11.19 | $10.49 | 2.10% | |
Class R | $1,000.00 | $1,151.70 | $1,016.12 | $9.34 | $8.75 | 1.75% | |
Institutional Service Class | $1,000.00 | $1,153.80 | $1,018.60 | $6.68 | $6.26 | 1.25% | |
Institutional Class | $1,000.00 | $1,154.80 | $1,019.34 | $5.88 | $5.51 | 1.10% | |
| Emerging Markets Sustainable Leaders Fund | Class A | $1,000.00 | $1,156.50 | $1,017.31 | $8.07 | $7.55 | 1.51% |
Class C | $1,000.00 | $1,153.90 | $1,014.33 | $11.27 | $10.54 | 2.11% | |
Class R | $1,000.00 | $1,156.10 | $1,016.27 | $9.20 | $8.60 | 1.72% | |
Institutional Service Class | $1,000.00 | $1,158.20 | $1,018.94 | $6.31 | $5.91 | 1.18% | |
Institutional Class | $1,000.00 | $1,159.80 | $1,019.29 | $5.94 | $5.56 | 1.11% | |
| Global Equity Impact Fund | Class A | $1,000.00 | $1,142.10 | $1,018.65 | $6.59 | $6.21 | 1.24% |
Institutional Class | $1,000.00 | $1,143.70 | $1,019.94 | $5.21 | $4.91 | 0.98% | |
| Global Infrastructure Fund | Class A | $1,000.00 | $1,144.30 | $1,018.65 | $6.59 | $6.21 | 1.24% |
Institutional Class | $1,000.00 | $1,145.50 | $1,019.89 | $5.27 | $4.96 | 0.99% |
| 2023 Semi-Annual Report | 131 |
| Beginning Account Value, November 1, 2022 | Actual Ending Account Value, April 30, 2023 | Hypothetical Ending Account Value | Actual Expenses Paid During Period1 | Hypothetical Expenses Paid During Period1,2 | Annualized Expense Ratio** | ||
| International Small Cap Fund | Class A | $1,000.00 | $1,154.20 | $1,018.15 | $7.16 | $6.71 | 1.34% |
Class C | $1,000.00 | $1,150.30 | $1,014.93 | $10.61 | $9.94 | 1.99% | |
Class R | $1,000.00 | $1,152.50 | $1,016.86 | $8.54 | $8.00 | 1.60% | |
Institutional Class | $1,000.00 | $1,155.60 | $1,019.89 | $5.29 | $4.96 | 0.99% | |
| International Sustainable Leaders Fund | Class A | $1,000.00 | $1,231.60 | $1,018.79 | $6.70 | $6.06 | 1.21% |
Institutional Class | $1,000.00 | $1,233.30 | $1,020.08 | $5.26 | $4.76 | 0.95% | |
| Realty Income & Growth Fund | Class A | $1,000.00 | $1,046.90 | $1,018.60 | $6.34 | $6.26 | 1.25% |
Institutional Class | $1,000.00 | $1,047.30 | $1,019.84 | $5.08 | $5.01 | 1.00% | |
| U.S. Small Cap Equity Fund | Class A | $1,000.00 | $1,029.60 | $1,017.90 | $6.99 | $6.95 | 1.39% |
Class C | $1,000.00 | $1,026.60 | $1,014.93 | $10.00 | $9.94 | 1.99% | |
Class R | $1,000.00 | $1,028.30 | $1,016.56 | $8.35 | $8.30 | 1.66% | |
Institutional Service Class | $1,000.00 | $1,031.30 | $1,019.44 | $5.44 | $5.41 | 1.08% | |
Institutional Class | $1,000.00 | $1,031.90 | $1,019.89 | $4.99 | $4.96 | 0.99% | |
| U.S. Sustainable Leaders Fund | Class A | $1,000.00 | $1,071.80 | $1,018.89 | $6.11 | $5.96 | 1.19% |
Class C | $1,000.00 | $1,067.00 | $1,015.37 | $9.74 | $9.49 | 1.90% | |
Institutional Service Class | $1,000.00 | $1,072.30 | $1,020.03 | $4.93 | $4.81 | 0.96% | |
Institutional Class | $1,000.00 | $1,072.60 | $1,020.33 | $4.63 | $4.51 | 0.90% | |
| U.S. Sustainable Leaders Smaller Companies Fund | Class A | $1,000.00 | $979.30 | $1,018.65 | $6.09 | $6.21 | 1.24% |
Class R | $1,000.00 | $977.70 | $1,017.16 | $7.55 | $7.70 | 1.54% | |
Institutional Service Class | $1,000.00 | $978.90 | $1,019.59 | $5.15 | $5.26 | 1.05% | |
Institutional Class | $1,000.00 | $981.30 | $1,020.33 | $4.42 | $4.51 | 0.90% |
| ** | The expense ratio presented represents a six-month, annualized ratio. |
| 1 | Expenses are equal to the Fund’s annualized expense ratio multiplied by the average account value over the period multiplied by 181/365 (to reflect the one-half year period). |
| 2 | Represents the hypothetical 5% return before expenses. |
| 3 | Information shown reflects values using the expense ratios and rates of return for the period January 27, 2023 (commencement of operations) to April 30, 2023. |
| 4 | Expenses are equal to the Fund’s annualized expense ratio multiplied by the average account value over the period multiplied by 91/365 (to reflect the commencement of operations to period end). |
| 132 | 2023 Semi-Annual Report |
| 2023 Semi-Annual Report | 133 |
| 134 | 2023 Semi-Annual Report |
| • | information regarding the Committee and the monthly discussions by the Committee of various items including, but not limited to, the following: |
| ○ | Review and analysis of appropriate liquidity categories for portfolio investments |
| ○ | Review of highly liquid investment minimum (“HLIM”) and reasonably anticipated trading sizes (“RATS”) |
| ○ | Review of current and upcoming market events, such as market closures, that may impact liquidity |
| ○ | Review of large shareholder concentrations that may impact liquidity in the event of redemption monthly liquidity reports being provided to portfolio managers |
| • | the monitoring and classification of portfolio holdings in four liquidity categories (including the operation of the HLIM and any breaches) |
| 2023 Semi-Annual Report | 135 |
1900 Market Street, Suite 200
Philadelphia, PA 19103
1900 Market Street, Suite 200
Philadelphia, PA 19103
430 W. 7th Street, Ste. 219534
Kansas City, MO 64105-1407
1900 Market Street, Suite 200
Philadelphia, PA 19103
One Congress Street, Suite 1
Boston, MA 02114-2016
1601 Market Street
Philadelphia, PA 19103
1900 K Street N.W.
Washington, DC 20006
Fixed Income and Multi-Asset Series
| Class A - CUGAX ■ | Institutional Class - AGCIX■ | Institutional Service Class - CGFIX■ |
| Class A - BJBHX ■ | Institutional Class - JHYIX■ |
| Class A - NTFAX ■ | Institutional Class - ABEIX■ | Institutional Service Class - ABESX■ |
| Class A - AAHMX ■ | Class C - ACHMX■ | Institutional Class - AHYMX■ |
| Class A - ATOAX ■ | Class A1 - ATOBX■ | Institutional Class - ATOIX■ |

| Page 1 | |
| Page 12 | |
| Page 21 | |
| Page 26 | |
| Page 34 | |
| Page 39 | |
| Page 60 | |
| Page 84 | |
| Page 85 |
| Average Annual Total Return1 (For the periods ended April 30, 2023) | Six Month2 | 1 Yr. | 5 Yr. | 10 Yr. | |
Class A | w/o SC | (1.14%) | (6.65%) | (0.79%) | (0.08%) |
| w/SC3 | (4.08%) | (9.47%) | (1.39%) | (0.38%) | |
Institutional Service Class4 | w/o SC | (1.01%) | (6.38%) | (0.58%) | 0.09% |
Institutional Class4 | w/o SC | (0.89%) | (6.32%) | (0.49%) | 0.21% |
| 1 | The Fund changed its investment objective and principal investment strategies, including its 80% investment policy, effective November 15, 2019. The Fund also previously changed its investment objective and strategies effective August 15, 2016. Performance information for periods prior to November 15, 2019 does not reflect the current investment strategy. Please consult the Fund’s prospectus for more detail. |
| 2 | Not annualized |
| 3 | A 3.00% front-end sales charge was deducted. Prior to February 28, 2019 the front-end sales charge was 4.25%. |
| 4 | Not subject to any sales charges. |

| 2023 Semi-Annual Report | 1 |
| Asset Allocation | |
| Certificates of Deposit | 24.9% |
| U.S. Treasuries | 23.5% |
| Government Bonds | 20.9% |
| Common Stocks | 17.7% |
| Money Market Funds | 11.0% |
| Purchased Options | 1.0% |
| Other Assets in Excess of Liabilities | 1.0% |
| 100.0% |
| Top Ten Holdings | |
| Brazil Notas do Tesouro Nacional, Series NTNF 01/01/2027 | 7.8% |
| Italy Buoni Poliennali Del Tesoro, Series 7Y 10/15/2023 | 4.6% |
| French Republic Government Bond OAT 05/25/2023 | 4.5% |
| Japan Government Thirty Year Bond, Series 78 03/20/2053 | 4.0% |
| Mondelez International, Inc. | 0.4% |
| Novartis AG | 0.4% |
| Microsoft Corp. | 0.4% |
| Procter & Gamble Co. (The) | 0.3% |
| Medtronic PLC | 0.3% |
| PepsiCo, Inc. | 0.3% |
| Countries | |
| United States | 11.7% |
| Brazil | 8.1% |
| France | 4.8% |
| Japan | 4.6% |
| Italy | 4.6% |
| China | 2.3% |
| Other, less than 2% each | 3.5% |
| Short-Term Investments | 59.4% |
| Assets in Excess of Other Liabilities | 1.0% |
| 100.0% |
| 2 | 2023 Semi-Annual Report |
| Shares or Principal Amount | Value | ||
| COMMON STOCKS—17.7% | |||
| BRAZIL—0.3% | |||
| Materials—0.3% | |||
| Yara International ASA | 2,303 | $ 92,739 | |
| CANADA—0.9% | |||
| Consumer Staples—0.3% | |||
| Saputo, Inc. | 3,783 | 97,950 | |
| Industrials—0.3% | |||
| Canadian National Railway Co. | 895 | 106,685 | |
| Materials—0.3% | |||
| Nutrien Ltd. | 1,292 | 89,630 | |
| Total Canada | 294,265 | ||
| CHINA—2.3% | |||
| Communication Services—0.2% | |||
| Kingsoft Corp. Ltd. | 6,600 | 29,012 | |
| Tencent Holdings Ltd. | 500 | 22,208 | |
| 51,220 | |||
| Consumer Discretionary—0.4% | |||
| Alibaba Group Holding Ltd.(a) | 1,700 | 17,975 | |
| China Meidong Auto Holdings Ltd. | 10,000 | 15,518 | |
| H World Group Ltd., ADR(a) | 496 | 23,262 | |
| JD.com, Inc., A Shares | 800 | 14,278 | |
| Meituan, Class B(a)(b) | 1,100 | 18,800 | |
| Minth Group Ltd. | 8,000 | 23,165 | |
| Yum China Holdings, Inc. | 409 | 25,023 | |
| 138,021 | |||
| Consumer Staples—0.4% | |||
| China Mengniu Dairy Co. Ltd.(a) | 24,000 | 96,877 | |
| Hengan International Group Co. Ltd. | 5,000 | 22,332 | |
| Vinda International Holdings Ltd. | 9,000 | 23,516 | |
| 142,725 | |||
| Financials—0.4% | |||
| China CITIC Bank Corp. Ltd., H Shares | 51,000 | 27,589 | |
| China Pacific Insurance Group Co. Ltd., H Shares | 8,600 | 25,688 | |
| China Taiping Insurance Holdings Co. Ltd. | 17,000 | 19,527 | |
| Far East Horizon Ltd. | 27,000 | 24,290 | |
| Huatai Securities Co. Ltd., H Shares(b) | 19,000 | 24,541 | |
| New China Life Insurance Co. Ltd., H Shares | 8,600 | 24,627 | |
| 146,262 | |||
| Health Care—0.2% | |||
| China Traditional Chinese Medicine Holdings Co. Ltd. | 52,000 | 28,426 | |
| Shanghai Fosun Pharmaceutical Group Co. Ltd., H Shares | 7,500 | 21,439 | |
| Wuxi Biologics Cayman, Inc.(a)(b) | 3,000 | 17,889 | |
| 67,754 | |||
| Industrials—0.4% | |||
| Air China Ltd., H Shares(a) | 26,000 | 23,014 | |
| BOC Aviation Ltd.(b) | 2,900 | 22,985 | |
| China Southern Airlines Co. Ltd., H Shares(a) | 36,000 | 25,216 | |
| CRRC Corp. Ltd., H Shares | 55,000 | 35,591 | |
| Jiangsu Expressway Co. Ltd., H Shares | 24,000 | 24,311 | |
| 131,117 | |||
| Shares or Principal Amount | Value | ||
| Information Technology—0.2% | |||
| BYD Electronic International Co. Ltd. | 7,000 | $ 21,229 | |
| Chinasoft International Ltd.(a) | 28,000 | 18,666 | |
| ZTE Corp., H Shares | 9,800 | 31,564 | |
| 71,459 | |||
| Utilities—0.1% | |||
| Beijing Enterprises Holdings Ltd. | 7,500 | 31,125 | |
| Total China | 779,683 | ||
| DENMARK—0.3% | |||
| Materials—0.3% | |||
| Chr Hansen Holding AS | 1,281 | 99,700 | |
| FRANCE—0.3% | |||
| Consumer Staples—0.3% | |||
| Danone SA | 1,578 | 104,438 | |
| HONG KONG—0.3% | |||
| Consumer Staples—0.3% | |||
| WH Group Ltd.(b) | 162,500 | 90,470 | |
| IRELAND—0.3% | |||
| Consumer Staples—0.3% | |||
| Kerry Group PLC, Class A | 972 | 102,375 | |
| JAPAN—0.6% | |||
| Communication Services—0.3% | |||
| KDDI Corp. | 3,500 | 109,263 | |
| Consumer Staples—0.3% | |||
| Yakult Honsha Co. Ltd. | 1,400 | 105,300 | |
| Total Japan | 214,563 | ||
| MACAO—0.1% | |||
| Consumer Discretionary—0.1% | |||
| Galaxy Entertainment Group Ltd.(a) | 4,000 | 28,469 | |
| Sands China Ltd.(a) | 6,400 | 22,921 | |
| 51,390 | |||
| NETHERLANDS—0.3% | |||
| Consumer Staples—0.3% | |||
| Koninklijke Ahold Delhaize NV | 2,891 | 99,406 | |
| NORWAY—0.3% | |||
| Consumer Staples—0.3% | |||
| Mowi ASA | 5,371 | 102,475 | |
| PORTUGAL—0.3% | |||
| Consumer Staples—0.3% | |||
| Jeronimo Martins SGPS SA | 4,223 | 106,568 | |
| SWITZERLAND—0.4% | |||
| Health Care—0.4% | |||
| Novartis AG | 1,201 | 122,855 | |
| THAILAND—0.3% | |||
| Consumer Staples—0.3% | |||
| Charoen Pokphand Foods PCL | 154,900 | 92,211 | |
| UNITED STATES—10.7% | |||
| Communication Services—0.6% | |||
| AT&T, Inc. | 5,491 | 97,026 | |
| Verizon Communications, Inc. | 2,605 | 101,152 | |
| 198,178 | |||
| 2023 Semi-Annual Report | 3 |
| Shares or Principal Amount | Value | ||
| COMMON STOCKS (continued) | |||
| UNITED STATES (continued) | |||
| Consumer Staples—4.0% | |||
| Campbell Soup Co. | 1,784 | $ 96,871 | |
| Coca-Cola Co. (The) | 1,765 | 113,225 | |
| Darling Ingredients, Inc.(a) | 1,677 | 99,899 | |
| Dollar General Corp. | 458 | 101,429 | |
| Ingredion, Inc. | 957 | 101,605 | |
| Kroger Co. (The) | 1,987 | 96,628 | |
| Lamb Weston Holdings, Inc. | 950 | 106,219 | |
| Mondelez International, Inc., Class A | 1,603 | 122,982 | |
| Nestle SA | 878 | 112,638 | |
| PepsiCo, Inc. | 598 | 114,152 | |
| Procter & Gamble Co. (The) | 756 | 118,223 | |
| Sysco Corp. | 1,241 | 95,234 | |
| US Foods Holding Corp.(a) | 2,684 | 103,066 | |
| 1,382,171 | |||
| Financials—1.5% | |||
| BlackRock, Inc. | 145 | 97,324 | |
| Intercontinental Exchange, Inc. | 968 | 105,444 | |
| Marsh & McLennan Cos., Inc. | 625 | 112,619 | |
| PayPal Holdings, Inc.(a) | 1,354 | 102,904 | |
| Visa, Inc., A Shares | 460 | 107,056 | |
| 525,347 | |||
| Health Care—2.4% | |||
| Abbott Laboratories | 983 | 108,592 | |
| Bristol-Myers Squibb Co. | 1,458 | 97,351 | |
| CVS Health Corp. | 1,195 | 87,605 | |
| Danaher Corp. | 409 | 96,896 | |
| Johnson & Johnson | 652 | 106,732 | |
| Medtronic PLC | 1,258 | 114,415 | |
| Thermo Fisher Scientific, Inc. | 185 | 102,657 | |
| UnitedHealth Group, Inc. | 214 | 105,307 | |
| 819,555 | |||
| Industrials—0.6% | |||
| AGCO Corp. | 782 | 96,921 | |
| John Bean Technologies Corp. | 911 | 99,035 | |
| 195,956 | |||
| Information Technology—1.3% | |||
| Accenture PLC, Class A | 368 | 103,147 | |
| Adobe, Inc.(a) | 278 | 104,962 | |
| Cisco Systems, Inc. | 2,198 | 103,855 | |
| Microsoft Corp. | 392 | 120,446 | |
| 432,410 | |||
| Utilities—0.3% | |||
| NextEra Energy, Inc. | 1,366 | 104,677 | |
| Total United States | 3,658,294 | ||
| Total Common Stocks | 6,011,432 | ||
| GOVERNMENT BONDS—20.9% | |||
| BRAZIL—7.8% | |||
| Brazil Notas do Tesouro Nacional, Series NTNF, 10.00%, 01/01/2027 | BRL | 13,951,000 | 2,652,728 |
| FRANCE—4.5% | |||
| French Republic Government Bond OAT, 1.75%, 05/25/2023 | EUR | 1,399,000 | 1,539,980 |
| Shares or Principal Amount | Value | ||
| ITALY—4.6% | |||
| Italy Buoni Poliennali Del Tesoro, Series 7Y, 0.65%, 10/15/2023 | EUR | 1,433,000 | $ 1,560,233 |
| JAPAN—4.0% | |||
| Japan Government Thirty Year Bond, Series 78, 1.40%, 03/20/2053 | JPY | 180,200,000 | 1,357,402 |
| Total Government Bonds | 7,110,343 | ||
| Total Purchased Options (see detail below) | 351,871 | ||
| SHORT-TERM INVESTMENTS—59.4% | |||
| CERTIFICATES OF DEPOSIT—24.9% | |||
| HONG KONG—8.3% | |||
| Bank of Montreal, 4.60%, 05/02/2023 | $ | 1,398,727 | 1,398,727 |
| ING Bank NV, 4.60%, 05/02/2023 | 1,412,723 | 1,412,723 | |
| Total Hong Kong | 2,811,450 | ||
| NETHERLANDS—4.1% | |||
| Cooperatieve Rabobank UA, 4.75%, 05/02/2023 | 1,413,697 | 1,413,696 | |
| UNITED KINGDOM—8.3% | |||
| BNP Paribas SA, 4.65%, 05/02/2023 | 1,409,164 | 1,409,164 | |
| Credit Agricole Corporate & Investment Bank SA, 4.80%, 05/02/2023 | 1,413,576 | 1,413,576 | |
| Total United Kingdom | 2,822,740 | ||
| UNITED STATES—4.2% | |||
| Societe Generale SA, 4.65%, 05/01/2023 | 1,416,358 | 1,416,358 | |
| Total Certificates of Deposit | 8,464,244 | ||
| MONEY MARKET FUNDS—11.0% | |||
| State Street Institutional U.S. Government Money Market Fund, Premier Class, 4.76%(c) | 3,745,061 | 3,745,061 | |
| Total Money Market Funds | 3,745,061 | ||
| U.S. TREASURIES—23.5% | |||
| U.S. Treasury Bills | |||
| 4.43%, 05/04/2023(d) | 1,000,000 | 999,658 | |
| 4.67%, 06/06/2023(d) | 1,000,000 | 995,280 | |
| 4.72%, 07/06/2023(d) | 1,000,000 | 990,971 | |
| 4.92%, 08/01/2023(d) | 1,000,000 | 987,343 | |
| U.S. Treasury Notes, 1.13%, 01/15/2033(e) | 4,078,521 | 4,038,852 | |
| Total U.S. Treasuries | 8,012,104 | ||
| Total Short-Term Investments | 20,221,409 | ||
| Total Investments (Cost $33,287,609)(f)—99.0% | 33,695,055 | ||
| Other Assets in Excess of Liabilities—1.0% | 349,201 | ||
| Net Assets—100.0% | $34,044,256 | ||
| (a) | Non-income producing security. |
| (b) | Denotes a security issued under Regulation S or Rule 144A. |
| (c) | Registered investment company advised by State Street Global Advisors. The rate shown is the 7 day yield as of April 30, 2023. |
| (d) | The rate shown is the discount yield at the time of purchase. |
| (e) | Inflation linked security. |
| (f) | See accompanying Notes to Financial Statements for tax unrealized appreciation/(depreciation) of securities. |
| ADR | American Depositary Receipt |
| AUD | Australian Dollar |
| 4 | 2023 Semi-Annual Report |
| BRL | Brazilian Real |
| CAD | Canadian Dollar |
| CHF | Swiss Franc |
| CZK | Czech Koruna |
| DKK | Denmark Krone |
| EUR | Euro Currency |
| GBP | British Pound Sterling |
| HKD | Hong Kong Dollar |
| HUF | Hungarian Forint |
| IDR | Indonesian Rupiah |
| ILS | Israel Shekel |
| INR | Indian Rupee |
| JPY | Japanese Yen |
| KRW | South Korean Won |
| MXN | Mexican Peso |
| NOK | Norwegian Krone |
| NZD | New Zealand Dollar |
| PLC | Public Limited Company |
| PLN | Polish Zloty |
| SEK | Swedish Krona |
| THB | Thai Baht |
| TWD | New Taiwan Dollar |
| USD | U.S. Dollar |
| ZAR | South African Rand |
| At April 30, 2023, the Fund held the following futures contracts: |
| Futures Contracts | Number of Contracts Long/(Short) | Expiration Date | Notional Amount | Market Value | Unrealized Appreciation/ (Depreciation) |
| Long Contract Positions | |||||
| ICE U.S. MSCI Emerging Markets EM Index | 46 | 6/16/2023 | $2,199,366 | $2,263,660 | $64,294 |
| Ultra United States Treasury Note 10 Year | 61 | 6/21/2023 | 7,158,533 | 7,408,641 | 250,108 |
| $314,402 | |||||
| Short Contract Positions | |||||
| ICE U.S. mini MSCI EAFE Index | (22) | 6/16/2023 | $(2,206,009) | $(2,364,560) | $(158,551) |
| S&P 500 E-Mini | (14) | 6/16/2023 | (2,724,499) | (2,931,950) | (207,451) |
| $(366,002) | |||||
| $(51,600) |
| At April 30, 2023, the Fund held the following forward foreign currency contracts: |
| Purchase Contracts Settlement Date | Counterparty | Currency Purchased | Amount Purchased | Currency Sold | Amount Sold | Fair Value | Unrealized Appreciation/ (Depreciation) | |
| Australian Dollar/United States Dollar | ||||||||
| 05/02/2023 | JPMorgan Chase Bank N.A. | AUD | 144,921 | USD | 96,970 | $95,894 | $(1,076) | |
| 05/11/2023 | Goldman Sachs & Co. | AUD | 390,000 | USD | 268,439 | 258,157 | (10,282) | |
| 08/10/2023 | Morgan Stanley & Co. | AUD | 80,000 | USD | 52,882 | 53,154 | 272 | |
| Brazilian Real/United States Dollar | ||||||||
| 05/11/2023 | Barclays Bank PLC | BRL | 2,259,300 | USD | 429,293 | 452,247 | 22,954 | |
| 05/11/2023 | Barclays Bank PLC | BRL | 13,470,844 | USD | 2,696,645 | 2,696,478 | (167) | |
| 05/11/2023 | Goldman Sachs & Co. | BRL | 4,493,226 | USD | 852,705 | 899,415 | 46,710 | |
| 06/14/2023 | Barclays Bank PLC | BRL | 653,000 | USD | 129,957 | 129,855 | (102) | |
| 07/20/2023 | Citibank N.A. | BRL | 7,890,000 | USD | 1,536,284 | 1,558,506 | 22,222 | |
| British Pound/United States Dollar | ||||||||
| 05/11/2023 | Barclays Bank PLC | GBP | 100,000 | USD | 123,252 | 125,700 | 2,448 | |
| 05/11/2023 | JPMorgan Chase Bank N.A. | GBP | 76,000 | USD | 94,646 | 95,532 | 886 | |
| 05/11/2023 | UBS AG | GBP | 425,000 | USD | 524,740 | 534,224 | 9,484 | |
| 05/12/2023 | JPMorgan Chase Bank N.A. | GBP | 288,000 | USD | 362,073 | 362,023 | (50) | |
| 07/11/2023 | UBS AG | GBP | 733,000 | USD | 920,312 | 922,417 | 2,105 | |
| 08/10/2023 | Morgan Stanley & Co. | GBP | 509,000 | USD | 635,149 | 640,810 | 5,661 | |
| 2023 Semi-Annual Report | 5 |
| Purchase Contracts Settlement Date | Counterparty | Currency Purchased | Amount Purchased | Currency Sold | Amount Sold | Fair Value | Unrealized Appreciation/ (Depreciation) | |
| Canadian Dollar/United States Dollar | ||||||||
| 05/11/2023 | JPMorgan Chase Bank N.A. | CAD | 48,505 | USD | 35,923 | $35,809 | $(114) | |
| 05/11/2023 | Morgan Stanley & Co. | CAD | 420,655 | USD | 307,928 | 310,543 | 2,615 | |
| 05/11/2023 | UBS AG | CAD | 326,674 | USD | 243,043 | 241,162 | (1,881) | |
| 05/12/2023 | JPMorgan Chase Bank N.A. | CAD | 665,000 | USD | 490,407 | 490,936 | 529 | |
| 08/10/2023 | Morgan Stanley & Co. | CAD | 310,000 | USD | 227,330 | 229,272 | 1,942 | |
| Czech Koruna/United States Dollar | ||||||||
| 05/12/2023 | UBS AG | CZK | 2,892,000 | USD | 133,590 | 135,378 | 1,788 | |
| 06/14/2023 | Morgan Stanley & Co. | CZK | 2,802,100 | USD | 130,837 | 130,983 | 146 | |
| Danish Krone/United States Dollar | ||||||||
| 05/11/2023 | Citibank N.A. | DKK | 203,056 | USD | 29,608 | 30,037 | 429 | |
| 05/11/2023 | UBS AG | DKK | 956,961 | USD | 140,875 | 141,557 | 682 | |
| 08/10/2023 | UBS AG | DKK | 300,000 | USD | 44,516 | 44,644 | 128 | |
| Euro/United States Dollar | ||||||||
| 05/11/2023 | Barclays Bank PLC | EUR | 3,221,869 | USD | 3,542,268 | 3,551,903 | 9,635 | |
| 05/11/2023 | Citibank N.A. | EUR | 1,036,001 | USD | 1,107,780 | 1,142,125 | 34,345 | |
| 05/11/2023 | JPMorgan Chase Bank N.A. | EUR | 110,000 | USD | 120,698 | 121,268 | 570 | |
| 05/11/2023 | Morgan Stanley & Co. | EUR | 739,000 | USD | 801,981 | 814,700 | 12,719 | |
| 05/11/2023 | UBS AG | EUR | 3,490,000 | USD | 3,749,481 | 3,847,500 | 98,019 | |
| 05/12/2023 | Citibank N.A. | EUR | 246,000 | USD | 268,105 | 271,214 | 3,109 | |
| 08/10/2023 | Barclays Bank PLC | EUR | 518,000 | USD | 572,323 | 573,859 | 1,536 | |
| Hong Kong Dollar/United States Dollar | ||||||||
| 05/11/2023 | Barclays Bank PLC | HKD | 837,972 | USD | 107,051 | 106,791 | (260) | |
| 05/11/2023 | JPMorgan Chase Bank N.A. | HKD | 29,000 | USD | 3,708 | 3,696 | (12) | |
| 05/11/2023 | UBS AG | HKD | 6,549,631 | USD | 834,678 | 834,682 | 4 | |
| 05/11/2023 | UBS AG | HKD | 70,079 | USD | 8,945 | 8,931 | (14) | |
| 08/10/2023 | UBS AG | HKD | 29,000 | USD | 3,710 | 3,710 | – | |
| Hungarian Forint/United States Dollar | ||||||||
| 05/12/2023 | Citibank N.A. | HUF | 46,900,000 | USD | 132,626 | 138,125 | 5,499 | |
| 06/14/2023 | UBS AG | HUF | 44,490,000 | USD | 128,962 | 129,724 | 762 | |
| Indian Rupee/United States Dollar | ||||||||
| 05/12/2023 | JPMorgan Chase Bank N.A. | INR | 22,000,000 | USD | 266,499 | 269,149 | 2,650 | |
| 05/30/2023 | JPMorgan Chase Bank N.A. | INR | 92,900,000 | USD | 1,124,085 | 1,135,398 | 11,313 | |
| Indonesian Rupiah/United States Dollar | ||||||||
| 07/14/2023 | UBS AG | IDR | 23,000,000,000 | USD | 1,541,028 | 1,567,188 | 26,160 | |
| Israeli Shekel/United States Dollar | ||||||||
| 05/11/2023 | Goldman Sachs & Co. | ILS | 16,000 | USD | 4,516 | 4,410 | (106) | |
| 08/10/2023 | Barclays Bank PLC | ILS | 16,000 | USD | 4,416 | 4,427 | 11 | |
| Japanese Yen/United States Dollar | ||||||||
| 05/11/2023 | Barclays Bank PLC | JPY | 6,812,237 | USD | 51,060 | 50,068 | (992) | |
| 05/11/2023 | Citibank N.A. | JPY | 62,000,000 | USD | 482,490 | 455,685 | (26,805) | |
| 05/11/2023 | HSBC Bank PLC | JPY | 267,033,778 | USD | 2,023,083 | 1,962,635 | (60,448) | |
| 05/11/2023 | JPMorgan Chase Bank N.A. | JPY | 213,068,186 | USD | 1,569,800 | 1,566,001 | (3,799) | |
| 05/11/2023 | Morgan Stanley & Co. | JPY | 943,491 | USD | 7,187 | 6,934 | (253) | |
| 05/11/2023 | UBS AG | JPY | 6,024,037 | USD | 46,073 | 44,275 | (1,798) | |
| 05/12/2023 | JPMorgan Chase Bank N.A. | JPY | 53,400,000 | USD | 403,445 | 392,536 | (10,909) | |
| 07/11/2023 | Morgan Stanley & Co. | JPY | 306,700,000 | USD | 2,376,877 | 2,275,203 | (101,674) | |
| 07/13/2023 | JPMorgan Chase Bank N.A. | JPY | 189,000,000 | USD | 1,444,473 | 1,402,491 | (41,982) | |
| 08/10/2023 | JPMorgan Chase Bank N.A. | JPY | 42,000,000 | USD | 313,745 | 312,990 | (755) | |
| 6 | 2023 Semi-Annual Report |
| Purchase Contracts Settlement Date | Counterparty | Currency Purchased | Amount Purchased | Currency Sold | Amount Sold | Fair Value | Unrealized Appreciation/ (Depreciation) | |
| Mexican Peso/United States Dollar | ||||||||
| 05/12/2023 | JPMorgan Chase Bank N.A. | MXN | 2,420,000 | USD | 133,574 | $134,340 | $766 | |
| 05/30/2023 | Morgan Stanley & Co. | MXN | 20,600,000 | USD | 1,105,696 | 1,139,357 | 33,661 | |
| 06/14/2023 | JPMorgan Chase Bank N.A. | MXN | 4,750,000 | USD | 261,058 | 261,921 | 863 | |
| 07/20/2023 | Morgan Stanley & Co. | MXN | 28,100,000 | USD | 1,517,606 | 1,538,568 | 20,962 | |
| New Zealand Dollar/United States Dollar | ||||||||
| 05/12/2023 | JPMorgan Chase Bank N.A. | NZD | 428,000 | USD | 267,815 | 264,661 | (3,154) | |
| Norwegian Krone/United States Dollar | ||||||||
| 05/11/2023 | UBS AG | NOK | 2,221,072 | USD | 206,851 | 208,506 | 1,655 | |
| 05/11/2023 | UBS AG | NOK | 252,723 | USD | 24,283 | 23,725 | (558) | |
| 05/12/2023 | JPMorgan Chase Bank N.A. | NOK | 5,130,000 | USD | 480,068 | 481,609 | 1,541 | |
| Polish Zloty/United States Dollar | ||||||||
| 05/12/2023 | JPMorgan Chase Bank N.A. | PLN | 574,000 | USD | 138,280 | 137,851 | (429) | |
| 06/14/2023 | JPMorgan Chase Bank N.A. | PLN | 546,000 | USD | 131,296 | 130,886 | (410) | |
| South Korean Won/United States Dollar | ||||||||
| 05/11/2023 | HSBC Bank PLC | KRW | 1,500,000,000 | USD | 1,120,649 | 1,122,382 | 1,733 | |
| 05/12/2023 | JPMorgan Chase Bank N.A. | KRW | 174,000,000 | USD | 129,929 | 130,202 | 273 | |
| Swiss Franc/United States Dollar | ||||||||
| 05/11/2023 | HSBC Bank PLC | CHF | 260,209 | USD | 287,659 | 291,383 | 3,724 | |
| 05/11/2023 | Morgan Stanley & Co. | CHF | 370,000 | USD | 403,022 | 414,327 | 11,305 | |
| 08/10/2023 | HSBC Bank PLC | CHF | 280,000 | USD | 315,945 | 316,700 | 755 | |
| Thai Baht/United States Dollar | ||||||||
| 05/11/2023 | UBS AG | THB | 4,344,732 | USD | 127,603 | 127,335 | (268) | |
| 05/12/2023 | UBS AG | THB | 9,130,000 | USD | 268,096 | 267,607 | (489) | |
| $40,603,711 | $135,784 | |||||||
| Sale Contracts Settlement Date | Counterparty | Currency Purchased | Amount Purchased | Currency Sold | Amount Sold | Fair Value | Unrealized Appreciation/ (Depreciation) | |
| United States Dollar/Australian Dollar | ||||||||
| 05/11/2023 | HSBC Bank PLC | USD | 94,600 | AUD | 140,000 | $92,672 | $1,928 | |
| 05/11/2023 | Morgan Stanley & Co. | USD | 113,729 | AUD | 170,000 | 112,530 | 1,199 | |
| 05/11/2023 | Morgan Stanley & Co. | USD | 52,679 | AUD | 80,000 | 52,955 | (276) | |
| United States Dollar/Brazilian Real | ||||||||
| 05/11/2023 | Citibank N.A. | USD | 90,908 | BRL | 461,905 | 92,460 | (1,552) | |
| 05/11/2023 | UBS AG | USD | 3,815,822 | BRL | 19,761,466 | 3,955,680 | (139,858) | |
| 08/10/2023 | Barclays Bank PLC | USD | 2,650,244 | BRL | 13,470,844 | 2,649,748 | 496 | |
| United States Dollar/British Pound | ||||||||
| 05/11/2023 | JPMorgan Chase Bank N.A. | USD | 110,689 | GBP | 92,000 | 115,644 | (4,955) | |
| 05/11/2023 | Morgan Stanley & Co. | USD | 634,105 | GBP | 509,000 | 639,811 | (5,706) | |
| 05/12/2023 | JPMorgan Chase Bank N.A. | USD | 356,382 | GBP | 288,000 | 362,023 | (5,641) | |
| 07/11/2023 | Barclays Bank PLC | USD | 2,328,424 | GBP | 1,870,000 | 2,353,233 | (24,809) | |
| United States Dollar/Canadian Dollar | ||||||||
| 05/11/2023 | Morgan Stanley & Co. | USD | 226,926 | CAD | 310,000 | 228,853 | (1,927) | |
| 05/11/2023 | UBS AG | USD | 361,530 | CAD | 485,835 | 358,660 | 2,870 | |
| 05/12/2023 | JPMorgan Chase Bank N.A. | USD | 491,647 | CAD | 665,000 | 490,936 | 711 | |
| 08/10/2023 | Morgan Stanley & Co. | USD | 308,477 | CAD | 420,656 | 311,112 | (2,635) | |
| 2023 Semi-Annual Report | 7 |
| Sale Contracts Settlement Date | Counterparty | Currency Purchased | Amount Purchased | Currency Sold | Amount Sold | Fair Value | Unrealized Appreciation/ (Depreciation) | |
| United States Dollar/Czech Koruna | ||||||||
| 05/12/2023 | Morgan Stanley & Co. | USD | 135,247 | CZK | 2,892,000 | $135,378 | $(131) | |
| United States Dollar/Danish Krone | ||||||||
| 05/11/2023 | UBS AG | USD | 170,280 | DKK | 1,160,017 | 171,594 | (1,314) | |
| 08/10/2023 | UBS AG | USD | 97,484 | DKK | 656,961 | 97,764 | (280) | |
| United States Dollar/Euro | ||||||||
| 05/11/2023 | Barclays Bank PLC | USD | 667,169 | EUR | 609,000 | 671,384 | (4,215) | |
| 05/11/2023 | Goldman Sachs & Co. | USD | 33,804 | EUR | 31,130 | 34,319 | (515) | |
| 05/11/2023 | JPMorgan Chase Bank N.A. | USD | 256,986 | EUR | 240,000 | 264,585 | (7,599) | |
| 05/11/2023 | Morgan Stanley & Co. | USD | 8,405,468 | EUR | 7,716,740 | 8,507,209 | (101,741) | |
| 05/12/2023 | JPMorgan Chase Bank N.A. | USD | 271,731 | EUR | 246,000 | 271,214 | 517 | |
| 08/10/2023 | Barclays Bank PLC | USD | 3,559,745 | EUR | 3,221,869 | 3,569,302 | (9,557) | |
| United States Dollar/Hong Kong Dollar | ||||||||
| 05/11/2023 | HSBC Bank PLC | USD | 52,657 | HKD | 411,311 | 52,417 | 240 | |
| 05/11/2023 | UBS AG | USD | 902,424 | HKD | 7,046,371 | 897,987 | 4,437 | |
| 05/11/2023 | UBS AG | USD | 3,696 | HKD | 29,000 | 3,696 | – | |
| 08/10/2023 | UBS AG | USD | 837,858 | HKD | 6,549,631 | 837,920 | (62) | |
| United States Dollar/Hungarian Forint | ||||||||
| 05/12/2023 | UBS AG | USD | 137,345 | HUF | 46,900,000 | 138,125 | (780) | |
| United States Dollar/Indian Rupee | ||||||||
| 05/12/2023 | Goldman Sachs & Co. | USD | 268,801 | INR | 22,000,000 | 269,149 | (348) | |
| 05/30/2023 | Morgan Stanley & Co. | USD | 1,116,842 | INR | 92,900,000 | 1,135,398 | (18,556) | |
| United States Dollar/Israeli Shekel | ||||||||
| 05/11/2023 | Barclays Bank PLC | USD | 4,400 | ILS | 16,000 | 4,410 | (10) | |
| United States Dollar/Japanese Yen | ||||||||
| 05/11/2023 | Citibank N.A. | USD | 2,367,426 | JPY | 304,214,235 | 2,235,902 | 131,524 | |
| 05/11/2023 | JPMorgan Chase Bank N.A. | USD | 460,135 | JPY | 62,000,000 | 455,685 | 4,450 | |
| 05/11/2023 | Morgan Stanley & Co. | USD | 1,369,070 | JPY | 183,106,749 | 1,345,791 | 23,279 | |
| 05/11/2023 | UBS AG | USD | 49,377 | JPY | 6,560,745 | 48,220 | 1,157 | |
| 05/12/2023 | JPMorgan Chase Bank N.A. | USD | 392,760 | JPY | 53,400,000 | 392,536 | 224 | |
| 07/11/2023 | JPMorgan Chase Bank N.A. | USD | 893,930 | JPY | 117,000,000 | 867,945 | 25,985 | |
| 08/10/2023 | JPMorgan Chase Bank N.A. | USD | 1,591,645 | JPY | 213,068,186 | 1,587,814 | 3,831 | |
| United States Dollar/Mexican Peso | ||||||||
| 05/12/2023 | JPMorgan Chase Bank N.A. | USD | 133,889 | MXN | 2,420,000 | 134,340 | (451) | |
| 05/30/2023 | JPMorgan Chase Bank N.A. | USD | 1,132,876 | MXN | 20,600,000 | 1,139,357 | (6,481) | |
| United States Dollar/New Taiwan Dollar | ||||||||
| 07/13/2023 | HSBC Bank PLC | USD | 1,440,233 | TWD | 43,400,000 | 1,420,815 | 19,418 | |
| 07/20/2023 | UBS AG | USD | 2,290,391 | TWD | 69,000,000 | 2,260,722 | 29,669 | |
| United States Dollar/New Zealand Dollar | ||||||||
| 05/12/2023 | JPMorgan Chase Bank N.A. | USD | 264,341 | NZD | 428,000 | 264,661 | (320) | |
| 06/14/2023 | JPMorgan Chase Bank N.A. | USD | 132,155 | NZD | 214,000 | 132,313 | (158) | |
| United States Dollar/Norwegian Krone | ||||||||
| 05/11/2023 | Goldman Sachs & Co. | USD | 247,588 | NOK | 2,473,796 | 232,231 | 15,357 | |
| 05/12/2023 | JPMorgan Chase Bank N.A. | USD | 490,665 | NOK | 5,130,000 | 481,609 | 9,056 | |
| 08/10/2023 | UBS AG | USD | 207,721 | NOK | 2,221,072 | 209,445 | (1,724) | |
| United States Dollar/Polish Zloty | ||||||||
| 05/12/2023 | UBS AG | USD | 133,383 | PLN | 574,000 | 137,851 | (4,468) | |
| United States Dollar/South African Rand | ||||||||
| 05/30/2023 | Morgan Stanley & Co. | USD | 1,118,103 | ZAR | 20,800,000 | 1,134,400 | (16,297) | |
| 8 | 2023 Semi-Annual Report |
| Sale Contracts Settlement Date | Counterparty | Currency Purchased | Amount Purchased | Currency Sold | Amount Sold | Fair Value | Unrealized Appreciation/ (Depreciation) | |
| United States Dollar/South Korean Won | ||||||||
| 05/11/2023 | Morgan Stanley & Co. | USD | 1,160,511 | KRW | 1,500,000,000 | $1,122,382 | $38,129 | |
| 05/12/2023 | Citibank N.A. | USD | 132,626 | KRW | 174,000,000 | 130,202 | 2,424 | |
| 06/14/2023 | JPMorgan Chase Bank N.A. | USD | 131,567 | KRW | 175,860,000 | 131,815 | (248) | |
| 08/10/2023 | HSBC Bank PLC | USD | 1,126,888 | KRW | 1,500,000,000 | 1,128,664 | (1,776) | |
| United States Dollar/Swedish Krona | ||||||||
| 07/20/2023 | Morgan Stanley & Co. | USD | 2,294,390 | SEK | 23,900,000 | 2,340,103 | (45,713) | |
| United States Dollar/Swiss Franc | ||||||||
| 05/11/2023 | HSBC Bank PLC | USD | 312,776 | CHF | 280,000 | 313,545 | (769) | |
| 05/11/2023 | JPMorgan Chase Bank N.A. | USD | 97,996 | CHF | 90,000 | 100,782 | (2,786) | |
| 05/11/2023 | Morgan Stanley & Co. | USD | 283,432 | CHF | 260,209 | 291,383 | (7,951) | |
| 06/14/2023 | JPMorgan Chase Bank N.A. | USD | 133,205 | CHF | 118,000 | 132,666 | 539 | |
| 08/10/2023 | HSBC Bank PLC | USD | 199,047 | CHF | 176,402 | 199,523 | (476) | |
| United States Dollar/Thai Baht | ||||||||
| 05/11/2023 | Morgan Stanley & Co. | USD | 132,925 | THB | 4,344,732 | 127,334 | 5,591 | |
| 05/12/2023 | UBS AG | USD | 266,355 | THB | 9,130,000 | 267,607 | (1,252) | |
| 06/14/2023 | UBS AG | USD | 395,552 | THB | 13,430,000 | 394,941 | 611 | |
| 08/10/2023 | UBS AG | USD | 128,740 | THB | 4,344,732 | 128,486 | 254 | |
| $50,169,238 | $(99,441) | |||||||
| At April 30, 2023, Fund's open forward foreign cross currency contracts were as follows: |
| Purchase/Sale Settlement Date | Counterparty | Currency Purchased | Amount Purchased | Currency Sold | Amount Sold | Fair Value | Unrealized Appreciation/ (Depreciation) | |
| Australian Dollar/New Zealand Dollar | ||||||||
| 05/02/2023 | Goldman Sachs & Co. | AUD | 5,464,555 | NZD | 6,020,000 | $3,897,594 | $3,790,721 | $(106,873) |
| 05/02/2023 | Morgan Stanley & Co. | AUD | 1,434,398 | NZD | 1,580,000 | 997,123 | 969,192 | (27,931) |
| 08/02/2023 | JPMorgan Chase Bank N.A. | AUD | 2,605,423 | NZD | 2,850,000 | 1,755,144 | 1,724,226 | (30,918) |
| Euro/British Pound | ||||||||
| 05/12/2023 | Morgan Stanley & Co. | EUR | 2,638,800 | GBP | 2,340,000 | 2,899,647 | 2,867,478 | (32,169) |
| New Zealand Dollar/Australian Dollar | ||||||||
| 05/02/2023 | Goldman Sachs & Co. | NZD | 1,710,000 | AUD | 1,589,796 | 1,077,556 | 1,083,053 | 5,497 |
| 05/02/2023 | JPMorgan Chase Bank N.A. | NZD | 5,890,000 | AUD | 5,454,080 | 3,659,077 | 3,692,490 | 33,413 |
| $14,127,160 | $(158,981) | |||||||
| Unrealized appreciation on forward foreign currency exchange contracts | $767,377 | |||||||
| Unrealized depreciation on forward foreign currency exchange contracts | $(890,015) | |||||||
| At April 30, 2023, the Fund held the following centrally cleared credit default swaps: | ||||||||
| Expiration Date | Notional Amount | Credit Index | Fixed Rate | Implied Credit Spread* | Frequency of Payments Made | Premiums Paid (Received) | Value | Unrealized Appreciation/ (Depreciation) |
| Sell Protection: | ||||||||
| 06/20/2028 | 9,500,000 | CDX.NA.IG.S40 | Equal to 1.00% | 0.75% | Quarterly | $45,189 | $118,051 | $72,862 |
| $45,189 | $118,051 | $72,862 | ||||||
| 2023 Semi-Annual Report | 9 |
| * | Implied credit spreads, represented in absolute terms, are utilized in determining the market value of credit default swaps agreements on corporate issues or sovereign issues and serve as an indicator of the current status of the payment/performance risk and represent the likelihood or risk of default for the credit derivative. The implied credit spread of particular referenced entity reflects the cost of buying/selling protection and may include upfront payments required to be made prior to entering into the agreement. For credit default swap with asset-backed securities or credit indices as the underlying assets, the quoted market prices and resulting market values serve as an indicator of the current status of the payment/performance risk. Wider credit spreads and increasing market values, in absolute terms when compared to the notional amount of the swap, represent a deterioration of the reference entity’s credit soundness and a greater likelihood or risk of default or other credit event occurring as defined under the terms of the agreement. |
| At April 30, 2023, the Fund held the following centrally cleared interest rate swaps: |
| Currency | Notional Amount | Expiration Date | Counterparty | Receive (Pay) Floating Rate | Floating Rate Index | Fixed Rate | Frequency of Paid Payments Made | Premiums Paid (Received) | Value | Unrealized Appreciation/ (Depreciation) |
| JPY | 482,000,000 | 04/19/2033 | Citigroup | Receive | 12-month SOFR | 0.72% | Annually | $- | $(60,235) | $(60,235) |
| $- | $(60,235) | $(60,235) | ||||||||
| AUD | 7,270,000 | 02/17/2033 | Citigroup | Pay | 6-month BBSW | 4.64% | Semi-annual | - | 88,942 | 88,942 |
| $- | $88,942 | $88,942 | ||||||||
| $- | $28,707 | $28,707 | ||||||||
| At April 30, 2023, the Fund held the following over-the-counter total return swaps: | ||||||||
| Currency | Notional Amount | Expiration Date | Receive (Pay) Total Return of Equity Index | Equity Index | Floating Rate Index | Frequency of Payments Made | Value | Unrealized Appreciation/ (Depreciation) |
| USD | 1,180,956 | 08/17/2023 | Pay | KOSPI 200 Index | 1-month SOFR | Monthly | $(51,599) | $(51,599) |
| USD | 1,566,865 | 10/05/2023 | Pay | S&P 500 Low Volatility Index | 1-month SOFR | Monthly | 13,535 | 13,535 |
| USD | 2,192,365 | 09/05/2023 | Receive | MSCI Daily TR World Gross Consumer Staples | 1-month SOFR | Monthly | (56,277) | (56,277) |
| USD | 3,050,337 | 10/02/2023 | Receive | MSCI LTD World Index | 1-month SOFR | Monthly | (6,661) | (6,661) |
| $(101,002) | ||||||||
| At April 30, 2023, the Fund held the following purchased options: | |||||||
| Description | Expiration Date | Exercise Price | Contracts | Notional Amount | Cost | Value | Unrealized Value |
| Call Options Purchased 0.1% | |||||||
| Index Options 0.1% | |||||||
| CBOE Volatility Index | 08/16/2023 | 23.00 | 120 | 276,000 | $39,180 | $43,200 | $4,020 |
| Put Options Purchased 0.9% | |||||||
| Index Options 0.6% | |||||||
| S&P 500 Index | 07/21/2023 | 4,050.00 | 10 | 4,050,000 | $163,515 | $73,530 | $(89,985) |
| S&P 500 Index | 07/21/2023 | 4,100.00 | 10 | 4,100,000 | 160,605 | 84,600 | (76,005) |
| CBOE Volatility Index | 05/17/2023 | 21.00 | 120 | 252,000 | 26,583 | 38,879 | 12,296 |
| $197,009 | $(153,694) | ||||||
| 10 | 2023 Semi-Annual Report |
| Description | Expiration Date | Pay | Receive | Notional Amount | Cost | Value | Unrealized Value |
| Swaptions 0.3% | |||||||
| 10 year Interest Rate Swap Put, expiring 09/20/2023 | 09/20/2023 | 3-month LIBOR | 4.24% | 7,436,106 | $39,040 | $24,830 | $(14,210) |
| 10 year Interest Rate Swap Put, expiring 09/21/2023 | 09/21/2023 | 3-month LIBOR | 4.24% | 20,231,947 | 98,125 | 46,480 | (51,645) |
| 10 year Interest Rate Swap Put, expiring 09/22/2023 | 09/22/2023 | 3-month LIBOR | 4.52% | 20,231,947 | 85,986 | 40,352 | (45,634) |
| $111,662 | $(111,489) |
| At April 30, 2023 the Fund held the following written options: | |||||||
| Description | Expiration Date | Exercise Price | Contracts | Notional Amount | Cost | Value | Unrealized Value |
| Put Options Written 0.7% | |||||||
| Index Options 0.1% | |||||||
| S&P 500 Index | 07/21/2023 | 3,650.00 | (5) | (1,800,000) | $(35,767) | $(11,675) | $24,092 |
| S&P 500 Index | 07/21/2023 | 3,250.00 | (5) | (1,625,000) | (15,593) | (4,845) | 10,748 |
| S&P 500 Index | 07/21/2023 | 3,700.00 | (5) | (1,850,000) | (33,997) | (13,375) | 20,622 |
| S&P 500 Index | 07/21/2023 | 3,275.00 | (5) | (1,637,500) | (13,698) | (5,050) | 8,648 |
| $(34,945) | $64,110 | ||||||
| Description | Expiration Date | Pay | Receive | Notional Amount | Cost | Value | Unrealized Value |
| Swaptions 0.6% | |||||||
| 10 year Interest Rate Swap Put | 09/20/2023 | 3-month LIBOR | 4.50% | (6,127,337) | $(30,842) | $(41,784) | $(10,942) |
| 10 year Interest Rate Swap Put | 09/21/2023 | 3-month LIBOR | 4.58% | (16,636,331) | (70,637) | (101,361) | (30,724) |
| 10 year Interest Rate Swap Put | 09/22/2023 | 3-month LIBOR | 4.85% | (16,636,332) | (81,681) | (68,588) | 13,093 |
| $(211,733) | $(28,573) |
| 2023 Semi-Annual Report | 11 |
| Average Annual Total Return1 (For the periods ended April 30, 2023) | Six Month2 | 1 Yr. | 5 Yr. | 10 Yr. | |
Class A | w/o SC | 6.83% | (0.60%) | 1.70% | 2.09% |
| w/SC3 | 3.65% | (3.53%) | 1.08% | 1.78% | |
Institutional Class4 | w/o SC | 6.88% | (0.30%) | 1.96% | 2.36% |
| 1 | Returns prior to December 3, 2021 reflect the performance of a predecessor fund (the “Predecessor Fund”). Returns of the Predecessor Fund have not been adjusted to reflect the expenses applicable to the respective classes. The Fund and the Predecessor Fund have substantially similar investment objectives and strategies. Please consult the Fund’s prospectus for more detail. |
| 2 | Not annualized |
| 3 | A 3.00% front-end sales charge was deducted. |
| 4 | Not subject to any sales charges. |

| 12 | 2023 Semi-Annual Report |
| Asset Allocation | |
| Corporate Bonds | 95.3% |
| Short-Term Investment | 2.3% |
| Exchange-Traded Funds | 1.3% |
| U.S. Treasuries | 0.8% |
| Other Assets in Excess of Liabilities | 0.3% |
| 100.0% |
| Industries | |
| Diversified Telecommunication Services | 8.7% |
| Media | 6.7% |
| Oil, Gas & Consumable Fuels | 5.4% |
| Energy Equipment & Services | 4.9% |
| Pharmaceutical | 4.9% |
| Entertainment | 4.4% |
| Chemicals | 4.2% |
| Real Estate Investment Trust (REIT) Funds | 4.1% |
| Commercial Services & Supplies | 4.0% |
| Auto Parts & Equipment | 3.3% |
| Healthcare Providers & Services | 3.2% |
| Packaging & Containers | 3.2% |
| Auto Manufacturers | 2.9% |
| Aerospace & Defense | 2.8% |
| Electric Utilities | 2.8% |
| Commercial Banks | 2.7% |
| Leisure Time | 2.6% |
| Metals & Mining | 2.5% |
| Building Materials | 2.5% |
| Other, less than 2% each | 21.6% |
| Short-Term Investment | 2.3% |
| Assets in Excess of Other Liabilities | 0.3% |
| 100.0% |
| Top Ten Holdings | |
| Iron Mountain, Inc. 07/15/2028 | 1.6% |
| Monitchem HoldCo 3 SA 05/01/2028 | 1.5% |
| 180 Medical, Inc. 10/15/2029 | 1.3% |
| iShares iBoxx High Yield Corporate Bond ETF | 1.3% |
| SunCoke Energy, Inc. 06/30/2029 | 1.1% |
| First Quantum Minerals Ltd. 03/01/2026 | 1.1% |
| Viatris, Inc. 06/22/2030 | 1.0% |
| NRG Energy, Inc. 02/15/2029 | 1.0% |
| Organon & Co. / Organon Foreign Debt Co-Issuer BV 04/30/2028 | 1.0% |
| CCO Holdings LLC / CCO Holdings Capital Corp. 01/15/2034 | 1.0% |
| Countries | |
| United States | 56.7% |
| United Kingdom | 6.7% |
| Luxembourg | 5.0% |
| Germany | 4.2% |
| Netherlands | 3.0% |
| Canada | 2.9% |
| Spain | 2.8% |
| Mexico | 2.4% |
| France | 2.2% |
| Other, less than 2% each | 11.5% |
| Short-Term Investment | 2.3% |
| Assets in Excess of Other Liabilities | 0.3% |
| 100.0% |
| 2023 Semi-Annual Report | 13 |
| Shares or Principal Amount | Value | ||
| CORPORATE BONDS—95.3% | |||
| AUSTRIA—0.5% | |||
| Holding Companies-Diversified Operations—0.5% | |||
| Benteler International AG | |||
| 9.38%, 05/15/2028(a) | EUR | 240,000 | $ 264,456 |
| 10.50%, 05/15/2028(a) | $ | 200,000 | 200,000 |
| 464,456 | |||
| BELGIUM—0.4% | |||
| Media—0.4% | |||
| Telenet Finance Luxembourg Notes Sarl, 5.50%, 03/01/2028(a) | 400,000 | 369,200 | |
| BRAZIL—1.3% | |||
| Chemicals—0.4% | |||
| Braskem Netherlands Finance BV, 4.50%, 01/10/2028(a) | 425,000 | 388,938 | |
| Healthcare Providers & Services—0.6% | |||
| Rede D'or Finance Sarl | |||
| 4.95%, 01/17/2028(a) | 380,000 | 346,040 | |
| 4.50%, 01/22/2030(a) | 204,000 | 172,945 | |
| 518,985 | |||
| Oil & Gas Services—0.3% | |||
| Guara Norte Sarl, 5.20%, 06/15/2034(a)(b) | 264,976 | 225,685 | |
| Total Brazil | 1,133,608 | ||
| CANADA—2.9% | |||
| Diversified Telecommunication Services—0.6% | |||
| Rogers Communications, Inc., (fixed rate to 03/15/2027, variable rate thereafter), 5.25%, 03/15/2082(a) | 589,000 | 532,162 | |
| Environmental Control—0.3% | |||
| GFL Environmental, Inc., 4.75%, 06/15/2029(a) | 285,000 | 265,252 | |
| Machinery-Diversified—0.5% | |||
| Titan Acquisition Ltd. / Titan Co-Borrower LLC, 7.75%, 04/15/2026(a) | 543,000 | 483,270 | |
| Metals & Mining—0.6% | |||
| Teck Resources Ltd., 3.90%, 07/15/2030 | 604,000 | 562,617 | |
| Oil & Gas Services—0.8% | |||
| Enerflex Ltd., 9.00%, 10/15/2027(a) | 697,000 | 694,491 | |
| Oil, Gas & Consumable Fuels—0.1% | |||
| Baytex Energy Corp., 8.50%, 04/30/2030(a) | 71,000 | 71,378 | |
| Total Canada | 2,609,170 | ||
| CHINA—0.2% | |||
| Real Estate—0.2% | |||
| Country Garden Holdings Co. Ltd., 3.13%, 10/22/2025(a) | 200,000 | 99,813 | |
| Kaisa Group Holdings Ltd. | |||
| 9.75%, 09/28/2023(a)(c)(d) | 230,000 | 22,075 | |
| 9.38%, 06/30/2024(a)(c) | 495,000 | 47,510 | |
| Zhenro Properties Group Ltd. | |||
| Shares or Principal Amount | Value | ||
| 7.88%, 04/14/2024(a)(c)(d) | $ | 200,000 | $ 12,000 |
| 7.10%, 09/10/2024(a)(c)(d) | 429,000 | 25,740 | |
| 207,138 | |||
| COLOMBIA—0.3% | |||
| Oil, Gas & Consumable Fuels—0.3% | |||
| Ecopetrol SA, 6.88%, 04/29/2030 | 307,000 | 277,369 | |
| CZECH REPUBLIC—0.3% | |||
| Entertainment—0.3% | |||
| Allwyn Entertainment Financing UK PLC, 7.25%, 04/30/2030(a) | EUR | 257,000 | 285,760 |
| FRANCE—2.2% | |||
| Diversified Telecommunication Services—0.5% | |||
| Iliad Holding SASU, 6.50%, 10/15/2026(a) | $ | 532,000 | 511,896 |
| Electric Utilities—0.6% | |||
| Electricite de France SA | |||
| (fixed rate to 01/29/2025, variable rate thereafter), 5.38%, 01/29/2025(a)(e) | EUR | 200,000 | 211,014 |
| (fixed rate to 01/22/2026, variable rate thereafter), 5.00%, 01/22/2026(a)(e) | 300,000 | 304,124 | |
| 515,138 | |||
| Healthcare Providers & Services—0.6% | |||
| Chrome Bidco SASU, 3.50%, 05/31/2028(a) | 587,000 | 521,614 | |
| Packaging & Containers—0.5% | |||
| Verallia SA, 1.88%, 11/10/2031(a) | 500,000 | 444,949 | |
| Total France | 1,993,597 | ||
| GERMANY—4.2% | |||
| Apparel—0.5% | |||
| CT Investment GmbH, 5.50%, 04/15/2026(a) | 490,000 | 476,316 | |
| Auto Parts & Equipment—1.7% | |||
| IHO Verwaltungs GmbH, PIK, 8.75%, 05/15/2028(a)(f) | 437,996 | 489,433 | |
| Schaeffler AG | |||
| 2.88%, 03/26/2027(a) | 350,000 | 363,684 | |
| 3.38%, 10/12/2028(a) | 200,000 | 198,503 | |
| ZF Europe Finance BV | |||
| 2.00%, 02/23/2026(a) | 200,000 | 200,546 | |
| 2.50%, 10/23/2027(a) | 300,000 | 287,276 | |
| 1,539,442 | |||
| Building Materials—0.4% | |||
| HT Troplast GmbH, 9.25%, 07/15/2025(a) | 300,000 | 325,612 | |
| Commercial Banks—0.4% | |||
| Deutsche Bank AG | |||
| 2.63%, 12/16/2024(a) | GBP | 100,000 | 117,196 |
| (fixed rate to 04/30/2026, variable rate thereafter), 7.13%, 04/30/2026(a)(e) | 300,000 | 291,144 | |
| 408,340 | |||
| Commercial Services & Supplies—0.5% | |||
| Techem Verwaltungsgesellschaft 674 mbH, 6.00%, 07/30/2026(a) | EUR | 395,639 | 409,543 |
| Machinery-Diversified—0.2% | |||
| TK Elevator Midco GmbH, 4.38%, 07/15/2027(a) | 176,000 | 172,844 | |
| 14 | 2023 Semi-Annual Report |
| Shares or Principal Amount | Value | ||
| CORPORATE BONDS (continued) | |||
| GERMANY (continued) | |||
| Pharmaceutical—0.5% | |||
| Gruenenthal GmbH | |||
| 3.63%, 11/15/2026(a) | EUR | 199,000 | $ 206,395 |
| 4.13%, 05/15/2028(a) | 230,000 | 231,895 | |
| 438,290 | |||
| Total Germany | 3,770,387 | ||
| HONG KONG—0.5% | |||
| Lodging—0.5% | |||
| Melco Resorts Finance Ltd., 5.75%, 07/21/2028(a) | $ | 534,000 | 463,245 |
| INDIA—0.3% | |||
| Chemicals—0.3% | |||
| UPL Corp. Ltd., 4.63%, 06/16/2030(a) | 313,000 | 267,994 | |
| ISRAEL—0.6% | |||
| Pharmaceutical—0.6% | |||
| Teva Pharmaceutical Finance Netherlands III BV | |||
| 3.15%, 10/01/2026 | 227,000 | 205,113 | |
| 7.88%, 09/15/2029 | 326,000 | 341,374 | |
| 546,487 | |||
| ITALY—1.8% | |||
| Commercial Banks—0.4% | |||
| UniCredit SpA, (fixed rate to 06/03/2023, variable rate thereafter), 6.63%, 06/03/2023(a)(e) | EUR | 330,000 | 364,194 |
| Commercial Services & Supplies—0.3% | |||
| Autostrade per l'Italia SpA, 2.00%, 12/04/2028(a) | 250,000 | 239,738 | |
| Diversified Telecommunication Services—0.6% | |||
| Telecom Italia Capital SA, 6.38%, 11/15/2033 | $ | 600,000 | 536,385 |
| Entertainment—0.3% | |||
| Lottomatica SpA/Roma, 6.25%, 07/15/2025(a) | EUR | 200,000 | 222,584 |
| Hand/Machine Tools—0.2% | |||
| IMA Industria Macchine Automatiche SpA, 3.75%, 01/15/2028(a) | 231,000 | 221,413 | |
| Total Italy | 1,584,314 | ||
| LUXEMBOURG—5.0% | |||
| Biotechnology—0.5% | |||
| Cidron Aida Finco Sarl | |||
| 5.00%, 04/01/2028(a) | 151,000 | 148,540 | |
| 6.25%, 04/01/2028(a) | GBP | 253,000 | 273,263 |
| 421,803 | |||
| Chemicals—1.5% | |||
| Monitchem HoldCo 3 SA, 8.75%, 05/01/2028(a) | EUR | 1,230,000 | 1,362,114 |
| Shares or Principal Amount | Value | ||
| Commercial Services & Supplies—0.8% | |||
| Albion Financing 1 SARL/Aggreko Holdings, Inc., 5.25%, 10/15/2026(a) | EUR | 246,000 | $ 249,117 |
| Albion Financing 2Sarl, 8.75%, 04/15/2027(a) | $ | 519,000 | 450,960 |
| 700,077 | |||
| Diversified Telecommunication Services—1.3% | |||
| Altice France Holding SA, 8.00%, 05/15/2027(a) | EUR | 533,000 | 418,564 |
| Matterhorn Telecom SA, 3.13%, 09/15/2026(a) | 712,000 | 720,720 | |
| 1,139,284 | |||
| Energy-Alternate Sources—0.5% | |||
| Cullinan Holdco Scsp, 4.63%, 10/15/2026(a) | 462,000 | 443,677 | |
| Entertainment—0.0% | |||
| LHMC Finco 2 Sarl, PIK, 7.25%, 10/02/2025(a)(f) | 12,166 | 12,534 | |
| Machinery-Diversified—0.0% | |||
| Galapagos SA, 5.38%, 06/15/2049(a)(c)(g)(h) | 60,500 | – | |
| Media—0.4% | |||
| Altice Financing SA, 5.75%, 08/15/2029(a) | $ | 449,000 | 358,146 |
| Total Luxembourg | 4,437,635 | ||
| MEXICO—2.4% | |||
| Building Materials—0.5% | |||
| Cemex SAB de CV, (fixed rate to 03/14/2028, variable rate thereafter), 9.13%, 03/14/2025(a)(e) | 497,000 | 493,522 | |
| Chemicals—0.2% | |||
| Braskem Idesa SAPI, 6.99%, 02/20/2032(a) | 200,000 | 143,100 | |
| Diversified Telecommunication Services—0.7% | |||
| Sixsigma Networks Mexico SA de CV, 7.50%, 05/02/2025(a) | 750,000 | 636,944 | |
| Oil, Gas & Consumable Fuels—1.0% | |||
| Petroleos Mexicanos, 5.35%, 02/12/2028 | 1,030,000 | 855,476 | |
| Total Mexico | 2,129,042 | ||
| NETHERLANDS—3.0% | |||
| Chemicals—0.3% | |||
| OCI NV, 3.63%, 10/15/2025(a) | EUR | 247,500 | 265,534 |
| Commercial Banks—0.4% | |||
| Stichting AK Rabobank Certificaten, 6.50%, 12/29/2049(a)(e)(i) | 355,750 | 371,911 | |
| Home Furnishings—0.3% | |||
| Nobel Bidco BV, 3.13%, 06/15/2028(a) | 340,000 | 276,042 | |
| Media—1.6% | |||
| Summer BidCo BV, PIK, 9.00%, 11/15/2025(a)(f) | 367,063 | 338,336 | |
| UPC Holding BV, 5.50%, 01/15/2028(a) | $ | 400,000 | 358,000 |
| UPCB Finance VII Ltd., 3.63%, 06/15/2029(a) | EUR | 200,000 | 191,239 |
| VZ Vendor Financing II BV, 2.88%, 01/15/2029(a) | 582,000 | 502,669 | |
| 1,390,244 | |||
| 2023 Semi-Annual Report | 15 |
| Shares or Principal Amount | Value | ||
| CORPORATE BONDS (continued) | |||
| NETHERLANDS (continued) | |||
| Packaging & Containers—0.4% | |||
| Trivium Packaging Finance BV, 5.50%, 08/15/2026(a) | $ | 383,000 | $ 371,837 |
| Total Netherlands | 2,675,568 | ||
| NIGERIA—0.8% | |||
| Engineering & Construction—0.8% | |||
| IHS Netherlands Holdco BV, 8.00%, 09/18/2027(a) | 760,000 | 667,812 | |
| PANAMA—0.4% | |||
| Diversified Telecommunication Services—0.4% | |||
| C&W Senior Financing DAC, 6.88%, 09/15/2027(a) | 436,000 | 381,500 | |
| REPUBLIC OF IRELAND—0.5% | |||
| Commercial Services & Supplies—0.5% | |||
| Cimpress PLC, 7.00%, 06/15/2026 | 549,000 | 459,634 | |
| SLOVENIA—0.1% | |||
| Internet—0.1% | |||
| United Group BV, 5.25%, 02/01/2030(a) | EUR | 123,000 | 101,108 |
| SOUTH AFRICA—0.3% | |||
| Diversified Telecommunication Services—0.3% | |||
| Liquid Telecommunications Financing PLC, 5.50%, 09/04/2026(a) | $ | 384,000 | 228,480 |
| SPAIN—2.8% | |||
| Commercial Banks—1.1% | |||
| Banco Bilbao Vizcaya Argentaria SA, (fixed rate to 03/05/2025, variable rate thereafter), Series 9, 6.50%, 03/05/2025(e) | 600,000 | 547,158 | |
| Banco de Sabadell SA, (fixed rate to 06/16/2027, variable rate thereafter), FRN, 0.88%, 06/16/2028(a) | EUR | 200,000 | 181,703 |
| Unicaja Banco SA, (fixed rate to 11/05/2026, variable rate thereafter), FRN, 7.25%, 11/15/2027(a)(j) | 200,000 | 222,827 | |
| 951,688 | |||
| Diversified Telecommunication Services—1.1% | |||
| Lorca Telecom Bondco SA, 4.00%, 09/18/2027(a) | 500,000 | 505,833 | |
| Telefonica Europe BV, (fixed rate to 06/22/2026, variable rate thereafter), Series ., 3.88%, 06/22/2026(a)(e) | 500,000 | 508,372 | |
| 1,014,205 | |||
| Engineering & Construction—0.5% | |||
| Cellnex Finance Co. SA | |||
| 1.00%, 09/15/2027(a) | 100,000 | 96,069 | |
| 1.50%, 06/08/2028(a) | 100,000 | 96,101 | |
| 2.00%, 09/15/2032(a) | 300,000 | 262,284 | |
| 454,454 | |||
| Shares or Principal Amount | Value | ||
| Entertainment—0.1% | |||
| Cirsa Finance International Sarl, 6.25%, 12/20/2023(a) | EUR | 72,397 | $ 79,475 |
| Total Spain | 2,499,822 | ||
| SWEDEN—1.0% | |||
| Commercial Services & Supplies—0.7% | |||
| Verisure Holding AB, 3.25%, 02/15/2027(a) | 333,000 | 321,635 | |
| Verisure Midholding AB, 5.25%, 02/15/2029(a) | 275,000 | 243,933 | |
| 565,568 | |||
| Diversified Financial Services—0.3% | |||
| Intrum AB, 4.88%, 08/15/2025(a) | 300,000 | 298,141 | |
| Total Sweden | 863,709 | ||
| SWITZERLAND—0.7% | |||
| Chemicals—0.7% | |||
| Consolidated Energy Finance SA, 5.63%, 10/15/2028(a) | $ | 652,000 | 573,095 |
| TURKEY—0.4% | |||
| Diversified Telecommunication Services—0.4% | |||
| Turk Telekomunikasyon AS, 4.88%, 06/19/2024(a) | 410,000 | 389,131 | |
| UNITED KINGDOM—6.7% | |||
| Aerospace & Defense—0.8% | |||
| Rolls-Royce PLC, 4.63%, 02/16/2026(a) | EUR | 680,000 | 734,247 |
| Commercial Banks—0.5% | |||
| HSBC Bank Capital Funding Sterling 1 LP, (fixed rate to 11/05/2031, variable rate thereafter), FRN, 5.84%, 11/05/2031(a)(e) | GBP | 320,000 | 413,927 |
| Diversified Financial Services—0.5% | |||
| Jerrold Finco PLC | |||
| 4.88%, 01/15/2026(a) | 134,000 | 147,436 | |
| 5.25%, 01/15/2027(a) | 306,000 | 327,735 | |
| 475,171 | |||
| Diversified Telecommunication Services—0.7% | |||
| TalkTalk Telecom Group Ltd., 3.88%, 02/20/2025(a) | 188,000 | 180,726 | |
| Vodafone Group PLC, (fixed rate to 07/03/2024, variable rate thereafter), 6.25%, 10/03/2078(a) | $ | 460,000 | 448,500 |
| 629,226 | |||
| Entertainment—0.7% | |||
| Pinewood Finance Co. Ltd., 3.25%, 09/30/2025(a) | GBP | 500,000 | 588,159 |
| Food Products—0.5% | |||
| Bellis Acquisition Co. PLC | |||
| 3.25%, 02/16/2026(a) | 278,000 | 286,489 | |
| 4.50%, 02/16/2026(a) | 106,000 | 111,734 | |
| 398,223 | |||
| Media—0.7% | |||
| Virgin Media Vendor Financing Notes III DAC | |||
| 16 | 2023 Semi-Annual Report |
| Shares or Principal Amount | Value | ||
| CORPORATE BONDS (continued) | |||
| UNITED KINGDOM (continued) | |||
| 4.88%, 07/15/2028(a) | GBP | 544,000 | $ 560,225 |
| 4.88%, 07/15/2028(a) | 100,000 | 102,983 | |
| 663,208 | |||
| Oil, Gas & Consumable Fuels—0.6% | |||
| Ithaca Energy North Sea PLC, 9.00%, 07/15/2026(a) | $ | 581,000 | 559,288 |
| Pharmaceutical—1.3% | |||
| 180 Medical, Inc., 3.88%, 10/15/2029(a) | 1,345,000 | 1,197,797 | |
| Water Utility—0.4% | |||
| Thames Water Kemble Finance PLC, 4.63%, 05/19/2026(a) | GBP | 300,000 | 331,755 |
| Total United Kingdom | 5,991,001 | ||
| UNITED STATES—54.6% | |||
| Advertising—0.7% | |||
| Summer BC Bidco B LLC, 5.50%, 10/31/2026(a) | $ | 721,000 | 605,159 |
| Aerospace & Defense—2.0% | |||
| Howmet Aerospace, Inc. | |||
| 6.88%, 05/01/2025 | 43,000 | 44,286 | |
| 3.00%, 01/15/2029 | 455,000 | 408,318 | |
| 5.95%, 02/01/2037 | 804,000 | 818,120 | |
| TransDigm, Inc., 6.75%, 08/15/2028(a) | 517,000 | 525,034 | |
| 1,795,758 | |||
| Agriculture—1.0% | |||
| Darling Ingredients, Inc., 6.00%, 06/15/2030(a) | 461,000 | 456,051 | |
| Turning Point Brands, Inc., 5.63%, 02/15/2026(a) | 503,000 | 460,245 | |
| 916,296 | |||
| Apparel—0.3% | |||
| Wolverine World Wide, Inc., 4.00%, 08/15/2029(a) | 282,000 | 234,412 | |
| Auto Manufacturers—3.0% | |||
| Ford Motor Co. | |||
| 9.63%, 04/22/2030 | 422,000 | 490,727 | |
| 6.10%, 08/19/2032 | 558,000 | 532,154 | |
| Ford Motor Credit Co. LLC | |||
| 4.54%, 03/06/2025 | GBP | 162,000 | 194,654 |
| 4.95%, 05/28/2027 | $ | 364,000 | 344,232 |
| 7.35%, 11/04/2027 | 704,000 | 723,924 | |
| 2.90%, 02/16/2028 | 396,000 | 342,790 | |
| 2,628,481 | |||
| Auto Parts & Equipment—1.7% | |||
| Adient Global Holdings Ltd. | |||
| 3.50%, 08/15/2024(a) | EUR | 41,645 | 45,024 |
| 7.00%, 04/15/2028(a) | $ | 79,000 | 81,009 |
| 8.25%, 04/15/2031(a) | 326,000 | 333,925 | |
| Clarios Global LP / Clarios US Finance Co., 6.75%, 05/15/2028(a) | 219,000 | 219,848 | |
| Goodyear Europe BV, 2.75%, 08/15/2028(a) | EUR | 352,000 | 322,726 |
| Goodyear Tire & Rubber Co. (The) | |||
| 9.50%, 05/31/2025 | $ | 285,000 | 291,761 |
| Shares or Principal Amount | Value | ||
| 5.00%, 07/15/2029 | $ | 115,000 | $ 101,655 |
| 5.25%, 07/15/2031 | 152,000 | 131,100 | |
| 1,527,048 | |||
| Building Materials—1.5% | |||
| Builders FirstSource, Inc., 4.25%, 02/01/2032(a) | 273,000 | 239,197 | |
| MIWD Holdco II LLC / MIWD Finance Corp., 5.50%, 02/01/2030(a) | 641,000 | 538,440 | |
| New Enterprise Stone & Lime Co., Inc., 5.25%, 07/15/2028(a) | 672,000 | 601,440 | |
| 1,379,077 | |||
| Chemicals—0.9% | |||
| ASP Unifrax Holdings, Inc., 5.25%, 09/30/2028(a) | 272,000 | 224,134 | |
| Celanese US Holdings LLC | |||
| 6.17%, 07/15/2027 | 386,000 | 390,728 | |
| 6.38%, 07/15/2032 | 162,000 | 164,287 | |
| 779,149 | |||
| Coal—1.1% | |||
| SunCoke Energy, Inc., 4.88%, 06/30/2029(a) | 1,153,000 | 1,003,859 | |
| Commercial Services & Supplies—1.2% | |||
| Avis Budget Car Rental LLC / Avis Budget Finance, Inc., 5.38%, 03/01/2029(a) | 321,000 | 291,184 | |
| Neptune Bidco US, Inc., 9.29%, 04/15/2029(a) | 486,000 | 457,447 | |
| Sabre GLBL, Inc., 11.25%, 12/15/2027(a) | 380,000 | 333,925 | |
| 1,082,556 | |||
| Computers & Peripherals—0.4% | |||
| McAfee Corp., 7.38%, 02/15/2030(a) | 465,000 | 385,996 | |
| Diversified Financial Services—0.6% | |||
| Encore Capital Group, Inc., 4.88%, 10/15/2025(a) | EUR | 500,000 | 502,968 |
| Diversified Telecommunication Services—1.9% | |||
| Frontier Communications Holdings LLC | |||
| 6.00%, 01/15/2030(a) | $ | 152,000 | 116,267 |
| 8.75%, 05/15/2030(a) | 256,000 | 253,210 | |
| 8.63%, 03/15/2031(a) | 57,000 | 55,540 | |
| Level 3 Financing, Inc., 10.50%, 05/15/2030(a) | 397,000 | 380,049 | |
| Sprint Capital Corp. | |||
| 6.88%, 11/15/2028 | 169,000 | 182,196 | |
| 8.75%, 03/15/2032 | 563,000 | 688,164 | |
| 1,675,426 | |||
| Electric Utilities—2.3% | |||
| NRG Energy, Inc. | |||
| 3.38%, 02/15/2029(a) | 1,035,000 | 876,432 | |
| 3.63%, 02/15/2031(a) | 241,000 | 195,086 | |
| 7.00%, 03/15/2033(a) | 150,000 | 155,628 | |
| Talen Energy Supply LLC, 8.63%, 06/01/2030(a) | 156,000 | 156,000 | |
| Vistra Operations Co. LLC | |||
| 5.63%, 02/15/2027(a) | 504,000 | 491,550 | |
| 4.38%, 05/01/2029(a) | 221,000 | 197,587 | |
| 2,072,283 | |||
| 2023 Semi-Annual Report | 17 |
| Shares or Principal Amount | Value | ||
| CORPORATE BONDS (continued) | |||
| UNITED STATES (continued) | |||
| Energy Equipment & Services—4.8% | |||
| Cheniere Energy Partners LP | |||
| 4.50%, 10/01/2029 | $ | 831,000 | $ 781,835 |
| 4.00%, 03/01/2031 | 177,000 | 158,313 | |
| EnLink Midstream LLC, 6.50%, 09/01/2030(a) | 597,000 | 603,072 | |
| EnLink Midstream Partners LP, 5.45%, 06/01/2047 | 300,000 | 250,500 | |
| ITT Holdings LLC, 6.50%, 08/01/2029(a) | 688,000 | 571,226 | |
| Venture Global Calcasieu Pass LLC | |||
| 3.88%, 08/15/2029(a) | 255,000 | 229,041 | |
| 6.25%, 01/15/2030(a) | 106,000 | 107,485 | |
| 4.13%, 08/15/2031(a) | 643,000 | 569,603 | |
| 3.88%, 11/01/2033(a) | 410,000 | 345,720 | |
| Western Midstream Operating LP | |||
| 3.95%, 06/01/2025 | 263,000 | 253,284 | |
| 4.65%, 07/01/2026 | 156,000 | 151,663 | |
| 6.15%, 04/01/2033 | 289,000 | 293,858 | |
| 4,315,600 | |||
| Entertainment—3.0% | |||
| Affinity Interactive, 6.88%, 12/15/2027(a) | 727,000 | 653,928 | |
| Caesars Entertainment, Inc., 7.00%, 02/15/2030(a) | 18,000 | 18,161 | |
| CCM Merger, Inc., 6.38%, 05/01/2026(a) | 511,000 | 499,502 | |
| Cedar Fair LP / Canada's Wonderland Co. / Magnum Management Corp. / Millennium Op, 6.50%, 10/01/2028 | 499,000 | 493,034 | |
| International Game Technology PLC, 3.50%, 06/15/2026(a) | EUR | 547,000 | 584,657 |
| Six Flags Theme Parks, Inc., 7.00%, 07/01/2025(a) | $ | 372,000 | 376,553 |
| 2,625,835 | |||
| Environmental Control—0.4% | |||
| Clean Harbors, Inc. | |||
| 4.88%, 07/15/2027(a) | 237,000 | 229,421 | |
| 6.38%, 02/01/2031(a) | 129,000 | 131,611 | |
| 361,032 | |||
| Healthcare Providers & Services—1.9% | |||
| HCA, Inc., 5.63%, 09/01/2028 | 588,000 | 600,227 | |
| IQVIA, Inc., 1.75%, 03/15/2026(a) | EUR | 315,000 | 319,953 |
| Tenet Healthcare Corp. | |||
| 4.63%, 07/15/2024 | $ | 520,000 | 515,530 |
| 6.13%, 10/01/2028 | 154,000 | 149,412 | |
| 6.13%, 06/15/2030(a) | 111,000 | 109,791 | |
| 1,694,913 | |||
| Home Builders—0.5% | |||
| Adams Homes, Inc., 7.50%, 02/15/2025(a) | 443,000 | 417,706 | |
| Home Furnishings—0.6% | |||
| Tempur Sealy International, Inc., 3.88%, 10/15/2031(a) | 614,000 | 509,042 | |
| Internet—1.0% | |||
| Netflix, Inc. | |||
| Shares or Principal Amount | Value | ||
| 4.63%, 05/15/2029 | EUR | 341,000 | $ 383,851 |
| 6.38%, 05/15/2029 | $ | 465,000 | 502,432 |
| 886,283 | |||
| Iron/Steel—0.2% | |||
| Cleveland-Cliffs, Inc., 6.75%, 04/15/2030(a) | 213,000 | 207,033 | |
| Leisure Time—2.8% | |||
| Carnival Corp., 6.00%, 05/01/2029(a) | 374,000 | 293,552 | |
| MajorDrive Holdings IV LLC, 6.38%, 06/01/2029(a) | 683,000 | 539,570 | |
| NCL Corp. Ltd. | |||
| 5.88%, 02/15/2027(a) | 299,000 | 282,040 | |
| 8.38%, 02/01/2028(a) | 115,000 | 115,688 | |
| 7.75%, 02/15/2029(a) | 325,000 | 275,191 | |
| Royal Caribbean Cruises Ltd. | |||
| 11.50%, 06/01/2025(a) | 209,000 | 221,801 | |
| 5.50%, 04/01/2028(a) | 271,000 | 238,967 | |
| Viking Cruises Ltd., 13.00%, 05/15/2025(a) | 465,000 | 489,412 | |
| 2,456,221 | |||
| Lodging—0.6% | |||
| Travel & Leisure Co., 4.63%, 03/01/2030(a) | 590,000 | 508,875 | |
| Machinery-Diversified—0.5% | |||
| Chart Industries, Inc. | |||
| 7.50%, 01/01/2030(a) | 333,000 | 342,990 | |
| 9.50%, 01/01/2031(a) | 92,000 | 97,405 | |
| 440,395 | |||
| Media—3.5% | |||
| CCO Holdings LLC / CCO Holdings Capital Corp. | |||
| 4.25%, 02/01/2031(a) | 935,000 | 765,775 | |
| 4.25%, 01/15/2034(a) | 1,126,000 | 857,720 | |
| CSC Holdings LLC | |||
| 6.50%, 02/01/2029(a) | 296,000 | 247,140 | |
| 5.75%, 01/15/2030(a) | 519,000 | 264,869 | |
| DISH Network Corp., 11.75%, 11/15/2027(a) | 466,000 | 440,204 | |
| Univision Communications, Inc., 7.38%, 06/30/2030(a) | 603,000 | 578,594 | |
| 3,154,302 | |||
| Metals & Mining—0.8% | |||
| Novelis Corp., 3.25%, 11/15/2026(a) | 769,000 | 703,992 | |
| Oil & Gas Services—0.7% | |||
| Weatherford International Ltd., 8.63%, 04/30/2030(a) | 606,000 | 617,284 | |
| Oil, Gas & Consumable Fuels—3.3% | |||
| Hilcorp Energy I LP / Hilcorp Finance Co., 5.75%, 02/01/2029(a) | 539,000 | 503,565 | |
| Noble Finance II LLC, 8.00%, 04/15/2030(a) | 389,000 | 398,344 | |
| Occidental Petroleum Corp. | |||
| 6.63%, 09/01/2030 | 298,000 | 318,115 | |
| 6.45%, 09/15/2036 | 578,000 | 613,402 | |
| Southwestern Energy Co., 4.75%, 02/01/2032 | 788,000 | 694,823 | |
| Viper Energy Partners LP, 5.38%, 11/01/2027(a) | 435,000 | 420,493 | |
| 2,948,742 | |||
| 18 | 2023 Semi-Annual Report |
| Shares or Principal Amount | Value | ||
| CORPORATE BONDS (continued) | |||
| UNITED STATES (continued) | |||
| Packaging & Containers—2.3% | |||
| Ardagh Metal Packaging Finance USA LLC / Ardagh Metal Packaging Finance PLC, 6.00%, 06/15/2027(a) | $ | 620,000 | $ 616,934 |
| Ball Corp. | |||
| 2.88%, 08/15/2030 | 152,000 | 127,342 | |
| 3.13%, 09/15/2031 | 316,000 | 263,181 | |
| Graphic Packaging International LLC | |||
| 2.63%, 02/01/2029(a) | EUR | 114,000 | 109,540 |
| 3.50%, 03/01/2029(a) | $ | 375,000 | 332,095 |
| 3.75%, 02/01/2030(a) | 666,000 | 595,354 | |
| Trident TPI Holdings, Inc., 12.75%, 12/31/2028(a) | 11,000 | 11,265 | |
| 2,055,711 | |||
| Pharmaceutical—2.6% | |||
| Organon & Co. / Organon Foreign Debt Co-Issuer BV, 2.88%, 04/30/2028(a) | EUR | 908,000 | 864,416 |
| Perrigo Finance Unlimited Co., 4.40%, 06/15/2030 | $ | 545,000 | 491,861 |
| Viatris, Inc., 2.70%, 06/22/2030 | 1,132,000 | 922,284 | |
| 2,278,561 | |||
| Real Estate Investment Trust (REIT) Funds—4.0% | |||
| GLP Capital, LP/GLP Financing II, Inc. REIT, 5.75%, 06/01/2028 | 541,000 | 532,493 | |
| Iron Mountain, Inc., 5.00%, 07/15/2028(a) | 1,537,000 | 1,446,662 | |
| Park Intermediate Holdings LLC/PK Domestic Property LLC/PK Finance Co-Issuer | |||
| 7.50%, 06/01/2025(a) | 137,000 | 137,685 | |
| 4.88%, 05/15/2029(a) | 491,000 | 424,715 | |
| Starwood Property Trust, Inc., 3.63%, 07/15/2026(a) | 471,000 | 405,550 | |
| Uniti Group LP / Uniti Group Finance Inc / CSL Capital LLC, 10.50%, 02/15/2028(a) | 674,000 | 644,949 | |
| 3,592,054 | |||
| Retail—1.7% | |||
| Academy Ltd., 6.00%, 11/15/2027(a) | 593,000 | 582,442 | |
| Macy's Retail Holdings LLC, 5.88%, 04/01/2029(a) | 308,000 | 282,137 | |
| Staples, Inc., 7.50%, 04/15/2026(a) | 737,000 | 621,539 | |
| 1,486,118 | |||
| Software—0.8% | |||
| Consensus Cloud Solutions, Inc. | |||
| 6.00%, 10/15/2026(a) | 215,000 | 197,683 | |
| 6.50%, 10/15/2028(a) | 607,000 | 531,125 | |
| 728,808 | |||
| Total United States | 48,576,975 | ||
| ZAMBIA—1.1% | |||
| Metals & Mining—1.1% | |||
| First Quantum Minerals Ltd., 6.88%, 03/01/2026(a) | 977,000 | 959,238 | |
| Total Corporate Bonds | 84,906,475 | ||
| Shares or Principal Amount | Value | ||
| EXCHANGE-TRADED FUNDS—1.3% | |||
| iShares iBoxx High Yield Corporate Bond ETF | 15,083 | $ 1,136,655 | |
| Total Exchange-Traded Funds | 1,136,655 | ||
| U.S. TREASURIES—0.8% | |||
| U.S. Treasury Note, 3.88%, 12/31/2029 | $ | 650,000 | 664,574 |
| Total U.S. Treasuries | 664,574 | ||
| SHORT-TERM INVESTMENT—2.3% | |||
| State Street Institutional U.S. Government Money Market Fund, Premier Class, 4.76%(k) | 2,096,752 | 2,096,752 | |
| Total Short-Term Investment | 2,096,752 | ||
| Total Investments (Cost $95,824,514)(l)—99.7% | 88,804,456 | ||
| Other Assets in Excess of Liabilities—0.3% | 248,713 | ||
| Net Assets—100.0% | $89,053,169 | ||
| (a) | Denotes a security issued under Regulation S or Rule 144A. |
| (b) | Sinkable security. |
| (c) | Security is in default. |
| (d) | Illiquid security. |
| (e) | Perpetual bond. This is a bond that has no maturity date, is redeemable and pays a steady stream of interest indefinitely. The maturity date presented for these instruments represents the next call/put date. |
| (f) | Payment-in-kind security for which part of the income earned may be paid as additional principal. |
| (g) | Level 3 security. See Note 2(a) of the accompanying Notes to Financial Statements. |
| (h) | The Fund’s adviser has deemed this security to be illiquid based upon procedures approved by the Board of Trustees. Illiquid securities held by the Fund represent 0.00% of net assets as of April 30, 2023. |
| (i) | Step bond. Rate disclosed is as of April 30, 2023. |
| (j) | Variable or Floating Rate security. Rate disclosed is as of April 30, 2023. |
| (k) | Registered investment company advised by State Street Global Advisors. The rate shown is the 7 day yield as of April 30, 2023. |
| (l) | See accompanying Notes to Financial Statements for tax unrealized appreciation/(depreciation) of securities. |
| ETF | Exchange-Traded Fund |
| EUR | Euro Currency |
| FRN | Floating Rate Note |
| GBP | British Pound Sterling |
| PIK | Payment-In-Kind |
| PLC | Public Limited Company |
| REIT | Real Estate Investment Trust |
| USD | U.S. Dollar |
| 2023 Semi-Annual Report | 19 |
| At April 30, 2023, the Fund held the following forward foreign currency contracts: |
| Purchase Contracts Settlement Date | Counterparty | Currency Purchased | Amount Purchased | Currency Sold | Amount Sold | Fair Value | Unrealized Appreciation/ (Depreciation) | |
| British Pound/United States Dollar | ||||||||
| 07/19/2023 | Morgan Stanley & Co. | GBP | 109,964 | USD | 136,935 | $138,405 | $1,470 | |
| Euro/United States Dollar | ||||||||
| 07/19/2023 | Royal Bank of Canada | EUR | 125,300 | USD | 139,038 | 138,664 | (374) | |
| $277,069 | $1,096 | |||||||
| Sale Contracts Settlement Date | Counterparty | Currency Purchased | Amount Purchased | Currency Sold | Amount Sold | Fair Value | Unrealized Appreciation/ (Depreciation) | |
| United States Dollar/British Pound | ||||||||
| 07/19/2023 | Royal Bank of Canada | USD | 4,104,725 | GBP | 3,302,589 | $4,156,768 | $(52,043) | |
| United States Dollar/Euro | ||||||||
| 07/19/2023 | Deutsche Bank AG | USD | 285,262 | EUR | 257,310 | 284,753 | 509 | |
| 07/19/2023 | Royal Bank of Canada | USD | 17,120,092 | EUR | 15,524,628 | 17,180,363 | (60,271) | |
| $21,621,884 | $(111,805) | |||||||
| Unrealized appreciation on forward foreign currency exchange contracts | $1,979 | |||||||
| Unrealized depreciation on forward foreign currency exchange contracts | $(112,688) | |||||||
| 20 | 2023 Semi-Annual Report |
| Average Annual Total Return1 (For the periods ended April 30, 2023) | Six Month2 | 1 Yr. | 5 Yr. | 10 Yr. | |
Class A | w/o SC | 5.40% | 0.73% | 0.98% | 1.12% |
| w/SC3 | 2.74% | (1.77%) | 0.47% | 0.86% | |
Institutional Service Class4 | w/o SC | 5.55% | 1.02% | 1.25% | 1.38% |
Institutional Class4 | w/o SC | 5.55% | 1.13% | 1.25% | 1.38% |
| 1 | The Fund changed its investment strategy effective February 28, 2019. Performance information for periods prior to February 28, 2019 does not reflect such investment policy. |
| 2 | Not annualized |
| 3 | A 2.50% front-end sales charge was deducted. Prior to February 28, 2019 the front-end sales charge was 4.25% |
| 4 | Not subject to any sales charge. Returns before the first offering of the Institutional Class and Institutional Service Class shares (February 25, 2013) are based on the previous performance of Class D shares. Returns of each class have not been adjusted to reflect the expenses applicable to the respective classes. Excluding the effect of any fee waivers or reimbursements, this performance is substantially similar to what the Institutional Service Class, and Institutional Class shares would have produced because all classes invest in the same portfolio of securities. Returns for the Institutional Service Class, and Institutional Class shares would only differ to the extent of the differences in expenses of the classes. |

| 2023 Semi-Annual Report | 21 |
| Asset Allocation | |
| Municipal Bonds | 98.7% |
| Short-Term Investment | 0.1% |
| Other Assets in Excess of Liabilities | 1.2% |
| 100.0% |
| Top Ten Holdings | |
| Mississippi Business Finance Corp. Revenue Bonds (PSL-North America), Series A 11/01/2032 | 8.3% |
| New Jersey Transportation Trust Fund Authority Revenue Bonds, Series A 12/15/2034 | 4.6% |
| Harris County Health Facilities Development Corp. Revenue Bonds (SCH Health Care System), Prerefunded/Escrowed to Maturity, Series B 07/01/2027 | 2.8% |
| County of Meade, Kentucky (Nucor Steel Brandenburg Project) Series 2021A-1 Industrial Building Revenue Bonds, AMT, VRDN, Series A-1 08/01/2061 | 2.5% |
| Metropolitan Transportation Authority Revenue Bonds, Series C-1 11/15/2027 | 2.5% |
| New York State Dormitory Authority Revenue Bonds (State University Educational Facilities 3rd Generation), Series A 05/15/2023 | 2.5% |
| Connecticut State Health & Educational Facilities Authority Revenue Bonds (Masonicare Corp Obligated Group), Series F 07/01/2027 | 2.4% |
| Ohio Higher Educational Facility Commission Revenue Bonds 07/01/2030 | 2.3% |
| Hudson Yards Infrastructure Corp. Revenue Bonds, Series A 02/15/2042 | 2.2% |
| California Community Choice Financing Authority Revenue Bonds (Clean Energy Project), Series C 01/01/2054 | 2.2% |
| States | |
| New York | 17.3% |
| Texas | 12.6% |
| Mississippi | 8.3% |
| Florida | 7.2% |
| California | 6.0% |
| New Jersey | 5.9% |
| Wisconsin | 4.8% |
| Pennsylvania | 4.7% |
| Ohio | 3.8% |
| Michigan | 3.7% |
| Kentucky | 3.6% |
| Connecticut | 3.3% |
| Tennessee | 2.9% |
| South Carolina | 2.2% |
| Other, less than 2% each | 12.4% |
| Short-Term Investment | 0.1% |
| Assets in Excess of Other Liabilities | 1.2% |
| 100.0% |
| 22 | 2023 Semi-Annual Report |
| Shares or Principal Amount | Value | ||
| MUNICIPAL BONDS —98.7% | |||
| ARIZONA—0.2% | |||
| The Industrial Developement Authority Of The County Of Maricopa Education Revenue Bonds (Legacy Traditional Schools Projects), Series B, 5.00%, 07/01/2049(a) | $ | 100,000 | $ 88,921 |
| CALIFORNIA—6.0% | |||
| Bay Area Toll Authority Revenue Bonds, Series A, 2.95%, 04/01/2047(b) | 335,000 | 329,698 | |
| California Community Choice Financing Authority Revenue Bonds (Clean Energy Project), Series C, 5.25%, 01/01/2054(b) | 1,000,000 | 1,043,988 | |
| Los Angeles Community College District General Obligation Unlimited Bonds, Series I, 4.00%, 08/01/2029 | 400,000 | 420,823 | |
| M-S-R Energy Authority Gas Revenue Bonds | |||
| Series A, 6.50%, 11/01/2039 | 500,000 | 586,038 | |
| Series B, 6.13%, 11/01/2029 | 440,000 | 473,400 | |
| Total California | 2,853,947 | ||
| COLORADO—0.3% | |||
| Colorado Educational & Cultural Facilities Authority Revenue Bonds (Aspen View Academy), 4.00%, 05/01/2041 | 170,000 | 148,185 | |
| CONNECTICUT—3.3% | |||
| Connecticut State Health & Educational Facilities Authority Revenue Bonds (Masonicare Corp Obligated Group), Series F, 5.00%, 07/01/2027 | 1,135,000 | 1,140,855 | |
| State Of Connecticut General Obligation Bonds, Series B, 3.00%, 06/01/2040 | 500,000 | 433,283 | |
| Total Connecticut | 1,574,138 | ||
| DISTRICT OF COLUMBIA—1.2% | |||
| Washington Convention & Sports Authority Revenue Bonds, Series A, 5.00%, 10/01/2030 | 500,000 | 546,138 | |
| FLORIDA—7.2% | |||
| City of Lakeland Revenue Bonds, Series B, AMT, 5.00%, 10/01/2028 | 565,000 | 629,400 | |
| Florida Development Finance Corp. Revenue Bonds (Glenridge On Palmer Ranch), 5.00%, 06/01/2035 | 225,000 | 207,852 | |
| Florida Development Finance Corp. Revenue Bonds (Global Outreach Charter AC), Series A, 4.00%, 06/30/2041(a) | 765,000 | 616,772 | |
| Florida Development Finance Corp. Revenue Bonds (Imagine School at Broward), Series A, 5.00%, 12/15/2039(a) | 500,000 | 513,563 | |
| Palm Beach County Educational Facilities Authority Revenue Bonds (Palm Beach Atlantic University, Inc.) | |||
| 4.00%, 10/01/2027 | 260,000 | 261,851 | |
| 4.00%, 10/01/2028 | 270,000 | 272,995 | |
| Palm Beach County Revenue Bonds (Provident Group - LU Properties LLC - LYNN University Housing Project), Series A, 5.00%, 06/01/2057(a) | 600,000 | 514,073 | |
| Shares or Principal Amount | Value | ||
| Polk County Industrial Development Authority Revenue Bonds (Carpenter's Home Estates, Inc. Project), Series A, 5.00%, 01/01/2039 | $ | 160,000 | $ 147,861 |
| Volusia County Educational Facility Authority Revenue Bonds, Series B, 5.00%, 10/15/2023 | 250,000 | 251,770 | |
| Total Florida | 3,416,137 | ||
| GEORGIA—1.1% | |||
| Main Street Natural Gas, Inc. Revenue Bonds | |||
| Series A, 5.00%, 05/15/2035 | 250,000 | 263,362 | |
| Series B, 5.00%, 06/01/2026 | 250,000 | 256,494 | |
| Total Georgia | 519,856 | ||
| HAWAII—1.3% | |||
| City & County Honolulu HI Wastewater System Revenue Bonds, Series A, 5.00%, 07/01/2047 | 560,000 | 594,738 | |
| KENTUCKY—3.6% | |||
| County of Meade, Kentucky (Nucor Steel Brandenburg Project) Series 2021A-1 Industrial Building Revenue Bonds, AMT, VRDN, Series A-1, 4.81%, 08/01/2061(b) | 1,200,000 | 1,200,000 | |
| Kentucky Public Energy Authority Revenue Bonds, Series A, 4.00%, 04/01/2048(b) | 500,000 | 500,444 | |
| Total Kentucky | 1,700,444 | ||
| LOUISIANA—1.8% | |||
| Louisiana Public Facilities Authority Revenue Bonds, (Pre-refunded @ $100.000000, 05/15/2026), 3.00%, 05/15/2031 | 10,000 | 10,031 | |
| New Orleans Aviation Board Revenue Bonds (Louis Armstrong International Airport), (AGM), 5.00%, 01/01/2028 | 500,000 | 551,152 | |
| New Orleans Aviation Board Revenue Bonds (Parking Facilities Corp.), (AGM), Series B, 5.00%, 10/01/2027 | 250,000 | 273,524 | |
| Total Louisiana | 834,707 | ||
| MASSACHUSETTS—1.7% | |||
| Massachusetts Development Finance Agency Revenue Bonds (Massachusetts Seven Hills Foundation & Affiliates Issue), 5.00%, 09/01/2031 | 270,000 | 281,947 | |
| Massachusetts Development Finance Agency Revenue Bonds (Wellforce Obligated Group), Series A, 5.00%, 07/01/2036 | 500,000 | 512,662 | |
| Total Massachusetts | 794,609 | ||
| MICHIGAN—3.7% | |||
| Flint Hospital Building Authority Revenue Bonds | |||
| 4.00%, 07/01/2035 | 1,000,000 | 975,345 | |
| 4.00%, 07/01/2038 | 750,000 | 682,420 | |
| Michigan Finance Authority Revenue Bonds (Cesar Chavez Academy), 3.25%, 02/01/2024 | 90,000 | 88,984 | |
| Total Michigan | 1,746,749 | ||
| 2023 Semi-Annual Report | 23 |
| Shares or Principal Amount | Value | ||
| MUNICIPAL BONDS (continued) | |||
| MISSISSIPPI—8.3% | |||
| Mississippi Business Finance Corp. Revenue Bonds (PSL-North America), Series A, 5.15%, 11/01/2032(b) | $ | 3,940,000 | $ 3,940,000 |
| MISSOURI—0.3% | |||
| State Health & Educational Facilities Authority Revenue Bond (Bethesda Health Group, Inc.), 4.00%, 08/01/2036 | 165,000 | 143,614 | |
| NEW HAMPSHIRE—1.1% | |||
| New Hampshire Health & Education Facilities Authority Revenue Bonds (Dartmouth College) | |||
| Series A, 5.00%, 08/01/2035 | 250,000 | 265,427 | |
| Series A, 5.00%, 08/01/2036 | 245,000 | 258,542 | |
| Total New Hampshire | 523,969 | ||
| NEW JERSEY—5.9% | |||
| New Jersey Educational Facilities Authority Revenue Bonds (The College of New Jersey) | |||
| (Pre-refunded @ $100, 07/01/2026), Series F, 4.00%, 07/01/2033 | 70,000 | 72,757 | |
| Series F, 4.00%, 07/01/2033 | 30,000 | 30,584 | |
| New Jersey Transportation Trust Fund Authority Revenue Bonds, Series A, 5.00%, 12/15/2034 | 2,000,000 | 2,173,876 | |
| Newark Housing Authority Revenue Bonds (Newark Redevelopment Project), 4.00%, 01/01/2037 | 500,000 | 507,070 | |
| Total New Jersey | 2,784,287 | ||
| NEW YORK—17.3% | |||
| Build NYC Resource Corp. Revenue Bonds (Classical Charter Schools Project), Series A, 4.75%, 06/15/2053 | 850,000 | 827,323 | |
| Build NYC Resource Corporation Revenue Bonds (Kipp NYC Public School Facilities - Canal West Project), 5.25%, 07/01/2052 | 100,000 | 102,798 | |
| City of Elmira General Obligation Limited Bonds | |||
| 5.00%, 07/01/2025(a) | 85,000 | 87,852 | |
| 5.00%, 07/01/2033(a) | 625,000 | 669,144 | |
| City of Poughkeepsie General Obligation Limited Bonds, 5.00%, 06/01/2031 | 145,000 | 151,829 | |
| Hudson Yards Infrastructure Corp. Revenue Bonds, Series A, 5.00%, 02/15/2042 | 1,000,000 | 1,056,280 | |
| Metropolitan Transportation Authority Revenue Bonds | |||
| Series A-1, 5.00%, 11/15/2027 | 695,000 | 723,131 | |
| Series C-1, 5.00%, 11/15/2027 | 1,150,000 | 1,190,170 | |
| Nassau County Local Economic Assistance Corp. Revenue Bonds (Catholic Health Services), 5.00%, 07/01/2030 | 1,000,000 | 1,021,124 | |
| New York City Water & Sewer System Revenue Bonds, Series EE, 5.00%, 06/15/2037 | 295,000 | 318,045 | |
| New York State Dormitory Authority Revenue Bonds (State University Educational Facilities 3rd Generation), Series A, 5.50%, 05/15/2023 | 1,160,000 | 1,160,917 | |
| Shares or Principal Amount | Value | ||
| New York Transportation Development Corp. Revenue Bonds, AMT, 4.00%, 10/31/2034 | $ | 250,000 | $ 248,234 |
| Port Authority of New York & New Jersey Revenue Bonds, 5.00%, 10/15/2042 | 560,000 | 596,889 | |
| Total New York | 8,153,736 | ||
| OHIO—3.8% | |||
| Buckeye Tobacco Settlement Financing Authority Tobacco Settlement Assets-Backed Revenue Bonds, Series B-2, 5.00%, 06/01/2055 | 610,000 | 568,571 | |
| Ohio Air Quality Development Authority Revenue Bonds (Ohio Valley Electric Corp. Project), Series A, 3.25%, 09/01/2029 | 135,000 | 125,963 | |
| Ohio Higher Educational Facility Commission Revenue Bonds, 4.00%, 07/01/2030 | 1,095,000 | 1,106,262 | |
| Total Ohio | 1,800,796 | ||
| PENNSYLVANIA—4.7% | |||
| Montgomery County Industrial Development Authority Revenue Bonds (Imagine School at Broward), 4.00%, 12/01/2037 | 300,000 | 295,956 | |
| Pennsylvania Turnpike Commission Revenue Bonds, (AGM), Series A, 5.25%, 07/15/2029 | 850,000 | 990,648 | |
| School Dist. of the City of Erie, General Obligation Limited Bonds, Series A (AGM ST AID WITHHLDG), Series A, 5.00%, 04/01/2034 | 825,000 | 915,000 | |
| Total Pennsylvania | 2,201,604 | ||
| PUERTO RICO—0.2% | |||
| Electric Power Authority Revenue Bonds, Series VV, 5.25%, 07/01/2026 | 100,000 | 100,420 | |
| RHODE ISLAND—1.4% | |||
| Tobacco Settlement Financing Corp. Revenue Bonds, Series B, 4.50%, 06/01/2045 | 650,000 | 643,027 | |
| SOUTH CAROLINA—2.2% | |||
| City of Rock Hill SC Combined Utility System Revenue Bonds | |||
| 5.00%, 01/01/2025 | 500,000 | 514,610 | |
| 5.00%, 01/01/2026 | 500,000 | 525,626 | |
| Total South Carolina | 1,040,236 | ||
| TENNESSEE—2.9% | |||
| Knox County Health Educational & Housing Facilities Board Revenue Bonds (University Health System, Inc.), 5.00%, 09/01/2036 | 500,000 | 516,076 | |
| Metropolitan Government Nashville & Davidson Health & Educational Facilities Revenue Bonds (Trevecca Nazarene University Project), 5.00%, 10/01/2034 | 360,000 | 371,582 | |
| Tennessee Energy Acquisition Corp. Revenue Bonds, Series A, 5.25%, 09/01/2023 | 500,000 | 501,261 | |
| Total Tennessee | 1,388,919 | ||
| TEXAS—12.6% | |||
| Arlington Higher Education Finance Corp. Revenue Bonds, (Basis Texas Charter Schools, Inc.), Series A, 4.88%, 06/15/2056(b) | 190,000 | 190,562 | |
| 24 | 2023 Semi-Annual Report |
| Shares or Principal Amount | Value | ||
| MUNICIPAL BONDS (continued) | |||
| TEXAS (continued) | |||
| Harris County Health Facilities Development Corp. Revenue Bonds (SCH Health Care System), Prerefunded/Escrowed to Maturity, Series B, 5.75%, 07/01/2027 | $ | 1,240,000 | $ 1,318,596 |
| Matagorda County Navigation District No. 1 Revenue Bonds, Series B-1, 4.00%, 06/01/2030 | 1,000,000 | 981,010 | |
| Port of Beaumont Navigation District of Jefferson County Dock & Wharf Facilities Revenue Bonds (Jefferson Railport Terminal II LLC), Series A, 4.00%, 01/01/2050(a) | 1,000,000 | 711,713 | |
| Tarrant County Cultural Education Facilities Finance Corp. Revenue Bonds (Baylor Scott & White Obligated Group), Series A, 5.00%, 11/15/2029 | 800,000 | 848,370 | |
| Tarrant County Cultural Education Facilities Finance Corp. Revenue Bonds (Texas Health Resources Obligated Group), Series A, 4.00%, 02/15/2036 | 1,000,000 | 1,011,765 | |
| Texas Municipal Gas Acquisition & Supply Corp. I Revenue Bonds, Series D, 6.25%, 12/15/2026 | 825,000 | 861,870 | |
| Total Texas | 5,923,886 | ||
| UTAH—1.4% | |||
| Salt Lake City Corp. Airport Revenue Bonds, Series B, 5.00%, 07/01/2042 | 100,000 | 104,178 | |
| Utah Charter School Finance Authority Revenue Bonds (Scholar Academy), Series A, 4.50%, 04/15/2048(a)(b) | 570,000 | 567,828 | |
| Total Utah | 672,006 | ||
| WASHINGTON—0.4% | |||
| State Housing Finance Commission Revenue Bonds (Transforming Age Project), Series A, 5.00%, 01/01/2024(a) | 180,000 | 178,223 | |
| WISCONSIN—4.8% | |||
| Public Finance Authority Revenue Bonds | |||
| 5.00%, 06/15/2029 | 530,000 | 558,032 | |
| 5.00%, 06/15/2034 | 425,000 | 445,175 | |
| Series A, 5.00%, 07/01/2038 | 1,000,000 | 1,011,569 | |
| Wisconsin Health & Educational Facilities Authority Revenue Bonds (Froedtert Health, Inc. Obligated Group), Series A, Series 2017 A, 5.00%, 04/01/2035 | 250,000 | 265,797 | |
| Total Wisconsin | 2,280,573 | ||
| Total Municipal Bonds | 46,593,865 | ||
| SHORT-TERM INVESTMENT—0.1% | |||
| BlackRock Liquidity Funds MuniCash, Institutional Shares | 64,459 | 64,453 | |
| Total Short-Term Investment | 64,453 | ||
| Total Investments (Cost $48,005,190)(c)—98.8% | 46,658,318 | ||
| Other Assets in Excess of Liabilities—1.2% | 568,832 | ||
| Net Assets—100.0% | $47,227,150 | ||
| (a) | Denotes a security issued under Regulation S or Rule 144A. |
| (b) | Variable Rate Instrument. The rate shown is based on the latest available information as of April 30, 2023. Certain variable rate securities are not based on a published reference rate and spread but are determined by the issuer or agent and are based on current market conditions. These securities do not indicate a reference rate and spread in their description. |
| (c) | See accompanying Notes to Financial Statements for tax unrealized appreciation/(depreciation) of securities. |
| AMT | Alternative Minimum Tax |
| VRDN | Variable Rate Demand Note |
| 2023 Semi-Annual Report | 25 |
| Average Annual Total Return1 (For the periods ended April 30, 2023) | Six Month2 | 1 Yr. | 5 Yr. | Inception3 | |
Class A | w/o SC | 2.81% | (1.29%) | 0.61% | 1.96% |
| w/SC4 | 0.26% | (3.71%) | 0.10% | 1.69% | |
Class C5 | w/o SC | 2.43% | (1.91%) | 0.26% | (2.54%) |
| w/SC6 | 1.43% | (2.88%) | 0.26% | (2.54%) | |
Institutional Class7 | w/o SC | 2.94% | (1.04%) | 0.86% | 2.21% |
| 1 | The Fund changed its investment strategy effective February 28, 2019. Performance information for periods prior to February 28, 2019 does not reflect the Fund’s current investment strategy. Returns prior to May 7, 2018 reflect the performance of a predecessor fund (the “Predecessor Fund”). Returns of the Predecessor Fund have not been adjusted to reflect the expenses applicable to the respective classes. The Fund and the Predecessor Fund had substantially similar investment objectives and strategies prior to the Fund’s adoption of its current investment strategies on February 28, 2019. Please consult the Fund’s prospectus for more detail. |
| 2 | Not annualized |
| 3 | Predecessor Fund commenced operations on May 31, 2013. |
| 4 | A 2.50% front-end sales charge was deducted. Prior to February 28, 2019 the front-end sales charge was 4.25%. |
| 5 | Class C returns prior to the commencement of operations of Class C (inception date: 12/18/2020) are based on the previous performance of the Fund’s Class A shares (inception date: 5/31/2013). Excluding the effect of any fee waivers or reimbursements, this performance is substantially similar to what each individual class would have produced because all classes invest in the same portfolio of securities. Returns would only differ to the extent of the differences in expenses between the two classes. |
| 6 | A 1.00% contingent deferred sales charge (CDSC) was deducted from the one year return because it is charged when Class C shares are sold within the first year after purchase. |
| 7 | Not subject to any sales charges. |

| 26 | 2023 Semi-Annual Report |
| Asset Allocation | |
| Municipal Bonds | 99.0% |
| Other Assets in Excess of Liabilities | 1.0% |
| 100.0% |
| Top Ten Holdings | |
| Colorado Health Facilities Authority Revenue Bonds (Aberdeen Ridge), Series B-1 05/15/2030 | 4.4% |
| Madison County Capital Resource Corp. Revenue Bonds (Cazenovia College Project), Series A 09/01/2022 | 3.2% |
| Shakopee Minnesota Senior Housing Revenue Bonds (Benedictine Living Community of Shakopee LLC Project) 11/01/2058 | 3.1% |
| Washington State Housing Finance Commission Revenue Bonds(Eliseo Project), Series B-1 07/01/2028 | 2.7% |
| Public Finance Authority Revenue Bonds (Masonic & Eastern Star Home of NC, Inc.), Series B-1 03/01/2027 | 2.7% |
| Public Finance Authority Revenue Bonds, Series A-1 01/01/2027 | 2.6% |
| Calhoun County Navigation Industrial Development Authority Revenue Bonds (Max Midstream Texas LLC), AMT, Series A 07/01/2026 | 2.6% |
| Florida Development Finance Corp. Revenue Bonds (Mayflower Retirement Center, Inc. Obligated Group), Series B-2 06/01/2026 | 2.1% |
| California Public Finance Authority Revenue Bonds (Kendal at Sonoma Obligated Group), Series B-1 05/15/2029 | 2.0% |
| City of Elmira General Obligation Limited Bonds 07/01/2033 | 2.0% |
| States | |
| New York | 14.1% |
| Wisconsin | 10.5% |
| Illinois | 6.8% |
| Florida | 6.5% |
| Colorado | 6.0% |
| Texas | 5.8% |
| Washington | 5.6% |
| Arizona | 4.8% |
| California | 3.9% |
| Louisiana | 3.2% |
| Minnesota | 3.1% |
| Mississippi | 3.1% |
| Connecticut | 3.1% |
| Massachusetts | 2.9% |
| Utah | 2.8% |
| Pennsylvania | 2.7% |
| Maryland | 2.7% |
| Oregon | 2.7% |
| Other, less than 2% each | 8.7% |
| Assets in Excess of Other Liabilities | 1.0% |
| 100.0% |
| 2023 Semi-Annual Report | 27 |
| Principal Amount | Value | ||
| MUNICIPAL BONDS —99.0% | |||
| ALABAMA—0.1% | |||
| Jemison Water & Sewer Revenue Bonds, Series A, 3.50%, 03/01/2026 | $ | 180,000 | $ 174,616 |
| ARIZONA—4.8% | |||
| Arizona Industrial Development Authority Revenue Bonds (Great Lakes Senior Living Communities LLC Project Third Tier) | |||
| Series C, 5.13%, 01/01/2034(a) | 775,000 | 485,971 | |
| Series C, 5.13%, 01/01/2035(a) | 815,000 | 497,357 | |
| Arizona Industrial Development Authority Revenue Bonds (Kaizen Education Foundation), 5.00%, 07/01/2023(a) | 405,000 | 405,360 | |
| Arizona Industrial Development Authority Revenue Bonds (Somerset Academy of Las Vegas), Series A, 3.00%, 12/15/2031(a) | 655,000 | 560,416 | |
| Arizona Industrial Development Authority Revenue Refunding Bonds (Doral Academy of Northern Nevada Project) | |||
| Series A, 4.00%, 07/15/2026(a) | 125,000 | 122,093 | |
| Series A, 4.00%, 07/15/2027(a) | 125,000 | 121,505 | |
| Series A, 4.00%, 07/15/2028(a) | 185,000 | 178,908 | |
| Series A, 4.00%, 07/15/2029(a) | 200,000 | 192,011 | |
| Series A, 4.00%, 07/15/2030(a) | 215,000 | 204,618 | |
| Series A, 4.00%, 07/15/2031(a) | 215,000 | 202,880 | |
| Series A, 4.00%, 07/15/2032(a) | 225,000 | 210,289 | |
| Series A, 4.00%, 07/15/2033(a) | 185,000 | 171,323 | |
| Series A, 4.00%, 07/15/2034(a) | 185,000 | 168,969 | |
| Series A, 4.00%, 07/15/2035(a) | 255,000 | 228,659 | |
| Series A, 4.00%, 07/15/2036(a) | 250,000 | 221,585 | |
| Series A, 4.00%, 07/15/2037(a) | 275,000 | 239,368 | |
| La Paz County Industrial Development Authority Revenue Bonds (Charter School Solutions), Series A, 5.00%, 02/15/2026(a) | 330,000 | 335,986 | |
| Maricopa County Industrial Development Authority Revenue Bonds (Ottawa University) | |||
| 5.00%, 10/01/2026(a) | 245,000 | 245,316 | |
| 5.13%, 10/01/2030(a) | 425,000 | 429,287 | |
| Maricopa County Industrial Development Authority Revenue Bonds (Paragon Management, Inc.), 4.00%, 07/01/2026(a) | 1,010,000 | 990,548 | |
| The Industrial Developement Authority Of The County Of Maricopa Education Revenue Bonds (Legacy Traditional Schools Projects), Series B, 5.00%, 07/01/2049(a) | 635,000 | 564,647 | |
| Total Arizona | 6,777,096 | ||
| ARKANSAS—1.1% | |||
| County of Baxter Hospital Revenue Bonds (Baxter Regional Medical Center), Series A, 5.00%, 09/01/2026 | 1,490,000 | 1,551,488 | |
| CALIFORNIA—3.9% | |||
| California Community Choice Financing Authority Revenue Bonds (Clean Energy Project), Series C, 5.25%, 01/01/2054(b) | 2,500,000 | 2,609,971 | |
| Principal Amount | Value | ||
| California Municipal Finance Authority Revenue Bonds (Simpson University), Series A, 5.00%, 10/01/2026(a) | $ | 40,000 | $ 39,837 |
| California Public Finance Authority Revenue Bonds (Kendal at Sonoma Obligated Group), Series B-1, 3.13%, 05/15/2029(a) | 3,075,000 | 2,836,731 | |
| Total California | 5,486,539 | ||
| COLORADO—6.0% | |||
| Colorado Educational & Cultural Facilities Authority Revenue Bonds (Aspen View Academy, Inc.) | |||
| 4.00%, 05/01/2024 | 150,000 | 148,872 | |
| 4.00%, 05/01/2027 | 65,000 | 63,997 | |
| 4.00%, 05/01/2029 | 145,000 | 142,451 | |
| 4.00%, 05/01/2030 | 120,000 | 117,394 | |
| 4.00%, 05/01/2036 | 175,000 | 162,918 | |
| Colorado Health Facilities Authority Revenue Bonds, Series B, 5.00%, 05/15/2028 | 100,000 | 100,060 | |
| Colorado Health Facilities Authority Revenue Bonds (Aberdeen Ridge) | |||
| Series B-1, 3.50%, 05/15/2030 | 6,950,000 | 6,099,567 | |
| Series B-2, 2.63%, 05/15/2029 | 1,705,000 | 1,516,767 | |
| Total Colorado | 8,352,026 | ||
| CONNECTICUT—3.1% | |||
| City of West Haven General Obligation Unlimited Bonds | |||
| Series A, 5.00%, 11/01/2025 | 325,000 | 340,068 | |
| Series A, 5.00%, 11/01/2026 | 325,000 | 347,104 | |
| Series A, 5.00%, 11/01/2027 | 635,000 | 690,961 | |
| Series B, 5.00%, 11/01/2025 | 240,000 | 251,128 | |
| Series B, 5.00%, 11/01/2026 | 200,000 | 213,602 | |
| Series B, 5.00%, 11/01/2027 | 200,000 | 217,625 | |
| State Health & Educational Facilities Authority Revenue Bond (McLean Affiliates Obligated Group), Series A, 5.00%, 01/01/2030(a) | 500,000 | 494,116 | |
| State Health & Educational Facilities Authority Revenue Bond (University of Hartford) | |||
| Series N, 5.00%, 07/01/2025 | 400,000 | 405,070 | |
| Series N, 5.00%, 07/01/2026 | 575,000 | 586,208 | |
| Series N, 5.00%, 07/01/2027 | 430,000 | 441,960 | |
| Series N, 5.00%, 07/01/2029 | 300,000 | 312,475 | |
| Total Connecticut | 4,300,317 | ||
| FLORIDA—6.5% | |||
| Capital Trust Agency, Inc. Revenue Bonds (Wonderful Foundations Charter School Holdings LLC), Series A-1, 4.50%, 01/01/2035(a) | 300,000 | 271,276 | |
| Celebration Pointe Community Development District No.1 Special Assessment Revenue Bonds, 4.75%, 05/01/2024 | 25,000 | 25,103 | |
| Florida Development Finance Corp. Educational Facilities Revenue Bonds (Imagine School At Broward Project) | |||
| Series A, 4.00%, 12/15/2029(a) | 530,000 | 530,776 | |
| Series A, 5.00%, 12/15/2034(a) | 530,000 | 559,838 | |
| 28 | 2023 Semi-Annual Report |
| Principal Amount | Value | ||
| MUNICIPAL BONDS (continued) | |||
| FLORIDA (continued) | |||
| Florida Development Finance Corp. Educational Facilities Revenue Bonds (Miami Arts Charter School Project), Series A, 5.00%, 06/15/2024(a) | $ | 100,000 | $ 98,041 |
| Florida Development Finance Corp. Revenue Bonds (Glenridge on Palmer Ranch Obligated Group) | |||
| 3.00%, 06/01/2023(a) | 115,000 | 114,781 | |
| 4.00%, 06/01/2024(a) | 105,000 | 103,516 | |
| Florida Development Finance Corp. Revenue Bonds (Global Outreach Charter Academy Obligated Group) | |||
| Series A, 4.00%, 06/30/2027(a) | 150,000 | 144,474 | |
| Series A, 4.00%, 06/30/2028(a) | 195,000 | 186,044 | |
| Series A, 4.00%, 06/30/2029(a) | 205,000 | 193,713 | |
| Series A, 4.00%, 06/30/2030(a) | 215,000 | 200,825 | |
| Series A, 4.00%, 06/30/2031(a) | 225,000 | 207,498 | |
| Series A, 4.00%, 06/30/2036(a) | 625,000 | 538,499 | |
| Florida Development Finance Corp. Revenue Bonds (Mayflower Retirement Center, Inc. Obligated Group) | |||
| Series B-1, 2.38%, 06/01/2027(a) | 835,000 | 805,417 | |
| Series B-2, 1.75%, 06/01/2026(a) | 3,065,000 | 2,982,116 | |
| Lee County Industrial Development Authority Refunding Revenue Bonds (Shell Point Obligated Group), 4.00%, 11/15/2030 | 5,000 | 4,765 | |
| Palm Beach County Revenue Bonds (Provident Group - LU Properties LLC - LYNN University Housing Project), Series A, 5.00%, 06/01/2057(a) | 400,000 | 342,715 | |
| Palm Beach County Revenue Bonds (Provident Group - PBAU Properties LLC - Palm Beach Atlantic University Housing Project), Series A, 5.00%, 04/01/2029(a) | 1,315,000 | 1,328,426 | |
| Polk County Industrial Development Authority Revenue Bonds (Carpenter's Home Estates, Inc. Project) | |||
| Series A, 5.00%, 01/01/2029 | 315,000 | 312,834 | |
| Series A, 5.00%, 01/01/2039 | 240,000 | 221,792 | |
| Total Florida | 9,172,449 | ||
| IDAHO—0.5% | |||
| Idaho Housing & Finance Association Revenue Bonds (Idaho Arts Charter School, Inc.), Series A, 4.00%, 12/01/2026(a) | 600,000 | 596,453 | |
| Idaho Housing & Finance Association Revenue Bonds (Victory Charter School), Series A, 4.00%, 07/01/2026(a) | 80,000 | 79,592 | |
| Total Idaho | 676,045 | ||
| ILLINOIS—6.8% | |||
| Cook County School District No. 144 Prairie Hills General Obligation Unlimited Bonds, Series A, 4.00%, 12/01/2033 | 600,000 | 616,570 | |
| Governors State University Certificates of Participation (Capital Improvement Project), 5.00%, 07/01/2026 | 400,000 | 423,809 | |
| Principal Amount | Value | ||
| Illinois Finance Authority Educational Facility Revenue Bonds (Rogers Park Montessori School), 5.00%, 02/01/2024 | $ | 55,000 | $ 55,012 |
| Illinois Finance Authority Revenue Bonds (Acero Charter Schools, Inc. Obligated Group) | |||
| 4.00%, 10/01/2027(a) | 405,000 | 389,897 | |
| 4.00%, 10/01/2028(a) | 580,000 | 554,621 | |
| 4.00%, 10/01/2029(a) | 910,000 | 863,433 | |
| 4.00%, 10/01/2030(a) | 630,000 | 592,092 | |
| 4.00%, 10/01/2032(a) | 685,000 | 630,160 | |
| 4.00%, 10/01/2033(a) | 1,060,000 | 962,651 | |
| 4.00%, 10/01/2034(a) | 445,000 | 397,322 | |
| Illinois Finance Authority Revenue Bonds (Benedictine University) | |||
| 5.00%, 10/01/2028 | 120,000 | 122,497 | |
| 5.00%, 10/01/2029 | 200,000 | 205,007 | |
| 5.00%, 10/01/2030 | 100,000 | 102,774 | |
| Illinois Finance Authority Revenue Bonds (CHF-Chicago LLC) | |||
| Series A, 5.00%, 02/15/2027 | 420,000 | 428,086 | |
| Series A, 5.00%, 02/15/2028 | 400,000 | 409,727 | |
| Series A, 5.00%, 02/15/2029 | 520,000 | 533,054 | |
| Series A, 5.00%, 02/15/2030 | 335,000 | 343,146 | |
| Series A, 5.00%, 02/15/2031 | 370,000 | 378,417 | |
| Series A, 5.00%, 02/15/2032 | 225,000 | 229,678 | |
| Illinois Finance Authority Revenue Bonds (Chicago Charter School Foundation) | |||
| 5.00%, 12/01/2028 | 250,000 | 261,951 | |
| 5.00%, 12/01/2029 | 315,000 | 329,740 | |
| Village of Matteson Revenue Bonds | |||
| 5.00%, 12/01/2026 | 150,000 | 161,384 | |
| 5.00%, 12/01/2027 | 150,000 | 164,366 | |
| 5.00%, 12/01/2028 | 350,000 | 388,131 | |
| Total Illinois | 9,543,525 | ||
| INDIANA—0.2% | |||
| City of Valparaiso Exempt Facilities Revenue Bonds (Pratt Paper LLC), 5.88%, 01/01/2024 | 70,000 | 70,682 | |
| Hammond Local Public Improvement Bond Bank Revenue Bonds, Series B, 4.63%, 07/15/2023(a) | 225,000 | 224,540 | |
| Total Indiana | 295,222 | ||
| KANSAS—0.5% | |||
| City of Manhattan Revenue Bonds (Meadowlark Hills Retirement Community Obligated Group) | |||
| Series B-1, 2.88%, 06/01/2028 | 375,000 | 345,499 | |
| Series B-2, 2.38%, 06/01/2027 | 430,000 | 401,919 | |
| Total Kansas | 747,418 | ||
| LOUISIANA—3.2% | |||
| Louisiana Local Government Environmental Facilities & Community Development Authority Revenue Bonds (Provident Group - ULM Properties LLC - University Of Louisiana At Manroe Project), Series A, 5.00%, 07/01/2029(a) | 1,000,000 | 958,953 | |
| 2023 Semi-Annual Report | 29 |
| Principal Amount | Value | ||
| MUNICIPAL BONDS (continued) | |||
| LOUISIANA (continued) | |||
| Louisiana Local Government Environmental Facilities & Community Development Authority Revenue Bonds (St. James Place of Baton Rouge), Series A, 5.50%, 11/15/2025 | $ | 155,000 | $ 153,376 |
| Louisiana Local Government Environmental Facilities & Community Development Authority Revenue Bonds (The Glen System Retirement Project) | |||
| Series A, 5.00%, 01/01/2024 | 180,000 | 178,154 | |
| Series A, 5.00%, 01/01/2025 | 370,000 | 360,273 | |
| Series A, 5.00%, 01/01/2026 | 390,000 | 373,758 | |
| Series A, 5.00%, 01/01/2027 | 410,000 | 385,369 | |
| Series A, 5.00%, 01/01/2028 | 430,000 | 396,557 | |
| Series A, 5.00%, 01/01/2029 | 450,000 | 407,289 | |
| Louisiana Local Government Environmental Facilities & Community Development Authority Student Housing Revenue Bonds (Provident Group - ULM Properties LLC - University Of Louisiana At Manroe Project), Series A, 5.00%, 07/01/2039(a) | 1,000,000 | 844,115 | |
| Louisiana Public Facilities Authority Revenue Bonds (Young Audiences Charter School Project), Series A, 5.00%, 04/01/2030(a) | 400,000 | 395,157 | |
| Total Louisiana | 4,453,001 | ||
| MARYLAND—2.7% | |||
| Anne Arundel County Consolidated Special Taxing District Bonds (Villages at Two Rivers Project), 4.20%, 07/01/2024 | 50,000 | 49,919 | |
| Frederick County Educational Facilities Revenue Bonds (Mount St. Marys University) | |||
| Series A, 5.00%, 09/01/2027(a) | 1,495,000 | 1,486,288 | |
| Series A, 5.00%, 09/01/2032(a) | 740,000 | 737,222 | |
| Maryland Industrial Development Financing Authority Revenue Bonds (Occidental Petroleum Corp.), 5.65%, 03/01/2030(b) | 1,500,000 | 1,500,000 | |
| Total Maryland | 3,773,429 | ||
| MASSACHUSETTS—2.9% | |||
| Massachusetts Development Finance Agency Revenue Bonds (Linden Ponds, Inc.), 4.00%, 11/15/2023(a) | 230,000 | 229,182 | |
| Massachusetts Development Finance Agency Revenue Bonds (NewBridge on The Charles, Inc.) | |||
| 4.00%, 10/01/2025(a) | 500,000 | 497,712 | |
| 4.00%, 10/01/2026(a) | 500,000 | 496,051 | |
| 4.00%, 10/01/2027(a) | 450,000 | 444,611 | |
| Massachusetts Development Finance Agency Revenue Bonds (Provident Commonwealth Education Resource, Inc.), 5.00%, 10/01/2024 | 1,500,000 | 1,507,655 | |
| Massachusetts Development Finance Agency Revenue Bonds (Wellforce Issue) | |||
| Series A, 5.00%, 07/01/2033 | 500,000 | 521,622 | |
| Series A, 5.00%, 07/01/2034 | 300,000 | 311,684 | |
| Total Massachusetts | 4,008,517 | ||
| Principal Amount | Value | ||
| MICHIGAN—1.6% | |||
| Calhoun County Hospital Finance Authority Revenue Bonds (Ella E.M. Brown Charitable Circle), 5.00%, 02/15/2024 | $ | 500,000 | $ 503,333 |
| Charyl Stockwell Academy Revenue Bonds, 4.88%, 10/01/2023 | 20,000 | 19,937 | |
| Flint Hospital Building Authority Revenue Bonds (Hurley Medical Center), Series B, 4.75%, 07/01/2028 | 1,000,000 | 985,725 | |
| Kalamazoo Economic Development Corp. Revenue Bonds (Heritage Community of Kalamazoo Obligated Group), Series B-2, 2.63%, 05/15/2025 | 115,000 | 109,944 | |
| Michigan Finance Authority Public School Academy Limited Revenue Bond (Cesar Chavez Academy Project), 4.00%, 02/01/2029 | 700,000 | 665,362 | |
| Total Michigan | 2,284,301 | ||
| MINNESOTA—3.1% | |||
| Shakopee Minnesota Senior Housing Revenue Bonds (Benedictine Living Community of Shakopee LLC Project), 5.85%, 11/01/2058(a)(b) | 4,465,000 | 4,389,037 | |
| MISSISSIPPI—3.1% | |||
| Mississippi Business Finance Corp. Revenue Bonds (PSL-North America), Series A, 5.15%, 11/01/2032(b) | 985,000 | 985,000 | |
| Mississippi Development Bank Obligation Bonds (Mangolia Regional Health Centre) | |||
| 5.00%, 10/01/2023(a) | 415,000 | 415,958 | |
| 5.00%, 10/01/2024(a) | 440,000 | 444,614 | |
| 5.00%, 10/01/2025(a) | 660,000 | 670,465 | |
| Mississippi Development Bank Revenue Bonds (Hancock County Gomesa Project), 4.55%, 11/01/2039(a) | 1,865,000 | 1,847,917 | |
| Total Mississippi | 4,363,954 | ||
| MISSOURI—1.1% | |||
| Platte County Industrial Development Authority Transportation Revenue Bonds, 5.00%, 12/01/2025(c)(d) | 675,000 | 303,750 | |
| Plaza at Noah's Ark Community Improvement District Revenue Bonds | |||
| 3.00%, 05/01/2023 | 100,000 | 100,000 | |
| 3.00%, 05/01/2024 | 100,000 | 98,486 | |
| 3.00%, 05/01/2025 | 100,000 | 96,980 | |
| 3.00%, 05/01/2026 | 100,000 | 95,541 | |
| State Health & Educational Facilities Authority Revenue Bond (Bethesda Health Group, Inc.) | |||
| 4.00%, 08/01/2029 | 385,000 | 366,124 | |
| 4.00%, 08/01/2031 | 310,000 | 288,841 | |
| 4.00%, 08/01/2036 | 275,000 | 239,356 | |
| Total Missouri | 1,589,078 | ||
| 30 | 2023 Semi-Annual Report |
| Principal Amount | Value | ||
| MUNICIPAL BONDS (continued) | |||
| NEW JERSEY—0.2% | |||
| New Jersey Economic Development Authority Revenue Bonds (Greater Brunswick Charter School Project), Series A, 4.75%, 08/01/2024(a) | $ | 50,000 | $ 49,865 |
| Passaic County Improvement Authority Charter School Revenue Bonds (Paterson Arts and Science Charter School Project), 5.25%, 07/01/2043 | 200,000 | 204,249 | |
| Total New Jersey | 254,114 | ||
| NEW YORK—14.1% | |||
| Amherst Development Corp. Revenue Bonds (Daemen College) | |||
| 5.00%, 10/01/2025 | 600,000 | 608,277 | |
| 5.00%, 10/01/2026 | 630,000 | 643,639 | |
| 4.00%, 10/01/2037 | 500,000 | 447,555 | |
| Build NYC Resource Corp. Revenue Bonds (Classical Charter Schools Project), Series A, 4.50%, 06/15/2043 | 690,000 | 673,919 | |
| Build NYC Resource Corp. Revenue Bonds (Metropolitan Lighthouse Charter School Project) | |||
| Series A, 5.00%, 06/01/2023(a) | 370,000 | 370,208 | |
| Series A, 5.00%, 06/01/2024(a) | 390,000 | 392,102 | |
| Series A, 5.00%, 06/01/2025(a) | 410,000 | 412,476 | |
| Series A, 5.00%, 06/01/2026(a) | 430,000 | 432,663 | |
| Series A, 5.00%, 06/01/2027(a) | 450,000 | 452,950 | |
| Series A, 5.00%, 06/01/2032(a) | 500,000 | 496,022 | |
| City of Elmira General Obligation Limited Bonds | |||
| 5.00%, 07/01/2025(a) | 845,000 | 873,353 | |
| 5.00%, 07/01/2033(a) | 2,635,000 | 2,821,110 | |
| City of Poughkeepsie General Obligation Limited Bonds, 5.00%, 06/01/2031 | 455,000 | 476,428 | |
| Madison County Capital Resource Corp. Revenue Bonds (Cazenovia College Project), Series A, 5.50%, 09/01/2022(c)(d)(e) | 6,500,000 | 4,550,000 | |
| New York Transportation Development Corp. Speciality Facility Revenue Bonds, 3.00%, 08/01/2031 | 1,000,000 | 873,190 | |
| Westchester County Local Development Corporation Revenue Bonds (Purchase Senior Learning Community Inc. Project, Series B, 3.60%, 07/01/2029(a) | 2,000,000 | 1,755,121 | |
| Westchester County Local Development Corporation Revenue Bonds (Purchase Senior Learning Community Inc. Project) | |||
| Series C, 3.20%, 07/01/2028(a) | 1,675,000 | 1,557,442 | |
| Series D, 2.88%, 07/01/2026(a) | 1,000,000 | 948,331 | |
| Western Regional Off-Track Betting Corp. Revenue Bonds, 3.00%, 12/01/2026(a) | 1,060,000 | 974,251 | |
| Total New York | 19,759,037 | ||
| Principal Amount | Value | ||
| OHIO—0.8% | |||
| Buckeye Tobacco Settlement Financing Authority Tobacco Settlement Assets-Backed Revenue Bonds, Series B-2, 5.00%, 06/01/2055 | $ | 1,000,000 | $ 932,083 |
| Cleveland-Cuyahoga County Port Authority Revenue Bonds, 5.00%, 12/01/2028 | 180,000 | 182,987 | |
| Total Ohio | 1,115,070 | ||
| OREGON—2.7% | |||
| Hospital Facilities Authority of Multnomah County Oregon Revenue Bonds | |||
| 0.95%, 06/01/2027 | 1,000,000 | 872,063 | |
| Series B, 1.20%, 06/01/2028 | 1,800,000 | 1,524,770 | |
| Yamhill County Hospital Authority Revenue Bonds (Friendsview Manor Obligated Group), Series B-2, 2.13%, 11/15/2027 | 1,500,000 | 1,347,258 | |
| Total Oregon | 3,744,091 | ||
| PENNSYLVANIA—2.7% | |||
| City of Scranton PA General Obligation Bonds, 5.00%, 09/01/2023(a) | 1,000,000 | 998,728 | |
| Delaware County Industrial Development Authority Revenue Bonds (CCSA Foundation), Series A, 4.38%, 06/01/2026(a) | 2,135,000 | 2,099,567 | |
| Indiana County Hospital Authority Revenue Bonds (Indiana Regional Medical Center), Series A, 5.00%, 06/01/2023 | 100,000 | 100,117 | |
| Lehigh County Industrial Development Authority Revenue Bonds (Seven Generations Charter School), Series A, 4.00%, 05/01/2031 | 680,000 | 633,496 | |
| Total Pennsylvania | 3,831,908 | ||
| PUERTO RICO—0.9% | |||
| HTA HRRB Assured Custodial Trust CTFS Revenue Bonds, 5.50%, 07/01/2030 | 1,000,000 | 1,030,921 | |
| HTA TRRB Assured Custodial Trust CTFS Revenue Bonds, 5.50%, 07/01/2023 | 200,000 | 200,217 | |
| Total Puerto Rico | 1,231,138 | ||
| RHODE ISLAND—0.4% | |||
| Rhode Island Health & Educational Building Corp. Revenue Bonds (Care New England Health System Obligated Group), Series B, 5.00%, 09/01/2023 | 500,000 | 500,873 | |
| SOUTH CAROLINA—1.0% | |||
| South Carolina Jobs-Economic Development Authority Revenue Bonds (Lowcountry Leadership Charter School), Series A, 4.00%, 12/01/2029(a) | 1,030,000 | 1,000,087 | |
| South Carolina Jobs-Economic Development Authority Revenue Bonds (RePower South Berkeley LLC), Series A, 5.25%, 02/01/2027(a)(c)(d)(f) | 1,060,000 | 424,000 | |
| Total South Carolina | 1,424,087 | ||
| 2023 Semi-Annual Report | 31 |
| Principal Amount | Value | ||
| MUNICIPAL BONDS (continued) | |||
| TEXAS—5.8% | |||
| Arlington Higher Education Finance Corp. Revenue Bonds (Wayside Schools) | |||
| Series A, 5.00%, 08/15/2023 | $ | 155,000 | $ 154,827 |
| Series A, 5.00%, 08/15/2028 | 80,000 | 79,774 | |
| Series A, 4.00%, 08/15/2029 | 75,000 | 70,760 | |
| Series A, 4.00%, 08/15/2030 | 80,000 | 74,742 | |
| Series A, 4.00%, 08/15/2031 | 90,000 | 83,142 | |
| Arlington Higher Education Finance Corp. Revenue Bonds, (Basis Texas Charter Schools, Inc.), Series A, 4.88%, 06/15/2056(a)(b) | 560,000 | 561,656 | |
| Bexar County Health Facilities Development Corp. Revenue Bonds (Army Retirement Residence Obligation Group), 5.00%, 07/15/2023 | 300,000 | 299,857 | |
| Calhoun County Navigation Industrial Development Authority Revenue Bonds (Max Midstream Texas LLC), AMT, Series A, 3.63%, 07/01/2026(a) | 4,000,000 | 3,639,358 | |
| Change Desertexpress Enterprises LLC to Brightline West Passenger Rail Project, VRN, Series B, 2.00%, 11/15/2061(b) | 708,386 | 304,842 | |
| Decatur Hospital Authority Revenue Bonds (Wise Regional Health System), Series A, 5.00%, 09/01/2023 | 275,000 | 275,119 | |
| New Hope Cultural Education Facilities Finance Corp. Revenue Bonds (Cardinal Bay, Inc.) | |||
| Series C, 5.00%, 07/01/2023 | 300,000 | 135,000 | |
| Series D, 6.00%, 07/01/2026 | 95,000 | 38,000 | |
| New Hope Cultural Education Facilities Finance Corp.(Outlook at Windhaven Forefront Living Obligated Group), Series B-3, 4.25%, 10/01/2026 | 2,000,000 | 1,963,819 | |
| New Hope Cultural Education Facilities Finance Corporation Education Revenue And Refunding Bonds (Jubilee Academic Center), 4.00%, 08/15/2023(a) | 360,000 | 358,696 | |
| SA Energy Acquisition Public Facility Corp. Revenue Bonds, 5.50%, 08/01/2023 | 50,000 | 50,134 | |
| Total Texas | 8,089,726 | ||
| UTAH—2.8% | |||
| Utah Charter School Finance Authority Revenue Bonds (Esperanza Elementary School) | |||
| Series A, 4.50%, 10/15/2028(a) | 500,000 | 488,417 | |
| Series A, 4.63%, 10/15/2048(a)(b) | 1,000,000 | 989,503 | |
| Utah Charter School Finance Authority Revenue Bonds (Freedom Academy Foundation), Series A, 3.25%, 06/15/2031(a) | 535,000 | 477,426 | |
| Utah Charter School Finance Authority Revenue Bonds (Wasatch Waldorf Charter School, Inc.), Series A, 4.75%, 05/15/2048(a)(b) | 2,000,000 | 1,999,702 | |
| Total Utah | 3,955,048 | ||
| Principal Amount | Value | ||
| WASHINGTON—5.6% | |||
| Washington State Housing Finance Commission Revenue Bonds (Spokane International Academy) | |||
| Series A, 4.00%, 07/01/2025(a) | $ | 355,000 | $ 348,924 |
| Series A, 4.00%, 07/01/2026(a) | 285,000 | 279,101 | |
| Series A, 4.00%, 07/01/2027(a) | 295,000 | 287,801 | |
| Series A, 4.00%, 07/01/2028(a) | 305,000 | 296,112 | |
| Series A, 4.00%, 07/01/2029(a) | 320,000 | 308,781 | |
| Washington State Housing Finance Commission Revenue Bonds(Eliseo Project) | |||
| Series B-1, 2.50%, 07/01/2028(a) | 4,375,000 | 3,836,780 | |
| Series B-2, 2.13%, 07/01/2027(a) | 2,750,000 | 2,465,612 | |
| Total Washington | 7,823,111 | ||
| WEST VIRGINIA—0.3% | |||
| Ohio County Development Authority Revenue Bonds (Ohio County Sport Complex Project), 4.00%, 09/01/2023 | 425,000 | 421,680 | |
| WISCONSIN—10.5% | |||
| Public Finance Authority Educational Facilities Revenue Refunding Bonds (The Methodist University) | |||
| 4.00%, 03/01/2029(a) | 890,000 | 813,292 | |
| 4.00%, 03/01/2030(a) | 950,000 | 854,122 | |
| Public Finance Authority Revenue Bonds | |||
| Series A, 5.00%, 10/01/2029(a) | 500,000 | 499,164 | |
| Series A-1, 6.00%, 01/01/2027 | 4,100,000 | 3,679,081 | |
| Public Finance Authority Revenue Bonds (Masonic & Eastern Star Home of NC, Inc.) | |||
| Series B-1, 3.50%, 03/01/2027(a) | 4,000,000 | 3,751,804 | |
| Series B-2, 3.00%, 03/01/2026(a) | 790,000 | 764,510 | |
| Public Finance Authority Revenue Bonds (Washoe Barton Medical Clinic) | |||
| Series A, 3.00%, 12/01/2026 | 250,000 | 239,912 | |
| Series A, 4.00%, 12/01/2031 | 700,000 | 687,385 | |
| Public Finance Authority Revenue Bonds (Wonderful Foundations Charter School Holdings LLC), Series A-1, 4.50%, 01/01/2035(a) | 1,000,000 | 904,252 | |
| Wisconsin Health & Educational Facilities Authority Revenue Bond, Series A, 5.00%, 11/01/2023 | 360,000 | 358,260 | |
| Wisconsin Public Finance Authority Educational Facilities Revenue Bonds (Guilford College) | |||
| 5.00%, 01/01/2026 | 685,000 | 691,195 | |
| 5.00%, 01/01/2027 | 830,000 | 840,645 | |
| 32 | 2023 Semi-Annual Report |
| Principal Amount | Value | ||
| MUNICIPAL BONDS (continued) | |||
| WISCONSIN (continued) | |||
| Wisconsin Public Finance Authority Educational Facilities Revenue Bonds (Piedmont Community Charter School) | |||
| 5.00%, 06/15/2024 | $ | 210,000 | $ 211,230 |
| 5.00%, 06/15/2026 | 230,000 | 235,334 | |
| 5.00%, 06/15/2027 | 160,000 | 165,427 | |
| Total Wisconsin | 14,695,613 | ||
| Total Municipal Bonds | 138,783,554 | ||
| Total Investments (Cost $152,199,256)(g)—99.0% | 138,783,554 | ||
| Other Assets in Excess of Liabilities—1.0% | 1,334,464 | ||
| Net Assets—100.0% | $140,118,018 | ||
| (a) | Denotes a security issued under Regulation S or Rule 144A. |
| (b) | Variable Rate Instrument. The rate shown is based on the latest available information as of April 30, 2023. Certain variable rate securities are not based on a published reference rate and spread but are determined by the issuer or agent and are based on current market conditions. These securities do not indicate a reference rate and spread in their description. |
| (c) | Security is in default. |
| (d) | Illiquid security. |
| (e) | Level 3 security. Fair Value is determined pursuant to procedures approved by the Fund's Board of Trustees. See Note 2(a) of the accompanying Notes to Financial Statements for inputs used. |
| (f) | Security is in forbearance as of April 30, 2023. |
| (g) | See accompanying Notes to Financial Statements for tax unrealized appreciation/(depreciation) of securities. |
| AMT | Alternative Minimum Tax |
| VRN | Variable Rate Note |
| 2023 Semi-Annual Report | 33 |
| Average Annual Total Return1 (For the periods ended April 30, 2023) | Six Month2 | 1 Yr. | 5 Yr. | 10 Yr. | |
Class A | w/o SC | 1.52% | 2.11% | 0.90% | 0.66% |
Class A13 | w/o SC | 1.62% | 2.11% | 0.92% | 0.67% |
| w/SC4 | 1.12% | 1.60% | 0.82% | 0.62% | |
Institutional Class5 | w/o SC | 1.75% | 2.47% | 1.10% | 0.89% |
| 1 | Returns prior to May 7, 2018 reflect the performance of a predecessor fund (the “Predecessor Fund”). Returns of the Predecessor Fund have not been adjusted to reflect the expenses applicable to the respective classes. The Fund and the Predecessor Fund have substantially similar investment objectives and strategies. Please consult the Fund’s prospectus for more detail. |
| 2 | Not annualized |
| 3 | Returns before the first offering of Class A1 (February 28, 2019) are based on the previous performance of Class A. Returns of the class have not been adjusted to reflect the expenses applicable to the respective classes. Excluding the effect of any fee waivers or reimbursements, this performance is substantially similar to what Class A would have produced because all classes invest in the same portfolio of securities. Returns for Class A shares would only differ to the extent of the difference in expenses of the classes. |
| 4 | A 0.50% front-end sales charge was deducted. |
| 5 | Not subject to any sales charges. |

| 34 | 2023 Semi-Annual Report |
| Asset Allocation | |
| Municipal Bonds | 98.2% |
| Certificates of Deposit | 1.6% |
| Money Market Funds | –% |
| Other Assets in Excess of Liabilities | 0.2% |
| 100.0% |
| Top Ten Holdings | |
| Mississippi Business Finance Corp. Revenue Bonds (PSL-North America), Series A 11/01/2032 | 9.7% |
| Maryland Industrial Development Financing Authority Revenue Bonds (Occidental Petroleum Corp.) 03/01/2030 | 7.7% |
| Pennsylvania Economic Development Financing Authority Exempt Facilities Revenue Bonds (PPL Energy Supply, LLC Project), VRDN, Series C 12/01/2037 | 4.8% |
| County of Meade, Kentucky (Nucor Steel Brandenburg Project) Series 2021A-1 Industrial Building Revenue Bonds, AMT, VRDN, Series A-1 08/01/2061 | 4.4% |
| Wisconsin Health & Educational Facilities Authority Revenue Bonds (Marshfield Clinic Health System), VRDN 02/15/2053 | 4.3% |
| Indiana Finance Authority RevenueBonds (ArcelorMittal SA) 08/01/2030 | 4.2% |
| Arkansas Development Finance Authority Revenue Bonds (Baptist Memorial Health Care Obligated Group), VRDN, Series B-4 09/01/2044 | 4.1% |
| Central Bradford Progress Authority Revenue Bonds (The Guthrie Clinic Issue), VRDN, Series D 12/01/2041 | 3.7% |
| City of New York General Obligation Limited Bonds, VRDN, Series 2 04/01/2042 | 3.3% |
| Black Belt Energy Gas District Revenue Bonds, FRN, Series B-1 12/01/2048 | 3.2% |
| States | |
| Pennsylvania | 11.7% |
| Mississippi | 11.5% |
| New York | 9.5% |
| Texas | 8.2% |
| Maryland | 7.7% |
| California | 7.5% |
| Alabama | 7.2% |
| Kentucky | 5.7% |
| Wisconsin | 5.2% |
| Indiana | 4.4% |
| Arkansas | 4.1% |
| South Carolina | 3.0% |
| Arizona | 2.6% |
| Other, less than 2% each | 9.9% |
| Short-Term Investments | 1.6% |
| Assets in Excess of Other Liabilities | 0.2% |
| 100.0% |
| 2023 Semi-Annual Report | 35 |
| Shares or Principal Amount | Value | ||
| MUNICIPAL BONDS —98.2% | |||
| ALABAMA—7.2% | |||
| Black Belt Energy Gas District Revenue Bonds, FRN, Series B-1, 4.15%, 12/01/2048(a) | $ | 20,000,000 | $ 19,977,460 |
| Chatom Industrial Development Board Revenue Bonds Powersouth Energy Coop., Inc. F/K/A Alabama Elec Coop, Inc., VRN, Series A, 3.25%, 08/01/2037(a) | 3,100,000 | 3,082,329 | |
| Health Care Authority for Baptist Health Revenue Bonds, Series B, 5.21%, 11/01/2042(a) | 15,925,000 | 15,925,000 | |
| The Industrial Development Board of the Town of West Jefferson Solid Waste Disposal Revenue Bonds (Alabama Power Company Miller Plant Project), 3.98%, 12/01/2038(a) | 6,000,000 | 6,000,000 | |
| Total Alabama | 44,984,789 | ||
| ARIZONA—2.6% | |||
| Cochise County Pollution Control Corp. Revenue Bonds (Arizona Electric Power Cooperative, Inc.), 4.25%, 09/01/2024(a) | 4,200,000 | 4,198,252 | |
| The Industrial Development Authority of the City of Chandler, Arizona Industrial Development Revenue Bonds, AMT, VRN, 2.70%, 12/01/2037(a) | 2,250,000 | 2,239,676 | |
| The Industrial Development Authority of the City of Phoenix, Arizona Solid Waste Disposal Revenue Bonds (Republic Services, Inc. Project), AMT, FRN, Series D, 3.50%, 12/01/2035(a) | 10,000,000 | 10,000,000 | |
| Total Arizona | 16,437,928 | ||
| ARKANSAS—4.1% | |||
| Arkansas Development Finance Authority Revenue Bonds (Baptist Memorial Health Care Obligated Group), VRDN, Series B-4, 5.21%, 09/01/2044(a) | 25,462,000 | 25,462,000 | |
| CALIFORNIA—7.5% | |||
| California Community Choice Financing Authority Revenue Bonds (Clean Energy Project), Series C, 5.00%, 10/01/2024 | 290,000 | 292,169 | |
| California Infrastructure and Economic Development Bank Brightline West Passenger Rail Project Series Revenue Bonds, FRN, Series A, 3.65%, 01/01/2050(a)(b) | 20,000,000 | 19,955,786 | |
| California Municipal Finance Authority Solid Waste Disposal Facilities Revenue Refunding Bonds (Republic Services, Inc. Project), Series A, 4.10%, 07/01/2041(a) | 1,000,000 | 997,551 | |
| California Pollution Control Financing Authority Revenue Bonds (Republic Services, Inc.), Series A, 3.88%, 08/01/2023(b) | 15,000,000 | 15,000,000 | |
| Shares or Principal Amount | Value | ||
| California Statewide Communities Development Authority Revenue Bonds (CommonSpirit Health Obligated Group), (AGM), Series E, 4.05%, 07/01/2040(a) | $ | 6,950,000 | $ 6,950,000 |
| Change Commonspirit Health to Dignity Health | |||
| AGM, Series D, 3.99%, 07/01/2041(a) | 2,675,000 | 2,675,000 | |
| AGM, Series F, 3.99%, 07/01/2040(a) | 1,550,000 | 1,550,000 | |
| Total California | 47,420,506 | ||
| COLORADO—0.2% | |||
| E-470 Public Highway Authority Revenue Bonds, FRN, Series B, 3.57%, 09/01/2039(a) | 1,500,000 | 1,490,202 | |
| CONNECTICUT—1.0% | |||
| City of West Have, Connecticut General Obligation Bond Anticipation Notes, 5.00%, 09/28/2023 | 6,530,000 | 6,527,926 | |
| FLORIDA—0.8% | |||
| Miami-Dade County Industrial Development Authority Revenue Bonds (Waste Management, Inc.) | |||
| AMT, FRN, Series A, 4.24%, 11/01/2033(a) | 3,000,000 | 2,930,212 | |
| AMT, FRN, Series B, 4.24%, 11/01/2048(a) | 2,000,000 | 1,953,475 | |
| Total Florida | 4,883,687 | ||
| ILLINOIS—0.2% | |||
| State of Illinois General Obligation Unlimited Bonds, Series A, 5.00%, 10/01/2023 | 1,030,000 | 1,035,799 | |
| INDIANA—4.4% | |||
| Indiana Finance Authority Economic Development Revenue Bonds (Republic Services, Inc.), Series A, 4.00%, 05/01/2034(a) | 1,000,000 | 999,868 | |
| Indiana Finance Authority RevenueBonds (ArcelorMittal SA), 4.40%, 08/01/2030(a) | 26,400,000 | 26,400,000 | |
| Total Indiana | 27,399,868 | ||
| KENTUCKY—5.7% | |||
| County of Meade, Kentucky (Nucor Steel Brandenburg Project) Series 2020A-1 Industrial Building Revenue Bonds, AMT, VRDN, Series A-1, 4.81%, 07/01/2060(a) | 1,160,000 | 1,160,000 | |
| County of Meade, Kentucky (Nucor Steel Brandenburg Project) Series 2021A-1 Industrial Building Revenue Bonds, AMT, VRDN, Series A-1, 4.81%, 08/01/2061(a) | 28,050,000 | 28,050,000 | |
| County of Meade, Kentucky Industrial Building Revenue Bonds (Nucor Steel Brandenburg Project) (Green Bonds), AMT, VRDN, Series B-1, 4.85%, 08/01/2061(a) | 1,200,000 | 1,200,000 | |
| Kentucky Public Energy Authority Revenue Bonds, Series A, 4.00%, 04/01/2048(a) | 5,000,000 | 5,004,441 | |
| Pulaski County Solid Waste Disposal Revenue Bonds (East Kentucky Power Cooperative, Inc.), Series B, 4.00%, 08/15/2023 | 700,000 | 701,727 | |
| Total Kentucky | 36,116,168 | ||
| 36 | 2023 Semi-Annual Report |
| Shares or Principal Amount | Value | ||
| MUNICIPAL BONDS (continued) | |||
| LOUISIANA—1.6% | |||
| Louisiana Stadium And Exposition District Bond Anticipation Notes, 5.00%, 07/03/2023 | $ | 10,175,000 | $ 10,185,827 |
| MARYLAND—7.7% | |||
| Maryland Industrial Development Financing Authority Revenue Bonds (Occidental Petroleum Corp.), 5.65%, 03/01/2030(a) | 48,405,000 | 48,405,000 | |
| MICHIGAN—0.1% | |||
| Michigan Strategic Fund Tax-Exempt Adjustable Mode Exempt Facilities Revenue Bonds (Waste Management, Inc.), AMT, VRN, 0.58%, 08/01/2027(a) | 500,000 | 478,574 | |
| MISSISSIPPI—11.5% | |||
| Mississippi Business Finance Corp. Revenue Bonds (PSL-North America), Series A, 5.15%, 11/01/2032(a) | 61,090,000 | 61,090,000 | |
| Mississippi Business Finance Corp. Solid Waste Disposal Facilities Revenue Refunding Bonds (Gulf Power Company Project), VRDN, 4.00%, 11/01/2042(a) | 8,700,000 | 8,700,000 | |
| Mississippi Business Finance Corporation Revenue Bonds (Mississippi Power Company Project), 4.10%, 12/01/2027(a) | 2,800,000 | 2,800,000 | |
| Total Mississippi | 72,590,000 | ||
| NEW HAMPSHIRE—0.3% | |||
| National Finance Authority Solid Waste Disposal Refunding Revenue Bonds (Waste Management, Inc. Project), FRN, Series A3, 3.95%, 04/01/2024(a) | 2,000,000 | 1,999,835 | |
| NEW JERSEY—0.5% | |||
| Township of Mendham NJ Notes, 4.00%, 05/04/2023 | 3,273,000 | 3,272,945 | |
| NEW YORK—9.5% | |||
| City of Elmira General Obligation Limited Bonds | |||
| 2.00%, 05/01/2023 | 455,000 | 455,000 | |
| 4.00%, 05/01/2024 | 675,000 | 678,537 | |
| City of Long Beach New York Anticipation Notes, Series A, 4.00%, 02/16/2024 | 10,000,000 | 9,987,440 | |
| City of New York General Obligation Limited Bonds, VRDN, Series 2, 4.00%, 04/01/2042(a) | 21,000,000 | 21,000,000 | |
| Liberty New York Development Corp. Revenue CTFS, VRDN, Series 2015-XM0106, 4.21%, 10/01/2035(a)(b) | 3,750,000 | 3,750,000 | |
| Metropolitan Transportation Authority Revenue Bonds, FRN, Series D-1, 3.55%, 11/01/2035(a) | 4,490,000 | 4,446,148 | |
| New York City General Obligation Unlimited Bonds | |||
| Series C-4, 4.00%, 10/01/2027(a) | 3,150,000 | 3,150,000 | |
| (AGM), Series J-2, 4.00%, 06/01/2036(a) | 1,050,000 | 1,050,000 | |
| (AGM), Series J-3, 4.00%, 06/01/2036(a) | 4,075,000 | 4,075,000 | |
| Shares or Principal Amount | Value | ||
| New York State Energy Research & Development Authority Pollution Control Revenue Bonds (New York State Electric & Gas Corporation Project), Series C, 2.63%, 04/01/2034(a) | $ | 1,500,000 | $ 1,495,646 |
| New York Transportation Development Corp. Revenue Bonds (Delta Air Lines, Inc.), AMT, Series A, 5.00%, 01/01/2024 | 1,500,000 | 1,509,748 | |
| Triborough Bridge & Tunnel Authority Revenue Bonds, Series B, 3.60%, 01/01/2032(a) | 3,915,000 | 3,881,750 | |
| Village Of Johnson City Broome County, New York Bond Anticipation Notes, Series C, 5.25%, 09/29/2023 | 4,550,000 | 4,552,012 | |
| Total New York | 60,031,281 | ||
| NORTH CAROLINA—0.2% | |||
| Fayetteville State University Revenue Bonds | |||
| (AGM), 5.00%, 04/01/2024 | 425,000 | 430,973 | |
| (AGM), 5.00%, 04/01/2026 | 470,000 | 493,805 | |
| Total North Carolina | 924,778 | ||
| OHIO—1.1% | |||
| State of Ohio Hospital Revenue Bonds (University Hospitals Health System, Inc.), Series B, 4.40%, 01/15/2045(a) | 6,650,000 | 6,650,000 | |
| OKLAHOMA—1.9% | |||
| Oklahoma Development Finance Authority Revenue Bonds (INTEGRIS Health Obligated Group ), VRDN, Series B, 4.47%, 08/15/2031(a) | 10,680,000 | 10,680,000 | |
| The Oklahoma Development Finance Authority Health System Revenue Refunding Bonds (Integris Obigated Group), Series A, 5.00%, 08/15/2023 | 1,500,000 | 1,503,918 | |
| Total Oklahoma | 12,183,918 | ||
| OREGON—0.7% | |||
| Gilliam County, Solid Waste Disposal Revenue Bonds, (Waste Management Project), VRN, Series A, 3.00%, 08/01/2025(a) | 4,500,000 | 4,500,000 | |
| PENNSYLVANIA—11.7% | |||
| Berks County Municipal Authority Revenue Bonds, Series 2015-XF2049, 4.56%, 11/01/2044(a)(b) | 8,420,000 | 8,420,000 | |
| Central Bradford Progress Authority Revenue Bonds (The Guthrie Clinic Issue), VRDN, Series D, 4.49%, 12/01/2041(a) | 23,405,000 | 23,405,000 | |
| Montgomery County Higher Education And Health Authority Thomas Jefferson University Variable Rate Revenue Bonds, VRDN, Series D, 4.43%, 09/01/2050(a) | 2,100,000 | 2,100,000 | |
| 2023 Semi-Annual Report | 37 |
| Shares or Principal Amount | Value | ||
| MUNICIPAL BONDS (continued) | |||
| PENNSYLVANIA (continued) | |||
| Pennsylvania Economic Development Financing Authority Exempt Facilities Revenue Bonds (PPL Energy Supply, LLC Project), VRDN, Series C, 5.25%, 12/01/2037(a) | $ | 30,000,000 | $ 30,000,000 |
| Pennsylvania Economic Development Financing Authority Solid Waste Disposal Revenue Bonds (Waste Management PA Obligated Group), 3.50%, 08/01/2045(a) | 10,000,000 | 10,000,000 | |
| Total Pennsylvania | 73,925,000 | ||
| SOUTH CAROLINA—3.0% | |||
| South Carolina Jobs-Economic Development Authority Revenue Bonds (Prisma Health Obligated Group), VRDN, Series C, 4.46%, 05/01/2048(a) | 18,825,000 | 18,825,000 | |
| TENNESSEE—0.1% | |||
| The Industrial Development Board Of The Metropolitan Government Of Nashville And Davidson County Tax-Exempt Adjustable Mode Exempt Facilities Revenue Bonds (Waste Management, Inc. Of Tennessee Project), 0.58%, 08/01/2031(a) | 350,000 | 335,002 | |
| TEXAS—8.2% | |||
| City of Houston TX Hotel Occupancy Tax & Revenue Bonds | |||
| 4.00%, 09/01/2023 | 180,000 | 180,324 | |
| 4.00%, 09/01/2025 | 425,000 | 431,861 | |
| Mission Economic Development Corp. Solid Waste Disposal Revenue Bonds (Republic Services, Inc. Project) | |||
| 3.50%, 01/01/2026(a) | 500,000 | 500,000 | |
| AMT, FRN, Series A, 3.50%, 05/01/2050(a) | 1,000,000 | 1,000,000 | |
| Port of Corpus Christi Authority of Nueces County Revenue Bonds (Flint Hills Resources LP), AMT, VRDN, Series A, 4.35%, 07/01/2029(a)(b) | 15,000,000 | 15,000,000 | |
| Port of Corpus Christi Authority of Nueces County Solid Waste Disposal Revenue Bonds (Flint Hills Resources LP), AMT, VRDN, Series F, 4.39%, 01/01/2032(a) | 13,300,000 | 13,300,000 | |
| Port of Port Arthur Navigation District Revenue Bonds, 4.40%, 04/01/2040(a) | 9,200,000 | 9,200,000 | |
| Port of Port Arthur Navigation District Revenue Bonds (Motiva Enterprises Class C), VRDN, 4.42%, 04/01/2040(a) | 1,600,000 | 1,600,000 | |
| Port of Port Arthur Navigation District Revenue Bonds (Motiva Enterprises LLC), VRDN, Series M, 4.46%, 12/01/2027(a) | 6,000,000 | 6,000,000 | |
| Texas Municipal Gas Acquisition & Supply Corp III Revenue Bonds | |||
| 5.00%, 12/15/2024 | 3,100,000 | 3,124,116 | |
| 5.00%, 12/15/2025 | 1,500,000 | 1,522,370 | |
| Total Texas | 51,858,671 | ||
| Shares or Principal Amount | Value | ||
| VIRGINIA—0.9% | |||
| Industrial Developement Authority of Gloucester County, VIirgina Variable Rate Demand Solid Waste Disposal Revenue Bonds, (Waste Management Disposal Services of Virgina, Inc. Project), Series A, 3.00%, 09/01/2038(a) | $ | 5,615,000 | $ 5,591,683 |
| WEST VIRGINIA—0.3% | |||
| West Virginia Hospital Finance Authority Revenue Bonds (West Virginia United Health System Obligated Group), Series E, 4.44%, 06/01/2033(a) | 2,150,000 | 2,150,000 | |
| WISCONSIN—5.2% | |||
| Public Finance Authority Solid Waste Disposal Refunding Revenue Bonds (Waste Management, Inc. Project), Series A-2, 3.50%, 10/01/2025(a) | 3,535,000 | 3,535,000 | |
| Wisconsin Health & Educational Facilities Authority Revenue Bonds, Series C, 5.21%, 02/15/2053(a) | 2,000,000 | 2,000,000 | |
| Wisconsin Health & Educational Facilities Authority Revenue Bonds (Marshfield Clinic Health System), VRDN, 5.21%, 02/15/2053(a) | 27,000,000 | 27,000,000 | |
| Total Wisconsin | 32,535,000 | ||
| Total Municipal Bonds | 618,201,387 | ||
| SHORT-TERM INVESTMENTS—1.6% | |||
| CERTIFICATES OF DEPOSIT—1.6% | |||
| UNITED STATES—1.6% | |||
| County of Mercer, 3.50%, 05/03/2023 | 9,750,000 | 9,750,000 | |
| Total Certificates of Deposit | 9,750,000 | ||
| MONEY MARKET FUNDS—0.0% | |||
| BlackRock Liquidity Funds MuniCash, Institutional Shares | 104,575 | 104,564 | |
| Total Money Market Funds | 104,564 | ||
| Total Short-Term Investments | 9,854,564 | ||
| Total Investments (Cost $628,796,572)(c)—99.8% | 628,055,951 | ||
| Other Assets in Excess of Liabilities—0.2% | 1,537,089 | ||
| Net Assets—100.0% | $629,593,040 | ||
| (a) | Variable Rate Instrument. The rate shown is based on the latest available information as of April 30, 2023. Certain variable rate securities are not based on a published reference rate and spread but are determined by the issuer or agent and are based on current market conditions. These securities do not indicate a reference rate and spread in their description. |
| (b) | Denotes a security issued under Regulation S or Rule 144A. |
| (c) | See accompanying Notes to Financial Statements for tax unrealized appreciation/(depreciation) of securities. |
| AMT | Alternative Minimum Tax |
| FRN | Floating Rate Note |
| VRDN | Variable Rate Demand Note |
| VRN | Variable Rate Note |
| 38 | 2023 Semi-Annual Report |
| abrdn Global Absolute Return Strategies Fund | abrdn Global High Income Fund | abrdn Intermediate Municipal Income Fund | abrdn Short Duration High Yield Municipal Fund | abrdn Ultra Short Municipal Income Fund | |||||
| Assets: | |||||||||
| Investments, at value | $13,473,646 | $86,707,704 | $46,593,865 | $138,783,554 | $618,201,387 | ||||
| Short-term investments, at value | 20,221,409 | 2,096,752 | 64,453 | – | 9,854,564 | ||||
| Foreign Currency, at value | 632,993 | 1,027 | – | – | – | ||||
| Cash | 171,376 | – | – | – | 7,125 | ||||
| Cash collateral pledged for futures | 436,865 | – | – | – | – | ||||
| Receivable for investments sold | – | 555,976 | – | 990,000 | – | ||||
| Interest and dividends receivable | 153,880 | 1,391,250 | 613,473 | 1,773,202 | 2,959,191 | ||||
| Receivable for interest rate swaps closed | 6,182,353 | – | – | – | – | ||||
| Receivable for capital shares issued | 551 | 7,165 | 17,853 | 10,037 | 470,530 | ||||
| Unrealized appreciation on forward foreign currency exchange contracts | 767,377 | 1,979 | – | – | – | ||||
| Receivable from Adviser | 33,134 | – | 18,982 | 40,363 | 175,460 | ||||
| Unrealized appreciation on total return swap contracts | 13,535 | – | – | – | – | ||||
| Variation margin receivable for future contracts | 35,745 | – | – | – | – | ||||
| Tax reclaim receivable | 1,584 | – | – | – | – | ||||
| Prepaid expenses | 23,585 | 80 | 34,846 | 31,550 | 74,542 | ||||
| Total Assets | 42,148,033 | 90,761,933 | 47,343,472 | 141,628,706 | 631,742,799 | ||||
| Liabilities: | |||||||||
| Due to Custodian | – | – | – | 993,573 | – | ||||
| Payable for investments purchased | – | 1,418,190 | – | – | – | ||||
| Unrealized depreciation on forward foreign currency exchange contracts | 890,015 | 112,688 | – | – | – | ||||
| Unrealized depreciation on total return swap contracts | 114,537 | – | – | – | – | ||||
| Distributions payable | – | 68 | 12,861 | 30,971 | 202,598 | ||||
| Payable for capital shares redeemed | 134,669 | 19,050 | 27,658 | 115,870 | 1,477,831 | ||||
| Cash collateral due to broker | 240,000 | – | – | – | – | ||||
| Payable for interest rate swaps closed | 6,111,661 | – | – | – | – | ||||
| Variation margin payable for centrally cleared swap contracts | 4,862 | – | – | – | – | ||||
| Line of credit payable | – | – | – | 175,000 | – | ||||
| Written options outstanding, at value | 246,678 | – | – | – | – | ||||
| Accrued expenses and other payables: | |||||||||
| Administration fees | 2,277 | 5,903 | 3,136 | 13,428 | 38,986 | ||||
| Audit fees | 37,950 | 26,808 | 20,243 | 21,288 | 25,266 | ||||
| Custodian fees | 253,115 | 59,086 | 8,719 | 27,882 | 25,561 | ||||
| Distribution fees | 2,490 | 12,498 | 988 | 4,408 | – | ||||
| Fund accounting fees | 1,869 | 4,321 | 2,120 | 9,666 | 30,669 | ||||
| Interest expense on line of credit | – | – | 867 | 1,235 | – | ||||
| Investment advisory fees | 17,080 | 23,832 | 16,661 | 76,207 | 261,512 | ||||
| Legal fees | 804 | 2,077 | 1,106 | 3,302 | 14,749 | ||||
| Printing fees | 11,274 | 11,259 | 3,879 | 6,169 | 7,156 | ||||
| Sub-transfer agent and administrative services fees | 4,956 | 13,402 | 935 | 10,949 | 41,308 | ||||
| Transfer agent fees | 2,155 | 5,311 | 2,193 | 2,878 | 4,561 | ||||
| Other accrued expenses | 27,385 | (5,729) | 14,956 | 17,862 | 19,562 | ||||
| Total liabilities | 8,103,777 | 1,708,764 | 116,322 | 1,510,688 | 2,149,759 | ||||
| Net assets | $34,044,256 | $89,053,169 | $47,227,150 | $140,118,018 | $629,593,040 | ||||
| Cost: | |||||||||
| Investments | 13,119,900 | 93,727,761 | 47,940,735 | 152,199,256 | 618,942,003 | ||||
| Short-Term Investments | 20,167,709 | 2,096,753 | 64,455 | – | 9,854,569 | ||||
| Foreign currency | 650,262 | 1,224 | – | – | – | ||||
| Cash at broker for future contracts, at cost | 436,865 | – | – | – | – | ||||
| Premiums on written options | 282,215 | – | – | – | – | ||||
| Represented by: | |||||||||
| Paid in capital in excess of par value | $40,759,015 | $343,773,578 | $49,269,851 | $181,040,948 | $631,886,251 | ||||
| Distributable earnings (accumulated loss) | (6,714,759) | (254,720,409) | (2,042,701) | (40,922,930) | (2,293,211) | ||||
| Net Assets | $34,044,256 | $89,053,169 | $47,227,150 | $140,118,018 | $629,593,040 Amounts listed as “–” are $0 or round to $0. See Notes to Financial Statements. |
| 2023 Semi-Annual Report | 39 |
| abrdn Global Absolute Return Strategies Fund | abrdn Global High Income Fund | abrdn Intermediate Municipal Income Fund | abrdn Short Duration High Yield Municipal Fund | abrdn Ultra Short Municipal Income Fund | |||||
| Net Assets: | |||||||||
| Class A | $11,986,793 | $60,458,775 | $4,651,585 | $9,423,033 | $106,449,467 | ||||
| Class A1 | – | – | – | – | 264,924 | ||||
| Class C | – | – | – | 24,970 | – | ||||
| Institutional Service Class | 4,832,511 | – | 19,011 | – | – | ||||
| Institutional Class | 17,224,952 | 28,594,394 | 42,556,554 | 130,670,015 | 522,878,649 | ||||
| Total | $34,044,256 | $89,053,169 | $47,227,150 | $140,118,018 | $629,593,040 | ||||
| Shares Outstanding (unlimited number of shares authorized): | |||||||||
| Class A Shares | 1,376,377 | 8,271,776 | 526,589 | 1,025,317 | 10,567,333 | ||||
| Class A1 Shares | – | – | – | – | 26,283 | ||||
| Class C Shares | – | – | – | 2,715 | – | ||||
| Institutional Service Class Shares | 548,193 | – | 2,150 | – | – | ||||
| Institutional Class Shares | 1,936,145 | 4,300,834 | 4,813,736 | 14,217,248 | 52,201,656 | ||||
| Total Shares Outstanding per Class | 3,860,715 | 12,572,610 | 5,342,475 | 15,245,280 | 62,795,272 | ||||
| Net Asset Value and Redemption Price Per Share (Net assets by class divided by shares outstanding by class, respectively): | |||||||||
| Class A Shares | $8.71 | $7.31 | $8.83 | $9.19 | $10.07 | ||||
| Class A1 Shares | – | – | – | – | 10.08 | ||||
| Class C Shares (a) | – | – | – | 9.20 | – | ||||
| Institutional Service Class Shares | 8.82 | – | 8.84 | – | – | ||||
| Institutional Class Shares | 8.90 | 6.65 | 8.84 | 9.19 | 10.02 | ||||
| Maximum Offering Price Per Share (100%/(100% - maximum sales charge) of net asset value adjusted to the nearest cent): | |||||||||
| Class A Shares | $8.98 | $7.54 | $9.06 | $9.43 | $10.07 | ||||
| Class A1 Shares | – | – | – | – | 10.13 | ||||
| Maximum Sales Charge: | |||||||||
| Class A Shares | 3.00(b)% | 3.00(b)% | 2.50(c)% | 2.50(c)% | –% | ||||
| Class A1 Shares | –% | –% | –% | –% | 0.50(d)% |
| (a) | For Class C Shares, the redemption price per share is reduced by 1.00% for shares held less than one year due to contingent deferred sales charge. |
| (b) | Unless you are otherwise eligible to purchase Class A shares without a sales charge, a contingent deferred sales charge (CDSC) of up to 1.00% will be charged on Class A shares redeemed within 18 months of purchase if you paid no sales charge on the original purchase and a finder’s fee was paid. |
| (c) | Unless you are otherwise eligible to purchase Class A shares without a sales charge, a contingent deferred sales charge (CDSC) of up to 0.75% will be charged on Class A shares redeemed within 12 months of purchase if you paid no sales charge on the original purchase and a finder’s fee was paid. |
| (d) | Unless you are otherwise eligible to purchase Class A1 shares without a sales charge, a contingent deferred sales charge (CDSC) of up to 0.25% will be charged on Class A1 shares redeemed within 12 months of purchase if you paid no sales charge on the original purchase and a finder’s fee was paid. |
| 40 | 2023 Semi-Annual Report |
| abrdn Global Absolute Return Strategies Fund(a) | abrdn Global High Income Fund | abrdn Intermediate Municipal Income Fund(b) | abrdn Short Duration High Yield Municipal Fund | abrdn Ultra Short Municipal Income Fund | |||||
| Investment Income: | |||||||||
| Dividend income | $68,615 | $61,693 | $1,000 | $438 | $16,155 | ||||
| Interest income | 613,625 | 2,998,489 | 886,701 | 2,734,203 | 11,291,376 | ||||
| Securities lending income, net | — | 6,152 | — | — | — | ||||
| Foreign tax withholding | (3,957) | — | — | — | — | ||||
| Total Income | 678,283 | 3,066,334 | 887,701 | 2,734,641 | 11,307,531 | ||||
| Expenses | |||||||||
| Investment advisory fees | 112,901 | 313,837 | 101,175 | 509,634 | 1,600,210 | ||||
| Trustee fees | 2,453 | 5,911 | 2,878 | — | — | ||||
| Administration fees | 15,053 | 38,626 | 19,045 | 62,724 | 256,034 | ||||
| Legal fees | 9,081 | 11,491 | 5,659 | 19,560 | 77,720 | ||||
| Audit fees | 29,990 | 26,808 | 20,243 | 21,407 | 25,266 | ||||
| Printing fees | 9,644 | 10,637 | 4,626 | 7,193 | 16,133 | ||||
| Custodian fees | 93,997 | 9,343 | 3,982 | 11,454 | 15,366 | ||||
| Transfer agent fees | 13,972 | 27,578 | 13,423 | 16,207 | 26,670 | ||||
| Distribution fees Class A | 15,957 | 76,267 | 6,030 | 14,162 | 138,023 | ||||
| Distribution fees Class A1 | — | — | — | — | 326 | ||||
| Distribution fees Class C | 171 | — | 816 | 134 | — | ||||
| Sub-transfer agent and administrative service fees Institutional Class | 12,376 | 12,459 | 6,700 | 37,840 | 200,818 | ||||
| Sub-transfer agent and administrative service fees Class A | 10,030 | 30,595 | 859 | 3,601 | 36,360 | ||||
| Sub-transfer agent and administrative service fees Class A1 | — | — | — | — | 8 | ||||
| Sub-transfer agent and administrative service fees Class C | 25 | — | 30 | 6 | — | ||||
| Sub-transfer agent and administrative service fees Institutional Service Class | 3,076 | — | — | — | — | ||||
| Fund accounting fees | 753 | 1,931 | 952 | 3,136 | 12,802 | ||||
| Registration and filing fees | 26,626 | 15,986 | 26,379 | — | 7,616 | ||||
| Other | 18,831 | 20,827 | 15,076 | 27,189 | 88,338 | ||||
| Total expenses before reimbursed/waived expenses | 374,936 | 602,296 | 227,873 | 734,247 | 2,501,690 | ||||
| Interest expense (Note 9) | 38 | 1,100 | 867 | 65,544 | 291 | ||||
| Total operating expenses before reimbursed/waived expenses | 374,974 | 603,396 | 228,740 | 799,791 | 2,501,981 | ||||
| Expenses reimbursed | (223,396) | (161,524) | (101,183) | (210,317) | (923,151) | ||||
| Net expenses | 151,578 | 441,872 | 127,557 | 589,474 | 1,578,830 | ||||
| Net Investment Income | 526,705 | 2,624,462 | 760,144 | 2,145,167 | 9,728,701 | ||||
| REALIZED/UNREALIZED GAIN/(LOSS) FROM INVESTMENTS: | |||||||||
| Realized gain/(loss) on investment transactions | 313,557 | (4,353,714) | (113,039) | (4,592,330) | 218,261 | ||||
| Realized gain/(loss) on futures contracts | (460,993) | — | — | — | — | ||||
| Realized gain/(loss) on written options | 92,035 | — | — | — | — | ||||
| Realized gain/(loss) on swap contracts | (946,861) | — | — | — | — | ||||
| Realized gain/(loss) on forward foreign currency exchange contracts | (88,875) | (2,087,604) | — | — | — | ||||
| Realized gain/(loss) on foreign currency transactions | 81,379 | 2,635 | — | — | — | ||||
| Net realized gain/(loss) from investments, futures contracts, written options, swap contracts, forward foreign currency exchange contracts and foreign currency transactions | (1,009,758) | (6,438,683) | (113,039) | (4,592,330) | 218,261 | ||||
| Net change in unrealized appreciation/(depreciation) on investment transactions | 991,836 | 9,994,048 | 1,945,575 | 7,580,230 | 769,820 | ||||
| Net change in unrealized appreciation/(depreciation) on swap contracts | 247,545 | — | — | — | — | ||||
| Net change in unrealized appreciation/(depreciation) on futures contracts | (150,143) | — | — | — | — | ||||
| Net change in unrealized appreciation/(depreciation) on written options | 35,537 | — | — | — | — | ||||
| Net change in unrealized appreciation/(depreciation) on forward foreign currency exchange contracts | (1,109,278) | 218,432 | — | — | — Amounts listed as “–” are $0 or round to $0. See Notes to Financial Statements. |
| 2023 Semi-Annual Report | 41 |
| abrdn Global Absolute Return Strategies Fund(a) | abrdn Global High Income Fund | abrdn Intermediate Municipal Income Fund(b) | abrdn Short Duration High Yield Municipal Fund | abrdn Ultra Short Municipal Income Fund | |||||
| Net change in unrealized appreciation/(depreciation) on translation of assets and liabilities denominated in foreign currencies | $21,061 | $14,545 | $— | $— | $— | ||||
| Net change in unrealized appreciation/(depreciation) from investments, swap contracts, futures contracts, written options, forward foreign currency exchange contracts and translation of assets and liabilities denominated in foreign currencies | 36,558 | 10,227,025 | 1,945,575 | 7,580,230 | 769,820 | ||||
| Net realized/unrealized gain/(loss) from investments, written options, swaps, futures contracts, forward foreign currency exchange contracts and translation of assets and liabilities denominated in foreign currencies | (973,200) | 3,788,342 | 1,832,536 | 2,987,900 | 988,081 | ||||
| CHANGE IN NET ASSETS RESULTING FROM OPERATIONS | $(446,495) | $6,412,804 | $2,592,680 | $5,133,067 | $10,716,782 |
| (a) | Effective February 27, 2023, Class C had zero assets. On February 27, 2023, the abrdn Global Absolute Return Strategies Fund ceased offering Class C Shares. |
| (b) | Effective April 30, 2023, Class C had zero assets. On April 30, 2023, the abrdn Intermediate Municipal Income Fund ceased offering Class C Shares. |
| 42 | 2023 Semi-Annual Report |
| abrdn Global Absolute Return Strategies Fund(a) | abrdn Global High Income Fund | abrdn Intermediate Municipal Income Fund(b) | |||||||||
| Six-Month Period Ended April 30, 2023 (unaudited) | Year Ended October 31, 2022 | Six-Month Period Ended April 30, 2023 (unaudited) | Year Ended October 31, 2022 | Six-Month Period Ended April 30, 2023 (unaudited) | Year Ended October 31, 2022 | ||||||
| From Investment Activities: | |||||||||||
| Operations: | |||||||||||
| Net investment income | $526,705 | $93,959 | $2,624,462 | $5,444,906 | $760,144 | $1,515,521 | |||||
| Net realized gain/(loss) from investments, written options, swap contracts, futures contracts, forward foreign currency exchange contracts and foreign currency transactions | (1,009,758) | (6,892,722) | (6,438,683) | (3,970,478) | (113,039) | (277,553) | |||||
| Net change in unrealized appreciation/(depreciation) from investments, written options, swap contracts, futures contracts, forward foreign currency exchange contracts and translation of assets and liabilities denominated in foreign currencies | 36,558 | 1,044,540 | 10,227,025 | (19,283,957) | 1,945,575 | (7,458,428) | |||||
| Changes in net assets resulting from operations | (446,495) | (5,754,223) | 6,412,804 | (17,809,529) | 2,592,680 | (6,220,460) | |||||
| Distributions to Shareholders From: | |||||||||||
| Distributable earnings | |||||||||||
| Class A | — | (754,555) | (2,916,619) | (3,663,466) | (70,848) | (140,410) | |||||
| Class C | — | (17,763) | — | — | (1,843) | (4,679) | |||||
| Institutional Service Class | — | (253,944) | — | — | (300) | (551) | |||||
| Institutional Class | — | (1,692,167) | (1,962,115) | (2,564,748) | (687,235) | (1,372,129) | |||||
| Change in net assets from shareholder distributions | — | (2,718,429) | (4,878,734) | (6,228,214) | (760,226) | (1,517,769) | |||||
| Change in net assets from capital transactions | (7,114,701) | (41,858,918) | (14,188,981) | (11,569,430) | (1,345,944) | (6,590,631) | |||||
| Change in net assets | (7,561,196) | (50,331,570) | (12,654,911) | (35,607,173) | 486,510 | (14,328,860) | |||||
| Net Assets: | |||||||||||
| Beginning of period | 41,605,452 | 91,937,022 | 101,708,080 | 137,315,253 | 46,740,640 | 61,069,500 | |||||
| End of period | $34,044,256 | $41,605,452 | $89,053,169 | $101,708,080 | $47,227,150 | $46,740,640 | |||||
| (a) | Effective February 27, 2023, Class C had zero assets. On February 27, 2023, the abrdn Global Absolute Return Strategies Fund ceased offering Class C Shares. |
| (b) | Effective April 30, 2023, Class C had zero assets. On April 30, 2023, the abrdn Intermediate Municipal Income Fund ceased offering Class C Shares. |
| 2023 Semi-Annual Report | 43 |
| abrdn Global Absolute Return Strategies Fund | abrdn Global High Income Fund | abrdn Intermediate Municipal Income Fund | |||||||||
| Six-Month Period Ended April 30, 2023 (unaudited) | Year Ended October 31, 2022 | Six-Month Period Ended April 30, 2023 (unaudited) | Year Ended October 31, 2022 | Six-Month Period Ended April 30, 2023 (unaudited) | Year Ended October 31, 2022 | ||||||
| Capital Transactions: | |||||||||||
| Class A Shares | |||||||||||
| Proceeds from shares issued | $345,921 | $526,551 | $6,982,356 | $12,776,028 | $35,196 | $18,422 | |||||
| Dividends reinvested | — | 663,592 | 2,624,451 | 3,297,835 | 65,642 | 99,019 | |||||
| Cost of shares redeemed | (1,758,424) | (7,625,011) | (11,667,295) | (22,032,899) | (562,801) | (450,934) | |||||
| Total Class A | (1,412,503) | (6,434,868) | (2,060,488) | (5,959,036) | (461,963) | (333,493) | |||||
| Class C Shares | |||||||||||
| Proceeds from shares issued | 16,067 | — | — | — | 15,447 | 2,528 | |||||
| Dividends reinvested | — | 17,763 | — | — | 1,797 | 4,679 | |||||
| Cost of shares redeemed | (56,036) | (386,089) | — | — | (240,948) | (68,323) | |||||
| Total Class C | (39,969) | (368,326) | — | — | (223,704) | (61,116) | |||||
| Institutional Service Class Shares | |||||||||||
| Proceeds from shares issued | 28,735 | 434,256 | — | — | — | — | |||||
| Dividends reinvested | — | 250,598 | — | — | 297 | 551 | |||||
| Cost of shares redeemed | (289,869) | (1,550,394) | — | — | (15) | (12) | |||||
| Total Institutional Service Class | (261,134) | (865,540) | — | — | 282 | 539 | |||||
| Institutional Class Shares | |||||||||||
| Proceeds from shares issued | 156,086 | 977,914 | 744,684 | 63,863,945 | 463,242 | 446,936 | |||||
| Dividends reinvested | — | 1,658,375 | 1,907,461 | 2,507,170 | 623,988 | 1,141,100 | |||||
| Cost of shares redeemed | (5,557,181) | (36,826,473) | (14,780,638) | (71,981,509) | (1,747,789) | (7,784,597) | |||||
| Total Institutional Class | (5,401,095) | (34,190,184) | (12,128,493) | (5,610,394) | (660,559) | (6,196,561) | |||||
| Change in net assets from capital transactions: | $(7,114,701) | $(41,858,918) | $(14,188,981) | $(11,569,430) | $(1,345,944) | $(6,590,631) | |||||
| 44 | 2023 Semi-Annual Report |
| abrdn Global Absolute Return Strategies Fund | abrdn Global High Income Fund | abrdn Intermediate Municipal Income Fund | |||||||||
| Six-Month Period Ended April 30, 2023 (unaudited) | Year Ended October 31, 2022 | Six-Month Period Ended April 30, 2023 (unaudited) | Year Ended October 31, 2022 | Six-Month Period Ended April 30, 2023 (unaudited) | Year Ended October 31, 2022 | ||||||
| Share Transactions: | |||||||||||
| Class A Shares | |||||||||||
| Issued | 39,244 | 55,689 | 950,334 | 1,561,497 | 3,966 | 2,023 | |||||
| Reinvested | – | 66,293 | 364,575 | 412,682 | 7,447 | 10,853 | |||||
| Redeemed | (200,363) | (773,840) | (1,592,093) | (2,698,533) | (63,514) | (47,334) | |||||
| Total Class A Shares | (161,119) | (651,858) | (277,184) | (724,354) | (52,101) | (34,458) | |||||
| Class C Shares | |||||||||||
| Issued | 1,893 | – | – | – | 1,756 | 257 | |||||
| Reinvested | – | 1,818 | – | – | 204 | 514 | |||||
| Redeemed | (6,674) | (44,685) | – | – | (27,503) | (7,189) | |||||
| Total Class C Shares | (4,781) | (42,867) | – | – | (25,543) | (6,418) | |||||
| Institutional Service Class Shares | |||||||||||
| Issued | 3,226 | 45,858 | – | – | – | – | |||||
| Reinvested | – | 24,836 | – | – | 34 | 61 | |||||
| Redeemed | (32,667) | (162,173) | – | – | (2) | (2) | |||||
| Total Institutional Service Class Shares | (29,441) | (91,479) | – | – | 32 | 59 | |||||
| Institutional Class Shares | |||||||||||
| Issued | 17,177 | 100,971 | 111,433 | 8,717,393 | 52,754 | 49,533 | |||||
| Reinvested | – | 163,065 | 290,721 | 342,010 | 70,737 | 124,513 | |||||
| Redeemed | (620,224) | (3,663,228) | (2,237,675) | (9,729,545) | (198,032) | (845,859) | |||||
| Total Institutional Class Shares | (603,047) | (3,399,192) | (1,835,521) | (670,142) | (74,541) | (671,813) | |||||
| Total change in shares: | (798,388) | (4,185,396) | (2,112,705) | (1,394,496) | (152,153) | (712,630) | |||||
| 2023 Semi-Annual Report | 45 |
| abrdn Short Duration High Yield Municipal Fund | abrdn Ultra Short Municipal Income Fund | ||||||
| Six-Month Period Ended April 30, 2023 (unaudited) | Year Ended October 31, 2022 | Six-Month Period Ended April 30, 2023 (unaudited) | Year Ended October 31, 2022 | ||||
| From Investment Activities: | |||||||
| Operations: | |||||||
| Net investment income | $2,145,167 | $8,521,893 | $9,728,701 | $5,446,809 | |||
| Net realized gain/(loss) from investments | (4,592,330) | (14,412,641) | 218,261 | (1,209,824) | |||
| Net change in unrealized appreciation/(depreciation) from investments | 7,580,230 | (27,251,780) | 769,820 | (1,666,737) | |||
| Changes in net assets resulting from operations | 5,133,067 | (33,142,528) | 10,716,782 | 2,570,248 | |||
| Distributions to Shareholders From: | |||||||
| Distributable earnings | |||||||
| Class A | (141,080) | (416,033) | (1,558,701) | (691,462) | |||
| Class A1 | — | — | (3,714) | (2,430) | |||
| Class C | (234) | (414) | — | — | |||
| Institutional Class | (1,995,979) | (8,124,949) | (8,184,710) | (4,742,311) | |||
| Change in net assets from shareholder distributions | (2,137,293) | (8,541,396) | (9,747,125) | (5,436,203) | |||
| Change in net assets from capital transactions | (58,108,350) | (209,708,294) | (57,337,282) | (266,309,347) | |||
| Change in net assets | (55,112,576) | (251,392,218) | (56,367,625) | (269,175,302) | |||
| Net Assets: | |||||||
| Beginning of period | 195,230,594 | 446,622,812 | 685,960,665 | 955,135,967 | |||
| End of period | $140,118,018 | $195,230,594 | $629,593,040 | $685,960,665 | |||
| 46 | 2023 Semi-Annual Report |
| abrdn Short Duration High Yield Municipal Fund | abrdn Ultra Short Municipal Income Fund | ||||||
| Six-Month Period Ended April 30, 2023 (unaudited) | Year Ended October 31, 2022 | Six-Month Period Ended April 30, 2023 (unaudited) | Year Ended October 31, 2022 | ||||
| Capital Transactions: | |||||||
| Class A Shares | |||||||
| Proceeds from shares issued | $349,035 | $1,322,146 | $21,404,864 | $37,177,427 | |||
| Dividends reinvested | 135,364 | 405,175 | 1,502,759 | 671,735 | |||
| Cost of shares redeemed | (5,689,540) | (7,030,507) | (40,551,481) | (74,784,580) | |||
| Total Class A | (5,205,141) | (5,303,186) | (17,643,858) | (36,935,418) | |||
| Class A1 Shares | |||||||
| Proceeds from shares issued | — | — | — | — | |||
| Dividends reinvested | — | — | 3,649 | 2,416 | |||
| Cost of shares redeemed | — | — | — | (250,283) | |||
| Total Class A1 | — | — | 3,649 | (247,867) | |||
| Class C Shares | |||||||
| Proceeds from shares issued | — | 2,492 | — | — | |||
| Dividends reinvested | 231 | 414 | — | — | |||
| Cost of shares redeemed | (2,477) | — | — | — | |||
| Total Class C | (2,246) | 2,906 | — | — | |||
| Institutional Class Shares | |||||||
| Proceeds from shares issued | 21,596,144 | 107,043,551 | 145,788,105 | 442,073,742 | |||
| Dividends reinvested | 1,121,357 | 5,360,263 | 6,724,976 | 3,773,158 | |||
| Cost of shares redeemed | (75,618,464) | (316,811,828) | (192,210,154) | (674,972,962) | |||
| Total Institutional Class | (52,900,963) | (204,408,014) | (39,697,073) | (229,126,062) | |||
| Change in net assets from capital transactions: | $(58,108,350) | $(209,708,294) | $(57,337,282) | $(266,309,347) | |||
| 2023 Semi-Annual Report | 47 |
| abrdn Short Duration High Yield Municipal Fund | abrdn Ultra Short Municipal Income Fund | ||||||
| Six-Month Period Ended April 30, 2023 (unaudited) | Year Ended October 31, 2022 | Six-Month Period Ended April 30, 2023 (unaudited) | Year Ended October 31, 2022 | ||||
| Share Transactions: | |||||||
| Class A Shares | |||||||
| Issued | 38,004 | 132,314 | 2,125,257 | 3,693,629 | |||
| Reinvested | 14,733 | 41,925 | 149,181 | 66,770 | |||
| Redeemed | (618,894) | (718,079) | (4,026,806) | (7,427,627) | |||
| Total Class A Shares | (566,157) | (543,840) | (1,752,368) | (3,667,228) | |||
| Class A1 Shares | |||||||
| Issued | – | – | – | – | |||
| Reinvested | – | – | 362 | 240 | |||
| Redeemed | – | – | – | (24,854) | |||
| Total Class A1 Shares | – | – | 362 | (24,614) | |||
| Class C Shares | |||||||
| Issued | – | 268 | – | – | |||
| Reinvested | 25 | 43 | – | – | |||
| Redeemed | (270) | – | – | – | |||
| Total Class C Shares | (245) | 311 | – | – | |||
| Institutional Class Shares | |||||||
| Issued | 2,344,466 | 10,858,475 | 14,557,881 | 44,161,941 | |||
| Reinvested | 122,056 | 550,123 | 671,356 | 377,171 | |||
| Redeemed | (8,230,395) | (32,819,086) | (19,194,415) | (67,415,367) | |||
| Total Institutional Class Shares | (5,763,873) | (21,410,488) | (3,965,178) | (22,876,255) | |||
| Total change in shares: | (6,330,275) | (21,954,017) | (5,717,184) | (26,568,097) | |||
| 48 | 2023 Semi-Annual Report |
| Investment Activities | Distributions | |||||||
| Net Asset Value, Beginning of Period | Net Investment Income (Loss) (a) | Net Realized and Unrealized Gains (Losses) on Investments | Total from Investment Activities | Net Investment Income | Net Realized Gains | Total Distributions | Net Asset Value, End of Period | |
| Class A Shares | ||||||||
| Six-Months Ended April 30, 2023* | $8.83 | $0.11 | $(0.23) | $ (0.12) | $ – | $ – | $ – | $ 8.71 |
| Year Ended October 31, 2022 | 10.29 | (–)(h) | (1.07) | (1.07) | (0.02) | (0.37) | (0.39) | 8.83 |
| Year Ended October 31, 2021 | 10.29 | (0.03) | 0.05 | 0.02 | (0.02) | – | (0.02) | 10.29 |
| Year Ended October 31, 2020 | 10.13 | 0.04 | 0.29 | 0.33 | (0.17) | – | (0.17) | 10.29 |
| Year Ended October 31, 2019 | 10.41 | 0.17 | 0.25 | 0.42 | (0.60) | (0.10) | (0.70) | 10.13 |
| Year Ended October 31, 2018 | 10.22 | 0.17 | 0.05 | 0.22 | – | (0.03) | (0.03) | 10.41 |
| Institutional Service Class Shares | ||||||||
| Six-Months Ended April 30, 2023* | 8.92 | 0.13 | (0.23) | (0.10) | – | – | – | 8.82 |
| Year Ended October 31, 2022 | 10.36 | 0.02 | (1.08) | (1.06) | (0.01) | (0.37) | (0.38) | 8.92 |
| Year Ended October 31, 2021 | 10.35 | (0.02) | 0.06 | 0.04 | (0.03) | – | (0.03) | 10.36 |
| Year Ended October 31, 2020 | 10.20 | 0.06 | 0.29 | 0.35 | (0.20) | – | (0.20) | 10.35 |
| Year Ended October 31, 2019 | 10.47 | 0.19 | 0.27 | 0.46 | (0.63) | (0.10) | (0.73) | 10.20 |
| Year Ended October 31, 2018 | 10.26 | 0.18 | 0.06 | 0.24 | – | (0.03) | (0.03) | 10.47 |
| Institutional Class Shares | ||||||||
| Six-Months Ended April 30, 2023* | 9.00 | 0.13 | (0.23) | (0.10) | – | – | – | 8.90 |
| Year Ended October 31, 2022 | 10.44 | 0.03 | (1.07) | (1.04) | (0.03) | (0.37) | (0.40) | 9.00 |
| Year Ended October 31, 2021 | 10.43 | (–) | 0.05 | 0.05 | (0.04) | – | (0.04) | 10.44 |
| Year Ended October 31, 2020 | 10.30 | 0.08 | 0.26 | 0.34 | (0.21) | – | (0.21) | 10.43 |
| Year Ended October 31, 2019 | 10.55 | 0.20 | 0.27 | 0.47 | (0.62) | (0.10) | (0.72) | 10.30 |
| Year Ended October 31, 2018 | 10.33 | 0.20 | 0.05 | 0.25 | – | (0.03) | (0.03) | 10.55 |
| * | Unaudited |
| (a) | Net investment income/(loss) is based on average shares outstanding during the period. |
| (b) | Excludes sales charge. |
| (c) | Not Annualized for periods less than one year. |
| (d) | Annualized for periods less than one year. |
| (e) | During the period, certain fees were waived and/or reimbursed. If such waivers/reimbursements had not occurred, the ratios would have been as indicated. |
| (f) | Portfolio turnover is calculated on the basis of the Fund as a whole without distinguishing among the classes of shares. |
| (g) | The total return shown above includes the impact of financial statement rounding of the NAV per share and/or financial statement adjustments. |
| (h) | Less than $0.005 per share. |
| (i) | Interest expense is less than 0.001%. |
| 50 | 2023 Semi-Annual Report |
| Ratios/Supplemental Data | |||||
| Total Return (b)(c) | Net Assets at End of Period (000's) | Ratio of Expenses (Net of Reimbursements/ Waivers) to Average Net Assets (d) | Ratio of Expenses (Prior to Reimbursements) to Average Net Assets(d)(e) | Ratio of Net Investment Income (Loss) to Average Net Assets | Portfolio Turnover (c)(f) |
| (1.36%)(g) | $ 11,987 | 1.06% | 2.18% | 2.57% | 37.02% |
| (10.81%)(g) | 13,569 | 1.04% | 1.86% | (0.05%) | 180.82% |
| 0.18% | 22,522 | 0.96% | 2.93% | (0.31%) | 424.59% |
| 3.26% | 1,078 | 0.97%(i) | 2.52%(i) | 0.35% | 238.35% |
| 4.41% | 802 | 1.18%(i) | 3.04%(i) | 1.69% | 53.05% |
| 2.10% | 1,119 | 1.12%(i) | 2.79%(i) | 1.60% | 62.39% |
| (1.12%)(g) | 4,833 | 0.77% | 1.89% | 2.87% | 37.02% |
| (10.62%)(g) | 5,153 | 0.78% | 1.60% | 0.23% | 180.82% |
| 0.33%(g) | 6,929 | 0.78% | 2.75% | (0.20%) | 424.59% |
| 3.45%(g) | 8,148 | 0.80%(i) | 2.35%(i) | 0.62% | 238.35% |
| 4.72% | 8,934 | 1.00%(i) | 2.86%(i) | 1.86% | 53.05% |
| 2.29% | 9,768 | 0.96%(i) | 2.63%(i) | 1.75% | 62.39% |
| (1.11%)(g) | 17,225 | 0.65% | 1.90% | 2.93% | 37.02% |
| (10.42%)(g) | 22,843 | 0.65% | 1.58% | 0.26% | 180.82% |
| 0.46% | 62,007 | 0.65% | 2.65% | (0.04%) | 424.59% |
| 3.34%(g) | 11,885 | 0.66%(i) | 2.24%(i) | 0.74% | 238.35% |
| 4.82%(g) | 2,876 | 0.86%(i) | 2.84%(i) | 1.98% | 53.05% |
| 2.47% | 5,521 | 0.85%(i) | 2.70%(i) | 1.94% | 62.39% |
| 2023 Semi-Annual Report | 51 |
| Investment Activities | Distributions | |||||||
| Net Asset Value, Beginning of Period | Net Investment Income (Loss) (a) | Net Realized and Unrealized Gains (Losses) on Investments | Total from Investment Activities | Net Investment Income | Tax Return of Capital | Total Distributions | Net Asset Value, End of Period | |
| Class A Shares | ||||||||
| Six-Months Ended April 30, 2023* | $7.18 | $0.19 | $0.29 | $ 0.48 | $ (0.35) | $ – | $ (0.35) | $ 7.31 |
| Year Ended October 31, 2022 | 8.84 | 0.38 | (1.63) | (1.25) | (0.41) | – | (0.41) | 7.18 |
| Year Ended October 31, 2021 | 8.45 | 0.39 | 0.40 | 0.79 | (0.40) | – | (0.40) | 8.84 |
| Year Ended October 31, 2020 | 8.71 | 0.40 | (0.28) | 0.12 | (0.38) | – | (0.38) | 8.45 |
| Year Ended October 31, 2019 | 8.74 | 0.44 | 0.19 | 0.63 | (0.58) | (0.08) | (0.66) | 8.71 |
| Year Ended October 31, 2018 | 9.23 | 0.50 | (0.56) | (0.06) | (0.43) | – | (0.43) | 8.74 |
| Institutional Class Shares | ||||||||
| Six-Months Ended April 30, 2023* | 6.57 | 0.19 | 0.25 | 0.44 | (0.36) | – | (0.36) | 6.65 |
| Year Ended October 31, 2022 | 8.13 | 0.36 | (1.48) | (1.12) | (0.44) | – | (0.44) | 6.57 |
| Year Ended October 31, 2021 | 7.81 | 0.38 | 0.37 | 0.75 | (0.43) | – | (0.43) | 8.13 |
| Year Ended October 31, 2020 | 8.08 | 0.39 | (0.25) | 0.14 | (0.41) | – | (0.41) | 7.81 |
| Year Ended October 31, 2019 | 8.16 | 0.43 | 0.17 | 0.60 | (0.61) | (0.07) | (0.68) | 8.08 |
| Year Ended October 31, 2018 | 8.65 | 0.49 | (0.53) | (0.04) | (0.45) | – | (0.45) | 8.16 |
| * | Unaudited |
| (a) | Net investment income/(loss) is based on average shares outstanding during the period. |
| (b) | Not Annualized for periods less than one year. |
| (c) | Annualized for periods less than one year. |
| (d) | During the period, certain fees were waived and/or reimbursed. If such waivers/reimbursements had not occurred, the ratios would have been as indicated. |
| (e) | Portfolio turnover is calculated on the basis of the Fund as a whole without distinguishing among the classes of shares. |
| (f) | Includes interest expense that amounts to 0.01% for Class A and Institutional Class for the six months ended April 30, 2023. Includes interest expense that amounts to less than 0.01%. |
| 52 | 2023 Semi-Annual Report |
| Ratios/Supplemental Data | |||||
| Total Return (b) | Net Assets at End of Period (000's) | Ratio of Expenses (Net of Reimbursements/ Waivers) to Average Net Assets (c)(d) | Ratio of Expenses (Prior to Reimbursements) to Average Net Assets(c)(d) | Ratio of Net Investment Income (Loss) to Average Net Assets (c) | Portfolio Turnover (b)(e) |
| 6.83% | $ 60,459 | 1.01%(f) | 1.36%(f) | 5.32% | 30.80% |
| (14.49%) | 61,410 | 1.00% | 1.41% | 4.73% | 96.73% |
| 9.46% | 81,980 | 1.00% | 1.40% | 4.41% | 98.16% |
| 1.55% | 87,358 | 1.00%(f) | 1.45%(f) | 4.76% | 99.46% |
| 7.65% | 116,126 | 1.00%(f) | 1.33%(f) | 5.14% | 98.17% |
| (0.66%) | 131,219 | 1.00%(f) | 1.22%(f) | 5.56% | 36.77% |
| 6.88% | 28,594 | 0.76%(f) | 1.08%(f) | 5.63% | 30.80% |
| (14.20%) | 40,298 | 0.75% | 1.11% | 4.94% | 96.73% |
| 9.73% | 55,335 | 0.75% | 1.09% | 4.65% | 98.16% |
| 1.86% | 58,237 | 0.75%(f) | 1.10%(f) | 5.01% | 99.46% |
| 7.91% | 101,888 | 0.75%(f) | 1.05%(f) | 5.39% | 98.17% |
| (0.43%) | 89,839 | 0.75%(f) | 0.95%(f) | 5.80% | 36.77% |
| 2023 Semi-Annual Report | 53 |
| Investment Activities | Distributions | |||||||
| Net Asset Value, Beginning of Period | Net Investment Income (Loss) (a) | Net Realized and Unrealized Gains (Losses) on Investments | Total from Investment Activities | Net Investment Income | Net Realized Gains | Total Distributions | Net Asset Value, End of Period | |
| Class A Shares | ||||||||
| Six-Months Ended April 30, 2023* | $8.50 | $0.13 | $0.33 | $ 0.46 | $ (0.13) | $ – | $ (0.13) | $ 8.83 |
| Year Ended October 31, 2022 | 9.83 | 0.24 | (1.33) | (1.09) | (0.24) | – | (0.24) | 8.50 |
| Year Ended October 31, 2021 | 9.73 | 0.24 | 0.12 | 0.36 | (0.24) | (0.02) | (0.26) | 9.83 |
| Year Ended October 31, 2020 | 9.92 | 0.26 | (0.18) | 0.08 | (0.26) | (0.01) | (0.27) | 9.73 |
| Year Ended October 31, 2019 | 9.54 | 0.28 | 0.38 | 0.66 | (0.28) | –(h) | (0.28) | 9.92 |
| Year Ended October 31, 2018 | 9.89 | 0.29 | (0.35) | (0.06) | (0.29) | – | (0.29) | 9.54 |
| Institutional Service Class Shares | ||||||||
| Six-Months Ended April 30, 2023* | 8.51 | 0.14 | 0.33 | 0.47 | (0.14) | – | (0.14) | 8.84 |
| Year Ended October 31, 2022 | 9.84 | 0.27 | (1.34) | (1.07) | (0.26) | – | (0.26) | 8.51 |
| Year Ended October 31, 2021 | 9.74 | 0.26 | 0.12 | 0.38 | (0.26) | (0.02) | (0.28) | 9.84 |
| Year Ended October 31, 2020 | 9.93 | 0.28 | (0.18) | 0.10 | (0.28) | (0.01) | (0.29) | 9.74 |
| Year Ended October 31, 2019 | 9.54 | 0.30 | 0.40 | 0.70 | (0.31) | –(h) | (0.31) | 9.93 |
| Year Ended October 31, 2018 | 9.89 | 0.31 | (0.35) | (0.04) | (0.31) | – | (0.31) | 9.54 |
| Institutional Class Shares | ||||||||
| Six-Months Ended April 30, 2023* | 8.51 | 0.14 | 0.33 | 0.47 | (0.14) | – | (0.14) | 8.84 |
| Year Ended October 31, 2022 | 9.84 | 0.26 | (1.33) | (1.07) | (0.26) | – | (0.26) | 8.51 |
| Year Ended October 31, 2021 | 9.74 | 0.26 | 0.12 | 0.38 | (0.26) | (0.02) | (0.28) | 9.84 |
| Year Ended October 31, 2020 | 9.93 | 0.28 | (0.18) | 0.10 | (0.28) | (0.01) | (0.29) | 9.74 |
| Year Ended October 31, 2019 | 9.55 | 0.30 | 0.39 | 0.69 | (0.31) | –(h) | (0.31) | 9.93 |
| Year Ended October 31, 2018 | 9.90 | 0.31 | (0.35) | (0.04) | (0.31) | – | (0.31) | 9.55 |
| * | Unaudited |
| (a) | Net investment income/(loss) is based on average shares outstanding during the period. |
| (b) | Excludes sales charge. |
| (c) | Not Annualized for periods less than one year. |
| (d) | Annualized for periods less than one year. |
| (e) | During the period, certain fees were waived and/or reimbursed. If such waivers/reimbursements had not occurred, the ratios would have been as indicated. |
| (f) | Portfolio turnover is calculated on the basis of the Fund as a whole without distinguishing among the classes of shares. |
| (g) | Interest expense is less than 0.001%. |
| (h) | Less than $0.005 per share. |
| 54 | 2023 Semi-Annual Report |
| Ratios/Supplemental Data | |||||
| Total Return (b)(c) | Net Assets at End of Period (000's) | Ratio of Expenses (Net of Reimbursements/ Waivers) to Average Net Assets (d) | Ratio of Expenses (Prior to Reimbursements) to Average Net Assets(d)(e) | Ratio of Net Investment Income (Loss) to Average Net Assets (d) | Portfolio Turnover (c)(f) |
| 5.40% | $ 4,652 | 0.79% | 1.18% | 2.94% | 40.83% |
| (11.24%) | 4,919 | 0.76%(g) | 1.13%(g) | 2.59% | 20.98% |
| 3.62% | 6,028 | 0.76% | 1.12% | 2.38% | 53.74% |
| 0.83% | 6,670 | 0.76%(g) | 1.09%(g) | 2.63% | 55.63% |
| 7.05% | 7,526 | 0.76%(g) | 1.16%(g) | 2.84% | 58.33% |
| (0.65%) | 7,141 | 0.80% | 1.08% | 2.95% | 14.38% |
| 5.55% | 19 | 0.50% | 0.90% | 3.22% | 40.83% |
| (10.98%) | 18 | 0.50%(g) | 0.87%(g) | 2.87% | 20.98% |
| 3.90% | 20 | 0.50% | 0.86% | 2.64% | 53.74% |
| 1.09% | 20 | 0.50%(g) | 0.83%(g) | 2.87% | 55.63% |
| 7.43% | 19 | 0.50%(g) | 0.90%(g) | 3.10% | 58.33% |
| (0.40%) | 18 | 0.54% | 0.82% | 3.21% | 14.38% |
| 5.55% | 42,557 | 0.50% | 0.93% | 3.23% | 40.83% |
| (10.99%) | 41,587 | 0.50%(g) | 0.88%(g) | 2.84% | 20.98% |
| 3.90% | 54,707 | 0.50% | 0.87% | 2.64% | 53.74% |
| 1.10% | 58,015 | 0.50%(g) | 0.84%(g) | 2.89% | 55.63% |
| 7.32% | 63,256 | 0.50%(g) | 0.90%(g) | 3.11% | 58.33% |
| (0.39%) | 65,428 | 0.54% | 0.83% | 3.21% | 14.38% |
| 2023 Semi-Annual Report | 55 |
| Investment Activities | Distributions | ||||||||
| Net Asset Value, Beginning of Period | Net Investment Income (Loss) (a) | Net Realized and Unrealized Gains (Losses) on Investments | Total from Investment Activities | Net Investment Income | Tax Return of Capital | Total Distributions | Redemption Fees | Net Asset Value, End of Period | |
| Class A Shares | |||||||||
| Six-Months Ended April 30, 2023* | $9.05 | $0.11 | $0.14 | $ 0.25 | $ (0.11) | $ – | $ (0.11) | $ – | $ 9.19 |
| Year Ended October 31, 2022 | 10.26 | 0.22 | (1.20) | (0.98) | (0.23) | – | (0.23) | – | 9.05 |
| Year Ended October 31, 2021 | 9.99 | 0.22 | 0.27 | 0.49 | (0.22) | – | (0.22) | – | 10.26 |
| Year Ended October 31, 2020 | 10.25 | 0.29 | (0.27) | 0.02 | (0.28) | – | (0.28) | – | 9.99 |
| Year Ended October 31, 2019 | 10.07 | 0.30 | 0.18 | 0.48 | (0.30) | – | (0.30) | – | 10.25 |
| Year Ended October 31, 2018 | 10.24 | 0.31 | (0.17) | 0.14 | (0.31) | –(h) | (0.31) | –(h) | 10.07 |
| Class C Shares | |||||||||
| Six-Months Ended April 30, 2023* | 9.05 | 0.08 | 0.15 | 0.23 | (0.08) | – | (0.08) | – | 9.20 |
| Year Ended October 31, 2022 | 10.27 | 0.15 | (1.22) | (1.07) | (0.15) | – | (0.15) | – | 9.05 |
| Year Ended October 31, 2021(j) | 10.13 | 0.12 | 0.14 | 0.26 | (0.12) | – | (0.12) | – | 10.27 |
| Institutional Class Shares | |||||||||
| Six-Months Ended April 30, 2023* | 9.05 | 0.13 | 0.14 | 0.27 | (0.13) | – | (0.13) | – | 9.19 |
| Year Ended October 31, 2022 | 10.26 | 0.24 | (1.20) | (0.96) | (0.25) | – | (0.25) | – | 9.05 |
| Year Ended October 31, 2021 | 9.99 | 0.24 | 0.27 | 0.51 | (0.24) | – | (0.24) | – | 10.26 |
| Year Ended October 31, 2020 | 10.25 | 0.31 | (0.26) | 0.05 | (0.31) | – | (0.31) | – | 9.99 |
| Year Ended October 31, 2019 | 10.07 | 0.32 | 0.18 | 0.50 | (0.32) | – | (0.32) | – | 10.25 |
| Year Ended October 31, 2018 | 10.24 | 0.33 | (0.16) | 0.17 | (0.34) | –(h) | (0.34) | –(h) | 10.07 |
| * | Unaudited |
| (a) | Net investment income/(loss) is based on average shares outstanding during the period. |
| (b) | Excludes sales charge. |
| (c) | Not Annualized for periods less than one year. |
| (d) | Annualized for periods less than one year. |
| (e) | During the period, certain fees were waived and/or reimbursed. If such waivers/reimbursements had not occurred, the ratios would have been as indicated. |
| (f) | Portfolio turnover is calculated on the basis of the Fund as a whole without distinguishing among the classes of shares. |
| (g) | Includes interest expense that amounts to 0.08% for the six-months ended April 30, 2023. Includes interest expense that amounts to 0.03% for the year ended October 31, 2022. Includes interest expense that amounts to less than 0.01% for the year ended October 31, 2020. Includes interest expense that amounts to 0.01% for the year ended October 31, 2018. |
| (h) | Less than $0.005 per share. |
| (i) | The total return shown above includes the impact of financial statement rounding of the NAV per share and/or financial statement adjustments. |
| (j) | For the period from December 21, 2020 (commencement of operations) through October 31, 2021. |
| 56 | 2023 Semi-Annual Report |
| Ratios/Supplemental Data | |||||
| Total Return (b)(c) | Net Assets at End of Period (000's) | Ratio of Expenses (Net of Reimbursements/ Waivers) to Average Net Assets (d) | Ratio of Expenses (Prior to Reimbursements) to Average Net Assets(d)(e) | Ratio of Net Investment Income (Loss) to Average Net Assets (d) | Portfolio Turnover (c)(f) |
| 2.81% | $ 9,423 | 0.99%(g) | 1.27%(g) | 2.50% | 20.08% |
| (9.71%) | 14,399 | 0.93%(g) | 1.17%(g) | 2.27% | 57.98% |
| 4.92% | 21,907 | 0.90% | 1.14% | 2.14% | 95.56% |
| 0.25% | 22,417 | 0.90%(g) | 1.12%(g) | 2.84% | 149.01% |
| 4.78% | 27,577 | 0.90% | 1.13% | 2.96% | 104.52% |
| 1.42% | 29,433 | 0.91%(g) | 1.11%(g) | 3.03% | 86.19% |
| 2.54%(i) | 25 | 1.73%(g) | 1.99%(g) | 1.76% | 20.08% |
| (10.47%)(i) | 27 | 1.68%(g) | 1.87%(g) | 1.57% | 57.98% |
| 2.52% | 27 | 1.65% | 1.86% | 1.33% | 95.56% |
| 2.94% | 130,670 | 0.73%(g) | 1.00%(g) | 2.75% | 20.08% |
| (9.48%) | 180,805 | 0.68%(g) | 0.90%(g) | 2.49% | 57.98% |
| 5.18% | 424,689 | 0.65% | 0.88% | 2.37% | 95.56% |
| 0.51% | 270,153 | 0.65%(g) | 0.87%(g) | 3.07% | 149.01% |
| 5.05% | 229,716 | 0.65% | 0.90% | 3.19% | 104.52% |
| 1.67% | 177,810 | 0.66%(g) | 0.87%(g) | 3.27% | 86.19% |
| 2023 Semi-Annual Report | 57 |
| Investment Activities | Distributions | |||||||
| Net Asset Value, Beginning of Period | Net Investment Income (Loss) | Net Realized and Unrealized Gains (Losses) on Investments | Total from Investment Activities | Net Investment Income | Total Distributions | Redemption Fees | Net Asset Value, End of Period | |
| Class A Shares | ||||||||
| Six-Months Ended April 30, 2023* | $10.06 | $0.14(f) | $0.01 | $ 0.15 | $ (0.14) | $ (0.14) | $ – | $ 10.07 |
| Year Ended October 31, 2022 | 10.09 | 0.05(f) | (0.02) | 0.03 | (0.06) | (0.06) | – | 10.06 |
| Year Ended October 31, 2021 | 10.09 | –(f)(h) | (–)(h) | (–)(h) | –(h) | –(h) | – | 10.09 |
| Year Ended October 31, 2020 | 10.10 | 0.07(f) | –(h) | 0.07 | (0.08) | (0.08) | – | 10.09 |
| Year Ended October 31, 2019 | 10.09 | 0.13(f) | 0.01 | 0.14 | (0.13) | (0.13) | – | 10.10 |
| Year Ended October 31, 2018 | 10.09 | 0.11(f) | – | 0.11 | (0.11) | (0.11) | –(h) | 10.09 |
| Class A1 Shares | ||||||||
| Six-Months Ended April 30, 2023* | 10.06 | 0.14(f) | 0.02 | 0.16 | (0.14) | (0.14) | – | 10.08 |
| Year Ended October 31, 2022 | 10.10 | 0.05(f) | (0.03) | 0.02 | (0.06) | (0.06) | – | 10.06 |
| Year Ended October 31, 2021 | 10.10 | –(f)(h) | (–)(h) | (–)(h) | –(h) | –(h) | – | 10.10 |
| Year Ended October 31, 2020 | 10.10 | 0.03(f) | 0.05 | 0.08 | (0.08) | (0.08) | – | 10.10 |
| Year Ended October 31, 2019(i) | 10.10 | 0.08 | –(h) | 0.08 | (0.08) | (0.08) | – | 10.10 |
| Institutional Class Shares | ||||||||
| Six-Months Ended April 30, 2023* | 10.00 | 0.15(f) | 0.02 | 0.17 | (0.15) | (0.15) | – | 10.02 |
| Year Ended October 31, 2022 | 10.04 | 0.07(f) | (0.03) | 0.04 | (0.08) | (0.08) | – | 10.00 |
| Year Ended October 31, 2021 | 10.03 | 0.01(f) | 0.01 | 0.02 | (0.01) | (0.01) | – | 10.04 |
| Year Ended October 31, 2020 | 10.04 | 0.10(f) | (0.01) | 0.09 | (0.10) | (0.10) | – | 10.03 |
| Year Ended October 31, 2019 | 10.04 | 0.15(f) | – | 0.15 | (0.15) | (0.15) | – | 10.04 |
| Year Ended October 31, 2018 | 10.04 | 0.130(f) | – | 0.13 | (0.13) | (0.13) | –(h) | 10.04 |
| * | Unaudited |
| (a) | Excludes sales charge. |
| (b) | Not Annualized for periods less than one year. |
| (c) | Annualized for periods less than one year. |
| (d) | During the period, certain fees were waived and/or reimbursed. If such waivers/reimbursements had not occurred, the ratios would have been as indicated. |
| (e) | Portfolio turnover is calculated on the basis of the Fund as a whole without distinguishing among the classes of shares. |
| (f) | Net investment income/(loss) is based on average shares outstanding during the period. |
| (g) | Includes interest expense that amounts to 0.01% for Class A and Institutional Class for the six months ended April 30, 2023. Includes interest expense that amounts to less than 0.01%. |
| (h) | Less than $0.005 per share. |
| (i) | For the period from February 28, 2019 (commencement of operations) through October 31, 2019. |
| 58 | 2023 Semi-Annual Report |
| Ratios/Supplemental Data | |||||
| Total Return (a)(b) | Net Assets at End of Period (000's) | Ratio of Expenses (Net of Reimbursements/ Waivers) to Average Net Assets (c) | Ratio of Expenses (Prior to Reimbursements) to Average Net Assets(c)(d) | Ratio of Net Investment Income (Loss) to Average Net Assets (c) | Portfolio Turnover (b)(e) |
| 1.52% | $ 106,449 | 0.70%(g) | 0.98%(g) | 2.81% | 133.88% |
| 0.30% | 123,920 | 0.60%(g) | 0.95%(g) | 0.52% | 320.87% |
| 0.02% | 161,362 | 0.54%(g) | 0.96%(g) | 0.02% | 261.23% |
| 0.69% | 263,068 | 0.70%(g) | 0.94%(g) | 0.72% | 299.40% |
| 1.36% | 204,501 | 0.70% | 0.95% | 1.25% | 231.49% |
| 1.09% | 223,255 | 0.70% | 0.92% | 1.08% | 177.63% |
| 1.62% | 265 | 0.70% | 0.92% | 2.85% | 133.88% |
| 0.20% | 261 | 0.60%(g) | 0.89%(g) | 0.52% | 320.87% |
| 0.02% | 510 | 0.54%(g) | 0.89%(g) | 0.02% | 261.23% |
| 0.79% | 558 | 0.70%(g) | 0.90%(g) | 0.34% | 299.40% |
| 0.81% | 35 | 0.70% | 0.94% | 1.13% | 231.49% |
| 1.75% | 522,879 | 0.45%(g) | 0.74%(g) | 3.09% | 133.88% |
| 0.37% | 561,780 | 0.44%(g) | 0.71%(g) | 0.71% | 320.87% |
| 0.21% | 793,264 | 0.45%(g) | 0.71%(g) | 0.11% | 261.23% |
| 0.94% | 928,424 | 0.45%(g) | 0.71%(g) | 0.98% | 299.40% |
| 1.51% | 680,881 | 0.45% | 0.72% | 1.50% | 231.49% |
| 1.34% | 802,312 | 0.45% | 0.67% | 1.32% | 177.63% |
| 2023 Semi-Annual Report | 59 |
April 30, 2023
| • | abrdn Global Absolute Return Strategies Fund (“Global Absolute Return Strategies Fund”) |
| • | abrdn Global High Income Fund ("Global High Income Fund") |
| • | abrdn Intermediate Municipal Income Fund ("Intermediate Municipal Income Fund") |
| • | abrdn Short Duration High Yield Municipal Fund ("Short Duration High Yield Municipal Fund") |
| • | abrdn Ultra Short Municipal Income Fund ("Ultra Short Municipal Income Fund") |
| a. | Security Valuation: |
| The Funds value their securities at current market value or fair value, consistent with regulatory requirements. "Fair value" is defined in the Funds' Valuation and Liquidity Procedures as the price that could be received to sell an asset or paid to transfer a liability in an orderly transaction between willing market participants without a compulsion to transact at the measurement date. Pursuant to Rule 2a-5 under the 1940 Act, the Board of Trustees (the "Board") designated abrdn Inc. ("abrdn" or the "Adviser") as the valuation designee ("Valuation Designee") for the Funds to perform the fair value determinations relating to Fund investments for which market quotations are not readily available. | |
| Equity securities that are traded on an exchange are valued at the last quoted sale price or the official close price on the principal exchange on which the security is traded at the “Valuation Time” subject to application, when appropriate, of the valuation factors described in the paragraph below. Under normal circumstances, the Valuation Time is as of the close of regular trading on the New York Stock Exchange ("NYSE") (usually 4:00 p.m. Eastern Time). In the absence of a sale price, the security is valued at the mean of the bid/ask price quoted at the close on the principal exchange on which the security is traded. Securities traded on NASDAQ are valued at the NASDAQ official closing price. | |
| In accordance with the authoritative guidance on fair value measurements and disclosures under U.S. GAAP, the Funds disclose the fair value of their investments using a three-level hierarchy that classifies the inputs to valuation techniques used to measure the fair value. The hierarchy assigns Level 1, the highest level, measurements to valuations based upon unadjusted quoted prices in active markets for identical assets, Level 2 measurements to valuations based upon other significant observable inputs, including adjusted quoted prices in active markets for similar assets, and Level 3, the lowest level, measurements to valuations based upon unobservable inputs that are significant to the valuation. Inputs refer broadly to the assumptions that market participants would use in pricing the asset or liability, including assumptions about risk, for example, the risk inherent in a particular valuation technique used to measure fair value including a pricing model and/or the risk inherent in the inputs to the valuation technique. Inputs may be observable or unobservable. Observable inputs are inputs that reflect the assumptions market participants would use in pricing the asset or liability, which are based on market data obtained from sources independent of the reporting entity. Unobservable inputs are inputs that reflect the reporting entity’s own assumptions about the assumptions market participants would use in pricing the asset or liability developed based on the best information available in the circumstances. A financial instrument’s level within the fair value hierarchy is based upon the lowest level of any input that is significant to the fair value measurement. Open-end mutual funds are valued at the respective net asset value (“NAV”) as reported by such company. The prospectuses for the registered open-end management investment companies in which a Fund invests explain the circumstances under which those companies will use fair value pricing and the effects of using fair value pricing. Closed-end funds and exchange-traded funds (“ETFs”) are valued at the market price of the security at the Valuation Time. A security using any of these pricing methodologies is determined to be a Level 1 investment. | |
| Foreign equity securities that are traded on foreign exchanges that close prior to the Valuation Time are valued by applying valuation factors to the last sale price or the mean price as noted above. Valuation factors are provided by an independent pricing service provider. These |
| 60 | 2023 Semi-Annual Report |
April 30, 2023
| valuation factors are used when pricing a Fund's portfolio holdings to estimate market movements between the time foreign markets close and the time a Fund values such foreign securities. These valuation factors are based on inputs such as depositary receipts, indices, futures, sector indices/ETFs, exchange rates, and local exchange opening and closing prices of each security. When prices with the application of valuation factors are utilized, the value assigned to the foreign securities may not be the same as quoted or published prices of the securities on their primary markets. A security that applies a valuation factor is determined to be a Level 2 investment because the exchange-traded price has been adjusted. Valuation factors are not utilized if the independent pricing service provider is unable to provide a valuation factor or if the valuation factor falls below a predetermined threshold; in such case, the security is determined to be a Level 1 investment. | |
| Long-term debt and other fixed income securities are valued at the last quoted or evaluated bid price on the valuation date provided by an independent pricing service provider. If there are no current day bids, the security is valued at the previously applied bid. Pricing services generally price debt securities assuming orderly transactions of an institutional “round lot” size, and the strategies employed by the Adviser as Valuation Designee generally trade in round lot sizes. In certain circumstances, fixed income securities may be held or transactions may be conducted in smaller, “odd lot” sizes. Odd lots may trade at lower or occasionally higher prices than institutional round lot trades. Short-term debt securities (such as commercial paper and U.S. treasury bills) having a remaining maturity of 60 days or less are valued at the last quoted or evaluated bid price on the valuation date provided by an independent pricing service, or on the basis of amortized cost if it represents the best approximation for fair value. Debt and other fixed-income securities are generally determined to be Level 2 investments. | |
| Short-term investments are comprised of cash and cash equivalents invested in short-term investment funds which are redeemable daily. The Funds sweep available cash into the State Street Institutional U.S. Government Money Market Fund, which has elected to qualify as a “government money market fund” pursuant to Rule 2a-7 under the 1940 Act, and has an objective, which is not guaranteed, to maintain a $1.00 per share NAV. Registered investment companies are valued at their NAV as reported by such company. Generally, these investment types are categorized as Level 1 investments. | |
| Derivative instruments are generally valued according to the following procedures. Exchange traded derivatives are generally Level 1 investments and over-the-counter and centrally cleared derivatives are generally Level 2 investments. Forward currency exchange contracts are generally valued based on the current spot exchange rates and the forward exchange rate points (ex. 1-month, 3-month) that are obtained from an approved pricing agent. Based on the actual settlement dates of the forward contracts held, an interpolated value of the forward points is combined with the spot exchange rate to derive the valuation. Futures contracts are generally valued at the most recent settlement price as of NAV determination. Swap agreements are generally valued by an approved pricing agent based on the terms of the swap agreement (including future cash flows). Exchange-traded options are valued at the last quoted sales price. In the absence of a sales price, options are valued at the mean of the bid/ask price quoted at the close on the exchange on which the options trade. When market quotations or exchange rates are not readily available, or if the Adviser concludes that such market quotations do not accurately reflect fair value, the fair value of a Fund’s assets are determined in good faith in accordance with the Valuation Procedures. | |
| In the event that a security’s market quotations are not readily available or are deemed unreliable (for reasons other than because the foreign exchange on which it trades closes before the Valuation Time), the security is valued at fair value as determined by the Valuation Designee, taking into account the relevant factors and surrounding circumstances using valuation policies and procedures approved by the Board. Under normal circumstances the Valuation Time is as of the close of regular trading on the NYSE (usually 4:00 p.m. Eastern Time). A security that has been fair valued by the Adviser may be classified as Level 2 or Level 3 depending on the nature of the inputs. | |
| The three-level hierarchy of inputs is summarized below: |
| • | Level 1 - quoted prices in active markets for identical investments; |
| • | Level 2 - other significant observable inputs (including valuation factors, quoted prices for similar securities, interest rates, prepayment speeds, and credit risk); or |
| • | Level 3 - significant unobservable inputs (including a Fund’s own assumptions in determining the fair value of investments). |
| 2023 Semi-Annual Report | 61 |
April 30, 2023
| Security Type | Standard Inputs |
| Debt and other fixed-income securities | Reported trade data, broker-dealer price quotations, benchmark yields, issuer spreads on comparable securities, credit quality, yield, and maturity. |
| Foreign equities utilizing a fair value factor | Depositary receipts, indices, futures, sector indices/ETFs, exchange rates, and local exchange opening and closing prices of each security. |
| Forward foreign currency contracts | Forward exchange rate quotations. |
| Swap agreements | Market information pertaining to the underlying reference assets, i.e., credit spreads, credit event probabilities, fair values, forward rates, and volatility measures. |
| Investments, at Value | Level 1 – Quoted Prices | Level 2 – Other Significant Observable Inputs | Level 3 – Significant Unobservable Inputs | Total |
| Global Absolute Return Strategies Fund | ||||
| Assets | ||||
| Investments in Securities | ||||
Common Stocks | $3,888,206 | $2,123,226 | $– | $6,011,432 |
Government Bonds | – | 7,110,343 | – | 7,110,343 |
Short-Term Investments | 3,745,061 | 16,476,348 | – | 20,221,409 |
Purchased Options | 351,871 | – | – | 351,871 |
Total Investments | $7,985,138 | $25,709,917 | $– | $33,695,055 |
| Other Financial Instruments | ||||
Centrally Cleared Credit Default Swap Contracts | $– | $118,051 | $– | $118,051 |
Centrally Cleared Interest Rate Swap Agreements | – | 88,942 | – | 88,942 |
Foreign Currency Exchange Contracts | – | 767,377 | – | 767,377 |
Futures Contracts | 314,402 | – | – | 314,402 |
Other the Counter Total Return Swaps | – | 13,535 | – | 13,535 |
Written Options | 246,679 | – | – | 246,679 |
Total Other Financial Instruments | $561,081 | $987,905 | $– | $1,548,986 |
Total Assets | $8,546,219 | $26,697,822 | $– | $35,244,041 |
| Liabilities | ||||
| Other Financial Instruments | ||||
Centrally Cleared Interest Rate Swap Agreements | $– | $(60,235) | $– | $(60,235) |
Foreign Currency Exchange Contracts | – | (890,015) | – | (890,015) |
Futures Contracts | (366,002) | – | – | (366,002) |
Total Return Swaps | – | (114,537) | – | (114,537) |
Total Liabilities | $(366,002) | $(1,064,787) | $– | $(1,430,789) |
| 62 | 2023 Semi-Annual Report |
April 30, 2023
| Investments, at Value | Level 1 – Quoted Prices | Level 2 – Other Significant Observable Inputs | Level 3 – Significant Unobservable Inputs | Total |
| Global High Income Fund | ||||
| Assets | ||||
| Investments in Securities | ||||
Corporate Bonds | $– | $84,906,475 | $– | $84,906,475 |
Exchange-Traded Funds | 1,136,655 | – | – | 1,136,655 |
U.S. Treasuries | – | 664,574 | – | 664,574 |
Short-Term Investment | 2,096,752 | – | – | 2,096,752 |
Total Investments | $3,233,407 | $85,571,049 | $– | $88,804,456 |
| Other Financial Instruments | ||||
Foreign Currency Exchange Contracts | $– | $1,979 | $– | $1,979 |
Total Assets | $3,233,407 | $85,573,028 | $– | $88,806,435 |
| Liabilities | ||||
| Other Financial Instruments | ||||
Foreign Currency Exchange Contracts | $– | $(112,688) | $– | $(112,688) |
Total Liabilities | $– | $(112,688) | $– | $(112,688) |
| Intermediate Municipal Income Fund | ||||
| Assets | ||||
| Investments in Securities | ||||
Municipal Bonds | $– | $46,593,865 | $– | $46,593,865 |
Short-Term Investment | 64,453 | – | – | 64,453 |
Total Investments | $64,453 | $46,593,865 | $– | $46,658,318 |
Total Assets | $64,453 | $46,593,865 | $– | $46,658,318 |
| Short Duration High Yield Municipal Fund | ||||
| Assets | ||||
| Investments in Securities | ||||
Municipal Bonds | $– | $134,233,554 | $4,550,000 | $138,783,554 |
Total Investments | $– | $134,233,554 | $4,550,000 | $138,783,554 |
Total Assets | $– | $134,233,554 | $4,550,000 | $138,783,554 |
| Ultra Short Municipal Income Fund | ||||
| Assets | ||||
| Investments in Securities | ||||
Municipal Bonds | $– | $618,201,387 | $– | $618,201,387 |
Short-Term Investments | 104,564 | 9,750,000 | – | 9,854,564 |
Total Investments | $104,564 | $627,951,387 | $– | $628,055,951 |
Total Assets | $104,564 | $627,951,387 | $– | $628,055,951 |
| 2023 Semi-Annual Report | 63 |
April 30, 2023
| Rollforward of Level 3 Fair Value Measurement For the Six Months Ended April 30, 2023 | ||||||||||
| Investments in Securities | Balance as of October 31, 2022 | Accrued Discounts (Premiums) | Realized Gain (Loss) | Change in Unrealized Appreciation (Depreciation) | Net Purchases | Net Sales | Net Transfers in to Level 3 | Net Transfers out of Level 3 | Balance as of April 30, 2023 | Change in Unrealized Appreciation (Depreciation) from Investments Held at April 30, 2023 |
| Municipal Bonds | ||||||||||
United States | $5,850,000 | $- | $- | $(1,300,000) | $- | $- | $- | $- | $4,550,000 | $(1,300,000) |
Total | $5,850,000 | $- | $- | $(1,300,000) | $- | $- | $- | $- | $4,550,000 | $(1,300,000) |
| Description | Fair Value at 04/30/23 | Valuation Technique (s) | Unobservable Inputs | Range | Weighted Average |
| Municipal Bonds | $4,550,000 | Liquidation/Recovery Analysis | Bid/Ask Spread | 70 | 70 |
| b. | Restricted Securities: |
| Restricted securities are privately-placed securities whose resale is restricted under U.S. securities laws. The Funds may invest in restricted securities, including unregistered securities eligible for resale without registration pursuant to Rule 144A and privately-placed securities of U.S. and non-U.S. issuers offered outside the U.S. without registration pursuant to Regulation S under the Securities Act of 1933, as amended. Rule 144A securities may be freely traded among certain qualified institutional investors, such as the Funds, but resale of such securities in the U.S. is permitted only in limited circumstances. |
| c. | Foreign Currency Translation: |
| Foreign securities, currencies and other assets and liabilities denominated in foreign currencies are translated into U.S. dollars at the exchange rate of said currencies against the U.S. dollar, as of the Valuation Time, as provided by an independent pricing service. Purchases and sales of securities, and income and expenses are translated at the prevailing rate of exchange on the respective date of these transactions. The Funds do not isolate that portion of the results of operations resulting from changes in foreign exchange rates on investments from fluctuations arising from changes in market prices of securities held. These fluctuations are included with the net realized and unrealized gain or loss from investments and foreign currencies within the Statements of Operations. |
| d. | Derivative Financial Instruments: |
| Certain Funds are authorized to use derivatives to manage currency risk, credit risk, and interest rate risk and to replicate, or use as a substitute for, physical securities. Losses may arise due to changes in the value of the contract or if the counterparty does not perform under the contract. The use of derivative instruments involves, to varying degrees, elements of market risk in excess of the amount recognized in the Statements of Assets and Liabilities. | |
| Forward Foreign Currency Exchange Contracts: | |
| A forward foreign currency exchange contract ("forward contract") involves an obligation to purchase and sell a specific currency at a future date, which may be any fixed number of days from the date of the contract agreed upon by the parties, at a price set at the time of the |
| 64 | 2023 Semi-Annual Report |
April 30, 2023
| contract. Forward contracts are used to manage a Fund's currency exposure in an efficient manner. They are used to sell unwanted currency exposure that comes with holding securities in a market, or to buy currency exposure where the exposure from holding securities is insufficient to give the desired currency exposure either in absolute terms or relative to a particular benchmark or index. The use of forward contracts allows for the separation of investment decision-making between foreign exchange holdings and their currencies. | |
| The forward contract is marked-to-market daily and the change in market value is recorded by a Fund as unrealized appreciation or depreciation. Forward contracts' prices are received daily from an independent pricing provider. When the forward contract is closed, a Fund records a realized gain or loss equal to the difference between the value at the time it was opened and the value at the time it was closed. These realized and unrealized gains and losses are reported on the Statement of Operations. A Fund could be exposed to risks if the counterparties to the contracts are unable to meet the terms of their contracts or from unanticipated movements in exchange rates. | |
| While a Fund may enter into forward contracts to seek to reduce currency exchange rate risks, transactions in such contracts involve certain risks. A Fund could be exposed to risks if the counterparties to the contracts are unable to meet the terms of their contracts and from unanticipated movements in exchange rates. Thus, while a Fund may benefit from such transactions, unanticipated changes in currency prices may result in a poorer overall performance for a Fund than if it had not engaged in any such transactions. Moreover, there may be an imperfect correlation between a Fund’s portfolio holdings or securities quoted or denominated in a particular currency and forward contracts entered into by the Fund. Such imperfect correlation may prevent a Fund from achieving a complete hedge, which will expose the Fund to the risk of foreign exchange loss. | |
| Forward contracts are subject to the risk that the counterparties to such contracts may default on their obligations. Since a forward foreign currency exchange contract is not guaranteed by an exchange or clearing house, a default on the contract would deprive a Fund of unrealized profits, transaction costs or the benefits of a currency hedge or force a Fund to cover its purchase or sale commitments, if any, at the market price at the time of the default. | |
| Futures Contracts | |
| Certain Funds may invest in financial futures contracts (“futures contracts”) for the purpose of hedging their existing portfolio securities, or securities that a Fund intends to purchase, against fluctuations in value caused by changes in prevailing market interest rates or prices. Futures contracts may also be entered into for non-hedging purposes; however, in those instances, the aggregate initial margin and premiums required to establish a Fund’s positions may not exceed 5% of a Fund’s NAV after taking into account unrealized profits and unrealized losses on any such contract into which it has entered. | |
| Upon entering into a futures contract, a Fund is required to pledge to the broker an amount of cash and/or other assets equal to a certain percentage of the contract amount. This payment is known as initial margin. Subsequent payments, known as “variation margin,” are calculated each day, depending on the daily fluctuations in the fair value/market value of the underlying assets. An unrealized gain/(loss) equal to the variation margin is recognized on a daily basis. When the contract expires or is closed, the gain/(loss) is realized and is presented in the Statement of Operations as a net realized gain/(loss) on futures contracts. Futures contracts are valued daily at their last quoted sale price on the exchange on which they are traded. | |
| A “sale” of a futures contract means a contractual obligation to deliver the securities or foreign currency called for by the contract at a fixed price at a specified time in the future. A “purchase” of a futures contract means a contractual obligation to acquire the securities or foreign currency at a fixed price at a specified time in the future. | |
| There are significant risks associated with a Fund's use of futures contracts, including the following: (1) the success of a hedging strategy may depend on the ability of a Fund's investment adviser and/or sub-adviser to predict movements in the prices of individual securities, fluctuations in markets and movements in interest rates; (2) there may be an imperfect or no correlation between the movement in the price of futures contracts, interest rates and the value/market value of the securities held by a Fund; (3) there may not be a liquid secondary market for a futures contract; (4) trading restrictions or limitations may be imposed by an exchange; and (5) government regulations may restrict trading in futures contracts. In addition, should market conditions change unexpectedly, a Fund may not achieve the anticipated benefits of the futures contracts and may realize a loss. | |
| During the six-month period ended April 30, 2023, the Global Absolute Return Strategies Fund invested in futures for both investment and hedging purposes. | |
| Options | |
| Options are instruments that provide a right to buy (call) or sell (put) a particular security or an index of securities at a fixed price within a certain time period. Options differ from forward and futures contracts in that the buyer of the option has no obligation to perform under the contract. An option is out-of-the money if the exercise price of the option is above, in the case of a call option, or below, in the case of a put |
| 2023 Semi-Annual Report | 65 |
April 30, 2023
| option, the current price (or interest rate or yield for certain options) of the referenced security or instrument. Use of put and call options may result in losses to a Fund, force the sale or purchase of portfolio securities at inopportune times or for prices higher than (in the case of put options) or lower than (in the case of call options) current market values, limit the amount of appreciation a Fund can realize on its investments or cause a Fund to hold a security it might otherwise sell. | |
| For the six-month period ended April 30, 2023, the Global Absolute Return Strategies Fund invested in options for both investment and hedging purposes. | |
| Swaps | |
| A swap is an agreement that obligates two parties to exchange a series of cash flows and/or meet certain obligations at specified intervals based upon or calculated by reference to changes in specified prices or rates (interest rates in the case of interest rate swaps, currency exchange rates in the case of currency swaps) or the occurrence of a credit event with respect to an underlying reference obligation (in the case of a credit default swap) for a specified amount of an underlying asset or notional principal amount. A Fund will enter into swaps only on a net basis, which means that the two payment streams are netted out, with a Fund receiving or paying, as the case may be, only the amount of the difference between the two payments. Except for currency swaps and credit default swaps, the notional principal amount is used solely to calculate the payment streams but is not exchanged. With respect to currency swaps, actual principal amounts of currencies may be exchanged by the counterparties at the initiation, and again upon the termination of the transaction. | |
| Traditionally, swaps were customized, privately negotiated agreements executed between two parties (“OTC Swaps”) but since 2013, certain swaps are required to be cleared pursuant to rules and regulations related to the Dodd – Frank Wall Street Reform and Consumer Protection Act (“Dodd Frank”) and/or Regulation (EU) No 648/2012 on OTC Derivatives, Central Counterparties and Trade Repositories (“EMIR”) (“Cleared Swaps”). Like OTC Swaps, Cleared Swaps are negotiated bilaterally. Unlike OTC Swaps, the act of clearing results in two swaps executed between each of the parties and a central counterparty (“CCP”), and thus the counterparty credit exposure of the parties is to the CCP rather than to one another. Upon entering into a Cleared Swap, a Fund is required to pledge an amount of cash and/or other assets equal to a certain percentage of the contract amount. This payment is known as “initial margin”. Subsequent payments, known as “variation margin,” are calculated each day, depending on the daily fluctuations in the fair value/market value of the underlying assets. An unrealized gain/(loss) equal to the variation margin is recognized on a daily basis. When the contract matures or is terminated, the gain or loss is realized and is presented in the Statements of Operations as a net realized gain or loss on swap contracts. The margin requirements associated with OTC Swaps and Cleared Swaps may not be the same. | |
| Entering into swap agreements involves, to varying degrees, elements of credit, market and interest rate risk in excess of the amounts reported on the Statement of Assets and Liabilities. Such risks involve the possibility that there will be no liquid market for these agreements, that the counterparty to the agreements may default on its obligation to perform and that there may be unfavorable changes in the value of the index or securities underlying the agreement. The Funds' maximum risk of loss from counterparty risk related to swaps is the fair value of the contract. This risk is mitigated by the posting of collateral by the counterparties to the Funds to cover the Funds' exposure to the counterparty. | |
| Interest Rate Swaps | |
| A Fund uses interest rate swap contracts to manage its exposure to interest rates. Interest rate swap contracts typically represent the exchange between a Fund and a counterparty of respective commitments to make variable rate and fixed rate payments with respect to a notional amount of principal. Interest rate swap contracts may have a term that is greater than one year, but typically require periodic interim settlement in cash, at which time the specified value of the variable interest rate is reset for the next settlement period. Net payments of interest are recorded as realized gains or losses. During the period that the swap contract is open, the contract is marked-to-market as the net amount due to or from a Fund and changes in the value of swap contracts are recorded as unrealized gains or losses. | |
| During the six-month period ended April 30, 2023, the Global Absolute Return Strategies Fund held interest rate swaps to implement investment views and hedge interest rate risk. | |
| Credit Default Swaps | |
| A credit default swap is an agreement whereby one party, the buyer, is obligated to pay the other party, the seller, a periodic stream of payments over the term of the contract in return for a contingent payment upon the occurrence of a credit event with respect to an underlying reference obligation. A Fund might use credit default swap contracts to limit or to reduce risk exposure of the Fund to defaults of corporate and sovereign issues (i.e., to reduce risk when the Fund owns or has exposure to such issuers). A Fund also might use credit default swap contracts to create direct or synthetic short or long exposure to domestic or foreign corporate debt securities or certain sovereign debt securities to which the Fund is not otherwise exposed. |
| 66 | 2023 Semi-Annual Report |
April 30, 2023
| Summary of Derivative Instruments | |
| Certain Funds may use derivatives for various purposes as noted above. The following is a summary of the fair value of derivative instruments, not accounted for as hedging instruments, as of April 30, 2023: | |
| Risk Exposure Category | |||||||
| Interest Rate Contracts | Foreign Currency Contracts | Credit Contracts | Equity Contracts | Commodity Contracts | Other | Total | |
| Global Absolute Return Strategies Fund | |||||||
| Assets: | |||||||
| Unrealized appreciation on: | |||||||
| Forward Foreign Currency Exchange Contracts | $– | $767,377 | $– | $– | $– | $– | $767,377 |
| Futures Contracts | 250,108 | – | – | 64,294 | – | – | 314,402 |
| Purchased Options | – | – | – | 158,130 | – | 82,079 | 240,209 |
| Purchased Swaptions | 111,662 | – | – | – | – | – | 111,662 |
| Swap Contracts | 88,942 | – | 72,862 | 13,535 | – | – | 175,339 |
Total | $450,712 | $767,377 | $72,862 | $235,959 | $– | $82,079 | $1,608,989 |
| Liabilities: | |||||||
| Unrealized depreciation on: | |||||||
| Forward Foreign Currency Exchange Contracts | $– | $890,015 | $– | $– | $– | $– | $890,015 |
| Futures Contracts | – | – | – | 366,002 | – | – | 366,002 |
| Written Options, market value | – | – | – | 34,945 | – | – | 34,945 |
| Written Swaptions, market value | 211,733 | – | – | – | – | – | 211,733 |
| Swap Contracts | 60,235 | – | – | 114,537 | – | – | 174,772 |
Total | $271,968 | $890,015 | $– | $515,484 | $– | $– | $1,677,467 |
| Global High Income Fund | |||||||
| Assets: | |||||||
| Unrealized appreciation on: | |||||||
| Forward Foreign Currency Exchange Contracts | $– | $1,979 | $– | $– | $– | $– | $1,979 |
Total | $– | $1,979 | $– | $– | $– | $– | $1,979 |
| Liabilities: | |||||||
| Unrealized depreciation on: | |||||||
| Forward Foreign Currency Exchange Contracts | $– | $112,688 | $– | $– | $– | $– | $112,688 |
Total | $– | $112,688 | $– | $– | $– | $– | $112,688 |
| 2023 Semi-Annual Report | 67 |
April 30, 2023
| Gross Amounts Not Offset in the Statement of Assets and Liabilities | Gross Amounts Not Offset in the Statement of Assets and Liabilities | |||||||
| Gross Amounts of Assets Presented in Statement of Assets and Liabilities | Financial Instruments | Collateral Received | Net Amount | Gross Amounts of Liabilities Presented in Statement of Assets and Liabilities | Financial Instruments | Collateral Pledged | Net Amount | |
| Description | Assets | Liabilities | ||||||
| Global Absolute Return Strategies Fund | ||||||||
| Foreign Currency Exchange Contracts | ||||||||
| Barclays Bank PLC | $37,080 | $(37,080) | $– | $– | $40,112 | $(37,080) | $– | $3,032 |
| Citibank N.A. | 199,552 | (28,357) | – | 171,195 | 28,357 | (28,357) | – | – |
| Goldman Sachs & Co. | 67,564 | (67,564) | – | – | 118,124 | (67,564) | – | 50,560 |
| HSBC Bank PLC | 27,798 | (27,798) | – | – | 63,469 | (27,798) | – | 35,671 |
| JPMorgan Chase Bank N.A. | 98,117 | (98,117) | – | – | 122,247 | (98,117) | – | 24,130 |
| Morgan Stanley & Co. | 157,481 | (157,481) | – | – | 362,960 | (157,481) | – | 205,479 |
| UBS AG | 179,785 | (154,746) | – | 25,039 | 154,746 | (154,746) | – | – |
| Total Return Swaps | ||||||||
| Citibank N.A. | – | – | – | – | 62,938 | – | – | 62,938 |
| Morgan Stanley & Co. | – | – | – | – | 51,599 | – | – | 51,599 |
| Gross Amounts Not Offset in the Statement of Assets and Liabilities | Gross Amounts Not Offset in the Statement of Assets and Liabilities | |||||||
| Gross Amounts of Assets Presented in Statement of Assets and Liabilities | Financial Instruments | Collateral Received | Net Amount | Gross Amounts of Liabilities Presented in Statement of Assets and Liabilities | Financial Instruments | Collateral Pledged | Net Amount | |
| Description | Assets | Liabilities | ||||||
| Global High Income Fund | ||||||||
| Foreign Currency Exchange Contracts | ||||||||
| Deutsche Bank AG | $509 | $– | $– | $509 | $– | $– | $– | $– |
| Morgan Stanley & Co. | 1,470 | – | – | 1,470 | – | – | – | – |
| Royal Bank of Canada | – | – | – | – | 112,688 | – | – | 112,688 |
| 68 | 2023 Semi-Annual Report |
April 30, 2023
| Risk Exposure Category | ||||||
| Interest Rate Contracts | Foreign Currency Contracts | Credit Contracts | Equity Contracts | Commodity Contracts | Total | |
| Global Absolute Return Strategies Fund | ||||||
| Realized Gain (Loss) on Derivatives Recognized as a Result of Operations: | ||||||
| Net realized gain (loss) on: | ||||||
| Purchased Options | $– | $– | $– | $(233,886) | $– | $(233,886) |
| Futures Contracts | (456,822) | – | – | (4,171) | – | (460,993) |
| Forward Currency Contracts | – | (88,875) | – | – | – | (88,875) |
| Swap Contracts | (463,160) | – | (141,332) | (342,369) | – | (946,861) |
| Written Options | – | – | – | 92,035 | – | 92,035 |
Total | $(919,982) | $(88,875) | $(141,332) | $(488,391) | $– | $(1,638,580) |
| Net Change in Unrealized Appreciation (Depreciation) on Derivatives Recognized as a Result of Operations: | ||||||
| Net change in unrealized appreciation (depreciation) of: | ||||||
| Purchased Options | $111,490 | $– | $– | $165,990 | $– | $277,480 |
| Futures Contracts | 610,019 | – | – | (760,162) | – | (150,143) |
| Forward Currency Contracts | – | (1,109,278) | – | – | – | (1,109,278) |
| Swap Contracts | 375,100 | – | 87,215 | (214,769) | – | 247,546 |
| Written Options | 28,573 | – | – | (64,110) | – | (35,537) |
Total | $1,125,182 | $(1,109,278) | $87,215 | $(873,051) | $– | $(769,932) |
| Global High Income Fund | ||||||
| Realized Gain (Loss) on Derivatives Recognized as a Result of Operations: | ||||||
| Net realized gain (loss) on: | ||||||
| Forward Currency Contracts | $– | $(2,087,604) | $– | $– | $– | $(2,087,604) |
Total | $– | $(2,087,604) | $– | $– | $– | $(2,087,604) |
| Net Change in Unrealized Appreciation (Depreciation) on Derivatives Recognized as a Result of Operations: | ||||||
| Net change in unrealized appreciation (depreciation) of: | ||||||
| Forward Currency Contracts | $– | $218,432 | $– | $– | $– | $218,432 |
Total | $– | $218,432 | $– | $– | $– | $218,432 |
| 2023 Semi-Annual Report | 69 |
April 30, 2023
| Derivative | Average Notional Value |
| Global Absolute Return Strategies Fund | |
| Purchased Options Contracts | $358,781 |
| Long Futures Contracts | $12,652,564 |
| Short Futures Contracts | $(13,722,182) |
| Written Options Contracts | $161,924 |
| Swap Contracts at Notional Amount | $129,780,819 |
| Foreign Currency Contracts Purchased | $38,603,692 |
| Foreign Currency Contracts Sold | $51,365,169 |
| Global High Income Fund | |
| Foreign Currency Contracts Purchased | $1,908,824 |
| Foreign Currency Contracts Sold | $22,883,017 |
| e. | Security Transactions, Investment Income and Expenses: |
| Security transactions are recorded on the trade date. Realized and unrealized gains/(losses) from security and currency transactions are calculated on the identified cost basis. Dividend income and corporate actions are recorded generally on the ex-date, except for certain dividends and corporate actions which may be recorded after the ex-date, as soon as a Fund acquires information regarding such dividends or corporate actions. | |
| Interest income and expenses are recorded on an accrual basis. Expenses directly attributable to a Fund are charged to that Fund. Expenses not directly attributable to a Fund are allocated proportionately among the relevant Funds based on net assets of each Fund as of the month end. For each of the Funds, the method for allocating income, fund level expenses, and realized and unrealized gains or losses to a class is based on the total net asset value of that class’s shares in proportion to the total net assets of the relevant Fund. Expenses specific to a class (such as Rule 12b-1 and administrative services fees) are charged to that class. |
| f. | Distributions: |
| Distributions from net investment income, if any, are declared daily and paid monthly for the Intermediate Municipal Income Fund, Short Duration High Yield Municipal Fund and the Ultra Short Municipal Income Fund. Distributions from net investment income, if any, are declared and paid monthly for the Global High Income Fund and annually for the Global Absolute Return Strategies Fund. The Funds will also declare and pay distributions at least annually from net realized gains on investment transactions and net realized foreign exchange gains, if any. Dividends and distributions to shareholders are recorded on the ex-dividend date. | |
| Dividends and distributions to shareholders are determined in accordance with federal income tax regulations, which may differ from GAAP. These differences are primarily due to differing treatment for foreign currencies and loss deferrals. |
| g. | Federal Income Taxes: |
| Each Fund intends to continue to qualify as a “regulated investment company” by complying with the provisions available to certain investment companies, as defined in Subchapter M of the Internal Revenue Code of 1986, as amended, and to make distributions of net investment income and net realized capital gains sufficient to relieve the Funds from all federal income taxes. Therefore, no federal income tax provision is required. Management of the Funds has concluded that there are no significant uncertain tax positions that would require recognition in the financial statements. Since tax authorities can examine previously filed tax returns, the Funds' U.S. federal and state tax returns for each of the most recent four fiscal years up to the most recent fiscal year ended October 31, 2022 are subject to such review. |
| h. | Foreign Withholding Tax: |
| Interest income from non-U.S. sources received by the Funds are generally subject to non-U.S. withholding taxes and are recorded on the Statement of Operations. The Funds file for tax reclaims for the refund of such withholdings taxes according to tax treaties. Tax reclaims that are deemed collectible are booked as tax reclaim receivable on the Statement of Assets and Liabilities. Foreign tax authorities can examine |
| 70 | 2023 Semi-Annual Report |
April 30, 2023
| previously filed withholding tax reclaims for various periods of time, depending on the statute of limitations in each foreign jurisdiction. In some cases, amounts that have been refunded by foreign tax authorities and received by the Funds are still subject to such review. | |
| In addition, the Funds may be subject to capital gains tax in certain countries in which they invest. The above taxes may be reduced or eliminated under the terms of applicable U.S. income tax treaties with some of these countries. The Funds accrue such taxes when the related income is earned. | |
| In addition, when the Funds sell securities within certain countries in which they invest, the capital gains realized may be subject to tax. Based on these market requirements and as required under GAAP, the Funds accrue deferred capital gains tax on securities currently held that have unrealized appreciation within these countries. The amount of deferred capital gains tax accrued is reported on the Statement of Operations as part of the Net Change in Unrealized Appreciation/Depreciation on Investments. |
| i. | Securities Lending: |
| Through an agreement with Securities Finance Trust Company as the Lending Agent and State Street Bank and Trust Company (the Funds’ custodian), the Funds may lend their portfolio securities to brokers, dealers and other financial institutions that pay a negotiated fee in order to generate additional income. The Funds receive non-cash collateral in the form of U.S. Government Securities, with respect to each loan of U.S. securities, typically equal to at least 102% of the value of the portfolio securities loaned, and, with respect to each loan of non-U.S. securities, typically equal to at least 105% of the value of the portfolio securities loaned, and at all times thereafter require the borrower to mark to market such collateral on a daily basis so that the market value of such collateral does not fall below 100% of the market value of the portfolio securities so loaned. | |
| Income generated from securities lending includes the difference between (i) the sum of income received from the investment of collateral received from the borrowers that are counterparties to loans, loan fees received from loans, and fees paid by borrower on loans collateralized with collateral other than cash collateral; and ii) any rebate paid to a borrower, and any other allocable fees and expenses in connection with loans of securities. All income is accrued daily and is apportioned 90% to the Funds and 10% to the Lending Agent. | |
| The Funds continue to own the loaned securities and continue to recognize unrealized gains and losses on the securities on loan. However, securities lending involves certain risks, including the event of default or insolvency of the borrower, and possible delays or restrictions upon a Fund’s ability to recover the loaned securities or dispose of the collateral for the loan. Securities on loan are noted within the Statement of Investments. Non-cash securities lending collateral held by the Lending Agent on behalf of the Funds cannot be sold or repledged by the Funds and therefore, this amount is not presented on the Funds’ Statements of Investments. | |
| At April 30, 2023, the Funds did not have any securities on loan. |
| a. | Investment Adviser: |
| Under the Investment Advisory Agreement with the Trust, the Adviser manages the Funds in accordance with the policies and procedures established by the Board. | |
| For services provided under the terms of the current Investment Advisory Agreement, each Fund pays the Adviser an annual management fee (as a percentage of its average daily net assets) paid monthly according to the following schedule: | |
| Fund | Fee Schedule | |
Global Absolute Return Strategies Fund | Up to $500 million | 0.600% |
| $500 million up to $1 billion | 0.550% | |
| On $1 billion and more | 0.500% | |
Global High Income Fund | Up to $5 billion | 0.650% |
| $5 billion up to $7.5 billion | 0.630% | |
| $7.5 billion up to $10 billion | 0.600% | |
| $10 billion and more | 0.590% | |
Intermediate Municipal Income Fund | Up to $250 million | 0.425% |
| $250 million up to $1 billion | 0.375% | |
| On $1 billion and more | 0.355% |
| 2023 Semi-Annual Report | 71 |
April 30, 2023
| Fund | Fee Schedule | |
Short Duration High Yield Municipal Fund | Up to $250 million | 0.650% |
| On $250 million and more | 0.600% | |
Ultra Short Municipal Income Fund | Up to $2.5 billion | 0.500% |
| On $2.5 billion and more | 0.450% |
| Fund | Limit |
Global Absolute Return Strategies Fund | 0.65% |
Global High Income Fund | 0.75% |
Intermediate Municipal Income Fund | 0.50% |
| Fund | Class A Limit | Class A1 Limit | Class C Limit | Institutional Class Limit |
Short Duration High Yield Municipal Fund | 0.90% | – | 1.65% | 0.65% |
Ultra Short Municipal Income Fund | 0.70% | 0.70% | – | 0.45% |
| Fund | Amount Fiscal Year 2020 (Expires 10/31/23) | Amount Fiscal Year 2021 (Expires 10/31/24) | Amount Fiscal Year 2022 (Expires 10/31/25) | Amount Six Months Ended April 30, 2023 (Expires 4/30/26) | Total* |
Global Absolute Return Strategies Fund | $347,710 | $540,814 | $507,424 | $223,396 | $1,619,344 |
Global High Income Fund | 698,958 | 562,810 | 439,426 | 161,524 | 1,862,718 |
| 72 | 2023 Semi-Annual Report |
April 30, 2023
| Fund | Amount Fiscal Year 2020 (Expires 10/31/23) | Amount Fiscal Year 2021 (Expires 10/31/24) | Amount Fiscal Year 2022 (Expires 10/31/25) | Amount Six Months Ended April 30, 2023 (Expires 4/30/26) | Total* |
Intermediate Municipal Income Fund | $233,940 | $233,143 | $206,321 | $101,183 | $774,587 |
Short Duration High Yield Municipal Fund | 582,868 | 812,551 | 760,410 | 210,317 | 2,366,146 |
Ultra Short Municipal Income Fund | 2,517,221 | 2,920,672 | 2,289,342 | 923,151 | 8,650,386 |
| * | Amounts reported are due to expire throughout the respective 3-year expiration period presented above. |
| b. | Fund Administration: |
| Under the terms of the Fund Administration Agreement, abrdn provides various administrative and accounting services, including daily valuation of the Funds' shares, preparation of financial statements, tax returns, regulatory reports, and presentation of quarterly reports to the Board. For services provided pursuant to the Fund Administration Agreement, the Trust pays abrdn an annual fee of 0.08% based on the Trust’s average daily net assets. The fee is then allocated proportionately among all funds within the Trust (including the Funds) in relation to the average daily net assets of each fund. This asset-based fee is subject to an annual minimum fee based on the number of funds served. Pursuant to a sub-administration agreement with abrdn, State Street Bank and Trust Company ("State Street") provides sub-administration services with respect to the Funds. abrdn pays State Street for providing such services. |
| c. | Distributor and Shareholder Servicing: |
| The Trust and Aberdeen Fund Distributors, LLC (the “Distributor”) are parties to the current Underwriting Agreement (the “Underwriting Agreement”) whereby the Distributor acts as principal underwriter for the Trust’s shares. | |
| The Trust has adopted a Distribution Plan (the “Plan”) pursuant to Rule 12b-1 under the 1940 Act with respect to certain classes of shares. The Plan permits the Funds to compensate the Distributor, for expenses associated with the distribution-related and/or shareholder services provided by such entities. These fees are paid to the Distributor and are either kept or paid to shareholders’ financial advisors or other intermediaries for distribution and shareholder services. Although actual distribution expenses may be more or less, under the Plan, the Funds pay the Distributor an annual fee of the following amounts, based on the total net assets of each, respective class: | |
| Fund | Class A Shares | Class A1 Shares | Class C Shares(a) |
Global Absolute Return Strategies Fund | 0.25% | – | – |
Global High Income Fund | 0.25% | – | – |
Intermediate Municipal Income Fund | 0.25% | – | – |
Short Duration High Yield Municipal Fund | 0.25% | – | 1.00% |
| 2023 Semi-Annual Report | 73 |
April 30, 2023
| Fund | Class A Shares | Class A1 Shares | Class C Shares(a) |
Ultra Short Municipal Income Fund | 0.25% | 0.25% | – |
| (a) | 0.25% of which is service fees. |
| Fund | Commissions Retained from Front-End Sales Charges of Class A Shares | Commissions Retained from CDSC Fees of Class C (Certain Class A) Shares |
Global Absolute Return Strategies Fund | $15 | $– |
Global High Income Fund | 313 | – |
Intermediate Municipal Income Fund | 16 | – |
Short Duration High Yield Municipal Fund | – | 1,217 |
Ultra Short Municipal Income Fund | – | – |
| Total Retained | $344 | $ 1,217 |
| d. | Administrative Services Fees/Transfer Agent Out-of-Pocket Expenses: |
| The Funds may pay and/or reimburse administrative services fees/sub-transfer agent expenses to certain broker-dealers and financial intermediaries who provide administrative support services to beneficial shareholders on behalf of the Funds (sometimes referred to as “sub-transfer agency fees”), subject to certain limitations approved by the Board. These fees may be in addition to Rule 12b-1 fees. Sub-transfer agency fees generally include, but are not limited to, costs associated with recordkeeping, networking, sub-transfer agency or other administrative or shareholder services. | |
| Class A, Class A1, Class R and Institutional Service Class shares of the Funds pay for such services pursuant to an Administrative Services Plan adopted by the Board. Under the Administrative Services Plan, a Fund may pay a broker-dealer or other intermediary a maximum annual sub-transfer agent and administrative services fee of 0.25% for Class A, Class A1, Class R and Institutional Service Class shares. Under an amendment to the Administrative Services Plan that is in effect until at least February 29, 2024, the administrative service fee is limited to a maximum of 0.15% for contracts with fees that are calculated as a percentage of Fund assets and a maximum of $16 per account for contracts with fees that are calculated on a dollar per account basis; however, many intermediaries do not charge the maximum permitted fee or even a portion thereof. Class C and Institutional Class shares may also pay for the services described above directly as these classes are not subject to an Administrative Services Plan. |
| 74 | 2023 Semi-Annual Report |
April 30, 2023
| The aggregate amount of sub-transfer agent and administrative service fees paid during the six-month period ended April 30, 2023 was as follows: | |
| Fund | Class A | Class A1 | Class C | Institutional Service | Institutional |
Global Absolute Return Strategies Fund | $10,030 | $– | $25 | $3,076 | $12,376 |
Global High Income Fund | 30,595 | – | – | – | 12,459 |
Intermediate Municipal Income Fund | 859 | – | 30 | – | 6,700 |
Short Duration High Yield Municipal Fund | 3,601 | – | 6 | – | 37,840 |
Ultra Short Municipal Income Fund | 36,360 | 8 | – | – | 200,818 |
| e. | Purchase/Sale Transactions Between Affiliates: |
| The Funds are permitted to buy or sell securities with funds that have a common investment adviser (or investment advisers which are affiliates) under specific procedures which have been approved by the Board. The procedures are designed to satisfy the requirements of Rule 17a-7 of the Investment Company Act of 1940 (“Rule 17a-7”). During the six-month period ended April 30, 2023, the Intermediate Municipal Income Fund engaged in purchases and sales of securities pursuant to Rule 17a-7 for the amount of $4,001,628 and $3,006,182, respectively. During the six-month period ended April 30, 2023, the Short Duration High Yield Municipal Fund engaged in sales of securities pursuant to Rule 17a-7 for the amount of $8,508,341. During the six-month period ended April 30, 2023, the Ultra Short Municipal Income Fund engaged in purchases of securities pursuant to Rule 17a-7 for the amount of $7,512,895. No other Funds engaged in these trades. |
| Fund | Purchase | Sales |
Global Absolute Return Strategies Fund | $8,304,900 | $4,255,313 |
Global High Income Fund | 28,522,069 | 43,762,439 |
Intermediate Municipal Income Fund | 19,323,597 | 20,366,664 |
Short Duration High Yield Municipal Fund | 32,037,734 | 88,435,000 |
Ultra Short Municipal Income Fund | 798,145,328 | 876,948,704 |
| a. | Absolute Return Strategy Risk |
| The Global Absolute Return Strategies Fund is subject to risks related to its absolute return strategy. Absolute return funds employ certain techniques that are intended to reduce risk and volatility in the portfolio and provide protection against a decline in the fund’s assets. They are not designed to outperform stocks and bonds in strong markets and there is no guarantee of positive returns or that the Fund’s objective will be achieved. |
| b. | Bank Loan Risk |
| The Global High Income Fund may buy or sell bank loans. There are a number of risks associated with an investment in bank loans including credit risk, interest rate risk, illiquid securities risk, and prepayment risk. There is also the possibility that the collateral securing a loan, if any, may be difficult to liquidate or be insufficient to cover the amount owed under the loan. Bank loans have significantly longer settlement periods (e.g., longer than seven days) than more traditional investments resulting in the proceeds from the sale of such loans not being readily available to make additional investments or to meet a Fund’s redemption obligations. In addition, loans are not registered under the federal securities laws like stocks and bonds, so investors in loans have less protection against improper practices than investors in registered securities. These risks could cause a Fund to lose income or principal on a particular investment, which in turn could affect a Fund’s returns. |
| 2023 Semi-Annual Report | 75 |
April 30, 2023
| c. | Credit Default Swap Risk |
| The Global Absolute Return Strategies Fund and Global High Income Fund may buy or sell credit default swaps. Credit default swap contracts, a type of derivative instrument, particularly selling credit default swaps, involve special risks and may result in losses to the Funds. |
| d. | Cybersecurity Risk |
| Cybersecurity incidents may allow an unauthorized party to gain access to Fund assets, customer data (including private shareholder information), or proprietary information, or cause each Fund, the Adviser and/or their service providers (including, but not limited to, Fund accountants, custodians, sub-custodians, transfer agents and financial intermediaries) to suffer data breaches, data corruption or lose operational functionality. |
| e. | Derivatives Risk (including Options, Futures and Swaps) |
| Certain Funds are subject to Derivatives Risk. Derivatives are speculative and may hurt the Fund’s performance. The potential benefits to be derived from the Fund’s options, futures and derivatives strategy are dependent upon the portfolio managers’ ability to discern pricing inefficiencies and predict trends in these markets, which decisions could prove to be inaccurate. | |
| Speculative Exposure Risk. To the extent that a derivative or practice is not used as a hedge, the Fund is directly exposed to its risks. Gains or losses from speculative positions in a derivative may be much greater than the derivative’s original cost. For example, potential losses from writing uncovered call options and from speculative short sales are unlimited. | |
| Hedged Exposure Risk. Losses generated by a derivative or practice used by the Fund for hedging purposes should be substantially offset by gains on the hedged investment. However, while hedging can reduce or eliminate losses, it can also reduce or eliminate gains. | |
| Correlation Risk. The Fund is exposed to the risk that changes in the value of a hedging instrument will not match those of the investment being hedged. | |
| Counterparty Risk. Derivative transactions depend on the creditworthiness of the counterparty and the counterparty’s ability to fulfill its contractual obligations. | |
| Other Derivatives Risks. Fixed income derivatives are subject to interest rate risk. In addition, certain derivatives may be subject to illiquid securities risk, mispricing or valuation complexity, market risk and management risk. The Fund may need to sell portfolio securities at inopportune times to satisfy margin or payment obligations under derivatives investments. Changes in regulation relating to the Fund’s use of derivatives and related instruments could potentially limit or impact the Fund’s ability to invest in derivatives, limit the Fund’s ability to employ certain strategies that use derivatives and/or adversely affect the value of derivatives and the Fund’s performance. |
| f. | Emerging Markets Risk |
| The risks of investing in emerging markets countries are a magnification of the risks that apply to foreign investments. These risks are greater for securities of companies in emerging markets countries because the countries may have less stable governments, more volatile currencies and less established markets (see “Foreign Securities Risk” below). |
| g. | Equity Securities Risk |
| The Global Absolute Return Strategies Fund and Global High Income Fund may invest in equity securities. The stock or other security of a company may not perform as well as expected, and may decrease in value, because of factors related to the company (such as poorer than expected earnings or certain management decisions), to the industry in which the company is engaged (such as a reduction in the demand for products or services in a particular industry), or to the market as a whole (such as periods of market volatility or instability, or general and prolonged periods of economic decline). |
| h. | Fixed Income Securities Risk |
| Fixed income securities are subject to, among other risks, credit risk, extension risk, issuer risk, interest rate risk, market risk and prepayment risk. |
| i. | Foreign Currency Exposure Risk |
| The value of foreign currencies relative to the U.S. Dollar fluctuates in response to market, economic, political, regulatory, geopolitical or other conditions. A decline in the value of a foreign currency versus the U.S. Dollar reduces the value in U.S. Dollars of investments |
| 76 | 2023 Semi-Annual Report |
April 30, 2023
| denominated in that foreign currency. This risk may impact a Fund more greatly to the extent the Fund does not hedge its currency risk, or hedging techniques used by the Adviser are unsuccessful. |
| j. | Foreign Securities Risk |
| Foreign countries in which a Fund may invest may have markets that are less liquid, less regulated and more volatile than U.S. markets. The value of a Fund’s investments may decline because of factors such as unfavorable or unsuccessful government actions, reduction of government or central bank support and political or financial instability. To the extent the Fund focuses its investments in a single country or only a few countries in a particular geographic region, economic, political, regulatory or other conditions affecting such country or region may have a greater impact on Fund performance relative to a more geographically diversified fund. | |
| Russia/Ukraine Risk. In February 2022, Russia commenced a military attack on Ukraine. The outbreak of hostilities between the two countries and the threat of wider spread hostilities could have a severe adverse effect on the region and global economies, including significant negative impacts on the markets for certain securities and commodities, such as oil and natural gas. In addition, sanctions imposed on Russia by the United States and other countries, and any sanctions imposed in the future, could have a significant adverse impact on the Russian economy and related markets. The price and liquidity of investments may fluctuate widely as a result of the conflict and related events. How long the armed conflict and related events will last cannot be predicted. These tensions and any related events could have a significant impact on Fund performance and the value of Fund investments. |
| k. | High-Yield Bonds and Other Lower-Rated Securities Risk |
| A Fund’s investments in high-yield bonds (commonly referred to as “junk bonds”) and other lower-rated securities will subject the Fund to substantial risk of loss. Investments in high-yield bonds are speculative and issuers of these securities are generally considered to be less financially secure and less able to repay interest and principal than issuers of investment-grade securities. Prices of high-yield bonds tend to be very volatile. These securities are less liquid than investment-grade debt securities and may be difficult to price or sell, particularly in times of negative sentiment toward high-yield securities. |
| l. | Illiquid Securities Risk |
| Illiquid securities are assets that a Fund reasonably expects cannot be sold or disposed of in current market conditions in seven calendar days or less without the sale or disposition significantly changing the market value of the asset. An inability to sell a portfolio position can adversely affect a Fund’s value or prevent the Fund from being able to take advantage of other investment opportunities. Illiquid securities and relatively less liquid securities may also be difficult to value. | |
| The Adviser employs procedures and tests using third-party and internal data inputs that seek to assess and manage the liquidity of a Fund’s portfolio holdings. These procedures and tests take into account a Fund’s investment strategy and liquidity of portfolio investments during both normal and foreseeable stressed conditions, cash-flow projections during both normal and reasonably foreseeable stressed conditions, relevant market, trading and other factors, and monitor whether liquidity should be adjusted based on changed market conditions. These procedures and tests are designed to assist a Fund in determining its ability to meet redemption requests in various market conditions. In light of the dynamic nature of markets, there can be no assurance that these procedures and tests will enable a Fund to ensure that it has sufficient liquidity to meet redemption requests. |
| m. | Impact of Large Redemptions and Purchases of Fund Shares |
| Occasionally, shareholders may make large redemptions or purchases of Fund shares, which may cause a Fund to have to sell securities or invest additional cash. These transactions may adversely affect the Fund’s performance and increase transaction costs. In addition, large redemption requests may exceed the cash balance of a Fund and result in credit line borrowing fees and/or overdraft charges to a Fund until the sales of portfolio securities necessary to cover the redemption request settle. |
| n. | Interest Rate Risk |
| Each Fund’s fixed income investments are subject to interest rate risk, which generally causes the value of a fixed income portfolio to decrease when interest rates rise resulting in a decrease in each Fund’s net assets. Interest rate fluctuations tend to have a greater impact on fixed income-securities with a greater time to maturity and/or lower coupon. A fund with a longer average portfolio duration will be more sensitive to changes in interest rates than a fund with a shorter average portfolio duration. In periods of market volatility, the market values of fixed income securities may be more sensitive to changes in interest rates. The Fund may be subject to increased interest rate risk due to recent interest rate hikes. It is not possible to determine if, and for how long, interest rate hikes will continue. |
| 2023 Semi-Annual Report | 77 |
April 30, 2023
| o. | Issuer Risk |
| The value of a security may decline for reasons directly related to the issuer, such as management performance, financial leverage and reduced demand for the issuer's goods or services. |
| p. | Management Risk |
| Each Fund is subject to the risk that the Adviser or Subadviser (as applicable) may make poor security selections. The Adviser, Subadviser and their portfolio managers apply their own investment techniques and risk analyses in making investment decisions for a Fund and there can be no guarantee that these decisions will achieve the desired results for a Fund. In addition, the Adviser or Subadviser may select securities that underperform the relevant market or other funds with similar investment objectives and strategies. |
| q. | Market Risk |
| Deteriorating market conditions might cause a general weakness in the market that reduces the prices, or yield, of securities in that market. Developments in a particular class of bonds or the stock market could also adversely affect a Fund by reducing the relative attractiveness of bonds or stocks as an investment. Also, to the extent that a Fund emphasizes bonds or stocks from any given industry, it could be hurt if that industry does not do well. Additionally, a Fund could lose value if the individual stocks in which it maintains long positions and/or the overall stock markets on which the stocks trade decline in price. In addition, a Fund that engages in short sales could lose value if the individual stocks which they sell short increase in price. Stocks and stock markets may experience short-term volatility (price fluctuation) as well as extended periods of price decline or increase. Individual stocks are affected by many factors, including: |
| • | corporate earnings; |
| • | production; |
| • | management; |
| • | sales; and |
| • | market trends, including investor demand for a particular type of stock, such as growth or value stocks, small or large stocks, or stocks within a particular industry. |
| 78 | 2023 Semi-Annual Report |
April 30, 2023
| r. | Municipal Securities Risk |
| The Intermediate Municipal Income Fund, Short Duration High Yield Municipal Fund and Ultra Short Municipal Income Fund (the “Municipal Funds”) are subject to municipal securities risk. Municipal bonds can be significantly affected by political and economic changes, including inflation, as well as uncertainties in the municipal market related to taxation, legislative changes, or the rights of municipal security holders. Municipal bonds have varying levels of sensitivity to changes in interest rates. Interest rate risk is generally lower for shorter-term municipal bonds and higher for long term municipal bonds. | |
| Municipal Bond Tax Risk. A municipal bond that is issued as tax-exempt may later be declared to be taxable. In addition, if the federal income tax rate is reduced, the value of the tax exemption may be less valuable, causing the value of a municipal bond to decline. | |
| Municipal Market Volatility and Illiquidity Risk. The municipal bond market can be susceptible to unusual volatility, particularly for lower-rated and unrated securities. Liquidity can be reduced unpredictably in response to overall economic conditions or credit tightening. During times of reduced market liquidity, a Fund may not be able to readily sell bonds without the sale significantly changing the market value of the bond. If the Fund needed to sell large blocks of bonds to meet shareholder redemption requests or to raise cash, those sales could further reduce the bonds’ prices. | |
| Municipal Sector Risk. From time to time a Fund may invest a substantial amount of its assets in municipal securities whose interest is paid solely from revenues of similar projects. If the Fund concentrates its investments in this manner, it assumes the economic risks relating to such projects and this may have a significant impact on the Fund’s investment performance. |
| s. | Non-Hedging Foreign Currency Trading Risk |
| Foreign exchange rates can be extremely volatile and a variance in the degree of volatility of the market or in the direction of the market from the Adviser’s expectations may produce significant losses to certain Funds. |
| t. | Portfolio Turnover Risk |
| Certain Funds may engage in active and frequent trading of portfolio securities to achieve its investment objective. High portfolio turnover may result in greater transaction costs which may reduce Fund performance. The sale of Fund portfolio securities may also result in greater realization and/or distribution to shareholders of gains or losses as compared to a fund with less active trading, which may include short-term gains taxable at ordinary income tax rates. |
| u. | Private Placements and Other Restricted Securities Risk |
| The Global High Income Fund and Short Duration High Yield Municipal Fund are subject to Private Placements Risk. Investments in private placements and other restricted securities, including Regulation S Securities and Rule 144A Securities, could have the effect of increasing the Fund’s level of illiquidity. Private placements and restricted securities may be less liquid than other investments because such securities may not always be readily sold in broad public markets and the Fund might be unable to dispose of such securities promptly or at prices reflecting their true value. |
| 2023 Semi-Annual Report | 79 |
April 30, 2023
| v. | Sector Risk |
| To the extent that a Fund has a significant portion of its assets invested in securities of companies conducting business in a broadly related group of industries within an economic sector, the Fund may be more vulnerable to unfavorable developments in that economic sector than funds that invest more broadly. | |
| Financials Sector Risk. To the extent that the financials sector represents a significant portion of a Fund’s portfolio, the Fund will be sensitive to changes in, and its performance may depend to a greater extent on, factors impacting this sector. Performance of companies in the financials sector may be adversely impacted by many factors, including, among others, government regulations, economic conditions, credit rating downgrades, changes in interest rates, and decreased liquidity in credit markets as well as cyber-attacks. |
| w. | Sovereign Debt Risk |
| The Global Absolute Return Strategies Fund and Global High Income Fund are subject to Sovereign Debt Risk. Periods of economic and political uncertainty may result in the illiquidity and increased price volatility of a foreign government’s debt securities held by the Fund and impact an issuer’s ability and willingness to pay interest or repay principal when due. The Fund may have limited recourse to compel payment in the event of a default. A foreign government’s default on its debt securities may cause the value of securities held by the Fund to decline significantly. |
| x. | Tender Option Bonds Risk |
| The Municipal Funds are subject to Tender Option Bonds Risk. Tender option bonds are synthetic floating-rate or variable-rate securities issued when long-term bonds are purchased in the primary or secondary market and then deposited into a trust. Tender option bonds may be considered derivatives, and may expose the Fund to the same risks as investments in derivatives, as well as risks associated with leverage, especially the risk of increased volatility. |
| y. | Tobacco Related Bonds Risk |
| The Short Duration High Yield Municipal Fund is subject to Tobacco Related Bonds Risk. In 1998, the largest U.S. tobacco manufacturers reached an out of court agreement, the MSA, to settle claims against them by 46 states and six other U.S. jurisdictions. The tobacco manufacturers agreed to make annual payments to the government entities in exchange for the release of all litigation claims. A number of the states have sold bonds that are backed by those future payments. The Funds may invest in two types of those bonds: (i) bonds that make payments only from a state’s interest in the MSA and (ii) bonds that make payments from both the MSA revenue and from an “appropriation pledge” by the state. An “appropriation pledge” requires the state to pass a specific periodic appropriation to make the payments and is generally not an unconditional guarantee of payment by a state. The settlement payments are based on factors, including, but not limited to, annual domestic cigarette shipments, cigarette consumption, inflation and the financial capability of participating tobacco companies. Payments could be reduced if consumption decreases, if market share is lost to non-MSA manufacturers, or if there is a negative outcome in litigation regarding the MSA. |
| z. | U.S. Government Securities Risk |
| Securities issued by U.S. Government agencies or government sponsored entities may not be guaranteed by the U.S. Treasury. The U.S. Government does not guarantee the net asset value of a Fund’s shares. |
| aa. | Valuation Risk |
| The price that a Fund could receive upon the sale of any particular portfolio investment may differ from the Fund’s valuation of the investment, particularly for securities that trade in thin or volatile markets or that are valued using a fair valuation methodology or a price provided by an independent pricing service. As a result, the price received upon the sale of an investment may be less than the value ascribed by a Fund, and the Fund could realize a greater than expected loss or lesser than expected gain upon the sale of the investment. The ability to value a Fund's investments may also be impacted by technological issues and/or errors by pricing services or other third-party service providers. |
| bb. | Variable and Floating Rate Securities Risk |
| Certain Funds are subject to Variable and Floating Rate Securities Risk. For floating and variable rate obligations, there may be a lag between an actual change in the underlying interest rate benchmark and the reset time for an interest payment of such an obligation, which could harm or benefit the Fund, depending on the interest rate environment or other circumstances. Variable rate demand obligations (“VRDOs”) |
| 80 | 2023 Semi-Annual Report |
April 30, 2023
| are floating rate securities that combine an interest in a long term municipal bond with a right to demand payment before maturity from a bank or other financial institution. If the bank or financial institution is unable to pay, the Fund may lose money. |
| cc. | Yield Risk |
| The Ultra Short Municipal Income Fund is subject to Yield Risk. The amount of income received by the Fund will go up or down depending on day-to-day variations in short-term interest rates, and when interest rates are very low the Fund’s expenses could absorb all or a significant portion of the Fund’s income. If interest rates increase, the Fund’s yield may not increase proportionately. For example, the Adviser may discontinue any temporary voluntary fee limitation or recoup amounts previously waived and/or reimbursed. | |
| Please read the Funds' prospectuses for more detailed information regarding these and other risks. |
| Tax Cost of Securities | Unrealized Appreciation | Unrealized Depreciation | Net Unrealized Appreciation/ (Depreciation) | |
Global Absolute Return Strategies Fund | $34,632,805 | $815,104 | $(2,799,903) | $(1,984,799) |
Global High Income Fund | 95,526,172 | 1,197,942 | (7,919,658) | (6,721,716) |
Intermediate Municipal Income Fund | 48,005,216 | 461,839 | (1,808,737) | (1,346,898) |
Short Duration High Yield Municipal Fund | 152,199,257 | 366,250 | (13,781,953) | (13,415,703) |
Ultra Short Municipal Income Fund | 628,811,376 | 61,251 | (816,676) | (755,425) |
| Distributions paid from | |||||
| Fund | Ordinary Income | Net Long Term Capital Gains | Total Taxable Distributions | Tax Exempt Distributions | Total Distributions Paid |
Global Absolute Return Strategies Fund | $2,028,333 | $690,096 | $2,718,429 | $– | $2,718,429 |
Global High Income Fund | 6,228,214 | – | 6,228,214 | – | 6,228,214 |
Intermediate Municipal Income Fund | 6,021 | – | 6,021 | 1,511,748 | 1,517,769 |
Short Duration High Yield Municipal Fund | 39,887 | – | 39,887 | 8,501,509 | 8,541,396 |
Ultra Short Municipal Income Fund | 2,830 | – | 2,830 | 5,433,373 | 5,436,203 |
| 2023 Semi-Annual Report | 81 |
April 30, 2023
| Fund | Undistributed Tax Exempt Income | Undistributed Ordinary Income | Undistributed Long-Term Capital Gains | Accumulated Earnings | Distributions Payable | Late Year Ordinary and Post-October Capital Loss Deferrals | Other Temporary Differences | Unrealized Appreciation/ (Depreciation) | Accumulated Capital and Other Losses | Total Accumulated Earnings/ (Deficit) |
Global Absolute Return Strategies Fund | $– | $– | $– | $– | $– | $– | $– | $(1,125,254) | $(5,143,117) | $(6,268,371) |
Global High Income Fund | $– | $2,816,485 | $– | $– | $– | $– | $(89,177) | $(17,188,771) | $(241,793,016) | (256,254,479) |
Intermediate Municipal Income Fund | – | – | – | – | – | – | (4,063) | (3,292,472) | (578,620) | (3,875,155) |
Short Duration High Yield Municipal Fund | 248,290 | – | – | – | – | – | (140,671) | (20,942,190) | (23,084,133) | (43,918,704) |
Ultra Short Municipal Income Fund | 57,234 | – | – | – | – | – | (42,876) | (1,525,243) | (1,751,983) | (3,262,868) |
| Fund | Amounts | Expires |
Global Absolute Return Strategies Fund | $5,143,117 | Unlimited (Short—Term) |
Global High Income Fund | 56,034,813 | Unlimited (Short—Term) |
Global High Income Fund | 185,758,203 | Unlimited (Long—Term) |
Intermediate Municipal Income Fund | 272,610 | Unlimited (Short—Term) |
Intermediate Municipal Income Fund | 306,010 | Unlimited (Long—Term) |
Short Duration High Yield Municipal Fund | 12,689,468 | Unlimited (Short—Term) |
Short Duration High Yield Municipal Fund | 10,394,665 | Unlimited (Long—Term) |
Ultra Short Municipal Income Fund | 1,751,983 | Unlimited (Short—Term) |
| Fund | Record Ownership % | Number of Account Owners |
Global Absolute Return Strategies Fund | 43.8% | 5 |
Global High Income Fund | 37.4 | 4 |
Intermediate Municipal Income Fund | 52.1 | 1 |
Short Duration High Yield Municipal Fund | 46.8 | 4 |
Ultra Short Municipal Income Fund | 73.7 | 5 |
| 82 | 2023 Semi-Annual Report |
April 30, 2023
| Fund | Average Outstanding Daily Balance | Average Weighted Interest Rate | Days Utilized |
Global Absolute Return Strategies Fund | $450,000 | 5.18% | 2 |
Global High Income Fund | 6,675,000 | 5.93% | 1 |
Intermediate Municipal Income Fund | 285,294 | 6.18% | 17 |
Short Duration High Yield Municipal Fund | 3,845,026 | 5.48% | 112 |
Ultra Short Municipal Income Fund | 441,214 | 5.93% | 4 |
| 2023 Semi-Annual Report | 83 |
| Beginning Account Value, November 1, 2022 | Actual Ending Account Value, April 30, 2023 | Hypothetical Ending Account Value | Actual Expenses Paid During Period1 | Hypothetical Expenses Paid During Period1,2 | Annualized Expense Ratio** | ||
| Global Absolute Return Strategies Fund | Class A | $ 1,000.00 | $ 988.60 | $ 1,019.54 | $ 5.23 | $ 5.31 | 1.06% |
Institutional Service Class | $ 1,000.00 | $ 989.90 | $ 1,020.98 | $ 3.80 | $ 3.86 | 0.77% | |
Institutional Class | $ 1,000.00 | $ 991.10 | $ 1,021.57 | $ 3.21 | $ 3.26 | 0.65% | |
| Global High Income Fund | Class A | $ 1,000.00 | $ 1,068.30 | $ 1,019.79 | $ 5.18 | $ 5.06 | 1.01% |
Institutional Class | $ 1,000.00 | $ 1,068.80 | $ 1,021.03 | $ 3.90 | $ 3.81 | 0.76% | |
| Intermediate Municipal Income Fund | Class A | $ 1,000.00 | $ 1,054.00 | $ 1,020.88 | $ 4.02 | $ 3.96 | 0.79% |
Institutional Service Class | $ 1,000.00 | $ 1,055.50 | $ 1,022.32 | $ 2.55 | $ 2.51 | 0.50% | |
Institutional Class | $ 1,000.00 | $ 1,055.50 | $ 1,022.32 | $ 2.55 | $ 2.51 | 0.50% | |
| Short Duration High Yield Municipal Fund | Class A | $ 1,000.00 | $ 1,028.10 | $ 1,019.89 | $ 4.98 | $ 4.96 | 0.99% |
Class C | $ 1,000.00 | $ 1,024.30 | $ 1,016.22 | $ 8.68 | $ 8.65 | 1.73% | |
Institutional Class | $ 1,000.00 | $ 1,029.40 | $ 1,021.18 | $ 3.67 | $ 3.66 | 0.73% | |
| Ultra Short Municipal Income Fund | Class A | $ 1,000.00 | $ 1,015.20 | $ 1,021.32 | $ 3.50 | $ 3.51 | 0.70% |
Class A1 | $ 1,000.00 | $ 1,016.20 | $ 1,021.32 | $ 3.50 | $ 3.51 | 0.70% | |
Institutional Class | $ 1,000.00 | $ 1,017.50 | $ 1,022.56 | $ 2.25 | $ 2.26 | 0.45% |
| ** | The expense ratio presented represents a six-month, annualized ratio. |
| 1 | Expenses are equal to the Fund’s annualized expense ratio multiplied by the average account value over the period multiplied by 181/365 (to reflect the one-half year period). |
| 2 | Represents the hypothetical 5% return before expenses. |
| 84 | 2023 Semi-Annual Report |
| • | information regarding the Committee and the monthly discussions by the Committee of various items including, but not limited to, the following: |
| ○ | Review and analysis of appropriate liquidity categories for portfolio investments |
| ○ | Review of highly liquid investment minimum (“HLIM”) and reasonably anticipated trading sizes (“RATS”) |
| ○ | Review of current and upcoming market events, such as market closures, that may impact liquidity |
| ○ | Review of large shareholder concentrations that may impact liquidity in the event of redemption monthly liquidity reports being provided to portfolio managers |
| • | the monitoring and classification of portfolio holdings in four liquidity categories (including the operation of the HLIM and any breaches) |
| 2023 Semi-Annual Report | 85 |
1900 Market Street, Suite 200
Philadelphia, PA 19103
1900 Market Street, Suite 200
Philadelphia, PA 19103
430 W. 7th Street, Ste. 219534
Kansas City, MO 64105-1407
1900 Market Street, Suite 200
Philadelphia, PA 19103
One Congress Street, Suite 1
Boston, MA 02114-2016
1601 Market Street
Philadelphia, PA 19103
1900 K Street N.W.
Washington, DC 20006
(b) Not applicable.
Item 2. Code of Ethics.
Not applicable – for annual reports only.
Item 3. Audit Committee Financial Expert.
Not applicable – for annual reports only.
Item 4. Principal Accountant Fees and Services.
Not applicable – for annual reports only.
Item 5. Audit Committee of Listed Registrants.
Not applicable – for annual reports only.
Item 6. Investments.
(a) Included as part of the Reports to Shareholders filed under Item 1 of this Form N-CSR.
(b) Not applicable.
Item 7. Disclosure of Proxy Voting Policies and Procedures for Closed-End Management Investment Companies.
Not applicable.
Item 8. Portfolio Managers of Closed-End Management Investment Companies.
Not applicable.
Item 9. Purchases of Equity Securities by Closed-End Management Investment Company and Affiliated Purchasers.
Not applicable.
Item 10. Submission of Matters to a Vote of Security Holders.
During the period ended April 30, 2023, there were no material changes to the procedures by which shareholders may recommend nominees to the Registrant’s Board of Trustees.
Item 11. Controls and Procedures.
(a) The Registrant’s principal executive and principal financial officers, or persons performing similar functions, have concluded that the Registrant’s disclosure controls and procedures (as defined in Rule 30a-3(c) under the Investment Company Act of 1940 (the “Act”) (17 CFR 270.30a-3(c))) are effective, as of a date within 90 days of the filing date of the report that includes the disclosure required by this paragraph, based on the evaluation of these controls and procedures required by Rule 30a-3(b) under the Act (17 CFR 270.30a3(b)) and Rule 13a-15(b) or 15d-15(b) under the Securities Exchange Act of 1934 (17 CFR 240.13a-15(b) or 240.15d15(b)).
(b) There were no changes in the Registrant’s internal control over financial reporting (as defined in Rule 30a-3(d) under the Act (17 CFR 270.30a-3(d)) that occurred during the second fiscal quarter of the period covered by this report that have materially affected, or is reasonably likely to materially affect, the Registrant’s internal control over financial reporting.
Item 12. Disclosure of Securities Lending Activities for Closed-End Management Investment Companies.
Not applicable.
Item 13. Exhibits.
(a)(1) Not applicable.
(a)(3) Not applicable.
(a)(4) Not applicable.
SIGNATURES
Pursuant to the requirements of the Securities Exchange Act of 1934 and the Investment Company Act of 1940, the registrant has duly caused this report to be signed on its behalf by the undersigned, thereunto duly authorized.
abrdn Funds
| By: | /s/ Alan Goodson | |
| Alan Goodson | ||
| Principal Executive Officer of abrdn Funds | ||
Date: July 10, 2023
Pursuant to the requirements of the Securities Exchange Act of 1934 and the Investment Company Act of 1940, this report has been signed below by the following persons on behalf of the registrant and in the capacities and on the dates indicated.
| By: | /s/ Alan Goodson | |
| Alan Goodson | ||
| Principal Executive Officer of abrdn Funds | ||
Date: July 10, 2023
| By: | /s/ Michael Marsico | |
| Michael Marsico | ||
| Principal Financial Officer of abrdn Funds | ||
Date: July 10, 2023