UNITED STATES
SECURITIES AND EXCHANGE COMMISSION
Washington, D.C. 20549
FORM N-CSR
CERTIFIED SHAREHOLDER REPORT OF
REGISTERED MANAGEMENT INVESTMENT COMPANIES
| Investment Company Act file number: | 811-22132 |
| | |
| Exact name of registrant as specified in charter: | abrdn Funds |
| | |
| Address of principal executive offices: | 1900 Market Street, Suite 200 |
| | Philadelphia, PA 19103 |
| | |
| Name and address of agent for service: | Michael Marsico |
| | abrdn Inc. |
| | 1900 Market Street, Suite 200 |
| | Philadelphia, PA 19103 |
| | |
| Registrant’s telephone number, including area code: | 866-667-9231 |
| | |
| Date of fiscal year end: | October 31 |
| | |
| Date of reporting period: | October 31, 2024 |
Item 1. Reports to Stockholders.
TABLE OF CONTENTS
0001413594 aberdeen:AberdeenIndexMSCIChinaAOnshoreIndexNetTR7003BroadBasedIndexMember 2018-11-30 0001413594 aberdeen:AberdeenIndexMSCIChinaAOnshoreIndexNetTR7006BroadBasedIndexMember 2015-07-31 0001413594 aberdeen:AberdeenIndexMSCIEmergingMarketsexMinusChinaIndexNetTR7015BroadBasedIndexMember 2020-02-29 0001413594 aberdeen:C000057051Member 2015-08-31 0001413594 aberdeen:C000111354Member 2023-05-31 0001413594 aberdeen:C000229254Member 2020-02-29 0001413594 aberdeen:AberdeenIndexICEBofAUSHighYieldConstrainedIndex6955AdditionalIndexMember 2015-09-30 0001413594 aberdeen:C000123602Member 2015-02-28 0001413594 aberdeen:AberdeenIndexMSCIAllCountryWorldMinusexUSAIndexNetTR7040BroadBasedIndexMember 2020-01-31 0001413594 aberdeen:AberdeenIndexMSCIAllCountryWorldMinusexUSASmallCapIndexNetTR7044AdditionalIndexMember 2024-01-31 0001413594 aberdeen:AberdeenIndexSP500Index2431BroadBasedIndexMember 2018-01-31 0001413594 aberdeen:AberdeenIndexRussell3000Index7000BroadBasedIndexMember 2023-08-31 0001413594 aberdeen:C000103445Member aberdeen:FR443510607CTIMember 2024-10-31 0001413594 aberdeen:AberdeenIndexBloombergMunicipalBondIndex12180BroadBasedIndexMember 2016-05-31
abrdn Emerging Markets Dividend Fund
Annual Shareholder Report - October 31, 2024
This annual shareholder report contains important information about the abrdn Emerging Markets Dividend Fund (the "Fund") for the period of November 1, 2023 to October 31, 2024. You can find additional information about the Fund at abrdn.com/us/literature. You can also request this information by contacting us at 866-667-9231.
This report describes material changes to the Fund that occurred during the reporting period.
What were the Fund costs for the last year?
(based on a hypothetical $10,000 investment)
| Share Class | Costs of a $10,000 investment | Costs paid as a percentage of a $10,000 investment |
|---|
| Institutional | $116 | 1.01% |
How did the fund perform last year and what affected its performance?
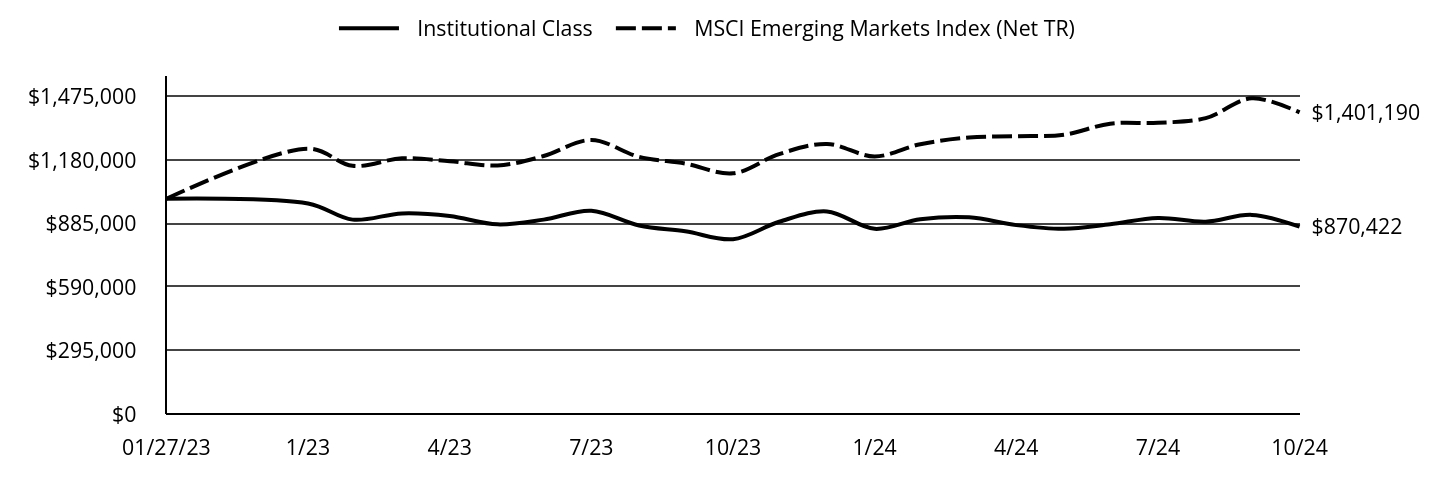
The following discussion compares the performance of the Fund to the MSCI Emerging Markets Index (Net TR) (the “Index”) to show how the Fund’s performance measures against the returns of similar investments for the reporting period.
What contributed to performance?
Taiwanese chip maker Taiwan Semiconductor Manufacturing Company executed consistently well and reported strong results that exceeded expectations. Our semiconductor stock in the Netherlands, ASML Holding, also boosted gains, although we exited the position during the review period for opportunities elsewhere. Both the stocks’ outperformance was mostly driven by a cyclical upturn in semiconductor pricing and strong artificial intelligence (AI)-led demand. The tech rally faded in the final three months of the review period on global macro uncertainties and a September rotation into Chinese equities following the government’s comprehensive stimulus announcements. Elsewhere in the Netherlands, financial services company Adyen, which was held in the portfolio before the strategy change, posted solid second half results in February, with better-than-expected volumes and where the company gave full year guidance for the first time since IPO. We sold the holding when the Fund’s scope transitioned towards the emerging markets.
What detracted from performance?
South Korea’s Samsung Electronics’ preferred shares lagged on uncertainty around its high bandwidth memory (HBM) product, designed to service high-end tech around AI, qualifying for use by a key customer. However, we believe Samsung remains on a track for a turnaround in the medium term. Elsewhere, Chinese equities softened due to slow demand recovery and stimulus measures by the government not having a sustainable impact. Consequently, brewer Budweiser APAC underperformed. In addition, its results were affected by the challenging Korea business, while its China business fared within expectations. In Hong Kong, insurer AIA Group sold off amid concerns over the impact of low Chinese rates on its business and AIA Group management’s decision to focus on growth rather than boost shareholder returns.
abrdn Emerging Markets Dividend Fund
(JIEIX)
Total Return Based on $1,000,000 Investment
The following graph reflects a hypothetical $1,000,000 investment for the most recently completed 10 fiscal years as compared to a broad-based securities market index and an additional performance benchmark.
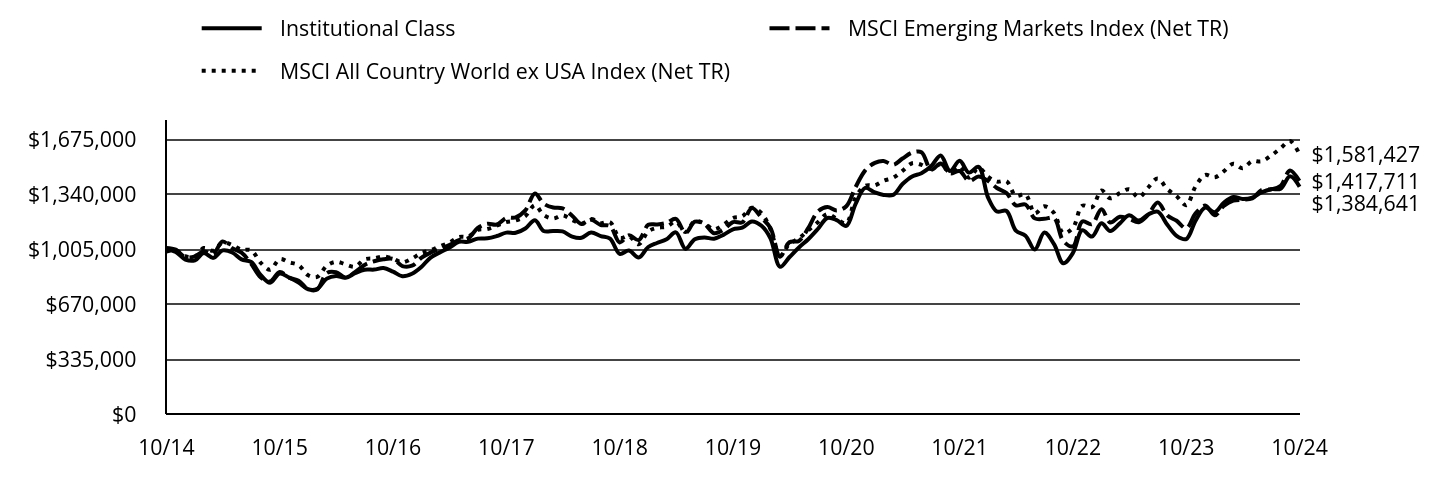
| Institutional Class | MSCI Emerging Markets Index (Net TR) | MSCI All Country World ex USA Index (Net TR) |
|---|
| 10/14 | $1,000,000 | $1,011,791 | $990,102 |
| 11/14 | $987,104 | $1,001,089 | $997,265 |
| 12/14 | $940,862 | $954,953 | $961,307 |
| 01/15 | $936,107 | $960,677 | $959,883 |
| 02/15 | $980,736 | $990,422 | $1,011,201 |
| 03/15 | $951,105 | $976,338 | $994,856 |
| 04/15 | $996,466 | $1,051,433 | $1,045,115 |
| 05/15 | $984,028 | $1,009,327 | $1,028,795 |
| 06/15 | $941,960 | $983,113 | $1,000,095 |
| 07/15 | $925,864 | $914,965 | $997,314 |
| 08/15 | $845,752 | $832,209 | $921,084 |
| 09/15 | $799,660 | $807,173 | $878,379 |
| 10/15 | $855,995 | $864,752 | $943,768 |
| 11/15 | $831,120 | $831,020 | $924,286 |
| 12/15 | $800,316 | $812,495 | $906,877 |
| 01/16 | $759,693 | $759,785 | $845,188 |
| 02/16 | $762,350 | $758,542 | $835,528 |
| 03/16 | $824,614 | $858,918 | $903,464 |
| 04/16 | $840,939 | $863,586 | $927,243 |
| 05/16 | $829,929 | $831,373 | $911,591 |
| 06/16 | $857,265 | $864,600 | $897,645 |
| 07/16 | $879,285 | $908,109 | $942,036 |
| 08/16 | $879,664 | $930,677 | $947,994 |
| 09/16 | $889,156 | $942,644 | $959,684 |
| 10/16 | $867,136 | $944,892 | $945,886 |
| 11/16 | $839,041 | $901,398 | $924,007 |
| 12/16 | $854,546 | $903,388 | $947,642 |
| 01/17 | $897,235 | $952,824 | $981,212 |
| 02/17 | $951,462 | $981,992 | $996,859 |
| 03/17 | $984,536 | $1,006,781 | $1,022,131 |
| 04/17 | $1,012,611 | $1,028,822 | $1,044,012 |
| 05/17 | $1,048,761 | $1,059,239 | $1,077,890 |
| 06/17 | $1,049,146 | $1,069,902 | $1,081,237 |
| 07/17 | $1,068,375 | $1,133,678 | $1,121,089 |
| 08/17 | $1,070,298 | $1,158,965 | $1,126,955 |
| 09/17 | $1,084,143 | $1,154,357 | $1,147,876 |
| 10/17 | $1,104,911 | $1,194,824 | $1,169,471 |
| 11/17 | $1,103,757 | $1,197,222 | $1,178,971 |
| 12/17 | $1,130,260 | $1,240,199 | $1,205,322 |
| 01/18 | $1,180,905 | $1,343,565 | $1,272,453 |
| 02/18 | $1,114,986 | $1,281,600 | $1,212,454 |
| 03/18 | $1,114,584 | $1,257,771 | $1,191,070 |
| 04/18 | $1,112,173 | $1,252,206 | $1,210,086 |
| 05/18 | $1,080,821 | $1,207,836 | $1,182,145 |
| 06/18 | $1,073,184 | $1,157,654 | $1,159,926 |
| 07/18 | $1,105,742 | $1,183,084 | $1,187,668 |
| 08/18 | $1,083,635 | $1,151,095 | $1,162,810 |
| 09/18 | $1,067,959 | $1,144,985 | $1,168,107 |
| 10/18 | $975,513 | $1,045,277 | $1,073,096 |
| 11/18 | $996,012 | $1,088,353 | $1,083,253 |
| 12/18 | $953,202 | $1,059,521 | $1,034,222 |
| 01/19 | $1,017,290 | $1,152,290 | $1,112,366 |
| 02/19 | $1,041,627 | $1,154,880 | $1,134,101 |
| 03/19 | $1,063,936 | $1,164,573 | $1,140,855 |
| 04/19 | $1,106,526 | $1,189,090 | $1,170,994 |
| 05/19 | $1,005,933 | $1,102,808 | $1,108,146 |
| 06/19 | $1,065,153 | $1,171,635 | $1,174,873 |
| 07/19 | $1,075,699 | $1,157,308 | $1,160,652 |
| 08/19 | $1,067,992 | $1,100,882 | $1,124,806 |
| 09/19 | $1,091,112 | $1,121,897 | $1,153,752 |
| 10/19 | $1,125,184 | $1,169,204 | $1,194,009 |
| 11/19 | $1,135,325 | $1,167,595 | $1,204,535 |
| 12/19 | $1,173,286 | $1,254,704 | $1,256,697 |
| 01/20 | $1,146,948 | $1,196,217 | $1,222,938 |
| 02/20 | $1,070,485 | $1,133,136 | $1,126,271 |
| 03/20 | $896,744 | $958,608 | $963,195 |
| 04/20 | $954,941 | $1,046,391 | $1,036,186 |
| 05/20 | $1,014,412 | $1,054,428 | $1,070,098 |
| 06/20 | $1,064,538 | $1,131,938 | $1,118,456 |
| 07/20 | $1,126,983 | $1,233,090 | $1,168,321 |
| 08/20 | $1,194,101 | $1,260,347 | $1,218,333 |
| 09/20 | $1,180,932 | $1,240,132 | $1,188,384 |
| 10/20 | $1,146,099 | $1,265,682 | $1,162,835 |
| 11/20 | $1,280,334 | $1,382,742 | $1,319,254 |
| 12/20 | $1,377,061 | $1,484,392 | $1,390,560 |
| 01/21 | $1,349,614 | $1,529,900 | $1,393,582 |
| 02/21 | $1,334,604 | $1,541,602 | $1,421,170 |
| 03/21 | $1,335,032 | $1,518,320 | $1,439,139 |
| 04/21 | $1,401,077 | $1,556,123 | $1,481,502 |
| 05/21 | $1,447,393 | $1,592,210 | $1,527,844 |
| 06/21 | $1,467,121 | $1,594,954 | $1,517,944 |
| 07/21 | $1,508,720 | $1,487,616 | $1,492,929 |
| 08/21 | $1,575,193 | $1,526,554 | $1,521,307 |
| 09/21 | $1,480,415 | $1,465,888 | $1,472,594 |
| 10/21 | $1,542,171 | $1,480,346 | $1,507,745 |
| 11/21 | $1,470,551 | $1,420,017 | $1,439,854 |
| 12/21 | $1,505,289 | $1,446,662 | $1,499,358 |
| 01/22 | $1,316,592 | $1,419,278 | $1,444,107 |
| 02/22 | $1,233,393 | $1,376,855 | $1,415,522 |
| 03/22 | $1,236,824 | $1,345,758 | $1,417,778 |
| 04/22 | $1,116,744 | $1,270,898 | $1,328,751 |
| 05/22 | $1,086,295 | $1,276,494 | $1,338,289 |
| 06/22 | $1,001,382 | $1,191,671 | $1,223,160 |
| 07/22 | $1,105,165 | $1,188,744 | $1,265,033 |
| 08/22 | $1,034,404 | $1,193,707 | $1,224,346 |
| 09/22 | $918,183 | $1,053,766 | $1,101,997 |
| 10/22 | $981,225 | $1,021,048 | $1,134,926 |
| 11/22 | $1,119,746 | $1,172,488 | $1,268,902 |
| 12/22 | $1,080,955 | $1,156,008 | $1,259,414 |
| 01/23 | $1,161,506 | $1,247,288 | $1,361,562 |
| 02/23 | $1,114,750 | $1,166,411 | $1,313,769 |
| 03/23 | $1,161,506 | $1,201,738 | $1,345,885 |
| 04/23 | $1,210,114 | $1,188,119 | $1,369,267 |
| 05/23 | $1,178,172 | $1,168,163 | $1,319,483 |
| 06/23 | $1,215,670 | $1,212,518 | $1,378,687 |
| 07/23 | $1,232,798 | $1,287,999 | $1,434,740 |
| 08/23 | $1,152,710 | $1,208,658 | $1,369,939 |
| 09/23 | $1,085,122 | $1,177,049 | $1,326,670 |
| 10/23 | $1,065,678 | $1,131,315 | $1,271,933 |
| 11/23 | $1,177,709 | $1,221,854 | $1,386,426 |
| 12/23 | $1,257,334 | $1,269,621 | $1,456,083 |
| 01/24 | $1,229,558 | $1,210,668 | $1,441,620 |
| 02/24 | $1,286,499 | $1,268,263 | $1,478,117 |
| 03/24 | $1,322,145 | $1,299,690 | $1,524,323 |
| 04/24 | $1,309,646 | $1,305,505 | $1,496,950 |
| 05/24 | $1,317,979 | $1,312,879 | $1,540,405 |
| 06/24 | $1,350,384 | $1,364,663 | $1,538,940 |
| 07/24 | $1,369,364 | $1,368,725 | $1,574,573 |
| 08/24 | $1,372,605 | $1,390,823 | $1,619,416 |
| 09/24 | $1,448,064 | $1,483,696 | $1,663,023 |
| 10/24 | $1,384,641 | $1,417,711 | $1,581,427 |
Average Annual Total Returns for the Period Ended October 31, 2024 (%)
| AATR | 1 Year | 5 Years | 10 Years |
|---|
| Institutional Class | 30.02% | 4.25% | 3.31% |
| MSCI Emerging Markets Index (Net TR) | 25.32% | 3.93% | 3.43% |
| MSCI All Country World ex USA Index (Net TR) | 24.33% | 5.78% | 4.79% |
THE FUND'S PAST PERFORMANCE IS NOT A GOOD PREDICTOR OF THE FUND'S FUTURE PERFORMANCE.
Fund performance data shown above does not reflect the deduction of taxes that a shareholder would pay on Fund distributions or redemption of Fund shares.
In connection with a change in name and strategy of the Fund, the Fund's primary prospectus benchmark changed to the MSCI Emerging Markets Index (Net TR) effective as of February 29, 2024.
Key Fund Statistics as of October 31, 2024
| Total Net Assets | $78,415,816 |
| Total Number of Portfolio Holdings | 85 |
| Portfolio Turnover Rate | 122% |
| Total Advisory Fees Paid | $264,051 |
abrdn Emerging Markets Dividend Fund
(JIEIX)
What did the Fund invest in?
The tables below show the investment makeup of the Fund as of October 31, 2024.
Geographic Allocation (% of total net assets)
| China | 23.5% | |
| Taiwan | 18.3% | |
| India | 10.6% | |
| South Korea | 10.0% | |
| Mexico | 7.0% | |
| Brazil | 5.1% | |
| Indonesia | 4.6% | |
| United States | 4.1% | |
| South Africa | 2.1% | |
| Other | 14.7% | |
Ten Largest Holdings (% of total net assets)
| Taiwan Semiconductor Manufacturing Co. Ltd. | 10.7% |
| Tencent Holdings Ltd. | 5.9% |
| Samsung Electronics Co. Ltd. | 5.6% |
| HDFC Bank Ltd. | 5.0% |
| iShares MSCI India ETF | 4.1% |
| Grupo Mexico SAB de CV | 3.5% |
| MediaTek, Inc. | 2.8% |
| ICICI Bank Ltd. | 2.7% |
| Alibaba Group Holding Ltd. | 2.4% |
| Infosys Ltd. | 2.2% |
Below is a summary of certain changes for the Fund since November 1, 2023. For more information, you may refer to the Fund's next prospectus, which we expect to be available by February 28, 2025 at abrdn.com/us/literature or upon request at 866-667-9231.
Effective February 29, 2024, the Fund changed its name from abrdn International Sustainable Leaders Fund to abrdn Emerging Markets Dividend Fund.
The Fund changed its investment objective from "The Fund seeks long-term growth of capital" to "The Fund seeks total return consisting of income and long-term capital appreciation".
The Fund’s 80% policy changed from a policy where the Fund invests at least 80% of the value of its net assets, plus any borrowings for investment purposes, in equity securities issued by companies located throughout the world to a policy where the Fund invests at least 80% of the value of its net assets, plus any borrowings for investment purposes, in equity securities of emerging market companies that pay dividend income.
Dividend Strategy Risk was added as a principal risk of the Fund and Sustainable Investing Risk was removed as a principal risk of the Fund.
Availability of Additional Information
You can find additional information, including the Fund's prospectus, financial information, fund holdings, and proxy voting information at abrdn.com/us/literature or call 866-667-9231. The QR code can be used to access the Fund's prospectus, financial information and holdings.
abrdn Emerging Markets Dividend Fund
(JIEIX)
abrdn Focused U.S. Small Cap Equity Fund
Annual Shareholder Report - October 31, 2024
This annual shareholder report contains important information about the abrdn Focused U.S. Small Cap Equity Fund (the "Fund") for the period of November 1, 2023 to October 31, 2024. You can find additional information about the Fund at abrdn.com/us/literature. You can also request this information by contacting us at 866-667-9231.
This report describes material changes to the Fund that occurred during the reporting period.
What were the Fund costs for the last year?
(based on a hypothetical $10,000 investment)
| Share Class | Costs of a $10,000 investment | Costs paid as a percentage of a $10,000 investment |
|---|
| Institutional | $106 | 0.90% |
How did the fund perform last year and what affected its performance?
The following discussion compares the performance of the Fund to the Russell 2000 Index (the “Index”) to show how the Fund’s performance measures against the returns of similar investments for the reporting period.
What contributed to performance?
The Fund's overweight to Q2 Holdings was positive as robust demand for its digital banking solutions led to accelerated growth. Meanwhile, our overweight to casual diner Brinker International led the consumer discretionary sector’s outperformance for the Fund, as the company’s strong execution resulted in driving industry-leading traffic and sales growth. e.l.f. Beauty was also favorable as the company continued its above-category growth, benefitting from strong innovation and an attractive value proposition. However, we sold e.l.f Beauty as it became a mid-capitalization company and left the Russell 2000 Index. Lastly, within the information technology sector, CyberArk Software added to returns as demand for the company’s identity access management solutions accelerated. Despite this, we disposed of our position due to CyberArk Software’s market capitalization exceeding our targeted range.
What detracted from performance?
The Fund's exposure to Alphatec Holdings drove the healthcare sector’s underperformance for the Fund as concerns regarding the company’s increased capital needs were heightened due to weaker-than-expected cash generation. Also within this sector, Conmed Corporation detracted from performance due to underwhelming earnings and increased investor concern about the competitive environment. Therefore, the Fund sold both positions. Meanwhile, ATS Corporation also hurt performance, and we disposed of our position as we saw further risks to spending on electric-vehicle production lines among North American automotive manufacturers. Crown Holdings’ shares fell, and the Fund sold its position due to concerns about the growing competitiveness in the materials industry.
abrdn Focused U.S. Small Cap Equity Fund
(GGUIX)
Total Return Based on $1,000,000 Investment
The following graph reflects a hypothetical $1,000,000 investment for the most recently completed 10 fiscal years as compared to a broad-based securities market index and an additional performance benchmarks.
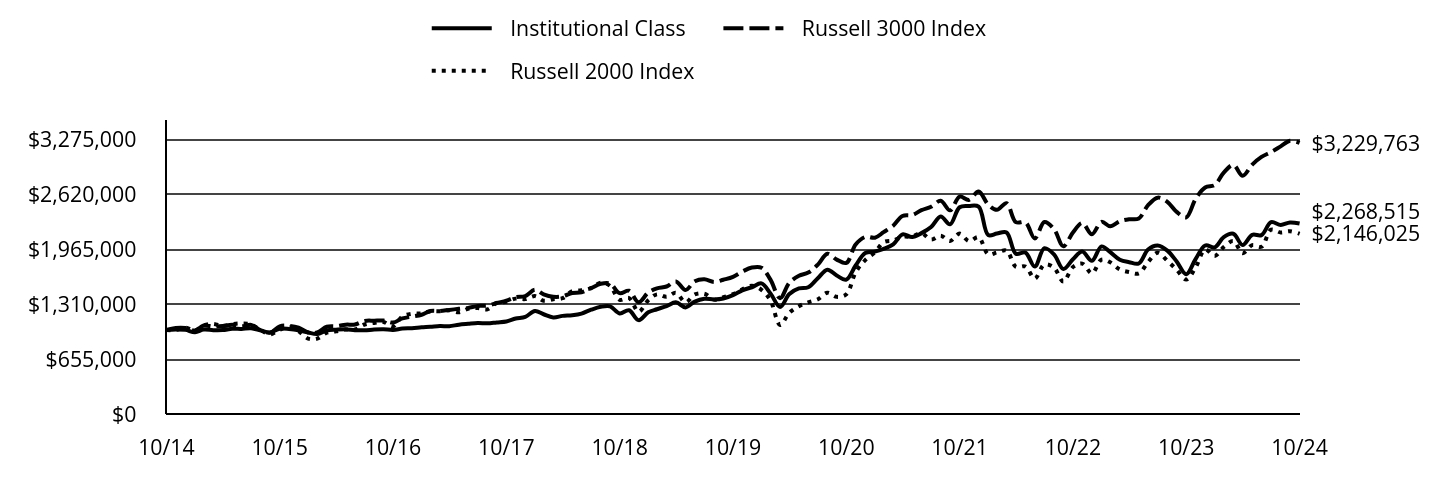
| Institutional Class | Russell 3000 Index | Russell 2000 Index |
|---|
| 10/14 | $1,000,000 | $1,000,000 | $1,000,000 |
| 11/14 | $1,006,369 | $1,024,234 | $1,000,896 |
| 12/14 | $1,001,817 | $1,024,222 | $1,029,422 |
| 01/15 | $974,148 | $995,717 | $996,309 |
| 02/15 | $1,006,588 | $1,053,370 | $1,055,457 |
| 03/15 | $998,955 | $1,042,661 | $1,073,844 |
| 04/15 | $999,909 | $1,047,377 | $1,046,458 |
| 05/15 | $1,014,220 | $1,061,864 | $1,070,349 |
| 06/15 | $1,013,266 | $1,044,098 | $1,078,364 |
| 07/15 | $1,019,945 | $1,061,561 | $1,065,831 |
| 08/15 | $994,184 | $997,475 | $998,854 |
| 09/15 | $972,240 | $968,409 | $949,847 |
| 10/15 | $1,015,175 | $1,044,899 | $1,003,361 |
| 11/15 | $1,012,312 | $1,050,692 | $1,036,000 |
| 12/15 | $997,689 | $1,029,126 | $983,982 |
| 01/16 | $971,492 | $971,057 | $897,456 |
| 02/16 | $952,935 | $970,744 | $897,416 |
| 03/16 | $994,414 | $1,039,091 | $969,040 |
| 04/16 | $1,004,239 | $1,045,530 | $984,249 |
| 05/16 | $1,009,696 | $1,064,235 | $1,006,419 |
| 06/16 | $998,781 | $1,066,424 | $1,005,785 |
| 07/16 | $996,598 | $1,108,747 | $1,065,837 |
| 08/16 | $1,006,422 | $1,111,575 | $1,084,685 |
| 09/16 | $1,009,696 | $1,113,322 | $1,096,767 |
| 10/16 | $1,000,964 | $1,089,235 | $1,044,627 |
| 11/16 | $1,017,337 | $1,137,981 | $1,161,115 |
| 12/16 | $1,022,230 | $1,160,186 | $1,193,649 |
| 01/17 | $1,032,083 | $1,182,023 | $1,198,357 |
| 02/17 | $1,038,241 | $1,225,984 | $1,221,484 |
| 03/17 | $1,048,094 | $1,226,818 | $1,223,083 |
| 04/17 | $1,045,631 | $1,239,822 | $1,236,495 |
| 05/17 | $1,064,105 | $1,252,511 | $1,211,340 |
| 06/17 | $1,073,957 | $1,263,814 | $1,253,214 |
| 07/17 | $1,082,579 | $1,287,643 | $1,262,525 |
| 08/17 | $1,080,115 | $1,290,124 | $1,246,463 |
| 09/17 | $1,091,200 | $1,321,587 | $1,324,254 |
| 10/17 | $1,102,284 | $1,350,427 | $1,335,542 |
| 11/17 | $1,136,769 | $1,391,433 | $1,374,031 |
| 12/17 | $1,157,277 | $1,405,340 | $1,368,486 |
| 01/18 | $1,225,833 | $1,479,417 | $1,404,250 |
| 02/18 | $1,188,291 | $1,424,886 | $1,349,875 |
| 03/18 | $1,150,748 | $1,396,283 | $1,367,334 |
| 04/18 | $1,168,703 | $1,401,590 | $1,379,155 |
| 05/18 | $1,176,865 | $1,441,157 | $1,462,871 |
| 06/18 | $1,196,452 | $1,450,582 | $1,473,353 |
| 07/18 | $1,242,155 | $1,498,721 | $1,499,031 |
| 08/18 | $1,276,433 | $1,551,352 | $1,563,654 |
| 09/18 | $1,281,330 | $1,553,920 | $1,526,045 |
| 10/18 | $1,198,084 | $1,439,501 | $1,360,291 |
| 11/18 | $1,235,626 | $1,468,332 | $1,381,913 |
| 12/18 | $1,118,147 | $1,331,675 | $1,217,761 |
| 01/19 | $1,211,325 | $1,445,979 | $1,354,758 |
| 02/19 | $1,247,562 | $1,496,832 | $1,425,188 |
| 03/19 | $1,285,523 | $1,518,689 | $1,395,360 |
| 04/19 | $1,330,387 | $1,579,333 | $1,442,762 |
| 05/19 | $1,269,994 | $1,477,131 | $1,330,554 |
| 06/19 | $1,339,015 | $1,580,880 | $1,424,594 |
| 07/19 | $1,371,800 | $1,604,380 | $1,432,796 |
| 08/19 | $1,364,898 | $1,571,674 | $1,362,053 |
| 09/19 | $1,375,251 | $1,599,258 | $1,390,392 |
| 10/19 | $1,414,939 | $1,633,685 | $1,427,010 |
| 11/19 | $1,473,607 | $1,695,785 | $1,485,753 |
| 12/19 | $1,509,695 | $1,744,748 | $1,528,594 |
| 01/20 | $1,555,277 | $1,742,843 | $1,479,569 |
| 02/20 | $1,436,762 | $1,600,150 | $1,355,016 |
| 03/20 | $1,274,489 | $1,380,101 | $1,060,619 |
| 04/20 | $1,429,469 | $1,562,882 | $1,206,299 |
| 05/20 | $1,495,108 | $1,646,463 | $1,284,799 |
| 06/20 | $1,509,695 | $1,684,104 | $1,330,213 |
| 07/20 | $1,617,269 | $1,779,733 | $1,367,031 |
| 08/20 | $1,719,374 | $1,908,665 | $1,444,054 |
| 09/20 | $1,650,089 | $1,839,168 | $1,395,818 |
| 10/20 | $1,600,860 | $1,799,473 | $1,425,052 |
| 11/20 | $1,768,604 | $2,018,385 | $1,687,725 |
| 12/20 | $1,918,240 | $2,109,188 | $1,833,713 |
| 01/21 | $1,934,377 | $2,099,806 | $1,925,990 |
| 02/21 | $1,966,650 | $2,165,440 | $2,046,028 |
| 03/21 | $2,021,111 | $2,243,056 | $2,066,577 |
| 04/21 | $2,140,119 | $2,358,684 | $2,109,973 |
| 05/21 | $2,107,845 | $2,369,451 | $2,114,323 |
| 06/21 | $2,154,238 | $2,427,879 | $2,155,287 |
| 07/21 | $2,226,853 | $2,468,936 | $2,077,463 |
| 08/21 | $2,351,912 | $2,539,345 | $2,123,932 |
| 09/21 | $2,259,126 | $2,425,410 | $2,061,308 |
| 10/21 | $2,462,851 | $2,589,427 | $2,148,995 |
| 11/21 | $2,476,971 | $2,550,012 | $2,059,447 |
| 12/21 | $2,469,455 | $2,650,429 | $2,105,451 |
| 01/22 | $2,131,029 | $2,494,488 | $1,902,752 |
| 02/22 | $2,149,537 | $2,431,653 | $1,923,064 |
| 03/22 | $2,162,756 | $2,510,527 | $1,946,998 |
| 04/22 | $1,908,937 | $2,285,227 | $1,754,033 |
| 05/22 | $1,922,156 | $2,282,163 | $1,756,683 |
| 06/22 | $1,755,587 | $2,091,240 | $1,612,208 |
| 07/22 | $1,975,035 | $2,287,436 | $1,780,527 |
| 08/22 | $1,901,005 | $2,202,070 | $1,744,093 |
| 09/22 | $1,726,504 | $1,997,874 | $1,576,947 |
| 10/22 | $1,842,838 | $2,161,712 | $1,750,551 |
| 11/22 | $1,935,376 | $2,274,545 | $1,791,440 |
| 12/22 | $1,824,330 | $2,141,363 | $1,675,172 |
| 01/23 | $1,996,187 | $2,288,844 | $1,838,444 |
| 02/23 | $1,927,444 | $2,235,348 | $1,807,391 |
| 03/23 | $1,837,550 | $2,295,119 | $1,721,034 |
| 04/23 | $1,808,466 | $2,319,572 | $1,690,093 |
| 05/23 | $1,792,602 | $2,328,597 | $1,674,481 |
| 06/23 | $1,959,172 | $2,487,606 | $1,810,619 |
| 07/23 | $2,006,763 | $2,576,779 | $1,921,345 |
| 08/23 | $1,945,952 | $2,527,037 | $1,825,223 |
| 09/23 | $1,816,398 | $2,406,664 | $1,717,768 |
| 10/23 | $1,665,693 | $2,342,866 | $1,600,619 |
| 11/23 | $1,845,482 | $2,561,335 | $1,745,490 |
| 12/23 | $2,006,763 | $2,697,193 | $1,958,760 |
| 01/24 | $1,985,611 | $2,727,085 | $1,882,577 |
| 02/24 | $2,107,233 | $2,874,703 | $1,989,021 |
| 03/24 | $2,146,893 | $2,967,434 | $2,060,226 |
| 04/24 | $2,012,051 | $2,836,862 | $1,915,222 |
| 05/24 | $2,133,673 | $2,970,895 | $2,011,303 |
| 06/24 | $2,131,029 | $3,062,866 | $1,992,698 |
| 07/24 | $2,284,378 | $3,119,802 | $2,195,154 |
| 08/24 | $2,252,651 | $3,187,716 | $2,162,363 |
| 09/24 | $2,281,734 | $3,253,656 | $2,177,476 |
| 10/24 | $2,268,515 | $3,229,763 | $2,146,025 |
Average Annual Total Returns for the Period Ended October 31, 2024 (%)
| AATR | 1 Year | 5 Years | 10 Years |
|---|
| Institutional Class | 36.19% | 9.90% | 8.54% |
| Russell 3000 Index | 37.86% | 14.60% | 12.44% |
| Russell 2000 Index | 34.07% | 8.50% | 7.94% |
THE FUND'S PAST PERFORMANCE IS NOT A GOOD PREDICTOR OF THE FUND'S FUTURE PERFORMANCE.
Fund performance data shown above does not reflect the deduction of taxes that a shareholder would pay on Fund distributions or redemption of Fund shares.
In accordance with regulatory changes requiring the Fund's primary benchmark to represent the overall applicable market, the Fund's primary prospectus benchmark changed to the Russell 3000 Index effective as of February 29, 2024.
Key Fund Statistics as of October 31, 2024
| Total Net Assets | $12,405,460 |
| Total Number of Portfolio Holdings | 39 |
| Portfolio Turnover Rate | 110% |
| Total Advisory Fees Paid | $0 |
abrdn Focused U.S. Small Cap Equity Fund
(GGUIX)
What did the Fund invest in?
The tables below show the investment makeup of the Fund as of October 31, 2024.
Sector Allocation (% of total net assets)
| Financials | 20.5% |
| Industrials | 17.3% |
| Health Care | 15.0% |
| Consumer Discretionary | 13.5% |
| Information Technology | 12.9% |
| Materials | 7.4% |
| Energy | 4.8% |
| Consumer Staples | 2.6% |
| Real Estate | 2.5% |
| Communication Services | 2.2% |
| Other | 1.3% |
Ten Largest Holdings (% of total net assets)
| Q2 Holdings, Inc. | 4.4% |
| Wintrust Financial Corp. | 3.9% |
| WSFS Financial Corp. | 3.8% |
| Corcept Therapeutics, Inc. | 3.5% |
| Brinker International, Inc. | 3.2% |
| Amicus Therapeutics, Inc. | 3.2% |
| Seacoast Banking Corp. of Florida | 3.1% |
| TMX Group Ltd. | 3.1% |
| Enpro, Inc. | 3.1% |
| Merit Medical Systems, Inc. | 3.1% |
Below is a summary of certain changes for the Fund since November 1, 2023. For more information, you may refer to the Fund's next prospectus, which we expect to be available by February 28, 2025 at abrdn.com/us/literature or upon request at 866-667-9231.
Effective February 29, 2024, the Fund changed its name from abrdn U.S. Sustainable Leaders Smaller Companies Fund to abrdn Focused U.S. Small Cap Equity Fund.
The Fund’s 80% policy changed from a policy where the Fund invests at least 80% of the value of its net assets, plus any borrowings for investment purposes, in equity securities issued by smaller U.S. companies to a policy where the Fund invests at least 80% of the value of its net assets, plus any borrowings for investment purposes, in equity securities issued by U.S. small-cap companies.
Focus Risk was added as a principal risk of the Fund and Sustainable Investing Risk was removed as a principal risk of the Fund.
Availability of Additional Information
You can find additional information, including the Fund's prospectus, financial information, fund holdings, and proxy voting information at abrdn.com/us/literature or call 866-667-9231. The QR code can be used to access the Fund's prospectus, financial information and holdings.
abrdn Focused U.S. Small Cap Equity Fund
(GGUIX)
abrdn China A Share Equity Fund
Annual Shareholder Report - October 31, 2024
This annual shareholder report contains important information about the abrdn China A Share Equity Fund (the "Fund") for the period of November 1, 2023 to October 31, 2024. You can find additional information about the Fund at abrdn.com/us/literature. You can also request this information by contacting us at 866-667-9231.
What were the Fund costs for the last year?
(based on a hypothetical $10,000 investment)
| Share Class | Costs of a $10,000 investment | Costs paid as a percentage of a $10,000 investment |
|---|
| A | $141 | 1.38% |
How did the fund perform last year and what affected its performance?
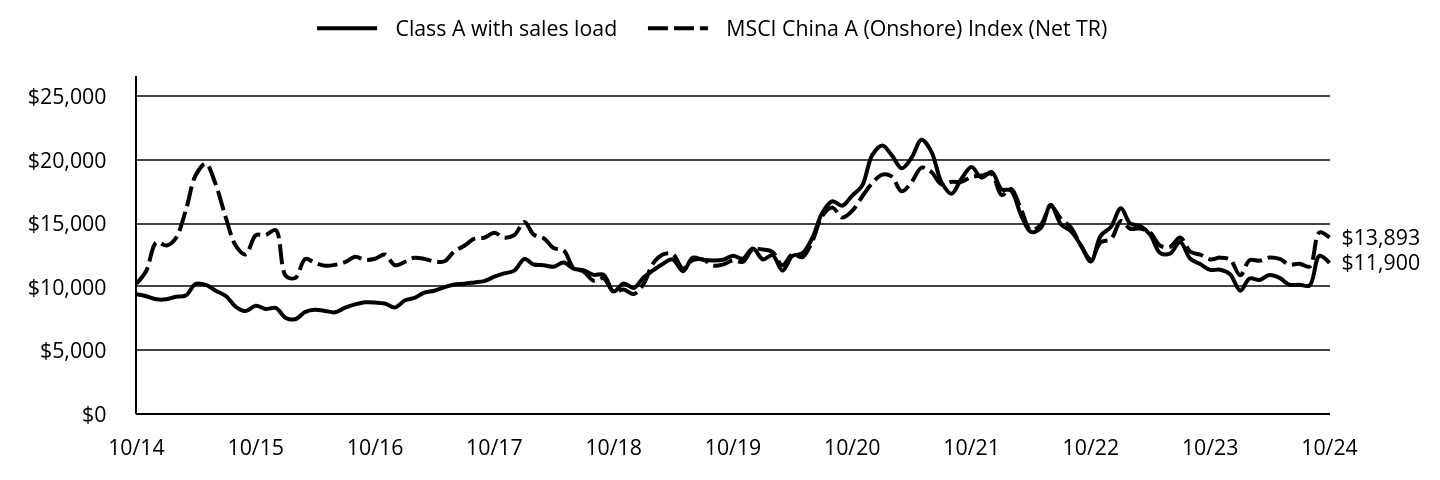
The following discussion compares the performance of the Fund to the MSCI China A (Onshore) Index (Net TR) (the “Index”) to show how the Fund’s performance measures against the returns of similar investments for the reporting period.
What contributed to performance?
The Fund's holdings in select consumer names were key contributors, as policy support via “trade-in” programs for new energy vehicles, consumer appliances and electronics, and resilient overseas demand boosted Fuyao Glass and Midea Group. Both companies also delivered solid earnings results. In the industrials sector, Contemporary Amperex Technology rose sharply due to solid results, a low valuation and the anticipated vehicle trade-in programs. Similarly, Sungrow Power was also boosted by the September 2024 Chinese stimulus announcements. Among our financial holdings, Citic Securities was helped by an improving market backdrop, and China Merchants Bank rebounded on growing signs of a recovery in market sentiment.
What detracted from performance?
Weakness in our IT holdings was the largest detractor, amid a challenging domestic macro backdrop. Maxscend Microelectronics lagged after disappointing earnings, and we exited our position owing to softer guidance and persistent demand weakness. Hundsun Technologies and Glodon were weighed down by concerns over slowing IT spending, as local government financing remained under pressure. Elsewhere, private eyecare hospital chain Aier Eye Hospital remained weak following last year’s de-rating, driven by the market’s misaligned growth expectations. Yifeng Pharmacy lagged amid an unsettling sector-wide regulatory investigation into drug price transparency. Spirits producer Kweichow Moutai was impacted by weakness in the wholesale price of its premium products and slower growth in shipments.
abrdn China A Share Equity Fund
(GOPAX)
Total Return Based on $10,000 Investment
The following graph reflects a hypothetical $10,000 investment for the most recently completed 10 fiscal years as compared to a broad-based securities market index, which is also the performance benchmark.
| Class A with sales load | MSCI China A (Onshore) Index (Net TR) |
|---|
| 10/14 | $9,426 | $10,267 |
| 11/14 | $9,272 | $11,285 |
| 12/14 | $9,028 | $13,526 |
| 01/15 | $9,033 | $13,261 |
| 02/15 | $9,229 | $13,823 |
| 03/15 | $9,332 | $16,058 |
| 04/15 | $10,245 | $18,793 |
| 05/15 | $10,170 | $19,705 |
| 06/15 | $9,714 | $18,104 |
| 07/15 | $9,302 | $15,486 |
| 08/15 | $8,440 | $13,246 |
| 09/15 | $8,102 | $12,563 |
| 10/15 | $8,530 | $14,079 |
| 11/15 | $8,264 | $14,086 |
| 12/15 | $8,354 | $14,483 |
| 01/16 | $7,565 | $10,882 |
| 02/16 | $7,465 | $10,709 |
| 03/16 | $8,040 | $12,209 |
| 04/16 | $8,202 | $11,891 |
| 05/16 | $8,117 | $11,677 |
| 06/16 | $8,007 | $11,747 |
| 07/16 | $8,373 | $11,954 |
| 08/16 | $8,635 | $12,380 |
| 09/16 | $8,792 | $12,130 |
| 10/16 | $8,777 | $12,222 |
| 11/16 | $8,697 | $12,558 |
| 12/16 | $8,395 | $11,716 |
| 01/17 | $8,958 | $11,988 |
| 02/17 | $9,136 | $12,299 |
| 03/17 | $9,564 | $12,214 |
| 04/17 | $9,708 | $12,020 |
| 05/17 | $9,973 | $12,027 |
| 06/17 | $10,203 | $12,801 |
| 07/17 | $10,261 | $13,245 |
| 08/17 | $10,362 | $13,813 |
| 09/17 | $10,463 | $13,877 |
| 10/17 | $10,809 | $14,280 |
| 11/17 | $11,069 | $13,891 |
| 12/17 | $11,292 | $14,092 |
| 01/18 | $12,210 | $15,124 |
| 02/18 | $11,773 | $14,129 |
| 03/18 | $11,720 | $13,838 |
| 04/18 | $11,589 | $13,069 |
| 05/18 | $11,928 | $12,885 |
| 06/18 | $11,453 | $11,497 |
| 07/18 | $11,307 | $11,212 |
| 08/18 | $10,957 | $10,490 |
| 09/18 | $10,962 | $10,687 |
| 10/18 | $9,646 | $9,604 |
| 11/18 | $10,282 | $9,799 |
| 12/18 | $9,923 | $9,443 |
| 01/19 | $10,769 | $10,261 |
| 02/19 | $11,300 | $11,835 |
| 03/19 | $11,840 | $12,561 |
| 04/19 | $12,171 | $12,589 |
| 05/19 | $11,246 | $11,464 |
| 06/19 | $12,312 | $12,114 |
| 07/19 | $12,147 | $12,174 |
| 08/19 | $12,088 | $11,683 |
| 09/19 | $12,142 | $11,765 |
| 10/19 | $12,463 | $12,099 |
| 11/19 | $12,224 | $11,981 |
| 12/19 | $13,029 | $12,982 |
| 01/20 | $12,167 | $12,946 |
| 02/20 | $12,507 | $12,770 |
| 03/20 | $11,288 | $11,720 |
| 04/20 | $12,441 | $12,562 |
| 05/20 | $12,659 | $12,356 |
| 06/20 | $13,842 | $13,591 |
| 07/20 | $15,847 | $15,604 |
| 08/20 | $16,755 | $16,250 |
| 09/20 | $16,400 | $15,469 |
| 10/20 | $17,212 | $16,013 |
| 11/20 | $17,973 | $17,109 |
| 12/20 | $20,382 | $18,181 |
| 01/21 | $21,134 | $18,848 |
| 02/21 | $20,403 | $18,706 |
| 03/21 | $19,352 | $17,540 |
| 04/21 | $20,166 | $18,248 |
| 05/21 | $21,602 | $19,402 |
| 06/21 | $20,655 | $19,054 |
| 07/21 | $18,256 | $18,083 |
| 08/21 | $17,345 | $18,280 |
| 09/21 | $18,529 | $18,287 |
| 10/21 | $19,440 | $18,681 |
| 11/21 | $18,611 | $18,773 |
| 12/21 | $19,061 | $18,914 |
| 01/22 | $17,687 | $17,245 |
| 02/22 | $17,602 | $17,719 |
| 03/22 | $15,685 | $16,135 |
| 04/22 | $14,338 | $14,481 |
| 05/22 | $14,655 | $14,889 |
| 06/22 | $16,472 | $16,385 |
| 07/22 | $14,950 | $15,386 |
| 08/22 | $14,380 | $14,680 |
| 09/22 | $13,307 | $13,267 |
| 10/22 | $12,013 | $12,183 |
| 11/22 | $14,037 | $13,519 |
| 12/22 | $14,723 | $13,763 |
| 01/23 | $16,192 | $15,193 |
| 02/23 | $15,014 | $14,586 |
| 03/23 | $14,803 | $14,598 |
| 04/23 | $14,126 | $14,295 |
| 05/23 | $12,679 | $13,246 |
| 06/23 | $12,631 | $13,156 |
| 07/23 | $13,545 | $13,901 |
| 08/23 | $12,230 | $12,780 |
| 09/23 | $11,812 | $12,548 |
| 10/23 | $11,348 | $12,171 |
| 11/23 | $11,358 | $12,313 |
| 12/23 | $11,009 | $12,159 |
| 01/24 | $9,710 | $10,926 |
| 02/24 | $10,670 | $12,105 |
| 03/24 | $10,553 | $12,076 |
| 04/24 | $10,946 | $12,327 |
| 05/24 | $10,717 | $12,208 |
| 06/24 | $10,177 | $11,763 |
| 07/24 | $10,182 | $11,837 |
| 08/24 | $10,118 | $11,610 |
| 09/24 | $12,457 | $14,289 |
| 10/24 | $11,900 | $13,893 |
Average Annual Total Returns for the Period Ended October 31, 2024 (%)
| AATR | 1 Year | 5 Years | 10 Years |
|---|
| Class A without sales load | 4.87% | (0.92%) | 2.36% |
| Class A with sales load - 5.75% | (1.16%) | (2.08%) | 1.75% |
| MSCI China A (Onshore) Index (Net TR) | 14.15% | 2.80% | 3.07% |
THE FUND'S PAST PERFORMANCE IS NOT A GOOD PREDICTOR OF THE FUND'S FUTURE PERFORMANCE.
Fund performance data shown above does not reflect the deduction of taxes that a shareholder would pay on Fund distributions or redemption of Fund shares.
Key Fund Statistics as of October 31, 2024
| Total Net Assets | $19,502,737 |
| Total Number of Portfolio Holdings | 48 |
| Portfolio Turnover Rate | 61% |
| Total Advisory Fees Paid | $0 |
abrdn China A Share Equity Fund
(GOPAX)
What did the Fund invest in?
The tables below show the investment makeup of the Fund as of October 31, 2024.
Sector Allocation (% of total net assets)
| Industrials | 26.3% |
| Financials | 17.3% |
| Consumer Discretionary | 16.3% |
| Consumer Staples | 16.3% |
| Health Care | 6.7% |
| Information Technology | 5.9% |
| Exchange-Traded Funds | 3.9% |
| Utilities | 2.0% |
| Materials | 1.9% |
| Other | 3.4% |
Ten Largest Holdings (% of total net assets)
| Kweichow Moutai Co. Ltd., Class A | 7.8% |
| Contemporary Amperex Technology Co. Ltd., Class A | 7.3% |
| Fuyao Glass Industry Group Co. Ltd., Class A | 4.7% |
| China Merchants Bank Co. Ltd., Class A | 4.7% |
| KraneShares Bosera MSCI China A 50 Connect Index ETF | 3.9% |
| Midea Group Co. Ltd., Class A | 3.7% |
| Proya Cosmetics Co. Ltd., Class A | 3.7% |
| Sungrow Power Supply Co. Ltd., Class A | 3.6% |
| BYD Co. Ltd., Class A | 3.5% |
| Inner Mongolia Yili Industrial Group Co. Ltd., Class A | 3.1% |
Availability of Additional Information
You can find additional information, including the Fund's prospectus, financial information, fund holdings, and proxy voting information at abrdn.com/us/literature or call 866-667-9231. The QR code can be used to access the Fund's prospectus, financial information and holdings.
abrdn China A Share Equity Fund
(GOPAX)
abrdn China A Share Equity Fund
Annual Shareholder Report - October 31, 2024
This annual shareholder report contains important information about the abrdn China A Share Equity Fund (the "Fund") for the period of November 1, 2023 to October 31, 2024. You can find additional information about the Fund at abrdn.com/us/literature. You can also request this information by contacting us at 866-667-9231.
What were the Fund costs for the last year?
(based on a hypothetical $10,000 investment)
| Share Class | Costs of a $10,000 investment | Costs paid as a percentage of a $10,000 investment |
|---|
| C | $204 | 2.00% |
How did the fund perform last year and what affected its performance?
The following discussion compares the performance of the Fund to the MSCI China A (Onshore) Index (Net TR) (the “Index”) to show how the Fund’s performance measures against the returns of similar investments for the reporting period.
What contributed to performance?
The Fund's holdings in select consumer names were key contributors, as policy support via “trade-in” programs for new energy vehicles, consumer appliances and electronics, and resilient overseas demand boosted Fuyao Glass and Midea Group. Both companies also delivered solid earnings results. In the industrials sector, Contemporary Amperex Technology rose sharply due to solid results, a low valuation and the anticipated vehicle trade-in programs. Similarly, Sungrow Power was also boosted by the September 2024 Chinese stimulus announcements. Among our financial holdings, Citic Securities was helped by an improving market backdrop, and China Merchants Bank rebounded on growing signs of a recovery in market sentiment.
What detracted from performance?
Weakness in our IT holdings was the largest detractor, amid a challenging domestic macro backdrop. Maxscend Microelectronics lagged after disappointing earnings, and we exited our position owing to softer guidance and persistent demand weakness. Hundsun Technologies and Glodon were weighed down by concerns over slowing IT spending, as local government financing remained under pressure. Elsewhere, private eyecare hospital chain Aier Eye Hospital remained weak following last year’s de-rating, driven by the market’s misaligned growth expectations. Yifeng Pharmacy lagged amid an unsettling sector-wide regulatory investigation into drug price transparency. Spirits producer Kweichow Moutai was impacted by weakness in the wholesale price of its premium products and slower growth in shipments.
abrdn China A Share Equity Fund
(GOPCX)
Total Return Based on $10,000 Investment
The following graph reflects a hypothetical $10,000 investment for the most recently completed 10 fiscal years as compared to a broad-based securities market index, which is also the performance benchmark.
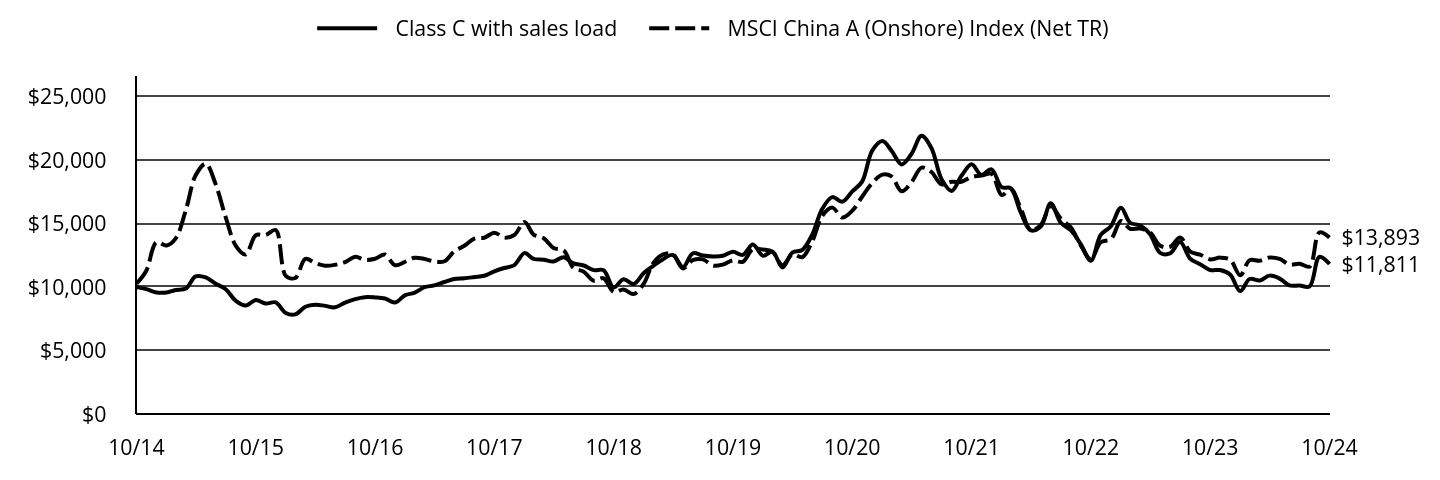
| Class C with sales load | MSCI China A (Onshore) Index (Net TR) |
|---|
| 10/14 | $10,000 | $10,267 |
| 11/14 | $9,836 | $11,285 |
| 12/14 | $9,574 | $13,526 |
| 01/15 | $9,569 | $13,261 |
| 02/15 | $9,769 | $13,823 |
| 03/15 | $9,877 | $16,058 |
| 04/15 | $10,837 | $18,793 |
| 05/15 | $10,750 | $19,705 |
| 06/15 | $10,262 | $18,104 |
| 07/15 | $9,821 | $15,486 |
| 08/15 | $8,907 | $13,246 |
| 09/15 | $8,540 | $12,563 |
| 10/15 | $8,982 | $14,079 |
| 11/15 | $8,701 | $14,086 |
| 12/15 | $8,790 | $14,483 |
| 01/16 | $7,952 | $10,882 |
| 02/16 | $7,843 | $10,709 |
| 03/16 | $8,446 | $12,209 |
| 04/16 | $8,608 | $11,891 |
| 05/16 | $8,514 | $11,677 |
| 06/16 | $8,399 | $11,747 |
| 07/16 | $8,774 | $11,954 |
| 08/16 | $9,050 | $12,380 |
| 09/16 | $9,201 | $12,130 |
| 10/16 | $9,180 | $12,222 |
| 11/16 | $9,092 | $12,558 |
| 12/16 | $8,774 | $11,716 |
| 01/17 | $9,362 | $11,988 |
| 02/17 | $9,539 | $12,299 |
| 03/17 | $9,981 | $12,214 |
| 04/17 | $10,127 | $12,020 |
| 05/17 | $10,393 | $12,027 |
| 06/17 | $10,627 | $12,801 |
| 07/17 | $10,684 | $13,245 |
| 08/17 | $10,783 | $13,813 |
| 09/17 | $10,887 | $13,877 |
| 10/17 | $11,236 | $14,280 |
| 11/17 | $11,496 | $13,891 |
| 12/17 | $11,725 | $14,092 |
| 01/18 | $12,669 | $15,124 |
| 02/18 | $12,210 | $14,129 |
| 03/18 | $12,147 | $13,838 |
| 04/18 | $12,007 | $13,069 |
| 05/18 | $12,351 | $12,885 |
| 06/18 | $11,856 | $11,497 |
| 07/18 | $11,694 | $11,212 |
| 08/18 | $11,329 | $10,490 |
| 09/18 | $11,324 | $10,687 |
| 10/18 | $9,964 | $9,604 |
| 11/18 | $10,610 | $9,799 |
| 12/18 | $10,235 | $9,443 |
| 01/19 | $11,100 | $10,261 |
| 02/19 | $11,642 | $11,835 |
| 03/19 | $12,189 | $12,561 |
| 04/19 | $12,523 | $12,589 |
| 05/19 | $11,564 | $11,464 |
| 06/19 | $12,653 | $12,114 |
| 07/19 | $12,476 | $12,174 |
| 08/19 | $12,408 | $11,683 |
| 09/19 | $12,455 | $11,765 |
| 10/19 | $12,778 | $12,099 |
| 11/19 | $12,528 | $11,981 |
| 12/19 | $13,341 | $12,982 |
| 01/20 | $12,453 | $12,946 |
| 02/20 | $12,791 | $12,770 |
| 03/20 | $11,538 | $11,720 |
| 04/20 | $12,715 | $12,562 |
| 05/20 | $12,927 | $12,356 |
| 06/20 | $14,125 | $13,591 |
| 07/20 | $16,161 | $15,604 |
| 08/20 | $17,076 | $16,250 |
| 09/20 | $16,711 | $15,469 |
| 10/20 | $17,523 | $16,013 |
| 11/20 | $18,296 | $17,109 |
| 12/20 | $20,733 | $18,181 |
| 01/21 | $21,490 | $18,848 |
| 02/21 | $20,733 | $18,706 |
| 03/21 | $19,655 | $17,540 |
| 04/21 | $20,473 | $18,248 |
| 05/21 | $21,910 | $19,402 |
| 06/21 | $20,943 | $19,054 |
| 07/21 | $18,494 | $18,083 |
| 08/21 | $17,566 | $18,280 |
| 09/21 | $18,754 | $18,287 |
| 10/21 | $19,666 | $18,681 |
| 11/21 | $18,821 | $18,773 |
| 12/21 | $19,264 | $18,914 |
| 01/22 | $17,867 | $17,245 |
| 02/22 | $17,770 | $17,719 |
| 03/22 | $15,827 | $16,135 |
| 04/22 | $14,458 | $14,481 |
| 05/22 | $14,771 | $14,889 |
| 06/22 | $16,594 | $16,385 |
| 07/22 | $15,055 | $15,386 |
| 08/22 | $14,464 | $14,680 |
| 09/22 | $13,379 | $13,267 |
| 10/22 | $12,072 | $12,183 |
| 11/22 | $14,100 | $13,519 |
| 12/22 | $14,782 | $13,763 |
| 01/23 | $16,248 | $15,193 |
| 02/23 | $15,060 | $14,586 |
| 03/23 | $14,839 | $14,598 |
| 04/23 | $14,151 | $14,295 |
| 05/23 | $12,691 | $13,246 |
| 06/23 | $12,640 | $13,156 |
| 07/23 | $13,549 | $13,901 |
| 08/23 | $12,225 | $12,780 |
| 09/23 | $11,799 | $12,548 |
| 10/23 | $11,334 | $12,171 |
| 11/23 | $11,334 | $12,313 |
| 12/23 | $10,981 | $12,159 |
| 01/24 | $9,680 | $10,926 |
| 02/24 | $10,629 | $12,105 |
| 03/24 | $10,510 | $12,076 |
| 04/24 | $10,896 | $12,327 |
| 05/24 | $10,663 | $12,208 |
| 06/24 | $10,123 | $11,763 |
| 07/24 | $10,118 | $11,837 |
| 08/24 | $10,055 | $11,610 |
| 09/24 | $12,373 | $14,289 |
| 10/24 | $11,811 | $13,893 |
Average Annual Total Returns for the Period Ended October 31, 2024 (%)
| AATR | 1 Year | 5 Years | 10 Years |
|---|
| Class C without sales load | 4.21% | (1.56%) | 1.68% |
| Class C with sales load - 1.00% | 3.21% | (1.56%) | 1.68% |
| MSCI China A (Onshore) Index (Net TR) | 14.15% | 2.80% | 3.07% |
THE FUND'S PAST PERFORMANCE IS NOT A GOOD PREDICTOR OF THE FUND'S FUTURE PERFORMANCE.
Fund performance data shown above does not reflect the deduction of taxes that a shareholder would pay on Fund distributions or redemption of Fund shares.
Key Fund Statistics as of October 31, 2024
| Total Net Assets | $19,502,737 |
| Total Number of Portfolio Holdings | 48 |
| Portfolio Turnover Rate | 61% |
| Total Advisory Fees Paid | $0 |
abrdn China A Share Equity Fund
(GOPCX)
What did the Fund invest in?
The tables below show the investment makeup of the Fund as of October 31, 2024.
Sector Allocation (% of total net assets)
| Industrials | 26.3% |
| Financials | 17.3% |
| Consumer Discretionary | 16.3% |
| Consumer Staples | 16.3% |
| Health Care | 6.7% |
| Information Technology | 5.9% |
| Exchange-Traded Funds | 3.9% |
| Utilities | 2.0% |
| Materials | 1.9% |
| Other | 3.4% |
Ten Largest Holdings (% of total net assets)
| Kweichow Moutai Co. Ltd., Class A | 7.8% |
| Contemporary Amperex Technology Co. Ltd., Class A | 7.3% |
| Fuyao Glass Industry Group Co. Ltd., Class A | 4.7% |
| China Merchants Bank Co. Ltd., Class A | 4.7% |
| KraneShares Bosera MSCI China A 50 Connect Index ETF | 3.9% |
| Midea Group Co. Ltd., Class A | 3.7% |
| Proya Cosmetics Co. Ltd., Class A | 3.7% |
| Sungrow Power Supply Co. Ltd., Class A | 3.6% |
| BYD Co. Ltd., Class A | 3.5% |
| Inner Mongolia Yili Industrial Group Co. Ltd., Class A | 3.1% |
Availability of Additional Information
You can find additional information, including the Fund's prospectus, financial information, fund holdings, and proxy voting information at abrdn.com/us/literature or call 866-667-9231. The QR code can be used to access the Fund's prospectus, financial information and holdings.
abrdn China A Share Equity Fund
(GOPCX)
abrdn China A Share Equity Fund
Annual Shareholder Report - October 31, 2024
This annual shareholder report contains important information about the abrdn China A Share Equity Fund (the "Fund") for the period of November 1, 2023 to October 31, 2024. You can find additional information about the Fund at abrdn.com/us/literature. You can also request this information by contacting us at 866-667-9231.
What were the Fund costs for the last year?
(based on a hypothetical $10,000 investment)
| Share Class | Costs of a $10,000 investment | Costs paid as a percentage of a $10,000 investment |
|---|
| R | $168 | 1.64% |
How did the fund perform last year and what affected its performance?
The following discussion compares the performance of the Fund to the MSCI China A (Onshore) Index (Net TR) (the “Index”) to show how the Fund’s performance measures against the returns of similar investments for the reporting period.
What contributed to performance?
The Fund's holdings in select consumer names were key contributors, as policy support via “trade-in” programs for new energy vehicles, consumer appliances and electronics, and resilient overseas demand boosted Fuyao Glass and Midea Group. Both companies also delivered solid earnings results. In the industrials sector, Contemporary Amperex Technology rose sharply due to solid results, a low valuation and the anticipated vehicle trade-in programs. Similarly, Sungrow Power was also boosted by the September 2024 Chinese stimulus announcements. Among our financial holdings, Citic Securities was helped by an improving market backdrop, and China Merchants Bank rebounded on growing signs of a recovery in market sentiment.
What detracted from performance?
Weakness in our IT holdings was the largest detractor, amid a challenging domestic macro backdrop. Maxscend Microelectronics lagged after disappointing earnings, and we exited our position owing to softer guidance and persistent demand weakness. Hundsun Technologies and Glodon were weighed down by concerns over slowing IT spending, as local government financing remained under pressure. Elsewhere, private eyecare hospital chain Aier Eye Hospital remained weak following last year’s de-rating, driven by the market’s misaligned growth expectations. Yifeng Pharmacy lagged amid an unsettling sector-wide regulatory investigation into drug price transparency. Spirits producer Kweichow Moutai was impacted by weakness in the wholesale price of its premium products and slower growth in shipments.
abrdn China A Share Equity Fund
(GOPRX)
Total Return Based on $10,000 Investment
The following graph reflects a hypothetical $10,000 investment for the most recently completed 10 fiscal years as compared to a broad-based securities market index, which is also the performance benchmark.
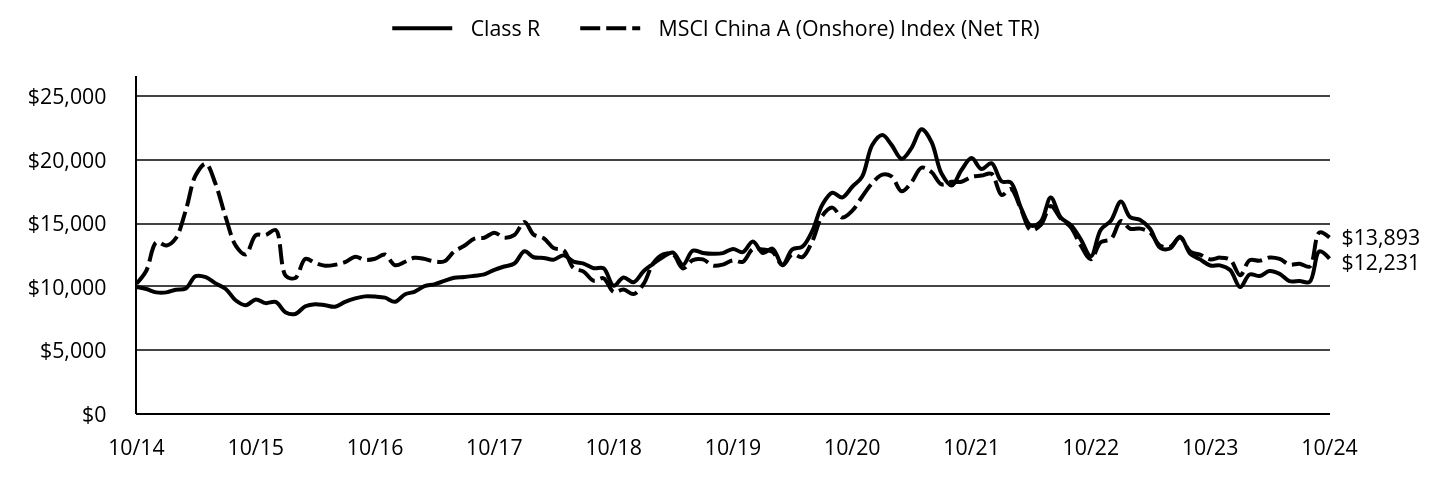
| Class R | MSCI China A (Onshore) Index (Net TR) |
|---|
| 10/14 | $10,000 | $10,267 |
| 11/14 | $9,839 | $11,285 |
| 12/14 | $9,578 | $13,526 |
| 01/15 | $9,578 | $13,261 |
| 02/15 | $9,784 | $13,823 |
| 03/15 | $9,890 | $16,058 |
| 04/15 | $10,855 | $18,793 |
| 05/15 | $10,770 | $19,705 |
| 06/15 | $10,287 | $18,104 |
| 07/15 | $9,845 | $15,486 |
| 08/15 | $8,935 | $13,246 |
| 09/15 | $8,568 | $12,563 |
| 10/15 | $9,017 | $14,079 |
| 11/15 | $8,731 | $14,086 |
| 12/15 | $8,823 | $14,483 |
| 01/16 | $7,987 | $10,882 |
| 02/16 | $7,875 | $10,709 |
| 03/16 | $8,481 | $12,209 |
| 04/16 | $8,650 | $11,891 |
| 05/16 | $8,558 | $11,677 |
| 06/16 | $8,446 | $11,747 |
| 07/16 | $8,828 | $11,954 |
| 08/16 | $9,104 | $12,380 |
| 09/16 | $9,262 | $12,130 |
| 10/16 | $9,246 | $12,222 |
| 11/16 | $9,160 | $12,558 |
| 12/16 | $8,837 | $11,716 |
| 01/17 | $9,434 | $11,988 |
| 02/17 | $9,619 | $12,299 |
| 03/17 | $10,061 | $12,214 |
| 04/17 | $10,210 | $12,020 |
| 05/17 | $10,483 | $12,027 |
| 06/17 | $10,725 | $12,801 |
| 07/17 | $10,781 | $13,245 |
| 08/17 | $10,884 | $13,813 |
| 09/17 | $10,992 | $13,877 |
| 10/17 | $11,352 | $14,280 |
| 11/17 | $11,614 | $13,891 |
| 12/17 | $11,847 | $14,092 |
| 01/18 | $12,811 | $15,124 |
| 02/18 | $12,344 | $14,129 |
| 03/18 | $12,292 | $13,838 |
| 04/18 | $12,152 | $13,069 |
| 05/18 | $12,505 | $12,885 |
| 06/18 | $12,002 | $11,497 |
| 07/18 | $11,847 | $11,212 |
| 08/18 | $11,479 | $10,490 |
| 09/18 | $11,474 | $10,687 |
| 10/18 | $10,095 | $9,604 |
| 11/18 | $10,753 | $9,799 |
| 12/18 | $10,375 | $9,443 |
| 01/19 | $11,261 | $10,261 |
| 02/19 | $11,810 | $11,835 |
| 03/19 | $12,370 | $12,561 |
| 04/19 | $12,712 | $12,589 |
| 05/19 | $11,743 | $11,464 |
| 06/19 | $12,857 | $12,114 |
| 07/19 | $12,681 | $12,174 |
| 08/19 | $12,614 | $11,683 |
| 09/19 | $12,665 | $11,765 |
| 10/19 | $12,997 | $12,099 |
| 11/19 | $12,743 | $11,981 |
| 12/19 | $13,577 | $12,982 |
| 01/20 | $12,674 | $12,946 |
| 02/20 | $13,026 | $12,770 |
| 03/20 | $11,754 | $11,720 |
| 04/20 | $12,955 | $12,562 |
| 05/20 | $13,177 | $12,356 |
| 06/20 | $14,400 | $13,591 |
| 07/20 | $16,482 | $15,604 |
| 08/20 | $17,423 | $16,250 |
| 09/20 | $17,050 | $15,469 |
| 10/20 | $17,894 | $16,013 |
| 11/20 | $18,684 | $17,109 |
| 12/20 | $21,181 | $18,181 |
| 01/21 | $21,960 | $18,848 |
| 02/21 | $21,191 | $18,706 |
| 03/21 | $20,099 | $17,540 |
| 04/21 | $20,939 | $18,248 |
| 05/21 | $22,421 | $19,402 |
| 06/21 | $21,433 | $19,054 |
| 07/21 | $18,936 | $18,083 |
| 08/21 | $17,986 | $18,280 |
| 09/21 | $19,210 | $18,287 |
| 10/21 | $20,149 | $18,681 |
| 11/21 | $19,287 | $18,773 |
| 12/21 | $19,744 | $18,914 |
| 01/22 | $18,318 | $17,245 |
| 02/22 | $18,228 | $17,719 |
| 03/22 | $16,238 | $16,135 |
| 04/22 | $14,840 | $14,481 |
| 05/22 | $15,162 | $14,889 |
| 06/22 | $17,039 | $16,385 |
| 07/22 | $15,460 | $15,386 |
| 08/22 | $14,863 | $14,680 |
| 09/22 | $13,753 | $13,267 |
| 10/22 | $12,417 | $12,183 |
| 11/22 | $14,502 | $13,519 |
| 12/22 | $15,212 | $13,763 |
| 01/23 | $16,723 | $15,193 |
| 02/23 | $15,505 | $14,586 |
| 03/23 | $15,280 | $14,598 |
| 04/23 | $14,581 | $14,295 |
| 05/23 | $13,082 | $13,246 |
| 06/23 | $13,031 | $13,156 |
| 07/23 | $13,967 | $13,901 |
| 08/23 | $12,608 | $12,780 |
| 09/23 | $12,174 | $12,548 |
| 10/23 | $11,695 | $12,171 |
| 11/23 | $11,701 | $12,313 |
| 12/23 | $11,340 | $12,159 |
| 01/24 | $9,999 | $10,926 |
| 02/24 | $10,985 | $12,105 |
| 03/24 | $10,861 | $12,076 |
| 04/24 | $11,261 | $12,327 |
| 05/24 | $11,030 | $12,208 |
| 06/24 | $10,467 | $11,763 |
| 07/24 | $10,472 | $11,837 |
| 08/24 | $10,405 | $11,610 |
| 09/24 | $12,806 | $14,289 |
| 10/24 | $12,231 | $13,893 |
Average Annual Total Returns for the Period Ended October 31, 2024 (%)
| AATR | 1 Year | 5 Years | 10 Years |
|---|
| Class R | 4.58% | (1.21%) | 2.03% |
| MSCI China A (Onshore) Index (Net TR) | 14.15% | 2.80% | 3.07% |
THE FUND'S PAST PERFORMANCE IS NOT A GOOD PREDICTOR OF THE FUND'S FUTURE PERFORMANCE.
Fund performance data shown above does not reflect the deduction of taxes that a shareholder would pay on Fund distributions or redemption of Fund shares.
Key Fund Statistics as of October 31, 2024
| Total Net Assets | $19,502,737 |
| Total Number of Portfolio Holdings | 48 |
| Portfolio Turnover Rate | 61% |
| Total Advisory Fees Paid | $0 |
abrdn China A Share Equity Fund
(GOPRX)
What did the Fund invest in?
The tables below show the investment makeup of the Fund as of October 31, 2024.
Sector Allocation (% of total net assets)
| Industrials | 26.3% |
| Financials | 17.3% |
| Consumer Discretionary | 16.3% |
| Consumer Staples | 16.3% |
| Health Care | 6.7% |
| Information Technology | 5.9% |
| Exchange-Traded Funds | 3.9% |
| Utilities | 2.0% |
| Materials | 1.9% |
| Other | 3.4% |
Ten Largest Holdings (% of total net assets)
| Kweichow Moutai Co. Ltd., Class A | 7.8% |
| Contemporary Amperex Technology Co. Ltd., Class A | 7.3% |
| Fuyao Glass Industry Group Co. Ltd., Class A | 4.7% |
| China Merchants Bank Co. Ltd., Class A | 4.7% |
| KraneShares Bosera MSCI China A 50 Connect Index ETF | 3.9% |
| Midea Group Co. Ltd., Class A | 3.7% |
| Proya Cosmetics Co. Ltd., Class A | 3.7% |
| Sungrow Power Supply Co. Ltd., Class A | 3.6% |
| BYD Co. Ltd., Class A | 3.5% |
| Inner Mongolia Yili Industrial Group Co. Ltd., Class A | 3.1% |
Availability of Additional Information
You can find additional information, including the Fund's prospectus, financial information, fund holdings, and proxy voting information at abrdn.com/us/literature or call 866-667-9231. The QR code can be used to access the Fund's prospectus, financial information and holdings.
abrdn China A Share Equity Fund
(GOPRX)
abrdn China A Share Equity Fund
Annual Shareholder Report - October 31, 2024
This annual shareholder report contains important information about the abrdn China A Share Equity Fund (the "Fund") for the period of November 1, 2023 to October 31, 2024. You can find additional information about the Fund at abrdn.com/us/literature. You can also request this information by contacting us at 866-667-9231.
What were the Fund costs for the last year?
(based on a hypothetical $10,000 investment)
| Share Class | Costs of a $10,000 investment | Costs paid as a percentage of a $10,000 investment |
|---|
| Institutional | $103 | 1.00% |
How did the fund perform last year and what affected its performance?
The following discussion compares the performance of the Fund to the MSCI China A (Onshore) Index (Net TR) (the “Index”) to show how the Fund’s performance measures against the returns of similar investments for the reporting period.
What contributed to performance?
The Fund's holdings in select consumer names were key contributors, as policy support via “trade-in” programs for new energy vehicles, consumer appliances and electronics, and resilient overseas demand boosted Fuyao Glass and Midea Group. Both companies also delivered solid earnings results. In the industrials sector, Contemporary Amperex Technology rose sharply due to solid results, a low valuation and the anticipated vehicle trade-in programs. Similarly, Sungrow Power was also boosted by the September 2024 Chinese stimulus announcements. Among our financial holdings, Citic Securities was helped by an improving market backdrop, and China Merchants Bank rebounded on growing signs of a recovery in market sentiment.
What detracted from performance?
Weakness in our IT holdings was the largest detractor, amid a challenging domestic macro backdrop. Maxscend Microelectronics lagged after disappointing earnings, and we exited our position owing to softer guidance and persistent demand weakness. Hundsun Technologies and Glodon were weighed down by concerns over slowing IT spending, as local government financing remained under pressure. Elsewhere, private eyecare hospital chain Aier Eye Hospital remained weak following last year’s de-rating, driven by the market’s misaligned growth expectations. Yifeng Pharmacy lagged amid an unsettling sector-wide regulatory investigation into drug price transparency. Spirits producer Kweichow Moutai was impacted by weakness in the wholesale price of its premium products and slower growth in shipments.
abrdn China A Share Equity Fund
(GOPIX)
Total Return Based on $1,000,000 Investment
The following graph reflects a hypothetical $1,000,000 investment for the most recently completed 10 fiscal years as compared to a broad-based securities market index, which is also the performance benchmark.
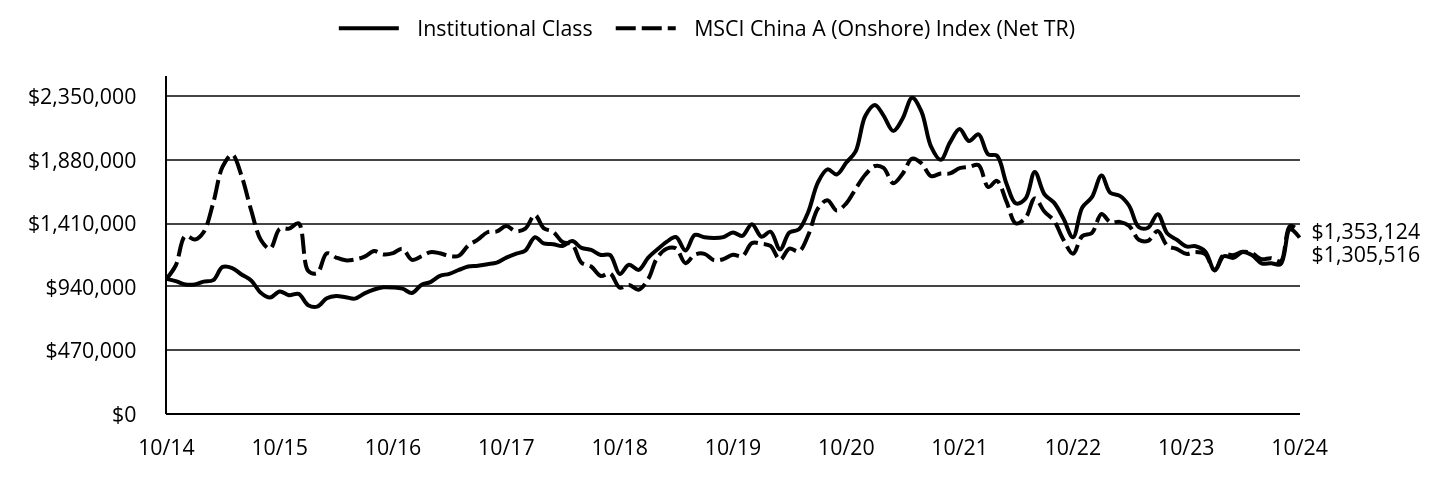
| Institutional Class | MSCI China A (Onshore) Index (Net TR) |
|---|
| 10/14 | $1,000,000 | $1,000,000 |
| 11/14 | $983,728 | $1,099,072 |
| 12/14 | $958,476 | $1,317,317 |
| 01/15 | $958,970 | $1,291,529 |
| 02/15 | $979,732 | $1,346,276 |
| 03/15 | $991,101 | $1,563,929 |
| 04/15 | $1,088,481 | $1,830,386 |
| 05/15 | $1,080,572 | $1,919,169 |
| 06/15 | $1,032,487 | $1,763,219 |
| 07/15 | $988,826 | $1,508,250 |
| 08/15 | $897,535 | $1,290,124 |
| 09/15 | $861,910 | $1,223,543 |
| 10/15 | $907,273 | $1,371,212 |
| 11/15 | $879,047 | $1,371,888 |
| 12/15 | $889,128 | $1,410,541 |
| 01/16 | $804,953 | $1,059,859 |
| 02/16 | $794,368 | $1,043,028 |
| 03/16 | $856,365 | $1,189,068 |
| 04/16 | $873,503 | $1,158,156 |
| 05/16 | $864,430 | $1,137,283 |
| 06/16 | $853,845 | $1,144,134 |
| 07/16 | $892,656 | $1,164,284 |
| 08/16 | $921,387 | $1,205,761 |
| 09/16 | $937,516 | $1,181,374 |
| 10/16 | $936,508 | $1,190,371 |
| 11/16 | $927,939 | $1,223,098 |
| 12/16 | $896,019 | $1,141,056 |
| 01/17 | $956,844 | $1,167,529 |
| 02/17 | $976,267 | $1,197,845 |
| 03/17 | $1,022,269 | $1,189,543 |
| 04/17 | $1,037,603 | $1,170,673 |
| 05/17 | $1,066,227 | $1,171,403 |
| 06/17 | $1,091,273 | $1,246,793 |
| 07/17 | $1,097,917 | $1,290,025 |
| 08/17 | $1,108,651 | $1,345,289 |
| 09/17 | $1,120,407 | $1,351,548 |
| 10/17 | $1,157,720 | $1,390,823 |
| 11/17 | $1,185,832 | $1,352,878 |
| 12/17 | $1,210,024 | $1,372,471 |
| 01/18 | $1,308,875 | $1,472,955 |
| 02/18 | $1,262,296 | $1,376,087 |
| 03/18 | $1,257,121 | $1,347,734 |
| 04/18 | $1,243,147 | $1,272,814 |
| 05/18 | $1,279,893 | $1,254,919 |
| 06/18 | $1,229,691 | $1,119,726 |
| 07/18 | $1,214,164 | $1,092,005 |
| 08/18 | $1,176,901 | $1,021,691 |
| 09/18 | $1,177,419 | $1,040,842 |
| 10/18 | $1,036,646 | $935,372 |
| 11/18 | $1,104,962 | $954,403 |
| 12/18 | $1,066,437 | $919,704 |
| 01/19 | $1,157,905 | $999,361 |
| 02/19 | $1,215,592 | $1,152,687 |
| 03/19 | $1,273,799 | $1,223,379 |
| 04/19 | $1,309,659 | $1,226,098 |
| 05/19 | $1,210,395 | $1,116,545 |
| 06/19 | $1,325,770 | $1,179,819 |
| 07/19 | $1,308,100 | $1,185,646 |
| 08/19 | $1,302,383 | $1,137,907 |
| 09/19 | $1,308,620 | $1,145,890 |
| 10/19 | $1,343,440 | $1,178,410 |
| 11/19 | $1,317,974 | $1,166,840 |
| 12/19 | $1,404,920 | $1,264,425 |
| 01/20 | $1,312,020 | $1,260,832 |
| 02/20 | $1,349,506 | $1,243,733 |
| 03/20 | $1,218,032 | $1,141,481 |
| 04/20 | $1,343,530 | $1,223,522 |
| 05/20 | $1,366,891 | $1,203,401 |
| 06/20 | $1,495,105 | $1,323,651 |
| 07/20 | $1,712,416 | $1,519,793 |
| 08/20 | $1,810,750 | $1,582,620 |
| 09/20 | $1,773,264 | $1,506,584 |
| 10/20 | $1,861,275 | $1,559,628 |
| 11/20 | $1,944,397 | $1,666,329 |
| 12/20 | $2,205,334 | $1,770,692 |
| 01/21 | $2,287,524 | $1,835,729 |
| 02/21 | $2,208,644 | $1,821,878 |
| 03/21 | $2,095,564 | $1,708,314 |
| 04/21 | $2,184,925 | $1,777,268 |
| 05/21 | $2,340,479 | $1,889,697 |
| 06/21 | $2,238,431 | $1,855,754 |
| 07/21 | $1,979,174 | $1,761,144 |
| 08/21 | $1,880,988 | $1,780,406 |
| 09/21 | $2,010,065 | $1,781,095 |
| 10/21 | $2,109,354 | $1,819,416 |
| 11/21 | $2,020,545 | $1,828,394 |
| 12/21 | $2,069,601 | $1,842,097 |
| 01/22 | $1,921,247 | $1,679,587 |
| 02/22 | $1,912,187 | $1,725,766 |
| 03/22 | $1,704,943 | $1,571,457 |
| 04/22 | $1,558,854 | $1,410,404 |
| 05/22 | $1,593,961 | $1,450,158 |
| 06/22 | $1,791,578 | $1,595,843 |
| 07/22 | $1,626,803 | $1,498,549 |
| 08/22 | $1,564,516 | $1,429,708 |
| 09/22 | $1,448,438 | $1,292,167 |
| 10/22 | $1,308,010 | $1,186,602 |
| 11/22 | $1,528,843 | $1,316,710 |
| 12/22 | $1,604,719 | $1,340,416 |
| 01/23 | $1,764,965 | $1,479,763 |
| 02/23 | $1,636,995 | $1,420,582 |
| 03/23 | $1,614,345 | $1,421,769 |
| 04/23 | $1,541,301 | $1,392,301 |
| 05/23 | $1,383,320 | $1,290,122 |
| 06/23 | $1,378,790 | $1,281,297 |
| 07/23 | $1,479,014 | $1,353,884 |
| 08/23 | $1,335,756 | $1,244,749 |
| 09/23 | $1,290,457 | $1,222,071 |
| 10/23 | $1,240,062 | $1,185,347 |
| 11/23 | $1,241,761 | $1,199,267 |
| 12/23 | $1,203,906 | $1,184,229 |
| 01/24 | $1,062,337 | $1,064,090 |
| 02/24 | $1,167,372 | $1,178,946 |
| 03/24 | $1,155,384 | $1,176,173 |
| 04/24 | $1,198,768 | $1,200,551 |
| 05/24 | $1,174,222 | $1,188,949 |
| 06/24 | $1,115,425 | $1,145,629 |
| 07/24 | $1,115,996 | $1,152,909 |
| 08/24 | $1,109,717 | $1,130,775 |
| 09/24 | $1,366,596 | $1,391,692 |
| 10/24 | $1,305,516 | $1,353,124 |
Average Annual Total Returns for the Period Ended October 31, 2024 (%)
| AATR | 1 Year | 5 Years | 10 Years |
|---|
| Institutional Class | 5.28% | (0.57%) | 2.70% |
| MSCI China A (Onshore) Index (Net TR) | 14.15% | 2.80% | 3.07% |
THE FUND'S PAST PERFORMANCE IS NOT A GOOD PREDICTOR OF THE FUND'S FUTURE PERFORMANCE.
Fund performance data shown above does not reflect the deduction of taxes that a shareholder would pay on Fund distributions or redemption of Fund shares.
Key Fund Statistics as of October 31, 2024
| Total Net Assets | $19,502,737 |
| Total Number of Portfolio Holdings | 48 |
| Portfolio Turnover Rate | 61% |
| Total Advisory Fees Paid | $0 |
abrdn China A Share Equity Fund
(GOPIX)
What did the Fund invest in?
The tables below show the investment makeup of the Fund as of October 31, 2024.
Sector Allocation (% of total net assets)
| Industrials | 26.3% |
| Financials | 17.3% |
| Consumer Discretionary | 16.3% |
| Consumer Staples | 16.3% |
| Health Care | 6.7% |
| Information Technology | 5.9% |
| Exchange-Traded Funds | 3.9% |
| Utilities | 2.0% |
| Materials | 1.9% |
| Other | 3.4% |
Ten Largest Holdings (% of total net assets)
| Kweichow Moutai Co. Ltd., Class A | 7.8% |
| Contemporary Amperex Technology Co. Ltd., Class A | 7.3% |
| Fuyao Glass Industry Group Co. Ltd., Class A | 4.7% |
| China Merchants Bank Co. Ltd., Class A | 4.7% |
| KraneShares Bosera MSCI China A 50 Connect Index ETF | 3.9% |
| Midea Group Co. Ltd., Class A | 3.7% |
| Proya Cosmetics Co. Ltd., Class A | 3.7% |
| Sungrow Power Supply Co. Ltd., Class A | 3.6% |
| BYD Co. Ltd., Class A | 3.5% |
| Inner Mongolia Yili Industrial Group Co. Ltd., Class A | 3.1% |
Availability of Additional Information
You can find additional information, including the Fund's prospectus, financial information, fund holdings, and proxy voting information at abrdn.com/us/literature or call 866-667-9231. The QR code can be used to access the Fund's prospectus, financial information and holdings.
abrdn China A Share Equity Fund
(GOPIX)
abrdn China A Share Equity Fund
Annual Shareholder Report - October 31, 2024
This annual shareholder report contains important information about the abrdn China A Share Equity Fund (the "Fund") for the period of November 1, 2023 to October 31, 2024. You can find additional information about the Fund at abrdn.com/us/literature. You can also request this information by contacting us at 866-667-9231.
What were the Fund costs for the last year?
(based on a hypothetical $10,000 investment)
| Share Class | Costs of a $10,000 investment | Costs paid as a percentage of a $10,000 investment |
|---|
| Institutional Service | $112 | 1.09% |
How did the fund perform last year and what affected its performance?
The following discussion compares the performance of the Fund to the MSCI China A (Onshore) Index (Net TR) (the “Index”) to show how the Fund’s performance measures against the returns of similar investments for the reporting period.
What contributed to performance?
The Fund's holdings in select consumer names were key contributors, as policy support via “trade-in” programs for new energy vehicles, consumer appliances and electronics, and resilient overseas demand boosted Fuyao Glass and Midea Group. Both companies also delivered solid earnings results. In the industrials sector, Contemporary Amperex Technology rose sharply due to solid results, a low valuation and the anticipated vehicle trade-in programs. Similarly, Sungrow Power was also boosted by the September 2024 Chinese stimulus announcements. Among our financial holdings, Citic Securities was helped by an improving market backdrop, and China Merchants Bank rebounded on growing signs of a recovery in market sentiment.
What detracted from performance?
Weakness in our IT holdings was the largest detractor, amid a challenging domestic macro backdrop. Maxscend Microelectronics lagged after disappointing earnings, and we exited our position owing to softer guidance and persistent demand weakness. Hundsun Technologies and Glodon were weighed down by concerns over slowing IT spending, as local government financing remained under pressure. Elsewhere, private eyecare hospital chain Aier Eye Hospital remained weak following last year’s de-rating, driven by the market’s misaligned growth expectations. Yifeng Pharmacy lagged amid an unsettling sector-wide regulatory investigation into drug price transparency. Spirits producer Kweichow Moutai was impacted by weakness in the wholesale price of its premium products and slower growth in shipments.
abrdn China A Share Equity Fund
(GOPSX)
Institutional Service Class
Total Return Based on $1,000,000 Investment
The following graph reflects a hypothetical $1,000,000 investment for the most recently completed 10 fiscal years as compared to a broad-based securities market index, which is also the performance benchmark.

| Institutional Service Class | MSCI China A (Onshore) Index (Net TR) |
|---|
| 10/14 | $1,000,000 | $1,000,000 |
| 11/14 | $983,728 | $1,099,072 |
| 12/14 | $958,421 | $1,317,317 |
| 01/15 | $958,916 | $1,291,529 |
| 02/15 | $979,676 | $1,346,276 |
| 03/15 | $991,044 | $1,563,929 |
| 04/15 | $1,088,419 | $1,830,386 |
| 05/15 | $1,080,510 | $1,919,169 |
| 06/15 | $1,032,217 | $1,763,219 |
| 07/15 | $988,568 | $1,508,250 |
| 08/15 | $897,796 | $1,290,124 |
| 09/15 | $861,677 | $1,223,543 |
| 10/15 | $907,028 | $1,371,212 |
| 11/15 | $878,810 | $1,371,888 |
| 12/15 | $888,888 | $1,410,541 |
| 01/16 | $804,736 | $1,059,859 |
| 02/16 | $794,657 | $1,043,028 |
| 03/16 | $856,134 | $1,189,068 |
| 04/16 | $873,267 | $1,158,156 |
| 05/16 | $864,196 | $1,137,283 |
| 06/16 | $853,110 | $1,144,134 |
| 07/16 | $891,407 | $1,164,284 |
| 08/16 | $919,626 | $1,205,761 |
| 09/16 | $936,255 | $1,181,374 |
| 10/16 | $934,743 | $1,190,371 |
| 11/16 | $926,177 | $1,223,098 |
| 12/16 | $894,426 | $1,141,056 |
| 01/17 | $955,177 | $1,167,529 |
| 02/17 | $974,066 | $1,197,845 |
| 03/17 | $1,020,013 | $1,189,543 |
| 04/17 | $1,035,328 | $1,170,673 |
| 05/17 | $1,063,917 | $1,171,403 |
| 06/17 | $1,088,422 | $1,246,793 |
| 07/17 | $1,095,059 | $1,290,025 |
| 08/17 | $1,105,780 | $1,345,289 |
| 09/17 | $1,117,521 | $1,351,548 |
| 10/17 | $1,154,789 | $1,390,823 |
| 11/17 | $1,182,357 | $1,352,878 |
| 12/17 | $1,206,420 | $1,372,471 |
| 01/18 | $1,305,146 | $1,472,955 |
| 02/18 | $1,258,109 | $1,376,087 |
| 03/18 | $1,252,940 | $1,347,734 |
| 04/18 | $1,239,501 | $1,272,814 |
| 05/18 | $1,275,683 | $1,254,919 |
| 06/18 | $1,225,545 | $1,119,726 |
| 07/18 | $1,210,038 | $1,092,005 |
| 08/18 | $1,172,822 | $1,021,691 |
| 09/18 | $1,173,339 | $1,040,842 |
| 10/18 | $1,032,745 | $935,372 |
| 11/18 | $1,100,974 | $954,403 |
| 12/18 | $1,062,816 | $919,704 |
| 01/19 | $1,153,722 | $999,361 |
| 02/19 | $1,210,862 | $1,152,687 |
| 03/19 | $1,268,523 | $1,223,379 |
| 04/19 | $1,304,365 | $1,226,098 |
| 05/19 | $1,205,668 | $1,116,545 |
| 06/19 | $1,319,949 | $1,179,819 |
| 07/19 | $1,302,807 | $1,185,646 |
| 08/19 | $1,296,573 | $1,137,907 |
| 09/19 | $1,302,288 | $1,145,890 |
| 10/19 | $1,337,611 | $1,178,410 |
| 11/19 | $1,311,638 | $1,166,840 |
| 12/19 | $1,398,330 | $1,264,425 |
| 01/20 | $1,306,084 | $1,260,832 |
| 02/20 | $1,342,440 | $1,243,733 |
| 03/20 | $1,212,211 | $1,141,481 |
| 04/20 | $1,336,471 | $1,223,522 |
| 05/20 | $1,359,804 | $1,203,401 |
| 06/20 | $1,487,319 | $1,323,651 |
| 07/20 | $1,703,281 | $1,519,793 |
| 08/20 | $1,800,953 | $1,582,620 |
| 09/20 | $1,763,512 | $1,506,584 |
| 10/20 | $1,850,874 | $1,559,628 |
| 11/20 | $1,933,352 | $1,666,329 |
| 12/20 | $2,192,836 | $1,770,692 |
| 01/21 | $2,274,337 | $1,835,729 |
| 02/21 | $2,195,589 | $1,821,878 |
| 03/21 | $2,083,249 | $1,708,314 |
| 04/21 | $2,171,359 | $1,777,268 |
| 05/21 | $2,326,102 | $1,889,697 |
| 06/21 | $2,224,225 | $1,855,754 |
| 07/21 | $1,966,503 | $1,761,144 |
| 08/21 | $1,869,032 | $1,780,406 |
| 09/21 | $1,996,791 | $1,781,095 |
| 10/21 | $2,095,364 | $1,819,416 |
| 11/21 | $2,006,703 | $1,828,394 |
| 12/21 | $2,055,718 | $1,842,097 |
| 01/22 | $1,907,629 | $1,679,587 |
| 02/22 | $1,899,151 | $1,725,766 |
| 03/22 | $1,692,844 | $1,571,457 |
| 04/22 | $1,547,582 | $1,410,404 |
| 05/22 | $1,582,060 | $1,450,158 |
| 06/22 | $1,778,193 | $1,595,843 |
| 07/22 | $1,614,278 | $1,498,549 |
| 08/22 | $1,552,669 | $1,429,708 |
| 09/22 | $1,437,363 | $1,292,167 |
| 10/22 | $1,297,753 | $1,186,602 |
| 11/22 | $1,517,060 | $1,316,710 |
| 12/22 | $1,591,669 | $1,340,416 |
| 01/23 | $1,750,497 | $1,479,763 |
| 02/23 | $1,623,322 | $1,420,582 |
| 03/23 | $1,600,713 | $1,421,769 |
| 04/23 | $1,528,364 | $1,392,301 |
| 05/23 | $1,371,797 | $1,290,122 |
| 06/23 | $1,366,710 | $1,281,297 |
| 07/23 | $1,466,190 | $1,353,884 |
| 08/23 | $1,324,318 | $1,244,749 |
| 09/23 | $1,279,101 | $1,222,071 |
| 10/23 | $1,229,361 | $1,185,347 |
| 11/23 | $1,230,491 | $1,199,267 |
| 12/23 | $1,192,679 | $1,184,229 |
| 01/24 | $1,052,498 | $1,064,090 |
| 02/24 | $1,156,779 | $1,178,946 |
| 03/24 | $1,144,812 | $1,176,173 |
| 04/24 | $1,187,550 | $1,200,551 |
| 05/24 | $1,163,047 | $1,188,949 |
| 06/24 | $1,104,354 | $1,145,629 |
| 07/24 | $1,104,923 | $1,152,909 |
| 08/24 | $1,099,225 | $1,130,775 |
| 09/24 | $1,353,374 | $1,391,692 |
| 10/24 | $1,292,971 | $1,353,124 |
Average Annual Total Returns for the Period Ended October 31, 2024 (%)
| AATR | 1 Year | 5 Years | 10 Years |
|---|
| Institutional Service Class | 5.17% | (0.68%) | 2.60% |
| MSCI China A (Onshore) Index (Net TR) | 14.15% | 2.80% | 3.07% |
THE FUND'S PAST PERFORMANCE IS NOT A GOOD PREDICTOR OF THE FUND'S FUTURE PERFORMANCE.
Fund performance data shown above does not reflect the deduction of taxes that a shareholder would pay on Fund distributions or redemption of Fund shares.
Key Fund Statistics as of October 31, 2024
| Total Net Assets | $19,502,737 |
| Total Number of Portfolio Holdings | 48 |
| Portfolio Turnover Rate | 61% |
| Total Advisory Fees Paid | $0 |
abrdn China A Share Equity Fund
(GOPSX)
Institutional Service Class
What did the Fund invest in?
The tables below show the investment makeup of the Fund as of October 31, 2024.
Sector Allocation (% of total net assets)
| Industrials | 26.3% |
| Financials | 17.3% |
| Consumer Discretionary | 16.3% |
| Consumer Staples | 16.3% |
| Health Care | 6.7% |
| Information Technology | 5.9% |
| Exchange-Traded Funds | 3.9% |
| Utilities | 2.0% |
| Materials | 1.9% |
| Other | 3.4% |
Ten Largest Holdings (% of total net assets)
| Kweichow Moutai Co. Ltd., Class A | 7.8% |
| Contemporary Amperex Technology Co. Ltd., Class A | 7.3% |
| Fuyao Glass Industry Group Co. Ltd., Class A | 4.7% |
| China Merchants Bank Co. Ltd., Class A | 4.7% |
| KraneShares Bosera MSCI China A 50 Connect Index ETF | 3.9% |
| Midea Group Co. Ltd., Class A | 3.7% |
| Proya Cosmetics Co. Ltd., Class A | 3.7% |
| Sungrow Power Supply Co. Ltd., Class A | 3.6% |
| BYD Co. Ltd., Class A | 3.5% |
| Inner Mongolia Yili Industrial Group Co. Ltd., Class A | 3.1% |
Availability of Additional Information
You can find additional information, including the Fund's prospectus, financial information, fund holdings, and proxy voting information at abrdn.com/us/literature or call 866-667-9231. The QR code can be used to access the Fund's prospectus, financial information and holdings.
abrdn China A Share Equity Fund
(GOPSX)
Institutional Service Class
abrdn Dynamic Dividend Fund
Annual Shareholder Report - October 31, 2024
This annual shareholder report contains important information about the abrdn Dynamic Dividend Fund (the "Fund") for the period of November 1, 2023 to October 31, 2024. You can find additional information about the Fund at abrdn.com/us/literature. You can also request this information by contacting us at 866-667-9231.
What were the Fund costs for the last year?
(based on a hypothetical $10,000 investment)
| Share Class | Costs of a $10,000 investment | Costs paid as a percentage of a $10,000 investment |
|---|
| A | $167 | 1.50% |
How did the fund perform last year and what affected its performance?
The following discussion compares the performance of the Fund to the MSCI All Country World Index (Net TR) to show how the Fund’s performance measures against the returns of similar investments for the reporting period.
What contributed to performance?
Top individual contributors included Broadcom, Fidelity National Information Services (FIS) and Blackstone. Broadcom shares rose after the successful VMware acquisition, which is expected to enhance earnings. Confidence in the company’s AI further supported performance. FIS reported good results, leading to earnings upgrades for 2024 and 2025. An improved balance sheet structure has allowed for a significant share buyback program, providing additional support to the shares. Blackstone’s gains were driven by accelerated capital deployment, improved sentiment in commercial real estate markets, and expectations of U.S. interest rate cuts, all of which should support distributable earnings growth going forward.
What detracted from performance?
The largest detractors included the Fund’s lack of exposure to semiconductor designer NVIDIA, holdings in South Korean chemicals company LG Chem and performance of German power producer RWE. Not holding NVIDIA negatively affected relative returns, as its shares performed strongly due to excitement surrounding artificial intelligence (AI). Our holding in LG Chem also detracted. The slowdown in electric vehicle (EV) sales outside of China was keenly felt by the EV battery division, and the recovery in petrochemical earnings was slower than expected due to prolonged inventory destocking. Additionally, RWE underperformed as falling European gas prices drove power prices lower.
abrdn Dynamic Dividend Fund
(ADAVX)
Total Return Based on $10,000 Investment
The following graph reflects a hypothetical $10,000 investment for the most recently completed 10 fiscal years as compared to a broad-based securities market index, which is also the performance benchmark.
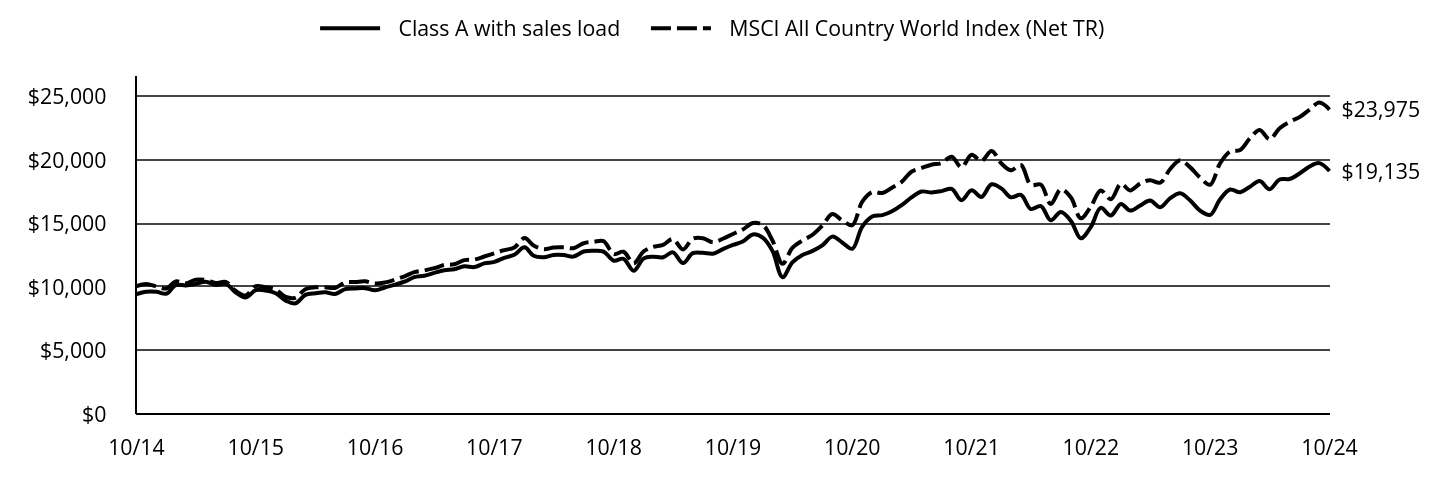
| Class A with sales load | MSCI All Country World Index (Net TR) |
|---|
| 10/14 | $9,433 | $10,070 |
| 11/14 | $9,629 | $10,239 |
| 12/14 | $9,627 | $10,041 |
| 01/15 | $9,475 | $9,884 |
| 02/15 | $10,149 | $10,435 |
| 03/15 | $10,122 | $10,273 |
| 04/15 | $10,246 | $10,571 |
| 05/15 | $10,421 | $10,557 |
| 06/15 | $10,164 | $10,309 |
| 07/15 | $10,239 | $10,398 |
| 08/15 | $9,568 | $9,685 |
| 09/15 | $9,178 | $9,334 |
| 10/15 | $9,748 | $10,067 |
| 11/15 | $9,720 | $9,984 |
| 12/15 | $9,508 | $9,804 |
| 01/16 | $8,925 | $9,213 |
| 02/16 | $8,711 | $9,149 |
| 03/16 | $9,377 | $9,827 |
| 04/16 | $9,510 | $9,972 |
| 05/16 | $9,589 | $9,985 |
| 06/16 | $9,451 | $9,924 |
| 07/16 | $9,832 | $10,352 |
| 08/16 | $9,885 | $10,387 |
| 09/16 | $9,910 | $10,451 |
| 10/16 | $9,742 | $10,273 |
| 11/16 | $9,963 | $10,351 |
| 12/16 | $10,186 | $10,575 |
| 01/17 | $10,438 | $10,864 |
| 02/17 | $10,776 | $11,169 |
| 03/17 | $10,888 | $11,305 |
| 04/17 | $11,115 | $11,482 |
| 05/17 | $11,314 | $11,735 |
| 06/17 | $11,399 | $11,789 |
| 07/17 | $11,629 | $12,118 |
| 08/17 | $11,568 | $12,164 |
| 09/17 | $11,859 | $12,399 |
| 10/17 | $11,975 | $12,657 |
| 11/17 | $12,298 | $12,902 |
| 12/17 | $12,534 | $13,110 |
| 01/18 | $13,130 | $13,850 |
| 02/18 | $12,466 | $13,268 |
| 03/18 | $12,343 | $12,984 |
| 04/18 | $12,523 | $13,108 |
| 05/18 | $12,520 | $13,124 |
| 06/18 | $12,396 | $13,053 |
| 07/18 | $12,794 | $13,447 |
| 08/18 | $12,855 | $13,552 |
| 09/18 | $12,790 | $13,611 |
| 10/18 | $12,069 | $12,591 |
| 11/18 | $12,223 | $12,776 |
| 12/18 | $11,275 | $11,876 |
| 01/19 | $12,255 | $12,813 |
| 02/19 | $12,380 | $13,156 |
| 03/19 | $12,344 | $13,322 |
| 04/19 | $12,727 | $13,771 |
| 05/19 | $11,883 | $12,955 |
| 06/19 | $12,661 | $13,803 |
| 07/19 | $12,690 | $13,843 |
| 08/19 | $12,624 | $13,515 |
| 09/19 | $12,983 | $13,799 |
| 10/19 | $13,312 | $14,177 |
| 11/19 | $13,576 | $14,523 |
| 12/19 | $14,142 | $15,034 |
| 01/20 | $13,867 | $14,868 |
| 02/20 | $12,845 | $13,667 |
| 03/20 | $10,773 | $11,822 |
| 04/20 | $11,931 | $13,089 |
| 05/20 | $12,517 | $13,658 |
| 06/20 | $12,824 | $14,094 |
| 07/20 | $13,271 | $14,840 |
| 08/20 | $13,966 | $15,748 |
| 09/20 | $13,508 | $15,240 |
| 10/20 | $13,008 | $14,870 |
| 11/20 | $14,739 | $16,703 |
| 12/20 | $15,554 | $17,478 |
| 01/21 | $15,657 | $17,399 |
| 02/21 | $15,939 | $17,802 |
| 03/21 | $16,440 | $18,277 |
| 04/21 | $17,050 | $19,076 |
| 05/21 | $17,519 | $19,373 |
| 06/21 | $17,443 | $19,628 |
| 07/21 | $17,549 | $19,764 |
| 08/21 | $17,730 | $20,258 |
| 09/21 | $16,840 | $19,422 |
| 10/21 | $17,614 | $20,413 |
| 11/21 | $17,088 | $19,921 |
| 12/21 | $18,089 | $20,718 |
| 01/22 | $17,746 | $19,701 |
| 02/22 | $17,063 | $19,192 |
| 03/22 | $17,248 | $19,608 |
| 04/22 | $16,140 | $18,038 |
| 05/22 | $16,368 | $18,059 |
| 06/22 | $15,255 | $16,537 |
| 07/22 | $15,910 | $17,692 |
| 08/22 | $15,205 | $17,040 |
| 09/22 | $13,835 | $15,409 |
| 10/22 | $14,736 | $16,339 |
| 11/22 | $16,229 | $17,606 |
| 12/22 | $15,633 | $16,913 |
| 01/23 | $16,543 | $18,126 |
| 02/23 | $16,019 | $17,606 |
| 03/23 | $16,420 | $18,149 |
| 04/23 | $16,819 | $18,410 |
| 05/23 | $16,288 | $18,213 |
| 06/23 | $16,975 | $19,270 |
| 07/23 | $17,380 | $19,976 |
| 08/23 | $16,804 | $19,418 |
| 09/23 | $16,014 | $18,615 |
| 10/23 | $15,680 | $18,055 |
| 11/23 | $16,884 | $19,721 |
| 12/23 | $17,675 | $20,669 |
| 01/24 | $17,461 | $20,790 |
| 02/24 | $17,880 | $21,682 |
| 03/24 | $18,344 | $22,363 |
| 04/24 | $17,703 | $21,625 |
| 05/24 | $18,467 | $22,503 |
| 06/24 | $18,506 | $23,004 |
| 07/24 | $18,934 | $23,375 |
| 08/24 | $19,495 | $23,969 |
| 09/24 | $19,754 | $24,526 |
| 10/24 | $19,135 | $23,975 |
Average Annual Total Returns for the Period Ended October 31, 2024 (%)
| AATR | 1 Year | 5 Years | 10 Years |
|---|
| Class A without sales load | 22.03% | 7.53% | 7.33% |
| Class A with sales load - 5.75% | 15.01% | 6.28% | 6.70% |
| MSCI All Country World Index (Net TR) | 32.79% | 11.08% | 9.06% |
THE FUND'S PAST PERFORMANCE IS NOT A GOOD PREDICTOR OF THE FUND'S FUTURE PERFORMANCE.
Fund performance data shown above does not reflect the deduction of taxes that a shareholder would pay on Fund distributions or redemption of Fund shares.
Key Fund Statistics as of October 31, 2024
| Total Net Assets | $97,498,755 |
| Total Number of Portfolio Holdings | 88 |
| Portfolio Turnover Rate | 75% |
| Total Advisory Fees Paid | $816,717 |
abrdn Dynamic Dividend Fund
(ADAVX)
What did the Fund invest in?
The tables below show the investment makeup of the Fund as of October 31, 2024.
Sector Allocation (% of total net assets)
| Information Technology | 21.4% |
| Financials | 18.0% |
| Health Care | 11.8% |
| Consumer Discretionary | 10.3% |
| Industrials | 8.3% |
| Consumer Staples | 8.1% |
| Utilities | 5.8% |
| Energy | 4.9% |
| Communication Services | 4.2% |
| Materials | 4.0% |
| Real Estate | 2.6% |
| Other | 0.6% |
Ten Largest Holdings (% of total net assets)
| Apple, Inc. | 4.0% |
| Microsoft Corp. | 3.6% |
| Broadcom, Inc. | 2.6% |
| Alphabet, Inc., Class C | 2.2% |
| Taiwan Semiconductor Manufacturing Co. Ltd. | 1.9% |
| Goldman Sachs Group, Inc. | 1.8% |
| JPMorgan Chase & Co. | 1.7% |
| AbbVie, Inc. | 1.6% |
| Cisco Systems, Inc. | 1.5% |
| Lowe's Cos., Inc. | 1.5% |
Availability of Additional Information
You can find additional information, including the Fund's prospectus, financial information, fund holdings, and proxy voting information at abrdn.com/us/literature or call 866-667-9231. The QR code can be used to access the Fund's prospectus, financial information and holdings.
abrdn Dynamic Dividend Fund
(ADAVX)
abrdn Dynamic Dividend Fund
Annual Shareholder Report - October 31, 2024
This annual shareholder report contains important information about the abrdn Dynamic Dividend Fund (the "Fund") for the period of November 1, 2023 to October 31, 2024. You can find additional information about the Fund at abrdn.com/us/literature. You can also request this information by contacting us at 866-667-9231.
What were the Fund costs for the last year?
(based on a hypothetical $10,000 investment)
| Share Class | Costs of a $10,000 investment | Costs paid as a percentage of a $10,000 investment |
|---|
| Institutional | $139 | 1.25% |
How did the fund perform last year and what affected its performance?
The following discussion compares the performance of the Fund to the MSCI All Country World Index (Net TR) to show how the Fund’s performance measures against the returns of similar investments for the reporting period.
What contributed to performance?
Top individual contributors included Broadcom, Fidelity National Information Services (FIS) and Blackstone. Broadcom shares rose after the successful VMware acquisition, which is expected to enhance earnings. Confidence in the company’s AI further supported performance. FIS reported good results, leading to earnings upgrades for 2024 and 2025. An improved balance sheet structure has allowed for a significant share buyback program, providing additional support to the shares. Blackstone’s gains were driven by accelerated capital deployment, improved sentiment in commercial real estate markets, and expectations of U.S. interest rate cuts, all of which should support distributable earnings growth going forward.
What detracted from performance?
The largest detractors included the Fund’s lack of exposure to semiconductor designer NVIDIA, holdings in South Korean chemicals company LG Chem and performance of German power producer RWE. Not holding NVIDIA negatively affected relative returns, as its shares performed strongly due to excitement surrounding artificial intelligence (AI). Our holding in LG Chem also detracted. The slowdown in electric vehicle (EV) sales outside of China was keenly felt by the EV battery division, and the recovery in petrochemical earnings was slower than expected due to prolonged inventory destocking. Additionally, RWE underperformed as falling European gas prices drove power prices lower.
abrdn Dynamic Dividend Fund
(ADVDX)
Total Return Based on $1,000,000 Investment
The following graph reflects a hypothetical $1,000,000 investment for the most recently completed 10 fiscal years as compared to a broad-based securities market index, which is also the performance benchmark.
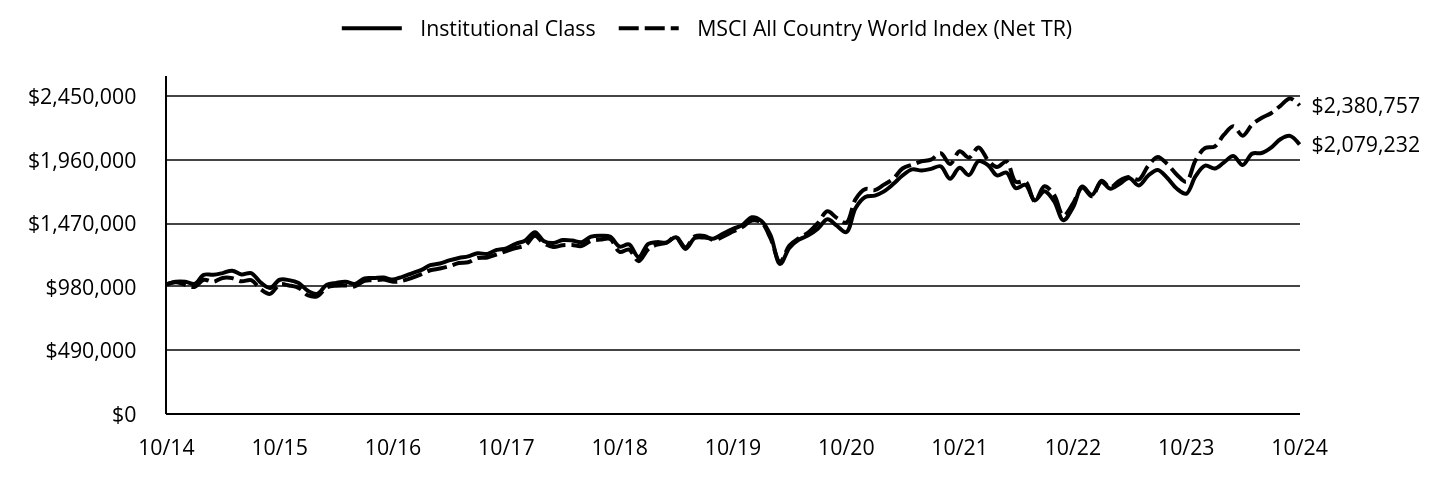
| Institutional Class | MSCI All Country World Index (Net TR) |
|---|
| 10/14 | $1,000,000 | $1,000,000 |
| 11/14 | $1,020,888 | $1,016,729 |
| 12/14 | $1,020,888 | $997,105 |
| 01/15 | $1,005,060 | $981,520 |
| 02/15 | $1,074,009 | $1,036,162 |
| 03/15 | $1,074,009 | $1,020,104 |
| 04/15 | $1,087,400 | $1,049,705 |
| 05/15 | $1,106,241 | $1,048,335 |
| 06/15 | $1,076,489 | $1,023,654 |
| 07/15 | $1,087,363 | $1,032,544 |
| 08/15 | $1,013,597 | $961,763 |
| 09/15 | $972,394 | $926,919 |
| 10/15 | $1,035,931 | $999,666 |
| 11/15 | $1,033,154 | $991,412 |
| 12/15 | $1,010,815 | $973,534 |
| 01/16 | $949,043 | $914,820 |
| 02/16 | $926,447 | $908,523 |
| 03/16 | $997,493 | $975,853 |
| 04/16 | $1,011,784 | $990,258 |
| 05/16 | $1,020,407 | $991,509 |
| 06/16 | $1,003,063 | $985,503 |
| 07/16 | $1,046,675 | $1,027,974 |
| 08/16 | $1,049,598 | $1,031,431 |
| 09/16 | $1,052,539 | $1,037,752 |
| 10/16 | $1,037,756 | $1,020,139 |
| 11/16 | $1,058,570 | $1,027,892 |
| 12/16 | $1,085,483 | $1,050,096 |
| 01/17 | $1,112,545 | $1,078,809 |
| 02/17 | $1,148,824 | $1,109,071 |
| 03/17 | $1,160,980 | $1,122,639 |
| 04/17 | $1,185,422 | $1,140,135 |
| 05/17 | $1,203,848 | $1,165,312 |
| 06/17 | $1,216,196 | $1,170,611 |
| 07/17 | $1,241,016 | $1,203,326 |
| 08/17 | $1,234,780 | $1,207,936 |
| 09/17 | $1,266,119 | $1,231,273 |
| 10/17 | $1,278,717 | $1,256,841 |
| 11/17 | $1,313,534 | $1,281,171 |
| 12/17 | $1,338,978 | $1,301,826 |
| 01/18 | $1,402,891 | $1,375,271 |
| 02/18 | $1,335,475 | $1,317,512 |
| 03/18 | $1,319,346 | $1,289,308 |
| 04/18 | $1,342,037 | $1,301,620 |
| 05/18 | $1,338,748 | $1,303,245 |
| 06/18 | $1,325,656 | $1,296,188 |
| 07/18 | $1,368,499 | $1,335,276 |
| 08/18 | $1,375,224 | $1,345,767 |
| 09/18 | $1,368,596 | $1,351,624 |
| 10/18 | $1,291,702 | $1,250,335 |
| 11/18 | $1,308,512 | $1,268,621 |
| 12/18 | $1,210,768 | $1,179,267 |
| 01/19 | $1,312,603 | $1,272,381 |
| 02/19 | $1,326,223 | $1,306,414 |
| 03/19 | $1,322,725 | $1,322,843 |
| 04/19 | $1,364,060 | $1,367,510 |
| 05/19 | $1,273,862 | $1,286,390 |
| 06/19 | $1,357,578 | $1,370,623 |
| 07/19 | $1,361,059 | $1,374,639 |
| 08/19 | $1,354,214 | $1,342,029 |
| 09/19 | $1,393,019 | $1,370,268 |
| 10/19 | $1,428,645 | $1,407,770 |
| 11/19 | $1,457,253 | $1,442,136 |
| 12/19 | $1,518,322 | $1,492,921 |
| 01/20 | $1,489,184 | $1,476,430 |
| 02/20 | $1,379,670 | $1,357,179 |
| 03/20 | $1,157,367 | $1,173,956 |
| 04/20 | $1,282,045 | $1,299,716 |
| 05/20 | $1,345,242 | $1,356,242 |
| 06/20 | $1,378,575 | $1,399,577 |
| 07/20 | $1,430,718 | $1,473,596 |
| 08/20 | $1,502,013 | $1,563,788 |
| 09/20 | $1,452,978 | $1,513,367 |
| 10/20 | $1,403,345 | $1,476,579 |
| 11/20 | $1,589,827 | $1,658,586 |
| 12/20 | $1,674,102 | $1,735,593 |
| 01/21 | $1,685,466 | $1,727,700 |
| 02/21 | $1,716,118 | $1,767,719 |
| 03/21 | $1,774,277 | $1,814,934 |
| 04/21 | $1,840,407 | $1,894,287 |
| 05/21 | $1,887,362 | $1,923,767 |
| 06/21 | $1,879,631 | $1,949,117 |
| 07/21 | $1,891,503 | $1,962,548 |
| 08/21 | $1,911,338 | $2,011,669 |
| 09/21 | $1,815,782 | $1,928,568 |
| 10/21 | $1,899,638 | $2,027,009 |
| 11/21 | $1,843,260 | $1,978,197 |
| 12/21 | $1,951,726 | $2,057,326 |
| 01/22 | $1,919,164 | $1,956,286 |
| 02/22 | $1,841,716 | $1,905,761 |
| 03/22 | $1,862,152 | $1,947,038 |
| 04/22 | $1,742,799 | $1,791,193 |
| 05/22 | $1,767,861 | $1,793,289 |
| 06/22 | $1,647,966 | $1,642,122 |
| 07/22 | $1,719,094 | $1,756,795 |
| 08/22 | $1,643,340 | $1,692,119 |
| 09/22 | $1,495,601 | $1,530,133 |
| 10/22 | $1,593,325 | $1,622,472 |
| 11/22 | $1,755,082 | $1,748,317 |
| 12/22 | $1,690,985 | $1,679,519 |
| 01/23 | $1,789,823 | $1,799,902 |
| 02/23 | $1,737,859 | $1,748,316 |
| 03/23 | $1,777,264 | $1,802,222 |
| 04/23 | $1,820,866 | $1,828,124 |
| 05/23 | $1,763,710 | $1,808,544 |
| 06/23 | $1,838,459 | $1,913,550 |
| 07/23 | $1,882,674 | $1,983,601 |
| 08/23 | $1,820,688 | $1,928,171 |
| 09/23 | $1,739,989 | $1,848,440 |
| 10/23 | $1,699,676 | $1,792,863 |
| 11/23 | $1,835,041 | $1,958,337 |
| 12/23 | $1,916,664 | $2,052,403 |
| 01/24 | $1,893,901 | $2,064,435 |
| 02/24 | $1,939,713 | $2,153,027 |
| 03/24 | $1,990,470 | $2,220,625 |
| 04/24 | $1,921,286 | $2,147,360 |
| 05/24 | $2,009,334 | $2,234,572 |
| 06/24 | $2,013,952 | $2,284,341 |
| 07/24 | $2,056,148 | $2,321,182 |
| 08/24 | $2,122,256 | $2,380,132 |
| 09/24 | $2,146,038 | $2,435,425 |
| 10/24 | $2,079,232 | $2,380,757 |
Average Annual Total Returns for the Period Ended October 31, 2024 (%)
| AATR | 1 Year | 5 Years | 10 Years |
|---|
| Institutional Class | 22.33% | 7.79% | 7.59% |
| MSCI All Country World Index (Net TR) | 32.79% | 11.08% | 9.06% |
THE FUND'S PAST PERFORMANCE IS NOT A GOOD PREDICTOR OF THE FUND'S FUTURE PERFORMANCE.
Fund performance data shown above does not reflect the deduction of taxes that a shareholder would pay on Fund distributions or redemption of Fund shares.
Key Fund Statistics as of October 31, 2024
| Total Net Assets | $97,498,755 |
| Total Number of Portfolio Holdings | 88 |
| Portfolio Turnover Rate | 75% |
| Total Advisory Fees Paid | $816,717 |
abrdn Dynamic Dividend Fund
(ADVDX)
What did the Fund invest in?
The tables below show the investment makeup of the Fund as of October 31, 2024.
Sector Allocation (% of total net assets)
| Information Technology | 21.4% |
| Financials | 18.0% |
| Health Care | 11.8% |
| Consumer Discretionary | 10.3% |
| Industrials | 8.3% |
| Consumer Staples | 8.1% |
| Utilities | 5.8% |
| Energy | 4.9% |
| Communication Services | 4.2% |
| Materials | 4.0% |
| Real Estate | 2.6% |
| Other | 0.6% |
Ten Largest Holdings (% of total net assets)
| Apple, Inc. | 4.0% |
| Microsoft Corp. | 3.6% |
| Broadcom, Inc. | 2.6% |
| Alphabet, Inc., Class C | 2.2% |
| Taiwan Semiconductor Manufacturing Co. Ltd. | 1.9% |
| Goldman Sachs Group, Inc. | 1.8% |
| JPMorgan Chase & Co. | 1.7% |
| AbbVie, Inc. | 1.6% |
| Cisco Systems, Inc. | 1.5% |
| Lowe's Cos., Inc. | 1.5% |
Availability of Additional Information
You can find additional information, including the Fund's prospectus, financial information, fund holdings, and proxy voting information at abrdn.com/us/literature or call 866-667-9231. The QR code can be used to access the Fund's prospectus, financial information and holdings.
abrdn Dynamic Dividend Fund
(ADVDX)
abrdn EM SMA Completion Fund
Annual Shareholder Report - October 31, 2024
This annual shareholder report contains important information about the abrdn EM SMA Completion Fund (the "Fund") for the period of November 1, 2023 to October 31, 2024. You can find additional information about the Fund at abrdn.com/us/literature. You can also request this information by contacting us at 866-667-9231.
What were the Fund costs for the last year?
(based on a hypothetical $10,000 investment)
| Share Class | Costs of a $10,000 investment | Costs paid as a percentage of a $10,000 investment |
|---|
| Institutional | $0 | 0.00% |
How did the fund perform last year and what affected its performance?
The following discussion compares the performance of the Fund to the MSCI Emerging Markets Index (Net TR) (the “Index”) to show how the Fund’s performance measures against the returns of similar investments for the reporting period. The Fund is a “completion fund,” meaning that it is intended to be used as part of a broader investment program by certain separately managed account clients.
What contributed to performance? Taiwanese electronic test equipment maker Chroma ATE was the top stock contributor, benefitting from increased demand for system level testers due to the rising complexity of semiconductor chips. The company reported strong results and projected continued demand for semiconductor equipment tests into the fourth quarter and 2025. In South Korea, HD Korea Shipbuilding & Offshore Engineering outperformed on good results and improving order flows that included large containers, and favourable new vessel pricing. Finally, while Chinese equities dragged performance over the review period, China’s wide-ranging stimulus measures in September 2024 led to investors rotating from value names into growth and quality. Battery maker Contemporary Amperex Technology rallied as a result.
What detracted from performance? Non-exposure to Taiwanese chip maker Taiwan Semiconductor Manufacturing Co was the largest detractor. The company executed consistently well and reported strong results that exceeded market expectations. It also benefited from the broadening of the artificial intelligence (AI)-led tech sector rally beyond the US earlier in 2024. The tech rally subsequently faded in the final three months of the reporting period on global macro uncertainties and a September rotation into Chinese equities following the stimulus announcements.South Korea’s Samsung Electronics’ preferred shares lagged on uncertainty around its high bandwidth memory (HBM) product, designed to service high-end tech around AI. Within Latin America, pharmacy retailer Raia Drogasil underperformed, mostly driven by revisions in short-term earnings expectations. These consumer names also lagged likely due to changing views towards the interest rate environment.
abrdn EM SMA Completion Fund
(ASEMX)
Total Return Based on $1,000,000 Investment
The following graph reflects a hypothetical $1,000,000 investment for the life of the Fund as compared to a broad-based securities market index, which is also the performance benchmark.
| Institutional Class | MSCI Emerging Markets Index (Net TR) |
|---|
| 01/27/23 | $1,000,000 | $1,000,000 |
| 01/31/23 | $978,000 | $1,232,752 |
| 02/28/23 | $903,000 | $1,152,818 |
| 03/31/23 | $932,000 | $1,187,733 |
| 04/30/23 | $920,000 | $1,174,273 |
| 05/31/23 | $881,000 | $1,154,550 |
| 06/30/23 | $903,000 | $1,198,388 |
| 07/31/23 | $944,000 | $1,272,989 |
| 08/31/23 | $876,000 | $1,194,573 |
| 09/30/23 | $849,000 | $1,163,322 |
| 10/31/23 | $812,000 | $1,118,131 |
| 11/30/23 | $893,000 | $1,207,615 |
| 12/31/23 | $941,188 | $1,254,826 |
| 01/31/24 | $860,313 | $1,196,560 |
| 02/29/24 | $904,794 | $1,253,483 |
| 03/31/24 | $913,893 | $1,284,544 |
| 04/30/24 | $877,499 | $1,290,291 |
| 05/31/24 | $860,313 | $1,297,579 |
| 06/30/24 | $881,542 | $1,348,760 |
| 07/31/24 | $910,860 | $1,352,774 |
| 08/31/24 | $893,674 | $1,374,615 |
| 09/30/24 | $925,013 | $1,466,405 |
| 10/31/24 | $870,422 | $1,401,190 |
Average Annual Total Returns for the Period Ended October 31, 2024 (%)
| AATR | 1 Year | Since Inception 1/27/23 |
|---|
| Institutional Class | 7.19% | (7.58%) |
| MSCI Emerging Markets Index (Net TR) | 25.32% | 7.59% |
THE FUND'S PAST PERFORMANCE IS NOT A GOOD PREDICTOR OF THE FUND'S FUTURE PERFORMANCE.
Fund performance data shown above does not reflect the deduction of taxes that a shareholder would pay on Fund distributions or redemption of Fund shares.
Key Fund Statistics as of October 31, 2024
| Total Net Assets | $341,440 |
| Total Number of Portfolio Holdings | 32 |
| Portfolio Turnover Rate | 47% |
| Total Advisory Fees Paid | $0 |
abrdn EM SMA Completion Fund
(ASEMX)
What did the Fund invest in?
The tables below show the investment makeup of the Fund as of October 31, 2024.
Geographic Allocation (% of total net assets)
| South Korea | 22.5% | |
| China | 19.5% | |
| India | 18.1% | |
| Taiwan | 11.2% | |
| Saudi Arabia | 7.4% | |
| Brazil | 6.5% | |
| United Arab Emirates | 5.2% | |
| Mexico | 3.3% | |
| Indonesia | 2.4% | |
| Poland | 2.0% | |
| Other | 1.9% | |
Ten Largest Holdings (% of total net assets)
| Samsung Electronics Co. Ltd. | 11.9% |
| UltraTech Cement Ltd. | 5.1% |
| Al Rajhi Bank | 4.9% |
| SK Hynix, Inc. | 4.6% |
| Contemporary Amperex Technology Co. Ltd., Class A | 4.5% |
| Mahindra & Mahindra Ltd. | 4.5% |
| Larsen & Toubro Ltd. | 4.5% |
| ITC Ltd. | 4.0% |
| Accton Technology Corp. | 3.6% |
| MediaTek, Inc. | 3.3% |
Availability of Additional Information
You can find additional information, including the Fund's prospectus, financial information, fund holdings, and proxy voting information at abrdn.com/us/literature or call 866-667-9231. The QR code can be used to access the Fund's prospectus, financial information and holdings.
abrdn EM SMA Completion Fund
(ASEMX)
abrdn Emerging Markets ex-China Fund
Annual Shareholder Report - October 31, 2024
This annual shareholder report contains important information about the abrdn Emerging Markets ex-China Fund (the "Fund") for the period of November 1, 2023 to October 31, 2024. You can find additional information about the Fund at abrdn.com/us/literature. You can also request this information by contacting us at 866-667-9231.
This report describes material changes to the Fund that occurred during the reporting period.
What were the Fund costs for the last year?
(based on a hypothetical $10,000 investment)
| Share Class | Costs of a $10,000 investment | Costs paid as a percentage of a $10,000 investment |
|---|
| A | $152 | 1.38% |
How did the fund perform last year and what affected its performance?
The following discussion compares the performance of the Fund to the MSCI Emerging Markets ex-China Index (Net TR) (the “Index”) to show how the Fund’s performance measures against the returns of similar investments for the reporting period.
What contributed to performance?
Taiwanese electronic test equipment maker Chroma ATE was the top stock contributor, benefitting from increased demand for system level testers due to the rising complexity of semiconductor chips. The company reported strong results and guidance for continued demand for semiconductor equipment tests into the fourth quarter and 2025. Israeli semiconductor equipment provider Nova was buoyed by solid results on sustained demand for its leading-edge metrology equipment. The Fund has since sold the stock due to geopolitical risks and as its valuation had become quite full. HD Korea Shipbuilding & Offshore Engineering outperformed on good earnings results and improving order flows that includes large containers, and favourable new vessel pricing. Power Grid Corporation of India was also a top contributor, with solid fundamentals, earnings visibility, and a robust pipeline of projects.
What detracted from performance?
From a stock perspective, Brazilian car rental company Localiza and pharmacy retailer Raia Drogasil were the top detractors. Their share prices corrected due to revisions in short-term earnings expectations and were impacted by changing market sentiment towards the interest rate environment. In Taiwan, we sold Hon Hai Precision Industry early into the fiscal year on concerns around near-term softness in Apple sales and a weakening outlook for electric vehicles. Hon Hai shares, however, re-rated later in the period, which cost us performance. Not holding SK Hynix earlier in the period was costly as its share price jumped on the back of growing demand for high-performance memory chips. The Fund’s core memory position in Samsung Electronics’ preferred shares lagged behind technology peers because of the uncertainty around its high bandwidth memory (HBM) product.
abrdn Emerging Markets ex-China Fund
(GLLAX)
Total Return Based on $10,000 Investment
The following graph reflects a hypothetical $10,000 investment for the most recently completed 10 fiscal years as compared to a broad-based securities market index, which is also the performance benchmark.
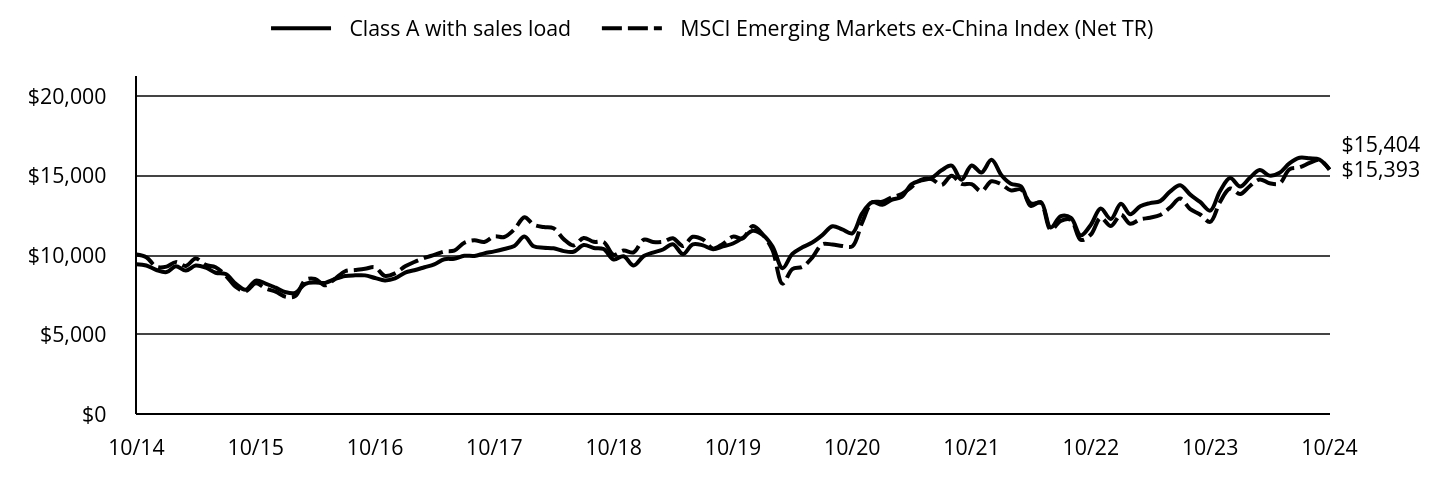
| Class A with sales load | MSCI Emerging Markets ex-China Index (Net TR) |
|---|
| 10/14 | $9,427 | $10,043 |
| 11/14 | $9,352 | $9,872 |
| 12/14 | $9,072 | $9,271 |
| 01/15 | $8,942 | $9,283 |
| 02/15 | $9,304 | $9,567 |
| 03/15 | $9,032 | $9,326 |
| 04/15 | $9,353 | $9,791 |
| 05/15 | $9,217 | $9,389 |
| 06/15 | $8,899 | $9,243 |
| 07/15 | $8,816 | $8,719 |
| 08/15 | $8,194 | $8,003 |
| 09/15 | $7,823 | $7,736 |
| 10/15 | $8,404 | $8,242 |
| 11/15 | $8,217 | $7,907 |
| 12/15 | $7,956 | $7,705 |
| 01/16 | $7,671 | $7,379 |
| 02/16 | $7,630 | $7,424 |
| 03/16 | $8,198 | $8,438 |
| 04/16 | $8,282 | $8,503 |
| 05/16 | $8,261 | $8,108 |
| 06/16 | $8,504 | $8,519 |
| 07/16 | $8,691 | $8,993 |
| 08/16 | $8,733 | $9,067 |
| 09/16 | $8,733 | $9,143 |
| 10/16 | $8,566 | $9,238 |
| 11/16 | $8,413 | $8,699 |
| 12/16 | $8,539 | $8,862 |
| 01/17 | $8,909 | $9,304 |
| 02/17 | $9,056 | $9,573 |
| 03/17 | $9,244 | $9,828 |
| 04/17 | $9,426 | $10,026 |
| 05/17 | $9,747 | $10,236 |
| 06/17 | $9,782 | $10,289 |
| 07/17 | $9,964 | $10,786 |
| 08/17 | $9,957 | $10,941 |
| 09/17 | $10,118 | $10,833 |
| 10/17 | $10,244 | $11,192 |
| 11/17 | $10,397 | $11,150 |
| 12/17 | $10,589 | $11,631 |
| 01/18 | $11,177 | $12,396 |
| 02/18 | $10,567 | $11,923 |
| 03/18 | $10,475 | $11,776 |
| 04/18 | $10,437 | $11,703 |
| 05/18 | $10,261 | $11,017 |
| 06/18 | $10,223 | $10,617 |
| 07/18 | $10,643 | $11,092 |
| 08/18 | $10,460 | $10,847 |
| 09/18 | $10,391 | $10,833 |
| 10/18 | $9,734 | $10,024 |
| 11/18 | $9,941 | $10,299 |
| 12/18 | $9,353 | $10,185 |
| 01/19 | $9,954 | $10,976 |
| 02/19 | $10,171 | $10,841 |
| 03/19 | $10,363 | $10,848 |
| 04/19 | $10,697 | $11,070 |
| 05/19 | $10,071 | $10,586 |
| 06/19 | $10,689 | $11,162 |
| 07/19 | $10,622 | $10,990 |
| 08/19 | $10,380 | $10,419 |
| 09/19 | $10,555 | $10,715 |
| 10/19 | $10,739 | $11,176 |
| 11/19 | $11,098 | $11,062 |
| 12/19 | $11,539 | $11,838 |
| 01/20 | $11,264 | $11,294 |
| 02/20 | $10,557 | $10,333 |
| 03/20 | $9,187 | $8,212 |
| 04/20 | $10,083 | $9,125 |
| 05/20 | $10,505 | $9,270 |
| 06/20 | $10,798 | $9,849 |
| 07/20 | $11,264 | $10,695 |
| 08/20 | $11,824 | $10,672 |
| 09/20 | $11,626 | $10,589 |
| 10/20 | $11,384 | $10,561 |
| 11/20 | $12,634 | $12,059 |
| 12/20 | $13,341 | $13,323 |
| 01/21 | $13,177 | $13,372 |
| 02/21 | $13,487 | $13,636 |
| 03/21 | $13,677 | $13,860 |
| 04/21 | $14,469 | $14,298 |
| 05/21 | $14,719 | $14,764 |
| 06/21 | $14,866 | $14,797 |
| 07/21 | $15,349 | $14,432 |
| 08/21 | $15,642 | $15,010 |
| 09/21 | $14,754 | $14,496 |
| 10/21 | $15,659 | $14,477 |
| 11/21 | $15,211 | $14,033 |
| 12/21 | $16,011 | $14,660 |
| 01/22 | $15,019 | $14,457 |
| 02/22 | $14,499 | $14,087 |
| 03/22 | $14,344 | $14,146 |
| 04/22 | $13,102 | $13,269 |
| 05/22 | $13,352 | $13,285 |
| 06/22 | $11,743 | $11,611 |
| 07/22 | $12,466 | $12,169 |
| 08/22 | $12,360 | $12,231 |
| 09/22 | $11,252 | $10,963 |
| 10/22 | $11,926 | $11,307 |
| 11/22 | $12,938 | $12,365 |
| 12/22 | $12,287 | $11,837 |
| 01/23 | $13,247 | $12,552 |
| 02/23 | $12,586 | $11,984 |
| 03/23 | $13,085 | $12,263 |
| 04/23 | $13,284 | $12,363 |
| 05/23 | $13,409 | $12,537 |
| 06/23 | $14,007 | $13,004 |
| 07/23 | $14,406 | $13,568 |
| 08/23 | $13,820 | $12,900 |
| 09/23 | $13,359 | $12,571 |
| 10/23 | $12,811 | $12,102 |
| 11/23 | $14,032 | $13,354 |
| 12/23 | $14,866 | $14,208 |
| 01/24 | $14,327 | $13,855 |
| 02/24 | $14,866 | $14,347 |
| 03/24 | $15,367 | $14,778 |
| 04/24 | $15,016 | $14,539 |
| 05/24 | $15,191 | $14,524 |
| 06/24 | $15,793 | $15,405 |
| 07/24 | $16,143 | $15,534 |
| 08/24 | $16,106 | $15,816 |
| 09/24 | $16,030 | $16,015 |
| 10/24 | $15,404 | $15,393 |
Average Annual Total Returns for the Period Ended October 31, 2024 (%)
| AATR | 1 Year | 5 Years | 10 Years |
|---|
| Class A without sales load | 20.25% | 7.48% | 5.03% |
| Class A with sales load - 5.75% | 13.30% | 6.22% | 4.42% |
| MSCI Emerging Markets ex-China Index (Net TR) | 27.19% | 6.61% | 4.36% |
THE FUND'S PAST PERFORMANCE IS NOT A GOOD PREDICTOR OF THE FUND'S FUTURE PERFORMANCE.
Fund performance data shown above does not reflect the deduction of taxes that a shareholder would pay on Fund distributions or redemption of Fund shares.
Key Fund Statistics as of October 31, 2024
| Total Net Assets | $161,812,599 |
| Total Number of Portfolio Holdings | 73 |
| Portfolio Turnover Rate | 35% |
| Total Advisory Fees Paid | $364,926 |
abrdn Emerging Markets ex-China Fund
(GLLAX)
What did the Fund invest in?
The tables below show the investment makeup of the Fund as of October 31, 2024.
Geographic Allocation (% of total net assets)
| India | 25.2% | |
| Taiwan | 23.7% | |
| South Korea | 13.8% | |
| Brazil | 7.9% | |
| Saudi Arabia | 6.7% | |
| Mexico | 5.0% | |
| United Arab Emirates | 3.5% | |
| Indonesia | 3.2% | |
| Kazakhstan | 3.1% | |
| United States | 2.4% | |
| Other | 5.5% | |
Ten Largest Holdings (% of total net assets)
| Taiwan Semiconductor Manufacturing Co. Ltd. | 14.5% |
| Samsung Electronics Co. Ltd. | 5.0% |
| ICICI Bank Ltd. | 2.9% |
| Chroma ATE, Inc. | 2.8% |
| Power Grid Corp. of India Ltd. | 2.3% |
| ITC Ltd. | 2.3% |
| Al Rajhi Bank | 2.2% |
| Kaspi.KZ JSC | 2.0% |
| SBI Life Insurance Co. Ltd. | 2.0% |
| Shinhan Financial Group Co. Ltd. | 2.0% |
Below is a summary of certain changes for the Fund since November 1, 2023. For more information, you may refer to the Fund's next prospectus, which we expect to be available by February 28, 2025 at abrdn.com/us/literature or upon request at 866-667-9231.
Effective February 29, 2024, the Fund's management fee changed from 0.90% on assets up to $500 million, 0.85% on assets of $500 million up to $2 billion and 0.80% on assets of $2 billion and more, to 0.80% on assets up to $500 million, 0.75% on assets of $500 million up to $2 billion and 0.70% on assets of $2 billion and more. The Fund's expense limitation changed from 1.10% to 0.99% for all share classes of the Fund.
Availability of Additional Information
You can find additional information, including the Fund's prospectus, financial information, fund holdings, and proxy voting information at abrdn.com/us/literature or call 866-667-9231. The QR code can be used to access the Fund's prospectus, financial information and holdings.
abrdn Emerging Markets ex-China Fund
(GLLAX)
abrdn Emerging Markets ex-China Fund
Annual Shareholder Report - October 31, 2024
This annual shareholder report contains important information about the abrdn Emerging Markets ex-China Fund (the "Fund") for the period of November 1, 2023 to October 31, 2024. You can find additional information about the Fund at abrdn.com/us/literature. You can also request this information by contacting us at 866-667-9231.
This report describes material changes to the Fund that occurred during the reporting period.
What were the Fund costs for the last year?
(based on a hypothetical $10,000 investment)
| Share Class | Costs of a $10,000 investment | Costs paid as a percentage of a $10,000 investment |
|---|
| C | $221 | 2.01% |
How did the fund perform last year and what affected its performance?
The following discussion compares the performance of the Fund to the MSCI Emerging Markets ex-China Index (Net TR) (the “Index”) to show how the Fund’s performance measures against the returns of similar investments for the reporting period.
What contributed to performance?
Taiwanese electronic test equipment maker Chroma ATE was the top stock contributor, benefitting from increased demand for system level testers due to the rising complexity of semiconductor chips. The company reported strong results and guidance for continued demand for semiconductor equipment tests into the fourth quarter and 2025. Israeli semiconductor equipment provider Nova was buoyed by solid results on sustained demand for its leading-edge metrology equipment. The Fund has since sold the stock due to geopolitical risks and as its valuation had become quite full. HD Korea Shipbuilding & Offshore Engineering outperformed on good earnings results and improving order flows that includes large containers, and favourable new vessel pricing. Power Grid Corporation of India was also a top contributor, with solid fundamentals, earnings visibility, and a robust pipeline of projects.
What detracted from performance?
From a stock perspective, Brazilian car rental company Localiza and pharmacy retailer Raia Drogasil were the top detractors. Their share prices corrected due to revisions in short-term earnings expectations and were impacted by changing market sentiment towards the interest rate environment. In Taiwan, we sold Hon Hai Precision Industry early into the fiscal year on concerns around near-term softness in Apple sales and a weakening outlook for electric vehicles. Hon Hai shares, however, re-rated later in the period, which cost us performance. Not holding SK Hynix earlier in the period was costly as its share price jumped on the back of growing demand for high-performance memory chips. The Fund’s core memory position in Samsung Electronics’ preferred shares lagged behind technology peers because of the uncertainty around its high bandwidth memory (HBM) product.
abrdn Emerging Markets ex-China Fund
(GLLCX)
Total Return Based on $10,000 Investment
The following graph reflects a hypothetical $10,000 investment for the most recently completed 10 fiscal years as compared to a broad-based securities market index, which is also the performance benchmark.
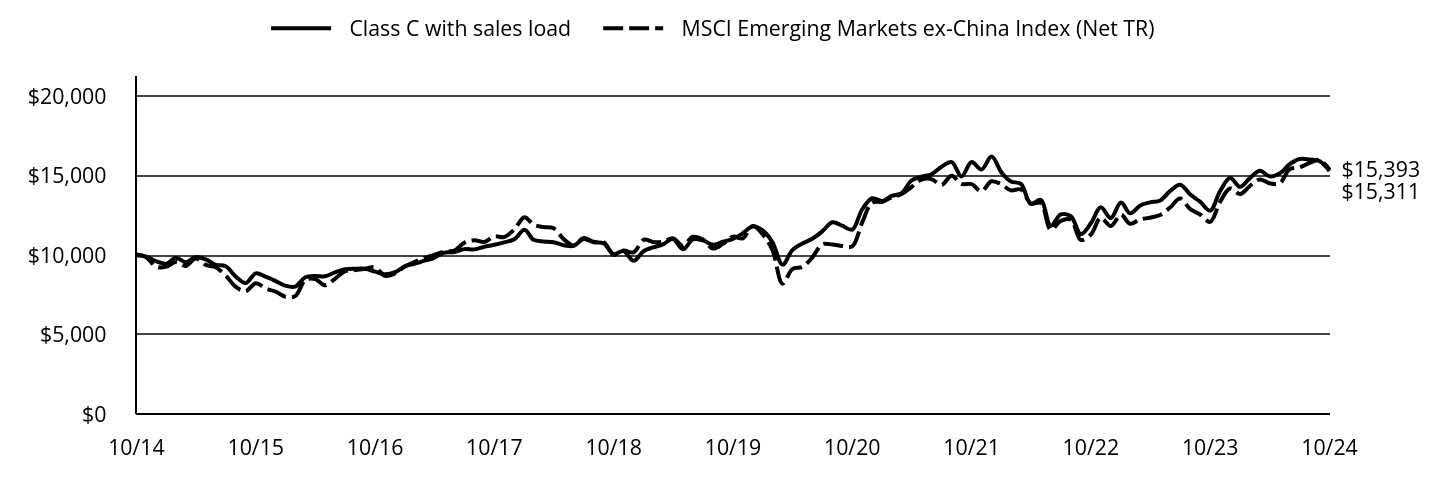
| Class C with sales load | MSCI Emerging Markets ex-China Index (Net TR) |
|---|
| 10/14 | $10,000 | $10,043 |
| 11/14 | $9,916 | $9,872 |
| 12/14 | $9,610 | $9,271 |
| 01/15 | $9,473 | $9,283 |
| 02/15 | $9,846 | $9,567 |
| 03/15 | $9,557 | $9,326 |
| 04/15 | $9,892 | $9,791 |
| 05/15 | $9,739 | $9,389 |
| 06/15 | $9,400 | $9,243 |
| 07/15 | $9,307 | $8,719 |
| 08/15 | $8,646 | $8,003 |
| 09/15 | $8,249 | $7,736 |
| 10/15 | $8,857 | $8,242 |
| 11/15 | $8,649 | $7,907 |
| 12/15 | $8,374 | $7,705 |
| 01/16 | $8,074 | $7,379 |
| 02/16 | $8,027 | $7,424 |
| 03/16 | $8,612 | $8,438 |
| 04/16 | $8,697 | $8,503 |
| 05/16 | $8,674 | $8,108 |
| 06/16 | $8,920 | $8,519 |
| 07/16 | $9,113 | $8,993 |
| 08/16 | $9,151 | $9,067 |
| 09/16 | $9,151 | $9,143 |
| 10/16 | $8,966 | $9,238 |
| 11/16 | $8,805 | $8,699 |
| 12/16 | $8,932 | $8,862 |
| 01/17 | $9,319 | $9,304 |
| 02/17 | $9,458 | $9,573 |
| 03/17 | $9,659 | $9,828 |
| 04/17 | $9,837 | $10,026 |
| 05/17 | $10,169 | $10,236 |
| 06/17 | $10,200 | $10,289 |
| 07/17 | $10,386 | $10,786 |
| 08/17 | $10,370 | $10,941 |
| 09/17 | $10,533 | $10,833 |
| 10/17 | $10,657 | $11,192 |
| 11/17 | $10,811 | $11,150 |
| 12/17 | $11,004 | $11,631 |
| 01/18 | $11,611 | $12,396 |
| 02/18 | $10,970 | $11,923 |
| 03/18 | $10,869 | $11,776 |
| 04/18 | $10,818 | $11,703 |
| 05/18 | $10,632 | $11,017 |
| 06/18 | $10,590 | $10,617 |
| 07/18 | $11,021 | $11,092 |
| 08/18 | $10,818 | $10,847 |
| 09/18 | $10,751 | $10,833 |
| 10/18 | $10,067 | $10,024 |
| 11/18 | $10,270 | $10,299 |
| 12/18 | $9,654 | $10,185 |
| 01/19 | $10,271 | $10,976 |
| 02/19 | $10,492 | $10,841 |
| 03/19 | $10,685 | $10,848 |
| 04/19 | $11,026 | $11,070 |
| 05/19 | $10,372 | $10,586 |
| 06/19 | $10,999 | $11,162 |
| 07/19 | $10,934 | $10,990 |
| 08/19 | $10,667 | $10,419 |
| 09/19 | $10,851 | $10,715 |
| 10/19 | $11,035 | $11,176 |
| 11/19 | $11,385 | $11,062 |
| 12/19 | $11,832 | $11,838 |
| 01/20 | $11,548 | $11,294 |
| 02/20 | $10,819 | $10,333 |
| 03/20 | $9,409 | $8,212 |
| 04/20 | $10,327 | $9,125 |
| 05/20 | $10,743 | $9,270 |
| 06/20 | $11,037 | $9,849 |
| 07/20 | $11,510 | $10,695 |
| 08/20 | $12,078 | $10,672 |
| 09/20 | $11,860 | $10,589 |
| 10/20 | $11,614 | $10,561 |
| 11/20 | $12,882 | $12,059 |
| 12/20 | $13,592 | $13,323 |
| 01/21 | $13,422 | $13,372 |
| 02/21 | $13,734 | $13,636 |
| 03/21 | $13,914 | $13,860 |
| 04/21 | $14,709 | $14,298 |
| 05/21 | $14,955 | $14,764 |
| 06/21 | $15,097 | $14,797 |
| 07/21 | $15,571 | $14,432 |
| 08/21 | $15,864 | $15,010 |
| 09/21 | $14,965 | $14,496 |
| 10/21 | $15,874 | $14,477 |
| 11/21 | $15,400 | $14,033 |
| 12/21 | $16,214 | $14,660 |
| 01/22 | $15,198 | $14,457 |
| 02/22 | $14,653 | $14,087 |
| 03/22 | $14,493 | $14,146 |
| 04/22 | $13,243 | $13,269 |
| 05/22 | $13,488 | $13,285 |
| 06/22 | $11,853 | $11,611 |
| 07/22 | $12,569 | $12,169 |
| 08/22 | $12,452 | $12,231 |
| 09/22 | $11,329 | $10,963 |
| 10/22 | $12,013 | $11,307 |
| 11/22 | $13,018 | $12,365 |
| 12/22 | $12,345 | $11,837 |
| 01/23 | $13,320 | $12,552 |
| 02/23 | $12,642 | $11,984 |
| 03/23 | $13,136 | $12,263 |
| 04/23 | $13,334 | $12,363 |
| 05/23 | $13,447 | $12,537 |
| 06/23 | $14,040 | $13,004 |
| 07/23 | $14,436 | $13,568 |
| 08/23 | $13,828 | $12,900 |
| 09/23 | $13,376 | $12,571 |
| 10/23 | $12,811 | $12,102 |
| 11/23 | $14,026 | $13,354 |
| 12/23 | $14,859 | $14,208 |
| 01/24 | $14,308 | $13,855 |
| 02/24 | $14,845 | $14,347 |
| 03/24 | $15,325 | $14,778 |
| 04/24 | $14,972 | $14,539 |
| 05/24 | $15,142 | $14,524 |
| 06/24 | $15,721 | $15,405 |
| 07/24 | $16,060 | $15,534 |
| 08/24 | $16,032 | $15,816 |
| 09/24 | $15,933 | $16,015 |
| 10/24 | $15,311 | $15,393 |
Average Annual Total Returns for the Period Ended October 31, 2024 (%)
| AATR | 1 Year | 5 Years | 10 Years |
|---|
| Class C without sales load | 19.51% | 6.77% | 4.35% |
| Class C with sales load - 1.00% | 18.51% | 6.77% | 4.35% |
| MSCI Emerging Markets ex-China Index (Net TR) | 27.19% | 6.61% | 4.36% |
THE FUND'S PAST PERFORMANCE IS NOT A GOOD PREDICTOR OF THE FUND'S FUTURE PERFORMANCE.
Fund performance data shown above does not reflect the deduction of taxes that a shareholder would pay on Fund distributions or redemption of Fund shares.
Key Fund Statistics as of October 31, 2024
| Total Net Assets | $161,812,599 |
| Total Number of Portfolio Holdings | 73 |
| Portfolio Turnover Rate | 35% |
| Total Advisory Fees Paid | $364,926 |
abrdn Emerging Markets ex-China Fund
(GLLCX)
What did the Fund invest in?
The tables below show the investment makeup of the Fund as of October 31, 2024.
Geographic Allocation (% of total net assets)
| India | 25.2% | |
| Taiwan | 23.7% | |
| South Korea | 13.8% | |
| Brazil | 7.9% | |
| Saudi Arabia | 6.7% | |
| Mexico | 5.0% | |
| United Arab Emirates | 3.5% | |
| Indonesia | 3.2% | |
| Kazakhstan | 3.1% | |
| United States | 2.4% | |
| Other | 5.5% | |
Ten Largest Holdings (% of total net assets)
| Taiwan Semiconductor Manufacturing Co. Ltd. | 14.5% |
| Samsung Electronics Co. Ltd. | 5.0% |
| ICICI Bank Ltd. | 2.9% |
| Chroma ATE, Inc. | 2.8% |
| Power Grid Corp. of India Ltd. | 2.3% |
| ITC Ltd. | 2.3% |
| Al Rajhi Bank | 2.2% |
| Kaspi.KZ JSC | 2.0% |
| SBI Life Insurance Co. Ltd. | 2.0% |
| Shinhan Financial Group Co. Ltd. | 2.0% |
Below is a summary of certain changes for the Fund since November 1, 2023. For more information, you may refer to the Fund's next prospectus, which we expect to be available by February 28, 2025 at abrdn.com/us/literature or upon request at 866-667-9231.
Effective February 29, 2024, the Fund's management fee changed from 0.90% on assets up to $500 million, 0.85% on assets of $500 million up to $2 billion and 0.80% on assets of $2 billion and more, to 0.80% on assets up to $500 million, 0.75% on assets of $500 million up to $2 billion and 0.70% on assets of $2 billion and more. The Fund's expense limitation changed from 1.10% to 0.99% for all share classes of the Fund.
Availability of Additional Information
You can find additional information, including the Fund's prospectus, financial information, fund holdings, and proxy voting information at abrdn.com/us/literature or call 866-667-9231. The QR code can be used to access the Fund's prospectus, financial information and holdings.
abrdn Emerging Markets ex-China Fund
(GLLCX)
abrdn Emerging Markets ex-China Fund
Annual Shareholder Report - October 31, 2024
This annual shareholder report contains important information about the abrdn Emerging Markets ex-China Fund (the "Fund") for the period of November 1, 2023 to October 31, 2024. You can find additional information about the Fund at abrdn.com/us/literature. You can also request this information by contacting us at 866-667-9231.
This report describes material changes to the Fund that occurred during the reporting period.
What were the Fund costs for the last year?
(based on a hypothetical $10,000 investment)
| Share Class | Costs of a $10,000 investment | Costs paid as a percentage of a $10,000 investment |
|---|
| R | $180 | 1.64% |
How did the fund perform last year and what affected its performance?
The following discussion compares the performance of the Fund to the MSCI Emerging Markets ex-China Index (Net TR) (the “Index”) to show how the Fund’s performance measures against the returns of similar investments for the reporting period.
What contributed to performance?
Taiwanese electronic test equipment maker Chroma ATE was the top stock contributor, benefitting from increased demand for system level testers due to the rising complexity of semiconductor chips. The company reported strong results and guidance for continued demand for semiconductor equipment tests into the fourth quarter and 2025. Israeli semiconductor equipment provider Nova was buoyed by solid results on sustained demand for its leading-edge metrology equipment. The Fund has since sold the stock due to geopolitical risks and as its valuation had become quite full. HD Korea Shipbuilding & Offshore Engineering outperformed on good earnings results and improving order flows that includes large containers, and favourable new vessel pricing. Power Grid Corporation of India was also a top contributor, with solid fundamentals, earnings visibility, and a robust pipeline of projects.
What detracted from performance?
From a stock perspective, Brazilian car rental company Localiza and pharmacy retailer Raia Drogasil were the top detractors. Their share prices corrected due to revisions in short-term earnings expectations and were impacted by changing market sentiment towards the interest rate environment. In Taiwan, we sold Hon Hai Precision Industry early into the fiscal year on concerns around near-term softness in Apple sales and a weakening outlook for electric vehicles. Hon Hai shares, however, re-rated later in the period, which cost us performance. Not holding SK Hynix earlier in the period was costly as its share price jumped on the back of growing demand for high-performance memory chips. The Fund’s core memory position in Samsung Electronics’ preferred shares lagged behind technology peers because of the uncertainty around its high bandwidth memory (HBM) product.
abrdn Emerging Markets ex-China Fund
(GWLRX)
Total Return Based on $10,000 Investment
The following graph reflects a hypothetical $10,000 investment for the most recently completed 10 fiscal years as compared to a broad-based securities market index, which is also the performance benchmark.
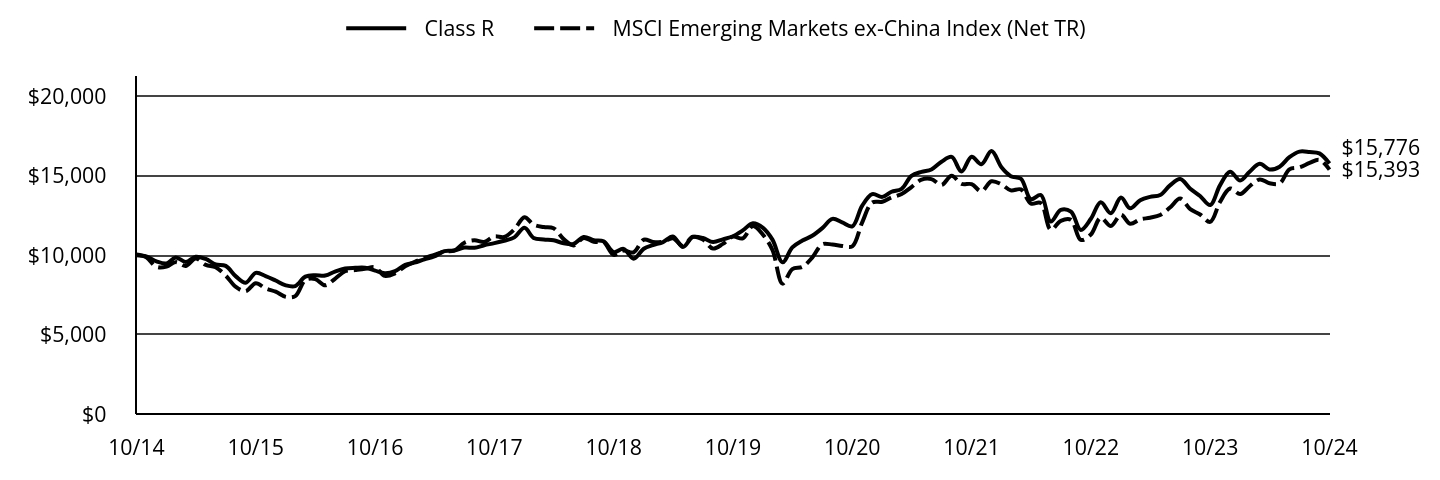
| Class R | MSCI Emerging Markets ex-China Index (Net TR) |
|---|
| 10/14 | $10,000 | $10,043 |
| 11/14 | $9,925 | $9,872 |
| 12/14 | $9,619 | $9,271 |
| 01/15 | $9,484 | $9,283 |
| 02/15 | $9,859 | $9,567 |
| 03/15 | $9,577 | $9,326 |
| 04/15 | $9,908 | $9,791 |
| 05/15 | $9,765 | $9,389 |
| 06/15 | $9,423 | $9,243 |
| 07/15 | $9,332 | $8,719 |
| 08/15 | $8,672 | $8,003 |
| 09/15 | $8,272 | $7,736 |
| 10/15 | $8,887 | $8,242 |
| 11/15 | $8,690 | $7,907 |
| 12/15 | $8,409 | $7,705 |
| 01/16 | $8,105 | $7,379 |
| 02/16 | $8,059 | $7,424 |
| 03/16 | $8,652 | $8,438 |
| 04/16 | $8,744 | $8,503 |
| 05/16 | $8,721 | $8,108 |
| 06/16 | $8,972 | $8,519 |
| 07/16 | $9,169 | $8,993 |
| 08/16 | $9,208 | $9,067 |
| 09/16 | $9,215 | $9,143 |
| 10/16 | $9,033 | $9,238 |
| 11/16 | $8,873 | $8,699 |
| 12/16 | $8,999 | $8,862 |
| 01/17 | $9,390 | $9,304 |
| 02/17 | $9,536 | $9,573 |
| 03/17 | $9,742 | $9,828 |
| 04/17 | $9,926 | $10,026 |
| 05/17 | $10,264 | $10,236 |
| 06/17 | $10,294 | $10,289 |
| 07/17 | $10,486 | $10,786 |
| 08/17 | $10,471 | $10,941 |
| 09/17 | $10,632 | $10,833 |
| 10/17 | $10,762 | $11,192 |
| 11/17 | $10,915 | $11,150 |
| 12/17 | $11,126 | $11,631 |
| 01/18 | $11,730 | $12,396 |
| 02/18 | $11,092 | $11,923 |
| 03/18 | $10,992 | $11,776 |
| 04/18 | $10,941 | $11,703 |
| 05/18 | $10,757 | $11,017 |
| 06/18 | $10,715 | $10,617 |
| 07/18 | $11,151 | $11,092 |
| 08/18 | $10,950 | $10,847 |
| 09/18 | $10,882 | $10,833 |
| 10/18 | $10,194 | $10,024 |
| 11/18 | $10,404 | $10,299 |
| 12/18 | $9,784 | $10,185 |
| 01/19 | $10,408 | $10,976 |
| 02/19 | $10,637 | $10,841 |
| 03/19 | $10,829 | $10,848 |
| 04/19 | $11,178 | $11,070 |
| 05/19 | $10,518 | $10,586 |
| 06/19 | $11,150 | $11,162 |
| 07/19 | $11,086 | $10,990 |
| 08/19 | $10,829 | $10,419 |
| 09/19 | $11,004 | $10,715 |
| 10/19 | $11,196 | $11,176 |
| 11/19 | $11,563 | $11,062 |
| 12/19 | $12,019 | $11,838 |
| 01/20 | $11,727 | $11,294 |
| 02/20 | $10,982 | $10,333 |
| 03/20 | $9,559 | $8,212 |
| 04/20 | $10,492 | $9,125 |
| 05/20 | $10,926 | $9,270 |
| 06/20 | $11,227 | $9,849 |
| 07/20 | $11,708 | $10,695 |
| 08/20 | $12,293 | $10,672 |
| 09/20 | $12,066 | $10,589 |
| 10/20 | $11,821 | $10,561 |
| 11/20 | $13,113 | $12,059 |
| 12/20 | $13,848 | $13,323 |
| 01/21 | $13,678 | $13,372 |
| 02/21 | $13,999 | $13,636 |
| 03/21 | $14,187 | $13,860 |
| 04/21 | $14,998 | $14,298 |
| 05/21 | $15,253 | $14,764 |
| 06/21 | $15,404 | $14,797 |
| 07/21 | $15,894 | $14,432 |
| 08/21 | $16,195 | $15,010 |
| 09/21 | $15,272 | $14,496 |
| 10/21 | $16,205 | $14,477 |
| 11/21 | $15,734 | $14,033 |
| 12/21 | $16,562 | $14,660 |
| 01/22 | $15,522 | $14,457 |
| 02/22 | $14,981 | $14,087 |
| 03/22 | $14,822 | $14,146 |
| 04/22 | $13,538 | $13,269 |
| 05/22 | $13,793 | $13,285 |
| 06/22 | $12,127 | $11,611 |
| 07/22 | $12,859 | $12,169 |
| 08/22 | $12,742 | $12,231 |
| 09/22 | $11,597 | $10,963 |
| 10/22 | $12,297 | $11,307 |
| 11/22 | $13,337 | $12,365 |
| 12/22 | $12,651 | $11,837 |
| 01/23 | $13,638 | $12,552 |
| 02/23 | $12,957 | $11,984 |
| 03/23 | $13,472 | $12,263 |
| 04/23 | $13,680 | $12,363 |
| 05/23 | $13,791 | $12,537 |
| 06/23 | $14,403 | $13,004 |
| 07/23 | $14,806 | $13,568 |
| 08/23 | $14,195 | $12,900 |
| 09/23 | $13,736 | $12,571 |
| 10/23 | $13,166 | $12,102 |
| 11/23 | $14,403 | $13,354 |
| 12/23 | $15,261 | $14,208 |
| 01/24 | $14,703 | $13,855 |
| 02/24 | $15,261 | $14,347 |
| 03/24 | $15,762 | $14,778 |
| 04/24 | $15,400 | $14,539 |
| 05/24 | $15,581 | $14,524 |
| 06/24 | $16,180 | $15,405 |
| 07/24 | $16,529 | $15,534 |
| 08/24 | $16,501 | $15,816 |
| 09/24 | $16,417 | $16,015 |
| 10/24 | $15,776 | $15,393 |
Average Annual Total Returns for the Period Ended October 31, 2024 (%)
| AATR | 1 Year | 5 Years | 10 Years |
|---|
| Class R | 19.83% | 7.10% | 4.66% |
| MSCI Emerging Markets ex-China Index (Net TR) | 27.19% | 6.61% | 4.36% |
THE FUND'S PAST PERFORMANCE IS NOT A GOOD PREDICTOR OF THE FUND'S FUTURE PERFORMANCE.
Fund performance data shown above does not reflect the deduction of taxes that a shareholder would pay on Fund distributions or redemption of Fund shares.
Key Fund Statistics as of October 31, 2024
| Total Net Assets | $161,812,599 |
| Total Number of Portfolio Holdings | 73 |
| Portfolio Turnover Rate | 35% |
| Total Advisory Fees Paid | $364,926 |
abrdn Emerging Markets ex-China Fund
(GWLRX)
What did the Fund invest in?
The tables below show the investment makeup of the Fund as of October 31, 2024.
Geographic Allocation (% of total net assets)
| India | 25.2% | |
| Taiwan | 23.7% | |
| South Korea | 13.8% | |
| Brazil | 7.9% | |
| Saudi Arabia | 6.7% | |
| Mexico | 5.0% | |
| United Arab Emirates | 3.5% | |
| Indonesia | 3.2% | |
| Kazakhstan | 3.1% | |
| United States | 2.4% | |
| Other | 5.5% | |
Ten Largest Holdings (% of total net assets)
| Taiwan Semiconductor Manufacturing Co. Ltd. | 14.5% |
| Samsung Electronics Co. Ltd. | 5.0% |
| ICICI Bank Ltd. | 2.9% |
| Chroma ATE, Inc. | 2.8% |
| Power Grid Corp. of India Ltd. | 2.3% |
| ITC Ltd. | 2.3% |
| Al Rajhi Bank | 2.2% |
| Kaspi.KZ JSC | 2.0% |
| SBI Life Insurance Co. Ltd. | 2.0% |
| Shinhan Financial Group Co. Ltd. | 2.0% |
Below is a summary of certain changes for the Fund since November 1, 2023. For more information, you may refer to the Fund's next prospectus, which we expect to be available by February 28, 2025 at abrdn.com/us/literature or upon request at 866-667-9231.
Effective February 29, 2024, the Fund's management fee changed from 0.90% on assets up to $500 million, 0.85% on assets of $500 million up to $2 billion and 0.80% on assets of $2 billion and more, to 0.80% on assets up to $500 million, 0.75% on assets of $500 million up to $2 billion and 0.70% on assets of $2 billion and more. The Fund's expense limitation changed from 1.10% to 0.99% for all share classes of the Fund.
Availability of Additional Information
You can find additional information, including the Fund's prospectus, financial information, fund holdings, and proxy voting information at abrdn.com/us/literature or call 866-667-9231. The QR code can be used to access the Fund's prospectus, financial information and holdings.
abrdn Emerging Markets ex-China Fund
(GWLRX)
abrdn Emerging Markets ex-China Fund
Annual Shareholder Report - October 31, 2024
This annual shareholder report contains important information about the abrdn Emerging Markets ex-China Fund (the "Fund") for the period of November 1, 2023 to October 31, 2024. You can find additional information about the Fund at abrdn.com/us/literature. You can also request this information by contacting us at 866-667-9231.
This report describes material changes to the Fund that occurred during the reporting period.
What were the Fund costs for the last year?
(based on a hypothetical $10,000 investment)
| Share Class | Costs of a $10,000 investment | Costs paid as a percentage of a $10,000 investment |
|---|
| Institutional | $111 | 1.01% |
How did the fund perform last year and what affected its performance?
The following discussion compares the performance of the Fund to the MSCI Emerging Markets ex-China Index (Net TR) (the “Index”) to show how the Fund’s performance measures against the returns of similar investments for the reporting period.
What contributed to performance?
Taiwanese electronic test equipment maker Chroma ATE was the top stock contributor, benefitting from increased demand for system level testers due to the rising complexity of semiconductor chips. The company reported strong results and guidance for continued demand for semiconductor equipment tests into the fourth quarter and 2025. Israeli semiconductor equipment provider Nova was buoyed by solid results on sustained demand for its leading-edge metrology equipment. The Fund has since sold the stock due to geopolitical risks and as its valuation had become quite full. HD Korea Shipbuilding & Offshore Engineering outperformed on good earnings results and improving order flows that includes large containers, and favourable new vessel pricing. Power Grid Corporation of India was also a top contributor, with solid fundamentals, earnings visibility, and a robust pipeline of projects.
What detracted from performance?
From a stock perspective, Brazilian car rental company Localiza and pharmacy retailer Raia Drogasil were the top detractors. Their share prices corrected due to revisions in short-term earnings expectations and were impacted by changing market sentiment towards the interest rate environment. In Taiwan, we sold Hon Hai Precision Industry early into the fiscal year on concerns around near-term softness in Apple sales and a weakening outlook for electric vehicles. Hon Hai shares, however, re-rated later in the period, which cost us performance. Not holding SK Hynix earlier in the period was costly as its share price jumped on the back of growing demand for high-performance memory chips. The Fund’s core memory position in Samsung Electronics’ preferred shares lagged behind technology peers because of the uncertainty around its high bandwidth memory (HBM) product.
abrdn Emerging Markets ex-China Fund
(GWLIX)
Total Return Based on $1,000,000 Investment
The following graph reflects a hypothetical $1,000,000 investment for the most recently completed 10 fiscal years as compared to a broad-based securities market index, which is also the performance benchmark.
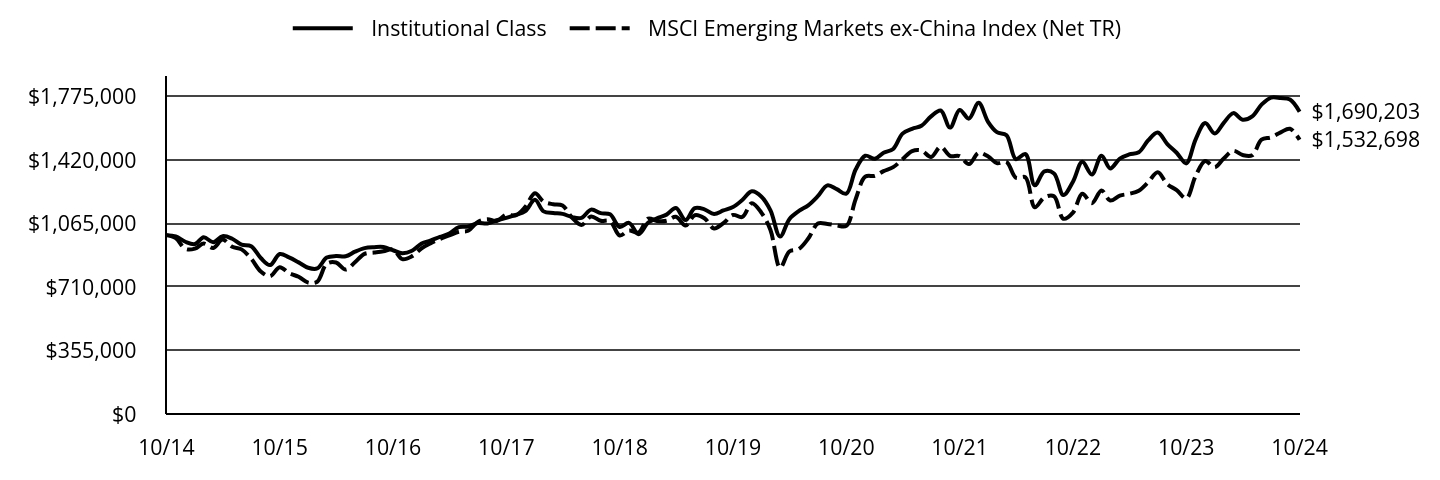
| Institutional Class | MSCI Emerging Markets ex-China Index (Net TR) |
|---|
| 10/14 | $1,000,000 | $1,000,000 |
| 11/14 | $992,775 | $982,922 |
| 12/14 | $963,009 | $923,059 |
| 01/15 | $949,976 | $924,315 |
| 02/15 | $988,351 | $952,552 |
| 03/15 | $960,245 | $928,575 |
| 04/15 | $994,358 | $974,920 |
| 05/15 | $979,842 | $934,850 |
| 06/15 | $946,934 | $920,334 |
| 07/15 | $938,132 | $868,187 |
| 08/15 | $872,118 | $796,889 |
| 09/15 | $832,684 | $770,312 |
| 10/15 | $894,473 | $820,670 |
| 11/15 | $875,348 | $787,296 |
| 12/15 | $847,671 | $767,142 |
| 01/16 | $817,397 | $734,677 |
| 02/16 | $813,706 | $739,211 |
| 03/16 | $874,254 | $840,163 |
| 04/16 | $883,114 | $846,672 |
| 05/16 | $881,637 | $807,277 |
| 06/16 | $907,481 | $848,187 |
| 07/16 | $927,418 | $895,399 |
| 08/16 | $932,586 | $902,810 |
| 09/16 | $933,325 | $910,324 |
| 10/16 | $915,603 | $919,800 |
| 11/16 | $899,359 | $866,154 |
| 12/16 | $912,861 | $882,334 |
| 01/17 | $953,167 | $926,431 |
| 02/17 | $968,842 | $953,168 |
| 03/17 | $989,742 | $978,600 |
| 04/17 | $1,009,148 | $998,306 |
| 05/17 | $1,044,230 | $1,019,225 |
| 06/17 | $1,047,962 | $1,024,438 |
| 07/17 | $1,067,368 | $1,073,974 |
| 08/17 | $1,065,129 | $1,089,394 |
| 09/17 | $1,083,043 | $1,078,638 |
| 10/17 | $1,096,478 | $1,114,328 |
| 11/17 | $1,112,899 | $1,110,175 |
| 12/17 | $1,134,200 | $1,158,045 |
| 01/18 | $1,197,257 | $1,234,262 |
| 02/18 | $1,132,562 | $1,187,205 |
| 03/18 | $1,123,554 | $1,172,543 |
| 04/18 | $1,118,641 | $1,165,248 |
| 05/18 | $1,100,625 | $1,096,953 |
| 06/18 | $1,096,530 | $1,057,142 |
| 07/18 | $1,142,389 | $1,104,444 |
| 08/18 | $1,122,735 | $1,080,064 |
| 09/18 | $1,116,184 | $1,078,601 |
| 10/18 | $1,045,757 | $998,047 |
| 11/18 | $1,068,687 | $1,025,419 |
| 12/18 | $1,004,963 | $1,014,091 |
| 01/19 | $1,070,582 | $1,092,835 |
| 02/19 | $1,093,954 | $1,079,383 |
| 03/19 | $1,114,628 | $1,080,166 |
| 04/19 | $1,151,483 | $1,102,257 |
| 05/19 | $1,084,066 | $1,054,051 |
| 06/19 | $1,150,584 | $1,111,348 |
| 07/19 | $1,144,292 | $1,094,256 |
| 08/19 | $1,118,224 | $1,037,409 |
| 09/19 | $1,137,999 | $1,066,900 |
| 10/19 | $1,157,775 | $1,112,784 |
| 11/19 | $1,196,427 | $1,101,412 |
| 12/19 | $1,244,745 | $1,178,648 |
| 01/20 | $1,214,976 | $1,124,572 |
| 02/20 | $1,138,691 | $1,028,801 |
| 03/20 | $991,703 | $817,691 |
| 04/20 | $1,089,385 | $908,517 |
| 05/20 | $1,134,970 | $922,995 |
| 06/20 | $1,166,600 | $980,669 |
| 07/20 | $1,217,767 | $1,064,860 |
| 08/20 | $1,278,236 | $1,062,608 |
| 09/20 | $1,256,839 | $1,054,378 |
| 10/20 | $1,231,721 | $1,051,530 |
| 11/20 | $1,366,615 | $1,200,702 |
| 12/20 | $1,443,830 | $1,326,551 |
| 01/21 | $1,427,085 | $1,331,412 |
| 02/21 | $1,460,576 | $1,357,736 |
| 03/21 | $1,481,973 | $1,380,036 |
| 04/21 | $1,567,561 | $1,423,683 |
| 05/21 | $1,594,539 | $1,470,070 |
| 06/21 | $1,611,285 | $1,473,281 |
| 07/21 | $1,664,312 | $1,437,012 |
| 08/21 | $1,696,873 | $1,494,550 |
| 09/21 | $1,601,051 | $1,443,318 |
| 10/21 | $1,699,664 | $1,441,428 |
| 11/21 | $1,651,288 | $1,397,214 |
| 12/21 | $1,739,651 | $1,459,656 |
| 01/22 | $1,631,572 | $1,439,429 |
| 02/22 | $1,575,455 | $1,402,585 |
| 03/22 | $1,558,827 | $1,408,536 |
| 04/22 | $1,424,768 | $1,321,208 |
| 05/22 | $1,452,827 | $1,322,737 |
| 06/22 | $1,278,238 | $1,156,135 |
| 07/22 | $1,356,180 | $1,211,674 |
| 08/22 | $1,344,748 | $1,217,781 |
| 09/22 | $1,224,199 | $1,091,525 |
| 10/22 | $1,299,023 | $1,125,853 |
| 11/22 | $1,410,219 | $1,231,217 |
| 12/22 | $1,339,191 | $1,178,597 |
| 01/23 | $1,444,278 | $1,249,803 |
| 02/23 | $1,372,873 | $1,193,256 |
| 03/23 | $1,428,111 | $1,220,971 |
| 04/23 | $1,451,014 | $1,230,976 |
| 05/23 | $1,463,140 | $1,248,319 |
| 06/23 | $1,529,156 | $1,294,815 |
| 07/23 | $1,573,616 | $1,350,963 |
| 08/23 | $1,508,947 | $1,284,471 |
| 09/23 | $1,460,445 | $1,251,637 |
| 10/23 | $1,401,165 | $1,205,026 |
| 11/23 | $1,534,545 | $1,329,646 |
| 12/23 | $1,626,396 | $1,414,682 |
| 01/24 | $1,568,020 | $1,379,491 |
| 02/24 | $1,627,754 | $1,428,504 |
| 03/24 | $1,682,057 | $1,471,409 |
| 04/24 | $1,645,402 | $1,447,619 |
| 05/24 | $1,664,409 | $1,446,111 |
| 06/24 | $1,729,573 | $1,533,818 |
| 07/24 | $1,768,943 | $1,546,701 |
| 08/24 | $1,766,228 | $1,574,759 |
| 09/24 | $1,758,083 | $1,594,547 |
| 10/24 | $1,690,203 | $1,532,698 |
Average Annual Total Returns for the Period Ended October 31, 2024 (%)
| AATR | 1 Year | 5 Years | 10 Years |
|---|
| Institutional Class | 20.63% | 7.86% | 5.39% |
| MSCI Emerging Markets ex-China Index (Net TR) | 27.19% | 6.61% | 4.36% |
THE FUND'S PAST PERFORMANCE IS NOT A GOOD PREDICTOR OF THE FUND'S FUTURE PERFORMANCE.
Fund performance data shown above does not reflect the deduction of taxes that a shareholder would pay on Fund distributions or redemption of Fund shares.
Key Fund Statistics as of October 31, 2024
| Total Net Assets | $161,812,599 |
| Total Number of Portfolio Holdings | 73 |
| Portfolio Turnover Rate | 35% |
| Total Advisory Fees Paid | $364,926 |
abrdn Emerging Markets ex-China Fund
(GWLIX)
What did the Fund invest in?
The tables below show the investment makeup of the Fund as of October 31, 2024.
Geographic Allocation (% of total net assets)
| India | 25.2% | |
| Taiwan | 23.7% | |
| South Korea | 13.8% | |
| Brazil | 7.9% | |
| Saudi Arabia | 6.7% | |
| Mexico | 5.0% | |
| United Arab Emirates | 3.5% | |
| Indonesia | 3.2% | |
| Kazakhstan | 3.1% | |
| United States | 2.4% | |
| Other | 5.5% | |
Ten Largest Holdings (% of total net assets)
| Taiwan Semiconductor Manufacturing Co. Ltd. | 14.5% |
| Samsung Electronics Co. Ltd. | 5.0% |
| ICICI Bank Ltd. | 2.9% |
| Chroma ATE, Inc. | 2.8% |
| Power Grid Corp. of India Ltd. | 2.3% |
| ITC Ltd. | 2.3% |
| Al Rajhi Bank | 2.2% |
| Kaspi.KZ JSC | 2.0% |
| SBI Life Insurance Co. Ltd. | 2.0% |
| Shinhan Financial Group Co. Ltd. | 2.0% |
Below is a summary of certain changes for the Fund since November 1, 2023. For more information, you may refer to the Fund's next prospectus, which we expect to be available by February 28, 2025 at abrdn.com/us/literature or upon request at 866-667-9231.
Effective February 29, 2024, the Fund's management fee changed from 0.90% on assets up to $500 million, 0.85% on assets of $500 million up to $2 billion and 0.80% on assets of $2 billion and more, to 0.80% on assets up to $500 million, 0.75% on assets of $500 million up to $2 billion and 0.70% on assets of $2 billion and more. The Fund's expense limitation changed from 1.10% to 0.99% for all share classes of the Fund.
Availability of Additional Information
You can find additional information, including the Fund's prospectus, financial information, fund holdings, and proxy voting information at abrdn.com/us/literature or call 866-667-9231. The QR code can be used to access the Fund's prospectus, financial information and holdings.
abrdn Emerging Markets ex-China Fund
(GWLIX)
abrdn Emerging Markets ex-China Fund
Annual Shareholder Report - October 31, 2024
This annual shareholder report contains important information about the abrdn Emerging Markets ex-China Fund (the "Fund") for the period of November 1, 2023 to October 31, 2024. You can find additional information about the Fund at abrdn.com/us/literature. You can also request this information by contacting us at 866-667-9231.
This report describes material changes to the Fund that occurred during the reporting period.
What were the Fund costs for the last year?
(based on a hypothetical $10,000 investment)
| Share Class | Costs of a $10,000 investment | Costs paid as a percentage of a $10,000 investment |
|---|
| Institutional Service | $116 | 1.05% |
How did the fund perform last year and what affected its performance?
The following discussion compares the performance of the Fund to the MSCI Emerging Markets ex-China Index (Net TR) (the “Index”) to show how the Fund’s performance measures against the returns of similar investments for the reporting period.
What contributed to performance?
Taiwanese electronic test equipment maker Chroma ATE was the top stock contributor, benefitting from increased demand for system level testers due to the rising complexity of semiconductor chips. The company reported strong results and guidance for continued demand for semiconductor equipment tests into the fourth quarter and 2025. Israeli semiconductor equipment provider Nova was buoyed by solid results on sustained demand for its leading-edge metrology equipment. The Fund has since sold the stock due to geopolitical risks and as its valuation had become quite full. HD Korea Shipbuilding & Offshore Engineering outperformed on good earnings results and improving order flows that includes large containers, and favourable new vessel pricing. Power Grid Corporation of India was also a top contributor, with solid fundamentals, earnings visibility, and a robust pipeline of projects.
What detracted from performance?
From a stock perspective, Brazilian car rental company Localiza and pharmacy retailer Raia Drogasil were the top detractors. Their share prices corrected due to revisions in short-term earnings expectations and were impacted by changing market sentiment towards the interest rate environment. In Taiwan, we sold Hon Hai Precision Industry early into the fiscal year on concerns around near-term softness in Apple sales and a weakening outlook for electric vehicles. Hon Hai shares, however, re-rated later in the period, which cost us performance. Not holding SK Hynix earlier in the period was costly as its share price jumped on the back of growing demand for high-performance memory chips. The Fund’s core memory position in Samsung Electronics’ preferred shares lagged behind technology peers because of the uncertainty around its high bandwidth memory (HBM) product.
abrdn Emerging Markets ex-China Fund
(GLLSX)
Institutional Service Class
Total Return Based on $1,000,000 Investment
The following graph reflects a hypothetical $1,000,000 investment for the most recently completed 10 fiscal years as compared to a broad-based securities market index, which is also the performance benchmark.
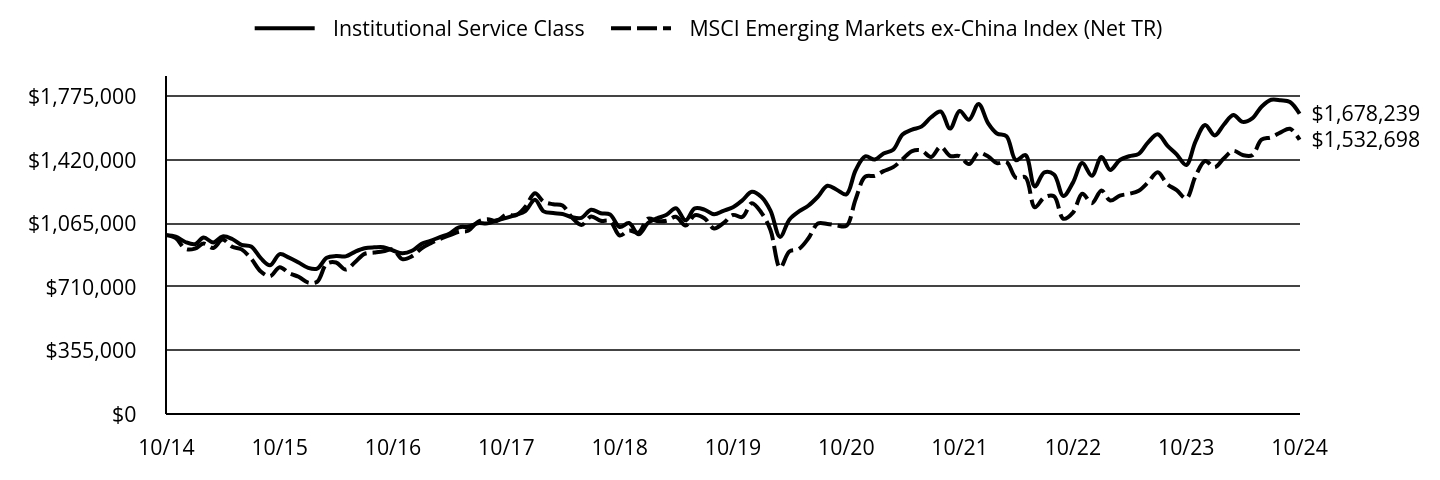
| Institutional Service Class | MSCI Emerging Markets ex-China Index (Net TR) |
|---|
| 10/14 | $1,000,000 | $1,000,000 |
| 11/14 | $992,063 | $982,922 |
| 12/14 | $961,618 | $923,059 |
| 01/15 | $949,326 | $924,315 |
| 02/15 | $986,923 | $952,552 |
| 03/15 | $958,856 | $928,575 |
| 04/15 | $992,920 | $974,920 |
| 05/15 | $978,424 | $934,850 |
| 06/15 | $945,810 | $920,334 |
| 07/15 | $936,388 | $868,187 |
| 08/15 | $871,160 | $796,889 |
| 09/15 | $831,469 | $770,312 |
| 10/15 | $893,975 | $820,670 |
| 11/15 | $874,351 | $787,296 |
| 12/15 | $847,011 | $767,142 |
| 01/16 | $817,099 | $734,677 |
| 02/16 | $812,722 | $739,211 |
| 03/16 | $873,275 | $840,163 |
| 04/16 | $882,759 | $846,672 |
| 05/16 | $881,300 | $807,277 |
| 06/16 | $906,834 | $848,187 |
| 07/16 | $926,532 | $895,399 |
| 08/16 | $931,639 | $902,810 |
| 09/16 | $932,369 | $910,324 |
| 10/16 | $914,130 | $919,800 |
| 11/16 | $898,809 | $866,154 |
| 12/16 | $912,294 | $882,334 |
| 01/17 | $952,119 | $926,431 |
| 02/17 | $967,607 | $953,168 |
| 03/17 | $988,994 | $978,600 |
| 04/17 | $1,008,169 | $998,306 |
| 05/17 | $1,043,570 | $1,019,225 |
| 06/17 | $1,047,257 | $1,024,438 |
| 07/17 | $1,066,432 | $1,073,974 |
| 08/17 | $1,065,695 | $1,089,394 |
| 09/17 | $1,083,395 | $1,078,638 |
| 10/17 | $1,096,670 | $1,114,328 |
| 11/17 | $1,112,895 | $1,110,175 |
| 12/17 | $1,134,586 | $1,158,045 |
| 01/18 | $1,197,618 | $1,234,262 |
| 02/18 | $1,132,969 | $1,187,205 |
| 03/18 | $1,123,272 | $1,172,543 |
| 04/18 | $1,118,423 | $1,165,248 |
| 05/18 | $1,099,837 | $1,096,953 |
| 06/18 | $1,096,604 | $1,057,142 |
| 07/18 | $1,141,859 | $1,104,444 |
| 08/18 | $1,122,464 | $1,080,064 |
| 09/18 | $1,115,191 | $1,078,601 |
| 10/18 | $1,045,694 | $998,047 |
| 11/18 | $1,067,513 | $1,025,419 |
| 12/18 | $1,004,620 | $1,014,091 |
| 01/19 | $1,069,291 | $1,092,835 |
| 02/19 | $1,093,211 | $1,079,383 |
| 03/19 | $1,113,586 | $1,080,166 |
| 04/19 | $1,149,909 | $1,102,257 |
| 05/19 | $1,082,580 | $1,054,051 |
| 06/19 | $1,149,023 | $1,111,348 |
| 07/19 | $1,142,821 | $1,094,256 |
| 08/19 | $1,116,244 | $1,037,409 |
| 09/19 | $1,135,734 | $1,066,900 |
| 10/19 | $1,156,110 | $1,112,784 |
| 11/19 | $1,194,204 | $1,101,412 |
| 12/19 | $1,242,056 | $1,178,648 |
| 01/20 | $1,212,745 | $1,124,572 |
| 02/20 | $1,136,720 | $1,028,801 |
| 03/20 | $990,164 | $817,691 |
| 04/20 | $1,086,341 | $908,517 |
| 05/20 | $1,132,140 | $922,995 |
| 06/20 | $1,164,199 | $980,669 |
| 07/20 | $1,214,577 | $1,064,860 |
| 08/20 | $1,275,947 | $1,062,608 |
| 09/20 | $1,253,964 | $1,054,378 |
| 10/20 | $1,228,317 | $1,051,530 |
| 11/20 | $1,362,964 | $1,200,702 |
| 12/20 | $1,439,906 | $1,326,551 |
| 01/21 | $1,422,502 | $1,331,412 |
| 02/21 | $1,456,393 | $1,357,736 |
| 03/21 | $1,477,461 | $1,380,036 |
| 04/21 | $1,562,646 | $1,423,683 |
| 05/21 | $1,590,125 | $1,470,070 |
| 06/21 | $1,606,612 | $1,473,281 |
| 07/21 | $1,658,823 | $1,437,012 |
| 08/21 | $1,690,882 | $1,494,550 |
| 09/21 | $1,595,621 | $1,443,318 |
| 10/21 | $1,693,630 | $1,441,428 |
| 11/21 | $1,645,083 | $1,397,214 |
| 12/21 | $1,732,974 | $1,459,656 |
| 01/22 | $1,624,664 | $1,439,429 |
| 02/22 | $1,568,465 | $1,402,585 |
| 03/22 | $1,553,137 | $1,408,536 |
| 04/22 | $1,419,282 | $1,321,208 |
| 05/22 | $1,446,870 | $1,322,737 |
| 06/22 | $1,272,142 | $1,156,135 |
| 07/22 | $1,350,821 | $1,211,674 |
| 08/22 | $1,338,559 | $1,217,781 |
| 09/22 | $1,219,009 | $1,091,525 |
| 10/22 | $1,293,600 | $1,125,853 |
| 11/22 | $1,402,933 | $1,231,217 |
| 12/22 | $1,331,595 | $1,178,597 |
| 01/23 | $1,437,068 | $1,249,803 |
| 02/23 | $1,364,555 | $1,193,256 |
| 03/23 | $1,419,928 | $1,220,971 |
| 04/23 | $1,441,023 | $1,230,976 |
| 05/23 | $1,454,207 | $1,248,319 |
| 06/23 | $1,518,809 | $1,294,815 |
| 07/23 | $1,563,635 | $1,350,963 |
| 08/23 | $1,500,351 | $1,284,471 |
| 09/23 | $1,451,570 | $1,251,637 |
| 10/23 | $1,392,242 | $1,205,026 |
| 11/23 | $1,524,083 | $1,329,646 |
| 12/23 | $1,615,787 | $1,414,682 |
| 01/24 | $1,557,321 | $1,379,491 |
| 02/24 | $1,617,115 | $1,428,504 |
| 03/24 | $1,671,595 | $1,471,409 |
| 04/24 | $1,633,061 | $1,447,619 |
| 05/24 | $1,652,992 | $1,446,111 |
| 06/24 | $1,718,102 | $1,533,818 |
| 07/24 | $1,756,636 | $1,546,701 |
| 08/24 | $1,753,979 | $1,574,759 |
| 09/24 | $1,744,678 | $1,594,547 |
| 10/24 | $1,678,239 | $1,532,698 |
Average Annual Total Returns for the Period Ended October 31, 2024 (%)
| AATR | 1 Year | 5 Years | 10 Years |
|---|
| Institutional Service Class | 20.54% | 7.74% | 5.31% |
| MSCI Emerging Markets ex-China Index (Net TR) | 27.19% | 6.61% | 4.36% |
THE FUND'S PAST PERFORMANCE IS NOT A GOOD PREDICTOR OF THE FUND'S FUTURE PERFORMANCE.
Fund performance data shown above does not reflect the deduction of taxes that a shareholder would pay on Fund distributions or redemption of Fund shares.
Key Fund Statistics as of October 31, 2024
| Total Net Assets | $161,812,599 |
| Total Number of Portfolio Holdings | 73 |
| Portfolio Turnover Rate | 35% |
| Total Advisory Fees Paid | $364,926 |
abrdn Emerging Markets ex-China Fund
(GLLSX)
Institutional Service Class
What did the Fund invest in?
The tables below show the investment makeup of the Fund as of October 31, 2024.
Geographic Allocation (% of total net assets)
| India | 25.2% | |
| Taiwan | 23.7% | |
| South Korea | 13.8% | |
| Brazil | 7.9% | |
| Saudi Arabia | 6.7% | |
| Mexico | 5.0% | |
| United Arab Emirates | 3.5% | |
| Indonesia | 3.2% | |
| Kazakhstan | 3.1% | |
| United States | 2.4% | |
| Other | 5.5% | |
Ten Largest Holdings (% of total net assets)
| Taiwan Semiconductor Manufacturing Co. Ltd. | 14.5% |
| Samsung Electronics Co. Ltd. | 5.0% |
| ICICI Bank Ltd. | 2.9% |
| Chroma ATE, Inc. | 2.8% |
| Power Grid Corp. of India Ltd. | 2.3% |
| ITC Ltd. | 2.3% |
| Al Rajhi Bank | 2.2% |
| Kaspi.KZ JSC | 2.0% |
| SBI Life Insurance Co. Ltd. | 2.0% |
| Shinhan Financial Group Co. Ltd. | 2.0% |
Below is a summary of certain changes for the Fund since November 1, 2023. For more information, you may refer to the Fund's next prospectus, which we expect to be available by February 28, 2025 at abrdn.com/us/literature or upon request at 866-667-9231.
Effective February 29, 2024, the Fund's management fee changed from 0.90% on assets up to $500 million, 0.85% on assets of $500 million up to $2 billion and 0.80% on assets of $2 billion and more, to 0.80% on assets up to $500 million, 0.75% on assets of $500 million up to $2 billion and 0.70% on assets of $2 billion and more. The Fund's expense limitation changed from 1.10% to 0.99% for all share classes of the Fund.
Availability of Additional Information
You can find additional information, including the Fund's prospectus, financial information, fund holdings, and proxy voting information at abrdn.com/us/literature or call 866-667-9231. The QR code can be used to access the Fund's prospectus, financial information and holdings.
abrdn Emerging Markets ex-China Fund
(GLLSX)
Institutional Service Class
abrdn Emerging Markets Fund
Annual Shareholder Report - October 31, 2024
This annual shareholder report contains important information about the abrdn Emerging Markets Fund (the "Fund") for the period of November 1, 2023 to October 31, 2024. You can find additional information about the Fund at abrdn.com/us/literature. You can also request this information by contacting us at 866-667-9231.
What were the Fund costs for the last year?
(based on a hypothetical $10,000 investment)
| Share Class | Costs of a $10,000 investment | Costs paid as a percentage of a $10,000 investment |
|---|
| A | $119 | 1.09% |
How did the fund perform last year and what affected its performance?
The following discussion compares the performance of the Fund to the MSCI Emerging Markets Index (Net TR) to show how the Fund’s performance measures against the returns of similar investments for the reporting period.
What contributed to performance?
Chipmaker TSMC was the top stock contributor, reporting strong results exceeding market expectations, and benefitting from the global AI-driven tech sector rally for the greater part of the reporting period. Several high conviction names in China did well, including Tencent, battery maker Contemporary Amperex Technology Co. and electrical goods manufacturer Midea Group. HD Korea Shipbuilding & Offshore Engineering outperformed on good results and improving order flows that included large containers and favorable new vessel pricing. Power Grid Corporation of India was also a top contributor, with solid fundamentals, earnings visibility, and a robust pipeline of projects. Peruvian miner, Southern Copper, outperformed on relatively improving demand outlook and pricing for copper.
What detracted from performance?
The Fund’s exposure to China and Hong Kong dragged on performance for the greater part of the year up until mid-September 2024 when Chinese authorities announced a slew of stimulus measures that saw a sharp re-rating across the board, but that exuberance was short-lived. The Fund consolidated its exposure by backing the highest conviction ideas. In Taiwan, the Fund sold Hon Hai Precision Industry early into the reporting period on concerns around near-term softness in Apple sales and a weakening outlook for electric vehicles. Hon Hai shares, however, re-rated later in the period, which detracted from Fund performance. Not holding SK Hynix earlier in the period was costly as its share price jumped on the back of growing demand for high-performance memory chips. The Fund’s core memory position in Samsung Electronics’ preferred shares lagged technology peers on the uncertainty around its high bandwidth memory (HBM) product qualifying for use by a key customer.
abrdn Emerging Markets Fund
(GEGAX)
Total Return Based on $10,000 Investment
The following graph reflects a hypothetical $10,000 investment for the most recently completed 10 fiscal years as compared to a broad-based securities market index, which is also the performance benchmark.
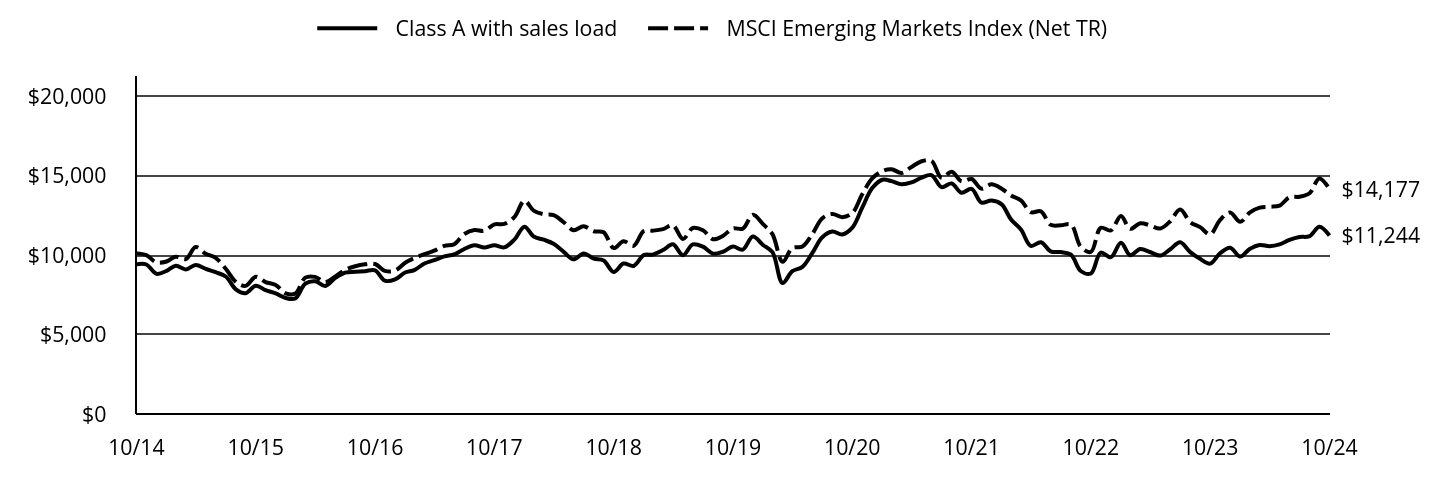
| Class A with sales load | MSCI Emerging Markets Index (Net TR) |
|---|
| 10/14 | $9,424 | $10,118 |
| 11/14 | $9,417 | $10,011 |
| 12/14 | $8,832 | $9,550 |
| 01/15 | $9,015 | $9,607 |
| 02/15 | $9,343 | $9,904 |
| 03/15 | $9,107 | $9,763 |
| 04/15 | $9,389 | $10,514 |
| 05/15 | $9,146 | $10,093 |
| 06/15 | $8,930 | $9,831 |
| 07/15 | $8,661 | $9,150 |
| 08/15 | $7,852 | $8,322 |
| 09/15 | $7,608 | $8,072 |
| 10/15 | $8,078 | $8,648 |
| 11/15 | $7,800 | $8,310 |
| 12/15 | $7,599 | $8,125 |
| 01/16 | $7,305 | $7,598 |
| 02/16 | $7,278 | $7,585 |
| 03/16 | $8,208 | $8,589 |
| 04/16 | $8,361 | $8,636 |
| 05/16 | $8,060 | $8,314 |
| 06/16 | $8,555 | $8,646 |
| 07/16 | $8,910 | $9,081 |
| 08/16 | $8,957 | $9,307 |
| 09/16 | $8,997 | $9,426 |
| 10/16 | $9,050 | $9,449 |
| 11/16 | $8,395 | $9,014 |
| 12/16 | $8,478 | $9,034 |
| 01/17 | $8,910 | $9,528 |
| 02/17 | $9,065 | $9,820 |
| 03/17 | $9,483 | $10,068 |
| 04/17 | $9,686 | $10,288 |
| 05/17 | $9,929 | $10,592 |
| 06/17 | $10,057 | $10,699 |
| 07/17 | $10,395 | $11,337 |
| 08/17 | $10,624 | $11,590 |
| 09/17 | $10,482 | $11,544 |
| 10/17 | $10,624 | $11,948 |
| 11/17 | $10,496 | $11,972 |
| 12/17 | $10,983 | $12,402 |
| 01/18 | $11,802 | $13,436 |
| 02/18 | $11,181 | $12,816 |
| 03/18 | $10,977 | $12,578 |
| 04/18 | $10,724 | $12,522 |
| 05/18 | $10,213 | $12,078 |
| 06/18 | $9,743 | $11,577 |
| 07/18 | $10,111 | $11,831 |
| 08/18 | $9,784 | $11,511 |
| 09/18 | $9,668 | $11,450 |
| 10/18 | $8,945 | $10,453 |
| 11/18 | $9,477 | $10,884 |
| 12/18 | $9,325 | $10,595 |
| 01/19 | $10,007 | $11,523 |
| 02/19 | $10,042 | $11,549 |
| 03/19 | $10,325 | $11,646 |
| 04/19 | $10,690 | $11,891 |
| 05/19 | $10,001 | $11,028 |
| 06/19 | $10,683 | $11,716 |
| 07/19 | $10,538 | $11,573 |
| 08/19 | $10,104 | $11,009 |
| 09/19 | $10,221 | $11,219 |
| 10/19 | $10,545 | $11,692 |
| 11/19 | $10,359 | $11,676 |
| 12/19 | $11,178 | $12,547 |
| 01/20 | $10,647 | $11,962 |
| 02/20 | $10,192 | $11,331 |
| 03/20 | $8,249 | $9,586 |
| 04/20 | $8,997 | $10,464 |
| 05/20 | $9,270 | $10,544 |
| 06/20 | $10,130 | $11,319 |
| 07/20 | $11,136 | $12,331 |
| 08/20 | $11,493 | $12,603 |
| 09/20 | $11,311 | $12,401 |
| 10/20 | $11,737 | $12,657 |
| 11/20 | $12,982 | $13,827 |
| 12/20 | $14,229 | $14,844 |
| 01/21 | $14,757 | $15,299 |
| 02/21 | $14,672 | $15,416 |
| 03/21 | $14,468 | $15,183 |
| 04/21 | $14,588 | $15,561 |
| 05/21 | $14,891 | $15,922 |
| 06/21 | $15,052 | $15,950 |
| 07/21 | $14,292 | $14,876 |
| 08/21 | $14,524 | $15,266 |
| 09/21 | $13,933 | $14,659 |
| 10/21 | $14,186 | $14,803 |
| 11/21 | $13,313 | $14,200 |
| 12/21 | $13,448 | $14,467 |
| 01/22 | $13,205 | $14,193 |
| 02/22 | $12,271 | $13,769 |
| 03/22 | $11,620 | $13,458 |
| 04/22 | $10,592 | $12,709 |
| 05/22 | $10,820 | $12,765 |
| 06/22 | $10,247 | $11,917 |
| 07/22 | $10,200 | $11,887 |
| 08/22 | $10,035 | $11,937 |
| 09/22 | $9,007 | $10,538 |
| 10/22 | $8,850 | $10,210 |
| 11/22 | $10,168 | $11,725 |
| 12/22 | $9,878 | $11,560 |
| 01/23 | $10,784 | $12,473 |
| 02/23 | $10,005 | $11,664 |
| 03/23 | $10,387 | $12,017 |
| 04/23 | $10,204 | $11,881 |
| 05/23 | $9,981 | $11,682 |
| 06/23 | $10,363 | $12,125 |
| 07/23 | $10,816 | $12,880 |
| 08/23 | $10,196 | $12,087 |
| 09/23 | $9,774 | $11,770 |
| 10/23 | $9,472 | $11,313 |
| 11/23 | $10,116 | $12,219 |
| 12/23 | $10,473 | $12,696 |
| 01/24 | $9,919 | $12,107 |
| 02/24 | $10,393 | $12,683 |
| 03/24 | $10,650 | $12,997 |
| 04/24 | $10,569 | $13,055 |
| 05/24 | $10,682 | $13,129 |
| 06/24 | $10,963 | $13,647 |
| 07/24 | $11,147 | $13,687 |
| 08/24 | $11,203 | $13,908 |
| 09/24 | $11,797 | $14,837 |
| 10/24 | $11,244 | $14,177 |
Average Annual Total Returns for the Period Ended October 31, 2024 (%)
| AATR | 1 Year | 5 Years | 10 Years |
|---|
| Class A without sales load | 18.70% | 1.29% | 1.78% |
| Class A with sales load - 5.75% | 11.85% | 0.10% | 1.18% |
| MSCI Emerging Markets Index (Net TR) | 25.32% | 3.93% | 3.43% |
THE FUND'S PAST PERFORMANCE IS NOT A GOOD PREDICTOR OF THE FUND'S FUTURE PERFORMANCE.
Fund performance data shown above does not reflect the deduction of taxes that a shareholder would pay on Fund distributions or redemption of Fund shares.
Key Fund Statistics as of October 31, 2024
| Total Net Assets | $1,240,789,006 |
| Total Number of Portfolio Holdings | 65 |
| Portfolio Turnover Rate | 33% |
| Total Advisory Fees Paid | $12,628,392 |
abrdn Emerging Markets Fund
(GEGAX)
What did the Fund invest in?
The tables below show the investment makeup of the Fund as of October 31, 2024.
Geographic Allocation (% of total net assets)
| China | 27.0% | |
| India | 19.5% | |
| Taiwan | 18.1% | |
| South Korea | 9.8% | |
| Mexico | 5.7% | |
| Brazil | 4.5% | |
| Saudi Arabia | 3.3% | |
| Indonesia | 2.3% | |
| United Arab Emirates | 2.1% | |
| Other | 7.8% | |
Ten Largest Holdings (% of total net assets)
| Taiwan Semiconductor Manufacturing Co. Ltd. | 12.6% |
| Tencent Holdings Ltd. | 7.3% |
| Samsung Electronics Co. Ltd. | 4.3% |
| Alibaba Group Holding Ltd. | 3.9% |
| HDFC Bank Ltd. | 2.8% |
| Power Grid Corp. of India Ltd. | 2.6% |
| Southern Copper Corp. | 2.4% |
| Contemporary Amperex Technology Co. Ltd., Class A | 2.4% |
| ICICI Bank Ltd. | 2.0% |
| Al Rajhi Bank | 1.8% |
Availability of Additional Information
You can find additional information, including the Fund's prospectus, financial information, fund holdings, and proxy voting information at abrdn.com/us/literature or call 866-667-9231. The QR code can be used to access the Fund's prospectus, financial information and holdings.
abrdn Emerging Markets Fund
(GEGAX)
abrdn Emerging Markets Fund
Annual Shareholder Report - October 31, 2024
This annual shareholder report contains important information about the abrdn Emerging Markets Fund (the "Fund") for the period of November 1, 2023 to October 31, 2024. You can find additional information about the Fund at abrdn.com/us/literature. You can also request this information by contacting us at 866-667-9231.
What were the Fund costs for the last year?
(based on a hypothetical $10,000 investment)
| Share Class | Costs of a $10,000 investment | Costs paid as a percentage of a $10,000 investment |
|---|
| C | $228 | 2.10% |
How did the fund perform last year and what affected its performance?
The following discussion compares the performance of the Fund to the MSCI Emerging Markets Index (Net TR) to show how the Fund’s performance measures against the returns of similar investments for the reporting period.
What contributed to performance?
Chipmaker TSMC was the top stock contributor, reporting strong results exceeding market expectations, and benefitting from the global AI-driven tech sector rally for the greater part of the reporting period. Several high conviction names in China did well, including Tencent, battery maker Contemporary Amperex Technology Co. and electrical goods manufacturer Midea Group. HD Korea Shipbuilding & Offshore Engineering outperformed on good results and improving order flows that included large containers and favorable new vessel pricing. Power Grid Corporation of India was also a top contributor, with solid fundamentals, earnings visibility, and a robust pipeline of projects. Peruvian miner, Southern Copper, outperformed on relatively improving demand outlook and pricing for copper.
What detracted from performance?
The Fund’s exposure to China and Hong Kong dragged on performance for the greater part of the year up until mid-September 2024 when Chinese authorities announced a slew of stimulus measures that saw a sharp re-rating across the board, but that exuberance was short-lived. The Fund consolidated its exposure by backing the highest conviction ideas. In Taiwan, the Fund sold Hon Hai Precision Industry early into the reporting period on concerns around near-term softness in Apple sales and a weakening outlook for electric vehicles. Hon Hai shares, however, re-rated later in the period, which detracted from Fund performance. Not holding SK Hynix earlier in the period was costly as its share price jumped on the back of growing demand for high-performance memory chips. The Fund’s core memory position in Samsung Electronics’ preferred shares lagged technology peers on the uncertainty around its high bandwidth memory (HBM) product qualifying for use by a key customer.
abrdn Emerging Markets Fund
(GEGCX)
Total Return Based on $10,000 Investment
The following graph reflects a hypothetical $10,000 investment for the most recently completed 10 fiscal years as compared to a broad-based securities market index, which is also the performance benchmark.
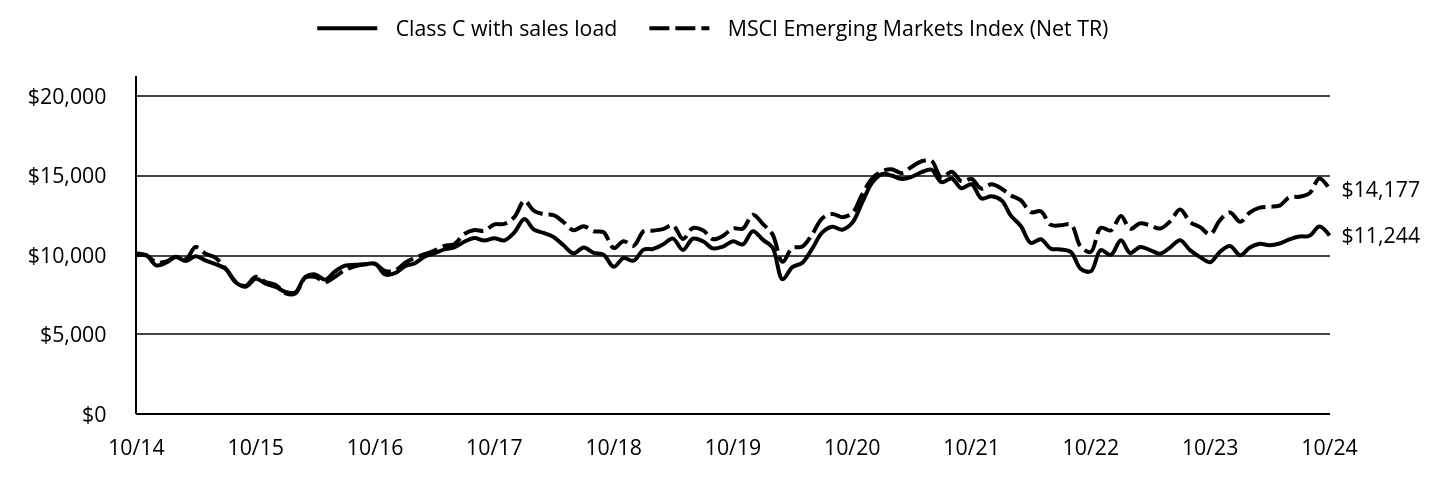
| Class C with sales load | MSCI Emerging Markets Index (Net TR) |
|---|
| 10/14 | $10,000 | $10,118 |
| 11/14 | $9,986 | $10,011 |
| 12/14 | $9,358 | $9,550 |
| 01/15 | $9,547 | $9,607 |
| 02/15 | $9,890 | $9,904 |
| 03/15 | $9,638 | $9,763 |
| 04/15 | $9,932 | $10,514 |
| 05/15 | $9,666 | $10,093 |
| 06/15 | $9,437 | $9,831 |
| 07/15 | $9,143 | $9,150 |
| 08/15 | $8,290 | $8,322 |
| 09/15 | $8,022 | $8,072 |
| 10/15 | $8,520 | $8,648 |
| 11/15 | $8,218 | $8,310 |
| 12/15 | $8,003 | $8,125 |
| 01/16 | $7,690 | $7,598 |
| 02/16 | $7,655 | $7,585 |
| 03/16 | $8,635 | $8,589 |
| 04/16 | $8,791 | $8,636 |
| 05/16 | $8,464 | $8,314 |
| 06/16 | $8,983 | $8,646 |
| 07/16 | $9,345 | $9,081 |
| 08/16 | $9,394 | $9,307 |
| 09/16 | $9,430 | $9,426 |
| 10/16 | $9,480 | $9,449 |
| 11/16 | $8,791 | $9,014 |
| 12/16 | $8,868 | $9,034 |
| 01/17 | $9,317 | $9,528 |
| 02/17 | $9,480 | $9,820 |
| 03/17 | $9,907 | $10,068 |
| 04/17 | $10,114 | $10,288 |
| 05/17 | $10,370 | $10,592 |
| 06/17 | $10,498 | $10,699 |
| 07/17 | $10,847 | $11,337 |
| 08/17 | $11,082 | $11,590 |
| 09/17 | $10,925 | $11,544 |
| 10/17 | $11,068 | $11,948 |
| 11/17 | $10,932 | $11,972 |
| 12/17 | $11,434 | $12,402 |
| 01/18 | $12,285 | $13,436 |
| 02/18 | $11,628 | $12,816 |
| 03/18 | $11,406 | $12,578 |
| 04/18 | $11,148 | $12,522 |
| 05/18 | $10,612 | $12,078 |
| 06/18 | $10,119 | $11,577 |
| 07/18 | $10,491 | $11,831 |
| 08/18 | $10,147 | $11,511 |
| 09/18 | $10,026 | $11,450 |
| 10/18 | $9,275 | $10,453 |
| 11/18 | $9,818 | $10,884 |
| 12/18 | $9,658 | $10,595 |
| 01/19 | $10,360 | $11,523 |
| 02/19 | $10,396 | $11,549 |
| 03/19 | $10,683 | $11,646 |
| 04/19 | $11,048 | $11,891 |
| 05/19 | $10,332 | $11,028 |
| 06/19 | $11,041 | $11,716 |
| 07/19 | $10,883 | $11,573 |
| 08/19 | $10,432 | $11,009 |
| 09/19 | $10,547 | $11,219 |
| 10/19 | $10,876 | $11,692 |
| 11/19 | $10,683 | $11,676 |
| 12/19 | $11,517 | $12,547 |
| 01/20 | $10,969 | $11,962 |
| 02/20 | $10,499 | $11,331 |
| 03/20 | $8,485 | $9,586 |
| 04/20 | $9,250 | $10,464 |
| 05/20 | $9,532 | $10,544 |
| 06/20 | $10,413 | $11,319 |
| 07/20 | $11,438 | $12,331 |
| 08/20 | $11,799 | $12,603 |
| 09/20 | $11,611 | $12,401 |
| 10/20 | $12,045 | $12,657 |
| 11/20 | $13,308 | $13,827 |
| 12/20 | $14,589 | $14,844 |
| 01/21 | $15,120 | $15,299 |
| 02/21 | $15,026 | $15,416 |
| 03/21 | $14,807 | $15,183 |
| 04/21 | $14,931 | $15,561 |
| 05/21 | $15,229 | $15,922 |
| 06/21 | $15,389 | $15,950 |
| 07/21 | $14,604 | $14,876 |
| 08/21 | $14,836 | $15,266 |
| 09/21 | $14,218 | $14,659 |
| 10/21 | $14,473 | $14,803 |
| 11/21 | $13,578 | $14,200 |
| 12/21 | $13,711 | $14,467 |
| 01/22 | $13,452 | $14,193 |
| 02/22 | $12,495 | $13,769 |
| 03/22 | $11,830 | $13,458 |
| 04/22 | $10,776 | $12,709 |
| 05/22 | $11,011 | $12,765 |
| 06/22 | $10,419 | $11,917 |
| 07/22 | $10,363 | $11,887 |
| 08/22 | $10,200 | $11,937 |
| 09/22 | $9,146 | $10,538 |
| 10/22 | $8,992 | $10,210 |
| 11/22 | $10,322 | $11,725 |
| 12/22 | $10,020 | $11,560 |
| 01/23 | $10,940 | $12,473 |
| 02/23 | $10,142 | $11,664 |
| 03/23 | $10,525 | $12,017 |
| 04/23 | $10,329 | $11,881 |
| 05/23 | $10,101 | $11,682 |
| 06/23 | $10,484 | $12,125 |
| 07/23 | $10,940 | $12,880 |
| 08/23 | $10,305 | $12,087 |
| 09/23 | $9,881 | $11,770 |
| 10/23 | $9,564 | $11,313 |
| 11/23 | $10,215 | $12,219 |
| 12/23 | $10,576 | $12,696 |
| 01/24 | $10,005 | $12,107 |
| 02/24 | $10,470 | $12,683 |
| 03/24 | $10,722 | $12,997 |
| 04/24 | $10,633 | $13,055 |
| 05/24 | $10,739 | $13,129 |
| 06/24 | $10,999 | $13,647 |
| 07/24 | $11,179 | $13,687 |
| 08/24 | $11,228 | $13,908 |
| 09/24 | $11,806 | $14,837 |
| 10/24 | $11,244 | $14,177 |
Average Annual Total Returns for the Period Ended October 31, 2024 (%)
| AATR | 1 Year | 5 Years | 10 Years |
|---|
| Class C without sales load | 17.57% | 0.67% | 1.18% |
| Class C with sales load - 1.00% | 16.57% | 0.67% | 1.18% |
| MSCI Emerging Markets Index (Net TR) | 25.32% | 3.93% | 3.43% |
THE FUND'S PAST PERFORMANCE IS NOT A GOOD PREDICTOR OF THE FUND'S FUTURE PERFORMANCE.
Fund performance data shown above does not reflect the deduction of taxes that a shareholder would pay on Fund distributions or redemption of Fund shares.
Key Fund Statistics as of October 31, 2024
| Total Net Assets | $1,240,789,006 |
| Total Number of Portfolio Holdings | 65 |
| Portfolio Turnover Rate | 33% |
| Total Advisory Fees Paid | $12,628,392 |
abrdn Emerging Markets Fund
(GEGCX)
What did the Fund invest in?
The tables below show the investment makeup of the Fund as of October 31, 2024.
Geographic Allocation (% of total net assets)
| China | 27.0% | |
| India | 19.5% | |
| Taiwan | 18.1% | |
| South Korea | 9.8% | |
| Mexico | 5.7% | |
| Brazil | 4.5% | |
| Saudi Arabia | 3.3% | |
| Indonesia | 2.3% | |
| United Arab Emirates | 2.1% | |
| Other | 7.8% | |
Ten Largest Holdings (% of total net assets)
| Taiwan Semiconductor Manufacturing Co. Ltd. | 12.6% |
| Tencent Holdings Ltd. | 7.3% |
| Samsung Electronics Co. Ltd. | 4.3% |
| Alibaba Group Holding Ltd. | 3.9% |
| HDFC Bank Ltd. | 2.8% |
| Power Grid Corp. of India Ltd. | 2.6% |
| Southern Copper Corp. | 2.4% |
| Contemporary Amperex Technology Co. Ltd., Class A | 2.4% |
| ICICI Bank Ltd. | 2.0% |
| Al Rajhi Bank | 1.8% |
Availability of Additional Information
You can find additional information, including the Fund's prospectus, financial information, fund holdings, and proxy voting information at abrdn.com/us/literature or call 866-667-9231. The QR code can be used to access the Fund's prospectus, financial information and holdings.
abrdn Emerging Markets Fund
(GEGCX)
abrdn Emerging Markets Fund
Annual Shareholder Report - October 31, 2024
This annual shareholder report contains important information about the abrdn Emerging Markets Fund (the "Fund") for the period of November 1, 2023 to October 31, 2024. You can find additional information about the Fund at abrdn.com/us/literature. You can also request this information by contacting us at 866-667-9231.
What were the Fund costs for the last year?
(based on a hypothetical $10,000 investment)
| Share Class | Costs of a $10,000 investment | Costs paid as a percentage of a $10,000 investment |
|---|
| R | $190 | 1.74% |
How did the fund perform last year and what affected its performance?
The following discussion compares the performance of the Fund to the MSCI Emerging Markets Index (Net TR) to show how the Fund’s performance measures against the returns of similar investments for the reporting period.
What contributed to performance?
Chipmaker TSMC was the top stock contributor, reporting strong results exceeding market expectations, and benefitting from the global AI-driven tech sector rally for the greater part of the reporting period. Several high conviction names in China did well, including Tencent, battery maker Contemporary Amperex Technology Co. and electrical goods manufacturer Midea Group. HD Korea Shipbuilding & Offshore Engineering outperformed on good results and improving order flows that included large containers and favorable new vessel pricing. Power Grid Corporation of India was also a top contributor, with solid fundamentals, earnings visibility, and a robust pipeline of projects. Peruvian miner, Southern Copper, outperformed on relatively improving demand outlook and pricing for copper.
What detracted from performance?
The Fund’s exposure to China and Hong Kong dragged on performance for the greater part of the year up until mid-September 2024 when Chinese authorities announced a slew of stimulus measures that saw a sharp re-rating across the board, but that exuberance was short-lived. The Fund consolidated its exposure by backing the highest conviction ideas. In Taiwan, the Fund sold Hon Hai Precision Industry early into the reporting period on concerns around near-term softness in Apple sales and a weakening outlook for electric vehicles. Hon Hai shares, however, re-rated later in the period, which detracted from Fund performance. Not holding SK Hynix earlier in the period was costly as its share price jumped on the back of growing demand for high-performance memory chips. The Fund’s core memory position in Samsung Electronics’ preferred shares lagged technology peers on the uncertainty around its high bandwidth memory (HBM) product qualifying for use by a key customer.
abrdn Emerging Markets Fund
(GEMRX)
Total Return Based on $10,000 Investment
The following graph reflects a hypothetical $10,000 investment for the most recently completed 10 fiscal years as compared to a broad-based securities market index, which is also the performance benchmark.
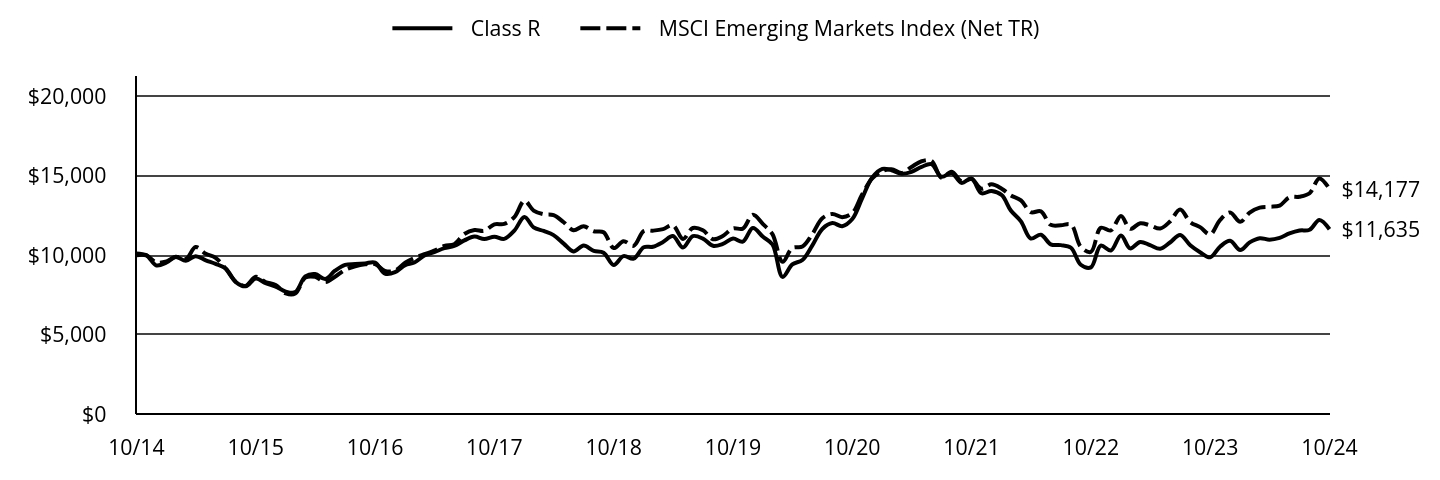
| Class R | MSCI Emerging Markets Index (Net TR) |
|---|
| 10/14 | $10,000 | $10,118 |
| 11/14 | $9,987 | $10,011 |
| 12/14 | $9,357 | $9,550 |
| 01/15 | $9,552 | $9,607 |
| 02/15 | $9,894 | $9,904 |
| 03/15 | $9,650 | $9,763 |
| 04/15 | $9,943 | $10,514 |
| 05/15 | $9,678 | $10,093 |
| 06/15 | $9,454 | $9,831 |
| 07/15 | $9,161 | $9,150 |
| 08/15 | $8,308 | $8,322 |
| 09/15 | $8,043 | $8,072 |
| 10/15 | $8,541 | $8,648 |
| 11/15 | $8,239 | $8,310 |
| 12/15 | $8,024 | $8,125 |
| 01/16 | $7,711 | $7,598 |
| 02/16 | $7,676 | $7,585 |
| 03/16 | $8,663 | $8,589 |
| 04/16 | $8,819 | $8,636 |
| 05/16 | $8,499 | $8,314 |
| 06/16 | $9,025 | $8,646 |
| 07/16 | $9,394 | $9,081 |
| 08/16 | $9,444 | $9,307 |
| 09/16 | $9,486 | $9,426 |
| 10/16 | $9,536 | $9,449 |
| 11/16 | $8,847 | $9,014 |
| 12/16 | $8,930 | $9,034 |
| 01/17 | $9,381 | $9,528 |
| 02/17 | $9,545 | $9,820 |
| 03/17 | $9,982 | $10,068 |
| 04/17 | $10,196 | $10,288 |
| 05/17 | $10,447 | $10,592 |
| 06/17 | $10,583 | $10,699 |
| 07/17 | $10,933 | $11,337 |
| 08/17 | $11,176 | $11,590 |
| 09/17 | $11,026 | $11,544 |
| 10/17 | $11,169 | $11,948 |
| 11/17 | $11,033 | $11,972 |
| 12/17 | $11,550 | $12,402 |
| 01/18 | $12,410 | $13,436 |
| 02/18 | $11,753 | $12,816 |
| 03/18 | $11,529 | $12,578 |
| 04/18 | $11,269 | $12,522 |
| 05/18 | $10,734 | $12,078 |
| 06/18 | $10,236 | $11,577 |
| 07/18 | $10,611 | $11,831 |
| 08/18 | $10,272 | $11,511 |
| 09/18 | $10,156 | $11,450 |
| 10/18 | $9,390 | $10,453 |
| 11/18 | $9,947 | $10,884 |
| 12/18 | $9,784 | $10,595 |
| 01/19 | $10,506 | $11,523 |
| 02/19 | $10,536 | $11,549 |
| 03/19 | $10,835 | $11,646 |
| 04/19 | $11,215 | $11,891 |
| 05/19 | $10,485 | $11,028 |
| 06/19 | $11,207 | $11,716 |
| 07/19 | $11,047 | $11,573 |
| 08/19 | $10,594 | $11,009 |
| 09/19 | $10,718 | $11,219 |
| 10/19 | $11,054 | $11,692 |
| 11/19 | $10,857 | $11,676 |
| 12/19 | $11,715 | $12,547 |
| 01/20 | $11,160 | $11,962 |
| 02/20 | $10,679 | $11,331 |
| 03/20 | $8,636 | $9,586 |
| 04/20 | $9,421 | $10,464 |
| 05/20 | $9,702 | $10,544 |
| 06/20 | $10,605 | $11,319 |
| 07/20 | $11,655 | $12,331 |
| 08/20 | $12,025 | $12,603 |
| 09/20 | $11,833 | $12,401 |
| 10/20 | $12,284 | $12,657 |
| 11/20 | $13,587 | $13,827 |
| 12/20 | $14,892 | $14,844 |
| 01/21 | $15,436 | $15,299 |
| 02/21 | $15,354 | $15,416 |
| 03/21 | $15,131 | $15,183 |
| 04/21 | $15,257 | $15,561 |
| 05/21 | $15,570 | $15,922 |
| 06/21 | $15,742 | $15,950 |
| 07/21 | $14,944 | $14,876 |
| 08/21 | $15,183 | $15,266 |
| 09/21 | $14,557 | $14,659 |
| 10/21 | $14,825 | $14,803 |
| 11/21 | $13,908 | $14,200 |
| 12/21 | $14,047 | $14,467 |
| 01/22 | $13,790 | $14,193 |
| 02/22 | $12,817 | $13,769 |
| 03/22 | $12,135 | $13,458 |
| 04/22 | $11,055 | $12,709 |
| 05/22 | $11,296 | $12,765 |
| 06/22 | $10,689 | $11,917 |
| 07/22 | $10,639 | $11,887 |
| 08/22 | $10,473 | $11,937 |
| 09/22 | $9,401 | $10,538 |
| 10/22 | $9,235 | $10,210 |
| 11/22 | $10,606 | $11,725 |
| 12/22 | $10,298 | $11,560 |
| 01/23 | $11,250 | $12,473 |
| 02/23 | $10,433 | $11,664 |
| 03/23 | $10,837 | $12,017 |
| 04/23 | $10,635 | $11,881 |
| 05/23 | $10,408 | $11,682 |
| 06/23 | $10,803 | $12,125 |
| 07/23 | $11,275 | $12,880 |
| 08/23 | $10,627 | $12,087 |
| 09/23 | $10,189 | $11,770 |
| 10/23 | $9,869 | $11,313 |
| 11/23 | $10,534 | $12,219 |
| 12/23 | $10,912 | $12,696 |
| 01/24 | $10,326 | $12,107 |
| 02/24 | $10,810 | $12,683 |
| 03/24 | $11,074 | $12,997 |
| 04/24 | $10,980 | $13,055 |
| 05/24 | $11,091 | $13,129 |
| 06/24 | $11,371 | $13,647 |
| 07/24 | $11,558 | $13,687 |
| 08/24 | $11,609 | $13,908 |
| 09/24 | $12,221 | $14,837 |
| 10/24 | $11,635 | $14,177 |
Average Annual Total Returns for the Period Ended October 31, 2024 (%)
| AATR | 1 Year | 5 Years | 10 Years |
|---|
| Class R | 17.89% | 1.03% | 1.53% |
| MSCI Emerging Markets Index (Net TR) | 25.32% | 3.93% | 3.43% |
THE FUND'S PAST PERFORMANCE IS NOT A GOOD PREDICTOR OF THE FUND'S FUTURE PERFORMANCE.
Fund performance data shown above does not reflect the deduction of taxes that a shareholder would pay on Fund distributions or redemption of Fund shares.
Key Fund Statistics as of October 31, 2024
| Total Net Assets | $1,240,789,006 |
| Total Number of Portfolio Holdings | 65 |
| Portfolio Turnover Rate | 33% |
| Total Advisory Fees Paid | $12,628,392 |
abrdn Emerging Markets Fund
(GEMRX)
What did the Fund invest in?
The tables below show the investment makeup of the Fund as of October 31, 2024.
Geographic Allocation (% of total net assets)
| China | 27.0% | |
| India | 19.5% | |
| Taiwan | 18.1% | |
| South Korea | 9.8% | |
| Mexico | 5.7% | |
| Brazil | 4.5% | |
| Saudi Arabia | 3.3% | |
| Indonesia | 2.3% | |
| United Arab Emirates | 2.1% | |
| Other | 7.8% | |
Ten Largest Holdings (% of total net assets)
| Taiwan Semiconductor Manufacturing Co. Ltd. | 12.6% |
| Tencent Holdings Ltd. | 7.3% |
| Samsung Electronics Co. Ltd. | 4.3% |
| Alibaba Group Holding Ltd. | 3.9% |
| HDFC Bank Ltd. | 2.8% |
| Power Grid Corp. of India Ltd. | 2.6% |
| Southern Copper Corp. | 2.4% |
| Contemporary Amperex Technology Co. Ltd., Class A | 2.4% |
| ICICI Bank Ltd. | 2.0% |
| Al Rajhi Bank | 1.8% |
Availability of Additional Information
You can find additional information, including the Fund's prospectus, financial information, fund holdings, and proxy voting information at abrdn.com/us/literature or call 866-667-9231. The QR code can be used to access the Fund's prospectus, financial information and holdings.
abrdn Emerging Markets Fund
(GEMRX)
abrdn Emerging Markets Fund
Annual Shareholder Report - October 31, 2024
This annual shareholder report contains important information about the abrdn Emerging Markets Fund (the "Fund") for the period of November 1, 2023 to October 31, 2024. You can find additional information about the Fund at abrdn.com/us/literature. You can also request this information by contacting us at 866-667-9231.
What were the Fund costs for the last year?
(based on a hypothetical $10,000 investment)
| Share Class | Costs of a $10,000 investment | Costs paid as a percentage of a $10,000 investment |
|---|
| Institutional | $120 | 1.10% |
How did the fund perform last year and what affected its performance?
The following discussion compares the performance of the Fund to the MSCI Emerging Markets Index (Net TR) to show how the Fund’s performance measures against the returns of similar investments for the reporting period.
What contributed to performance?
Chipmaker TSMC was the top stock contributor, reporting strong results exceeding market expectations, and benefitting from the global AI-driven tech sector rally for the greater part of the reporting period. Several high conviction names in China did well, including Tencent, battery maker Contemporary Amperex Technology Co. and electrical goods manufacturer Midea Group. HD Korea Shipbuilding & Offshore Engineering outperformed on good results and improving order flows that included large containers and favorable new vessel pricing. Power Grid Corporation of India was also a top contributor, with solid fundamentals, earnings visibility, and a robust pipeline of projects. Peruvian miner, Southern Copper, outperformed on relatively improving demand outlook and pricing for copper.
What detracted from performance?
The Fund’s exposure to China and Hong Kong dragged on performance for the greater part of the year up until mid-September 2024 when Chinese authorities announced a slew of stimulus measures that saw a sharp re-rating across the board, but that exuberance was short-lived. The Fund consolidated its exposure by backing the highest conviction ideas. In Taiwan, the Fund sold Hon Hai Precision Industry early into the reporting period on concerns around near-term softness in Apple sales and a weakening outlook for electric vehicles. Hon Hai shares, however, re-rated later in the period, which detracted from Fund performance. Not holding SK Hynix earlier in the period was costly as its share price jumped on the back of growing demand for high-performance memory chips. The Fund’s core memory position in Samsung Electronics’ preferred shares lagged technology peers on the uncertainty around its high bandwidth memory (HBM) product qualifying for use by a key customer.
abrdn Emerging Markets Fund
(ABEMX)
Total Return Based on $1,000,000 Investment
The following graph reflects a hypothetical $1,000,000 investment for the most recently completed 10 fiscal years as compared to a broad-based securities market index, which is also the performance benchmark.
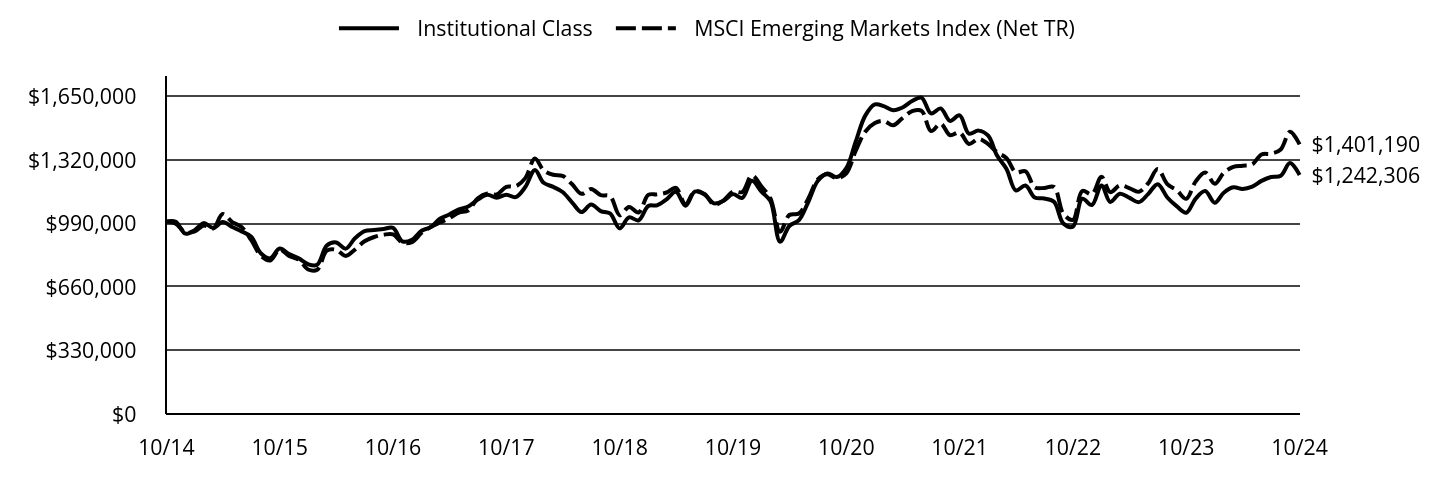
| Institutional Class | MSCI Emerging Markets Index (Net TR) |
|---|
| 10/14 | $1,000,000 | $1,000,000 |
| 11/14 | $998,658 | $989,423 |
| 12/14 | $937,104 | $943,824 |
| 01/15 | $956,554 | $949,482 |
| 02/15 | $991,982 | $978,881 |
| 03/15 | $966,974 | $964,960 |
| 04/15 | $997,539 | $1,039,180 |
| 05/15 | $971,837 | $997,565 |
| 06/15 | $949,121 | $971,657 |
| 07/15 | $921,185 | $904,303 |
| 08/15 | $835,283 | $822,511 |
| 09/15 | $808,920 | $797,767 |
| 10/15 | $859,522 | $854,675 |
| 11/15 | $830,707 | $821,336 |
| 12/15 | $808,887 | $803,027 |
| 01/16 | $778,269 | $750,931 |
| 02/16 | $775,421 | $749,703 |
| 03/16 | $875,107 | $848,909 |
| 04/16 | $891,484 | $853,522 |
| 05/16 | $859,442 | $821,684 |
| 06/16 | $912,846 | $854,525 |
| 07/16 | $950,584 | $897,526 |
| 08/16 | $956,281 | $919,831 |
| 09/16 | $961,265 | $931,659 |
| 10/16 | $966,962 | $933,881 |
| 11/16 | $897,181 | $890,893 |
| 12/16 | $905,633 | $892,860 |
| 01/17 | $952,501 | $941,720 |
| 02/17 | $969,806 | $970,548 |
| 03/17 | $1,014,511 | $995,048 |
| 04/17 | $1,036,863 | $1,016,833 |
| 05/17 | $1,063,542 | $1,046,895 |
| 06/17 | $1,077,963 | $1,057,434 |
| 07/17 | $1,114,015 | $1,120,467 |
| 08/17 | $1,139,252 | $1,145,459 |
| 09/17 | $1,124,110 | $1,140,905 |
| 10/17 | $1,139,973 | $1,180,900 |
| 11/17 | $1,126,994 | $1,183,271 |
| 12/17 | $1,179,502 | $1,225,747 |
| 01/18 | $1,267,928 | $1,327,907 |
| 02/18 | $1,201,426 | $1,266,665 |
| 03/18 | $1,180,233 | $1,243,114 |
| 04/18 | $1,153,924 | $1,237,614 |
| 05/18 | $1,099,114 | $1,193,760 |
| 06/18 | $1,049,420 | $1,144,163 |
| 07/18 | $1,088,883 | $1,169,297 |
| 08/18 | $1,054,536 | $1,137,680 |
| 09/18 | $1,042,113 | $1,131,642 |
| 10/18 | $964,648 | $1,033,096 |
| 11/18 | $1,021,650 | $1,075,670 |
| 12/18 | $1,006,725 | $1,047,174 |
| 01/19 | $1,080,967 | $1,138,862 |
| 02/19 | $1,084,679 | $1,141,422 |
| 03/19 | $1,115,861 | $1,151,002 |
| 04/19 | $1,155,209 | $1,175,233 |
| 05/19 | $1,081,710 | $1,089,956 |
| 06/19 | $1,155,952 | $1,157,981 |
| 07/19 | $1,140,361 | $1,143,822 |
| 08/19 | $1,094,331 | $1,088,053 |
| 09/19 | $1,107,694 | $1,108,823 |
| 10/19 | $1,142,588 | $1,155,579 |
| 11/19 | $1,123,285 | $1,153,989 |
| 12/19 | $1,212,282 | $1,240,083 |
| 01/20 | $1,155,563 | $1,182,277 |
| 02/20 | $1,106,406 | $1,119,931 |
| 03/20 | $895,410 | $947,436 |
| 04/20 | $977,086 | $1,034,197 |
| 05/20 | $1,007,336 | $1,042,140 |
| 06/20 | $1,101,112 | $1,118,747 |
| 07/20 | $1,211,526 | $1,218,720 |
| 08/20 | $1,250,095 | $1,245,660 |
| 09/20 | $1,231,189 | $1,225,680 |
| 10/20 | $1,278,077 | $1,250,933 |
| 11/20 | $1,414,204 | $1,366,628 |
| 12/20 | $1,550,674 | $1,467,094 |
| 01/21 | $1,608,671 | $1,512,072 |
| 02/21 | $1,600,277 | $1,523,637 |
| 03/21 | $1,578,909 | $1,500,626 |
| 04/21 | $1,592,646 | $1,537,988 |
| 05/21 | $1,626,223 | $1,573,655 |
| 06/21 | $1,644,538 | $1,576,367 |
| 07/21 | $1,562,121 | $1,470,280 |
| 08/21 | $1,588,067 | $1,508,765 |
| 09/21 | $1,523,201 | $1,448,805 |
| 10/21 | $1,552,200 | $1,463,095 |
| 11/21 | $1,456,809 | $1,403,469 |
| 12/21 | $1,472,633 | $1,429,803 |
| 01/22 | $1,446,153 | $1,402,738 |
| 02/22 | $1,344,504 | $1,360,810 |
| 03/22 | $1,273,605 | $1,330,075 |
| 04/22 | $1,161,706 | $1,256,088 |
| 05/22 | $1,187,332 | $1,261,618 |
| 06/22 | $1,124,975 | $1,177,784 |
| 07/22 | $1,119,850 | $1,174,891 |
| 08/22 | $1,102,766 | $1,179,796 |
| 09/22 | $990,012 | $1,041,486 |
| 10/22 | $973,783 | $1,009,149 |
| 11/22 | $1,118,996 | $1,158,824 |
| 12/22 | $1,086,221 | $1,142,536 |
| 01/23 | $1,187,973 | $1,232,752 |
| 02/23 | $1,101,875 | $1,152,818 |
| 03/23 | $1,144,489 | $1,187,733 |
| 04/23 | $1,124,487 | $1,174,273 |
| 05/23 | $1,101,006 | $1,154,550 |
| 06/23 | $1,142,750 | $1,198,388 |
| 07/23 | $1,194,061 | $1,272,989 |
| 08/23 | $1,125,357 | $1,194,573 |
| 09/23 | $1,080,134 | $1,163,332 |
| 10/23 | $1,046,216 | $1,118,131 |
| 11/23 | $1,118,399 | $1,207,615 |
| 12/23 | $1,158,486 | $1,254,826 |
| 01/24 | $1,097,606 | $1,196,560 |
| 02/24 | $1,149,662 | $1,253,483 |
| 03/24 | $1,177,897 | $1,284,544 |
| 04/24 | $1,169,073 | $1,290,291 |
| 05/24 | $1,181,426 | $1,297,579 |
| 06/24 | $1,211,425 | $1,348,760 |
| 07/24 | $1,231,718 | $1,352,774 |
| 08/24 | $1,237,894 | $1,374,615 |
| 09/24 | $1,304,068 | $1,466,405 |
| 10/24 | $1,242,306 | $1,401,190 |
Average Annual Total Returns for the Period Ended October 31, 2024 (%)
| AATR | 1 Year | 5 Years | 10 Years |
|---|
| Institutional Class | 18.74% | 1.69% | 2.19% |
| MSCI Emerging Markets Index (Net TR) | 25.32% | 3.93% | 3.43% |
THE FUND'S PAST PERFORMANCE IS NOT A GOOD PREDICTOR OF THE FUND'S FUTURE PERFORMANCE.
Fund performance data shown above does not reflect the deduction of taxes that a shareholder would pay on Fund distributions or redemption of Fund shares.
Key Fund Statistics as of October 31, 2024
| Total Net Assets | $1,240,789,006 |
| Total Number of Portfolio Holdings | 65 |
| Portfolio Turnover Rate | 33% |
| Total Advisory Fees Paid | $12,628,392 |
abrdn Emerging Markets Fund
(ABEMX)
What did the Fund invest in?
The tables below show the investment makeup of the Fund as of October 31, 2024.
Geographic Allocation (% of total net assets)
| China | 27.0% | |
| India | 19.5% | |
| Taiwan | 18.1% | |
| South Korea | 9.8% | |
| Mexico | 5.7% | |
| Brazil | 4.5% | |
| Saudi Arabia | 3.3% | |
| Indonesia | 2.3% | |
| United Arab Emirates | 2.1% | |
| Other | 7.8% | |
Ten Largest Holdings (% of total net assets)
| Taiwan Semiconductor Manufacturing Co. Ltd. | 12.6% |
| Tencent Holdings Ltd. | 7.3% |
| Samsung Electronics Co. Ltd. | 4.3% |
| Alibaba Group Holding Ltd. | 3.9% |
| HDFC Bank Ltd. | 2.8% |
| Power Grid Corp. of India Ltd. | 2.6% |
| Southern Copper Corp. | 2.4% |
| Contemporary Amperex Technology Co. Ltd., Class A | 2.4% |
| ICICI Bank Ltd. | 2.0% |
| Al Rajhi Bank | 1.8% |
Availability of Additional Information
You can find additional information, including the Fund's prospectus, financial information, fund holdings, and proxy voting information at abrdn.com/us/literature or call 866-667-9231. The QR code can be used to access the Fund's prospectus, financial information and holdings.
abrdn Emerging Markets Fund
(ABEMX)
abrdn Emerging Markets Fund
Annual Shareholder Report - October 31, 2024
This annual shareholder report contains important information about the abrdn Emerging Markets Fund (the "Fund") for the period of November 1, 2023 to October 31, 2024. You can find additional information about the Fund at abrdn.com/us/literature. You can also request this information by contacting us at 866-667-9231.
What were the Fund costs for the last year?
(based on a hypothetical $10,000 investment)
| Share Class | Costs of a $10,000 investment | Costs paid as a percentage of a $10,000 investment |
|---|
| Institutional Service | $137 | 1.25% |
How did the fund perform last year and what affected its performance?
The following discussion compares the performance of the Fund to the MSCI Emerging Markets Index (Net TR) to show how the Fund’s performance measures against the returns of similar investments for the reporting period.
What contributed to performance?
Chipmaker TSMC was the top stock contributor, reporting strong results exceeding market expectations, and benefitting from the global AI-driven tech sector rally for the greater part of the reporting period. Several high conviction names in China did well, including Tencent, battery maker Contemporary Amperex Technology Co. and electrical goods manufacturer Midea Group. HD Korea Shipbuilding & Offshore Engineering outperformed on good results and improving order flows that included large containers and favorable new vessel pricing. Power Grid Corporation of India was also a top contributor, with solid fundamentals, earnings visibility, and a robust pipeline of projects. Peruvian miner, Southern Copper, outperformed on relatively improving demand outlook and pricing for copper.
What detracted from performance?
The Fund’s exposure to China and Hong Kong dragged on performance for the greater part of the year up until mid-September 2024 when Chinese authorities announced a slew of stimulus measures that saw a sharp re-rating across the board, but that exuberance was short-lived. The Fund consolidated its exposure by backing the highest conviction ideas. In Taiwan, the Fund sold Hon Hai Precision Industry early into the reporting period on concerns around near-term softness in Apple sales and a weakening outlook for electric vehicles. Hon Hai shares, however, re-rated later in the period, which detracted from Fund performance. Not holding SK Hynix earlier in the period was costly as its share price jumped on the back of growing demand for high-performance memory chips. The Fund’s core memory position in Samsung Electronics’ preferred shares lagged technology peers on the uncertainty around its high bandwidth memory (HBM) product qualifying for use by a key customer.
abrdn Emerging Markets Fund
(AEMSX)
Institutional Service Class
Total Return Based on $1,000,000 Investment
The following graph reflects a hypothetical $1,000,000 investment for the most recently completed 10 fiscal years as compared to a broad-based securities market index, which is also the performance benchmark.
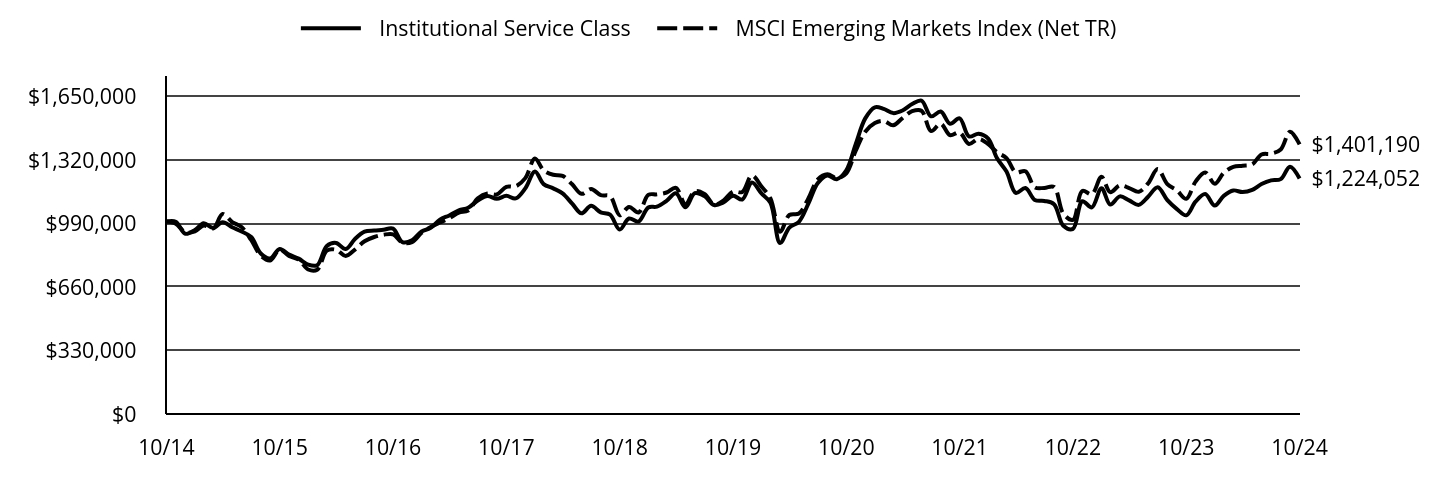
| Institutional Service Class | MSCI Emerging Markets Index (Net TR) |
|---|
| 10/14 | $1,000,000 | $1,000,000 |
| 11/14 | $999,328 | $989,423 |
| 12/14 | $936,679 | $943,824 |
| 01/15 | $956,135 | $949,482 |
| 02/15 | $990,878 | $978,881 |
| 03/15 | $966,558 | $964,960 |
| 04/15 | $996,437 | $1,039,180 |
| 05/15 | $970,727 | $997,565 |
| 06/15 | $948,304 | $971,657 |
| 07/15 | $919,673 | $904,303 |
| 08/15 | $833,781 | $822,511 |
| 09/15 | $808,104 | $797,767 |
| 10/15 | $857,952 | $854,675 |
| 11/15 | $828,465 | $821,336 |
| 12/15 | $807,370 | $803,027 |
| 01/16 | $776,099 | $750,931 |
| 02/16 | $773,256 | $749,703 |
| 03/16 | $872,756 | $848,909 |
| 04/16 | $889,103 | $853,522 |
| 05/16 | $857,120 | $821,684 |
| 06/16 | $909,713 | $854,525 |
| 07/16 | $947,381 | $897,526 |
| 08/16 | $953,067 | $919,831 |
| 09/16 | $957,331 | $931,659 |
| 10/16 | $963,017 | $933,881 |
| 11/16 | $893,367 | $890,893 |
| 12/16 | $902,533 | $892,860 |
| 01/17 | $948,522 | $941,720 |
| 02/17 | $965,768 | $970,548 |
| 03/17 | $1,010,319 | $995,048 |
| 04/17 | $1,031,877 | $1,016,833 |
| 05/17 | $1,058,464 | $1,046,895 |
| 06/17 | $1,072,117 | $1,057,434 |
| 07/17 | $1,108,764 | $1,120,467 |
| 08/17 | $1,133,196 | $1,145,459 |
| 09/17 | $1,118,106 | $1,140,905 |
| 10/17 | $1,133,915 | $1,180,900 |
| 11/17 | $1,120,262 | $1,183,271 |
| 12/17 | $1,172,768 | $1,225,747 |
| 01/18 | $1,260,690 | $1,327,907 |
| 02/18 | $1,194,567 | $1,266,665 |
| 03/18 | $1,172,768 | $1,243,114 |
| 04/18 | $1,146,610 | $1,237,614 |
| 05/18 | $1,092,840 | $1,193,760 |
| 06/18 | $1,042,703 | $1,144,163 |
| 07/18 | $1,081,941 | $1,169,297 |
| 08/18 | $1,047,789 | $1,137,680 |
| 09/18 | $1,036,163 | $1,131,642 |
| 10/18 | $958,415 | $1,033,096 |
| 11/18 | $1,015,818 | $1,075,670 |
| 12/18 | $1,000,248 | $1,047,174 |
| 01/19 | $1,073,328 | $1,138,862 |
| 02/19 | $1,077,758 | $1,141,422 |
| 03/19 | $1,108,023 | $1,151,002 |
| 04/19 | $1,147,147 | $1,175,233 |
| 05/19 | $1,074,067 | $1,089,956 |
| 06/19 | $1,147,886 | $1,157,981 |
| 07/19 | $1,132,384 | $1,143,822 |
| 08/19 | $1,085,878 | $1,088,053 |
| 09/19 | $1,099,165 | $1,108,823 |
| 10/19 | $1,133,860 | $1,155,579 |
| 11/19 | $1,114,667 | $1,153,989 |
| 12/19 | $1,202,750 | $1,240,083 |
| 01/20 | $1,146,371 | $1,182,277 |
| 02/20 | $1,097,509 | $1,119,931 |
| 03/20 | $888,531 | $947,436 |
| 04/20 | $968,965 | $1,034,197 |
| 05/20 | $999,034 | $1,042,140 |
| 06/20 | $1,091,495 | $1,118,747 |
| 07/20 | $1,200,495 | $1,218,720 |
| 08/20 | $1,239,584 | $1,245,660 |
| 09/20 | $1,220,039 | $1,225,680 |
| 10/20 | $1,266,646 | $1,250,933 |
| 11/20 | $1,401,204 | $1,366,628 |
| 12/20 | $1,536,370 | $1,467,094 |
| 01/21 | $1,594,003 | $1,512,072 |
| 02/21 | $1,585,661 | $1,523,637 |
| 03/21 | $1,563,670 | $1,500,626 |
| 04/21 | $1,577,319 | $1,537,988 |
| 05/21 | $1,610,686 | $1,573,655 |
| 06/21 | $1,628,886 | $1,576,367 |
| 07/21 | $1,546,986 | $1,470,280 |
| 08/21 | $1,572,011 | $1,508,765 |
| 09/21 | $1,508,312 | $1,448,805 |
| 10/21 | $1,536,370 | $1,463,095 |
| 11/21 | $1,442,337 | $1,403,469 |
| 12/21 | $1,456,921 | $1,429,803 |
| 01/22 | $1,431,465 | $1,402,738 |
| 02/22 | $1,330,490 | $1,360,810 |
| 03/22 | $1,260,062 | $1,330,075 |
| 04/22 | $1,148,905 | $1,256,088 |
| 05/22 | $1,174,361 | $1,261,618 |
| 06/22 | $1,112,419 | $1,177,784 |
| 07/22 | $1,107,328 | $1,174,891 |
| 08/22 | $1,090,357 | $1,179,796 |
| 09/22 | $978,352 | $1,041,486 |
| 10/22 | $962,230 | $1,009,149 |
| 11/22 | $1,105,631 | $1,158,824 |
| 12/22 | $1,073,916 | $1,142,536 |
| 01/23 | $1,173,272 | $1,232,752 |
| 02/23 | $1,088,603 | $1,152,818 |
| 03/23 | $1,130,938 | $1,187,733 |
| 04/23 | $1,110,202 | $1,174,273 |
| 05/23 | $1,086,875 | $1,154,550 |
| 06/23 | $1,129,210 | $1,198,388 |
| 07/23 | $1,178,456 | $1,272,989 |
| 08/23 | $1,111,066 | $1,194,573 |
| 09/23 | $1,066,140 | $1,163,332 |
| 10/23 | $1,032,445 | $1,118,131 |
| 11/23 | $1,103,291 | $1,207,615 |
| 12/23 | $1,143,442 | $1,254,826 |
| 01/24 | $1,082,984 | $1,196,560 |
| 02/24 | $1,133,804 | $1,253,483 |
| 03/24 | $1,161,842 | $1,284,544 |
| 04/24 | $1,153,080 | $1,290,291 |
| 05/24 | $1,164,471 | $1,297,579 |
| 06/24 | $1,195,138 | $1,348,760 |
| 07/24 | $1,214,414 | $1,352,774 |
| 08/24 | $1,220,548 | $1,374,615 |
| 09/24 | $1,285,387 | $1,466,405 |
| 10/24 | $1,224,052 | $1,401,190 |
Average Annual Total Returns for the Period Ended October 31, 2024 (%)
| AATR | 1 Year | 5 Years | 10 Years |
|---|
| Institutional Service Class | 18.56% | 1.54% | 2.04% |
| MSCI Emerging Markets Index (Net TR) | 25.32% | 3.93% | 3.43% |
THE FUND'S PAST PERFORMANCE IS NOT A GOOD PREDICTOR OF THE FUND'S FUTURE PERFORMANCE.
Fund performance data shown above does not reflect the deduction of taxes that a shareholder would pay on Fund distributions or redemption of Fund shares.
Key Fund Statistics as of October 31, 2024
| Total Net Assets | $1,240,789,006 |
| Total Number of Portfolio Holdings | 65 |
| Portfolio Turnover Rate | 33% |
| Total Advisory Fees Paid | $12,628,392 |
abrdn Emerging Markets Fund
(AEMSX)
Institutional Service Class
What did the Fund invest in?
The tables below show the investment makeup of the Fund as of October 31, 2024.
Geographic Allocation (% of total net assets)
| China | 27.0% | |
| India | 19.5% | |
| Taiwan | 18.1% | |
| South Korea | 9.8% | |
| Mexico | 5.7% | |
| Brazil | 4.5% | |
| Saudi Arabia | 3.3% | |
| Indonesia | 2.3% | |
| United Arab Emirates | 2.1% | |
| Other | 7.8% | |
Ten Largest Holdings (% of total net assets)
| Taiwan Semiconductor Manufacturing Co. Ltd. | 12.6% |
| Tencent Holdings Ltd. | 7.3% |
| Samsung Electronics Co. Ltd. | 4.3% |
| Alibaba Group Holding Ltd. | 3.9% |
| HDFC Bank Ltd. | 2.8% |
| Power Grid Corp. of India Ltd. | 2.6% |
| Southern Copper Corp. | 2.4% |
| Contemporary Amperex Technology Co. Ltd., Class A | 2.4% |
| ICICI Bank Ltd. | 2.0% |
| Al Rajhi Bank | 1.8% |
Availability of Additional Information
You can find additional information, including the Fund's prospectus, financial information, fund holdings, and proxy voting information at abrdn.com/us/literature or call 866-667-9231. The QR code can be used to access the Fund's prospectus, financial information and holdings.
abrdn Emerging Markets Fund
(AEMSX)
Institutional Service Class
abrdn Global Equity Impact Fund
Annual Shareholder Report - October 31, 2024
This annual shareholder report contains important information about the abrdn Global Equity Impact Fund (the "Fund") for the period of November 1, 2023 to October 31, 2024. You can find additional information about the Fund at abrdn.com/us/literature. You can also request this information by contacting us at 866-667-9231.
What were the Fund costs for the last year?
(based on a hypothetical $10,000 investment)
| Share Class | Costs of a $10,000 investment | Costs paid as a percentage of a $10,000 investment |
|---|
| A | $142 | 1.29% |
How did the fund perform last year and what affected its performance?
The following discussion compares the performance of the Fund to the MSCI All Country World Index (Net TR) (the “Index”) to show how the Fund’s performance measures against the returns of similar investments for the reporting period.
What contributed to performance?
Tetra Tech, the US environmental consultancy, rose strongly as it announced results that beat expectations and raised its guidance for the year. Sentiment towards the US insulin pump manufacturer Insulet Corporation recovered as fears that GLP-1 weight-loss drugs could adversely affect the company's addressable market and future growth eased. Additionally, the shares were helped during the period by earlier-than-expected approval of its main Omnipod product for use in Type II diabetes patients. Shares in battery manufacturer Contemporary Amperex Technology Company performed well after the multi-faceted stimulus measures announced in China in September 2024.
What detracted from performance?
Not owning NVIDIA, which is included in the Index but does not meet the Fund’s impact criteria, had the largest negative effect on performance. The company’s recent results moderately exceeded guidance, and its comments about a strong demand environment, coupled with supply constraints for both existing and new products, drove the shares higher. Coursera, the US-based education platform, was weak as investors feared that the growth of its online education business could be held back by the rise of ChatGPT and other artificial-intelligence engines. Remitly Global, the US digital remittance business, fell as higher investments concerned investors and raised questions about returns and the competitive landscape.
abrdn Global Equity Impact Fund
(JETAX)
Total Return Based on $10,000 Investment
The following graph reflects a hypothetical $10,000 investment for the most recently completed 10 fiscal years as compared to a broad-based securities market index, which is also the performance benchmark.
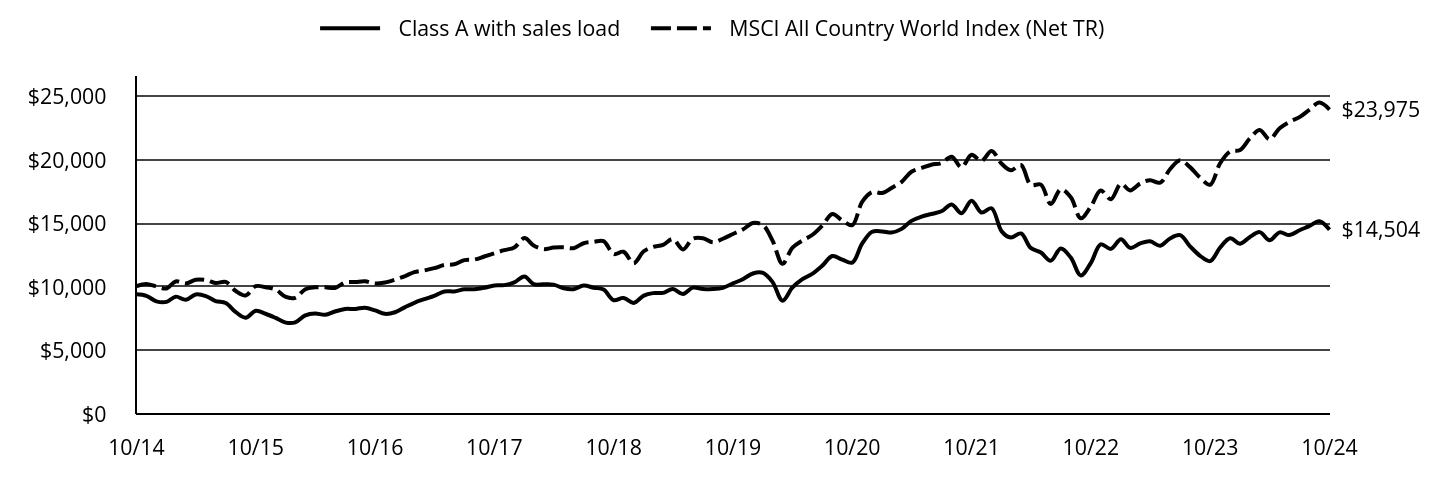
| Class A with sales load | MSCI All Country World Index (Net TR) |
|---|
| 10/14 | $9,422 | $10,070 |
| 11/14 | $9,307 | $10,239 |
| 12/14 | $8,870 | $10,041 |
| 01/15 | $8,830 | $9,884 |
| 02/15 | $9,241 | $10,435 |
| 03/15 | $8,991 | $10,273 |
| 04/15 | $9,410 | $10,571 |
| 05/15 | $9,289 | $10,557 |
| 06/15 | $8,894 | $10,309 |
| 07/15 | $8,741 | $10,398 |
| 08/15 | $8,015 | $9,685 |
| 09/15 | $7,580 | $9,334 |
| 10/15 | $8,128 | $10,067 |
| 11/15 | $7,894 | $9,984 |
| 12/15 | $7,564 | $9,804 |
| 01/16 | $7,197 | $9,213 |
| 02/16 | $7,214 | $9,149 |
| 03/16 | $7,772 | $9,827 |
| 04/16 | $7,913 | $9,972 |
| 05/16 | $7,813 | $9,985 |
| 06/16 | $8,072 | $9,924 |
| 07/16 | $8,272 | $10,352 |
| 08/16 | $8,272 | $10,387 |
| 09/16 | $8,372 | $10,451 |
| 10/16 | $8,155 | $10,273 |
| 11/16 | $7,888 | $10,351 |
| 12/16 | $8,012 | $10,575 |
| 01/17 | $8,418 | $10,864 |
| 02/17 | $8,757 | $11,169 |
| 03/17 | $9,045 | $11,305 |
| 04/17 | $9,307 | $11,482 |
| 05/17 | $9,646 | $11,735 |
| 06/17 | $9,654 | $11,789 |
| 07/17 | $9,815 | $12,118 |
| 08/17 | $9,824 | $12,164 |
| 09/17 | $9,942 | $12,399 |
| 10/17 | $10,120 | $12,657 |
| 11/17 | $10,146 | $12,902 |
| 12/17 | $10,369 | $13,110 |
| 01/18 | $10,831 | $13,850 |
| 02/18 | $10,221 | $13,268 |
| 03/18 | $10,213 | $12,984 |
| 04/18 | $10,186 | $13,108 |
| 05/18 | $9,899 | $13,124 |
| 06/18 | $9,830 | $13,053 |
| 07/18 | $10,117 | $13,447 |
| 08/18 | $9,943 | $13,552 |
| 09/18 | $9,803 | $13,611 |
| 10/18 | $8,959 | $12,591 |
| 11/18 | $9,142 | $12,776 |
| 12/18 | $8,747 | $11,876 |
| 01/19 | $9,323 | $12,813 |
| 02/19 | $9,518 | $13,156 |
| 03/19 | $9,536 | $13,322 |
| 04/19 | $9,838 | $13,771 |
| 05/19 | $9,447 | $12,955 |
| 06/19 | $9,953 | $13,803 |
| 07/19 | $9,847 | $13,843 |
| 08/19 | $9,838 | $13,515 |
| 09/19 | $9,935 | $13,799 |
| 10/19 | $10,281 | $14,177 |
| 11/19 | $10,610 | $14,523 |
| 12/19 | $11,066 | $15,034 |
| 01/20 | $11,111 | $14,868 |
| 02/20 | $10,404 | $13,667 |
| 03/20 | $8,925 | $11,822 |
| 04/20 | $9,950 | $13,089 |
| 05/20 | $10,613 | $13,658 |
| 06/20 | $11,039 | $14,094 |
| 07/20 | $11,683 | $14,840 |
| 08/20 | $12,436 | $15,748 |
| 09/20 | $12,155 | $15,240 |
| 10/20 | $11,919 | $14,870 |
| 11/20 | $13,415 | $16,703 |
| 12/20 | $14,350 | $17,478 |
| 01/21 | $14,377 | $17,399 |
| 02/21 | $14,286 | $17,802 |
| 03/21 | $14,577 | $18,277 |
| 04/21 | $15,206 | $19,076 |
| 05/21 | $15,542 | $19,373 |
| 06/21 | $15,752 | $19,628 |
| 07/21 | $15,961 | $19,764 |
| 08/21 | $16,489 | $20,258 |
| 09/21 | $15,807 | $19,422 |
| 10/21 | $16,799 | $20,413 |
| 11/21 | $15,870 | $19,921 |
| 12/21 | $16,202 | $20,718 |
| 01/22 | $14,381 | $19,701 |
| 02/22 | $13,889 | $19,192 |
| 03/22 | $14,217 | $19,608 |
| 04/22 | $13,079 | $18,038 |
| 05/22 | $12,714 | $18,059 |
| 06/22 | $12,068 | $16,537 |
| 07/22 | $13,033 | $17,692 |
| 08/22 | $12,295 | $17,040 |
| 09/22 | $10,911 | $15,409 |
| 10/22 | $11,904 | $16,339 |
| 11/22 | $13,361 | $17,606 |
| 12/22 | $13,003 | $16,913 |
| 01/23 | $13,766 | $18,126 |
| 02/23 | $13,079 | $17,606 |
| 03/23 | $13,432 | $18,149 |
| 04/23 | $13,595 | $18,410 |
| 05/23 | $13,251 | $18,213 |
| 06/23 | $13,824 | $19,270 |
| 07/23 | $14,081 | $19,976 |
| 08/23 | $13,184 | $19,418 |
| 09/23 | $12,459 | $18,615 |
| 10/23 | $12,038 | $18,055 |
| 11/23 | $13,089 | $19,721 |
| 12/23 | $13,838 | $20,669 |
| 01/24 | $13,414 | $20,790 |
| 02/24 | $13,925 | $21,682 |
| 03/24 | $14,321 | $22,363 |
| 04/24 | $13,684 | $21,625 |
| 05/24 | $14,301 | $22,503 |
| 06/24 | $14,089 | $23,004 |
| 07/24 | $14,465 | $23,375 |
| 08/24 | $14,812 | $23,969 |
| 09/24 | $15,169 | $24,526 |
| 10/24 | $14,504 | $23,975 |
Average Annual Total Returns for the Period Ended October 31, 2024 (%)
| AATR | 1 Year | 5 Years | 10 Years |
|---|
| Class A without sales load | 20.48% | 7.12% | 4.41% |
| Class A with sales load - 5.75% | 13.54% | 5.86% | 3.79% |
| MSCI All Country World Index (Net TR) | 32.79% | 11.08% | 9.06% |
THE FUND'S PAST PERFORMANCE IS NOT A GOOD PREDICTOR OF THE FUND'S FUTURE PERFORMANCE.
Fund performance data shown above does not reflect the deduction of taxes that a shareholder would pay on Fund distributions or redemption of Fund shares.
Key Fund Statistics as of October 31, 2024
| Total Net Assets | $42,973,272 |
| Total Number of Portfolio Holdings | 42 |
| Portfolio Turnover Rate | 49% |
| Total Advisory Fees Paid | $117,353 |
abrdn Global Equity Impact Fund
(JETAX)
What did the Fund invest in?
The tables below show the investment makeup of the Fund as of October 31, 2024.
Geographic Allocation (% of total net assets)
| United States | 56.6% | |
| United Kingdom | 10.7% | |
| Taiwan | 6.7% | |
| China | 4.9% | |
| Denmark | 4.4% | |
| Netherlands | 3.0% | |
| Canada | 3.0% | |
| Brazil | 2.9% | |
| Ireland | 2.4% | |
| Other | 5.4% | |
Ten Largest Holdings (% of total net assets)
| Microsoft Corp. | 6.1% |
| Tetra Tech, Inc. | 4.6% |
| RELX PLC | 4.0% |
| UnitedHealth Group, Inc. | 4.0% |
| NextEra Energy, Inc. | 3.8% |
| Taiwan Semiconductor Manufacturing Co. Ltd. | 3.5% |
| AstraZeneca PLC | 3.3% |
| Prologis, Inc. | 3.2% |
| Westinghouse Air Brake Technologies Corp. | 3.2% |
| Novo Nordisk AS, Class B | 3.1% |
Availability of Additional Information
You can find additional information, including the Fund's prospectus, financial information, fund holdings, and proxy voting information at abrdn.com/us/literature or call 866-667-9231. The QR code can be used to access the Fund's prospectus, financial information and holdings.
abrdn Global Equity Impact Fund
(JETAX)
abrdn Global Equity Impact Fund
Annual Shareholder Report - October 31, 2024
This annual shareholder report contains important information about the abrdn Global Equity Impact Fund (the "Fund") for the period of November 1, 2023 to October 31, 2024. You can find additional information about the Fund at abrdn.com/us/literature. You can also request this information by contacting us at 866-667-9231.
What were the Fund costs for the last year?
(based on a hypothetical $10,000 investment)
| Share Class | Costs of a $10,000 investment | Costs paid as a percentage of a $10,000 investment |
|---|
| Institutional | $115 | 1.04% |
How did the fund perform last year and what affected its performance?
The following discussion compares the performance of the Fund to the MSCI All Country World Index (Net TR) (the “Index”) to show how the Fund’s performance measures against the returns of similar investments for the reporting period.
What contributed to performance?
Tetra Tech, the US environmental consultancy, rose strongly as it announced results that beat expectations and raised its guidance for the year. Sentiment towards the US insulin pump manufacturer Insulet Corporation recovered as fears that GLP-1 weight-loss drugs could adversely affect the company's addressable market and future growth eased. Additionally, the shares were helped during the period by earlier-than-expected approval of its main Omnipod product for use in Type II diabetes patients. Shares in battery manufacturer Contemporary Amperex Technology Company performed well after the multi-faceted stimulus measures announced in China in September 2024.
What detracted from performance?
Not owning NVIDIA, which is included in the Index but does not meet the Fund’s impact criteria, had the largest negative effect on performance. The company’s recent results moderately exceeded guidance, and its comments about a strong demand environment, coupled with supply constraints for both existing and new products, drove the shares higher. Coursera, the US-based education platform, was weak as investors feared that the growth of its online education business could be held back by the rise of ChatGPT and other artificial-intelligence engines. Remitly Global, the US digital remittance business, fell as higher investments concerned investors and raised questions about returns and the competitive landscape.
abrdn Global Equity Impact Fund
(JETIX)
Total Return Based on $1,000,000 Investment
The following graph reflects a hypothetical $1,000,000 investment for the most recently completed 10 fiscal years as compared to a broad-based securities market index, which is also the performance benchmark.
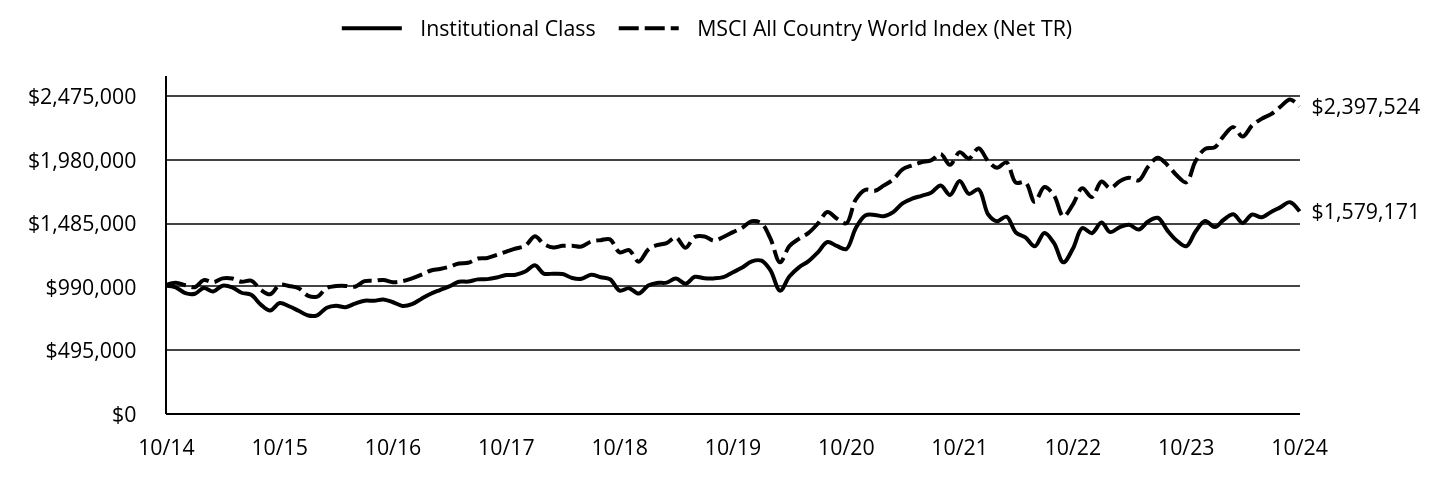
| Institutional Class | MSCI All Country World Index (Net TR) |
|---|
| 10/14 | $1,000,000 | $1,007,043 |
| 11/14 | $987,755 | $1,023,889 |
| 12/14 | $941,793 | $1,004,127 |
| 01/15 | $937,508 | $988,432 |
| 02/15 | $982,070 | $1,043,460 |
| 03/15 | $954,647 | $1,027,288 |
| 04/15 | $1,000,066 | $1,057,098 |
| 05/15 | $987,211 | $1,055,718 |
| 06/15 | $945,221 | $1,030,863 |
| 07/15 | $928,938 | $1,039,816 |
| 08/15 | $852,670 | $968,536 |
| 09/15 | $806,394 | $933,447 |
| 10/15 | $864,667 | $1,006,706 |
| 11/15 | $839,815 | $998,395 |
| 12/15 | $804,534 | $980,390 |
| 01/16 | $767,238 | $921,262 |
| 02/16 | $769,014 | $914,921 |
| 03/16 | $828,510 | $982,726 |
| 04/16 | $843,606 | $997,232 |
| 05/16 | $832,950 | $998,492 |
| 06/16 | $860,479 | $992,443 |
| 07/16 | $882,679 | $1,035,214 |
| 08/16 | $882,679 | $1,038,695 |
| 09/16 | $893,335 | $1,045,061 |
| 10/16 | $871,135 | $1,027,323 |
| 11/16 | $842,718 | $1,035,131 |
| 12/16 | $855,734 | $1,057,491 |
| 01/17 | $899,200 | $1,086,406 |
| 02/17 | $935,421 | $1,116,881 |
| 03/17 | $966,210 | $1,130,545 |
| 04/17 | $994,281 | $1,148,164 |
| 05/17 | $1,031,408 | $1,173,519 |
| 06/17 | $1,032,314 | $1,178,855 |
| 07/17 | $1,049,519 | $1,211,800 |
| 08/17 | $1,051,330 | $1,216,443 |
| 09/17 | $1,064,008 | $1,239,945 |
| 10/17 | $1,083,024 | $1,265,692 |
| 11/17 | $1,085,741 | $1,290,194 |
| 12/17 | $1,110,807 | $1,310,994 |
| 01/18 | $1,160,280 | $1,384,956 |
| 02/18 | $1,094,938 | $1,326,790 |
| 03/18 | $1,094,005 | $1,298,388 |
| 04/18 | $1,091,204 | $1,310,787 |
| 05/18 | $1,060,400 | $1,312,423 |
| 06/18 | $1,053,866 | $1,305,316 |
| 07/18 | $1,084,670 | $1,344,680 |
| 08/18 | $1,066,001 | $1,355,245 |
| 09/18 | $1,051,066 | $1,361,143 |
| 10/18 | $961,455 | $1,259,140 |
| 11/18 | $981,057 | $1,277,556 |
| 12/18 | $939,111 | $1,187,572 |
| 01/19 | $1,000,957 | $1,281,342 |
| 02/19 | $1,021,889 | $1,315,614 |
| 03/19 | $1,023,792 | $1,332,159 |
| 04/19 | $1,056,143 | $1,377,141 |
| 05/19 | $1,015,229 | $1,295,450 |
| 06/19 | $1,069,463 | $1,380,276 |
| 07/19 | $1,058,046 | $1,384,320 |
| 08/19 | $1,057,094 | $1,351,481 |
| 09/19 | $1,067,560 | $1,379,918 |
| 10/19 | $1,105,620 | $1,417,685 |
| 11/19 | $1,141,776 | $1,452,292 |
| 12/19 | $1,190,180 | $1,503,435 |
| 01/20 | $1,195,058 | $1,486,828 |
| 02/20 | $1,119,940 | $1,366,737 |
| 03/20 | $960,924 | $1,182,223 |
| 04/20 | $1,071,162 | $1,308,869 |
| 05/20 | $1,143,353 | $1,365,793 |
| 06/20 | $1,189,204 | $1,409,434 |
| 07/20 | $1,259,445 | $1,483,974 |
| 08/20 | $1,340,416 | $1,574,801 |
| 09/20 | $1,310,174 | $1,524,025 |
| 10/20 | $1,285,785 | $1,486,978 |
| 11/20 | $1,446,752 | $1,670,267 |
| 12/20 | $1,547,793 | $1,747,816 |
| 01/21 | $1,551,722 | $1,739,867 |
| 02/21 | $1,540,919 | $1,780,169 |
| 03/21 | $1,573,328 | $1,827,716 |
| 04/21 | $1,642,075 | $1,907,628 |
| 05/21 | $1,678,413 | $1,937,315 |
| 06/21 | $1,701,001 | $1,962,844 |
| 07/21 | $1,724,572 | $1,976,370 |
| 08/21 | $1,781,534 | $2,025,837 |
| 09/21 | $1,707,876 | $1,942,150 |
| 10/21 | $1,815,907 | $2,041,284 |
| 11/21 | $1,715,733 | $1,992,129 |
| 12/21 | $1,751,400 | $2,071,815 |
| 01/22 | $1,554,835 | $1,970,063 |
| 02/22 | $1,502,745 | $1,919,182 |
| 03/22 | $1,538,127 | $1,960,750 |
| 04/22 | $1,415,273 | $1,803,808 |
| 05/22 | $1,376,943 | $1,805,919 |
| 06/22 | $1,307,162 | $1,653,686 |
| 07/22 | $1,411,342 | $1,769,167 |
| 08/22 | $1,331,733 | $1,704,036 |
| 09/22 | $1,182,343 | $1,540,910 |
| 10/22 | $1,289,471 | $1,633,899 |
| 11/22 | $1,448,689 | $1,760,630 |
| 12/22 | $1,409,693 | $1,691,347 |
| 01/23 | $1,492,372 | $1,812,578 |
| 02/23 | $1,417,961 | $1,760,629 |
| 03/23 | $1,457,234 | $1,814,914 |
| 04/23 | $1,474,803 | $1,840,999 |
| 05/23 | $1,437,597 | $1,821,281 |
| 06/23 | $1,500,640 | $1,927,026 |
| 07/23 | $1,529,578 | $1,997,570 |
| 08/23 | $1,431,396 | $1,941,751 |
| 09/23 | $1,352,850 | $1,861,458 |
| 10/23 | $1,307,376 | $1,805,489 |
| 11/23 | $1,422,095 | $1,972,129 |
| 12/23 | $1,503,773 | $2,066,858 |
| 01/24 | $1,457,696 | $2,078,974 |
| 02/24 | $1,514,245 | $2,168,190 |
| 03/24 | $1,557,180 | $2,236,264 |
| 04/24 | $1,489,112 | $2,162,483 |
| 05/24 | $1,555,085 | $2,250,309 |
| 06/24 | $1,533,094 | $2,300,429 |
| 07/24 | $1,574,982 | $2,337,529 |
| 08/24 | $1,612,681 | $2,396,894 |
| 09/24 | $1,651,427 | $2,452,576 |
| 10/24 | $1,579,171 | $2,397,524 |
Average Annual Total Returns for the Period Ended October 31, 2024 (%)
| AATR | 1 Year | 5 Years | 10 Years |
|---|
| Institutional Class | 20.79% | 7.39% | 4.68% |
| MSCI All Country World Index (Net TR) | 32.79% | 11.08% | 9.06% |
THE FUND'S PAST PERFORMANCE IS NOT A GOOD PREDICTOR OF THE FUND'S FUTURE PERFORMANCE.
Fund performance data shown above does not reflect the deduction of taxes that a shareholder would pay on Fund distributions or redemption of Fund shares.
Key Fund Statistics as of October 31, 2024
| Total Net Assets | $42,973,272 |
| Total Number of Portfolio Holdings | 42 |
| Portfolio Turnover Rate | 49% |
| Total Advisory Fees Paid | $117,353 |
abrdn Global Equity Impact Fund
(JETIX)
What did the Fund invest in?
The tables below show the investment makeup of the Fund as of October 31, 2024.
Geographic Allocation (% of total net assets)
| United States | 56.6% | |
| United Kingdom | 10.7% | |
| Taiwan | 6.7% | |
| China | 4.9% | |
| Denmark | 4.4% | |
| Netherlands | 3.0% | |
| Canada | 3.0% | |
| Brazil | 2.9% | |
| Ireland | 2.4% | |
| Other | 5.4% | |
Ten Largest Holdings (% of total net assets)
| Microsoft Corp. | 6.1% |
| Tetra Tech, Inc. | 4.6% |
| RELX PLC | 4.0% |
| UnitedHealth Group, Inc. | 4.0% |
| NextEra Energy, Inc. | 3.8% |
| Taiwan Semiconductor Manufacturing Co. Ltd. | 3.5% |
| AstraZeneca PLC | 3.3% |
| Prologis, Inc. | 3.2% |
| Westinghouse Air Brake Technologies Corp. | 3.2% |
| Novo Nordisk AS, Class B | 3.1% |
Availability of Additional Information
You can find additional information, including the Fund's prospectus, financial information, fund holdings, and proxy voting information at abrdn.com/us/literature or call 866-667-9231. The QR code can be used to access the Fund's prospectus, financial information and holdings.
abrdn Global Equity Impact Fund
(JETIX)
abrdn Global Infrastructure Fund
Annual Shareholder Report - October 31, 2024
This annual shareholder report contains important information about the abrdn Global Infrastructure Fund (the "Fund") for the period of November 1, 2023 to October 31, 2024. You can find additional information about the Fund at abrdn.com/us/literature. You can also request this information by contacting us at 866-667-9231.
This report describes material changes to the Fund that occurred during the reporting period.
What were the Fund costs for the last year?
(based on a hypothetical $10,000 investment)
| Share Class | Costs of a $10,000 investment | Costs paid as a percentage of a $10,000 investment |
|---|
| A | $140 | 1.25% |
How did the fund perform last year and what affected its performance?
The following discussion compares the performance of the Fund to the S&P Global Infrastructure Index (Net TR) (the “Index”) to show how the Fund’s performance measures against the returns of similar investments for the reporting period.
What contributed to performance?
Vistra Corporation, a leading power producer in the U.S., maintained its robust performance trajectory, with investors showing optimism towards sustained demand, particularly driven by the expansion of data centers. Similarly, International Container Terminal Services, a global port operator based in the Philippines, demonstrated exceptional performance. This was attributed to consistent market share gains in several of its key locations, including Melbourne, Manila, and Mexico. Helios Towers, which specializes in operating towers across Africa, also outperformed. The company's success was underpinned by significant organic growth, enhanced tenancy ratios, and improved profit margins, highlighting its strong operational efficiency.
What detracted from performance?
RWE, a leading German energy company, experienced a decline in performance as a result of falling gas prices in Europe, which also led to a decrease in power prices. Similarly, CCR, a prominent toll-road operator in Brazil, saw its performance dip, influenced by broader economic challenges in Brazil and a declining currency. CCR has been adversely affected by the increase in interest rates. Furthermore, CCR disclosed that it did not win bids for several toll road projects in Brazil. EDP Renováveis, a Portuguese renewable energy firm, also saw a downturn in performance, attributed to lower power prices and asset rotation gains that fell short of expectations.
abrdn Global Infrastructure Fund
(AIAFX)
Total Return Based on $10,000 Investment
The following graph reflects a hypothetical $10,000 investment for the most recently completed 10 fiscal years as compared to a broad-based securities market index, which is also the performance benchmark.
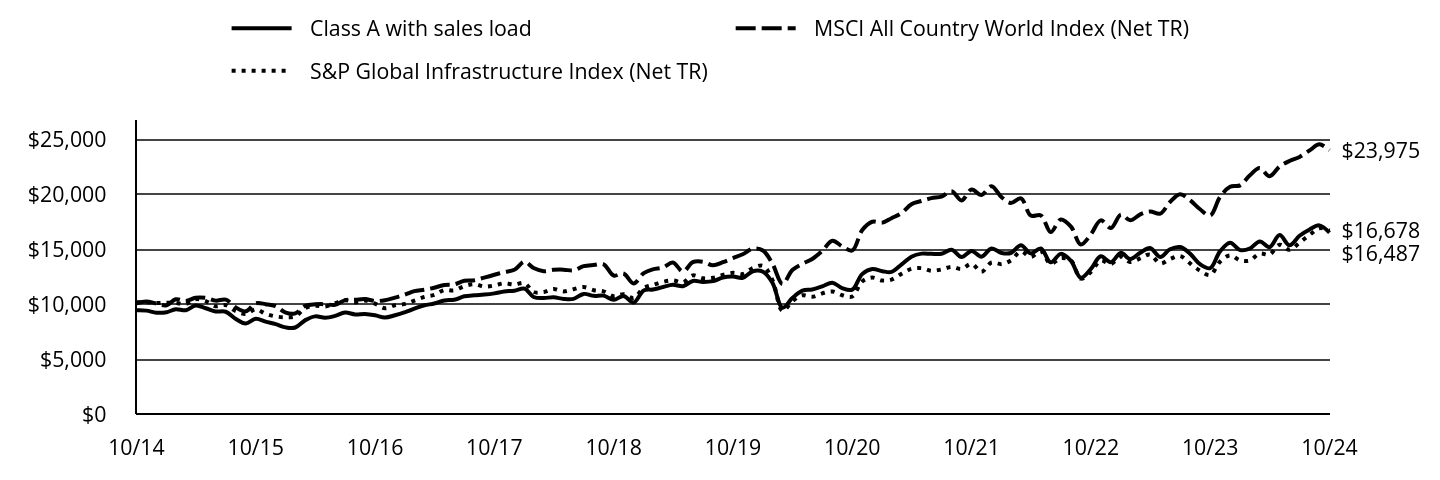
| Class A with sales load | MSCI All Country World Index (Net TR) | S&P Global Infrastructure Index (Net TR) |
|---|
| 10/14 | $9,424 | $10,070 | $10,164 |
| 11/14 | $9,400 | $10,239 | $10,166 |
| 12/14 | $9,211 | $10,041 | $10,098 |
| 01/15 | $9,254 | $9,884 | $10,107 |
| 02/15 | $9,531 | $10,435 | $10,096 |
| 03/15 | $9,430 | $10,273 | $10,005 |
| 04/15 | $9,863 | $10,571 | $10,440 |
| 05/15 | $9,618 | $10,557 | $10,269 |
| 06/15 | $9,323 | $10,309 | $9,795 |
| 07/15 | $9,298 | $10,398 | $9,900 |
| 08/15 | $8,638 | $9,685 | $9,349 |
| 09/15 | $8,234 | $9,334 | $9,091 |
| 10/15 | $8,656 | $10,067 | $9,524 |
| 11/15 | $8,396 | $9,984 | $9,112 |
| 12/15 | $8,169 | $9,804 | $8,869 |
| 01/16 | $7,876 | $9,213 | $8,799 |
| 02/16 | $7,866 | $9,149 | $8,877 |
| 03/16 | $8,536 | $9,827 | $9,622 |
| 04/16 | $8,877 | $9,972 | $9,842 |
| 05/16 | $8,752 | $9,985 | $9,782 |
| 06/16 | $8,917 | $9,924 | $10,069 |
| 07/16 | $9,226 | $10,352 | $10,347 |
| 08/16 | $9,053 | $10,387 | $10,149 |
| 09/16 | $9,098 | $10,451 | $10,326 |
| 10/16 | $8,981 | $10,273 | $10,033 |
| 11/16 | $8,771 | $10,351 | $9,616 |
| 12/16 | $8,975 | $10,575 | $9,884 |
| 01/17 | $9,259 | $10,864 | $10,015 |
| 02/17 | $9,575 | $11,169 | $10,307 |
| 03/17 | $9,884 | $11,305 | $10,651 |
| 04/17 | $10,046 | $11,482 | $10,828 |
| 05/17 | $10,328 | $11,735 | $11,269 |
| 06/17 | $10,384 | $11,789 | $11,250 |
| 07/17 | $10,700 | $12,118 | $11,621 |
| 08/17 | $10,800 | $12,164 | $11,800 |
| 09/17 | $10,857 | $12,399 | $11,582 |
| 10/17 | $10,968 | $12,657 | $11,689 |
| 11/17 | $11,143 | $12,902 | $11,883 |
| 12/17 | $11,209 | $13,110 | $11,769 |
| 01/18 | $11,402 | $13,850 | $11,902 |
| 02/18 | $10,640 | $13,268 | $11,096 |
| 03/18 | $10,548 | $12,984 | $11,098 |
| 04/18 | $10,613 | $13,108 | $11,367 |
| 05/18 | $10,466 | $13,124 | $11,144 |
| 06/18 | $10,470 | $13,053 | $11,348 |
| 07/18 | $10,918 | $13,447 | $11,547 |
| 08/18 | $10,743 | $13,552 | $11,258 |
| 09/18 | $10,763 | $13,611 | $11,144 |
| 10/18 | $10,377 | $12,591 | $10,701 |
| 11/18 | $10,730 | $12,776 | $10,896 |
| 12/18 | $10,137 | $11,876 | $10,548 |
| 01/19 | $11,237 | $12,813 | $11,465 |
| 02/19 | $11,321 | $13,156 | $11,727 |
| 03/19 | $11,547 | $13,322 | $12,008 |
| 04/19 | $11,755 | $13,771 | $12,147 |
| 05/19 | $11,620 | $12,955 | $11,962 |
| 06/19 | $12,095 | $13,803 | $12,600 |
| 07/19 | $12,010 | $13,843 | $12,346 |
| 08/19 | $12,078 | $13,515 | $12,383 |
| 09/19 | $12,410 | $13,799 | $12,645 |
| 10/19 | $12,495 | $14,177 | $12,835 |
| 11/19 | $12,381 | $14,523 | $12,725 |
| 12/19 | $12,984 | $15,034 | $13,265 |
| 01/20 | $12,931 | $14,868 | $13,473 |
| 02/20 | $11,932 | $13,667 | $12,179 |
| 03/20 | $9,660 | $11,822 | $9,377 |
| 04/20 | $10,542 | $13,089 | $10,259 |
| 05/20 | $11,213 | $13,658 | $10,798 |
| 06/20 | $11,320 | $14,094 | $10,654 |
| 07/20 | $11,609 | $14,840 | $10,968 |
| 08/20 | $11,939 | $15,748 | $11,141 |
| 09/20 | $11,446 | $15,240 | $10,800 |
| 10/20 | $11,309 | $14,870 | $10,680 |
| 11/20 | $12,717 | $16,703 | $12,051 |
| 12/20 | $13,184 | $17,478 | $12,403 |
| 01/21 | $12,986 | $17,399 | $12,136 |
| 02/21 | $12,920 | $17,802 | $12,222 |
| 03/21 | $13,609 | $18,277 | $12,751 |
| 04/21 | $14,304 | $19,076 | $13,198 |
| 05/21 | $14,582 | $19,373 | $13,260 |
| 06/21 | $14,562 | $19,628 | $13,022 |
| 07/21 | $14,574 | $19,764 | $13,142 |
| 08/21 | $14,939 | $20,258 | $13,371 |
| 09/21 | $14,273 | $19,422 | $13,190 |
| 10/21 | $14,825 | $20,413 | $13,663 |
| 11/21 | $14,303 | $19,921 | $12,925 |
| 12/21 | $15,040 | $20,718 | $13,773 |
| 01/22 | $14,640 | $19,701 | $13,628 |
| 02/22 | $14,640 | $19,192 | $13,961 |
| 03/22 | $15,347 | $19,608 | $14,774 |
| 04/22 | $14,605 | $18,038 | $14,285 |
| 05/22 | $15,051 | $18,059 | $14,796 |
| 06/22 | $13,792 | $16,537 | $13,643 |
| 07/22 | $14,559 | $17,692 | $14,180 |
| 08/22 | $13,919 | $17,040 | $13,956 |
| 09/22 | $12,383 | $15,409 | $12,304 |
| 10/22 | $13,189 | $16,339 | $12,922 |
| 11/22 | $14,340 | $17,606 | $13,955 |
| 12/22 | $13,809 | $16,913 | $13,637 |
| 01/23 | $14,665 | $18,126 | $14,317 |
| 02/23 | $14,090 | $17,606 | $13,827 |
| 03/23 | $14,657 | $18,149 | $14,145 |
| 04/23 | $15,092 | $18,410 | $14,508 |
| 05/23 | $14,275 | $18,213 | $13,685 |
| 06/23 | $14,977 | $19,270 | $14,086 |
| 07/23 | $15,177 | $19,976 | $14,363 |
| 08/23 | $14,559 | $19,418 | $13,680 |
| 09/23 | $13,620 | $18,615 | $13,030 |
| 10/23 | $13,258 | $18,055 | $12,633 |
| 11/23 | $14,784 | $19,721 | $13,849 |
| 12/23 | $15,578 | $20,669 | $14,425 |
| 01/24 | $14,902 | $20,790 | $13,964 |
| 02/24 | $15,031 | $21,682 | $13,954 |
| 03/24 | $15,694 | $22,363 | $14,587 |
| 04/24 | $15,170 | $21,625 | $14,504 |
| 05/24 | $16,266 | $22,503 | $15,394 |
| 06/24 | $15,343 | $23,004 | $14,927 |
| 07/24 | $16,207 | $23,375 | $15,576 |
| 08/24 | $16,784 | $23,969 | $16,285 |
| 09/24 | $17,151 | $24,526 | $16,896 |
| 10/24 | $16,487 | $23,975 | $16,678 |
Average Annual Total Returns for the Period Ended October 31, 2024 (%)
| AATR | 1 Year | 5 Years | 10 Years |
|---|
| Class A without sales load | 24.35% | 5.70% | 5.75% |
| Class A with sales load - 5.75% | 17.19% | 4.46% | 5.13% |
| MSCI All Country World Index (Net TR) | 32.79% | 11.08% | 9.06% |
| S&P Global Infrastructure Index (Net TR) | 32.01% | 5.38% | 5.08% |
THE FUND'S PAST PERFORMANCE IS NOT A GOOD PREDICTOR OF THE FUND'S FUTURE PERFORMANCE.
Fund performance data shown above does not reflect the deduction of taxes that a shareholder would pay on Fund distributions or redemption of Fund shares.
Key Fund Statistics as of October 31, 2024
| Total Net Assets | $42,754,281 |
| Total Number of Portfolio Holdings | 54 |
| Portfolio Turnover Rate | 14% |
| Total Advisory Fees Paid | $180,830 |
abrdn Global Infrastructure Fund
(AIAFX)
What did the Fund invest in?
The tables below show the investment makeup of the Fund as of October 31, 2024.
Geographic Allocation (% of total net assets)
| United States | 43.2% | |
| France | 10.6% | |
| Spain | 7.9% | |
| Canada | 5.6% | |
| United Kingdom | 4.4% | |
| Italy | 4.4% | |
| Brazil | 4.0% | |
| Mexico | 2.9% | |
| Germany | 2.6% | |
| Malaysia | 2.3% | |
| Philippines | 2.3% | |
| Other | 9.8% | |
Ten Largest Holdings (% of total net assets)
| Williams Cos., Inc. | 3.6% |
| Kinder Morgan, Inc. | 3.4% |
| Enbridge, Inc. | 3.3% |
| Norfolk Southern Corp. | 3.2% |
| Aena SME SA | 3.0% |
| NextEra Energy, Inc. | 2.9% |
| American Tower Corp. | 2.8% |
| Ferrovial SE | 2.7% |
| Enel SpA | 2.7% |
| Cellnex Telecom SA | 2.7% |
Below is a summary of certain changes for the Fund since November 1, 2023. For more information, you may refer to the Fund's next prospectus, which we expect to be available by February 28, 2025 at abrdn.com/us/literature or upon request at 866-667-9231.
Effective February 29, 2024, the Fund's management fee changed from 0.85% on assets up to $250 million, 0.80% on assets of $250 million up to $750 million, 0.75% on assets of $750 million up to $1 billion and 0.65% on assets of $1 billion and more to 0.75% on assets up to $250 million, 0.70% on assets of $250 million up to $750 million, 0.65% on assets of $750 million up to $1 billion and 0.55% on assets of $1 billion and more.
Availability of Additional Information
You can find additional information, including the Fund's prospectus, financial information, fund holdings, and proxy voting information at abrdn.com/us/literature or call 866-667-9231. The QR code can be used to access the Fund's prospectus, financial information and holdings.
abrdn Global Infrastructure Fund
(AIAFX)
abrdn Global Infrastructure Fund
Annual Shareholder Report - October 31, 2024
This annual shareholder report contains important information about the abrdn Global Infrastructure Fund (the "Fund") for the period of November 1, 2023 to October 31, 2024. You can find additional information about the Fund at abrdn.com/us/literature. You can also request this information by contacting us at 866-667-9231.
This report describes material changes to the Fund that occurred during the reporting period.
What were the Fund costs for the last year?
(based on a hypothetical $10,000 investment)
| Share Class | Costs of a $10,000 investment | Costs paid as a percentage of a $10,000 investment |
|---|
| Institutional | $112 | 1.00% |
How did the fund perform last year and what affected its performance?
The following discussion compares the performance of the Fund to the S&P Global Infrastructure Index (Net TR) (the “Index”) to show how the Fund’s performance measures against the returns of similar investments for the reporting period.
What contributed to performance?
Vistra Corporation, a leading power producer in the U.S., maintained its robust performance trajectory, with investors showing optimism towards sustained demand, particularly driven by the expansion of data centers. Similarly, International Container Terminal Services, a global port operator based in the Philippines, demonstrated exceptional performance. This was attributed to consistent market share gains in several of its key locations, including Melbourne, Manila, and Mexico. Helios Towers, which specializes in operating towers across Africa, also outperformed. The company's success was underpinned by significant organic growth, enhanced tenancy ratios, and improved profit margins, highlighting its strong operational efficiency.
What detracted from performance?
RWE, a leading German energy company, experienced a decline in performance as a result of falling gas prices in Europe, which also led to a decrease in power prices. Similarly, CCR, a prominent toll-road operator in Brazil, saw its performance dip, influenced by broader economic challenges in Brazil and a declining currency. CCR has been adversely affected by the increase in interest rates. Furthermore, CCR disclosed that it did not win bids for several toll road projects in Brazil. EDP Renováveis, a Portuguese renewable energy firm, also saw a downturn in performance, attributed to lower power prices and asset rotation gains that fell short of expectations.
abrdn Global Infrastructure Fund
(AIFRX)
Total Return Based on $1,000,000 Investment
The following graph reflects a hypothetical $1,000,000 investment for the most recently completed 10 fiscal years as compared to a broad-based securities market index, which is also the performance benchmark.
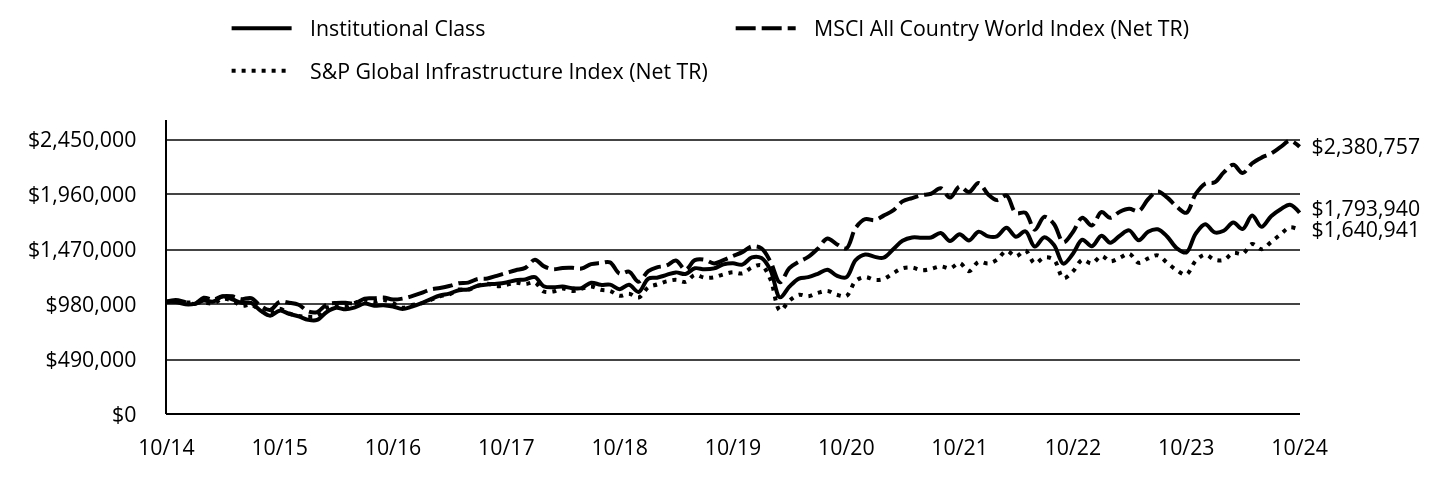
| Institutional Class | MSCI All Country World Index (Net TR) | S&P Global Infrastructure Index (Net TR) |
|---|
| 10/14 | $1,000,000 | $1,000,000 | $1,000,000 |
| 11/14 | $997,517 | $1,016,729 | $1,000,245 |
| 12/14 | $977,628 | $997,105 | $993,566 |
| 01/15 | $982,688 | $981,520 | $994,425 |
| 02/15 | $1,012,037 | $1,036,162 | $993,392 |
| 03/15 | $1,001,917 | $1,020,104 | $984,393 |
| 04/15 | $1,047,876 | $1,049,705 | $1,027,207 |
| 05/15 | $1,022,343 | $1,048,335 | $1,010,347 |
| 06/15 | $991,193 | $1,023,654 | $963,737 |
| 07/15 | $989,130 | $1,032,544 | $974,078 |
| 08/15 | $918,994 | $961,763 | $919,880 |
| 09/15 | $875,674 | $926,919 | $894,433 |
| 10/15 | $921,049 | $999,666 | $937,107 |
| 11/15 | $893,407 | $991,412 | $896,551 |
| 12/15 | $869,416 | $973,534 | $872,605 |
| 01/16 | $838,817 | $914,820 | $865,725 |
| 02/16 | $837,762 | $908,523 | $873,451 |
| 03/16 | $908,983 | $975,853 | $946,765 |
| 04/16 | $945,790 | $990,258 | $968,326 |
| 05/16 | $932,454 | $991,509 | $962,466 |
| 06/16 | $950,591 | $985,503 | $990,725 |
| 07/16 | $983,481 | $1,027,974 | $1,018,064 |
| 08/16 | $965,149 | $1,031,431 | $998,594 |
| 09/16 | $970,002 | $1,037,752 | $1,016,019 |
| 10/16 | $958,013 | $1,020,139 | $987,130 |
| 11/16 | $935,670 | $1,027,892 | $946,128 |
| 12/16 | $957,468 | $1,050,096 | $972,507 |
| 01/17 | $988,318 | $1,078,809 | $985,413 |
| 02/17 | $1,021,923 | $1,109,071 | $1,014,108 |
| 03/17 | $1,055,529 | $1,122,639 | $1,047,969 |
| 04/17 | $1,072,778 | $1,140,135 | $1,065,390 |
| 05/17 | $1,103,381 | $1,165,312 | $1,108,764 |
| 06/17 | $1,109,501 | $1,170,611 | $1,106,939 |
| 07/17 | $1,143,208 | $1,203,326 | $1,143,385 |
| 08/17 | $1,154,443 | $1,207,936 | $1,160,985 |
| 09/17 | $1,160,623 | $1,231,273 | $1,139,563 |
| 10/17 | $1,172,529 | $1,256,841 | $1,150,126 |
| 11/17 | $1,191,807 | $1,281,171 | $1,169,215 |
| 12/17 | $1,198,971 | $1,301,826 | $1,157,982 |
| 01/18 | $1,220,176 | $1,375,271 | $1,171,027 |
| 02/18 | $1,138,793 | $1,317,512 | $1,091,791 |
| 03/18 | $1,129,050 | $1,289,308 | $1,091,972 |
| 04/18 | $1,135,994 | $1,301,620 | $1,118,453 |
| 05/18 | $1,120,948 | $1,303,245 | $1,096,431 |
| 06/18 | $1,121,527 | $1,296,188 | $1,116,553 |
| 07/18 | $1,170,035 | $1,335,276 | $1,136,102 |
| 08/18 | $1,150,748 | $1,345,767 | $1,107,711 |
| 09/18 | $1,153,132 | $1,351,624 | $1,096,462 |
| 10/18 | $1,112,412 | $1,250,335 | $1,052,873 |
| 11/18 | $1,150,771 | $1,268,621 | $1,072,071 |
| 12/18 | $1,087,252 | $1,179,267 | $1,037,864 |
| 01/19 | $1,205,677 | $1,272,381 | $1,128,099 |
| 02/19 | $1,214,604 | $1,306,414 | $1,153,823 |
| 03/19 | $1,239,075 | $1,322,843 | $1,181,441 |
| 04/19 | $1,261,898 | $1,367,510 | $1,195,198 |
| 05/19 | $1,247,483 | $1,286,390 | $1,176,942 |
| 06/19 | $1,298,627 | $1,370,623 | $1,239,750 |
| 07/19 | $1,289,537 | $1,374,639 | $1,214,711 |
| 08/19 | $1,297,415 | $1,342,029 | $1,218,419 |
| 09/19 | $1,333,232 | $1,370,268 | $1,244,190 |
| 10/19 | $1,343,013 | $1,407,770 | $1,262,863 |
| 11/19 | $1,330,787 | $1,442,136 | $1,252,051 |
| 12/19 | $1,395,972 | $1,492,921 | $1,305,121 |
| 01/20 | $1,390,388 | $1,476,430 | $1,325,639 |
| 02/20 | $1,283,674 | $1,357,179 | $1,198,278 |
| 03/20 | $1,039,275 | $1,173,956 | $922,578 |
| 04/20 | $1,134,610 | $1,299,716 | $1,009,349 |
| 05/20 | $1,206,739 | $1,356,242 | $1,062,449 |
| 06/20 | $1,219,124 | $1,399,577 | $1,048,293 |
| 07/20 | $1,249,523 | $1,473,596 | $1,079,165 |
| 08/20 | $1,285,621 | $1,563,788 | $1,096,225 |
| 09/20 | $1,232,854 | $1,513,367 | $1,062,646 |
| 10/20 | $1,218,147 | $1,476,579 | $1,050,818 |
| 11/20 | $1,370,335 | $1,658,586 | $1,185,664 |
| 12/20 | $1,421,174 | $1,735,593 | $1,220,375 |
| 01/21 | $1,399,886 | $1,727,700 | $1,194,044 |
| 02/21 | $1,392,790 | $1,767,719 | $1,202,489 |
| 03/21 | $1,467,771 | $1,814,934 | $1,254,603 |
| 04/21 | $1,543,241 | $1,894,287 | $1,298,600 |
| 05/21 | $1,573,169 | $1,923,767 | $1,304,692 |
| 06/21 | $1,571,228 | $1,949,117 | $1,281,243 |
| 07/21 | $1,572,539 | $1,962,548 | $1,293,011 |
| 08/21 | $1,612,541 | $2,011,669 | $1,315,582 |
| 09/21 | $1,540,836 | $1,928,568 | $1,297,776 |
| 10/21 | $1,600,989 | $2,027,009 | $1,344,331 |
| 11/21 | $1,545,463 | $1,978,197 | $1,271,744 |
| 12/21 | $1,624,838 | $2,057,326 | $1,355,103 |
| 01/22 | $1,582,399 | $1,956,286 | $1,340,876 |
| 02/22 | $1,582,399 | $1,905,761 | $1,373,596 |
| 03/22 | $1,658,799 | $1,947,038 | $1,453,626 |
| 04/22 | $1,579,356 | $1,791,193 | $1,405,475 |
| 05/22 | $1,627,565 | $1,793,289 | $1,455,771 |
| 06/22 | $1,491,976 | $1,642,122 | $1,342,345 |
| 07/22 | $1,575,548 | $1,756,795 | $1,395,229 |
| 08/22 | $1,506,361 | $1,692,119 | $1,373,189 |
| 09/22 | $1,339,961 | $1,530,133 | $1,210,617 |
| 10/22 | $1,428,416 | $1,622,472 | $1,271,371 |
| 11/22 | $1,552,807 | $1,748,317 | $1,373,052 |
| 12/22 | $1,495,411 | $1,679,519 | $1,341,730 |
| 01/23 | $1,588,609 | $1,799,902 | $1,408,628 |
| 02/23 | $1,526,477 | $1,748,316 | $1,360,431 |
| 03/23 | $1,588,553 | $1,802,222 | $1,391,778 |
| 04/23 | $1,636,281 | $1,828,124 | $1,427,486 |
| 05/23 | $1,547,949 | $1,808,544 | $1,346,477 |
| 06/23 | $1,624,183 | $1,913,550 | $1,385,947 |
| 07/23 | $1,645,733 | $1,983,601 | $1,413,227 |
| 08/23 | $1,579,645 | $1,928,171 | $1,346,002 |
| 09/23 | $1,478,241 | $1,848,440 | $1,281,991 |
| 10/23 | $1,439,111 | $1,792,863 | $1,243,004 |
| 11/23 | $1,605,051 | $1,958,337 | $1,362,638 |
| 12/23 | $1,691,386 | $2,052,403 | $1,419,314 |
| 01/24 | $1,618,197 | $2,064,435 | $1,373,969 |
| 02/24 | $1,632,835 | $2,153,027 | $1,372,956 |
| 03/24 | $1,705,612 | $2,220,625 | $1,435,218 |
| 04/24 | $1,648,782 | $2,147,360 | $1,427,044 |
| 05/24 | $1,768,345 | $2,234,572 | $1,514,655 |
| 06/24 | $1,667,915 | $2,284,341 | $1,468,656 |
| 07/24 | $1,762,438 | $2,321,182 | $1,532,555 |
| 08/24 | $1,824,957 | $2,380,132 | $1,602,334 |
| 09/24 | $1,865,188 | $2,435,425 | $1,662,424 |
| 10/24 | $1,793,940 | $2,380,757 | $1,640,941 |
Average Annual Total Returns for the Period Ended October 31, 2024 (%)
| AATR | 1 Year | 5 Years | 10 Years |
|---|
| Institutional Class | 24.66% | 5.96% | 6.02% |
| MSCI All Country World Index (Net TR) | 32.79% | 11.08% | 9.06% |
| S&P Global Infrastructure Index (Net TR) | 32.01% | 5.38% | 5.08% |
THE FUND'S PAST PERFORMANCE IS NOT A GOOD PREDICTOR OF THE FUND'S FUTURE PERFORMANCE.
Fund performance data shown above does not reflect the deduction of taxes that a shareholder would pay on Fund distributions or redemption of Fund shares.
Key Fund Statistics as of October 31, 2024
| Total Net Assets | $42,754,281 |
| Total Number of Portfolio Holdings | 54 |
| Portfolio Turnover Rate | 14% |
| Total Advisory Fees Paid | $180,830 |
abrdn Global Infrastructure Fund
(AIFRX)
What did the Fund invest in?
The tables below show the investment makeup of the Fund as of October 31, 2024.
Geographic Allocation (% of total net assets)
| United States | 43.2% | |
| France | 10.6% | |
| Spain | 7.9% | |
| Canada | 5.6% | |
| United Kingdom | 4.4% | |
| Italy | 4.4% | |
| Brazil | 4.0% | |
| Mexico | 2.9% | |
| Germany | 2.6% | |
| Malaysia | 2.3% | |
| Philippines | 2.3% | |
| Other | 9.8% | |
Ten Largest Holdings (% of total net assets)
| Williams Cos., Inc. | 3.6% |
| Kinder Morgan, Inc. | 3.4% |
| Enbridge, Inc. | 3.3% |
| Norfolk Southern Corp. | 3.2% |
| Aena SME SA | 3.0% |
| NextEra Energy, Inc. | 2.9% |
| American Tower Corp. | 2.8% |
| Ferrovial SE | 2.7% |
| Enel SpA | 2.7% |
| Cellnex Telecom SA | 2.7% |
Below is a summary of certain changes for the Fund since November 1, 2023. For more information, you may refer to the Fund's next prospectus, which we expect to be available by February 28, 2025 at abrdn.com/us/literature or upon request at 866-667-9231.
Effective February 29, 2024, the Fund's management fee changed from 0.85% on assets up to $250 million, 0.80% on assets of $250 million up to $750 million, 0.75% on assets of $750 million up to $1 billion and 0.65% on assets of $1 billion and more to 0.75% on assets up to $250 million, 0.70% on assets of $250 million up to $750 million, 0.65% on assets of $750 million up to $1 billion and 0.55% on assets of $1 billion and more.
Availability of Additional Information
You can find additional information, including the Fund's prospectus, financial information, fund holdings, and proxy voting information at abrdn.com/us/literature or call 866-667-9231. The QR code can be used to access the Fund's prospectus, financial information and holdings.
abrdn Global Infrastructure Fund
(AIFRX)
abrdn High Income Opportunities Fund
Annual Shareholder Report - October 31, 2024
This annual shareholder report contains important information about the abrdn High Income Opportunities Fund (the "Fund") for the period of November 1, 2023 to October 31, 2024. You can find additional information about the Fund at abrdn.com/us/literature. You can also request this information by contacting us at 866-667-9231.
What were the Fund costs for the last year?
(based on a hypothetical $10,000 investment)
| Share Class | Costs of a $10,000 investment | Costs paid as a percentage of a $10,000 investment |
|---|
| A | $103 | 0.95% |
How did the fund perform last year and what affected its performance?
The following discussion compares the performance of the Fund to the ICE BofA US High Yield Constrained, and prior to 8/18/23 the ICE BofA Global High Yield Constrained (USD Hedged) (the “Index”) to show how the Fund’s performance measures against the returns of similar investments for the reporting period.
What contributed to performance?
Top performers such as wireline operator Frontier Communications, office supply distributor Staples, golf cart producer Club Car, and building products manufacturer Cornerstone all had an outsized contribution to total returns. Additionally, the Fund's position in global copper producer First Quantum was additive to performance as its bonds bounced back after selling off at the end of the prior period due to political unrest in Panama that resulted in a mine shutdown.
What detracted from performance?
The Fund's lack of exposure to deeply distressed credits such as Bausch Health and Lumen Technologies, both of which are U.S. companies that are attempting in-market restructurings, negatively impacted relative performance. This is due to companies rated CC and lower being the top performing credits in the overall market during the period, as investors went bargain hunting for low-dollar priced, highly leveraged capital structures. Similarly, a handful of credits that performed poorly, which negatively affected the Fund. These laggards included French telecom company Altice France and glass packaging manufacturer Ardagh Packaging.
abrdn High Income Opportunities Fund
(BJBHX)
Total Return Based on $10,000 Investment
The following graph reflects a hypothetical $10,000 investment for the most recently completed 10 fiscal years as compared to a broad-based securities market index and an additional performance benchmark
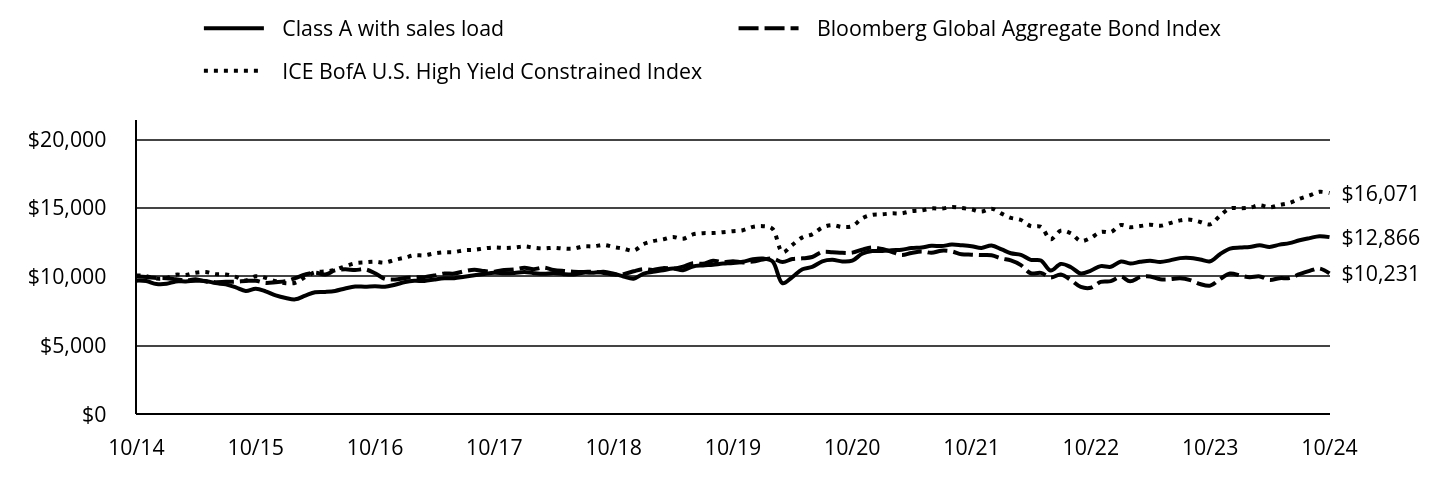
| Class A with sales load | Bloomberg Global Aggregate Bond Index | ICE BofA U.S. High Yield Constrained Index |
|---|
| 10/14 | $9,701 | $10,001 | $10,080 |
| 11/14 | $9,671 | $9,965 | $10,027 |
| 12/14 | $9,451 | $9,896 | $9,853 |
| 01/15 | $9,467 | $9,881 | $9,896 |
| 02/15 | $9,645 | $9,801 | $10,135 |
| 03/15 | $9,642 | $9,706 | $10,114 |
| 04/15 | $9,695 | $9,809 | $10,281 |
| 05/15 | $9,679 | $9,634 | $10,327 |
| 06/15 | $9,521 | $9,592 | $10,174 |
| 07/15 | $9,431 | $9,613 | $10,149 |
| 08/15 | $9,210 | $9,624 | $9,976 |
| 09/15 | $8,948 | $9,674 | $9,717 |
| 10/15 | $9,108 | $9,694 | $10,017 |
| 11/15 | $8,925 | $9,533 | $9,898 |
| 12/15 | $8,626 | $9,584 | $9,653 |
| 01/16 | $8,437 | $9,667 | $9,515 |
| 02/16 | $8,339 | $9,882 | $9,549 |
| 03/16 | $8,612 | $10,149 | $9,966 |
| 04/16 | $8,855 | $10,284 | $10,310 |
| 05/16 | $8,882 | $10,147 | $10,369 |
| 06/16 | $8,950 | $10,443 | $10,483 |
| 07/16 | $9,133 | $10,522 | $10,744 |
| 08/16 | $9,275 | $10,470 | $10,969 |
| 09/16 | $9,263 | $10,528 | $11,029 |
| 10/16 | $9,292 | $10,236 | $11,075 |
| 11/16 | $9,251 | $9,829 | $11,010 |
| 12/16 | $9,404 | $9,784 | $11,217 |
| 01/17 | $9,603 | $9,894 | $11,378 |
| 02/17 | $9,685 | $9,941 | $11,549 |
| 03/17 | $9,681 | $9,956 | $11,540 |
| 04/17 | $9,785 | $10,069 | $11,680 |
| 05/17 | $9,873 | $10,224 | $11,769 |
| 06/17 | $9,878 | $10,215 | $11,779 |
| 07/17 | $9,982 | $10,387 | $11,908 |
| 08/17 | $10,085 | $10,490 | $11,943 |
| 09/17 | $10,188 | $10,396 | $12,044 |
| 10/17 | $10,268 | $10,356 | $12,117 |
| 11/17 | $10,238 | $10,471 | $12,081 |
| 12/17 | $10,263 | $10,508 | $12,114 |
| 01/18 | $10,333 | $10,633 | $12,192 |
| 02/18 | $10,246 | $10,538 | $12,093 |
| 03/18 | $10,193 | $10,651 | $12,041 |
| 04/18 | $10,250 | $10,480 | $12,092 |
| 05/18 | $10,174 | $10,401 | $12,032 |
| 06/18 | $10,152 | $10,354 | $12,026 |
| 07/18 | $10,281 | $10,337 | $12,195 |
| 08/18 | $10,273 | $10,348 | $12,192 |
| 09/18 | $10,346 | $10,259 | $12,298 |
| 10/18 | $10,200 | $10,144 | $12,143 |
| 11/18 | $10,006 | $10,176 | $12,027 |
| 12/18 | $9,842 | $10,381 | $11,884 |
| 01/19 | $10,216 | $10,540 | $12,361 |
| 02/19 | $10,342 | $10,479 | $12,570 |
| 03/19 | $10,451 | $10,610 | $12,702 |
| 04/19 | $10,590 | $10,579 | $12,872 |
| 05/19 | $10,454 | $10,722 | $12,747 |
| 06/19 | $10,732 | $10,960 | $13,062 |
| 07/19 | $10,810 | $10,929 | $13,156 |
| 08/19 | $10,862 | $11,151 | $13,162 |
| 09/19 | $10,940 | $11,038 | $13,228 |
| 10/19 | $10,981 | $11,111 | $13,300 |
| 11/19 | $11,071 | $11,027 | $13,368 |
| 12/19 | $11,251 | $11,092 | $13,611 |
| 01/20 | $11,305 | $11,233 | $13,665 |
| 02/20 | $11,112 | $11,309 | $13,478 |
| 03/20 | $9,513 | $11,055 | $11,769 |
| 04/20 | $9,962 | $11,272 | $12,305 |
| 05/20 | $10,530 | $11,322 | $12,850 |
| 06/20 | $10,697 | $11,422 | $13,069 |
| 07/20 | $11,107 | $11,787 | $13,563 |
| 08/20 | $11,212 | $11,769 | $13,740 |
| 09/20 | $11,096 | $11,726 | $13,605 |
| 10/20 | $11,151 | $11,738 | $13,662 |
| 11/20 | $11,653 | $11,951 | $14,228 |
| 12/20 | $11,850 | $12,112 | $14,492 |
| 01/21 | $11,851 | $12,005 | $14,526 |
| 02/21 | $11,920 | $11,798 | $14,591 |
| 03/21 | $11,949 | $11,571 | $14,599 |
| 04/21 | $12,071 | $11,717 | $14,752 |
| 05/21 | $12,113 | $11,827 | $14,814 |
| 06/21 | $12,235 | $11,723 | $14,951 |
| 07/21 | $12,215 | $11,879 | $14,945 |
| 08/21 | $12,321 | $11,830 | $15,048 |
| 09/21 | $12,276 | $11,620 | $14,982 |
| 10/21 | $12,205 | $11,591 | $14,876 |
| 11/21 | $12,076 | $11,558 | $14,720 |
| 12/21 | $12,255 | $11,541 | $14,933 |
| 01/22 | $11,967 | $11,305 | $14,573 |
| 02/22 | $11,693 | $11,171 | $14,269 |
| 03/22 | $11,580 | $10,830 | $14,112 |
| 04/22 | $11,216 | $10,237 | $13,664 |
| 05/22 | $11,168 | $10,265 | $13,616 |
| 06/22 | $10,430 | $9,936 | $12,711 |
| 07/22 | $10,917 | $10,147 | $13,340 |
| 08/22 | $10,673 | $9,746 | $13,134 |
| 09/22 | $10,224 | $9,246 | $12,582 |
| 10/22 | $10,437 | $9,182 | $12,817 |
| 11/22 | $10,758 | $9,614 | $13,241 |
| 12/22 | $10,708 | $9,666 | $13,234 |
| 01/23 | $11,093 | $9,983 | $13,745 |
| 02/23 | $10,943 | $9,652 | $13,586 |
| 03/23 | $11,068 | $9,957 | $13,670 |
| 04/23 | $11,149 | $10,001 | $13,766 |
| 05/23 | $11,058 | $9,805 | $13,688 |
| 06/23 | $11,174 | $9,804 | $13,887 |
| 07/23 | $11,338 | $9,872 | $14,083 |
| 08/23 | $11,351 | $9,737 | $14,137 |
| 09/23 | $11,242 | $9,453 | $13,971 |
| 10/23 | $11,110 | $9,340 | $13,796 |
| 11/23 | $11,624 | $9,811 | $14,426 |
| 12/23 | $12,027 | $10,219 | $14,959 |
| 01/24 | $12,106 | $10,078 | $14,962 |
| 02/24 | $12,155 | $9,951 | $15,006 |
| 03/24 | $12,269 | $10,006 | $15,185 |
| 04/24 | $12,156 | $9,753 | $15,033 |
| 05/24 | $12,318 | $9,881 | $15,203 |
| 06/24 | $12,427 | $9,895 | $15,350 |
| 07/24 | $12,635 | $10,168 | $15,651 |
| 08/24 | $12,795 | $10,409 | $15,900 |
| 09/24 | $12,936 | $10,586 | $16,160 |
| 10/24 | $12,866 | $10,231 | $16,071 |
Average Annual Total Returns for the Period Ended October 31, 2024 (%)
| AATR | 1 Year | 5 Years | 10 Years |
|---|
| Class A without sales load | 15.81% | 3.22% | 2.86% |
| Class A with sales load - 3.00% | 12.33% | 2.59% | 2.55% |
| Bloomberg Global Aggregate Bond Index | 9.54% | (1.64%) | 0.23% |
ICE BofA U.S. High Yield Constrained IndexFootnote Reference* | 16.49% | 3.86% | 4.77% |
| Footnote | Description |
Footnote* | Prior to 8/18/23, the ICE BofA Global High Yield Constrained (USD Hedged). |
THE FUND'S PAST PERFORMANCE IS NOT A GOOD PREDICTOR OF THE FUND'S FUTURE PERFORMANCE.
Fund performance data shown above does not reflect the deduction of taxes that a shareholder would pay on Fund distributions or redemption of Fund shares.
In accordance with regulatory changes requiring the Fund's primary benchmark to represent the overall applicable market, the Fund's primary prospectus benchmark changed to the Bloomberg Global Aggregate Bond Index effective as of February 29, 2024.
Key Fund Statistics as of October 31, 2024
| Total Net Assets | $81,441,063 |
| Total Number of Portfolio Holdings | 204 |
| Portfolio Turnover Rate | 112% |
| Total Advisory Fees Paid | $189,718 |
abrdn High Income Opportunities Fund
(BJBHX)
What did the Fund invest in?
The tables below show the investment makeup of the Fund as of October 31, 2024.
Credit Quality Allocation (% of total net assets)
| A | 0.4% |
| BBB | 2.1% |
| BB | 43.1% |
| B | 47.2% |
| CCC | 5.7% |
| CC | 0.5% |
| Non Rated | 1.1% |
Ratings and portfolio credit quality will vary over time. Credit quality ratings on the underlying securities of the Fund are received from S&P, Moody’s and Fitch and are an indication of the issuer’s creditworthiness. The chart reflects the highest security rating provided by one or more of these rating agencies.
Ten Largest Holdings (% of total net assets)
| Petroleos Mexicanos, 3.750%, due 11/16/25 | 1.8% |
| Affinity Interactive, 6.875%, due 12/15/27 | 1.6% |
| Enerflex Ltd., 9.000%, due 10/15/27 | 1.5% |
| CCO Holdings LLC/CCO Holdings Capital Corp., 4.250%, due 02/01/31 | 1.3% |
| Venture Global LNG, Inc., 9.875%, due 02/01/32 | 1.3% |
| Warnermedia Holdings, Inc., 4.279%, due 03/15/32 | 1.2% |
| Lorca Holdco Ltd. | 1.2% |
| Delek Logistics Partners LP/Delek Logistics Finance Corp., 8.625%, due 03/15/29 | 1.2% |
| First Quantum Minerals Ltd., 6.875%, due 10/15/27 | 1.2% |
| Connect Finco SARL/Connect U.S. Finco LLC, 9.000%, due 09/15/29 | 1.2% |
Availability of Additional Information
You can find additional information, including the Fund's prospectus, financial information, fund holdings, and proxy voting information at abrdn.com/us/literature or call 866-667-9231. The QR code can be used to access the Fund's prospectus, financial information and holdings.
abrdn High Income Opportunities Fund
(BJBHX)
abrdn High Income Opportunities Fund
Annual Shareholder Report - October 31, 2024
This annual shareholder report contains important information about the abrdn High Income Opportunities Fund (the "Fund") for the period of November 1, 2023 to October 31, 2024. You can find additional information about the Fund at abrdn.com/us/literature. You can also request this information by contacting us at 866-667-9231.
What were the Fund costs for the last year?
(based on a hypothetical $10,000 investment)
| Share Class | Costs of a $10,000 investment | Costs paid as a percentage of a $10,000 investment |
|---|
| Institutional | $76 | 0.70% |
How did the fund perform last year and what affected its performance?
The following discussion compares the performance of the Fund to the ICE BofA US High Yield Constrained, and prior to 8/18/23 the ICE BofA Global High Yield Constrained (USD Hedged) (the “Index”) to show how the Fund’s performance measures against the returns of similar investments for the reporting period.
What contributed to performance?
Top performers such as wireline operator Frontier Communications, office supply distributor Staples, golf cart producer Club Car, and building products manufacturer Cornerstone all had an outsized contribution to total returns. Additionally, the Fund's position in global copper producer First Quantum was additive to performance as its bonds bounced back after selling off at the end of the prior period due to political unrest in Panama that resulted in a mine shutdown.
What detracted from performance?
The Fund's lack of exposure to deeply distressed credits such as Bausch Health and Lumen Technologies, both of which are U.S. companies that are attempting in-market restructurings, negatively impacted relative performance. This is due to companies rated CC and lower being the top performing credits in the overall market during the period, as investors went bargain hunting for low-dollar priced, highly leveraged capital structures. Similarly, a handful of credits that performed poorly, which negatively affected the Fund. These laggards included French telecom company Altice France and glass packaging manufacturer Ardagh Packaging.
abrdn High Income Opportunities Fund
(JHYIX)
Total Return Based on $1,000,000 Investment
The following graph reflects a hypothetical $1,000,000 investment for the most recently completed 10 fiscal years as compared to a broad-based securities market index and an additional performance benchmark
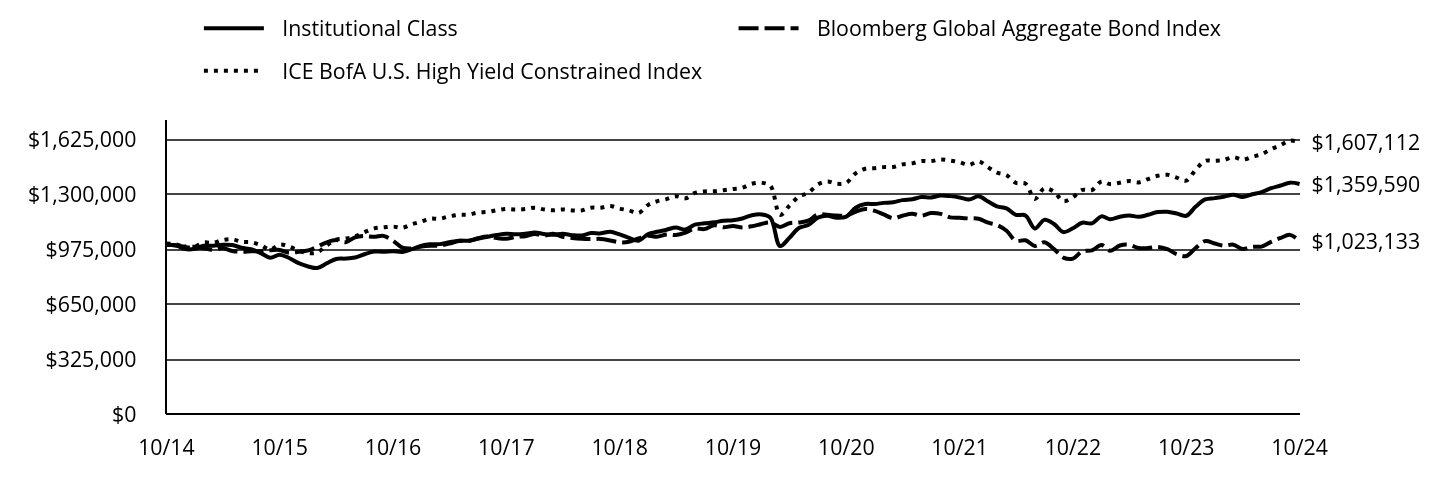
| Institutional Class | Bloomberg Global Aggregate Bond Index | ICE BofA U.S. High Yield Constrained Index |
|---|
| 10/14 | $1,000,000 | $1,000,139 | $1,008,045 |
| 11/14 | $997,025 | $996,487 | $1,002,710 |
| 12/14 | $974,382 | $989,626 | $985,270 |
| 01/15 | $976,401 | $988,061 | $989,629 |
| 02/15 | $993,892 | $980,060 | $1,013,500 |
| 03/15 | $994,915 | $970,613 | $1,011,416 |
| 04/15 | $999,845 | $980,936 | $1,028,142 |
| 05/15 | $998,305 | $963,398 | $1,032,737 |
| 06/15 | $982,436 | $959,178 | $1,017,396 |
| 07/15 | $973,972 | $961,327 | $1,014,894 |
| 08/15 | $951,119 | $962,446 | $997,551 |
| 09/15 | $923,790 | $967,351 | $971,651 |
| 10/15 | $941,495 | $969,394 | $1,001,696 |
| 11/15 | $921,710 | $953,344 | $989,799 |
| 12/15 | $891,428 | $958,412 | $965,255 |
| 01/16 | $872,029 | $966,717 | $951,475 |
| 02/16 | $862,657 | $988,244 | $954,915 |
| 03/16 | $890,555 | $1,014,949 | $996,554 |
| 04/16 | $916,326 | $1,028,449 | $1,030,990 |
| 05/16 | $918,367 | $1,014,652 | $1,036,870 |
| 06/16 | $924,919 | $1,044,282 | $1,048,276 |
| 07/16 | $944,141 | $1,052,154 | $1,074,372 |
| 08/16 | $960,028 | $1,047,043 | $1,096,870 |
| 09/16 | $958,888 | $1,052,808 | $1,102,910 |
| 10/16 | $962,262 | $1,023,588 | $1,107,537 |
| 11/16 | $958,017 | $982,919 | $1,100,956 |
| 12/16 | $973,868 | $978,403 | $1,121,701 |
| 01/17 | $994,852 | $989,434 | $1,137,772 |
| 02/17 | $1,002,963 | $994,110 | $1,154,925 |
| 03/17 | $1,003,998 | $995,637 | $1,153,959 |
| 04/17 | $1,014,530 | $1,006,860 | $1,167,953 |
| 05/17 | $1,024,465 | $1,022,441 | $1,176,860 |
| 06/17 | $1,024,052 | $1,021,543 | $1,177,934 |
| 07/17 | $1,035,829 | $1,038,719 | $1,190,750 |
| 08/17 | $1,047,530 | $1,049,009 | $1,194,285 |
| 09/17 | $1,057,932 | $1,039,560 | $1,204,350 |
| 10/17 | $1,065,770 | $1,035,626 | $1,211,703 |
| 11/17 | $1,062,634 | $1,047,127 | $1,208,102 |
| 12/17 | $1,065,753 | $1,050,756 | $1,211,372 |
| 01/18 | $1,072,518 | $1,063,277 | $1,219,247 |
| 02/18 | $1,064,309 | $1,053,843 | $1,209,314 |
| 03/18 | $1,058,679 | $1,065,060 | $1,204,124 |
| 04/18 | $1,065,286 | $1,048,000 | $1,209,150 |
| 05/18 | $1,057,075 | $1,040,051 | $1,203,183 |
| 06/18 | $1,054,855 | $1,035,427 | $1,202,582 |
| 07/18 | $1,069,505 | $1,033,698 | $1,219,458 |
| 08/18 | $1,067,566 | $1,034,782 | $1,219,169 |
| 09/18 | $1,077,202 | $1,025,862 | $1,229,798 |
| 10/18 | $1,061,212 | $1,014,403 | $1,214,300 |
| 11/18 | $1,041,160 | $1,017,575 | $1,202,733 |
| 12/18 | $1,024,407 | $1,038,148 | $1,188,368 |
| 01/19 | $1,063,738 | $1,053,954 | $1,236,112 |
| 02/19 | $1,076,743 | $1,047,887 | $1,257,017 |
| 03/19 | $1,089,225 | $1,061,006 | $1,270,180 |
| 04/19 | $1,102,456 | $1,057,865 | $1,287,214 |
| 05/19 | $1,090,275 | $1,072,190 | $1,274,653 |
| 06/19 | $1,119,052 | $1,095,962 | $1,306,228 |
| 07/19 | $1,126,770 | $1,092,917 | $1,315,579 |
| 08/19 | $1,132,958 | $1,115,141 | $1,316,212 |
| 09/19 | $1,141,900 | $1,103,798 | $1,322,771 |
| 10/19 | $1,145,204 | $1,111,148 | $1,329,954 |
| 11/19 | $1,155,680 | $1,102,723 | $1,336,787 |
| 12/19 | $1,174,761 | $1,109,153 | $1,361,108 |
| 01/20 | $1,179,678 | $1,123,312 | $1,366,468 |
| 02/20 | $1,159,694 | $1,130,867 | $1,347,775 |
| 03/20 | $992,763 | $1,105,528 | $1,176,882 |
| 04/20 | $1,040,746 | $1,127,233 | $1,230,478 |
| 05/20 | $1,099,262 | $1,132,179 | $1,284,954 |
| 06/20 | $1,116,905 | $1,142,237 | $1,306,896 |
| 07/20 | $1,160,640 | $1,178,667 | $1,356,339 |
| 08/20 | $1,171,410 | $1,176,870 | $1,373,968 |
| 09/20 | $1,160,030 | $1,172,637 | $1,360,488 |
| 10/20 | $1,166,462 | $1,173,758 | $1,366,153 |
| 11/20 | $1,219,228 | $1,195,100 | $1,422,773 |
| 12/20 | $1,240,676 | $1,211,153 | $1,449,241 |
| 01/21 | $1,241,187 | $1,200,486 | $1,452,608 |
| 02/21 | $1,247,775 | $1,179,822 | $1,459,061 |
| 03/21 | $1,251,436 | $1,157,126 | $1,459,942 |
| 04/21 | $1,264,152 | $1,171,744 | $1,475,204 |
| 05/21 | $1,269,258 | $1,182,749 | $1,481,364 |
| 06/21 | $1,282,019 | $1,172,314 | $1,495,115 |
| 07/21 | $1,280,081 | $1,187,918 | $1,494,508 |
| 08/21 | $1,290,937 | $1,182,978 | $1,504,759 |
| 09/21 | $1,287,705 | $1,161,958 | $1,498,237 |
| 10/21 | $1,279,904 | $1,159,149 | $1,487,583 |
| 11/21 | $1,267,176 | $1,155,759 | $1,471,984 |
| 12/21 | $1,286,441 | $1,154,145 | $1,493,264 |
| 01/22 | $1,255,421 | $1,130,492 | $1,457,298 |
| 02/22 | $1,227,605 | $1,117,056 | $1,426,890 |
| 03/22 | $1,215,167 | $1,083,038 | $1,411,175 |
| 04/22 | $1,177,215 | $1,023,700 | $1,366,389 |
| 05/22 | $1,173,820 | $1,026,495 | $1,361,564 |
| 06/22 | $1,096,082 | $993,557 | $1,271,109 |
| 07/22 | $1,147,323 | $1,014,679 | $1,334,049 |
| 08/22 | $1,123,039 | $974,638 | $1,313,449 |
| 09/22 | $1,075,052 | $924,562 | $1,258,169 |
| 10/22 | $1,098,160 | $918,203 | $1,281,700 |
| 11/22 | $1,130,377 | $961,415 | $1,324,100 |
| 12/22 | $1,126,667 | $966,614 | $1,323,404 |
| 01/23 | $1,167,987 | $998,347 | $1,374,469 |
| 02/23 | $1,150,962 | $965,157 | $1,358,615 |
| 03/23 | $1,165,781 | $995,677 | $1,367,031 |
| 04/23 | $1,173,679 | $1,000,071 | $1,376,647 |
| 05/23 | $1,165,223 | $980,522 | $1,368,753 |
| 06/23 | $1,177,312 | $980,445 | $1,388,746 |
| 07/23 | $1,193,283 | $987,234 | $1,408,307 |
| 08/23 | $1,195,183 | $973,729 | $1,413,701 |
| 09/23 | $1,184,829 | $945,283 | $1,397,089 |
| 10/23 | $1,171,645 | $933,985 | $1,379,644 |
| 11/23 | $1,224,481 | $981,082 | $1,442,626 |
| 12/23 | $1,268,073 | $1,021,857 | $1,495,863 |
| 01/24 | $1,275,811 | $1,007,757 | $1,496,150 |
| 02/24 | $1,283,770 | $995,092 | $1,500,580 |
| 03/24 | $1,295,706 | $1,000,570 | $1,518,455 |
| 04/24 | $1,283,005 | $975,319 | $1,503,271 |
| 05/24 | $1,298,504 | $988,101 | $1,520,330 |
| 06/24 | $1,311,745 | $989,520 | $1,535,004 |
| 07/24 | $1,334,773 | $1,016,844 | $1,565,126 |
| 08/24 | $1,350,179 | $1,040,903 | $1,590,022 |
| 09/24 | $1,367,216 | $1,058,617 | $1,616,005 |
| 10/24 | $1,359,590 | $1,023,133 | $1,607,112 |
Average Annual Total Returns for the Period Ended October 31, 2024 (%)
| AATR | 1 Year | 5 Years | 10 Years |
|---|
| Institutional Class | 16.04% | 3.49% | 3.12% |
| Bloomberg Global Aggregate Bond Index | 9.54% | (1.64%) | 0.23% |
ICE BofA U.S. High Yield Constrained IndexFootnote Reference* | 16.49% | 3.86% | 4.77% |
| Footnote | Description |
Footnote* | Prior to 8/18/23, the ICE BofA Global High Yield Constrained (USD Hedged). |
THE FUND'S PAST PERFORMANCE IS NOT A GOOD PREDICTOR OF THE FUND'S FUTURE PERFORMANCE.
Fund performance data shown above does not reflect the deduction of taxes that a shareholder would pay on Fund distributions or redemption of Fund shares.
In accordance with regulatory changes requiring the Fund's primary benchmark to represent the overall applicable market, the Fund's primary prospectus benchmark changed to the Bloomberg Global Aggregate Bond Index effective as of February 29, 2024.
Key Fund Statistics as of October 31, 2024
| Total Net Assets | $81,441,063 |
| Total Number of Portfolio Holdings | 204 |
| Portfolio Turnover Rate | 112% |
| Total Advisory Fees Paid | $189,718 |
abrdn High Income Opportunities Fund
(JHYIX)
What did the Fund invest in?
The tables below show the investment makeup of the Fund as of October 31, 2024.
Credit Quality Allocation (% of total net assets)
| A | 0.4% |
| BBB | 2.1% |
| BB | 43.1% |
| B | 47.2% |
| CCC | 5.7% |
| CC | 0.5% |
| Non Rated | 1.1% |
Ratings and portfolio credit quality will vary over time. Credit quality ratings on the underlying securities of the Fund are received from S&P, Moody’s and Fitch and are an indication of the issuer’s creditworthiness. The chart reflects the highest security rating provided by one or more of these rating agencies.
Ten Largest Holdings (% of total net assets)
| Petroleos Mexicanos, 3.750%, due 11/16/25 | 1.8% |
| Affinity Interactive, 6.875%, due 12/15/27 | 1.6% |
| Enerflex Ltd., 9.000%, due 10/15/27 | 1.5% |
| CCO Holdings LLC/CCO Holdings Capital Corp., 4.250%, due 02/01/31 | 1.3% |
| Venture Global LNG, Inc., 9.875%, due 02/01/32 | 1.3% |
| Warnermedia Holdings, Inc., 4.279%, due 03/15/32 | 1.2% |
| Lorca Holdco Ltd. | 1.2% |
| Delek Logistics Partners LP/Delek Logistics Finance Corp., 8.625%, due 03/15/29 | 1.2% |
| First Quantum Minerals Ltd., 6.875%, due 10/15/27 | 1.2% |
| Connect Finco SARL/Connect U.S. Finco LLC, 9.000%, due 09/15/29 | 1.2% |
Availability of Additional Information
You can find additional information, including the Fund's prospectus, financial information, fund holdings, and proxy voting information at abrdn.com/us/literature or call 866-667-9231. The QR code can be used to access the Fund's prospectus, financial information and holdings.
abrdn High Income Opportunities Fund
(JHYIX)
abrdn Infrastructure Debt Fund
Annual Shareholder Report - October 31, 2024
This annual shareholder report contains important information about the abrdn Infrastructure Debt Fund (the "Fund") for the period of November 1, 2023 to October 31, 2024. You can find additional information about the Fund at abrdn.com/us/literature. You can also request this information by contacting us at 866-667-9231.
What were the Fund costs for the last year?
(based on a hypothetical $10,000 investment)
| Share Class | Costs of a $10,000 investment | Costs paid as a percentage of a $10,000 investment |
|---|
| A | $111 | 1.04% |
How did the fund perform last year and what affected its performance?
The following discussion compares the performance of the Fund to the Bloomberg U.S. Aggregate Bond Index (the “Index”) to show how the Fund’s performance measures against the returns of similar investments for the reporting period.
What contributed to performance?
The Fund’s exposure to telecom, media and technology, and electric sectors helped performance. Within individual holdings, Chicago-B reference bonds and VZ Vendor Financing bonds were among the key positive contributors to performance. The bonds of electric generators Clearway, Vistra and NRG Energy were strong due to increased demand for electricity and the prospect of additional earnings from artificial-intelligence energy demand. Liquefied natural gas terminal developer and operator Venture Global was also a contributor to performance as the company has been successful in expanding its capacity. In terms of ratings, all bonds across high and lower-quality segments benefited the Fund. AA-, BB-, and AAA- rated bonds were particularly favorable.
What detracted from performance?
The Fund’s holdings in the consumer and banking sectors hurt performance. Within individual holdings, National Finance Authority bonds and the State of Massachusetts bonds were unfavorable. In the case of National Finance Authority, elevated leverage and work-from-home trends have put pressure on the office space which is leased by the federal government. Meanwhile, the bonds of pulp and paper producer Suzano and those of JSC Georgian Railway also detracted from performance.
abrdn Infrastructure Debt Fund
(CUGAX)
Total Return Based on $10,000 Investment
The following graph reflects a hypothetical $10,000 investment for the most recently completed 10 fiscal years as compared to a broad-based securities market index, which is also the performance benchmark.
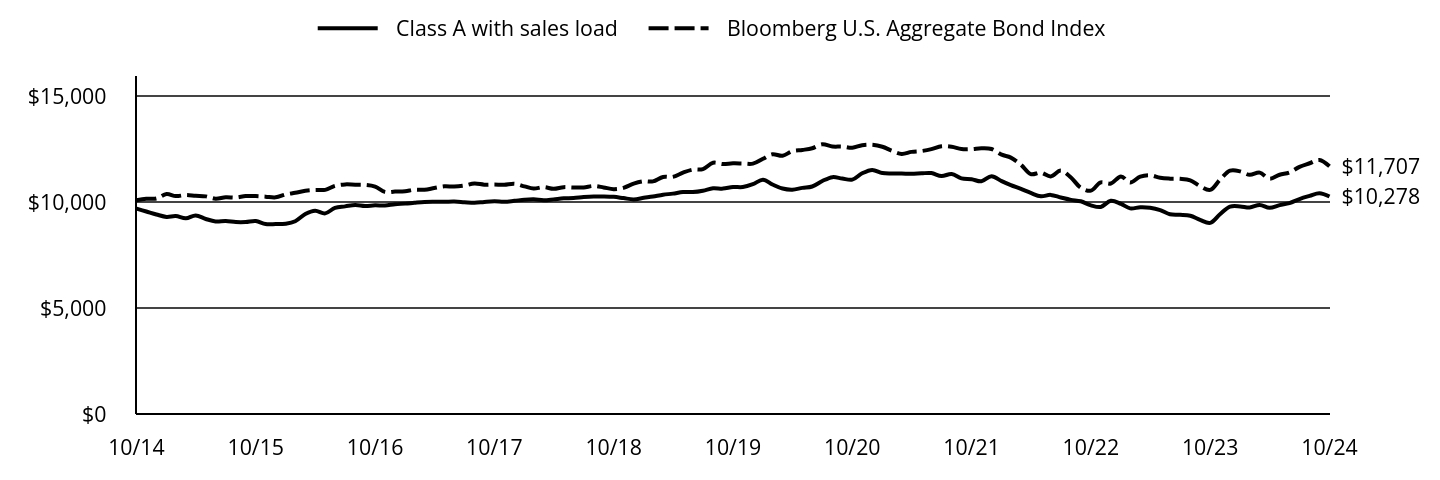
| Class A with sales load | Bloomberg U.S. Aggregate Bond Index |
|---|
| 10/14 | $9,702 | $10,098 |
| 11/14 | $9,568 | $10,170 |
| 12/14 | $9,427 | $10,179 |
| 01/15 | $9,311 | $10,393 |
| 02/15 | $9,349 | $10,295 |
| 03/15 | $9,243 | $10,343 |
| 04/15 | $9,379 | $10,306 |
| 05/15 | $9,214 | $10,281 |
| 06/15 | $9,098 | $10,169 |
| 07/15 | $9,117 | $10,240 |
| 08/15 | $9,069 | $10,225 |
| 09/15 | $9,069 | $10,294 |
| 10/15 | $9,117 | $10,296 |
| 11/15 | $8,972 | $10,269 |
| 12/15 | $8,973 | $10,235 |
| 01/16 | $8,993 | $10,376 |
| 02/16 | $9,109 | $10,450 |
| 03/16 | $9,449 | $10,546 |
| 04/16 | $9,605 | $10,586 |
| 05/16 | $9,479 | $10,589 |
| 06/16 | $9,741 | $10,779 |
| 07/16 | $9,809 | $10,847 |
| 08/16 | $9,877 | $10,835 |
| 09/16 | $9,829 | $10,829 |
| 10/16 | $9,858 | $10,746 |
| 11/16 | $9,848 | $10,492 |
| 12/16 | $9,910 | $10,506 |
| 01/17 | $9,939 | $10,527 |
| 02/17 | $9,979 | $10,598 |
| 03/17 | $10,018 | $10,592 |
| 04/17 | $10,028 | $10,674 |
| 05/17 | $10,028 | $10,756 |
| 06/17 | $10,038 | $10,745 |
| 07/17 | $10,008 | $10,792 |
| 08/17 | $9,979 | $10,888 |
| 09/17 | $10,018 | $10,836 |
| 10/17 | $10,048 | $10,843 |
| 11/17 | $10,028 | $10,829 |
| 12/17 | $10,071 | $10,879 |
| 01/18 | $10,121 | $10,753 |
| 02/18 | $10,140 | $10,651 |
| 03/18 | $10,101 | $10,720 |
| 04/18 | $10,140 | $10,640 |
| 05/18 | $10,190 | $10,716 |
| 06/18 | $10,200 | $10,703 |
| 07/18 | $10,249 | $10,705 |
| 08/18 | $10,278 | $10,774 |
| 09/18 | $10,278 | $10,705 |
| 10/18 | $10,259 | $10,620 |
| 11/18 | $10,200 | $10,683 |
| 12/18 | $10,139 | $10,880 |
| 01/19 | $10,212 | $10,995 |
| 02/19 | $10,275 | $10,989 |
| 03/19 | $10,359 | $11,200 |
| 04/19 | $10,411 | $11,203 |
| 05/19 | $10,484 | $11,402 |
| 06/19 | $10,487 | $11,545 |
| 07/19 | $10,551 | $11,570 |
| 08/19 | $10,666 | $11,870 |
| 09/19 | $10,648 | $11,807 |
| 10/19 | $10,722 | $11,842 |
| 11/19 | $10,722 | $11,836 |
| 12/19 | $10,856 | $11,828 |
| 01/20 | $11,071 | $12,056 |
| 02/20 | $10,845 | $12,273 |
| 03/20 | $10,652 | $12,200 |
| 04/20 | $10,598 | $12,417 |
| 05/20 | $10,684 | $12,475 |
| 06/20 | $10,748 | $12,554 |
| 07/20 | $11,007 | $12,741 |
| 08/20 | $11,190 | $12,638 |
| 09/20 | $11,125 | $12,632 |
| 10/20 | $11,071 | $12,575 |
| 11/20 | $11,372 | $12,698 |
| 12/20 | $11,533 | $12,716 |
| 01/21 | $11,382 | $12,625 |
| 02/21 | $11,361 | $12,443 |
| 03/21 | $11,361 | $12,287 |
| 04/21 | $11,350 | $12,384 |
| 05/21 | $11,371 | $12,425 |
| 06/21 | $11,382 | $12,512 |
| 07/21 | $11,242 | $12,652 |
| 08/21 | $11,339 | $12,628 |
| 09/21 | $11,134 | $12,518 |
| 10/21 | $11,091 | $12,515 |
| 11/21 | $10,994 | $12,552 |
| 12/21 | $11,237 | $12,520 |
| 01/22 | $11,002 | $12,250 |
| 02/22 | $10,812 | $12,114 |
| 03/22 | $10,632 | $11,777 |
| 04/22 | $10,442 | $11,330 |
| 05/22 | $10,285 | $11,403 |
| 06/22 | $10,352 | $11,224 |
| 07/22 | $10,229 | $11,498 |
| 08/22 | $10,117 | $11,174 |
| 09/22 | $10,050 | $10,691 |
| 10/22 | $9,859 | $10,552 |
| 11/22 | $9,781 | $10,940 |
| 12/22 | $10,072 | $10,891 |
| 01/23 | $9,927 | $11,226 |
| 02/23 | $9,714 | $10,936 |
| 03/23 | $9,770 | $11,214 |
| 04/23 | $9,747 | $11,282 |
| 05/23 | $9,635 | $11,159 |
| 06/23 | $9,434 | $11,119 |
| 07/23 | $9,411 | $11,111 |
| 08/23 | $9,366 | $11,040 |
| 09/23 | $9,172 | $10,760 |
| 10/23 | $9,031 | $10,590 |
| 11/23 | $9,435 | $11,069 |
| 12/23 | $9,797 | $11,493 |
| 01/24 | $9,808 | $11,462 |
| 02/24 | $9,756 | $11,300 |
| 03/24 | $9,876 | $11,404 |
| 04/24 | $9,741 | $11,116 |
| 05/24 | $9,870 | $11,304 |
| 06/24 | $9,965 | $11,411 |
| 07/24 | $10,156 | $11,678 |
| 08/24 | $10,303 | $11,846 |
| 09/24 | $10,428 | $12,004 |
| 10/24 | $10,278 | $11,707 |
Average Annual Total Returns for the Period Ended October 31, 2024 (%)
| AATR | 1 Year | 5 Years | 10 Years |
|---|
| Class A without sales load | 13.81% | (0.84%) | 0.58% |
| Class A with sales load - 3.00% | 10.36% | (1.44%) | 0.27% |
| Bloomberg U.S. Aggregate Bond Index | 10.55% | (0.23%) | 1.49% |
THE FUND'S PAST PERFORMANCE IS NOT A GOOD PREDICTOR OF THE FUND'S FUTURE PERFORMANCE.
Fund performance data shown above does not reflect the deduction of taxes that a shareholder would pay on Fund distributions or redemption of Fund shares.
Key Fund Statistics as of October 31, 2024
| Total Net Assets | $24,219,713 |
| Total Number of Portfolio Holdings | 50 |
| Portfolio Turnover Rate | 57% |
| Total Advisory Fees Paid | $0 |
abrdn Infrastructure Debt Fund
(CUGAX)
What did the Fund invest in?
The tables below show the investment makeup of the Fund as of October 31, 2024.
Sector Allocation (% of total net assets)
| AAA | 2.6% |
| AA | 19.1% |
| A | 10.8% |
| BBB | 18.3% |
| BB | 36.0% |
| B | 8.0% |
| Below B | 1.4% |
| Not Rated | 3.9% |
Ratings and portfolio credit quality will vary over time. Credit quality ratings on the underlying securities of the Fund are received from S&P, Moody’s and Fitch and are an indication of the issuer’s creditworthiness. The chart reflects the highest security rating provided by one or more of these rating agencies.
Ten Largest Holdings (% of total net assets)
| Port of Beaumont Navigation District, 10.000%, due 07/01/26 | 4.2% |
| Massachusetts Development Finance Agency, 8.500%, due 10/01/26 | 4.2% |
| Gabon Blue Bond Master Trust, 6.097%, due 08/01/38 | 4.1% |
| Dutchess County Local Development Corp., 5.918%, due 07/01/39 | 3.9% |
| Toledo Hospital, 6.015%, due 11/15/48 | 3.6% |
| Illinois Municipal Electric Agency, 7.288%, due 02/01/35 | 3.6% |
| City of Chicago, 6.314%, due 01/01/44 | 3.5% |
| New York Transportation Development Corp., 6.971%, due 06/30/51 | 3.3% |
| California Statewide Communities Development Authority, 7.140%, due 08/15/47 | 3.3% |
| Low Income Investment Fund, 3.386%, due 07/01/26 | 3.2% |
Availability of Additional Information
You can find additional information, including the Fund's prospectus, financial information, fund holdings, and proxy voting information at abrdn.com/us/literature or call 866-667-9231. The QR code can be used to access the Fund's prospectus, financial information and holdings.
abrdn Infrastructure Debt Fund
(CUGAX)
abrdn Infrastructure Debt Fund
Annual Shareholder Report - October 31, 2024
This annual shareholder report contains important information about the abrdn Infrastructure Debt Fund (the "Fund") for the period of November 1, 2023 to October 31, 2024. You can find additional information about the Fund at abrdn.com/us/literature. You can also request this information by contacting us at 866-667-9231.
What were the Fund costs for the last year?
(based on a hypothetical $10,000 investment)
| Share Class | Costs of a $10,000 investment | Costs paid as a percentage of a $10,000 investment |
|---|
| Institutional | $72 | 0.67% |
How did the fund perform last year and what affected its performance?
The following discussion compares the performance of the Fund to the Bloomberg U.S. Aggregate Bond Index (the “Index”) to show how the Fund’s performance measures against the returns of similar investments for the reporting period.
What contributed to performance?
The Fund’s exposure to telecom, media and technology, and electric sectors helped performance. Within individual holdings, Chicago-B reference bonds and VZ Vendor Financing bonds were among the key positive contributors to performance. The bonds of electric generators Clearway, Vistra and NRG Energy were strong due to increased demand for electricity and the prospect of additional earnings from artificial-intelligence energy demand. Liquefied natural gas terminal developer and operator Venture Global was also a contributor to performance as the company has been successful in expanding its capacity. In terms of ratings, all bonds across high and lower-quality segments benefited the Fund. AA-, BB-, and AAA- rated bonds were particularly favorable.
What detracted from performance?
The Fund’s holdings in the consumer and banking sectors hurt performance. Within individual holdings, National Finance Authority bonds and the State of Massachusetts bonds were unfavorable. In the case of National Finance Authority, elevated leverage and work-from-home trends have put pressure on the office space which is leased by the federal government. Meanwhile, the bonds of pulp and paper producer Suzano and those of JSC Georgian Railway also detracted from performance.
abrdn Infrastructure Debt Fund
(AGCIX)
Total Return Based on $1,000,000 Investment
The following graph reflects a hypothetical $1,000,000 investment for the most recently completed 10 fiscal years as compared to a broad-based securities market index, which is also the performance benchmark.
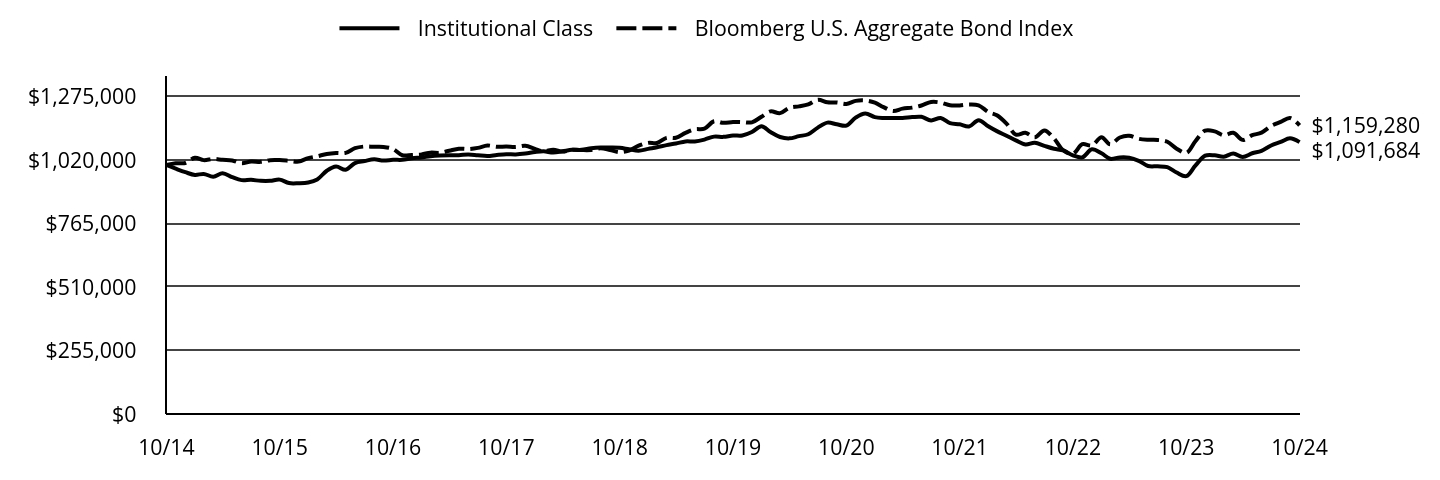
| Institutional Class | Bloomberg U.S. Aggregate Bond Index |
|---|
| 10/14 | $1,000,000 | $1,000,000 |
| 11/14 | $985,222 | $1,007,094 |
| 12/14 | $971,054 | $1,008,036 |
| 01/15 | $960,110 | $1,029,174 |
| 02/15 | $964,090 | $1,019,497 |
| 03/15 | $953,145 | $1,024,231 |
| 04/15 | $967,074 | $1,020,556 |
| 05/15 | $951,156 | $1,018,098 |
| 06/15 | $939,216 | $1,006,997 |
| 07/15 | $940,211 | $1,013,997 |
| 08/15 | $936,232 | $1,012,541 |
| 09/15 | $936,232 | $1,019,390 |
| 10/15 | $941,206 | $1,019,559 |
| 11/15 | $927,277 | $1,016,866 |
| 12/15 | $926,828 | $1,013,580 |
| 01/16 | $929,824 | $1,027,528 |
| 02/16 | $941,809 | $1,034,817 |
| 03/16 | $976,764 | $1,044,311 |
| 04/16 | $993,743 | $1,048,320 |
| 05/16 | $980,759 | $1,048,589 |
| 06/16 | $1,007,725 | $1,067,430 |
| 07/16 | $1,015,715 | $1,074,178 |
| 08/16 | $1,022,706 | $1,072,950 |
| 09/16 | $1,017,713 | $1,072,321 |
| 10/16 | $1,020,709 | $1,064,119 |
| 11/16 | $1,020,709 | $1,038,949 |
| 12/16 | $1,027,081 | $1,040,414 |
| 01/17 | $1,030,111 | $1,042,455 |
| 02/17 | $1,035,160 | $1,049,462 |
| 03/17 | $1,038,190 | $1,048,911 |
| 04/17 | $1,039,200 | $1,057,006 |
| 05/17 | $1,039,200 | $1,065,142 |
| 06/17 | $1,042,229 | $1,064,070 |
| 07/17 | $1,039,200 | $1,068,649 |
| 08/17 | $1,036,170 | $1,078,234 |
| 09/17 | $1,040,210 | $1,073,099 |
| 10/17 | $1,043,239 | $1,073,720 |
| 11/17 | $1,042,229 | $1,072,342 |
| 12/17 | $1,045,677 | $1,077,264 |
| 01/18 | $1,051,756 | $1,064,857 |
| 02/18 | $1,054,796 | $1,054,763 |
| 03/18 | $1,049,730 | $1,061,527 |
| 04/18 | $1,054,796 | $1,053,632 |
| 05/18 | $1,060,876 | $1,061,151 |
| 06/18 | $1,060,876 | $1,059,846 |
| 07/18 | $1,066,955 | $1,060,098 |
| 08/18 | $1,069,995 | $1,066,920 |
| 09/18 | $1,069,995 | $1,060,049 |
| 10/18 | $1,068,982 | $1,051,672 |
| 11/18 | $1,062,902 | $1,057,950 |
| 12/18 | $1,057,112 | $1,077,386 |
| 01/19 | $1,064,625 | $1,088,827 |
| 02/19 | $1,071,064 | $1,088,196 |
| 03/19 | $1,079,650 | $1,109,092 |
| 04/19 | $1,086,089 | $1,109,376 |
| 05/19 | $1,094,675 | $1,129,069 |
| 06/19 | $1,094,464 | $1,143,248 |
| 07/19 | $1,102,027 | $1,145,763 |
| 08/19 | $1,113,912 | $1,175,451 |
| 09/19 | $1,112,894 | $1,169,191 |
| 10/19 | $1,118,334 | $1,172,713 |
| 11/19 | $1,118,334 | $1,172,116 |
| 12/19 | $1,132,383 | $1,171,299 |
| 01/20 | $1,155,697 | $1,193,840 |
| 02/20 | $1,132,383 | $1,215,327 |
| 03/20 | $1,112,400 | $1,208,175 |
| 04/20 | $1,106,849 | $1,229,652 |
| 05/20 | $1,115,731 | $1,235,377 |
| 06/20 | $1,123,502 | $1,243,159 |
| 07/20 | $1,150,146 | $1,261,728 |
| 08/20 | $1,170,129 | $1,251,543 |
| 09/20 | $1,163,468 | $1,250,857 |
| 10/20 | $1,157,917 | $1,245,272 |
| 11/20 | $1,190,113 | $1,257,491 |
| 12/20 | $1,206,716 | $1,259,224 |
| 01/21 | $1,192,231 | $1,250,195 |
| 02/21 | $1,188,888 | $1,232,142 |
| 03/21 | $1,188,888 | $1,216,756 |
| 04/21 | $1,188,888 | $1,226,369 |
| 05/21 | $1,192,231 | $1,230,375 |
| 06/21 | $1,193,345 | $1,239,020 |
| 07/21 | $1,178,860 | $1,252,874 |
| 08/21 | $1,188,888 | $1,250,488 |
| 09/21 | $1,167,718 | $1,239,662 |
| 10/21 | $1,163,261 | $1,239,320 |
| 11/21 | $1,154,347 | $1,242,986 |
| 12/21 | $1,179,889 | $1,239,806 |
| 01/22 | $1,155,573 | $1,213,095 |
| 02/22 | $1,135,889 | $1,199,562 |
| 03/22 | $1,117,363 | $1,166,236 |
| 04/22 | $1,098,837 | $1,121,979 |
| 05/22 | $1,082,626 | $1,129,213 |
| 06/22 | $1,089,573 | $1,111,498 |
| 07/22 | $1,076,837 | $1,138,657 |
| 08/22 | $1,065,258 | $1,106,483 |
| 09/22 | $1,058,310 | $1,058,676 |
| 10/22 | $1,038,626 | $1,044,963 |
| 11/22 | $1,030,521 | $1,083,393 |
| 12/22 | $1,062,942 | $1,078,506 |
| 01/23 | $1,046,732 | $1,111,685 |
| 02/23 | $1,024,732 | $1,082,942 |
| 03/23 | $1,030,521 | $1,110,451 |
| 04/23 | $1,029,363 | $1,117,181 |
| 05/23 | $1,016,626 | $1,105,017 |
| 06/23 | $995,784 | $1,101,075 |
| 07/23 | $994,627 | $1,100,308 |
| 08/23 | $991,153 | $1,093,280 |
| 09/23 | $969,596 | $1,065,498 |
| 10/23 | $955,073 | $1,048,683 |
| 11/23 | $998,356 | $1,096,174 |
| 12/23 | $1,037,261 | $1,138,134 |
| 01/24 | $1,038,603 | $1,135,009 |
| 02/24 | $1,033,383 | $1,118,973 |
| 03/24 | $1,045,967 | $1,129,306 |
| 04/24 | $1,032,211 | $1,100,781 |
| 05/24 | $1,047,026 | $1,119,443 |
| 06/24 | $1,057,023 | $1,130,041 |
| 07/24 | $1,078,341 | $1,156,435 |
| 08/24 | $1,092,587 | $1,173,053 |
| 09/24 | $1,107,036 | $1,188,760 |
| 10/24 | $1,091,684 | $1,159,280 |
Average Annual Total Returns for the Period Ended October 31, 2024 (%)
| AATR | 1 Year | 5 Years | 10 Years |
|---|
| Institutional Class | 14.30% | (0.48%) | 0.88% |
| Bloomberg U.S. Aggregate Bond Index | 10.55% | (0.23%) | 1.49% |
THE FUND'S PAST PERFORMANCE IS NOT A GOOD PREDICTOR OF THE FUND'S FUTURE PERFORMANCE.
Fund performance data shown above does not reflect the deduction of taxes that a shareholder would pay on Fund distributions or redemption of Fund shares.
Key Fund Statistics as of October 31, 2024
| Total Net Assets | $24,219,713 |
| Total Number of Portfolio Holdings | 50 |
| Portfolio Turnover Rate | 57% |
| Total Advisory Fees Paid | $0 |
abrdn Infrastructure Debt Fund
(AGCIX)
What did the Fund invest in?
The tables below show the investment makeup of the Fund as of October 31, 2024.
Sector Allocation (% of total net assets)
| AAA | 2.6% |
| AA | 19.1% |
| A | 10.8% |
| BBB | 18.3% |
| BB | 36.0% |
| B | 8.0% |
| Below B | 1.4% |
| Not Rated | 3.9% |
Ratings and portfolio credit quality will vary over time. Credit quality ratings on the underlying securities of the Fund are received from S&P, Moody’s and Fitch and are an indication of the issuer’s creditworthiness. The chart reflects the highest security rating provided by one or more of these rating agencies.
Ten Largest Holdings (% of total net assets)
| Port of Beaumont Navigation District, 10.000%, due 07/01/26 | 4.2% |
| Massachusetts Development Finance Agency, 8.500%, due 10/01/26 | 4.2% |
| Gabon Blue Bond Master Trust, 6.097%, due 08/01/38 | 4.1% |
| Dutchess County Local Development Corp., 5.918%, due 07/01/39 | 3.9% |
| Toledo Hospital, 6.015%, due 11/15/48 | 3.6% |
| Illinois Municipal Electric Agency, 7.288%, due 02/01/35 | 3.6% |
| City of Chicago, 6.314%, due 01/01/44 | 3.5% |
| New York Transportation Development Corp., 6.971%, due 06/30/51 | 3.3% |
| California Statewide Communities Development Authority, 7.140%, due 08/15/47 | 3.3% |
| Low Income Investment Fund, 3.386%, due 07/01/26 | 3.2% |
Availability of Additional Information
You can find additional information, including the Fund's prospectus, financial information, fund holdings, and proxy voting information at abrdn.com/us/literature or call 866-667-9231. The QR code can be used to access the Fund's prospectus, financial information and holdings.
abrdn Infrastructure Debt Fund
(AGCIX)
abrdn Infrastructure Debt Fund
Annual Shareholder Report - October 31, 2024
This annual shareholder report contains important information about the abrdn Infrastructure Debt Fund (the "Fund") for the period of November 1, 2023 to October 31, 2024. You can find additional information about the Fund at abrdn.com/us/literature. You can also request this information by contacting us at 866-667-9231.
What were the Fund costs for the last year?
(based on a hypothetical $10,000 investment)
| Share Class | Costs of a $10,000 investment | Costs paid as a percentage of a $10,000 investment |
|---|
| Institutional Service | $85 | 0.79% |
How did the fund perform last year and what affected its performance?
The following discussion compares the performance of the Fund to the Bloomberg U.S. Aggregate Bond Index (the “Index”) to show how the Fund’s performance measures against the returns of similar investments for the reporting period.
What contributed to performance?
The Fund’s exposure to telecom, media and technology, and electric sectors helped performance. Within individual holdings, Chicago-B reference bonds and VZ Vendor Financing bonds were among the key positive contributors to performance. The bonds of electric generators Clearway, Vistra and NRG Energy were strong due to increased demand for electricity and the prospect of additional earnings from artificial-intelligence energy demand. Liquefied natural gas terminal developer and operator Venture Global was also a contributor to performance as the company has been successful in expanding its capacity. In terms of ratings, all bonds across high and lower-quality segments benefited the Fund. AA-, BB-, and AAA- rated bonds were particularly favorable.
What detracted from performance?
The Fund’s holdings in the consumer and banking sectors hurt performance. Within individual holdings, National Finance Authority bonds and the State of Massachusetts bonds were unfavorable. In the case of National Finance Authority, elevated leverage and work-from-home trends have put pressure on the office space which is leased by the federal government. Meanwhile, the bonds of pulp and paper producer Suzano and those of JSC Georgian Railway also detracted from performance.
abrdn Infrastructure Debt Fund
(CGFIX)
Institutional Service Class
Total Return Based on $1,000,000 Investment
The following graph reflects a hypothetical $1,000,000 investment for the most recently completed 10 fiscal years as compared to a broad-based securities market index, which is also the performance benchmark.
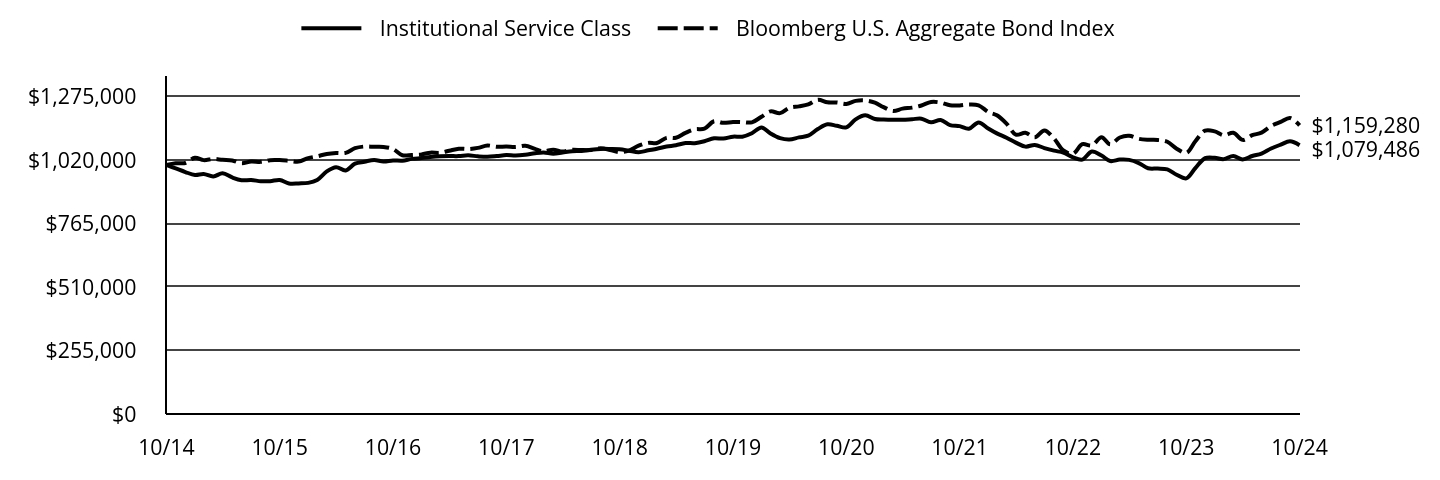
| Institutional Service Class | Bloomberg U.S. Aggregate Bond Index |
|---|
| 10/14 | $1,000,000 | $1,000,000 |
| 11/14 | $986,166 | $1,007,094 |
| 12/14 | $971,723 | $1,008,036 |
| 01/15 | $959,751 | $1,029,174 |
| 02/15 | $963,742 | $1,019,497 |
| 03/15 | $953,765 | $1,024,231 |
| 04/15 | $966,735 | $1,020,556 |
| 05/15 | $949,775 | $1,018,098 |
| 06/15 | $938,800 | $1,006,997 |
| 07/15 | $939,798 | $1,013,997 |
| 08/15 | $934,810 | $1,012,541 |
| 09/15 | $934,810 | $1,019,390 |
| 10/15 | $939,798 | $1,019,559 |
| 11/15 | $925,831 | $1,016,866 |
| 12/15 | $926,046 | $1,013,580 |
| 01/16 | $928,048 | $1,027,528 |
| 02/16 | $940,062 | $1,034,817 |
| 03/16 | $974,100 | $1,044,311 |
| 04/16 | $991,119 | $1,048,320 |
| 05/16 | $978,105 | $1,048,589 |
| 06/16 | $1,005,135 | $1,067,430 |
| 07/16 | $1,013,144 | $1,074,178 |
| 08/16 | $1,020,152 | $1,072,950 |
| 09/16 | $1,014,145 | $1,072,321 |
| 10/16 | $1,018,150 | $1,064,119 |
| 11/16 | $1,017,149 | $1,038,949 |
| 12/16 | $1,024,537 | $1,040,414 |
| 01/17 | $1,027,574 | $1,042,455 |
| 02/17 | $1,031,624 | $1,049,462 |
| 03/17 | $1,034,661 | $1,048,911 |
| 04/17 | $1,035,673 | $1,057,006 |
| 05/17 | $1,035,673 | $1,065,142 |
| 06/17 | $1,038,711 | $1,064,070 |
| 07/17 | $1,034,661 | $1,068,649 |
| 08/17 | $1,032,636 | $1,078,234 |
| 09/17 | $1,035,673 | $1,073,099 |
| 10/17 | $1,039,723 | $1,073,720 |
| 11/17 | $1,037,698 | $1,072,342 |
| 12/17 | $1,041,154 | $1,077,264 |
| 01/18 | $1,047,249 | $1,064,857 |
| 02/18 | $1,050,296 | $1,054,763 |
| 03/18 | $1,045,217 | $1,061,527 |
| 04/18 | $1,050,296 | $1,053,632 |
| 05/18 | $1,055,375 | $1,061,151 |
| 06/18 | $1,056,390 | $1,059,846 |
| 07/18 | $1,061,469 | $1,060,098 |
| 08/18 | $1,064,517 | $1,066,920 |
| 09/18 | $1,064,517 | $1,060,049 |
| 10/18 | $1,063,501 | $1,051,672 |
| 11/18 | $1,057,406 | $1,057,950 |
| 12/18 | $1,051,271 | $1,077,386 |
| 01/19 | $1,058,811 | $1,088,827 |
| 02/19 | $1,065,273 | $1,088,196 |
| 03/19 | $1,073,890 | $1,109,092 |
| 04/19 | $1,079,276 | $1,109,376 |
| 05/19 | $1,087,893 | $1,129,069 |
| 06/19 | $1,087,666 | $1,143,248 |
| 07/19 | $1,095,257 | $1,145,763 |
| 08/19 | $1,107,186 | $1,175,451 |
| 09/19 | $1,106,031 | $1,169,191 |
| 10/19 | $1,113,674 | $1,172,713 |
| 11/19 | $1,113,674 | $1,172,116 |
| 12/19 | $1,127,588 | $1,171,299 |
| 01/20 | $1,150,963 | $1,193,840 |
| 02/20 | $1,126,475 | $1,215,327 |
| 03/20 | $1,107,552 | $1,208,175 |
| 04/20 | $1,101,986 | $1,229,652 |
| 05/20 | $1,110,891 | $1,235,377 |
| 06/20 | $1,117,570 | $1,243,159 |
| 07/20 | $1,144,285 | $1,261,728 |
| 08/20 | $1,163,208 | $1,251,543 |
| 09/20 | $1,157,642 | $1,250,857 |
| 10/20 | $1,150,963 | $1,245,272 |
| 11/20 | $1,183,244 | $1,257,491 |
| 12/20 | $1,199,426 | $1,259,224 |
| 01/21 | $1,184,921 | $1,250,195 |
| 02/21 | $1,182,690 | $1,232,142 |
| 03/21 | $1,181,574 | $1,216,756 |
| 04/21 | $1,181,574 | $1,226,369 |
| 05/21 | $1,183,806 | $1,230,375 |
| 06/21 | $1,186,037 | $1,239,020 |
| 07/21 | $1,171,532 | $1,252,874 |
| 08/21 | $1,180,458 | $1,250,488 |
| 09/21 | $1,160,375 | $1,239,662 |
| 10/21 | $1,155,912 | $1,239,320 |
| 11/21 | $1,145,870 | $1,242,986 |
| 12/21 | $1,171,007 | $1,239,806 |
| 01/22 | $1,146,683 | $1,213,095 |
| 02/22 | $1,126,993 | $1,199,562 |
| 03/22 | $1,109,619 | $1,166,236 |
| 04/22 | $1,089,928 | $1,121,979 |
| 05/22 | $1,073,713 | $1,129,213 |
| 06/22 | $1,080,662 | $1,111,498 |
| 07/22 | $1,067,921 | $1,138,657 |
| 08/22 | $1,057,497 | $1,106,483 |
| 09/22 | $1,049,389 | $1,058,676 |
| 10/22 | $1,030,857 | $1,044,963 |
| 11/22 | $1,021,591 | $1,083,393 |
| 12/22 | $1,054,022 | $1,078,506 |
| 01/23 | $1,037,806 | $1,111,685 |
| 02/23 | $1,015,799 | $1,082,942 |
| 03/23 | $1,021,591 | $1,110,451 |
| 04/23 | $1,020,432 | $1,117,181 |
| 05/23 | $1,007,692 | $1,105,017 |
| 06/23 | $986,843 | $1,101,075 |
| 07/23 | $985,684 | $1,100,308 |
| 08/23 | $982,210 | $1,093,280 |
| 09/23 | $960,813 | $1,065,498 |
| 10/23 | $946,269 | $1,048,683 |
| 11/23 | $988,416 | $1,096,174 |
| 12/23 | $1,027,361 | $1,138,134 |
| 01/24 | $1,028,726 | $1,135,009 |
| 02/24 | $1,023,516 | $1,118,973 |
| 03/24 | $1,036,115 | $1,129,306 |
| 04/24 | $1,022,360 | $1,100,781 |
| 05/24 | $1,036,000 | $1,119,443 |
| 06/24 | $1,046,021 | $1,130,041 |
| 07/24 | $1,066,141 | $1,156,435 |
| 08/24 | $1,081,635 | $1,173,053 |
| 09/24 | $1,094,860 | $1,188,760 |
| 10/24 | $1,079,486 | $1,159,280 |
Average Annual Total Returns for the Period Ended October 31, 2024 (%)
| AATR | 1 Year | 5 Years | 10 Years |
|---|
| Institutional Service Class | 14.08% | (0.62%) | 0.77% |
| Bloomberg U.S. Aggregate Bond Index | 10.55% | (0.23%) | 1.49% |
THE FUND'S PAST PERFORMANCE IS NOT A GOOD PREDICTOR OF THE FUND'S FUTURE PERFORMANCE.
Fund performance data shown above does not reflect the deduction of taxes that a shareholder would pay on Fund distributions or redemption of Fund shares.
Key Fund Statistics as of October 31, 2024
| Total Net Assets | $24,219,713 |
| Total Number of Portfolio Holdings | 50 |
| Portfolio Turnover Rate | 57% |
| Total Advisory Fees Paid | $0 |
abrdn Infrastructure Debt Fund
(CGFIX)
Institutional Service Class
What did the Fund invest in?
The tables below show the investment makeup of the Fund as of October 31, 2024.
Sector Allocation (% of total net assets)
| AAA | 2.6% |
| AA | 19.1% |
| A | 10.8% |
| BBB | 18.3% |
| BB | 36.0% |
| B | 8.0% |
| Below B | 1.4% |
| Not Rated | 3.9% |
Ratings and portfolio credit quality will vary over time. Credit quality ratings on the underlying securities of the Fund are received from S&P, Moody’s and Fitch and are an indication of the issuer’s creditworthiness. The chart reflects the highest security rating provided by one or more of these rating agencies.
Ten Largest Holdings (% of total net assets)
| Port of Beaumont Navigation District, 10.000%, due 07/01/26 | 4.2% |
| Massachusetts Development Finance Agency, 8.500%, due 10/01/26 | 4.2% |
| Gabon Blue Bond Master Trust, 6.097%, due 08/01/38 | 4.1% |
| Dutchess County Local Development Corp., 5.918%, due 07/01/39 | 3.9% |
| Toledo Hospital, 6.015%, due 11/15/48 | 3.6% |
| Illinois Municipal Electric Agency, 7.288%, due 02/01/35 | 3.6% |
| City of Chicago, 6.314%, due 01/01/44 | 3.5% |
| New York Transportation Development Corp., 6.971%, due 06/30/51 | 3.3% |
| California Statewide Communities Development Authority, 7.140%, due 08/15/47 | 3.3% |
| Low Income Investment Fund, 3.386%, due 07/01/26 | 3.2% |
Availability of Additional Information
You can find additional information, including the Fund's prospectus, financial information, fund holdings, and proxy voting information at abrdn.com/us/literature or call 866-667-9231. The QR code can be used to access the Fund's prospectus, financial information and holdings.
abrdn Infrastructure Debt Fund
(CGFIX)
Institutional Service Class
abrdn Intermediate Municipal Income Fund
Annual Shareholder Report - October 31, 2024
This annual shareholder report contains important information about the abrdn Intermediate Municipal Income Fund (the "Fund") for the period of November 1, 2023 to October 31, 2024. You can find additional information about the Fund at abrdn.com/us/literature. You can also request this information by contacting us at 866-667-9231.
What were the Fund costs for the last year?
(based on a hypothetical $10,000 investment)
| Share Class | Costs of a $10,000 investment | Costs paid as a percentage of a $10,000 investment |
|---|
| A | $84 | 0.79% |
How did the fund perform last year and what affected its performance?
The following discussion compares the performance of the Fund to the ICE BofA US Municipal Securities Index (1-22 Yr) to show how the Fund’s performance measures against the returns of similar investments for the reporting period.
What contributed to performance?
The Fund’s exposures to other revenue, industrial development, pollution control revenue, and hospital bonds added to returns. Within individual holdings, the Port of Beaumont Navigation District’s revenue bonds and Indiana Finance Authority’s bonds were among the key positive contributors to performance as the projects’ completion and ramp-up period has led to increased demand. In terms of ratings, non-rated, BBB- and AA-rated bonds were especially favorable.
What detracted from performance?
The Fund’s holdings in local general obligation, other transportation, and life care bonds hurt performance. Within individual holdings, the Mississippi Business Finance Corporation’s revenue bonds and the Nassau County Local Economic Assistance Corporation’s bonds were unfavorable. In the case of Nassau County, these bonds are fundamentally stable from a credit perspective. However, given the size of the issue and the idiosyncratic nature of trades associated with these bonds, they did not experience the same kind of spread compression that other larger healthcare providers experienced during the period. In terms of ratings, A-rated bonds detracted from performance.
abrdn Intermediate Municipal Income Fund
(NTFAX)
Total Return Based on $10,000 Investment
The following graph reflects a hypothetical $10,000 investment for the most recently completed 10 fiscal years as compared to a broad-based securities market index and an additional performance benchmark.
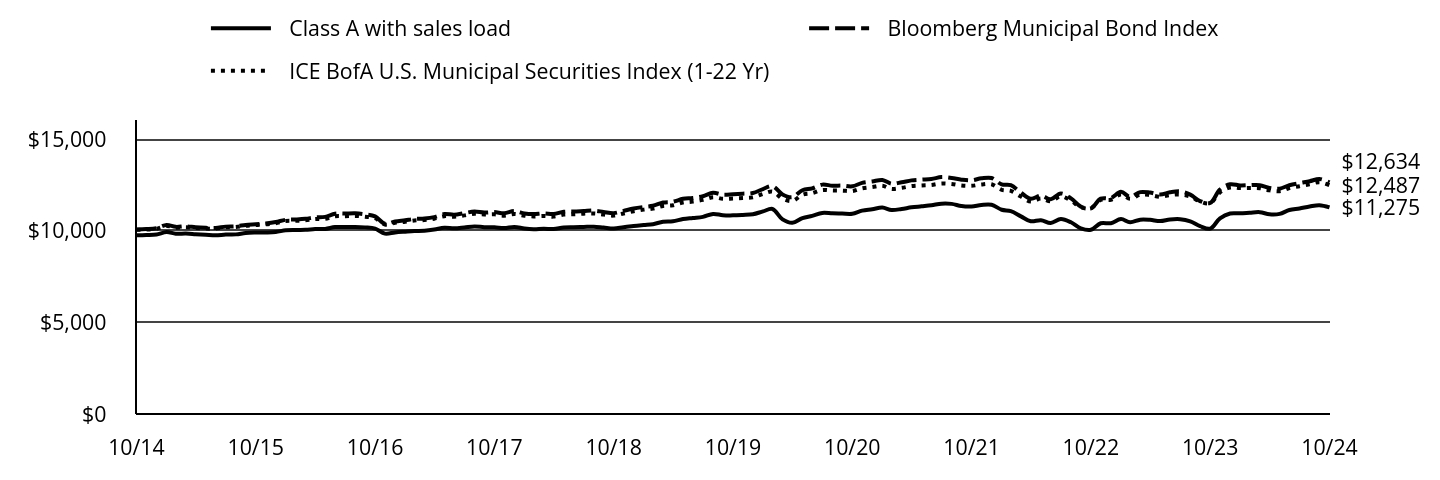
| Class A with sales load | Bloomberg Municipal Bond Index | ICE BofA U.S. Municipal Securities Index (1-22 Yr) |
|---|
| 10/14 | $9,746 | $10,069 | $10,051 |
| 11/14 | $9,763 | $10,086 | $10,059 |
| 12/14 | $9,791 | $10,137 | $10,101 |
| 01/15 | $9,927 | $10,317 | $10,255 |
| 02/15 | $9,838 | $10,210 | $10,167 |
| 03/15 | $9,843 | $10,240 | $10,187 |
| 04/15 | $9,811 | $10,186 | $10,152 |
| 05/15 | $9,779 | $10,158 | $10,119 |
| 06/15 | $9,747 | $10,148 | $10,114 |
| 07/15 | $9,792 | $10,222 | $10,183 |
| 08/15 | $9,799 | $10,242 | $10,199 |
| 09/15 | $9,873 | $10,316 | $10,268 |
| 10/15 | $9,898 | $10,357 | $10,311 |
| 11/15 | $9,905 | $10,398 | $10,345 |
| 12/15 | $9,931 | $10,472 | $10,411 |
| 01/16 | $10,024 | $10,596 | $10,530 |
| 02/16 | $10,041 | $10,613 | $10,539 |
| 03/16 | $10,046 | $10,647 | $10,566 |
| 04/16 | $10,090 | $10,725 | $10,633 |
| 05/16 | $10,096 | $10,754 | $10,644 |
| 06/16 | $10,200 | $10,925 | $10,785 |
| 07/16 | $10,203 | $10,932 | $10,789 |
| 08/16 | $10,207 | $10,947 | $10,807 |
| 09/16 | $10,181 | $10,892 | $10,766 |
| 10/16 | $10,116 | $10,778 | $10,682 |
| 11/16 | $9,840 | $10,376 | $10,338 |
| 12/16 | $9,905 | $10,497 | $10,436 |
| 01/17 | $9,949 | $10,567 | $10,491 |
| 02/17 | $9,984 | $10,640 | $10,557 |
| 03/17 | $9,998 | $10,663 | $10,578 |
| 04/17 | $10,062 | $10,741 | $10,656 |
| 05/17 | $10,157 | $10,911 | $10,793 |
| 06/17 | $10,130 | $10,872 | $10,760 |
| 07/17 | $10,175 | $10,960 | $10,836 |
| 08/17 | $10,230 | $11,043 | $10,922 |
| 09/17 | $10,194 | $10,987 | $10,881 |
| 10/17 | $10,188 | $11,014 | $10,892 |
| 11/17 | $10,142 | $10,955 | $10,822 |
| 12/17 | $10,208 | $11,069 | $10,909 |
| 01/18 | $10,118 | $10,939 | $10,815 |
| 02/18 | $10,080 | $10,906 | $10,779 |
| 03/18 | $10,105 | $10,947 | $10,803 |
| 04/18 | $10,088 | $10,908 | $10,768 |
| 05/18 | $10,176 | $11,033 | $10,878 |
| 06/18 | $10,191 | $11,042 | $10,895 |
| 07/18 | $10,205 | $11,069 | $10,928 |
| 08/18 | $10,220 | $11,097 | $10,942 |
| 09/18 | $10,171 | $11,025 | $10,883 |
| 10/18 | $10,122 | $10,957 | $10,823 |
| 11/18 | $10,191 | $11,079 | $10,938 |
| 12/18 | $10,251 | $11,211 | $11,057 |
| 01/19 | $10,308 | $11,296 | $11,149 |
| 02/19 | $10,356 | $11,357 | $11,208 |
| 03/19 | $10,488 | $11,536 | $11,350 |
| 04/19 | $10,514 | $11,579 | $11,384 |
| 05/19 | $10,636 | $11,739 | $11,538 |
| 06/19 | $10,695 | $11,782 | $11,586 |
| 07/19 | $10,752 | $11,877 | $11,679 |
| 08/19 | $10,916 | $12,065 | $11,826 |
| 09/19 | $10,846 | $11,968 | $11,740 |
| 10/19 | $10,836 | $11,989 | $11,759 |
| 11/19 | $10,859 | $12,019 | $11,780 |
| 12/19 | $10,897 | $12,056 | $11,819 |
| 01/20 | $11,052 | $12,273 | $12,006 |
| 02/20 | $11,186 | $12,431 | $12,133 |
| 03/20 | $10,615 | $11,980 | $11,744 |
| 04/20 | $10,431 | $11,830 | $11,623 |
| 05/20 | $10,687 | $12,206 | $11,965 |
| 06/20 | $10,811 | $12,307 | $12,051 |
| 07/20 | $10,968 | $12,514 | $12,221 |
| 08/20 | $10,945 | $12,455 | $12,190 |
| 09/20 | $10,936 | $12,458 | $12,187 |
| 10/20 | $10,926 | $12,420 | $12,165 |
| 11/20 | $11,097 | $12,608 | $12,313 |
| 12/20 | $11,172 | $12,685 | $12,383 |
| 01/21 | $11,263 | $12,765 | $12,451 |
| 02/21 | $11,128 | $12,563 | $12,281 |
| 03/21 | $11,184 | $12,640 | $12,340 |
| 04/21 | $11,274 | $12,746 | $12,433 |
| 05/21 | $11,329 | $12,784 | $12,469 |
| 06/21 | $11,385 | $12,819 | $12,495 |
| 07/21 | $11,476 | $12,926 | $12,579 |
| 08/21 | $11,463 | $12,878 | $12,547 |
| 09/21 | $11,347 | $12,785 | $12,466 |
| 10/21 | $11,322 | $12,748 | $12,448 |
| 11/21 | $11,402 | $12,856 | $12,524 |
| 12/21 | $11,412 | $12,877 | $12,535 |
| 01/22 | $11,144 | $12,525 | $12,230 |
| 02/22 | $11,063 | $12,480 | $12,174 |
| 03/22 | $10,783 | $12,075 | $11,860 |
| 04/22 | $10,516 | $11,741 | $11,588 |
| 05/22 | $10,574 | $11,916 | $11,753 |
| 06/22 | $10,423 | $11,720 | $11,610 |
| 07/22 | $10,633 | $12,030 | $11,875 |
| 08/22 | $10,458 | $11,766 | $11,638 |
| 09/22 | $10,131 | $11,315 | $11,280 |
| 10/22 | $10,050 | $11,221 | $11,228 |
| 11/22 | $10,407 | $11,746 | $11,675 |
| 12/22 | $10,408 | $11,779 | $11,690 |
| 01/23 | $10,634 | $12,118 | $11,980 |
| 02/23 | $10,458 | $11,844 | $11,737 |
| 03/23 | $10,603 | $12,106 | $11,970 |
| 04/23 | $10,593 | $12,079 | $11,947 |
| 05/23 | $10,523 | $11,974 | $11,853 |
| 06/23 | $10,611 | $12,094 | $11,942 |
| 07/23 | $10,627 | $12,142 | $11,973 |
| 08/23 | $10,511 | $11,967 | $11,865 |
| 09/23 | $10,250 | $11,616 | $11,592 |
| 10/23 | $10,109 | $11,517 | $11,497 |
| 11/23 | $10,677 | $12,249 | $12,096 |
| 12/23 | $10,940 | $12,533 | $12,351 |
| 01/24 | $10,947 | $12,469 | $12,324 |
| 02/24 | $10,978 | $12,485 | $12,332 |
| 03/24 | $11,011 | $12,485 | $12,321 |
| 04/24 | $10,896 | $12,330 | $12,201 |
| 05/24 | $10,917 | $12,294 | $12,154 |
| 06/24 | $11,126 | $12,482 | $12,323 |
| 07/24 | $11,210 | $12,596 | $12,428 |
| 08/24 | $11,320 | $12,696 | $12,533 |
| 09/24 | $11,392 | $12,821 | $12,647 |
| 10/24 | $11,275 | $12,634 | $12,487 |
Average Annual Total Returns for the Period Ended October 31, 2024 (%)
| AATR | 1 Year | 5 Years | 10 Years |
|---|
| Class A without sales load | 11.53% | 0.80% | 1.47% |
| Class A with sales load - 2.50% | 8.78% | 0.30% | 1.21% |
| Bloomberg Municipal Bond Index | 9.70% | 1.05% | 2.30% |
| ICE BofA U.S. Municipal Securities Index (1-22 Yr) | 8.61% | 1.21% | 2.19% |
THE FUND'S PAST PERFORMANCE IS NOT A GOOD PREDICTOR OF THE FUND'S FUTURE PERFORMANCE.
Fund performance data shown above does not reflect the deduction of taxes that a shareholder would pay on Fund distributions or redemption of Fund shares.
In accordance with regulatory changes requiring the Fund's primary benchmark to represent the overall applicable market, the Fund's primary prospectus benchmark changed to the Bloomberg Municipal Bond Index effective as of February 29, 2024.
Key Fund Statistics as of October 31, 2024
| Total Net Assets | $44,030,106 |
| Total Number of Portfolio Holdings | 96 |
| Portfolio Turnover Rate | 71% |
| Total Advisory Fees Paid | $0 |
abrdn Intermediate Municipal Income Fund
(NTFAX)
What did the Fund invest in?
The tables below show the investment makeup of the Fund as of October 31, 2024.
Credit Quality Allocation (% of total net assets)
| AAA | 3.2% |
| AA | 24.9% |
| A | 22.3% |
| BBB | 36.2% |
| BB | 2.4% |
| Not Rated | 11.0% |
Ratings and portfolio credit quality will vary over time. Credit quality ratings on the underlying securities of the Fund are received from S&P, Moody’s and Fitch and are an indication of the issuer’s creditworthiness. The chart reflects the highest security rating provided by one or more of these rating agencies.
Ten Largest Holdings (% of total net assets)
| Mississippi Business Finance Corp., 4.390%, due 11/01/32 | 4.1% |
| Buckeye Tobacco Settlement Financing Authority, Class 2, 5.000%, due 06/01/55 | 3.3% |
| New Jersey Transportation Trust Fund Authority, 5.000%, due 12/15/34 | 2.8% |
| Harris County Cultural Education Facilities Finance Corp., 4.000%, due 12/01/45 | 2.7% |
| Metropolitan Transportation Authority, 5.000%, due 11/15/27 | 2.7% |
| Connecticut State Health & Educational Facilities Authority, 5.000%, due 07/01/27 | 2.6% |
| California Community Choice Financing Authority, 5.250%, due 01/01/54 | 2.4% |
| Indiana Finance Authority, 5.125%, due 06/01/58 | 2.4% |
| Public Finance Authority, 5.000%, due 07/01/38 | 2.3% |
| Metropolitan Nashville Airport Authority, 5.000%, due 07/01/40 | 2.3% |
Availability of Additional Information
You can find additional information, including the Fund's prospectus, financial information, fund holdings, and proxy voting information at abrdn.com/us/literature or call 866-667-9231. The QR code can be used to access the Fund's prospectus, financial information and holdings.
abrdn Intermediate Municipal Income Fund
(NTFAX)
abrdn Intermediate Municipal Income Fund
Annual Shareholder Report - October 31, 2024
This annual shareholder report contains important information about the abrdn Intermediate Municipal Income Fund (the "Fund") for the period of November 1, 2023 to October 31, 2024. You can find additional information about the Fund at abrdn.com/us/literature. You can also request this information by contacting us at 866-667-9231.
What were the Fund costs for the last year?
(based on a hypothetical $10,000 investment)
| Share Class | Costs of a $10,000 investment | Costs paid as a percentage of a $10,000 investment |
|---|
| Institutional | $53 | 0.50% |
How did the fund perform last year and what affected its performance?
The following discussion compares the performance of the Fund to the ICE BofA US Municipal Securities Index (1-22 Yr) to show how the Fund’s performance measures against the returns of similar investments for the reporting period.
What contributed to performance?
The Fund’s exposures to other revenue, industrial development, pollution control revenue, and hospital bonds added to returns. Within individual holdings, the Port of Beaumont Navigation District’s revenue bonds and Indiana Finance Authority’s bonds were among the key positive contributors to performance as the projects’ completion and ramp-up period has led to increased demand. In terms of ratings, non-rated, BBB- and AA-rated bonds were especially favorable.
What detracted from performance?
The Fund’s holdings in local general obligation, other transportation, and life care bonds hurt performance. Within individual holdings, the Mississippi Business Finance Corporation’s revenue bonds and the Nassau County Local Economic Assistance Corporation’s bonds were unfavorable. In the case of Nassau County, these bonds are fundamentally stable from a credit perspective. However, given the size of the issue and the idiosyncratic nature of trades associated with these bonds, they did not experience the same kind of spread compression that other larger healthcare providers experienced during the period. In terms of ratings, A-rated bonds detracted from performance.
abrdn Intermediate Municipal Income Fund
(ABEIX)
Total Return Based on $1,000,000 Investment
The following graph reflects a hypothetical $1,000,000 investment for the most recently completed 10 fiscal years as compared to a broad-based securities market index and an additional performance benchmark.

| Institutional Class | Bloomberg Municipal Bond Index | ICE BofA U.S. Municipal Securities Index (1-22 Yr) |
|---|
| 10/14 | $1,000,000 | $1,000,000 | $1,000,000 |
| 11/14 | $1,000,902 | $1,001,730 | $1,000,818 |
| 12/14 | $1,004,019 | $1,006,784 | $1,004,962 |
| 01/15 | $1,018,147 | $1,024,628 | $1,020,307 |
| 02/15 | $1,009,242 | $1,014,059 | $1,011,560 |
| 03/15 | $1,010,020 | $1,016,987 | $1,013,483 |
| 04/15 | $1,006,946 | $1,011,652 | $1,010,054 |
| 05/15 | $1,003,868 | $1,008,857 | $1,006,782 |
| 06/15 | $1,000,805 | $1,007,937 | $1,006,224 |
| 07/15 | $1,005,625 | $1,015,238 | $1,013,090 |
| 08/15 | $1,006,523 | $1,017,232 | $1,014,703 |
| 09/15 | $1,014,367 | $1,024,601 | $1,021,615 |
| 10/15 | $1,017,215 | $1,028,674 | $1,025,851 |
| 11/15 | $1,018,158 | $1,032,764 | $1,029,207 |
| 12/15 | $1,021,026 | $1,040,020 | $1,035,844 |
| 01/16 | $1,030,878 | $1,052,429 | $1,047,675 |
| 02/16 | $1,032,760 | $1,054,085 | $1,048,543 |
| 03/16 | $1,033,512 | $1,057,423 | $1,051,185 |
| 04/16 | $1,038,361 | $1,065,199 | $1,057,932 |
| 05/16 | $1,039,170 | $1,068,080 | $1,058,991 |
| 06/16 | $1,050,048 | $1,085,071 | $1,072,968 |
| 07/16 | $1,050,668 | $1,085,734 | $1,073,373 |
| 08/16 | $1,051,320 | $1,087,199 | $1,075,231 |
| 09/16 | $1,047,840 | $1,081,773 | $1,071,121 |
| 10/16 | $1,042,334 | $1,070,424 | $1,062,807 |
| 11/16 | $1,014,196 | $1,030,502 | $1,028,546 |
| 12/16 | $1,021,092 | $1,042,600 | $1,038,294 |
| 01/17 | $1,024,803 | $1,049,474 | $1,043,715 |
| 02/17 | $1,029,689 | $1,056,761 | $1,050,352 |
| 03/17 | $1,031,402 | $1,059,055 | $1,052,443 |
| 04/17 | $1,038,240 | $1,066,740 | $1,060,153 |
| 05/17 | $1,048,276 | $1,083,670 | $1,073,824 |
| 06/17 | $1,045,762 | $1,079,783 | $1,070,567 |
| 07/17 | $1,050,559 | $1,088,519 | $1,078,113 |
| 08/17 | $1,056,497 | $1,096,803 | $1,086,593 |
| 09/17 | $1,052,947 | $1,091,226 | $1,082,560 |
| 10/17 | $1,052,532 | $1,093,890 | $1,083,626 |
| 11/17 | $1,047,901 | $1,088,033 | $1,076,684 |
| 12/17 | $1,054,956 | $1,099,405 | $1,085,312 |
| 01/18 | $1,045,891 | $1,086,462 | $1,076,022 |
| 02/18 | $1,042,232 | $1,083,215 | $1,072,425 |
| 03/18 | $1,045,002 | $1,087,213 | $1,074,830 |
| 04/18 | $1,043,509 | $1,083,333 | $1,071,290 |
| 05/18 | $1,051,719 | $1,095,739 | $1,082,265 |
| 06/18 | $1,053,491 | $1,096,674 | $1,083,913 |
| 07/18 | $1,055,235 | $1,099,335 | $1,087,231 |
| 08/18 | $1,056,983 | $1,102,158 | $1,088,638 |
| 09/18 | $1,053,313 | $1,095,023 | $1,082,808 |
| 10/18 | $1,048,463 | $1,088,280 | $1,076,787 |
| 11/18 | $1,055,751 | $1,100,325 | $1,088,225 |
| 12/18 | $1,062,203 | $1,113,500 | $1,100,065 |
| 01/19 | $1,068,336 | $1,121,917 | $1,109,247 |
| 02/19 | $1,073,546 | $1,127,924 | $1,115,123 |
| 03/19 | $1,086,384 | $1,145,754 | $1,129,245 |
| 04/19 | $1,090,408 | $1,150,060 | $1,132,598 |
| 05/19 | $1,103,322 | $1,165,915 | $1,147,939 |
| 06/19 | $1,109,620 | $1,170,220 | $1,152,718 |
| 07/19 | $1,115,780 | $1,179,651 | $1,161,931 |
| 08/19 | $1,133,077 | $1,198,258 | $1,176,542 |
| 09/19 | $1,126,050 | $1,188,653 | $1,167,990 |
| 10/19 | $1,125,254 | $1,190,783 | $1,169,898 |
| 11/19 | $1,127,887 | $1,193,761 | $1,171,989 |
| 12/19 | $1,130,958 | $1,197,406 | $1,175,881 |
| 01/20 | $1,148,396 | $1,218,919 | $1,194,510 |
| 02/20 | $1,161,418 | $1,234,638 | $1,207,083 |
| 03/20 | $1,103,539 | $1,189,854 | $1,168,441 |
| 04/20 | $1,084,671 | $1,174,921 | $1,156,403 |
| 05/20 | $1,111,554 | $1,212,297 | $1,190,419 |
| 06/20 | $1,124,688 | $1,222,275 | $1,199,009 |
| 07/20 | $1,141,202 | $1,242,861 | $1,215,918 |
| 08/20 | $1,139,108 | $1,237,029 | $1,212,768 |
| 09/20 | $1,138,355 | $1,237,291 | $1,212,454 |
| 10/20 | $1,137,626 | $1,233,575 | $1,210,344 |
| 11/20 | $1,154,419 | $1,252,190 | $1,225,001 |
| 12/20 | $1,162,546 | $1,259,818 | $1,231,997 |
| 01/21 | $1,173,388 | $1,267,846 | $1,238,729 |
| 02/21 | $1,159,615 | $1,247,702 | $1,221,809 |
| 03/21 | $1,165,670 | $1,255,397 | $1,227,685 |
| 04/21 | $1,175,281 | $1,265,927 | $1,236,948 |
| 05/21 | $1,181,332 | $1,269,704 | $1,240,599 |
| 06/21 | $1,187,445 | $1,273,190 | $1,243,114 |
| 07/21 | $1,197,120 | $1,283,750 | $1,251,501 |
| 08/21 | $1,194,890 | $1,279,038 | $1,248,359 |
| 09/21 | $1,184,232 | $1,269,808 | $1,240,258 |
| 10/21 | $1,181,936 | $1,266,095 | $1,238,488 |
| 11/21 | $1,190,465 | $1,276,873 | $1,245,985 |
| 12/21 | $1,191,781 | $1,278,933 | $1,247,101 |
| 01/22 | $1,162,945 | $1,243,925 | $1,216,751 |
| 02/22 | $1,155,951 | $1,239,469 | $1,211,216 |
| 03/22 | $1,125,767 | $1,199,289 | $1,179,982 |
| 04/22 | $1,098,079 | $1,166,117 | $1,152,943 |
| 05/22 | $1,105,663 | $1,183,440 | $1,169,359 |
| 06/22 | $1,090,125 | $1,164,057 | $1,155,084 |
| 07/22 | $1,112,277 | $1,194,813 | $1,181,439 |
| 08/22 | $1,094,229 | $1,168,627 | $1,157,898 |
| 09/22 | $1,059,054 | $1,123,774 | $1,122,302 |
| 10/22 | $1,052,078 | $1,114,429 | $1,117,069 |
| 11/22 | $1,088,362 | $1,166,554 | $1,161,568 |
| 12/22 | $1,089,991 | $1,169,894 | $1,163,062 |
| 01/23 | $1,113,940 | $1,203,500 | $1,191,898 |
| 02/23 | $1,095,790 | $1,176,286 | $1,167,684 |
| 03/23 | $1,109,996 | $1,202,385 | $1,190,882 |
| 04/23 | $1,110,449 | $1,199,638 | $1,188,607 |
| 05/23 | $1,103,353 | $1,189,242 | $1,179,275 |
| 06/23 | $1,112,878 | $1,201,155 | $1,188,129 |
| 07/23 | $1,114,889 | $1,205,907 | $1,191,172 |
| 08/23 | $1,101,698 | $1,188,547 | $1,180,476 |
| 09/23 | $1,075,851 | $1,153,712 | $1,153,253 |
| 10/23 | $1,060,175 | $1,143,894 | $1,143,822 |
| 11/23 | $1,121,220 | $1,216,510 | $1,203,451 |
| 12/23 | $1,149,108 | $1,244,784 | $1,228,786 |
| 01/24 | $1,150,071 | $1,238,426 | $1,226,094 |
| 02/24 | $1,153,655 | $1,240,017 | $1,226,966 |
| 03/24 | $1,157,379 | $1,239,978 | $1,225,877 |
| 04/24 | $1,145,598 | $1,224,621 | $1,213,842 |
| 05/24 | $1,148,069 | $1,221,029 | $1,209,258 |
| 06/24 | $1,170,264 | $1,239,745 | $1,226,075 |
| 07/24 | $1,178,102 | $1,251,044 | $1,236,443 |
| 08/24 | $1,191,240 | $1,260,911 | $1,246,876 |
| 09/24 | $1,199,148 | $1,273,373 | $1,258,302 |
| 10/24 | $1,187,133 | $1,254,806 | $1,242,323 |
Average Annual Total Returns for the Period Ended October 31, 2024 (%)
| AATR | 1 Year | 5 Years | 10 Years |
|---|
| Institutional Class | 11.98% | 1.08% | 1.73% |
| Bloomberg Municipal Bond Index | 9.70% | 1.05% | 2.30% |
| ICE BofA U.S. Municipal Securities Index (1-22 Yr) | 8.61% | 1.21% | 2.19% |
THE FUND'S PAST PERFORMANCE IS NOT A GOOD PREDICTOR OF THE FUND'S FUTURE PERFORMANCE.
Fund performance data shown above does not reflect the deduction of taxes that a shareholder would pay on Fund distributions or redemption of Fund shares.
In accordance with regulatory changes requiring the Fund's primary benchmark to represent the overall applicable market, the Fund's primary prospectus benchmark changed to the Bloomberg Municipal Bond Index effective as of February 29, 2024.
Key Fund Statistics as of October 31, 2024
| Total Net Assets | $44,030,106 |
| Total Number of Portfolio Holdings | 96 |
| Portfolio Turnover Rate | 71% |
| Total Advisory Fees Paid | $0 |
abrdn Intermediate Municipal Income Fund
(ABEIX)
What did the Fund invest in?
The tables below show the investment makeup of the Fund as of October 31, 2024.
Credit Quality Allocation (% of total net assets)
| AAA | 3.2% |
| AA | 24.9% |
| A | 22.3% |
| BBB | 36.2% |
| BB | 2.4% |
| Not Rated | 11.0% |
Ratings and portfolio credit quality will vary over time. Credit quality ratings on the underlying securities of the Fund are received from S&P, Moody’s and Fitch and are an indication of the issuer’s creditworthiness. The chart reflects the highest security rating provided by one or more of these rating agencies.
Ten Largest Holdings (% of total net assets)
| Mississippi Business Finance Corp., 4.390%, due 11/01/32 | 4.1% |
| Buckeye Tobacco Settlement Financing Authority, Class 2, 5.000%, due 06/01/55 | 3.3% |
| New Jersey Transportation Trust Fund Authority, 5.000%, due 12/15/34 | 2.8% |
| Harris County Cultural Education Facilities Finance Corp., 4.000%, due 12/01/45 | 2.7% |
| Metropolitan Transportation Authority, 5.000%, due 11/15/27 | 2.7% |
| Connecticut State Health & Educational Facilities Authority, 5.000%, due 07/01/27 | 2.6% |
| California Community Choice Financing Authority, 5.250%, due 01/01/54 | 2.4% |
| Indiana Finance Authority, 5.125%, due 06/01/58 | 2.4% |
| Public Finance Authority, 5.000%, due 07/01/38 | 2.3% |
| Metropolitan Nashville Airport Authority, 5.000%, due 07/01/40 | 2.3% |
Availability of Additional Information
You can find additional information, including the Fund's prospectus, financial information, fund holdings, and proxy voting information at abrdn.com/us/literature or call 866-667-9231. The QR code can be used to access the Fund's prospectus, financial information and holdings.
abrdn Intermediate Municipal Income Fund
(ABEIX)
abrdn Intermediate Municipal Income Fund
Annual Shareholder Report - October 31, 2024
This annual shareholder report contains important information about the abrdn Intermediate Municipal Income Fund (the "Fund") for the period of November 1, 2023 to October 31, 2024. You can find additional information about the Fund at abrdn.com/us/literature. You can also request this information by contacting us at 866-667-9231.
What were the Fund costs for the last year?
(based on a hypothetical $10,000 investment)
| Share Class | Costs of a $10,000 investment | Costs paid as a percentage of a $10,000 investment |
|---|
| Institutional Service | $53 | 0.50% |
How did the fund perform last year and what affected its performance?
The following discussion compares the performance of the Fund to the ICE BofA US Municipal Securities Index (1-22 Yr) to show how the Fund’s performance measures against the returns of similar investments for the reporting period.
What contributed to performance?
The Fund’s exposures to other revenue, industrial development, pollution control revenue, and hospital bonds added to returns. Within individual holdings, the Port of Beaumont Navigation District’s revenue bonds and Indiana Finance Authority’s bonds were among the key positive contributors to performance as the projects’ completion and ramp-up period has led to increased demand. In terms of ratings, non-rated, BBB- and AA-rated bonds were especially favorable.
What detracted from performance?
The Fund’s holdings in local general obligation, other transportation, and life care bonds hurt performance. Within individual holdings, the Mississippi Business Finance Corporation’s revenue bonds and the Nassau County Local Economic Assistance Corporation’s bonds were unfavorable. In the case of Nassau County, these bonds are fundamentally stable from a credit perspective. However, given the size of the issue and the idiosyncratic nature of trades associated with these bonds, they did not experience the same kind of spread compression that other larger healthcare providers experienced during the period. In terms of ratings, A-rated bonds detracted from performance.
abrdn Intermediate Municipal Income Fund
(ABESX)
Institutional Service Class
Total Return Based on $1,000,000 Investment
The following graph reflects a hypothetical $1,000,000 investment for the most recently completed 10 fiscal years as compared to a broad-based securities market index and an additional performance benchmark.
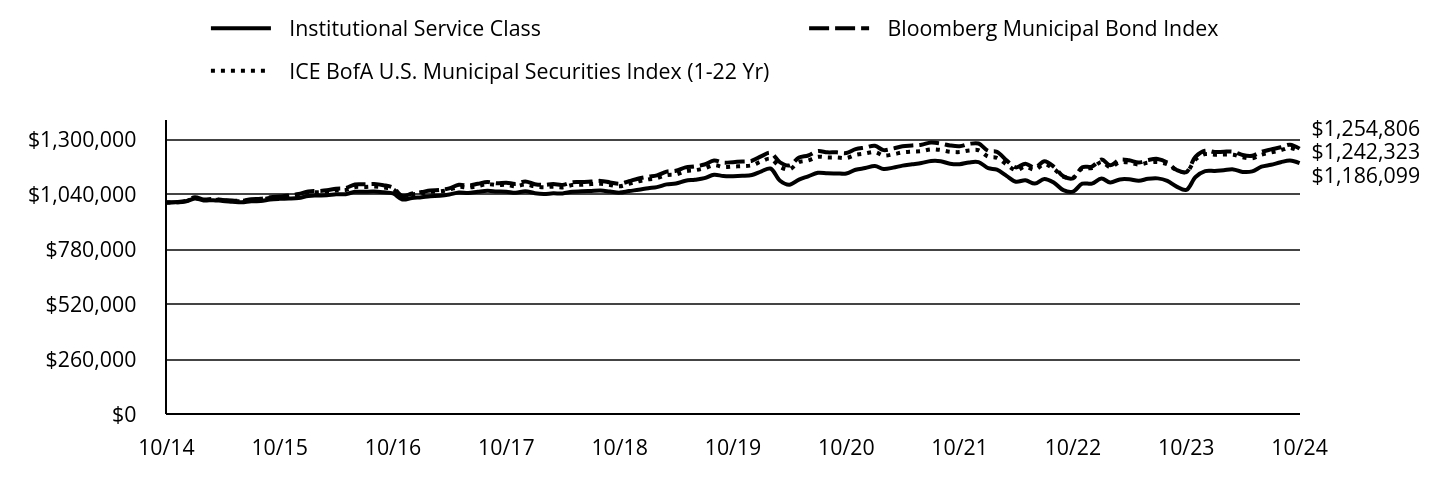
| Institutional Service Class | Bloomberg Municipal Bond Index | ICE BofA U.S. Municipal Securities Index (1-22 Yr) |
|---|
| 10/14 | $1,000,000 | $1,000,000 | $1,000,000 |
| 11/14 | $1,000,922 | $1,001,730 | $1,000,818 |
| 12/14 | $1,004,065 | $1,006,784 | $1,004,962 |
| 01/15 | $1,019,204 | $1,024,628 | $1,020,307 |
| 02/15 | $1,009,353 | $1,014,059 | $1,011,560 |
| 03/15 | $1,011,130 | $1,016,987 | $1,013,483 |
| 04/15 | $1,006,982 | $1,011,652 | $1,010,054 |
| 05/15 | $1,003,926 | $1,008,857 | $1,006,782 |
| 06/15 | $1,000,884 | $1,007,937 | $1,006,224 |
| 07/15 | $1,005,728 | $1,015,238 | $1,013,090 |
| 08/15 | $1,006,637 | $1,017,232 | $1,014,703 |
| 09/15 | $1,014,496 | $1,024,601 | $1,021,615 |
| 10/15 | $1,017,359 | $1,028,674 | $1,025,851 |
| 11/15 | $1,018,330 | $1,032,764 | $1,029,207 |
| 12/15 | $1,021,228 | $1,040,020 | $1,035,844 |
| 01/16 | $1,031,100 | $1,052,429 | $1,047,675 |
| 02/16 | $1,033,001 | $1,054,085 | $1,048,543 |
| 03/16 | $1,033,757 | $1,057,423 | $1,051,185 |
| 04/16 | $1,038,602 | $1,065,199 | $1,057,932 |
| 05/16 | $1,039,433 | $1,068,080 | $1,058,991 |
| 06/16 | $1,050,315 | $1,085,071 | $1,072,968 |
| 07/16 | $1,050,933 | $1,085,734 | $1,073,373 |
| 08/16 | $1,051,587 | $1,087,199 | $1,075,231 |
| 09/16 | $1,048,107 | $1,081,773 | $1,071,121 |
| 10/16 | $1,042,604 | $1,070,424 | $1,062,807 |
| 11/16 | $1,014,465 | $1,030,502 | $1,028,546 |
| 12/16 | $1,021,362 | $1,042,600 | $1,038,294 |
| 01/17 | $1,025,026 | $1,049,474 | $1,043,715 |
| 02/17 | $1,029,853 | $1,056,761 | $1,050,352 |
| 03/17 | $1,031,566 | $1,059,055 | $1,052,443 |
| 04/17 | $1,037,355 | $1,066,740 | $1,060,153 |
| 05/17 | $1,047,323 | $1,083,670 | $1,073,824 |
| 06/17 | $1,044,668 | $1,079,783 | $1,070,567 |
| 07/17 | $1,050,380 | $1,088,519 | $1,078,113 |
| 08/17 | $1,055,118 | $1,096,803 | $1,086,593 |
| 09/17 | $1,052,476 | $1,091,226 | $1,082,560 |
| 10/17 | $1,050,846 | $1,093,890 | $1,083,626 |
| 11/17 | $1,046,111 | $1,088,033 | $1,076,684 |
| 12/17 | $1,053,110 | $1,099,405 | $1,085,312 |
| 01/18 | $1,044,078 | $1,086,462 | $1,076,022 |
| 02/18 | $1,040,452 | $1,083,215 | $1,072,425 |
| 03/18 | $1,043,254 | $1,087,213 | $1,074,830 |
| 04/18 | $1,042,875 | $1,083,333 | $1,071,290 |
| 05/18 | $1,051,110 | $1,095,739 | $1,082,265 |
| 06/18 | $1,052,818 | $1,096,674 | $1,083,913 |
| 07/18 | $1,054,554 | $1,099,335 | $1,087,231 |
| 08/18 | $1,056,297 | $1,102,158 | $1,088,638 |
| 09/18 | $1,051,528 | $1,095,023 | $1,082,808 |
| 10/18 | $1,046,673 | $1,088,280 | $1,076,787 |
| 11/18 | $1,053,952 | $1,100,325 | $1,088,225 |
| 12/18 | $1,060,398 | $1,113,500 | $1,100,065 |
| 01/19 | $1,067,619 | $1,121,917 | $1,109,247 |
| 02/19 | $1,072,823 | $1,127,924 | $1,115,123 |
| 03/19 | $1,085,653 | $1,145,754 | $1,129,245 |
| 04/19 | $1,089,665 | $1,150,060 | $1,132,598 |
| 05/19 | $1,102,567 | $1,165,915 | $1,147,939 |
| 06/19 | $1,107,732 | $1,170,220 | $1,152,718 |
| 07/19 | $1,115,002 | $1,179,651 | $1,161,931 |
| 08/19 | $1,131,155 | $1,198,258 | $1,176,542 |
| 09/19 | $1,125,252 | $1,188,653 | $1,167,990 |
| 10/19 | $1,124,441 | $1,190,783 | $1,169,898 |
| 11/19 | $1,125,933 | $1,193,761 | $1,171,989 |
| 12/19 | $1,130,125 | $1,197,406 | $1,175,881 |
| 01/20 | $1,147,551 | $1,218,919 | $1,194,510 |
| 02/20 | $1,160,590 | $1,234,638 | $1,207,083 |
| 03/20 | $1,102,690 | $1,189,854 | $1,168,441 |
| 04/20 | $1,083,827 | $1,174,921 | $1,156,403 |
| 05/20 | $1,108,374 | $1,212,297 | $1,190,419 |
| 06/20 | $1,123,795 | $1,222,275 | $1,199,009 |
| 07/20 | $1,140,289 | $1,242,861 | $1,215,918 |
| 08/20 | $1,138,188 | $1,237,029 | $1,212,768 |
| 09/20 | $1,137,437 | $1,237,291 | $1,212,454 |
| 10/20 | $1,136,717 | $1,233,575 | $1,210,344 |
| 11/20 | $1,154,665 | $1,252,190 | $1,225,001 |
| 12/20 | $1,162,790 | $1,259,818 | $1,231,997 |
| 01/21 | $1,172,453 | $1,267,846 | $1,238,729 |
| 02/21 | $1,158,693 | $1,247,702 | $1,221,809 |
| 03/21 | $1,164,743 | $1,255,397 | $1,227,685 |
| 04/21 | $1,174,349 | $1,265,927 | $1,236,948 |
| 05/21 | $1,180,395 | $1,269,704 | $1,240,599 |
| 06/21 | $1,186,507 | $1,273,190 | $1,243,114 |
| 07/21 | $1,196,176 | $1,283,750 | $1,251,501 |
| 08/21 | $1,195,141 | $1,279,038 | $1,248,359 |
| 09/21 | $1,183,296 | $1,269,808 | $1,240,258 |
| 10/21 | $1,181,010 | $1,266,095 | $1,238,488 |
| 11/21 | $1,189,535 | $1,276,873 | $1,245,985 |
| 12/21 | $1,190,852 | $1,278,933 | $1,247,101 |
| 01/22 | $1,162,043 | $1,243,925 | $1,216,751 |
| 02/22 | $1,155,058 | $1,239,469 | $1,211,216 |
| 03/22 | $1,126,112 | $1,199,289 | $1,179,982 |
| 04/22 | $1,098,447 | $1,166,117 | $1,152,943 |
| 05/22 | $1,104,815 | $1,183,440 | $1,169,359 |
| 06/22 | $1,089,295 | $1,164,057 | $1,155,084 |
| 07/22 | $1,111,438 | $1,194,813 | $1,181,439 |
| 08/22 | $1,093,409 | $1,168,627 | $1,157,898 |
| 09/22 | $1,058,260 | $1,123,774 | $1,122,302 |
| 10/22 | $1,051,292 | $1,114,429 | $1,117,069 |
| 11/22 | $1,088,783 | $1,166,554 | $1,161,568 |
| 12/22 | $1,089,172 | $1,169,894 | $1,163,062 |
| 01/23 | $1,113,096 | $1,203,500 | $1,191,898 |
| 02/23 | $1,094,958 | $1,176,286 | $1,167,684 |
| 03/23 | $1,109,150 | $1,202,385 | $1,190,882 |
| 04/23 | $1,109,598 | $1,199,638 | $1,188,607 |
| 05/23 | $1,102,501 | $1,189,242 | $1,179,275 |
| 06/23 | $1,112,017 | $1,201,155 | $1,188,129 |
| 07/23 | $1,114,025 | $1,205,907 | $1,191,172 |
| 08/23 | $1,102,110 | $1,188,547 | $1,180,476 |
| 09/23 | $1,075,013 | $1,153,712 | $1,153,253 |
| 10/23 | $1,059,355 | $1,143,894 | $1,143,822 |
| 11/23 | $1,120,346 | $1,216,510 | $1,203,451 |
| 12/23 | $1,148,207 | $1,244,784 | $1,228,786 |
| 01/24 | $1,149,159 | $1,238,426 | $1,226,094 |
| 02/24 | $1,152,729 | $1,240,017 | $1,226,966 |
| 03/24 | $1,156,447 | $1,239,978 | $1,225,877 |
| 04/24 | $1,144,666 | $1,224,621 | $1,213,842 |
| 05/24 | $1,147,119 | $1,221,029 | $1,209,258 |
| 06/24 | $1,169,289 | $1,239,745 | $1,226,075 |
| 07/24 | $1,178,435 | $1,251,044 | $1,236,443 |
| 08/24 | $1,190,235 | $1,260,911 | $1,246,876 |
| 09/24 | $1,198,124 | $1,273,373 | $1,258,302 |
| 10/24 | $1,186,099 | $1,254,806 | $1,242,323 |
Average Annual Total Returns for the Period Ended October 31, 2024 (%)
| AATR | 1 Year | 5 Years | 10 Years |
|---|
| Institutional Service Class | 11.96% | 1.07% | 1.72% |
| Bloomberg Municipal Bond Index | 9.70% | 1.05% | 2.30% |
| ICE BofA U.S. Municipal Securities Index (1-22 Yr) | 8.61% | 1.21% | 2.19% |
THE FUND'S PAST PERFORMANCE IS NOT A GOOD PREDICTOR OF THE FUND'S FUTURE PERFORMANCE.
Fund performance data shown above does not reflect the deduction of taxes that a shareholder would pay on Fund distributions or redemption of Fund shares.
In accordance with regulatory changes requiring the Fund's primary benchmark to represent the overall applicable market, the Fund's primary prospectus benchmark changed to the Bloomberg Municipal Bond Index effective as of February 29, 2024.
Key Fund Statistics as of October 31, 2024
| Total Net Assets | $44,030,106 |
| Total Number of Portfolio Holdings | 96 |
| Portfolio Turnover Rate | 71% |
| Total Advisory Fees Paid | $0 |
abrdn Intermediate Municipal Income Fund
(ABESX)
Institutional Service Class
What did the Fund invest in?
The tables below show the investment makeup of the Fund as of October 31, 2024.
Credit Quality Allocation (% of total net assets)
| AAA | 3.2% |
| AA | 24.9% |
| A | 22.3% |
| BBB | 36.2% |
| BB | 2.4% |
| Not Rated | 11.0% |
Ratings and portfolio credit quality will vary over time. Credit quality ratings on the underlying securities of the Fund are received from S&P, Moody’s and Fitch and are an indication of the issuer’s creditworthiness. The chart reflects the highest security rating provided by one or more of these rating agencies.
Ten Largest Holdings (% of total net assets)
| Mississippi Business Finance Corp., 4.390%, due 11/01/32 | 4.1% |
| Buckeye Tobacco Settlement Financing Authority, Class 2, 5.000%, due 06/01/55 | 3.3% |
| New Jersey Transportation Trust Fund Authority, 5.000%, due 12/15/34 | 2.8% |
| Harris County Cultural Education Facilities Finance Corp., 4.000%, due 12/01/45 | 2.7% |
| Metropolitan Transportation Authority, 5.000%, due 11/15/27 | 2.7% |
| Connecticut State Health & Educational Facilities Authority, 5.000%, due 07/01/27 | 2.6% |
| California Community Choice Financing Authority, 5.250%, due 01/01/54 | 2.4% |
| Indiana Finance Authority, 5.125%, due 06/01/58 | 2.4% |
| Public Finance Authority, 5.000%, due 07/01/38 | 2.3% |
| Metropolitan Nashville Airport Authority, 5.000%, due 07/01/40 | 2.3% |
Availability of Additional Information
You can find additional information, including the Fund's prospectus, financial information, fund holdings, and proxy voting information at abrdn.com/us/literature or call 866-667-9231. The QR code can be used to access the Fund's prospectus, financial information and holdings.
abrdn Intermediate Municipal Income Fund
(ABESX)
Institutional Service Class
abrdn International Small Cap Fund
Annual Shareholder Report - October 31, 2024
This annual shareholder report contains important information about the abrdn International Small Cap Fund (the "Fund") for the period of November 1, 2023 to October 31, 2024. You can find additional information about the Fund at abrdn.com/us/literature. You can also request this information by contacting us at 866-667-9231.
What were the Fund costs for the last year?
(based on a hypothetical $10,000 investment)
| Share Class | Costs of a $10,000 investment | Costs paid as a percentage of a $10,000 investment |
|---|
| A | $155 | 1.34% |
How did the fund perform last year and what affected its performance?
The following discussion compares the performance of the Fund to the MSCI All Country World ex USA Small Cap Index (Net TR) (the “Index”) to show how the Fund’s performance measures against the returns of similar investments for the reporting period.
What contributed to performance?
ASICS Corporation, the Japanese sports apparel company, continued on its journey of delivering returns for shareholders. The firm announced the unwinding of cross holdings, which will allow ASICS to invest capital more efficiently. At the same time, earnings results again beat expectations. Nova, the Israeli manufacturer of equipment for measuring microscopic parameters of semiconductors, released another strong set of results and upgraded its guidance. The company continues to gain good traction for its high-end products. FPT Corporation, the Vietnamese provider of information technology (IT) services, telecommunications, and higher education, performed well after it announced a new partnership with NVIDIA to provide Graphics Processing Unit resources delivered as a cloud service). FPT continues to see strong demand from its Japanese clients in IT services, more than offsetting macroeconomic pressures in its telecommunications business.
What detracted from performance?
Regional, the Mexican bank, underperformed as investors reacted negatively to Claudia Sheinbaum winning the presidential election, which affected both the local market and the peso. Shares in Johns Lyng Group, the Australian insurance repair company, fell after the company’s results missed expectations due to benign weather conditions reducing its repair volumes. YouGov, the UK-based provider of panel-based market research, opinion data, and analytics tools, disappointed investors after an unscheduled trading update.
abrdn International Small Cap Fund
(WVCCX)
Total Return Based on $10,000 Investment
The following graph reflects a hypothetical $10,000 investment for the most recently completed 10 fiscal years as compared to a broad-based securities market index and an additional performance benchmark.
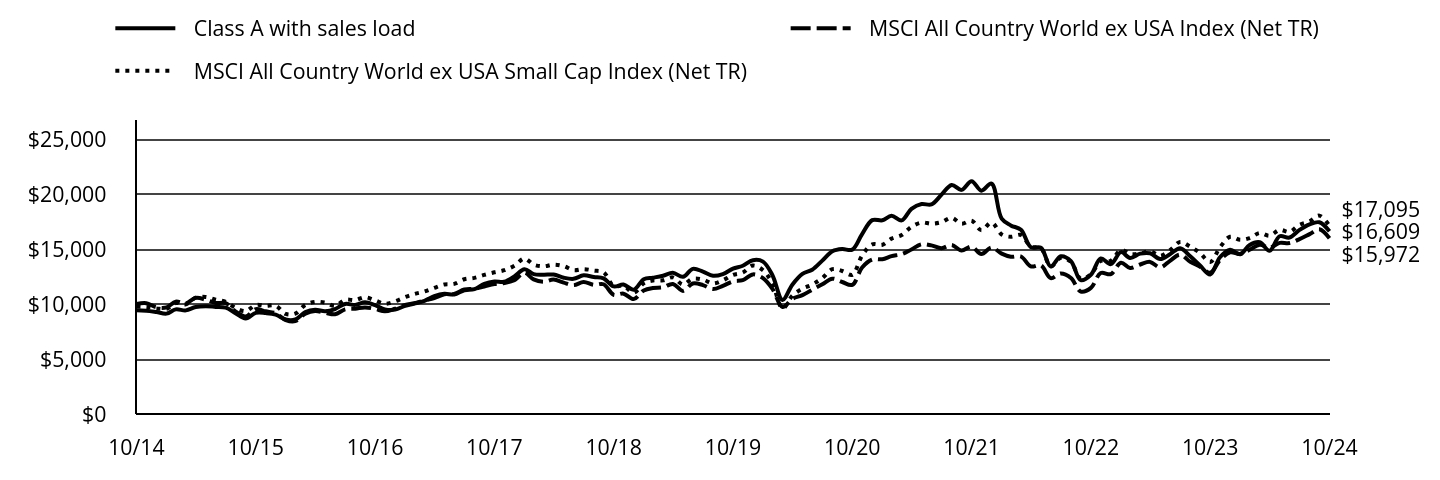
| Class A with sales load | MSCI All Country World ex USA Index (Net TR) | MSCI All Country World ex USA Small Cap Index (Net TR) |
|---|
| 10/14 | $9,424 | $10,000 | $9,764 |
| 11/14 | $9,396 | $10,072 | $9,723 |
| 12/14 | $9,274 | $9,709 | $9,602 |
| 01/15 | $9,125 | $9,695 | $9,567 |
| 02/15 | $9,514 | $10,213 | $10,089 |
| 03/15 | $9,423 | $10,048 | $9,980 |
| 04/15 | $9,731 | $10,556 | $10,576 |
| 05/15 | $9,805 | $10,391 | $10,635 |
| 06/15 | $9,738 | $10,101 | $10,401 |
| 07/15 | $9,667 | $10,073 | $10,203 |
| 08/15 | $9,135 | $9,303 | $9,634 |
| 09/15 | $8,685 | $8,872 | $9,358 |
| 10/15 | $9,195 | $9,532 | $9,913 |
| 11/15 | $9,178 | $9,335 | $9,842 |
| 12/15 | $9,042 | $9,159 | $9,852 |
| 01/16 | $8,589 | $8,536 | $9,097 |
| 02/16 | $8,593 | $8,439 | $9,128 |
| 03/16 | $9,267 | $9,125 | $9,920 |
| 04/16 | $9,472 | $9,365 | $10,197 |
| 05/16 | $9,339 | $9,207 | $10,130 |
| 06/16 | $9,545 | $9,066 | $9,833 |
| 07/16 | $10,009 | $9,515 | $10,380 |
| 08/16 | $9,922 | $9,575 | $10,355 |
| 09/16 | $10,154 | $9,693 | $10,611 |
| 10/16 | $9,891 | $9,553 | $10,331 |
| 11/16 | $9,514 | $9,332 | $10,025 |
| 12/16 | $9,491 | $9,571 | $10,237 |
| 01/17 | $9,837 | $9,910 | $10,630 |
| 02/17 | $10,033 | $10,068 | $10,910 |
| 03/17 | $10,287 | $10,323 | $11,136 |
| 04/17 | $10,713 | $10,544 | $11,470 |
| 05/17 | $10,932 | $10,887 | $11,781 |
| 06/17 | $10,863 | $10,920 | $11,831 |
| 07/17 | $11,255 | $11,323 | $12,248 |
| 08/17 | $11,347 | $11,382 | $12,381 |
| 09/17 | $11,835 | $11,594 | $12,647 |
| 10/17 | $12,047 | $11,812 | $12,883 |
| 11/17 | $12,020 | $11,908 | $13,075 |
| 12/17 | $12,505 | $12,174 | $13,477 |
| 01/18 | $13,160 | $12,852 | $14,140 |
| 02/18 | $12,723 | $12,246 | $13,583 |
| 03/18 | $12,668 | $12,030 | $13,429 |
| 04/18 | $12,680 | $12,222 | $13,585 |
| 05/18 | $12,394 | $11,940 | $13,447 |
| 06/18 | $12,290 | $11,715 | $13,081 |
| 07/18 | $12,608 | $11,995 | $13,172 |
| 08/18 | $12,457 | $11,744 | $13,044 |
| 09/18 | $12,338 | $11,798 | $12,883 |
| 10/18 | $11,603 | $10,838 | $11,630 |
| 11/18 | $11,770 | $10,941 | $11,659 |
| 12/18 | $11,304 | $10,446 | $11,024 |
| 01/19 | $12,255 | $11,235 | $11,888 |
| 02/19 | $12,391 | $11,454 | $12,137 |
| 03/19 | $12,570 | $11,523 | $12,156 |
| 04/19 | $12,843 | $11,827 | $12,424 |
| 05/19 | $12,471 | $11,192 | $11,783 |
| 06/19 | $13,196 | $11,866 | $12,303 |
| 07/19 | $12,951 | $11,723 | $12,221 |
| 08/19 | $12,565 | $11,361 | $11,869 |
| 09/19 | $12,725 | $11,653 | $12,157 |
| 10/19 | $13,224 | $12,059 | $12,649 |
| 11/19 | $13,478 | $12,166 | $12,861 |
| 12/19 | $13,985 | $12,693 | $13,496 |
| 01/20 | $13,856 | $12,352 | $13,075 |
| 02/20 | $12,623 | $11,375 | $11,872 |
| 03/20 | $10,375 | $9,728 | $9,581 |
| 04/20 | $11,761 | $10,465 | $10,746 |
| 05/20 | $12,742 | $10,808 | $11,397 |
| 06/20 | $13,118 | $11,296 | $11,769 |
| 07/20 | $13,945 | $11,800 | $12,357 |
| 08/20 | $14,797 | $12,305 | $13,170 |
| 09/20 | $15,000 | $12,003 | $13,003 |
| 10/20 | $14,945 | $11,745 | $12,659 |
| 11/20 | $16,357 | $13,324 | $14,410 |
| 12/20 | $17,629 | $14,045 | $15,418 |
| 01/21 | $17,615 | $14,075 | $15,391 |
| 02/21 | $18,026 | $14,354 | $15,948 |
| 03/21 | $17,605 | $14,535 | $16,271 |
| 04/21 | $18,650 | $14,963 | $17,018 |
| 05/21 | $19,095 | $15,431 | $17,412 |
| 06/21 | $19,051 | $15,331 | $17,304 |
| 07/21 | $19,942 | $15,079 | $17,443 |
| 08/21 | $20,824 | $15,365 | $17,846 |
| 09/21 | $20,378 | $14,873 | $17,304 |
| 10/21 | $21,165 | $15,228 | $17,574 |
| 11/21 | $20,309 | $14,542 | $16,704 |
| 12/21 | $20,947 | $15,143 | $17,410 |
| 01/22 | $17,759 | $14,585 | $16,324 |
| 02/22 | $17,146 | $14,297 | $16,112 |
| 03/22 | $16,747 | $14,320 | $16,276 |
| 04/22 | $15,172 | $13,420 | $15,226 |
| 05/22 | $15,118 | $13,517 | $15,085 |
| 06/22 | $13,410 | $12,354 | $13,420 |
| 07/22 | $14,336 | $12,777 | $14,195 |
| 08/22 | $13,894 | $12,366 | $13,823 |
| 09/22 | $12,169 | $11,130 | $12,297 |
| 10/22 | $12,659 | $11,463 | $12,697 |
| 11/22 | $14,144 | $12,816 | $13,910 |
| 12/22 | $13,627 | $12,720 | $13,933 |
| 01/23 | $14,719 | $13,752 | $14,936 |
| 02/23 | $14,183 | $13,269 | $14,555 |
| 03/23 | $14,578 | $13,593 | $14,588 |
| 04/23 | $14,611 | $13,830 | $14,803 |
| 05/23 | $14,086 | $13,327 | $14,392 |
| 06/23 | $14,524 | $13,925 | $14,887 |
| 07/23 | $15,081 | $14,491 | $15,643 |
| 08/23 | $14,335 | $13,836 | $15,207 |
| 09/23 | $13,497 | $13,399 | $14,634 |
| 10/23 | $12,686 | $12,846 | $13,816 |
| 11/23 | $14,248 | $14,003 | $15,153 |
| 12/23 | $14,938 | $14,706 | $16,115 |
| 01/24 | $14,524 | $14,560 | $15,839 |
| 02/24 | $15,368 | $14,929 | $15,997 |
| 03/24 | $15,613 | $15,396 | $16,455 |
| 04/24 | $14,840 | $15,119 | $16,215 |
| 05/24 | $16,162 | $15,558 | $16,741 |
| 06/24 | $16,043 | $15,543 | $16,563 |
| 07/24 | $16,739 | $15,903 | $17,194 |
| 08/24 | $17,251 | $16,356 | $17,511 |
| 09/24 | $17,430 | $16,796 | $18,037 |
| 10/24 | $16,609 | $15,972 | $17,095 |
Average Annual Total Returns for the Period Ended October 31, 2024 (%)
| AATR | 1 Year | 5 Years | 10 Years |
|---|
| Class A without sales load | 30.93% | 4.66% | 5.83% |
| Class A with sales load - 5.75% | 23.40% | 3.43% | 5.20% |
| MSCI All Country World ex USA Index (Net TR) | 24.33% | 5.78% | 4.79% |
| MSCI All Country World ex USA Small Cap Index (Net TR) | 23.73% | 6.21% | 5.76% |
THE FUND'S PAST PERFORMANCE IS NOT A GOOD PREDICTOR OF THE FUND'S FUTURE PERFORMANCE.
Fund performance data shown above does not reflect the deduction of taxes that a shareholder would pay on Fund distributions or redemption of Fund shares.
In accordance with regulatory changes requiring the Fund's primary benchmark to represent the overall applicable market, the Fund's primary prospectus benchmark changed to the MSCI AC World ex USA Index (Net TR) effective as of February 29, 2024.
Key Fund Statistics as of October 31, 2024
| Total Net Assets | $123,567,861 |
| Total Number of Portfolio Holdings | 44 |
| Portfolio Turnover Rate | 32% |
| Total Advisory Fees Paid | $764,470 |
abrdn International Small Cap Fund
(WVCCX)
What did the Fund invest in?
The tables below show the investment makeup of the Fund as of October 31, 2024.
Geographic Allocation (% of total net assets)
| United Kingdom | 19.5% | |
| Japan | 15.8% | |
| Germany | 8.5% | |
| France | 8.2% | |
| Taiwan | 8.0% | |
| India | 7.9% | |
| Vietnam | 4.9% | |
| Israel | 4.8% | |
| Italy | 3.9% | |
| Australia | 3.8% | |
| Thailand | 2.9% | |
| Sweden | 2.8% | |
| Poland | 2.0% | |
| Other | 7.0% | |
Ten Largest Holdings (% of total net assets)
| Poly Medicure Ltd. | 5.4% |
| FPT Corp. | 4.9% |
| CTS Eventim AG & Co. KGaA | 4.8% |
| Gaztransport Et Technigaz SA | 4.6% |
| Diploma PLC | 4.1% |
| Intermediate Capital Group PLC | 4.0% |
| Japan Elevator Service Holdings Co. Ltd. | 4.0% |
| Interparfums SA | 3.6% |
| Gamma Communications PLC | 3.4% |
| Asics Corp. | 3.0% |
Availability of Additional Information
You can find additional information, including the Fund's prospectus, financial information, fund holdings, and proxy voting information at abrdn.com/us/literature or call 866-667-9231. The QR code can be used to access the Fund's prospectus, financial information and holdings.
abrdn International Small Cap Fund
(WVCCX)
abrdn International Small Cap Fund
Annual Shareholder Report - October 31, 2024
This annual shareholder report contains important information about the abrdn International Small Cap Fund (the "Fund") for the period of November 1, 2023 to October 31, 2024. You can find additional information about the Fund at abrdn.com/us/literature. You can also request this information by contacting us at 866-667-9231.
What were the Fund costs for the last year?
(based on a hypothetical $10,000 investment)
| Share Class | Costs of a $10,000 investment | Costs paid as a percentage of a $10,000 investment |
|---|
| C | $229 | 1.99% |
How did the fund perform last year and what affected its performance?
The following discussion compares the performance of the Fund to the MSCI All Country World ex USA Small Cap Index (Net TR) (the “Index”) to show how the Fund’s performance measures against the returns of similar investments for the reporting period.
What contributed to performance?
ASICS Corporation, the Japanese sports apparel company, continued on its journey of delivering returns for shareholders. The firm announced the unwinding of cross holdings, which will allow ASICS to invest capital more efficiently. At the same time, earnings results again beat expectations. Nova, the Israeli manufacturer of equipment for measuring microscopic parameters of semiconductors, released another strong set of results and upgraded its guidance. The company continues to gain good traction for its high-end products. FPT Corporation, the Vietnamese provider of information technology (IT) services, telecommunications, and higher education, performed well after it announced a new partnership with NVIDIA to provide Graphics Processing Unit resources delivered as a cloud service). FPT continues to see strong demand from its Japanese clients in IT services, more than offsetting macroeconomic pressures in its telecommunications business.
What detracted from performance?
Regional, the Mexican bank, underperformed as investors reacted negatively to Claudia Sheinbaum winning the presidential election, which affected both the local market and the peso. Shares in Johns Lyng Group, the Australian insurance repair company, fell after the company’s results missed expectations due to benign weather conditions reducing its repair volumes. YouGov, the UK-based provider of panel-based market research, opinion data, and analytics tools, disappointed investors after an unscheduled trading update.
abrdn International Small Cap Fund
(CPVCX)
Total Return Based on $10,000 Investment
The following graph reflects a hypothetical $10,000 investment for the most recently completed 10 fiscal years as compared to a broad-based securities market index and an additional performance benchmark.
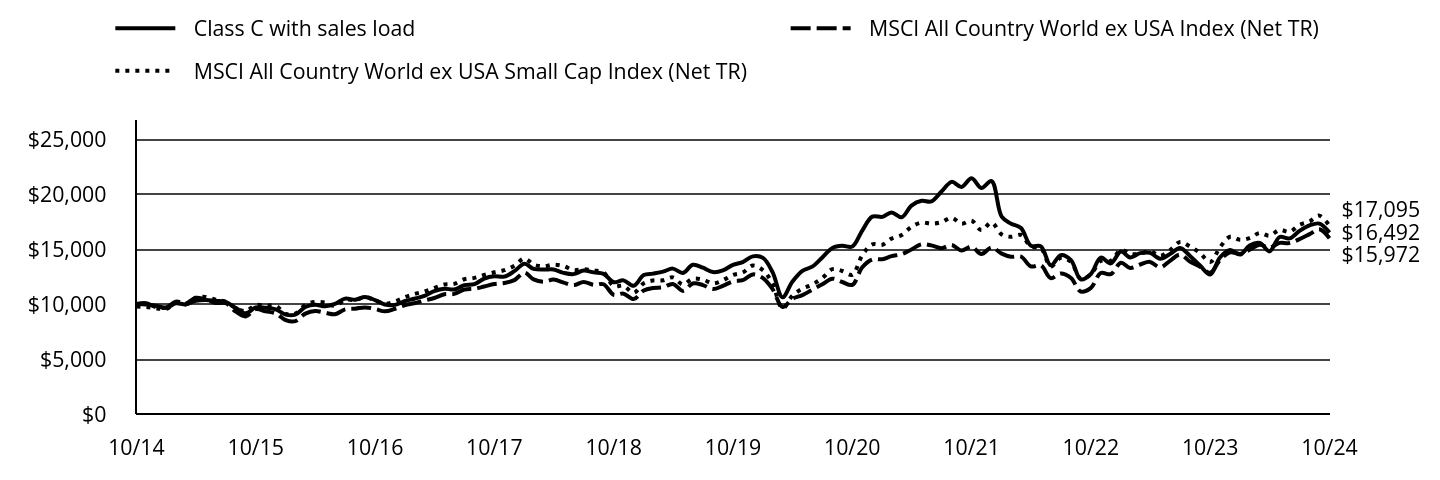
| Class C with sales load | MSCI All Country World ex USA Index (Net TR) | MSCI All Country World ex USA Small Cap Index (Net TR) |
|---|
| 10/14 | $10,000 | $10,000 | $9,764 |
| 11/14 | $9,964 | $10,072 | $9,723 |
| 12/14 | $9,829 | $9,709 | $9,602 |
| 01/15 | $9,664 | $9,695 | $9,567 |
| 02/15 | $10,070 | $10,213 | $10,089 |
| 03/15 | $9,967 | $10,048 | $9,980 |
| 04/15 | $10,289 | $10,556 | $10,576 |
| 05/15 | $10,358 | $10,391 | $10,635 |
| 06/15 | $10,285 | $10,101 | $10,401 |
| 07/15 | $10,201 | $10,073 | $10,203 |
| 08/15 | $9,637 | $9,303 | $9,634 |
| 09/15 | $9,152 | $8,872 | $9,358 |
| 10/15 | $9,690 | $9,532 | $9,913 |
| 11/15 | $9,663 | $9,335 | $9,842 |
| 12/15 | $9,517 | $9,159 | $9,852 |
| 01/16 | $9,036 | $8,536 | $9,097 |
| 02/16 | $9,032 | $8,439 | $9,128 |
| 03/16 | $9,734 | $9,125 | $9,920 |
| 04/16 | $9,942 | $9,365 | $10,197 |
| 05/16 | $9,799 | $9,207 | $10,130 |
| 06/16 | $10,011 | $9,066 | $9,833 |
| 07/16 | $10,493 | $9,515 | $10,380 |
| 08/16 | $10,393 | $9,575 | $10,355 |
| 09/16 | $10,636 | $9,693 | $10,611 |
| 10/16 | $10,354 | $9,553 | $10,331 |
| 11/16 | $9,951 | $9,332 | $10,025 |
| 12/16 | $9,920 | $9,571 | $10,237 |
| 01/17 | $10,277 | $9,910 | $10,630 |
| 02/17 | $10,477 | $10,068 | $10,910 |
| 03/17 | $10,738 | $10,323 | $11,136 |
| 04/17 | $11,173 | $10,544 | $11,470 |
| 05/17 | $11,395 | $10,887 | $11,781 |
| 06/17 | $11,317 | $10,920 | $11,831 |
| 07/17 | $11,721 | $11,323 | $12,248 |
| 08/17 | $11,813 | $11,382 | $12,381 |
| 09/17 | $12,313 | $11,594 | $12,647 |
| 10/17 | $12,522 | $11,812 | $12,883 |
| 11/17 | $12,487 | $11,908 | $13,075 |
| 12/17 | $12,987 | $12,174 | $13,477 |
| 01/18 | $13,659 | $12,852 | $14,140 |
| 02/18 | $13,198 | $12,246 | $13,583 |
| 03/18 | $13,130 | $12,030 | $13,429 |
| 04/18 | $13,139 | $12,222 | $13,585 |
| 05/18 | $12,830 | $11,940 | $13,447 |
| 06/18 | $12,718 | $11,715 | $13,081 |
| 07/18 | $13,041 | $11,995 | $13,172 |
| 08/18 | $12,875 | $11,744 | $13,044 |
| 09/18 | $12,745 | $11,798 | $12,883 |
| 10/18 | $11,983 | $10,838 | $11,630 |
| 11/18 | $12,149 | $10,941 | $11,659 |
| 12/18 | $11,661 | $10,446 | $11,024 |
| 01/19 | $12,632 | $11,235 | $11,888 |
| 02/19 | $12,765 | $11,454 | $12,137 |
| 03/19 | $12,941 | $11,523 | $12,156 |
| 04/19 | $13,218 | $11,827 | $12,424 |
| 05/19 | $12,829 | $11,192 | $11,783 |
| 06/19 | $13,565 | $11,866 | $12,303 |
| 07/19 | $13,304 | $11,723 | $12,221 |
| 08/19 | $12,904 | $11,361 | $11,869 |
| 09/19 | $13,058 | $11,653 | $12,157 |
| 10/19 | $13,565 | $12,059 | $12,649 |
| 11/19 | $13,816 | $12,166 | $12,861 |
| 12/19 | $14,332 | $12,693 | $13,496 |
| 01/20 | $14,192 | $12,352 | $13,075 |
| 02/20 | $12,919 | $11,375 | $11,872 |
| 03/20 | $10,615 | $9,728 | $9,581 |
| 04/20 | $12,028 | $10,465 | $10,746 |
| 05/20 | $13,020 | $10,808 | $11,397 |
| 06/20 | $13,396 | $11,296 | $11,769 |
| 07/20 | $14,237 | $11,800 | $12,357 |
| 08/20 | $15,095 | $12,305 | $13,170 |
| 09/20 | $15,291 | $12,003 | $13,003 |
| 10/20 | $15,230 | $11,745 | $12,659 |
| 11/20 | $16,659 | $13,324 | $14,410 |
| 12/20 | $17,949 | $14,045 | $15,418 |
| 01/21 | $17,921 | $14,075 | $15,391 |
| 02/21 | $18,330 | $14,354 | $15,948 |
| 03/21 | $17,893 | $14,535 | $16,271 |
| 04/21 | $18,947 | $14,963 | $17,018 |
| 05/21 | $19,385 | $15,431 | $17,412 |
| 06/21 | $19,328 | $15,331 | $17,304 |
| 07/21 | $20,226 | $15,079 | $17,443 |
| 08/21 | $21,106 | $15,365 | $17,846 |
| 09/21 | $20,646 | $14,873 | $17,304 |
| 10/21 | $21,431 | $15,228 | $17,574 |
| 11/21 | $20,551 | $14,542 | $16,704 |
| 12/21 | $21,184 | $15,143 | $17,410 |
| 01/22 | $17,949 | $14,585 | $16,324 |
| 02/22 | $17,322 | $14,297 | $16,112 |
| 03/22 | $16,915 | $14,320 | $16,276 |
| 04/22 | $15,315 | $13,420 | $15,226 |
| 05/22 | $15,248 | $13,517 | $15,085 |
| 06/22 | $13,521 | $12,354 | $13,420 |
| 07/22 | $14,445 | $12,777 | $14,195 |
| 08/22 | $13,989 | $12,366 | $13,823 |
| 09/22 | $12,250 | $11,130 | $12,297 |
| 10/22 | $12,736 | $11,463 | $12,697 |
| 11/22 | $14,220 | $12,816 | $13,910 |
| 12/22 | $13,693 | $12,720 | $13,933 |
| 01/23 | $14,780 | $13,752 | $14,936 |
| 02/23 | $14,233 | $13,269 | $14,555 |
| 03/23 | $14,626 | $13,593 | $14,588 |
| 04/23 | $14,651 | $13,830 | $14,803 |
| 05/23 | $14,117 | $13,327 | $14,392 |
| 06/23 | $14,546 | $13,925 | $14,887 |
| 07/23 | $15,099 | $14,491 | $15,643 |
| 08/23 | $14,344 | $13,836 | $15,207 |
| 09/23 | $13,497 | $13,399 | $14,634 |
| 10/23 | $12,680 | $12,846 | $13,816 |
| 11/23 | $14,233 | $14,003 | $15,153 |
| 12/23 | $14,915 | $14,706 | $16,115 |
| 01/24 | $14,497 | $14,560 | $15,839 |
| 02/24 | $15,326 | $14,929 | $15,997 |
| 03/24 | $15,559 | $15,396 | $16,455 |
| 04/24 | $14,786 | $15,119 | $16,215 |
| 05/24 | $16,093 | $15,558 | $16,741 |
| 06/24 | $15,964 | $15,543 | $16,563 |
| 07/24 | $16,645 | $15,903 | $17,194 |
| 08/24 | $17,149 | $16,356 | $17,511 |
| 09/24 | $17,314 | $16,796 | $18,037 |
| 10/24 | $16,492 | $15,972 | $17,095 |
Average Annual Total Returns for the Period Ended October 31, 2024 (%)
| AATR | 1 Year | 5 Years | 10 Years |
|---|
| Class C without sales load | 30.06% | 3.98% | 5.13% |
| Class C with sales load - 1.00% | 29.06% | 3.98% | 5.13% |
| MSCI All Country World ex USA Index (Net TR) | 24.33% | 5.78% | 4.79% |
| MSCI All Country World ex USA Small Cap Index (Net TR) | 23.73% | 6.21% | 5.76% |
THE FUND'S PAST PERFORMANCE IS NOT A GOOD PREDICTOR OF THE FUND'S FUTURE PERFORMANCE.
Fund performance data shown above does not reflect the deduction of taxes that a shareholder would pay on Fund distributions or redemption of Fund shares.
In accordance with regulatory changes requiring the Fund's primary benchmark to represent the overall applicable market, the Fund's primary prospectus benchmark changed to the MSCI AC World ex USA Index (Net TR) effective as of February 29, 2024.
Key Fund Statistics as of October 31, 2024
| Total Net Assets | $123,567,861 |
| Total Number of Portfolio Holdings | 44 |
| Portfolio Turnover Rate | 32% |
| Total Advisory Fees Paid | $764,470 |
abrdn International Small Cap Fund
(CPVCX)
What did the Fund invest in?
The tables below show the investment makeup of the Fund as of October 31, 2024.
Geographic Allocation (% of total net assets)
| United Kingdom | 19.5% | |
| Japan | 15.8% | |
| Germany | 8.5% | |
| France | 8.2% | |
| Taiwan | 8.0% | |
| India | 7.9% | |
| Vietnam | 4.9% | |
| Israel | 4.8% | |
| Italy | 3.9% | |
| Australia | 3.8% | |
| Thailand | 2.9% | |
| Sweden | 2.8% | |
| Poland | 2.0% | |
| Other | 7.0% | |
Ten Largest Holdings (% of total net assets)
| Poly Medicure Ltd. | 5.4% |
| FPT Corp. | 4.9% |
| CTS Eventim AG & Co. KGaA | 4.8% |
| Gaztransport Et Technigaz SA | 4.6% |
| Diploma PLC | 4.1% |
| Intermediate Capital Group PLC | 4.0% |
| Japan Elevator Service Holdings Co. Ltd. | 4.0% |
| Interparfums SA | 3.6% |
| Gamma Communications PLC | 3.4% |
| Asics Corp. | 3.0% |
Availability of Additional Information
You can find additional information, including the Fund's prospectus, financial information, fund holdings, and proxy voting information at abrdn.com/us/literature or call 866-667-9231. The QR code can be used to access the Fund's prospectus, financial information and holdings.
abrdn International Small Cap Fund
(CPVCX)
abrdn International Small Cap Fund
Annual Shareholder Report - October 31, 2024
This annual shareholder report contains important information about the abrdn International Small Cap Fund (the "Fund") for the period of November 1, 2023 to October 31, 2024. You can find additional information about the Fund at abrdn.com/us/literature. You can also request this information by contacting us at 866-667-9231.
What were the Fund costs for the last year?
(based on a hypothetical $10,000 investment)
| Share Class | Costs of a $10,000 investment | Costs paid as a percentage of a $10,000 investment |
|---|
| R | $188 | 1.63% |
How did the fund perform last year and what affected its performance?
The following discussion compares the performance of the Fund to the MSCI All Country World ex USA Small Cap Index (Net TR) (the “Index”) to show how the Fund’s performance measures against the returns of similar investments for the reporting period.
What contributed to performance?
ASICS Corporation, the Japanese sports apparel company, continued on its journey of delivering returns for shareholders. The firm announced the unwinding of cross holdings, which will allow ASICS to invest capital more efficiently. At the same time, earnings results again beat expectations. Nova, the Israeli manufacturer of equipment for measuring microscopic parameters of semiconductors, released another strong set of results and upgraded its guidance. The company continues to gain good traction for its high-end products. FPT Corporation, the Vietnamese provider of information technology (IT) services, telecommunications, and higher education, performed well after it announced a new partnership with NVIDIA to provide Graphics Processing Unit resources delivered as a cloud service). FPT continues to see strong demand from its Japanese clients in IT services, more than offsetting macroeconomic pressures in its telecommunications business.
What detracted from performance?
Regional, the Mexican bank, underperformed as investors reacted negatively to Claudia Sheinbaum winning the presidential election, which affected both the local market and the peso. Shares in Johns Lyng Group, the Australian insurance repair company, fell after the company’s results missed expectations due to benign weather conditions reducing its repair volumes. YouGov, the UK-based provider of panel-based market research, opinion data, and analytics tools, disappointed investors after an unscheduled trading update.
abrdn International Small Cap Fund
(WPVAX)
Total Return Based on $10,000 Investment
The following graph reflects a hypothetical $10,000 investment for the most recently completed 10 fiscal years as compared to a broad-based securities market index and an additional performance benchmark.
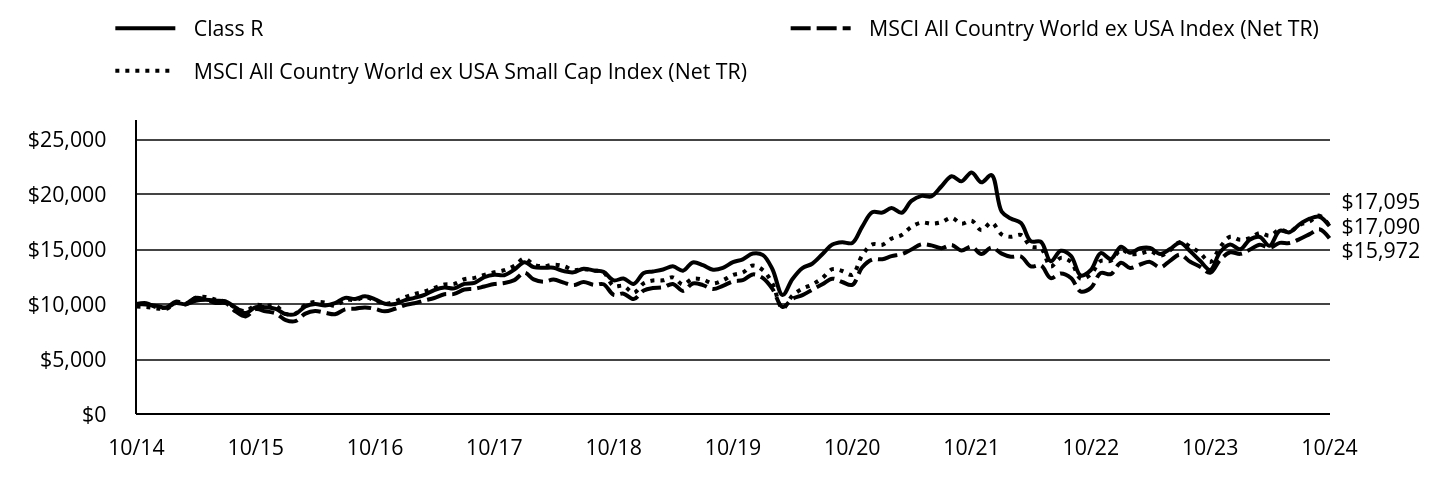
| Class R | MSCI All Country World ex USA Index (Net TR) | MSCI All Country World ex USA Small Cap Index (Net TR) |
|---|
| 10/14 | $10,000 | $10,000 | $9,764 |
| 11/14 | $9,961 | $10,072 | $9,723 |
| 12/14 | $9,833 | $9,709 | $9,602 |
| 01/15 | $9,673 | $9,695 | $9,567 |
| 02/15 | $10,079 | $10,213 | $10,089 |
| 03/15 | $9,982 | $10,048 | $9,980 |
| 04/15 | $10,303 | $10,556 | $10,576 |
| 05/15 | $10,377 | $10,391 | $10,635 |
| 06/15 | $10,306 | $10,101 | $10,401 |
| 07/15 | $10,227 | $10,073 | $10,203 |
| 08/15 | $9,664 | $9,303 | $9,634 |
| 09/15 | $9,184 | $8,872 | $9,358 |
| 10/15 | $9,723 | $9,532 | $9,913 |
| 11/15 | $9,704 | $9,335 | $9,842 |
| 12/15 | $9,556 | $9,159 | $9,852 |
| 01/16 | $9,076 | $8,536 | $9,097 |
| 02/16 | $9,076 | $8,439 | $9,128 |
| 03/16 | $9,783 | $9,125 | $9,920 |
| 04/16 | $9,998 | $9,365 | $10,197 |
| 05/16 | $9,859 | $9,207 | $10,130 |
| 06/16 | $10,073 | $9,066 | $9,833 |
| 07/16 | $10,557 | $9,515 | $10,380 |
| 08/16 | $10,465 | $9,575 | $10,355 |
| 09/16 | $10,709 | $9,693 | $10,611 |
| 10/16 | $10,427 | $9,553 | $10,331 |
| 11/16 | $10,027 | $9,332 | $10,025 |
| 12/16 | $10,000 | $9,571 | $10,237 |
| 01/17 | $10,361 | $9,910 | $10,630 |
| 02/17 | $10,564 | $10,068 | $10,910 |
| 03/17 | $10,832 | $10,323 | $11,136 |
| 04/17 | $11,273 | $10,544 | $11,470 |
| 05/17 | $11,498 | $10,887 | $11,781 |
| 06/17 | $11,421 | $10,920 | $11,831 |
| 07/17 | $11,833 | $11,323 | $12,248 |
| 08/17 | $11,926 | $11,382 | $12,381 |
| 09/17 | $12,435 | $11,594 | $12,647 |
| 10/17 | $12,652 | $11,812 | $12,883 |
| 11/17 | $12,622 | $11,908 | $13,075 |
| 12/17 | $13,125 | $12,174 | $13,477 |
| 01/18 | $13,808 | $12,852 | $14,140 |
| 02/18 | $13,349 | $12,246 | $13,583 |
| 03/18 | $13,287 | $12,030 | $13,429 |
| 04/18 | $13,296 | $12,222 | $13,585 |
| 05/18 | $12,989 | $11,940 | $13,447 |
| 06/18 | $12,880 | $11,715 | $13,081 |
| 07/18 | $13,213 | $11,995 | $13,172 |
| 08/18 | $13,046 | $11,744 | $13,044 |
| 09/18 | $12,919 | $11,798 | $12,883 |
| 10/18 | $12,149 | $10,838 | $11,630 |
| 11/18 | $12,319 | $10,941 | $11,659 |
| 12/18 | $11,826 | $10,446 | $11,024 |
| 01/19 | $12,817 | $11,235 | $11,888 |
| 02/19 | $12,958 | $11,454 | $12,137 |
| 03/19 | $13,141 | $11,523 | $12,156 |
| 04/19 | $13,423 | $11,827 | $12,424 |
| 05/19 | $13,031 | $11,192 | $11,783 |
| 06/19 | $13,782 | $11,866 | $12,303 |
| 07/19 | $13,527 | $11,723 | $12,221 |
| 08/19 | $13,120 | $11,361 | $11,869 |
| 09/19 | $13,282 | $11,653 | $12,157 |
| 10/19 | $13,803 | $12,059 | $12,649 |
| 11/19 | $14,064 | $12,166 | $12,861 |
| 12/19 | $14,592 | $12,693 | $13,496 |
| 01/20 | $14,449 | $12,352 | $13,075 |
| 02/20 | $13,164 | $11,375 | $11,872 |
| 03/20 | $10,812 | $9,728 | $9,581 |
| 04/20 | $12,257 | $10,465 | $10,746 |
| 05/20 | $13,273 | $10,808 | $11,397 |
| 06/20 | $13,663 | $11,296 | $11,769 |
| 07/20 | $14,521 | $11,800 | $12,357 |
| 08/20 | $15,405 | $12,305 | $13,170 |
| 09/20 | $15,614 | $12,003 | $13,003 |
| 10/20 | $15,553 | $11,745 | $12,659 |
| 11/20 | $17,015 | $13,324 | $14,410 |
| 12/20 | $18,339 | $14,045 | $15,418 |
| 01/21 | $18,317 | $14,075 | $15,391 |
| 02/21 | $18,734 | $14,354 | $15,948 |
| 03/21 | $18,295 | $14,535 | $16,271 |
| 04/21 | $19,377 | $14,963 | $17,018 |
| 05/21 | $19,833 | $15,431 | $17,412 |
| 06/21 | $19,784 | $15,331 | $17,304 |
| 07/21 | $20,707 | $15,079 | $17,443 |
| 08/21 | $21,619 | $15,365 | $17,846 |
| 09/21 | $21,152 | $14,873 | $17,304 |
| 10/21 | $21,959 | $15,228 | $17,574 |
| 11/21 | $21,064 | $14,542 | $16,704 |
| 12/21 | $21,723 | $15,143 | $17,410 |
| 01/22 | $18,410 | $14,585 | $16,324 |
| 02/22 | $17,775 | $14,297 | $16,112 |
| 03/22 | $17,359 | $14,320 | $16,276 |
| 04/22 | $15,721 | $13,420 | $15,226 |
| 05/22 | $15,661 | $13,517 | $15,085 |
| 06/22 | $13,886 | $12,354 | $13,420 |
| 07/22 | $14,842 | $12,777 | $14,195 |
| 08/22 | $14,379 | $12,366 | $13,823 |
| 09/22 | $12,592 | $11,130 | $12,297 |
| 10/22 | $13,097 | $11,463 | $12,697 |
| 11/22 | $14,628 | $12,816 | $13,910 |
| 12/22 | $14,093 | $12,720 | $13,933 |
| 01/23 | $15,215 | $13,752 | $14,936 |
| 02/23 | $14,660 | $13,269 | $14,555 |
| 03/23 | $15,064 | $13,593 | $14,588 |
| 04/23 | $15,094 | $13,830 | $14,803 |
| 05/23 | $14,551 | $13,327 | $14,392 |
| 06/23 | $14,998 | $13,925 | $14,887 |
| 07/23 | $15,576 | $14,491 | $15,643 |
| 08/23 | $14,799 | $13,836 | $15,207 |
| 09/23 | $13,930 | $13,399 | $14,634 |
| 10/23 | $13,092 | $12,846 | $13,816 |
| 11/23 | $14,702 | $14,003 | $15,153 |
| 12/23 | $15,406 | $14,706 | $16,115 |
| 01/24 | $14,976 | $14,560 | $15,839 |
| 02/24 | $15,842 | $14,929 | $15,997 |
| 03/24 | $16,090 | $15,396 | $16,455 |
| 04/24 | $15,291 | $15,119 | $16,215 |
| 05/24 | $16,654 | $15,558 | $16,741 |
| 06/24 | $16,520 | $15,543 | $16,563 |
| 07/24 | $17,235 | $15,903 | $17,194 |
| 08/24 | $17,756 | $16,356 | $17,511 |
| 09/24 | $17,938 | $16,796 | $18,037 |
| 10/24 | $17,090 | $15,972 | $17,095 |
Average Annual Total Returns for the Period Ended October 31, 2024 (%)
| AATR | 1 Year | 5 Years | 10 Years |
|---|
| Class R | 30.54% | 4.36% | 5.51% |
| MSCI All Country World ex USA Index (Net TR) | 24.33% | 5.78% | 4.79% |
| MSCI All Country World ex USA Small Cap Index (Net TR) | 23.73% | 6.21% | 5.76% |
THE FUND'S PAST PERFORMANCE IS NOT A GOOD PREDICTOR OF THE FUND'S FUTURE PERFORMANCE.
Fund performance data shown above does not reflect the deduction of taxes that a shareholder would pay on Fund distributions or redemption of Fund shares.
In accordance with regulatory changes requiring the Fund's primary benchmark to represent the overall applicable market, the Fund's primary prospectus benchmark changed to the MSCI AC World ex USA Index (Net TR) effective as of February 29, 2024.
Key Fund Statistics as of October 31, 2024
| Total Net Assets | $123,567,861 |
| Total Number of Portfolio Holdings | 44 |
| Portfolio Turnover Rate | 32% |
| Total Advisory Fees Paid | $764,470 |
abrdn International Small Cap Fund
(WPVAX)
What did the Fund invest in?
The tables below show the investment makeup of the Fund as of October 31, 2024.
Geographic Allocation (% of total net assets)
| United Kingdom | 19.5% | |
| Japan | 15.8% | |
| Germany | 8.5% | |
| France | 8.2% | |
| Taiwan | 8.0% | |
| India | 7.9% | |
| Vietnam | 4.9% | |
| Israel | 4.8% | |
| Italy | 3.9% | |
| Australia | 3.8% | |
| Thailand | 2.9% | |
| Sweden | 2.8% | |
| Poland | 2.0% | |
| Other | 7.0% | |
Ten Largest Holdings (% of total net assets)
| Poly Medicure Ltd. | 5.4% |
| FPT Corp. | 4.9% |
| CTS Eventim AG & Co. KGaA | 4.8% |
| Gaztransport Et Technigaz SA | 4.6% |
| Diploma PLC | 4.1% |
| Intermediate Capital Group PLC | 4.0% |
| Japan Elevator Service Holdings Co. Ltd. | 4.0% |
| Interparfums SA | 3.6% |
| Gamma Communications PLC | 3.4% |
| Asics Corp. | 3.0% |
Availability of Additional Information
You can find additional information, including the Fund's prospectus, financial information, fund holdings, and proxy voting information at abrdn.com/us/literature or call 866-667-9231. The QR code can be used to access the Fund's prospectus, financial information and holdings.
abrdn International Small Cap Fund
(WPVAX)
abrdn International Small Cap Fund
Annual Shareholder Report - October 31, 2024
This annual shareholder report contains important information about the abrdn International Small Cap Fund (the "Fund") for the period of November 1, 2023 to October 31, 2024. You can find additional information about the Fund at abrdn.com/us/literature. You can also request this information by contacting us at 866-667-9231.
What were the Fund costs for the last year?
(based on a hypothetical $10,000 investment)
| Share Class | Costs of a $10,000 investment | Costs paid as a percentage of a $10,000 investment |
|---|
| Institutional | $114 | 0.99% |
How did the fund perform last year and what affected its performance?
The following discussion compares the performance of the Fund to the MSCI All Country World ex USA Small Cap Index (Net TR) (the “Index”) to show how the Fund’s performance measures against the returns of similar investments for the reporting period.
What contributed to performance?
ASICS Corporation, the Japanese sports apparel company, continued on its journey of delivering returns for shareholders. The firm announced the unwinding of cross holdings, which will allow ASICS to invest capital more efficiently. At the same time, earnings results again beat expectations. Nova, the Israeli manufacturer of equipment for measuring microscopic parameters of semiconductors, released another strong set of results and upgraded its guidance. The company continues to gain good traction for its high-end products. FPT Corporation, the Vietnamese provider of information technology (IT) services, telecommunications, and higher education, performed well after it announced a new partnership with NVIDIA to provide Graphics Processing Unit resources delivered as a cloud service). FPT continues to see strong demand from its Japanese clients in IT services, more than offsetting macroeconomic pressures in its telecommunications business.
What detracted from performance?
Regional, the Mexican bank, underperformed as investors reacted negatively to Claudia Sheinbaum winning the presidential election, which affected both the local market and the peso. Shares in Johns Lyng Group, the Australian insurance repair company, fell after the company’s results missed expectations due to benign weather conditions reducing its repair volumes. YouGov, the UK-based provider of panel-based market research, opinion data, and analytics tools, disappointed investors after an unscheduled trading update.
abrdn International Small Cap Fund
(ABNIX)
Total Return Based on $1,000,000 Investment
The following graph reflects a hypothetical $1,000,000 investment for the most recently completed 10 fiscal years as compared to a broad-based securities market index and an additional performance benchmark.
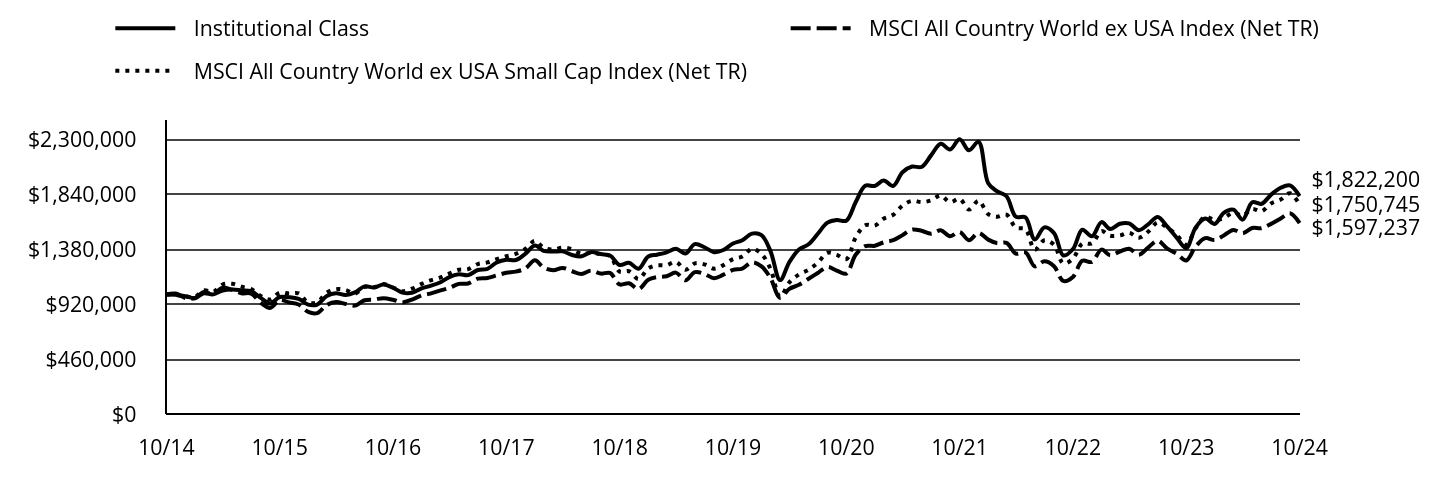
| Institutional Class | MSCI All Country World ex USA Index (Net TR) | MSCI All Country World ex USA Small Cap Index (Net TR) |
|---|
| 10/14 | $1,000,000 | $1,000,000 | $1,000,000 |
| 11/14 | $996,966 | $1,007,234 | $995,799 |
| 12/14 | $984,645 | $970,918 | $983,431 |
| 01/15 | $968,856 | $969,479 | $979,825 |
| 02/15 | $1,010,122 | $1,021,310 | $1,033,287 |
| 03/15 | $1,000,793 | $1,004,801 | $1,022,097 |
| 04/15 | $1,033,447 | $1,055,563 | $1,083,168 |
| 05/15 | $1,041,700 | $1,039,080 | $1,089,219 |
| 06/15 | $1,034,987 | $1,010,093 | $1,065,212 |
| 07/15 | $1,027,424 | $1,007,284 | $1,044,910 |
| 08/15 | $971,605 | $930,292 | $986,619 |
| 09/15 | $923,443 | $887,160 | $958,447 |
| 10/15 | $978,427 | $953,203 | $1,015,260 |
| 11/15 | $976,607 | $933,526 | $1,008,001 |
| 12/15 | $962,269 | $915,943 | $1,009,027 |
| 01/16 | $914,419 | $853,637 | $931,655 |
| 02/16 | $915,230 | $843,881 | $934,814 |
| 03/16 | $987,005 | $912,496 | $1,015,921 |
| 04/16 | $1,009,308 | $936,513 | $1,044,328 |
| 05/16 | $995,520 | $920,705 | $1,037,454 |
| 06/16 | $1,017,418 | $906,619 | $1,007,033 |
| 07/16 | $1,067,295 | $951,454 | $1,063,070 |
| 08/16 | $1,058,374 | $957,471 | $1,060,524 |
| 09/16 | $1,083,516 | $969,278 | $1,086,702 |
| 10/16 | $1,055,941 | $955,342 | $1,058,089 |
| 11/16 | $1,015,796 | $933,245 | $1,026,672 |
| 12/16 | $1,013,590 | $957,116 | $1,048,465 |
| 01/17 | $1,050,933 | $991,021 | $1,088,645 |
| 02/17 | $1,072,272 | $1,006,824 | $1,117,320 |
| 03/17 | $1,099,766 | $1,032,349 | $1,140,482 |
| 04/17 | $1,145,316 | $1,054,449 | $1,174,695 |
| 05/17 | $1,169,117 | $1,088,666 | $1,206,558 |
| 06/17 | $1,161,730 | $1,092,046 | $1,211,623 |
| 07/17 | $1,204,408 | $1,132,296 | $1,254,427 |
| 08/17 | $1,214,667 | $1,138,222 | $1,268,021 |
| 09/17 | $1,267,193 | $1,159,351 | $1,295,256 |
| 10/17 | $1,289,763 | $1,181,162 | $1,319,441 |
| 11/17 | $1,287,301 | $1,190,757 | $1,339,093 |
| 12/17 | $1,339,796 | $1,217,371 | $1,380,257 |
| 01/18 | $1,410,356 | $1,285,174 | $1,448,107 |
| 02/18 | $1,364,025 | $1,224,574 | $1,391,139 |
| 03/18 | $1,358,499 | $1,202,977 | $1,375,375 |
| 04/18 | $1,360,199 | $1,222,183 | $1,391,281 |
| 05/18 | $1,329,595 | $1,193,963 | $1,377,196 |
| 06/18 | $1,318,968 | $1,171,522 | $1,339,663 |
| 07/18 | $1,353,823 | $1,199,541 | $1,349,000 |
| 08/18 | $1,337,671 | $1,174,434 | $1,335,874 |
| 09/18 | $1,325,344 | $1,179,785 | $1,319,388 |
| 10/18 | $1,246,707 | $1,083,824 | $1,191,057 |
| 11/18 | $1,264,985 | $1,094,082 | $1,194,022 |
| 12/18 | $1,215,099 | $1,044,561 | $1,129,057 |
| 01/19 | $1,318,083 | $1,123,486 | $1,217,482 |
| 02/19 | $1,332,722 | $1,145,438 | $1,243,021 |
| 03/19 | $1,352,410 | $1,152,261 | $1,244,913 |
| 04/19 | $1,382,195 | $1,182,701 | $1,272,443 |
| 05/19 | $1,342,819 | $1,119,224 | $1,206,781 |
| 06/19 | $1,421,066 | $1,186,618 | $1,260,026 |
| 07/19 | $1,394,815 | $1,172,255 | $1,251,614 |
| 08/19 | $1,353,925 | $1,136,051 | $1,215,541 |
| 09/19 | $1,371,593 | $1,165,286 | $1,245,074 |
| 10/19 | $1,426,114 | $1,205,946 | $1,295,460 |
| 11/19 | $1,453,374 | $1,216,576 | $1,317,210 |
| 12/19 | $1,508,767 | $1,269,260 | $1,382,177 |
| 01/20 | $1,495,453 | $1,235,164 | $1,339,027 |
| 02/20 | $1,362,843 | $1,137,530 | $1,215,878 |
| 03/20 | $1,119,992 | $972,824 | $981,272 |
| 04/20 | $1,270,176 | $1,046,545 | $1,100,535 |
| 05/20 | $1,376,690 | $1,080,796 | $1,167,262 |
| 06/20 | $1,417,698 | $1,129,637 | $1,205,298 |
| 07/20 | $1,507,702 | $1,180,001 | $1,265,580 |
| 08/20 | $1,600,369 | $1,230,513 | $1,348,824 |
| 09/20 | $1,622,737 | $1,200,264 | $1,331,741 |
| 10/20 | $1,617,411 | $1,174,460 | $1,296,428 |
| 11/20 | $1,770,791 | $1,332,442 | $1,475,822 |
| 12/20 | $1,908,726 | $1,404,462 | $1,579,029 |
| 01/21 | $1,907,661 | $1,407,514 | $1,576,251 |
| 02/21 | $1,952,929 | $1,435,378 | $1,633,281 |
| 03/21 | $1,907,661 | $1,453,526 | $1,666,383 |
| 04/21 | $2,021,631 | $1,496,313 | $1,742,913 |
| 05/21 | $2,070,094 | $1,543,117 | $1,783,301 |
| 06/21 | $2,065,834 | $1,533,119 | $1,772,239 |
| 07/21 | $2,163,294 | $1,507,853 | $1,786,461 |
| 08/21 | $2,260,221 | $1,536,515 | $1,827,731 |
| 09/21 | $2,212,290 | $1,487,315 | $1,772,162 |
| 10/21 | $2,298,566 | $1,522,818 | $1,799,870 |
| 11/21 | $2,205,899 | $1,454,248 | $1,710,761 |
| 12/21 | $2,276,230 | $1,514,347 | $1,783,093 |
| 01/22 | $1,930,133 | $1,458,544 | $1,671,785 |
| 02/22 | $1,864,346 | $1,429,673 | $1,650,137 |
| 03/22 | $1,821,442 | $1,431,951 | $1,666,933 |
| 04/22 | $1,650,967 | $1,342,035 | $1,559,329 |
| 05/22 | $1,645,247 | $1,351,668 | $1,544,960 |
| 06/22 | $1,459,899 | $1,235,388 | $1,374,417 |
| 07/22 | $1,561,154 | $1,277,680 | $1,453,832 |
| 08/22 | $1,513,101 | $1,236,586 | $1,415,701 |
| 09/22 | $1,326,037 | $1,113,014 | $1,259,414 |
| 10/22 | $1,379,811 | $1,146,272 | $1,300,338 |
| 11/22 | $1,541,704 | $1,281,587 | $1,424,609 |
| 12/22 | $1,486,170 | $1,272,004 | $1,426,991 |
| 01/23 | $1,605,064 | $1,375,174 | $1,529,718 |
| 02/23 | $1,547,365 | $1,326,903 | $1,490,636 |
| 03/23 | $1,591,076 | $1,359,340 | $1,494,007 |
| 04/23 | $1,594,573 | $1,382,956 | $1,516,014 |
| 05/23 | $1,538,040 | $1,332,674 | $1,473,979 |
| 06/23 | $1,586,414 | $1,392,470 | $1,524,615 |
| 07/23 | $1,648,192 | $1,449,083 | $1,602,044 |
| 08/23 | $1,566,598 | $1,383,634 | $1,557,383 |
| 09/23 | $1,475,680 | $1,339,933 | $1,498,768 |
| 10/23 | $1,387,675 | $1,284,649 | $1,414,968 |
| 11/23 | $1,559,022 | $1,400,286 | $1,551,889 |
| 12/23 | $1,634,690 | $1,470,639 | $1,650,436 |
| 01/24 | $1,590,017 | $1,456,032 | $1,622,119 |
| 02/24 | $1,682,890 | $1,492,894 | $1,638,367 |
| 03/24 | $1,709,929 | $1,539,562 | $1,685,239 |
| 04/24 | $1,625,873 | $1,511,915 | $1,660,709 |
| 05/24 | $1,771,061 | $1,555,804 | $1,714,513 |
| 06/24 | $1,758,129 | $1,554,325 | $1,696,331 |
| 07/24 | $1,835,132 | $1,590,314 | $1,760,929 |
| 08/24 | $1,892,149 | $1,635,606 | $1,793,366 |
| 09/24 | $1,912,135 | $1,679,648 | $1,847,281 |
| 10/24 | $1,822,200 | $1,597,237 | $1,750,745 |
Average Annual Total Returns for the Period Ended October 31, 2024 (%)
| AATR | 1 Year | 5 Years | 10 Years |
|---|
| Institutional Class | 31.31% | 5.02% | 6.18% |
| MSCI All Country World ex USA Index (Net TR) | 24.33% | 5.78% | 4.79% |
| MSCI All Country World ex USA Small Cap Index (Net TR) | 23.73% | 6.21% | 5.76% |
THE FUND'S PAST PERFORMANCE IS NOT A GOOD PREDICTOR OF THE FUND'S FUTURE PERFORMANCE.
Fund performance data shown above does not reflect the deduction of taxes that a shareholder would pay on Fund distributions or redemption of Fund shares.
In accordance with regulatory changes requiring the Fund's primary benchmark to represent the overall applicable market, the Fund's primary prospectus benchmark changed to the MSCI AC World ex USA Index (Net TR) effective as of February 29, 2024.
Key Fund Statistics as of October 31, 2024
| Total Net Assets | $123,567,861 |
| Total Number of Portfolio Holdings | 44 |
| Portfolio Turnover Rate | 32% |
| Total Advisory Fees Paid | $764,470 |
abrdn International Small Cap Fund
(ABNIX)
What did the Fund invest in?
The tables below show the investment makeup of the Fund as of October 31, 2024.
Geographic Allocation (% of total net assets)
| United Kingdom | 19.5% | |
| Japan | 15.8% | |
| Germany | 8.5% | |
| France | 8.2% | |
| Taiwan | 8.0% | |
| India | 7.9% | |
| Vietnam | 4.9% | |
| Israel | 4.8% | |
| Italy | 3.9% | |
| Australia | 3.8% | |
| Thailand | 2.9% | |
| Sweden | 2.8% | |
| Poland | 2.0% | |
| Other | 7.0% | |
Ten Largest Holdings (% of total net assets)
| Poly Medicure Ltd. | 5.4% |
| FPT Corp. | 4.9% |
| CTS Eventim AG & Co. KGaA | 4.8% |
| Gaztransport Et Technigaz SA | 4.6% |
| Diploma PLC | 4.1% |
| Intermediate Capital Group PLC | 4.0% |
| Japan Elevator Service Holdings Co. Ltd. | 4.0% |
| Interparfums SA | 3.6% |
| Gamma Communications PLC | 3.4% |
| Asics Corp. | 3.0% |
Availability of Additional Information
You can find additional information, including the Fund's prospectus, financial information, fund holdings, and proxy voting information at abrdn.com/us/literature or call 866-667-9231. The QR code can be used to access the Fund's prospectus, financial information and holdings.
abrdn International Small Cap Fund
(ABNIX)
abrdn Realty Income & Growth Fund
Annual Shareholder Report - October 31, 2024
This annual shareholder report contains important information about the abrdn Realty Income & Growth Fund (the "Fund") for the period of November 1, 2023 to October 31, 2024. You can find additional information about the Fund at abrdn.com/us/literature. You can also request this information by contacting us at 866-667-9231.
This report describes material changes to the Fund that occurred during the reporting period.
What were the Fund costs for the last year?
(based on a hypothetical $10,000 investment)
| Share Class | Costs of a $10,000 investment | Costs paid as a percentage of a $10,000 investment |
|---|
| A | $146 | 1.25% |
How did the fund perform last year and what affected its performance?
The following discussion compares the performance of the Fund to the MSCI US REIT Index (the “Index”) to show how the Fund’s performance measures against the returns of similar investments for the reporting period.
What contributed to performance?
Overweight positions in healthcare REITs with outsized senior housing exposure, such as American Healthcare, Welltower and Ventas, all benefited the Fund. The healthcare REITs continued to benefit from better-than-expected earnings growth for senior housing and improving operator health in skilled nursing. Both those segments benefitted from little to no supply growth and improving demand due to an aging population. The Fund also benefited from an underweight exposure to the hotel & resort sector, which lagged the overall REIT sector due to weaker revenue-per-available-room growth, stemming from slowing leisure travel. Our lack of exposure to Rexford Industrial Realty helped performance as weakness in industrial demand, particularly in Southern California, penalized the REIT Index.
What detracted from performance?
The Fund’s underweight to self-storage REITs, including the underweight to Extra Space, detracted from performance as investors expected move-in rates to bottom (which ultimately did not materialize). Similarly, our underweight to other specialized REITs, including non-exposure to Iron Mountain was unfavorable as it benefited from exposure to data centers and artificial intelligence. The Fund has since added a material position in Iron Mountain. At the stock level, our overweight to SITE Centers was weak ahead of its spin-off of Curbline Properties due to selling pressure from tax specific issues. We subsequently sold SITE Centers and maintained our position in Curbline. American Homes 4 Rent was also negative as the single-family rental sector underperformed the multi-family sector on moderating blended rate growth. As such, the Fund disposed of this position.
abrdn Realty Income & Growth Fund
(AIAGX)
Total Return Based on $10,000 Investment
The following graph reflects a hypothetical $10,000 investment for the most recently completed 10 fiscal years as compared to a broad-based securities market index and an additional performance benchmark.
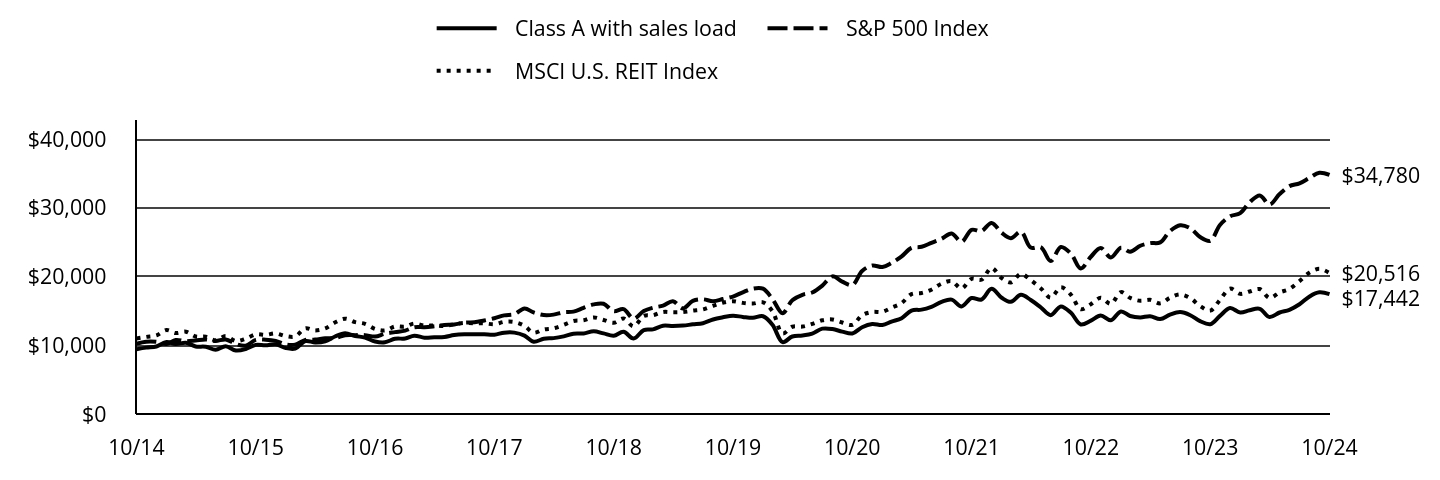
| Class A with sales load | S&P 500 Index | MSCI U.S. REIT Index |
|---|
| 10/14 | $9,424 | $10,244 | $10,997 |
| 11/14 | $9,654 | $10,520 | $11,217 |
| 12/14 | $9,825 | $10,493 | $11,434 |
| 01/15 | $10,464 | $10,178 | $12,207 |
| 02/15 | $10,182 | $10,763 | $11,771 |
| 03/15 | $10,371 | $10,593 | $11,977 |
| 04/15 | $9,831 | $10,695 | $11,271 |
| 05/15 | $9,777 | $10,832 | $11,242 |
| 06/15 | $9,338 | $10,622 | $10,726 |
| 07/15 | $9,842 | $10,845 | $11,331 |
| 08/15 | $9,233 | $10,191 | $10,625 |
| 09/15 | $9,444 | $9,939 | $10,947 |
| 10/15 | $10,057 | $10,777 | $11,582 |
| 11/15 | $9,993 | $10,809 | $11,512 |
| 12/15 | $10,153 | $10,638 | $11,722 |
| 01/16 | $9,593 | $10,111 | $11,330 |
| 02/16 | $9,518 | $10,097 | $11,286 |
| 03/16 | $10,613 | $10,782 | $12,462 |
| 04/16 | $10,406 | $10,824 | $12,163 |
| 05/16 | $10,576 | $11,018 | $12,452 |
| 06/16 | $11,274 | $11,047 | $13,311 |
| 07/16 | $11,739 | $11,454 | $13,870 |
| 08/16 | $11,350 | $11,470 | $13,363 |
| 09/16 | $11,119 | $11,472 | $13,119 |
| 10/16 | $10,550 | $11,263 | $12,372 |
| 11/16 | $10,440 | $11,680 | $12,160 |
| 12/16 | $10,941 | $11,911 | $12,730 |
| 01/17 | $10,985 | $12,137 | $12,728 |
| 02/17 | $11,398 | $12,619 | $13,169 |
| 03/17 | $11,095 | $12,633 | $12,857 |
| 04/17 | $11,164 | $12,763 | $12,878 |
| 05/17 | $11,214 | $12,943 | $12,796 |
| 06/17 | $11,482 | $13,023 | $13,069 |
| 07/17 | $11,587 | $13,291 | $13,235 |
| 08/17 | $11,592 | $13,332 | $13,204 |
| 09/17 | $11,584 | $13,607 | $13,190 |
| 10/17 | $11,538 | $13,925 | $13,059 |
| 11/17 | $11,835 | $14,352 | $13,404 |
| 12/17 | $11,840 | $14,511 | $13,376 |
| 01/18 | $11,398 | $15,342 | $12,817 |
| 02/18 | $10,519 | $14,777 | $11,832 |
| 03/18 | $10,948 | $14,401 | $12,294 |
| 04/18 | $11,037 | $14,456 | $12,471 |
| 05/18 | $11,294 | $14,804 | $12,963 |
| 06/18 | $11,685 | $14,896 | $13,535 |
| 07/18 | $11,727 | $15,450 | $13,632 |
| 08/18 | $12,039 | $15,953 | $14,049 |
| 09/18 | $11,723 | $16,044 | $13,683 |
| 10/18 | $11,382 | $14,947 | $13,280 |
| 11/18 | $11,952 | $15,252 | $13,902 |
| 12/18 | $10,982 | $13,875 | $12,764 |
| 01/19 | $12,208 | $14,987 | $14,268 |
| 02/19 | $12,316 | $15,468 | $14,364 |
| 03/19 | $12,842 | $15,769 | $14,841 |
| 04/19 | $12,796 | $16,407 | $14,803 |
| 05/19 | $12,858 | $15,364 | $14,844 |
| 06/19 | $13,047 | $16,447 | $15,033 |
| 07/19 | $13,212 | $16,684 | $15,220 |
| 08/19 | $13,748 | $16,419 | $15,739 |
| 09/19 | $14,063 | $16,727 | $16,188 |
| 10/19 | $14,301 | $17,089 | $16,418 |
| 11/19 | $14,126 | $17,709 | $16,167 |
| 12/19 | $13,995 | $18,244 | $16,062 |
| 01/20 | $14,224 | $18,237 | $16,249 |
| 02/20 | $12,991 | $16,735 | $14,960 |
| 03/20 | $10,453 | $14,668 | $11,726 |
| 04/20 | $11,277 | $16,549 | $12,692 |
| 05/20 | $11,415 | $17,337 | $12,715 |
| 06/20 | $11,691 | $17,682 | $13,099 |
| 07/20 | $12,414 | $18,679 | $13,636 |
| 08/20 | $12,358 | $20,021 | $13,751 |
| 09/20 | $11,984 | $19,260 | $13,313 |
| 10/20 | $11,710 | $18,748 | $12,968 |
| 11/20 | $12,626 | $20,801 | $14,365 |
| 12/20 | $13,090 | $21,600 | $14,846 |
| 01/21 | $12,940 | $21,382 | $14,869 |
| 02/21 | $13,443 | $21,972 | $15,463 |
| 03/21 | $13,936 | $22,934 | $16,146 |
| 04/21 | $15,051 | $24,158 | $17,446 |
| 05/21 | $15,180 | $24,327 | $17,609 |
| 06/21 | $15,598 | $24,895 | $18,083 |
| 07/21 | $16,308 | $25,486 | $18,962 |
| 08/21 | $16,641 | $26,261 | $19,325 |
| 09/21 | $15,644 | $25,040 | $18,260 |
| 10/21 | $16,871 | $26,794 | $19,673 |
| 11/21 | $16,655 | $26,608 | $19,531 |
| 12/21 | $18,210 | $27,801 | $21,239 |
| 01/22 | $16,906 | $26,362 | $19,766 |
| 02/22 | $16,316 | $25,573 | $19,135 |
| 03/22 | $17,332 | $26,522 | $20,376 |
| 04/22 | $16,581 | $24,209 | $19,467 |
| 05/22 | $15,498 | $24,254 | $18,270 |
| 06/22 | $14,379 | $22,252 | $16,923 |
| 07/22 | $15,654 | $24,304 | $18,447 |
| 08/22 | $14,713 | $23,312 | $17,342 |
| 09/22 | $13,024 | $21,165 | $15,237 |
| 10/22 | $13,589 | $22,879 | $15,979 |
| 11/22 | $14,328 | $24,158 | $16,902 |
| 12/22 | $13,626 | $22,766 | $16,033 |
| 01/23 | $14,921 | $24,196 | $17,732 |
| 02/23 | $14,253 | $23,606 | $16,888 |
| 03/23 | $14,050 | $24,473 | $16,470 |
| 04/23 | $14,226 | $24,855 | $16,605 |
| 05/23 | $13,807 | $24,963 | $16,096 |
| 06/23 | $14,453 | $26,612 | $16,908 |
| 07/23 | $14,821 | $27,467 | $17,392 |
| 08/23 | $14,371 | $27,030 | $16,865 |
| 09/23 | $13,513 | $25,741 | $15,721 |
| 10/23 | $13,061 | $25,200 | $15,034 |
| 11/23 | $14,281 | $27,501 | $16,597 |
| 12/23 | $15,409 | $28,750 | $18,236 |
| 01/24 | $14,769 | $29,233 | $17,481 |
| 02/24 | $15,103 | $30,794 | $17,830 |
| 03/24 | $15,300 | $31,785 | $18,179 |
| 04/24 | $14,106 | $30,487 | $16,894 |
| 05/24 | $14,766 | $31,999 | $17,683 |
| 06/24 | $15,154 | $33,147 | $18,193 |
| 07/24 | $15,960 | $33,550 | $19,333 |
| 08/24 | $17,105 | $34,364 | $20,578 |
| 09/24 | $17,698 | $35,098 | $21,125 |
| 10/24 | $17,442 | $34,780 | $20,516 |
Average Annual Total Returns for the Period Ended October 31, 2024 (%)
| AATR | 1 Year | 5 Years | 10 Years |
|---|
| Class A without sales load | 33.65% | 4.07% | 6.36% |
| Class A with sales load - 5.75% | 25.98% | 2.84% | 5.73% |
| S&P 500 Index | 38.02% | 15.27% | 13.00% |
| MSCI U.S. REIT Index | 36.47% | 4.56% | 6.43% |
THE FUND'S PAST PERFORMANCE IS NOT A GOOD PREDICTOR OF THE FUND'S FUTURE PERFORMANCE.
Fund performance data shown above does not reflect the deduction of taxes that a shareholder would pay on Fund distributions or redemption of Fund shares.
In accordance with regulatory changes requiring the Fund's primary benchmark to represent the overall applicable market, the Fund's primary prospectus benchmark changed to the S&P 500 Index effective as of February 29, 2024.
Key Fund Statistics as of October 31, 2024
| Total Net Assets | $40,706,671 |
| Total Number of Portfolio Holdings | 29 |
| Portfolio Turnover Rate | 45% |
| Total Advisory Fees Paid | $181,699 |
abrdn Realty Income & Growth Fund
(AIAGX)
What did the Fund invest in?
The tables below show the investment makeup of the Fund as of October 31, 2024.
Industry Allocation (% of total net assets)
| Health Care REITs | 23.4% |
| Retail REITs | 19.4% |
| Data Center REITs | 16.9% |
| Industrial REITs | 9.8% |
| Multi-Family Residential REITs | 9.3% |
| Self Storage REITs | 6.6% |
| Office REITs | 6.6% |
| Other Specialized REITs | 4.6% |
| Single-Family Residential REITs | 2.6% |
| Hotel & Resort REITs | 0.6% |
| Other | 0.2% |
Ten Largest Holdings (% of total net assets)
| Welltower, Inc. | 9.9% |
| Equinix, Inc. | 9.4% |
| Prologis, Inc. | 8.4% |
| Digital Realty Trust, Inc. | 7.5% |
| Realty Income Corp. | 6.0% |
| Public Storage | 5.4% |
| Iron Mountain, Inc. | 4.6% |
| AvalonBay Communities, Inc. | 4.6% |
| Ventas, Inc. | 4.2% |
| Omega Healthcare Investors, Inc. | 3.6% |
Below is a summary of certain changes for the Fund since November 1, 2023. For more information, you may refer to the Fund's next prospectus, which we expect to be available by February 28, 2025 at abrdn.com/us/literature or upon request at 866-667-9231.
Effective February 29, 2004, the Fund's management fee changed from 1.00% on assets up to $250 million, 0.95% on assets of $250 million up to $750 million, 0.90% on assets of $750 million up to $1 billion and 0.80% on assets of $1 billion and more to 0.80% on all assets. The Fund's expense limitation changed from 1.00% for Institutional Class and 1.25% for Class A 1.25% to 0.99% for Institutional Class and 1.24% for Class A.
Availability of Additional Information
You can find additional information, including the Fund's prospectus, financial information, fund holdings, and proxy voting information at abrdn.com/us/literature or call 866-667-9231. The QR code can be used to access the Fund's prospectus, financial information and holdings.
abrdn Realty Income & Growth Fund
(AIAGX)
abrdn Realty Income & Growth Fund
Annual Shareholder Report - October 31, 2024
This annual shareholder report contains important information about the abrdn Realty Income & Growth Fund (the "Fund") for the period of November 1, 2023 to October 31, 2024. You can find additional information about the Fund at abrdn.com/us/literature. You can also request this information by contacting us at 866-667-9231.
This report describes material changes to the Fund that occurred during the reporting period.
What were the Fund costs for the last year?
(based on a hypothetical $10,000 investment)
| Share Class | Costs of a $10,000 investment | Costs paid as a percentage of a $10,000 investment |
|---|
| Institutional | $117 | 1.00% |
How did the fund perform last year and what affected its performance?
The following discussion compares the performance of the Fund to the MSCI US REIT Index (the “Index”) to show how the Fund’s performance measures against the returns of similar investments for the reporting period.
What contributed to performance?
Overweight positions in healthcare REITs with outsized senior housing exposure, such as American Healthcare, Welltower and Ventas, all benefited the Fund. The healthcare REITs continued to benefit from better-than-expected earnings growth for senior housing and improving operator health in skilled nursing. Both those segments benefitted from little to no supply growth and improving demand due to an aging population. The Fund also benefited from an underweight exposure to the hotel & resort sector, which lagged the overall REIT sector due to weaker revenue-per-available-room growth, stemming from slowing leisure travel. Our lack of exposure to Rexford Industrial Realty helped performance as weakness in industrial demand, particularly in Southern California, penalized the REIT Index.
What detracted from performance?
The Fund’s underweight to self-storage REITs, including the underweight to Extra Space, detracted from performance as investors expected move-in rates to bottom (which ultimately did not materialize). Similarly, our underweight to other specialized REITs, including non-exposure to Iron Mountain was unfavorable as it benefited from exposure to data centers and artificial intelligence. The Fund has since added a material position in Iron Mountain. At the stock level, our overweight to SITE Centers was weak ahead of its spin-off of Curbline Properties due to selling pressure from tax specific issues. We subsequently sold SITE Centers and maintained our position in Curbline. American Homes 4 Rent was also negative as the single-family rental sector underperformed the multi-family sector on moderating blended rate growth. As such, the Fund disposed of this position.
abrdn Realty Income & Growth Fund
(AIGYX)
Total Return Based on $1,000,000 Investment
The following graph reflects a hypothetical $1,000,000 investment for the most recently completed 10 fiscal years as compared to a broad-based securities market index and an additional performance benchmark.
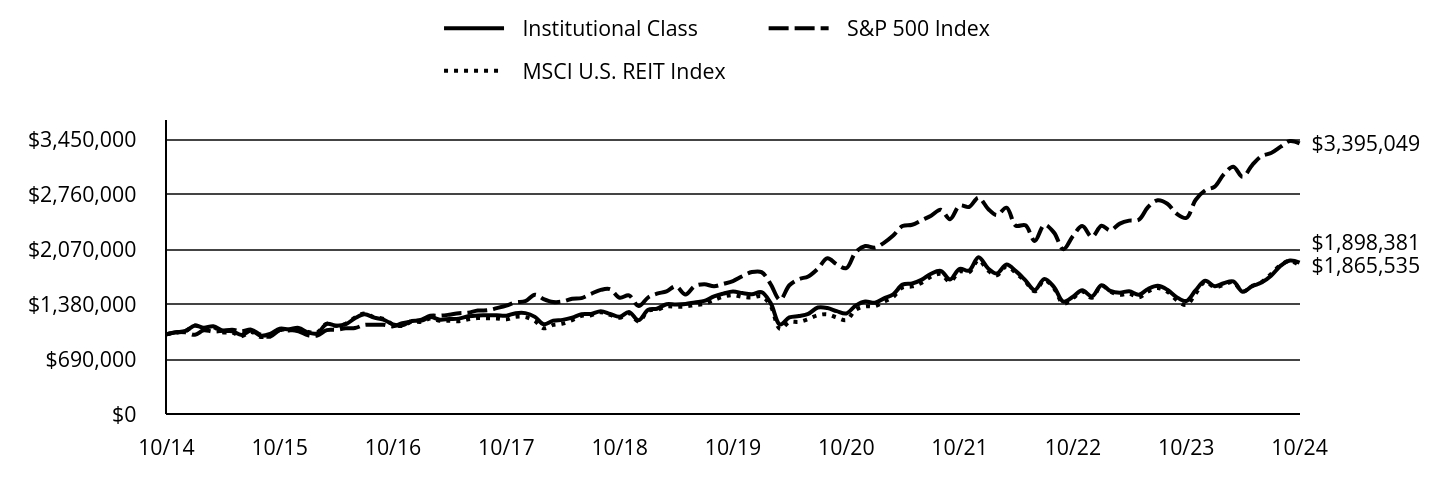
| Institutional Class | S&P 500 Index | MSCI U.S. REIT Index |
|---|
| 10/14 | $1,000,000 | $1,000,000 | $1,000,000 |
| 11/14 | $1,024,425 | $1,026,895 | $1,019,959 |
| 12/14 | $1,042,626 | $1,024,308 | $1,039,692 |
| 01/15 | $1,110,839 | $993,559 | $1,109,957 |
| 02/15 | $1,081,469 | $1,050,660 | $1,070,348 |
| 03/15 | $1,101,247 | $1,034,045 | $1,089,046 |
| 04/15 | $1,044,417 | $1,043,964 | $1,024,831 |
| 05/15 | $1,039,164 | $1,057,389 | $1,022,246 |
| 06/15 | $992,722 | $1,036,920 | $975,348 |
| 07/15 | $1,046,213 | $1,058,645 | $1,030,325 |
| 08/15 | $981,638 | $994,773 | $966,172 |
| 09/15 | $1,004,167 | $970,159 | $995,449 |
| 10/15 | $1,069,815 | $1,051,995 | $1,053,192 |
| 11/15 | $1,063,007 | $1,055,124 | $1,046,766 |
| 12/15 | $1,080,170 | $1,038,483 | $1,065,895 |
| 01/16 | $1,021,071 | $986,949 | $1,030,274 |
| 02/16 | $1,013,125 | $985,617 | $1,026,214 |
| 03/16 | $1,130,205 | $1,052,480 | $1,133,189 |
| 04/16 | $1,108,172 | $1,056,560 | $1,105,947 |
| 05/16 | $1,126,199 | $1,075,534 | $1,132,303 |
| 06/16 | $1,201,187 | $1,078,320 | $1,210,394 |
| 07/16 | $1,251,153 | $1,118,077 | $1,261,227 |
| 08/16 | $1,209,767 | $1,119,647 | $1,215,058 |
| 09/16 | $1,184,911 | $1,119,858 | $1,192,883 |
| 10/16 | $1,124,877 | $1,099,431 | $1,124,951 |
| 11/16 | $1,113,175 | $1,140,148 | $1,105,724 |
| 12/16 | $1,166,859 | $1,162,684 | $1,157,557 |
| 01/17 | $1,171,574 | $1,184,736 | $1,157,403 |
| 02/17 | $1,215,587 | $1,231,777 | $1,197,467 |
| 03/17 | $1,184,018 | $1,233,214 | $1,169,061 |
| 04/17 | $1,191,944 | $1,245,879 | $1,171,007 |
| 05/17 | $1,196,699 | $1,263,412 | $1,163,559 |
| 06/17 | $1,225,625 | $1,271,298 | $1,188,354 |
| 07/17 | $1,237,344 | $1,297,439 | $1,203,463 |
| 08/17 | $1,238,409 | $1,301,411 | $1,200,621 |
| 09/17 | $1,237,743 | $1,328,257 | $1,199,362 |
| 10/17 | $1,233,447 | $1,359,252 | $1,187,443 |
| 11/17 | $1,264,592 | $1,400,940 | $1,218,862 |
| 12/17 | $1,266,063 | $1,416,516 | $1,216,255 |
| 01/18 | $1,218,884 | $1,497,618 | $1,165,453 |
| 02/18 | $1,125,636 | $1,442,420 | $1,075,924 |
| 03/18 | $1,171,011 | $1,405,763 | $1,117,877 |
| 04/18 | $1,181,092 | $1,411,157 | $1,134,026 |
| 05/18 | $1,208,533 | $1,445,141 | $1,178,694 |
| 06/18 | $1,250,955 | $1,454,035 | $1,230,774 |
| 07/18 | $1,255,473 | $1,508,145 | $1,239,595 |
| 08/18 | $1,289,359 | $1,557,289 | $1,277,467 |
| 09/18 | $1,255,722 | $1,566,153 | $1,244,223 |
| 10/18 | $1,219,274 | $1,459,106 | $1,207,515 |
| 11/18 | $1,280,779 | $1,488,840 | $1,264,126 |
| 12/18 | $1,177,079 | $1,354,411 | $1,160,673 |
| 01/19 | $1,308,965 | $1,462,948 | $1,297,374 |
| 02/19 | $1,320,504 | $1,509,921 | $1,306,112 |
| 03/19 | $1,377,518 | $1,539,261 | $1,349,533 |
| 04/19 | $1,373,349 | $1,601,586 | $1,346,017 |
| 05/19 | $1,380,020 | $1,499,808 | $1,349,750 |
| 06/19 | $1,400,389 | $1,605,509 | $1,366,951 |
| 07/19 | $1,418,938 | $1,628,583 | $1,383,995 |
| 08/19 | $1,476,268 | $1,602,786 | $1,431,130 |
| 09/19 | $1,510,307 | $1,632,775 | $1,472,014 |
| 10/19 | $1,535,877 | $1,668,140 | $1,492,874 |
| 11/19 | $1,517,126 | $1,728,692 | $1,470,042 |
| 12/19 | $1,503,582 | $1,780,867 | $1,460,549 |
| 01/20 | $1,528,054 | $1,780,169 | $1,477,534 |
| 02/20 | $1,396,882 | $1,633,627 | $1,360,331 |
| 03/20 | $1,123,449 | $1,431,853 | $1,066,275 |
| 04/20 | $1,211,855 | $1,615,408 | $1,154,118 |
| 05/20 | $1,228,741 | $1,692,346 | $1,156,184 |
| 06/20 | $1,257,151 | $1,726,002 | $1,191,062 |
| 07/20 | $1,335,786 | $1,823,323 | $1,239,883 |
| 08/20 | $1,329,737 | $1,954,385 | $1,250,374 |
| 09/20 | $1,290,113 | $1,880,124 | $1,210,522 |
| 10/20 | $1,261,714 | $1,830,125 | $1,179,229 |
| 11/20 | $1,360,096 | $2,030,458 | $1,306,194 |
| 12/20 | $1,410,433 | $2,108,525 | $1,349,936 |
| 01/21 | $1,395,477 | $2,087,238 | $1,352,030 |
| 02/21 | $1,448,397 | $2,144,793 | $1,406,041 |
| 03/21 | $1,501,930 | $2,238,726 | $1,468,166 |
| 04/21 | $1,622,961 | $2,358,204 | $1,586,391 |
| 05/21 | $1,637,945 | $2,374,674 | $1,601,199 |
| 06/21 | $1,682,804 | $2,430,111 | $1,644,282 |
| 07/21 | $1,760,240 | $2,487,838 | $1,724,259 |
| 08/21 | $1,796,069 | $2,563,482 | $1,757,235 |
| 09/21 | $1,688,862 | $2,444,255 | $1,660,375 |
| 10/21 | $1,821,980 | $2,615,504 | $1,788,905 |
| 11/21 | $1,798,829 | $2,597,381 | $1,775,974 |
| 12/21 | $1,967,979 | $2,713,786 | $1,931,269 |
| 01/22 | $1,826,464 | $2,573,355 | $1,797,363 |
| 02/22 | $1,762,981 | $2,496,305 | $1,739,943 |
| 03/22 | $1,874,571 | $2,588,992 | $1,852,806 |
| 04/22 | $1,792,434 | $2,363,227 | $1,770,142 |
| 05/22 | $1,675,853 | $2,367,563 | $1,661,258 |
| 06/22 | $1,555,467 | $2,172,135 | $1,538,827 |
| 07/22 | $1,694,205 | $2,372,416 | $1,677,349 |
| 08/22 | $1,592,819 | $2,275,664 | $1,576,932 |
| 09/22 | $1,410,711 | $2,066,079 | $1,385,497 |
| 10/22 | $1,471,518 | $2,233,351 | $1,452,964 |
| 11/22 | $1,552,593 | $2,358,160 | $1,536,877 |
| 12/22 | $1,475,506 | $2,222,296 | $1,457,881 |
| 01/23 | $1,616,579 | $2,361,931 | $1,612,349 |
| 02/23 | $1,544,603 | $2,304,303 | $1,535,642 |
| 03/23 | $1,522,209 | $2,388,903 | $1,497,663 |
| 04/23 | $1,541,146 | $2,426,190 | $1,509,889 |
| 05/23 | $1,497,446 | $2,436,736 | $1,463,620 |
| 06/23 | $1,568,181 | $2,597,744 | $1,537,461 |
| 07/23 | $1,607,863 | $2,681,197 | $1,581,474 |
| 08/23 | $1,559,363 | $2,638,508 | $1,533,518 |
| 09/23 | $1,466,396 | $2,512,709 | $1,429,512 |
| 10/23 | $1,417,565 | $2,459,876 | $1,367,015 |
| 11/23 | $1,550,740 | $2,684,525 | $1,509,178 |
| 12/23 | $1,672,523 | $2,806,485 | $1,658,240 |
| 01/24 | $1,603,460 | $2,853,645 | $1,589,555 |
| 02/24 | $1,640,995 | $3,006,018 | $1,621,283 |
| 03/24 | $1,663,138 | $3,102,735 | $1,653,010 |
| 04/24 | $1,532,755 | $2,976,005 | $1,536,184 |
| 05/24 | $1,604,011 | $3,123,569 | $1,607,951 |
| 06/24 | $1,648,577 | $3,235,650 | $1,654,284 |
| 07/24 | $1,735,666 | $3,275,035 | $1,757,925 |
| 08/24 | $1,860,952 | $3,354,477 | $1,871,147 |
| 09/24 | $1,926,072 | $3,426,119 | $1,920,947 |
| 10/24 | $1,898,381 | $3,395,049 | $1,865,535 |
Average Annual Total Returns for the Period Ended October 31, 2024 (%)
| AATR | 1 Year | 5 Years | 10 Years |
|---|
| Institutional Class | 33.92% | 4.33% | 6.62% |
| S&P 500 Index | 38.02% | 15.27% | 13.00% |
| MSCI U.S. REIT Index | 36.47% | 4.56% | 6.43% |
THE FUND'S PAST PERFORMANCE IS NOT A GOOD PREDICTOR OF THE FUND'S FUTURE PERFORMANCE.
Fund performance data shown above does not reflect the deduction of taxes that a shareholder would pay on Fund distributions or redemption of Fund shares.
In accordance with regulatory changes requiring the Fund's primary benchmark to represent the overall applicable market, the Fund's primary prospectus benchmark changed to the S&P 500 Index effective as of February 29, 2024.
Key Fund Statistics as of October 31, 2024
| Total Net Assets | $40,706,671 |
| Total Number of Portfolio Holdings | 29 |
| Portfolio Turnover Rate | 45% |
| Total Advisory Fees Paid | $181,699 |
abrdn Realty Income & Growth Fund
(AIGYX)
What did the Fund invest in?
The tables below show the investment makeup of the Fund as of October 31, 2024.
Industry Allocation (% of total net assets)
| Health Care REITs | 23.4% |
| Retail REITs | 19.4% |
| Data Center REITs | 16.9% |
| Industrial REITs | 9.8% |
| Multi-Family Residential REITs | 9.3% |
| Self Storage REITs | 6.6% |
| Office REITs | 6.6% |
| Other Specialized REITs | 4.6% |
| Single-Family Residential REITs | 2.6% |
| Hotel & Resort REITs | 0.6% |
| Other | 0.2% |
Ten Largest Holdings (% of total net assets)
| Welltower, Inc. | 9.9% |
| Equinix, Inc. | 9.4% |
| Prologis, Inc. | 8.4% |
| Digital Realty Trust, Inc. | 7.5% |
| Realty Income Corp. | 6.0% |
| Public Storage | 5.4% |
| Iron Mountain, Inc. | 4.6% |
| AvalonBay Communities, Inc. | 4.6% |
| Ventas, Inc. | 4.2% |
| Omega Healthcare Investors, Inc. | 3.6% |
Below is a summary of certain changes for the Fund since November 1, 2023. For more information, you may refer to the Fund's next prospectus, which we expect to be available by February 28, 2025 at abrdn.com/us/literature or upon request at 866-667-9231.
Effective February 29, 2004, the Fund's management fee changed from 1.00% on assets up to $250 million, 0.95% on assets of $250 million up to $750 million, 0.90% on assets of $750 million up to $1 billion and 0.80% on assets of $1 billion and more to 0.80% on all assets. The Fund's expense limitation changed from 1.00% for Institutional Class and 1.25% for Class A 1.25% to 0.99% for Institutional Class and 1.24% for Class A.
Availability of Additional Information
You can find additional information, including the Fund's prospectus, financial information, fund holdings, and proxy voting information at abrdn.com/us/literature or call 866-667-9231. The QR code can be used to access the Fund's prospectus, financial information and holdings.
abrdn Realty Income & Growth Fund
(AIGYX)
abrdn Short Duration High Yield Municipal Fund
Annual Shareholder Report - October 31, 2024
This annual shareholder report contains important information about the abrdn Short Duration High Yield Municipal Fund (the "Fund") for the period of November 1, 2023 to October 31, 2024. You can find additional information about the Fund at abrdn.com/us/literature. You can also request this information by contacting us at 866-667-9231.
This report describes material changes to the Fund that occurred during the reporting period.
What were the Fund costs for the last year?
(based on a hypothetical $10,000 investment)
| Share Class | Costs of a $10,000 investment | Costs paid as a percentage of a $10,000 investment |
|---|
| A | $97 | 0.93% |
How did the fund perform last year and what affected its performance?
Management's Discussion of Fund Performance
The following discussion compares the performance of the Fund to the S&P Municipal Bond Short Intermediate Index to show how the Fund’s performance measures against the returns of similar investments for the reporting period.
What contributed to performance?
The Fund’s exposures to life care, hospital and higher education bonds particularly helped relative performance. Within individual holdings, the Fund's position in California Public Authority Senior Living’s revenue bonds was among the positive contributors for the Fund. The Authority’s bonds were severely discounted due to their low coupons in a rising-rate environment. However, as the facility filled up with new entrants, these bonds were recalled by the issuer and proceeds returned to the Fund, leading to a significant pick-up in appreciation. In terms of ratings, non-rated and BB-rated bonds benefited the Fund.
What detracted from performance?
The Fund’s holdings in industrial development and pollution control revenue bonds and other revenue bonds hurt performance. Within individual holdings, Wisconsin Public Finance Authority’s hospital revenue bonds and South Carolina Jobs-Economic Development Authority’s bonds detracted from performance. Wisconsin Public Finance’s bonds initially suffered from strains on credit but benefited from the purchase of collateral from a national healthcare provider. The South Carolina Jobs’ bonds have been negatively affected by operational difficulties and depressed recycled waste market levels. In terms of ratings, CCC and B-rated bonds detracted from performance.
abrdn Short Duration High Yield Municipal Fund
(AAHMX)
Total Return Based on $10,000 Investment
The following graph reflects a hypothetical $10,000 investment for the most recently completed 10 fiscal years as compared to a broad-based securities market index and an additional performance benchmark.
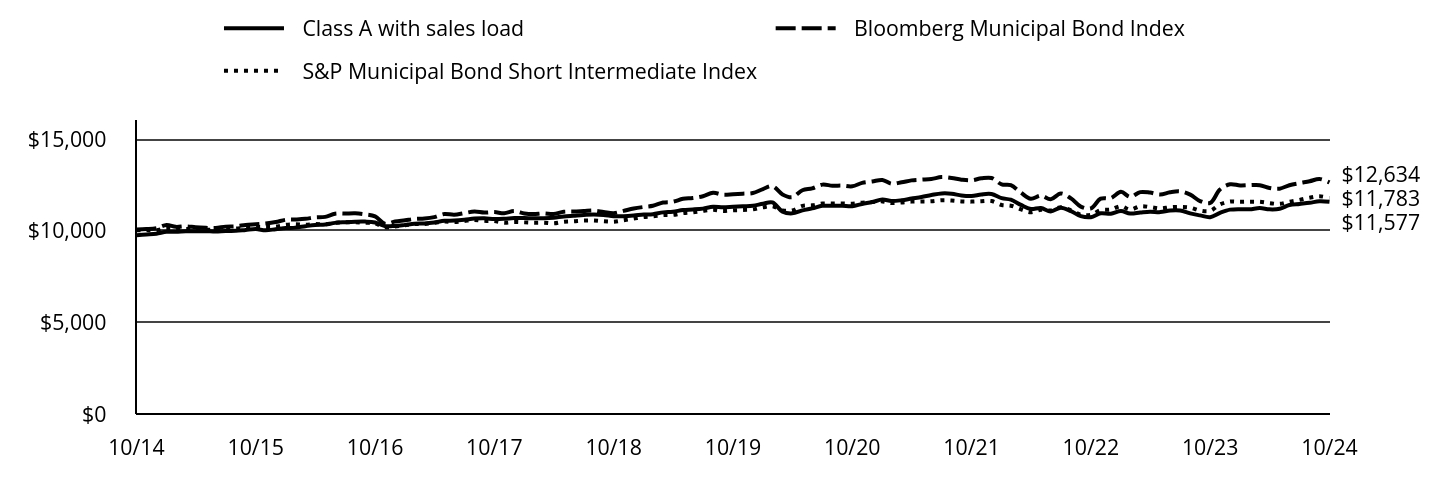
| Class A with sales load | Bloomberg Municipal Bond Index | S&P Municipal Bond Short Intermediate Index |
|---|
| 10/14 | $9,754 | $10,069 | $10,027 |
| 11/14 | $9,793 | $10,086 | $10,033 |
| 12/14 | $9,839 | $10,137 | $10,025 |
| 01/15 | $9,945 | $10,317 | $10,141 |
| 02/15 | $9,937 | $10,210 | $10,092 |
| 03/15 | $9,965 | $10,240 | $10,088 |
| 04/15 | $9,971 | $10,186 | $10,083 |
| 05/15 | $9,975 | $10,158 | $10,052 |
| 06/15 | $9,952 | $10,148 | $10,060 |
| 07/15 | $9,986 | $10,222 | $10,106 |
| 08/15 | $9,993 | $10,242 | $10,115 |
| 09/15 | $10,040 | $10,316 | $10,169 |
| 10/15 | $10,087 | $10,357 | $10,209 |
| 11/15 | $10,025 | $10,398 | $10,201 |
| 12/15 | $10,079 | $10,472 | $10,222 |
| 01/16 | $10,142 | $10,596 | $10,319 |
| 02/16 | $10,168 | $10,613 | $10,347 |
| 03/16 | $10,245 | $10,647 | $10,325 |
| 04/16 | $10,311 | $10,725 | $10,366 |
| 05/16 | $10,339 | $10,754 | $10,349 |
| 06/16 | $10,426 | $10,925 | $10,433 |
| 07/16 | $10,464 | $10,932 | $10,461 |
| 08/16 | $10,491 | $10,947 | $10,461 |
| 09/16 | $10,495 | $10,892 | $10,431 |
| 10/16 | $10,448 | $10,778 | $10,399 |
| 11/16 | $10,249 | $10,376 | $10,181 |
| 12/16 | $10,261 | $10,497 | $10,227 |
| 01/17 | $10,318 | $10,567 | $10,299 |
| 02/17 | $10,374 | $10,640 | $10,361 |
| 03/17 | $10,398 | $10,663 | $10,366 |
| 04/17 | $10,453 | $10,741 | $10,425 |
| 05/17 | $10,538 | $10,911 | $10,504 |
| 06/17 | $10,551 | $10,872 | $10,470 |
| 07/17 | $10,595 | $10,960 | $10,531 |
| 08/17 | $10,661 | $11,043 | $10,586 |
| 09/17 | $10,676 | $10,987 | $10,536 |
| 10/17 | $10,639 | $11,014 | $10,530 |
| 11/17 | $10,653 | $10,955 | $10,433 |
| 12/17 | $10,690 | $11,069 | $10,471 |
| 01/18 | $10,687 | $10,939 | $10,454 |
| 02/18 | $10,675 | $10,906 | $10,436 |
| 03/18 | $10,682 | $10,947 | $10,437 |
| 04/18 | $10,710 | $10,908 | $10,402 |
| 05/18 | $10,779 | $11,033 | $10,485 |
| 06/18 | $10,816 | $11,042 | $10,513 |
| 07/18 | $10,855 | $11,069 | $10,552 |
| 08/18 | $10,883 | $11,097 | $10,557 |
| 09/18 | $10,858 | $11,025 | $10,511 |
| 10/18 | $10,790 | $10,957 | $10,492 |
| 11/18 | $10,785 | $11,079 | $10,570 |
| 12/18 | $10,823 | $11,211 | $10,658 |
| 01/19 | $10,883 | $11,296 | $10,741 |
| 02/19 | $10,900 | $11,357 | $10,782 |
| 03/19 | $11,000 | $11,536 | $10,853 |
| 04/19 | $11,028 | $11,579 | $10,860 |
| 05/19 | $11,130 | $11,739 | $10,957 |
| 06/19 | $11,158 | $11,782 | $11,003 |
| 07/19 | $11,205 | $11,877 | $11,083 |
| 08/19 | $11,308 | $12,065 | $11,140 |
| 09/19 | $11,279 | $11,968 | $11,074 |
| 10/19 | $11,306 | $11,989 | $11,112 |
| 11/19 | $11,333 | $12,019 | $11,130 |
| 12/19 | $11,359 | $12,056 | $11,162 |
| 01/20 | $11,472 | $12,273 | $11,275 |
| 02/20 | $11,542 | $12,431 | $11,328 |
| 03/20 | $11,038 | $11,980 | $11,108 |
| 04/20 | $10,947 | $11,830 | $11,105 |
| 05/20 | $11,110 | $12,206 | $11,355 |
| 06/20 | $11,218 | $12,307 | $11,385 |
| 07/20 | $11,355 | $12,514 | $11,479 |
| 08/20 | $11,356 | $12,455 | $11,478 |
| 09/20 | $11,358 | $12,458 | $11,488 |
| 10/20 | $11,335 | $12,420 | $11,474 |
| 11/20 | $11,459 | $12,608 | $11,531 |
| 12/20 | $11,562 | $12,685 | $11,563 |
| 01/21 | $11,698 | $12,765 | $11,599 |
| 02/21 | $11,619 | $12,563 | $11,510 |
| 03/21 | $11,664 | $12,640 | $11,543 |
| 04/21 | $11,754 | $12,746 | $11,587 |
| 05/21 | $11,843 | $12,784 | $11,598 |
| 06/21 | $11,946 | $12,819 | $11,605 |
| 07/21 | $12,034 | $12,926 | $11,659 |
| 08/21 | $12,019 | $12,878 | $11,648 |
| 09/21 | $11,921 | $12,785 | $11,599 |
| 10/21 | $11,892 | $12,748 | $11,586 |
| 11/21 | $11,980 | $12,856 | $11,611 |
| 12/21 | $12,000 | $12,877 | $11,618 |
| 01/22 | $11,774 | $12,525 | $11,400 |
| 02/22 | $11,690 | $12,480 | $11,362 |
| 03/22 | $11,406 | $12,075 | $11,162 |
| 04/22 | $11,183 | $11,741 | $11,010 |
| 05/22 | $11,241 | $11,916 | $11,145 |
| 06/22 | $11,053 | $11,720 | $11,108 |
| 07/22 | $11,256 | $12,030 | $11,279 |
| 08/22 | $11,068 | $11,766 | $11,114 |
| 09/22 | $10,796 | $11,315 | $10,872 |
| 10/22 | $10,738 | $11,221 | $10,862 |
| 11/22 | $10,951 | $11,746 | $11,122 |
| 12/22 | $10,926 | $11,779 | $11,154 |
| 01/23 | $11,068 | $12,118 | $11,340 |
| 02/23 | $10,936 | $11,844 | $11,150 |
| 03/23 | $10,993 | $12,106 | $11,334 |
| 04/23 | $11,039 | $12,079 | $11,292 |
| 05/23 | $11,014 | $11,974 | $11,214 |
| 06/23 | $11,099 | $12,094 | $11,278 |
| 07/23 | $11,100 | $12,142 | $11,300 |
| 08/23 | $10,942 | $11,967 | $11,257 |
| 09/23 | $10,834 | $11,616 | $11,100 |
| 10/23 | $10,738 | $11,517 | $11,083 |
| 11/23 | $10,971 | $12,249 | $11,434 |
| 12/23 | $11,148 | $12,533 | $11,591 |
| 01/24 | $11,176 | $12,469 | $11,574 |
| 02/24 | $11,168 | $12,485 | $11,583 |
| 03/24 | $11,233 | $12,485 | $11,574 |
| 04/24 | $11,165 | $12,330 | $11,505 |
| 05/24 | $11,194 | $12,294 | $11,463 |
| 06/24 | $11,400 | $12,482 | $11,577 |
| 07/24 | $11,460 | $12,596 | $11,679 |
| 08/24 | $11,520 | $12,696 | $11,802 |
| 09/24 | $11,606 | $12,821 | $11,879 |
| 10/24 | $11,577 | $12,634 | $11,783 |
Average Annual Total Returns for the Period Ended October 31, 2024 (%)
| AATR | 1 Year | 5 Years | 10 Years |
|---|
| Class A without sales load | 7.82% | 0.47% | 1.73% |
| Class A with sales load - 2.50% | 5.08% | (0.03%) | 1.48% |
| Bloomberg Municipal Bond Index | 9.70% | 1.05% | 2.30% |
| S&P Municipal Bond Short Intermediate Index | 6.32% | 1.18% | 1.63% |
THE FUND'S PAST PERFORMANCE IS NOT A GOOD PREDICTOR OF THE FUND'S FUTURE PERFORMANCE.
Fund performance data shown above does not reflect the deduction of taxes that a shareholder would pay on Fund distributions or redemption of Fund shares.
In accordance with regulatory changes requiring the Fund's primary benchmark to represent the overall applicable market, the Fund's primary prospectus benchmark changed to the Bloomberg Municipal Bond Index effective as of February 29, 2024.
Key Fund Statistics as of October 31, 2024
| Total Net Assets | $100,919,836 |
| Total Number of Portfolio Holdings | 125 |
| Portfolio Turnover Rate | 105% |
| Total Advisory Fees Paid | $298,451 |
abrdn Short Duration High Yield Municipal Fund
(AAHMX)
What did the Fund invest in?
The tables below show the investment makeup of the Fund as of October 31, 2024.
Credit Quality Allocation (% of total net assets)
| AA | 10.4% |
| A | 9.1% |
| BBB | 18.6% |
| BB | 13.8% |
| B | 0.5% |
| Below B | 0.8% |
| Not Rated | 46.9% |
Ratings and portfolio credit quality will vary over time. Credit quality ratings on the underlying securities of the Fund are received from S&P, Moody’s and Fitch and are an indication of the issuer’s creditworthiness. The chart reflects the highest security rating provided by one or more of these rating agencies.
Ten Largest Holdings (% of total net assets)
| Colorado Health Facilities Authority, 3.500%, due 05/15/30 | 6.5% |
| City of Shakopee Senior Housing Revenue, 5.850%, due 11/01/58 | 4.3% |
| Washington State Housing Finance Commission, 2.500%, due 07/01/28 | 4.1% |
| Calhoun County Navigation Industrial Development Authority, 3.625%, due 07/01/26 | 3.7% |
| Madison County Capital Resource Corp., 5.500%, due 09/01/22 | 3.5% |
| California Public Finance Authority, 3.125%, due 05/15/29 | 3.0% |
| Palomar Health, 5.000%, due 11/01/30 | 3.0% |
| Kansas Independent College Finance Authority, 8.500%, due 05/01/25 | 2.8% |
| City of Elmira City, 5.000%, due 07/01/33 | 2.7% |
| New Hampshire Business Finance Authority, 4.250%, due 07/20/41 | 2.1% |
Below is a summary of certain changes for the Fund since November 1, 2023. For more information, you may refer to the Fund's next prospectus, which we expect to be available by February 28, 2025 at abrdn.com/us/literature or upon request at 866-667-9231.
Effective February 29, 2024, the Fund's management fee changed from 0.65% on assets up to $250 million and 0.60% on assets of $250 million and more to 0.55% on assets up to $250 million and 0.50% on assets of $250 million and more.
Availability of Additional Information
You can find additional information, including the Fund's prospectus, financial information, fund holdings, and proxy voting information at abrdn.com/us/literature or call 866-667-9231. The QR code can be used to access the Fund's prospectus, financial information and holdings.
abrdn Short Duration High Yield Municipal Fund
(AAHMX)
abrdn Short Duration High Yield Municipal Fund
Annual Shareholder Report - October 31, 2024
This annual shareholder report contains important information about the abrdn Short Duration High Yield Municipal Fund (the "Fund") for the period of November 1, 2023 to October 31, 2024. You can find additional information about the Fund at abrdn.com/us/literature. You can also request this information by contacting us at 866-667-9231.
This report describes material changes to the Fund that occurred during the reporting period.
What were the Fund costs for the last year?
(based on a hypothetical $10,000 investment)
| Share Class | Costs of a $10,000 investment | Costs paid as a percentage of a $10,000 investment |
|---|
| C | $174 | 1.68% |
How did the fund perform last year and what affected its performance?
Management's Discussion of Fund Performance
The following discussion compares the performance of the Fund to the S&P Municipal Bond Short Intermediate Index to show how the Fund’s performance measures against the returns of similar investments for the reporting period.
What contributed to performance?
The Fund’s exposures to life care, hospital and higher education bonds particularly helped relative performance. Within individual holdings, the Fund's position in California Public Authority Senior Living’s revenue bonds was among the positive contributors for the Fund. The Authority’s bonds were severely discounted due to their low coupons in a rising-rate environment. However, as the facility filled up with new entrants, these bonds were recalled by the issuer and proceeds returned to the Fund, leading to a significant pick-up in appreciation. In terms of ratings, non-rated and BB-rated bonds benefited the Fund.
What detracted from performance?
The Fund’s holdings in industrial development and pollution control revenue bonds and other revenue bonds hurt performance. Within individual holdings, Wisconsin Public Finance Authority’s hospital revenue bonds and South Carolina Jobs-Economic Development Authority’s bonds detracted from performance. Wisconsin Public Finance’s bonds initially suffered from strains on credit but benefited from the purchase of collateral from a national healthcare provider. The South Carolina Jobs’ bonds have been negatively affected by operational difficulties and depressed recycled waste market levels. In terms of ratings, CCC and B-rated bonds detracted from performance.
abrdn Short Duration High Yield Municipal Fund
(ACHMX)
Total Return Based on $10,000 Investment
The following graph reflects a hypothetical $10,000 investment for the most recently completed 10 fiscal years as compared to a broad-based securities market index and an additional performance benchmark.
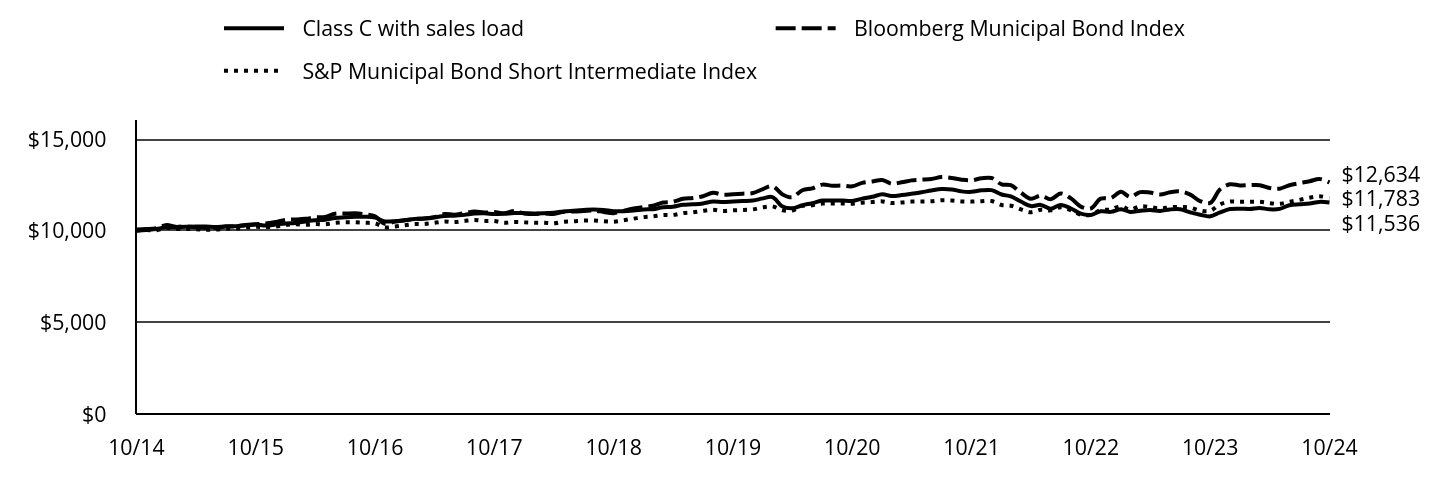
| Class C with sales load | Bloomberg Municipal Bond Index | S&P Municipal Bond Short Intermediate Index |
|---|
| 10/14 | $10,000 | $10,069 | $10,027 |
| 11/14 | $10,041 | $10,086 | $10,033 |
| 12/14 | $10,088 | $10,137 | $10,025 |
| 01/15 | $10,196 | $10,317 | $10,141 |
| 02/15 | $10,188 | $10,210 | $10,092 |
| 03/15 | $10,217 | $10,240 | $10,088 |
| 04/15 | $10,223 | $10,186 | $10,083 |
| 05/15 | $10,227 | $10,158 | $10,052 |
| 06/15 | $10,203 | $10,148 | $10,060 |
| 07/15 | $10,239 | $10,222 | $10,106 |
| 08/15 | $10,246 | $10,242 | $10,115 |
| 09/15 | $10,294 | $10,316 | $10,169 |
| 10/15 | $10,342 | $10,357 | $10,209 |
| 11/15 | $10,278 | $10,398 | $10,201 |
| 12/15 | $10,334 | $10,472 | $10,222 |
| 01/16 | $10,398 | $10,596 | $10,319 |
| 02/16 | $10,425 | $10,613 | $10,347 |
| 03/16 | $10,504 | $10,647 | $10,325 |
| 04/16 | $10,572 | $10,725 | $10,366 |
| 05/16 | $10,600 | $10,754 | $10,349 |
| 06/16 | $10,690 | $10,925 | $10,433 |
| 07/16 | $10,728 | $10,932 | $10,461 |
| 08/16 | $10,756 | $10,947 | $10,461 |
| 09/16 | $10,760 | $10,892 | $10,431 |
| 10/16 | $10,712 | $10,778 | $10,399 |
| 11/16 | $10,508 | $10,376 | $10,181 |
| 12/16 | $10,521 | $10,497 | $10,227 |
| 01/17 | $10,578 | $10,567 | $10,299 |
| 02/17 | $10,636 | $10,640 | $10,361 |
| 03/17 | $10,660 | $10,663 | $10,366 |
| 04/17 | $10,717 | $10,741 | $10,425 |
| 05/17 | $10,804 | $10,911 | $10,504 |
| 06/17 | $10,818 | $10,872 | $10,470 |
| 07/17 | $10,863 | $10,960 | $10,531 |
| 08/17 | $10,931 | $11,043 | $10,586 |
| 09/17 | $10,946 | $10,987 | $10,536 |
| 10/17 | $10,908 | $11,014 | $10,530 |
| 11/17 | $10,923 | $10,955 | $10,433 |
| 12/17 | $10,960 | $11,069 | $10,471 |
| 01/18 | $10,957 | $10,939 | $10,454 |
| 02/18 | $10,944 | $10,906 | $10,436 |
| 03/18 | $10,952 | $10,947 | $10,437 |
| 04/18 | $10,981 | $10,908 | $10,402 |
| 05/18 | $11,051 | $11,033 | $10,485 |
| 06/18 | $11,090 | $11,042 | $10,513 |
| 07/18 | $11,129 | $11,069 | $10,552 |
| 08/18 | $11,158 | $11,097 | $10,557 |
| 09/18 | $11,132 | $11,025 | $10,511 |
| 10/18 | $11,063 | $10,957 | $10,492 |
| 11/18 | $11,058 | $11,079 | $10,570 |
| 12/18 | $11,097 | $11,211 | $10,658 |
| 01/19 | $11,158 | $11,296 | $10,741 |
| 02/19 | $11,175 | $11,357 | $10,782 |
| 03/19 | $11,278 | $11,536 | $10,853 |
| 04/19 | $11,306 | $11,579 | $10,860 |
| 05/19 | $11,411 | $11,739 | $10,957 |
| 06/19 | $11,440 | $11,782 | $11,003 |
| 07/19 | $11,489 | $11,877 | $11,083 |
| 08/19 | $11,593 | $12,065 | $11,140 |
| 09/19 | $11,564 | $11,968 | $11,074 |
| 10/19 | $11,592 | $11,989 | $11,112 |
| 11/19 | $11,619 | $12,019 | $11,130 |
| 12/19 | $11,647 | $12,056 | $11,162 |
| 01/20 | $11,762 | $12,273 | $11,275 |
| 02/20 | $11,834 | $12,431 | $11,328 |
| 03/20 | $11,317 | $11,980 | $11,108 |
| 04/20 | $11,223 | $11,830 | $11,105 |
| 05/20 | $11,391 | $12,206 | $11,355 |
| 06/20 | $11,501 | $12,307 | $11,385 |
| 07/20 | $11,642 | $12,514 | $11,479 |
| 08/20 | $11,643 | $12,455 | $11,478 |
| 09/20 | $11,645 | $12,458 | $11,488 |
| 10/20 | $11,621 | $12,420 | $11,474 |
| 11/20 | $11,749 | $12,608 | $11,531 |
| 12/20 | $11,851 | $12,685 | $11,563 |
| 01/21 | $11,983 | $12,765 | $11,599 |
| 02/21 | $11,894 | $12,563 | $11,510 |
| 03/21 | $11,943 | $12,640 | $11,543 |
| 04/21 | $12,015 | $12,746 | $11,587 |
| 05/21 | $12,098 | $12,784 | $11,598 |
| 06/21 | $12,195 | $12,819 | $11,605 |
| 07/21 | $12,276 | $12,926 | $11,659 |
| 08/21 | $12,252 | $12,878 | $11,648 |
| 09/21 | $12,145 | $12,785 | $11,599 |
| 10/21 | $12,119 | $12,748 | $11,586 |
| 11/21 | $12,201 | $12,856 | $11,611 |
| 12/21 | $12,213 | $12,877 | $11,618 |
| 01/22 | $11,976 | $12,525 | $11,400 |
| 02/22 | $11,872 | $12,480 | $11,362 |
| 03/22 | $11,589 | $12,075 | $11,162 |
| 04/22 | $11,343 | $11,741 | $11,010 |
| 05/22 | $11,407 | $11,916 | $11,145 |
| 06/22 | $11,198 | $11,720 | $11,108 |
| 07/22 | $11,408 | $12,030 | $11,279 |
| 08/22 | $11,211 | $11,766 | $11,114 |
| 09/22 | $10,929 | $11,315 | $10,872 |
| 10/22 | $10,862 | $11,221 | $10,862 |
| 11/22 | $11,059 | $11,746 | $11,122 |
| 12/22 | $11,027 | $11,779 | $11,154 |
| 01/23 | $11,176 | $12,118 | $11,340 |
| 02/23 | $11,024 | $11,844 | $11,150 |
| 03/23 | $11,087 | $12,106 | $11,334 |
| 04/23 | $11,126 | $12,079 | $11,292 |
| 05/23 | $11,081 | $11,974 | $11,214 |
| 06/23 | $11,160 | $12,094 | $11,278 |
| 07/23 | $11,167 | $12,142 | $11,300 |
| 08/23 | $11,001 | $11,967 | $11,257 |
| 09/23 | $10,873 | $11,616 | $11,100 |
| 10/23 | $10,782 | $11,517 | $11,083 |
| 11/23 | $10,997 | $12,249 | $11,434 |
| 12/23 | $11,179 | $12,533 | $11,591 |
| 01/24 | $11,200 | $12,469 | $11,574 |
| 02/24 | $11,186 | $12,485 | $11,583 |
| 03/24 | $11,244 | $12,485 | $11,574 |
| 04/24 | $11,167 | $12,330 | $11,505 |
| 05/24 | $11,190 | $12,294 | $11,463 |
| 06/24 | $11,388 | $12,482 | $11,577 |
| 07/24 | $11,440 | $12,596 | $11,679 |
| 08/24 | $11,481 | $12,696 | $11,802 |
| 09/24 | $11,572 | $12,821 | $11,879 |
| 10/24 | $11,536 | $12,634 | $11,783 |
Average Annual Total Returns for the Period Ended October 31, 2024 (%)
| AATR | 1 Year | 5 Years | 10 Years |
|---|
| Class C without sales load | 6.99% | (0.10%) | 1.44% |
| Class C with sales load - 1.00% | 5.99% | (0.10%) | 1.44% |
| Bloomberg Municipal Bond Index | 9.70% | 1.05% | 2.30% |
| S&P Municipal Bond Short Intermediate Index | 6.32% | 1.18% | 1.63% |
THE FUND'S PAST PERFORMANCE IS NOT A GOOD PREDICTOR OF THE FUND'S FUTURE PERFORMANCE.
Fund performance data shown above does not reflect the deduction of taxes that a shareholder would pay on Fund distributions or redemption of Fund shares.
In accordance with regulatory changes requiring the Fund's primary benchmark to represent the overall applicable market, the Fund's primary prospectus benchmark changed to the Bloomberg Municipal Bond Index effective as of February 29, 2024.
Key Fund Statistics as of October 31, 2024
| Total Net Assets | $100,919,836 |
| Total Number of Portfolio Holdings | 125 |
| Portfolio Turnover Rate | 105% |
| Total Advisory Fees Paid | $298,451 |
abrdn Short Duration High Yield Municipal Fund
(ACHMX)
What did the Fund invest in?
The tables below show the investment makeup of the Fund as of October 31, 2024.
Credit Quality Allocation (% of total net assets)
| AA | 10.4% |
| A | 9.1% |
| BBB | 18.6% |
| BB | 13.8% |
| B | 0.5% |
| Below B | 0.8% |
| Not Rated | 46.9% |
Ratings and portfolio credit quality will vary over time. Credit quality ratings on the underlying securities of the Fund are received from S&P, Moody’s and Fitch and are an indication of the issuer’s creditworthiness. The chart reflects the highest security rating provided by one or more of these rating agencies.
Ten Largest Holdings (% of total net assets)
| Colorado Health Facilities Authority, 3.500%, due 05/15/30 | 6.5% |
| City of Shakopee Senior Housing Revenue, 5.850%, due 11/01/58 | 4.3% |
| Washington State Housing Finance Commission, 2.500%, due 07/01/28 | 4.1% |
| Calhoun County Navigation Industrial Development Authority, 3.625%, due 07/01/26 | 3.7% |
| Madison County Capital Resource Corp., 5.500%, due 09/01/22 | 3.5% |
| California Public Finance Authority, 3.125%, due 05/15/29 | 3.0% |
| Palomar Health, 5.000%, due 11/01/30 | 3.0% |
| Kansas Independent College Finance Authority, 8.500%, due 05/01/25 | 2.8% |
| City of Elmira City, 5.000%, due 07/01/33 | 2.7% |
| New Hampshire Business Finance Authority, 4.250%, due 07/20/41 | 2.1% |
Below is a summary of certain changes for the Fund since November 1, 2023. For more information, you may refer to the Fund's next prospectus, which we expect to be available by February 28, 2025 at abrdn.com/us/literature or upon request at 866-667-9231.
Effective February 29, 2024, the Fund's management fee changed from 0.65% on assets up to $250 million and 0.60% on assets of $250 million and more to 0.55% on assets up to $250 million and 0.50% on assets of $250 million and more.
Availability of Additional Information
You can find additional information, including the Fund's prospectus, financial information, fund holdings, and proxy voting information at abrdn.com/us/literature or call 866-667-9231. The QR code can be used to access the Fund's prospectus, financial information and holdings.
abrdn Short Duration High Yield Municipal Fund
(ACHMX)
abrdn Short Duration High Yield Municipal Fund
Annual Shareholder Report - October 31, 2024
This annual shareholder report contains important information about the abrdn Short Duration High Yield Municipal Fund (the "Fund") for the period of November 1, 2023 to October 31, 2024. You can find additional information about the Fund at abrdn.com/us/literature. You can also request this information by contacting us at 866-667-9231.
This report describes material changes to the Fund that occurred during the reporting period.
What were the Fund costs for the last year?
(based on a hypothetical $10,000 investment)
| Share Class | Costs of a $10,000 investment | Costs paid as a percentage of a $10,000 investment |
|---|
| Institutional | $71 | 0.68% |
How did the fund perform last year and what affected its performance?
Management's Discussion of Fund Performance
The following discussion compares the performance of the Fund to the S&P Municipal Bond Short Intermediate Index to show how the Fund’s performance measures against the returns of similar investments for the reporting period.
What contributed to performance?
The Fund’s exposures to life care, hospital and higher education bonds particularly helped relative performance. Within individual holdings, the Fund's position in California Public Authority Senior Living’s revenue bonds was among the positive contributors for the Fund. The Authority’s bonds were severely discounted due to their low coupons in a rising-rate environment. However, as the facility filled up with new entrants, these bonds were recalled by the issuer and proceeds returned to the Fund, leading to a significant pick-up in appreciation. In terms of ratings, non-rated and BB-rated bonds benefited the Fund.
What detracted from performance?
The Fund’s holdings in industrial development and pollution control revenue bonds and other revenue bonds hurt performance. Within individual holdings, Wisconsin Public Finance Authority’s hospital revenue bonds and South Carolina Jobs-Economic Development Authority’s bonds detracted from performance. Wisconsin Public Finance’s bonds initially suffered from strains on credit but benefited from the purchase of collateral from a national healthcare provider. The South Carolina Jobs’ bonds have been negatively affected by operational difficulties and depressed recycled waste market levels. In terms of ratings, CCC and B-rated bonds detracted from performance.
abrdn Short Duration High Yield Municipal Fund
(AHYMX)
Total Return Based on $1,000,000 Investment
The following graph reflects a hypothetical $1,000,000 investment for the most recently completed 10 fiscal years as compared to a broad-based securities market index and an additional performance benchmark.
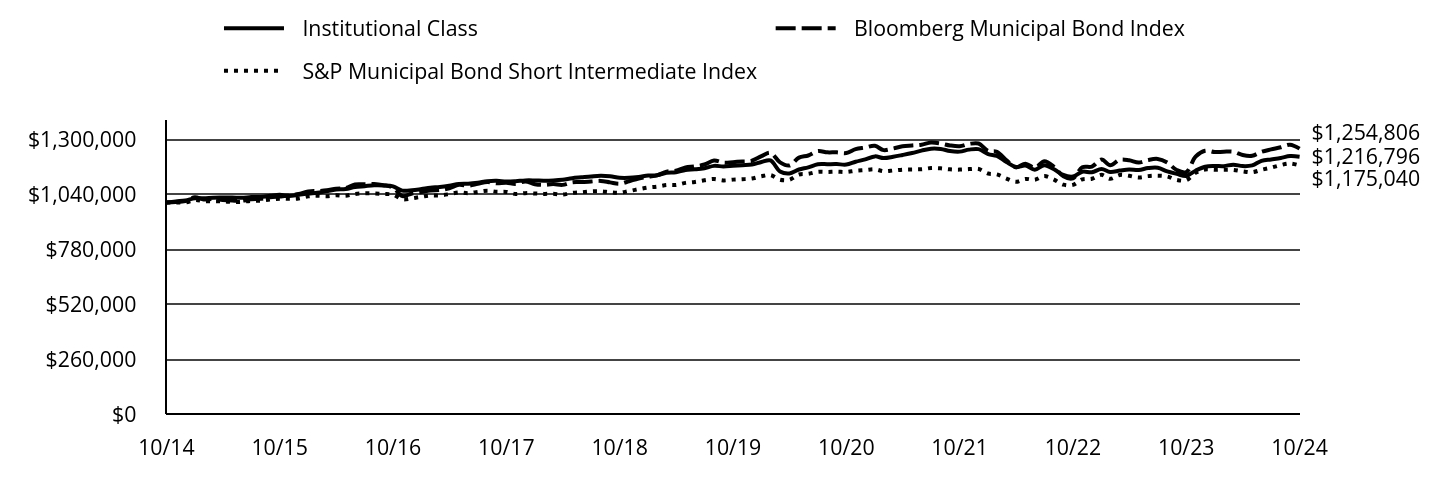
| Institutional Class | Bloomberg Municipal Bond Index | S&P Municipal Bond Short Intermediate Index |
|---|
| 10/14 | $1,000,000 | $1,000,000 | $1,000,000 |
| 11/14 | $1,005,264 | $1,001,730 | $1,000,561 |
| 12/14 | $1,009,140 | $1,006,784 | $999,791 |
| 01/15 | $1,020,177 | $1,024,628 | $1,011,346 |
| 02/15 | $1,019,575 | $1,014,059 | $1,006,485 |
| 03/15 | $1,022,651 | $1,016,987 | $1,006,003 |
| 04/15 | $1,023,522 | $1,011,652 | $1,005,502 |
| 05/15 | $1,024,110 | $1,008,857 | $1,002,490 |
| 06/15 | $1,021,931 | $1,007,937 | $1,003,223 |
| 07/15 | $1,025,652 | $1,015,238 | $1,007,813 |
| 08/15 | $1,026,566 | $1,017,232 | $1,008,740 |
| 09/15 | $1,031,561 | $1,024,601 | $1,014,164 |
| 10/15 | $1,036,539 | $1,028,674 | $1,018,097 |
| 11/15 | $1,030,362 | $1,032,764 | $1,017,346 |
| 12/15 | $1,036,168 | $1,040,020 | $1,019,385 |
| 01/16 | $1,042,855 | $1,052,429 | $1,029,053 |
| 02/16 | $1,045,715 | $1,054,085 | $1,031,921 |
| 03/16 | $1,053,857 | $1,057,423 | $1,029,652 |
| 04/16 | $1,060,893 | $1,065,199 | $1,033,779 |
| 05/16 | $1,063,923 | $1,068,080 | $1,032,110 |
| 06/16 | $1,073,185 | $1,085,071 | $1,040,432 |
| 07/16 | $1,077,282 | $1,085,734 | $1,043,214 |
| 08/16 | $1,081,278 | $1,087,199 | $1,043,265 |
| 09/16 | $1,080,921 | $1,081,773 | $1,040,249 |
| 10/16 | $1,076,365 | $1,070,424 | $1,037,071 |
| 11/16 | $1,056,028 | $1,030,502 | $1,015,313 |
| 12/16 | $1,057,587 | $1,042,600 | $1,019,866 |
| 01/17 | $1,063,604 | $1,049,474 | $1,027,071 |
| 02/17 | $1,069,577 | $1,056,761 | $1,033,254 |
| 03/17 | $1,073,334 | $1,059,055 | $1,033,739 |
| 04/17 | $1,079,277 | $1,066,740 | $1,039,659 |
| 05/17 | $1,087,162 | $1,083,670 | $1,047,497 |
| 06/17 | $1,088,790 | $1,079,783 | $1,044,184 |
| 07/17 | $1,093,592 | $1,088,519 | $1,050,200 |
| 08/17 | $1,100,619 | $1,096,803 | $1,055,699 |
| 09/17 | $1,102,353 | $1,091,226 | $1,050,686 |
| 10/17 | $1,098,774 | $1,093,890 | $1,050,148 |
| 11/17 | $1,100,504 | $1,088,033 | $1,040,432 |
| 12/17 | $1,104,481 | $1,099,405 | $1,044,289 |
| 01/18 | $1,104,427 | $1,086,462 | $1,042,526 |
| 02/18 | $1,103,397 | $1,083,215 | $1,040,734 |
| 03/18 | $1,104,375 | $1,087,213 | $1,040,825 |
| 04/18 | $1,107,509 | $1,083,333 | $1,037,326 |
| 05/18 | $1,114,828 | $1,095,739 | $1,045,612 |
| 06/18 | $1,118,933 | $1,096,674 | $1,048,451 |
| 07/18 | $1,123,111 | $1,099,335 | $1,052,287 |
| 08/18 | $1,126,226 | $1,102,158 | $1,052,795 |
| 09/18 | $1,123,888 | $1,095,023 | $1,048,227 |
| 10/18 | $1,117,077 | $1,088,280 | $1,046,292 |
| 11/18 | $1,116,835 | $1,100,325 | $1,054,103 |
| 12/18 | $1,121,003 | $1,113,500 | $1,062,862 |
| 01/19 | $1,127,381 | $1,121,917 | $1,071,154 |
| 02/19 | $1,129,313 | $1,127,924 | $1,075,298 |
| 03/19 | $1,140,064 | $1,145,754 | $1,082,375 |
| 04/19 | $1,143,143 | $1,150,060 | $1,083,011 |
| 05/19 | $1,154,013 | $1,165,915 | $1,092,672 |
| 06/19 | $1,157,091 | $1,170,220 | $1,097,320 |
| 07/19 | $1,162,294 | $1,179,651 | $1,105,278 |
| 08/19 | $1,173,152 | $1,198,258 | $1,110,972 |
| 09/19 | $1,170,434 | $1,188,653 | $1,104,375 |
| 10/19 | $1,173,461 | $1,190,783 | $1,108,137 |
| 11/19 | $1,176,494 | $1,193,761 | $1,109,944 |
| 12/19 | $1,179,504 | $1,197,406 | $1,113,182 |
| 01/20 | $1,191,459 | $1,218,919 | $1,124,436 |
| 02/20 | $1,198,941 | $1,234,638 | $1,129,708 |
| 03/20 | $1,146,800 | $1,189,854 | $1,107,723 |
| 04/20 | $1,137,578 | $1,174,921 | $1,107,475 |
| 05/20 | $1,155,955 | $1,212,297 | $1,132,399 |
| 06/20 | $1,166,244 | $1,222,275 | $1,135,420 |
| 07/20 | $1,180,766 | $1,242,861 | $1,144,803 |
| 08/20 | $1,181,149 | $1,237,029 | $1,144,624 |
| 09/20 | $1,181,551 | $1,237,291 | $1,145,684 |
| 10/20 | $1,179,438 | $1,233,575 | $1,144,285 |
| 11/20 | $1,192,615 | $1,252,190 | $1,149,997 |
| 12/20 | $1,203,558 | $1,259,818 | $1,153,119 |
| 01/21 | $1,218,024 | $1,267,846 | $1,156,713 |
| 02/21 | $1,210,031 | $1,247,702 | $1,147,825 |
| 03/21 | $1,216,107 | $1,255,397 | $1,151,164 |
| 04/21 | $1,224,588 | $1,265,927 | $1,155,498 |
| 05/21 | $1,234,123 | $1,269,704 | $1,156,593 |
| 06/21 | $1,245,071 | $1,273,190 | $1,157,310 |
| 07/21 | $1,254,535 | $1,283,750 | $1,162,721 |
| 08/21 | $1,253,174 | $1,279,038 | $1,161,642 |
| 09/21 | $1,243,302 | $1,269,808 | $1,156,756 |
| 10/21 | $1,240,514 | $1,266,095 | $1,155,443 |
| 11/21 | $1,249,937 | $1,276,873 | $1,157,897 |
| 12/21 | $1,252,239 | $1,278,933 | $1,158,590 |
| 01/22 | $1,228,951 | $1,243,925 | $1,136,883 |
| 02/22 | $1,220,404 | $1,239,469 | $1,133,082 |
| 03/22 | $1,191,070 | $1,199,289 | $1,113,167 |
| 04/22 | $1,168,013 | $1,166,117 | $1,098,002 |
| 05/22 | $1,174,279 | $1,183,440 | $1,111,460 |
| 06/22 | $1,154,943 | $1,164,057 | $1,107,741 |
| 07/22 | $1,176,354 | $1,194,813 | $1,124,816 |
| 08/22 | $1,157,007 | $1,168,627 | $1,108,350 |
| 09/22 | $1,130,061 | $1,123,774 | $1,084,233 |
| 10/22 | $1,122,912 | $1,114,429 | $1,083,239 |
| 11/22 | $1,145,453 | $1,166,554 | $1,109,130 |
| 12/22 | $1,143,130 | $1,169,894 | $1,112,348 |
| 01/23 | $1,158,208 | $1,203,500 | $1,130,889 |
| 02/23 | $1,144,614 | $1,176,286 | $1,111,957 |
| 03/23 | $1,150,863 | $1,202,385 | $1,130,341 |
| 04/23 | $1,155,891 | $1,199,638 | $1,126,154 |
| 05/23 | $1,153,450 | $1,189,242 | $1,118,295 |
| 06/23 | $1,162,610 | $1,201,155 | $1,124,706 |
| 07/23 | $1,164,287 | $1,205,907 | $1,126,895 |
| 08/23 | $1,146,729 | $1,188,547 | $1,122,607 |
| 09/23 | $1,135,569 | $1,153,712 | $1,106,926 |
| 10/23 | $1,125,748 | $1,143,894 | $1,105,229 |
| 11/23 | $1,150,432 | $1,216,510 | $1,140,258 |
| 12/23 | $1,169,246 | $1,244,784 | $1,155,931 |
| 01/24 | $1,172,454 | $1,238,426 | $1,154,280 |
| 02/24 | $1,171,828 | $1,240,017 | $1,155,132 |
| 03/24 | $1,178,953 | $1,239,978 | $1,154,264 |
| 04/24 | $1,171,983 | $1,224,621 | $1,147,329 |
| 05/24 | $1,175,332 | $1,221,029 | $1,143,152 |
| 06/24 | $1,197,192 | $1,239,745 | $1,154,545 |
| 07/24 | $1,203,685 | $1,251,044 | $1,164,717 |
| 08/24 | $1,210,292 | $1,260,911 | $1,177,006 |
| 09/24 | $1,219,544 | $1,273,373 | $1,184,612 |
| 10/24 | $1,216,796 | $1,254,806 | $1,175,040 |
Average Annual Total Returns for the Period Ended October 31, 2024 (%)
| AATR | 1 Year | 5 Years | 10 Years |
|---|
| Institutional Class | 8.09% | 0.73% | 1.98% |
| Bloomberg Municipal Bond Index | 9.70% | 1.05% | 2.30% |
| S&P Municipal Bond Short Intermediate Index | 6.32% | 1.18% | 1.63% |
THE FUND'S PAST PERFORMANCE IS NOT A GOOD PREDICTOR OF THE FUND'S FUTURE PERFORMANCE.
Fund performance data shown above does not reflect the deduction of taxes that a shareholder would pay on Fund distributions or redemption of Fund shares.
In accordance with regulatory changes requiring the Fund's primary benchmark to represent the overall applicable market, the Fund's primary prospectus benchmark changed to the Bloomberg Municipal Bond Index effective as of February 29, 2024.
Key Fund Statistics as of October 31, 2024
| Total Net Assets | $100,919,836 |
| Total Number of Portfolio Holdings | 125 |
| Portfolio Turnover Rate | 105% |
| Total Advisory Fees Paid | $298,451 |
abrdn Short Duration High Yield Municipal Fund
(AHYMX)
What did the Fund invest in?
The tables below show the investment makeup of the Fund as of October 31, 2024.
Credit Quality Allocation (% of total net assets)
| AA | 10.4% |
| A | 9.1% |
| BBB | 18.6% |
| BB | 13.8% |
| B | 0.5% |
| Below B | 0.8% |
| Not Rated | 46.9% |
Ratings and portfolio credit quality will vary over time. Credit quality ratings on the underlying securities of the Fund are received from S&P, Moody’s and Fitch and are an indication of the issuer’s creditworthiness. The chart reflects the highest security rating provided by one or more of these rating agencies.
Ten Largest Holdings (% of total net assets)
| Colorado Health Facilities Authority, 3.500%, due 05/15/30 | 6.5% |
| City of Shakopee Senior Housing Revenue, 5.850%, due 11/01/58 | 4.3% |
| Washington State Housing Finance Commission, 2.500%, due 07/01/28 | 4.1% |
| Calhoun County Navigation Industrial Development Authority, 3.625%, due 07/01/26 | 3.7% |
| Madison County Capital Resource Corp., 5.500%, due 09/01/22 | 3.5% |
| California Public Finance Authority, 3.125%, due 05/15/29 | 3.0% |
| Palomar Health, 5.000%, due 11/01/30 | 3.0% |
| Kansas Independent College Finance Authority, 8.500%, due 05/01/25 | 2.8% |
| City of Elmira City, 5.000%, due 07/01/33 | 2.7% |
| New Hampshire Business Finance Authority, 4.250%, due 07/20/41 | 2.1% |
Below is a summary of certain changes for the Fund since November 1, 2023. For more information, you may refer to the Fund's next prospectus, which we expect to be available by February 28, 2025 at abrdn.com/us/literature or upon request at 866-667-9231.
Effective February 29, 2024, the Fund's management fee changed from 0.65% on assets up to $250 million and 0.60% on assets of $250 million and more to 0.55% on assets up to $250 million and 0.50% on assets of $250 million and more.
Availability of Additional Information
You can find additional information, including the Fund's prospectus, financial information, fund holdings, and proxy voting information at abrdn.com/us/literature or call 866-667-9231. The QR code can be used to access the Fund's prospectus, financial information and holdings.
abrdn Short Duration High Yield Municipal Fund
(AHYMX)
abrdn U.S. Small Cap Equity Fund
Annual Shareholder Report - October 31, 2024
This annual shareholder report contains important information about the abrdn U.S. Small Cap Equity Fund (the "Fund") for the period of November 1, 2023 to October 31, 2024. You can find additional information about the Fund at abrdn.com/us/literature. You can also request this information by contacting us at 866-667-9231.
What were the Fund costs for the last year?
(based on a hypothetical $10,000 investment)
| Share Class | Costs of a $10,000 investment | Costs paid as a percentage of a $10,000 investment |
|---|
| A | $162 | 1.40% |
How did the fund perform last year and what affected its performance?
The following discussion compares the performance of the Fund to the Russell 2000 Index (the “Index”) to show how the Fund’s performance measures against the returns of similar investments for the reporting period.
What contributed to performance?
Our overweight to casual diner Brinker International led to the consumer discretionary sector’s outperformance relative to the benchmark, as the company’s strong execution resulted in industry-leading traffic and sales growth. Q2 Holdings was positive as robust demand for its digital banking solutions led to accelerated growth. Parsons Corporation also added to returns as its shares rose after the company reported robust organic growth and secured several new project wins, including a lead designer role in the $1.66 billion Honolulu rail transit project. However, we sold Parsons Corporation as it became a mid-capitalization company and left the Russell 2000 Index.
What detracted from performance?
The Fund’s exposure to the information technology sector was particularly unfavorable. Within this sector, software company Five9’s shares fell after new customer additions failed to materialize and weaker demand from existing customers forced management to reduce the company’s guidance. Cohu’s shares also struggled as the recovery outlook for key end markets continued to be pushed out, pressuring sales of the company’s semiconductor testing equipment. Lack of exposure to Super Micro Computer, which is not held by the Fund due to its market capitalization, also weighed on performance.
abrdn U.S. Small Cap Equity Fund
(GSXAX)
Total Return Based on $10,000 Investment
The following graph reflects a hypothetical $10,000 investment for the most recently completed 10 fiscal years as compared to a broad-based securities market index and an additional performance benchmark.
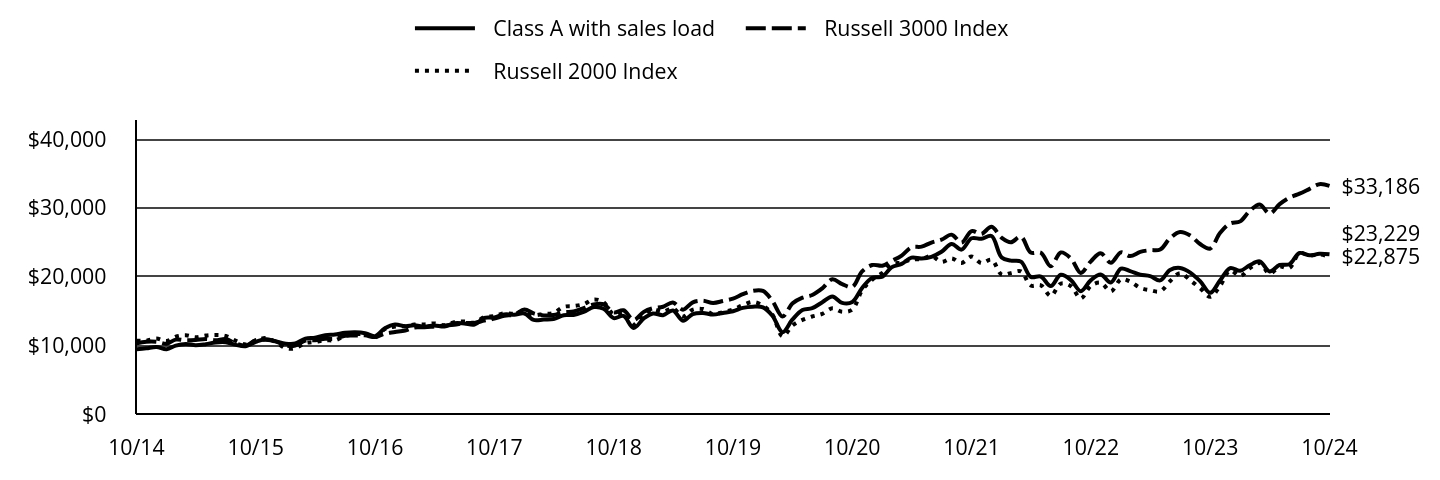
| Class A with sales load | Russell 3000 Index | Russell 2000 Index |
|---|
| 10/14 | $9,424 | $10,275 | $10,659 |
| 11/14 | $9,558 | $10,524 | $10,669 |
| 12/14 | $9,752 | $10,524 | $10,973 |
| 01/15 | $9,420 | $10,231 | $10,620 |
| 02/15 | $9,957 | $10,824 | $11,250 |
| 03/15 | $10,197 | $10,713 | $11,446 |
| 04/15 | $10,004 | $10,762 | $11,154 |
| 05/15 | $10,162 | $10,911 | $11,409 |
| 06/15 | $10,406 | $10,728 | $11,494 |
| 07/15 | $10,438 | $10,908 | $11,361 |
| 08/15 | $10,059 | $10,249 | $10,647 |
| 09/15 | $9,870 | $9,951 | $10,125 |
| 10/15 | $10,497 | $10,736 | $10,695 |
| 11/15 | $10,887 | $10,796 | $11,043 |
| 12/15 | $10,560 | $10,574 | $10,488 |
| 01/16 | $10,229 | $9,978 | $9,566 |
| 02/16 | $10,248 | $9,975 | $9,566 |
| 03/16 | $10,970 | $10,677 | $10,329 |
| 04/16 | $11,088 | $10,743 | $10,491 |
| 05/16 | $11,455 | $10,935 | $10,728 |
| 06/16 | $11,577 | $10,958 | $10,721 |
| 07/16 | $11,806 | $11,393 | $11,361 |
| 08/16 | $11,877 | $11,422 | $11,562 |
| 09/16 | $11,759 | $11,440 | $11,691 |
| 10/16 | $11,321 | $11,192 | $11,135 |
| 11/16 | $12,476 | $11,693 | $12,377 |
| 12/16 | $13,017 | $11,921 | $12,723 |
| 01/17 | $12,776 | $12,145 | $12,774 |
| 02/17 | $12,914 | $12,597 | $13,020 |
| 03/17 | $12,697 | $12,606 | $13,037 |
| 04/17 | $12,890 | $12,739 | $13,180 |
| 05/17 | $12,725 | $12,870 | $12,912 |
| 06/17 | $13,202 | $12,986 | $13,358 |
| 07/17 | $13,174 | $13,231 | $13,458 |
| 08/17 | $13,017 | $13,256 | $13,286 |
| 09/17 | $13,971 | $13,579 | $14,115 |
| 10/17 | $14,042 | $13,876 | $14,236 |
| 11/17 | $14,491 | $14,297 | $14,646 |
| 12/17 | $14,452 | $14,440 | $14,587 |
| 01/18 | $14,614 | $15,201 | $14,968 |
| 02/18 | $13,683 | $14,641 | $14,389 |
| 03/18 | $13,742 | $14,347 | $14,575 |
| 04/18 | $13,809 | $14,402 | $14,701 |
| 05/18 | $14,377 | $14,808 | $15,593 |
| 06/18 | $14,409 | $14,905 | $15,705 |
| 07/18 | $14,846 | $15,400 | $15,978 |
| 08/18 | $15,556 | $15,940 | $16,667 |
| 09/18 | $15,315 | $15,967 | $16,266 |
| 10/18 | $13,955 | $14,791 | $14,500 |
| 11/18 | $14,263 | $15,087 | $14,730 |
| 12/18 | $12,520 | $13,683 | $12,980 |
| 01/19 | $13,903 | $14,858 | $14,441 |
| 02/19 | $14,629 | $15,380 | $15,191 |
| 03/19 | $14,381 | $15,605 | $14,873 |
| 04/19 | $15,061 | $16,228 | $15,379 |
| 05/19 | $13,574 | $15,178 | $14,183 |
| 06/19 | $14,543 | $16,244 | $15,185 |
| 07/19 | $14,692 | $16,485 | $15,272 |
| 08/19 | $14,457 | $16,149 | $14,518 |
| 09/19 | $14,701 | $16,433 | $14,820 |
| 10/19 | $14,953 | $16,786 | $15,211 |
| 11/19 | $15,444 | $17,424 | $15,837 |
| 12/19 | $15,615 | $17,928 | $16,294 |
| 01/20 | $15,517 | $17,908 | $15,771 |
| 02/20 | $14,294 | $16,442 | $14,443 |
| 03/20 | $11,904 | $14,181 | $11,305 |
| 04/20 | $13,720 | $16,059 | $12,858 |
| 05/20 | $15,129 | $16,918 | $13,695 |
| 06/20 | $15,391 | $17,304 | $14,179 |
| 07/20 | $16,270 | $18,287 | $14,571 |
| 08/20 | $17,096 | $19,612 | $15,392 |
| 09/20 | $16,163 | $18,898 | $14,878 |
| 10/20 | $16,295 | $18,490 | $15,190 |
| 11/20 | $18,330 | $20,739 | $17,990 |
| 12/20 | $19,823 | $21,672 | $19,546 |
| 01/21 | $19,972 | $21,576 | $20,530 |
| 02/21 | $21,339 | $22,250 | $21,809 |
| 03/21 | $21,840 | $23,048 | $22,028 |
| 04/21 | $22,753 | $24,236 | $22,491 |
| 05/21 | $22,629 | $24,346 | $22,537 |
| 06/21 | $22,871 | $24,947 | $22,974 |
| 07/21 | $23,598 | $25,369 | $22,144 |
| 08/21 | $24,733 | $26,092 | $22,639 |
| 09/21 | $23,913 | $24,921 | $21,972 |
| 10/21 | $25,569 | $26,607 | $22,907 |
| 11/21 | $25,486 | $26,202 | $21,952 |
| 12/21 | $25,892 | $27,234 | $22,442 |
| 01/22 | $22,776 | $25,631 | $20,282 |
| 02/22 | $22,318 | $24,986 | $20,498 |
| 03/22 | $22,169 | $25,796 | $20,753 |
| 04/22 | $19,950 | $23,481 | $18,697 |
| 05/22 | $20,001 | $23,450 | $18,725 |
| 06/22 | $18,608 | $21,488 | $17,185 |
| 07/22 | $20,247 | $23,504 | $18,979 |
| 08/22 | $19,485 | $22,627 | $18,591 |
| 09/22 | $17,866 | $20,528 | $16,809 |
| 10/22 | $19,479 | $22,212 | $18,659 |
| 11/22 | $20,298 | $23,371 | $19,095 |
| 12/22 | $19,119 | $22,003 | $17,856 |
| 01/23 | $21,150 | $23,518 | $19,596 |
| 02/23 | $20,787 | $22,968 | $19,265 |
| 03/23 | $20,268 | $23,583 | $18,345 |
| 04/23 | $20,056 | $23,834 | $18,015 |
| 05/23 | $19,434 | $23,927 | $17,849 |
| 06/23 | $20,958 | $25,560 | $19,300 |
| 07/23 | $21,246 | $26,477 | $20,480 |
| 08/23 | $20,576 | $25,966 | $19,455 |
| 09/23 | $19,324 | $24,729 | $18,310 |
| 10/23 | $17,628 | $24,073 | $17,061 |
| 11/23 | $19,406 | $26,318 | $18,606 |
| 12/23 | $21,225 | $27,714 | $20,879 |
| 01/24 | $20,835 | $28,021 | $20,067 |
| 02/24 | $21,629 | $29,538 | $21,201 |
| 03/24 | $22,203 | $30,491 | $21,960 |
| 04/24 | $20,740 | $29,149 | $20,415 |
| 05/24 | $21,683 | $30,526 | $21,439 |
| 06/24 | $21,793 | $31,471 | $21,241 |
| 07/24 | $23,420 | $32,056 | $23,399 |
| 08/24 | $23,078 | $32,754 | $23,049 |
| 09/24 | $23,304 | $33,432 | $23,210 |
| 10/24 | $23,229 | $33,186 | $22,875 |
Average Annual Total Returns for the Period Ended October 31, 2024 (%)
| AATR | 1 Year | 5 Years | 10 Years |
|---|
| Class A without sales load | 31.77% | 9.21% | 9.44% |
| Class A with sales load - 5.75% | 24.20% | 7.93% | 8.79% |
| Russell 3000 Index | 37.86% | 14.60% | 12.44% |
| Russell 2000 Index | 34.07% | 8.50% | 7.94% |
THE FUND'S PAST PERFORMANCE IS NOT A GOOD PREDICTOR OF THE FUND'S FUTURE PERFORMANCE.
Fund performance data shown above does not reflect the deduction of taxes that a shareholder would pay on Fund distributions or redemption of Fund shares.
In accordance with regulatory changes requiring the Fund's primary benchmark to represent the overall applicable market, the Fund's primary prospectus benchmark changed to the Russell 3000 Index effective as of February 29, 2024.
Key Fund Statistics as of October 31, 2024
| Total Net Assets | $344,708,444 |
| Total Number of Portfolio Holdings | 54 |
| Portfolio Turnover Rate | 47% |
| Total Advisory Fees Paid | $2,733,674 |
abrdn U.S. Small Cap Equity Fund
(GSXAX)
What did the Fund invest in?
The tables below show the investment makeup of the Fund as of October 31, 2024.
Sector Allocation (% of total net assets)
| Financials | 20.9% |
| Health Care | 15.4% |
| Industrial | 15.0% |
| Information Technology | 13.5% |
| Consumer Discretionary | 12.1% |
| Materials | 7.1% |
| Energy | 4.9% |
| Communication Services | 2.3% |
| Utilities | 2.2% |
| Real Estate | 2.0% |
| Consumer Staples | 2.0% |
| Other | 2.6% |
Ten Largest Holdings (% of total net assets)
| Q2 Holdings, Inc. | 3.2% |
| Wintrust Financial Corp. | 3.0% |
| WSFS Financial Corp. | 2.8% |
| Banner Corp. | 2.8% |
| Seacoast Banking Corp. of Florida | 2.7% |
| Integer Holdings Corp. | 2.7% |
| Merit Medical Systems, Inc. | 2.7% |
| Atmus Filtration Technologies, Inc. | 2.6% |
| Corcept Therapeutics, Inc. | 2.5% |
| Graphic Packaging Holding Co. | 2.5% |
Availability of Additional Information
You can find additional information, including the Fund's prospectus, financial information, fund holdings, and proxy voting information at abrdn.com/us/literature or call 866-667-9231. The QR code can be used to access the Fund's prospectus, financial information and holdings.
abrdn U.S. Small Cap Equity Fund
(GSXAX)
abrdn U.S. Small Cap Equity Fund
Annual Shareholder Report - October 31, 2024
This annual shareholder report contains important information about the abrdn U.S. Small Cap Equity Fund (the "Fund") for the period of November 1, 2023 to October 31, 2024. You can find additional information about the Fund at abrdn.com/us/literature. You can also request this information by contacting us at 866-667-9231.
What were the Fund costs for the last year?
(based on a hypothetical $10,000 investment)
| Share Class | Costs of a $10,000 investment | Costs paid as a percentage of a $10,000 investment |
|---|
| C | $230 | 1.99% |
How did the fund perform last year and what affected its performance?
The following discussion compares the performance of the Fund to the Russell 2000 Index (the “Index”) to show how the Fund’s performance measures against the returns of similar investments for the reporting period.
What contributed to performance?
Our overweight to casual diner Brinker International led to the consumer discretionary sector’s outperformance relative to the benchmark, as the company’s strong execution resulted in industry-leading traffic and sales growth. Q2 Holdings was positive as robust demand for its digital banking solutions led to accelerated growth. Parsons Corporation also added to returns as its shares rose after the company reported robust organic growth and secured several new project wins, including a lead designer role in the $1.66 billion Honolulu rail transit project. However, we sold Parsons Corporation as it became a mid-capitalization company and left the Russell 2000 Index.
What detracted from performance?
The Fund’s exposure to the information technology sector was particularly unfavorable. Within this sector, software company Five9’s shares fell after new customer additions failed to materialize and weaker demand from existing customers forced management to reduce the company’s guidance. Cohu’s shares also struggled as the recovery outlook for key end markets continued to be pushed out, pressuring sales of the company’s semiconductor testing equipment. Lack of exposure to Super Micro Computer, which is not held by the Fund due to its market capitalization, also weighed on performance.
abrdn U.S. Small Cap Equity Fund
(GSXCX)
Total Return Based on $10,000 Investment
The following graph reflects a hypothetical $10,000 investment for the most recently completed 10 fiscal years as compared to a broad-based securities market index and an additional performance benchmark.
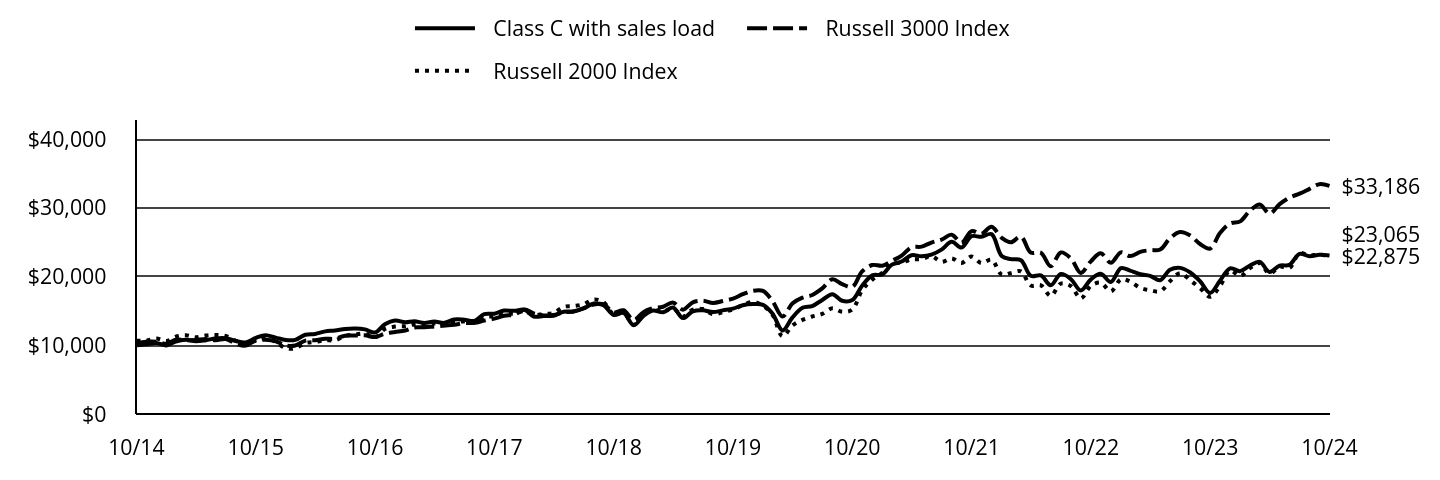
| Class C with sales load | Russell 3000 Index | Russell 2000 Index |
|---|
| 10/14 | $10,000 | $10,275 | $10,659 |
| 11/14 | $10,142 | $10,524 | $10,669 |
| 12/14 | $10,335 | $10,524 | $10,973 |
| 01/15 | $9,981 | $10,231 | $10,620 |
| 02/15 | $10,542 | $10,824 | $11,250 |
| 03/15 | $10,792 | $10,713 | $11,446 |
| 04/15 | $10,580 | $10,762 | $11,154 |
| 05/15 | $10,741 | $10,911 | $11,409 |
| 06/15 | $10,995 | $10,728 | $11,494 |
| 07/15 | $11,019 | $10,908 | $11,361 |
| 08/15 | $10,613 | $10,249 | $10,647 |
| 09/15 | $10,410 | $9,951 | $10,125 |
| 10/15 | $11,066 | $10,736 | $10,695 |
| 11/15 | $11,467 | $10,796 | $11,043 |
| 12/15 | $11,118 | $10,574 | $10,488 |
| 01/16 | $10,759 | $9,978 | $9,566 |
| 02/16 | $10,778 | $9,975 | $9,566 |
| 03/16 | $11,528 | $10,677 | $10,329 |
| 04/16 | $11,646 | $10,743 | $10,491 |
| 05/16 | $12,024 | $10,935 | $10,728 |
| 06/16 | $12,146 | $10,958 | $10,721 |
| 07/16 | $12,377 | $11,393 | $11,361 |
| 08/16 | $12,448 | $11,422 | $11,562 |
| 09/16 | $12,316 | $11,440 | $11,691 |
| 10/16 | $11,849 | $11,192 | $11,135 |
| 11/16 | $13,052 | $11,693 | $12,377 |
| 12/16 | $13,608 | $11,921 | $12,723 |
| 01/17 | $13,349 | $12,145 | $12,774 |
| 02/17 | $13,486 | $12,597 | $13,020 |
| 03/17 | $13,250 | $12,606 | $13,037 |
| 04/17 | $13,443 | $12,739 | $13,180 |
| 05/17 | $13,259 | $12,870 | $12,912 |
| 06/17 | $13,755 | $12,986 | $13,358 |
| 07/17 | $13,717 | $13,231 | $13,458 |
| 08/17 | $13,542 | $13,256 | $13,286 |
| 09/17 | $14,524 | $13,579 | $14,115 |
| 10/17 | $14,594 | $13,876 | $14,236 |
| 11/17 | $15,052 | $14,297 | $14,646 |
| 12/17 | $15,005 | $14,440 | $14,587 |
| 01/18 | $15,160 | $15,201 | $14,968 |
| 02/18 | $14,189 | $14,641 | $14,389 |
| 03/18 | $14,241 | $14,347 | $14,575 |
| 04/18 | $14,302 | $14,402 | $14,701 |
| 05/18 | $14,877 | $14,808 | $15,593 |
| 06/18 | $14,906 | $14,905 | $15,705 |
| 07/18 | $15,349 | $15,400 | $15,978 |
| 08/18 | $16,071 | $15,940 | $16,667 |
| 09/18 | $15,811 | $15,967 | $16,266 |
| 10/18 | $14,401 | $14,791 | $14,500 |
| 11/18 | $14,708 | $15,087 | $14,730 |
| 12/18 | $12,904 | $13,683 | $12,980 |
| 01/19 | $14,321 | $14,858 | $14,441 |
| 02/19 | $15,060 | $15,380 | $15,191 |
| 03/19 | $14,795 | $15,605 | $14,873 |
| 04/19 | $15,484 | $16,228 | $15,379 |
| 05/19 | $13,951 | $15,178 | $14,183 |
| 06/19 | $14,933 | $16,244 | $15,185 |
| 07/19 | $15,082 | $16,485 | $15,272 |
| 08/19 | $14,828 | $16,149 | $14,518 |
| 09/19 | $15,076 | $16,433 | $14,820 |
| 10/19 | $15,324 | $16,786 | $15,211 |
| 11/19 | $15,821 | $17,424 | $15,837 |
| 12/19 | $15,985 | $17,928 | $16,294 |
| 01/20 | $15,876 | $17,908 | $15,771 |
| 02/20 | $14,615 | $16,442 | $14,443 |
| 03/20 | $12,164 | $14,181 | $11,305 |
| 04/20 | $14,017 | $16,059 | $12,858 |
| 05/20 | $15,448 | $16,918 | $13,695 |
| 06/20 | $15,707 | $17,304 | $14,179 |
| 07/20 | $16,595 | $18,287 | $14,571 |
| 08/20 | $17,428 | $19,612 | $15,392 |
| 09/20 | $16,468 | $18,898 | $14,878 |
| 10/20 | $16,589 | $18,490 | $15,190 |
| 11/20 | $18,653 | $20,739 | $17,990 |
| 12/20 | $20,165 | $21,672 | $19,546 |
| 01/21 | $20,302 | $21,576 | $20,530 |
| 02/21 | $21,686 | $22,250 | $21,809 |
| 03/21 | $22,180 | $23,048 | $22,028 |
| 04/21 | $23,097 | $24,236 | $22,491 |
| 05/21 | $22,954 | $24,346 | $22,537 |
| 06/21 | $23,188 | $24,947 | $22,974 |
| 07/21 | $23,916 | $25,369 | $22,144 |
| 08/21 | $25,047 | $26,092 | $22,639 |
| 09/21 | $24,209 | $24,921 | $21,972 |
| 10/21 | $25,866 | $26,607 | $22,907 |
| 11/21 | $25,775 | $26,202 | $21,952 |
| 12/21 | $26,170 | $27,234 | $22,442 |
| 01/22 | $22,997 | $25,631 | $20,282 |
| 02/22 | $22,529 | $24,986 | $20,498 |
| 03/22 | $22,364 | $25,796 | $20,753 |
| 04/22 | $20,111 | $23,481 | $18,697 |
| 05/22 | $20,154 | $23,450 | $18,725 |
| 06/22 | $18,741 | $21,488 | $17,185 |
| 07/22 | $20,379 | $23,504 | $18,979 |
| 08/22 | $19,608 | $22,627 | $18,591 |
| 09/22 | $17,970 | $20,528 | $16,809 |
| 10/22 | $19,582 | $22,212 | $18,659 |
| 11/22 | $20,397 | $23,371 | $19,095 |
| 12/22 | $19,202 | $22,003 | $17,856 |
| 01/23 | $21,227 | $23,518 | $19,596 |
| 02/23 | $20,852 | $22,968 | $19,265 |
| 03/23 | $20,327 | $23,583 | $18,345 |
| 04/23 | $20,102 | $23,834 | $18,015 |
| 05/23 | $19,465 | $23,927 | $17,849 |
| 06/23 | $20,984 | $25,560 | $19,300 |
| 07/23 | $21,256 | $26,477 | $20,480 |
| 08/23 | $20,580 | $25,966 | $19,455 |
| 09/23 | $19,315 | $24,729 | $18,310 |
| 10/23 | $17,608 | $24,073 | $17,061 |
| 11/23 | $19,380 | $26,318 | $18,606 |
| 12/23 | $21,190 | $27,714 | $20,879 |
| 01/24 | $20,787 | $28,021 | $20,067 |
| 02/24 | $21,565 | $29,538 | $21,201 |
| 03/24 | $22,127 | $30,491 | $21,960 |
| 04/24 | $20,665 | $29,149 | $20,415 |
| 05/24 | $21,593 | $30,526 | $21,439 |
| 06/24 | $21,687 | $31,471 | $21,241 |
| 07/24 | $23,299 | $32,056 | $23,399 |
| 08/24 | $22,943 | $32,754 | $23,049 |
| 09/24 | $23,159 | $33,432 | $23,210 |
| 10/24 | $23,065 | $33,186 | $22,875 |
Average Annual Total Returns for the Period Ended October 31, 2024 (%)
| AATR | 1 Year | 5 Years | 10 Years |
|---|
| Class C without sales load | 31.04% | 8.53% | 8.72% |
| Class C with sales load - 1.00% | 30.04% | 8.53% | 8.72% |
| Russell 3000 Index | 37.86% | 14.60% | 12.44% |
| Russell 2000 Index | 34.07% | 8.50% | 7.94% |
THE FUND'S PAST PERFORMANCE IS NOT A GOOD PREDICTOR OF THE FUND'S FUTURE PERFORMANCE.
Fund performance data shown above does not reflect the deduction of taxes that a shareholder would pay on Fund distributions or redemption of Fund shares.
In accordance with regulatory changes requiring the Fund's primary benchmark to represent the overall applicable market, the Fund's primary prospectus benchmark changed to the Russell 3000 Index effective as of February 29, 2024.
Key Fund Statistics as of October 31, 2024
| Total Net Assets | $344,708,444 |
| Total Number of Portfolio Holdings | 54 |
| Portfolio Turnover Rate | 47% |
| Total Advisory Fees Paid | $2,733,674 |
abrdn U.S. Small Cap Equity Fund
(GSXCX)
What did the Fund invest in?
The tables below show the investment makeup of the Fund as of October 31, 2024.
Sector Allocation (% of total net assets)
| Financials | 20.9% |
| Health Care | 15.4% |
| Industrial | 15.0% |
| Information Technology | 13.5% |
| Consumer Discretionary | 12.1% |
| Materials | 7.1% |
| Energy | 4.9% |
| Communication Services | 2.3% |
| Utilities | 2.2% |
| Real Estate | 2.0% |
| Consumer Staples | 2.0% |
| Other | 2.6% |
Ten Largest Holdings (% of total net assets)
| Q2 Holdings, Inc. | 3.2% |
| Wintrust Financial Corp. | 3.0% |
| WSFS Financial Corp. | 2.8% |
| Banner Corp. | 2.8% |
| Seacoast Banking Corp. of Florida | 2.7% |
| Integer Holdings Corp. | 2.7% |
| Merit Medical Systems, Inc. | 2.7% |
| Atmus Filtration Technologies, Inc. | 2.6% |
| Corcept Therapeutics, Inc. | 2.5% |
| Graphic Packaging Holding Co. | 2.5% |
Availability of Additional Information
You can find additional information, including the Fund's prospectus, financial information, fund holdings, and proxy voting information at abrdn.com/us/literature or call 866-667-9231. The QR code can be used to access the Fund's prospectus, financial information and holdings.
abrdn U.S. Small Cap Equity Fund
(GSXCX)
abrdn U.S. Small Cap Equity Fund
Annual Shareholder Report - October 31, 2024
This annual shareholder report contains important information about the abrdn U.S. Small Cap Equity Fund (the "Fund") for the period of November 1, 2023 to October 31, 2024. You can find additional information about the Fund at abrdn.com/us/literature. You can also request this information by contacting us at 866-667-9231.
What were the Fund costs for the last year?
(based on a hypothetical $10,000 investment)
| Share Class | Costs of a $10,000 investment | Costs paid as a percentage of a $10,000 investment |
|---|
| R | $190 | 1.64% |
How did the fund perform last year and what affected its performance?
The following discussion compares the performance of the Fund to the Russell 2000 Index (the “Index”) to show how the Fund’s performance measures against the returns of similar investments for the reporting period.
What contributed to performance?
Our overweight to casual diner Brinker International led to the consumer discretionary sector’s outperformance relative to the benchmark, as the company’s strong execution resulted in industry-leading traffic and sales growth. Q2 Holdings was positive as robust demand for its digital banking solutions led to accelerated growth. Parsons Corporation also added to returns as its shares rose after the company reported robust organic growth and secured several new project wins, including a lead designer role in the $1.66 billion Honolulu rail transit project. However, we sold Parsons Corporation as it became a mid-capitalization company and left the Russell 2000 Index.
What detracted from performance?
The Fund’s exposure to the information technology sector was particularly unfavorable. Within this sector, software company Five9’s shares fell after new customer additions failed to materialize and weaker demand from existing customers forced management to reduce the company’s guidance. Cohu’s shares also struggled as the recovery outlook for key end markets continued to be pushed out, pressuring sales of the company’s semiconductor testing equipment. Lack of exposure to Super Micro Computer, which is not held by the Fund due to its market capitalization, also weighed on performance.
abrdn U.S. Small Cap Equity Fund
(GNSRX)
Total Return Based on $10,000 Investment
The following graph reflects a hypothetical $10,000 investment for the most recently completed 10 fiscal years as compared to a broad-based securities market index and an additional performance benchmark.
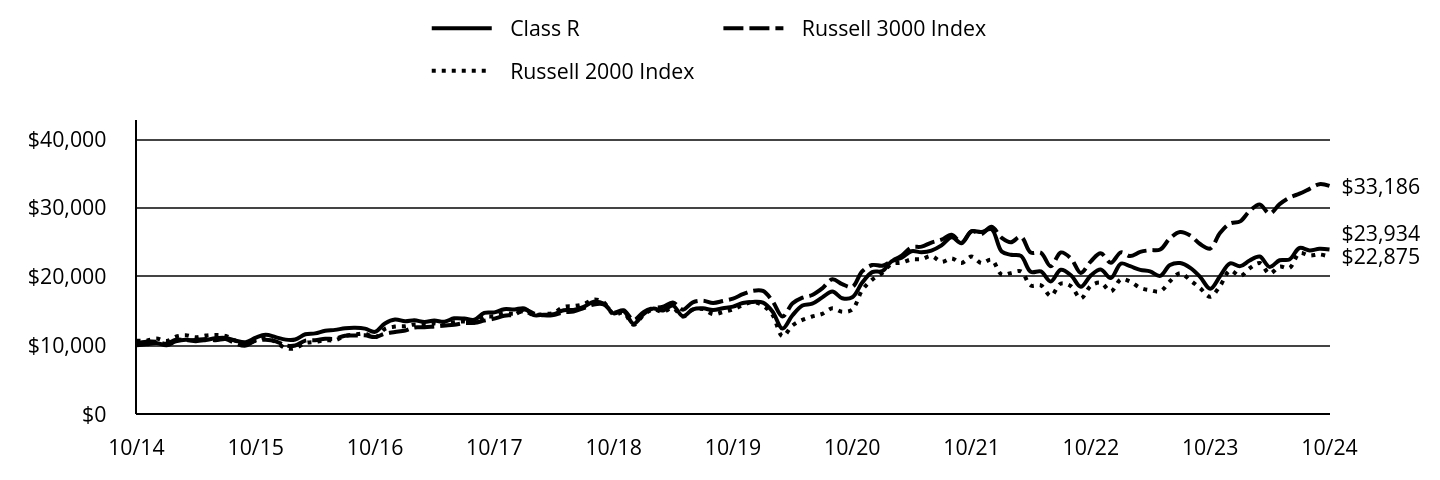
| Class R | Russell 3000 Index | Russell 2000 Index |
|---|
| 10/14 | $10,000 | $10,275 | $10,659 |
| 11/14 | $10,139 | $10,524 | $10,669 |
| 12/14 | $10,341 | $10,524 | $10,973 |
| 01/15 | $9,987 | $10,231 | $10,620 |
| 02/15 | $10,556 | $10,824 | $11,250 |
| 03/15 | $10,807 | $10,713 | $11,446 |
| 04/15 | $10,601 | $10,762 | $11,154 |
| 05/15 | $10,767 | $10,911 | $11,409 |
| 06/15 | $11,022 | $10,728 | $11,494 |
| 07/15 | $11,054 | $10,908 | $11,361 |
| 08/15 | $10,650 | $10,249 | $10,647 |
| 09/15 | $10,448 | $9,951 | $10,125 |
| 10/15 | $11,112 | $10,736 | $10,695 |
| 11/15 | $11,520 | $10,796 | $11,043 |
| 12/15 | $11,175 | $10,574 | $10,488 |
| 01/16 | $10,821 | $9,978 | $9,566 |
| 02/16 | $10,843 | $9,975 | $9,566 |
| 03/16 | $11,601 | $10,677 | $10,329 |
| 04/16 | $11,726 | $10,743 | $10,491 |
| 05/16 | $12,112 | $10,935 | $10,728 |
| 06/16 | $12,238 | $10,958 | $10,721 |
| 07/16 | $12,475 | $11,393 | $11,361 |
| 08/16 | $12,543 | $11,422 | $11,562 |
| 09/16 | $12,417 | $11,440 | $11,691 |
| 10/16 | $11,955 | $11,192 | $11,135 |
| 11/16 | $13,175 | $11,693 | $12,377 |
| 12/16 | $13,744 | $11,921 | $12,723 |
| 01/17 | $13,484 | $12,145 | $12,774 |
| 02/17 | $13,628 | $12,597 | $13,020 |
| 03/17 | $13,395 | $12,606 | $13,037 |
| 04/17 | $13,592 | $12,739 | $13,180 |
| 05/17 | $13,413 | $12,870 | $12,912 |
| 06/17 | $13,915 | $12,986 | $13,358 |
| 07/17 | $13,879 | $13,231 | $13,458 |
| 08/17 | $13,709 | $13,256 | $13,286 |
| 09/17 | $14,709 | $13,579 | $14,115 |
| 10/17 | $14,785 | $13,876 | $14,236 |
| 11/17 | $15,251 | $14,297 | $14,646 |
| 12/17 | $15,206 | $14,440 | $14,587 |
| 01/18 | $15,372 | $15,201 | $14,968 |
| 02/18 | $14,390 | $14,641 | $14,389 |
| 03/18 | $14,448 | $14,347 | $14,575 |
| 04/18 | $14,516 | $14,402 | $14,701 |
| 05/18 | $15,103 | $14,808 | $15,593 |
| 06/18 | $15,135 | $14,905 | $15,705 |
| 07/18 | $15,587 | $15,400 | $15,978 |
| 08/18 | $16,323 | $15,940 | $16,667 |
| 09/18 | $16,067 | $15,967 | $16,266 |
| 10/18 | $14,637 | $14,791 | $14,500 |
| 11/18 | $14,955 | $15,087 | $14,730 |
| 12/18 | $13,124 | $13,683 | $12,980 |
| 01/19 | $14,571 | $14,858 | $14,441 |
| 02/19 | $15,328 | $15,380 | $15,191 |
| 03/19 | $15,063 | $15,605 | $14,873 |
| 04/19 | $15,768 | $16,228 | $15,379 |
| 05/19 | $14,213 | $15,178 | $14,183 |
| 06/19 | $15,214 | $16,244 | $15,185 |
| 07/19 | $15,369 | $16,485 | $15,272 |
| 08/19 | $15,120 | $16,149 | $14,518 |
| 09/19 | $15,374 | $16,433 | $14,820 |
| 10/19 | $15,628 | $16,786 | $15,211 |
| 11/19 | $16,142 | $17,424 | $15,837 |
| 12/19 | $16,311 | $17,928 | $16,294 |
| 01/20 | $16,204 | $17,908 | $15,771 |
| 02/20 | $14,925 | $16,442 | $14,443 |
| 03/20 | $12,424 | $14,181 | $11,305 |
| 04/20 | $14,323 | $16,059 | $12,858 |
| 05/20 | $15,782 | $16,918 | $13,695 |
| 06/20 | $16,052 | $17,304 | $14,179 |
| 07/20 | $16,965 | $18,287 | $14,571 |
| 08/20 | $17,816 | $19,612 | $15,392 |
| 09/20 | $16,841 | $18,898 | $14,878 |
| 10/20 | $16,971 | $18,490 | $15,190 |
| 11/20 | $19,089 | $20,739 | $17,990 |
| 12/20 | $20,641 | $21,672 | $19,546 |
| 01/21 | $20,792 | $21,576 | $20,530 |
| 02/21 | $22,208 | $22,250 | $21,809 |
| 03/21 | $22,726 | $23,048 | $22,028 |
| 04/21 | $23,673 | $24,236 | $22,491 |
| 05/21 | $23,540 | $24,346 | $22,537 |
| 06/21 | $23,781 | $24,947 | $22,974 |
| 07/21 | $24,534 | $25,369 | $22,144 |
| 08/21 | $25,704 | $26,092 | $22,639 |
| 09/21 | $24,848 | $24,921 | $21,972 |
| 10/21 | $26,559 | $26,607 | $22,907 |
| 11/21 | $26,469 | $26,202 | $21,952 |
| 12/21 | $26,882 | $27,234 | $22,442 |
| 01/22 | $23,637 | $25,631 | $20,282 |
| 02/22 | $23,162 | $24,986 | $20,498 |
| 03/22 | $22,999 | $25,796 | $20,753 |
| 04/22 | $20,687 | $23,481 | $18,697 |
| 05/22 | $20,742 | $23,450 | $18,725 |
| 06/22 | $19,286 | $21,488 | $17,185 |
| 07/22 | $20,983 | $23,504 | $18,979 |
| 08/22 | $20,189 | $22,627 | $18,591 |
| 09/22 | $18,508 | $20,528 | $16,809 |
| 10/22 | $20,173 | $22,212 | $18,659 |
| 11/22 | $21,014 | $23,371 | $19,095 |
| 12/22 | $19,786 | $22,003 | $17,856 |
| 01/23 | $21,885 | $23,518 | $19,596 |
| 02/23 | $21,502 | $22,968 | $19,265 |
| 03/23 | $20,969 | $23,583 | $18,345 |
| 04/23 | $20,744 | $23,834 | $18,015 |
| 05/23 | $20,094 | $23,927 | $17,849 |
| 06/23 | $21,668 | $25,560 | $19,300 |
| 07/23 | $21,960 | $26,477 | $20,480 |
| 08/23 | $21,260 | $25,966 | $19,455 |
| 09/23 | $19,961 | $24,729 | $18,310 |
| 10/23 | $18,211 | $24,073 | $17,061 |
| 11/23 | $20,044 | $26,318 | $18,606 |
| 12/23 | $21,918 | $27,714 | $20,879 |
| 01/24 | $21,510 | $28,021 | $20,067 |
| 02/24 | $22,327 | $29,538 | $21,201 |
| 03/24 | $22,910 | $30,491 | $21,960 |
| 04/24 | $21,402 | $29,149 | $20,415 |
| 05/24 | $22,368 | $30,526 | $21,439 |
| 06/24 | $22,476 | $31,471 | $21,241 |
| 07/24 | $24,151 | $32,056 | $23,399 |
| 08/24 | $23,793 | $32,754 | $23,049 |
| 09/24 | $24,026 | $33,432 | $23,210 |
| 10/24 | $23,934 | $33,186 | $22,875 |
Average Annual Total Returns for the Period Ended October 31, 2024 (%)
| AATR | 1 Year | 5 Years | 10 Years |
|---|
| Class R | 31.43% | 8.90% | 9.12% |
| Russell 3000 Index | 37.86% | 14.60% | 12.44% |
| Russell 2000 Index | 34.07% | 8.50% | 7.94% |
THE FUND'S PAST PERFORMANCE IS NOT A GOOD PREDICTOR OF THE FUND'S FUTURE PERFORMANCE.
Fund performance data shown above does not reflect the deduction of taxes that a shareholder would pay on Fund distributions or redemption of Fund shares.
In accordance with regulatory changes requiring the Fund's primary benchmark to represent the overall applicable market, the Fund's primary prospectus benchmark changed to the Russell 3000 Index effective as of February 29, 2024.
Key Fund Statistics as of October 31, 2024
| Total Net Assets | $344,708,444 |
| Total Number of Portfolio Holdings | 54 |
| Portfolio Turnover Rate | 47% |
| Total Advisory Fees Paid | $2,733,674 |
abrdn U.S. Small Cap Equity Fund
(GNSRX)
What did the Fund invest in?
The tables below show the investment makeup of the Fund as of October 31, 2024.
Sector Allocation (% of total net assets)
| Financials | 20.9% |
| Health Care | 15.4% |
| Industrial | 15.0% |
| Information Technology | 13.5% |
| Consumer Discretionary | 12.1% |
| Materials | 7.1% |
| Energy | 4.9% |
| Communication Services | 2.3% |
| Utilities | 2.2% |
| Real Estate | 2.0% |
| Consumer Staples | 2.0% |
| Other | 2.6% |
Ten Largest Holdings (% of total net assets)
| Q2 Holdings, Inc. | 3.2% |
| Wintrust Financial Corp. | 3.0% |
| WSFS Financial Corp. | 2.8% |
| Banner Corp. | 2.8% |
| Seacoast Banking Corp. of Florida | 2.7% |
| Integer Holdings Corp. | 2.7% |
| Merit Medical Systems, Inc. | 2.7% |
| Atmus Filtration Technologies, Inc. | 2.6% |
| Corcept Therapeutics, Inc. | 2.5% |
| Graphic Packaging Holding Co. | 2.5% |
Availability of Additional Information
You can find additional information, including the Fund's prospectus, financial information, fund holdings, and proxy voting information at abrdn.com/us/literature or call 866-667-9231. The QR code can be used to access the Fund's prospectus, financial information and holdings.
abrdn U.S. Small Cap Equity Fund
(GNSRX)
abrdn U.S. Small Cap Equity Fund
Annual Shareholder Report - October 31, 2024
This annual shareholder report contains important information about the abrdn U.S. Small Cap Equity Fund (the "Fund") for the period of November 1, 2023 to October 31, 2024. You can find additional information about the Fund at abrdn.com/us/literature. You can also request this information by contacting us at 866-667-9231.
What were the Fund costs for the last year?
(based on a hypothetical $10,000 investment)
| Share Class | Costs of a $10,000 investment | Costs paid as a percentage of a $10,000 investment |
|---|
| Institutional | $115 | 0.99% |
How did the fund perform last year and what affected its performance?
The following discussion compares the performance of the Fund to the Russell 2000 Index (the “Index”) to show how the Fund’s performance measures against the returns of similar investments for the reporting period.
What contributed to performance?
Our overweight to casual diner Brinker International led to the consumer discretionary sector’s outperformance relative to the benchmark, as the company’s strong execution resulted in industry-leading traffic and sales growth. Q2 Holdings was positive as robust demand for its digital banking solutions led to accelerated growth. Parsons Corporation also added to returns as its shares rose after the company reported robust organic growth and secured several new project wins, including a lead designer role in the $1.66 billion Honolulu rail transit project. However, we sold Parsons Corporation as it became a mid-capitalization company and left the Russell 2000 Index.
What detracted from performance?
The Fund’s exposure to the information technology sector was particularly unfavorable. Within this sector, software company Five9’s shares fell after new customer additions failed to materialize and weaker demand from existing customers forced management to reduce the company’s guidance. Cohu’s shares also struggled as the recovery outlook for key end markets continued to be pushed out, pressuring sales of the company’s semiconductor testing equipment. Lack of exposure to Super Micro Computer, which is not held by the Fund due to its market capitalization, also weighed on performance.
abrdn U.S. Small Cap Equity Fund
(GSCIX)
Total Return Based on $1,000,000 Investment
The following graph reflects a hypothetical $1,000,000 investment for the most recently completed 10 fiscal years as compared to a broad-based securities market index and an additional performance benchmark.
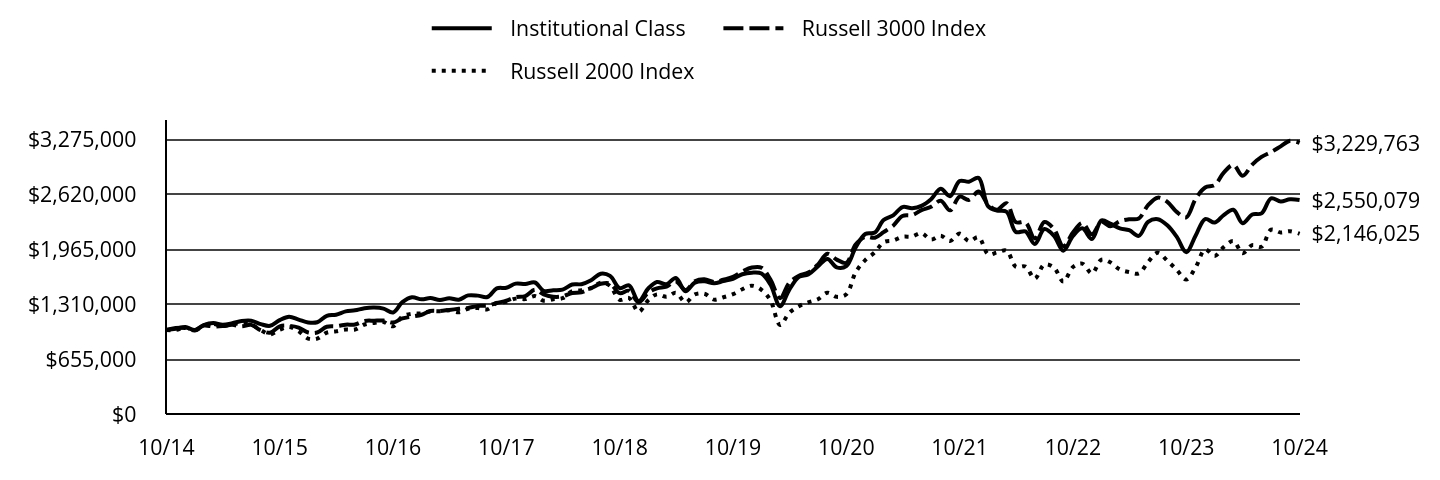
| Institutional Class | Russell 3000 Index | Russell 2000 Index |
|---|
| 10/14 | $1,000,000 | $1,000,000 | $1,000,000 |
| 11/14 | $1,014,842 | $1,024,234 | $1,000,896 |
| 12/14 | $1,035,299 | $1,024,222 | $1,029,422 |
| 01/15 | $1,000,401 | $995,717 | $996,309 |
| 02/15 | $1,057,762 | $1,053,370 | $1,055,457 |
| 03/15 | $1,083,434 | $1,042,661 | $1,073,844 |
| 04/15 | $1,063,377 | $1,047,377 | $1,046,458 |
| 05/15 | $1,080,225 | $1,061,864 | $1,070,349 |
| 06/15 | $1,106,699 | $1,044,098 | $1,078,364 |
| 07/15 | $1,110,309 | $1,061,561 | $1,065,831 |
| 08/15 | $1,070,598 | $997,475 | $998,854 |
| 09/15 | $1,050,542 | $968,409 | $949,847 |
| 10/15 | $1,117,930 | $1,044,899 | $1,003,361 |
| 11/15 | $1,159,246 | $1,050,692 | $1,036,000 |
| 12/15 | $1,124,749 | $1,029,126 | $983,982 |
| 01/16 | $1,089,852 | $971,057 | $897,456 |
| 02/16 | $1,092,659 | $970,744 | $897,416 |
| 03/16 | $1,169,274 | $1,039,091 | $969,040 |
| 04/16 | $1,182,511 | $1,045,530 | $984,249 |
| 05/16 | $1,221,821 | $1,064,235 | $1,006,419 |
| 06/16 | $1,235,058 | $1,066,424 | $1,005,785 |
| 07/16 | $1,259,928 | $1,108,747 | $1,065,837 |
| 08/16 | $1,267,549 | $1,111,575 | $1,084,685 |
| 09/16 | $1,255,114 | $1,113,322 | $1,096,767 |
| 10/16 | $1,209,386 | $1,089,235 | $1,044,627 |
| 11/16 | $1,332,531 | $1,137,981 | $1,161,115 |
| 12/16 | $1,391,095 | $1,160,186 | $1,193,649 |
| 01/17 | $1,365,423 | $1,182,023 | $1,198,357 |
| 02/17 | $1,380,666 | $1,225,984 | $1,221,484 |
| 03/17 | $1,357,802 | $1,226,818 | $1,223,083 |
| 04/17 | $1,378,259 | $1,239,822 | $1,236,495 |
| 05/17 | $1,361,011 | $1,252,511 | $1,211,340 |
| 06/17 | $1,412,756 | $1,263,814 | $1,253,214 |
| 07/17 | $1,409,948 | $1,287,643 | $1,262,525 |
| 08/17 | $1,393,502 | $1,290,124 | $1,246,463 |
| 09/17 | $1,495,788 | $1,321,587 | $1,324,254 |
| 10/17 | $1,503,811 | $1,350,427 | $1,335,542 |
| 11/17 | $1,552,748 | $1,391,433 | $1,374,031 |
| 12/17 | $1,549,138 | $1,405,340 | $1,368,486 |
| 01/18 | $1,566,386 | $1,479,417 | $1,404,250 |
| 02/18 | $1,467,308 | $1,424,886 | $1,349,875 |
| 03/18 | $1,474,128 | $1,396,283 | $1,367,334 |
| 04/18 | $1,481,348 | $1,401,590 | $1,379,155 |
| 05/18 | $1,542,318 | $1,441,157 | $1,462,871 |
| 06/18 | $1,546,330 | $1,450,582 | $1,473,353 |
| 07/18 | $1,593,662 | $1,498,721 | $1,499,031 |
| 08/18 | $1,669,876 | $1,551,352 | $1,563,654 |
| 09/18 | $1,644,605 | $1,553,920 | $1,526,045 |
| 10/18 | $1,498,997 | $1,439,501 | $1,360,291 |
| 11/18 | $1,532,290 | $1,468,332 | $1,381,913 |
| 12/18 | $1,345,734 | $1,331,675 | $1,217,761 |
| 01/19 | $1,494,552 | $1,445,979 | $1,354,758 |
| 02/19 | $1,572,829 | $1,496,832 | $1,425,188 |
| 03/19 | $1,546,433 | $1,518,689 | $1,395,360 |
| 04/19 | $1,620,159 | $1,579,333 | $1,442,762 |
| 05/19 | $1,460,874 | $1,477,131 | $1,330,554 |
| 06/19 | $1,565,092 | $1,580,880 | $1,424,594 |
| 07/19 | $1,581,931 | $1,604,380 | $1,432,796 |
| 08/19 | $1,556,445 | $1,571,674 | $1,362,053 |
| 09/19 | $1,583,751 | $1,599,258 | $1,390,392 |
| 10/19 | $1,611,057 | $1,633,685 | $1,427,010 |
| 11/19 | $1,664,759 | $1,695,785 | $1,485,753 |
| 12/19 | $1,683,339 | $1,744,748 | $1,528,594 |
| 01/20 | $1,673,086 | $1,742,843 | $1,479,569 |
| 02/20 | $1,541,758 | $1,600,150 | $1,355,016 |
| 03/20 | $1,284,473 | $1,380,101 | $1,060,619 |
| 04/20 | $1,481,221 | $1,562,882 | $1,206,299 |
| 05/20 | $1,633,541 | $1,646,463 | $1,284,799 |
| 06/20 | $1,662,346 | $1,684,104 | $1,330,213 |
| 07/20 | $1,758,034 | $1,779,733 | $1,367,031 |
| 08/20 | $1,847,376 | $1,908,665 | $1,444,054 |
| 09/20 | $1,747,294 | $1,839,168 | $1,395,818 |
| 10/20 | $1,761,940 | $1,799,473 | $1,425,052 |
| 11/20 | $1,982,610 | $2,018,385 | $1,687,725 |
| 12/20 | $2,144,908 | $2,109,188 | $1,833,713 |
| 01/21 | $2,161,427 | $2,099,806 | $1,925,990 |
| 02/21 | $2,310,100 | $2,165,440 | $2,046,028 |
| 03/21 | $2,365,336 | $2,243,056 | $2,066,577 |
| 04/21 | $2,464,967 | $2,358,684 | $2,109,973 |
| 05/21 | $2,452,061 | $2,369,451 | $2,114,323 |
| 06/21 | $2,478,905 | $2,427,879 | $2,155,287 |
| 07/21 | $2,558,403 | $2,468,936 | $2,077,463 |
| 08/21 | $2,682,297 | $2,539,345 | $2,123,932 |
| 09/21 | $2,594,539 | $2,425,410 | $2,061,308 |
| 10/21 | $2,774,701 | $2,589,427 | $2,148,995 |
| 11/21 | $2,766,957 | $2,550,012 | $2,059,447 |
| 12/21 | $2,811,814 | $2,650,429 | $2,105,451 |
| 01/22 | $2,473,636 | $2,494,488 | $1,902,752 |
| 02/22 | $2,424,240 | $2,431,653 | $1,923,064 |
| 03/22 | $2,409,041 | $2,510,527 | $1,946,998 |
| 04/22 | $2,168,390 | $2,285,227 | $1,754,033 |
| 05/22 | $2,174,723 | $2,282,163 | $1,756,683 |
| 06/22 | $2,024,000 | $2,091,240 | $1,612,208 |
| 07/22 | $2,202,588 | $2,287,436 | $1,780,527 |
| 08/22 | $2,120,893 | $2,202,070 | $1,744,093 |
| 09/22 | $1,945,471 | $1,997,874 | $1,576,947 |
| 10/22 | $2,121,526 | $2,161,712 | $1,750,551 |
| 11/22 | $2,211,454 | $2,274,545 | $1,791,440 |
| 12/22 | $2,083,699 | $2,141,363 | $1,675,172 |
| 01/23 | $2,305,213 | $2,288,844 | $1,838,444 |
| 02/23 | $2,266,515 | $2,235,348 | $1,807,391 |
| 03/23 | $2,211,136 | $2,295,119 | $1,721,034 |
| 04/23 | $2,189,118 | $2,319,572 | $1,690,093 |
| 05/23 | $2,121,730 | $2,328,597 | $1,674,481 |
| 06/23 | $2,288,533 | $2,487,606 | $1,810,619 |
| 07/23 | $2,320,559 | $2,576,779 | $1,921,345 |
| 08/23 | $2,247,833 | $2,527,037 | $1,825,223 |
| 09/23 | $2,111,722 | $2,406,664 | $1,717,768 |
| 10/23 | $1,927,572 | $2,342,866 | $1,600,619 |
| 11/23 | $2,122,397 | $2,561,335 | $1,745,490 |
| 12/23 | $2,322,560 | $2,697,193 | $1,958,760 |
| 01/24 | $2,280,526 | $2,727,085 | $1,882,577 |
| 02/24 | $2,368,598 | $2,874,703 | $1,989,021 |
| 03/24 | $2,431,983 | $2,967,434 | $2,060,226 |
| 04/24 | $2,272,520 | $2,836,862 | $1,915,222 |
| 05/24 | $2,376,604 | $2,970,895 | $2,011,303 |
| 06/24 | $2,389,281 | $3,062,866 | $1,992,698 |
| 07/24 | $2,568,761 | $3,119,802 | $2,195,154 |
| 08/24 | $2,532,064 | $3,187,716 | $2,162,363 |
| 09/24 | $2,558,086 | $3,253,656 | $2,177,476 |
| 10/24 | $2,550,079 | $3,229,763 | $2,146,025 |
Average Annual Total Returns for the Period Ended October 31, 2024 (%)
| AATR | 1 Year | 5 Years | 10 Years |
|---|
| Institutional Class | 32.33% | 9.63% | 9.82% |
| Russell 3000 Index | 37.86% | 14.60% | 12.44% |
| Russell 2000 Index | 34.07% | 8.50% | 7.94% |
THE FUND'S PAST PERFORMANCE IS NOT A GOOD PREDICTOR OF THE FUND'S FUTURE PERFORMANCE.
Fund performance data shown above does not reflect the deduction of taxes that a shareholder would pay on Fund distributions or redemption of Fund shares.
In accordance with regulatory changes requiring the Fund's primary benchmark to represent the overall applicable market, the Fund's primary prospectus benchmark changed to the Russell 3000 Index effective as of February 29, 2024.
Key Fund Statistics as of October 31, 2024
| Total Net Assets | $344,708,444 |
| Total Number of Portfolio Holdings | 54 |
| Portfolio Turnover Rate | 47% |
| Total Advisory Fees Paid | $2,733,674 |
abrdn U.S. Small Cap Equity Fund
(GSCIX)
What did the Fund invest in?
The tables below show the investment makeup of the Fund as of October 31, 2024.
Sector Allocation (% of total net assets)
| Financials | 20.9% |
| Health Care | 15.4% |
| Industrial | 15.0% |
| Information Technology | 13.5% |
| Consumer Discretionary | 12.1% |
| Materials | 7.1% |
| Energy | 4.9% |
| Communication Services | 2.3% |
| Utilities | 2.2% |
| Real Estate | 2.0% |
| Consumer Staples | 2.0% |
| Other | 2.6% |
Ten Largest Holdings (% of total net assets)
| Q2 Holdings, Inc. | 3.2% |
| Wintrust Financial Corp. | 3.0% |
| WSFS Financial Corp. | 2.8% |
| Banner Corp. | 2.8% |
| Seacoast Banking Corp. of Florida | 2.7% |
| Integer Holdings Corp. | 2.7% |
| Merit Medical Systems, Inc. | 2.7% |
| Atmus Filtration Technologies, Inc. | 2.6% |
| Corcept Therapeutics, Inc. | 2.5% |
| Graphic Packaging Holding Co. | 2.5% |
Availability of Additional Information
You can find additional information, including the Fund's prospectus, financial information, fund holdings, and proxy voting information at abrdn.com/us/literature or call 866-667-9231. The QR code can be used to access the Fund's prospectus, financial information and holdings.
abrdn U.S. Small Cap Equity Fund
(GSCIX)
abrdn U.S. Small Cap Equity Fund
Annual Shareholder Report - October 31, 2024
This annual shareholder report contains important information about the abrdn U.S. Small Cap Equity Fund (the "Fund") for the period of November 1, 2023 to October 31, 2024. You can find additional information about the Fund at abrdn.com/us/literature. You can also request this information by contacting us at 866-667-9231.
What were the Fund costs for the last year?
(based on a hypothetical $10,000 investment)
| Share Class | Costs of a $10,000 investment | Costs paid as a percentage of a $10,000 investment |
|---|
| Institutional Service | $128 | 1.10% |
How did the fund perform last year and what affected its performance?
The following discussion compares the performance of the Fund to the Russell 2000 Index (the “Index”) to show how the Fund’s performance measures against the returns of similar investments for the reporting period.
What contributed to performance?
Our overweight to casual diner Brinker International led to the consumer discretionary sector’s outperformance relative to the benchmark, as the company’s strong execution resulted in industry-leading traffic and sales growth. Q2 Holdings was positive as robust demand for its digital banking solutions led to accelerated growth. Parsons Corporation also added to returns as its shares rose after the company reported robust organic growth and secured several new project wins, including a lead designer role in the $1.66 billion Honolulu rail transit project. However, we sold Parsons Corporation as it became a mid-capitalization company and left the Russell 2000 Index.
What detracted from performance?
The Fund’s exposure to the information technology sector was particularly unfavorable. Within this sector, software company Five9’s shares fell after new customer additions failed to materialize and weaker demand from existing customers forced management to reduce the company’s guidance. Cohu’s shares also struggled as the recovery outlook for key end markets continued to be pushed out, pressuring sales of the company’s semiconductor testing equipment. Lack of exposure to Super Micro Computer, which is not held by the Fund due to its market capitalization, also weighed on performance.
abrdn U.S. Small Cap Equity Fund
(GSXIX)
Institutional Service Class
Total Return Based on $1,000,000 Investment
The following graph reflects a hypothetical $1,000,000 investment for the most recently completed 10 fiscal years as compared to a broad-based securities market index and an additional performance benchmark.
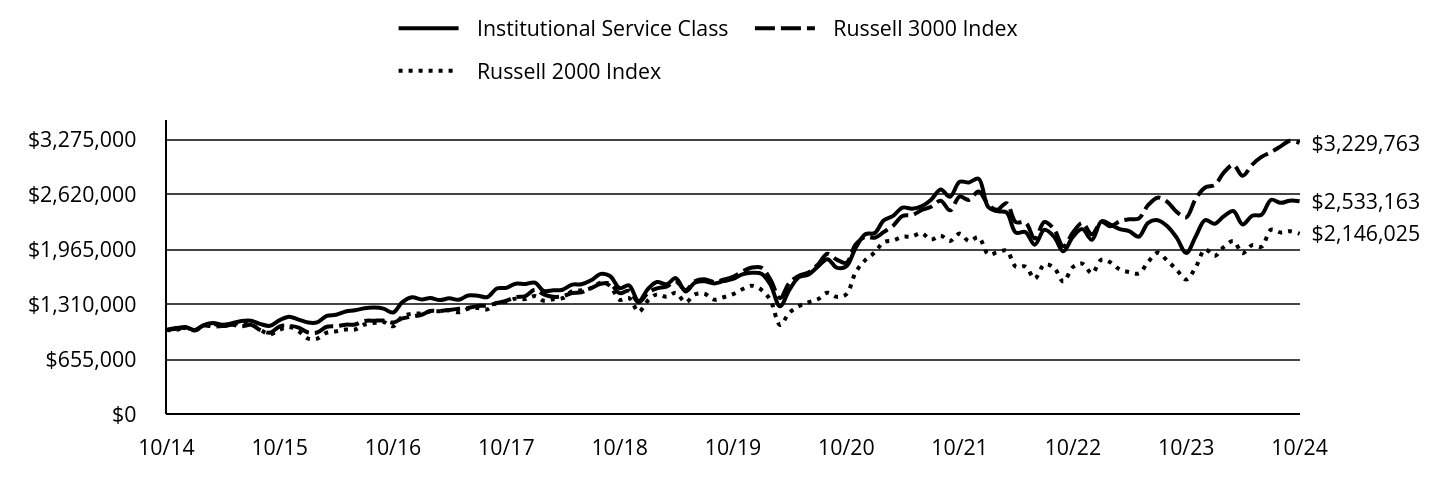
| Institutional Service Class | Russell 3000 Index | Russell 2000 Index |
|---|
| 10/14 | $1,000,000 | $1,000,000 | $1,000,000 |
| 11/14 | $1,014,824 | $1,024,234 | $1,000,896 |
| 12/14 | $1,035,256 | $1,024,222 | $1,029,422 |
| 01/15 | $1,000,401 | $995,717 | $996,309 |
| 02/15 | $1,058,093 | $1,053,370 | $1,055,457 |
| 03/15 | $1,083,734 | $1,042,661 | $1,073,844 |
| 04/15 | $1,063,301 | $1,047,377 | $1,046,458 |
| 05/15 | $1,080,529 | $1,061,864 | $1,070,349 |
| 06/15 | $1,106,971 | $1,044,098 | $1,078,364 |
| 07/15 | $1,110,176 | $1,061,561 | $1,065,831 |
| 08/15 | $1,070,513 | $997,475 | $998,854 |
| 09/15 | $1,050,481 | $968,409 | $949,847 |
| 10/15 | $1,117,788 | $1,044,899 | $1,003,361 |
| 11/15 | $1,159,054 | $1,050,692 | $1,036,000 |
| 12/15 | $1,124,599 | $1,029,126 | $983,982 |
| 01/16 | $1,089,343 | $971,057 | $897,456 |
| 02/16 | $1,092,147 | $970,744 | $897,416 |
| 03/16 | $1,169,071 | $1,039,091 | $969,040 |
| 04/16 | $1,181,891 | $1,045,530 | $984,249 |
| 05/16 | $1,221,554 | $1,064,235 | $1,006,419 |
| 06/16 | $1,234,776 | $1,066,424 | $1,005,785 |
| 07/16 | $1,259,215 | $1,108,747 | $1,065,837 |
| 08/16 | $1,267,228 | $1,111,575 | $1,084,685 |
| 09/16 | $1,254,407 | $1,113,322 | $1,096,767 |
| 10/16 | $1,208,734 | $1,089,235 | $1,044,627 |
| 11/16 | $1,332,131 | $1,137,981 | $1,161,115 |
| 12/16 | $1,390,625 | $1,160,186 | $1,193,649 |
| 01/17 | $1,364,984 | $1,182,023 | $1,198,357 |
| 02/17 | $1,380,208 | $1,225,984 | $1,221,484 |
| 03/17 | $1,356,971 | $1,226,818 | $1,223,083 |
| 04/17 | $1,377,804 | $1,239,822 | $1,236,495 |
| 05/17 | $1,360,577 | $1,252,511 | $1,211,340 |
| 06/17 | $1,411,859 | $1,263,814 | $1,253,214 |
| 07/17 | $1,409,054 | $1,287,643 | $1,262,525 |
| 08/17 | $1,392,628 | $1,290,124 | $1,246,463 |
| 09/17 | $1,494,792 | $1,321,587 | $1,324,254 |
| 10/17 | $1,502,804 | $1,350,427 | $1,335,542 |
| 11/17 | $1,551,683 | $1,391,433 | $1,374,031 |
| 12/17 | $1,547,676 | $1,405,340 | $1,368,486 |
| 01/18 | $1,565,304 | $1,479,417 | $1,404,250 |
| 02/18 | $1,465,946 | $1,424,886 | $1,349,875 |
| 03/18 | $1,472,756 | $1,396,283 | $1,367,334 |
| 04/18 | $1,480,369 | $1,401,590 | $1,379,155 |
| 05/18 | $1,541,266 | $1,441,157 | $1,462,871 |
| 06/18 | $1,545,272 | $1,450,582 | $1,473,353 |
| 07/18 | $1,592,147 | $1,498,721 | $1,499,031 |
| 08/18 | $1,668,670 | $1,551,352 | $1,563,654 |
| 09/18 | $1,643,429 | $1,553,920 | $1,526,045 |
| 10/18 | $1,497,997 | $1,439,501 | $1,360,291 |
| 11/18 | $1,530,849 | $1,468,332 | $1,381,913 |
| 12/18 | $1,344,495 | $1,331,675 | $1,217,761 |
| 01/19 | $1,493,126 | $1,445,979 | $1,354,758 |
| 02/19 | $1,571,759 | $1,496,832 | $1,425,188 |
| 03/19 | $1,544,942 | $1,518,689 | $1,395,360 |
| 04/19 | $1,618,575 | $1,579,333 | $1,442,762 |
| 05/19 | $1,459,491 | $1,477,131 | $1,330,554 |
| 06/19 | $1,563,578 | $1,580,880 | $1,424,594 |
| 07/19 | $1,580,395 | $1,604,380 | $1,432,796 |
| 08/19 | $1,555,396 | $1,571,674 | $1,362,053 |
| 09/19 | $1,582,213 | $1,599,258 | $1,390,392 |
| 10/19 | $1,609,485 | $1,633,685 | $1,427,010 |
| 11/19 | $1,662,665 | $1,695,785 | $1,485,753 |
| 12/19 | $1,681,675 | $1,744,748 | $1,528,594 |
| 01/20 | $1,671,436 | $1,742,843 | $1,479,569 |
| 02/20 | $1,540,276 | $1,600,150 | $1,355,016 |
| 03/20 | $1,282,832 | $1,380,101 | $1,060,619 |
| 04/20 | $1,478,840 | $1,562,882 | $1,206,299 |
| 05/20 | $1,630,966 | $1,646,463 | $1,284,799 |
| 06/20 | $1,659,734 | $1,684,104 | $1,330,213 |
| 07/20 | $1,754,813 | $1,779,733 | $1,367,031 |
| 08/20 | $1,844,040 | $1,908,665 | $1,444,054 |
| 09/20 | $1,744,086 | $1,839,168 | $1,395,818 |
| 10/20 | $1,758,226 | $1,799,473 | $1,425,052 |
| 11/20 | $1,978,613 | $2,018,385 | $1,687,725 |
| 12/20 | $2,140,217 | $2,109,188 | $1,833,713 |
| 01/21 | $2,156,716 | $2,099,806 | $1,925,990 |
| 02/21 | $2,304,691 | $2,165,440 | $2,046,028 |
| 03/21 | $2,359,859 | $2,243,056 | $2,066,577 |
| 04/21 | $2,458,852 | $2,358,684 | $2,109,973 |
| 05/21 | $2,445,962 | $2,369,451 | $2,114,323 |
| 06/21 | $2,472,258 | $2,427,879 | $2,155,287 |
| 07/21 | $2,551,659 | $2,468,936 | $2,077,463 |
| 08/21 | $2,674,885 | $2,539,345 | $2,123,932 |
| 09/21 | $2,586,719 | $2,425,410 | $2,061,308 |
| 10/21 | $2,766,144 | $2,589,427 | $2,148,995 |
| 11/21 | $2,757,895 | $2,550,012 | $2,059,447 |
| 12/21 | $2,802,611 | $2,650,429 | $2,105,451 |
| 01/22 | $2,465,336 | $2,494,488 | $1,902,752 |
| 02/22 | $2,415,979 | $2,431,653 | $1,923,064 |
| 03/22 | $2,400,792 | $2,510,527 | $1,946,998 |
| 04/22 | $2,160,333 | $2,285,227 | $1,754,033 |
| 05/22 | $2,166,661 | $2,282,163 | $1,756,683 |
| 06/22 | $2,016,058 | $2,091,240 | $1,612,208 |
| 07/22 | $2,193,871 | $2,287,436 | $1,780,527 |
| 08/22 | $2,112,241 | $2,202,070 | $1,744,093 |
| 09/22 | $1,937,592 | $1,997,874 | $1,576,947 |
| 10/22 | $2,112,241 | $2,161,712 | $1,750,551 |
| 11/22 | $2,202,097 | $2,274,545 | $1,791,440 |
| 12/22 | $2,075,073 | $2,141,363 | $1,675,172 |
| 01/23 | $2,295,783 | $2,288,844 | $1,838,444 |
| 02/23 | $2,256,442 | $2,235,348 | $1,807,391 |
| 03/23 | $2,201,098 | $2,295,119 | $1,721,034 |
| 04/23 | $2,178,427 | $2,319,572 | $1,690,093 |
| 05/23 | $2,111,747 | $2,328,597 | $1,674,481 |
| 06/23 | $2,277,113 | $2,487,606 | $1,810,619 |
| 07/23 | $2,308,453 | $2,576,779 | $1,921,345 |
| 08/23 | $2,236,438 | $2,527,037 | $1,825,223 |
| 09/23 | $2,100,412 | $2,406,664 | $1,717,768 |
| 10/23 | $1,916,376 | $2,342,866 | $1,600,619 |
| 11/23 | $2,110,414 | $2,561,335 | $1,745,490 |
| 12/23 | $2,309,119 | $2,697,193 | $1,958,760 |
| 01/24 | $2,267,111 | $2,727,085 | $1,882,577 |
| 02/24 | $2,353,795 | $2,874,703 | $1,989,021 |
| 03/24 | $2,417,141 | $2,967,434 | $2,060,226 |
| 04/24 | $2,258,443 | $2,836,862 | $1,915,222 |
| 05/24 | $2,361,796 | $2,970,895 | $2,011,303 |
| 06/24 | $2,373,799 | $3,062,866 | $1,992,698 |
| 07/24 | $2,551,834 | $3,119,802 | $2,195,154 |
| 08/24 | $2,515,160 | $3,187,716 | $2,162,363 |
| 09/24 | $2,541,165 | $3,253,656 | $2,177,476 |
| 10/24 | $2,533,163 | $3,229,763 | $2,146,025 |
Average Annual Total Returns for the Period Ended October 31, 2024 (%)
| AATR | 1 Year | 5 Years | 10 Years |
|---|
| Institutional Service Class | 32.19% | 9.50% | 9.74% |
| Russell 3000 Index | 37.86% | 14.60% | 12.44% |
| Russell 2000 Index | 34.07% | 8.50% | 7.94% |
THE FUND'S PAST PERFORMANCE IS NOT A GOOD PREDICTOR OF THE FUND'S FUTURE PERFORMANCE.
Fund performance data shown above does not reflect the deduction of taxes that a shareholder would pay on Fund distributions or redemption of Fund shares.
In accordance with regulatory changes requiring the Fund's primary benchmark to represent the overall applicable market, the Fund's primary prospectus benchmark changed to the Russell 3000 Index effective as of February 29, 2024.
Key Fund Statistics as of October 31, 2024
| Total Net Assets | $344,708,444 |
| Total Number of Portfolio Holdings | 54 |
| Portfolio Turnover Rate | 47% |
| Total Advisory Fees Paid | $2,733,674 |
abrdn U.S. Small Cap Equity Fund
(GSXIX)
Institutional Service Class
What did the Fund invest in?
The tables below show the investment makeup of the Fund as of October 31, 2024.
Sector Allocation (% of total net assets)
| Financials | 20.9% |
| Health Care | 15.4% |
| Industrial | 15.0% |
| Information Technology | 13.5% |
| Consumer Discretionary | 12.1% |
| Materials | 7.1% |
| Energy | 4.9% |
| Communication Services | 2.3% |
| Utilities | 2.2% |
| Real Estate | 2.0% |
| Consumer Staples | 2.0% |
| Other | 2.6% |
Ten Largest Holdings (% of total net assets)
| Q2 Holdings, Inc. | 3.2% |
| Wintrust Financial Corp. | 3.0% |
| WSFS Financial Corp. | 2.8% |
| Banner Corp. | 2.8% |
| Seacoast Banking Corp. of Florida | 2.7% |
| Integer Holdings Corp. | 2.7% |
| Merit Medical Systems, Inc. | 2.7% |
| Atmus Filtration Technologies, Inc. | 2.6% |
| Corcept Therapeutics, Inc. | 2.5% |
| Graphic Packaging Holding Co. | 2.5% |
Availability of Additional Information
You can find additional information, including the Fund's prospectus, financial information, fund holdings, and proxy voting information at abrdn.com/us/literature or call 866-667-9231. The QR code can be used to access the Fund's prospectus, financial information and holdings.
abrdn U.S. Small Cap Equity Fund
(GSXIX)
Institutional Service Class
abrdn U.S. Sustainable Leaders Fund
Annual Shareholder Report - October 31, 2024
This annual shareholder report contains important information about the abrdn U.S. Sustainable Leaders Fund (the "Fund") for the period of November 1, 2023 to October 31, 2024. You can find additional information about the Fund at abrdn.com/us/literature. You can also request this information by contacting us at 866-667-9231.
This report describes material changes to the Fund that occurred during the reporting period.
What were the Fund costs for the last year?
(based on a hypothetical $10,000 investment)
| Share Class | Costs of a $10,000 investment | Costs paid as a percentage of a $10,000 investment |
|---|
| A | $133 | 1.19% |
How did the fund perform last year and what affected its performance?
The following discussion compares the performance of the Fund to the Russell 3000 Index (the “Index”) to show how the Fund’s performance measures against the returns of similar investments for the reporting period.
What contributed to performance?
At the stock level, our overweight to American Express was a key contributor to returns as its robust results throughout the period led to increased investor confidence in the continuation of revenue growth and ongoing low credit losses. Within the semiconductor sector, our holding in Marvell Technology performed well due to increased demand for its artificial-Intelligence (AI), although this did not compensate for the negative effect from our underweight to NVIDIA. Our position in Tetra Tech helped performance as its shares benefited from strong results and an easing of investor concerns that a change of presidential administration may affect future project wins.
What detracted from performance?
The Fund’s underweight to NVIDIA hurt performance as its stock performed strongly and lifted the semiconductor sector’s performance. Also, within the broader information technology sector, our overweight to Microsoft Corporation was unfavorable. The shares rose over the period, but underperformed the broader index, held back by the potentially growing capital-expenditure burden of AI investment. Also, within the software sector, Nice Ltd contributed negatively, due to investor concern that its call center software could be partially displaced by AI deployments. However, we believe that Nice is well positioned to offer these AI enhancements to customers and can add to growth. Elsewhere, Lululemon Athletica was negative on the back of growing evidence that the active apparel category could be slowing following years of strong growth, and we sold our position.
abrdn U.S. Sustainable Leaders Fund
(GXXAX)
Total Return Based on $10,000 Investment
The following graph reflects a hypothetical $10,000 investment for the most recently completed 10 fiscal years as compared to a broad-based securities market index, which is also the performance benchmark.

| Class A with sales load | Russell 3000 Index |
|---|
| 10/14 | $9,423 | $10,275 |
| 11/14 | $9,620 | $10,524 |
| 12/14 | $9,651 | $10,524 |
| 01/15 | $9,260 | $10,231 |
| 02/15 | $9,801 | $10,824 |
| 03/15 | $9,703 | $10,713 |
| 04/15 | $9,733 | $10,762 |
| 05/15 | $9,808 | $10,911 |
| 06/15 | $9,646 | $10,728 |
| 07/15 | $9,669 | $10,908 |
| 08/15 | $9,163 | $10,249 |
| 09/15 | $8,828 | $9,951 |
| 10/15 | $9,471 | $10,736 |
| 11/15 | $9,622 | $10,796 |
| 12/15 | $9,276 | $10,574 |
| 01/16 | $8,853 | $9,978 |
| 02/16 | $8,774 | $9,975 |
| 03/16 | $9,452 | $10,677 |
| 04/16 | $9,556 | $10,743 |
| 05/16 | $9,660 | $10,935 |
| 06/16 | $9,604 | $10,958 |
| 07/16 | $9,875 | $11,393 |
| 08/16 | $10,075 | $11,422 |
| 09/16 | $9,979 | $11,440 |
| 10/16 | $9,684 | $11,192 |
| 11/16 | $10,147 | $11,693 |
| 12/16 | $10,273 | $11,921 |
| 01/17 | $10,507 | $12,145 |
| 02/17 | $10,786 | $12,597 |
| 03/17 | $10,876 | $12,606 |
| 04/17 | $10,929 | $12,739 |
| 05/17 | $11,154 | $12,870 |
| 06/17 | $11,244 | $12,986 |
| 07/17 | $11,370 | $13,231 |
| 08/17 | $11,298 | $13,256 |
| 09/17 | $11,568 | $13,579 |
| 10/17 | $11,729 | $13,876 |
| 11/17 | $12,206 | $14,297 |
| 12/17 | $12,387 | $14,440 |
| 01/18 | $13,196 | $15,201 |
| 02/18 | $12,617 | $14,641 |
| 03/18 | $12,358 | $14,347 |
| 04/18 | $12,537 | $14,402 |
| 05/18 | $12,657 | $14,808 |
| 06/18 | $12,807 | $14,905 |
| 07/18 | $13,236 | $15,400 |
| 08/18 | $13,495 | $15,940 |
| 09/18 | $13,525 | $15,967 |
| 10/18 | $12,507 | $14,791 |
| 11/18 | $12,867 | $15,087 |
| 12/18 | $11,563 | $13,683 |
| 01/19 | $12,630 | $14,858 |
| 02/19 | $13,119 | $15,380 |
| 03/19 | $13,391 | $15,605 |
| 04/19 | $13,880 | $16,228 |
| 05/19 | $13,300 | $15,178 |
| 06/19 | $14,016 | $16,244 |
| 07/19 | $14,425 | $16,485 |
| 08/19 | $14,425 | $16,149 |
| 09/19 | $14,436 | $16,433 |
| 10/19 | $14,709 | $16,786 |
| 11/19 | $15,402 | $17,424 |
| 12/19 | $15,791 | $17,928 |
| 01/20 | $16,054 | $17,908 |
| 02/20 | $14,901 | $16,442 |
| 03/20 | $13,197 | $14,181 |
| 04/20 | $14,864 | $16,059 |
| 05/20 | $16,042 | $16,918 |
| 06/20 | $16,142 | $17,304 |
| 07/20 | $17,132 | $18,287 |
| 08/20 | $18,348 | $19,612 |
| 09/20 | $17,658 | $18,898 |
| 10/20 | $17,283 | $18,490 |
| 11/20 | $19,050 | $20,739 |
| 12/20 | $19,830 | $21,672 |
| 01/21 | $19,450 | $21,576 |
| 02/21 | $19,562 | $22,250 |
| 03/21 | $20,352 | $23,048 |
| 04/21 | $21,579 | $24,236 |
| 05/21 | $21,396 | $24,346 |
| 06/21 | $21,904 | $24,947 |
| 07/21 | $22,905 | $25,369 |
| 08/21 | $23,653 | $26,092 |
| 09/21 | $22,764 | $24,921 |
| 10/21 | $24,428 | $26,607 |
| 11/21 | $24,062 | $26,202 |
| 12/21 | $24,737 | $27,234 |
| 01/22 | $22,093 | $25,631 |
| 02/22 | $21,508 | $24,986 |
| 03/22 | $21,810 | $25,796 |
| 04/22 | $19,940 | $23,481 |
| 05/22 | $19,789 | $23,450 |
| 06/22 | $18,052 | $21,488 |
| 07/22 | $19,846 | $23,504 |
| 08/22 | $18,637 | $22,627 |
| 09/22 | $16,617 | $20,528 |
| 10/22 | $17,712 | $22,212 |
| 11/22 | $18,921 | $23,371 |
| 12/22 | $18,130 | $22,003 |
| 01/23 | $19,362 | $23,518 |
| 02/23 | $18,869 | $22,968 |
| 03/23 | $18,718 | $23,583 |
| 04/23 | $18,983 | $23,834 |
| 05/23 | $18,699 | $23,927 |
| 06/23 | $20,007 | $25,560 |
| 07/23 | $20,329 | $26,477 |
| 08/23 | $19,912 | $25,966 |
| 09/23 | $18,907 | $24,729 |
| 10/23 | $18,243 | $24,073 |
| 11/23 | $19,874 | $26,318 |
| 12/23 | $20,825 | $27,714 |
| 01/24 | $21,414 | $28,021 |
| 02/24 | $22,610 | $29,538 |
| 03/24 | $22,933 | $30,491 |
| 04/24 | $21,718 | $29,149 |
| 05/24 | $22,135 | $30,526 |
| 06/24 | $22,249 | $31,471 |
| 07/24 | $22,097 | $32,056 |
| 08/24 | $22,477 | $32,754 |
| 09/24 | $22,705 | $33,432 |
| 10/24 | $22,439 | $33,186 |
Average Annual Total Returns for the Period Ended October 31, 2024 (%)
| AATR | 1 Year | 5 Years | 10 Years |
|---|
| Class A without sales load | 23.00% | 8.81% | 9.06% |
| Class A with sales load - 5.75% | 15.89% | 7.53% | 8.42% |
| Russell 3000 Index | 37.86% | 14.60% | 12.44% |
THE FUND'S PAST PERFORMANCE IS NOT A GOOD PREDICTOR OF THE FUND'S FUTURE PERFORMANCE.
Fund performance data shown above does not reflect the deduction of taxes that a shareholder would pay on Fund distributions or redemption of Fund shares.
Key Fund Statistics as of October 31, 2024
| Total Net Assets | $349,092,086 |
| Total Number of Portfolio Holdings | 32 |
| Portfolio Turnover Rate | 18% |
| Total Advisory Fees Paid | $2,388,889 |
abrdn U.S. Sustainable Leaders Fund
(GXXAX)
What did the Fund invest in?
The tables below show the investment makeup of the Fund as of October 31, 2024.
Sector Allocation (% of total net assets)
| Information Technology | 36.6% |
| Financials | 17.1% |
| Health Care | 17.0% |
| Industrials | 14.6% |
| Consumer Discretionary | 4.2% |
| Consumer Staples | 3.5% |
| Materials | 2.3% |
| Utilities | 2.2% |
| Other | 2.5% |
Ten Largest Holdings (% of total net assets)
| Microsoft Corp. | 12.4% |
| Mastercard, Inc., Class A | 6.8% |
| American Express Co. | 4.5% |
| TJX Cos., Inc. | 4.2% |
| Marvell Technology, Inc. | 4.1% |
| NVIDIA Corp. | 4.0% |
| LPL Financial Holdings, Inc. | 3.7% |
| Procter & Gamble Co. | 3.5% |
| Eli Lilly & Co. | 3.5% |
| Hubbell, Inc. | 3.4% |
Below is a summary of certain changes for the Fund since November 1, 2023. For more information, you may refer to the Fund's next prospectus, which we expect to be available by February 28, 2025 at abrdn.com/us/literature or upon request at 866-667-9231.
Effective February 29, 2024, the Fund's management fee changed from 0.75% on assets up to $500 million, 0.70% on assets of $500 million up to $2 billion and 0.65% on assets of $2 billion and more to 0.70% on assets up to $500 million, 0.65% on assets of $500 million up to $2 billion and 0.60% on assets of $2 billion and more.
Availability of Additional Information
You can find additional information, including the Fund's prospectus, financial information, fund holdings, and proxy voting information at abrdn.com/us/literature or call 866-667-9231. The QR code can be used to access the Fund's prospectus, financial information and holdings.
abrdn U.S. Sustainable Leaders Fund
(GXXAX)
abrdn U.S. Sustainable Leaders Fund
Annual Shareholder Report - October 31, 2024
This annual shareholder report contains important information about the abrdn U.S. Sustainable Leaders Fund (the "Fund") for the period of November 1, 2023 to October 31, 2024. You can find additional information about the Fund at abrdn.com/us/literature. You can also request this information by contacting us at 866-667-9231.
This report describes material changes to the Fund that occurred during the reporting period.
What were the Fund costs for the last year?
(based on a hypothetical $10,000 investment)
| Share Class | Costs of a $10,000 investment | Costs paid as a percentage of a $10,000 investment |
|---|
| C | $211 | 1.90% |
How did the fund perform last year and what affected its performance?
The following discussion compares the performance of the Fund to the Russell 3000 Index (the “Index”) to show how the Fund’s performance measures against the returns of similar investments for the reporting period.
What contributed to performance?
At the stock level, our overweight to American Express was a key contributor to returns as its robust results throughout the period led to increased investor confidence in the continuation of revenue growth and ongoing low credit losses. Within the semiconductor sector, our holding in Marvell Technology performed well due to increased demand for its artificial-Intelligence (AI), although this did not compensate for the negative effect from our underweight to NVIDIA. Our position in Tetra Tech helped performance as its shares benefited from strong results and an easing of investor concerns that a change of presidential administration may affect future project wins.
What detracted from performance?
The Fund’s underweight to NVIDIA hurt performance as its stock performed strongly and lifted the semiconductor sector’s performance. Also, within the broader information technology sector, our overweight to Microsoft Corporation was unfavorable. The shares rose over the period, but underperformed the broader index, held back by the potentially growing capital-expenditure burden of AI investment. Also, within the software sector, Nice Ltd contributed negatively, due to investor concern that its call center software could be partially displaced by AI deployments. However, we believe that Nice is well positioned to offer these AI enhancements to customers and can add to growth. Elsewhere, Lululemon Athletica was negative on the back of growing evidence that the active apparel category could be slowing following years of strong growth, and we sold our position.
abrdn U.S. Sustainable Leaders Fund
(GXXCX)
Total Return Based on $10,000 Investment
The following graph reflects a hypothetical $10,000 investment for the most recently completed 10 fiscal years as compared to a broad-based securities market index, which is also the performance benchmark.
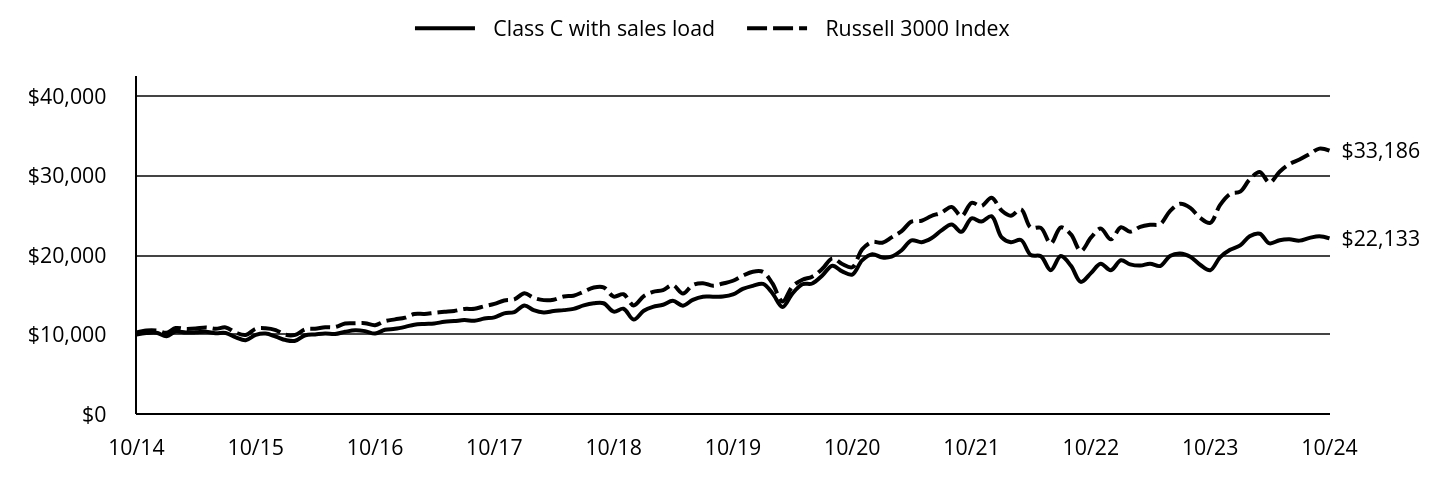
| Class C with sales load | Russell 3000 Index |
|---|
| 10/14 | $10,000 | $10,275 |
| 11/14 | $10,203 | $10,524 |
| 12/14 | $10,235 | $10,524 |
| 01/15 | $9,807 | $10,231 |
| 02/15 | $10,374 | $10,824 |
| 03/15 | $10,262 | $10,713 |
| 04/15 | $10,288 | $10,762 |
| 05/15 | $10,367 | $10,911 |
| 06/15 | $10,186 | $10,728 |
| 07/15 | $10,204 | $10,908 |
| 08/15 | $9,662 | $10,249 |
| 09/15 | $9,300 | $9,951 |
| 10/15 | $9,973 | $10,736 |
| 11/15 | $10,131 | $10,796 |
| 12/15 | $9,758 | $10,574 |
| 01/16 | $9,313 | $9,978 |
| 02/16 | $9,220 | $9,975 |
| 03/16 | $9,925 | $10,677 |
| 04/16 | $10,027 | $10,743 |
| 05/16 | $10,138 | $10,935 |
| 06/16 | $10,073 | $10,958 |
| 07/16 | $10,351 | $11,393 |
| 08/16 | $10,555 | $11,422 |
| 09/16 | $10,444 | $11,440 |
| 10/16 | $10,128 | $11,192 |
| 11/16 | $10,610 | $11,693 |
| 12/16 | $10,734 | $11,921 |
| 01/17 | $10,977 | $12,145 |
| 02/17 | $11,251 | $12,597 |
| 03/17 | $11,346 | $12,606 |
| 04/17 | $11,399 | $12,739 |
| 05/17 | $11,621 | $12,870 |
| 06/17 | $11,705 | $12,986 |
| 07/17 | $11,832 | $13,231 |
| 08/17 | $11,748 | $13,256 |
| 09/17 | $12,022 | $13,579 |
| 10/17 | $12,181 | $13,876 |
| 11/17 | $12,677 | $14,297 |
| 12/17 | $12,849 | $14,440 |
| 01/18 | $13,680 | $15,201 |
| 02/18 | $13,074 | $14,641 |
| 03/18 | $12,790 | $14,347 |
| 04/18 | $12,968 | $14,402 |
| 05/18 | $13,086 | $14,808 |
| 06/18 | $13,241 | $14,905 |
| 07/18 | $13,680 | $15,400 |
| 08/18 | $13,941 | $15,940 |
| 09/18 | $13,952 | $15,967 |
| 10/18 | $12,897 | $14,791 |
| 11/18 | $13,264 | $15,087 |
| 12/18 | $11,905 | $13,683 |
| 01/19 | $13,006 | $14,858 |
| 02/19 | $13,487 | $15,380 |
| 03/19 | $13,763 | $15,605 |
| 04/19 | $14,258 | $16,228 |
| 05/19 | $13,652 | $15,178 |
| 06/19 | $14,382 | $16,244 |
| 07/19 | $14,781 | $16,485 |
| 08/19 | $14,781 | $16,149 |
| 09/19 | $14,795 | $16,433 |
| 10/19 | $15,056 | $16,786 |
| 11/19 | $15,758 | $17,424 |
| 12/19 | $16,149 | $17,928 |
| 01/20 | $16,396 | $17,908 |
| 02/20 | $15,220 | $16,442 |
| 03/20 | $13,473 | $14,181 |
| 04/20 | $15,159 | $16,059 |
| 05/20 | $16,350 | $16,918 |
| 06/20 | $16,442 | $17,304 |
| 07/20 | $17,448 | $18,287 |
| 08/20 | $18,670 | $19,612 |
| 09/20 | $17,958 | $18,898 |
| 10/20 | $17,572 | $18,490 |
| 11/20 | $19,350 | $20,739 |
| 12/20 | $20,127 | $21,672 |
| 01/21 | $19,716 | $21,576 |
| 02/21 | $19,823 | $22,250 |
| 03/21 | $20,628 | $23,048 |
| 04/21 | $21,863 | $24,236 |
| 05/21 | $21,648 | $24,346 |
| 06/21 | $22,131 | $24,947 |
| 07/21 | $23,133 | $25,369 |
| 08/21 | $23,867 | $26,092 |
| 09/21 | $22,954 | $24,921 |
| 10/21 | $24,636 | $26,607 |
| 11/21 | $24,242 | $26,202 |
| 12/21 | $24,916 | $27,234 |
| 01/22 | $22,238 | $25,631 |
| 02/22 | $21,634 | $24,986 |
| 03/22 | $21,923 | $25,796 |
| 04/22 | $20,032 | $23,481 |
| 05/22 | $19,875 | $23,450 |
| 06/22 | $18,116 | $21,488 |
| 07/22 | $19,901 | $23,504 |
| 08/22 | $18,667 | $22,627 |
| 09/22 | $16,645 | $20,528 |
| 10/22 | $17,748 | $22,212 |
| 11/22 | $18,930 | $23,371 |
| 12/22 | $18,118 | $22,003 |
| 01/23 | $19,360 | $23,518 |
| 02/23 | $18,858 | $22,968 |
| 03/23 | $18,699 | $23,583 |
| 04/23 | $18,937 | $23,834 |
| 05/23 | $18,647 | $23,927 |
| 06/23 | $19,914 | $25,560 |
| 07/23 | $20,231 | $26,477 |
| 08/23 | $19,809 | $25,966 |
| 09/23 | $18,805 | $24,729 |
| 10/23 | $18,118 | $24,073 |
| 11/23 | $19,730 | $26,318 |
| 12/23 | $20,680 | $27,714 |
| 01/24 | $21,235 | $28,021 |
| 02/24 | $22,397 | $29,538 |
| 03/24 | $22,714 | $30,491 |
| 04/24 | $21,499 | $29,149 |
| 05/24 | $21,895 | $30,526 |
| 06/24 | $22,001 | $31,471 |
| 07/24 | $21,842 | $32,056 |
| 08/24 | $22,186 | $32,754 |
| 09/24 | $22,397 | $33,432 |
| 10/24 | $22,133 | $33,186 |
Average Annual Total Returns for the Period Ended October 31, 2024 (%)
| AATR | 1 Year | 5 Years | 10 Years |
|---|
| Class C without sales load | 22.16% | 8.01% | 8.27% |
| Class C with sales load - 1.00% | 21.16% | 8.01% | 8.27% |
| Russell 3000 Index | 37.86% | 14.60% | 12.44% |
THE FUND'S PAST PERFORMANCE IS NOT A GOOD PREDICTOR OF THE FUND'S FUTURE PERFORMANCE.
Fund performance data shown above does not reflect the deduction of taxes that a shareholder would pay on Fund distributions or redemption of Fund shares.
Key Fund Statistics as of October 31, 2024
| Total Net Assets | $349,092,086 |
| Total Number of Portfolio Holdings | 32 |
| Portfolio Turnover Rate | 18% |
| Total Advisory Fees Paid | $2,388,889 |
abrdn U.S. Sustainable Leaders Fund
(GXXCX)
What did the Fund invest in?
The tables below show the investment makeup of the Fund as of October 31, 2024.
Sector Allocation (% of total net assets)
| Information Technology | 36.6% |
| Financials | 17.1% |
| Health Care | 17.0% |
| Industrials | 14.6% |
| Consumer Discretionary | 4.2% |
| Consumer Staples | 3.5% |
| Materials | 2.3% |
| Utilities | 2.2% |
| Other | 2.5% |
Ten Largest Holdings (% of total net assets)
| Microsoft Corp. | 12.4% |
| Mastercard, Inc., Class A | 6.8% |
| American Express Co. | 4.5% |
| TJX Cos., Inc. | 4.2% |
| Marvell Technology, Inc. | 4.1% |
| NVIDIA Corp. | 4.0% |
| LPL Financial Holdings, Inc. | 3.7% |
| Procter & Gamble Co. | 3.5% |
| Eli Lilly & Co. | 3.5% |
| Hubbell, Inc. | 3.4% |
Below is a summary of certain changes for the Fund since November 1, 2023. For more information, you may refer to the Fund's next prospectus, which we expect to be available by February 28, 2025 at abrdn.com/us/literature or upon request at 866-667-9231.
Effective February 29, 2024, the Fund's management fee changed from 0.75% on assets up to $500 million, 0.70% on assets of $500 million up to $2 billion and 0.65% on assets of $2 billion and more to 0.70% on assets up to $500 million, 0.65% on assets of $500 million up to $2 billion and 0.60% on assets of $2 billion and more.
Availability of Additional Information
You can find additional information, including the Fund's prospectus, financial information, fund holdings, and proxy voting information at abrdn.com/us/literature or call 866-667-9231. The QR code can be used to access the Fund's prospectus, financial information and holdings.
abrdn U.S. Sustainable Leaders Fund
(GXXCX)
abrdn U.S. Sustainable Leaders Fund
Annual Shareholder Report - October 31, 2024
This annual shareholder report contains important information about the abrdn U.S. Sustainable Leaders Fund (the "Fund") for the period of November 1, 2023 to October 31, 2024. You can find additional information about the Fund at abrdn.com/us/literature. You can also request this information by contacting us at 866-667-9231.
This report describes material changes to the Fund that occurred during the reporting period.
What were the Fund costs for the last year?
(based on a hypothetical $10,000 investment)
| Share Class | Costs of a $10,000 investment | Costs paid as a percentage of a $10,000 investment |
|---|
| Institutional | $101 | 0.90% |
How did the fund perform last year and what affected its performance?
The following discussion compares the performance of the Fund to the Russell 3000 Index (the “Index”) to show how the Fund’s performance measures against the returns of similar investments for the reporting period.
What contributed to performance?
At the stock level, our overweight to American Express was a key contributor to returns as its robust results throughout the period led to increased investor confidence in the continuation of revenue growth and ongoing low credit losses. Within the semiconductor sector, our holding in Marvell Technology performed well due to increased demand for its artificial-Intelligence (AI), although this did not compensate for the negative effect from our underweight to NVIDIA. Our position in Tetra Tech helped performance as its shares benefited from strong results and an easing of investor concerns that a change of presidential administration may affect future project wins.
What detracted from performance?
The Fund’s underweight to NVIDIA hurt performance as its stock performed strongly and lifted the semiconductor sector’s performance. Also, within the broader information technology sector, our overweight to Microsoft Corporation was unfavorable. The shares rose over the period, but underperformed the broader index, held back by the potentially growing capital-expenditure burden of AI investment. Also, within the software sector, Nice Ltd contributed negatively, due to investor concern that its call center software could be partially displaced by AI deployments. However, we believe that Nice is well positioned to offer these AI enhancements to customers and can add to growth. Elsewhere, Lululemon Athletica was negative on the back of growing evidence that the active apparel category could be slowing following years of strong growth, and we sold our position.
abrdn U.S. Sustainable Leaders Fund
(GGLIX)
Total Return Based on $1,000,000 Investment
The following graph reflects a hypothetical $1,000,000 investment for the most recently completed 10 fiscal years as compared to a broad-based securities market index, which is also the performance benchmark.
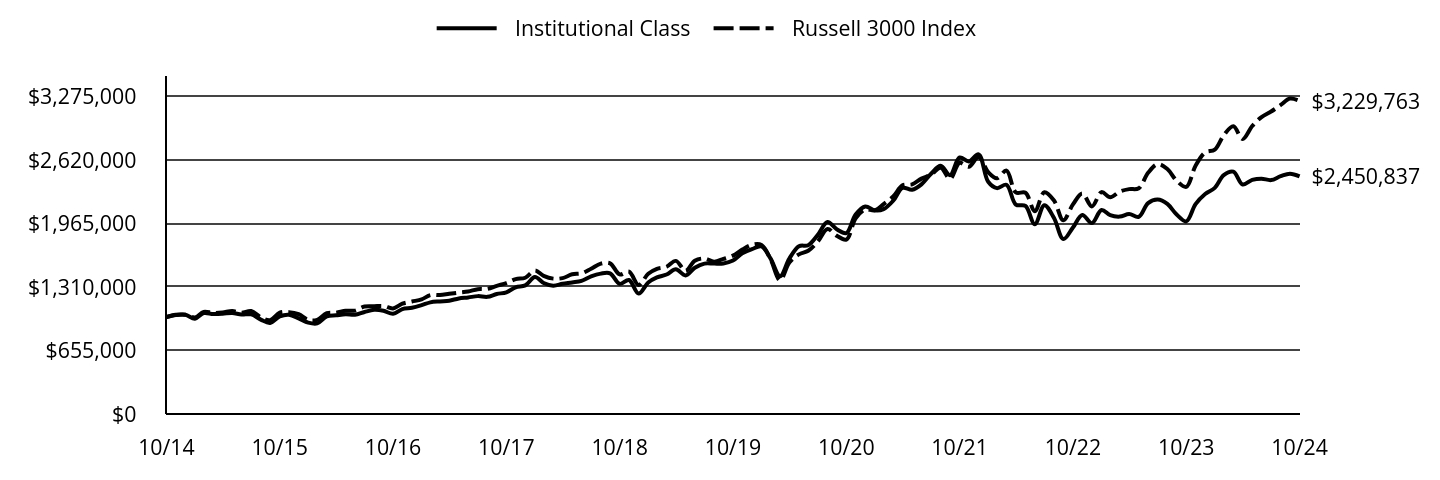
| Institutional Class | Russell 3000 Index |
|---|
| 10/14 | $1,000,000 | $1,000,000 |
| 11/14 | $1,020,729 | $1,024,234 |
| 12/14 | $1,024,703 | $1,024,222 |
| 01/15 | $983,532 | $995,717 |
| 02/15 | $1,040,714 | $1,053,370 |
| 03/15 | $1,030,542 | $1,042,661 |
| 04/15 | $1,033,600 | $1,047,377 |
| 05/15 | $1,042,774 | $1,061,864 |
| 06/15 | $1,025,471 | $1,044,098 |
| 07/15 | $1,027,770 | $1,061,561 |
| 08/15 | $974,121 | $997,475 |
| 09/15 | $939,187 | $968,409 |
| 10/15 | $1,006,821 | $1,044,899 |
| 11/15 | $1,023,730 | $1,050,692 |
| 12/15 | $987,097 | $1,029,126 |
| 01/16 | $942,560 | $971,057 |
| 02/16 | $934,463 | $970,744 |
| 03/16 | $1,006,531 | $1,039,091 |
| 04/16 | $1,017,868 | $1,045,530 |
| 05/16 | $1,029,205 | $1,064,235 |
| 06/16 | $1,023,536 | $1,066,424 |
| 07/16 | $1,052,688 | $1,108,747 |
| 08/16 | $1,074,551 | $1,111,575 |
| 09/16 | $1,064,834 | $1,113,322 |
| 10/16 | $1,033,254 | $1,089,235 |
| 11/16 | $1,082,649 | $1,137,981 |
| 12/16 | $1,096,003 | $1,160,186 |
| 01/17 | $1,122,336 | $1,182,023 |
| 02/17 | $1,151,393 | $1,225,984 |
| 03/17 | $1,161,381 | $1,226,818 |
| 04/17 | $1,168,646 | $1,239,822 |
| 05/17 | $1,192,255 | $1,252,511 |
| 06/17 | $1,202,243 | $1,263,814 |
| 07/17 | $1,215,864 | $1,287,643 |
| 08/17 | $1,208,599 | $1,290,124 |
| 09/17 | $1,237,657 | $1,321,587 |
| 10/17 | $1,254,909 | $1,350,427 |
| 11/17 | $1,306,668 | $1,391,433 |
| 12/17 | $1,326,613 | $1,405,340 |
| 01/18 | $1,412,979 | $1,479,417 |
| 02/18 | $1,351,720 | $1,424,886 |
| 03/18 | $1,323,601 | $1,396,283 |
| 04/18 | $1,342,681 | $1,401,590 |
| 05/18 | $1,356,741 | $1,441,157 |
| 06/18 | $1,372,809 | $1,450,582 |
| 07/18 | $1,420,009 | $1,498,721 |
| 08/18 | $1,448,128 | $1,551,352 |
| 09/18 | $1,451,140 | $1,553,920 |
| 10/18 | $1,342,681 | $1,439,501 |
| 11/18 | $1,381,847 | $1,468,332 |
| 12/18 | $1,242,053 | $1,331,675 |
| 01/19 | $1,356,826 | $1,445,979 |
| 02/19 | $1,409,099 | $1,496,832 |
| 03/19 | $1,438,645 | $1,518,689 |
| 04/19 | $1,492,054 | $1,579,333 |
| 05/19 | $1,429,554 | $1,477,131 |
| 06/19 | $1,507,964 | $1,580,880 |
| 07/19 | $1,551,146 | $1,604,380 |
| 08/19 | $1,551,146 | $1,571,674 |
| 09/19 | $1,553,418 | $1,599,258 |
| 10/19 | $1,582,964 | $1,633,685 |
| 11/19 | $1,657,964 | $1,695,785 |
| 12/19 | $1,700,317 | $1,744,748 |
| 01/20 | $1,729,009 | $1,742,843 |
| 02/20 | $1,605,509 | $1,600,150 |
| 03/20 | $1,422,129 | $1,380,101 |
| 04/20 | $1,603,014 | $1,562,882 |
| 05/20 | $1,730,257 | $1,646,463 |
| 06/20 | $1,741,484 | $1,684,104 |
| 07/20 | $1,847,520 | $1,779,733 |
| 08/20 | $1,979,753 | $1,908,665 |
| 09/20 | $1,906,152 | $1,839,168 |
| 10/20 | $1,866,232 | $1,799,473 |
| 11/20 | $2,057,097 | $2,018,385 |
| 12/20 | $2,141,022 | $2,109,188 |
| 01/21 | $2,100,704 | $2,099,806 |
| 02/21 | $2,113,216 | $2,165,440 |
| 03/21 | $2,199,413 | $2,243,056 |
| 04/21 | $2,332,880 | $2,358,684 |
| 05/21 | $2,313,416 | $2,369,451 |
| 06/21 | $2,369,027 | $2,427,879 |
| 07/21 | $2,478,858 | $2,468,936 |
| 08/21 | $2,559,494 | $2,539,345 |
| 09/21 | $2,463,565 | $2,425,410 |
| 10/21 | $2,645,691 | $2,589,427 |
| 11/21 | $2,605,373 | $2,550,012 |
| 12/21 | $2,678,589 | $2,650,429 |
| 01/22 | $2,395,016 | $2,494,488 |
| 02/22 | $2,329,993 | $2,431,653 |
| 03/22 | $2,364,311 | $2,510,527 |
| 04/22 | $2,160,211 | $2,285,227 |
| 05/22 | $2,145,761 | $2,282,163 |
| 06/22 | $1,957,917 | $2,091,240 |
| 07/22 | $2,152,986 | $2,287,436 |
| 08/22 | $2,021,133 | $2,202,070 |
| 09/22 | $1,804,390 | $1,997,874 |
| 10/22 | $1,923,599 | $2,161,712 |
| 11/22 | $2,053,645 | $2,274,545 |
| 12/22 | $1,968,946 | $2,141,363 |
| 01/23 | $2,104,923 | $2,288,844 |
| 02/23 | $2,050,532 | $2,235,348 |
| 03/23 | $2,036,028 | $2,295,119 |
| 04/23 | $2,063,223 | $2,319,572 |
| 05/23 | $2,034,215 | $2,328,597 |
| 06/23 | $2,175,631 | $2,487,606 |
| 07/23 | $2,211,891 | $2,576,779 |
| 08/23 | $2,166,566 | $2,527,037 |
| 09/23 | $2,057,784 | $2,406,664 |
| 10/23 | $1,987,076 | $2,342,866 |
| 11/23 | $2,164,753 | $2,561,335 |
| 12/23 | $2,269,024 | $2,697,193 |
| 01/24 | $2,332,658 | $2,727,085 |
| 02/24 | $2,463,563 | $2,874,703 |
| 03/24 | $2,499,926 | $2,967,434 |
| 04/24 | $2,367,203 | $2,836,862 |
| 05/24 | $2,414,474 | $2,970,895 |
| 06/24 | $2,427,201 | $3,062,866 |
| 07/24 | $2,412,656 | $3,119,802 |
| 08/24 | $2,452,655 | $3,187,716 |
| 09/24 | $2,478,109 | $3,253,656 |
| 10/24 | $2,450,837 | $3,229,763 |
Average Annual Total Returns for the Period Ended October 31, 2024 (%)
| AATR | 1 Year | 5 Years | 10 Years |
|---|
| Institutional Class | 23.34% | 9.14% | 9.38% |
| Russell 3000 Index | 37.86% | 14.60% | 12.44% |
THE FUND'S PAST PERFORMANCE IS NOT A GOOD PREDICTOR OF THE FUND'S FUTURE PERFORMANCE.
Fund performance data shown above does not reflect the deduction of taxes that a shareholder would pay on Fund distributions or redemption of Fund shares.
Key Fund Statistics as of October 31, 2024
| Total Net Assets | $349,092,086 |
| Total Number of Portfolio Holdings | 32 |
| Portfolio Turnover Rate | 18% |
| Total Advisory Fees Paid | $2,388,889 |
abrdn U.S. Sustainable Leaders Fund
(GGLIX)
What did the Fund invest in?
The tables below show the investment makeup of the Fund as of October 31, 2024.
Sector Allocation (% of total net assets)
| Information Technology | 36.6% |
| Financials | 17.1% |
| Health Care | 17.0% |
| Industrials | 14.6% |
| Consumer Discretionary | 4.2% |
| Consumer Staples | 3.5% |
| Materials | 2.3% |
| Utilities | 2.2% |
| Other | 2.5% |
Ten Largest Holdings (% of total net assets)
| Microsoft Corp. | 12.4% |
| Mastercard, Inc., Class A | 6.8% |
| American Express Co. | 4.5% |
| TJX Cos., Inc. | 4.2% |
| Marvell Technology, Inc. | 4.1% |
| NVIDIA Corp. | 4.0% |
| LPL Financial Holdings, Inc. | 3.7% |
| Procter & Gamble Co. | 3.5% |
| Eli Lilly & Co. | 3.5% |
| Hubbell, Inc. | 3.4% |
Below is a summary of certain changes for the Fund since November 1, 2023. For more information, you may refer to the Fund's next prospectus, which we expect to be available by February 28, 2025 at abrdn.com/us/literature or upon request at 866-667-9231.
Effective February 29, 2024, the Fund's management fee changed from 0.75% on assets up to $500 million, 0.70% on assets of $500 million up to $2 billion and 0.65% on assets of $2 billion and more to 0.70% on assets up to $500 million, 0.65% on assets of $500 million up to $2 billion and 0.60% on assets of $2 billion and more.
Availability of Additional Information
You can find additional information, including the Fund's prospectus, financial information, fund holdings, and proxy voting information at abrdn.com/us/literature or call 866-667-9231. The QR code can be used to access the Fund's prospectus, financial information and holdings.
abrdn U.S. Sustainable Leaders Fund
(GGLIX)
abrdn U.S. Sustainable Leaders Fund
Annual Shareholder Report - October 31, 2024
This annual shareholder report contains important information about the abrdn U.S. Sustainable Leaders Fund (the "Fund") for the period of November 1, 2023 to October 31, 2024. You can find additional information about the Fund at abrdn.com/us/literature. You can also request this information by contacting us at 866-667-9231.
This report describes material changes to the Fund that occurred during the reporting period.
What were the Fund costs for the last year?
(based on a hypothetical $10,000 investment)
| Share Class | Costs of a $10,000 investment | Costs paid as a percentage of a $10,000 investment |
|---|
| Institutional Service | $107 | 0.96% |
How did the fund perform last year and what affected its performance?
The following discussion compares the performance of the Fund to the Russell 3000 Index (the “Index”) to show how the Fund’s performance measures against the returns of similar investments for the reporting period.
What contributed to performance?
At the stock level, our overweight to American Express was a key contributor to returns as its robust results throughout the period led to increased investor confidence in the continuation of revenue growth and ongoing low credit losses. Within the semiconductor sector, our holding in Marvell Technology performed well due to increased demand for its artificial-Intelligence (AI), although this did not compensate for the negative effect from our underweight to NVIDIA. Our position in Tetra Tech helped performance as its shares benefited from strong results and an easing of investor concerns that a change of presidential administration may affect future project wins.
What detracted from performance?
The Fund’s underweight to NVIDIA hurt performance as its stock performed strongly and lifted the semiconductor sector’s performance. Also, within the broader information technology sector, our overweight to Microsoft Corporation was unfavorable. The shares rose over the period, but underperformed the broader index, held back by the potentially growing capital-expenditure burden of AI investment. Also, within the software sector, Nice Ltd contributed negatively, due to investor concern that its call center software could be partially displaced by AI deployments. However, we believe that Nice is well positioned to offer these AI enhancements to customers and can add to growth. Elsewhere, Lululemon Athletica was negative on the back of growing evidence that the active apparel category could be slowing following years of strong growth, and we sold our position.
abrdn U.S. Sustainable Leaders Fund
(GXXIX)
Institutional Service Class
Total Return Based on $1,000,000 Investment
The following graph reflects a hypothetical $1,000,000 investment for the most recently completed 10 fiscal years as compared to a broad-based securities market index, which is also the performance benchmark.
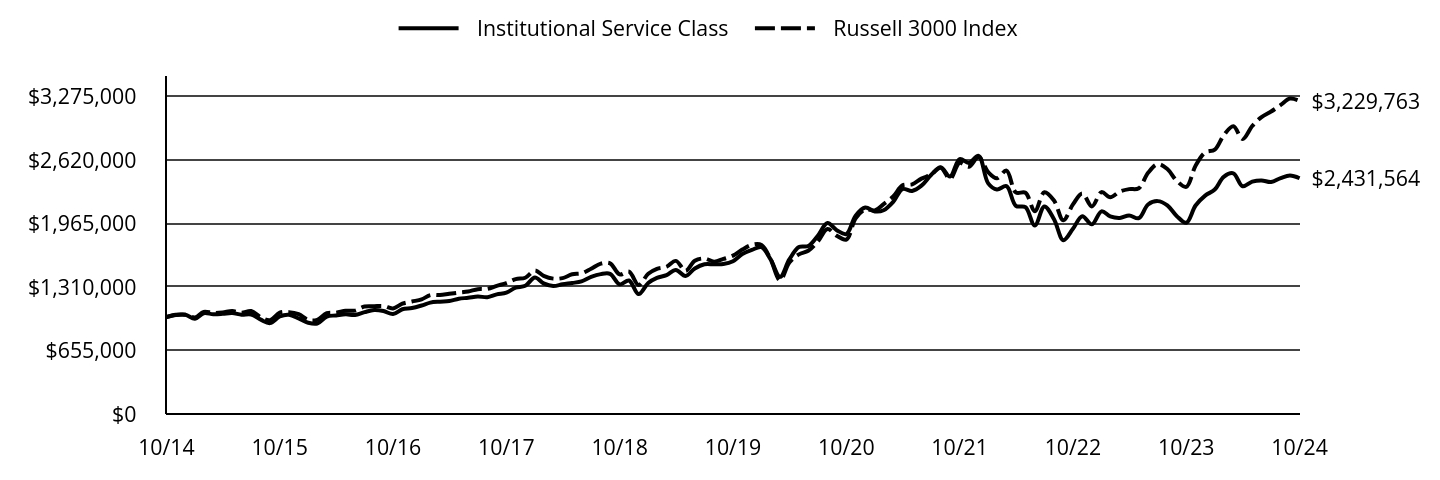
| Institutional Service Class | Russell 3000 Index |
|---|
| 10/14 | $1,000,000 | $1,000,000 |
| 11/14 | $1,020,744 | $1,024,234 |
| 12/14 | $1,024,420 | $1,024,222 |
| 01/15 | $983,229 | $995,717 |
| 02/15 | $1,039,675 | $1,053,370 |
| 03/15 | $1,029,278 | $1,042,661 |
| 04/15 | $1,033,102 | $1,047,377 |
| 05/15 | $1,041,513 | $1,061,864 |
| 06/15 | $1,024,730 | $1,044,098 |
| 07/15 | $1,027,029 | $1,061,561 |
| 08/15 | $973,378 | $997,475 |
| 09/15 | $937,470 | $968,409 |
| 10/15 | $1,005,859 | $1,044,899 |
| 11/15 | $1,022,765 | $1,050,692 |
| 12/15 | $985,895 | $1,029,126 |
| 01/16 | $941,376 | $971,057 |
| 02/16 | $933,281 | $970,744 |
| 03/16 | $1,005,321 | $1,039,091 |
| 04/16 | $1,016,654 | $1,045,530 |
| 05/16 | $1,027,986 | $1,064,235 |
| 06/16 | $1,022,320 | $1,066,424 |
| 07/16 | $1,050,650 | $1,108,747 |
| 08/16 | $1,072,505 | $1,111,575 |
| 09/16 | $1,061,982 | $1,113,322 |
| 10/16 | $1,031,223 | $1,089,235 |
| 11/16 | $1,080,599 | $1,137,981 |
| 12/16 | $1,093,298 | $1,160,186 |
| 01/17 | $1,119,609 | $1,182,023 |
| 02/17 | $1,148,643 | $1,225,984 |
| 03/17 | $1,158,623 | $1,226,818 |
| 04/17 | $1,164,974 | $1,239,822 |
| 05/17 | $1,189,471 | $1,252,511 |
| 06/17 | $1,198,544 | $1,263,814 |
| 07/17 | $1,212,154 | $1,287,643 |
| 08/17 | $1,204,896 | $1,290,124 |
| 09/17 | $1,233,929 | $1,321,587 |
| 10/17 | $1,251,168 | $1,350,427 |
| 11/17 | $1,302,884 | $1,391,433 |
| 12/17 | $1,322,428 | $1,405,340 |
| 01/18 | $1,408,717 | $1,479,417 |
| 02/18 | $1,347,512 | $1,424,886 |
| 03/18 | $1,319,418 | $1,396,283 |
| 04/18 | $1,338,482 | $1,401,590 |
| 05/18 | $1,351,526 | $1,441,157 |
| 06/18 | $1,367,579 | $1,450,582 |
| 07/18 | $1,414,737 | $1,498,721 |
| 08/18 | $1,442,831 | $1,551,352 |
| 09/18 | $1,445,841 | $1,553,920 |
| 10/18 | $1,337,479 | $1,439,501 |
| 11/18 | $1,376,610 | $1,468,332 |
| 12/18 | $1,236,553 | $1,331,675 |
| 01/19 | $1,351,238 | $1,445,979 |
| 02/19 | $1,403,471 | $1,496,832 |
| 03/19 | $1,432,994 | $1,518,689 |
| 04/19 | $1,486,362 | $1,579,333 |
| 05/19 | $1,423,910 | $1,477,131 |
| 06/19 | $1,501,124 | $1,580,880 |
| 07/19 | $1,544,272 | $1,604,380 |
| 08/19 | $1,544,272 | $1,571,674 |
| 09/19 | $1,546,543 | $1,599,258 |
| 10/19 | $1,576,066 | $1,633,685 |
| 11/19 | $1,649,873 | $1,695,785 |
| 12/19 | $1,693,123 | $1,744,748 |
| 01/20 | $1,720,552 | $1,742,843 |
| 02/20 | $1,597,121 | $1,600,150 |
| 03/20 | $1,415,092 | $1,380,101 |
| 04/20 | $1,594,628 | $1,562,882 |
| 05/20 | $1,721,799 | $1,646,463 |
| 06/20 | $1,733,020 | $1,684,104 |
| 07/20 | $1,838,996 | $1,779,733 |
| 08/20 | $1,969,908 | $1,908,665 |
| 09/20 | $1,896,348 | $1,839,168 |
| 10/20 | $1,856,451 | $1,799,473 |
| 11/20 | $2,045,961 | $2,018,385 |
| 12/20 | $2,129,858 | $2,109,188 |
| 01/21 | $2,089,541 | $2,099,806 |
| 02/21 | $2,102,053 | $2,165,440 |
| 03/21 | $2,188,248 | $2,243,056 |
| 04/21 | $2,320,322 | $2,358,684 |
| 05/21 | $2,300,858 | $2,369,451 |
| 06/21 | $2,355,078 | $2,427,879 |
| 07/21 | $2,464,907 | $2,468,936 |
| 08/21 | $2,544,151 | $2,539,345 |
| 09/21 | $2,449,615 | $2,425,410 |
| 10/21 | $2,628,956 | $2,589,427 |
| 11/21 | $2,590,029 | $2,550,012 |
| 12/21 | $2,663,313 | $2,650,429 |
| 01/22 | $2,379,250 | $2,494,488 |
| 02/22 | $2,315,924 | $2,431,653 |
| 03/22 | $2,350,301 | $2,510,527 |
| 04/22 | $2,147,658 | $2,285,227 |
| 05/22 | $2,133,183 | $2,282,163 |
| 06/22 | $1,945,015 | $2,091,240 |
| 07/22 | $2,140,421 | $2,287,436 |
| 08/22 | $2,008,341 | $2,202,070 |
| 09/22 | $1,793,032 | $1,997,874 |
| 10/22 | $1,910,638 | $2,161,712 |
| 11/22 | $2,040,908 | $2,274,545 |
| 12/22 | $1,956,062 | $2,141,363 |
| 01/23 | $2,090,462 | $2,288,844 |
| 02/23 | $2,037,792 | $2,235,348 |
| 03/23 | $2,021,446 | $2,295,119 |
| 04/23 | $2,048,689 | $2,319,572 |
| 05/23 | $2,019,630 | $2,328,597 |
| 06/23 | $2,161,295 | $2,487,606 |
| 07/23 | $2,195,803 | $2,576,779 |
| 08/23 | $2,152,213 | $2,527,037 |
| 09/23 | $2,043,241 | $2,406,664 |
| 10/23 | $1,972,408 | $2,342,866 |
| 11/23 | $2,150,397 | $2,561,335 |
| 12/23 | $2,253,067 | $2,697,193 |
| 01/24 | $2,314,994 | $2,727,085 |
| 02/24 | $2,446,135 | $2,874,703 |
| 03/24 | $2,482,563 | $2,967,434 |
| 04/24 | $2,349,601 | $2,836,862 |
| 05/24 | $2,396,957 | $2,970,895 |
| 06/24 | $2,409,707 | $3,062,866 |
| 07/24 | $2,393,314 | $3,119,802 |
| 08/24 | $2,433,385 | $3,187,716 |
| 09/24 | $2,458,885 | $3,253,656 |
| 10/24 | $2,431,564 | $3,229,763 |
Average Annual Total Returns for the Period Ended October 31, 2024 (%)
| AATR | 1 Year | 5 Years | 10 Years |
|---|
| Institutional Service Class | 23.28% | 9.06% | 9.29% |
| Russell 3000 Index | 37.86% | 14.60% | 12.44% |
THE FUND'S PAST PERFORMANCE IS NOT A GOOD PREDICTOR OF THE FUND'S FUTURE PERFORMANCE.
Fund performance data shown above does not reflect the deduction of taxes that a shareholder would pay on Fund distributions or redemption of Fund shares.
Key Fund Statistics as of October 31, 2024
| Total Net Assets | $349,092,086 |
| Total Number of Portfolio Holdings | 32 |
| Portfolio Turnover Rate | 18% |
| Total Advisory Fees Paid | $2,388,889 |
abrdn U.S. Sustainable Leaders Fund
(GXXIX)
Institutional Service Class
What did the Fund invest in?
The tables below show the investment makeup of the Fund as of October 31, 2024.
Sector Allocation (% of total net assets)
| Information Technology | 36.6% |
| Financials | 17.1% |
| Health Care | 17.0% |
| Industrials | 14.6% |
| Consumer Discretionary | 4.2% |
| Consumer Staples | 3.5% |
| Materials | 2.3% |
| Utilities | 2.2% |
| Other | 2.5% |
Ten Largest Holdings (% of total net assets)
| Microsoft Corp. | 12.4% |
| Mastercard, Inc., Class A | 6.8% |
| American Express Co. | 4.5% |
| TJX Cos., Inc. | 4.2% |
| Marvell Technology, Inc. | 4.1% |
| NVIDIA Corp. | 4.0% |
| LPL Financial Holdings, Inc. | 3.7% |
| Procter & Gamble Co. | 3.5% |
| Eli Lilly & Co. | 3.5% |
| Hubbell, Inc. | 3.4% |
Below is a summary of certain changes for the Fund since November 1, 2023. For more information, you may refer to the Fund's next prospectus, which we expect to be available by February 28, 2025 at abrdn.com/us/literature or upon request at 866-667-9231.
Effective February 29, 2024, the Fund's management fee changed from 0.75% on assets up to $500 million, 0.70% on assets of $500 million up to $2 billion and 0.65% on assets of $2 billion and more to 0.70% on assets up to $500 million, 0.65% on assets of $500 million up to $2 billion and 0.60% on assets of $2 billion and more.
Availability of Additional Information
You can find additional information, including the Fund's prospectus, financial information, fund holdings, and proxy voting information at abrdn.com/us/literature or call 866-667-9231. The QR code can be used to access the Fund's prospectus, financial information and holdings.
abrdn U.S. Sustainable Leaders Fund
(GXXIX)
Institutional Service Class
abrdn Ultra Short Municipal Income Fund
Annual Shareholder Report - October 31, 2024
This annual shareholder report contains important information about the abrdn Ultra Short Municipal Income Fund (the "Fund") for the period of November 1, 2023 to October 31, 2024. You can find additional information about the Fund at abrdn.com/us/literature. You can also request this information by contacting us at 866-667-9231.
This report describes material changes to the Fund that occurred during the reporting period.
What were the Fund costs for the last year?
(based on a hypothetical $10,000 investment)
| Share Class | Costs of a $10,000 investment | Costs paid as a percentage of a $10,000 investment |
|---|
| A | $71 | 0.70% |
How did the fund perform last year and what affected its performance?
The following discussion compares the performance of the Fund to the Bloomberg Barclays Municipal Bond 1 Year (1-2) Index to show how the Fund’s performance measures against the returns of similar investments for the reporting period.
What contributed to performance?
The Fund’s exposures to state and local general obligation bonds and dedicated tax bonds contributed favorably to returns. Among individual holdings, Maryland Industrial Development Financing Authority’s bonds and Pennsylvania Higher Education bonds were notable contributors to performance. These issuers have continued to provide relatively attractive opportunities to investors through variable-rate demand bonds while maintaining stability in their balance sheet management. In terms of ratings, AA- and AAA-rated bonds added to relative performance.
What detracted from performance?
The Fund’s holdings in the other revenue, multi-family and public power sectors hurt performance. Within individual holdings, Black Belt Energy Gas District’s revenue bonds and New York Transnational Development Corporation’s bonds were among the negative contributors. Our allocation to short variable-rate securities led to the Fund’s underperformance during the period. While these bonds generally provide stability during volatile periods, this allocation underperformed, particularly during the strong bond performance in late 2023. In terms of ratings, A-rated bonds detracted from performance.
abrdn Ultra Short Municipal Income Fund
(ATOAX)
Total Return Based on $10,000 Investment
The following graph reflects a hypothetical $10,000 investment for the most recently completed 10 fiscal years as compared to a broad-based securities market index and an additional performance benchmark.
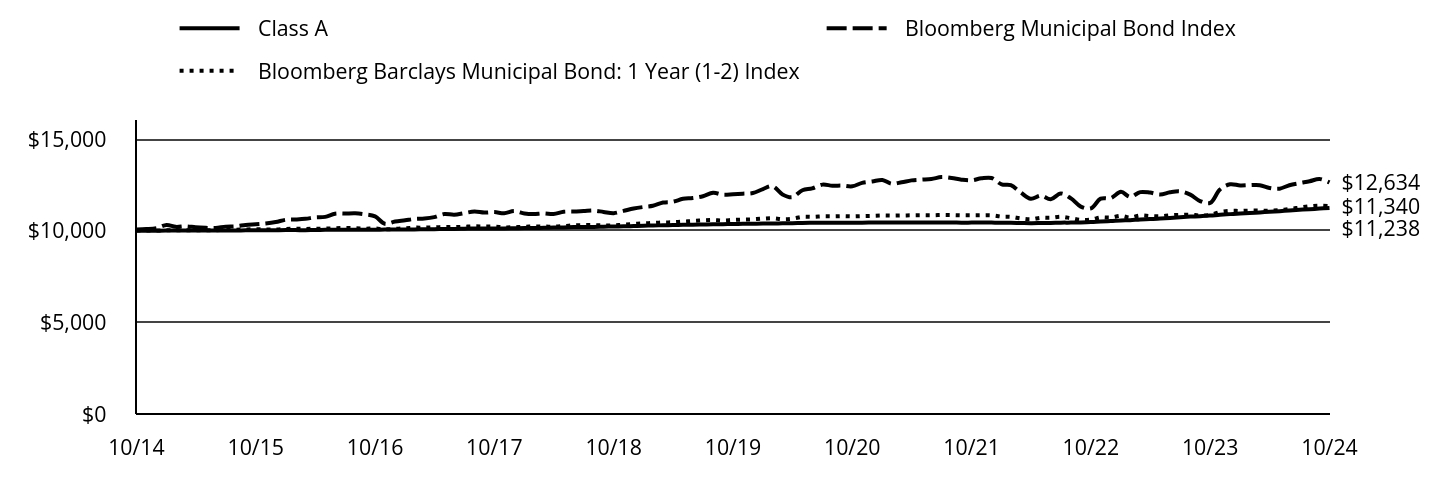
| Class A | Bloomberg Municipal Bond Index | Bloomberg Barclays Municipal Bond: 1 Year (1-2) Index |
|---|
| 10/14 | $10,000 | $10,069 | $10,004 |
| 11/14 | $10,002 | $10,086 | $10,010 |
| 12/14 | $10,003 | $10,137 | $10,004 |
| 01/15 | $10,005 | $10,317 | $10,023 |
| 02/15 | $10,007 | $10,210 | $10,027 |
| 03/15 | $10,008 | $10,240 | $10,027 |
| 04/15 | $10,010 | $10,186 | $10,027 |
| 05/15 | $10,012 | $10,158 | $10,027 |
| 06/15 | $10,005 | $10,148 | $10,027 |
| 07/15 | $10,008 | $10,222 | $10,040 |
| 08/15 | $10,011 | $10,242 | $10,057 |
| 09/15 | $10,024 | $10,316 | $10,069 |
| 10/15 | $10,026 | $10,357 | $10,080 |
| 11/15 | $10,029 | $10,398 | $10,067 |
| 12/15 | $10,030 | $10,472 | $10,065 |
| 01/16 | $10,032 | $10,596 | $10,096 |
| 02/16 | $10,034 | $10,613 | $10,112 |
| 03/16 | $10,027 | $10,647 | $10,098 |
| 04/16 | $10,041 | $10,725 | $10,109 |
| 05/16 | $10,045 | $10,754 | $10,114 |
| 06/16 | $10,049 | $10,925 | $10,132 |
| 07/16 | $10,052 | $10,932 | $10,150 |
| 08/16 | $10,056 | $10,947 | $10,134 |
| 09/16 | $10,051 | $10,892 | $10,113 |
| 10/16 | $10,056 | $10,778 | $10,120 |
| 11/16 | $10,059 | $10,376 | $10,076 |
| 12/16 | $10,063 | $10,497 | $10,096 |
| 01/17 | $10,067 | $10,567 | $10,132 |
| 02/17 | $10,072 | $10,640 | $10,166 |
| 03/17 | $10,077 | $10,663 | $10,166 |
| 04/17 | $10,084 | $10,741 | $10,182 |
| 05/17 | $10,090 | $10,911 | $10,201 |
| 06/17 | $10,096 | $10,872 | $10,192 |
| 07/17 | $10,111 | $10,960 | $10,217 |
| 08/17 | $10,116 | $11,043 | $10,240 |
| 09/17 | $10,122 | $10,987 | $10,227 |
| 10/17 | $10,118 | $11,014 | $10,228 |
| 11/17 | $10,124 | $10,955 | $10,182 |
| 12/17 | $10,132 | $11,069 | $10,189 |
| 01/18 | $10,141 | $10,939 | $10,217 |
| 02/18 | $10,148 | $10,906 | $10,235 |
| 03/18 | $10,157 | $10,947 | $10,227 |
| 04/18 | $10,168 | $10,908 | $10,218 |
| 05/18 | $10,179 | $11,033 | $10,252 |
| 06/18 | $10,198 | $11,042 | $10,288 |
| 07/18 | $10,206 | $11,069 | $10,309 |
| 08/18 | $10,206 | $11,097 | $10,306 |
| 09/18 | $10,217 | $11,025 | $10,286 |
| 10/18 | $10,228 | $10,957 | $10,295 |
| 11/18 | $10,240 | $11,079 | $10,327 |
| 12/18 | $10,252 | $11,211 | $10,366 |
| 01/19 | $10,273 | $11,296 | $10,398 |
| 02/19 | $10,284 | $11,357 | $10,422 |
| 03/19 | $10,295 | $11,536 | $10,450 |
| 04/19 | $10,308 | $11,579 | $10,458 |
| 05/19 | $10,319 | $11,739 | $10,497 |
| 06/19 | $10,330 | $11,782 | $10,529 |
| 07/19 | $10,340 | $11,877 | $10,564 |
| 08/19 | $10,349 | $12,065 | $10,579 |
| 09/19 | $10,358 | $11,968 | $10,557 |
| 10/19 | $10,367 | $11,989 | $10,587 |
| 11/19 | $10,374 | $12,019 | $10,606 |
| 12/19 | $10,381 | $12,056 | $10,621 |
| 01/20 | $10,387 | $12,273 | $10,659 |
| 02/20 | $10,393 | $12,431 | $10,680 |
| 03/20 | $10,403 | $11,980 | $10,627 |
| 04/20 | $10,406 | $11,830 | $10,652 |
| 05/20 | $10,424 | $12,206 | $10,757 |
| 06/20 | $10,430 | $12,307 | $10,757 |
| 07/20 | $10,434 | $12,514 | $10,784 |
| 08/20 | $10,436 | $12,455 | $10,785 |
| 09/20 | $10,437 | $12,458 | $10,794 |
| 10/20 | $10,438 | $12,420 | $10,785 |
| 11/20 | $10,439 | $12,608 | $10,798 |
| 12/20 | $10,449 | $12,685 | $10,808 |
| 01/21 | $10,449 | $12,765 | $10,826 |
| 02/21 | $10,450 | $12,563 | $10,822 |
| 03/21 | $10,450 | $12,640 | $10,830 |
| 04/21 | $10,450 | $12,746 | $10,838 |
| 05/21 | $10,450 | $12,784 | $10,842 |
| 06/21 | $10,450 | $12,819 | $10,841 |
| 07/21 | $10,450 | $12,926 | $10,855 |
| 08/21 | $10,451 | $12,878 | $10,853 |
| 09/21 | $10,440 | $12,785 | $10,841 |
| 10/21 | $10,441 | $12,748 | $10,839 |
| 11/21 | $10,441 | $12,856 | $10,842 |
| 12/21 | $10,441 | $12,877 | $10,841 |
| 01/22 | $10,431 | $12,525 | $10,770 |
| 02/22 | $10,431 | $12,480 | $10,756 |
| 03/22 | $10,421 | $12,075 | $10,666 |
| 04/22 | $10,412 | $11,741 | $10,623 |
| 05/22 | $10,416 | $11,916 | $10,704 |
| 06/22 | $10,422 | $11,720 | $10,707 |
| 07/22 | $10,439 | $12,030 | $10,765 |
| 08/22 | $10,441 | $11,766 | $10,680 |
| 09/22 | $10,453 | $11,315 | $10,588 |
| 10/22 | $10,472 | $11,221 | $10,602 |
| 11/22 | $10,501 | $11,746 | $10,724 |
| 12/22 | $10,527 | $11,779 | $10,718 |
| 01/23 | $10,559 | $12,118 | $10,808 |
| 02/23 | $10,575 | $11,844 | $10,717 |
| 03/23 | $10,614 | $12,106 | $10,832 |
| 04/23 | $10,632 | $12,079 | $10,801 |
| 05/23 | $10,662 | $11,974 | $10,789 |
| 06/23 | $10,693 | $12,094 | $10,840 |
| 07/23 | $10,735 | $12,142 | $10,864 |
| 08/23 | $10,768 | $11,967 | $10,875 |
| 09/23 | $10,790 | $11,616 | $10,831 |
| 10/23 | $10,824 | $11,517 | $10,860 |
| 11/23 | $10,868 | $12,249 | $11,018 |
| 12/23 | $10,904 | $12,533 | $11,082 |
| 01/24 | $10,934 | $12,469 | $11,078 |
| 02/24 | $10,965 | $12,485 | $11,095 |
| 03/24 | $10,998 | $12,485 | $11,095 |
| 04/24 | $11,032 | $12,330 | $11,096 |
| 05/24 | $11,066 | $12,294 | $11,123 |
| 06/24 | $11,100 | $12,482 | $11,186 |
| 07/24 | $11,140 | $12,596 | $11,259 |
| 08/24 | $11,173 | $12,696 | $11,333 |
| 09/24 | $11,205 | $12,821 | $11,369 |
| 10/24 | $11,238 | $12,634 | $11,340 |
Average Annual Total Returns for the Period Ended October 31, 2024 (%)
| AATR | 1 Year | 5 Years | 10 Years |
|---|
| Class A | 3.82% | 1.63% | 1.17% |
| Bloomberg Municipal Bond Index | 9.70% | 1.05% | 2.30% |
| Bloomberg Barclays Municipal Bond: 1 Year (1-2) Index | 4.42% | 1.38% | 1.26% |
THE FUND'S PAST PERFORMANCE IS NOT A GOOD PREDICTOR OF THE FUND'S FUTURE PERFORMANCE.
Fund performance data shown above does not reflect the deduction of taxes that a shareholder would pay on Fund distributions or redemption of Fund shares.
In accordance with regulatory changes requiring the Fund's primary benchmark to represent the overall applicable market, the Fund's primary prospectus benchmark changed to the Bloomberg Municipal Bond Index effective as of February 29, 2024.
Key Fund Statistics as of October 31, 2024
| Total Net Assets | $723,228,512 |
| Total Number of Portfolio Holdings | 86 |
| Portfolio Turnover Rate | 226% |
| Total Advisory Fees Paid | $1,274,112 |
abrdn Ultra Short Municipal Income Fund
(ATOAX)
What did the Fund invest in?
The tables below show the investment makeup of the Fund as of October 31, 2024.
Credit Quality Allocation (% of total net assets)
| AAA | 5.6% |
| AA | 14.5% |
| A | 44.6% |
| BBB | 28.5% |
| Not Rated | 6.9% |
Ratings and portfolio credit quality will vary over time. Credit quality ratings on the underlying securities of the Fund are received from S&P, Moody’s and Fitch and are an indication of the issuer’s creditworthiness. The chart reflects the highest security rating provided by one or more of these rating agencies.
Ten Largest Holdings (% of total net assets)
| Mississippi Business Finance Corp., 4.390%, due 11/01/32 | 8.1% |
| Maryland Industrial Development Financing Authority, 5.260%, due 03/01/30 | 6.9% |
| Harris County Cultural Education Facilities Finance Corp., 3.770%, due 11/15/46 | 4.1% |
| JPMorgan Chase Putters/Drivers Trust, 4.550%, due 03/20/27 | 3.7% |
| Health Care Authority for Baptist Health, 4.660%, due 11/01/42 | 3.5% |
| Arkansas Development Finance Authority, 4.680%, due 09/01/44 | 3.5% |
| Iowa Finance Authority, 3.500%, due 12/01/46 | 3.5% |
| Florida Insurance Assistance Interlocal Agency, Inc., 3.990%, due 09/01/32 | 3.5% |
| County of Meade, 4.600%, due 08/01/61 | 3.4% |
| Central Bradford Progress Authority, 3.860%, due 12/01/41 | 3.2% |
Below is a summary of certain changes for the Fund since November 1, 2023. For more information, you may refer to the Fund's next prospectus, which we expect to be available by February 28, 2025 at abrdn.com/us/literature or upon request at 866-667-9231.
Effective February 29, 2004, the Fund's management fee changed from 0.65% on assets up to $250 million and 0.60% on assets of $250 million and more to 0.55% on assets up to $250 million and 0.40% on assets of $250 million and more.
Availability of Additional Information
You can find additional information, including the Fund's prospectus, financial information, fund holdings, and proxy voting information at abrdn.com/us/literature or call 866-667-9231. The QR code can be used to access the Fund's prospectus, financial information and holdings.
abrdn Ultra Short Municipal Income Fund
(ATOAX)
abrdn Ultra Short Municipal Income Fund
Annual Shareholder Report - October 31, 2024
This annual shareholder report contains important information about the abrdn Ultra Short Municipal Income Fund (the "Fund") for the period of November 1, 2023 to October 31, 2024. You can find additional information about the Fund at abrdn.com/us/literature. You can also request this information by contacting us at 866-667-9231.
This report describes material changes to the Fund that occurred during the reporting period.
What were the Fund costs for the last year?
(based on a hypothetical $10,000 investment)
| Share Class | Costs of a $10,000 investment | Costs paid as a percentage of a $10,000 investment |
|---|
| A1 | $71 | 0.70% |
How did the fund perform last year and what affected its performance?
The following discussion compares the performance of the Fund to the Bloomberg Barclays Municipal Bond 1 Year (1-2) Index to show how the Fund’s performance measures against the returns of similar investments for the reporting period.
What contributed to performance?
The Fund’s exposures to state and local general obligation bonds and dedicated tax bonds contributed favorably to returns. Among individual holdings, Maryland Industrial Development Financing Authority’s bonds and Pennsylvania Higher Education bonds were notable contributors to performance. These issuers have continued to provide relatively attractive opportunities to investors through variable-rate demand bonds while maintaining stability in their balance sheet management. In terms of ratings, AA- and AAA-rated bonds added to relative performance.
What detracted from performance?
The Fund’s holdings in the other revenue, multi-family and public power sectors hurt performance. Within individual holdings, Black Belt Energy Gas District’s revenue bonds and New York Transnational Development Corporation’s bonds were among the negative contributors. Our allocation to short variable-rate securities led to the Fund’s underperformance during the period. While these bonds generally provide stability during volatile periods, this allocation underperformed, particularly during the strong bond performance in late 2023. In terms of ratings, A-rated bonds detracted from performance.
abrdn Ultra Short Municipal Income Fund
(ATOBX)
Total Return Based on $10,000 Investment
The following graph reflects a hypothetical $10,000 investment for the most recently completed 10 fiscal years as compared to a broad-based securities market index and an additional performance benchmark.
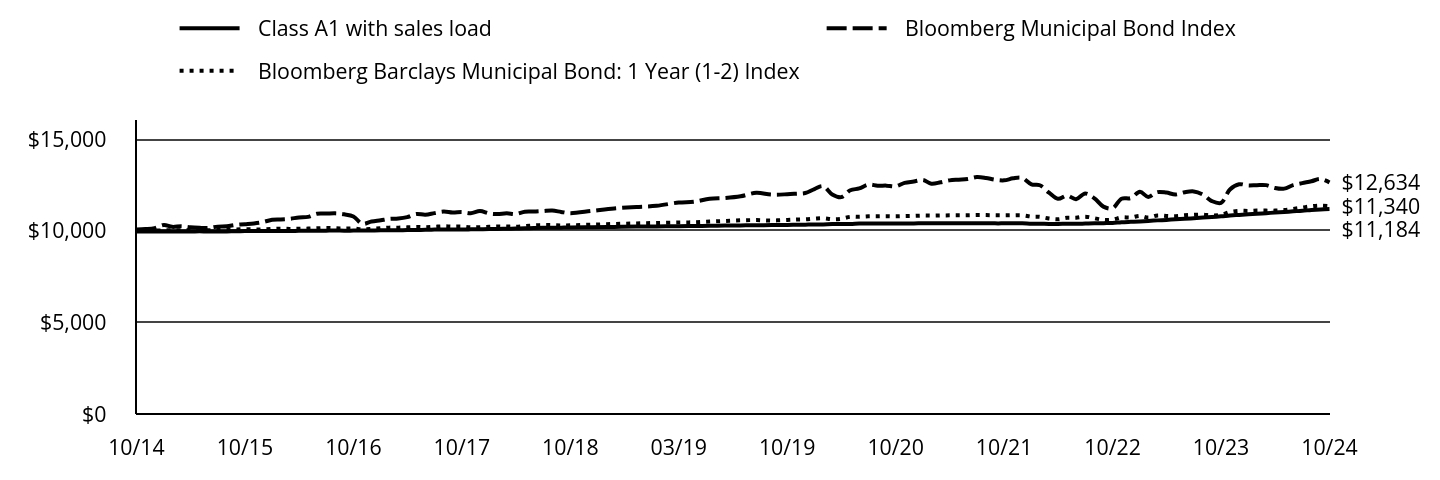
| Class A1 with sales load | Bloomberg Municipal Bond Index | Bloomberg Barclays Municipal Bond: 1 Year (1-2) Index |
|---|
| 10/14 | $9,951 | $10,069 | $10,004 |
| 11/14 | $9,952 | $10,086 | $10,010 |
| 12/14 | $9,954 | $10,137 | $10,004 |
| 01/15 | $9,956 | $10,317 | $10,023 |
| 02/15 | $9,957 | $10,210 | $10,027 |
| 03/15 | $9,959 | $10,240 | $10,027 |
| 04/15 | $9,961 | $10,186 | $10,027 |
| 05/15 | $9,963 | $10,158 | $10,027 |
| 06/15 | $9,956 | $10,148 | $10,027 |
| 07/15 | $9,959 | $10,222 | $10,040 |
| 08/15 | $9,962 | $10,242 | $10,057 |
| 09/15 | $9,974 | $10,316 | $10,069 |
| 10/15 | $9,977 | $10,357 | $10,080 |
| 11/15 | $9,980 | $10,398 | $10,067 |
| 12/15 | $9,981 | $10,472 | $10,065 |
| 01/16 | $9,983 | $10,596 | $10,096 |
| 02/16 | $9,984 | $10,613 | $10,112 |
| 03/16 | $9,978 | $10,647 | $10,098 |
| 04/16 | $9,991 | $10,725 | $10,109 |
| 05/16 | $9,996 | $10,754 | $10,114 |
| 06/16 | $9,999 | $10,925 | $10,132 |
| 07/16 | $10,003 | $10,932 | $10,150 |
| 08/16 | $10,007 | $10,947 | $10,134 |
| 09/16 | $10,001 | $10,892 | $10,113 |
| 10/16 | $10,006 | $10,778 | $10,120 |
| 11/16 | $10,010 | $10,376 | $10,076 |
| 12/16 | $10,014 | $10,497 | $10,096 |
| 01/17 | $10,018 | $10,567 | $10,132 |
| 02/17 | $10,023 | $10,640 | $10,166 |
| 03/17 | $10,028 | $10,663 | $10,166 |
| 04/17 | $10,034 | $10,741 | $10,182 |
| 05/17 | $10,040 | $10,911 | $10,201 |
| 06/17 | $10,046 | $10,872 | $10,192 |
| 07/17 | $10,061 | $10,960 | $10,217 |
| 08/17 | $10,067 | $11,043 | $10,240 |
| 09/17 | $10,072 | $10,987 | $10,227 |
| 10/17 | $10,068 | $11,014 | $10,228 |
| 11/17 | $10,074 | $10,955 | $10,182 |
| 12/17 | $10,082 | $11,069 | $10,189 |
| 01/18 | $10,091 | $10,939 | $10,217 |
| 02/18 | $10,098 | $10,906 | $10,235 |
| 03/18 | $10,107 | $10,947 | $10,227 |
| 04/18 | $10,118 | $10,908 | $10,218 |
| 05/18 | $10,128 | $11,033 | $10,252 |
| 06/18 | $10,148 | $11,042 | $10,288 |
| 07/18 | $10,156 | $11,069 | $10,309 |
| 08/18 | $10,156 | $11,097 | $10,306 |
| 09/18 | $10,167 | $11,025 | $10,286 |
| 10/18 | $10,178 | $10,957 | $10,295 |
| 11/18 | $10,189 | $11,079 | $10,327 |
| 12/18 | $10,202 | $11,211 | $10,366 |
| 01/19 | $10,223 | $11,296 | $10,398 |
| 02/19 | $10,234 | $11,357 | $10,422 |
| 03/19 | $10,245 | $11,536 | $10,450 |
| 04/19 | $10,257 | $11,579 | $10,458 |
| 05/19 | $10,268 | $11,739 | $10,497 |
| 06/19 | $10,280 | $11,782 | $10,529 |
| 07/19 | $10,289 | $11,877 | $10,564 |
| 08/19 | $10,298 | $12,065 | $10,579 |
| 09/19 | $10,307 | $11,968 | $10,557 |
| 10/19 | $10,316 | $11,989 | $10,587 |
| 11/19 | $10,323 | $12,019 | $10,606 |
| 12/19 | $10,331 | $12,056 | $10,621 |
| 01/20 | $10,336 | $12,273 | $10,659 |
| 02/20 | $10,342 | $12,431 | $10,680 |
| 03/20 | $10,363 | $11,980 | $10,627 |
| 04/20 | $10,366 | $11,830 | $10,652 |
| 05/20 | $10,363 | $12,206 | $10,757 |
| 06/20 | $10,389 | $12,307 | $10,757 |
| 07/20 | $10,393 | $12,514 | $10,784 |
| 08/20 | $10,396 | $12,455 | $10,785 |
| 09/20 | $10,397 | $12,458 | $10,794 |
| 10/20 | $10,398 | $12,420 | $10,785 |
| 11/20 | $10,398 | $12,608 | $10,798 |
| 12/20 | $10,399 | $12,685 | $10,808 |
| 01/21 | $10,409 | $12,765 | $10,826 |
| 02/21 | $10,409 | $12,563 | $10,822 |
| 03/21 | $10,409 | $12,640 | $10,830 |
| 04/21 | $10,410 | $12,746 | $10,838 |
| 05/21 | $10,410 | $12,784 | $10,842 |
| 06/21 | $10,410 | $12,819 | $10,841 |
| 07/21 | $10,410 | $12,926 | $10,855 |
| 08/21 | $10,410 | $12,878 | $10,853 |
| 09/21 | $10,400 | $12,785 | $10,841 |
| 10/21 | $10,400 | $12,748 | $10,839 |
| 11/21 | $10,400 | $12,856 | $10,842 |
| 12/21 | $10,401 | $12,877 | $10,841 |
| 01/22 | $10,380 | $12,525 | $10,770 |
| 02/22 | $10,380 | $12,480 | $10,756 |
| 03/22 | $10,370 | $12,075 | $10,666 |
| 04/22 | $10,372 | $11,741 | $10,623 |
| 05/22 | $10,376 | $11,916 | $10,704 |
| 06/22 | $10,382 | $11,720 | $10,707 |
| 07/22 | $10,388 | $12,030 | $10,765 |
| 08/22 | $10,401 | $11,766 | $10,680 |
| 09/22 | $10,413 | $11,315 | $10,588 |
| 10/22 | $10,421 | $11,221 | $10,602 |
| 11/22 | $10,461 | $11,746 | $10,724 |
| 12/22 | $10,486 | $11,779 | $10,718 |
| 01/23 | $10,508 | $12,118 | $10,808 |
| 02/23 | $10,534 | $11,844 | $10,717 |
| 03/23 | $10,563 | $12,106 | $10,832 |
| 04/23 | $10,590 | $12,079 | $10,801 |
| 05/23 | $10,621 | $11,974 | $10,789 |
| 06/23 | $10,652 | $12,094 | $10,840 |
| 07/23 | $10,682 | $12,142 | $10,864 |
| 08/23 | $10,716 | $11,967 | $10,875 |
| 09/23 | $10,748 | $11,616 | $10,831 |
| 10/23 | $10,783 | $11,517 | $10,860 |
| 11/23 | $10,826 | $12,249 | $11,018 |
| 12/23 | $10,862 | $12,533 | $11,082 |
| 01/24 | $10,892 | $12,469 | $11,078 |
| 02/24 | $10,923 | $12,485 | $11,095 |
| 03/24 | $10,955 | $12,485 | $11,095 |
| 04/24 | $10,990 | $12,330 | $11,096 |
| 05/24 | $11,023 | $12,294 | $11,123 |
| 06/24 | $11,056 | $12,482 | $11,186 |
| 07/24 | $11,086 | $12,596 | $11,259 |
| 08/24 | $11,130 | $12,696 | $11,333 |
| 09/24 | $11,162 | $12,821 | $11,369 |
| 10/24 | $11,184 | $12,634 | $11,340 |
Average Annual Total Returns for the Period Ended October 31, 2024 (%)
| AATR | 1 Year | 5 Years | 10 Years |
|---|
| Class A1 without sales load | 3.72% | 1.63% | 1.17% |
| Class A1 with sales load - 0.50% | 3.21% | 1.53% | 1.12% |
| Bloomberg Municipal Bond Index | 9.70% | 1.05% | 2.30% |
| Bloomberg Barclays Municipal Bond: 1 Year (1-2) Index | 4.42% | 1.38% | 1.26% |
THE FUND'S PAST PERFORMANCE IS NOT A GOOD PREDICTOR OF THE FUND'S FUTURE PERFORMANCE.
Fund performance data shown above does not reflect the deduction of taxes that a shareholder would pay on Fund distributions or redemption of Fund shares.
In accordance with regulatory changes requiring the Fund's primary benchmark to represent the overall applicable market, the Fund's primary prospectus benchmark changed to the Bloomberg Municipal Bond Index effective as of February 29, 2024.
Key Fund Statistics as of October 31, 2024
| Total Net Assets | $723,228,512 |
| Total Number of Portfolio Holdings | 86 |
| Portfolio Turnover Rate | 226% |
| Total Advisory Fees Paid | $1,274,112 |
abrdn Ultra Short Municipal Income Fund
(ATOBX)
What did the Fund invest in?
The tables below show the investment makeup of the Fund as of October 31, 2024.
Credit Quality Allocation (% of total net assets)
| AAA | 5.6% |
| AA | 14.5% |
| A | 44.6% |
| BBB | 28.5% |
| Not Rated | 6.9% |
Ratings and portfolio credit quality will vary over time. Credit quality ratings on the underlying securities of the Fund are received from S&P, Moody’s and Fitch and are an indication of the issuer’s creditworthiness. The chart reflects the highest security rating provided by one or more of these rating agencies.
Ten Largest Holdings (% of total net assets)
| Mississippi Business Finance Corp., 4.390%, due 11/01/32 | 8.1% |
| Maryland Industrial Development Financing Authority, 5.260%, due 03/01/30 | 6.9% |
| Harris County Cultural Education Facilities Finance Corp., 3.770%, due 11/15/46 | 4.1% |
| JPMorgan Chase Putters/Drivers Trust, 4.550%, due 03/20/27 | 3.7% |
| Health Care Authority for Baptist Health, 4.660%, due 11/01/42 | 3.5% |
| Arkansas Development Finance Authority, 4.680%, due 09/01/44 | 3.5% |
| Iowa Finance Authority, 3.500%, due 12/01/46 | 3.5% |
| Florida Insurance Assistance Interlocal Agency, Inc., 3.990%, due 09/01/32 | 3.5% |
| County of Meade, 4.600%, due 08/01/61 | 3.4% |
| Central Bradford Progress Authority, 3.860%, due 12/01/41 | 3.2% |
Below is a summary of certain changes for the Fund since November 1, 2023. For more information, you may refer to the Fund's next prospectus, which we expect to be available by February 28, 2025 at abrdn.com/us/literature or upon request at 866-667-9231.
Effective February 29, 2004, the Fund's management fee changed from 0.65% on assets up to $250 million and 0.60% on assets of $250 million and more to 0.55% on assets up to $250 million and 0.40% on assets of $250 million and more.
Availability of Additional Information
You can find additional information, including the Fund's prospectus, financial information, fund holdings, and proxy voting information at abrdn.com/us/literature or call 866-667-9231. The QR code can be used to access the Fund's prospectus, financial information and holdings.
abrdn Ultra Short Municipal Income Fund
(ATOBX)
abrdn Ultra Short Municipal Income Fund
Annual Shareholder Report - October 31, 2024
This annual shareholder report contains important information about the abrdn Ultra Short Municipal Income Fund (the "Fund") for the period of November 1, 2023 to October 31, 2024. You can find additional information about the Fund at abrdn.com/us/literature. You can also request this information by contacting us at 866-667-9231.
This report describes material changes to the Fund that occurred during the reporting period.
What were the Fund costs for the last year?
(based on a hypothetical $10,000 investment)
| Share Class | Costs of a $10,000 investment | Costs paid as a percentage of a $10,000 investment |
|---|
| Institutional | $46 | 0.45% |
How did the fund perform last year and what affected its performance?
The following discussion compares the performance of the Fund to the Bloomberg Barclays Municipal Bond 1 Year (1-2) Index to show how the Fund’s performance measures against the returns of similar investments for the reporting period.
What contributed to performance?
The Fund’s exposures to state and local general obligation bonds and dedicated tax bonds contributed favorably to returns. Among individual holdings, Maryland Industrial Development Financing Authority’s bonds and Pennsylvania Higher Education bonds were notable contributors to performance. These issuers have continued to provide relatively attractive opportunities to investors through variable-rate demand bonds while maintaining stability in their balance sheet management. In terms of ratings, AA- and AAA-rated bonds added to relative performance.
What detracted from performance?
The Fund’s holdings in the other revenue, multi-family and public power sectors hurt performance. Within individual holdings, Black Belt Energy Gas District’s revenue bonds and New York Transnational Development Corporation’s bonds were among the negative contributors. Our allocation to short variable-rate securities led to the Fund’s underperformance during the period. While these bonds generally provide stability during volatile periods, this allocation underperformed, particularly during the strong bond performance in late 2023. In terms of ratings, A-rated bonds detracted from performance.
abrdn Ultra Short Municipal Income Fund
(ATOIX)
Total Return Based on $1,000,000 Investment
The following graph reflects a hypothetical $1,000,000 investment for the most recently completed 10 fiscal years as compared to a broad-based securities market index and an additional performance benchmark.
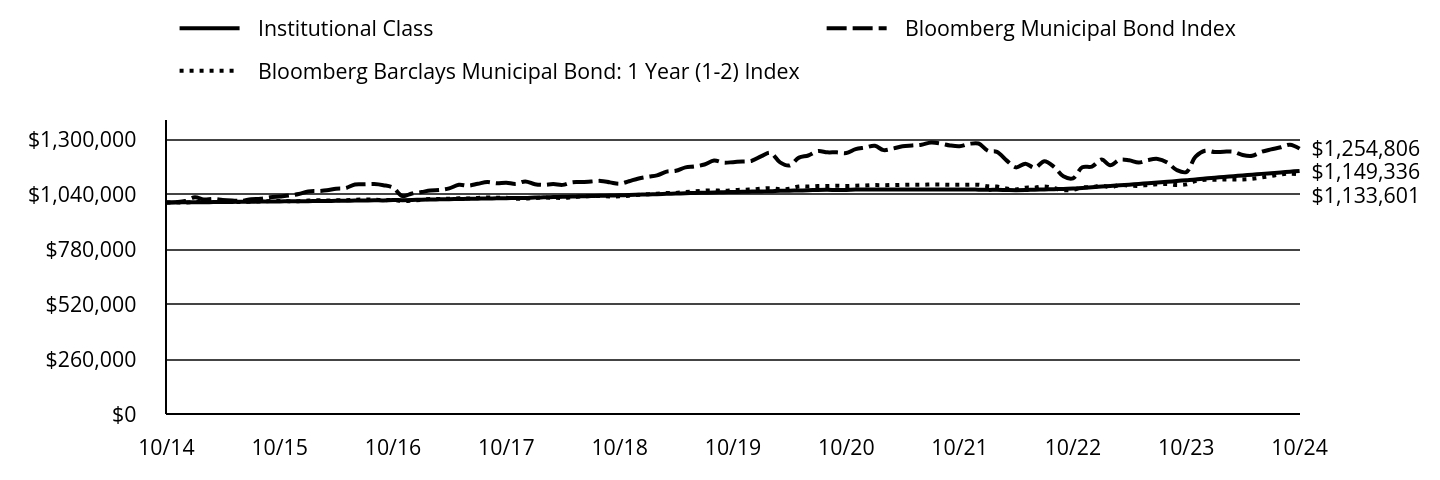
| Institutional Class | Bloomberg Municipal Bond Index | Bloomberg Barclays Municipal Bond: 1 Year (1-2) Index |
|---|
| 10/14 | $1,000,000 | $1,000,000 | $1,000,000 |
| 11/14 | $1,000,357 | $1,001,730 | $1,000,614 |
| 12/14 | $1,000,729 | $1,006,784 | $1,000,064 |
| 01/15 | $1,001,113 | $1,024,628 | $1,001,967 |
| 02/15 | $1,001,502 | $1,014,059 | $1,002,302 |
| 03/15 | $1,001,839 | $1,016,987 | $1,002,330 |
| 04/15 | $1,002,234 | $1,011,652 | $1,002,349 |
| 05/15 | $1,002,700 | $1,008,857 | $1,002,314 |
| 06/15 | $1,003,173 | $1,007,937 | $1,002,289 |
| 07/15 | $1,003,665 | $1,015,238 | $1,003,657 |
| 08/15 | $1,004,165 | $1,017,232 | $1,005,320 |
| 09/15 | $1,004,670 | $1,024,601 | $1,006,549 |
| 10/15 | $1,005,153 | $1,028,674 | $1,007,587 |
| 11/15 | $1,005,617 | $1,032,764 | $1,006,327 |
| 12/15 | $1,005,963 | $1,040,020 | $1,006,163 |
| 01/16 | $1,006,340 | $1,052,429 | $1,009,253 |
| 02/16 | $1,006,738 | $1,054,085 | $1,010,837 |
| 03/16 | $1,007,247 | $1,057,423 | $1,009,412 |
| 04/16 | $1,007,843 | $1,065,199 | $1,010,532 |
| 05/16 | $1,008,485 | $1,068,080 | $1,011,042 |
| 06/16 | $1,009,080 | $1,085,071 | $1,012,796 |
| 07/16 | $1,009,663 | $1,085,734 | $1,014,568 |
| 08/16 | $1,010,265 | $1,087,199 | $1,013,043 |
| 09/16 | $1,009,922 | $1,081,773 | $1,010,881 |
| 10/16 | $1,011,609 | $1,070,424 | $1,011,594 |
| 11/16 | $1,011,173 | $1,030,502 | $1,007,200 |
| 12/16 | $1,011,791 | $1,042,600 | $1,009,184 |
| 01/17 | $1,013,448 | $1,049,474 | $1,012,857 |
| 02/17 | $1,014,115 | $1,056,761 | $1,016,185 |
| 03/17 | $1,014,855 | $1,059,055 | $1,016,172 |
| 04/17 | $1,015,696 | $1,066,740 | $1,017,791 |
| 05/17 | $1,016,500 | $1,083,670 | $1,019,694 |
| 06/17 | $1,017,317 | $1,079,783 | $1,018,827 |
| 07/17 | $1,018,102 | $1,088,519 | $1,021,275 |
| 08/17 | $1,018,847 | $1,096,803 | $1,023,573 |
| 09/17 | $1,019,605 | $1,091,226 | $1,022,353 |
| 10/17 | $1,020,409 | $1,093,890 | $1,022,453 |
| 11/17 | $1,021,234 | $1,088,033 | $1,017,841 |
| 12/17 | $1,021,250 | $1,099,405 | $1,018,513 |
| 01/18 | $1,023,366 | $1,086,462 | $1,021,349 |
| 02/18 | $1,024,320 | $1,083,215 | $1,023,101 |
| 03/18 | $1,025,444 | $1,087,213 | $1,022,342 |
| 04/18 | $1,026,772 | $1,083,333 | $1,021,414 |
| 05/18 | $1,028,022 | $1,095,739 | $1,024,784 |
| 06/18 | $1,029,145 | $1,096,674 | $1,028,389 |
| 07/18 | $1,030,142 | $1,099,335 | $1,030,529 |
| 08/18 | $1,031,405 | $1,102,158 | $1,030,158 |
| 09/18 | $1,032,683 | $1,095,023 | $1,028,184 |
| 10/18 | $1,034,046 | $1,088,280 | $1,029,090 |
| 11/18 | $1,035,465 | $1,100,325 | $1,032,323 |
| 12/18 | $1,036,945 | $1,113,500 | $1,036,203 |
| 01/19 | $1,038,244 | $1,121,917 | $1,039,425 |
| 02/19 | $1,039,528 | $1,127,924 | $1,041,783 |
| 03/19 | $1,040,881 | $1,145,754 | $1,044,633 |
| 04/19 | $1,042,363 | $1,150,060 | $1,045,403 |
| 05/19 | $1,043,705 | $1,165,915 | $1,049,295 |
| 06/19 | $1,045,090 | $1,170,220 | $1,052,539 |
| 07/19 | $1,046,249 | $1,179,651 | $1,056,008 |
| 08/19 | $1,047,391 | $1,198,258 | $1,057,498 |
| 09/19 | $1,048,532 | $1,188,653 | $1,055,280 |
| 10/19 | $1,049,657 | $1,190,783 | $1,058,315 |
| 11/19 | $1,050,585 | $1,193,761 | $1,060,152 |
| 12/19 | $1,051,573 | $1,197,406 | $1,061,720 |
| 01/20 | $1,052,370 | $1,218,919 | $1,065,461 |
| 02/20 | $1,053,181 | $1,234,638 | $1,067,620 |
| 03/20 | $1,055,476 | $1,189,854 | $1,062,302 |
| 04/20 | $1,056,000 | $1,174,921 | $1,064,751 |
| 05/20 | $1,057,007 | $1,212,297 | $1,075,274 |
| 06/20 | $1,057,815 | $1,222,275 | $1,075,263 |
| 07/20 | $1,059,507 | $1,242,861 | $1,077,958 |
| 08/20 | $1,059,974 | $1,237,029 | $1,078,133 |
| 09/20 | $1,059,249 | $1,237,291 | $1,078,940 |
| 10/20 | $1,059,564 | $1,233,575 | $1,078,072 |
| 11/20 | $1,060,876 | $1,252,190 | $1,079,421 |
| 12/20 | $1,061,121 | $1,259,818 | $1,080,384 |
| 01/21 | $1,061,323 | $1,267,846 | $1,082,169 |
| 02/21 | $1,061,451 | $1,247,702 | $1,081,812 |
| 03/21 | $1,061,483 | $1,255,397 | $1,082,595 |
| 04/21 | $1,061,555 | $1,265,927 | $1,083,341 |
| 05/21 | $1,061,606 | $1,269,704 | $1,083,774 |
| 06/21 | $1,061,655 | $1,273,190 | $1,083,718 |
| 07/21 | $1,061,673 | $1,283,750 | $1,085,076 |
| 08/21 | $1,061,693 | $1,279,038 | $1,084,853 |
| 09/21 | $1,061,720 | $1,269,808 | $1,083,726 |
| 10/21 | $1,061,740 | $1,266,095 | $1,083,491 |
| 11/21 | $1,061,767 | $1,276,873 | $1,083,805 |
| 12/21 | $1,060,733 | $1,278,933 | $1,083,715 |
| 01/22 | $1,059,697 | $1,243,925 | $1,076,546 |
| 02/22 | $1,059,783 | $1,239,469 | $1,075,164 |
| 03/22 | $1,058,918 | $1,199,289 | $1,066,218 |
| 04/22 | $1,058,213 | $1,166,117 | $1,061,920 |
| 05/22 | $1,058,864 | $1,183,440 | $1,070,007 |
| 06/22 | $1,060,721 | $1,164,057 | $1,070,316 |
| 07/22 | $1,061,631 | $1,194,813 | $1,076,092 |
| 08/22 | $1,063,123 | $1,168,627 | $1,067,573 |
| 09/22 | $1,063,534 | $1,123,774 | $1,058,381 |
| 10/22 | $1,065,665 | $1,114,429 | $1,059,747 |
| 11/22 | $1,068,839 | $1,166,554 | $1,071,963 |
| 12/22 | $1,071,688 | $1,169,894 | $1,071,432 |
| 01/23 | $1,075,246 | $1,203,500 | $1,080,425 |
| 02/23 | $1,078,101 | $1,176,286 | $1,071,292 |
| 03/23 | $1,081,241 | $1,202,385 | $1,082,793 |
| 04/23 | $1,084,316 | $1,199,638 | $1,079,658 |
| 05/23 | $1,087,636 | $1,189,242 | $1,078,480 |
| 06/23 | $1,091,066 | $1,201,155 | $1,083,615 |
| 07/23 | $1,094,414 | $1,205,907 | $1,085,946 |
| 08/23 | $1,098,037 | $1,188,547 | $1,087,122 |
| 09/23 | $1,101,592 | $1,153,712 | $1,082,638 |
| 10/23 | $1,105,366 | $1,143,894 | $1,085,619 |
| 11/23 | $1,108,991 | $1,216,510 | $1,101,345 |
| 12/23 | $1,113,933 | $1,244,784 | $1,107,779 |
| 01/24 | $1,117,288 | $1,238,426 | $1,107,415 |
| 02/24 | $1,120,641 | $1,240,017 | $1,109,122 |
| 03/24 | $1,124,211 | $1,239,978 | $1,109,044 |
| 04/24 | $1,127,990 | $1,224,621 | $1,109,181 |
| 05/24 | $1,131,706 | $1,221,029 | $1,111,864 |
| 06/24 | $1,135,317 | $1,239,745 | $1,118,149 |
| 07/24 | $1,138,597 | $1,251,044 | $1,125,503 |
| 08/24 | $1,142,178 | $1,260,911 | $1,132,880 |
| 09/24 | $1,145,733 | $1,273,373 | $1,136,442 |
| 10/24 | $1,149,336 | $1,254,806 | $1,133,601 |
Average Annual Total Returns for the Period Ended October 31, 2024 (%)
| AATR | 1 Year | 5 Years | 10 Years |
|---|
| Institutional Class | 3.98% | 1.83% | 1.40% |
| Bloomberg Municipal Bond Index | 9.70% | 1.05% | 2.30% |
| Bloomberg Barclays Municipal Bond: 1 Year (1-2) Index | 4.42% | 1.38% | 1.26% |
THE FUND'S PAST PERFORMANCE IS NOT A GOOD PREDICTOR OF THE FUND'S FUTURE PERFORMANCE.
Fund performance data shown above does not reflect the deduction of taxes that a shareholder would pay on Fund distributions or redemption of Fund shares.
In accordance with regulatory changes requiring the Fund's primary benchmark to represent the overall applicable market, the Fund's primary prospectus benchmark changed to the Bloomberg Municipal Bond Index effective as of February 29, 2024.
Key Fund Statistics as of October 31, 2024
| Total Net Assets | $723,228,512 |
| Total Number of Portfolio Holdings | 86 |
| Portfolio Turnover Rate | 226% |
| Total Advisory Fees Paid | $1,274,112 |
abrdn Ultra Short Municipal Income Fund
(ATOIX)
What did the Fund invest in?
The tables below show the investment makeup of the Fund as of October 31, 2024.
Credit Quality Allocation (% of total net assets)
| AAA | 5.6% |
| AA | 14.5% |
| A | 44.6% |
| BBB | 28.5% |
| Not Rated | 6.9% |
Ratings and portfolio credit quality will vary over time. Credit quality ratings on the underlying securities of the Fund are received from S&P, Moody’s and Fitch and are an indication of the issuer’s creditworthiness. The chart reflects the highest security rating provided by one or more of these rating agencies.
Ten Largest Holdings (% of total net assets)
| Mississippi Business Finance Corp., 4.390%, due 11/01/32 | 8.1% |
| Maryland Industrial Development Financing Authority, 5.260%, due 03/01/30 | 6.9% |
| Harris County Cultural Education Facilities Finance Corp., 3.770%, due 11/15/46 | 4.1% |
| JPMorgan Chase Putters/Drivers Trust, 4.550%, due 03/20/27 | 3.7% |
| Health Care Authority for Baptist Health, 4.660%, due 11/01/42 | 3.5% |
| Arkansas Development Finance Authority, 4.680%, due 09/01/44 | 3.5% |
| Iowa Finance Authority, 3.500%, due 12/01/46 | 3.5% |
| Florida Insurance Assistance Interlocal Agency, Inc., 3.990%, due 09/01/32 | 3.5% |
| County of Meade, 4.600%, due 08/01/61 | 3.4% |
| Central Bradford Progress Authority, 3.860%, due 12/01/41 | 3.2% |
Below is a summary of certain changes for the Fund since November 1, 2023. For more information, you may refer to the Fund's next prospectus, which we expect to be available by February 28, 2025 at abrdn.com/us/literature or upon request at 866-667-9231.
Effective February 29, 2004, the Fund's management fee changed from 0.65% on assets up to $250 million and 0.60% on assets of $250 million and more to 0.55% on assets up to $250 million and 0.40% on assets of $250 million and more.
Availability of Additional Information
You can find additional information, including the Fund's prospectus, financial information, fund holdings, and proxy voting information at abrdn.com/us/literature or call 866-667-9231. The QR code can be used to access the Fund's prospectus, financial information and holdings.
abrdn Ultra Short Municipal Income Fund
(ATOIX)
Item 2. Code of Ethics.
(a) As of October 31, 2024, the Registrant had adopted a code of ethics that applies to the Registrant’s principal executive officer, principal financial officer, principal accounting officer or controller, or persons performing similar functions, regardless of whether these individuals are employed by the Registrant or a third party (the “Code of Ethics”).
(c) There have been no amendments during the period covered by this report to a provision of the Code of Ethics.
(d) During the period covered by the report, the Registrant did not grant any waivers to the provisions of the Code of Ethics.
(e) Not applicable.
(f) The Code of Ethics is included with this Form N-CSR as Exhibit 19(a)(1).
Item 3. Audit Committee Financial Expert.
The Registrant’s Board of Trustees has determined that there is at least one member who qualifies as an “audit committee financial expert” serving on its Audit Committee. Mr. Rahn K. Porter is the “audit committee financial expert” and is considered to be an “Independent Trustee” as each term is defined in Item 3 of Form N-CSR.
Item 4. Principal Accountant Fees and Services.
Fiscal
Year Ended | | | (a)
Audit Fees | | | (b)
Audit-Related Fees | | | (c)1
Tax Fees | | | (d)2
All Other Fees | |
| October 31, 2024 | | | $ | 716,000 | | | $ | 0 | | | $ | 0 | | | $ | 0 | |
| October 31, 2023 | | | $ | 713,500 | | | $ | 0 | | | $ | 0 | | | $ | 4,664 | |
1 The Tax Fees are for the completion of the Registrant’s federal and state tax returns.
2 Other Fees include services related to pursuing Article 63 European Union Tax Reclaims related to prior years.
(e)(1) Pre-Approval Policies and Procedures. Except as permitted by Rule 2-01(c)(7)(i)(C) of Regulation S-X, the Registrant’s (hereinafter, the “Trust”) Audit Committee Charter authorizes the Audit Committee (“Committee”) to annually select, retain or terminate the Trust’s independent auditor and, in connection therewith, to evaluate the terms of the engagement and the qualifications and independence of the independent auditor, including whether the independent auditor provides any consulting, auditing or tax services to the investment adviser (hereinafter, the “Adviser”) or a sub-adviser, and to receive the independent auditor’s specific representations as to their independence, delineating all relationships between the independent auditor and the Trust, consistent with PCAOB 3526 or any other applicable auditing standard. PCAOB Rule 3526 requires that, at least annually, the auditor: (1) disclose to the Committee in writing all relationships between the auditor and its related entities and the Trust and its related entities that in the auditor’s professional judgment may reasonably be thought to bear on independence; (2) confirm in its letter that, in its professional judgment, it is independent of the Trust within the meaning of the Securities Acts administered by the SEC; and (3) discuss the auditor’s independence with the Committee. The Committee is responsible for actively engaging in a dialogue with the independent auditor with respect to any disclosed relationships or services that may impact the objectivity and independence of the independent auditor and for taking, or recommending that the full Board take, appropriate action to oversee the independence of the independent auditor. The Committee is also authorized to review in advance, and consider approval of, any and all proposals by management or the Adviser that the Trust, Adviser or their affiliated persons, employ the independent auditor to render “permissible non-audit services” to the Trust and to consider whether such services are consistent with the independent auditor’s independence. The Committee may delegate to one or more of its members (“Delegates”) authority to pre-approve permissible non-audit services to be provided to the Trust. Any pre-approval determination of a Delegate shall be presented to the full Committee at its next meeting. The Committee shall communicate any pre-approval made by it or a Delegate to the Adviser, who will ensure that the appropriate disclosure is made in the Trust’s periodic reports required by Section 30 of the Investment Company Act of 1940, as amended, and other documents as required under the federal securities laws.
(e)(2) None of the services described in each of paragraphs (b) through (d) of this Item involved a waiver of the pre-approval requirement by the Audit Committee pursuant to Rule 2-01 (c)(7)(i)(C) of Regulation S-X.
(f) Not applicable.
(g) The aggregate non-audit fees billed by the Registrant’s accountant for services to the Registrant and to the Registrant’s investment adviser and all entities controlling, controlled by, or under common control with the Adviser that provide services to the Registrant for the Registrant’s fiscal years ended October 31, 2024 and October 31, 2023 and were $629,124 and $1,171,994, respectively.
(h) The Registrant’s Audit Committee of the Board of Trustees has considered whether the provision of non-audit services that were rendered to the Registrant’s investment adviser (not including any sub-adviser whose role is primarily portfolio management and is subcontracted with or overseen by another investment adviser), and any entity controlling, controlled by, or under common control with the investment adviser that provides ongoing services to the Registrant that were not pre-approved pursuant to paragraph (c)(7)(ii) or Rule 2-01 of Regulation S-X is compatible with maintaining the principal accountant’s independence and has concluded that it is.
(i) Not applicable.
(j) Not applicable.
Item 5. Audit Committee of Listed Registrants.
Not applicable.
Item 6. Investments.
(a) Included as part of the Financial Statements filed under Item 7 of this Form N-CSR.
(b) Not applicable.
Item 7. Financial Statements and Financial Highlights for Open-End Management Investment Companies.
abrdn Funds
Equity Series
Annual Financial Statements and Additional Information
October 31, 2024
abrdn China A Share Equity Fund
| Class A - GOPAX ■ | Class C - GOPCX■ | Class R - GOPRX■ | Institutional Class - GOPIX■ | Institutional Service Class - GOPSX |
abrdn Dynamic Dividend Fund
| Class A - ADAVX ■ | Institutional Class - ADVDX |
abrdn EM SMA Completion Fund
Institutional Class - ASEMX
abrdn Emerging Markets Dividend Fund (formerly, abrdn International Sustainable Leaders Fund)
Institutional Class - JIEIX
abrdn Emerging Markets ex-China Fund
| Class A - GLLAX ■ | Class C - GLLCX■ | Class R - GWLRX■ | Institutional Class - GWLIX■ | Institutional Service Class - GLLSX |
abrdn Emerging Markets Fund
| Class A - GEGAX ■ | Class C - GEGCX■ | Class R - GEMRX■ | Institutional Class - ABEMX■ | Institutional Service Class - AEMSX |
abrdn Focused U.S. Small Cap Equity Fund (formerly, abrdn U.S. Sustainable Leaders Smaller Companies Fund)
Institutional Class - GGUIX
abrdn Global Equity Impact Fund
| Class A - JETAX ■ | Institutional Class - JETIX |
abrdn Global Infrastructure Fund
| Class A - AIAFX ■ | Institutional Class - AIFRX |
abrdn International Small Cap Fund
| Class A - WVCCX ■ | Class C - CPVCX■ | Class R - WPVAX■ | Institutional Class - ABNIX |
abrdn Realty Income & Growth Fund
| Class A - AIAGX ■ | Institutional Class - AIGYX |
abrdn U.S. Small Cap Equity Fund
| Class A - GSXAX ■ | Class C - GSXCX■ | Class R - GNSRX■ | Institutional Class - GSCIX■ | Institutional Service Class - GSXIX |
abrdn U.S. Sustainable Leaders Fund
| Class A - GXXAX ■ | Class C - GXXCX■ | Institutional Class - GGLIX■ | Institutional Service Class - GXXIX |
Investors should carefully consider a fund’s investment objectives, risks, fees, charges and expenses before investing any money. To obtain this and other fund information, please call 866-667-9231 to request a prospectus, or download a prospectus at https://www.abrdn.com/us/literature. Please read it carefully before investing any money.
Investing in mutual funds involves risk, including possible loss of principal.
abrdn Funds is distributed by Aberdeen Fund Distributors LLC, Member FINRA, 1900 Market Street, Suite 200, Philadelphia, PA 19103.
abrdn Inc. has been registered as an investment adviser under the Investment Advisers Act of 1940 since August 23, 1995.
The complete schedule of portfolio holdings for each fund of abrdn Funds (each a “Fund” and collectively, the “Funds”) is included in the Funds’ semi-annual and annual reports to shareholders. abrdn Funds also files complete schedules of portfolio holdings for each Fund with the Securities and Exchange Commission (the “Commission”) for the first and third quarters of each fiscal year on Form N-PORT. The Funds’ Form N-PORT filings are available on the Commission’s website at http://www.sec.gov and the Funds make the information on the exhibit to Form N-PORT available to shareholders upon request without charge by calling 1-866-667-9231.
Statement Regarding Availability of Proxy Voting Record.
Information regarding the policies and procedures that the Funds use to determine how to vote proxies relating to portfolio securities is available without charge, upon request, by calling 1-866-667-9231. The information is also included in the Funds’ Statement of Additional Information, which is available on the Funds’ website at https://www.abrdn.com/us/literature and on the Commission’s website at www.sec.gov.
Information relating to how each Fund voted proxies relating to portfolio securities held during the most recent twelve months ended June 30 is available by August 30 of the relevant year: (i) upon request and without charge by calling 1-866-667-9231; and (ii) on the Commission’s website at www.sec.gov.
Financial Statements and Financial Highlights for Open-End Management Investment Companies
Statement of Investments
October 31, 2024 abrdn China A Share Equity Fund
| | Shares | Value |
| COMMON STOCKS—92.7% | |
| CHINA—92.7% |
| Consumer Discretionary—16.3% | | | |
| BYD Co. Ltd., A Shares (Stock Connect)(a) | | 16,500 | $ 679,317 |
| BYD Co. Ltd., H Shares | | 3,000 | 108,356 |
| China Tourism Group Duty Free Corp. Ltd., A Shares (Stock Connect)(a) | | 16,695 | 159,144 |
| Fuyao Glass Industry Group Co. Ltd., A Shares (Stock Connect)(a) | | 114,338 | 914,114 |
| Midea Group Co. Ltd.(b) | | 18,300 | 171,957 |
| Midea Group Co. Ltd., A Shares (Stock Connect)(a) | | 72,942 | 730,595 |
| Zhejiang Shuanghuan Driveline Co. Ltd., A Shares (Stock Connect)(a) | | 106,400 | 419,785 |
| | | | 3,183,268 |
| Consumer Staples—16.3% | | | |
| Foshan Haitian Flavouring & Food Co. Ltd., A Shares (Stock Connect)(a) | | 25,071 | 154,221 |
| Inner Mongolia Yili Industrial Group Co. Ltd., A Shares (Stock Connect)(a) | | 152,700 | 599,621 |
| Kweichow Moutai Co. Ltd., A Shares (Stock Connect)(a) | | 7,063 | 1,515,744 |
| Proya Cosmetics Co. Ltd., A Shares (Stock Connect)(a) | | 53,893 | 726,082 |
| Yifeng Pharmacy Chain Co. Ltd., A Shares (Stock Connect)(a) | | 53,620 | 178,719 |
| | | | 3,174,387 |
| Energy —0.0% | | | |
| G3 Exploration Ltd.(b)(c)(d)(e) | | 53,000 | – |
| Financials—17.3% | | | |
| Bank of Ningbo Co. Ltd., A Shares (Stock Connect)(a) | | 94,616 | 339,894 |
| China Construction Bank Corp., A Shares (Stock Connect)(a) | | 90,700 | 101,077 |
| China Construction Bank Corp., H Shares | | 410,000 | 318,257 |
| China Merchants Bank Co. Ltd., A Shares (Stock Connect)(a) | | 173,232 | 909,785 |
| CITIC Securities Co. Ltd., A Shares (Stock Connect)(a) | | 86,200 | 340,370 |
| CITIC Securities Co. Ltd., H Shares | | 89,000 | 245,804 |
| Jiangsu Changshu Rural Commercial Bank Co. Ltd., A Shares (Stock Connect)(a) | | 237,100 | 231,641 |
| Ping An Insurance Group Co. of China Ltd., A Shares (Stock Connect)(a) | | 73,737 | 579,675 |
| Ping An Insurance Group Co. of China Ltd., H Shares | | 48,500 | 300,495 |
| | | | 3,366,998 |
| Health Care—6.7% | | | |
| Aier Eye Hospital Group Co. Ltd., A Shares (Stock Connect)(a) | | 75,827 | 154,141 |
| China Resources Sanjiu Medical & Pharmaceutical Co. Ltd., A Shares (Stock Connect)(a) | | 29,480 | 186,543 |
| Hangzhou Tigermed Consulting Co. Ltd., A Shares (Stock Connect)(a) | | 35,767 | 316,212 |
| | Shares | Value |
| |
|
| Jiangsu Hengrui Pharmaceuticals Co. Ltd., A Shares (Stock Connect)(a) | | 39,255 | $ 257,298 |
| Shenzhen Mindray Bio-Medical Electronics Co. Ltd., A Shares (Stock Connect)(a) | | 10,510 | 393,442 |
| | | | 1,307,636 |
| Industrials—26.3% | | | |
| Centre Testing International Group Co. Ltd., A Shares (Stock Connect)(a) | | 204,888 | 397,092 |
| Contemporary Amperex Technology Co. Ltd., A Shares (Stock Connect)(a) | | 41,302 | 1,432,289 |
| Guangzhou Baiyun International Airport Co. Ltd., A Shares (Stock Connect)(a) | | 228,600 | 311,162 |
| Jiangsu Hengli Hydraulic Co. Ltd., A Shares (Stock Connect)(a) | | 56,700 | 412,122 |
| NARI Technology Co. Ltd., A Shares (Stock Connect)(a) | | 137,662 | 502,600 |
| Shanghai International Airport Co. Ltd., A Shares (Stock Connect)(a) | | 19,210 | 94,347 |
| Shenzhen Inovance Technology Co. Ltd., A Shares (Stock Connect)(a) | | 41,789 | 326,015 |
| Sieyuan Electric Co. Ltd., A Shares (Stock Connect)(a) | | 37,539 | 402,721 |
| Sungrow Power Supply Co. Ltd., A Shares (Stock Connect)(a) | | 55,509 | 706,909 |
| Yutong Bus Co. Ltd., A Shares (Stock Connect)(a) | | 106,200 | 361,394 |
| Zhejiang Weixing New Building Materials Co. Ltd., A Shares (Stock Connect)(a) | | 92,100 | 192,840 |
| | | | 5,139,491 |
| Information Technology—5.9% | | | |
| Glodon Co. Ltd., A Shares (Stock Connect)(a) | | 18,304 | 36,400 |
| Hundsun Technologies, Inc., A Shares (Stock Connect)(a) | | 37,995 | 142,793 |
| Luxshare Precision Industry Co. Ltd., A Shares (Stock Connect)(a) | | 63,870 | 375,994 |
| SG Micro Corp., A Shares (Stock Connect)(a) | | 40,213 | 503,217 |
| StarPower Semiconductor Ltd., A Shares (Stock Connect)(a) | | 7,300 | 98,585 |
| | | | 1,156,989 |
| Materials—1.9% | | | |
| Satellite Chemical Co. Ltd., A Shares (Stock Connect)(a) | | 67,000 | 177,925 |
| Wanhua Chemical Group Co. Ltd., A Shares (Stock Connect)(a) | | 17,817 | 188,469 |
| | | | 366,394 |
| Utilities—2.0% | | | |
| ENN Natural Gas Co. Ltd., A Shares (Stock Connect)(a) | | 148,900 | 383,775 |
| Total China | | 18,078,938 |
| Total Common Stocks | | 18,078,938 |
| EXCHANGE-TRADED FUNDS—3.9% | |
| KraneShares Bosera MSCI China A 50 Connect Index ETF | | 31,027 | 769,470 |
| Total Exchange-Traded Funds | | 769,470 |
See accompanying Notes to Financial Statements.
Statement of Investments (concluded)
October 31, 2024 abrdn China A Share Equity Fund
| | Shares | Value |
| SHORT-TERM INVESTMENT—3.5% | |
| State Street Institutional U.S. Government Money Market Fund, Premier Class, 4.82%(f) | | 678,929 | $ 678,929 |
| Total Short-Term Investment | | 678,929 |
Total Investments
(Cost $20,795,698)(g)—100.1% | 19,527,337 |
| Liabilities in Excess of Other Assets—(0.1%) | (24,600) |
| Net Assets—100.0% | $19,502,737 |
| (a) | China A Shares. These shares are issued in local currency, traded in the local stock markets and are held through either a Qualified Foreign Institutional Investor (QFII) license or the Shanghai or Shenzhen Hong-Kong Stock Connect program. |
| (b) | Non-income producing security. |
| (c) | Fair Value is determined pursuant to procedures approved by the Fund’s Board of Trustees. Unless otherwise noted, securities are valued by applying valuation factors to the exchange traded price. See Note 2(a) of the accompanying Notes to Financial Statements for inputs used. |
| (d) | The Fund’s adviser has deemed this security to be illiquid based upon procedures approved by the Board of Trustees. Illiquid securities held by the Fund represent 0.0% of net assets as of October 31, 2024. |
| (e) | Level 3 security. See Note 2(a) of the accompanying Notes to Financial Statements. |
| (f) | Registered investment company advised by State Street Global Advisors. The rate shown is the 7 day yield as of October 31, 2024. |
| (g) | See accompanying Notes to Financial Statements for tax unrealized appreciation/(depreciation) of securities. |
| | Amounts listed as “–” are $0 or round to $0. |
See accompanying Notes to Financial Statements.
Statement of Investments
October 31, 2024 abrdn Dynamic Dividend Fund
| | Shares | Value |
| COMMON STOCKS—98.1% | |
| AUSTRALIA—0.8% |
| Materials—0.8% | | | |
| Rio Tinto PLC, ADR | | 11,600 | $ 752,724 |
| BRAZIL—1.6% |
| Industrials—1.0% | | | |
| CCR SA | | 436,700 | 925,388 |
| Materials—0.6% | | | |
| Vale SA, ADR | | 57,500 | 615,250 |
| Total Brazil | | 1,540,638 |
| CANADA—1.2% |
| Energy—1.2% | | | |
| Enbridge, Inc. | | 28,400 | 1,147,360 |
| CHINA—1.5% |
| Communication Services—0.8% | | | |
| Tencent Holdings Ltd. | | 15,100 | 787,346 |
| Financials—0.7% | | | |
| Ping An Insurance Group Co. of China Ltd., H Shares | | 113,700 | 704,460 |
| Total China | | 1,491,806 |
| DENMARK—2.2% |
| Financials—1.3% | | | |
| Tryg AS | | 55,300 | 1,305,121 |
| Health Care—0.9% | | | |
| Novo Nordisk AS, Class B | | 7,500 | 841,238 |
| Total Denmark | | 2,146,359 |
| FRANCE—6.0% |
| Consumer Discretionary—0.8% | | | |
| LVMH Moet Hennessy Louis Vuitton SE | | 1,210 | 805,521 |
| Consumer Staples—2.3% | | | |
| Danone SA | | 18,300 | 1,307,325 |
| Pernod Ricard SA | | 7,300 | 910,810 |
| | | | 2,218,135 |
| Energy—0.9% | | | |
| TotalEnergies SE, ADR | | 14,300 | 894,608 |
| Industrials—0.7% | | | |
| Teleperformance SE | | 6,249 | 662,406 |
| Utilities—1.3% | | | |
| Engie SA | | 74,600 | 1,250,409 |
| Total France | | 5,831,079 |
| GERMANY—4.3% |
| Communication Services—1.2% | | | |
| Deutsche Telekom AG | | 37,900 | 1,145,850 |
| Consumer Discretionary—0.9% | | | |
| Mercedes-Benz Group AG | | 14,400 | 874,809 |
| Financials—1.2% | | | |
| Muenchener Rueckversicherungs-Gesellschaft AG in Muenchen | | 2,300 | 1,176,175 |
| Utilities—1.0% | | | |
| RWE AG | | 30,000 | 972,287 |
| Total Germany | | 4,169,121 |
| HONG KONG—0.6% |
| Financials—0.6% | | | |
| Hong Kong Exchanges & Clearing Ltd. | | 14,500 | 580,585 |
| | Shares | Value |
| |
| IRELAND—0.9% |
| Information Technology—0.9% | | | |
| Accenture PLC, Class A | | 2,500 | $ 862,050 |
| ISRAEL—0.7% |
| Energy—0.7% | | | |
| Energean PLC | | 56,600 | 734,208 |
| JAPAN—1.1% |
| Financials—1.1% | | | |
| Mitsubishi UFJ Financial Group, Inc. | | 99,800 | 1,051,915 |
| NETHERLANDS—3.3% |
| Financials—1.2% | | | |
| ING Groep NV, Series N | | 71,800 | 1,218,474 |
| Information Technology—2.1% | | | |
| ASML Holding NV | | 1,500 | 1,009,696 |
| BE Semiconductor Industries NV | | 9,600 | 1,021,883 |
| | | | 2,031,579 |
| Total Netherlands | | 3,250,053 |
| SINGAPORE—1.2% |
| Financials—1.2% | | | |
| Oversea-Chinese Banking Corp. Ltd. | | 106,400 | 1,220,738 |
| SOUTH KOREA—0.6% |
| Materials—0.6% | | | |
| LG Chem Ltd. | | 2,600 | 584,595 |
| SPAIN—1.1% |
| Consumer Discretionary—1.1% | | | |
| Amadeus IT Group SA | | 14,300 | 1,036,653 |
| TAIWAN—1.9% |
| Information Technology—1.9% | | | |
| Taiwan Semiconductor Manufacturing Co. Ltd., ADR | | 9,800 | 1,867,292 |
| UNITED KINGDOM—5.1% |
| Consumer Discretionary—1.0% | | | |
| Playtech PLC(a) | | 53,100 | 497,091 |
| Taylor Wimpey PLC | | 271,100 | 512,564 |
| | | | 1,009,655 |
| Financials—1.3% | | | |
| London Stock Exchange Group PLC | | 9,200 | 1,246,930 |
| Health Care—1.3% | | | |
| AstraZeneca PLC, ADR | | 17,900 | 1,273,585 |
| Industrials—1.0% | | | |
| Melrose Industries PLC | | 151,900 | 930,296 |
| Real Estate—0.5% | | | |
| UNITE Group PLC, REIT | | 42,500 | 480,762 |
| Total United Kingdom | | 4,941,228 |
| UNITED STATES—64.0% |
| Communication Services—2.2% | | | |
| Alphabet, Inc., Class C | | 12,400 | 2,141,356 |
| Consumer Discretionary—6.5% | | | |
| Genuine Parts Co. | | 7,700 | 883,190 |
| Las Vegas Sands Corp. | | 14,800 | 767,380 |
| Lowe's Cos., Inc. | | 5,600 | 1,466,248 |
| NIKE, Inc., Class B | | 10,400 | 802,152 |
| TJX Cos., Inc. | | 12,900 | 1,458,087 |
| Wyndham Hotels & Resorts, Inc. | | 11,219 | 990,862 |
| | | | 6,367,919 |
See accompanying Notes to Financial Statements.
Statement of Investments (concluded)
October 31, 2024 abrdn Dynamic Dividend Fund
| | Shares | Value |
| COMMON STOCKS (continued) | |
| UNITED STATES (continued) |
| Consumer Staples—5.8% | | | |
| Coca-Cola Co. | | 21,600 | $ 1,410,696 |
| Keurig Dr. Pepper, Inc. | | 30,300 | 998,385 |
| Mondelez International, Inc., Class A | | 15,000 | 1,027,200 |
| Nestle SA | | 9,800 | 926,028 |
| Target Corp. | | 8,500 | 1,275,340 |
| | | | 5,637,649 |
| Energy—2.0% | | | |
| Schlumberger NV | | 16,700 | 669,169 |
| Williams Cos., Inc. | | 24,800 | 1,298,776 |
| | | | 1,967,945 |
| Financials—9.3% | | | |
| Bank of America Corp. | | 28,500 | 1,191,870 |
| Blackstone, Inc. | | 5,900 | 989,725 |
| CME Group, Inc. | | 4,800 | 1,081,728 |
| Fidelity National Information Services, Inc. | | 14,900 | 1,336,977 |
| Goldman Sachs Group, Inc. | | 3,300 | 1,708,707 |
| JPMorgan Chase & Co. | | 7,400 | 1,642,208 |
| MetLife, Inc. | | 14,100 | 1,105,722 |
| | | | 9,056,937 |
| Health Care—9.6% | | | |
| AbbVie, Inc. | | 7,800 | 1,590,186 |
| CVS Health Corp. | | 13,700 | 773,502 |
| Eli Lilly & Co. | | 600 | 497,844 |
| Johnson & Johnson | | 4,100 | 655,426 |
| Medtronic PLC | | 11,400 | 1,017,450 |
| Merck & Co., Inc. | | 10,400 | 1,064,128 |
| Roche Holding AG | | 4,000 | 1,239,614 |
| Sanofi SA | | 13,100 | 1,384,405 |
| UnitedHealth Group, Inc. | | 2,000 | 1,129,000 |
| | | | 9,351,555 |
| Industrials—5.7% | | | |
| FedEx Corp. | | 3,800 | 1,040,630 |
| Ferrovial SE | | 26,100 | 1,047,467 |
| Norfolk Southern Corp. | | 5,600 | 1,402,408 |
| Schneider Electric SE | | 4,200 | 1,088,004 |
| Waste Management, Inc. | | 4,700 | 1,014,495 |
| | | | 5,593,004 |
| Information Technology—15.2% | | | |
| Amdocs Ltd. | | 12,900 | 1,131,910 |
| Analog Devices, Inc. | | 6,400 | 1,427,904 |
| Apple, Inc. | | 17,300 | 3,908,243 |
| Broadcom, Inc. | | 14,700 | 2,495,619 |
| Cisco Systems, Inc. | | 26,900 | 1,473,313 |
| | Shares | Value |
| |
|
| Microsoft Corp. | | 8,600 | $ 3,494,610 |
| Oracle Corp. | | 5,300 | 889,552 |
| | | | 14,821,151 |
| Materials—2.0% | | | |
| Linde PLC | | 2,700 | 1,234,686 |
| Newmont Corp. | | 15,300 | 695,232 |
| | | | 1,929,918 |
| Real Estate—2.1% | | | |
| American Tower Corp., REIT | | 4,800 | 1,024,992 |
| Gaming & Leisure Properties, Inc., REIT | | 20,200 | 1,013,838 |
| | | | 2,038,830 |
| Utilities—3.6% | | | |
| CMS Energy Corp. | | 16,500 | 1,148,565 |
| FirstEnergy Corp. | | 22,200 | 928,626 |
| NextEra Energy Partners LP | | 16,200 | 313,470 |
| NextEra Energy, Inc. | | 13,600 | 1,077,800 |
| | | | 3,468,461 |
| Total United States | | 62,374,725 |
| Total Common Stocks | | 95,583,129 |
| PREFERRED STOCKS—1.3% | |
| SOUTH KOREA—1.3% |
| Information Technology—1.3% | | | |
| Samsung Electronics Co. Ltd. | | 37,700 | 1,296,890 |
| Total Preferred Stocks | | 1,296,890 |
| SHORT-TERM INVESTMENT—0.0% | |
| State Street Institutional U.S. Government Money Market Fund, Premier Class, 4.82%(b) | | 24,021 | 24,021 |
| Total Short-Term Investment | | 24,021 |
Total Investments
(Cost $70,395,462)(c)—99.4% | 96,904,040 |
| Other Assets in Excess of Liabilities—0.6% | 594,715 |
| Net Assets—100.0% | $97,498,755 |
| (a) | Non-income producing security. |
| (b) | Registered investment company advised by State Street Global Advisors. The rate shown is the 7 day yield as of October 31, 2024. |
| (c) | See accompanying Notes to Financial Statements for tax unrealized appreciation/(depreciation) of securities. |
| ADR | American Depositary Receipt |
| EUR | Euro Currency |
| PLC | Public Limited Company |
| REIT | Real Estate Investment Trust |
| USD | U.S. Dollar |
| As of October 31, 2024, the Fund held the following forward foreign currency contracts: |
Sale Contracts
Settlement Date | Counterparty | Currency
Purchased | Amount
Purchased | Currency
Sold | Amount
Sold | Fair Value | Unrealized
Appreciation/
(Depreciation) |
| United States Dollar/Euro | | | | | |
| 01/13/2025 | HSBC Bank PLC | USD | 8,863,536 | EUR | 8,000,000 | $8,728,574 | $134,962 |
See accompanying Notes to Financial Statements.
Statement of Investments
October 31, 2024 abrdn EM SMA Completion Fund
| | Shares | Value |
| COMMON STOCKS—83.4% | |
| BRAZIL—3.7% |
| Consumer Staples—2.2% | | | |
| Raia Drogasil SA | | 1,778 | $ 7,486 |
| Energy—1.5% | | | |
| PRIO SA | | 728 | 5,161 |
| Total Brazil | | 12,647 |
| CHINA—19.6% |
| Consumer Discretionary—2.8% | | | |
| Midea Group Co. Ltd.(a) | | 1,000 | 9,397 |
| Health Care—5.0% | | | |
| Aier Eye Hospital Group Co. Ltd., A Shares (Stock Connect)(b) | | 4,800 | 9,765 |
| Shenzhen Mindray Bio-Medical Electronics Co. Ltd., A Shares (Stock Connect)(b) | | 195 | 7,306 |
| | | | 17,071 |
| Industrials—10.2% | | | |
| Contemporary Amperex Technology Co. Ltd., A Shares (Stock Connect)(b) | | 445 | 15,445 |
| NARI Technology Co. Ltd., A Shares (Stock Connect)(b) | | 2,880 | 10,523 |
| Sungrow Power Supply Co. Ltd., A Shares (Stock Connect)(b) | | 703 | 8,960 |
| | | | 34,928 |
| Real Estate—1.6% | | | |
| China Resources Land Ltd. | | 1,630 | 5,433 |
| Total China | | 66,829 |
| INDIA—18.1% |
| Consumer Discretionary—4.5% | | | |
| Mahindra & Mahindra Ltd., GDR(c)(d) | | 469 | 15,383 |
| Consumer Staples—4.0% | | | |
| ITC Ltd., GDR(c) | | 2,337 | 13,598 |
| Industrials—4.5% | | | |
| Larsen & Toubro Ltd., GDR(c) | | 356 | 15,272 |
| Materials—5.1% | | | |
| UltraTech Cement Ltd., GDR(c)(d) | | 133 | 17,503 |
| Total India | | 61,756 |
| INDONESIA—2.4% |
| Communication Services—2.4% | | | |
| Telkom Indonesia Persero Tbk. PT | | 45,500 | 8,133 |
| MEXICO—3.2% |
| Financials—0.6% | | | |
| Grupo Financiero Banorte SAB de CV, Class O | | 320 | 2,233 |
| Materials—2.6% | | | |
| Grupo Mexico SAB de CV | | 1,694 | 8,889 |
| Total Mexico | | 11,122 |
| POLAND—2.0% |
| Industrials—2.0% | | | |
| InPost SA(a) | | 359 | 7,003 |
| SAUDI ARABIA—7.4% |
| Energy—2.5% | | | |
| Saudi Arabian Oil Co.(c) | | 1,179 | 8,469 |
| Financials—4.9% | | | |
| Al Rajhi Bank | | 716 | 16,730 |
| Total Saudi Arabia | | 25,199 |
| | Shares | Value |
| |
| SOUTH KOREA—10.6% |
| Industrials—6.0% | | | |
| HD Korea Shipbuilding & Offshore Engineering Co. Ltd. | | 71 | $ 9,394 |
| Samsung C&T Corp. | | 54 | 4,559 |
| Samsung E&A Co. Ltd.(a) | | 494 | 6,358 |
| | | | 20,311 |
| Information Technology—4.6% | | | |
| SK Hynix, Inc. | | 121 | 15,841 |
| Total South Korea | | 36,152 |
| TAIWAN—11.2% |
| Information Technology—11.2% | | | |
| Accton Technology Corp. | | 741 | 12,452 |
| Chroma ATE, Inc. | | 519 | 6,560 |
| MediaTek, Inc. | | 290 | 11,289 |
| Yageo Corp. | | 465 | 7,909 |
| | | | 38,210 |
| UNITED ARAB EMIRATES—5.2% |
| Financials—2.6% | | | |
| Abu Dhabi Islamic Bank PJSC | | 2,614 | 8,967 |
| Real Estate—2.6% | | | |
| Aldar Properties PJSC | | 4,256 | 8,822 |
| Total United Arab Emirates | | 17,789 |
| Total Common Stocks | | 284,840 |
| PREFERRED STOCKS—14.7% | |
| BRAZIL—2.8% |
| Financials—2.8% | | | |
| Itausa SA | | 5,185 | 9,516 |
| SOUTH KOREA—11.9% |
| Information Technology—11.9% | | | |
| Samsung Electronics Co. Ltd. | | 1,179 | 40,558 |
| Total Preferred Stocks | | 50,074 |
| SHORT-TERM INVESTMENT—1.5% | |
| State Street Institutional U.S. Government Money Market Fund, Premier Class, 4.82%(e) | | 5,157 | 5,157 |
| Total Short-Term Investment | | 5,157 |
Total Investments
(Cost $342,651)(f)—99.6% | 340,071 |
| Other Assets in Excess of Liabilities—0.4% | 1,369 |
| Net Assets—100.0% | $341,440 |
| (a) | Non-income producing security. |
| (b) | China A Shares. These shares are issued in local currency, traded in the local stock markets and are held through either a Qualified Foreign Institutional Investor (QFII) license or the Shanghai or Shenzhen Hong-Kong Stock Connect program. |
| (c) | Denotes a security issued under Regulation S or Rule 144A. |
| (d) | The Fund’s adviser has deemed this security to be illiquid based upon procedures approved by the Board of Trustees. Illiquid securities held by the Fund represent 9.6% of net assets as of October 31, 2024. |
| (e) | Registered investment company advised by State Street Global Advisors. The rate shown is the 7 day yield as of October 31, 2024. |
| (f) | See accompanying Notes to Financial Statements for tax unrealized appreciation/(depreciation) of securities. |
| GDR | Global Depositary Receipt |
See accompanying Notes to Financial Statements.
Statement of Investments
October 31, 2024 abrdn Emerging Markets Dividend Fund
| | Shares | Value |
| COMMON STOCKS—89.5% | |
| BRAZIL—3.9% |
| Communication Services—1.6% | | | |
| Telefonica Brasil SA | | 135,703 | $ 1,235,691 |
| Consumer Staples—0.4% | | | |
| SLC Agricola SA | | 95,498 | 280,998 |
| Financials—1.0% | | | |
| B3 SA - Brasil Bolsa Balcao | | 172,481 | 316,862 |
| Itau Unibanco Holding SA | | 95,277 | 497,572 |
| | | | 814,434 |
| Health Care—0.5% | | | |
| Odontoprev SA | | 215,554 | 410,160 |
| Utilities—0.4% | | | |
| Cia de Saneamento Basico do Estado de Sao Paulo SABESP | | 18,013 | 286,917 |
| Total Brazil | | 3,028,200 |
| CHILE—0.4% |
| Materials—0.4% | | | |
| Sociedad Quimica y Minera de Chile SA, ADR | | 8,975 | 344,550 |
| CHINA—23.5% |
| Communication Services—8.2% | | | |
| Autohome, Inc., ADR | | 14,443 | 405,848 |
| NetEase, Inc. | | 85,900 | 1,382,027 |
| Tencent Holdings Ltd. | | 88,400 | 4,609,361 |
| | | | 6,397,236 |
| Consumer Discretionary—8.8% | | | |
| Alibaba Group Holding Ltd. | | 151,900 | 1,858,087 |
| ANTA Sports Products Ltd. | | 107,000 | 1,142,031 |
| China Tourism Group Duty Free Corp. Ltd., A Shares (Stock Connect)(a) | | 34,900 | 332,955 |
| Fu Shou Yuan International Group Ltd. | | 783,000 | 397,654 |
| JD.com, Inc., A Shares (Stock Connect)(a) | | 21,650 | 439,045 |
| Li Auto, Inc., A Shares (Stock Connect)(a)(b) | | 35,700 | 448,931 |
| Li Ning Co. Ltd. | | 391,000 | 797,799 |
| Midea Group Co. Ltd.(b) | | 72,500 | 681,252 |
| PDD Holdings, Inc., ADR(b) | | 4,103 | 494,781 |
| Zhongsheng Group Holdings Ltd. | | 221,000 | 339,851 |
| | | | 6,932,386 |
| Consumer Staples—2.1% | | | |
| Wuliangye Yibin Co. Ltd., A Shares (Stock Connect)(a) | | 60,400 | 1,247,100 |
| Yifeng Pharmacy Chain Co. Ltd., A Shares (Stock Connect)(a) | | 111,800 | 372,943 |
| | | | 1,620,043 |
| Financials—1.0% | | | |
| China Construction Bank Corp., H Shares | | 615,000 | 477,385 |
| Ping An Insurance Group Co. of China Ltd., H Shares | | 46,000 | 285,006 |
| | | | 762,391 |
| Health Care—1.6% | | | |
| Aier Eye Hospital Group Co. Ltd., A Shares (Stock Connect)(a) | | 185,800 | 378,004 |
| | Shares | Value |
| |
|
| Hangzhou Tigermed Consulting Co. Ltd., H Shares(c) | | 72,500 | $ 327,337 |
| Shenzhen Mindray Bio-Medical Electronics Co. Ltd., A Shares (Stock Connect)(a) | | 14,800 | 554,495 |
| | | | 1,259,836 |
| Industrials—1.8% | | | |
| Contemporary Amperex Technology Co. Ltd., A Shares (Stock Connect)(a) | | 22,800 | 791,318 |
| SITC International Holdings Co. Ltd. | | 233,000 | 659,369 |
| | | | 1,450,687 |
| Total China | | 18,422,579 |
| COLOMBIA—0.4% |
| Energy—0.4% | | | |
| Geopark Ltd. | | 40,178 | 314,996 |
| GEORGIA—1.6% |
| Financials—1.6% | | | |
| Bank of Georgia Group PLC | | 22,916 | 1,229,241 |
| GREECE—0.8% |
| Financials—0.8% | | | |
| National Bank of Greece SA | | 84,055 | 658,548 |
| HONG KONG—1.7% |
| Consumer Staples—1.4% | | | |
| Budweiser Brewing Co. APAC Ltd.(c) | | 1,077,400 | 1,123,704 |
| Financials—0.3% | | | |
| AIA Group Ltd. | | 31,000 | 244,662 |
| Total Hong Kong | | 1,368,366 |
| INDIA—10.6% |
| Consumer Discretionary—0.8% | | | |
| Mahindra & Mahindra Ltd., GDR(c)(d) | | 18,673 | 612,474 |
| Financials—7.6% | | | |
| HDFC Bank Ltd., ADR | | 61,976 | 3,906,347 |
| ICICI Bank Ltd., ADR | | 68,488 | 2,082,720 |
| | | | 5,989,067 |
| Information Technology—2.2% | | | |
| Infosys Ltd., ADR | | 83,370 | 1,743,267 |
| Total India | | 8,344,808 |
| INDONESIA—4.6% |
| Communication Services—1.7% | | | |
| Telkom Indonesia Persero Tbk. PT | | 7,354,200 | 1,314,510 |
| Financials—2.9% | | | |
| Bank Mandiri Persero Tbk. PT | | 2,960,500 | 1,256,787 |
| Bank Rakyat Indonesia Persero Tbk. PT | | 3,442,300 | 1,049,399 |
| | | | 2,306,186 |
| Total Indonesia | | 3,620,696 |
| KAZAKHSTAN—1.7% |
| Energy—0.0% | | | |
| NAC Kazatomprom JSC, GDR(c) | | 229 | 8,954 |
| Financials—1.4% | | | |
| Kaspi.KZ JSC, ADR | | 9,731 | 1,071,772 |
| Industrials—0.3% | | | |
| Air Astana JSC, GDR(b)(c)(d) | | 35,339 | 216,275 |
| Total Kazakhstan | | 1,297,001 |
See accompanying Notes to Financial Statements.
Statement of Investments (continued)
October 31, 2024 abrdn Emerging Markets Dividend Fund
| | Shares | Value |
| COMMON STOCKS (continued) | |
| LATVIA—0.0% |
| Financials—0.0% | | | |
| Parex Bank(b)(d)(e) | | 1,424,182 | $ – |
| MACAO—1.1% |
| Consumer Discretionary—1.1% | | | |
| Sands China Ltd.(b) | | 328,000 | 834,523 |
| MALAYSIA—0.8% |
| Financials—0.8% | | | |
| RHB Bank Bhd. | | 408,094 | 596,514 |
| MEXICO—7.0% |
| Financials—1.5% | | | |
| Grupo Financiero Banorte SAB de CV, Class O | | 171,060 | 1,193,859 |
| Industrials—2.0% | | | |
| Grupo Aeroportuario del Centro Norte SAB de CV | | 97,208 | 810,718 |
| Grupo Aeroportuario del Sureste SAB de CV, B Shares | | 27,853 | 742,877 |
| | | | 1,553,595 |
| Materials—3.5% | | | |
| Grupo Mexico SAB de CV | | 519,532 | 2,725,989 |
| Total Mexico | | 5,473,443 |
| NIGERIA—0.3% |
| Energy—0.3% | | | |
| SEPLAT Energy PLC(c) | | 84,921 | 245,283 |
| PANAMA—0.3% |
| Industrials—0.3% | | | |
| Copa Holdings SA, Class A | | 2,739 | 266,505 |
| PERU—1.0% |
| Financials—1.0% | | | |
| Credicorp Ltd. | | 4,194 | 772,241 |
| PHILIPPINES—0.8% |
| Industrials—0.8% | | | |
| Asian Terminals, Inc.(d) | | 1,812,600 | 598,273 |
| SAUDI ARABIA—0.6% |
| Financials—0.6% | | | |
| Saudi National Bank | | 55,451 | 487,466 |
| SINGAPORE—1.5% |
| Information Technology—0.2% | | | |
| AEM Holdings Ltd. | | 165,337 | 161,196 |
| Real Estate—1.3% | | | |
| Capitaland India Trust, UNIT | | 1,223,200 | 1,007,540 |
| Total Singapore | | 1,168,736 |
| SOUTH AFRICA—2.1% |
| Communication Services—1.0% | | | |
| Vodacom Group Ltd. | | 124,881 | 781,841 |
| Financials—0.9% | | | |
| Sanlam Ltd. | | 140,065 | 696,988 |
| Materials—0.2% | | | |
| Anglo American Platinum Ltd. | | 4,804 | 188,833 |
| Total South Africa | | 1,667,662 |
| SOUTH KOREA—4.4% |
| Financials—1.2% | | | |
| Shinhan Financial Group Co. Ltd. | | 25,404 | 946,304 |
| | Shares | Value |
| |
|
| Industrials—2.4% | | | |
| HD Korea Shipbuilding & Offshore Engineering Co. Ltd. | | 5,621 | $ 743,719 |
| KEPCO Plant Service & Engineering Co. Ltd. | | 9,419 | 304,329 |
| Samsung C&T Corp. | | 6,287 | 530,851 |
| Samsung E&A Co. Ltd.(b) | | 25,846 | 332,636 |
| | | | 1,911,535 |
| Information Technology—0.5% | | | |
| SK Hynix, Inc. | | 3,162 | 413,949 |
| Materials—0.3% | | | |
| Hansol Chemical Co. Ltd. | | 2,173 | 197,008 |
| Total South Korea | | 3,468,796 |
| TAIWAN—18.3% |
| Industrials—0.4% | | | |
| Sporton International, Inc. | | 49,000 | 319,743 |
| Information Technology—17.9% | | | |
| Accton Technology Corp. | | 30,000 | 504,110 |
| Chroma ATE, Inc. | | 120,000 | 1,516,782 |
| Hon Hai Precision Industry Co. Ltd. | | 100,000 | 640,973 |
| MediaTek, Inc. | | 57,000 | 2,218,906 |
| Sinbon Electronics Co. Ltd. | | 29,000 | 237,384 |
| Taiwan Semiconductor Manufacturing Co. Ltd., ADR | | 16,728 | 3,187,353 |
| Taiwan Semiconductor Manufacturing Co. Ltd. | | 165,000 | 5,174,316 |
| Yageo Corp. | | 29,870 | 508,041 |
| | | | 13,987,865 |
| Total Taiwan | | 14,307,608 |
| THAILAND—0.5% |
| Communication Services—0.5% | | | |
| Digital Telecommunications Infrastructure Fund, UNIT | | 1,404,200 | 389,073 |
| UNITED ARAB EMIRATES—1.6% |
| Consumer Discretionary—0.4% | | | |
| Americana Restaurants International PLC | | 463,517 | 284,471 |
| Energy—0.2% | | | |
| ADNOC Drilling Co. PJSC | | 139,389 | 192,402 |
| Real Estate—0.7% | | | |
| Aldar Properties PJSC | | 251,639 | 521,599 |
| Utilities—0.3% | | | |
| National Central Cooling Co. PJSC | | 306,826 | 270,651 |
| Total United Arab Emirates | | 1,269,123 |
| Total Common Stocks | | 70,174,231 |
| EXCHANGE-TRADED FUNDS—4.1% | |
| iShares MSCI India ETF | | 59,028 | 3,235,915 |
| Total Exchange-Traded Funds | | 3,235,915 |
| PREFERRED STOCKS—6.8% | |
| BRAZIL—1.2% |
| Energy—1.2% | | | |
| Petroleo Brasileiro SA | | 148,053 | 919,681 |
See accompanying Notes to Financial Statements.
Statement of Investments (concluded)
October 31, 2024 abrdn Emerging Markets Dividend Fund
| | Shares | Value |
| PREFERRED STOCKS (continued) | |
| SOUTH KOREA—5.6% |
| Information Technology—5.6% | | | |
| Samsung Electronics Co. Ltd. | | 128,472 | $ 4,419,471 |
| Total Preferred Stocks | | 5,339,152 |
Total Investments
(Cost $84,647,983)(f)—100.4% | 78,749,298 |
| Liabilities in Excess of Other Assets—(0.4%) | (333,482) |
| Net Assets—100.0% | $78,415,816 |
| (a) | China A Shares. These shares are issued in local currency, traded in the local stock markets and are held through either a Qualified Foreign Institutional Investor (QFII) license or the Shanghai or Shenzhen Hong-Kong Stock Connect program. |
| (b) | Non-income producing security. |
| (c) | Denotes a security issued under Regulation S or Rule 144A. |
| (d) | The Fund’s adviser has deemed this security to be illiquid based upon procedures approved by the Board of Trustees. Illiquid securities held by the Fund represent 1.8% of net assets as of October 31, 2024. |
| (e) | Level 3 security. See Note 2(a) of the accompanying Notes to Financial Statements. |
| (f) | See accompanying Notes to Financial Statements for tax unrealized appreciation/(depreciation) of securities. |
| ADR | American Depositary Receipt |
| ETF | Exchange-Traded Fund |
| GDR | Global Depositary Receipt |
| PLC | Public Limited Company |
See accompanying Notes to Financial Statements.
Statement of Investments
October 31, 2024 abrdn Emerging Markets ex-China Fund
| | Shares | Value |
| COMMON STOCKS—93.3% | |
| AUSTRALIA—0.4% |
| Materials—0.4% | | | |
| BHP Group Ltd. | | 22,668 | $ 628,777 |
| BRAZIL—6.7% |
| Consumer Discretionary—1.6% | | | |
| MercadoLibre, Inc.(a) | | 1,314 | 2,676,855 |
| Consumer Staples—1.2% | | | |
| Raia Drogasil SA | | 474,470 | 1,997,717 |
| Energy—1.5% | | | |
| PRIO SA | | 350,358 | 2,483,639 |
| Financials—1.3% | | | |
| NU Holdings Ltd., Class A(a) | | 134,923 | 2,035,988 |
| Industrials—1.1% | | | |
| Localiza Rent a Car SA | | 235,005 | 1,708,196 |
| Total Brazil | | 10,902,395 |
| CANADA—0.6% |
| Materials—0.6% | | | |
| Capstone Copper Corp.(a) | | 132,601 | 917,117 |
| CHILE—0.5% |
| Materials—0.5% | | | |
| Sociedad Quimica y Minera de Chile SA, ADR | | 22,228 | 853,333 |
| INDIA—25.2% |
| Communication Services—1.8% | | | |
| Bharti Airtel Ltd. | | 85,456 | 1,643,174 |
| Info Edge India Ltd. | | 14,158 | 1,247,377 |
| | | | 2,890,551 |
| Consumer Discretionary—2.0% | | | |
| Indian Hotels Co. Ltd. | | 180,339 | 1,445,426 |
| Mahindra & Mahindra Ltd. | | 55,426 | 1,804,763 |
| | | | 3,250,189 |
| Consumer Staples—3.3% | | | |
| Hindustan Unilever Ltd. | | 55,248 | 1,657,869 |
| ITC Ltd. | | 634,811 | 3,686,494 |
| | | | 5,344,363 |
| Financials—9.0% | | | |
| 360 ONE WAM Ltd. | | 69,867 | 899,730 |
| Cholamandalam Financial Holdings Ltd. | | 50,926 | 1,028,196 |
| Cholamandalam Investment & Finance Co. Ltd. | | 112,638 | 1,694,356 |
| HDFC Bank Ltd. | | 141,335 | 2,902,757 |
| ICICI Bank Ltd. | | 310,540 | 4,772,943 |
| SBI Life Insurance Co. Ltd.(b) | | 165,425 | 3,176,839 |
| | | | 14,474,821 |
| Health Care—0.6% | | | |
| Torrent Pharmaceuticals Ltd. | | 26,511 | 1,005,293 |
| Industrials—2.2% | | | |
| Havells India Ltd. | | 77,095 | 1,502,750 |
| Larsen & Toubro Ltd. | | 48,708 | 2,091,439 |
| | | | 3,594,189 |
| Information Technology—1.5% | | | |
| Tata Consultancy Services Ltd. | | 52,504 | 2,473,711 |
| Materials—1.2% | | | |
| UltraTech Cement Ltd. | | 14,921 | 1,961,356 |
| | Shares | Value |
| |
|
| Real Estate—1.3% | | | |
| Godrej Properties Ltd.(a) | | 58,779 | $ 2,006,018 |
| Utilities—2.3% | | | |
| Power Grid Corp. of India Ltd. | | 984,909 | 3,746,573 |
| Total India | | 40,747,064 |
| INDONESIA—3.2% |
| Communication Services—1.2% | | | |
| Telkom Indonesia Persero Tbk. PT | | 10,502,400 | 1,877,227 |
| Financials—1.6% | | | |
| Bank Negara Indonesia Persero Tbk. PT | | 7,567,400 | 2,524,001 |
| Utilities—0.4% | | | |
| ReNew Energy Global PLC, Class A(a) | | 122,083 | 690,990 |
| Total Indonesia | | 5,092,218 |
| KAZAKHSTAN—3.1% |
| Energy—1.1% | | | |
| NAC Kazatomprom JSC, GDR(b)(c) | | 45,936 | 1,796,098 |
| Financials—2.0% | | | |
| Kaspi.KZ JSC | | 11,184 | 1,287,256 |
| Kaspi.KZ JSC, ADR | | 17,913 | 1,972,938 |
| | | | 3,260,194 |
| Total Kazakhstan | | 5,056,292 |
| MEXICO—5.0% |
| Consumer Staples—0.7% | | | |
| Fomento Economico Mexicano SAB de CV, ADR | | 11,784 | 1,141,752 |
| Financials—0.3% | | | |
| Grupo Financiero Banorte SAB de CV, Class O | | 68,109 | 475,345 |
| Industrials—1.0% | | | |
| Grupo Aeroportuario del Centro Norte SAB de CV, ADR | | 25,261 | 1,693,750 |
| Materials—3.0% | | | |
| Grupo Mexico SAB de CV | | 361,407 | 1,896,305 |
| Southern Copper Corp. | | 26,336 | 2,885,109 |
| | | | 4,781,414 |
| Total Mexico | | 8,092,261 |
| NETHERLANDS—0.7% |
| Information Technology—0.7% | | | |
| ASML Holding NV | | 1,585 | 1,066,913 |
| PERU—0.9% |
| Financials—0.9% | | | |
| Credicorp Ltd. | | 7,903 | 1,455,179 |
| POLAND—1.6% |
| Industrials—1.6% | | | |
| InPost SA(a) | | 129,739 | 2,530,961 |
| SAUDI ARABIA—6.7% |
| Consumer Discretionary—0.9% | | | |
| Leejam Sports Co. JSC | | 29,877 | 1,511,470 |
| Energy—1.7% | | | |
| Saudi Arabian Oil Co.(b) | | 371,244 | 2,666,666 |
| Financials—3.6% | | | |
| Al Rajhi Bank | | 149,775 | 3,499,584 |
| Saudi Tadawul Group Holding Co. | | 35,525 | 2,249,190 |
| | | | 5,748,774 |
See accompanying Notes to Financial Statements.
Statement of Investments (concluded)
October 31, 2024 abrdn Emerging Markets ex-China Fund
| | Shares | Value |
| COMMON STOCKS (continued) | |
| SAUDI ARABIA (continued) |
| Industrials—0.5% | | | |
| Riyadh Cables Group Co. | | 31,539 | $ 855,922 |
| Total Saudi Arabia | | 10,782,832 |
| SOUTH AFRICA—0.8% |
| Financials—0.8% | | | |
| Sanlam Ltd. | | 244,321 | 1,215,785 |
| SOUTH KOREA—8.8% |
| Financials—2.0% | | | |
| Shinhan Financial Group Co. Ltd. | | 84,763 | 3,157,438 |
| Health Care—0.8% | | | |
| Samsung Biologics Co. Ltd.(a)(b) | | 1,816 | 1,313,404 |
| Industrials—3.9% | | | |
| HD Korea Shipbuilding & Offshore Engineering Co. Ltd. | | 22,141 | 2,929,495 |
| Samsung C&T Corp. | | 22,429 | 1,893,823 |
| Samsung E&A Co. Ltd.(a) | | 117,593 | 1,513,412 |
| | | | 6,336,730 |
| Information Technology—2.1% | | | |
| Samsung Electronics Co. Ltd., GDR(b) | | 983 | 854,669 |
| Samsung Electronics Co. Ltd., Preferred Shares, GDR(b) | | 110 | 95,920 |
| SK Hynix, Inc. | | 19,255 | 2,520,745 |
| | | | 3,471,334 |
| Total South Korea | | 14,278,906 |
| TAIWAN—23.7% |
| Consumer Discretionary—1.6% | | | |
| Makalot Industrial Co. Ltd. | | 146,880 | 1,575,797 |
| momo.com, Inc. | | 22,848 | 265,127 |
| Poya International Co. Ltd. | | 43,875 | 681,930 |
| | | | 2,522,854 |
| Information Technology—22.1% | | | |
| Accton Technology Corp. | | 137,000 | 2,302,104 |
| Chroma ATE, Inc. | | 361,000 | 4,562,986 |
| Delta Electronics, Inc. | | 121,000 | 1,494,456 |
| Globalwafers Co. Ltd. | | 98,579 | 1,283,213 |
| MediaTek, Inc. | | 38,000 | 1,479,270 |
| Taiwan Semiconductor Manufacturing Co. Ltd. | | 746,000 | 23,394,173 |
| Yageo Corp. | | 75,352 | 1,281,618 |
| | | | 35,797,820 |
| Total Taiwan | | 38,320,674 |
| TURKEY—0.5% |
| Consumer Staples—0.5% | | | |
| Coca-Cola Icecek AS | | 585,684 | 870,022 |
| UNITED ARAB EMIRATES—3.5% |
| Financials—1.1% | | | |
| Abu Dhabi Islamic Bank PJSC | | 537,544 | 1,843,986 |
| Real Estate—1.3% | | | |
| Aldar Properties PJSC | | 999,585 | 2,071,944 |
| Utilities—1.1% | | | |
| Emirates Central Cooling Systems Corp. | | 3,816,596 | 1,818,392 |
| Total United Arab Emirates | | 5,734,322 |
| | Shares | Value |
| |
| UNITED STATES—1.4% |
| Information Technology—1.4% | | | |
| Globant SA(a) | | 11,057 | $ 2,320,754 |
| Total Common Stocks | | 150,865,805 |
| PREFERRED STOCKS—6.1% | |
| BRAZIL—1.1% |
| Financials—1.1% | | | |
| Itausa SA | | 982,862 | 1,803,900 |
| SOUTH KOREA—5.0% |
| Information Technology—5.0% | | | |
| Samsung Electronics Co. Ltd. | | 235,566 | 8,103,534 |
| Total Preferred Stocks | | 9,907,434 |
| SHORT-TERM INVESTMENT—1.0% | |
| State Street Institutional U.S. Government Money Market Fund, Premier Class, 4.82%(d) | | 1,639,385 | 1,639,385 |
| Total Short-Term Investment | | 1,639,385 |
Total Investments
(Cost $154,402,616)(e)—100.4% | 162,412,624 |
| Liabilities in Excess of Other Assets—(0.4%) | (600,025) |
| Net Assets—100.0% | $161,812,599 |
| (a) | Non-income producing security. |
| (b) | Denotes a security issued under Regulation S or Rule 144A. |
| (c) | The Fund’s adviser has deemed this security to be illiquid based upon procedures approved by the Board of Trustees. Illiquid securities held by the Fund represent 1.1% of net assets as of October 31, 2024. |
| (d) | Registered investment company advised by State Street Global Advisors. The rate shown is the 7 day yield as of October 31, 2024. |
| (e) | See accompanying Notes to Financial Statements for tax unrealized appreciation/(depreciation) of securities. |
| ADR | American Depositary Receipt |
| GDR | Global Depositary Receipt |
| PLC | Public Limited Company |
See accompanying Notes to Financial Statements.
Statement of Investments
October 31, 2024 abrdn Emerging Markets Fund
| | Shares | Value |
| COMMON STOCKS—92.3% | |
| BRAZIL—3.3% |
| Consumer Discretionary—0.9% | | | |
| MercadoLibre, Inc.(a) | | 5,155 | $ 10,501,663 |
| Consumer Staples—0.8% | | | |
| Raia Drogasil SA | | 2,342,006 | 9,860,822 |
| Energy—0.7% | | | |
| PRIO SA | | 1,202,872 | 8,526,993 |
| Financials—0.9% | | | |
| NU Holdings Ltd., Class A(a) | | 761,551 | 11,491,805 |
| Total Brazil | | 40,381,283 |
| CHINA—27.0% |
| Communication Services—7.3% | | | |
| Tencent Holdings Ltd. | | 1,745,900 | 91,034,873 |
| Consumer Discretionary—8.7% | | | |
| Alibaba Group Holding Ltd. | | 3,925,400 | 48,016,696 |
| ANTA Sports Products Ltd. | | 1,901,400 | 20,293,989 |
| Midea Group Co. Ltd.(a) | | 1,266,500 | 11,900,776 |
| Midea Group Co. Ltd., A Shares (Stock Connect)(b) | | 1,296,311 | 12,994,668 |
| Trip.com Group Ltd.(a) | | 217,100 | 13,971,356 |
| | | | 107,177,485 |
| Consumer Staples—1.3% | | | |
| Kweichow Moutai Co. Ltd., A Shares (Stock Connect)(b) | | 72,506 | 15,572,833 |
| Financials—2.9% | | | |
| PICC Property & Casualty Co. Ltd., H Shares | | 9,977,900 | 15,136,172 |
| Ping An Insurance Group Co. of China Ltd., H Shares | | 3,399,000 | 21,059,455 |
| | | | 36,195,627 |
| Health Care—1.0% | | | |
| Shenzhen Mindray Bio-Medical Electronics Co. Ltd., A Shares (Stock Connect)(b) | | 336,797 | 12,618,385 |
| Industrials—4.9% | | | |
| Contemporary Amperex Technology Co. Ltd., A Shares (Stock Connect)(b) | | 838,781 | 29,111,523 |
| NARI Technology Co. Ltd., A Shares (Stock Connect)(b) | | 4,385,979 | 16,026,249 |
| Sungrow Power Supply Co. Ltd., A Shares (Stock Connect)(b) | | 1,218,598 | 15,531,637 |
| | | | 60,669,409 |
| Real Estate—0.9% | | | |
| China Resources Land Ltd. | | 3,341,000 | 11,137,001 |
| Total China | | 334,405,613 |
| HONG KONG—1.5% |
| Financials—1.5% | | | |
| AIA Group Ltd. | | 2,414,200 | 19,053,636 |
| INDIA—19.5% |
| Communication Services—1.1% | | | |
| Bharti Airtel Ltd. | | 711,135 | 13,673,921 |
| Consumer Discretionary—2.1% | | | |
| Indian Hotels Co. Ltd. | | 1,557,119 | 12,480,382 |
| Mahindra & Mahindra Ltd. | | 423,065 | 13,775,706 |
| | | | 26,256,088 |
| | Shares | Value |
| |
|
| Consumer Staples—1.2% | | | |
| Hindustan Unilever Ltd. | | 468,521 | $ 14,059,272 |
| Financials—7.3% | | | |
| Cholamandalam Investment & Finance Co. Ltd. | | 622,319 | 9,361,228 |
| HDFC Bank Ltd. | | 1,710,770 | 35,136,016 |
| ICICI Bank Ltd. | | 1,623,961 | 24,959,985 |
| SBI Life Insurance Co. Ltd.(c) | | 1,119,192 | 21,493,078 |
| | | | 90,950,307 |
| Health Care—0.6% | | | |
| Torrent Pharmaceuticals Ltd. | | 201,630 | 7,645,776 |
| Industrials—0.9% | | | |
| Havells India Ltd. | | 588,134 | 11,464,013 |
| Information Technology—1.5% | | | |
| Tata Consultancy Services Ltd. | | 394,178 | 18,571,584 |
| Materials—1.7% | | | |
| UltraTech Cement Ltd. | | 155,291 | 20,412,904 |
| Real Estate—0.5% | | | |
| Godrej Properties Ltd.(a) | | 181,699 | 6,201,051 |
| Utilities—2.6% | | | |
| Power Grid Corp. of India Ltd. | | 8,472,758 | 32,230,191 |
| Total India | | 241,465,107 |
| INDONESIA—2.3% |
| Communication Services—1.0% | | | |
| Telkom Indonesia Persero Tbk. PT | | 73,108,900 | 13,067,684 |
| Financials—1.3% | | | |
| Bank Negara Indonesia Persero Tbk. PT | | 47,564,300 | 15,864,409 |
| Total Indonesia | | 28,932,093 |
| KAZAKHSTAN—1.1% |
| Financials—1.1% | | | |
| Kaspi.KZ JSC, ADR | | 120,591 | 13,281,893 |
| MEXICO—5.7% |
| Consumer Staples—1.0% | | | |
| Fomento Economico Mexicano SAB de CV, ADR | | 128,523 | 12,452,593 |
| Financials—0.3% | | | |
| Grupo Financiero Banorte SAB de CV, Class O | | 614,223 | 4,286,776 |
| Industrials—0.9% | | | |
| Grupo Aeroportuario del Sureste SAB de CV, B Shares | | 415,684 | 11,086,846 |
| Materials—3.5% | | | |
| Grupo Mexico SAB de CV | | 2,562,817 | 13,447,121 |
| Southern Copper Corp. | | 271,855 | 29,781,715 |
| | | | 43,228,836 |
| Total Mexico | | 71,055,051 |
| PERU—0.5% |
| Financials—0.5% | | | |
| Credicorp Ltd. | | 35,157 | 6,473,458 |
| POLAND—0.7% |
| Industrials—0.7% | | | |
| InPost SA(a) | | 459,786 | 8,969,548 |
See accompanying Notes to Financial Statements.
Statement of Investments (concluded)
October 31, 2024 abrdn Emerging Markets Fund
| | Shares | Value |
| COMMON STOCKS (continued) | |
| RUSSIA—0.0% |
| Energy—0.0% | | | |
| LUKOIL PJSC, ADR(a)(d)(e) | | 625,991 | $ – |
| Novatek PJSC(d)(e) | | 267,284 | – |
| | | | – |
| Financials—0.0% | | | |
| Sberbank of Russia PJSC(d)(e) | | 6,211,074 | – |
| Total Russia | | – |
| SAUDI ARABIA—3.3% |
| Energy—1.5% | | | |
| Saudi Arabian Oil Co.(c) | | 2,496,371 | 17,931,571 |
| Financials—1.8% | | | |
| Al Rajhi Bank | | 969,952 | 22,663,519 |
| Total Saudi Arabia | | 40,595,090 |
| SOUTH AFRICA—0.8% |
| Financials—0.8% | | | |
| Sanlam Ltd. | | 2,118,540 | 10,542,230 |
| SOUTH KOREA—5.5% |
| Financials—1.3% | | | |
| Shinhan Financial Group Co. Ltd. | | 438,436 | 16,331,826 |
| Industrials—2.4% | | | |
| HD Korea Shipbuilding & Offshore Engineering Co. Ltd. | | 101,682 | 13,453,634 |
| Samsung C&T Corp. | | 87,907 | 7,422,547 |
| Samsung E&A Co. Ltd.(a) | | 704,195 | 9,062,931 |
| | | | 29,939,112 |
| Information Technology—1.8% | | | |
| SK Hynix, Inc. | | 164,698 | 21,561,244 |
| Total South Korea | | 67,832,182 |
| TAIWAN—18.1% |
| Information Technology—18.1% | | | |
| Accton Technology Corp. | | 1,019,000 | 17,122,949 |
| Delta Electronics, Inc. | | 1,361,000 | 16,809,541 |
| MediaTek, Inc. | | 561,000 | 21,838,701 |
| Taiwan Semiconductor Manufacturing Co. Ltd. | | 4,980,017 | 156,170,752 |
| Yageo Corp. | | 713,819 | 12,140,927 |
| | | | 224,082,870 |
| UNITED ARAB EMIRATES—2.1% |
| Financials—1.1% | | | |
| Abu Dhabi Islamic Bank PJSC | | 3,829,280 | 13,135,930 |
| Real Estate—1.0% | | | |
| Aldar Properties PJSC | | 6,318,832 | 13,097,704 |
| Total United Arab Emirates | | 26,233,634 |
| UNITED STATES—0.9% |
| Information Technology—0.9% | | | |
| Globant SA(a) | | 52,831 | 11,088,699 |
| Total Common Stocks | | 1,144,392,387 |
| PREFERRED STOCKS—5.5% | |
| BRAZIL—1.2% |
| Financials—1.2% | | | |
| Itausa SA | | 8,175,588 | 15,005,101 |
| | Shares | Value |
| |
| SOUTH KOREA—4.3% |
| Information Technology—4.3% | | | |
| Samsung Electronics Co. Ltd. | | 1,556,202 | $ 53,533,766 |
| Total Preferred Stocks | | 68,538,867 |
| SHORT-TERM INVESTMENT—2.6% | |
| State Street Institutional U.S. Government Money Market Fund, Premier Class, 4.82%(f) | | 32,633,579 | 32,633,579 |
| Total Short-Term Investment | | 32,633,579 |
Total Investments
(Cost $1,096,393,127)(g)—100.4% | 1,245,564,833 |
| Liabilities in Excess of Other Assets—(0.4%) | (4,775,827) |
| Net Assets—100.0% | $1,240,789,006 |
| (a) | Non-income producing security. |
| (b) | China A Shares. These shares are issued in local currency, traded in the local stock markets and are held through either a Qualified Foreign Institutional Investor (QFII) license or the Shanghai or Shenzhen Hong-Kong Stock Connect program. |
| (c) | Denotes a security issued under Regulation S or Rule 144A. |
| (d) | The Fund’s adviser has deemed this security to be illiquid based upon procedures approved by the Board of Trustees. Illiquid securities held by the Fund represent 0.0% of net assets as of October 31, 2024. |
| (e) | Level 3 security. See Note 2(a) of the accompanying Notes to Financial Statements. |
| (f) | Registered investment company advised by State Street Global Advisors. The rate shown is the 7 day yield as of October 31, 2024. |
| (g) | See accompanying Notes to Financial Statements for tax unrealized appreciation/(depreciation) of securities. |
| ADR | American Depositary Receipt |
See accompanying Notes to Financial Statements.
Statement of Investments
October 31, 2024 abrdn Focused U.S. Small Cap Equity Fund
| | Shares | Value |
| COMMON STOCKS—98.7% | |
| CANADA—5.9% |
| Consumer Discretionary—2.8% | | | |
| Aritzia, Inc.(a) | | 10,900 | $ 350,951 |
| Financials—3.1% | | | |
| TMX Group Ltd. | | 12,264 | 383,066 |
| Total Canada | | 734,017 |
| ISRAEL—1.7% |
| Information Technology—1.7% | | | |
| Camtek Ltd. | | 2,663 | 211,868 |
| UNITED STATES—91.1% |
| Communication Services—2.2% | | | |
| Integral Ad Science Holding Corp.(a) | | 22,772 | 269,620 |
| Consumer Discretionary—10.6% | | | |
| Boot Barn Holdings, Inc.(a) | | 2,319 | 288,831 |
| Brinker International, Inc.(a) | | 3,901 | 400,672 |
| Steven Madden Ltd. | | 5,922 | 266,312 |
| Stride, Inc.(a) | | 3,892 | 363,046 |
| | | | 1,318,861 |
| Consumer Staples—2.6% | | | |
| Vita Coco Co., Inc.(a) | | 11,052 | 327,250 |
| Energy—4.8% | | | |
| Magnolia Oil & Gas Corp., Class A | | 7,383 | 186,642 |
| Northern Oil & Gas, Inc. | | 4,744 | 171,970 |
| SM Energy Co. | | 5,579 | 234,151 |
| | | | 592,763 |
| Financials—17.5% | | | |
| Donnelley Financial Solutions, Inc.(a) | | 4,493 | 262,122 |
| Live Oak Bancshares, Inc. | | 6,558 | 260,418 |
| PJT Partners, Inc., Class A | | 2,192 | 304,600 |
| Seacoast Banking Corp. of Florida | | 14,490 | 386,883 |
| Wintrust Financial Corp. | | 4,139 | 479,669 |
| WSFS Financial Corp. | | 9,598 | 471,934 |
| | | | 2,165,626 |
| Health Care—15.0% | | | |
| Amicus Therapeutics, Inc.(a) | | 34,534 | 394,378 |
| Corcept Therapeutics, Inc.(a) | | 8,950 | 438,281 |
| Integer Holdings Corp.(a) | | 2,678 | 332,742 |
| Ligand Pharmaceuticals, Inc.(a) | | 3,024 | 319,637 |
| Merit Medical Systems, Inc.(a) | | 3,852 | 380,038 |
| | | | 1,865,076 |
| Industrials—17.3% | | | |
| Atmus Filtration Technologies, Inc. | | 7,376 | 287,222 |
| AZEK Co., Inc.(a) | | 7,016 | 308,704 |
| Casella Waste Systems, Inc., Class A(a) | | 3,476 | 340,231 |
| Enpro, Inc. | | 2,612 | 380,333 |
| H&E Equipment Services, Inc. | | 5,187 | 271,021 |
| Parsons Corp.(a) | | 2,689 | 290,842 |
| WNS Holdings Ltd.(a) | | 5,470 | 262,505 |
| | | | 2,140,858 |
| Information Technology—11.2% | | | |
| JFrog Ltd.(a) | | 7,624 | 222,468 |
| Q2 Holdings, Inc.(a) | | 6,390 | 540,978 |
| Vertex, Inc., Class A(a) | | 7,374 | 306,095 |
| Workiva, Inc.(a) | | 4,040 | 322,230 |
| | | | 1,391,771 |
| | Shares | Value |
| |
|
| Materials—7.4% | | | |
| Graphic Packaging Holding Co. | | 11,360 | $ 321,034 |
| Knife River Corp.(a) | | 2,765 | 269,090 |
| Materion Corp. | | 3,216 | 326,842 |
| | | | 916,966 |
| Real Estate—2.5% | | | |
| Terreno Realty Corp., REIT | | 5,197 | 311,560 |
| Total United States | | 11,300,351 |
| Total Common Stocks | | 12,246,236 |
| SHORT-TERM INVESTMENT—1.1% | |
| State Street Institutional U.S. Government Money Market Fund, Premier Class, 4.82%(b) | | 136,748 | 136,748 |
| Total Short-Term Investment | | 136,748 |
Total Investments
(Cost $10,878,011)(c)—99.8% | 12,382,984 |
| Other Assets in Excess of Liabilities—0.2% | 22,476 |
| Net Assets—100.0% | $12,405,460 |
| (a) | Non-income producing security. |
| (b) | Registered investment company advised by State Street Global Advisors. The rate shown is the 7 day yield as of October 31, 2024. |
| (c) | See accompanying Notes to Financial Statements for tax unrealized appreciation/(depreciation) of securities. |
| REIT | Real Estate Investment Trust |
See accompanying Notes to Financial Statements.
Statement of Investments
October 31, 2024 abrdn Global Equity Impact Fund
| | Shares | Value |
| COMMON STOCKS—99.5% | |
| BRAZIL—2.9% |
| Consumer Discretionary—2.0% | | | |
| MercadoLibre, Inc.(a) | | 424 | $ 863,765 |
| Financials—0.9% | | | |
| Banco Bradesco SA | | 181,705 | 400,443 |
| Total Brazil | | 1,264,208 |
| CANADA—3.0% |
| Industrials—3.0% | | | |
| WSP Global, Inc. | | 7,282 | 1,301,592 |
| CHINA—4.9% |
| Financials—1.5% | | | |
| Ping An Insurance Group Co. of China Ltd., H Shares | | 102,000 | 631,969 |
| Health Care—0.9% | | | |
| Shenzhen Mindray Bio-Medical Electronics Co. Ltd., A Shares (Stock Connect) | | 10,700 | 400,885 |
| Industrials—2.5% | | | |
| Contemporary Amperex Technology Co. Ltd., A Shares (Stock Connect) | | 30,800 | 1,068,974 |
| Total China | | 2,101,828 |
| DENMARK—4.4% |
| Health Care—3.1% | | | |
| Novo Nordisk AS, Class B | | 11,996 | 1,345,531 |
| Industrials—1.3% | | | |
| Vestas Wind Systems AS(a) | | 28,800 | 548,851 |
| Total Denmark | | 1,894,382 |
| INDONESIA—1.6% |
| Health Care—1.6% | | | |
| Medikaloka Hermina Tbk. PT(b) | | 7,267,300 | 694,549 |
| IRELAND—2.5% |
| Industrials—2.5% | | | |
| Kingspan Group PLC | | 11,886 | 1,049,616 |
| MEXICO—1.7% |
| Financials—1.7% | | | |
| Gentera SAB de CV | | 556,040 | 711,393 |
| NETHERLANDS—3.0% |
| Information Technology—3.0% | | | |
| ASML Holding NV | | 1,926 | 1,296,450 |
| SOUTH AFRICA—1.7% |
| Consumer Staples—1.7% | | | |
| Clicks Group Ltd. | | 34,599 | 738,570 |
| TAIWAN—6.7% |
| Industrials—1.8% | | | |
| Voltronic Power Technology Corp. | | 11,610 | 763,523 |
| Information Technology—4.9% | | | |
| Sinbon Electronics Co. Ltd. | | 74,000 | 605,739 |
| Taiwan Semiconductor Manufacturing Co. Ltd. | | 48,000 | 1,505,255 |
| | | | 2,110,994 |
| Total Taiwan | | 2,874,517 |
| UNITED KINGDOM—10.6% |
| Consumer Discretionary—1.8% | | | |
| Coats Group PLC | | 644,569 | 791,005 |
| | Shares | Value |
| |
|
| Health Care—3.2% | | | |
| AstraZeneca PLC | | 9,827 | $ 1,398,319 |
| Industrials—4.0% | | | |
| RELX PLC | | 37,353 | 1,712,997 |
| Utilities—1.6% | | | |
| SSE PLC | | 29,453 | 669,272 |
| Total United Kingdom | | 4,571,593 |
| UNITED STATES—56.5% |
| Consumer Discretionary—0.9% | | | |
| Coursera, Inc.(a) | | 58,585 | 407,166 |
| Health Care—9.1% | | | |
| Insulet Corp.(a) | | 4,525 | 1,047,673 |
| Merck & Co., Inc. | | 11,323 | 1,158,570 |
| UnitedHealth Group, Inc. | | 3,030 | 1,710,435 |
| | | | 3,916,678 |
| Industrials—24.6% | | | |
| Advanced Drainage Systems, Inc. | | 7,610 | 1,140,587 |
| Carlisle Cos., Inc. | | 2,378 | 1,004,063 |
| Hubbell, Inc. | | 2,895 | 1,236,252 |
| MSA Safety, Inc. | | 5,070 | 841,367 |
| NEXTracker, Inc., Class A(a) | | 8,188 | 326,046 |
| Schneider Electric SE | | 4,608 | 1,193,696 |
| Tetra Tech, Inc. | | 40,731 | 1,990,931 |
| Trane Technologies PLC | | 1,270 | 470,103 |
| Veralto Corp. | | 9,710 | 992,265 |
| Westinghouse Air Brake Technologies Corp. | | 7,303 | 1,372,818 |
| | | | 10,568,128 |
| Information Technology—10.3% | | | |
| Analog Devices, Inc. | | 4,379 | 976,999 |
| Autodesk, Inc.(a) | | 2,889 | 819,898 |
| Microsoft Corp. | | 6,446 | 2,619,332 |
| | | | 4,416,229 |
| Real Estate—5.5% | | | |
| Equinix, Inc., REIT | | 1,072 | 973,462 |
| Prologis, Inc., REIT | | 12,241 | 1,382,498 |
| | | | 2,355,960 |
| Utilities—6.1% | | | |
| American Water Works Co., Inc. | | 7,125 | 984,034 |
| NextEra Energy, Inc. | | 20,695 | 1,640,078 |
| | | | 2,624,112 |
| Total United States | | 24,288,273 |
| Total Common Stocks | | 42,786,971 |
| SHORT-TERM INVESTMENT—0.1% | |
| State Street Institutional U.S. Government Money Market Fund, Premier Class, 4.82%(c) | | 29,194 | 29,194 |
| Total Short-Term Investment | | 29,194 |
Total Investments
(Cost $38,717,694)(d)—99.6% | 42,816,165 |
| Other Assets in Excess of Liabilities—0.4% | 157,107 |
| Net Assets—100.0% | $42,973,272 |
See accompanying Notes to Financial Statements.
Statement of Investments (concluded)
October 31, 2024 abrdn Global Equity Impact Fund
| (a) | Non-income producing security. |
| (b) | Denotes a security issued under Regulation S or Rule 144A. |
| (c) | Registered investment company advised by State Street Global Advisors. The rate shown is the 7 day yield as of October 31, 2024. |
| (d) | See accompanying Notes to Financial Statements for tax unrealized appreciation/(depreciation) of securities. |
| PLC | Public Limited Company |
| REIT | Real Estate Investment Trust |
See accompanying Notes to Financial Statements.
Statement of Investments
October 31, 2024 abrdn Global Infrastructure Fund
| | Shares | Value |
| COMMON STOCKS—99.3% | |
| ARGENTINA—2.0% |
| Industrials—0.7% | | | |
| Corp. America Airports SA(a) | | 16,400 | $ 309,796 |
| Materials—1.3% | | | |
| Loma Negra Cia Industrial Argentina SA, ADR(a) | | 58,900 | 539,524 |
| Total Argentina | | 849,320 |
| AUSTRALIA—0.9% |
| Industrials—0.9% | | | |
| Aurizon Holdings Ltd. | | 185,300 | 410,860 |
| BRAZIL—4.0% |
| Industrials—3.2% | | | |
| CCR SA | | 349,400 | 740,395 |
| Rumo SA | | 183,200 | 630,642 |
| | | | 1,371,037 |
| Utilities—0.8% | | | |
| Serena Energia SA(a) | | 239,907 | 344,450 |
| Total Brazil | | 1,715,487 |
| CANADA—5.6% |
| Energy—3.3% | | | |
| Enbridge, Inc. | | 35,100 | 1,417,764 |
| Industrials—2.3% | | | |
| Canadian Pacific Kansas City Ltd. | | 12,600 | 972,216 |
| Total Canada | | 2,389,980 |
| FRANCE—10.6% |
| Industrials—6.1% | | | |
| Eiffage SA | | 8,600 | 800,433 |
| Getlink SE | | 51,600 | 876,923 |
| Vinci SA | | 8,500 | 952,176 |
| | | | 2,629,532 |
| Utilities—4.5% | | | |
| Engie SA | | 51,200 | 858,189 |
| Veolia Environnement SA | | 33,200 | 1,054,090 |
| | | | 1,912,279 |
| Total France | | 4,541,811 |
| GERMANY—2.6% |
| Utilities—2.6% | | | |
| RWE AG | | 34,000 | 1,101,926 |
| HONG KONG—1.2% |
| Utilities—1.2% | | | |
| CLP Holdings Ltd. | | 59,100 | 502,031 |
| INDONESIA—0.7% |
| Communication Services—0.7% | | | |
| Sarana Menara Nusantara Tbk. PT | | 5,845,200 | 297,939 |
| ITALY—4.4% |
| Communication Services—1.7% | | | |
| Infrastrutture Wireless Italiane SpA(b) | | 62,600 | 705,800 |
| Utilities—2.7% | | | |
| Enel SpA | | 152,900 | 1,159,605 |
| Total Italy | | 1,865,405 |
| JAPAN—1.7% |
| Industrials—1.7% | | | |
| Japan Airport Terminal Co. Ltd. | | 20,100 | 736,306 |
| | Shares | Value |
| |
| MALAYSIA—2.3% |
| Industrials—2.3% | | | |
| Malaysia Airports Holdings Bhd. | | 435,400 | $ 1,008,211 |
| MEXICO—2.9% |
| Industrials—2.9% | | | |
| Grupo Aeroportuario del Centro Norte SAB de CV | | 80,100 | 668,037 |
| Promotora y Operadora de Infraestructura SAB de CV | | 64,900 | 565,465 |
| | | | 1,233,502 |
| NIGERIA—1.0% |
| Communication Services—1.0% | | | |
| IHS Holding Ltd.(a) | | 149,000 | 439,550 |
| PHILIPPINES—2.3% |
| Industrials—2.3% | | | |
| International Container Terminal Services, Inc. | | 142,100 | 968,363 |
| SPAIN—7.9% |
| Communication Services—2.7% | | | |
| Cellnex Telecom SA(a)(b) | | 31,100 | 1,142,171 |
| Industrials—3.7% | | | |
| Aena SME SA(b) | | 5,700 | 1,263,234 |
| Sacyr SA | | 97,977 | 326,266 |
| | | | 1,589,500 |
| Utilities—1.5% | | | |
| EDP Renovaveis SA | | 46,500 | 630,243 |
| Total Spain | | 3,361,914 |
| TANZANIA—1.6% |
| Communication Services—1.6% | | | |
| Helios Towers PLC(a) | | 508,900 | 698,198 |
| UNITED KINGDOM—4.4% |
| Industrials—1.0% | | | |
| Mobico Group PLC(a) | | 495,300 | 442,914 |
| Utilities—3.4% | | | |
| National Grid PLC, ADR | | 11,200 | 712,208 |
| SSE PLC | | 31,977 | 726,626 |
| | | | 1,438,834 |
| Total United Kingdom | | 1,881,748 |
| UNITED STATES—43.2% |
| Energy—9.5% | | | |
| Cheniere Energy, Inc. | | 5,700 | 1,090,866 |
| Kinder Morgan, Inc. | | 58,700 | 1,438,737 |
| Williams Cos., Inc. | | 29,500 | 1,544,915 |
| | | | 4,074,518 |
| Industrials—11.8% | | | |
| CoreCivic, Inc.(a) | | 47,800 | 660,118 |
| Dycom Industries, Inc.(a) | | 2,600 | 453,258 |
| Ferrovial SE | | 29,200 | 1,171,879 |
| Norfolk Southern Corp. | | 5,500 | 1,377,365 |
| Union Pacific Corp. | | 3,100 | 719,417 |
| Waste Management, Inc. | | 3,000 | 647,550 |
| | | | 5,029,587 |
| Real Estate—5.0% | | | |
| American Tower Corp., REIT | | 5,600 | 1,195,824 |
| Crown Castle, Inc., REIT | | 8,900 | 956,661 |
| | | | 2,152,485 |
See accompanying Notes to Financial Statements.
Statement of Investments (concluded)
October 31, 2024 abrdn Global Infrastructure Fund
| | Shares | Value |
| COMMON STOCKS (continued) | |
| UNITED STATES (continued) |
| Utilities—16.9% | | | |
| Altus Power, Inc.(a) | | 69,300 | $ 238,392 |
| American Electric Power Co., Inc. | | 7,368 | 727,590 |
| CenterPoint Energy, Inc. | | 33,300 | 983,349 |
| Clearway Energy, Inc., Class C | | 22,000 | 624,360 |
| CMS Energy Corp. | | 13,394 | 932,356 |
| FirstEnergy Corp. | | 14,800 | 619,084 |
| NextEra Energy Partners LP | | 25,300 | 489,555 |
| NextEra Energy, Inc. | | 15,878 | 1,258,331 |
| PPL Corp. | | 25,667 | 835,718 |
| TXNM Energy, Inc. | | 11,535 | 502,234 |
| | | | 7,210,969 |
| Total United States | | 18,467,559 |
| Total Common Stocks | | 42,470,110 |
| SHORT-TERM INVESTMENT—0.7% | |
| State Street Institutional U.S. Government Money Market Fund, Premier Class, 4.82%(c) | | 291,827 | 291,827 |
| Total Short-Term Investment | | 291,827 |
Total Investments
(Cost $34,174,624)(d)—100.0% | 42,761,937 |
| Liabilities in Excess of Other Assets—(0.0%) | (7,656) |
| Net Assets—100.0% | $42,754,281 |
| (a) | Non-income producing security. |
| (b) | Denotes a security issued under Regulation S or Rule 144A. |
| (c) | Registered investment company advised by State Street Global Advisors. The rate shown is the 7 day yield as of October 31, 2024. |
| (d) | See accompanying Notes to Financial Statements for tax unrealized appreciation/(depreciation) of securities. |
| ADR | American Depositary Receipt |
| PLC | Public Limited Company |
| REIT | Real Estate Investment Trust |
See accompanying Notes to Financial Statements.
Statement of Investments
October 31, 2024 abrdn International Small Cap Fund
| | Shares | Value |
| COMMON STOCKS—96.1% | |
| AUSTRALIA—3.8% |
| Financials—1.9% | | | |
| Steadfast Group Ltd. | | 647,634 | $ 2,332,425 |
| Industrials—1.9% | | | |
| ALS Ltd. | | 140,000 | 1,292,394 |
| Johns Lyng Group Ltd. | | 443,013 | 1,109,258 |
| | | | 2,401,652 |
| Total Australia | | 4,734,077 |
| FRANCE—8.2% |
| Consumer Staples—3.6% | | | |
| Interparfums SA | | 96,351 | 4,400,707 |
| Energy—4.6% | | | |
| Gaztransport Et Technigaz SA | | 38,962 | 5,668,935 |
| Total France | | 10,069,642 |
| GERMANY—6.7% |
| Communication Services—4.8% | | | |
| CTS Eventim AG & Co. KGaA | | 56,968 | 5,982,502 |
| Industrials—1.9% | | | |
| Rational AG | | 2,363 | 2,314,091 |
| Total Germany | | 8,296,593 |
| INDIA—7.8% |
| Consumer Discretionary—1.5% | | | |
| UNO Minda Ltd. | | 160,628 | 1,869,527 |
| Health Care—5.3% | | | |
| Poly Medicure Ltd. | | 193,753 | 6,626,636 |
| Information Technology—1.0% | | | |
| Newgen Software Technologies Ltd. | | 78,739 | 1,198,135 |
| Total India | | 9,694,298 |
| ISRAEL—4.8% |
| Information Technology—4.8% | | | |
| CyberArk Software Ltd.(a) | | 12,660 | 3,500,743 |
| Nova Ltd.(a) | | 13,041 | 2,416,498 |
| | | | 5,917,241 |
| ITALY—3.8% |
| Consumer Discretionary—1.3% | | | |
| Brunello Cucinelli SpA | | 15,701 | 1,553,157 |
| Financials—1.3% | | | |
| FinecoBank Banca Fineco SpA | | 97,117 | 1,550,389 |
| Industrials—1.2% | | | |
| Interpump Group SpA | | 34,844 | 1,548,215 |
| Total Italy | | 4,651,761 |
| JAPAN—16.0% |
| Consumer Discretionary—3.0% | | | |
| Asics Corp. | | 215,100 | 3,757,129 |
| Financials—0.8% | | | |
| Nihon M&A Center Holdings, Inc. | | 212,700 | 920,746 |
| Health Care—1.7% | | | |
| Mani, Inc. | | 170,800 | 2,037,816 |
| Industrials—10.5% | | | |
| BayCurrent, Inc. | | 36,600 | 1,189,465 |
| Japan Elevator Service Holdings Co. Ltd. | | 255,000 | 4,882,585 |
| Open Up Group, Inc. | | 97,400 | 1,283,657 |
| | Shares | Value |
| |
|
| Sanwa Holdings Corp. | | 133,300 | $ 3,377,028 |
| SHO-BOND Holdings Co. Ltd. | | 64,400 | 2,265,497 |
| | | | 12,998,232 |
| Total Japan | | 19,713,923 |
| MEXICO—1.7% |
| Financials—1.7% | | | |
| Regional SAB de CV | | 333,265 | 2,120,058 |
| NORWAY—1.4% |
| Materials—1.4% | | | |
| Borregaard ASA | | 96,921 | 1,709,303 |
| POLAND—2.0% |
| Consumer Staples—2.0% | | | |
| Dino Polska SA(a)(b) | | 30,412 | 2,520,182 |
| SPAIN—1.8% |
| Consumer Discretionary—1.8% | | | |
| CIE Automotive SA | | 83,906 | 2,251,504 |
| SWEDEN—2.8% |
| Industrials—2.8% | | | |
| AddTech AB, B Shares | | 125,626 | 3,497,584 |
| TAIWAN—8.0% |
| Consumer Discretionary—2.0% | | | |
| Makalot Industrial Co. Ltd. | | 226,720 | 2,432,358 |
| Industrials—2.1% | | | |
| Voltronic Power Technology Corp. | | 40,500 | 2,663,451 |
| Information Technology—3.9% | | | |
| Chroma ATE, Inc. | | 110,000 | 1,390,383 |
| Sinbon Electronics Co. Ltd. | | 415,000 | 3,397,050 |
| | | | 4,787,433 |
| Total Taiwan | | 9,883,242 |
| THAILAND—2.9% |
| Information Technology—2.9% | | | |
| Fabrinet(a) | | 14,938 | 3,599,610 |
| UNITED KINGDOM—19.5% |
| Communication Services—5.7% | | | |
| 4imprint Group PLC | | 29,897 | 1,969,335 |
| Gamma Communications PLC | | 203,594 | 4,168,888 |
| YouGov PLC | | 157,389 | 937,536 |
| | | | 7,075,759 |
| Consumer Discretionary—2.8% | | | |
| Games Workshop Group PLC | | 22,291 | 3,445,704 |
| Financials—5.5% | | | |
| Alpha Group International PLC(b) | | 68,856 | 1,891,150 |
| Intermediate Capital Group PLC | | 183,887 | 4,884,850 |
| | | | 6,776,000 |
| Industrials—4.1% | | | |
| Diploma PLC | | 93,021 | 5,113,710 |
| Materials—1.4% | | | |
| Hill & Smith PLC | | 66,702 | 1,744,588 |
| Total United Kingdom | | 24,155,761 |
| VIETNAM—4.9% |
| Information Technology—4.9% | | | |
| FPT Corp. | | 1,121,758 | 6,005,244 |
| Total Common Stocks | | 118,820,023 |
See accompanying Notes to Financial Statements.
Statement of Investments (concluded)
October 31, 2024 abrdn International Small Cap Fund
| | Shares | Value |
| PREFERRED STOCKS—1.8% | |
| GERMANY—1.8% |
| Industrials—1.8% | | | |
| Jungheinrich AG | | 79,720 | $ 2,182,132 |
| Total Preferred Stocks | | 2,182,132 |
| SHORT-TERM INVESTMENT—0.8% | |
| State Street Institutional U.S. Government Money Market Fund, Premier Class, 4.82%(c) | | 938,650 | 938,650 |
| Total Short-Term Investment | | 938,650 |
Total Investments
(Cost $104,368,481)(d)—98.7% | 121,940,805 |
| Other Assets in Excess of Liabilities—1.3% | 1,627,056 |
| Net Assets—100.0% | $123,567,861 |
| (a) | Non-income producing security. |
| (b) | Denotes a security issued under Regulation S or Rule 144A. |
| (c) | The rate shown is the 7 day yield as of October 31, 2024. |
| (d) | See accompanying Notes to Financial Statements for tax unrealized appreciation/(depreciation) of securities. |
| PLC | Public Limited Company |
See accompanying Notes to Financial Statements.
Statement of Investments
October 31, 2024 abrdn Realty Income & Growth Fund
| | | Shares | Value |
| COMMON STOCKS—99.8% | |
| UNITED STATES—99.8% |
| Data Center REITs—16.8% | | | |
| Digital Realty Trust, Inc., REIT | | 17,057 | $ 3,040,069 |
| Equinix, Inc., REIT | | 4,195 | 3,809,396 |
| | | | 6,849,465 |
| Health Care REITs—23.5% | | | |
| American Healthcare REIT, Inc. | | 37,916 | 1,008,566 |
| Healthpeak Properties, Inc., REIT | | 59,238 | 1,329,893 |
| Omega Healthcare Investors, Inc., REIT | | 34,035 | 1,445,466 |
| Ventas, Inc., REIT | | 26,358 | 1,726,185 |
| Welltower, Inc., REIT | | 30,011 | 4,047,884 |
| | | | 9,557,994 |
| Hotel & Resort REITs—0.6% | | | |
| Host Hotels & Resorts, Inc., REIT | | 13,885 | 239,377 |
| Industrial REITs—9.8% | | | |
| Prologis, Inc., REIT | | 30,186 | 3,409,207 |
| STAG Industrial, Inc. | | 15,524 | 578,735 |
| | | | 3,987,942 |
| Multi-Family Residential REITs—9.3% | | | |
| AvalonBay Communities, Inc., REIT | | 8,397 | 1,860,859 |
| Camden Property Trust, REIT | | 5,227 | 605,234 |
| Essex Property Trust, Inc., REIT | | 4,644 | 1,318,246 |
| | | | 3,784,339 |
| Office REITs—6.5% | | | |
| BXP, Inc., REIT | | 14,136 | 1,138,796 |
| Highwoods Properties, Inc. | | 16,582 | 556,160 |
| Kilroy Realty Corp., REIT | | 14,248 | 573,055 |
| Vornado Realty Trust | | 9,684 | 401,014 |
| | | | 2,669,025 |
| Other Specialized REITs—4.6% | | | |
| Iron Mountain, Inc., REIT | | 15,126 | 1,871,540 |
| Retail REITs—19.5% | | | |
| Brixmor Property Group, Inc., REIT | | 30,992 | 835,235 |
| Curbline Properties Corp., REIT(a) | | 35,692 | 807,710 |
| FrontView REIT, Inc.(a) | | 16,100 | 300,426 |
| Kimco Realty Corp., REIT | | 36,611 | 868,413 |
| NNN REIT, Inc. | | 19,482 | 846,298 |
| Realty Income Corp., REIT | | 40,927 | 2,429,836 |
| Regency Centers Corp., REIT | | 14,303 | 1,021,806 |
| Simon Property Group, Inc., REIT | | 4,850 | 820,232 |
| | | | 7,929,956 |
| Self Storage REITs—6.6% | | | |
| Extra Space Storage, Inc., REIT | | 2,916 | 476,183 |
| Public Storage, REIT | | 6,694 | 2,202,728 |
| | | | 2,678,911 |
| Single-Family Residential REITs—2.6% | | | |
| Sun Communities, Inc., REIT | | 7,893 | 1,047,243 |
| Total United States | | 40,615,792 |
| Total Common Stocks | | 40,615,792 |
Total Investments
(Cost $30,744,117)(b)—99.8% | | 40,615,792 |
| Other Assets in Excess of Liabilities—0.2% | | 90,879 |
| Net Assets—100.0% | | $40,706,671 |
| (a) | Non-income producing security. |
| (b) | See accompanying Notes to Financial Statements for tax unrealized appreciation/(depreciation) of securities. |
| REIT | Real Estate Investment Trust |
See accompanying Notes to Financial Statements.
Statement of Investments
October 31, 2024 abrdn U.S. Small Cap Equity Fund
| | Shares | Value |
| COMMON STOCKS—97.4% | |
| CANADA—4.8% |
| Consumer Discretionary—2.1% | | | |
| Aritzia, Inc.(a) | | 219,696 | $ 7,073,632 |
| Financials—1.6% | | | |
| TMX Group Ltd. | | 181,028 | 5,654,403 |
| Industrials—1.1% | | | |
| ATS Corp.(a) | | 126,970 | 3,805,407 |
| Total Canada | | 16,533,442 |
| ISRAEL—1.3% |
| Information Technology—1.3% | | | |
| Camtek Ltd. | | 55,044 | 4,379,300 |
| UNITED STATES—91.3% |
| Communication Services—2.3% | | | |
| Integral Ad Science Holding Corp.(a) | | 667,512 | 7,903,342 |
| Consumer Discretionary—10.0% | | | |
| Boot Barn Holdings, Inc.(a) | | 53,913 | 6,714,864 |
| Brinker International, Inc.(a) | | 66,971 | 6,878,592 |
| La-Z-Boy, Inc. | | 132,378 | 5,036,983 |
| Steven Madden Ltd. | | 173,764 | 7,814,167 |
| Stride, Inc.(a) | | 86,436 | 8,062,750 |
| | | | 34,507,356 |
| Consumer Staples—2.0% | | | |
| Vita Coco Co., Inc.(a) | | 238,267 | 7,055,086 |
| Energy—4.9% | | | |
| Magnolia Oil & Gas Corp., Class A | | 202,519 | 5,119,680 |
| Northern Oil & Gas, Inc. | | 154,223 | 5,590,584 |
| SM Energy Co. | | 148,061 | 6,214,120 |
| | | | 16,924,384 |
| Financials—19.3% | | | |
| Banner Corp. | | 148,449 | 9,506,674 |
| Donnelley Financial Solutions, Inc.(a) | | 137,428 | 8,017,550 |
| First Interstate BancSystem, Inc., Class A | | 246,176 | 7,582,221 |
| Live Oak Bancshares, Inc. | | 128,946 | 5,120,446 |
| NMI Holdings, Inc.(a) | | 46,080 | 1,782,374 |
| PJT Partners, Inc., Class A | | 36,208 | 5,031,464 |
| Seacoast Banking Corp. of Florida | | 351,965 | 9,397,465 |
| Wintrust Financial Corp. | | 90,362 | 10,472,052 |
| WSFS Financial Corp. | | 193,358 | 9,507,413 |
| | | | 66,417,659 |
| Health Care—15.4% | | | |
| Alphatec Holdings, Inc.(a) | | 413,166 | 3,243,353 |
| Amicus Therapeutics, Inc.(a) | | 564,733 | 6,449,251 |
| ANI Pharmaceuticals, Inc.(a) | | 59,812 | 3,423,938 |
| Catalyst Pharmaceuticals, Inc.(a) | | 38,343 | 835,877 |
| CONMED Corp. | | 55,548 | 3,790,596 |
| Corcept Therapeutics, Inc.(a) | | 177,929 | 8,713,183 |
| Integer Holdings Corp.(a) | | 73,879 | 9,179,466 |
| Ligand Pharmaceuticals, Inc.(a) | | 79,475 | 8,400,507 |
| Merit Medical Systems, Inc.(a) | | 93,009 | 9,176,268 |
| OmniAb, Inc. 12.5 Earnout(a)(b)(c) | | 58,211 | – |
| OmniAb, Inc. 15.0 Earnout(a)(b)(c) | | 58,211 | – |
| | | | 53,212,439 |
| Industrials—13.9% | | | |
| Atmus Filtration Technologies, Inc. | | 228,868 | 8,912,120 |
| AZEK Co., Inc.(a) | | 171,110 | 7,528,840 |
| | Shares | Value |
| |
|
| Casella Waste Systems, Inc., Class A(a) | | 70,975 | $ 6,947,033 |
| Enpro, Inc. | | 55,372 | 8,062,717 |
| H&E Equipment Services, Inc. | | 115,115 | 6,014,759 |
| Werner Enterprises, Inc. | | 155,406 | 5,732,927 |
| WNS Holdings Ltd.(a) | | 95,575 | 4,586,644 |
| | | | 47,785,040 |
| Information Technology—12.2% | | | |
| Cohu, Inc.(a) | | 165,084 | 4,113,893 |
| Five9, Inc.(a) | | 113,774 | 3,359,746 |
| JFrog Ltd.(a) | | 205,207 | 5,987,940 |
| Q2 Holdings, Inc.(a) | | 129,729 | 10,982,857 |
| Verint Systems, Inc.(a) | | 150,321 | 3,201,838 |
| Vertex, Inc., Class A(a) | | 183,069 | 7,599,194 |
| Workiva, Inc.(a) | | 86,192 | 6,874,674 |
| | | | 42,120,142 |
| Materials—7.1% | | | |
| Graphic Packaging Holding Co. | | 300,144 | 8,482,069 |
| Knife River Corp.(a) | | 80,143 | 7,799,517 |
| Materion Corp. | | 81,443 | 8,277,052 |
| | | | 24,558,638 |
| Real Estate—2.0% | | | |
| Terreno Realty Corp., REIT | | 113,226 | 6,787,899 |
| Utilities—2.2% | | | |
| ONE Gas, Inc. | | 107,891 | 7,689,392 |
| Total United States | | 314,961,377 |
| Total Common Stocks | | 335,874,119 |
| SHORT-TERM INVESTMENT—2.3% | |
| State Street Institutional U.S. Government Money Market Fund, Premier Class, 4.82%(d) | | 2,889,065 | 7,836,444 |
| Total Short-Term Investment | | 7,836,444 |
Total Investments
(Cost $308,462,444)(e)—99.7% | 343,710,563 |
| Other Assets in Excess of Liabilities—0.3% | 997,881 |
| Net Assets—100.0% | $344,708,444 |
| (a) | Non-income producing security. |
| (b) | The Fund’s adviser has deemed this security to be illiquid based upon procedures approved by the Board of Trustees. Illiquid securities held by the Fund represent 0.0% of net assets as of October 31, 2024. |
| (c) | Level 3 security. See Note 2(a) of the accompanying Notes to Financial Statements. |
| (d) | Registered investment company advised by State Street Global Advisors. The rate shown is the 7 day yield as of October 31, 2024. |
| (e) | See accompanying Notes to Financial Statements for tax unrealized appreciation/(depreciation) of securities. |
| REIT | Real Estate Investment Trust |
See accompanying Notes to Financial Statements.
Statement of Investments
October 31, 2024 abrdn U.S. Sustainable Leaders Fund
| | Shares | Value |
| COMMON STOCKS—97.5% | |
| CANADA—2.3% |
| Industrials—2.3% | | | |
| Canadian Pacific Kansas City Ltd. | | 104,546 | $ 8,066,769 |
| IRELAND—2.5% |
| Information Technology—2.5% | | | |
| Accenture PLC, Class A | | 25,518 | 8,799,117 |
| ISRAEL—3.1% |
| Information Technology—3.1% | | | |
| Nice Ltd., ADR(a) | | 62,004 | 10,770,095 |
| UNITED STATES—89.6% |
| Consumer Discretionary—4.2% | | | |
| TJX Cos., Inc. | | 127,677 | 14,431,331 |
| Consumer Staples—3.5% | | | |
| Procter & Gamble Co. | | 74,501 | 12,306,075 |
| Financials—17.1% | | | |
| American Express Co. | | 58,362 | 15,762,409 |
| LPL Financial Holdings, Inc. | | 45,814 | 12,927,795 |
| Mastercard, Inc., Class A | | 47,329 | 23,645,095 |
| MSCI, Inc. | | 12,855 | 7,342,776 |
| | | | 59,678,075 |
| Health Care—17.0% | | | |
| Boston Scientific Corp.(a) | | 85,471 | 7,181,273 |
| Danaher Corp. | | 36,296 | 8,916,475 |
| Eli Lilly & Co. | | 14,538 | 12,062,760 |
| Integer Holdings Corp.(a) | | 41,905 | 5,206,696 |
| Merck & Co., Inc. | | 97,834 | 10,010,375 |
| ResMed, Inc. | | 22,233 | 5,390,836 |
| UnitedHealth Group, Inc. | | 18,720 | 10,567,440 |
| | | | 59,335,855 |
| Industrials—12.3% | | | |
| Advanced Drainage Systems, Inc. | | 40,972 | 6,140,883 |
| Hubbell, Inc. | | 27,492 | 11,739,909 |
| Tetra Tech, Inc. | | 189,125 | 9,244,430 |
| Trex Co., Inc.(a) | | 83,641 | 5,925,965 |
| Veralto Corp. | | 12,098 | 1,236,295 |
| Waste Management, Inc. | | 40,436 | 8,728,110 |
| | | | 43,015,592 |
| Information Technology—31.0% | | | |
| Adobe, Inc.(a) | | 17,328 | 8,284,170 |
| Amdocs Ltd. | | 101,856 | 8,937,355 |
| Cadence Design Systems, Inc.(a) | | 31,469 | 8,689,220 |
| Marvell Technology, Inc. | | 179,616 | 14,389,038 |
| Microsoft Corp. | | 106,605 | 43,318,942 |
| NVIDIA Corp. | | 105,198 | 13,966,087 |
| ServiceNow, Inc.(a) | | 11,467 | 10,698,596 |
| | | | 108,283,408 |
| Materials—2.3% | | | |
| Linde PLC | | 17,781 | 8,110,803 |
| Utilities—2.2% | | | |
| American Water Works Co., Inc. | | 56,070 | 7,743,828 |
| Total United States | | 312,904,967 |
| Total Common Stocks | | 340,540,948 |
| | Shares | Value |
| SHORT-TERM INVESTMENT—2.5% | |
| State Street Institutional U.S. Government Money Market Fund, Premier Class, 4.82%(b) | | 8,655,722 | $ 8,655,722 |
| Total Short-Term Investment | | 8,655,722 |
Total Investments
(Cost $258,178,662)(c)—100.0% | 349,196,670 |
| Liabilities in Excess of Other Assets—(0.0%) | (104,584) |
| Net Assets—100.0% | $349,092,086 |
| (a) | Non-income producing security. |
| (b) | Registered investment company advised by State Street Global Advisors. The rate shown is the 7 day yield as of October 31, 2024. |
| (c) | See accompanying Notes to Financial Statements for tax unrealized appreciation/(depreciation) of securities. |
| ADR | American Depositary Receipt |
| PLC | Public Limited Company |
See accompanying Notes to Financial Statements.
Statement of Assets and Liabilities
October 31, 2024
| | abrdn
China
A Share
Equity Fund | | abrdn
Dynamic
Dividend Fund | | abrdn
EM SMA
Completion
Fund | | abrdn
Emerging Markets
Dividend Fund | | abrdn
Emerging
Markets
ex-China
Fund |
| Assets: | | | | | | | | | |
| Investments, at value | $18,848,408 | | $96,880,019 | | $334,914 | | $78,749,298 | | $160,773,239 |
| Short-term investments, at value | 678,929 | | 24,021 | | 5,157 | | – | | 1,639,385 |
| Foreign Currency, at value | – | | – | | 372 | | 97,204 | | 983,828 |
| Receivable for investments sold | – | | – | | 571 | | 822,235 | | 120,961 |
| Interest and dividends receivable | 5,558 | | 91,102 | | 406 | | 141,901 | | 139,449 |
| Receivable for capital shares issued | 945 | | 8,341 | | – | | 137 | | 27,232 |
| Unrealized appreciation on forward foreign currency exchange contracts | – | | 134,962 | | – | | – | | – |
| Receivable from Adviser | 13,999 | | 39,282 | | 19,150 | | 15,983 | | 93,848 |
| Tax reclaim receivable | – | | 508,140 | | – | | 152,652 | | 149,772 |
| Prepaid expenses | 29,849 | | 20,967 | | 13 | | 21,160 | | 39,757 |
| Total Assets | 19,577,688 | | 97,706,834 | | 360,583 | | 80,000,570 | | 163,967,471 |
| Liabilities: | | | | | | | | | |
| Due to Custodian | – | | – | | 1,258 | | 1,193 | | – |
| Payable for investments purchased | – | | – | | – | | 6,484 | | 952,007 |
| Payable for capital shares redeemed | 31,300 | | 66,206 | | – | | 74,188 | | 50,476 |
| Payable to IRS on behalf of shareholders related to Article 63 EU Tax Reclaims (see Note 2(i)) | – | | – | | – | | 357,966 | | 36,768 |
| Accrued foreign capital gains tax | – | | – | | – | | – | | 830,919 |
| Line of credit payable | – | | – | | – | | 1,075,000 | | – |
| Accrued expenses and other payables: | | | | | | | | | |
| Administration fees | 1,365 | | 6,094 | | 26 | | 5,594 | | 11,326 |
| Audit and tax fees | 2,683 | | 2,683 | | 2,683 | | 2,683 | | 2,683 |
| Custodian fees | 8,803 | | 22,815 | | 7,609 | | 24,740 | | 55,730 |
| Distribution fees | 3,134 | | 823 | | – | | 9,250 | | 8,586 |
| Fund accounting fees | 207 | | 1,342 | | – | | 1,029 | | 2,227 |
| Interest expense on line of credit | 1,132 | | 442 | | – | | 580 | | – |
| Investment advisory fees | 14,503 | | 85,268 | | – | | – | | 113,255 |
| Legal fees | 291 | | 1,587 | | – | | 1,399 | | 2,540 |
| Printing fees | 1,868 | | 4,324 | | 1,317 | | 2,616 | | 9,089 |
| Sub-transfer agent and administrative services fees | 658 | | 4,769 | | – | | 6,992 | | 7,785 |
| Transfer agent fees | 2,024 | | 3,224 | | 131 | | 6,479 | | 10,914 |
| Other accrued expenses | 6,983 | | 8,502 | | 6,119 | | 8,561 | | 60,567 |
| Total liabilities | 74,951 | | 208,079 | | 19,143 | | 1,584,754 | | 2,154,872 |
| Net assets | $19,502,737 | | $97,498,755 | | $341,440 | | $78,415,816 | | $161,812,599 |
| Cost: | | | | | | | | | |
| Investments | 20,116,769 | | 70,371,441 | | 337,494 | | 84,647,983 | | 152,763,231 |
| Short-Term Investments | 678,929 | | 24,021 | | 5,157 | | – | | 1,639,385 |
| Foreign currency | – | | – | | 372 | | 97,164 | | 983,602 |
| Represented by: | | | | | | | | | |
| Paid in capital in excess of par value | $49,803,257 | | $74,051,163 | | $383,393 | | $477,962,253 | | $201,556,216 |
| Distributable earnings (accumulated loss) | (30,300,520) | | 23,447,592 | | (41,953) | | (399,546,437) | | (39,743,617) |
| Net Assets | $19,502,737 | | $97,498,755 | | $341,440 | | $78,415,816 | | $161,812,599 |
| Net Assets: | | | | | | | | | |
| Class A | $7,634,742 | | $3,832,436 | | $– | | $– | | $32,613,860 |
| Class C | 670,273 | | – | | – | | – | | 351,053 |
| Class R | 2,132,788 | | – | | – | | – | | 2,483,609 |
| Institutional Service Class | 345,290 | | – | | – | | – | | 48,158,121 |
| Institutional Class | 8,719,644 | | 93,666,319 | | 341,440 | | 78,415,816 | | 78,205,956 |
| Total | $19,502,737 | | $97,498,755 | | $341,440 | | $78,415,816 | | $161,812,599
Amounts listed as “–” are $0 or round to $0.
See accompanying Notes to Financial Statements. |
Statement of Assets and Liabilities (continued)
October 31, 2024
| | abrdn
China
A Share
Equity Fund | | abrdn
Dynamic
Dividend Fund | | abrdn
EM SMA
Completion
Fund | | abrdn
Emerging Markets
Dividend Fund | | abrdn
Emerging
Markets
ex-China
Fund |
| Shares Outstanding (unlimited number of shares authorized): | | | | | | | | | |
| Class A Shares | 340,224 | | 879,432 | | – | | – | | 2,651,713 |
| Class C Shares | 32,243 | | – | | – | | – | | 32,387 |
| Class R Shares | 98,280 | | – | | – | | – | | 219,433 |
| Institutional Service Class Shares | 15,218 | | – | | – | | – | | 3,813,735 |
| Institutional Class Shares | 381,215 | | 21,484,270 | | 39,677 | | 2,620,376 | | 6,281,959 |
| Total Shares Outstanding per Class | 867,180 | | 22,363,702 | | 39,677 | | 2,620,376 | | 12,999,227 |
| Net Asset Value and Redemption Price Per Share (Net assets by class divided by shares outstanding by class, respectively): | | | | | | | | | |
| Class A Shares | $22.44 | | $4.36 | | $– | | $– | | $12.30 |
| Class C Shares | 20.79 | | – | | – | | – | | 10.84 |
| Class R Shares | 21.70 | | – | | – | | – | | 11.32 |
| Institutional Service Class Shares | 22.69 | | – | | – | | – | | 12.63 |
| Institutional Class Shares | 22.87 | | 4.36 | | 8.61 | | 29.93 | | 12.45 |
| Maximum Offering Price Per Share (100%/(100% - maximum sales charge) of net asset value adjusted to the nearest cent): | | | | | | | | | |
| Class A Shares | $23.81 | | $4.63 | | $– | | $– | | $13.05 |
| Maximum Sales Charge: | | | | | | | | | |
| Class A Shares | 5.75% | | 5.75% | | –% | | 5.75% | | 5.75% |
Amounts listed as “–” are $0 or round to $0.
See accompanying Notes to Financial Statements.
Statement of Assets and Liabilities (continued)
October 31, 2024
| | abrdn
Emerging
Markets Fund | | abrdn
Focused U.S.
Small Cap
Equity Fund | | abrdn
Global Equity
Impact Fund | | abrdn
Global
Infrastructure
Fund |
| Assets: | | | | | | | |
| Investments, at value | $1,212,931,254 | | $12,246,236 | | $42,786,971 | | $42,470,110 |
| Short-term investments, at value | 32,633,579 | | 136,748 | | 29,194 | | 291,827 |
| Foreign Currency, at value | 1,744,027 | | – | | 274,010 | | 7,777 |
| Receivable for investments sold | 4,853,471 | | – | | 115,499 | | 178,141 |
| Interest and dividends receivable | 1,388,014 | | 2,267 | | 24,884 | | 25,271 |
| Receivable for capital shares issued | 128,192 | | 6,981 | | 94 | | 990 |
| Receivable from Adviser | – | | 20,288 | | – | | 6,874 |
| Tax reclaim receivable | 375,910 | | – | | 52,475 | | 12,527 |
| Prepaid expenses | 64,908 | | 21,129 | | 15,215 | | 16,356 |
| Total Assets | 1,254,119,355 | | 12,433,649 | | 43,298,342 | | 43,009,873 |
| Liabilities: | | | | | | | |
| Payable for investments purchased | 839,057 | | – | | – | | 154,976 |
| Payable for capital shares redeemed | 552,722 | | 646 | | 4 | | 41,258 |
| Payable to IRS on behalf of shareholders related to Article 63 EU Tax Reclaims (see Note 2(i)) | – | | – | | 275,889 | | – |
| Accrued foreign capital gains tax | 9,968,012 | | – | | – | | – |
| Accrued expenses and other payables: | | | | | | | |
| Administration fees | 89,053 | | 891 | | 3,031 | | 2,615 |
| Audit and tax fees | 2,683 | | 2,683 | | 2,683 | | 2,683 |
| Custodian fees | 288,429 | | 3,362 | | 11,314 | | 8,070 |
| Distribution fees | 55,134 | | 1,542 | | 5,307 | | 2,420 |
| Fund accounting fees | 17,823 | | 211 | | 566 | | 580 |
| Interest expense on line of credit | – | | 116 | | 39 | | 51 |
| Investment advisory fees | 1,185,208 | | 8,354 | | 8,380 | | 27,893 |
| Legal fees | 22,145 | | 211 | | 711 | | 693 |
| Printing fees | 60,368 | | 1,064 | | 3,781 | | 3,524 |
| Sub-transfer agent and administrative services fees | 170,801 | | 852 | | 3,142 | | 1,348 |
| Transfer agent fees | 21,023 | | 1,794 | | 2,664 | | 2,078 |
| Other accrued expenses | 57,891 | | 6,463 | | 7,559 | | 7,403 |
| Total liabilities | 13,330,349 | | 28,189 | | 325,070 | | 255,592 |
| Net assets | $1,240,789,006 | | $12,405,460 | | $42,973,272 | | $42,754,281 |
| Cost: | | | | | | | |
| Investments | 1,063,759,548 | | 10,741,263 | | 38,688,500 | | 33,882,797 |
| Short-Term Investments | 32,633,579 | | 136,748 | | 29,194 | | 291,827 |
| Foreign currency | 1,744,027 | | – | | 285,664 | | 7,769 |
| Represented by: | | | | | | | |
| Paid in capital in excess of par value | $1,237,410,689 | | $12,092,401 | | $46,970,618 | | $32,254,417 |
| Distributable earnings (accumulated loss) | 3,378,317 | | 313,059 | | (3,997,346) | | 10,499,864 |
| Net Assets | $1,240,789,006 | | $12,405,460 | | $42,973,272 | | $42,754,281 |
| Net Assets: | | | | | | | |
| Class A | $36,921,056 | | $– | | $24,124,483 | | $11,127,438 |
| Class C | 1,681,880 | | – | | – | | – |
| Class R | 101,750,456 | | – | | – | | – |
| Institutional Service Class | 451,337,299 | | – | | – | | – |
| Institutional Class | 649,098,315 | | 12,405,460 | | 18,848,789 | | 31,626,843 |
| Total | $1,240,789,006 | | $12,405,460 | | $42,973,272 | | $42,754,281 |
| Shares Outstanding (unlimited number of shares authorized): | | | | | | | |
| Class A Shares | 2,634,466 | | – | | 1,604,443 | | 466,441 |
| Class C Shares | 121,882 | | – | | – | | – |
| Class R Shares | 7,430,680 | | – | | – | | – |
| Institutional Service Class Shares | 32,297,387 | | – | | – | | – |
| Institutional Class Shares | 46,100,605 | | 1,445,797 | | 1,249,920 | | 1,322,357 |
| Total Shares Outstanding per Class | 88,585,020 | | 1,445,797 | | 2,854,363 | | 1,788,798
Amounts listed as “–” are $0 or round to $0.
See accompanying Notes to Financial Statements. |
Statement of Assets and Liabilities (continued)
October 31, 2024
| | abrdn
Emerging
Markets Fund | abrdn
Focused U.S.
Small Cap
Equity Fund | abrdn
Global Equity
Impact Fund | abrdn
Global
Infrastructure
Fund |
| Net Asset Value and Redemption Price Per Share (Net assets by class divided by shares outstanding by class, respectively): | | | | |
| Class A Shares | $14.01 | $– | $15.04 | $23.86 |
| Class C Shares | 13.80 | – | – | – |
| Class R Shares | 13.69 | – | – | – |
| Institutional Service Class Shares | 13.97 | – | – | – |
| Institutional Class Shares | 14.08 | 8.58 | 15.08 | 23.92 |
| Maximum Offering Price Per Share (100%/(100% - maximum sales charge) of net asset value adjusted to the nearest cent): | | | | |
| Class A Shares | $14.86 | $– | $15.96 | $25.32 |
| Maximum Sales Charge: | | | | |
| Class A Shares | 5.75% | 5.75% | 5.75% | 5.75% |
Amounts listed as “–” are $0 or round to $0.
See accompanying Notes to Financial Statements.
Statement of Assets and Liabilities (continued)
October 31, 2024
| | abrdn
International
Small Cap
Fund | | abrdn
Realty
Income &
Growth Fund | | abrdn
U.S. Small Cap
Equity Fund | | abrdn
U.S. Sustainable
Leaders Fund |
| Assets: | | | | | | | |
| Investments, at value | $121,002,155 | | $40,615,792 | | $335,874,119 | | $340,540,948 |
| Short-term investments, at value | 938,650 | | – | | 7,836,444 | | 8,655,722 |
| Foreign Currency, at value | 2,061,417 | | – | | – | | – |
| Receivable for investments sold | – | | 363,569 | | 2,628,224 | | – |
| Interest and dividends receivable | 104,134 | | 13,915 | | 62,472 | | 227,665 |
| Receivable for capital shares issued | 115,258 | | 130 | | 54,784 | | 1,012 |
| Receivable from Adviser | 17,984 | | 8,586 | | 28,551 | | – |
| Tax reclaim receivable | 72,540 | | – | | – | | – |
| Prepaid expenses | 32,080 | | 12,353 | | 32,020 | | 45,300 |
| Total Assets | 124,344,218 | | 41,014,345 | | 346,516,614 | | 349,470,647 |
| Liabilities: | | | | | | | |
| Payable for investments purchased | – | | 26,404 | | 1,318,498 | | – |
| Payable for capital shares redeemed | 43,796 | | 1,540 | | 112,792 | | 26,292 |
| Accrued foreign capital gains tax | 553,219 | | – | | – | | – |
| Line of credit payable | – | | 229,271 | | – | | – |
| Accrued expenses and other payables: | | | | | | | |
| Administration fees | 8,631 | | 2,112 | | 23,631 | | 24,171 |
| Audit and tax fees | 2,683 | | 3,470 | | 2,945 | | 2,683 |
| Custodian fees | 23,556 | | 2,923 | | 8,548 | | 3,445 |
| Distribution fees | 13,258 | | 110 | | 32,780 | | 49,615 |
| Fund accounting fees | 1,742 | | 529 | | 4,796 | | 4,729 |
| Interest expense on line of credit | 481 | | 168 | | – | | – |
| Investment advisory fees | 89,386 | | 28,122 | | 249,013 | | 214,386 |
| Legal fees | 1,987 | | 655 | | 5,343 | | 5,545 |
| Printing fees | 7,818 | | 2,608 | | 13,835 | | 5,275 |
| Sub-transfer agent and administrative services fees | 9,532 | | 2,082 | | 5,576 | | 12,611 |
| Transfer agent fees | 6,685 | | 1,836 | | 13,489 | | 14,141 |
| Other accrued expenses | 13,583 | | 5,844 | | 16,924 | | 15,668 |
| Total liabilities | 776,357 | | 307,674 | | 1,808,170 | | 378,561 |
| Net assets | $123,567,861 | | $40,706,671 | | $344,708,444 | | $349,092,086 |
| Cost: | | | | | | | |
| Investments | 103,429,831 | | 30,744,117 | | 300,626,000 | | 249,522,940 |
| Short-Term Investments | 938,650 | | – | | 7,836,444 | | 8,655,722 |
| Foreign currency | 2,069,078 | | – | | – | | – |
| Represented by: | | | | | | | |
| Paid in capital in excess of par value | $149,836,667 | | $27,352,837 | | $343,788,588 | | $285,130,391 |
| Distributable earnings (accumulated loss) | (26,268,806) | | 13,353,834 | | 919,856 | | 63,961,695 |
| Net Assets | $123,567,861 | | $40,706,671 | | $344,708,444 | | $349,092,086 |
| Net Assets: | | | | | | | |
| Class A | $56,341,957 | | $524,435 | | $99,115,826 | | $228,270,143 |
| Class C | 311,418 | | – | | 11,558,844 | | 299,456 |
| Class R | 1,685,561 | | – | | 3,758,884 | | – |
| Institutional Service Class | – | | – | | 36,818,955 | | 112,647,265 |
| Institutional Class | 65,228,925 | | 40,182,236 | | 193,455,935 | | 7,875,222 |
| Total | $123,567,861 | | $40,706,671 | | $344,708,444 | | $349,092,086 |
| Shares Outstanding (unlimited number of shares authorized): | | | | | | | |
| Class A Shares | 1,846,193 | | 42,755 | | 2,917,533 | | 19,315,288 |
| Class C Shares | 11,591 | | – | | 469,718 | | 35,734 |
| Class R Shares | 59,736 | | – | | 130,814 | | – |
| Institutional Service Class Shares | – | | – | | 969,062 | | 8,439,484 |
| Institutional Class Shares | 2,103,851 | | 3,254,942 | | 5,060,891 | | 584,380 |
| Total Shares Outstanding per Class | 4,021,371 | | 3,297,697 | | 9,548,018 | | 28,374,886
Amounts listed as “–” are $0 or round to $0.
See accompanying Notes to Financial Statements. |
Statement of Assets and Liabilities (concluded)
October 31, 2024
| | abrdn
International
Small Cap
Fund | abrdn
Realty
Income &
Growth Fund | abrdn
U.S. Small Cap
Equity Fund | abrdn
U.S. Sustainable
Leaders Fund |
| Net Asset Value and Redemption Price Per Share (Net assets by class divided by shares outstanding by class, respectively): | | | | |
| Class A Shares | $30.52 | $12.27 | $33.97 | $11.82 |
| Class C Shares | 26.87 | – | 24.61 | 8.38 |
| Class R Shares | 28.22 | – | 28.73 | – |
| Institutional Service Class Shares | – | – | 37.99 | 13.35 |
| Institutional Class Shares | 31.00 | 12.34 | 38.23 | 13.48 |
| Maximum Offering Price Per Share (100%/(100% - maximum sales charge) of net asset value adjusted to the nearest cent): | | | | |
| Class A Shares | $32.38 | $13.02 | $36.04 | $12.54 |
| Maximum Sales Charge: | | | | |
| Class A Shares | 5.75% | 5.75% | 5.75% | 5.75% |
Amounts listed as “–” are $0 or round to $0.
See accompanying Notes to Financial Statements.
Statements of Operations
For the Year Ended October 31, 2024
| | abrdn
China
A Share
Equity Fund | | abrdn
Dynamic
Dividend Fund | | abrdn
EM SMA
Completion
Fund | | abrdn
Emerging Markets
Dividend Fund | | abrdn
Emerging
Markets
ex-China
Fund |
| Investment Income: | | | | | | | | | |
| Dividend income | $442,830 | | $6,605,649 | | $10,041 | | $2,664,730 | | $2,145,057 |
| Interest income | 28,782 | | 20,352 | | 405 | | 27,546 | | 130,524 |
| Foreign tax withholding | (43,264) | | (554,319) | | (1,178) | | (261,351) | | (307,056) |
| Total Income | 428,348 | | 6,071,682 | | 9,268 | | 2,430,925 | | 1,968,525 |
| Expenses | | | | | | | | | |
| Investment advisory fees | 160,667 | | 996,833 | | — | | 600,383 | | 804,983 |
| Trustee fees | 2,434 | | 13,355 | | 45 | | 10,868 | | 15,420 |
| Administration fees | 15,121 | | 79,747 | | 260 | | 64,041 | | 78,795 |
| Legal fees | 3,650 | | 24,160 | | 68 | | 18,406 | | 23,108 |
| Audit and tax fees | 47,166 | | 42,366 | | 31,056 | | 43,866 | | 47,166 |
| Printing fees | 7,364 | | 16,793 | | 6,769 | | 27,649 | | 26,764 |
| Custodian fees | 35,138 | | 69,971 | | 21,115 | | 56,798 | | 144,275 |
| Transfer agent fees | 21,768 | | 37,774 | | — | | 42,675 | | 78,558 |
| Distribution fees Class A | 16,547 | | 9,773 | | — | | 173,321 | | 68,124 |
| Distribution fees Class C | 7,242 | | — | | — | | — | | 2,660 |
| Distribution fees Class R | 10,257 | | — | | — | | — | | 6,668 |
| Sub-transfer agent and administrative service fees Institutional Class | 4,012 | | 57,662 | | — | | 8,788 | | 47,861 |
| Sub-transfer agent and administrative service fees Class A | 8,559 | | 2,721 | | — | | 94,184 | | 29,056 |
| Sub-transfer agent and administrative service fees Class C | 401 | | — | | — | | — | | 314 |
| Sub-transfer agent and administrative service fees Class R | 2,848 | | — | | — | | — | | 1,723 |
| Sub-transfer agent and administrative service fees Institutional Service Class | 263 | | — | | — | | — | | 11,739 |
| Fund accounting fees | 756 | | 3,987 | | 13 | | 3,202 | | 3,940 |
| Registration and filing fees | 68,863 | | — | | 44 | | 14,365 | | 93,488 |
| Other | 32,078 | | 81,288 | | 23,260 | | 104,260 | | 69,209 |
| Total expenses before reimbursed/waived expenses | 445,134 | | 1,436,430 | | 82,630 | | 1,262,806 | | 1,553,851 |
| Interest expense (Note 9) | 1,554 | | 4,218 | | — | | 4,463 | | 292 |
| Total operating expenses before reimbursed/waived expenses | 446,688 | | 1,440,648 | | 82,630 | | 1,267,269 | | 1,554,143 |
| Expenses reimbursed Institutional Class | (105,286) | | (172,701) | | (82,630) | | (70,008) | | (250,405) |
| Expenses reimbursed Class A | (72,765) | | (7,415) | | — | | (266,324) | | (105,256) |
| Expenses reimbursed Class C | (8,369) | | — | | — | | — | | (1,358) |
| Expenses reimbursed Class R | (22,561) | | — | | — | | — | | (5,356) |
| Expenses reimbursed Institutional Service Class | (3,307) | | — | | — | | — | | (77,682) |
| Net expenses | 234,400 | | 1,260,532 | | — | | 930,937 | | 1,114,086 |
| Net Investment Income | 193,948 | | 4,811,150 | | 9,268 | | 1,499,988 | | 854,439 |
| REALIZED/UNREALIZED GAIN/(LOSS) FROM INVESTMENTS: | | | | | | | | | |
| Realized gain/(loss) on investment transactions | (9,876,737) | | (805,189) | | (30,532) | | 6,351,027 | | 656,807 |
| Realized gain/(loss) on forward foreign currency exchange contracts | — | | (206,723) | | — | | — | | — |
| Realized gain/(loss) on foreign currency transactions | (13,759) | | 9,703 | | (6,632) | | 18,650 | | (127,604) |
| Net realized gain/(loss) from investments, forward foreign currency exchange contracts and foreign currency transactions | (9,890,496) | | (1,002,209) | | (37,164) | | 6,369,677 | | 529,203 |
| Net change in unrealized appreciation/(depreciation) on investment transactions (including $0, $0, $0, $46,440 and $(726,242) change in deferred capital gains tax, respectively) | 9,851,151 | | 15,821,850 | | 45,387 | | 12,537,952 | | 6,941,933 |
| Net change in unrealized appreciation/(depreciation) on forward foreign currency exchange contracts | — | | 108,897 | | — | | — | | —
Amounts listed as “–” are $0 or round to $0.
See accompanying Notes to Financial Statements. |
Statements of Operations (continued)
For the Year Ended October 31, 2024
| | abrdn
China
A Share
Equity Fund | | abrdn
Dynamic
Dividend Fund | | abrdn
EM SMA
Completion
Fund | | abrdn
Emerging Markets
Dividend Fund | | abrdn
Emerging
Markets
ex-China
Fund |
| Net change in unrealized appreciation/(depreciation) on translation of assets and liabilities denominated in foreign currencies | $— | | $15,931 | | $(6) | | $(61,388) | | $(16,446) |
| Net change in unrealized appreciation/(depreciation) from investments, forward foreign currency exchange contracts and translation of assets and liabilities denominated in foreign currencies | 9,851,151 | | 15,946,678 | | 45,381 | | 12,476,564 | | 6,925,487 |
| Net realized/unrealized gain/(loss) from investments, forward foreign currency exchange contracts and translation of assets and liabilities denominated in foreign currencies | (39,345) | | 14,944,469 | | 8,217 | | 18,846,241 | | 7,454,690 |
| CHANGE IN NET ASSETS RESULTING FROM OPERATIONS | $154,603 | | $19,755,619 | | $17,485 | | $20,346,229 | | $8,309,129 |
Amounts listed as “–” are $0 or round to $0.
See accompanying Notes to Financial Statements.
Statements of Operations (continued)
For the Year Ended October 31, 2024
| | abrdn
Emerging
Markets Fund | | abrdn
Focused U.S.
Small Cap
Equity Fund | | abrdn
Global Equity
Impact Fund | | abrdn
Global
Infrastructure
Fund |
| Investment Income: | | | | | | | |
| Dividend income | $42,289,666 | | $95,830 | | $736,765 | | $1,306,490 |
| Interest income | 1,748,555 | | 10,249 | | 44,222 | | 3,149 |
| Foreign tax withholding | (4,978,153) | | (2,045) | | (107,414) | | (102,659) |
| Total Income | 39,060,068 | | 104,034 | | 673,573 | | 1,206,980 |
| Expenses | | | | | | | |
| Investment advisory fees | 13,923,523 | | 98,821 | | 333,428 | | 338,948 |
| Trustee fees | 197,855 | | 1,779 | | 5,887 | | 5,791 |
| Administration fees | 1,237,647 | | 10,541 | | 35,566 | | 34,613 |
| Legal fees | 297,867 | | 2,688 | | 10,035 | | 8,705 |
| Audit and tax fees | 47,166 | | 39,566 | | 43,866 | | 38,366 |
| Printing fees | 173,960 | | 12,794 | | 15,360 | | 12,136 |
| Custodian fees | 784,091 | | 10,951 | | 27,891 | | 32,420 |
| Transfer agent fees | 251,564 | | 19,231 | | 30,515 | | 23,505 |
| Distribution fees Class A | 102,487 | | 17,668 | | 63,753 | | 27,922 |
| Distribution fees Class C | 19,127 | | — | | — | | — |
| Distribution fees Class R | 514,747 | | 11,810 | | — | | — |
| Sub-transfer agent and administrative service fees Institutional Class | 845,432 | | 3,947 | | 19,720 | | 19,644 |
| Sub-transfer agent and administrative service fees Class A | — | | 5,815 | | 31,562 | | 8,026 |
| Sub-transfer agent and administrative service fees Class C | 2,142 | | — | | — | | — |
| Sub-transfer agent and administrative service fees Class R | 147,453 | | 3,622 | | — | | — |
| Sub-transfer agent and administrative service fees Institutional Service Class | 693,704 | | 367 | | — | | — |
| Fund accounting fees | 61,882 | | 527 | | 1,778 | | 1,731 |
| Registration and filing fees | 88,170 | | 53,566 | | 19,101 | | 31,134 |
| Other | 292,795 | | 25,227 | | 103,536 | | 31,434 |
| Total expenses before reimbursed/waived expenses | 19,681,612 | | 318,920 | | 741,998 | | 614,375 |
| Interest expense (Note 9) | 14,892 | | 416 | | 723 | | 5,025 |
| Total operating expenses before reimbursed/waived expenses | 19,696,504 | | 319,336 | | 742,721 | | 619,400 |
| Expenses reimbursed Institutional Class | (1,115,065) | | (50,241) | | (89,495) | | (116,398) |
| Expenses reimbursed Class A | (11,837) | | (83,321) | | (126,580) | | (41,720) |
| Expenses reimbursed Class C | (2,694) | | — | | — | | — |
| Expenses reimbursed Class R | (29,729) | | (28,393) | | — | | — |
| Expenses reimbursed Institutional Service Class | (135,806) | | (2,773) | | — | | — |
| Net expenses | 18,401,373 | | 154,608 | | 526,646 | | 461,282 |
| Net Investment Income | 20,658,695 | | (50,574) | | 146,927 | | 745,698 |
| REALIZED/UNREALIZED GAIN/(LOSS) FROM INVESTMENTS: | | | | | | | |
| Realized gain/(loss) on investment transactions | (30,359,660) | | 772,308 | | 2,995,417 | | 2,314,981 |
| Realized gain/(loss) on foreign currency transactions | (1,358,981) | | 176 | | 36,210 | | 953 |
| Net realized gain/(loss) from investments and foreign currency transactions | (31,718,641) | | 772,484 | | 3,031,627 | | 2,315,934 |
| Net change in unrealized appreciation/(depreciation) on investment transactions (including $(2,871,589), $0, $0 and $0 change in deferred capital gains tax, respectively) | 295,603,631 | | 3,224,516 | | 5,207,429 | | 6,315,604 |
| Net change in unrealized appreciation/(depreciation) on translation of assets and liabilities denominated in foreign currencies | (11,884) | | — | | (25,563) | | 139 |
| Net change in unrealized appreciation/(depreciation) from investments and translation of assets and liabilities denominated in foreign currencies | 295,591,747 | | 3,224,516 | | 5,181,866 | | 6,315,743 |
| Net realized/unrealized gain/(loss) from investments and translation of assets and liabilities denominated in foreign currencies | 263,873,106 | | 3,997,000 | | 8,213,493 | | 8,631,677 |
| CHANGE IN NET ASSETS RESULTING FROM OPERATIONS | $284,531,801 | | $3,946,426 | | $8,360,420 | | $9,377,375 |
Amounts listed as “–” are $0 or round to $0.
See accompanying Notes to Financial Statements.
Statements of Operations (concluded)
For the Year Ended October 31, 2024
| | abrdn
International
Small Cap
Fund | | abrdn
Realty
Income &
Growth Fund | | abrdn
U.S. Small Cap
Equity Fund | | abrdn
U.S. Sustainable
Leaders Fund |
| Investment Income: | | | | | | | |
| Dividend income | $2,571,505 | | $740,605 | | $3,357,340 | | $3,365,491 |
| Interest income | 116,238 | | 10,688 | | 242,294 | | 474,801 |
| Foreign tax withholding | (275,133) | | — | | (37,804) | | (24,680) |
| Total Income | 2,412,610 | | 751,293 | | 3,561,830 | | 3,815,612 |
| Expenses | | | | | | | |
| Investment advisory fees | 1,107,570 | | 331,715 | | 3,230,535 | | 2,573,880 |
| Trustee fees | 17,781 | | 5,204 | | 50,898 | | 48,274 |
| Administration fees | 107,474 | | 30,655 | | 308,053 | | 287,484 |
| Legal fees | 26,843 | | 7,799 | | 75,608 | | 72,115 |
| Audit and tax fees | 44,766 | | 34,240 | | 42,490 | | 39,566 |
| Printing fees | 22,543 | | 10,237 | | 41,918 | | 32,626 |
| Custodian fees | 67,061 | | 8,861 | | 26,406 | | 15,038 |
| Transfer agent fees | 80,940 | | 21,232 | | 154,068 | | 175,868 |
| Distribution fees Class A | 143,460 | | 1,009 | | 242,195 | | 587,759 |
| Distribution fees Class C | 3,457 | | — | | 145,643 | | 2,952 |
| Distribution fees Class R | 8,878 | | — | | 17,826 | | — |
| Sub-transfer agent and administrative service fees Institutional Class | 66,136 | | 25,349 | | 164,292 | | 5,210 |
| Sub-transfer agent and administrative service fees Class A | 55,141 | | 350 | | 152,088 | | 93,149 |
| Sub-transfer agent and administrative service fees Class C | 442 | | — | | 16,724 | | 263 |
| Sub-transfer agent and administrative service fees Class R | 2,425 | | — | | 5,350 | | — |
| Sub-transfer agent and administrative service fees Institutional Service Class | — | | — | | 39,489 | | 69,553 |
| Fund accounting fees | 5,374 | | 1,533 | | 15,403 | | 14,374 |
| Registration and filing fees | 56,617 | | 29,832 | | 73,972 | | 56,238 |
| Other | 69,546 | | 23,626 | | 108,657 | | 98,248 |
| Total expenses before reimbursed/waived expenses | 1,886,454 | | 531,642 | | 4,911,615 | | 4,172,597 |
| Interest expense (Note 9) | 1,518 | | 1,479 | | 6,277 | | — |
| Total operating expenses before reimbursed/waived expenses | 1,887,972 | | 533,121 | | 4,917,892 | | 4,172,597 |
| Expenses reimbursed Institutional Class | (220,152) | | (148,355) | | (356,883) | | (9,460) |
| Expenses reimbursed Class A | (118,137) | | (1,661) | | (79,596) | | (117,468) |
| Expenses reimbursed Class C | (1,157) | | — | | (28,628) | | (404) |
| Expenses reimbursed Class R | (3,654) | | — | | (2,914) | | — |
| Expenses reimbursed Institutional Service Class | — | | — | | (28,840) | | (57,659) |
| Net expenses | 1,544,872 | | 383,105 | | 4,421,031 | | 3,987,606 |
| Net Investment Income | 867,738 | | 368,188 | | (859,201) | | (171,994) |
| REALIZED/UNREALIZED GAIN/(LOSS) FROM INVESTMENTS: | | | | | | | |
| Realized gain/(loss) on investment transactions | 4,698,578 | | 4,325,027 | | 33,613,369 | | 5,091,871 |
| Realized gain/(loss) on foreign currency transactions | 25,967 | | 10 | | 10,229 | | (3,546) |
| Net realized gain/(loss) from investments and foreign currency transactions | 4,724,545 | | 4,325,037 | | 33,623,598 | | 5,088,325 |
| Net change in unrealized appreciation/(depreciation) on investment transactions (including $(553,219), $0, $0 and $0 change in deferred capital gains tax, respectively) | 31,131,406 | | 6,398,199 | | 74,680,350 | | 67,089,523 |
| Net change in unrealized appreciation/(depreciation) on translation of assets and liabilities denominated in foreign currencies | (7,867) | | 14 | | — | | 16 |
| Net change in unrealized appreciation/(depreciation) from investments and translation of assets and liabilities denominated in foreign currencies | 31,123,539 | | 6,398,213 | | 74,680,350 | | 67,089,539 |
| Net realized/unrealized gain/(loss) from investments and translation of assets and liabilities denominated in foreign currencies | 35,848,084 | | 10,723,250 | | 108,303,948 | | 72,177,864 |
| CHANGE IN NET ASSETS RESULTING FROM OPERATIONS | $36,715,822 | | $11,091,438 | | $107,444,747 | | $72,005,870 |
Amounts listed as “–” are $0 or round to $0.
See accompanying Notes to Financial Statements.
Statements of Changes in Net Assets
| | abrdn China A
Share Equity Fund | | abrdn Dynamic
Dividend Fund | | abrdn EM
SMA Completion Fund |
| | Year Ended
October 31,
2024 | | Year Ended
October 31,
2023 | | Year Ended
October 31,
2024 | | Year Ended
October 31,
2023 | | Year Ended
October 31,
2024 | | Period Ended
October 31,
2023(a) |
| From Investment Activities: | | | | | | | | | | | |
| Operations: | | | | | | | | | | | |
| Net investment income | $193,948 | | $126,327 | | $4,811,150 | | $5,612,076 | | $9,268 | | $7,182 |
| Net realized gain/(loss) from investments, forward foreign currency exchange contracts and foreign currency transactions | (9,890,496) | | (9,020,161) | | (1,002,209) | | 173,529 | | (37,164) | | (15,322) |
| Net change in unrealized appreciation/(depreciation) from investments, forward foreign currency exchange contracts and translation of assets and liabilities denominated in foreign currencies | 9,851,151 | | 6,684,460 | | 15,946,678 | | 1,668,139 | | 45,381 | | (47,981) |
| Changes in net assets resulting from operations | 154,603 | | (2,209,374) | | 19,755,619 | | 7,453,744 | | 17,485 | | (56,121) |
| Distributions to Shareholders From: | | | | | | | | | | | |
| Distributable earnings | | | | | | | | | | | |
| Class A | (26,204) | | — | | (185,757) | | (236,809) | | — | | — |
| Institutional Service Class | (2,754) | | — | | — | | — | | — | | — |
| Institutional Class | (78,937) | | — | | (4,798,817) | | (5,842,025) | | (3,317) | | — |
| Tax return of capital | | | | | | | | | | | |
| Class A | — | | — | | (23,935) | | (1,892) | | — | | — |
| Institutional Class | — | | — | | (586,397) | | (45,952) | | — | | — |
| Change in net assets from shareholder distributions | (107,895) | | — | | (5,594,906) | | (6,126,678) | | (3,317) | | — |
| Change in net assets from capital transactions | (4,630,913) | | (4,464,878) | | (8,209,902) | | (10,235,550) | | 59,721 | | 323,672 |
| Change in net assets | (4,584,205) | | (6,674,252) | | 5,950,811 | | (8,908,484) | | 73,889 | | 267,551 |
| Net Assets: | | | | | | | | | | | |
| Beginning of year | 24,086,942 | | 30,761,194 | | 91,547,944 | | 100,456,428 | | 267,551 | | — |
| End of year | $19,502,737 | | $24,086,942 | | $97,498,755 | | $91,547,944 | | $341,440 | | $267,551 |
| (a) | For the period from January 27, 2023 (commencement of operations) through October 31, 2023. |
Amounts listed as “–” are $0 or round to $0.
See accompanying Notes to Financial Statements.
Statements of Changes in Net Assets (continued)
| | abrdn China A
Share Equity Fund | | abrdn Dynamic
Dividend Fund | | abrdn EM
SMA Completion Fund |
| | Year Ended
October 31,
2024 | | Year Ended
October 31,
2023 | | Year Ended
October 31,
2024 | | Year Ended
October 31,
2023 | | Year Ended
October 31,
2024 | | Period Ended
October 31,
2023(a) |
| Capital Transactions: | | | | | | | | | | | |
| Class A Shares | | | | | | | | | | | |
| Proceeds from shares issued | $4,503,737 | | $5,194,252 | | $377,863 | | $592,964 | | $— | | $— |
| Dividends reinvested | 22,461 | | — | | 174,733 | | 185,707 | | — | | — |
| Cost of shares redeemed | (4,758,297) | | (6,375,831) | | (884,122) | | (1,310,921) | | — | | — |
| Total Class A | (232,099) | | (1,181,579) | | (331,526) | | (532,250) | | — | | — |
| Class C Shares | | | | | | | | | | | |
| Proceeds from shares issued | 1,206 | | 57,522 | | — | | — | | — | | — |
| Dividends reinvested | — | | — | | — | | — | | — | | — |
| Cost of shares redeemed | (321,702) | | (592,324) | | — | | — | | — | | — |
| Total Class C | (320,496) | | (534,802) | | — | | — | | — | | — |
| Class R Shares | | | | | | | | | | | |
| Proceeds from shares issued | 746,650 | | 2,823,701 | | — | | — | | — | | — |
| Dividends reinvested | — | | — | | — | | — | | — | | — |
| Cost of shares redeemed | (1,060,773) | | (2,380,534) | | — | | — | | — | | — |
| Total Class R | (314,123) | | 443,167 | | — | | — | | — | | — |
| Institutional Service Class Shares | | | | | | | | | | | |
| Proceeds from shares issued | 38,662 | | 42,194 | | — | | — | | — | | — |
| Dividends reinvested | 2,740 | | — | | — | | — | | — | | — |
| Cost of shares redeemed | (53,531) | | (15,847) | | — | | — | | — | | — |
| Total Institutional Service Class | (12,129) | | 26,347 | | — | | — | | — | | — |
| Institutional Class Shares | | | | | | | | | | | |
| Proceeds from shares issued | 7,555,000 | | 9,084,199 | | 2,330,993 | | 4,631,748 | | 61,404 | | 331,263 |
| Dividends reinvested | 78,729 | | — | | 4,666,545 | | 5,082,172 | | 3,317 | | — |
| Cost of shares redeemed | (11,385,795) | | (12,302,210) | | (14,875,914) | | (19,417,220) | | (5,000) | | (7,591) |
| Total Institutional Class | (3,752,066) | | (3,218,011) | | (7,878,376) | | (9,703,300) | | 59,721 | | 323,672 |
| Change in net assets from capital transactions: | $(4,630,913) | | $(4,464,878) | | $(8,209,902) | | $(10,235,550) | | $59,721 | | $323,672 |
| (a) | For the period from January 27, 2023 (commencement of operations) through October 31, 2023. |
Amounts listed as “–” are $0 or round to $0.
See accompanying Notes to Financial Statements.
Statements of Changes in Net Assets (continued)
| | abrdn China A
Share Equity Fund | | abrdn Dynamic
Dividend Fund | | abrdn EM
SMA Completion Fund |
| | Year Ended
October 31,
2024 | | Year Ended
October 31,
2023 | | Year Ended
October 31,
2024 | | Year Ended
October 31,
2023 | | Year Ended
October 31,
2024 | | Period Ended
October 31,
2023(a) |
| Share Transactions: | | | | | | | | | | | |
| Class A Shares | | | | | | | | | | | |
| Issued | 204,241 | | 197,819 | | 86,508 | | 148,283 | | – | | – |
| Reinvested | 1,111 | | – | | 41,067 | | 46,006 | | – | | – |
| Redeemed | (234,235) | | (251,295) | | (208,556) | | (326,632) | | – | | – |
| Total Class A Shares | (28,883) | | (53,476) | | (80,981) | | (132,343) | | – | | – |
| Class C Shares | | | | | | | | | | | |
| Issued | 62 | | 2,283 | | – | | – | | – | | – |
| Reinvested | – | | – | | – | | – | | – | | – |
| Redeemed | (17,242) | | (25,007) | | – | | – | | – | | – |
| Total Class C Shares | (17,180) | | (22,724) | | – | | – | | – | | – |
| Class R Shares | | | | | | | | | | | |
| Issued | 36,718 | | 102,257 | | – | | – | | – | | – |
| Reinvested | – | | – | | – | | – | | – | | – |
| Redeemed | (53,261) | | (94,387) | | – | | – | | – | | – |
| Total Class R Shares | (16,543) | | 7,870 | | – | | – | | – | | – |
| Institutional Service Class Shares | | | | | | | | | | | |
| Issued | 1,710 | | 1,497 | | – | | – | | – | | – |
| Reinvested | 134 | | – | | – | | – | | – | | – |
| Redeemed | (2,663) | | (642) | | – | | – | | – | | – |
| Total Institutional Service Class Shares | (819) | | 855 | | – | | – | | – | | – |
| Institutional Class Shares | | | | | | | | | | | |
| Issued | 339,675 | | 317,673 | | 547,038 | | 1,139,327 | | 6,914 | | 33,767 |
| Reinvested | 3,833 | | – | | 1,095,283 | | 1,258,816 | | 370 | | – |
| Redeemed | (530,257) | | (481,946) | | (3,479,935) | | (4,784,758) | | (554) | | (820) |
| Total Institutional Class Shares | (186,749) | | (164,273) | | (1,837,614) | | (2,386,615) | | 6,730 | | 32,947 |
| Total change in shares: | (250,174) | | (231,748) | | (1,918,595) | | (2,518,958) | | 6,730 | | 32,947 |
| (a) | For the period from January 27, 2023 (commencement of operations) through October 31, 2023. |
Amounts listed as “–” are 0 or round to 0.
See accompanying Notes to Financial Statements.
Statements of Changes in Net Assets (continued)
| | abrdn Emerging Markets
Dividend Fund | | abrdn Emerging Markets
ex-China Fund | | abrdn Emerging
Markets Fund |
| | Year Ended
October 31,
2024 | | Year Ended
October 31,
2023 | | Year Ended
October 31,
2024 | | Year Ended
October 31,
2023 | | Year Ended
October 31,
2024 | | Year Ended
October 31,
2023 |
| From Investment Activities: | | | | | | | | | | | |
| Operations: | | | | | | | | | | | |
| Net investment income | $1,499,988 | | $255,784 | | $854,439 | | $378,903 | | $20,658,695 | | $31,383,946 |
| Net realized gain/(loss) from investments and foreign currency transactions | 6,369,677 | | 2,663 | | 529,203 | | (140,475) | | (31,718,641) | | (20,307,060) |
| Net change in unrealized appreciation/(depreciation) from investments and translation of assets and liabilities denominated in foreign currencies | 12,476,564 | | 7,729,576 | | 6,925,487 | | 816,602 | | 295,591,747 | | 194,754,320 |
| Changes in net assets resulting from operations | 20,346,229 | | 7,988,023 | | 8,309,129 | | 1,055,030 | | 284,531,801 | | 205,831,206 |
| Distributions to Shareholders From: | | | | | | | | | | | |
| Distributable earnings | | | | | | | | | | | |
| Class A | — | | (5,324,309) | | (112,037) | | (4,756,449) | | (404,695) | | (888,931) |
| Class C | — | | — | | — | | (32,983) | | (391) | | (21,039) |
| Class R | — | | — | | (1,443) | | (140,911) | | (928,377) | | (1,335,257) |
| Institutional Service Class | — | | — | | (1,155) | | (55,201) | | (7,007,136) | | (9,738,793) |
| Institutional Class | — | | (701,988) | | (185,817) | | (974,995) | | (16,530,067) | | (28,752,203) |
| Change in net assets from shareholder distributions | — | | (6,026,297) | | (300,452) | | (5,960,539) | | (24,870,666) | | (40,736,223) |
| Change in net assets from capital transactions | (13,250,508) | | (12,655,116) | | 112,791,076 | | 21,271,829 | | (795,632,978) | | (649,848,035) |
| Change in net assets | 7,095,721 | | (10,693,390) | | 120,799,753 | | 16,366,320 | | (535,971,843) | | (484,753,052) |
| Net Assets: | | | | | | | | | | | |
| Beginning of year | 71,320,095 | | 82,013,485 | | 41,012,846 | | 24,646,526 | | 1,776,760,849 | | 2,261,513,901 |
| End of year | $78,415,816 | | $71,320,095 | | $161,812,599 | | $41,012,846 | | $1,240,789,006 | | $1,776,760,849 |
Amounts listed as “–” are $0 or round to $0.
See accompanying Notes to Financial Statements.
Statements of Changes in Net Assets (continued)
| | abrdn Emerging Markets
Dividend Fund | | abrdn Emerging Markets
ex-China Fund | | abrdn Emerging
Markets Fund |
| | Year Ended
October 31,
2024 | | Year Ended
October 31,
2023 | | Year Ended
October 31,
2024 | | Year Ended
October 31,
2023 | | Year Ended
October 31,
2024 | | Year Ended
October 31,
2023 |
| Capital Transactions: | | | | | | | | | | | |
| Class A Shares | | | | | | | | | | | |
| Proceeds from shares issued | $489,464 | | $741,850 | | $2,334,901 | | $1,958,180 | | $6,375,968 | | $12,274,473 |
| Proceeds from shares issued from the reorganization | — | | — | | 10,051,470 | | — | | — | | — |
| Exchanged* | (74,063,048) | | — | | — | | — | | — | | — |
| Dividends reinvested | — | | 5,115,908 | | 105,943 | | 4,454,545 | | 347,254 | | 614,614 |
| Cost of shares redeemed | (11,187,276) | | (11,265,194) | | (3,804,305) | | (2,983,503) | | (19,329,237) | | (38,045,587) |
| Total Class A | (84,760,860) | | (5,407,436) | | 8,688,009 | | 3,429,222 | | (12,606,015) | | (25,156,500) |
| Class C Shares | | | | | | | | | | | |
| Proceeds from shares issued | — | | — | | 193,714 | | 46,036 | | 13,435 | | 291,548 |
| Proceeds from shares issued from the reorganization | — | | — | | 16,492 | | — | | — | | — |
| Dividends reinvested | — | | — | | — | | 32,955 | | 377 | | 17,548 |
| Cost of shares redeemed | — | | — | | (40,691) | | (35,727) | | (741,495) | | (2,778,650) |
| Total Class C | — | | — | | 169,515 | | 43,264 | | (727,683) | | (2,469,554) |
| Class R Shares | | | | | | | | | | | |
| Proceeds from shares issued | — | | — | | 96,837 | | 113,913 | | 3,555,798 | | 6,384,949 |
| Proceeds from shares issued from the reorganization | — | | — | | 2,225,186 | | — | | — | | — |
| Dividends reinvested | — | | — | | 1,401 | | 137,915 | | 928,326 | | 1,333,126 |
| Cost of shares redeemed | — | | — | | (428,056) | | (220,782) | | (13,212,841) | | (10,749,281) |
| Total Class R | — | | — | | 1,895,368 | | 31,046 | | (8,728,717) | | (3,031,206) |
| Institutional Service Class Shares | | | | | | | | | | | |
| Proceeds from shares issued | — | | — | | 311,463 | | 44,950 | | 5,614,355 | | 45,598,969 |
| Proceeds from shares issued from the reorganization | — | | — | | 51,591,402 | | — | | — | | — |
| Dividends reinvested | — | | — | | 1,155 | | 55,201 | | 7,005,231 | | 9,735,404 |
| Cost of shares redeemed | — | | — | | (3,206,743) | | (228,936) | | (112,874,655) | | (102,773,176) |
| Total Institutional Service Class | — | | — | | 48,697,277 | | (128,785) | | (100,255,069) | | (47,438,803) |
| Institutional Class Shares | | | | | | | | | | | |
| Proceeds from shares issued | 534,074 | | 450,460 | | 59,473,208 | | 25,228,249 | | 101,436,121 | | 199,709,758 |
| Proceeds from shares issued from the reorganization | — | | — | | 6,826,009 | | — | | — | | — |
| Exchanged* | 74,063,048 | | — | | — | | — | | — | | — |
| Dividends reinvested | — | | 644,247 | | 185,458 | | 966,643 | | 12,439,531 | | 20,681,800 |
| Cost of shares redeemed | (3,086,770) | | (8,342,387) | | (13,143,768) | | (8,297,810) | | (787,191,146) | | (792,143,530) |
| Total Institutional Class | 71,510,352 | | (7,247,680) | | 53,340,907 | | 17,897,082 | | (673,315,494) | | (571,751,972) |
| Change in net assets from capital transactions: | $(13,250,508) | | $(12,655,116) | | $112,791,076 | | $21,271,829 | | $(795,632,978) | | $(649,848,035) |
| * | On October 18, 2024, all issued and outstanding Class A shares of the abrdn Emerging Markets Dividend Fund were converted to Institutional Class shares. |
Amounts listed as “–” are $0 or round to $0.
See accompanying Notes to Financial Statements.
Statements of Changes in Net Assets (continued)
| | abrdn Emerging Markets
Dividend Fund | | abrdn Emerging Markets
ex-China Fund | | abrdn Emerging
Markets Fund |
| | Year Ended
October 31,
2024 | | Year Ended
October 31,
2023 | | Year Ended
October 31,
2024 | | Year Ended
October 31,
2023 | | Year Ended
October 31,
2024 | | Year Ended
October 31,
2023 |
| Share Transactions: | | | | | | | | | | | |
| Class A Shares | | | | | | | | | | | |
| Issued | 17,873 | | 29,579 | | 193,792 | | 174,756 | | 479,686 | | 957,427 |
| Issued from the reorganization | – | | – | | 804,839 | | – | | – | | – |
| Exchanged* | (2,462,243) | | – | | – | | – | | – | | – |
| Reinvested | – | | 224,776 | | 9,125 | | 447,693 | | 27,172 | | 49,169 |
| Redeemed | (413,652) | | (466,115) | | (311,974) | | (277,378) | | (1,459,224) | | (3,022,868) |
| Total Class A Shares | (2,858,022) | | (211,760) | | 695,782 | | 345,071 | | (952,366) | | (2,016,272) |
| Class C Shares | | | | | | | | | | | |
| Issued | – | | – | | 18,040 | | 4,800 | | 1,002 | | 23,313 |
| Issued from the reorganization | – | | – | | 1,495 | | – | | – | | – |
| Reinvested | – | | – | | – | | 3,732 | | 30 | | 1,418 |
| Redeemed | – | | – | | (4,145) | | (3,542) | | (56,422) | | (222,865) |
| Total Class C Shares | – | | – | | 15,390 | | 4,990 | | (55,390) | | (198,134) |
| Class R Shares | | | | | | | | | | | |
| Issued | – | | – | | 8,485 | | 10,996 | | 279,056 | | 506,935 |
| Issued from the reorganization | – | | – | | 193,427 | | – | | – | | – |
| Reinvested | – | | – | | 131 | | 15,007 | | 73,852 | | 108,208 |
| Redeemed | – | | – | | (37,448) | | (21,917) | | (999,490) | | (854,803) |
| Total Class R Shares | – | | – | | 164,595 | | 4,086 | | (646,582) | | (239,660) |
| Institutional Service Class Shares | | | | | | | | | | | |
| Issued | – | | – | | 24,662 | | 4,040 | | 419,790 | | 3,701,217 |
| Issued from the reorganization | – | | – | | 4,027,935 | | – | | – | | – |
| Reinvested | – | | – | | 97 | | 5,412 | | 548,140 | | 778,210 |
| Redeemed | – | | – | | (244,421) | | (22,634) | | (8,641,068) | | (8,146,881) |
| Total Institutional Service Class Shares | – | | – | | 3,808,273 | | (13,182) | | (7,673,138) | | (3,667,454) |
| Institutional Class Shares | | | | | | | | | | | |
| Issued | 19,424 | | 17,660 | | 4,851,457 | | 2,265,416 | | 7,681,917 | | 15,507,628 |
| Issued from the reorganization | – | | – | | 540,700 | | – | | – | | – |
| Exchanged* | 2,378,099 | | – | | – | | – | | – | | – |
| Reinvested | – | | 27,450 | | 15,824 | | 96,375 | | 967,304 | | 1,644,022 |
| Redeemed | (109,667) | | (322,064) | | (1,065,460) | | (721,469) | | (58,922,757) | | (61,761,696) |
| Total Institutional Class Shares | 2,287,856 | | (276,954) | | 4,342,521 | | 1,640,322 | | (50,273,536) | | (44,610,046) |
| Total change in shares: | (570,166) | | (488,714) | | 9,026,561 | | 1,981,287 | | (59,601,012) | | (50,731,566) |
| * | On October 18, 2024, all issued and outstanding Class A shares of the abrdn Emerging Markets Dividend Fund were converted to Institutional Class shares. |
Amounts listed as “–” are 0 or round to 0.
See accompanying Notes to Financial Statements.
Statements of Changes in Net Assets (continued)
| | abrdn Focused U.S.
Small Cap
Equity Fund | | abrdn Global
Equity Impact Fund |
| | Year Ended
October 31,
2024 | | Year Ended
October 31,
2023 | | Year Ended
October 31,
2024 | | Year Ended
October 31,
2023 |
| From Investment Activities: | | | | | | | |
| Operations: | | | | | | | |
| Net investment income (loss) | $(50,574) | | $(27,384) | | $146,927 | | $308,588 |
| Net realized gain/(loss) from investments and foreign currency transactions | 772,484 | | (1,568,318) | | 3,031,627 | | 1,788,388 |
| Net change in unrealized appreciation/(depreciation) from investments and translation of assets and liabilities denominated in foreign currencies | 3,224,516 | | 395,733 | | 5,181,866 | | (1,142,860) |
| Changes in net assets resulting from operations | 3,946,426 | | (1,199,969) | | 8,360,420 | | 954,116 |
| Distributions to Shareholders From: | | | | | | | |
| Distributable earnings | | | | | | | |
| Class A | — | | — | | (263,696) | | (1,341,529) |
| Institutional Class | — | | — | | (251,255) | | (1,047,552) |
| Change in net assets from shareholder distributions | — | | — | | (514,951) | | (2,389,081) |
| Change in net assets from capital transactions | (2,988,945) | | (3,316,057) | | (7,651,088) | | (2,156,440) |
| Change in net assets | 957,481 | | (4,516,026) | | 194,381 | | (3,591,405) |
| Net Assets: | | | | | | | |
| Beginning of year | 11,447,979 | | 15,964,005 | | 42,778,891 | | 46,370,296 |
| End of year | $12,405,460 | | $11,447,979 | | $42,973,272 | | $42,778,891 |
Amounts listed as “–” are $0 or round to $0.
See accompanying Notes to Financial Statements.
Statements of Changes in Net Assets (continued)
| | abrdn Focused U.S.
Small Cap
Equity Fund | | abrdn Global
Equity Impact Fund |
| | Year Ended
October 31,
2024 | | Year Ended
October 31,
2023 | | Year Ended
October 31,
2024 | | Year Ended
October 31,
2023 |
| Capital Transactions: | | | | | | | |
| Class A Shares | | | | | | | |
| Proceeds from shares issued | $551,076 | | $258,266 | | $534,632 | | $1,058,951 |
| Exchanged* | (7,704,572) | | — | | — | | — |
| Dividends reinvested | — | | — | | 249,520 | | 1,269,842 |
| Cost of shares redeemed | (1,465,473) | | (1,523,549) | | (6,738,797) | | (2,978,749) |
| Total Class A | (8,618,969) | | (1,265,283) | | (5,954,645) | | (649,956) |
| Class R Shares | | | | | | | |
| Proceeds from shares issued | 1,918,835 | | 371,358 | | — | | — |
| Exchanged* | (278,952) | | — | | — | | — |
| Dividends reinvested | — | | — | | — | | — |
| Cost of shares redeemed | (4,399,914) | | (415,902) | | — | | — |
| Total Class R | (2,760,031) | | (44,544) | | — | | — |
| Institutional Service Class Shares | | | | | | | |
| Proceeds from shares issued | 34,301 | | 24,646 | | — | | — |
| Exchanged* | (56,828) | | — | | — | | — |
| Dividends reinvested | — | | — | | — | | — |
| Cost of shares redeemed | (279,219) | | (55,610) | | — | | — |
| Total Institutional Service Class | (301,746) | | (30,964) | | — | | — |
| Institutional Class Shares | | | | | | | |
| Proceeds from shares issued | 1,855,244 | | 382,594 | | 439,403 | | 669,409 |
| Exchanged* | 8,040,352 | | — | | — | | — |
| Dividends reinvested | — | | — | | 222,829 | | 928,599 |
| Cost of shares redeemed | (1,203,795) | | (2,357,860) | | (2,358,675) | | (3,104,492) |
| Total Institutional Class | 8,691,801 | | (1,975,266) | | (1,696,443) | | (1,506,484) |
| Change in net assets from capital transactions: | $(2,988,945) | | $(3,316,057) | | $(7,651,088) | | $(2,156,440) |
| * | On October 18, 2024, all issued and outstanding Class A, Class R and Institutional Service Class shares of the abrdn Focused U.S. Small Cap Fund were converted to Institutional Class shares. |
Amounts listed as “–” are $0 or round to $0.
See accompanying Notes to Financial Statements.
Statements of Changes in Net Assets (continued)
| | abrdn Focused U.S.
Small Cap
Equity Fund | | abrdn Global
Equity Impact Fund |
| | Year Ended
October 31,
2024 | | Year Ended
October 31,
2023 | | Year Ended
October 31,
2024 | | Year Ended
October 31,
2023 |
| Share Transactions: | | | | | | | |
| Class A Shares | | | | | | | |
| Issued | 78,520 | | 40,277 | | 36,572 | | 75,119 |
| Exchanged* | (979,901) | | – | | – | | – |
| Reinvested | – | | – | | 17,621 | | 92,621 |
| Redeemed | (206,314) | | (239,072) | | (470,985) | | (211,139) |
| Total Class A Shares | (1,107,695) | | (198,795) | | (416,792) | | (43,399) |
| Class R Shares | | | | | | | |
| Issued | 318,794 | | 68,338 | | – | | – |
| Exchanged* | (33,523) | | – | | – | | – |
| Reinvested | – | | – | | – | | – |
| Redeemed | (701,950) | | (76,597) | | – | | – |
| Total Class R Shares | (416,679) | | (8,259) | | – | | – |
| Institutional Service Class Shares | | | | | | | |
| Issued | 4,698 | | 3,686 | | – | | – |
| Exchanged* | (8,508) | | – | | – | | – |
| Reinvested | – | | – | | – | | – |
| Redeemed | (33,510) | | (8,000) | | – | | – |
| Total Institutional Service Class Shares | (37,320) | | (4,314) | | – | | – |
| Institutional Class Shares | | | | | | | |
| Issued | 214,643 | | 53,831 | | 29,832 | | 46,069 |
| Exchanged* | 916,823 | | – | | – | | – |
| Reinvested | – | | – | | 15,726 | | 67,633 |
| Redeemed | (151,082) | | (331,519) | | (163,157) | | (223,301) |
| Total Institutional Class Shares | 980,384 | | (277,688) | | (117,599) | | (109,599) |
| Total change in shares: | (581,310) | | (489,056) | | (534,391) | | (152,998) |
| * | On October 18, 2024, all issued and outstanding Class A, Class R and Institutional Service Class shares of the abrdn Focused U.S. Small Cap Fund were converted to Institutional Class shares. |
Amounts listed as “–” are 0 or round to 0.
See accompanying Notes to Financial Statements.
Statements of Changes in Net Assets (continued)
| | abrdn Global
Infrastructure Fund | | abrdn International
Small Cap Fund | | abrdn Realty
Income & Growth Fund |
| | Year Ended
October 31,
2024 | | Year Ended
October 31,
2023 | | Year Ended
October 31,
2024 | | Year Ended
October 31,
2023 | | Year Ended
October 31,
2024 | | Year Ended
October 31,
2023 |
| From Investment Activities: | | | | | | | | | | | |
| Operations: | | | | | | | | | | | |
| Net investment income | $745,698 | | $1,278,382 | | $867,738 | | $1,169,018 | | $368,188 | | $1,135,136 |
| Net realized gain/(loss) from investments and foreign currency transactions | 2,315,934 | | 479,415 | | 4,724,545 | | (24,439,192) | | 4,325,037 | | 728,623 |
| Net change in unrealized appreciation/(depreciation) from investments and translation of assets and liabilities denominated in foreign currencies | 6,315,743 | | (1,075,074) | | 31,123,539 | | 29,971,329 | | 6,398,213 | | (3,008,343) |
| Changes in net assets resulting from operations | 9,377,375 | | 682,723 | | 36,715,822 | | 6,701,155 | | 11,091,438 | | (1,144,584) |
| Distributions to Shareholders From: | | | | | | | | | | | |
| Distributable earnings | | | | | | | | | | | |
| Class A | (357,908) | | (521,132) | | (369,121) | | (937,040) | | (14,283) | | (32,712) |
| Class C | — | | — | | — | | (3,288) | | — | | — |
| Class R | — | | — | | (7,616) | | (32,584) | | — | | — |
| Institutional Class | (1,108,807) | | (1,726,422) | | (702,261) | | (2,192,455) | | (1,490,512) | | (3,593,964) |
| Change in net assets from shareholder distributions | (1,466,715) | | (2,247,554) | | (1,078,998) | | (3,165,367) | | (1,504,795) | | (3,626,676) |
| Change in net assets from capital transactions | (5,642,490) | | (4,943,954) | | (40,355,177) | | (53,732,742) | | (3,496,710) | | (2,601,329) |
| Change in net assets | 2,268,170 | | (6,508,785) | | (4,718,353) | | (50,196,954) | | 6,089,933 | | (7,372,589) |
| Net Assets: | | | | | | | | | | | |
| Beginning of year | 40,486,111 | | 46,994,896 | | 128,286,214 | | 178,483,168 | | 34,616,738 | | 41,989,327 |
| End of year | $42,754,281 | | $40,486,111 | | $123,567,861 | | $128,286,214 | | $40,706,671 | | $34,616,738 |
Amounts listed as “–” are $0 or round to $0.
See accompanying Notes to Financial Statements.
Statements of Changes in Net Assets (continued)
| | abrdn Global
Infrastructure Fund | | abrdn International
Small Cap Fund | | abrdn Realty
Income & Growth Fund |
| | Year Ended
October 31,
2024 | | Year Ended
October 31,
2023 | | Year Ended
October 31,
2024 | | Year Ended
October 31,
2023 | | Year Ended
October 31,
2024 | | Year Ended
October 31,
2023 |
| Capital Transactions: | | | | | | | | | | | |
| Class A Shares | | | | | | | | | | | |
| Proceeds from shares issued | $349,577 | | $331,170 | | $938,194 | | $4,476,015 | | $199,267 | | $20,475 |
| Dividends reinvested | 292,134 | | 430,907 | | 354,810 | | 901,341 | | 10,547 | | 24,005 |
| Cost of shares redeemed | (1,557,288) | | (1,732,897) | | (10,409,490) | | (12,822,651) | | (45,390) | | (134,011) |
| Total Class A | (915,577) | | (970,820) | | (9,116,486) | | (7,445,295) | | 164,424 | | (89,531) |
| Class C Shares | | | | | | | | | | | |
| Proceeds from shares issued | — | | — | | 65,493 | | 28,197 | | — | | — |
| Dividends reinvested | — | | — | | — | | 3,288 | | — | | — |
| Cost of shares redeemed | — | | — | | (151,854) | | (69,957) | | — | | — |
| Total Class C | — | | — | | (86,361) | | (38,472) | | — | | — |
| Class R Shares | | | | | | | | | | | |
| Proceeds from shares issued | — | | — | | 128,386 | | 415,475 | | — | | — |
| Dividends reinvested | — | | — | | 7,614 | | 32,542 | | — | | — |
| Cost of shares redeemed | — | | — | | (449,392) | | (830,704) | | — | | — |
| Total Class R | — | | — | | (313,392) | | (382,687) | | — | | — |
| Institutional Class Shares | | | | | | | | | | | |
| Proceeds from shares issued | 3,503,303 | | 3,029,659 | | 6,238,602 | | 14,673,322 | | 316,408 | | 245,962 |
| Dividends reinvested | 1,079,010 | | 1,691,984 | | 702,164 | | 2,174,000 | | 1,446,878 | | 3,503,197 |
| Cost of shares redeemed | (9,309,226) | | (8,694,777) | | (37,779,704) | | (62,713,610) | | (5,424,420) | | (6,260,957) |
| Total Institutional Class | (4,726,913) | | (3,973,134) | | (30,838,938) | | (45,866,288) | | (3,661,134) | | (2,511,798) |
| Change in net assets from capital transactions: | $(5,642,490) | | $(4,943,954) | | $(40,355,177) | | $(53,732,742) | | $(3,496,710) | | $(2,601,329) |
Amounts listed as “–” are $0 or round to $0.
See accompanying Notes to Financial Statements.
Statements of Changes in Net Assets (continued)
| | abrdn Global
Infrastructure Fund | | abrdn International
Small Cap Fund | | abrdn Realty
Income & Growth Fund |
| | Year Ended
October 31,
2024 | | Year Ended
October 31,
2023 | | Year Ended
October 31,
2024 | | Year Ended
October 31,
2023 | | Year Ended
October 31,
2024 | | Year Ended
October 31,
2023 |
| Share Transactions: | | | | | | | | | | | |
| Class A Shares | | | | | | | | | | | |
| Issued | 15,098 | | 15,296 | | 33,039 | | 170,980 | | 18,208 | | 1,948 |
| Reinvested | 12,660 | | 20,046 | | 13,040 | | 35,458 | | 951 | | 2,349 |
| Redeemed | (67,441) | | (79,628) | | (366,071) | | (490,328) | | (4,310) | | (13,058) |
| Total Class A Shares | (39,683) | | (44,286) | | (319,992) | | (283,890) | | 14,849 | | (8,761) |
| Class C Shares | | | | | | | | | | | |
| Issued | – | | – | | 2,708 | | 1,191 | | – | | – |
| Reinvested | – | | – | | – | | 146 | | – | | – |
| Redeemed | – | | – | | (6,043) | | (3,058) | | – | | – |
| Total Class C Shares | – | | – | | (3,335) | | (1,721) | | – | | – |
| Class R Shares | | | | | | | | | | | |
| Issued | – | | – | | 5,012 | | 17,098 | | – | | – |
| Reinvested | – | | – | | 302 | | 1,381 | | – | | – |
| Redeemed | – | | – | | (16,804) | | (33,956) | | – | | – |
| Total Class R Shares | – | | – | | (11,490) | | (15,477) | | – | | – |
| Institutional Class Shares | | | | | | | | | | | |
| Issued | 147,692 | | 136,612 | | 215,469 | | 557,884 | | 28,833 | | 23,258 |
| Reinvested | 46,652 | | 78,491 | | 25,477 | | 84,526 | | 130,235 | | 340,946 |
| Redeemed | (405,458) | | (406,658) | | (1,312,676) | | (2,358,303) | | (488,100) | | (600,390) |
| Total Institutional Class Shares | (211,114) | | (191,555) | | (1,071,730) | | (1,715,893) | | (329,032) | | (236,186) |
| Total change in shares: | (250,797) | | (235,841) | | (1,406,547) | | (2,016,981) | | (314,183) | | (244,947) |
Amounts listed as “–” are 0 or round to 0.
See accompanying Notes to Financial Statements.
Statements of Changes in Net Assets (continued)
| | abrdn U.S. Small Cap
Equity Fund | | abrdn U.S. Sustainable
Leaders Fund |
| | Year Ended
October 31,
2024 | | Year Ended
October 31,
2023 | | Year Ended
October 31,
2024 | | Year Ended
October 31,
2023 |
| From Investment Activities: | | | | | | | |
| Operations: | | | | | | | |
| Net investment income (loss) | $(859,201) | | $(1,622,933) | | $(171,994) | | $632,659 |
| Net realized gain/(loss) from investments and foreign currency transactions | 33,623,598 | | (59,887,042) | | 5,088,325 | | (31,853,046) |
| Net change in unrealized appreciation/(depreciation) from investments and translation of assets and liabilities denominated in foreign currencies | 74,680,350 | | 36,388,453 | | 67,089,539 | | 42,354,320 |
| Changes in net assets resulting from operations | 107,444,747 | | (25,121,522) | | 72,005,870 | | 11,133,933 |
| Distributions to Shareholders From: | | | | | | | |
| Distributable earnings | | | | | | | |
| Class A | — | | (5,913,035) | | (242,416) | | (963,742) |
| Class C | — | | (1,721,556) | | — | | (2,414) |
| Class R | — | | (202,505) | | — | | — |
| Institutional Service Class | — | | (1,601,455) | | (321,771) | | (409,828) |
| Institutional Class | — | | (25,542,201) | | (23,249) | | (31,379) |
| Change in net assets from shareholder distributions | — | | (34,980,752) | | (587,436) | | (1,407,363) |
| Change in net assets from capital transactions | (127,766,617) | | (302,711,344) | | (39,835,154) | | (29,348,917) |
| Change in net assets | (20,321,870) | | (362,813,618) | | 31,583,280 | | (19,622,347) |
| Net Assets: | | | | | | | |
| Beginning of year | 365,030,314 | | 727,843,932 | | 317,508,806 | | 337,131,153 |
| End of year | $344,708,444 | | $365,030,314 | | $349,092,086 | | $317,508,806 |
Amounts listed as “–” are $0 or round to $0.
See accompanying Notes to Financial Statements.
Statements of Changes in Net Assets (continued)
| | abrdn U.S. Small Cap
Equity Fund | | abrdn U.S. Sustainable
Leaders Fund |
| | Year Ended
October 31,
2024 | | Year Ended
October 31,
2023 | | Year Ended
October 31,
2024 | | Year Ended
October 31,
2023 |
| Capital Transactions: | | | | | | | |
| Class A Shares | | | | | | | |
| Proceeds from shares issued | $12,704,578 | | $13,008,753 | | $820,318 | | $579,382 |
| Dividends reinvested | — | | 4,786,280 | | 214,930 | | 875,365 |
| Cost of shares redeemed | (23,073,308) | | (27,629,223) | | (27,813,631) | | (21,628,726) |
| Total Class A | (10,368,730) | | (9,834,190) | | (26,778,383) | | (20,173,979) |
| Class C Shares | | | | | | | |
| Proceeds from shares issued | 366,652 | | 1,999,206 | | 53,100 | | 290,815 |
| Dividends reinvested | — | | 1,614,621 | | — | | 2,414 |
| Cost of shares redeemed | (9,014,073) | | (9,276,781) | | (144,626) | | (197,203) |
| Total Class C | (8,647,421) | | (5,662,954) | | (91,526) | | 96,026 |
| Class R Shares | | | | | | | |
| Proceeds from shares issued | 886,537 | | 630,204 | | — | | — |
| Dividends reinvested | — | | 192,619 | | — | | — |
| Cost of shares redeemed | (795,147) | | (854,184) | | — | | — |
| Total Class R | 91,390 | | (31,361) | | — | | — |
| Institutional Service Class Shares | | | | | | | |
| Proceeds from shares issued | 6,686,749 | | 6,236,824 | | 333,524 | | 753,807 |
| Dividends reinvested | — | | 1,545,659 | | 315,660 | | 404,905 |
| Cost of shares redeemed | (7,670,618) | | (6,713,328) | | (12,245,689) | | (9,090,927) |
| Total Institutional Service Class | (983,869) | | 1,069,155 | | (11,596,505) | | (7,932,215) |
| Institutional Class Shares | | | | | | | |
| Proceeds from shares issued | 27,115,806 | | 80,441,718 | | 1,484,717 | | 1,097,691 |
| Dividends reinvested | — | | 22,298,024 | | 22,193 | | 30,699 |
| Cost of shares redeemed | (134,973,793) | | (390,991,736) | | (2,875,650) | | (2,467,139) |
| Total Institutional Class | (107,857,987) | | (288,251,994) | | (1,368,740) | | (1,338,749) |
| Change in net assets from capital transactions: | $(127,766,617) | | $(302,711,344) | | $(39,835,154) | | $(29,348,917) |
Amounts listed as “–” are $0 or round to $0.
See accompanying Notes to Financial Statements.
Statements of Changes in Net Assets (concluded)
| | abrdn U.S. Small Cap
Equity Fund | | abrdn U.S. Sustainable
Leaders Fund |
| | Year Ended
October 31,
2024 | | Year Ended
October 31,
2023 | | Year Ended
October 31,
2024 | | Year Ended
October 31,
2023 |
| Share Transactions: | | | | | | | |
| Class A Shares | | | | | | | |
| Issued | 404,343 | | 435,773 | | 72,213 | | 58,031 |
| Reinvested | – | | 169,726 | | 19,754 | | 90,711 |
| Redeemed | (739,006) | | (933,504) | | (2,431,774) | | (2,173,816) |
| Total Class A Shares | (334,663) | | (328,005) | | (2,339,807) | | (2,025,074) |
| Class C Shares | | | | | | | |
| Issued | 16,296 | | 92,000 | | 6,846 | | 41,035 |
| Reinvested | – | | 78,152 | | – | | 348 |
| Redeemed | (398,802) | | (427,812) | | (18,717) | | (27,636) |
| Total Class C Shares | (382,506) | | (257,660) | | (11,871) | | 13,747 |
| Class R Shares | | | | | | | |
| Issued | 33,261 | | 25,276 | | – | | – |
| Reinvested | – | | 8,039 | | – | | – |
| Redeemed | (29,323) | | (33,247) | | – | | – |
| Total Class R Shares | 3,938 | | 68 | | – | | – |
| Institutional Service Class Shares | | | | | | | |
| Issued | 192,888 | | 192,089 | | 25,821 | | 66,985 |
| Reinvested | – | | 49,256 | | 25,726 | | 37,216 |
| Redeemed | (216,362) | | (204,239) | | (945,631) | | (812,255) |
| Total Institutional Service Class Shares | (23,474) | | 37,106 | | (894,084) | | (708,054) |
| Institutional Class Shares | | | | | | | |
| Issued | 775,981 | | 2,457,296 | | 112,324 | | 95,661 |
| Reinvested | – | | 708,099 | | 1,793 | | 2,798 |
| Redeemed | (3,812,302) | | (11,771,742) | | (219,402) | | (220,421) |
| Total Institutional Class Shares | (3,036,321) | | (8,606,347) | | (105,285) | | (121,962) |
| Total change in shares: | (3,773,026) | | (9,154,838) | | (3,351,047) | | (2,841,343) |
Amounts listed as “–” are 0 or round to 0.
See accompanying Notes to Financial Statements.
Financial Highlights
Selected Data for Each Share of Capital Outstanding Throughout the Periods Indicated
abrdn China A Share Equity Fund
| | | Investment Activities | Distributions | |
| | Net
Asset
Value,
Beginning
of Period | Net
Investment
Income
(Loss)
(a) | Net
Realized
and
Unrealized
Gains
(Losses) on
Investments | Total
from
Investment
Activities | Net
Investment
Income | Net
Realized
Gains | Total
Distributions | Net
Asset
Value,
End of
Period |
| Class A Shares | | | | | | | | |
| Year Ended October 31, 2024 | $21.48 | $0.19 | $0.85 | $ 1.04 | $ (0.08) | $ – | $ (0.08) | $ 22.44 |
| Year Ended October 31, 2023 | 22.74 | 0.06 | (1.32) | (1.26) | – | – | – | 21.48 |
| Year Ended October 31, 2022 | 37.76 | 0.01 | (14.09) | (14.08) | – | (0.94) | (0.94) | 22.74 |
| Year Ended October 31, 2021 | 33.90 | (0.11) | 4.50 | 4.39 | – | (0.53) | (0.53) | 37.76 |
| Year Ended October 31, 2020 | 25.61 | 0.08 | 9.29 | 9.37 | –(g) | (1.08) | (1.08) | 33.90 |
| Class C Shares | | | | | | | | |
| Year Ended October 31, 2024 | 19.95 | 0.05 | 0.79 | 0.84 | – | – | – | 20.79 |
| Year Ended October 31, 2023 | 21.25 | (0.10) | (1.20) | (1.30) | – | – | – | 19.95 |
| Year Ended October 31, 2022 | 35.58 | (0.22) | (13.17) | (13.39) | – | (0.94) | (0.94) | 21.25 |
| Year Ended October 31, 2021 | 32.18 | (0.31) | 4.24 | 3.93 | – | (0.53) | (0.53) | 35.58 |
| Year Ended October 31, 2020 | 24.52 | (0.09) | 8.83 | 8.74 | – | (1.08) | (1.08) | 32.18 |
| Class R Shares | | | | | | | | |
| Year Ended October 31, 2024 | 20.75 | 0.13 | 0.82 | 0.95 | – | – | – | 21.70 |
| Year Ended October 31, 2023 | 22.03 | (0.03) | (1.25) | (1.28) | – | – | – | 20.75 |
| Year Ended October 31, 2022 | 36.71 | (0.06) | (13.68) | (13.74) | – | (0.94) | (0.94) | 22.03 |
| Year Ended October 31, 2021 | 33.07 | (0.23) | 4.40 | 4.17 | – | (0.53) | (0.53) | 36.71 |
| Year Ended October 31, 2020 | 25.08 | (0.06) | 9.13 | 9.07 | – | (1.08) | (1.08) | 33.07 |
| Institutional Service Class Shares | | | | | | | | |
| Year Ended October 31, 2024 | 21.75 | 0.25 | 0.86 | 1.11 | (0.17) | – | (0.17) | 22.69 |
| Year Ended October 31, 2023 | 22.96 | 0.12 | (1.33) | (1.21) | – | – | – | 21.75 |
| Year Ended October 31, 2022 | 38.05 | 0.05 | (14.18) | (14.13) | (0.02) | (0.94) | (0.96) | 22.96 |
| Year Ended October 31, 2021 | 34.11 | (0.04) | 4.53 | 4.49 | (0.02) | (0.53) | (0.55) | 38.05 |
| Year Ended October 31, 2020 | 25.75 | 0.15 | 9.34 | 9.49 | (0.05) | (1.08) | (1.13) | 34.11 |
| Institutional Class Shares | | | | | | | | |
| Year Ended October 31, 2024 | 21.90 | 0.25 | 0.89 | 1.14 | (0.17) | – | (0.17) | 22.87 |
| Year Ended October 31, 2023 | 23.10 | 0.15 | (1.35) | (1.20) | – | – | – | 21.90 |
| Year Ended October 31, 2022 | 38.24 | 0.06 | (14.23) | (14.17) | (0.03) | (0.94) | (0.97) | 23.10 |
| Year Ended October 31, 2021 | 34.26 | 0.12 | 4.43 | 4.55 | (0.04) | (0.53) | (0.57) | 38.24 |
| Year Ended October 31, 2020 | 25.85 | 0.05 | 9.51 | 9.56 | (0.07) | (1.08) | (1.15) | 34.26 |
| (a) | Net investment income/(loss) is based on average shares outstanding during the period. |
| (b) | Excludes sales charge. |
| (c) | During the period, certain fees were waived and/or reimbursed. If such waivers/reimbursements had not occurred, the ratios would have been as indicated. |
| (d) | Portfolio turnover is calculated on the basis of the Fund as a whole without distinguishing among the classes of shares. |
| (e) | Includes interest expense that amounts to 0.03% for the year ended October 31, 2023. Includes interest expense that amounts to less than 0.01% for the years ended October 31, 2024, October 31, 2022, October 31, 2021, and October 31, 2020, respectively. |
| (f) | The total return shown above includes the impact of financial statement rounding of the NAV per share and/or financial statement adjustments. |
| (g) | Less than $0.005 per share. |
Amounts listed as “–” are $0 or round to $0.
See accompanying Notes to Financial Statements.
Financial Highlights (continued)
Selected Data for Each Share of Capital Outstanding Throughout the Periods Indicated
abrdn China A Share Equity Fund (concluded)
| | Ratios/Supplemental Data |
Total
Return
(b) | Net Assets
at End
of Period
(000's) | Ratio of Expenses
(Net of
Reimbursements/
Waivers)
to Average
Net Assets | Ratio of Expenses
(Prior to
Reimbursements) to
Average Net Assets(c) | Ratio of Net
Investment Income
(Loss) to
Average Net Assets | Portfolio
Turnover
(d) |
| | | | | | |
| 4.87% | $ 7,635 | 1.38%(e) | 2.48%(e) | 0.93% | 61% |
| (5.54%) | 7,929 | 1.38%(e) | 1.79%(e) | 0.23% | 36% |
| (38.20%) | 9,609 | 1.33%(e) | 1.78%(e) | 0.04% | 24% |
| 12.98%(f) | 18,476 | 1.32%(e) | 1.58%(e) | (0.28%) | 45% |
| 38.06%(f) | 10,888 | 1.32%(e) | 2.55%(e) | 0.28% | 56% |
| | | | | | |
| 4.21% | 670 | 2.00%(e) | 3.16%(e) | 0.28% | 61% |
| (6.12%) | 986 | 2.02%(e) | 2.49%(e) | (0.42%) | 36% |
| (38.62%) | 1,533 | 1.99%(e) | 2.51%(e) | (0.76%) | 24% |
| 12.23% | 3,782 | 1.99%(e) | 2.33%(e) | (0.86%) | 45% |
| 37.13% | 587 | 1.99%(e) | 3.37%(e) | (0.37%) | 56% |
| | | | | | |
| 4.58% | 2,133 | 1.64%(e) | 2.74%(e) | 0.69% | 61% |
| (5.81%) | 2,382 | 1.67%(e) | 2.08%(e) | (0.12%) | 36% |
| (38.37%) | 2,356 | 1.61%(e) | 2.06%(e) | (0.22%) | 24% |
| 12.63%(f) | 4,557 | 1.64%(e) | 1.90%(e) | (0.62%) | 45% |
| 37.63%(f) | 3,215 | 1.62%(e) | 2.85%(e) | (0.23%) | 56% |
| | | | | | |
| 5.17% | 345 | 1.09%(e) | 2.19%(e) | 1.24% | 61% |
| (5.27%) | 349 | 1.12%(e) | 1.53%(e) | 0.47% | 36% |
| (38.07%) | 349 | 1.10%(e) | 1.55%(e) | 0.15% | 24% |
| 13.21% | 959 | 1.08%(e) | 1.34%(e) | (0.10%) | 45% |
| 38.37% | 639 | 1.09%(e) | 2.32%(e) | 0.55% | 56% |
| | | | | | |
| 5.28% | 8,720 | 1.00%(e) | 2.14%(e) | 1.22% | 61% |
| (5.19%) | 12,440 | 1.03%(e) | 1.49%(e) | 0.56% | 36% |
| (37.99%) | 16,915 | 0.99%(e) | 1.51%(e) | 0.19% | 24% |
| 13.33% | 60,300 | 0.99%(e) | 1.33%(e) | 0.32% | 45% |
| 38.55% | 4,919 | 0.99%(e) | 2.34%(e) | 0.20% | 56% |
Financial Highlights (continued)
Selected Data for Each Share of Capital Outstanding Throughout the Periods Indicated
abrdn Dynamic Dividend Fund
| | | Investment Activities | Distributions |
| | Net
Asset
Value,
Beginning
of Period | Net
Investment
Income
(Loss)
(a) | Net
Realized
and
Unrealized
Gains
(Losses) on
Investments | Total
from
Investment
Activities | Net
Investment
Income | Net
Realized
Gains | Tax
Return
of
Capital | Total
Distributions |
| Class A Shares | | | | | | | | |
| Year Ended October 31, 2024 | $3.77 | $0.20 | $0.62 | $ 0.82 | $ (0.20) | $ – | $ (0.03) | $ (0.23) |
| Year Ended October 31, 2023 | 3.75 | 0.21 | 0.04 | 0.25 | (0.23) | – | –(f) | (0.23) |
| Year Ended October 31, 2022 | 4.74 | 0.20(g) | (0.95) | (0.75) | (0.22) | (0.01) | (0.01) | (0.24) |
| Year Ended October 31, 2021 | 3.68 | 0.23 | 1.06 | 1.29 | (0.23) | – | – | (0.23) |
| Year Ended October 31, 2020 | 3.99 | 0.20 | (0.28) | (0.08) | (0.23) | – | – | (0.23) |
| Institutional Class Shares | | | | | | | | |
| Year Ended October 31, 2024 | 3.77 | 0.21 | 0.62 | 0.83 | (0.21) | – | (0.03) | (0.24) |
| Year Ended October 31, 2023 | 3.75 | 0.22 | 0.04 | 0.26 | (0.24) | – | –(f) | (0.24) |
| Year Ended October 31, 2022 | 4.74 | 0.21(g) | (0.95) | (0.74) | (0.23) | (0.01) | (0.01) | (0.25) |
| Year Ended October 31, 2021 | 3.69 | 0.24 | 1.05 | 1.29 | (0.24) | – | – | (0.24) |
| Year Ended October 31, 2020 | 4.00 | 0.21 | (0.28) | (0.07) | (0.24) | – | – | (0.24) |
| (a) | Net investment income/(loss) is based on average shares outstanding during the period. |
| (b) | Excludes sales charge. |
| (c) | During the period, certain fees were waived and/or reimbursed. If such waivers/reimbursements had not occurred, the ratios would have been as indicated. |
| (d) | Portfolio turnover is calculated on the basis of the Fund as a whole without distinguishing among the classes of shares. |
| (e) | Includes interest expense that amounts to less than 0.01%. |
| (f) | Less than $0.005 per share. |
| (g) | Included within Net Investment Income per share, Total Return, and Ratio of Net Investment Income to Average Net Assets reflects the effects of a liability accrued on
February 28, 2022 relating to withholding tax refunds that the Fund previously received and recorded which are being contested by the local tax authority. The accrued
liability resulted in a decrease in net assets of approximately 0.87% as of October 31, 2022. (See Note 2i of the Notes to Financial Statements). If such amounts were
excluded, the Net Investment Income per share, Total Return, and Ratio of Net Investment Loss to Average Net Assets for Class A Shares would have been $0.24,
(15.67%), and 5.49%, respectively. For Institutional Class Shares, these amounts would have been $0.24, (15.45%), and 5.67%, respectively. |
| (h) | The total return shown above includes the impact of financial statement rounding of the NAV per share and/or financial statement adjustments. |
Amounts listed as “–” are $0 or round to $0.
See accompanying Notes to Financial Statements.
Financial Highlights (continued)
Selected Data for Each Share of Capital Outstanding Throughout the Periods Indicated
abrdn Dynamic Dividend Fund (concluded)
| | | Ratios/Supplemental Data |
Net
Asset
Value,
End of
Period | Total
Return
(b) | Net Assets
at End
of Period
(000's) | Ratio of Expenses
(Net of
Reimbursements/
Waivers)
to Average
Net Assets | Ratio of Expenses
(Prior to
Reimbursements) to
Average Net Assets(c) | Ratio of Net
Investment Income
(Loss) to
Average Net Assets | Portfolio
Turnover
(d) |
| | | | | | | |
| $ 4.36 | 22.03% | $ 3,832 | 1.50%(e) | 1.69%(e) | 4.61% | 75% |
| 3.77 | 6.41% | 3,619 | 1.56%(e) | 1.69%(e) | 5.16% | 63% |
| 3.75 | (16.34%)(g) | 4,094 | 1.50% | 1.61% | 4.62%(g) | 79% |
| 4.74 | 35.40% | 4,986 | 1.50% | 1.66% | 5.03% | 59% |
| 3.68 | (2.04%)(h) | 3,885 | 1.50% | 1.60% | 5.20% | 85% |
| | | | | | | |
| 4.36 | 22.33% | 93,666 | 1.25%(e) | 1.43%(e) | 4.84% | 75% |
| 3.77 | 6.67% | 87,929 | 1.31%(e) | 1.42%(e) | 5.42% | 63% |
| 3.75 | (16.12%)(g) | 96,362 | 1.25% | 1.34% | 4.81%(g) | 79% |
| 4.74 | 35.36% | 123,166 | 1.25% | 1.39% | 5.26% | 59% |
| 3.69 | (1.77%) | 100,350 | 1.25% | 1.35% | 5.37% | 85% |
Financial Highlights (continued)
Selected Data for Each Share of Capital Outstanding Throughout the Periods Indicated
abrdn EM SMA Completion Fund
| | | Investment Activities | Distributions | | |
| | Net
Asset
Value,
Beginning
of Period | Net
Investment
Income
(Loss)
(a) | Net
Realized
and
Unrealized
Gains
(Losses) on
Investments | Total
from
Investment
Activities | Net
Investment
Income | Total
Distributions | Net
Asset
Value,
End of
Period | Total
Return
(b)(c) |
| Institutional Class Shares | | | | | | | | |
| Year Ended October 31, 2024 | $8.12 | $0.25 | $0.34 | $ 0.59 | $ (0.10) | $ (0.10) | $ 8.61 | 7.19% |
| Period Ended October 31, 2023(h) | 10.00 | 0.24 | (2.12) | (1.88) | – | – | 8.12 | (18.80%) |
| (a) | Net investment income/(loss) is based on average shares outstanding during the period. |
| (b) | Excludes sales charge. |
| (c) | Not Annualized for periods less than one year. |
| (d) | Annualized for periods less than one year. |
| (e) | During the period, certain fees were waived and/or reimbursed. If such waivers/reimbursements had not occurred, the ratios would have been as indicated. |
| (f) | Portfolio turnover is calculated on the basis of the Fund as a whole without distinguishing among the classes of shares. |
| (g) | Amounts listed as “–” are 0% or round to 0% |
| (h) | For the period from January 27, 2023 (commencement of operations) through October 31, 2023. |
Amounts listed as “–” are $0 or round to $0.
See accompanying Notes to Financial Statements.
Financial Highlights (continued)
Selected Data for Each Share of Capital Outstanding Throughout the Periods Indicated
abrdn EM SMA Completion Fund (concluded)
| Ratios/Supplemental Data |
Net Assets
at End
of Period
(000's) | Ratio of Expenses
(Net of
Reimbursements/
Waivers)
to Average
Net Assets
(d) | Ratio of Expenses
(Prior to
Reimbursements) to
Average Net Assets(d)(e) | Ratio of Net
Investment Income
(Loss) to
Average Net Assets
(d) | Portfolio
Turnover
(f) |
| | | | | |
| $ 341 | –(g) | 25.44% | 2.85% | 47% |
| 268 | –(g) | 27.99% | 3.52% | 30% |
| | | | | |
Financial Highlights (continued)
Selected Data for Each Share of Capital Outstanding Throughout the Periods Indicated
abrdn Emerging Markets Dividend Fund
| | | Investment Activities | Distributions | | |
| | Net
Asset
Value,
Beginning
of Period | Net
Investment
Income
(Loss)
(a) | Net
Realized
and
Unrealized
Gains
(Losses) on
Investments | Total
from
Investment
Activities | Net
Investment
Income | Total
Distributions | Net
Asset
Value,
End of
Period | Total
Return |
| Institutional Class Shares* | | | | | | | | |
| Year Ended October 31, 2024 | $23.02 | $0.56 | $6.35 | $ 6.91 | $ – | $ – | $ 29.93 | 30.02% |
| Year Ended October 31, 2023 | 22.88 | 0.17 | 1.84 | 2.01 | (1.87) | (1.87) | 23.02 | 8.61% |
| Year Ended October 31, 2022 | 35.96 | 0.42(f) | (13.50) | (13.08) | – | – | 22.88 | (36.37%)(f)(g) |
| Year Ended October 31, 2021 | 26.98 | (0.04) | 9.32 | 9.28 | (0.30) | (0.30) | 35.96 | 34.56% |
| Year Ended October 31, 2020 | 27.74 | 0.24 | 0.30 | 0.54 | (1.30) | (1.30) | 26.98 | 1.86%(h) |
| * | On October 18, 2024, all issued and outstanding Class A shares of the abrdn Emerging Markets Dividend Fund were converted to Institutional Class shares. |
| (a) | Net investment income/(loss) is based on average shares outstanding during the period. |
| (b) | Beginning with the year ended October 31, 2022, income taxes on recovered refunds were included in foreign tax withholding on the Statement of Operations and, as such, are not included within the ratios of expenses to average net assets. Income taxes on recovered refunds for years prior to October 31, 2022 were reflected as expenses on the Statement of Operations and included within the ratios of expenses to average net assets. |
| (c) | Includes interest expense that amounts to less than 0.01%. |
| (d) | During the period, certain fees were waived and/or reimbursed. If such waivers/reimbursements had not occurred, the ratios would have been as indicated. |
| (e) | Portfolio turnover is calculated on the basis of the Fund as a whole without distinguishing among the classes of shares. |
| (f) | Included within Net Investment Income per share, Total Return, and Ratio of Net Investment Income to Average Net Assets are the effects of withholding tax refunds and income taxes on recovered refunds (See Note 2i of the Notes to Financial Statements). If such amounts were excluded, the Net Investment Income per share, Total Return, and Ratio of Net Investment Loss to Average Net Assets for the Institutional Class shares, these amounts would have been $0.08, (37.18%), and 0.29%, respectively. |
| (g) | The total return shown above includes the impact of financial statement rounding of the NAV per share and/or financial statement adjustments. |
| (h) | Included within Total Return is the effect of withholding tax refunds and income taxes on recovered refunds (See Note 2i of the Notes to Financial Statements). If such amounts were excluded, the Total Return for Institutional Class shares, this amount would have been (0.11%). |
| (i) | As the result of a name and strategy change effective February 29, 2024, portfolio turnover is higher than historical levels. |
Amounts listed as “–” are $0 or round to $0.
See accompanying Notes to Financial Statements.
Financial Highlights (continued)
Selected Data for Each Share of Capital Outstanding Throughout the Periods Indicated
abrdn Emerging Markets Dividend Fund (concluded)
| Ratios/Supplemental Data |
Net Assets
at End
of Period
(000's) | Ratio of Expenses
(Net of
Reimbursements/
Waivers Excluding
Accruals for Estimated
Tax Due on Foreign Tax
Refund Recoveries)
to Average
Net Assets
(b) | Ratio of Expenses
(Net of
Reimbursements/
Waivers)
to Average
Net Assets
(b)(c) | Ratio of Expenses
(Prior to
Reimbursements) to
Average Net Assets(b)(c)(d) | Ratio of Net
Investment Income
(Loss) to
Average Net Assets | Portfolio
Turnover
(e) |
| | | | | | |
| | | | | | |
| $ 78,416 | 1.01% | 1.01% | 1.70% | 1.98% | 122%(i) |
| 7,653 | 1.04% | 1.04% | 1.34% | 0.67% | 23% |
| 13,946 | 0.93% | 0.93% | 1.27% | 1.50%(f) | 38% |
| 25,253 | 1.13% | 1.13% | 1.31% | (0.11%) | 114% |
| 20,047 | 1.13% | 1.13% | 1.33% | 0.90% | 34% |
| | | | | | |
Financial Highlights (continued)
Selected Data for Each Share of Capital Outstanding Throughout the Periods Indicated
abrdn Emerging Markets ex-China Fund
| | | Investment Activities | Distributions | |
| | Net
Asset
Value,
Beginning
of Period | Net
Investment
Income
(Loss)
(a) | Net
Realized
and
Unrealized
Gains
(Losses) on
Investments | Total
from
Investment
Activities | Net
Investment
Income | Net
Realized
Gains | Total
Distributions | Net
Asset
Value,
End of
Period |
| Class A Shares | | | | | | | | |
| Year Ended October 31, 2024 | $10.28 | $0.09 | $1.99 | $ 2.08 | $ (0.06) | $ – | $ (0.06) | $ 12.30 |
| Year Ended October 31, 2023 | 12.38 | 0.12 | 0.70 | 0.82 | (0.11) | (2.81) | (2.92) | 10.28 |
| Year Ended October 31, 2022 | 18.17 | 0.08 | (3.93) | (3.85) | – | (1.94) | (1.94) | 12.38 |
| Year Ended October 31, 2021 | 13.21 | (0.06) | 5.02 | 4.96 | – | – | – | 18.17 |
| Year Ended October 31, 2020 | 12.87 | (0.01) | 0.77 | 0.76 | (0.08) | (0.34) | (0.42) | 13.21 |
| Class C Shares | | | | | | | | |
| Year Ended October 31, 2024 | 9.07 | 0.01 | 1.76 | 1.77 | – | – | – | 10.84 |
| Year Ended October 31, 2023 | 11.24 | 0.05 | 0.62 | 0.67 | (0.03) | (2.81) | (2.84) | 9.07 |
| Year Ended October 31, 2022 | 16.77 | (0.02) | (3.57) | (3.59) | – | (1.94) | (1.94) | 11.24 |
| Year Ended October 31, 2021 | 12.27 | (0.15) | 4.65 | 4.50 | – | – | – | 16.77 |
| Year Ended October 31, 2020 | 11.98 | (0.08) | 0.71 | 0.63 | – | (0.34) | (0.34) | 12.27 |
| Class R Shares | | | | | | | | |
| Year Ended October 31, 2024 | 9.47 | 0.03 | 1.85 | 1.88 | (0.03) | – | (0.03) | 11.32 |
| Year Ended October 31, 2023 | 11.59 | 0.08 | 0.65 | 0.73 | (0.04) | (2.81) | (2.85) | 9.47 |
| Year Ended October 31, 2022 | 17.19 | 0.02 | (3.68) | (3.66) | – | (1.94) | (1.94) | 11.59 |
| Year Ended October 31, 2021 | 12.54 | (0.11) | 4.76 | 4.65 | – | – | – | 17.19 |
| Year Ended October 31, 2020 | 12.21 | (0.05) | 0.73 | 0.68 | (0.01) | (0.34) | (0.35) | 12.54 |
| Institutional Service Class Shares | | | | | | | | |
| Year Ended October 31, 2024 | 10.56 | 0.08 | 2.08 | 2.16 | (0.09) | – | (0.09) | 12.63 |
| Year Ended October 31, 2023 | 12.66 | 0.14 | 0.72 | 0.86 | (0.15) | (2.81) | (2.96) | 10.56 |
| Year Ended October 31, 2022 | 18.49 | 0.11 | (4.00) | (3.89) | – | (1.94) | (1.94) | 12.66 |
| Year Ended October 31, 2021 | 13.41 | (0.02) | 5.10 | 5.08 | – | – | – | 18.49 |
| Year Ended October 31, 2020 | 13.05 | 0.02 | 0.80 | 0.82 | (0.12) | (0.34) | (0.46) | 13.41 |
| Institutional Class Shares | | | | | | | | |
| Year Ended October 31, 2024 | 10.40 | 0.13 | 2.01 | 2.14 | (0.09) | – | (0.09) | 12.45 |
| Year Ended October 31, 2023 | 12.50 | 0.16 | 0.72 | 0.88 | (0.17) | (2.81) | (2.98) | 10.40 |
| Year Ended October 31, 2022 | 18.27 | 0.08 | (3.91) | (3.83) | – | (1.94) | (1.94) | 12.50 |
| Year Ended October 31, 2021 | 13.24 | –(g) | 5.03 | 5.03 | – | – | – | 18.27 |
| Year Ended October 31, 2020 | 12.88 | 0.03 | 0.79 | 0.82 | (0.12) | (0.34) | (0.46) | 13.24 |
| (a) | Net investment income/(loss) is based on average shares outstanding during the period. |
| (b) | Excludes sales charge. |
| (c) | During the period, certain fees were waived and/or reimbursed. If such waivers/reimbursements had not occurred, the ratios would have been as indicated. |
| (d) | Portfolio turnover is calculated on the basis of the Fund as a whole without distinguishing among the classes of shares. |
| (e) | Includes interest expense that amounts to less than 0.01%. |
| (f) | The total return shown above includes the impact of financial statement rounding of the NAV per share and/or financial statement adjustments. |
| (g) | Less than $0.005 per share. |
Amounts listed as “–” are $0 or round to $0.
See accompanying Notes to Financial Statements.
Financial Highlights (continued)
Selected Data for Each Share of Capital Outstanding Throughout the Periods Indicated
abrdn Emerging Markets ex-China Fund (concluded)
| | Ratios/Supplemental Data |
Total
Return
(b) | Net Assets
at End
of Period
(000's) | Ratio of Expenses
(Net of
Reimbursements/
Waivers)
to Average
Net Assets | Ratio of Expenses
(Prior to
Reimbursements) to
Average Net Assets(c) | Ratio of Net
Investment Income
(Loss) to
Average Net Assets | Portfolio
Turnover
(d) |
| | | | | | |
| 20.25% | $ 32,614 | 1.38%(e) | 1.77%(e) | 0.70% | 35% |
| 7.41% | 20,114 | 1.46%(e) | 2.36%(e) | 1.12% | 36% |
| (23.84%) | 19,947 | 1.48%(e) | 2.17%(e) | 0.55% | 129% |
| 37.55% | 27,814 | 1.53% | 2.17% | (0.35%) | 22% |
| 5.93%(f) | 22,455 | 1.53%(e) | 2.17%(e) | (0.06%) | 29% |
| | | | | | |
| 19.51% | 351 | 2.01%(e) | 2.52%(e) | 0.12% | 35% |
| 6.64% | 154 | 2.11%(e) | 3.17%(e) | 0.48% | 36% |
| (24.32%) | 135 | 2.14%(e) | 3.05%(e) | (0.12%) | 129% |
| 36.67% | 195 | 2.19% | 3.03% | (1.01%) | 22% |
| 5.24% | 205 | 2.19%(e) | 3.04%(e) | (0.68%) | 29% |
| | | | | | |
| 19.83% | 2,484 | 1.64%(e) | 2.04%(e) | 0.23% | 35% |
| 7.07% | 519 | 1.80%(e) | 2.70%(e) | 0.74% | 36% |
| (24.12%) | 588 | 1.88%(e) | 2.57%(e) | 0.13% | 129% |
| 37.08% | 903 | 1.87% | 2.51% | (0.69%) | 22% |
| 5.58% | 898 | 1.91%(e) | 2.55%(e) | (0.42%) | 29% |
| | | | | | |
| 20.54% | 48,158 | 1.05%(e) | 1.47%(e) | 0.60% | 35% |
| 7.63% | 58 | 1.20%(e) | 2.10%(e) | 1.17% | 36% |
| (23.62%) | 236 | 1.23%(e) | 1.92%(e) | 0.78% | 129% |
| 37.88% | 343 | 1.29% | 1.93% | (0.12%) | 22% |
| 6.25% | 250 | 1.29%(e) | 1.93%(e) | 0.18% | 29% |
| | | | | | |
| 20.63% | 78,206 | 1.01%(e) | 1.50%(e) | 1.07% | 35% |
| 7.86% | 20,168 | 1.11%(e) | 2.13%(e) | 1.44% | 36% |
| (23.57%) | 3,740 | 1.13%(e) | 1.88%(e) | 0.61% | 129% |
| 37.99% | 1,583 | 1.19% | 1.88% | (0.02%) | 22% |
| 6.39% | 1,409 | 1.19%(e) | 1.88%(e) | 0.27% | 29% |
Financial Highlights (continued)
Selected Data for Each Share of Capital Outstanding Throughout the Periods Indicated
abrdn Emerging Markets Fund
| | | Investment Activities | Distributions | |
| | Net
Asset
Value,
Beginning
of Period | Net
Investment
Income
(Loss)
(a) | Net
Realized
and
Unrealized
Gains
(Losses) on
Investments | Total
from
Investment
Activities | Net
Investment
Income | Net
Realized
Gains | Total
Distributions | Net
Asset
Value,
End of
Period |
| Class A Shares | | | | | | | | |
| Year Ended October 31, 2024 | $11.91 | $0.19 | $2.03 | $ 2.22 | $ (0.12) | $ – | $ (0.12) | $ 14.01 |
| Year Ended October 31, 2023 | 11.29 | 0.13 | 0.66 | 0.79 | (0.17) | – | (0.17) | 11.91 |
| Year Ended October 31, 2022 | 20.15 | 0.06 | (6.98) | (6.92) | (0.02) | (1.92) | (1.94) | 11.29 |
| Year Ended October 31, 2021 | 16.79 | 0.04 | 3.46 | 3.50 | – | (0.14) | (0.14) | 20.15 |
| Year Ended October 31, 2020 | 15.30 | 0.01 | 1.71 | 1.72 | (0.22) | (0.01) | (0.23) | 16.79 |
| Class C Shares | | | | | | | | |
| Year Ended October 31, 2024 | 11.74 | 0.06 | 2.00 | 2.06 | –(g) | – | –(g) | 13.80 |
| Year Ended October 31, 2023 | 11.09 | 0.06 | 0.65 | 0.71 | (0.06) | – | (0.06) | 11.74 |
| Year Ended October 31, 2022 | 19.90 | (0.01) | (6.88) | (6.89) | – | (1.92) | (1.92) | 11.09 |
| Year Ended October 31, 2021 | 16.68 | (0.08) | 3.44 | 3.36 | – | (0.14) | (0.14) | 19.90 |
| Year Ended October 31, 2020 | 15.18 | (0.06) | 1.69 | 1.63 | (0.12) | (0.01) | (0.13) | 16.68 |
| Class R Shares | | | | | | | | |
| Year Ended October 31, 2024 | 11.72 | 0.10 | 1.99 | 2.09 | (0.12) | – | (0.12) | 13.69 |
| Year Ended October 31, 2023 | 11.11 | 0.11 | 0.66 | 0.77 | (0.16) | – | (0.16) | 11.72 |
| Year Ended October 31, 2022 | 19.89 | 0.04 | (6.90) | (6.86) | –(g) | (1.92) | (1.92) | 11.11 |
| Year Ended October 31, 2021 | 16.60 | 0.01 | 3.42 | 3.43 | – | (0.14) | (0.14) | 19.89 |
| Year Ended October 31, 2020 | 15.14 | –(g) | 1.68 | 1.68 | (0.21) | (0.01) | (0.22) | 16.60 |
| Institutional Service Class Shares | | | | | | | | |
| Year Ended October 31, 2024 | 11.95 | 0.17 | 2.03 | 2.20 | (0.18) | – | (0.18) | 13.97 |
| Year Ended October 31, 2023 | 11.34 | 0.18 | 0.66 | 0.84 | (0.23) | – | (0.23) | 11.95 |
| Year Ended October 31, 2022 | 20.26 | 0.11 | (7.01) | (6.90) | (0.10) | (1.92) | (2.02) | 11.34 |
| Year Ended October 31, 2021 | 16.85 | 0.12 | 3.46 | 3.58 | (0.03) | (0.14) | (0.17) | 20.26 |
| Year Ended October 31, 2020 | 15.37 | 0.07 | 1.70 | 1.77 | (0.28) | (0.01) | (0.29) | 16.85 |
| Institutional Class Shares | | | | | | | | |
| Year Ended October 31, 2024 | 12.03 | 0.19 | 2.05 | 2.24 | (0.19) | – | (0.19) | 14.08 |
| Year Ended October 31, 2023 | 11.40 | 0.20 | 0.66 | 0.86 | (0.23) | – | (0.23) | 12.03 |
| Year Ended October 31, 2022 | 20.34 | 0.14 | (7.05) | (6.91) | (0.11) | (1.92) | (2.03) | 11.40 |
| Year Ended October 31, 2021 | 16.90 | 0.14 | 3.48 | 3.62 | (0.04) | (0.14) | (0.18) | 20.34 |
| Year Ended October 31, 2020 | 15.39 | 0.09 | 1.72 | 1.81 | (0.29) | (0.01) | (0.30) | 16.90 |
| (a) | Net investment income/(loss) is based on average shares outstanding during the period. |
| (b) | Excludes sales charge. |
| (c) | During the period, certain fees were waived and/or reimbursed. If such waivers/reimbursements had not occurred, the ratios would have been as indicated. |
| (d) | Portfolio turnover is calculated on the basis of the Fund as a whole without distinguishing among the classes of shares. |
| (e) | Includes interest expense that amounts to less than 0.01%. |
| (f) | The total return shown above includes the impact of financial statement rounding of the NAV per share and/or financial statement adjustments. |
| (g) | Less than $0.005 per share. |
Amounts listed as “–” are $0 or round to $0.
See accompanying Notes to Financial Statements.
Financial Highlights (continued)
Selected Data for Each Share of Capital Outstanding Throughout the Periods Indicated
abrdn Emerging Markets Fund (concluded)
| | Ratios/Supplemental Data |
Total
Return
(b) | Net Assets
at End
of Period
(000's) | Ratio of Expenses
(Net of
Reimbursements/
Waivers)
to Average
Net Assets | Ratio of Expenses
(Prior to
Reimbursements) to
Average Net Assets(c) | Ratio of Net
Investment Income
(Loss) to
Average Net Assets | Portfolio
Turnover
(d) |
| | | | | | |
| 18.70% | $ 36,921 | 1.09%(e) | 1.12%(e) | 1.43% | 33% |
| 6.93%(f) | 42,710 | 1.60%(e) | 1.60%(e) | 1.04% | 30% |
| (37.56%)(f) | 63,232 | 1.60%(e) | 1.63%(e) | 0.39% | 37% |
| 20.87% | 116,268 | 1.56%(e) | 1.56%(e) | 0.20% | 37% |
| 11.31% | 107,572 | 1.59%(e) | 1.59%(e) | 0.09% | 26% |
| | | | | | |
| 17.57% | 1,682 | 2.10%(e) | 2.24%(e) | 0.42% | 33% |
| 6.36% | 2,081 | 2.10%(e) | 2.20%(e) | 0.50% | 30% |
| (37.87%) | 4,162 | 2.10%(e) | 2.21%(e) | (0.09%) | 37% |
| 20.16% | 10,662 | 2.10%(e) | 2.13%(e) | (0.38%) | 37% |
| 10.74% | 11,786 | 2.10%(e) | 2.19%(e) | (0.40%) | 26% |
| | | | | | |
| 17.89% | 101,750 | 1.74%(e) | 1.77%(e) | 0.79% | 33% |
| 6.87% | 94,625 | 1.75%(e) | 1.75%(e) | 0.88% | 30% |
| (37.71%) | 92,428 | 1.75%(e) | 1.78%(e) | 0.26% | 37% |
| 20.68% | 133,696 | 1.72%(e) | 1.72%(e) | 0.04% | 37% |
| 11.13% | 113,707 | 1.73%(e) | 1.73%(e) | 0.01% | 26% |
| | | | | | |
| 18.56% | 451,337 | 1.25%(e) | 1.28%(e) | 1.27% | 33% |
| 7.30% | 477,809 | 1.25%(e) | 1.25%(e) | 1.37% | 30% |
| (37.37%) | 494,873 | 1.25%(e) | 1.28%(e) | 0.79% | 37% |
| 21.29% | 476,046 | 1.21%(e) | 1.21%(e) | 0.56% | 37% |
| 11.64%(f) | 362,229 | 1.24%(e) | 1.24%(e) | 0.50% | 26% |
| | | | | | |
| 18.74% | 649,098 | 1.10%(e) | 1.22%(e) | 1.43% | 33% |
| 7.44% | 1,159,535 | 1.10%(e) | 1.19%(e) | 1.52% | 30% |
| (37.26%) | 1,606,819 | 1.10%(e) | 1.22%(e) | 0.90% | 37% |
| 21.45% | 4,184,781 | 1.10%(e) | 1.14%(e) | 0.69% | 37% |
| 11.86% | 3,414,059 | 1.10%(e) | 1.18%(e) | 0.59% | 26% |
Financial Highlights (continued)
Selected Data for Each Share of Capital Outstanding Throughout the Periods Indicated
abrdn Focused U.S. Small Cap Equity Fund
| | | Investment Activities | Distributions | |
| | Net
Asset
Value,
Beginning
of Period | Net
Investment
Income
(Loss)
(a) | Net
Realized
and
Unrealized
Gains
(Losses) on
Investments | Total
from
Investment
Activities | Net
Investment
Income | Net
Realized
Gains | Total
Distributions | Net
Asset
Value,
End of
Period |
| Institutional Class Shares* | | | | | | | | |
| Year Ended October 31, 2024 | $6.30 | $(0.01) | $2.29 | $ 2.28 | $ – | $ – | $ – | $ 8.58 |
| Year Ended October 31, 2023 | 6.97 | 0.01 | (0.68) | (0.67) | – | – | – | 6.30 |
| Year Ended October 31, 2022 | 12.21 | (0.02) | (2.31) | (2.33) | – | (2.91) | (2.91) | 6.97 |
| Year Ended October 31, 2021 | 8.78 | (0.01) | 4.45 | 4.44 | – | (1.01) | (1.01) | 12.21 |
| Year Ended October 31, 2020 | 8.20 | 0.01 | 1.04 | 1.05 | (0.01) | (0.46) | (0.47) | 8.78 |
| * | On October 18, 2024, all issued and outstanding Class A, Class R and Institutional Service Class shares of the abrdn Focused U.S. Small Cap Fund were converted to Institutional Class shares. |
| (a) | Net investment income/(loss) is based on average shares outstanding during the period. |
| (b) | Excludes sales charge. |
| (c) | During the period, certain fees were waived and/or reimbursed. If such waivers/reimbursements had not occurred, the ratios would have been as indicated. |
| (d) | Portfolio turnover is calculated on the basis of the Fund as a whole without distinguishing among the classes of shares. |
| (e) | Includes interest expense that amounts to less than 0.01%. |
| (f) | Includes interest expense that amounts to less than 0.01% for the Institutional Class for the years ended October 31, 2021 and October 31, 2020. |
| (g) | As the result of a name and strategy change effective February 29, 2024, portfolio turnover is higher than historical levels. |
Amounts listed as “–” are $0 or round to $0.
See accompanying Notes to Financial Statements.
Financial Highlights (continued)
Selected Data for Each Share of Capital Outstanding Throughout the Periods Indicated
abrdn Focused U.S. Small Cap Equity Fund (concluded)
| | Ratios/Supplemental Data |
Total
Return
(b) | Net Assets
at End
of Period
(000's) | Ratio of Expenses
(Net of
Reimbursements/
Waivers)
to Average
Net Assets | Ratio of Expenses
(Prior to
Reimbursements) to
Average Net Assets(c) | Ratio of Net
Investment Income
(Loss) to
Average Net Assets | Portfolio
Turnover
(d) |
| | | | | | |
| | | | | | |
| | | | | | |
| | | | | | |
| | | | | | |
| 36.19% | $ 12,405 | 0.90%(e) | 2.36%(e) | (0.13%) | 110%(g) |
| (9.61%) | 2,934 | 0.90%(e) | 2.13%(e) | 0.11% | 17% |
| (25.17%) | 5,182 | 0.90% | 2.15% | (0.25%) | 56% |
| 53.85% | 5,531 | 0.90%(f) | 2.24%(f) | (0.12%) | 157% |
| 13.14% | 3,451 | 0.90%(f) | 1.94%(f) | 0.17% | 46% |
Financial Highlights (continued)
Selected Data for Each Share of Capital Outstanding Throughout the Periods Indicated
abrdn Global Equity Impact Fund
| | | Investment Activities | Distributions | |
| | Net
Asset
Value,
Beginning
of Period | Net
Investment
Income
(Loss)
(a) | Net
Realized
and
Unrealized
Gains
(Losses) on
Investments | Total
from
Investment
Activities | Net
Investment
Income | Total
Distributions | Net
Asset
Value,
End of
Period |
| Class A Shares | | | | | | | |
| Year Ended October 31, 2024 | $12.61 | $0.03 | $2.54 | $ 2.57 | $ (0.14) | $ (0.14) | $ 15.04 |
| Year Ended October 31, 2023 | 13.07 | 0.07 | 0.13 | 0.20 | (0.66) | (0.66) | 12.61 |
| Year Ended October 31, 2022 | 18.45 | 0.39(f) | (5.77) | (5.38) | –(g) | –(g) | 13.07 |
| Year Ended October 31, 2021 | 13.14 | – | 5.37 | 5.37 | (0.06) | (0.06) | 18.45 |
| Year Ended October 31, 2020 | 11.59 | 0.05 | 1.77 | 1.82 | (0.27) | (0.27) | 13.14 |
| Institutional Class Shares | | | | | | | |
| Year Ended October 31, 2024 | 12.65 | 0.07 | 2.55 | 2.62 | (0.19) | (0.19) | 15.08 |
| Year Ended October 31, 2023 | 13.12 | 0.11 | 0.13 | 0.24 | (0.71) | (0.71) | 12.65 |
| Year Ended October 31, 2022 | 18.49 | 0.41(f) | (5.77) | (5.36) | (0.01) | (0.01) | 13.12 |
| Year Ended October 31, 2021 | 13.18 | 0.04 | 5.37 | 5.41 | (0.10) | (0.10) | 18.49 |
| Year Ended October 31, 2020 | 11.62 | 0.08 | 1.79 | 1.87 | (0.31) | (0.31) | 13.18 |
| (a) | Net investment income/(loss) is based on average shares outstanding during the period. |
| (b) | Beginning with the year ended October 31, 2022, income taxes on recovered refunds were included in foreign tax withholding on the Statement of Operations and, as such, are not included within the ratios of expenses to average net assets. Income taxes on recovered refunds for years prior to October 31, 2022 were reflected as expenses on the Statement of Operations and included within the ratios of expenses to average net assets. |
| (c) | During the period, certain fees were waived and/or reimbursed. If such waivers/reimbursements had not occurred, the ratios would have been as indicated. |
| (d) | Portfolio turnover is calculated on the basis of the Fund as a whole without distinguishing among the classes of shares. |
| (e) | Includes interest expense that amounts to less than 0.01%. |
| (f) | Included within Net Investment Income per share, Total Return, and Ratio of Net Investment Income to Average Net Assets are the effects of withholding tax refunds and income taxes on recovered refunds (See Note 2i of the Notes to Financial Statements). If such amounts were excluded, the Net Investment Income per share, Total Return, and Ratio of Net Investment Loss to Average Net Assets for Class A shares would have been $0.07, (30.98%) and 0.47%, respectively. For Institutional Class shares, these amounts would have been $0.07, (30.83%) and 0.49%, respectively. |
| (g) | Less than $0.005 per share. |
| (h) | The total return shown above includes the impact of financial statement rounding of the NAV per share and/or financial statement adjustments. |
| (i) | Included within Total Return is the effect of withholding tax refunds and income taxes on recovered refunds (See Note 2i of the Notes to Financial Statements). If such amounts were excluded, the Total Return for Class A Shares would have been 15.82%. For Institutional Class Shares, this amount would have been 16.12%. |
Amounts listed as “–” are $0 or round to $0.
See accompanying Notes to Financial Statements.
Financial Highlights (continued)
Selected Data for Each Share of Capital Outstanding Throughout the Periods Indicated
abrdn Global Equity Impact Fund (concluded)
| | Ratios/Supplemental Data |
Total
Return | Net Assets
at End
of Period
(000's) | Ratio of Expenses
(Net of
Reimbursements/
Waivers Excluding
Accruals for Estimated
Tax Due on Foreign Tax
Refund Recoveries)
to Average
Net Assets
(b) | Ratio of Expenses
(Net of
Reimbursements/
Waivers)
to Average
Net Assets
(b)(c) | Ratio of Expenses
(Prior to
Reimbursements) to
Average Net Assets(b)(c) | Ratio of Net
Investment Income
(Loss) to
Average Net Assets | Portfolio
Turnover
(d) |
| | | | | | | |
| 20.48% | $ 24,124 | 1.29% | 1.29%(e) | 1.79%(e) | 0.23% | 49% |
| 1.13% | 25,480 | 1.40% | 1.40% | 1.81% | 0.53% | 31% |
| (29.14%)(f)(h) | 26,986 | 1.17% | 1.17% | 1.72% | 2.59%(f) | 37% |
| 40.95% | 43,059 | 1.38% | 1.38% | 1.73% | 0.02% | 17% |
| 15.93%(i) | 32,180 | 1.41% | 1.41% | 1.92% | 0.40% | 32% |
| | | | | | | |
| 20.79% | 18,849 | 1.04% | 1.04%(e) | 1.51%(e) | 0.47% | 49% |
| 1.39% | 17,299 | 1.14% | 1.14% | 1.55% | 0.77% | 31% |
| (28.99%)(f)(h) | 19,384 | 0.92% | 0.92% | 1.44% | 2.71%(f) | 37% |
| 41.23% | 32,312 | 1.13% | 1.13% | 1.45% | 0.24% | 17% |
| 16.30%(i) | 27,839 | 1.16% | 1.16% | 1.61% | 0.65% | 32% |
Financial Highlights (continued)
Selected Data for Each Share of Capital Outstanding Throughout the Periods Indicated
abrdn Global Infrastructure Fund
| | | Investment Activities | Distributions | |
| | Net
Asset
Value,
Beginning
of Period | Net
Investment
Income
(Loss)
(a) | Net
Realized
and
Unrealized
Gains
(Losses) on
Investments | Total
from
Investment
Activities | Net
Investment
Income | Net
Realized
Gains | Tax
Return
of
Capital | Total
Distributions | Net
Asset
Value,
End of
Period |
| Class A Shares | | | | | | | | | |
| Year Ended October 31, 2024 | $19.81 | $0.36 | $4.44 | $ 4.80 | $ (0.54) | $ (0.21) | $ – | $ (0.75) | $ 23.86 |
| Year Ended October 31, 2023 | 20.62 | 0.53 | (0.36) | 0.17 | (0.59) | (0.39) | – | (0.98) | 19.81 |
| Year Ended October 31, 2022 | 24.18 | 0.41 | (3.00) | (2.59) | (0.71) | (0.26) | – | (0.97) | 20.62 |
| Year Ended October 31, 2021 | 19.03 | 0.45 | 5.41 | 5.86 | (0.71) | – | – | (0.71) | 24.18 |
| Year Ended October 31, 2020 | 21.93 | 0.53 | (2.59) | (2.06) | (0.56) | (0.14) | (0.14) | (0.84) | 19.03 |
| Institutional Class Shares | | | | | | | | | |
| Year Ended October 31, 2024 | 19.86 | 0.41 | 4.45 | 4.86 | (0.59) | (0.21) | – | (0.80) | 23.92 |
| Year Ended October 31, 2023 | 20.66 | 0.59 | (0.36) | 0.23 | (0.64) | (0.39) | – | (1.03) | 19.86 |
| Year Ended October 31, 2022 | 24.22 | 0.47 | (3.01) | (2.54) | (0.76) | (0.26) | – | (1.02) | 20.66 |
| Year Ended October 31, 2021 | 19.05 | 0.52 | 5.41 | 5.93 | (0.76) | – | – | (0.76) | 24.22 |
| Year Ended October 31, 2020 | 21.97 | 0.58 | (2.60) | (2.02) | (0.62) | (0.14) | (0.14) | (0.90) | 19.05 |
| (a) | Net investment income is based on average shares outstanding during the period. |
| (b) | Excludes sales charge. |
| (c) | During the period, certain fees were waived and/or reimbursed. If such waivers/reimbursements had not occurred, the ratios would have been as indicated. |
| (d) | Portfolio turnover is calculated on the basis of the Fund as a whole without distinguishing among the classes of shares. |
| (e) | Includes interest expense that amounts to less than 0.01%. |
| (f) | The total return shown above includes the impact of financial statement rounding of the NAV per share and/or financial statement adjustments. |
Amounts listed as “–” are $0 or round to $0.
See accompanying Notes to Financial Statements.
Financial Highlights (continued)
Selected Data for Each Share of Capital Outstanding Throughout the Periods Indicated
abrdn Global Infrastructure Fund (concluded)
| | Ratios/Supplemental Data |
Total
Return
(b) | Net Assets
at End
of Period
(000's) | Ratio of Expenses
(Net of
Reimbursements/
Waivers)
to Average
Net Assets | Ratio of Expenses
(Prior to
Reimbursements) to
Average Net Assets(c) | Ratio of Net
Investment Income
(Loss) to
Average Net Assets | Portfolio
Turnover
(d) |
| | | | | | |
| 24.35% | $ 11,127 | 1.25%(e) | 1.62%(e) | 1.55% | 14% |
| 0.53% | 10,028 | 1.24%(e) | 1.58%(e) | 2.45% | 20% |
| (11.04%) | 11,350 | 1.24% | 1.58% | 1.81% | 23% |
| 31.09% | 13,227 | 1.24% | 1.63% | 1.95% | 31% |
| (9.49%) | 9,206 | 1.33% | 1.55% | 2.61% | 24% |
| | | | | | |
| 24.66%(f) | 31,627 | 1.00%(e) | 1.36%(e) | 1.79% | 14% |
| 0.80%(f) | 30,458 | 0.99%(e) | 1.33%(e) | 2.71% | 20% |
| (10.82%)(f) | 35,645 | 0.99% | 1.33% | 2.05% | 23% |
| 31.43% | 45,076 | 0.99% | 1.38% | 2.25% | 31% |
| (9.30%) | 32,640 | 1.08% | 1.27% | 2.90% | 24% |
Financial Highlights (continued)
Selected Data for Each Share of Capital Outstanding Throughout the Periods Indicated
abrdn International Small Cap Fund
| | | Investment Activities | Distributions | |
| | Net
Asset
Value,
Beginning
of Period | Net
Investment
Income
(Loss)
(a) | Net
Realized
and
Unrealized
Gains
(Losses) on
Investments | Total
from
Investment
Activities | Net
Investment
Income | Net
Realized
Gains | Total
Distributions | Net
Asset
Value,
End of
Period |
| Class A Shares | | | | | | | | |
| Year Ended October 31, 2024 | $23.46 | $0.13 | $7.10 | $ 7.23 | $ (0.17) | $ – | $ (0.17) | $ 30.52 |
| Year Ended October 31, 2023 | 23.78 | 0.13 | (0.05) | 0.08 | (0.40) | – | (0.40) | 23.46 |
| Year Ended October 31, 2022 | 42.73 | 0.28 | (16.37) | (16.09) | – | (2.86) | (2.86) | 23.78 |
| Year Ended October 31, 2021 | 30.18 | (0.20) | 12.75 | 12.55 | – | – | – | 42.73 |
| Year Ended October 31, 2020 | 28.11 | (0.09) | 3.63 | 3.54 | (0.34) | (1.13) | (1.47) | 30.18 |
| Class C Shares | | | | | | | | |
| Year Ended October 31, 2024 | 20.66 | (0.05) | 6.26 | 6.21 | – | – | – | 26.87 |
| Year Ended October 31, 2023 | 20.94 | (0.03) | (0.04) | (0.07) | (0.21) | – | (0.21) | 20.66 |
| Year Ended October 31, 2022 | 38.21 | 0.09 | (14.50) | (14.41) | – | (2.86) | (2.86) | 20.94 |
| Year Ended October 31, 2021 | 27.16 | (0.39) | 11.44 | 11.05 | – | – | – | 38.21 |
| Year Ended October 31, 2020 | 25.43 | (0.25) | 3.27 | 3.02 | (0.16) | (1.13) | (1.29) | 27.16 |
| Class R Shares | | | | | | | | |
| Year Ended October 31, 2024 | 21.71 | 0.05 | 6.57 | 6.62 | (0.11) | – | (0.11) | 28.22 |
| Year Ended October 31, 2023 | 22.06 | 0.06 | (0.04) | 0.02 | (0.37) | – | (0.37) | 21.71 |
| Year Ended October 31, 2022 | 39.97 | 0.21 | (15.26) | (15.05) | – | (2.86) | (2.86) | 22.06 |
| Year Ended October 31, 2021 | 28.31 | (0.28) | 11.94 | 11.66 | – | – | – | 39.97 |
| Year Ended October 31, 2020 | 26.46 | (0.15) | 3.40 | 3.25 | (0.27) | (1.13) | (1.40) | 28.31 |
| Institutional Class Shares | | | | | | | | |
| Year Ended October 31, 2024 | 23.81 | 0.23 | 7.20 | 7.43 | (0.24) | – | (0.24) | 31.00 |
| Year Ended October 31, 2023 | 24.12 | 0.22 | (0.05) | 0.17 | (0.48) | – | (0.48) | 23.81 |
| Year Ended October 31, 2022 | 43.15 | 0.44 | (16.61) | (16.17) | – | (2.86) | (2.86) | 24.12 |
| Year Ended October 31, 2021 | 30.37 | (0.06) | 12.84 | 12.78 | – | – | – | 43.15 |
| Year Ended October 31, 2020 | 28.25 | 0.01 | 3.65 | 3.66 | (0.41) | (1.13) | (1.54) | 30.37 |
| (a) | Net investment income/(loss) is based on average shares outstanding during the period. |
| (b) | Excludes sales charge. |
| (c) | During the period, certain fees were waived and/or reimbursed. If such waivers/reimbursements had not occurred, the ratios would have been as indicated. |
| (d) | Portfolio turnover is calculated on the basis of the Fund as a whole without distinguishing among the classes of shares. |
| (e) | Includes interest expense that amounts to less than 0.01%. |
| (f) | The total return shown above includes the impact of financial statement rounding of the NAV per share and/or financial statement adjustments. |
Amounts listed as “–” are $0 or round to $0.
See accompanying Notes to Financial Statements.
Financial Highlights (continued)
Selected Data for Each Share of Capital Outstanding Throughout the Periods Indicated
abrdn International Small Cap Fund (concluded)
| | Ratios/Supplemental Data |
Total
Return
(b) | Net Assets
at End
of Period
(000's) | Ratio of Expenses
(Net of
Reimbursements/
Waivers)
to Average
Net Assets | Ratio of Expenses
(Prior to
Reimbursements) to
Average Net Assets(c) | Ratio of Net
Investment Income
(Loss) to
Average Net Assets | Portfolio
Turnover
(d) |
| | | | | | |
| 30.93% | $ 56,342 | 1.34%(e) | 1.55%(e) | 0.46% | 32% |
| 0.21% | 50,828 | 1.34%(e) | 1.49%(e) | 0.49% | 36% |
| (40.18%)(f) | 58,262 | 1.35%(e) | 1.43%(e) | 0.91% | 47% |
| 41.58%(f) | 112,408 | 1.34%(e) | 1.42%(e) | (0.54%) | 43% |
| 13.02% | 90,560 | 1.40% | 1.61% | (0.33%) | 30% |
| | | | | | |
| 30.06% | 311 | 1.99%(e) | 2.32%(e) | (0.18%) | 32% |
| (0.44%) | 308 | 1.99%(e) | 2.32%(e) | (0.14%) | 36% |
| (40.56%)(f) | 349 | 1.99%(e) | 2.23%(e) | 0.35% | 47% |
| 40.68%(f) | 561 | 1.99%(e) | 2.18%(e) | (1.15%) | 43% |
| 12.27% | 554 | 2.05% | 2.38% | (1.02%) | 30% |
| | | | | | |
| 30.54% | 1,686 | 1.63%(e) | 1.84%(e) | 0.19% | 32% |
| (0.04%) | 1,546 | 1.60%(e) | 1.75%(e) | 0.27% | 36% |
| (40.36%) | 1,913 | 1.64%(e) | 1.72%(e) | 0.76% | 47% |
| 41.19% | 2,535 | 1.62%(e) | 1.70%(e) | (0.80%) | 43% |
| 12.68% | 1,649 | 1.69% | 1.90% | (0.61%) | 30% |
| | | | | | |
| 31.31% | 65,229 | 0.99%(e) | 1.28%(e) | 0.80% | 32% |
| 0.57% | 75,604 | 0.99%(e) | 1.24%(e) | 0.81% | 36% |
| (39.96%)(f) | 117,960 | 0.99%(e) | 1.18%(e) | 1.44% | 47% |
| 42.08%(f) | 191,244 | 0.99%(e) | 1.15%(e) | (0.15%) | 43% |
| 13.41% | 46,330 | 1.04% | 1.35% | 0.03% | 30% |
Financial Highlights (continued)
Selected Data for Each Share of Capital Outstanding Throughout the Periods Indicated
abrdn Realty Income & Growth Fund
| | | Investment Activities | Distributions | | |
| | Net
Asset
Value,
Beginning
of Period | Net
Investment
Income
(Loss)
(a) | Net
Realized
and
Unrealized
Gains
(Losses) on
Investments | Total
from
Investment
Activities | Net
Investment
Income | Net
Realized
Gains | Total
Distributions | Net
Asset
Value,
End of
Period | Total
Return
(b) |
| Class A Shares | | | | | | | | | |
| Year Ended October 31, 2024 | $9.53 | $0.10 | $3.05 | $ 3.15 | $ (0.25) | $ (0.16) | $ (0.41) | $ 12.27 | 33.65% |
| Year Ended October 31, 2023 | 10.84 | 0.27 | (0.65) | (0.38) | (0.26) | (0.67) | (0.93) | 9.53 | (3.88%) |
| Year Ended October 31, 2022 | 15.68 | 0.15 | (2.72) | (2.57) | (0.31) | (1.96) | (2.27) | 10.84 | (19.45%) |
| Year Ended October 31, 2021 | 12.40 | 0.11 | 4.84 | 4.95 | (0.13) | (1.54) | (1.67) | 15.68 | 44.07% |
| Year Ended October 31, 2020 | 17.98 | 0.25 | (3.17) | (2.92) | (0.60) | (2.06) | (2.66) | 12.40 | (18.12%) |
| Institutional Class Shares | | | | | | | | | |
| Year Ended October 31, 2024 | 9.58 | 0.11 | 3.08 | 3.19 | (0.27) | (0.16) | (0.43) | 12.34 | 33.92% |
| Year Ended October 31, 2023 | 10.89 | 0.30 | (0.65) | (0.35) | (0.29) | (0.67) | (0.96) | 9.58 | (3.67%) |
| Year Ended October 31, 2022 | 15.74 | 0.20 | (2.75) | (2.55) | (0.34) | (1.96) | (2.30) | 10.89 | (19.24%) |
| Year Ended October 31, 2021 | 12.44 | 0.14 | 4.86 | 5.00 | (0.16) | (1.54) | (1.70) | 15.74 | 44.41% |
| Year Ended October 31, 2020 | 18.02 | 0.28 | (3.16) | (2.88) | (0.64) | (2.06) | (2.70) | 12.44 | (17.85%) |
| (a) | Net investment income/(loss) is based on average shares outstanding during the period. |
| (b) | Excludes sales charge. |
| (c) | During the period, certain fees were waived and/or reimbursed. If such waivers/reimbursements had not occurred, the ratios would have been as indicated. |
| (d) | Portfolio turnover is calculated on the basis of the Fund as a whole without distinguishing among the classes of shares. |
| (e) | Includes interest expense that amounts to less than 0.01% for Class A and Institutional Class for the years ended October 31, 2024, October 31, 2023 and October 31, 2022. Includes interest expense that amounts to 0.01% and 0.05% for Class A and Institutional Class for the years ended October 31, 2021 and October 31, 2020, respectively. |
See accompanying Notes to Financial Statements.
Financial Highlights (continued)
Selected Data for Each Share of Capital Outstanding Throughout the Periods Indicated
abrdn Realty Income & Growth Fund (concluded)
| Ratios/Supplemental Data |
Net Assets
at End
of Period
(000's) | Ratio of Expenses
(Net of
Reimbursements/
Waivers)
to Average
Net Assets | Ratio of Expenses
(Prior to
Reimbursements) to
Average Net Assets(c) | Ratio of Net
Investment Income
(Loss) to
Average Net Assets | Portfolio
Turnover
(d) |
| | | | | |
| $ 524 | 1.25%(e) | 1.66%(e) | 0.86% | 45% |
| 266 | 1.26%(e) | 1.75%(e) | 2.58% | 24% |
| 397 | 1.25%(e) | 1.67%(e) | 1.13% | 23% |
| 1,090 | 1.26%(e) | 1.72%(e) | 0.80% | 33% |
| 1,971 | 1.30%(e) | 1.71%(e) | 1.84% | 23% |
| | | | | |
| 40,182 | 1.00%(e) | 1.39%(e) | 0.96% | 45% |
| 34,351 | 1.01%(e) | 1.47%(e) | 2.82% | 24% |
| 41,592 | 1.00%(e) | 1.42%(e) | 1.53% | 23% |
| 56,593 | 1.01%(e) | 1.47%(e) | 1.01% | 33% |
| 46,235 | 1.05%(e) | 1.48%(e) | 2.05% | 23% |
| | | | | |
Financial Highlights (continued)
Selected Data for Each Share of Capital Outstanding Throughout the Periods Indicated
abrdn U.S. Small Cap Equity Fund
| | | Investment Activities | Distributions | |
| | Net
Asset
Value,
Beginning
of Period | Net
Investment
Income
(Loss)
(a) | Net
Realized
and
Unrealized
Gains
(Losses) on
Investments | Total
from
Investment
Activities | Net
Investment
Income | Net
Realized
Gains | Total
Distributions | Net
Asset
Value,
End of
Period |
| Class A Shares | | | | | | | | |
| Year Ended October 31, 2024 | $25.78 | $(0.15) | $8.34 | $ 8.19 | $ – | $ – | $ – | $ 33.97 |
| Year Ended October 31, 2023 | 30.19 | (0.17) | (2.55) | (2.72) | – | (1.69) | (1.69) | 25.78 |
| Year Ended October 31, 2022 | 49.57 | (0.25) | (9.33) | (9.58) | – | (9.80) | (9.80) | 30.19 |
| Year Ended October 31, 2021 | 33.55 | (0.24) | 18.64 | 18.40 | – | (2.38) | (2.38) | 49.57 |
| Year Ended October 31, 2020 | 33.19 | (0.20) | 3.08 | 2.88 | – | (2.52) | (2.52) | 33.55 |
| Class C Shares | | | | | | | | |
| Year Ended October 31, 2024 | 18.78 | (0.24) | 6.07 | 5.83 | – | – | – | 24.61 |
| Year Ended October 31, 2023 | 22.59 | (0.25) | (1.87) | (2.12) | – | (1.69) | (1.69) | 18.78 |
| Year Ended October 31, 2022 | 39.79 | (0.36) | (7.04) | (7.40) | – | (9.80) | (9.80) | 22.59 |
| Year Ended October 31, 2021 | 27.48 | (0.42) | 15.11 | 14.69 | – | (2.38) | (2.38) | 39.79 |
| Year Ended October 31, 2020 | 27.79 | (0.33) | 2.54 | 2.21 | – | (2.52) | (2.52) | 27.48 |
| Class R Shares | | | | | | | | |
| Year Ended October 31, 2024 | 21.86 | (0.20) | 7.07 | 6.87 | – | – | – | 28.73 |
| Year Ended October 31, 2023 | 25.92 | (0.21) | (2.16) | (2.37) | – | (1.69) | (1.69) | 21.86 |
| Year Ended October 31, 2022 | 44.07 | (0.31) | (8.04) | (8.35) | – | (9.80) | (9.80) | 25.92 |
| Year Ended October 31, 2021 | 30.12 | (0.32) | 16.65 | 16.33 | – | (2.38) | (2.38) | 44.07 |
| Year Ended October 31, 2020 | 30.14 | (0.27) | 2.77 | 2.50 | – | (2.52) | (2.52) | 30.12 |
| Institutional Service Class Shares | | | | | | | | |
| Year Ended October 31, 2024 | 28.74 | (0.07) | 9.32 | 9.25 | – | – | – | 37.99 |
| Year Ended October 31, 2023 | 33.38 | (0.10) | (2.85) | (2.95) | – | (1.69) | (1.69) | 28.74 |
| Year Ended October 31, 2022 | 53.65 | (0.19) | (10.28) | (10.47) | – | (9.80) | (9.80) | 33.38 |
| Year Ended October 31, 2021 | 36.06 | (0.15) | 20.12 | 19.97 | – | (2.38) | (2.38) | 53.65 |
| Year Ended October 31, 2020 | 35.41 | (0.12) | 3.29 | 3.17 | – | (2.52) | (2.52) | 36.06 |
| Institutional Class Shares | | | | | | | | |
| Year Ended October 31, 2024 | 28.89 | (0.02) | 9.36 | 9.34 | – | – | – | 38.23 |
| Year Ended October 31, 2023 | 33.50 | (0.05) | (2.87) | (2.92) | – | (1.69) | (1.69) | 28.89 |
| Year Ended October 31, 2022 | 53.75 | (0.15) | (10.30) | (10.45) | – | (9.80) | (9.80) | 33.50 |
| Year Ended October 31, 2021 | 36.09 | (0.10) | 20.14 | 20.04 | – | (2.38) | (2.38) | 53.75 |
| Year Ended October 31, 2020 | 35.40 | (0.09) | 3.30 | 3.21 | – | (2.52) | (2.52) | 36.09 |
| (a) | Net investment income/(loss) is based on average shares outstanding during the period. |
| (b) | Excludes sales charge. |
| (c) | During the period, certain fees were waived and/or reimbursed. If such waivers/reimbursements had not occurred, the ratios would have been as indicated. |
| (d) | Portfolio turnover is calculated on the basis of the Fund as a whole without distinguishing among the classes of shares. |
| (e) | Includes interest expense that amounts to less than 0.01%. |
Amounts listed as “–” are $0 or round to $0.
See accompanying Notes to Financial Statements.
Financial Highlights (continued)
Selected Data for Each Share of Capital Outstanding Throughout the Periods Indicated
abrdn U.S. Small Cap Equity Fund (concluded)
| | Ratios/Supplemental Data |
Total
Return
(b) | Net Assets
at End
of Period
(000's) | Ratio of Expenses
(Net of
Reimbursements/
Waivers)
to Average
Net Assets | Ratio of Expenses
(Prior to
Reimbursements) to
Average Net Assets(c) | Ratio of Net
Investment Income
(Loss) to
Average Net Assets | Portfolio
Turnover
(d) |
| | | | | | |
| 31.77% | $ 99,116 | 1.40%(e) | 1.48%(e) | (0.48%) | 47% |
| (9.50%) | 83,828 | 1.39%(e) | 1.43%(e) | (0.57%) | 30% |
| (23.82%) | 108,078 | 1.35%(e) | 1.35%(e) | (0.74%) | 59% |
| 56.92% | 172,963 | 1.35% | 1.35% | (0.56%) | 78% |
| 8.97% | 124,673 | 1.40%(e) | 1.40%(e) | (0.62%) | 61% |
| | | | | | |
| 31.04% | 11,559 | 1.99%(e) | 2.19%(e) | (1.06%) | 47% |
| (10.08%) | 16,007 | 2.00%(e) | 2.15%(e) | (1.17%) | 30% |
| (24.30%) | 25,068 | 1.99%(e) | 2.06%(e) | (1.38%) | 59% |
| 55.93% | 44,295 | 1.99% | 2.06% | (1.20%) | 78% |
| 8.25% | 36,621 | 2.05%(e) | 2.10%(e) | (1.26%) | 61% |
| | | | | | |
| 31.43% | 3,759 | 1.64%(e) | 1.72%(e) | (0.73%) | 47% |
| (9.73%) | 2,773 | 1.64%(e) | 1.68%(e) | (0.82%) | 30% |
| (24.04%) | 3,286 | 1.65%(e) | 1.65%(e) | (1.03%) | 59% |
| 56.50% | 5,408 | 1.63% | 1.63% | (0.84%) | 78% |
| 8.59% | 3,554 | 1.75%(e) | 1.75%(e) | (0.96%) | 61% |
| | | | | | |
| 32.19% | 36,819 | 1.10%(e) | 1.18%(e) | (0.19%) | 47% |
| (9.27%) | 28,529 | 1.13%(e) | 1.17%(e) | (0.31%) | 30% |
| (23.64%) | 31,893 | 1.11%(e) | 1.11%(e) | (0.50%) | 59% |
| 57.33% | 41,568 | 1.11% | 1.11% | (0.31%) | 78% |
| 9.24% | 31,548 | 1.13%(e) | 1.13%(e) | (0.35%) | 61% |
| | | | | | |
| 32.33% | 193,456 | 0.99%(e) | 1.14%(e) | (0.06%) | 47% |
| (9.14%) | 233,893 | 1.00%(e) | 1.14%(e) | (0.16%) | 30% |
| (23.54%) | 559,518 | 0.99%(e) | 1.07%(e) | (0.38%) | 59% |
| 57.48% | 931,614 | 0.99% | 1.06% | (0.21%) | 78% |
| 9.37% | 536,973 | 1.04%(e) | 1.10%(e) | (0.27%) | 61% |
Financial Highlights (continued)
Selected Data for Each Share of Capital Outstanding Throughout the Periods Indicated
abrdn U.S. Sustainable Leaders Fund
| | | Investment Activities | Distributions | |
| | Net
Asset
Value,
Beginning
of Period | Net
Investment
Income
(Loss)
(a) | Net
Realized
and
Unrealized
Gains
(Losses) on
Investments | Total
from
Investment
Activities | Net
Investment
Income | Net
Realized
Gains | Total
Distributions | Net
Asset
Value,
End of
Period |
| Class A Shares | | | | | | | | |
| Year Ended October 31, 2024 | $9.62 | $(0.01) | $2.22 | $ 2.21 | $ (0.01) | $ – | $ (0.01) | $ 11.82 |
| Year Ended October 31, 2023 | 9.38 | 0.01 | 0.27 | 0.28 | – | (0.04) | (0.04) | 9.62 |
| Year Ended October 31, 2022 | 17.32 | (0.05) | (3.52) | (3.57) | – | (4.37) | (4.37) | 9.38 |
| Year Ended October 31, 2021 | 13.79 | (0.05) | 5.31 | 5.26 | – | (1.73) | (1.73) | 17.32 |
| Year Ended October 31, 2020 | 12.95 | (0.03) | 2.17 | 2.14 | (0.01) | (1.29) | (1.30) | 13.79 |
| Class C Shares | | | | | | | | |
| Year Ended October 31, 2024 | 6.86 | (0.07) | 1.59 | 1.52 | – | – | – | 8.38 |
| Year Ended October 31, 2023 | 6.76 | (0.04) | 0.18 | 0.14 | – | (0.04) | (0.04) | 6.86 |
| Year Ended October 31, 2022 | 13.77 | (0.09) | (2.55) | (2.64) | – | (4.37) | (4.37) | 6.76 |
| Year Ended October 31, 2021 | 11.36 | (0.12) | 4.26 | 4.14 | – | (1.73) | (1.73) | 13.77 |
| Year Ended October 31, 2020 | 10.94 | (0.10) | 1.81 | 1.71 | – | (1.29) | (1.29) | 11.36 |
| Institutional Service Class Shares | | | | | | | | |
| Year Ended October 31, 2024 | 10.86 | 0.01 | 2.52 | 2.53 | (0.04) | – | (0.04) | 13.35 |
| Year Ended October 31, 2023 | 10.56 | 0.04 | 0.30 | 0.34 | – | (0.04) | (0.04) | 10.86 |
| Year Ended October 31, 2022 | 18.91 | (0.03) | (3.95) | (3.98) | – | (4.37) | (4.37) | 10.56 |
| Year Ended October 31, 2021 | 14.89 | (0.02) | 5.77 | 5.75 | – | (1.73) | (1.73) | 18.91 |
| Year Ended October 31, 2020 | 13.88 | (–)(f) | 2.34 | 2.34 | (0.04) | (1.29) | (1.33) | 14.89 |
| Institutional Class Shares | | | | | | | | |
| Year Ended October 31, 2024 | 10.96 | 0.02 | 2.53 | 2.55 | (0.03) | – | (0.03) | 13.48 |
| Year Ended October 31, 2023 | 10.65 | 0.04 | 0.31 | 0.35 | – | (0.04) | (0.04) | 10.96 |
| Year Ended October 31, 2022 | 19.03 | (0.02) | (3.99) | (4.01) | – | (4.37) | (4.37) | 10.65 |
| Year Ended October 31, 2021 | 14.96 | (0.01) | 5.81 | 5.80 | – | (1.73) | (1.73) | 19.03 |
| Year Ended October 31, 2020 | 13.93 | 0.01 | 2.35 | 2.36 | (0.04) | (1.29) | (1.33) | 14.96 |
| (a) | Net investment income/(loss) is based on average shares outstanding during the period. |
| (b) | Excludes sales charge. |
| (c) | During the period, certain fees were waived and/or reimbursed. If such waivers/reimbursements had not occurred, the ratios would have been as indicated. |
| (d) | Portfolio turnover is calculated on the basis of the Fund as a whole without distinguishing among the classes of shares. |
| (e) | Includes interest expense that amounts to less than 0.01%. |
| (f) | Less than $0.005 per share. |
Amounts listed as “–” are $0 or round to $0.
See accompanying Notes to Financial Statements.
Financial Highlights (concluded)
Selected Data for Each Share of Capital Outstanding Throughout the Periods Indicated
abrdn U.S. Sustainable Leaders Fund (concluded)
| | Ratios/Supplemental Data |
Total
Return
(b) | Net Assets
at End
of Period
(000's) | Ratio of Expenses
(Net of
Reimbursements/
Waivers)
to Average
Net Assets | Ratio of Expenses
(Prior to
Reimbursements) to
Average Net Assets(c) | Ratio of Net
Investment Income
(Loss) to
Average Net Assets | Portfolio
Turnover
(d) |
| | | | | | |
| 23.00% | $ 228,270 | 1.19% | 1.24% | (0.13%) | 18% |
| 3.00% | 208,286 | 1.19%(e) | 1.27%(e) | 0.11% | 32% |
| (27.49%) | 222,190 | 1.19%(e) | 1.24%(e) | (0.43%) | 44% |
| 41.35% | 345,638 | 1.19% | 1.23% | (0.33%) | 111% |
| 17.50% | 264,977 | 1.19% | 1.26% | (0.24%) | 50% |
| | | | | | |
| 22.16% | 299 | 1.90% | 2.04% | (0.83%) | 18% |
| 2.09% | 327 | 1.90%(e) | 2.09%(e) | (0.55%) | 32% |
| (27.96%) | 229 | 1.90%(e) | 2.08%(e) | (1.14%) | 44% |
| 40.20% | 329 | 1.90% | 2.07% | (1.01%) | 111% |
| 16.71% | 1,143 | 1.90% | 2.08% | (0.94%) | 50% |
| | | | | | |
| 23.28% | 112,647 | 0.96% | 1.01% | 0.10% | 18% |
| 3.23% | 101,341 | 0.96%(e) | 1.04%(e) | 0.33% | 32% |
| (27.32%) | 106,068 | 0.97%(e) | 1.02%(e) | (0.20%) | 44% |
| 41.61% | 158,581 | 0.97% | 1.01% | (0.11%) | 111% |
| 17.79% | 121,611 | 0.97% | 1.04% | (0.01%) | 50% |
| | | | | | |
| 23.34% | 7,875 | 0.90% | 1.01% | 0.16% | 18% |
| 3.30% | 7,555 | 0.90%(e) | 1.04%(e) | 0.39% | 32% |
| (27.29%) | 8,644 | 0.90%(e) | 1.01%(e) | (0.14%) | 44% |
| 41.77% | 14,953 | 0.90% | 1.00% | (0.05%) | 111% |
| 17.89% | 10,982 | 0.90% | 1.01% | 0.05% | 50% |
Notes to Financial Statements
October 31, 2024
1. Organization
abrdn Funds (the "Trust") was organized as a statutory trust under the laws of the state of Delaware by a Certificate of Trust filed on September 27, 2007 and is registered under the Investment Company Act of 1940, as amended (the "1940 Act"), as an open-end management investment company. As of October 31, 2024, the Trust had authorized an unlimited number of shares of beneficial interest ("shares") without par value. As of October 31, 2024, the Trust operated twenty (20) separate series, or mutual funds, each with its own investment objective(s) and strategies. This report contains the financial statements and financial highlights of the fifteen (15) funds listed below (each, a "Fund"; collectively, the "Funds"):
| • | abrdn China A Share Equity Fund ("China A Share Equity Fund") |
| • | abrdn Dynamic Dividend Fund (“Dynamic Dividend Fund”) |
| • | abrdn EM SMA Completion Fund* ("EM SMA Completion Fund") |
| • | abrdn Emerging Markets Dividend Active ETF** ("Emerging Markets Dividend Active ETF") |
| • | abrdn Emerging Markets Dividend Fund (formerly, abrdn International Sustainable Leaders Fund) (“Emerging Markets Dividend Fund”) |
| • | abrdn Emerging Markets ex-China Fund (“Emerging Markets ex-China Fund”) |
| • | abrdn Emerging Markets Fund (“Emerging Markets Fund”) |
| • | abrdn Focused U.S. Small Cap Active ETF** ("Focused U.S. Small Cap Active ETF") |
| • | abrdn Focused U.S. Small Cap Equity Fund (formerly, abrdn U.S. Sustainable Leaders Smaller Companies Fund) (“Focused U.S. Small Cap Equity Fund”) |
| • | abrdn Global Equity Impact Fund (“Global Equity Impact Fund”) |
| • | abrdn Global Infrastructure Fund (“Global Infrastructure Fund”) |
| • | abrdn International Small Cap Fund (formerly, (“International Small Cap Fund”) |
| • | abrdn Realty Income & Growth Fund (“Realty Income & Growth Fund”) |
| • | abrdn U.S. Small Cap Equity Fund (“U.S. Small Cap Equity Fund”) |
| • | abrdn U.S. Sustainable Leaders Fund (“U.S. Sustainable Leaders Fund”) |
Effective after the close of business on October 18, 2024, as part of the reorganizations of the Emerging Markets Dividend Fund and Focused U.S. Small Cap Equity Fund into the Emerging Markets Dividend Active ETF and Focused U.S. Small Cap Active ETF, respectively, which is expected to occur on or around February 14, 2025, all issued and outstanding Class A, Class R and Institutional Service Class shares of the Focused U.S. Small Cap Fund and all issued and outstanding Class A shares of the Emerging Markets Dividend Fund were converted to Institutional Class shares of the respective Fund on the basis of the relative net asset values of the two relevant classes, without the imposition of any sales load, fee or other charge.
*Not available to the General Public. Shares of the Fund may be purchased only by or on behalf of separately managed account clients where abrdn Inc. ("abrdn" or the "Adviser"), the Fund's Adviser or an affiliate of the Adviser has an agreement with the managed account program sponsor (the"Program Sponsor"), or directly with the client, to provide management or advisory services to the managed account or to the Program Sponsor for its use in managing such account. The Fund is a "completion fund," meaning that it is intended to be used as part of a broader investment program by certain separately managed account clients.
**Not available for Sale. Shares of the Emerging Markets Dividend Active ETF and Focused U.S. Small Cap Active ETF are not available for sale until after the applicable reorganization of the Emerging Markets Dividend Fund and Focused U.S. Small Cap Equity Fund, respectively, which is expected to occur on or around February 14, 2025. The Emerging Markets Dividend Active ETF and Focused U.S. Small Cap Active ETF were effective October 29, 2024.
Fund Reorganization. On June 21, 2024, the Emerging Markets ex-China Fund acquired the assets and assumed the liabilities of the Emerging Markets Sustainable Leaders Fund (the "Acquired Fund") pursuant to a plan of reorganization approved by the Board of Trustees (the "Board") on March 13, 2024 (the "Reorganization"). In the Reorganization, holders of each class shares of the Acquired Fund received an amount of Emerging Markers ex-China Fund shares with a net asset value ("NAV") equal to the aggregate net asset value of their holding of the Acquired Fund shares of the same class, as determined at the close of regular business on June 21, 2024. Any applicable fractional shares were paid as cash-in-lieu to the applicable holder. The Reorganization was structured as a tax-free transaction. The Emerging Markets ex-China Fund is considered the tax survivor and accounting survivor of the Reorganization. The Adviser or its affiliates bore the costs in connection with the Reorganization including, but not limited to, printing costs and legal fees associated with the Reorganization. Shareholders continued to pay brokerage or trading expenses, related to the purchase and sale of securities held by the Funds, including those related to securities sold immediately before the Reorganization and bought or sold following the Reorganization to realign the portfolio with the Emerging Markets ex-China Fund’s investment strategy.
Notes to Financial Statements (continued)
October 31, 2024
The following is a summary of the NAV per share issued as of June 21, 2024.
| Acquired Fund | Emerging Markets
ex-China Fund
NAV per
Share ($) 6/21/2024 | Conversion Ratio | Shares Issued |
| Class A | 12.4888 | 0.888132 | 804,839 |
| Class C | 11.0319 | 0.928571 | 1,495 |
| Class R | 11.5040 | 0.898720 | 193,427 |
| Institutional Service Class | 12.8082 | 0.892204 | 4,027,935 |
| Institutional Class | 12.6245 | 0.914317 | 540,699 |
Amounts listed as “–” are $0 or round to $0.
2. Summary of Significant Accounting Policies
The Trust is an investment company and accordingly follows the investment company accounting and reporting guidance of the Financial Accounting Standards Board ("FASB") Accounting Standards Codification Topic 946 Financial Services-Investment Companies. The following is a summary of significant accounting policies followed by the Funds in the preparation of their financial statements. The policies conform to generally accepted accounting principles ("U.S. GAAP") in the United States of America. The preparation of financial statements requires management to make estimates and assumptions that affect the reported amounts of assets and liabilities, disclosure of contingent assets and liabilities at the date of the financial statements, and the reported amounts of income and expenses for the period. Actual results could differ from those estimates. The accounting records of the Funds are maintained in U.S. Dollars.
a.
| Security Valuation: |
| | The Funds value their securities at current fair value, consistent with regulatory requirements. "Fair value" is defined in the Funds' Valuation and Liquidity Procedures as the price that could be received to sell an asset or paid to transfer a liability in an orderly transaction between willing market participants without a compulsion to transact at the measurement date, also known as market value. Pursuant to Rule 2a-5 under the 1940 Act, the Board designated the Adviser as the valuation designee ("Valuation Designee") for the Funds to perform the fair value determinations relating to Fund investments for which market quotations are not readily available or deemed unreliable. |
| | Equity securities that are traded on an exchange are valued at the last quoted sale price or the official close price on the principal exchange on which the security is traded at the “Valuation Time” subject to application, when appropriate, of the valuation factors described in the paragraph below. Under normal circumstances, the Valuation Time is as of the close of regular trading on the New York Stock Exchange ("NYSE") (usually 4:00 p.m. Eastern Time). In the absence of a sale price, the security is valued at the mean of the bid/ask price quoted at the close on the principal exchange on which the security is traded. Securities traded on NASDAQ are valued at the NASDAQ official closing price. |
| | In accordance with the authoritative guidance on fair value measurements and disclosures under U.S. GAAP, the Funds disclose the fair value of their investments using a three-level hierarchy that classifies the inputs to valuation techniques used to measure the fair value. The hierarchy assigns Level 1, the highest level, measurements to valuations based upon unadjusted quoted prices in active markets for identical assets, Level 2 measurements to valuations based upon other significant observable inputs, including adjusted quoted prices in active markets for similar assets, and Level 3, the lowest level, measurements to valuations based upon unobservable inputs that are significant to the valuation. Inputs refer broadly to the assumptions that market participants would use in pricing the asset or liability, including assumptions about risk, for example, the risk inherent in a particular valuation technique used to measure fair value including a pricing model and/or the risk inherent in the inputs to the valuation technique. Inputs may be observable or unobservable. Observable inputs are inputs that reflect the assumptions market participants would use in pricing the asset or liability, which are based on market data obtained from sources independent of the reporting entity. Unobservable inputs are inputs that reflect the reporting entity’s own assumptions about the assumptions market participants would use in pricing the asset or liability developed based on the best information available in the circumstances. A financial instrument’s level within the fair value hierarchy is based upon the lowest level of any input that is significant to the fair value measurement. |
| | Open-end mutual funds are valued at the respective NAV as reported by such company. The prospectuses for the registered open-end management investment companies in which a Fund invests explain the circumstances under which those companies will use fair value pricing and the effects of using fair value pricing. Closed-end funds and exchange-traded funds ("ETFs") are valued at the market price of the security at the Valuation Time (defined above). A security using any of these pricing methodologies is generally determined to be a Level 1 investment. |
Notes to Financial Statements (continued)
October 31, 2024
| | Foreign equity securities that are traded on foreign exchanges that close prior to the Valuation Time are valued by applying valuation factors to the last sale price or the mean price as noted above. Valuation factors are provided by an independent pricing service provider. These valuation factors are used when pricing a Fund's portfolio holdings to estimate market movements between the time foreign markets close and the time a Fund values such foreign securities. These valuation factors are based on inputs such as depositary receipts, indices, futures, sector indices/ETFs, exchange rates, and local exchange opening and closing prices of each security. When prices with the application of valuation factors are utilized, the value assigned to the foreign securities may not be the same as quoted or published prices of the securities on their primary markets. A security that applies a valuation factor is generally determined to be a Level 2 investment because the exchange-traded price has been adjusted. Valuation factors are not utilized if the independent pricing service provider is unable to provide a valuation factor or if the valuation factor falls below a predetermined threshold; in such case, the security is determined to be a Level 1 investment. |
| | Long-term debt and other fixed income securities are valued at the last quoted or evaluated bid price on the valuation date provided by an independent pricing service provider. If there are no current day bids, the security is valued at the previously applied bid. Pricing services generally price debt securities assuming orderly transactions of an institutional “round lot” size, and the strategies employed by the Adviser as Valuation Designee generally trade in round lot sizes. In certain circumstances, fixed income securities may be held or transactions may be conducted in smaller, “odd lot” sizes. Odd lots may trade at lower or occasionally higher prices than institutional round lot trades. Short-term debt securities (such as commercial paper and U.S. treasury bills) having a remaining maturity of 60 days or less are valued at the last quoted or evaluated bid price on the valuation date provided by an independent pricing service, or on the basis of amortized cost if it represents the best approximation for fair value. Debt and other fixed-income securities are generally determined to be Level 2 investments. |
| | Short-term investments are comprised of cash and cash equivalents invested in short-term investment funds which are redeemable daily. The Funds sweep available cash into the State Street Institutional U.S. Government Money Market Fund, which has elected to qualify as a “government money market fund” pursuant to Rule 2a-7 under the 1940 Act, and has an objective, which is not guaranteed, to maintain a $1.00 per share NAV. Generally, these investment types are categorized as Level 1 investments. |
| | Forward foreign currency contracts are generally valued based on the bid price of the forward rates and the current spot rate. Forward exchange rate quotations are available for scheduled settlement dates, such as 1-, 3-, 6-, 9- and 12-month periods. An interpolated valuation is derived based on the actual settlement dates of the forward contracts held. Futures contracts are valued at the settlement price or at the last bid price if no settlement price is available. Interest rate swaps agreements are generally valued by an approved pricing agent based on the terms of the swap agreement (including future cash flows). |
| | In the event that a security’s market quotations are not readily available or are deemed unreliable (for reasons other than because the foreign exchange on which it trades closes before the Valuation Time), the security is valued at fair value as determined by the Valuation Designee, taking into account the relevant factors and surrounding circumstances using valuation policies and procedures approved by the Board. Under normal circumstances the Valuation Time is as of the close of regular trading on the NYSE (usually 4:00 p.m. Eastern Time). A security that has been fair valued by the Adviser may be classified as Level 2 or Level 3 depending on the nature of the inputs. |
| | The three-level hierarchy of inputs is summarized below: |
| • | Level 1 - quoted prices (unadjusted) in active markets for identical investments; |
| • | Level 2 - other significant observable inputs (including valuation factors, quoted prices for similar securities, interest rates, prepayment speeds, and credit risk, etc.); or |
| • | Level 3 - significant unobservable inputs (including a Fund’s own assumptions in determining the fair value of investments). |
Notes to Financial Statements (continued)
October 31, 2024
A summary of standard inputs is listed below:
| Security Type | Standard Inputs |
| Debt and other fixed-income securities | Reported trade data, broker-dealer price quotations, benchmark yields, issuer spreads on comparable securities, credit quality, yield, and maturity. |
| Foreign equities utilizing a fair value factor | Depositary receipts, indices, futures, sector indices/ETFs, exchange rates, and local exchange opening and closing prices of each security. |
| Forward foreign currency contracts | Forward exchange rate quotations. |
| Swap agreements | Market information pertaining to the underlying reference assets, i.e., credit spreads, credit event probabilities, fair values, forward rates, and volatility measures. |
The following is a summary of the inputs used as of October 31, 2024 in valuing the Funds' investments at fair value. The inputs or methodologies used for valuing securities are not necessarily an indication of the risk associated with investing in those securities. Please refer to the Statements of Investments for a detailed breakout of the security types:
| Investments, at Value | Level 1 – Quoted
Prices | Level 2 – Other Significant
Observable Inputs | Level 3 – Significant
Unobservable Inputs | Total |
| China A Share Equity Fund |
| Assets | | |
| Investments in Securities | | | |
Common Stocks
| $915,048 | $17,163,890 | $– | $18,078,938 |
Exchange-Traded Funds
| 769,470 | – | – | 769,470 |
Short-Term Investment
| 678,929 | – | – | 678,929 |
Total Investments
| $2,363,447 | $17,163,890 | $– | $19,527,337 |
Total Investment Assets
| $2,363,447 | $17,163,890 | $– | $19,527,337 |
| Dynamic Dividend Fund |
| Assets | | |
| Investments in Securities | | | |
Common Stocks
| $65,024,077 | $30,559,052 | $– | $95,583,129 |
Preferred Stocks
| – | 1,296,890 | – | 1,296,890 |
Short-Term Investment
| 24,021 | – | – | 24,021 |
Total Investments
| $65,048,098 | $31,855,942 | $– | $96,904,040 |
| Other Financial Instruments | | | |
Foreign Currency Exchange Contracts
| $– | $134,962 | $– | $134,962 |
Total Investment Assets
| $65,048,098 | $31,990,904 | $– | $97,039,002 |
| EM SMA Completion Fund |
| Assets | | |
| Investments in Securities | | | |
Common Stocks
| $103,889 | $180,951 | $– | $284,840 |
Preferred Stocks
| 9,516 | 40,558 | – | 50,074 |
Short-Term Investment
| 5,157 | – | – | 5,157 |
Total Investments
| $118,562 | $221,509 | $– | $340,071 |
Total Investment Assets
| $118,562 | $221,509 | $– | $340,071 |
Notes to Financial Statements (continued)
October 31, 2024
| Investments, at Value | Level 1 – Quoted
Prices | Level 2 – Other Significant
Observable Inputs | Level 3 – Significant
Unobservable Inputs | Total |
| Emerging Markets Dividend Fund |
| Assets | | |
| Investments in Securities | | | |
Common Stocks
| $28,892,258 | $41,281,973 | $– | $70,174,231 |
Exchange-Traded Funds
| 3,235,915 | – | – | 3,235,915 |
Preferred Stocks
| 919,681 | 4,419,471 | – | 5,339,152 |
Total Investments
| $33,047,854 | $45,701,444 | $– | $78,749,298 |
Total Investment Assets
| $33,047,854 | $45,701,444 | $– | $78,749,298 |
| Emerging Markets ex-China Fund |
| Assets | | |
| Investments in Securities | | | |
Common Stocks
| $36,356,640 | $114,509,165 | $– | $150,865,805 |
Preferred Stocks
| 1,803,900 | 8,103,534 | – | 9,907,434 |
Short-Term Investment
| 1,639,385 | – | – | 1,639,385 |
Total Investments
| $39,799,925 | $122,612,699 | $– | $162,412,624 |
Total Investment Assets
| $39,799,925 | $122,612,699 | $– | $162,412,624 |
| Emerging Markets Fund |
| Assets | | |
| Investments in Securities | | | |
Common Stocks
| $177,859,320 | $966,533,067 | $– | $1,144,392,387 |
Preferred Stocks
| 15,005,101 | 53,533,766 | – | 68,538,867 |
Short-Term Investment
| 32,633,579 | – | – | 32,633,579 |
Total Investments
| $225,498,000 | $1,020,066,833 | $– | $1,245,564,833 |
Total Investment Assets
| $225,498,000 | $1,020,066,833 | $– | $1,245,564,833 |
| Focused U.S. Small Cap Equity Fund |
| Assets | | |
| Investments in Securities | | | |
Common Stocks
| $12,246,236 | $– | $– | $12,246,236 |
Short-Term Investment
| 136,748 | – | – | 136,748 |
Total Investments
| $12,382,984 | $– | $– | $12,382,984 |
Total Investment Assets
| $12,382,984 | $– | $– | $12,382,984 |
| Global Equity Impact Fund |
| Assets | | |
| Investments in Securities | | | |
Common Stocks
| $27,804,889 | $14,982,082 | $– | $42,786,971 |
Short-Term Investment
| 29,194 | – | – | 29,194 |
Total Investments
| $27,834,083 | $14,982,082 | $– | $42,816,165 |
Total Investment Assets
| $27,834,083 | $14,982,082 | $– | $42,816,165 |
Notes to Financial Statements (continued)
October 31, 2024
| Investments, at Value | Level 1 – Quoted
Prices | Level 2 – Other Significant
Observable Inputs | Level 3 – Significant
Unobservable Inputs | Total |
| Global Infrastructure Fund |
| Assets | | |
| Investments in Securities | | | |
Common Stocks
| $28,051,352 | $14,418,758 | $– | $42,470,110 |
Short-Term Investment
| 291,827 | – | – | 291,827 |
Total Investments
| $28,343,179 | $14,418,758 | $– | $42,761,937 |
Total Investment Assets
| $28,343,179 | $14,418,758 | $– | $42,761,937 |
| International Small Cap Fund |
| Assets | | |
| Investments in Securities | | | |
Common Stocks
| $21,926,432 | $96,893,591 | $– | $118,820,023 |
Preferred Stocks
| – | 2,182,132 | – | 2,182,132 |
Short-Term Investment
| 938,650 | – | – | 938,650 |
Total Investments
| $22,865,082 | $99,075,723 | $– | $121,940,805 |
Total Investment Assets
| $22,865,082 | $99,075,723 | $– | $121,940,805 |
| Realty Income & Growth Fund |
| Assets | | |
| Investments in Securities | | | |
Common Stocks
| $40,615,792 | $– | $– | $40,615,792 |
Total Investment Assets
| $40,615,792 | $– | $– | $40,615,792 |
| U.S. Small Cap Equity Fund |
| Assets | | |
| Investments in Securities | | | |
Common Stocks
| $335,874,119 | $– | $– | $335,874,119 |
Short-Term Investment
| 7,836,444 | – | – | 7,836,444 |
Total Investments
| $343,710,563 | $– | $– | $343,710,563 |
Total Investment Assets
| $343,710,563 | $– | $– | $343,710,563 |
| U.S. Sustainable Leaders Fund |
| Assets | | |
| Investments in Securities | | | |
Common Stocks
| $340,540,948 | $– | $– | $340,540,948 |
Short-Term Investment
| 8,655,722 | – | – | 8,655,722 |
Total Investments
| $349,196,670 | $– | $– | $349,196,670 |
Total Investment Assets
| $349,196,670 | $– | $– | $349,196,670 |
Amounts listed as “–” are $0 or round to $0.
For the fiscal year ended October 31, 2024, there were no significant changes to the fair valuation methodologies.
Level 3 investments held during and at the end of the year ended October 31, 2024 in relation to net assets, of the China A Share Equity Fund, Emerging Markets Dividend Fund and of the Emerging Markets Fund were not significant (0.0% of total net assets) and accordingly, a reconciliation of Level 3 assets for the year ended October 31, 2024 is not presented. The valuation technique used at October 31, 2024 was fair valuation at zero pursuant to procedures approved by the Board.
Notes to Financial Statements (continued)
October 31, 2024
b.
| Restricted Securities: |
| | Restricted securities are privately-placed securities whose resale is restricted under U.S. securities laws. The Funds may invest in restricted securities, including unregistered securities eligible for resale without registration pursuant to Rule 144A and privately-placed securities of U.S. and non-U.S. issuers offered outside the U.S. without registration pursuant to Regulation S under the Securities Act of 1933, as amended (the "1933 Act"). Rule 144A securities may be freely traded among certain qualified institutional investors, such as the Funds, but resale of such securities in the U.S. is permitted only in limited circumstances. |
c.
| Foreign Currency Translation: |
| | Foreign securities, currencies and other assets and liabilities denominated in foreign currencies are translated into U.S. dollars at the exchange rate of said currencies against the U.S. dollar, as of the Valuation Time, as provided by an independent pricing service. Purchases and sales of securities, and income and expenses are translated at the prevailing rate of exchange on the respective date of these transactions. The Funds do not isolate that portion of the results of operations resulting from changes in foreign exchange rates on investments from fluctuations arising from changes in market prices of securities held. These fluctuations are included with the net realized and unrealized gain or loss from investments and foreign currencies within the Statements of Operations. |
d.
| Rights Issues and Warrants: |
| | Rights issues give the right, normally to existing shareholders, to buy a proportional number of additional securities at a given price (generally at a discount) within a fixed period (generally a short-term period) and are offered at the company’s discretion. Warrants are securities that give the holder the right to buy common stock at a specified price for a specified period of time. Rights issues and warrants are speculative and have no value if they are not exercised before the expiration date. Rights issues and warrants are valued at the last sale price on the exchange on which they are traded. |
e.
| Derivative Financial Instruments: |
| | Certain Funds are authorized to use derivatives to manage currency risk, credit risk, and interest rate risk and to replicate, or use as a substitute for, physical securities. Losses may arise due to changes in the value of the contract or if the counterparty does not perform under the contract. The use of derivative instruments involves, to varying degrees, elements of market risk in excess of the amount recognized in the Statements of Assets and Liabilities. |
| | Forward Foreign Currency Exchange Contracts: |
| | A forward foreign currency exchange contract ("forward contract") involves an obligation to purchase and sell a specific currency at a future date, which may be any fixed number of days from the date of the contract agreed upon by the parties, at a price set at the time of the contract. Forward contracts are used to manage a Fund's currency exposure in an efficient manner. They are used to sell unwanted currency exposure that comes with holding securities in a market, or to buy currency exposure where the exposure from holding securities is insufficient to give the desired currency exposure either in absolute terms or relative to a particular benchmark or index. The use of forward contracts allows for the separation of investment decision-making between foreign exchange holdings and their currencies. |
| | The forward contract is marked-to-market daily and the change in fair value is recorded by a Fund as unrealized appreciation or depreciation. Forward contracts' prices are received daily from an independent pricing provider. When the forward contract is closed, a Fund records a realized gain or loss equal to the difference between the value at the time it was opened and the value at the time it was closed. These realized and unrealized gains and losses are reported on the Statement of Operations. A Fund could be exposed to risks if the counterparties to the contracts are unable to meet the terms of their contracts or from unanticipated movements in exchange rates. |
| | During the year ended October 31, 2024, the Funds used forward contracts for the purposes of efficient portfolio management and managing active currency risk relative to the benchmark. |
| | While a Fund may enter into forward contracts to seek to reduce currency exchange rate risks, transactions in such contracts involve certain risks. A Fund could be exposed to risks if the counterparties to the contracts are unable to meet the terms of their contracts and from unanticipated movements in exchange rates. Thus, while a Fund may benefit from such transactions, unanticipated changes in currency prices may result in a poorer overall performance for a Fund than if it had not engaged in any such transactions. Moreover, there may be an imperfect correlation between a Fund’s portfolio holdings or securities quoted or denominated in a particular currency and forward contracts entered into by the Fund. Such imperfect correlation may prevent a Fund from achieving a complete hedge, which will expose the Fund to the risk of foreign exchange loss. |
Notes to Financial Statements (continued)
October 31, 2024
Forward contracts are subject to the risk that the counterparties to such contracts may default on their obligations. Since a forward foreign currency exchange contract is not guaranteed by an exchange or clearing house, a default on the contract would deprive a Fund of unrealized profits, transaction costs or the benefits of a currency hedge or force a Fund to cover its purchase or sale commitments, if any, at the market price at the time of the default.
| | Summary of Derivative Instruments |
| | Certain Funds may use derivatives for various purposes as noted above. The following is a summary of the fair value of derivative instruments, not accounted for as hedging instruments, as of October 31, 2024: |
| | |
| | Risk Exposure Category |
| | Interest
Rate
Contracts | Foreign
Currency
Contracts | Credit
Contracts | Equity
Contracts | Commodity
Contracts | Other | Total |
| Dynamic Dividend Fund |
| Assets: |
| Unrealized appreciation on: |
| Forward Foreign Currency Exchange Contracts | $– | $134,962 | $– | $– | $– | $– | $134,962 |
Total
| $– | $134,962 | $– | $– | $– | $– | $134,962 |
Amounts listed as “–” are $0 or round to $0.
Certain funds have transactions that may be subject to enforceable master netting arrangements. A reconciliation of the gross amounts on the Statements of Assets and Liabilities as of October 31, 2024 to the net amounts by broker and derivative type, including any collateral received or pledged, is included in the following tables:
| | |
| | | Gross Amounts Not Offset
in the Statement of
Assets and Liabilities | | Gross Amounts Not Offset
in the Statement of
Assets and Liabilities |
| | Gross Amounts
of Assets
Presented in
Statement of
Assets and
Liabilities | Financial
Instruments | Collateral
Received | Net
Amount | Gross Amounts
of Liabilities
Presented in
Statement of
Assets and
Liabilities | Financial
Instruments | Collateral
Pledged | Net
Amount |
| Description | Assets | Liabilities |
| Dynamic Dividend Fund |
| Foreign Currency Exchange Contracts |
| HSBC Bank PLC | $134,962 | $– | $– | $134,962 | $– | $– | $– | $– |
Amounts listed as “–” are $0 or round to $0.
Notes to Financial Statements (continued)
October 31, 2024
The following is a summary of the location of realized gain/(loss) and net change in unrealized appreciation/(depreciation) on derivatives in the Statement of Operations for the fiscal year ended October 31, 2024:
| | Risk Exposure Category |
| | Interest
Rate
Contracts | Foreign
Currency
Contracts | Credit
Contracts | Equity
Contracts | Commodity
Contracts | Total |
| Dynamic Dividend Fund |
Realized Gain/(Loss) on Derivatives Recognized
as a Result of Operations: |
| Forward Currency Contracts | $– | $(206,723) | $– | $– | $– | $(206,723) |
Total
| $– | $(206,723) | $– | $– | $– | $(206,723) |
Net Change in Unrealized Appreciation/Depreciation on
Derivatives Recognized as a Result of Operations: |
| Forward Currency Contracts | $– | $108,897 | $– | $– | $– | $108,897 |
Total
| $– | $108,897 | $– | $– | $– | $108,897 |
Amounts listed as “–” are $0 or round to $0.
The table below summarizes the weighted average values of derivatives holdings by the Funds during the fiscal year ended October 31, 2024.
| Derivative | Average
Notional Value |
| Dynamic Dividend Fund |
| Foreign Currency Contracts Sold | $8,713,120 |
f.
| Security Transactions, Investment Income and Expenses: |
| | Security transactions are recorded on the trade date. Realized and unrealized gains/(losses) from security and currency transactions are calculated on the identified cost basis. Dividend income and corporate actions are recorded generally on the ex-date, except for certain dividends and corporate actions which may be recorded after the ex-date, as soon as a Fund acquires information regarding such dividends or corporate actions. |
| | Interest income and expenses are recorded on an accrual basis. The calendar year-end amounts of ordinary income, capital gains and return of capital included in distributions received from the Funds’ investments in real estate investment trusts (“REITs”) are reported to the Funds after the end of the fiscal year; accordingly, the Funds estimate these amounts for accounting purposes until the characterization of REIT distributions is reported to the Funds after the end of the fiscal year. Estimates are based on the most recent REIT distribution information available. Expenses directly attributable to a Fund are charged to that Fund. Expenses not directly attributable to a Fund are allocated proportionately among the relevant Funds based on net assets of each Fund as of month-end. For each of the Funds, the method for allocating income, fund level expenses, and realized and unrealized gains or losses to a class is based on the average net asset value of that class’ shares in proportion to the average net assets of the relevant Fund when incurred. Expenses specific to a class (such as Rule 12b-1 and administrative services fees) are charged to that class. |
g.
| Distributions: |
| | Distributions from net investment income, if any, are declared and paid annually for all Funds except the Dynamic Dividend Fund, which declares and pays monthly, and the Global Infrastructure Fund and Realty Income & Growth Fund, which declare and pay quarterly. The Funds will also declare and pay distributions at least annually from net realized gains on investment transactions and net realized foreign exchange gains, if any. Dividends and distributions to shareholders are recorded on the ex-dividend date. The Funds will also declare and pay distributions at least annually from net realized gains on investment transactions and net realized foreign exchange gains, if any. Dividends and distributions to shareholders are determined in accordance with federal income tax regulations, which may differ from U.S. GAAP. These differences are primarily due to differing treatment for foreign currencies and loss deferrals. |
Notes to Financial Statements (continued)
October 31, 2024
h.
| Federal Income Taxes: |
| | Each Fund intends to continue to qualify as a “regulated investment company” by complying with the provisions available to certain investment companies, as defined in Subchapter M of the Internal Revenue Code of 1986, as amended (the"Code"), and to make distributions of net investment income and net realized capital gains sufficient to relieve the Funds from all federal income taxes. Therefore, no federal income tax provision is required. Management of the Funds has concluded that there are no significant uncertain tax positions that would require recognition in the financial statements. Since tax authorities can examine previously filed tax returns, the Funds' U.S. federal and state tax returns for each of the most recent four fiscal years up to the most recent fiscal year ended October 31, 2024 are subject to such review. |
| | Each Fund recognizes interest and penalties related to tax items, including uncertain tax positions, within interest expense and other expenses respectively. No interest expense or penalties related to taxation have been recognized as of and for the year ended October 31, 2024. |
i.
| Foreign Withholding Tax: |
| | Dividend and interest income from non-U.S. sources received by the Fund are generally subject to non-U.S. withholding taxes and are recorded on the Statement of Operations. The Funds file for tax reclaims for the refund of such withholdings taxes according to tax treaties. Tax reclaims that are deemed collectible are booked as tax reclaim receivable on the Statement of Assets and Liabilities. Foreign tax authorities can examine previously filed withholding tax reclaims for various periods of time, depending on the statute of limitations in each foreign jurisdiction. In some cases, amounts that have been refunded by foreign tax authorities and received by the Funds are still subject to such review. |
| | In addition, when the Funds sell securities within certain countries in which they invest, the capital gains realized may be subject to tax. Based on these market requirements and as required under U.S. GAAP, the Funds accrue deferred capital gains tax on securities currently held that have unrealized appreciation within these countries. The amount of deferred capital gains tax accrued is reported on the Statement of Operations as part of the Net Change in Unrealized Appreciation/Depreciation on Investments. |
| | abrdn Emerging Markets Dividend Fund (“EMD”) and abrdn Global Equity Impact Fund (“GEI”) |
| | Consistent with U.S. GAAP accrual requirements, for uncertain tax positions, each Fund recognizes Article 63 EU Tax Reclaims when it is more likely than not that the Fund will sustain its position that it is due. During the year ended October 31, 2024, Article 63 EU Tax reclaims and interest, as applicable, were paid to each Fund related to French dividend withholding tax, representing $968,148 and $528,135 on various receipt dates for EMD and GEI, respectively, which had been previously recorded in each Fund’s respective net asset value during the fiscal year 2022. |
| | As of October 31, 2024, EMD and GEI have remaining Article 63 EU Tax Reclaims, primarily related to Germany and Spain. Certain of the outstanding Article 63 EU Tax Reclaims related to Germany and Spain are not deemed to meet the recognition criteria under U.S. GAAP as of October 31, 2024, and have not been recorded in each Fund’s respective net asset value. As of October 31, 2024, the total amount of outstanding reclaims (before the impact of interest, tax or additional costs incurred in the pursuit of such reclaims) filed with Germany and Spain represents approximately $2,821,194 and $1,778,759 for EMD and GEI, respectively. These amounts net of estimated taxes represent $1,622,187 and $1,022,787 for EMD and GEI, respectively. Recognition by EMD or GEI of these amounts would have a positive impact on either Fund's performance. |
| | The receipt of Article 63 EU reclaims from these jurisdictions also results in a tax liability to the shareholders to offset the tax benefits that shareholders received in the past. Such amounts are estimated based on a closing agreement template created by the IRS, which is applicable to all industry participants, in relation to the remittance by a fund of taxes due by its shareholders and paid on their behalf by the fund. The Funds accrue this tax liability which each intends to settle on behalf of its shareholders in accordance with U.S. GAAP. |
| | As of October 31, 2024, an estimated tax amount has been accrued of $357,966 and $275,889 for EMD and GEI, respectively, related to the reclaims received during the period from France. This amount is reflected as Payable to IRS on behalf of shareholders related to Article 63 EU Tax reclaims on the accompanying Statements of Assets and Liabilities. |
| | In October 2024, the Funds executed a closing agreement with the IRS which finalized the amount of taxes to be paid on behalf of shareholders related to the reclaims and interest received from Spain in 2023. The amounts paid to the IRS in EMD and GEI were $1,808,852 and $1,067,073, respectively, which were previously recorded in each Fund's respective net asset value during the fiscal year 2022. |
Notes to Financial Statements (continued)
October 31, 2024
abrdn Emerging Markets ex-China Fund
abrdn Emerging Markets ex-China Fund (inherited claims filed by the abrdn Emerging Markets Sustainable Leaders Fund) filed for Article 63 EU Tax Reclaims in France and Germany. On March 29, 2024, the Emerging Markets Sustainable Leaders Fund received a French EU reclaim payment for $82,401 related to claim years 2018-2020. The Fund accrued an IRS tax liability of $36,768 at the time of recognition.
As of October 31, 2024, the abrdn Emerging Markets ex-China Fund has remaining Article 63 EU Tax Reclaims, primarily related to Germany and France. Certain of the outstanding Article 63 EU Tax Reclaims related to Germany and France are not deemed to meet the recognition criteria under U.S. GAAP as of October 31, 2024, and have not been recorded in the Fund’s net asset value. Recognition by the abrdn Emerging Markets ex-China Fund of these amounts would have a positive impact on the Fund's performance.
j.
| Securities Lending: |
| | Through an agreement with Securities Finance Trust Company as the Lending Agent and State Street Bank and Trust Company (the Funds’ custodian) ("State Street"), the Funds may lend their portfolio securities to brokers, dealers and other financial institutions that pay a negotiated fee in order to generate additional income. The Funds receive non-cash collateral in the form of U.S. Government Securities, with respect to each loan of U.S. securities, typically equal to at least 102% of the value of the portfolio securities loaned, and, with respect to each loan of non-U.S. securities, typically equal to at least 105% of the value of the portfolio securities loaned, and at all times thereafter require the borrower to mark to market such collateral on a daily basis so that the fair value of such collateral does not fall below 100% of the fair value of the portfolio securities so loaned. |
| | Income generated from securities lending includes the difference between (i) the sum of income received from the investment of collateral received from the borrowers that are counterparties to loans, loan fees received from loans, and fees paid by borrower on loans collateralized with collateral other than cash collateral; and ii) any rebate paid to a borrower, and any other allocable fees and expenses in connection with loans of securities. All income is accrued daily and is apportioned 90% to the Funds and 10% to the Lending Agent. |
| | The Funds continue to own the loaned securities and continue to recognize unrealized gains and losses on the securities on loan. However, securities lending involves certain risks including the event of default or insolvency of the borrower and possible delays or restrictions upon a Fund’s ability to recover the loaned securities or dispose of the collateral for the loan. Securities on loan are noted within the Statement of Investments. Non-cash securities lending collateral held by the Lending Agent on behalf of the Funds cannot be sold or repledged by the Funds and, therefore, this amount is not presented on the Funds’ Statements of Investments. |
| | For the fiscal year ended October 31, 2024, no lending activity took place. |
3. Agreements and Transactions with Affiliates
a.
| Investment Adviser: |
| | Under the Investment Advisory Agreements with the Trust, abrdn manages the Funds in accordance with the policies and procedures established by the Board. |
| | For services provided under the terms of the current Investment Advisory Agreements, each Fund pays the Adviser an annual management fee (as a percentage of its average daily net assets) paid monthly according to the following schedule: |
| | |
| Fund | Fee Schedule | |
China A Share Equity Fund
| Up to $500 million | 0.850% |
| | $500 million up to $2 billion | 0.800% |
| | On $2 billion and more | 0.750% |
Dynamic Dividend Fund
| Up to $250 million | 1.000% |
| | On $250 million and more | 0.950% |
EM SMA Completion Fund
| On all assets | -1 |
Emerging Markets Dividend Fund
| $0 up to $500 million | 0.750% |
| | $500 million up to $2 billion | 0.730% |
| | $2 billion and more | 0.700% |
Emerging Markets ex-China Fund
| Up to $500 million | 0.800% |
| | $500 million up to $2 billion | 0.750% |
| | On $2 billion and more | 0.700% |
Notes to Financial Statements (continued)
October 31, 2024
| Fund | Fee Schedule | |
Emerging Markets Fund
| On all assets | 0.900% |
Focused U.S. Small Cap Equity Fund
| Up to $500 million | 0.750% |
| | $500 million up to $2 billion | 0.700% |
| | On $2 billion and more | 0.650% |
Global Equity Impact Fund
| $0 up to $500 million | 0.750% |
| | $500 million up to $2 billion | 0.730% |
| | $2 billion and more | 0.700% |
Global Infrastructure Fund
| Up to $250 million | 0.750% |
| | $250 million up to $750 million | 0.700% |
| | $750 million to $1 billion | 0.650% |
| | On $1 billion and more | 0.550% |
International Small Cap Fund
| Up to $100 million | 0.850% |
| | On $100 million and more | 0.750% |
Realty Income & Growth Fund
| On all assets | 0.800% |
U.S. Small Cap Equity Fund
| Up to $100 million | 0.950% |
| | On $100 million and more | 0.800% |
U.S. Sustainable Leaders Fund
| Up to $500 million | 0.700% |
| | $500 million up to $2 billion | 0.650% |
| | On $2 billion and more | 0.600% |
| 1 | None of the Adviser, abrdn Asia Limited (“aAL”) or abrdn Investments Limited (“aIL” and collectively with aAL, the “Sub-advisers”) charges a management fee or sub-advisory fee to the Fund. |
The Adviser has engaged the services of affiliates aAL and aIL as Sub-advisers pursuant to subadvisory agreements. The Subadvisers manage a portion of certain Funds’ investments and have the responsibility for making all investment decisions for the portion of a Fund’s assets they manage. Pursuant to the subadvisory agreements, the Adviser pays fees to the Subadvisers.
The Trust and abrdn have entered into written contracts (“Expense Limitation Agreements”) limiting operating expenses for all classes of the Funds from exceeding the amounts listed in the tables below. For each Fund, this contractual limitation may not be terminated before February 28, 2025 (except for Emerging Markets ex-China Fund, whose contractual limitation may not be terminated before February 28, 2026) without the approval of the Trustees who are not “interested persons” of the Trust, as such term is defined by the 1940 Act (the “Independent Trustees”). For each Fund except the Dynamic Dividend Fund, Emerging Markets Dividend Fund, Global Equity Impact Fund and Global Infrastructure Fund, this limit excludes certain expenses, including any taxes, interest, brokerage fees, short-sale dividend expenses, acquired fund fees and expenses, Rule 12b-1 fees, administrative services fees, transfer agent out-of-pocket expenses for Class A shares, Class R shares, and Institutional Service Class shares and extraordinary expenses. The Expense Limitation Agreement with respect to the Dynamic Dividend Fund and Global Infrastructure Fund excludes certain expenses, including any interest, brokerage commissions, acquired fund fees and expenses, and extraordinary expenses. The Expense Limitation Agreement with respect to the Emerging Markets Dividend Fund and Global Equity Impact Fund excludes certain expenses, including any taxes, interest, brokerage fees, short-sale dividend expenses, acquired fund fees and expenses and Rule 12b-1 fees for Class A shares and extraordinary expenses.
| Fund | Limit |
China A Share Equity Fund
| 0.99% |
EM SMA Completion Fund
| 0.00% |
Emerging Markets Dividend Fund
| 0.90% |
Emerging Markets ex-China Fund
| 0.99% |
Emerging Markets Fund
| 1.10% |
Focused U.S. Small Cap Equity Fund
| 0.90% |
Global Equity Impact Fund
| 0.90% |
International Small Cap Fund
| 0.99% |
U.S. Small Cap Equity Fund
| 0.99% |
Notes to Financial Statements (continued)
October 31, 2024
| Fund | Limit |
U.S. Sustainable Leaders Fund
| 0.90% |
| Fund | Class A
Limit | Institutional
Class Limit |
Dynamic Dividend Fund
| 1.50% | 1.25% |
Global Infrastructure Fund
| 1.24% | 0.99% |
Realty Income & Growth Fund
| 1.24% | 0.99% |
Reimbursements, if any, are settled with the Adviser monthly. abrdn may request and receive reimbursement from a Fund of the advisory fees waived and other expenses reimbursed pursuant to the Expense Limitation Agreements as of a date not more than three years after the date when the Adviser limited the fees or reimbursed the expenses; provided that the following requirements are met: the reimbursements do not cause a class to exceed the lesser of the applicable expense limitation in the contract at the time the fees were limited or expenses are paid or the applicable expense limitation in effect at the time the expenses are being recouped by the Adviser, and the payment of such reimbursement is approved by the Board on a quarterly basis (the “Reimbursement Requirements”). Except as provided for in the Expense Limitation Agreements, reimbursement of amounts previously waived or assumed by abrdn is not permitted.
As of October 31, 2024, to the extent the Reimbursement Requirements are met, the cumulative potential reimbursements to abrdn for each Fund, based on expenses reimbursed by abrdn, including adjustments described above, would be:
| Fund | Amount
Fiscal Year
2022
(Expires 10/31/25) | Amount
Fiscal Year
2023
(Expires 10/31/26) | Amount
Fiscal Year
2024
(Expires 10/31/27) | Total* |
China A Share Equity Fund
| $299,918 | $158,769 | $212,288 | $670,975 |
Dynamic Dividend Fund
| 104,327 | 119,893 | 180,116 | 404,336 |
EM SMA Completion Fund
| – | 57,180 | 82,630 | 139,810 |
Emerging Markets Dividend Fund
| 427,265 | 260,483 | 336,332 | 1,024,080 |
Emerging Markets ex-China Fund
| 183,875 | 296,060 | 440,057 | 919,992 |
Emerging Markets Fund
| 3,610,371 | 1,294,758 | 1,295,131 | 6,200,260 |
Focused U.S. Small Cap Equity Fund
| 213,043 | 159,457 | 164,728 | 537,228 |
Global Equity Impact Fund
| 300,400 | 202,030 | 216,075 | 718,505 |
Global Infrastructure Fund
| 181,503 | 166,135 | 158,118 | 505,756 |
International Small Cap Fund
| 386,527 | 361,392 | 343,100 | 1,091,019 |
Realty Income & Growth Fund
| 214,703 | 186,600 | 150,016 | 551,319 |
U.S. Small Cap Equity Fund
| 573,835 | 674,100 | 496,861 | 1,744,796 |
U.S. Sustainable Leaders Fund
| 209,581 | 290,346 | 184,991 | 684,918 |
Amounts listed as “–” are $0 or round to $0.
| * | Amounts reported are due to expire throughout the respective 3-year expiration period presented above. |
b.
| Fund Administration: |
| | Under the terms of the Fund Administration Agreement, abrdn provides various administrative and accounting services, including daily valuation of the Funds' shares, preparation of financial statements, tax returns, regulatory reports, and presentation of quarterly reports to the Board. For services provided pursuant to the Fund Administration Agreement, the Trust pays abrdn an annual fee of 0.08% based on the Trust’s average daily net assets. The fee is then allocated proportionately among all funds within the Trust (including the Funds) in relation to the average daily net assets of each fund. This asset-based fee is subject to an annual minimum fee based on the number of funds served. Pursuant to a sub-administration agreement with abrdn, State Street provides sub-administration services with respect to the Funds. abrdn pays State Street for providing such services. |
Notes to Financial Statements (continued)
October 31, 2024
c.
| Distributor and Shareholder Servicing: |
| | The Trust and Aberdeen Fund Distributors, LLC (the “Distributor”) are parties to the current Underwriting Agreement (the “Underwriting Agreement”) whereby the Distributor acts as principal underwriter for the Trust’s shares. |
| | The Trust has adopted a Distribution Plan (the “Plan”) pursuant to Rule 12b-1 under the 1940 Act with respect to certain classes of shares. The Plan permits the Funds to compensate the Distributor, for expenses associated with the distribution-related and/or shareholder services provided by such entities. These fees are paid to the Distributor and are either kept or paid to shareholders’ financial advisors or other intermediaries for distribution and shareholder services. Although actual distribution expenses may be more or less, under the Plan, the Funds pay the Distributor an annual fee of the following amounts, based on the total net assets of each, respective class: |
| | |
| Fund | Class A
Shares | Class C
Shares(a) | Class R
Shares(a) |
China A Share Equity Fund
| 0.25% | 1.00% | 0.50% |
Dynamic Dividend Fund
| 0.25% | – | – |
EM SMA Completion Fund
| – | – | – |
Emerging Markets Dividend Fund
| 0.25% | – | – |
Emerging Markets ex-China Fund
| 0.25% | 1.00% | 0.50% |
Emerging Markets Fund
| 0.25% | 1.00% | 0.50% |
Focused U.S. Small Cap Equity Fund
| 0.25% | – | 0.50% |
Global Equity Impact Fund
| 0.25% | – | – |
Global Infrastructure Fund
| 0.25% | – | – |
International Small Cap Fund
| 0.25% | 1.00% | 0.50% |
Realty Income & Growth Fund
| 0.25% | – | – |
U.S. Small Cap Equity Fund
| 0.25% | 1.00% | 0.50% |
U.S. Sustainable Leaders Fund
| 0.25% | 1.00% | – |
| (a) | 0.25% of which is service fees. |
The Adviser or an affiliate of the Adviser may pay additional amounts from its own resources to dealers or other financial intermediaries, for aid in distribution or for aid in providing administrative services to shareholders.
Pursuant to the current Underwriting Agreement, the Distributor will also receive the proceeds of contingent deferred sales charges (“CDSCs”) of 1.00% imposed on certain redemptions of Class C (and up to 1.00% for certain Class A) shares.
In addition, the Distributor will re-allow to dealers 5.00% of sales charges on Class A shares of the Funds, which have a maximum front-end sales charge of 5.75% and the Distributor or the Adviser may compensate broker dealers or financial intermediaries from its own resources at the rate of 1.00% on sales of Class C shares of the Funds, which have a maximum CDSC of 1.00% (the CDSC assessed on sales within one year of purchase). The amount the Distributor retained for commissions from front-end sales charges and CDSC fees for the fiscal year ended October 31, 2024 was as follows:
| Fund | Commissions Retained
from Front-End Sales
Charges of Class A
Shares | Commissions Retained
from CDSC Fees of
Class C (Certain Class A) Shares |
China A Share Equity Fund
| $1,960 | $11 |
Dynamic Dividend Fund
| 1,343 | – |
EM SMA Completion Fund
| – | – |
Emerging Markets Dividend Fund
| – | – |
Emerging Markets ex-China Fund
| 9,698 | – |
Emerging Markets Fund
| 341 | 129 |
Focused U.S. Small Cap Equity Fund
| 14,535 | – |
Global Equity Impact Fund
| – | – |
Notes to Financial Statements (continued)
October 31, 2024
| Fund | Commissions Retained
from Front-End Sales
Charges of Class A
Shares | Commissions Retained
from CDSC Fees of
Class C (Certain Class A) Shares |
Global Infrastructure Fund
| $2,600 | $– |
International Small Cap Fund
| 926 | – |
Realty Income & Growth Fund
| – | – |
U.S. Small Cap Equity Fund
| 36,512 | 296 |
U.S. Sustainable Leaders Fund
| 2,105 | – |
| Total Retained | $70,020 | $ 436 |
Amounts listed as “–” are $0 or round to $0.
d.
| Administrative Services Fees/Transfer Agent Out-of-Pocket Expenses: |
| | The Funds may pay and/or reimburse administrative services fees/sub-transfer agent expenses to certain broker-dealers and financial intermediaries who provide administrative support services to beneficial shareholders on behalf of the Funds (sometimes referred to as “sub-transfer agency fees”), subject to certain limitations approved by the Board. These fees may be in addition to Rule 12b-1 fees. Sub-transfer agency fees generally include, but are not limited to, costs associated with recordkeeping, networking, sub-transfer agency or other administrative or shareholder services. |
| | Class A, Class R and Institutional Service Class shares of the Funds pay for such services pursuant to an Administrative Services Plan adopted by the Board. Under the Administrative Services Plan, a Fund may pay a broker-dealer or other intermediary a maximum annual administrative services fee of 0.25% for Class A, Class R and Institutional Service Class shares. Under an amendment to the Administrative Services Plan that is in effect until at least February 28, 2025, the administrative service fee for a Fund is limited to a maximum of 0.15% for contracts with fees that are calculated as a percentage of Fund assets and a maximum of $16 per account for contracts with fees that are calculated on a dollar per account basis; however, many intermediaries do not charge the maximum permitted fee or even a portion thereof. Class C and Institutional Class shares may also pay for the services described above directly, as these classes are not subject to an Administrative Services Plan. |
| | The aggregate amount of sub-transfer agent and administrative service fees paid during the year ended October 31, 2024 was as follows: |
| | |
| Fund | Class A | Class C | Class R | Institutional
Service | Institutional |
China A Share Equity Fund
| $8,559 | $401 | $2,848 | $263 | $4,012 |
Dynamic Dividend Fund
| 2,721 | – | – | – | 57,662 |
EM SMA Completion Fund
| – | – | – | – | – |
Emerging Markets Dividend Fund
| 94,184 | – | – | – | 8,788 |
Emerging Markets ex-China Fund
| 29,056 | 314 | 1,723 | 11,739 | 47,861 |
Emerging Markets Fund
| – | 2,142 | 147,453 | 693,704 | 845,432 |
Focused U.S. Small Cap Equity Fund
| 5,815 | – | 3,622 | 367 | 3,947 |
Global Equity Impact Fund
| 31,562 | – | – | – | 19,720 |
Global Infrastructure Fund
| 8,026 | – | – | – | 19,644 |
International Small Cap Fund
| 55,141 | 442 | 2,425 | – | 66,136 |
Realty Income & Growth Fund
| 350 | – | – | – | 25,349 |
U.S. Small Cap Equity Fund
| 152,088 | 16,724 | 5,350 | 39,489 | 164,292 |
U.S. Sustainable Leaders Fund
| 93,149 | 263 | – | 69,553 | 5,210 |
Amounts listed as “–” are $0 or round to $0.
Notes to Financial Statements (continued)
October 31, 2024
e.
| Purchase/Sale Transactions Between Affiliates |
| | The Funds are permitted to buy or sell securities with funds that have a common investment adviser (or investment advisers which are affiliates) under specific procedures which have been approved by the Board. The procedures are designed to satisfy the requirements of Rule 17a-7 of the Investment Company Act of 1940 (“Rule 17a-7”). During the year ended October 31, 2024, the Funds did not engage in any of these trades. |
4. Investment Transactions
Purchases and sales of securities (excluding short-term securities) for the fiscal year ended October 31, 2024, were as follows:
| Fund | Purchases | Sales |
China A Share Equity Fund
| $11,355,777 | $15,854,427 |
Dynamic Dividend Fund
| 74,017,154 | 82,504,617 |
EM SMA Completion Fund
| 198,837 | 161,036 |
Emerging Markets Dividend Fund
| 98,253,518 | 110,917,243 |
Emerging Markets ex-China Fund
| 133,810,084 | 34,167,685 |
Emerging Markets Fund
| 501,023,154 | 1,315,417,549 |
Focused U.S. Small Cap Equity Fund
| 14,229,013 | 17,223,042 |
Global Equity Impact Fund
| 21,773,531 | 29,867,330 |
Global Infrastructure Fund
| 6,133,011 | 13,872,857 |
International Small Cap Fund
| 41,780,200 | 79,515,878 |
Realty Income & Growth Fund
| 16,986,070 | 19,995,254 |
U.S. Small Cap Equity Fund
| 178,513,703 | 301,141,889 |
U.S. Sustainable Leaders Fund
| 62,373,484 | 101,192,053 |
5. Portfolio Investment Risks
a.
| Active Management Risk |
| | Each Fund is subject to the risk that the Adviser or Subadviser (as applicable) may make poor security selections. The Adviser, Subadviser and their portfolio managers apply their own investment techniques and risk analyses in making investment decisions for a Fund and there can be no guarantee that these decisions will achieve the desired results for a Fund. In addition, the Adviser or Subadviser may select securities that underperform the relevant market or other funds with similar investment objectives and strategies. |
b.
| Concentration Risk |
| | The Global Infrastructure Fund and Realty Income & Growth Fund are subject to concentration risk. Each Fund's strategy of concentrating in companies in a specific industry means that its performance will be closely tied to the performance of a particular market segment. Each Fund’s concentration in these companies may present more risks than if it were broadly diversified over numerous industries and sectors of the economy. A downturn in these companies would have a larger impact on each Fund than on a mutual fund that does not concentrate in such companies. At times, the performance of these companies will lag the performance of other industries or the broader market as a whole. |
c.
| Cybersecurity Risk |
| | Cybersecurity incidents may allow an unauthorized party to gain access to Fund assets, customer data (including private shareholder information), or proprietary information, or cause each Fund, the Adviser and/or their service providers (including, but not limited to, Fund accountants, custodians, sub-custodians, transfer agents and financial intermediaries) to suffer data breaches, data corruption or lose operational functionality. |
d.
| Dividend Strategy Risk |
| | The Dynamic Dividend Fund, Emerging Markets Dividend Fund and Realty Income & Growth Fund are subject to dividend strategy risk. There is no guarantee that the issuers of the stocks held by the Fund will declare dividends in the future or that, if dividends are declared, they will remain at their current levels or increase over time. The Fund’s emphasis on dividend paying stocks could cause the Fund to underperform similar funds that invest without consideration of a company’s track record of paying dividends or ability to pay dividends in the future. |
Notes to Financial Statements (continued)
October 31, 2024
| | Dividend-paying stocks may not participate in a broad market advance to the same degree as other stocks, and a sharp rise in interest rates or economic downturn could cause a company to unexpectedly reduce or eliminate its dividend. |
e.
| Emerging Markets Risk |
| | Emerging markets are countries generally considered to be relatively less developed or industrialized, and investments in emerging markets countries are subject to a magnification of the risks that apply to foreign investments. These risks are greater for securities of companies in emerging markets countries because of illiquidity, increased price volatility, smaller market capitalizations, less government regulation, less extensive and less frequent accounting, financial and other reporting requirements, loss resulting from problems in share registration and custody, substantial economic and political disruptions and the nationalization of foreign deposits or assets (see “Foreign Securities Risk” below). |
| | China Risk. Exposure to China and Hong Kong securities subjects the China A Shares Equity Fund to additional risks, and may make it significantly more volatile than more geographically diverse mutual funds. Additional risks associated with investments in China and Hong Kong include exposure to currency fluctuations, less liquidity, expropriation, confiscatory taxation, nationalization, exchange control regulations (including currency blockage), trading halts, imposition of tariffs, limitations on repatriation and differing legal standards. Any spread of an infectious illness, public health threat or similar issue could reduce consumer demand or economic output, result in market closures, travel restrictions or quarantines, and generally have a significant impact on the Chinese economy, which in turn could adversely affect the Fund’s investments. |
| | China A Shares Risk. Trading in China A Shares through Stock Connect and the QFII Programs involves additional risks. Stock Connect is subject to a daily quota (the “Daily Quota”), which limits the maximum net purchases under Stock Connect each day and, as such, buy orders for China A Shares would be rejected once the Daily Quota is exceeded (although the Fund will be permitted to sell China A Shares regardless of the Daily Quota balance). Further, Stock Connect, which relies on the connectivity of the Shanghai or Shenzhen markets with Hong Kong, is subject to operational risk, regulations that are relatively untested and are subject to change, and extended market closures for holidays or otherwise. During an extended market closure, the Fund’s ability to trade in China A Shares will be impacted which may affect the Fund’s performance. The QFII Programs are subject to the risk that the Adviser may have its QFII Programs license revoked or restricted with respect to the Fund or the Fund may be impacted by the rules, restrictions and quota limitations connected to reliance on a QFII Programs license. |
| | India Risk. The value of a Fund’s assets may be adversely affected by political, economic, social and religious factors, changes in Indian law or regulations and the status of India’s relations with other countries. In addition, the economy of India may differ favorably or unfavorably from the U.S. economy in such respects as the rate of growth of gross domestic product, the rate of inflation, capital reinvestment, resource self-sufficiency and balance of payments position. The Indian government has exercised and continues to exercise significant influence over many aspects of the economy, and the number of public sector enterprises in India is substantial. Accordingly, Indian government actions in the future could have a significant effect on the Indian economy, which could affect private sector companies and a Fund, market conditions, and prices and yields of securities in a Fund’s portfolio. Economic growth in India is constrained by inadequate infrastructure, a cumbersome bureaucracy, corruption, labor market rigidities, regulatory and foreign investment controls, the “reservation” of key products for small-scale industries and high fiscal deficits. Changes in economic policies, or lack of movement toward economic liberalization, could negatively affect the general business and economic conditions in India, which could in turn affect a Fund’s investments. The securities market in India is substantially smaller, less liquid and significantly more volatile than the securities market in the United States. The relatively small market capitalizations of, and trading values on, Indian stock exchanges may cause a Fund’s investments in securities listed on these exchanges to be comparatively less liquid and subject to greater price volatility than comparable U.S. investments. |
| | Russia/Ukraine Risk. In February 2022, Russia commenced a military attack on Ukraine. The outbreak of hostilities between the two countries and the threat of wider spread hostilities could have a severe adverse effect on the region and global economies, including significant negative impacts on the markets for certain securities and commodities, such as oil and natural gas. In addition, sanctions imposed on Russia by the United States and other countries, and any sanctions imposed in the future, could have a significant adverse impact on the Russian economy and related markets. The price and liquidity of investments may fluctuate widely as a result of the conflict and related events. How long the armed conflict and related events will last cannot be predicted. These tensions and any related events could have a significant impact on Fund performance and the value of the Funds’ investments. |
| | The Republic of Korea (South Korea) Risk. Concentrating investments in South Korea subjects the Fund to additional risks, and may make it significantly more volatile than geographically diverse mutual funds. Additional risks associated with investments in South Korea include political, economic and social instability, and the potential for increasing militarization in North Korea. The financial sector in South Korea has been subject to systemic weaknesses and illiquidity, which could be a material risk for any investments in South Korea if exacerbated. South Korea is dependent on. A significant increase in energy prices could have an adverse impact on South Korea’s economy as South Korea is dependent on foreign sources for much of its energy needs. The South Korean government has exercised and continues to exercise significant |
Notes to Financial Statements (continued)
October 31, 2024
| | influence over many aspects of the economy. Accordingly, South Korean government actions in the future could have a significant effect on the South Korean economy, which could affect private sector companies and the Fund, market conditions, and prices and yields of securities in the Fund’s portfolio. |
| | Shanghai-Hong Kong and Shenzhen-Hong Kong Stock Connect Risk. Investing in China A shares through Stock Connect involves various considerations and risks, including, but not limited to, illiquidity risk; currency risk; greater price volatility; legal and regulatory uncertainty risk; execution risk; operational risk; tax risk; credit risk; and economic, social and political instability of the stock market in the People’s Republic of China. |
| | Taiwan Risk. Including risks associated with investing in emerging markets, a Fund’s investment in or exposure to Taiwan is also subject to risks associated with, among other things, currency fluctuations, commodity shortages, less liquidity, expropriation, confiscatory taxation, nationalization and exchange control regulations (including currency blockage). Inflation and rapid fluctuations in inflation and interest rates have had, and may continue to have, negative effects on the economy and securities markets of Taiwan. In addition, investments in Taiwan could be adversely affected by political and economic relationship with China. |
f.
| Equity Linked Notes |
| | The China A Share Equity Fund may invest in equity-linked notes, which are generally subject to the same risks as the foreign equity securities or the basket of foreign securities they are linked to. If the linked security(ies) declines in value, the note may return a lower amount at maturity. The trading price of an equity-linked note also depends on the value of the linked security(ies). |
g.
| ESG Integration Risk |
| | To the extent ESG (Environmental, Social and Governance) factors are used to evaluate investments, the consideration of such factors may adversely affect a Fund’s performance. Not every ESG factor may be identified or evaluated for every investment. ESG characteristics are not the only factors considered and, as a result, the issuers in which a Fund invests may not be issuers with favorable ESG characteristics or high ESG ratings. The application of ESG factors may result in a Fund performing differently than its benchmark index and other funds in its peer group that do not consider ESG factors or consider different ESG factors. |
h.
| Equity Securities Risk |
| | The stock or other security of a company may not perform as well as expected, and may decrease in value, because of factors related to the company (such as poorer than expected earnings or certain management decisions), to the industry in which the company is engaged (such as a reduction in the demand for products or services in a particular industry), or to the market as a whole (such as periods of market volatility or instability, or general and prolonged periods of economic decline). |
i.
| Exchange-Traded Fund Risk |
| | To the extent that the China A Share Equity Fund invests in ETFs, the Fund may be subject to, among other risks, tracking error risk and passive and, in some cases, active management investment risk. An active secondary market in ETF shares may not develop or be maintained and may be halted or interrupted due to actions by its listing exchange, unusual market conditions or other reasons. There can be no assurance that an ETF’s shares will continue to be listed on an active exchange. In addition, Fund shareholders bear both their proportionate share of the Fund’s expenses and similar expenses incurred through the Fund’s ownership of the ETF. |
j.
| Focus Risk |
| | The Focused U.S. Small Cap Equity Fund invests a greater proportion of its assets in the securities of a smaller number of issuers and will be subject to greater volatility with respect to its investments than funds that invest in a larger number of securities. |
k.
| Foreign Currency Exposure Risk |
| | The value of foreign currencies relative to the U.S. Dollar fluctuates in response to market, economic, political, regulatory, geopolitical or other conditions. A decline in the value of a foreign currency versus the U.S. Dollar reduces the value in U.S. Dollars of investments denominated in that foreign currency. This risk may impact a Fund more greatly to the extent the Fund does not hedge its currency risk, or hedging techniques used by the Adviser are unsuccessful. |
Notes to Financial Statements (continued)
October 31, 2024
l.
| Foreign Securities Risk |
| | Foreign countries in which a Fund may invest may have markets that are less liquid, less regulated and more volatile than U.S. markets. The value of a Fund’s investments may decline because of factors such as unfavorable or unsuccessful government actions, reduction of government or central bank support and political or financial instability. To the extent the Fund focuses its investments in a single country or only a few countries in a particular geographic region, economic, political, regulatory or other conditions affecting such country or region may have a greater impact on Fund performance relative to a more geographically diversified fund. |
| | Japan Risk. The Japanese economy is heavily dependent upon international trade and may be subject to considerable degrees of economic, political and social instability, which could negatively affect the International Small Cap Fund. The Japanese yen has fluctuated widely during recent periods and may be affected by currency volatility elsewhere in Asia, especially Southeast Asia. In addition, the yen has had a history of unpredictable and volatile movements against the U.S. dollar. The performance of the global economy could have a major impact upon equity returns in Japan. Since the mid-2000s, Japan's economic growth has remained relatively low. Any economic recession may be likely compounded by an unstable financial sector, low domestic consumption, and certain corporate structural weaknesses, which remain some of the major issues facing the Japanese economy. Japan has also experienced natural disasters, such as earthquakes and tidal waves, of varying degrees of severity, which could negatively affect the International Small Cap Fund. |
m.
| Illiquid Securities Risk |
| | Illiquid securities are assets that a Fund reasonably expects cannot be sold or disposed of in current market conditions in seven calendar days or less without the sale or disposition significantly changing the fair value of the asset. An inability to sell a portfolio position can adversely affect a Fund’s value or prevent the Fund from being able to take advantage of other investment opportunities. Illiquid securities and relatively less liquid securities may also be difficult to value. |
| | The Adviser employs procedures and tests using third-party and internal data inputs that seek to assess and manage the liquidity of a Fund’s portfolio holdings. These procedures and tests take into account a Fund’s investment strategy and liquidity of portfolio investments during both normal and foreseeable stressed conditions, cash-flow projections during both normal and reasonably foreseeable stressed conditions, relevant market, trading and other factors, and monitor whether liquidity should be adjusted based on changed market conditions. These procedures and tests are designed to assist a Fund in determining its ability to meet redemption requests in various market conditions. In light of the dynamic nature of markets, there can be no assurance that these procedures and tests will enable a Fund to ensure that it has sufficient liquidity to meet redemption requests. |
n.
| Impact of Large Redemptions and Purchases of Fund Shares |
| | Occasionally, shareholders may make large redemptions or purchases of Fund shares, which may cause a Fund to have to sell securities or invest additional cash. These transactions may adversely affect the Fund’s performance and increase transaction costs. In addition, large redemption requests may exceed the cash balance of a Fund and result in credit line borrowing fees and/or overdraft charges to a Fund until the sales of portfolio securities necessary to cover the redemption request settle. |
o.
| Impact Investing and Sustainable Investing Risk |
| | In implementing the Global Equity Impact Fund’s ESG and the U.S. Sustainable Leaders Fund's "Sustainable Leaders" investment strategy, the Adviser may select or exclude securities of issuers in certain industries, sectors, regions or countries for reasons other than the issuer’s investment performance. For this reason, the Fund’s ESG or Sustainable Leaders strategy could cause it to perform differently compared to funds that do not have such strategy. ESG and Sustainable Leaders investing is qualitative and subjective by nature. In addition, the Fund may be required to sell a security when it might otherwise be disadvantageous for it to do so. In evaluating an issuer, the Adviser utilizes, in part, information and data obtained through voluntary or third-party reporting that may be incomplete, inaccurate or unavailable, which could cause the Adviser to incorrectly assess an issuer’s business practices with respect to the environment, social responsibility and corporate governance. Securities of companies with ESG practices may shift into and out of favor depending on market and economic conditions and may be linked to long-term rather than short-term returns. The definition of “impact investing” will vary according to an investor’s beliefs and values. In addition, there is a risk that the companies identified as sustainable leaders by the Adviser do not operate as expected when addressing ESG issues. There is no guarantee that the Adviser’s definition of impact investing, security selection criteria or investment judgment will reflect the beliefs or values of any particular investor. |
p.
| Infrastructure-Related Investment Risk |
| | Because the Global Infrastructure Fund concentrates its investments in infrastructure-related entities, the Fund has greater exposure to the potential adverse economic, regulatory, political and other changes affecting such entities. Infrastructure related entities are subject to a |
Notes to Financial Statements (continued)
October 31, 2024
| | variety of factors that may adversely affect their business or operations, including high interest costs in connection with capital construction programs, costs associated with environmental and other regulations, the effects of economic slowdown and surplus capacity, increased competition from other providers of services, uncertainties concerning the availability of fuel at reasonable prices, the effects of energy conservation policies and other factors. Additionally, infrastructure-related entities may be subject to regulation by various governmental authorities and may also be affected by governmental regulation of rates charged to customers, service interruption due to environmental, operational or other mishaps and the imposition of special tariffs and changes in tax laws, regulatory policies and accounting standards. |
q.
| Issuer Risk |
| | The value of a security may decline for reasons directly related to the issuer, such as management performance, financial leverage and reduced demand for the issuer's goods or services. |
r.
| Market Risk |
| | Deteriorating market conditions might cause a general weakness in the market that reduces the prices, or yield, of securities in that market. Developments in a particular class of bonds or the stock market could also adversely affect a Fund by reducing the relative attractiveness of bonds or stocks as an investment. Also, to the extent that a Fund emphasizes bonds or stocks from any given industry, it could be hurt if that industry does not do well. Additionally, a Fund could lose value if the individual stocks in which it maintains long positions and/or the overall stock markets on which the stocks trade decline in price. In addition, a Fund that engages in short sales could lose value if the individual stocks which they sell short increase in price. Stocks and stock markets may experience short-term volatility (price fluctuation) as well as extended periods of price decline or increase. Individual stocks are affected by many factors, including: |
| • | corporate earnings; |
| • | production; |
| • | management; |
| • | sales; and |
| • | market trends, including investor demand for a particular type of stock, such as growth or value stocks, small or large stocks, or stocks within a particular industry. |
Stock markets are affected by numerous factors, including interest rates, the outlook for corporate profits, the health of the national and world economies, the fluctuation of other stock markets around the world, and financial, economic and other global market developments and disruptions, such as those arising from war, terrorism, market manipulation, government interventions, defaults and shutdowns, political changes or diplomatic developments, public health emergencies and natural/environmental disasters. In addition, any spread of an infectious illness, public health threat or similar issue could reduce consumer demand or economic output, result in market closures, travel restrictions or quarantines, and generally have a significant impact on the world economy, which in turn could adversely affect the Fund’s investments.
Policy and legislative changes in the United States and in other countries are affecting many aspects of financial regulation, and governmental and quasi-governmental authorities and regulators throughout the world have responded to serious economic disruptions with a variety of significant fiscal and monetary policy changes, including but not limited to, direct capital infusions into companies, new monetary programs and interest rate hikes or reductions. The impact of these policies and legislative changes on the markets, and the practical implications for market participants, may not be fully known for some time. A reversal of these policies, or the ineffectiveness of these policies, could increase volatility in securities markets, which could adversely impact a Fund’s investments. The current market environment could make identifying investment risks and opportunities especially difficult for the Adviser.
Economies and financial markets throughout the world are becoming increasingly interconnected. As a result, whether or not a Fund invests in securities of issuers located in or with significant exposure to countries experiencing economic and financial difficulties, the value and liquidity of the Fund’s investments may be negatively affected by such events.
s.
| Mid-Cap Securities Risk |
| | Securities of medium-sized companies tend to be more volatile and less liquid than securities of larger companies. |
t.
| Non-Diversified Fund Risk |
| | The EM SMA Completion Fund and the Realty Income & Growth Fund's performance may be more volatile than a diversified fund because these Funds may invest a greater percentage of their total assets in the securities of a single issuer. |
Notes to Financial Statements (continued)
October 31, 2024
u.
| Non-U.S. Taxation Risk |
| | Income, proceeds and gains received by a Fund from sources within foreign countries may be subject to withholding and other taxes imposed by such countries, which will reduce the return on those investments. Tax treaties between certain countries and the United States may reduce or eliminate such taxes. |
| | If, at the close of its taxable year, more than 50% of the value of a Fund’s total assets consists of securities of foreign corporations, including for this purpose foreign governments, the Fund will be permitted to make an election under the Code that will allow shareholders a deduction or credit for foreign taxes paid by the Fund. In such a case, shareholders will include in gross income from foreign sources their pro rata shares of such taxes. A shareholder’s ability to claim an offsetting foreign tax credit or deduction in respect of such foreign taxes is subject to certain limitations imposed by the Code, which may result in the shareholder’s not receiving a full credit or deduction (if any) for the amount of such taxes. Shareholders who do not itemize on their U.S. federal income tax returns may claim a credit (but not a deduction) for such foreign taxes. If a Fund does not qualify for or chooses not to make such an election, shareholders will not be entitled separately to claim a credit or deduction for U.S. federal income tax purposes with respect to foreign taxes paid by the Fund; in that case the foreign tax will nonetheless reduce the Fund’s taxable income. Even if a Fund elects to pass through to its shareholders foreign tax credits or deductions, tax-exempt shareholders and those who invest in the Fund through tax-advantaged accounts such as IRAs will not benefit from any such tax credit or deduction. |
v.
| Portfolio Turnover Risk |
| | The Dynamic Dividend Fund may engage in active and frequent trading of portfolio securities to achieve its investment objective. High portfolio turnover may result in greater transaction costs which may reduce Fund performance. The sale of Fund portfolio securities may also result in greater realization and/or distribution to shareholders of gains or losses as compared to a Fund with less active trading, which may include short-term gains taxable at ordinary income tax rates. |
w.
| Qualified Dividend Income Tax Risk |
| | With respect to the Dynamic Dividend Fund, no assurance can be given as to what percentage of the distributions paid on shares, if any, will consist of tax-advantaged qualified dividend income or long-term capital gains or what the tax rates on various types of income will be in future years. The favorable U.S. federal tax treatment may be adversely affected, changed or repealed by future changes in tax laws at any time. In addition, it may be difficult to obtain information regarding whether distributions by non-U.S. entities in which a Fund invests should be regarded as qualified dividend income. Furthermore, to receive qualified dividend income treatment, a Fund must meet holding period and other requirements with respect to the dividend paying securities in its portfolio, and the shareholder must meet holding period and other requirements with respect to the common shares of a Fund. |
x.
| REIT and Real Estate Risk |
| | Investment in real estate investment trusts ("REITs") and real estate involves the risks that are associated with direct ownership of real estate and with the real estate industry in general. These risks include: declines in the value of real estate; risks related to local economic conditions, overbuilding and increased competition; increases in property taxes and operating expenses; changes in zoning laws; casualty or condemnation losses; variations in rental income, neighborhood values or the appeal of properties to tenants; changes in interest rates and changes in general economic and market conditions. REITs’ share prices may decline because of adverse developments affecting the real estate industry including changes in interest rates. The returns from REITs may trail returns from the overall market. Additionally, there is always a risk that a given REIT will fail to qualify for favorable tax treatment. REITs may be leveraged, which increases risk. Certain REITs charge management fees, which may result in layering the management fee paid by the Fund. |
y.
| Sector Risk |
| | To the extent that a Fund has a significant portion of its assets invested in securities of companies conducting business in a broadly related group of industries within an economic sector, the Fund may be more vulnerable to unfavorable developments in that economic sector than funds that invest more broadly. |
| | Consumer Staples Sector Risk. Companies in the consumer staples sector may be adversely affected by changes in the global economy, consumer spending, competition, demographics and consumer preferences, and production spending. Companies in the consumer staples sector may also be affected by changes in global economic, environmental and political events, economic conditions, the depletion of resources, and government regulation. For instance, government regulations may affect the permissibility of using various food additives and production methods of companies that make food products, which could affect company profitability. In addition, tobacco companies may be adversely affected by the adoption of proposed legislation and/or by litigation. Companies in the consumer staples sector also may be subject |
Notes to Financial Statements (continued)
October 31, 2024
| | to risks pertaining to the supply of, demand for and prices of raw materials. The prices of raw materials fluctuate in response to a number of factors, including, without limitation, changes in government agricultural support programs, exchange rates, import and export controls, changes in international agricultural and trading policies, and seasonal and weather conditions. Companies in the consumer staples sector may be subject to severe competition, which may also have an adverse impact on their profitability. |
| | Financials Sector Risk. To the extent that the financials sector represents a significant portion of a Fund, the Fund will be sensitive to changes in, and its performance may depend to a greater extent on, factors impacting this sector. Performance of companies in the financials sector may be adversely impacted by many factors, including, among others, government regulations, economic conditions, credit rating downgrades, changes in interest rates, decreased liquidity in credit markets as well as cyber-attacks. |
| | Healthcare Sector Risk. To the extent that the healthcare sector represents a significant portion of a Fund, the Fund will be sensitive to changes in, and its performance may depend to a greater extent on, factors impacting this sector. Healthcare-related companies may be smaller and less seasoned than companies in other sectors, and performance of companies in the healthcare sector may be adversely impacted by many factors, including, among others, government regulation. restrictions on government reimbursement for medical expenses, changes to the costs of medical products and services, pricing pressure, increased emphasis on outpatient services, a limited number of products, industry innovation, changes in technologies, and other market developments. Many healthcare-related companies are dependent on patent protection, and, therefore, the expiration of patents may adversely affect the profitability of healthcare-related companies. |
| | Industrials Sector Risk. To the extent that the industrial sector represents a significant portion of a Fund’s holdings, the Fund will be sensitive to changes in, and its performance may be adversely impacted by issues impacting this sector. The value of securities issued by companies in the industrials sector may be adversely affected by supply and demand related to their specific products or services and industrials sector products in general. The products of manufacturing companies may face obsolescence due to rapid technological developments and frequent new product introduction. Government regulations, world events, economic conditions and exchange rates may adversely affect the performance of companies in the industrials sector. Companies in the industrials sector may be adversely affected by liability for environmental damage and product liability claims. The industrials sector may also be adversely affected by changes or trends in commodity prices, which may be influenced by unpredictable factors. Companies in the industrials sector, particularly aerospace and defense companies, may also be adversely affected by government spending policies because companies involved in this sector rely to a significant extent on government demand for their products and services. |
| | Information Technology Sector Risk. To the extent that the information technology sector represents a significant portion of a Fund, the Fund will be sensitive to changes in, and its performance may depend to a greater extent on, factors impacting this sector. Information technology companies face intense competition, both domestically and internationally, which may have an adverse effect on their profit margins. Like other technology companies, information technology companies may have limited product lines, markets, financial resources or personnel. The products of information technology companies may face obsolescence due to rapid technological developments, frequent new product introduction, unpredictable changes in growth rates and competition for the services of qualified personnel. Companies in the information technology sector are heavily dependent on patent and intellectual property rights. The loss or impairment of these rights may adversely affect the profitability of these companies. |
| | Utilities Sector Risk. To the extent that the utilities sector represents a significant portion of the Fund’s portfolio, the Fund will be sensitive to changes in, and its performance may depend to a greater extent on, factors impacting this sector. Performance of companies in the utilities sector may be adversely impacted by many factors, including, among others, general economic conditions, supply and demand, financing and operating costs, rate caps, interest rates, liabilities arising from governmental or civil actions, consumer confidence and spending, competition, resource conservation and depletion, man-made or natural disasters, geopolitical events, and environmental, and other government regulations. |
z.
| Small-Cap Securities Risk |
| | Securities of smaller companies are usually less stable in price and less liquid than those of larger, more established companies. Therefore, they generally involve greater risk. |
aa.
| Valuation Risk |
| | The price that a Fund could receive upon the sale of any particular portfolio investment may differ from the Fund’s valuation of the investment, particularly for securities that trade in thin or volatile markets or that are valued using a fair valuation methodology or a price provided by an independent pricing service. As a result, the price received upon the sale of an investment may be less than the value ascribed |
Notes to Financial Statements (continued)
October 31, 2024
| | by a Fund, and the Fund could realize a greater than expected loss or lesser than expected gain upon the sale of the investment. The ability to value a Fund's investments may also be impacted by technological issues and/or errors by pricing services or other third-party service providers. |
| | Please read the Funds' prospectuses for more detailed information regarding these and other risks. |
6. Contingencies
In the normal course of business, the Funds may provide general indemnifications pursuant to certain contracts and organizational documents. The Funds' maximum exposure under these arrangements is dependent on future claims that may be made against the Funds, and therefore, cannot be estimated; however, the Funds expect the risk of loss from such claims to be remote.
7. Tax Information
As of October 31, 2024, the tax cost of securities and the breakdown of unrealized appreciation/(depreciation) for each Fund were as follows:
| Fund | Tax Cost of
Securities | Unrealized
Appreciation | Unrealized
Depreciation | Net
Unrealized
Appreciation/
(Depreciation) |
China A Share Equity Fund
| $22,789,257 | $1,142,101 | $(4,404,021) | $(3,261,920) |
Dynamic Dividend Fund
| 71,653,262 | 30,867,651 | (5,481,911) | 25,385,740 |
EM SMA Completion Fund
| 343,360 | 35,293 | (38,582) | (3,289) |
Emerging Markets Dividend Fund
| 84,275,619 | 9,627,352 | (15,153,673) | (5,526,321) |
Emerging Markets ex-China Fund
| 155,513,536 | 17,581,839 | (10,682,751) | 6,899,088 |
Emerging Markets Fund
| 1,141,618,886 | 247,419,535 | (143,473,588) | 103,945,947 |
Focused U.S. Small Cap Equity Fund
| 10,999,847 | 1,912,324 | (529,187) | 1,383,137 |
Global Equity Impact Fund
| 38,136,641 | 6,954,727 | (2,188,275) | 4,766,452 |
Global Infrastructure Fund
| 34,240,942 | 9,910,613 | (1,389,618) | 8,520,995 |
International Small Cap Fund
| 106,161,171 | 26,397,950 | (10,618,316) | 15,779,634 |
Realty Income & Growth Fund
| 30,899,198 | 10,294,706 | (578,112) | 9,716,594 |
U.S. Small Cap Equity Fund
| 312,012,627 | 58,057,751 | (26,359,815) | 31,697,936 |
U.S. Sustainable Leaders Fund
| 258,191,907 | 95,422,086 | (4,417,323) | 91,004,763 |
Notes to Financial Statements (continued)
October 31, 2024
The tax character of distributions during the fiscal year ended October 31, 2024 was as follows (total distributions paid may differ from the Statements of Changes in Net Assets because for tax purposes dividends are recognized when actually paid):
| Distributions paid from |
| Fund | Ordinary
Income | Net Long Term
Capital Gains | Total
Taxable
Distributions | Tax Exempt
Distributions | Return of
Capital | Total
Distributions Paid |
China A Share Equity Fund
| $107,895 | $– | $107,895 | $– | $– | $107,895 |
Dynamic Dividend Fund
| 4,984,574 | – | 4,984,574 | – | 610,332 | 5,594,906 |
EM SMA Completion Fund
| 3,317 | – | 3,317 | – | – | 3,317 |
Emerging Markets Dividend Fund
| – | – | – | – | – | – |
Emerging Markets ex-China Fund
| 300,452 | – | 300,452 | – | – | 300,452 |
Emerging Markets Fund
| 24,870,666 | – | 24,870,666 | – | – | 24,870,666 |
Focused U.S. Small Cap Equity Fund
| – | – | – | – | – | – |
Global Equity Impact Fund
| 514,951 | – | 514,951 | – | – | 514,951 |
Global Infrastructure Fund
| 1,078,132 | 388,583 | 1,466,715 | – | – | 1,466,715 |
International Small Cap Fund
| 1,078,998 | – | 1,078,998 | – | – | 1,078,998 |
Realty Income & Growth Fund
| 933,192 | 571,603 | 1,504,795 | – | – | 1,504,795 |
U.S. Small Cap Equity Fund
| – | – | – | – | – | – |
U.S. Sustainable Leaders Fund
| 587,436 | – | 587,436 | – | – | 587,436 |
Amounts listed as “–” are $0 or round to $0.
The tax character of distributions during the fiscal year ended October 31, 2023 was as follows (total distributions paid may differ from the Statements of Changes in Net Assets because for tax purposes dividends are recognized when actually paid):
| Distributions paid from |
| Fund | Ordinary
Income | Net Long Term
Capital Gains | Total
Taxable
Distributions | Tax Exempt
Distributions | Return of
Capital | Total
Distributions Paid |
China A Share Equity Fund
| $– | $– | $– | $– | $– | $– |
Dynamic Dividend Fund
| 6,078,834 | – | 6,078,834 | – | 47,844 | 6,126,678 |
EM SMA Completion Fund
| – | – | – | – | – | – |
Emerging Markets Dividend Fund
| 6,026,297 | – | 6,026,297 | – | – | 6,026,297 |
Emerging Markets ex-China Fund
| 244,237 | 5,716,302 | 5,960,539 | – | – | 5,960,539 |
Emerging Markets Fund
| 40,736,223 | – | 40,736,223 | – | – | 40,736,223 |
Focused U.S. Small Cap Equity Fund
| – | – | – | – | – | – |
Global Equity Impact Fund
| 2,389,081 | – | 2,389,081 | – | – | 2,389,081 |
Global Infrastructure Fund
| 1,381,951 | 865,603 | 2,247,554 | – | – | 2,247,554 |
International Small Cap Fund
| 3,165,367 | – | 3,165,367 | – | – | 3,165,367 |
Realty Income & Growth Fund
| 986,640 | 2,640,036 | 3,626,676 | – | – | 3,626,676 |
U.S. Small Cap Equity Fund
| – | 34,980,752 | 34,980,752 | – | – | 34,980,752 |
U.S. Sustainable Leaders Fund
| 1,407,365 | – | 1,407,365 | – | – | 1,407,365 |
Amounts listed as “–” are $0 or round to $0.
Notes to Financial Statements (continued)
October 31, 2024
As of October 31, 2024, the components of accumulated earnings/(deficit) on a tax basis were as follows:
| Fund | Undistributed
Tax Exempt
Income | Undistributed
Ordinary
Income | Undistributed
Long-Term
Capital
Gains | Accumulated
Earnings | Distributions
Payable | Late Year
Ordinary and
Post-October
Capital Loss
Deferrals | Unrealized
Appreciation/
(Depreciation)* | Accumulated
Capital and
Other
Losses** | Total
Accumulated
Earnings/
(Deficit) |
China A Share Equity Fund
| $– | $180,189 | $– | $– | $– | $– | $(3,261,921) | $(27,218,788) | $(30,300,520) |
Dynamic Dividend Fund
| – | – | – | – | – | – | 25,395,924 | (1,948,332) | 23,447,592 |
EM SMA Completion Fund
| – | 1,600 | – | – | – | – | (3,309) | (40,244) | (41,953) |
Emerging Markets Dividend Fund
| – | 1,736,943 | – | – | – | – | (5,357,762) | (395,925,618) | (399,546,437) |
Emerging Markets ex-China Fund
| – | 685,114 | 216,218 | – | – | – | 6,049,768 | (46,694,717) | (39,743,617) |
Emerging Markets Fund
| – | 10,260,752 | – | – | – | – | 93,919,849 | (100,802,284) | 3,378,317 |
Focused U.S. Small Cap Equity Fund
| – | – | – | – | – | (46,128) | 1,383,136 | (1,023,949) | 313,059 |
Global Equity Impact Fund
| – | – | – | – | – | (135,256) | 4,762,627 | (8,624,717) | (3,997,346) |
Global Infrastructure Fund
| – | – | 1,979,625 | – | – | – | 8,520,239 | – | 10,499,864 |
International Small Cap Fund
| – | 2,723,028 | – | – | – | – | 15,209,726 | (44,201,560) | (26,268,806) |
Realty Income & Growth Fund
| – | 161,165 | 3,544,230 | – | – | – | 9,648,439 | – | 13,353,834 |
U.S. Small Cap Equity Fund
| – | – | – | – | – | (869,330) | 31,697,936 | (29,908,750) | 919,856 |
U.S. Sustainable Leaders Fund
| – | – | – | – | – | (218,528) | 91,004,763 | (26,824,540) | 63,961,695 |
Amounts listed as “–” are $0 or round to $0.
| * | The difference between book-basis and tax-basis unrealized appreciation/(depreciation) is attributable to tax deferral of losses on wash sales and corporate actions. |
| ** | As of October 31, 2024, for federal income tax purposes, some Funds have capital loss carryforwards available to offset capital gains, if any, to the extent provided by the Treasury regulations, with no expiration. |
As of October 31, 2024, for federal income tax purposes, capital loss carryforwards, as shown in the table below, were available to the extent provided by the regulations to offset future realized gains of each respective Fund with no expiration.
| Fund | Amounts | Expires |
China A Share Equity Fund
| $2,259,940 | Unlimited (Short—Term) |
China A Share Equity Fund
| 24,958,848 | Unlimited (Long—Term) |
Dynamic Dividend Fund
| 1,948,332 | Unlimited (Short—Term) |
EM SMA Completion Fund
| 8,845 | Unlimited (Short—Term) |
EM SMA Completion Fund
| 31,399 | Unlimited (Long—Term) |
Emerging Markets Dividend Fund
| 5,275,127 | Unlimited (Short—Term) |
Emerging Markets Dividend Fund
| 390,650,491 | Unlimited (Long—Term) |
Emerging Markets ex-China Fund
| 8,031,350 | Unlimited (Short—Term) |
Emerging Markets ex-China Fund
| 38,663,367 | Unlimited (Long—Term) |
Emerging Markets Fund
| 37,468,381 | Unlimited (Short—Term) |
Emerging Markets Fund
| 63,333,903 | Unlimited (Long—Term) |
Focused U.S. Small Cap Equity Fund
| 518,938 | Unlimited (Short—Term) |
Focused U.S. Small Cap Equity Fund
| 505,011 | Unlimited (Long—Term) |
Global Equity Impact Fund
| 1,128,114 | Unlimited (Short—Term) |
Global Equity Impact Fund
| 7,496,603 | Unlimited (Long—Term) |
International Small Cap Fund
| 28,720,538 | Unlimited (Short—Term) |
International Small Cap Fund
| 15,481,022 | Unlimited (Long—Term) |
U.S. Small Cap Equity Fund
| 13,570,356 | Unlimited (Short—Term) |
U.S. Small Cap Equity Fund
| 16,338,394 | Unlimited (Long—Term) |
U.S. Sustainable Leaders Fund
| 4,764,975 | Unlimited (Short—Term) |
U.S. Sustainable Leaders Fund
| 22,059,565 | Unlimited (Long—Term) |
Notes to Financial Statements (continued)
October 31, 2024
U.S. GAAP requires that certain components of net assets be adjusted to reflect permanent differences between financial and tax reporting. Accordingly, the table below details the necessary reclassifications, which are a result of permanent differences primarily attributable to equalization and net operating loss. These reclassifications have no effect on net assets or NAVs per share.
| Fund | Paid-in
Capital | Distributable
Earnings/
(Accumulated
Loss) |
Dynamic Dividend Fund
| $(158,560) | $158,560 |
Emerging Markets ex-China Fund
| 44,321,392 | (44,321,392) |
Focused U.S. Small Cap Equity Fund
| (14,774) | 14,774 |
Global Equity Impact Fund
| (525) | 525 |
Global Infrastructure Fund
| 1 | (1) |
Realty Income & Growth Fund
| 246,202 | (246,202) |
U.S. Small Cap Equity Fund
| (1,242,271) | 1,242,271 |
U.S. Sustainable Leaders Fund
| 42,904 | (42,904) |
Amounts listed as “–” are $0 or round to $0.
8. Significant Shareholders
As of October 31, 2024, the Funds had shareholders with the percentage ownership indicated, which are considered significant shareholders (holdings greater than 5.0%) for financial reporting purposes:
| Fund | Record
Ownership % | Number of
Account Owners |
China A Share Equity Fund
| 46.9% | 3 |
Dynamic Dividend Fund
| 45.5 | 3 |
EM SMA Completion Fund1
| 100.0 | 1 |
Emerging Markets Dividend Fund
| 76.1 | 2 |
Emerging Markets ex-China Fund
| 46.4 | 5 |
Emerging Markets Fund
| 78.0 | 5 |
Focused U.S. Small Cap Equity Fund
| 56.0 | 5 |
Global Equity Impact Fund
| 46.0 | 5 |
Global Infrastructure Fund
| 57.8 | 4 |
International Small Cap Fund
| 56.4 | 2 |
Realty Income & Growth Fund
| 58.1 | 3 |
U.S. Small Cap Equity Fund
| 42.8 | 5 |
U.S. Sustainable Leaders Fund
| 13.7 | 1 |
| 1 | New funds or classes may be seeded with related party capital. As of year end, this Fund is wholly owned by a related party based on its recent formation. |
9. Line of Credit
The Trust, on behalf of each of the funds of the Trust (including the Funds) (the “Borrowers”), has entered into an agreement (the “Agreement”) with State Street Bank and Trust Company (the “Bank”), subject to annual renewal. The Agreement provides for a revolving credit facility (the “Credit Facility”) in the amount of $150,000,000 to be utilized for temporary or emergency purposes to fund shareholder redemptions or other short-term liquidity purposes.
As of October 31, 2024, the Emerging Markets Dividend Fund had $1,075,000, and the Realty Income & Growth Fund had $229,271 repayable to State Street.
Principal on each outstanding loan made under the Agreement bears interest at a variable rate per annum equal to (a) 10 basis points + (b) the higher of (i) the Federal Funds Rate on such date (not less than zero) plus one and one quarter of one percent (1.25%) or (ii) the Overnight Bank
Notes to Financial Statements (continued)
October 31, 2024
Funding Rate on such date plus one and one quarter of one percent (1.25%). In addition, the Borrowers shall pay to the Bank a commitment fee at the rate of 0.25% per annum on the daily unused portion of the Credit Facility, as applicable, which is allocated among the Borrowers in such manner as is determined by the Board to be reasonable. For each Fund that borrowed under the Credit Facility during the fiscal year ended October 31, 2024, the following table shows the average outstanding daily balance of the days the Fund utilized the Credit Facility and the average weighted interest rate paid by the Fund during the fiscal year ended October 31, 2024.
| Fund | Average Outstanding
Daily Balance | Average Weighted
Interest Rate | Days
Utilized |
China A Share Equity Fund
| $591,255 | 6.31% | 15 |
Dynamic Dividend Fund
| 340,571 | 6.62% | 67 |
EM SMA Completion Fund
| - | - | - |
Emerging Markets Dividend Fund
| 319,729 | 6.59% | 79 |
Emerging Markets ex-China Fund
| 787,500 | 6.68% | 2 |
Emerging Markets Fund
| 16,051,020 | 6.68% | 5 |
Focused U.S. Small Cap Equity Fund
| 607,718 | 6.40% | 6 |
Global Equity Impact Fund
| 782,824 | 6.65% | 5 |
Global Infrastructure Fund
| 312,120 | 6.66% | 87 |
International Small Cap Fund
| 510,275 | 6.45% | 19 |
Realty Income & Growth Fund
| 211,671 | 6.62% | 38 |
U.S. Small Cap Equity Fund
| 3,009,998 | 6.68% | 12 |
U.S. Sustainable Leaders Fund
| - | - | - |
10. Fund Reorganization
Effective June 21, 2024, the abrdn Emerging Markets ex-China Fund (the “Acquiring Fund”) acquired all of the assets and assumed all of the liabilities of the abrdn Emerging Markets Sustainable Leaders Fund (the “Acquired Fund”) pursuant to a plan of reorganization approved by the Board of Trustees on March 13, 2024.
The acquisition was accomplished by a tax-free exchange as follows:
6,229,012 shares of the Acquired Fund, fair valued at $70,710,559 for 5,568,395 shares of the Acquiring Fund.
The investment portfolio and cash of the Acquired Fund, with a fair value of $70,515,326 and identified cost of $68,266,807, were the principal assets acquired by the Acquiring Fund. For financial reporting purposes, assets received and shares issued by the Acquiring Fund were recorded at value; however, the cost basis of the investments received from the Acquired Fund was carried forward to align ongoing reporting of the Acquiring Fund’s realized and unrealized gains and losses with amounts distributable to shareholders for tax purposes. The Acquiring Fund acquired capital loss carryovers of $44,284,297 which is subject to loss limitations from the Acquired Fund. Immediately prior to the Reorganization, the investment portfolio and cash of the Acquiring Fund was $89,594,936.
Assuming that the Reorganization had been completed on November 1, 2023, the Acquiring Fund’s pro forma results of operations for the year ended October 31, 2024 are as follows:
| | |
| Net investment income | $1,556,512 |
| Net realized and unrealized gain from investments | 17,408,713 |
| Net increase in net assets from operations | 18,965,225 |
Because the combined investment portfolios have been managed as a single integrated portfolio since the Reorganization was completed, it is not practicable to separate the amounts of revenue and earnings of the Acquired Fund that have been included in the Statement of Operations since June 21, 2024.
Notes to Financial Statements (continued)
October 31, 2024
The chart below shows a summary of net assets and shares outstanding, before and after the Reorganization.
| | Before Reorganization | After Reorganization |
| | abrdn Emerging Markets
Sustainable Leaders Fund | abrdn Emerging Markets
ex-China Fund | abrdn Emerging Markets
ex-China Fund |
| Net Assets: | | | |
Class A Shares
| $10,051,470 | $24,333,406 | $34,384,876 |
Class C Shares
| 16,492 | 303,752 | 320,244 |
Class R Shares
| 2,225,186 | 587,197 | 2,812,383 |
Institutional Service Class Shares
| 51,591,402 | 136,241 | 51,727,643 |
Institutional Class Shares
| 6,826,009 | 64,008,924 | 70,834,933 |
| Shares Outstanding: | | | |
Class A Shares
| 906,216 | 1,948,414 | 2,753,253 |
Class C Shares
| 1,610 | 27,534 | 29,029 |
Class R Shares
| 215,225 | 51,043 | 244,470 |
Institutional Service Class Shares
| 4,514,592 | 10,637 | 4,038,572 |
Institutional Class Shares
| 591,369 | 5,070,228 | 5,610,927 |
| Net Asset Value per Share: | | | |
Class A Shares
| $11.09 | $12.49 | $12.49 |
Class C Shares
| 10.24 | 11.03 | 11.03 |
Class R Shares
| 10.34 | 11.50 | 11.50 |
Institutional Service Class Shares
| 11.43 | 12.81 | 12.81 |
Institutional Class Shares
| 11.54 | 12.62 | 12.62 |
Net unrealized appreciation/(depreciation)
| 2,248,519 | 8,308,139 | 10,556,658 |
Accumulated net realized gain/(loss)
| (44,320,926) | (3,991,335) | (48,312,261) |
Amounts listed as “–” are $0 or round to $0.
11. New Accounting Pronouncement
In November 2023, the FASB issued ASU 2023-07, “Segment Reporting (Topic 280): Improvements to Reportable Segment Disclosures (“ASU 2023-07”), which enhances disclosure requirements about significant segment expenses that are regularly provided to the chief operating decision maker (the “CODM”). ASU 2023-07, among other things, (i) requires a single segment public entity to provide all of the disclosures as required by Topic 280, (ii) requires a public entity to disclose the title and position of the CODM and an explanation of how the CODM uses the reported measure(s) of segment profit or loss in assessing segment performance and deciding how to allocate resources and (iii) provides the ability for a public entity to elect more than one performance measure. ASU 2023-07 is effective for the fiscal years beginning after December 15, 2023, and interim periods within fiscal years beginning after December 15, 2024. Early adoption is permitted and retrospective adoption is required for all prior periods presented. The Trust is currently assessing the impact of this guidance, however, the Trust does not expect a material impact on its financial statements.
12. Subsequent Events
Management has evaluated the need for disclosures and/or adjustments resulting from subsequent events through the date the financial statements were issued. Based on this evaluation, no disclosures and/or adjustments were required to the financial statements as of October 31, 2024, other than as noted below.
At a meeting held on September 11, 2024, the Board approved, on behalf of each Fund listed below, the conversion of each Fund into an ETF (each, a “Conversion”), which will continue to be managed by abrdn Inc., the investment adviser for the Funds, and, as applicable, abrdn Investments Limited, the sub-adviser for the abrdn Emerging Markets Dividend Fund. The Board, including all of the Trustees who are not “interested persons” (as defined in the Investment Company Act of 1940, as amended (the “1940 Act”)) of the Trust, determined that participation in the Conversions is in the best interests of each Fund and that the interests of existing shareholders of the Funds will not be diluted as a result of the Conversions.
Notes to Financial Statements (concluded)
October 31, 2024
Each Fund will be converted from a mutual fund to an ETF, as listed in the table below, which is expected to occur on or around February 14, 2025:
| Current Fund | Proposed ETF |
| abrdn Focused U.S. Small Cap Equity Fund | abrdn Focused U.S. Small Cap Active ETF |
| abrdn Emerging Markets Dividend Fund | abrdn Emerging Markets Dividend Active ETF |
At a meeting held on December 11, 2024 (the "Meeting"), the Board approved changes in the name, 80% policy, benchmark index and portfolio managers for the Global Equity Impact Fund. As of the effective date of an amendment to the Trust’s registration statement, which is anticipated to be on or about February 28, 2025 (the "Effective Date"): (i) the abrdn Global Equity Impact Fund will change its name from "abrdn Global Equity Impact Fund" to the "abrdn Focused Emerging Markets ex-China Fund"; (ii) the Global Equity Impact Fund’s 80% policy will change from a non-fundamental policy to invest, under normal circumstances, at least 80% of the value of its net assets, plus any borrowings for investment purposes, in equity securities issued by companies located throughout the world (including the U.S.) to a non-fundamental policy to invest, under normal circumstances, at least 80% of the value of its net assets, plus any borrowings for investment purposes, in equity securities of emerging market (excluding China) companies; (iii) the MSCI Emerging Markets ex-China Index (Net TR) will replace the MSCI All Country World Index (Net TR) as the abrdn Global Equity Impact Fund’s primary benchmark; and (iv) the abrdn Global Equity Impact Fund's portfolio managers will be Devan Kaloo and Nick Robinson.
At the Meeting, the Board also approved a change in the Dynamic Dividend Fund's non-fundamental policy to invest, under normal circumstances, at least 80% of its net assets in the equity securities of certain domestic and foreign corporations that pay dividend income that it believes are undervalued relative to the market and to the securities' historic valuations to a non-fundamental policy to invest, under normal circumstances, at least 80% of its net assets in the equity securities of certain domestic and foreign corporations that pay dividend income. Such change will take effect on the Effective Date.
At the Meeting, the Board also approved a change in the Realty Income & Growth Fund's name from "abrdn Realty Income & Growth Fund" to "abrdn Real Estate Fund". Such change will take effect on the Effective Date. At the Meeting, the Board also approved a change in the abrdn Global Infrastructure Fund's name from "abrdn Global Infrastructure Fund" to "abrdn Global Infrastructure Equity Fund". Such change will take effect on the Effective Date.
At the Meeting, the Board also approved the adoption of a conversion feature for Class C of the U.S. Sustainable Leaders Fund and the Institutional Service Class of the China A Share Equity Fund. Under the relevant conversion feature, effective after the close of business on February 26, 2025, all of the issued and outstanding shares of Class C of abrdn U.S. Sustainable Leaders Fund will be converted into shares of Class A of the same Fund and all of the issued and outstanding shares of Institutional Service Class of abrdn China A Share Equity Fund will be converted into shares of Institutional Class of the same Fund.
Report of Independent Registered Public Accounting Firm
To the Shareholders and Board of Trustees
abrdn Funds:
Opinion on the Financial Statements
We have audited the accompanying statements of assets and liabilities of abrdn China A Share Equity Fund, abrdn Dynamic Dividend Fund, abrdn EM SMA Completion Fund, abrdn Emerging Markets Dividend Fund (formerly, abrdn International Sustainable Leaders Fund), abrdn Emerging Markets ex-China Fund, abrdn Emerging Markets Fund, abrdn Focused U.S. Small Cap Equity Fund (formerly, abrdn U.S. Sustainable Leaders Smaller Companies Fund), abrdn Global Equity Impact Fund, abrdn Global Infrastructure Fund, abrdn International Small Cap Fund, abrdn Realty Income & Growth Fund, abrdn U.S. Small Cap Equity Fund, and abrdn U.S. Sustainable Leaders Fund, thirteen of the funds comprising abrdn Funds (each, a Fund and collectively, the Funds), including the statements of investments, as of October 31, 2024, the related statements of operations for the year then ended, the statements of changes in net assets for each of the years in the two-year period then ended, except for abrdn EM SMA Completion Fund, for which the period is for the year ended October 31, 2024 and the period from January 27, 2023 (commencement of operations) through October 31, 2023, and the related notes (collectively, the financial statements) and the financial highlights for each of the years in the five-year period then ended, except for abrdn EM SMA Completion Fund, for which the period is for the year ended October 31, 2024 and the period from January 27, 2023 through October 31, 2023. In our opinion, the financial statements and financial highlights present fairly, in all material respects, the financial position of the Funds as of October 31, 2024, the results of their operations for the year then ended, the changes in their net assets for each of the years or periods in the two-year period then ended, and the financial highlights for each of the years or periods in the five-year period then ended, in conformity with U.S. generally accepted accounting principles.
Basis for Opinion
These financial statements and financial highlights are the responsibility of the Funds' management. Our responsibility is to express an opinion on these financial statements and financial highlights based on our audits. We are a public accounting firm registered with the Public Company Accounting Oversight Board (United States) (PCAOB) and are required to be independent with respect to the Funds in accordance with the U.S. federal securities laws and the applicable rules and regulations of the Securities and Exchange Commission and the PCAOB.
We conducted our audits in accordance with the standards of the PCAOB. Those standards require that we plan and perform the audit to obtain reasonable assurance about whether the financial statements and financial highlights are free of material misstatement, whether due to error or fraud. Our audits included performing procedures to assess the risks of material misstatement of the financial statements and financial highlights, whether due to error or fraud, and performing procedures that respond to those risks. Such procedures included examining, on a test basis, evidence regarding the amounts and disclosures in the financial statements and financial highlights. Such procedures also included confirmation of securities owned as of October 31, 2024, by correspondence with the custodian and brokers; when replies were not received from brokers, we performed other auditing procedures. Our audits also included evaluating the accounting principles used and significant estimates made by management, as well as evaluating the overall presentation of the financial statements and financial highlights. We believe that our audits provide a reasonable basis for our opinion.

We have served as the auditor of one or more abrdn investment companies since 2009.
Columbus, Ohio
December 27, 2024
Other Tax Information (Unaudited)
For the year ended October 31, 2024, certain dividends paid by the Funds may be subject to a maximum tax rate of 15% or 20% (depending upon income levels) as qualified dividend income. The Funds intend to designate the maximum amount allowable as taxed at a maximum rate of 15%. Complete information will be reported in conjunction with your 2024 Form 1099-DIV.
| Fund | Qualified
Dividend
Income |
| China A Share Equity Fund | 29.67% |
| Dynamic Dividend Fund | 69.15% |
| EM SMA Completion Fund | 49.02% |
| Emerging Markets ex-China Fund | 47.28% |
| Emerging Markets Fund | 26.26% |
| Global Equity Impact Fund | 10.69% |
| Global Infrastructure Fund | 100.00% |
| International Small Cap Fund | 12.14% |
| Realty Income & Growth Fund | 0.06% |
For the taxable year ended October 31, 2024, the following percentage of income dividends paid by the Funds qualify for the dividends received deduction available to corporate shareholders:
| Fund | Dividends
Received
Deduction |
| Dynamic Dividend Fund | 22.36% |
| Emerging Markets ex-China Fund | 1.34% |
| Emerging Markets Fund | 0.88% |
| Global Equity Impact Fund | 10.69% |
| Global Infrastructure Fund | 35.33% |
| Realty Income & Growth Fund | 0.06% |
The Funds intend to elect to pass through to their shareholders the credit for taxes paid in foreign countries during its fiscal year ended October 31, 2024. In accordance with the current tax laws, the foreign income and foreign tax per share (for a share outstanding as of October 31, 2024) were as follows:
| Fund | Foreign Tax |
| China A Share Equity Fund | $0.0525 |
| EM SMA Completion Fund | $0.0292 |
| Emerging Markets ex-China Fund | $0.0284 |
| Emerging Markets Fund | $0.1425 |
| Global Infrastructure Fund | $0.0574 |
| International Small Cap Fund | $0.0683 |
During the year ended October 31, 2024, the following Funds reported dividends as long-term capital gains:
| Fund | Amount |
| Global Infrastructure Fund | $388,583 |
| Realty Income & Growth Fund | $765,933 |
Changes in and Disagreement with Accountants for Open-End Management Investment Companies
Proxy Disclosures for Open-End Management Investment Companies
Remuneration Paid to Trustees, Officers, and Others of Open-End Management Investment Companies
Remuneration paid to trustees, officers and others is included in the Statement of Operations under the line items “Trustee Fees” and “Investment Advisory Fees” as part of the financial statements filed under Item 7 of this Form N-CSR.
Board of Trustees' Consideration of Investment Advisory and Sub-Advisory Agreements (Unaudited)
At a regularly scheduled quarterly meeting (the “Quarterly Meeting”) of the Board of Trustees (the “Board” or the “Trustees”) of the abrdn Funds (the “Trust”) held on June 11, 2024, the Board, including a majority of the Trustees who are not considered to be “interested persons” of the Trust (the “Independent Trustees”) under the Investment Company Act of 1940, as amended (the “1940 Act”), approved for an annual period the continuation of the Trust’s advisory agreements (the “Advisory Agreement”) with abrdn Inc. (the “Adviser”) and the applicable sub-advisory agreement (the “Sub-Advisory Agreement,” and collectively with the Advisory Agreement, the “Agreements”) by and among: (i) the Trust, the Adviser and abrdn Asia Limited (“AAL”) and (ii) the Trust, the Adviser and abrdn Investments Limited (“aIL”) (AAL and aIL, each a “Sub-Adviser,” and collectively, the “Sub-Advisers” and together with the Adviser, the “Advisers” or “abrdn”) for each of the following series of the Trust: abrdn China A Share Equity Fund, abrdn Dynamic Dividend Fund, abrdn EM SMA Completion Fund, abrdn Emerging Markets Dividend Fund, abrdn Emerging Markets ex-China Fund, abrdn Emerging Markets Fund, abrdn Focused U.S. Small Cap Equity Fund, abrdn Global Equity Impact Fund, abrdn Global Infrastructure Fund, abrdn International Small Cap Fund, abrdn Realty Income & Growth Fund, abrdn U.S. Small Cap Equity Fund and abrdn U.S. Sustainable Leaders Fund (each a “Fund,” and collectively the “Funds”). In connection with their consideration of whether to approve the continuation of the Agreements, the Board members received and reviewed a variety of information provided by the Advisers relating to the Funds, the Agreements and the Advisers, including information regarding the nature, extent and quality of services provided by the Advisers under respective Agreements, comparative investment performance, fee and expense information of peer groups of funds for respective Funds (each a “Peer Group,” and collectively the “Peer Groups”) selected by Institutional Shareholder Services Inc. (“ISS”), an independent third-party provider of investment company data and other performance information for relevant benchmark indices (collectively, the “15(c) Materials”). In addition, the Independent Trustees held a separate telephonic meeting in advance of the Quarterly Meeting (the “Review Meeting”) to review the materials provided and the relevant legal considerations, and met in executive session outside the presence of Fund management at the Review Meeting and Quarterly Meeting with their independent legal counsel to discuss the Agreements. The Independent Trustees also, together with the independent board members of other registered investment companies advised by the Advisers and their affiliates (collectively, the “abrdn Funds complex”), met in advance of the Quarterly Meeting with the Chief Investment Officer (the “CIO”) of abrdn plc, the ultimate parent of the Advisers. During their meeting with the CIO, the Independent Trustees received information on, and responses to their questions concerning, among other items, abrdn plc’s and the Advisers’ investment decision-making framework, monitoring of investment theses and responses to underperformance, key personnel and investment teams, and investment product development at abrdn plc, including with respect to the abrdn Funds complex. In addition to the 15(c) Materials, the Board received and reviewed materials in advance of each regular quarterly meeting that contained information about the Funds and their investment performance and information relating to the services provided by the Advisers.
The 15(c) Materials provided to the Board generally included, among other items: (i) information on the investment performance of the Funds and the performance of the Funds’ respective Peer Groups and the Funds’ performance benchmarks; (ii) information on the Funds’ advisory fees and other expenses, including information comparing each Fund’s expenses to those of the respective Peer Group and information about any applicable expense limitations and fee “breakpoints”; (iii) information about the profitability of the Agreements to the Advisers; (iv) a report prepared by the Advisers in response to a request submitted by the Independent Trustees’ independent legal counsel on behalf of such Trustees; and (v) a memorandum from the Independent Trustees’ independent legal counsel on the responsibilities of the Board in considering for approval the investment advisory and investment sub-advisory arrangements under the 1940 Act and Delaware law.
In addition, the Board, including the Independent Trustees, also considered information that the Advisers had provided concerning: (i) the Advisers’ investment personnel and operations; (ii) the Advisers’ financial stability and financial condition; (iii) the resources devoted by the Advisers to the Fund; (iv) each Fund’s investment objective and strategies and the Advisers’ record of compliance with the Funds’ investment policies and restrictions; (v) the Advisers’ and their affiliates’ compliance program; (vi) arrangements relating to the distribution of the Funds’ shares and the related costs; (vii) possible conflicts of interest; and (viii) the allocation of the Funds’ brokerage, if any, including, if applicable, allocations to brokers affiliated with the Advisers and the use, if any, of “soft” commission dollars to pay Fund expenses and to pay for research and other similar services. The Board also considered the nature, extent and quality of the services provided to the Funds by the Adviser's affiliates. Throughout the process, including at the meeting with the CCO, the Review Meeting and the Quarterly Meeting, the Trustees were afforded and availed themselves of the opportunity to ask questions of and request additional information from the Advisers.
The Independent Trustees were advised by separate independent legal counsel throughout the process and also consulted in executive sessions with their counsel regarding their consideration of the continuation of the Agreements. In considering whether to approve the continuation of the Agreements, the Board of Trustees, including the Independent Trustees, did not identify any single factor as determinative. Individual Trustees may have evaluated the information presented differently from one another and given different weights to various factors. Matters considered by the Trustees, including the Independent Trustees, in connection with their approval of the continuation of the Agreements included the factors listed below.
Investment performance of the Funds and the Advisers. The Trustees received and reviewed information that compared the Funds’ return over various periods of time to those of comparable unaffiliated investment companies and discussed this information and other related performance data with management. The Board received and considered information on performance compiled by ISS on each Fund’s total return as compared with the funds in the respective Fund’s Morningstar category (the “Morningstar Group”), and in comparison to the Fund’s performance benchmark. The Trustees also considered the performance of the Funds compared to the performance of comparable funds or accounts managed by abrdn Inc. and its affiliates to the extent available. In addition, the Trustees also reviewed data prepared by ISS that analyzed the performance of the Funds using a variety of performance metrics.
Board of Trustees' Consideration of Investment Advisory and Sub-Advisory Agreements (Unaudited)
(continued)
The Trustees also considered, as applicable, the performance of the Funds since the Advisers commenced management of the Funds. The Trustees also considered the Advisers' and the Sub-Advisers’ performance generally, the performance of the fund family generally, the historical responsiveness of abrdn Inc. to Trustee concerns about performance, and the willingness of the Adviser and the Sub-Advisers to take steps intended to improve performance. The Board received additional information concerning those Funds that had changed their investment strategies during the year, and also received information from the Advisers providing additional discussion about the factors contributing to differences in performance for Funds that the Advisers considered performance outliers over the year. The Board concluded that the Funds’ overall performance, in conjunction with management’s explanation of the reasons for underperformance and the actions taken to improve performance, was acceptable.
The costs of the services provided and profits realized by the Advisers and their affiliates from their relationships with the Funds. The Trustees considered the fees charged to the Funds for advisory services as well as the total expense levels of the Funds. This information included comparisons (provided by ISS) of each Fund’s net management fee and total expense ratio to those of its expense Peer Group and information about the advisory fees charged by abrdn Inc. and/or its affiliates to any separately managed and other accounts with a similar strategy. In reviewing the ISS comparison of each Fund’s net management fee to that of its respective Peer Group, the Board noted that the fee for the Funds includes both advisory and administrative fees.The Trustees noted that for certain Funds, abrdn Inc. had contractually reduced its advisory fee during the previous year. In evaluating the Funds’ advisory fees, the Trustees considered the demands, complexity and quality of the investment management of the Funds. In considering the fees charged by abrdn Inc. and/or its affiliates to any comparable accounts, the Trustees also considered, among other things, management’s discussion of the different investment restrictions, objectives or policies that may be involved in managing accounts of different types.
The Trustees also noted that the sub-advisory fees, as applicable, for the Funds would not be paid by the Funds, but would be paid by the Adviser out of its advisory fee. The Board also considered that the Adviser had entered into or renewed expense limitation agreements with each of the Funds, pursuant to which the Adviser agreed to waive a portion of its advisory fee and/or reimburse certain expenses as a means of limiting each Fund’s total annual operating expenses for a period of time, and that for certain Funds, the Adviser had increased the amount of its reimbursements over the previous year to lower the total operating expenses of the respective Funds.
The Trustees also considered the compensation the Adviser and its affiliates received, directly and indirectly, from their relationships with the Funds. The Trustees reviewed information provided by management as to the profitability of the Adviser and its affiliates’ relationships with the Funds, including the engagement the Adviser and its affiliates to provide administrative and distribution services, respectively, to the Funds. The Trustees also considered information about the allocation of expenses used to calculate profitability. When reviewing profitability, the Trustees also considered information about the expense levels of the Funds, the performance of the Funds, court cases regarding adviser profitability, and whether the adviser had implemented breakpoints and expense limitations with respect to the Funds. The Trustees also examined the profitability of abrdn Inc. and its affiliates on a Fund-by-Fund basis. The Board determined that the cost of services provided and profits realized by the Advisers were reasonable in light of the services provided by the Advisers to the Funds under the Advisory Agreements.
The nature, extent and quality of the services provided to the Funds under the Agreements. The Trustees considered the nature, extent and quality of the services provided by the Adviser and the Sub-Advisers, as applicable, to the Funds and the resources dedicated to the Funds by abrdn Inc. and its affiliates. The Trustees took into account the Advisers’ investment experience and considered, with respect to the Funds that had engaged a Sub-Adviser, the allocation of responsibilities between the Advisers. Board also considered the background and experience of the Advisers’ senior management personnel and the qualifications, background and responsibilities of the portfolio managers that are primarily responsible for the day-to-day portfolio management services for the Funds. The Board also considered the financial condition of the Advisers and the Advisers’ ability to provide quality services to each Fund. Management reported on, among other things, its business plans and organizational structures. The Board reviewed information on the Advisers’ risk management processes. The Board also considered that it received information on a regular basis from the Trust’s Chief Compliance Officer regarding the Advisers’ compliance policies and procedures and considered the Advisers’ brokerage policies and practices. The Trustees also took into account the Advisers’ investment experience and considered information regarding the Advisers’ compliance with applicable laws and Securities and Exchange Commission and other regulatory inquiries or audits of the Funds and/or the Advisers. The Trustees also considered the benefits to shareholders of investing in a mutual fund that is part of a family of funds that offers shareholders the right to exchange shares of one type of fund for shares of another type of fund, and provides a variety of fund and shareholder services. In determining that the nature, extent and quality of the services provided to the Funds were adequate and appropriate, the Trustees also took into account their knowledge of management and the quality of the performance of management’s duties through Board meetings, discussion and reports during the preceding year.
The Independent Trustees also took into account their recent meetings, together with the independent board members of other registered investment companies in the abrdn Funds complex, with the chair of abrdn plc and abrdn plc’s interim Chief Executive Officer. During those meetings, the abrdn plc representatives responded to questions from the Independent Trustees and affirmed abrdn’s long-term commitment to the investment business and the abrdn Funds complex in particular.
Economies of Scale. The Trustees considered the existence of any economies of scale in the provision of services by the Advisers and the Sub-Advisers and whether those economies would be shared with the Funds through breakpoints in the investment advisory fees or other means, such as expense waivers or limitations. The Board noted management’s discussion of the Funds’ advisory fee structures. The Trustees noted that each of the Funds was subject to a contractual expense limitation agreement and considered that certain Funds had breakpoints in their
Board of Trustees' Consideration of Investment Advisory and Sub-Advisory Agreements (Unaudited)
(concluded)
investment advisory fees that lowered the fee rate as a Fund’s assets grew. The Trustees also took note of the costs of the services provided and the profitability to the Adviser and its affiliates from their relationships with the Funds, as discussed above.
Other Factors. The Trustees also considered other factors, which included: (i) the nature, quality, cost and extent of administrative services performed by abrdn Inc. under the Advisory Agreement and under a separate agreement covering administrative services; (ii) whether the Funds have operated in accordance with their investment objectives as well as the Funds’ record of compliance with their investment restrictions, and the compliance programs of the Trust and the Advisers; (iii) the compliance-related resources the Adviser and its affiliates were providing to the Funds; (iv) the effect of any market and economic volatility on the performance, asset levels and expense ratios of the Funds; and (v) so-called “fallout benefits” to the Advisers and their affiliates, such as reputational and other indirect benefits. The Trustees considered any possible conflicts of interest associated with these fallout and other benefits, and the reporting, disclosure and other processes in place to disclose and monitor such possible conflicts of interest.
* * *
Based on their evaluation of all factors that they deemed to be material, including those factors described above, and assisted by the advice of independent counsel, the Trustees, including the Independent Trustees, concluded that renewal of the Agreements would be in the best interest of each of the Funds and its shareholders. Accordingly, the Board, and the Independent Trustees, voting separately, approved the Agreements for an additional one-year period.
abrdn Inc.
1900 Market Street, Suite 200
Philadelphia, PA 19103
abrdn.us
AOE-0140-AR
abrdn Funds
Fixed Income Series
Annual Financial Statements and Additional Information
October 31, 2024
abrdn High Income Opportunities Fund
| Class A- BJBHX ■ | Institutional Class - JHYIX■ |
abrdn Infrastructure Debt Fund
| Class A- CUGAX ■ | Institutional Class - AGCIX■ | Institutional Service Class - CGFIX■ |
abrdn Intermediate Municipal Income Fund
| Class A - NTFAX ■ | Institutional Class - ABEIX■ | Institutional Service Class - ABESX■ |
abrdn Short Duration High Yield Municipal Fund
| Class A - AAHMX ■ | Class C - ACHMX■ | Institutional Class - AHYMX■ |
abrdn Ultra Short Municipal Income Fund
| Class A - ATOAX ■ | Class A1 - ATOBX■ | Institutional Class - ATOIX■ |
Investors should carefully consider a fund’s investment objectives, risks, fees, charges and expenses before investing any money. To obtain this and other fund information, please call 866-667-9231 to request a prospectus, or download a prospectus at https://www.abrdn.com/us/literature. Please read it carefully before investing any money.
Investing in mutual funds involves risk, including possible loss of principal.
abrdn Funds is distributed by Aberdeen Fund Distributors LLC, Member FINRA, 1900 Market Street, Suite 200, Philadelphia, PA 19103.
abrdn Inc. has been registered as an investment adviser under the Investment Advisers Act of 1940 since August 23, 1995.
The complete schedule of portfolio holdings for each fund of abrdn Funds (each a “Fund” and collectively, the “Funds”) is included in the Funds’ semi-annual and annual reports to shareholders. abrdn Funds also files complete schedules of portfolio holdings for each Fund with the Securities and Exchange Commission (the “Commission”) for the first and third quarters of each fiscal year on Form N-PORT. The Funds’ Form N-PORT filings are available on the Commission’s website at http://www.sec.gov and the Funds make the information on the exhibit to Form N-PORT available to shareholders upon request without charge by calling 1-866-667-9231.
Statement Regarding Availability of Proxy Voting Record.
Information regarding the policies and procedures that the Funds use to determine how to vote proxies relating to portfolio securities is available without charge, upon request, by calling 1-866-667-9231. The information is also included in the Funds’ Statement of Additional Information, which is available on the Funds’ website at https://www.abrdn.com/us/literature and on the Commission’s website at www.sec.gov.
Information relating to how each Fund voted proxies relating to portfolio securities held during the most recent twelve months ended June 30 is available by August 30 of the relevant year: (i) upon request and without charge by calling 1-866-667-9231; and (ii) on the Commission’s website at www.sec.gov.
Financial Statements and Financial Highlights for Open-End Management Investment Companies
Statement of Investments
October 31, 2024 abrdn High Income Opportunities Fund
| | Shares or
Principal
Amount | Value |
| BANK LOANS—2.9% | |
| Masorange Holdco Ltd., 2024 USD Term Loan B4(a) | | 997,494 | $ 996,247 |
| CD&R Firefly Bidco Ltd., 2024 GBP Term Loan B5(a) | | 650,000 | 838,495 |
| Albion Financing 3 SARL, 2024 USD Term Loan B(a) | | 498,750 | 499,997 |
| Total Bank Loans | | 2,334,739 |
| CORPORATE BONDS—91.6% | |
| AUSTRIA—0.3% |
Holding Companies-Diversified
Operations—0.3% | | | |
| Benteler International AG, 9.38%, 05/15/2028(b) | EUR | 200,000 | 224,976 |
| BRAZIL—1.2% |
| Chemicals—0.4% | | | |
| Braskem Netherlands Finance BV, 8.00%, 10/15/2034(b) | $ | 314,000 | 313,215 |
| Food Products—0.5% | | | |
| Minerva Luxembourg SA, 8.88%, 09/13/2033(b) | | 400,000 | 420,016 |
| Oil & Gas Services—0.3% | | | |
| Guara Norte SARL, 5.20%, 06/15/2034(b)(c) | | 240,992 | 228,342 |
| Total Brazil | | 961,573 |
| CANADA—2.7% |
Diversified Telecommunication
Services—0.2% | | | |
| Rogers Communications, Inc., (fixed rate to 03/15/2027, variable rate thereafter), VRN, 5.25%, 03/15/2082(b) | | 224,000 | 219,261 |
| Oil & Gas—0.6% | | | |
| Saturn Oil & Gas, Inc., 9.63%, 06/15/2029(b)(c) | | 473,000 | 467,104 |
| Oil & Gas Services—1.5% | | | |
| Enerflex Ltd., 9.00%, 10/15/2027(b) | | 1,162,000 | 1,206,216 |
| Retail—0.4% | | | |
| 1011778 BC ULC/New Red Finance, Inc., 5.63%, 09/15/2029(b) | | 335,000 | 334,154 |
| Total Canada | | 2,226,735 |
| CAYMAN ISLANDS—0.9% |
| Diversified Financial Services—0.9% | | | |
| Azorra Finance Ltd., 7.75%, 04/15/2030(b) | | 738,000 | 729,215 |
| CHILE—0.3% |
| Airlines—0.3% | | | |
| Latam Airlines Group SA, 7.88%, 04/15/2030(b) | | 260,000 | 260,325 |
| | Shares or
Principal
Amount | Value |
| |
| CHINA—0.1% |
| Real Estate—0.1% | | | |
| Country Garden Holdings Co. Ltd., 3.13%, 10/22/2025(b)(d) | $ | 200,000 | $ 18,772 |
| Kaisa Group Holdings Ltd. | | | |
| 9.75%, 09/28/2023(b)(d) | | 230,000 | 10,925 |
| 9.38%, 06/30/2024(b)(d) | | 495,000 | 23,512 |
| Zhenro Properties Group Ltd. | | | |
| 7.88%, 04/14/2024(b)(d)(e) | | 200,000 | 2,000 |
| 7.10%, 09/10/2024(b)(d)(e) | | 429,000 | 3,488 |
| | | | 58,697 |
| COLOMBIA—0.9% |
| Oil, Gas & Consumable Fuels—0.9% | | | |
| Ecopetrol SA | | | |
| 6.88%, 04/29/2030 | | 307,000 | 299,113 |
| 8.38%, 01/19/2036 | | 413,000 | 403,647 |
| | | | 702,760 |
| FRANCE—3.6% |
Diversified Telecommunication
Services—0.5% | | | |
| Iliad Holding SASU, 8.50%, 04/15/2031(b) | | 400,000 | 426,109 |
| Entertainment—0.7% | | | |
| Banijay Entertainment SAS, 8.13%, 05/01/2029(b) | | 552,000 | 572,357 |
| Healthcare Providers & Services—0.9% | | | |
| CAB SELAS, 3.38%, 02/01/2028(b) | EUR | 400,000 | 403,603 |
| Cerba Healthcare SACA, 3.50%, 05/31/2028(b) | | 387,000 | 351,262 |
| | | | 754,865 |
| Machinery-Diversified—0.5% | | | |
| Nova Alexandre III SAS, FRN, 8.43%, 07/15/2029(a)(b) | | 353,000 | 376,296 |
| Retail—1.0% | | | |
| Afflelou SAS, 6.00%, 07/25/2029(b) | | 160,000 | 177,486 |
| Bertrand Franchise Finance SAS, FRN, 6.96%, 07/18/2030(a)(b) | | 188,000 | 205,436 |
| Mobilux Finance SAS, 4.25%, 07/15/2028(b) | | 400,000 | 421,655 |
| | | | 804,577 |
| Total France | | 2,934,204 |
| GERMANY—2.6% |
| Apparel—0.6% | | | |
| CT Investment GmbH, 6.38%, 04/15/2030(b) | | 200,000 | 224,294 |
| PrestigeBidCo GmbH, FRN, 6.93%, 07/01/2029(a)(b) | | 234,000 | 257,505 |
| | | | 481,799 |
| Building Materials—0.7% | | | |
| HT Troplast GmbH, 9.38%, 07/15/2028(b) | | 476,000 | 535,011 |
See accompanying Notes to Financial Statements.
Statement of Investments (continued)
October 31, 2024 abrdn High Income Opportunities Fund
| | Shares or
Principal
Amount | Value |
| CORPORATE BONDS (continued) | |
| GERMANY (continued) |
| Chemicals—0.2% | | | |
| ASK Chemicals Deutschland Holding GmbH, 10.00%, 11/15/2029(b) | EUR | 176,000 | $ 193,598 |
| Commercial Banks—0.5% | | | |
| Deutsche Bank AG, (fixed rate to 04/30/2026, variable rate thereafter), VRN, 7.13%, 04/30/2026(b)(f) | GBP | 300,000 | 378,448 |
| Lodging—0.2% | | | |
| Motel One GmbH/Muenchen, 7.75%, 04/02/2031(b) | EUR | 175,000 | 202,039 |
| Machinery-Diversified—0.4% | | | |
| TK Elevator Midco GmbH, 4.38%, 07/15/2027(b) | | 276,000 | 298,153 |
| Total Germany | | 2,089,048 |
| HONG KONG—0.8% |
| Lodging—0.8% | | | |
| Melco Resorts Finance Ltd. | | | |
| 5.75%, 07/21/2028(b) | $ | 534,000 | 509,516 |
| 5.38%, 12/04/2029(b) | | 200,000 | 182,709 |
| | | | 692,225 |
| IRELAND—0.7% |
| Commercial Services & Supplies—0.7% | | | |
| Cimpress PLC, 7.38%, 09/15/2032(b) | | 604,000 | 594,634 |
| ISRAEL—2.6% |
| Pharmaceutical—2.6% | | | |
| Teva Pharmaceutical Finance Netherlands III BV | | | |
| 3.15%, 10/01/2026 | | 456,000 | 434,701 |
| 4.75%, 05/09/2027 | | 355,000 | 344,891 |
| 7.88%, 09/15/2029 | | 619,000 | 667,832 |
| 8.13%, 09/15/2031 | | 591,000 | 660,990 |
| | | | 2,108,414 |
| ITALY—1.2% |
Diversified Telecommunication
Services—1.0% | | | |
| Optics Bidco SpA, Series 2033, 6.38%, 11/15/2033(b) | | 342,000 | 344,644 |
| Telecom Italia Capital SA | | | |
| 6.38%, 11/15/2033 | | 258,000 | 260,736 |
| 7.20%, 07/18/2036 | | 200,000 | 202,802 |
| | | | 808,182 |
| Pharmaceutical—0.2% | | | |
| Rossini SARL, 6.75%, 12/31/2029(b) | EUR | 140,000 | 160,079 |
| Total Italy | | 968,261 |
| JERSEY—0.5% |
| Auto Manufacturers—0.5% | | | |
| Aston Martin Capital Holdings Ltd., 10.00%, 03/31/2029(b) | $ | 385,000 | 374,019 |
| | Shares or
Principal
Amount | Value |
| |
| LUXEMBOURG—2.5% |
| Biotechnology—0.4% | | | |
| Cidron Aida Finco SARL, 6.25%, 04/01/2028(b) | GBP | 253,000 | $ 314,389 |
| Chemicals—1.0% | | | |
| INEOS Finance PLC, 7.50%, 04/15/2029(b) | $ | 440,000 | 453,947 |
| Monitchem HoldCo 3 SA, 8.75%, 05/01/2028(b) | EUR | 330,000 | 363,592 |
| | | | 817,539 |
| Commercial Services & Supplies—0.7% | | | |
| Albion Financing 2 SARL, 8.75%, 04/15/2027(b) | $ | 519,000 | 531,786 |
| Energy-Alternate Sources—0.4% | | | |
| Cullinan Holdco SCSp, 4.63%, 10/15/2026(b) | EUR | 362,000 | 345,826 |
| Entertainment—0.0% | | | |
| LHMC Finco 2 SARL, 7.250% Cash or 8.000% PIK, 10/02/2025(b)(g) | | 7,358 | 8,005 |
| Machinery-Diversified—0.0% | | | |
| Galapagos SA, 5.38%, 06/15/2021(b)(d)(e)(h) | | 60,500 | – |
| Total Luxembourg | | 2,017,545 |
| MEXICO—3.3% |
| Building Materials—0.4% | | | |
| Cemex SAB de CV, (fixed rate to 03/14/2028, variable rate thereafter), VRN, 9.13%, 03/14/2028(b)(f) | $ | 297,000 | 316,185 |
| Chemicals—0.2% | | | |
| Braskem Idesa SAPI, 6.99%, 02/20/2032(b) | | 200,000 | 148,530 |
| Oil, Gas & Consumable Fuels—2.7% | | | |
| Petroleos Mexicanos | | | |
| 3.75%, 11/16/2025(b) | GBP | 1,192,000 | 1,477,973 |
| 5.35%, 02/12/2028 | $ | 784,000 | 730,210 |
| | | | 2,208,183 |
| Total Mexico | | 2,672,898 |
| NETHERLANDS—3.5% |
| Commercial Banks—0.3% | | | |
| Stichting AK Rabobank Certificaten, 6.50%, 12/29/2049(b)(f)(i) | EUR | 239,500 | 292,755 |
| Commercial Services & Supplies—0.5% | | | |
| Boost Newco Borrower LLC/GTCR W Dutch Finance Sub BV, 8.50%, 01/15/2031(b) | GBP | 279,000 | 388,054 |
| Food Products—0.8% | | | |
| Flora Food Management BV, 6.88%, 07/02/2029(b) | EUR | 400,000 | 439,893 |
| Sigma Holdco BV, 7.88%, 05/15/2026(b) | $ | 200,000 | 198,073 |
| | | | 637,966 |
| Media—1.4% | | | |
| Sunrise FinCo I BV, 4.88%, 07/15/2031(b) | | 200,000 | 183,000 |
| Sunrise HoldCo IV BV, 5.50%, 01/15/2028(b) | | 600,000 | 593,426 |
| VZ Vendor Financing II BV, 2.88%, 01/15/2029(b) | EUR | 185,000 | 184,543 |
| Ziggo Bond Co. BV, 5.13%, 02/28/2030(b) | $ | 200,000 | 180,974 |
| | | | 1,141,943 |
See accompanying Notes to Financial Statements.
Statement of Investments (continued)
October 31, 2024 abrdn High Income Opportunities Fund
| | Shares or
Principal
Amount | Value |
| CORPORATE BONDS (continued) | |
| NETHERLANDS (continued) |
| Semiconductors—0.5% | | | |
| BE Semiconductor Industries NV, 4.50%, 07/15/2031(b) | EUR | 363,000 | $ 405,252 |
| Total Netherlands | | 2,865,970 |
| NIGERIA—0.6% |
| Engineering & Construction—0.6% | | | |
| IHS Netherlands Holdco BV, 8.00%, 09/18/2027(b) | $ | 533,000 | 532,473 |
| SLOVENIA—0.2% |
| Media—0.2% | | | |
| Summer BidCo BV, 10.000% Cash or 10.750% PIK, 02/15/2029(b)(g) | EUR | 122,026 | 139,773 |
| SPAIN—1.8% |
| Commercial Banks—0.7% | | | |
| Banco Bilbao Vizcaya Argentaria SA, (fixed rate to 03/05/2025, variable rate thereafter), VRN, Series 9, 6.50%, 03/05/2025(f) | $ | 600,000 | 600,130 |
Diversified Telecommunication
Services—0.5% | | | |
| Telefonica Europe BV, (fixed rate to 02/24/2028, variable rate thereafter), VRN, 2.88%, 02/24/2028(b)(f) | EUR | 400,000 | 416,141 |
| Pharmaceutical—0.6% | | | |
| Grifols SA, 3.88%, 10/15/2028(b) | | 500,000 | 493,996 |
| Total Spain | | 1,510,267 |
| SWEDEN—0.7% |
| Commercial Services & Supplies—0.3% | | | |
| Verisure Midholding AB, 5.25%, 02/15/2029(b) | | 275,000 | 298,569 |
| Engineering & Construction—0.4% | | | |
| Assemblin Caverion Group AB | | | |
| 6.25%, 07/01/2030(b) | | 120,000 | 134,406 |
| FRN, 6.83%, 07/01/2031(a)(b) | | 153,000 | 166,133 |
| | | | 300,539 |
| Total Sweden | | 599,108 |
| SWITZERLAND—1.3% |
| Chemicals—1.3% | | | |
| Consolidated Energy Finance SA | | | |
| 5.63%, 10/15/2028(b) | $ | 811,000 | 660,908 |
| 12.00%, 02/15/2031(b) | | 380,000 | 370,613 |
| | | | 1,031,521 |
| TURKEY—0.3% |
| Metals & Mining—0.3% | | | |
| WE Soda Investments Holding PLC, 9.50%, 10/06/2028(b) | | 213,000 | 219,433 |
| UNITED KINGDOM—7.0% |
| Building Materials—0.6% | | | |
| Project Grand U.K. PLC, 9.00%, 06/01/2029(b) | EUR | 402,000 | 453,017 |
| | Shares or
Principal
Amount | Value |
| |
|
| Chemicals—0.8% | | | |
| INEOS Quattro Finance 2 PLC, 8.50%, 03/15/2029(b) | EUR | 240,000 | $ 277,376 |
| Synthomer PLC, 7.38%, 05/02/2029(b) | | 301,000 | 340,902 |
| | | | 618,278 |
| Commercial Services & Supplies—1.3% | | | |
| Amber Finco PLC, 6.63%, 07/15/2029(b) | | 230,000 | 261,441 |
| BCP V Modular Services Finance PLC, 6.75%, 11/30/2029(b) | | 400,000 | 377,449 |
| Belron U.K. Finance PLC | | | |
| 4.63%, 10/15/2029(b) | | 130,000 | 143,343 |
| 5.75%, 10/15/2029(b) | $ | 300,000 | 300,603 |
| | | | 1,082,836 |
| Diversified Financial Services—0.7% | | | |
| Jerrold Finco PLC, 7.88%, 04/15/2030(b) | GBP | 406,000 | 537,181 |
Diversified Telecommunication
Services—1.1% | | | |
| Connect Finco SARL/Connect U.S. Finco LLC, 9.00%, 09/15/2029(b) | $ | 991,000 | 941,300 |
| Entertainment—1.0% | | | |
| 888 Acquisitions Ltd., 7.56%, 07/15/2027(b) | EUR | 200,000 | 212,601 |
| Pinewood Finco PLC, 6.00%, 03/27/2030(b) | GBP | 494,000 | 639,298 |
| | | | 851,899 |
| Food Products—0.7% | | | |
| Bellis Acquisition Co. PLC, 8.13%, 05/14/2030(b) | | 300,000 | 382,240 |
| Iceland Bondco PLC, 10.88%, 12/15/2027(b) | | 150,000 | 207,384 |
| | | | 589,624 |
| Healthcare Products—0.3% | | | |
| RAY Financing LLC, 6.50%, 07/15/2031(b) | EUR | 214,000 | 241,519 |
| Media—0.4% | | | |
| Virgin Media Vendor Financing Notes III DAC, 4.88%, 07/15/2028(b) | GBP | 244,000 | 293,389 |
| Oil & Gas Services—0.1% | | | |
| OEG Finance PLC, 7.25%, 09/27/2029(b) | EUR | 105,000 | 117,069 |
| Total United Kingdom | | 5,726,112 |
| UNITED STATES—50.8% |
| Advertising—0.4% | | | |
| Summer BC Bidco B LLC, 5.50%, 10/31/2026(b) | $ | 321,000 | 316,362 |
| Agriculture—0.5% | | | |
| Darling Ingredients, Inc., 6.00%, 06/15/2030(b) | | 407,000 | 404,202 |
| Auto Parts & Equipment—0.9% | | | |
| Goodyear Tire & Rubber Co. | | | |
| 5.00%, 07/15/2029 | | 460,000 | 416,482 |
| 5.25%, 07/15/2031 | | 152,000 | 133,617 |
| 5.63%, 04/30/2033 | | 183,000 | 158,262 |
| | | | 708,361 |
| Building Materials—1.8% | | | |
| Camelot Return Merger Sub, Inc., 8.75%, 08/01/2028(b) | | 322,000 | 323,485 |
| Cornerstone Building Brands, Inc. | | | |
| 6.13%, 01/15/2029(b) | | 259,000 | 231,487 |
See accompanying Notes to Financial Statements.
Statement of Investments (continued)
October 31, 2024 abrdn High Income Opportunities Fund
| | Shares or
Principal
Amount | Value |
| CORPORATE BONDS (continued) | |
| UNITED STATES (continued) |
| 9.50%, 08/15/2029(b) | $ | 115,000 | $ 118,388 |
| Miter Brands Acquisition Holdco, Inc./MIWD Borrower LLC, 6.75%, 04/01/2032(b) | | 310,000 | 315,347 |
| New Enterprise Stone & Lime Co., Inc., 5.25%, 07/15/2028(b) | | 503,000 | 486,735 |
| | | | 1,475,442 |
| Coal—0.8% | | | |
| SunCoke Energy, Inc., 4.88%, 06/30/2029(b) | | 728,000 | 657,361 |
| Commercial Services & Supplies—2.6% | | | |
| Dcli Bidco LLC, 7.75%, 11/15/2029(b) | | 579,000 | 588,786 |
| Neptune Bidco U.S., Inc., 9.29%, 04/15/2029(b) | | 884,000 | 826,123 |
| Sabre GLBL, Inc. | | | |
| 8.63%, 06/01/2027(b) | | 410,000 | 395,757 |
| 11.25%, 12/15/2027(b) | | 259,000 | 266,828 |
| | | | 2,077,494 |
| Computers & Peripherals—0.1% | | | |
| NCR Atleos Corp., 9.50%, 04/01/2029(b) | | 99,000 | 108,960 |
| Cosmetics/Personal Care—0.1% | | | |
| Perrigo Finance Unlimited Co., 5.38%, 09/30/2032 | EUR | 100,000 | 110,951 |
Diversified Telecommunication
Services—1.6% | | | |
| Frontier Communications Holdings LLC | | | |
| 6.00%, 01/15/2030(b) | $ | 416,000 | 407,103 |
| 8.63%, 03/15/2031(b) | | 459,000 | 491,961 |
| U.S. Cellular Corp., 6.70%, 12/15/2033 | | 397,000 | 428,265 |
| | | | 1,327,329 |
| Electric Utilities—1.9% | | | |
| NRG Energy, Inc. | | | |
| 6.00%, 02/01/2033(b) | | 193,000 | 191,932 |
| 7.00%, 03/15/2033(b) | | 403,000 | 437,300 |
| 6.25%, 11/01/2034(b) | | 369,000 | 368,612 |
| PG&E Corp., (fixed rate to 12/15/2029, variable rate thereafter), VRN, 7.38%, 03/15/2055 | | 241,000 | 248,933 |
| Talen Energy Supply LLC, 8.63%, 06/01/2030(b) | | 303,000 | 326,855 |
| | | | 1,573,632 |
Electrical Components &
Equipment—0.8% | | | |
| EnerSys, 6.63%, 01/15/2032(b) | | 631,000 | 648,052 |
| Energy Equipment & Services—3.0% | | | |
| Hess Midstream Operations LP, 4.25%, 02/15/2030(b) | | 280,000 | 261,450 |
| ITT Holdings LLC, 6.50%, 08/01/2029(b) | | 793,000 | 732,806 |
| Venture Global Calcasieu Pass LLC, 4.13%, 08/15/2031(b) | | 452,000 | 411,969 |
| Venture Global LNG, Inc., 9.88%, 02/01/2032(b) | | 957,000 | 1,044,591 |
| | | | 2,450,816 |
| Entertainment—3.9% | | | |
| Affinity Interactive, 6.88%, 12/15/2027(b) | | 1,631,000 | 1,335,635 |
| | Shares or
Principal
Amount | Value |
| |
|
| CCM Merger, Inc., 6.38%, 05/01/2026(b) | $ | 843,000 | $ 840,282 |
| Warnermedia Holdings, Inc., 4.28%, 03/15/2032 | | 1,138,000 | 997,267 |
| | | | 3,173,184 |
| Food Products—1.8% | | | |
| Fiesta Purchaser, Inc. | | | |
| 7.88%, 03/01/2031(b) | | 603,000 | 632,371 |
| 9.63%, 09/15/2032(b) | | 227,000 | 237,272 |
| U.S. Foods, Inc., 5.75%, 04/15/2033(b) | | 627,000 | 617,458 |
| | | | 1,487,101 |
| Healthcare Providers & Services—1.3% | | | |
| CHS/Community Health Systems, Inc. | | | |
| 8.00%, 12/15/2027(b) | | 168,000 | 167,725 |
| 5.25%, 05/15/2030(b) | | 415,000 | 362,184 |
| 10.88%, 01/15/2032(b) | | 487,000 | 521,925 |
| | | | 1,051,834 |
| Home Builders—0.7% | | | |
| Adams Homes, Inc., 9.25%, 10/15/2028(b) | | 522,000 | 546,131 |
| Home Furnishings—1.0% | | | |
| Tempur Sealy International, Inc., 3.88%, 10/15/2031(b) | | 908,000 | 789,837 |
| Housewares—0.5% | | | |
| CD&R Smokey Buyer, Inc./Radio Systems Corp., 9.50%, 10/15/2029(b) | | 406,000 | 411,246 |
| Insurance—0.5% | | | |
| Panther Escrow Issuer LLC, 7.13%, 06/01/2031(b) | | 392,000 | 401,361 |
| Internet—1.0% | | | |
| Cogent Communications Group, Inc./Cogent Communications Finance, Inc., 7.00%, 06/15/2027(b) | | 795,000 | 799,443 |
| Iron/Steel—0.9% | | | |
| Cleveland-Cliffs, Inc. | | | |
| 7.00%, 03/15/2032(b) | | 609,000 | 609,689 |
| 7.38%, 05/01/2033(b) | | 118,000 | 118,873 |
| | | | 728,562 |
| Leisure Time—2.3% | | | |
| Acushnet Co., 7.38%, 10/15/2028(b) | | 383,000 | 399,385 |
| Carnival Corp., 7.63%, 03/01/2026(b) | | 158,000 | 159,105 |
| MajorDrive Holdings IV LLC, 6.38%, 06/01/2029(b) | | 891,000 | 854,323 |
| Royal Caribbean Cruises Ltd. | | | |
| 5.63%, 09/30/2031(b) | | 91,000 | 90,628 |
| 6.00%, 02/01/2033(b) | | 319,000 | 320,959 |
| | | | 1,824,400 |
| Lodging—0.7% | | | |
| Genting New York LLC/GENNY Capital, Inc., 7.25%, 10/01/2029(b) | | 592,000 | 600,865 |
| Machinery-Diversified—0.5% | | | |
| Chart Industries, Inc., 7.50%, 01/01/2030(b) | | 392,000 | 407,712 |
| Media—4.7% | | | |
| CCO Holdings LLC/CCO Holdings Capital Corp. | | | |
| 4.25%, 02/01/2031(b) | | 1,218,000 | 1,056,965 |
See accompanying Notes to Financial Statements.
Statement of Investments (continued)
October 31, 2024 abrdn High Income Opportunities Fund
| | Shares or
Principal
Amount | Value |
| CORPORATE BONDS (continued) | |
| UNITED STATES (continued) |
| 4.75%, 02/01/2032(b) | $ | 708,000 | $ 612,102 |
| 4.25%, 01/15/2034(b) | | 196,000 | 156,586 |
| CSC Holdings LLC | | | |
| 11.75%, 01/31/2029(b) | | 262,000 | 255,591 |
| 6.50%, 02/01/2029(b) | | 303,000 | 256,129 |
| 5.75%, 01/15/2030(b) | | 265,000 | 139,590 |
| 4.13%, 12/01/2030(b) | | 277,000 | 204,462 |
| Univision Communications, Inc. | | | |
| 8.00%, 08/15/2028(b) | | 488,000 | 495,929 |
| 7.38%, 06/30/2030(b) | | 238,000 | 228,492 |
| 8.50%, 07/31/2031(b) | | 459,000 | 451,169 |
| | | | 3,857,015 |
| Oil & Gas—2.8% | | | |
| Aethon United BR LP/Aethon United Finance Corp., 7.50%, 10/01/2029(b) | | 588,000 | 592,077 |
| Hilcorp Energy I LP/Hilcorp Finance Co., 6.88%, 05/15/2034(b) | | 513,000 | 491,052 |
| Moss Creek Resources Holdings, Inc., 8.25%, 09/01/2031(b) | | 482,000 | 472,262 |
| Nabors Industries, Inc., 8.88%, 08/15/2031(b) | | 601,000 | 568,200 |
| Permian Resources Operating LLC, 6.25%, 02/01/2033(b) | | 158,000 | 156,861 |
| | | | 2,280,452 |
| Oil, Gas & Consumable Fuels—0.9% | | | |
| Permian Resources Operating LLC, 5.88%, 07/01/2029(b) | | 335,000 | 330,245 |
| Vital Energy, Inc., 9.75%, 10/15/2030 | | 388,000 | 409,382 |
| | | | 739,627 |
| Packaging & Containers—1.6% | | | |
| Ardagh Metal Packaging Finance USA LLC/Ardagh Metal Packaging Finance PLC | | | |
| 6.00%, 06/15/2027(b) | | 220,000 | 219,377 |
| 3.00%, 09/01/2029(b) | EUR | 200,000 | 189,031 |
| Berry Global, Inc., 5.63%, 07/15/2027(b) | $ | 161,000 | 160,729 |
| Graphic Packaging International LLC, 6.38%, 07/15/2032(b) | | 752,000 | 758,713 |
| | | | 1,327,850 |
| Paper & Forest Products—0.8% | | | |
| Glatfelter Corp., 7.25%, 11/15/2031(b) | | 630,000 | 624,645 |
| Pharmaceutical—2.5% | | | |
| Bausch Health Cos., Inc. | | | |
| 5.00%, 01/30/2028(b) | | 183,000 | 117,120 |
| 4.88%, 06/01/2028(b) | | 406,000 | 313,720 |
| 5.00%, 02/15/2029(b) | | 208,000 | 119,600 |
| Organon & Co./Organon Foreign Debt Co-Issuer BV | | | |
| 5.13%, 04/30/2031(b) | | 222,000 | 202,466 |
| 6.75%, 05/15/2034(b) | | 606,000 | 607,150 |
| 7.88%, 05/15/2034(b) | | 213,000 | 219,868 |
| Perrigo Finance Unlimited Co., 4.90%, 06/15/2030(i) | | 499,000 | 472,425 |
| | | | 2,052,349 |
| | Shares or
Principal
Amount | Value |
| |
|
| Pipelines—2.9% | | | |
| Delek Logistics Partners LP/Delek Logistics Finance Corp., 8.63%, 03/15/2029(b) | $ | 953,000 | $ 977,817 |
| Energy Transfer LP, (fixed rate to 11/15/2026, variable rate thereafter), VRN, Series H, 6.50%, 11/15/2026(f) | | 210,000 | 209,338 |
| Hess Midstream Operations LP, 6.50%, 06/01/2029(b) | | 442,000 | 449,335 |
| Venture Global LNG, Inc. | | | |
| (fixed rate to 09/30/2029, variable rate thereafter), VRN, 9.00%, 09/30/2029(b)(f) | | 477,000 | 476,964 |
| 7.00%, 01/15/2030(b) | | 207,000 | 208,278 |
| | | | 2,321,732 |
Real Estate Investment Trust (REIT)
Funds—0.3% | | | |
| Uniti Group LP/Uniti Group Finance 2019, Inc./CSL Capital LLC, 10.50%, 02/15/2028(b) | | 259,000 | 275,879 |
| Retail—2.5% | | | |
| Academy Ltd., 6.00%, 11/15/2027(b) | | 275,000 | 273,572 |
| Macy's Retail Holdings LLC, 5.88%, 03/15/2030(b) | | 333,000 | 322,061 |
| Staples, Inc., 10.75%, 09/01/2029(b) | | 714,000 | 690,426 |
| Walgreens Boots Alliance, Inc. | | | |
| 3.45%, 06/01/2026 | | 347,000 | 333,794 |
| 8.13%, 08/15/2029 | | 387,000 | 384,648 |
| | | | 2,004,501 |
| Software—2.2% | | | |
| Cloud Software Group, Inc. | | | |
| 9.00%, 09/30/2029(b) | | 329,000 | 328,970 |
| 8.25%, 06/30/2032(b) | | 686,000 | 705,104 |
| Consensus Cloud Solutions, Inc., 6.00%, 10/15/2026(b) | | 215,000 | 212,654 |
| Helios Software Holdings, Inc./ION Corporate Solutions Finance SARL, 7.88%, 05/01/2029(b) | EUR | 507,000 | 557,969 |
| | | | 1,804,697 |
| Total United States | | 41,369,385 |
| ZAMBIA—1.2% |
| Metals & Mining—1.2% | | | |
| First Quantum Minerals Ltd., 6.88%, 10/15/2027(b) | $ | 950,000 | 943,617 |
| Total Corporate Bonds | | 74,553,188 |
| EXCHANGE-TRADED FUNDS—0.7% | |
| iShares iBoxx $ High Yield Corporate Bond ETF | | 7,400 | 585,636 |
| Total Exchange-Traded Funds | | 585,636 |
| GOVERNMENT BONDS—0.9% | |
| COLOMBIA—0.9% |
| Colombia Government International Bonds, 8.38%, 11/07/2054 | | 773,000 | 751,901 |
| Total Government Bonds | | 751,901 |
See accompanying Notes to Financial Statements.
Statement of Investments (continued)
October 31, 2024 abrdn High Income Opportunities Fund
| | Shares or
Principal
Amount | Value |
| SHORT-TERM INVESTMENT—6.2% | |
| State Street Institutional U.S. Government Money Market Fund, Premier Class, 4.82%(j) | | 5,056,903 | $ 5,056,903 |
| Total Short-Term Investment | | 5,056,903 |
Total Investments
(Cost $84,198,943)(k)—102.3% | 83,282,367 |
| Liabilities in Excess of Other Assets—(2.3%) | (1,841,304) |
| Net Assets—100.0% | $81,441,063 |
Amounts listed as “–” are $0 or round to $0.
| (a) | Variable or Floating Rate security. Rate disclosed is as of October 31, 2024. |
| (b) | Denotes a security issued under Regulation S or Rule 144A. |
| (c) | Sinkable security. |
| (d) | Security is in default. |
| (e) | The Fund’s adviser has deemed this security to be illiquid based upon procedures approved by the Board of Trustees. Illiquid securities held by the Fund represent 0.0% of net assets as of October 31, 2024. |
| (f) | Perpetual maturity. Maturity date presented represents the next call date. |
| (g) | Payment-in-kind security for which part of the income earned may be paid as additional principal. |
| (h) | Level 3 security. See Note 2(a) of the accompanying Notes to Financial Statements. |
| (i) | Step bond. Rate disclosed is as of October 31, 2024. |
| (j) | Registered investment company advised by State Street Global Advisors. The rate shown is the 7 day yield as of October 31, 2024. |
| (k) | See accompanying Notes to Financial Statements for tax unrealized appreciation/(depreciation) of securities. |
| ETF | Exchange-Traded Fund |
| EUR | Euro Currency |
| FRN | Floating Rate Note |
| GBP | British Pound Sterling |
| PIK | Payment-In-Kind |
| PLC | Public Limited Company |
| REIT | Real Estate Investment Trust |
| USD | U.S. Dollar |
| VRN | Variable Rate Note |
| As of October 31, 2024, the Fund held the following forward foreign currency contracts: |
Purchase Contracts
Settlement Date | Counterparty | Currency
Purchased | Amount
Purchased | Currency
Sold | Amount
Sold | Fair Value | Unrealized
Appreciation/
(Depreciation) |
| British Pound/United States Dollar | | | | | |
| 01/13/2025 | Barclays Bank PLC | GBP | 466,079 | USD | 604,822 | $600,881 | $(3,941) |
| Euro/United States Dollar | | | | | |
| 01/13/2025 | Barclays Bank PLC | EUR | 181,824 | USD | 197,420 | 198,383 | 963 |
| 01/13/2025 | UBS AG | EUR | 173,650 | USD | 187,989 | 189,465 | 1,476 |
| 01/13/2025 | UBS AG | EUR | 95,911 | USD | 105,082 | 104,645 | (437) |
| | $1,093,374 | $(1,939) |
Sale Contracts
Settlement Date | Counterparty | Currency
Purchased | Amount
Purchased | Currency
Sold | Amount
Sold | Fair Value | Unrealized
Appreciation/
(Depreciation) |
| United States Dollar/British Pound | | | | | |
| 01/13/2025 | HSBC Bank PLC | USD | 6,289,049 | GBP | 4,776,678 | $6,158,209 | $130,840 |
See accompanying Notes to Financial Statements.
Statement of Investments (concluded)
October 31, 2024 abrdn High Income Opportunities Fund
Sale Contracts
Settlement Date | Counterparty | Currency
Purchased | Amount
Purchased | Currency
Sold | Amount
Sold | Fair Value | Unrealized
Appreciation/
(Depreciation) |
| United States Dollar/Euro | | | | | |
| 01/13/2025 | Citibank N.A. | USD | 191,174 | EUR | 176,000 | $192,029 | $(855) |
| 01/13/2025 | Deutsche Bank AG | USD | 11,230,559 | EUR | 10,136,679 | 11,059,844 | 170,715 |
| 01/13/2025 | HSBC Bank PLC | USD | 143,913 | EUR | 130,000 | 141,839 | 2,074 |
| 01/13/2025 | Royal Bank of Canada | USD | 335,290 | EUR | 305,418 | 333,233 | 2,057 |
| | $17,885,154 | $304,831 |
| Unrealized appreciation on forward foreign currency exchange contracts | $308,125 |
| Unrealized depreciation on forward foreign currency exchange contracts | $(5,233) |
See accompanying Notes to Financial Statements.
Statement of Investments
October 31, 2024 abrdn Infrastructure Debt Fund
| | Principal
Amount | Value |
| CORPORATE BONDS—54.7% | |
| CANADA—3.1% |
| Electric Utilities—1.8% | | | |
| TransAlta Corp., 7.75%, 11/15/2029 | $ | 423,000 | $ 446,685 |
| Oil & Gas Services—1.3% | | | |
| Enerflex Ltd., 9.00%, 10/15/2027(a) | | 292,000 | 303,111 |
| Total Canada | | 749,796 |
| CAYMAN ISLANDS—0.9% |
| Diversified Financial Services—0.9% | | | |
| Azorra Finance Ltd., 7.75%, 04/15/2030(a) | | 227,000 | 224,298 |
| GEORGIA—1.2% |
| Transportation—1.2% | | | |
| Georgian Railway JSC, 4.00%, 06/17/2028(a) | | 336,000 | 295,447 |
| GUATEMALA—1.8% |
| Electric Utilities—1.8% | | | |
| Investment Energy Resources Ltd., 6.25%, 04/26/2029(a) | | 451,000 | 435,217 |
| MEXICO—2.5% |
| Building Materials—2.5% | | | |
| Cemex SAB de CV, (fixed rate to 03/14/2028, variable rate thereafter), VRN, 9.13%, 03/14/2028(a)(b) | | 558,000 | 594,044 |
| NETHERLANDS—2.1% |
| Media—2.1% | | | |
| VZ Vendor Financing II BV, 2.88%, 01/15/2029(a) | EUR | 515,000 | 513,730 |
| PERU—1.2% |
| Electric Utilities—1.2% | | | |
| Consorcio Transmantaro SA, 4.70%, 04/16/2034(a)(c) | $ | 316,000 | 296,709 |
| SPAIN—1.5% |
Diversified Telecommunication
Services—1.5% | | | |
| Telefonica Europe BV, (fixed rate to 02/03/2030, variable rate thereafter), VRN, 6.14%, 02/03/2030(a)(b) | EUR | 300,000 | 350,799 |
| UNITED KINGDOM—2.6% |
Diversified Telecommunication
Services—2.6% | | | |
| Connect Finco SARL/Connect U.S. Finco LLC, 9.00%, 09/15/2029(a) | $ | 200,000 | 189,970 |
| Vmed O2 U.K. Financing I PLC, 4.50%, 07/15/2031(a) | GBP | 401,000 | 443,646 |
| | | | 633,616 |
| UNITED STATES—37.8% |
| Building Materials—1.0% | | | |
| Cornerstone Building Brands, Inc., 9.50%, 08/15/2029(a) | $ | 235,000 | 241,923 |
| Commercial Services & Supplies—0.8% | | | |
| Dcli Bidco LLC, 7.75%, 11/15/2029(a) | | 180,000 | 183,042 |
| | Principal
Amount | Value |
| |
|
| Diversified Financial Services—7.2% | | | |
| Gabon Blue Bond Master Trust, Series 2, 6.10%, 08/01/2038(a)(c) | $ | 1,000,000 | $ 981,940 |
| Low Income Investment Fund, Series 2019, 3.39%, 07/01/2026 | | 800,000 | 773,286 |
| | | | 1,755,226 |
Diversified Telecommunication
Services—2.2% | | | |
| Frontier Communications Holdings LLC, 8.63%, 03/15/2031(a) | | 276,000 | 295,820 |
| U.S. Cellular Corp., 6.70%, 12/15/2033 | | 220,000 | 237,326 |
| | | | 533,146 |
| Electric Utilities—7.0% | | | |
| Clearway Energy Operating LLC, 3.75%, 01/15/2032(a) | | 551,000 | 488,266 |
| NRG Energy, Inc., 7.00%, 03/15/2033(a) | | 123,000 | 133,469 |
| Talen Energy Supply LLC, 8.63%, 06/01/2030(a) | | 409,000 | 441,200 |
| Vistra Corp., (fixed rate to 12/15/2026, variable rate thereafter), VRN, 7.00%, 12/15/2026(a)(b) | | 635,000 | 640,364 |
| | | | 1,703,299 |
Electrical Components &
Equipment—1.9% | | | |
| EnerSys, 6.63%, 01/15/2032(a) | | 439,000 | 450,864 |
| Energy Equipment & Services—2.2% | | | |
| Venture Global LNG, Inc., 9.88%, 02/01/2032(a) | | 487,000 | 531,574 |
| Engineering & Construction—2.9% | | | |
| LBJ Infrastructure Group LLC, 3.80%, 12/31/2057(a)(c) | | 1,000,000 | 708,120 |
| Healthcare Providers & Services—3.6% | | | |
| Toledo Hospital, 6.02%, 11/15/2048 | | 1,000,000 | 883,110 |
| Internet—0.7% | | | |
| Cogent Communications Group, Inc./Cogent Communications Finance, Inc., 7.00%, 06/15/2027(a) | | 180,000 | 181,006 |
| Iron/Steel—0.2% | | | |
| Cleveland-Cliffs, Inc., 7.38%, 05/01/2033(a) | | 37,000 | 37,274 |
| Machinery-Diversified—1.8% | | | |
| Chart Industries, Inc., 9.50%, 01/01/2031(a) | | 407,000 | 437,540 |
| Media—3.4% | | | |
| CCO Holdings LLC/CCO Holdings Capital Corp., 4.25%, 01/15/2034(a) | | 573,000 | 457,775 |
| Univision Communications, Inc., 7.38%, 06/30/2030(a) | | 377,000 | 361,938 |
| | | | 819,713 |
| Packaging & Containers—1.4% | | | |
| Ardagh Metal Packaging Finance USA LLC/Ardagh Metal Packaging Finance PLC, 3.00%, 09/01/2029(a) | EUR | 358,000 | 338,366 |
See accompanying Notes to Financial Statements.
Statement of Investments (concluded)
October 31, 2024 abrdn Infrastructure Debt Fund
| | Principal
Amount | Value |
| CORPORATE BONDS (continued) | |
| UNITED STATES (continued) |
| Pipelines—1.5% | | | |
| Delek Logistics Partners LP/Delek Logistics Finance Corp., 8.63%, 03/15/2029(a) | $ | 343,000 | $ 351,932 |
| Total United States | | 9,156,135 |
| Total Corporate Bonds | | 13,249,791 |
| MUNICIPAL BONDS —44.7% | |
| CALIFORNIA—10.4% |
| California Infrastructure & Economic Development Bank | | | |
| 4.41%, 10/01/2049 | | 900,000 | 716,151 |
| VRDN, Series A-4, 8.00%, 01/01/2050(a)(d) | | 390,000 | 401,895 |
| California Statewide Communities Development Authority, (AGM), Series B, 7.14%, 08/15/2047 | | 740,000 | 791,497 |
| City & County of San Francisco Community Facilities District No., Series B, 6.33%, 09/01/2051 | | 590,000 | 619,841 |
| Total California | | 2,529,384 |
| FLORIDA—0.9% |
| County of Miami-Dade Seaport Department, 6.22%, 11/01/2055 | | 200,000 | 211,610 |
| ILLINOIS—7.0% |
| City of Chicago, (AGM), Series B, 6.31%, 01/01/2044 | | 800,000 | 837,988 |
| Illinois Municipal Electric Agency, 7.29%, 02/01/2035 | | 800,000 | 871,366 |
| Total Illinois | | 1,709,354 |
| MARYLAND—4.1% |
| Maryland Economic Development Corp. | | | |
| 5.94%, 05/31/2057 | | 470,000 | 481,806 |
| Series A-2, 7.13%, 06/01/2025 | | 500,000 | 502,709 |
| Total Maryland | | 984,515 |
| MASSACHUSETTS—4.2% |
| Massachusetts Development Finance Agency, Series E, 8.50%, 10/01/2026 | | 1,000,000 | 1,014,917 |
| NEW HAMPSHIRE—2.2% |
| New Hampshire Business Finance Authority, 3.25%, 04/01/2028 | | 750,000 | 528,244 |
| | Principal
Amount | Value |
| |
| NEW YORK—7.3% |
| Dutchess County Local Development Corp., Series B, 5.92%, 07/01/2039 | $ | 960,000 | $ 952,078 |
| New York Transportation Development Corp., Series B, 6.97%, 06/30/2051 | | 800,000 | 810,559 |
| Total New York | | 1,762,637 |
| TEXAS—4.2% |
| Port of Beaumont Navigation District, Series B, 10.00%, 07/01/2026(a) | | 1,000,000 | 1,023,012 |
| WISCONSIN—4.4% |
| County of Fond Du Lac | | | |
| (BAM), 6.18%, 11/01/2042(a) | | 650,000 | 658,564 |
| (BAM), 6.20%, 05/01/2054(a) | | 400,000 | 405,548 |
| Total Wisconsin | | 1,064,112 |
| Total Municipal Bonds | | 10,827,785 |
Total Investments
(Cost $23,575,707)(e)—99.4% | 24,077,576 |
| Other Assets in Excess of Liabilities—0.6% | 142,137 |
| Net Assets—100.0% | $24,219,713 |
| (a) | Denotes a security issued under Regulation S or Rule 144A. |
| (b) | Perpetual maturity. Maturity date presented represents the next call date. |
| (c) | Sinkable security. |
| (d) | Variable Rate Instrument. The rate shown is based on the latest available information as of October 31, 2024. Certain variable rate securities are not based on a published reference rate and spread but are determined by the issuer or agent and are based on current market conditions. These securities do not indicate a reference rate and spread in their description. |
| (e) | See accompanying Notes to Financial Statements for tax unrealized appreciation/(depreciation) of securities. |
| AGM | Assured Guaranty Municipal Corp. |
| BAM | Build America Mutual Assurance Company |
| EUR | Euro Currency |
| GBP | British Pound Sterling |
| PLC | Public Limited Company |
| USD | U.S. Dollar |
| VRDN | Variable Rate Demand Note |
| VRN | Variable Rate Note |
| As of October 31, 2024, the Fund held the following forward foreign currency contracts: |
Sale Contracts
Settlement Date | Counterparty | Currency
Purchased | Amount
Purchased | Currency
Sold | Amount
Sold | Fair Value | Unrealized
Appreciation/
(Depreciation) |
| United States Dollar/British Pound | | | | | |
| 01/13/2025 | HSBC Bank PLC | USD | 460,192 | GBP | 349,526 | $450,612 | $9,580 |
| United States Dollar/Euro | | | | | |
| 01/13/2025 | HSBC Bank PLC | USD | 1,241,544 | EUR | 1,120,585 | 1,222,611 | 18,933 |
| | $1,673,223 | $28,513 |
See accompanying Notes to Financial Statements.
Statement of Investments
October 31, 2024 abrdn Intermediate Municipal Income Fund
| | Shares or
Principal
Amount | Value |
| COMMERCIAL MORTGAGE-BACKED SECURITIES—0.5% | |
| National Finance Authority Affordable Housing Certificates, Class A | | 250,000 | $ 249,167 |
| Total Commercial Mortgage-Backed Securities | | 249,167 |
| MUNICIPAL BONDS —97.4% | |
| ALABAMA—0.4% |
| Black Belt Energy Gas District, VRDN, Series D-1, 5.50%, 06/01/2049(a) | $ | 145,000 | 154,661 |
| ARIZONA—0.2% |
| Maricopa County Industrial Development Authority, Series B, 5.00%, 07/01/2049(b) | | 100,000 | 99,746 |
| CALIFORNIA—6.7% |
| Burbank-Glendale-Pasadena Airport Authority Brick Campaign, (AGM), Series B, 4.38%, 07/01/2049 | | 100,000 | 99,142 |
| California Community Choice Financing Authority, VRDN, Series C, 5.25%, 01/01/2054(a) | | 1,000,000 | 1,073,664 |
| California Infrastructure & Economic Development Bank, VRDN, Series A-4, 8.00%, 01/01/2050(a)(b) | | 580,000 | 597,689 |
| California School Finance Authority, 5.50%, 08/01/2047(b) | | 100,000 | 104,873 |
| M-S-R Energy Authority | | | |
| Series A, 6.50%, 11/01/2039 | | 500,000 | 636,832 |
| Series B, 6.13%, 11/01/2029 | | 405,000 | 429,581 |
| Total California | | 2,941,781 |
| CONNECTICUT—3.6% |
| Connecticut State Health & Educational Facilities Authority, Series F, 5.00%, 07/01/2027 | | 1,135,000 | 1,145,840 |
| State of Connecticut, Series B, 3.00%, 06/01/2040 | | 500,000 | 438,009 |
| Total Connecticut | | 1,583,849 |
| FLORIDA—4.0% |
| Capital Projects Finance Authority, Series A-1, 5.00%, 11/01/2048 | | 315,000 | 312,282 |
| Capital Trust Authority | | | |
| Series A, 6.00%, 06/15/2054(b) | | 120,000 | 125,356 |
| Series A, 6.13%, 06/15/2060(b) | | 195,000 | 203,972 |
| Florida Development Finance Corp. | | | |
| (AGM), 5.00%, 07/01/2044 | | 400,000 | 415,031 |
| (AGM), 5.25%, 07/01/2053 | | 200,000 | 208,169 |
| Series A, 5.00%, 12/15/2039(b) | | 500,000 | 508,619 |
| Total Florida | | 1,773,429 |
| GEORGIA—1.2% |
| Main Street Natural Gas, Inc. | | | |
| Series A, 5.00%, 05/15/2035 | | 250,000 | 265,512 |
| Series B, 5.00%, 06/01/2026 | | 250,000 | 255,135 |
| Total Georgia | | 520,647 |
| | Shares or
Principal
Amount | Value |
| |
| ILLINOIS—0.5% |
| St. Clair County Community Unit School District No. 187 Cahokia | | | |
| (AGM), Series A, 5.00%, 01/01/2049 | $ | 105,000 | $ 109,624 |
| (AGM), Series A, 5.00%, 01/01/2054 | | 100,000 | 104,022 |
| Total Illinois | | 213,646 |
| INDIANA—4.4% |
| Indiana Finance Authority | | | |
| Series A, 5.00%, 07/01/2049 | | 215,000 | 218,296 |
| Series A, 5.00%, 07/01/2054 | | 165,000 | 167,530 |
| Series A, 5.00%, 06/01/2053 | | 450,000 | 459,094 |
| Series A, 5.13%, 06/01/2058 | | 1,050,000 | 1,073,063 |
| Total Indiana | | 1,917,983 |
| LOUISIANA—0.0% |
| Louisiana Public Facilities Authority, (Pre-refunded @ $100.000000, 05/15/2026), 3.00%, 05/15/2031 | | 10,000 | 9,973 |
| MARYLAND—0.8% |
| Maryland Economic Development Corp., Series A-1, 5.00%, 06/01/2026 | | 345,000 | 350,002 |
| MASSACHUSETTS—1.0% |
| Massachusetts Development Finance Agency | | | |
| Series N, 5.25%, 10/01/2036 | | 130,000 | 134,027 |
| Series N, 5.25%, 10/01/2037 | | 135,000 | 138,748 |
| Series N, 5.25%, 10/01/2038 | | 145,000 | 148,520 |
| Total Massachusetts | | 421,295 |
| MISSISSIPPI—5.7% |
| Mississippi Business Finance Corp. | | | |
| VRDN, 4.40%, 12/01/2027(a) | | 700,000 | 700,000 |
| VRDN, Series A, 4.39%, 11/01/2032(a) | | 1,825,000 | 1,825,000 |
| Total Mississippi | | 2,525,000 |
| NEW HAMPSHIRE—3.3% |
| New Hampshire Business Finance Authority | | | |
| Series 2, 4.25%, 07/20/2041 | | 709,810 | 694,383 |
| Series A, 5.25%, 07/01/2048 | | 250,000 | 264,036 |
| New Hampshire Health & Education Facilities Authority Act | | | |
| Series A, 5.00%, 08/01/2035 | | 250,000 | 258,736 |
| Series A, 5.00%, 08/01/2036 | | 245,000 | 253,276 |
| Total New Hampshire | | 1,470,431 |
| NEW JERSEY—6.1% |
| New Jersey Transportation Trust Fund Authority, Series A, 5.00%, 12/15/2034 | | 1,150,000 | 1,211,298 |
| New Jersey Turnpike Authority, Series B, 4.13%, 01/01/2054 | | 1,000,000 | 991,415 |
| Newark Housing Authority, 4.00%, 01/01/2037 | | 500,000 | 501,119 |
| Total New Jersey | | 2,703,832 |
| NEW YORK—14.8% |
| Build NYC Resource Corp. | | | |
| 5.25%, 07/01/2052 | | 100,000 | 103,563 |
| Series A, 4.75%, 06/15/2053 | | 850,000 | 830,579 |
| City of Elmira | | | |
| 5.00%, 07/01/2025(b) | | 85,000 | 85,685 |
| 5.00%, 07/01/2033(b) | | 625,000 | 644,556 |
See accompanying Notes to Financial Statements.
Statement of Investments (continued)
October 31, 2024 abrdn Intermediate Municipal Income Fund
| | Shares or
Principal
Amount | Value |
| MUNICIPAL BONDS (continued) | |
| NEW YORK (continued) |
| Metropolitan Transportation Authority | | | |
| (BAM), Series A, 4.00%, 11/15/2048 | $ | 220,000 | $ 210,133 |
| Series A-1, 5.00%, 11/15/2027 | | 695,000 | 710,173 |
| Series C-1, 5.00%, 11/15/2027 | | 1,150,000 | 1,168,354 |
| Nassau County Local Economic Assistance Corp., 5.00%, 07/01/2030 | | 1,000,000 | 1,000,666 |
| New York City Municipal Water Finance Authority, Series EE, 5.00%, 06/15/2037 | | 295,000 | 306,884 |
| New York State Dormitory Authority, (AGC), 5.50%, 10/01/2054 | | 85,000 | 93,445 |
| New York Transportation Development Corp. | | | |
| AMT, 4.00%, 10/31/2034 | | 250,000 | 241,849 |
| Series A-P3, 5.25%, 01/01/2050 | | 1,000,000 | 999,957 |
| Suffolk Regional Off-Track Betting Co., 5.00%, 12/01/2034 | | 100,000 | 103,293 |
| Total New York | | 6,499,137 |
| NORTH CAROLINA—0.6% |
| North Carolina Medical Care Commission | | | |
| Series 2024B-1, 4.25%, 10/01/2028 | | 30,000 | 30,191 |
| Series A, 5.13%, 10/01/2054 | | 210,000 | 216,347 |
| Total North Carolina | | 246,538 |
| OHIO—5.5% |
| Buckeye Tobacco Settlement Financing Authority, Series B-2, 5.00%, 06/01/2055 | | 1,605,000 | 1,449,227 |
| Ohio Higher Educational Facility Commission, Series B, 4.00%, 07/01/2046 | | 1,085,000 | 979,513 |
| Total Ohio | | 2,428,740 |
| PENNSYLVANIA—2.1% |
| Pennsylvania Turnpike Commission Registration Fee Revenue, (AGM), Series A, 5.25%, 07/15/2029 | | 850,000 | 934,741 |
| PUERTO RICO—0.2% |
| Puerto Rico Electric Power Authority, (NPFG), Series V, 5.25%, 07/01/2026 | | 100,000 | 99,067 |
| SOUTH CAROLINA—2.6% |
| South Carolina Jobs-Economic Development Authority | | | |
| 5.50%, 11/15/2044 | | 165,000 | 174,684 |
| Series A, 5.00%, 12/01/2039(b) | | 1,000,000 | 972,394 |
| Total South Carolina | | 1,147,078 |
| TENNESSEE—4.0% |
| Knox County Health Educational & Housing Facility Board | | | |
| 5.00%, 09/01/2036 | | 500,000 | 501,984 |
| (BAM), Series A-1, 5.00%, 07/01/2064 | | 105,000 | 108,348 |
| Metropolitan Nashville Airport Authority, Series B, 5.00%, 07/01/2040 | | 1,000,000 | 1,003,984 |
| Shelby County Health & Educational Facilities Board, Series A1, 5.25%, 06/01/2056(b) | | 125,000 | 127,733 |
| Total Tennessee | | 1,742,049 |
| | Shares or
Principal
Amount | Value |
| |
| TEXAS—19.6% |
| Arlington Higher Education Finance Corp. | | | |
| (PSF-GTD), 4.00%, 08/15/2050 | $ | 1,000,000 | $ 961,663 |
| Series A, 4.75%, 08/15/2044 | | 500,000 | 486,487 |
| Series A, 5.00%, 08/15/2049 | | 135,000 | 134,466 |
| VRDN, Series A, 4.88%, 06/15/2056(a)(b) | | 190,000 | 191,706 |
| Clifton Higher Education Finance Corp. | | | |
| (PSF-GTD), 4.00%, 08/15/2049 | | 200,000 | 190,693 |
| (PSF-GTD), Series A, 4.00%, 08/15/2044 | | 190,000 | 183,200 |
| (PSF-GTD), Series A, 4.13%, 08/15/2049 | | 40,000 | 38,777 |
| Series A, 6.25%, 06/15/2053(b) | | 600,000 | 609,028 |
| (PSF-GTD), Series A, 4.25%, 08/15/2053 | | 65,000 | 64,783 |
| Series A, 6.00%, 06/15/2054(b) | | 50,000 | 50,023 |
| Harris County Cultural Education Facilities Finance Corp., 4.00%, 12/01/2045 | | 1,250,000 | 1,194,407 |
| Harris County Health Facilities Development Corp., Prerefunded/Escrowed to Maturity, Series B, 5.75%, 07/01/2027 | | 915,000 | 947,998 |
| Harris County Industrial Development Corp., VRDN, 4.05%, 11/01/2050(a) | | 500,000 | 502,941 |
| Matagorda County Navigation District No. 1, Series B-1, 4.00%, 06/01/2030 | | 1,000,000 | 1,000,270 |
| Port of Beaumont Navigation District | | | |
| Series A, 5.00%, 01/01/2039(b) | | 200,000 | 205,750 |
| Series A, 4.00%, 01/01/2050(b) | | 1,000,000 | 850,428 |
| Tarrant County Cultural Education Facilities Finance Corp., Series A, 4.00%, 02/15/2036 | | 1,000,000 | 991,992 |
| Total Texas | | 8,604,612 |
| UTAH—1.5% |
| City of Salt Lake City Airport Revenue, Series B, 5.00%, 07/01/2042 | | 100,000 | 102,257 |
| Utah Charter School Finance Authority, VRDN, Series A, 5.88%, 04/15/2048(a)(b) | | 570,000 | 566,388 |
| Total Utah | | 668,645 |
| WASHINGTON—0.5% |
| Skagit County Public Hospital District No. 1, 5.50%, 12/01/2054 | | 225,000 | 237,988 |
| WISCONSIN—8.1% |
| Public Finance Authority | | | |
| 5.00%, 06/15/2029 | | 530,000 | 552,919 |
| 5.00%, 06/15/2034 | | 425,000 | 437,270 |
| 6.25%, 02/01/2039(b) | | 655,000 | 676,735 |
| 5.00%, 02/01/2054 | | 120,000 | 121,318 |
| Series A, 5.00%, 12/15/2044(b) | | 55,000 | 55,481 |
| Series A, 5.00%, 07/01/2038 | | 1,000,000 | 1,018,769 |
| Series A, 5.00%, 06/01/2044 | | 130,000 | 133,017 |
| Series A, 5.00%, 06/15/2044 | | 190,000 | 191,963 |
| Series A, 5.25%, 06/01/2054 | | 85,000 | 87,125 |
| Series A, 5.00%, 12/15/2054(b) | | 50,000 | 49,612 |
| Wisconsin Health & Educational Facilities Authority, Series A, 5.00%, 04/01/2035 | | 250,000 | 257,710 |
| Total Wisconsin | | 3,581,919 |
| Total Municipal Bonds | | 42,876,789 |
See accompanying Notes to Financial Statements.
Statement of Investments (concluded)
October 31, 2024 abrdn Intermediate Municipal Income Fund
| | Shares or
Principal
Amount | Value |
| SHORT-TERM INVESTMENT—0.7% | |
| BlackRock Liquidity Funds MuniCash, Institutional shares | | 285,777 | $ 285,806 |
| Total Short-Term Investment | | 285,806 |
Total Investments
(Cost $43,259,477)(c)—98.6% | 43,411,762 |
| Other Assets in Excess of Liabilities—1.4% | 618,344 |
| Net Assets—100.0% | $44,030,106 |
| (a) | Variable Rate Instrument. The rate shown is based on the latest available information as of October 31, 2024. Certain variable rate securities are not based on a published reference rate and spread but are determined by the issuer or agent and are based on current market conditions. These securities do not indicate a reference rate and spread in their description. |
| (b) | Denotes a security issued under Regulation S or Rule 144A. |
| (c) | See accompanying Notes to Financial Statements for tax unrealized appreciation/(depreciation) of securities. |
| AGC | Assured Guaranty Corp. |
| AGM | Assured Guaranty Municipal Corp. |
| AMT | Alternative Minimum Tax |
| BAM | Build America Mutual Assurance Company |
| PSF-GTD | Permanent School Fund Guarantee Program |
| VRDN | Variable Rate Demand Note |
See accompanying Notes to Financial Statements.
Statement of Investments
October 31, 2024 abrdn Short Duration High Yield Municipal Fund
| | Shares or
Principal
Amount | Value |
| COMMERCIAL MORTGAGE-BACKED SECURITIES—0.7% | |
| National Finance Authority Affordable Housing Certificates, Class A | | 750,000 | $ 747,501 |
| Total Commercial Mortgage-Backed Securities | | 747,501 |
| CORPORATE BONDS—0.3% | |
| UNITED STATES—0.3% |
| Healthcare Providers & Services—0.3% | | | |
| Sunland Medical Foundation (escrow), 12.00%, 01/01/2050(a)(b)(c) | $ | 4,100,000 | 280,030 |
| Total Corporate Bonds | | 280,030 |
| MUNICIPAL BONDS —97.9% | |
| ALABAMA—0.7% |
| Black Belt Energy Gas District | | | |
| VRDN, Series A, 5.25%, 05/01/2055(d) | | 400,000 | 433,339 |
| VRDN, Series D-1, 5.50%, 06/01/2049(d) | | 285,000 | 303,989 |
| Total Alabama | | 737,328 |
| ARIZONA—7.1% |
| Arizona Industrial Development Authority | | | |
| Series A, 4.00%, 07/15/2028(e) | | 185,000 | 185,410 |
| Series A, 4.00%, 07/15/2029(e) | | 200,000 | 200,131 |
| Series A, 4.00%, 07/15/2030(e) | | 215,000 | 214,088 |
| Series A, 4.00%, 07/15/2031(e) | | 215,000 | 212,834 |
| Series A, 4.00%, 07/15/2032(e) | | 450,000 | 442,568 |
| Series A, 4.00%, 07/15/2035(e) | | 255,000 | 244,820 |
| Series A, 4.00%, 07/15/2036(e) | | 495,000 | 469,937 |
| Series A, 4.00%, 07/15/2037(e) | | 270,000 | 253,729 |
| Series A, 5.00%, 07/15/2040(e) | | 415,000 | 417,853 |
| Series A, 4.00%, 07/15/2041(e) | | 135,000 | 122,243 |
| Series C, 5.13%, 01/01/2034(b)(e)(f) | | 775,000 | 426,250 |
| Series C, 5.13%, 01/01/2035(b)(e)(f) | | 815,000 | 448,250 |
| Industrial Development Authority of the City of Phoenix, Series A, 5.00%, 07/01/2059 | | 1,500,000 | 1,495,229 |
| Maricopa County Industrial Development Authority | | | |
| 5.00%, 10/01/2026(e) | | 135,000 | 133,752 |
| 5.13%, 10/01/2030(e) | | 425,000 | 419,746 |
| Series B, 5.00%, 07/01/2049(e) | | 635,000 | 633,387 |
| Sierra Vista Industrial Development Authority, 5.00%, 06/15/2054(e) | | 800,000 | 792,626 |
| Total Arizona | | 7,112,853 |
| ARKANSAS—0.8% |
| City of Osceola, VRDN, 5.50%, 04/01/2036(d) | | 835,000 | 837,835 |
| CALIFORNIA—9.1% |
| California Community Choice Financing Authority, VRDN, Series C, 5.25%, 01/01/2054(d) | | 1,000,000 | 1,073,664 |
| California Infrastructure & Economic Development Bank, VRDN, Series A-4, 8.00%, 01/01/2050(d)(e) | | 1,935,000 | 1,994,015 |
| California Municipal Finance Authority, Series A, 5.00%, 10/01/2026(e) | | 20,000 | 20,069 |
| California Public Finance Authority, Series B-1, 3.13%, 05/15/2029(e) | | 3,075,000 | 3,011,310 |
| | Shares or
Principal
Amount | Value |
| |
|
| California School Finance Authority, 5.50%, 08/01/2043(e) | $ | 100,000 | $ 105,823 |
| Palomar Health, 5.00%, 11/01/2030 | | 3,000,000 | 3,007,693 |
| Total California | | 9,212,574 |
| COLORADO—8.1% |
| Colorado Health Facilities Authority | | | |
| Series B-1, 3.50%, 05/15/2030 | | 6,950,000 | 6,526,997 |
| Series B-2, 2.63%, 05/15/2029 | | 1,705,000 | 1,617,824 |
| Total Colorado | | 8,144,821 |
| FLORIDA—8.7% |
| Capital Projects Finance Authority, Series A-1, 5.00%, 11/01/2048 | | 685,000 | 679,090 |
| Capital Trust Agency, Inc. | | | |
| Series A, 3.00%, 12/15/2029(e) | | 360,000 | 336,573 |
| Series A, 6.00%, 05/01/2043(e) | | 2,000,000 | 2,027,061 |
| Series A-1, 4.50%, 01/01/2035(e) | | 300,000 | 300,389 |
| Capital Trust Authority | | | |
| Series A, 5.63%, 06/15/2044(e) | | 250,000 | 259,626 |
| Series A, 6.00%, 06/15/2054(e) | | 210,000 | 219,373 |
| Florida Development Finance Corp. | | | |
| VRDN, 6.13%, 07/01/2032(d)(e) | | 500,000 | 512,382 |
| (AGM), 5.00%, 07/01/2044 | | 600,000 | 622,547 |
| Series A, 4.00%, 12/15/2029(e) | | 795,000 | 792,181 |
| Series A, 5.00%, 12/15/2039(e) | | 305,000 | 310,258 |
| VRDN, Series A, 4.38%, 10/01/2054(d)(e) | | 500,000 | 499,945 |
| Series A1, 5.00%, 06/01/2044(e) | | 250,000 | 254,179 |
| Miami-Dade County Industrial Development Authority, 5.25%, 09/15/2044 | | 1,950,000 | 1,924,903 |
| Total Florida | | 8,738,507 |
| IDAHO—0.5% |
| Idaho Housing & Finance Association, Series A, 4.00%, 12/01/2026(e) | | 500,000 | 494,748 |
| ILLINOIS—2.6% |
| Cook County School District No. 144 Prairie Hills, (BAM), Series A, 4.00%, 12/01/2033 | | 600,000 | 605,847 |
| Illinois Finance Authority | | | |
| 5.00%, 12/01/2028 | | 250,000 | 259,504 |
| 5.00%, 12/01/2029 | | 315,000 | 326,330 |
| St. Clair County Community Unit School District No. 187 Cahokia | | | |
| (AGM), Series A, 5.00%, 01/01/2049 | | 425,000 | 443,718 |
| (AGM), Series A, 5.00%, 01/01/2054 | | 300,000 | 312,066 |
| Village of Matteson | | | |
| (BAM), 5.00%, 12/01/2026 | | 150,000 | 155,685 |
| (BAM), 5.00%, 12/01/2027 | | 150,000 | 157,507 |
| (BAM), 5.00%, 12/01/2028 | | 350,000 | 371,530 |
| Total Illinois | | 2,632,187 |
| INDIANA—1.4% |
| Indiana Finance Authority | | | |
| Series A, 5.00%, 07/01/2049 | | 435,000 | 441,668 |
| Series A, 5.00%, 07/01/2054 | | 335,000 | 340,137 |
| Series A, 5.00%, 06/01/2043 | | 100,000 | 103,415 |
| Series A, 5.00%, 06/01/2053 | | 550,000 | 561,115 |
| Total Indiana | | 1,446,335 |
See accompanying Notes to Financial Statements.
Statement of Investments (continued)
October 31, 2024 abrdn Short Duration High Yield Municipal Fund
| | Shares or
Principal
Amount | Value |
| MUNICIPAL BONDS (continued) | |
| KANSAS—2.8% |
| Kansas Independent College Finance Authority, Series B, 8.50%, 05/01/2025 | $ | 2,750,000 | $ 2,776,888 |
| LOUISIANA—0.4% |
| Louisiana Local Government Environmental Facilities & Community Development Authority, Series A, 5.50%, 11/15/2025 | | 100,000 | 100,150 |
| Louisiana Public Facilities Authority, Series A, 5.00%, 04/01/2030(e) | | 350,000 | 349,442 |
| Total Louisiana | | 449,592 |
| MARYLAND—0.6% |
| Maryland Economic Development Corp., Series A-1, 5.00%, 06/01/2037 | | 575,000 | 589,976 |
| MASSACHUSETTS—1.1% |
| Massachusetts Development Finance Agency | | | |
| Series N, 5.25%, 10/01/2036 | | 370,000 | 381,463 |
| Series N, 5.25%, 10/01/2037 | | 265,000 | 272,357 |
| Series N, 5.25%, 10/01/2038 | | 405,000 | 414,831 |
| Total Massachusetts | | 1,068,651 |
| MICHIGAN—0.8% |
| Flint Hospital Building Authority, Series B, 4.75%, 07/01/2028 | | 805,000 | 798,715 |
| MINNESOTA—4.3% |
| City of Shakopee Senior Housing Revenue, VRDN, 5.85%, 11/01/2058(d)(e) | | 4,425,000 | 4,363,398 |
| MISSISSIPPI—1.7% |
| Mississippi Development Bank, 4.55%, 11/01/2039(e) | | 1,710,000 | 1,733,651 |
| MISSOURI—0.2% |
| Industrial Development Authority of The County of Platte County Missouri, (CNTY APPROP), 5.00%, 12/01/2025(b)(f) | | 675,000 | 209,250 |
| NEW HAMPSHIRE—3.1% |
| New Hampshire Business Finance Authority | | | |
| 4.88%, 12/01/2033(e) | | 1,000,000 | 991,992 |
| Series 2, 4.25%, 07/20/2041 | | 2,129,429 | 2,083,148 |
| Total New Hampshire | | 3,075,140 |
| NEW JERSEY—0.2% |
| Passaic County Improvement Authority, 5.25%, 07/01/2043 | | 200,000 | 208,380 |
| NEW YORK—10.4% |
| Build NYC Resource Corp. | | | |
| Series A, 5.00%, 06/01/2025(e) | | 410,000 | 410,766 |
| Series A, 5.00%, 06/01/2026(e) | | 430,000 | 434,254 |
| Series A, 5.00%, 06/01/2027(e) | | 450,000 | 458,557 |
| Series A, 5.00%, 06/01/2032(e) | | 500,000 | 508,541 |
| Series A, 4.50%, 06/15/2043 | | 690,000 | 676,821 |
| City of Elmira | | | |
| 5.00%, 07/01/2025(e) | | 240,000 | 241,933 |
| 5.00%, 07/01/2033(e) | | 2,635,000 | 2,717,448 |
| Madison County Capital Resource Corp., Series A, 5.50%, 09/01/2022(b)(f) | | 6,500,000 | 3,510,000 |
| Metropolitan Transportation Authority, (BAM), Series A, 4.00%, 11/15/2048 | | 335,000 | 319,975 |
| | Shares or
Principal
Amount | Value |
| |
|
| New York State Dormitory Authority, 5.25%, 10/01/2049 | $ | 100,000 | $ 106,101 |
| Suffolk Regional Off-Track Betting Co. | | | |
| 5.00%, 12/01/2034 | | 150,000 | 154,940 |
| 6.00%, 12/01/2053 | | 300,000 | 312,362 |
| Western Regional Off-Track Betting Corp., 3.00%, 12/01/2026(e) | | 670,000 | 653,783 |
| Total New York | | 10,505,481 |
| OHIO—1.2% |
| Buckeye Tobacco Settlement Financing Authority, Series B-2, 5.00%, 06/01/2055 | | 1,200,000 | 1,083,534 |
| Cleveland-Cuyahoga County Port Authority, 5.00%, 12/01/2028 | | 155,000 | 158,410 |
| Total Ohio | | 1,241,944 |
| PENNSYLVANIA—1.0% |
| Pennsylvania Economic Development Financing Authority, VRDN, Series B, 5.25%, 12/01/2038(d) | | 1,000,000 | 1,012,801 |
| SOUTH CAROLINA—2.5% |
| South Carolina Jobs-Economic Development Authority | | | |
| 5.25%, 02/01/2027(b)(e)(f)(g) | | 1,060,000 | 53,000 |
| 5.25%, 11/15/2039 | | 300,000 | 315,577 |
| 5.50%, 11/15/2044 | | 335,000 | 354,662 |
| Series A, 4.00%, 12/01/2029(e) | | 1,030,000 | 996,222 |
| Series A, 5.00%, 12/01/2039(e) | | 795,000 | 773,053 |
| Total South Carolina | | 2,492,514 |
| TENNESSEE—0.7% |
| Knox County Health Educational & Housing Facility Board, (BAM), Series A-1, 5.00%, 07/01/2064 | | 195,000 | 201,217 |
| Shelby County Health & Educational Facilities Board, Series A1, 5.00%, 06/01/2044(e) | | 500,000 | 509,464 |
| Total Tennessee | | 710,681 |
| TEXAS—12.4% |
| Arlington Higher Education Finance Corp. | | | |
| Series A, 4.75%, 08/15/2044 | | 500,000 | 486,487 |
| Series A, 5.00%, 08/15/2049 | | 665,000 | 662,367 |
| VRDN, Series A, 4.88%, 06/15/2056(d)(e) | | 560,000 | 565,028 |
| Calhoun County Navigation Industrial Development Authority, AMT, Series A, 3.63%, 07/01/2026(e) | | 4,000,000 | 3,684,863 |
| Clifton Higher Education Finance Corp. | | | |
| Series A, 6.00%, 06/15/2048(e) | | 1,000,000 | 1,006,968 |
| Series A, 6.25%, 06/15/2053(e) | | 200,000 | 203,010 |
| Series A, 6.00%, 06/15/2054(e) | | 200,000 | 200,092 |
| New Hope Cultural Education Facilities Finance Corp. | | | |
| Series B, 4.75%, 07/01/2051 | | 1,000,000 | 560,000 |
| Series B, 2.00%, 11/15/2061(d)(h) | | 729,847 | 265,452 |
| Series B-3, 4.25%, 10/01/2026 | | 2,000,000 | 1,999,931 |
| Series D, 6.00%, 07/01/2026(f) | | 95,000 | 13,300 |
| Port of Beaumont Navigation District, Series A, 5.00%, 01/01/2039(e) | | 800,000 | 823,001 |
See accompanying Notes to Financial Statements.
Statement of Investments (concluded)
October 31, 2024 abrdn Short Duration High Yield Municipal Fund
| | Shares or
Principal
Amount | Value |
| MUNICIPAL BONDS (continued) | |
| TEXAS (continued) |
| Texas Private Activity Bond Surface Transportation Corp. | | | |
| 5.50%, 06/30/2043 | $ | 1,150,000 | $ 1,230,183 |
| 5.00%, 06/30/2058 | | 800,000 | 810,899 |
| Total Texas | | 12,511,581 |
| UTAH—2.4% |
| Utah Charter School Finance Authority | | | |
| Series A, 4.50%, 10/15/2028(b)(e) | | 500,000 | 493,448 |
| VRDN, Series A, 5.63%, 10/15/2048(d)(e) | | 1,950,000 | 1,950,366 |
| Total Utah | | 2,443,814 |
| WASHINGTON—4.5% |
| Skagit County Public Hospital District No. 1, 5.50%, 12/01/2054 | | 375,000 | 396,647 |
| Washington State Housing Finance Commission | | | |
| Series B-1, 2.50%, 07/01/2028(e) | | 4,375,000 | 4,127,439 |
| Series B-2, 2.13%, 07/01/2027(e) | | 55,000 | 55,000 |
| Total Washington | | 4,579,086 |
| WISCONSIN—8.6% |
| Public Finance Authority | | | |
| 5.50%, 12/15/2028(e) | | 2,000,000 | 2,006,047 |
| 5.38%, 12/15/2032(e) | | 2,000,000 | 2,000,964 |
| 6.25%, 02/01/2039(e) | | 1,305,000 | 1,348,304 |
| 5.00%, 02/01/2054 | | 315,000 | 318,459 |
| 5.00%, 02/01/2064 | | 315,000 | 316,544 |
| Series A, 5.00%, 12/15/2044(e) | | 220,000 | 221,922 |
| Series A, 5.13%, 07/15/2037(e) | | 600,000 | 609,225 |
| Series A, 5.00%, 06/01/2044 | | 520,000 | 532,069 |
| Series A, 5.00%, 06/15/2044 | | 310,000 | 313,203 |
| Series A, 5.38%, 07/15/2047(e) | | 500,000 | 504,776 |
| Series A, 5.25%, 06/01/2054 | | 80,000 | 82,000 |
| Series A, 5.00%, 12/15/2054(e) | | 390,000 | 386,976 |
| Total Wisconsin | | 8,640,489 |
| Total Municipal Bonds | | 98,769,220 |
Total Investments
(Cost $105,909,790)—98.9% | 99,796,751 |
| Other Assets in Excess of Liabilities—1.1% | 1,123,085 |
| Net Assets—100.0% | $100,919,836 |
| (a) | Fair Value is determined pursuant to procedures approved by the Fund’s Board of Trustees. Unless otherwise noted, securities are valued by applying valuation factors to the exchange traded price. See Note 2(a) of the accompanying Notes to Financial Statements for inputs used. |
| (b) | The Fund’s adviser has deemed this security to be illiquid based upon procedures approved by the Board of Trustees. Illiquid securities held by the Fund represent 5.4% of net assets as of October 31, 2024. |
| (c) | Level 3 security. See Note 2(a) of the accompanying Notes to Financial Statements. |
| (d) | Variable Rate Instrument. The rate shown is based on the latest available information as of October 31, 2024. Certain variable rate securities are not based on a published reference rate and spread but are determined by the issuer or agent and are based on current market conditions. These securities do not indicate a reference rate and spread in their description. |
| (e) | Denotes a security issued under Regulation S or Rule 144A. |
| (f) | Security is in default. |
| (g) | Security is in forbearance as of October 31, 2024. |
| (h) | Payment-in-kind security for which part of the income earned may be paid as additional principal. |
| AGM | Assured Guaranty Municipal Corp. |
| AMT | Alternative Minimum Tax |
| BAM | Build America Mutual Assurance Company |
| VRDN | Variable Rate Demand Note |
See accompanying Notes to Financial Statements.
Statement of Investments
October 31, 2024 abrdn Ultra Short Municipal Income Fund
| | Shares or
Principal
Amount | Value |
| MUNICIPAL BONDS —102.1% | |
| ALABAMA—3.7% |
| Columbia Industrial Development Board, VRDN, 4.05%, 06/01/2028(a) | $ | 400,000 | $ 400,000 |
| Health Care Authority for Baptist Health, VRDN, Series B, 4.66%, 11/01/2042(a) | | 25,657,000 | 25,657,000 |
| Walker County Economic & Industrial Development Authority, VRDN, 4.10%, 08/01/2063(a) | | 100,000 | 100,000 |
| West Jefferson Industrial Development Board, VRDN, 4.40%, 12/01/2038(a) | | 520,000 | 520,000 |
| Total Alabama | | 26,677,000 |
| ARIZONA—1.4% |
| Industrial Development Authority of the City of Phoenix Arizona, AMT, VRDN, Series D, 4.25%, 12/01/2035(a) | | 10,000,000 | 10,000,000 |
| ARKANSAS—3.5% |
| Arkansas Development Finance Authority, VRDN, Series B-4, 4.68%, 09/01/2044(a) | | 25,462,000 | 25,462,000 |
| CALIFORNIA—4.8% |
| California Municipal Finance Authority | | | |
| VRDN, Series A, 3.80%, 07/01/2041(a) | | 2,000,000 | 1,997,486 |
| VRDN, Series A, 4.25%, 12/01/2044(a) | | 3,500,000 | 3,501,095 |
| VRDN, Series B, 4.15%, 07/01/2051(a) | | 1,750,000 | 1,745,875 |
| California Pollution Control Financing Authority | | | |
| VRDN, 4.05%, 07/01/2043(a)(b) | | 2,950,000 | 2,948,093 |
| VRDN, Series A-1, 3.85%, 11/01/2042(a)(b) | | 1,000,000 | 997,150 |
| AMT, VRDN, Series A2, 3.85%, 11/01/2042(a)(b) | | 1,000,000 | 997,150 |
| California Statewide Communities Development Authority | | | |
| (AGM), Series D, 3.40%, 07/01/2041(a) | | 1,375,000 | 1,375,000 |
| (AGM), Series E, 6.00%, 07/01/2040(a) | | 20,900,000 | 20,900,000 |
| Total California | | 34,461,849 |
| FLORIDA—4.9% |
| Florida Insurance Assistance Interlocal Agency, Inc., VRDN, Series A-2, 3.99%, 09/01/2032(a) | | 25,250,000 | 25,250,000 |
| Miami-Dade County Industrial Development Authority, 3.35%, 09/01/2027 | | 10,000,000 | 10,000,000 |
| Total Florida | | 35,250,000 |
| GEORGIA—2.2% |
| Bartow County Development Authority | | | |
| VRDN, 4.10%, 11/01/2062(a) | | 1,000,000 | 1,000,000 |
| VRDN, 4.25%, 11/01/2062(a) | | 1,500,000 | 1,500,000 |
| Bartow-Cartersville Joint Development Authority, VRDN, Series A, 3.48%, 08/01/2033(a)(b) | | 12,000,000 | 12,000,000 |
| Development Authority of Heard County, VRDN, 4.40%, 12/01/2037(a) | | 1,300,000 | 1,300,000 |
| Total Georgia | | 15,800,000 |
| | Shares or
Principal
Amount | Value |
| |
| ILLINOIS—1.1% |
| County of Lake, (Pre-refunded @ $100.000000, 11/01/2024), 5.45%, 05/01/2040 | $ | 8,149,416 | $ 8,149,416 |
| INDIANA—4.5% |
| Indiana Finance Authority | | | |
| VRDN, 3.95%, 05/01/2028(a) | | 1,000,000 | 1,000,000 |
| VRDN, 3.25%, 08/01/2030(a) | | 21,600,000 | 21,600,000 |
| Tender Option Bond Trust Receipts/Certificates, Series 2024-MS0022, 3.74%, 03/01/2054(a)(b) | | 10,000,000 | 10,000,000 |
| Total Indiana | | 32,600,000 |
| IOWA—4.4% |
| Crawford County Memorial Hospital, Inc., 5.00%, 06/15/2027 | | 2,515,000 | 2,550,776 |
| Iowa Finance Authority | | | |
| VRDN, Series A, 3.50%, 07/01/2038(a) | | 4,130,000 | 4,130,000 |
| VRDN, Series B, 3.50%, 12/01/2046(a) | | 25,400,000 | 25,400,000 |
| Total Iowa | | 32,080,776 |
| KANSAS—0.9% |
| City of Dodge City, VRDN, 3.64%, 03/01/2027(a) | | 1,000,000 | 1,000,000 |
| City of Liberal, VRDN, 3.64%, 02/01/2029(a) | | 1,000,000 | 1,000,000 |
| City of Seneca, 5.00%, 09/01/2025 | | 4,330,000 | 4,338,914 |
| Total Kansas | | 6,338,914 |
| KENTUCKY—3.4% |
| County of Meade | | | |
| AMT, VRDN, Series A-1, 4.60%, 08/01/2061(a) | | 24,800,000 | 24,800,000 |
| AMT, VRDN, Series B-1, 4.50%, 08/01/2061(a) | | 100,000 | 100,000 |
| Total Kentucky | | 24,900,000 |
| LOUISIANA—1.2% |
| Calcasieu Parish Industrial Development Board, Inc., VRDN, 3.35%, 06/01/2025(a) | | 8,900,000 | 8,900,000 |
| MARYLAND—6.9% |
| Maryland Economic Development Corp., Series A-1, 5.00%, 06/01/2025 | | 235,000 | 235,968 |
| Maryland Industrial Development Financing Authority, VRDN, 5.26%, 03/01/2030(a) | | 49,905,000 | 49,905,000 |
| Total Maryland | | 50,140,968 |
| MASSACHUSETTS—2.1% |
| City of Holyoke, 5.00%, 04/11/2025 | | 14,880,429 | 14,921,325 |
| MINNESOTA—3.6% |
| JPMorgan Chase Putters/Drivers Trust, VRDN, 4.55%, 03/20/2027(a)(b) | | 26,450,000 | 26,450,000 |
| MISSISSIPPI—9.0% |
| Mississippi Business Finance Corp. | | | |
| AMT, VRDN, 4.15%, 07/01/2025(a) | | 2,800,000 | 2,800,000 |
| VRDN, 4.40%, 12/01/2027(a) | | 1,000,000 | 1,000,000 |
| VRDN, Series 1, 4.35%, 11/01/2052(a) | | 200,000 | 200,000 |
| VRDN, Series A, 4.39%, 11/01/2032(a) | | 58,370,000 | 58,370,000 |
| VRDN, Series C, 3.75%, 05/01/2037(a) | | 2,711,000 | 2,711,000 |
| Total Mississippi | | 65,081,000 |
See accompanying Notes to Financial Statements.
Statement of Investments (continued)
October 31, 2024 abrdn Ultra Short Municipal Income Fund
| | Shares or
Principal
Amount | Value |
| MUNICIPAL BONDS (continued) | |
| MISSOURI—1.2% |
| Citizens Memorial Hospital District, Series A, 5.00%, 12/01/2026 | $ | 9,000,000 | $ 9,042,535 |
| NEVADA—0.2% |
| State of Nevada Department of Business & Industry, VRDN, Series 2001-REMK, 4.15%, 12/01/2026(a)(b) | | 1,600,000 | 1,600,236 |
| NEW HAMPSHIRE—2.8% |
| New Hampshire Business Finance Authority, VRDN, Series A, 4.50%, 10/01/2033(a) | | 20,000,000 | 20,021,768 |
| NEW JERSEY—2.9% |
| Casino Reinvestment Development Authority, Inc., 5.25%, 11/01/2044 | | 2,370,000 | 2,370,000 |
| Township of Irvington, 4.50%, 12/05/2024 | | 6,751,153 | 6,752,759 |
| Township of Weehawken | | | |
| 4.50%, 03/26/2025 | | 4,476,000 | 4,478,389 |
| 4.50%, 07/03/2025 | | 7,181,000 | 7,200,983 |
| Total New Jersey | | 20,802,131 |
| NEW YORK—7.8% |
| City of Cortland, 4.50%, 05/16/2025 | | 20,033,000 | 20,050,567 |
| City of New York, VRDN, Series 3, 4.00%, 04/01/2042(a) | | 2,500,000 | 2,500,000 |
| City of Utica, 4.00%, 08/29/2025 | | 10,374,350 | 10,394,342 |
| New York State Dormitory Authority, VRDN, Series C, 4.14%, 05/01/2044(a) | | 9,800,000 | 9,800,000 |
| New York State Housing Finance Agency, VRDN, 3.37%, 05/15/2030(a) | | 13,700,000 | 13,700,000 |
| Total New York | | 56,444,909 |
| NORTH CAROLINA—0.1% |
| Fayetteville State University, (AGM), 5.00%, 04/01/2026 | | 470,000 | 480,031 |
| OHIO—0.1% |
| State of Ohio, VRDN, Series C, 3.60%, 01/15/2045(a) | | 650,000 | 650,000 |
| OKLAHOMA—1.2% |
| Oklahoma Development Finance Authority, VRDN, Series B, 3.88%, 08/15/2031(a) | | 8,770,000 | 8,770,000 |
| OREGON—0.6% |
| Oregon Education Districts, Series A, 4.50%, 12/31/2024 | | 4,105,000 | 4,109,835 |
| PENNSYLVANIA—7.5% |
| Central Bradford Progress Authority, VRDN, Series D, 3.86%, 12/01/2041(a) | | 23,030,000 | 23,030,000 |
| Montgomery County Higher Education & Health Authority, VRDN, Series D, 4.04%, 09/01/2050(a) | | 6,000,000 | 6,000,000 |
| Pennsylvania Economic Development Financing Authority | | | |
| VRDN, Series A, 3.85%, 04/01/2034(a) | | 1,000,000 | 997,149 |
| VRDN, Series B-1, 3.85%, 04/01/2049(a) | | 1,000,000 | 997,150 |
| VRDN, Series B-2, 4.15%, 04/01/2049(a) | | 1,250,000 | 1,247,053 |
| | Shares or
Principal
Amount | Value |
| |
|
| Pennsylvania Higher Educational Facilities Authority, VRDN, Series B, 4.04%, 09/01/2045(a) | $ | 18,500,000 | $ 18,500,000 |
| Philadelphia Authority for Industrial Development, VRDN, Series B, 4.04%, 09/01/2050(a) | | 3,200,000 | 3,200,000 |
| Total Pennsylvania | | 53,971,352 |
| SOUTH CAROLINA—0.6% |
| County of Berkeley, VRDN, Series A, 3.60%, 03/01/2029(a) | | 4,105,000 | 4,105,000 |
| TENNESSEE—1.7% |
| Chattanooga Health Educational & Housing Facility Board, VRDN, Series C, 3.60%, 05/01/2039(a) | | 4,680,000 | 4,680,000 |
| Public Building Authority of Blount County Tennessee, VRDN, (CNTY GTD), Series C-1-A, 3.55%, 06/01/2029(a) | | 7,900,000 | 7,900,000 |
| Total Tennessee | | 12,580,000 |
| TEXAS—13.1% |
| City of Houston Hotel Occupancy Tax & Special Revenue, 4.00%, 09/01/2025 | | 425,000 | 427,158 |
| Harris County Cultural Education Facilities Finance Corp., VRDN, Series B, 3.77%, 11/15/2046(a) | | 30,000,000 | 30,000,000 |
| Las Varas Public Facility Corp., 3.75%, 11/01/2025 | | 3,700,000 | 3,698,881 |
| Love Field Airport Modernization Corp., 5.00%, 11/01/2024 | | 3,000,000 | 3,000,000 |
| Mission Economic Development Corp., VRDN, 4.25%, 01/01/2026(a) | | 6,250,000 | 6,250,000 |
| Port of Corpus Christi Authority of Nueces County | | | |
| VRDN, 4.25%, 01/01/2030(a)(b) | | 1,200,000 | 1,200,000 |
| VRDN, Series A, 4.12%, 07/01/2029(a)(b) | | 18,200,000 | 18,200,000 |
| Port of Port Arthur Navigation District, VRDN, Series E, 3.40%, 11/01/2040(a) | | 7,300,000 | 7,300,000 |
| State of Texas, VRDN, Series B, 3.36%, 04/01/2036(a) | | 5,000,000 | 5,000,000 |
| Tarrant County Cultural Education Facilities Finance Corp., VRDN, Series B, 4.00%, 10/01/2041(a) | | 8,100,000 | 8,100,000 |
| Tender Option Bond Trust Receipts/Certificates, VRDN, Series 2021-MS0002, 3.64%, 06/15/2056(a)(b) | | 7,000,000 | 7,000,000 |
| Texas Municipal Gas Acquisition & Supply Corp. III | | | |
| 5.00%, 12/15/2024 | | 3,100,000 | 3,104,296 |
| 5.00%, 12/15/2025 | | 1,500,000 | 1,517,130 |
| Total Texas | | 94,797,465 |
| WEST VIRGINIA—3.5% |
| West Virginia Economic Development Authority, VRDN, Series A, 3.31%, 02/01/2036(a) | | 7,300,000 | 7,300,000 |
| West Virginia Hospital Finance Authority, VRDN, Series E, 3.85%, 06/01/2033(a) | | 18,345,000 | 18,345,000 |
| Total West Virginia | | 25,645,000 |
See accompanying Notes to Financial Statements.
Statement of Investments (concluded)
October 31, 2024 abrdn Ultra Short Municipal Income Fund
| | Shares or
Principal
Amount | Value |
| MUNICIPAL BONDS (continued) | |
| WISCONSIN—1.2% |
| Town of Red Cedar, AMT, VRDN, 3.65%, 09/01/2027(a) | $ | 8,575,000 | $ 8,575,000 |
| Total Municipal Bonds | | 738,808,510 |
| SHORT-TERM INVESTMENTS—1.3% | |
| COMMERCIAL PAPER—1.3% | |
| UNITED STATES—1.3% |
| City of New Braunfels Utility System Revenue, 3.90%, 12/17/2024 | | 9,285,000 | 9,285,000 |
| Total Commercial Paper | | 9,285,000 |
| MONEY MARKET FUNDS—0.0% | |
| BlackRock Liquidity Funds MuniCash, Institutional shares | | 58,628 | 58,634 |
| Total Money Market Funds | | 58,634 |
| Total Short-Term Investments | | 9,343,634 |
Total Investments
(Cost $748,185,049)(c)—103.4% | 748,152,144 |
| Liabilities in Excess of Other Assets—(3.4%) | (24,923,632) |
| Net Assets—100.0% | $723,228,512 |
| (a) | Variable Rate Instrument. The rate shown is based on the latest available information as of October 31, 2024. Certain variable rate securities are not based on a published reference rate and spread but are determined by the issuer or agent and are based on current market conditions. These securities do not indicate a reference rate and spread in their description. |
| (b) | Denotes a security issued under Regulation S or Rule 144A. |
| (c) | See accompanying Notes to Financial Statements for tax unrealized appreciation/(depreciation) of securities. |
| AGM | Assured Guaranty Municipal Corp. |
| AMT | Alternative Minimum Tax |
| VRDN | Variable Rate Demand Note |
See accompanying Notes to Financial Statements.
Statement of Assets and Liabilities
October 31, 2024
| | abrdn
High Income
Opportunities Fund | | abrdn
Infrastructure
Debt Fund | | abrdn
Intermediate
Municipal
Income Fund | | abrdn
Short Duration
High Yield
Municipal Fund | | abrdn
Ultra Short
Municipal
Income Fund |
| Assets: | | | | | | | | | |
| Investments, at value | $78,225,464 | | $24,077,576 | | $43,125,956 | | $99,796,751 | | $738,808,510 |
| Short-term investments, at value | 5,056,903 | | – | | 285,806 | | – | | 9,343,634 |
| Foreign Currency, at value | 12,885 | | 1,943 | | – | | – | | – |
| Cash | – | | 110,528 | | – | | – | | – |
| Receivable for investments sold | 218,047 | | – | | – | | 682,000 | | 13,006,926 |
| Interest and dividends receivable | 1,290,607 | | 441,554 | | 650,552 | | 1,531,693 | | 3,957,800 |
| Receivable for capital shares issued | 6,019 | | 1,422 | | – | | 55,000 | | 1,664,722 |
| Unrealized appreciation on forward foreign currency exchange contracts | 308,125 | | 28,513 | | – | | – | | – |
| Receivable from Adviser | – | | – | | 17,398 | | 23,091 | | 119,559 |
| Tax reclaim receivable | – | | 1,873 | | – | | – | | – |
| Prepaid expenses | 8,941 | | 20,282 | | 12,422 | | 12,608 | | 46,821 |
| Total Assets | 85,126,991 | | 24,683,691 | | 44,092,134 | | 102,101,143 | | 766,947,972 |
| Liabilities: | | | | | | | | | |
| Due to Custodian | – | | – | | – | | 5,409 | | – |
| Payable for investments purchased | 3,457,273 | | 120,065 | | – | | – | | 38,692,641 |
| Unrealized depreciation on forward foreign currency exchange contracts | 5,233 | | – | | – | | – | | – |
| Distributions payable | – | | – | | 4,632 | | 10,066 | | 73,243 |
| Payable for capital shares redeemed | 157,633 | | 30,888 | | 18,575 | | 238,016 | | 4,525,705 |
| Line of credit payable | – | | 250,000 | | – | | 840,130 | | – |
| Accrued expenses and other payables: | | | | | | | | | |
| Administration fees | 5,567 | | 1,649 | | 3,026 | | 10,907 | | 46,353 |
| Audit and tax fees | 4,258 | | 4,258 | | 2,683 | | 2,683 | | 2,683 |
| Custodian fees | 13,545 | | 4,618 | | 3,015 | | 3,386 | | 5,669 |
| Distribution fees | 11,491 | | 1,812 | | 847 | | 1,460 | | 32,788 |
| Fund accounting fees | 1,035 | | 324 | | 598 | | 1,363 | | 9,500 |
| Interest expense on line of credit | – | | 43 | | 64 | | 1,773 | | – |
| Investment advisory fees | 4,367 | | 24,401 | | 16,076 | | 47,153 | | 246,042 |
| Legal fees | 1,319 | | 415 | | 720 | | 1,571 | | 11,292 |
| Printing fees | 6,775 | | 5,723 | | 2,126 | | 2,795 | | 10,011 |
| Sub-transfer agent and administrative services fees | 4,848 | | 2,594 | | 1,245 | | 4,500 | | 33,440 |
| Transfer agent fees | 4,977 | | 2,065 | | 1,587 | | 1,369 | | 5,862 |
| Other accrued expenses | 7,607 | | 15,123 | | 6,834 | | 8,726 | | 24,231 |
| Total liabilities | 3,685,928 | | 463,978 | | 62,028 | | 1,181,307 | | 43,719,460 |
| Net assets | $81,441,063 | | $24,219,713 | | $44,030,106 | | $100,919,836 | | $723,228,512 |
| Cost: | | | | | | | | | |
| Investments | 79,142,040 | | 23,575,707 | | 42,973,671 | | 105,909,790 | | 738,841,415 |
| Short-Term Investments | 5,056,903 | | – | | 285,806 | | – | | 9,343,634 |
| Foreign currency | 13,179 | | 1,988 | | – | | – | | – |
| Represented by: | | | | | | | | | |
| Paid in capital in excess of par value | $331,486,436 | | $31,648,437 | | $45,662,540 | | $142,606,366 | | $724,676,343 |
| Distributable earnings (accumulated loss) | (250,045,373) | | (7,428,724) | | (1,632,434) | | (41,686,530) | | (1,447,831) |
| Net Assets | $81,441,063 | | $24,219,713 | | $44,030,106 | | $100,919,836 | | $723,228,512 |
| Net Assets: | | | | | | | | | |
| Class A | $53,827,901 | | $8,463,659 | | $3,815,807 | | $6,763,491 | | $154,685,941 |
| Class A1 | – | | – | | – | | – | | 279,913 |
| Class C | – | | – | | – | | 9,745 | | – |
| Institutional Service Class | – | | 4,075,624 | | 12,346 | | – | | – |
| Institutional Class | 27,613,162 | | 11,680,430 | | 40,201,953 | | 94,146,600 | | 568,262,658 |
| Total | $81,441,063 | | $24,219,713 | | $44,030,106 | | $100,919,836 | | $723,228,512
Amounts listed as “–” are $0 or round to $0.
See accompanying Notes to Financial Statements. |
Statement of Assets and Liabilities (concluded)
October 31, 2024
| | abrdn
High Income
Opportunities Fund | | abrdn
Infrastructure
Debt Fund | | abrdn
Intermediate
Municipal
Income Fund | | abrdn
Short Duration
High Yield
Municipal Fund | | abrdn
Ultra Short
Municipal
Income Fund |
| Shares Outstanding (unlimited number of shares authorized): | | | | | | | | | |
| Class A Shares | 6,950,958 | | 988,614 | | 427,822 | | 735,382 | | 15,337,492 |
| Class A1 Shares | – | | – | | – | | – | | 27,733 |
| Class C Shares | – | | – | | – | | 1,058 | | – |
| Institutional Service Class Shares | – | | 471,034 | | 1,383 | | – | | – |
| Institutional Class Shares | 3,965,942 | | 1,333,559 | | 4,503,355 | | 10,236,405 | | 56,657,513 |
| Total Shares Outstanding per Class | 10,916,900 | | 2,793,207 | | 4,932,560 | | 10,972,845 | | 72,022,738 |
| Net Asset Value and Redemption Price Per Share (Net assets by class divided by shares outstanding by class, respectively): | | | | | | | | | |
| Class A Shares | $7.74 | | $8.56 | | $8.92 | | $9.20 | | $10.09 |
| Class A1 Shares | – | | – | | – | | – | | 10.09 |
| Class C Shares | – | | – | | – | | 9.21 | | – |
| Institutional Service Class Shares | – | | 8.65 | | 8.93 | | – | | – |
| Institutional Class Shares | 6.96 | | 8.76 | | 8.93 | | 9.20 | | 10.03 |
| Maximum Offering Price Per Share (100%/(100% - maximum sales charge) of net asset value adjusted to the nearest cent): | | | | | | | | | |
| Class A Shares | $7.98 | | $8.82 | | $9.15 | | $9.44 | | $– |
| Class A1 Shares | – | | – | | – | | – | | 10.14 |
| Maximum Sales Charge: | | | | | | | | | |
| Class A Shares | 3.00(a)% | | 3.00(a)% | | 2.50(b)% | | 2.50(b)% | | –% |
| Class A1 Shares | –% | | –% | | –% | | –% | | 0.50(c)% |
| (a) | Unless you are otherwise eligible to purchase Class A shares without a sales charge, a contingent deferred sales charge (CDSC) of up to 1.00% will be charged on Class A shares redeemed within 18 months of purchase if you paid no sales charge on the original purchase and a finder’s fee was paid. |
| (b) | Unless you are otherwise eligible to purchase Class A shares without a sales charge, a contingent deferred sales charge (CDSC) of up to 0.75% will be charged on Class A shares redeemed within 12 months of purchase if you paid no sales charge on the original purchase and a finder’s fee was paid. |
| (c) | Unless you are otherwise eligible to purchase Class A1 shares without a sales charge, a contingent deferred sales charge (CDSC) of up to 0.25% will be charged on Class A1 shares redeemed within 12 months of purchase if you paid no sales charge on the original purchase and a finder’s fee was paid. |
Amounts listed as “–” are $0 or round to $0.
See accompanying Notes to Financial Statements.
Statements of Operations
For the Year Ended October 31, 2024
| | abrdn
High Income
Opportunities Fund | | abrdn
Infrastructure
Debt Fund | | abrdn
Intermediate
Municipal
Income Fund | | abrdn
Short Duration
High Yield
Municipal Fund | | abrdn
Ultra Short
Municipal
Income Fund |
| Investment Income: | | | | | | | | | |
| Dividend income | $43,660 | | $— | | $— | | $— | | $— |
| Interest income | 6,388,568 | | 1,620,384 | | 1,972,326 | | 4,414,034 | | 28,547,789 |
| Total Income | 6,432,228 | | 1,620,384 | | 1,972,326 | | 4,414,034 | | 28,547,789 |
| Expenses | | | | | | | | | |
| Investment advisory fees | 466,296 | | 123,533 | | 190,883 | | 602,226 | | 2,894,241 |
| Trustee fees | 11,332 | | 3,280 | | 6,057 | | 13,702 | | 91,620 |
| Administration fees | 67,825 | | 19,765 | | 35,931 | | 82,560 | | 537,039 |
| Legal fees | 16,675 | | 4,934 | | 9,052 | | 23,582 | | 136,714 |
| Audit and tax fees | 54,016 | | 58,216 | | 52,266 | | 53,266 | | 45,466 |
| Printing fees | 19,687 | | 14,442 | | 9,600 | | 10,069 | | 39,252 |
| Custodian fees | 17,199 | | 15,662 | | 9,291 | | 9,686 | | 17,393 |
| Transfer agent fees | 54,611 | | 22,414 | | 18,652 | | 21,413 | | 56,573 |
| Distribution fees Class A | 140,129 | | 22,565 | | 10,454 | | 18,181 | | 328,144 |
| Distribution fees Class A1 | — | | — | | — | | — | | 687 |
| Distribution fees Class C | — | | — | | — | | 149 | | — |
| Sub-transfer agent and administrative service fees Institutional Class | 16,394 | | 15,214 | | 13,396 | | 52,920 | | 430,238 |
| Sub-transfer agent and administrative service fees Class A | 70,721 | | 11,283 | | 1,514 | | 4,062 | | 114,829 |
| Sub-transfer agent and administrative service fees Class A1 | — | | — | | — | | — | | 16 |
| Sub-transfer agent and administrative service fees Institutional Service Class | — | | 5,062 | | — | | — | | — |
| Fund accounting fees | 3,391 | | 988 | | 1,797 | | 4,128 | | 26,852 |
| Registration and filing fees | 25,558 | | 42,199 | | 42,668 | | 50,277 | | 83,689 |
| Other | 46,840 | | 34,998 | | 33,501 | | 46,681 | | 167,049 |
| Total expenses before reimbursed/waived expenses | 1,010,674 | | 394,555 | | 435,062 | | 992,902 | | 4,969,802 |
| Interest expense (Note 9) | 1,974 | | 4,745 | | 1,472 | | 28,625 | | 590 |
| Total operating expenses before reimbursed/waived expenses | 1,012,648 | | 399,300 | | 436,534 | | 1,021,527 | | 4,970,392 |
| Expenses reimbursed Institutional Class | (80,339) | | (99,920) | | (181,235) | | (282,278) | | (1,297,752) |
| Expenses reimbursed Class A | (196,239) | | (65,764) | | (17,215) | | (21,458) | | (321,919) |
| Expenses reimbursed Class A1 | — | | — | | — | | — | | (458) |
| Expenses reimbursed Class C | — | | — | | — | | (39) | | — |
| Expenses reimbursed Institutional Service Class | — | | (29,368) | | (76) | | — | | — |
| Net expenses | 736,070 | | 204,248 | | 238,008 | | 717,752 | | 3,350,263 |
| Net Investment Income | 5,696,158 | | 1,416,136 | | 1,734,318 | | 3,696,282 | | 25,197,526 |
| REALIZED/UNREALIZED GAIN/(LOSS) FROM INVESTMENTS: | | | | | | | | | |
| Realized gain/(loss) on investment transactions | (736,174) | | 396,719 | | (558,690) | | (6,405,280) | | 85,885 |
| Realized gain/(loss) on forward foreign currency exchange contracts | (694,803) | | (85,406) | | — | | — | | — |
| Realized gain/(loss) on foreign currency transactions | (1,824) | | 787 | | — | | — | | — |
| Net realized gain/(loss) from investments, forward foreign currency exchange contracts and foreign currency transactions | (1,432,801) | | 312,100 | | (558,690) | | (6,405,280) | | 85,885 |
| Net change in unrealized appreciation/(depreciation) on investment transactions | 8,051,117 | | 1,626,644 | | 3,812,662 | | 10,836,761 | | 741,074 |
| Net change in unrealized appreciation/(depreciation) on forward foreign currency exchange contracts | 212,053 | | 16,016 | | — | | — | | —
Amounts listed as “–” are $0 or round to $0.
See accompanying Notes to Financial Statements. |
Statements of Operations (concluded)
For the Year Ended October 31, 2024
| | abrdn
High Income
Opportunities Fund | | abrdn
Infrastructure
Debt Fund | | abrdn
Intermediate
Municipal
Income Fund | | abrdn
Short Duration
High Yield
Municipal Fund | | abrdn
Ultra Short
Municipal
Income Fund |
| Net change in unrealized appreciation/(depreciation) on translation of assets and liabilities denominated in foreign currencies | $(6,512) | | $1,114 | | $— | | $— | | $— |
| Net change in unrealized appreciation/(depreciation) from investments, forward foreign currency exchange contracts and translation of assets and liabilities denominated in foreign currencies | 8,256,658 | | 1,643,774 | | 3,812,662 | | 10,836,761 | | 741,074 |
| Net realized/unrealized gain/(loss) from investments, forward foreign currency exchange contracts and translation of assets and liabilities denominated in foreign currencies | 6,823,857 | | 1,955,874 | | 3,253,972 | | 4,431,481 | | 826,959 |
| CHANGE IN NET ASSETS RESULTING FROM OPERATIONS | $12,520,015 | | $3,372,010 | | $4,988,290 | | $8,127,763 | | $26,024,485 |
Amounts listed as “–” are $0 or round to $0.
See accompanying Notes to Financial Statements.
Statements of Changes in Net Assets
| | abrdn High Income
Opportunities Fund | | abrdn Infrastructure
Debt Fund(a) | | abrdn Intermediate
Municipal Income Fund(b) |
| | Year Ended
October 31,
2024 | | Year Ended
October 31,
2023 | | Year Ended
October 31,
2024 | | Year Ended
October 31,
2023 | | Year Ended
October 31,
2024 | | Year Ended
October 31,
2023 |
| From Investment Activities: | | | | | | | | | | | |
| Operations: | | | | | | | | | | | |
| Net investment income | $5,696,158 | | $5,460,163 | | $1,416,136 | | $1,248,095 | | $1,734,318 | | $1,563,037 |
| Net realized gain/(loss) from investments, written options, swap contracts, futures contracts, forward foreign currency exchange contracts and foreign currency transactions | (1,432,801) | | (7,765,715) | | 312,100 | | (2,649,587) | | (558,690) | | (647,195) |
| Net change in unrealized appreciation/(depreciation) from investments, swap contracts, futures contracts, forward foreign currency exchange contracts and translation of assets and liabilities denominated in foreign currencies | 8,256,658 | | 8,464,207 | | 1,643,774 | | (1,333,425) | | 3,812,662 | | (367,930) |
| Changes in net assets resulting from operations | 12,520,015 | | 6,158,655 | | 3,372,010 | | (2,734,917) | | 4,988,290 | | 547,912 |
| Distributions to Shareholders From: | | | | | | | | | | | |
| Distributable earnings | | | | | | | | | | | |
| Class A | (3,215,969) | | (4,327,145) | | (542,338) | | (80,387) | | (150,524) | | (142,569) |
| Class C | — | | — | | — | | — | | — | | (1,842) |
| Institutional Service Class | — | | — | | (250,535) | | (52,631) | | (711) | | (635) |
| Institutional Class | (1,959,940) | | (2,978,763) | | (709,164) | | (162,498) | | (1,583,070) | | (1,418,073) |
| Tax return of capital | | | | | | | | | | | |
| Class A | (167,660) | | (63,974) | | — | | — | | — | | — |
| Institutional Class | (85,935) | | (37,788) | | — | | — | | — | | — |
| Change in net assets from shareholder distributions | (5,429,504) | | (7,407,670) | | (1,502,037) | | (295,516) | | (1,734,305) | | (1,563,119) |
| Change in net assets from capital transactions | (8,232,057) | | (17,876,456) | | (3,829,092) | | (12,396,187) | | (1,912,607) | | (3,036,705) |
| Change in net assets | (1,141,546) | | (19,125,471) | | (1,959,119) | | (15,426,620) | | 1,341,378 | | (4,051,912) |
| Net Assets: | | | | | | | | | | | |
| Beginning of year | 82,582,609 | | 101,708,080 | | 26,178,832 | | 41,605,452 | | 42,688,728 | | 46,740,640 |
| End of year | $81,441,063 | | $82,582,609 | | $24,219,713 | | $26,178,832 | | $44,030,106 | | $42,688,728 |
| (a) | Effective February 27, 2023, Class C had zero assets. On February 27, 2023, the Infrastructure Debt Fund (formerly, abrdn Global Absolute Return Strategies Fund) ceased offering Class C Shares. |
| (b) | Effective May 1, 2023, Class C had zero assets. On May 1, 2023, the abrdn Intermediate Municipal Income Fund ceased offering Class C Shares. |
Amounts listed as “–” are $0 or round to $0.
See accompanying Notes to Financial Statements.
Statements of Changes in Net Assets (continued)
| | abrdn High Income
Opportunities Fund | | abrdn Infrastructure
Debt Fund | | abrdn Intermediate
Municipal Income Fund |
| | Year Ended
October 31,
2024 | | Year Ended
October 31,
2023 | | Year Ended
October 31,
2024 | | Year Ended
October 31,
2023 | | Year Ended
October 31,
2024 | | Year Ended
October 31,
2023 |
| Capital Transactions: | | | | | | | | | | | |
| Class A Shares | | | | | | | | | | | |
| Proceeds from shares issued | $8,370,839 | | $12,550,100 | | $286,498 | | $540,392 | | $160,276 | | $37,875 |
| Dividends reinvested | 3,060,543 | | 3,958,693 | | 509,783 | | 74,480 | | 142,513 | | 134,281 |
| Cost of shares redeemed | (17,842,257) | | (22,096,463) | | (1,997,489) | | (4,112,396) | | (818,289) | | (987,906) |
| Total Class A | (6,410,875) | | (5,587,670) | | (1,201,208) | | (3,497,524) | | (515,500) | | (815,750) |
| Class C Shares | | | | | | | | | | | |
| Proceeds from shares issued | — | | — | | — | | 16,067 | | — | | 15,447 |
| Dividends reinvested | — | | — | | — | | — | | — | | 1,797 |
| Cost of shares redeemed | — | | — | | — | | (56,036) | | — | | (240,948) |
| Total Class C | — | | — | | — | | (39,969) | | — | | (223,704) |
| Institutional Service Class Shares | | | | | | | | | | | |
| Proceeds from shares issued | — | | — | | 359,473 | | 61,691 | | — | | — |
| Dividends reinvested | — | | — | | 247,804 | | 52,119 | | 689 | | 634 |
| Cost of shares redeemed | — | | — | | (1,033,205) | | (612,356) | | (7,962) | | (15) |
| Total Institutional Service Class | — | | — | | (425,928) | | (498,546) | | (7,273) | | 619 |
| Institutional Class Shares | | | | | | | | | | | |
| Proceeds from shares issued | 4,551,062 | | 12,964,796 | | 1,701,587 | | 236,018 | | 693,977 | | 639,214 |
| Dividends reinvested | 1,916,216 | | 2,901,499 | | 683,901 | | 157,473 | | 1,478,197 | | 1,310,880 |
| Cost of shares redeemed | (8,288,460) | | (28,155,081) | | (4,587,444) | | (8,753,639) | | (3,562,008) | | (3,947,964) |
| Total Institutional Class | (1,821,182) | | (12,288,786) | | (2,201,956) | | (8,360,148) | | (1,389,834) | | (1,997,870) |
| Change in net assets from capital transactions: | $(8,232,057) | | $(17,876,456) | | $(3,829,092) | | $(12,396,187) | | $(1,912,607) | | $(3,036,705) |
Amounts listed as “–” are $0 or round to $0.
See accompanying Notes to Financial Statements.
Statements of Changes in Net Assets (continued)
| | abrdn High Income
Opportunities Fund | | abrdn Infrastructure
Debt Fund | | abrdn Intermediate
Municipal Income Fund |
| | Year Ended
October 31,
2024 | | Year Ended
October 31,
2023 | | Year Ended
October 31,
2024 | | Year Ended
October 31,
2023 | | Year Ended
October 31,
2024 | | Year Ended
October 31,
2023 |
| Share Transactions: | | | | | | | | | | | |
| Class A Shares | | | | | | | | | | | |
| Issued | 1,101,201 | | 1,712,330 | | 33,421 | | 62,457 | | 17,970 | | 4,273 |
| Reinvested | 401,704 | | 549,312 | | 59,852 | | 9,229 | | 16,043 | | 15,421 |
| Redeemed | (2,339,803) | | (3,022,746) | | (233,392) | | (480,449) | | (91,801) | | (112,774) |
| Total Class A Shares | (836,898) | | (761,104) | | (140,119) | | (408,763) | | (57,788) | | (93,080) |
| Class C Shares | | | | | | | | | | | |
| Issued | – | | – | | – | | 1,893 | | – | | 1,755 |
| Reinvested | – | | – | | – | | – | | – | | 205 |
| Redeemed | – | | – | | – | | (6,674) | | – | | (27,503) |
| Total Class C Shares | – | | – | | – | | (4,781) | | – | | (25,543) |
| Institutional Service Class Shares | | | | | | | | | | | |
| Issued | – | | – | | 41,684 | | 7,044 | | – | | – |
| Reinvested | – | | – | | 28,796 | | 6,359 | | 78 | | 73 |
| Redeemed | – | | – | | (119,733) | | (70,750) | | (884) | | (2) |
| Total Institutional Service Class Shares | – | | – | | (49,253) | | (57,347) | | (806) | | 71 |
| Institutional Class Shares | | | | | | | | | | | |
| Issued | 660,269 | | 1,949,629 | | 192,243 | | 26,633 | | 77,838 | | 72,827 |
| Reinvested | 278,557 | | 442,174 | | 78,602 | | 19,024 | | 166,197 | | 150,491 |
| Redeemed | (1,208,983) | | (4,292,059) | | (527,831) | | (994,304) | | (401,023) | | (451,252) |
| Total Institutional Class Shares | (270,157) | | (1,900,256) | | (256,986) | | (948,647) | | (156,988) | | (227,934) |
| Total change in shares: | (1,107,055) | | (2,661,360) | | (446,358) | | (1,419,538) | | (215,582) | | (346,486) |
Amounts listed as “–” are 0 or round to 0.
See accompanying Notes to Financial Statements.
Statements of Changes in Net Assets (continued)
| | abrdn Short Duration
High Yield Municipal Fund | | abrdn Ultra Short
Municipal Income Fund |
| | Year Ended
October 31,
2024 | | Year Ended
October 31,
2023 | | Year Ended
October 31,
2024 | | Year Ended
October 31,
2023 |
| From Investment Activities: | | | | | | | |
| Operations: | | | | | | | |
| Net investment income | $3,696,282 | | $3,930,856 | | $25,197,526 | | $21,830,099 |
| Net realized gain/(loss) from investments | (6,405,280) | | (6,165,156) | | 85,885 | | 244,302 |
| Net change in unrealized appreciation/(depreciation) from investments | 10,836,761 | | 4,046,132 | | 741,074 | | 736,462 |
| Changes in net assets resulting from operations | 8,127,763 | | 1,811,832 | | 26,024,485 | | 22,810,863 |
| Distributions to Shareholders From: | | | | | | | |
| Distributable earnings | | | | | | | |
| Class A | (240,173) | | (258,153) | | (4,664,103) | | (3,528,612) |
| Class A1 | — | | — | | (9,768) | | (8,522) |
| Class C | (368) | | (471) | | — | | — |
| Institutional Class | (3,419,367) | | (3,788,889) | | (20,542,581) | | (18,266,725) |
| Change in net assets from shareholder distributions | (3,659,908) | | (4,047,513) | | (25,216,452) | | (21,803,859) |
| Change in net assets from capital transactions | (17,868,469) | | (78,674,463) | | 99,358,624 | | (63,905,814) |
| Change in net assets | (13,400,614) | | (80,910,144) | | 100,166,657 | | (62,898,810) |
| Net Assets: | | | | | | | |
| Beginning of year | 114,320,450 | | 195,230,594 | | 623,061,855 | | 685,960,665 |
| End of year | $100,919,836 | | $114,320,450 | | $723,228,512 | | $623,061,855 |
Amounts listed as “–” are $0 or round to $0.
See accompanying Notes to Financial Statements.
Statements of Changes in Net Assets (continued)
| | abrdn Short Duration
High Yield Municipal Fund | | abrdn Ultra Short
Municipal Income Fund |
| | Year Ended
October 31,
2024 | | Year Ended
October 31,
2023 | | Year Ended
October 31,
2024 | | Year Ended
October 31,
2023 |
| Capital Transactions: | | | | | | | |
| Class A Shares | | | | | | | |
| Proceeds from shares issued | $579,637 | | $669,608 | | $138,413,228 | | $44,677,410 |
| Dividends reinvested | 231,049 | | 248,519 | | 4,563,657 | | 3,444,983 |
| Cost of shares redeemed | (2,233,726) | | (7,335,534) | | (93,271,190) | | (67,386,187) |
| Total Class A | (1,423,040) | | (6,417,407) | | 49,705,695 | | (19,263,794) |
| Class A1 Shares | | | | | | | |
| Proceeds from shares issued | — | | — | | — | | — |
| Dividends reinvested | — | | — | | 9,768 | | 8,506 |
| Cost of shares redeemed | — | | — | | — | | — |
| Total Class A1 | — | | — | | 9,768 | | 8,506 |
| Class C Shares | | | | | | | |
| Proceeds from shares issued | — | | — | | — | | — |
| Dividends reinvested | 368 | | 470 | | — | | — |
| Cost of shares redeemed | (15,566) | | (2,476) | | — | | — |
| Total Class C | (15,198) | | (2,006) | | — | | — |
| Institutional Class Shares | | | | | | | |
| Proceeds from shares issued | 43,369,108 | | 36,569,062 | | 469,850,377 | | 301,383,302 |
| Dividends reinvested | 2,670,733 | | 2,130,007 | | 17,810,743 | | 15,482,096 |
| Cost of shares redeemed | (62,470,072) | | (110,954,119) | | (438,017,959) | | (361,515,924) |
| Total Institutional Class | (16,430,231) | | (72,255,050) | | 49,643,161 | | (44,650,526) |
| Change in net assets from capital transactions: | $(17,868,469) | | $(78,674,463) | | $99,358,624 | | $(63,905,814) |
Amounts listed as “–” are $0 or round to $0.
See accompanying Notes to Financial Statements.
Statements of Changes in Net Assets (concluded)
| | abrdn Short Duration
High Yield Municipal Fund | | abrdn Ultra Short
Municipal Income Fund |
| | Year Ended
October 31,
2024 | | Year Ended
October 31,
2023 | | Year Ended
October 31,
2024 | | Year Ended
October 31,
2023 |
| Share Transactions: | | | | | | | |
| Class A Shares | | | | | | | |
| Issued | 63,898 | | 73,635 | | 13,727,777 | | 4,435,893 |
| Reinvested | 25,336 | | 27,225 | | 452,572 | | 341,958 |
| Redeemed | (246,394) | | (799,792) | | (9,249,632) | | (6,690,777) |
| Total Class A Shares | (157,160) | | (698,932) | | 4,930,717 | | (1,912,926) |
| Class A1 Shares | | | | | | | |
| Issued | – | | – | | – | | – |
| Reinvested | – | | – | | 968 | | 844 |
| Redeemed | – | | – | | – | | – |
| Total Class A1 Shares | – | | – | | 968 | | 844 |
| Class C Shares | | | | | | | |
| Issued | – | | – | | – | | – |
| Reinvested | 40 | | 51 | | – | | – |
| Redeemed | (1,723) | | (270) | | – | | – |
| Total Class C Shares | (1,683) | | (219) | | – | | – |
| Institutional Class Shares | | | | | | | |
| Issued | 4,768,921 | | 4,000,689 | | 46,849,889 | | 30,086,344 |
| Reinvested | 292,287 | | 233,376 | | 1,775,896 | | 1,545,320 |
| Redeemed | (6,892,568) | | (12,147,421) | | (43,675,572) | | (36,091,198) |
| Total Institutional Class Shares | (1,831,360) | | (7,913,356) | | 4,950,213 | | (4,459,534) |
| Total change in shares: | (1,990,203) | | (8,612,507) | | 9,881,898 | | (6,371,616) |
Amounts listed as “–” are 0 or round to 0.
See accompanying Notes to Financial Statements.
[THIS PAGE INTENTIONALLY LEFT BLANK]
Financial Highlights
Selected Data for Each Share of Capital Outstanding Throughout the Periods Indicated
abrdn High Income Opportunities Fund
| | | Investment Activities | Distributions | |
| | Net
Asset
Value,
Beginning
of Period | Net
Investment
Income
(Loss)
(a) | Net
Realized
and
Unrealized
Gains
(Losses) on
Investments | Total
from
Investment
Activities | Net
Investment
Income | Tax
Return
of
Capital | Total
Distributions | Net
Asset
Value,
End of
Period |
| Class A Shares | | | | | | | | |
| Year Ended October 31, 2024 | $7.10 | $0.51 | $0.59 | $ 1.10 | $ (0.44) | $ (0.02) | $ (0.46) | $ 7.74 |
| Year Ended October 31, 2023 | 7.18 | 0.41 | 0.04 | 0.45 | (0.52) | (0.01) | (0.53) | 7.10 |
| Year Ended October 31, 2022 | 8.84 | 0.38 | (1.63) | (1.25) | (0.41) | – | (0.41) | 7.18 |
| Year Ended October 31, 2021 | 8.45 | 0.39 | 0.40 | 0.79 | (0.40) | – | (0.40) | 8.84 |
| Year Ended October 31, 2020 | 8.71 | 0.40 | (0.28) | 0.12 | (0.38) | – | (0.38) | 8.45 |
| Institutional Class Shares | | | | | | | | |
| Year Ended October 31, 2024 | 6.44 | 0.47 | 0.54 | 1.01 | (0.47) | (0.02) | (0.49) | 6.96 |
| Year Ended October 31, 2023 | 6.57 | 0.39 | 0.04 | 0.43 | (0.55) | (0.01) | (0.56) | 6.44 |
| Year Ended October 31, 2022 | 8.13 | 0.36 | (1.48) | (1.12) | (0.44) | – | (0.44) | 6.57 |
| Year Ended October 31, 2021 | 7.81 | 0.38 | 0.37 | 0.75 | (0.43) | – | (0.43) | 8.13 |
| Year Ended October 31, 2020 | 8.08 | 0.39 | (0.25) | 0.14 | (0.41) | – | (0.41) | 7.81 |
| (a) | Net investment income is based on average shares outstanding during the period. |
| (b) | During the period, certain fees were waived and/or reimbursed. If such waivers/reimbursements had not occurred, the ratios would have been as indicated. |
| (c) | Portfolio turnover is calculated on the basis of the Fund as a whole without distinguishing among the classes of shares. |
| (d) | Includes interest expense that amounts to less than 0.01%. |
Amounts listed as “–” are $0 or round to $0.
See accompanying Notes to Financial Statements.
Financial Highlights (continued)
Selected Data for Each Share of Capital Outstanding Throughout the Periods Indicated
abrdn High Income Opportunities Fund (concluded)
| | Ratios/Supplemental Data |
Total
Return | Net Assets
at End
of Period
(000's) | Ratio of Expenses
(Net of
Reimbursements/
Waivers)
to Average
Net Assets | Ratio of Expenses
(Prior to
Reimbursements) to
Average Net Assets(b) | Ratio of Net
Investment Income
(Loss) to
Average Net Assets | Portfolio
Turnover
(c) |
| | | | | | |
| 15.81% | $ 53,828 | 0.95%(d) | 1.30%(d) | 6.63% | 112% |
| 6.45% | 55,312 | 1.00%(d) | 1.34%(d) | 5.64% | 75% |
| (14.49%) | 61,410 | 1.00% | 1.41% | 4.73% | 97% |
| 9.46% | 81,980 | 1.00% | 1.40% | 4.41% | 98% |
| 1.55% | 87,358 | 1.00%(d) | 1.45%(d) | 4.76% | 99% |
| | | | | | |
| 16.04% | 27,613 | 0.70%(d) | 0.98%(d) | 6.89% | 112% |
| 6.69% | 27,270 | 0.75%(d) | 1.05%(d) | 5.87% | 75% |
| (14.20%) | 40,298 | 0.75% | 1.11% | 4.94% | 97% |
| 9.73% | 55,335 | 0.75% | 1.09% | 4.65% | 98% |
| 1.86% | 58,237 | 0.75%(d) | 1.10%(d) | 5.01% | 99% |
Financial Highlights (continued)
Selected Data for Each Share of Capital Outstanding Throughout the Periods Indicated
abrdn Infrastructure Debt Fund
| | | Investment Activities | Distributions | |
| | Net
Asset
Value,
Beginning
of Period | Net
Investment
Income
(Loss)
(a) | Net
Realized
and
Unrealized
Gains
(Losses) on
Investments | Total
from
Investment
Activities | Net
Investment
Income | Net
Realized
Gains | Total
Distributions | Net
Asset
Value,
End of
Period |
| Class A Shares | | | | | | | | |
| Year Ended October 31, 2024 | $7.99 | $0.47 | $0.62 | $ 1.09 | $ (0.52) | $ – | $ (0.52) | $ 8.56 |
| Year Ended October 31, 2023 | 8.83 | 0.30 | (1.07) | (0.77) | (0.07) | – | (0.07) | 7.99 |
| Year Ended October 31, 2022 | 10.29 | (–)(h) | (1.07) | (1.07) | (0.02) | (0.37) | (0.39) | 8.83 |
| Year Ended October 31, 2021 | 10.29 | (0.03) | 0.05 | 0.02 | (0.02) | – | (0.02) | 10.29 |
| Year Ended October 31, 2020 | 10.13 | 0.04 | 0.29 | 0.33 | (0.17) | – | (0.17) | 10.29 |
| Institutional Service Class Shares | | | | | | | | |
| Year Ended October 31, 2024 | 8.07 | 0.50 | 0.62 | 1.12 | (0.54) | – | (0.54) | 8.65 |
| Year Ended October 31, 2023 | 8.92 | 0.33 | (1.08) | (0.75) | (0.10) | – | (0.10) | 8.07 |
| Year Ended October 31, 2022 | 10.36 | 0.02 | (1.08) | (1.06) | (0.01) | (0.37) | (0.38) | 8.92 |
| Year Ended October 31, 2021 | 10.35 | (0.02) | 0.06 | 0.04 | (0.03) | – | (0.03) | 10.36 |
| Year Ended October 31, 2020 | 10.20 | 0.06 | 0.29 | 0.35 | (0.20) | – | (0.20) | 10.35 |
| Institutional Class Shares | | | | | | | | |
| Year Ended October 31, 2024 | 8.15 | 0.51 | 0.64 | 1.15 | (0.54) | – | (0.54) | 8.76 |
| Year Ended October 31, 2023 | 9.00 | 0.33 | (1.08) | (0.75) | (0.10) | – | (0.10) | 8.15 |
| Year Ended October 31, 2022 | 10.44 | 0.03 | (1.07) | (1.04) | (0.03) | (0.37) | (0.40) | 9.00 |
| Year Ended October 31, 2021 | 10.43 | (–)(h) | 0.05 | 0.05 | (0.04) | – | (0.04) | 10.44 |
| Year Ended October 31, 2020 | 10.30 | 0.08 | 0.26 | 0.34 | (0.21) | – | (0.21) | 10.43 |
| (a) | Net investment income/(loss) is based on average shares outstanding during the period. |
| (b) | Excludes sales charge. |
| (c) | During the period, certain fees were waived and/or reimbursed. If such waivers/reimbursements had not occurred, the ratios would have been as indicated. |
| (d) | Portfolio turnover is calculated on the basis of the Fund as a whole without distinguishing among the classes of shares. |
| (e) | Includes interest expense that amounts to 0.02% for the year ended October 31, 2024. |
| (f) | The total return shown above includes the impact of financial statement rounding of the NAV per share and/or financial statement adjustments. |
| (g) | Includes interest expense that amounts to less than 0.01%. |
| (h) | Less than $0.005 per share. |
Amounts listed as “–” are $0 or round to $0.
See accompanying Notes to Financial Statements.
Financial Highlights (continued)
Selected Data for Each Share of Capital Outstanding Throughout the Periods Indicated
abrdn Infrastructure Debt Fund (concluded)
| | Ratios/Supplemental Data |
Total
Return
(b) | Net Assets
at End
of Period
(000's) | Ratio of Expenses
(Net of
Reimbursements/
Waivers)
to Average
Net Assets | Ratio of Expenses
(Prior to
Reimbursements) to
Average Net Assets(c) | Ratio of Net
Investment Income
(Loss) to
Average Net Assets | Portfolio
Turnover
(d) |
| | | | | | |
| 13.81% | $ 8,464 | 1.04%(e) | 1.77%(e) | 5.52% | 57% |
| (8.71%)(f) | 9,017 | 1.05%(g) | 1.58%(g) | 3.45% | 141% |
| (10.81%)(f) | 13,569 | 1.04% | 1.86% | (0.05%) | 181% |
| 0.18% | 22,522 | 0.96% | 2.93% | (0.31%) | 425% |
| 3.26% | 1,078 | 0.97%(g) | 2.52%(g) | 0.35% | 238% |
| | | | | | |
| | | | | | |
| 14.08% | 4,076 | 0.79%(e) | 1.52%(e) | 5.77% | 57% |
| (8.41%)(f) | 4,198 | 0.78%(g) | 1.31%(g) | 3.80% | 141% |
| (10.62%)(f) | 5,153 | 0.78% | 1.60% | 0.23% | 181% |
| 0.33%(f) | 6,929 | 0.78% | 2.75% | (0.20%) | 425% |
| 3.45%(f) | 8,148 | 0.80%(g) | 2.35%(g) | 0.62% | 238% |
| | | | | | |
| 14.30% | 11,680 | 0.67%(e) | 1.53%(e) | 5.89% | 57% |
| (8.35%)(f) | 12,964 | 0.66%(g) | 1.31%(g) | 3.80% | 141% |
| (10.42%)(f) | 22,843 | 0.65% | 1.58% | 0.26% | 181% |
| 0.46% | 62,007 | 0.65% | 2.65% | (0.04%) | 425% |
| 3.34%(f) | 11,885 | 0.66%(g) | 2.24%(g) | 0.74% | 238% |
Financial Highlights (continued)
Selected Data for Each Share of Capital Outstanding Throughout the Periods Indicated
abrdn Intermediate Municipal Income Fund
| | | Investment Activities | Distributions | |
| | Net
Asset
Value,
Beginning
of Period | Net
Investment
Income
(Loss)
(a) | Net
Realized
and
Unrealized
Gains
(Losses) on
Investments | Total
from
Investment
Activities | Net
Investment
Income | Net
Realized
Gains | Total
Distributions | Net
Asset
Value,
End of
Period |
| Class A Shares | | | | | | | | |
| Year Ended October 31, 2024 | $8.29 | $0.32 | $0.63 | $ 0.95 | $ (0.32) | $ – | $ (0.32) | $ 8.92 |
| Year Ended October 31, 2023 | 8.50 | 0.27 | (0.21) | 0.06 | (0.27) | – | (0.27) | 8.29 |
| Year Ended October 31, 2022 | 9.83 | 0.24 | (1.33) | (1.09) | (0.24) | – | (0.24) | 8.50 |
| Year Ended October 31, 2021 | 9.73 | 0.24 | 0.12 | 0.36 | (0.24) | (0.02) | (0.26) | 9.83 |
| Year Ended October 31, 2020 | 9.92 | 0.26 | (0.18) | 0.08 | (0.26) | (0.01) | (0.27) | 9.73 |
| Institutional Service Class Shares | | | | | | | | |
| Year Ended October 31, 2024 | 8.29 | 0.35 | 0.63 | 0.98 | (0.34) | – | (0.34) | 8.93 |
| Year Ended October 31, 2023 | 8.51 | 0.29 | (0.21) | 0.08 | (0.30) | – | (0.30) | 8.29 |
| Year Ended October 31, 2022 | 9.84 | 0.27 | (1.34) | (1.07) | (0.26) | – | (0.26) | 8.51 |
| Year Ended October 31, 2021 | 9.74 | 0.26 | 0.12 | 0.38 | (0.26) | (0.02) | (0.28) | 9.84 |
| Year Ended October 31, 2020 | 9.93 | 0.28 | (0.18) | 0.10 | (0.28) | (0.01) | (0.29) | 9.74 |
| Institutional Class Shares | | | | | | | | |
| Year Ended October 31, 2024 | 8.29 | 0.35 | 0.64 | 0.99 | (0.35) | – | (0.35) | 8.93 |
| Year Ended October 31, 2023 | 8.51 | 0.30 | (0.22) | 0.08 | (0.30) | – | (0.30) | 8.29 |
| Year Ended October 31, 2022 | 9.84 | 0.26 | (1.33) | (1.07) | (0.26) | – | (0.26) | 8.51 |
| Year Ended October 31, 2021 | 9.74 | 0.26 | 0.12 | 0.38 | (0.26) | (0.02) | (0.28) | 9.84 |
| Year Ended October 31, 2020 | 9.93 | 0.28 | (0.18) | 0.10 | (0.28) | (0.01) | (0.29) | 9.74 |
| (a) | Net investment income/(loss) is based on average shares outstanding during the period. |
| (b) | Excludes sales charge. |
| (c) | During the period, certain fees were waived and/or reimbursed. If such waivers/reimbursements had not occurred, the ratios would have been as indicated. |
| (d) | Portfolio turnover is calculated on the basis of the Fund as a whole without distinguishing among the classes of shares. |
| (e) | Includes interest expense that amounts to less than 0.01%. |
Amounts listed as “–” are $0 or round to $0.
See accompanying Notes to Financial Statements.
Financial Highlights (continued)
Selected Data for Each Share of Capital Outstanding Throughout the Periods Indicated
abrdn Intermediate Municipal Income Fund (concluded)
| | Ratios/Supplemental Data |
Total
Return
(b) | Net Assets
at End
of Period
(000's) | Ratio of Expenses
(Net of
Reimbursements/
Waivers)
to Average
Net Assets | Ratio of Expenses
(Prior to
Reimbursements) to
Average Net Assets(c) | Ratio of Net
Investment Income
(Loss) to
Average Net Assets | Portfolio
Turnover
(d) |
| | | | | | |
| 11.53% | $ 3,816 | 0.79%(e) | 1.20%(e) | 3.60% | 71% |
| 0.59% | 4,024 | 0.80%(e) | 1.23%(e) | 3.07% | 80% |
| (11.24%) | 4,919 | 0.76%(e) | 1.13%(e) | 2.59% | 21% |
| 3.62% | 6,028 | 0.76% | 1.12% | 2.38% | 54% |
| 0.83% | 6,670 | 0.76%(e) | 1.09%(e) | 2.63% | 56% |
| | | | | | |
| | | | | | |
| 11.96% | 12 | 0.50%(e) | 0.91%(e) | 3.89% | 71% |
| 0.77% | 18 | 0.51%(e) | 0.94%(e) | 3.36% | 80% |
| (10.98%) | 18 | 0.50%(e) | 0.87%(e) | 2.87% | 21% |
| 3.90% | 20 | 0.50% | 0.86% | 2.64% | 54% |
| 1.09% | 20 | 0.50%(e) | 0.83%(e) | 2.87% | 56% |
| | | | | | |
| 11.98% | 40,202 | 0.50%(e) | 0.95%(e) | 3.89% | 71% |
| 0.77% | 38,647 | 0.51%(e) | 0.97%(e) | 3.38% | 80% |
| (10.99%) | 41,587 | 0.50%(e) | 0.88%(e) | 2.84% | 21% |
| 3.90% | 54,707 | 0.50% | 0.87% | 2.64% | 54% |
| 1.10% | 58,015 | 0.50%(e) | 0.84%(e) | 2.89% | 56% |
Financial Highlights (continued)
Selected Data for Each Share of Capital Outstanding Throughout the Periods Indicated
abrdn Short Duration High Yield Municipal Fund
| | | Investment Activities | Distributions | | |
| | Net
Asset
Value,
Beginning
of Period | Net
Investment
Income
(Loss)
(a) | Net
Realized
and
Unrealized
Gains
(Losses) on
Investments | Total
from
Investment
Activities | Net
Investment
Income | Total
Distributions | Net
Asset
Value,
End of
Period | Total
Return
(b) |
| Class A Shares | | | | | | | | |
| Year Ended October 31, 2024 | $8.82 | $0.30 | $0.38 | $ 0.68 | $ (0.30) | $ (0.30) | $ 9.20 | 7.82% |
| Year Ended October 31, 2023 | 9.05 | 0.23 | (0.22) | 0.01 | (0.24) | (0.24) | 8.82 | –(f) |
| Year Ended October 31, 2022 | 10.26 | 0.22 | (1.20) | (0.98) | (0.23) | (0.23) | 9.05 | (9.71%) |
| Year Ended October 31, 2021 | 9.99 | 0.22 | 0.27 | 0.49 | (0.22) | (0.22) | 10.26 | 4.92% |
| Year Ended October 31, 2020 | 10.25 | 0.29 | (0.27) | 0.02 | (0.28) | (0.28) | 9.99 | 0.25% |
| Class C Shares | | | | | | | | |
| Year Ended October 31, 2024 | 8.83 | 0.23 | 0.38 | 0.61 | (0.23) | (0.23) | 9.21 | 6.99% |
| Year Ended October 31, 2023 | 9.05 | 0.16 | (0.21) | (0.05) | (0.17) | (0.17) | 8.83 | (0.63%)(g) |
| Year Ended October 31, 2022 | 10.27 | 0.15 | (1.22) | (1.07) | (0.15) | (0.15) | 9.05 | (10.47%)(g) |
| Year Ended October 31, 2021(h) | 10.13 | 0.12 | 0.14 | 0.26 | (0.12) | (0.12) | 10.27 | 2.52% |
| Institutional Class Shares | | | | | | | | |
| Year Ended October 31, 2024 | 8.82 | 0.33 | 0.38 | 0.71 | (0.33) | (0.33) | 9.20 | 8.09% |
| Year Ended October 31, 2023 | 9.05 | 0.25 | (0.22) | 0.03 | (0.26) | (0.26) | 8.82 | 0.25% |
| Year Ended October 31, 2022 | 10.26 | 0.24 | (1.20) | (0.96) | (0.25) | (0.25) | 9.05 | (9.48%) |
| Year Ended October 31, 2021 | 9.99 | 0.24 | 0.27 | 0.51 | (0.24) | (0.24) | 10.26 | 5.18% |
| Year Ended October 31, 2020 | 10.25 | 0.31 | (0.26) | 0.05 | (0.31) | (0.31) | 9.99 | 0.51% |
| (a) | Net investment income is based on average shares outstanding during the period. |
| (b) | Excludes sales charge. |
| (c) | During the period, certain fees were waived and/or reimbursed. If such waivers/reimbursements had not occurred, the ratios would have been as indicated. |
| (d) | Portfolio turnover is calculated on the basis of the Fund as a whole without distinguishing among the classes of shares. |
| (e) | Includes interest expense that amounts to 0.03% for the year ended October 31, 2024 and for the year ended October 31, 2022. Includes interest expense that amounts to 0.05% for the year ended October 31, 2023. Includes interest expense that amounts to less than 0.01% for the year ended October 31, 2020. |
| (f) | Amount is less than 0.005%. |
| (g) | The total return shown above includes the impact of financial statement rounding of the NAV per share and/or financial statement adjustments. |
| (h) | For the period from December 21, 2020 (commencement of operations) through October 31, 2021. |
Amounts listed as “–” are $0 or round to $0.
See accompanying Notes to Financial Statements.
Financial Highlights (continued)
Selected Data for Each Share of Capital Outstanding Throughout the Periods Indicated
abrdn Short Duration High Yield Municipal Fund (concluded)
| Ratios/Supplemental Data |
Net Assets
at End
of Period
(000's) | Ratio of Expenses
(Net of
Reimbursements/
Waivers)
to Average
Net Assets | Ratio of Expenses
(Prior to
Reimbursements) to
Average Net Assets(c) | Ratio of Net
Investment Income
(Loss) to
Average Net Assets | Portfolio
Turnover
(d) |
| | | | | |
| $ 6,763 | 0.93%(e) | 1.23%(e) | 3.34% | 105% |
| 7,871 | 0.95%(e) | 1.26%(e) | 2.48% | 58% |
| 14,399 | 0.93%(e) | 1.17%(e) | 2.27% | 58% |
| 21,907 | 0.90% | 1.14% | 2.14% | 96% |
| 22,417 | 0.90%(e) | 1.12%(e) | 2.84% | 149% |
| | | | | |
| 10 | 1.68%(e) | 1.94%(e) | 2.55% | 105% |
| 24 | 1.70%(e) | 2.01%(e) | 1.73% | 58% |
| 27 | 1.68%(e) | 1.87%(e) | 1.57% | 58% |
| 27 | 1.65% | 1.86% | 1.33% | 96% |
| | | | | |
| 94,147 | 0.68%(e) | 0.97%(e) | 3.60% | 105% |
| 106,425 | 0.70%(e) | 1.01%(e) | 2.73% | 58% |
| 180,805 | 0.68%(e) | 0.90%(e) | 2.49% | 58% |
| 424,689 | 0.65% | 0.88% | 2.37% | 96% |
| 270,153 | 0.65%(e) | 0.87%(e) | 3.07% | 149% |
| | | | | |
Financial Highlights (continued)
Selected Data for Each Share of Capital Outstanding Throughout the Periods Indicated
abrdn Ultra Short Municipal Income Fund
| | | Investment Activities | Distributions | | |
| | Net
Asset
Value,
Beginning
of Period | Net
Investment
Income
(Loss)
(a) | Net
Realized
and
Unrealized
Gains
(Losses) on
Investments | Total
from
Investment
Activities | Net
Investment
Income | Total
Distributions | Net
Asset
Value,
End of
Period | Total
Return
(b) |
| Class A Shares | | | | | | | | |
| Year Ended October 31, 2024 | $10.07 | $0.36 | $0.02 | $ 0.38 | $ (0.36) | $ (0.36) | $ 10.09 | 3.82% |
| Year Ended October 31, 2023 | 10.06 | 0.32 | 0.01 | 0.33 | (0.32) | (0.32) | 10.07 | 3.36% |
| Year Ended October 31, 2022 | 10.09 | 0.05 | (0.02) | 0.03 | (0.06) | (0.06) | 10.06 | 0.30% |
| Year Ended October 31, 2021 | 10.09 | –(f) | (–)(f) | (–)(f) | –(f) | –(f) | 10.09 | 0.02% |
| Year Ended October 31, 2020 | 10.10 | 0.07 | –(f) | 0.07 | (0.08) | (0.08) | 10.09 | 0.69% |
| Class A1 Shares | | | | | | | | |
| Year Ended October 31, 2024 | 10.08 | 0.36 | 0.01 | 0.37 | (0.36) | (0.36) | 10.09 | 3.72% |
| Year Ended October 31, 2023 | 10.06 | 0.32 | 0.02 | 0.34 | (0.32) | (0.32) | 10.08 | 3.47% |
| Year Ended October 31, 2022 | 10.10 | 0.05 | (0.03) | 0.02 | (0.06) | (0.06) | 10.06 | 0.20% |
| Year Ended October 31, 2021 | 10.10 | –(f) | (–)(f) | (–)(f) | –(f) | –(f) | 10.10 | 0.02% |
| Year Ended October 31, 2020 | 10.10 | 0.03 | 0.05 | 0.08 | (0.08) | (0.08) | 10.10 | 0.79% |
| Institutional Class Shares | | | | | | | | |
| Year Ended October 31, 2024 | 10.02 | 0.38 | 0.01 | 0.39 | (0.38) | (0.38) | 10.03 | 3.98% |
| Year Ended October 31, 2023 | 10.00 | 0.35 | 0.02 | 0.37 | (0.35) | (0.35) | 10.02 | 3.73% |
| Year Ended October 31, 2022 | 10.04 | 0.07 | (0.03) | 0.04 | (0.08) | (0.08) | 10.00 | 0.37% |
| Year Ended October 31, 2021 | 10.03 | 0.01 | 0.01 | 0.02 | (0.01) | (0.01) | 10.04 | 0.21% |
| Year Ended October 31, 2020 | 10.04 | 0.10 | (0.01) | 0.09 | (0.10) | (0.10) | 10.03 | 0.94% |
| (a) | Net investment income/(loss) is based on average shares outstanding during the period. |
| (b) | Excludes sales charge. |
| (c) | During the period, certain fees were waived and/or reimbursed. If such waivers/reimbursements had not occurred, the ratios would have been as indicated. |
| (d) | Portfolio turnover is calculated on the basis of the Fund as a whole without distinguishing among the classes of shares. |
| (e) | Includes interest expense that amounts to less than 0.01%. |
| (f) | Less than $0.005 per share. |
Amounts listed as “–” are $0 or round to $0.
See accompanying Notes to Financial Statements.
Financial Highlights (concluded)
Selected Data for Each Share of Capital Outstanding Throughout the Periods Indicated
abrdn Ultra Short Municipal Income Fund (concluded)
| Ratios/Supplemental Data |
Net Assets
at End
of Period
(000's) | Ratio of Expenses
(Net of
Reimbursements/
Waivers)
to Average
Net Assets | Ratio of Expenses
(Prior to
Reimbursements) to
Average Net Assets(c) | Ratio of Net
Investment Income
(Loss) to
Average Net Assets | Portfolio
Turnover
(d) |
| | | | | |
| $ 154,686 | 0.70%(e) | 0.95%(e) | 3.55% | 226% |
| 104,837 | 0.70%(e) | 0.98%(e) | 3.22% | 231% |
| 123,920 | 0.60%(e) | 0.95%(e) | 0.52% | 321% |
| 161,362 | 0.54%(e) | 0.96%(e) | 0.02% | 261% |
| 263,068 | 0.70%(e) | 0.94%(e) | 0.72% | 299% |
| | | | | |
| 280 | 0.70%(e) | 0.87%(e) | 3.55% | 226% |
| 270 | 0.70%(e) | 0.92%(e) | 3.22% | 231% |
| 261 | 0.60%(e) | 0.89%(e) | 0.52% | 321% |
| 510 | 0.54%(e) | 0.89%(e) | 0.02% | 261% |
| 558 | 0.70%(e) | 0.90%(e) | 0.34% | 299% |
| | | | | |
| 568,263 | 0.45%(e) | 0.69%(e) | 3.80% | 226% |
| 517,955 | 0.45%(e) | 0.74%(e) | 3.46% | 231% |
| 561,780 | 0.44%(e) | 0.71%(e) | 0.71% | 321% |
| 793,264 | 0.45%(e) | 0.71%(e) | 0.11% | 261% |
| 928,424 | 0.45%(e) | 0.71%(e) | 0.98% | 299% |
| | | | | |
Notes to Financial Statements
October 31, 2024
1. Organization
abrdn Funds (the “Trust”) was organized as a statutory trust under the laws of the state of Delaware by a Certificate of Trust filed on September 27, 2007 and is registered under the Investment Company Act of 1940, as amended (the “1940 Act”), as an open-end management investment company. As of October 31, 2024, the Trust had authorized an unlimited number of shares of beneficial interest (“shares”) without par value. As of October 31, 2024, the Trust operated twenty (20) separate series, or mutual funds, each with its own investment objective(s) and strategies. This report contains the financial statements and financial highlights of the five (5) funds listed below (each a “Fund”; collectively, the “Funds”):
| • | abrdn High Income Opportunities Fund (“High Income Opportunities Fund”) |
| • | abrdn Infrastructure Debt Fund ("Infrastructure Debt Fund") |
| • | abrdn Intermediate Municipal Income Fund ("Intermediate Municipal Income Fund") |
| • | abrdn Short Duration High Yield Municipal Fund ("Short Duration High Yield Municipal Fund") |
| • | abrdn Ultra Short Municipal Income Fund ("Ultra Short Municipal Income Fund") |
2. Summary of Significant Accounting Policies
The Trust is an investment company and accordingly follows the investment company accounting and reporting guidance of the Financial Accounting Standards Board ("FASB") Accounting Standards Codification Topic 946 Financial Services-Investment Companies. The following is a summary of significant accounting policies followed by the Funds in the preparation of their financial statements. The policies conform to generally accepted accounting principles ("U.S. GAAP") in the United States of America. The preparation of financial statements requires management to make estimates and assumptions that affect the reported amounts of assets and liabilities, disclosure of contingent assets and liabilities at the date of the financial statements, and the reported amounts of income and expenses for the period. Actual results could differ from those estimates. The accounting records of the Funds are maintained in U.S. Dollars.
a.
| Security Valuation: |
| | The Funds value their securities at current fair value, consistent with regulatory requirements. "Fair value" is defined in the Funds' Valuation and Liquidity Procedures as the price that could be received to sell an asset or paid to transfer a liability in an orderly transaction between willing market participants without a compulsion to transact at the measurement date, also known as market value. Pursuant to Rule 2a-5 under the 1940 Act, the Board of Trustees (the "Board") designated abrdn Inc. ("abrdn" or the "Adviser") as the valuation designee ("Valuation Designee") for the Funds to perform the fair value determinations relating to Fund investments for which market quotations are not readily available or deemed unreliable. |
| | Equity securities that are traded on an exchange are valued at the last quoted sale price or the official close price on the principal exchange on which the security is traded at the “Valuation Time” subject to application, when appropriate, of the valuation factors described in the paragraph below. Under normal circumstances, the Valuation Time is as of the close of regular trading on the New York Stock Exchange ("NYSE") (usually 4:00 p.m. Eastern Time). In the absence of a sale price, the security is valued at the mean of the bid/ask price quoted at the close on the principal exchange on which the security is traded. Securities traded on NASDAQ are valued at the NASDAQ official closing price. |
| | In accordance with the authoritative guidance on fair value measurements and disclosures under U.S. GAAP, the Funds disclose the fair value of their investments using a three-level hierarchy that classifies the inputs to valuation techniques used to measure the fair value. The hierarchy assigns Level 1, the highest level, measurements to valuations based upon unadjusted quoted prices in active markets for identical assets, Level 2 measurements to valuations based upon other significant observable inputs, including adjusted quoted prices in active markets for similar assets, and Level 3, the lowest level, measurements to valuations based upon unobservable inputs that are significant to the valuation. Inputs refer broadly to the assumptions that market participants would use in pricing the asset or liability, including assumptions about risk, for example, the risk inherent in a particular valuation technique used to measure fair value including a pricing model and/or the risk inherent in the inputs to the valuation technique. Inputs may be observable or unobservable. Observable inputs are inputs that reflect the assumptions market participants would use in pricing the asset or liability, which are based on market data obtained from sources independent of the reporting entity. Unobservable inputs are inputs that reflect the reporting entity’s own assumptions about the assumptions market participants would use in pricing the asset or liability developed based on the best information available in the circumstances. A financial instrument’s level within the fair value hierarchy is based upon the lowest level of any input that is significant to the fair value measurement. |
| | Open-end mutual funds are valued at the respective net asset value (“NAV”) as reported by such company. The prospectuses for the registered open-end management investment companies in which a Fund invests explain the circumstances under which those companies will use fair value pricing and the effects of using fair value pricing. Closed-end funds and exchange-traded funds ("ETFs") are valued at the market price of the security at the Valuation Time (defined above). A security using any of these pricing methodologies is generally determined to be a Level 1 investment. |
Notes to Financial Statements (continued)
October 31, 2024
| | Foreign equity securities that are traded on foreign exchanges that close prior to the Valuation Time are valued by applying valuation factors to the last sale price or the mean price as noted above. Valuation factors are provided by an independent pricing service provider. These valuation factors are used when pricing a Fund's portfolio holdings to estimate market movements between the time foreign markets close and the time a Fund values such foreign securities. These valuation factors are based on inputs such as depositary receipts, indices, futures, sector indices/ETFs, exchange rates, and local exchange opening and closing prices of each security. When prices with the application of valuation factors are utilized, the value assigned to the foreign securities may not be the same as quoted or published prices of the securities on their primary markets. A security that applies a valuation factor is generally determined to be a Level 2 investment because the exchange-traded price has been adjusted. Valuation factors are not utilized if the independent pricing service provider is unable to provide a valuation factor or if the valuation factor falls below a predetermined threshold; in such case, the security is determined to be a Level 1 investment. |
| | Long-term debt and other fixed income securities are valued at the last quoted or evaluated bid price on the valuation date provided by an independent pricing service provider. If there are no current day bids, the security is valued at the previously applied bid. Pricing services generally price debt securities assuming orderly transactions of an institutional “round lot” size, and the strategies employed by the Adviser as Valuation Designee generally trade in round lot sizes. In certain circumstances, fixed income securities may be held or transactions may be conducted in smaller, “odd lot” sizes. Odd lots may trade at lower or occasionally higher prices than institutional round lot trades. Short-term debt securities (such as commercial paper and U.S. treasury bills) having a remaining maturity of 60 days or less are valued at the last quoted or evaluated bid price on the valuation date provided by an independent pricing service, or on the basis of amortized cost if it represents the best approximation for fair value. Debt and other fixed-income securities are generally determined to be Level 2 investments. |
| | Short-term investments are comprised of cash and cash equivalents invested in short-term investment funds which are redeemable daily. The Funds sweep available cash into the State Street Institutional U.S. Government Money Market Fund, which has elected to qualify as a “government money market fund” pursuant to Rule 2a-7 under the 1940 Act, and has an objective, which is not guaranteed, to maintain a $1.00 per share NAV. Generally, these investment types are categorized as Level 1 investments. |
| | Derivative instruments are generally valued according to the following procedures. Exchange traded derivatives are generally Level 1 investments and over-the-counter and centrally cleared derivatives are generally Level 2 investments. Forward currency exchange contracts are generally valued based on the current spot exchange rates and the forward exchange rate points (ex. 1-month, 3-month) that are obtained from an approved pricing agent. Based on the actual settlement dates of the forward contracts held, an interpolated value of the forward points is combined with the spot exchange rate to derive the valuation. Futures contracts are generally valued at the most recent settlement price as of NAV determination. Swap agreements are generally valued by an approved pricing agent based on the terms of the swap agreement (including future cash flows). Exchange-traded options are valued at the last quoted sales price. In the absence of a sales price, options are valued at the mean of the bid/ask price quoted at the close on the exchange on which the options trade. When market quotations or exchange rates are not readily available, or if the Adviser concludes that such market quotations do not accurately reflect fair value, the fair value of a Fund’s assets are determined in good faith in accordance with the Valuation Procedures. |
| | In the event that a security’s market quotations are not readily available or are deemed unreliable (for reasons other than because the foreign exchange on which it trades closes before the Valuation Time), the security is valued at fair value as determined by the Valuation Designee, taking into account the relevant factors and surrounding circumstances using valuation policies and procedures approved by the Board. A security that has been fair valued by the Adviser may be classified as Level 2 or Level 3 depending on the nature of the inputs. |
| | The three-level hierarchy of inputs is summarized below: |
| • | Level 1 - quoted prices (unadjusted) in active markets for identical investments; |
| • | Level 2 - other significant observable inputs (including valuation factors, quoted prices for similar securities, interest rates, prepayment speeds, and credit risk, etc.); or |
| • | Level 3 - significant unobservable inputs (including a Fund’s own assumptions in determining the fair value of investments). |
Notes to Financial Statements (continued)
October 31, 2024
A summary of standard inputs is listed below:
| Security Type | Standard Inputs |
| Debt and other fixed-income securities | Reported trade data, broker-dealer price quotations, benchmark yields, issuer spreads on comparable securities, credit quality, yield, and maturity. |
| Foreign equities utilizing a fair value factor | Depositary receipts, indices, futures, sector indices/ETFs, exchange rates, and local exchange opening and closing prices of each security. |
| Forward foreign currency contracts | Forward exchange rate quotations. |
The following is a summary of the inputs used as of October 31, 2024 in valuing the Funds' investments at fair value. The inputs or methodologies used for valuing securities are not necessarily an indication of the risk associated with investing in those securities. Please refer to the Statements of Investments for a detailed breakout of the security types:
| Investments, at Value | Level 1 – Quoted
Prices | Level 2 – Other Significant
Observable Inputs | Level 3 – Significant
Unobservable Inputs | Total |
| High Income Opportunities Fund |
| Assets | | |
| Investments in Securities | | | |
Bank Loans
| $– | $2,334,739 | $– | $2,334,739 |
Corporate Bonds
| – | 74,553,188 | – | 74,553,188 |
Exchange-Traded Funds
| 585,636 | – | – | 585,636 |
Government Bonds
| – | 751,901 | – | 751,901 |
Short-Term Investment
| 5,056,903 | – | – | 5,056,903 |
Total Investments
| $5,642,539 | $77,639,828 | $– | $83,282,367 |
| Other Financial Instruments | | | |
Foreign Currency Exchange Contracts
| $– | $308,125 | $– | $308,125 |
Total Investment Assets
| $5,642,539 | $77,947,953 | $– | $83,590,492 |
| Liabilities | | |
| Other Financial Instruments | | | |
Foreign Currency Exchange Contracts
| $– | $(5,233) | $– | $(5,233) |
Total Investment Liabilities
| $– | $(5,233) | $– | $(5,233) |
| Infrastructure Debt Fund |
| Assets | | |
| Investments in Securities | | | |
Corporate Bonds
| $– | $13,249,791 | $– | $13,249,791 |
Municipal Bonds
| – | 10,827,785 | – | 10,827,785 |
Total Investments
| $– | $24,077,576 | $– | $24,077,576 |
| Other Financial Instruments | | | |
Foreign Currency Exchange Contracts
| $– | $28,513 | $– | $28,513 |
Total Investment Assets
| $– | $24,106,089 | $– | $24,106,089 |
Notes to Financial Statements (continued)
October 31, 2024
| Investments, at Value | Level 1 – Quoted
Prices | Level 2 – Other Significant
Observable Inputs | Level 3 – Significant
Unobservable Inputs | Total |
| Intermediate Municipal Income Fund |
| Assets | | |
| Investments in Securities | | | |
Commercial Mortgage-Backed Securities
| $– | $249,167 | $– | $249,167 |
Municipal Bonds
| – | 42,876,789 | – | 42,876,789 |
Short-Term Investment
| 285,806 | – | – | 285,806 |
Total Investments
| $285,806 | $43,125,956 | $– | $43,411,762 |
Total Investment Assets
| $285,806 | $43,125,956 | $– | $43,411,762 |
| Short Duration High Yield Municipal Fund |
| Assets | | |
| Investments in Securities | | | |
Commercial Mortgage-Backed Securities
| $– | $747,501 | $– | $747,501 |
Corporate Bonds
| – | – | 280,030 | 280,030 |
Municipal Bonds
| – | 98,769,220 | – | 98,769,220 |
Total Investments
| $– | $99,516,721 | $280,030 | $99,796,751 |
Total Investment Assets
| $– | $99,516,721 | $280,030 | $99,796,751 |
| Ultra Short Municipal Income Fund |
| Assets | | |
| Investments in Securities | | | |
Municipal Bonds
| $– | $738,808,510 | $– | $738,808,510 |
Short-Term Investments
| 58,634 | 9,285,000 | – | 9,343,634 |
Total Investments
| $58,634 | $748,093,510 | $– | $748,152,144 |
Total Investment Assets
| $58,634 | $748,093,510 | $– | $748,152,144 |
Amounts listed as “–” are $0 or round to $0.
Level 3 investments held during and at the end of the year ended October 31, 2024 in relation to net assets of the High Income Opportunities Fund and Short Duration High Yield Municipal Fund were not significant (0.0% and 0.3% of total net assets, respectively) and accordingly, a reconciliation of Level 3 assets for the year ended October 31, 2024 is not presented.
The valuation technique used to value the Level 3 security in the Short Duration High Yield Municipal Fund is the Fund’s current entitlement to monies held in a secure escrow account, which is only released when all of the terms of an agreement are met.
b.
| Restricted Securities: |
| | Restricted securities are privately-placed securities whose resale is restricted under U.S. securities laws. The Funds may invest in restricted securities, including unregistered securities eligible for resale without registration pursuant to Rule 144A and privately-placed securities of U.S. and non-U.S. issuers offered outside the U.S. without registration pursuant to Regulation S under the Securities Act of 1933, as amended (the "1933 Act"). Rule 144A securities may be freely traded among certain qualified institutional investors, such as the Funds, but resale of such securities in the U.S. is permitted only in limited circumstances. |
c.
| Foreign Currency Translation: |
| | Foreign securities, currencies and other assets and liabilities denominated in foreign currencies are translated into U.S. dollars at the exchange rate of said currencies against the U.S. dollar, as of the Valuation Time, as provided by an independent pricing service. Purchases and sales of securities, and income and expenses are translated at the prevailing rate of exchange on the respective date of these transactions. The Funds do not isolate that portion of the results of operations resulting from changes in foreign exchange rates on investments from fluctuations arising from changes in market prices of securities held. These fluctuations are included with the net realized and unrealized gain or loss from investments and foreign currencies within the Statements of Operations. |
Notes to Financial Statements (continued)
October 31, 2024
d.
| Derivative Financial Instruments: |
| | Certain Funds are authorized to use derivatives to manage currency risk, credit risk, and interest rate risk and to replicate, or use as a substitute for, physical securities. Losses may arise due to changes in the value of the contract or if the counterparty does not perform under the contract. The use of derivative instruments involves, to varying degrees, elements of market risk in excess of the amount recognized in the Statements of Assets and Liabilities. |
| | Forward Foreign Currency Exchange Contracts: |
| | A forward foreign currency exchange contract ("forward contract") involves an obligation to purchase and sell a specific currency at a future date, which may be any fixed number of days from the date of the contract agreed upon by the parties, at a price set at the time of the contract. Forward contracts are used to manage a Fund's currency exposure in an efficient manner. They are used to sell unwanted currency exposure that comes with holding securities in a market, or to buy currency exposure where the exposure from holding securities is insufficient to give the desired currency exposure either in absolute terms or relative to a particular benchmark or index. The use of forward contracts allows for the separation of investment decision-making between foreign exchange holdings and their currencies. |
| | The forward contract is marked-to-market daily and the change in fair value is recorded by a Fund as unrealized appreciation or depreciation. Forward contracts' prices are received daily from an independent pricing provider. When the forward contract is closed, a Fund records a realized gain or loss equal to the difference between the value at the time it was opened and the value at the time it was closed. These realized and unrealized gains and losses are reported on the Statement of Operations. A Fund could be exposed to risks if the counterparties to the contracts are unable to meet the terms of their contracts or from unanticipated movements in exchange rates. |
| | While a Fund may enter into forward contracts to seek to reduce currency exchange rate risks, transactions in such contracts involve certain risks. A Fund could be exposed to risks if the counterparties to the contracts are unable to meet the terms of their contracts and from unanticipated movements in exchange rates. Thus, while a Fund may benefit from such transactions, unanticipated changes in currency prices may result in a poorer overall performance for a Fund than if it had not engaged in any such transactions. Moreover, there may be an imperfect correlation between a Fund’s portfolio holdings or securities quoted or denominated in a particular currency and forward contracts entered into by the Fund. Such imperfect correlation may prevent a Fund from achieving a complete hedge, which will expose the Fund to the risk of foreign exchange loss. |
| | Forward contracts are subject to the risk that the counterparties to such contracts may default on their obligations. Since a forward foreign currency exchange contract is not guaranteed by an exchange or clearing house, a default on the contract would deprive a Fund of unrealized profits, transaction costs or the benefits of a currency hedge or force a Fund to cover its purchase or sale commitments, if any, at the market price at the time of the default. |
| | Futures Contracts |
| | Certain Funds may invest in financial futures contracts (“futures contracts”) for the purpose of hedging their existing portfolio securities, or securities that a Fund intends to purchase, against fluctuations in value caused by changes in prevailing market interest rates or prices. Futures contracts may also be entered into for non-hedging purposes; however, in those instances, the aggregate initial margin and premiums required to establish a Fund’s positions may not exceed 5% of a Fund’s NAV after taking into account unrealized profits and unrealized losses on any such contract into which it has entered. |
| | Upon entering into a futures contract, a Fund is required to pledge to the broker an amount of cash and/or other assets equal to a certain percentage of the contract amount. This payment is known as initial margin. Subsequent payments, known as “variation margin,” are calculated each day, depending on the daily fluctuations in the fair value of the underlying assets. An unrealized gain/(loss) equal to the variation margin is recognized on a daily basis. When the contract expires or is closed, the gain/(loss) is realized and is presented in the Statement of Operations as a net realized gain/(loss) on futures contracts. Futures contracts are valued daily at their last quoted sale price on the exchange on which they are traded. |
| | A “sale” of a futures contract means a contractual obligation to deliver the securities or foreign currency called for by the contract at a fixed price at a specified time in the future. A “purchase” of a futures contract means a contractual obligation to acquire the securities or foreign currency at a fixed price at a specified time in the future. |
| | There are significant risks associated with a Fund's use of futures contracts, including the following: (1) the success of a hedging strategy may depend on the ability of a Fund's investment manager and/or sub-adviser to predict movements in the prices of individual securities, fluctuations in markets and movements in interest rates; (2) there may be an imperfect or no correlation between the movement in the price of futures contracts, interest rates and the fair value of the securities held by a Fund; (3) there may not be a liquid secondary market for a futures contract; (4) trading restrictions or limitations may be imposed by an exchange; and (5) government regulations may restrict trading |
Notes to Financial Statements (continued)
October 31, 2024
| | in futures contracts. In addition, should market conditions change unexpectedly, a Fund may not achieve the anticipated benefits of the futures contracts and may realize a loss. |
| | Options |
| | Options are instruments that provide a right to buy (call) or sell (put) a particular security or an index of securities at a fixed price within a certain time period. Options differ from forward and futures contracts in that the buyer of the option has no obligation to perform under the contract. An option is out-of-the money if the exercise price of the option is above, in the case of a call option, or below, in the case of a put option, the current price (or interest rate or yield for certain options) of the referenced security or instrument. Use of put and call options may result in losses to a Fund, force the sale or purchase of portfolio securities at inopportune times or for prices higher than (in the case of put options) or lower than (in the case of call options) current fair values, limit the amount of appreciation a Fund can realize on its investments or cause a Fund to hold a security it might otherwise sell. |
| | Summary of Derivative Instruments |
| | Certain Funds may use derivatives for various purposes as noted above. The following is a summary of the fair value of derivative instruments, not accounted for as hedging instruments, as of October 31, 2024: |
| | |
| | Risk Exposure Category |
| | Interest
Rate
Contracts | Foreign
Currency
Contracts | Credit
Contracts | Equity
Contracts | Commodity
Contracts | Other | Total |
| High Income Opportunities Fund |
| Assets: |
| Unrealized appreciation on: |
| Forward Foreign Currency Exchange Contracts | $– | $308,125 | $– | $– | $– | $– | $308,125 |
Total
| $– | $308,125 | $– | $– | $– | $– | $308,125 |
| Liabilities: |
| Unrealized depreciation on: |
| Forward Foreign Currency Exchange Contracts | $– | $5,233 | $– | $– | $– | $– | $5,233 |
Total
| $– | $5,233 | $– | $– | $– | $– | $5,233 |
| Infrastructure Debt Fund |
| Assets: |
| Unrealized appreciation on: |
| Forward Foreign Currency Exchange Contracts | $– | $28,513 | $– | $– | $– | $– | $28,513 |
Total
| $– | $28,513 | $– | $– | $– | $– | $28,513 |
Amounts listed as “–” are $0 or round to $0.
Certain funds have transactions that may be subject to enforceable master netting arrangements. A reconciliation of the gross amounts on the Statements of Assets and Liabilities as of October 31, 2024 to the net amounts by broker and derivative type, including any collateral received or pledged, is included in the following tables:
Notes to Financial Statements (continued)
October 31, 2024
| | |
| | | Gross Amounts Not Offset
in the Statement of
Assets and Liabilities | | Gross Amounts Not Offset
in the Statement of
Assets and Liabilities |
| | Gross Amounts
of Assets
Presented in
Statement of
Assets and
Liabilities | Financial
Instruments | Collateral
Received | Net
Amount | Gross Amounts
of Liabilities
Presented in
Statement of
Assets and
Liabilities | Financial
Instruments | Collateral
Pledged | Net
Amount |
| Description | Assets | Liabilities |
| High Income Opportunities Fund |
| Foreign Currency Exchange Contracts |
| Barclays Bank PLC | $963 | $(963) | $– | $– | $3,941 | $(963) | $– | $2,978 |
| Citibank N.A. | – | – | – | – | 855 | – | – | 855 |
| Deutsche Bank AG | 170,715 | – | – | 170,715 | – | – | – | – |
| HSBC Bank PLC | 132,914 | – | – | 132,914 | – | – | – | – |
| Royal Bank of Canada | 2,057 | – | – | 2,057 | – | – | – | – |
| UBS AG | 1,476 | (437) | – | 1,039 | 437 | (437) | – | – |
Amounts listed as “–” are $0 or round to $0.
| | |
| | | Gross Amounts Not Offset
in the Statement of
Assets and Liabilities | | Gross Amounts Not Offset
in the Statement of
Assets and Liabilities |
| | Gross Amounts
of Assets
Presented in
Statement of
Assets and
Liabilities | Financial
Instruments | Collateral
Received | Net
Amount | Gross Amounts
of Liabilities
Presented in
Statement of
Assets and
Liabilities | Financial
Instruments | Collateral
Pledged | Net
Amount |
| Description | Assets | Liabilities |
| Infrastructure Debt Fund |
| Foreign Currency Exchange Contracts |
| HSBC Bank PLC | $28,513 | $– | $– | $28,513 | $– | $– | $– | $– |
Amounts listed as “–” are $0 or round to $0.
The following is a summary of the effect of derivative instruments on the Statement of Operations for the year ended October 31, 2024:
| | Risk Exposure Category |
| | Interest
Rate
Contracts | Foreign
Currency
Contracts | Credit
Contracts | Equity
Contracts | Commodity
Contracts | Total |
| High Income Opportunities Fund |
Realized Gain/(Loss) on Derivatives Recognized
as a Result of Operations: |
| Forward Currency Contracts | $– | $(694,803) | $– | $– | $– | $(694,803) |
Total
| $– | $(694,803) | $– | $– | $– | $(694,803) |
Notes to Financial Statements (continued)
October 31, 2024
| | Risk Exposure Category |
| | Interest
Rate
Contracts | Foreign
Currency
Contracts | Credit
Contracts | Equity
Contracts | Commodity
Contracts | Total |
Net Change in Unrealized Appreciation/Depreciation on
Derivatives Recognized as a Result of Operations: |
| Forward Currency Contracts | $– | $212,053 | $– | $– | $– | $212,053 |
Total
| $– | $212,053 | $– | $– | $– | $212,053 |
| Infrastructure Debt Fund |
Realized Gain/(Loss) on Derivatives Recognized
as a Result of Operations: |
| Forward Currency Contracts | $– | $(85,406) | $– | $– | $– | $(85,406) |
Total
| $– | $(85,406) | $– | $– | $– | $(85,406) |
Net Change in Unrealized Appreciation/Depreciation on
Derivatives Recognized as a Result of Operations: |
| Forward Currency Contracts | $– | $16,016 | $– | $– | $– | $16,016 |
Total
| $– | $16,016 | $– | $– | $– | $16,016 |
Amounts listed as “–” are $0 or round to $0.
The table below summarizes the weighted average values of derivatives holdings by the Funds during the fiscal year ended October 31, 2024.
| Derivative | Average
Notional Value |
| High Income Opportunities Fund |
| Foreign Currency Contracts Purchased | $2,739,431 |
| Foreign Currency Contracts Sold | $19,969,324 |
| Infrastructure Debt Fund |
| Foreign Currency Contracts Purchased | $382,529 |
| Foreign Currency Contracts Sold | $2,238,433 |
e.
| Security Transactions, Investment Income and Expenses: |
| | Security transactions are recorded on the trade date. Realized and unrealized gains/(losses) from security and currency transactions are calculated on the identified cost basis. Dividend income and corporate actions are recorded generally on the ex-date, except for certain dividends and corporate actions which may be recorded after the ex-date, as soon as a Fund acquires information regarding such dividends or corporate actions. |
| | Interest income and expenses are recorded on an accrual basis. Expenses directly attributable to a Fund are charged to that Fund. Expenses not directly attributable to a Fund are allocated proportionately among the relevant Funds based on net assets of each Fund as of the month end. For each of the Funds, the method for allocating income, fund level expenses, and realized and unrealized gains or losses to a class is based on the total net asset value of that class’s shares in proportion to the total net assets of the relevant Fund. Expenses specific to a class (such as Rule 12b-1 and administrative services fees) are charged to that class. |
f.
| Distributions: |
| | Distributions from net investment income, if any, are declared daily and paid monthly for the Intermediate Municipal Income Fund, Short Duration High Yield Municipal Fund and the Ultra Short Municipal Income Fund. Distributions from net investment income, if any, are declared and paid monthly for the High Income Opportunities Fund and the Infrastructure Debt Fund. The Funds will also declare and pay distributions at least annually from net realized gains on investment transactions and net realized foreign exchange gains, if any. Dividends and distributions to shareholders are recorded on the ex-dividend date. |
Notes to Financial Statements (continued)
October 31, 2024
| | Dividends and distributions to shareholders are determined in accordance with federal income tax regulations, which may differ from U.S. GAAP. These differences are primarily due to differing treatment for foreign currencies and loss deferrals. |
g.
| Federal Income Taxes: |
| | Each Fund intends to continue to qualify as a “regulated investment company” by complying with the provisions available to certain investment companies, as defined in Subchapter M of the Internal Revenue Code of 1986, as amended, and to make distributions of net investment income and net realized capital gains sufficient to relieve the Funds from all federal income taxes. Therefore, no federal income tax provision is required. Management of the Funds has concluded that there are no significant uncertain tax positions that would require recognition in the financial statements. Since tax authorities can examine previously filed tax returns, the Funds' U.S. federal and state tax returns for each of the most recent four fiscal years up to the most recent fiscal year ended October 31, 2024 are subject to such review. |
| | Each Fund may recognize interest and penalties related to tax items, including uncertain tax positions, within interest expense and other expenses respectively. No interest expense or penalties related to taxation have been recognized as of and for the year ended October 31, 2024. |
h.
| Foreign Withholding Tax: |
| | Interest income from non-U.S. sources received by the Funds are generally subject to non-U.S. withholding taxes and are recorded on the Statements of Operations. The Funds file for tax reclaims for the refund of such withholdings taxes according to tax treaties. Tax reclaims that are deemed collectible are booked as tax reclaim receivable on the Statements of Assets and Liabilities. Foreign tax authorities can examine previously filed withholding tax reclaims for various periods of time, depending on the statute of limitations in each foreign jurisdiction. In some cases, amounts that have been refunded by foreign tax authorities and received by the Funds are still subject to such review. |
| | In addition, the Funds may be subject to capital gains tax in certain countries in which they invest. The above taxes may be reduced or eliminated under the terms of applicable U.S. income tax treaties with some of these countries. The Funds accrue such taxes when the related income is earned. |
| | In addition, when the Funds sell securities within certain countries in which they invest, the capital gains realized may be subject to tax. Based on these market requirements and as required under U.S. GAAP, the Funds accrue deferred capital gains tax on securities currently held that have unrealized appreciation within these countries. The amount of deferred capital gains tax accrued is reported on the Statements of Operations as part of the Net Change in Unrealized Appreciation/Depreciation on Investments. |
i.
| Securities Lending: |
| | Through an agreement with Securities Finance Trust Company as the Lending Agent and State Street Bank and Trust Company (the Funds’ custodian, "State Street"), the Funds may lend their portfolio securities to brokers, dealers and other financial institutions that pay a negotiated fee in order to generate additional income. The Funds receive non-cash collateral in the form of U.S. Government Securities, with respect to each loan of U.S. securities, typically equal to at least 102% of the value of the portfolio securities loaned, and, with respect to each loan of non-U.S. securities, typically equal to at least 105% of the value of the portfolio securities loaned, and at all times thereafter require the borrower to mark to market such collateral on a daily basis so that the fair value of such collateral does not fall below 100% of the fair value of the portfolio securities so loaned. |
| | Income generated from securities lending includes the difference between (i) the sum of income received from the investment of collateral received from the borrowers that are counterparties to loans, loan fees received from loans, and fees paid by borrower on loans collateralized with collateral other than cash collateral; and ii) any rebate paid to a borrower, and any other allocable fees and expenses in connection with loans of securities. All income is accrued daily and is apportioned 90% to the Funds and 10% to the Lending Agent. |
| | The Funds continue to own the loaned securities and continue to recognize unrealized gains and losses on the securities on loan. However, securities lending involves certain risks, including the event of default or insolvency of the borrower, and possible delays or restrictions upon a Fund’s ability to recover the loaned securities or dispose of the collateral for the loan. Securities on loan are noted within the Statement of Investments. Non-cash securities lending collateral held by the Lending Agent on behalf of the Funds cannot be sold or repledged by the Funds and therefore, this amount is not presented on the Funds’ Statements of Investments. |
| | For the fiscal year ended October 31, 2024, no lending activity took place. |
Notes to Financial Statements (continued)
October 31, 2024
3. Agreements and Transactions with Affiliates
a.
| Investment Adviser: |
| | Under the Investment Advisory Agreements with the Trust, the Adviser manages the Funds in accordance with the policies and procedures established by the Board. |
| | For services provided under the terms of the current Investment Advisory Agreements, each Fund pays the Adviser an annual management fee (as a percentage of its average daily net assets) paid monthly according to the following schedule: |
| | |
| Fund | Fee Schedule | |
High Income Opportunities Fund
| Up to $500 million | 0.550% |
| | $500 million up to $1 billion | 0.525% |
| | On $1 billion and more | 0.500% |
Infrastructure Debt Fund
| Up to $500 million | 0.500% |
| | $500 million up to $1 billion | 0.475% |
| | On $1 billion and more | 0.450% |
Intermediate Municipal Income Fund
| Up to $250 million | 0.425% |
| | $250 million up to $1 billion | 0.375% |
| | On $1 billion and more | 0.355% |
Short Duration High Yield Municipal Fund
| Up to $250 million | 0.550% |
| | On $250 million and more | 0.500% |
Ultra Short Municipal Income Fund
| On all assets | 0.400% |
The Adviser has engaged the services of affiliate abrdn Investments Limited (on behalf of Infrastructure Debt Fund) as subadviser (the “Subadviser”) pursuant to sub-advisory agreements. The Subadviser manages a portion of the applicable Fund’s investments and has the responsibility for making all investment decisions for the portion of such Fund’s assets they manage. Pursuant to the subadvisory agreements, the Adviser pays fees to the Subadviser, if any.
The Trust and abrdn have entered into written contracts (“Expense Limitation Agreements”) limiting operating expenses for all classes of the Funds from exceeding the amounts listed in the tables below. For each Fund, this contractual limitation may not be terminated before February 28, 2025 without the approval of the Trustees who are not “interested persons” of the Trust, as such term is defined by the 1940 Act (the “Independent Trustees”). For the High Income Opportunities Fund and the Infrastructure Debt Fund this contractual limitation may not be terminated before February 28, 2025 without the approval of the Independent Trustees. For the Intermediate Municipal Income Fund and the Infrastructure Debt Fund, this limit excludes certain expenses, including any taxes, interest, brokerage fees, short-sale dividend expenses, Acquired Fund Fees and Expenses, Rule 12b-1 fees, administrative services fees, transfer agent out-of-pocket expenses for Class A shares, Class R shares and Institutional Service Class shares and extraordinary expenses. The Expense Limitation Agreement with respect to the High Income Opportunities Fund limit excludes certain expenses, including any taxes, interest, brokerage fees, short-sale dividend expenses, Acquired Fund Fees and Expenses, and Rule 12b-1 fees for Class A shares and extraordinary expenses. The Expense Limitation Agreements with respect to the Short Duration High Yield Municipal Fund and Ultra Short Municipal Income Fund includes Rule 12b-1 Fees, but excludes certain expenses, including any interest, brokerage commissions, Acquired Fund Fees and Expenses, and extraordinary expenses.
| Fund | Limit |
High Income Opportunities Fund
| 0.70% |
Infrastructure Debt Fund
| 0.65% |
Intermediate Municipal Income Fund
| 0.50% |
| Fund | Class A
Limit | Class A1
Limit | Class C
Limit | Institutional
Class Limit |
Short Duration High Yield Municipal Fund
| 0.90% | – | 1.65% | 0.65% |
Ultra Short Municipal Income Fund
| 0.70% | 0.70% | – | 0.45% |
Amounts listed as “–” are $0 or round to $0.
Notes to Financial Statements (continued)
October 31, 2024
abrdn may request and receive reimbursement from a Fund of the advisory fees waived and other expenses reimbursed pursuant to the Expense Limitation Agreements as of a date not more than three years after the date when the Adviser limited the fees or reimbursed the expenses; provided that the following requirements are met: the reimbursements do not cause a class to exceed the lesser of the applicable expense limitation in the contract at the time the fees were limited or expenses are paid or the applicable expense limitation in effect at the time the expenses are being recouped by the Adviser, and the payment of such reimbursement is approved by the Board on a quarterly basis (the “Reimbursement Requirements”). Except as provided for in the Expense Limitation Agreements, reimbursement of amounts previously waived or assumed by abrdn is not permitted.
As of October 31, 2024, to the extent the Reimbursement Requirements are met, the cumulative potential reimbursements to abrdn for each Fund, based on expenses reimbursed by abrdn, including adjustments described above, would be:
| Fund | Amount
Fiscal Year
2022
(Expires 10/31/25) | Amount
Fiscal Year
2023
(Expires 10/31/26) | Amount
Fiscal Year
2024
(Expires 10/31/27) | Total* |
High Income Opportunities Fund
| $439,426 | $310,592 | $276,578 | $1,026,596 |
Infrastructure Debt Fund
| 507,424 | 201,396 | 195,052 | 903,872 |
Intermediate Municipal Income Fund
| 206,321 | 215,294 | 198,526 | 620,141 |
Short Duration High Yield Municipal Fund
| 760,410 | 448,911 | 303,775 | 1,513,096 |
Ultra Short Municipal Income Fund
| 2,289,342 | 1,869,917 | 1,620,129 | 5,779,388 |
| * | Amounts reported are due to expire throughout the respective 3-year expiration period presented above. |
In accordance with the Funds’ Expense Limitation Agreements and criteria, as described above, the Adviser did not recapture any expenses for which it previously reimbursed the Funds. Accordingly, at October 31, 2024, the Funds did not have liabilities payable to the Adviser for recapture of previously reimbursed expenses.
b.
| Fund Administration: |
| | Under the terms of the Fund Administration Agreement, abrdn provides various administrative and accounting services, including daily valuation of the Funds' shares, preparation of financial statements, tax returns, regulatory reports, and presentation of quarterly reports to the Board. For services provided pursuant to the Fund Administration Agreement, the Trust pays abrdn an annual fee of 0.08% based on the Trust’s average daily net assets. The fee is then allocated proportionately among all funds within the Trust (including the Funds) in relation to the average daily net assets of each fund. This asset-based fee is subject to an annual minimum fee based on the number of funds served. Pursuant to a sub-administration agreement with abrdn, State Street provides sub-administration services with respect to the Funds. abrdn pays State Street for providing such services. |
c.
| Distributor and Shareholder Servicing: |
| | The Trust and Aberdeen Fund Distributors, LLC (the “Distributor”) are parties to the current Underwriting Agreement (the “Underwriting Agreement”) whereby the Distributor acts as principal underwriter for the Trust’s shares. |
| | The Trust has adopted a Distribution Plan (the “Plan”) pursuant to Rule 12b-1 under the 1940 Act with respect to certain classes of shares. The Plan permits the Funds to compensate the Distributor, for expenses associated with the distribution-related and/or shareholder services provided by such entities. These fees are paid to the Distributor and are either kept or paid to shareholders’ financial advisors or other intermediaries for distribution and shareholder services. Although actual distribution expenses may be more or less, under the Plan, the Funds pay the Distributor an annual fee of the following amounts, based on the total net assets of each, respective class: |
| | |
| Fund | Class A
Shares | Class A1
Shares | Class C
Shares(a) |
High Income Opportunities Fund
| 0.25% | – | – |
Infrastructure Debt Fund
| 0.25% | – | – |
Intermediate Municipal Income Fund
| 0.25% | – | – |
Short Duration High Yield Municipal Fund
| 0.25% | – | 1.00% |
Notes to Financial Statements (continued)
October 31, 2024
| Fund | Class A
Shares | Class A1
Shares | Class C
Shares(a) |
Ultra Short Municipal Income Fund
| 0.25% | 0.25% | – |
Amounts listed as “–” are 0% or round to 0%.
| (a) | 0.25% of which is service fees. |
The Adviser or an affiliate of the Adviser may pay additional amounts from its own resources to dealers or other financial intermediaries, for aid in distribution or for aid in providing administrative services to shareholders.
Pursuant to the current Underwriting Agreement, the Distributor will also receive the proceeds of contingent deferred sales charges (“CDSCs”) of 1.00% imposed on certain redemptions of Class C (and up to 1.00% for certain Class A) shares.
The Distributor re-allows to dealer 2.50% of sales charges on Class A shares of the High Income Opportunities Fund and Infrastructure Debt Fund; 2.00% of sales charges on Class A shares of the Intermediate Municipal Income Fund and Short Duration High Yield Municipal Fund; and 0.50% of sales charges on Class A1 of the Ultra Short Municipal Income Fund. In addition, the Distributor or Adviser may compensate broker dealers or financial intermediaries for sales of Class C shares from its own resources at the rate of 1.00% on sales of Class C shares, which have a maximum CDSC of 1.00% (the CDSC assessed on sales within one year of purchase). The amount the Distributor retained for commissions from front-end sales charges and CDSC fees for the fiscal year ended October 31, 2024 was as follows:
| Fund | Commissions Retained
from Front-End Sales
Charges of Class A
Shares | Commissions Retained
from CDSC Fees of
Class C (Certain Class A) Shares |
High Income Opportunities Fund
| $236 | $– |
Infrastructure Debt Fund
| 50 | – |
Intermediate Municipal Income Fund
| 32 | 2 |
Short Duration High Yield Municipal Fund
| 20 | 58 |
Ultra Short Municipal Income Fund
| – | – |
| Total Retained | $338 | $ 60 |
Amounts listed as “–” are $0 or round to $0.
d.
| Administrative Services Fees/Transfer Agent Out-of-Pocket Expenses |
| | The Funds may pay and/or reimburse administrative services fees/sub-transfer agent expenses to certain broker-dealers and financial intermediaries who provide administrative support services to beneficial shareholders on behalf of the Funds (sometimes referred to as “sub-transfer agency fees”), subject to certain limitations approved by the Board. These fees may be in addition to Rule 12b-1 fees. Sub-transfer agency fees generally include, but are not limited to, costs associated with recordkeeping, networking, sub-transfer agency or other administrative or shareholder services. |
| | Class A, Class A1, Class R and Institutional Service Class shares of the Funds pay for such services pursuant to an Administrative Services Plan adopted by the Board. Under the Administrative Services Plan, a Fund may pay a broker-dealer or other intermediary a maximum annual sub-transfer agent and administrative services fee of 0.25% for Class A, Class A1, Class R and Institutional Service Class shares. Under an amendment to the Administrative Services Plan that is in effect until at least February 28, 2025, the administrative service fee is limited to a maximum of 0.15% for contracts with fees that are calculated as a percentage of Fund assets and a maximum of $16 per account for contracts with fees that are calculated on a dollar per account basis; however, many intermediaries do not charge the maximum permitted fee or even a portion thereof. Class C and Institutional Class shares may also pay for the services described above directly as these classes are not subject to an Administrative Services Plan. |
Notes to Financial Statements (continued)
October 31, 2024
| | The aggregate amount of sub-transfer agent and administrative service fees paid during the fiscal year ended October 31, 2024 was as follows: |
| | |
| Fund | Class A | Class A1 | Institutional
Service | Institutional |
High Income Opportunities Fund
| $70,721 | $– | $– | $16,394 |
Infrastructure Debt Fund
| 11,283 | – | 5,062 | 15,214 |
Intermediate Municipal Income Fund
| 1,514 | – | – | 13,396 |
Short Duration High Yield Municipal Fund
| 4,062 | – | – | 52,920 |
Ultra Short Municipal Income Fund
| 114,829 | 16 | – | 430,238 |
Amounts listed as “–” are $0 or round to $0.
e.
| Purchase/Sale Transactions Between Affiliates |
| | The Funds are permitted to buy or sell securities with funds that have a common investment adviser (or investment advisers which are affiliates) under specific procedures which have been approved by the Board. The procedures are designed to satisfy the requirements of Rule 17a-7 of the Investment Company Act of 1940 (“Rule 17a-7”). During the year ended October 31, 2024, the Funds did not engage in any of these trades. |
4. Investment Transactions
Purchases and sales of securities (excluding short-term securities) for the fiscal year ended October 31, 2024, were as follows:
| Fund | Purchases | Sales |
High Income Opportunities Fund
| $90,443,537 | $100,050,242 |
Infrastructure Debt Fund
| 13,780,743 | 17,520,648 |
Intermediate Municipal Income Fund
| 31,547,031 | 33,486,925 |
Short Duration High Yield Municipal Fund
| 105,480,680 | 125,615,797 |
Ultra Short Municipal Income Fund
| 1,540,778,175 | 1,448,763,152 |
5. Portfolio Investment Risks
a.
| Active Management Risk |
| | Each Fund is subject to the risk that the Adviser or Subadviser (as applicable) may make poor security selections. The Adviser, Subadviser and their portfolio managers apply their own investment techniques and risk analyses in making investment decisions for a Fund and there can be no guarantee that these decisions will achieve the desired results for a Fund. In addition, the Adviser or Subadviser may select securities that underperform the relevant market or other funds with similar investment objectives and strategies. |
b.
| Auction Rate Securities Risk |
| | The Intermediate Municipal Income Fund, Short Duration High Yield Municipal Fund and Ultra Short Municipal Income Fund (the “Municipal Funds”) may buy or sell auction rate securities. Auction rate securities are variable rate bonds whose interest rates are reset at specified intervals through a “Dutch” auction process. A “Dutch” auction is a competitive bidding process designed to determine a single uniform clearing rate that enables purchases and sales of the auction rate securities to take place at par. All accepted bids and holders of the auction rate securities receive the same rate. Auction rate securities holders rely on the liquidity generated by the auction. There is a risk that an auction will fail due to insufficient demand for the securities. If an auction fails, an auction rate security may become illiquid until a subsequent successful auction is conducted, the issuer redeems the issue, or a secondary market develops. |
c.
| Bank Loan Risk |
| | The High Income Opportunities Fund and Infrastructure Debt Fund may buy or sell bank loans. There are some risks associated with an investment in bank loans including credit risk, interest rate risk, illiquid securities risk, and prepayment risk. There is also the possibility that the collateral securing a loan, if any, may be difficult to liquidate or be insufficient to cover the amount owed under the loan. Bank loans have significantly longer settlement periods (e.g., longer than seven days) than more traditional investments resulting in the proceeds from the sale |
Notes to Financial Statements (continued)
October 31, 2024
| | of such loans not being readily available to make additional investments or to meet a Fund’s redemption obligations. In addition, loans are not registered under the federal securities laws like stocks and bonds, so investors in loans have less protection against improper practices than investors in registered securities. These risks could cause a Fund to lose income or principal on a particular investment, which in turn could affect a Fund’s returns. |
d.
| Cybersecurity Risk |
| | Cybersecurity incidents may allow an unauthorized party to gain access to Fund assets, customer data (including private shareholder information), or proprietary information, or cause each Fund, the Adviser and/or their service providers (including, but not limited to, Fund accountants, custodians, sub-custodians, transfer agents and financial intermediaries) to suffer data breaches, data corruption or lose operational functionality. |
e.
| Derivatives Risk (including Options, Futures and Swaps) |
| | The High Income Opportunities Fund and Infrastructure Debt Fund are subject to Derivatives Risk. Derivatives are speculative and may hurt the Fund’s performance. The potential benefits to be derived from the Fund’s options, futures and derivatives strategy are dependent upon the portfolio managers’ ability to discern pricing inefficiencies and predict trends in these markets, which decisions could prove to be inaccurate. |
| | Speculative Exposure Risk. To the extent that a derivative or practice is not used as a hedge, the Fund is directly exposed to its risks. Gains or losses from speculative positions in a derivative may be much greater than the derivative’s original cost. For example, potential losses from writing uncovered call options and from speculative short sales are unlimited. |
| | Hedged Exposure Risk. Losses generated by a derivative or practice used by the Fund for hedging purposes should be substantially offset by gains on the hedged investment. However, while hedging can reduce or eliminate losses, it can also reduce or eliminate gains. |
| | Correlation Risk. The Fund is exposed to the risk that changes in the value of a hedging instrument will not match those of the investment being hedged. |
| | Counterparty Risk. Derivative transactions depend on the creditworthiness of the counterparty and the counterparty’s ability to fulfill its contractual obligations. |
| | Other Derivatives Risks. Fixed income derivatives are subject to interest rate risk. In addition, certain derivatives may be subject to illiquid securities risk, mispricing or valuation complexity, market risk and management risk. The Fund may need to sell portfolio securities at inopportune times to satisfy margin or payment obligations under derivatives investments. Changes in regulation relating to the Fund’s use of derivatives and related instruments could potentially limit or impact the Fund’s ability to invest in derivatives, limit the Fund’s ability to employ certain strategies that use derivatives and/or adversely affect the value of derivatives and the Fund’s performance. |
f.
| Emerging Markets Risk |
| | Emerging markets are countries generally considered to be relatively less developed or industrialized, and investments in emerging markets countries are subject to a magnification of the risks that apply to foreign investments. These risks are greater for securities of companies in emerging markets countries because the countries may have less stable governments, more volatile currencies and less established markets (see “Foreign Securities Risk” below). |
g.
| ESG Integration Risk |
| | To the extent ESG (Environmental, Social and Governance) factors are used to evaluate investments, the consideration of such factors may adversely affect a Fund’s performance. Not every ESG factor may be identified or evaluated for every investment. ESG characteristics are not the only factors considered and, as a result, the issuers in which a Fund invests may not be issuers with favorable ESG characteristics or high ESG ratings. The application of ESG factors may result in a Fund performing differently than its benchmark index and other funds in its peer group that do not consider ESG factors or consider different ESG factors. |
h.
| Fixed Income Securities Risk |
| | Fixed income securities fluctuate in price based on changes in an issuer’s financial condition and overall market and economic conditions. The value of a fixed income security may also fall due to specific conditions that affect a particular sector of the securities market or a particular issuer. Fixed income securities are subject to, among other risks, credit risk, extension risk, issuer risk, interest rate risk, market risk and prepayment risk. |
Notes to Financial Statements (continued)
October 31, 2024
i.
| Foreign Currency Exposure Risk |
| | The value of foreign currencies relative to the U.S. Dollar fluctuates in response to market, economic, political, regulatory, geopolitical or other conditions. A decline in the value of a foreign currency versus the U.S. Dollar reduces the value in U.S. Dollars of investments denominated in that foreign currency. This risk may impact a Fund more greatly to the extent the Fund does not hedge its currency risk, or hedging techniques used by the Adviser are unsuccessful. |
j.
| Foreign Securities Risk |
| | Foreign countries in which a Fund may invest may have markets that are less liquid, less regulated and more volatile than U.S. markets. The value of a Fund’s investments may decline because of factors such as unfavorable or unsuccessful government actions, reduction of government or central bank support and political or financial instability. To the extent the Fund focuses its investments in a single country or only a few countries in a particular geographic region, economic, political, regulatory or other conditions affecting such country or region may have a greater impact on Fund performance relative to a more geographically diversified fund. |
k.
| Green, Social and Sustainability Bond Risk |
| | The Infrastructure Debt Fund’s performance may differ from the performance of other funds that do not invest green, social and sustainability bonds because the Fund’s investment strategy may select or exclude securities of certain issuers for reasons in addition to performance. Investing in green, social and sustainability bonds is qualitative and subjective by nature, and there is no guarantee that the factors utilized by the Adviser or any judgment exercised by the Adviser will reflect the opinions of any particular investor. |
l.
| High-Yield Bonds and Other Lower-Rated Securities Risk |
| | A Fund’s investments in high-yield bonds (commonly referred to as “junk bonds”) and other lower-rated securities will subject the Fund to substantial risk of loss. Investments in high-yield bonds are speculative and issuers of these securities are generally considered to be less financially secure and less able to repay interest and principal than issuers of investment-grade securities. Prices of high-yield bonds tend to be very volatile. These securities are less liquid than investment-grade debt securities and may be difficult to price or sell, particularly in times of negative sentiment toward high-yield securities. |
m.
| Illiquid Securities Risk |
| | Illiquid securities are assets that a Fund reasonably expects cannot be sold or disposed of in current market conditions in seven calendar days or less without the sale or disposition significantly changing the fair value of the asset. An inability to sell a portfolio position can adversely affect a Fund’s value or prevent the Fund from being able to take advantage of other investment opportunities. Illiquid securities and relatively less liquid securities may also be difficult to value. |
| | The Adviser employs procedures and tests using third-party and internal data inputs that seek to assess and manage the liquidity of a Fund’s portfolio holdings. These procedures and tests take into account a Fund’s investment strategy and liquidity of portfolio investments during both normal and foreseeable stressed conditions, cash-flow projections during both normal and reasonably foreseeable stressed conditions, relevant market, trading and other factors, and monitor whether liquidity should be adjusted based on changed market conditions. These procedures and tests are designed to assist a Fund in determining its ability to meet redemption requests in various market conditions. In light of the dynamic nature of markets, there can be no assurance that these procedures and tests will enable a Fund to ensure that it has sufficient liquidity to meet redemption requests. |
n.
| Impact of Large Redemptions and Purchases of Fund Shares |
| | Occasionally, shareholders may make large redemptions or purchases of Fund shares, which may cause a Fund to have to sell securities or invest additional cash. These transactions may adversely affect the Fund’s performance and increase transaction costs. In addition, large redemption requests may exceed the cash balance of a Fund and result in credit line borrowing fees and/or overdraft charges to a Fund until the sales of portfolio securities necessary to cover the redemption request settle. |
o.
| Infrastructure-Related Investments Risk |
| | Because the Infrastructure Debt Fund concentrates its investments in infrastructure-related entities, the Fund has greater exposure to the potential adverse economic, regulatory, political and other changes affecting such entities. Infrastructure related entities are subject to a variety of factors that may adversely affect their business or operations, including high interest costs in connection with capital construction programs, costs associated with environmental and other regulations, the effects of economic slowdown and surplus capacity, increased competition from other providers of services, uncertainties concerning the availability of fuel at reasonable prices, the effects of energy |
Notes to Financial Statements (continued)
October 31, 2024
| | conservation policies and other factors. Additionally, infrastructure-related entities may be subject to regulation by various governmental authorities and may also be affected by governmental regulation of rates charged to customers, service interruption due to environmental, operational or other mishaps, the imposition of special tariffs and changes in tax laws, regulatory policies and accounting standards. |
p.
| Interest Rate Risk |
| | Each Fund’s fixed income investments are subject to interest rate risk, which generally causes the value of a fixed income portfolio to decrease when interest rates rise resulting in a decrease in each Fund’s net assets. Interest rate fluctuations tend to have a greater impact on fixed income-securities with a greater time to maturity and/or lower coupon. A fund with a longer average portfolio duration will be more sensitive to changes in interest rates than a fund with a shorter average portfolio duration. In periods of market volatility, the fair values of fixed income securities may be more sensitive to changes in interest rates. The Fund may be subject to greater interest rate risk due to changing interest rate environment and the effect of potential government monetary and fiscal policy initiatives and resulting market reaction to those initiatives. |
q.
| Issuer Risk |
| | The value of a security may decline for reasons directly related to the issuer, such as management performance, financial leverage and reduced demand for the issuer's goods or services. |
r.
| Market Risk |
| | Deteriorating market conditions might cause a general weakness in the market that reduces the prices, or yield, of securities in that market. Developments in a particular class of bonds or the stock market could also adversely affect a Fund by reducing the relative attractiveness of bonds or stocks as an investment. Also, to the extent that a Fund emphasizes bonds or stocks from any given industry, it could be hurt if that industry does not do well. Additionally, a Fund could lose value if the individual stocks in which it maintains long positions and/or the overall stock markets on which the stocks trade decline in price. In addition, a Fund that engages in short sales could lose value if the individual stocks which they sell short increase in price. Stocks and stock markets may experience short-term volatility (price fluctuation) as well as extended periods of price decline or increase. Individual stocks are affected by many factors, including: |
| • | corporate earnings; |
| • | production; |
| • | management; |
| • | sales; and |
| • | market trends, including investor demand for a particular type of stock, such as growth or value stocks, small or large stocks, or stocks within a particular industry. |
Stock markets are affected by numerous factors, including interest rates, the outlook for corporate profits, the health of the national and world economies, the fluctuation of other stock markets around the world, and financial, economic and other global market developments and disruptions, such as those arising from war, terrorism, market manipulation, government interventions, defaults and shutdowns, political changes or diplomatic developments, public health emergencies and natural/environmental disasters. In addition, any spread of an infectious illness, public health threat or similar issue could reduce consumer demand or economic output, result in market closures, travel restrictions or quarantines, and generally have a significant impact on the world economy, which in turn could adversely affect the Fund’s investments.
Policy and legislative changes in the United States and in other countries are affecting many aspects of financial regulation, and governmental and quasi-governmental authorities and regulators throughout the world have responded to serious economic disruptions with a variety of significant fiscal and monetary policy changes, including but not limited to, direct capital infusions into companies, new monetary programs and interest rate hikes or reductions. The impact of these policies and legislative changes on the markets, and the practical implications for market participants, may not be fully known for some time. A reversal of these policies, or the ineffectiveness of these policies, could increase volatility in securities markets, which could adversely impact a Fund’s investments. The current market environment could make identifying investment risks and opportunities especially difficult for the Adviser.
Economies and financial markets throughout the world are becoming increasingly interconnected. As a result, whether or not a Fund invests in securities of issuers located in or with significant exposure to countries experiencing economic and financial difficulties, the value and liquidity of the Fund’s investments may be negatively affected by such events.
s.
| Municipal Securities Risk |
| | The Infrastructure Debt Fund and the Municipal Funds are subject to municipal securities risk. Municipal bonds can be significantly affected by political and economic changes, including inflation, as well as uncertainties in the municipal market related to taxation, legislative changes, or |
Notes to Financial Statements (continued)
October 31, 2024
| | the rights of municipal security holders. Municipal bonds have varying levels of sensitivity to changes in interest rates. Interest rate risk is generally lower for shorter-term municipal bonds and higher for long term municipal bonds. |
| | Municipal Bond Tax Risk. A municipal bond that is issued as tax-exempt may later be declared to be taxable. In addition, if the federal income tax rate is reduced, the value of the tax exemption may be less valuable, causing the value of a municipal bond to decline. |
| | Municipal Market Volatility and Illiquidity Risk. The municipal bond market can be volatile, particularly for lower-rated and unrated securities. Liquidity can be reduced unpredictably in response to overall economic conditions or credit tightening. During times of reduced market liquidity, a Fund may not be able to readily sell bonds without the sale significantly changing the fair value of the bond. If the Fund needed to sell large blocks of bonds to meet shareholder redemption requests or to raise cash, those sales could further reduce the bonds’ prices. |
| | Municipal Sector Risk. From time to time, a Fund may invest a substantial amount of its assets in municipal securities whose interest is paid solely from revenues of similar projects. If a Fund concentrates its investments in this manner, it assumes the economic risks relating to such projects and any adverse changes to such projects may have a significant negative impact on the Fund’s investment performance. |
t.
| Portfolio Turnover Risk |
| | The High Income Opportunities Fund, Short Duration High Yield Municipal Fund and Ultra Short Municipal Income Fund may engage in active and frequent trading of portfolio securities to achieve their investment objectives. High portfolio turnover may result in greater transaction costs which may reduce Fund performance. The sale of Fund portfolio securities may also result in greater realization and/or distribution to shareholders of gains or losses as compared to a fund with less active trading, which may include short-term gains taxable at ordinary income tax rates. |
u.
| Private Placements and Other Restricted Securities Risk |
| | The High Income Opportunities Fund and Short Duration High Yield Municipal Fund are subject to Private Placements Risk. Investments in private placements and other restricted securities, including Regulation S Securities and Rule 144A Securities, could have the effect of increasing the Fund’s level of illiquidity. Private placements and restricted securities may be less liquid than other investments because such securities may not always be readily sold in broad public markets and the Fund might be unable to dispose of such securities promptly or at prices reflecting their true value. |
v.
| Sector Risk |
| | To the extent that a Fund has a significant portion of its assets invested in securities of companies conducting business in a broadly related group of industries within an economic sector, the Fund may be more vulnerable to unfavorable developments in that economic sector than funds that invest more broadly. |
w.
| Sovereign Debt Risk |
| | The High Income Opportunities Fund is subject to Sovereign Debt Risk. Periods of economic and political uncertainty may result in the illiquidity and increased price volatility of a foreign government’s debt securities held by the Fund and impact an issuer’s ability and willingness to pay interest or repay principal when due. The Fund may have limited recourse to compel payment in the event of a default. A foreign government’s default on its debt securities may cause the value of securities held by the Fund to decline significantly. |
x.
| Tender Option Bonds Risk |
| | The Municipal Funds are subject to Tender Option Bonds Risk. Tender option bonds are synthetic floating-rate or variable-rate securities issued when long-term bonds are purchased in the primary or secondary market and then deposited into a trust. Tender option bonds may be considered derivatives, and may expose the Fund to the same risks as investments in derivatives, as well as risks associated with leverage, especially the risk of increased volatility. |
y.
| Tobacco Related Bonds Risk |
| | The Short Duration High Yield Municipal Fund is subject to Tobacco Related Bonds Risk. In 1998, the largest U.S. tobacco manufacturers reached an out of court agreement, the Master Service Agreement ("MSA"), to settle claims against them by 46 states and six other U.S. jurisdictions. The tobacco manufacturers agreed to make annual payments to the government entities in exchange for the release of all litigation claims. A number of the states have sold bonds that are backed by those future payments. The Funds may invest in two types of those bonds: (i) bonds that make payments only from a state’s interest in the MSA and (ii) bonds that make payments from both the MSA revenue and from an “appropriation pledge” by the state. An “appropriation pledge” requires the state to pass a specific periodic |
Notes to Financial Statements (continued)
October 31, 2024
| | appropriation to make the payments and is generally not an unconditional guarantee of payment by a state. The MSA settlement payments are based on factors, including, but not limited to, annual domestic cigarette shipments, cigarette consumption, inflation and the financial capability of participating tobacco companies. Payments could be reduced if consumption decreases, if market share is lost to non-MSA manufacturers, or if there is a negative outcome in litigation regarding the MSA. |
z.
| U.S. Government Securities Risk |
| | Securities issued by U.S. Government agencies or government sponsored entities may not be guaranteed by the U.S. Treasury. The U.S. Government does not guarantee the net asset value of a Fund’s shares. |
aa.
| Valuation Risk |
| | The price that a Fund could receive upon the sale of any particular portfolio investment may differ from the Fund’s valuation of the investment, particularly for securities that trade in thin or volatile markets or that are valued using a fair valuation methodology or a price provided by an independent pricing service. As a result, the price received upon the sale of an investment may be less than the value ascribed by a Fund, and the Fund could realize a greater than expected loss or lesser than expected gain upon the sale of the investment. The ability to value a Fund's investments may also be impacted by technological issues and/or errors by pricing services or other third-party service providers. |
bb.
| Variable and Floating Rate Securities Risk |
| | Certain Funds are subject to Variable and Floating Rate Securities Risk. For floating and variable rate obligations, there may be a lag between an actual change in the underlying interest rate benchmark and the reset time for an interest payment of such an obligation, which could harm or benefit the Fund, depending on the interest rate environment or other circumstances. Variable rate demand obligations (“VRDOs”) are floating rate securities that combine an interest in a long term municipal bond with a right to demand payment before maturity from a bank or other financial institution. If the bank or financial institution is unable to pay, the Fund may lose money. |
cc.
| Yield Risk |
| | The High Income Opportunities Fund and Ultra Short Municipal Income Fund are subject to Yield Risk. The amount of income received by the Fund will go up or down depending on day-to-day variations in short-term interest rates, and when interest rates are very low the Fund’s expenses could absorb all or a significant portion of the Fund’s income. If interest rates increase, the Fund’s yield may not increase proportionately. For example, the Adviser may discontinue any temporary voluntary fee limitation or recoup amounts previously waived and/or reimbursed. |
| | Please read the Funds' prospectuses for more detailed information regarding these and other risks. |
6. Contingencies
In the normal course of business, the Funds may provide general indemnifications pursuant to certain contracts and organizational documents. The Funds' maximum exposure under these arrangements is dependent on future claims that may be made against the Funds, and therefore, cannot be estimated; however, the Funds expect the risk of loss from such claims to be remote.
7. Tax Information
As of October 31, 2024, the tax cost of securities and the breakdown of unrealized appreciation/(depreciation) for each Fund were as follows:
| Fund | Tax Cost of
Securities | Unrealized
Appreciation | Unrealized
Depreciation | Net
Unrealized
Appreciation/
(Depreciation) |
High Income Opportunities Fund
| $84,152,581 | $2,383,670 | $(2,950,992) | $(567,322) |
Infrastructure Debt Fund
| 23,609,480 | 696,897 | (200,288) | 496,609 |
Intermediate Municipal Income Fund
| 43,259,476 | 617,962 | (465,676) | 152,286 |
Short Duration High Yield Municipal Fund
| 105,908,714 | 1,254,144 | (7,366,107) | (6,111,963) |
Ultra Short Municipal Income Fund
| 748,185,139 | 112,189 | (145,184) | (32,995) |
Notes to Financial Statements (continued)
October 31, 2024
The tax character of distributions during the fiscal year ended October 31, 2024 was as follows (total distributions paid may differ from the Statements of Changes in Net Assets because for tax purposes dividends are recognized when actually paid):
| Distributions paid from |
| Fund | Ordinary
Income | Net Long Term
Capital Gains | Total
Taxable
Distributions | Tax Exempt
Distributions | Return of
Capital | Total
Distributions Paid |
High Income Opportunities Fund
| $5,175,909 | $– | $5,175,909 | $– | $253,595 | $5,429,504 |
Infrastructure Debt Fund
| 1,502,037 | – | 1,502,037 | – | – | 1,502,037 |
Intermediate Municipal Income Fund
| 21,026 | – | 21,026 | 1,713,279 | – | 1,734,305 |
Short Duration High Yield Municipal Fund
| 23,137 | – | 23,137 | 3,636,771 | – | 3,659,908 |
Ultra Short Municipal Income Fund
| 18,857 | – | 18,857 | 25,197,595 | – | 25,216,452 |
Amounts listed as “–” are $0 or round to $0.
The tax character of distributions during the fiscal year ended October 31, 2023 was as follows (total distributions paid may differ from the Statements of Changes in Net Assets because for tax purposes dividends are recognized when actually paid):
| Distributions paid from |
| Fund | Ordinary
Income | Net Long Term
Capital Gains | Total
Taxable
Distributions | Tax Exempt
Distributions | Return of
Capital | Total
Distributions Paid |
High Income Opportunities Fund
| $7,305,908 | $– | $7,305,908 | $– | $101,762 | $7,407,670 |
Infrastructure Debt Fund
| 295,516 | – | 295,516 | – | – | 295,516 |
Intermediate Municipal Income Fund
| 12,366 | – | 12,366 | 1,550,753 | – | 1,563,119 |
Short Duration High Yield Municipal Fund
| 62,543 | – | 62,543 | 3,984,970 | – | 4,047,513 |
Ultra Short Municipal Income Fund
| 24,357 | – | 24,357 | 21,779,502 | – | 21,803,859 |
Amounts listed as “–” are $0 or round to $0.
As of October 31, 2024, the components of accumulated earnings/(deficit) on a tax basis were as follows:
| Fund | Undistributed
Tax Exempt
Income | Undistributed
Ordinary
Income | Undistributed
Long-Term
Capital
Gains | Accumulated
Earnings | Distributions
Payable | Late Year
Ordinary and
Post-October
Capital Loss
Deferrals | Other
Temporary
Differences | Unrealized
Appreciation/
(Depreciation)* | Accumulated
Capital and
Other
Losses** | Total
Accumulated
Earnings/
(Deficit) |
High Income Opportunities Fund
| $– | $– | $– | $– | $– | $– | $(332,051) | $(955,663) | $(248,757,659) | $(250,045,373) |
Infrastructure Debt Fund
| – | 234,453 | – | – | – | – | – | 496,632 | (8,159,809) | (7,428,724) |
Intermediate Municipal Income Fund
| 4,443 | – | – | – | – | – | (4,632) | 152,288 | (1,784,533) | (1,632,434) |
Short Duration High Yield Municipal Fund
| 1,316,644 | – | – | – | – | – | (968,204) | (6,111,963) | (35,923,007) | (41,686,530) |
Ultra Short Municipal Income Fund
| 80,814 | – | – | – | – | – | (73,243) | (32,993) | (1,422,409) | (1,447,831) |
Amounts listed as “–” are $0 or round to $0.
| * | The difference between book-basis and tax-basis unrealized appreciation/(depreciation) is attributable to tax deferral of losses on wash sales and corporate actions. |
| ** | As of October 31, 2024, for federal income tax purposes, some Funds have capital loss carryforwards available to offset capital gains, if any, to the extent provided by the Treasury regulations, with no expiration. |
Notes to Financial Statements (continued)
October 31, 2024
As of October 31, 2024, for federal income tax purposes, the following Funds have capital loss carryforwards available to offset capital gains, if any, to the extent provided by the Treasury regulations.
| Fund | Amounts | Expires |
High Income Opportunities Fund
| $55,861,028 | Unlimited (Short—Term) |
High Income Opportunities Fund
| 192,896,631 | Unlimited (Long—Term) |
Infrastructure Debt Fund
| 7,258,580 | Unlimited (Short—Term) |
Infrastructure Debt Fund
| 901,229 | Unlimited (Long—Term) |
Intermediate Municipal Income Fund
| 188,578 | Unlimited (Short—Term) |
Intermediate Municipal Income Fund
| 1,595,955 | Unlimited (Long—Term) |
Short Duration High Yield Municipal Fund
| 12,860,275 | Unlimited (Short—Term) |
Short Duration High Yield Municipal Fund
| 23,062,732 | Unlimited (Long—Term) |
Ultra Short Municipal Income Fund
| 1,422,409 | Unlimited (Short—Term) |
8. Significant Shareholders
As of October 31, 2024, the Funds had shareholders with the percentage ownership indicated, which are considered significant shareholders (holdings greater than 5.0%) for financial reporting purposes:
| Fund | Record
Ownership % | Number of
Account Owners |
High Income Opportunities Fund
| 44.4% | 4 |
Infrastructure Debt Fund
| 44.7 | 3 |
Intermediate Municipal Income Fund
| 51.0 | 1 |
Short Duration High Yield Municipal Fund
| 85.4 | 3 |
Ultra Short Municipal Income Fund
| 69.5 | 5 |
9. Line of Credit
The Trust, on behalf of each of the funds of the Trust (including the Funds) (the “Borrowers”), has entered into an agreement (the “Agreement”) with State Street Bank and Trust Company (the “Bank”), subject to annual renewal. The Agreement provides for a revolving credit facility (the “Credit Facility”) in the amount of $150,000,000 to be utilized for temporary or emergency purposes to fund shareholder redemptions or other short-term liquidity purposes.
As of October 31, 2024, the Infrastructure Debt Fund had $250,000 and the Short Duration High Yield Municipal Fund had $840,130 repayable to State Street.
Principal on each outstanding loan made under the Agreement bears interest at a variable rate per annum equal to (a) 10 basis points + (b) the higher of (i) the Federal Funds Rate on such date (not less than zero) plus one and one quarter of one percent (1.25%) or (ii) the Overnight Bank Funding Rate on such date plus one and one quarter of one percent (1.25%). In addition, the Borrowers shall pay to the Bank a commitment fee at the rate of 0.25% per annum on the daily unused portion of the Credit Facility, as applicable, which is allocated among the Borrowers in such manner as is determined by the Board to be reasonable. For each Fund that borrowed under the Credit Facility during the fiscal year ended October 31, 2024, the following table shows the average outstanding daily balance of the days the Fund utilized the Credit Facility and the average weighted interest rate paid by the Fund during the fiscal year ended October 31, 2024.
| Fund | Average Outstanding
Daily Balance | Average Weighted
Interest Rate | Days
Utilized |
High Income Opportunities Fund
| $1,064,075 | 6.68% | 10 |
Infrastructure Debt Fund
| 330,619 | 6.68% | 78 |
Intermediate Municipal Income Fund
| 532,384 | 6.64% | 15 |
Short Duration High Yield Municipal Fund
| 1,583,155 | 6.65% | 97 |
Ultra Short Municipal Income Fund
| 1,600,000 | 6.64% | 2 |
Notes to Financial Statements (concluded)
October 31, 2024
10. New Accounting Pronouncement
In November 2023, the FASB issued ASU 2023-07, “Segment Reporting (Topic 280): Improvements to Reportable Segment Disclosures (“ASU 2023-07”), which enhances disclosure requirements about significant segment expenses that are regularly provided to the chief operating decision maker (the “CODM”). ASU 2023-07, among other things, (i) requires a single segment public entity to provide all of the disclosures as required by Topic 280, (ii) requires a public entity to disclose the title and position of the CODM and an explanation of how the CODM uses the reported measure(s) of segment profit or loss in assessing segment performance and deciding how to allocate resources and (iii) provides the ability for a public entity to elect more than one performance measure. ASU 2023-07 is effective for the fiscal years beginning after December 15, 2023, and interim periods within fiscal years beginning after December 15, 2024. Early adoption is permitted and retrospective adoption is required for all prior periods presented. The Trust is currently assessing the impact of this guidance, however, the Trust does not expect a material impact on its financial statements.
11. Subsequent Events
Management has evaluated the need for disclosures and/or adjustments resulting from subsequent events through the date the financial statements were issued. Based on this evaluation, no disclosures and/or adjustments were required to the financial statements as of October 31, 2024, other than as noted below.
At a meeting on December 11, 2024, the Board approved a non-fundamental policy that the abrdn High Income Opportunities Fund will invest, under normal circumstances, at least 80% of its net assets in high income producing instruments. Such change will take effect on February 28, 2025.
Report of Independent Registered Public Accounting Firm
To the Shareholders and Board of Trustees
abrdn Funds:
Opinion on the Financial Statements
We have audited the accompanying statements of assets and liabilities of abrdn High Income Opportunities Fund, abrdn Infrastructure Debt Fund, abrdn Intermediate Municipal Income Fund, abrdn Short Duration High Yield Municipal Fund, and abrdn Ultra Short Municipal Income Fund, five of the funds comprising abrdn Funds (each, a Fund and collectively, the Funds), including the statements of investments, as of October 31, 2024, the related statements of operations for the year then ended, the statements of changes in net assets for each of the years in the two-year period then ended, and the related notes (collectively, the financial statements) and the financial highlights for each of the years in the five-year period then ended. In our opinion, the financial statements and financial highlights present fairly, in all material respects, the financial position of the Funds as of October 31, 2024, the results of their operations for the year then ended, the changes in their net assets for each of the years in the two-year period then ended, and the financial highlights for each of the years in the five-year period then ended, in conformity with U.S. generally accepted accounting principles.
Basis for Opinion
These financial statements and financial highlights are the responsibility of the Funds' management. Our responsibility is to express an opinion on these financial statements and financial highlights based on our audits. We are a public accounting firm registered with the Public Company Accounting Oversight Board (United States) (PCAOB) and are required to be independent with respect to the Funds in accordance with the U.S. federal securities laws and the applicable rules and regulations of the Securities and Exchange Commission and the PCAOB.
We conducted our audits in accordance with the standards of the PCAOB. Those standards require that we plan and perform the audit to obtain reasonable assurance about whether the financial statements and financial highlights are free of material misstatement, whether due to error or fraud. Our audits included performing procedures to assess the risks of material misstatement of the financial statements and financial highlights, whether due to error or fraud, and performing procedures that respond to those risks. Such procedures included examining, on a test basis, evidence regarding the amounts and disclosures in the financial statements and financial highlights. Such procedures also included confirmation of securities owned as of October 31, 2024, by correspondence with the custodian and brokers; when replies were not received from brokers, we performed other auditing procedures. Our audits also included evaluating the accounting principles used and significant estimates made by management, as well as evaluating the overall presentation of the financial statements and financial highlights. We believe that our audits provide a reasonable basis for our opinion.

We have served as the auditor of one or more abrdn investment companies since 2009.
Columbus, Ohio
December 27, 2024
Changes in and Disagreement with Accountants for Open-End Management Investment Companies
Proxy Disclosures for Open-End Management Investment Companies
Remuneration Paid to Trustees, Officers, and Others of Open-End Management Investment Companies
Remuneration paid to trustees, officers and others is included in the Statement of Operations under the line items “Trustee Fees” and “Investment Advisory Fees” as part of the financial statements filed under Item 7 of this Form N-CSR.
Board of Trustees' Consideration of Advisory and Sub-Advisory Agreements (Unaudited)
At a regularly scheduled quarterly meeting (the “Quarterly Meeting”) of the Board of the Trust held on June 11, 2024, the Board, including a majority of the Independent Trustees, approved for an annual period the continuation of the Trust’s Advisory Agreements with the Adviser and the applicable sub-advisory agreements (the “Sub-Advisory Agreements,” and collectively with the Advisory Agreements, the “Agreements”) by and among the Trust, the Adviser and the Subadviser (collectively, the “Advisers”) for each of the following series of the Trust: abrdn High Income Opportunities Fund, abrdn Infrastructure Debt Fund, abrdn Intermediate Municipal Income Fund, abrdn Short Duration High Yield Municipal Fund and abrdn Ultra Short Municipal Income Fund. In connection with their consideration of whether to approve the continuation of the Agreements, the Board members received and reviewed a variety of information provided by the Advisers relating to the Funds, the Agreements and the Advisers, including information regarding the nature, extent and quality of services provided by the Advisers under respective Agreements, comparative investment performance, fee and expense information of peer groups of funds for respective Funds (each a “Peer Group,” and collectively the “Peer Groups”) selected by Institutional Shareholder Services Inc. (“ISS”), an independent third-party provider of investment company data and other performance information for relevant benchmark indices (collectively, the “15(c) Materials”). In addition, the Independent Trustees held a separate telephonic meeting in advance of the Quarterly Meeting (the “Review Meeting”) to review the materials provided and the relevant legal considerations, and met in executive session outside the presence of Fund management at the Review Meeting and Quarterly Meeting with their independent legal counsel to discuss the Advisory Agreements. The Independent Trustees also, together with the independent board members of other registered investment companies advised by the Advisers and their affiliates (collectively, the “abrdn Funds complex”), met in advance of the Quarterly Meeting with the Chief Investment Officer (the “CIO”) of abrdn plc, the ultimate parent of the Advisers. During their meeting with the CIO, the Independent Trustees received information on, and responses to their questions concerning, among other items, abrdn plc’s and the Advisers’ investment decision-making framework, monitoring of investment theses and responses to underperformance, key personnel and investment teams, and investment product development at abrdn plc, including with respect to the abrdn Funds complex. In addition to the 15(c) Materials, the Board received and reviewed materials in advance of each regular quarterly meeting that contained information about the Fund and its investment performance and information relating to the services provided by the Advisers.
The 15(c) Materials provided to the Board generally included, among other items: (i) information on the investment performance of the Funds and the performance of the Funds’ respective Peer Groups and the Funds’ performance benchmarks; (ii) information on the Funds’ advisory fees and other expenses, including information comparing each Fund’s expenses to those of the respective Peer Group and information about any applicable expense limitations and fee “breakpoints”; (iii) information about the profitability of the Agreements to the Advisers; (iv) a report prepared by the Advisers in response to a request submitted by the Independent Trustees’ independent legal counsel on behalf of such Trustees; and (v) a memorandum from the Independent Trustees’ independent legal counsel on the responsibilities of the Board in considering for approval the investment advisory and investment sub-advisory arrangements under the 1940 Act and Delaware law.
In addition, the Board, including the Independent Trustees, also considered information that the Advisers had provided concerning: (i) the Advisers’ investment personnel and operations; (ii) the Advisers’ financial stability and financial condition; (iii) the resources devoted by the Advisers to the Fund; (iv) each Fund’s investment objective and strategies and the Advisers’ record of compliance with the Funds’ investment policies and restrictions; the Advisers’ and their affiliates’ compliance program; (vi) arrangements relating to the distribution of the Funds’ shares and the related costs; and (vii) possible conflicts of interest. The Board also considered the nature, extent and quality of the services provided to the Funds by the Adviser’s affiliates.Throughout the process, including at the meeting with the CCO, the Review Meeting and the Quarterly Meeting, the Trustees were afforded and availed themselves of the opportunity to ask questions of and request additional information from the Adviser.
The Independent Trustees were advised by separate independent legal counsel throughout the process and also consulted in executive sessions with their counsel regarding their consideration of the continuation of the Agreements. In considering whether to approve the continuation of the Agreements, the Board of Trustees, including the Independent Trustees, did not identify any single factor as determinative. Individual Trustees may have evaluated the information presented differently from one another and given different weights to various factors. Matters considered by the Trustees, including the Independent Trustees, in connection with their approval of the continuation of the Agreements included the factors listed below.
Investment performance of the Funds and the Advisers. The Trustees received and reviewed information that compared the Funds’ return over various periods of time to those of comparable unaffiliated investment companies and discussed this information and other related performance data with management. The Board received and considered information on performance compiled by ISS on each Fund’s total return as compared with the funds in the respective Fund’s Morningstar category (the “Morningstar Group”), and in comparison to the Fund’s performance benchmark. The Trustees also considered the performance of the Funds compared to the performance of comparable funds or accounts managed by the Adviser and its affiliates to the extent available. In addition, the Trustees also reviewed data prepared by ISS that analyzed the performance of the Funds using a variety of performance metrics.
The Trustees also considered, as applicable, the performance of the Funds since the Advisers commenced management of the Funds. The Trustees also considered abrdn Inc.’s and the Subadviser’s performance generally, the performance of the fund family generally, the historical responsiveness of the Adviser to Trustee concerns about performance, and the willingness of the Adviser and the Subadviser’s to take steps intended to improve performance. The Board received additional information concerning those Funds that had changed their investment strategies during the year, and also received information from the Advisers providing additional discussion about the factors contributing to differences in performance for Funds that the Advisers considered performance outliers over the year. The Board concluded that the Funds’ overall performance, in conjunction with management’s explanation of the reasons for underperformance and the actions taken to improve performance, was acceptable.
Board of Trustees' Consideration of Advisory and Sub-Advisory Agreements (Unaudited) (continued)
The costs of the services provided and profits realized by the Advisers and their affiliates from their relationships with the Funds. The Trustees considered the fees charged to the Funds for advisory services as well as the total expense levels of the Funds. This information included comparisons (provided by ISS) of each Fund’s net management fee and total expense ratio to those of its expense Peer Group and information about the advisory fees charged by abrdn Inc. and/or its affiliates to any separately managed and other accounts with a similar strategy. In reviewing the ISS comparison of each Fund’s net management fee to that of its respective Peer Group, the Board noted that the fee for the Funds includes both advisory and administrative fees. The Trustees noted that for certain Funds, abrdn Inc. had contractually reduced its advisory fee during the previous year. In evaluating the Funds’ advisory fees, the Trustees considered the demands, complexity and quality of the investment management of the Funds. In considering the fees charged by abrdn Inc. and/or its affiliates to any comparable accounts, the Trustees also considered, among other things, management’s discussion of the different investment restrictions, objectives or policies that may be involved in managing accounts of different types.
The Trustees also noted that the sub-advisory fees, as applicable, for the Funds would not be paid by the Funds, but would be paid by abrdn Inc. out of its advisory fee.The Board also considered that abrdn Inc. had entered into or renewed expense limitation agreements with each of the Funds, pursuant to which abrdn Inc. agreed to waive a portion of its advisory fee and/or reimburse certain expenses as a means of limiting each Fund’s total annual operating expenses for a period of time, and that for certain Funds, abrdn Inc. had increased the amount of its reimbursements over the previous year to lower the total operating expenses of the respective Funds.
The Trustees also considered the compensation abrdn Inc. and its affiliates received, directly and indirectly, from their relationships with the Funds. The Trustees reviewed information provided by management as to the profitability of the Adviser and its affiliates’ relationships with the Funds, including the engagement abrdn Inc. and its affiliates to provide administrative and distribution services, respectively, to the Funds. The Trustees also considered information about the allocation of expenses used to calculate profitability. When reviewing profitability, the Trustees also considered information about the expense levels of the Funds, the performance of the Funds, court cases regarding adviser profitability, and whether the Adviser. had implemented breakpoints and expense limitations with respect to the Funds. The Trustees also examined the profitability of abrdn Inc. and its affiliates on a Fund-by-Fund basis. The Board determined that the cost of services provided and profits realized by the Advisers were reasonable in light of the services provided by the Advisers to the Funds under the Agreements.
The nature, extent and quality of the services provided to the Funds under the Agreements. The Trustees considered the nature, extent and quality of the services provided by the Adviser and the Subadvisers, as applicable, to the Funds and the resources dedicated to the Funds by the Adviser and its affiliates. The Trustees took into account the Advisers’ investment experience and considered, with respect to the Funds that had engaged a Subadviser, the allocation of responsibilities between the Advisers. Board also considered the background and experience of the Advisers’ senior management personnel and the qualifications, background and responsibilities of the portfolio managers that are primarily responsible for the day-to-day portfolio management services for the Funds. The Board also considered the financial condition of the Advisers and the Advisers’ ability to provide quality services to each Fund. abrdn reported on, among other things, its business plans and organizational structures. The Board reviewed information on the Advisers’ risk management processes. The Board also considered that it received information on a regular basis from the Trust’s Chief Compliance Officer regarding the Advisers’ compliance policies and procedures and considered the Advisers’ brokerage policies and practices. The Trustees also took into account the Advisers’ investment experience and considered information regarding the Advisers’ compliance with applicable laws and the Commission and other regulatory inquiries or audits of the Funds and/or the Advisers. The Trustees also considered the benefits to shareholders of investing in a mutual fund that is part of a family of funds that offers shareholders the right to exchange shares of one type of fund for shares of another type of fund, and provides a variety of fund and shareholder services. In determining that the nature, extent and quality of the services provided to the Fund were adequate and appropriate, the Trustees also took into account their knowledge of management and the quality of the performance of management’s duties through Board meetings, discussion and reports during the preceding year.
The Independent Trustees also took into account their recent meetings, together with the independent board members of other registered investment companies in the abrdn Funds complex, with the chair of abrdn plc and abrdn plc’s interim Chief Executive Officer. During those meetings, the abrdn plc representatives responded to questions from the Independent Trustees and affirmed abrdn’s long-term commitment to the investment business and the abrdn Funds complex in particular.
Economies of Scale. The Trustees considered the existence of any economies of scale in the provision of services by the Adviser and the Subadviser and whether those economies would be shared with the Funds through breakpoints in the investment advisory fees or other means, such as expense waivers or limitations. The Board noted management’s discussion of the Funds’ advisory fee structures. The Trustees noted that each of the Funds was subject to a contractual expense limitation agreement and considered that certain Funds had breakpoints in their investment advisory fees that lowered the fee rate as a Fund’s assets grew. The Trustees also took note of the costs of the services provided and the profitability to abrdn and its affiliates from their relationships with the Funds, as discussed above.
Other Factors. The Trustees also considered other factors, which included: (i) the nature, quality, cost and extent of administrative services performed by abrdn Inc. under the Advisory Agreements and under a separate agreement covering administrative services; (ii) whether the Funds have operated in accordance with their investment objectives as well as the Funds’ record of compliance with their investment restrictions, and the compliance programs of the Trust and the Advisers; (iii) the compliance-related resources the Adviser and its affiliates were providing to the Funds; (iv) the effect of any market and economic volatility on the performance, asset levels and expense ratios of the Funds; and (v) so-called “fallout benefits” to the Advisers and their affiliates (if any), such as reputational and other indirect benefits. The Trustees considered any possible conflicts
Board of Trustees' Consideration of Advisory and Sub-Advisory Agreements (Unaudited) (concluded)
of interest associated with these fallout and other benefits, and the reporting, disclosure and other processes in place to disclose and monitor such possible conflicts of interest.
* * *
Based on their evaluation of all factors that they deemed to be material, including those factors described above, and assisted by the advice of independent counsel, the Trustees, including the Independent Trustees, concluded that renewal of the Agreements would be in the best interest of each of the Funds and its shareholders. Accordingly, the Board, and the Independent Trustees, voting separately, approved the Agreements for an additional one-year period.
abrdn Inc.
1900 Market Street, Suite 200
Philadelphia, PA 19103
abrdn.us
AOE-0143-AR
| (b) | Included in the response to Item 7(a) of this Form N-CSR. |
Item 8. Changes in and Disagreements with Accountants for Open-End Management Investment Companies.
Not applicable.
Item 9. Proxy Disclosures for Open-End Management Investment Companies.
Not applicable.
Item 10. Remuneration Paid to Directors, Officers, and Others of Open-End Management Investment Companies.
Included in the response to Item 7 of this Form N-CSR.
Item 11. Statement Regarding Basis for Approval of Investment Advisory Contract.
Included in the response to Item 7 of this Form N-CSR.
Item 12. Disclosure of Proxy Voting Policies and Procedures for Closed-End Management Investment Companies.
Not applicable.
Item 13. Portfolio Managers of Closed-End Management Investment Companies.
Not applicable.
Item 14. Purchases of Equity Securities by Closed-End Management Investment Company and Affiliated Purchasers.
Not applicable.
Item 15. Submission of Matters to a Vote of Security Holders.
During the period ended October 31, 2024, there were no material changes to the procedures by which shareholders may recommend nominees to the Registrant’s Board of Trustees.
Item 16. Controls and Procedures.
(a) The Registrant’s principal executive and principal financial officers, or persons performing similar functions, have concluded that the Registrant’s disclosure controls and procedures (as defined in Rule 30a-3(c) under the Investment Company Act of 1940 (the “Act”) (17 CFR 270.30a-3(c))) are effective, as of a date within 90 days of the filing date of the report that includes the disclosure required by this paragraph, based on the evaluation of these controls and procedures required by Rule 30a-3(b) under the Act (17 CFR 270.30a3(b)) and Rule 13a-15(b) or 15d-15(b) under the Securities Exchange Act of 1934 (17 CFR 240.13a-15(b) or 240.15d15(b)).
(b) There were no changes in the Registrant’s internal control over financial reporting (as defined in Rule 30a-3(d) under the Act (17 CFR 270.30a-3(d))) that occurred during the period covered by this report that have materially affected, or are reasonably likely to materially affect, the Registrant’s internal control over financial reporting.
Item 17. Disclosure of Securities Lending Activities for Closed-End Management Investment Companies.
Not applicable.
Item 18. Recovery of Erroneously Awarded Compensation.
Not applicable.
Item 19. Exhibits.
(a)(1) The Code of Ethics of the Registrant for the period covered by this report as required pursuant to Item 2 of this Form N-CSR.
(a)(2) Not applicable.
(a)(3) Certifications of the Registrant pursuant to Rule 30a-2(a) under the Act are exhibits to this report.
(a)(4) Not applicable.
(a)(5) Not applicable.
(b) Certifications of the Registrant pursuant to Rule 30a-2(b) under the Act are exhibits to this report.
SIGNATURES
Pursuant to the requirements of the Securities Exchange Act of 1934 and the Investment Company Act of 1940, the registrant has duly caused this report to be signed on its behalf by the undersigned, thereunto duly authorized.
| abrdn Funds | |
| | |
| By: | /s/ Alan Goodson | |
| Alan Goodson | |
| Principal Executive Officer | |
| abrdn Funds | |
| | |
| Date: January 10, 2025 | |
Pursuant to the requirements of the Securities Exchange Act of 1934 and the Investment Company Act of 1940, this report has been signed below by the following persons on behalf of the registrant and in the capacities and on the dates indicated.
| | |
| By: | /s/ Alan Goodson | |
| Alan Goodson | |
| Principal Executive Officer | |
| abrdn Funds | |
| | |
| Date: January 10, 2025 | |
| | |
| By: | /s/ Michael Marsico | |
| Michael Marsico | |
| Principal Financial Officer | |
| abrdn Funds | |
| | |
| Date: January 10, 2025 | |