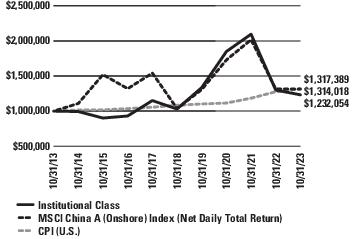
abrdn China A Share Equity Fund (Unaudited)
Chinese stock markets had a volatile1 ride over the 12 months in review. The period began with a significant rally in November 2022, driven by the expectation of an economic reopening. Increased liquidity support for the struggling property sector from the government and state-owned banks also boosted sentiment.
The government duly diluted the zero-COVID policy in December 2022, and all social distancing measures were lifted. Chinese stock markets subsequently enjoyed solid gains over the first quarter of 2023. The optimistic tone proved short-lived, though, as the second quarter saw investors focus on fundamentals amid ongoing concerns about the strength of China’s post-COVID recovery. The absence of any announcements about government stimulus measures compounded these concerns.
Entering the summer months, market participants were initially lifted by news that the People's Bank of China had key interest rates decrease, as well as a request by the authorities for state-owned banks to cut their deposit rates. The mood was also helped when the long-awaited Politburo meeting signaled the government’s desire to improve the operating environment for private enterprises and the platform economy, boost capital markets, and increase investor confidence.
Yet, by August 2023, stocks were held in check by heightened concerns about the health of the real estate sector, as Country Garden, one of the country’s top three property developers, faced a serious liquidity issue. Around this time, we also saw stamp duty cut by half to boost capital-market confidence and a mortgage-rate reduction by the large banks designed to increase homeowners’ disposable income. The market slid again in the final months of the period amid uncertainty about the U.S. Federal Reserve’s policy direction, growing tensions between China and the West, and ongoing investor outflows despite the economy showing signs of recovery.
On the economic front, concerns over the pace of the recovery lingered, and sentiment had yet to recover fully. The government announced a 5% economic growth target for 2023, down from last year’s 5.5% GDP goal-the COVID affected Chinese economy grew by a relatively modest 3% in 2022. More positively, the economy expanded by 5.5% year over year in the first half of 2023.
Meanwhile, the ongoing, if somewhat patchy, recovery in the manufacturing and services sectors as evidenced by purchasing managers’ survey (PMI)2 readings, showed both segments in expansionary territory. Analysts believed this increase was underpinned by the supportive policy measures announced during the summer.
Fund performance review
The abrdn China A Share Equity Fund (Institutional Class shares, net of fees) returned -5.19% for the 12-month reporting period ended
October 31, 2023, versus the -0.11% return of its benchmark, the Morgan Stanley Capital International (MSCI) China A Onshore Index (Net Daily Total Return), during the same period.
The Fund underperformed its benchmark over the 12-month review period. Looking at the laggards, the consumer sectors retreated as initial hopes of a recovery faded in the first quarter of 2023, and domestic investors rotated away from consumer names. Notably, China Tourism Group Duty Free was the biggest detractor at the stock level, as some one-off impacts from currency, changes to tax legislation, and a softer sales recovery pace hurt its share price. However, we continue to back the company, as we believe it remains uniquely positioned as the largest duty-free group globally with near-monopoly status in China and a clear cost advantage. Construction software company Glodon was also weak after underwhelming results alongside relatively soft real estate sentiment. However, we remain constructive on Glodon’s ability to meet its growth target and capitalize on opportunities, primarily as developers focus more on cost management and operational efficiency in this environment. In the alternative energy space, solar energy names such as Longi Green Energy fell on concerns over demand and geopolitical tensions. Battery separator leader Yunnan Energy was also weak due to concerns about overcapacity in the electric vehicle (EV) battery supply chain, alongside corporate governance issues.
Despite the negative sentiment around the Chinese consumer, some of our holdings were able to continue to deliver satisfactory earnings growth, including spirits producer Kweichow Moutai, electrical appliance manufacturer Midea Group, and Fuyao Glass, which all contributed positively to performance. Maxscend Microelectronics delivered strong third-quarter results thanks to the recovering smartphone market. At the same time, China Merchants Bank and Bank of Ningbo were lifted by improving investor sentiment following recent concerns about their mortgage and real estate exposure. Lastly, Jiangsu Hengrui Pharmaceuticals benefited from recovering fundamentals.
In notable portfolio activity over the period, we established a position in Zhejiang Weixing New Building Materials, a leading plastic pipe manufacturer with a solid track record. The company has demonstrated its resilience during the property downturn, and we feel it is well positioned to benefit from a potential recovery of the secondary housing market. We also initiated a position in Hefei Meiya Optoelectronic Technology for its unique exposure in dental equipment and our conviction in the long-term growth potential of the Chinese dental industry. Lasty, in June this year, we introduced BYD, a leading new-energy EV manufacturer that controls multiple steps in its supply chain, as we were attracted by the company’s market share gains and its model cycle trajectory, supported by its vertical penetration in battery and in-house supply of components.
{foots1}
| 1 | If the price of a fund moves significantly over a short period of time it is said to be 'volatile' or has 'high volatility'. If the price remains relatively stable, it is said to have 'low volatility'. Volatility can be used as a measure of risk. |
{foots1}
| 2 | Purchasing Managers’ Index (PMI) is a common economic indicator of the health of the manufacturing sector. |
abrdn Dynamic Dividend Fund (Unaudited)
Global stock markets generally rose over the 12 months under review. Inflation dominated the economic environment. Central banks in Western economies raised interest rates faster and much further than previously anticipated to counter multi-decade-high inflation. Despite these aggressive central bank actions, core inflation-which strips out volatile items such as energy and food-stayed at elevated levels in many countries. Nevertheless, global economic growth held up better than many investors expected, defying fears of a recession triggered by higher rates.
As U.S. and Eurozone inflation trended down towards the end of 2022, investors’ hopes rose that an end to interest rate rises could be in sight. Therefore, 2023 started with strong stock market gains. However, the collapse of two regional U.S. banks and the forced sale of Credit Suisse to rival UBS in March then evoked fears of a banking crisis. Despite an initial sell-off, stock markets recovered, helped by expectations of lower peak interest rates. After more market volatility1 in April and May, equities performed strongly over June and July due to news of a compromise agreement on the U.S. debt ceiling2 and further encouraging inflation data. This was despite still-hawkish rhetoric from central banks. Equities then generated negative returns in August, September, and October given concerns that interest rates would stay higher for longer, with the outbreak of war between Israel and Hamas adding to existing inflationary worries.
Fund performance review
The abrdn Dynamic Dividend Fund (Institutional Class shares, net of fees) returned 6.67% for the 12-month period ending October 31, 2023, versus the 10.50% return of its benchmark, the Morgan Stanley Capital International (MSCI) All Country (AC) World Index (Net Daily Total Return), during the same period.
The Fund posted a positive total return but underperformed its benchmark. Asset allocation and, to a lesser extent, stock selection detracted from performance. The Fund’s stock selection and underweight3 positions in both the communication services and information technology sectors were headwinds. By region, North America detracted the most due to stock selection. Africa and the Middle East had a broadly neutral effect as negative stock selection offset the value added from being underweight the region relative to the benchmark.
The largest detractors from performance were the Fund’s lack of exposure to semiconductor manufacturer NVIDIA and social media giant Meta Platforms (with the former only paying a small dividend
and the latter not paying a dividend). A holding in U.S.-based discount retailer Target Corporation also hurt performance.
Shares in U.S.-based chipmaker NVIDIA surged after the company gave a very bullish sales forecast on the demand for artificial intelligence (AI) processors. This took the stock to an all-time high and dragged the rest of the sector up with it. Shares in social media and advertising giant Meta Platforms also rose strongly as the company benefited from its aggressive cost-cutting program and its investments in AI. The latter have helped the company to attract traffic to Facebook and Instagram, as well as to increase its advertising revenues. Target Corporation's performance for the year was hindered by a challenging macroeconomic environment, diminished consumer confidence, and a normalisation of discretionary spending post-pandemic. Earnings estimates for the company steadily declined throughout the year. In addition, Target Corporation’s share price was negatively affected by the controversy surrounding its Pride Month merchandise.
Conversely, the Fund’s stock selection was positive in both the materials and financials sectors. By region, the U.K. was the largest positive as stock selection was only partially offset by a negative effect from being overweight4. Holdings in Asia-Pacific (excluding Japan) also added value due to stock selection.
At the individual stock level, key contributors to performance included holdings in semiconductor manufacturers BE Semiconductor Industries and Broadcom, as well as U.K.-listed industrial turnaround specialist Melrose Industries. BE Semiconductor Industries benefited from U.S.-based chipmaker NVIDIA’s previously mentioned very bullish sales forecast on the demand for AI processors. Broadcom shares performed well as the company reported strong results, helped by surging demand for its AI-related semiconductors. Melrose Industries spun off its automotive business to become a pure-play aerospace company. In addition, it held its first ‘capital markets day’ as a standalone company. Management presented a comprehensive overview of the aerospace business's positive fundamentals.
The Fund earns income through a combination of investing in companies that pay dividends and implementing a dividend-capture strategy. In a dividend-capture trade, the Fund sells a stock on or shortly after the stock's ex-dividend5 date and reinvests the sales proceeds into one or more other stocks that are expected to pay dividends before the next dividend payment on the stock that it is selling. While employing this strategy, the Fund purchases companies
{foots1}
| 1 | If the price of a fund moves significantly over a short period of time it is said to be 'volatile' or has 'high volatility'. If the price remains relatively stable, it is said to have 'low volatility'. Volatility can be used as a measure of risk. |
{foots1}
| 2 | The maximum amount of money that the U.S. government is allowed to borrow to meet its obligations. |
{foots1}
| 3 | A portfolio holding less of a particular security (or sector or region) than the security’s weight in the benchmark portfolio. |
{foots1}
| 4 | A portfolio holding an excess amount of a particular security (or sector or region) compared to the security’s weight in the benchmark portfolio. |
{foots1}
| 5 | Also abbreviated as 'xd', this is a share sold without the right to receive the declared dividend payment which is marked as due to those shareholders who are on the share register. The stock market authorities usually specify the date on which a share will begin trading 'xd'. The share price invariably drops when the share goes 'xd' taking the known income of the dividend out of the share price. |
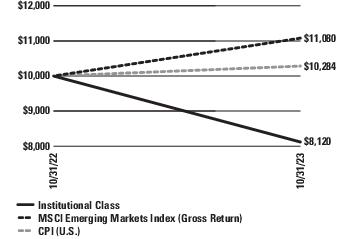
abrdn EM SMA Completion Fund (Unaudited)
Emerging market equities generally fell over the period under review, driven largely by interest-rate expectations and the pace of China’s economic recovery after Beijing rolled back its controversial zero-COVID policy at the end of 2022. Geopolitical risks heightened at the close of the period amid the threat of a wider conflict in the Middle East between Israel and Hamas, and the subsequent ongoing military response.
An aggressive series of interest rate hikes by the U.S. Federal Reserve (Fed) to rein in inflation had initially sparked concerns over a potential slowdown in the U.S. economy. However, an exceptionally resilient labor market, together with moderating inflation levels as the period progressed, led to renewed market optimism about a benign soft landing1 in the world’s largest economy and fueled hopes that the Fed could be nearing the end of its monetary tightening2 cycle. Towards the period-end, investor sentiment shifted once again to worries about higher-for-longer U.S. interest rates, which pushed the U.S. dollar higher and dampened the outlook for the emerging market asset class.
Over in China, initial optimism surrounding the country’s reopening from COVID restrictions fizzled as it became apparent that the pace of recovery in domestic consumption would be slower than investors had expected. Authorities stepped in to try and speed up the recovery, with the Beijing government rolling out targeted stimulus measures and the People’s Bank of China drumming up support with interest rate cuts. China’s 2023 budget deficit was also raised from 3% of GDP to about 3.8%-a move that is considered rare and one that the government had resisted even during the COVID crisis. The flurry of policy moves resulted in some signs of recovery emerging towards the end of the period amid signs of stabilization in the economy. The property sector, however, remained fragile but is still well-supported by policymakers.
Against this backdrop, emerging Asia trailed the wider asset class, dragged lower by double-digit losses in China. Taiwan’s technology-heavy market outperformed on global artificial intelligence (AI)-related trends, while Indian equities bucked the downtrend to close higher. In emerging Europe, the Middle East and Africa, Gulf bourses3 fell on volatile oil prices and geopolitical concerns. Latin America was underpinned by the outperformance in Brazil and Mexico.
Fund performance review
The abrdn EM SMA Completion Fund returned -18.80% (Institutional Class shares, net of fees) for the period from January 27, 2023 (inception) to October 31, 2023, versus the -10.39% return of its
benchmark, the Morgan Stanley Capital International (MSCI) Emerging Markets Index4 (Gross Return), during the same period.
The Fund’s performance fell, underperforming its benchmark during the reporting period. The major drag on relative returns was China, including the off-benchmark position in Hong Kong. Our domestic consumption-focused names disappointed due to a slower-than-expected pace of economic recovery in China following the post-COVID reopening.
China Tourism Group Duty Free was weighed down by sluggish holiday duty-free sales in Hainan over the period. Our new position in digital platform provider Glodon also detracted from performance, alongside the exposure to condiment maker Foshan Haitian Flavoring & Food and LONGi Green Energy Technology, which we exited on waning conviction. Hong Kong-listed brewer Budweiser APAC was not spared from the sell-off as the weak investor sentiment carried over to the H-share market.5
We remain constructive on China as there are signs that growth is stabilizing. We believe the recovery will pick up pace in the coming months and in 2024, as consumers have a better outlook on their income and bonus prospects heading into next year. Broadly, the Fund remains well positioned to take advantage of a gradual recovery in domestic consumption. The portfolio has exposure to both onshore and offshore names that are potential beneficiaries. Policy measures will likely remain accommodative and calibrated towards specific sectors like autos, electronics, household products, and property.
The Fund’s holdings in South Korea also proved costly. A notable laggard was LG Chem, which sold off alongside other domestic electric vehicle (EV) battery plays due to concerns over slowing demand and global supply risk. In our view, LG Chem remains an attractive EV battery name and the company’s better-than-expected results and a strong order backlog reassure us of its positioning. Meanwhile, Samsung Electronics recovered with the memory cycle, as we expected. However, our holding is in the preference shares6, which lagged the ordinary shares this year. We own the preference shares as they trade on a cheaper valuation relative to the ordinary shares, while paying a higher dividend yield. We have been engaging Samsung Electronics actively on governance, stewarding them toward better governance standards, which we believe will benefit the company over the long term.
On a more positive note, stock selection in Taiwan contributed to relative returns, thanks to the outperformance of our two new information technology holdings, which we introduced and built up over the period. Fabless semiconductor company MediaTek and
{foots1}
| 1 | A milder economic slowdown compared to a recession. |
{foots1}
| 2 | Monetary policy - Decisions made by a government, usually through its central bank, regarding the amount of money in circulation in the economy. This includes setting official interest rates. |
{foots1}
| 3 | Bourses refer to stock markets in non-English speaking countries. |
{foots1}
| 4 | The MSCI Emerging Markets Index is an unmanaged index considered representative of growth stocks of developing countries. The index is computed using the net return, which withholds applicable taxes for non‐resident investors. |
{foots1}
| 5 | Shares of mainland Chinese companies traded on the Hong Kong Stock Exchange in Hong Kong dollars. |
{foots1}
| 6 | Shares in a company that have a higher claim on the assets and earnings than common stock. Dividends for preference shares generally must be paid out before those to common shares. Preference shares usually don’t have voting rights. |
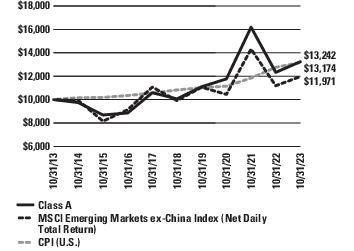
abrdn Emerging Markets ex-China Fund (Unaudited)
Emerging market equities generally rose over the 12 months under review, driven largely by interest-rate expectations and the pace of China’s economic recovery as Beijing rolled back its controversial zero-COVID-19 policy at the end of 2022. Geopolitical risks heightened at the close of the period amid the threat of a wider conflict in the Middle East between Israel and Hamas, and the subsequent ongoing military response.
An aggressive series of interest rate hikes by the U.S. Federal Reserve (Fed) to rein in inflation initially sparked concerns over a potential slowdown in the U.S. economy. However, an exceptionally resilient labor market, together with moderating inflation levels as the year progressed, led to renewed market optimism about a benign soft landing1 in the world’s largest economy and fueled hopes that the Fed could be nearing the end of its monetary tightening2 cycle. Towards the period-end, investor sentiment shifted once again to worries about ‘higher-for-longer’ U.S. interest rates, which pushed the U.S. dollar higher and dampened the outlook for the emerging market asset class.
Over in China, initial optimism surrounding the country’s reopening from COVID-19 restrictions fizzled as it became apparent that the pace of recovery in domestic consumption would be slower than investors had expected. Authorities stepped in to try and speed up the recovery, with the Beijing government rolling out targeted stimulus measures and the People’s Bank of China drumming up support with interest-rate cuts. The flurry of policy moves resulted in some signs of recovery emerging towards the end of the period amid signs of stabilization in the economy. The property sector, however, remained fragile but is still well-supported by policymakers.
Across emerging Asia, the technology-heavy markets of South Korea and Taiwan advanced on global artificial intelligence (AI)-related trends. Elsewhere, Gulf indices fell on volatile oil prices and geopolitical concerns, while Latin America lagged amid the underperformance in Brazil.
Fund performance review
The abrdn Emerging Markets ex-China Fund (Institutional Class shares, net of fees) returned 7.86% for the 12-month period ended October 31, 2023, versus the 7.03% return of its benchmark, the Morgan Stanley Capital International (MSCI) Emerging Markets ex-China Index (Net Daily Total Return), during the same period.
The Fund’s performance rose during the reporting period, outpacing its benchmark. From a regional perspective, emerging Europe, the Middle East, and Africa contributed most to the outperformance. The off-benchmark position in the Netherlands was especially rewarding, particularly e-commerce company Inpost, which reported strong results and fewer losses at its international division. Our semiconductor holdings in ASM International and ASML Holding were lifted by an AI-driven tech rally. The AI supercycle is an exciting theme
that requires significant investment in semiconductors and technology hardware to make possible, and it is part of a wider capital expenditure theme that should support emerging markets.
Also working in the portfolio’s favor was the underweight3 position to Gulf markets, where market sentiment was dominated by volatile energy prices and regional geopolitical uncertainties. Meanwhile, our new holding in Americana Restaurants International, a quick-service restaurant operator in the Middle East, added value as the company posted results that beat market estimates.
On the flip side, our exposure to South African mining company Anglo American Platinum detracted amid the decline in prices for the platinum group of metals it produces.
Within Latin America, our holdings in Mexico were underpinned by positive market sentiment, as economic indicators and domestic consumption strength proved encouraging. The country further benefits from nearshoring trends due to a global effort by companies to diversify their supply chains and shift manufacturing production to better manage reliance on China. Conglomerate Fomento Economico Mexicano turned in a robust performance.
Conversely, stock selection in Brazil disappointed. Not holding Petrobras was costly. The state-run oil company rallied in the second half of the period on higher oil prices, though this was partly mitigated by our position in French energy name TotalEnergies, which we introduced and built up over the period. A significant portion of TotalEnergies’ assets is in emerging markets. 3R Petroleum Oleo e Gas came under pressure after its board of directors approved a capital increase through the issuance of new shares. On a more encouraging note, e-commerce player MercadoLibre outperformed on strong domestic consumption trends and competitive strength.
There were some bright spots in emerging Asia. Taiwanese textile firm Makalot Industrial was the top single-stock contributor over the period, supported by its resilient fundamentals and rising margins. Kazakh financial technology company Kaspi.kz, which we initiated over the year, also contributed positively after reporting better-than-expected results with raised guidance that underscored its competitive advantages.
However, our overall exposure to the region weighed slightly on relative performance, largely owing to negative selection effects in South Korea. Samsung Electronics recovered with the memory cycle, as we expected. However, our holding is in the preference shares4, which lagged the ordinary shares this year. We own the preference shares as they trade on a cheaper valuation relative to the ordinary shares, while paying a higher dividend yield. We have been actively engaging with Samsung Electronics on governance, stewarding them toward better governance standards, which we believe will benefit the company over the long-term. Moreover, LG Chem sold off alongside other domestic electric vehicle (EV) battery plays due to concerns
{foots1}
| 1 | A milder economic slowdown compared to a recession. |
{foots1}
| 2 | Monetary policy - Decisions made by a government, usually through its central bank, regarding the amount of money in circulation in the economy. This includes setting official interest rates. |
{foots1}
| 3 | A portfolio holding less of a particular security (or sector or region) than the security’s weight in the benchmark portfolio. |
{foots1}
| 4 | Shares in a company that have a higher claim on the assets and earnings than common stock. Dividends for preference shares generally must be paid out before those to common shares. Preference shares usually don’t have voting rights. |
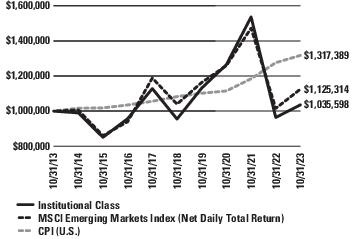
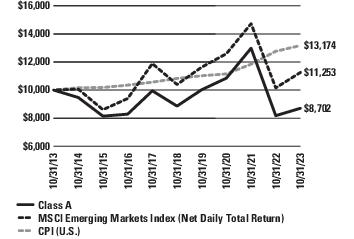
abrdn Emerging Markets Fund (Unaudited)
Emerging market equities generally rose over the 12 months under review, driven largely by interest-rate expectations and the pace of China’s economic recovery as Beijing rolled back its controversial zero-COVID policy at the end of 2022. Geopolitical risks heightened at the close of the period amid the threat of a wider conflict in the Middle East between Israel and Hamas, and the subsequent ongoing military response.
An aggressive series of interest rate hikes by the U.S. Federal Reserve (Fed) to rein in inflation initially sparked concerns over a potential slowdown in the U.S. economy. However, an exceptionally resilient labor market, together with moderating inflation levels as the year progressed, led to renewed market optimism about a benign soft landing1 in the world’s largest economy and fueled hopes that the Fed could be nearing the end of its monetary2 tightening cycle. Towards the period-end, investor sentiment shifted once again to worries about higher-for-longer U.S. interest rates, which pushed the U.S. dollar higher and dampened the outlook for the emerging market asset class.
Over in China, initial optimism surrounding the country’s reopening from COVID restrictions fizzled as it became apparent that the pace of recovery in domestic consumption would be slower than investors had expected. Authorities stepped in to try and speed up the recovery, with the Beijing government rolling out targeted stimulus measures and the People’s Bank of China drumming up support with interest-rate cuts. China’s 2023 budget deficit was also raised from 3.0% of GDP to about 3.8%—a move that is considered rare and one that the government had resisted even during the COVID crisis. The flurry of policy moves resulted in some signs of recovery emerging towards the end of the period amid signs of stabilization in the economy. The property sector, however, remained fragile but is still well-supported by policymakers.
Against this backdrop, emerging Asia finished ahead of the wider asset class, buoyed by double-digit returns in China. The technology-heavy markets of South Korea and Taiwan also advanced on global artificial intelligence (AI)-related trends. Emerging Europe, the Middle East, and Africa trailed, with Gulf indices falling on volatile oil prices and geopolitical concerns. Latin America was hurt by the underperformance in Brazil.
Fund performance review
The abrdn Emerging Markets Fund (Institutional Class shares, net of fees) returned 7.44% for the 12-month period ended October 31, 2023, versus the 10.80% return of its benchmark, the Morgan Stanley Capital International (MSCI) Emerging Markets Index (Net Daily Total Return), during the same period.3
The Fund’s performance rose but underperformed its benchmark during the reporting period. The major drag on relative returns was
China. Our domestic consumption-focused names disappointed due to a slower-than-expected pace of economic recovery in China following the post-COVID reopening. The losses from domestic China were partially offset by our off-benchmark position in Hong Kong, where our holdings posted resilient quarterly earnings.
China Tourism Group Duty Free was weighed down by sluggish holiday duty-free sales in Hainan over the period, while luxury car dealer Zhongsheng Group faced pressure from weak consumer sentiment and lackluster car sales. Condiment maker Foshan Haitian Flavoring & Food and LONGi Green Energy Technology also detracted—we exited both names over the period on waning conviction.
We remain constructive on China as there are signs that growth is stabilizing. We believe the recovery will pick up pace in the coming months and in 2024, as consumers have a better outlook on their income and bonus prospects heading into next year. Broadly, the Fund remains well positioned to take advantage of a gradual recovery in domestic consumption. The portfolio has exposure to both onshore and offshore names that are potential beneficiaries. Policy measures will likely remain accommodative and calibrated toward specific sectors like autos, electronics, household products, and property. We saw this in June as China introduced targeted measures to boost electric-vehicle (EV) and auto sales, which benefited our new position in EV maker Li Auto.
Positive stock selection in Mexico also helped to offset some of the drag on relative performance from our exposure to domestic China. Our holdings in Mexico were underpinned by positive market sentiment, as economic indicators and domestic consumption strength proved encouraging. The country further benefits from nearshoring trends due to a global effort by companies to diversify their supply chains and shift manufacturing production to better manage reliance on China. Conglomerate Fomento Economico Mexicano was the top single-stock contributor over the period. Elsewhere in Latin America, Brazilian e-commerce player MercadoLibre advanced on strong domestic consumption trends and competitive strength.
Also working in the portfolio’s favor was the underweight4 position to the Middle East, where market sentiment was dominated by volatile energy prices and regional geopolitical uncertainties. Towards the period-end, oil prices rose past $90 per barrel. We established a position in Saudi Arabian Oil Group (Aramco) during this period, which contributed to relative returns. Aramco’s high-quality, low-cost oil production assets should help support cash flow over the long-term, in our opinion. Likewise, we introduced and built up our position in French energy name TotalEnergies, which also added value. A significant portion of the company’s assets is in emerging markets. Meanwhile, our new holding in Americana Restaurants International, a
{foots1}
| 1 | A milder economic slowdown compared to a recession. |
{foots1}
| 2 | Monetary policy are decisions made by a government, usually through its central bank, regarding the amount of money in circulation in the economy. This includes setting official interest rates. |
{foots1}
| 3 | The MSCI Emerging Markets Index is an unmanaged index considered representative of growth stocks of developing countries. The index is computed using the net return, which withholds applicable taxes for non‐resident investors. |
{foots1}
| 4 | A portfolio holding less of a particular security (or sector or region) than the security’s weight in the benchmark portfolio. |
abrdn Emerging Markets Sustainable Leaders Fund (Unaudited)
Emerging market equities generally rose over the 12 months under review, driven largely by interest-rate expectations and the pace of China’s economic recovery as Beijing rolled back its controversial zero-COVID-19 policy at the end of 2022. Geopolitical risks heightened at the close of the period amid the threat of a wider conflict in the Middle East following Hamas’ attack on Israel, and the subsequent ongoing military response.
An aggressive series of interest rate hikes by the U.S. Federal Reserve (Fed) to rein in inflation initially sparked concerns over a potential slowdown in the U.S. economy. However, an exceptionally resilient labor market, together with moderating inflation levels as the year progressed, led to renewed market optimism about a benign soft landing1 in the world’s largest economy and fueled hopes that the Fed could be nearing the end of its monetary2 tightening cycle. Towards the period-end, investor sentiment shifted once again to worries about ‘higher-for-longer’ U.S. interest rates, which pushed the U.S. dollar higher and dampened the outlook for the emerging market asset class.
Over in China, initial optimism surrounding the country’s reopening from COVID-19 restrictions fizzled as it became apparent that the pace of recovery in domestic consumption would be slower than investors had expected. Authorities stepped in to try and speed up the recovery, with the Beijing government rolling out targeted stimulus measures and the People’s Bank of China drumming up support with interest-rate cuts. China’s 2023 budget deficit was also raised from 3% of GDP to about 3.8%—a move that is considered rare and one that the government had resisted even during the COVID-19 crisis. The flurry of policy moves resulted in some signs of recovery emerging towards the end of the period amid signs of stabilization in the economy. The property sector, however, remained fragile but is still well-supported by policymakers.
Against this backdrop, emerging Asia finished ahead of the wider asset class, buoyed by double-digit returns in China. The technology-heavy markets of South Korea and Taiwan also advanced on global artificial intelligence (AI)-related trends. Emerging Europe, the Middle East and Africa trailed, with Gulf indices falling on volatile oil prices and geopolitical concerns. Latin America was hurt by the underperformance in Brazil.
Fund performance review
The abrdn Emerging Markets Sustainable Leaders Fund (Institutional Class shares, net of fees) returned 6.97% for the 12-month period ended October 31, 2023, versus the 10.80% return of its benchmark, the Morgan Stanley Capital International (MSCI) Emerging Markets Index (Net Daily Total Returns)3, during the same period.
The Fund’s performance rose but underperformed its benchmark during the reporting period. The major drag on relative returns was China, including the off-benchmark position in Hong Kong. Our
domestic consumption-focused names disappointed due to a slower-than-expected pace of economic recovery in China following the post-COVID reopening.
China Tourism Group Duty Free was weighed down by sluggish holiday duty-free sales in Hainan over the period, while luxury car dealer Zhongsheng Group faced pressure from weak consumer sentiment and lackluster car sales. Our holdings in digital platform provider Glodon and financial software company Hundsun Technologies also detracted, alongside the exposure to LONGi Green Energy Technology, which we divested over the period on waning conviction.
We remain constructive on China as there are signs that growth is stabilizing. We believe the recovery will pick up pace in the coming months and in 2024, as consumers have a better outlook on their income and bonus prospects heading into next year. Broadly, the Fund remains well positioned to take advantage of a gradual recovery in domestic consumption. The portfolio has exposure to both onshore and offshore names that are potential beneficiaries. Policy measures will likely remain accommodative and calibrated towards specific sectors like autos, electronics, household products, and property.
Positive stock selection in Mexico helped to offset some of the drag on relative performance from our exposure to China. Our holdings in Mexico were underpinned by positive market sentiment, as economic indicators and domestic consumption strength proved encouraging. The country further benefits from nearshoring trends due to a global effort by companies to diversify their supply chains and shift manufacturing production to better manage reliance on China. The new position in soft drink bottler and convenience store operator Fomento Economico Mexicano, which also operates as the world’s largest Coca-Cola bottler through its subsidiary, proved favorable. Elsewhere in Latin America, Brazilian e-commerce player MercadoLibre advanced on strong domestic consumption trends and competitive strength.
Also working in the portfolio’s favor was the underweight4 to the Middle East, where market sentiment was dominated by volatile energy prices and regional geopolitical uncertainties.
At the stock level, South Korea-based LG Chem was the top single-stock detractor as the company sold off alongside other domestic electric vehicle (EV) battery plays due to concerns over slowing demand and global supply risk. In our view, LG Chem remains an attractive EV battery name and the company’s better-than-expected results and a strong order backlog assure us of its positioning. Another notable laggard was India’s Crompton Greaves Consumer Electricals, which we exited over the period. On the flip side, the position in Power Grid Corp of India, which has been successfully winning new transmission projects under competitive bidding, added value. Kazakh financial technology company Kaspi.kz also contributed positively after reporting better-than-expected
{foots1}
| 1 | A milder economic slowdown compared to a recession. |
{foots1}
| 2 | Monetary policy refers to decisions made by a government, usually through its central bank, regarding the amount of money in circulation in the economy. This includes setting official interest rates. |
{foots1}
| 3 | The MSCI Emerging Markets Index is an unmanaged index considered representative of growth stocks of developing countries. The index is computed using the net return, which withholds applicable taxes for non‐resident investors. |
{foots1}
| 4 | A portfolio holding less of a particular security (or sector or region) than the security’s weight in the benchmark portfolio. |
abrdn Global Equity Impact Fund (Unaudited)
Global stock markets generally rose over the 12 months under review. Inflation dominated the economic environment. Central banks in Western economies raised interest rates faster and much further than previously anticipated to counter multi-decade-high inflation. Despite these aggressive central bank actions, core inflation—which strips out volatile items such as energy and food—stayed at elevated levels in many countries. Nevertheless, global economic growth held up better than many investors expected, defying fears of a recession triggered by higher rates.
As U.S. and Eurozone inflation trended down towards the end of 2022, investors’ hopes rose that an end to interest-rate rises could be in sight. Therefore, 2023 started with strong stock market gains. However, the collapse of two regional U.S. banks and the forced sale of Credit Suisse to rival UBS in March then evoked fears of a banking crisis. Despite an initial sell-off, stock markets recovered, helped by expectations of lower peak interest rates. After more market volatility1 in April and May, equities performed strongly over June and July due to news of a compromise agreement on the U.S. debt ceiling2 and further encouraging inflation data. This was despite still-hawkish rhetoric from central banks. Equities then generated negative returns in August, September, and October given concerns that interest rates would stay higher for longer, with the outbreak of war between Israel and Hamas adding to existing inflationary worries.
Fund performance review
The abrdn Global Equity Impact Fund (Institutional Class shares, net of fees) returned 1.39% for the 12-month period ended October 31, 2023, versus the 10.50% return of its benchmark, the Morgan Stanley Capital International (MSCI) All Country (AC) World Index (Net Daily Total Return), during the same period.
The Fund underperformed its benchmark due to sector allocation and, to a lesser extent, stock selection. The main detractors from the Fund’s performance were information technology and communication services due to stock selection and underweight3 positions in both sectors. The Fund invests in companies that have products and services that we believe align with the United Nations’ Sustainable Development Goals (SDGs). None of the large technology companies pass our assessment process and this underweight was a major drag in the period. In contrast, stock selection in the healthcare sector added value but was partially offset by having an overweight4 exposure. Not having any holdings in the energy sector was also beneficial.
In terms of individual stock detractors, Samsung SDI, the South Korean electric-vehicle battery manufacturer, sits within our ‘Sustainable Energy’ pillar and had been a strong performer on the back of consistent delivery. However, negative sentiment towards China, along with uncertainty about the wider economic backdrop and automotive demand, weighed on the shares during the period.
Insulet shares underperformed after Novo Nordisk’s SELECT trial results showed that Wegovy, the GLP-1 drug, led to weight loss among obese patients. Medical device manufacturers, particularly in the diabetes area, sold off heavily as investors feared weight-loss drugs would reduce the amount of insulin required and may stop some patients developing Type 2 diabetes. Otherwise, two of the largest detractors were NVIDIA and Microsoft, which are both companies that do not fit within our ‘Impact Framework’.5
On the positive side, Novo Nordisk, the Denmark-based pharmaceutical company, released strong results as part of its SELECT trial for its drug Wegovy. The trial showed a 20% reduction in cardiovascular risk for obese patients. Novo Nordisk’s innovation around preventing and reducing the severity of cardiovascular issues reinforces our view of the positive impact that the company has within global healthcare and social care. Coursera, the education platform, delivered strong second-quarter results, beating expectations and raising guidance for the full year. Longer term, the platform reiterated its position within workforce retraining and its positive exposure to the disruption of artificial intelligence and reskilling requirements. This reinforces our view on Coursera’s positive impact on global education and employment needs. Schneider Electric’s full-year results exceeded expectations. The board also decided to split the office of chairman from that of chief executive officer. Guidance for 2023 also remains encouraging, given the secular trends of electrification, digitalization, and sustainability. This position continues to align with our focus in the ‘Sustainable Energy’ pillar.
In activity, we initiated a position in Wabtec, a U.S.-based business that sells equipment into the rail industry. Its components enhance efficiencies and drive down emissions. Wabtec is supporting the intermodal transport switch from trucks to trains. We believe we are at the starting point of market-share gains given that the industry has been underinvesting. We also purchased Litalico, a Japanese education business. As a provider of support and training services to people with disabilities in Japan, Litalico sits within our ‘Education and Employment’ pillar, where the twin focuses are on quality, affordable education and employment opportunities. In addition, we initiated a position in Medikaloka Hermina, which is one of the largest private hospital providers in Indonesia. It plays a key role in the Indonesian government's push to increase universal health coverage among Indonesians and to improve the quality of service. We had a positive meeting, covering some of the fundamentals concerning the company’s mix of patients, its aspirations for growth through managing more intensive cases, and the anticipated inflection point for information technology costs.
We sold our holding in Goodman Group. The Australian real estate business delivered good growth, but macroeconomic fears about the valuation of its assets continued to pressure the share price. Our large
{foots1}
| 1 | If the price of a fund moves significantly over a short period of time it is said to be 'volatile' or has 'high volatility'. If the price remains relatively stable, it is said to have 'low volatility'. Volatility can be used as a measure of risk. |
{foots1}
| 2 | The maximum amount of money that the U.S. government is allowed to borrow to meet its obligations. |
{foots1}
| 3 | A portfolio holding less of a particular security (or sector or region) than the security’s weight in the benchmark portfolio. |
{foots1}
| 4 | A portfolio holding an excess amount of a particular security (or sector or region) compared to the security’s weight in the benchmark portfolio. |
{foots1}
| 5 | The abrdn Impact Framework is a strategy for measuring and managing investments' impact, specifically aligning with the United Nations Sustainable Development Goals for sustainable and responsible investing. |
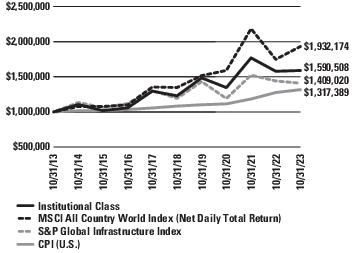
abrdn Global Infrastructure Fund (Unaudited)
Global stock markets generally rose over the 12 months under review. Inflation dominated the economic environment. Central banks in Western economies raised interest rates faster and much further than previously anticipated to counter multi-decade-high inflation. Despite these aggressive central bank actions, core inflation— which strips out volatile items such as energy and food—stayed at elevated levels in many countries. Nevertheless, global economic growth held up better than many investors expected, defying fears of a recession triggered by higher rates.
As U.S. and eurozone inflation trended down towards the end of 2022, investors’ hopes rose that an end to interest rate rises could be in sight. Therefore, 2023 started with strong stock market gains. However, the collapse of two regional U.S. banks and the forced sale of Credit Suisse to rival UBS in March then evoked fears of a banking crisis. Despite an initial sell-off, stock markets recovered, helped by expectations of lower peak interest rates. After more market volatility1 in April and May, equities performed strongly over June and July due to news of a compromise agreement on the U.S. debt ceiling2 and further encouraging inflation data. This was despite still-hawkish rhetoric from central banks. Equities then generated negative returns in August, September, and October given concerns that interest rates would stay higher for longer, with the outbreak of war between Israel and Hamas adding to existing inflationary worries.
In terms of listed infrastructure stocks, the past 12 months have seen them lag the overall market as investors focused on the impact of rising interest rates. This was especially seen in the utility sector, where renewables had been the main source of growth. Higher rates negatively affected the value of existing assets and, more importantly, raised questions about the returns on future projects and growth rates going forward. While higher rates are undoubtedly a negative for renewable projects, investors have only focused on the negative side of the return equation and have largely ignored the higher prices that renewable developers are able to lock in over the long term. We continue to be confident in the long-term prospects for renewables, due to continued support from governments worldwide and the increasing adoption of green-energy strategies by companies across most industries. Elsewhere in the infrastructure sector, we saw transportation continue to rebound post-COVID, with leisure travel being especially strong. A number of airports are now seeing traffic above their pre-pandemic numbers.
Fund performance review
The abdrn Global Infrastructure Fund returned 0.75% (Institutional Class shares, net of fees) for the 12-month reporting period ended October 31, 2023, versus the 10.50% return of its broad-based benchmark, the Morgan Stanley Capital International (MSCI) All Country (AC) World Index (Net Daily Total Return), and the -2.23% return of its secondary benchmark that more closely aligns with the Fund’s strategy, the S&P Global Infrastructure Index (Net Total Returns), during the same period.
During the past 12 months, infrastructure sector returns have reflected developments in the global markets overall. The secondary benchmark S&P Global Infrastructure Index gives exposure to three main infrastructure segments: utilities, transportation, and energy. On the other hand, the Fund’s portfolio-held issuers, primarily in the industrials, utilities, energy, and communication sectors. In the past year, the industrials and utilities sectors were the two largest contributors to the Fund’s relative returns, thanks to positive stock selection in both sectors and an underweight3 exposure to the latter. Meanwhile, a non-benchmark exposure to communication services detracted from the Fund’s relative returns.
At a stock level, Ferrovial, a worldwide infrastructure operator, positively affected performance during the reporting period. The company's stock appreciated as traffic on its toll roads recovered. Furthermore, the 407 Express Toll Route has recommenced dividend payments, and there may be potential for toll increases. Early next year, management intends to have Ferrovial listed in the U.S. Vistra Corp., the U.S. independent power producer, saw its earnings estimates rise throughout the year, supported by strong power prices and output. As the company increased its hedges for 2024 and 2025, management also expressed confidence in achieving its guidance. Vinci, a Europe-based owner of infrastructure concessions and a construction company, reported strong earnings during the period. Traffic at its airports continues to improve as economies reopen post-COVID lockdowns. In addition, the company’s construction order book is at a record high.
On the other hand, NextEra Energy Partners, the U.S. renewables operator, announced that it would cut dividend growth guidance from 12–15% to 5–8% as a result of the higher cost of capital that has reduced its ability to acquire new renewable assets. Shares in Helios Towers, the African tower company, sold off as sentiment for highly levered, emerging-market firms soured. This was despite the company releasing good results that highlighted the strong growth in its key markets. Crown Castle International, the U.S. tower operator, continued to lag the benchmark as investors focused on a slowing growth rate in towers and a decline in fibre revenues. The share prices of both Helios and Crown Castle were also negatively affected by investor sentiment about higher interest rates.
Outlook
Macroeconomic factors continue to dominate market sentiment, with investors scrutinizing the latest data and trying to predict when a pause or pivot in the direction of interest rates might occur. Geopolitical pressures remain globally. Recessionary concerns are all too present as global growth stagnates against a backdrop of elevated inflationary pressures, in our view. Our focus remains at the stock level, ensuring the portfolio is diversified and robust enough to preserve capital in periods of market weakness. We have exposure to what we feel are high-quality businesses with the financial backbone to withstand volatility, underpinned by strong structural drivers.
{foots1}
| 1 | If the price of a fund moves significantly over a short period of time it is said to be 'volatile' or has 'high volatility'. If the price remains relatively stable, it is said to have 'low volatility'. Volatility can be used as a measure of risk. |
{foots1}
| 2 | The maximum amount of money that the U.S. government is allowed to borrow to meet its obligations. |
{foots1}
| 3 | A portfolio holding less of a particular security (or sector or region) than the security’s weight in the benchmark portfolio. |
abrdn International Small Cap Fund (Unaudited)
Global stock markets generally rose over the 12 months under review. Inflation dominated the economic environment. Central banks in Western economies raised interest rates faster and much further than previously anticipated to counter multi-decade-high inflation. Despite these aggressive central bank actions, core inflation—which strips out volatile items such as energy and food—stayed at elevated levels in many countries. Nevertheless, global economic growth held up better than many investors expected, defying fears of a recession triggered by higher rates.
As U.S. and Eurozone inflation trended down towards the end of 2022, investors’ hopes rose that an end to interest rate rises could be in sight. Therefore, 2023 started with strong stock market gains. However, the collapse of two regional U.S. banks and the forced sale of Credit Suisse to rival UBS in March then evoked fears of a banking crisis. Despite an initial sell-off, stock markets recovered, helped by expectations of lower peak interest rates. After more market volatility1 in April and May, equities performed strongly over June and July due to news of a compromise agreement on the U.S. debt ceiling2 and further encouraging inflation data. This was despite still-hawkish rhetoric from central banks. Equities then generated negative returns in August, September, and October given concerns that interest rates would stay higher for longer, with the outbreak of conflict between Israel and Hamas adding to existing inflationary worries.
Fund performance review
The abrdn International Small Cap Fund (Institutional Class shares, net of fees) returned 0.57% for the 12-month period ended October 31, 2023, versus the 8.82% return of its benchmark, the Morgan Stanley Capital International (MSCI) All Country (AC) World Index (ex-USA) Small Cap Index (Net Daily Total Return), during the same period.
The Fund underperformed its benchmark due to stock selection and, to a lesser extent, sector allocation.
In terms of individual stock detractors, WNS (Holdings), the Indian provider of business process management services, underperformed as investors became concerned that its business model could be adversely affected by artificial intelligence (AI). Affle (India), the digital advertising company that’s main role is matching the demand and supply of adverts, also underperformed. The company’s results were slightly weaker than expected, driven by macroeconomic headwinds in developed markets, which are causing an industry slowdown in digital advertising expenditure. However, Affle’s performance in emerging markets continued to be strong. Nonetheless, we have sold the Fund’s position in the company. IDP Education was another detractor after a regulatory change in Canada that opened up the English language-testing market to more competitors. IDP Education essentially lost its monopoly position, leading to the risks of a lower market share and margin erosion. Therefore, we sold the Fund’s position.
More positively, BE Semiconductor Industries benefited from U.S.-based chipmaker NVIDIA’s very bullish sales forecast on the demand for AI processors, which took the stock to an all-time high and dragged the rest of the sector up with it. Games Workshop, the world’s largest table-top hobby company, performed strongly. In the middle of December 2022, the company announced that it had reached an agreement in principle with Amazon for the latter to develop Games Workshop’s intellectual property into film and TV productions, and for Amazon to get associated merchandising rights. These rights will initially be for the Warhammer 40,000 universe. However, this has broader implications, with TV/film products improving the company’s brand reach and awareness. Dino Polska was another strong performer after investors welcomed data showing a slowdown in sequential food consumer price inflation in Poland.
In terms of activity, we initiated a holding for the Fund in ASICS. The company has come through a major restructuring, which has addressed multiple inefficiencies within its operations and sought to reposition it in a digital era. ASICS’ current operations are running ahead of consensus expectations as its strong market position in the performance running shoe category positively affects other shoe categories. The company continues to enjoy upward sales momentum across its product range, while also expanding into new geographies.
We also introduced a position for the Fund in Sanwa Holdings, which is a global leader in the manufacturing and supply of shutters, garage doors, and industrial doors. Management commentary suggests the demand outlook is less negative than consensus forecasts imply. Factors supportive of growth include (i) robust demand for non-residential construction in Japan and the U.S., (ii) expansion in Asia, (iii) the normalization of service revenue and (iv) a moderation in steel prices. Approximately 20% of the company’s sales are driven by service revenue, which has been negatively affected by the COVID-19 pandemic as engineers were unable to carry out work at customer locations.
Another new holding was Makalot, which is one of the largest listed-garment manufacturers globally. Over the last year or so, the industry has been negatively affected by the destocking cycle. However, management believes that this is now coming to an end. On a medium-to-long-term basis, Makalot continues to benefit from favorable industry tailwinds, such as end-market demand growth and ongoing supplier consolidation. These are in addition to management-led growth initiatives, namely new client wins, capacity expansion, and an improving product mix.
Meanwhile, we disposed of the Fund’s holding in Chunbo, a company that manufactures and sells chemical materials used in the electric-vehicle cycle. We sold the position given a lack of earnings momentum. In addition, we have some environmental, social, and governance concerns, particularly in relation to the company’s husband-and-wife co-chief executive officer (CEO) structure, the
{foots1}
| 1 | If the price of a fund moves significantly over a short period of time it is said to be 'volatile' or has 'high volatility'. If the price remains relatively stable, it is said to have 'low volatility'. Volatility can be used as a measure of risk. |
{foots1}
| 2 | The maximum amount of money that the U.S. government is allowed to borrow to meet its obligations. |
abrdn International Sustainable Leaders Fund (Unaudited)
Global stock markets generally rose over the 12 months under review. Inflation dominated the economic environment. Central banks in Western economies raised interest rates faster and much further than previously anticipated to counter multi-decade-high inflation. Despite these aggressive central bank actions, core inflation—which strips out volatile items such as energy and food—stayed at elevated levels in many countries. Nevertheless, global economic growth held up better than many investors expected, defying fears of a recession triggered by higher rates.
As U.S. and Eurozone inflation trended down towards the end of 2022, investors’ hopes rose that an end to interest rate rises could be in sight. Therefore, 2023 started with strong stock market gains. However, the collapse of two regional U.S. banks and the forced sale of Credit Suisse to rival UBS in March then evoked fears of a banking crisis. Despite an initial sell-off, stock markets recovered, helped by expectations of lower peak interest rates. After more market volatility1 in April and May, equities performed strongly over June and July due to news of a compromise agreement on the U.S. debt ceiling2 and further encouraging inflation data. This was despite still-hawkish rhetoric from central banks. Equities then generated negative returns in August, September, and October given concerns that interest rates would stay higher for longer, with the outbreak of war between Israel and Hamas adding to existing inflationary worries.
Fund performance review
The abrdn International Sustainable Leaders Fund (Institutional Class shares, net of fees) returned 8.61% for the 12-month period ending October 31, 2023, versus the 12.07% return of its benchmark, the Morgan Stanley Capital International (MSCI) All Country (AC) World (ex-USA) Index (Net Daily Total Return), during the same period.
The Fund underperformed its benchmark primarily due to style headwinds for high-quality sustainable leaders during the summer months, which punctuated an otherwise positive period of relative performance. This underperformance was due to a renewed rise in bond yields consistent with higher-for-longer interest rate expectations, prompting long-duration stocks3 to lag. These negative style dynamics were visible in both sector allocation and stock selection.
In terms of individual stock detractors, shares in global payment platform Adyen sold off materially after weaker-than-expected growth in the company’s first-half report, particularly in the North American market, where competition has intensified in some areas. However, the company has reiterated its mid-term targets. Although the timing for operating leverage to reaccelerate has been pushed out, we do not think that the company’s mid-to-long-term growth has been materially impaired. Shares in Samsung SDI, a leading manufacturer of batteries and electronic materials, were weak because of management’s comments about slightly
weaker-than-expected demand for cylindrical batteries used in automobiles and power-tools. However, we believe this tailwind should be short term in nature. Shares in specialist chemical company Croda International also fell after a profit warning. The company reduced its full-year guidance to a level 15% below where investors were previously expecting it to be for 2023, driven by customer destocking in Croda’s Consumer Care and Crop divisions.
In terms of contributors to performance, shares in pharmaceutical company Novo Nordisk rose on the back of positive SELECT trial results, which demonstrated a 20% cardiovascular risk benefit from weight loss induced by its GLP-1 drug, Wegovy. This significantly increased the probability of widespread commercial/Medicare coverage for GLP-1s, thereby leading to significant earnings upgrades. Shares in animal healthcare business Dechra Pharmaceuticals rose after the company announced that it had entered discussions with private equity firm EQT (with the Abu Dhabi Investment Authority as a potential co-investor) for a possible all-cash offer for the business. Elsewhere, China’s reopening following its ‘Zero-COVID’ policy buoyed consumer stocks, such as global cosmetics company L’Oréal. We continue to hold the position given the attractive compounding nature of the company’s earnings streams.
Meanwhile, in activity, we initiated a holding in Wolters Kluwer, the Dutch professional information and publishing company, given its attractive market position, pricing power, and relatively stable business model. We also introduced Edenred, the global market-leading provider of prepaid corporate services, given its attractive inflation and rates exposure. In addition, we introduced a holding in London Stock Exchange Group. The company is the global leader as a financial data and infrastructure provider, with a wide economic moat4 derived from its scale, large switching costs for customers, and high barriers to entry.
We sold the Fund’s holding in Spirax-Sarco Engineering after good performance in order to invest into higher conviction ideas. We also disposed of our positions in Danish insurer Tryg and Canadian wealth management firm CI Financial.
Outlook and strategy
Signs of a weakening economic cycle are becoming increasingly evident, along with indications of pressure on credit as savings are eroded and the labor market cools, in our view. We believe financing costs for businesses are rising and are starting to make investors nervous, with a few recent examples where we have seen the shares of companies with weaker balance sheets come under pressure. We believe that this is not a meaningful risk for the Fund given the importance we place on financial strength. We think we are clearly late in the rate-hiking cycle, particularly one where the pace and quantum of tightening has been so marked. This means that a highly uncertain outlook is likely to cause further volatility in our view, as
{foots1}
| 1 | If the price of a fund moves significantly over a short period of time it is said to be 'volatile' or has 'high volatility'. If the price remains relatively stable, it is said to have 'low volatility'. Volatility can be used as a measure of risk. |
{foots1}
| 2 | The maximum amount of money that the U.S. government is allowed to borrow to meet its obligations. |
{foots1}
| 3 | Shares of companies with expected long-term growth, typically in sectors like technology or healthcare. These stocks are often less sensitive to immediate economic cycles but more to interest rate changes. |
{foots1}
| 4 | A competitive advantage that a company has over its peers in the same industry. |
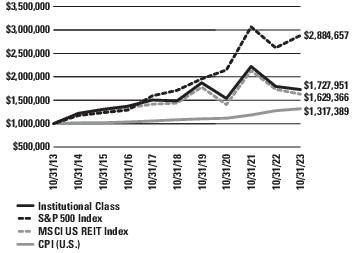
abrdn Realty Income & Growth Fund (Unaudited)
The U.S. real estate investment trust (REIT)1 market significantly underperformed the broader equity market, as measured by the S&P 500 Index, amid shifting sentiment around interest rates and the U.S. Federal Reserve (Fed) recently stating that interest rates would remain higher for a prolonged period. U.S. REITs also underperformed the global real estate index, as measured by the FTSE EPRA/NAREIT Global Net Index.
The key themes during the period included high inflation and high interest rates, and concerns of a banking sector crisis following the collapse of a few regional banks in the U.S. As the review period progressed, economic data generally was better than feared, although the risk of a global recession remained. The Fed indicated that, based on its “dot plot”2 projections, the federal funds rate would be roughly 50 basis points higher in every time period, and rates would remain above 3% up to and during 2026. Investors inferred that the new nominal neutral rate3 was 3% versus the long-term expectation of 2.5%, leading to a subsequent sell-off in risk assets.4 Indeed, the 10-year Treasury yield in the U.S. breached 5% during the reporting period. Not only were nominal interest rates on the rise, but with the sharp move, real interest rates5 closed above 2% for the first time since March 2009.
Additionally, the real estate sector faced increased scrutiny following the failure of some regional banks in the U.S. earlier in the period. These failures led to an examination into the health of all U.S. regional banks and with it a reassessment of loan portfolios, particularly for commercial real estate, exacerbating refinancing6 concerns for a number of landlords. In general, operating conditions have continued to moderate from the robust levels that we saw last year, where numerous sectors were able to pass through double-digit rental rate growth.
Fund performance review
The abrdn Realty Income & Growth Fund (Institutional Share Class, net of fees) returned -3.67% for the 12-month reporting period ending October 31, 2023, versus the -5.92% return of the Morgan Stanley Capital International (MSCI) US REIT Index during the same period.
Our holdings in the healthcare sector contributed to the Fund’s positive relative performance. The skilled nursing and senior housing REITs sub-sectors outperformed as occupancies continued to recover from the pandemic lows. Improving tenant health for skilled nursing REITs and outsized rental and net operating income7 growth for senior housing landlords also underpinned the sector. As a result, the Fund’s holdings Welltower and Sabra Health Care posted gains.
Meanwhile, our lack of exposure to diversified healthcare REIT Healthpeak Properties proved beneficial as it underperformed following concerns that life science tenants were experiencing funding difficulties in the wake of the regional banking crisis. Medical Properties Trust also underperformed as concerns around tenant health continue to plague the company; the Fund’s lack of exposure benefited the Fund. Our exposure to data centers was also positive, especially our overweight8position in Digital Realty Trust, as the potential demand driver of artificial intelligence (AI) became more apparent to the market.
Conversely, stock selection and underweight9allocation to the retail sector weighed on the Fund’s relative performance. Within the retail sector, our overweight position in triple net lease REIT Realty Income Corporation was a notable detractor amid the high interest-rate environment. Elsewhere, the Fund was negatively affected relative to the benchmark by not owning Iron Mountain, as its data business benefited from the excitement around AI. Additionally, the overweight position in multi-family residential REIT UDR underperformed after the company reported weaker-than-expected second-quarter results.
In key portfolio activity for the review period, the Fund purchased Equinix and Digital Realty where we see demand trends starting to show signs of improvement and the potential demand opportunity that exists from the growth of AI computing. We also increased the Fund’s position in Omega Healthcare due to increased confidence about the health of skilled nursing operators. Additionally, the Fund increased its exposure to the single-family rental sector by reinitiating a position in Invitation Homes, as we believe the lack of housing affordability due to rising interest rates could drive more families into the rental housing market as they outgrow traditional apartment space. Lastly, the Fund initiated a position in Hudson Pacific Properties, due to our increased conviction in the issuer.
These purchases were funded by reducing the Fund’s exposure to the apartment sector and exiting the Fund’s position in Equity Residential and UDR, due to concerns about supply pressures, particularly in the sunbelt markets. The Fund also reduced positions in industrial REIT Prologis due to the prospect for slowing near-term rental growth after several years of strong performance. We also reduced the Fund’s exposure to the cell tower sector, where we exited SBA Communications and reduced the Fund’s holdings in American Tower. While we think the long-term prospects for the cell tower sector remain positive, we believe that the lower capital expenditure spending by the carriers—reflecting the timing of their fifth generation (5G) deployments and the lack of a major consumer-facing product that drives a faster rollout of 5G capabilities—could negatively affect
{foots1}
| 1 | A form of indirect property investment. Distributions from REITs are made tax-free and are taxed according to the tax status of the shareholders. |
{foots1}
| 2 | A chart that the U.S. Federal Reserve uses to display its members' predictions for the future path of the federal funds rate. |
{foots1}
| 3 | An interest rate when the economy is producing its maximum output and inflation is steady. Nominal interest rate is the interest rate including inflation. |
{foots1}
| 4 | Investments that have a significant potential for price variation, either increasing or decreasing significantly. |
{foots1}
| 5 | The interest rate adjusted for inflation. This is calculated by subtracting the inflation rate from the interest rate before the adjustment. |
{foots1}
| 6 | The process of replacing existing debt with new debt. |
{foots1}
| 7 | Net operating income is a commonly used figure to assess the profitability of a property. The calculation involves subtracting all operating expenses on the property from all the revenue generated from the property. |
{foots1}
| 8 | A portfolio holding an excess amount of a particular security (or sector or region) compared to the security’s weight in the benchmark portfolio. |
{foots1}
| 9 | A portfolio holding less of a particular security (or sector or region) than the security’s weight in the benchmark portfolio. |
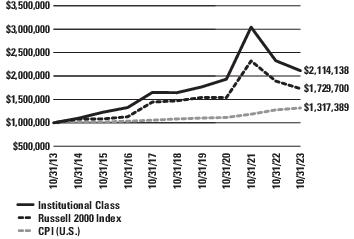
abrdn U.S. Small Cap Equity Fund (Unaudited)
Global stock markets generally rose over the 12 months under review. Inflation dominated the economic environment. Central banks in Western economies raised interest rates faster and much further than previously anticipated to counter multi-decade-high inflation. Despite these aggressive central bank actions, core inflation—which strips out volatile items such as energy and food—stayed at elevated levels in many countries. Nevertheless, global economic growth held up better than many investors expected, defying fears of a recession triggered by higher rates.
As U.S. and Eurozone inflation trended down towards the end of 2022, investors’ hopes rose that an end to interest-rate rises could be in sight. Therefore, 2023 started with strong stock market gains. However, the collapse of two regional U.S. banks and the forced sale of Credit Suisse to rival UBS in March then evoked fears of a banking crisis. Despite an initial sell-off, stock markets recovered, helped by expectations of lower peak interest rates. After more market volatility1 in April and May, equities performed strongly over June and July due to news of a compromise agreement on the U.S. debt ceiling2 and further encouraging inflation data. This was despite still-hawkish rhetoric from central banks. Equities then generated negative returns in August, September, and October given concerns that interest rates would stay higher for longer, with the outbreak of war between Israel and Hamas adding to existing inflationary worries.
Broader U.S. equity markets also posted gains, despite the macroeconomic uncertainty. U.S. small-cap companies, as represented by the Russell 2000 Index, declined over -8.6% in the past 12 months, underperforming the 10.1% return of large-cap stocks, as measured by the S&P 500 Index3. The Russell 2000 Index is a subset of the Russell 3000 Index4 and represents approximately 10% of the U.S. market. The small-cap asset class typically offers a different exposure to the U.S. sectors compared to large cap asset class. Thus, the Russell 2000 Index has a higher weighting towards the financials, healthcare, and industrials sectors. Eight of the 11 sectors in the Russell 2000 Index declined in the past 12 months. Healthcare, financials, utilities, and communication services sectors were the main detractors from the Index’s performance. Conversely, the energy sector returned approximately 6.7% on the back of elevated oil prices.
Fund performance revie
The abrdn U.S. Small Cap Equity Fund returned -9.14% (Institutional Class shares, net of fees) for the 12-month reporting period ending
October 31, 2023, versus the -8.56% return of its benchmark, the Russell 2000 Index, during the same period.
During the reporting period, stock selection in the consumer discretionary5 sector weighed on the Fund’s performance. On the other hand, stock selection in and an overweight6 allocation to the consumer staples7 sector benefited the Fund’s performance. Stock selection in and an underweight8 allocation to the healthcare sector also had a positive effect relative to the Fund’s benchmark.
At the stock level, Ameresco, a clean technology engineering and construction company, underperformed as investors became increasingly concerned that the demand for its services and project-level returns could be negatively affected by higher interest rates. Meanwhile, fashion retailer Aritzia declined after lowering its outlook due to decelerating traffic and higher-than-expected expenses. Eyewear retailer and optical exam provider National Vision Holding was also negative as the company announced its more-than-30-year partnership with Walmart will end in 2024.
Conversely, cosmetics company e.l.f. Beauty was a top performer after delivering accelerated sales growth on the back of continued market share gains. Semiconductor company Onto Innovation performed well as investors became increasingly confident that demand for its advanced packaging solutions would benefit from the rise in artificial intelligence applications. Online education provider Stride was also a top performer as improved operational performance resulted in a return to enrolment growth, following two years of post-pandemic declines.
In terms of key portfolio activity, we added several new positions. In the healthcare sector, the Fund initiated Pacira Biosciences, a biopharma company specializing in non-opioid pain management therapies. We also bought medical-device companies Merit Medical Systems and Alphatec Holdings. In the energy sector, the Fund introduced positions in several high-quality exploration and production companies: SM Energy, Magnolia Oil & Gas, and Callon Petroleum. Within the consumer sectors, the Fund initiated a position in Boot Barn, a leading national retailer in the niche western, country, and workwear market, and The Vita Coco Company, a leading
{foots1}
| 1 | If the price of a fund moves significantly over a short period of time it is said to be 'volatile' or has 'high volatility'. If the price remains relatively stable, it is said to have 'low volatility'. Volatility can be used as a measure of risk. |
{foots1}
| 2 | The maximum amount of money that the U.S. government is allowed to borrow to meet its obligations. |
{foots1}
| 3 | The S&P 500 Index is an unmanaged index considered representative of the broader U.S. stock market.. |
{foots1}
| 4 | The Russell 3000® Index measures the performance of the largest 3,000 U.S. companies representing approximately 96% of the investable U.S. equity market, as of the most recent reconstitution. |
{foots1}
| 5 | Sector associated with goods and services that rely upon consumers and are sensitive to changes in the economy. Examples include retailers and media companies. |
{foots1}
| 6 | A portfolio holding an excess amount of a particular security (or sector or region) compared to the security’s weight in the benchmark portfolio. |
{foots1}
| 7 | Industries associated with goods and services that consumers tend to buy in any economic climate and thus are less sensitive to changes in the economy. Examples include food and drugs. |
{foots1}
| 8 | A portfolio holding less of a particular security (or sector or region) than the security’s weight in the benchmark portfolio. |
abrdn U.S. Sustainable Leaders Fund (Unaudited)
Global stock markets generally rose over the 12 months under review. Inflation dominated the economic environment. Central banks in Western economies raised interest rates faster and much further than previously anticipated to counter multi-decade-high inflation. Despite these aggressive central bank actions, core inflation—which strips out volatile items such as energy and food—stayed at elevated levels in many countries. Nevertheless, global economic growth held up better than many investors expected, defying fears of a recession triggered by higher rates.
As U.S. and Eurozone inflation trended down towards the end of 2022, investors’ hopes rose that an end to interest rate rises could be in sight. Therefore, 2023 started with strong stock market gains. However, the collapse of two regional U.S. banks and the forced sale of Credit Suisse to rival UBS in March then evoked fears of a banking crisis. Despite an initial sell-off, stock markets recovered, helped by expectations of lower peak interest rates. After more market volatility1 in April and May, equities performed strongly over June and July due to news of a compromise agreement on the U.S. debt ceiling2 and further encouraging inflation data. This was despite still-hawkish rhetoric from central banks. Equities then generated negative returns in August, September, and October given concerns that interest rates would stay higher for longer, with the outbreak of war between Israel and Hamas adding to existing inflationary worries.
U.S. equity markets posted gains, despite the macroeconomic uncertainty. Within the Russell 3000 Index, six of the 11 sectors declined in the past 12 months although these were narrowly concentrated within the market. The utilities, real estate, and healthcare sectors were notable detractors. Conversely, the communication services and information technology sectors returned approximately 31.94% and 28.47%, respectively.
Fund performance review
The abrdn U.S. Sustainable Leaders Fund returned 3.30% (Institutional Share class, net of fees) on a U.S. dollar basis for the 12-month reporting period ending October 31, 2023, versus the 8.38% return of its benchmark, the Russell 3000 Index3, and versus the 17.32% return of its secondary benchmark, the Russell 3000 Growth Index4, during the same period.
During the past 12 months, weak stock selection in the information technology sector, in particular our lack of exposure to chipmaker NVIDIA, which recorded gains, weighed on relative performance. On the other hand, our stock selection in the healthcare sector added to relative returns.
At the stock level, SVB Financial Group, which went into receivership, was unfavorable. Its shares fell substantially in the day before trading
was suspended and lost most of their remaining value when trading restarted several weeks later, and we exited our position. New Fortress Energy was also weak as declines in European natural gas prices made investors less optimistic about the level of profitability that the company could achieve with its new liquefied natural gas facilities, which are intended to help supply the European markets after the switch away from Russian gas supplies.
Conversely, Microsoft Corporation contributed to performance as investors continued to gain more confidence in its ability to monetize developments in artificial intelligence (AI) across a wide range of its products. Biopharmaceutical company Horizon Therapeutics was positive following its acquisition by Amgen. Meanwhile, pharmaceutical company Eli Lilly’s stock benefited substantially after its peer Novo Nordisk’s trial showed that the GLP-1 anti-obesity drug had a significant impact in overall cardiovascular health, which made investors more positive on the company’s similar drug set to launch next year.
In terms of key portfolio activity, within the healthcare sector, the Fund bought life science and diagnostics company Danaher, as we are positive on its medium-term growth prospects, especially in biopharma processing, and believe that the current inventory overhang affecting the industry might be temporary. We also initiated a position in Eli Lilly due to the potential benefits from anti-obesity drug sales and its new drug pipeline. We added healthcare and insurance provider UnitedHealth Group as we expect growth opportunities for its value-based care initiatives. In industrials, the Fund bought the Canadian railroad Canadian Pacific Kansas City due to potential benefits from Kansas City Southern deal synergies, funding it from the sale of Canadian National Railway Company. We also initiated our preferred waste company Waste Management.
Within the consumer segments, we introduced a Fund holding in our preferred consumer-staple5 company, Procter & Gamble (P&G). We believe P&G could continue to benefit from its investment in new products and improved marketing, which it is funding from some of the higher sales it made during the pandemic. The Fund added clothing retailer Lululemon Athletica as we think it has strong potential from sustainable growth through gaining market share, new store growth, and expanding into new markets. We initiated holding in the department store TJX Companies as we see value-based retail benefiting from a tighter consumer environment. Elsewhere, we added index provider company Morgan Stanley Capital International (MSCI), where we see strong growth prospects for its index-provider business. Lastly, we initiated software company Cadence Design Systems, which we believe could benefit from ongoing structural growth in semiconductor design, with the added benefit of cloud
{foots1}
| 1 | If the price of a fund moves significantly over a short period of time it is said to be 'volatile' or has 'high volatility'. If the price remains relatively stable, it is said to have 'low volatility'. Volatility can be used as a measure of risk. |
{foots1}
| 2 | The maximum amount of money that the U.S. government is allowed to borrow to meet its obligations. |
{foots1}
| 3 | The Russell 3000® Index measures the performance of the largest 3,000 U.S. companies representing approximately 96% of the investable U.S. equity market, as of the most recent reconstitution. |
{foots1}
| 4 | The Russell 3000® Growth Index measures the performance of the broad growth segment of the U.S. equity universe. It includes those Russell 3000® companies with relatively higher price-to-book ratios, higher I/B/E/S forecast medium term (2 year) growth and higher sales per share historical growth (5 years). |
{foots1}
| 5 | Consumer staples refers to industries associated with goods and services that consumers tend to buy in any economic climate and thus are less sensitive to changes in the economy. Examples include food and drugs. |
abrdn U.S. Sustainable Leaders Smaller Companies Fund (Unaudited)
Global stock markets generally rose over the 12 months under review. Inflation dominated the economic environment. Central banks in Western economies raised interest rates faster and much further than previously anticipated to counter multi-decade-high inflation. Despite these aggressive central bank actions, core inflation—which strips out volatile items such as energy and food—stayed at elevated levels in many countries. Nevertheless, global economic growth held up better than many investors expected, defying fears of a recession triggered by higher rates.
As U.S. and eurozone inflation trended down towards the end of 2022, investors’ hopes rose that an end to interest-rate rises could be in sight. Therefore, 2023 started with strong stock market gains. However, the collapse of two regional U.S. banks and the forced sale of Credit Suisse to rival UBS in March then evoked fears of a banking crisis. Despite an initial sell-off, stock markets recovered, helped by expectations of lower peak interest rates. After more market volatility1 in April and May, equities performed strongly over June and July due to news of a compromise agreement on the U.S. debt ceiling2 and further encouraging inflation data. This was despite still-hawkish rhetoric from central banks. Equities then generated negative returns in August, September, and October given concerns that interest rates would stay higher for longer, with the outbreak of war between Israel and Hamas adding to existing inflationary worries.
Broader U.S. equity markets, as measured by the Russell 3000 Index3, also posted gains, despite the macroeconomic uncertainty. Within the Russell 2500 Index, five of the 11 sectors declined in the past 12 months. Healthcare, financials, utilities, and communication services were notable laggards. Conversely, industrials returned approximately 6.0%.
Fund performance review
The abrdn U.S. Sustainable Leaders Smaller Companies Fund returned -9.61% (Institutional Class shares, net of fees) for the 12-month reporting period ending October 31, 2023, versus the -4.63% return of its benchmark, the Russell 2500 Index4, and versus the -4.80% return of its secondary benchmark, the Russell 2500 Growth Index5, during the same period.
During the reporting period, weak stock selection in the consumer staples6, information technology, and financials sectors weighed on
the Fund’s performance. On the other hand, our stock selection in the healthcare sector was strong and added to returns.
At the stock level, SVB Financial Group, which went into receivership, was unfavorable. The shares fell substantially in the day before trading was suspended and lost most of their remaining value when trading restarted several weeks later, and we exited the Fund’s position. Ameresco, a clean technology engineering and construction company, underperformed as investors became increasingly concerned that the demand for its services and project-level returns could be negatively affected by higher interest rates. Meanwhile, fashion retailer Aritzia declined after lowering its outlook due to decelerating traffic and higher-than-expected expenses.
Conversely, Vertiv Holdings added to returns as the adoption of artificial intelligence (AI) could provide a tailwind for its thermal offering, increasing investor confidence in the company’s growth prospects. Semiconductor company Onto Innovation was positive as it confirmed a large order for its advanced packaging system, a segment benefiting from demand for AI. Electrical raceway systems manufacturer Atkore was also favorable as its stock benefitted from the strong performance of cyclicals7.
In key portfolio activity, the Fund initiated holdings in medical-device company Merit Medical Systems and cosmetics company e.l.f. Beauty. In the healthcare sector, the Fund sold biopharmaceutical company Horizon Therapeutics and life sciences company Cryoport. Within the financials sector, the Fund disposed of the American bank Live Oak Bancshares and investment company Hannon Armstrong Sustainable. Within the consumer segments, the Fund sold vitamin and health-supplement company Jamieson Wellness, enterprise telecommunications company Cogent Communications Holdings, and retailer Burlington Stores. We also sold SunOpta, a manufacturer of plant-based milks and fruit products. In the information technology sector, we disposed of energy technology company SolarEdge Technologies and semiconductor manufacturer Wolfspeed. Elsewhere, we sold The Shyft Group, a manufacturer of truck and van products.
Outlook
{foots1}
| 1 | If the price of a fund moves significantly over a short period of time it is said to be 'volatile' or has 'high volatility'. If the price remains relatively stable it is said to have 'low volatility'. Volatility can be used as a measure of risk. |
{foots1}
| 2 | The maximum amount of money that the U.S. government is allowed to borrow to meet its obligations. |
{foots1}
| 3 | The Russell 3000® Index measures the performance of the largest 3,000 U.S. companies representing approximately 96% of the investable U.S. equity market, as of the most recent reconstitution. |
{foots1}
| 4 | The Russell 2500® Index measures the performance of the small to mid-cap segment of the U.S. equity universe, commonly referred to as “smid” cap. The Russell 2500® Index is a subset of the Russell 3000® Index. It includes approximately 2,500 of the smallest securities based on a combination of their market cap and current index membership. |
{foots1}
| 5 | The Russell 2500® Growth Index measures the performance of the small to mid-cap growth segment of the US equity universe. It includes those Russell 2500® companies with relatively higher price-to-book ratios, higher I/B/E/S forecast medium term (2 year) growth and higher sales per share historical growth (5 years). |
{foots1}
| 6 | Industries associated with goods and services that consumers tend to buy in any economic climate and thus are less sensitive to changes in the economy. Examples include food and drugs. |
{foots1}
| 7 | Companies who produce products/services which are likely to be affected by changes in economic conditions – e.g. luxury goods, holidays. |
Notes to Financial Statements (continued)
October 31, 2023
| | conservation policies and other factors. Additionally, infrastructure-related entities may be subject to regulation by various governmental authorities and may also be affected by governmental regulation of rates charged to customers, service interruption due to environmental, operational or other mishaps and the imposition of special tariffs and changes in tax laws, regulatory policies and accounting standards. |
n.
| Issuer Risk |
| | The value of a security may decline for reasons directly related to the issuer, such as management performance, financial leverage and reduced demand for the issuer's goods or services. |
o.
| Management Risk |
| | Each Fund is subject to the risk that the Adviser or Subadviser (as applicable) may make poor security selections. The Adviser, Subadviser and their portfolio managers apply their own investment techniques and risk analyses in making investment decisions for a Fund and there can be no guarantee that these decisions will achieve the desired results for a Fund. In addition, the Adviser or Subadviser may select securities that underperform the relevant market or other funds with similar investment objectives and strategies. |
p.
| Market Risk |
| | Deteriorating market conditions might cause a general weakness in the market that reduces the prices, or yield, of securities in that market. Developments in a particular class of bonds or the stock market could also adversely affect a Fund by reducing the relative attractiveness of bonds or stocks as an investment. Also, to the extent that a Fund emphasizes bonds or stocks from any given industry, it could be hurt if that industry does not do well. Additionally, a Fund could lose value if the individual stocks in which it maintains long positions and/or the overall stock markets on which the stocks trade decline in price. In addition, a Fund that engages in short sales could lose value if the individual stocks which they sell short increase in price. Stocks and stock markets may experience short-term volatility (price fluctuation) as well as extended periods of price decline or increase. Individual stocks are affected by many factors, including: |
| • | corporate earnings; |
| • | production; |
| • | management; |
| • | sales; and |
| • | market trends, including investor demand for a particular type of stock, such as growth or value stocks, small or large stocks, or stocks within a particular industry. |
Stock markets are affected by numerous factors, including interest rates, the outlook for corporate profits, the health of the national and world economies, the fluctuation of other stock markets around the world, and financial, economic and other global market developments and disruptions, such as those arising from war, terrorism, market manipulation, government interventions, defaults and shutdowns, political changes or diplomatic developments, public health emergencies and natural/environmental disasters. In addition, any spread of an infectious illness, public health threat or similar issue could reduce consumer demand or economic output, result in market closures, travel restrictions or quarantines, and generally have a significant impact on the world economy, which in turn could adversely affect the Fund’s investments.
In addition, as noted above, uncertainties remain relating to certain aspects of the United Kingdom’s future economic, trading and legal relationships with the European Union and with other countries.
Whether or not a Fund invests in securities of issuers located in Europe (whether the EU, Eurozone or UK) or with significant exposure to European, EU, Eurozone or UK issuers or countries, the unavoidable uncertainties and events related to Brexit could negatively affect the value and liquidity of a Fund’s investments, increase taxes and costs of business and cause volatility in currency exchange rates and interest rates.
Economies and financial markets throughout the world are becoming increasingly interconnected. Economic, financial or political events, trading and tariff arrangements, war, terrorism, natural disasters, public health issues like pandemics or epidemics, and other circumstances in one country or region could have profound impacts on global economies or markets. As a result, whether or not a Fund invests in securities of issuers located in or with significant exposure to countries experiencing economic and financial difficulties, the value and liquidity of the Fund’s investments may be negatively affected by such events. In addition, as described above under “Foreign Securities Risk,” the ongoing military conflict between Russia and Ukraine may continue to result in significant negative impacts on the markets for certain securities and commodities globally, in addition to fluctuating pricing and liquidity of investments. These factors could have a significant impact on Fund performance and the value of the Funds’ investments. The impact of these measures, and whether they will be effective to mitigate the economic and market disruption, will not be known for some time.
Report of Independent Registered Public Accounting Firm
To the Shareholders and Board of Trustees
abrdn Funds:
Opinion on the Financial Statements
We have audited the accompanying statements of assets and liabilities of abrdn China A Share Equity Fund, abrdn Dynamic Dividend Fund, abrdn EM SMA Completion Fund (commencement of operations January 27, 2023), abrdn Emerging Markets ex-China Fund, abrdn Emerging Markets Fund, abrdn Emerging Markets Sustainable Leaders Fund, abrdn Global Equity Impact Fund, abrdn Global Infrastructure Fund, abrdn International Small Cap Fund, abrdn International Sustainable Leaders Fund, abrdn Realty Income & Growth Fund, abrdn U.S. Small Cap Equity Fund, abrdn U.S. Sustainable Leaders Fund, and abrdn U.S. Sustainable Leaders Smaller Companies Fund, fourteen of the funds comprising abrdn Funds (each, a Fund and collectively, the Funds), including the statements of investments, as of October 31, 2023, the related statements of operations for the year then ended except for abrdn EM SMA Completion Fund, for which the period is from January 27, 2023 through October 31, 2023, statements of changes in net assets for each of the years in the two-year period then ended except for abrdn EM SMA Completion Fund, for which the period is from January 27, 2023 through October 31, 2023, and the related notes (collectively, the financial statements) and the financial highlights for each of the years or periods in the five-year period then ended. In our opinion, the financial statements and financial highlights present fairly, in all material respects, the financial position of the Funds as of October 31, 2023, the results of their operations for the year or period then ended, the changes in their net assets for each of the years or periods in the two-year period then ended, and the financial highlights for each of the years or periods in the five-year period then ended, in conformity with U.S. generally accepted accounting principles.
Basis for Opinion
These financial statements and financial highlights are the responsibility of the Funds' management. Our responsibility is to express an opinion on these financial statements and financial highlights based on our audits. We are a public accounting firm registered with the Public Company Accounting Oversight Board (United States) (PCAOB) and are required to be independent with respect to the Funds in accordance with the U.S. federal securities laws and the applicable rules and regulations of the Securities and Exchange Commission and the PCAOB.
We conducted our audits in accordance with the standards of the PCAOB. Those standards require that we plan and perform the audit to obtain reasonable assurance about whether the financial statements and financial highlights are free of material misstatement, whether due to error or fraud. Our audits included performing procedures to assess the risks of material misstatement of the financial statements and financial highlights, whether due to error or fraud, and performing procedures that respond to those risks. Such procedures included examining, on a test basis, evidence regarding the amounts and disclosures in the financial statements and financial highlights. Such procedures also included confirmation of securities owned as of October 31, 2023, by correspondence with custodians and brokers; when replies were not received from brokers, we performed other auditing procedures. Our audits also included evaluating the accounting principles used and significant estimates made by management, as well as evaluating the overall presentation of the financial statements and financial highlights. We believe that our audits provide a reasonable basis for our opinion.

We have served as the auditor of one or more abrdn investment companies since 2009.
Philadelphia, Pennsylvania
December 28, 2023
Shareholder Expense Examples (Unaudited)
As a shareholder of the abrdn Funds, you incur two types of costs: (1) transaction costs, including sales charges (loads) paid on purchase payments and (2) ongoing costs, including investment advisory fees, administration fees, transfer agent out-of-pocket expenses, distribution fees and other Fund expenses. The examples below are intended to help you understand your ongoing costs (in dollars) of investing in the abrdn Funds and to compare these costs with the ongoing costs of investing in other mutual funds.
The examples assume that you had a $1,000 investment in the Class at the beginning of the reporting period, May 1, 2023 and continued to hold your shares at the end of the reporting period, October 31, 2023.
Actual Expenses
The table below provides information about actual account values and actual expenses. You may use the information together with the amount you invested, to estimate the expenses that you paid over the period. Simply divide your account value by $1,000 (for example, an $8,600 account value divided by $1,000 = 8.6), then multiply the result by the number under the heading entitled “Actual Expenses Paid During Period” for the class of a Fund that you own to estimate the expenses you paid on your account during the period.
Hypothetical Example for Comparison Purposes
The table below provides information about hypothetical account values and hypothetical expenses based on the Class’ actual expense ratio and an assumed rate of return of 5% per year before expenses, which is not the Class’ actual return. The hypothetical account values and expenses may not be used to estimate the actual ending account balance or expenses you paid for the period. You may use this information to compare the ongoing costs of investing in the Class of a Fund and other funds. To do so, compare the 5% hypothetical example with the 5% hypothetical examples that appear in the shareholder reports of the other funds.
Please note that the expenses shown in the table are meant to highlight your ongoing costs only and do not reflect any transaction costs, such as sales charges (loads). Therefore, the information for each Class in the table is useful in comparing ongoing costs only, and will not help you determine the relative total costs of owning different funds. In addition, if these transaction costs were included, your costs would have been higher. The examples also assume all dividends and distributions have been reinvested.
| | | Beginning Account
Value,
May 1, 2023 | Actual
Ending Account
Value,
October 31, 2023 | Hypothetical
Ending Account
Value | Actual Expenses
Paid During
Period1 | Hypothetical
Expenses
Paid During
Period1,2 | Annualized
Expense
Ratio** |
| China A Share Equity Fund | Class A
| $1,000.00 | $803.30 | $1,017.95 | $6.55 | $7.32 | 1.44% |
| | Class C
| $1,000.00 | $800.90 | $1,014.72 | $9.44 | $10.56 | 2.08% |
| | Class R
| $1,000.00 | $802.10 | $1,016.38 | $7.95 | $8.89 | 1.75% |
| | Institutional Service Class
| $1,000.00 | $804.40 | $1,019.46 | $5.18 | $5.80 | 1.14% |
| | Institutional Class
| $1,000.00 | $804.60 | $1,019.81 | $4.87 | $5.45 | 1.07% |
| Dynamic Dividend Fund | Class A
| $1,000.00 | $932.30 | $1,017.04 | $7.89 | $8.24 | 1.62% |
| | Institutional Class
| $1,000.00 | $933.40 | $1,018.25 | $6.73 | $7.02 | 1.38% |
| EM SMA Completion Fund | Institutional Class
| $1,000.00 | $882.60 | $1,025.21 | $— | $— | —% |
| Emerging Markets ex-China Fund | Class A
| $1,000.00 | $964.40 | $1,017.85 | $7.23 | $7.43 | 1.46% |
| | Class C
| $1,000.00 | $960.80 | $1,014.57 | $10.43 | $10.71 | 2.11% |
| | Class R
| $1,000.00 | $962.40 | $1,016.18 | $8.85 | $9.10 | 1.79% |
| | Institutional Service Class
| $1,000.00 | $966.10 | $1,019.26 | $5.85 | $6.01 | 1.18% |
| | Institutional Class
| $1,000.00 | $965.60 | $1,019.66 | $5.45 | $5.60 | 1.10% |
| Emerging Markets Fund | Class A
| $1,000.00 | $928.30 | $1,017.09 | $7.83 | $8.19 | 1.61% |
| | Class C
| $1,000.00 | $925.90 | $1,014.62 | $10.19 | $10.66 | 2.10% |
| | Class R
| $1,000.00 | $927.90 | $1,016.38 | $8.50 | $8.89 | 1.75% |
| | Institutional Service Class
| $1,000.00 | $930.00 | $1,018.96 | $6.03 | $6.31 | 1.24% |
| | Institutional Class
| $1,000.00 | $930.40 | $1,019.66 | $5.35 | $5.60 | 1.10% |
| Emerging Markets Sustainable Leaders Fund | Class A
| $1,000.00 | $920.30 | $1,017.59 | $7.31 | $7.68 | 1.51% |
| | Class C
| $1,000.00 | $917.40 | $1,014.47 | $10.29 | $10.82 | 2.13% |
| | Class R
| $1,000.00 | $918.80 | $1,016.33 | $8.51 | $8.94 | 1.76% |
| | Institutional Service Class
| $1,000.00 | $922.60 | $1,019.31 | $5.67 | $5.96 | 1.17% |
| | Institutional Class
| $1,000.00 | $922.40 | $1,019.56 | $5.43 | $5.70 | 1.12% |
| Global Equity Impact Fund | Class A
| $1,000.00 | $885.50 | $1,017.34 | $7.41 | $7.93 | 1.56% |
| | Institutional Class
| $1,000.00 | $886.50 | $1,018.60 | $6.23 | $6.67 | 1.31% |
| Global Infrastructure Fund | Class A
| $1,000.00 | $878.50 | $1,018.96 | $5.87 | $6.31 | 1.24% |
| | Institutional Class
| $1,000.00 | $879.50 | $1,020.22 | $4.69 | $5.04 | 0.99% |
Supplemental Information (Unaudited)
Board of Trustees’ Consideration of Advisory and Sub-Advisory Agreements
At a regularly scheduled quarterly meeting (the “Quarterly Meeting”) of the Board of Trustees (the “Board” or the “Trustees”) of the abrdn Funds (the “Trust”) held on June 13, 2023, the Board, including a majority of the Trustees who are not considered to be “interested persons” of the Trust (the “Independent Trustees”) under the Investment Company Act of 1940, as amended (the “1940 Act”), approved for an annual period the continuation of the Trust’s advisory agreement (the “Advisory Agreement”) with abrdn Inc. (“AI”) and the applicable sub-advisory agreements (each a “Sub-Advisory Agreement,” and collectively with the Advisory Agreement, the “Agreements”) by and among: (i) the Trust, AI and abrdn Asia Limited (“AAL”) and (ii) the Trust, AI and abrdn Investments Limited (“aIL”) (AAL and aIL, each a “Sub-Adviser,” and collectively, the “Sub-Advisers”) for each of the following series of the Trust: abrdn China A Share Equity Fund, abrdn Dynamic Dividend Fund, abrdn Emerging Markets Fund, abrdn U.S. Sustainable Leaders Smaller Companies Fund, abrdn Emerging Markets Ex-China Fund, abrdn EM SMA Completion Fund, abrdn Global Infrastructure Fund, abrdn Emerging Markets Sustainable Leaders Fund, abrdn International Small Cap Fund, abrdn Realty Income & Growth Fund, abrdn U.S. Sustainable Leaders Fund, abrdn U.S. Small Cap Equity Fund, abrdn Global Equity Impact Fund, and abrdn International Sustainable Leaders Fund (each a “Fund,” and collectively the “Funds”). In addition, the Independent Trustees held a separate telephonic meeting on June 7, 2023 and a separate in-person meeting on June 12, 2023 (together with the Quarterly Meeting held on June 13, 2023, the “Meetings”) to review the materials provided and the relevant legal considerations. AAL and aIL are affiliates of AI. AI and the Sub-Advisers are sometimes referred to collectively as the “Advisers” or “abrdn.”
In connection with their consideration of whether to approve the continuation of the Agreements, the Board members received and reviewed a variety of information provided by the Advisers relating to the Funds, the Agreements and the Advisers, including information regarding the nature, extent and quality of services provided by the Advisers under the respective Agreements, comparative investment performance, fee and expense information of peer groups of funds for respective Funds (each a “Peer Group,” and collectively the “Peer Groups”) selected by Institutional Shareholder Services Inc. (“ISS”), an independent third-party provider of investment company data and other performance information for relevant benchmark indices. The materials provided to the Board generally included, among other items: (i) information on the Funds’ advisory fees and other expenses, including information comparing each Fund’s expenses to those of the respective Peer Group and information about any applicable expense limitations and fee “breakpoints”; (ii) information about the profitability of the Agreements to the Advisers; (iii) information on the investment performance of the Funds and the performance of the Funds’ respective Peer Groups and the Funds’ performance benchmarks; (iv) a report prepared by the Advisers in response to a request submitted by the Independent Trustees’ independent legal counsel on behalf of such Trustees; and (v) a memorandum from the Independent Trustees’ independent legal counsel on the responsibilities of the Board in considering for approval the investment advisory and investment sub-advisory arrangements under the 1940 Act and Delaware law.
The Board, including the Independent Trustees, also considered other matters such as: (i) the Advisers’ investment personnel and operations; (ii) the Advisers’ financial stability and financial condition; (iii) the resources devoted by the Advisers to the Fund; (iv) each Fund’s investment objective and strategies; (v) the Advisers’ record of compliance with the Funds’ investment policies and restrictions, policies on personal securities transactions and other compliance policies; (vi) arrangements relating to the distribution of the Funds’ shares and the related costs; (vii) possible conflicts of interest; and (viii) the allocation of the Funds’ brokerage, if any, including, if applicable, allocations to brokers affiliated with the Advisers and the use, if any, of “soft” commission dollars to pay Fund expenses and to pay for research and other similar services. The Board also considered the nature, extent and quality of the services provided to the Funds by AI’s affiliates. Throughout the process, the Trustees were afforded the opportunity to ask questions of and request additional information from AI and the Sub-Advisers.
The Board also noted that, in addition to the materials requested by the Trustees in connection with their annual consideration of the continuation of the Agreements, the Trustees received and reviewed materials in advance of each regular quarterly meeting of the Board that contained information relating to the services provided by the Advisers, including detailed information about each Fund’s investment performance. This information generally included, among other things, third-party performance rankings for various periods (including, as applicable, periods prior to the Advisers’ management of the Funds) comparing each Fund against its respective Peer Group, total return information for the Funds for various periods, and details of sales and redemptions of Fund shares for the period. The Board also received periodic presentations from the portfolio management teams in connection with the performance of the Funds.
The Independent Trustees were advised by separate independent legal counsel throughout the process. The Independent Trustees also consulted in executive sessions with their independent legal counsel regarding consideration of the continuation of the Agreements. In considering whether to approve the continuation of the Agreements, the Board of Trustees, including the Independent Trustees, did not identify any single factor as determinative. Individual Trustees may have evaluated the information presented differently from one another, giving different weights to various factors. Matters considered by the Trustees, including the Independent Trustees, in connection with their approval of the continuation of the Agreements included the factors listed below.
The costs of the services provided and profits realized by the Advisers and their affiliates from their relationships with the Funds. The Trustees considered the fees charged to the Funds for advisory services as well as the total expense levels of the Funds. This information included comparisons (provided by ISS) of each Fund’s net management fee and total expense level to those of its expense Peer Group and information about the advisory fees charged by AI and abrdn to any separately managed and other accounts with a similar strategy. In reviewing the comparison of each Fund’s net management fee to that of comparable funds, the Board noted that the fee for the Funds includes both advisory and administrative fees. In evaluating the Funds’ advisory fees, the Trustees considered the demands, complexity and quality of the investment management of the
Supplemental Information (Unaudited) (continued)
Funds. In considering the fees charged by AI to any comparable accounts, the Trustees also considered, among other things, management’s discussion of the different investment restrictions, objectives or policies that may be involved in managing accounts of different types.
The Trustees also noted that the sub-advisory fees, as applicable, for the Funds would not be paid by the Funds, but would be paid by AI out of its advisory fee. The Board also considered that AI had entered into or renewed expense limitation agreements with each of the Funds, pursuant to which AI agreed to waive a portion of its advisory fee and/or reimburse certain expenses as a means of limiting each Fund’s total annual operating expenses for a period of time.
The Trustees also considered the compensation AI and its affiliates received, directly and indirectly, from their relationships with the Funds. The Trustees reviewed information provided by management as to the profitability of AI and its affiliates’ relationships with the Funds, including the engagement of affiliates of AI to provide administrative and distribution services to the Funds. The Trustees also considered information about the allocation of expenses used to calculate profitability. When reviewing profitability, the Trustees also considered information about the expense levels of the Funds, the performance of the Funds, court cases regarding adviser profitability, and whether AI had implemented breakpoints and expense limitations with respect to the Funds. The Trustees also examined the profitability of AI and its affiliates on a Fund-by-Fund basis.
After reviewing these and related factors, including taking into account management’s discussion regarding Fund expenses, the Board concluded that the advisory fees, and as applicable, the sub-advisory fees, were fair and reasonable, and that the costs of these services generally and the related profitability of AI and its affiliates from their relationships with the Funds were reasonable and supported the continuation of the Agreements.
Investment performance of the Funds and the Advisers. The Trustees received and reviewed with the Advisers, among other performance data, information about the performance of the Funds over various time periods, including information that compared the performance of the Funds to the performance of respective Peer Groups and each Fund’s performance benchmark. The Trustees also considered the performance of the Funds compared to the performance of comparable funds or accounts managed by AI and its affiliates to the extent available. In addition, the Trustees also reviewed data prepared by ISS that analyzed the performance of the Funds using a variety of performance metrics.
The Trustees also considered, as applicable, the performance of the Advisers since they commenced management of the Funds. The Trustees also considered AI’s and the Sub-Advisers’ performance generally, the performance of the fund family generally, the historical responsiveness of AI to Trustee concerns about performance, and the willingness of AI and the Sub-Advisers to take steps intended to improve performance.
Based on these factors, the Board determined that the Advisers are appropriate investment advisers for the Funds. The Board noted that it would continue to monitor the Funds’ performance and any actions taken by AI and its affiliates relating to performance.
The nature, extent and quality of the services provided to the Funds under the Agreements. The Trustees considered the nature, extent and quality of the services provided by AI and the Sub-Advisers, as applicable, to the Funds and the resources dedicated to the Funds by AI and its affiliates. The Board considered the Advisers’ risk management processes. The Board also considered the background and experience of the Advisers’ senior management personnel and the qualifications, background and responsibilities of the portfolio managers that are primarily responsible for the day-to-day portfolio management services for the Funds. AI’s role in coordinating the activities of the Trust’s other service providers was also considered. The Board also considered the allocation of responsibilities among the Advisers. The Board also considered that it receives information on a regular basis from the Trust’s Chief Compliance Officer regarding the Advisers’ compliance policies and procedures. The Board was also mindful of the Advisers’ focus on the monitoring of the performance of the Funds and in addressing performance matters. The Trustees considered not only the advisory services provided by AI to the Funds, but also the administrative services provided by AI to the Funds under a separate administration agreement. The Trustees also took into account the Advisers’ investment experience. The Trustees also considered the benefits to shareholders of investing in a mutual fund that is part of a family of funds that offers shareholders the right to exchange shares of one type of fund for shares of another type of fund, and provides a variety of fund and shareholder services. The Board also took into account its knowledge of management and the quality of the performance of management’s duties through Board meetings, discussion and reports during the preceding year.
After reviewing these and related factors, the Board concluded that the nature, extent and quality of the services provided supported the continuation of the Agreements.
Economies of Scale. The Trustees considered the existence of any economies of scale in the provision of services by AI and the Sub-Advisers and whether those economies would be shared with the Funds through breakpoints in the investment advisory fees or other means, such as expense waivers or limitations. The Board noted management’s discussion of the Funds’ advisory fee structures. The Trustees noted that each of the Funds was subject to a contractual expense limitation agreement and considered that certain Funds were subject to breakpoints in their investment advisory fees. The Board also considered how the Funds’ potential future growth and increased size would have an effect on fees, noting that if a Fund’s assets increase over time, the Fund may realize other economies of scale if assets increase at a proportionally higher rate than the increase in certain expenses. The Trustees also took note of the costs of the services provided and the profitability to AI and its affiliates from their relationships with the Funds, as discussed above.
After reviewing these and related factors, the Board concluded that the advisory fees, and as applicable, sub-advisory fees were reasonable and supported the continuation of the Agreements.
abrdn Intermediate Municipal Income Fund (Unaudited)
The overall U.S. municipal (muni) bond market gained during the reporting period. The Bloomberg Municipal Bond Index, a broad municipal bond market benchmark, rose 2.26%, while the taxable bond market, as measured by the Bloomberg U.S. Aggregate Bond Index, returned 0.14% for the reporting period.
The period was defined by fluctuating market performances, as fears of high inflation, tightening monetary policy1, and the risk of a global recession caused volatility2 with most government bond prices falling during the period. The U.S. Federal Reserve (Fed) was determined to control inflation and did so by hiking the federal Fed funds rates by 225 basis points over the period, which helped to lower inflation, as the annual Consumer Price Index3 reading fell from 7.1% in November 2022 to 3.2% in October 2023. The slowing of inflation combined with strong growth and a stable labor market has since pushed back expectations for a recession. The resilient growth story along with positive fundaments helped to bolster muni performance for the 12-month reporting period. This is evidenced by the outperformance of the lower credit quality area within the municipal market, where the Bloomberg High Yield Municipal Bond Index returned 3.57% for the period.
Fund performance review
The abrdn Intermediate Municipal Income Fund returned 0.77% (Institutional class shares, net of fees) for the 12-month reporting period ended October 31, 2023. This was compared to a 2.39% return for its benchmark, the ICE BofA Merrill Lynch 1–22 Year U.S. Municipal Securities Index, during the same period.
During the reporting period, the Fund’s exposure to the other revenue, hospital, and higher education segments of the market were notable detractors from its performance. This was partially offset by our exposure to other transportation and local general obligation bonds. From a quality perspective, the Fund’s allocation to non-rated4, AA and BB bonds weighed on its relative performance. Conversely, BBB and AAA bonds were favorable.
We spent most of the reporting period extending the Fund’s underweight5 duration6 to a more neutral stance utilizing a barbell
approach7 to extend duration, investing in long duration (12 years and out) and short duration bonds (2 years and in). We maintained the Fund’s allocation to high yield securities as we believe muni fundamentals remain solid.
Market outlook
We have an optimistic outlook for the muni bond market as inflation pressures have continued to abate and the Fed is expected to be nearing an end to its rate increases. However, we are cautious on extending to a material overweight8 duration within the strategy at this time. We feel that the Fed may keep rates at elevated levels for a longer period than is currently being priced into the markets and given the existing labor market strength and the overall resilience of U.S. consumption, markets could prove volatile in the near term.
In terms of market technicals, overall mutual fund outflows have been persistent through 2023 so far, albeit at a much slower and more manageable pace than in 2022. We expect the pace of outflows to subside in 2024 as we believe the muni asset class presents a strong relative value case at this point in the economic cycle9. From a supply standpoint, issuance was down 3.7% relative to this point last year, which was viewed by many market participants as a light issuance year. We expect a pickup in issuance in 2024 as projected interest rate stability is expected to provide a more favorable market environment for issuers to come to market.
Given this backdrop, we are focusing more on fundamentals and adding marginally to higher credit quality names as opportunities to lock in attractive yields arise. We continue to be constructive on the solid credit fundamentals of the muni market at this point of the cycle. However, we believe that some spread10 widening in the high yield market may take place in 2024 as spreads appear tight across a bevy of sectors. While we expect to retain the Fund’s conservative duration positioning overall, we expect to continue to implement a barbell approach. We believe that investing in the shortest and longest parts of the curve, while underweight in the belly of the curve, may offer the best yield for duration risk.
{foots1}
| 1 | Decisions made by a government, usually through its central bank, regarding the amount of money in circulation in the economy. This includes setting official interest rates. |
{foots1}
| 2 | If the price of a fund moves significantly over a short period of time it is said to be 'volatile' or has 'high volatility'. If the price remains relatively stable, it is said to have 'low volatility'. Volatility can be used as a measure of risk. |
{foots1}
| 3 | A measure of inflation. An index of the cost of all goods and services to a typical consumer. |
{foots1}
| 4 | S&P Global Ratings’ credit ratings express the agency’s opinion about the ability and willingness of an issuer, such as a corporation or state or city government, to meet its financial obligations in full and on time. Typically, ratings are expressed as letter grades that range, for example, from AAA to D to communicate the agency’s opinion of relative level of credit risk. Ratings from AA to CCC may be modified by the addition of a plus (+) or minus (-) sign to show relative standing within the major rating categories. |
{foots1}
| 5 | A portfolio holding less of a particular security (or sector or region) than the security’s weight in the benchmark portfolio. |
{foots1}
| 6 | A measure of the maturity of a bond or portfolio of bonds that takes into account the periodic coupon payments. It attempts to measure market risk, or volatility, in a bond by considering maturity and the time pattern of interest payments prior to repayment. Two bonds with the same term to maturity but different coupon rates will respond differently to changes in interest rates. So will bonds with the same coupon rate but different terms to maturity. The higher the duration, the greater a bond’s price-sensitivity to changes in yield. |
{foots1}
| 7 | An investment strategy where the portfolio is split between securities with short- and long-term maturity dates to balance risk and return. A maturity date is the time when an insurance policy, security, etc. matures. |
{foots1}
| 8 | A portfolio holding more of a particular security (or sector or region) than the security’s weight in the benchmark portfolio. |
{foots1}
| 9 | The recurring and fluctuating levels of economic activity an economy experiences over an extended period of time. |
{foots1}
| 10 | Difference in yield of two fixed income securities with similar maturities but different credit quality. |
abrdn Short Duration High Yield Municipal Fund (Unaudited)
The overall U.S. municipal (muni) bond market gained during the reporting period. The Bloomberg Municipal Bond Index, a broad municipal bond market benchmark, rose 2.26%, while the taxable bond market, as measured by the Bloomberg U.S. Aggregate Bond Index, returned 0.14% for the reporting period.
The period was defined by fluctuating market performances as fears of high inflation, tightening monetary policy1, and the risk of a global recession caused volatility2 with most government bond prices falling during the period. The U.S. Federal Reserve (Fed) was determined to control inflation and did so by hiking the Fed funds rates by 225 basis points over the period, which helped to lower inflation, as the annual Consumer Price Index3 reading fell from 7.1% in November 2022 to 3.2% in October 2023. The slowing of inflation combined with strong growth and a stable labor market has since pushed back expectations for a recession. The resilient growth story along with positive fundaments helped to bolster muni performance for the 12-month reporting period. This is evidenced by the outperformance of the lower credit quality area within the municipal market, where the Bloomberg High Yield Municipal Bond Index returned 3.57% for the period.
Fund performance review
The abrdn Short Duration High Yield Municipal Fund returned 0.25% (Institutional class shares, net of fees) for the 12-month reporting period ended October 31, 2023. This was compared to a 2.03% return for its benchmark, the S&P Municipal Bond Short Intermediate Index, and the 3.74% return of its blended secondary benchmark, comprising 30% Bloomberg 1–10 Year Municipal Bond Index/70% Bloomberg 1–10 Year Municipal High Yield Index.
During the reporting period, the Fund’s exposure to a few select sectors, including hospitals and other revenue, weighed on relative performance. Conversely, the Fund’s exposure to life care, higher education, and local general obligation bonds were key contributors to returns. From a credit-quality perspective, the Fund’s exposure to non-rated4 and BBB bonds hurt relative performance while BB bonds were contributors.
We spent most of the review period extending the portfolio’s relatively short duration5 incrementally. As the belly of the yield curve remained inverted6, we used a barbell7 approach for extending the portfolio’s duration, investing in long duration (12 years and out) and short duration bonds (2 years and in). Over the period, we maintained the Fund’s allocation to high yield and non-rated issues as we believed these securities could perform well, especially those with lower coupons and shorter-maturity profiles.
Market outlook
We have an optimistic outlook for the muni bond market as inflation pressures have continued to abate and the Fed is expected to be nearing an end to its rate increases. However, we are cautious on extending to overweight8 duration within the strategy at this time given the inversion of the yield curve at the front end. Additionally, we feel that the Fed might keep rates at elevated levels for a longer period than is currently being priced into the markets given the existing labor market strength and the overall resilience of U.S. consumption.
In terms of market technicals, overall mutual fund outflows have been persistent through 2023 so far, albeit at a much slower and more manageable pace than in 2022. We expect the pace of outflows to subside in 2024 as we believe the muni asset class presents a strong relative value case at this point in the economic cycle9. From a supply standpoint, issuance was down 3.7% relative to this point last year, which was viewed by many market participants as a light issuance year. We expect a pickup in issuance in 2024 as projected interest rate stability is expected to provide a more favorable market environment for issuers to come to market.
Given this backdrop, we are focusing more on fundamentals and adding marginally to higher credit quality names as opportunities to lock in attractive yields arise. We continue to be constructive on the solid credit fundamentals of the muni market at this point of the cycle. However, we believe that some spread10 widening in the high yield market may take place in 2024, as spreads appear tight across a bevy of sectors. While we expect to retain the Fund’s conservative
{foots1}
| 1 | Decisions made by a government, usually through its central bank, regarding the amount of money in circulation in the economy. This includes setting official interest rates. |
{foots1}
| 2 | If the price of a fund moves significantly over a short period of time it is said to be 'volatile' or has 'high volatility'. If the price remains relatively stable, it is said to have 'low volatility'. Volatility can be used as a measure of risk. |
{foots1}
| 3 | A measure of inflation. An index of the cost of all goods and services to a typical consumer. |
{foots1}
| 4 | S&P Global Ratings’ credit ratings express the agency’s opinion about the ability and willingness of an issuer, such as a corporation or state or city government, to meet its financial obligations in full and on time. Typically, ratings are expressed as letter grades that range, for example, from AAA to D to communicate the agency’s opinion of relative level of credit risk. Ratings from AA to CCC may be modified by the addition of a plus (+) or minus (-) sign to show relative standing within the major rating categories. |
{foots1}
| 5 | A measure of the maturity of a bond or portfolio of bonds that takes into account the periodic coupon payments. It attempts to measure market risk, or volatility, in a bond by considering maturity and the time pattern of interest payments prior to repayment. Two bonds with the same term to maturity but different coupon rates will respond differently to changes in interest rates. So will bonds with the same coupon rate but different terms to maturity. The higher the duration, the greater a bond’s price-sensitivity to changes in yield. |
{foots1}
| 6 | Inverted yield curve - when longer-dated bond yields fall below the yield on shorter-dated bonds. |
{foots1}
| 7 | An investment strategy where the portfolio is split between securities with short- and long-term maturity dates to balance risk and return. A maturity date is the time when an insurance policy, security, etc. matures. |
{foots1}
| 8 | A portfolio holding an excess amount of a particular security (or sector or region) compared to the security’s weight in the benchmark portfolio. |
{foots1}
| 9 | The recurring and fluctuating levels of economic activity an economy experiences over an extended period of time. |
{foots1}
| 10 | Difference in yield of two fixed income securities with similar maturities but different credit quality. |
abrdn Ultra Short Municipal Income Fund (Unaudited)
The overall U.S. municipal (muni) bond market gained during the reporting period. The Bloomberg Municipal Bond Index, a broad municipal bond market benchmark, rose 2.26%, while the taxable bond market, as measured by the Bloomberg U.S. Aggregate Bond Index, returned 0.14% for the reporting period.
The period was defined by fluctuating market performances, as fears of high inflation, tightening monetary policy1, and the risk of a global recession caused volatility2 with most government bond prices falling during the period. The U.S. Federal Reserve (Fed) was determined to control inflation and did so by hiking the Fed funds rates by 225 basis points over the period, which helped to lower inflation, as the annual Consumer Price Index3 reading fell from 7.1% in November 2022 to 3.2% in October 2023. The slowing of inflation combined with strong growth and a stable labor market has since pushed back expectations for a recession. The resilient growth story along with positive fundaments have helped to bolster muni performance for the 12-month reporting period. This is evidenced by the outperformance of the lower credit quality area within the municipal market, where the Bloomberg High Yield Municipal Bond Index returned 3.57% for the period.
Fund performance review
The abrdn Ultra Short Municipal Income Fund returned 3.73% (Institutional class shares, net of fees) for the 12-month reporting period ended October 31, 2023. This was compared to a 2.44% return for its benchmark, the Bloomberg Municipal Bond: 1 Year (1–2) Index, during the same period.
During the reporting period, the Fund’s allocation to industrials and pre-paid gas bonds were key contributors to relative performance. However, the Fund’s exposure to resource recovery bonds detracted from performance. From a yield curve perspective, the short part of the curve generally outperformed the belly of the curve during the 12 months. The Fund’s high concentration in shorter-dated securities contributed positively to performance versus the benchmark. In terms of credit quality, the Fund’s exposure to non-rated4 and BBB bonds added to returns while A bonds were unfavorable.
During the 12-month period, we focused on maintaining the Fund’s duration5 through investment in short-term bonds and variable rate securities. The allocation of capital helped to bolster the Fund’s yield
as well as provide stability in the net asset value (NAV)6 during the volatile periods throughout the year.
Market outlook
We have an optimistic outlook of the muni bond market as inflation pressures have continued to abate and the Fed is expected to be nearing an end to its rate increases. However, we are cautious on extending to overweight7 duration within the strategy at this time given the inversion of the yield curve at the front end and our primary focus on capital preservation. Additionally, we feel that the Fed might keep rates at elevated levels for a longer period than is currently being priced into the markets given the existing labor market strength and the overall resilience of U.S. consumption.
In terms of market technicals, overall mutual fund outflows have been persistent through 2023 so far, albeit at a much slower and more manageable pace than in 2022. We expect the pace of outflows to subside in 2024 as we believe the muni asset class presents a strong relative value case at this point in the economic cycle8. From a supply standpoint, municipal issuance was down 3.7% relative to this point last year, which was viewed by many market participants as a light issuance year. We expect a pickup in issuance in 2024 as projected interest rate stability is expected to provide a more favorable market environment for issuers to come to market.
Given this backdrop, we are focusing more on fundamentals and maintaining credit quality while looking for opportunities to lock in attractive yields as they arise. Retaining the Fund’s conservative duration positioning while focusing on credit fundamentals should result in a more stable NAV throughout an uncertain and volatile market landscape. With a relatively shorter duration over time, we feel the Fund should be insulated from sharp movements in its NAV relative to its peers.
Portfolio Management:
U.S. Municipal Team
PAST PERFORMANCE DOES NOT GUARANTEE FUTURE RESULTS.
The performance data quoted represents past performance and current returns may be lower or higher. Class A Shares are not subject to a front-end sales charge and are subject to a 0.25% 12b-1 fee. Class A1 Shares have up to a
{foots1}
| 1 | Decisions made by a government, usually through its central bank, regarding the amount of money in circulation in the economy. This includes setting official interest rates. |
{foots1}
| 2 | If the price of a fund moves significantly over a short period of time it is said to be 'volatile' or has 'high volatility'. If the price remains relatively stable, it is said to have 'low volatility'. Volatility can be used as a measure of risk. |
{foots1}
| 3 | A measure of inflation. An index of the cost of all goods and services to a typical consumer. |
{foots1}
| 4 | S&P Global Ratings’ credit ratings express the agency’s opinion about the ability and willingness of an issuer, such as a corporation or state or city government, to meet its financial obligations in full and on time. Typically, ratings are expressed as letter grades that range, for example, from AAA to D to communicate the agency’s opinion of relative level of credit risk. Ratings from AA to CCC may be modified by the addition of a plus (+) or minus (-) sign to show relative standing within the major rating categories. |
{foots1}
| 5 | A measure of the maturity of a bond or portfolio of bonds that takes into account the periodic coupon payments. It attempts to measure market risk, or volatility, in a bond by considering maturity and the time pattern of interest payments prior to repayment. Two bonds with the same term to maturity but different coupon rates will respond differently to changes in interest rates. So will bonds with the same coupon rate but different terms to maturity. The higher the duration, the greater a bond’s price-sensitivity to changes in yield. |
{foots1}
| 6 | A key measure of the value of a company, fund or trust – the total value of assets less liabilities, divided by the number of shares. |
{foots1}
| 7 | A portfolio holding an excess amount of a particular security (or sector or region) compared to the security’s weight in the benchmark portfolio. |
{foots1}
| 8 | The recurring and fluctuating levels of economic activity an economy experiences over an extended period of time. |
Notes to Financial Statements (continued)
October 31, 2023
n.
| Issuer Risk |
| | The value of a security may decline for reasons directly related to the issuer, such as management performance, financial leverage and reduced demand for the issuer's goods or services. |
o.
| Management Risk |
| | Each Fund is subject to the risk that the Adviser or Subadviser (as applicable) may make poor security selections. The Adviser, Subadviser and their portfolio managers apply their own investment techniques and risk analyses in making investment decisions for a Fund and there can be no guarantee that these decisions will achieve the desired results for a Fund. In addition, the Adviser or Subadviser may select securities that underperform the relevant market or other funds with similar investment objectives and strategies. |
p.
| Market Risk |
| | Deteriorating market conditions might cause a general weakness in the market that reduces the prices, or yield, of securities in that market. Developments in a particular class of bonds or the stock market could also adversely affect a Fund by reducing the relative attractiveness of bonds or stocks as an investment. Also, to the extent that a Fund emphasizes bonds or stocks from any given industry, it could be hurt if that industry does not do well. Additionally, a Fund could lose value if the individual stocks in which it maintains long positions and/or the overall stock markets on which the stocks trade decline in price. In addition, a Fund that engages in short sales could lose value if the individual stocks which they sell short increase in price. Stocks and stock markets may experience short-term volatility (price fluctuation) as well as extended periods of price decline or increase. Individual stocks are affected by many factors, including: |
| • | corporate earnings; |
| • | production; |
| • | management; |
| • | sales; and |
| • | market trends, including investor demand for a particular type of stock, such as growth or value stocks, small or large stocks, or stocks within a particular industry. |
Stock markets are affected by numerous factors, including interest rates, the outlook for corporate profits, the health of the national and world economies, the fluctuation of other stock markets around the world, and financial, economic and other global market developments and disruptions, such as those arising from war, terrorism, market manipulation, government interventions, defaults and shutdowns, political changes or diplomatic developments, public health emergencies and natural/environmental disasters. In addition, any spread of an infectious illness, public health threat or similar issue could reduce consumer demand or economic output, result in market closures, travel restrictions or quarantines, and generally have a significant impact on the world economy, which in turn could adversely affect the Fund’s investments.
In addition, as noted above, uncertainties remain relating to certain aspects of the United Kingdom’s future economic, trading and legal relationships with the European Union and with other countries.
Whether or not a Fund invests in securities of issuers located in Europe (whether the EU, Eurozone or UK) or with significant exposure to European, EU, Eurozone or UK issuers or countries, the unavoidable uncertainties and events related to Brexit could negatively affect the value and liquidity of a Fund’s investments, increase taxes and costs of business and cause volatility in currency exchange rates and interest rates.
Economies and financial markets throughout the world are becoming increasingly interconnected. Economic, financial or political events, trading and tariff arrangements, war, terrorism, natural disasters, public health issues like pandemics or epidemics, and other circumstances in one country or region could have profound impacts on global economies or markets. As a result, whether or not a Fund invests in securities of issuers located in or with significant exposure to countries experiencing economic and financial difficulties, the value and liquidity of the Fund’s investments may be negatively affected by such events. In addition, as described above under “Foreign Securities Risk,” the ongoing military conflict between Russia and Ukraine may continue to result in significant negative impacts on the markets for certain securities and commodities globally, in addition to fluctuating pricing and liquidity of investments. These factors could have a significant impact on Fund performance and the value of the Funds’ investments. The impact of these measures, and whether they will be effective to mitigate the economic and market disruption, will not be known for some time.
q.
| Municipal Securities Risk |
| | The Intermediate Municipal Income Fund, Short Duration High Yield Municipal Fund and Ultra Short Municipal Income Fund (the “Municipal Funds”) are subject to municipal securities risk. Municipal bonds can be significantly affected by political and economic changes, including inflation, as well as uncertainties in the municipal market related to taxation, legislative changes, or the rights of municipal security holders. |
Report of Independent Registered Public Accounting Firm
To the Shareholders and Board of Trustees
abrdn Funds:
Opinion on the Financial Statements
We have audited the accompanying statements of assets and liabilities of abrdn High Income Opportunities Fund (formerly, abrdn Global High Income Fund), abrdn Infrastructure Debt Fund (formerly, abrdn Global Absolute Return Strategies Fund), abrdn Intermediate Municipal Income Fund, abrdn Short Duration High Yield Municipal Fund, and abrdn Ultra Short Municipal Income Fund, five of the funds comprising abrdn Funds (each, a Fund and collectively, the Funds), including the statements of investments, as of October 31, 2023, the related statements of operations for the year then ended, the statements of changes in net assets for each of the years in the two-year period then ended, and the related notes (collectively, the financial statements) and the financial highlights for each of the years in the five-year period then ended. In our opinion, the financial statements and financial highlights present fairly, in all material respects, the financial position of the Funds as of October 31, 2023, the results of their operations for the year then ended, the changes in their net assets for each of the years in the two-year period then ended, and the financial highlights for each of the years in the five-year period then ended, in conformity with U.S. generally accepted accounting principles.
Basis for Opinion
These financial statements and financial highlights are the responsibility of the Funds' management. Our responsibility is to express an opinion on these financial statements and financial highlights based on our audits. We are a public accounting firm registered with the Public Company Accounting Oversight Board (United States) (PCAOB) and are required to be independent with respect to the Funds in accordance with the U.S. federal securities laws and the applicable rules and regulations of the Securities and Exchange Commission and the PCAOB.
We conducted our audits in accordance with the standards of the PCAOB. Those standards require that we plan and perform the audit to obtain reasonable assurance about whether the financial statements and financial highlights are free of material misstatement, whether due to error or fraud. Our audits included performing procedures to assess the risks of material misstatement of the financial statements and financial highlights, whether due to error or fraud, and performing procedures that respond to those risks. Such procedures included examining, on a test basis, evidence regarding the amounts and disclosures in the financial statements and financial highlights. Such procedures also included confirmation of securities owned as of October 31, 2023, by correspondence with custodians and brokers; when replies were not received from brokers, we performed other auditing procedures. Our audits also included evaluating the accounting principles used and significant estimates made by management, as well as evaluating the overall presentation of the financial statements and financial highlights. We believe that our audits provide a reasonable basis for our opinion.

We have served as the auditor of one or more abrdn investment companies since 2009.
Philadelphia, Pennsylvania
December 28, 2023
Shareholder Expense Examples (Unaudited)
As a shareholder of the abrdn Funds, you incur two types of costs: (1) transaction costs, including sales charges (loads) paid on purchase payments and (2) ongoing costs, including investment advisory fees, administration fees, transfer agent out-of-pocket expenses, distribution fees and other Fund expenses. The examples below are intended to help you understand your ongoing costs (in dollars) of investing in the abrdn Funds and to compare these costs with the ongoing costs of investing in other mutual funds.
The examples assume that you had a $1,000 investment in the Class at the beginning of the reporting period, May 1, 2023 and continued to hold your shares at the end of the reporting period, October 31, 2023.
Actual Expenses
The table below provides information about actual account values and actual expenses. You may use the information together with the amount you invested, to estimate the expenses that you paid over the period. Simply divide your account value by $1,000 (for example, an $8,600 account value divided by $1,000 = 8.6), then multiply the result by the number under the heading entitled “Actual Expenses Paid During Period” for the class of a Fund that you own to estimate the expenses you paid on your account during the period.
Hypothetical Example for Comparison Purposes
The table below provides information about hypothetical account values and hypothetical expenses based on the Class’ actual expense ratio and an assumed rate of return of 5% per year before expenses, which is not the Class’ actual return. The hypothetical account values and expenses may not be used to estimate the actual ending account balance or expenses you paid for the period. You may use this information to compare the ongoing costs of investing in the Class of a Fund and other funds. To do so, compare the 5% hypothetical example with the 5% hypothetical examples that appear in the shareholder reports of the other funds.
Please note that the expenses shown in the table are meant to highlight your ongoing costs only and do not reflect any transaction costs, such as sales charges (loads). Therefore, the information for each Class in the table is useful in comparing ongoing costs only, and will not help you determine the relative total costs of owning different funds. In addition, if these transaction costs were included, your costs would have been higher. The examples also assume all dividends and distributions have been reinvested.
| | | Beginning Account
Value,
May 1, 2023 | Actual
Ending Account
Value,
October 31, 2023 | Hypothetical
Ending Account
Value | Actual Expenses
Paid During
Period1 | Hypothetical
Expenses
Paid During
Period1,2 | Annualized
Expense
Ratio** |
| High Income Opportunities Fund | Class A
| $1,000.00 | $996.50 | $1,020.16 | $5.03 | $5.09 | 1.00% |
| | Institutional Class
| $1,000.00 | $998.30 | $1,021.43 | $3.78 | $3.82 | 0.75% |
| Infrastructure Debt Fund | Class A
| $1,000.00 | $926.50 | $1,019.91 | $5.10 | $5.35 | 1.05% |
| | Institutional Service Class
| $1,000.00 | $927.30 | $1,021.22 | $3.84 | $4.02 | 0.79% |
| | Institutional Class
| $1,000.00 | $927.80 | $1,021.88 | $3.21 | $3.36 | 0.66% |
| Intermediate Municipal Income Fund | Class A
| $1,000.00 | $954.30 | $1,021.12 | $3.99 | $4.13 | 0.81% |
| | Institutional Service Class
| $1,000.00 | $954.70 | $1,022.53 | $2.61 | $2.70 | 0.53% |
| | Institutional Class
| $1,000.00 | $954.70 | $1,022.64 | $2.51 | $2.60 | 0.51% |
| Short Duration High Yield Municipal Fund | Class A
| $1,000.00 | $972.70 | $1,020.62 | $4.52 | $4.63 | 0.91% |
| | Class C
| $1,000.00 | $969.00 | $1,016.84 | $8.24 | $8.44 | 1.66% |
| | Institutional Class
| $1,000.00 | $973.90 | $1,021.88 | $3.28 | $3.36 | 0.66% |
| Ultra Short Municipal Income Fund | Class A
| $1,000.00 | $1,018.10 | $1,021.68 | $3.56 | $3.57 | 0.70% |
| | Class A1
| $1,000.00 | $1,018.10 | $1,021.68 | $3.56 | $3.57 | 0.70% |
| | Institutional Class
| $1,000.00 | $1,019.40 | $1,022.94 | $2.29 | $2.29 | 0.45% |
| ** | The expense ratio presented represents a six-month, annualized ratio. |
| 1 | Expenses are equal to the Fund’s annualized expense ratio multiplied by the average account value over the period multiplied by 184/365 (to reflect the one-half year period). |
| 2 | Represents the hypothetical 5% return before expenses. |
Supplemental Information (Unaudited)
Board of Trustees’ Consideration of Advisory and Sub-Advisory Agreements
At a regularly scheduled quarterly meeting (the “Quarterly Meeting”) of the Board of Trustees (the “Board” or the “Trustees”) of the abrdn Funds (the “Trust”) held on June 13, 2023, the Board, including a majority of the Trustees who are not considered to be “interested persons” of the Trust (the “Independent Trustees”) under the Investment Company Act of 1940, as amended (the “1940 Act”), approved for an annual period the continuation of the Trust’s advisory agreement (the “Advisory Agreement”) with abrdn Inc. (“AI”) and the applicable sub-advisory agreement (the “Sub-Advisory Agreement,” and collectively with the Advisory Agreement, the “Agreements”) by and among the Trust, AI and abrdn Investments Limited (“aIL” or the “Sub-Adviser”) for each of the following series of the Trust: abrdn Global Absolute Return Strategies Fund (effective August 18, 2023, renamed abrdn Infrastructure Debt Fund), abrdn Intermediate Municipal Income Fund, abrdn Short Duration High Yield Municipal Fund, abrdn Ultra Short Municipal Income Fund, and abrdn Global High Income Fund (effective August 18, 2023, renamed abrdn High Income Opportunities Fund) (each a “Fund,” and collectively the “Funds”). In addition, the Independent Trustees held a separate telephonic meeting on June 7, 2023 and a separate in-person meeting on June 12, 2023 (together with the Quarterly Meeting held on June 13, 2023, the “Meetings”) to review the materials provided and the relevant legal considerations. aIL is an affiliate of AI. AI and the Sub-Adviser are sometimes referred to collectively as the “Advisers” or “abrdn.”
In connection with their consideration of whether to approve the continuation of the Agreements, the Board members received and reviewed a variety of information provided by the Advisers relating to the Funds, the Agreements and the Advisers, including information regarding the nature, extent and quality of services provided by the Advisers under the respective Agreements, comparative investment performance, fee and expense information of peer groups of funds for respective Funds (each a “Peer Group,” and collectively the “Peer Groups”) selected by Institutional Shareholder Services Inc. (“ISS”), an independent third-party provider of investment company data and other performance information for relevant benchmark indices. The materials provided to the Board generally included, among other items: (i) information on the Funds’ advisory fees and other expenses, including information comparing each Fund’s expenses to those of the respective Peer Group and information about any applicable expense limitations and fee “breakpoints”; (ii) information about the profitability of the Agreements to the Advisers; (iii) information on the investment performance of the Funds and the performance of the Funds’ respective Peer Groups and the Funds’ performance benchmarks; (iv) a report prepared by the Advisers in response to a request submitted by the Independent Trustees’ independent legal counsel on behalf of such Trustees; and (v) a memorandum from the Independent Trustees’ independent legal counsel on the responsibilities of the Board in considering for approval the investment advisory and investment sub-advisory arrangements under the 1940 Act and Delaware law.
The Board, including the Independent Trustees, also considered other matters such as: (i) the Advisers’ investment personnel and operations; (ii) the Advisers’ financial stability and financial condition; (iii) the resources devoted by the Advisers to the Fund; (iv) each Fund’s investment objective and strategies; (v) the Advisers’ record of compliance with the Funds’ investment policies and restrictions, policies on personal securities transactions and other compliance policies; (vi) arrangements relating to the distribution of the Funds’ shares and the related costs; and (vii) possible conflicts of interest. The Board also considered the nature, extent and quality of the services provided to the Funds by AI’s affiliates. Throughout the process, the Trustees were afforded the opportunity to ask questions of and request additional information from AI and the Sub-Adviser.
The Board also noted that, in addition to the materials requested by the Trustees in connection with their annual consideration of the continuation of the Agreements, the Trustees received and reviewed materials in advance of each regular quarterly meeting of the Board that contained information relating to the services provided by the Advisers, including detailed information about each Fund’s investment performance. This information generally included, among other things, third-party performance rankings for various periods (including, as applicable, periods prior to the Advisers’ management of the Funds) comparing each Fund against its respective Peer Group, total return information for the Funds for various periods, and details of sales and redemptions of Fund shares for the period. The Board also received periodic presentations from the portfolio management teams in connection with the performance of the Funds.
The Independent Trustees were advised by separate independent legal counsel throughout the process. The Independent Trustees also consulted in executive sessions with their independent legal counsel regarding consideration of the continuation of the Agreements. In considering whether to approve the continuation of the Agreements, the Board of Trustees, including the Independent Trustees, did not identify any single factor as determinative. Individual Trustees may have evaluated the information presented differently from one another, giving different weights to various factors. Matters considered by the Trustees, including the Independent Trustees, in connection with their approval of the continuation of the Agreements included the factors listed below.
The costs of the services provided and profits realized by the Advisers and their affiliates from their relationships with the Funds. The Trustees considered the fees charged to the Funds for advisory services as well as the total expense levels of the Funds. This information included comparisons (provided by ISS) of each Fund’s net management fee and total expense level to those of its expense Peer Group and information about the advisory fees charged by AI and abrdn to any separately managed and other accounts with a similar strategy. In reviewing the comparison of each Fund’s net management fee to that of comparable funds, the Board noted that the fee for the Funds includes both advisory and administrative fees. In evaluating the Funds’ advisory fees, the Trustees considered the demands, complexity and quality of the investment management of the Funds. In considering the fees charged by AI to any comparable accounts, the Trustees also considered, among other things, management’s discussion of the different investment restrictions, objectives or policies that may be involved in managing accounts of different types.
Supplemental Information (Unaudited) (continued)
The Trustees also noted that the sub-advisory fees, as applicable, for the Funds would not be paid by the Funds, but would be paid by AI out of its advisory fee. The Board also considered that AI had entered into or renewed expense limitation agreements with each of the Funds, pursuant to which AI agreed to waive a portion of its advisory fee and/or reimburse certain expenses as a means of limiting each Fund’s total annual operating expenses for a period of time.
The Trustees also considered the compensation AI and its affiliates received, directly and indirectly, from their relationships with the Funds. The Trustees reviewed information provided by management as to the profitability of AI and its affiliates’ relationships with the Funds, including the engagement of affiliates of AI to provide administrative and distribution services to the Funds. The Trustees also considered information about the allocation of expenses used to calculate profitability. When reviewing profitability, the Trustees also considered information about the expense levels of the Funds, the performance of the Funds, court cases regarding adviser profitability, and whether AI had implemented breakpoints and expense limitations with respect to the Funds. The Trustees also examined the profitability of AI and its affiliates on a Fund-by-Fund basis.
After reviewing these and related factors, including taking into account management’s discussion regarding Fund expenses, the Board concluded that the advisory fees, and as applicable, the sub-advisory fees, were fair and reasonable, and that the costs of these services generally and the related profitability of AI and its affiliates from their relationships with the Funds were reasonable and supported the continuation of the Agreements.
Investment performance of the Funds and the Advisers. The Trustees received and reviewed with the Advisers, among other performance data, information about the performance of the Funds over various time periods, including information that compared the performance of the Funds to the performance of respective Peer Groups and each Fund’s performance benchmark. The Trustees also considered the performance of the Funds compared to the performance of comparable funds or accounts managed by AI and its affiliates to the extent available. In addition, the Trustees also reviewed data prepared by ISS that analyzed the performance of the Funds using a variety of performance metrics.
The Trustees also considered, as applicable, the performance of the Advisers since they commenced management of the Funds. The Trustees also considered AI’s and the Sub-Adviser’s performance generally, the performance of the fund family generally, the historical responsiveness of AI to Trustee concerns about performance, and the willingness of AI and the Sub-Adviser to take steps intended to improve performance.
Based on these factors, the Board determined that the Advisers are appropriate investment advisers for the Funds. The Board noted that it would continue to monitor the Funds’ performance and any actions taken by AI and its affiliates relating to performance.
The nature, extent and quality of the services provided to the Funds under the Agreements. The Trustees considered the nature, extent and quality of the services provided by AI and the Sub-Adviser, as applicable, to the Funds and the resources dedicated to the Funds by AI and its affiliates. The Board considered the Advisers’ risk management processes. The Board also considered the background and experience of the Advisers’ senior management personnel and the qualifications, background and responsibilities of the portfolio managers that are primarily responsible for the day-to-day portfolio management services for the Funds. AI’s role in coordinating the activities of the Trust’s other service providers was also considered. The Board also considered the allocation of responsibilities among the Advisers. The Board also considered that it receives information on a regular basis from the Trust’s Chief Compliance Officer regarding the Advisers’ compliance policies and procedures. The Board was also mindful of the Advisers’ focus on the monitoring of the performance of the Funds and in addressing performance matters. The Trustees considered not only the advisory services provided by AI to the Funds, but also the administrative services provided by AI to the Funds under a separate administration agreement. The Trustees also took into account the Advisers’ investment experience. The Trustees also considered the benefits to shareholders of investing in a mutual fund that is part of a family of funds that offers shareholders the right to exchange shares of one type of fund for shares of another type of fund, and provides a variety of fund and shareholder services. The Board also took into account its knowledge of management and the quality of the performance of management’s duties through Board meetings, discussion and reports during the preceding year.
After reviewing these and related factors, the Board concluded that the nature, extent and quality of the services provided supported the continuation of the Agreements.
Economies of Scale. The Trustees considered the existence of any economies of scale in the provision of services by AI and the Sub-Adviser and whether those economies would be shared with the Funds through breakpoints in the investment advisory fees or other means, such as expense waivers or limitations. The Board noted management’s discussion of the Funds’ advisory fee structures. The Trustees noted that each of the Funds was subject to a contractual expense limitation agreement and considered that certain Funds were subject to breakpoints in their investment advisory fees. The Board also considered how the Funds’ potential future growth and increased size would have an effect on fees, noting that if a Fund’s assets increase over time, the Fund may realize other economies of scale if assets increase at a proportionally higher rate than the increase in certain expenses. The Trustees also took note of the costs of the services provided and the profitability to AI and its affiliates from their relationships with the Funds, as discussed above.
After reviewing these and related factors, the Board concluded that the advisory fees, and as applicable, sub-advisory fees were reasonable and supported the continuation of the Agreements.
The Trustees also considered other factors, which included but were not limited to the following:
| • | the nature, quality, cost and extent of administrative services performed by AI under the Advisory Agreement and under a separate agreement covering administrative services. |
Item 2. Code of Ethics.
(a) As of October 31, 2023, the Registrant had adopted a code of ethics that applies to the Registrant’s principal executive officer, principal financial officer, principal accounting officer or controller, or persons performing similar functions, regardless of whether these individuals are employed by the Registrant or a third party (the “Code of Ethics”).
(c) There have been no amendments during the period covered by this report to a provision of the Code of Ethics.
(d) During the period covered by the report, the Registrant did not grant any waivers to the provisions of the Code of Ethics.
(f) The Code of Ethics is included with this Form N-CSR as Exhibit 13(a)(1).
Item 3. Audit Committee Financial Expert.
The Registrant’s Board of Trustees has determined that there is at least one member who qualifies as an “audit committee financial expert” serving on its Audit Committee. Mr. Rahn K. Porter is the “audit committee financial expert” and is considered to be an “Independent Trustee” as each term is defined in Item 3 of Form N-CSR.
Item 4. Principal Accountant Fees and Services.
Fiscal
Year Ended | | | (a)
Audit Fees | | | (b)
Audit-Related Fees | | | (c)1
Tax Fees | | | (d)
All Other Fees | |
| October 31, 2023 | | | $ | 713,500 | | | $ | 0 | | | $ | 0 | | | $ | 4,664 | |
| October 31, 2022 | | | $ | 690,310 | | | $ | 0 | | | $ | 0 | | | $ | 7,929 | |
1 The Tax Fees are for the completion of the Registrant’s federal and state tax returns.
(e)(1) Pre-Approval Policies and Procedures. Except as permitted by Rule 2-01(c)(7)(i)(C) of Regulation S-X, the Registrant’s (hereinafter, the “Trust”) Audit Committee Charter authorizes the Audit Committee (“Committee”) to annually select, retain or terminate the Trust’s independent auditor and, in connection therewith, to evaluate the terms of the engagement and the qualifications and independence of the independent auditor, including whether the independent auditor provides any consulting, auditing or tax services to the investment adviser (hereinafter, the “Adviser”) or a sub-adviser, and to receive the independent auditor’s specific representations as to their independence, delineating all relationships between the independent auditor and the Trust, consistent with PCAOB 3526 or any other applicable auditing standard. PCAOB Rule 3526 requires that, at least annually, the auditor: (1) disclose to the Committee in writing all relationships between the auditor and its related entities and the Trust and its related entities that in the auditor’s professional judgment may reasonably be thought to bear on independence; (2) confirm in its letter that, in its professional judgment, it is independent of the Trust within the meaning of the Securities Acts administered by the SEC; and (3) discuss the auditor’s independence with the Committee. The Committee is responsible for actively engaging in a dialogue with the independent auditor with respect to any disclosed relationships or services that may impact the objectivity and independence of the independent auditor and for taking, or recommending that the full Board take, appropriate action to oversee the independence of the independent auditor. The Committee is also authorized to review in advance, and consider approval of, any and all proposals by management or the Adviser that the Trust, Adviser or their affiliated persons, employ the independent auditor to render “permissible non-audit services” to the Trust and to consider whether such services are consistent with the independent auditor’s independence. The Committee may delegate to one or more of its members (“Delegates”) authority to pre-approve permissible non-audit services to be provided to the Trust. Any pre-approval determination of a Delegate shall be presented to the full Committee at its next meeting. The Committee shall communicate any pre-approval made by it or a Delegate to the Adviser, who will ensure that the appropriate disclosure is made in the Trust’s periodic reports required by Section 30 of the Investment Company Act of 1940, as amended, and other documents as required under the federal securities laws.
(e)(2) None of the services described in each of paragraphs (b) through (d) of this Item involved a waiver of the pre-approval requirement by the Audit Committee pursuant to Rule 2-01 (c)(7)(i)(C) of Regulation S-X.
(f) Not applicable.
(g) The aggregate non-audit fees billed by the Registrant’s accountant for services to the Registrant and to the Registrant’s investment adviser and all entities controlling, controlled by, or under common control with the Adviser that provide services to the Registrant for the Registrant’s fiscal years ended October 31, 2022 and October 31, 2021 and were $1,108,929 and $1,547,556, respectively.
(h) The Registrant’s Audit Committee of the Board of Trustees has considered whether the provision of non-audit services that were rendered to the Registrant’s investment adviser (not including any sub-adviser whose role is primarily portfolio management and is subcontracted with or overseen by another investment adviser), and any entity controlling, controlled by, or under common control with the investment adviser that provides ongoing services to the Registrant that were not pre-approved pursuant to paragraph (c)(7)(ii) or Rule 2-01 of Regulation S-X is compatible with maintaining the principal accountant’s independence and has concluded that it is.
Item 5. Audit Committee of Listed Registrants.
Not applicable.
Item 6. Investments.
(a) Included as part of the Reports to Shareholders filed under Item 1 of this Form N-CSR.
(b) Not applicable.
Item 7. Disclosure of Proxy Voting Policies and Procedures for Closed-End Management Investment Companies.
Not applicable.
Item 8. Portfolio Managers of Closed-End Management Investment Companies.
Not applicable.
Item 9. Purchases of Equity Securities by Closed-End Management Investment Company and Affiliated Purchasers.
Not applicable.
Item 10. Submission of Matters to a Vote of Security Holders.
During the period ended October 31, 2023, there were no material changes to the procedures by which shareholders may recommend nominees to the Registrant’s Board of Trustees.
Item 11. Controls and Procedures.
(a) The Registrant’s principal executive and principal financial officers, or persons performing similar functions, have concluded that the Registrant’s disclosure controls and procedures (as defined in Rule 30a-3(c) under the Investment Company Act of 1940 (the “Act”) (17 CFR 270.30a-3(c))) are effective, as of a date within 90 days of the filing date of the report that includes the disclosure required by this paragraph, based on the evaluation of these controls and procedures required by Rule 30a-3(b) under the Act (17 CFR 270.30a3(b)) and Rule 13a-15(b) or 15d-15(b) under the Securities Exchange Act of 1934 (17 CFR 240.13a-15(b) or 240.15d15(b)).
(b) There were no changes in the Registrant’s internal control over financial reporting (as defined in Rule 30a-3(d) under the Act (17 CFR 270.30a-3(d))) that occurred during the second fiscal quarter of the period covered by this report that have materially affected, or are reasonably likely to materially affect, the Registrant’s internal control over financial reporting. However, subsequent to the Registrant’s last fiscal year, a control enhancement has been implemented so that, for abrdn Global Equity Impact Fund and abrdn International Sustainable Leaders Fund, the liability to the Internal Revenue Service on behalf of shareholders related to Article 63 EU Tax Reclaims is measured consistent with the terms of the agreement governing such liability.
Item 12. Disclosure of Securities Lending Activities for Closed-End Management Investment Companies.
Not applicable.
Item 13. Exhibits.
(a)(1) The Code of Ethics of the Registrant for the period covered by this report as required pursuant to Item 2 of this Form N-CSR.
(a)(2) Certifications of the Registrant pursuant to Rule 30a-2(a) under the Act are exhibits to this report.
(a)(3) Not applicable.
(a)(4) Not applicable.
(b) Certifications of the Registrant pursuant to Rule 30a-2(b) under the Act are exhibits to this report.