UNITED STATES
SECURITIES AND EXCHANGE COMMISSION
WASHINGTON, D.C. 20549
FORM N-CSR
CERTIFIED SHAREHOLDER REPORT OF REGISTERED
MANAGEMENT INVESTMENT COMPANIES
Investment Company Act file number 811-22137
| Oppenheimer Master Loan Fund, LLC |
(Exact name of registrant as specified in charter)
| 6803 South Tucson Way, Centennial, Colorado 80112-3924 |
(Address of principal executive offices) (Zip code)
Arthur S. Gabinet OppenheimerFunds, Inc. Two World Financial Center, New York, New York 10281-1008 |
(Name and address of agent for service)
Registrant’s telephone number, including area code: (303) 768-3200
Date of fiscal year end: September 30
Date of reporting period: 9/28/2012
Item 1. Reports to Stockholders.
September 30, 2012
Oppenheimer Master Loan Fund, LLC |
Annual Report |

ANNUAL REPORT
Listing of Top Holdings
Fund Performance Discussion
Financial Statements

Portfolio Managers
Margaret Hui
Joseph Welsh
Shares of Oppenheimer Master Loan Fund, LLC are issued solely in private placement transactions that do not involve any “public offering” within the meaning of Section 4(2) of the Securities Act of 1933, as amended (the “Securities Act”). Investments in the Fund may only be made by certain “accredited investors” within the meaning of Regulation D under the Securities Act, including other investment companies. This report does not constitute an offer to sell, or the solicitation of an offer to buy, any interests in the Fund.
Shares of Oppenheimer funds are not deposits or obligations of any bank, are not guaranteed by any bank, are not insured by the FDIC or any other agency, and involve investment risks, including the possible loss of the principal amount invested.
| 2 | OPPENHEIMER MASTER LOAN FUND, LLC |
PERFORMANCE
| Average Annual Total Returns | ||||
| For the Periods Ended 9/28/12 | ||||
| 1-Year | Since Inception (10/31/07) | |||
| 11.42% | 5.29 | % | ||
The Fund’s benchmark, the Credit Suisse Leveraged Loan Index,1 returned 10.73% for the 12 months ended September 30, 2012.
The performance data quoted represents past performance, which does not guarantee future results. The investment return and principal value of an investment in the Fund will fluctuate so that an investor’s shares, when redeemed, may be worth more or less than their original cost. Current performance may be lower or higher than the performance quoted. Returns do not consider capital gains or income taxes on an individual’s investment. September 28, 2012 was the last business day of the Fund’s fiscal year. See Note 1 of the accompanying Notes to Financial Statements. Index returns are calculated through September 30, 2012. See page 6 for further performance information.
1. The Credit Suisse Leveraged Loan Index is a representative index of tradable, senior secured, U.S. dollar-denominated, non-investment-grade loans. Indices cannot be purchased directly by investors. Index performance is shown for illustrative purposes only and does not predict or depict the performance of the Fund.
| 3 | OPPENHEIMER MASTER LOAN FUND, LLC |
Top Ten Corporate Loans Industries | ||||
Media | | 12.1 | % | |
Commercial Services & Supplies | | 11.6 | | |
Hotels, Restaurants & Leisure | | 6.3 | | |
Health Care Providers & Services | | 5.3 | | |
Health Care Equipment & Supplies | | 4.6 | | |
Electrical Equipment | | 4.0 | | |
Chemicals | | 3.8 | | |
Aerospace & Defense | | 2.9 | | |
Auto Components | | 2.8 | | |
| Diversified Telecommunication Services | 2.7 | |||
| Portfolio holdings and allocations are subject to change. Percentages are as of September 28, 2012, and are based on net assets. | ||||
Credit Rating Breakdown | NRSRO Only Total | |||
AAA | | 3.6% | | |
BBB | | 1.1 | | |
BB | | 33.8 | | |
B | | 53.4 | | |
CCC | | 5.4 | | |
CC | | 0.6 | | |
C | | 0.1 | | |
| Unrated | 2.0 | |||
| Total | 100.0% | |||
| The percentages above are based on the market value of the Fund’s securities as of September 28, 2012, and are subject to change. Except for securities labeled “Unrated,” and except for certain securities issued or guaranteed by a sovereign entity, all securities have been rated by at least one Nationally Recognized Statistical Rating Organization (“NRSRO”), such as Standard & Poor’s (“S&P”). For securities rated only by an NRSRO other than S&P, OppenheimerFunds, Inc. converts that rating to the equivalent S&P rating. If two or more NRSROs have assigned a rating to a security, the highest S&P equivalent rating is used. Unrated securities issued or guaranteed by a foreign sovereign are assigned a credit rating equal to the highest NRSRO rating assigned to that foreign sovereign. Fund assets invested in Oppenheimer Institutional Money Market Fund are assigned that fund’s S&P rating, which is currently AAA. For the purposes of this table, “investment-grade” securities are securities rated within the NRSROs’ four highest rating categories, which include AAA, AA, A and BBB. Unrated securities do not necessarily indicate low credit quality, and may or may not be the equivalent of investment-grade. Please consult the Fund’s prospectus and Statement of Additional Information for further information. | ||||
| 4 | OPPENHEIMER MASTER LOAN FUND, LLC |
How has the Fund performed? Below is a discussion of the Fund’s performance during the reporting period ended September 28, 2012, followed by a graphical comparison of the Fund’s performance to an appropriate broad-based market index.
Management’s Discussion of Fund Performance. Over the 12-month period, Oppenheimer Master Loan Fund, LLC produced a total return of 11.42%, outperforming the Credit Suisse Leveraged Loan Index, which returned 10.73%. Bank loans generally participated fully in the market upturns this period, and they held up better than other high yield bonds during the downturns.
Most sectors produced positive returns for the Fund this period, particularly loans from issuers in the financial and forest products industries. The financials sector benefited from modestly overweight exposure and strong credit selections, including a number of prime mortgage servicing companies. The Fund also benefited from the forest products sector due to an overweight and credit picks.
While there were few detractors from performance, the aerospace-defense sector delivered relatively disappointing contributions to Fund performance partly due to a potential sequestration and a winding down of operations in Iraq and Afghanistan. Additionally, a handful of holdings in the diversified media and utilities industries were purchased at prices below our estimate of their intrinsic values and have not yet appreciated to levels that we believe reflect their underlying fundamental strengths.
Despite heightened market volatility, we maintained an investment posture we considered neither aggressive nor defensive; instead, the Fund’s generally neutral stance reflected a balance between economically sensitive issuers and those traditionally considered defensive.
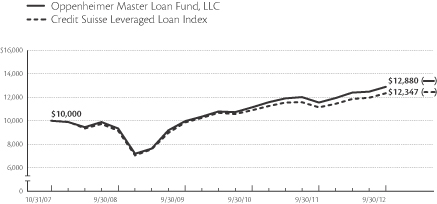
Comparing the Fund’s performance to the Market. The graph that follows shows the performance of a hypothetical $10,000 investment in shares of the Fund held until September 28, 2012. Performance is measured from the inception of the Fund on October 31, 2007. The Fund’s performance reflects reinvestment of all dividends and capital gains distributions. Past performance cannot guarantee future results.
The Fund’s performance is compared to the Credit Suisse Leveraged Loan Index, a representative index of tradable, senior secured, U.S. dollar-denominated, non-investment-grade loans. The Index is unmanaged and cannot be purchased directly by investors. Index performance is shown for illustrative purposes only and does not predict or depict the performance of the Fund. While index comparisons may be useful to provide a benchmark for the Fund’s performance, it must be noted that the Fund’s investments are not limited to securities comprising the index.
| 5 | OPPENHEIMER MASTER LOAN FUND, LLC |
FUND PERFORMANCE DISCUSSION
Comparison of Change in Value of $10,000 Hypothetical Investments in:
Average Annual Total Returns of the Fund at 9/28/12
1-Year 11.42% Since Inception (10/31/07) 5.29%
The performance data quoted represents past performance, which does not guarantee future results. The investment return and principal value of an investment in the Fund will fluctuate so that an investor’s shares, when redeemed, may be worth more or less than their original cost. Current performance may be lower or higher than the performance quoted. Returns do not consider capital gains or income taxes on an individual’s investment. September 28, 2012 was the last business day of the Fund’s fiscal year. See Note 1 of the accompanying Notes to Financial Statements. Index returns are calculated through September 30, 2012. See page 7 for further information.
| 6 | OPPENHEIMER MASTER LOAN FUND, LLC |
NOTES
The Fund’s returns in the graph do not reflect the deduction of income taxes on an individual’s investment. Taxes may reduce any gains you may realize if you sell your shares.
Shares of Oppenheimer Master Loan Fund, LLC are issued solely in private placement transactions that do not involve any “public offering” within the meaning of Section 4(2) of the Securities Act of 1933, as amended (the “Securities Act”). Investments in the Fund may only be made by certain “accredited investors” within the meaning of Regulation D under the Securities Act, including other investment companies. This report does not constitute an offer to sell, or the solicitation of an offer to buy, any interests in the Fund.
The Fund’s investment strategy and focus can change over time. The mention of specific fund holdings does not constitute a recommendation by OppenheimerFunds, Inc.
The Fund commenced operations on 10/31/07.
| 7 | OPPENHEIMER MASTER LOAN FUND, LLC |
Fund Expenses. As a shareholder of the Fund, you incur ongoing costs, including management fees; distribution and service fees; and other Fund expenses. These examples are intended to help you understand your ongoing costs (in dollars) of investing in the Fund and to compare these costs with the ongoing costs of investing in other mutual funds.
The examples are based on an investment of $1,000.00 invested at the beginning of the period and held for the entire 6-month period ended September 28, 2012.
Actual Expenses. The first section of the table provides information about actual account values and actual expenses. You may use the information in this section, together with the amount you invested, to estimate the expense that you paid over the period. Simply divide your account value by $1,000.00 (for example, an $8,600.00 account value divided by $1,000.00 = 8.60), then multiply the result by the number in the first section under the heading entitled “Expenses Paid During Period” to estimate the expenses you paid on your account during this period.
Hypothetical Example for Comparison Purposes. The second section of the table provides information about hypothetical account values and hypothetical expenses based on the Fund’s actual expense ratio, and an assumed rate of return of 5% per year before expenses, which is not the actual return. The hypothetical account values and expenses may not be used to estimate the actual ending account balance or expenses you paid for the period. You may use this information to compare the ongoing costs of investing in the Fund and other funds. To do so, compare this 5% hypothetical example with the 5% hypothetical examples that appear in the shareholder reports of the other funds.
Please note that the expenses shown in the table are meant to highlight your ongoing costs only and do not reflect any transactional costs, such as front-end or contingent deferred sales charges (loads), or a $12.00 fee imposed annually on accounts valued at less than $500.00 (subject to exceptions described in the Statement of Additional Information). Therefore, the “hypothetical” section of the table is useful in comparing ongoing costs only, and will not help you determine the relative total costs of owning different funds. In addition, if these transactional costs were included, your costs would have been higher.
| 8 | OPPENHEIMER MASTER LOAN FUND, LLC |
| Actual | Beginning Account Value April 1, 2012 | Ending Account Value September 28, 2012 | Expenses Paid During 6 Months Ended September 28, 2012 | |||||||||
| $ | 1,000.00 | $ | 1,038.70 | $ | 1.66 | |||||||
| Hypothetical (5% return before expenses) | ||||||||||||
| 1,000.00 | 1,023.09 | 1.66 | ||||||||||
Expenses are equal to the Fund’s annualized expense ratio, multiplied by the average account value over the period, multiplied by 181/366 (to reflect the one-half year period). The annualized expense ratio, excluding indirect expenses from affiliated fund, based on the 6-month period ended September 28, 2012 is as follows:
| Expense Ratio |
| 0.33% |
The expense ratio reflects reduction to voluntary waivers and/or reimbursements of expenses by the Fund’s Manager. Some of these undertakings may be modified or terminated at any time, as indicated in the Fund’s prospectus. The “Financial Highlights” table in the Fund’s financial statements, included in this report, also shows the gross expense ratio, without such waivers or reimbursements and reduction to custodian expenses, if applicable.
| 9 | OPPENHEIMER MASTER LOAN FUND, LLC |
STATEMENT OF INVESTMENTS September 28, 2012*
| Principal Amount | Value | |||||||
| Corporate Loans—94.7% | ||||||||
| Consumer Discretionary—29.0% | ||||||||
| Auto Components—2.8% | ||||||||
| FleetPride Corp., Sr. Sec. Credit Facilities 1st Lien Term Loan, Tranche B, 6.75%, 12/6/171 | $ | 5,970,000 | $ | 6,040,894 | ||||
| Goodyear Tire & Rubber Co. (The), Sr. Sec. Credit Facilities 2nd Lien Term Loan, 4.75%, 4/30/191 | 15,715,000 | 15,878,703 | ||||||
| Metaldyne LLC, Sr. Sec. Credit Facilities 1st Lien Term Loan, Tranche B, 5.25%, 5/18/171 | 5,516,000 | 5,605,635 | ||||||
| Remy International, Inc., Sr. Sec. Credit Facilities 1st Lien Term Loan, Tranche B, 6.25%, 12/16/161 | 3,728,967 | 3,756,935 | ||||||
| Schaeffler AG, Sr. Sec. Credit Facilities 1st Lien Term Loan, Tranche C2, 6%, 1/27/171 | 10,465,000 | 10,569,650 | ||||||
| TI Group Auto Systems LLC, Sr. Sec. Credit Facilities 1st Lien Term Loan, 6.75%, 3/14/181 | 11,497,225 | 11,403,810 | ||||||
| Transtar Industries, Inc., Sr. Sec. Credit Facilities 1st Lien Term Loan, 5.41%, 12/21/161 | 3,024,946 | 3,019,273 | ||||||
| UCI International, Inc., Sr. Sec. Credit Facilities 1st Lien Term Loan, Tranche B, 5.50%, 7/26/171 | 2,441,261 | 2,471,778 | ||||||
| 58,746,678 | ||||||||
| Automobiles—0.0% | ||||||||
| Chrysler LLC, Sr. Sec. Credit Facilities Term Loan, Tranche B1, 5.333%, 8/3/132 | 8,849,833 | 44,249 | ||||||
| Distributors—2.1% | ||||||||
| 99 Cents Only Stores, Sr. Sec. Credit Facilities 1st Lien Term Loan, Tranche B1, 5.25%, 1/11/191 | 7,058,894 | 7,147,131 | ||||||
| Capital Automotive LP, Sr. Sec. Credit Facilities 1st Lien Term Loan, Tranche B, 5.25%, 3/11/171 | 12,888,920 | 12,985,586 | ||||||
| General Nutrition Centers, Inc., Sr. Sec. Credit Facilities 1st Lien Term Loan, Tranche B, 5.164%, 3/2/181 | 2,366 | 2,370 | ||||||
| Leslie’s Poolmart, Inc., Sr. Sec. Credit Facilities Term Loan, 4.50%, 11/21/161 | 8,596,875 | 8,613,035 | ||||||
| Rite Aid Corp., Sr. Sec. Credit Facilities 1st Lien Term Loan, Tranche 5, 4.50%, 3/3/181 | 6,077,642 | 6,070,045 | ||||||
| Sprouts Farmers LLC, Sr. Sec. Credit Facilities 1st Lien Term Loan, 6%, 4/18/181 | 8,495,625 | | 8,506,245 | | ||||
| 43,324,412 | ||||||||
| Diversified Consumer Services—0.4% | ||||||||
| Laureate Education, Inc., Sr. Sec. Credit Facilities 1st Lien Term Loan, 7%, 8/15/141 | 3,636,407 | 3,595,497 | ||||||
| Monitronics International, Inc., Sr. Sec. Credit Facilites 1st Lien Term Loan, Tranche B, 5.50%, 3/23/181 | 5,492,400 | | 5,564,488 | | ||||
| 9,159,985 | ||||||||
| Hotels, Restaurants & Leisure—6.3% | ||||||||
| 24 Hour Fitness Worldwide, Inc., Sr. Sec. Credit Facilities 1st Lien Term Loan, Tranche B, 7.50%, 4/22/161 | 8,934,350 | 9,057,198 | ||||||
| 10 | OPPENHEIMER MASTER LOAN FUND, LLC |
| | Principal Amount | | Value | |||||
| Hotels, Restaurants & Leisure Continued | ||||||||
| American Seafoods Group LLC, Sr. Sec. Credit Facilities 1st Lien Term Loan, Tranche B, 4.25%, 3/18/181 | $ | 5,561,312 | $ | 5,502,223 | ||||
| CCM Merger, Inc./MotorCity Casino, Sr. Sec. Credit Facilities 1st Lien Term Loan, 6%, 3/1/171 | 16,886,830 | 17,055,698 | ||||||
| Caesars Entertainment Operating Co., Inc., Extended Sr. Sec. Credit Facilities Term Loan, 4.467%, 1/28/181 | 25,028,629 | 22,007,323 | ||||||
| DineEquity, Inc., Sr. Sec. Credit Facilities 1st Lien Term Loan, Tranche B1, 4.25%-5.164%, 10/19/171 | 4,714,997 | 4,755,074 | ||||||
| Focus Brands, Inc., Sr. Sec. Credit Facilities 1st Lien Term Loan, Tranche B, 6.25%-7.131%, 2/21/181 | 6,191,320 | 6,277,223 | ||||||
| Focus Brands, Inc., Sr. Sec. Credit Facilities Lien Term Loan, Tranche B, 6.25%, 2/21/181 | 89,705 | 90,938 | ||||||
| Golden Nugget, Inc., Sr. Sec. Credit Facilities 1st Lien Term Loan, Tranche B, 3.18%, 6/30/141,3 | 6,217,506 | 5,965,697 | ||||||
| Golden Nugget, Inc., Sr. Sec. Credit Facilities 1st Lien Term Loan, Delayed Draw, 3.18%, 6/30/141,3 | 3,344,448 | 3,208,998 | ||||||
| Golden Nugget, Inc., Sr. Sec. Credit Facilities 2nd Lien Term Loan, Tranche 2L, 3.47%, 11/2/141 | 2,528,348 | 2,250,230 | ||||||
| Isle of Capri Casinos, Inc., Sr. Sec. Credit Facilities 1st Lien Term Loan, 4.75%, 3/15/171 | 4,865,900 | 4,907,465 | ||||||
| Landry’s, Inc., Sr. Sec. Credit Facilities 1st Lien Term Loan, Tranche B, 6.50%, 4/24/181 | 9,492,300 | 9,637,058 | ||||||
| Michael Foods, Inc., Sr. Sec. Credit Facilities 1st Lien Term Loan, 4.25%, 2/25/181 | 4,548,089 | 4,583,623 | ||||||
| NP OPCO LLC, Sr. Sec. Credit Facilities 1st Lien Term Loan, Tranche B, 4.25%, 9/7/191 | 1,765,000 | 1,771,986 | ||||||
| Peninsula Gaming LLC, Sr. Sec. Credit Facilities 1st Lien Term Loan, Tranche B, 4.50%, 8/3/171 | 8,060,000 | 8,185,938 | ||||||
| Revel Entertainment LLC, Sr. Sec. Credit Facilities 1st Lien Term Loan, 9%, 2/17/171 | 13,030,000 | 10,352,739 | ||||||
| Rock Ohio Caesars LLC, Sr. Sec. Credit Facilities 1st Lien Term Loan, 1%, 8/19/171 | 86,667 | 89,050 | ||||||
| Rock Ohio Caesars LLC, Sr. Sec. Credit Facilities 1st Lien Term Loan, 1%-8.50%, 8/19/171 | 433,333 | 445,250 | ||||||
| Town Sports International, Sr. Sec. Credit Facilities 1st Lien Term Loan, Tranche B, 5.75%, 5/11/181 | 7,032,933 | 7,129,635 | ||||||
| Turtle Bay Holding Co. LLC, Sr. Sec. Credit Facilities Term Loan: Tranche A, 10.175%, 3/1/131,3 | 323,016 | 319,786 | ||||||
| Tranche B, 2.704%, 3/1/151,3 | 637,581 | 569,041 | ||||||
| U.S. Foodservice, Inc., Extended Sr. Sec. Credit Facilities 1st Lien Term Loan, Tranche B, 5.75%, 3/31/171 | 9,926,427 | 9,838,886 | ||||||
| 134,001,059 | ||||||||
| Household Durables—0.7% | ||||||||
| Party City Holdings, Inc., Sec. Credit Facilities 1st Lien Term Loan, Tranche B, 5.75%, 7/27/191 | 5,099,999 | 5,170,922 | ||||||
| 11 | OPPENHEIMER MASTER LOAN FUND, LLC |
STATEMENT OF INVESTMENTS Continued
| Principal Amount | Value | |||||||
| Household Durables Continued | ||||||||
| Spectrum Brands Holdings, Inc., Sr. Sec. Credit Facilities 1st Lien Term Loan, 5%-6.148%, 6/17/161 | $ | 3,923,715 | $ | 3,949,289 | ||||
| Wilton Brands, Inc., Sr. Sec. Credit Facilities 1st Lien Term Loan, Tranche B, 7.50%, 8/22/181 | 5,850,000 | | 5,915,813 | | ||||
| 15,036,024 | ||||||||
| Leisure Equipment & Products—0.9% | ||||||||
| Caesars Entertainment Corp. Sr. Credit Facilities 1st Lien Term Loan, Tranche B, 9.25%, 4/25/171 | 6,670,000 | 6,579,955 | ||||||
| MGM Resorts International, Extended Sr. Sec. Credit Facilities 1st Lien Term Loan, Tranche C, 5%, 2/23/151 | 10,140,000 | 10,245,922 | ||||||
| Stockbridge/SBE Holdings LLC, Sr. Sec. Credit Facilities 1st Lien Term Loan, Tranche B, 13%, 5/2/171 | 2,930,000 | | 2,930,000 | | ||||
| 19,755,877 | ||||||||
| Media—12.1% | ||||||||
| Advanstar Communications, Inc., Sr. Sec. Credit Facilities 1st Lien Term Loan, 2.62%, 6/2/141 | 11,259,010 | 8,932,144 | ||||||
| Affinion Group, Inc., Sr. Sec. Credit Facilities 1st Lien Term Loan, Tranche B, 5%, 10/9/161 | 19,971,690 | 18,398,920 | ||||||
| Alpha Media Group, Inc., Sr. Sec. Credit Facilities Term Loan, Tranche B, 3%, 7/15/131,3 | 2,045,183 | 511,296 | ||||||
| Atlantic Broadband Finance LLC, Sr. Sec. Credit Facilities 1st Lien Term Loan, 5.25%, 4/4/191 | 7,655,813 | 7,705,032 | ||||||
| Atlantic Broadband Finance LLC, Sr. Sec. Credit Facilities 2nd Lien Term Loan, 9.75%, 10/4/191 | 1,510,000 | 1,583,613 | ||||||
| Barrington Broadcasting LLC, Sr. Sec. Credit Facilities 1st Lien Term Loan, Tranche B, 7.50%, 6/14/171 | 3,886,784 | 3,935,369 | ||||||
| Bresnan Broadband Holdings LLC, Sr. Sec. Credit Facilities 1st Lien Term Loan, 4.50%, 12/14/171 | 5,656,818 | 5,690,845 | ||||||
| Cinram International, Inc., Sr. Sec. Credit Facilities 1st Lien Term Loan, Tranche B, 12.144%, 12/31/132,3 | 10,454,652 | 3,589,427 | ||||||
| Cinram International, Inc., Sr. Sec. Credit Facilities 2nd Lien Term Loan, 0.432%, 12/31/132,3 | 543,949 | 13,600 | ||||||
| Clear Channel Communications, Inc., Sr. Sec. Credit Facilities 1st Lien Term Loan: Tranche A, 3.616%, 7/30/141 | 11,968,674 | 11,295,437 | ||||||
| Tranche B, 3.866%, 1/29/161 | 13,059,306 | 10,708,631 | ||||||
| Cogeco Cable, Inc., Sr. Sec. Credit Facilities 1st Lien Term Loan, Tranche B, 3.50%, 9/10/191 | 4,085,000 | 4,111,262 | ||||||
| Cumulus Media, Inc., Sr. Sec. Credit Facilities 1st Lien Term Loan, Tranche B, 5.75%, 9/17/181 | 5,611,028 | 5,650,103 | ||||||
| DG FastChannel, Inc., Sr. Sec. Credit Facilities 1st Lien Term Loan, Tranche B, 5.75%, 7/26/181 | 5,998,888 | 5,848,916 | ||||||
| Dex Media West LLC, Sr. Sec. Credit Facilities 1st Lien Exit Term Loan, 7.25%, 10/24/141 | 5,159,904 | 3,420,279 | ||||||
| 12 | OPPENHEIMER MASTER LOAN FUND, LLC |
| Principal Amount | Value | |||||||
| Media Continued | ||||||||
| Entercom Radio LLC, Sr. Sec. Credit Facilities 1st Lien Term Loan, Tranche B, 6.25%, 11/23/181 | $ | 1,885,333 | $ | 1,899,709 | ||||
| Fox Acquisition Sub LLC, Sr. Sec. Credit Facilities 1st Lien Term Loan, Tranche B, 5.50%, 7/31/171 | 10,225,000 | 10,327,250 | ||||||
| Getty Images, Inc., Sr. Sec. Credit Facilities 1st Lien Term Loan, 5.25%, 11/7/161 | 4,031,534 | 4,040,968 | ||||||
| Granite Broadcasting Corp., Sr. Sec. Credit Facilities 1st Lien Term Loan, 8.50%, 5/23/181 | 5,770,538 | 5,763,324 | ||||||
| Gray Television, Inc., Sr. Sec. Credit Facilities Term Loan, 3.74%, 12/31/141 | 2,678,854 | 2,677,180 | ||||||
| Instant Web, Inc., Sr. Sec. Credit Facilities 1st Lien Term Loan, Tranche B, 3.591%, 8/7/141 | 849,192 | 662,370 | ||||||
| Instant Web, Inc., Sr. Sec. Credit Facilities 1st Lien Term Loan, Delayed Draw, Tranche B, 3.591%, 8/7/141 | 74,036 | 57,748 | ||||||
| Intelsat Jackson Holdings SA, Sr. Sec. Credit Facilities 1st Lien Term Loan, Tranche B, 5.25%, 4/2/181 | 1,234,375 | 1,240,470 | ||||||
| Intelsat Jackson Holdings SA, Sr. Sec. Credit Facilities Term Loan, 3.221%, 2/1/141 | 2,346,580 | 2,333,674 | ||||||
| Legendary Pictures, Inc., Sr. Sec. Credit Facilities Term Loan, Tranche B, 6%, 6/9/171 | 5,458,543 | 5,403,957 | ||||||
| Lin Television Corp., Sr. Sec. Credit Facilities 1st Lien Term Loan, Tranche B, 5%, 12/21/181 | 2,823,663 | 2,858,958 | ||||||
| Mediacom Communications Corp., Sr. Sec. Credit Facilities 1st Lien Term Loan, Tranche E, 4.50%, 10/23/171 | 5,376,250 | 5,318,455 | ||||||
| Mediacom Communications Corp./MCC Georgia LLC, Sr. Sec. Credit Facilities 1st Lien Term Loan, Tranche FA, 4.50%, 10/23/171 | 6,842,500 | 6,808,288 | ||||||
| Merrill Corp., Sr. Sec. Credit Facilities 1st Lien Term Loan, 9.59%, 12/24/121,4 | 5,000,000 | 4,906,250 | ||||||
| Merrill Corp., Sr. Sec. Credit Facilities 2nd Lien Term Loan, 10.987%-14.747%, 11/15/131,3,4 | 11,524,069 | 8,297,330 | ||||||
| Mood Media Corp., Sr. Sec. Credit Facilities 1st Lien Term Loan, Tranche B, 7.623%, 5/6/181 | 7,406,250 | 7,390,053 | ||||||
| Newport Television LLC, Sr. Sec. Credit Facilities Term Loan, Tranche B, 8.853%, 9/14/161 | 12,191,513 | 12,301,919 | ||||||
| Newport Television LLC/High Plains Broadcasting Operating Co. LLC, Sr. Sec. Credit Facilities Term Loan, 8.853%, 9/14/161 | 3,370,126 | 3,400,646 | ||||||
| OneLink Communications/San Juan Cable LLC, Sr. Sec. Credit Facilities 1st Lien Term Loan, 6%, 6/9/171 | 7,193,938 | 7,202,930 | ||||||
| Playboy Enterprises, Inc., Sr. Sec. Credit Facilities 1st Lien Term Loan, 8.25%, 3/6/171 | 2,897,786 | 2,926,837 | ||||||
| Radio One, Inc., Sr. Sec. Credit Facilities 1st Lien Term Loan, Tranche B, 7.50%, 3/31/161 | 6,383,235 | 6,431,109 | ||||||
| Star Tribune Co., Sr. Sec. Credit Facilities 1st Lien Term Loan: | ||||||||
| Tranche A, 8%, 9/29/141 | 267,856 | 258,481 | ||||||
| Tranche B, 8%, 9/29/141,3 | 357,141 | 344,641 | ||||||
| Summit Entertainment LLC, Sr. Sec. Credit Facilities 1st Lien Term Loan, Tranche B, 6.75%, 9/7/161 | 2,333,451 | 2,339,285 | ||||||
| 13 | OPPENHEIMER MASTER LOAN FUND, LLC |
STATEMENT OF INVESTMENTS Continued
| Principal Amount | Value | |||||||
| Media Continued | ||||||||
| Univision Communications, Inc., Extended Sr. Sec. Credit Facilities 1st Lien Term Loan, 4.466%, 3/31/171 | $ | 24,301,000 | $ | 24,115,364 | ||||
| Univision Communications, Inc., Sr. Sec. Credit Facilities 1st Lien Term Loan, 2.216%, 9/29/141 | 694,300 | 693,432 | ||||||
| WaveDivision Holdings LLC, Sr. Sec. Credit Facilities 1st Lien Term Loan, Tranche B, 4.25%, 8/9/191 | 12,850,000 | 12,962,438 | ||||||
| Wide Open West Finance LLC, Sr. Sec. Credit Facilities 1st Lien Term Loan, 6.25%, 7/17/181 | 19,326,563 | 19,532,422 | ||||||
| Zuffa LLC, Sr. Sec. Credit Facilities Incremental Term Loan, Tranche B, 7.50%, 6/19/151 | 635,953 | | 639,398 | | ||||
| 254,529,760 | ||||||||
| Multiline Retail—0.5% | ||||||||
| Neiman Marcus Group, Inc., Sec. Credit Facilities 1st Lien Term Loan, 4.75%, 5/16/181 | 11,245,000 | 11,326,144 | ||||||
| Specialty Retail—2.6% | ||||||||
| Burlington Coat Factory Investments Holdings, Inc., Sr. Sec. Credit Facilities 1st Lien Term Loan, Tranche B, 5.50%, 2/23/171 | 11,444,451 | 11,605,898 | ||||||
| Harbor Freight Tools USA, Inc., Sr. Sec. Credit Facilities 1st Lien Term Loan, Tranche B, 5.50%, 11/14/171 | 9,710,000 | 9,764,619 | ||||||
| J. Crew Group, Inc., Sr. Sec. Credit Facilities 1st Lien Term Loan, Tranche B, 4.75%, 3/7/181 | 7,133,879 | 7,145,343 | ||||||
| Jo-Ann Stores, Inc., Sr. Sec Credit Facilities 1st Lien Term Loan, Tranche B, 4.75%, 3/16/181 | 10,490,882 | 10,533,506 | ||||||
| Michaels Stores, Inc., Sr. Sec. Credit Facilities 1st Lien Term Loan, Tranche B2, 4.875%-4.938%, 7/31/161 | 10,002,246 | 10,098,698 | ||||||
| Toys R Us Delaware, Inc., Sr. Sec. Credit Facilities 1st Lien Term Loan, Tranche B, 6%, 9/1/161 | 5,586,000 | | 5,562,723 | | ||||
| 54,710,787 | ||||||||
| Textiles, Apparel & Luxury Goods—0.6% | ||||||||
| Freedom Group, Inc., Sr. Sec Credit Facilities 1st Lien Term Loan, Tranche B, 5.50%, 4/19/191 | 2,740,000 | 2,761,120 | ||||||
| Visant Corp., Sr. Sec. Credit Facilities 1st Lien Term Loan, 5.25%, 12/22/161 | 9,884,843 | | 9,572,413 | | ||||
| 12,333,533 | ||||||||
| Consumer Staples—4.8% | ||||||||
| Beverages—0.5% | ||||||||
| Ferrara Candy Co., Sr. Sec. Credit Facilities 1st Lien Term Loan, Tranche B, 7.50%-8.361%, 6/18/181 | 11,670,750 | 11,823,929 | ||||||
| Food & Staples Retailing—1.4% | ||||||||
| BJ’S Wholesale Club, Inc., Sr. Sec. Credit Facilities 1st Lien Term Loan, Tranche B, 5.75%, 9/29/181 | 3,800,000 | 3,828,025 | ||||||
| BJ’S Wholesale Club, Inc., Sr. Sec. Credit Facilities 2nd Lien Term Loan, 9.75%, 3/29/191 | 605,000 | 615,588 | ||||||
| 14 | OPPENHEIMER MASTER LOAN FUND, LLC |
| Principal Amount | Value | |||||||
| Food & Staples Retailing Continued | ||||||||
| Fairway Group Acquisition, Sr. Sec. Credit Facilities 1st Lien Term Loan, 8.25%, 8/13/181 | $ | 3,380,000 | $ | 3,413,800 | ||||
| Roundy’s Supermarkets, Inc., Sr. Sec. Credit Facilities 1st Lien Term Loan, Tranche B, 5.656%, 2/13/191 | 9,691,300 | 9,521,702 | ||||||
| SUPERVALU, Inc., Sr. Sec. Credit Facilities 1st Lien Term Loan, Tranche B, 8%, 8/1/181 | 11,381,475 | | 11,467,724 | | ||||
| 28,846,839 | ||||||||
| Food Products—1.8% | ||||||||
| Del Monte Foods Co., Sr. Sec. Credit Facilities 1st Lien Term Loan, Tranche B, 4.50%, 3/8/181 | 11,972,446 | 11,977,439 | ||||||
| JBS USA LLC, Sr. Sec. Credit Facilities 1st Lien Term Loan, Tranche B, 4.25%, 5/25/181 | 2,962,500 | 2,955,075 | ||||||
| Pierre Foods, Inc., Sr. Sec. Credit Facilities 1st Lien Term Loan, 7%-7.377%, 9/30/161 | 15,631,474 | 15,721,027 | ||||||
| Pierre Foods, Inc., Sr. Sec. Credit Facilities 2nd Lien Term Loan, 11.25%, 9/29/171 | 6,525,000 | | 6,594,328 | | ||||
| 37,247,869 | ||||||||
| Household Products—0.1% | ||||||||
| ACCO Brands Corp., Sr. Sec. Credit Facilities 1st Lien Term Loan, Tranche B, 4.25%, 5/1/191 | 2,069,600 | 2,087,063 | ||||||
| Personal Products—1.0% | ||||||||
| Levlad LLC, Sr. Sec. Credit Facilities 1st Lien Term Loan, 9.836%, 3/5/151,3 | 1,117,401 | 1,072,705 | ||||||
| NBTY, Inc., Sr. Sec. Credit Facilities 1st Lien Term Loan, Tranche B1, 4.25%, 10/1/171 | 4,298,506 | 4,321,194 | ||||||
| Prestige Brands, Inc., Sr. Sec. Credit Facilities 1st Lien Term Loan, 5.25%, 1/31/191 | 2,670,909 | 2,701,910 | ||||||
| Revlon, Inc., Sr. Sec. Credit Facilities 1st Lien Term Loan, 4.75%, 11/19/171 | 13,085,535 | | 13,161,182 | | ||||
| 21,256,991 | ||||||||
| Energy—2.9% | ||||||||
| Energy Equipment & Services—2.0% | ||||||||
| Buffalo Gulf Coast Terminals, Sr. Sec. Credit Facilities 1st Lien Term Loan, 7.50%, 10/31/171 | 6,642,900 | 6,775,758 | ||||||
| CCS, Inc., Sr. Sec. Credit Facilities 1st Lien Term Loan, Tranche B, 3.216%-6.50%, 11/14/141 | 8,384,564 | 8,360,967 | ||||||
| EP Energy LLC, Sr. Sec. Credit Facilities 1st Lien Term Loan, 5%, 5/24/181 | 4,085,000 | 4,129,690 | ||||||
| Frac Tech International LLC, Sr. Sec. Credit Facilities 1st Lien Term Loan, Tranche B, 6.25%, 5/6/161 | 6,718,392 | 6,485,352 | ||||||
| Sheridan Production Co. LLC, Sr. Sec. Credit Facilities 1st Lien Term Loan, 6.50%, 4/20/171 | 14,109,535 | 14,168,330 | ||||||
| Sheridan Production Co. LLC, Sr. Sec. Credit Facilities Term Loan: | ||||||||
| Tranche I-A, 6.50%, 4/20/171 | 1,869,629 | 1,877,420 | ||||||
| Tranche I-M, 6.50%, 4/20/171 | 1,141,980 | | 1,146,739 | | ||||
| 42,944,256 | ||||||||
| 15 | OPPENHEIMER MASTER LOAN FUND, LLC |
STATEMENT OF INVESTMENTS Continued
| Principal Amount | Value | |||||||
| Oil, Gas & Consumable Fuels—0.9% | ||||||||
| ATP Oil & Gas Corp., Sr. Sec. Credit Facilities 1st Lien Term Loan, Debtor in Possession, Delayed Draw, 8.50%, 2/27/141 | $ | 1,517,973 | $ | 1,506,588 | ||||
| ATP Oil & Gas Corp., Sr. Sec. Credit Facilities 1st Lien Term Loan, Debtor in Possession, 8.50%, 2/17/141 | 2,232,027 | 2,215,287 | ||||||
| NGPL PipeCo LLC, Sr. Sec. Credit Facilities 1st Lien Term Loan, Tranche B, 6.75%, 9/15/171 | 7,865,000 | 8,035,411 | ||||||
| Samson Investment Co., Sr. Sec. Credit Facilities 2nd Lien Term Loan, 6%, 9/19/181 | 6,375,000 | | 6,424,139 | | ||||
| 18,181,425 | ||||||||
| Financials—4.5% | ||||||||
| Capital Markets—1.9% | ||||||||
| American Capital Ltd., Sr. Sec. Credit Facilities 1st Lien Term Loan, 5.50%, 7/19/161 | 2,600,000 | 2,613,000 | ||||||
| Fortress Investment Group LLC, Sr. Sec. Credit Facilities Term Loan, 5.75%, 10/7/151 | 2,446,799 | 2,456,419 | ||||||
| Nuveen Investments, Inc., Extended Sr. Sec. Credit Facilities 1st Lien Term Loan, 5.862%-5.947%, 5/13/171 | 9,278,420 | 9,276,490 | ||||||
| Nuveen Investments, Inc., Sr. Sec. Credit Facilities 1st Lien Term Loan, Tranche B, 5.862%-5.947%, 5/13/171 | 6,938,575 | 6,940,746 | ||||||
| Nuveen Investments, Inc., Sr. Sec. Credit Facilities 2nd Lien Term Loan, 8.25%, 2/28/191 | 6,340,000 | 6,398,119 | ||||||
| Springleaf Financial Funding Co., Sr. Sec. Credit Facilities 1st Lien Term Loan, 5.50%, 5/10/171 | 12,905,000 | | 12,659,805 | | ||||
| 40,344,579 | ||||||||
| Commercial Banks—0.1% | ||||||||
| ResCap Residential Capital LLC, Sr. Sec. Credit Facilities 1st Lien Term Loan, Debtor in Possession: | ||||||||
| Tranche A1, 5%, 11/18/131 | 1,825,000 | 1,835,265 | ||||||
| Tranche A2, 6.75%, 11/18/131 | 785,000 | | 797,102 | | ||||
| 2,632,367 | ||||||||
| Consumer Finance—0.3% | ||||||||
| Fly Leasing Ltd., Sr. Sec. Credit Facilities 1st Lien Term Loan, 6.75%, 8/8/181 | 7,440,000 | 7,443,102 | ||||||
| Diversified Financial Services—0.5% | ||||||||
| iStar Financial, Inc., Sr. Sec. Credit Facilities 1st Lien Term Loan, Tranche A2, 7%, 6/30/141 | 10,000,000 | 10,075,000 | ||||||
| Insurance—0.7% | ||||||||
| Flying Fortress, Inc., Sr. Sec. Credit Facilities 1st Lien Term Loan, 5%, 6/30/171 | 4,285,000 | 4,343,919 | ||||||
| Swett & Crawford Group, Inc., Sr. Sec. Credit Facilities 1st Lien Term Loan, 2.466%, 4/3/141 | 10,467,378 | | 9,944,009 | | ||||
| 14,287,928 | ||||||||
| 16 | OPPENHEIMER MASTER LOAN FUND, LLC |
| Principal Amount | Value | |||||||
| Real Estate Management & Development—0.8% | ||||||||
| Realogy Corp., Extended Sr. Sec. Credit Facilities 1st Lien Term Loan: | ||||||||
| Tranche B, 3.245%, 10/10/131 | $ | 626,579 | $ | 620,035 | ||||
| Tranche B, 4.478%, 10/10/161 | 10,856,398 | 10,743,307 | ||||||
| Realogy Corp., Sr. Sec. Credit Facilities 2nd Lien Term Loan, Delayed Draw, Tranche B, 13.50%, 10/15/17 | 5,443,000 | | 5,504,234 | | ||||
| 16,867,576 | ||||||||
| Thrifts & Mortgage Finance—0.2% | ||||||||
| Homeward Residential, Inc., Sr. Sec. Credit Facilities 1st Lien Term Loan, Tranche B, 8.25%, 8/8/171 | 3,450,000 | 3,503,906 | ||||||
| Health Care—11.5% | ||||||||
| Biotechnology—0.5% | ||||||||
| Grifols, Inc., Sr. Sec. Credit Facilities 1st Lien Term Loan, Tranche B, 4.50%, 6/1/171 | 11,438,171 | 11,462,477 | ||||||
| Health Care Equipment & Supplies—4.6% | ||||||||
| Alere, Inc., Sr. Sec. Credit Facilities 1st Lien Term Loan, Tranche B2, 4.75%, 6/30/171 | 2,189,000 | 2,197,686 | ||||||
| Axcan Intermediate Holdings, Inc., Sr. Sec. Credit Facilities 1st Lien Term Loan, Delayed Draw, Tranche B, 5.50%, 2/10/171 | 4,882,989 | 4,882,989 | ||||||
| BSN Medical GmbH & Co., Sec. Credit Facilities 1st Lien Term Loan, Tranche B1, 6%, 6/3/191 | 7,275,000 | 7,332,596 | ||||||
| Bausch & Lomb, Inc., Sr. Sec. Credit Facilities 1st Lien Term Loan, Tranche B, 5.25%, 5/17/191 | 10,548,563 | 10,677,782 | ||||||
| Capsugel Holdings US, Inc., Sr. Sec. Credit Facilities 1st Lien Term Loan, Tranche B, 4.75%, 8/1/181 | 3,524,862 | 3,548,362 | ||||||
| Carestream Health, Inc., Sr. Sec. Credit Facilities 1st Lien Term Loan, Tranche B, 5%, 2/25/171 | 14,083,368 | 13,960,139 | ||||||
| Convatec Ltd., Sr. Sec. Credit Facilities 1st Lien Term Loan, Tranche B, 5.75%, 12/22/161 | 8,705,607 | 8,746,928 | ||||||
| DJO Finance LLC/DJO Finance Corp., Extended Sr. Sec. Credit Facilities 1st Lien Term Loan, 5.216%, 11/1/161 | 7,201,391 | 7,212,647 | ||||||
| DJO Finance LLC/DJO Finance Corp., Sr. Sec. Credit Facilities 1st Lien Term Loan, Tranche B, 6.25%, 9/15/171 | 5,766,025 | 5,794,855 | ||||||
| Emdeon, Inc., Sr. Sec. Credit Facilities 1st Lien Term Loan, Tranche B, 5%, 11/2/181 | 1,345,243 | 1,357,015 | ||||||
| Golden Gate National Senior Care LLC, Sr. Sec. Credit Facilities 1st Lien Term Loan, 5%, 5/4/181 | 11,125,096 | 10,763,530 | ||||||
| HCR ManorCare, Inc., Sr. Sec. Credit Facilities 1st Lien Term Loan, 5%, 4/6/181 | 7,169,892 | 7,062,344 | ||||||
| Hologic, Inc., Sr. Sec. Credit Facilities 1st Lien Term Loan, Tranche B, 4.50%, 8/1/191 | 1,210,000 | 1,225,730 | ||||||
| IASIS Healthcare LLC, Sr. Sec. Credit Facilities 1st Lien Term Loan, Tranche B, 5%, 5/3/181 | 5,461,825 | 5,485,720 | ||||||
| LHP Hospital Group, Inc., Sr. Sec. Credit Facilities 1st Lien Term Loan, Tranche B, 9%, 7/3/181 | 2,294,250 | 2,323,000 | ||||||
| 17 | OPPENHEIMER MASTER LOAN FUND, LLC |
STATEMENT OF INVESTMENTS Continued
| Principal Amount | Value | |||||||
| Health Care Equipment & Supplies Continued | ||||||||
| National Mentor Holdings, Inc., Sr. Sec. Credit Facilities 1st Lien Term Loan, Tranche B, 7%, 2/9/171 | $ | 6,060,690 | $ | 6,062,205 | | |||
| 98,633,528 | ||||||||
| Health Care Providers & Services—5.3% | ||||||||
| Ardent Health Services LLC, Sr. Sec. Credit Facilities 1st Lien Term Loan, 6.50%, 9/15/151 | 11,081,713 | 11,137,122 | ||||||
| Aveta, Inc./MMM Holdings, Inc. Sr. Sec. Credit Facilities 1st lien Term Loan, Tranche B, 8.50%, 4/4/171 | 3,198,875 | 3,238,861 | ||||||
| Aveta, Inc./NAMM Holdings, Inc., Sr. Sec. Credit Facilities 1st Lien Term Loan, Tranche B, 8.50%, 4/4/171 | 3,137,750 | 3,133,828 | ||||||
| Community Health Systems, Inc., Extended Sr. Sec. Credit Facilities 1st Lien Term Loan, 3.862%-3.923%, 1/25/171 | 405,142 | 407,533 | ||||||
| Emergency Medical Services Corp., Sr. Sec. Credit Facilities 1st Lien Term Loan, 5.25%, 5/25/181 | 9,750,040 | 9,813,006 | ||||||
| Gentiva Health Services, Inc., Sr. Sec. Credit Facilities 1st Lien Term Loan, Tranche B1, 6.50%, 8/17/161 | 9,805,475 | 9,768,704 | ||||||
| Kindred Healthcare, Inc., Sr. Sec. Credit Facilities 1st Lien Term Loan, 5.25%, 6/1/181 | 9,598,943 | 9,481,836 | ||||||
| Multiplan, Inc., Sr. Sec. Credit Facilities 1st Lien Term Loan, 4.75%, 8/26/171 | 13,454,448 | 13,518,921 | ||||||
| Pharmaceutical Product Development, Inc., Sr. Sec. Credit Facilities 1st Lien Term Loan, 6.25%, 12/5/181 | 10,778,550 | 10,890,830 | ||||||
| Select Medical Corp., Sr. Sec. Credit Facilities 1st Lien Term Loan, Tranche B, 5.50%-5.902%, 6/1/181 | 16,063,574 | 16,174,010 | ||||||
| Sun Healthcare Group, Inc., Sr. Sec. Credit Facilities 1st Lien Term Loan, Tranche B, 8.75%-8.87%, 10/18/161 | 6,983,889 | 6,975,159 | ||||||
| US Renal Care, Inc., Sr. Sec. Credit Facilities 1st Lien Term Loan, 6.25%-7.131%, 7/3/191 | 3,640,875 | 3,695,488 | ||||||
| Vanguard Health Systems, Inc., Sr. Sec. Credit Facilities 1st Lien Term Loan, Tranche B, 5%, 1/29/161 | 7,332,928 | 7,385,175 | ||||||
| inVentiv Health, Inc., Sr. Sec Credit Facilities 1st Lien Term Loan, Tranche B, 6.50%, 8/4/161 | 5,865,749 | | 5,689,776 | | ||||
| 111,310,249 | ||||||||
| Pharmaceuticals—1.1% | ||||||||
| Catalent Pharma Solutions, Inc., Extended Sr. Sec. Credit Facilities 1st Lien Term Loan, Tranche B, 4.216%, 9/15/161 | 5,783,718 | 5,805,407 | ||||||
| Catalent Pharma Solutions, Inc., Sr. Sec. Credit Facilities 1st Lien Term Loan, Tranche B, 5.25%, 9/15/171 | 8,994,178 | 9,084,120 | ||||||
| Par Pharmaceutical, Inc., Sr. Sec. Credit Facilities 1st Lien Term Loan, Tranche B, 5%, 8/2/191 | 4,735,000 | 4,732,041 | ||||||
| Valeant Pharmaceuticals International, Inc., Sr. Sec. Credit Facilities 1st Lien Term Loan, Tranche B, 3.25%, 9/12/191 | 2,965,000 | | 2,969,943 | | ||||
| 22,591,511 | ||||||||
| 18 | OPPENHEIMER MASTER LOAN FUND, LLC |
| Principal Amount | Value | |||||||
| Industrials—26.5% | ||||||||
| Aerospace & Defense—2.9% | ||||||||
| AM General LLC, Sr. Sec. Credit Facilities Term Loan, Tranche B, 3.201%, 9/30/131 | $ | 6,122,980 | $ | 5,898,468 | ||||
| Delta Air Lines, Inc., Sr. Sec. Credit Facilities 1st Lien Term Loan, Tranche B, 5.50%, 4/20/171 | 5,268,312 | 5,324,430 | ||||||
| Delta Air Lines, Inc., Sr. Sec. Credit Facilities 1st Lien Term Loan, 4.25%, 3/7/161 | 11,362,520 | 11,404,993 | ||||||
| DynCorp International LLC, Sr. Sec. Credit Facilities 1st Lien Term Loan, Tranche B, 6.25%, 7/7/161 | 5,768,913 | 5,772,519 | ||||||
| Evergreen Holdings, Inc., Sr. Sec. Credit Facilities 1st Lien Term Loan, 11.50%, 6/30/151 | 10,469,557 | 9,841,384 | ||||||
| IAP Worldwide Services, Inc., Sr. Sec. Credit Facilities 1st Lien Term Loan, 9.25%, 12/30/121 | 19,249,928 | 16,314,313 | ||||||
| US Airways Group, Inc., Sr. Sec. Credit Facilities Term Loan, 2.716%, 3/21/141 | 5,000,000 | 4,910,000 | ||||||
| United Air Lines, Inc., Sr. Sec. Credit Facilities Term Loan, 2.25%, 2/1/141 | 1,267,176 | | 1,258,069 | | ||||
| 60,724,176 | ||||||||
| Building Products—1.1% | ||||||||
| Atrium Cos., Inc., Sr. Sec. Credit Facilities 1st Lien Exit Term Loan, 10.881%, 4/30/161,3 | 15,285,146 | 13,782,111 | ||||||
| CPG International, Inc., Sr. Sec. Credit Facilities 1st Lien Term Loan, 5.75%, 9/4/191 | 7,200,000 | 7,227,000 | ||||||
| Champion Opco LLC, Sr. Sec. Credit Facilities Term Loan, 9.487%, 12/31/131,3 | 1,287,067 | 920,253 | ||||||
| Flag Luxury Properties LLC, Sr. Sec. Credit Facilities 1st Lien Term Loan, 7.231%, 3/21/112 | 1,837,461 | 110,248 | ||||||
| Goodman Global, Inc., Sr. Sec. Credit Facilities 2nd Lien Term Loan, 9%, 10/30/171 | 620,455 | | 628,520 | | ||||
| 22,668,132 | ||||||||
| Commercial Services & Supplies—11.6% | ||||||||
| ADS Waste Holdings, Inc., Sr. Sec. Credit Facilities 1st Lien Term Loan, Tranche B, 4%, 9/11/191 | 9,900,000 | 9,982,497 | ||||||
| Advantage Sales & Marketing LLC, Sr. Sec. Credit Facilities 1st Lien Term Loan, 5.25%, 12/17/171 | 6,396,075 | 6,413,665 | ||||||
| Advantage Sales & Marketing LLC, Sr. Sec. Credit Facilities 2nd Lien Term Loan, 9.25%, 6/18/181 | 5,188,000 | 5,191,243 | ||||||
| Allied Security Holdings LLC, Sr. Sec. Credit Facilities 1st Lien Term Loan, Tranche B, 5.25%, 2/3/171 | 3,447,500 | 3,460,428 | ||||||
| Allied Security Holdings LLC, Sr. Sec. Credit Facilities 2nd Lien Term Loan, 9%, 2/2/181 | 2,525,000 | 2,523,422 | ||||||
| Asurion Corp., Sr. Sec. Credit Facilities 1st Lien Term Loan, Tranche B, 5.50%, 5/24/181 | 11,761,477 | 11,840,138 | ||||||
| Asurion Corp., Sr. Sec. Credit Facilities 2nd Lien Term Loan, 9%, 5/24/191 | 4,358,280 | 4,516,268 | ||||||
| Booz Allen & Hamilton, Inc., Sr. Sec. Credit Facilities 1st Lien Term Loan, Tranche B, 4.50%, 7/31/191 | 1,320,000 | 1,329,212 | ||||||
| 19 | OPPENHEIMER MASTER LOAN FUND, LLC |
STATEMENT OF INVESTMENTS Continued
| Principal Amount | Value | |||||||
| Commercial Services & Supplies Continued | ||||||||
| Brock Holdings III, Inc., Sr. Sec. Credit Facilities 1st Lien Term Loan, Tranche B, 6%-6.639%, 3/16/171 | $ | 6,306,882 | $ | 6,385,719 | ||||
| Brock Holdings III, Inc., Sr. Sec. Credit Facilities 2nd Lien Term Loan, 10%, 3/16/181 | 3,680,000 | 3,689,200 | ||||||
| Ceridian Corp., Extended Sr. Sec. Credit Facilities 1st Lien Term Loan, Tranche B, 5.977%, 5/9/171 | 8,105,561 | 8,166,353 | ||||||
| Corporate Executive Board, Sr. Sec. Credit Facilities 1st Lien Term Loan, Tranche B, 5%, 7/2/191 | 4,170,000 | 4,193,456 | ||||||
| EVERTEC, Inc., Sr. Sec. Credit Facilities 1st Lien Term Loan, Tranche B, 5.25%, 9/30/161 | 8,045,955 | 8,045,955 | ||||||
| Expert Global Solutions, Inc., Sr. Sec. Credit Facilities 1st Lien Term Loan, Tranche B, 8%, 4/3/181 | 12,905,150 | 13,023,748 | ||||||
| First Data Corp., Extended Sr. Sec. Credit Facilities 1st Lien Term Loan, 4.217%, 3/26/181 | 21,961,525 | 21,031,893 | ||||||
| First Data Corp., Sr. Sec. Credit Facilities 1st Lien Term Loan, Tranche E2, 5.217%, 3/24/171 | 9,864,081 | 9,716,889 | ||||||
| First Data Corp., Sr. Sec. Credit Facilities Term Loan: | ||||||||
| Tranche B, 5%, 9/30/181 | 5,080,000 | 4,999,568 | ||||||
| Tranche B-1, 2.967%-3.027%, 9/24/141 | 229,369 | 228,595 | ||||||
| Tranche B-2, 2.967%, 9/24/141 | 111,188 | 110,743 | ||||||
| Tranche B-3, 2.967%, 9/24/141 | 97,134 | 96,664 | ||||||
| Infogroup, Inc., Sr. Sec. Credit Facilities 1st Lien Term Loan, Tranche B, 5.75%, 5/26/181 | 874,330 | 786,897 | ||||||
| Interactive Data Corp., Sr. Sec. Credit Facilities 1st Lien Term Loan, 4.50%, 2/11/181 | 9,773,946 | 9,841,093 | ||||||
| KAR Auction Services, Inc., Sr. Sec. Credit Facilities 1st Lien Term Loan, Tranche B, 5%, 5/19/171 | 5,525,063 | 5,560,743 | ||||||
| Language Line LLC, Sr. Sec. Credit Facilities 1st Lien Term Loan, Tranche B, 6.25%, 6/20/161 | 7,762,000 | 7,719,953 | ||||||
| Language Line LLC, Sr. Sec. Credit Facilities 2nd Lien Term Loan, 10.50%, 12/20/161 | 4,440,000 | 4,430,290 | ||||||
| MoneyGram International, Inc., Sr. Sec. Credit Facilities 1st Lien Term Loan, Tranche B, 4.25%, 11/17/171 | 3,583,077 | 3,569,081 | ||||||
| NES Rentals Holdings, Inc., Sr. Sec. Credit Facilities 2nd Lien Term Loan, 13.25%, 10/20/141 | 555,000 | 552,225 | ||||||
| New Breed Logistics, Inc., Sr. Sec. Credit Facilities 1st Lien Term Loan, Tranche B, 4.75%, 9/7/191 | 7,600,000 | 7,600,000 | ||||||
| Plato Learning, Inc., Sr. Sec. Credit Facilities 1st Lien Term Loan, 7.50%, 5/17/181 | 6,023,750 | 6,046,339 | ||||||
| Protection One, Inc., Sr. Sec. Credit Facilities 1st Lien Term Loan, Tranche B, 5.75%, 3/21/191 | 8,955,000 | 9,011,109 | ||||||
| Sabre, Inc., Extended Sr. Sec. Credit Facilities 1st Lien Term Loan, Tranche B, 5.989%, 9/30/171 | 2,093,921 | 2,081,707 | ||||||
| Sabre, Inc., Extended Sr. Sec. Credit Facilities 1st Lien Term Loan, 5.966%, 12/29/171 | 2,462,408 | 2,444,324 | ||||||
| 20 | OPPENHEIMER MASTER LOAN FUND, LLC |
| Principal Amount | Value | |||||||
| Commercial Services & Supplies Continued | ||||||||
| Sabre, Inc., Extended Sr. Sec. Credit Facilities 1st Lien Term Loan, 5.966%, 9/30/171 | $ | 13,602,529 | $ | 13,523,186 | ||||
| Sedgwick CMS, Inc., Sr. Sec. Credit Facilities 1st Lien Term Loan, 5%, 12/31/161 | 5,278,354 | 5,265,158 | ||||||
| TransUnion LLC, Sr. Sec. Credit Facilities 1st Lien Term Loan, Tranche B, 5.50%, 2/10/181 | 3,870,752 | 3,911,394 | ||||||
| Travelport LLC, Extended Sr. Sec. Credit Facilities 1st Lien Term Loan, Tranche B, 4.50%-4.961%, 8/21/151 | 2,720,997 | 2,599,686 | ||||||
| Travelport LLC, Extended Sr. Sec. Credit Facilities 1st Lien Term Loan, Delayed Draw, 4.50%-4.961%, 8/21/151 | 7,388,716 | 7,059,305 | ||||||
| Travelport LLC, Sr. Sec. Credit Facilities 1st Lien Term Loan, Tranche S, 4.862%, 8/23/151 | 406,897 | 388,756 | ||||||
| Travelport LLC, Sr. Sec. Credit Facilities Term Loan, Tranche B, 11%, 11/22/151 | 805,000 | 820,764 | ||||||
| U.S. Investigations Services, Inc., Sr. Sec. Credit Facilities Term Loan, Tranche B, 2.969%, 2/21/151 | 8,842,128 | 8,245,285 | ||||||
| WCA Waste Corp., Sr. Sec. Credit Facilities 1st Lien Term Loan, Tranche B, 5.50%, 3/23/181 | 6,034,675 | 6,072,486 | ||||||
| Waste Industries USA, Inc., Sr. Sec. Credit Facilities 1st Lien Term Loan, Tranche B, 4.75%, 3/17/171 | 5,189,910 | 5,222,430 | ||||||
| West Corp., Sr. Sec. Credit Facilities 1st Lien Term Loan, Tranche B6, 5.75%, 8/1/181 | 8,450,000 | | 8,539,781 | | ||||
| 246,237,648 | ||||||||
| Construction & Engineering—0.2% | ||||||||
| Custom Building Products, Sr. Sec. Credit Facilities Term Loan, 5.75%, 3/19/151 | 3,803,390 | 3,808,144 | ||||||
| Electrical Equipment—4.0% | ||||||||
| Applied Systems, Inc., Sr. Sec. Credit Facilities 1st Lien Term Loan, Tranche B, 5.50%, 12/8/161 | 1,241,275 | 1,244,378 | ||||||
| Applied Systems, Inc., Sr. Sec. Credit Facilities 2nd Lien Term Loan, 9.50%, 6/8/171 | 1,745,000 | 1,749,363 | ||||||
| Attachmate Corp., Sr. Sec. Credit Facilities 1st Lien Term Loan, 7.25%, 11/22/171 | 15,027,844 | 15,168,730 | ||||||
| Attachmate Corp., Sr. Sec. Credit Facilities 2nd Lien Term Loan, 11%, 11/22/181 | 1,815,000 | 1,779,834 | ||||||
| BNY ConvergEx Group LLC, Sr. Sec. Credit Facilities 1st Lien Term Loan, Tranche B, 5.25%, 12/19/161 | 7,633,045 | 7,384,972 | ||||||
| CCC Information Services Group, Inc., Sr. Sec. Credit Facilities 1st Lien Term Loan, Tranche B, 5.75%, 11/11/151 | 1,432,071 | 1,440,425 | ||||||
| Eagle Parent, Inc., Sr. Sec. Credit Facilities 1st Lien Term Loan, Tranche B, 5%, 5/16/181 | 9,228,188 | 9,299,706 | ||||||
| Freescale Semiconductor Holdings, Inc., Extended Sr. Sec. Credit Facilities 1st Lien Term Loan, 4.481%, 12/1/161 | 18,541,258 | 18,161,162 | ||||||
| Genesys Telecommunications, Sr. Sec. Credit Facilities 1st Lien Term Loan, Tranche B, 6.75%, 1/31/191 | 8,379,000 | 8,476,758 | ||||||
| OpenLink Financial, Inc., Sr. Sec. Credit Facilities 1st Lien Term Loan, 7.75%, 10/30/171 | 4,962,500 | 4,993,594 | ||||||
| 21 | OPPENHEIMER MASTER LOAN FUND, LLC |
STATEMENT OF INVESTMENTS Continued
| Principal Amount | Value | |||||||
| Electrical Equipment Continued | ||||||||
| Rocket Software, Inc., Sr. Sec. Credit Facilities 1st Lien Term Loan, 7%, 2/8/181 | $ | 2,729,375 | $ | 2,736,198 | ||||
| Trizetto Group Inc. (The), Sr. Sec. Credit Facilities 1st Lien Term Loan, Tranche B, 4.75%, 5/2/181 | 12,736,350 | | 12,700,535 | | ||||
| 85,135,655 | ||||||||
| Industrial Conglomerates—1.1% | ||||||||
| Hillman Group, Inc., Sr. Sec. Credit Facilities 1st Lien Term Loan, Tranche B2, 5%, 5/31/161 | 5,608,490 | 5,664,574 | ||||||
| Rexnord LLC, Sr. Sec. Credit Facilities 1st Lien Term Loan, Tranche B, 5%, 4/1/181 | 5,558,000 | 5,591,087 | ||||||
| Sensus USA, Inc., Sr. Sec. Credit Facilities 1st Lien Term Loan, 4.75%, 5/9/171 | 7,047,663 | 7,074,091 | ||||||
| Terex Corp., Sr. Sec. Credit Facilities 1st Lien Term Loan, Tranche 2, 5.50%, 4/28/171 | 4,466,250 | | 4,488,581 | | ||||
| 22,818,333 | ||||||||
| Machinery—2.3% | ||||||||
| BOC Edwards Ltd., Sr. Sec. Credit Facilities 1st Lien Term Loan, Tranche B, 5.50%, 5/31/161 | 6,172,727 | 6,219,157 | ||||||
| CPM Holdings, Inc., Sr. Sec. Credit Facilities 1st Lien Term Loan, Tranche B, 6.25%, 8/15/171 | 3,730,000 | 3,739,325 | ||||||
| Colfax Corp., Sr. Sec. Credit Facilities 1st Lien Term Loan, Tranche B, 4.50%, 1/11/191 | 3,880,675 | 3,910,995 | ||||||
| Edwards Cayman Islands II Ltd., Extended Sr. Sec. Credit Facilities 1st Lien Term Loan, Tranche B, 5.50%, 5/31/161 | 861,619 | 869,720 | ||||||
| Manitowoc Co., Inc. (The), Sr. Sec. Credit Facilities 1st Lien Term Loan, Tranche B, 4.25%, 11/13/171 | 2,772,200 | 2,793,685 | ||||||
| Pelican Products, Inc., Sr. Sec. Credit Facilities 1st Lien Term Loan, Tranche B, 7%, 7/11/181 | 3,401,475 | 3,401,475 | ||||||
| Pinafore LLC, Sr. Sec. Credit Facilities 1st Lien Term Loan, Tranche B, 4.25%, 9/29/161 | 4,729,177 | 4,763,463 | ||||||
| Schrader International, Inc., Sr. Sec. Credit Facilities 1st Lien Term Loan, Tranche B, 6.25%, 4/27/181 | 2,250,000 | 2,280,938 | ||||||
| Veyance Technologies, Inc., Sr. Sec. Credit Facilities 1st Lien Term Loan, 2.47%, 7/31/141 | 19,448,090 | 19,243,885 | ||||||
| Veyance Technologies, Inc., Sr. Sec. Credit Facilities Term Loan, Delayed Draw, 2.47%, 7/31/141 | 2,432,296 | | 2,406,757 | | ||||
| 49,629,400 | ||||||||
| Marine—0.3% | ||||||||
| Autoparts Holdings Ltd., Sr. Sec. Credit Facilities 1st Lien Term Loan, 6.50%, 7/29/171 | 2,916,091 | 2,916,091 | ||||||
| Navistar, Inc., Sr. Sec. Credit Facilities 1st Lien Term Loan, Tranche B, 7%, 8/17/171 | 3,180,000 | | 3,231,675 | | ||||
| 6,147,766 | ||||||||
| 22 | OPPENHEIMER MASTER LOAN FUND, LLC |
| Principal Amount | Value | |||||||
| Road & Rail—1.8% | ||||||||
| Swift Transportation Co., Sr. Sec. Credit Facilities 1st Lien Term Loan, Tranche B2, 5%, 12/21/171 | $ | 8,940,893 | $ | 9,000,501 | ||||
| U.S. Xpress Enterprises, Inc., Sr. Sec. Credit Facilities Term Loan, 7.377%-7.50%, 10/12/141 | 24,272,136 | 23,847,374 | ||||||
| Wabash National Corp., Sr. Sec. Credit Facilities 1st Lien Term Loan, Tranche B, 6%, 5/8/191 | 5,213,800 | | 5,285,670 | | ||||
| 38,133,545 | ||||||||
| Trading Companies & Distributors—1.2% | ||||||||
| International Lease Finance Corp./Delos Aircraft, Inc., Sr. Sec. Credit Facilities 1st Lien Term Loan, 4.75%, 4/12/161 | 5,000,000 | 5,056,250 | ||||||
| Ocwen Financial Corp., Sr. Sec. Credit Facilities 1st Lien Term Loan, Tranche B, 7%, 9/1/161 | 3,298,407 | 3,334,294 | ||||||
| Walter Investment Management Corp., Sr. Sec. Credit Facilities 1st Lien Term Loan, Tranche B, 7.75%, 6/30/161 | 3,400,000 | 3,442,500 | ||||||
| Walter Investment Management Corp., Sr. Sec. Credit Facilities 2nd Lien Term Loan, 12.50%, 12/30/161 | 3,000,000 | 3,120,000 | ||||||
| iStar Financial, Inc., Sr. Sec. Credit Facilities 1st Lien Term Loan: | ||||||||
| Tranche A1, 5.25%, 3/19/161 | 2,190,774 | 2,211,313 | ||||||
| Tranche A2, 7%, 3/19/171 | 8,390,000 | | 8,452,925 | | ||||
| 25,617,282 | ||||||||
| Information Technology—3.9% | ||||||||
| Computers & Peripherals—0.4% | ||||||||
| CDW Corp., Extended Sr. Sec. Credit Facilities 1st Lien Term Loan, Tranche B, 4%, 7/15/171 | 9,114,974 | 9,010,151 | ||||||
| Electronic Equipment, Instruments & Components—0.2% | ||||||||
| Aeroflex, Inc., Sr. Sec. Credit Facilities 1st Lien Term Loan, Tranche B, 5.75%, 5/9/181 | 3,427,580 | 3,425,438 | ||||||
| Internet Software & Services—0.5% | ||||||||
| Avaya, Inc., Extended Sr. Sec. Credit Facilities 1st Lien Term Loan, Tranche B3, 4.927%, 10/26/171 | 3,571,979 | 3,274,315 | ||||||
| Avaya, Inc., Sr. Sec. Credit Facilities 1st Lien Term Loan, Tranche B1, 3.177%, 10/24/141 | 6,738,819 | | 6,546,762 | | ||||
| 9,821,077 | ||||||||
| IT Services—0.9% | ||||||||
| Sophia LP, Sr. Sec Credit Facilities 1st Lien Term Loan, 6.25%, 7/19/181 | 2,668,447 | 2,706,472 | ||||||
| Vertafore, Inc., Sr. Sec Credit Facilities 1st Lien Term Loan, 5.25%, 7/29/161 | 17,169,019 | | 17,240,744 | | ||||
| 19,947,216 | ||||||||
| Semiconductors & Semiconductor Equipment—1.0% | ||||||||
| Freescale Semiconductor, Inc., Sr. Sec. Credit Facilities 1st Lien Term Loan, Tranche B, 6%, 2/28/191 | 5,049,142 | 5,062,815 | ||||||
| NXP BV, Sr. Sec. Credit Facilities 1st Lien Term Loan, Tranche B, 5.25%, 3/19/191 | 11,741,000 | 11,897,543 | ||||||
| 23 | OPPENHEIMER MASTER LOAN FUND, LLC |
STATEMENT OF INVESTMENTS Continued
| Principal Amount | Value | |||||||
| Semiconductors & Semiconductor Equipment Continued | ||||||||
| NXP BV/NXP Funding LLC, Sr. Sec Credit Facilities 1st Lien Term Loan, 5.50%, 3/3/171 | $ | 3,199,680 | $ | 3,262,339 | | |||
| 20,222,697 | ||||||||
| Software—0.9% | ||||||||
| Deltek, Inc., Sr. Sec. Credit Facilities 1st Lien Term Loan, 5.50%, 11/3/161 | 3,661,350 | 3,653,723 | ||||||
| Infor US, Inc., Sr. Sec. Credit Facilities 1st Lien Term Loan, Tranche B2, 4%, 4/5/181 | 9,983,356 | 10,035,350 | ||||||
| RedPrairie Corp., Sr. Sec. Credit Facilities 1st Lien Term Loan, 6%, 8/6/181 | 5,410,417 | | 5,445,198 | | ||||
| 19,134,271 | ||||||||
| Materials—6.5% | ||||||||
| Chemicals—3.8% | ||||||||
| Ascend Performance Materials LLC, Sr. Sec. Credit Facilities 1st Lien Term Loan, Tranche B, 6.75%, 4/10/181 | 3,880,500 | 3,895,052 | ||||||
| Chemtura Corp., Sr. Sec. Credit Facilities 1st Lien Exit Term Loan, Tranche B, 5.50%, 8/29/161 | 6,731,000 | 6,804,624 | ||||||
| Cristal Inorganic Chemicals, Inc., Sr. Sec. Credit Facilities 2nd Lien Term Loan, 6.112%, 11/15/141 | 600,000 | 601,375 | ||||||
| Houghton International, Inc., Sr. Sec. Credit Facilities 1st Lien Term Loan, Tranche B, 6.75%, 1/29/161 | 3,000,516 | 3,029,010 | ||||||
| Ineos US Finance LLC, Sr. Sec. Credit Facilities 1st Lien Term Loan, 6.50%, 5/4/181 | 7,129,611 | 7,212,365 | ||||||
| K2 Pure Solutions NoCal LP, Sr. Sec. Credit Facilities 1st Lien Term Loan, 10%, 9/10/151 | 4,259,636 | 4,344,829 | ||||||
| Momentive Performance Materials, Inc., Extended Sr. Sec. Credit Facilities 1st Lien Term Loan, Tranche B, 3.75%, 5/5/151 | 3,176,145 | 3,076,890 | ||||||
| Momentive Performance Materials, Inc., Sr. Sec. Credit Facilities 1st Lien Term Loan, Tranche B, 3.75%, 5/5/151 | 1,950,200 | 1,889,256 | ||||||
| Momentive Specialty Chemicals, Sr. Sec. Credit Facilities 1st Lien Term Loan: | ||||||||
| Tranche C1-B, 4%, 5/5/151 | 650,732 | 647,207 | ||||||
| Tranche C2-B, 4.125%, 5/5/151 | 437,032 | 434,664 | ||||||
| Tranche C4-B, 4.25%, 5/5/151 | 4,643,033 | 4,526,957 | ||||||
| Nexeo Solutions LLC, Sr. Sec. Credit Facilities 1st Lien Term Loan, Tranche B, 5%, 9/8/171 | 1,171,963 | 1,166,103 | ||||||
| PQ Corp., Sr. Sec. Credit Facilities 1st Lien Term Loan, 3.966%, 7/30/141 | 3,088,716 | 3,076,411 | ||||||
| PQ Corp., Sr. Sec. Credit Facilities 2nd Lien Term Loan, 6.716%, 7/30/151 | 19,555,358 | 18,724,256 | ||||||
| PolyOne Corp., Sr. Sec. Credit Facilities 1st Lien Term Loan, Tranche B, 5%, 12/20/171 | 1,007,388 | 1,016,518 | ||||||
| Potters Holdings II LP, Sr. Sec. Credit Facilities 1st Lien Term Loan, 6%, 5/6/171 | 1,787,375 | 1,789,615 | ||||||
| Potters Holdings II LP, Sr. Sec. Credit Facilities 2nd Lien Term Loan, 10.25%, 11/6/171 | 1,535,000 | 1,551,309 | ||||||
| Styron Corp., Sr. Sec. Credit Facilities 1st Lien Term Loan, Tranche B, 8%, 8/2/171 | 6,005,658 | 5,773,473 | ||||||
| Tronox, Inc., Sr. Sec. Credit Facilities 1st Lien Term Loan, Tranche B, 4.25%, 2/8/181 | 1,085,493 | 1,096,375 | ||||||
| 24 | OPPENHEIMER MASTER LOAN FUND, LLC |
| Principal Amount | Value | |||||||
| Chemicals Continued | ||||||||
| Tronox, Inc., Sr. Sec. Credit Facilities 1st Lien Term Loan, Delayed Draw, 4.25%, 2/8/181 | $ | 296,786 | $ | 299,754 | ||||
| Univar, Inc., Sr. Sec. Credit Facilities 1st Lien Term Loan, Tranche B, 5%, 6/30/171 | 9,619,473 | | 9,597,675 | | ||||
| 80,553,718 | ||||||||
| Construction Materials—0.7% | ||||||||
| Grohe Holding GmbH, Sr. Sec. Credit Facilities 1st Lien Term Loan, Tranche B, 6.75%, 5/18/171 | 6,583,500 | 6,501,206 | ||||||
| Realogy Corp., Non-Extended Sr. Sec. Credit Facilities 1st Lien Term Loan, 4.495%, 10/10/161 | 847,486 | 815,625 | ||||||
| Roofing Supply Group LLC, Sr. Sec. Credit Facilities 1st Lien Term Loan, Tranche B, 6.50%-7.377%, 5/31/191 | 6,517,250 | | 6,606,863 | | ||||
| 13,923,694 | ||||||||
| Containers & Packaging—0.7% | ||||||||
| Consolidated Container Holdings LLC, Sr. Sec. Credit Facilities 1st Lien Term Loan, Tranche B, 6.25%, 7/3/191 | 3,640,000 | 3,683,982 | ||||||
| Hilex Poly Co. LLC, Sr. Sec. Credit Facilities 1st Lien Term Loan, Tranche B, 11.25%, 11/19/151 | 3,586,507 | 3,658,237 | ||||||
| Reynolds Group Holdings Ltd., Sr. Sec. Credit Facilities 1st Lien Term Loan, 3.75%, 9/18/181 | 7,650,000 | | 7,690,614 | | ||||
| 15,032,833 | ||||||||
| Metals & Mining—1.3% | ||||||||
| Aleris International, Inc., Sr. Sec. Credit Facilities Term Loan, 2.408%, 12/19/132 | 837,221 | 84 | ||||||
| Arch Coal, Inc., Sr. Sec. Credit Facilities 1st Lien Term Loan, 5.75%, 5/16/181 | 10,922,625 | 11,024,992 | ||||||
| Fairmount Minerals Ltd., Sr. Sec. Credit Facilities 1st Lien Term Loan, Tranche B, 5.25%, 3/15/171 | 5,985,000 | 5,980,511 | ||||||
| Noranda Aluminum Acquisition Corp., Sr. Sec. Credit Facilities 1st Lien Term Loan, Tranche B, 5.75%, 2/28/191 | 4,975,000 | 5,038,745 | ||||||
| Patriot Coal Corp., Sr. Sec. Credit Facilities 1st Lien Term Loan, Debtor in Possession, 9.25%, 12/31/131 | 6,375,000 | | 6,430,782 | | ||||
| 28,475,114 | ||||||||
| Telecommunication Services—3.2% | ||||||||
| Diversified Telecommunication Services—2.7% | ||||||||
| IPC Systems, Inc., Extended Sr. Sec. Credit Facilities 1st Lien Term Loan, Tranche B, 5.466%, 7/31/171 | 9,902,326 | 9,654,768 | ||||||
| Level 3 Communications, Inc., Sr. Sec. Credit Facilities 1st Lien Term Loan, Tranche B, 5.25%, 8/1/191 | 3,135,000 | 3,162,431 | ||||||
| Level 3 Financing, Inc., Sr. Sec. Credit Facilities 1st Lien Term Loan: Tranche B II, 3.25%, 8/1/191 | 15,055,000 | 15,111,456 | ||||||
| Tranche B2, 5.75%, 9/1/181 | 2,210,000 | 2,224,504 | ||||||
| Tranche B3, 5.656%, 9/3/181 | 13,565,000 | 13,654,027 | ||||||
| U.S. TelePacific Corp., Sr. Sec. Credit Facilities 1st Lien Term Loan, Tranche B, 5.75%, 2/23/171 | 5,851,314 | 5,753,790 | ||||||
| 25 | OPPENHEIMER MASTER LOAN FUND, LLC |
STATEMENT OF INVESTMENTS Continued
| Principal Amount | Value | |||||||
| Diversified Telecommunication Services Continued | ||||||||
| Zayo Group LLC, Sr. Sec. Credit Facilities 1st Lien Term Loan, Tranche B, 7.125%, 7/2/191 | $ | 6,743,100 | $ | 6,827,389 | | |||
| 56,388,365 | ||||||||
| Wireless Telecommunication Services—0.5% | ||||||||
| Global Tel*Link Corp., Sr. Sec. Credit Facilities 1st Lien Term Loan, Tranche B, 6%, 12/14/171 | 10,337,420 | 10,436,806 | ||||||
| Utilities—1.9% | ||||||||
| Electric Utilities—1.9% | ||||||||
| BRSP LLC, Sr. Sec. Credit Facilities Term Loan, 7.50%, 6/24/141 | 6,044,600 | 6,044,600 | ||||||
| Entegra Holdings LLC, Sr. Sec. Credit Facilities 3rd Lien Term Loan, Tranche B, 3.743%, 10/19/151,3 | 2,881,369 | 1,695,205 | ||||||
| GenOn Energy, Inc., Sr. Sec. Credit Facilities 1st Lien Term Loan, Tranche B, 6%, 12/4/171 | 4,315,759 | 4,355,835 | ||||||
| La Paloma Generating Co. LLC, Sr. Sec. Credit Facilities 1st Lien Term Loan, 9%, 8/25/171 | 5,959,563 | 5,929,759 | ||||||
| La Paloma Generating Co. LLC, Sr. Sec. Credit Facilities 2nd Lien Term Loan, 10.25%, 8/25/181 | 1,270,000 | 1,203,325 | ||||||
| MACH Gen LLC, Sr. Sec. Credit Facilities 2nd Lien Term Loan, 4.976%, 2/22/151,3 | 13,979,736 | 8,935,386 | ||||||
| New Development Holdings LLC, Sr. Sec. Credit Facilities 1st Lien Term Loan, Tranche B, 4.50%, 4/1/181 | 4,352,262 | 4,370,807 | ||||||
| Texas Competitive Electric Holdings Co. LLC, Non-Extended Sr. Sec. Credit Facilities 1st Lien Term Loan, 3.728%-3.938%, 10/10/141 | 9,365,000 | | 6,999,167 | | ||||
| | 39,534,084 | | ||||||
| Total Corporate Loans (Cost $1,988,098,671) | 2,001,334,648 | |||||||
| Corporate Bonds and Notes—2.2% | ||||||||
| Advanced Micro Devices, Inc., 7.50% Sr. Unsec. Nts., 8/15/225 | 2,085,000 | 2,022,450 | ||||||
| Aleris International, Inc., 6% Bonds, 7/1/20 | 43,747 | 43,310 | ||||||
| Berry Plastics Holding Corp., 4.264% Sr. Sec. Nts., 9/15/141 | 8,685,000 | 8,663,288 | ||||||
| Catalyst Paper Corp., 11% Sr. Sec. Nts., 12/15/162 | 2,481,168 | 1,960,123 | ||||||
| CCO Holdings LLC/CCO Holdings Capital Corp., 5.25% Sr. Unsec. Nts., 9/30/22 | 2,600,000 | 2,626,000 | ||||||
| CHS/Community Health Systems, Inc., 5.125% Sr. Sec. Nts., 8/15/18 | 2,600,000 | 2,704,000 | ||||||
| CIT Group, Inc., 5% Sr. Unsec. Nts., 8/15/22 | 1,565,000 | 1,636,458 | ||||||
| Clear Channel Communications, Inc., 5.75% Sr. Unsec. Unsub. Nts., 1/15/13 | 4,800,000 | 4,830,000 | ||||||
| Continental Rubber of America Corp., 4.50% Sr. Sec. Nts., 9/15/195 | 1,970,000 | 2,017,280 | ||||||
| Drill Rigs Holdings, Inc., 6.50% Sr. Sec. Nts., 10/1/175 | 1,010,000 | 1,006,213 | ||||||
| First Data Corp., 6.75% Sr. Sec. Nts., 11/1/205 | 3,130,000 | 3,126,088 | ||||||
| K Hovnanian Enterprises, Inc., 7.25% Sr. Sec. Nts., 10/15/205 | 2,495,000 | 2,563,613 | ||||||
| Offshore Group Investments Ltd., 11.50% Sr. Sec. Nts., 8/1/15 | 205,000 | 227,550 | ||||||
| Univision Communications, Inc., 6.75% Sr. Sec. Nts., 9/15/225 | 3,590,000 | 3,607,950 | ||||||
| 26 | OPPENHEIMER MASTER LOAN FUND, LLC |
| Principal Amount | Value | |||||||
| Corporate Bonds and Notes Continued | ||||||||
| Verso Paper Holdings LLC/Verso Paper, Inc.: 11.75% Sr. Sec. Nts., 1/15/195 | $ | 1,300,000 | $ | 1,007,500 | ||||
| 11.75% Sr. Sec. Nts., 1/15/195 | 5,230,000 | 5,543,800 | ||||||
| Western Express, Inc., 12.50% Sr. Sec. Nts., 4/15/155 | 3,120,000 | | 2,106,000 | | ||||
| Total Corporate Bonds and Notes (Cost $44,754,529) | 45,691,623 | |||||||
| Shares | ||||||||
| Preferred Stocks—0.0% | ||||||||
| Alpha Media Group, Inc., Preferred6 (Cost $0) | 105 | — | ||||||
| Common Stocks—0.7% | ||||||||
| Aleris Corp.7 | 50,627 | 2,341,499 | ||||||
| Alpha Media Group, Inc.6 | 784 | — | ||||||
| Champion Opco LLC6 | 237,986 | — | ||||||
| Cinram International Income Fund6 | 16,132,097 | — | ||||||
| Levlad LLC6 | 7,730 | 23,189 | ||||||
| Turtle Bay Holding Co. LLC6 | 293,838 | 264,454 | ||||||
| Young Broadcasting, Inc., Cl. A6,8 | 3,899 | | 13,061,650 | | ||||
| Total Common Stocks (Cost $11,540,349) | 15,690,792 | |||||||
| Units | ||||||||
| Rights, Warrants and Certificates—0.5% | ||||||||
| Champion Opco LLC Wts., Strike Price $0.000001, Exp. 1/27/206 | 86,682 | — | ||||||
| ION Media Networks, Inc. Wts., Strike Price $0.01, Exp. 12/18/166 | 6,081 | 4,484,738 | ||||||
| Young Broadcasting, Inc. Wts., Strike Price $0.01, Exp. 12/24/246,8 | 1,494 | | 5,004,900 | | ||||
| Total Rights, Warrants and Certificates (Cost $4,752,157) | 9,489,638 | |||||||
| Shares | ||||||||
| Investment Company—3.7% | ||||||||
| Oppenheimer Institutional Money Market Fund, Cl. E, 0.18%8,9 (Cost $77,763,778) | 77,763,778 | 77,763,778 | ||||||
| Total Investments, at Value (Cost $2,126,909,484) | 101.8 | % | 2,149,970,479 | |||||
| Liabilities in Excess of Other Assets | (1.8 | ) | (37,628,665 | ) | ||||
| Net Assets | 100.0 | % | $ | 2,112,341,814 | ||||
Footnotes to Statement of Investments
*September 28, 2012 represents the last business day of the Fund’s 2012 fiscal year. See Note 1 of the accompanying Notes.
1. Represents the current interest rate for a variable or increasing rate security.
2. This security is not accruing income because the issuer has missed an interest payment on it and/or is not anticipated to make future interest and/or principal payments. The rate shown is the original contractual interest rate. See Note 1 of the accompanying Notes.
3. Interest or dividend is paid-in-kind, when applicable.
4. Subject to a forbearance agreement. Rate shown is the original contractual interest rate. See Note 1 of the accompanying Notes.
| 27 | OPPENHEIMER MASTER LOAN FUND, LLC |
STATEMENT OF INVESTMENTS Continued
—5. Represents securities sold under Rule 144A, which are exempt from registration under the Securities Act of 1933, as amended. These securities have been determined to be liquid under guidelines established by the Board of Trustees. These securities amount to $23,000,894 or 1.09% of the Fund’s net assets as of September 28, 2012.
6. Non-income producing security.
7. Restricted security. The aggregate value of restricted securities as of September 28, 2012 was $2,341,499, which represents 0.11% of the Fund’s net assets. See Note 6 of the accompanying Notes. Information concerning restricted securities is as follows:
| Security | Acquisition Date | Cost | Value | Unrealized Depreciation | ||||||||||||||||
| Aleris Corp. | 4/23/10 | $ | 2,349,471 | $ | 2,341,499 | $ | 7,972 | |||||||||||||
8. Is or was an affiliate, as defined in the Investment Company Act of 1940, at or during the period ended September 28, 2012, by virtue of the Fund owning at least 5% of the voting securities of the issuer or as a result of the Fund and the issuer having the same investment adviser. Transactions during the period in which the issuer was an affiliate are as follows:
| Shares/Units/ Principal September 30, 2011 | Gross Additions | Gross Reductions | Shares/Units/ Principal September 28, 2012 | |||||||||||||||||
| Oppenheimer Institutional Money Market Fund, Cl. E | 23,263,778 | 801,100,000 | 746,600,000 | 77,763,778 | ||||||||||||||||
| Young Broadcasting, Inc., Cl. A | 5,508 | — | 1,609 | 3,899 | ||||||||||||||||
| Young Broadcasting, Inc., Sr. Sec. Credit Facilities 1st Lien Exit Term Loan, 8%, 6/30/15 | 4,457,172 | — | 4,457,172 | — | ||||||||||||||||
| Young Broadcasting, Inc. Wts., Strike Price $0.01, Exp. 12/24/24 | 1,920 | 135 | 561 | 1,494 | ||||||||||||||||
| Value | Income | Realized Gain | ||||||||||||||||||
| Oppenheimer Institutional Money Market Fund, Cl. E | $ | 77,763,778 | $ | 153,124 | $ | — | ||||||||||||||
| Young Broadcasting, Inc., Cl. A | 13,061,650 | — | 2,072,193 | |||||||||||||||||
| Young Broadcasting, Inc., Sr. Sec. Credit Facilities 1st Lien Exit Term Loan, 8%, 6/30/15 | — | 179,416 | — | |||||||||||||||||
| Young Broadcasting, Inc. Wts., Strike Price $0.01, Exp. 12/24/24 | 5,004,900 | — | 729,300 | |||||||||||||||||
| $ | 95,830,328 | $ | 332,540 | $ | 2,801,493 | |||||||||||||||
9. Rate shown is the 7-day yield as of September 28, 2012.
See accompanying Notes to Financial Statements.
| 28 | OPPENHEIMER MASTER LOAN FUND, LLC |
STATEMENT OF ASSETS AND LIABILITIES September 28, 20121
| Assets | ||||
| Investments, at value—see accompanying statement of investments: | ||||
| Unaffiliated companies (cost $2,038,162,664) | $ | 2,054,140,151 | ||
| Affiliated companies (cost $88,746,820) | | 95,830,328 | | |
| 2,149,970,479 | ||||
| Cash | 26,914,769 | |||
| Receivables and other assets: | ||||
| Investments sold | 42,359,498 | |||
| Interest, dividends and principal paydowns | 9,087,603 | |||
| Other | | 24,177 | | |
| Total assets | 2,228,356,526 | |||
| Liabilities | ||||
| Payables and other liabilities: | ||||
| Investments purchased | 115,193,460 | |||
| Shares of beneficial interest redeemed | 76,923 | |||
| Trustees’ compensation | 15,815 | |||
| Shareholder communications | 6,360 | |||
| Other | | 722,154 | | |
| Total liabilities | 116,014,712 | |||
| Net Assets—applicable to 163,984,720 shares of beneficial interest outstanding | $ | 2,112,341,814 | | |
| Net Asset Value, Redemption Price Per Share and Offering Price Per Share | $12.88 | |||
1. September 28, 2012 represents the last business day of the Fund’s 2012 fiscal year. See Note 1 of the accompanying Notes.
See accompanying Notes to Financial Statements.
| 29 | OPPENHEIMER MASTER LOAN FUND, LLC |
STATEMENT OF OPERATIONS For the Year Ended September 28, 20121
| Investment Income | ||||
| Interest: | ||||
| Unaffiliated companies | $ | 148,538,543 | ||
| Affiliated companies | 179,416 | |||
| Dividends: | ||||
| Unaffiliated companies | 162,006 | |||
| Affiliated companies | 153,124 | |||
| Other income | | 559,965 | | |
| Total investment income | 149,593,054 | |||
| Expenses | ||||
| Management fees | 6,139,317 | |||
| Custodian fees and expenses | 411,427 | |||
| Shareholder communications | 14,464 | |||
| Trustees’ compensation | 49,869 | |||
| Administration service fees | 1,500 | |||
| Other | | 202,298 | | |
| Total expenses | 6,818,875 | |||
| Less waivers and reimbursements of expenses | | (74,201 | ) | |
| Net expenses | 6,744,674 | |||
| Net Investment Income | 142,848,380 | |||
| Realized and Unrealized Gain (Loss) | ||||
| Net realized gain (loss) on investments from: | ||||
Unaffiliated companies | (22,960,823 | ) | ||
Affiliated companies | | 2,801,493 | | |
| Net realized loss | (20,159,330 | ) | ||
| Net change in unrealized appreciation/depreciation on: | ||||
| Investments | 99,020,734 | |||
| Translation of assets and liabilities denominated in foreign currencies | | 7,633 | | |
| Net change in unrealized appreciation/depreciation | 99,028,367 | |||
| Net Increase in Net Assets Resulting from Operations | $ | 221,717,417 | | |
1. September 28, 2012 represents the last business day of the Fund’s 2012 fiscal year. See Note 1 of the accompanying Notes.
See accompanying Notes to Financial Statements.
| 30 | OPPENHEIMER MASTER LOAN FUND, LLC |
STATEMENTS OF CHANGES IN NET ASSETS
| Year Ended September 28, 20121 | Year Ended September 30, 2011 | |||||||
| Operations | ||||||||
| Net investment income | $ | 142,848,380 | $ | 161,979,907 | ||||
| Net realized gain (loss) | (20,159,330 | ) | 7,587,706 | |||||
| Net change in unrealized appreciation/depreciation | | 99,028,367 | | | (95,567,957 | ) | ||
| Net increase in net assets resulting from operations | 221,717,417 | 73,999,656 | ||||||
| Beneficial Interest Transactions | ||||||||
| Net increase (decrease) in net assets resulting from beneficial interest transactions: | ||||||||
| Proceeds from contributions | 307,778,373 | 228,687,040 | ||||||
| Payments for withdrawals | | (359,203,397 | ) | | (198,724,070 | ) | ||
| (51,425,024 | ) | 29,962,970 | ||||||
| Net Assets | ||||||||
| Total increase | 170,292,393 | 103,962,626 | ||||||
| Beginning of period | | 1,942,049,421 | | | 1,838,086,795 | | ||
| End of period | $ | 2,112,341,814 | | $ | 1,942,049,421 | | ||
1. September 28, 2012 represents the last business day of the Fund’s 2012 fiscal year. See Note 1 of the accompanying Notes.
See accompanying Notes to Financial Statements.
| 31 | OPPENHEIMER MASTER LOAN FUND, LLC |
| Year Ended September 28, | Year Ended September 30, | |||||||||||||||||||
| 20121 | 2011 | 2010 | 2009 | 20082 | ||||||||||||||||
| Per Share Operating Data | ||||||||||||||||||||
| Net asset value, beginning of period | $ | 11.56 | $ | 11.14 | $ | 9.96 | $ | 9.35 | $ | 10.00 | ||||||||||
| Income (loss) from investment operations: | ||||||||||||||||||||
| Net investment income3 | .86 | .93 | .92 | .76 | .68 | |||||||||||||||
| Net realized and unrealized gain (loss) | | .46 | | | (.51 | ) | | .26 | | | (.15 | ) | | (1.33 | ) | |||||
| Total from investment operations | 1.32 | .42 | 1.18 | .61 | (.65 | ) | ||||||||||||||
| Net asset value, end of period | $12.88 | $11.56 | $11.14 | $9.96 | $ 9.35 | |||||||||||||||
| Total Return, at Net Asset Value4 | 11.42 | % | 3.77 | % | 11.85 | % | 6.52 | % | (6.50 | )% | ||||||||||
| Ratios/Supplemental Data | ||||||||||||||||||||
| Net assets, end of period (in thousands) | $2,112,342 | $1,942,049 | $1,838,087 | $1,073,069 | $534,056 | |||||||||||||||
| Average net assets (in thousands) | $2,045,550 | $2,048,386 | $1,449,988 | $ 613,182 | $523,536 | |||||||||||||||
| Ratios to average net assets:5 | ||||||||||||||||||||
| Net investment income | 6.98 | % | 7.91 | % | 8.68 | % | 8.84 | % | 7.56 | % | ||||||||||
| Total expenses6 | 0.33 | % | 0.34 | % | 0.36 | % | 0.36 | % | 0.39 | % | ||||||||||
| Expenses after payments, waivers and/or reimbursements and reduction to custodian expenses | 0.33 | % | 0.34 | % | 0.35 | % | 0.35 | % | 0.37 | % | ||||||||||
| Portfolio turnover rate | 60 | % | 67 | % | 72 | % | 56 | % | 53 | % | ||||||||||
1. September 28, 2012 represents the last business day of the Fund’s 2012 fiscal year. See Note 1 of the accompanying Notes.
2. For the period from October 31, 2007 (commencement of operations) to September 30, 2008.
3. Per share amounts calculated based on the average shares outstanding during the period.
4. Assumes an initial investment on the business day before the first day of the fiscal period, with all dividends and distributions reinvested in additional shares on the reinvestment date, and redemption at the net asset value calculated on the last business day of the fiscal period. Total returns are not annualized for periods less than one full year. Returns do not reflect the deduction of taxes that a shareholder would pay on fund distributions or the redemption of fund shares.
5. Annualized for periods less than one full year.
6. Total expenses including indirect expenses from affiliated fund were as follows:
| Year Ended September 28, 2012 | 0.33 | % | ||
| Year Ended September 30, 2011 | 0.34 | % | ||
| Year Ended September 30, 2010 | 0.37 | % | ||
| Year Ended September 30, 2009 | 0.37 | % | ||
| Period Ended September 30, 2008 | 0.41 | % |
See accompanying Notes to Financial Statements.
| 32 | OPPENHEIMER MASTER LOAN FUND, LLC |
1. Significant Accounting Policies
Oppenheimer Master Loan Fund, LLC (the “Fund”) is organized as a Delaware limited liability company and registered under the Investment Company Act of 1940, as amended, as a diversified, open-end management investment company. The Fund’s investment objective is to seek as high a level of current income and preservation of capital as is consistent with investing primarily in loans and other debt securities. The Fund’s investment adviser is OppenheimerFunds, Inc. (the “Manager”). As of September 28, 2012, approximately 100% of the shares of the Fund were owned by the Manager, other funds advised or sub-advised by the Manager or an affiliate of the Manager.
Shares of the Fund are issued solely in private placement transactions that do not involve any “public offering” within the meaning of Section 4(2) of the Securities Act of 1933, as amended (the “Securities Act”). Investments in the Fund may only be made by certain “accredited investors” within the meaning of Regulation D under the Securities Act, including other investment companies. The Fund currently offers one class of shares.
For federal income tax purposes, the Fund qualifies as a partnership, and each investor in the Fund is treated as the owner of its proportionate share of the net assets, income, expenses, and realized and unrealized gains and losses of the Fund. Accordingly, as a “pass-through” entity, the Fund pays no dividends or capital gain distributions.
The following is a summary of significant accounting policies consistently followed by the Fund.
Fiscal Year End. The last day of the Fund’s fiscal year was the last day the New York Stock Exchange was open for trading. The Fund’s financial statements have been presented through that date to maintain consistency with the Fund’s net asset value calculations used for shareholder transactions.
Securities on a When-Issued or Delayed Delivery Basis. The Fund purchases and sells interests in Senior Loans and other portfolio securities on a “when issued” basis, and may purchase or sell securities on a “delayed delivery” basis. “When-issued” or “delayed delivery” refers to securities whose terms and indenture are available and for which a market exists, but which are not available for immediate delivery. Delivery and payment for securities that have been purchased by the Fund on a when-issued basis normally takes place within six months and possibly as long as two years or more after the trade date. During this period, such securities do not earn interest, are subject to market fluctuation and may increase or decrease in value prior to their delivery. The purchase of securities on a when-issued basis may increase the volatility of the Fund’s net asset value to the extent the Fund executes such transactions while remaining substantially fully invested. When the Fund engages in when-issued or delayed delivery transactions, it relies on the buyer or seller, as the case may be, to complete the transaction. Their failure to do so may cause the Fund to lose the opportunity to obtain or dispose of the security at a price and yield it considers advantageous. The Fund may also sell securities that it purchased on a when-issued basis or forward commitment prior to settlement of the original purchase.
| 33 | OPPENHEIMER MASTER LOAN FUND, LLC |
NOTES TO FINANCIAL STATEMENTS Continued
1. Significant Accounting Policies Continued
Loans. Under normal market conditions, the Fund will invest at least 80% of its net assets in loans made to U.S. and foreign borrowers that are corporations, partnerships or other business entities. The Fund will do so directly as an original lender or by assignment or indirectly through participation agreements or certain derivative instruments. While many of these loans will be collateralized, the Fund can also invest in uncollateralized loans. Loans are often issued in connection with recapitalizations, acquisitions, leveraged buyouts, and refinancing of borrowers. The loans often pay interest at rates that float above (or are adjusted periodically based on) a benchmark that reflects current interest rates although the Fund can also invest in loans with fixed interest rates.
As of September 28, 2012, securities with an aggregate market value of $2,001,334,648, representing 94.7% of the Fund’s net assets were comprised of loans.
Credit Risk. Loans and debt securities are subject to credit risk. Credit risk relates to the ability of the borrower under a loan or issuer of a debt to meet interest or principal payments or both as they become due. The Fund may acquire securities that have missed an interest payment, and is not obligated to dispose of securities whose issuers subsequently miss an interest payment. Information concerning securities not accruing income as of September 28, 2012 is as follows:
| Cost | $ | 12,729,367 | ||
| Market Value | $ | 5,717,731 | ||
| Market Value as a % of Net Assets | 0.27 | % |
The Fund has entered into forbearance agreements with certain obligors under which the Fund has agreed to temporarily forego receipt of the original principal or coupon interest rates. As of September 28, 2012, securities with an aggregate market value of $13,203,580, representing 0.63% of the Fund’s net assets, were subject to these forbearance agreements. Interest and principal payments are contractually owed to the Fund with respect to these securities and will not be collected under these forbearance agreements.
Investment in Oppenheimer Institutional Money Market Fund. The Fund is permitted to invest daily available cash balances in an affiliated money market fund. The Fund may invest the available cash in Class E shares of Oppenheimer Institutional Money Market Fund (“IMMF”) to seek current income while preserving liquidity. IMMF is a registered open-end management investment company, regulated as a money market fund under the Investment Company Act of 1940, as amended. The Manager is also the investment adviser of IMMF. When applicable, the Fund’s investment in IMMF is included in the Statement of Investments. Shares of IMMF are valued at their net asset value per share. As a shareholder, the Fund is subject to its proportional share of IMMF’s Class E expenses, including its management fee. The Manager will waive fees and/or reimburse Fund expenses in an amount equal to the indirect management fees incurred through the Fund’s investment in IMMF.
Foreign Currency Translation. The Fund’s accounting records are maintained in U.S. dollars. The values of securities denominated in foreign currencies and amounts related to
| 34 | OPPENHEIMER MASTER LOAN FUND, LLC |
the purchase and sale of foreign securities and foreign investment income are translated into U.S. dollars as of the close of the Exchange, normally 4:00 P.M. Eastern time, on each day the Exchange is open for trading. Foreign exchange rates may be valued primarily using a reliable bank, dealer or service authorized by the Board of Trustees.
Reported net realized gains and losses from foreign currency transactions arise from sales of portfolio securities, sales and maturities of short-term securities, sales of foreign currencies, exchange rate fluctuations between the trade and settlement dates on securities transactions, and the difference between the amounts of dividends, interest, and foreign withholding taxes recorded on the Fund’s books and the U.S. dollar equivalent of the amounts actually received or paid. Net unrealized appreciation and depreciation on the translation of assets and liabilities denominated in foreign currencies arise from changes in the values of assets and liabilities, including investments in securities at fiscal period end, resulting from changes in exchange rates.
The effect of changes in foreign currency exchange rates on investments is separately identified from the fluctuations arising from changes in market values of securities held and reported with all other foreign currency gains and losses in the Fund’s Statement of Operations.
Federal Taxes. The Fund, as an entity, will not be subject to U.S. federal income tax. The Fund will be treated for U.S. federal income tax purposes as a partnership, and not as an association taxable as a corporation. Therefore, a tax provision is not required. Each shareholder is required for U.S. federal income tax purposes to take into account, in its taxable year with which (or within which a taxable year of the Fund ends), its distributive share of all items of Fund income, gains, losses, and deductions for such taxable year of the Fund. A shareholder must take such items into account even if the Fund does not distribute cash or other property to such shareholder during its taxable year.
Although the Fund is treated as a partnership for Federal tax purposes, it is intended that the Fund’s assets, income and distributions will be managed in such a way that investment in the Fund would not cause an investor that is a regulated investment company under Subchapter M of the Code (“RIC”) to fail that qualification.
Trustees’ Compensation. The Board of Trustees has adopted a compensation deferral plan for independent trustees that enables trustees to elect to defer receipt of all or a portion of the annual compensation they are entitled to receive from the Fund. For purposes of determining the amount owed to the Trustee under the plan, deferred amounts are treated as though equal dollar amounts had been invested in shares of the Fund or in other Oppenheimer funds selected by the Trustee. The Fund purchases shares of the funds selected for deferral by the Trustee in amounts equal to his or her deemed investment, resulting in a Fund asset equal to the deferred compensation liability. Such assets are included as a component of “Other” within the asset section of the Statement of Assets and Liabilities. Deferral of trustees’ fees under the plan will not affect the net assets
| 35 | OPPENHEIMER MASTER LOAN FUND, LLC |
NOTES TO FINANCIAL STATEMENTS Continued
1. Significant Accounting Policies Continued
of the Fund, and will not materially affect the Fund’s assets, liabilities or net investment income per share. Amounts will be deferred until distributed in accordance with the compensation deferral plan.
Investment Income. Dividend income is recorded on the ex-dividend date or upon ex-dividend notification in the case of certain foreign dividends where the ex-dividend date may have passed. Non-cash dividends included in dividend income, if any, are recorded at the fair market value of the securities received. Interest income is recognized on an accrual basis. Discount and premium, which are included in interest income on the Statement of Operations, are amortized or accreted daily.
Custodian Fees. “Custodian fees and expenses” in the Statement of Operations may include interest expense incurred by the Fund on any cash overdrafts of its custodian account during the period. Such cash overdrafts may result from the effects of failed trades in portfolio securities and from cash outflows resulting from unanticipated shareholder redemption activity. The Fund pays interest to its custodian on such cash overdrafts, to the extent they are not offset by positive cash balances maintained by the Fund, at a rate equal to the Federal Funds Rate plus 0.50%. The “Reduction to custodian expenses” line item, if applicable, represents earnings on cash balances maintained by the Fund during the period. Such interest expense and other custodian fees may be paid with these earnings.
Security Transactions. Security transactions are recorded on the trade date. Realized gains and losses on securities sold are determined on the basis of identified cost.
Indemnifications. The Fund’s organizational documents provide current and former trustees and officers with a limited indemnification against liabilities arising in connection with the performance of their duties to the Fund. In the normal course of business, the Fund may also enter into contracts that provide general indemnifications. The Fund’s maximum exposure under these arrangements is unknown as this would be dependent on future claims that may be made against the Fund. The risk of material loss from such claims is considered remote.
Other. The preparation of financial statements in conformity with accounting principles generally accepted in the United States of America requires management to make estimates and assumptions that affect the reported amounts of assets and liabilities and disclosure of contingent assets and liabilities at the date of the financial statements and the reported amounts of increases and decreases in net assets from operations during the reporting period. Actual results could differ from those estimates.
2. Securities Valuation
The Fund calculates the net asset value of its shares as of the close of the New York Stock Exchange (the “Exchange”), normally 4:00 P.M. Eastern time, on each day the Exchange is open for trading.
| 36 | OPPENHEIMER MASTER LOAN FUND, LLC |
The Fund’s Board has adopted procedures for the valuation of the Fund’s securities and has delegated the day-to-day responsibility for valuation determinations under those procedures to the Manager. The Manager has established a Valuation Committee which is responsible for determining a “fair valuation” for any security for which market quotations are not “readily available.” The Valuation Committee’s fair valuation determinations are subject to review, approval and ratification by the Fund’s Board at its next regularly scheduled meeting covering the calendar quarter in which the fair valuation was determined.
Valuation Methods and Inputs
Securities are valued using unadjusted quoted market prices, when available, as supplied primarily by third party pricing services or dealers.
The following methodologies are used to determine the market value or the fair value of the types of securities described below:
Securities traded on a registered U.S. securities exchange (including exchange-traded derivatives other than futures and futures options) are valued based on the last sale price of the security reported on the principal exchange on which it is traded, prior to the time when the Fund’s assets are valued. In the absence of a sale, the security is valued at the last sale price on the prior trading day, if it is within the spread of the current day’s closing “bid” and “asked” prices, and if not, at the current day’s closing bid price. A security of a foreign issuer traded on a foreign exchange but not listed on a registered U.S. securities exchange is valued based on the last sale price on the principal exchange on which the security is traded, as identified by the third party pricing service used by the Manager, prior to the time when the Fund’s assets are valued. If the last sale price is unavailable, the security is valued at the most recent official closing price on the principal exchange on which it is traded. If the last sales price or official closing price for a foreign security is not available, the security is valued at the mean between the bid and asked price per the exchange or, if not available from the exchange, obtained from two dealers. If bid and asked prices are not available from either the exchange or two dealers, the security is valued by using one of the following methodologies (listed in order of priority); (1) using a bid from the exchange, (2) the mean between the bid and asked price as provided by a single dealer, or (3) a bid from a single dealer.
Shares of a registered investment company that are not traded on an exchange are valued at that investment company’s net asset value per share.
Corporate and government debt securities (of U.S. or foreign issuers) and municipal debt securities, event-linked bonds, loans, mortgage-backed securities, collateralized mortgage obligations, and asset-backed securities are valued at the mean between the “bid” and “asked” prices utilizing evaluated prices obtained from third party pricing services or broker-dealers who may use matrix pricing methods to determine the evaluated prices.
Short-term money market type debt securities with a remaining maturity of sixty days or less are valued at cost adjusted by the amortization of discount or premium to maturity (amortized cost), which approximates market value. Short-term debt securities with a remaining maturity in excess of sixty days are valued at the mean between the “bid” and “asked” prices utilizing evaluated prices obtained from third party pricing services or broker-dealers.
| 37 | OPPENHEIMER MASTER LOAN FUND, LLC |
NOTES TO FINANCIAL STATEMENTS Continued
2. Securities Valuation Continued
A description of the standard inputs that may generally be considered by the third party pricing vendors in determining their evaluated prices is provided below.
| Security Type | Standard inputs generally considered by third-party pricing vendors | |
| Corporate debt, government debt, municipal, mortgage-backed and asset-backed securities | Reported trade data, broker-dealer price quotations, benchmark yields, issuer spreads on comparable securities, the credit quality, yield, maturity, and other appropriate factors. | |
| Loans | Information obtained from market participants regarding reported trade data and broker-dealer price quotations. | |
| Event-linked bonds | Information obtained from market participants regarding reported trade data and broker-dealer price quotations. |
If a market value or price cannot be determined for a security using the methodologies described above, or if, in the “good faith” opinion of the Manager, the market value or price obtained does not constitute a “readily available market quotation,” or a significant event has occurred that would materially affect the value of the security the security is fair valued either (i) by a standardized fair valuation methodology applicable to the security type or the significant event as previously approved by the Valuation Committee and the Fund’s Board or (ii) as determined in good faith by the Manager’s Valuation Committee. The Valuation Committee considers all relevant facts that are reasonably available, through either public information or information available to the Manager, when determining the fair value of a security. Fair value determinations by the Manager are subject to review, approval and ratification by the Fund’s Board at its next regularly scheduled meeting covering the calendar quarter in which the fair valuation was determined. Those fair valuation standardized methodologies include, but are not limited to, valuing securities at the last sale price or initially at cost and subsequently adjusting the value based on: changes in company specific fundamentals, changes in an appropriate securities index, or changes in the value of similar securities which may be further adjusted for any discounts related to security-specific resale restrictions. When possible, such methodologies use observable market inputs such as unadjusted quoted prices of similar securities, observable interest rates, currency rates and yield curves. The methodologies used for valuing securities are not necessarily an indication of the risks associated with investing in those securities nor can it be assured that the Fund can obtain the fair value assigned to a security if it were to sell the security.
To assess the continuing appropriateness of security valuations, the Manager, or its third party service provider who is subject to oversight by the Manager, regularly compares prior day prices, prices on comparable securities, and sale prices to the current day prices and challenges those prices exceeding certain tolerance levels with the third party pricing service or broker source. For those securities valued by fair valuations, whether through a standardized fair valuation methodology or a fair valuation determination, the Valuation Committee reviews and affirms the reasonableness of the valuations based on such methodologies and fair valuation determinations on a regular basis after considering all relevant information that is reasonably available.
| 38 | OPPENHEIMER MASTER LOAN FUND, LLC |
Classifications
Each investment asset or liability of the Fund is assigned a level at measurement date based on the significance and source of the inputs to its valuation. Various data inputs are used in determining the value of each of the Fund’s investments as of the reporting period end. These data inputs are categorized in the following hierarchy under applicable financial accounting standards:
| 1) | Level 1—unadjusted quoted prices in active markets for identical assets or liabilities (including securities actively traded on a securities exchange) |
| 2) | Level 2—inputs other than unadjusted quoted prices that are observable for the asset or liability (such as unadjusted quoted prices for similar assets and market corroborated inputs such as interest rates, prepayment speeds, credit risks, etc.) |
| 3) | Level 3—significant unobservable inputs (including the Manager’s own judgments about assumptions that market participants would use in pricing the asset or liability). |
The inputs used for valuing securities are not necessarily an indication of the risks associated with investing in those securities.
The table below categorizes amounts that are included in the Fund’s Statement of Assets and Liabilities as of September 28, 2012 based on valuation input level:
| Level 1— Unadjusted Quoted Prices | Level 2— Other Significant Observable Inputs | Level 3— Significant Unobservable Inputs | Value | |||||||||||||||||||||
| Assets Table | ||||||||||||||||||||||||
| Investments, at Value: | ||||||||||||||||||||||||
| Corporate Loans | $ | — | $ | 2,001,334,564 | $ | 84 | $ | 2,001,334,648 | ||||||||||||||||
| Corporate Bonds and Notes | — | 45,648,313 | 43,310 | 45,691,623 | ||||||||||||||||||||
| Preferred Stocks | — | — | — | — | ||||||||||||||||||||
| Common Stocks | — | 2,629,142 | 13,061,650 | 15,690,792 | ||||||||||||||||||||
| Rights, Warrants and Certificates | — | — | 9,489,638 | 9,489,638 | ||||||||||||||||||||
| Investment Company | 77,763,778 | — | — | 77,763,778 | ||||||||||||||||||||
| Total Assets | $ | 77,763,778 | $ | 2,049,612,019 | $ | 22,594,682 | $ | 2,149,970,479 | ||||||||||||||||
Currency contracts and forwards, if any, are reported at their unrealized appreciation/depreciation at measurement date, which represents the change in the contract’s value from trade date. Futures, if any, are reported at their variation margin at measurement date, which represents the amount due to/from the Fund at that date. All additional assets and liabilities included in the above table are reported at their market value at measurement date.
| 39 | OPPENHEIMER MASTER LOAN FUND, LLC |
NOTES TO FINANCIAL STATEMENTS Continued
2. Securities Valuation Continued
The table below shows the transfers between Level 1 and Level 3. The Fund’s policy is to recognize transfers in and transfers out as of the beginning of the reporting period.
| Transfers out of Level 1* | Transfers out of Level 2* | Transfers into Level 3* | ||||||||||
| Assets Table | ||||||||||||
| Investments, at Value: | ||||||||||||
| Common Stocks | ||||||||||||
Consumer Discretionary | $ | (19,157 | ) | $ | — | $ | 19,157 | |||||
| Rights, Warrants and Certificates | — | (4,560,750 | ) | 4,560,750 | ||||||||
| Total Assets | $ | (19,157 | ) | $ | (4,560,750 | ) | $ | 4,579,907 | ||||
* Transferred from Level 1 and 2 to Level 3 because of the lack of observable market data due to a decrease in market activity for these securities.
The following is a reconciliation of assets in which significant unobservable inputs (level 3) were used in determining fair value:
| Value as of September 30, 2011 | Realized gain | Change in unrealized appreciation | Accretion/ (amortization) of premium/ discounta | Purchases | Sales | Transfers into Level 3b | Value as of September 28, 2012 | |||||||||||||||||||||||||
| Assets Table | ||||||||||||||||||||||||||||||||
| Investments, at Value: | ||||||||||||||||||||||||||||||||
| Corporate Loans | $ | 84 | $ | — | $ | — | $ | — | $ | — | $ | — | $ | — | $ | 84 | ||||||||||||||||
| Corporate Bonds and Notes | 43,747 | — | — | (437 | ) | — | — | — | 43,310 | |||||||||||||||||||||||
| Common Stocks | 14,975,262 | 2,072,192 | 918,863 | — | 385,876 | (5,309,700 | ) | 19,157 | 13,061,650 | |||||||||||||||||||||||
| Rights, Warrants and Certificates | 4,992,000 | 729,300 | 667,382 | — | 391,500 | (1,851,294 | ) | 4,560,750 | 9,489,638 | |||||||||||||||||||||||
| Total Assets | $ | 20,011,093 | $ | 2,801,492 | $ | 1,586,245 | $ | (437 | ) | $ | 777,376 | $ | (7,160,994 | ) | $ | 4,579,907 | $ | 22,594,682 | ||||||||||||||
a. Included in net investment income.
b. Transferred from Level 1 and 2 to Level 3 because of the lack of observable market data.
The total change in unrealized appreciation/depreciation included in the Statement of Operations attributable to level 3 investments still held at September 28, 2012 includes:
Change in unrealized | ||||
| Common Stocks | $ | 918,863 | ||
| Rights, Warrants and Certificates | 667,382 | |||
| Total | $ | 1,586,245 | ||
As of September 28, 2012, for certain common stocks that do not trade, the Manager has determined the fair value using weekly broker-dealer price quotations. For certain warrants that do not trade, the Manager has determined the fair value using monthly broker-dealer
| 40 | OPPENHEIMER MASTER LOAN FUND, LLC |
price quotations. The Manager fair valued certain thinly traded corporate bonds using monthly broker quotes.
The Manager periodically reviews pricing vendor and broker methodologies and inputs for securities classified within Level 3 to confirm that they are determined using unobservable inputs and have been appropriately classified. Such securities’ fair valuations could change significantly based on changes in unobservable inputs used by the pricing vendor or broker.
For the assets in which significant unobservable inputs (Level 3) were used by the Manager in determining fair valuation, valuations were provided by a pricing service or broker.
There have been no significant changes to the fair valuation methodologies of the Fund during the period.
3. Shares of Beneficial Interest
The Fund has authorized an unlimited number of $0.001 par value shares of beneficial interest. Transactions in shares of beneficial interest were as follows:
| Year Ended September 28, 2012 | Year Ended September 30, 2011 | |||||||||||||||
| Shares | Amount | Shares | Amount | |||||||||||||
| Contributions | 24,864,897 | $ | 307,778,373 | 20,013,205 | $ | 228,687,040 | ||||||||||
| Withdrawals | (28,949,768 | ) | (359,203,397 | ) | (16,885,032 | ) | (198,724,070 | ) | ||||||||
| Net increase (decrease) | (4,084,871 | ) | $ | (51,425,024 | ) | 3,128,173 | $ | 29,962,970 | ||||||||
4. Purchases and Sales of Securities
The aggregate cost of purchases and proceeds from sales of securities, other than short-term obligations and investments in IMMF, for the year ended September 28, 2012, were as follows:
| Purchases | Sales | |||||||
| Investment securities | $ | 1,246,734,580 | $ | 1,177,659,007 | ||||
5. Fees and Other Transactions with Affiliates
Management Fees. Under the investment advisory agreement, the Fund pays the Manager a management fee based on the daily net assets of the Fund at an annual rate of 0.30%.
Administration Service Fees. The Fund pays the Manager a fee of $1,500 per year for preparing and filing the Fund’s tax returns.
Transfer Agent Fees. OppenheimerFunds Services (“OFS”), a division of the Manager, acts as the transfer and shareholder servicing agent for the Fund. For the year ended September 28, 2012, the Fund paid no fees to OFS for services to the Fund.
Waivers and Reimbursements of Expenses. The Manager will waive fees and/or reimburse Fund expenses in an amount equal to the indirect management fees incurred through the Fund’s investment in IMMF. During the year ended September 28, 2012, the Manager waived fees and/or reimbursed the Fund $74,201 for IMMF management fees.
| 41 | OPPENHEIMER MASTER LOAN FUND, LLC |
NOTES TO FINANCIAL STATEMENTS Continued
5. Fees and Other Transactions with Affiliates Continued
Some of these undertakings may be modified or terminated at any time; some may not be modified or terminated until after one year from the date of the current prospectus, as indicated therein.
6. Restricted Securities
As of September 28, 2012, investments in securities included issues that are restricted. A restricted security may have a contractual restriction on its resale and is valued under methods approved by the Board of Trustees as reflecting fair value. Securities that are restricted are marked with an applicable footnote on the Statement of Investments. Restricted securities are reported on a schedule following the Statement of Investments.
7. Loan Commitments
Pursuant to the terms of certain credit agreements, the Fund has unfunded loan commitments of $86,667 at September 28, 2012. The Fund generally will maintain with its custodian, liquid investments having an aggregate value at least equal to the par value of unfunded loan commitments. At September 28, 2012, these commitments have a market value of $89,050 and have been included as Corporate Loans in the Statement of Investments.
8. Pending Litigation
Since 2009, a number of class action lawsuits have been pending in federal courts against OppenheimerFunds, Inc., the Fund’s investment advisor (the “Manager”), OppenheimerFunds Distributor, Inc., the Fund’s principal underwriter and distributor (the “Distributor”), and certain funds (but not including the Fund) advised by the Manager and distributed by the Distributor (the “Defendant Funds”). Several of these lawsuits also name as defendants certain officers and current and former trustees of the respective Defendant Funds. The lawsuits raise claims under federal securities law and allege, among other things, that the disclosure documents of the respective Defendant Funds contained misrepresentations and omissions and that the respective Defendant Funds’ investment policies were not followed. The plaintiffs in these actions seek unspecified damages, equitable relief and awards of attorneys’ fees and litigation expenses. The Defendant Funds’ Boards of Trustees have also engaged counsel to represent the Funds and the present and former Independent Trustees named in those suits.
Other class action and individual lawsuits have been filed since 2008 in various state and federal courts against the Manager and certain of its affiliates by investors seeking to recover investments they allegedly lost as a result of the “Ponzi” scheme run by Bernard L. Madoff and his firm, Bernard L. Madoff Investment Securities, LLC (“BLMIS”). Plaintiffs in these suits allege that they suffered losses as a result of their investments in several funds managed by an affiliate of the Manager and assert a variety of claims, including breach of fiduciary duty, fraud, negligent misrepresentation, unjust enrichment, and violation of federal and state securities laws and regulations, among others. They seek unspecified
| 42 | OPPENHEIMER MASTER LOAN FUND, LLC |
damages, equitable relief and awards of attorneys’ fees and litigation expenses. Neither the Distributor, nor any of the Oppenheimer mutual funds, their independent trustees or directors are named as defendants in these lawsuits. None of the Oppenheimer mutual funds invested in any funds or accounts managed by Madoff or BLMIS. On February 28, 2011, a stipulation of partial settlement of three groups of consolidated putative class action lawsuits relating to these matters was filed in the U.S. District Court for the Southern District of New York. On August 19, 2011, the court entered an order and final judgment approving the settlement as fair, reasonable and adequate. In September 2011, certain parties filed notices of appeal from the court’s order approving the settlement. The settlement does not resolve other outstanding lawsuits against the Manager and its affiliates relating to BLMIS.
On April 16, 2010, a lawsuit was filed in New York state court against the Manager, an affiliate of the Manager and AAArdvark IV Funding Limited (“AAArdvark IV”), an entity advised by the Manager’s affiliate, in connection with investments made by the plaintiffs in AAArdvark IV. Plaintiffs allege breach of contract against the defendants and seek compensatory damages, costs and disbursements, including attorney fees. On July 15, 2011, a lawsuit was filed in New York state court against the Manager, an affiliate of the Manager and AAArdvark Funding Limited (“AAArdvark I”), an entity advised by the Manager’s affiliate, in connection with investments made by the plaintiffs in AAArdvark I. The complaint alleges breach of contract against the defendants and seeks compensatory damages, costs and disbursements, including attorney fees. On November 9, 2011, a lawsuit was filed in New York state court against the Manager, an affiliate of the Manager and AAArdvark XS Funding Limited (“AAArdvark XS”), an entity advised by the Manager’s affiliate, in connection with investments made by the plaintiffs in AAArdvark XS. The complaint alleges breach of contract against the defendants and seeks compensatory damages, costs and disbursements, including attorney fees.
The Manager believes the lawsuits and appeals described above are without legal merit and, with the exception of actions it has settled, is defending against them vigorously. While it is premature to render any opinion as to the outcome in these lawsuits, or whether any costs that the Defendant Funds may bear in defending the suits might not be reimbursed by insurance, the Manager believes that these suits should not impair the ability of the Manager or the Distributor to perform their respective duties to the Fund, and that the outcome of all of the suits together should not have any material effect on the operations of any of the Oppenheimer mutual funds.
| 43 | OPPENHEIMER MASTER LOAN FUND, LLC |
REPORT OF INDEPENDENT REGISTERED PUBLIC ACCOUNTING FIRM
The Board of Trustees and Shareholders of Oppenheimer Master Loan Fund, LLC:
We have audited the accompanying statement of assets and liabilities of Oppenheimer Master Loan Fund, LLC, including the statement of investments, as of September 28, 2012, and the related statement of operations for the year then ended, the statements of changes in net assets for each of the years in the two-year period then ended, and the financial highlights for each of the years in the four-year period then ended and for the period from October 31, 2007 (commencement of operations) to September 30, 2008. These financial statements and financial highlights are the responsibility of the Fund’s management. Our responsibility is to express an opinion on these financial statements and financial highlights based on our audits.
We conducted our audits in accordance with the standards of the Public Company Accounting Oversight Board (United States). Those standards require that we plan and perform the audit to obtain reasonable assurance about whether the financial statements and financial highlights are free of material misstatement. An audit includes examining, on a test basis, evidence supporting the amounts and disclosures in the financial statements. Our procedures included confirmation of securities owned as of September 28, 2012, by correspondence with the custodian, transfer agent and brokers, or by other appropriate auditing procedures where replies from brokers were not received. An audit also includes assessing the accounting principles used and significant estimates made by management, as well as evaluating the overall financial statement presentation. We believe that our audits provide a reasonable basis for our opinion.
In our opinion, the financial statements and financial highlights referred to above present fairly, in all material respects, the financial position of Oppenheimer Master Loan Fund, LLC as of September 28, 2012, the results of its operations for the year then ended, the changes in its net assets for each of the years in the two-year period then ended, and the financial highlights for each of the years in the four-year period then ended and for the period from October 31, 2007 (commencement of operations) to September 30, 2008, in conformity with U.S. generally accepted accounting principles.
KPMG LLP
Denver, Colorado
November 21, 2012
| 44 | OPPENHEIMER MASTER LOAN FUND, LLC |
BOARD APPROVAL OF THE FUND’S INVESTMENT
ADVISORY AGREEMENT Unaudited
Each year, the Board of Trustees (the “Board”), including a majority of the independent Trustees, is required to determine whether to renew the Fund’s investment advisory agreement (the “Agreement”). The Investment Company Act of 1940, as amended, requires that the Board request and evaluate, and that the Manager provide, such information as may be reasonably necessary to evaluate the terms of the Agreement. The Board employs an independent consultant to prepare a report that provides information, including comparative information that the Board requests for that purpose. In addition to in-person meetings focused on this evaluation, the Board receives information throughout the year regarding Fund services, fees, expenses and performance.
The Manager and the independent consultant provided information to the Board on the following factors: (i) the nature, quality and extent of the Manager’s services, (ii) the investment performance of the Fund and the Manager, (iii) the fees and expenses of the Fund, including comparative expense information, (iv) the profitability of the Manager and its affiliates, including an analysis of the cost of providing services, (v) whether economies of scale are realized as the Fund grows and whether fee levels reflect these economies of scale for Fund investors and (vi) other benefits to the Manager from its relationship with the Fund. The Board was aware that there are alternatives to retaining the Manager.
Outlined below is a summary of the principal information considered by the Board as well as the Board’s conclusions.
Nature, Quality and Extent of Services. The Board considered information about the nature, quality and extent of the services provided to the Fund and information regarding the Manager’s key personnel who provide such services. The Manager’s duties include providing the Fund with the services of the portfolio managers and the Manager’s investment team, who provide research, analysis and other advisory services in regard to the Fund’s investments; securities trading services; oversight of third-party service providers; monitoring compliance with applicable Fund policies and procedures and adherence to the Fund’s investment restrictions; and risk management. The Manager is responsible for providing certain administrative services to the Fund as well. Those services include providing and supervising all administrative and clerical personnel who are necessary in order to provide effective corporate administration for the Fund; compiling and maintaining records with respect to the Fund’s operations; preparing and filing reports required by the Securities and Exchange Commission; preparing periodic reports regarding the operations of the Fund for its shareholders; preparing proxy materials for shareholder meetings; and preparing the registration statements required by Federal and state securities laws for the sale of the Fund’s shares. The Manager also provides the Fund with office space, facilities and equipment.
| 45 | OPPENHEIMER MASTER LOAN FUND, LLC |
BOARD APPROVAL OF THE FUND’S INVESTMENT
ADVISORY AGREEMENT Unaudited / Continued
The Board also considered the quality of the services provided and the quality of the Manager’s resources that are available to the Fund. The Board took account of the fact that the Manager has had over fifty years of experience as an investment adviser and that its assets under management rank it among the top mutual fund managers in the United States. The Board evaluated the Manager’s advisory, administrative, accounting, legal, compliance services and risk management, and information the Board has received regarding the experience and professional qualifications of the Manager’s key personnel and the size and functions of its staff. In its evaluation of the quality of the portfolio management services provided, the Board considered the experience of Margaret Hui and Joseph Welsh, the portfolio managers for the Fund, and the Manager’s investment team and analysts. The Board members also considered the totality of their experiences with the Manager as directors or trustees of the Fund and other funds advised by the Manager. The Board considered information regarding the quality of services provided by affiliates of the Manager, which its members have become knowledgeable about in connection with the renewal of the Fund’s service agreements. The Board concluded, in light of the Manager’s experience, reputation, personnel, operations and resources that the Fund benefits from the services provided under the Agreement.
Investment Performance of the Manager and the Fund. Throughout the year, the Manager provided information on the investment performance of the Fund and the Manager, including comparative performance information. The Board also reviewed information, prepared by the Manager and by the independent consultant, comparing the Fund’s historical performance to relevant market indices and to the performance of other front-end load and no-load loan participation funds. The Board noted that the Fund outperformed its performance universe median for the one- and three-year periods. The Board also considered that other Oppenheimer Funds hold all outstanding shares of the Fund.
Costs of Services by the Manager. The Board reviewed the fees paid to the Manager and the other expenses borne by the Fund. The Board also considered the comparability of the fees charged and the services provided to the Fund to the fees and services for other clients or accounts advised by the Manager. The independent consultant provided comparative data in regard to the fees and expenses of the Fund and other retail no-load loan participation funds with comparable asset levels and distribution features. The Board considered that the Fund’s actual and contractual management fees and total expenses were well below that of its expense group median and average.
Economies of Scale and Profits Realized by the Manager. The Board considered information regarding the Manager’s costs in serving as the Fund’s investment adviser,
| 46 | OPPENHEIMER MASTER LOAN FUND, LLC |
including the costs associated with the personnel and systems necessary to manage the Fund, and information regarding the Manager’s profitability from its relationship with the Fund. The Board reviewed whether the Manager may realize economies of scale in managing and supporting the Fund and whether those economies of scale benefit the Fund’s shareholders at the current level of Fund assets in relation to its management fee.
Other Benefits to the Manager. In addition to considering the profits realized by the Manager, the Board considered information that was provided regarding the direct and indirect benefits the Manager receives as a result of its relationship with the Fund, including compensation paid to the Manager’s affiliates. The Board also considered that the Manager must be able to pay and retain experienced professional personnel at competitive rates to provide quality services to the Fund.
Conclusions. These factors were also considered by the independent Trustees meeting separately from the full Board, assisted by experienced counsel to the Fund and to the independent Trustees. Fund counsel and the independent Trustees’ counsel are independent of the Manager within the meaning and intent of the Securities and Exchange Commission Rules.
Based on its review of the information it received and its evaluations described above, the Board, including a majority of the independent Trustees, decided to continue the Agreement. In addition, the Board, including a majority of the Independent Trustees, approved the restructuring of the Fund’s investment advisory arrangement so that effective January 1, 2013, (i) OFI Global Asset Management, Inc. (“OFI Global”), a wholly owned subsidiary of the Manager, will serve as the investment adviser to the Fund in place of the Manager under a Restated Advisory Agreement (“Restated Advisory Agreement”), and (ii) OFI Global will enter into a Sub-Advisory Agreement (“Sub-Advisory Agreement”) with the Manager to provide investment sub-advisory services to the Fund. OFI Global will pay the Manager a percentage of the net investment advisory fee (after all applicable waivers have been deducted) that it receives from the Fund. The Agreement will continue until earlier of August 31, 2013 or the effective date of the Restated Advisory Agreement between the Fund and OFI Global. The Restated Advisory Agreement and Sub-Advisory Agreement will continue until August 31, 2013.
In arriving at its decisions, the Board did not single out any factor or factors as being more important than others, but considered all of the above information, and considered the terms and conditions of the Agreement, Restated Advisory Agreement and Sub-Advisory Agreement, including the management fees, in light of all the surrounding circumstances.
| 47 | OPPENHEIMER MASTER LOAN FUND, LLC |
PORTFOLIO PROXY VOTING POLICIES AND PROCEDURES;
UPDATES TO STATEMENTS OF INVESTMENTS Unaudited
The Fund has adopted Portfolio Proxy Voting Policies and Procedures under which the Fund votes proxies relating to securities (“portfolio proxies”) held by the Fund. A description of the Fund’s Portfolio Proxy Voting Policies and Procedures is available (i) without charge, upon request, by calling the Fund toll-free at 1.800.CALL OPP (225.5677), (ii) on the Fund’s website at www.oppenheimerfunds.com, and (iii) on the SEC’s website at www.sec.gov. In addition, the Fund is required to file Form N-PX, with its complete proxy voting record for the 12 months ended June 30th, no later than August 31st of each year. The Fund’s voting record is available (i) without charge, upon request, by calling the Fund toll-free at 1.800.CALL OPP (225.5677), and (ii) in the Form N-PX filing on the SEC’s website at www.sec.gov.
The Fund files its complete schedule of portfolio holdings with the SEC for the first quarter and the third quarter of each fiscal year on Form N-Q. The Fund’s Form N-Q filings are available on the SEC’s website at www.sec.gov. Those forms may be reviewed and copied at the SEC’s Public Reference Room in Washington, D.C. Information on the operation of the Public Reference Room may be obtained by calling 1-800-SEC-0330.
| 48 | OPPENHEIMER MASTER LOAN FUND, LLC |
TRUSTEES AND OFFICERS Unaudited
| Name, Position(s) Held with the Fund, Length of Service, Age | Principal Occupation(s) During the Past 5 Years; Other Trusteeships/Directorships Held; Number of Portfolios in the Fund Complex Currently Overseen | |
| INDEPENDENT TRUSTEES | The address of each Trustee in the chart below is 6803 S. Tucson Way, Centennial, Colorado 80112-3924. Each Trustee serves for an indefinite term, or until his or her resignation, retirement, death or removal. | |
William L. Armstrong, Chairman of the Board of Trustees and Trustee (since 2007) Age: 75 | President, Colorado Christian University (since 2006); Chairman, Cherry Creek Mortgage Company (since 1991), Chairman, Centennial State Mortgage Company (since 1994), Chairman, The El Paso Mortgage Company (since 1993); Chairman, Ambassador Media Corporation (since 1984); Chairman, Broadway Ventures (since 1984); Director of Helmerich & Payne, Inc. (oil and gas drilling/production company) (since 1992), former Director of Campus Crusade for Christ (non-profit) (1991-2008); former Director, The Lynde and Harry Bradley Foundation, Inc. (non-profit organization) (2002-2006); former Chairman of: Transland Financial Services, Inc. (private mortgage banking company) (1997-2003), Great Frontier Insurance (1995-2000), Frontier Real Estate, Inc. (residential real estate brokerage) (1994-2000) and Frontier Title (title insurance agency) (1995-2000); former Director of the following: UNUMProvident (insurance company) (1991-2004), Storage Technology Corporation (computer equipment company) (1991-2003) and International Family Entertainment (television channel) (1992-1997); U.S. Senator (January 1979-January 1991). Oversees 36 portfolios in the OppenheimerFunds complex. Mr. Armstrong has served on the Boards of certain Oppenheimer funds since 1999, during which time he has become familiar with the Fund’s (and other Oppenheimer funds’) financial, accounting, regulatory and investment matters and has contributed to the Boards’ deliberations. | |
Edward L. Cameron, Trustee (since 2007) Age: 74 | Member of The Life Guard of Mount Vernon (George Washington historical site) (June 2000–June 2006); Partner of PricewaterhouseCoopers LLP (accounting firm) (July 1974-June 1999); Chairman of Price Waterhouse LLP Global Investment Management Industry Services Group (accounting firm) (July 1994-June 1998). Oversees 36 portfolios in the OppenheimerFunds complex. Mr. Cameron has served on the Boards of certain Oppenheimer funds since 1999, during which time he has become familiar with the Fund’s (and other Oppenheimer funds’) financial, accounting, regulatory and investment matters and has contributed to the Boards’ deliberations. | |
Jon S. Fossel, Trustee (since 2007) Age: 70 | Chairman of the Board (2006-December 2011) and Director (June 2002-December 2011) of UNUMProvident (insurance company); Director of Northwestern Energy Corp. (public utility corporation) (November 2004-December 2009); Director of P.R. Pharmaceuticals (October 1999-October 2003); Director of Rocky Mountain Elk Foundation (non-profit organization) (February 1998-February 2003 and February 2005-February 2007); Chairman and Director (until October 1996) and President and Chief Executive Officer (until October 1995) of the Manager; President, Chief Executive Officer and Director of the following: Oppenheimer Acquisition Corp. (“OAC”) (parent holding company of the Manager), Shareholders Services, Inc. and Shareholder Financial Services, Inc. (until October 1995). Oversees 36 portfolios in the OppenheimerFunds complex. Mr. Fossel has served on the Boards of certain Oppenheimer funds since 1990, during which time he has become familiar with the Fund’s (and other Oppenheimer funds’) financial, accounting, regulatory and investment matters and has contributed to the Boards’ deliberations. | |
| 49 | OPPENHEIMER MASTER LOAN FUND, LLC |
TRUSTEES AND OFFICERS Unaudited / Continued
Sam Freedman, Trustee (since 2007) Age: 71 | Director of Colorado UpLIFT (charitable organization) (since September 1984). Mr. Freedman held several positions with the Manager and with subsidiary or affiliated companies of the Manager (until October 1994). Oversees 36 portfolios in the OppenheimerFunds complex. Mr. Freedman has served on the Boards of certain Oppenheimer funds since 1996, during which time he has become familiar with the Fund’s (and other Oppenheimer funds’) financial, accounting, regulatory and investment matters and has contributed to the Boards’ deliberations. | |
Richard F. Grabish, Trustee (since 2008) Age: 64 | Formerly Senior Vice President and Assistant Director of Sales and Marketing (March 1997-December 2007), Director (March 1987-December 2007) and Manager of Private Client Services (June 1985-June 2005) of A.G. Edwards & Sons, Inc. (broker/dealer and investment firm); Chairman and Chief Executive Officer of A.G. Edwards Trust Company, FSB (March 2001-December 2007); President and Vice Chairman of A.G. Edwards Trust Company, FSB (investment adviser) (April 1987-March 2001); President of A.G. Edwards Trust Company, FSB (investment adviser) (June 2005-December 2007). Oversees 36 portfolios in the OppenheimerFunds complex. Mr. Grabish has served on the Boards of certain Oppenheimer funds since 2001, during the course of which he has become familiar with the Fund’s (and other Oppenheimer funds’) financial, accounting, regulatory and investment matters and has contributed to the Boards’ deliberations. | |
Beverly L. Hamilton, Trustee (since 2007) Age: 65 | Trustee of Monterey Institute for International Studies (educational organization) (since February 2000); Board Member of Middlebury College (educational organization) (December 2005-June 2011); Chairman (since 2010) of American Funds’ Emerging Markets Growth Fund, Inc. (mutual fund); Director of The California Endowment (philanthropic organization) (April 2002-April 2008); Director (February 2002-2005) and Chairman of Trustees (2006-2007) of the Community Hospital of Monterey Peninsula; Director (October 1991-2005); Vice Chairman (2006-2009) of American Funds’ Emerging Markets Growth Fund, Inc. (mutual fund); President of ARCO Investment Management Company (February 1991-April 2000); Member of the investment committees of The Rockefeller Foundation (2001-2006) and The University of Michigan (since 2000); Advisor at Credit Suisse First Boston’s Sprout venture capital unit (venture capital fund) (1994-January 2005); Trustee of MassMutual Institutional Funds (investment company) (1996-June 2004); Trustee of MML Series Investment Fund (investment company) (April 1989-June 2004); Member of the investment committee of Hartford Hospital (2000-2003); and Advisor to Unilever (Holland) pension fund (2000-2003). Oversees 36 portfolios in the OppenheimerFunds complex. Ms. Hamilton has served on the Boards of certain Oppenheimer funds since 2002, during which time she has become familiar with the Fund’s (and other Oppenheimer funds’) financial, accounting, regulatory and investment matters and has contributed to the Boards’ deliberations. | |
Victoria J. Herget, Trustee (since 2012) Age: 60 | Independent Director of the First American Funds (mutual fund family) (2003-2011); former Managing Director (1993-2001), Principal (1985-1993), Vice President (1978-1985) and Assistant Vice President (1973-1978) of Zurich Scudder Investments (and its predecessor firms); Board Chair (2008-Present) and Director (2004-Present), United Educators (insurance company); Trustee (1992-2007), Chair of the Board of Trustees (1999-2007), Investment Committee Chair (1994-1999) and Investment Committee member (2007-2010) of Wellesley College; Trustee (since 2000) and Chair (since 2010), Newberry Library; Trustee, Mather LifeWays (since 2001); Trustee, BoardSource (2006-2009) and Chicago City Day School (1994-2005). Oversees 36 portfolios | |
| 50 | OPPENHEIMER MASTER LOAN FUND, LLC |
Victoria J. Herget, Continued | in the OppenheimerFunds complex. Ms. Herget has served on the Boards of certain Oppenheimer funds since 2012, during which time she has become familiar with the Fund’s (and other Oppenheimer funds’) financial, accounting, regulatory and investment matters and has contributed to the Boards’ deliberations. | |
Robert J. Malone, Trustee (since 2007) Age: 68 | Board of Directors of Opera Colorado Foundation (non-profit organization) (since March 2008); Director of Jones Knowledge, Inc. (2006-2010); Director of Jones International University (educational organization) (since August 2005); Chairman, Chief Executive Officer and Director of Steele Street Bank & Trust (commercial banking) (since August 2003); Director of Colorado UpLIFT (charitable organization) (1986-2010); Trustee of the Gallagher Family Foundation (non-profit organization) (since 2000); Former Chairman of U.S. Bank-Colorado (subsidiary of U.S. Bancorp and formerly Colorado National Bank) (July 1996-April 1999); Director of Commercial Assets, Inc. (real estate investment trust) (1993-2000); Director of Jones Knowledge, Inc. (2001-July 2004); Director of U.S. Exploration, Inc. (oil and gas exploration) (1997-February 2004); Chairman of the Board (1991-1994) and Trustee (1985-1994) of Regis University; and Chairman of the Board (1990-1991) and Trustee (1984-1999) of Young Presidents Organization. Oversees 36 portfolios in the OppenheimerFunds complex. Mr. Malone has served on the Boards of certain Oppenheimer funds since 2002, during which time he has become familiar with the Fund’s (and other Oppenheimer funds’) financial, accounting, regulatory and investment matters and has contributed to the Boards’ deliberations. | |
Karen L. Stuckey, Trustee (since 2012) Age: 59 | Partner (1990-2012) of PricewaterhouseCoopers LLP (held various positions 1975-1990); Trustee (1992-2006) and member of Executive, Nominating and Audit Committees and Chair of Finance Committee of Lehigh University; and member, Women’s Investment Management Forum since inception. Oversees 36 portfolios in the OppenheimerFunds complex. Ms. Stuckey has served on the Boards of certain Oppenheimer funds since 2012, during which time she has become familiar with the Fund’s (and other Oppenheimer funds’) financial, accounting, regulatory and investment matters and has contributed to the Boards’ deliberations. | |
James D. Vaughn, Trustee (since 2012) Age: 67 | Retired; former managing partner (1994-2001) of Denver office of Deloitte & Touche LLP, (held various positions 1969-1993); Trustee and Chairman of the Audit Committee of Schroder Funds (since 2003); Board member and Chairman of Audit Committee of AMG National Trust Bank (since 2005); Trustee, Audit Committee member and Investment Committee member, University of South Dakota Foundation (since 1996); Board member, Executive Committee Member, Audit Committee Member and past Board Chair, Junior Achievement (since 1993); former Board member, Mile High United Way, Boys and Girls Clubs, Boy Scouts, Colorado Business Committee for the Arts, Economic Club of Colorado and Metro Denver Network. Oversees 36 portfolios in the OppenheimerFunds complex. Mr. Vaughn has served on the Boards of certain Oppenheimer funds since 2012, during which time he has become familiar with the Fund’s (and other Oppenheimer funds’) financial, accounting, regulatory and investment matters and has contributed to the Boards’ deliberations. | |
F. William Marshall, Jr., Trustee (since 2007) Age: 70 | Trustee Emeritus of Worcester Polytech Institute (WPI) (private university) (since 2009); Trustee of MassMutual Select Funds (formerly MassMutual Institutional Funds) (investment company) (since 1996) and MML Series Investment Fund (investment company) (since 1996) and Mass Mutual Premier Funds (investment company) (since January 2012); President and | |
| 51 | OPPENHEIMER MASTER LOAN FUND, LLC |
TRUSTEES AND OFFICERS Unaudited / Continued
F. William Marshall, Jr., Continued | Treasurer of the SIS Funds (private charitable fund) (January 1999 – March 2011); Former Trustee of WPI (1985-2008); Former Chairman of the Board (2004-2006) and Former Chairman of the Investment Committee of WPI (1994-2008); Chairman of SIS & Family Bank, F.S.B. (formerly SIS Bank) (commercial bank) (January 1999-July 1999); Executive Vice President of Peoples Heritage Financial Group, Inc. (commercial bank) (January 1999-July 1999); and Former President and Chief Executive Officer of SIS Bancorp. (1993-1999). Oversees 40 portfolios in the OppenheimerFunds complex. Mr. Marshall has served on the Boards of certain Oppenheimer funds since 2000, during which time he has become familiar with the Fund’s (and other Oppenheimer funds’) financial, accounting, regulatory and investment matters and has contributed to the Boards’ deliberations. | |
| INTERESTED TRUSTEE AND OFFICER | The address of Mr. Glavin is Two World Financial Center, 225 Liberty Street, 11th Floor, New York, New York 10281-1008. Mr. Glavin serves as a Trustee for an indefinite term, or until his resignation, retirement, death or removal and as an Officer for an indefinite term, or until his resignation, retirement, death or removal. Mr. Glavin is an Interested Trustee due to his positions with OppenheimerFunds, Inc. and its affiliates. | |
William F. Glavin, Jr., Trustee, President and Principal Executive Officer (since 2009) Age: 54 | Chairman of the Manager (since December 2009); Chief Executive Officer and Director of the Manager (since January 2009); President of the Manager (since May 2009); Director of Oppenheimer Acquisition Corp. (“OAC”) (the Manager’s parent holding company) (since June 2009); Executive Vice President (March 2006-February 2009) and Chief Operating Officer (July 2007-February 2009) of Massachusetts Mutual Life Insurance Company (OAC’s parent company); Director (May 2004-March 2006) and Chief Operating Officer and Chief Compliance Officer (May 2004-January 2005), President (January 2005-March 2006) and Chief Executive Officer (June 2005-March 2006) of Babson Capital Management LLC; Director (March 2005-March 2006), President (May 2003-March 2006) and Chief Compliance Officer (July 2005-March 2006) of Babson Capital Securities, Inc. (a broker-dealer); President (May 2003-March 2006) of Babson Investment Company, Inc.; Director (May 2004-August 2006) of Babson Capital Europe Limited; Director (May 2004-October 2006) of Babson Capital Guernsey Limited; Director (May 2004-March 2006) of Babson Capital Management LLC; Non-Executive Director (March 2005-March 2007) of Baring Asset Management Limited; Director (February 2005-June 2006) Baring Pension Trustees Limited; Director and Treasurer (December 2003-November 2006) of Charter Oak Capital Management, Inc.; Director (May 2006-September 2006) of C.M. Benefit Insurance Company; Director (May 2008-June 2009) and Executive Vice President (June 2007-July 2009) of C.M. Life Insurance Company; President (March 2006-May 2007) of MassMutual Assignment Company; Director (January 2005-December 2006), Deputy Chairman (March 2005-December 2006) and President (February 2005-March 2005) of MassMutual Holdings (Bermuda) Limited; Director (May 2008-June 2009) and Executive Vice President (June 2007-July 2009) of MML Bay State Life Insurance Company; Chief Executive Officer and President (April 2007-January 2009) of MML Distributors, LLC; and Chairman (March 2006-December 2008) and Chief Executive Officer (May 2007-December 2008) of MML Investors Services, Inc. Oversees 62 portfolios as a Trustee/Director and 94 portfolios as an officer in the OppenheimerFunds complex. | |
| 52 | OPPENHEIMER MASTER LOAN FUND, LLC |
| OTHER OFFICERS OF THE FUND | The addresses of the Officers in the chart below are as follows: for Messrs. Gabinet and Ms. Nasta, Two World Financial Center, 225 Liberty Street, New York, New York 10281-1008, for Messrs. Welsh, Vandehey, Wixted and Ms. Hui, 6803 S. Tucson Way, Centennial, Colorado 80112-3924. Each Officer serves for an indefinite term or until his or her resignation, retirement, death or removal. | |
Margaret Hui, Vice President (since 2007) Age: 54 | Vice President of the Manager (since February 2005); Assistant Vice President of the Manager (October 1999-February 2005); Vice President-Syndications of Sanwa Bank California (January 1998-September 1999). A portfolio manager and officer of 2 portfolios in the OppenheimerFunds complex. | |
Joseph Welsh, Vice President (since 2007) Age: 48 | Head of the Manager’s High Yield Corporate Debt Team (since April 2009); Senior Vice President of the Manager (since May 2009); Vice President of the Manager (December 2000-April 2009); Assistant Vice President of the Manager (December 1996-November 2000); a high yield bond analyst of the Manager (January 1995-December 1996); a CFA. A portfolio manager and officer of 5 portfolios in the OppenheimerFunds complex. | |
Arthur S. Gabinet, Secretary and Chief Legal Officer (since 2011) Age: 54 | Executive Vice President (since May 2010) and General Counsel (since January 2011) of the Manager; General Counsel of the Distributor (since January 2011); General Counsel of Centennial Asset Management Corporation (since January 2011); Executive Vice President and General Counsel of HarbourView Asset Management Corporation (since January 2011); Assistant Secretary (since January 2011) and Director (since January 2011) of OppenheimerFunds International Ltd. and OppenheimerFunds plc; Vice President and Director of Oppenheimer Partnership Holdings, Inc. (since January 2011); Director of Oppenheimer Real Asset Management, Inc. (since January 2011); Executive Vice President and General Counsel of Shareholder Financial Services, Inc. and Shareholder Services, Inc. (since January 2011); Executive Vice President and General Counsel of OFI Private Investments, Inc. (since January 2011); Vice President of OppenheimerFunds Legacy Program (January 2011-January 2012); Executive Vice President and General Counsel of OFI Institutional Asset Management, Inc. (since January 2011); General Counsel, Asset Management of the Manager (May 2010-December 2010); Principal, The Vanguard Group (November 2005-April 2010); District Administrator, U.S. Securities and Exchange Commission (January 2003-October 2005). An officer of 94 portfolios in the OppenheimerFunds complex. | |
Christina M. Nasta, Vice President and Chief Business Officer (since 2011) Age: 39 | Senior Vice President of the Manager (since July 2010); Vice President of the Manager (since January 2003); Vice President of OppenheimerFunds Distributor, Inc. (since January 2003). An officer of 94 portfolios in the OppenheimerFunds complex. | |
Mark S. Vandehey, Vice President and Chief Compliance Officer (since 2007) Age: 62 | Senior Vice President and Chief Compliance Officer of the Manager (since March 2004); Chief Compliance Officer of OppenheimerFunds Distributor, Inc., Centennial Asset Management and Shareholder Services, Inc. (since March 2004); Vice President of OppenheimerFunds Distributor, Inc., Centennial Asset Management Corporation and Shareholder Services, Inc. (since June 1983). An officer of 94 portfolios in the OppenheimerFunds complex. | |
Brian W. Wixted, Treasurer and Principal Financial & Accounting Officer (since 2007) Age: 52 | Senior Vice President of the Manager (since March 1999); Treasurer of the Manager and the following: HarbourView Asset Management Corporation, Shareholder Financial Services, Inc., Shareholder Services, Inc., Oppenheimer Real Asset Management, Inc. and Oppenheimer Partnership Holdings, Inc. (March 1999-June 2008), OFI Private Investments, Inc. (March 2000-June 2008), OppenheimerFunds International Ltd. and OppenheimerFunds plc (since May | |
| 53 | OPPENHEIMER MASTER LOAN FUND, LLC |
TRUSTEES AND OFFICERS Unaudited / Continued
Brian W. Wixted, Continued | 2000), OFI Institutional Asset Management, Inc. (since November 2000), and OppenheimerFunds Legacy Program (charitable trust program established by the Manager) (June 2003-January 2012); Treasurer and Chief Financial Officer of OFI Trust Company (trust company subsidiary of the Manager) (since May 2000); Assistant Treasurer of OAC (March 1999-June 2008). An officer of 94 portfolios in the OppenheimerFunds complex. |
The Fund’s Statement of Additional Information contains additional information about the Fund’s Trustees and Officers and is available without charge upon request, by calling 1.800.CALL OPP (225.5677).
| 54 | OPPENHEIMER MASTER LOAN FUND, LLC |
OPPENHEIMER MASTER LOAN FUND, LLC
| Manager | OppenheimerFunds, Inc. | |
| Distributor | OppenheimerFunds Distributor, Inc. | |
| Transfer and Shareholder Servicing Agent | OppenheimerFunds Services | |
| Independent Registered Public Accounting Firm | KPMG LLP | |
| Counsel | K&L Gates LLP |
©2012 OppenheimerFunds, Inc. All rights reserved.
| 55 | OPPENHEIMER MASTER LOAN FUND, LLC |
As an Oppenheimer fund shareholder, you are entitled to know how we protect your personal information and how we limit its disclosure.
Information Sources
We obtain nonpublic personal information about our shareholders from the following sources:
| l | Applications or other forms |
| l | When you create a user ID and password for online account access |
| l | When you enroll in eDocs Direct, our electronic document delivery service |
| l | Your transactions with us, our affiliates or others |
| l | A software program on our website, often referred to as a “cookie,” which indicates which parts of our site you’ve visited |
| l | When you set up challenge questions to reset your password online |
If you visit www.oppenheimerfunds.com and do not log on to the secure account information areas, we do not obtain any personal information about you. When you do log on to a secure area, we do obtain your user ID and password to identify you. We also use this information to provide you with products and services you have requested, to inform you about products and services that you may be interested in and assist you in other ways.
We do not collect personal information through our website unless you willingly provide it to us, either directly by email or in those areas of the website that request information. In order to update your personal information (including your mailing address, email address and phone number) you must first log on and visit your user profile.
If you have set your browser to warn you before accepting cookies, you will receive the warning message with each cookie. You can refuse cookies by turning them off in your browser. However, doing so may limit your access to certain sections of our website.
We use cookies to help us improve and manage our website. For example, cookies help us recognize new versus repeat visitors to the site, track the pages visited, and enable some special features on the website. This data helps us provide a better service for our website visitors.
Protection of Information
We do not disclose any non-public personal information (such as names on a customer list) about current or former customers to anyone, except as permitted by law.
Disclosure of Information
We send your financial advisor (as designated by you) copies of confirmations, account statements and other documents reporting activity in your fund accounts. We may also use details about you and your investments to help us, our financial service affiliates, or firms that jointly market their financial products and services with ours, to better serve your investment needs or suggest financial services or educational material that may be of interest to you. If this requires us to provide you with an opportunity to “opt in” or “opt out” of such information sharing with a firm not affiliated with us, you will receive notification on how to do so, before any such sharing takes place.
Right of Refusal
We will not disclose your personal information to unaffiliated third parties (except as permitted by law), unless we first offer you a reasonable opportunity to refuse or “opt out” of such disclosure.
Internet Security and Encryption
In general, the email services provided by our website are encrypted and provide a secure and private means of communication with us. To protect your own privacy, confidential and/or personal information should only be communicated via email when you are advised that you are using a secure website.
| 56 | OPPENHEIMER MASTER LOAN FUND, LLC |
PRIVACY POLICY NOTICE
As a security measure, we do not include personal or account information in non-secure emails, and we advise you not to send such information to us in non-secure emails. Instead, you may take advantage of the secure features of our website to encrypt your email correspondence. To do this, you will need to use a browser that supports Secure Sockets Layer (SSL) protocol.
We do not guarantee or warrant that any part of our website, including files available for download, are free of viruses or other harmful code. It is your responsibility to take appropriate precautions, such as use of an anti-virus software package, to protect your computer hardware and software.
| l | All transactions, including redemptions, exchanges and purchases, are secured by SSL and 128-bit encryption. SSL is used to establish a secure connection between your PC and OppenheimerFunds’ server. It transmits information in an encrypted and scrambled format. |
| l | Encryption is achieved through an electronic scrambling technology that uses a “key” to code and then decode the data. Encryption acts like the cable converter box you may have on your television set. It scrambles data with a secret code so that no one can make sense of it while it is being transmitted. When the data reaches its destination, the same software unscrambles the data. |
| l | You can exit the secure area by either closing your browser, or for added security, you can use the Log Out button before you close your browser. |
Other Security Measures
We maintain physical, electronic and procedural safeguards to protect your personal account information. Our employees and agents have access to that information only so that they may offer you products or provide services, for example, when responding to your account questions.
How You Can Help
You can also do your part to keep your account information private and to prevent unauthorized transactions. If you obtain a user ID and password for your account, do not allow it to be used by anyone else. Also, take special precautions when accessing your account on a computer used by others.
Who We Are
This joint notice describes the privacy policies of the Oppenheimer funds, OppenheimerFunds Distributor, Inc., the trustee of OppenheimerFunds Individual Retirement Accounts (IRAs) and the custodian of the OppenheimerFunds 403(b)(7) tax sheltered custodial accounts. It applies to all Oppenheimer fund accounts you presently have, or may open in the future, using your Social Security number—whether or not you remain a shareholder of our funds. This notice was last updated January 16, 2004. In the event it is updated or changed, we will post an updated notice on our website at www.oppenheimerfunds.com. If you have any questions about these privacy policies, write to us at P.O. Box 5270, Denver, CO 80217-5270, email us by clicking on the Contact Us section of our website at www.oppenheimerfunds.com or call us at 1.800.CALL OPP (225.5677).
| 57 | OPPENHEIMER MASTER LOAN FUND, LLC |
INFORMATION AND SERVICES
General Information
Representatives available Mon–Fri 8am–8pm ET
1.800.CALL OPP (1.800.225.5677)
Written Correspondence and Transaction Requests
OppenheimerFunds Services
P.O. Box 5270, Denver, CO 80217-5270
For Overnight Delivery
OppenheimerFunds Services
12100 East Iliff Avenue, Suite 300
Aurora, CO 80014
RA1241.001.0912 November 23, 2012

Item 2. Code of Ethics.
The registrant has adopted a code of ethics that applies to the registrant’s principal executive officer, principal financial officer, principal accounting officer or controller or persons performing similar functions.
Item 3. Audit Committee Financial Expert.
The Board of Directors of the registrant has determined that F. William Marshall, Jr., the Chairman of the Board’s Audit Committee, is the audit committee financial expert and that Mr. Marshall is “independent” for purposes of this Item 3.
Item 4. Principal Accountant Fees and Services.
| (a) | Audit Fees |
The principal accountant for the audit of the registrant’s annual financial statements billed $38,000 in fiscal 2012 and $37,300 in fiscal 2011.
| (b) | Audit-Related Fees |
The principal accountant for the audit of the registrant’s annual financial statements billed no such fees in fiscal 2012 and $1,500 in fiscal 2011.
The principal accountant for the audit of the registrant’s annual financial statements billed $416,206 in fiscal 2012 and $153,900 in fiscal 2011 to the registrant’s investment adviser or any entity controlling, controlled by, or under common control with the adviser that provides ongoing services to the registrant.
Such services include: Internal control reviews, compliance procedures, GIPS attestation procedures, internal audit training, and surprise exams.
| (c) | Tax Fees |
The principal accountant for the audit of the registrant’s annual financial statements billed no such fees in fiscal 2012 and $10,720 in fiscal 2011.
The principal accountant for the audit of the registrant’s annual financial statements billed $359,124 in fiscal 2012 and no such fees in fiscal 2011 to the registrant’s investment adviser or any entity controlling, controlled by, or under common control with the adviser that provides ongoing services to the registrant.
Such services include: tax compliance, tax planning and tax advice. Tax compliance generally involves preparation of original and amended tax returns, claims for a refund and tax payment-planning services. Tax planning and tax advice includes assistance with tax audits and appeals, tax advice related to mergers and acquisitions and requests for rulings or technical advice from taxing authorities.
| (d) | All Other Fees |
The principal accountant for the audit of the registrant’s annual financial statements billed no such fees in fiscal 2012 and no such fees in fiscal 2011.
The principal accountant for the audit of the registrant’s annual financial statements billed no such fees in fiscal 2012 and no such fees in fiscal 2011 to the registrant’s investment adviser or any entity controlling, controlled by, or under common control with the adviser that provides ongoing services to the registrant.
Such fees would include the cost to the principal accountant of attending audit committee meetings and consultations regarding the registrant’s retirement plan with respect to its Directors.
| (e) | (1) During its regularly scheduled periodic meetings, the registrant’s audit committee will pre-approve all audit, audit-related, tax and other services to be provided by the principal accountants of the registrant. |
The audit committee has delegated pre-approval authority to its Chairman for any subsequent new engagements that arise between regularly scheduled meeting dates provided that any fees such pre-approved are presented to the audit committee at its next regularly scheduled meeting.
Under applicable laws, pre-approval of non-audit services maybe waived provided that: 1) the aggregate amount of all such services provided constitutes no more than five percent of the total amount of fees paid by the registrant to it principal accountant during the fiscal year in which services are provided 2) such services were not recognized by the registrant at the time of engagement as non-audit services and 3) such services are promptly brought to the attention of the audit committee of the registrant and approved prior to the completion of the audit.
(2) 100%
| (f) | Not applicable as less than 50%. |
| (g) | The principal accountant for the audit of the registrant’s annual financial statements billed $775,330 in fiscal 2012 and $166,120 in fiscal 2011 to the registrant and the registrant’s investment adviser or any entity controlling, controlled by, or under common control with the adviser that provides ongoing services to the registrant related to non-audit fees. Those billings did not include any prohibited non-audit services as defined by the Securities Exchange Act of 1934. |
| (h) | The registrant’s audit committee of the board of Directors has considered whether the provision of non-audit services that were rendered to the registrant’s investment adviser, and any entity controlling, controlled by, or under common control with the investment adviser that provides ongoing services to the registrant that were not pre-approved pursuant to paragraph (c)(7)(ii) of Rule 2-01 of Regulation S-X is compatible with maintaining the principal accountant’s independence. No such services were rendered. |
Item 5. Audit Committee of Listed Registrants
Not applicable.
Item 6. Schedule of Investments.
a) Not applicable. The complete schedule of investments is included in Item 1 of this Form N-CSR.
b) Not applicable.
Item 7. Disclosure of Proxy Voting Policies and Procedures for Closed-End Management Investment Companies.
Not applicable.
Item 8. Portfolio Managers of Closed-End Management Investment Companies.
Not applicable.
Item 9. Purchases of Equity Securities by Closed-End Management Investment Company and Affiliated Purchasers.
Not applicable.
Item 10. Submission of Matters to a Vote of Security Holders.
The Fund’s Governance Committee Provisions with Respect to Nominations of Directors/Trustees to the Respective Boards
| 1. | The Fund’s Governance Committee (the “Committee”) will evaluate potential Board candidates to assess their qualifications. The Committee shall have the authority, upon |
approval of the Board, to retain an executive search firm to assist in this effort. The Committee may consider recommendations by business and personal contacts of current Board members and by executive search firms which the Committee may engage from time to time and may also consider shareholder recommendations. The Committee may consider the advice and recommendation of the Funds’ investment manager and its affiliates in making the selection.
| 2. | The Committee shall screen candidates for Board membership. The Committee has not established specific qualifications that it believes must be met by a trustee nominee. In evaluating trustee nominees, the Committee considers, among other things, an individual’s background, skills, and experience; whether the individual is an “interested person” as defined in the Investment Company Act of 1940; and whether the individual would be deemed an “audit committee financial expert” within the meaning of applicable SEC rules. The Committee also considers whether the individual’s background, skills, and experience will complement the background, skills, and experience of other nominees and will contribute to the Board. There are no differences in the manner in which the Committee evaluates nominees for trustees based on whether the nominee is recommended by a shareholder. |
| 3. | The Committee may consider nominations from shareholders for the Board at such times as the Committee meets to consider new nominees for the Board. The Committee shall have the sole discretion to determine the candidates to present to the Board and, in such cases where required, to shareholders. Recommendations for trustee nominees should, at a minimum, be accompanied by the following: |
| • | the name, address, and business, educational, and/or other pertinent background of the person being recommended; |
| • | a statement concerning whether the person is an “interested person” as defined in the Investment Company Act of 1940; |
| • | any other information that the Funds would be required to include in a proxy statement concerning the person if he or she was nominated; and |
| • | the name and address of the person submitting the recommendation and, if that person is a shareholder, the period for which that person held Fund shares. |
The recommendation also can include any additional information which the person submitting it believes would assist the Committee in evaluating the recommendation.
| 4. | Shareholders should note that a person who owns securities issued by Massachusetts Mutual Life Insurance Company (the parent company of the Funds’ investment adviser) would be deemed an “interested person” under the Investment Company Act of 1940. In addition, certain other relationships with Massachusetts Mutual Life Insurance Company or its subsidiaries, with registered broker-dealers, or with the Funds’ outside legal counsel may cause a person to be deemed an “interested person.” |
| 5. | Before the Committee decides to nominate an individual as a trustee, Committee members and other directors customarily interview the individual in person. In addition, the individual customarily is asked to complete a detailed questionnaire which is designed to elicit information which must be disclosed under SEC and stock exchange rules and to determine whether the individual is subject to any statutory disqualification from serving as a trustee of a registered investment company. |
Item 11. Controls and Procedures.
Based on their evaluation of the registrant’s disclosure controls and procedures (as defined in rule 30a-3(c) under the Investment Company Act of 1940 (17 CFR 270.30a-3(c)) as of 9/28/2012, the registrant’s principal executive officer and principal financial officer found the registrant’s disclosure controls and procedures to provide reasonable assurances that information required to be disclosed by the registrant in the reports that it files under the Securities Exchange Act of 1934 (a) is accumulated and communicated to registrant’s management, including its principal executive officer and principal financial officer, to allow timely decisions regarding required disclosure, and (b) is recorded, processed, summarized and reported, within the time periods specified in the rules and forms adopted by the U.S. Securities and Exchange Commission.
There have been no changes in the registrant’s internal controls over financial reporting that occurred during the registrant’s second fiscal quarter of the period covered by this report that have materially affected, or are reasonably likely to materially affect, the registrant’s internal control over financial reporting.
Item 12. Exhibits.
| (a) | (1) Exhibit attached hereto. |
(2) Exhibits attached hereto.
(3) Not applicable.
(b) Exhibit attached hereto.
SIGNATURES
Pursuant to the requirements of the Securities Exchange Act of 1934 and the Investment Company Act of 1940, the registrant has duly caused this report to be signed on its behalf by the undersigned, thereunto duly authorized.
Oppenheimer Master Loan Fund, LLC
| By: | /s/ William F. Glavin, Jr. | |
| William F. Glavin, Jr. | ||
| Principal Executive Officer | ||
Date: | 11/12/2012 | |
Pursuant to the requirements of the Securities Exchange Act of 1934 and the Investment Company Act of 1940, this report has been signed below by the following persons on behalf of the registrant and in the capacities and on the dates indicated.
| By: | /s/ William F. Glavin, Jr. | |
| William F. Glavin, Jr. | ||
| Principal Executive Officer | ||
| Date: | 11/12/2012 | |
| By: | /s/ Brian W. Wixted | |
| Brian W. Wixted | ||
| Principal Financial Officer | ||
| Date: | 11/12/2012 | |