UNITED STATES
SECURITIES AND EXCHANGE COMMISSION
WASHINGTON, D.C. 20549
FORM N-CSR
CERTIFIED SHAREHOLDER REPORT OF REGISTERED MANAGEMENT
INVESTMENT COMPANIES
Investment Company Act file number 811-22137
Oppenheimer Master Loan Fund, LLC
(Exact name of registrant as specified in charter)
6803 South Tucson Way, Centennial, Colorado 80112-3924
(Address of principal executive offices) (Zip code)
Arthur S. Gabinet
OFI Global Asset Management, Inc.
225 Liberty Street, New York, New York 10281-1008
(Name and address of agent for service)
Registrant’s telephone number, including area code: (303) 768-3200
Date of fiscal year end: September 30
Date of reporting period: 9/30/2015
Item 1. Reports to Stockholders.
Annual Report
| 9/30/2015 | |||||||
| ||||||||
| ||||||||
Oppenheimer Master Loan Fund, LLC
| ||||||||

| ||||||
| 4 | ||||||
| 7 | ||||||
| 8 | ||||||
| 10 | ||||||
| 29 | ||||||
| 30 | ||||||
| 31 | ||||||
| 32 | ||||||
| 33 | ||||||
| 46 | ||||||
Board Approval of the Fund’s Investment Advisory and Sub-Advisory Agreements | 47 | |||||
Portfolio Proxy Voting Policies and Procedures; Updates to Statement of Investments | 50 | |||||
| 51 | ||||||
| ||||||
PORTFOLIO MANAGERS: Margaret Hui, CFA1 and Joseph Welsh, CFA
| ||||||
| ||||||
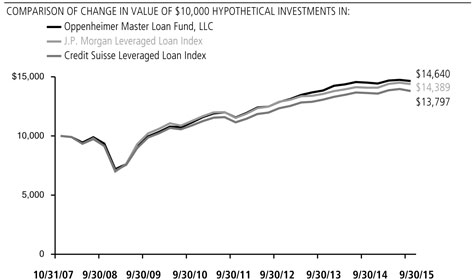
AVERAGE ANNUAL TOTAL RETURNS AT 9/30/15
| ||||||
Oppenheimer Master Loan Fund, LLC | J.P. Morgan Leveraged Loan Index | Credit Suisse Leveraged Loan Index | ||||
1-Year | 0.90 % | 2.18 % | 1.23 % | |||
| ||||||
5-Year | 5.62 | 5.01 | 4.85 | |||
| ||||||
Since Inception (10/31/07) | 4.93 | 4.70 | 4.15 | |||
| ||||||
Performance data quoted represents past performance, which does not guarantee future results. The investment return and principal value of an investment in the Fund will fluctuate so that an investor’s shares, when redeemed, may be worth more or less than their original cost. Current performance may be lower or higher than the performance quoted. Returns do not consider capital gains or income taxes on an individual’s investment. Fund returns include changes in share price and reinvested distributions.
The Fund’s performance is compared to the performance of the J.P. Morgan Leveraged Loan Index and the Credit Suisse Leveraged Loan Index. The J.P. Morgan Leveraged Loan Index tracks the performance of U.S. dollar denominated senior floating rate bank loans. The Credit Suisse Leveraged Loan Index tracks the performance of U.S. dollar denominated senior
1. On August 10, 2015, it was announced that Margaret Hui will be retiring from OppenheimerFunds. Effective October 28, 2015, David Lukkes, CFA, will take her place as co-portfolio manager of the Fund.
2 OPPENHEIMER MASTER LOAN FUND, LLC
floating rate bank loans. The indices are unmanaged and cannot be purchased directly by investors. While index comparisons may be useful to provide a benchmark for the Fund’s performance, it must be noted that the Fund’s investments are not limited to the investments comprising the indices. Index performance includes reinvestment of income, but does not reflect transaction costs, fees, expenses or taxes. Index performance is shown for illustrative purposes only as a benchmark for the Fund’s performance, and does not predict or depict performance of the Fund. The Fund’s performance reflects the effects of the Fund’s business and operating expenses.
The Fund’s investment strategy and focus can change over time. The mention of specific fund holdings does not constitute a recommendation by OppenheimerFunds, Inc. or its affiliates.
Shares of Oppenheimer Master Loan Fund, LLC are issued solely in private placement transactions that do not involve any “public offering” within the meaning of Section 4(a)(2) of the Securities Act of 1933, as amended (the “Securities Act”). Investments in the Fund may only be made by certain “accredited investors” within the meaning of Regulation D under the Securities Act, including other investment companies. This report does not constitute an offer to sell, or the solicitation of an offer to buy, any interests in the Fund.
Shares of Oppenheimer funds are not deposits or obligations of any bank, are not guaranteed by any bank, are not insured by the FDIC or any other agency, and involve investment risks, including the possible loss of the principal amount invested.
3 OPPENHEIMER MASTER LOAN FUND, LLC
The Fund produced a total return of 0.90% during the 12-month reporting period ended September 30, 2015, lagging the J.P. Morgan Leveraged Loan Index (the “Index”), which returned 2.18%. Senior floating-rate bank loans produced moderately positive total returns over the reporting period in a recovering U.S. economy characterized by improving business fundamentals. The Fund lagged the Index, in part due to weakness among energy companies that struggled with plummeting commodity prices.
MARKET OVERVIEW
In 2014, growth in the U.S. continued at a higher pace than any other developed economy and employment gains remained positive. Growth in the rest of the world was subdued, however, with major developed economies like the Eurozone and Japan continuing to disappoint due to weak aggregate demand. The biggest surprise of the reporting period and possibly all of 2014 was the precipitous fall in the price of commodities such as crude oil, iron ore, and coal. Weak demand amid tepid global
growth, combined with increasing supplies, was responsible for the drop. The U.S. energy revolution has kept supply high and OPEC’s decision to continue strong production has continued to put pressure on oil prices.
The start of 2015 was marked by cooling U.S. growth after the positive results in 2014. The dollar continued to strengthen significantly during this time against most of the U.S.’s major trading partners, which
4 OPPENHEIMER MASTER LOAN FUND, LLC
acted as a drag on growth. Businesses, especially U.S. firms with revenues dependent on exporting goods and services, cited this as a headwind. The Federal Reserve (the “Fed”) appeared to remain on track to raise U.S. rates during 2015, but made it clear that it will remain flexible on the timing and extent of rate hikes.
Valuations in most major risk asset classes hit their peaks in mid-2015 which left them incrementally more vulnerable to profit taking as negative macroeconomic catalysts emerged. Uncertainty around the global economic impact and extent of China’s ongoing economic slowdown led the way; this continued to put more downward pressure on commodity prices. The timing of when the Fed would raise interest rates added further uncertainty into the market. Looking ahead, an objective look at the global economy reveals persistent strength in many U.S. economic indicators coupled with continued, albeit modest, global growth impulses and an accommodative worldwide monetary policy backdrop.
Senior loans, as measured by the J.P. Morgan Leveraged Loan Index, recorded a third-quarter return of -0.76%. Slow global growth, falling commodity prices and uncertainty over Fed action contributed to increased market volatility and a “risk-off” sentiment. While senior loan prices saw some decline during this time, it was muted in comparison to a number of other asset classes. For the same period, the S&P 500 Index and the J.P. Morgan Domestic High
Yield Index returned -6.44% and -4.89%, respectively.
FUND REVIEW
The Fund’s relative performance was hurt mainly by underperformance in the energy industry. The Fund fared better after we reduced the allocation to the energy sector in the beginning of 2015. However, these adjustments were not enough to completely erase the impact of previous declines in this industry. The Fund also received generally disappointing results for the reporting period overall from the gaming-and-leisure industry, where returns were dampened by high-profile bankruptcies. In other areas, company-specific problems undermined relative results in the health care and consumer products sectors.
On a more positive note, the Fund achieved above-average results in the services sector, where an emphasis on higher yielding loans buoyed total returns in the recovering economy. Underweight exposure to metals-and-mining companies enabled the Fund to avoid the full brunt of weakness stemming from lower commodity prices. The Fund’s positions in most of the benchmark’s other industries produced results that were roughly in line with market averages.
STRATEGY & OUTLOOK
The team’s credit analysts have identified attractively valued opportunities in the automotive, broadcasting and services sectors which have resulted in moderate sector overweights relative to the Index. On
5 OPPENHEIMER MASTER LOAN FUND, LLC
the other hand, we believe that issuers within the metals/mining and energy sectors may continue to experience volatility due to global growth concerns; we are underweight those sectors as well as the consumer products and cable/satellite sectors where issuer-level valuations appear to be less compelling.
Looking ahead, we believe that senior loans remain well-positioned in both a range-bound interest rate environment as well as one where interest rates begin to rise. With the J.P. Morgan Leveraged Loan Index spread roughly 530 basis points over LIBOR (London inter-bank lending rate) at period end, we believe senior loan spreads (and yields) offer attractive value as they reside above their historical average and even further above their historically tightest
levels. In addition to the attractive income potential that senior loans offer, continued support from collateralized loan obligation (CLO) formations may lead to spread tightening and potential price appreciation.
As the U.S. economy continues to expand at a modest rate and corporate issuers carry manageable levels of debt, we believe that the likelihood of wide-spread credit deterioration is quite low. Metals/mining and energy are sectors that may continue to experience turbulence due to their exposure to commodity prices. However, those sectors make up only 2% and 4% respectively of the Index and thus we believe the default scenario for the broader market is expected to remain relatively benign for the foreseeable future.
6 OPPENHEIMER MASTER LOAN FUND, LLC
TOP TEN CORPORATE LOAN INDUSTRIES
| ||||
Media | 10.7% | |||
Health Care Equipment & Supplies | 10.0 | |||
Commercial Services & Supplies | 9.0 | |||
Hotels, Restaurants & Leisure | 6.6 | |||
Internet Software & Services | 5.7 | |||
Industrial Conglomerates | 5.1 | |||
Diversified Telecommunication Services | 4.9 | |||
Chemicals | 3.5 | |||
Distributors | 3.1 | |||
Diversified Consumer Services | 3.0 | |||
Portfolio holdings and allocations are subject to change. Percentages are as of September 30, 2015, and are based on net assets.
| CREDIT RATING BREAKDOWN
| NRSRO ONLY TOTAL
| |||
AAA | 3.1% | |||
BBB | 1.8 | |||
BB | 28.6 | |||
B | 61.1 | |||
CCC | 2.3 | |||
D | 1.3 | |||
Unrated | 1.8 | |||
Total | 100.0% | |||
The percentages above are based on the market value of the Fund’s securities as of September 30, 2015, and are subject to change. Except for securities labeled “Unrated,” and except for certain securities issued or guaranteed by a foreign sovereign, all securities have been rated by at least one Nationally Recognized Statistical Rating Organization (“NRSRO”), such as Standard & Poor’s (“S&P”). For securities rated only by an NRSRO other than S&P, OppenheimerFunds, Inc. (the “Sub-Adviser”) converts that rating to the equivalent S&P rating. If two or more NRSROs have assigned a rating to a security, the highest S&P equivalent rating is used. Unrated securities issued or guaranteed by a foreign sovereign are assigned a credit rating equal to the highest NRSRO rating assigned to that foreign sovereign. For securities not rated by an NRSRO, the Sub-Adviser uses its own credit analysis to assign ratings in categories similar to those of S&P. The use of similar categories is not an indication that the Sub-Adviser’s credit analysis process is consistent or comparable with any NRSRO’s process were that NRSRO to rate the same security. Fund assets invested in Oppenheimer Institutional Money Market Fund are assigned that fund’s S&P rating, which is currently AAA. For the purposes of this table, “investment-grade” securities are securities rated within the NRSROs’ four highest rating categories (AAA, AA, A and BBB). Unrated securities do not necessarily indicate low credit quality, and may or may not be the equivalent of investment-grade. Please consult the Fund’s prospectus and Statement of Additional Information for further information.
7 OPPENHEIMER MASTER LOAN FUND, LLC
Fund Expenses. As a shareholder of the Fund, you incur two types of costs: (1) transaction costs, which may include sales charges (loads) on purchase payments and/or contingent deferred sales charges on redemptions; and (2) ongoing costs, including management fees; distribution and service fees; and other Fund expenses. These examples are intended to help you understand your ongoing costs (in dollars) of investing in the Fund and to compare these costs with the ongoing costs of investing in other mutual funds.
The examples are based on an investment of $1,000.00 invested at the beginning of the period and held for the entire 6-month period ended September 30, 2015.
Actual Expenses. The first section of the table provides information about actual account values and actual expenses. You may use the information in this section, together with the amount you invested, to estimate the expense that you paid over the period. Simply divide your account value by $1,000.00 (for example, an $8,600.00 account value divided by $1,000.00 = 8.60), then multiply the result by the number in the first section under the heading entitled “Expenses Paid During 6 Months Ended September 30, 2015” to estimate the expenses you paid on your account during this period.
Hypothetical Example for Comparison Purposes. The second section of the table provides information about hypothetical account values and hypothetical expenses based on the Fund’s actual expense ratio, and an assumed rate of return of 5% per year before expenses, which is not the Fund’s actual return. The hypothetical account values and expenses may not be used to estimate the actual ending account balance or expenses you paid for the period. You may use this information to compare the ongoing costs of investing in the Fund and other funds. To do so, compare this 5% hypothetical example with the 5% hypothetical examples that appear in the shareholder reports of the other funds.
Please note that the expenses shown in the table are meant to highlight your ongoing costs only and do not reflect any transactional costs, such as front-end or contingent deferred sales charges (loads). Therefore, the “hypothetical” section of the table is useful in comparing ongoing costs only, and will not help you determine the relative total costs of owning different funds. In addition, if these transactional costs were included, your costs would have been higher.
8 OPPENHEIMER MASTER LOAN FUND, LLC
| Actual | Beginning Account Value April 1, 2015 | Ending Account Value | Expenses Paid During 6 Months Ended | |||
| $ 1,000.00 | $ 997.30 | $ 1.70 | ||||
| Hypothetical | ||||||
| (5% return before expenses) | ||||||
| 1,000.00 | 1,023.36 | 1.73 | ||||
Expenses are equal to the Fund’s annualized expense ratio, multiplied by the average account value over the period, multiplied by 183/365 (to reflect the one-half year period). Those annualized expense ratios, excluding indirect expenses from affiliated funds, based on the 6-month period ended September 30, 2015 are as follows:
| Expense Ratio |
| 0.34% |
|
The expense ratio reflects voluntary and/or contractual waivers and/or reimbursements of expenses by the Fund’s Manager. Some of these undertakings may be modified or terminated at any time, as indicated in the Fund’s prospectus. The “Financial Highlights” table in the Fund’s financial statements, included in this report, also shows the gross expense ratio, without such waivers or reimbursements and reduction to custodian expenses, if applicable.
9 OPPENHEIMER MASTER LOAN FUND, LLC
STATEMENT OF INVESTMENTS September 30, 2015
| Principal Amount | Value | |||||||
| ||||||||
Corporate Loans—96.5% | ||||||||
| ||||||||
| Consumer Discretionary—30.5% | ||||||||
| ||||||||
Auto Components—1.2%
|
| |||||||
| Affinia Group, Inc., Sr. Sec. Credit Facilities 1st Lien Term Loan, Tranche B2, 4.75%, 4/25/201 | $ | 3,585,871 | $ | 3,598,199 | ||||
| ||||||||
| Cooper Standard, Sr. Sec. Credit Facilities 1st Lien Term Loan, Tranche B, 4.00%, 3/26/211 | 1,291,730 | 1,285,932 | ||||||
| ||||||||
| FleetPride, Inc., Sr. Sec. Credit Facilities 1st Lien Term Loan, 5.25%, 11/19/191 | 4,664,337 | 4,512,746 | ||||||
| ||||||||
| Remy International, Inc., Sr. Sec. Credit Facilities 1st Lien Term Loan, Tranche B, 4.25%, 3/5/201 | 466,010 | 466,301 | ||||||
| ||||||||
Tower Automotive Holdings USA LLC, Sr. Sec. Credit Facilities 1st Lien Term Loan, Tranche B, 4.00%, 4/23/201 | 3,229,800 | 3,201,540 | ||||||
| ||||||||
Transtar Holding Co., Sr. Sec. Credit Facilities 1st Lien Term Loan, 5.75%, 10/9/181 | 2,780,237 | 2,696,830 | ||||||
|
| |||||||
|
| 15,761,548
|
| ||||||
| ||||||||
| Automobiles—0.7% | ||||||||
| ||||||||
| Chrysler LLC, Sr. Sec. Credit Facilities Term Loan, Tranche B1, 5.333%, 8/3/491,2 | 7,906,399 | 791 | ||||||
| ||||||||
| Federal-Mogul Holdings Corp., Sr. Sec. Credit Facilities 1st Lien Term Loan, Tranche C, 4.75%, 4/15/211 | 9,144,895 | 8,726,216 | ||||||
|
| |||||||
|
| 8,727,007
|
| ||||||
| ||||||||
| Distributors—3.1% | ||||||||
| ||||||||
| Ascena Retail Group, Inc., Sr. Sec. Credit Facilities 1st Lien Term Loan, Tranche B, 5.25%, 7/29/221 | 7,125,000 | 6,881,560 | ||||||
| ||||||||
| Bass Pro Group LLC, Sr. Sec. Credit Facilities 1st Lien Term Loan, Tranche B, 4.00%, 6/5/201 | 3,422,800 | 3,412,816 | ||||||
| ||||||||
| BJ’s Wholesale Club, Inc., Sr. Sec. Credit Facilities 1st Lien Term Loan, Tranche B, 4.50%, 9/26/191 | 5,169,063 | 5,149,973 | ||||||
| ||||||||
| Capital Automotive LP, Sr. Sec. Credit Facilities 1st Lien Term Loan, Tranche B, 4.00%, 4/10/191 | 828,454 | 829,563 | ||||||
| ||||||||
| Capital Automotive LP, Sr. Sec. Credit Facilities 2nd Lien Term Loan, 6.00%, 4/30/201 | 7,268,328 | 7,341,011 | ||||||
| ||||||||
| Gymboree Corp. (The), Sr. Sec. Credit Facilities 1st Lien Term Loan, 5.00%, 2/23/181 | 2,329,488 | 1,547,654 | ||||||
| ||||||||
| Leslie’s Poolmart, Inc., Sr. Sec. Credit Facilities 1st Lien Term Loan, Tranche B, 4.25%, 10/16/191 | 1,554,913 | 1,523,815 | ||||||
| ||||||||
| PetSmart, Inc., Sr. Sec. Credit Facilities 1st Lien Term Loan, Tranche B, 4.25%, 3/11/221 | 6,100,233 | 6,096,695 | ||||||
| ||||||||
| Staples, Inc., Sr. Sec. Credit Facilities 1st Lien Term Loan, Tranche B, 3.50%, 4/24/211 | 6,840,000 | 6,823,311 | ||||||
|
| |||||||
|
| 39,606,398
|
| ||||||
| ||||||||
| Diversified Consumer Services—3.0% | ||||||||
| ||||||||
| 4L Technologies, Inc., Sr. Sec. Credit Facilities 1st Lien Term Loan, 5.50%-6.75%, 5/8/201 | 1,830,312 | 1,757,100 | ||||||
| ||||||||
| Affinion Group, Inc., Sr. Sec. Credit Facilities 1st Lien Term Loan, Tranche B, 6.75%, 4/30/181 | 2,751,167 | 2,598,133 | ||||||
| ||||||||
| Interactive Data Corp., Sr. Sec. Credit Facilities 1st Lien Term Loan, Tranche B, 4.75%, 4/23/211 | 10,954,140 | 10,945,924 | ||||||
10 OPPENHEIMER MASTER LOAN FUND, LLC
| Principal Amount | Value | |||||||
| ||||||||
| Diversified Consumer Services (Continued) | ||||||||
| ||||||||
| IQOR US, Inc., Sr. Sec. Credit Facilities 1st Lien Term Loan, Tranche B, 6.00%, 4/1/211 | $ | 3,907,716 | $ | 3,173,169 | ||||
| ||||||||
| IQOR US, Inc., Sr. Sec. Credit Facilities 2nd Lien Term Loan, 9.75%, 4/1/221 | 1,100,036 | 869,028 | ||||||
| ||||||||
| Koosharem LLC, Sr. Sec. Credit Facilities 1st Lien Exit Term Loan, 7.50%, 5/15/201 | 3,481,489 | 3,429,267 | ||||||
| ||||||||
| Laureate Education, Inc., Sr. Sec. Credit Facilities 1st Lien Term Loan, Tranche B, 5.00%, 6/15/181 | 6,369,487 | 5,684,767 | ||||||
| ||||||||
Nord Anglia Education Finance, Sr. Sec. Credit Facilities 1st Lien Term Loan, Tranche B, 5.00%, 3/31/211 | 5,484,701 | 5,409,287 | ||||||
| ||||||||
| ServiceMaster Co. LLC (The), Sr. Sec. Credit Facilities 1st Lien Term Loan, Tranche B, 4.25%, 7/1/211 | 4,592,611 | 4,601,631 | ||||||
|
| |||||||
|
| 38,468,306
|
| ||||||
| ||||||||
| Hotels, Restaurants & Leisure—6.6% | ||||||||
| ||||||||
| Amaya Gaming, Sr. Sec. Credit Facilities 1st Lien Term Loan, 5.00%, 7/29/211 | 5,591,721 | 5,544,101 | ||||||
| ||||||||
American Casino & Entertainment Properties, Sr. Sec. Credit Facilities 1st Lien Term Loan, 5.00%, 7/7/221 | 1,197,000 | 1,199,993 | ||||||
| ||||||||
| Bowlmor AMF, Sr. Sec. Credit Facilities 1st Lien Term Loan, Tranche B, 7.25%, 9/20/211 | 2,727,165 | 2,728,869 | ||||||
| ||||||||
Caesars Entertainment Operating Co., Inc., Extended Sr. Sec. Credit Facilities 1st Lien Term Loan, Tranche B5, 6.00%, 3/1/171,6 | 1,788,615 | 1,658,195 | ||||||
| ||||||||
| Caesars Entertainment Operating Co., Inc., Sr. Sec. Credit Facilities 1st Lien Term Loan: | ||||||||
| Tranche B4, 10.50%, 10/31/161,6 | 802,296 | 756,966 | ||||||
| Tranche B6, 7.00%, 3/1/171,6 | 3,764,067 | 3,526,125 | ||||||
| Tranche B7, 9.75%, 1/29/181,6 | 4,557,500 | 4,155,870 | ||||||
| ||||||||
Caesars Entertainment Resort Properties LLC, Sr. Sec. Credit Facilities 1st Lien Term Loan, Tranche B, 7.00%, 10/11/201 | 10,980,792 | 10,267,040 | ||||||
| ||||||||
| Caesars Growth Properties Holdings LLC, Sr. Sec. Credit Facilities 1st Lien Term Loan, 6.25%, 5/10/211 | 5,067,203 | 4,459,138 | ||||||
| ||||||||
| CEC Entertainment, Inc., Sr. Sec. Credit Facilities Term Loan, Tranche B, 4.00%, 2/14/211 | 3,227,843 | 3,144,458 | ||||||
| ||||||||
| Cinemark USA, Inc., Sr. Sec. Credit Facilities 1st Lien Term Loan, 3.19%-3.20%, 5/6/221 | 338,261 | 339,830 | ||||||
| ||||||||
| Corner Investment Propco LLC, Sr. Sec. Credit Facilities 1st Lien Term Loan, 11.00%, 11/2/191 | 3,545,488 | 3,492,306 | ||||||
| ||||||||
| Del Monte Foods Co., Inc., Sr. Sec. Credit Facilities 1st Lien Term Loan, 4.25%-5.50%, 2/18/211 | 3,758,166 | 3,570,258 | ||||||
| ||||||||
| Eldorado Resorts, Inc., Sr. Sec. Credit Facilities 1st Lien Term Loan, Tranche B, 4.25%, 7/25/221 | 2,553,600 | 2,565,303 | ||||||
| ||||||||
| Equinox Holdings, Inc., Sr. Sec. Credit Facilities 1st Lien Term Loan, Tranche B, 5.00%, 1/31/201 | 1,541,928 | 1,545,782 | ||||||
| ||||||||
| Golden Nugget, Inc., Sr. Sec. Credit Facilities 1st Lien Term Loan, Tranche B, 5.50%, 11/21/191 | 1,934,085 | 1,946,414 | ||||||
| ||||||||
Golden Nugget, Inc., Sr. Sec. Credit Facilities 1st Lien Term Loan, Delayed Draw, Tranche B, 5.50%, 11/21/191 | 2,392,455 | 2,407,707 | ||||||
| ||||||||
| Jacobs Entertainment, Inc., Sr. Sec. Credit Facilities 1st Lien Term Loan, 5.25%, 10/29/181 | 3,323,815 | 3,290,577 | ||||||
| ||||||||
La Quinta Intermediate Holdings LLC, Sr. Sec. Credit Facilities 1st Lien Term Loan, Tranche B, 4.00%, 4/14/211 | 1,538,063 | 1,525,087 | ||||||
11 OPPENHEIMER MASTER LOAN FUND, LLC
STATEMENT OF INVESTMENTS Continued
| Principal Amount | Value | |||||||
| ||||||||
| Hotels, Restaurants & Leisure (Continued) | ||||||||
| ||||||||
| Landry’s, Inc., Sr. Sec. Credit Facilities 1st Lien Term Loan, Tranche B, 4.00%, 4/24/181 | $ | 2,653,281 | $ | 2,657,428 | ||||
| ||||||||
| Peninsula Gaming LLC, Sr. Sec. Credit Facilities 1st Lien Term Loan, Tranche B, 4.25%, 11/20/171 | 3,074,896 | 3,078,340 | ||||||
| ||||||||
| Pinnacle Operating Corp., Sr. Sec. Credit Facilities 1st Lien Term Loan, Tranche B, 4.75%, 11/15/181 | 5,239,202 | 5,232,711 | ||||||
| ||||||||
| Regal Cinemas Corp., Sr. Sec. Credit Facilities 1st Lien Term Loan, Tranche B, 3.75%, 4/1/221 | 673,125 | 675,046 | ||||||
| ||||||||
| Revel Entertainment, Inc., Sr. Sec. Credit Facilities 2nd Lien Exit Term Loan, 14.50%, 5/20/181,2,3 | 3,430,706 | 17,157 | ||||||
| ||||||||
| Scientific Games International, Inc., Sr. Sec. Credit Facilities 1st Lien Term Loan: | ||||||||
| Tranche B1, 6.00%, 10/18/201 | 1,366,921 | 1,352,911 | ||||||
| Tranche B2, 6.00%, 10/1/211 | 3,614,831 | 3,577,328 | ||||||
| ||||||||
SeaWorld Parks & Entertainment, Inc., Sr. Sec. Credit Facilities 1st Lien Term Loan, Tranche B3, 4.00%, 5/14/201 | 1,342,877 | 1,329,014 | ||||||
| ||||||||
| US Foods, Inc., Sr. Sec. Credit Facilities 1st Lien Term Loan, Tranche B, 4.50%, 3/31/191 | 3,492,225 | 3,494,393 | ||||||
| ||||||||
Weight Watchers International, Inc., Sr. Sec. Credit Facilities 1st Lien Term Loan, Tranche B2, 4.00%, 4/2/201 | 7,205,053 | 3,917,748 | ||||||
|
| |||||||
|
| 83,456,095
|
| ||||||
| ||||||||
| Household Durables—0.9% | ||||||||
| ||||||||
| SRAM LLC, Sr. Sec. Credit Facilities 1st Lien Term Loan, 4.00%- 5.25%, 4/10/201 | 4,283,453 | 4,171,013 | ||||||
| ||||||||
| Sun Products Corp. (The), Sr. Sec. Credit Facilities 1st Lien Term Loan, Tranche B, 5.50%, 3/23/201 | 4,980,490 | 4,706,563 | ||||||
| ||||||||
| Wilton Brands LLC, Sr. Sec. Credit Facilities 1st Lien Term Loan, 7.25%, 8/30/181 | 2,020,693 | 1,977,753 | ||||||
|
| |||||||
|
| 10,855,329
|
| ||||||
| ||||||||
| Internet & Catalog Retail—0.3% | ||||||||
| ||||||||
| Camping World, Sr. Sec. Credit Facilities 1st Lien Term Loan, Tranche B, 5.25%, 2/20/201 | 3,236,598 | 3,242,666 | ||||||
| ||||||||
| Leisure Products—1.3% | ||||||||
| ||||||||
| Boyd Gaming Corp., Sr. Sec. Credit Facilities 1st Lien Term Loan, Tranche B, 4.00%, 8/14/201 | 1,891,273 | 1,893,507 | ||||||
| ||||||||
| Hilton Worldwide, Inc., Sr. Sec. Credit Facilities 1st Lien Term Loan, Tranche B, 3.50%, 10/26/201 | 1,570,279 | 1,570,934 | ||||||
| ||||||||
Intrawest Operations Group LLC, Sr. Sec. Credit Facilities 1st Lien Term Loan, Tranche B, 4.75%, 12/9/201 | 3,156,075 | 3,162,980 | ||||||
| ||||||||
| Pinnacle Entertainment, Inc., Sr. Sec. Credit Facilities 1st Lien Term Loan, Tranche B2, 3.75%, 8/13/201 | 1,476,557 | 1,477,744 | ||||||
| ||||||||
| Playa Resorts Holding BV, Sr. Sec. Credit Facilities 1st Lien Term Loan, Tranche B, 4.00%, 8/9/191 | 2,264,780 | 2,259,118 | ||||||
| ||||||||
| Station Casinos LLC, Sr. Sec. Credit Facilities 1st Lien Term Loan, Tranche B, 4.25%, 3/2/201 | 6,706,263 | 6,702,668 | ||||||
|
| |||||||
| 17,066,951 | ||||||||
12 OPPENHEIMER MASTER LOAN FUND, LLC
| Principal Amount | Value | |||||||
| ||||||||
| Media—10.7% | ||||||||
| ||||||||
| Alpha Media Group, Inc., Sr. Sec. Credit Facilities Term Loan, Tranche B, 3.05%, 7/15/161,2,3 | $ | 2,641,924 | $ | 264 | ||||
| ||||||||
| Altice Financing SA, Sr. Sec. Credit Facilities 1st Lien Term Loan, Delayed Draw, 5.50%, 7/2/191 | 8,276,687 | 8,333,589 | ||||||
| ||||||||
| Ancestry.com, Inc., Sr. Sec. Credit Facilities 1st Lien Term Loan, Tranche B, 5.00%, 8/29/221 | 865,000 | 861,756 | ||||||
| ||||||||
| Catalina Marketing, Sr. Sec. Credit Facilities 1st Lien Term Loan, 4.50%, 4/1/211 | 4,963,816 | 4,244,063 | ||||||
| ||||||||
| Catalina Marketing, Sr. Sec. Credit Facilities 2nd Lien Term Loan, 7.75%, 4/11/221 | 2,200,072 | 1,479,548 | ||||||
| ||||||||
| CCO Safari III LLC, Sr. Sec. Credit Facilities 1st Lien Term Loan, Tranche I, 3.75%, 1/23/231 | 5,635,000 | 5,609,028 | ||||||
| ||||||||
| Cinram International, Inc., Sr. Sec. Credit Facilities 2nd Lien Term Loan, 0.432%, 8/3/491,2,3 | 482,232 | 1,220 | ||||||
| ||||||||
Clear Channel Communications, Inc., Extended Sr. Sec. Credit Facilities 1st Lien Term Loan, Tranche D, 6.948%, 1/30/191 | 13,598,671 | 11,320,894 | ||||||
| ||||||||
Clear Channel Communications, Inc., Sr. Sec. Credit Facilities 1st Lien Term Loan, Tranche E, 7.671%, 7/30/191 | 701,532 | 588,410 | ||||||
| ||||||||
Cumulus Media Holdings, Inc., Sr. Sec. Credit Facilities 1st Lien Term Loan, Tranche B, 4.25%, 12/18/201 | 815,727 | 711,722 | ||||||
| ||||||||
Deluxe Entertainment Services, Sr. Sec. Credit Facilities 1st Lien Term Loan, Tranche B, 6.50%, 2/26/201 | 5,923,910 | 5,668,442 | ||||||
| ||||||||
| Endemol, Sr. Sec. Credit Facilities 1st Lien Term Loan, 6.75%, 8/11/211 | 2,727,165 | 2,660,690 | ||||||
| ||||||||
| Formula One, Sr. Sec. Credit Facilities 1st Lien Term Loan, Tranche B, 4.75%, 7/30/211 | 6,399,025 | 6,327,036 | ||||||
| ||||||||
| Getty Images, Inc., Sr. Sec. Credit Facilities 1st Lien Term Loan, Tranche B, 4.75%, 10/18/191 | 2,561,425 | 1,678,801 | ||||||
| ||||||||
| Gray Television, Inc., Sr. Sec. Credit Facilities 1st Lien Term Loan, 3.75%, 6/10/211 | 2,348,000 | 2,345,309 | ||||||
| ||||||||
Harland Clarke Holdings Corp., Sr. Sec. Credit Facilities 1st Lien Term Loan, Tranche B4, 6.00%, 8/4/191 | 2,951,743 | 2,944,346 | ||||||
| ||||||||
| Hoyts Group, Sr. Sec. Credit Facilities 1st Lien Term Loan, Tranche B, 4.00%, 5/29/201 | 506,017 | 504,752 | ||||||
| ||||||||
| IMG Worldwide, Inc., Sr. Sec. Credit Facilities 1st Lien Term Loan, Tranche B, 5.25%, 5/6/211 | 4,397,434 | 4,387,540 | ||||||
| ||||||||
| Internet Brands, Sr. Sec. Credit Facilities 1st Lien Term Loan, Tranche B, 4.75%, 6/30/211 | 2,753,408 | 2,737,347 | ||||||
| ||||||||
ION Media Networks, Inc., Sr. Sec. Credit Facilities 1st Lien Term Loan, Tranche B, 4.75%, 12/18/201 | 6,057,995 | 6,050,423 | ||||||
| ||||||||
Legendary Pictures, Inc., Sr. Sec. Credit Facilities 1st Lien Term Loan, Tranche B, 7.00%, 4/22/201 | 4,480,000 | 4,480,000 | ||||||
| ||||||||
Liberty Cablevision of Puerto Rico LLC, Sr. Sec. Credit Facilities 1st Lien Term Loan, 4.50%, 1/7/221 | 3,129,094 | 3,056,083 | ||||||
| ||||||||
| Media General, Inc., Sr. Sec. Credit Facilities 1st Lien Term Loan, Tranche B, 4.00%, 7/30/201 | 4,355,295 | 4,330,118 | ||||||
| ||||||||
| Mergermarket USA, Inc., Sr. Sec. Credit Facilities 1st Lien Term Loan, 4.50%, 2/4/211 | 3,287,074 | 3,221,332 | ||||||
| ||||||||
| Merrill Communications LLC, Sr. Sec. Credit Facilities 1st Lien Term Loan, 6.25%, 6/1/221 | 4,135,122 | 4,114,446 | ||||||
13 OPPENHEIMER MASTER LOAN FUND, LLC
STATEMENT OF INVESTMENTS Continued
| Principal Amount | Value | |||||||
| ||||||||
| Media (Continued) | ||||||||
| ||||||||
| NEP/NCP Holdco, Inc., Sr. Sec. Credit Facilities 1st Lien Term Loan, Tranche B, 4.25%, 1/22/201 | $ | 7,318,862 | $ | 7,181,634 | ||||
| ||||||||
| Numericable US LLC, Sr. Sec. Credit Facilities 1st Lien Term Loan, Tranche B, 4.00%, 7/29/221 | 1,985,000 | 1,960,896 | ||||||
| ||||||||
| Penton Business Media, Inc., Sr. Sec. Credit Facilities 1st Lien Term Loan, 5.00%, 10/3/191 | 2,713,684 | 2,703,507 | ||||||
| ||||||||
Project Sunshine IV Pty Ltd., Sr. Sec. Credit Facilities 1st Lien Term Loan, Tranche B, 8.00%, 9/23/191 | 761,767 | 764,624 | ||||||
| ||||||||
Salem Communications Corp., Sr. Sec. Credit Facilities 1st Lien Term Loan, Tranche B, 4.50%, 3/13/201 | 1,051,147 | 1,046,767 | ||||||
| ||||||||
| SuperMedia, Inc., Sr. Sec. Credit Facilities 1st Lien Term Loan, 11.60%, 12/30/161 | 2,212,623 | 1,204,496 | ||||||
| ||||||||
| Technicolor, Sr. Sec. Credit Facilities 1st Lien Term Loan, Tranche B, 5.00%, 7/11/201 | 6,907,294 | 6,895,794 | ||||||
| ||||||||
| Tribune Co., Sr. Sec. Credit Facilities 1st Lien Term Loan, Tranche B, 3.75%, 12/27/201 | 5,207,595 | 5,192,951 | ||||||
| ||||||||
| TWCC Holding Corp., Sr. Sec. Credit Facilities 2nd Lien Term Loan, 7.00%, 6/26/201 | 2,988,436 | 2,812,865 | ||||||
| ||||||||
| Univision Communications, Inc., Sr. Sec. Credit Facilities 1st Lien Term Loan: | ||||||||
| Tranche C2, 4.00%, 3/1/201 | 33,026 | 32,819 | ||||||
| Tranche C4, 4.00%, 3/1/201 | 6,962,991 | 6,911,736 | ||||||
| ||||||||
| WaveDivision Holdings LLC, Sr. Sec. Credit Facilities 1st Lien Term Loan, 4.00%, 10/12/191 | 4,912,424 | 4,910,857 | ||||||
| ||||||||
Yankee Cable Acquisition LLC, Sr. Sec. Credit Facilities 1st Lien Term Loan, Tranche B, 4.25%, 3/1/201 | 5,422,900 | 5,423,713 | ||||||
| ||||||||
| YP LLC, Sr. Sec. Credit Facilities 1st Lien Term Loan, Tranche B, 8.00%, 6/4/181 | 1,574,144 | 1,562,338 | ||||||
|
| |||||||
|
| 136,262,156
|
| ||||||
| ||||||||
| Multiline Retail—1.4% | ||||||||
| ||||||||
| J.C. Penney Corp., Inc., Sr. Sec. Credit Facilities 1st Lien Term Loan, 6.00%, 5/22/181 | 6,622,948 | 6,593,973 | ||||||
| ||||||||
| J.C. Penney Corp., Inc., Sr. Sec. Credit Facilities 1st Lien Term Loan, 5.00%, 6/14/191 | 1,979,540 | 1,976,535 | ||||||
| ||||||||
| Neiman Marcus, Sr. Sec. Credit Facilities Term Loan, 4.25%, 10/25/201 | 9,555,869 | 9,373,983 | ||||||
|
| |||||||
|
| 17,944,491
|
| ||||||
| ||||||||
| Specialty Retail—1.3% | ||||||||
| ||||||||
Burlington Coat Factory Warehouse Corp., Sr. Sec. Credit Facilities 1st Lien Term Loan, Tranche B3, 4.25%, 8/13/211 | 6,397,537 | 6,413,486 | ||||||
| ||||||||
Harbor Freight Tools USA, Inc., Sr. Sec. Credit Facilities 1st Lien Term Loan, Tranche B, 4.75%, 7/26/191 | 5,902,062 | 5,932,800 | ||||||
| ||||||||
| Key Safety Systems, Inc., Sr. Sec. Credit Facilities 1st Lien Term Loan, 4.75%, 8/30/211 | 2,697,032 | 2,636,349 | ||||||
| ||||||||
| National Vision, Sr. Sec. Credit Facilities 1st Lien Term Loan, Tranche B, 4.00%, 3/5/211 | 2,256,367 | 2,183,035 | ||||||
|
| |||||||
| 17,165,670 | ||||||||
14 OPPENHEIMER MASTER LOAN FUND, LLC
| Principal Amount | Value | |||||||
| ||||||||
| Consumer Staples—3.2% | ||||||||
| ||||||||
| Beverages—0.7% | ||||||||
| ||||||||
Burger King, Sr. Sec. Credit Facilities 1st Lien Term Loan, Tranche B2, 3.75%, 12/10/211 | $ 5,617,246 | $ 5,614,718 | ||||||
| ||||||||
Hostess Brands LLC, Sr. Sec. Credit Facilities 1st Lien Term Loan, 4.50%, 8/3/221 | 3,670,000 | 3,679,725 | ||||||
|
| |||||||
|
| 9,294,443
|
| ||||||
| ||||||||
| Food & Staples Retailing—1.2% | ||||||||
| ||||||||
| Albertsons Holdings LLC, Sr. Sec. Credit Facilities 1st Lien Term Loan: | ||||||||
| Tranche B2, 5.375%, 3/21/191 | 5,424,444 | 5,432,456 | ||||||
| Tranche B4, 5.50%, 8/25/211 | 5,423,197 | 5,434,906 | ||||||
| ||||||||
New Albertsons, Inc., Sr. Sec. Credit Facilities 1st Lien Term Loan, Tranche B, 4.75%, 6/25/211 | 3,914,574 | 3,914,085 | ||||||
| ||||||||
Rite Aid Corp., Sr. Sec. Credit Facilities 2nd Lien Term Loan, Tranche 1, 5.75%, 8/21/201 | 772,798 | 782,458 | ||||||
|
| |||||||
|
| 15,563,905
|
| ||||||
| ||||||||
| Food Products—1.3% | ||||||||
| ||||||||
AdvancePierre Foods, Inc., Sr. Sec. Credit Facilities 1st Lien Term Loan, Tranche B, 5.75%, 7/10/171 | 2,290,852 | 2,295,490 | ||||||
| ||||||||
CSM Bakery Supplies, Sr. Sec. Credit Facilities 1st Lien Term Loan, Tranche B, 5.00%, 7/3/201 | 3,900,225 | 3,870,485 | ||||||
| ||||||||
CSM Bakery Supplies, Sr. Sec. Credit Facilities 2nd Lien Term Loan, 8.75%, 7/5/211 | 610,104 | 573,498 | ||||||
| ||||||||
Dole Food Co., Inc., Sr. Sec. Credit Facilities 1st Lien Term Loan, 4.50%-5.75%, 11/1/181 | 3,004,435 | 3,000,680 | ||||||
| ||||||||
JBS USA LLC, Sr. Sec. Credit Facilities 1st Lien Term Loan, Tranche B, 3.75%, 9/18/201 | 3,623,648 | 3,620,818 | ||||||
| ||||||||
Performance Food Group, Inc., Sr. Sec. Credit Facilities 2nd Lien Term Loan, 6.25%, 11/14/191 | 2,502,642 | 2,508,899 | ||||||
|
| |||||||
|
| 15,869,870
|
| ||||||
| ||||||||
| Energy—2.6% | ||||||||
| ||||||||
| Energy Equipment & Services—2.4% | ||||||||
| ||||||||
American Energy-Marcellus LLC, Sr. Sec. Credit Facilities 1st Lien Term Loan, 5.25%, 8/4/201 | 4,986,331 | 2,850,521 | ||||||
| ||||||||
Ameriforge Group, Inc., Sr. Sec. Credit Facilities 1st Lien Term Loan, 5.00%, 12/19/191 | 1,678,235 | 1,166,373 | ||||||
| ||||||||
Drillships Financing Holding, Inc., Sr. Sec. Credit Facilities 1st Lien Term Loan, Tranche B1, 6.00%, 3/31/211 | 1,124,592 | 666,321 | ||||||
| ||||||||
ExGen Texas Power LLC, Sr. Sec. Credit Facilities 1st Lien Term Loan, Tranche B, 5.75%, 9/20/211 | 3,865,449 | 3,266,305 | ||||||
| ||||||||
Fieldwood Energy LLC, Sr. Sec. Credit Facilities 1st Lien Term Loan, Tranche B, 3.875%, 9/25/181 | 1,604,648 | 1,377,992 | ||||||
| ||||||||
Harvey Gulf International Marine LLC, Sr. Sec. Credit Facilities 1st Lien Term Loan, Tranche B, 5.50%, 6/18/201 | 75,000 | 49,406 | ||||||
| ||||||||
HGIM, Sr. Sec. Credit Facilities 1st Lien Term Loan, Tranche B, 5.50%, 6/18/201 | 696,539 | 458,845 | ||||||
| ||||||||
NFR Energy LLC, Sr. Sec. Credit Facilities 2nd Lien Term Loan, 8.75%, 12/31/181,2 | 2,514,368 | 471,444 | ||||||
| ||||||||
Offshore Group Investment Ltd., Sr. Sec. Credit Facilities 1st Lien Term Loan: Tranche B, 5.00%, 10/25/171 | 1,954,730 | 675,604 | ||||||
15 OPPENHEIMER MASTER LOAN FUND, LLC
STATEMENT OF INVESTMENTS Continued
Principal Amount | Value | |||||||
| ||||||||
Energy Equipment & Services (Continued) | ||||||||
| ||||||||
| Offshore Group Investment Ltd., Sr. Sec. Credit Facilities 1st Lien Term Loan: (Continued) | ||||||||
| Tranche B, 5.75%, 3/28/191 | $ | 1,528,533 | $ 487,857 | |||||
| ||||||||
| Pacific Drilling SA, Sr. Sec. Credit Facilities 1st Lien Term Loan, Tranche B, 4.50%, 6/3/181 | 753,074 | 451,217 | ||||||
| ||||||||
| ProPetro Services, Inc., Sr. Sec. Credit Facilities 1st Lien Term Loan, Tranche B, 7.25%, 9/30/191 | 3,344,479 | 2,257,523 | ||||||
| ||||||||
| Quicksilver Resources, Inc., Sr. Sec. Credit Facilities 2nd Lien Term Loan, 7.00%, 6/21/191,2 | 10,094,576 | 4,492,086 | ||||||
| ||||||||
| Samson Investment Co., Sr. Sec. Credit Facilities 2nd Lien Term Loan, 5.00%, 9/25/181 | 225,000 | 33,188 | ||||||
| ||||||||
| Seadrill Operating LP, Sr. Sec. Credit Facilities 1st Lien Term Loan, Tranche B, 4.00%, 2/12/211 | 4,542,127 | 2,788,866 | ||||||
| ||||||||
| Templar Energy LLC, Sr. Sec. Credit Facilities 2nd Lien Term Loan, Tranche B, 8.50%, 11/25/201 | 6,349,506 | 2,904,899 | ||||||
| ||||||||
| TPF II Power LLC, Sr. Sec. Credit Facilities 1st Lien Term Loan, Tranche B, 5.50%, 10/4/211 | 6,422,103 | 6,429,463 | ||||||
|
| |||||||
|
| 30,827,910
|
| ||||||
| ||||||||
Oil, Gas & Consumable Fuels—0.2% | ||||||||
| ||||||||
Southcross Energy Partners LP, Sr. Sec. Credit Facilities 1st Lien Term Loan, Tranche B, 5.25%, 7/29/211
|
| 2,377,961
|
|
| 2,181,780
|
| ||
| ||||||||
Financials—2.7% | ||||||||
| ||||||||
Commercial Banks—1.2% | ||||||||
| ||||||||
| Acrisure LLC, Sr. Sec. Credit Facilities 1st Lien Term Loan, Tranche B, 5.25%, 5/13/221 | 2,556,654 | 2,481,488 | ||||||
| ||||||||
| Acrisure LLC, Sr. Sec. Credit Facilities 1st Lien Term Loan, Delayed Draw, 2.125%-5.25%, 5/13/221 | 808,166 | 793,013 | ||||||
| ||||||||
| Alliant Holdings I LLC, Sr. Sec. Credit Facilities 1st Lien Term Loan, Tranche B, 4.50%, 8/12/221 | 3,591,000 | 3,582,023 | ||||||
| ||||||||
| HUB International Ltd., Sr. Sec. Credit Facilities 1st Lien Term Loan, Tranche B, 4.00%, 10/2/201 | 5,728,293 | 5,611,339 | ||||||
| ||||||||
| Hyperion Insurance Group Ltd., Sr. Sec. Credit Facilities 1st Lien Term Loan, Tranche B, 5.50%, 4/9/221 | 2,621,367 | 2,632,290 | ||||||
|
| |||||||
|
| 15,100,153
|
| ||||||
| ||||||||
Consumer Finance—0.2% | ||||||||
| ||||||||
| PGX Holdings, Inc., Sr. Sec. Credit Facilities 1st Lien Term Loan, 6.25%, 9/29/201 | 1,735,176 | 1,741,350 | ||||||
| ||||||||
| PGX Holdings, Inc., Sr. Sec. Credit Facilities 2nd Lien Term Loan, 10.00%, 9/29/211 | 974,953 | 979,828 | ||||||
|
| |||||||
|
| 2,721,178
|
| ||||||
| ||||||||
| Diversified Financial Services—0.6% | ||||||||
| ||||||||
| Altisource Solutions Sarl, Sr. Sec. Credit Facilities 1st Lien Term Loan, Tranche B, 4.50%, 12/9/201 | 877,514 | 780,988 | ||||||
| ||||||||
Guggenheim Partners Investment Management, Sr. Sec. Credit Facilities 1st Lien Term Loan, Tranche B, 4.25%, 7/22/201 | 2,250,893 | 2,254,645 | ||||||
| ||||||||
| RCS Capital, Sr. Sec. Credit Facilities 1st Lien Term Loan, 7.50%, 4/29/191 | 4,377,843 | 4,158,951 | ||||||
|
| |||||||
| 7,194,584 | ||||||||
16 OPPENHEIMER MASTER LOAN FUND, LLC
| Principal Amount | Value | |||||||
| ||||||||
| Insurance—0.7% | ||||||||
| ||||||||
Aqgen Liberty Management I, Inc., Sr. Sec. Credit Facilities 1st Lien Term Loan, 6.50%, 7/1/191 | $ 4,366,496 | $ 4,322,831 | ||||||
| ||||||||
National Financial Partners Corp., Sr. Sec. Credit Facilities 1st Lien Term Loan, Tranche B, 4.50%, 7/1/201 | 5,207,178 | 5,135,579 | ||||||
|
| |||||||
|
| 9,458,410
|
| ||||||
| ||||||||
| Health Care—11.5% | ||||||||
| ||||||||
| Health Care Equipment & Supplies—10.0% | ||||||||
| ||||||||
21st Century Oncology, Inc., Sr. Sec. Credit Facilities 1st Lien Term Loan, Tranche B, 6.50%, 4/30/221 | 8,259,300 | 7,908,280 | ||||||
| ||||||||
Accellent, Inc., Sr. Sec. Credit Facilities 1st Lien Term Loan, 4.50%, 3/12/211 | 2,576,811 | 2,574,879 | ||||||
| ||||||||
Air Medical Group Holdings, Inc., Sr. Sec. Credit Facilities 1st Lien Term Loan, Tranche B, 4.50%, 4/28/221 | 4,466,354 | 4,415,063 | ||||||
| ||||||||
Akorn, Inc., Sr. Sec. Credit Facilities 1st Lien Term Loan, Tranche B, 4.50%, 4/16/211 | 7,408,188 | 7,395,838 | ||||||
| ||||||||
Alvogen Pharma US, Inc., Sr. Sec. Credit Facilities 1st Lien Term Loan, 6.00%, 4/1/221 | 3,623,221 | 3,616,428 | ||||||
| ||||||||
AMAG Pharmaceuticals, Inc., Sr. Sec. Credit Facilities 1st Lien Term Loan, Tranche B, 5.00%, 8/17/211 | 720,000 | 715,500 | ||||||
| ||||||||
Ardent Legacy Acquisitions, Inc., Sr. Sec. Credit Facilities 1st Lien Term Loan, Tranche B, 6.50%, 8/4/211 | 1,440,000 | 1,443,600 | ||||||
| ||||||||
CareCore National LLC, Sr. Sec. Credit Facilities 1st Lien Term Loan, Tranche B, 5.50%, 3/5/211 | 4,508,393 | 4,350,600 | ||||||
| ||||||||
Carestream Health, Inc., Sr. Sec. Credit Facilities 1st Lien Term Loan, Tranche B, 5.00%, 6/7/191 | 11,276,670 | 10,862,253 | ||||||
| ||||||||
CHS/Community Health Systems, Inc., Sr. Sec. Credit Facilities 1st Lien Term Loan: Tranche G, 3.75%, 12/31/191 | 799,610 | 800,110 | ||||||
| Tranche H, 4.00%, 1/27/211 | 2,468,553 | 2,473,695 | ||||||
| ||||||||
Connolly Corp., Sr. Sec. Credit Facilities 1st Lien Term Loan, Tranche B, 4.50%, 5/14/211 | 4,119,144 | 4,117,858 | ||||||
| ||||||||
ConvaTec, Inc., Sr. Sec. Credit Facilities 1st Lien Term Loan, Tranche B, 4.50%, 6/15/201 | 2,932,650 | 2,932,650 | ||||||
| ||||||||
CT Technologies Intermediate Holdings, Inc., Sr. Sec. Credit Facilities 1st Lien Term Loan, Tranche B, 5.25%, 11/18/211 | 7,384,937 | 7,397,248 | ||||||
| ||||||||
DJO Finance LLC, Sr. Sec. Credit Facilities 1st Lien Term Loan, Tranche B, 4.25%, 6/8/201 | 3,710,000 | 3,700,725 | ||||||
| ||||||||
Drumm Investors LLC, Sr. Sec. Credit Facilities 1st Lien Term Loan, 6.75%, 5/4/181 | 4,378,764 | 4,417,078 | ||||||
| ||||||||
Endo Luxembourg Finance I Co. Sarl, Sr. Sec. Credit Facilities 1st Lien Term Loan, Tranche B, 3.75%, 6/24/221 | 900,000 | 898,805 | ||||||
| ||||||||
eResearchTechnology, Inc., Sr. Sec. Credit Facilities 1st Lien Term Loan, Tranche B, 5.50%, 5/8/221 | 1,924,663 | 1,924,662 | ||||||
| ||||||||
HCR ManorCare, Inc., Sr. Sec. Credit Facilities 1st Lien Term Loan, 5.00%, 4/6/181 | 2,341,249 | 2,222,724 | ||||||
| ||||||||
IASIS Healthcare LLC, Sr. Sec. Credit Facilities 1st Lien Term Loan, Tranche B2, 4.50%, 5/3/181 | 7,460,114 | 7,477,212 | ||||||
| ||||||||
Indivior Finance Sarl, Sr. Sec. Credit Facilities 1st Lien Term Loan, Tranche B, 7.00%, 12/19/191 | 3,954,872 | 3,801,621 | ||||||
| ||||||||
inVentiv Health, Inc., Sr. Sec. Credit Facilities 1st Lien Term Loan, Tranche B4, 7.75%, 5/15/181 | 2,655,730 | 2,656,837 | ||||||
17 OPPENHEIMER MASTER LOAN FUND, LLC
STATEMENT OF INVESTMENTS Continued
| Principal Amount | Value | |||||||
| ||||||||
| Health Care Equipment & Supplies (Continued) | ||||||||
| ||||||||
LHP Operations Co. LLC, Sr. Sec. Credit Facilities 1st Lien Term Loan, Tranche B, 9.00%, 7/3/181 | $ 1,048,991 | $ 1,028,011 | ||||||
| ||||||||
LifeCare Holdings LLC, Sr. Sec. Credit Facilities 1st Lien Exit Term Loan, Tranche A, 6.50%, 11/30/181 | 2,020,159 | 2,013,846 | ||||||
| ||||||||
Medpace, Sr. Sec. Credit Facilities 1st Lien Term Loan, Tranche B, 4.75%, 3/31/211 | 1,266,254 | 1,263,088 | ||||||
| ||||||||
National Mentor, Sr. Sec. Credit Facilities 1st Lien Term Loan, Tranche B, 4.25%, 1/31/211 | 4,900,024 | 4,892,370 | ||||||
| ||||||||
National Surgical Hospitals, Inc., Sr. Sec. Credit Facilities 1st Lien Term Loan, Tranche B, 4.50%, 6/1/221 | 688,275 | 689,342 | ||||||
| ||||||||
New Trident Holdcorp, Inc., Sr. Sec. Credit Facilities 1st Lien Term Loan, Tranche B, 6.50%, 7/31/191 | 1,368,417 | 1,327,364 | ||||||
| ||||||||
Opal Acquisition, Inc., Sr. Sec. Credit Facilities 1st Lien Term Loan, Tranche B, 5.00%, 11/27/201 | 6,931,502 | 6,811,933 | ||||||
| ||||||||
Ortho-Clinical Diagnostics, Inc., Sr. Sec. Credit Facilities 1st Lien Term Loan, Tranche B, 4.75%, 6/30/211 | 2,254,612 | 2,228,779 | ||||||
| ||||||||
P2 Lower Acquisition LLC, Sr. Sec. Credit Facilities 1st Lien Term Loan, 5.50%, 10/22/201 | 1,529,248 | 1,537,850 | ||||||
| ||||||||
Pharmaceutical Product Development LLC, Sr. Sec. Credit Facilities 1st Lien Term Loan, Tranche B, 4.25%, 8/18/221 | 5,745,600 | 5,709,092 | ||||||
| ||||||||
PRA Holdings, Inc., Sr. Sec. Credit Facilities 1st Lien Term Loan, 4.50%, 9/24/201 | 4,422,428 | 4,429,535 | ||||||
| ||||||||
Sage Products Holdings III LLC, Sr. Sec. Credit Facilities 1st Lien Term Loan, 4.25%, 12/13/191 | 728,434 | 728,662 | ||||||
| ||||||||
Sterigenics-Nordion Holdings LLC, Sr. Sec. Credit Facilities 1st Lien Term Loan, Tranche B, 4.25%, 5/15/221 | 2,115,000 | 2,112,356 | ||||||
| ||||||||
US Renal Care, Inc., Sr. Sec. Credit Facilities 1st Lien Term Loan, Tranche B2, 4.25%, 7/3/191 | 4,164,876 | 4,162,273 | ||||||
|
| |||||||
|
| 127,038,167
|
| ||||||
| ||||||||
| Health Care Providers & Services—1.1% | ||||||||
| ||||||||
American Renal Holdings, Inc., Sr. Sec. Credit Facilities 1st Lien Term Loan, Delayed Draw, Tranche B, 4.50%, 8/20/191 | 1,901,658 | 1,895,320 | ||||||
| ||||||||
Genesis Healthcare Corp., Sr. Sec. Credit Facilities 1st Lien Term Loan, Tranche B, 10.00%, 12/4/171 | 2,684,125 | 2,745,637 | ||||||
| ||||||||
Millennium Laboratories LLC, Sr. Sec. Credit Facilities 1st Lien Term Loan, Tranche B, 5.25%, 4/14/211 | 9,543,772 | 3,030,148 | ||||||
| ||||||||
Steward Health Care System LLC, Sr. Sec. Credit Facilities 1st Lien Term Loan, 6.75%, 4/10/201 | 1,820,858 | 1,819,148 | ||||||
| ||||||||
Surgery Center Holdings LLC, Sr. Sec. Credit Facilities 1st Lien Term Loan, 5.25%, 11/3/201 | 4,780,003 | 4,785,978 | ||||||
|
| |||||||
|
| 14,276,231
|
| ||||||
| ||||||||
| Health Care Technology—0.0% | ||||||||
| ||||||||
Vitera Healthcare Solutions LLC, Sr. Sec. Credit Facilities 1st Lien Term Loan, 6.00%, 11/4/201 | 249,761 | 248,044 | ||||||
18 OPPENHEIMER MASTER LOAN FUND, LLC
| Principal Amount | Value | |||||||
| ||||||||
| Life Sciences Tools & Services—0.4% | ||||||||
| ||||||||
JLL/Delta Dutch Newco BV, Sr. Sec. Credit Facilities 1st Lien Term Loan, Tranche B, 4.25%, 3/11/211
|
| $ 4,377,092
|
|
| $ 4,321,284
|
| ||
| ||||||||
| Industrials—22.9% | ||||||||
| ||||||||
| Aerospace & Defense—1.2% | ||||||||
| ||||||||
| AM General LLC, Sr. Sec. Credit Facilities 1st Lien Term Loan, Tranche B, 10.25%, 3/22/181 | 1,336,736 | 1,129,542 | ||||||
| ||||||||
| Doncasters Group Ltd., Sr. Sec. Credit Facilities 1st Lien Term Loan, Tranche B, 4.50%, 4/9/201 | 4,389,788 | 4,384,301 | ||||||
| ||||||||
| Landmark Aviation Canadian, Sr. Sec. Credit Facilities 1st Lien Term Loan, Tranche B, 4.75%, 10/25/191 | 209,421 | 208,897 | ||||||
| ||||||||
| LM US Member LLC, Sr. Sec. Credit Facilities 1st Lien Term Loan, Tranche B, 4.75%, 10/25/191 | 5,276,714 | 5,263,522 | ||||||
| ||||||||
| Sequa Corp., Sr. Sec. Credit Facilities 1st Lien Term Loan, Tranche B, 5.25%, 6/19/171 | 2,277,797 | 1,937,836 | ||||||
| ||||||||
| TurboCombustor Technology, Inc., Sr. Sec. Credit Facilities 1st Lien Term Loan, Tranche B, 5.50%, 12/2/201 | 2,802,918 | 2,732,845 | ||||||
|
| |||||||
|
| 15,656,943
|
| ||||||
| ||||||||
| Commercial Services & Supplies—9.0% | ||||||||
| ||||||||
| Access CIG LLC, Sr. Sec. Credit Facilities 1st Lien Term Loan, 6.00%- 7.25%, 10/18/211 | 1,825,763 | 1,830,327 | ||||||
| ||||||||
| Allied Security Holdings LLC, Sr. Sec. Credit Facilities 1st Lien Term Loan, Tranche B, 4.25%, 2/12/211 | 2,147,375 | 2,135,296 | ||||||
| ||||||||
| Allied Security Holdings LLC, Sr. Sec. Credit Facilities 2nd Lien Term Loan, Tranche B, 8.00%, 8/12/211 | 204,528 | 202,568 | ||||||
| ||||||||
| Ascend Learning LLC, Sr. Sec. Credit Facilities 1st Lien Term Loan, 5.50%-6.75%, 7/26/191 | 10,856,827 | 10,888,577 | ||||||
| ||||||||
| Asurion LLC, Sr. Sec. Credit Facilities 1st Lien Term Loan: | ||||||||
| Tranche B, 5.00%, 8/4/221 | 9,190,866 | 8,734,200 | ||||||
| Tranche B1, 5.00%, 5/24/191 | 5,458,837 | 5,221,020 | ||||||
| ||||||||
| Asurion LLC, Sr. Sec. Credit Facilities 2nd Lien Term Loan, 8.50%, 3/3/211 | 230,000 | 208,897 | ||||||
| ||||||||
| Audio Visual Services Corp., Sr. Sec. Credit Facilities 1st Lien Term Loan, 4.50%, 1/22/211 | 4,390,758 | 4,379,781 | ||||||
| ||||||||
| Ceridan HCM Holding, Inc., Sr. Sec. Credit Facilities 1st Lien Exit Term Loan, Tranche B2, 4.50%, 5/9/171 | 2,759,299 | 2,623,633 | ||||||
| ||||||||
| CEVA Group plc, Sr. Sec. Credit Facilities 1st Lien Term Loan, 6.50%, 3/19/211 | 845,483 | 759,392 | ||||||
| ||||||||
| CEVA Group plc, Sr. Sec. Credit Facilities Letter of Credit 1st Lien Term Loan, 6.50%, 3/14/211 | 1,684,671 | 1,512,695 | ||||||
| ||||||||
| EWT Holdings III Corp., Sr. Sec. Credit Facilities 1st Lien Term Loan, 4.75%, 1/15/211 | 2,824,574 | 2,810,451 | ||||||
| ||||||||
| Expert Global Solutions, Inc., Sr. Sec. Credit Facilities 1st Lien Term Loan, Tranche B, 8.50%, 4/3/181 | 868,866 | 869,952 | ||||||
| ||||||||
| First Advantage, Sr. Sec. Credit Facilities 1st Lien Term Loan, Tranche B, 6.25%, 6/30/221 | 2,842,589 | 2,846,143 | ||||||
| ||||||||
| Garda World Security Co., Sr. Sec. Credit Facilities 1st Lien Term Loan, Tranche B, 4.00%, 11/6/201 | 2,316,076 | 2,283,507 | ||||||
| ||||||||
| Garda World Security Co., Sr. Sec. Credit Facilities 1st Lien Term Loan, Delayed Draw, 4.00%-4.055%, 11/6/201 | 240,357 | 236,977 | ||||||
19 OPPENHEIMER MASTER LOAN FUND, LLC
STATEMENT OF INVESTMENTS Continued
| Principal Amount | Value | |||||||
| ||||||||
| Commercial Services & Supplies (Continued) | ||||||||
| ||||||||
| GCA Services Group, Inc., Sr. Sec. Credit Facilities 1st Lien Term Loan, 4.25%-5.50%, 11/1/191 | $ 2,070,878 | $ 2,066,349 | ||||||
| ||||||||
| IG Investments Holdings LLC, Sr. Sec. Credit Facilities 1st Lien Term Loan, Tranche B, 6.00%, 10/31/211 | 5,728,679 | 5,721,518 | ||||||
| ||||||||
| Information Resources, Inc., Sr. Sec. Credit Facilities 1st Lien Term Loan, Tranche B, 4.75%, 9/30/201 | 1,010,092 | 1,013,349 | ||||||
| ||||||||
| Inmar, Inc., Sr. Sec. Credit Facilities 1st Lien Term Loan, Tranche B, 4.25%, 1/27/211 | 1,916,975 | 1,889,019 | ||||||
| ||||||||
| Knowledge Universe, Sr. Sec. Credit Facilities 1st Lien Term Loan, 6.00%, 8/12/221 | 3,610,000 | 3,555,850 | ||||||
| ||||||||
| Leighton Services, Sr. Sec. Credit Facilities 1st Lien Term Loan, Tranche B, 5.50%, 5/23/221 | 2,415,000 | 2,421,038 | ||||||
| ||||||||
| Livingston International, Inc., Sr. Sec. Credit Facilities 1st Lien Term Loan, Tranche B1, 5.00%, 4/18/191 | 1,265,041 | 1,230,253 | ||||||
| ||||||||
| Livingston International, Inc., Sr. Sec. Credit Facilities 2nd Lien Term Loan, 9.00%, 4/17/201 | 551,135 | 498,777 | ||||||
| ||||||||
| Novitex Acquisition LLC, Sr. Sec. Credit Facilities 1st Lien Term Loan, 7.50%, 7/1/201 | 2,037,626 | 1,935,745 | ||||||
| ||||||||
| Ozburn-Hessey Holding Co. LLC, Sr. Sec. Credit Facilities 1st Lien Term Loan, Tranche B, 6.75%, 5/23/191 | 3,121,941 | 3,116,088 | ||||||
| ||||||||
| Packers Holdings LLC, Sr. Sec. Credit Facilities 1st Lien Term Loan, Tranche B, 5.00%, 12/2/211 | 665,164 | 667,242 | ||||||
| ||||||||
| Protection One, Inc., Sr. Sec. Credit Facilities 1st Lien Term Loan, 5.00%, 7/1/211 | 7,155,000 | 7,164,838 | ||||||
| ||||||||
| Sabre, Inc., Sr. Sec. Credit Facilities 1st Lien Term Loan, Tranche B, 4.00%, 2/19/191 | 11,035,143 | 11,037,438 | ||||||
| ||||||||
| Sabre, Inc., Sr. Sec. Credit Facilities Incremental 1st Lien Term Loan, Tranche B2, 4.00%, 2/19/191 | 1,404,164 | 1,406,504 | ||||||
| ||||||||
| Ship Midco Ltd., Sr. Sec. Credit Facilities 1st Lien Term Loan, Tranche C, 4.75%, 11/29/191 | 4,122,824 | 4,138,235 | ||||||
| ||||||||
| SourceHOV LLC, Sr. Sec. Credit Facilities 1st Lien Term Loan, Tranche B, 7.75%, 10/31/191 | 2,993,454 | 2,726,536 | ||||||
| ||||||||
| TransFirst, Inc., Sr. Sec. Credit Facilities 1st Lien Term Loan, 4.75%, 11/12/211 | 11,110,979 | 11,122,090 | ||||||
| ||||||||
| TransFirst, Inc., Sr. Sec. Credit Facilities 2nd Lien Term Loan, 9.00%, 11/11/221 | 593,680 | 587,496 | ||||||
| ||||||||
| Universal Services, Sr. Sec. Credit Facilities 1st Lien Term Loan, 4.75%, 7/28/221 | 4,395,090 | 4,349,768 | ||||||
| ||||||||
| Universal Services, Sr. Sec. Credit Facilities 1st Lien Term Loan, Delayed Draw, 1.875%-6.00%, 7/28/221 | 309,910 | 306,714 | ||||||
|
| |||||||
|
| 114,498,263
|
| ||||||
| ||||||||
| Electrical Equipment—1.8% | ||||||||
| ||||||||
| Applied Systems, Inc., Sr. Sec. Credit Facilities 1st Lien Term Loan, Tranche B, 4.25%, 1/25/211 | 2,897,080 | 2,892,425 | ||||||
| ||||||||
First Data Corp., Sr. Sec. Credit Facilities 1st Lien Term Loan: Tranche B, 4.187%, 3/24/211 | 5,178,056 | 5,182,660 | ||||||
| Tranche C1, 3.687%, 3/23/181 | 3,246,386 | 3,223,307 | ||||||
| ||||||||
| Freescale Semiconductor, Inc., Sr. Sec. Credit Facilities 1st Lien Term Loan: Tranche B4, 4.25%, 2/28/201 | 6,379,018 | 6,378,501 | ||||||
20 OPPENHEIMER MASTER LOAN FUND, LLC
| Principal Amount | Value | |||||||
| ||||||||
| Electrical Equipment (Continued) | ||||||||
| ||||||||
| Freescale Semiconductor, Inc., Sr. Sec. Credit Facilities 1st Lien Term Loan: (Continued) | ||||||||
| Tranche B5, 5.00%, 1/15/211 | $ 4,620,151 | $ 4,629,442 | ||||||
| ||||||||
| Internap Network Services Corp., Sr. Sec. Credit Facilities 1st Lien Term Loan, 6.00%, 11/22/191 | 1,371,417 | 1,369,703 | ||||||
|
| |||||||
|
| 23,676,038
|
| ||||||
| ||||||||
| Industrial Conglomerates—5.1% | ||||||||
| ||||||||
Apex Tool Group LLC, Sr. Sec. Credit Facilities 1st Lien Term Loan, Tranche B, 4.50%, 1/31/201 | 5,182,608 | 5,070,860 | ||||||
| ||||||||
Boyd Corp., Sr. Sec. Credit Facilities 1st Lien Term Loan, 5.25%, 4/15/221 | 2,214,450 | 2,198,765 | ||||||
| ||||||||
Calpine Corp., Sr. Sec. Credit Facilities 1st Lien Term Loan, Tranche B5, 3.50%, 5/27/221 | 1,905,225 | 1,880,219 | ||||||
| ||||||||
CPI Acquisition, Inc., Sr. Sec. Credit Facilities 1st Lien Term Loan, Tranche B, 6.75%, 8/17/221 | 3,150,000 | 3,118,500 | ||||||
| ||||||||
CST Brands, Sr. Sec. Credit Facilities 1st Lien Term Loan, Tranche B, 4.50%, 9/30/211 | 3,431,835 | 3,428,619 | ||||||
| ||||||||
Dayco Products LLC, Sr. Sec. Credit Facilities 1st Lien Term Loan, Tranche B, 5.25%, 12/12/191 | 3,060,491 | 3,066,230 | ||||||
| ||||||||
Doosan Bobcat, Sr. Sec. Credit Facilities 1st Lien Term Loan, Tranche B, 4.50%, 5/28/211 | 5,691,604 | 5,710,522 | ||||||
| ||||||||
Excelitas Technologies Corp., Sr. Sec. Credit Facilities 1st Lien Term Loan, 6.00%, 11/2/201 | 5,780,339 | 5,614,155 | ||||||
| ||||||||
Filtration Group, Inc., Sr. Sec. Credit Facilities 1st Lien Term Loan, Tranche B, 4.25%, 11/20/201 | 3,251,213 | 3,257,309 | ||||||
| ||||||||
Gates Global LLC, Sr. Sec. Credit Facilities 1st Lien Term Loan, 4.25%, 7/5/211 | 5,809,668 | 5,528,265 | ||||||
| ||||||||
Hillman Group, Inc. (The), Sr. Sec. Credit Facilities 1st Lien Term Loan, Tranche B, 4.50%, 6/30/211 | 3,813,589 | 3,811,206 | ||||||
| ||||||||
Milacron LLC, Sr. Sec. Credit Facilities 1st Lien Term Loan, Tranche B, 4.50%, 9/28/201 | 4,289,401 | 4,321,571 | ||||||
| ||||||||
Sensus USA, Inc., Sr. Sec. Credit Facilities 1st Lien Term Loan, Tranche B, 4.50%, 5/9/171 | 3,787,851 | 3,778,382 | ||||||
| ||||||||
TransDigm, Sr. Sec. Credit Facilities 1st Lien Term Loan, Tranche E, 3.50%, 5/14/221 | 3,085,245 | 3,047,645 | ||||||
| ||||||||
US Farathane LLC, Sr. Sec. Credit Facilities 1st Lien Term Loan, Tranche B, 6.75%, 12/23/211 | 4,524,877 | 4,553,103 | ||||||
| ||||||||
Wencor Group, Sr. Sec. Credit Facilities 1st Lien Term Loan, 4.50%, 6/25/211 | 2,168,838 | 2,129,528 | ||||||
| ||||||||
WP CPP Holdings LLC, Sr. Sec. Credit Facilities 1st Lien Term Loan, 4.50%, 12/28/191 | 4,071,533 | 4,045,069 | ||||||
|
| |||||||
|
| 64,559,948
|
| ||||||
| ||||||||
| Machinery—1.3% | ||||||||
| ||||||||
BWAY, Sr. Sec. Credit Facilities 1st Lien Term Loan, Tranche B, 5.50%, 8/14/201 | 7,503,586 | 7,487,176 | ||||||
| ||||||||
International Equipment Solutions LLC, Sr. Sec. Credit Facilities 1st Lien Term Loan, 6.75%-7.75%, 8/16/191 | 1,657,477 | 1,624,327 | ||||||
| ||||||||
Pelican Products, Inc., Sr. Sec. Credit Facilities 1st Lien Term Loan, Tranche B, 5.25%, 4/8/201 | 1,497,828 | 1,490,339 | ||||||
21 OPPENHEIMER MASTER LOAN FUND, LLC
STATEMENT OF INVESTMENTS Continued
| Principal Amount | Value | |||||||
| ||||||||
| Machinery (Continued) | ||||||||
| ||||||||
| RBS Global, Inc., Sr. Sec. Credit Facilities 1st Lien Term Loan, Tranche B, 4.00%, 8/21/201 | $ 6,340,860 | $ 6,300,095 | ||||||
|
| |||||||
|
| 16,901,937
|
| ||||||
| ||||||||
| Marine—0.3% | ||||||||
| ||||||||
| Commercial Barge Line Co., Sr. Sec. Credit Facilities 1st Lien Term Loan, Tranche B, 7.50%, 9/22/191 |
| 3,744,132
|
|
| 3,716,051
|
| ||
| ||||||||
| Road & Rail—1.5% | ||||||||
| ||||||||
| Wabash National Corp., Sr. Sec. Credit Facilities 1st Lien Term Loan, Tranche B, 4.25%, 3/18/221 | 1,283,090 | 1,286,298 | ||||||
| ||||||||
| Western Express, Inc., Sr. Sec. Credit Facilities 2nd Lien Term Loan, 8.532%, 2/23/221 | 12,017,200 | 11,923,466 | ||||||
| ||||||||
| YRC Worldwide, Inc., Sr. Sec. Credit Facilities 1st Lien Term Loan, 8.25%, 2/13/191 | 6,128,811 | 5,914,302 | ||||||
|
| |||||||
|
| 19,124,066
|
| ||||||
| ||||||||
| Trading Companies & Distributors—1.0% | ||||||||
| ||||||||
| iStar Financial, Inc., Sr. Sec. Credit Facilities 1st Lien Term Loan, Tranche A2, 7.00%, 3/19/171 | 1,607,121 | 1,647,299 | ||||||
| ||||||||
| Ocwen Financial Corp., Sr. Sec. Credit Facilities 1st Lien Term Loan, 5.00%, 2/15/181 | 772,198 | 772,440 | ||||||
| ||||||||
| Orchard Acquisition Co. LLC, Sr. Sec. Credit Facilities 1st Lien Term Loan, Tranche B, 9.00%, 2/8/191 | 4,422,466 | 3,847,546 | ||||||
| ||||||||
| Walter Investment Management Corp., Sr. Sec. Credit Facilities 1st Lien Term Loan, 4.75%, 12/11/201 | 6,421,187 | 5,977,052 | ||||||
|
| |||||||
|
| 12,244,337
|
| ||||||
| ||||||||
| Transportation Infrastructure—1.7% | ||||||||
| ||||||||
| Goodyear Tire & Rubber Co. (The), Sr. Sec. Credit Facilities 2nd Lien Term Loan, Tranche B, 3.75%, 4/30/191 | 995,272 | 998,836 | ||||||
| ||||||||
| Metaldyne, Sr. Sec. Credit Facilities 1st Lien Term Loan, Tranche B, 3.75%, 10/20/211 | 2,887,180 | 2,884,344 | ||||||
| ||||||||
| Navistar, Inc., Sr. Sec. Credit Facilities 1st Lien Term Loan, Tranche B, 6.50%, 8/7/201 | 7,600,000 | 7,429,000 | ||||||
| ||||||||
| Schaeffler, Sr. Sec. Credit Facilities 1st Lien Term Loan, Tranche B, 4.25%, 5/15/201 | 3,875,000 | 3,884,083 | ||||||
| ||||||||
| TI Group Automotive Systems LLC, Sr. Sec. Credit Facilities 1st Lien Term Loan, Tranche B, 4.50%, 6/24/221 | 6,205,000 | 6,101,581 | ||||||
|
| |||||||
|
| 21,297,844
|
| ||||||
| ||||||||
| Information Technology—8.0% | ||||||||
| ||||||||
| Communications Equipment—0.2% | ||||||||
| ||||||||
| Birch Communications, Inc., Sr. Sec. Credit Facilities 1st Lien Term Loan, Tranche B, 7.75%, 7/17/201 |
| 3,031,021
|
|
| 3,034,810
|
| ||
| ||||||||
| Electronic Equipment, Instruments, & Components—0.6% | ||||||||
| ||||||||
| Aricent Technologies, Sr. Sec. Credit Facilities 1st Lien Term Loan, 5.50%, 4/14/211 | 2,465,762 | 2,452,664 | ||||||
22 OPPENHEIMER MASTER LOAN FUND, LLC
| Principal Amount | Value | |||||||
| ||||||||
| Electronic Equipment, Instruments, & Components (Continued) | ||||||||
| ||||||||
| Kronos, Inc., Sr. Sec. Credit Facilities 1st Lien Term Loan, Tranche B, 4.50%, 10/30/191 | $ 4,718,928 | $ 4,715,980 | ||||||
|
| |||||||
|
| 7,168,644
|
| ||||||
| ||||||||
| Internet Software & Services—5.7% | ||||||||
| ||||||||
| Active Network, Inc. (The), Sr. Sec. Credit Facilities 1st Lien Term Loan, 5.50%, 11/13/201 | 3,386,076 | 3,359,624 | ||||||
| ||||||||
| Avaya, Inc., Sr. Sec. Credit Facilities 1st Lien Term Loan, Tranche B7, 6.25%, 4/30/201 | 10,293,666 | 8,029,059 | ||||||
| ||||||||
| Blue Coat Systems, Inc., Sr. Sec. Credit Facilities 1st Lien Term Loan, Tranche B, 4.50%, 5/20/221 | 3,440,000 | 3,420,650 | ||||||
| ||||||||
| CommScope, Inc., Sr. Sec. Credit Facilities 1st Lien Term Loan, Tranche B, 4.00%, 12/29/221 | 1,340,000 | 1,339,791 | ||||||
| ||||||||
| Compuware Corp., Sr. Sec. Credit Facilities 1st Lien Term Loan, Tranche B2, 6.25%, 12/15/211 | 5,163,656 | 4,950,655 | ||||||
| ||||||||
| Dell International LLC, Sr. Sec. Credit Facilities 1st Lien Term Loan, Tranche B2, 4.00%, 4/29/201 | 8,001,510 | 7,988,492 | ||||||
| ||||||||
| Deltek, Inc., Sr. Sec. Credit Facilities 1st Lien Term Loan, 5.00%, 6/25/221 | 5,935,125 | 5,941,309 | ||||||
| ||||||||
| Epicor Software Corp., Sr. Sec. Credit Facilities 1st Lien Term Loan, 4.75%, 6/1/221 | 2,748,113 | 2,738,299 | ||||||
| ||||||||
| First Data Corp., Sr. Sec. Credit Facilities 1st Lien Term Loan, Tranche B, 4.047%, 7/8/221 | 1,000,000 | 995,375 | ||||||
| ||||||||
| Informatica Corp., Sr. Sec. Credit Facilities 1st Lien Term Loan, Tranche B, 4.50%, 8/5/221 | 5,079,590 | 5,047,314 | ||||||
| ||||||||
| Linxens France SA, Sr. Sec. Credit Facilities 1st Lien Term Loan, 5.00%, 7/31/221 | 1,450,000 | 1,451,813 | ||||||
| ||||||||
| Micro Focus US, Inc., Sr. Sec. Credit Facilities 1st Lien Term Loan, Tranche B, 5.25%, 11/19/211 | 6,301,999 | 6,310,532 | ||||||
| ||||||||
| Mitchell International, Inc., Sr. Sec. Credit Facilities 1st Lien Term Loan, Tranche B, 4.50%, 10/12/201 | 3,709,773 | 3,705,521 | ||||||
| ||||||||
| Riverbed Technology, Inc., Sr. Sec. Credit Facilities 1st Lien Term Loan, Tranche B, 6.00%, 4/25/221 | 5,761,944 | 5,780,981 | ||||||
| ||||||||
| TIBCO Software, Inc., Sr. Sec. Credit Facilities 1st Lien Term Loan, Tranche B, 6.50%, 12/4/201 | 7,358,224 | 7,344,427 | ||||||
| ||||||||
| TTM Technologies, Inc., Sr. Sec. Credit Facilities 1st Lien Term Loan, Tranche B, 6.00%, 5/31/211 | 3,055,000 | 2,856,425 | ||||||
| ||||||||
| Zebra Technologies Corp., Sr. Sec. Credit Facilities 1st Lien Term Loan, Tranche B, 4.75%, 10/27/211 | 1,404,372 | 1,415,335 | ||||||
|
| |||||||
|
| 72,675,602
|
| ||||||
| ||||||||
| IT Services—0.2% | ||||||||
| ||||||||
| Vetafore, Inc., Sr. Sec. Credit Facilities 1st Lien Term Loan, 4.25%, 10/3/191 |
| 2,173,158
|
|
| 2,173,838
|
| ||
| ||||||||
| Office Electronics—0.4% | ||||||||
| ||||||||
| BMC Software, Inc., Sr. Sec. Credit Facilities 1st Lien Term Loan, Tranche B, 5.00%, 9/10/201 | 5,352,390 | 4,882,592 | ||||||
23 OPPENHEIMER MASTER LOAN FUND, LLC
STATEMENT OF INVESTMENTS Continued
| Principal Amount | Value | |||||||
| ||||||||
| Software—0.9% | ||||||||
| ||||||||
| Aptean, Inc., Sr. Sec. Credit Facilities 1st Lien Term Loan, Tranche B, 5.25%, 2/21/201 | $ 1,784,647 | $ 1,762,339 | ||||||
| ||||||||
| Blackboard, Inc., Sr. Sec. Credit Facilities 1st Lien Term Loan, Tranche B3, 4.75%, 10/4/181 | 3,389,841 | 3,377,147 | ||||||
| ||||||||
| Infor US, Inc., Sr. Sec. Credit Facilities 1st Lien Term Loan, Tranche B5, 3.75%, 6/3/201 | 1,706,003 | 1,658,021 | ||||||
| ||||||||
| RP Crown Parent LLC, Sr. Sec. Credit Facilities 1st Lien Term Loan, Tranche B, 6.00%, 12/21/181 | 5,253,841 | 4,764,577 | ||||||
|
| |||||||
|
| 11,562,084
|
| ||||||
| ||||||||
| Materials—7.3% | ||||||||
| ||||||||
| Chemicals—3.5% | ||||||||
| ||||||||
| Allnex Luxembourg & CY SCA, Sr. Sec. Credit Facilities 1st Lien Term Loan: | ||||||||
| Tranche B1, 4.50%, 10/4/191 | 962,638 | 963,841 | ||||||
| Tranche B2, 4.50%, 10/4/191 | 499,466 | 500,091 | ||||||
| ||||||||
| American Pacific Corp., Sr. Sec. Credit Facilities 1st Lien Term Loan, Tranche B, 7.00%, 2/26/191 | 1,597,987 | 1,600,651 | ||||||
| ||||||||
| CeramTec Acquisition Corp., Sr. Sec. Credit Facilities 1st Lien Term Loan, Tranche B2, 4.25%, 8/28/201 | 387,650 | 388,135 | ||||||
| ||||||||
| CeramTec Service GmbH, Sr. Sec. Credit Facilities 1st Lien Term Loan: | ||||||||
| Tranche B1, 4.25%, 8/28/201 | 3,770,985 | 3,775,699 | ||||||
| Tranche B3, 4.25%, 8/28/201 | 1,141,327 | 1,142,754 | ||||||
| ||||||||
| Cyanco Intermediate Corp., Sr. Sec. Credit Facilities 1st Lien Term Loan, Tranche B, 5.50%, 5/1/201 | 4,065,635 | 3,943,666 | ||||||
| ||||||||
| Emerald Performance Materials LLC, Sr. Sec. Credit Facilities 1st Lien Term Loan, 4.50%, 7/23/211 | 2,379,406 | 2,376,431 | ||||||
| ||||||||
| Ineos US Finance LLC, Sr. Sec. Credit Facilities 1st Lien Term Loan, Tranche B, 4.25%, 3/31/221 | 947,383 | 920,383 | ||||||
| ||||||||
| Nusil Technology LLC, Sr. Sec. Credit Facilities 1st Lien Term Loan, Tranche B, 5.25%, 4/7/171 | 1,265,560 | 1,260,286 | ||||||
| ||||||||
| OCI Beaumont LLC, Sr. Sec. Credit Facilities 1st Lien Term Loan, Tranche B3, 5.50%, 8/20/191 | 2,060,893 | 2,091,806 | ||||||
| ||||||||
| PQ Corp., Sr. Sec. Credit Facilities 1st Lien Term Loan, Tranche B, 4.00%, 8/7/171 | 2,058,128 | 2,054,913 | ||||||
| ||||||||
| Road Infrastructure Investment, Sr. Sec. Credit Facilities 1st Lien Term Loan, 4.25%, 3/31/211 | 3,440,993 | 3,376,475 | ||||||
| ||||||||
| Royal Holdings, Inc., Sr. Sec. Credit Facilities 1st Lien Term Loan, 4.50%, 6/20/221 | 2,438,888 | 2,432,790 | ||||||
| ||||||||
| Solenis International LP, Sr. Sec. Credit Facilities 1st Lien Term Loan, 4.25%, 8/2/211 | 2,727,165 | 2,693,075 | ||||||
| ||||||||
| Styrolution Group GmbH, Sr. Sec. Credit Facilities 1st Lien Term Loan, Tranche B1, 6.50%, 11/7/191 | 6,050,706 | 6,106,173 | ||||||
| ||||||||
| Tronox Pigments BV, Sr. Sec. Credit Facilities 1st Lien Term Loan, Tranche B, 4.25%, 3/19/201 | 1,947,111 | 1,705,074 | ||||||
| ||||||||
| Univar, Inc., Sr. Sec. Credit Facilities 1st Lien Term Loan: | ||||||||
| Tranche B, 4.25%, 6/18/221 | 225,000 | 221,871 | ||||||
| Tranche B, 4.25%, 7/1/221 | 7,575,000 | 7,469,662 | ||||||
|
| |||||||
|
| 45,023,776
|
| ||||||
| ||||||||
| Construction Materials—1.8% | ||||||||
| ||||||||
| Atkore, Sr. Sec. Credit Facilities 1st Lien Term Loan, 4.50%, 4/9/211 | 2,615,301 | 2,504,151 | ||||||
24 OPPENHEIMER MASTER LOAN FUND, LLC
| Principal Amount | Value | |||||||
| ||||||||
| Construction Materials (Continued) | ||||||||
| ||||||||
| Continental Building Products LLC, Sr. Sec. Credit Facilities 1st Lien Term Loan, Tranche B, 4.00%, 8/28/201 | $ | 4,208,237 | $ | 4,195,962 | ||||
| ||||||||
| CPG International, Inc., Sr. Sec. Credit Facilities Term Loan, Tranche B, 4.75%, 9/30/201 | 2,382,843 | 2,364,971 | ||||||
| ||||||||
| GYP Holdings, Sr. Sec. Credit Facilities 1st Lien Term Loan, 4.75%, 3/27/211 | 2,464,682 | 2,412,307 | ||||||
| ||||||||
| HD Supply, Inc., Sr. Sec. Credit Facilities 1st Lien Term Loan, 3.75%, 8/13/211 | 4,690,000 | 4,675,344 | ||||||
| ||||||||
| Quikrete Holdings, Inc., Sr. Sec. Credit Facilities 1st Lien Term Loan, Tranche B, 4.00%, 9/28/201 | 2,811,884 | 2,807,666 | ||||||
| ||||||||
| Quikrete Holdings, Inc., Sr. Sec. Credit Facilities 2nd Lien Term Loan, 7.00%, 3/26/211 | 3,208,184 | 3,224,225 | ||||||
|
| |||||||
|
| 22,184,626
|
| ||||||
| ||||||||
| Containers & Packaging—1.4% | ||||||||
| ||||||||
Ardagh Holdings USA, Inc., Sr. Sec. Credit Facilities 1st Lien Term Loan, Delayed Draw, Tranche B, 4.00%, 12/17/191 | 2,626,545 | 2,620,635 | ||||||
| ||||||||
| Consolidated Container Holdings LLC, Sr. Sec. Credit Facilities 1st Lien Term Loan, Tranche B, 5.00%, 7/3/191 | 3,158,861 | 2,975,252 | ||||||
| ||||||||
| Exopack/Coveris, Sr. Sec. Credit Facilities 1st Lien Term Loan, Tranche B, 4.50%, 5/8/191 | 3,178,360 | 3,184,319 | ||||||
| ||||||||
| KIK Custom Products, Inc., Sr. Sec. Credit Facilities 1st Lien Term Loan, Tranche B, 6.00%, 8/26/221 | 3,245,000 | 3,182,803 | ||||||
| ||||||||
| Kloeckner Pentaplast of America, Inc., Sr. Sec. Credit Facilities 1st Lien Term Loan, 5.00%, 4/22/201 | 1,382,472 | 1,388,513 | ||||||
| ||||||||
| Kloeckner Pentaplast of America, Inc., Sr. Sec. Credit Facilities 1st Lien Term Loan, 5.00%, 4/28/201 | 3,233,567 | 3,247,694 | ||||||
| ||||||||
| Reynolds Group Holdings, Inc., Sr. Sec. Credit Facilities 1st Lien Term Loan, Tranche B1, 4.50%, 12/1/181 | 720,000 | 721,350 | ||||||
|
| |||||||
|
| 17,320,566
|
| ||||||
| ||||||||
| Metals & Mining—0.3% | ||||||||
| ||||||||
| Alpha Natural Resources, Inc., Sr. Sec. Credit Facilities 1st Lien Term Loan, Tranche B, 3.50%, 5/22/201 | 1,441,314 | 670,985 | ||||||
| ||||||||
| Novelis, Inc., Sr. Sec. Credit Facilities 1st Lien Term Loan, Tranche B, 4.00%, 6/2/221 | 2,787,530 | 2,756,460 | ||||||
|
| |||||||
|
| 3,427,445
|
| ||||||
| ||||||||
| Paper & Forest Products—0.3% | ||||||||
| ||||||||
| Signode Industrial Group US, Inc., Sr. Sec. Credit Facilities 1st Lien Term Loan, Tranche B, 3.75%, 4/30/211 |
| 4,318,508
|
|
| 4,275,996
|
| ||
| ||||||||
| Telecommunication Services—4.9% | ||||||||
| ||||||||
| Diversified Telecommunication Services—4.9% | ||||||||
| ||||||||
| Cincinnati Bell, Inc., Sr. Sec. Credit Facilities 1st Lien Term Loan, Tranche B, 4.00%, 9/10/201 | 2,293,448 | 2,283,128 | ||||||
| ||||||||
Communications Sales & Leasing, Inc., Sr. Sec. Credit Facilities 1st Lien Term Loan, Tranche B, 5.00%, 10/14/221 | 9,283,148 | 8,714,555 | ||||||
| ||||||||
| FairPoint Communications, Inc., Sr. Sec. Credit Facilities 1st Lien Term Loan, Tranche B, 7.50%, 2/14/191 | 1,644,648 | 1,654,721 | ||||||
| ||||||||
| Global Tel*Link Corp., Sr. Sec. Credit Facilities 1st Lien Term Loan, 5.00%, 5/22/201 | 5,870,751 | 5,773,255 | ||||||
25 OPPENHEIMER MASTER LOAN FUND, LLC
STATEMENT OF INVESTMENTS Continued
| Principal Amount | Value | |||||||
| ||||||||
| Diversified Telecommunication Services (Continued) | ||||||||
| ||||||||
| IPC Corp., Sr. Sec. Credit Facilities 1st Lien Term Loan, Tranche B, 5.50%, 8/6/211 | $ 3,343,170 | $ 3,301,381 | ||||||
| ||||||||
| IPC Corp., Sr. Sec. Credit Facilities 2nd Lien Term Loan, 10.50%, 2/4/221 | 1,968,972 | 1,860,679 | ||||||
| ||||||||
| Level 3 Financing, Inc., Sr. Sec. Credit Facilities 1st Lien Term Loan: | ||||||||
| Tranche BI, 4.00%, 1/15/201 | 8,707,848 | 8,698,052 | ||||||
| Tranche BII, 3.50%, 5/31/221 | 3,520,000 | 3,500,932 | ||||||
| ||||||||
| LTS Buyer LLC, Sr. Sec. Credit Facilities 1st Lien Term Loan, Tranche B, 4.00%, 4/13/201 | 9,499,778 | 9,349,367 | ||||||
| ||||||||
| Securus Technologies Holdings, Sr. Sec. Credit Facilities 1st Lien Term Loan, Tranche B2, 4.75%, 4/30/201 | 3,777,663 | 3,673,778 | ||||||
| ||||||||
| Securus Technologies Holdings, Sr. Sec. Credit Facilities 2nd Lien Term Loan, 9.00%, 4/30/211 | 1,057,322 | 960,400 | ||||||
| ||||||||
| US TelePacific Corp., Sr. Sec. Credit Facilities 1st Lien Term Loan, 6.00%, 11/25/201 | 3,137,737 | 3,136,758 | ||||||
| ||||||||
| XO Communications, Sr. Sec. Credit Facilities 1st Lien Term Loan, 4.25%, 3/22/211 | 2,522,179 | 2,511,821 | ||||||
| ||||||||
| Zayo Group LLC, Sr. Sec. Credit Facilities 1st Lien Term Loan, Tranche B, 3.75%, 5/6/211 | 6,722,815 | 6,692,562 | ||||||
|
| |||||||
|
| 62,111,389
|
| ||||||
| ||||||||
| Wireless Telecommunication Services—0.0% | ||||||||
| ||||||||
| NTELOS, Inc., Sr. Sec. Credit Facilities 1st Lien Term Loan, Tranche B, 5.75%, 11/9/191 |
| 509,378
|
|
| 510,015
|
| ||
| ||||||||
| Utilities—2.9% | ||||||||
| ||||||||
| Electric Utilities—2.3% | ||||||||
| ||||||||
| Alinta Energy Finance Pty Ltd., Sr. Sec. Credit Facilities 1st Lien Term Loan, Tranche B, 6.375%, 8/13/191 | 7,741,733 | 7,750,202 | ||||||
| ||||||||
Alinta Energy Finance Pty Ltd., Sr. Sec. Credit Facilities 1st Lien Term Loan, Delayed Draw, Tranche B, 6.375%, 8/13/181 | 514,516 | 515,079 | ||||||
| ||||||||
| Atlantic Power LP, Sr. Sec. Credit Facilities 1st Lien Term Loan, 4.75%, 2/20/211 | 3,851,335 | 3,844,114 | ||||||
| ||||||||
Energy Future Intermediate Holding Co. LLC, Sr. Sec. Credit Facilities 1st Lien Term Loan, Debtor in Possession, 4.25%, 6/20/161 | 1,049,194 | 1,047,445 | ||||||
| ||||||||
Green Energy Partners/Stonewall LLC, Sr. Sec. Credit Facilities 1st Lien Term Loan, Tranche B1, 6.50%, 11/15/211 | 642,458 | 652,496 | ||||||
| ||||||||
| InterGen NV, Sr. Sec. Credit Facilities 1st Lien Term Loan, Tranche B, 5.50%, 6/15/201 | 3,669,446 | 3,426,345 | ||||||
| ||||||||
| LA Frontera Generation LLC, Sr. Sec. Credit Facilities 1st Lien Term Loan, 4.50%, 9/30/201 | 739,939 | 654,846 | ||||||
| ||||||||
| Moxie Patriot LLC, Sr. Sec. Credit Facilities 1st Lien Term Loan, Tranche B1, 6.75%, 12/19/201 | 6,346,006 | 6,155,626 | ||||||
| ||||||||
| Sandy Creek Energy Associates LP, Sr. Sec. Credit Facilities 1st Lien Term Loan, Tranche B, 5.00%, 11/9/201 | 1,779,417 | 1,580,345 | ||||||
| ||||||||
| Wheelabrator, Sr. Sec. Credit Facilities 1st Lien Term Loan: | ||||||||
| Tranche B, 5.00%, 12/17/211 | 2,715,491 | 2,665,708 | ||||||
| Tranche C, 5.00%, 12/17/211 | 120,385 | 118,178 | ||||||
|
| |||||||
| 28,410,384 | ||||||||
26 OPPENHEIMER MASTER LOAN FUND, LLC
| Principal Amount | Value | |||||||
| ||||||||
| Gas Utilities—0.6% | ||||||||
| ||||||||
| Panda Temple Power II LLC, Sr. Sec. Credit Facilities 1st Lien Term Loan, Tranche B, 7.25%, 4/3/191 | $ 8,308,675 | $ 7,893,241 | ||||||
|
| |||||||
| Total Corporate Loans (Cost $1,277,286,916) |
| 1,226,983,011
|
| |||||
| ||||||||
Corporate Bonds and Notes—0.1% | ||||||||
| ||||||||
| Erickson Air-Crane, Inc., 6% Sub. Nts., 11/2/20 | 868,095 | 427,005 | ||||||
| ||||||||
| Tenet Healthcare Corp., 3.837% Sr. Sec. Nts., 6/15/201,4 | 1,650,000 | 1,641,750 | ||||||
|
| |||||||
| Total Corporate Bonds and Notes (Cost $2,451,099) |
| 2,068,755
|
| |||||
| Shares | ||||||||
| ||||||||
Preferred Stock—0.0% | ||||||||
| ||||||||
| Alpha Media Group, Inc., Preferred5 (Cost $–) |
| 105
|
|
| —
|
| ||
| ||||||||
Common Stocks—1.0% | ||||||||
| ||||||||
| Alpha Media Group, Inc.5 | 784 | — | ||||||
| ||||||||
| Cinram International Income Fund5 | 16,132,097 | — | ||||||
| ||||||||
| Everyware Global, Inc.5 | 106,918 | 855,344 | ||||||
| ||||||||
| ION Media Networks, Inc.5 | 6,081 | 2,006,730 | ||||||
| ||||||||
| Mach Gen LLC5 | 34,118 | 1,887,868 | ||||||
| ||||||||
| Media General, Inc.5 | 546,336 | 7,643,241 | ||||||
| ||||||||
| Precision Partners5 | 43 | 4,236 | ||||||
| ||||||||
| Revel Entertainment, Inc.5 | 87,478 | — | ||||||
|
| |||||||
| Total Common Stocks (Cost $17,432,796) |
| 12,397,419
|
| |||||
| ||||||||
Investment Company—3.1% | ||||||||
| ||||||||
Oppenheimer Institutional Money Market Fund, Cl. E, 0.18%7,8 (Cost $39,153,521)
|
| 39,153,521
|
|
| 39,153,521
|
| ||
| ||||||||
| Total Investments, at Value (Cost $1,336,324,332) | 100.7% | 1,280,602,706 | ||||||
| ||||||||
| Net Other Assets (Liabilities) | (0.7) | (8,766,664) | ||||||
|
| |||||||
Net Assets | 100.0% | $ 1,271,836,042 | ||||||
|
| |||||||
Footnotes to Statement of Investments
1. Represents the current interest rate for a variable or increasing rate security.
2. This security is not accruing income because the issuer has missed an interest payment on it and/or is not anticipated to make future interest and or principal payments. The rate shown is the contractual interest rate. See Note 4 of the accompanying Notes.
3. Interest or dividend is paid-in-kind, when applicable.
4. Represents securities sold under Rule 144A, which are exempt from registration under the Securities Act of 1933, as amended. These securities have been determined to be liquid under guidelines established by the Board of Directors. These securities amount to $1,641,750 or 0.13% of the Fund’s net assets at period end.
5. Non-income producing security.
6. Subject to a forbearance agreement. Rate shown is the contractual interest rate. See Note 4 of the accompanying Notes.
27 OPPENHEIMER MASTER LOAN FUND, LLC
STATEMENT OF INVESTMENTS Continued
Footnotes to Statement of Investments (Continued)
7. Is or was an affiliate, as defined in the Investment Company Act of 1940, as amended, at or during the reporting period, by virtue of the Fund owning at least 5% of the voting securities of the issuer or as a result of the Fund and the issuer having the same investment adviser. Transactions during the reporting period in which the issuer was an affiliate are as follows:
| Shares | Shares | |||||||||||||||
| September 30, | Gross | Gross | September 30, | |||||||||||||
| 2014 | Additions | Reductions | 2015 | |||||||||||||
| ||||||||||||||||
| Oppenheimer Institutional Money Market Fund, Cl. E | 23,690,812 | 583,571,493 | 568,108,784 | 39,153,521 | ||||||||||||
Value |
Income | |||||||||||||||
| ||||||||||||||||
| Oppenheimer Institutional Money Market Fund, Cl. E | $ | 39,153,521 | $ | 62,876 | ||||||||||||
8. Rate shown is the 7-day yield at period end.
See accompanying Notes to Financial Statements.
28 OPPENHEIMER MASTER LOAN FUND, LLC
STATEMENT OF ASSETS AND LIABILITIES September 30, 2015
| ||||
Assets | ||||
| Investments, at value—see accompanying statement of investments: | ||||
| Unaffiliated companies (cost $1,297,170,811) | $ | 1,241,449,185 | ||
| Affiliated companies (cost $39,153,521) | 39,153,521 | |||
|
| |||
| 1,280,602,706 | ||||
| ||||
| Cash | 11,872,122 | |||
| ||||
| Receivables and other assets: | ||||
| Investments sold | 8,978,558 | |||
| Interest, dividends and principal paydowns | 4,200,840 | |||
| Shares of beneficial interest sold | 114,679 | |||
| Other | 33,042 | |||
|
| |||
Total assets
| 1,305,801,947 | |||
| ||||
Liabilities | ||||
| Payables and other liabilities: | ||||
| Investments purchased | 33,370,404 | |||
| Shares of beneficial interest redeemed | 312,083 | |||
| Directors’ compensation | 28,838 | |||
| Shareholder communications | 3,624 | |||
| Other | 250,956 | |||
|
| |||
Total liabilities
| 33,965,905 | |||
| ||||
| Net Assets—applicable to 86,862,381 shares of beneficial interest outstanding | $ | 1,271,836,042 | ||
|
| |||
| ||||
| Net asset Value, Redemption Price and Offering Price Per Share | $14.64 | |||
See accompanying Notes to Financial Statements.
29 OPPENHEIMER MASTER LOAN FUND, LLC
STATEMENT OF OPERATIONS For the Year Ended September 30, 2015
| ||||
Investment Income | ||||
| Interest | $ | 70,528,805 | ||
| ||||
| Dividends: | ||||
| Unaffiliated companies | 318,888 | |||
| Affiliated companies | 62,876 | |||
| ||||
| Other income | 420,390 | |||
|
| |||
Total investment income
| 71,330,959 | |||
| ||||
Expenses | ||||
| Management fees | 3,965,336 | |||
| ||||
| Transfer and shareholder servicing agent fees | 35,029 | |||
| ||||
| Shareholder communications | 13,268 | |||
| ||||
| Custodian fees and expenses | 327,734 | |||
| ||||
| Directors’ compensation | 36,854 | |||
| ||||
| Other | 197,628 | |||
|
| |||
| Total expenses | 4,575,849 | |||
| Less waivers and reimbursements of expenses | (46,532) | |||
|
| |||
| Net expenses | 4,529,317 | |||
| ||||
| Net Investment Income | 66,801,642 | |||
| ||||
Realized and Unrealized Gain (Loss) | ||||
| Net realized loss on unaffiliated companies | (23,939,963) | |||
| ||||
| Net change in unrealized appreciation/depreciation on: | ||||
| Investments | (31,581,280) | |||
| Translation of assets and liabilities denominated in foreign currencies | (97,280) | |||
| Unfunded loan commitments | (17,072) | |||
|
| |||
Net change in unrealized appreciation/depreciation
| (31,695,632) | |||
| ||||
| Net Increase in Net Assets Resulting from Operations | $ | 11,166,047 | ||
|
| |||
See accompanying Notes to Financial Statements.
30 OPPENHEIMER MASTER LOAN FUND, LLC
STATEMENTS OF CHANGES IN NET ASSETS
| Year Ended September 30, 2015 | Year Ended September 30, 2014 | |||||||
| ||||||||
Operations | ||||||||
| Net investment income | $ | 66,801,642 | $ | 72,070,515 | ||||
| ||||||||
| Net realized gain (loss) | (23,939,963) | 6,390,999 | ||||||
| ||||||||
| Net change in unrealized appreciation/depreciation | (31,695,632) | (23,742,620) | ||||||
|
|
|
| |||||
Net increase in net assets resulting from operations
| 11,166,047 | 54,718,894 | ||||||
| ||||||||
Beneficial Interest Transactions | ||||||||
| Net increase (decrease) in net assets resulting from beneficial interest transactions: | ||||||||
| Proceeds from contributions | 144,513,932 | 880,891,938 | ||||||
| Payments for withdrawals | (384,916,932) | (248,507,154) | ||||||
|
|
|
| |||||
|
| (240,403,000)
|
| 632,384,784 | |||||
| ||||||||
Net Assets | ||||||||
| Total increase (decrease) | (229,236,953) | 687,103,678 | ||||||
| ||||||||
| Beginning of period | 1,501,072,995 | 813,969,317 | ||||||
|
|
|
| |||||
End of period |
$ |
1,271,836,042 |
| $ | 1,501,072,995 | |||
|
| |||||||
See accompanying Notes to Financial Statements.
31 OPPENHEIMER MASTER LOAN FUND, LLC
| Year Ended September 30, 2015 | Year Ended September 30, 2014 | Year Ended September 30, 2013 | Year Ended September 28, 20121 | Year Ended September 30, 2011 | ||||||||||||||||
| ||||||||||||||||||||
Per Share Operating Data | ||||||||||||||||||||
| Net asset value, beginning of period | $ | 14.51 | $ | 13.84 | $ | 12.88 | $ | 11.56 | $ | 11.14 | ||||||||||
| ||||||||||||||||||||
| Income (loss) from investment operations: | ||||||||||||||||||||
| Net investment income2 | 0.74 | 0.74 | 0.90 | 0.86 | 0.93 | |||||||||||||||
| Net realized and unrealized gain (loss) | (0.61) | (0.07) | 0.06 | 0.46 | (0.51) | |||||||||||||||
|
| |||||||||||||||||||
| Total from investment operations | 0.13 | 0.67 | 0.96 | 1.32 | 0.42 | |||||||||||||||
| ||||||||||||||||||||
| Net asset value, end of period | $ | 14.64 | $ | 14.51 | $ | 13.84 | $ | 12.88 | $ | 11.56 | ||||||||||
|
| |||||||||||||||||||
| ||||||||||||||||||||
Total Return, at Net Asset Value3 | 0.90% | 4.84% | 7.45% | 11.42% | 3.77% | |||||||||||||||
| ||||||||||||||||||||
Ratios/Supplemental Data | ||||||||||||||||||||
| Net assets, end of period (in thousands) | $ | 1,271,836 | $ | 1,501,073 | $ | 813,969 | $ | 2,112,342 | $ | 1,942,049 | ||||||||||
| ||||||||||||||||||||
| Average net assets (in thousands) | $ | 1,321,015 | $ | 1,398,916 | $ | 1,492,179 | $ | 2,045,550 | $ | 2,048,386 | ||||||||||
| ||||||||||||||||||||
| Ratios to average net assets:4 | ||||||||||||||||||||
| Net investment income | 5.06% | 5.15% | 6.78% | 6.98% | 7.91% | |||||||||||||||
| Total expenses5 | 0.35% | 0.34% | 0.36% | 0.33% | 0.34% | |||||||||||||||
Expenses after payments, waivers and/or reimbursements and reduction to custodian expenses | 0.35% | 0.33% | 0.36% | 0.33% | 0.34% | |||||||||||||||
| ||||||||||||||||||||
| Portfolio turnover rate | 57 % | 73 % | 105 % | 60 % | 67 % | |||||||||||||||
1. September 28, 2012 represents the last business day of the Fund’s reporting period.
2. Per share amounts calculated based on the average shares outstanding during the period.
3. Assumes an initial investment on the business day before the first day of the fiscal period, with all dividends and distributions reinvested in additional shares on the reinvestment date, and redemption at the net asset value calculated on the last business day of the fiscal period. Sales charges are not reflected in the total returns. Total returns are not annualized for periods less than one full year. Returns do not reflect the deduction of taxes that a shareholder would pay on fund distributions or the redemption of fund shares. The returns do not include adjustments in accordance with generally accepted accounting principles required at the period end for financial reporting purposes.
4. Annualized for periods less than one full year.
5. Total expenses including indirect expenses from affiliated fund fees and expenses were as follows:
| Year Ended September 30, 2015 | 0.35 | % | ||||
| Year Ended September 30, 2014 | 0.35 | % | ||||
| Year Ended September 30, 2013 | 0.36 | % | ||||
| Year Ended September 28, 2012 | 0.33 | % | ||||
| Year Ended September 30, 2011 | 0.34 | % |
See accompanying Notes to Financial Statement.
32 OPPENHEIMER MASTER LOAN FUND, LLC
NOTES TO FINANCIAL STATEMENTS September 30, 2015
1. Organization
Oppenheimer Master Loan Fund, LLC (the “Fund”) is organized as a Delaware limited liability company and registered under the Investment Company Act of 1940 (“1940 Act”), as amended, as a diversified open-end, management investment company. The Fund’s investment objective is to seek income. The Fund’s investment adviser is OFI Global Asset Management, Inc. (“OFI Global” or the “Manager”), a wholly-owned subsidiary of OppenheimerFunds, Inc. (“OFI” or the “Sub-Adviser”). The Manager has entered into a sub-advisory agreement with OFI. At period end, approximately 78.9% of the shares of the Fund were owned by the Manager, other funds advised or sub-advised by the Manager or an affiliate of the Manager.
Shares of the Fund are issued solely in private placement transactions that do not involve any “public offering” within the meaning of Section 4(a)(2) of the Securities Act of 1933, as amended (the “Securities Act”). Investments in the Fund may only be made by certain “accredited investors” within the meaning of Regulation D under the Securities Act, including other investment companies. The Fund currently offers one class of shares.
For federal income tax purposes, the Fund qualifies as a partnership, and each investor in the Fund is treated as the owner of its proportionate share of the net assets, income, expenses, and realized and unrealized gains and losses of the Fund. Accordingly, as a “pass-through” entity, the Fund pays no dividends or capital gain distributions.
The following is a summary of significant accounting policies followed in the Fund’s preparation of financial statements in accordance with accounting principles generally accepted in the United States (“U.S. GAAP”).
2. Significant Accounting Policies
Security Valuation. All investments in securities are recorded at their estimated fair value, as described in Note 3.
Reporting Period End Date. The last day of the Fund’s reporting period is the last day the New York Stock Exchange was open for trading during the period. The Fund’s financial statements have been presented through that date to maintain consistency with the Fund’s net asset value calculations used for shareholder transactions.
Foreign Currency Translation. The Fund’s accounting records are maintained in U.S. dollars. The values of securities denominated in foreign currencies and amounts related to the purchase and sale of foreign securities and foreign investment income are translated into U.S. dollars as of the close of the New York Stock Exchange (the “Exchange”), normally 4:00 P.M. Eastern time, on each day the Exchange is open for trading. Foreign exchange rates may be valued primarily using a reliable bank, dealer or service authorized by the Board of Directors.
Reported net realized gains and losses from foreign currency transactions arise from sales of portfolio securities, sales and maturities of short-term securities, sales of foreign currencies, exchange rate fluctuations between the trade and settlement dates on securities transactions, and the difference between the amounts of dividends, interest, and foreign withholding taxes recorded on the Fund’s books and the U.S. dollar equivalent of the amounts actually received
33 OPPENHEIMER MASTER LOAN FUND, LLC
NOTES TO FINANCIAL STATEMENTS Continued
2. Significant Accounting Policies (Continued)
or paid. Net unrealized appreciation and depreciation on the translation of assets and liabilities denominated in foreign currencies arise from changes in the values of assets and liabilities, including investments in securities at fiscal period end, resulting from changes in exchange rates.
The effect of changes in foreign currency exchange rates on investments is separately identified from the fluctuations arising from changes in market values of securities held and reported with all other foreign currency gains and losses in the Fund’s Statement of Operations.
Investment Income. Dividend income is recorded on the ex-dividend date or upon ex-dividend notification in the case of certain foreign dividends where the ex-dividend date may have passed. Non-cash dividends included in dividend income, if any, are recorded at the fair market value of the securities received. Interest income is recognized on an accrual basis. Discount and premium, which are included in interest income on the Statement of Operations, are amortized or accreted daily.
Custodian Fees. “Custodian fees and expenses” in the Statement of Operations may include interest expense incurred by the Fund on any cash overdrafts of its custodian account during the period. Such cash overdrafts may result from the effects of failed trades in portfolio securities and from cash outflows resulting from unanticipated shareholder redemption activity. The Fund pays interest to its custodian on such cash overdrafts, to the extent they are not offset by positive cash balances maintained by the Fund, at a rate equal to the Federal Funds Rate plus 0.50%. The “Reduction to custodian expenses” line item, if applicable, represents earnings on cash balances maintained by the Fund during the period. Such interest expense and other custodian fees may be paid with these earnings.
Security Transactions. Security transactions are recorded on the trade date. Realized gains and losses on securities sold are determined on the basis of identified cost.
Indemnifications. The Fund’s organizational documents provide current and former Directors and officers with a limited indemnification against liabilities arising in connection with the performance of their duties to the Fund. In the normal course of business, the Fund may also enter into contracts that provide general indemnifications. The Fund’s maximum exposure under these arrangements is unknown as this would be dependent on future claims that may be made against the Fund. The risk of material loss from such claims is considered remote.
Federal Taxes. The Fund, as an entity, will not be subject to U.S. federal income tax. The Fund will be treated for U.S. federal income tax purposes as a partnership, and not as an association taxable as a corporation. Therefore, a tax provision is not required. Each shareholder is required for U.S. federal income tax purposes to take into account, in its taxable year with which (or within which a taxable year of the Fund ends), its distributive
34 OPPENHEIMER MASTER LOAN FUND, LLC
2. Significant Accounting Policies (Continued)
share of all items of Fund income, gains, losses, and deductions for such taxable year of the Fund. A shareholder must take such items into account even if the Fund does not distribute cash or other property to such shareholder during its taxable year.
Although the Fund is treated as a partnership for Federal tax purposes, it is intended that the Fund’s assets, income and distributions will be managed in such a way that investment in the Fund would not cause an investor that is a regulated investment company under Subchapter M of the Code (“RIC”) to fail that qualification.
Use of Estimates. The preparation of financial statements in conformity with accounting principles generally accepted in the United States of America requires management to make estimates and assumptions that affect the reported amounts of assets and liabilities and disclosure of contingent assets and liabilities at the date of the financial statements and the reported amounts of increases and decreases in net assets from operations during the reporting period. Actual results could differ from those estimates.
3. Securities Valuation
The Fund calculates the net asset value of its shares as of the close of the New York Stock Exchange (the “Exchange”), normally 4:00 P.M. Eastern time, on each day the Exchange is open for trading.
The Fund’s Board has adopted procedures for the valuation of the Fund’s securities and has delegated the day-to-day responsibility for valuation determinations under those procedures to the Manager. The Manager has established a Valuation Committee which is responsible for determining a “fair valuation” for any security for which market quotations are not “readily available.” The Valuation Committee’s fair valuation determinations are subject to review, approval and ratification by the Fund’s Board at its next regularly scheduled meeting covering the calendar quarter in which the fair valuation was determined.
Valuation Methods and Inputs
Securities are valued using unadjusted quoted market prices, when available, as supplied primarily by third party pricing services or dealers.
The following methodologies are used to determine the market value or the fair value of the types of securities described below:
Securities traded on a registered U.S. securities exchange (including exchange-traded derivatives other than futures and futures options) are valued based on the last sale price of the security reported on the principal exchange on which it is traded, prior to the time when the Fund’s assets are valued. In the absence of a sale, the security is valued at the mean between the bid and asked price on the principal exchange or, if not available from the principal exchange, obtained from two dealers. If bid and asked prices are not available from either the exchange or two dealers, the security is valued by using one of the following methodologies (listed in order of priority): (1) using a bid from the principal exchange, (2) the mean between the bid and asked price as provided by a single dealer, or (3) a bid from a single dealer. A security of a foreign issuer traded on a foreign exchange, but not listed on a registered U.S. securities exchange, is valued based on the last sale price on the principal
35 OPPENHEIMER MASTER LOAN FUND, LLC
NOTES TO FINANCIAL STATEMENTS Continued
3. Securities Valuation (Continued)
exchange on which the security is traded, as identified by the third party pricing service used by the Manager, prior to the time when the Fund’s assets are valued. If the last sale price is unavailable, the security is valued at the most recent official closing price on the principal exchange on which it is traded. If the last sales price or official closing price for a foreign security is not available, the security is valued at the mean between the bid and asked price per the exchange or, if not available from the exchange, obtained from two dealers. If bid and asked prices are not available from either the exchange or two dealers, the security is valued by using one of the following methodologies (listed in order of priority): (1) using a bid from the exchange, (2) the mean between the bid and asked price as provided by a single dealer, or (3) a bid from a single dealer.
Shares of a registered investment company that are not traded on an exchange are valued at that investment company’s net asset value per share.
Corporate and government debt securities (of U.S. or foreign issuers) and municipal debt securities, event-linked bonds, loans, mortgage-backed securities, collateralized mortgage obligations, and asset-backed securities are valued at the mean between the “bid” and “asked” prices utilizing evaluated prices obtained from third party pricing services or broker-dealers who may use matrix pricing methods to determine the evaluated prices.
Short-term money market type debt securities with a remaining maturity of sixty days or less are valued at cost adjusted by the amortization of discount or premium to maturity (amortized cost), which approximates market value. Short-term debt securities with a remaining maturity in excess of sixty days are valued at the mean between the “bid” and “asked” prices utilizing evaluated prices obtained from third party pricing services or broker-dealers.
A description of the standard inputs that may generally be considered by the third party pricing vendors in determining their evaluated prices is provided below.
| Security Type | Standard inputs generally considered by third-party pricing vendors | |
| ||
| Corporate debt, government debt, municipal, mortgage-backed and asset-backed securities | Reported trade data, broker-dealer price quotations, benchmark yields, issuer spreads on comparable securities, the credit quality, yield, maturity, and other appropriate factors. | |
| ||
| Loans | Information obtained from market participants regarding reported trade data and broker-dealer price quotations. | |
| ||
| Event-linked bonds | Information obtained from market participants regarding reported trade data and broker-dealer price quotations. | |
If a market value or price cannot be determined for a security using the methodologies described above, or if, in the “good faith” opinion of the Manager, the market value or price obtained does not constitute a “readily available market quotation,” or a significant event has occurred that would materially affect the value of the security, the security is fair valued either (i) by a standardized fair valuation methodology applicable to the security type or the significant event as previously approved by the Valuation Committee and the Fund’s Board or (ii) as determined in good faith by the Manager’s Valuation Committee. The Valuation Committee considers all relevant facts that are reasonably available, through either public information or information available to the Manager, when determining the fair value of a security. Fair value determinations by the Manager are subject to review, approval and
36 OPPENHEIMER MASTER LOAN FUND, LLC
3. Securities Valuation (Continued)
ratification by the Fund’s Board at its next regularly scheduled meeting covering the calendar quarter in which the fair valuation was determined. Those fair valuation standardized methodologies include, but are not limited to, valuing securities at the last sale price or initially at cost and subsequently adjusting the value based on: changes in company specific fundamentals, changes in an appropriate securities index, or changes in the value of similar securities which may be further adjusted for any discounts related to security-specific resale restrictions. When possible, such methodologies use observable market inputs such as unadjusted quoted prices of similar securities, observable interest rates, currency rates and yield curves. The methodologies used for valuing securities are not necessarily an indication of the risks associated with investing in those securities nor can it be assured that the Fund can obtain the fair value assigned to a security if it were to sell the security.
To assess the continuing appropriateness of security valuations, the Manager, or its third party service provider who is subject to oversight by the Manager, regularly compares prior day prices, prices on comparable securities, and sale prices to the current day prices and challenges those prices exceeding certain tolerance levels with the third party pricing service or broker source. For those securities valued by fair valuations, whether through a standardized fair valuation methodology or a fair valuation determination, the Valuation Committee reviews and affirms the reasonableness of the valuations based on such methodologies and fair valuation determinations on a regular basis after considering all relevant information that is reasonably available.
Classifications
Each investment asset or liability of the Fund is assigned a level at measurement date based on the significance and source of the inputs to its valuation. Various data inputs are used in determining the value of each of the Fund’s investments as of the reporting period end. These data inputs are categorized in the following hierarchy under applicable financial accounting standards:
1) Level 1-unadjusted quoted prices in active markets for identical assets or liabilities (including securities actively traded on a securities exchange)
2) Level 2-inputs other than unadjusted quoted prices that are observable for the asset or liability (such as unadjusted quoted prices for similar assets and market corroborated inputs such as interest rates, prepayment speeds, credit risks, etc.)
3) Level 3-significant unobservable inputs (including the Manager’s own judgments about assumptions that market participants would use in pricing the asset or liability).
The inputs used for valuing securities are not necessarily an indication of the risks associated with investing in those securities.
The table below categorizes amounts that are included in the Fund’s Statement of Assets and Liabilities at period end based on valuation input level:
37 OPPENHEIMER MASTER LOAN FUND, LLC
NOTES TO FINANCIAL STATEMENTS Continued
3. Securities Valuation (Continued)
| Level 1— Unadjusted Quoted Prices | Level 2— Other Significant | Level 3— Significant Unobservable Inputs | Value | |||||||||||||
| ||||||||||||||||
Assets Table | ||||||||||||||||
Investments, at Value: | ||||||||||||||||
Corporate Loans | $ | — | $ | 1,214,401,112 | $ | 12,581,899 | $ | 1,226,983,011 | ||||||||
Corporate Bonds and Notes | — | 2,068,755 | — | 2,068,755 | ||||||||||||
Preferred Stock | — | — | — | — | ||||||||||||
Common Stocks | 7,643,241 | 2,743,212 | 2,010,966 | 12,397,419 | ||||||||||||
Investment Company | 39,153,521 | — | — | 39,153,521 | ||||||||||||
|
| |||||||||||||||
Total Assets | $ | 46,796,762 | $ | 1,219,213,079 | $ | 14,592,865 | $ | 1,280,602,706 | ||||||||
|
| |||||||||||||||
Forward currency exchange contracts and futures contracts, if any, are reported at their unrealized appreciation/depreciation at measurement date, which represents the change in the contract’s value from trade date. All additional assets and liabilities included in the above table are reported at their market value at measurement date.
The table below shows the transfers between Level 2 and Level 3. The Fund’s policy is to recognize transfers in and transfers out as of the beginning of the reporting period.
| Transfers into Level 2* | Transfers out of Level 2** | Transfers into Level 3** | Transfers out of Level 3* | |||||||||||||
| ||||||||||||||||
Assets Table | ||||||||||||||||
Investments, at Value: | ||||||||||||||||
Corporate Loans | $ | 797,184 | $ | (9,088,753) | $ | 9,088,753 | $ | (797,184) | ||||||||
|
| |||||||||||||||
Total Assets | $ | 797,184 | $ | (9,088,753) | $ | 9,088,753 | $ | (797,184) | ||||||||
|
| |||||||||||||||
* Transferred from Level 3 to Level 2 due to the availability of market data for this security.
** Transferred from Level 2 to Level 3 because of the lack of observable market data.
The following is a reconciliation of assets in which significant unobservable inputs (level 3) were used in determining fair value:
| Value as of September 30, 2014 | Realized gain (loss) | Change in unrealized appreciation/ depreciation | Accretion/ (amortization) of premium/ discounta | |||||||||||||
| ||||||||||||||||
Assets Table | ||||||||||||||||
Investments, at Value: | ||||||||||||||||
Corporate Loans | $ | 860,959 | $ | 74,962 | $ | (1,739,252) | $ | 14,847 | ||||||||
Corporate Bonds and Notes | 797,184 | — | — | — | ||||||||||||
Common Stocks | 1,918,312 | — | 92,654 | — | ||||||||||||
|
| |||||||||||||||
Total Assets | $ | 3,576,455 | $ | 74,962 | $ | (1,646,598) | $ | 14,847 | ||||||||
|
| |||||||||||||||
a. Included in net investment income.
38 OPPENHEIMER MASTER LOAN FUND, LLC
3. Securities Valuation (Continued)
| Purchases | Sales | Transfers into Level 3 | Transfers out of Level 3 | Value as of September 30, 2015 | ||||||||||||||||
| ||||||||||||||||||||
Assets Table | ||||||||||||||||||||
Investments, at Value: | ||||||||||||||||||||
Corporate Loans | $ | 4,390,400 | $ | (108,770) | $ | 9,088,753 | $ | — | $ | 12,581,899 | ||||||||||
Corporate Bonds and Notes | — | — | — | (797,184) | — | |||||||||||||||
Common Stocks | — | — | — | — | 2,010,966 | |||||||||||||||
|
| |||||||||||||||||||
Total Assets | $ | 4,390,400 | $ | (108,770) | $ | 9,088,753 | $ | (797,184) | $ | 14,592,865 | ||||||||||
|
| |||||||||||||||||||
The total change in unrealized appreciation/depreciation included in the Statement of Operations attributable to Level 3 investments still held at period end:
| Change in unrealized appreciation/depreciation | ||||
| ||||
Assets Table | ||||
Investments, at Value: | ||||
Corporate Loans | $ | (1,739,252) | ||
Corporate Bonds and Notes | — | |||
Common Stocks | 92,654 | |||
|
| |||
Total | $ | (1,646,598) | ||
|
| |||
The following table summarizes the valuation techniques and significant unobservable inputs used in determining fair value measurements for those investments classified as Level 3 at period end:
| Value as of September 30, 2015 | Valuation Technique | Unobservable input | Range of Unobservable Inputs | Unobservable Input Used | ||||||||||
| ||||||||||||||
Assets Table | ||||||||||||||
Investments, at Value: | ||||||||||||||
Corporate Loans | $ 4,480,000 | Broker quote | N/A | N/A | N/A (a) | |||||||||
Corporate Loans | 8,100,844 | Pricing service | N/A | N/A | N/A (a) | |||||||||
Corporate Loans | 1,055 | Estimated recovery proceeds | Nominal value | N/A |
| 0.01% of par (b) |
| |||||||
Common Stocks | 4,236 | Discount to estimated distribution | Discount rate | N/A | 25% (c) | |||||||||
| Estimated final distribution | N/A | �� | $129.86/ share | | ||||||||||
Common Stocks | 2,006,730 | Market Comparable Companies | LTM EBITDA | N/A | $195.8 M (d) | |||||||||
| Enterprise Value to EBITDA Multiple | 6 - 8 x | 6x | ||||||||||||
|
| |||||||||||||
Total | $ | 14,592,865 | ||||||||||||
|
| |||||||||||||
39 OPPENHEIMER MASTER LOAN FUND, LLC
NOTES TO FINANCIAL STATEMENTS Continued
3. Securities Valuation (Continued)
a) Securities classified as Level 3 whose unadjusted values were provided by a pricing service or broker-dealer for which such inputs are unobservable. The Manager periodically reviews pricing vendor and broker methodologies and inputs to confirm they are determined using unobservable inputs and have been appropriately classified. Such securities’ fair valuations could change significantly based on changes in unobservable inputs used by the pricing service or broker.
(b) The Fund fair values certain corporate loans using a nominal value to reflect the low probability of future recovery. The Manager monitors such investments for additional market information or the occurrence of a significant event which would warrant a re-evaluation of the security’s fair valuation. A significant increase (decrease) in the future distribution amount will result in a significant increase (decrease) to the fair value of the investment.
(c) The Fund fair values certain common stocks at the estimated final distribution less a discount for uncertainty regarding timing of final distribution. A significant increase (decrease) in the future distribution amount, or a significant decrease (increase) to the discount rate, will result in a significant increase (decrease) to the fair value of the investment.
(d) The Fund fair values certain common stocks using a market comparable companies approach. This model incorporates the total debt outstanding and calculates enterprise value as a multiple of Earnings Before Interest, Taxes, Depreciation, and Amortization (EBITDA) for the last twelve months. This model is reviewed and updated based on receipt of quarterly financial statements. A significant increase (decrease) to the EBITDA, or a significant increase (decrease) to the multiple used, will result in a significant increase (decrease) to the fair value of the investment.
4. Investments and Risks
Investments in Affiliated Funds. The Fund is permitted to invest in other mutual funds advised by the Manager (“Affiliated Funds”). Affiliated Funds are open-end management investment companies registered under the 1940 Act, as amended. The Manager is the investment adviser of, and the Sub-Adviser provides investment and related advisory services to, the Affiliated Funds. When applicable, the Fund’s investments in Affiliated Funds are included in the Statement of Investments. Shares of Affiliated Funds are valued at their net asset value per share. As a shareholder, the Fund is subject to its proportional share of the Affiliated Funds’ expenses, including their management fee. The Manager will waive fees and/or reimburse Fund expenses in an amount equal to the indirect management fees incurred through the Fund’s investment in the Affiliated Funds.
Each of the Affiliated Funds in which the Fund invests has its own investment risks, and those risks can affect the value of the Fund’s investments and therefore the value of the Fund’s shares. To the extent that the Fund invests more of its assets in one Affiliated Fund than in another, the Fund will have greater exposure to the risks of that Affiliated Fund.
Investment in Oppenheimer Institutional Money Market Fund. The Fund is permitted to invest daily available cash balances in a money market Affiliated Fund. The Fund may invest the available cash in Class E shares of Oppenheimer Institutional Money Market Fund (“IMMF”) to seek current income while preserving liquidity or for defensive purposes. IMMF is regulated as a money market fund under the Investment Company Act of 1940, as amended.
Loans. Under normal market conditions, the Fund will invest at least 80% of its net assets in loans made to U.S. and foreign borrowers that are corporations, partnerships or other business entities. The Fund will do so directly as an original lender or by assignment or indirectly through participation agreements or certain derivative instruments. While many of these loans will be collateralized, the Fund can also invest in uncollateralized loans. Loans are often issued in connection with recapitalizations, acquisitions, leveraged buyouts, and refinancing of borrowers. The loans often pay interest at rates that float above (or are
40 OPPENHEIMER MASTER LOAN FUND, LLC
4. Investments and Risks (Continued)
adjusted periodically based on) a benchmark that reflects current interest rates although the Fund can also invest in loans with fixed interest rates.
At period end, securities with an aggregate market value of $1,226,983,011, representing 96.5% of the Fund’s net assets were comprised of loans.
Securities on a When-Issued or Delayed Delivery Basis. The Fund purchases and sells interests in Senior Loans and other portfolio securities on a “when issued” basis, and may purchase or sell securities on a “delayed delivery” basis. “When-issued” or “delayed delivery” refers to securities whose terms and indenture are available and for which a market exists, but which are not available for immediate delivery. Delivery and payment for securities that have been purchased by the Fund on a when-issued basis normally takes place within six months and possibly as long as two years or more after the trade date. During this period, such securities do not earn interest, are subject to market fluctuation and may increase or decrease in value prior to their delivery. The purchase of securities on a when-issued basis may increase the volatility of the Fund’s net asset value to the extent the Fund executes such transactions while remaining substantially fully invested. When the Fund engages in when-issued or delayed delivery transactions, it relies on the buyer or seller, as the case may be, to complete the transaction. Their failure to do so may cause the Fund to lose the opportunity to obtain or dispose of the security at a price and yield it considers advantageous. The Fund may also sell securities that it purchased on a when-issued basis or forward commitment prior to settlement of the original purchase.
Equity Security Risk. Stocks and other equity securities fluctuate in price. The value of the Fund’s portfolio may be affected by changes in the equity markets generally. Equity markets may experience significant short-term volatility and may fall sharply at times. Different markets may behave differently from each other and U.S. equity markets may move in the opposite direction from one or more foreign stock markets. Adverse events in any part of the equity or fixed-income markets may have unexpected negative effects on other market segments.
The prices of individual equity securities generally do not all move in the same direction at the same time and a variety of factors can affect the price of a particular company’s securities. These factors may include, but are not limited to, poor earnings reports, a loss of customers, litigation against the company, general unfavorable performance of the company’s sector or industry, or changes in government regulations affecting the company or its industry.
Credit Risk. Loans and debt securities are subject to credit risk. Credit risk relates to the ability of the borrower under a loan or issuer of a debt to meet interest or principal payments or both as they become due. The Fund may acquire securities that have missed an interest payment, and is not obligated to dispose of securities whose issuers subsequently miss an interest payment. Information concerning securities not accruing income at period end is as follows:
41 OPPENHEIMER MASTER LOAN FUND, LLC
NOTES TO FINANCIAL STATEMENTS Continued
4. Investments and Risks (Continued)
Cost | $17,375,785 | |||
Market Value | $4,982,962 | |||
Market Value as % of Net Assets | 0.39% |
The Fund has entered into forbearance agreements with certain obligors under which the Fund has agreed to temporarily forego receipt of the original principal or coupon interest rates. At period end, securities with an aggregate market value of $10,097,156, representing 0.79% of the Fund’s net assets, were subject to these forbearance agreements.
5. Market Risk Factors
The Fund’s investments in securities and/or financial derivatives may expose the fund to various market risk factors:
Commodity Risk. Commodity risk relates to the change in value of commodities or commodity indexes as they relate to increases or decreases in the commodities market. Commodities are physical assets that have tangible properties. Examples of these types of assets are crude oil, heating oil, metals, livestock, and agricultural products.
Credit Risk. Credit risk relates to the ability of the issuer of debt to meet interest and principal payments, or both, as they come due. In general, lower-grade, higher-yield debt securities are subject to credit risk to a greater extent than lower-yield, higher-quality securities.
Equity Risk. Equity risk relates to the change in value of equity securities as they relate to increases or decreases in the general market.
Foreign Exchange Rate Risk. Foreign exchange rate risk relates to the change in the U.S. dollar value of a security held that is denominated in a foreign currency. The U.S. dollar value of a foreign currency denominated security will decrease as the dollar appreciates against the currency, while the U.S. dollar value will increase as the dollar depreciates against the currency.
Interest Rate Risk. Interest rate risk refers to the fluctuations in value of fixed-income securities resulting from the inverse relationship between price and yield. For example, an increase in general interest rates will tend to reduce the market value of already issued fixed-income investments, and a decline in general interest rates will tend to increase their value. In addition, debt securities with longer maturities, which tend to have higher yields, are subject to potentially greater fluctuations in value from changes in interest rates than obligations with shorter maturities.
Volatility Risk. Volatility risk refers to the magnitude of the movement, but not the direction of the movement, in a financial instrument’s price over a defined time period. Large increases or decreases in a financial instrument’s price over a relative time period typically indicate greater volatility risk, while small increases or decreases in its price typically indicate lower volatility risk.
6. Shares of Beneficial Interest
The Fund has authorized an unlimited number of $0.001 par value shares of beneficial interest. Transactions in shares of beneficial interest were as follows:
42 OPPENHEIMER MASTER LOAN FUND, LLC
6. Shares of Beneficial Interest (Continued)
| Year Ended September 30, 2015 | Year Ended September 30, 2014 | |||||||||||||||
| Shares | Amount | Shares | Amount | |||||||||||||
| ||||||||||||||||
Contributions | 9,833,323 | $ | 144,513,932 | 61,782,616 | $ | 880,891,938 | ||||||||||
Withdrawals | (26,396,281 | ) | (384,916,932) | (17,162,494 | ) | (248,507,154) | ||||||||||
|
| |||||||||||||||
Net increase (decrease) | (16,562,958 | ) | $ | (240,403,000) | 44,620,122 | $ | 632,384,784 | |||||||||
|
| |||||||||||||||
7. Purchases and Sales of Securities
The aggregate cost of purchases and proceeds from sales of securities, other than short-term obligations and investments in IMMF, for the reporting period were as follows:
| Purchases | Sales | |||||||
| ||||||||
Investment securities | $ | 729,063,433 | $ | 816,985,848 | ||||
8. Fees and Other Transactions with Affiliates
Management Fees. Under the investment advisory agreement, the Fund pays the Manager a management fee based on the daily net assets of the Fund at an annual rate of 0.30%.
Sub-Adviser Fees. The Manager has retained the Sub-Adviser to provide the day-to-day portfolio management of the Fund. Under the Sub-Advisory Agreement, the Manager pays the Sub-Adviser an annual fee in monthly installments, equal to a percentage of the investment management fee collected by the Manager from the Fund, which shall be calculated after any investment management fee waivers. The fee paid to the Sub-Adviser is paid by the Manager, not by the Fund.
Transfer Agent Fees. OFI Global (the “Transfer Agent”) serves as the transfer and shareholder servicing agent for the Fund. The Fund pays the Transfer Agent a fee based on annual net assets. Fees incurred with respect to these services are detailed in the Statement of Operations and Financial Highlights, respectively.
Sub-Transfer Agent Fees. The Transfer Agent has retained Shareholder Services, Inc., a wholly-owned subsidiary of OFI (the “Sub-Transfer Agent”), to provide the day-to-day transfer agent and shareholder servicing of the Fund. Under the Sub-Transfer Agency Agreement, the Transfer Agent pays the Sub-Transfer Agent an annual fee in monthly installments, equal to a percentage of the transfer agent fee collected by the Transfer Agent from the Fund, which shall be calculated after any applicable fee waivers. The fee paid to the Sub-Transfer Agent is paid by the Transfer Agent, not by the Fund.
Directors’ Compensation. The Fund’s Board of Directors (“Board”) has adopted a compensation deferral plan for Independent Directors that enables Directors to elect to defer receipt of all or a portion of the annual compensation they are entitled to receive from the Fund. For purposes of determining the amount owed to the Directors under the plan, deferred amounts are treated as though equal dollar amounts had been invested in shares of the Fund or in other Oppenheimer funds selected by the Directors. The Fund purchases shares of the
43 OPPENHEIMER MASTER LOAN FUND, LLC
NOTES TO FINANCIAL STATEMENTS Continued
8. Fees and Other Transactions with Affiliates (Continued)
funds selected for deferral by the Directors in amounts equal to his or her deemed investment, resulting in a Fund asset equal to the deferred compensation liability. Such assets are included as a component of “Other” within the asset section of the Statement of Assets and Liabilities. Deferral of Directors’ fees under the plan will not affect the net assets of the Fund and will not materially affect the Fund’s assets, liabilities or net investment income per share. Amounts will be deferred until distributed in accordance with the compensation deferral plan.
Waivers and Reimbursements of Expenses. The Manager will waive fees and/or reimburse Fund expenses in an amount equal to the indirect management fees incurred through the Fund’s investment in IMMF. During the reporting period, the Manager waived fees and/or reimbursed the Fund $46,532 for IMMF management fees.
Waivers and/or reimbursements may be modified or terminated as set forth according to the terms in the prospectus.
9. Borrowings and Other Financing
Loan Commitments. Pursuant to the terms of certain credit agreements, the Fund has unfunded loan commitments of $813,945 at period end. The Fund generally will maintain with its custodian, liquid investments having an aggregate value at least equal to the par value of unfunded loan commitments. At period end, these commitments have a market value of $813,945 and have been included as Corporate Loans in the Statement of Investments.
10. Pending Litigation
In 2009, several putative class action lawsuits were filed and later consolidated before the U.S. District Court for the District of Colorado against OppenheimerFunds, Inc. (“OFI”), OppenheimerFunds Distributor, Inc. (“OFDI”), and Oppenheimer Rochester California Municipal Fund, a fund advised by OFI Global Asset Management, Inc. and distributed by the Distributor (the “California Fund”), in connection with the California Fund’s investment performance. The plaintiffs asserted claims against OFI, OFDI and certain present and former trustees and officers of the California Fund under the federal securities laws, alleging, among other things, that the disclosure documents of the California Fund contained misrepresentations and omissions and the investment policies of the California Fund were not followed. Plaintiffs in the suit filed an amended complaint and defendants filed a motion to dismiss. In 2011, the court issued an order which granted in part and denied in part the defendants’ motion to dismiss. In 2012, plaintiffs filed a motion, which defendants opposed, to certify a class and appoint class representatives and class counsel. In March 2015, the court granted plaintiffs’ motion for class certification. In May 2015, the U.S. Court of Appeals for the Tenth Circuit vacated the class certification order and remanded the matter to the district court for further proceedings. In July 2015, the district court held an evidentiary hearing on plaintiffs’ motion for class certification.
OFI and OFDI believe the suit is without merit; that it is premature to render any opinion as to the likelihood of an outcome unfavorable to them in the suit; and that no estimate can yet be made as to the amount or range of any potential loss. Furthermore, OFI believes that the
44 OPPENHEIMER MASTER LOAN FUND, LLC
10. Pending Litigation (Continued)
suit should not impair the ability of OFI or OFDI to perform their respective duties to the Fund and that the outcome of the suit should not have any material effect on the operations of any of the Oppenheimer funds.
45 OPPENHEIMER MASTER LOAN FUND, LLC
REPORT OF INDEPENDENT REGISTERED PUBLIC ACCOUNTING FIRM
The Board of Directors and Shareholders of Oppenheimer Master Loan Fund, LLC:
We have audited the accompanying statement of assets and liabilities of Oppenheimer Master Loan Fund, LLC, including the statement of investments, as of September 30, 2015, and the related statement of operations for the year then ended, the statements of changes in net assets for each of the years in the two-year period then ended, and the financial highlights for each of the years in the five-year period then ended. These financial statements and financial highlights are the responsibility of the Fund’s management. Our responsibility is to express an opinion on these financial statements and financial highlights based on our audits.
We conducted our audits in accordance with the standards of the Public Company Accounting Oversight Board (United States). Those standards require that we plan and perform the audit to obtain reasonable assurance about whether the financial statements and financial highlights are free of material misstatement. An audit includes examining, on a test basis, evidence supporting the amounts and disclosures in the financial statements. Our procedures included confirmation of securities owned as of September 30, 2015, by correspondence with the custodian, transfer agent and brokers, or by other appropriate auditing procedures where replies from brokers were not received. An audit also includes assessing the accounting principles used and significant estimates made by management, as well as evaluating the overall financial statement presentation. We believe that our audits provide a reasonable basis for our opinion.
In our opinion, the financial statements and financial highlights referred to above present fairly, in all material respects, the financial position of Oppenheimer Master Loan Fund, LLC as of September 30, 2015, the results of its operations for the year then ended, the changes in its net assets for each of the years in the two-year period then ended, and the financial highlights for each of the years in the five-year period then ended, in conformity with U.S. generally accepted accounting principles.
KPMG LLP
Denver, Colorado
November 25, 2015
46 OPPENHEIMER MASTER LOAN FUND, LLC
BOARD APPROVAL OF THE FUND’S INVESTMENT ADVISORY AND
SUB-ADVISORY AGREEMENTS Unaudited
The Fund has entered into an investment advisory agreement with OFI Global Asset Management, Inc. (“OFI Global” or the “Adviser”), a wholly-owned subsidiary of OppenheimerFunds, Inc. (“OFI” or the “Sub-Adviser”) (“OFI Global” and “OFI” together the “Managers”) and OFI Global has entered into a sub-advisory agreement with OFI whereby OFI provides investment sub-advisory services to the Fund (collectively, the “Agreements”). Each year, the Board of Trustees (the “Board”), including a majority of the independent Trustees, is required to determine whether to approve the terms of the Agreements and the renewal thereof. The Investment Company Act of 1940, as amended, requires that the Board request and evaluate, and that the Managers provide, such information as may be reasonably necessary to evaluate the terms of the Agreements. The Board employs an independent consultant to prepare a report that provides information, including comparative information that the Board requests for that purpose. In addition to in-person meetings focused on this evaluation, the Board receives information throughout the year regarding Fund services, fees, expenses and performance.
The Adviser, Sub-Adviser and the independent consultant provided information to the Board on the following factors: (i) the nature, quality and extent of the Managers’ services, (ii) the comparative investment performance of the Fund and the Managers, (iii) the fees and expenses of the Fund, including comparative fee and expense information, (iv) the profitability of the Managers and their affiliates, including an analysis of the cost of providing services, (v) whether economies of scale are realized as the Fund grows and whether fee levels reflect these economies of scale for Fund investors and (vi) other benefits to the Managers from their relationship with the Fund. The Board was aware that there are alternatives to retaining the Managers.
Outlined below is a summary of the principal information considered by the Board as well as the Board’s conclusions.
Nature, Quality and Extent of Services. The Board considered information about the nature, quality and extent of the services provided to the Fund and information regarding the Managers’ key personnel who provide such services. The Managers’ duties include providing the Fund with the services of the portfolio managers and the Sub-Adviser’s investment team, who provide research, analysis and other advisory services in regard to the Fund’s investments; and securities trading services. OFI Global is responsible for oversight of third-party service providers; monitoring compliance with applicable Fund policies and procedures and adherence to the Fund’s investment restrictions; risk management; and oversight of the Sub-Adviser. OFI Global is also responsible for providing certain administrative services to the Fund as well. Those services include providing and supervising all administrative and clerical personnel who are necessary in order to provide effective corporate administration for the Fund; compiling and maintaining records with respect to the Fund’s operations; preparing and filing reports required by the U.S. Securities and Exchange Commission; preparing periodic reports regarding the operations of the Fund for its shareholders; preparing proxy materials for shareholder meetings; and preparing the registration statements required by federal and state securities laws for the sale of the Fund’s shares. OFI Global also provides the Fund with office space, facilities and equipment.
The Board also considered the quality of the services provided and the quality of the Managers’ resources that are available to the Fund. The Board took account of the fact that
47 OPPENHEIMER MASTER LOAN FUND, LLC
BOARD APPROVAL OF THE FUND’S INVESTMENT ADVISORY AND
SUB-ADVISORY AGREEMENTS Unaudited / Continued
the Sub-Adviser has had over fifty years of experience as an investment adviser and that its assets under management rank it among the top mutual fund managers in the United States. The Board evaluated the Managers’ advisory, administrative, accounting, legal, compliance services and risk management, and information the Board has received regarding the experience and professional qualifications of the Managers’ key personnel and the size and functions of its staff. In its evaluation of the quality of the portfolio management services provided, the Board considered the experience of Joseph Welsh and Margaret Hui, the portfolio managers for the Fund, and the Sub-Adviser’s investment team and analysts. The Board members also considered the totality of their experiences with the Managers as directors or trustees of the Fund and other funds advised by the Managers. The Board considered information regarding the quality of services provided by affiliates of the Managers, which the Board members have become knowledgeable about through their experiences with the Managers and in connection with the renewal of the Fund’s service agreements. The Board concluded, in light of the Managers’ experience, reputation, personnel, operations and resources that the Fund benefits from the services provided under the Agreements.
Investment Performance of the Managers and the Fund. Throughout the year, the Adviser and the Sub-Adviser provided information on the investment performance of the Fund, the Adviser and the Sub-Adviser, including comparative performance information. The Board also reviewed information, prepared by the Adviser, the Sub-Adviser and the independent consultant, comparing the Fund’s historical performance to its benchmark and to the performance of other retail bank loan funds. The Board considered that the Fund outperformed its performance category median for the one-, three- and five-year periods. The Board also considered that the Fund performed in the first quintile of its performance category for the three- and five-year periods and in the third quintile of its performance category for the one-year period.
Fees and Expenses of the Fund. The Board reviewed the fees paid to the Adviser and the other expenses borne by the Fund. The Board noted that the Adviser, not the Fund, pays the Sub-Adviser’s fee under the sub-advisory agreement. The independent consultant provided comparative data in regard to the fees and expenses of the Fund and other retail front-end load bank loan funds with comparable asset levels and distribution features. The Board considered that the Fund’s contractual management fees as well as its total expenses were well below its respective peer group median and category median. Within the total asset range of $1 billion to $2 billion, the Fund’s effective management fee rate was lower than its peer group median and category median.
Economies of Scale and Profits Realized by the Managers. The Board considered information regarding the Managers’ costs in serving as the Fund’s investment adviser and sub-adviser, including the costs associated with the personnel and systems necessary to manage the Fund, and information regarding the Managers’ profitability from their relationship with the Fund. The Board reviewed whether the Managers may realize economies of scale in managing and supporting the Fund and whether those economies of scale benefit the Fund’s shareholders at the current level of Fund assets in relation to its management fee.
Other Benefits to the Managers. In addition to considering the profits realized by the Managers, the Board considered information that was provided regarding the direct and
48 OPPENHEIMER MASTER LOAN FUND, LLC
indirect benefits the Managers receive as a result of their relationship with the Fund, including compensation paid to the Managers’ affiliates.
Conclusions. These factors were also considered by the independent Trustees meeting separately from the full Board, assisted by experienced counsel to the Fund and to the independent Trustees. Fund counsel and the independent Trustees’ counsel are independent of the Managers within the meaning and intent of the Securities and Exchange Commission Rules.
Based on its review of the information it received and its evaluations described above, the Board, including a majority of the independent Trustees, decided to continue the Agreements through August 31, 2016. In arriving at its decision, the Board did not identify any factor or factors as being more important than others, but considered all of the above information, and considered the terms and conditions of the Agreements, including the management fees, in light of all the surrounding circumstances.
49 OPPENHEIMER MASTER LOAN FUND, LLC
PORTFOLIO PROXY VOTING POLICIES AND PROCEDURES;
UPDATES TO STATEMENTS OF INVESTMENTS Unaudited
The Fund has adopted Portfolio Proxy Voting Policies and Procedures under which the Fund votes proxies relating to securities (“portfolio proxies”) held by the Fund. A description of the Fund’s Portfolio Proxy Voting Policies and Procedures is available (i) without charge, upon request, by calling the Fund toll-free at 1.800.CALL OPP (225.5677), (ii) on the Fund’s website at www.oppenheimerfunds.com, and (iii) on the SEC’s website at www.sec.gov. In addition, the Fund is required to file Form N-PX, with its complete proxy voting record for the 12 months ended June 30th, no later than August 31st of each year. The Fund’s voting record is available (i) without charge, upon request, by calling the Fund toll-free at 1.800.CALL OPP (225.5677), and (ii) in the Form N-PX filing on the SEC’s website at www.sec.gov.
The Fund files its complete schedule of portfolio holdings with the SEC for the first quarter and the third quarter of each fiscal year on Form N-Q. The Fund’s Form N-Q filings are available on the SEC’s website at www.sec.gov. Those forms may be reviewed and copied at the SEC’s Public Reference Room in Washington, D.C. Information on the operation of the Public Reference Room may be obtained by calling 1-800-SEC-0330.
Householding—Delivery of Shareholder Documents
This is to inform you about OppenheimerFunds’ “householding” policy. If more than one member of your household maintains an account in a particular fund, OppenheimerFunds will mail only one copy of the fund’s prospectus (or, if available, the fund’s summary prospectus), annual and semiannual report and privacy policy. The consolidation of these mailings, called householding, benefits your fund through reduced mailing expense, and benefits you by reducing the volume of mail you receive from OppenheimerFunds. Householding does not affect the delivery of your account statements.
Please note that we will continue to household these mailings for as long as you remain an OppenheimerFunds shareholder, unless you request otherwise. If you prefer to receive multiple copies of these materials, please call us at 1.800.CALL-OPP (225-5677). You may also notify us in writing or via email. We will begin sending you individual copies of the prospectus (or, if available, the summary prospectus), reports and privacy policy within 30 days of receiving your request to stop householding.
50 OPPENHEIMER MASTER LOAN FUND, LLC
DIRECTORS AND OFFICERS Unaudited
Name, Position(s) Held with the Fund, Length of Service, Year of Birth | Principal Occupation(s) During the Past 5 Years; Other Trusteeships/Directorships Held; Number of Portfolios in the Fund Complex Currently Overseen | |
INDEPENDENT DIRECTORS | The address of each Director in the chart below is 6803 S. Tucson Way, Centennial, Colorado 80112-3924. Each Director serves for an indefinite term, or until his or her resignation, retirement, death or removal. | |
Sam Freedman, Chairman of the Board of Directors (since 2013) and Director (since 2007) Year of Birth: 1940 | Director of Colorado UpLIFT (charitable organization) (since September 1984). Mr. Freedman held several positions with the Sub-Adviser and with subsidiary or affiliated companies of the Sub-Adviser (until October 1994). Oversees 38 portfolios in the OppenheimerFunds complex. Mr. Freedman has served on the Boards of certain Oppenheimer funds since 1996, during which time he has become familiar with the Fund’s (and other Oppenheimer funds’) financial, accounting, regulatory and investment matters and has contributed to the Boards’ deliberations. | |
Jon S. Fossel, Director (since 2007) Year of Birth: 1942 | Chairman of the Board of Jack Creek Preserve Foundation (non-profit organization) (since 2005); Chairman of the Board (2006-December 2011) and Director (June 2002-December 2011) of UNUMProvident (insurance company); Director of Northwestern Energy Corp. (public utility corporation) (November 2004-December 2009); Director of P.R. Pharmaceuticals (October 1999-October 2003); Director of Rocky Mountain Elk Foundation (non-profit organization) (February 1998-February 2003 and February 2005-February 2007); Chairman and Director (until October 1996) and President and Chief Executive Officer (until October 1995) of the Sub-Adviser; President, Chief Executive Officer and Director of the following: Oppenheimer Acquisition Corp. (“OAC”) (parent holding company of the Sub-Adviser), Shareholders Services, Inc. and Shareholder Financial Services, Inc. (until October 1995). Oversees 38 portfolios in the OppenheimerFunds complex. Mr. Fossel has served on the Boards of certain Oppenheimer funds since 1990, during which time he has become familiar with the Fund’s (and other Oppenheimer funds’) financial, accounting, regulatory and investment matters and has contributed to the Boards’ deliberations. | |
Richard F. Grabish, Director (since 2008) Year of Birth: 1948 | Formerly Senior Vice President and Assistant Director of Sales and Marketing (March 1997-December 2007), Director (March 1987-December 2007) and Manager of Private Client Services (June 1985-June 2005) of A.G. Edwards & Sons, Inc. (broker/dealer and investment firm); Chairman and Chief Executive Officer of A.G. Edwards Trust Company, FSB (March 2001-December 2007); President and Vice Chairman of A.G. Edwards Trust Company, FSB (investment adviser) (April 1987-March 2001); President of A.G. Edwards Trust Company, FSB (investment adviser) (June 2005-December 2007). Oversees 38 portfolios in the OppenheimerFunds complex. Mr. Grabish has served on the Boards of certain Oppenheimer funds since 2001, during which time he has become familiar with the Fund’s (and other Oppenheimer funds’) financial, accounting, regulatory and investment matters and has contributed to the Boards’ deliberations. | |
Beverly L. Hamilton, Director (since 2007) Year of Birth: 1946 | Trustee of Monterey Institute for International Studies (educational organization) (since February 2000); Board Member of Middlebury College (educational organization) (December 2005-June 2011); Chairman (since | |
51 OPPENHEIMER MASTER LOAN FUND, LLC
DIRECTORS AND OFFICERS Unaudited / Continued
Beverly L. Hamilton, Continued | 2010) of American Funds’ Emerging Markets Growth Fund, Inc. (mutual fund); Director of The California Endowment (philanthropic organization) (April 2002-April 2008); Director (February 2002-2005) and Chairman of Trustees (2006-2007) of the Community Hospital of Monterey Peninsula; Director (October 1991-2005); Vice Chairman (2006-2009) of American Funds’ Emerging Markets Growth Fund, Inc. (mutual fund); President of ARCO Investment Management Company (February 1991-April 2000); Member of the investment committees of The Rockefeller Foundation (2001-2006) and The University of Michigan (since 2000); Advisor at Credit Suisse First Boston’s Sprout venture capital unit (venture capital fund) (1994-January 2005); Trustee of MassMutual Institutional Funds (investment company) (1996-June 2004); Trustee of MML Series Investment Fund (investment company) (April 1989-June 2004); Member of the investment committee of Hartford Hospital (2000-2003); and Advisor to Unilever (Holland) pension fund (2000-2003). Oversees 38 portfolios in the OppenheimerFunds complex. Ms. Hamilton has served on the Boards of certain Oppenheimer funds since 2002, during which time she has become familiar with the Fund’s (and other Oppenheimer funds’) financial, accounting, regulatory and investment matters and has contributed to the Boards’ deliberations. | |
Victoria J. Herget, Director (since 2012) Year of Birth: 1951 | Board Chair (2008-Present) and Director (2004-Present), United Educators (insurance company); Trustee (since 2000) and Chair (since 2010), Newberry Library (independent research library); Trustee, Mather LifeWays (senior living organization) (since 2001); Independent Director of the First American Funds (mutual fund family) (2003-2011); former Managing Director (1993-2001), Principal (1985-1993), Vice President (1978-1985) and Assistant Vice President (1973-1978) of Zurich Scudder Investments (investment adviser) (and its predecessor firms); Trustee (1992-2007), Chair of the Board of Trustees (1999-2007), Investment Committee Chair (1994-1999) and Investment Committee member (2007-2010) of Wellesley College; Trustee, BoardSource (non-profit organization) (2006-2009) and Chicago City Day School (K-8 School) (1994-2005). Oversees 38 portfolios in the OppenheimerFunds complex. Ms. Herget has served on the Boards of certain Oppenheimer funds since 2012, during which time she has become familiar with the Fund’s (and other Oppenheimer funds’) financial, accounting, regulatory and investment matters and has contributed to the Boards’ deliberations. | |
Robert J. Malone, Director (since 2007) Year of Birth: 1944 | Chairman of the Board (since 2012) and Director (since August 2005) of Jones International University (educational organization) (since August 2005); Chairman, Chief Executive Officer and Director of Steele Street Bank Trust (commercial banking) (since August 2003); Trustee of the Gallagher Family Foundation (non-profit organization) (since 2000); Board of Directors of Opera Colorado Foundation (non-profit organization) (2008-2012); Director of Colorado UpLIFT (charitable organization) (1986-2010); Director of Jones Knowledge, Inc. (2006-2010); Former Chairman of U.S. Bank-Colorado (subsidiary of U.S. Bancorp and formerly Colorado National Bank) (July 1996- April 1999); Director of Commercial Assets, Inc. (real estate investment trust) (1993-2000); Director of U.S. Exploration, Inc. (oil and gas exploration) (1997- February 2004); Chairman of the Board (1991-1994) and Trustee (1985- 1994) of Regis University; and Chairman of the Board (1990-1991 and Trustee (1984-1999) of Young Presidents Organization. Oversees 38 portfolios in the OppenheimerFunds complex. Mr. Malone has served on the Boards of certain Oppenheimer funds since 2002, during which time he has become | |
52 OPPENHEIMER MASTER LOAN FUND, LLC
Robert J. Malone, Continued | familiar with the Fund’s (and other Oppenheimer funds’) financial, accounting, regulatory and investment matters and has contributed to the Boards’ deliberations. | |
F. William Marshall, Jr., Director (since 2007) Year of Birth: 1942 | Trustee Emeritus of Worcester Polytech Institute (WPI) (private university) (since 2009); Trustee of MassMutual Select Funds (formerly MassMutual Institutional Funds) (investment company) (since 1996), MML Series Investment Fund (investment company) (since 1996) and Mass Mutual Premier Funds (investment company) (since January 2012); President and Treasurer of the SIS Funds (private charitable fund) (January 1999-March 2011); Former Trustee of WPI (1985-2008); Former Chairman of the Board (2004-2006) and Former Chairman of the Investment Committee of WPI (1994-2008); Chairman of SIS Family Bank, F.S.B. (formerly SIS Bank) (commercial bank) (January 1999-July 1999); Executive Vice President of Peoples Heritage Financial Group, Inc. (commercial bank) (January 1999-July 1999); and Former President and Chief Executive Officer of SIS Bancorp. (1993-1999). Oversees 42 portfolios in the OppenheimerFunds complex. Mr. Marshall has served on the Boards of certain Oppenheimer funds since 2000, during which time he has become familiar with the Fund’s (and other Oppenheimer funds’) financial, accounting, regulatory and investment matters and has contributed to the Boards’ deliberations. | |
Karen L. Stuckey, Director (since 2012) Year of Birth: 1953 | Partner (1990-2012) of PricewaterhouseCoopers LLP (professional services firm) (held various positions 1975-1990); Trustee (1992-2006) and member of Executive, Nominating and Audit Committees and Chair of Finance Committee of Lehigh University; and member, Women’s Investment Management Forum (professional organization) since inception. Oversees 38 portfolios in the OppenheimerFunds complex. Ms. Stuckey has served on the Boards of certain Oppenheimer funds since 2012, during which time she has become familiar with the Fund’s (and other Oppenheimer funds’) financial, accounting, regulatory and investment matters and has contributed to the Boards’ deliberations. | |
James D. Vaughn, Director (since 2012) Year of Birth: 1945 | Retired; former managing partner (1994-2001) of Denver office of Deloitte & Touche LLP, (held various positions 1969-1993); Trustee and Chairman of the Audit Committee of Schroder Funds (2003-2012); Board member and Chairman of Audit Committee of AMG National Trust Bank (since 2005); Trustee and Investment Committee member, University of South Dakota Foundation (since 1996); Board member, Audit Committee Member and past Board Chair, Junior Achievement (since 1993); former Board member, Mile High United Way, Boys and Girls Clubs, Boy Scouts, Colorado Business Committee for the Arts, Economic Club of Colorado and Metro Denver Network. Oversees 38 portfolios in the OppenheimerFunds complex. Mr. Vaughn has served on the Boards of certain Oppenheimer funds since 2012, during which time he has become familiar with the Fund’s (and other Oppenheimer funds’) financial, accounting, regulatory and investment matters and has contributed to the Boards’ deliberations. | |
53 OPPENHEIMER MASTER LOAN FUND, LLC
DIRECTORS AND OFFICERS Unaudited / Continued
INTERESTED DIRECTOR | Mr. Steinmetz is an “Interested Director” because he is affiliated with the Manager and the Sub-Adviser by virtue of his positions as Chairman of the Sub-Adviser and officer and director of the Manager. Both as a Director and as an officer, Mr. Steinmetz serves for an indefinite term, or until his resignation, retirement, death or removal. Mr. Steinmetz’s address is 225 Liberty Street, New York, New York 10281-1008.
| |
Arthur P. Steinmetz, Director (since 2015), President and Principal Executive Officer (since 2014) Year of Birth: 1958 | Chairman of the Sub-Adviser (since January 2015); CEO and Chairman of the Manager (since July 2014), President of the Manager (since May 2013), a Director of the Manager (since January 2013), Director of the Sub-Adviser (since July 2014), President, Management Director and CEO of Oppenheimer Acquisition Corp. (the Sub-Adviser’s parent holding company) (since July 2014), and President and Director of OFI SteelPath, Inc. (since January 2013). Chief Investment Officer of the OppenheimerFunds advisory entities from (January 2013-December 2013); Executive Vice President of the Manager (January 2013-May 2013); Chief Investment Officer of the Sub-Adviser (October 2010-December 2012); Chief Investment Officer, Fixed-Income, of the Sub-Adviser (April 2009-October 2010); Executive Vice President of the Sub-Adviser (October 2009-December 2012); Director of Fixed Income of the Sub-Adviser (January 2009-April 2009); and a Senior Vice President of the Sub-Adviser (March 1993-September 2009). An officer of 91 portfolios in the OppenheimerFunds complex. |
OTHER OFFICERS OF THE FUND | The addresses of the Officers in the chart below are as follows: for Messrs. Gabinet, Mss. Sexton and Picciotto, 225 Liberty Street, New York, New York 10281-1008, for Messrs. Welsh, Wixted and Ms. Hui, 6803 S. Tucson Way, Centennial, Colorado 80112-3924. Each Officer serves for an indefinite term or until his or her resignation, retirement, death or removal.
| |
Margaret Hui, Vice President (since 2007) Year of Birth: 1958 | Vice President of the Sub-Adviser (since February 2005); Senior Portfolio Manager of the Sub-Adviser (since January 2005); Assistant Vice President of the Sub-Adviser (October 1999-January 2005). Ms. Hui is a portfolio manager and officer of other portfolios in the OppenheimerFunds complex.
| |
Joseph Welsh, Vice President (since 2007) Year of Birth: 1964 | Head of High Yield Corporate Debt Team (since April 2009), Senior Vice President of the Sub-Adviser (since May 2009). Vice President of the Sub-Adviser (December 2000-April 2009). A portfolio manager and officer of other portfolios in the OppenheimerFunds complex.
| |
Arthur S. Gabinet, Secretary and Chief Legal Officer (since 2011) Year of Birth: 1958 | Executive Vice President, Secretary and General Counsel of the Manager (since January 2013); General Counsel OFI SteelPath, Inc. (since January 2013); Executive Vice President (May 2010-December 2012) and General Counsel (since January 2011) of the Sub-Adviser; General Counsel of the Distributor (since January 2011); General Counsel of Centennial Asset Management Corporation (January 2011-December 2012); Executive Vice President (January 2011-December 2012) and General Counsel of HarbourView Asset Management Corporation (since January 2011); Assistant Secretary (since January 2011) and Director (since January 2011) of OppenheimerFunds International Ltd. and OppenheimerFunds plc; Director of Oppenheimer Real Asset Management, Inc. (January 2011-December 2012) and General Counsel (since January 2011); Executive Vice President (January 2011-December 2011) and General Counsel of Shareholder Financial Services, Inc. and Shareholder Services, Inc. (since January 2011); Executive Vice President (January 2011- |
54 OPPENHEIMER MASTER LOAN FUND, LLC
Arthur S. Gabinet, Continued | December 2012) and General Counsel of OFI Private Investments Inc. (since January 2011); Vice President of OppenheimerFunds Legacy Program (January 2011-December 2011); Executive Vice President (January 2011-December 2012) and General Counsel of OFI Institutional Asset Management, Inc. (since January 2011); General Counsel, Asset Management of the Sub-Adviser (May 2010-December 2010); Principal, The Vanguard Group (November 2005-April 2010); District Administrator, U.S. Securities and Exchange Commission (January 2003-October 2005). An officer of 91 portfolios in the OppenheimerFunds complex.
| |
Jennifer Sexton, Vice President and Chief Business Officer (since 2014) Year of Birth: 1969 | Senior Vice President of OppenheimerFunds Distributor, Inc. (since June 2014); Vice President of OppenheimerFunds Distributor, Inc. (April 2006-June 2014); Vice President of the Sub-Adviser (January 1998-March 2006); Assistant Vice President of the Sub-Adviser (October 1991-December 1998). An officer of 91 portfolios in the OppenheimerFunds complex.
| |
Mary Ann Picciotto, Chief Compliance Officer and Chief Anti-Money Laundering Officer (since 2014) Year of Birth: 1973 | Senior Vice President and Chief Compliance Officer of the Manager (since March 2014); Chief Compliance Officer of the Sub-Adviser, OFI SteelPath, Inc., OFI Global Trust Company, OFI Global Institutional, Inc., Oppenheimer Real Asset Management, Inc., OFI Private Investments, Inc., Harborview Asset Management Corporation, Trinity Investment Management Corporation, and Shareholder Services, Inc. (since March 2014); Managing Director of Morgan Stanley Investment Management Inc. and certain of its various affiliated entities; Chief Compliance Officer of various Morgan Stanley Funds (May 2010-January 2014); Chief Compliance Officer of Morgan Stanley Investment Management Inc. (April 2007-January 2014). An officer of 91 portfolios in the OppenheimerFunds complex.
| |
Brian W. Wixted, Treasurer and Principal Financial & Accounting Officer (since 2007) Year of Birth: 1959 | Senior Vice President of the Manager (since January 2013); Treasurer of the Sub-Adviser, HarbourView Asset Management Corporation, Shareholder Financial Services, Inc., Shareholder Services, Inc., and Oppenheimer Real Asset Management, Inc. (March 1999-June 2008), OFI Private Investments, Inc. (March 2000-June 2008), OppenheimerFunds International Ltd. and OppenheimerFunds plc (since May 2000), OFI Institutional Asset Management, Inc. (November 2000-June 2008), and OppenheimerFunds Legacy Program (charitable trust program established by the Sub-Adviser) (June 2003-December 2011); Treasurer and Chief Financial Officer of OFI Trust Company (since May 2000); Assistant Treasurer of Oppenheimer Acquisition Corporation (March 1999-June 2008). An officer of 91 portfolios in the OppenheimerFunds complex. |
The Fund’s Statement of Additional Information contains additional information about the Fund’s Directors and Officers and is available without charge upon request, by calling 1.800.CALL OPP (225.5677).
55 OPPENHEIMER MASTER LOAN FUND, LLC
OPPENHEIMER MASTER LOAN FUND, LLC
| ||
| Manager | OFI Global Asset Management, Inc.
| |
| Sub-Adviser | OppenheimerFunds, Inc.
| |
| Distributor | OppenheimerFunds Distributor, Inc.
| |
Transfer and Shareholder Servicing Agent | OFI Global Asset Management, Inc.
| |
| Sub-Transfer Agent | Shareholder Services, Inc. DBA OppenheimerFunds Services
| |
Independent Registered Public Accounting Firm | KPMG LLP
| |
| Counsel | Ropes & Gray LLP | |
© 2015 OppenheimerFunds, Inc. All rights reserved.
56 OPPENHEIMER MASTER LOAN FUND, LLC
THIS PAGE INTENTIONALLY LEFT BLANK.
57 OPPENHEIMER MASTER LOAN FUND, LLC
THIS PAGE INTENTIONALLY LEFT BLANK.
58 OPPENHEIMER MASTER LOAN FUND, LLC
THIS PAGE INTENTIONALLY LEFT BLANK.
59 OPPENHEIMER MASTER LOAN FUND, LLC
THIS PAGE INTENTIONALLY LEFT BLANK.
60 OPPENHEIMER MASTER LOAN FUND, LLC
THIS PAGE INTENTIONALLY LEFT BLANK.
61 OPPENHEIMER MASTER LOAN FUND, LLC
THIS PAGE INTENTIONALLY LEFT BLANK.
62 OPPENHEIMER MASTER LOAN FUND, LLC
THIS PAGE INTENTIONALLY LEFT BLANK.
63 OPPENHEIMER MASTER LOAN FUND, LLC
Visit us at oppenheimerfunds.com for 24-hr access to account information and transactions or call us at 800 CALL OPP (800 225 5677) for 24-hr automated information and automated transactions. Representatives also available Mon–Fri 8am–8pm ET. | ||
Visit Us
oppenheimerfunds.com
Call Us
800 225 5677
| ||
Follow Us
| ||
 | Oppenheimer funds are distributed by OppenheimerFunds Distributor, Inc. 225 Liberty Street, New York, NY 10281-1008 © 2015 OppenheimerFunds Distributor, Inc. All rights reserved.
RA1241.001.0915 November 23, 2015 | |

Item 2. Code of Ethics.
The registrant has adopted a code of ethics that applies to the registrant’s principal executive officer, principal financial officer, principal accounting officer or controller or persons performing similar functions.
Item 3. Audit Committee Financial Expert.
The Board of Directors of the registrant has determined that F. William Marshall, Jr., the Chairman of the Board’s Audit Committee, is the audit committee financial expert and that Mr. Marshall is “independent” for purposes of this Item 3.
Item 4. Principal Accountant Fees and Services.
| (a) | Audit Fees |
The principal accountant for the audit of the registrant’s annual financial statements billed $51,900 in fiscal 2015 and $39,600 in fiscal 2014.
| (b) | Audit-Related Fees |
The principal accountant for the audit of the registrant’s annual financial statements billed no such fees in fiscal 2015 and no such fees in fiscal 2014.
The principal accountant for the audit of the registrant’s annual financial statements billed $185,479 in fiscal 2015 and $1,042,959 in fiscal 2014 to the registrant’s investment adviser or any entity controlling, controlled by, or under common control with the adviser that provides ongoing services to the registrant.
Such services include: Internal control reviews, GIPS attestation procedures, system conversion testing, and corporate restructuring.
| (c) | Tax Fees |
The principal accountant for the audit of the registrant’s annual financial statements billed no such fees in fiscal 2015 and no such fees in fiscal 2014.
The principal accountant for the audit of the registrant’s annual financial statements billed $628,126 in fiscal 2015 and $467,462 in fiscal 2014 to the registrant’s investment adviser or any entity controlling, controlled by, or under common control with the adviser that provides ongoing services to the registrant.
Such services include: tax compliance, tax planning and tax advice. Tax compliance generally involves preparation of original and amended tax returns, claims for a refund and tax payment-planning services. Tax planning and tax advice includes assistance with tax audits and appeals, tax advice related to mergers and acquisitions and requests for rulings or technical advice from taxing authorities.
| (d) | All Other Fees |
The principal accountant for the audit of the registrant’s annual financial statements billed no such fees in fiscal 2015 and no such fees in fiscal 2014.
The principal accountant for the audit of the registrant’s annual financial statements billed no such fees in fiscal 2015 and no such fees in fiscal 2014 to the registrant’s investment adviser or any entity controlling, controlled by, or under common control with the adviser that provides ongoing services to the registrant.
Such fees would include the cost to the principal accountant of attending audit committee meetings and consultations regarding the registrant’s retirement plan with respect to its Directors.
| (e) | (1) During its regularly scheduled periodic meetings, the registrant’s audit committee will pre-approve all audit, audit-related, tax and other services to be provided by the principal accountants of the registrant. |
The audit committee has delegated pre-approval authority to its Chairman for any subsequent new engagements that arise between regularly scheduled meeting dates provided that any fees such pre-approved are presented to the audit committee at its next regularly scheduled meeting.
Under applicable laws, pre-approval of non-audit services may be waived provided that: 1) the aggregate amount of all such services provided constitutes no more than five percent of the total amount of fees paid by the registrant to its principal accountant during the fiscal year in which services are provided 2) such services were not recognized by the registrant at the time of engagement as non-audit services and 3) such services are promptly brought to the attention of the audit committee of the registrant and approved prior to the completion of the audit.
(2) 0%
| (f) | Not applicable as less than 50%. |
| (g) | The principal accountant for the audit of the registrant’s annual financial statements billed $813,605 in fiscal 2015 and $1,510,421 in fiscal 2014 to the registrant and the registrant’s investment adviser or any entity controlling, controlled by, or under common control with the adviser that provides ongoing services to the registrant related to non-audit fees. Those billings did not include any prohibited non-audit services as defined by the Securities Exchange Act of 1934. |
| (h) | The registrant’s audit committee of the board of Directors has considered whether the provision of non-audit services that were rendered to the registrant’s investment adviser, and any entity controlling, controlled by, or under common control with the investment adviser that provides ongoing services to the registrant that were not pre-approved pursuant to paragraph (c)(7)(ii) of Rule 2-01 of Regulation S-X is compatible with maintaining the principal accountant’s independence. No such services were rendered. |
Item 5. Audit Committee of Listed Registrants
Not applicable.
Item 6. Schedule of Investments.
a) Not applicable. The complete schedule of investments is included in Item 1 of this Form N-CSR.
b) Not applicable.
Item 7. Disclosure of Proxy Voting Policies and Procedures for Closed-End Management Investment Companies.
Not applicable.
Item 8. Portfolio Managers of Closed-End Management Investment Companies.
Not applicable.
Item 9. Purchases of Equity Securities by Closed-End Management Investment Company and Affiliated Purchasers.
Not applicable.
Item 10. Submission of Matters to a Vote of Security Holders.
The Fund’s Governance Committee Provisions with Respect to Nominations of Directors/Trustees to the Respective Boards
None
Item 11. Controls and Procedures.
Based on their evaluation of the registrant’s disclosure controls and procedures (as defined in rule 30a-3(c) under the Investment Company Act of 1940 (17 CFR 270.30a-3(c)) as of 9/30/2015, the registrant’s principal executive officer and principal financial officer found the registrant’s disclosure controls and procedures to provide reasonable assurances that information required to be disclosed by the registrant in the reports that it files under the Securities Exchange Act of 1934 (a) is accumulated and communicated to registrant’s management, including its principal executive officer and principal financial officer, to allow timely decisions regarding required disclosure, and (b) is recorded, processed, summarized and reported, within the time periods specified in the rules and forms adopted by the U.S. Securities and Exchange Commission.
There have been no changes in the registrant’s internal controls over financial reporting that occurred during the registrant’s second fiscal quarter of the period covered by this report that have materially affected, or are reasonably likely to materially affect, the registrant’s internal control over financial reporting.
Item 12. Exhibits.
| (a) | (1) Exhibit attached hereto. |
(2) Exhibits attached hereto.
(3) Not applicable.
| (b) | Exhibit attached hereto. |
SIGNATURES
Pursuant to the requirements of the Securities Exchange Act of 1934 and the Investment Company Act of 1940, the registrant has duly caused this report to be signed on its behalf by the undersigned, thereunto duly authorized.
Oppenheimer Master Loan Fund, LLC
| By: | /s/ Arthur P. Steinmetz | |
| Arthur P. Steinmetz | ||
| Principal Executive Officer | ||
| Date: | 11/17/2015 |
Pursuant to the requirements of the Securities Exchange Act of 1934 and the Investment Company Act of 1940, this report has been signed below by the following persons on behalf of the registrant and in the capacities and on the dates indicated.
| By: | /s/ Arthur P. Steinmetz | |
| Arthur P. Steinmetz | ||
| Principal Executive Officer | ||
| Date: | 11/17/2015 | |
| By: | /s/ Brian W. Wixted | |
| Brian W. Wixted | ||
| Principal Financial Officer | ||
| Date: | 11/17/2015 | |