UNITED STATES
SECURITIES AND EXCHANGE COMMISSION
WASHINGTON, D.C. 20549
FORM N-CSR
CERTIFIED SHAREHOLDER REPORT OF REGISTERED MANAGEMENT
INVESTMENT COMPANIES
Investment Company Act file number
811-22131
Miller Investment Trust
(Exact name of registrant as specified in charter)
20 William Street Wellesley, MA
02481
(Address of principal executive offices)
(Zip code)
Gemini Fund Services, LLC., 450 Wireless Blvd., Hauppauge, NY 11788
(Name and address of agent for service)
Registrant's telephone number, including area code:
631-470-2619
Date of fiscal year end:
10/31
Date of reporting period:10/31/14
Form N-CSR is to be used by management investment companies to file reports with the Commission not later than 10 days after the transmission to stockholders of any report that is required to be transmitted to stockholders under Rule 30e-1 under the Investment Company Act of 1940 (17 CFR 270.30e-1). The Commission may use the information provided on Form N-CSR in its regulatory, disclosure review, inspection and policymaking roles.
A registrant is required to disclose the information specified by Form N-CSR, and the Commission will make this information public. A registrant is not required to respond to the collection of information contained in Form N-CSR unless the Form displays a currently valid Office of Management and Budget ("OMB") control number. Please direct comments concerning the accuracy of the information collection burden estimate and any suggestions for reducing the burden to Secretary, Securities and Exchange Commission, 450 Fifth Street, NW, Washington, DC 20549-0609. The OMB has reviewed this collection of information under the clearance requirements of 44 U.S.C. § 3507.
Item 1. Reports to Stockholders.
| |
 |
| |
| Miller Convertible Bond Fund |
| |
| |
| |
| |
| |
| Annual Report |
| |
| October 31, 2014 |
| |
| |
| |
| 1-877- 441- 4434 |
| www.millerconvertiblefund.com |
| |
| |
| |
| |
| |
| |
| |
| Investment Advisor |
| Wellesley Investment Advisors, Inc. |
| The Wellesley Office Park |
| 20 William Street |
| Wellesley, MA 02481 |
| 781-416-4000 |
| |
| |
| |
| |
| |
| |
| This report and the financial statements contained herein are submitted for the general information of shareholders and are not authorized for distribution to prospective investors unless preceded or accompanied by an effective prospectus. Nothing herein contained is to be considered an offer of sale or solicitation of an offer to buy shares of Miller Convertible Bond Fund. Such offering is made only by prospectus, which includes details as to offering price and other material information. |
| |
| Distributed by Northern Lights Distributors, LLC. Member FINRA |
| |
| |
| |
Dear Miller Convertible Bond Fund Shareholder,
We are pleased to present this report on your fund for the fiscal year ended October 31, 2014.
The Miller Convertible Bond Fund posted a positive absolute return for the fiscal year, our continuing goal over a complete bull-and-bear cycle. The fund’s performance since inception and for the year ended October 31, 2014 is as follows:
| | | One Year Ended | | Annualized Since |
| | | October 31, 2014 | | Inception |
| A shares (MCFAX.LW) | | 7.98% | | 6.96% (12/27/07) |
| | | | | |
| I shares (MCIFX) | | 8.49% | | 7.55% (12/27/07) |
| | | | | |
| C shares (MCFCX) | | 7.42% | | 8.57% (12/01/09) |
The fund’s total assets under management grew from approximately $392 million on October 31, 2013 to over $724 million on October 31, 2014.
The bull market in equities continued into its sixth year with the S&P Total Return Index up 17.27% for the year ended October 31, 2014. Since we are the only U.S. convertible bond fund invested exclusively in convertible bonds and cash, we typically underperform both major stock indices and convertible benchmarks in rising equity markets. In addition, given the age of the bull market, we have taken steps to reduce risk in the fund. With that said, we were still able to generate returns that were close to the long-term average for the fund. While we are happy that our investors were able to enjoy strong returns in 2014, we strictly follow the principles that have served our investors well over the years, which are described below.
Strategy Review
We remain committed to the same strategy we have utilized since our company was founded in 1991. It is important to note that we do not change our investment strategy regardless of what the current investment climate is. We invest only in convertible bonds (no convertible preferreds, mandatory preferreds, or other structures) which offer the return of the majority of principal within seven years of issuance. Before making an investment, we perform a thorough analysis of a company’s balance sheet and income statement. We invest almost exclusively in profitable companies. In addition, we avoid companies that have unsafe debt loads or inadequate liquidity. While we usually invest with the idea of holding bonds until the next liquidity date (maturity, put or call), we consider selling or reducing our exposure if one of the following scenarios occur:
| ● | An issuer’s credit quality deteriorates |
| ● | The bond loses its favorable risk/reward characteristics due to price appreciation |
| ● | We perceive an opportunity to increase portfolio diversification |
| ● | We believe more attractive investments are available |
Because one of our key risk-management practices involves careful limits on prices we pay, we tend not to purchase convertibles that trade at prices substantially above par and thus have significantly negative yields to the next liquidity date. This discipline often results in the elimination of some of the most equity-sensitive convertibles. As a result, our performance tends to lag broader equity indices in rising markets but seeks to decline less in falling stock markets.
At the end of the period we owned 74 convertible bonds, with our largest holding representing less than 3% of the fund’s value. Our holdings span the convertible market, from investment-grade to small-cap, with a broad distribution of industries represented. Just under half of our rated convertible bonds are investment grade.
Convertible Market Review and Comment
The convertible market turned in another strong year mainly driven by the continued strength in equities. Over the last year the S&P Total Return Index gained 17.27%. The convertible benchmark Merrill Lynch V0A0 Index returned 13.80% while the Miller Convertible Bond Fund I shares gained 8.49%. Our fund outperformed bonds which returned 4.14% as measured by the Barclays Aggregate Bond Index. The fund’s total return for the one-year period was comprised of approximately 81% capital appreciation and 19% income. The strength in equity markets has led to a bias towards return from growth. The year was marked by a period of relatively low volatility until the October equity selloff when the fund experienced its largest drawdown of 6.1%.
There are two interesting observations about the returns mentioned above. The Merrill Lynch V0A0 captured almost 80% of the upside of stocks, while the Miller Convertible Bond Fund I shares had an upside capture rate of 49%. Typically, convertibles do not capture 80% of the upside in stocks. However, as the result of a six-year stock bull market, the benchmark index has become extremely equity sensitive. In fact, at the end of the year, the average bond price in the Merrill Lynch V0A0 index was about 157. Bonds trading at these prices typically provide upside participation in stock moves, but don’t provide much protection when equities sell off. In contrast, the average bond price in the Miller Convertible Bond Fund was approximately 107 at the end of the year. With the bull market in equities extending into its sixth year, we have purposely reduced risk in our fund to maintain a defensive posture. Convertible bonds trading close to par allow investors to participate in equity up moves, while providing downside protection in the event of a market downturn. Investors in the Miller Convertible Bond Fund typically enjoy an upside capture rate higher than 49%. One deterrent to performance was the fact that the fund was heavily weighted in small- and mid-cap names which have underperformed relative to large-cap companies. More importantly, we remain committed to the preservation of capital, and feel it is prudent to remain defensive in the face of a very mature bull market.
New Issuance
The new issue market remained hot for the second year in a row. Over $49 billion of new paper came to the market surpassing last year’s lofty levels of new issuance. Some of the new issues that met our criteria were convertible bonds issued by:
| ● | J2 Global Communications (2.03% of our bond portfolio as of 10/31/14) a cloud-based communications and storage messaging service; |
| ● | TTM Technologies (2.31% of our bond portfolio as of 10/31/14), an independent provider of printed circuit boards; |
| ● | Renewable Energy Group (2.36% of our portfolio as of 10/31/14) a biofuels and renewable chemicals producer; and |
| ● | Colony Financial (1.95% of our bond portfolio as of 10/31/14), a mortgage finance company. |
Potential catalysts for continued strength in convertible issuance include increased M&A activity, higher interest rates and corporations’ desires to buy back stock while simultaneously issuing convertibles.
As we look ahead, we continue to believe that a balanced portfolio of convertible bonds offer investors the best of both worlds: upside participation to improving equity markets and capital preservation should the equity markets correct. As always, we thank you for your confidence and trust in our management.
Sincerely,
Greg Miller, Co-Portfolio Manager
Michael Miller, Co-Portfolio Manager
Notes:
The S&P 500 Total Return is a free-float capitalization-weighted index based on the common stock prices of 500 top publicly traded American companies, as determined by S&P and considered by many to be the best representation of the market.
Barclays’ Aggregate Bond is a market capitalization-weighted index often used to represent investment grade bonds being traded in United States. The index includes Treasury securities, Government agency bonds, Mortgage-backed bonds, corporate bonds and a small amount of foreign bonds traded in U.S.
The Merrill Lynch V0A0 represents all US convertibles, excluding mandatory convertibles, small issues and bankruptcies
A Drawdown is the peak-to-trough decline during a specific record period of an investment, fund or commodity. A drawdown is usually quoted as the percentage between the peak and the trough.
Upside capture is a statistical measure of an investment manager’s overall performance in up-markets. The ratio is calculated by dividing the manager’s returns by the returns of the index during the up-market, and multiplying that factor by 100.
2509-NLD-12/4/2014
| Miller Convertible Fund |
| PERFORMANCE OF A $10,000 INVESTMENT (Unaudited) |
| Since Inception through October 31, 2014 |
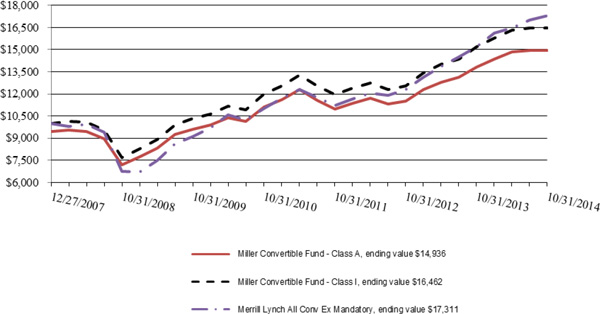
| Annualized Total Returns as of October 31, 2014 |
| | | | | | | Since | | Since |
| | | | | | | Inception* | | Inception** |
| | | One Year | | Five Year | | (Class A and I) | | (Class C) |
| Miller Convertible Fund: | | | | | | | | |
| Class A, without sales charge | | 7.98% | | 9.20% | | 6.96% | | — |
| Class A, with sales charge of 5.75% | | 1.74% | | 7.91% | | 6.03% | | — |
| Class I | | 8.49% | | 9.77% | | 7.55% | | — |
| Class C | | 7.42% | | N/A | | — | | 8.57% |
| ML All Conv Ex Mandatory Index | | 13.80% | | 13.66% | | 8.34% | | 13.00% |
| * | Class A and Class I shares commenced operations on December 27, 2007. |
| ** | Class C shares commenced operations on December 1, 2009. |
The Merrill Lynch All Convertible Excluding Mandatory Index measures the performance of convertible securities of all corporate sectors with as a par amount of $25 million or more and a maturity of at least one year and excludes preferred equity redemption stocks and converted securities. Investors cannot directly invest in an index or benchmark.
Past performance is not predictive of future results. The investment return and principal value of an investment will fluctuate. An investor’s shares, when redeemed, may be worth more or less than the original cost. Total return is calculated assuming reinvestment of all dividends and distributions. Total returns would have been lower had the adviser not waived its fees and reimbursed a portion of the Fund’s expenses. The Fund’s total gross annual operating expenses, per its prospectus dated February 3, 2014, including underlying funds, are 1.51%, 1.04%, and 2.01% for Class A shares, Class I shares, and Class C shares, respectively. The graph does not reflect the deduction of taxes that a shareholder would have to pay on fund distributions or the redemption of the fund shares. For performance information current to the most recent month-end, please call 1-877-441-4434.
| Miller Convertible Fund |
| PORTFOLIO OF INVESTMENTS |
| October 31, 2014 |
| | | Principal | | | Interest | | | Maturity | | | |
| Security | | Amount | | | Rate (%) | | | Date | | Value | |
| | | | | | | | | | | | |
| CONVERTIBLE BONDS - 90.48% | | | | | | | | | | | | | | |
| AEROSPACE/DEFENSE - 0.14% | | | | | | | | | | | | | | |
| AAR Corp. | | $ | 1,000,000 | | | | 2.2500 | | | 3/1/2016 | | $ | 1,027,500 | |
| | | | | | | | | | | | | | | |
| AUTO MANUFACTURERS - 0.82% | | | | | | | | | | | | | | |
| Tesla Motors, Inc. | | | 5,000,000 | | | | 0.2500 | | | 3/1/2019 | | | 4,834,375 | |
| Wabash National Corp. | | | 1,000,000 | | | | 3.3750 | | | 5/1/2018 | | | 1,135,000 | |
| | | | | | | | | | | | | | 5,969,375 | |
| BANKS - 3.92% | | | | | | | | | | | | | | |
| Barclays Bank PLC | | | 18,000,000 | | | | 0.0000 | | | 8/18/2021 | | | 17,818,200 | |
| Kansas City Southern - Goldman Sachs Synthetic | | | 10,000,000 | | | | 0.0000 | | | 2/16/2021 | | | 10,623,100 | |
| | | | | | | | | | | | | | 28,441,300 | |
| BIOTECHNOLOGY - 8.43% | | | | | | | | | | | | | | |
| Acorda Therapeutics, Inc. | | | 4,500,000 | | | | 1.7500 | | | 6/15/2021 | | | 4,792,500 | |
| Cubist Pharmaceuticals, Inc. | | | 10,000,000 | | | | 1.8750 | | | 9/1/2020 | | | 11,700,000 | |
| Emergent Biosolutions, Inc. - 144A | | | 17,000,000 | | | | 2.8750 | | | 1/15/2021 | | | 17,456,875 | |
| Ligand Pharmaceuticals, Inc. - 144A | | | 16,000,000 | | | | 0.7500 | | | 8/15/2019 | | | 16,220,000 | |
| United Therapeutics Corp. | | | 4,000,000 | | | | 1.0000 | | | 9/15/2016 | | | 10,970,000 | |
| | | | | | | | | | | | | | 61,139,375 | |
| COMMERCIAL SERVICES - 3.80% | | | | | | | | | | | | | | |
| Albany Molecular Research, Inc. - 144A | | | 6,000,000 | | | | 2.2500 | | | 11/15/2018 | | | 9,596,250 | |
| Carriage Services, Inc. - 144A | | | 5,000,000 | | | | 2.7500 | | | 3/15/2021 | | | 5,393,775 | |
| Euronet Services, Inc. - 144A | | | 5,700,000 | | | | 1.5000 | | | 10/1/2044 | | | 5,792,625 | |
| Macquarie Infrastructure | | | 6,000,000 | | | | 2.8750 | | | 7/15/2019 | | | 6,795,000 | |
| | | | | | | | | | | | | | 27,577,650 | |
| COMPUTERS - 4.33% | | | | | | | | | | | | | | |
| Apple, Inc. - Wells Fargo & Co. Synthetic | | | 7,200,000 | | | | 0.0000 | | | 1/24/2020 | | | 8,581,680 | |
| Apple, Inc. - Wells Fargo & Co. Synthetic | | | 2,800,000 | | | | 0.0000 | | | 1/24/2020 | | | 3,337,320 | |
| Electronics For Imaging, Inc. - 144A | | | 14,000,000 | | | | 0.7500 | | | 9/1/2019 | | | 14,761,250 | |
| SanDisk Corp. | | | 4,000,000 | | | | 0.5000 | | | 10/15/2020 | | | 4,730,000 | |
| | | | | | | | | | | | | | 31,410,250 | |
| DISTRIBUTION/WHOLESALE - 1.06% | | | | | | | | | | | | | | |
| Titan Machinery, Inc. | | | 10,000,000 | | | | 3.7500 | | | 5/1/2019 | | | 7,712,500 | |
| | | | | | | | | | | | | | | |
| DIVERSIFIED FINANCIAL SERVICES - 2.25% | | | | | | | | | | | | | | |
| BGC Partners, Inc. | | | 5,000,000 | | | | 4.5000 | | | 7/15/2016 | | | 5,343,750 | |
| Encore Capital Group, Inc. - 144A | | | 5,000,000 | | | | 2.8750 | | | 3/15/2021 | | | 4,909,375 | |
| Portfolio Recovery Associates, Inc. | | | 5,000,000 | | | | 3.0000 | | | 8/1/2020 | | | 6,031,250 | |
| | | | | | | | | | | | | | 16,284,375 | |
| ELECTRONICS - 2.09% | | | | | | | | | | | | | | |
| TTM Technologies, Inc. | | | 16,000,000 | | | | 1.7500 | | | 12/15/2020 | | | 15,180,000 | |
| | | | | | | | | | | | | | | |
| ENERGY-ALTERNATE SOURCES - 2.14% | | | | | | | | | | | | | | |
| Renewable Energy Group, Inc. | | | 15,000,000 | | | | 2.7500 | | | 6/15/2019 | | | 15,496,875 | |
| | | | | | | | | | | | | | | |
| FOREST PRODUCTS & PAPER - 2.64% | | | | | | | | | | | | | | |
| International Paper Co. - Barclays Bank PLC Synthetic | | | 9,500,000 | | | | 0.0000 | | | 7/23/2021 | | | 9,801,150 | |
| International Paper Co. - Wells Fargo & Co. Synthetic | | | 9,500,000 | | | | 0.0000 | | | 6/10/2020 | | | 9,338,500 | |
| | | | | | | | | | | | | | 19,139,650 | |
| HEALTHCARE-PRODUCTS - 1.48% | | | | | | | | | | | | | | |
| Integra Lifesciences Holdings | | | 10,000,000 | | | | 1.6250 | | | 12/15/2016 | | | 10,750,000 | |
| | | | | | | | | | | | | | | |
| HEALTHCARE-SERVICES - 0.18% | | | | | | | | | | | | | | |
| Molina Healthcare, Inc. | | | 1,000,000 | | | | 1.1250 | | | 1/15/2020 | | | 1,305,625 | |
The accompanying notes are an integral part of these financial statements.
| Miller Convertible Fund |
| PORTFOLIO OF INVESTMENTS (Continued) |
| October 31, 2014 |
| | | Principal | | | Interest | | | Maturity | | | | |
| Security | | Amount | | | Rate (%) | | | Date | | Value | |
| | | | | | | | | | | | |
| HOME BUILDERS - 4.02% | | | | | | | | | | | | | | |
| M/I Homes, Inc. | | $ | 9,000,000 | | | | 3.0000 | | | 3/1/2018 | | $ | 9,157,500 | |
| Meritage Homes Corp. | | | 11,000,000 | | | | 1.8750 | | | 9/15/2032 | | | 10,972,500 | |
| Ryland Group, Inc. | | | 1,000,000 | | | | 0.2500 | | | 6/1/2019 | | | 916,250 | |
| Toll Brothers Finance Corp. | | | 8,000,000 | | | | 0.5000 | | | 9/15/2032 | | | 8,085,000 | |
| | | | | | | | | | | | | | 29,131,250 | |
| HOUSEHOLD PRODUCTS - 0.17% | | | | | | | | | | | | | | |
| Jarden Corp. | | | 1,000,000 | | | | 1.5000 | | | 6/15/2019 | | | 1,245,625 | |
| | | | | | | | | | | | | | | |
| INTERNET - 7.85% | | | | | | | | | | | | | | |
| AOL, Inc. - 144A | | | 8,000,000 | | | | 0.7500 | | | 9/1/2019 | | | 8,290,000 | |
| Blucora, Inc. | | | 8,000,000 | | | | 4.2500 | | | 4/1/2019 | | | 8,260,000 | |
| Google, Inc. - Goldman Sachs Group, Inc. Synthetic | | | 1,000,000 | | | | 0.0000 | | | 2/19/2021 | | | 928,400 | |
| Google, Inc. - UBS AG Synthetic | | | 11,000,000 | | | | 0.0000 | | | 2/15/2021 | | | 10,652,400 | |
| HomeAway, Inc. - 144A | | | 7,000,000 | | | | 0.1250 | | | 4/1/2019 | | | 6,803,125 | |
| J2 Global, Inc. | | | 13,000,000 | | | | 3.2500 | | | 6/15/2029 | | | 13,300,625 | |
| Priceline.com, Inc. | | | 1,000,000 | | | | 0.3500 | | | 6/15/2020 | | | 1,138,750 | |
| Yahoo!, Inc. - 144A | | | 7,000,000 | | | | 0.0000 | | | 12/1/2018 | | | 7,564,375 | |
| | | | | | | | | | | | | | 56,937,675 | |
| INVESTMENT COMPANIES - 11.64% | | | | | | | | | | | | | | |
| Ares Capital Corp. | | | 9,000,000 | | | | 4.3750 | | | 1/15/2019 | | | 9,225,000 | |
| BlackRock Kelso Capital Corp. | | | 9,000,000 | | | | 5.5000 | | | 2/15/2018 | | | 9,219,375 | |
| KCAP Financial, Inc. | | | 1,000,000 | | | | 8.7500 | | | 3/15/2016 | | | 1,125,000 | |
| New Mountain Finance Corp. - 144A | | | 16,000,000 | | | | 5.0000 | | | 6/15/2019 | | | 16,300,000 | |
| Prospect Capital Corp. - 144A | | | 15,000,000 | | | | 4.7500 | | | 4/15/2020 | | | 14,625,000 | |
| TCP Capital Corp. - 144A | | | 16,000,000 | | | | 5.2500 | | | 12/15/2019 | | | 15,980,000 | |
| TICC Capital Corp. | | | 10,000,000 | | | | 7.5000 | | | 11/1/2017 | | | 10,300,000 | |
| TPG Specialty Lending, Inc. - 144A | | | 8,000,000 | | | | 4.5000 | | | 12/15/2019 | | | 7,685,000 | |
| | | | | | | | | | | | | | 84,459,375 | |
| MACHINERY-DIVERSIFIED - 0.44% | | | | | | | | | | | | | | |
| Chart Industries, Inc. | | | 3,000,000 | | | | 2.0000 | | | 8/1/2018 | | | 3,213,750 | |
| | | | | | | | | | | | | | | |
| METAL FABRICATE/HARDWARE - 0.13% | | | | | | | | | | | | | | |
| RTI International Metals, Inc. | | | 1,000,000 | | | | 1.6250 | | | 10/15/2019 | | | 961,875 | |
| | | | | | | | | | | | | | | |
| MINING - 2.14% | | | | | | | | | | | | | | |
| Freeport-McMoran, Inc. - Barclays Synthetic | | | 17,000,000 | | | | 0.0000 | | | 5/20/2021 | | | 15,504,000 | |
| | | | | | | | | | | | | | | |
| OIL & GAS - 0.13% | | | | | | | | | | | | | | |
| Stone Energy Corp. | | | 1,000,000 | | | | 1.7500 | | | 3/1/2017 | | | 931,250 | |
| | | | | | | | | | | | | | | |
| OIL & GAS PRODUCERS - 0.85% | | | | | | | | | | | | | | |
| Ensco PLC Synthetic Convertible | | | 7,000,000 | | | | 0.0000 | | | 12/15/2020 | | | 6,141,800 | |
| | | | | | | | | | | | | | | |
| OIL & GAS SERVICES - 1.33% | | | | | | | | | | | | | | |
| SEACOR Holdings, Inc. - 144A | | | 10,000,000 | | | | 3.0000 | | | 11/15/2028 | | | 9,618,750 | |
| | | | | | | | | | | | | | | |
| PHARMACEUTICALS - 3.79% | | | | | | | | | | | | | | |
| Jazz Investments, Ltd. - 144A | | | 16,000,000 | | | | 1.8750 | | | 8/15/2021 | | | 18,540,000 | |
| Salix Pharmaceuticals Ltd. | | | 4,000,000 | | | | 1.5000 | | | 3/15/2019 | | | 8,957,500 | |
| | | | | | | | | | | | | | 27,497,500 | |
| REAL ESTATE - 1.41% | | | | | | | | | | | | | | |
| Forestar Group, Inc. | | | 10,000,000 | | | | 3.7500 | | | 3/1/2020 | | | 10,206,250 | |
The accompanying notes are an integral part of these financial statements.
| Miller Convertible Fund |
| PORTFOLIO OF INVESTMENTS (Continued) |
| October 31, 2014 |
| | | Principal | | | Interest | | | Maturity | | | |
| Security | | Amount | | | Rate (%) | | | Date | | Value | |
| | | | | | | | | | | | |
| REITS - 12.40 % | | | | | | | | | | | | | | |
| Apollo Commercial Real Estate Finance, Inc. | | $ | 14,000,000 | | | | 5.5000 | | | 3/15/2019 | | $ | 13,807,570 | |
| Blackstone Mortgage Trust, Inc. | | | 12,500,000 | | | | 5.2500 | | | 12/1/2018 | | | 12,937,500 | |
| Colony Financial, Inc. | | | 13,000,000 | | | | 3.8750 | | | 1/15/2021 | | | 12,780,625 | |
| National Health Investors, Inc. | | | 12,000,000 | | | | 3.2500 | | | 4/1/2021 | | | 12,007,500 | |
| Pennymac Corp. | | | 15,000,000 | | | | 5.3750 | | | 5/1/2020 | | | 14,625,000 | |
| Redwood Trust, Inc. | | | 6,000,000 | | | | 4.6250 | | | 4/15/2018 | | | 5,988,750 | |
| Resource Capital Corp. | | | 6,000,000 | | | | 6.0000 | | | 12/1/2018 | | | 5,902,500 | |
| Spirit Realty Capital, Inc. | | | 12,000,000 | | | | 2.8750 | | | 5/15/2019 | | | 11,872,560 | |
| | | | | | | | | | | | | | 89,922,005 | |
| RETAIL - 1.40 % | | | | | | | | | | | | | | |
| Ezcorp, Inc. - 144A | | | 11,000,000 | | | | 2.1250 | | | 6/15/2019 | | | 10,140,625 | |
| | | | | | | | | | | | | | | |
| SEMICONDUCTORS - 3.30 % | | | | | | | | | | | | | | |
| Intel Corp. - Wells Fargo & Co. Synthetic | | | 9,500,000 | | | | 0.0000 | | | 6/5/2020 | | | 11,572,900 | |
| NVIDIA Corp. - 144A | | | 10,000,000 | | | | 1.0000 | | | 12/1/2018 | | | 11,362,500 | |
| Rudolph Technologies, Inc. - 144A | | | 1,000,000 | | | | 3.7500 | | | 7/15/2016 | | | 1,041,875 | |
| | | | | | | | | | | | | | 23,977,275 | |
| SOFTWARE - 1.87 % | | | | | | | | | | | | | | |
| Akamai Technologies, Inc. - 144A | | | 1,000,000 | | | | 0.0000 | | | 2/15/2019 | | | 1,015,005 | |
| Synchronoss Technologies, Inc. | | | 4,000,000 | | | | 0.7500 | | | 8/15/2019 | | | 4,690,000 | |
| Verint Systems, Inc. | | | 7,000,000 | | | | 1.5000 | | | 6/1/2021 | | | 7,844,375 | |
| | | | | | | | | | | | | | 13,549,380 | |
| TELECOMMUNICATIONS - 2.11 % | | | | | | | | | | | | | | |
| Finisar Corp. - 144A | | | 10,000,000 | | | | 0.5000 | | | 12/15/2033 | | | 9,156,250 | |
| JDS Uniphase Corp. | | | 6,000,000 | | | | 0.6250 | | | 8/15/2033 | | | 6,180,000 | |
| | | | | | | | | | | | | | 15,336,250 | |
| TRANSPORTATION - 1.98 % | | | | | | | | | | | | | | |
| Hornbeck Offshore Services, Inc. | | | 15,000,000 | | | | 1.5000 | | | 9/1/2019 | | | 14,343,750 | |
| | | | | | | | | | | | | | | |
| TRUCKING & LEASING - 0.24 % | | | | | | | | | | | | | | |
| Greenbrier Cos, Inc. | | | 1,000,000 | | | | 3.5000 | | | 4/1/2018 | | | 1,767,500 | |
| | | | | | | | | | | | | | | |
| TOTAL CONVERTIBLE BONDS | | | | | | | | | | | | | 656,320,360 | |
| (Cost - $644,816,085) | | | | | | | | | | | | | | |
| | | | | | | | | | | | | | | |
| SHORT-TERM INVESTMENTS - 8.02 % | | | | | | | | | | | | | | |
| MONEY MARKET FUND - 8.02 % | | | | | | | | | | | | | | |
| Milestone Treasury Obligations Portfolio | | | 58,142,252 | | | | 0.0000 | + | | | | | 58,142,252 | |
| TOTAL SHORT-TERM INVESTMENTS | | | | | | | | | | | | | 58,142,252 | |
| (Cost - $58,142,252) | | | | | | | | | | | | | | |
| | | | | | | | | | | | | | | |
| TOTAL INVESTMENTS - 98.50 % | | | | | | | | | | | | | | |
| (Cost - $702,958,337) (a) | | | | | | | | | | | | | 714,462,612 | |
| OTHER ASSETS LESS LIABILITIES - 1.50 % | | | | | | | | | | | | | 10,894,743 | |
| NET ASSETS - 100.00 % | | | | | | | | | | | | $ | 725,357,355 | |
The accompanying notes are an integral part of these financial statements.
| Miller Convertible Fund |
| PORTFOLIO OF INVESTMENTS (Continued) |
| October 31, 2014 |
| | | | | | | | | | | Unrealized | |
| | | Notional | | | | | | Termination | | Appreciation | |
| TOTAL RETURN SWAP | | Amount | | | | | | Date | | (Depreciation) | |
| Agreement with ReFlow Fund, LLC dated March 1, 2014 to receive total return of the Fund, based on its daily change in NAV less USD-1M LIBOR plus an annualized spread of 2.45%. | | $ | 30,000,000 | | | | | | | 11/28/2014 | | $ | 206,385 | |
| + | Adjustable rate security. Interest rate is as of October 31, 2014. |
| REITS - | Real Estate Investment Trusts |
| 144A - | Security exempt from registration under Rule 144A of the Securities Act of 1933. These securities may be sold in transactions exempt from registration, normally to qualified institutional buyers. Total 144A securities amounted to 29.26% of net assets as of October 31, 2014. |
| (a) | Represents cost for financial reporting purposes. Aggregate cost for federal tax purposes is $701,565,229 and differs from value by net unrealized appreciation (depreciation) of securities as follows: |
| | | Unrealized | |
| | | Appreciation | |
| | | (Depreciation) | |
| | | | | |
| Unrealized Appreciation: | | $ | 35,545,882 | |
| Unrealized Depreciation: | | | (22,648,499 | ) |
| Net Unrealized Appreciation: | | $ | 12,897,383 | |
| PORTFOLIO ANALYSIS (Unaudited) | |
| As of October 31, 2014 | |
| | | % of Net | |
| Sector | | Assets | |
| Financial | | | 30.21 | % |
| Consumer, Non-Cyclical | | | 17.86 | % |
| Communications | | | 9.97 | % |
| Technology | | | 9.50 | % |
| Short-Term Investments | | | 8.01 | % |
| Consumer, Cyclical | | | 7.30 | % |
| Industrial | | | 6.44 | % |
| Basic Materials | | | 4.78 | % |
| Energy | | | 4.44 | % |
| Assets Less Liabilities | | | 1.49 | % |
| | | | 100.00 | % |
The accompanying notes are an integral part of these financial statements.
| Miller Convertible Bond Fund | | |
| STATEMENT OF ASSETS AND LIABILITIES | | |
| October 31, 2014 | | |
| Assets: | | | | |
| Investments in Securities at Value (identified cost $702,958,337) | | $ | 714,462,612 | |
| Interest Receivable | | | 4,563,614 | |
| Receivable from Securities Sold | | | 11,503,708 | |
| Receivable from Fund Shares Sold | | | 1,500,381 | |
| Receivable from Open Swap Contracts | | | 206,385 | |
| Prepaid Expenses and Other Assets | | | 57,354 | |
| Total Assets | | | 732,294,054 | |
| | | | | |
| Liabilities: | | | | |
| Redemptions Payable | | | 316,722 | |
| Payable for Securities Purchased | | | 5,700,000 | |
| Accrued Advisory Fees | | | 448,252 | |
| Accrued Distribution Fees | | | 184,051 | |
| Accrued Fees Payable to Other Affiliates | | | 31,317 | |
| Accrued Expenses and Other Liabilities | | | 256,357 | |
| Total Liabilities | | | 6,936,699 | |
| | | | | |
| Net Assets | | $ | 725,357,355 | |
| | | | | |
| Composition of Net Assets: | | | | |
| At October 31, 2014, Net Assets consisted of: | | | | |
| Paid-in-Capital | | $ | 687,071,358 | |
| Accumulated Net Investment Income | | | 7,377,090 | |
| Accumulated Net Realized Gain from Security Transactions | | | 19,198,247 | |
| Net Unrealized Appreciation on: | | | | |
| Investments | | | 11,504,275 | |
| Swaps | | | 206,385 | |
| Net Assets | | $ | 725,357,355 | |
| | | | | |
| Net Asset Value Per Share | | | | |
| Class A Shares | | | | |
| Net Assets | | $ | 305,993,653 | |
| Shares of Beneficial Interest Outstanding (no par value; unlimited shares authorized) | | | 24,002,519 | |
| Net Asset Value and Redemption Price per Share ($305,993,653 / 24,002,519) | | $ | 12.75 | |
| Maximum Offering Price Per Share ($12.75 / .9425) | | $ | 13.53 | |
| | | | | |
| Class I Shares | | | | |
| Net Assets | | $ | 352,395,286 | |
| Shares of Beneficial Interest Outstanding (no par value; unlimited shares authorized) | | | 27,618,166 | |
| Net Asset Value; Offering and Redemption Price per Share ($352,395,286 / 27,618,166) | | $ | 12.76 | |
| | | | | |
| Class C Shares | | | | |
| Net Assets | | $ | 66,968,416 | |
| Shares of Beneficial Interest Outstanding (no par value; unlimited shares authorized) | | | 5,281,567 | |
| Net Asset Value; Offering and Redemption Price per Share ($66,968,416 / 5,281,567) | | $ | 12.68 | |
The accompanying notes are an integral part of these financial statements.
| Miller Convertible Bond Fund | | |
| STATEMENT OF OPERATIONS | | |
| For the Year Ended October 31, 2014 | | |
| Investment Income: | | | | |
| Interest Income | | $ | 24,633,930 | |
| Total Investment Income | | | 24,633,930 | |
| | | | | |
| Expenses: | | | | |
| Investment Advisory Fees | | | 4,280,703 | |
| Distribution Fees (Class A) | | | 1,405,752 | |
| Distribution Fees (Class C) | | | 564,195 | |
| Administration Fees | | | 212,230 | |
| Non 12b-1 Shareholder Servicing Fees | | | 194,579 | |
| Legal Fees | | | 184,809 | |
| Transfer Agent Fees | | | 161,274 | |
| Trustees’ Fees | | | 82,439 | |
| Registration and Filing Fees | | | 80,466 | |
| Custody Fees | | | 73,291 | |
| Printing Expense | | | 69,556 | |
| Audit Fees | | | 36,078 | |
| Insurance Expense | | | 32,027 | |
| Chief Compliance Officer Fees | | | 21,406 | |
| Miscellaneous Expenses | | | 9,232 | |
| Total Expenses | | | 7,408,037 | |
| Net Investment Income | | | 17,225,893 | |
| | | | | |
| Net Realized and Unrealized Gain (Loss) on Investments: | | | | |
| Net Realized Gain (Loss) on: | | | | |
| Investments | | | 24,082,629 | |
| Swaps | | | (243,845 | ) |
| Total Net Realized Gain | | | 23,838,784 | |
| Net Change in Unrealized Appreciation (Depreciation) on: | | | | |
| Investments | | | (4,749,885 | ) |
| Swaps | | | 196,305 | |
| Total Net Change in Unrealized Depreciation | | | (4,553,580 | ) |
| Net Realized and Unrealized Gain on Investments | | | 19,285,204 | |
| | | | | |
| Net Increase in Net Assets Resulting From Operations | | $ | 36,511,097 | |
The accompanying notes are an integral part of these financial statements.
| Miller Convertible Bond Fund | | | | |
| STATEMENTS OF CHANGES IN NET ASSETS | | | | |
| | | | | |
| | | Year | | | Year | |
| | | Ended | | | Ended | |
| | | October 31, 2014 | | | October 31, 2013 | |
| Operations: | | | | | | | | |
| Net Investment Income | | $ | 17,225,893 | | | $ | 9,245,642 | |
| Net Realized Gain on Investments and Swaps | | | 23,838,784 | | | | 28,007,262 | |
| Net Change in Unrealized Appreciation (Depreciation) on Investments and Swaps | | | (4,553,580 | ) | | | 20,738,671 | |
| Net Increase in Net Assets | | | | | | | | |
| Resulting From Operations | | | 36,511,097 | | | | 57,991,575 | |
| | | | | | | | | |
| Distributions to Shareholders From: | | | | | | | | |
| Net Investment Income | | | | | | | | |
| Class A ($0.27 and $0.30 per share, respectively) | | | (6,245,394 | ) | | | (4,267,052 | ) |
| Class I ($0.37 and $0.36 per share, respectively) | | | (6,823,259 | ) | | | (2,343,584 | ) |
| Class C ($0.22 and $0.26 per share, respectively) | | | (1,021,158 | ) | | | (770,090 | ) |
| Class NF ($0.00 and $0.35 per share, respectively) | | | — | | | | (1,309,718 | ) |
| | | | (14,089,811 | ) | | | (8,690,444 | ) |
| Net Realized Gains | | | | | | | | |
| Class A ($0.49 and $0.00 per share, respectively) | | | (8,976,604 | ) | | | — | |
| Class I ($0.49 and $0.00 per share, respectively) | | | (5,378,769 | ) | | | — | |
| Class C ($0.49 and $0.00 per share, respectively) | | | (1,798,742 | ) | | | — | |
| Class NF ($0.00 and $0.00 per share, respectively) | | | — | | | | — | |
| | | | (16,154,115 | ) | | | — | |
| Total Distributions to Shareholders | | | (30,243,926 | ) | | | (8,690,444 | ) |
| | | | | | | | | |
| Beneficial Interest Transactions: | | | | | | | | |
| Class A | | | | | | | | |
| Proceeds from Shares Issued (11,458,068 and 8,259,108 shares, respectively) | | | 145,363,288 | | | | 98,219,245 | |
| Distributions Reinvested (1,136,576 and 314,240 shares, respectively) | | | 14,108,137 | | | | 3,717,808 | |
| Cost of Shares Redeemed (6,060,830 and 6,582,582 shares, respectively) | | | (77,012,865 | ) | | | (75,141,198 | ) |
| Total Class A Shares | | | 82,458,560 | | | | 26,795,855 | |
| Class I | | | | | | | | |
| Proceeds from Shares Issued (19,765,705 and 7,207,873 shares, respectively) | | | 252,847,395 | | | | 85,997,021 | |
| Distributions Reinvested (721,998 and 131,544 shares, respectively) | | | 9,028,166 | | | | 1,558,724 | |
| Cost of Shares Redeemed (3,139,186 and 2,418,626 shares, respectively) | | | (40,049,294 | ) | | | (27,784,297 | ) |
| Total Class I Shares | | | 221,826,267 | | | | 59,771,448 | |
| Class C | | | | | | | | |
| Proceeds from Shares Issued (1,980,820 and 1,091,607 shares, respectively) | | | 25,159,159 | | | | 12,978,981 | |
| Distributions Reinvested (216,029 and 59,802 shares, respectively) | | | 2,661,284 | | | | 704,210 | |
| Cost of Shares Redeemed (435,701 and 522,558 shares, respectively) | | | (5,513,393 | ) | | | (5,976,428 | ) |
| Total Class C Shares | | | 22,307,050 | | | | 7,706,763 | |
| Class NF | | | | | | | | |
| Proceeds from Shares Issued (0 and 1,844,434 shares, respectively) | | | — | | | | 21,351,094 | |
| Distributions Reinvested (0 and 103,185 shares, respectively) | | | — | | | | 1,195,401 | |
| Cost of Shares Redeemed (0 and 5,290,168 shares, respectively) | | | — | | | | (63,207,755 | ) |
| Total Class NF Shares | | | — | | | | (40,661,260 | ) |
| Total Beneficial Interest Transactions | | | 326,591,877 | | | | 53,612,806 | |
| | | | | | | | | |
| Increase in Net Assets | | | 332,859,048 | | | | 102,913,937 | |
| | | | | | | | | |
| Net Assets: | | | | | | | | |
| Beginning of Period | | | 392,498,307 | | | | 289,584,370 | |
| End of Period (accumulated net investment income of $7,377,090 and $2,560,895, respectively) | | $ | 725,357,355 | | | $ | 392,498,307 | |
The accompanying notes are an integral part of these financial statements.
| Miller Convertible Bond Fund |
| FINANCIAL HIGHLIGHTS |
| |
| The table below sets forth financial data for one share of beneficial interest outstanding throughout each year presented. |
| | | Class A | |
| | | | | | | | | | | | | | | | |
| | | Year Ended October 31, | |
| | | 2014 | | | 2013 | | | 2012 | | | 2011 | | | 2010 | |
| | | | | | | | | | | | | | | | |
| Net Asset Value, Beginning of Year | | $ | 12.55 | | | $ | 10.70 | | | $ | 10.76 | | | $ | 11.22 | | | $ | 10.09 | |
| Increase from operations: | | | | | | | | | | | | | | | | | | | | |
| Net investment income (a) | | | 0.37 | | | | 0.31 | | | | 0.23 | | | | 0.13 | | | | 0.27 | |
| Net gain (loss) from securities (both realized and unrealized) | | | 0.59 | | | | 1.84 | | | | 0.25 | | | | (0.24 | ) | | | 1.25 | |
| Total from operations | | | 0.96 | | | | 2.15 | | | | 0.48 | | | | (0.11 | ) | | | 1.52 | |
| Distributions to shareholders from: | | | | | | | | | | | | | | | | | | | | |
| Net investment income | | | (0.27 | ) | | | (0.30 | ) | | | (0.24 | ) | | | (0.32 | ) | | | (0.39 | ) |
| Net realized gain | | | (0.49 | ) | | | — | | | | (0.30 | ) | | | (0.03 | ) | | | — | |
| Total distributions | | | (0.76 | ) | | | (0.30 | ) | | | (0.54 | ) | | | (0.35 | ) | | | (0.39 | ) |
| | | | | | | | | | | | | | | | | | | | | |
| Net Asset Value, End of Year | | $ | 12.75 | | | $ | 12.55 | | | $ | 10.70 | | | $ | 10.76 | | | $ | 11.22 | |
| | | | | | | | | | | | | | | | | | | | | |
| Total Return (b) | | | 7.98 | % | | | 20.33 | % | | | 4.18 | % | | | (0.92 | )% | | | 15.36 | % |
| | | | | | | | | | | | | | | | | | | | | |
| Ratios/Supplemental Data | | | | | | | | | | | | | | | | | | | | |
| Net assets, end of year (in 000’s) | | $ | 305,994 | | | $ | 219,218 | | | $ | 165,595 | | | $ | 213,763 | | | $ | 116,490 | |
| Ratio of expenses to average net assets, before reimbursement/recapture | | | 1.45 | % | | | 1.50 | % | | | 1.48 | % | | | 1.48 | % | | | 1.68 | % |
| net of reimbursement/recapture | | | 1.45 | % | | | 1.50 | % | | | 1.48 | % | | | 1.53 | % (c) | | | 1.75 | % |
| Ratio of net investment income to average net assets | | | 2.87 | % | | | 2.69 | % | | | 2.12 | % | | | 1.17 | % (c) | | | 2.59 | % |
| Portfolio turnover rate | | | 78 | % | | | 104 | % | | | 59 | % | | | 69 | % | | | 84 | % |
| (a) | Per share amounts are calculated using the average shares method, which more appropriately presents the per share data for the year. |
| (b) | Total returns are historical in nature and assume changes in share price, reinvestment of dividends and capital gains distributions, if any. Total returns for periods less than one year are not annualized. Had the Adviser not absorbed a portion of the expenses during certain periods, total returns would have been lower. |
| (c) | Such ratio includes Adviser’s recapture of waived/reimbursed fees from prior periods. |
The accompanying notes are an integral part of the financial statements.
| Miller Convertible Bond Fund |
| FINANCIAL HIGHLIGHTS |
| |
| |
| The table below sets forth financial data for one share of beneficial interest outstanding throughout each year presented. |
| | | Class I | |
| | | | | | | | | | | | | | | | |
| | | Year Ended October 31, | |
| | | 2014 | | | 2013 | | | 2012 | | | 2011 | | | 2010 | |
| | | | | | | | | | | | | | | | |
| Net Asset Value, Beginning of Year | | $ | 12.59 | | | $ | 10.73 | | | $ | 10.82 | | | $ | 11.29 | | | $ | 10.19 | |
| Increase from operations: | | | | | | | | | | | | | | | | | | | | |
| Net investment income (a) | | | 0.43 | | | | 0.37 | | | | 0.28 | | | | 0.19 | | | | 0.34 | |
| Net gain (loss) from securities (both realized and unrealized) | | | 0.60 | | | | 1.85 | | | | 0.25 | | | | (0.23 | ) | | | 1.25 | |
| Total from operations | | | 1.03 | | | | 2.22 | | | | 0.53 | | | | (0.04 | ) | | | 1.59 | |
| Distributions to shareholders from: | | | | | | | | | | | | | | | | | | | | |
| Net investment income | | | (0.37 | ) | | | (0.36 | ) | | | (0.32 | ) | | | (0.40 | ) | | | (0.49 | ) |
| Net realized gain | | | (0.49 | ) | | | — | | | | (0.30 | ) | | | (0.03 | ) | | | — | |
| Total distributions | | | (0.86 | ) | | | (0.36 | ) | | | (0.62 | ) | | | (0.43 | ) | | | (0.49 | ) |
| | | | | | | | | | | | | | | | | | | | | |
| Net Asset Value, End of Year | | $ | 12.76 | | | $ | 12.59 | | | $ | 10.73 | | | $ | 10.82 | | | $ | 11.29 | |
| | | | | | | | | | | | | | | | | | | | | |
| Total Return (b) | | | 8.49 | % | | | 20.95 | % | | | 4.79 | % | | | (0.39 | )% | | | 16.07 | % |
| | | | | | | | | | | | | | | | | | | | | |
| Ratios/Supplemental Data | | | | | | | | | | | | | | | | | | | | |
| Net assets, end of year (in 000’s) | | $ | 352,395 | | | $ | 129,282 | | | $ | 57,387 | | | $ | 41,666 | | | $ | 21,512 | |
| Ratio of expenses to average net assets, before reimbursement/recapture | | | 0.95 | % | | | 1.00 | % | | | 0.98 | % | | | 0.98 | % | | | 1.18 | % |
| net of reimbursement/recapture | | | 0.95 | % | | | 1.00 | % | | | 0.98 | % | | | 1.00 | % (c) | | | 1.18 | % |
| Ratio of net investment income to average net assets | | | 3.37 | % | | | 3.19 | % | | | 2.62 | % | | | 1.70 | % (c) | | | 3.18 | % |
| Portfolio turnover rate | | | 78 | % | | | 104 | % | | | 59 | % | | | 69 | % | | | 84 | % |
| (a) | Per share amounts are calculated using the average shares method, which more appropriately presents the per share data for the year. |
| (b) | Total returns are historical in nature and assume changes in share price, reinvestment of dividends and capital gains distributions, if any. Total returns for periods less than one year are not annualized. Had the Adviser not absorbed a portion of the expenses during certain periods, total returns would have been lower. |
| (c) | Such ratio includes Adviser’s recapture of waived/reimbursed fees from prior periods. |
The accompanying notes are an integral part of the financial statements.
| Miller Convertible Bond Fund |
| FINANCIAL HIGHLIGHTS |
| |
| |
| The table below sets forth financial data for one share of beneficial interest outstanding throughout each period presented. |
| | | Class C | |
| | | | | | | | | | | | | | | December 1, 2009 * | |
| | | Year Ended | | | Through | |
| | | 2014 | | | 2013 | | | 2012 | | | 2011 | | | October 31, 2010 | |
| | | | | | | | | | | | | | | | |
| Net Asset Value, Beginning of Period | | $ | 12.50 | | | $ | 10.67 | | | $ | 10.73 | | | $ | 11.17 | | | $ | 10.23 | |
| Increase from operations: | | | | | | | | | | | | | | | | | | | | |
| Net investment income (a) | | | 0.30 | | | | 0.25 | | | | 0.17 | | | | 0.08 | | | | 0.31 | |
| Net gain (loss) from securities (both realized and unrealized) | | | 0.59 | | | | 1.84 | | | | 0.25 | | | | (0.23 | ) | | | 1.03 | |
| Total from operations | | | 0.89 | | | | 2.09 | | | | 0.42 | | | | (0.15 | ) | | | 1.34 | |
| Distributions to shareholders from: | | | | | | | | | | | | | | | | | | | | |
| Net investment income | | | (0.22 | ) | | | (0.26 | ) | | | (0.18 | ) | | | (0.26 | ) | | | (0.40 | ) |
| Net realized loss | | | (0.49 | ) | | | — | | | | (0.30 | ) | | | (0.03 | ) | | | — | |
| Total distributions | | | (0.71 | ) | | | (0.26 | ) | | | (0.48 | ) | | | (0.29 | ) | | | (0.40 | ) |
| | | | | | | | | | | | | | | | | | | | | |
| Net Asset Value, End of Period | | $ | 12.68 | | | $ | 12.50 | | | $ | 10.67 | | | $ | 10.73 | | | $ | 11.17 | |
| | | | | | | | | | | | | | | | | | | | | |
| Total Return (b) | | | 7.42 | % | | | 19.77 | % | | | 5.35 | % | | | (1.27 | )% | | | 13.45 | % |
| | | | | | | | | | | | | | | | | | | | | |
| Ratios/Supplemental Data | | | | | | | | | | | | | | | | | | | | |
| Net assets, end of period (in 000’s) | | $ | 66,968 | | | $ | 43,998 | | | $ | 30,855 | | | $ | 28,056 | | | $ | 9,821 | |
| Ratio of expenses to average net assets, before reimbursement | | | 1.95 | % | | | 2.00 | % | | | 1.98 | % | | | 1.98 | % | | | 2.20 | % (c) |
| net of reimbursement | | | 1.95 | % | | | 2.00 | % | | | 1.98 | % | | | 1.98 | % | | | 2.20 | % (c) |
| Ratio of net investment income to average net assets | | | 2.37 | % | | | 2.19 | % | | | 1.62 | % | | | 0.72 | % | | | 2.34 | % (c) |
| Portfolio turnover rate | | | 78 | % | | | 104 | % | | | 59 | % | | | 69 | % | | | 84 | % |
| * | Commencement of Operations |
| (a) | Per share amounts are calculated using the average shares method, which more appropriately presents the per share data for the period. |
| (b) | Total returns are historical in nature and assume changes in share price, reinvestment of dividends and capital gains distributions, if any. Total returns for periods less than one year are not annualized. |
The accompanying notes are an integral part of the financial statements.
Miller Convertible Bond Fund
NOTES TO FINANCIAL STATEMENTS
October 31, 2014
The Miller Convertible Bond Fund (the “Fund”) is a series of shares of beneficial interest of Miller Investment Trust (the “Trust”), a Delaware statutory trust organized on September 28, 2007. The Trust is registered as an open-end management investment company. The Fund is registered under the Investment Company Act of 1940, as amended, (the “1940 Act”), as a non-diversified, open-end management investment company. The Fund’s investment objective is to maximize total return while keeping volatility low and preserving principal. The Fund issues three classes of shares designated as Class A, Class I and Class C. Class I and Class C shares are offered at net asset value. Class A shares are offered at net asset value plus a maximum sales charge of 5.75%. Each class represents an interest in the same assets of the Fund and classes are identical except for differences in their sales charge structures and ongoing service and distribution charges. All classes of shares have equal voting privileges except that each class has exclusive voting rights with respect to its service and/or distribution plans. Class A and Class I shares commenced operations on December 27, 2007. Class C shares commenced operations on December 1, 2009. The Fund offered Class NF shares until August 14, 2013.
| 2. | SUMMARY OF SIGNIFICANT ACCOUNTING POLICIES |
The preparation of financial statements in accordance with accounting principles generally accepted in the United States of America (“GAAP”) requires management to make estimates and assumptions that affect the reported amounts of assets and liabilities and disclosure of contingent assets and liabilities at the date of the financial statements and the reported amounts of revenue and expenses during the period. Actual results could differ from those estimates.
The following is a summary of significant accounting policies followed by the Fund in preparation of its financial statements.
Security Valuation – The Fund’s securities are valued at the last sale price on the exchange in which such securities are primarily traded, as of the close of business on the day the securities are being valued. NASDAQ traded securities are valued using the NASDAQ Official Closing Price (“NOCP”). If the NOCP is not available, such securities shall be valued at the last sale price on the day of valuation, or if there has been no sale on such day, at the mean between the bid and asked prices. Exchange traded options, futures and options on futures are valued at the settlement price determined by the exchange. Debt securities (other than short-term obligations) are valued each day by an independent pricing service approved by the Board of Trustees (the “Board”) using methods which include current market quotations from a major market maker in the securities and based on methods which include the consideration of yields or prices of securities of comparable quality, coupon, maturity and type. Short-term investments that mature in 60 days or less may be valued at amortized cost, provided such valuations represent fair value.
Securities for which current market quotations are not readily available or for which quotations are not deemed to be representative of market values are valued at fair value as determined in good faith by or under the direction of the Trust’s Board of Trustees in accordance with the Trust’s Portfolio Securities Valuation Procedures (the “Procedures”). The Procedures consider, among others, the following factors to determine a security’s fair value: the nature and pricing history (if any) of the security; whether any dealer quotations for the security are available; and possible valuation methodologies that could be used to determine the fair value of the security.
The Fund utilizes various methods to measure the fair value of its investments on a recurring basis. GAAP establishes a hierarchy that prioritizes inputs to valuation methods. The three levels of input are:
Level 1 – Unadjusted quoted prices in active markets for identical assets and liabilities that the Fund has the ability to access.
Level 2 – Observable inputs other than quoted prices included in Level 1 that are observable for the asset or liability, either directly or indirectly. These inputs may include quoted prices for the identical instrument in an inactive market, prices for similar instruments, interest rates, prepayment speeds, credit risk, yield curves, default rates and similar data.
Miller Convertible Bond Fund
NOTES TO FINANCIAL STATEMENTS (Unaudited) (Continued)
October 31, 2014
Level 3 – Unobservable inputs for the asset or liability, to the extent relevant observable inputs are not available, representing the Fund’s own assumptions about the assumptions a market participate would use in valuing the asset or liability, and would be based on the best information available.
The availability of observable inputs can vary from security to security and is affected by a wide variety of factors, including, for example, the type of security, whether the security is new and not yet established in the marketplace, the liquidity of markets, and other characteristics particular to the security. To the extent that valuation is based on models or inputs that are less observable or unobservable in the market, the determination of fair value requires more judgment. Accordingly, the degree of judgment exercised in determining fair value is greatest for instruments categorized in Level 3.
The inputs used to measure fair value may fall into different levels of the fair value hierarchy. In such cases, for disclosure purposes, the level in the fair value hierarchy within which the fair value measurement falls in its entirety, is determined based on the lowest level input that is significant to the fair value measurement in its entirety.
The inputs or methodology used for valuing securities are not necessarily an indication of the risk associated with investing in those securities. The following tables summarize the inputs used as of October 31, 2014 for the Fund’s assets and liabilities measured at fair value:
| | | | | | | | | | | | | |
| Assets | | Level 1 | | | Level 2 | | | Level 3 | | | Total | |
| Investments in Securities: | | | | | | | | | | | | | | | | |
| Convertible Bonds* | | $ | — | | | $ | 656,320,360 | | | $ | — | | | $ | 656,320,360 | |
| Short-Term Investments | | | 58,142,252 | | | | — | | | | — | | | | 58,142,252 | |
Total Investments in Securities
Derivatives | | $ | 58,142,252 | | | $ | 656,320,360 | | | $ | — | | | $ | 714,462,612 | |
| Total Return Swap** | | $ | — | | | $ | 206,385 | | | $ | — | | | $ | 206,385 | |
There were no transfers into or out of Level 1, Level 2, and Level 3 in the current year. Transfers between the Levels for investment in securities or other financial instruments are measured at the end of the reporting period.
| * | Please refer to the Portfolio of Investments for Industry classifications. |
| ** | Represents variation margin on the last day of the reporting period. |
Derivative Transactions – The Fund may enter into total return swaps. Total return swaps are agreements that provide the Fund with a return based on the performance of an underlying asset, in exchange for fee payments to a counterparty based on a specific rate. The difference in the value of these income streams is recorded daily by the Fund, and is settled in cash at the end of each month. The fee paid by the Fund will typically be determined by multiplying the face value of the swap agreement by an agreed upon interest rate. In addition, if the underlying asset declines in value over the term of the swap, the Fund would also be required to pay the dollar value of that decline to the counterparty. Total return swaps could result in losses if the underlying asset does not perform as anticipated by the Adviser. Wellesley Investment Advisors, Inc. serves as the Fund’s Investment Adviser (the “Adviser”). The Fund may use its own net asset value as the underlying asset in a total return swap. This strategy serves to reduce cash drag (the impact of cash on the Fund’s overall return) by replacing it with the impact of market exposure based upon the Fund’s own investment holdings. The Fund records fluctuations in the value of open swap contracts on a daily basis as unrealized gains or losses. Realized gains and losses from terminated swaps are included in net realized gains/losses on swap contracts. Risks may exceed amounts recognized on the Statement of Assets and Liabilities. The Fund values the total return swaps in which it enters based on a formula of the underlying asset’s nightly value, USD-1M LIBOR-BBA and an annual fee or various agreed upon inputs.
During the year ended October 31, 2014, the Fund invested in total return swaps. The total return swaps can be found on the Statement of Assets and Liabilities under receivable for open swap contracts. At October 31, 2014, the receivable for open swap contracts was $206,385. For the year ended October 31, 2014, the net realized loss on swaps was $243,845 and the net change in unrealized appreciation was $196,305.
The average notional value of total return swaps that the Fund invested in during the year ended October 31, 2014 was $36,282,293.
Miller Convertible Bond Fund
NOTES TO FINANCIAL STATEMENTS (Unaudited) (Continued)
October 31, 2014
Offsetting of Financial Assets and Derivative Assets - The Fund’s policy is to recognize a net asset or liability equal to the net unrealized appreciation/depreciation for swap contracts. The following table shows additional information regarding the offsetting of assets and liabilities at October 31, 2014.
| | | | | | Gross Amounts of Assets Not Offset | | | | |
| | | | | | Presented in the Statement of Assets and | | | | |
| Assets | | | | | Liabilities | | | | |
| | | Gross/Net | | | | | | | | | | |
| | | Amounts of | | | Financial | | | | | | | |
| | | Recognized | | | Instruments | | | Cash Collateral | | | Net Amount of | |
| Description | | Assets | | | Pledged | | | Pledged | | | Assets/Liabilities | |
| Swaps | | $ | 206,385 | (1) | | $ | — | | | $ | 206,385 | (2) | | $ | — | |
| Total | | $ | 206,385 | | | $ | — | | | $ | 206,385 | | | $ | — | |
| (1) | Swap contracts at value as presented in the Portfolio of Investments. |
| (2) | The amount is limited to the derivative liability balance and, accordingly, does not include excess collateral pledged. |
Security Transactions and Investment Income – Investment security transactions are accounted for on a trade date basis. Cost is determined and gains and losses are based upon the specific identification method for both financial statement and federal income tax purposes.
Dividend income is recorded on the ex-dividend date and interest income is recorded on the accrual basis. Purchase discounts and premiums on securities are accreted and amortized over the life of the respective securities.
Withholding taxes on foreign dividends, if any, have been provided for in accordance with Fund’s understanding of the applicable country’s tax rules and rates.
Expenses – Common expenses, income and gains and losses are allocated daily among share classes of the Fund based on the relative proportion of net assets represented by each class. Class specific expenses are charged directly to the responsible class of shares of the Fund.
Federal Income Taxes – The Fund intends to continue to comply with the requirements of Subchapter M of the Internal Revenue Code applicable to regulated investment companies and will distribute all of its taxable income, if any, to shareholders. Accordingly, no provision for Federal income taxes is required in the financial statements.
The Fund recognizes the tax benefits of uncertain tax positions only when the position is “more likely than not” to be sustained assuming examination by tax authorities. Management has reviewed the tax positions on returns filed for fiscal year ends (2011-2013), or expected to be taken in the Fund’s current fiscal year end return, and concluded that no liability for unrecognized tax benefits should be recorded related to uncertain tax positions. The Fund identifies its major tax jurisdictions as U.S. Federal and the state of Massachusetts. The Fund recognizes interest and penalties, if any, related to unrecognized tax benefits as income tax expense in the Statements of Operations. During the year ended October 31, 2014, the Fund did not incur any interest or penalties.
Distributions to Shareholders – Distributions from investment income, if any, are declared and paid quarterly and are recorded on the ex-dividend date. The Fund will declare and pay net realized capital gains, if any, annually. The character of income and gains to be distributed is determined in accordance with income tax regulations which may differ from GAAP.
Indemnification – The Trust indemnifies its officers and trustees for certain liabilities that may arise from the performance of their duties to the Trust. Additionally, in the normal course of business, the Fund enters into contracts that contain a variety of representations and warranties and which provide general indemnities. The Fund’s maximum exposure under these arrangements is unknown, as this would involve future claims that may be made against the Fund that has not yet occurred. However, based on experience, the Trust expects the risk of loss due to these warranties and indemnities to be remote.
Miller Convertible Bond Fund
NOTES TO FINANCIAL STATEMENTS (Unaudited) (Continued)
October 31, 2014
Legal – On December 1, 2011, Miller Investment Trust, on behalf of the Miller Convertible Bond Fund (the “Fund”), filed a civil suit against Morgan Stanley & Co. Incorporated and KPMG, a Hong Kong partnership, seeking to recover damages for losses suffered related to an investment by the Fund in convertible debt issued by ShengdaTech, Inc. (“ShengdaTech”). Morgan Stanley & Co. served as the underwriter of the debt pursuant to offering documents issued December 10, 2010. KPMG Hong Kong served as ShengdaTech’s auditor for fiscal years 2008 through 2010. On June 26, 2012, the Fund also filed a civil suit against the officers and directors of ShengdaTech and Hansen, Barnett & Maxwell, P.C. (“Hansen”), ShengdaTech’s auditor for fiscal year 2007, seeking to recover against these defendants damages for losses suffered from this same investment. Hansen has since been dismissed from the action. Fund shareholders do not bear any direct expense related to the suits because counsel for the Fund is performing services on a contingency fee basis by which it would be paid a portion of any damages recovered. Management of Miller Investment Trust does not believe an estimate of the likelihood of prevailing in any of these suits can be made, nor an estimate of the financial effect on the Fund if it were to prevail in any of these suits.
| 3. | ADVISORY FEE AND OTHER RELATED PARTY TRANSACTIONS |
The business activities of the Fund are supervised under the direction of the Board, which is responsible for the overall management of the Fund. The Fund has employed Gemini Fund Services, LLC (“GFS”) to provide administration, fund accounting, and transfer agent services.
Pursuant to an Investment Advisory Agreement with the Fund, the Adviser, under the oversight of the Board, directs the daily operations of the Fund and supervises the performance of administrative and professional services provided by others. As compensation for its services and the related expenses borne by the Adviser, the Fund pays the Adviser a management fee, computed and accrued daily and paid monthly, at an annual rate of 0.75% of the average daily net assets of the Fund. For the year ended October 31, 2014, the Adviser earned advisory fees of $4,280,703.
Pursuant to separate servicing agreements with GFS, the Fund pays GFS customary fees for providing administration, fund accounting, transfer agency and custody administration services to the Fund.
Northern Lights Compliance Services, LLC (“NLCS”) – NLCS, an affiliate of GFS, provides a Chief Compliance Officer to the Trust, as well as related compliance services, pursuant to a consulting agreement between NLCS and the Trust. Under the terms of such agreement, NLCS receives customary fees from the Fund.
An officer of the Fund is also an officer of NLCS. In addition, certain affiliates of NLCS provide ancillary services to the Fund as follows:
Distributor – The distributor of the Fund is Northern Lights Distributors, LLC (the “Distributor”), an affiliate of GFS. The Board has adopted, on behalf of the Fund, a Distribution Plan and Agreement pursuant to Rule 12b-1 under the Investment Company Act of 1940 (the “Plan”), as amended, to pay for certain distribution activities and shareholder services. Prior to April 1, 2009, Class A shares paid 0.25% per year of its average daily net assets for such distribution and shareholder service activities. Subsequent to such date and pursuant to a shareholder vote, the Distribution Plan was amended to increase the annual rate to 0.50%. Class C pays 1.00% per year of its average daily net assets for distribution and shareholder service activities under the Plan. For the year ended October 31, 2014, the Fund incurred distribution fees of $1,405,752 and $564,195 for Class A shares and Class C shares, respectively.
Gemcom, LLC (“Gemcom”) – Gemcom, an affiliate of GFS, provides EDGAR conversion and filing services as well as print management services for the Fund on an ad-hoc basis. For the provision of these services, GemCom receives customary fees from the Fund.
| 4. | INVESTMENT TRANSACTIONS |
The cost of security purchases and the proceeds from the sale of securities, other than short-term securities, for the year ended October 31, 2014, amounted to $663,640,687 and $407,771,778, respectively.
Miller Convertible Bond Fund
NOTES TO FINANCIAL STATEMENTS (Unaudited) (Continued)
October 31, 2014
| 5. | DISTRIBUTIONS TO SHAREHOLDERS AND TAX COMPONENTS OF CAPITAL |
The tax character of fund distributions for the following years was as follows:
| | | Fiscal Year Ended | | | Fiscal Year Ended | |
| | | October 31, 2014 | | | October 31, 2013 | |
| Ordinary Income | | $ | 15,271,391 | | | $ | 8,690,444 | |
| Long-Term Capital Gain | | | 14,972,535 | | | | — | |
| Return of Capital | | | — | | | | — | |
| | | $ | 30,243,926 | | | $ | 8,690,444 | |
As of October 31, 2014, the components of accumulated earnings/(deficit) on a tax basis were as follows:
| Undistributed | | | Undistributed | | | | | | Total | |
| Ordinary | | | Long-Term | | | Unrealized | | | Accumulated | |
| Income | | | Capital Gains | | | Appreciation | | | Deficits | |
| $ | 15,811,028 | | | $ | 9,577,586 | | | $ | 12,897,383 | | | $ | 38,285,997 | |
The difference between book basis and tax basis distributable earnings and unrealized appreciation is primarily attributable to the tax income on contingent convertible debt securities, the mark-to market on open swap contracts and the tax deferral of losses on wash sales.
Permanent book and tax differences, primarily attributable to tax adjustments for swaps, and the tax treatment on contingent convertible debt securities and equalization debits, resulted in reclassification for the period ended October 31, 2014 as follows:
| Paid in | | | Undistributed Net | | | Accumulated Net | |
| Capital | | | Investment Income | | | Realized Loss | |
| $ | 2,859,195 | | | $ | 1,680,113 | | | $ | (4,539,308 | ) |
Subsequent events after the date of the Statement of Assets and Liabilities have been evaluated through the date the financial statements were issued. Management has concluded that there is no impact requiring adjustment or disclosure in the financial statements.
REPORT OF INDEPENDENT REGISTERED PUBLIC ACCOUNTING FIRM
To the Board of Trustees and Shareholders of the Miller Convertible Bond Fund
Wellesley, Massachusetts
We have audited the accompanying statement of assets and liabilities of the Miller Convertible Bond Fund (the “Fund”), including the portfolio of investments, as of October 31, 2014, and the related statement of operations for the year then ended, the statements of changes in net assets for each of the two years in the period then ended (collectively, the “financial statements”), the financial highlights for each of the four years in the period then ended. The financial highlights for the period ended prior to October 31, 2011 were audited by other auditors, whose report, dated December 30, 2010, expressed an unqualified opinion on those financial highlights. These financial statements and financial highlights are the responsibility of the Fund’s management. Our responsibility is to express an opinion on these financial statements and financial highlights based on our audits.
We conducted our audits in accordance with the standards of the Public Company Accounting Oversight Board (United States). Those standards require that we plan and perform the audit to obtain reasonable assurance about whether the financial statements, financial highlights, and portfolio of investments are free of material misstatement. The Fund is not required to have, nor were we engaged to perform, an audit of its internal control over financial reporting. Our audits included consideration of internal control over financial reporting as a basis for designing audit procedures that are appropriate in the circumstances, but not for the purpose of expressing an opinion on the effectiveness of the Fund’s internal control over financial reporting. Accordingly, we express no such opinion. An audit also includes examining, on a test basis, evidence supporting the amounts and disclosures in the financial statements, assessing the accounting principles used and significant estimates made by management, as well as evaluating the overall financial statement presentation. Our procedures included confirmation of securities owned as of October 31, 2014, by correspondence with the custodian and brokers. We believe that our audits provide a reasonable basis for our opinion.
In our opinion, such financial statements and financial highlights referred to above present fairly, in all material respects, the financial position of the Miller Convertible Bond Fund as of October 31, 2014, and the results of its operations for the year then ended, the changes in its net assets for each of the two years in the period then ended, and the financial highlights for each of the four years in the period then ended, in conformity with accounting principles generally accepted in the United States of America.
/s/ Deloitte & Touche LLP
Chicago, Illinois
December 30, 2014
Miller Convertible Fund
TRUSTEES AND OFFICERS (Unaudited)
October 31, 2014
This chart provides information about the Trustees and Officers who oversee the Fund. Officers elected by the Trustees manage the day-to-day operations of the Fund and execute policies formulated by the Trustees. The term of office of each Trustee listed below will continue indefinitely.
Independent Trustees:
Name, Address and Age
Position Held with Fund | | Principal Occupation
During the Past Five Years | | Number of
Portfolios in Fund
Complex**
Overseen by
Trustee | | Other Directorships
held by Trustee |
Neal Chorney
Year of Birth: 1948
c/o Sunrise Financial Group
139 Orange St.
New Haven, CT 06510
Trustee*
Since 2007 | | Vice President – Real Estate Investing & Property Management, Sunrise Financial LLC (2006 – Present) (commercial and investment real estate lending); Vice President – Loan Review, The Bank of Southern Connecticut (2003 – 2006) (community bank); Self-Employed (2002 – 2003) (banking consultant) | | 1 | | None |
| | | | | | | |
Daniel Mainzer
Year of Birth: 1963
c/o Flanigan, Cotillo &
Mainzer, LLP
1881 Worcester Road, Suite
200
Framingham, MA 01701
Trustee*
Since 2007 | | Partner, Flanigan, Cotillo & Mainzer, LLP (2010-present) Principal, KLR & Co (2009 –2010), Partner, Sullivan Shuman & Freedberg LLC (2002 – 2009) (certified public accounting firms) | | 1 | | None |
| | | | | | | |
Michael Blank
Year of Birth: 1950
c/o Braintree Street Realty
119 Braintree Street,
Suite 502
Boston, MA 02134
Trustee*
Since 2009 | | Principal, Braintree Street Realty, LLC (1986-Present) President, Evanteal Properties (2011-Present) | | 1 | | Board of Directors JNF New England (2012-Present); Trustee, Rivermoor Realty Trust (1991- 2011) |
| | | | | | | |
| Interested Trustees and Officers: |
| | | | | | | |
Greg Miller***
Year of Birth: 1949
c/o Wellesley Investment
Advisors, Inc.
20 William Street, Suite G-5
Wellesley, MA 02481
Trustee, President and
Treasurer*
Since 2007 | | Chief Executive Officer, Wellesley Investment Advisors, Inc. (1991 – Present) (registered investment advisory firm) | | 1 | | None |
Miller Convertible Fund
TRUSTEES AND OFFICERS (Unaudited) (Continued)
October 31, 2014
Interested Trustees and Officers (Continued):
Name, Address and Age
Position Held with Fund | | Principal Occupation
During the Past Five Years | | Number of
Portfolios in Fund
Complex **
Overseen by Trustee | | Other
Directorships held
by Trustee |
Darlene Murphy
Year of Birth: 1962
c/o Wellesley Investment
Advisors, Inc.
20 William Street, Suite G-5
Wellesley, MA 02481
Secretary*
Since 2007 | | President/Director, Wellesley Investment Advisors, Inc. (1991 – Present) (registered investment advisory firm) President/Director, Sudbury Wealth Management. (2009 – 2010) | | N/A | | N/A |
Michael J. Wagner
Year of Birth: 1950
80 Arkay Drive, Suite 110,
Hauppauge, NY 11788
Chief Compliance Officer*
Since 2007 | | President (2006 – Present) and Senior Vice President (2004 – 2006), Northern Lights Compliance Services, LLC (provides CCO services to mutual funds); Vice President, GemCom, LLC (2004 – Present) (provides Edgar services to mutual funds); President (2004 – 2006) and Chief Operating Officer (2003 – 2006). | | N/A | | N/A |
| * | The term of office will continue indefinitely. |
| ** | The term “Fund Complex” refers to the Miller Investment Trust. |
| *** | Greg Miller is an “interested person” of the Trust as that term is defined under the 1940 Act, because of his affiliation with Wellesley Investment Advisors, Inc. (the Funds’ Advisor). |
The Trust’s Statement of Additional Information includes additional information about the Trustees and is available free of charge, upon request, by calling toll-free at 1-877-441-4434.
Miller Convertible Bond Fund
DISCLOSURE OF FUND EXPENSES (Unaudited)
October 31, 2014
As a shareholder of the Fund you incur ongoing costs, including management fees, distribution and/or service (12b-1 fees) fees and other Fund expenses. This example is intended to help you understand your ongoing costs (in dollars) of investing in the Fund and to compare these costs with the ongoing costs of investing in other mutual funds. Please note, the expenses shown in the tables are meant to highlight ongoing costs only and do not reflect any transactional costs.
This example is based on an investment of $1,000 invested for the period of time as indicated in the table below.
Actual Expenses: The first line of the table provides information about actual account values and actual expenses. You may use the information in this line, together with the amount you invested, to estimate the expenses that you paid over the period. Simply divide your account value by $1,000 (for example, an $8,600 account value divided by $1,000 = 8.6), then multiply the result by the number in the first line under the heading entitled “Expenses Paid During the Period” to estimate the expenses you paid on your account during the period.
Hypothetical Examples for Comparison Purposes: The second line of the table below provides information about hypothetical account values and hypothetical expenses based on the Fund’s actual expense ratio and an assumed rate of return of 5% per year before expenses, which is not the Fund’s actual return. The hypothetical account values and expenses may not be used to estimate the actual ending account balance or expenses you paid for the period. You may use this information to compare the ongoing costs of investing in the Fund and other funds. To do so, compare this 5% hypothetical example with the 5% hypothetical examples that appear in the shareholder reports of the other funds.
Please note that the expenses shown in the table are meant to highlight your ongoing costs only and do not reflect any transactional costs which may be applicable to your account. Therefore, the second line of the table is useful in comparing ongoing costs only, and will not help you determine the relative total costs of owning different funds. In addition, if these transactional costs were included, your costs would have been higher.
| | | Beginning | | | | |
| | | Account | | Ending | | Expenses Paid |
| | | Value | | Account Value | | During the Period* |
| | | (5/1/14) | | (10/31/14) | | (5/1/14 to 10/31/14) |
| Actual | | | | | | |
| Class A | | $1,000.00 | | $1,006.50 | | $7.33 |
| Class I | | $1,000.00 | | $1,008.90 | | $4.81 |
| Class C | | $1,000.00 | | $1,003.40 | | $9.85 |
| Hypothetical | | | | | | |
| (5% return before expenses) | | | | | | |
| Class A | | $1,000.00 | | $1,017.90 | | $7.37 |
| Class I | | $1,000.00 | | $1,020.42 | | $4.84 |
| Class C | | $1,000.00 | | $1,015.38 | | $9.91 |
| * | Expenses Paid During Period are equal to the Fund’s annualized expense ratio of 1.45% for Class A, 0.95% for Class I, and 1.95% for Class C multiplied by the average account value over the period, multiplied by 184 days and divided by 365 (to reflect the number of days in the six-month period ended October 31, 2014). |
Renewal of the Investment Advisory Agreement
In connection with a meeting of the Board of Trustees of the Trust held on October 17, 2014 (the “Meeting”), the Board, including the Independent Trustees, discussed the renewal of a Management Agreement (the “Agreement”) between the Trust and Wellesley Investment Advisors, Inc. (“the “Adviser”), on behalf of the Miller Convertible Fund (the “Fund”). In considering whether the continuance of the Agreement was in the best interests of the Fund and its shareholders, the Board interviewed representatives of the Adviser and received materials specifically relating to the Agreement. Both in the Meeting and at other meetings, the Board, including the Independent Trustees, received information relating to the Adviser’s investment and management services under the Agreement. This information included materials regarding: (i) the investment performance of the Fund, including comparisons to the Fund’s peer group of funds selected by the Adviser from all convertible bond mutual funds with assets in excess of $25 million but less than $1 billion (“Peer Group”) as well as comparisons to a universe of funds consisting of the Fund and all other funds in the Morningstar category “Convertible Bonds,” as classified by the independent evaluation service, Morningstar, Inc. (“Morningstar Category”); (ii) the management fee rate and net expense ratio of the Fund as compared to the average management fee rates and net expense ratios of the Fund’s Peer Group and Morningstar Category; (iii) the investment process, portfolio holdings, investment restrictions, valuation procedures, and financial statements for the Fund; (iv) purchases and redemptions of the Fund’s shares; (v) the general investment outlook in the markets in which the Fund invests; (vi) arrangements with respect to the distribution of the Fund’s shares; (vi) the allocation and cost of the Fund’s brokerage; and (vii) the overall nature, quality and extent of services provided by the Adviser.
As part of their review, the Board requested, and the Adviser provided, additional information in order to evaluate the quality of the Adviser’s services and the reasonableness of its fees under the Agreement. The Board observed that there is a range of investment options available to shareholders of the Fund, including other mutual funds, and that the Fund’s shareholders have chosen to invest in the Fund. The following summarizes matters considered by the Board in connection with its continuance of the Agreement. However, the Board did not identify any single factor as all-important or controlling, and the following summary does not detail all the matters considered. Matters considered by the Board, including the Independent Trustees, in connection with its approval of the Agreement included the following:
Nature, Extent and Quality of Services and Personnel. The Board examined the nature, extent and quality of the services provided by the Adviser to the Fund. The Independent Trustees also engaged in discussions with the Adviser’s senior management responsible for the overall functioning of the Fund’s investment operations. The Board considered information regarding the Adviser’s efforts in the area of compliance and investment processes. The Trustees discussed the Adviser’s personnel, and the high level of service provided by them including managing the growth of Fund assets, which among other things requires specialized skill in sourcing sufficient suitable convertible securities in light of the Fund’s growth. The Board also discussed the financial strength of the Adviser and concluded that they are satisfied the Adviser has delivered a high quality of services to the Fund and its shareholders. The Board concluded that the Fund’s management team and the Adviser’s overall resources were adequate and that the Adviser had the investment management capabilities and personnel essential to performing its duties under the Agreement.
Performance of the Adviser. The Trustees reviewed the performance of the Fund, noting that for the one, three and five-year periods ended September 30, 2014 the Fund had returns of 10.70%, 13.24% and 9.47%, respectively, underperforming the peer group averages of 12.11%, 14.55% and 11.42%, respectively, and the Morningstar category averages of 10.71%, 14.74% and 10.99%, respectively. The Board discussed the Fund’s investment strategy and noted that the Adviser continues to follow the same strategy as it has in the past to achieve favorable risk-adjusted returns. The Trustees noted that the goal of the Fund is to outperform over complete market cycles and as such will tend to underperform peers that take greater risk during bull markets. The Trustees also noted that the
Fund’s portfolio is entirely invested in convertible bonds and, therefore, the Fund has a different risk profile than its peer group. The Board concluded that the Fund’s performance was reasonable.
Fees & Expenses. The Trustees reviewed information regarding comparative fees charged by the Adviser to other accounts managed by the Adviser, as well as fees charged by the Fund’s Peer Group and Morningstar Category. The Trustees considered the Fund’s advisory fee rate and noted it was higher than both the peer group average and Morningstar category average. The Trustees reviewed the expense ratios of the Fund relative to the average expense ratio of the peer group and Morningstar category. The Trustees concluded that based on the specialized nature of the Fund, the Adviser’s unique experience and expertise in the area, and the fees charged by the Adviser to its other clients, the Fund’s management fee was reasonable and the Fund’s average expense ratio was satisfactory for purposes of approving the continuance of the Management Agreement.
Economies of Scale. The Trustees concluded that given current asset levels and total expenses, the benefits to be derived from economies of scale were not relevant considerations at this time and that the Trustees would review the issue following further growth in Fund assets.
Profitability. The Trustees considered the profits to be realized by the Adviser, taking into consideration other benefits to the Adviser, such as the Rule 12b-1 fees to be paid to the Adviser. The Board considered that a portion of the 12b-1 fees being charged are for shareholder servicing. The Board also reviewed financial profit projections based upon assumptions about Fund asset levels and Adviser costs, noting that any such projections are speculative and do not guarantee Adviser profits. It was the consensus of the Board that the Adviser’s relationship with the Fund was not unreasonably profitable.
Conclusion. Having requested and received such information from the Adviser as the Board believed to be reasonably necessary to evaluate the terms of the Agreement, the Board, including all of the Independent Trustees, concluded that the advisory fee is fair and reasonable and approved the continuance of the Agreement as in the best interest of the Fund and its shareholders.
PRIVACY notice
| FACTS | WHAT DOES MILLER INVESTMENT TRUST DO WITH YOUR PERSONAL INFORMATION? |
| | |
| Why? | Financial companies choose how they share your personal information. Federal law gives consumers the right to limit some but not all sharing. Federal law also requires us to tell you how we collect, share, and protect your personal information. Please read this notice carefully to understand what we do. |
| | |
| What? | The types of personal information we collect and share depend on the product or service you have with us. This information can include: |
| | |
| | ■ | Social Security number | ■ | Purchase History |
| | | | | |
| | ■ | Assets | ■ | Account Balances |
| | | | | |
| | ■ | Retirement Assets | ■ | Account Transactions |
| | | | | |
| | ■ | Transaction History | ■ | Wire Transfer Instructions |
| | | | | |
| | ■ | Checking Account Information | | |
| | |
| | When you are no longer our customer, we continue to share your information as described in this notice. |
| | |
| How? | All financial companies need to share customers’ personal information to run their everyday business. In the section below, we list the reasons financial companies can share their customers’ personal information; the reasons Miller Investment Trust chooses to share; and whether you can limit this sharing. |
| Reasons we can share your personal information | Does Miller
Investment Trust
share? | Can you limit this sharing? |
For our everyday business purposes – such as to process your transactions, maintain your account(s), respond to court orders and legal investigations, or report to credit bureaus | Yes | No |
For our marketing purposes – to offer our products and services to you | No | We don’t share |
| For joint marketing with other financial companies | No | We don’t share |
For our affiliates’ everyday business purposes – information about your transactions and experiences | No | We don’t share |
For our affiliates’ everyday business purposes – information about your creditworthiness | No | We don’t share |
| For non-affiliates to market to you | No | We don’t share |
| Questions? | Call 1-877-441-4434 |
| Who we are |
| Who is providing this notice? | Miller Investment Trust |
| What we do |
| How does Miller Investment Trust protect my personal information? | To protect your personal information from unauthorized access and use, we use security measures that comply with federal law. These measures include computer safeguards and secured files and buildings. Our service providers are held accountable for adhering to strict policies and procedures to prevent any misuse of your nonpublic personal information. |
| How does Miller Investment Trust collect my personal information? | We collect your personal information, for example, when you ■ Open an account ■ Provide account information ■ Give us your contact information ■ Make deposits or withdrawals from your account ■ Make a wire transfer ■ Tell us where to send the money ■ Tells us who receives the money ■ Show your government-issued ID ■ Show your driver’s license We also collect your personal information from other companies. |
| Why can’t I limit all sharing? | Federal law gives you the right to limit only ■ Sharing for affiliates’ everyday business purposes – information about your creditworthiness ■ Affiliates from using your information to market to you ■ Sharing for non-affiliates to market to you State laws and individual companies may give you additional rights to limit sharing. |
| Definitions |
| Affiliates | Companies related by common ownership or control. They can be financial and nonfinancial companies. ■ Miller Investment Trust does not share with our affiliates. |
| Non-affiliates | Companies not related by common ownership or control. They can be financial and nonfinancial companies ■ Miller Investment Trust does not share with non-affiliates so they can market you. |
| Joint marketing | A formal agreement between nonaffiliated financial companies that together market financial products or services to you. ■ Miller Investment Trust does not jointly market. |
| | | | | | |
| MILLER CONVERTIBLE BOND FUND |
| |
| | | |
| Advisor | | Wellesley Investment Advisors, Inc. |
| | | The Wellesley Office Park |
| | | 20 William Street |
| | | Wellesley, MA 02481 |
| | | |
| Distributor | | Northern Lights Distributors, LLC |
| | | 17605 Wright Street |
| | | Omaha, NE 68130 |
| | | |
| Legal Counsel | | Seward & Kissel, LLP |
| | | 901 K Street – Suite 800 |
| | | Washington, DC 20001 |
| | | |
| Transfer Agent | | Gemini Fund Services, LLC |
| | | 17605 Wright Street |
| | | Omaha, NE 68130 |
| | | |
| Custodian | | Bank of New York Mellon Corp. |
| | | One Wall Street |
| | | New York, NY 10286 |
How to Obtain Proxy Voting Information
Information regarding how the Fund voted proxies relating to portfolio securities during the most recent 12-month period ending June 30th, as well as a description of the policies and procedures that the Fund uses to determine how to vote proxies is available without charge, upon request, by calling toll-free 1-877-441-4434 or by referring to the Security and Exchange Commission’s (“SEC”) website at http://www.sec.gov.
How to Obtain 1st and 3rd Fiscal Quarter Portfolio Holdings
The Fund files its complete schedule of portfolio holdings with the SEC for the first and third quarters of each fiscal year on Form N-Q. Form N-Q is available on the SEC’s website at http://www.sec.gov and may be reviewed and copied at the SEC’s Public Reference Room in Washington, DC (1-800-SEC-0330). The information on Form N-Q is available without charge, upon request, by calling 1-877-441-4434.
Miller Convertible Bond Fund ● 4020 South 147th St. ●Suite 2 ● Omaha, NE 68137
1-877-441-4434
Item 2. Code of Ethics.
(a)
As of the end of the period covered by this report, the registrant has adopted a code of ethics that applies to the registrant's principal executive officer, principal financial officer, principal accounting officer or controller, or persons performing similar functions, regardless of whether these individuals are employed by the registrant or a third party.
(b)
For purposes of this item, “code of ethics” means written standards that are reasonably designed to deter wrongdoing and to promote:
(1)
Honest and ethical conduct, including the ethical handling of actual or apparent conflicts of interest between personal and professional relationships;
(2)
Full, fair, accurate, timely, and understandable disclosure in reports and documents that a registrant files with, or submits to, the Commission and in other public communications made by the registrant;
(3)
Compliance with applicable governmental laws, rules, and regulations;
(4)
The prompt internal reporting of violations of the code to an appropriate person or persons identified in the code; and
(5)
Accountability for adherence to the code.
(c)
Amendments:
During the period covered by the report, there have not been any amendments to the provisions of the code of ethics.
(d)
Waivers:
During the period covered by the report, the registrant has not granted any express or implicit waivers from the provisions of the code of ethics.
Item 3. Audit Committee Financial Expert.
The Board has determined, based on questionnaires completed by the Audit Committee members, that no one on the committee satisfies the definition of "financial expert;" however the Board also determined that collectively the Audit Committee members have the requisite knowledge and experience to perform the Audit Committee duties.
Item 4. Principal Accountant Fees and Services.
(a)
Audit Fees
FY 2014
$ 29,500
FY 2013
$ 28,000
(b)
Audit-Related Fees
FY 2014
$ 4,300
FY 2013
$ 0
Tax Fees
(c)
FY 2014
$ 4,375
FY 2013
$ 4,175
(d)
All Other Fees
FY 2014
$ 0
FY 2013
$ 0
The above “Tax Fees” were billed for professional services rendered for tax compliance and tax return preparation.
(e)
(1)
Audit Committee’s Pre-Approval Policies
The registrant’s Audit Committee is required to pre-approve all audit services and, when appropriate, any non-audit services (including audit-related, tax and all other services) to the registrant. The registrant’s Audit Committee is also required to pre-approve, when appropriate, any non-audit services (including audit-related, tax and all other services) to its adviser, or any entity controlling, controlled by or under common control with the adviser that provides ongoing services to the registrant to the extent that the services are determined to have a direct impact on the operations or financial reporting of the registrant. Services are reviewed on an engagement by engagement basis by the audit committee.
(2)
Percentages of 2013 Services Approved by the Audit Committee
Registrant
Adviser
Audit-Related Fees:
0 %
0 %
Tax Fees:
0 %
0%
All Other Fees:
0 %
0%
(f)
During audit of registrant's financial statements for the most recent fiscal year, less than 50 percent of the hours expended on the principal accountant's engagement were attributed to work performed by persons other than the principal accountant's full-time, permanent employees.
(g)
The aggregate non-audit fees billed by the registrant's accountant for services rendered to the registrant, and rendered to the registrant's investment adviser (not including any sub-adviser whose role is primarily portfolio management and is subcontracted with or overseen by another investment adviser), and any entity controlling, controlled by, or under common control with the adviser that provides ongoing services to the registrant:
Registrant
Adviser
FY 2014
$4,300
$ None
FY 2013
$4,175
$ None
(h)
Not applicable. All non-audit services to the registrant were pre-approved by the Audit Committee for FY 2013.
Item 5. Audit Committee of Listed Companies. Not applicable to open-end investment companies.
Item 6. Schedule of Investments. Schedule of investments in securities of unaffiliated issuers is included under Item 1.
Item 7. Disclosure of Proxy Voting Policies and Procedures for Closed-End Funds. Not applicable to open-end investment companies.
Item 8. Portfolio Managers of Closed-End Funds. Not applicable to open-end investment companies.
Item 9. Purchases of Equity Securities by Closed-End Funds. Not applicable to open-end investment companies.
Item 10. Submission of Matters to a Vote of Security Holders. None
Item 11. Controls and Procedures.
(a)
Based on an evaluation of the registrant’s disclosure controls and procedures as of a date within 90 days of filing date of this Form N-CSR, the disclosure controls and procedures are reasonably designed to ensure that the information required in filings on Forms N-CSR is recorded, processed, summarized, and reported on a timely basis.
(b)
There were no significant changes in the registrant’s internal control over financial reporting that occurred during the registrant’s last fiscal half-year that have materially affected, or are reasonably likely to materially affect, the registrant’s internal control over financial reporting.
Item 12. Exhibits.
(a)(1)
Sarbanes Oxley Code of Ethics filed herewith..
(a)(2)
Certifications required by Section 302 of the Sarbanes-Oxley Act of 2002 (and Item 11(a)(2) of Form N-CSR) are filed herewith..
(a)(3)
Not applicable for open-end investment companies.
(b)
Certifications required by Section 906 of the Sarbanes-Oxley Act of 2002 (and Item 11(b) of Form N-CSR) are filed herewith.
SIGNATURES
Pursuant to the requirements of the Securities Exchange Act of 1934 and the Investment Company Act of 1940, the registrant has duly caused this report to be signed on its behalf by the undersigned, thereunto duly authorized.
(Registrant) Miller Investment Trust
By (Signature and Title)
/s/ Greg Miller
Greg Miller, President and Treasurer
Date 1/8/15
Pursuant to the requirements of the Securities Exchange Act of 1934 and the Investment Company Act of 1940, this report has been signed below by the following person on behalf of the registrant and in the capacities and on the dates indicated.
By (Signature and Title)
/s/Greg Miller
Greg Miller, President and Treasurer
Date 1/8/15