united states
securities and exchange commission
washington, d.c. 20549
form n-csr
certified shareholder report of registered management
investment companies
Investment Company Act file number 811-22131
Miller Investment Trust
(Exact name of registrant as specified in charter)
20 William Street Wellesley, MA 02481
(Address of principal executive offices) (Zip code)
James Ash, Gemini Fund Services, LLC., 80 Arkay Drive Suite 110, Hauppauge, NY 11788
(Name and address of agent for service)
Registrant's telephone number, including area code: 781-416-4000
Date of fiscal year end: 10/31
Date of reporting period:10/31/15
Item 1. Reports to Stockholders.
| |
 |
| |
| |
| |
| Miller Convertible Bond Fund |
| Miller Convertible Plus Fund |
| Miller Intermediate Bond Fund |
| |
| |
| |
| |
| |
| |
| Annual Report |
| |
| October 31, 2015 |
| |
| |
| |
| 1-877- 441- 4434 |
| www.TheMillerFamilyOfFunds.com |
| |
| |
| |
| |
| |
| Investment Advisor |
| Wellesley Investment Advisors, Inc. |
| The Wellesley Office Park |
| 20 William Street |
| Wellesley, MA 02481 |
| 781-416-4000 |
| |
| |
| |
| |
| This report and the financial statements contained herein are submitted for the general information of shareholders and are not authorized for distribution to prospective investors unless preceded or accompanied by an effective prospectus. Nothing herein contained is to be considered an offer of sale or solicitation of an offer to buy shares of Miller Funds. Such offering is made only by prospectus, which includes details as to offering price and other material information. |
| |
| Distributed by Northern Lights Distributors, LLC. Member FINRA |
| |
| |
| Miller Funds |
| TABLE OF CONTENTS |
| October 31, 2015 |
| Fund Name | Miller Convertible Bond
Fund | Miller Convertible Plus Fund | Miller Intermediate Bond Fund |
| Schedule of Investments | October 31, 2015 | October 31, 2015 | October 31, 2015 |
| Statement of Assets and Liabilities | October 31, 2015 | October 31, 2015 | October 31, 2015 |
| Statement of Operations | Year ended October 31, 2015 | Period from December 31, 2014 to October 31, 2015 | Period from December 31, 2014 to October |
| Statement of changes in Net Assets | Years ended October 31, 2015 and 2014 | Period from December 31, 2014 to October 31, 2015 | Period from December 31, 2014 to October 31, 2015 |
| Statement of Cash Flows | Not applicable | Period from December 31, 2014 to October 31, 2015 | Not applicable |
| Financial Highlights | Years ended October 31, 2015, 2014, 2013, 2012, and 2011 | Period from December 31, 2014 to October 31, 2015 | Period from December 31, 2014 to October 31, 2015 |
Dear Shareholder,
The Miller Convertible Bond Fund posted a positive absolute return for the fiscal year, one of our continuing goals. In addition, our new funds, the Miller Convertible Plus Fund and the Miller Intermediate Bond Fund have performed well during their brief ten month histories. Our funds’ performance since inception and for the year ended October 31, 2015 is as follows:
| | | One Year Ended | | Annualized Since |
| Miller Convertible Bond Fund | | October 31, 2015 | | Inception |
| A shares (MCFAX.LW) | | 0.49% | | 6.11 % (12/27/07) |
| I shares (MCIFX) | | 1.08% | | 6.71% (12/27/07) |
| C shares (MCFCX) | | 0.07% | | 7.08% (12/01/09) |
| | | | | |
| | | | | Annualized Since |
| Miller Convertible Plus Fund | | | | Inception |
| A shares (MCPAX) | | | | 5.88% (12/31/14) |
| I shares (MCPIX) | | | | 5.99% (12/31/14) |
| C shares (MCCCX) | | | | 5.14% (12/31/14) |
| | | | | |
| | | | | Annualized Since |
| Miller Intermediate Bond Fund | | | | Inception |
| A shares (MIFAX) | | | | 3.84% (12/31/14) |
| I shares (MIFIX) | | | | 3.92% (12/31/14) |
| C shares (MIFCX) | | | | 3.80% (12/31/14) |
The funds’ total assets under management for the period ended October 31, 2015 were as follows:
| Miller Convertible Bond Fund | $705,882,627 |
| Miller Convertible Plus Fund | $ 61,400,656 |
| Miller Intermediate Bond Fund | $ 42,356,849 |
Equities as measured by the S&P 500 Total Return Index1 returned 6.43% over the last year. The Barclays Aggregate Bond Index2 and the Bank of America/Merrill Lynch All Convertibles Ex Mandatory Index (V0A0)3 were up 1.85% and .62% respectively. The Miller Convertible Bond Fund I shares returned 1.64% over the time
period. One goal the Miller Convertible Bond Fund and the Miller Convertible Plus Fund is to outperform both the stocks and bonds over a full market cycle. However, sometimes there are shorter periods within a market cycle where we underperform both asset classes. This was also the case for the convertible bond benchmark index. While market conditions can change over short time periods, our investment philosophy does not. We strictly follow the principles that have served our investors well over the years, which are described below and in the funds’ prospectus.
Bond Strategy Review
We remain committed to the same strategy we have utilized since our company was founded in 1991. It is important to note that we do not change our investment strategy regardless of what the current investment climate is. We invest only in convertible bonds and notes (no convertible preferreds, mandatory preferreds, or other structures) which typically offer the return of the majority of principal within seven years of issuance. Before making an investment, we perform a thorough analysis of a company’s balance sheet and income statement. We seek to invest in profitable companies and we avoid companies that have unsafe debt loads. While we usually invest with the idea of holding bonds until the next liquidity date (maturity, put or call), we consider selling or reducing our exposure if one of the following scenarios occur:
| ● | An issuer’s credit quality deteriorates |
| ● | The bond loses its favorable risk/reward characteristics due to price appreciation |
| ● | We perceive an opportunity to increase portfolio diversification |
| ● | We believe more attractive investments are available |
Because one of our key risk management practices involves careful limits on prices we pay, we tend not to purchase convertibles that trade at prices substantially above par and thus have significantly negative yields to the next liquidity date. This discipline often results in the elimination of some of the most equity-sensitive convertibles. As a result, our performance tends to lag broader equity indices in rising markets but seeks to decline less in falling stock markets.
At the end of the period, the Miller Convertible Bond Fund owned 74 convertible bonds, with our largest holding representing 4.2% of the fund’s value. Our holdings span the convertible market, from investment-grade to small-cap, with a broad distribution of industries represented. Generally, half of our rated convertible bonds are investment grade.
Convertible Market Review and Comment
Convertible bonds faced a challenging environment over the last year. Although equities were higher and bond yields fell, credit spreads widened significantly. Equities, as measured by the S&P 500 Total Return Index, were up 6.43%. Yields on the 10-year Treasury bond went from 2.34% to 2.14%. Meanwhile, investment grade credit spreads widened 47 basis points and high yield credit spreads widened 1.78%.
The Miller Convertible Bond Fund’s total return for the year was comprised of 50% capital appreciation and 50% income. We typically look for a return distribution of 70% capital appreciation and 30% income. However, there can be times when our returns are balanced between the two. The year was characterized by high volatility, and as a result, our largest drawdown was 8.14%.4
All returns are as of October 31, 2015.
New Issuance
The new issue market remained healthy for the year ended October 31, 2015. Over $36 billion of new paper came to the market in that time period. Some of the new issues that met our criteria were convertible bonds issued by:
| ● | LinkedIn (2.31% of the Miller Convertible Bond Fund’s portfolio as of October 31, 2015), a social networking website used for professional networking; |
| ● | LGI Homes (4.24% of the Miller Convertible Bond Fund’s portfolio as of October 31, 2015), a designer and builder of homes in Texas, Arizona, Florida and Georgia; |
| ● | Redwood Trust (2.52% of the Miller Convertible Bond Fund’s portfolio as of October 31, 2015 a REIT engaged in residential and commercial mortgage banking activities; and |
| ● | ON Semiconductor (2.52% of the Miller Convertible Bond Fund’s portfolio as of October 31, 2015 a producer of analog, standard logic, and discrete semiconductors for data and power management. |
Potential catalysts for continued strength in convertible issuance include increased merger and acquisition activity, higher interest rates and corporations’ desires to buy back stock while simultaneously issuing convertibles.
As we look ahead, we continue to believe that a balanced portfolio of convertible bonds offer investors the best of both worlds: upside participation to improving equity markets and capital preservation should the equity markets correct. As always, we thank you for your confidence and trust in our management.
Sincerely,
Greg Miller, Co-Portfolio Manager
Michael Miller, Co-Portfolio Manager
| 1 | The Standard and Poor’s 500 Total Return Index is a free-float capitalization-weighted index, based on the common stock prices of 500 top publicly traded American companies, as determined by S&P, and considered by many to be the best representation of the market. |
| 2 | The Barclays U.S. Aggregate Bond index is a market capitalization-weighted index often used to represent investment grade bonds being traded in United States. |
| 3 | The Bank of America/Merrill Lynch All Convertibles Ex Mandatory Index (V0A0) represents all US convertibles, excluding mandatory convertibles, small issues and bankruptcies. |
| 4 | A drawdown is the peak-to-trough decline during a specific record period of an investment, fund or commodity. A drawdown is usually quoted as the percentage between the peak and the trough. |
Investors cannot directly invest in an index and unmanaged index returns do not reflect any fees, expenses or sales charges.
2649-NLD-12/8/2015
| Miller Convertible Bond Fund |
| PERFORMANCE OF A $10,000 INVESTMENT (Unaudited) |
| Since Inception through October 31, 2015 |

| Annualized Total Returns as of October 31, 2015 |
| |
| | | | Since | Since |
| | | | Inception* | Inception** |
| | One Year | Five Year | (Class A and I) | (Class C) |
| Miller Convertible Bond Fund: | | | | |
| Class A, without sales charge | 0.49% | 6.23% | 6.11% | — |
| Class A, with sales charge of 5.75% | (5.30)% | 4.98% | 5.31% | — |
| Class I | 1.08% | 6.78% | 6.71% | — |
| Class C | 0.07% | 5.73% | — | 7.08% |
| Barclays Aggregate Bond Index | 1.96% | 3.03% | 4.51% | 3.71% |
| * | Class A and Class I shares commenced operations on December 27, 2007. |
| ** | Class C shares commenced operations on December 1, 2009. |
The Barclays Aggregate Bond Index is an unmanaged index which represents the U.S. investment-grade fixed-rate bond market (including government and corporate securities, mortgage pass-through securities and asset-backed securities). Investors cannot invest directly in an index or benchmark.
Past performance is not predictive of future results. The investment return and principal value of an investment will fluctuate. An investor’s shares, when redeemed, may be worth more or less than the original cost. Total return is calculated assuming reinvestment of all dividends and distributions. Average annual total return reflects the change in the value of an investment, assuming reinvestment of the class’ distributions from dividend income and capital gains (the profits earned upon the sale of securities that have grown in value, if any) and assuming a constant rate of performance each year. Total returns would have been lower had the adviser not waived its fees and reimbursed a portion of the Fund’s expenses. The Fund’s total gross annual operating expenses, per its prospectus dated February 27, 2015, including underlying funds, are 1.45%, 0.95%, and 1.95% for Class A shares, Class I shares, and Class C shares, respectively. The graph does not reflect the deduction of taxes that a shareholder would have to pay on fund distributions or the redemption of the fund shares. For performance information current to the most recent month-end, please call 1-877-441-4434.
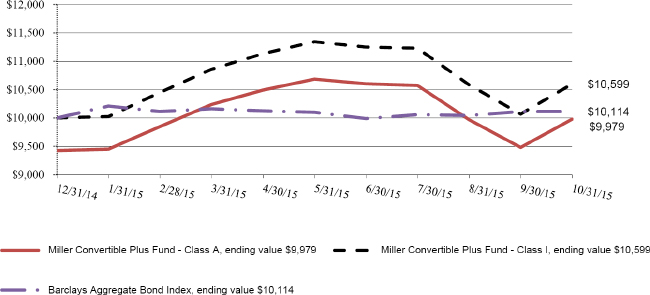
| Miller Convertible Plus Fund |
| PERFORMANCE OF A $10,000 INVESTMENT (Unaudited) |
| Since Inception through October 31, 2015 |
| | Since |
| | Inception* |
| Miller Convertible Plus Fund: | |
| Class A, without sales charge | 5.88% |
| Class A, with sales charge of 5.75% | (0.21)% |
| Class I | 5.99% |
| Class C | 5.14% |
| Barclays Aggregate Bond Index | 1.14% |
| * | Class A, Class C, and Class I shares commenced operations on December 31, 2014. Returns are not annualized. |
The Barclays Aggregate Bond Index is an unmanaged index which represents the U.S. investment-grade fixed-rate bond market (including government and corporate securities, mortgage pass-through securities and asset-backed securities). Investors cannot invest directly in an index or benchmark.
Past performance is not predictive of future results. The investment return and principal value of an investment will fluctuate. An investor’s shares, when redeemed, may be worth more or less than the original cost. Total return is calculated assuming reinvestment of all dividends and distributions. Average annual total return reflects the change in the value of an investment, assuming reinvestment of the class’ distributions from dividend income and capital gains (the profits earned upon the sale of securities that have grown in value, if any) and assuming a constant rate of performance each year. Total returns would have been lower had the adviser not waived its fees and reimbursed a portion of the Fund’s expenses. The Fund’s total gross annual operating expenses, per its prospectus dated February 27, 2015, including underlying funds, are 3.50%, 3.25%, and 4.25% for Class A shares, Class I shares, and Class C shares, respectively. The graph does not reflect the deduction of taxes that a shareholder would have to pay on fund distributions or the redemption of the fund shares. For performance information current to the most recent month-end, please call 1-877-441-4434.
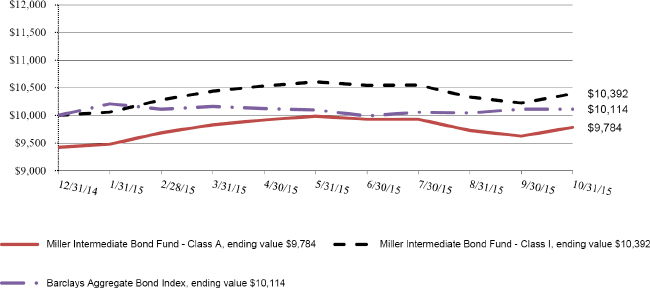
| Miller Intermediate Bond Fund |
| PERFORMANCE OF A $10,000 INVESTMENT (Unaudited) |
| Since Inception through October 31, 2015 |
| | Since |
| | Inception* |
| Miller Intermediate Bond Fund: | |
| Class A, without sales charge | 3.84% |
| Class A, with sales charge of 5.75% | (2.16)% |
| Class I | 3.92% |
| Class C | 3.80% |
| Barclays Aggregate Bond Index | 1.14% |
| * | Class A, Class C, and Class I shares commenced operations on December 31, 2014. Returns are not annualized |
The Barclays Aggregate Bond Index is an unmanaged index which represents the U.S. investment-grade fixed-rate bond market (including government and corporate securities, mortgage pass-through securities and asset-backed securities). Investors cannot invest directly in an index or benchmark.
Past performance is not predictive of future results. The investment return and principal value of an investment will fluctuate. An investor’s shares, when redeemed, may be worth more or less than the original cost. Total return is calculated assuming reinvestment of all dividends and distributions. Average annual total return reflects the change in the value of an investment, assuming reinvestment of the class’ distributions from dividend income and capital gains (the profits earned upon the sale of securities that have grown in value, if any) and assuming a constant rate of performance each year. Total returns would have been lower had the adviser not waived its fees and reimbursed a portion of the Fund’s expenses. The Fund’s total gross annual operating expenses, per its prospectus dated February 27, 2015, including underlying funds, are 1.71%, 1.46%, and 2.26% for Class A shares, Class I shares, and Class C shares, respectively. The graph does not reflect the deduction of taxes that a shareholder would have to pay on fund distributions or the redemption of the fund shares. For performance information current to the most recent month-end, please call 1-877-441-4434.
| Miller Convertible Bond Fund |
| SCHEDULE OF INVESTMENTS |
| October 31, 2015 |
| | | Principal | | | Interest Rate | | | | | |
| Security | | Amount | | | (%) | | Maturity Date | | Market Value | |
| | | | | | | | | | | | | |
| CONVERTIBLE BONDS - 92.72% | | | | | | | | | | | | |
| APPAREL - 0.96% | | | | | | | | | | | | |
| Iconix Brand Group, Inc. | | $ | 8,000,000 | | | 1.5000 | | 3/15/2018 | | $ | 6,795,000 | |
| | | | | | | | | | | | | |
| AUTO MANUFACTURERS - 2.95% | | | | | | | | | | | | |
| General Motors Co. - Societe Generale SA Synthetic | | | 6,500,000 | | | 0.0000 | | 11/16/2021 | | | 6,542,900 | |
| General Motors Co. - Societe Generale SA Synthetic | | | 14,300,000 | | | 0.0000 | | 11/16/2021 | | | 14,394,380 | |
| | | | | | | | | | | | 20,937,280 | |
| BIOTECHNOLOGY - 7.82% | | | | | | | | | | | | |
| Acorda Therapeutics, Inc. | | | 8,000,000 | | | 1.7500 | | 6/15/2021 | | | 8,540,000 | |
| Ani Pharmaceuticals, Inc. | | | 20,000,000 | | | 3.0000 | | 12/1/2019 | | | 19,250,000 | |
| Emergent Biosolutions, Inc. | | | 15,000,000 | | | 2.8750 | | 1/15/2021 | | | 18,468,750 | |
| United Therapeutics Corp. | | | 3,000,000 | | | 1.0000 | | 9/15/2016 | | | 9,196,875 | |
| | | | | | | | | | | | 55,455,625 | |
| COMMERCIAL SERVICES - 1.15% | | | | | | | | | | | | |
| Albany Molecular Research, Inc. | | | 1,000,000 | | | 2.2500 | | 11/15/2018 | | | 1,268,750 | |
| Carriage Services, Inc. | | | 2,000,000 | | | 2.7500 | | 3/15/2021 | | | 2,212,500 | |
| Huron Consulting Group, Inc. | | | 5,000,000 | | | 1.2500 | | 10/1/2019 | | | 4,646,875 | |
| | | | | | | | | | | | 8,128,125 | |
| COMPUTERS - 9.01% | | | | | | | | | | | | |
| Apple, Inc. - Wells Fargo & Co. Synthetic | | | 7,000,000 | | | 0.0000 | | 1/24/2020 | | | 8,921,500 | |
| Brocade Communications Systems, Inc. - 144A | | | 6,000,000 | | | 1.3750 | | 1/1/2020 | | | 5,913,750 | |
| Electronics For Imaging, Inc. | | | 18,000,000 | | | 0.7500 | | 9/1/2019 | | | 19,226,250 | |
| Intel Corp. - Wells Fargo & Co. Synthetic | | | 10,000,000 | | | 0.0000 | | 6/5/2020 | | | 11,877,000 | |
| SanDisk Corp. | | | 17,000,000 | | | 0.5000 | | 10/15/2020 | | | 18,009,375 | |
| | | | 63,947,875 | | | | | | | | | |
| DIVERSIFIED FINANCIAL SERVICES - 1.41% | | | | | | | | | | | | |
| BGC Partners, Inc. | | | 4,000,000 | | | 4.5000 | | 7/15/2016 | | | 4,212,500 | |
| Encore Capital Group, Inc. | | | 6,500,000 | | | 2.8750 | | 3/15/2021 | | | 5,813,438 | |
| | | | | | | | | | | | 10,025,938 | |
| ELECTRICAL COMPONENTS & EQUIPMENT - 0.13% | | | | | | | | | | | | |
| SunPower Corp. | | | 1,000,000 | | | 0.8750 | | 6/1/2021 | | | 919,375 | |
| | | | | | | | | | | | | |
| ELECTRONICS - 2.99% | | | | | | | | | | | | |
| TTM Technologies, Inc. | | | 22,000,000 | | | 1.7500 | | 12/15/2020 | | | 21,202,500 | |
| | | | | | | | | | | | | |
| ENERGY-ALTERNATE SOURCES - 1.61% | | | | | | | | | | | | |
| Renewable Energy Group, Inc. | | | 13,800,000 | | | 2.7500 | | 6/15/2019 | | | 11,445,375 | |
| | | | | | | | | | | | | |
| ENGINEERING & CONSTRUCTION - 0.15% | | | | | | | | | | | | |
| Dycom Industries, Inc. - 144A | | | 1,000,000 | | | 0.7500 | | 9/15/2021 | | | 1,043,750 | |
| | | | | | | | | | | | | |
| FOREST PRODUCTS & PAPER - 1.32% | | | | | | | | | | | | |
| International Paper Co. - Wells Fargo & Co. Synthetic | | | 10,000,000 | | | 0.0000 | | 6/10/2020 | | | 9,338,000 | |
| | | | | | | | | | | | | |
| HEALTHCARE-PRODUCTS - 2.56% | | | | | | | | | | | | |
| Integra LifeSciences Holdings Corp. | | | 5,000,000 | | | 1.6250 | | 12/15/2016 | | | 5,965,625 | |
| Trinity Biotech Investment Ltd. - 144A | | | 14,000,000 | | | 4.0000 | | 4/1/2045 | | | 12,188,750 | |
| | | | | | | | | | | | 18,154,375 | |
| HOLDING COMPANIES-DIVERSIFIED - 2.50% | | | | | | | | | | | | |
| RWT Holdings, Inc. - 144A | | | 19,000,000 | | | 5.6250 | | 11/15/2019 | | | 17,765,000 | |
The accompanying notes are an integral part of these financial statements.
| Miller Convertible Bond Fund |
| SCHEDULE OF INVESTMENTS (Continued) |
| October 31, 2015 |
| | | Principal | | | Interest Rate | | | | | |
| Security | | Amount | | | (%) | | Maturity Date | | Market Value | |
| | | | | | | | | | | | | |
| HOME BUILDERS - 9.89% | | | | | | | | | | | | |
| KB Home | | $ | 10,000,000 | | | 1.3750 | | 2/1/2019 | | $ | 9,243,750 | |
| LGI Homes, Inc. - 144A | | | 21,000,000 | | | 4.2500 | | 11/15/2019 | | | 29,938,125 | |
| M/I Homes, Inc. | | | 12,000,000 | | | 3.0000 | | 3/1/2018 | | | 11,640,000 | |
| Meritage Homes Corp. | | | 11,000,000 | | | 1.8750 | | 9/15/2032 | | | 11,020,625 | |
| Toll Brothers Finance Corp. | | | 8,000,000 | | | 0.5000 | | 9/15/2032 | | | 8,305,000 | |
| | | | | | | | | | | | 70,147,500 | |
| INSURANCE - 0.14% | | | | | | | | | | | | |
| HCI Group, Inc. | | | 1,000,000 | | | 3.8750 | | 3/15/2019 | | | 973,125 | |
| | | | | | | | | | | | | |
| INTERNET - 5.73% | | | | | | | | | | | | |
| Google, Inc. - Goldman Sachs Group, Inc. Synthetic | | | 2,000,000 | | | 0.0000 | | 2/19/2021 | | | 2,154,220 | |
| Google, Inc. - UBS AG Synthetic | | | 11,500,000 | | | 0.0000 | | 2/15/2021 | | | 11,994,500 | |
| J2 Global, Inc. | | | 8,000,000 | | | 3.2500 | | 6/15/2029 | | | 10,190,000 | |
| LinkedIn Corp. - 144A | | | 15,000,000 | | | 0.5000 | | 11/1/2019 | | | 16,312,575 | |
| | | | | | | | | | | | 40,651,295 | |
| INVESTMENT COMPANIES - 1.52% | | | | | | | | | | | | |
| Ares Capital Corp. | | | 1,000,000 | | | 4.3750 | | 1/15/2019 | | | 1,027,500 | |
| BlackRock Capital Investment Corp | | | 1,000,000 | | | 5.5000 | | 2/15/2018 | | | 1,037,500 | |
| KCAP Financial, Inc. | | | 1,000,000 | | | 8.7500 | | 3/15/2016 | | | 1,001,250 | |
| New Mountain Finance Corp. | | | 4,000,000 | | | 5.0000 | | 6/15/2019 | | | 4,012,500 | |
| Prospect Capital Corp. | | | 3,000,000 | | | 4.7500 | | 4/15/2020 | | | 2,696,250 | |
| TCP Capital Corp. | | | 1,000,000 | | | 5.2500 | | 12/15/2019 | | | 1,000,625 | |
| | | | | | | | | | | | 10,775,625 | |
| MACHINERY - DIVERSIFIED - 0.12% | | | | | | | | | | | | |
| Chart Industries, Inc. | | | 1,000,000 | | | 2.0000 | | 8/1/2018 | | | 877,500 | |
| | | | | | | | | | | | | |
| MISCELLANEOUS MANUFACTURING - 2.90% | | | | | | | | | | | | |
| General Electric Co. - Barclays Bank PLC Synthetic | | | 20,000,000 | | | 0.0000 | | 8/18/2021 | | | 20,582,000 | |
| | | | | | | | | | | | | |
| OIL & GAS SERVICES - 3.04% | | | | | | | | | | | | |
| Helix Energy Solutions Group, Inc. | | | 8,000,000 | | | 3.2500 | | 3/15/2032 | | | 6,670,000 | |
| Newpark Resources, Inc. | | | 7,000,000 | | | 4.0000 | | 10/1/2017 | | | 6,693,750 | |
| SEACOR Holdings, Inc. | | | 10,000,000 | | | 3.0000 | | 11/15/2028 | | | 8,193,750 | |
| | | | | | | | | | | | 21,557,500 | |
| PHARMACEUTICALS - 6.50% | | | | | | | | | | | | |
| Horizon Pharma Investment, Ltd. - 144A | | | 9,750,000 | | | 2.5000 | | 3/15/2022 | | | 8,421,562 | |
| Impax Laboratories, Inc. - 144A | | | 19,000,000 | | | 2.0000 | | 6/15/2022 | | | 17,575,000 | |
| Jazz Investments, Ltd. | | | 19,000,000 | | | 1.8750 | | 8/15/2021 | | | 20,123,090 | |
| | | | | | | | | | | | 46,119,652 | |
| REAL ESTATE - 1.35% | | | | | | | | | | | | |
| Forestar Group, Inc. | | | 11,000,000 | | | 3.7500 | | 3/1/2020 | | | 9,590,625 | |
| | | | | | | | | | | | | |
| REIT - 9.19% | | | | | | | | | | | | |
| Apollo Commercial Real Estate Finance, Inc. | | | 11,000,000 | | | 5.5000 | | 3/15/2019 | | | 11,061,930 | |
| Blackstone Mortgage Trust, Inc. | | | 12,000,000 | | | 5.2500 | | 12/1/2018 | | | 12,592,500 | |
| Colony Capital, Inc. | | | 15,000,000 | | | 3.8750 | | 1/15/2021 | | | 14,503,125 | |
| PennyMac Corp. | | | 10,000,000 | | | 5.3750 | | 5/1/2020 | | | 9,100,000 | |
| Resource Capital Corp. | | | 3,000,000 | | | 6.0000 | | 12/1/2018 | | | 2,760,000 | |
| Resource Capital Corp. | | | 16,000,000 | | | 8.0000 | | 1/15/2020 | | | 15,210,000 | |
| | | | | | | | | | | | 65,227,555 | |
| RETAIL - 0.81% | | | | | | | | | | | | |
| GNC Holdings, Inc. - 144A | | | 7,000,000 | | | 1.5000 | | 8/15/2020 | | | 5,775,000 | |
The accompanying notes are an integral part of these financial statements.
| Miller Convertible Bond Fund |
| SCHEDULE OF INVESTMENTS (Continued) |
| October 31, 2015 |
| | | Principal | | | Interest Rate | | | | | |
| Security | | Amount | | | (%) | | Maturity Date | | Market Value | |
| | | | | | | | | | | | | |
| SEMICONDUCTORS - 2.70% | | | | | | | | | | | | |
| NVIDIA Corp. | | $ | 1,000,000 | | | 1.0000 | | 12/1/2018 | | $ | 1,466,875 | |
| ON Semiconductor Corp. - 144A | | | 18,000,000 | | | 1.0000 | | 12/1/2020 | | | 17,775,000 | |
| | | | | | | | | | | | 19,241,875 | |
| SOFTWARE - 2.74% | | | | | | | | | | | | |
| Akamai Technologies, Inc. | | | 2,000,000 | | | 0.0000 | | 2/15/2019 | | | 2,028,760 | |
| BroadSoft, Inc. - 144A | | | 5,000,000 | | | 1.0000 | | 9/1/2022 | | | 5,115,625 | |
| Synchronoss Technologies, Inc. | | | 9,000,000 | | | 0.7500 | | 8/15/2019 | | | 9,219,375 | |
| Verint Systems, Inc. | | | 3,000,000 | | | 1.5000 | | 6/1/2021 | | | 3,043,125 | |
| | | | | | | | | | | | 19,406,885 | |
| TELECOMMUNICATIONS - 4.51% | | | | | | | | | | | | |
| CalAmp Corp. - 144A | | | 20,000,000 | | | 1.6250 | | 5/15/2020 | | | 19,512,500 | |
| Finisar Corp. | | | 14,000,000 | | | 0.5000 | | 12/15/2033 | | | 12,556,250 | |
| | | | | | | | | | | | 32,068,750 | |
| TRANSPORTATION - 7.02% | | | | | | | | | | | | |
| Atlas Air Worldwide Holdings | | | 23,000,000 | | | 2.2500 | | 6/1/2022 | | | 19,478,125 | |
| Echo Global Logistics, Inc. | | | 21,800,000 | | | 2.5000 | | 5/1/2020 | | | 20,655,500 | |
| Hornbeck Offshore Services, Inc. | | | 13,000,000 | | | 1.5000 | | 9/1/2019 | | | 9,644,375 | |
| | | | | | | | | | | | 49,778,000 | |
| | | | | | | | | | | | | |
| TOTAL CONVERTIBLE BONDS | | | | | | | | | | | 657,931,105 | |
| (Cost - $663,392,106) | | | | | | | | | | | | |
| | | | | | | | | | | | | |
| U.S. TREASURY OBLIGATIONS - 4.92% | | | | | | | | | | | | |
| United States Treasury Notes | | | 15,000,000 | | | 0.6250 | | 6/30/2017 | | | 14,994,630 | |
| United States Treasury Notes | | | 5,000,000 | | | 0.7500 | | 2/28/2018 | | | 4,985,320 | |
| United States Treasury Notes | | | 5,000,000 | | | 1.0000 | | 6/30/2019 | | | 4,954,070 | |
| United States Treasury Notes | | | 5,000,000 | | | 1.2500 | | 1/31/2020 | | | 4,965,330 | |
| United States Treasury Notes | | | 1,000,000 | | | 1.5000 | | 5/31/2020 | | | 1,001,927 | |
| United States Treasury Notes | | | 4,000,000 | | | 1.6250 | | 6/30/2020 | | | 4,024,064 | |
| TOTAL U.S. TREASURY OBLIGATIONS | | | | | | | | | | | 34,925,341 | |
| (Cost - $34,829,801) | | | | | | | | | | | | |
| | | Shares | | | | | | | | | |
| SHORT-TERM INVESTMENTS - 1.84% | | | | | | | | | | | | |
| MONEY MARKET FUND - 1.84% | | | | | | | | | | | | |
| Milestone Treasury Obligations Portfolio - Institutional Class + | | | 13,026,181 | | | 0.0100 | | | | | 13,026,181 | |
| TOTAL SHORT-TERM INVESTMENTS | | | | | | | | | | | | |
| (Cost - $13,026,181) | | | | | | | | | | | | |
| | | | | | | | | | | | | |
| TOTAL INVESTMENTS - 99.48% | | | | | | | | | | | | |
| (Cost - $711,248,088) (a) | | | | | | | | | | $ | 705,882,627 | |
| OTHER ASSETS LESS LIABILITIES - 0.52% | | | | | | | | | | | 3,669,564 | |
| NET ASSETS - 100.00% | | | | | | | | | | $ | 709,552,191 | |
| + | Variable rate security. Interest rate is as of October 31, 2015. |
REIT - Real Estate Investment Trusts.
144A- Security exempt from registration under Rule 144a of the Securities Act of 1933. These securities may be sold in transactions exempt from registration, normally to qualified institutional buyers.
| (a) | Represents cost for financial reporting purposes. Aggregate cost for federal tax purposes is $706,182,354 and differs from value by net unrealized appreciation (depreciation) of securities as follows: |
| Unrealized Appreciation: | | $ | 40,426,489 | |
| Unrealized Depreciation: | | | (40,726,216 | ) |
| Net Unrealized Depreciation: | | $ | (299,727 | ) |
The accompanying notes are an integral part of these financial statements.
| Miller Convertible Bond Fund |
| SCHEDULE OF INVESTMENTS (Continued) |
| October 31, 2015 |
| | | Notional | | | Termination | | Payable for Open | |
| TOTAL RETURN SWAP | | Amount | | | Date | | Swap Contracts | |
| | | | | | | | | | | |
| Agreement with ReFlow Fund, LLC dated March 1, 2015 to receive total return of the Fund, based on its daily change in NAV less USD-1M LIBOR plus an annualized spread of 1.95%. | | $ | 47,967,604 | | | 12/31/2015 | | $ | (64,298 | ) |
| PORTFOLIO ANALYSIS (Unaudited) |
| As of October 31, 2015 |
| | | % of Net | |
| Sector | | Assets | |
| Financial | | | 25.71 | % |
| Consumer, Non-Cyclical | | | 18.02 | % |
| Consumer, Cyclical | | | 11.66 | % |
| Technology | | | 11.53 | % |
| Industrial | | | 10.40 | % |
| Communications | | | 8.25 | % |
| Government | | | 4.92 | % |
| Energy | | | 4.65 | % |
| Diversified | | | 2.50 | % |
| Short-Term Investments | | | 1.84 | % |
| Assets Less Liabilities | | | 0.52 | % |
| | | | 100.00 | % |
The accompanying notes are an integral part of these financial statements.
| Miller Convertible Plus Fund |
| SCHEDULE OF INVESTMENTS |
| October 31, 2015 |
| | | Principal | | | Interest Rate | | | | | |
| Security | | Amount | | | (%) | | Maturity Date | | Market Value | |
| | | | | | | | | | | | | |
| CONVERTIBLE BONDS - 133.45% | | | | | | | | | | | | |
| APPAREL - 1.96% | | | | | | | | | | | | |
| Iconix Brand Group, Inc. * | | $ | 1,000,000 | | | 1.5000 | | 3/15/2018 | | $ | 849,375 | |
| | | | | | | | | | | | | |
| AUTO MANUFACTURERS - 1.86% | | | | | | | | | | | | |
| General Motors Co. - Societe Generale SA Synthetic * | | | 800,000 | | | 0.0000 | | 11/16/2021 | | | 805,280 | |
| | | | | | | | | | | | | |
| BANKS - 1.04% | | | | | | | | | | | | |
| Goldman Sachs Group, Inc. - Kansas City Southern Synthetic * | | | 500,000 | | | 0.0000 | | 2/16/2021 | | | 450,015 | |
| | | | | | | | | | | | | |
| BIOTECHNOLOGY - 12.85% | | | | | | | | | | | | |
| Acorda Therapeutics, Inc. * | | | 1,500,000 | | | 1.7500 | | 6/15/2021 | | | 1,601,250 | |
| ANI Pharmaceuticals, Inc. * | | | 2,200,000 | | | 3.0000 | | 12/1/2019 | | | 2,117,500 | |
| Emergent BioSolutions, Inc. * | | | 1,500,000 | | | 2.8750 | | 1/15/2021 | | | 1,846,875 | |
| | | | | | | | | | | | 5,565,625 | |
| COMPUTERS - 9.27% | | | | | | | | | | | | |
| Brocade Communications Systems, Inc. - 144A * | | | 300,000 | | | 1.3750 | | 1/1/2020 | | | 295,688 | |
| Electronics For Imaging, Inc. * | | | 1,500,000 | | | 0.7500 | | 9/1/2019 | | | 1,602,188 | |
| Sandisk Corp. * | | | 2,000,000 | | | 0.5000 | | 10/15/2020 | | | 2,118,750 | |
| | | | | | | | | | | | 4,016,626 | |
| DIVERSIFIED FINIANCIAL SERVICES - 1.03% | | | | | | | | | | | | |
| Encore Capital Group, Inc. * | | | 500,000 | | | 2.8750 | | 3/15/2021 | | | 447,187 | |
| | | | | | | | | | | | | |
| ELECTRICAL COMPONENTS & EQUIPMENT - 2.12% | | | | | | | | | | | | |
| SunPower Corp. * | | | 1,000,000 | | | 0.8750 | | 6/1/2021 | | | 919,375 | |
| | | | | | | | | | | | | |
| ELECTRONICS - 4.90% | | | | | | | | | | | | |
| TTM Technologies, Inc. * | | | 2,200,000 | | | 1.7500 | | 12/15/2020 | | | 2,120,250 | |
| | | | | | | | | | | | | |
| ENERGY-ALTERNATE SOURCES - 1.40% | | | | | | | | | | | | |
| Renewable Energy Group, Inc. * | | | 733,000 | | | 2.7500 | | 6/15/2019 | | | 607,932 | |
| | | | | | | | | | | | | |
| FOREST PRODUCTS & PAPER - 2.18% | | | | | | | | | | | | |
| International Paper Co. - Barclays Bank PLC Synthetic * | | | 1,000,000 | | | 0.0000 | | 7/23/2021 | | | 945,200 | |
| | | | | | | | | | | | | |
| HEALTHCARE PRODUCTS - 3.62% | | | | | | | | | | | | |
| Trinity Biotech Investment Ltd. - 144A * | | | 1,800,000 | | | 4.0000 | | 4/1/2045 | | | 1,567,125 | |
| | | | | | | | | | | | | |
| HOLDING COMPANIES-DIVERSIFIED - 4.32% | | | | | | | | | | | | |
| RWT Holdings, Inc. - 144A * | | | 2,000,000 | | | 5.6250 | | 11/15/2019 | | | 1,870,000 | |
| | | | | | | | | | | | | |
| HOME BUILDERS - 10.51% | | | | | | | | | | | | |
| CalAtlantic Group, Inc. * | | | 500,000 | | | 0.2500 | | 6/1/2019 | | | 460,000 | |
| LGI Homes, Inc. - 144A * | | | 1,500,000 | | | 4.2500 | | 11/15/2019 | | | 2,138,437 | |
| M/I Homes, Inc. * | | | 1,500,000 | | | 3.0000 | | 3/1/2018 | | | 1,455,000 | |
| Meritage Homes Corp. * | | | 500,000 | | | 1.8750 | | 9/15/2032 | | | 500,938 | |
| | | | | | | | | | | | 4,554,375 | |
| INTERNET - 8.66% | | | | | | | | | | | | |
| Google, Inc. - Goldman Sachs Group, Inc. Synthetic * | | | 450,000 | | | 0.0000 | | 2/19/2021 | | | 484,699 | |
| Google, Inc. - UBS AG Synthetic * | | | 540,000 | | | 0.0000 | | 2/15/2021 | | | 563,220 | |
| J2 Global, Inc. * | | | 500,000 | | | 3.2500 | | 6/15/2029 | | | 636,875 | |
| LinkedIn Corp. - 144A * | | | 1,900,000 | | | 0.5000 | | 11/1/2019 | | | 2,066,260 | |
| | | | | | | | | | | | 3,751,054 | |
| INVESTMENT COMPANIES - 1.16% | | | | | | | | | | | | |
| New Mountain Finance Corp. * | | | 500,000 | | | 5.0000 | | 6/15/2019 | | | 501,563 | |
The accompanying notes are an integral part of these financial statements.
| Miller Convertible Plus Fund |
| SCHEDULE OF INVESTMENTS (Continued) |
| October 31, 2015 |
| | | Principal | | | Interest Rate | | | | | |
| Security | | Amount | | | (%) | | Maturity Date | | Market Value | |
| | | | | | | | | | | |
| MISCELLANEOUS MANUFACTURING - 5.23% | | | | | | | | | | | | |
| General Electric Co. - Barclays Bank PLC Synthetic * | | $ | 2,200,000 | | | 0.0000 | | 8/18/2021 | | $ | 2,264,020 | |
| | | | | | | | | | | | | |
| OIL & GAS SERVICES - 0.95% | | | | | | | | | | | | |
| Seacor Holdings, Inc. * | | | 500,000 | | | 3.0000 | | 11/15/2028 | | | 409,687 | |
| | | | | | | | | | | | | |
| PHARMACEUTICALS - 11.72% | | | | | | | | | | | | |
| Horizon Pharma Investment, Ltd. - 144A * | | | 1,526,000 | | | 2.5000 | | 3/15/2022 | | | 1,318,082 | |
| Impax Laboratories, Inc. - 144A * | | | 2,000,000 | | | 2.0000 | | 6/15/2022 | | | 1,850,000 | |
| Jazz Investments, Ltd. * | | | 1,800,000 | | | 1.8750 | | 8/15/2021 | | | 1,906,398 | |
| | | | | | | | | | | | 5,074,480 | |
| REITS - 18.36% | | | | | | | | | | | | |
| Apollo Commercial Real Estate * | | | 1,800,000 | | | 5.5000 | | 3/15/2019 | | | 1,810,135 | |
| Blackstone Mortgage Trust, Inc. * | | | 1,700,000 | | | 5.2500 | | 12/1/2018 | | | 1,783,937 | |
| Colony Financials, Inc. * | | | 1,500,000 | | | 3.8750 | | 1/15/2021 | | | 1,450,313 | |
| PennyMac Corp. * | | | 1,000,000 | | | 5.3750 | | 5/1/2020 | | | 910,000 | |
| Resource Capital Corp. * | | | 2,100,000 | | | 8.0000 | | 1/15/2020 | | | 1,996,313 | |
| | | | | | | | | | | | 7,950,698 | |
| RETAIL - 0.95% | | | | | | | | | | | | |
| GNC Holdings, Inc. - 144A * | | | 500,000 | | | 1.5000 | | 8/15/2020 | | | 412,500 | |
| | | | | | | | | | | | | |
| SEMICONDUCTORS - 4.56% | | | | | | | | | | | | |
| ON Semiconductor Corp. - 144A * | | | 2,000,000 | | | 1.0000 | | 12/1/2020 | | | 1,975,000 | |
| | | | | | | | | | | | | |
| SOFTWARE - 8.27% | | | | | | | | | | | | |
| BroadSoft, Inc. - 144A * | | | 1,800,000 | | | 1.0000 | | 9/1/2022 | | | 1,841,625 | |
| Synchronoss Technologies, Inc. * | | | 1,700,000 | | | 0.7500 | | 8/15/2019 | | | 1,741,437 | |
| | | | | | | | | | | | 3,583,062 | |
| TELECOMMUNICATIONS - 6.57% | | | | | | | | | | | | |
| CalAmp Corp. - 144A * | | | 2,000,000 | | | 1.6250 | | 5/15/2020 | | | 1,951,250 | |
| Finisar Corp. * | | | 1,000,000 | | | 0.5000 | | 12/15/2033 | | | 896,875 | |
| | | | | | | | | | | | 2,848,125 | |
| TRANSPORTATION - 9.96% | | | | | | | | | | | | |
| Atlas Air Worldwide Holdings, Inc. * | | | 2,200,000 | | | 2.2500 | | 6/1/2022 | | | 1,863,125 | |
| Echo Global Logistics, Inc. * | | | 2,200,000 | | | 2.5000 | | 5/1/2020 | | | 2,084,500 | |
| Hornbeck Offshore Services, Inc. * | | | 500,000 | | | 1.5000 | | 9/1/2019 | | | 370,937 | |
| | | | | | | | | | | | 4,318,562 | |
| TOTAL CONVERTIBLE BONDS | | | | | | | | | | | | |
| (Cost - $59,079,208) | | | | | | | | | | | 57,807,116 | |
| | | | | | | | | | | | | |
| U.S. TREASURY OBLIGATIONS - 4.60% | | | | | | | | | | | | |
| United States Treasury Notes * | | | 500,000 | | | 0.6250 | | 6/30/2017 | | | 499,821 | |
| United States Treasury Notes * | | | 1,000,000 | | | 0.6250 | | 4/30/2018 | | | 992,461 | |
| United States Treasury Notes * | | | 500,000 | | | 1.3750 | | 2/29/2020 | | | 498,985 | |
| TOTAL U.S. TREASURY OBLIGATIONS | | | | | | | | | | | 1,991,267 | |
| (Cost - $1,993,173) | | | | | | | | | | | | |
| | | | | | | | | | | | | |
| SHORT-TERM INVESTMENTS - 3.70% | | | | | | | | | | | | |
| MONEY MARKET FUND - 3.70% | | Shares | | | | | | | | | |
| Milestone Treasury Obligations Portfolio - Institutional Class + | | | 1,602,273 | | | 0.0100 | | | | | 1,602,273 | |
| TOTAL SHORT-TERM INVESTMENTS | | | | | | | | | | | | |
| (Cost - $1,602,273) | | | | | | | | | | | | |
The accompanying notes are an integral part of these financial statements.
| Miller Convertible Plus Fund |
| SCHEDULE OF INVESTMENTS (Continued) |
| October 31, 2015 |
| | | Market Value | |
| | | | | |
| TOTAL INVESTMENTS - 141.75% | | | | |
| (Cost - $62,674,654) (a) | | $ | 61,400,656 | |
| LIABILITIES IN EXCESS OF OTHER ASSETS - (41.75)% | | | (18,083,443 | ) |
| NET ASSETS - 100.00% | | $ | 43,317,213 | |
| * | All or a portion of this security is seggregated as collateral for the Line of Credit as of October 31, 2015. |
| + | Variable rate security. Interest rate is as of October 31, 2015. |
REITS - Real Estate Investment Trusts.
144a- Security exempt from registration under Rule 144a of the Securities Act of 1933. These securities may be sold in transactions exempt from registration, normally to qualified institutional buyers.
| (a) | Represents cost for financial reporting purposes. Aggregate cost for federal tax purposes is $62,545,494 and differs from value by net unrealized appreciation (depreciation) of securities as follows: |
| Unrealized Appreciation: | | $ | 1,875,739 | |
| Unrealized Depreciation: | | | (3,020,577 | ) |
| Net Unrealized Depreciation: | | $ | (1,144,838 | ) |
| | | Notional | | | Termination | | Receivable from | |
| TOTAL RETURN SWAP | | Amount | | | Date | | Open Swap Contracts | |
| | | | | | | | | | | |
| Agreement with ReFlow Fund, LLC dated January 9, 2015 to receive total return of the Fund, based on its daily change in NAV less USD-1M LIBOR plus an annualized spread of 1.95%. | | $ | 3,592,643 | | | 11/30/2015 | | $ | 249,347 | |
| PORTFOLIO ANALYSIS (Unaudited) |
| As of October 31, 2015 |
| | | % of Net | |
| Sector | | Assets | |
| Financial | | | 33.27 | % |
| Consumer, Non-Cyclical | | | 28.18 | % |
| Technology | | | 22.10 | % |
| Industrial | | | 16.99 | % |
| Consumer, Cyclical | | | 13.42 | % |
| Communications | | | 12.82 | % |
| Government | | | 4.60 | % |
| Diversified | | | 4.32 | % |
| Short-Term Investments | | | 3.70 | % |
| Energy | | | 2.35 | % |
| Liabilities in Excess of Assets | | | (41.75 | )% |
| | | | 100.00 | % |
The accompanying notes are an integral part of these financial statements.
| Miller Intermediate Bond Fund |
| SCHEDULE OF INVESTMENTS |
| October 31, 2015 |
| | | Principal | | | Interest Rate | | | | | |
| Security | | Amount | | | (%) | | Maturity Date | | Market Value | |
| | | | | | | | | | | | | |
| CONVERTIBLE BONDS - 48.32% | | | | | | | | | | | | |
| AUTO MANUFACTURERS - 1.66% | | | | | | | | | | | | |
| General Motors Co. - Societe Generale SA Synthetic | | $ | 700,000 | | | 0.0000 | | 11/16/2021 | | $ | 704,620 | |
| | | | | | | | | | | | | |
| BANKS - 0.42% | | | | | | | | | | | | |
| Goldman Sachs Group, Inc. - Kansas City Southern Synthetic | | | 200,000 | | | 0.0000 | | 2/16/2021 | | | 180,006 | |
| | | | | | | | | | | | | |
| BIOTECHNOLOGY - 2.55% | | | | | | | | | | | | |
| ANI Pharmaceuticals, Inc. | | | 1,000,000 | | | 3.0000 | | 12/1/2019 | | | 962,500 | |
| Emergent BioSolutions, Inc. | | | 100,000 | | | 2.8750 | | 1/15/2021 | | | 123,125 | |
| | | | | | | | | | | | 1,085,625 | |
| COMPUTERS - 3.00% | | | | | | | | | | | | |
| Electronics For Imaging, Inc. | | | 500,000 | | | 0.7500 | | 9/1/2019 | | | 534,063 | |
| SanDisk Corp. | | | 700,000 | | | 0.5000 | | 10/15/2020 | | | 741,562 | |
| | | | | | | | | | | | 1,275,625 | |
| DIVERSIFIED FINANCIAL SERVICES - 1.05% | | | | | | | | | | | | |
| Encore Capital Group, Inc. | | | 500,000 | | | 2.8750 | | 3/15/2021 | | | 447,188 | |
| | | | | | | | | | | | | |
| ELECTRONICS - 2.26% | | | | | | | | | | | | |
| TTM Technologies, Inc. | | | 1,000,000 | | | 1.7500 | | 12/15/2020 | | | 963,750 | |
| | | | | | | | | | | | | |
| FOREST PRODUCTS & PAPER - 1.32% | | | | | | | | | | | | |
| International Paper Co. - Wells Fargo & Co Synthetic | | | 600,000 | | | 0.0000 | | 6/10/2020 | | | 560,280 | |
| | | | | | | | | | | | | |
| HEALTHCARE PRODUCTS - 1.23% | | | | | | | | | | | | |
| Trinity Biotech Investment, Ltd. - 144A | | | 600,000 | | | 4.0000 | | 4/1/2045 | | | 522,375 | |
| | | | | | | | | | | | | |
| HOLDING COMPANIES-DIVERSIFIED - 0.88% | | | | | | | | | | | | |
| RWT Holdings, Inc. - 144A | | | 400,000 | | | 5.6250 | | 11/15/2019 | | | 374,000 | |
| | | | | | | | | | | | | |
| HOME BUILDERS - 2.92% | | | | | | | | | | | | |
| LGI Homes, Inc. - 144A | | | 600,000 | | | 4.2500 | | 11/15/2019 | | | 855,375 | |
| M/I Homes, Inc. | | | 400,000 | | | 3.0000 | | 3/1/2018 | | | 388,000 | |
| | | | | | | | | | | | 1,243,375 | |
| INTERNET - 2.84% | | | | | | | | | | | | |
| Google, Inc. - Goldman Sachs Group, Inc. Synthetic | | | 400,000 | | | 0.0000 | | 2/19/2021 | | | 430,844 | |
| J2 Global, Inc. | | | 100,000 | | | 3.2500 | | 6/15/2029 | | | 127,375 | |
| LinkedIn Corp. - 144A | | | 600,000 | | | 0.5000 | | 11/1/2019 | | | 652,503 | |
| | | | | | | | | | | | 1,210,722 | |
| MISCELLANEOUS MANUFACTURING - 2.66% | | | | | | | | | | | | |
| General Electric Co. - Barclays Bank PLC Synthetic | | | 1,100,000 | | | 0.0000 | | 8/18/2021 | | | 1,132,010 | |
| | | | | | | | | | | | | |
| OIL & GAS SERVICES - 0.77% | | | | | | | | | | | | |
| Seacor Holdings, Inc. | | | 400,000 | | | 3.0000 | | 11/15/2028 | | | 327,750 | |
| | | | | | | | | | | | | |
| PHARMACEUTICALS - 5.90% | | | | | | | | | | | | |
| Horizon Pharma Investment, Ltd. - 144A | | | 610,000 | | | 2.5000 | | 3/15/2022 | | | 526,887 | |
| Impax Laboratories, Inc. - 144A | | | 1,000,000 | | | 2.0000 | | 6/15/2022 | | | 925,000 | |
| Jazz Investments, Ltd. | | | 1,000,000 | | | 1.8750 | | 8/15/2021 | | | 1,059,110 | |
| | | | | | | | | | | | 2,510,997 | |
| REITS - 6.38% | | | | | | | | | | | | |
| Apollo Commercial Real Estate | | | 700,000 | | | 5.5000 | | 3/15/2019 | | | 703,941 | |
| Blackstone Mortgage Trust, Inc. | | | 300,000 | | | 5.2500 | | 12/1/2018 | | | 314,813 | |
| Colony Financials, Inc. | | | 300,000 | | | 3.8750 | | 1/15/2021 | | | 290,062 | |
| PennyMac Corp. | | | 500,000 | | | 5.3750 | | 5/1/2020 | | | 455,000 | |
| Resource Capital Corp. | | | 1,000,000 | | | 8.0000 | | 1/15/2020 | | | 950,625 | |
| | | | | | | | | | | | 2,714,441 | |
The accompanying notes are an integral part of these financial statements.
| Miller Intermediate Bond Fund |
| SCHEDULE OF INVESTMENTS (Continued) |
| October 31, 2015 |
| | | Principal | | | Interest Rate | | | | | |
| Security | | Amount | | | (%) | | Maturity Date | | Market Value | |
| | | | | | | | | | | | | |
| SEMICONDUCTORS - 2.32% | | | | | | | | | | | | |
| ON Semiconductor Corp. - 144A | | $ | 1,000,000 | | | 1.0000 | | 12/1/2020 | | $ | 987,500 | |
| | | | | | | | | | | | | |
| SOFTWARE - 2.89% | | | | | | | | | | | | |
| BroadSoft, Inc. - 144A | | | 400,000 | | | 1.0000 | | 9/1/2022 | | | 409,250 | |
| Synchronoss Technologies, Inc. | | | 800,000 | | | 0.7500 | | 8/15/2019 | | | 819,500 | |
| | | | | | | | | | | | 1,228,750 | |
| TELECOMMUNICATIONS - 2.71% | | | | | | | | | | | | |
| CalAmp Corp. - 144A | | | 1,000,000 | | | 1.6250 | | 5/15/2020 | | | 975,625 | |
| Finisar Corp. | | | 200,000 | | | 0.5000 | | 12/15/2033 | | | 179,375 | |
| | | | | | | | | | | | 1,155,000 | |
| TRANSPORTATION - 4.56% | | | | | | | | | | | | |
| Atlas Air Worldwide Holdings, Inc. | | | 1,000,000 | | | 2.2500 | | 6/1/2022 | | | 846,875 | |
| Echo Global Logistics, Inc. | | | 1,000,000 | | | 2.5000 | | 5/1/2020 | | | 947,500 | |
| Hornbeck Offshore Services, Inc. | | | 200,000 | | | 1.5000 | | 9/1/2019 | | | 148,375 | |
| | | | | | | | | | | | 1,942,750 | |
| TOTAL CONVERTIBLE BONDS | | | | | | | | | | | | |
| (Cost - $20,728,978) | | | | | | | | | | | 20,566,764 | |
| | | | | | | | | | | | | |
| CORPORATE BONDS & NOTES - 15.06% | | | | | | | | | | | | |
| AEROSPACE/DEFENSE - 0.67% | | | | | | | | | | | | |
| L-3 Communications Corp. | | | 300,000 | | | 3.9500 | | 5/28/2024 | | | 286,917 | |
| | | | | | | | | | | | | |
| AIRLINES - 0.36% | | | | | | | | | | | | |
| Allegiant Travel Co. | | | 150,000 | | | 5.5000 | | 7/15/2019 | | | 153,900 | |
| | | | | | | | | | | | | |
| CHEMICALS - 0.95% | | | | | | | | | | | | |
| Celanese US Holdings LLC | | | 200,000 | | | 4.6250 | | 11/15/2022 | | | 201,750 | |
| Chemtura Corp. | | | 200,000 | | | 5.7500 | | 7/15/2021 | | | 204,000 | |
| | | | | | | | | | | | 405,750 | |
| ELECTRICAL COMPONENTS & EQUIPMENT - 0.46% | | | | | | | | | | | | |
| Anixter, Inc. | | | 190,000 | | | 5.1250 | | 10/1/2021 | | | 195,225 | |
| | | | | | | | | | | | | |
| ELECTRONICS - 0.59% | | | | | | | | | | | | |
| Jabil Circuit, Inc. | | | 250,000 | | | 4.7000 | | 9/15/2022 | | | 252,563 | |
| | | | | | | | | | | | | |
| HOME BUILDERS - 0.96% | | | | | | | | | | | | |
| DR Horton, Inc. | | | 200,000 | | | 4.3750 | | 9/15/2022 | | | 205,000 | |
| MDC Holdings, Inc. | | | 200,000 | | | 5.5000 | | 1/15/2024 | | | 205,000 | |
| | | | | | | | | | | | 410,000 | |
| INVESTMENT COMPANIES - 1.66% | | | | | | | | | | | | |
| FS Investment Corp. | | | 350,000 | | | 4.0000 | | 7/15/2019 | | | 352,513 | |
| PennantPark Investment Co. | | | 350,000 | | | 4.5000 | | 10/1/2019 | | | 352,212 | |
| | | | | | | | | | | | 704,725 | |
| IRON/STEEL - 1.22% | | | | | | | | | | | | |
| Carpenter Technology Corp. | | | 350,000 | | | 4.4500 | | 3/1/2023 | | | 341,933 | |
| Commercial Metals Co. | | | 200,000 | | | 4.8750 | | 5/15/2023 | | | 178,000 | |
| | | | | | | | | | | | 519,933 | |
| MACHINERY-CONSTRUCTION & MINING - 0.84% | | | | | | | | | | | | |
| Joy Global, Inc. | | | 400,000 | | | 5.1250 | | 10/15/2021 | | | 357,810 | |
| | | | | | | | | | | | | |
| MINING - 0.87% | | | | | | | | | | | | |
| Newmont Mining Corp. | | | 400,000 | | | 3.5000 | | 3/15/2022 | | | 369,759 | |
The accompanying notes are an integral part of these financial statements.
| Miller Intermediate Bond Fund |
| SCHEDULE OF INVESTMENTS (Continued) |
| October 31, 2015 |
| | | Principal | | | Interest Rate | | | | | |
| Security | | Amount | | | (%) | | Maturity Date | | Market Value | |
| | | | | | | | | | | |
| MISCELLANEOUS MANUFACTURING - 0.90% | | | | | | | | | | | | |
| Trinity Industries, Inc. | | $ | 400,000 | | | 4.5500 | | 10/1/2024 | | $ | 380,918 | |
| | | | | | | | | | | | | |
| OIL & GAS - 0.36% | | | | | | | | | | | | |
| Atwood Oceanics Inc. | | | 200,000 | | | 6.5000 | | 2/1/2020 | | | 155,000 | |
| | | | | | | | | | | | | |
| OIL & GAS SERVICES - 1.52% | | | | | | | | | | | | |
| FMC Technologies, Inc. | | | 400,000 | | | 3.4500 | | 10/1/2022 | | | 368,932 | |
| Oceaneering International, Inc. | | | 300,000 | | | 4.6500 | | 11/15/2024 | | | 279,477 | |
| | | | | | | | | | | | 648,409 | |
| RETAIL - 1.70% | | | | | | | | | | | | |
| Coach, Inc. | | | 350,000 | | | 4.2500 | | 4/1/2025 | | | 332,186 | |
| Staples, Inc. | | | 400,000 | | | 4.3750 | | 1/12/2023 | | | 390,486 | |
| | | | | | | | | | | | 722,672 | |
| SEMICONDUCTORS - 1.41% | | | | | | | | | | | | |
| KLA-Tencor Corp. | | | 350,000 | | | 4.6500 | | 11/1/2024 | | | 353,062 | |
| Micron Technology, Inc. - 144A | | | 250,000 | | | 5.2500 | | 8/1/2023 | | | 244,872 | |
| | | | | | | | | | | | 597,934 | |
| TELECOMMUNICATIONS - 0.59% | | | | | | | | | | | | |
| Juniper Networks, Inc. | | | 250,000 | | | 4.5000 | | 3/15/2024 | | | 250,322 | |
| | | | | | | | | | | | | |
| TOTAL CORPORATE BONDS & NOTES (Cost - $6,585,871) | | | | | | | | | | | 6,411,837 | |
| | | | | | | | | | | | | |
| U.S. TREASURY OBLIGATIONS - 35.26% | | | | | | | | | | | | |
| United States Treasury Notes | | | 600,000 | | | 0.6250 | | 12/31/2016 | | | 600,941 | |
| United States Treasury Notes | | | 800,000 | | | 0.5000 | | 1/31/2017 | | | 799,776 | |
| United States Treasury Notes | | | 850,000 | | | 0.5000 | | 2/28/2017 | | | 849,336 | |
| United States Treasury Notes | | | 900,000 | | | 0.6250 | | 6/30/2017 | | | 899,678 | |
| United States Treasury Notes | | | 600,000 | | | 1.0000 | | 12/15/2017 | | | 602,449 | |
| United States Treasury Notes | | | 600,000 | | | 0.8750 | | 1/15/2018 | | | 600,395 | |
| United States Treasury Notes | | | 400,000 | | | 0.7500 | | 2/28/2018 | | | 398,825 | |
| United States Treasury Notes | | | 850,000 | | | 1.0000 | | 3/15/2018 | | | 852,197 | |
| United States Treasury Notes | | | 600,000 | | | 1.3750 | | 12/31/2018 | | | 604,891 | |
| United States Treasury Notes | | | 600,000 | | | 1.6250 | | 12/31/2019 | | | 605,414 | |
| United States Treasury Notes | | | 600,000 | | | 1.2500 | | 1/31/2020 | | | 595,840 | |
| United States Treasury Notes | | | 850,000 | | | 1.3750 | | 2/29/2020 | | | 848,274 | |
| United States Treasury Notes | | | 2,000,000 | | | 1.1250 | | 4/30/2020 | | | 1,971,328 | |
| United States Treasury Notes | | | 700,000 | | | 1.3750 | | 8/31/2020 | | | 696,254 | |
| United States Treasury Notes | | | 600,000 | | | 2.1250 | | 12/31/2021 | | | 611,586 | |
| United States Treasury Notes | | | 600,000 | | | 1.5000 | | 1/31/2022 | | | 588,918 | |
| United States Treasury Notes | | | 850,000 | | | 1.7500 | | 2/28/2022 | | | 846,259 | |
| United States Treasury Notes | | | 600,000 | | | 1.6250 | | 11/15/2022 | | | 589,363 | |
| United States Treasury Notes | | | 600,000 | | | 2.2500 | | 11/15/2024 | | | 606,559 | |
| United States Treasury Notes | | | 850,000 | | | 2.0000 | | 2/15/2025 | | | 840,299 | |
| TOTAL U.S. TREASURY OBLIGATIONS | | | | | | | | | | | 15,008,582 | |
| (Cost - $15,007,994) | | | | | | | | | | | | |
| | | | | | | | | | | | | |
| SHORT-TERM INVESTMENTS - 0.87% | | | | | | | | | | | | |
| MONEY MARKET FUND - 0.87% | | Shares | | | | | | | | | |
| Milestone Treasury Obligations Portfolio - Institutional Class + | | | 369,666 | | | 0.0100 | | | | | 369,666 | |
| TOTAL SHORT-TERM INVESTMENTS | | | | | | | | | | | | |
| (Cost - $369,666) | | | | | | | | | | | | |
The accompanying notes are an integral part of these financial statements.
| Miller Intermediate Bond Fund |
| SCHEDULE OF INVESTMENTS (Continued) |
| October 31, 2015 |
| | | Market Value | |
| | | | | |
| TOTAL INVESTMENTS - 99.51% | | | | |
| (Cost - $42,692,509) (a) | | $ | 42,356,849 | |
| OTHER ASSETS LESS LIABILITIES - 0.49% | | | 208,423 | |
| NET ASSETS - 100.00% | | $ | 42,565,272 | |
| + | Variable rate security. Interest rate is as of October 31, 2015. |
REITS - Real Estate Investment Trusts.
144a - Security exempt from registration under Rule 144a of the Securities Act of 1933. These securities may be sold in transactions exempt from registration, normally to qualified institutional buyers.
| (a) | Represents cost for financial reporting purposes. Aggregate cost for federal tax purposes is $42,717,393 and differs from value by net unrealized appreciation (depreciation) of securities as follows: |
| Unrealized Appreciation: | | $ | 749,807 | |
| Unrealized Depreciation: | | | (1,110,351 | ) |
| Net Unrealized Depreciation: | | $ | (360,544 | ) |
| PORTFOLIO ANALYSIS (Unaudited) |
| As of October 31, 2015 |
| | | % of Net | |
| Sector | | Assets | |
| Government | | | 35.26 | % |
| Financial | | | 16.15 | % |
| Industrial | | | 10.29 | % |
| Consumer, Non-Cyclical | | | 9.68 | % |
| Technology | | | 9.61 | % |
| Consumer, Cyclical | | | 5.94 | % |
| Communications | | | 5.13 | % |
| Basic Materials | | | 3.04 | % |
| Energy | | | 2.66 | % |
| Diversified | | | 0.88 | % |
| Short-Term Investments | | | 0.87 | % |
| Assets Less Liabilities | | | 0.49 | % |
| | | | 100.00 | % |
The accompanying notes are an integral part of these financial statements.
| Miller Funds |
| STATEMENT OF ASSETS AND LIABILITIES |
| October 31, 2015 |
| | | Miller | | | Miller | | | Miller | |
| | | Convertible | | | Convertible | | | Intermediate | |
| | | Bond Fund | | | Plus Fund | | | Bond Fund | |
| Assets: | | | | | | | | | | | | |
| Investments in Securities at Cos | | $ | 711,248,088 | | | $ | 62,674,654 | | | $ | 42,692,509 | |
| Investments in Securities at Value | | $ | 705,882,627 | | | $ | 61,400,656 | | | $ | 42,356,849 | |
| Segregated Cash- Collateral for Loan | | | — | | | | 56,035 | | | | — | |
| Interest Receivable | | | 4,947,367 | | | | 461,865 | | | | 279,291 | |
| Receivable from Fund Shares Sold | | | 1,646,843 | | | | 21,000 | | | | 21,000 | |
| Receivable from Open Swap Contracts | | | — | | | | 249,347 | | | | — | |
| Prepaid Expenses and Other Assets | | | 54,357 | | | | 41,754 | | | | 43,559 | |
| Total Assets | | | 712,531,194 | | | | 62,230,657 | | | | 42,700,699 | |
| | | | | | | | | | | | | |
| Liabilities: | | | | | | | | | | | | |
| Loan Payable | | | — | | | | 18,600,000 | | | | — | |
| Redemptions Payable | | | 326,259 | | | | 2,600 | | | | 88,495 | |
| Payable for Securities Purchased | | | 1,882,716 | | | | 189,866 | | | | — | |
| Payable for Open Swap Contracts | | | 64,298 | | | | — | | | | — | |
| Interest Payable | | | — | | | | 18,773 | | | | — | |
| Accrued Advisory Fees | | | 445,391 | | | | 71,622 | | | | 16,608 | |
| Accrued Distribution Fees | | | 126,261 | | | | 65 | | | | 188 | |
| Accrued Expenses and Other Liabilities | | | 134,078 | | | | 30,518 | | | | 30,136 | |
| Total Liabilities | | | 2,979,003 | | | | 18,913,444 | | | | 135,427 | |
| | | | | | | | | | | | | |
| Net Assets | | $ | 709,552,191 | | | $ | 43,317,213 | | | $ | 42,565,272 | |
| | | | | | | | | | | | | |
| Composition of Net Assets: | | | | | | | | | | | | |
| At October 31, 2015, Net Assets consisted of: | | | | | | | | | | | | |
| Paid-in-Capital | | $ | 707,377,735 | | | $ | 43,962,937 | | | $ | 42,573,907 | |
| Undistributed Net Investment Income | | | 7,496,092 | | | | 30,674 | | | | 129,963 | |
| Accumulated Net Realized Gain from Security Transactions and Swaps | | | 465,544 | | | | 348,253 | | | | 197,062 | |
| Net Unrealized Appreciation (Depreciation) on: | | | | | | | | | | | | |
| Investments | | | (5,365,461 | ) | | | (1,273,998 | ) | | | (335,660 | ) |
| Swaps | | | (421,719 | ) | | | 249,347 | | | | — | |
| Net Assets | | $ | 709,552,191 | | | $ | 43,317,213 | | | $ | 42,565,272 | |
| | | | | | | | | | | | | |
| Net Asset Value Per Share | | | | | | | | | | | | |
| Class A Shares | | | | | | | | | | | | |
| Net Assets | | $ | 159,608,023 | | | $ | 82,231 | | | $ | 863,122 | |
| Shares of Beneficial Interest Outstanding (no par value; unlimited shares authorized) | | | 13,133,785 | | | | 3,917 | | | | 55,806 | |
| Net Asset Value and Redemption Price per Share | | $ | 12.15 | | | $ | 20.99 | | | $ | 15.47 | |
| Maximum Offering Price Per Share (Includes a Maximum Sales Charge of 5.75%) | | $ | 12.89 | | | $ | 22.28 | | | $ | 16.41 | |
| | | | | | | | | | | | | |
| Class I Shares | | | | | | | | | | | | |
| Net Assets | | $ | 480,547,702 | | | $ | 43,168,153 | | | $ | 41,597,162 | |
| Shares of Beneficial Interest Outstanding (no par value; unlimited shares authorized) | | | 39,538,473 | | | | 2,054,684 | | | | 2,688,452 | |
| Net Asset Value; Offering and Redemption Price per Share | | $ | 12.15 | | | $ | 21.01 | | | $ | 15.47 | |
| | | | | | | | | | | | | |
| Class C Shares | | | | | | | | | | | | |
| Net Assets | | $ | 69,396,466 | | | $ | 66,829 | | | $ | 104,988 | |
| Shares of Beneficial Interest Outstanding (no par value; unlimited shares authorized) | | | 5,747,737 | | | | 3,200 | | | | 6,745 | |
| Net Asset Value; Offering and Redemption Price per Share | | $ | 12.07 | | | $ | 20.88 | | | $ | 15.57 | |
The accompanying notes are an integral part of these financial statements.
| Miller Funds |
| STATEMENT OF OPERATIONS |
| For the Year Ended October 31, 2015 |
| | | Miller | | | Miller | | | Miller | |
| | | Convertible | | | Convertible | | | Intermediate | |
| | | Bond Fund | | | Plus Fund * | | | Bond Fund * | |
| Investment Income: | | | | | | | | | | | | |
| Interest Income | | $ | 27,024,803 | | | $ | 1,361,670 | | | $ | 734,747 | |
| Other Income | | | 1,409,887 | | | | — | | | | — | |
| Total Investment Income | | | 28,434,690 | | | | 1,361,670 | | | | 734,747 | |
| | | | | | | | | | | | | |
| Expenses: | | | | | | | | | | | | |
| Investment Advisory Fees | | | 5,313,832 | | | | 731,358 | | | | 240,328 | |
| Distribution Fees (Class A) | | | 1,328,062 | | | | 73 | | | | 382 | |
| Distribution Fees (Class C) | | | 676,304 | | | | 413 | | | | 147 | |
| Non 12b-1 Shareholder Servicing Fees | | | 306,277 | | | | 90 | | | | 283 | |
| Administration Fees | | | 252,400 | | | | 13,514 | | | | 16,039 | |
| Transfer Agent Fees | | | 217,480 | | | | 28,667 | | | | 31,101 | |
| Custody Fees | | | 92,260 | | | | 15,747 | | | | 6,656 | |
| Printing Expense | | | 88,146 | | | | 5,504 | | | | 6,109 | |
| Trustees’ Fees | | | 86,002 | | | | 20,602 | | | | 20,591 | |
| Registration and Filing Fees | | | 75,605 | | | | 60,966 | | | | 60,911 | |
| Legal Fees | | | 44,738 | | | | 82,866 | | | | 44,589 | |
| Audit Fees | | | 42,499 | | | | 20,749 | | | | 20,694 | |
| Chief Compliance Officer Fees | | | 27,423 | | | | 8,772 | | | | 5,829 | |
| Insurance Expense | | | 25,616 | | | | 466 | | | | 469 | |
| Interest Expense | | | — | | | | 144,652 | | | | — | |
| Miscellaneous Expenses | | | 40,777 | | | | 3,442 | | | | 3,279 | |
| Total Expenses | | | 8,617,421 | | | | 1,137,881 | | | | 457,407 | |
| Less: Fees Waived by Adviser | | | — | | | | (221,204 | ) | | | (140,113 | ) |
| Net Expenses | | | 8,617,421 | | | | 916,677 | | | | 317,294 | |
| Net Investment Income | | | 19,817,269 | | | | 444,993 | | | | 417,453 | |
| | | | | | | | | | | | | |
| Net Realized and Unrealized Gain (Loss) on Investments: | | | | | | | | | | | | |
| Net Realized Gain (Loss) on: | | | | | | | | | | | | |
| Investments | | | 3,287,657 | | | | 713,966 | | | | 220,240 | |
| Swaps | | | (879,835 | ) | | | (446,357 | ) | | | — | |
| Total Net Realized Gain | | | 2,407,822 | | | | 267,609 | | | | 220,240 | |
| Net Change in Unrealized Appreciation (Depreciation) on: | | | | | | | | | | | | |
| Investments | | | (16,869,736 | ) | | | (1,273,998 | ) | | | (335,660 | ) |
| Swaps | | | (628,104 | ) | | | 249,347 | | | | — | |
| Total Net Change in Unrealized Depreciation | | | (17,497,840 | ) | | | (1,024,651 | ) | | | (335,660 | ) |
| Net Realized and Unrealized Loss on Investments | | | (15,090,018 | ) | | | (757,042 | ) | | | (115,420 | ) |
| | | | | | | | | | | | | |
| Net Increase (Decrease) in Net Assets Resulting From Operations | | $ | 4,727,251 | | | $ | (312,049 | ) | | $ | 302,033 | |
| * | The Miller Convertible Plus Fund and the Miller Intermediate Bond Fund commenced operations on December 31, 2014. |
The accompanying notes are an integral part of these financial statements.
| Miller Convertible Bond Fund |
| STATEMENTS OF CHANGES IN NET ASSETS |
| | | Year | | | Year | |
| | | Ended | | | Ended | |
| | | October 31, 2015 | | | October 31, 2014 | |
| Operations: | | | | | | | | |
| Net Investment Income | | $ | 19,817,269 | | | $ | 17,225,893 | |
| Net Realized Gain on Investments and Swaps | | | 2,407,822 | | | | 23,838,784 | |
| Net Change in Unrealized Depreciation on Investments and Swaps | | | (17,497,840 | ) | | | (4,553,580 | ) |
| Net Increase in Net Assets Resulting From Operations | | | 4,727,251 | | | | 36,511,097 | |
| | | | | | | | | |
| Distributions to Shareholders From: | | | | | | | | |
| Net Investment Income | | | | | | | | |
| Class A ($0.32 and $0.27 per share, respectively) | | | (7,008,661 | ) | | | (6,245,394 | ) |
| Class I ($0.39 and $0.37 per share, respectively) | | | (11,319,535 | ) | | | (6,823,259 | ) |
| Class C ($0.26 and $0.22 per share, respectively) | | | (1,406,241 | ) | | | (1,021,158 | ) |
| | | | (19,734,437 | ) | | | (14,089,811 | ) |
| Net Realized Gains | | | | | | | | |
| Class A ($0.34 and $0.49 per share, respectively) | | | (8,138,665 | ) | | | (8,976,604 | ) |
| Class I ($0.34 and $0.49 per share, respectively) | | | (9,691,316 | ) | | | (5,378,769 | ) |
| Class C ($0.34 and $0.49 per share, respectively) | | | (1,759,008 | ) | | | (1,798,742 | ) |
| | | | (19,588,989 | ) | | | (16,154,115 | ) |
| Total Distributions to Shareholders | | | (39,323,426 | ) | | | (30,243,926 | ) |
| | | | | | | | | |
| Beneficial Interest Transactions: | | | | | | | | |
| Class A | | | | | | | | |
| Proceeds from Shares Issued (4,692,244 and 11,458,068 shares, respectively) | | | 58,306,872 | | | | 145,363,288 | |
| Distributions Reinvested (1,152,368 and 1,136,576 shares, respectively) | | | 14,033,646 | | | | 14,108,137 | |
| Cost of Shares Redeemed (16,713,346 and 6,060,830 shares, respectively) | | | (204,447,155 | ) | | | (77,012,865 | ) |
| Total Class A Shares | | | (132,106,637 | ) | | | 82,458,560 | |
| Class I | | | | | | | | |
| Proceeds from Shares Issued (22,030,137 and 19,765,705 shares, respectively) | | | 270,474,868 | | | | 252,847,395 | |
| Distributions Reinvested (1,408,855 and 721,998 shares, respectively) | | | 17,168,778 | | | | 9,028,166 | |
| Cost of Shares Redeemed (11,518,685 and 3,139,186 shares, respectively) | | | (142,433,826 | ) | | | (40,049,294 | ) |
| Total Class I Shares | | | 145,209,820 | | | | 221,826,267 | |
| Class C | | | | | | | | |
| Proceeds from Shares Issued (1,165,866 and 1,980,820 shares, respectively) | | | 14,423,058 | | | | 25,159,159 | |
| Distributions Reinvested (243,192 and 216,029 shares, respectively) | | | 2,946,420 | | | | 2,661,284 | |
| Cost of Shares Redeemed (942,888 and 435,701 shares, respectively) | | | (11,681,650 | ) | | | (5,513,393 | ) |
| Total Class C Shares | | | 5,687,828 | | | | 22,307,050 | |
| Total Beneficial Interest Transactions | | | 18,791,011 | | | | 326,591,877 | |
| | | | | | | | | |
| Increase (Decrease) in Net Assets | | | (15,805,164 | ) | | | 332,859,048 | |
| | | | | | | | | |
| Net Assets: | | | | | | | | |
| Beginning of Year | | | 725,357,355 | | | | 392,498,307 | |
| End of Year (undistributed net investment income of $7,496,092 and $7,377,090 respectively) | | $ | 709,552,191 | | | $ | 725,357,355 | |
The accompanying notes are an integral part of these financial statements.
| Miller Convertible Plus Fund |
| STATEMENT OF CHANGES IN NET ASSETS |
| | | Period | |
| | | Ended | |
| | | October 31, 2015 * | |
| Operations: | | | | |
| Net Investment Income | | $ | 444,993 | |
| Net Realized Gain on Investments and Swaps | | | 267,609 | |
| Net Change in Unrealized Depreciation on Investments and Swaps | | | (1,024,651 | ) |
| Net Decrease in Net Assets Resulting From Operations | | | (312,049 | ) |
| | | | | |
| Distributions to Shareholders From: | | | | |
| Net Investment Income | | | | |
| Class A ($0.19) | | | (281 | ) |
| Class I ($0.20) | | | (305,691 | ) |
| Class C ($0.15) | | | (221 | ) |
| Total Distributions to Shareholders | | | (306,193 | ) |
| | | | | |
| Beneficial Interest Transactions: | | | | |
| Class A | | | | |
| Proceeds from Shares Issued (4,393 shares) | | | 95,550 | |
| Distributions Reinvested (12 shares) | | | 281 | |
| Cost of Shares Redeemed (489 shares) | | | (10,963 | ) |
| Total Class A Shares | | | 84,868 | |
| Class I | | | | |
| Proceeds from Shares Issued (2,206,267 shares) | | | 47,045,002 | |
| Distributions Reinvested (13,605 shares) | | | 304,193 | |
| Cost of Shares Redeemed (165,188 shares) | | | (3,569,357 | ) |
| Total Class I Shares | | | 43,779,838 | |
| Class C | | | | |
| Proceeds from Shares Issued (12,174 shares) | | | 267,505 | |
| Distributions Reinvested (9 shares) | | | 221 | |
| Cost of Shares Redeemed (8,983 shares) | | | (196,977 | ) |
| Total Class C Shares | | | 70,749 | |
| Total Beneficial Interest Transactions | | | 43,935,455 | |
| | | | | |
| Increase in Net Assets | | | 43,317,213 | |
| | | | | |
| Net Assets: | | | | |
| Beginning of Period | | | — | |
| End of Period (undistributed net investment income of $30,674 | | $ | 43,317,213 | |
| * | The Miller Convertible Plus Fund commenced operations on December 31, 2014. |
The accompanying notes are an integral part of these financial statements.
| Miller Intermediate Bond Fund |
| STATEMENT OF CHANGES IN NET ASSETS |
| | | Period | |
| | | Ended | |
| | | October 31, 2015 * | |
| Operations: | | | | |
| Net Investment Income | | $ | 417,453 | |
| Net Realized Gain on Investments | | | 220,240 | |
| Net Change in Unrealized Depreciation on Investments | | | (335,660 | ) |
| Net Increase in Net Assets Resulting From Operations | | | 302,033 | |
| | | | | |
| Distributions to Shareholders From: | | | | |
| Net Investment Income | | | | |
| Class A ($0.11) | | | (2,793 | ) |
| Class I ($0.12) | | | (279,341 | ) |
| Total Distributions to Shareholders | | | (282,134 | ) |
| | | | | |
| Beneficial Interest Transactions: | | | | |
| Class A | | | | |
| Proceeds from Shares Issued (55,625 shares) | | | 855,954 | |
| Distributions Reinvested (181 shares) | | | 2,793 | |
| Total Class A Shares | | | 858,747 | |
| Class I | | | | |
| Proceeds from Shares Issued (2,930,522 shares) | | | 45,358,137 | |
| Distributions Reinvested (17,842 shares) | | | 278,011 | |
| Cost of Shares Redeemed (259,912 shares) | | | (4,055,795 | ) |
| Total Class I Shares | | | 41,580,353 | |
| Class C | | | | |
| Proceeds from Shares Issued (19,323 shares) | | | 305,015 | |
| Cost of Shares Redeemed (12,579 shares) | | | (198,742 | ) |
| Total Class C Shares | | | 106,273 | |
| Total Beneficial Interest Transactions | | | 42,545,373 | |
| | | | | |
| Increase in Net Assets | | | 42,565,272 | |
| | | | | |
| Net Assets: | | | | |
| Beginning of Period | | | — | |
| End of Period (undistributed net investment income of $129,963 | | $ | 42,565,272 | |
| * | The Miller Intermediate Bond Fund commenced operations on December 31, 2014. |
The accompanying notes are an integral part of these financial statements.
| Miller Convertible Plus Fund |
| STATEMENT OF CASH FLOWS |
| For the Period Ended October 31, 2015 * |
| Cash flows from operating activities: | | | | |
| Net decrease in net assets resulting from operations | | $ | (312,049 | ) |
| Adjustments to reconcile net decrease in net assets resulting from operations to net cash used in operating activities: | | | | |
| Purchases of investments | | | (109,180,291 | ) |
| Proceeds from sales of investments | | | 49,040,896 | |
| Proceeds from sales of short term investments, net | | | (1,602,273 | ) |
| Net realized gain from investments and swaps | | | (267,609 | ) |
| Net change in unrealized depreciation from investments and swaps | | | 1,024,651 | |
| Net accretion of discounts | | | (490,466 | ) |
| | | | | |
| Changes in assets and liabilities | | | | |
| (Increase)/decrease in assets: | | | | |
| Interest receivable | | | (461,865 | ) |
| Receivable from open swap contracts | | | (249,347 | ) |
| Prepaid expenses and other assets | | | (41,754 | ) |
| Increase/(decrease) in liabilities: | | | | |
| Payable for securities purchased | | | 189,866 | |
| Interest payable | | | 18,773 | |
| Accrued advisory fees | | | 71,622 | |
| Distribution fee payable | | | 65 | |
| Other accrued expenses payable | | | 30,518 | |
| Net cash used in operating activities | | | (62,229,263 | ) |
| | | | | |
| Cash flows from financing activities: | | | | |
| Net borrowings under of line of credit, net | | | 18,600,000 | |
| Proceeds from shares sold | | | 47,408,057 | |
| Payment on shares redeemed | | | (3,777,297 | ) |
| Cash distributions paid | | | (1,497 | ) |
| Net cash provided by financing activities | | | 62,229,263 | |
| | | | | |
| Net increase in cash | | | — | |
| Cash at beginning of period | | | — | |
| Cash at end of period | | | — | |
| | | | | |
| Supplemental disclosure of non-cash activity: | | | | |
| Noncash financing activities not including herein consists of reinvestment of dividends | | $ | 304,695 | |
| * | The Miller Convertible Plus Fund commenced operations on December 31, 2014. |
The accompanying notes are an integral part of these financial statements.
| Miller Convertible Bond Fund |
| FINANCIAL HIGHLIGHTS |
| |
| The table below sets forth financial data for one share of beneficial interest outstanding throughout each year presented. |
| | | Class A | |
| | | | | | | | | | | | | | | | |
| | | Year Ended October 31, | |
| | | 2015 | | | 2014 | | | 2013 | | | 2012 | | | 2011 | |
| | | | | | | | | | | | | | | | |
| Net Asset Value, Beginning of Year | | $ | 12.75 | | | $ | 12.55 | | | $ | 10.70 | | | $ | 10.76 | | | $ | 11.22 | |
| Increase (decrease) from operations: | | | | | | | | | | | | | | | | | | | | |
| Net investment income (a) | | | 0.23 | | | | 0.37 | | | | 0.31 | | | | 0.23 | | | | 0.13 | |
| Net gain (loss) from securities (both realized and unrealized) | | | (0.17 | ) | | | 0.59 | | | | 1.84 | | | | 0.25 | | | | (0.24 | ) |
| Total from operations | | | 0.06 | | | | 0.96 | | | | 2.15 | | | | 0.48 | | | | (0.11 | ) |
| Distributions to shareholders from: | | | | | | | | | | | | | | | | | | | | |
| Net investment income | | | (0.32 | ) | | | (0.27 | ) | | | (0.30 | ) | | | (0.24 | ) | | | (0.32 | ) |
| Net realized gain | | | (0.34 | ) | | | (0.49 | ) | | | — | | | | (0.30 | ) | | | (0.03 | ) |
| Total distributions | | | (0.66 | ) | | | (0.76 | ) | | | (0.30 | ) | | | (0.54 | ) | | | (0.35 | ) |
| | | | | | | | | | | | | | | | | | | | | |
| Net Asset Value, End of Year | | $ | 12.15 | | | $ | 12.75 | | | $ | 12.55 | | | $ | 10.70 | | | $ | 10.76 | |
| | | | | | | | | | | | | | | | | | | | | |
| Total Return (b) | | | 0.49 | % | | | 7.98 | % | | | 20.33 | % | | | 4.18 | % | | | (0.92 | )% |
| | | | | | | | | | | | | | | | | | | | | |
| Ratios/Supplemental Data | | | | | | | | | | | | | | | | | | | | |
| Net assets, end of year (in 000’s) | | $ | 159,608 | | | $ | 305,994 | | | $ | 219,218 | | | $ | 165,595 | | | $ | 213,763 | |
| Ratio of expenses to average net assets, before reimbursement/recapture | | | 1.44 | % | | | 1.45 | % | | | 1.50 | % | | | 1.48 | % | | | 1.48 | % |
| net of reimbursement/recapture | | | 1.44 | % | | | 1.45 | % | | | 1.50 | % | | | 1.48 | % | | | 1.53 | % (c) |
| Ratio of net investment income to average net assets | | | 3.10 | % | | | 2.87 | % | | | 2.69 | % | | | 2.12 | % | | | 1.17 | % (c) |
| Portfolio turnover rate | | | 81 | % | | | 78 | % | | | 104 | % | | | 59 | % | | | 69 | % |
| (a) | Per share amounts are calculated using the average shares method, which more appropriately presents the per share data for the year. |
| (b) | Total returns are historical in nature and assume changes in share price, reinvestment of dividends and capital gains distributions, if any, excluding the effect of sales loads. Total returns for periods less than one year are not annualized. Had the Adviser not absorbed a portion of the expenses during certain years, total returns would have been lower. |
| (c) | Such ratio includes Adviser’s recapture of waived/reimbursed fees from prior years. |
The accompanying notes are an integral part of the financial statements.
| Miller Convertible Bond Fund |
| FINANCIAL HIGHLIGHTS |
| |
| The table below sets forth financial data for one share of beneficial interest outstanding throughout each year presented. |
| | | Class I | |
| | | | | | | | | | | | | | | | |
| | | Year Ended October 31, | |
| | | 2015 | | | 2014 | | | 2013 | | | 2012 | | | 2011 | |
| | | | | | | | | | | | | | | | |
| Net Asset Value, Beginning of Year | | $ | 12.76 | | | $ | 12.59 | | | $ | 10.73 | | | $ | 10.82 | | | $ | 11.29 | |
| Increase (decrease) from operations: | | | | | | | | | | | | | | | | | | | | |
| Net investment income (a) | | | 0.45 | | | | 0.43 | | | | 0.37 | | | | 0.28 | | | | 0.19 | |
| Net gain (loss) from securities (both realized and unrealized) | | | (0.33 | ) | | | 0.60 | | | | 1.85 | | | | 0.25 | | | | (0.23 | ) |
| Total from operations | | | 0.12 | | | | 1.03 | | | | 2.22 | | | | 0.53 | | | | (0.04 | ) |
| Distributions to shareholders from: | | | | | | | | | | | | | | | | | | | | |
| Net investment income | | | (0.39 | ) | | | (0.37 | ) | | | (0.36 | ) | | | (0.32 | ) | | | (0.40 | ) |
| Net realized gain | | | (0.34 | ) | | | (0.49 | ) | | | — | | | | (0.30 | ) | | | (0.03 | ) |
| Total distributions | | | (0.73 | ) | | | (0.86 | ) | | | (0.36 | ) | | | (0.62 | ) | | | (0.43 | ) |
| | | | | | | | | | | | | | | | | | | | | |
| Net Asset Value, End of Year | | $ | 12.15 | | | $ | 12.76 | | | $ | 12.59 | | | $ | 10.73 | | | $ | 10.82 | |
| | | | | | | | | | | | | | | | | | | | | |
| Total Return (b) | | | 1.08 | % | | | 8.49 | % | | | 20.95 | % | | | 4.79 | % | | | (0.39 | )% |
| | | | | | | | | | | | | | | | | | | | | |
| Ratios/Supplemental Data | | | | | | | | | | | | | | | | | | | | |
| Net assets, end of year (in 000’s) | | $ | 480,548 | | | $ | 352,395 | | | $ | 129,282 | | | $ | 57,387 | | | $ | 41,666 | |
| Ratio of expenses to average net assets, before reimbursement/recapture | | | 0.94 | % | | | 0.95 | % | | | 1.00 | % | | | 0.98 | % | | | 0.98 | % |
| net of reimbursement/recapture | | | 0.94 | % | | | 0.95 | % | | | 1.00 | % | | | 0.98 | % | | | 1.00 | % (c) |
| Ratio of net investment income to average net assets | | | 3.60 | % | | | 3.37 | % | | | 3.19 | % | | | 2.62 | % | | | 1.70 | % (c) |
| Portfolio turnover rate | | | 81 | % | | | 78 | % | | | 104 | % | | | 59 | % | | | 69 | % |
| (a) | Per share amounts are calculated using the average shares method, which more appropriately presents the per share data for the year. |
| (b) | Total returns are historical in nature and assume changes in share price, reinvestment of dividends and capital gains distributions, if any. Total returns for periods less than one year are not annualized. Had the Adviser not absorbed a portion of the expenses during certain years, total returns would have been lower. |
| (c) | Such ratio includes Adviser’s recapture of waived/reimbursed fees from prior years. |
The accompanying notes are an integral part of the financial statements.
| Miller Convertible Bond Fund |
| FINANCIAL HIGHLIGHTS |
| |
| The table below sets forth financial data for one share of beneficial interest outstanding throughout each period presented. |
| | | Class C | |
| | | | | | | | | | | | | | | | | | Period | |
| | | Year Ended | | | Ended | |
| | | 2015 | | | 2014 | | | 2013 | | | 2012 | | | 2011 | | | October 31, 2010 * | |
| | | | | | | | | | | | | | | | | | | |
| Net Asset Value, Beginning of Period | | $ | 12.68 | | | $ | 12.50 | | | $ | 10.67 | | | $ | 10.73 | | | $ | 11.17 | | | $ | 10.23 | |
| Increase (decrease) from operations: | | | | | | | | | | | | | | | | | | | | | | | | |
| Net investment income (a) | | | 0.26 | | | | 0.30 | | | | 0.25 | | | | 0.17 | | | | 0.08 | | | | 0.31 | |
| Net gain (loss) from securities (both realized and unrealized) | | | (0.27 | ) | | | 0.59 | | | | 1.84 | | | | 0.25 | | | | (0.23 | ) | | | 1.03 | |
| Total from operations | | | (0.01 | ) | | | 0.89 | | | | 2.09 | | | | 0.42 | | | | (0.15 | ) | | | 1.34 | |
| Distributions to shareholders from: | | | | | | | | | | | | | | | | | | | | | | | | |
| Net investment income | | | (0.26 | ) | | | (0.22 | ) | | | (0.26 | ) | | | (0.18 | ) | | | (0.26 | ) | | | (0.40 | ) |
| Net realized gain | | | (0.34 | ) | | | (0.49 | ) | | | — | | | | (0.30 | ) | | | (0.03 | ) | | | — | |
| Total distributions | | | (0.60 | ) | | | (0.71 | ) | | | (0.26 | ) | | | (0.48 | ) | | | (0.29 | ) | | | (0.40 | ) |
| | | | | | | | | | | | | | | | | | | | | | | | | |
| Net Asset Value, End of Period | | $ | 12.07 | | | $ | 12.68 | | | $ | 12.50 | | | $ | 10.67 | | | $ | 10.73 | | | $ | 11.17 | |
| | | | | | | | | | | | | | | | | | | | | | | | | |
| Total Return (b) | | | 0.07 | % | | | 7.42 | % | | | 19.77 | % | | | 5.35 | % | | | (1.27 | )% | | | 13.45 | % |
| | | | | | | | | | | | | | | | | | | | | | | | | |
| Ratios/Supplemental Data | | | | | | | | | | | | | | | | | | | | | | | | |
| Net assets, end of period (in 000’s) | | $ | 69,396 | | | $ | 66,968 | | | $ | 43,998 | | | $ | 30,855 | | | $ | 28,056 | | | $ | 9,821 | |
| Ratio of expenses to average net assets, before reimbursement | | | 1.94 | % | | | 1.95 | % | | | 2.00 | % | | | 1.98 | % | | | 1.98 | % | | | 2.20 | % (c) |
| net of reimbursement | | | 1.94 | % | | | 1.95 | % | | | 2.00 | % | | | 1.98 | % | | | 1.98 | % | | | 2.20 | % (c) |
| Ratio of net investment income to average net assets | | | 2.60 | % | | | 2.37 | % | | | 2.19 | % | | | 1.62 | % | | | 0.72 | % | | | 2.34 | % (c) |
| Portfolio turnover rate | | | 81 | % | | | 78 | % | | | 104 | % | | | 59 | % | | | 69 | % | | | 84 | % (d) |
| * | Miller Convertible Bond Fund Class C commenced operations December 1, 2009. |
| (a) | Per share amounts are calculated using the average shares method, which more appropriately presents the per share data for the period. |
| (b) | Total returns are historical in nature and assume changes in share price, reinvestment of dividends and capital gains distributions, if any. Total returns for periods less than one year are not annualized. Had the Adviser not absorbed a portion of the expenses during certain periods, total returns would have been lower. |
The accompanying notes are an integral part of the financial statements.
| Miller Convertible Plus Fund |
| FINANCIAL HIGHLIGHTS |
| |
| The table below sets forth financial data for one share of beneficial interest outstanding throughout the period presented. |
| | | Class A | |
| | | Period | |
| | | Ended | |
| | | October 31, 2015 * | |
| | | | |
| Net Asset Value, Beginning of Period | | $ | 20.00 | |
| Increase from operations: | | | | |
| Net investment income (a) | | | 0.50 | |
| Net gain from securities (both realized and unrealized) | | | 0.68 | |
| Total from operations | | | 1.18 | |
| Distributions to shareholders from: | | | | |
| Net investment income | | | (0.19 | ) |
| Total distributions | | | (0.19 | ) |
| | | | | |
| Net Asset Value, End of Period | | $ | 20.99 | |
| | | | | |
| Total Return (b) | | | 5.88 | % |
| | | | | |
| Ratios/Supplemental Data | | | | |
| Net assets, end of period (in 000’s) | | $ | 82 | |
| Ratio of expenses to average net assets, before reimbursement/recapture | | | 4.58 | % (c) |
| net of reimbursement/recapture | | | 3.74 | % (c) |
| Ratio of expenses to average net assets, (excluding interest expense) before reimbursement/recapture | | | 4.03 | % (c) |
| net of reimbursement/recapture | | | 3.20 | % (c) |
| Ratio of net investment income to average net assets | | | 1.45 | % (c) |
| Portfolio turnover rate | | | 109 | % (d) |
| * | Miller Convertible Plus Fund Class A commenced operations December 31, 2014. |
| (a) | Per share amounts are calculated using the average shares method, which more appropriately presents the per share data for the period. |
| (b) | Total returns are historical in nature and assume changes in share price, reinvestment of dividends and capital gains distributions, if any, excluding the effect of sales loads. Total returns for periods less than one year are not annualized. Had the Adviser not absorbed a portion of the expenses during certain periods, total returns would have been lower. |
The accompanying notes are an integral part of the financial statements.
| Miller Convertible Plus Fund |
| FINANCIAL HIGHLIGHTS |
| |
| The table below sets forth financial data for one share of beneficial interest outstanding throughout the period presented. |
| | | Class I | |
| | | Period | |
| | | Ended | |
| | | October 31, 2015 * | |
| | | | |
| Net Asset Value, Beginning of Period | | $ | 20.00 | |
| Increase from operations: | | | | |
| Net investment income (a) | | | 0.31 | |
| Net gain from securities (both realized and unrealized) | | | 0.90 | |
| Total from operations | | | 1.21 | |
| Distributions to shareholders from: | | | | |
| Net investment income | | | (0.20 | ) |
| Total distributions | | | (0.20 | ) |
| | | | | |
| Net Asset Value, End of Period | | $ | 21.01 | |
| | | | | |
| Total Return (b) | | | 5.99 | % |
| | | | | |
| Ratios/Supplemental Data | | | | |
| Net assets, end of period (in 000’s) | | $ | 43,168 | |
| Ratio of expenses to average net assets, before reimbursement/recapture | | | 4.33 | % (c) |
| net of reimbursement/recapture | | | 3.49 | % (c) |
| Ratio of expenses to average net assets, (excluding interest expense) before reimbursement/recapture | | | 3.78 | % (c) |
| net of reimbursement/recapture | | | 2.95 | % (c) |
| Ratio of net investment income to average net assets | | | 1.70 | % (c) |
| Portfolio turnover rate | | | 109 | % (d) |
| * | Miller Convertible Plus Fund Class I commenced operations December 31, 2014. |
| (a) | Per share amounts are calculated using the average shares method, which more appropriately presents the per share data for the period. |
| (b) | Total returns are historical in nature and assume changes in share price, reinvestment of dividends and capital gains distributions, if any. Total returns for periods less than one year are not annualized. Had the Adviser not absorbed a portion of the expenses during certain periods, total returns would have been lower. |
The accompanying notes are an integral part of the financial statements.
| Miller Convertible Plus Fund |
| FINANCIAL HIGHLIGHTS |
| |
| The table below sets forth financial data for one share of beneficial interest outstanding throughout the period presented. |
| | | Class C | |
| | | Period | |
| | | Ended | |
| | | October 31, 2015 * | |
| | | | |
| Net Asset Value, Beginning of Period | | $ | 20.00 | |
| Increase from operations: | | | | |
| Net investment income (a) | | | 0.12 | |
| Net gain from securities (both realized and unrealized) | | | 0.91 | |
| Total from operations | | | 1.03 | |
| Distributions to shareholders from: | | | | |
| Net investment income | | | (0.15 | ) |
| Total distributions | | | (0.15 | ) |
| | | | | |
| Net Asset Value, End of Period | | $ | 20.88 | |
| | | | | |
| Total Return (b) | | | 5.14 | % |
| | | | | |
| Ratios/Supplemental Data | | | | |
| Net assets, end of period (in 000’s) | | $ | 67 | |
| Ratio of expenses to average net assets, before reimbursement/recapture | | | 5.33 | % (c) |
| net of reimbursement/recapture | | | 4.49 | % (c) |
| Ratio of expenses to average net assets, (excluding interest expense) before reimbursement/recapture | | | 4.78 | % (c) |
| net of reimbursement/recapture | | | 3.95 | % (c) |
| Ratio of net investment income to average net assets | | | 0.70 | % (c) |
| Portfolio turnover rate | | | 109 | % (d) |
| * | Miller Convertible Plus Fund Class C commenced operations December 31, 2014. |
| (a) | Per share amounts are calculated using the average shares method, which more appropriately presents the per share data for the period. |
| (b) | Total returns are historical in nature and assume changes in share price, reinvestment of dividends and capital gains distributions, if any. Total returns for periods less than one year are not annualized. Had the Adviser not absorbed a portion of the expenses during certain periods, total returns would have been lower. |
The accompanying notes are an integral part of the financial statements.
| Miller Intermediate Bond Fund |
| FINANCIAL HIGHLIGHTS |
| |
| The table below sets forth financial data for one share of beneficial interest outstanding throughout the period presented. |
| | | Class A | |
| | | Period | |
| | | Ended | |
| | | October 31, 2015 * | |
| | | | |
| Net Asset Value, Beginning of Period | | $ | 15.00 | |
| Increase from operations: | | | | |
| Net investment income (a) | | | 0.34 | |
| Net gain from securities (both realized and unrealized) | | | 0.24 | |
| Total from operations | | | 0.58 | |
| | | | | |
| Distributions to shareholders from: | | | | |
| Net investment income | | | (0.11 | ) |
| Total distributions | | | (0.11 | ) |
| | | | | |
| Net Asset Value, End of Period | | $ | 15.47 | |
| | | | | |
| Total Return (b) | | | 3.84 | % |
| | | | | |
| Ratios/Supplemental Data | | | | |
| Net assets, end of period (in 000’s) | | $ | 863 | |
| Ratio of expenses to average net assets, before reimbursement/recapture | | | 2.05 | % (c) |
| net of reimbursement/recapture | | | 1.50 | % (c) |
| Ratio of net investment income to average net assets | | | 1.39 | % (c) |
| Portfolio turnover rate | | | 85 | % (d) |
| * | Miller Intermediate Bond Fund Class A commenced operations December 31, 2014. |
| (a) | Per share amounts are calculated using the average shares method, which more appropriately presents the per share data for the period. |
| (b) | Total returns are historical in nature and assume changes in share price, reinvestment of dividends and capital gains distributions, if any, excluding the effect of sales loads. Total returns for periods less than one year are not annualized. Had the Adviser not absorbed a portion of the expenses during certain periods, total returns would have been lower. |
The accompanying notes are an integral part of the financial statements.
| Miller Intermediate Bond Fund |
| FINANCIAL HIGHLIGHTS |
| |
| The table below sets forth financial data for one share of beneficial interest outstanding throughout the period presented. |
| | | Class I | |
| | | Period | |
| | | Ended | |
| | | October 31, 2015 * | |
| | | | |
| Net Asset Value, Beginning of Period | | $ | 15.00 | |
| Increase from operations: | | | | |
| Net investment income (a) | | | 0.21 | |
| Net gain from securities (both realized and unrealized) | | | 0.38 | |
| Total from operations | | | 0.59 | |
| Distributions to shareholders from: | | | | |
| Net investment income | | | (0.12 | ) |
| Total distributions | | | (0.12 | ) |
| | | | | |
| Net Asset Value, End of Period | | $ | 15.47 | |
| | | | | |
| Total Return (b) | | | 3.92 | % |
| | | | | |
| Ratios/Supplemental Data | | | | |
| Net assets, end of period (in 000’s) | | $ | 41,597 | |
| Ratio of expenses to average net assets, before reimbursement/recapture | | | 1.80 | % (c) |
| net of reimbursement/recapture | | | 1.25 | % (c) |
| Ratio of net investment income to average net assets | | | 1.64 | % (c) |
| Portfolio turnover rate | | | 85 | % (d) |
| * | Miller Intermediate Bond Fund Class I commenced operations December 31, 2014. |
| (a) | Per share amounts are calculated using the average shares method, which more appropriately presents the per share data for the period. |
| (b) | Total returns are historical in nature and assume changes in share price, reinvestment of dividends and capital gains distributions, if any. Total returns for periods less than one year are not annualized. Had the Adviser not absorbed a portion of the expenses during certain periods, total returns would have been lower. |
The accompanying notes are an integral part of the financial statements.
| Miller Intermediate Bond Fund |
| FINANCIAL HIGHLIGHTS |
| |
| The table below sets forth financial data for one share of beneficial interest outstanding throughout the period presented. |
| | | Class C | |
| | | Period | |
| | | Ended | |
| | | October 31, 2015 * | |
| | | | |
| Net Asset Value, Beginning of Period | | $ | 15.00 | |
| Increase from operations: | | | | |
| Net investment income (a) | | | 0.31 | |
| Net gain from securities (both realized and unrealized) | | | 0.26 | |
| Total from operations | | | 0.57 | |
| | | | | |
| Net Asset Value, End of Period | | $ | 15.57 | |
| | | | | |
| Total Return (b) | | | 3.80 | % |
| | | | | |
| Ratios/Supplemental Data | | | | |
| Net assets, end of period (in 000’s) | | $ | 105 | |
| Ratio of expenses to average net assets, before reimbursement/recapture | | | 2.80 | % (c) |
| net of reimbursement/recapture | | | 2.25 | % (c) |
| Ratio of net investment income to average net assets | | | 0.64 | % (c) |
| Portfolio turnover rate | | | 85 | % (d) |
| * | Miller Intermediate Bond Fund Class C commenced operations December 31, 2014. |
| (a) | Per share amounts are calculated using the average shares method, which more appropriately presents the per share data for the period. |
| (b) | Total returns are historical in nature and assume changes in share price, reinvestment of dividends and capital gains distributions, if any. Total returns for periods less than one year are not annualized. Had the Adviser not absorbed a portion of the expenses during certain periods, total returns would have been lower. |
The accompanying notes are an integral part of the financial statements.
| Miller Funds |
| NOTES TO FINANCIAL STATEMENTS |
| October 31, 2015 |
| |
The Miller Convertible Bond Fund (the “Convertible Bond Fund”), the Miller Convertible Plus Fund (the “Convertible Plus Fund”), and Miller Intermediate Bond Fund (the “Intermediate Bond Fund”) are series of Miller Investment Trust (the “Trust”), a Delaware statutory trust organized on September 28, 2007. The Trust is registered as an open-end management investment company. The Funds are registered under the Investment Company Act of 1940, as amended, (the “1940 Act”), as non-diversified, open-end management investment companies. Convertible Bond Fund’s investment objective is to maximize total return comprising current income and capital appreciation, consistent with preservation of capital. Convertible Plus Fund’s investment objective is to use leverage to maximize total return comprising current income and capital appreciation. Intermediate Bond Fund’s investment objective is to maximize total return comprising current income and capital appreciation, consistent with preservation of capital.
The Funds currently offer Class A, Class I and Class C shares. Convertible Bond Fund’s Class A and Class I shares commenced operations on December 27, 2007 and Class C shares commenced operations on December 1, 2009. The Convertible Bond Fund offered Class NF shares until August 14, 2013. Convertible Plus Fund’s Class A, Class I and Class C shares commenced operations on December 31, 2014. Intermediate Bond Fund’s Class A, Class I and Class C shares commenced operations on December 31, 2014. Class I and Class C shares are offered at net asset value. Class A shares are offered at net asset value plus a maximum sales charge of 5.75%. Each class represents an interest in the same assets of the Funds and classes are identical except for differences in their sales charge structures and ongoing service and distribution charges. All classes of shares have equal voting privileges except that each class has exclusive voting rights with respect to its service and/or distribution plans. The Funds’ income, expenses (other than class specific distribution fees) and realized and unrealized gains and losses are allocated proportionately each day based upon the relative net assets of each class.
Wellesley Investment Advisors, Inc. serves as the Funds’ investment adviser (the “Adviser”).
| 2. | SUMMARY OF SIGNIFICANT ACCOUNTING POLICIES |
The preparation of financial statements in accordance with accounting principles generally accepted in the United States of America (“GAAP”) requires management to make estimates and assumptions that affect the reported amounts of assets and liabilities and disclosure of contingent assets and liabilities at the date of the financial statements and the reported amounts of revenue and expenses during the period. Actual results could differ from those estimates. The Funds follow the specialized accounting and reporting requirements under GAAP that are applicable to investment companies.
The following is a summary of significant accounting policies followed by the Funds in preparation of their financial statements.
Security Valuation – The Funds’ securities are valued at the last sale price on the exchange in which such securities are primarily traded, as of the close of business on the day the securities are being valued. NASDAQ traded securities are valued using the NASDAQ Official Closing Price (“NOCP”). If the NOCP is not available, such securities shall be valued at the last sale price on the day of valuation, or if there has been no sale on such day, at the mean between the bid and asked prices. Exchange traded options, futures and options on futures are valued at the settlement price determined by the exchange. Debt securities and long term U.S. treasury obligations (other than short-term obligations) are valued each day by an independent pricing service approved by the Board of Trustees (the “Board”) using methods which include current market quotations from a major market maker in the securities and based on methods which include the consideration of yields or prices of securities of comparable quality, coupon, maturity and type. Short-term investments that mature in 60 days or less may be valued at amortized cost, provided such valuations represent fair value.
Securities for which current market quotations are not readily available or for which quotations are not deemed to be representative of market values are valued at fair value as determined in good faith by the Adviser in accordance with the Trust’s Portfolio Securities Valuation Procedures (the “Procedures”) adopted by the Trust’s Board. The Procedures consider, among others, the following factors to determine a security’s fair value: the nature and pricing
| Miller Funds |
| NOTES TO FINANCIAL STATEMENTS (Continued) |
| October 31, 2015 |
| |
history (if any) of the security; whether any dealer quotations for the security are available; and possible valuation methodologies that could be used to determine the fair value of the security.
The Funds utilize various methods to measure the fair value of their investments on a recurring basis. GAAP establishes a hierarchy that prioritizes inputs to valuation methods. The three levels of input are:
Level 1 – Unadjusted quoted prices in active markets for identical assets and liabilities that the Funds have the ability to access.
Level 2 – Observable inputs other than quoted prices included in Level 1 that are observable for the asset or liability, either directly or indirectly. These inputs may include quoted prices for the identical instrument in an inactive market, prices for similar instruments, interest rates, prepayment speeds, credit risk, yield curves, default rates and similar data.
Level 3 – Unobservable inputs for the asset or liability, to the extent relevant observable inputs are not available, representing the Funds’ own assumptions about the assumptions a market participate would use in valuing the asset or liability, and would be based on the best information available.
The availability of observable inputs can vary from security to security and is affected by a wide variety of factors, including, for example, the type of security, whether the security is new and not yet established in the marketplace, the liquidity of markets, and other characteristics particular to the security. To the extent that valuation is based on models or inputs that are less observable or unobservable in the market, the determination of fair value requires more judgment. Accordingly, the degree of judgment exercised in determining fair value is greatest for instruments categorized in Level 3.
The inputs used to measure fair value may fall into different levels of the fair value hierarchy. In such cases, for disclosure purposes, the level in the fair value hierarchy within which the fair value measurement falls in its entirety, is determined based on the lowest level input that is significant to the fair value measurement in its entirety.
The inputs or methodology used for valuing securities are not necessarily an indication of the risk associated with investing in those securities. The following tables summarize the inputs used as of October 31, 2015 for the Funds’ assets and liabilities measured at fair value:
Convertible Bond Fund
| | | | | | | | | | | | | |
| Assets | | Level 1 | | | Level 2 | | | Level 3 | | | Total | |
| Investments in Securities: | | | | | | | | | | | | | | | | |
| Convertible Bonds* | | $ | — | | | $ | 657,931,105 | | | $ | — | | | $ | 657,931,105 | |
| U.S. Treasury Obligations | | | — | | | | 34,925,341 | | | | — | | | | 34,925,341 | |
| Short-Term Investments | | | 13,026,181 | | | | — | | | | — | | | | 13,026,181 | |
| Total Investments in Securities | | $ | 13,026,181 | | | $ | 692,856,446 | | | $ | — | | | $ | 705,882,627 | |
| | | | | | | | | | | | | | | | | |
| Liabilities | | Level 1 | | | Level 2 | | | Level 3 | | | Total | |
| Derivatives | | | | | | | | | | | | | | | | |
| Total Return Swap** | | $ | — | | | $ | (64,298 | ) | | $ | — | | | $ | (64,298 | ) |
Convertible Plus Fund
| | | | | | | | | | | | | |
| Assets | | Level 1 | | | Level 2 | | | Level 3 | | | Total | |
| Investments in Securities: | | | | | | | | | | | | | | | | |
| Convertible Bonds* | | $ | — | | | $ | 57,807,116 | | | $ | — | | | $ | 57,807,116 | |
| U.S. Treasury Obligations | | | — | | | | 1,991,267 | | | | — | | | | 1,991,267 | |
| Short-Term Investments | | | 1,602,273 | | | | — | | | | — | | | | 1,602,273 | |
| Miller Funds |
| NOTES TO FINANCIAL STATEMENTS (Continued) |
| October 31, 2015 |
| Total Investments in Securities | | $ | 1,602,273 | | | $ | 59,798,383 | | | $ | — | | | $ | 61,400,656 | |
| Derivatives | | | | | | | | | | | | | | | | |
| Total Return Swap** | | $ | — | | | $ | 249,347 | | | $ | — | | | $ | 249,347 | |
Intermediate Bond Fund
| | | | | | | | | | | | | |
| Assets | | Level 1 | | | Level 2 | | | Level 3 | | | Total | |
| Investments in Securities: | | | | | | | | | | | | | | | | |
| Convertible Bonds* | | $ | — | | | $ | 20,566,764 | | | $ | — | | | $ | 20,566,764 | |
| Corporate Bonds & Notes* | | | — | | | | 6,411,837 | | | | — | | | | 6,411,837 | |
| U.S. Treasury Obligations | | | — | | | | 15,008,582 | | | | — | | | | 15,008,582 | |
| Short-Term Investments | | | 369,666 | | | | — | | | | — | | | | 369,666 | |
| Total Investments in Securities | | $ | 369,666 | | | $ | 41,987,183 | | | $ | — | | | $ | 42,356,849 | |
There were no transfers into or out of Level 1, Level 2, and Level 3 in the current year. Transfers between the Levels for investment in securities or other financial instruments are measured at the end of the reporting period.
| * | Please refer to the Schedule of Investments for Industry classifications. |
| ** | Represents variation margin on the last day of the reporting period. |
Derivative Transactions – The Funds may enter into total return swaps. Total return swaps are agreements that provide the Funds with a return based on the performance of an underlying asset, in exchange for fee payments to a counterparty based on a specific rate. The difference in the value of these income streams is recorded daily by the Funds, and is settled in cash at the end of each month. The fee paid by the Funds will typically be determined by multiplying the face value of the swap agreement by an agreed upon interest rate. In addition, if the underlying asset declines in value over the term of the swap, the Funds would also be required to pay the dollar value of that decline to the counterparty. Total return swaps could result in losses if the underlying asset does not perform as anticipated by the Adviser. Each Fund may use its own net asset value as the underlying asset in a total return swap. This strategy serves to reduce cash drag (the impact of cash on the Funds’ overall return) by replacing it with the impact of market exposure based upon the Funds’ own investment holdings. The Funds record fluctuations in the value of open swap contracts on a daily basis as unrealized gains or losses. Realized gains and losses from terminated swaps are included in net realized gains/losses on swap contracts. Risks may exceed amounts recognized on the Statement of Assets and Liabilities. The Funds value the total return swaps in which they enter based on a formula of the underlying asset’s nightly value, USD-1M LIBOR-BBA and an annual fee or various agreed upon inputs.
During the year or period ended October 31, 2015, the Convertible Bond Fund and the Convertible Plus Fund invested in total return swaps. The total return swaps can be found on the Statement of Assets and Liabilities under receivable for open swap contracts and payable for open swap contracts. At October 31, 2015, the payable for open swap contracts was $64,298 for the Convertible Bond Fund and the receivable for open swap contracts was $249,347 for the Convertible Plus Fund. For the year or period ended October 31, 2015, the net realized loss on swaps was $879,835 and $446,357 for the Convertible Bond Fund and Convertible Plus Fund, respectively. At October 31, 2015, the net change in unrealized depreciation was $628,104 for the Convertible Bond Fund and the net change in unrealized appreciation was $249,347 for the Convertible Plus Fund.
The average notional value of total return swaps that the Funds invested in during the year or period ended October 31, 2015 was $32,840,511 and $4,158,126 for the Convertible Bond Fund and the Convertible Plus Fund, respectively. The notional value of the derivative instruments outstanding as of October 31, 2015, as disclosed in the Schedule of Investments and the amount of realized and changes in unrealized gains and losses on derivative instruments during the period as disclosed above and within the Statement of Operations serve as indicators of the volume of derivative activity for the Funds.
| Miller Funds |
| NOTES TO FINANCIAL STATEMENTS (Continued) |
| October 31, 2015 |
| |
Offsetting of Financial Assets and Derivative Assets - The following tables present the Funds’ asset and liability derivatives available for offset under a master netting arrangement net of collateral pledged as of October 31, 2015.
Convertible Bond Fund
| | | | | | | | | | | | Gross Amounts Not Offset in the | | | | |
| Liabilities: | | | | | | | | | | | Statement of Assets & Liabilities | | | | |
| | | | | | | | | | | | | | | | |
| | | | | | | | | Net Amounts of | | | | | | | | | | |
| | | Gross Amounts of | | | Gross Amounts Offset | | | Assets Presented in | | | | | | | | | | |
| | | Recognized | | | in the Statement of | | | the Statement of | | | Financial | | | Cash Collateral | | | | |
| Description | | Liabilities (1) | | | Assets & Liabilities | | | Assets & Liabilities | | | Instruments | | | Pledged (2) | | | Net Amount | |
| Swaps | | $ | 64,298 | | | $ | — | | | $ | 64,298 | | | $ | — | | | $ | 64,298 | | | $ | — | |
| Total | | $ | 64,298 | | | $ | — | | | $ | 64,298 | | | $ | — | | | $ | 64,298 | | | $ | — | |
Convertible Plus Fund
| | | | | | | | | | | | Gross Amounts Not Offset in the | | | | |
| Assets: | | | | | | | | | | | Statement of Assets & Liabilities | | | | |
| | | | | | | | | | | | | | | | |
| | | | | | | | | Net Amounts of | | | | | | | | | | |
| | | Gross Amounts | | | Gross Amounts Offset | | | Assets Presented in | | | | | | | | | | |
| | | of Recognized | | | in the Statement of | | | the Statement of | | | Financial | | | Cash Collateral | | | | |
| Description | | Assets (1) | | | Assets & Liabilities | | | Assets & Liabilities | | | Instruments | | | Pledged (2) | | | Net Amount | |
| Swaps | | $ | 249,347 | | | $ | — | | | $ | 249,347 | | | $ | — | | | $ | 249,347 | | | $ | — | |
| Total | | $ | 249,347 | | | $ | — | | | $ | 249,347 | | | $ | — | | | $ | 249,347 | | | $ | — | |
| | | | | | | | | | | | | | | | | | | | | | | | | |
| (1) | Swap contracts at value as presented in the Schedule of Investments. |
| (2) | The amount is limited to the derivative liability balance and, accordingly, does not include excess collateral pledged. |
Security Transactions and Investment Income – Investment security transactions are accounted for on a trade date basis. Cost is determined and gains and losses are based upon the specific identification method for both financial statement and federal income tax purposes.
Dividend income is recorded on the ex-dividend date and interest income is recorded on the accrual basis. Purchase discounts and premiums on securities are accreted and amortized over the life of the respective securities.
Withholding taxes on foreign dividends, if any, have been provided for in accordance with Funds’ understanding of the applicable country’s tax rules and rates.
Expenses – Common expenses, income and gains and losses are allocated daily among share classes of the Funds based on the relative proportion of net assets represented by each class. Class specific expenses are charged directly to the responsible class of shares of the Funds.
Federal Income Taxes – The Funds intend to continue to comply with the requirements of Subchapter M of the Internal Revenue Code applicable to regulated investment companies and will distribute all of its taxable income, if any, to shareholders. Accordingly, no provision for Federal income taxes is required in the financial statements.
The Funds recognize the tax benefits of uncertain tax positions only when the position is “more likely than not” to be sustained assuming examination by tax authorities. Management has reviewed the tax positions on returns filed for open fiscal year ends 2012-2014 for the Convertible Bond Fund, or expected to be taken in all the Funds’ current fiscal year end returns, and concluded that no liability for unrecognized tax benefits should be recorded related to uncertain tax positions. The Funds identify their major tax jurisdictions as U.S. Federal and the state of Massachusetts. The Funds recognize interest and penalties, if any, related to unrecognized tax benefits as income tax expense in the Statements of Operations. During the year or period ended October 31, 2015, the Funds did not incur any interest or penalties.
| Miller Funds |
| NOTES TO FINANCIAL STATEMENTS (Continued) |
| October 31, 2015 |
| |
Distributions to Shareholders – Distributions from investment income, if any, are declared and paid quarterly and are recorded on the ex-dividend date. The Funds will declare and pay net realized capital gains, if any, annually. The character of income and gains to be distributed is determined in accordance with income tax regulations which may differ from GAAP.
Indemnification – The Trust indemnifies its officers and trustees for certain liabilities that may arise from the performance of their duties to the Trust. Additionally, in the normal course of business, the Funds enter into contracts that contain a variety of representations and warranties and which provide general indemnities. The Funds’ maximum exposure under these arrangements is unknown, as this would involve future claims that may be made against the Funds that have not yet occurred. However, based on experience, the Trust expects the risk of loss due to these warranties and indemnities to be remote.
Legal – On December 1, 2011, Miller Investment Trust, on behalf of the Convertible Bond Fund, filed a civil suit against Morgan Stanley & Co. Incorporated and KPMG, a Hong Kong partnership, seeking to recover damages for losses suffered related to an investment by the Convertible Bond Fund in convertible debt issued by ShengdaTech, Inc. (“ShengdaTech”). Morgan Stanley & Co. served as the underwriter of the debt pursuant to offering documents issued December 10, 2010. KPMG Hong Kong served as ShengdaTech’s auditor for fiscal years 2008 through 2010. On June 26, 2012, the Convertible Bond Fund also filed a civil suit against the officers and directors of ShengdaTech and Hansen, Barnett & Maxwell, P.C. (“Hansen”), ShengdaTech’s auditor for fiscal year 2007, seeking to recover against these defendants damages for losses suffered from this same investment. Hansen has since been dismissed from the action. Convertible Bond Fund’s shareholders do not bear any direct expense related to the suits because counsel for the Fund is performing services on a contingency fee basis by which it would be paid a portion of any damages recovered.
In November 2014, Miller Investment Trust, along with two other plaintiffs, settled the Convertible Bond Fund’s claims against ShengdaTech’s officers and directors for $2.4 million (the “D&O Settlement”). The Convertible Bond Fund’s share of the D&O Settlement was about $2.2 million or about $1.4 million after attorneys’ fees and expenses. In August 2015, the parties consummated the D&O Settlement, and the Convertible Bond Fund received the $1.4 million payment under the D&O Settlement, which can be found on the Statement of Operations under Other Income. The Convertible Bond Fund’s claims against Morgan Stanley & Co. and KPMG Hong Kong have not been dismissed or settled.
| 3. | ADVISORY FEE AND OTHER RELATED PARTY TRANSACTIONS |
The activities of the Funds are overseen by the Board. Pursuant to an Investment Advisory Agreement with the Funds, the Adviser, under the oversight of the Board, directs the daily operations of the Funds and supervises the performance of administrative and professional services provided by others. As compensation for its services and the related expenses borne by the Adviser, the Funds pays the Adviser a management fee, computed and accrued daily and paid monthly, at an annual rate of 0.75%, 1.95% and 0.95% for the Convertible Bond Fund, Convertible Plus Fund and the Intermediate Bond Fund, respectively, of the average daily net assets of each respective Fund. For the year or period ended October 31, 2015, the Adviser earned advisory fees of $5,313,832, $731,358 and $240,328 for the Convertible Bond Fund, Convertible Plus Fund and the Intermediate Bond Fund, respectively.
The Adviser, pursuant to an Expense Limitation Agreement (the “Agreement”) has contractually agreed to reduce its fees and/or absorb expenses of the Convertible Plus Fund and the Intermediate Bond Fund, at least until February 29, 2016, to ensure that Net Annual Operating Expenses (excluding any front-end or contingent deferred loads, brokerage fees and commissions, acquired fund fees and expenses, borrowing costs such as interest and dividend expense on securities sold short, taxes and extraordinary expenses such as litigation) will not exceed 3.20%, 2.95% and 3.95% of the Convertible Plus Fund’s average daily net assets for Class A, Class I and Class C shares, respectively and 1.50%, 1.25% and 2.25% of the Intermediate Bond Fund’s average daily net assets for Class A, Class I and Class C shares, respectively. The Agreement will allow the Adviser, subject to certain conditions, to recover amounts previously reimbursed for operating expenses to the Funds to the extent that the Funds’ expense ratios fall below the above indicated expense limitations. The amounts that can be recovered will be limited to the difference between the actual expense ratio and the amount of the expense limitation. Under such agreement, the
| Miller Funds |
| NOTES TO FINANCIAL STATEMENTS (Continued) |
| October 31, 2015 |
| |
Adviser can only recover such amounts for a period of up to three years. For the year or period ended October 31, 2015, the Adviser waived fees/reimbursed expenses of $221,204 and $140,113 for the Convertible Plus Fund and Intermediate Bond Fund, respectively, all of which will expire October 31, 2018.
Distributor – The distributor of the Funds is Northern Lights Distributors, LLC (the “Distributor”). The Board has adopted, on behalf of each Fund, a Distribution Plan and Agreement pursuant to Rule 12b-1 under the Investment Company Act of 1940 (the “Plan”), as amended, to pay for certain distribution activities and shareholder services. Prior to April 1, 2009, Convertible Bond Fund’s Class A shares paid 0.25% per year of its average daily net assets for such distribution and shareholder service activities. Subsequent to such date and pursuant to a shareholder vote, the Distribution Plan was amended to increase the annual rate to 0.50%. The Convertible Plus Fund and the Intermediate Bond Fund’s Class A pay 0.25% per year of its average daily net assets for distribution and shareholder service activities under the Plan. The Funds Class C pays 1.00% per year of its average daily net assets for distribution and shareholder service activities under the Plan. For the year or period ended October 31, 2015, the 12b-1 fees accrued amounted to $1,328,062 and $676,304 for the Convertible Bond Fund’s Class A shares and Class C shares, respectively, $73 and $413 for the Convertible Plus Fund’s Class A shares and Class C shares, respectively, and $382 and $147 for the Intermediate Bond Fund’s Class A and Class C shares, respectively.
The Distributor acts as each Fund’s principal underwriter in a continuous public offering of the Funds’ shares. For the year or period ended October 31, 2015, the Distributor received $216,612 in underwriting commissions for sales of Class A shares, of which $27,952 was retained by the principal underwriter or other affiliated broker-dealers for the Convertible Bond Fund. The Distributor did not receive any underwriting commissions for sales of Class A shares for the Convertible Plus Fund or the Intermediate Bond Fund.
In addition, certain affiliates of the Distributor provide services to the Funds as follows:
Gemini Fund Services, LLC (“GFS”) – GFS, an affiliate of the Distributor, provides administration, fund accounting, and transfer agent services to the Trust. Pursuant to separate servicing agreements with GFS, the Funds pay GFS customary fees for providing administration, fund accounting and transfer agency services to the Funds. Certain officers of the Trust are also officers of GFS, and are not paid any fees directly by the Funds for serving in such capacities.
Northern Lights Compliance Services, LLC (“NLCS”) – NLCS, an affiliate of GFS and the Distributor, provides a Chief Compliance Officer to the Trust, as well as related compliance services, pursuant to a consulting agreement between NLCS and the Trust. Under the terms of such agreement, NLCS receives customary fees from the Funds. An officer of the Trust is also an officer of NLCS.
Blu Giant, LLC (“Blu Giant”) – Blu Giant, an affiliate of GFS and the Distributor, provides EDGAR conversion and filing services as well as print management services for the Funds on an ad-hoc basis. For the provision of these services, Blu Giant receives customary fees from the Funds.
| 4. | INVESTMENT TRANSACTIONS |
The cost of security purchases and the proceeds from the sale of securities, other than short-term securities, for the year or period ended October 31, 2015, amounted to $586,121,453 and $547,860,316, respectively for the Convertible Bond Fund, $109,124,256 and $49,256,809, respectively for the Convertible Plus Fund and $68,340,547 and $26,371,483, respectively for the Intermediate Bond Fund.
Convertible Plus Fund may borrow for investment purposes, to meet repurchase requests and for temporary, extraordinary or emergency purposes. The Convertible Plus Fund is required to maintain asset coverage (that is, total assets including borrowings, less liabilities exclusive of borrowings) of 300% of the amount borrowed, with an exception for borrowings not in excess of 5% of Convertible Plus Fund’s total assets. The Convertible Plus Fund has entered into a line of credit agreement with Barclays Bank PLC, which permits the Convertible Plus Fund to borrow at a rate, per annum, equal to 0.90% plus the 3 month LIBOR rate to be paid quarterly. There is also an annual
| Miller Funds |
| NOTES TO FINANCIAL STATEMENTS (Continued) |
| October 31, 2015 |
| |
commitment fee. During the year or period ended October 31, 2015, the Convertible Plus Fund paid $144,652 in interest on the line of credit. Average borrowings and the average interest rate during the period ended October 31, 2015 were $14,460,000 and 1.50%, respectively. The largest outstanding amount borrowed during the period was $18,600,000. The balance on the line of credit as of October 31, 2015 was $18,600,000. The interest rate as of October 31, 2015 was 1.50%.
| 6. | DISTRIBUTIONS TO SHAREHOLDERS AND TAX COMPONENTS OF CAPITAL |
The tax character of fund distributions for the following periods was as follows:
For the period ended October 31, 2015:
| | | Ordinary | | | Long-Term | | | Return of | | | | |
| | | Income | | | Capital Gains | | | Capital | | | Total | |
| Convertible Bond Fund | | $ | 29,741,440 | | | $ | 9,581,986 | | | $ | — | | | $ | 39,323,426 | |
| Convertible Plus Fund | | | 306,193 | | | | — | | | | — | | | | 306,193 | |
| Intermediate Bond Fund | | | 282,134 | | | | — | | | | — | | | | 282,134 | |
| | | | | | | | | | | | | | | | | |
For the year ended October 31, 2014:
| | | Ordinary | | | Long-Term | | | Return of | | | | |
| | | Income | | | Capital Gains | | | Capital | | | Total | |
| Convertible Bond Fund | | $ | 15,271,391 | | | $ | 14,972,535 | | | $ | — | | | $ | 30,243,926 | |
As of October 31, 2015, the components of accumulated earnings/(deficit) on a tax basis were as follows:
| | | Undistributed | | | Undistributed | | | Unrealized | | | Total | |
| | | Ordinary | | | Long-Term | | | Appreciation/ | | | Accumulated | |
| | | Income | | | Capital Gains | | | (Depreciation) | | | Earnings/(Deficits) | |
| Convertible Bond Fund | | $ | 1,465,984 | | | $ | 1,008,199 | | | $ | (299,727 | ) | | $ | 2,174,456 | |
| Convertible Plus Fund | | | 499,114 | | | | — | | | | (1,144,838 | ) | | | (645,724 | ) |
| Intermediate Bond Fund | | | 351,909 | | | | — | | | | (360,544 | ) | | | (8,635 | ) |
The difference between book basis and tax basis distributable earnings and unrealized appreciation (depreciation) is primarily attributable to the tax income on contingent convertible debt securities, section 305(c) deemed dividend distributions, the mark-to market on open swap contracts and the tax deferral of losses on wash sales.
Permanent book and tax differences, primarily attributable to tax adjustments for swaps, and the tax treatment of short-term capital gains, proceeds from a litigation settlement, contingent convertible debt securities, section 305(c) deemed dividend distributions and equalization debits, resulted in reclassification for the period ended October 31, 2015 as follows:
| | | Paid | | | Undistributed | | | Undistributed | |
| | | In | | | Ordinary | | | Net Realized | |
| | | Capital | | | Income (Loss) | | | Gains (Loss) | |
| Convertible Bond Fund | | $ | 1,515,366 | | | $ | 36,170 | | | $ | (1,551,536 | ) |
| Convertible Plus Fund | | | 27,482 | | | | (414,319 | ) | | | 386,837 | |
| Intermediate Bond Fund | | | 28,534 | | | | (5,356 | ) | | | (23,178 | ) |
| 7. | NEW ACCOUNTING PRONOUNCEMENTS |
In May 2015, the FASB issued Accounting Standards Update (“ASU”) No. 2015-07 “Disclosure for Investments in Certain Entities that Calculate Net Asset Value per Share (or Its Equivalent)”. The amendments in ASU No. 2015-
| Miller Funds |
| NOTES TO FINANCIAL STATEMENTS (Continued) |
| October 31, 2015 |
| |
07 remove the requirement to categorize within the fair value hierarchy investments measured using the NAV practical expedient. The ASU also removes certain disclosure requirements for investments that qualify, but do not utilize, the NAV practical expedient. The amendments in the ASU are effective for fiscal years beginning after December 15, 2015, and interim periods within those fiscal years. Management is currently evaluating the impact these changes will have on the Funds’ financial statements and related disclosures.
Subsequent events after the date of the Statement of Assets and Liabilities have been evaluated through the date the financial statements were issued. Management has concluded that there is no impact requiring adjustment or disclosure in the financial statements.
REPORT OF INDEPENDENT REGISTERED PUBLIC ACCOUNTING FIRM
To the Board of Trustees of the Miller Investment Trust and Shareholders of the
Miller Convertible Bond Fund, Miller Convertible Plus Fund, and Miller Intermediate Bond Fund
Wellesley, Massachusetts
We have audited the accompanying financial statements of Miller Convertible Bond Fund, Miller Convertible Plus Fund, and Miller Intermediate Bond Fund (the “Funds”) as of October 31, 2015, and for the periods then ended, as listed in the table of contents. These financial statements, and financial highlights are the responsibility of the Funds’ management. Our responsibility is to express an opinion on these financial statements and financial highlights based on our audits.
We conducted our audits in accordance with the standards of the Public Company Accounting Oversight Board (United States). Those standards require that we plan and perform the audit to obtain reasonable assurance about whether the financial statements and financial highlights are free of material misstatement. The Funds are not required to have, nor were we engaged to perform, an audit of their internal control over financial reporting. Our audits included consideration of internal control over financial reporting as a basis for designing audit procedures that are appropriate in the circumstances, but not for the purpose of expressing an opinion on the effectiveness of the Funds’ internal control over financial reporting. Accordingly, we express no such opinion. An audit also includes examining, on a test basis, evidence supporting the amounts and disclosures in the financial statements, assessing the accounting principles used and significant estimates made by management, as well as evaluating the overall financial statement presentation. Our procedures included confirmation of securities owned as of October 31, 2015, by correspondence with the custodian and brokers. We believe that our audits provide a reasonable basis for our opinion.
In our opinion, such financial statements and financial highlights referred to in the table of contents present fairly, in all material respects, the financial position of the Miller Convertible Bond Fund, Miller Convertible Plus Fund, and Miller Intermediate Bond Fund as of October 31, 2015 the results of their operations, cash flows, changes in their net assets, and the financial highlights for the periods then ended, listed in the table of contents, in conformity with accounting principles generally accepted in the United States of America.
| /s/ Deloitte & Touche LLP |
| |
| Chicago, Illinois |
| December 30, 2015 |
| Miller Funds |
| DISCLOSURE OF FUND EXPENSES (Unaudited) |
| October 31, 2015 |
| |
As a shareholder of the Funds you incur ongoing costs, including management fees, distribution and/or service (12b-1 fees) fees and other Fund expenses. This example is intended to help you understand your ongoing costs (in dollars) of investing in the Funds and to compare these costs with the ongoing costs of investing in other mutual funds. Please note, the expenses shown in the tables are meant to highlight ongoing costs only and do not reflect any transactional costs.
This example is based on an investment of $1,000 invested for the period of time as indicated in the table below.
Actual Expenses: The first line of the table provides information about actual account values and actual expenses. You may use the information in this line, together with the amount you invested, to estimate the expenses that you paid over the period. Simply divide your account value by $1,000 (for example, an $8,600 account value divided by $1,000 = 8.6), then multiply the result by the number in the first line under the heading entitled “Expenses Paid During the Period” to estimate the expenses you paid on your account during the period.
Hypothetical Examples for Comparison Purposes: The second line of the table below provides information about hypothetical account values and hypothetical expenses based on the Funds’ actual expense ratio and an assumed rate of return of 5% per year before expenses, which is not the Funds’ actual return. The hypothetical account values and expenses may not be used to estimate the actual ending account balance or expenses you paid for the period. You may use this information to compare the ongoing costs of investing in the Funds and other funds. To do so, compare this 5% hypothetical example with the 5% hypothetical examples that appear in the shareholder reports of the other funds.
Please note that the expenses shown in the table are meant to highlight your ongoing costs only and do not reflect any transactional costs which may be applicable to your account. Therefore, the second line of the table is useful in comparing ongoing costs only, and will not help you determine the relative total costs of owning different funds. In addition, if these transactional costs were included, your costs would have been higher.
| | Beginning | | Annualized | Expenses Paid During the |
| | Account | Ending Account | Expense | Period |
| | Value (5/1/15) | Value (10/31/15) | Ratio | (5/1/15 to 10/31/15) |
| Actual * | | | | |
| Miller Convertible Bond Fund | | | | |
| Class A | $1,000.00 | $972.80 | 1.51% | $ 7.51 |
| Class I | $1,000.00 | $975.30 | 1.01% | $ 5.03 |
| Class C | $1,000.00 | $971.00 | 2.01% | $ 9.99 |
| Miller Convertible Plus Fund | | | | |
| Class A | $1,000.00 | $951.10 | 3.20% | $15.74 |
| Class I | $1,000.00 | $951.90 | 2.95% | $14.51 |
| Class C | $1,000.00 | $946.80 | 3.95% | $19.38 |
| Miller Intermediate Bond Fund | | | | |
| Class A | $1,000.00 | $986.50 | 1.50% | $ 7.51 |
| Class I | $1,000.00 | $984.90 | 1.25% | $ 6.25 |
| Class C | $1,000.00 | $984.80 | 2.25% | $11.26 |
| Hypothetical (5% return before expenses) * | | | | |
| Miller Convertible Bond Fund | | | | |
| Class A | $1,000.00 | $1,017.59 | 1.51% | $ 7.68 |
| Class I | $1,000.00 | $1,020.12 | 1.01% | $ 5.14 |
| Class C | $1,000.00 | $1,015.07 | 2.01% | $ 10.21 |
| Miller Convertible Plus Fund | | | | |
| Class A | $1,000.00 | $1,009.07 | 3.20% | $16.20 |
| Class I | $1,000.00 | $1,010.33 | 2.95% | $14.95 |
| Class C | $1,000.00 | $1,005.29 | 3.95% | $19.96 |
| Miller Intermediate Bond Fund | | | | |
| Class A | $1,000.00 | $1,017.64 | 1.50% | $ 7.63 |
| Class I | $1,000.00 | $1,018.90 | 1.25% | $ 6.36 |
| Class C | $1,000.00 | $1,013.86 | 2.25% | $11.42 |
| * | Expenses are equal to the average account value over the period, multiplied by the Fund’s annualized expense ratio, multiplied by the number of days in the six month period ended October 31, 2015 (184) divided by the number of days in the fiscal year (365). |
Approval of New Investment Advisory Agreement (Unaudited)
In connection with a meeting of the Board of Trustees of the Trust held on November 18, 2015 (the “Meeting”), the Board, including the Independent Trustees, discussed the renewal of the Management Agreement (the “Agreement”) between the Trust and Wellesley Investment Advisors, Inc. (the “Adviser”), on behalf of the Miller Convertible Bond Fund (the “Fund”). It was acknowledged that two series of the Trust, Miller Convertible Plus Fund and Miller Intermediate Bond Fund, have been in existence less than a year and, accordingly, the Board at the Meeting was not required by Section 15(a) of the Investment Company Act of 1940, as amended, to renew them.
In considering whether the continuance of the Agreement was in the best interests of the Fund and its shareholders, the Board had discussions with representatives of the Adviser and received materials specifically relating to the Agreement. Both in the Meeting specifically focused upon the review of the Agreement and at other meetings, the Board, including the Independent Trustees, received information relating to the Adviser’s investment and management services under the Agreement. This information included materials regarding: (i) the investment performance of the Fund, including comparisons to the Fund’s peer group of funds selected by the Adviser from all convertible bond mutual funds with assets in excess of $25 million but less than $1 billion (“Peer Group”) as well as comparisons to a universe of funds consisting of the Fund and all other funds in the Morningstar category “Convertibles,” as classified by the independent evaluation service, Morningstar, Inc. (“Morningstar Category”); (ii) the nature, extent and quality of the services provided by the Adviser; (iii) the costs of the services provided and profits realized the Adviser; and (iv) the potential for economies of scale.
As part of their review, the Board requested, and the Adviser provided, additional information in order to evaluate the quality of the Adviser’s services and the reasonableness of its fee under the Agreement. The following summarizes matters considered by the Board in connection with its continuance of the Agreement. However, the Board did not identify any single factor as all-important or controlling, and the following summary does not detail all the matters considered. Matters considered by the Board, including the Independent Trustees, in connection with its approval of the Agreement included the following:
Nature, Extent and Quality of Services and Personnel. The Board examined the nature, extent and quality of the services provided by the Adviser to the Fund. The Independent Trustees also engaged in discussions with the Adviser’s senior management responsible for the overall functioning of the Fund’s investment operations. The Board considered information regarding the Adviser’s efforts in the area of compliance and investment processes. The Trustees discussed the Adviser’s personnel, and the high level of service provided by them including managing the growth of Fund assets, which among other things requires specialized skill in sourcing sufficient suitable convertible. The Board also discussed the financial strength of the Adviser and concluded that it is satisfied the Adviser has delivered a high level of services to the Fund and its shareholders. The Board further concluded that the Fund’s management team and the Adviser’s overall resources were adequate and that the Adviser had the investment management skills and personnel that are more than capable to perform its duties under the Agreement.
Performance of the Adviser. The Trustees reviewed the performance of the Fund, noting that for the one, three and five-year periods ended September 30, 2015 the Fund had returns of -2.18%, 7.96% and 6.78%, respectively, outperforming the peer group averages of -3.79% and 7.41% for the one and three-year periods and slightly underperforming the peer group average of 6.88% for the five-year period. Similarly, the Fund outperformed the Morningstar category averages of -3.22% and 7.92% for the one and three-year periods ended September 30, 2015 and underperformed the Morningstar category average of 7.72% for the five-year period ended September 30, 2015.
The Board also noted the Fund’s performance of 6.30% since the Fund’s inception date, which is significantly higher than the peer group average of 4.67% and the Morningstar category average of 5.22%. In the Adviser’s view, this period is particularly relevant because it captures the major downturn in the convertible bond market in 2008. The Trustees noted that the goal of the Fund is to outperform over complete market cycles and as such will tend to
underperform peers that take greater risk during bull markets. The Trustees also noted that the Fund’s portfolio is entirely invested in convertible bonds and, therefore, the Fund has a different risk profile than its peer group. The Board noted that the Adviser continues to follow the same strategy as it has in the past to achieve favorable risk-adjusted returns. The Board concluded that the Fund’s performance was reasonable.
Fees & Expenses. The Trustees reviewed information regarding comparative fees charged by the Adviser to other accounts managed by the Adviser, including the Miller Convertible Plus Fund, a new fund that utilizes a similar strategy but with leverage. The Trustees also reviewed the fees charged by the Fund’s peer group average and Morningstar category average as of the end of September 30, 2015. The Trustees considered the Fund’s advisory fee rate of 0.75% and noted it was higher than the peer group average of 0.69% but lower than the Morningstar category average of 0.80%. The Trustees also reviewed the Fund’s net expense ratio of 0.95% and again noted that it was higher than the peer group average of 0.85% but lower than the Morningstar category average of 1.00%. The Trustees concluded that based on the specialized nature of the Fund, the Adviser’s expertise in the area, and the fees charged by the Adviser to its other clients, the Fund’s management fee was reasonable and the Fund’s net expense ratio was satisfactory for purposes of approving the continuance of the Management Agreement.
Economies of Scale. The Trustees concluded that given current asset levels and total expenses, the benefits to be derived from economies of scale were not relevant to consideration of break points at this time and that the Trustees would review the issue following further growth in Fund assets.
Profitability. The Trustees considered the profits to be realized by the Adviser, taking into consideration other benefits to the Adviser. The Board considered that a portion of the 12b-1 fees being charged are for shareholder servicing. The Board also reviewed financial profit projections based upon assumptions about Fund asset levels and Adviser costs, noting that any such projections are speculative and do not guarantee Adviser profits. It was the consensus of the Board that the Adviser’s relationship with the Fund was not unreasonably profitable.
Conclusion. Having requested and received such information from the Adviser as the Board believed to be reasonably necessary to evaluate the terms of the Agreement, the Board, including all of the Independent Trustees, concluded that the advisory fee is fair and reasonable and approved the continuance of the Agreement and the advisory fee thereunder as in the best interest of the Fund and its shareholders.
| Miller Convertible Fund |
| TRUSTEES AND OFFICERS (Unaudited) |
| October 31, 2015 |
| |
This chart provides information about the Trustees and Officers who oversee the Fund. Officers elected by the Trustees manage the day-to-day operations of the Fund and execute policies formulated by the Trustees. The term of office of each Trustee listed below will continue indefinitely.
Independent Trustees:
Name, Address and Age
Position Held with Fund | | Principal Occupation
During the Past Five Years | | Number of
Portfolios in Fund
Complex**
Overseen by
Trustee | | Other Directorships
held by Trustee |
Neal Chorney
Year of Birth: 1948
c/o Sunrise Financial Group
139 Orange St.
New Haven, CT 06510
Trustee*
Since 2007 | | Vice President – Real Estate Investing & Property Management, Sunrise Financial LLC (2006 – Present) (commercial and investment real estate lending) | | 3 | | None |
| | | | | | | |
Daniel Mainzer
Year of Birth: 1963
c/o Flanigan, Cotillo &
Mainzer, LLP
1881 Worcester Road, Suite
200
Framingham, MA 01701
Trustee*
Since 2007 | | Partner, Flanigan, Cotillo & Mainzer, LLP (2010-present) Principal, KLR & Co (2009 –2010) | | 3 | | None |
| | | | | | | |
Michael Blank
Year of Birth: 1950
c/o Braintree Street Realty
119 Braintree Street,
Suite 502
Boston, MA 02134
Trustee*
Since 2009 | | Principal, Braintree Street Realty, LLC (1986-Present) President, Evanteal Properties (2011-Present) | | 3 | | Board of Directors JNF New England (2012-Present); Trustee, Rivermoor Realty Trust (1991- 2011) |
| Miller Convertible Fund |
| TRUSTEES AND OFFICERS (Unaudited) (Continued) |
| October 31, 2015 |
| |
| Interested Trustees and Officers: |
| | | | | | | |
Name, Address and Age
Position Held with Fund | | Principal Occupation
During the Past Five Years | | Number of
Portfolios in Fund
Complex **
Overseen by
Trustee | | Other Directorships
held by Trustee |
Greg Miller***
Year of Birth: 1949
c/o Wellesley Investment
Advisors, Inc.
20 William Street, Suite G-5
Wellesley, MA 02481
Trustee, President and
Treasurer*
Since 2007 | | Chief Executive Officer and Registered Investment Advisor, Wellesley Investment Advisors, Inc. (1991 – Present) (registered investment advisory firm) | | 3 | | None |
Darlene Murphy
Year of Birth: 1962
c/o Wellesley Investment
Advisors, Inc.
20 William Street, Suite G-5
Wellesley, MA 02481
Secretary*
Since 2007 | | President, Wellesley Investment Advisors, Inc. (2011 – Present) (registered investment advisory firm) | | N/A | | N/A |
Michael J. Wagner
Year of Birth: 1950
80 Arkay Drive, Suite 110,
Hauppauge, NY 11788
Chief Compliance Officer*
Since 2007 | | President (2006 – Present), Northern Lights Compliance Services, LLC (provides CCO services to mutual funds); Vice President, GemCom, LLC (2004 – Present) (provides Edgar services to mutual funds) | | N/A | | N/A |
| * | The term of office will continue indefinitely. |
| ** | The term “Fund Complex” refers to the Miller Investment Trust. |
| *** | Greg Miller is an “interested person” of the Trust as that term is defined under the 1940 Act, because of his affiliation with Wellesley Investment Advisors, Inc. (the Funds’ Advisor). |
The Trust’s Statement of Additional Information includes additional information about the Trustees and is available free of charge, upon request, by calling toll-free at 1-877-441-4434.
PRIVACY notice
| FACTS | WHAT DOES MILLER INVESTMENT TRUST DO WITH YOUR PERSONAL INFORMATION? |
| | |
| Why? | Financial companies choose how they share your personal information. Federal law gives consumers the right to limit some but not all sharing. Federal law also requires us to tell you how we collect, share, and protect your personal information. Please read this notice carefully to understand what we do. |
| | |
| What? | The types of personal information we collect and share depend on the product or service you have with us. This information can include: |
| | |
| | ■ | Social Security number | ■ | Purchase History |
| | | | | |
| | ■ | Assets | ■ | Account Balances |
| | | | | |
| | ■ | Retirement Assets | ■ | Account Transactions |
| | | | | |
| | ■ | Transaction History | ■ | Wire Transfer Instructions |
| | | | | |
| | ■ | Checking Account Information | | |
| | |
| | When you are no longer our customer, we continue to share your information as described in this notice. |
| | |
| How? | All financial companies need to share customers’ personal information to run their everyday business. In the section below, we list the reasons financial companies can share their customers’ personal information; the reasons Miller Investment Trust chooses to share; and whether you can limit this sharing. |
| Reasons we can share your personal information | Does Miller
Investment Trust
share? | Can you limit this sharing? |
For our everyday business purposes – such as to process your transactions, maintain your account(s), respond to court orders and legal investigations, or report to credit bureaus | Yes | No |
For our marketing purposes – to offer our products and services to you | No | We don’t share |
| For joint marketing with other financial companies | No | We don’t share |
For our affiliates’ everyday business purposes – information about your transactions and experiences | No | We don’t share |
For our affiliates’ everyday business purposes – information about your creditworthiness | No | We don’t share |
| For non-affiliates to market to you | No | We don’t share |
| Questions? | Call 1-877-441-4434 |
| Who we are |
| Who is providing this notice? | Miller Investment Trust |
| What we do |
| How does Miller Investment Trust protect my personal information? | To protect your personal information from unauthorized access and use, we use security measures that comply with federal law. These measures include computer safeguards and secured files and buildings. Our service providers are held accountable for adhering to strict policies and procedures to prevent any misuse of your nonpublic personal information. |
| How does Miller Investment Trust collect my personal information? | We collect your personal information, for example, when you ■ Open an account ■ Provide account information ■ Give us your contact information ■ Make deposits or withdrawals from your account ■ Make a wire transfer ■ Tell us where to send the money ■ Tells us who receives the money ■ Show your government-issued ID ■ Show your driver’s license We also collect your personal information from other companies. |
| Why can’t I limit all sharing? | Federal law gives you the right to limit only ■ Sharing for affiliates’ everyday business purposes – information about your creditworthiness ■ Affiliates from using your information to market to you ■ Sharing for non-affiliates to market to you State laws and individual companies may give you additional rights to limit sharing. |
| Definitions |
| Affiliates | Companies related by common ownership or control. They can be financial and nonfinancial companies. ■ Miller Investment Trust does not share with our affiliates. |
| Non-affiliates | Companies not related by common ownership or control. They can be financial and nonfinancial companies ■ Miller Investment Trust does not share with non-affiliates so they can market you. |
| Joint marketing | A formal agreement between nonaffiliated financial companies that together market financial products or services to you. ■ Miller Investment Trust does not jointly market. |
| | | | | |
| MILLER FUNDS |
| |
| | | |
| Advisor | | Wellesley Investment Advisors, Inc. |
| | | The Wellesley Office Park |
| | | 20 William Street |
| | | Wellesley, MA 02481 |
| | | |
| Distributor | | Northern Lights Distributors, LLC |
| | | 17605 Wright Street |
| | | Omaha, NE 68130 |
| | | |
| Legal Counsel | | Seward & Kissel, LLP |
| | | 901 K Street – Suite 800 |
| | | Washington, DC 20001 |
| | | |
| Transfer Agent | | Gemini Fund Services, LLC |
| | | 17605 Wright Street |
| | | Omaha, NE 68130 |
| | | |
| Custodian | | Bank of New York Mellon Corp. |
| | | One Wall Street |
| | | New York, NY 10286 |
How to Obtain Proxy Voting Information
Information regarding how the Funds voted proxies relating to portfolio securities during the most recent 12-month period ending June 30th, as well as a description of the policies and procedures that the Funds use to determine how to vote proxies is available without charge, upon request, by calling toll-free 1-877-441-4434 or by referring to the Security and Exchange Commission’s (“SEC”) website at http://www.sec.gov.
How to Obtain 1st and 3rd Fiscal Quarter Portfolio Holdings
The Funds file their complete schedule of portfolio holdings with the SEC for the first and third quarters of each fiscal year on Form N-Q. Form N-Q is available on the SEC’s website at http://www.sec.gov and may be reviewed and copied at the SEC’s Public Reference Room in Washington, DC (1-800-SEC-0330). The information on Form N-Q is available without charge, upon request, by calling 1-877-441-4434.
| Miller Funds ● 17605 Wright St. ● Suite 2 ● Omaha, NE 68130 |
| 1-877-441-4434 |
Item 2. Code of Ethics.
As of the end of the period covered by this report, the registrant has adopted a code of ethics that applies to the registrant's principal executive officer, principal financial officer, principal accounting officer or controller, or persons performing similar functions, regardless of whether these individuals are employed by the registrant or a third party.
Item 3. Audit Committee Financial Expert.
The Board has determined, based on questionnaires completed by the Audit Committee members, that no one on the committee satisfies the definition of "financial expert;" however the Board also determined that collectively the Audit Committee members have the requisite knowledge and experience to perform the Audit Committee duties.
Item 4. Principal Accountant Fees and Services.
FY 2015 $ 81,000
FY 2014 $ 29,500
FY 2015 $ 4,300
FY 2014 $ 4,300
(c)
FY 2015 $ 11,375
FY 2014 $ 4,375
(d) All Other Fees
FY 2015 $ 0
FY 2014 $ 0
The above "Audit-Related Fees" represent fees billed for assurance and related services that are reasonably related to the performance of the registrant audit or the review of the registrant's financial statements and that are not reported under Audit Fees.
The above “Tax Fees” were billed for professional services rendered for tax compliance and tax return preparation.
(e) (1) Audit Committee’s Pre-Approval Policies
| | The registrant’s Audit Committee is required to pre-approve all audit services and, when appropriate, any non-audit services (including audit-related, tax and all other services) to the registrant. The registrant’s Audit Committee is also required to pre-approve, when appropriate, any non-audit services (including audit-related, tax and all other services) to its adviser, or any entity controlling, controlled by or under common control with the adviser that provides ongoing services to the registrant to the extent that the services are determined to have a direct impact on the operations or financial reporting of the registrant. Services are reviewed on an engagement by engagement basis by the audit committee. |
| (2) | Percentages of 2015 Services Approved by the Audit Committee |
| | Registrant | Adviser |
| | | | | | | |
| Audit-Related Fees: | | 0% | | | 0% | |
| Tax Fees: | | 0% | | | 0% | |
| All Other Fees: | | 0% | | | 0% | |
(f) During audit of registrant's financial statements for the most recent fiscal year, less than 50 percent of the hours expended on the principal accountant's engagement were attributed to work performed by persons other than the principal accountant's full-time, permanent employees.
(g) The aggregate non-audit fees billed by the registrant's accountant for services rendered to the registrant, and rendered to the registrant's investment adviser (not including any sub-adviser whose role is primarily portfolio management and is subcontracted with or overseen by another investment adviser), and any entity controlling, controlled by, or under common control with the adviser that provides ongoing services to the registrant:
| | Registrant | Adviser |
| | | |
| | FY 2015 | | | $4,300 | | | $ None | |
| | FY 2014 | | | $4,300 | | | $ None | |
(h) Not applicable. All non-audit services to the registrant were pre-approved by the Audit Committee for FY 2015.
Item 5. Audit Committee of Listed Companies. Not applicable.
Item 6. (a) Schedule of Investments. Schedule of investments in securities of unaffiliated issuers is included under Item 1.
(b) Not Applicable
Item 7. Disclosure of Proxy Voting Policies and Procedures for Closed-End Management Investment Companies. Not applicable.
Item 8. Portfolio Managers of Closed-End Management Investment Companies. Not applicable.
Item 9. Purchases of Equity Securities by Closed-End Management Investment Companies. Not applicable.
Item 10. Submission of Matters to a Vote of Security Holders. There were no material changes to the procedures by which shareholders may recommend nominees to the registrant's Board of Trustees.
Item 11. Controls and Procedures.
(a) The President and Treasurer has concluded that the registrant's disclosure controls and procedures (as defined in Rule 30a-3(c) under the Investment Company Act of 1940) provide reasonable assurances that material information relating to the registrant is made known to them by the appropriate persons, based on their evaluation of these controls and procedures as of a date within 90 days of the filing date of this report.
(b) There were no significant changes in the registrant’s internal control over financial reporting that occurred during the registrant’s last fiscal half-year that have materially affected, or are reasonably likely to materially affect, the registrant’s internal control over financial reporting.
Item 12. Exhibits.
(a)(1) Sarbanes Oxley Code of Ethics filed herewith.
(a)(2) Certifications required by Section 302 of the Sarbanes-Oxley Act of 2002 (and Item 11(a)(2) of Form N-CSR) are filed herewith.
(a)(3) Not applicable for open-end investment companies.
(b) Certifications required by Section 906 of the Sarbanes-Oxley Act of 2002 (and Item 11(b) of Form N-CSR) are filed herewith.
SIGNATURES
Pursuant to the requirements of the Securities Exchange Act of 1934 and the Investment Company Act of 1940, the registrant has duly caused this report to be signed on its behalf by the undersigned, thereunto duly authorized.
(Registrant) Miller Investment Trust
By (Signature and Title)
/s/ Greg Miller
Greg Miller, President and Treasurer
Date 1/11/16
Pursuant to the requirements of the Securities Exchange Act of 1934 and the Investment Company Act of 1940, this report has been signed below by the following person on behalf of the registrant and in the capacities and on the dates indicated.
By (Signature and Title)
/s/Greg Miller
Greg Miller, President and Treasurer
Date 1/11/16