united states
securities and exchange commission
washington, d.c. 20549
form n-csr
certified shareholder report of registered management
investment companies
Investment Company Act file number 811-22131
Miller Investment Trust
(Exact name of registrant as specified in charter)
20 William Street Wellesley, MA 02481
(Address of principal executive offices) (Zip code)
Gemini Fund Services, LLC., 80 Arkay Drive Suite 110, Hauppauge, NY 11788
(Name and address of agent for service)
Registrant's telephone number, including area code: 781-416-4000
Date of fiscal year end: 10/31
Date of reporting period:10/31/18
Item 1. Reports to Stockholders.
| |
 |
| |
| |
| Miller Convertible Bond Fund |
| Miller Convertible Plus Fund |
| Miller Intermediate Bond Fund |
| |
| |
| |
| |
| |
| Annual Report |
| |
| OCTOBER 31, 2018 |
| |
| |
| |
| 1-877- 441- 4434 |
| www.MillerFamilyOfFunds.com |
| |
| |
| |
| |
| |
| Investment Advisor |
| Wellesley Asset Management, Inc. |
| The Wellesley Office Park |
| 20 William Street |
| Wellesley, MA 02481 |
| 781-416-4000 |
| |
| |
| |
| |
| |
| This report and the financial statements contained herein are submitted for the general information of shareholders and are not authorized for distribution to prospective investors unless preceded or accompanied by an effective prospectus. Nothing herein contained is to be considered an offer of sale or solicitation of an offer to buy shares of Miller Funds. Such offering is made only by prospectus, which includes details as to offering price and other material information. |
| |
| Distributed by Northern Lights Distributors, LLC. Member FINRA |
| |
Beginning on January 1, 2021, as permitted by regulations adopted by the Securities and Exchange Commission, paper copies of the Funds’ shareholder reports like this one will no longer be sent by mail, unless you specifically request paper copies of the reports. Instead, the reports will be made available on the Funds’ website www.MillerFamilyOfFunds.com, and you will be notified by mail each time a report is posted and provided with a website link to access the report.
If you already elected to receive shareholder reports electronically, you will not be affected by this change and you need not take any action. You may elect to receive shareholder reports and other communications from the Funds electronically by contacting your financial intermediary (such as a broker-dealer or bank) or, if you are a direct investor, by following the instructions included with paper Fund documents that have been mailed to you. You may also elect to receive all future reports in paper free of charge.
Dear Fellow Shareholder,
We are pleased to provide you with this overview of performance of the funds for the fiscal year ending October 31, 2018. In this letter, we will discuss the major factors that influenced fiscal year performance.
Throughout the last year, all share classes of the Miller Family of Funds outperformed Bloomberg Barclays US Aggregate Bond Index but underperformed the S&P 500 Total Return Index. The results since inception were similar with all share classes outperforming the bond index but underperforming equity indices. Our funds’ performance for the fiscal year ending October 31, 2018 and since inception is as follows:
| | | One Year Ending | | Annualized Since |
| | | October 31, 2018 | | Inception |
| Miller Convertible Bond Fund | | | | |
| I shares (MCIFX) | | -1.08% | | 6.09% (12/27/07) |
| A shares (MCFAX.LW) | | -1.5% | | 5.53% (12/27/07) |
| C shares (MCFCX) | | -2.04% | | 5.84% (12/01/09) |
| | | | | |
| | | One Year Ending | | Annualized Since |
| | | October 31, 2018 | | Inception |
| Miller Convertible Plus Fund | | | | |
| I shares (MCPIX) | | -0.32% | | 6.83% (12/31/14) |
| A shares (MCPAX) | | -0.55% | | 6.59% (12/31/14) |
| C shares (MCCCX) | | -1.29% | | 5.75% (12/31/14) |
| | | | | |
| | | One Year Ending | | Annualized Since |
| | | October 31, 2018 | | Inception |
| Miller Intermediate Bond Fund | | | | |
| I shares (MIFIX) | | 0.96% | | 4.15% (12/31/14) |
| A shares (MIFAX) | | 0.67% | | 3.90% (12/31/14) |
| C shares (MIFCX) | | -0.16% | | 3.27% (12/31/14) |
The funds’ net assets under management for the period ending October 31, 2018 were as follows:
| Miller Convertible Bond Fund | | $ | 978,589,067 | |
| Miller Convertible Plus Fund | | $ | 142,347,061 | |
| Miller Intermediate Bond Fund | | $ | 109,152,939 | |
Convertible Market Review
Over the last fiscal year ending October 31, 2018, the Bank of America/Merrill Lynch All Convertibles ex Mandatory Index (V0A0) and the S&P 500 Total Return Index were up 4.05% and 7.35% respectively, while the Bloomberg Barclays US Aggregate Bond Index was down -2.05%. Convertible performance was helped by the performance and higher volatility of the underlying equities. This was partially offset by higher interest rates and higher credit spreads. Note the following definitions:
| ● | The Bank of America/Merrill Lynch All Convertibles ex Mandatory Index (V0A0) represents all US convertibles, excluding mandatory convertibles, small issues and bankruptcies. |
| ● | The Bloomberg Barclays US Aggregate Bond Index is an unmanaged index of prices of U.S. dollar-denominated, fixed-rate, taxable, investment grade fixed-income securities with remaining maturities of one year and longer. The Index includes Treasury, government, corporate, mortgage-backed, commercial mortgage-backed and asset-backed securities. |
| ● | The S&P 500 Total Return Index is a cap-weighted index of 500 common stocks and is regarded as a leading proxy for the US stock market. |
| ● | A credit spread is the difference in yield between a US Treasury bond and a debt security with the same maturity but of lesser quality. |
Please note: Investors cannot directly invest in an index and unmanaged index returns do not reflect any fees, expenses, or sales charges.
Stocks and convertible bonds moved higher over the last year after Congress passed new laws that lowered corporate tax rates. However, these moves were accompanied by substantially higher volatility. The VIX, a market indicator of stock volatility, had its largest one-day jump in history moving 130% on February 5th of this year. The VIX closed the year above 20 representing a 100% change from the previous year’s close. One possible source of stock market volatility was the prospect of higher inflation. As a result, the 10-year Treasury yield broke out of a multi-decade downtrend and closed at a multi-year high of around 3.15% on October 31, 2018. The combination of higher equity prices and higher yields provided an ideal scenario for new issuance which was very strong over the last year.
Miller Convertible Bond Fund
The Miller Convertible Bond Fund underperformed the V0A0 Index and the S&P 500 Total Return Index but outperformed the Bloomberg Barclays US Aggregate Bond Index for the year ending October 31, 2018. The fund’s overweight position in the transportation sector and underweight position in healthcare contributed to underperformance versus the V0A0 index. The fund’s underweight positions in the telecommunications sector and healthcare also contributed to underperformance versus the S&P 500 Total Return Index. In a period of rising rates, the fund’s shorter duration led to outperformance when compared to the Bloomberg Barclays US Aggregate Bond Index.
The fund’s position in Integrated Device Technologies (0.15% weight) as of October 31, 2018 resulted in a gain of over 30%. On the negative side, the fund’s position in LGI Homes (1.80% weight) as of October 31, 2018 resulted in a 28.33% loss.
The fund remains well diversified with 104 positions, the largest of which accounts for 3.1% of assets. Given the market volatility, returns varied widely. As a result, the largest drawdown, or peak to trough decline, was 5.84%.
Miller Convertible Plus Fund
The results for the Miller Convertible Plus Fund were better than the Miller Convertible Bond Fund, but still lower than the S&P 500 Total Return Index and the V0A0 Index. Similar to the Miller Convertible Bond Fund, the Plus Fund did outperform the Bloomberg Barclays US Aggregate Bond Index. The fund’s overweight position in the transportation sector and its underweight position in healthcare and telecommunications were detractors from performance. Like the Miller Convertible Bond Fund, the Plus Fund’s shorter duration led to outperformance versus the Bloomberg Barclays US Aggregate Bond Index.
The Miller Convertible Plus Fund’s top performing position was Amtrust Financial (2.35% weight) as of October 31, 2018 which returned 25.62%. Similar to the other funds in the Miller Family, The Miller Convertible Plus Fund’s most underperforming position was in LGI Homes (1.01% weight) as of October 31, 2018 which resulted in a 28.33% loss.
The fund is diversified with 55 positions with the largest being a JP Morgan note convertible into Apple and represents 4.95% of the fund’s assets. Because the fund uses leverage, it tends to be the most volatile in the Miller Family of Funds. During the last year, the largest drawdown in the Miller Convertible Plus Fund was 8.31%.
Miller Intermediate Bond Fund
During the period, the Miller Intermediate Bond Fund was the best performing fund within the Miller Family. However, it too underperformed the V0A0 Index and the S&P 500 Total Return Index, but it outperformed the Bloomberg Barclays US Aggregate Bond Index. The fund’s overweight allocation to investment grade bonds and its underweight allocation to high yield bonds contributed to outperformance compared to the V0A0 Index. However, this was more than offset by underweight exposures to healthcare and technology. Underweight exposures to the consumer discretionary and healthcare led to underperformance versus the S&P 500 Total Return Index.
The Intermediate Bond Fund’s best and worst positions were the same as those in the Miller Convertible Plus Fund. The fund gained 25.62% (0.86% weight) as of October 31, 2018 in Amtrust Financial, but lost 28.33% (0.56% weight) as of October 31, 2018 in LGI Homes.
The Intermediate Bond Fund has 51 positions and the largest position is a US two-year Treasury note which represents 4.4% of the fund’s assets. Though the fund owned individual positions with volatile returns, owning US Treasuries helped to dampen the volatility of returns. As a result, the fund’s largest drawdown during the fiscal year ending October 31, 2018 was only 3.32%.
Convertible Bond Strategy Review
We remain committed to the same strategy we have utilized since our company was founded in 1991. It is important to note that we do not alter our investment strategy regardless of the current investment climate. When investing in convertibles we only buy convertible bonds and notes (no convertible preferreds, mandatory preferreds, or other convertible structures) which typically offer the majority of principal return within seven years of issuance. Before making an investment, we perform a thorough analysis of a company’s balance sheet and income statement. We seek to invest in profitable companies and seek to avoid companies with unsafe debt loads. While we usually invest with the idea of holding bonds until the next liquidity date (maturity, put or call), we will consider selling or reducing our exposure if one of the following scenarios occur:
| ● | An issuer’s credit quality deteriorates |
| ● | The bond loses its favorable risk/reward characteristics due to price appreciation |
| ● | We perceive an opportunity to increase portfolio diversification |
| ● | We believe more attractive investments are available |
Because one of our key risk management practices involves careful limits on prices we pay for convertibles, we tend not to purchase those that trade at prices substantially above par, and thus have significantly negative yields to the next liquidity date. This discipline often results in the elimination of some of the most equity-sensitive convertibles. As a result, our performance tends to lag broader equity indices in rising equity markets but seeks to decline less in falling equity markets. Our holdings span the convertible market, from investment-grade to small-cap, with a broad distribution of industries represented. Many of our rated convertible bonds are investment grade and a large percentage of the bonds are not rated.
New Issuance
The new issue market remained robust over the last year as both stocks and interest rates moved higher. Almost $49 billion of new paper came to the market over the last year. Some of the new issues that met our criteria were convertible bonds issued by the following companies (weighting as of October 31, 2018):
| ● | Cowen Group (2.82% weight), a financial services company that provides investment banking, research, sales and trading, and prime brokerage services |
| ● | CalAmp (2.21% weight), a provider of wireless communications solutions for a range of applications globally |
| ● | Arbor Realty (1.04% weight), a REIT that specializes in structured finance assets in multifamily and commercial real estate markets, primarily consisting of bridge and mezzanine loans |
| ● | Cree Inc. (2.09% weight), a manufacturer of LED products, lighting products, and semiconductor products for power and RF applications |
Potential catalysts for continued strength in convertible issuance include rising interest rates, widening credit spreads, and higher stock prices.
As we look ahead, we continue to believe that a portfolio of convertible bonds may offer investors the potential of the best of both worlds: upside participation in improving equity markets and capital preservation at maturity, or put date, barring default should the equity markets correct. We believe that adding convertibles to a multi-asset portfolio in rising or falling markets may increases our overall risk-return profile. In addition, historically, convertible bonds have been the best performing fixed income asset class in periods of rising interest rates. We continue to seek to realize a total return on our funds that outperforms both the Bloomberg Barclays US Aggregate Bond Index and the S&P 500 Total Return Index over full market cycles.
For more detailed and timely information on our funds and Wellesley Asset Management, please visit our website at www.wellesleyassetmanagement.com where you can access quarterly commentaries and fund fact sheets. As always, we thank you for your continued trust and confidence in our management. We look forward to helping you achieve your future financial goals.
Sincerely,
Greg Miller, Portfolio Manager
Darlene Murphy, Portfolio Manager
Michael Miller, Portfolio Manager
2161-NLD-11/27/2018
DM11282018-1-273
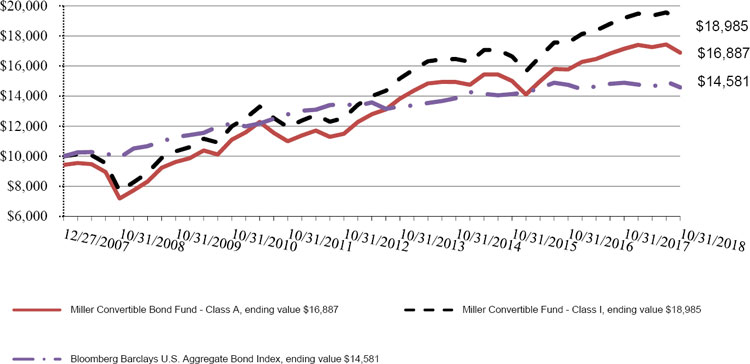
| Miller Convertible Bond Fund |
| PERFORMANCE OF A $10,000 INVESTMENT (Unaudited) |
| Since Inception through October 31, 2018 |
Annualized Total Returns as of October 31, 2018
| | | | | Since | Since |
| | | | | Inception* | Inception** |
| | One Year | Five Year | Ten Year | (Class A and I) | (Class C) |
| Miller Convertible Bond Fund: | | | | | |
| Class A, without sales charge | (1.50)% | 4.07% | 8.91% | 5.53% | — |
| Class A, with sales charge of 5.75% | (7.13)% | 2.84% | 8.26% | 4.95% | — |
| Class I | (1.08)% | 4.58% | 9.47% | 6.09% | — |
| Class C | (2.04)% | 3.54% | — | — | 5.84% |
| Bloomberg Barclays U.S. Aggregate Bond Index | (2.05)% | 1.83% | 3.94% | 3.54% | 2.80% |
| * | Class A and Class I shares commenced operations on December 27, 2007. |
| ** | Class C shares commenced operations on December 1, 2009. |
The Bloomberg Barclays U.S. Aggregate Bond Index is an unmanaged index of prices of U.S. dollar-denominated, fixed-rate, taxable, investment grade fixed-income securities with remaining maturities of one year and longer. The Index includes Treasury, government, corporate, mortgage-backed, commercial mortgage-backed and asset-backed securities.
Past performance is not predictive of future results. The investment return and principal value of an investment will fluctuate. An investor’s shares, when redeemed, may be worth more or less than the original cost. Total return is calculated assuming reinvestment of all dividends and distributions. Average annual total return reflects the change in the value of an investment, assuming reinvestment of the class’ distributions from dividend income and capital gains (the profits earned upon the sale of securities that have grown in value, if any) and assuming a constant rate of performance each year. Total returns would have been lower had the adviser not waived its fees and reimbursed a portion of the Fund’s expenses. The Fund’s total gross annual operating expenses, per its prospectus dated March 1, 2018, including underlying funds, are 1.45%, 0.95%, and 1.95% for Class A shares, Class I shares, and Class C shares, respectively. The graph does not reflect the deduction of taxes that a shareholder would have to pay on fund distributions or the redemption of the fund shares. For performance information current to the most recent month-end, please call 1-877-441-4434.
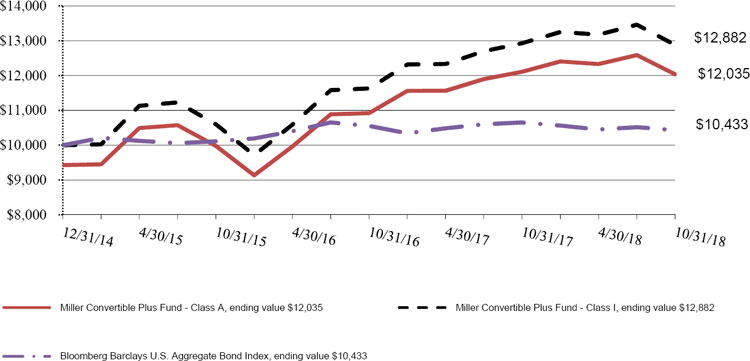
| Miller Convertible Plus Fund |
| PERFORMANCE OF A $10,000 INVESTMENT (Unaudited) |
| Since Inception through October 31, 2018 |
Annualized Total Returns as of October 31, 2018
| | One Year | Three Year | Since Inception* |
| Miller Convertible Plus Fund: | | | |
| Class A, without sales charge | (0.55)% | 6.44% | 6.59% |
| Class A, with sales charge of 5.75% | (6.26)% | 4.37% | 4.95% |
| Class I | (0.32)% | 6.72% | 6.83% |
| Class C | (1.29)% | 5.63% | 5.75% |
| Bloomberg Barclays U.S. Aggregate Bond Index | (2.05)% | 1.04% | 1.11% |
| * | Class A, Class C, and Class I shares commenced operations on December 31, 2014. |
The Bloomberg Barclays U.S. Aggregate Bond Index is an unmanaged index of prices of U.S. dollardenominated, fixed-rate, taxable, investment grade fixed-income securities with remaining maturities of one year and longer. The Index includes Treasury, government, corporate, mortgage-backed, commercial mortgage-backed and asset-backed securities.
Past performance is not predictive of future results. The investment return and principal value of an investment will fluctuate. An investor’s shares, when redeemed, may be worth more or less than the original cost. Total return is calculated assuming reinvestment of all dividends and distributions. Average annual total return reflects the change in the value of an investment, assuming reinvestment of the class’ distributions from dividend income and capital gains (the profits earned upon the sale of securities that have grown in value, if any) and assuming a constant rate of performance each year. Total returns would have been lower had the adviser not waived its fees and reimbursed a portion of the Fund’s expenses. The Fund’s total gross annual operating expenses, per its prospectus dated March 1, 2018, including underlying funds, are 4.33%, 4.15%, and 5.14% for Class A shares, Class I shares, and Class C shares, respectively. The graph does not reflect the deduction of taxes that a shareholder would have to pay on fund distributions or the redemption of the fund shares. For performance information current to the most recent month-end, please call 1-877-441-4434.
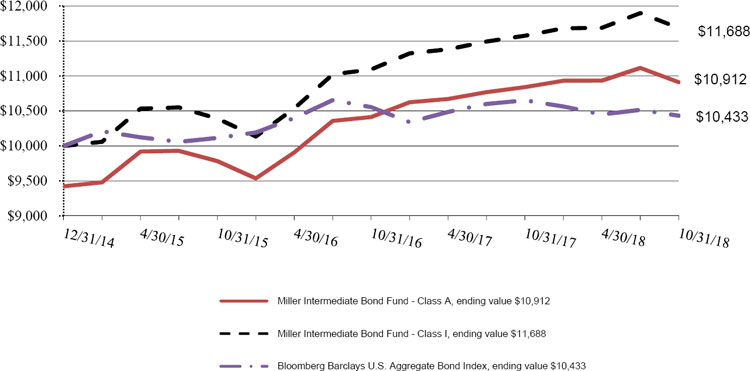
| Miller Intermediate Bond Fund |
| PERFORMANCE OF A $10,000 INVESTMENT (Unaudited) |
| Since Inception through October 31, 2018 |
Annualized Total Returns as of October 31, 2018
| | One Year | Three Year | Since Inception* |
| Miller Intermediate Bond Fund: | | | |
| Class A, without sales charge | 0.67% | 3.70% | 3.90% |
| Class A, with sales charge of 5.75% | (5.12)% | 1.69% | 2.30% |
| Class I | 0.96% | 3.99% | 4.15% |
| Class C | (0.16)% | 2.91% | 3.27% |
| Bloomberg Barclays U.S. Aggregate Bond Index | (2.05)% | 1.04% | 1.11% |
| * | Class A, Class C, and Class I shares commenced operations on December 31, 2014. |
The Bloomberg Barclays U.S. Aggregate Bond Index is an unmanaged index of prices of U.S. dollar-denominated, fixed-rate, taxable, investment grade fixed-income securities with remaining maturities of one year and longer. The Index includes Treasury, government, corporate, mortgage-backed, commercial mortgage-backed and asset-backed securities.
Past performance is not predictive of future results. The investment return and principal value of an investment will fluctuate. An investor’s shares, when redeemed, may be worth more or less than the original cost. Total return is calculated assuming reinvestment of all dividends and distributions. Average annual total return reflects the change in the value of an investment, assuming reinvestment of the class’ distributions from dividend income and capital gains (the profits earned upon the sale of securities that have grown in value, if any) and assuming a constant rate of performance each year. Total returns would have been lower had the adviser not waived its fees and reimbursed a portion of the Fund’s expenses. The Fund’s total gross annual operating expenses, per its prospectus dated March 1, 2018, including underlying funds, are 1.43%, 1.18%, and 2.18% for Class A shares, Class I shares, and Class C shares, respectively. The graph does not reflect the deduction of taxes that a shareholder would have to pay on fund distributions or the redemption of the fund shares. For performance information current to the most recent month-end, please call 1-877-441-4434.
| Miller Convertible Bond Fund |
| SCHEDULE OF INVESTMENTS |
| October 31, 2018 |
| | | Principal | | | | | | | | |
| Security | | Amount | | | Interest Rate (%) | | Maturity Date | | Fair Value | |
| | | | | | | | | | | | | |
| CONVERTIBLE BONDS - 94.57% | | | | | | | | | | | | |
| ADVERTISING - 0.32% | | | | | | | | | | | | |
| Quotient Technology, Inc. - 144A | | $ | 3,000,000 | | | 1.7500 | | 12/1/2022 | | $ | 3,068,463 | |
| | | | | | | | | | | | | |
| AEROSPACE/DEFENSE - 0.59% | | | | | | | | | | | | |
| Kaman Corp. | | | 5,000,000 | | | 3.2500 | | 5/1/2024 | | | 5,711,170 | |
| | | | | | | | | | | | | |
| AIRLINES - 1.24% | | | | | | | | | | | | |
| Delta Airlines, Inc. - Goldman Sachs Finance Corp. Synthetic | | | 12,800,000 | | | 0.0000 | | 9/28/2023 | | | 12,153,600 | |
| | | | | | | | | | | | | |
| AUTO PARTS & EQUIPMENT - 2.53% | | | | | | | | | | | | |
| General Motors - Societe General SA Synthetic | | | 10,100,000 | | | 0.0000 | | 11/16/2021 | | | 10,315,130 | |
| Horizon Global Corp. | | | 20,000,000 | | | 2.7500 | | 7/1/2022 | | | 14,464,940 | |
| | | | | | | | | | | | 24,780,070 | |
| BIOTECHNOLOGY - 1.03% | | | | | | | | | | | | |
| ANI Pharmaceuticals, Inc. | | | 9,000,000 | | | 3.0000 | | 12/1/2019 | | | 9,126,189 | |
| Ligand Pharmaceuticals, Inc. -144A | | | 1,000,000 | | | 0.7500 | | 5/15/2023 | | | 957,790 | |
| | | | | | | | | | | | 10,083,979 | |
| BUILDINGS MATERIALS - 0.65% | | | | | | | | | | | | |
| Patrick Industries, Inc. - 144A | | | 7,500,000 | | | 1.0000 | | 2/1/2023 | | | 6,342,188 | |
| | | | | | | | | | | | | |
| COMMERCIAL SERVICES - 1.33% | | | | | | | | | | | | |
| FTI Consulting, Inc. - 144A | | | 1,000,000 | | | 2.0000 | | 8/15/2023 | | | 952,500 | |
| Macquarie Infrastructure Corp. | | | 100,000 | | | 2.0000 | | 10/1/2023 | | | 89,254 | |
| Square, Inc. - 144A | | | 10,000,000 | | | 0.5000 | | 5/15/2023 | | | 12,003,350 | |
| | | | | | | | | | | | 13,045,104 | |
| COMPUTERS - 3.33% | | | | | | | | | | | | |
| Apple, Inc. - JPMorgan Chase Financial Co., LLC Synthetic | | | 30,000,000 | | | 0.0000 | | 10/16/2023 | | | 30,126,000 | |
| Intel Corp. - Wells Fargo & Co. Synthetic | | | 1,000,000 | | | 0.0000 | | 6/5/2020 | | | 1,641,236 | |
| Western Digital Corp. - 144A | | | 1000000 | | | 1.5000 | | 2/1/2024 | | | 845,401 | |
| | | | | | | | | | | | 32,612,637 | |
| DIVERSIFIED FINANCIAL SERVICES - 11.30% | | | | | | | | | | | | |
| Cowen, Inc. - 144A | | | 24,000,000 | | | 3.0000 | | 12/15/2022 | | | 25,431,288 | |
| Encore Capital Group, Inc. | | | 100,000 | | | 2.8750 | | 3/15/2021 | | | 87,871 | |
| Granite Point Mortgage Trust, Inc. - 144A | | | 21,000,000 | | | 5.6250 | | 12/1/2022 | | | 21,043,995 | |
| Granite Point Mortgage Trust, Inc. | | | 5,000,000 | | | 6.3750 | | 10/1/2023 | | | 5,008,310 | |
| Hannon Armstrong Sustainable Infrastructure Capital, Inc. | | | 20,000,000 | | | 4.1250 | | 9/1/2022 | | | 18,842,560 | |
| PRA Group, Inc. | | | 14,000,000 | | | 3.0000 | | 8/1/2020 | | | 13,215,888 | |
| PRA Group, Inc. | | | 100,000 | | | 3.5000 | | 6/1/2023 | | | 94,828 | |
| Voya Financial, Inc. - Bank of America Finance LLC Synthetic | | | 100,000 | | | 0.2500 | | 5/1/2023 | | | 90,315 | |
| Voya Financial, Inc. - Deutsche Bank AG Synthetic | | | 30,300,000 | | | 1.0000 | | 5/1/2023 | | | 26,803,077 | |
| | | | | | | | | | | | 110,618,132 | |
| ELECTRONICS - 3.18% | | | | | | | | | | | | |
| Knowles Corp. | | | 100,000 | | | 3.2500 | | 11/1/2021 | | | 112,506 | |
| OSI Systems, Inc. | | | 5,000,000 | | | 1.2500 | | 9/1/2022 | | | 4,590,285 | |
| TTM Technologies, Inc. | | | 3,000,000 | | | 1.7500 | | 12/15/2020 | | | 3,954,660 | |
| Vishay Intertechnology, Inc. - 144A | | | 25,000,000 | | | 2.2500 | | 6/15/2025 | | | 22,507,575 | |
| | | | | | | | | | | | 31,165,026 | |
| ENERGY-ALTERNATE SOURCES - 1.54% | | | | | | | | | | | | |
| NextEra Energy Partners LP - 144A | | | 15,000,000 | | | 1.5000 | | 9/15/2020 | | | 15,045,000 | |
| | | | | | | | | | | | | |
| ENGINEERING & CONSTRUCTION - 2.95% | | | | | | | | | | | | |
| Dycom Industries, Inc. | | | 100,000 | | | 0.7500 | | 9/15/2021 | | | 101,232 | |
| Tutor Perini Corp. | | | 30,000,000 | | | 2.8750 | | 6/15/2021 | | | 28,788,870 | |
| | | | | | | | | | | | 28,890,102 | |
| ENTERTAINMENT - 0.48% | | | | | | | | | | | | |
| Marriot Vacation Worldwide Corp. | | | 5,000,000 | | | 1.5000 | | 9/15/2022 | | | 4,706,500 | |
| | | | | | | | | | | | | |
| HOME BUILDERS - 3.81% | | | | | | | | | | | | |
| D.R. Horton, Inc. - Barclays Bank PLC Synthetic | | | 19,693,000 | | | 0.0000 | | 9/26/2023 | | | 18,720,166 | |
| KB Home | | | 1,000,000 | | | 1.3750 | | 2/1/2019 | | | 998,750 | |
| LGI Homes, Inc. | | | 8,725,000 | | | 4.2500 | | 11/15/2019 | | | 17,529,153 | |
| | | | | | | | | | | | 37,248,069 | |
| INSURANCE - 4.48% | | | | | | | | | | | | |
| AmTrust Financial Services, Inc. | | | 27,476,000 | | | 2.7500 | | 12/15/2044 | | | 25,799,964 | |
| HCI Group, Inc. | | | 500,000 | | | 3.8750 | | 3/15/2019 | | | 497,590 | |
| HCI Group, Inc. | | | 17,617,000 | | | 4.2500 | | 3/1/2037 | | | 17,530,976 | |
| | | | | | | | | | | | 43,828,530 | |
The accompanying notes are an integral part of these financial statements.
| Miller Convertible Bond Fund |
| SCHEDULE OF INVESTMENTS (Continued) |
| October 31, 2018 |
| | | Principal | | | | | Maturity | | | |
| Security | | Amount | | | Interest Rate (%) | | Date | | Fair Value | |
| | | | | | | | | | | | | |
| CONVERTIBLE BONDS - 94.57% (Continued) | | | | | | | | | | | | |
| INTERNET - 5.51% | | | | | | | | | | | | |
| Amazon.com, Inc.- JPMorgan Chase Financial Co., LLC Synthetic | | $ | 29,000,000 | | | 0.0000 | | 4/21/2023 | | $ | 28,686,800 | |
| Google, Inc. - Bank of America Finance LLC Synthetic | | | 14,374,000 | | | 0.0000 | | 9/28/2023 | | | 13,747,294 | |
| Twitter, Inc. - 144A | | | 12,000,000 | | | 0.2500 | | 6/15/2024 | | | 11,281,560 | |
| Twitter, Inc. | | | 100,000 | | | 1.0000 | | 9/15/2021 | | | 93,394 | |
| Zillow Group, Inc. | | | 100,000 | | | 1.5000 | | 7/1/2023 | | | 91,400 | |
| | | | | | | | | | | | 53,900,448 | |
| INVESTMENT COMPANIES - 0.29% | | | | | | | | | | | | |
| BlackRock Capital Investment Corp. | | | 1,000,000 | | | 5.0000 | | 6/15/2022 | | | 983,750 | |
| BlackRock TCP Capital Corp. | | | 100,000 | | | 4.6250 | | 3/1/2022 | | | 100,060 | |
| Goldman Sachs BDC, Inc. | | | 698,000 | | | 4.5000 | | 4/1/2022 | | | 684,170 | |
| New Mountain Finance Corp. | | | 100,000 | | | 5.0000 | | 6/15/2019 | | | 100,504 | |
| TPG Speciality Lending, Inc. | | | 1,000,000 | | | 4.5000 | | 8/1/2022 | | | 1,006,591 | |
| | | | | | | | | | | | 2,875,075 | |
| MINING - 2.85% | | | | | | | | | | | | |
| Newmont Mining Corp. - Barclays Bank PLC Synthetic | | | 27,966,000 | | | 0.0000 | | 10/30/2023 | | | 27,814,983 | |
| Royal Gold, Inc. | | | 100,000 | | | 2.8750 | | 6/15/2019 | | | 101,051 | |
| | | | | | | | | | | | 27,916,034 | |
| OIL & GAS - 2.94% | | | | | | | | | | | | |
| Oasis Petroleum, Inc. | | | 1,000,000 | | | 2.6250 | | 9/15/2023 | | | 1,129,513 | |
| PDC Energy, Inc. | | | 15,516,000 | | | 1.1250 | | 9/15/2021 | | | 14,662,620 | |
| SM Energy Co. | | | 1,000,000 | | | 1.5000 | | 7/1/2021 | | | 1,011,567 | |
| Helix Energy Solutions Group, Inc. | | | 10,000,000 | | | 4.1250 | | 9/15/2023 | | | 11,924,430 | |
| | | | | | | | | | | | 28,728,130 | |
| PHARMACEUTICALS - 6.65% | | | | | | | | | | | | |
| Jazz Investments I, Ltd. | | | 15,000,000 | | | 1.5000 | | 8/15/2024 | | | 14,992,065 | |
| Jazz Investments I, Ltd. | | | 5,000,000 | | | 1.8750 | | 8/15/2021 | | | 5,273,435 | |
| Pacira Pharmaceuticals, Inc. | | | 22,000,000 | | | 2.3750 | | 4/1/2022 | | | 23,104,664 | |
| Supernus Pharmaceuticals, Inc. - 144A | | | 20,000,000 | | | 0.6250 | | 4/1/2023 | | | 21,716,420 | |
| | | | | | | | | | | | 65,086,584 | |
| PRIVATE EQUITY - 0.30% | | | | | | | | | | | | |
| Hercules Capital, Inc. | | | 3,000,000 | | | 4.3750 | | 2/1/2022 | | | 2,885,607 | |
| | | | | | | | | | | | | |
| REITS - 12.46% | | | | | | | | | | | | |
| Apollo Commercial Real Estate Finance, Inc. | | | 27,000,000 | | | 4.7500 | | 8/23/2022 | | | 26,441,478 | |
| Apollo Commercial Real Estate Finance, Inc. | | | 1,000,000 | | | 5.3750 | | 10/15/2023 | | | 986,919 | |
| Arbor Realty Trust, Inc. - 144A | | | 22,000,000 | | | 5.2500 | | 7/1/2021 | | | 22,595,943 | |
| Arbor Realty Trust, Inc. | | | 100,000 | | | 5.3750 | | 11/15/2020 | | | 124,849 | |
| Blackstone Mortgage Trust, Inc. | | | 10,000,000 | | | 4.3750 | | 5/5/2022 | | | 9,889,270 | |
| Exantas Capital Corp. | | | 1,000,000 | | | 4.5000 | | 8/15/2022 | | | 1,021,234 | |
| KKR Real Estate Finance Trust, Inc. - 144A | | | 10,000,000 | | | 6.1250 | | 5/15/2023 | | | 10,106,070 | |
| New York Mortgage Trust, Inc. | | | 16,564,000 | | | 6.2500 | | 1/15/2022 | | | 16,627,009 | |
| PennyMac Corp. | | | 9,050,000 | | | 5.3750 | | 5/1/2020 | | | 8,967,428 | |
| Redwood Trust, Inc. | | | 10,300,000 | | | 4.7500 | | 8/15/2023 | | | 9,833,719 | |
| Two Harbors Investment Corp. - 144A | | | 1,000,000 | | | 6.2500 | | 1/15/2022 | | | 1,022,674 | |
| Western Asset Mortgage Capital Corp. | | | 14,554,000 | | | 6.7500 | | 10/1/2022 | | | 14,353,504 | |
| | | | | | | | | | | | 121,970,097 | |
| RETAIL - 2.51% | | | | | | | | | | | | |
| EZCORP, Inc. | | | 100,000 | | | 2.1250 | | 6/15/2019 | | | 98,275 | |
| EZCORP, Inc. - 144A | | | 22,000,000 | | | 2.3750 | | 5/1/2025 | | | 19,318,750 | |
| Vitamin Shoppe, Inc. | | | 6,000,000 | | | 2.2500 | | 12/1/2020 | | | 5,145,222 | |
| | | | | | | | | | | | 24,562,247 | |
| SEMICONDUCTORS - 8.62% | | | | | | | | | | | | |
| Cree, Inc. - 144A | | | 22,000,000 | | | 0.8750 | | 9/1/2023 | | | 20,610,810 | |
| Inphi Corp. | | | 3,000,000 | | | 0.7500 | | 9/1/2021 | | | 2,790,000 | |
| Integrated Device Technology, Inc. | | | 1,000,000 | | | 0.8750 | | 11/15/2022 | | | 1,503,470 | |
| ON Semiconductor Corp. | | | 1,000,000 | | | 1.0000 | | 12/1/2020 | | | 1,123,180 | |
| ON Semiconductor Corp. | | | 10,000,000 | | | 1.6250 | | 10/15/2023 | | | 10,910,090 | |
| Rambus, Inc. - 144A | | | 26,000,000 | | | 1.3750 | | 2/1/2023 | | | 22,862,164 | |
| Rovi Corp. | | | 100,000 | | | 0.5000 | | 3/1/2020 | | | 95,268 | |
| Silicon Laboratories, Inc. | | | 1,000,000 | | | 1.3750 | | 3/1/2022 | | | 1,081,494 | |
| Synaptics, Inc. | | | 26,000,000 | | | 0.5000 | | 6/15/2022 | | | 23,270,000 | |
| Veeco Instruments, Inc. | | | 100,000 | | | 2.7000 | | 1/15/2023 | | | 84,107 | |
| | | | | | | | | | | | 84,330,583 | |
| SOFTWARE - 1.06% | | | | | | | | | | | | |
| Akami Technologies, Inc. - 144A | | | 10,000,000 | | | 0.1250 | | 5/1/2025 | | | 9,781,250 | |
| CSG Systems International, Inc. | | | 500,000 | | | 4.2500 | | 3/15/2036 | | | 513,416 | |
| Guideware Software, Inc. | | | 100,000 | | | 1.2500 | | 3/15/2025 | | | 101,052 | |
| | | | | | | | | | | | 10,395,718 | |
The accompanying notes are an integral part of these financial statements.
| Miller Convertible Bond Fund |
| SCHEDULE OF INVESTMENTS (Continued) |
| October 31, 2018 |
| | | Principal | | | | | Maturity | | | |
| Security | | Amount | | | Interest Rate (%) | | Date | | Fair Value | |
| | | | | | | | | | | | | |
| CONVERTIBLE BONDS - 94.57% (Continued) | | | | | | | | | | | | |
| TELECOMMUNICATIONS - 6.79% | | | | | | | | | | | | |
| CalAmp Corp. | | $ | 1,000,000 | | | 1.6250 | | 5/15/2020 | | $ | 992,680 | |
| CalAmp Corp. - 144A | | | 22,000,000 | | | 2.0000 | | 8/1/2025 | | | 20,243,014 | |
| Finisar Corp. | | | 24,000,000 | | | 0.5000 | | 12/15/2036 | | | 21,401,592 | |
| Viavi Solutions, Inc. | | | 14,000,000 | | | 1.0000 | | 3/1/2024 | | | 15,108,982 | |
| Viavi Solutions, Inc. - 144A | | | 8,000,000 | | | 1.7500 | | 6/1/2023 | | | 8,668,288 | |
| | | | | | | | | | | | 66,414,556 | |
| TRANSPORTATION - 5.82% | | | | | | | | | | | | |
| Aegean Marine Petroleum Network, Inc.* | | | 23,000,000 | | | 4.2500 | | 12/15/2021 | | | 12,764,287 | |
| Air Transport Services Group, Inc. | | | 30,000,000 | | | 1.1250 | | 10/15/2024 | | | 27,453,870 | |
| Atlas Air Worldwide Holdings, Inc. | | | 1,000,000 | | | 1.8750 | | 6/1/2024 | | | 1,065,625 | |
| Atlas Air Worldwide Holdings, Inc. | | | 14,000,000 | | | 2.2500 | | 6/1/2022 | | | 14,612,500 | |
| Echo Global Logistics, Inc. | | | 1,000,000 | | | 2.5000 | | 5/1/2020 | | | 992,019 | |
| Kansas City Southern, Inc. - Goldman Sachs Group, Inc. Synthetic | | | 100,000 | | | 0.0000 | | 2/16/2021 | | | 93,155 | |
| | | | | | | | | | | | 56,981,456 | |
| TRUCKING & LEASING - 0.01% | | | | | | | | | | | | |
| Greenbrier Cos, Inc. | | | 100,000 | | | 2.8750 | | 2/1/2024 | | | 105,587 | |
| | | | | | | | | | | | | |
| | | | | | | | | | | | | |
| TOTAL CONVERTIBLE BONDS | | | | | | | | | | | 925,450,692 | |
| (Cost - $942,832,746) | | | | | | | | | | | | |
| | | | | | | | | | | | | |
| | | Shares | | | Dividend Rate (%) | | | | | | |
| PREFERRED STOCK - 3.14% | | | | | | | | | | | | |
| REITS - 3.14% | | | | | | | | | | | | |
| Great Ajax Corp. | | | 621,640 | | | 7.2500 | | 4/30/2024 | | | 15,391,806 | |
| Ready Capital Corp. | | | 587,300 | | | 7.0000 | | 8/15/2023 | | | 15,340,276 | |
| TOTAL PREFERRED STOCK | | | | | | | | | | | 30,732,082 | |
| (Cost - $30,366,731) | | | | | | | | | | | | |
| | | Principal | | | Interest Rate % | | | | | | |
| U.S. TREASURY OBLIGATIONS - 0.61% | | | | | | | | | | | | |
| United States Treasury Notes | | $ | 5,000,000 | | | 0.7500 | | 2/15/2019 | | | 4,977,058 | |
| United States Treasury Notes | | | 1,000,000 | | | 1.0000 | | 6/30/2019 | | | 989,746 | |
| TOTAL U.S. TREASURY OBLIGATIONS | | | | | | | | | | | 5,966,804 | |
| (Cost - $5,996,847) | | | | | | | | | | | | |
| | | Shares | | | | | | | | | |
| SHORT-TERM INVESTMENTS - 0.93% | | | | | | | | | | | | |
| MONEY MARKET FUND - 0.93% | | | | | | | | | | | | |
| Milestone Treasury Obligations Portfolio - Institutional Class | | | 9,076,823 | | | 2.0000+ | | | | | 9,076,823 | |
| TOTAL SHORT-TERM INVESTMENTS | | | | | | | | | | | | |
| (Cost - $9,076,823) | | | | | | | | | | | | |
| | | | | | | | | | | | | |
| TOTAL INVESTMENTS - 99.25% | | | | | | | | | | | | |
| (Cost - $988,273,147) | | | | | | | | | | $ | 971,226,401 | |
| OTHER ASSETS LESS LIABILITIES - 0.75% | | | | | | | | | | | 7,362,666 | |
| NET ASSETS - 100.00% | | | | | | | | | | $ | 978,589,067 | |
| + | Variable rate security. Interest rate is as of October 31, 2018. |
LLC - Limited Liability Company.
PLC - Public Limited Company.
REITS - Real Estate Investment Trusts.
144A - Security exempt from registration under Rule 144A of the Securities Act of 1933. These securities may be sold in transactions exempt from registration, normally to qualified institutional buyers.
| PORTFOLIO ANALYSIS | |
| As of October 31, 2018 | |
| | | % of Net | |
| Sector | | Assets | |
| Financial | | | 46.62 | % |
| Industrial | | | 11.89 | % |
| Technology | | | 9.77 | % |
| Consumer, Non cyclical | | | 9.01 | % |
| Communications | | | 8.27 | % |
| Consumer, Cyclical | | | 6.36 | % |
| Energy | | | 5.78 | % |
| Short-Term Investments | | | 0.93 | % |
| Government | | | 0.61 | % |
| Basic Materials | | | 0.01 | % |
| Other Assets Less Liabilities | | | 0.75 | % |
| | | | 100.00 | % |
The accompanying notes are an integral part of these financial statements.
| Miller Convertible Plus Fund |
| SCHEDULE OF INVESTMENTS |
| October 31, 2018 |
| | | Principal | | | Interest | | Maturity | | | |
| Security | | Amount | | | Rate (%) | | Date | | Fair Value | |
| | | | | | | | | | | |
| CONVERTIBLE BONDS - 137.49% | | | | | | | | | | | | |
| ADVERTISING - 1.44% | | | | | | | | | | | | |
| Quotient Technology, Inc. - 144A * | | $ | 2,000,000 | | | 1.7500 | | 12/1/2022 | | $ | 2,045,642 | |
| | | | | | | | | | | | | |
| AEROSPACE/DEFENSE - 2.41% | | | | | | | | | | | | |
| Kaman Corp. * | | | 3,000,000 | | | 3.2500 | | 5/1/2024 | | | 3,426,702 | |
| | | | | | | | | | | | | |
| AIRLINES - 2.98% | | | | | | | | | | | | |
| Delta Airlines, Inc. - Goldman Sachs Finance Corp. Synthetic * | | | 4,474,000 | | | 0.0000 | | 9/28/2023 | | | 4,248,063 | |
| | | | | | | | | | | | | |
| AUTO MANUFACTURERS - 3.89% | | | | | | | | | | | | |
| General Motors Co. - Societe Generale SA Synthetic * | | | 4,000,000 | | | 0.0000 | | 11/16/2021 | | | 4,085,200 | |
| Horizon Global Corp. * | | | 2,000,000 | | | 2.7500 | | 7/1/2022 | | | 1,446,494 | |
| | | | | | | | | | | | 5,531,694 | |
| BIOTECHNOLOGY - 2.02% | | | | | | | | | | | | |
| Ligand Pharmaceuticals, Inc. - 144A * | | | 3,000,000 | | | 0.7500 | | 5/15/2023 | | | 2,873,370 | |
| | | | | | | | | | | | | |
| COMMERCIAL SERVICES - 2.69% | | | | | | | | | | | | |
| FTI Consulting, Inc. - 144A * | | | 1,500,000 | | | 2.0000 | | 8/15/2023 | | | 1,428,750 | |
| Square, Inc. - 144A * | | | 2,000,000 | | | 0.5000 | | 5/15/2023 | | | 2,400,670 | |
| | | | | | | | | | | | 3,829,420 | |
| COMPUTERS - 4.50% | | | | | | | | | | | | |
| Apple, Inc. - JPMorgan Chase Financial Co., LLC Synthetic * | | | 6,380,000 | | | 0.0000 | | 10/16/2023 | | | 6,406,796 | |
| | | | | | | | | | | | | |
| DIVERSIFIED FINANCIAL SERVICES - 16.36% | | | | | | | | | | | | |
| Cowen, Inc. - 144A * | | | 6,000,000 | | | 3.0000 | | 12/15/2022 | | | 6,357,822 | |
| Granite Point Mortgage Trust, Inc. - 144A * | | | 6,000,000 | | | 5.6250 | | 12/1/2022 | | | 6,012,570 | |
| Hannon Armstrong Sustainable Infrastructure Capital, Inc. * | | | 5,000,000 | | | 4.1250 | | 9/1/2022 | | | 4,710,640 | |
| Voya Financial, Inc. - Deutsche Bank AG Synthetic * | | | 7,012,000 | | | 1.0000 | | 5/1/2023 | | | 6,202,745 | |
| | | | | | | | | | | | 23,283,777 | |
| ELECTRONICS - 4.58% | | | | | | | | | | | | |
| Knowles Corp. * | | | 1,000,000 | | | 3.2500 | | 11/1/2021 | | | 1,125,064 | |
| Vishay Intertechnology, Inc. - 144A * | | | 6,000,000 | | | 2.2500 | | 6/15/2025 | | | 5,401,818 | |
| | | | | | | | | | | | 6,526,882 | |
| ENERGY-ALTERNATE SOURCES - 1.41% | | | | | | | | | | | | |
| NextEra Energy Partners LP - 144A * | | | 2,000,000 | | | 1.5000 | | 9/15/2020 | | | 2,006,000 | |
| | | | | | | | | | | | | |
| ENGINEERING & CONSTRUCTION - 4.04% | | | | | | | | | | | | |
| Tutor Perini Corp. * | | | 6,000,000 | | | 2.8750 | | 6/15/2021 | | | 5,757,774 | |
| | | | | | | | | | | | | |
| HOME BUILDERS - 4.93% | | | | | | | | | | | | |
| D.R. Horton, Inc. - Barclays Bank PLC Synthetic * | | | 5,900,000 | | | 0.0000 | | 9/26/2023 | | | 5,608,540 | |
| LGI Homes, Inc. * | | | 700,000 | | | 4.2500 | | 11/15/2019 | | | 1,406,350 | |
| | | | | | | | | | | | 7,014,890 | |
| INSURANCE - 5.10% | | | | | | | | | | | | |
| AmTrust Financial Services, Inc. * | | | 3,500,000 | | | 2.7500 | | 12/15/2044 | | | 3,286,500 | |
| HCI Group, Inc. * | | | 4,000,000 | | | 4.2500 | | 3/1/2037 | | | 3,980,468 | |
| | | | | | | | | | | | 7,266,968 | |
| INTERNET - 7.25% | | | | | | | | | | | | |
| Amazon.com, Inc.- JPMorgan Chase Financial Co., LLC Synthetic * | | | 6,000,000 | | | 0.0000 | | 4/21/2023 | | | 5,935,200 | |
| Google, Inc. - Bank of America Finance LLC Synthetic * | | | 3,600,000 | | | 0.0000 | | 9/28/2023 | | | 3,443,040 | |
| Twitter, Inc. - 144A * | | | 1,000,000 | | | 0.2500 | | 6/15/2024 | | | 940,130 | |
| | | | | | | | | | | | 10,318,370 | |
| INVESTMENT COMPANIES - 2.75% | | | | | | | | | | | | |
| Goldman Sachs BDC, Inc. * | | | 4,000,000 | | | 4.5000 | | 4/1/2022 | | | 3,920,744 | |
| | | | | | | | | | | | | |
| OIL & GAS - 2.99% | | | | | | | | | | | | |
| PDC Energy, Inc. * | | | 4,500,000 | | | 1.1250 | | 9/15/2021 | | | 4,252,500 | |
| | | | | | | | | | | | | |
| MINING - 3.84% | | | | | | | | | | | | |
| Newmont Mining Corp. - Barclays Bank PLC Synthetic | | | 5,500,000 | | | 0.0000 | | 10/30/2023 | | | 5,470,300 | |
| | | | | | | | | | | | | |
| PHARMACEUTICALS - 11.01% | | | | | | | | | | | | |
| Jazz Investments I, Ltd. * | | | 5,000,000 | | | 1.5000 | | 8/15/2024 | | | 4,997,355 | |
| Pacira Pharmaceuticals, Inc. * | | | 5,000,000 | | | 2.3750 | | 4/1/2022 | | | 5,251,060 | |
| Supernus Pharmaceuticals, Inc. - 144A * | | | 5,000,000 | | | 0.6250 | | 4/1/2023 | | | 5,429,105 | |
| | | | | | | | | | | | 15,677,520 | |
The accompanying notes are an integral part of these financial statements.
| Miller Convertible Plus Fund |
| SCHEDULE OF INVESTMENTS (Continued) |
| October 31, 2018 |
| | | Principal | | | Interest | | Maturity | | | |
| Security | | Amount | | | Rate (%) | | Date | | Fair Value | |
| | | | | | | | | | | | | |
| CONVERTIBLE BONDS - 137.49% (Continued) | | | | | | | | | | | | |
| REITS - 16.81% | | | | | | | | | | | | |
| Apollo Commercial Real Estate Finance, Inc. * | | $ | 5,500,000 | | | 4.7500 | | 8/23/2022 | | $ | 5,386,227 | |
| Arbor Realty Trust, Inc. -144A * | | | 5,000,000 | | | 5.2500 | | 7/1/2021 | | | 5,080,120 | |
| Blackstone Mortgage Trust, Inc. * | | | 1,014,000 | | | 4.3750 | | 5/5/2022 | | | 1,002,772 | |
| KKR Real Estate Finance Trust, Inc. - 144A * | | | 2,000,000 | | | 6.1250 | | 5/15/2023 | | | 2,021,214 | |
| New York Mortgage Trust, Inc. * | | | 2,556,000 | | | 6.2500 | | 1/15/2022 | | | 2,565,723 | |
| Redwood Trust, Inc. * | | | 3,000,000 | | | 4.7500 | | 8/15/2023 | | | 2,864,190 | |
| Two Harbors Investment Corp. - 144A * | | | 2,000,000 | | | 6.2500 | | 1/15/2022 | | | 2,045,348 | |
| Western Asset Mortgage Capital Corp. * | | | 3,000,000 | | | 6.7500 | | 10/1/2022 | | | 2,958,672 | |
| | | | | | | | | | | | 23,924,266 | |
| RETAIL - 3.70% | | | | | | | | | | | | |
| EZCORP, Inc. - 144A * | | | 6,000,000 | | | 2.3750 | | 5/1/2025 | | | 5,268,750 | |
| | | | | | | | | | | | | |
| SEMICONDUCTORS - 12.64% | | | | | | | | | | | | |
| Cree, Inc. - 144A * | | | 5,500,000 | | | 0.8750 | | 9/1/2023 | | | 5,152,702 | |
| ON Semiconductor Corp. * | | | 2,000,000 | | | 1.6250 | | 10/15/2023 | | | 2,182,018 | |
| Rambus, Inc. - 144A * | | | 5,500,000 | | | 1.3750 | | 2/1/2023 | | | 4,836,227 | |
| Synaptics, Inc. * | | | 6,500,000 | | | 0.5000 | | 6/15/2022 | | | 5,817,500 | |
| | | | | | | | | | | | 17,988,447 | |
| SOFTWARE - 4.49% | | | | | | | | | | | | |
| Akami Technologies, Inc. - 144A * | | | 5,500,000 | | | 0.1250 | | 5/1/2025 | | | 5,379,688 | |
| Guidewire Software, Inc. * | | | 1,000,000 | | | 1.2500 | | 3/15/2025 | | | 1,010,521 | |
| | | | | | | | | | | | 6,390,209 | |
| TELECOMMUNICATIONS - 7.53% | | | | | | | | | | | | |
| CalAmp Corp. -144A * | | | 5,000,000 | | | 2.0000 | | 8/1/2025 | | | 4,600,685 | |
| Finisar Corp. * | | | 2,000,000 | | | 0.5000 | | 12/15/2036 | | | 1,783,466 | |
| Viavi Solutions, Inc. - 144A * | | | 4,000,000 | | | 1.7500 | | 6/1/2023 | | | 4,334,144 | |
| | | | | | | | | | | | 10,718,295 | |
| TRANSPORTATION - 8.13% | | | | | | | | | | | | |
| Aegean Marine Petroleum Network, Inc. ** | | | 5,500,000 | | | 4.2500 | | 12/15/2021 | | | 3,052,330 | |
| Air Transport Services Group, Inc. * | | | 6,000,000 | | | 1.1250 | | 10/15/2024 | | | 5,490,774 | |
| Atlas Air Worldwide Holdings, Inc. * | | | 2,900,000 | | | 2.2500 | | 6/1/2022 | | | 3,026,875 | |
| | | | | | | | | | | | 11,569,979 | |
| | | | | | | | | | | | | |
| TOTAL CONVERTIBLE BONDS | | | | | | | | | | | | |
| (Cost - $201,069,152) | | | | | | | | | | | 195,717,358 | |
| | | | | | | | | | | | | |
| | | | | | | Dividend | | | | | | |
| | | Shares | | | Rate (%) | | | | | | |
| PREFERRED STOCK - 5.89% | | | | | | | | | | | | |
| REITS - 5.89% | | | | | | | | | | | | |
| Great Ajax Corp. * | | | 170,000 | | | 7.2500 | | 4/30/2024 | | | 4,209,200 | |
| Ready Capital Corp. * | | | 160,000 | | | 7.0000 | | 8/15/2023 | | | 4,179,200 | |
| TOTAL PREFERRED STOCK | | | | | | | | | | | 8,388,400 | |
| (Cost - $8,255,800) | | | | | | | | | | | | |
| | | | | | | Interest | | | | | | |
| | | Principal | | | Rate % | | | | | | |
| U.S. TREASURY OBLIGATIONS - 1.00% | | | | | | | | | | | | |
| United States Treasury Notes * | | $ | 1,000,000 | | | 1.2500 | | 3/31/2021 | | | 961,933 | |
| United States Treasury Notes * | | | 500,000 | | | 1.2500 | | 7/31/2023 | | | 461,846 | |
| TOTAL U.S. TREASURY OBLIGATIONS | | | | | | | | | | | 1,423,779 | |
| (Cost - $1,479,184) | | | | | | | | | | | | |
The accompanying notes are an integral part of these financial statements.
| Miller Convertible Plus Fund |
| SCHEDULE OF INVESTMENTS (Continued) |
| October 31, 2018 |
| | | | | Interest | | | |
| Security | | Shares | | Rate (%) | | Fair Value | |
| | | | | | | | | |
| SHORT-TERM INVESTMENTS - 0.73% | | | | | | | | |
| MONEY MARKET FUND - 0.73% | | | | | | | | |
| Milestone Treasury Obligations Portfolio - Institutional Class | | 1,039,443 | | 2.0000 | + | $ | 1,039,443 | |
| TOTAL SHORT-TERM INVESTMENTS | | | | | | | | |
| (Cost - $1,039,443) | | | | | | | | |
| | | | | | | | | |
| TOTAL INVESTMENTS - 145.11% | | | | | | | | |
| (Cost - $211,843,579) | | | | | | $ | 206,568,980 | |
| LIABILITIES IN EXCESS OF OTHER ASSETS - (45.11)% | | | | | | | (64,221,919 | ) |
| NET ASSETS - 100.0% | | | | | | $ | 142,347,061 | |
| + | Variable rate security. Interest rate is as of October 31, 2018. |
LLC - Limited Liability Company.
PLC - Public Limited Company.
REITS - Real Estate Investment Trusts.
144A- Security exempt from registration under Rule 144A of the Securities Act of 1933. These securities may be sold in transactions exempt from registration, normally to qualified institutional buyers.
| * | All or a portion of this security is segregated as collateral for the Line of Credit as of October 31, 2018. |
| PORTFOLIO ANALYSIS | |
| As of October 31, 2018 | |
| | | % of Net | |
| Sector | | Assets | |
| Financial | | | 71.64 | % |
| Technology | | | 17.13 | % |
| Industrial | | | 17.02 | % |
| Consumer, Non-cyclical | | | 15.72 | % |
| Communications | | | 9.63 | % |
| Energy | | | 6.54 | % |
| Consumer, Cyclical | | | 5.70 | % |
| Government | | | 1.00 | % |
| Short-Term Investments | | | 0.73 | % |
| Liabilities in Excess of Other Assets | | | (45.11 | )% |
| | | | 100.00 | % |
The accompanying notes are an integral part of these financial statements.
| Miller Intermediate Bond Fund |
| SCHEDULE OF INVESTMENTS |
| October 31, 2018 |
| | | Principal | | | | | | | | |
| Security | | Amount | | | Interest Rate (%) | | Maturity Date | | Fair Value | |
| CONVERTIBLE BONDS - 68.38% | | | | | | | | | | | | |
| ADVERTISING - 0.94% | | | | | | | | | | | | |
| Quotient Technology, Inc. - 144A | | $ | 1,000,000 | | | 1.7500 | | 12/1/2022 | | $ | 1,022,821 | |
| | | | | | | | | | | | | |
| AIRLINES - 1.31% | | | | | | | | | | | | |
| Delta Airlines, Inc. - Goldman Sachs Finance Corp. Synthetic | | | 1,500,000 | | | 0.0000 | | 9/28/2023 | | | 1,424,250 | |
| | | | | | | | | | | | | |
| AUTO MANUFACTURERS - 1.87% | | | | | | | | | | | | |
| General Motors Co. - Societe Generale SA Synthetic | | | 2,000,000 | | | 0.0000 | | 11/16/2021 | | | 2,042,600 | |
| | | | | | | | | | | | | |
| COMPUTERS - 3.61% | | | | | | | | | | | | |
| Apple, Inc. - JPMorgan Chase Financial Co., LLC Synthetic | | | 3,080,000 | | | 0.0000 | | 10/16/2023 | | | 3,092,936 | |
| Western Digital Corp. - 144A | | | 1,000,000 | | | 1.5000 | | 2/1/2024 | | | 845,401 | |
| | | | | | | | | | | | 3,938,337 | |
| DIVERSIFIED FINANCIAL SERVICES - 9.95% | | | | | | | | | | | | |
| Cowen, Inc. - 144A | | | 2,600,000 | | | 3.0000 | | 12/15/2022 | | | 2,755,056 | |
| Granite Point Mortgage Trust, Inc. - 144A | | | 3,000,000 | | | 5.6250 | | 12/1/2022 | | | 3,006,285 | |
| Hannon Armstrong Sustainable Infrastructure Capital, Inc | | | 2,500,000 | | | 4.1250 | | 9/1/2022 | | | 2,355,320 | |
| Voya Financial, Inc. - Deutsche Bank AG Synthetic | | | 3,100,000 | | | 1.0000 | | 5/1/2023 | | | 2,742,229 | |
| | | | | | | | | | | | 10,858,890 | |
| ELECTRONICS - 1.65% | | | | | | | | | | | | |
| Vishay Intertechnology, Inc. - 144A | | | 2,000,000 | | | 2.2500 | | 6/15/2025 | | | 1,800,606 | |
| | | | | | | | | | | | | |
| ENERGY-ALTERNATE SOURCES - 1.38% | | | | | | | | | | | | |
| NextEra Energy Partners LP - 144A | | | 1,500,000 | | | 1.5000 | | 9/15/2020 | | | 1,504,500 | |
| | | | | | | | | | | | | |
| ENGINEERING & CONSTRUCTION - 2.64% | | | | | | | | | | | | |
| Tutor Perini Corp. | | | 3,000,000 | | | 2.8750 | | 6/15/2021 | | | 2,878,887 | |
| | | | | | | | | | | | | |
| HOME BUILDERS - 1.86% | | | | | | | | | | | | |
| D.R. Horton, Inc. - Barclays Bank PLC Synthetic | | | 1,500,000 | | | 0.0000 | | 9/26/2023 | | | 1,425,900 | |
| LGI Homes, Inc. | | | 300,000 | | | 4.2500 | | 11/15/2019 | | | 602,722 | |
| | | | | | | | | | | | 2,028,622 | |
| INSURANCE - 2.68% | | | | | | | | | | | | |
| AmTrust Financial Services, Inc. | | | 1,000,000 | | | 2.7500 | | 12/15/2044 | | | 939,000 | |
| HCI Group, Inc. | | | 2,000,000 | | | 4.2500 | | 3/1/2037 | | | 1,990,234 | |
| | | | | | | | | | | | 2,929,234 | |
| INTERNET - 4.03% | | | | | | | | | | | | |
| Amazon.com, Inc.- JPMorgan Chase Financial Co., LLC Synthetic | | | 3,000,000 | | | 0.0000 | | 4/21/2023 | | | 2,967,600 | |
| Google, Inc. - Bank of America Finance LLC Syntheti | | | 1,500,000 | | | 0.0000 | | 9/28/2023 | | | 1,434,600 | |
| | | | | | | | | | | | 4,402,200 | |
| INVESTMENT COMPANIES - 1.35% | | | | | | | | | | | | |
| Goldman Sachs BDC, Inc. | | | 1,500,000 | | | 4.5000 | | 4/1/2022 | | | 1,470,279 | |
| | | | | | | | | | | | | |
| MINING - 2.28% | | | | | | | | | | | | |
| Newmont Mining Corp. - Barclays Bank PLC Synthetic | | | 2,500,000 | | | 0.0000 | | 10/30/2023 | | | 2,486,500 | |
| | | | | | | | | | | | | |
| OIL & GAS - 0.87% | | | | | | | | | | | | |
| PDC Energy, Inc. | | | 1,000,000 | | | 1.1250 | | 9/15/2021 | | | 945,000 | |
| | | | | | | | | | | | | |
| PHARMACEUTICALS - 3.28% | | | | | | | | | | | | |
| Jazz Investments I, Ltd. | | | 2,500,000 | | | 1.5000 | | 8/15/2024 | | | 2,498,677 | |
| Supernus Pharmaceuticals, Inc. - 144A | | | 1,000,000 | | | 0.6250 | | 4/1/2023 | | | 1,085,821 | |
| | | | | | | | | | | | 3,584,498 | |
The accompanying notes are an integral part of these financial statements.
| Miller Intermediate Bond Fund |
| SCHEDULE OF INVESTMENTS (Continued) |
| October 31, 2018 |
| | | Principal | | | | | Maturity | | | |
| Security | | Amount | | | Interest Rate (%) | | Date | | Fair Value | |
| CONVERTIBLE BONDS - 68.38% (Continued) | | | | | | | | | | | | |
| REITS - 13.30% | | | | | | | | | | | | |
| Apollo Commercial Real Estate Finance, Inc | | $ | 3,000,000 | | | 4.7500 | | 8/23/2022 | | $ | 2,937,942 | |
| Arbor Realty Trust, Inc. - 144A | | | 2,500,000 | | | 5.2500 | | 7/1/2021 | | | 2,540,060 | |
| Blackstone Mortgage Trust, Inc. | | | 1,500,000 | | | 4.3750 | | 5/5/2022 | | | 1,483,390 | |
| New York Mortgage Trust, Inc. | | | 2,000,000 | | | 6.2500 | | 1/15/2022 | | | 2,007,608 | |
| PennyMac Corp. | | | 2,000,000 | | | 5.3750 | | 5/1/2020 | | | 1,981,752 | |
| Redwood Trust Inc. | | | 2,500,000 | | | 4.7500 | | 8/15/2023 | | | 2,386,825 | |
| Western Asset Mortgage Capital Corp. | | | 1,200,000 | | | 6.7500 | | 10/1/2022 | | | 1,183,469 | |
| | | | | | | | | | | | 14,521,046 | |
| RETAIL - 0.80% | | | | | | | | | | | | |
| EZCORP, Inc. - 144A | | | 1,000,000 | | | 2.3750 | | 5/1/2025 | | | 878,125 | |
| | | | | | | | | | | | | |
| SEMICONDUCTORS - 4.47% | | | | | | | | | | | | |
| Rambus, Inc. - 144A | | | 2,500,000 | | | 1.3750 | | 2/1/2023 | | | 2,198,285 | |
| Synaptics, Inc. | | | 3,000,000 | | | 0.5000 | | 6/15/2022 | | | 2,685,000 | |
| | | | | | | | | | | | 4,883,285 | |
| TELECOMMUNICATIONS - 6.34% | | | | | | | | | | | | |
| CalAmp Corp. -144A | | | 2,500,000 | | | 2.0000 | | 8/1/2025 | | | 2,300,343 | |
| Finisar Corp. | | | 3,000,000 | | | 0.5000 | | 12/15/2036 | | | 2,675,199 | |
| Viavi Solutions, Inc. | | | 1,000,000 | | | 1.0000 | | 3/1/2024 | | | 1,079,213 | |
| Viavi Solutions, Inc. - 144A | | | 800,000 | | | 1.7500 | | 6/1/2023 | | | 866,829 | |
| | | | | | | | | | | | 6,921,584 | |
| TRANSPORTATION - 3.77% | | | | | | | | | | | | |
| Aegean Marine Petroleum Network, Inc.* | | | 2,475,000 | | | 4.2500 | | 5/1/2022 | | | 1,373,548 | |
| Air Transport Services Group, Inc. | | | 3,000,000 | | | 1.1250 | | 10/15/2024 | | | 2,745,387 | |
| | | | | | | | | | | | 4,118,935 | |
| | | | | | | | | | | | | |
| TOTAL CONVERTIBLE BONDS | | | | | | | | | | | 74,640,199 | |
| (Cost - $77,285,870) | | | | | | | | | | | | |
| | | | | | | | | | | | | |
| | | Shares | | | Dividend Rate (%) | | | | | | |
| PREFERRED STOCK - 6.06% | | | | | | | | | | | | |
| REITS - 6.06% | | | | | | | | | | | | |
| Great Ajax Corp. | | | 130,000 | | | 7.2500 | | 4/30/2024 | | | 3,218,800 | |
| Ready Capital Corp. | | | 130,000 | | | 7.0000 | | 8/15/2023 | | | 3,395,600 | |
| TOTAL PREFERRED STOCK | | | | | | | | | | | 6,614,400 | |
| (Cost - $6,504,400) | | | | | | | | | | | | |
| | | Principal | | | Interest Rate% | | | | | | |
| U.S. TREASURY OBLIGATIONS - 22.67% | | | | | | | | | | | | |
| United States Treasury Notes | | $ | 3,000,000 | | | 1.1250 | | 2/28/2021 | | | 2,881,113 | |
| United States Treasury Notes | | | 2,300,000 | | | 1.2500 | | 7/31/2023 | | | 2,124,490 | |
| United States Treasury Notes | | | 2,850,000 | | | 1.3750 | | 2/29/2020 | | | 2,797,175 | |
| United States Treasury Notes | | | 2,000,000 | | | 1.3750 | | 8/31/2020 | | | 1,946,992 | |
| United States Treasury Notes | | | 5,000,000 | | | 1.3750 | | 5/31/2021 | | | 4,809,863 | |
| United States Treasury Notes | | | 600,000 | | | 1.3750 | | 12/31/2018 | | | 599,166 | |
| United States Treasury Notes | | | 4,100,000 | | | 1.5000 | | 1/31/2022 | | | 3,916,701 | |
| United States Treasury Notes | | | 1,000,000 | | | 1.5000 | | 2/28/2023 | | | 940,274 | |
| United States Treasury Notes | | | 2,000,000 | | | 1.6250 | | 5/31/2023 | | | 1,884,571 | |
| United States Treasury Notes | | | 3,000,000 | | | 1.6250 | | 11/15/2022 | | | 2,846,836 | |
| TOTAL U.S. TREASURY OBLIGATIONS | | | | | | | | | | | 24,747,181 | |
| (Cost - $25,203,471) | | | | | | | | | | | | |
The accompanying notes are an integral part of these financial statements.
| Miller Intermediate Bond Fund |
| SCHEDULE OF INVESTMENTS (Continued) |
| October 31, 2018 |
| Security | | Shares | | Interest Rate (%) | | Fair Value | |
| SHORT-TERM INVESTMENTS - 2.37% | | | | | | | | |
| MONEY MARKET FUND - 2.37% | | | | | | | | |
| Milestone Treasury Obligations Portfolio - Institutional Class | | 2,585,217 | | 2.0000 | + | $ | 2,585,217 | |
| TOTAL SHORT-TERM INVESTMENTS | | | | | | | | |
| (Cost - $2,585,217) | | | | | | | | |
| | | | | | | | | |
| TOTAL INVESTMENTS - 99.48% | | | | | | | | |
| (Cost - $111,578,958) | | | | | | $ | 108,586,997 | |
| OTHER ASSETS LESS LIABILITIES - 0.52% | | | | | | | 565,942 | |
| NET ASSETS - 100.00% | | | | | | $ | 109,152,939 | |
| + | Variable rate security. Interest rate is as of October 31, 2018. |
LLC - Limited Liability Company
PLC - Public Limited Company
REITS - Real Estate Investment Trusts.
144A- Security exempt from registration under Rule 144A of the Securities Act of 1933. These securities may be sold in transactions exempt from registration, normally to qualified institutional buyers.
| PORTFOLIO ANALYSIS | |
| As of October 31, 2018 | |
| | | % of Net | |
| Sector | | Assets | |
| Financial | | | 46.97 | % |
| Government | | | 22.67 | % |
| Communications | | | 7.28 | % |
| Industrial | | | 6.80 | % |
| Technology | | | 5.25 | % |
| Energy | | | 3.50 | % |
| Consumer, Non-cyclical | | | 3.28 | % |
| Short-Term Investments | | | 2.37 | % |
| Consumer, Cyclical | | | 1.36 | % |
| Other Assets Less Liabilities | | | 0.52 | % |
| | | | 100.00 | % |
The accompanying notes are an integral part of these financial statements.
| Miller Funds |
| STATEMENTS OF ASSETS AND LIABILITIES |
| October 31, 2018 |
| | | Miller | | | Miller | | | Miller | |
| | | Convertible | | | Convertible | | | Intermediate | |
| | | Bond Fund | | | Plus Fund | | | Bond Fund | |
| Assets: | | | | | | | | | | | | |
| Investments in Securities at Cost | | $ | 988,273,147 | | | $ | 211,843,579 | | | $ | 111,578,958 | |
| Investments in Securities at Fair Value | | $ | 971,226,401 | | | $ | 206,568,980 | | | $ | 108,586,997 | |
| Segregated Cash - Collateral for Loan | | | — | | | | 301,337 | | | | — | |
| Receivable for Securities Sold | | | — | | | | 1,362,962 | | | | — | |
| Receivable for Closed Swap Contracts | | | 61,330 | | | | — | | | | — | |
| Receivable for Fund Shares Sold | | | 3,534,467 | | | | 194,900 | | | | 42,444 | |
| Interest and Dividend Receivable | | | 6,738,908 | | | | 1,391,565 | | | | 739,062 | |
| Prepaid Expenses and Other Assets | | | 44,965 | | | | 38,248 | | | | 28,365 | |
| Total Assets | | | 981,606,071 | | | | 209,857,992 | | | | 109,396,868 | |
| | | | | | | | | | | | | |
| Liabilities: | | | | | | | | | | | | |
| Payable for Securities Purchased | | | 106,250 | | | | — | | | | — | |
| Line of Credit Payable | | | — | | | | 67,000,000 | | | | — | |
| Accrued Advisory Fees | | | 643,897 | | | | 201,315 | | | | 79,219 | |
| Interest Payable | | | — | | | | 213,021 | | | | — | |
| Accrued Distribution Fees | | | 94,902 | | | | 744 | | | | 320 | |
| Payable for Fund Shares Redeemed | | | 1,821,706 | | | | 38,050 | | | | 112,745 | |
| Accrued Expenses and Other Liabilities | | | 350,249 | | | | 57,801 | | | | 51,645 | |
| Total Liabilities | | | 3,017,004 | | | | 67,510,931 | | | | 243,929 | |
| | | | | | | | | | | | | |
| Net Assets | | $ | 978,589,067 | | | $ | 142,347,061 | | | $ | 109,152,939 | |
| | | | | | | | | | | | | |
| Composition of Net Assets: | | | | | | | | | | | | |
| At October 31, 2018, Net Assets consisted of: | | | | | | | | | | | | |
| Paid-in-Capital | | $ | 976,621,707 | | | $ | 142,248,470 | | | $ | 109,021,855 | |
| Accumulated Earnings | | | 1,967,360 | | | | 98,591 | | | | 131,084 | |
| Net Assets | | $ | 978,589,067 | | | $ | 142,347,061 | | | $ | 109,152,939 | |
| | | | | | | | | | | | | |
| Net Asset Value Per Share | | | | | | | | | | | | |
| Class A Shares | | | | | | | | | | | | |
| Net Assets | | $ | 91,985,485 | | | $ | 1,017,678 | | | $ | 393,725 | |
| Shares of Beneficial Interest Outstanding (no par value; unlimited shares authorized) | | | 7,408,345 | | | | 44,588 | | | | 24,512 | |
| Net Asset Value and Redemption Price per Share | | $ | 12.42 | | | $ | 22.82 | | | $ | 16.06 | |
| Maximum Offering Price Per Share (Includes a Maximum Sales Charge of 5.75%) | | $ | 13.18 | | | $ | 24.21 | | | $ | 17.04 | |
| | | | | | | | | | | | | |
| Class I Shares | | | | | | | | | | | | |
| Net Assets | | $ | 821,771,810 | | | $ | 140,725,880 | | | $ | 108,554,085 | |
| Shares of Beneficial Interest Outstanding (no par value; unlimited shares authorized) | | | 66,224,248 | | | | 6,166,929 | | | | 6,752,503 | |
| Net Asset Value, Offering and Redemption Price per Share | | $ | 12.41 | | | $ | 22.82 | | | $ | 16.08 | |
| | | | | | | | | | | | | |
| Class C Shares | | | | | | | | | | | | |
| Net Assets | | $ | 64,831,772 | | | $ | 603,503 | | | $ | 205,129 | |
| Shares of Beneficial Interest Outstanding (no par value; unlimited shares authorized) | | | 5,266,099 | | | | 26,773 | | | | 12,724 | |
| Net Asset Value, Offering and Redemption Price per Share | | $ | 12.31 | | | $ | 22.54 | | | $ | 16.12 | |
The accompanying notes are an integral part of these financial statements.
| Miller Funds |
| STATEMENTS OF OPERATIONS |
| For the Year Ended October 31, 2018 |
| | | Miller | | | Miller | | | Miller | |
| | | Convertible | | | Convertible | | | Intermediate | |
| | | Bond Fund | | | Plus Fund | | | Bond Fund | |
| Investment Income: | | | | | | | | | | | | |
| Interest Income | | $ | 28,116,739 | | | $ | 4,933,603 | | | $ | 3,478,871 | |
| Dividend Income | | | 2,305,167 | | | | 624,375 | | | | 463,125 | |
| Total Investment Income | | | 30,421,906 | | | | 5,557,978 | | | | 3,941,996 | |
| | | | | | | | | | | | | |
| Expenses: | | | | | | | | | | | | |
| Investment Advisory Fees | | | 7,558,213 | | | | 3,925,625 | | | | 1,290,302 | |
| Distribution Fees (Class A) | | | 536,397 | | | | 2,246 | | | | 867 | |
| Distribution Fees (Class C) | | | 692,684 | | | | 4,837 | | | | 2,500 | |
| Shareholder Service Fees | | | 582,171 | | | | 25,570 | | | | 26,584 | |
| Administration Fees | | | 349,638 | | | | 58,799 | | | | 57,245 | |
| Custodian Fees | | | 115,489 | | | | 28,248 | | | | 21,121 | |
| Transfer Agent Fees | | | 314,054 | | | | 66,079 | | | | 69,842 | |
| Audit Fees | | | 94,552 | | | | 14,663 | | | | 13,780 | |
| Trustees’ Fees | | | 118,304 | | | | 20,465 | | | | 20,614 | |
| Registration and Filing Fees | | | 64,964 | | | | 60,131 | | | | 60,088 | |
| Printing Expense | | | 79,643 | | | | 8,642 | | | | 5,934 | |
| Legal Fees | | | 75,122 | | | | 10,218 | | | | 11,271 | |
| Chief Compliance Officer Fees | | | 40,056 | | | | 5,513 | | | | 5,982 | |
| Insurance Expense | | | 23,458 | | | | 3,077 | | | | 3,322 | |
| Interest Expense | | | — | | | | 2,062,270 | | | | — | |
| Miscellaneous Expenses | | | 10,757 | | | | 6,677 | | | | 6,135 | |
| Total Expenses | | | 10,655,502 | | | | 6,303,060 | | | | 1,595,587 | |
| Less: Fees Waived by Adviser | | | — | | | | (1,563,016 | ) | | | (167,216 | ) |
| Net Expenses | | | 10,655,502 | | | | 4,740,044 | | | | 1,428,371 | |
| Net Investment Income | | | 19,766,404 | | | | 817,934 | | | | 2,513,625 | |
| | | | | | | | | | | | | |
| Net Realized and Unrealized Gain (Loss) on Investments: | | | | | | | | | | | | |
| Net Realized Gain (Loss) on: | | | | | | | | | | | | |
| Investments | | | 5,580,969 | | | | 5,672,768 | | | | 2,608,637 | |
| Swaps | | | (1,440,884 | ) | | | 344,288 | | | | (2,022 | ) |
| Total Net Realized Gain | | | 4,140,085 | | | | 6,017,056 | | | | 2,606,615 | |
| Net Change in Unrealized Appreciation (Depreciation) on: | | | | | | | | | | | | |
| Investments | | | (37,198,145 | ) | | | (8,044,883 | ) | | | (3,412,081 | ) |
| Swaps | | | (224,908 | ) | | | (269,869 | ) | | | 2,022 | |
| Total Net Change in Unrealized Depreciation | | | (37,423,053 | ) | | | (8,314,752 | ) | | | (3,410,059 | ) |
| Net Realized and Unrealized Loss on Investments | | | (33,282,968 | ) | | | (2,297,696 | ) | | | (803,444 | ) |
| | | | | | | | | | | | | |
| Net Increase (Decrease) in Net Assets Resulting From Operations | | $ | (13,516,564 | ) | | $ | (1,479,762 | ) | | $ | 1,710,181 | |
The accompanying notes are an integral part of these financial statements.
| Miller Convertible Bond Fund |
| STATEMENTS OF CHANGES IN NET ASSETS |
| | | Year | | | Year | |
| | | Ended | | | Ended | |
| | | October 31, 2018 | | | October 31, 2017 | |
| Operations: | | | | | | | | |
| Net Investment Income | | $ | 19,766,404 | | | $ | 55,335,908 | |
| Net Realized Gain on Investments and Swaps | | | 4,140,085 | | | | 18,087,212 | |
| Net Change in Unrealized Appreciation (Depreciation) on Investments and Swaps | | | (37,423,053 | ) | | | 6,332,655 | |
| Net Increase (Decrease) in Net Assets Resulting From Operations | | | (13,516,564 | ) | | | 79,755,775 | |
| | | | | | | | | |
| Distributions to Shareholders From: | | | | | | | | |
| Net Investment Income | | | | | | | | |
| Class A ($0.42 per share) | | | — | | | | (3,635,297 | ) |
| Class I ($0.48 per share) | | | — | | | | (27,989,690 | ) |
| Class C ($0.35 per share) | | | — | | | | (1,972,127 | ) |
| | | | — | | | | (33,597,114 | ) |
| Total Distributions Paid* | | | | | | | | |
| Class A ($0.59 per share) | | | (4,931,227 | ) | | | — | |
| Class I ($0.65 per share) | | | (40,351,640 | ) | | | — | |
| Class C ($0.54 per share) | | | (2,925,507 | ) | | | — | |
| | | | (48,208,374 | ) | | | — | |
| Total Distributions to Shareholders | | | (48,208,374 | ) | | | (33,597,114 | ) |
| | | | | | | | | |
| Beneficial Interest Transactions: | | | | | | | | |
| Class A | | | | | | | | |
| Proceeds from Shares Issued | | | 27,128,329 | | | | 26,761,471 | |
| Distributions Reinvested | | | 4,368,659 | | | | 3,198,999 | |
| Cost of Shares Redeemed | | | (43,292,140 | ) | | | (38,200,775 | ) |
| Total Class A Shares | | | (11,795,152 | ) | | | (8,240,305 | ) |
| Class I | | | | | | | | |
| Proceeds from Shares Issued | | | 315,477,846 | | | | 300,703,949 | |
| Distributions Reinvested | | | 30,611,359 | | | | 22,733,928 | |
| Cost of Shares Redeemed | | | (254,670,665 | ) | | | (214,469,748 | ) |
| Total Class I Shares | | | 91,418,540 | | | | 108,968,129 | |
| Class C | | | | | | | | |
| Proceeds from Shares Issued | | | 9,445,983 | | | | 8,700,882 | |
| Distributions Reinvested | | | 2,634,291 | | | | 1,723,295 | |
| Cost of Shares Redeemed | | | (14,518,729 | ) | | | (12,749,453 | ) |
| Total Class C Shares | | | (2,438,455 | ) | | | (2,325,276 | ) |
| Total Beneficial Interest Transactions | | | 77,184,933 | | | | 98,402,548 | |
| | | | | | | | | |
| Increase in Net Assets | | | 15,459,995 | | | | 144,561,209 | |
| | | | | | | | | |
| Net Assets: | | | | | | | | |
| Beginning of Year | | | 963,129,072 | | | | 818,567,863 | |
| End of Year** | | $ | 978,589,067 | | | $ | 963,129,072 | |
| * | Distributions from net investment income and net realized capital gains are combined for the year ended October 31, 2018. See “New Accounting Pronouncements” in the Notes to Financial Statements for more information. The dividends and distributions to shareholders for the year ended October 31, 2017 have not been reclassified to conform to the current year presentation. |
| ** | Net Assets- End of Year includes accumulated net investment income of $43,372,552 as of October 31, 2017. |
| SHARE ACTIVITY | | | | | | | | |
| Class A: | | | | | | | | |
| Shares Issued | | | 2,089,792 | | | | 2,078,561 | |
| Shares Reinvested | | | 337,317 | | | | 249,488 | |
| Shares Redeemed | | | (3,347,863 | ) | | | (2,961,106 | ) |
| Net decrease in shares of beneficial interest outstanding | | | (920,754 | ) | | | (633,057 | ) |
| | | | | | | | | |
| Class I: | | | | | | | | |
| Shares Issued | | | 24,327,632 | | | | 23,360,391 | |
| Shares Reinvested | | | 2,367,368 | | | | 1,774,759 | |
| Shares Redeemed | | | (19,755,173 | ) | | | (16,641,098 | ) |
| Net increase in shares of beneficial interest outstanding | | | 6,939,827 | | | | 8,494,052 | |
| | | | | | | | | |
| Class C: | | | | | | | | |
| Shares Issued | | | 743,179 | | | | 680,148 | |
| Shares Reinvested | | | 204,778 | | | | 135,208 | |
| Shares Redeemed | | | (1,131,337 | ) | | | (994,271 | ) |
| Net decrease in shares of beneficial interest outstanding | | | (183,380 | ) | | | (178,915 | ) |
The accompanying notes are an integral part of these financial statements.
| Miller Convertible Plus Fund |
| STATEMENTS OF CHANGES IN NET ASSETS |
| | | Year | | | Year | |
| | | Ended | | | Ended | |
| | | October 31, 2018 | | | October 31, 2017 | |
| Operations: | | | | | | | | |
| Net Investment Income | | $ | 817,934 | | | $ | 6,697,287 | |
| Net Realized Gain on Investments and Swaps | | | 6,017,056 | | | | 3,813,015 | |
| Net Change in Unrealized Appreciation (Depreciation) on Investments and Swaps | | | (8,314,752 | ) | | | 1,620,654 | |
| Net Increase (Decrease) in Net Assets Resulting From Operations | | | (1,479,762 | ) | | | 12,130,956 | |
| | | | | | | | | |
| Distributions to Shareholders From: | | | | | | | | |
| Net Investment Income | | | | | | | | |
| Class A ($0.51 per share) | | | — | | | | (37,359 | ) |
| Class I ($0.63 per share) | | | — | | | | (3,387,086 | ) |
| Class C ($0.38 per share) | | | — | | | | (7,902 | ) |
| | | | — | | | | (3,432,347 | ) |
| Total Distributions Paid* | | | | | | | | |
| Class A ($1.38 per share) | | | (46,991 | ) | | | — | |
| Class I ($1.43 per share) | | | (8,055,478 | ) | | | — | |
| Class C ($1.25 per share) | | | (20,824 | ) | | | — | |
| | | | (8,123,293 | ) | | | — | |
| Total Distributions to Shareholders | | | (8,123,293 | ) | | | (3,432,347 | ) |
| | | | | | | | | |
| Beneficial Interest Transactions: | | | | | | | | |
| Class A | | | | | | | | |
| Proceeds from Shares Issued | | | 349,277 | | | | 4,362,958 | |
| Distributions Reinvested | | | 44,936 | | | | 35,573 | |
| Cost of Shares Redeemed | | | (86,752 | ) | | | (4,088,971 | ) |
| Total Class A Shares | | | 307,461 | | | | 309,560 | |
| Class I | | | | | | | | |
| Proceeds from Shares Issued | | | 46,801,624 | | | | 68,331,490 | |
| Distributions Reinvested | | | 7,909,592 | | | | 3,348,256 | |
| Cost of Shares Redeemed | | | (40,932,951 | ) | | | (24,831,022 | ) |
| Total Class I Shares | | | 13,778,265 | | | | 46,848,724 | |
| Class C | | | | | | | | |
| Proceeds from Shares Issued | | | 259,395 | | | | 240,700 | |
| Distributions Reinvested | | | 18,315 | | | | 7,211 | |
| Cost of Shares Redeemed | | | (37,267 | ) | | | (398,875 | ) |
| Total Class C Shares | | | 240,443 | | | | (150,964 | ) |
| Total Beneficial Interest Transactions | | | 14,326,169 | | | | 47,007,320 | |
| | | | | | | | | |
| Increase in Net Assets | | | 4,723,114 | | | | 55,705,929 | |
| | | | | | | | | |
| Net Assets: | | | | | | | | |
| Beginning of Year | | | 137,623,947 | | | | 81,918,018 | |
| End of Year** | | $ | 142,347,061 | | | $ | 137,623,947 | |
| * | Distributions from net investment income and net realized capital gains are combined for the year ended October 31, 2018. See “New Accounting Pronouncements” in the Notes to Financial Statements for more information. The dividends and distributions to shareholders for the year ended October 31, 2017 have not been reclassified to conform to the current year presentation. |
| ** | Net Assets- End of Year includes accumulated net investment income of $5,159,024 as of October 31, 2017. |
| SHARE ACTIVITY | | | | | | | | |
| Class A: | | | | | | | | |
| Shares Issued | | | 14,522 | | | | 186,127 | |
| Shares Reinvested | | | 1,881 | | | | 1,516 | |
| Shares Redeemed | | | (3,599 | ) | | | (176,158 | ) |
| Net increase in shares of beneficial interest outstanding | | | 12,804 | | | | 11,485 | |
| | | | | | | | | |
| Class I: | | | | | | | | |
| Shares Issued | | | 1,938,184 | | | | 2,913,895 | |
| Shares Reinvested | | | 331,892 | | | | 142,484 | |
| Shares Redeemed | | | (1,719,424 | ) | | | (1,046,053 | ) |
| Net increase in shares of beneficial interest outstanding | | | 550,652 | | | | 2,010,326 | |
| | | | | | | | | |
| Class C: | | | | | | | | |
| Shares Issued | | | 10,865 | | | | 10,296 | |
| Shares Reinvested | | | 775 | | | | 309 | |
| Shares Redeemed | | | (1,581 | ) | | | (17,042 | ) |
| Net increase (decrease) in shares of beneficial interest outstanding | | | 10,059 | | | | (6,437 | ) |
The accompanying notes are an integral part of these financial statements.
| Miller Intermediate Bond Fund |
| STATEMENTS OF CHANGES IN NET ASSETS |
| | | Year | | | Year | |
| | | Ended | | | Ended | |
| | | October 31, 2018 | | | October 31, 2017 | |
| Operations: | | | | | | | | |
| Net Investment Income | | $ | 2,513,625 | | | $ | 5,723,133 | |
| Net Realized Gain on Investments and Swaps | | | 2,606,615 | | | | 1,485,532 | |
| Net Change in Unrealized Depreciation on Investments | | | (3,410,059 | ) | | | (1,257,542 | ) |
| Net Increase in Net Assets Resulting From Operations | | | 1,710,181 | | | | 5,951,123 | |
| | | | | | | | | |
| Distributions to Shareholders From: | | | | | | | | |
| Net Investment Income | | | | | | | | |
| Class A ($0.31 per share) | | | — | | | | (4,577 | ) |
| Class I ($0.36 per share) | | | — | | | | (3,177,652 | ) |
| Class C ($0.19 per share) | | | — | | | | (2,849 | ) |
| | | | — | | | | (3,185,078 | ) |
| Total Distributions Paid* | | | | | | | | |
| Class A ($0.60 per share) | | | (8,452 | ) | | | — | |
| Class I ($0.63 per share) | | | (5,350,950 | ) | | | — | |
| Class C ($0.50 per share) | | | (4,745 | ) | | | — | |
| | | | (5,364,147 | ) | | | — | |
| Total Distributions to Shareholders | | | (5,364,147 | ) | | | (3,185,078 | ) |
| | | | | | | | | |
| Capital Share Transactions: | | | | | | | | |
| Class A | | | | | | | | |
| Proceeds from Shares Issued | | | 610,288 | | | | 108,703 | |
| Distributions Reinvested | | | 7,442 | | | | 3,646 | |
| Cost of Shares Redeemed | | | (379,702 | ) | | | (206,194 | ) |
| Total Class A Shares | | | 238,028 | | | | (93,845 | ) |
| Class I | | | | | | | | |
| Proceeds from Shares Issued | | | 22,843,109 | | | | 72,539,548 | |
| Distributions Reinvested | | | 5,246,946 | | | | 3,109,402 | |
| Cost of Shares Redeemed | | | (63,439,061 | ) | | | (32,790,821 | ) |
| Total Class I Shares | | | (35,349,006 | ) | | | 42,858,129 | |
| Class C | | | | | | | | |
| Proceeds from Shares Issued | | | 756,121 | | | | 153,280 | |
| Distributions Reinvested | | | 4,745 | | | | 2,849 | |
| Cost of Shares Redeemed | | | (720,357 | ) | | | (245,857 | ) |
| Total Class C Shares | | | 40,509 | | | | (89,728 | ) |
| Total Beneficial Interest Transactions | | | (35,070,469 | ) | | | 42,674,556 | |
| | | | | | | | | |
| Increase (Decrease) in Net Assets | | | (38,724,435 | ) | | | 45,440,601 | |
| | | | | | | | | |
| Net Assets: | | | | | | | | |
| Beginning of Year | | | 147,877,374 | | | | 102,436,773 | |
| End of Year** | | $ | 109,152,939 | | | $ | 147,877,374 | |
| * | Distributions from net investment income and net realized capital gains are combined for the year ended October 31, 2018. See “New Accounting Pronouncements” in the Notes to Financial Statements for more information. The dividends and distributions to shareholders for the year ended October 31, 2017 have not been reclassified to conform to the current year presentation. |
| ** | Net Assets- End of Year includes accumulated net investment income of $3,242,598 as of October 31, 2017. |
| SHARE ACTIVITY | | | | | | | | |
| Class A: | | | | | | | | |
| Shares Issued | | | 37,108 | | | | 6,585 | |
| Shares Reinvested | | | 457 | | | | 223 | |
| Shares Redeemed | | | (23,676 | ) | | | (12,584 | ) |
| Net increase (decrease) in shares of beneficial interest outstanding | | | 13,889 | | | | (5,776 | ) |
| | | | | | | | | |
| Class I: | | | | | | | | |
| Shares Issued | | | 1,393,216 | | | | 4,430,132 | |
| Shares Reinvested | | | 321,355 | | | | 189,761 | |
| Shares Redeemed | | | (3,877,546 | ) | | | (1,992,318 | ) |
| Net increase (decrease) in shares of beneficial interest outstanding | | | (2,162,975 | ) | | | 2,627,575 | |
| | | | | | | | | |
| Class C: | | | | | | | | |
| Shares Issued | | | 45,971 | | | | 9,209 | |
| Shares Reinvested | | | 289 | | | | 173 | |
| Shares Redeemed | | | (43,329 | ) | | | (14,851 | ) |
| Net increase (decrease) in shares of beneficial interest outstanding | | | 2,931 | | | | (5,469 | ) |
The accompanying notes are an integral part of these financial statements.
| Miller Convertible Plus Fund |
| STATEMENT OF CASH FLOWS |
| For the Year Ended October 31, 2018 |
| Cash flows from operating activities: | | | | |
| Net increase in net assets resulting from operations | | $ | (1,479,762 | ) |
| Adjustments to reconcile net increase in net assets resulting from operations to net cash provided by operating activities: | | | | |
| Purchases of investments | | | (284,398,285 | ) |
| Proceeds from sales of investments | | | 275,305,766 | |
| Proceeds from short term investments, net | | | 3,624 | |
| Net realized gain from investments | | | (5,672,768 | ) |
| Net change in unrealized appreciation from investments | | | 8,044,883 | |
| Net accretion of discounts | | | (491,276 | ) |
| | | | | |
Changes in assets and liabilities
(Increase)/decrease in assets: | | | | |
| Segregated cash - collateral for loan | | | 2,047,218 | |
| Dividend and interest receivable | | | (79,505 | ) |
| Receivable from open swap contracts | | | 269,869 | |
| Receivable for securities sold | | | (1,362,962 | ) |
| Prepaid expenses and other assets | | | (3,300 | ) |
| Increase/(decrease) in liabilities: | | | | |
| Payable for securities purchased | | | (83,162 | ) |
| Interest payable | | | 78,399 | |
| Accrued advisory fees | | | (93,819 | ) |
| Accrued distribution fees | | | 207 | |
| Accrued expenses and other liabilities | | | 9,311 | |
| Net cash used in operating activities | | | (7,905,562 | ) |
| | | | | |
| Cash flows from financing activities: | | | | |
| Proceeds from revolving credit line payable to bank | | | 25,500,000 | |
| Repayment of borrowings under revolving credit line payable | | | (23,500,000 | ) |
| Proceeds from shares sold | | | 47,215,396 | |
| Payment on shares redeemed | | | (41,159,384 | ) |
| Cash distributions paid | | | (150,450 | ) |
| Net cash provided by financing activities | | | 7,905,562 | |
| | | | | |
| Net increase in cash | | | — | |
| Cash at beginning of year | | | — | |
| Cash at end of year | | $ | — | |
| | | | | |
| Supplemental disclosure of non-cash activity: | | | | |
| Noncash financing activities not including herein consists of: | | | | |
| Reinvestment of dividends | | $ | 7,972,843 | |
| Interest paid | | $ | 1,983,871 | |
The accompanying notes are an integral part of the financial statements.
| Miller Convertible Bond Fund |
| FINANCIAL HIGHLIGHTS |
The table below sets forth financial data for one share of beneficial interest outstanding throughout each year presented.
| | | Class A | |
| | | Year Ended October 31, | |
| | | 2018 | | | 2017 | | | 2016 | | | 2015 | | | 2014 | |
| Net Asset Value, Beginning of Year | | $ | 13.19 | | | $ | 12.53 | | | $ | 12.15 | | | $ | 12.75 | | | $ | 12.55 | |
| Increase (decrease) from operations: | | | | | | | | | | | | | | | | | | | | |
| Net investment income (a) | | | 0.20 | | | | 0.72 | | | | 0.28 | | | | 0.23 | | | | 0.37 | |
| Net gain (loss) from securities (both realized and unrealized) | | | (0.38 | ) | | | 0.36 | | | | 0.33 | | | | (0.17 | ) | | | 0.59 | |
| Total from operations | | | (0.18 | ) | | | 1.08 | | | | 0.61 | | | | 0.06 | | | | 0.96 | |
| Distributions to shareholders from: | | | | | | | | | | | | | | | | | | | | |
| Net investment income | | | (0.38 | ) | | | (0.42 | ) | | | (0.20 | ) | | | (0.32 | ) | | | (0.27 | ) |
| Net realized gain | | | (0.21 | ) | | | — | | | | (0.03 | ) | | | (0.34 | ) | | | (0.49 | ) |
| Total distributions | | | (0.59 | ) | | | (0.42 | ) | | | (0.23 | ) | | | (0.66 | ) | | | (0.76 | ) |
| Net Asset Value, End of Year | | $ | 12.42 | | | $ | 13.19 | | | $ | 12.53 | �� | | $ | 12.15 | | | $ | 12.75 | |
| Total Return (b) | | | (1.50 | )% | | | 8.72 | % | | | 5.07 | % | | | 0.49 | % | | | 7.98 | % |
| Ratios/Supplemental Data | | | | | | | | | | | | | | | | | | | | |
| Net assets, end of year (in 000’s) | | $ | 91,985 | | | $ | 109,900 | | | $ | 112,311 | | | $ | 159,608 | | | $ | 305,994 | |
| Ratio of expenses to average net assets | | | 1.44 | % | | | 1.45 | % | | | 1.49 | % | | | 1.44 | % | | | 1.45 | % |
| Ratio of net investment income to average net assets | | | 1.53 | % | | | 5.55 | % | | | 2.30 | % | | | 3.10 | % | | | 2.87 | % |
| Portfolio turnover rate | | | 107 | % | | | 79 | % | | | 46 | % | | | 81 | % | | | 78 | % |
| (a) | Per share amounts are calculated using the daily average shares method, which more appropriately presents the per share data for the year. |
| (b) | Total returns are historical in nature and assume changes in share price, reinvestment of dividends and capital gains distributions, if any, excluding the effect of sales loads. Total returns for periods less than one year are not annualized. |
The accompanying notes are an integral part of the financial statements.
| Miller Convertible Bond Fund |
| FINANCIAL HIGHLIGHTS |
The table below sets forth financial data for one share of beneficial interest outstanding throughout each year presented.
| | | Class I | |
| | | Year Ended October 31, | |
| | | 2018 | | | 2017 | | | 2016 | | | 2015 | | | 2014 | |
| Net Asset Value, Beginning of Year | | $ | 13.19 | | | $ | 12.53 | | | $ | 12.15 | | | $ | 12.76 | | | $ | 12.59 | |
| Increase (decrease) from operations: | | | | | | | | | | | | | | | | | | | | |
| Net investment income (a) | | | 0.27 | | | | 0.78 | | | | 0.39 | | | | 0.45 | | | | 0.43 | |
| Net gain (loss) from securities (both realized and unrealized) | | | (0.40 | ) | | | 0.36 | | | | 0.28 | | | | (0.33 | ) | | | 0.60 | |
| Total from operations | | | (0.13 | ) | | | 1.14 | | | | 0.67 | | | | 0.12 | | | | 1.03 | |
| Distributions to shareholders from: | | | | | | | | | | | | | | | | | | | | |
| Net investment income | | | (0.44 | ) | | | (0.48 | ) | | | (0.26 | ) | | | (0.39 | ) | | | (0.37 | ) |
| Net realized gain | | | (0.21 | ) | | | — | | | | (0.03 | ) | | | (0.34 | ) | | | (0.49 | ) |
| Total distributions | | | (0.65 | ) | | | (0.48 | ) | | | (0.29 | ) | | | (0.73 | ) | | | (0.86 | ) |
| Net Asset Value, End of Year | | $ | 12.41 | | | $ | 13.19 | | | $ | 12.53 | | | $ | 12.15 | | | $ | 12.76 | |
| Total Return (b) | | | (1.08 | )% | | | 9.27 | % | | | 5.56 | % | | | 1.08 | % | | | 8.49 | % |
| Ratios/Supplemental Data | | | | | | | | | | | | | | | | | | | | |
| Net assets, end of year (in 000’s) | | $ | 821,772 | | | $ | 781,823 | | | $ | 636,200 | | | $ | 480,548 | | | $ | 352,395 | |
| Ratio of expenses to average net assets | | | 0.94 | % | | | 0.95 | % | | | 0.99 | % | | | 0.94 | % | | | 0.95 | % |
| Ratio of net investment income to average net assets | | | 2.09 | % | | | 6.06 | % | | | 3.21 | % | | | 3.60 | % | | | 3.37 | % |
| Portfolio turnover rate | | | 107 | % | | | 79 | % | | | 46 | % | | | 81 | % | | | 78 | % |
| (a) | Per share amounts are calculated using the daily average shares method, which more appropriately presents the per share data for the year. |
| (b) | Total returns are historical in nature and assume changes in share price, reinvestment of dividends and capital gains distributions, if any, excluding the effect of sales loads. Total returns for periods less than one year are not annualized. |
The accompanying notes are an integral part of the financial statements.
| Miller Convertible Bond Fund |
| FINANCIAL HIGHLIGHTS |
The table below sets forth financial data for one share of beneficial interest outstanding throughout each year presented.
| | | Class C | |
| | | Year Ended October 31, | |
| | | 2018 | | | 2017 | | | 2016 | | | 2015 | | | 2014 | |
| Net Asset Value, Beginning of Year | | $ | 13.10 | | | $ | 12.45 | | | $ | 12.07 | | | $ | 12.68 | | | $ | 12.50 | |
| Increase (decrease) from operations: | | | | | | | | | | | | | | | | | | | | |
| Net investment income (a) | | | 0.14 | | | | 0.65 | | | | 0.24 | | | | 0.26 | | | | 0.30 | |
| Net gain (loss) from securities (both realized and unrealized) | | | (0.39 | ) | | | 0.35 | | | | 0.31 | | | | (0.27 | ) | | | 0.59 | |
| Total from operations | | | (0.25 | ) | | | 1.00 | | | | 0.55 | | | | (0.01 | ) | | | 0.89 | |
| Distributions to shareholders from: | | | | | | | | | | | | | | | | | | | | |
| Net investment income | | | (0.33 | ) | | | (0.35 | ) | | | (0.14 | ) | | | (0.26 | ) | | | (0.22 | ) |
| Net realized gain | | | (0.21 | ) | | | — | | | | (0.03 | ) | | | (0.34 | ) | | | (0.49 | ) |
| Total distributions | | | (0.54 | ) | | | (0.35 | ) | | | (0.17 | ) | | | (0.60 | ) | | | (0.71 | ) |
| Net Asset Value, End of Year | | $ | 12.31 | | | $ | 13.10 | | | $ | 12.45 | | | $ | 12.07 | | | $ | 12.68 | |
| Total Return (b) | | | (2.04 | )% | | | 8.14 | % | | | 4.50 | % | | | 0.07 | % | | | 7.42 | % |
| Ratios/Supplemental Data | | | | | | | | | | | | | | | | | | | | |
| Net assets, end of year (in 000’s) | | $ | 64,832 | | | $ | 71,406 | | | $ | 70,057 | | | $ | 69,396 | | | $ | 66,968 | |
| Ratio of expenses to average net assets | | | 1.94 | % | | | 1.95 | % | | | 1.99 | % | | | 1.94 | % | | | 1.95 | % |
| Ratio of net investment income to average net assets | | | 1.06 | % | | | 5.06 | % | | | 1.96 | % | | | 2.60 | % | | | 2.37 | % |
| Portfolio turnover rate | | | 107 | % | | | 79 | % | | | 46 | % | | | 81 | % | | | 78 | % |
| (a) | Per share amounts are calculated using the daily average shares method, which more appropriately presents the per share data for the year. |
| (b) | Total returns are historical in nature and assume changes in share price, reinvestment of dividends and capital gains distributions, if any, excluding the effect of sales loads. Total returns for periods less than one year are not annualized. |
The accompanying notes are an integral part of the financial statements.
| Miller Convertible Plus Fund |
| FINANCIAL HIGHLIGHTS |
The table below sets forth financial data for one share of beneficial interest outstanding throughout each period.
| | | Class A | |
| | | Year | | | Year | | | Year | | | Period | |
| | | Ended | | | Ended | | | Ended | | | Ended | |
| | | October 31, 2018 | | | October 31, 2017 | | | October 31, 2016 | | | October 31, 2015 * | |
| Net Asset Value, Beginning of Period | | $ | 24.31 | | | $ | 22.41 | | | $ | 20.99 | | | $ | 20.00 | |
| Increase from operations: | | | | | | | | | | | | | | | | |
| Net investment income (a) | | | 0.08 | | | | 1.16 | | | | 1.46 | | | | 0.50 | |
| Net gain from securities (both realized and unrealized) | | | (0.19 | ) | | | 1.25 | | | | 0.50 | | | | 0.68 | |
| Total from operations | | | (0.11 | ) | | | 2.41 | | | | 1.96 | | | | 1.18 | |
| Distributions to shareholders from: | | | | | | | | | | | | | | | | |
| Net investment income | | | (0.67 | ) | | | (0.51 | ) | | | (0.29 | ) | | | (0.19 | ) |
| Net realized gain | | | (0.71 | ) | | | — | | | | (0.25 | ) | | | — | |
| Total distributions | | | (1.38 | ) | | | (0.51 | ) | | | (0.54 | ) | | | (0.19 | ) |
| Net Asset Value, End of Period | | $ | 22.82 | | | $ | 24.31 | | | $ | 22.41 | | | $ | 20.99 | |
| Total Return (b) | | | (0.55 | )% | | | 10.87 | % | | | 9.43 | % | | | 5.88 | % |
| Ratios/Supplemental Data | | | | | | | | | | | | | | | | |
| Net assets, end of period (in 000’s) | | $ | 1,018 | | | $ | 773 | | | $ | 455 | | | $ | 82 | |
| Ratio of expenses to average net assets, | | | | | | | | | | | | | | | | |
| before reimbursement | | | 4.86 | % | | | 4.33 | % | | | 5.49 | % | | | 4.58 | % (c) |
| net of reimbursement | | | 3.72 | % | | | 4.17 | % | | | 5.00 | % | | | 3.74 | % (c) |
| Ratio of net investment income to average net assets | | | 0.34 | % | | | 4.89 | % | | | 6.77 | % | | | 1.45 | % (c) |
| Portfolio turnover rate | | | 141 | % | | | 122 | % | | | 81 | % | | | 109 | % (d) |
| * | Miller Convertible Plus Fund Class A commenced operations on December 31, 2014. |
| (a) | Per share amounts are calculated using the daily average shares method, which more appropriately presents the per share data for the period. |
| (b) | Total returns are historical in nature and assume changes in share price, reinvestment of dividends and capital gains distributions, if any, excluding the effect of sales loads. Total returns for periods less than one year are not annualized. Had the Adviser not absorbed a portion of the expenses during certain periods, total returns would have been lower. |
The accompanying notes are an integral part of these financial statements.
| Miller Convertible Plus Fund |
| FINANCIAL HIGHLIGHTS |
The table below sets forth financial data for one share of beneficial interest outstanding throughout each period.
| | | Class I | |
| | | Year | | | Year | | | Year | | | Period | |
| | | Ended | | | Ended | | | Ended | | | Ended | |
| | | October 31, 2018 | | | October 31, 2017 | | | October 31, 2016 | | | October 31, 2015 * | |
| Net Asset Value, Beginning of Period | | $ | 24.30 | | | $ | 22.45 | | | $ | 21.01 | | | $ | 20.00 | |
| Increase from operations: | | | | | | | | | | | | | | | | |
| Net investment income (a) | | | 0.14 | | | | 1.21 | | | | 0.45 | | | | 0.31 | |
| Net gain from securities (both realized and unrealized) | | | (0.19 | ) | | | 1.27 | | | | 1.56 | | | | 0.90 | |
| Total from operations | | | (0.05 | ) | | | 2.48 | | | | 2.01 | | | | 1.21 | |
| Distributions to shareholders from: | | | | | | | | | | | | | | | | |
| Net investment income | | | (0.72 | ) | | | (0.63 | ) | | | (0.32 | ) | | | (0.20 | ) |
| Net realized gain | | | (0.71 | ) | | | — | | | | (0.25 | ) | | | — | |
| Total distributions | | | (1.43 | ) | | | (0.63 | ) | | | (0.57 | ) | | | (0.20 | ) |
| Net Asset Value, End of Period | | $ | 22.82 | | | $ | 24.30 | | | $ | 22.45 | | | $ | 21.01 | |
| Total Return (b) | | | (0.32 | )% | | | 11.16 | % | | | 9.75 | % | | | 5.99 | % |
| Ratios/Supplemental Data | | | | | | | | | | | | | | | | |
| Net assets, end of period (in 000’s) | | $ | 140,726 | | | $ | 136,449 | | | $ | 80,948 | | | $ | 43,168 | |
| Ratio of expenses to average net assets, | | | | | | | | | | | | | | | | |
| before reimbursement | | | 4.60 | % | | | 4.15 | % | | | 4.11 | % | | | 4.33 | % (c) |
| net of reimbursement | | | 3.46 | % | | | 4.00 | % | | | 3.62 | % | | | 3.49 | % (c) |
| Ratio of net investment income to average net assets | | | 0.60 | % | | | 5.11 | % | | | 2.10 | % | | | 1.70 | % (c) |
| Portfolio turnover rate | | | 141 | % | | | 122 | % | | | 81 | % | | | 109 | % (d) |
| * | Miller Convertible Plus Fund Class I commenced operations on December 31, 2014. |
| (a) | Per share amounts are calculated using the daily average shares method, which more appropriately presents the per share data for the period. |
| (b) | Total returns are historical in nature and assume changes in share price, reinvestment of dividends and capital gains distributions, if any. Total returns for periods less than one year are not annualized. Had the Adviser not absorbed a portion of the expenses during certain periods, total returns would have been lower. |
The accompanying notes are an integral part of the financial statements.
| Miller Convertible Plus Fund |
| FINANCIAL HIGHLIGHTS |
The table below sets forth financial data for one share of beneficial interest outstanding throughout each period.
| | | Class C | |
| | | Year | | | Year | | | Year | | | Period | |
| | | Ended | | | Ended | | | Ended | | | Ended | |
| | | October 31, 2018 | | | October 31, 2017 | | | October 31, 2016 | | | October 31, 2015 * | |
| Net Asset Value, Beginning of Period | | $ | 24.07 | | | $ | 22.24 | | | $ | 20.88 | | | $ | 20.00 | |
| Increase from operations: | | | | | | | | | | | | | | | | |
| Net investment income (loss) (a) | | | (0.10 | ) | | | 0.96 | | | | 0.08 | | | | 0.12 | |
| Net gain from securities (both realized and unrealized) | | | (0.18 | ) | | | 1.25 | | | | 1.70 | | | | 0.91 | |
| Total from operations | | | (0.28 | ) | | | 2.21 | | | | 1.78 | | | | 1.03 | |
| Distributions to shareholders from: | | | | | | | | | | | | | | | | |
| Net investment income | | | (0.54 | ) | | | (0.38 | ) | | | (0.17 | ) | | | (0.15 | ) |
| Net realized gain | | | (0.71 | ) | | | — | | | | (0.25 | ) | | | — | |
| Total distributions | | | (1.25 | ) | | | (0.38 | ) | | | (0.42 | ) | | | (0.15 | ) |
| Net Asset Value, End of Period | | $ | 22.54 | | | $ | 24.07 | | | $ | 22.24 | | | $ | 20.88 | |
| Total Return (b) | | | (1.29 | )% | | | 9.98 | % | | | 8.61 | % | | | 5.14 | % |
| Ratios/Supplemental Data | | | | | | | | | | | | | | | | |
| Net assets, end of period (in 000’s) | | $ | 603 | | | $ | 402 | | | $ | 515 | | | $ | 67 | |
| Ratio of expenses to average net assets, | | | | | | | | | | | | | | | | |
| before reimbursement | | | 5.63 | % | | | 5.14 | % | | | 5.11 | % | | | 5.33 | % (c) |
| net of reimbursement | | | 4.48 | % | | | 4.98 | % | | | 4.62 | % | | | 4.49 | % (c) |
| Ratio of net investment income (loss) to average net assets | | | (0.40 | )% | | | 4.10 | % | | | 0.38 | % | | | 0.70 | % (c) |
| Portfolio turnover rate | | | 141 | % | | | 122 | % | | | 81 | % | | | 109 | % (d) |
| * | Miller Convertible Plus Fund Class C commenced operations on December 31, 2014 |
| (a) | Per share amounts are calculated using the daily average shares method, which more appropriately presents the per share data for the period. |
| (b) | Total returns are historical in nature and assume changes in share price, reinvestment of dividends and capital gains distributions, if any. Total returns for periods less than one year are not annualized. Had the Adviser not absorbed a portion of the expenses during certain periods, total returns would have been lower. |
The accompanying notes are an integral part of the financial statements.
| Miller Intermediate Bond Fund |
| FINANCIAL HIGHLIGHTS |
The table below sets forth financial data for one share of beneficial interest outstanding throughout each period.
| | | Class A | |
| | | Year | | | Year | | | Year | | | Period | |
| | | Ended | | | Ended | | | Ended | | | Ended | |
| | | October 31, 2018 | | | October 31, 2017 | | | October 31, 2016 | | | October 31, 2015 * | |
| Net Asset Value, Beginning of Period | | $ | 16.55 | | | $ | 16.20 | | | $ | 15.47 | | | $ | 15.00 | |
| Increase from operations: | | | | | | | | | | | | | | | | |
| Net investment income (a) | | | 0.29 | | | | 0.57 | | | | 0.14 | | | | 0.34 | |
| Net gain from securities (both realized and unrealized) | | | (0.18 | ) | | | 0.09 | | | | 0.84 | | | | 0.24 | |
| Total from operations | | | 0.11 | | | | 0.66 | | | | 0.98 | | | | 0.58 | |
| Distributions to shareholders from: | | | | | | | | | | | | | | | | |
| Net investment income | | | (0.35 | ) | | | (0.31 | ) | | | (0.16 | ) | | | (0.11 | ) |
| Net realized gain | | | (0.25 | ) | | | — | | | | (0.09 | ) | | | — | |
| Total distributions | | | (0.60 | ) | | | (0.31 | ) | | | (0.25 | ) | | | (0.11 | ) |
| Net Asset Value, End of Period | | $ | 16.06 | | | $ | 16.55 | | | $ | 16.20 | | | $ | 15.47 | |
| Total Return (b) | | | 0.67 | % | | | 4.11 | % | | | 6.42 | % | | | 3.84 | % |
| Ratios/Supplemental Data | | | | | | | | | | | | | | | | |
| Net assets, end of period (in 000’s) | | $ | 394 | | | $ | 176 | | | $ | 266 | | | $ | 863 | |
| Ratio of expenses to average net assets, | | | | | | | | | | | | | | | | |
| before reimbursement/recapture | | | 1.43 | % | | | 1.43 | % | | | 1.76 | % | | | 2.05 | % (c) |
| net of reimbursement/recapture | | | 1.30 | % | | | 1.50 | % | | | 1.50 | % | | | 1.50 | % (c) |
| Ratio of net investment income to average net assets | | | 1.79 | % | | | 3.48 | % | | | 0.90 | % | | | 1.39 | % (c) |
| Portfolio turnover rate | | | 98 | % | | | 83 | % | | | 40 | % | | | 85 | % (d) |
| * | Miller Intermediate Bond Fund Class A commenced operations on December 31, 2014. |
| (a) | Per share amounts are calculated using the daily average shares method, which more appropriately presents the per share data for the period. |
| (b) | Total returns are historical in nature and assume changes in share price, reinvestment of dividends and capital gains distributions, if any, excluding the effect of sales loads. Total returns for periods less than one year are not annualized. Had the Adviser not absorbed a portion of the expenses or recaptured expenses during certain periods, total returns would have been lower or higher, respectively. |
The accompanying notes are an integral part of these financial statements.
| Miller Intermediate Bond Fund |
| FINANCIAL HIGHLIGHTS |
The table below sets forth financial data for one share of beneficial interest outstanding throughout each period.
| | | Class I | |
| | | Year | | | Year | | | Year | | | Period | |
| | | Ended | | | Ended | | | Ended | | | Ended | |
| | | October 31, 2018 | | | October 31, 2017 | | | October 31, 2016 | | | October 31, 2015 * | |
| Net Asset Value, Beginning of Period | | $ | 16.55 | | | $ | 16.21 | | | $ | 15.47 | | | $ | 15.00 | |
| Increase from operations: | | | | | | | | | | | | | | | | |
| Net investment income (a) | | | 0.30 | | | | 0.62 | | | | 0.31 | | | | 0.21 | |
| Net gain from securities (both realized and unrealized) | | | (0.14 | ) | | | 0.08 | | | | 0.72 | | | | 0.38 | |
| Total from operations | | | 0.16 | | | | 0.70 | | | | 1.03 | | | | 0.59 | |
| Distributions to shareholders from: | | | | | | | | | | | | | | | | |
| Net investment income | | | (0.38 | ) | | | (0.36 | ) | | | (0.20 | ) | | | (0.12 | ) |
| Net realized gain | | | (0.25 | ) | | | — | | | | (0.09 | ) | | | — | |
| Total distributions | | | (0.63 | ) | | | (0.36 | ) | | | (0.29 | ) | | | (0.12 | ) |
| Net Asset Value, End of Period | | $ | 16.08 | | | $ | 16.55 | | | $ | 16.21 | | | $ | 15.47 | |
| Total Return (b) | | | 0.96 | % | | | 4.34 | % | | | 6.76 | % | | | 3.92 | % |
| Ratios/Supplemental Data | | | | | | | | | | | | | | | | |
| Net assets, end of period (in 000’s) | | $ | 108,554 | | | $ | 147,539 | | | $ | 101,923 | | | $ | 41,597 | |
| Ratio of expenses to average net assets, | | | | | | | | | | | | | | | | |
| before reimbursement/recapture | | | 1.17 | % | | | 1.18 | % | | | 1.51 | % | | | 1.80 | % (c) |
| net of reimbursement/recapture | | | 1.05 | % | | | 1.25 | % | | | 1.25 | % | | | 1.25 | % (c) |
| Ratio of net investment income to average net assets | | | 1.85 | % | | | 3.78 | % | | | 2.00 | % | | | 1.64 | % (c) |
| Portfolio turnover rate | | | 98 | % | | | 83 | % | | | 40 | % | | | 85 | % (d) |
| * | Miller Intermediate Bond Fund Class I commenced operations on December 31, 2014. |
| (a) | Per share amounts are calculated using the daily average shares method, which more appropriately presents the per share data for the period. |
| (b) | Total returns are historical in nature and assume changes in share price, reinvestment of dividends and capital gains distributions, if any, excluding the effect of sales loads. Total returns for periods less than one year are not annualized. Had the Adviser not absorbed a portion of the expenses or recaptured expenses during certain periods, total returns would have been lower or higher, respectively. |
The accompanying notes are an integral part of the financial statements.
| Miller Intermediate Bond Fund |
| FINANCIAL HIGHLIGHTS |
The table below sets forth financial data for one share of beneficial interest outstanding throughout each period.
| | | Class C | |
| | | Year | | | Year | | | Year | | | Period | |
| | | Ended | | | Ended | | | Ended | | | Ended | |
| | | October 31, 2018 | | | October 31, 2017 | | | October 31, 2016 | | | October 31, 2015 * | |
| Net Asset Value, Beginning of Period | | $ | 16.64 | | | $ | 16.29 | | | $ | 15.57 | | | $ | 15.00 | |
| Increase from operations: | | | | | | | | | | | | | | | | |
| Net investment income (a) | | | 0.14 | | | | 0.45 | | | | 0.07 | | | | 0.31 | |
| Net gain from securities (both realized and unrealized) | | | (0.16 | ) | | | 0.09 | | | | 0.80 | | | | 0.26 | |
| Total from operations | | | (0.02 | ) | | | 0.54 | | | | 0.87 | | | | 0.57 | |
| Distributions to shareholders from: | | | | | | | | | | | | | | | | |
| Net investment income | | | (0.25 | ) | | | (0.19 | ) | | | (0.06 | ) | | | — | |
| Net realized gain | | | (0.25 | ) | | | — | | | | (0.09 | ) | | | — | |
| Total distributions | | | (0.50 | ) | | | (0.19 | ) | | | (0.15 | ) | | | — | |
| Net Asset Value, End of Period | | $ | 16.12 | | | $ | 16.64 | | | $ | 16.29 | | | $ | 15.57 | |
| Total Return (b) | | | (0.16 | )% | | | 3.31 | % | | | 5.65 | % | | | 3.80 | % |
| Ratios/Supplemental Data | | | | | | | | | | | | | | | | |
| Net assets, end of period (in 000’s) | | $ | 205 | | | $ | 163 | | | $ | 249 | | | $ | 105 | |
| Ratio of expenses to average net assets, | | | | | | | | | | | | | | | | |
| before reimbursement/recapture | | | 2.17 | % | | | 2.18 | % | | | 2.51 | % | | | 2.80 | % (c) |
| net of reimbursement/recapture | | | 2.05 | % | | | 2.25 | % | | | 2.25 | % | | | 2.25 | % (c) |
| Ratio of net investment income to average net assets | | | 0.86 | % | | | 2.75 | % | | | 0.47 | % | | | 0.64 | % (c) |
| Portfolio turnover rate | | | 98 | % | | | 83 | % | | | 40 | % | | | 85 | % (d) |
| * | Miller Intermediate Bond Fund Class C commenced operations on December 31, 2014. |
| (a) | Per share amounts are calculated using the daily average shares method, which more appropriately presents the per share data for the period. |
| (b) | Total returns are historical in nature and assume changes in share price, reinvestment of dividends and capital gains distributions, if any, excluding the effect of sales loads. Total returns for periods less than one year are not annualized. Had the Adviser not absorbed a portion of the expenses or recaptured expenses during certain periods, total returns would have been lower or higher, respectively. |
The accompanying notes are an integral part of the financial statements.
| Miller Funds |
| NOTES TO FINANCIAL STATEMENTS |
| October 31, 2018 |
The Miller Convertible Bond Fund (the “Convertible Bond Fund”), the Miller Convertible Plus Fund (the “Convertible Plus Fund”), and Miller Intermediate Bond Fund (the “Intermediate Bond Fund”) referred to collectively, as the “Funds”, are separate series of the Miller Investment Trust (the “Trust”), a Delaware statutory trust organized on September 28, 2007. The Trust is registered as an open-end management investment company. The Funds are registered under the Investment Company Act of 1940, as amended (the “1940 Act”), as diversified, open-end management investment companies. Convertible Bond Fund’s primary investment objective is to maximize total return comprising current income and capital appreciation, consistent with preservation of capital. Convertible Plus Fund’s primary investment objective is to use leverage to maximize total return comprising current income and capital appreciation. Intermediate Bond Fund’s primary investment objective is to maximize total return comprising current income and capital appreciation, consistent with preservation of capital.
The Funds currently offer Class A, Class I and Class C shares. Convertible Bond Fund’s Class A and Class I shares commenced operations on December 27, 2007 and Class C shares commenced operations on December 1, 2009. Convertible Plus Fund’s Class A, Class I and Class C shares commenced operations on December 31, 2014. Intermediate Bond Fund’s Class A, Class I and Class C shares commenced operations on December 31, 2014. Class I and Class C shares are offered at net asset value. Class A shares are offered at net asset value plus a maximum sales charge of 5.75%. Each class represents an interest in the same assets of the respective Fund and classes are identical except for differences in their sales charge structures and ongoing service and distribution charges. All classes of shares have equal voting privileges except that each class has exclusive voting rights with respect to its service and/or distribution plans. The Funds’ income, expenses (other than class specific distribution fees) and realized and unrealized gains and losses are allocated proportionately each day based upon the relative net assets of each class.
Wellesley Asset Management, Inc. serves as the Funds’ investment adviser (the “Adviser”).
| 2. | SUMMARY OF SIGNIFICANT ACCOUNTING POLICIES |
The preparation of financial statements in accordance with accounting principles generally accepted in the United States of America (“GAAP”) requires management to make estimates and assumptions that affect the reported amounts of assets and liabilities and disclosure of contingent assets and liabilities at the date of the financial statements and the reported amounts of revenue and expenses during the period. Actual results could differ from those estimates. Each Fund is an investment company and accordingly follows the investment company accounting and reporting guidance of the Financial Accounting Standards Board (FASB) Accounting Standard Codification Topic 946 “Financial Services – Investment Companies.”
The following is a summary of significant accounting policies followed by the Funds in preparation of their financial statements.
Security Valuation – The Funds’ securities are valued at the last sale price on the exchange in which such securities are primarily traded, as of the close of business on the day the securities are being valued. NASDAQ traded securities are valued using the NASDAQ Official Closing Price (“NOCP”). If the NOCP is not available, such securities shall be valued at the last sale price on the day of valuation, or if there has been no sale on such day, at the mean between the bid and asked prices. Debt securities and long-term U.S. Treasury obligations (other than short-term obligations) are valued each day by an independent pricing service approved by the Trust’s Board of Trustees (the “Board”) using methods which include current market quotations from a major market maker or counterparty in/to the securities and based on methods which include the consideration of yields or prices of securities of comparable quality, coupon, maturity and type. Short-term investments that mature in 60 days or less, at the time of purchase, may be valued at amortized cost, provided such valuations represent fair value. Investments in open-end investment companies are valued at net asset value.
Securities for which current market quotations are not readily available or for which quotations are not deemed to be representative of market values are valued at fair value as determined in good faith by a Fair Valuation Committee in accordance with the Trust’s Portfolio Securities Valuation Procedures (the “Procedures”) adopted by the Board.
| Miller Funds |
| NOTES TO FINANCIAL STATEMENTS (Continued) |
| October 31, 2018 |
The Procedures consider, among others, the following factors to determine a security’s fair value: the nature and pricing history (if any) of the security; whether any dealer quotations for the security are available; and possible valuation methodologies that could be used to determine the fair value of the security.
The Funds utilize various methods to measure the fair value of their investments on a recurring basis. GAAP establishes a hierarchy that prioritizes inputs to valuation methods. The three levels of input are:
Level 1 – Unadjusted quoted prices in active markets for identical assets and liabilities that the Funds have the ability to access.
Level 2 – Observable inputs other than quoted prices included in Level 1 that are observable for the asset or liability, either directly or indirectly. These inputs may include quoted prices for the identical instrument in an inactive market, prices for similar instruments, interest rates, prepayment speeds, credit risk, yield curves, default rates and similar data.
Level 3 – Unobservable inputs for the asset or liability, to the extent relevant observable inputs are not available, representing the Funds’ own assumptions about the assumptions a market participate would use in valuing the asset or liability, and would be based on the best information available.
The availability of observable inputs can vary from security to security and is affected by a wide variety of factors, including, for example, the type of security, whether the security is new and not yet established in the marketplace, the liquidity of markets, and other characteristics particular to the security. To the extent that valuation is based on models or inputs that are less observable or unobservable in the market, the determination of fair value requires more judgment. Accordingly, the degree of judgment exercised in determining fair value is greatest for instruments categorized in Level 3.
The inputs used to measure fair value may fall into different levels of the fair value hierarchy. In such cases, for disclosure purposes, the level in the fair value hierarchy within which the fair value measurement falls in its entirety, is determined based on the lowest level input that is significant to the fair value measurement in its entirety.
The inputs or methodology used for valuing securities are not necessarily an indication of the risk associated with investing in those securities. The following tables summarize the inputs used as of October 31, 2018 for the Funds’ assets and liabilities measured at fair value:
Convertible Bond Fund
| Assets | | Level 1 | | | Level 2 | | | Level 3 | | | Total | |
| Investments in Securities: | | | | | | | | | | | | | | | | |
| Convertible Bonds* | | $ | — | | | $ | 925,450,692 | | | $ | — | | | $ | 925,450,692 | |
| Preferred Stock* | | | 30,732,082 | | | | — | | | | — | | | | 30,732,082 | |
| U.S. Treasury Obligations | | | — | | | | 5,966,804 | | | | — | | | | 5,966,804 | |
| Short-Term Investments | | | 9,076,823 | | | | — | | | | — | | | | 9,076,823 | |
| Total Investments in Securities | | $ | 39,808,905 | | | $ | 931,417,496 | | | $ | — | | | $ | 971,226,401 | |
| Miller Funds |
| NOTES TO FINANCIAL STATEMENTS (Continued) |
| October 31, 2018 |
Convertible Plus Fund
| Assets | | Level 1 | | | Level 2 | | | Level 3 | | | Total | |
| Investments in Securities: | | | | | | | | | | | | | | | | |
| Convertible Bonds* | | $ | — | | | $ | 195,717,358 | | | $ | — | | | $ | 195,717,358 | |
| Preferred Stock* | | | 8,388,400 | | | | — | | | | — | | | | 8,388,400 | |
| U.S. Treasury Obligations | | | — | | | | 1,423,779 | | | | — | | | | 1,423,779 | |
| Short-Term Investments | | | 1,039,443 | | | | — | | | | — | | | | 1,039,443 | |
| Total Investments in Securities | | $ | 9,427,843 | | | $ | 197,141,137 | | | $ | — | | | $ | 206,568,980 | |
| | | | | | | | | | | | | | | | | |
| Intermediate Bond Fund | | | | | | | | | | | | | | | | |
| | | | | | | | | | | | | | | | | |
| Assets | | Level 1 | | | Level 2 | | | Level 3 | | | Total | |
| Investments in Securities: | | | | | | | | | | | | | | | | |
| Convertible Bonds* | | $ | — | | | $ | 74,640,199 | | | $ | — | | | $ | 74,640,199 | |
| Preferred Stock* | | | 6,614,400 | | | | — | | | | — | | | | 6,614,400 | |
| U.S. Treasury Obligations | | | — | | | | 24,747,181 | | | | — | | | | 24,747,181 | |
| Short-Term Investments | | | 2,585,217 | | | | — | | | | — | | | | 2,585,217 | |
| Total Investments in Securities | | $ | 9,199,617 | | | $ | 99,387,380 | | | $ | — | | | $ | 108,586,997 | |
There were no transfers into or out of Level 1, Level 2, and Level 3 in the current period. Transfers between the Levels for investment in securities or other financial instruments are measured at the end of the reporting period.
| * | Please refer to the Schedule of Investments for industry classifications. |
Exchange Traded Funds (“ETFs”) – The Fund may invest in exchange traded funds. ETF shares are bought and sold on a securities exchange. An index ETF trades like common stock and represents a fixed portfolio of securities designed to track the performance and dividend yield of a particular domestic or foreign market index. The Fund may purchase an ETF to temporarily gain exposure to a portion of the U.S. or a foreign market while awaiting purchase of underlying securities. There are risks of owning the underlying securities the ETFs are designed to track, and the lack of liquidity of an ETF may result in it being more volatile. Additionally, ETFs have fees and expenses that reduce their value.
Synthetic Convertible Bond Risk – Synthetic convertible bonds are financial instruments created by combining two or more separate securities that, in total, have returns that are similar to a convertible bond. Synthetic convertible bonds are derivative debt securities and are subject to the creditworthiness of the counterparty of the synthetic security. The value of a synthetic convertible bond may decline substantially if the counterparty’s creditworthiness deteriorates. The value of a synthetic convertible bond may also respond differently to market fluctuations than a convertible bond because a synthetic convertible is composed of two or more separate securities, each with its own market value.
Leverage Risk – The use of leverage through activities such as borrowing or purchasing derivatives can magnify the effects of changes in the value of the Convertible Plus Fund and make the Convertible Plus Fund’s share price more volatile and sensitive to market movements. The leveraged investment techniques that the Convertible Plus Fund employs could cause investors in the Convertible Plus Fund to lose more money in adverse environments. Leverage may result in the creation of a liability that requires the Convertible Plus Fund to pay interest or fees, which may be greater than the income or gain received by the Convertible Plus Fund from the securities purchased with leverage proceeds.
Derivative Transactions – The Funds may enter into total return swaps. Total return swaps are agreements that provide the Funds with a return based on the performance of an underlying asset, in exchange for fee payments to a counterparty based on a specific rate. The difference in the value of these income streams is recorded daily by the Funds, and is settled in cash at the end of each month. The fee paid by the Funds will typically be determined by multiplying the face value of the swap agreement by an agreed upon interest rate. In addition, if the underlying asset declines in value over the term of the swap, the Funds would also be required to pay the dollar value of that decline
| Miller Funds |
| NOTES TO FINANCIAL STATEMENTS (Continued) |
| October 31, 2018 |
to the counterparty. Total return swaps could result in losses if the underlying asset does not perform as anticipated by the Adviser. Each Fund may use its own net asset value as the underlying asset in a total return swap. This strategy serves to reduce cash drag (the impact of cash on the Funds’ overall return) by replacing it with the impact of market exposure based upon the Funds’ own investment holdings. The Funds record fluctuations in the value of open swap contracts on a daily basis as unrealized gains or losses. Realized gains and losses from terminated swaps are included in net realized gains/losses on swap contracts. Risks may exceed amounts recognized on the Statement of Assets and Liabilities. The Funds value the total return swaps in which they enter based on a formula of the underlying asset’s nightly value, U.S. Dollar-1-Month London Interbank Offered Rate-British Banker’s Association (USD-1M LIBOR-BBA) and an annual fee or various agreed upon inputs.
During the year ended October 31, 2018, the Funds invested in total return swaps. The total return swaps can be found on the Statements of Assets and Liabilities under receivable/payable for open swap contracts. At October 31, 2018, the receivable for open swap contracts were $61,330, $0 and $0 for the Convertible Bond Fund, Convertible Plus Fund and Intermediate Bond Fund, respectively, on the Statements of Assets and Liabilities. For the year ended October 31, 2018, the net realized gain (loss) on swaps was $(1,440,884), $344,288 and $(2,022) for the Convertible Bond Fund, Convertible Plus Fund and Intermediate Bond Fund, respectively, on the Statements of Operations. For the year ended October 31, 2018, the net change in unrealized appreciation/(depreciation) was $(224,908), $(269,869) and $2,022 for the Convertible Bond Fund, Convertible Plus Fund and Intermediate Bond Fund, respectively, on the Statements of Operations. These swaps were subject to equity risk and interest rate risk.
The average notional value of total return swaps that the Funds invested in during the year ended October 31, 2018 were $22,465,618, $6,911,009 and $0 for the Convertible Bond Fund, Convertible Plus Fund and Intermediate Bond Fund, respectively. The average notional value previously discussed serves as the indicator of the volume for the Funds.
Security Transactions and Investment Income – Investment security transactions are accounted for on a trade date basis. Cost is determined and gains and losses are based upon the specific identification method for both financial statement and federal income tax purposes.
Dividend income is recorded on the ex-dividend date and interest income is recorded on the accrual basis. Purchase discounts and premiums on securities are accreted and amortized over the life of the respective securities.
Effective November 1, 2017, the Funds made a change in accounting estimate related to the calculation of accretion and amortization of purchase discounts or premiums on securities. The change in accounting estimate was made to more closely align the amortization period of premiums and discounts to expectations incorporated in market pricing on the underlying securities. As a result, adjustments were made to reclass components of distributable earnings. The change in accounting estimate did not impact net increase or decrease in net assets from operations for the year ended October 31, 2018.
Expenses – Common expenses, income and gains and losses are allocated daily among share classes of the Funds based on the relative proportion of net assets represented by each class. Class specific expenses are charged directly to the responsible class of shares of the Funds.
Federal Income Taxes – The Funds intend to continue to comply with the requirements of Subchapter M of the Internal Revenue Code applicable to regulated investment companies and will distribute all of its taxable income, if any, to shareholders. Accordingly, no provision for Federal income taxes is required in the financial statements. The Funds recognize the tax benefits of uncertain tax positions only when the position is “more likely than not” to be sustained assuming examination by tax authorities. Management has reviewed the tax positions on returns filed for open fiscal year ends October 31, 2015 through October 31, 2017, or expected to be taken in the Funds’ current fiscal year end returns, and concluded that no liability for unrecognized tax benefits should be recorded related to uncertain tax positions. The Funds identify their major tax jurisdictions as U.S. Federal and the state of Massachusetts. The Funds recognize interest and penalties, if any, related to unrecognized tax benefits as income tax expense in the Statements of Operations. During the year ended October 31, 2018, the Funds did not incur any interest or penalties.
| Miller Funds |
| NOTES TO FINANCIAL STATEMENTS (Continued) |
| October 31, 2018 |
Distributions to Shareholders – Distributions from investment income, if any, are declared and paid quarterly and are recorded on the ex-dividend date. The Funds will declare and pay net realized capital gains, if any, annually. The character of income and gains to be distributed is determined in accordance with income tax regulations which may differ from GAAP.
Indemnification – The Trust indemnifies its officers and trustees for certain liabilities that may arise from the performance of their duties to the Trust. Additionally, in the normal course of business, the Funds enter into contracts that contain a variety of representations and warranties and which provide general indemnities. The Funds’ maximum exposure under these arrangements is unknown, as this would involve future claims that may be made against the Funds that have not yet occurred. However, based on experience, the Trust expects the risk of loss due to these warranties and indemnities to be remote.
| 3. | INVESTMENT ADVISORY AGREEMENT AND TRANSACTIONS WITH RELATED PARTIES |
The activities of the Funds are overseen by the Board. Pursuant to an Investment Advisory Agreement with the Funds, the Adviser, under the oversight of the Board, directs the daily operations of the Funds and supervises the performance of administrative and professional services provided by others. As compensation for its services and the related expenses borne by the Adviser, the Funds pays the Adviser a management fee, computed and accrued daily and paid monthly, at an annual rate of 0.75% and 0.95% for the Convertible Bond Fund and the Intermediate Bond Fund, respectively, of the average daily net assets of each respective Fund. The Convertible Plus Fund pays the Adviser an annual rate of 1.95% of the average daily managed assets, which is equal its total assets including assets attributable to borrowings, minus accrued liabilities other than borrowings. For the year ended October 31, 2018, the Adviser earned advisory fees of $7,558,213, $3,925,625 and $1,290,302 for the Convertible Bond Fund, Convertible Plus Fund and the Intermediate Bond Fund, respectively.
The Adviser, pursuant to an Expense Limitation Agreement (the “Agreement”), has contractually agreed to reduce its fees and/or absorb expenses of the Convertible Plus Fund and the Intermediate Bond Fund, at least until February 28 2019, to ensure that net annual operating expenses (excluding any front-end or contingent deferred loads, brokerage fees and commissions, acquired fund fees and expenses, borrowing costs such as interest and dividend expense on securities sold short, taxes and extraordinary expenses such as litigation) will not exceed 2.20%, 1.95% and 2.95% of the Convertible Plus Fund’s average daily net assets for Class A, Class I and Class C shares, respectively and 1.30%, 1.05% and 2.05% of the Intermediate Bond Fund’s average daily net assets for Class A, Class I and Class C shares, respectively. The Agreement will allow the Adviser, subject to certain conditions, to recover amounts previously reimbursed for operating expenses to the Funds to the extent that the Funds’ expense ratios fall below the above indicated expense limitations. The amounts that can be recovered will be limited to the difference between the actual expense ratio and the amount of the expense limitation. Under such agreement, the Adviser can only recover such amounts for a period of up to three years. For the year ended October 31, 2018, the Adviser waived fees of $1,563,016 and $167,216 for the Convertible Plus Fund and the Intermediate Bond Fund, respectively.
As of October 31, 2018, the following amounts are subject to recapture by the Advisor by October 31 of the following years:
| | | 2019 | | | 2020 | | | 2021 | |
| Convertible Plus Fund | | $ | 234,298 | | | $ | 198,827 | | | $ | 1,563,016 | |
| Intermediate Bond Fund | | | 145,219 | | | | — | | | | 167,216 | |
Distributor – The distributor of the Funds is Northern Lights Distributors, LLC (the “Distributor”). The Board has adopted, on behalf of each Fund, a Distribution Plan and Agreement pursuant to Rule 12b-1 under the Investment Company Act of 1940 (the “Plan”), as amended, to pay for certain distribution activities and shareholder services. Convertible Bond Fund’s Class A shares pay 0.50% per year of its average daily net assets for such distribution and shareholder service activities. The Convertible Plus Fund and the Intermediate Bond Fund’s Class A pay 0.25% per year of its average daily net assets for distribution and shareholder service activities under the Plan. The Funds’ Class C pays 1.00% per year of its average daily net assets for distribution and shareholder service activities under
| Miller Funds |
| NOTES TO FINANCIAL STATEMENTS (Continued) |
| October 31, 2018 |
the Plan. For the year ended October 31, 2018, the 12b-1 fees accrued amounted to $536,397 and $692,684 for the Convertible Bond Fund’s Class A shares and Class C shares, respectively, $2,246 and $4,837 for the Convertible Plus Fund’s Class A shares and Class C shares, respectively, and $867 and $2,500 for the Intermediate Bond Fund’s Class A and Class C shares, respectively.
The Distributor acts as each Fund’s principal underwriter in a continuous public offering of the Funds’ shares. For the year ended October 31, 2018, the Distributor received $141,925 in underwriting commissions for sales of Class A shares, of which $17,388 was retained by the principal underwriter or other affiliated broker-dealers for the Convertible Bond Fund. For the year ended October 31, 2018, the Distributor received $425 in underwriting commissions for sales of Class A shares, of which $77 was retained by the principal underwriter or other affiliated broker-dealers for the Convertible Plus Fund. For the year ended October 31, 2018, the Distributor received $3,888 in underwriting commissions for sales of Class A shares, of which $714 was retained by the principal underwriter or other affiliated broker-dealers for the Intermediate Bond Fund.
In addition, certain affiliates of the Distributor provide services to the Funds as follows:
Gemini Fund Services, LLC (“GFS”) – GFS, an affiliate of the Distributor, provides administration, fund accounting, and transfer agent services to the Trust. Pursuant to separate servicing agreements with GFS, the Funds pay GFS customary fees for providing administration, fund accounting and transfer agency services to the Funds.
Northern Lights Compliance Services, LLC (“NLCS”) – NLCS, an affiliate of GFS and the Distributor, provides a Chief Compliance Officer to the Trust, as well as related compliance services, pursuant to a consulting agreement between NLCS and the Trust. Under the terms of such agreement, NLCS receives customary fees from the Funds. An officer of the Trust is also an officer of NLCS.
Blu Giant, LLC (“Blu Giant”) – Blu Giant, an affiliate of GFS and the Distributor, provides EDGAR conversion and filing services as well as print management services for the Funds on an ad-hoc basis. For the provision of these services, Blu Giant receives customary fees from the Funds.
Trustee Fees - Each Trustee who is not affiliated with the Trust or the Adviser receives an annual retainer fee of $50,000, as well as $10,000 for one annual in-person meeting and $1,000 each for three meetings conducted by telephone. Any additional as needed meetings, either in person or by telephone are covered by the retainer fee. The trustee, who is chair of the Audit Committee, receives an additional payment of $6,000 as an annual retainer fee for serving in that capacity. None of the Trustees who are affiliated with the Trust receive compensation from the Trust.
| 4. | INVESTMENT TRANSACTIONS |
The cost of security purchases and the proceeds from the sale of securities, other than short-term securities, for the year ended October 31, 2018, amounted to $1,111,559,853 and $1,036,501,405, respectively for the Convertible Bond Fund, $284,398,285 and $275,305,766, respectively for the Convertible Plus Fund and $128,653,500 and $160,846,643, respectively for the Intermediate Bond Fund.
The Convertible Plus Fund may borrow for investment purposes, to meet repurchase requests and for temporary, extraordinary or emergency purposes. The Convertible Plus Fund is required to maintain asset coverage (that is, total assets including borrowings, less liabilities exclusive of borrowings) of at least 300% of the amount borrowed, with an exception it expects to limit its borrowings for investment purposes to 33 1/3% of the value of the Fund’s total assets (including the amount borrowed). The Convertible Plus Fund has entered into a line of credit agreement with Barclays Bank PLC, which permits the Convertible Plus Fund to borrow at a rate, per annum, equal to 1.15% plus the 3 month LIBOR rate to be paid quarterly. There is also an annual commitment fee. During the year ended October 31, 2018, the Convertible Plus Fund recorded $2,062,270 in interest expense on the line of credit. Average borrowings and the average interest rate during the year ended October 31, 2018 were $64,400,273 and 3.16%, respectively. The largest outstanding amount borrowed during the period was $74,000,000. The balance on the line
| Miller Funds |
| NOTES TO FINANCIAL STATEMENTS (Continued) |
| October 31, 2018 |
of credit as of October 31, 2018 was $67,000,000 and the amount of the commitment is $77,000,000. The interest rate as of October 31, 2018 was 3.55%.
| 6. | AGGREGATE UNREALIZED APPRECIATION AND DEPRECIATION – TAX BASIS |
The identified cost of investments in securities owned by each Fund for federal income tax purposes and its respective gross unrealized appreciation and depreciation at October 31, 2018, were as follows:
| | | | | | Gross | | | Gross | | | Net Unrealized | |
| | | Tax | | | Unrealized | | | Unrealized | | | Appreciation/ | |
| | | Cost | | | Appreciation | | | Depreciation | | | (Depreciation) | |
| Convertible Bond Fund | | $ | 989,179,625 | | | $ | 32,853,580 | | | $ | (50,745,474 | ) | | $ | (17,891,894 | ) |
| Convertible Plus Fund | | | 212,285,993 | | | | 4,008,896 | | | | (9,725,909 | ) | | | (5,717,013 | ) |
| Intermediate Bond Fund | | | 111,679,484 | | | | 1,291,377 | | | | (4,383,864 | ) | | | (3,092,487 | ) |
| 7. | DISTRIBUTIONS TO SHAREHOLDERS AND TAX COMPONENTS OF CAPITAL |
The tax character of fund distributions for the following periods was as follows:
| For the year ended October 31, 2018: |
| |
| | | Ordinary | | | Long-Term | | | | |
| | | Income | | | Capital Gains | | | Total | |
| Convertible Bond Fund | | $ | 24,777,976 | | | $ | 23,430,398 | | | $ | 48,208,374 | |
| Convertible Plus Fund | | | 8,063,805 | | | | 59,488 | | | | 8,123,293 | |
| Intermediate Bond Fund | | | 5,012,986 | | | | 351,161 | | | | 5,364,147 | |
| | | | | | | | | | | | | |
| For the year ended October 31, 2017: |
| |
| | | Ordinary | | | Long-Term | | | | |
| | | Income | | | Capital Gains | | | Total | |
| Convertible Bond Fund | | $ | 33,597,114 | | | $ | — | | | $ | 33,597,114 | |
| Convertible Plus Fund | | | 3,432,347 | | | | — | | | | 3,432,347 | |
| Intermediate Bond Fund | | | 3,185,078 | | | | — | | | | 3,185,078 | |
As of October 31, 2018, the components of accumulated earnings/(deficit) on a tax basis were as follows:
| | | Undistributed | | | Undistributed | | | Unrealized | | | Total | |
| | | Ordinary | | | Long-Term | | | Appreciation/ | | | Accumulated | |
| | | Income | | | Capital Gains | | | (Depreciation) | | | Earnings/(Deficits | |
| Convertible Bond Fund | | $ | 11,497,121 | | | $ | 8,362,133 | | | $ | (17,891,894 | ) | | $ | 1,967,360 | |
| Convertible Plus Fund | | | 4,076,562 | | | | 1,739,042 | | | | (5,717,013 | ) | | | 98,591 | |
| Intermediate Bond Fund | | | 2,073,828 | | | | 1,149,743 | | | | (3,092,487 | ) | | | 131,084 | |
The difference between book basis and tax basis distributable earnings and unrealized depreciation is primarily attributable to the tax treatment of amortization on convertible securities, income on contingent convertible debt securities, Section 305(c) deemed dividend distributions, and the tax deferral of losses on wash sales.
| Miller Funds |
| NOTES TO FINANCIAL STATEMENTS (Continued) |
| October 31, 2018 |
Permanent book and tax differences, primarily attributable to tax adjustments for equalization debits resulted in reclassification for the year ended October 31, 2018 as follows:
| | | Paid | | | Total | |
| | | In | | | Distributable | |
| | | Capital | | | Earnings (Losses) | |
| Convertible Bond Fund | | $ | 3,315,525 | | | $ | (3,315,525 | ) |
| Convertible Plus Fund | | | 862,197 | | | | (862,197 | ) |
| Intermediate Bond Fund | | | 1,025,314 | | | | (1,025,314 | ) |
Each Fund is permitted to purchase and sell securities (“cross-trade”) from and to other Funds within the Trust as well as certain other clients of the Adviser pursuant to “Cross-Trading” Procedures adopted by the Board. These procedures have been designed to ensure that any cross-trade of securities by the respective Funds from or to another Fund that is or could be considered an affiliate of the Funds under certain limited circumstances by virtue of having a common investment adviser, common Officer, or common Trustee complies with Rule 17a-7 under the 1940 Act. Further, as defined under these procedures, each cross-trade is effected at the current market price to save costs where allowed. For the year ended October 31, 2018, the Convertible Bond Fund, the Convertible Plus Fund and the Intermediate Bond Fund engaged in cross-trades. The cost of security purchases and the proceeds from the sale of securities for the year ended October 31, 2018, amounted to $7,989,178 and $0, respectively for the Convertible Bond Fund, $0 and $5,738,500, respectively for the Convertible Plus Fund and $896,220 and $3,146,898, respectively for the Intermediate Bond Fund. The realized gains from cross-trades for the year ended October 31, 2018 were $0, $252,242 and $38,043 for the Convertible Bond Fund, the Convertible Plus Fund and the Intermediate Bond Fund, respectively.
| 9. | NEW ACCOUNTING PRONOUNCEMENTS |
In November 2016, the FASB issued ASU 2016-18, Statement of Cash Flows (Topic 230), which requires that the statement of cash flows explain the change during the period in the total of cash, cash equivalents, and amounts generally described as restricted cash or restricted cash equivalents. Therefore, amounts generally described as restricted cash and restricted cash equivalents should be included with cash and cash equivalents when reconciling the beginning-of-period and end-of-period total amounts shown on the statement of cash flows. ASU 2016-18 is effective retrospectively for interim and annual periods beginning after December 15, 2018. The adoption of this pronouncement did not have a material impact on the Company’s financial statements. At this time, management is evaluating the implications of this ASU and any impact on the financial statement disclosures.
In March 2017, the FASB issued ASU 2017-08, Premium Amortization on Purchased Callable Debt Securities, which amends the amortization period for certain callable debt securities purchased at a premium, shortening the period to the earliest call date. ASU 2017-08 is effective for fiscal years beginning after December 15, 2019, including interim periods within those fiscal years. Early application is permitted. At this time, management is evaluating the implications of this ASU and any impact on the financial statement disclosures.
In August 2018, the FASB issued Accounting Standards Update (“ASU”) No. 2018-13, which changes certain fair value measurement disclosure requirements. The new ASU, in addition to other modifications and additions, removes the requirement to disclose the amount and reasons for transfers between Level 1 and Level 2 of the fair value hierarchy, and the policy for the timing of transfers between levels. For investment companies, the amendments are effective for financial statements issued for fiscal years beginning after December 15, 2019, and interim periods within those fiscal years. Early adoption is allowed. At this time, management is evaluating the implications of this ASU and any impact on the financial statement disclosures.
In September 2018, the Securities and Exchange Commission adopted amendments to certain disclosure requirements under Regulation S-X to conform to US GAAP, including: (i) an amendment to require presentation of the total, rather than the components, of distributable earnings on the Statements of Assets and Liabilities; and (ii) an amendment to require presentation of the total, rather than the components, of distributions to shareholders, except for tax return of capital distributions, if any, on the Statements of Changes in Net Assets. The amendments also removed the requirement for parenthetical disclosure of undistributed net investment income on the Statements of
| Miller Funds |
| NOTES TO FINANCIAL STATEMENTS (Continued) |
| October 31, 2018 |
Changes in Net Assets. The Funds adopted and incorporated the new disclosures into the respective financial statements.
Subsequent events after the date of the Statements of Assets and Liabilities have been evaluated through the date the financial statements were issued. Management has determined that no events or transactions occurred requiring adjustment or disclosure in the financial statements.
REPORT OF INDEPENDENT REGISTERED PUBLIC ACCOUNTING FIRM
To the Board of Trustees of the Miller Investment Trust and Shareholders of the
Miller Convertible Bond Fund, Miller Convertible Plus Fund, and Miller Intermediate Bond Fund
Opinion on the Financial Statements and Financial Highlights
We have audited the accompanying statements of assets and liabilities of Miller Convertible Bond Fund, Miller Convertible Plus Fund, and Miller Intermediate Bond Fund (the “Funds”), including the schedules of investments as of October 31, 2018, the related statements of operations, the statements of changes in net assets and the financial highlights for the year then ended, and the related notes. In our opinion, the financial statements and financial highlights of each of the Funds present fairly, in all material respects, the financial position of the Funds as of October 31, 2018, and the results of their operations, the changes in their net assets, and the financial highlights for the year then ended, in conformity with accounting principles generally accepted in the United States of America. The statements of changes in net assets of the Funds for the year ended October 31, 2017 and the financial highlights of Miller Convertible Bond Fund for each of the four years in the period ended October 31, 2017, the financial highlights of Miller Convertible Miller Convertible Plus Fund for each of the two years in the period ended October 31, 2017 and the period December 31, 2014 to October 31, 2015, and the financial highlights of Miller Intermediate Bond Fund for each of the two years in the period ended October 31, 2017 and the period December 31, 2014 to October 31, 2015, were audited by other auditors whose report, dated January 12, 2018, expressed an unqualified opinion on those statements.
Basis for Opinion
These financial statements and financial highlights are the responsibility of the Funds’ management. Our responsibility is to express an opinion on the Funds’ financial statements and financial highlights based on our audits. We are a public accounting firm registered with the Public Company Accounting Oversight Board (United States) (PCAOB) and are required to be independent with respect to the Funds in accordance with the U.S. federal securities laws and the applicable rules and regulations of the Securities and Exchange Commission and the PCAOB.
We conducted our audits in accordance with the standards of the PCAOB. Those standards require that we plan and perform the audit to obtain reasonable assurance about whether the financial statements and financial highlights are free of material misstatement, whether due to error or fraud. The Funds are not required to have, nor were we engaged to perform, an audit of their internal control over financial reporting. As part of our audits we are required to obtain an understanding of internal control over financial reporting but not for the purpose of expressing an opinion on the effectiveness of the Funds internal control over financial reporting. Accordingly, we express no such opinion.
Our audits included performing procedures to assess the risks of material misstatement of the financial statements and financial highlights, whether due to error or fraud, and performing procedures that respond to those risks. Such procedures included examining, on a test basis, evidence regarding the amounts and disclosures in the financial statements and financial highlights. Our audits also included evaluating the accounting principles used and significant estimates made by management, as well as evaluating the overall presentation of the financial statements and financial highlights. Our procedures included confirmation of securities owned as of October 31, 2018, by correspondence with the custodian and brokers; when replies were not received from brokers, we performed other auditing procedures. We believe that our audits provide a reasonable basis for our opinion.

Costa Mesa, California
December 21, 2018
We have served as the auditor of one or more Miller Funds investment companies since 2018.
| Miller Funds |
| DISCLOSURE OF FUND EXPENSES (Unaudited) |
| October 31, 2018 |
As a shareholder of the Funds you incur ongoing costs, including management fees, distribution and/or service (12b-1 fees) fees and other Fund expenses. This example is intended to help you understand your ongoing costs (in dollars) of investing in the Funds and to compare these costs with the ongoing costs of investing in other mutual funds. Please note, the expenses shown in the tables are meant to highlight ongoing costs only and do not reflect any transactional costs.
This example is based on an investment of $1,000 invested for the period of time as indicated in the table below.
Actual Expenses: The first line of the table provides information about actual account values and actual expenses. You may use the information in this line, together with the amount you invested, to estimate the expenses that you paid over the period. Simply divide your account value by $1,000 (for example, an $8,600 account value divided by $1,000 = 8.6), then multiply the result by the number in the first line under the heading entitled “Expenses Paid During the Period” to estimate the expenses you paid on your account during the period.
Hypothetical Examples for Comparison Purposes: The second line of the table below provides information about hypothetical account values and hypothetical expenses based on the Funds’ actual expense ratio and an assumed rate of return of 5% per year before expenses, which is not the Funds’ actual return. The hypothetical account values and expenses may not be used to estimate the actual ending account balance or expenses you paid for the period. You may use this information to compare the ongoing costs of investing in the Funds and other funds. To do so, compare this 5% hypothetical example with the 5% hypothetical examples that appear in the shareholder reports of the other funds.
Please note that the expenses shown in the table are meant to highlight your ongoing costs only and do not reflect any transactional costs which may be applicable to your account. Therefore, the second line of the table is useful in comparing ongoing costs only, and will not help you determine the relative total costs of owning different funds. In addition, if these transactional costs were included, your costs would have been higher.
| | Beginning | | Annualized | Expenses Paid During the |
| | Account | Ending Account | Expense | Period |
| | Value (5/1/18) | Value (10/31/18) | Ratio | (5/1/18 to 10/31/18) |
| Actual * | | | | |
| Miller Convertible Bond Fund | | | | |
| Class A | $1,000.00 | $978.80 | 1.44% | $7.15 |
| Class I | $1,000.00 | $981.30 | 0.94% | $4.67 |
| Class C | $1,000.00 | $976.50 | 1.94% | $9.65 |
| Miller Convertible Plus Fund | | | | |
| Class A | $1,000.00 | $976.10 | 2.20% | $10.96 |
| Class I | $1,000.00 | $977.50 | 1.95% | $9.72 |
| Class C | $1,000.00 | $972.70 | 2.95% | $14.67 |
| Miller Intermediate Bond Fund | | | | |
| Class A | $1,000.00 | $998.10 | 1.30% | $6.55 |
| Class I | $1,000.00 | $999.80 | 1.05% | $5.29 |
| Class C | $1,000.00 | $993.60 | 2.05% | $10.30 |
| Hypothetical (5% return before expenses) * |
| Miller Convertible Bond Fund | | | | |
| Class A | $1,000.00 | $1,017.97 | 1.44% | $7.30 |
| Class I | $1,000.00 | $1,020.49 | 0.94% | $4.76 |
| Class C | $1,000.00 | $1,015.44 | 1.94% | $9.84 |
| Miller Convertible Plus Fund | | | | |
| Class A | $1,000.00 | $1,014.12 | 2.20% | $11.17 |
| Class I | $1,000.00 | $1,015.38 | 1.95% | $9.91 |
| Class C | $1,000.00 | $1,010.33 | 2.95% | $14.95 |
| Miller Intermediate Bond Fund | | | | |
| Class A | $1,000.00 | $1,018.65 | 1.30% | $6.62 |
| Class I | $1,000.00 | $1,019.91 | 1.05% | $5.35 |
| Class C | $1,000.00 | $1,014.87 | 2.05% | $10.41 |
| * | Expenses are equal to the average account value over the period, multiplied by the Fund’s annualized expense ratio, multiplied by the number of days in the six month period ended October 31, 2018 (184) divided by the number of days in the fiscal year (365). |
| Miller Funds |
| TAX INFORMATION (Unaudited) |
| October 31, 2018 |
We are required to advise you of the federal tax status of certain distributions received by shareholders during the fiscal year. The Funds hereby designate the following amounts for the Funds’ fiscal year ended October 31, 2018:
| | | Long-Term | |
| | | Capital Gains | |
| Convertible Bond Fund | | $ | 23,430,398 | |
| Convertible Plus Fund | | | 213,756 | |
| Intermediate Bond Fund | | | 527,653 | |
Individual shareholders should refer to their Form 1099 or other tax information, which will be mailed in January 2019, to determine the calendar year amounts to be included on their 2018 tax returns. Shareholders should consult their tax advisors.
Renewal of the Investment Advisory Agreement between Review of 15(c) Materials and Approve Continuance of Management Agreement
At an in person meeting held October 24, 2018, the Board of Trustees (the “Board”) including the Trustees who are not “interested persons”, as such term is defined under Section 2(a)(19) of the Investment Company Act of 1940, as amended (the “Independent Trustees”), considered the renewal of the Management Agreements between the Miller Investment Trust and Wellesley Asset Management, Inc. (the “Adviser”) with respect to the Miller Convertible Bond Fund (“Convertible Bond Fund”), Miller Convertible Plus Fund (“Convertible Plus Fund”) and Miller Intermediate Bond Fund (“Intermediate Bond Fund”) (each a “Management Agreement” and collectively the “Management Agreements”). In its consideration of the renewal of each Management Agreement, the Board including the Independent Trustees, did not identify any single factor as all-important or controlling, and the following summary does not detail all the matters considered.
The Board relied upon each Trustee’s own business judgment in determining the material factors to be considered when evaluating the Management Agreements and the weight to be given to each factor. The Board based its conclusions on a comprehensive evaluation of all the information provided and not on any one factor exclusively. Moreover, each Trustee may have afforded different weight to the various factors in reaching his conclusions with respect to the Management Agreements. Matters considered by the Board, including the Independent Trustees, in connection with its approval of each Management Agreement included the following:
Nature, Extent and Quality of Services and Personnel. The Board examined the nature, extent and quality of the services provided by the Adviser to the Funds. The Board also engaged in discussions with the Adviser’s senior management responsible for the overall functioning of each Fund’s investment operations. The Board considered information regarding the Adviser’s efforts in the area of compliance and investment processes. The Board discussed the Adviser’s personnel, and the high level of service provided by them including managing the growth of Fund assets, which among other things requires specialized skill in sourcing sufficient suitable convertible bonds. The Board also discussed the financial strength of the Adviser and concluded that it is satisfied and that the Adviser has delivered a high level of services to the Funds and their shareholders. The Board further concluded that the Adviser’s management team and the Adviser’s overall resources were adequate and that the Adviser had the investment management skills and personnel that are more than capable to perform its duties under each Agreement.
Performance. The Board reviewed and assessed the performance of the Funds.
Convertible Bond Fund. The Board noted that for the one, three and five-year periods ended September 28, 2018, the Convertible Bond Fund had returns of 3.92%, 7.02% and 5.82%, respectively, underperforming the peer group averages of 12.15%, 11.45% and 8.05% for the one, three and five-year periods. Similarly, the Fund underperformed the “Convertibles” Morningstar Category averages of 9.84%, 9.94% and 7.28% for the one, three and five-year periods ended September 28, 2018. The Fund, however, outperformed the Bloomberg Barclays US Aggregate Bond Index for the one-year period since September 30, 2018. The Adviser stated that the Fund was last in its Peer Group in one-year and three-year annualized performance and was outperformed by most funds in its Peer Group in the 5 year annualized performed. It was noted that the Convertible Bond Fund was outperformed by most mutual funds in the Convertible Morningstar Category. The
Adviser believes the Fund’s underperformance in this Category in part was because of its relatively larger positions in convertible bonds issued by companies with small to medium-sized market capitalizations. It was also noted that the Fund was designed to perform well in both up and down markets and over full market cycles, while many peer funds performed relatively better in ascending markets but would be expected to perform relatively poor in descending markets.
Convertible Plus Fund. The Board noted that for the one three-year periods ended September 30, 2018, the Convertible Plus Fund had returns of 5.96% and 10.38%, respectively, underperforming the peer group average of 10.48% for the one-year period and outperforming the peer group average of 10.37% for the three-year period. Similarly, the Fund underperformed the “Convertibles” Morningstar Category average of 9.84% for the one-year period and outperformed the Morningstar Category average of 9.94% for the three-year period ended September 30, 2018. The Fund outperformed the Bloomberg Barclays US Aggregate Bond Index for the one-year period since September 30, 2018. The Board considered that the Adviser’s goal is for the Fund’s total return to out-perform its benchmark indexes over full market cycles, including both ascending and descending markets.
Intermediate Bond Fund. The Board noted that for the one, three-year periods ended September 30, 2018, the Intermediate Bond Fund had returns of 3.41% and 5.33%, respectively, outperforming the peer group averages of (0.11)% and 3.38%. Similarly, the Fund outperformed the Morningstar Category averages of (0.98)% and 3.55% for the one and three-year periods ended September 30, 2018. It ranked second in its peer group and category for the three-year annualized performance. It was noted that the Fund’s 3-year Sharpe ratio was ranked second in its peer group and second best in its category. The Fund outperformed the Bloomberg Barclays US Aggregate Bond Index for the one-year period since September 30, 2018.
With respect to each of the Funds, the Board found that the Adviser continues to not deviate from its strategy to achieve favorable risk-adjusted returns in all market cycles. The Adviser is pleased with the performance of the Funds, and the Board concluded that each Fund’s performance was reasonable, especially in light of one of the longest run-ups in the equity market in history. It was further noted that the Fund generally has higher quality convertible bonds with shorter maturities than m any of the peer funds.
Fees & Expenses. The Board reviewed the fees charged by the Funds, including reviewing the fees compared to the Funds’ respective peer groups and Morningstar Categories. The Board further considered the fact that the Adviser manages separately managed accounts with similar investment strategies and the advisory fees it charges to such accounts.
Convertible Bond Fund. The Board noted that the Convertible Bond Fund’s advisory fee rate of 0.75% was higher than the peer group average of 0.56% and slightly lower than the Morningstar Category average of 0.82%. The Board further noted that the Convertible Bond Fund’s net expense ratio rate of 0.95% was higher than the peer group average of 0.70% but lower than the Morningstar Category average of 1.09%. The Board concluded that the advisory fee and net expense ratio were within an acceptable range of fees for the Fund when compared to peer funds.
Convertible Plus Fund. The Board noted that the Convertible Plus Fund’s advisory fee rate of 2.86% was significantly higher than the peer group average of 0.70% and significantly higher than the Morningstar Category average of 0.82%. The Board further noted that the Convertible Plus Fund’s
net expense ratio rate of 4.00% was significantly higher than the peer group average of 0.87% and significantly higher than the Morningstar Category average of 1.09%. The Board concluded that the advisory fee and net expense ratio were within an acceptable range of fees for the Fund when compared to peer funds.
Intermediate Bond Fund. The Board noted that the Intermediate Bond Fund’s advisory fee rate of 0.95% was higher than both the peer group average of 0.55%and Morningstar Category average of 0.44%. The Board further noted that the Intermediate Bond Fund’s net expense ratio rate of 1.25% was significantly higher than the peer group average of 0.70% and significantly higher than the Morningstar Category average of 0.58%. The Board noted that the Adviser imposed a contractual fee waiver that has lowered Fund’s expense ratio for the contractual fee waiver period. The Board concluded that the advisory fee and net expense ratio were within an acceptable range of fees for the Fund when compared to peer funds.
Economies of Scale. The Board considered whether the Adviser has realized or will realize economies of scale with respect to the management of each Fund. They continued to review the Adviser’s projections for asset growth of each Fund over the next 12 months, and discussed the expense limitation agreement currently in place.
Profitability. The Board considered the expenses of the Adviser, and reviewed the profits realized by the Adviser with respect to each Fund, and took into consideration other benefits to the Adviser. The Board found the profit earned by the Adviser with respect to each Fund to be acceptable and not unreasonable.
Conclusion. Having requested and received such information from the Adviser as the Board believed to be reasonably necessary to evaluate the terms of the Management Agreements, the Board, including all of the Independent Trustees, concluded that the advisory fee for each Fund is fair and reasonable and approved the continuance of the respective Management Agreements and the advisory fees thereunder as in the best interest of each Fund and its shareholders.
| Miller Funds | |
| TRUSTEES AND OFFICERS (Unaudited) | October 31, 2018 |
This chart provides information about the Trustees and Officers who oversee the Fund. Officers elected by the Trustees manage the day-to-day operations of the Fund and execute policies formulated by the Trustees. The term of office of each Trustee listed below will continue indefinitely.
Independent Trustees
Name, Address and Year of
Birth | Position/
Term of
Office* | Principal Occupation
During the Past Five
Years | Number of
Portfolios in Fund
Complex**
Overseen by
Trustee | Other
Directorships
held by Trustee
During the Past
Five Years |
Neal Chorney
1948 | Trustee Since 2007 | Vice President – Real Estate Investing & Property Management, Sunrise Financial LLC (2006 – Present) (commercial and investment real estate lending). | 3 | None |
Daniel Mainzer
1963 | Trustee Since 2007 | Partner, Flanigan, Cotillo & Mainzer, LLP, (2011 – Present). | 3 | None |
Michael Blank
1950 | Trustee Since 2009 | Principal, Braintree Street Realty, LLC (1986-Present) President, Evanteal Properties, LLC (2012-Present); Principal, Jewish National Fund (2012 – Present) | 3 | National Board of Directors, JNF USA (2012- Present) |
| Miller Funds | |
| TRUSTEES AND OFFICERS (Unaudited) | October 31, 2018 |
Interested Trustee and Officers
Name, Address and
Year of Birth | Position/
Term of
Office* | Principal Occupation
During the Past Five Years | Number of
Portfolios in Fund
Complex**
Overseen by
Trustee | Other
Directorships held
by Trustee During
Past Five Years |
Greg Miller***
1949 | Trustee, President, and Treasurer Since 2007 | Chief Executive Officer and Registered Investment Advisor, Wellesley Asset Management, Inc. (1991 – Present) (registered investment advisory firm) Director, New England Investment Properties (September 2012 – December 2016) | 3 | None |
Darlene Murphy
1962 | Treasurer Since 2018; Secretary Since 2007 | President, Wellesley Asset Management, Inc. (1991- Present) (registered investment advisory firm). Director, New England Investment Properties (September 2012 – December 2016) | N/A | N/A |
Michael J. Wagner
1950
80 Arkay Drive
Hauppauge, NY 11788 | Chief Compliance Officer Since 2007 | President (2006 – Present), Northern Lights Compliance Services, LLC (provides CCO services to mutual funds). | N/A | N/A |
| * | The term of office for each Trustee and Officer listed above will continue indefinitely. |
| ** | The term “Fund Complex” refers to the Miller Investment Trust, which as of the date of this SAI, consisted of the three Funds offered in the Prospectus. |
| *** | Greg Miller is an “interested person” of the Trust as that term is defined under the 1940 Act, because of his affiliation with Wellesley Asset Management, Inc. (the Fund’s Advisor). |
The Trust’s Statement of Additional Information includes additional information about the Trustees and is available free of charge, upon request, by calling toll-free at 1-877-441-4434.
PRIVACY notice
| FACTS | WHAT DOES MILLER INVESTMENT TRUST DO WITH YOUR PERSONAL INFORMATION? |
| | |
| Why? | Financial companies choose how they share your personal information. Federal law gives consumers the right to limit some but not all sharing. Federal law also requires us to tell you how we collect, share, and protect your personal information. Please read this notice carefully to understand what we do. |
| | |
| What? | The types of personal information we collect and share depend on the product or service you have with us. This information can include: |
| | |
| | ■ | Social Security number | ■ | Purchase History |
| | | | | |
| | ■ | Assets | ■ | Account Balances |
| | | | | |
| | ■ | Retirement Assets | ■ | Account Transactions |
| | | | | |
| | ■ | Transaction History | ■ | Wire Transfer Instructions |
| | | | | |
| | ■ | Checking Account Information | | |
| | |
| | When you are no longer our customer, we continue to share your information as described in this notice. |
| | |
| How? | All financial companies need to share customers’ personal information to run their everyday business. In the section below, we list the reasons financial companies can share their customers’ personal information; the reasons Miller Investment Trust chooses to share; and whether you can limit this sharing. |
| Reasons we can share your personal information | Does Miller
Investment Trust
share? | Can you limit this sharing? |
For our everyday business purposes – such as to process your transactions, maintain your account(s), respond to court orders and legal investigations, or report to credit bureaus | Yes | No |
For our marketing purposes – to offer our products and services to you | No | We don’t share |
| For joint marketing with other financial companies | No | We don’t share |
For our affiliates’ everyday business purposes – information about your transactions and experiences | No | We don’t share |
For our affiliates’ everyday business purposes – information about your creditworthiness | No | We don’t share |
| For non-affiliates to market to you | No | We don’t share |
| Questions? | Call 1-877-441-4434 |
| Who we are |
| Who is providing this notice? | Miller Investment Trust |
| What we do |
| How does Miller Investment Trust protect my personal information? | To protect your personal information from unauthorized access and use, we use security measures that comply with federal law. These measures include computer safeguards and secured files and buildings. Our service providers are held accountable for adhering to strict policies and procedures to prevent any misuse of your nonpublic personal information. |
| How does Miller Investment Trust collect my personal information? | We collect your personal information, for example, when you ■ Open an account ■ Provide account information ■ Give us your contact information ■ Make deposits or withdrawals from your account ■ Make a wire transfer ■ Tell us where to send the money ■ Tells us who receives the money ■ Show your government-issued ID ■ Show your driver’s license We also collect your personal information from other companies. |
| Why can’t I limit all sharing? | Federal law gives you the right to limit only ■ Sharing for affiliates’ everyday business purposes – information about your creditworthiness ■ Affiliates from using your information to market to you ■ Sharing for non-affiliates to market to you State laws and individual companies may give you additional rights to limit sharing. |
| Definitions |
| Affiliates | Companies related by common ownership or control. They can be financial and nonfinancial companies. ■ Miller Investment Trust does not share with our affiliates. |
| Non-affiliates | Companies not related by common ownership or control. They can be financial and nonfinancial companies ■ Miller Investment Trust does not share with non-affiliates so they can market you. |
| Joint marketing | A formal agreement between nonaffiliated financial companies that together market financial products or services to you. ■ Miller Investment Trust does not jointly market. |
| | | | | |
| MILLER FUNDS |
| |
| | | |
| Advisor | | Wellesley Asset Management, Inc. |
| | | The Wellesley Office Park |
| | | 20 William Street |
| | | Wellesley, MA 02481 |
| | | |
| Distributor | | Northern Lights Distributors, LLC |
| | | 17605 Wright Street |
| | | Omaha, NE 68130 |
| | | |
| Legal Counsel | | Thompson Hine LLP |
| | | 1919 M Street, N.W. – Suite 700 |
| | | Washington, DC 20036 |
| | | |
| Transfer Agent | | Gemini Fund Services, LLC |
| | | 17605 Wright Street |
| | | Omaha, NE 68130 |
| | | |
| Custodian | | Bank of New York Mellon Corp. |
| | | 101 Barclay Street |
| | | New York, NY 10286 |
How to Obtain Proxy Voting Information
Information regarding how the Funds voted proxies relating to portfolio securities during the most recent 12-month period ending June 30th, as well as a description of the policies and procedures that the Funds use to determine how to vote proxies is available without charge, upon request, by calling toll-free 1-877-441-4434 or by referring to the Security and Exchange Commission’s (“SEC”) website at http://www.sec.gov.
How to Obtain 1st and 3rd Fiscal Quarter Portfolio Holdings
The Funds file their complete schedule of portfolio holdings with the SEC for the first and third quarters of each fiscal year on Form N-Q. Form N-Q is available on the SEC’s website at http://www.sec.gov and may be reviewed and copied at the SEC’s Public Reference Room in Washington, DC (1-800-SEC-0330). The information on Form N-Q is available without charge, upon request, by calling 1-877-441-4434.
| Miller Funds ● 17605 Wright St. ● Suite 2 ● Omaha, NE 68130 |
| 1-877-441-4434 |
| |
Item 2. Code of Ethics.
As of the end of the period covered by this report, the registrant has adopted a code of ethics that applies to the registrant's principal executive officer, principal financial officer, principal accounting officer or controller, or persons performing similar functions, regardless of whether these individuals are employed by the registrant or a third party.
Item 3. Audit Committee Financial Expert.
The Board has determined, based on questionnaires completed by the Audit Committee members, that no one on the committee satisfies the definition of "financial expert;" however the Board also determined that collectively the Audit Committee members have the requisite knowledge and experience to perform the Audit Committee duties.
Item 4. Principal Accountant Fees and Services.
FY 2018 $105,000
FY 2017 $ 93,000
FY 2018 $ None
FY 2017 $ None
Tax Fees
FY 2018 $ 40,233
FY 2017 $ 18,000
(d) All Other Fees
FY 2018 $ 0
FY 2017 $ 0
The above "Audit-Related Fees" represent fees billed for assurance and related services that are reasonably related to the performance of the registrant audit or the review of the registrant's financial statements and that are not reported under Audit Fees.
The above “Tax Fees” were billed for professional services rendered for tax compliance and tax return preparation.
| (e) | (1) Audit Committee’s Pre-Approval Policies |
The registrant’s Audit Committee is required to pre-approve all audit services and, when appropriate, any non-audit services (including audit-related, tax and all other services) to the registrant. The registrant’s Audit Committee is also required to pre-approve, when appropriate, any non-audit services (including audit-related, tax and all other services) to its adviser, or any entity controlling, controlled by or under common control with the adviser that provides ongoing services to the registrant to the extent that the services are determined to have a direct impact on the operations or financial reporting of the registrant. Services are reviewed on an engagement by engagement basis by the audit committee.
| (2) | Percentages of 2018 Services Approved by the Audit Committee |
| | Registrant | Adviser |
| | | |
| Audit-Related Fees: | 0% | 0% |
| Tax Fees: | 0% | 0% |
| All Other Fees: | 0% | 0% |
(f) During audit of registrant's financial statements for the most recent fiscal year, less than 50 percent of the hours expended on the principal accountant's engagement were attributed to work performed by persons other than the principal accountant's full-time, permanent employees.
(g) The aggregate non-audit fees billed by the registrant's accountant for services rendered to the registrant, and rendered to the registrant's investment adviser (not including any sub-adviser whose role is primarily portfolio management and is subcontracted with or overseen by another investment adviser), and any entity controlling, controlled by, or under common control with the adviser that provides ongoing services to the registrant:
| | Registrant | Adviser |
| | | |
| FY 2018 | $ None | $ None |
| FY 2017 | $ None | $ None |
(h) Not applicable. All non-audit services to the registrant were pre-approved by the Audit Committee for FY 2017.
Item 5. Audit Committee of Listed Companies. Not applicable.
Item 6. (a) Schedule of Investments. Schedule of investments in securities of unaffiliated issuers is included under Item 1.
(b) Not Applicable
Item 7. Disclosure of Proxy Voting Policies and Procedures for Closed-End Management Investment Companies. Not applicable.
Item 8. Portfolio Managers of Closed-End Management Investment Companies. Not applicable.
Item 9. Purchases of Equity Securities by Closed-End Management Investment Companies. Not applicable.
Item 10. Submission of Matters to a Vote of Security Holders. There were no material changes to the procedures by which shareholders may recommend nominees to the registrant's Board of Trustees.
Item 11. Controls and Procedures.
(a) The President and Treasurer has concluded that the registrant's disclosure controls and procedures (as defined in Rule 30a-3(c) under the Investment Company Act of 1940) provide reasonable assurances that material information relating to the registrant is made known to them by the appropriate persons, based on their evaluation of these controls and procedures as of a date within 90 days of the filing date of this report.
(b) There were no significant changes in the registrant’s internal control over financial reporting that occurred during the registrant’s last fiscal half-year that have materially affected, or are reasonably likely to materially affect, the registrant’s internal control over financial reporting.
Item 12. Exhibits.
(a)(1) Sarbanes Oxley Code of Ethics filed herewith.
(a)(2) Certifications required by Section 302 of the Sarbanes-Oxley Act of 2002 (and Item 11(a)(2) of Form N-CSR) are filed herewith.
(a)(3) Not applicable for open-end investment companies.
(b) Certifications required by Section 906 of the Sarbanes-Oxley Act of 2002 (and Item 11(b) of Form N-CSR) are filed herewith.
SIGNATURES
Pursuant to the requirements of the Securities Exchange Act of 1934 and the Investment Company Act of 1940, the registrant has duly caused this report to be signed on its behalf by the undersigned, thereunto duly authorized.
(Registrant) Miller Investment Trust
By (Signature and Title)
/s/ Greg Miller
Greg Miller, President
Date 12/26/18
Pursuant to the requirements of the Securities Exchange Act of 1934 and the Investment Company Act of 1940, this report has been signed below by the following person on behalf of the registrant and in the capacities and on the dates indicated.
By (Signature and Title)
/s/Greg Miller
Greg Miller, President
Date 12/26/18
By (Signature and Title)
/s/Darlene Murphy
Darlene Murphy, Treasurer
Date 12/26/18