UNITED STATES
SECURITIES AND EXCHANGE COMMISSION
Washington, D.C. 20549
FORM N-CSR
CERTIFIED SHAREHOLDER REPORT OF REGISTERED
MANAGEMENT INVESTMENT COMPANIES
Investment Company Act file number:
811-22175
ALPS ETF TRUST
(Exact name of registrant as specified in charter)
1290 Broadway, Suite 1100, Denver, Colorado 80203
(Address of principal executive offices) (Zip code)
Andrea E. Kuchli, Esq., Assistant Secretary
ALPS ETF Trust
1290 Broadway, Suite 1100
Denver, Colorado 80203
(Name and address of agent for service)
Registrant’s Telephone Number, including Area Code: (303) 623-2577
Date of fiscal year end: November 30
Date of reporting period: December 1, 2016 – May 31, 2017
Item 1. Report to Stockholders.
| Performance Overview | |
| Alerian MLP ETF | 1 |
| Alerian Energy Infrastructure ETF | 4 |
| Disclosure of Fund Expenses | 7 |
| Financial Statements | |
| Alerian MLP ETF | |
| Schedule of Investments | 8 |
| Statement of Assets and Liabilities | 9 |
| Statement of Operations | 10 |
| Statements of Changes in Net Assets | 11 |
| Financial Highlights | 12 |
| Alerian Energy Infrastructure ETF | |
| Schedule of Investments | 13 |
| Statement of Assets and Liabilities | 15 |
| Statement of Operations | 16 |
| Statements of Changes in Net Assets | 17 |
| Financial Highlights | 18 |
| Notes to Financial Statements | 19 |
| Additional Information | 29 |
alpsfunds.com
Alerian MLP ETF
| Performance Overview | May 31, 2017 (Unaudited) |
INVESTMENT OBJECTIVE
The Alerian MLP ETF (the “Fund” or “AMLP”) seeks investment results that correspond (before fees and expenses) generally to the price and yield performance of its underlying index, the Alerian MLP Infrastructure Index (the “Underlying Index” or “AMZI”). The Shares of the Fund are listed and trade on the New York Stock Exchange (“NYSE”) Arca under the ticker symbol AMLP. The Fund generally will invest in all of the securities that comprise the Index in proportion to their weightings in the Underlying Index.
The Underlying Index is a rules based, modified capitalization weighted, float-adjusted index intended to give investors a means of tracking the overall performance of the United States energy infrastructure Master Limited Partnership (“MLP”) asset class. The Underlying Index is comprised of energy infrastructure MLPs that earn a majority of their cash flow from the transportation, storage, and processing of energy commodities.
PERFORMANCE OVERVIEW
During the six-month period of December 1, 2016 to May 31, 2017, the Fund delivered a total return of 0.75% (0.83% NAV). This compares to the Fund’s Underlying Index, which fell -1.64% on a price return but returned 1.67% on a total return basis. The difference in the performance between the AMZI and AMLP is primarily attributable to the Fund’s operating expenses and the tax impact of the Fund’s C corporation structure.
Top performers in the AMZI during the period include Antero Midstream Partners (AM) and ONEOK Partners (OKS), each generating at least 17% in price return. Laggards during the period include Enbridge Energy Partners (EEP) and NGL Energy Partners (NGL) each falling over 26%.
Rice Midstream Partners (RMP) was added to the index and Energy Transfer Partners (ETP) was removed due to its merger with Sunoco Logistics Partners (SXL) during the period. After the merger close, Sunoco Logistics changed its name and ticker to Energy Transfer Partners and ETP.
During the first calendar quarter of 2017, 15 of the 26 constituents in the AMZI increased their distribution, 9 constituents maintained their distribution, and 2 names decreased their distribution.
Energy MLPs rallied from December through January, largely as a function of the new administration and its pro-energy stance. Expedited approvals for the Dakota Access Pipeline and Keystone XL projects resulted in energy infrastructure MLPs rallying further. However, as oil prices began to decline from mid-$50/barrel to sub-$50/barrel in March, energy MLP equity performance became sluggish, mirroring the broader selloff in the energy sector. During April and May, oil prices recovered, only to fall again below the $50/barrel mark; this pricing volatility has continued to impact the performance of energy MLPs.
After a year-long hiatus, energy MLPs began announcing new infrastructure projects in areas of high production growth, namely the Permian and the SCOOP/STACK. In the Permian, oil production increased over 70% even during the commodity downturn. During the first quarter, MLPs proposed several newbuild and expansion crude oil takeaway projects, both to the Gulf Coast and to Cushing, Oklahoma. While the Permian is traditionally known as an oil play, oftentimes natural gas comes with the territory. Natural gas output has increased over one billion cubic feet per day since May 2016. During the period, MLPs also proposed a handful of natural gas takeaway solutions, some to the Gulf Coast and others further south to Mexico. Rig counts in Oklahoma have more than doubled in the past year. As a result, MLPs have begun announcing several large capacity natural gas takeaway projects from the SCOOP and STACK natural gas plays in Oklahoma. Such project announcements prove to be positives signs for the space. Execution will be the key.
The direction and magnitude of change in short-term commodity prices still remains unknown. In the meantime, energy infrastructure MLPs can only focus on what is within their control—that is, improving balance sheets, project execution, and focusing on growth opportunities. Over the long-term, we believe that fundamentals for energy infrastructure MLPs to support the growing supply of domestic energy resources remains intact.
Alerian MLP ETF
| Performance Overview | May 31, 2017 (Unaudited) |
Performance (as of May 31, 2017)
| | 6 Months | 1 Year | 3 Year | 5 Year | Since Inception^ |
| Alerian MLP ETF – NAV | 0.83% | 5.27% | -6.08% | 1.67% | 3.58% |
| Alerian MLP ETF – Market Price* | 0.75% | 5.53% | -6.04% | 1.68% | 3.59% |
| Alerian MLP Infrastructure Index | 1.67% | 7.37% | -7.96% | 3.53% | 6.42% |
S&P 500® Total Return Index | 10.81% | 17.47% | 10.13% | 15.42% | 15.48% |
Total Expense Ratio (per the current prospectus) 1.42%.
Performance data quoted represents past performance. Past performance does not guarantee future results. The table does not reflect the deduction of taxes that a shareholder would pay on Fund distributions or the redemption of Fund shares. Investment return and principal value of an investment will fluctuate so that an investor’s shares, when sold or redeemed, may be worth more or less than the original cost. Current performance data may be higher or lower than actual data quoted. For the most current month-end performance data please visit www.alpsfunds.com or call 1.877.398.8461. The Fund accrues deferred income taxes for future tax liabilities associated with the portion of MLP distributions considered to be a tax-deferred return of capital and for any net operating gains as well as capital appreciation of its investment. This deferred tax liability is reflected in the daily NAV and as a result the fund’s after-tax performance could differ significantly from the underlying assets even if the pre-tax performance is closely tracked.
NAV is an exchange-traded fund’s per-share value. The per-share dollar amount of the Fund is derived by dividing the total value of all the securities in its portfolio, less any liabilities, by the number of Fund shares outstanding. Market Price is the price at which a share can currently be traded in the market. Information detailing the number of days the Market Price of the Fund was greater than the Fund’s NAV and the number of days it was less than the Fund’s NAV can be obtained at www.alpsfunds.com.
| ^ | The Fund commenced Investment Operations on August 24, 2010 with an Inception Date, the first day of trading on the NYSE ARCA, of August 25, 2010. |
| * | Market Price is based on the midpoint of the bid-ask spread at 4 p.m. ET and does not represent the returns an investor would receive if shares were traded at other times. |
The Alerian MLP Infrastructure Index is comprised of 25 midstream energy Master Limited Partnerships and provides investors with an unbiased benchmark for the infrastructure component of this emerging asset class.
S&P 500® Total Return Index is the Standard & Poor’s composite index of 500 stocks, a widely recognized, unmanaged index of common stock prices. Total return assumes reinvestment of any dividends and distributions realized during a given time period.
The index is not actively managed and does not reflect any deductions for fees, expenses or taxes. One cannot invest directly in an index. Index performance does not reflect fund performance.
The Alerian MLP ETF is not suitable for all investors. Investments in the Fund are subject to investment risks, including possible loss of the principal amount invested.
ALPS Portfolio Solutions Distributor, Inc., a FINRA member, is the distributor for the Fund.
Alerian MLP ETF
| Performance Overview | May 31, 2017 (Unaudited) |
Top 10 Holdings* (as of May 31, 2017)
| Enterprise Products Partners LP | 10.31% |
| Magellan Midstream Partners LP | 10.23% |
| Energy Transfer Partners LP | 9.82% |
| Plains All American Pipeline LP | 7.90% |
| Williams Partners LP | 7.13% |
| Buckeye Partners LP | 6.44% |
| MPLX LP | 6.40% |
| ONEOK Partners LP | 5.60% |
| Western Gas Partners LP | 3.58% |
| EQT Midstream Partners LP | 3.11% |
| Total% of Top 10 Holdings | 70.52% |
Future holdings are subject to change.
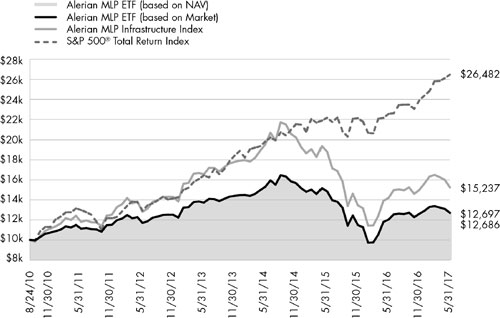
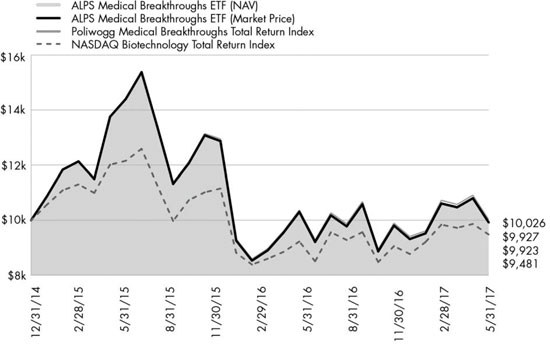
Growth of $10,000 (as of May 31, 2017)
Comparison of change in value of a $10,000 investment in the Fund and the Indexes
The chart above represents historical performance of a hypothetical investment of $10,000 in the Fund over the life of the Fund. Past performance does not guarantee future results. This chart does not reflect the deduction of taxes that a shareholder would pay on Fund distributions or the redemption of Fund shares.
Alerian Energy Infrastructure ETF
| Performance Overview | May 31, 2017 (Unaudited) |
INVESTMENT OBJECTIVE
The Alerian Energy Infrastructure ETF (the “Fund” or “ENFR”) seeks investment results that correspond (before fees and expenses) generally to the price and yield performance of its underlying index, the Alerian Energy Infrastructure Index (the “Underlying Index” or “AMEI”). As a secondary objective, the Fund seeks to provide total return through income and capital appreciation.
The Underlying Index is a composite of North American energy infrastructure companies engaged in the pipeline transportation, storage, and processing of energy commodities (also known as “midstream energy businesses”). Currently, each constituent is assigned to one of four categories: (i) U.S. Energy Infrastructure Master Limited Partnerships (“MLPs”) (ii) U.S. General Partners, (iii) U.S. Energy Infrastructure Companies, and (iv) Canadian Energy Infrastructure Companies. Each category is assigned an index weight of 25%.
PERFORMANCE OVERVIEW
During the six-month period of December 1, 2016 to May 31, 2017, the Fund delivered a total return of 0.96% (1.13% NAV). This compares to the Fund’s Underlying Index, which fell -0.81% on a price return and but returned 1.62% on a total return basis.
During the period, Antero Midstream Partners (AM) was added during a quarterly rebalancing. In addition, Spectra Energy (SE) was removed during a special rebalancing due to its merger with Enbridge Energy (ENB).
In December and January, energy infrastructure companies rallied, largely as a function of the new administration and its pro-energy stance. Expedited approvals for the Dakota Access Pipeline and Keystone XL projects resulted in energy infrastructure companies rallying further. However, as oil prices began to decline from mid-$50/barrel to sub-$50/barrel in March, energy infrastructure equity performance became sluggish, mirroring the broader selloff in the energy sector. During April and May, oil prices recovered, only to fall again below the $50/barrel mark; this pricing volatility has continued to impact the performance of energy infrastructure companies.
Volatility equals uncertainty, and uncertainty is the enemy of premium valuations. If oil averages $50 but swings wildly, investors are likely to remain skittish. On the other hand, stability at $50 or higher will likely push equity prices higher. Investors appear to remain focused on the significant amount of crude sitting in storage tanks, the large inventory of drilled uncompleted wells, uncertainty around global demand, and continued innovation by US shale producers in the Permian and SCOOP/STACK and, consequently, lower breakeven prices. While we do not believe oil will retest the lows of 2016, the combination of reserves, demand concerns, and efficiency is likely to put a ceiling on any meaningful near-term improvement in prices.
Despite the volatility in commodity prices, total North American production has continued to increase, largely as a function of productivity gains. Energy infrastructure companies are expected to continue building and operating the necessary infrastructure to connect the wellhead to the end user. We believe that technological advances in upstream are likely to continue, thereby lowering breakeven costs for producers and indirectly providing volume and cash flow support for fee-based midstream assets.
Alerian Energy Infrastructure ETF
| Performance Overview | May 31, 2017 (Unaudited) |
Performance (as of May 31, 2017)
| | 6 Months | 1 Year | 3 Year | Since Inception^ |
| Alerian Energy Infrastructure ETF - NAV | 1.13% | 15.15% | -4.15% | 0.25% |
| Alerian Energy Infrastructure ETF - Market Price* | 0.96% | 15.20% | -4.16% | 0.26% |
| Alerian Energy Infrastructure Index | 1.62% | 16.20% | -3.37% | 1.08% |
S&P 500® Total Return Index | 10.81% | 17.47% | 10.13% | 11.60% |
Total Expense Ratio (per the current prospectus) 0.65%.
Performance data quoted represents past performance. Past performance does not guarantee future results. The table does not reflect the deduction of taxes that a shareholder would pay on Fund distributions or the redemption of Fund shares. Investment return and principal value of an investment will fluctuate so that an investor’s shares, when sold or redeemed, may be worth more or less than the original cost. Current performance data may be higher or lower than actual data quoted. For most current month-end performance data please visit www.alpsfunds.com or call 1.866.675.2639.
NAV is an exchange-traded fund’s per-share value. The per-share dollar amount of the Fund is derived by dividing the total value of all the securities in its portfolio, less any liabilities, by the number of Fund shares outstanding. Market Price is the price at which a share can currently be traded in the market. Information detailing the number of days the Market Price of the Fund was greater than the Fund’s NAV and the number of days it was less than the Fund’s NAV can be obtained at www.alpsfunds.com.
| ^ | The Fund commenced Investment Operations on November 1, 2013. |
| * | Market Price is based on the midpoint of the bid-ask spread at 4 p.m. ET and does not represent the returns an investor would receive if shares were traded at other times. |
The Alerian Energy Infrastructure Index is comprised of 30 equity securities of issuers headquartered or incorporated in the United States and Canada that engage in the transportation, storage, and processing of energy commodities.
S&P 500® Total Return Index: the Standard & Poor’s composite index of 500 stocks, a widely recognized, unmanaged index of common stock prices. Total return assumes reinvestment of any dividends and distributions realized during a given time period.
The index is not actively managed and does not reflect any deductions for fees, expenses or taxes. One cannot invest directly in an index. Index performance does not reflect fund performance.
The Alerian Energy Infrastructure ETF is not suitable for all investors. Investments in the Fund are subject to investment risks, including possible loss of the principal amount invested.
ALPS Portfolio Solutions Distributor, Inc., a FINRA member, is the distributor for the Fund.
Alerian Energy Infrastructure ETF
| Performance Overview | May 31, 2017 (Unaudited) |
Top 10 Holdings* (as of May 31, 2017)
| Dominion Resources, Inc. | 5.52% |
| The Williams Cos., Inc. | 5.36% |
| TransCanada Corp. | 5.35% |
| Pembina Pipeline Corp. | 5.24% |
| CenterPoint Energy, Inc. | 5.15% |
| Enterprise Products Partners LP | 5.08% |
| Magellan Midstream Partners LP | 4.97% |
| ONEOK, Inc. | 4.88% |
| Enbridge, Inc. | 4.84% |
| Energy Transfer Equity LP | 4.80% |
| Total% of Top 10 Holdings | 51.19% |
Future holdings are subject to change.
Growth of $10,000 (as of May 31, 2017)
Comparison of change in value of a $10,000 investment in the Fund and the Indexes
The chart above represents historical performance of a hypothetical investment of $10,000 in the Fund over the life of the Fund. Past performance does not guarantee future results. This chart does not reflect the deduction of taxes that a shareholder would pay on Fund distributions or the redemption of Fund shares.
Alerian Exchange Traded Funds
| Disclosure of Fund Expenses | May 31, 2017 (Unaudited) |
Shareholder Expense Example: As a shareholder of a Fund, you incur two types of costs: (1) transaction costs which may include creation and redemption fees or brokerage charges, and (2) ongoing costs, including management fees and other Fund expenses. These examples are intended to help you understand your ongoing costs (in dollars) of investing in the Fund and to compare these costs with the ongoing costs of investing in other funds. It is based on an investment of $1,000 invested at the beginning of the (six month) period and held through May 31, 2017.
Actual Return: The first line of the table provides information about actual account values and actual expenses. You may use the information in this line, together with the amount you invested, to estimate the expenses that you incurred over the period. Simply divide your account value by $1,000 (for example, an $8,600 account value divided by $1,000 = 8.6), then multiply the result by the number in the first line under the heading entitled “Expenses Paid During Period” to estimate the expenses attributable to your investment during this period.
Hypothetical 5% Return: The second line of the table provides information about hypothetical account values and hypothetical expenses based on the Fund’s actual expense ratio and an assumed rate of return of 5% per year before expenses, which is not the Fund’s actual return. The hypothetical account values and expenses may not be used to estimate the actual ending account balance or expenses you paid for the period. You may use this information to compare ongoing costs of investing in the Fund and other funds. To do so, compare this 5% hypothetical example with the 5% hypothetical examples that appear in the shareholder reports of other funds.
The expenses shown in the table are meant to highlight ongoing Fund costs only and do not reflect any transaction costs, such as creation and redemption fees or brokerage charges. Therefore, the second line is useful in comparing ongoing costs only, and will not help you deter-mine the relative total costs of owning different funds. In addition, if these costs were included, your costs would have been higher.
| | Beginning Account Value 12/1/16 | Ending Account Value 5/31/17 | Expense Ratio(a) | Expenses Paid During Period 12/1/16 - 5/31/17(b) |
| Alerian MLP ETF | | | | |
| Actual | $1,000.00 | $1,008.30 | 0.85% | $4.26 |
| Hypothetical (5% return before expenses) | $1,000.00 | $1,020.69 | 0.85% | $4.28 |
| | | | | |
| Alerian Energy Infrastructure ETF | | | | |
| Actual | $1,000.00 | $1,011.30 | 0.65% | $3.26 |
| Hypothetical (5% return before expenses) | $1,000.00 | $1,021.69 | 0.65% | $3.28 |
(a) | Annualized, based on the Fund's most recent fiscal half-year expenses. |
(b) | Expenses are equal to the Fund's annualized expense ratio multiplied by the average account value over the period, multiplied by the number of days in the most recent fiscal half year (182), divided by 365. |
Alerian MLP ETF
| Schedule of Investments | May 31, 2017 (Unaudited) |
| Security Description | | | | | | Shares | | | Value | |
| Master Limited Partnerships (100.71%) | | | | | | | | | | |
| Gathering & Processing (30.27%) | | | | | | | | | | |
| Antero Midstream Partners LP | | | | | | | 5,711,120 | | | $ | 197,833,197 | |
| DCP Midstream LP | | | | | | | 6,747,571 | | | | 227,932,948 | |
| EnLink Midstream Partners LP | | | | | | | 11,844,479 | | | | 201,000,809 | |
MPLX LP(a) | | | | | | | 20,064,909 | | | | 663,145,243 | |
ONEOK Partners LP(a) | | | | | | | 11,860,720 | | | | 580,107,815 | |
Rice Midstream Partners LP(a) | | | | | | | 5,449,081 | | | | 133,556,975 | |
| Western Gas Partners LP | | | | | | | 6,660,918 | | | | 371,212,960 | |
| Williams Partners LP | | | | | | | 18,874,914 | | | | 739,330,381 | |
| Total Gathering & Processing | | | | | | | | | | | 3,114,120,328 | |
| | | | | | | | | | | | | |
| Pipeline Transportation | Natural Gas (29.59%) | | | | | | | | | | | | |
| Boardwalk Pipeline Partners LP | | | | | | | 9,282,234 | | | | 167,729,968 | |
| Energy Transfer Partners LP | | | | | | | 46,801,716 | | | | 1,018,405,340 | |
| Enterprise Products Partners LP | | | | | | | 39,844,490 | | | | 1,068,230,777 | |
EQT Midstream Partners LP(a) | | | | | | | 4,371,511 | | | | 322,442,651 | |
| Spectra Energy Partners LP | | | | | | | 5,832,226 | | | | 251,602,230 | |
TC PipeLines LP(a) | | | | | | | 3,825,251 | | | | 215,246,874 | |
| Total Pipeline Transportation | Natural Gas | | | | | | | | | | | 3,043,657,840 | |
| | | | | | | | | | | | | |
| Pipeline Transportation | Petroleum (40.85%) | | | | | | | | | | | | |
Buckeye Partners LP(a) | | | | | | | 10,437,429 | | | | 667,995,456 | |
Enbridge Energy Partners LP(a) | | | | | | | 16,078,681 | | | | 266,262,957 | |
Genesis Energy LP(a) | | | | | | | 7,668,436 | | | | 239,178,519 | |
Magellan Midstream Partners LP(a) | | | | | | | 14,612,383 | | | | 1,060,712,882 | |
NGL Energy Partners LP(a) | | | | | | | 8,183,748 | | | | 111,298,973 | |
NuStar Energy LP(a) | | | | | | | 4,856,897 | | | | 221,377,365 | |
| Phillips 66 Partners LP | | | | | | | 3,200,723 | | | | 158,499,803 | |
| Plains All American Pipeline LP | | | | | | | 30,934,200 | | | | 819,137,616 | |
| Shell Midstream Partners LP | | | | | | | 6,581,883 | | | | 196,337,570 | |
| Tallgrass Energy Partners LP | | | | | | | 3,425,744 | | | | 169,916,903 | |
Tesoro Logistics LP(a) | | | | | | | 5,500,984 | | | | 291,442,132 | |
| Total Pipeline Transportation | Petroleum | | | | | | | | | | | 4,202,160,176 | |
| | | | | | | | | | | | | |
| Total Master Limited Partnerships | | | | | | | | | | | | |
| (Cost $9,440,869,619) | | | | | | | | | | | 10,359,938,344 | |
| | | 7 Day Yield | | | Shares | | | Value | |
| Short Term Investments (0.05%) | | | | | | | | | |
| State Street Institutional Treasury Plus Money Market Fund | | | 0.680 | % | | | 5,584,346 | | | | 5,584,346 | |
| | | | | | | | | | | | | |
| Total Short Term Investments | | | | | | | | | | | | |
| (Cost $5,584,346) | | | | | | | | | | | 5,584,346 | |
| | | | | | | | | | | | | |
| Total Investments (100.76%) | | | | | | | | | | | | |
| (Cost $9,446,453,965) | | | | | | | | | | $ | 10,365,522,690 | |
| | | | | | | | | | | | | |
| Liabilities in Excess of Other Assets (-0.76%) | | | | | | | | | | | (78,146,354 | ) |
| | | | | | | | | | | | | |
| Net Assets (100.00%) | | | | | | | | | | $ | 10,287,376,336 | |
| (a) | Affiliated Company. See Note 8 in Notes to Financial Statements. |
See Notes to Financial Statements.
Alerian MLP ETF
| Statement of Assets and Liabilities | May 31, 2017 (Unaudited) |
| ASSETS: | | | |
| Investments, at value | | $ | 5,592,754,848 | |
| Investments in affiliates, at value | | | 4,772,767,842 | |
| Receivable for investments sold | | | 66,692,689 | |
| Receivable for fund shares sold | | | 7,214,158 | |
| Interest receivable | | | 12,672 | |
| Income tax receivable | | | 9,482 | |
| Franchise tax receivable | | | 108,666 | |
| Total Assets | | | 10,439,560,357 | |
| | | | | |
| LIABILITIES: | | | | |
| Payable for investments purchased | | | 7,170,042 | |
| Payable for shares redeemed | | | 66,885,334 | |
| Deferred tax liability | | | 70,534,508 | |
| Payable to adviser | | | 7,594,137 | |
| Total Liabilities | | | 152,184,021 | |
| NET ASSETS | | $ | 10,287,376,336 | |
| | | | | |
| NET ASSETS CONSIST OF: | | | | |
| Paid-in capital | | $ | 10,500,604,626 | |
| Accumulated net investment loss, net of deferred income taxes | | | (231,913,012 | ) |
| Accumulated net realized loss on investments, net of deferred income taxes | | | (593,623,273 | ) |
| Net unrealized appreciation on investments, net of deferred income taxes | | | 612,307,995 | |
| NET ASSETS | | $ | 10,287,376,336 | |
| | | | | |
| INVESTMENTS, AT COST | | $ | 5,213,429,380 | |
| INVESTMENTS IN AFFILIATES, AT COST | | | 4,233,024,585 | |
| | | | | |
| PRICING OF SHARES | | | | |
| Net Assets | | $ | 10,287,376,336 | |
| Shares of beneficial interest outstanding (Unlimited number of shares authorized, par value $0.01 per share) | | | 857,812,100 | |
| Net Asset Value, offering and redemption price per share | | $ | 11.99 | |
See Notes to Financial Statements.
Alerian MLP ETF
| Statement of Operations | For the Six Months Ended May 31, 2017 (Unaudited) |
| INVESTMENT INCOME: | | | |
| Distributions from master limited partnerships | | $ | 359,863,637 | |
| Less return of capital distributions | | | (359,863,637 | ) |
| Total Investment Income | | | – | |
| | | | | |
| EXPENSES: | | | | |
| Investment adviser fee | | | 43,874,611 | |
| Total Expenses | | | 43,874,611 | |
| NET INVESTMENT LOSS, BEFORE INCOME TAXES | | | (43,874,611 | ) |
| Deferred income tax benefit | | | 19,956,323 | |
| NET INVESTMENT LOSS | | | (23,918,288 | ) |
| | | | | |
| REALIZED AND UNREALIZED GAIN/(LOSS): | | | | |
| Net realized loss on investments, before income taxes | | | (5,284,248 | ) |
| Net realized gain on affiliated investments, before income taxes | | | 35,813,387 | |
| Deferred income tax expense | | | (3,217,344 | ) |
| Net realized gain | | | 27,311,795 | |
| Net change in unrealized appreciation on investments, before income taxes | | | 82,450,671 | |
| Deferred income tax expense | | | (42,282,808 | ) |
| Net change in unrealized appreciation | | | 40,167,863 | |
| NET REALIZED AND UNREALIZED GAIN | | | 67,479,658 | |
| NET INCREASE IN NET ASSETS RESULTING FROM OPERATIONS | | $ | 43,561,370 | |
See Notes to Financial Statements.
Alerian MLP ETF
Statements of Changes in Net Assets
| | | For the Six Months Ended May 31, 2017 (Unaudited) | | | For the Year Ended November 30, 2016 | |
| OPERATIONS: | | | | | | |
| Net investment income/(loss) | | $ | (23,918,288 | ) | | $ | 28,382,549 | |
| Net realized gain/(loss) | | | 27,311,795 | | | | (458,105,486 | ) |
| Net change in unrealized appreciation | | | 40,167,863 | | | | 1,264,630,644 | |
| Net increase in net assets resulting from operations | | | 43,561,370 | | | | 834,907,707 | |
| | | | | | | | | |
| DISTRIBUTIONS TO SHAREHOLDERS: | | | | | | | | |
| From tax return of capital | | | (366,606,324 | ) | | | (689,407,280 | ) |
| Total distributions | | | (366,606,324 | ) | | | (689,407,280 | ) |
| | | | | | | | | |
| CAPITAL SHARE TRANSACTIONS: | | | | | | | | |
| Proceeds from sale of shares | | | 1,547,727,242 | | | | 3,159,977,900 | |
| Cost of shares redeemed | | | (315,325,140 | ) | | | (1,131,213,513 | ) |
| Net increase from share transactions | | | 1,232,402,102 | | | | 2,028,764,387 | |
| | | | | | | | | |
| Net increase in net assets | | | 909,357,148 | | | | 2,174,264,814 | |
| | | | | | | | | |
| NET ASSETS: | | | | | | | | |
| Beginning of period | | | 9,378,019,188 | | | | 7,203,754,374 | |
| End of period * | | $ | 10,287,376,336 | | | $ | 9,378,019,188 | |
| *Including accumulated net investment loss, net of deferred income taxes of: | | $ | (231,913,012 | ) | | $ | (207,994,724 | ) |
| | | | | | | | | |
| OTHER INFORMATION: | | | | | | | | |
| SHARE TRANSACTIONS: | | | | | | | | |
| Beginning shares | | | 761,612,100 | | | | 588,062,100 | |
| Shares sold | | | 121,450,000 | | | | 271,600,000 | |
| Shares redeemed | | | (25,250,000 | ) | | | (98,050,000 | ) |
| Shares outstanding, end of year | | | 857,812,100 | | | | 761,612,100 | |
See Notes to Financial Statements.
Alerian MLP ETF
| Financial Highlights | For a Share Outstanding Throughout the Periods Presented |
| | | For the Six Months Ended May 31, 2017 (Unaudited) | | | For the Year Ended November 30, 2016 | | | For the Year Ended November 30, 2015 | | | For the Year Ended November 30, 2014 | | | For the Year Ended November 30, 2013 | | | For the Year Ended November 30, 2012 | |
| NET ASSET VALUE, BEGINNING OF PERIOD | | $ | 12.31 | | | $ | 12.25 | | | $ | 18.10 | | | $ | 17.69 | | | $ | 16.32 | | | $ | 15.97 | |
| | | | | | | | | | | | | | | | | | | | | | | | | |
| INCOME/(LOSS) FROM OPERATIONS: | | | | | | | | | | | | | | | | | | | | | | | | |
Net investment income/(loss)(a) | | | (0.03 | ) | | | 0.04 | | | | (0.13 | ) | | | (0.16 | ) | | | (0.09 | ) | | | (0.09 | ) |
| Net realized and unrealized gain/(loss) on investments | | | 0.15 | | | | 1.04 | | | | (4.53 | ) | | | 1.70 | | | | 2.53 | | | | 1.44 | |
| Total from investment operations | | | 0.12 | | | | 1.08 | | | | (4.66 | ) | | | 1.54 | | | | 2.44 | | | | 1.35 | |
| | | | | | | | | | | | | | | | | | | | | | | | | |
| DISTRIBUTIONS: | | | | | | | | | | | | | | | | | | | | | | | | |
| From net realized gains | | | – | | | | – | | | | – | | | | (0.73 | ) | | | – | | | | (0.00 | )(a)(b) |
| From tax return of capital | | | (0.44 | ) | | | (1.02 | ) | | | (1.19 | ) | | | (0.40 | ) | | | (1.07 | ) | | | (1.00 | ) |
| Total distributions | | | (0.44 | ) | | | (1.02 | ) | | | (1.19 | ) | | | (1.13 | ) | | | (1.07 | ) | | | (1.00 | ) |
| | | | | | | | | | | | | | | | | | | | | | | | | |
| NET INCREASE/(DECREASE) IN NET ASSET VALUE | | | (0.32 | ) | | | 0.06 | | | | (5.85 | ) | | | 0.41 | | | | 1.37 | | | | 0.35 | |
| NET ASSET VALUE, END OF PERIOD | | $ | 11.99 | | | $ | 12.31 | | | $ | 12.25 | | | $ | 18.10 | | | $ | 17.69 | | | $ | 16.32 | |
TOTAL RETURN(c) | | | 0.83 | % | | | 9.76 | % | | | (26.84 | )% | | | 8.82 | % | | | 15.16 | % | | | 8.62 | % |
| | | | | | | | | | | | | | | | | | | | | | | | | |
| RATIOS/SUPPLEMENTAL DATA: | | | | | | | | | | | | | | | | | | | | | | | | |
| Net assets, end of period (000s) | | $ | 10,287,376 | | | $ | 9,378,019 | | | $ | 7,203,754 | | | $ | 9,349,001 | | | $ | 7,384,685 | | | $ | 4,466,815 | |
| | | | | | | | | | | | | | | | | | | | | | | | | |
| RATIO TO AVERAGE NET ASSETS: | | | | | | | | | | | | | | | | | | | | | | | | |
| Expenses (excluding net current and deferred tax expenses/benefits and franchise tax expense) | | | 0.85 | %(d) | | | 0.85 | % | | | 0.85 | % | | | 0.85 | % | | | 0.85 | % | | | 0.85 | % |
Expenses (including net current and deferred tax expenses/benefits)(e) | | | 1.34 | %(d) | | | 1.42 | % | | | (11.40 | )% | | | 5.43 | % | | | 8.56 | % | | | 4.85 | % |
Expenses (including current and deferred tax expenses/benefits)(f) | | | 0.46 | %(d) | | | (0.36 | )% | | | 1.57 | % | | | 0.55 | % | | | 0.55 | % | | | 0.54 | % |
| Net investment loss (excluding deferred tax expenses/benefits and franchise tax expense) | | | (0.85 | )%(d) | | | (0.85 | )% | | | (0.85 | )% | | | (0.85 | )% | | | (0.85 | )% | | | (0.85 | )% |
Net investment income/(loss)(including deferred tax expenses/benefits)(f) | | | (0.46 | )%(d) | | | 0.36 | % | | | (1.57 | )% | | | (0.55 | )% | | | (0.55 | )% | | | (0.54 | )% |
PORTFOLIO TURNOVER RATE(g) | | | 7 | % | | | 31 | % | | | 21 | % | | | 29 | % | | | 12 | % | | | 12 | % |
(a) | Based on average shares outstanding during the period. |
(b) | Less than ($0.005) per share. |
(c) | Total return is calculated assuming an initial investment made at the net assets value at the beginning of the period and redemption at the net asset value on the last day of the period and assuming all distributions are reinvested at actual reinvestment prices. Total return calculated for a period of less than one year is not annualized. |
(e) | Includes amount of current and deferred taxes/benefits for all components of the Statement of Operations. |
(f) | Includes amount of current and deferred tax benefit associated with net investment income/(loss). |
(g) | Portfolio turnover for periods less than one year is not annualized and does not include securities received or delivered from processing creations or redemptions in-kind. |
See Notes to Financial Statements.
Alerian Energy Infrastructure ETF
| Schedule of Investments | May 31, 2017 (Unaudited) |
| Security Description | | Shares | | | Value | |
| Canadian Energy Infrastructure Companies (26.18%) | | | | | | |
| Energy (26.18%) | | | | | | |
| AltaGas, Ltd. | | | 25,280 | | | $ | 563,483 | |
| Enbridge, Inc. | | | 40,384 | | | | 1,554,553 | |
| Gibson Energy, Inc. | | | 21,744 | | | | 288,450 | |
| Inter Pipeline, Ltd. | | | 56,399 | | | | 1,116,832 | |
| Keyera Corp. | | | 28,298 | | | | 842,121 | |
| Pembina Pipeline Corp. | | | 52,645 | | | | 1,682,411 | |
| TransCanada Corp. | | | 37,014 | | | | 1,718,287 | |
| Veresen, Inc. | | | 48,348 | | | | 657,119 | |
| Total Energy | | | | | | | 8,423,256 | |
| | | | | | | | | |
| Total Canadian Energy Infrastructure Companies | | | | | | | | |
| (Cost $9,286,678) | | | | | | | 8,423,256 | |
| | | | | | | | | |
| U.S. Energy Infrastructure Companies (25.30%) | | | | | | | | |
| Energy (9.17%) | | | | | | | | |
| Kinder Morgan, Inc. | | | 80,066 | | | | 1,502,038 | |
| SemGroup Corp., Class A | | | 8,830 | | | | 273,730 | |
| Targa Resources Corp. | | | 25,549 | | | | 1,173,466 | |
| Total Energy | | | | | | | 2,949,234 | |
| | | | | | | | | |
| Industrials (2.53%) | | | | | | | | |
| Macquarie Infrastructure Corp. | | | 10,450 | | | | 814,055 | |
| | | | | | | | | |
| Utilities (13.60%) | | | | | | | | |
| CenterPoint Energy, Inc. | | | 57,791 | | | | 1,653,401 | |
| Dominion Energy, Inc. | | | 21,973 | | | | 1,774,759 | |
| OGE Energy Corp. | | | 26,637 | | | | 949,076 | |
| Total Utilities | | | | | | | 4,377,236 | |
| | | | | | | | | |
| Total U.S. Energy Infrastructure Companies | | | | | | | | |
| (Cost $8,783,914) | | | | | | | 8,140,525 | |
| | | | | | | | | |
| U.S. Energy Infrastructure MLPs (24.60%) | | | | | | | | |
| Energy (24.60%) | | | | | | | | |
| Antero Midstream Partners LP | | | 8,023 | | | | 277,917 | |
| Buckeye Partners LP | | | 14,661 | | | | 938,304 | |
| Cheniere Energy Partners LP | | | 4,726 | | | | 151,941 | |
| Energy Transfer Equity LP | | | 90,553 | | | | 1,543,023 | |
| Enterprise Products Partners LP | | | 60,864 | | | | 1,631,764 | |
| EQT GP Holdings LP | | | 2,755 | | | | 72,043 | |
| Magellan Midstream Partners LP | | | 22,011 | | | | 1,597,779 | |
| MPLX LP | | | 28,187 | | | | 931,580 | |
| NuStar GP Holdings LLC | | | 3,558 | | | | 92,330 | |
| Phillips 66 Partners LP | | | 4,496 | | | | 222,642 | |
| Shell Midstream Partners LP | | | 9,245 | | | | 275,778 | |
| Western Gas Equity Partners LP | | | 4,182 | | | | 181,457 | |
| Total Energy | | | | | | | 7,916,558 | |
| | | | | | | | | |
| Total U.S. Energy Infrastructure MLPs | | | | | | | | |
| (Cost $9,011,024) | | | | | | | 7,916,558 | |
See Notes to Financial Statements.
Alerian Energy Infrastructure ETF
| Schedule of Investments | May 31, 2017 (Unaudited) |
| Security Description | | Shares | | | Value | |
| U.S. General Partners (23.72%) | | | | | | |
| Energy (23.72%) | | | | | | |
| Archrock, Inc. | | | 62,125 | | | $ | 652,312 | |
| EnLink Midstream LLC | | | 56,144 | | | | 957,255 | |
| ONEOK, Inc. | | | 31,563 | | | | 1,568,050 | |
| Plains GP Holdings LP, Class A | | | 51,902 | | | | 1,384,226 | |
| Tallgrass Energy GP LP | | | 52,306 | | | | 1,347,926 | |
| The Williams Cos., Inc. | | | 60,198 | | | | 1,721,663 | |
| Total Energy | | | | | | | 7,631,432 | |
| | | | | | | | | |
| Total U.S. General Partners | | | | | | | | |
| (Cost $9,138,753) | | | | | | | 7,631,432 | |
| | | 7 Day Yield | | | Shares | | | Value | |
| Short Term Investments (0.05%) | | | | | | | | | |
| State Street Institutional Treasury Plus Money Market Fund | | | 0.680 | % | | | 17,002 | | | | 17,002 | |
| | | | | | | | | | | | | |
| Total Short Term Investments | | | | | | | | | | | | |
| (Cost $17,002) | | | | | | | | | | | 17,002 | |
| | | | | | | | | | | | | |
| Total Investments (99.85%) | | | | | | | | | | | | |
| (Cost $36,237,371) | | | | | | | | | | $ | 32,128,773 | |
| | | | | | | | | | | | | |
| Net Other Assets and Liabilities (0.15%) | | | | | | | | | | | 47,632 | |
| | | | | | | | | | | | | |
| Net Assets (100.00%) | | | | | | | | | | $ | 32,176,405 | |
See Notes to Financial Statements.
Alerian Energy Infrastructure ETF
| Statement of Assets and Liabilities | May 31, 2017 (Unaudited) |
| ASSETS: | | | |
| Investments, at value | | $ | 32,128,773 | |
| Dividends receivable | | | 65,623 | |
| Total Assets | | | 32,194,396 | |
| | | | | |
| LIABILITIES: | | | | |
| Payable to adviser | | | 17,991 | |
| Total Liabilities | | | 17,991 | |
| NET ASSETS | | $ | 32,176,405 | |
| | | | | |
| NET ASSETS CONSIST OF: | | | | |
| Paid-in capital | | $ | 35,961,704 | |
| Accumulated net investment loss | | | (62,787 | ) |
| Accumulated net realized gain | | | 385,832 | |
| Net unrealized depreciation | | | (4,108,344 | ) |
| NET ASSETS | | $ | 32,176,405 | |
| | | | | |
| INVESTMENTS, AT COST | | $ | 36,237,371 | |
| | | | | |
| PRICING OF SHARES | | | | |
| Net Assets | | $ | 32,176,405 | |
| Shares of beneficial interest outstanding (Unlimited number of shares authorized, par value $0.01 per share) | | | 1,400,000 | |
| Net Asset Value, offering and redemption price per share | | $ | 22.98 | |
See Notes to Financial Statements.
Alerian Energy Infrastructure ETF
| Statement of Operations | For the Six Months Ended May 31, 2017 (Unaudited) |
| INVESTMENT INCOME: | | | |
| Dividends | | $ | 716,183 | |
| Foreign taxes withheld | | | (26,932 | ) |
| Total Investment Income | | | 689,251 | |
| | | | | |
| EXPENSES: | | | | |
| Investment adviser fees | | | 92,689 | |
| Total Expenses | | | 92,689 | |
| NET INVESTMENT INCOME | | | 596,562 | |
| | | | | |
| REALIZED AND UNREALIZED GAIN/(LOSS): | | | | |
| Net realized gain on investments | | | 190,158 | |
| Net realized loss on foreign currency transactions | | | (754 | ) |
| Net realized gain | | | 189,404 | |
| Net change in unrealized depreciation on investments | | | (1,094,355 | ) |
| Net change in unrealized appreciation on translation of assets and liabilities denominated in foreign currencies | | | 266 | |
| Net change in unrealized depreciation | | | (1,094,089 | ) |
| NET UNREALIZED LOSS ON INVESTMENTS AND FOREIGN CURRENCIES | | | (904,685 | ) |
| NET DECREASE IN NET ASSETS RESULTING FROM OPERATIONS | | $ | (308,123 | ) |
See Notes to Financial Statements.
Alerian Energy Infrastructure ETF
Statements of Changes in Net Assets
| | | For the Six Months Ended May 31, 2017 (Unaudited) | | | For the Year Ended November 30, 2016 | |
| OPERATIONS: | | | | | | |
| Net investment income | | $ | 596,562 | | | $ | 536,608 | |
| Net realized gain/(loss) | | | 189,404 | | | | (813,397 | ) |
| Net change in unrealized appreciation/(depreciation) | | | (1,094,089 | ) | | | 2,855,014 | |
| Net increase/(decrease) in net assets resulting from operations | | | (308,123 | ) | | | 2,578,225 | |
| | | | | | | | | |
| DISTRIBUTIONS: | | | | | | | | |
| From net investment income | | | (298,610 | ) | | | (405,322 | ) |
| Dividends to shareholders from tax return of capital | | | – | | | | (88,512 | ) |
| Total distributions | | | (298,610 | ) | | | (493,834 | ) |
| | | | | | | | | |
| CAPITAL SHARE TRANSACTIONS: | | | | | | | | |
| Proceeds from sale of shares | | | 16,814,979 | | | | 9,559,448 | |
| Cost of shares redeemed | | | (2,388,525 | ) | | | (5,618,048 | ) |
| Net increase from share transactions | | | 14,426,454 | | | | 3,941,400 | |
| Net increase in net assets | | | 13,819,721 | | | | 6,025,791 | |
| | | | | | | | | |
| NET ASSETS: | | | | | | | | |
| Beginning of period | | | 18,356,684 | | | | 12,330,893 | |
| End of period * | | $ | 32,176,405 | | | $ | 18,356,684 | |
| | | | | | | | | |
| *Including accumulated net investment loss of: | | $ | (62,787 | ) | | $ | (360,739 | ) |
| | | | | | | | | |
| OTHER INFORMATION: | | | | | | | | |
| CAPITAL SHARE TRANSACTIONS: | | | | | | | | |
| Beginning shares | | | 800,000 | | | | 650,000 | |
| Shares sold | | | 700,000 | | | | 500,000 | |
| Shares redeemed | | | (100,000 | ) | | | (350,000 | ) |
| Shares outstanding, end of period | | | 1,400,000 | | | | 800,000 | |
See Notes to Financial Statements.
Alerian Energy Infrastructure ETF
| Financial Highlights | For a Share Outstanding Throughout the Periods Presented |
| | | For the Six Months Ended May 31, 2017 (Unaudited) | | | For the Year Ended November 30, 2016 | | | For the Year Ended November 30, 2015 | | | For the Year Ended November 30, 2014 | | | For the Period November 1, 2013 (Commencement of Operations) to November 30, 2013 | |
| NET ASSET VALUE, BEGINNING OF PERIOD | | $ | 22.95 | | | $ | 18.97 | | | $ | 28.55 | | | $ | 24.86 | | | $ | 25.00 | |
| | | | | | | | | | | | | | | | | | | | | |
| INCOME/(LOSS) FROM INVESTMENT OPERATIONS: | | | | | | | | | | | | | | | | | | | | |
Net investment income(a) | | | 0.50 | | | | 0.80 | | | | 0.83 | | | | 0.85 | | | | 0.06 | |
| Net realized and unrealized gain/(loss) on investments | | | (0.23 | ) | | | 3.95 | | | | (9.78 | ) | | | 3.40 | | | | (0.20 | ) |
| Total from investment operations | | | 0.27 | | | | 4.75 | | | | (8.95 | ) | | | 4.25 | | | | (0.14 | ) |
| | | | | | | | | | | | | | | | | | | | | |
| DISTRIBUTIONS: | | | | | | | | | | | | | | | | | | | | |
| From net investment income | | | (0.24 | ) | | | (0.63 | ) | | | (0.48 | ) | | | (0.56 | ) | | | – | |
| Tax return of capital | | | – | | | | (0.14 | ) | | | (0.15 | ) | | | – | | | | – | |
| Total distributions | | | (0.24 | ) | | | (0.77 | ) | | | (0.63 | ) | | | (0.56 | ) | | | – | |
| | | | | | | | | | | | | | | | | | | | | |
| NET INCREASE/(DECREASE) IN NET ASSET VALUE | | | 0.03 | | | | 3.98 | | | | (9.58 | ) | | | 3.69 | | | | (0.14 | ) |
| NET ASSET VALUE, END OF PERIOD | | $ | 22.98 | | | $ | 22.95 | | | $ | 18.97 | | | $ | 28.55 | | | $ | 24.86 | |
TOTAL RETURN(b) | | | 1.13 | % | | | 25.63 | % | | | (31.83 | )% | | | 17.12 | % | | | (0.56 | )% |
| | | | | | | | | | | | | | | | | | | | | |
| RATIOS/SUPPLEMENTAL DATA: | | | | | | | | | | | | | | | | | | | | |
| Net assets, end of period (000s) | | $ | 32,176 | | | $ | 18,357 | | | $ | 12,331 | | | $ | 17,131 | | | $ | 3,729 | |
| | | | | | | | | | | | | | | | | | | | | |
| Ratio of expenses to average net assets | | | 0.65 | %(c) | | | 0.65 | % | | | 0.65 | % | | | 0.65 | % | | | 0.65 | %(c) |
| Ratio of net investment income to average net assets | | | 4.18 | %(c) | | | 4.04 | % | | | 3.31 | % | | | 2.98 | % | | | 3.21 | %(c) |
PORTFOLIO TURNOVER RATE(d) | | | 17 | % | | | 38 | % | | | 47 | % | | | 27 | % | | | 0 | % |
(a) | Based on average shares outstanding during the period. |
(b) | Total return is calculated assuming an initial investment made at the net assets value at the beginning of the period and redemption at the net asset value on the last day of the period and assuming all distributions are reinvested at actual reinvestment prices. Total return calculated for a period of less than one year is not annualized. |
(d) | Portfolio turnover for periods less than one year is not annualized and does not include securities received or delivered from processing creations or redemptions in-kind. |
See Notes to Financial Statements.
Alerian Exchange Traded Funds
| Notes to Financial Statements | May 31, 2017 (Unaudited) |
1. ORGANIZATION
ALPS ETF Trust (the “Trust”), a Delaware statutory trust, is an open-end management investment company registered under the Investment Company Act of 1940, as amended (the “1940 Act”). As of May 31, 2017, the Trust consisted of twenty separate portfolios. Each portfolio represents a separate series of the Trust. This report pertains to the Alerian MLP ETF and the Alerian Energy Infrastructure ETF (each a “Fund” and collectively, the “Funds”).
The investment objective of the Alerian MLP ETF is to seek investment results that correspond (before fees and expenses) generally to the price and yield performance of its underlying index, the Alerian MLP Infrastructure Index. The investment objective of the Alerian Energy Infrastructure ETF is to seek investment results that correspond (before fees and expenses) generally to the price and yield performance of its underlying index, the Alerian Energy Infrastructure Index. The investment advisor uses a “passive management” or indexing investment approach to try to achieve each Fund’s investment objective. Each Fund is considered non-diversified and may invest a greater portion of assets in securities of individual issuers than a diversified fund. As a result, changes in the market value of a single investment could cause greater fluctuations in share price than would occur in a diversified fund.
Each Fund’s Shares (“Shares”) are listed on the NYSE Arca, Inc. (“the NYSE Arca”). Each Fund issues and redeems Shares at net asset value (“NAV”), in blocks of 50,000 Shares, each of which is called a “Creation Unit”. Creation Units are issued and redeemed principally in-kind for securities included in the Underlying Index. Except when aggregated in Creation Units, Shares are not redeemable securities of the Fund.
Pursuant to the Trust’s organizational documents, its Officers and Trustees are indemnified against certain liability arising out of the performance of their duties to the Trust. Additionally, in the normal course of business, the Trust enters into contracts with service providers that contain general indemnification clauses. The Trust’s maximum exposure under these arrangements is unknown, as this would involve future claims that may be made against the Trust that have not yet occurred.
2. SIGNIFICANT ACCOUNTING POLICIES
The following is a summary of significant accounting policies consistently followed by the Funds in the preparation of the financial statements. The accompanying financial statements were prepared in accordance with accounting principles generally accepted in the United States of America (“U.S. GAAP”). The preparation of financial statements in conformity with U.S. GAAP requires management to make certain estimates and assumptions that affect the reported amounts of assets and liabilities and disclosures of contingent assets and liabilities at the date of the financial statements and the reported amounts of revenue and expenses during the period. Actual results could differ from those estimates. Each Fund is considered an investment company under U.S. GAAP and follows the accounting and reporting guidance applicable to investment companies in the Financial Accounting Standards Board Accounting Standards Codification Topic 946.
A. Portfolio Valuation
Each Fund’s NAV is determined daily, as of the close of regular trading on the New York Stock Exchange (“NYSE”), normally 4:00 p.m. Eastern Time, on each day the NYSE is open for trading. The NAV is computed by dividing the value of all assets of the Fund (including accrued interest and dividends), less all liabilities (including accrued expenses and dividends declared but unpaid), by the total number of shares outstanding.
Portfolio securities listed on any exchange other than the NASDAQ Stock Market LLC (“NASDAQ”) are valued at the last sale price on the business day as of which such value is being determined. If there has been no sale on such day, the securities are valued at the mean of the most recent bid and ask prices on such day. Securities traded on the NASDAQ are valued at the NASDAQ Official Closing Price as determined by NASDAQ. Portfolio securities traded on more than one securities exchange are valued at the last sale price on the business day as of which such value is being determined at the close of the exchange representing the principal market for such securities. Portfolio securities traded in the over-the-counter market, but excluding securities traded on the NASDAQ, are valued at the latest quoted sale price in such market.
The Funds’ investments are valued at market value or, in the absence of market value with respect to any portfolio securities, at fair value according to procedures adopted by the Trust’s Board of Trustees (the “Board”). When market quotations are not readily available or when events occur that make established valuation methods unreliable, securities of the Funds may be valued in good faith by or under the direction of the Board. These securities generally include, but are not limited to, restricted securities (securities which may not be publicly sold without registration under the Securities Act of 1933) for which a pricing service is unable to provide a market price; securities whose trading has been formally suspended; a security whose market price is not available from a pre-established primary pricing source or the pricing source is not willing to provide a price; a security with respect to which an event has occurred that is most likely to materially affect the value of the security after the market has closed but before the calculation of the Funds’ NAV or make it difficult or impossible to obtain a reliable market quotation; or a security whose price, as provided by the pricing service, does not reflect the security’s “fair value” due to the security being de-listed from a national exchange or the security’s primary trading market is temporarily closed at a time when, under normal conditions, it would be open. As a general principle, the current “fair value” of a security would be the amount which the owner might reasonably expect to receive from the sale on the applicable exchange or principal market. A variety of factors may be considered in determining the fair value of such securities.
Alerian Exchange Traded Funds
| Notes to Financial Statements | May 31, 2017 (Unaudited) |
B. Fair Value Measurements
Each Fund discloses the classification of its fair value measurements following a three-tier hierarchy based on the inputs used to measure fair value. Inputs refer broadly to the assumptions that market participants would use in pricing the asset or liability, including assumptions about risk. Inputs may be observable or unobservable. Observable inputs reflect the assumptions market participants would use in pricing the asset or liability that are developed based on market data obtained from sources independent of the reporting entity. Unobservable inputs reflect the reporting entity’s own assumptions about the assumptions market participants would use in pricing the asset or liability that are developed based on the best information available.
Valuation techniques used to value the Funds’ investments by major category are as follows:
Equity securities, including restricted securities, and Limited Partnerships for which market quotations are readily available, are valued at the last reported sale price or official closing price as reported by a third party pricing vendor on the primary market or exchange on which they are traded and are categorized as Level 1 in the hierarchy. In the event there were no sales during the day or closing prices are not available, securities are valued at the mean of the most recent quoted bid and ask prices on such day and are generally categorized as Level 2 in the hierarchy. Investments in open-end mutual funds are valued at their closing NAV each business day and are categorized as Level 1 in the hierarchy.
Changes in valuation techniques may result in transfers in or out of an assigned level within the disclosure hierarchy.
Various inputs are used in determining the value of the Funds’ investments as of the end of the reporting period. When inputs used fall into different levels of the fair value hierarchy, the level in the hierarchy within which the fair value measurement falls is determined based on the lowest level input that is significant to the fair value measurement in its entirety. The designated input levels are not necessarily an indication of the risk or liquidity associated with these investments.
These inputs are categorized in the following hierarchy under applicable financial accounting standards:
| Level 1 | – | Unadjusted quoted prices in active markets for identical investments, unrestricted assets or liabilities that a Fund has the ability to access at the measurement date; |
| Level 2 | – | Quoted prices which are not active, quoted prices for similar assets or liabilities in active markets or inputs other than quoted prices that are observable (either directly or indirectly) for substantially the full term of the asset or liability; and |
| Level 3 | – | Significant unobservable prices or inputs (including the Fund’s own assumptions in determining the fair value of investments) where there is little or no market activity for the asset or liability at the measurement date. |
The following is a summary of the inputs used to value each Fund’s investments at May 31, 2017:
Alerian MLP ETF
| Investments in Securities at Value* | | Level 1- Unadjusted Quoted Prices | | Level 2- Other Significant Observable Inputs | | Level 3- Significant Unobservable Inputs | | | Total | |
| Master Limited Partnerships | | $ | 10,359,938,344 | | | $ | – | | | $ | – | | | $ | 10,359,938,344 | |
| Short Term Investments | | | 5,584,346 | | | | – | | | | – | | | | 5,584,346 | |
| TOTAL | | $ | 10,365,522,690 | | | $ | – | | | $ | – | | | $ | 10,365,522,690 | |
Alerian Exchange Traded Funds
| Notes to Financial Statements | May 31, 2017 (Unaudited) |
Alerian Energy Infrastructure ETF
| Investments in Securities at Value* | | Level 1- Unadjusted Quoted Prices | | Level 2- Other Significant Observable Inputs | | Level 3- Significant Unobservable Inputs | | | Total | |
| Canadian Energy Infrastructure Companies | | $ | 8,423,256 | | | $ | – | | | $ | – | | | $ | 8,423,256 | |
| U.S. Energy Infrastructure Companies | | | 8,140,525 | | | | – | | | | – | | | | 8,140,525 | |
| U.S. Energy Infrastructure MLPs | | | 7,916,558 | | | | – | | | | – | | | | 7,916,558 | |
| U.S. General Partners | | | 7,631,432 | | | | – | | | | – | | | | 7,631,432 | |
| Short Term Investments | | | 17,002 | | | | – | | | | – | | | | 17,002 | |
| TOTAL | | $ | 32,128,773 | | | $ | – | | | $ | – | | | $ | 32,128,773 | |
| * | For a detailed breakdown of sectors, see the accompanying Schedule of Investments. |
Each Fund recognizes transfers between levels as of the end of the period. For the six months ended May 31, 2017, the Funds did not have any transfers between Level 1 and Level 2 securities. The Funds did not have any securities that used significant unobservable inputs (Level 3) in determining fair value.
C. Foreign Currency Translation
The books and records of the Funds are maintained in U.S. dollars. Investment valuations and other assets and liabilities initially expressed in foreign currencies are converted each business day into U.S. dollars based upon current exchange rates. The portion of realized and unrealized gains or losses on investments due to fluctuations in foreign currency exchange rates is not separately disclosed and is included in realized and unrealized gains or losses on investments, when applicable.
D. Securities Transactions and Investment Income
Securities transactions are recorded as of the trade date. Realized gains and losses from securities transactions are recorded on the last in, first out (“LIFO”) cost basis. Dividend income and capital gains distributions, if any, are recorded on the ex-dividend date, net of any foreign taxes withheld. Interest income, if any, is recorded on the accrual basis, including amortization of premiums and accretion of discounts.
E. Dividends and Distributions to Shareholders
Each Fund intends to declare and make quarterly distributions, or as the Board may determine from time to time. Distributions of net realized capital gains earned by the Alerian Energy Infrastructure ETF, if any, are distributed at least annually. Distributions from net investment income and capital gains are determined in accordance with income tax regulations, which may differ from U.S. GAAP. These differences are primarily due to differing treatments of income and gains on various investment securities held by the Funds, timing differences and differing characterization of distributions made by the Funds.
Distributions received from each Fund’s investments in Master Limited Partnerships (“MLPs”) may be comprised of both income and return of capital. Each Fund records investment income and return of capital based on estimates made at the time such distributions are received. Such estimates are based on historical information available from each MLP and other industry sources. These estimates may subsequently be revised based on information received from MLPs after their tax reporting periods are concluded. For the six months ended May 31, 2017, the Alerian MLP ETF distributed $366,606,324 of which 100% is anticipated to be characterized as return of capital from MLP distributions received.
The Alerian MLP ETF also expects a portion of the distributions it receives from MLPs to be treated as a tax deferred return of capital, thus reducing the Alerian MLP ETF’s current tax liability. Return of capital distributions are not taxable income to the shareholder, but reduce the investor’s tax basis in the investor’s Fund Shares. Such a reduction in tax basis will result in larger taxable gains and/or lower tax losses on a subsequent sale of Fund Shares. Shareholders who periodically receive the payment of dividends or other distributions consisting of a return of capital may be under the impression that they are receiving net profits from the Funds when, in fact, they are not. Shareholders should not assume that the source of the distributions is from the net profits of the Funds.
F. Federal Income Taxation and Tax Basis Information
Alerian MLP ETF
The Alerian MLP ETF is taxed as a regular C-corporation for federal income tax purposes. Currently, the maximum marginal regular federal income tax rate for a corporation is 35 percent. The Fund may be subject to a 20 percent federal alternative minimum tax on its federal alternative taxable income to the extent that its alternative minimum tax exceeds its regular federal income tax. This differs from most investment companies, which elect to be treated as “regulated investment companies” under the Code in order to avoid paying entity level income taxes. Under current law, the Fund is not eligible to elect treatment as a regulated investment company due to its investments primarily in MLPs invested in energy assets. As a result, the Fund will be obligated to pay applicable federal and state corporate income taxes on its taxable income as opposed to most other investment companies, which are not so obligated. The Fund expects that a portion of the distributions it receives from MLPs may be treated as a tax-deferred return of capital, thus reducing the Fund’s current tax liability. However, the amount of taxes currently paid by the Fund will vary depending on the amount of income and gains derived from investments and/or sales of MLP interests and such taxes will reduce an investor’s return from an investment in the Fund.
Alerian Exchange Traded Funds
| Notes to Financial Statements | May 31, 2017 (Unaudited) |
Cash distributions from MLPs to the Fund that exceed such Fund’s allocable share of such MLP’s net taxable income are considered a tax-deferred return of capital that will reduce the Fund’s adjusted tax basis in the equity securities of the MLP. These reductions in such Fund’s adjusted tax basis in the MLP equity securities will increase the amount of gain (or decrease the amount of loss) recognized by the Fund on a subsequent sale of the securities. The Fund will accrue deferred income taxes for any future tax liability associated with (i) that portion of MLP distributions considered to be a tax-deferred return of capital as well as (ii) capital appreciation of its investments. Upon the sale of an MLP security, the Fund may be liable for previously deferred taxes. The Fund’s accrued deferred tax liability will be reflected each day in the Fund’s NAV. Increases in deferred tax liability will decrease NAV. Conversely, decreases in deferred liability will increase NAV, but only to the extent of previously accrued deferred tax liability, i.e., no deferred tax asset will be accrued. The Fund will rely to a large extent on information provided by the MLPs, which is not necessarily timely, to estimate deferred tax liability for purposes of financial statement reporting and determining the NAV. From time to time, ALPS Advisors, Inc. will modify the estimates or assumptions related to the Fund’s deferred tax liability as new information becomes available. The Fund’s estimates regarding its deferred tax liability are made in good faith, however, the daily estimate of the Fund’s deferred tax liability used to calculate the Fund’s NAV could vary significantly from the Fund’s actual tax liability. The Fund will generally compute deferred income taxes based on the federal income tax rate applicable to corporations, currently 35%, and an assumed rate attributable to state taxes.
The Fund recognizes interest and penalties related to unrecognized tax benefits within the income tax expense line in the accompanying statement of operations. Accrued interest and penalties are included within the related tax liability line in the balance sheet.
Since the Fund will be subject to taxation on its taxable income, the NAV of Fund shares will also be reduced by the accrual of any deferred tax liabilities. The Underlying Index however is calculated without any deductions for taxes. As a result, the Fund’s after tax performance could differ significantly from the Underlying Index even if the pretax performance of the Fund and the performance of the Underlying Index are closely correlated.
The Fund’s income tax expense/(benefit) consists of the following:
| Alerian MLP ETF | | Period ended May 31, 2017 | |
| | | Current | | | Deferred | | | Total | |
| Federal | | $ | – | | | $ | 24,094,568 | | | $ | 24,094,568 | |
| State | | | – | | | | 1,449,261 | | | | 1,449,261 | |
| Valuation Allowance | | | – | | | | – | | | | – | |
| Total tax expense/(benefit) | | $ | – | | | $ | 25,543,829 | | | $ | 25,543,829 | |
Deferred income taxes reflect the net tax effect of temporary differences between the carrying amount of assets and liabilities for financial reporting and tax purposes.
Alerian Exchange Traded Funds
| Notes to Financial Statements | May 31, 2017 (Unaudited) |
Components of the Fund’s deferred tax assets and liabilities are as follows:
| Alerian MLP ETF | | As of May 31, 2017 | |
| Deferred tax assets: | | | |
| Charitable contribution carryforward | | | 640,334 | |
| Income recognized from MLP investments | | | 312,340,677 | |
| Credit for prior year minimum tax | | | 331,761 | |
| Federal net operating loss carryforward | | | 567,221,410 | |
| Federal capital loss carryforward | | | 530,471,375 | |
| Less Deferred tax liabilities: | | | | |
| Accrued franchise taxes | | | (30,451 | ) |
| Net unrealized gain on investment securities | | | (1,480,449,978 | ) |
| Other | | | (1,059,636 | ) |
| Net Deferred tax liability | | $ | (70,534,508 | ) |
Due to the activities of the MLPs that the fund is invested in, the Fund is required to pay franchise tax in certain states. Generally speaking, franchise tax expense is a tax on equity of a corporation, or base minimum fees, imposed by various jurisdictions. The amounts of the tax are estimated throughout the year based upon the Fund’s estimate of underlying activities conducted in the states and reconciled to actual amounts paid upon the filing of the tax returns for the states. These taxes are paid as either estimated tax payments, extension payments, or with the tax return filings of the various states.
The net operating loss carryforward is available to offset future taxable income. The net operating loss can be carried forward for 20 years and, accordingly, would begin to expire as of November 30, 2032. The Fund has net operating loss carryforwards for federal income tax purposes as follows:
| Alerian MLP ETF | Period-Ended | | Amount | | Expiration |
| Federal | 11/30/2012 | | $ | 92,112,756 | | 11/30/2032 |
| Federal | 11/30/2013 | | | 349,770,934 | | 11/30/2033 |
| Federal | 11/30/2014 | | | 64,228,395 | | 11/30/2034 |
| Federal | 11/30/2015 | | | 270,791,678 | | 11/30/2035 |
| Federal | 11/30/2016 | | | 488,070,919 | | 11/30/2036 |
| Federal | 11/30/2017 | | | 257,474,127 | | 11/30/2037 |
| Total | | | $ | 1,522,448,808 | | |
The Fund also has state tax net operating loss carryforwards of various amounts per state. The Deferred Tax Assets associated with these state tax net operating losses are as follows:
| Alerian MLP ETF | Period-Ended | | Amount | | Expiration |
| State | 11/30/2012 | | $ | 2,950,477 | | Varies by State (5-20 years) |
| State | 11/30/2013 | | | 10,853,441 | | Varies by State (5-20 years) |
| State | 11/30/2014 | | | 1,931,661 | | Varies by State (5-20 years) |
| State | 11/30/2015 | | | 9,260,851 | | Varies by State (5-20 years) |
| State | 11/30/2016 | | | 4,321,405 | | Varies by State (5-20 years) |
| State | 11/30/2017 | | | 5,046,492 | | Varies by State (5-20 years) |
| Total | | | $ | 34,364,327 | | |
Alerian Exchange Traded Funds
| Notes to Financial Statements | May 31, 2017 (Unaudited) |
The capital loss carryforward is available to offset future taxable income. The capital loss can be carried forward for 5 years and, accordingly, would begin to expire as of November 30, 2020. The Fund has net capital loss carryforwards for federal income tax purposes as follows:
| Alerian MLP ETF | Year-Ended | | Amount | | Expiration |
| Federal | 11/30/2015 | | $ | 504,879,549 | | 11/30/2020 |
| Federal | 11/30/2016 | | | 585,454,823 | | 11/30/2021 |
| Federal | 11/30/2017 | | | 357,777,621 | | 11/30/2022 |
| Total | | | $ | 1,448,111,993 | | |
The Fund reviews the recoverability of its deferred tax assets based upon the weight of available evidence. When assessing the recoverability of its deferred tax assets, significant weight was given to the effects of potential future realized and unrealized gains on investments and the period over which these deferred tax assets can be realized. Currently, any capital losses that may be generated by the Fund in the future are eligible to be carried back up to three years and can be carried forward for five years to offset capital gains recognized by the fund in those years. Net operating losses that may be generated by the Fund in the future are eligible to be carried back up to two years and can be carried forward for 20 years to offset income generated by the Fund in those years.
Based upon the Fund’s assessment, it has determined that it is more likely than not that its deferred tax assets will be realized through future taxable income of the appropriate character. Accordingly, no valuation allowance has been established for the Fund’s deferred tax assets. The Fund will continue to assess the need for a valuation allowance in the future. Significant declines in the fair value of its portfolio of investments may change the Fund’s assessment of the recoverability of these assets and may result in the recording of a valuation allowance against all or a portion of the Fund’s gross deferred tax assets.
Total income tax expense/(benefit) (current and deferred) differs from the amount computed by applying the federal statutory income tax rate of 35% to net investment and realized and unrealized gain/(losses) on investment before taxes as follows:
| Alerian MLP ETF | | As of May 31, 2017 | |
| Income tax expense at statutory rate | | $ | 24,186,820 | |
| State income tax benefit (net of federal benefit) | | | 1,354,462 | |
| Permanent differences, net | | | (771,350 | ) |
| Other | | | 773,897 | |
| Net income tax expense | | $ | 25,543,829 | |
The following is a tabular reconciliation of the total amounts of unrecognized tax benefits:
| Alerian MLP ETF | | Inception to May 31, 2017 | |
| Unrecognized tax benefit - Beginning | | $ | – | |
| Gross increases - tax positions in prior period | | | – | |
| Gross decreases - tax positions in prior period | | | – | |
| Gross increases - tax positions in current period | | | – | |
| Settlement | | | – | |
| Lapse of statute of limitations | | | – | |
| Unrecognized tax benefit - Ending | | $ | – | |
The Fund recognizes interest accrued related to unrecognized tax benefits and penalties as income tax expense. For the period from inception to May 31, 2017, the Fund had no accrued penalties or interest.
The Fund recognizes the tax benefits of uncertain tax positions only where the position is “more likely than not” to be sustained assuming examination by tax authorities. Management has analyzed the Fund's tax positions and has concluded that no liability for unrecognized tax benefits should be recorded related to uncertain tax positions taken on U.S. tax returns and state tax returns filed since inception of the fund. Tax periods ended November 30, 2013 through November 30, 2016 remain subject to examination by tax authorities in the United States. Due to the nature of the Fund's investments, the Fund may be required to file income tax returns in several states. The Fund is not aware of any tax positions for which it is reasonably possible that the total amounts of unrecognized tax benefits will change materially in the next 12 months.
Alerian Exchange Traded Funds
| Notes to Financial Statements | May 31, 2017 (Unaudited) |
Alerian Energy Infrastructure ETF
The timing and character of income and capital gain distributions are determined in accordance with income tax regulations, which may differ from U.S. GAAP. Reclassifications are made to the Fund’s capital accounts for permanent tax differences to reflect income and gains available for distribution (or available capital loss carryforwards) under income tax regulations. The amounts and characteristics of tax basis distributions and composition of distributable earnings/(accumulated losses) are finalized at fiscal year-end; accordingly, tax basis balances have not been determined as of May 31, 2017.
No provision for income taxes is included in the accompanying financial statements, as the Alerian Energy Infrastructure ETF intends to distribute to shareholders all taxable investment income and realized gains and otherwise comply with Subchapter M of the Internal Revenue Code of 1986, as amended, applicable to regulated investment companies. The Alerian Energy Infrastructure ETF evaluates tax positions taken (or expected to be taken) in the course of preparing the Fund’s tax returns to determine whether these positions meet a “more-likely-than-not” standard that, based on the technical merits, have a more than fifty percent likelihood of being sustained by a taxing authority upon examination. A tax position that meets the “more-likely-than-not” recognition threshold is measured to determine the amount of benefit to recognize in the financial statements.
As of and during the six months ended May 31, 2017, the Alerian Energy Infrastructure ETF did not have a liability for any unrecognized tax benefits. The Alerian Energy Infrastructure ETF files U.S. federal, state, and local tax returns as required. The Fund’s tax returns are subject to examination by the relevant tax authorities until expiration of the applicable statute of limitations, which is generally three years after the filing of the tax return, but may extend to four years in certain jurisdictions. Tax returns for open years have incorporated no uncertain tax positions that require a provision for income taxes.
At November 30, 2016, the Fund had available for tax purposes unused capital loss carryforwards as follows:
| | | Short-Term | | | Long-Term | |
| Alerian Energy Infrastructure ETF | | $ | 527,381 | | | $ | 131,927 | |
Capital loss carryovers used during the year ended November 30, 2016 were $123,732.
The tax character of the distributions paid during the fiscal year ended November 30, 2016 was as follows:
| | | Ordinary Income | | | Long-Term Capital Gain | | | Return of Capital | |
| November 30, 2016 | | | | | | | | | |
| Alerian Energy Infrastructure ETF | | $ | 405,322 | | | $ | – | | | $ | 88,512 | |
As of May 31, 2017, the costs of investments for federal income tax purposes and accumulated net unrealized appreciation/(depreciation) on investments were as follows:
| | | Alerian MLP ETF | | | Alerian Energy Infrastructure ETF | |
| Cost of investments for income tax purposes | | $ | 7,101,695,248 | | | $ | 34,869,092 | |
| Gross appreciation (excess of value over tax cost) | | $ | 3,752,784,735 | | | $ | 2,611,871 | |
| Gross depreciation (excess of tax cost over value) | | | (488,957,293 | ) | | | (5,352,190 | ) |
| Net unrealized appreciation/(depreciation) | | $ | 3,263,827,442 | | | $ | (2,740,319 | ) |
The difference between cost amounts for financial statement purposes is due primarily to the recognition of pass-through income from a Fund’s investments in master limited partnerships and wash sales.
Alerian Exchange Traded Funds
| Notes to Financial Statements | May 31, 2017 (Unaudited) |
G. Lending of Portfolio Securities
The Alerian Energy Infrastructure ETF (the “Fund”) has entered into a securities lending agreement with State Street Bank & Trust Co. (“SSB”), the Fund’s lending agent. The Fund may lend its portfolio securities only to borrowers that are approved by SSB. The Fund will limit such lending to not more than 33 1/3% of the value of its total assets. The Fund’s securities held at SSB as custodian shall be available to be lent except those securities the Fund or ALPS Advisors Inc. specifically identifies in writing as not being available for lending. The borrower pledges and maintains with the Fund collateral consisting of cash (U.S. Dollars only), securities issued or guaranteed by the U.S. government or its agencies or instrumentalities, and cash equivalents (including irrevocable bank letters of credit) issued by a person other than the borrower or an affiliate of the borrower. The initial collateral received by the Fund is required to have a value of no less than 102% of the market value of the loaned securities for U.S equity securities and a value of no less than 105% of the market value for non-U.S. equity securities. The collateral is maintained thereafter, at a market value equal to not less than 102% of the current value of the U.S. equity securities on loan and not less than 105% of the current value of the non-U.S. equity securities on loan. The market value of the loaned securities is determined at the close of each business day and any additional required collateral is delivered to the Fund on the next business day. During the term of the loan, the Fund is entitled to all distributions made on or in respect of the loaned securities. Loans of securities are terminable at any time and the borrower, after notice, is required to return borrowed securities within the customary time period for settlement of securities transactions. As of May 31, 2017, the Fund had no securities on loan.
Any cash collateral received is reinvested in a money market fund managed by SSB as disclosed in the Fund’s Schedule of Investments and is reflected in the Statements of Assets and Liabilities as a payable for collateral upon return of securities loaned. Non-cash collateral, in the form of securities issued or guaranteed by the U.S. government or its agencies or instrumentalities, is not disclosed in the Fund’s Statements of Assets and Liabilities as it is held by the lending agent on behalf of the Fund, and the Fund does not have the ability to re-hypothecate these securities. Income earned by the Fund from securities lending activity is disclosed in the Statement of Operations.
3. INVESTMENT ADVISORY FEE AND OTHER AFFILIATED TRANSACTIONS
ALPS Advisors, Inc. (the “Adviser”) acts as each Fund's investment adviser pursuant to advisory agreements with the Trust on behalf of each Fund (the “Advisory Agreements”). Pursuant to the Advisory Agreements, each Fund pays the Adviser a unitary fee for the services and facilities it provides payable on a monthly basis as a percentage of the relevant Fund's average daily net assets as set out below.
| Fund | | Advisory Fee |
| Alerian MLP ETF | 0.85% | up to and including $10 billion |
| | 0.80% | greater than $10 billion up to and including $15 billion |
| | 0.755% | greater than $15 billion up to and including $20 billion |
| | 0.715% | greater than $20 billion |
| Alerian Energy Infrastructure ETF | 0.65% | |
Out of the unitary management fees, the Adviser pays substantially all expenses of the Funds, including the cost of transfer agency, custody, fund administration, legal, audit, independent trustees and other services, except for taxes, interest expenses, distribution fees or expenses, brokerage expenses, and extraordinary expenses such as litigation, and other expenses not incurred in the ordinary course of the each Fund's business. The Adviser’s unitary management fee is designed to pay substantially all the Funds’ expenses and to compensate the Adviser for providing services for each Fund.
ALPS Fund Services, Inc., an affiliate of the Adviser, is the administrator of the Funds.
Each Trustee who is not an officer or employee of the Adviser, any sub-adviser or any of their affiliates (“Independent Trustees”) receives (1) a quarterly retainer of $5,000, (2) a per meeting fee for regularly scheduled meetings of $3,750, (3) $1,500 for any special meeting held outside of a regularly scheduled board meeting, and (4) reimbursement for all reasonable out-of-pocket expenses relating to attendance at meetings.
Alerian Exchange Traded Funds
| Notes to Financial Statements | May 31, 2017 (Unaudited) |
4. PURCHASES AND SALES OF SECURITIES
For the six months ended May 31, 2017, the cost of purchases and proceeds from sales of investment securities, excluding short-term investments and in-kind transactions, were as follows:
| Fund | Purchases | | Sales | |
| Alerian MLP ETF | | $ | 773,390,567 | | | $ | 1,131,732,361 | |
| Alerian Energy Infrastructure ETF | | | 4,789,069 | | | | 4,813,804 | |
For the six months ended May 31, 2017, the cost of in-kind purchases and proceeds from in-kind sales were as follows:
| Fund | | Purchases | | | Sales | |
| Alerian MLP ETF | | $ | 1,547,458,748 | | | $ | – | |
| Alerian Energy Infrastructure ETF | | | 16,813,446 | | | | 2,097,260 | |
For the six months ended May 31, 2017, the Alerian Energy Infrastructure ETF had in-kind net realized gain of $97,772.
Gains on in-kind transactions are not considered taxable for federal income tax purposes and losses on in kind transactions are also not deductible for tax purposes.
5. MASTER LIMITED PARTNERSHIPS
MLPs are publicly traded partnerships engaged in, among other things, the transportation, storage and processing of minerals and natural resources, and are treated as partnerships for U.S. federal income tax purposes. By confining their operations to these specific activities, their interests, or units, are able to trade on public securities exchanges exactly like the shares of a corporation, without entity level taxation. To qualify as a MLP and to not be taxed as a corporation, a partnership must receive at least 90% of its income from qualifying sources as set forth in Section 7704(d) of the Internal Revenue Code of 1986, as amended (the “Code”). These qualifying sources include, among other things, natural resource-based activities such as the processing, transportation and storage of mineral or natural resources. MLPs generally have two classes of owners, the general partner and limited partners. The general partner of an MLP is typically owned by a major energy company, an investment fund, the direct management of the MLP, or is an entity owned by one or more of such parties. The general partner may be structured as a private or publicly traded corporation or other entity. The general partner typically controls the operations and management of the MLP through an up to 2% equity interest in the MLP plus, in many cases, ownership of common units and subordinated units. Limited partners typically own the remainder of the partnership, through ownership of common units, and have a limited role in the partnership’s operations and management.
MLPs are typically structured such that common units and general partner interests have first priority to receive quarterly cash distributions up to an established minimum amount (“minimum quarterly distributions” or “MQD”). Common and general partner interests also accrue arrearages in distributions to the extent the MQD is not paid. Once common and general partner interests have been paid, subordinated units receive distributions of up to the MQD; however, subordinated units do not accrue arrearages. Distributable cash in excess of the MQD is distributed to both common and subordinated units and generally on a pro rata basis. The general partner is also eligible to receive incentive distributions if the general partner operates the business in a manner which results in distributions paid per common unit surpassing specified target levels. As the general partner increases cash distributions to the limited partners, the general partner receives an increasingly higher percentage of the incremental cash distributions.
6. CAPITAL SHARE TRANSACTIONS
Shares are created and redeemed by each Fund only in Creation Unit size aggregations of 50,000 Shares. Only broker-dealers or large institutional investors with creation and redemption agreements called Authorized Participants (“AP”) are permitted to purchase or redeem Creation Units from the Funds. Such transactions are generally permitted on an in-kind basis, with a balancing cash component to equate the transaction to the NAV per unit of each Fund on the transaction date. Cash may be substituted equivalent to the value of certain securities generally when they are not available in sufficient quantity for delivery, not eligible for trading by the AP or as a result of other market circumstances.
Alerian Exchange Traded Funds
| Notes to Financial Statements | May 31, 2017 (Unaudited) |
7. RELATED PARTY TRANSACTIONS
The Funds engaged in cross trades between each other during the six months ended May 31, 2017 pursuant to Rule 17a-7 under the 1940 Act. Cross trading is the buying or selling of portfolio securities between funds to which the Adviser serves as the investment adviser. The Board previously adopted procedures that apply to transactions between the Funds of the Trust pursuant to Rule 17a-7. These transactions related to cross trades during the period complied with the requirements set forth by Rule 17a-7 and the Trust’s procedures.
Transactions related to cross trades during the six months ended May 31, 2017, were as follows:
| Fund | | Purchase cost paid | | | Sale proceeds received | | | Realized gain/ (loss) on sales | |
| Alerian MLP ETF | | $ | 500,144 | | | $ | 470,419 | | | $ | (6,035 | ) |
| Alerian Energy Infrastructure ETF | | | – | | | | 155,993 | | | | 5,964 | |
8. AFFILIATED COMPANIES
As defined by the Investment Company Act of 1940, an affiliated person, including an affiliated company, is one in which a Fund owns 5% or more of the outstanding voting securities, or a company which is under common ownership or control with the Fund.
For the six months ended May 31, 2017, the Alerian MLP ETF held shares in the following affiliates, as defined by the Investment Company Act of 1940.
| Security Name | | Share Balance December 1, 2016 | | | Purchases / Transfers In | | | Sales / Transfers Out | | | Corporate Actions | | | Share Balance May 31, 2017 | | | Dividend Income* | | | Realized Gain/ (Loss) | | | Market Value May 31, 2017 | |
| Master Limited Partnerships | | | | | | | | | | | | | | | | | | | | | | | | |
| Buckeye Partners LP | | | 8,925,623 | | | | 2,213,477 | | | | (701,671 | ) | | | – | | | | 10,437,429 | | | $ | – | | | $ | – | | | $ | 667,995,456 | |
| Enbridge Energy Partners LP | | | 14,705,996 | | | | 3,053,331 | | | | (1,680,646 | ) | | | – | | | | 16,078,681 | | | | – | | | | – | | | | 266,262,957 | |
Energy Transfer Partners LP(1)(2) | | | 39,694,657 | | | | 10,615,004 | | | | (12,937,418 | ) | | | 9,429,473 | | | | 46,801,716 | | | | – | | | | – | | | | 1,018,405,340 | |
| EQT Midstream Partners LP | | | 4,001,906 | | | | 830,458 | | | | (460,853 | ) | | | – | | | | 4,371,511 | | | | – | | | | – | | | | 322,442,651 | |
| Genesis Energy LP | | | 7,014,426 | | | | 1,456,144 | | | | (802,134 | ) | | | – | | | | 7,668,436 | | | | – | | | | – | | | | 239,178,519 | |
| Magellan Midstream Partners LP | | | 13,629,760 | | | | 2,088,154 | | | | (1,105,531 | ) | | | – | | | | 14,612,383 | | | | – | | | | – | | | | 1,060,712,882 | |
| MPLX LP | | | 17,376,799 | | | | 3,920,220 | | | | (1,232,110 | ) | | | – | | | | 20,064,909 | | | | – | | | | – | | | | 663,145,243 | |
| NGL Energy Partners LP | | | 6,573,790 | | | | 1,981,885 | | | | (371,927 | ) | | | – | | | | 8,183,748 | | | | – | | | | – | | | | 111,298,973 | |
| NuStar Energy LP | | | 4,392,697 | | | | 920,604 | | | | (456,404 | ) | | | – | | | | 4,856,897 | | | | – | | | | – | | | | 221,377,365 | |
| ONEOK Partners LP | | | 10,785,060 | | | | 2,245,055 | | | | (1,169,395 | ) | | | – | | | | 11,860,720 | | | | – | | | | – | | | | 580,107,815 | |
| Rice Midstream Partners LP | | | – | | | | 5,555,319 | | | | (106,238 | ) | | | – | | | | 5,449,081 | | | | – | | | | – | | | | 133,556,975 | |
| Tesoro Logistics LP | | | 4,643,793 | | | | 1,161,506 | | | | (304,315 | ) | | | – | | | | 5,500,984 | | | | – | | | | – | | | | 291,442,132 | |
| TC Pipelines LP | | | 3,329,485 | | | | 714,298 | | | | (218,532 | ) | | | – | | | | 3,825,251 | | | | – | | | | – | | | | 215,246,874 | |
| Total | | | | | | | | | | | | | | | | | | | | | | $ | – | | | $ | – | | | $ | 5,791,173,182 | |
| * | 100% of the Income received was estimated as Return of Capital. |
(1) | As of 05/31/2017, no longer an affiliated security |
(2) | On 05/01/2017, Sunoco Logistics Partners LP (SXL) merged with Energy Transfer Partners LP (ETP). Sunoco Logistics was the surviving entity and changed its name to Energy Transfer Partners LP as part of the completion of the merger. At the effective time of the merger, each ETP common unit converted into the right to receive 1.5 SXL common units. The December 1, 2016 share balances represent the combined SXL and ETP shares held as of that date. |
9. SUBSEQUENT EVENTS
On October 13, 2016, the Securities and Exchange Commission (“SEC”) amended Regulation S-X, which will require standardized, enhanced disclosure about derivatives in investment company financial statements, as well as other amendments. The compliance date for the amendments to Regulation S-X is August 1, 2017. Management is currently evaluating the impact to the financial statements and disclosures.
Alerian Exchange Traded Funds
| Additional Information | May 31, 2017 (Unaudited) |
PROXY VOTING RECORDS, POLICIES AND PROCEDURES
Information regarding how each Fund voted proxies relating to portfolio securities during the most recent 12-month period ended June 30 and a description of the Funds’ proxy voting policies and procedures used in determining how to vote for proxies are available without charge on the SEC’s website at www.sec.gov and upon request, by calling (toll-free) 1-866-675-2639.
PORTFOLIO HOLDINGS
The Trust is required to disclose, after its first and third fiscal quarters, the complete schedule of each Fund’s portfolio holdings with the SEC on Form N-Q. Form N-Q for each Fund will be available on the SEC’s website at www.sec.gov. Each Fund’s Form N-Q may also be reviewed and copied at the SEC’s Public Reference Room in Washington, D.C. and information on the operation of the Public Reference Room may be obtained by calling 1-800-SEC-0330. Each Fund’s Form N-Q will be available without charge, upon request, by calling (toll-free) 1-866-675-2639 or by writing to ALPS ETF Trust at 1290 Broadway, Suite 1100, Denver, Colorado 80203.
TAX INFORMATION
The Fund designated the following for federal income tax purposes for distributions made during the calendar year ended December 31, 2016:
| | Qualified Dividend Income | Dividend Received Deduction |
| Alerian Energy Infrastructure ETF | 100.00% | 64.82% |
| | | |
In early 2017, if applicable, shareholders of record received this information for the distributions paid to them by the Fund during the calendar year 2016 via Form 1099. The Fund will notify shareholders in early 2018 of amounts paid to them by the Fund, if any, during the calendar year 2017.
LICENSING AGREEMENTS
Alerian (the “Licensor”) has entered into an index licensing agreement with ALPS Advisors Inc. (the “Advisor”) with respect to each of the Alerian MLP ETF and the Alerian Energy Infrastructure ETF, to allow the Adviser’s use of AMZI and AMEI. The following disclosure relates to the Licensor:
Alerian is the designer of the construction and methodology for the underlying index (each an “Underlying Index”) for each of the Alerian MLP ETF and the Alerian Energy Infrastructure ETF (each a “Fund” and collectively, the “Funds”). “Alerian,” “Alerian MLP Infrastructure Index,” “Alerian Energy Infrastructure Index,” “Alerian Index Series” and “AMZI” are service marks or trademarks of Alerian. Alerian acts as brand licensor for each Underlying Index. Alerian is not responsible for the descriptions of either Underlying Index or the Funds that appear herein. Alerian is not affiliated with the Trust, the Adviser or the Distributor.
Neither Fund is issued, sponsored, endorsed, sold or promoted by Alerian (“Licensor”) or its affiliates. Licensor makes no representation or warranty, express or implied, to the owners of the Fund or any member of the public regarding the advisability of investing in securities generally or in the Fund particularly or the ability of the Alerian MLP Infrastructure Index (“Index”) to track general market performance. Licensor’s only relationship to the Licensee is the licensing of the Index which is determined, composed and calculated by Licensor without regard to the Licensee or the Fund. Licensor has no obligation to take the needs of the Licensee or the owners of the Fund into consideration in determining, composing or calculating the Index. Licensor is not responsible for and has not participated in the determination of the timing of, prices at, or quantities of the Fund to be issued or in the determination or calculation of the equation by which the Fund is to be converted into cash. Licensor has no obligation or liability in connection with the issuance, administration, marketing or trading of either Fund and is not responsible for and has not participated in the determination of pricing or the timing of the issuance or sale of the Shares of either Fund or in the determination or calculation of the NAV of the relevant Fund. Alerian MLP Infrastructure Index, Alerian MLP Infrastructure Total Return Index, AMZI and AMZIX are trademarks of GKD Index Partners, LLC and their general use is granted under a license from GKD Index Partners, LLC.
LICENSOR DOES NOT GUARANTEE THE QUALITY, ACCURACY AND/OR THE COMPLETENESS OF THE INDEX OR ANY DATA INCLUDED THEREIN AND SHALL HAVE NO LIABILITY FOR ERRORS OR OMISSIONS OF ANY KIND RELATED TO THE INDEX OR DATA. LICENSOR MAKES NO WARRANTY, EXPRESS OR IMPLIED, AS TO RESULTS TO BE OBTAINED BY LICENSEE, OWNERS OF THE FUND, OR ANY OTHER PERSON OR ENTITY FROM THE USE OF THE INDEX OR ANY DATA INCLUDED THEREIN IN CONNECTION WITH THE RIGHTS LICENSED TO LICENSEE OR FOR ANY OTHER USE. LICENSOR MAKES NO EXPRESS OR IMPLIED WARRANTIES, AND HEREBY EXPRESSLY DISCLAIMS ALL WARRANTIES OF MERCHANTABILITY OR FITNESS FOR A PARTICULAR PURPOSE OR USE WITH RESPECT TO THE INDEX OR ANY DATA INCLUDED THEREIN. WITHOUT LIMITING ANY OF THE FOREGOING, IN NO EVENT SHALL LICENSOR HAVE ANY LIABILITY FOR ANY SPECIAL, PUNITIVE, INDIRECT, OR CONSEQUENTIAL DAMAGES (INCLUDING LOST PROFITS), EVEN IF NOTIFIED OF THE POSSIBILITY OF SUCH DAMAGES.
Alerian Exchange Traded Funds
| Additional Information | May 31, 2017 (Unaudited) |
The Adviser does not guarantee the accuracy and/or the completeness of either Underlying Index or any data included therein, and the Adviser shall have no liability for any errors, omissions or interruptions therein. The Adviser makes no warranty, express or implied, as to results to be obtained by either Fund, owners of the Shares of the relevant Fund or any other person or entity from the use of either Underlying Index or any data included therein. The Adviser makes no express or implied warranties, and expressly disclaims all warranties of merchantability or fitness for a particular purpose or use with respect to either Underlying Index or any data included therein. Without limiting any of the foregoing, in no event shall the Adviser have any liability for any special, punitive, direct, indirect, or consequential damages (including lost profits) arising out of matters relating to the use of either Underlying Index, even if notified of the possibility of such damages.
(Applicable to the Alerian Energy Infrastructure ETF only)
The Underlying Index is the exclusive property of GKD Index Partners LLC d/b/a Alerian, which has contracted with S&P Opco, LLC (a subsidiary of S&P Dow Jones Indices LLC) (“S&P Dow Jones Indices”) to calculate and maintain the Underlying Index. S&P® is a registered trademark of Standard & Poor’s Financial Services LLC (“SPFS”); Dow Jones® is a registered trademark of Dow Jones Trademark Holdings LLC (“Dow Jones”); and these trademarks have been licensed to S&P Dow Jones Indices. “Calculated by S&P Dow Jones Indices” and its related stylized mark(s) have been licensed for use by Alerian.
The Fund is not sponsored, endorsed, sold or promoted by S&P Dow Jones Indices, SPFS, Dow Jones or any of their affiliates (collectively, “S&P Dow Jones Indices Entities”). S&P Dow Jones Indices Entities do not make any representation or warranty, express or implied, to the owners of the Fund or any member of the public regarding the advisability of investing in securities generally or in the Fund particularly or the ability of the Underlying Index to track general market performance. S&P Dow Jones Indices Entities only relationship to Alerian with respect to the Underlying Index is the licensing of certain trademarks, service marks and trade names of S&P Dow Jones Indices Entities and for the providing of calculation and maintenance services related to the Underlying Index. S&P Dow Jones Indices Entities are not responsible for and have not participated in the determination of the prices and amount of the Fund or the timing of the issuance or sale of the Fund or in the determination or calculation of the equation by which the Fund is to be converted into cash. S&P Dow Jones Indices Entities have no obligation or liability in connection with the administration, marketing or trading of the Fund. S&P Dow Jones Indices LLC is not an investment advisor. Inclusion of a security within the Underlying Index is not a recommendation by S&P Dow Jones Indices Entities to buy, sell, or hold such security, nor is it considered to be investment advice.
S&P DOW JONES INDICES ENTITIES DO NOT GUARANTEE THE ADEQUACY, ACCURACY, TIMELINESS AND/OR THE COMPLETENESS OF THE UNDERLYING INDEX OR ANY DATA RELATED THERETO OR ANY COMMUNICATION, INCLUDING BUT NOT LIMITED TO, ORAL OR WRITTEN COMMUNICATION (INCLUDING ELECTRONIC COMMUNICATIONS) WITH RESPECT THERETO. S&P DOW JONES INDICES ENTITIES SHALL NOT BE SUBJECT TO ANY DAMAGES OR LIABILITY FOR ANY ERRORS, OMISSIONS, OR DELAYS THEREIN. S&P DOW JONES INDICES ENTITIES MAKE NO EXPRESS OR IMPLIED WARRANTIES, AND EXPRESSLY DISCLAIMS ALL WARRANTIES, OF MERCHANTABILITY OR FITNESS FOR A PARTICULAR PURPOSE OR USE OR AS TO RESULTS TO BE OBTAINED BY ALERIAN, OWNERS OF THE FUND, OR ANY OTHER PERSON OR ENTITY FROM THE USE OF THE UNDERLYING INDEX OR WITH RESPECT TO ANY DATA RELATED THERETO. WITHOUT LIMITING ANY OF THE FOREGOING, IN NO EVENT WHATSOEVER SHALL S&P DOW JONES INDICES ENTITIES BE LIABLE FOR ANY INDIRECT, SPECIAL, INCIDENTAL, PUNITIVE, OR CONSEQUENTIAL DAMAGES INCLUDING BUT NOT LIMITED TO, LOSS OF PROFITS, TRADING LOSSES, LOST TIME OR GOODWILL, EVEN IF THEY HAVE BEEN ADVISED OF THE POSSIBILITY OF SUCH DAMAGES, WHETHER IN CONTRACT, TORT, STRICT LIABILITY, OR OTHERWISE.
Intentionally Left Blank
| Performance Overview | 1 |
| Disclosure of Fund Expenses | 3 |
| Schedule of Investments | 4 |
| Statement of Assets & Liabilities | 5 |
| Statement of Operations | 6 |
| Statements of Changes In Net Assets | 7 |
| Financial Highlights | 8 |
| Notes to Financial Statements | 9 |
| Additional Information | 14 |
alpsfunds.com
ALPS Equal Sector Weight ETF
| Performance Overview | May 31, 2017 (Unaudited) |
Investment Objective
The ALPS Equal Sector Weight ETF (the “Fund”) seeks investment results that replicate as closely as possible, before fees and expenses, the performance of the Bank of America Securities – Merrill Lynch Equal Sector Weight Index (the “Underlying Index”).
The Underlying Index is an index of indexes comprised in equal proportions of ten Select Sector SPDR Indexes (the “Underlying Sector Indexes”). These are the Consumer Discretionary Select Sector Index, Consumer Staples Select Sector Index, Materials Select Sector Index, Energy Select Sector Index, Technology Select Sector Index, Utilities Select Sector Index, Financial Select Sector Index, Industrial Select Sector Index, Health Care Select Sector Index and Real Estate Select Sector Index. In order to track the securities in the Underlying Index, the Fund will use a “fund of funds” approach, and seek to achieve its investment objective by investing at least 90% if its total assets in the shares of Select Sector SPDR exchange- traded funds (each, an “Underlying Sector ETF” and collectively, the “Underlying Sector ETFs”) that track the Underlying Sector Indexes of which the Underlying Index is comprised.
The Underlying Index is designed to track performance of the equally weighted Underlying Sector Indexes. Accordingly, each Underlying Index is rebalanced quarterly so that each rebalance will result in each Underlying Sector Index having an Index weight of 10% and the Underlying Sector Indexes in aggregate total to 100%.
Performance (as of May 31, 2017)
| | 6 Months | 1 Year | 3 Year | 5 Year | Since Inception^ |
| ALPS Equal Sector Weight ETF - NAV | 9.07% | 14.56% | 8.36% | 14.02% | 14.86% |
| ALPS Equal Sector Weight ETF - Market Price* | 9.02% | 14.48% | 8.34% | 14.03% | 14.88% |
| Bank of America Securities - Merrill Lynch Equal Sector Weight Index | 8.04% | 12.23% | 6.25% | 11.92% | 12.79% |
S&P 500® Total Return Index | 10.81% | 17.47% | 10.13% | 15.42% | 15.73% |
Total Expense Ratio (per the current Prospectus) 0.51%. Net Expense Ratio (per the current Prospectus) 0.48%. Net expense ratio reflects the reimbursement of distribution fees for underlying sector ETFs. Please see the prospectus for additional information.
Performance data quoted represents past performance. Past performance does not guarantee future results. The table does not reflect the deduction of taxes that a shareholder would pay on Fund distributions or the redemption of Fund shares. Investment return and principal value of an investment will fluctuate so that an investor’s shares, when sold or redeemed, may be worth more or less than the original cost. Current performance data may be higher or lower than actual data quoted. For the most current month-end performance data please visit www.alpsfunds.com or call 1.866.675.2639.
NAV is an exchange-traded fund’s per-share value. The per-share dollar amount of the Fund is derived by dividing the total value of all the securities in its portfolio, less any liabilities, by the number of Fund shares outstanding. Market Price is the price at which a share can currently be traded in the market. Information detailing the number of days the Market Price of the Fund was greater than the Fund’s NAV and the number of days it was less than the Fund’s NAV can be obtained at www.alpsfunds.com.
| ^ | The Fund commenced Investment Operations on July 6, 2009 with an Inception Date, the first day of trading on the Exchange, of July 7, 2009. |
| * | Market Price is based on the midpoint of the bid/ask spread at 4 p.m. ET and does not represent the returns an investor would receive if shares were traded at other times. |
Bank of America Securities - Merrill Lynch Equal Sector Weight Index: a U.S. equity index comprised, in equal weights, of ten sub-indices, and is a total return index.
S&P 500® Total Return Index: the Standard & Poor’s composite index of 500 stocks, a widely recognized, unmanaged index of common stock prices. Total return assumes reinvestment of any dividends and distributions realized during a given time period.
The indexes are not actively managed and do not reflect any deductions for fees, expenses or taxes. The indexes are reported on a total return basis, which assumes reinvestment of any dividends and distributions realized during a given time period. One cannot invest directly in an index. Index performance does not reflect fund performance.
The ALPS Equal Sector Weight ETF is not suitable for all investors. Investments in the Fund are subject to investment risks, including possible loss of the principal amount invested.
ALPS Portfolio Solutions Distributor, Inc., a FINRA member, is the distributor for the Fund.
ALPS Equal Sector Weight ETF
| Performance Overview | May 31, 2017 (Unaudited) |
The following table shows the sector weights of both the Fund and the S&P 500® as of May 31, 2017:
Sector Weighting Comparison (as of May 31, 2017)
| | EQL* | S&P 500® | +/- |
| Technology | 10.44% | 25.38% | -14.94% |
| Utilities | 10.35% | 3.26% | 7.09% |
| Consumer Discretionary | 10.27% | 12.48% | -2.21% |
| Consumer Staples | 10.15% | 9.41% | 0.74% |
| Industrials | 10.13% | 10.16% | -0.03% |
| Real Estate | 10.09% | 2.89% | 7.20% |
| Materials | 9.99% | 2.81% | 7.18% |
| Healthcare | 9.97% | 13.89% | -3.92% |
| Financials | 9.37% | 13.72% | -4.35% |
| Energy | 9.24% | 6.00% | 3.24% |
| Total | 100.00% | 100.00% | |
Source: S&P 500®
Future holdings are subject to change.
Growth of $10,000 (as of May 31, 2017)
Comparison of Change in Value of $10,000 Investment in the Fund and the Indexes
The chart above represents historical performance of a hypothetical investment of $10,000 in the Fund over the life of the Fund. Past performance does not guarantee future results. This chart does not reflect the deduction of taxes that a shareholder would pay on Fund distributions or the redemption of Fund shares.
ALPS Equal Sector Weight ETF
| Disclosure of Fund Expenses | May 31, 2017 (Unaudited) |
Shareholder Expense Example: As a shareholder of the Fund, you incur two types of costs: (1) transaction costs which may include creation and redemption fees or brokerage charges, and (2) ongoing costs, including management fees and other Fund expenses. These examples are intended to help you understand your ongoing costs (in dollars) of investing in the Fund and to compare these costs with the ongoing costs of investing in other funds. The example is based on an investment of $1,000 invested at the beginning of the (six month) period and held through May 31, 2017.
Actual Return: The first line of the table provides information about actual account values and actual expenses. You may use the information in this line, together with the amount you invested, to estimate the expenses that you incurred over the period. Simply divide your account value by $1,000 (for example, an $8,600 account value divided by $1,000 = 8.6), then multiply the result by the number in the first line under the heading entitled “Expenses Paid During Period” to estimate the expenses attributable to your investment during this period.
Hypothetical 5% Return: The second line of the table provides information about hypothetical account values and hypothetical expenses based on the Fund’s actual expense ratio and an assumed rate of return of 5% per year before expenses, which is not the Fund’s actual return. The hypothetical account values and expenses may not be used to estimate the actual ending account balance or expenses you paid for the period. You may use this information to compare ongoing costs of investing in the Fund and other funds. To do so, compare this 5% hypothetical example with the 5% hypothetical examples that appear in the shareholder reports of other funds.
The expenses shown in the table are meant to highlight ongoing Fund costs only and do not reflect any transaction costs, such as creation and redemption fees or brokerage charges. Therefore, the second line of the table is useful in comparing ongoing costs only, and will not help you determine the relative total costs of owning different funds. In addition, if these costs were included, your costs would have been higher.
| | Beginning Account Value 12/1/16 | Ending Account Value 5/31/17 | Expense Ratio(a) | Expenses Paid During Period 12/1/16 - 5/31/17(b) |
| ALPS Equal Sector Weight ETF | | | | |
| Actual | $1,000.00 | $1,090.70 | 0.15% | $0.78 |
Hypothetical (5% return before expenses) | $1,000.00 | $1,024.18 | 0.15% | $0.76 |
(a) | Annualized based on the Fund's most recent half-year expenses. |
(b) | Expenses are equal to the Fund's annualized expense ratio multiplied by the average account value over the period, multiplied by the number of days in the most recent fiscal half year (182), divided by 365. |
ALPS Equal Sector Weight ETF
| Schedule of Investments | May 31, 2017 (Unaudited) |
| SECURITY DESCRIPTION | | | SHARES | | | VALUE | |
| EXCHANGE TRADED FUNDS (100.00%) | | | | | | | |
| Consumer Discretionary (10.27%) | | | | | | | |
Consumer Discretionary Select Sector SPDR® Fund | | | | 183,813 | | | $ | 16,736,174 | |
| | | | | | | | | | |
| Consumer Staples (10.15%) | | | | | | | | | |
Consumer Staples Select Sector SPDR® Fund | | | | 292,070 | | | | 16,542,845 | |
| | | | | | | | | | |
| Energy (9.24%) | | | | | | | | | |
Energy Select Sector SPDR® Fund(a) | | | | 230,056 | | | | 15,054,865 | |
| | | | | | | | | | |
| Financials (9.37%) | | | | | | | | | |
Financial Select Sector SPDR® Fund | | | | 656,768 | | | | 15,269,856 | |
| | | | | | | | | | |
| Healthcare (9.97%) | | | | | | | | | |
Health Care Select Sector SPDR® Fund | | | | 213,651 | | | | 16,254,568 | |
| | | | | | | | | | |
| Industrials (10.13%) | | | | | | | | | |
Industrial Select Sector SPDR® Fund | | | | 244,488 | | | | 16,507,830 | |
| | | | | | | | | | |
| Materials (9.99%) | | | | | | | | | |
Materials Select Sector SPDR® Fund(a) | | | | 306,802 | | | | 16,285,050 | |
| | | | | | | | | | |
| Real Estate (10.09%) | | | | | | | | | |
Real Estate Select Sector SPDR® Fund | | | | 516,334 | | | | 16,450,401 | |
| | | | | | | | | | |
| Technology (10.44%) | | | | | | | | | |
Technology Select Sector SPDR® Fund | | | | 301,050 | | | | 17,018,357 | |
| | | | | | | | | | |
| Utilities (10.35%) | | | | | | | | | |
Utilities Select Sector SPDR® Fund | | | | 313,449 | | | | 16,876,094 | |
| | | | | | | | | | |
TOTAL EXCHANGE TRADED FUNDS (Cost $125,942,704) | | | | | | | | 162,996,040 | |
| | | | | | | | | | |
| | 7 DAY YIELD | | SHARES | | | VALUE | |
| SHORT TERM INVESTMENTS (0.01%) | | | | | | | | | |
| State Street Institutional Treasury Plus Money Market Fund | 0.680% | | | 14,970 | | | | 14,970 | |
| | | | | | | | | | |
TOTAL SHORT TERM INVESTMENTS (Cost $14,970) | | | | | | | | 14,970 | |
| | | | | | | | | | |
TOTAL INVESTMENTS (100.01%) (Cost $125,957,674) | | | | | | | $ | 163,011,010 | |
| | | | | | | | | | |
| NET LIABILITIES LESS OTHER ASSETS (-0.01%) | | | | | | | | (17,724 | ) |
| | | | | | | | | | |
| NET ASSETS (100.00%) | | | | | | | $ | 162,993,286 | |
(a) | Security, or a portion of the security position, is currently on loan. The total market value of securities on loan is $15,524,000. |
Common Abbreviations:
SPDR® - Standard & Poor's Depositary Receipts
See Notes to Financial Statements.
ALPS Equal Sector Weight ETF
| Statement of Assets and Liabilities | May 31, 2017 (Unaudited) |
| ASSETS: | | | |
| Investments, at value | | $ | 163,011,010 | |
Dividends receivable | | | 2,887 | |
Total Assets | | | 163,013,897 | |
| | | | | |
| LIABILITIES: | | | | |
Payable to adviser | | | 20,611 | |
| Total Liabilities | | | 20,611 | |
| NET ASSETS | | $ | 162,993,286 | |
| | | | | |
| NET ASSETS CONSIST OF: | | | | |
| Paid-in capital | | $ | 125,283,370 | |
| Accumulated net investment loss | | | (36,570 | ) |
| Accumulated net realized gain | | | 693,150 | |
Net unrealized appreciation | | | 37,053,336 | |
| NET ASSETS | | $ | 162,993,286 | |
| | | | | |
| INVESTMENTS, AT COST | | $ | 125,957,674 | |
| | | | | |
| PRICING OF SHARES | | | | |
| Net Assets | | $ | 162,993,286 | |
| Shares of beneficial interest outstanding (Unlimited number of shares authorized, par value $0.01 per share) | | | 2,550,000 | |
| Net Asset Value, offering and redemption price per share | | $ | 63.92 | |
See Notes to Financial Statements.
ALPS Equal Sector Weight ETF
| Statement of Operations | For the Six Months Ended May 31, 2017 (Unaudited) |
| INVESTMENT INCOME: | | | |
| Dividends | | $ | 1,737,077 | |
Securities lending income | | | 3,255 | |
Total investment income | | | 1,740,332 | |
| | | | | |
| EXPENSES: | | | | |
Investment adviser fees | | | 282,125 | |
| Total expenses before waiver/reimbursement | | | 282,125 | |
Less fees waiver/reimbursement by investment adviser | | | (167,750 | ) |
Net Expenses | | | 114,375 | |
| NET INVESTMENT INCOME | | | 1,625,957 | |
| REALIZED AND UNREALIZED GAIN/(LOSS) | | | | |
| Net realized gain on investments | | | 1,249,149 | |
Net change in unrealized appreciation on investments | | | 10,089,006 | |
| NET REALIZED AND UNREALIZED GAIN ON INVESTMENTS | | | 11,338,155 | |
| NET INCREASE IN NET ASSETS RESULTING FROM OPERATIONS | | $ | 12,964,112 | |
See Notes to Financial Statements.
ALPS Equal Sector Weight ETF
| Statements of Changes in Net Assets |
| | | For the Six Months Ended May 31, 2017 (Unaudited) | | | For the Year Ended November 30, 2016 | |
| OPERATIONS: | | | | | | |
| Net investment income | | $ | 1,625,957 | | | $ | 4,001,215 | |
| Net realized gain | | | 1,249,149 | | | | 2,016,943 | |
Net change in unrealized appreciation | | | 10,089,006 | | | | 4,873,106 | |
Net increase in net assets resulting from operations | | | 12,964,112 | | | | 10,891,264 | |
| | | | | | | | | |
| DISTRIBUTIONS TO SHAREHOLDERS: | | | | | | | | |
From net investment income | | | (2,793,191 | ) | | | (2,883,195 | ) |
Total distributions | | | (2,793,191 | ) | | | (2,883,195 | ) |
| | | | | | | | | |
| CAPITAL SHARE TRANSACTIONS: | | | | | | | | |
| Proceeds from sale of shares | | | 15,594,942 | | | – | |
Cost of shares redeemed | | | (3,163,247 | ) | | | (8,024,819 | ) |
Net increase/(decrease) from share transactions | | | 12,431,695 | | | | (8,024,819 | ) |
| Net increase/(decrease) in net assets | | | 22,602,616 | | | | (16,750 | ) |
| | | | | | | | | |
| NET ASSETS: | | | | | | | | |
Beginning of period | | | 140,390,670 | | | | 140,407,420 | |
| End of period * | | $ | 162,993,286 | | | $ | 140,390,670 | |
| | | | | | | | | |
| *Including accumulated net investment income/(loss) of: | | $ | (36,570 | ) | | $ | 1,130,664 | |
| | | | | | | | | |
| OTHER INFORMATION: | | | | | | | | |
| CAPITAL SHARE TRANSACTIONS: | | | | | | | | |
| Beginning shares | | | 2,350,000 | | | | 2,500,000 | |
| Shares sold | | | 250,000 | | | – | |
Shares redeemed | | | (50,000 | ) | | | (150,000 | ) |
| Shares outstanding, end of year | | | 2,550,000 | | | | 2,350,000 | |
See Notes to Financial Statements.
ALPS Equal Sector Weight ETF
| Financial Highlights | For a Share Outstanding Throughout the Periods Presented |
| | | For the Six Months Ended May 31, 2017 (Unaudited) | | | For the Year Ended November 30, 2016 | | | For the Year Ended November 30, 2015 | | | For the Year Ended November 30, 2014 | | | For the Year Ended November 30, 2013 | | | For the Year Ended November 30, 2012 | |
| NET ASSET VALUE, BEGINNING OF PERIOD | | $ | 59.74 | | | $ | 56.16 | | | $ | 57.01 | | | $ | 50.11 | | | $ | 39.79 | | | $ | 35.48 | |
| | | | | | | | | | | | | | | | | | | | | | | | | |
| INCOME FROM OPERATIONS: | | | | | | | | | | | | | | | | | | | | | | | | |
Net investment income(a) | | | 0.66 | | | | 1.66 | | | | 1.09 | | | | 0.90 | | | | 0.81 | | | | 0.69 | |
Net realized and unrealized gain/(loss) | | | 4.70 | | | | 3.11 | | | | (0.84 | ) | | | 6.90 | | | | 10.35 | | | | 4.35 | |
Total from investment operations | | | 5.36 | | | | 4.77 | | | | 0.25 | | | | 7.80 | | | | 11.16 | | | | 5.04 | |
| | | | | | | | | | | | | | | | | | | | | | | | | |
| DISTRIBUTIONS: | | | | | | | | | | | | | | | | | | | | | | | | |
| From net investment income | | | (1.18 | ) | | | (1.19 | ) | | | (1.10 | ) | | | (0.90 | ) | | | (0.84 | ) | | | (0.71 | ) |
From tax return of capital | | – | | | – | | | – | | | – | | | – | | | | (0.02 | ) |
Total distributions | | | (1.18 | ) | | | (1.19 | ) | | | (1.10 | ) | | | (0.90 | ) | | | (0.84 | ) | | | (0.73 | ) |
| | | | | | | | | | | | | | | | | | | | | | | | | |
| NET INCREASE/(DECREASE) IN NET ASSET VALUE | | | 4.18 | | | | 3.58 | | | | (0.85 | ) | | | 6.90 | | | | 10.32 | | | | 4.31 | |
| NET ASSET VALUE, END OF PERIOD | | $ | 63.92 | | | $ | 59.74 | | | $ | 56.16 | | | $ | 57.01 | | | $ | 50.11 | | | $ | 39.79 | |
TOTAL RETURN(b) | | | 9.07 | % | | | 8.62 | % | | | 0.48 | % | | | 15.71 | % | | | 28.41 | % | | | 14.35 | % |
| | | | | | | | | | | | | | | | | | | | | | | | | |
| RATIOS/SUPPLEMENTAL DATA: | | | | | | | | | | | | | | | | | | | | | | | | |
| Net assets, end of period (in 000s) | | $ | 162,993 | | | $ | 140,391 | | | $ | 140,407 | | | $ | 139,686 | | | $ | 110,245 | | | $ | 75,592 | |
| Ratio of expenses excluding waiver/reimbursement to average net assets | | | 0.37 | %(c) | | | 0.37 | % | | | 0.37 | % | | | 0.37 | % | | | 0.37 | % | | | 0.37 | % |
| Ratio of expenses including waiver/reimbursement to average net assets | | | 0.15 | %(c) | | | 0.15 | % | | | 0.21 | %(d) | | | 0.34 | % | | | 0.34 | % | | | 0.34 | % |
| Ratio of net investment income excluding waiver/reimbursement to average net assets | | | 1.91 | %(c) | | | 2.71 | % | | | 1.78 | % | | | 1.67 | % | | | 1.77 | % | | | 1.76 | % |
| Ratio of net investment income including waiver/reimbursement to average net assets | | | 2.13 | %(c) | | | 2.93 | % | | | 1.94 | %(d) | | | 1.70 | % | | | 1.80 | % | | | 1.79 | % |
Portfolio turnover rate(e) | | | 4 | % | | | 13 | % | | | 6 | % | | | 3 | % | | | 2 | % | | | 4 | % |
| (a) | Based on average shares outstanding during the period. |
| (b) | Total return is calculated assuming an initial investment made at the net asset value at the beginning of the period and redemption at the net asset value on the last day of the period and assuming all distributions are reinvested at reinvestment prices. |
| (d) | The effective expense ratio including waivers changed from 0.34% to 0.15% effective April 1, 2015 through March 31, 2016. |
| (e) | Portfolio turnover for periods less than one year are not annualized and does not include securities received or delivered from processing creations or redemptions in-kind. |
See Notes to Financial Statements.
ALPS Equal Sector Weight ETF
| Notes to Financial Statements | May 31, 2017 (Unaudited) |
1. ORGANIZATION
ALPS ETF Trust (the “Trust”), a Delaware statutory trust, is an open-end management investment company registered under the Investment Company Act of 1940, as amended (the “1940 Act”). As of May 31, 2017, the Trust consists of twenty separate portfolios. Each portfolio represents a separate series of the Trust. This report pertains solely to the ALPS Equal Sector Weight ETF (the “Fund”). The investment objective of the Fund is to seek investment results that replicate as closely as possible, before fees and expenses, the performance of the Bank of America Securities - Merrill Lynch Equal Sector Weight Index (the “Underlying Index”). The Fund is considered non-diversified and may invest a greater portion of assets in securities of individual issuers than a diversified fund. As a result, changes in the market value of a single investment could cause greater fluctuations in share price than would occur in a diversified fund.
The Fund’s Shares (“Shares”) are listed on the NYSE Arca, Inc. (the “NYSE Arca”). The Fund issues and redeems Shares at net asset value (“NAV”) in blocks of 50,000 Shares each of which is called a “Creation Unit”. Creation Units are issued and redeemed principally in-kind for securities included in the Underlying Index. Except when aggregated in Creation Units, Shares are not redeemable securities of the Fund.
Pursuant to the Trust’s organizational documents, its Officers and Trustees are indemnified against certain liability arising out of the performance of their duties to the Trust. Additionally, in the normal course of business, the Trust enters into contracts with service providers that contain general indemnification clauses. The Trust’s maximum exposure under these arrangements is unknown, as this would involve future claims that may be made against the Trust that have not yet occurred.
2. SIGNIFICANT ACCOUNTING POLICIES
The following is a summary of significant accounting policies consistently followed by the Fund in the preparation of the financial statements. The accompanying financial statements were prepared in accordance with accounting principles generally accepted in the United States of America (“U.S. GAAP”). The preparation of financial statements in conformity with U.S. GAAP requires management to make certain estimates and assumptions that affect the reported amounts of assets and liabilities and disclosures of contingent assets and liabilities at the date of the financial statements and the reported amounts of revenue and expenses during the period. Actual results could differ from those estimates. The Fund is considered an investment company under U.S. GAAP and follows the accounting and reporting guidance applicable to investment companies in the Financial Accounting Standards Board Accounting Standards Codification Topic 946.
A. Portfolio Valuation
The Fund’s NAV is determined daily, as of the close of regular trading on the New York Stock Exchange (the “NYSE”), normally 4:00 p.m. Eastern time, on each day the NYSE is open for trading. The NAV is computed by dividing the value of all assets of the Fund (including accrued interest and dividends), less all liabilities (including accrued expenses and dividends declared but unpaid), by the total number of shares outstanding.
Portfolio securities listed on any exchange other than the NASDAQ Stock Market LLC (“NASDAQ”) are valued at the last sale price on the business day as of which such value is being determined. If there has been no sale on such day, the securities are valued at the mean of the most recent bid and ask prices on such day. Securities traded on the NASDAQ are valued at the NASDAQ Official Closing Price as determined by NASDAQ. Portfolio securities traded on more than one securities exchange are valued at the last sale price on the business day as of which such value is being determined at the close of the exchange representing the principal market for such securities. Portfolio securities traded in the over-the-counter market, but excluding securities traded on the NASDAQ, are valued at the last quoted sale price in such market.
The Fund’s investments are valued at market value or, in the absence of market value with respect to any portfolio securities, at fair value according to procedures adopted by the Trust’s Board of Trustees (the “Board”). When market quotations are not readily available or when events occur that make established valuation methods unreliable, securities of the Fund may be valued in good faith by or under the direction of the Board. These securities generally include, but are not limited to, restricted securities (securities which may not be publicly sold without registration under the Securities Act of 1933) for which a pricing service is unable to provide a market price; securities whose trading has been formally suspended; a security whose market price is not available from a pre-established primary pricing source or the pricing source is not willing to provide a price; a security with respect to which an event has occurred that is most likely to materially affect the value of the security after the market has closed but before the calculation of the Fund’s NAV or make it difficult or impossible to obtain a reliable market quotation; or a security whose price, as provided by the pricing service, does not reflect the security’s “fair value” due to the security being de-listed from a national exchange or the security’s primary trading market is temporarily closed at a time when, under normal conditions, it would be open. As a general principle, the current “fair value” of a security would be the amount which the owner might reasonably expect to receive from the sale on the applicable exchange or principal market. A variety of factors may be considered in determining the fair value of such securities.
ALPS Equal Sector Weight ETF
| Notes to Financial Statements | May 31, 2017 (Unaudited) |
B. Fair Value Measurements
The Fund discloses the classification of its fair value measurements following a three-tier hierarchy based on the inputs used to measure fair value. Inputs refer broadly to the assumptions that market participants would use in pricing the asset or liability, including assumptions about risk. Inputs may be observable or unobservable. Observable inputs reflect the assumptions market participants would use in pricing the asset or liability that are developed based on market data obtained from sources independent of the reporting entity. Unobservable inputs reflect the reporting entity’s own assumptions about the assumptions market participants would use in pricing the asset or liability that are developed based on the best information available.
Valuation techniques used to value the Fund’s investments by major category are as follows:
Exchange Traded Funds, for which market quotations are readily available, are valued at the last reported sale price or official closing price as reported by a third party pricing vendor on the primary market or exchange on which they are traded and are categorized as Level 1 in the hierarchy. In the event there were no sales during the day or closing prices are not available, securities are valued at the mean of the most recent quoted bid and ask prices on such day and are generally categorized as Level 2 in the hierarchy. Investments in open-end mutual funds are valued at their closing NAV each business day and are categorized as Level 1 in the hierarchy.
Changes in valuation techniques may result in transfers in or out of an assigned level within the disclosure hierarchy.
Various inputs are used in determining the value of the Fund’s investments as of the end of the reporting period. When inputs used fall into different levels of the fair value hierarchy, the level in the hierarchy within which the fair value measurement falls is determined based on the lowest level input that is significant to the fair value measurement in its entirety. The designated input levels are not necessarily an indication of the risk or liquidity associated with these investments.
These inputs are categorized in the following hierarchy under applicable financial accounting standards:
| Level 1 – | Unadjusted quoted prices in active markets for identical investments, unrestricted assets or liabilities that a Fund has the ability to access at the measurement date; |
| Level 2 – | Quoted prices which are not active, quoted prices for similar assets or liabilities in active markets or inputs other than quoted prices that are observable (either directly or indirectly) for substantially the full term of the asset or liability; and |
| Level 3 – | Significant unobservable prices or inputs (including the Fund’s own assumptions in determining the fair value of investments) where there is little or no market activity for the asset or liability at the measurement date. |
The following is a summary of inputs used to value the Fund’s investments at May 31, 2017:
| Investments in Securities at Value* | | Level 1 - Unadjusted Quoted Prices | | | Level 2 - Significant Observable Inputs | | | Level 3 - Significant Unobservable Inputs | | | Total | |
| Exchange Traded Funds | | $ | 162,996,040 | | | $ | – | | | $ | – | | | $ | 162,996,040 | |
Short Term Investments | | | 14,970 | | | | – | | | | – | | | | 14,970 | |
| TOTAL | | $ | 163,011,010 | | | $ | – | | | $ | – | | | $ | 163,011,010 | |
| * | For a detailed sector breakdown, see the accompanying Schedule of Investments. |
The Fund recognizes transfers between levels as of the end of the period. For the six months ended May 31, 2017, the Fund did not have any transfers between Level 1 and Level 2 securities. The Fund did not have any securities that used significant unobservable inputs (Level 3) in determining fair value.
C. Securities Transactions and Investment Income
Securities transactions are recorded as of the trade date. Realized gains and losses from securities transactions are recorded on the highest cost basis. Dividend income and capital gains distributions, if any, are recorded on the ex-dividend date. Interest income, if any, is recorded on the accrual basis.
D. Dividends and Distributions to Shareholders
Dividends from net investment income of the Fund, if any, are declared and paid quarterly or as the Board may determine from time to time. Distributions of net realized capital gains earned by the Fund, if any, are distributed at least annually.
ALPS Equal Sector Weight ETF
| Notes to Financial Statements | May 31, 2017 (Unaudited) |
E. Federal Tax and Tax Basis Information
The timing and character of income and capital gain distributions are determined in accordance with income tax regulations, which may differ from U.S. GAAP. Reclassifications are made to the Fund’s capital accounts for permanent tax differences to reflect income and gains available for distribution (or available capital loss carryforwards) under income tax regulations. The amounts and characteristics of tax basis distributions and composition of distributable earnings/(accumulated losses) are finalized at fiscal year-end; accordingly, tax basis balances have not been determined as of May 31, 2017.
The tax character of the distributions paid during the fiscal year ended November 30, 2016 was as follows:
| | | Ordinary Income | |
| November 30, 2016 | | | |
| ALPS Equal Sector Weight ETF | | $ | 2,883,195 | |
At November 30, 2016, the Fund had available for tax purposes unused post-enactment capital loss carryforwards as follows:
| Fund | | Short-Term | | | Long-Term | |
| ALPS Equal Sector Weight ETF | | $ | 70,503 | | | $ | 407,184 | |
As of May 31, 2017, the cost of investments for federal income tax purposes and accumulated net unrealized appreciation/(depreciation) on investments were as follows:
| Gross appreciation (excess of value over tax cost) | | $ | 39,327,838 | |
Gross depreciation (excess of tax cost over value) | | | (2,359,043 | ) |
| Net unrealized appreciation (depreciation) | | | 36,968,795 | |
| Cost of investments for income tax purposes | | $ | 126,042,215 | |
The differences between book-basis and tax-basis are primarily due to the deferral of losses from wash sales.
F. Income Taxes
No provision for income taxes is included in the accompanying financial statements, as the Fund intends to distribute to shareholders all taxable investment income and realized gains and otherwise comply with Subchapter M of the Internal Revenue Code of 1986, as amended, applicable to regulated investment companies. The Fund evaluates tax positions taken (or expected to be taken) in the course of preparing the Fund’s tax returns to determine whether these positions meet a “more-likely-than-not” standard that, based on the technical merits, have a more than fifty percent likelihood of being sustained by a taxing authority upon examination. A tax position that meets the “more-likely-than-not” recognition threshold is measured to determine the amount of benefit to recognize in the financial statements.
As of and during the six months ended May 31, 2017, the Fund did not have a liability for any unrecognized tax benefits. The Fund files U.S. federal, state, and local tax returns as required. The Fund’s tax returns are subject to examination by the relevant tax authorities until expiration of the applicable statute of limitations, which is generally three years after the filing of the tax return, but may extend to four years in certain jurisdictions. Tax returns for open years have incorporated no uncertain tax positions that require a provision for income taxes.
G. Lending of Portfolio Securities
The Fund has entered into a securities lending agreement with State Street Bank & Trust Co. (“SSB”), the Fund’s lending agent. The Fund may lend its portfolio securities only to borrowers that are approved by SSB. The Fund will limit such lending to not more than 33 1/3% of the value of its total assets. The Fund’s securities held at SSB as custodian shall be available to be lent except those securities the Fund or ALPS Advisors Inc. specifically identifies in writing as not being available for lending. The borrower pledges and maintains with the Fund collateral consisting of cash (U.S. Dollars only), securities issued or guaranteed by the U.S. government or its agencies or instrumentalities, and cash equivalents (including irrevocable bank letters of credit) issued by a person other than the borrower or an affiliate of the borrower. The initial collateral received by the Fund is required to have a value of no less than 102% of the market value of the loaned securities for U.S equity securities and a value of no less than 105% of the market value for non-U.S. equity securities. The collateral is maintained thereafter, at a market value equal to not less than 102% of the current value of the U.S. equity securities on loan and not less than 105% of the current value of the non-U.S. equity securities on loan. The market value of the loaned securities is determined at the close of each business day and any additional required collateral is delivered to the Fund on the next business day. During the term of the loan, the Fund is entitled to all distributions made on or in respect of the loaned securities. Loans of securities are terminable at any time and the borrower, after notice, is required to return borrowed securities within the customary time period for settlement of securities transactions.
ALPS Equal Sector Weight ETF
| Notes to Financial Statements | May 31, 2017 (Unaudited) |
Any cash collateral received is reinvested in a money market fund managed by SSB as disclosed in the Fund’s Schedule of Investments and is reflected in the Statements of Assets and Liabilities as a payable for collateral upon return of securities loaned. Non-cash collateral, in the form of securities issued or guaranteed by the U.S. government or its agencies or instrumentalities, is not disclosed in the Fund’s Statements of Assets and Liabilities as it is held by the lending agent on behalf of the Fund, and the Fund does not have the ability to re-hypothecate these securities. Income earned by the Fund from securities lending activity is disclosed in the Statement of Operations.
The following is a summary of the Fund’s securities lending agreement and related cash and non-cash collateral received as of May 31, 2017:
| | | Market Value of Securities on Loan | | | | Non-Cash Collateral Received | | | |
| ALPS Equal Sector Weight ETF | | $ | 15,524,000 | | | $ | – | | | $ | 15,843,750 | | | $ | 15,843,750 | |
The risks of securities lending include the risk that the borrower may not provide additional collateral when required or may not return the securities when due. To mitigate these risks, the Fund benefits from a borrower default indemnity provided by SSB. SSB’s indemnity allows for full replacement of securities lent wherein SSB will purchase the unreturned loaned securities on the open market by applying the proceeds of the collateral, or to the extent such proceeds are insufficient or the collateral is unavailable, SSB will purchase the unreturned loan securities at SSB’s expense. However, the Fund could suffer a loss if the value of the investments purchased with cash collateral falls below the value of the cash collateral received.
The following table reflects a breakdown of transactions accounted for as secured borrowings, the gross obligation by the type of collateral pledged or securities loaned, and the remaining contractual maturity of those transactions as of May 31, 2017:
| ALPS Equal Sector Weight ETF | | | | | Remaining contractual maturity of the agreement | | | | |
| | | | | | | | | | | | | | | | |
| Securities Lending Transactions | | | | | Up to 30 days | | | 30-90 days | | | Greater than 90 days | | | Total | |
Exchange Traded Funds | | $ | – | | | $ | – | | | $ | – | | | $ | – | | | $ | – | |
| Total Borrowings | | | | | | | | | | | | | | | | | | | – | |
Gross amount of recognized liabilities for securities lending (collateral received) | | | | | | | $ | – | |
3. INVESTMENT ADVISORY FEE AND OTHER AFFILIATED TRANSACTIONS
ALPS Advisors, Inc. (the “Adviser”) acts as the Fund’s investment adviser pursuant to an Advisory Agreement with the Trust on behalf of the Fund (the “Advisory Agreement”). Pursuant to the Advisory Agreement, the Fund pays the Adviser a unitary fee for the services and facilities it provides payable on a monthly basis at the annual rate of 0.37% of the Fund’s average daily net assets.
The Adviser has agreed to waive 0.19% of its annual unitary fee payable by the Fund on a voluntary basis.
ALPS Portfolio Solutions Distributor, Inc. (“APSD”) is both the distributor for the Fund as well as the Select Sector SPDR exchange traded funds (“Underlying Sector ETFs”) that the Fund invests in. As required by exemptive relief obtained by the Underlying Sector ETFs, the Adviser will reimburse the Fund an amount equal to the distribution fee received by APSD from the Underlying Sector ETFs attributable to the Fund’s investment in the Underlying Sector ETFs, for so long as APSD acts as the distributor to the Fund and the Underlying Sector ETFs. Such reimbursement is generally expected to equal 0.03% annually.
Out of the unitary management fee, the Adviser pays substantially all expenses of the Fund, including the cost of transfer agency, custody, fund administration, legal, audit, independent trustees and other services, except for acquired fund fees and expenses, interest expenses, distribution fees or expenses, brokerage expenses, taxes and extraordinary expenses not incurred in the ordinary course of the Fund’s business. The Adviser’s unitary management fee is designed to pay substantially all of the Fund’s expenses and to compensate the Adviser for providing services for the Fund.
ALPS Fund Services, Inc., an affiliate of the Adviser, is the administrator of the Fund.
ALPS Equal Sector Weight ETF
| Notes to Financial Statements | May 31, 2017 (Unaudited) |
Each Trustee who is not an officer or employee of the Adviser, any sub-adviser or any of their affiliates (“Independent Trustees”) receives (1) a quarterly retainer of $5,000, (2) a per meeting fee for regularly scheduled meetings of $3,750, (3) $1,500 for any special meeting held outside of a regularly scheduled board meeting, and (4) reimbursement for all reasonable out-of-pocket expenses relating to attendance at meetings.
4. PURCHASES AND SALES OF SECURITIES
For the six months ended May 31, 2017, the cost of purchases and proceeds from sales of investment securities, excluding short-term investments and in-kind transactions, were as follows:
| Fund | | Purchases | | | Sales | |
| ALPS Equal Sector Weight ETF | | $ | 6,420,221 | | | $ | 7,567,093 | |
For the six months ended May 31, 2017 , the cost in-kind purchases and proceeds from in-kind sales were as follows:
| Fund | | Purchases | | | Sales | |
| ALPS Equal Sector Weight ETF | | $ | 15,595,380 | | | $ | 3,086,238 | |
For the six months ended May 31, 2017, the ALPS Equal Sector Weight ETF had in-kind net realized gain of $1,391,743.
Gains on in-kind transactions are generally not considered taxable gains for federal income tax purposes.
5. CAPITAL SHARE TRANSACTIONS
Shares are created and redeemed by the Fund only in Creation Unit size aggregations of 50,000 Shares. Only broker-dealers or large institutional investors with creation and redemption agreements called Authorized Participants (“AP”) are permitted to purchase or redeem Creation Units from the Fund. Such transactions are generally permitted on an in-kind basis, with a balancing cash component to equate the transaction to the NAV per unit of the Fund on the transaction date. Cash may be substituted equivalent to the value of certain securities generally when they are not available in sufficient quantity for delivery, not eligible for trading by the AP or as a result of other market circumstances.
6. SUBSEQUENT EVENTS
On October 13, 2016, the Securities and Exchange Commission (“SEC”) amended Regulation S-X, which will require standardized, enhanced disclosure about derivatives in investment company financial statements, as well as other amendments. The compliance date for the amendments to Regulation S-X is August 1, 2017. Management is currently evaluating the impact to the financial statements and disclosures.
ALPS Equal Sector Weight ETF
| Additional Information | May 31, 2017 (Unaudited) |
PROXY VOTING RECORDS, POLICIES AND PROCEDURES
Information regarding how the Fund voted proxies relating to portfolio securities during the most recent 12-month period ended June 30 and a description of the Fund’s proxy voting policies and procedures used in determining how to vote for proxies are available without charge on the SEC’s website at www.sec.gov and upon request, by calling (toll-free) 1-866-675-2639.
PORTFOLIO HOLDINGS
The Trust is required to disclose, after its first and third fiscal quarters, the complete schedule of the Fund’s portfolio holdings with the SEC on Form N-Q. Forms N-Q for the Fund are available on the SEC’s website at www.sec.gov. The Fund’s Forms N-Q may also be reviewed and copied at the SEC’s Public Reference Room in Washington, D.C. and information on the operation of the Public Reference Room may be obtained by calling 1- 800-SEC-0330. The Fund’s Forms N-Q are available without charge, upon request, by calling (toll-free) 1-866-675-2639 or by writing to ALPS ETF Trust at 1290 Broadway, Suite 1100, Denver, Colorado 80203.
TAX INFORMATION
The Fund designated the following for federal income tax purposes for distributions made during the calendar year ended December 31, 2016:
| | Qualified Dividend Income | Dividend Received Deduction |
| ALPS Equal Sector Weight ETF | 71.63% | 88.88% |
In early 2017, if applicable, shareholders of record received this information for the distributions paid to them by the Fund during the calendar year 2016 via Form 1099. The Fund will notify shareholders in early 2018 of amounts paid to them by the Fund, if any, during the calendar year 2017.
LICENSING AGREEMENT
Merrill Lynch, Pierce, Fenner & Smith Incorporated (“Merrill Lynch” or the “Licensor”) has entered into an index licensing agreement with ALPS Advisors Inc. (the “Advisor”) to allow the Advisor’s use of the Underlying Index of the ALPS Equal Sector Weight ETF (the “Fund”). The following disclosure relates to the Licensor:
The Fund is not issued, sponsored, endorsed, sold or promoted by Merrill Lynch or its affiliates (“Licensor”). Licensor makes no representation or warranty, express or implied, to the owners of the Fund or any member of the public regarding the advisability of investing in securities generally or in the Fund particularly or the ability of the Bank of America Securities Merrill Lynch Equal Sector Weight Index (“Index”) to track general market performance. Licensor’s only relationship to the Licensee is the licensing of the Index which is determined, composed and calculated by Licensor without regard to the Licensee or the Fund. Licensor has no obligation to take the needs of the Licensee or the owners of the Fund into consideration in determining, composing or calculating the Index. Licensor is not responsible for and has not participated in the determination of the timing of, prices at, or quantities of the Fund to be issued or in the determination or calculation of the equation by which the Fund is to be converted into cash. Licensor has no obligation or liability in connection with the issuance, administration, marketing or trading of the Fund.
LICENSOR DOES NOT GUARANTEE THE QUALITY, ACCURACY AND/OR THE COMPLETENESS OF THE INDEX OR ANY DATA INCLUDED THEREIN AND SHALL HAVE NO LIABILITY FOR ERRORS OR OMISSIONS OF ANY KIND RELATED TO THE INDEX OR DATA. LICENSOR MAKES NO WARRANTY, EXPRESS OR IMPLIED, AS TO RESULTS TO BE OBTAINED BY LICENSEE, OWNERS OF THE FUND, OR ANY OTHER PERSON OR ENTITY FROM THE USE OF THE INDEX OR ANY DATA INCLUDED THEREIN IN CONNECTION WITH THE RIGHTS LICENSED TO LICENSEE OR FOR ANY OTHER USE. LICENSOR MAKES NO EXPRESS OR IMPLIED WARRANTIES, AND HEREBY EXPRESSLY DISCLAIMS ALL WARRANTIES OF MERCHANTABILITY OR FITNESS FOR A PARTICULAR PURPOSE OR USE WITH RESPECT TO THE INDEX OR ANY DATA INCLUDED THEREIN. WITHOUT LIMITING ANY OF THE FOREGOING, IN NO EVENT SHALL LICENSOR HAVE ANY LIABILITY FOR ANY SPECIAL, PUNITIVE, INDIRECT, OR CONSEQUENTIAL DAMAGES (INCLUDING LOST PROFITS), EVEN IF NOTIFIED OF THE POSSIBILITY OF SUCH DAMAGES.
The Advisor does not guarantee the accuracy and/or the completeness of the Underlying Index or any data included therein, and the Advisor shall have no liability for any errors, omissions or interruptions therein. The Advisor makes no warranty, express or implied, as to results to be obtained by the Fund, owners of the Shares of the Fund or any other person or entity from the use of the Underlying Index or any data included therein. The Advisor makes no express or implied warranties, and expressly disclaims all warranties of merchantability or fitness for a particular purpose or use with respect to the Underlying Index or any data included therein. Without limiting any of the foregoing, in no event shall the Advisor have any liability for any special, punitive, direct, indirect or consequential damages (including lost profits) arising out of matters relating to the use of the Underlying Index even if notified of the possibility of such damages.
Intentionally Left Blank
| Performance Overview | 1 |
| Disclosure of Fund Expenses | 4 |
| Schedule of Investments | 5 |
| Statement of Assets & Liabilities | 8 |
| Statement of Operations | 9 |
| Statements of Changes In Net Assets | 10 |
| Financial Highlights | 11 |
| Notes to Financial Statements | 12 |
| Additional Information | 18 |
alpsfunds.com
ALPS Medical Breakthroughs ETF
| Performance Overview | May 31, 2017 (Unaudited) |
Investment Objective
ALPS Medical Breakthroughs ETF (the “Fund”) employs a “passive management” – or indexing – investment approach designed to seek investment results that correspond (before fees and expenses) generally to the performance of the Poliwogg Medical Breakthroughs IndexSM (the “Underlying Index”).
The Underlying Index is comprised of small- and mid-cap stocks of biotechnology and pharmaceutical companies that have one or more drugs in either Phase II or Phase III U.S. Food and Drug Administration ("FDA") clinical trials. In a Phase II trial, the drug is administered to a group of 100-300 people to see if it is effective and to evaluate its safety. In a Phase III trial, the drug is given to a larger group, between 500-3,000 people, to confirm its effectiveness, monitor side effects, compare it to commonly used treatments and collect information that will allow the drug or treatment to be used safely. Stocks selected for inclusion in the Underlying Index must be listed on a U.S. stock exchange. Underlying Index constituents must have a market capitalization of no less than $200 million and no more than $5 billion. Stocks included in the Underlying Index must also sustain an average daily trading volume in excess of $1 million for the 90-day period preceding an Underlying Index reconstitution. Constituents must be able to sustain the monthly rates at which they use shareholder capital ("cash burn rates") for at least 24 months. The Underlying Index is reconstituted semi-annually on the third Fridays of June and December.
Growth Of $10,000 (as of May 31, 2017)
Comparison of change in value of a $10,000 investment in the Fund and the Index
The chart above represents historical performance of a hypothetical investment of $10,000 in the Fund over the life of the Fund. Performance calculations are as of the end of each month. Past performance does not guarantee future results. This chart does not reflect the deduction of taxes that a shareholder would pay on Fund distributions or the redemption of Fund shares.
ALPS Medical Breakthroughs ETF
| Performance Overview | May 31, 2017 (Unaudited) |
Fund Performance (as of May 31, 2017)
| | 6 Months | 1 Year | Since Inception^ |
| ALPS Medical Breakthroughs ETF - NAV | 1.24% | -3.59% | -0.30% |
| ALPS Medical Breakthroughs ETF - Market Price* | 1.20% | -3.70% | -0.32% |
| Poliwogg Medical Breakthroughs Total Return Index | 1.33% | -3.36% | 0.11% |
| NASDAQ Biotechnology Total Return Index | 4.69% | 2.76% | -2.18% |
Total Expense Ratio (per the current prospectus) 0.50%
Performance data quoted represents past performance. Past performance does not guarantee future results. Investment return and principal value of an investment will fluctuate so that an investor’s shares, when sold or redeemed, may be worth more or less than the original cost. Current performance data may be higher or lower than actual data quoted. For most current month-end performance data please visit www.alpsfunds.com or call 1.844.234.5852.
NAV is an exchange-traded fund’s per-share value. The per-share dollar amount of the fund is derived by dividing the total value of all the securities in its portfolio, less any liabilities, by the number of fund shares outstanding. Market Price is the price at which a share can currently be traded in the market. Information detailing the number of days the Market Price of the Fund was greater than the Fund’s NAV and the number of days it was less than the Fund’s NAV can be obtained at www.alpsfunds.com.
| ^ | The Fund commenced investment operations on December 31, 2014. |
| * | Market Price is based on the midpoint of the bid-ask spread at 4 p.m. ET and does not represent the returns an investor would receive if shares were traded at other times. |
NASDAQ Biotechnology Total Return Index (Ticker: NBI) is a modified market capitalization-weighted index designed to measure the performance of the all NASDAQ stocks in the biotechnology sector. Total return assumes reinvestment of any dividends and distributions realized during a given time period.
Poliwogg Medical Breakthroughs Total Return Index is designed to capture research and development opportunities in the pharmaceutical industry. PMBI consists of small-cap and mid-cap pharmaceutical and biotechnology stocks listed on U.S. stock exchanges that have one or more drugs in either Phase II or Phase III U.S. FDA clinical trials. Total return assumes reinvestment of any dividends and distributions realized during a given time period.
One cannot invest directly in an index. Index performance does not reflect fund performance.
Companies in the pharmaceuticals and biotechnology industry may be subject to extensive litigation based on product liability and similar claims. Legislation introduced or considered by certain governments on such industries or on the healthcare sector cannot be predicted.
Companies in the pharmaceuticals industry are subject to competitive forces that may make it difficult to raise prices and, in fact, may result in price discounting. The profitability of some companies in the pharmaceuticals industry may be dependent on a relatively limited number of products. In addition, their products can become obsolete due to industry innovation, changes in technologies or other market developments. Many new products in the pharmaceuticals industry are subject to government approvals, regulation and reimbursement rates. The process of obtaining government approvals may be long and costly. Many companies in the pharmaceuticals industry are heavily dependent on patents and intellectual property rights. The loss or impairment of these rights may adversely affect the profitability of these companies.
The development of new drugs generally has a high failure rate, and such failures may negatively impact the stock price of the company developing the failed drug. Biotechnology companies may have persistent losses during a new product’s transition from development to production. In order to fund operations, biotechnology companies may require financing from the capital markets, which may not always be available on satisfactory terms or at all.
The Fund’s shares are not individually redeemable. Investors buy and sell shares of the Fund on a secondary market. Only market makers or “authorized participants” may trade directly with the Fund, typically in blocks of 50,000 shares.
The ALPS Medical Breakthroughs ETF is not suitable for all investors. Investments in the Fund are subject to investment risks, including possible loss of the principal amount invested.
ALPS Portfolio Solutions Distributor, Inc., a FINRA member, is the Distributor for the ALPS Medical Breakthroughs ETF.
ALPS Portfolio Solutions Distributor, Inc. is not affiliated with S-Network Global Indexes, Inc.
ALPS Medical Breakthroughs ETF
| Performance Overview | May 31, 2017 (Unaudited) |
Top Ten Holdings* (as of May 31, 2017)
| Alnylam Pharmaceuticals, Inc. | 5.01% |
| Ionis Pharmaceuticals, Inc. | 4.82% |
| Exelixis, Inc. | 4.10% |
| Taro Pharmaceutical Industries, Ltd. | 3.89% |
| Akorn, Inc. | 3.69% |
| Kite Pharma, Inc. | 3.53% |
| Galapagos NV, Sponsored ADR | 3.38% |
| Neurocrine Biosciences, Inc. | 3.37% |
| ACADIA Pharmaceuticals, Inc. | 2.77% |
| Bluebird Bio, Inc. | 2.74% |
| Total % of Top 10 Holdings | 37.30% |
| * | % of Total Investments (excluding investments purchased with collateral from securities loaned) |
Future holdings are subject to change.
Sector Allocation* (as of May 31, 2017)
ALPS Medical Breakthroughs ETF
| Disclosure of Fund Expenses | May 31, 2017 (Unaudited) |
Shareholder Expense Example: As a shareholder of the Fund, you incur two types of costs: (1) transaction costs which may include creation and redemption fees or brokerage charges, and (2) ongoing costs, including management fees and other Fund expenses. These examples are intended to help you understand your ongoing costs (in dollars) of investing in the Fund and to compare these costs with the ongoing costs of investing in other funds. It is based on an investment of $1,000 invested at the beginning of the (six month) period and held through May 31, 2017.
Actual Return: The first line of the table provides information about actual account values and actual expenses. You may use the information in this line, together with the amount you invested, to estimate the expenses that you incurred over the period. Simply divide your account value by $1,000 (for example, an $8,600 account value divided by $1,000 = 8.6), then multiply the result by the number in the first line under the heading entitled “Expenses Paid During Period” to estimate the expenses attributable to your investment during this period.
Hypothetical 5% Return: The second line of the table provides information about hypothetical account values and hypothetical expenses based on the Fund’s actual expense ratio and an assumed rate of return of 5% per year before expenses, which is not the Fund’s actual return. The hypothetical account values and expenses may not be used to estimate the actual ending account balance or expenses you paid for the period. You may use this information to compare ongoing costs of investing in the Fund and other funds. To do so, compare this 5% hypothetical example with the 5% hypothetical examples that appear in the shareholder reports of the other funds.
The expenses shown in the table are meant to highlight ongoing Fund costs only and do not reflect any transaction costs, such as creation and redemption fees, or brokerage charges. Therefore, the second line is useful in comparing ongoing costs only, and will not help you determine the relative total costs of owning different funds. In addition, if these costs were included, your costs would have been higher.
| | Beginning Account Value 12/1/16 | Ending Account Value 5/31/17 | Expense Ratio(a) | Expenses Paid During Period 12/1/16 - 5/31/17(b) |
| ALPS Medical Breakthroughs ETF | | | | |
| Actual | $1,000.00 | $1,012.40 | 0.50% | $2.51 |
| Hypothetical (5% return before expenses) | $1,000.00 | $1,022.44 | 0.50% | $2.52 |
| (a) | Annualized, based on the Fund's most recent fiscal half year expenses. |
| (b) | Expenses are equal to the Fund's annualized expense ratio multiplied by the average account value over the period, multiplied by the number of days in the most recent fiscal half year (182), divided by 365. |
ALPS Medical Breakthroughs ETF
| Schedule of Investments | May 31, 2017 (Unaudited) |
| Security Description | | Shares | | | Value | |
| COMMON STOCKS (99.90%) | | | | | | |
| Biotechnology (74.90%) | | | | | | |
AC Immune SA(a)(b) | | | 50,678 | | | $ | 451,034 | |
ACADIA Pharmaceuticals, Inc.(b) | | | 110,795 | | | | 2,848,539 | |
Acceleron Pharma, Inc.(b) | | | 34,533 | | | | 880,937 | |
Achillion Pharmaceuticals, Inc.(a)(b) | | | 125,038 | | | | 556,419 | |
Acorda Therapeutics, Inc.(b) | | | 42,455 | | | | 585,879 | |
Adamas Pharmaceuticals, Inc.(b) | | | 20,110 | | | | 309,292 | |
Adaptimmune Therapeutics Plc, ADR(a)(b) | | | 64,756 | | | | 341,912 | |
Aduro Biotech, Inc.(b) | | | 61,456 | | | | 614,560 | |
Advanced Accelerator Applications SA, ADR(a)(b) | | | 40,228 | | | | 1,519,814 | |
Agios Pharmaceuticals, Inc.(b) | | | 38,635 | | | | 1,803,095 | |
Aimmune Therapeutics, Inc.(b) | | | 45,784 | | | | 760,014 | |
Akebia Therapeutics, Inc.(b) | | | 35,060 | | | | 469,804 | |
Alder Biopharmaceuticals, Inc.(b) | | | 46,116 | | | | 710,186 | |
Alnylam Pharmaceuticals, Inc.(b) | | | 78,688 | | | | 5,150,917 | |
AMAG Pharmaceuticals, Inc.(b) | | | 31,412 | | | | 543,428 | |
Aquinox Pharmaceuticals, Inc.(a)(b) | | | 21,426 | | | | 273,396 | |
Ardelyx, Inc.(b) | | | 43,296 | | | | 203,491 | |
Ascendis Pharma A/S, ADR(a)(b) | | | 28,840 | | | | 687,834 | |
Atara Biotherapeutics, Inc.(b) | | | 26,404 | | | | 349,853 | |
Axovant Sciences, Ltd.(b) | | | 90,714 | | | | 1,940,372 | |
Bluebird Bio, Inc.(b) | | | 37,364 | | | | 2,815,377 | |
Celldex Therapeutics, Inc.(a)(b) | | | 111,862 | | | | 316,569 | |
ChemoCentryx, Inc.(b) | | | 43,732 | | | | 290,381 | |
Chimerix, Inc.(b) | | | 42,370 | | | | 189,818 | |
Concert Pharmaceuticals, Inc.(b) | | | 20,377 | | | | 255,935 | |
DBV Technologies SA, Sponsored ADR(b) | | | 44,103 | | | | 1,464,220 | |
Emergent BioSolutions, Inc.(b) | | | 37,223 | | | | 1,188,530 | |
Enanta Pharmaceuticals, Inc.(b) | | | 17,416 | | | | 523,873 | |
Epizyme, Inc.(b) | | | 53,066 | | | | 758,844 | |
Exelixis, Inc.(b) | | | 225,213 | | | | 4,213,735 | |
FibroGen, Inc.(b) | | | 57,782 | | | | 1,519,667 | |
Five Prime Therapeutics, Inc.(b) | | | 26,018 | | | | 735,009 | |
Flexion Therapeutics, Inc.(b) | | | 28,473 | | | | 486,604 | |
Galapagos NV, Sponsored ADR(b) | | | 42,183 | | | | 3,472,926 | |
Global Blood Therapeutics, Inc.(b) | | | 38,802 | | | | 1,047,654 | |
Halozyme Therapeutics, Inc.(b) | | | 118,461 | | | | 1,397,840 | |
Inotek Pharmaceuticals Corp.(a)(b) | | | 24,638 | | | | 41,885 | |
Intercept Pharmaceuticals, Inc.(a)(b) | | | 22,692 | | | | 2,539,235 | |
Ionis Pharmaceuticals, Inc.(b) | | | 108,180 | | | | 4,953,562 | |
Ironwood Pharmaceuticals, Inc.(b) | | | 119,988 | | | | 2,124,988 | |
Juno Therapeutics, Inc.(a)(b) | | | 96,852 | | | | 2,249,872 | |
Kite Pharma, Inc.(a)(b) | | | 50,163 | | | | 3,627,788 | |
Ligand Pharmaceuticals, Inc.(b) | | | 19,076 | | | | 2,065,549 | |
Loxo Oncology, Inc.(b) | | | 23,373 | | | | 1,066,977 | |
MacroGenics, Inc.(b) | | | 31,869 | | | | 565,675 | |
Minerva Neurosciences, Inc.(b) | | | 31,839 | | | | 262,672 | |
Myovant Sciences, Ltd.(a)(b) | | | 55,124 | | | | 781,658 | |
Neurocrine Biosciences, Inc.(b) | | | 79,694 | | | | 3,464,298 | |
OncoMed Pharmaceuticals, Inc.(b) | | | 33,930 | | | | 110,612 | |
Ophthotech Corp.(b) | | | 32,656 | | | | 74,129 | |
Otonomy, Inc.(b) | | | 27,621 | | | | 338,357 | |
| PDL BioPharma, Inc. | | | 151,440 | | | | 361,942 | |
Portola Pharmaceuticals, Inc.(b) | | | 51,725 | | | | 1,906,066 | |
ALPS Medical Breakthroughs ETF
| Schedule of Investments | May 31, 2017 (Unaudited) |
| Security Description | | Shares | | | Value | |
| Biotechnology (74.90%) (continued) | | | | | | |
Progenics Pharmaceuticals, Inc.(b) | | | 64,085 | | | $ | 408,221 | |
PTC Therapeutics, Inc.(b) | | | 31,394 | | | | 393,367 | |
Radius Health, Inc.(a)(b) | | | 39,439 | | | | 1,365,378 | |
Sage Therapeutics, Inc.(b) | | | 34,000 | | | | 2,247,740 | |
Seres Therapeutics, Inc.(b) | | | 36,918 | | | | 336,692 | |
Spark Therapeutics, Inc.(b) | | | 28,148 | | | | 1,433,578 | |
Ultragenyx Pharmaceutical, Inc.(b) | | | 38,173 | | | | 2,055,616 | |
Versartis, Inc.(b) | | | 31,830 | | | | 488,591 | |
| Total Biotechnology | | | | | | | 76,942,206 | |
| | | | | | | | | |
| Pharmaceuticals (25.00%) | | | | | | | | |
Aclaris Therapeutics, Inc.(b) | | | 23,831 | | | | 566,701 | |
Aerie Pharmaceuticals, Inc.(b) | | | 30,538 | | | | 1,693,332 | |
Akorn, Inc.(b) | | | 113,815 | | | | 3,786,625 | |
Clearside Biomedical, Inc.(a)(b) | | | 22,456 | | | | 154,497 | |
Depomed, Inc.(b) | | | 56,810 | | | | 595,369 | |
Endo International Plc(b) | | | 203,967 | | | | 2,688,285 | |
Foamix Pharmaceuticals, Ltd.(a)(b) | | | 34,001 | | | | 149,944 | |
GW Pharmaceuticals Plc, ADR(b) | | | 23,149 | | | | 2,282,723 | |
Horizon Pharma Plc(b) | | | 147,521 | | | | 1,475,210 | |
Impax Laboratories, Inc.(b) | | | 67,466 | | | | 1,028,857 | |
Lannett Co., Inc.(a)(b) | | | 34,019 | | | | 683,782 | |
Neuroderm, Ltd.(b) | | | 24,092 | | | | 574,594 | |
Novan, Inc.(a)(b) | | | 14,582 | | | | 72,181 | |
Ocular Therapeutix, Inc.(a)(b) | | | 26,307 | | | | 268,331 | |
Pacira Pharmaceuticals, Inc.(b) | | | 34,217 | | | | 1,519,235 | |
Reata Pharmaceuticals, Inc., Class A(a)(b) | | | 8,189 | | | | 226,262 | |
Revance Therapeutics, Inc.(b) | | | 26,086 | | | | 580,414 | |
SciClone Pharmaceuticals, Inc.(b) | | | 47,089 | | | | 447,346 | |
Sucampo Pharmaceuticals, Inc., Class A(a)(b) | | | 41,933 | | | | 419,330 | |
Supernus Pharmaceuticals, Inc.(b) | | | 45,850 | | | | 1,723,960 | |
Taro Pharmaceutical Industries, Ltd.(a)(b) | | | 37,535 | | | | 4,001,606 | |
TherapeuticsMD, Inc.(a)(b) | | | 179,835 | | | | 746,315 | |
| Total Pharmaceuticals | | | | | | | 25,684,899 | |
| | | | | | | | | |
TOTAL COMMON STOCKS (Cost $126,140,154) | | | | | | | 102,627,105 | |
| | | | | | | | | |
RIGHTS (0.00%)(c) | | | | | | | | |
Biotechnology (0.00%)(c) | | | | | | | | |
Dyax Corp. - CVR (Expiring 12/31/2019)(b) | | | 170,016 | | | | 1,700 | |
| Total Biotechnology | | | | | | | 1,700 | |
| | | | | | | | | |
TOTAL RIGHTS (Cost $–) | | | | | | | 1,700 | |
| | | 7 Day Yield | | | Shares | | | Value | |
| SHORT TERM INVESTMENTS (4.55%) | | | | | | | | | |
| Money Market Fund (0.11%) | | | | | | | | | |
| State Street Institutional Treasury Plus Money Market Fund (Cost $113,159) | | | 0.680 | % | | | 113,159 | | | | 113,159 | |
ALPS Medical Breakthroughs ETF
| Schedule of Investments | May 31, 2017 (Unaudited) |
| | 7 Day Yield | | Shares | | | Value | |
| Investments Purchased with Collateral from Securities Loaned (4.44%) | | | | | | | |
| State Street Navigator Securities Lending Prime Portfolio, 0.78% (Cost $4,564,730) | | | | 4,564,730 | | | | 4,564,730 | |
| | | | | | | | | | |
TOTAL SHORT TERM INVESTMENTS (Cost $4,677,889) | | | | | | | $ | 4,677,889 | |
| | | | | | | | | | |
TOTAL INVESTMENTS (104.45%) (Cost $130,818,043) | | | | | | | $ | 107,306,694 | |
| | | | | | | | | | |
| NET LIABILITIES LESS OTHER ASSETS (-4.45%) | | | | | | | | (4,575,573 | ) |
| | | | | | | | | | |
| NET ASSETS (100.00%) | | | | | | | $ | 102,731,121 | |
| (a) | Security, or a portion of the security position, is currently on loan. The total market value of securities on loan is $10,177,039. |
| (b) | Non-income producing security. |
| (c) | Less than 0.005% of Net Assets. |
See Notes to Financial Statements.
ALPS Medical Breakthroughs ETF
| Statement of Assets and Liabilities | May 31, 2017 (Unaudited) |
| ASSETS: | | | |
| Investments, at value | | $ | 107,306,694 | |
| Dividends receivable | | | 34,412 | |
| Total Assets | | | 107,341,106 | |
| | | | | |
| LIABILITIES: | | | | |
| Payable to adviser | | | 45,255 | |
| Payable for collateral upon return of securities loaned | | | 4,564,730 | |
| Total Liabilities | | | 4,609,985 | |
| NET ASSETS | | $ | 102,731,121 | |
| | | | | |
| NET ASSETS CONSIST OF: | | | | |
| Paid-in capital | | $ | 164,375,446 | |
| Accumulated net investment loss | | | (590,440 | ) |
| Accumulated net realized loss | | | (37,542,536 | ) |
| Net unrealized depreciation | | | (23,511,349 | ) |
| NET ASSETS | | $ | 102,731,121 | |
| | | | | |
| INVESTMENTS, AT COST | | $ | 130,818,043 | |
| | | | | |
| PRICING OF SHARES | | | | |
| Net Assets | | $ | 102,731,121 | |
| Shares of beneficial interest outstanding (Unlimited number of shares authorized, par value $0.01 per share) | | | 4,200,000 | |
| Net Asset Value, offering and redemption price per share | | $ | 24.46 | |
See Notes to Financial Statements.
ALPS Medical Breakthroughs ETF
| Statement of Operations | For the Six Months Ended May 31, 2017 (Unaudited) |
| INVESTMENT INCOME: | | | |
| Dividends | | $ | 173 | |
| Securities Lending Income | | | 179,547 | |
| Total Investment Income | | | 179,720 | |
| | | | | |
| EXPENSES: | | | | |
| Investment adviser fees | | | 259,604 | |
| Total Expenses | | | 259,604 | |
| NET INVESTMENT LOSS | | | (79,884 | ) |
| | | | | |
| REALIZED AND UNREALIZED GAIN/LOSS | | | | |
| Net realized loss on investments | | | (8,731,731 | ) |
| Net change in unrealized appreciation on investments | | | 9,390,970 | |
| NET REALIZED AND UNREALIZED GAIN ON INVESTMENTS | | | 659,239 | |
| NET INCREASE IN NET ASSETS RESULTING FROM OPERATIONS | | $ | 579,355 | |
See Notes to Financial Statements.
ALPS Medical Breakthroughs ETF
Statements of Changes in Net Assets
| | For the Six Months Ended May 31, 2017 (Unaudited) | | | For the Year Ended November 30, 2016 | |
| OPERATIONS: | | | | | | |
| Net investment loss | | $ | (79,884 | ) | | $ | (480,047 | ) |
| Net realized loss | | | (8,731,731 | ) | | | (30,798,551 | ) |
| Net change in unrealized appreciation/(depreciation) | | | 9,390,970 | | | | (12,050,766 | ) |
| Net increase/(decrease) in net assets resulting from operations | | | 579,355 | | | | (43,329,364 | ) |
| | | | | | | | | |
| CAPITAL SHARE TRANSACTIONS: | | | | | | | | |
| Proceeds from sale of shares | | | 7,873,642 | | | | 38,083,584 | |
| Cost of shares redeemed | | | (24,091,785 | ) | | | (47,208,086 | ) |
| Net decrease from capital share transactions | | | (16,218,143 | ) | | | (9,124,502 | ) |
| Net decrease in net assets | | | (15,638,788 | ) | | | (52,453,866 | ) |
| | | | | | | | | |
| NET ASSETS: | | | | | | | | |
| Beginning of period | | | 118,369,909 | | | | 170,823,775 | |
| End of period * | | $ | 102,731,121 | | | $ | 118,369,909 | |
| | | | | | | | | |
| *Including accumulated net investment loss of: | | $ | (590,440 | ) | | $ | (510,556 | ) |
| | | | | | | | | |
| OTHER INFORMATION: | | | | | | | | |
| CAPITAL SHARE TRANSACTIONS: | | | | | | | | |
| Beginning shares | | | 4,900,000 | | | | 5,300,000 | |
| Shares sold | | | 300,000 | | | | 1,550,000 | |
| Shares redeemed | | | (1,000,000 | ) | | | (1,950,000 | ) |
| Shares outstanding, end of period | | | 4,200,000 | | | | 4,900,000 | |
See Notes to Financial Statements.
ALPS Medical Breakthroughs ETF
| Financial Highlights | For a Share Outstanding Throughout the Periods Presented |
| | | For the Six Months Ended May 31, 2017 (Unaudited) | | | For the Year Ended November 30, 2016 | | | For the Period December 31, 2014 (Commencement of Operations) to November 30, 2015 | |
| NET ASSET VALUE, BEGINNING OF PERIOD | | $ | 24.16 | | | $ | 32.23 | | | $ | 24.64 | |
| | | | | | | | | | | | | |
| INCOME/(LOSS) FROM INVESTMENT OPERATIONS: | | | | | | | | | | | | |
Net investment loss (a) | | | (0.02 | ) | | | (0.09 | ) | | | (0.13 | ) |
| Net realized and unrealized gain/(loss) | | | 0.32 | | | | (7.98 | ) | | | 7.72 | |
| Total from investment operations | | | 0.30 | | | | (8.07 | ) | | | 7.59 | |
| | | | | | | | | | | | | |
| Net increase/(decrease) in net asset value | | | 0.30 | | | | (8.07 | ) | | | 7.59 | |
| NET ASSET VALUE, END OF PERIOD | | $ | 24.46 | | | $ | 24.16 | | | $ | 32.23 | |
TOTAL RETURN(b) | | | 1.24 | % | | | (25.04 | )% | | | 30.80 | % |
| | | | | | | | | | | | | |
| RATIOS/SUPPLEMENTAL DATA: | | | | | | | | | | | | |
| Net assets, end of period (000s) | | $ | 102,731 | | | $ | 118,370 | | | $ | 170,824 | |
| | | | | | | | | | | | | |
| Ratio of expenses to average net assets | | | 0.50 | %(c) | | | 0.50 | % | | | 0.50 | %(c) |
| Ratio of net investment loss to average net assets | | | (0.15 | )%(c) | | | (0.38 | )% | | | (0.42 | )%(c) |
Portfolio turnover rate(d) | | | 20 | % | | | 62 | % | | | 25 | % |
| (a) | Based on average shares outstanding during the period. |
| (b) | Total return is calculated assuming an initial investment made at the net asset value at the beginning of the period and redemption at the net asset value on the last day of the period and assuming all distributions are reinvested at reinvestment prices. Total return calculated for a period of less than one year is not annualized. |
(d) | Portfolio turnover for periods less than one year are not annualized and does not include securities received or delivered from processing creations or redemptions in-kind. |
See Notes to Financial Statements.
ALPS Medical Breakthroughs ETF
| Notes to Financial Statements | May 31, 2017 (Unaudited) |
1. ORGANIZATION
The ALPS ETF Trust (the “Trust”), a Delaware statutory trust, is an open-end management investment company registered under the Investment Company Act of 1940, as amended (the “1940 Act”). As of May 31, 2017, the Trust consisted of twenty separate portfolios. Each portfolio represents a separate series of the Trust. This report pertains solely to the ALPS Medical Breakthroughs ETF (the “Fund”). The investment objective of the Fund is to seek investment results that correspond generally, before fees and expenses, to the performance of the Poliwogg Medical Breakthroughs IndexSM (the “Underlying Index”). The Fund is considered non-diversified and may invest a greater portion of assets in securities of individual issuers than a diversified fund. As a result, changes in the market value of a single investment could cause greater fluctuations in share price than would occur in a diversified fund.
The Fund’s Shares (“Shares”) are listed on the NYSE Arca, Inc. (the “NYSE Arca”). The Fund issues and redeems Shares at net asset value (“NAV”) in blocks of 50,000 Shares, each of which is called a “Creation Unit”. Creation Units are issued and redeemed principally in-kind for securities included in the Underlying Index. Except when aggregated in Creation Units, Shares are not redeemable securities of the Fund.
Pursuant to the Trust’s organizational documents, its Officers and Trustees are indemnified against certain liability arising out of the performance of their duties to the Trust. Additionally, in the normal course of business, the Trust enters into contracts with service providers that contain general indemnification clauses. The Trust’s maximum exposure under these arrangements is unknown, as this would involve future claims that may be made against the Trust that have not yet occurred.
2. SIGNIFICANT ACCOUNTING POLICIES
The following is a summary of significant accounting policies consistently followed by the Fund in the preparation of the financial statements. The accompanying financial statements were prepared in accordance with accounting principles generally accepted in the United States of America (“U.S. GAAP”). The preparation of financial statements in conformity with U.S. GAAP requires management to make certain estimates and assumptions that affect the reported amounts of assets and liabilities and disclosures of contingent assets and liabilities at the date of the financial statements and the reported amounts of revenue and expenses during the period. Actual results could differ from those estimates. The Fund is considered an investment company under U.S. GAAP and follows the accounting and reporting guidance applicable to investment companies in the Financial Accounting Standards Board Accounting Standards Codification Topic 946.
A. Portfolio Valuation
The Fund’s NAV is determined daily, as of the close of regular trading on the New York Stock Exchange (the “NYSE”), normally 4:00 p.m. Eastern time, on each day the NYSE is open for trading. The NAV is computed by dividing the value of all assets of the Fund (including accrued interest and dividends), less all liabilities (including accrued expenses and dividends declared but unpaid), by the total number of shares outstanding.
Portfolio securities listed on any exchange other than the NASDAQ Stock Market LLC (“NASDAQ”) are valued at the last sale price on the business day as of which such value is being determined. If there has been no sale on such day, the securities are valued at the mean of the most recent bid and ask prices on such day. Securities traded on the NASDAQ are valued at the NASDAQ Official Closing Price as determined by NASDAQ. Portfolio securities traded on more than one securities exchange are valued at the last sale price on the business day as of which such value is being determined at the close of the exchange representing the principal market for such securities. Portfolio securities traded in the over-the-counter market, but excluding securities traded on the NASDAQ, are valued at the last quoted sale price in such market.
The Fund’s investments are valued at market value or, in the absence of market value with respect to any portfolio securities, at fair value according to procedures adopted by the Trust’s Board of Trustees (the “Board”). When market quotations are not readily available or when events occur that make established valuation methods unreliable, securities of the Fund may be valued in good faith by or under the direction of the Board. These securities generally include, but are not limited to, restricted securities (securities which may not be publicly sold without registration under the Securities Act of 1933) for which a pricing service is unable to provide a market price; securities whose trading has been formally suspended; a security whose market price is not available from a pre-established primary pricing source or the pricing source is not willing to provide a price; a security with respect to which an event has occurred that is most likely to materially affect the value of the security after the market has closed but before the calculation of the Fund’s NAV or make it difficult or impossible to obtain a reliable market quotation; or a security whose price, as provided by the pricing service, does not reflect the security’s “fair value” due to the security being de-listed from a national exchange or the security’s primary trading market is temporarily closed at a time when, under normal conditions, it would be open. As a general principle, the current “fair value” of a security would be the amount which the owner might reasonably expect to receive from the sale on the applicable exchange or principal market. A variety of factors may be considered in determining the fair value of such securities.
ALPS Medical Breakthroughs ETF
| Notes to Financial Statements | May 31, 2017 (Unaudited) |
B. Fair Value Measurements
The Fund discloses the classification of its fair value measurements following a three-tier hierarchy based on the inputs used to measure fair value. Inputs refer broadly to the assumptions that market participants would use in pricing the asset or liability; including assumptions about risk. Inputs may be observable or unobservable. Observable inputs reflect the assumptions market participants would use in pricing the asset or liability that are developed based on market data obtained from sources independent of the reporting entity. Unobservable inputs reflect the reporting entity’s own assumptions about the assumptions market participants would use in pricing the asset or liability that are developed based on the best information available.
Valuation techniques used to value the Fund's investments by major category are as follows:
Equity securities, including restricted securities, for which market quotations are readily available, are valued at the last reported sale price or official closing price as reported by a third party pricing vendor on the primary market or exchange on which they are traded and are categorized as Level 1 in the hierarchy. In the event there were no sales during the day or closing prices are not available, securities are valued at the mean of the most recent quoted bid and ask prices on such day and are generally categorized as Level 2 in the hierarchy. Investments in open-end mutual funds are valued at their closing NAV each business day and are categorized as Level 1 in the hierarchy.
Changes in valuation techniques may result in transfers in or out of an assigned level within the disclosure hierarchy.
Various inputs are used in determining the value of the Fund’s investments as of the end of the reporting period. When inputs used fall into different levels of the fair value hierarchy, the level in the hierarchy within which the fair value measurement falls is determined based on the lowest level input that is significant to the fair value measurement in its entirety. The designated input levels are not necessarily an indication of the risk or liquidity associated with these investments.
These inputs are categorized in the following hierarchy under applicable financial accounting standards:
| Level 1 – | Unadjusted quoted prices in active markets for identical investments, unrestricted assets or liabilities that a Fund has the ability to access at the measurement date; |
| Level 2 – | Quoted prices which are not active, quoted prices for similar assets or liabilities in active markets or inputs other than quoted prices that are observable (either directly or indirectly) for substantially the full term of the asset or liability; and |
| Level 3 – | Significant unobservable prices or inputs (including the Fund’s own assumptions in determining the fair value of investments) where there is little or no market activity for the asset or liability at the measurement date. |
The following is a summary of the inputs used to value the Fund’s investments as of May 31, 2017:
| Investments in Securities at Value | | Level 1 - Unadjusted Quoted Prices | | | Level 2 - Other Significant Observable Inputs | | | Level 3 - Significant Unobservable Inputs | | | Total | |
Common Stocks* | | $ | 102,627,105 | | | $ | – | | | $ | – | | | $ | 102,627,105 | |
Rights* | | | – | | | | 1,700 | | | | – | | | | 1,700 | |
| Short Term Investments | | | | | | | | | | | | | | | | |
| Money Market Fund | | | 113,159 | | | | – | | | | – | | | | 113,159 | |
| Investments Purchased with Collateral from Securities Loaned | | | 4,564,730 | | | | – | | | | – | | | | 4,564,730 | |
| TOTAL | | $ | 107,304,994 | | | $ | 1,700 | | | $ | – | | | $ | 107,306,694 | |
| * | For a detailed sector breakdown, see the accompanying Schedule of Investments. |
The Fund recognizes transfers between levels as of the end of the period. For the six months ended May 31, 2017, the Fund did not have any transfers between Level 1 and Level 2 securities. The Fund did not have any securities that used significant unobservable inputs (Level 3) in determining fair value.
ALPS Medical Breakthroughs ETF
| Notes to Financial Statements | May 31, 2017 (Unaudited) |
C. Other Risks
Equity Risk: A principal risk of investing in the Fund is equity risk, which is the risk that the value of the securities held by the Fund will fall due to general market and economic conditions, perceptions regarding the industries in which the issuers of securities held by the Fund participate or factors relating to specific companies in which the Fund invests. For example, an adverse event, such as an unfavorable earnings report, may depress the value of equity securities of an issuer held by the Fund; the price of common stock of an issuer may be particularly sensitive to general movements in the stock market; or a drop in the stock market may depress the price of most or all of the common stocks and other equity securities held by the Fund. In addition, common stock of an issuer in the Fund’s portfolio may decline in price if the issuer fails to make anticipated dividend payments because, among other reasons, the issuer of the security experiences a decline in its financial condition.
Small- and Mid- Capitalization Company Risk: Investments in securities of small and mid-capitalization companies are subject to the risks of common stocks. Investments in smaller companies may involve greater risks because these companies generally have a limited track record. Smaller companies often have narrower markets, more limited managerial and financial resources and a less diversified product offering than larger, more established companies. As a result, their performance can be more volatile, which may increase the volatility of the Fund’s portfolio.
Concentration Risk: The Fund seeks to track the Underlying Index, which itself currently is concentrated in the pharmaceuticals and biotechnology industries and may have concentration in certain other industries or sectors, as well as regions, economies or markets. Underperformance or increased risk in such other concentrated areas may result in underperformance or increased risk in the Fund.
Non-Correlation Risk: The Fund’s return may not match the return of the Underlying Index for a number of reasons. For example, the Fund incurs a number of operating expenses not applicable to the Underlying Index, and incurs costs in buying and selling securities, especially when rebalancing the Fund’s securities holdings to reflect changes in the composition of the Underlying Index. In addition, the performance of the Fund and the Underlying Index may vary due to asset valuation differences and differences between the Fund’s portfolio and the Underlying Index resulting from legal restrictions. Due to legal and regulatory rules and limitations, the Fund may not be able to invest in all securities included in the Underlying Index. For tax efficiency purposes, the Fund may sell certain securities to realize losses, causing it to deviate from the Underlying Index. The Fund may not be fully invested at times, either as a result of cash flows into the Fund or reserves of cash held by the Fund to meet redemptions and expenses. If the Fund utilizes a sampling approach or otherwise does not hold all of the securities in the Underlying Index, its return may not correlate as well with the return on the Underlying Index, as would be the case if it purchased all of the securities in the Underlying Index with the same weightings as the Underlying Index.
D. Securities Transactions and Investment Income
Securities transactions are recorded as of the trade date. Realized gains and losses from securities transactions are recorded on the highest cost basis. Dividend income and capital gains distributions, if any, are recorded on the ex-dividend date. Interest income, if any, is recorded on the accrual basis.
E. Dividends and Distributions to Shareholders
Dividends from net investment income of the Fund, if any, are declared and paid annually or as the Board may determine from time to time. Distributions of net realized capital gains earned by the Fund, if any, are distributed at least annually.
F. Federal Tax and Tax Basis Information (not updated)
The timing and character of income and capital gain distributions are determined in accordance with income tax regulations, which may differ from U.S. GAAP. Reclassifications are made to the Fund’s capital accounts for permanent tax differences to reflect income and gains available for distribution (or available capital loss carryforwards) under income tax regulations. The amounts and characteristics of tax basis distributions and composition of distributable earnings/(accumulated losses) are finalized at fiscal year-end; accordingly, tax basis balances have not been determined as of May 31, 2017.
There were no distributions paid for the year ended November 30, 2016.
At November 30, 2016, the Fund’s post-enactment capital losses deferred to the next tax year were as follows:
| Fund | | Short-Term | | | Long-Term | |
| ALPS Medical Breakthroughs ETF | | $ | 26,933,506 | | | $ | 598,618 | |
The Fund elected to defer to the period ending November 30, 2017, late year ordinary losses in the amount of $449,363.
ALPS Medical Breakthroughs ETF
| Notes to Financial Statements | May 31, 2017 (Unaudited) |
As of May 31, 2017, the cost of investments for federal income tax purposes and accumulated net unrealized appreciation/(depreciation) on investments were as follows:
| | | ALPS Medical Breakthroughs ETF | |
| Gross appreciation (excess of value over tax cost) | | $ | 12,880,045 | |
| Gross depreciation (excess of tax cost over value) | | | (36,623,455 | ) |
| Net unrealized appreciation (depreciation) | | $ | (23,743,410 | ) |
| Cost of investments for income tax purposes | | $ | 131,050,104 | |
The differences between book-basis and tax-basis are primarily due to Passive Foreign Investment Company (“PFIC”) adjustments and the deferral of losses due to wash sales.
G. Income Taxes
No provision for income taxes is included in the accompanying financial statements, as the Fund intends to distribute to shareholders all taxable investment income and realized gains and otherwise comply with Subchapter M of the Internal Revenue Code of 1986, as amended, applicable to regulated investment companies. The Fund evaluates tax positions taken (or expected to be taken) in the course of preparing the Fund’s tax returns to determine whether these positions meet a “more-likely-than-not” standard that, based on the technical merits, have a more than fifty percent likelihood of being sustained by a taxing authority upon examination. A tax position that meets the “more-likely-than-not” recognition threshold is measured to determine the amount of benefit to recognize in the financial statements.
As of and during the six months ended May 31, 2017, the Fund did not have a liability for any unrecognized tax benefits. The Fund files U.S. federal, state, and local tax returns as required. The Fund’s tax returns are subject to examination by the relevant tax authorities until expiration of the applicable statute of limitations, which is generally three years after the filing of the tax return, but may extend to four years in certain jurisdictions. Tax returns for open years have incorporated no uncertain tax positions that require a provision for income taxes.
H. Lending of Portfolio Securities
The Fund has entered into a securities lending agreement with State Street Bank & Trust Co. (“SSB”), the Fund’s lending agent. The Fund may lend its portfolio securities only to borrowers that are approved by SSB. The Fund will limit such lending to not more than 33 1/3% of the value of its total assets. The Fund’s securities held at SSB as custodian shall be available to be lent except those securities the Fund or ALPS Advisors Inc. specifically identifies in writing as not being available for lending. The borrower pledges and maintains with the Fund collateral consisting of cash (U.S. Dollars only), securities issued or guaranteed by the U.S. government or its agencies or instrumentalities, and cash equivalents (including irrevocable bank letters of credit) issued by a person other than the borrower or an affiliate of the borrower. The initial collateral received by the Fund is required to have a value of no less than 102% of the market value of the loaned securities for U.S equity securities and a value of no less than 105% of the market value for non-U.S. equity securities. The collateral is maintained thereafter, at a market value equal to not less than 102% of the current value of the U.S. equity securities on loan and not less than 105% of the current value of the non-U.S. equity securities on loan. The market value of the loaned securities is determined at the close of each business day and any additional required collateral is delivered to the Fund on the next business day. During the term of the loan, the Fund is entitled to all distributions made on or in respect of the loaned securities. Loans of securities are terminable at any time and the borrower, after notice, is required to return borrowed securities within the customary time period for settlement of securities transactions.
Any cash collateral received is reinvested in a money market fund managed by SSB as disclosed in the Fund’s Schedule of Investments and is reflected in the Statements of Assets and Liabilities as a payable for collateral upon return of securities loaned. Non-cash collateral, in the form of securities issued or guaranteed by the U.S. government or its agencies or instrumentalities, is not disclosed in the Fund’s Statements of Assets and Liabilities as it is held by the lending agent on behalf of the Fund, and the Fund does not have the ability to re-hypothecate these securities. Income earned by the Fund from securities lending activity is disclosed in the Statement of Operations.
The following is a summary of the Fund's securities lending agreement and related cash and non-cash collateral received as of May 31, 2017:
| | | Market Value of Securities on Loan | | Cash Collateral Received | | Non-Cash Collateral Received | | Total Collateral Received | |
| ALPS Medical Breakthroughs ETF | | $ | 10,177,039 | | | $ | 4,564,730 | | | $ | 5,755,441 | | | $ | 10,320,171 | |
The risks of securities lending include the risk that the borrower may not provide additional collateral when required or may not return the securities when due. To mitigate these risks, the Fund benefits from a borrower default indemnity provided by SSB. SSB’s indemnity allows for full replacement of securities lent wherein SSB will purchase the unreturned loaned securities on the open market by applying the proceeds of the collateral, or to the extent such proceeds are insufficient or the collateral is unavailable, SSB will purchase the unreturned loan securities at SSB’s expense. However, the Fund could suffer a loss if the value of the investments purchased with cash collateral falls below the value of the cash collateral received.
ALPS Medical Breakthroughs ETF
| Notes to Financial Statements | May 31, 2017 (Unaudited) |
The following table reflects a breakdown of transactions accounted for as secured borrowings, the gross obligation by the type of collateral pledged or securities loaned, and the remaining contractual maturity of those transactions as of May 31, 2017:
| ALPS Medical Breakthroughs ETF | | Remaining contractual maturity of the lending agreement | |
| Securities Lending Transactions | | Overnight & Continuous | | | Up to 30 days | | | 30-90 days | | | Greater than 90 days | | | Total | |
| Common Stocks | | $ | 4,564,730 | | | $ | – | | | $ | – | | | $ | – | | | $ | 4,564,730 | |
| Total Borrowings | | | | | | | | | | | | | | | | | | | 4,564,730 | |
| Gross amount of recognized liabilities for securities lending (collateral received) | | | | | | | | | | | | | | | $ | 4,564,730 | |
3. INVESTMENT ADVISORY FEE AND OTHER AFFILIATED TRANSACTIONS
ALPS Advisors, Inc. (the “Adviser”) acts as the Fund’s investment adviser pursuant to an Advisory Agreement with the Trust on behalf of the Fund (the “Advisory Agreement”). Pursuant to the Advisory Agreement, the Fund pays the Adviser a unitary fee for the services and facilities it provides, payable on a monthly basis at the annual rate of 0.50% of the Fund’s average daily net assets. From time to time, the Adviser may waive all or a portion of its fee.
Out of the unitary management fee, the Adviser pays substantially all expenses of the Fund, including the licensing fees to the Index provider, the cost of transfer agency, custody, fund administration, legal, audit, independent trustees and other services, except for interest expenses, distribution fees or expenses, brokerage expenses, taxes and extraordinary expenses not incurred in the ordinary course of the Fund’s business. The Adviser’s unitary management fee is designed to pay substantially all the Fund’s expenses and to compensate the Adviser for providing services for the Fund.
ALPS Fund Services, Inc., an affiliate of the Adviser, is the administrator of the Fund.
Each Trustee who is not an officer or employee of the Adviser, any sub-adviser or any of their affiliates (“Independent Trustees”) receives (1) a quarterly retainer of $5,000, (2) a per meeting fee for regularly scheduled meetings of $3,750, (3) $1,500 for any special meeting held outside of a regularly scheduled board meeting, and (4) reimbursement for all reasonable out-of-pocket expenses relating to attendance at meetings.
4. PURCHASES AND SALES OF SECURITIES
For the six months ended May 31, 2017, the cost of purchases and proceeds from sales of investment securities, excluding in-kind transactions and short-term investments, were as follows:
| Fund | | Purchases | | | Sales | |
| ALPS Medical Breakthroughs ETF | | $ | 21,284,088 | | | $ | 21,434,798 | |
For the six months ended May 31, 2017, the cost of in-kind purchases and proceeds from in-kind sales were as follows:
| Fund | | Purchases | | | Sales | |
| ALPS Medical Breakthroughs ETF | | $ | 7,873,141 | | | $ | 24,093,219 | |
For the six months ended May 31, 2017, the ALPS Medical Breakthroughs ETF had in-kind net realized loss of $94,247.
Gains on in-kind transactions are not considered taxable for federal income tax purposes and losses on in kind transactions are also not deductible for tax purposes.
ALPS Medical Breakthroughs ETF
| Notes to Financial Statements | May 31, 2017 (Unaudited) |
5. CAPITAL SHARE TRANSACTIONS
Shares are created and redeemed by the Fund only in Creation Unit size aggregations of 50,000 Shares. Only broker-dealers or large institutional investors with creation and redemption agreements called Authorized Participants (“AP”) are permitted to purchase or redeem Creation Units from the Fund. Such transactions are generally permitted on an in-kind basis, with a balancing cash component to equate the transaction to the NAV per unit of the Fund on the transaction date. Cash may be substituted equivalent to the value of certain securities generally when they are not available in sufficient quantity for delivery, not eligible for trading by the AP or as a result of other market circumstances.
6. SUBSEQUENT EVENTS
On October 13, 2016, the Securities and Exchange Commission (“SEC”) amended Regulation S-X, which will require standardized, enhanced disclosure about derivatives in investment company financial statements, as well as other amendments. The compliance date for the amendments to Regulation S-X is August 1, 2017. Management is currently evaluating the impact to the financial statements and disclosures.
ALPS Medical Breakthroughs ETF
| Additional Information | May 31, 2017 (Unaudited) |
PROXY VOTING RECORDS, POLICIES AND PROCEDURES
Information regarding how the Fund voted proxies relating to portfolio securities during the most recent 12-month period ended June 30 and a description of the Fund’s proxy voting policies and procedures used in determining how to vote for proxies are available without charge on the SEC’s website at www.sec.gov and upon request, by calling (toll-free) 1-866-675-2639.
PORTFOLIO HOLDINGS
The Trust is required to disclose, after its first and third fiscal quarters, the complete schedule of the Fund’s portfolio holdings with the SEC on Form N-Q. Forms N-Q for the Fund are available on the SEC’s website at www.sec.gov. The Fund’s Forms N-Q may also be reviewed and copied at the SEC’s Public Reference Room in Washington, D.C. and information on the operation of the Public Reference Room may be obtained by calling 1-800-SEC-0330. The Fund’s Forms N-Q are available without charge, upon request, by calling (toll-free) 1-866-675-2639 or by writing to ALPS ETF Trust at 1290 Broadway, Suite 1100, Denver, Colorado 80203.
LICENSING AGREEMENT
The Poliwogg Medical Breakthroughs IndexSM is a service mark of S-Network Global Indexes, Inc. and has been licensed for use by ALPS Advisors, Inc. The ALPS Medical Breakthroughs ETF is not sponsored, endorsed, sold or promoted by S-Network Global Indexes, Inc. and S-Network Global Indexes, Inc. makes no representation regarding the advisability of investing in the ALPS Medical Breakthroughs ETF.
The ALPS Medical Breakthroughs ETF is not sponsored, endorsed, sold or promoted by Standard & Poor’s, a division of The McGraw-Hill Companies, Inc. (“S&P”) or its third party licensors. Neither S&P nor its third party licensors make any representation or warranty, express or implied, to the owners of the ALPS Medical Breakthroughs ETF or any member of the public regarding the advisability of investing in securities generally or in the ALPS Medical Breakthroughs ETF particularly or the ability of the Poliwogg Medical Breakthroughs IndexSM to track general stock market performance. S&P’s and its third party licensor’s only relationship to S-Network Global Indexes, LLC is the licensing of certain trademarks, service marks and trade names of S&P and/or its third party licensors and for the providing of calculation and maintenance services related to the Poliwogg Medical Breakthroughs IndexSM. Neither S&P nor its third party licensors is responsible for and has not participated in the determination of the prices and amount of the ALPS Medical Breakthroughs ETF or the timing of the issuance or sale of the ALPS Medical Breakthroughs ETF or in the determination or calculation of the equation by which the ALPS Medical Breakthroughs ETF is to be converted into cash. S&P has no obligation or liability in connection with the administration, marketing or trading of the ALPS Medical Breakthroughs ETF.
NEITHER S&P, ITS AFFILIATES NOR THEIR THIRD PARTY LICENSORS GUARANTEE THE ADEQUACY, ACCURACY, TIMELINESS OR COMPLETENESS OF THE POLIWOGG MEDICAL BREAKTHROUGHS INDEXSM OR ANY DATA INCLUDED THEREIN OR ANY COMMUNICATIONS, INCLUDING BUT NOT LIMITED TO, ORAL OR WRITTEN COMMUNICATIONS (INCLUDING ELECTRONIC COMMUNICATIONS) WITH RESPECT THERETO. S&P, ITS AFFILIATES AND THEIR THIRD PARTY LICENSORS SHALL NOT BE SUBJECT TO ANY DAMAGES OR LIABILITY FOR ANY ERRORS, OMISSIONS OR DELAYS THEREIN. S&P MAKES NO EXPRESS OR IMPLIED WARRANTIES, AND EXPRESSLY DISCLAIMS ALL WARRANTIES OF MERCHANTABILITY OR FITNESS FOR A PARTICULAR PURPOSE OR USE WITH RESPECT TO ITS TRADEMARKS, THE INDEX OR ANY DATA INCLUDED THEREIN. WITHOUT LIMITING ANY OF THE FOREGOING, IN NO EVENT WHATSOEVER SHALL S&P, ITS AFFILIATES OR THEIR THIRD PARTY LICENSORS BE LIABLE FOR ANY INDIRECT, SPECIAL, INCIDENTAL, PUNITIVE OR CONSEQUENTIAL DAMAGES, INCLUDING BUT NOT LIMITED TO, LOSS OF PROFITS, TRADING LOSSES, LOST TIME OR GOODWILL, EVEN IF THEY HAVE BEEN ADVISED OF THE POSSIBILITY OF SUCH DAMAGES, WHETHER IN CONTRACT, TORT, STRICT LIABILITY OR OTHERWISE.
Standard & Poor’s®, and S&P® are registered trademarks of The McGraw-Hill Companies, Inc.; “Calculated by S&P Custom Indices” and its related stylized mark are service marks of The McGraw-Hill Companies, Inc. These marks have been licensed for use by S-Network Global Indexes, LLC. The Adviser does not guarantee the accuracy and/or the completeness of either Underlying Index or any data included therein, and the Adviser shall have no liability for any errors, omissions or interruptions therein. The Adviser makes no warranty, express or implied, as to results to be obtained by the Funds, owners of the Shares of the Funds or any other person or entity from the use of either Underlying Index or any data included therein. The Adviser makes no express or implied warranties, and expressly disclaims all warranties of merchantability or fitness for a particular purpose or use with respect to either Underlying Index or any data included therein. Without limiting any of the foregoing, in no event shall the Adviser have any liability for any special, punitive, direct, indirect or consequential damages (including lost profits) arising out of matters relating to the use of either Underlying Index even if notified of the possibility of such damages.
Intentionally Left Blank

| Performance Overview | 1 |
| Disclosure of Fund Expenses | 9 |
| Schedules of Investments | 10 |
| Statements of Assets and Liabilities | 16 |
| Statements of Operations | 17 |
| Statements of Changes in Net Assets | 18 |
| Financial Highlights | 22 |
| Notes to Financial Statements | 26 |
| Additional Information | 33 |
| Board Considerations Regarding Approval of Investment Advisory Agreement | 36 |
alpsfunds.com
ALPS Sector Dividend Dogs ETF
| Performance Overview | May 31, 2017 (Unaudited) |
Investment Objective
The ALPS Sector Dividend Dogs ETF (the “Fund”) seeks investment results that replicate as closely as possible, before fees and expenses, the performance of the S-Network® Sector Dividend Dogs Index (the “Underlying Index”). The Shares of the Fund are listed and trade on the NYSE Arca under the ticker symbol SDOG. The Fund generally will invest in all of the securities that comprise the Underlying Index in proportion to their weightings in the Underlying Index.
The Underlying Index is a rules based index intended to give investors a means of tracking the overall performance of the highest dividend paying stocks (i.e. “Dividend Dogs”) in the S&P 500® (“SPX”) on a sector-by-sector basis. “Dividend Dogs” refers to the five stocks in each of the ten Global Industry Classification Standard (“GICS”) sectors that make up the S&P 500® which offer the highest dividend yields.
Performance (as of May 31, 2017)
| | 6 Months | 1 Year | 3 Year | Since Inception^ |
| ALPS Sector Dividend Dogs ETF – NAV | 1.85% | 10.07% | 8.50% | 15.30% |
| ALPS Sector Dividend Dogs ETF – Market Price* | 1.80% | 10.07% | 8.49% | 15.30% |
S-Network® Sector Dividend Dogs TR Index | 2.07% | 10.57% | 9.01% | 15.86% |
S&P 500® Total Return Index | 10.81% | 17.47% | 10.13% | 14.74% |
Total Expense Ratio (per the current prospectus) 0.40%.
Performance data quoted represents past performance. Past performance does not guarantee future results. The table does not reflect the deduction of taxes that a shareholder would pay on Fund distributions or the redemption of Fund shares. Investment return and principal value of an investment will fluctuate so that an investor’s shares, when sold or redeemed, may be worth more or less than the original cost. Current performance data may be higher or lower than actual data quoted. For the most current month-end performance data please visit www.alpsfunds.com or call 1.866.675.2639.
NAV is an exchange-traded fund’s per-share value. The per-share dollar amount of the Fund is derived by dividing the total value of all the securities in its portfolio, less any liabilities, by the number of Fund shares outstanding. Market Price is the price at which a share can currently be traded in the market. Information detailing the number of days the Market Price of the Fund was greater than the Fund’s NAV and the number of days it was less than the Fund’s NAV can be obtained at www.alpsfunds.com.
| ^ | The Fund Commencement Date was June 29, 2012. |
| * | Market Price is based on the midpoint of the bid-ask spread at 4 p.m. ET and does not represent the returns an investor would receive if shares were traded at other times. |
The S-Network® Sector Dividend Dogs Index is designed to serve as a fair, impartial and transparent measure of the performance of US large cap equities with above average dividend yields. The Underlying Index is a portfolio of fifty stocks derived from the S&P 500® Index. The index is reported on a total return basis, which assumes reinvestment of any dividends and distributions realized during a given time period.
The S&P 500® Total Return Index is an index of 500 stocks chosen for market size, liquidity and industry grouping among other factors.
The indexes are not actively managed and do not reflect any deductions for fees, expenses or taxes. One cannot invest directly in an index. Index performance does not reflect fund performance.
The ALPS Sector Dividend Dogs ETF is not suitable for all investors. Investments in the Fund are subject to investment risks, including possible loss of the principal amount invested.
ALPS Portfolio Solutions Distributor, Inc., a FINRA member, is the distributor for the ETF.
ALPS Sector Dividend Dogs ETF
| Performance Overview | May 31, 2017 (Unaudited) |
Top 10 Holdings* (as of May 31, 2017)
| Caterpillar, Inc. | 2.43% |
| PPL Corp. | 2.35% |
| Philip Morris International, Inc. | 2.31% |
| HP, Inc. | 2.30% |
| CenturyLink, Inc. | 2.30% |
| Entergy Corp. | 2.29% |
| The Coca-Cola Co. | 2.29% |
| Eaton Corp. Plc | 2.28% |
| Duke Energy Corp. | 2.26% |
| International Paper Co. | 2.23% |
| Total % of Top 10 Holdings | 23.04% |
Sector Allocation* (as of May 31, 2017)
| Utilities | 11.08% |
| Industrials | 10.87% |
| Consumer Staples | 10.83% |
| Health Care | 10.46% |
| Financials | 10.36% |
| Consumer Discretionary | 10.11% |
| Information Technology | 10.10% |
| Energy | 10.04% |
| Materials | 9.81% |
| Telecommunication Services | 6.25% |
| Money Market Fund | 0.09% |
| Total | 100.00% |
Future holdings are subject to change.
Growth of $10,000 (as of May 31, 2017)
Comparison of Change in Value of $10,000 Investment in the Fund and the Indexes
The chart above represents historical performance of a hypothetical investment of $10,000 in the Fund over the life of the Fund. Past performance does not guarantee future results. This chart does not reflect the deduction of taxes that a shareholder would pay on Fund distributions or the redemption of Fund shares.
ALPS International Sector Dividend Dogs ETF
| Performance Overview | May 31, 2017 (Unaudited) |
Investment Objective
The ALPS International Sector Dividend Dogs ETF (the “Fund”) seeks investment results that replicate as closely as possible, before fees and expenses, the performance of the S-Network® International Sector Dividend Dogs Index (the “Underlying Index”). The Shares of the Fund are listed and trade on the NYSE Arca under the ticker symbol IDOG. The Fund generally will invest in all of the securities that comprise the Underlying Index in proportion to their weightings in the Underlying Index.
The Underlying Index is a rules-based index intended to give investors a means of tracking the overall performance of the highest dividend paying stocks (i.e. “Dividend Dogs”) in the S-Net International Developed Markets (ex-Americas) Index, a universe of mainly large capitalization stocks in international developed markets not located in the Americas (the “S-Net Developed Markets”) on a sector-by-sector basis. “Dividend Dogs” refers to the five stocks in each of the ten Global Industry Classification Standard (“GICS”) sectors that make up the S-Net Developed Markets which offer the highest dividend yields.
Performance (as of May 31, 2017)
| | 6 Months | 1 Year | 3 Year | Since Inception^ |
| ALPS International Sector Dividend Dogs ETF – NAV | 19.25% | 18.35% | -1.15% | 5.61% |
| ALPS International Sector Dividend Dogs ETF – Market Price* | 19.70% | 18.60% | -1.24% | 5.70% |
S-Network® International Sector Dividend Dogs NTR Index | 19.64% | 18.96% | -0.73% | 6.03% |
| MSCI EAFE Index | 17.91% | 16.44% | 1.53% | 6.54% |
Total Expense Ratio (per the current prospectus) 0.50%.
Performance data quoted represents past performance. Past performance does not guarantee future results. The table does not reflect the deduction of taxes that a shareholder would pay on Fund distributions or the redemption of Fund shares. Investment return and principal value of an investment will fluctuate so that an investor’s shares, when sold or redeemed, may be worth more or less than the original cost. Current performance data may be higher or lower than actual data quoted. For the most current month-end performance data please visit www.alpsfunds.com or call 1.866.675.2639.
NAV is an exchange-traded fund’s per-share value. The per-share dollar amount of the Fund is derived by dividing the total value of all the securities in its portfolio, less any liabilities, by the number of Fund shares outstanding. Market Price is the price at which a share can currently be traded in the market. Information detailing the number of days the Market Price of the Fund was greater than the Fund’s NAV and the number of days it was less than the Fund’s NAV can be obtained at www.alpsfunds.com.
| ^ | The Fund Commencement Date was June 28, 2013. |
| * | Market Price is based on the midpoint of the bid-ask spread at 4 p.m. ET and does not represent the returns an investor would receive if shares were traded at other times. |
The S-Network® International Sector Dividend Dogs Index is designed to serve as a fair, impartial and transparent measure of the performance of international large cap equities with above average dividend yields. The Underlying Index is a portfolio of fifty stocks derived from the S-Net International Developed Markets Index (ex-Americas) Index. Total Return assumes reinvestment of any dividends and distributions realized during a given time period. Net Total Return (NTR) is obtained by reinvesting the net dividend, which is equal to the ordinary gross dividend minus the amount of withholding tax.
MSCI EAFE® Index is a stock market index that is designed to measure the equity market performance of developed markets outside of the U.S. & Canada.
The indexes are not actively managed and do not reflect any deductions for fees, expenses or taxes. One cannot invest directly in an index. Index performance does not reflect fund performance.
The ALPS International Sector Dividend Dogs ETF is not suitable for all investors. Investments in the Fund are subject to investment risks, including possible loss of the principal amount invested.
ALPS Portfolio Solutions Distributor, Inc., a FINRA member, is the distributor for the ETF.
ALPS International Sector Dividend Dogs ETF
| Performance Overview | May 31, 2017 (Unaudited) |
Top 10 Holdings* (as of May 31, 2017)
| Electricite DE France SA | 2.38% |
| Gas Natural SDG SA | 2.38% |
| Novo Nordisk A/S, Class B | 2.33% |
| Vodafone Group Plc | 2.25% |
| Abertis Infraestructuras SA | 2.24% |
| Nokia OYI | 2.22% |
| Vivendi SA | 2.18% |
| AstraZeneca Plc | 2.17% |
| Atlantia SpA | 2.17% |
| E.ON SE | 2.17% |
| Total % of Top 10 Holdings | 22.49% |
Sector Allocation* (as of May 31, 2017)
| Utilities | 13.05% |
| Health Care | 10.69% |
| Information Technology | 10.20% |
| Industrials | 10.20% |
| Telecommunication Services | 10.03% |
| Consumer Discretionary | 9.91% |
| Materials | 9.77% |
| Consumer Staples | 9.60% |
| Financials | 8.61% |
| Energy | 7.84% |
| Money Market Fund | 0.10% |
| Total | 100.00% |
Future holdings are subject to change.
Growth of $10,000 (as of May 31, 2017)
Comparison of Change in Value of $10,000 Investment in the Fund and the Indexes
The chart above represents historical performance of a hypothetical investment of $10,000 in the Fund over the life of the Fund. Past performance does not guarantee future results. This chart does not reflect the deduction of taxes that a shareholder would pay on Fund distributions or the redemption of Fund shares.
ALPS Emerging Sector Dividend Dogs ETF
| Performance Overview | May 31, 2017 (Unaudited) |
Investment Objective
The ALPS Emerging Sector Dividend Dogs ETF (the “Fund”) seeks investment results that replicate as closely as possible, before fees and expenses, the performance of the S-Network® Emerging Sector Dividend Dogs Index (the “Underlying Index”). The Shares of the Fund are listed and trade on the NYSE Arca under the ticker symbol EDOG. The Fund generally will invest in all of the securities that comprise the Underlying Index in proportion to their weightings in the Underlying Index.
The Underlying Index is a rules-based index intended to give investors a means of tracking the overall performance of the highest dividend paying stocks (i.e. “Dividend Dogs”) in the S-Network® Emerging Markets Index, a universe of mainly large capitalization stocks domiciled in emerging markets (the “S-Network Emerging Markets���) on a sector-by-sector basis. “Dividend Dogs” refers to the five stocks in each of the ten Global Industry Classification Standard (“GICS”) sectors that make up the S-Network® Emerging Markets which offer the highest dividend yields. Emerging market countries are countries that major international financial institutions, such as the World Bank, generally consider to be less economically mature than developed nations.
Performance (as of May 31, 2017)
| | 6 Months | 1 Year | 3 Year | Since Inception^ |
| ALPS Emerging Sector Dividend Dogs ETF – NAV | 14.73% | 19.58% | -0.15% | 2.10% |
| ALPS Emerging Sector Dividend Dogs ETF – Market Price* | 14.33% | 19.90% | -0.34% | 2.14% |
S-Network® Emerging Sector Dividend Dogs NTR Index | 15.23% | 20.53% | 0.86% | 3.07% |
MSCI Emerging Markets Net TR Index® | 17.51% | 27.41% | 1.62% | 3.38% |
Total Expense Ratio (per the current prospectus) 0.60%.
Performance data quoted represents past performance. Past performance does not guarantee future results. The table does not reflect the deduction of taxes that a shareholder would pay on Fund distributions or the redemption of Fund shares. Investment return and principal value of an investment will fluctuate so that an investor’s shares, when sold or redeemed, may be worth more or less than the original cost. Current performance data may be higher or lower than actual data quoted. For the most current month-end performance data please visit www.alpsfunds.com or call 1.866.675.2639.
NAV is an exchange-traded fund’s per-share value. The per-share dollar amount of the Fund is derived by dividing the total value of all the securities in its portfolio, less any liabilities, by the number of Fund shares outstanding. Market Price is the price at which a share can currently be traded in the market. Information detailing the number of days the Market Price of the Fund was greater than the Fund’s NAV and the number of days it was less than the Fund’s NAV can be obtained at www.alpsfunds.com.
| ^ | The Fund Commencement Date was March 28, 2014. |
| * | Market Price is based on the midpoint of the bid-ask spread at 4 p.m. ET and does not represent the returns an investor would receive if shares were traded at other times. |
The S-Network® Emerging Sector Dividend Dogs Index is a portfolio of stocks derived from a universe of mainly large capitalization stocks domiciled in emerging markets (the “S-Network Emerging Markets Index” “SNEMX”). The index methodology selects the five stocks in each of the ten GICS sectors that make up the universe which offer the highest dividend yields as of the last trading day of November. The fifty stocks that are selected for inclusion in the portfolio are equally weighted. The universe includes stocks whose domicile and primary exchange listings are in countries identified by the World Bank as Upper Middle Income (certain lower middle income countries are also included, as well as stocks traded on the Taiwan Stock Exchange despite non-recognition by the World Bank). The selection criteria for the universe, in addition to the aforementioned country qualifications, also include requirements for sector inclusion, primary exchange listing, minimum market capitalization, share price, average daily trading volume and other factors. Total Return assumes reinvestment of any dividends and distributions realized during a given time period. Net Total Return (NTR) is obtained by reinvesting the net dividend, which is equal to the ordinary gross dividend minus the amount of withholding tax.
The MSCI Emerging Markets Index® is a free float-adjusted market capitalization index that is designed to measure equity market performance in the global emerging markets.
The indexes are not actively managed and do not reflect any deductions for fees, expenses or taxes. One cannot invest directly in an index. Index performance does not reflect fund performance.
The ALPS Emerging Sector Dividend Dogs ETF is not suitable for all investors. Investments in the Fund are subject to investment risks, including possible loss of the principal amount invested.
ALPS Portfolio Solutions Distributor, Inc., a FINRA member, is the distributor for the ETF.
ALPS Emerging Sector Dividend Dogs ETF
| Performance Overview | May 31, 2017 (Unaudited) |
Top 10 Holdings* (as of May 31, 2017)
| Fibria Celulose SA, Sponsored ADR | 2.61% |
| Powszechny Zaklad Ubezpieczen | 2.52% |
| Turkiye Sise ve Cam Fabrikalari A.S. | 2.32% |
| Gudang Garam Tbk Pt | 2.22% |
| Yangzijiang Shipbuilding Holdings, Ltd. | 2.20% |
| Huaneng Power International, Inc., Sponsored ADR | 2.20% |
| Eregli Demir Ve Celik Fabrikal | 2.18% |
| Richter Gedeon Nyrt | 2.17% |
| Tofas Turk Otomobil Fabrikasi A.S. | 2.13% |
| Malayan Banking Bhd | 2.13% |
| Total % of Top 10 Holdings | 22.68% |
Sector Allocation* (as of May 31, 2017)
| Financials | 10.70% |
| Materials | 10.64% |
| Utilities | 10.33% |
| Industrials | 10.29% |
| Information Technology | 9.93% |
| Energy | 9.86% |
| Consumer Staples | 9.67% |
| Telecommunication Services | 9.55% |
| Consumer Discretionary | 9.42% |
| Health Care | 9.38% |
| Money Market Fund | 0.23% |
| Total | 100.00% |
Future holdings are subject to change.
Growth of $10,000 (as of May 31, 2017)
Comparison of Change in Value of $10,000 Investment in the Fund and the Indexes
The chart above represents historical performance of a hypothetical investment of $10,000 in the Fund over the life of the Fund. Past performance does not guarantee future results. This chart does not reflect the deduction of taxes that a shareholder would pay on Fund distributions or the redemption of Fund shares.
ALPS | Dorsey Wright Sector Momentum ETF
| Performance Overview | May 31, 2017 (Unaudited) |
Investment Objective
The ALPS | Dorsey Wright Sector Momentum ETF (the “Fund”) employs a “passive management” – or indexing – investment approach designed to seek investment results that correspond (before fees and expenses) generally to the performance of the Dorsey Wright US Sector Momentum Index (the “Underlying Index”).
The Underlying Index is a rules-based index intended to track the overall performance of the stocks with the highest relative strength or “momentum” within the NASDAQ US Large Mid Cap Index on a sector-by-sector basis.
Performance (as of May 31, 2017)
| | Since Inception^ |
| ALPS | Dorsey Wright Sector Momentum ETF - NAV | 8.91% |
| ALPS | Dorsey Wright Sector Momentum ETF - Market Price* | 8.99% |
| Dorsey Wright US Sector Momentum Index | 8.60% |
S&P 500® Total Return Index | 7.16% |
Total Expense Ratio (per the current prospectus) 0.40%
Performance data quoted represents past performance. Past performance does not guarantee future results. Investment return and principal value of an investment will fluctuate so that an investor’s shares, when redeemed, may be worth more or less than their original cost. Current performance may be higher or lower than actual data quoted. For the most current month-end performance data please visit www.alpsfunds.com or call 1.855.759.5679.
NAV is an exchange-traded fund’s per-share value. The per-share dollar amount of the Fund is derived by dividing the total value of all the securities in its portfolio, less any liabilities, by the number of Fund shares outstanding. Market Price is the price at which a share can currently be traded in the market. Information detailing the number of days the Market Price of the Fund was greater than the Fund’s NAV and the number of days it was less than the Fund’s NAV can be obtained at www.alpsfunds.com.
| ^ | The Fund Commencement date was January 10, 2017. Total return for a period of less than one year is not annualized. |
| * | Market Price is based on the midpoint of the bid-ask spread at 4 p.m. ET and does not represent the returns an investor would receive if shares were traded at other times. |
The Fund is new with limited operating history.
The Dorsey Wright US Sector Momentum Index is a rules-based index intended to track the overall performance of the stocks with the highest relative strength or “momentum” within the NASDAQ US Large Mid Cap Index on a sector-by-sector basis.
The S&P 500® Index is the Standard & Poor’s composite index of 500 stocks, a widely recognized, unmanaged index of common stock prices
The indexes are reported on a total return basis, which assumes reinvestment of any dividends and distributions realized during a given time period. The indexes are not actively managed and do not reflect any deductions for fees, expenses or taxes. One cannot invest directly in an index. Index performance does not reflect fund performance.
The NASDAQ US Large Mid Cap Index is designed to track the performance of securities assigned to United States and comprised of the Large Mid Cap segment.
The Fund’s shares are not individually redeemable. Investors buy and sell shares of the Fund on a secondary market. Only market makers or “authorized participants” may trade directly with the Fund, typically in blocks of 50,000 shares.
The ALPS | Dorsey Wright Sector Momentum ETF is not suitable for all investors. Investments in the Fund are subject to investment risks, including possible loss of the principal amount invested.
ALPS Portfolio Solutions Distributor, Inc., a FINRA member, is the distributor for the ALPS | Dorsey Wright Sector Momentum ETF.
ALPS Portfolio Solutions Distributor, Inc. is not affiliated with Nasdaq, Inc.
ALPS | Dorsey Wright Sector Momentum ETF
| Performance Overview | May 31, 2017 (Unaudited) |
Top 10 Holdings* (as of May 31, 2017)
| NVIDIA Corp. | 2.68% |
| Mettler-Toledo International, Inc. | 2.37% |
| Wyndham Worldwide Corp. | 2.36% |
| West Pharmaceutical Services, Inc. | 2.31% |
| IDEX Corp. | 2.30% |
| Amazon.com, Inc. | 2.29% |
| Domino's Pizza, Inc. | 2.25% |
| Yum! Brands, Inc. | 2.24% |
| American Tower Corp | 2.22% |
| The Cooper Cos, Inc. | 2.21% |
| Total % of Top 10 Holdings | 23.23% |
Sector Allocation* (as of May 31, 2017)
| Industrials | 20.90% |
| Consumer, Cyclical | 20.66% |
| Information Technology | 14.98% |
| Health Care | 10.68% |
| Financials | 10.20% |
| Energy | 9.17% |
| Basic Materials | 9.13% |
| Technology | 4.20% |
| Money Market Fund | 0.08% |
| Total | 100.00% |
Future holdings are subject to change.
Growth of $10,000 (as of May 31, 2017)
Comparison of Change in Value of $10,000 Investment in the Fund and the Indexes
The chart above represents historical performance of a hypothetical investment of $10,000 in the Fund over the life of the Fund. Past performance does not guarantee future results. This chart does not reflect the deduction of taxes that a shareholder would pay on Fund distributions or the redemption of Fund shares.
ALPS ETF Trust
| Disclosure of Fund Expenses | May 31, 2017 (Unaudited) |
Shareholder Expense Example: As a shareholder of a Fund, you incur two types of costs: (1) transaction costs which may include creation and redemption fees or brokerage charges, and (2) ongoing costs, including management fees and other Fund expenses. These examples are intended to help you understand your ongoing costs (in dollars) of investing in the Fund and to compare these costs with the ongoing costs of investing in other funds. It is based on an investment of $1,000 invested at the beginning of the (six month) period and held through May 31, 2017.
Actual Return: The first line of the table provides information about actual account values and actual expenses. You may use the information in this line, together with the amount you invested, to estimate the expenses that you incurred over the period. Simply divide your account value by $1,000 (for example, an $8,600 account value divided by $1,000 = 8.6), then multiply the result by the number in the first line under the heading entitled “Expenses Paid During Period” to estimate the expenses attributable to your investment during this period.
Hypothetical 5% Return: The second line of the table provides information about hypothetical account values and hypothetical expenses based on the Fund’s actual expense ratio and an assumed rate of return of 5% per year before expenses, which is not the Fund’s actual return. The hypothetical account values and expenses may not be used to estimate the actual ending account balance or expenses you paid for the period. You may use this information to compare ongoing costs of investing in the Fund and other funds. To do so, compare this 5% hypothetical example with the 5% hypothetical examples that appear in the shareholder reports of other funds.
The expenses shown in the table are meant to highlight ongoing Fund costs only and do not reflect any transaction costs, such as creation and redemption fees or brokerage charges. Therefore, the second line is useful in comparing ongoing costs only, and will not help you determine the relative total costs of owning different funds. In addition, if these costs were included, your costs would have been higher.
| | Beginning Account Value 12/1/16 | Ending Account Value 5/31/17 | Expense Ratio(a) | Expenses Paid During Period 12/1/16 - 5/31/17(b) |
| ALPS Sector Dividend Dogs ETF | | | | |
| Actual | $1,000.00 | $1,018.50 | 0.40% | $2.01 |
| Hypothetical (5% return before expenses) | $1,000.00 | $1,022.94 | 0.40% | $2.02 |
| ALPS International Sector Dividend Dogs ETF | | | | |
| Actual | $1,000.00 | $1,193.50 | 0.50% | $2.73 |
| Hypothetical (5% return before expenses) | $1,000.00 | $1,022.44 | 0.50% | $2.52 |
| ALPS Emerging Sector Dividend Dogs ETF | | | | |
| Actual | $1,000.00 | $1,147.30 | 0.60% | $3.21 |
| Hypothetical (5% return before expenses) | $1,000.00 | $1,021.94 | 0.60% | $3.02 |
| ALPS/Dorsey Wright Sector Momentum ETF | | | | |
Actual(c) | $1,000.00 | $1,089.10 | 0.40% | $1.63 |
| Hypothetical (5% return before expenses) | $1,000.00 | $1,022.94 | 0.40% | $2.02 |
| (a) | Annualized based on the Fund's most recent half-year expenses. |
| (b) | Expenses are equal to the Fund's annualized expense ratio multiplied by the average account value over the period, multiplied by the number of days in the most recent fiscal half year (182), divided by 365. |
| (c) | The ALPS/Dorsey Wright Sector Momentum ETF commenced operations on January 10, 2017. Actual expenses on this Fund are equal to the Fund's annualized expense ratio multiplied by the average account value of the period, multiplied by the number of days since the Fund launched (142), divided by 365. |
ALPS Sector Dividend Dogs ETF
| Schedule of Investments | May 31, 2017 (Unaudited) |
| Security Description | | Shares | | | Value | |
| COMMON STOCKS (99.57%) | | | | | | |
Consumer Discretionary (10.08%) | | | | | | |
| Ford Motor Co. | | | 3,803,110 | | | $ | 42,290,583 | |
| Garmin, Ltd. | | | 907,493 | | | | 47,225,936 | |
| General Motors Co. | | | 1,299,131 | | | | 44,079,515 | |
| Mattel, Inc. | | | 1,864,880 | | | | 42,724,401 | |
| Staples, Inc. | | | 5,490,406 | | | | 49,852,886 | |
| Total Consumer Discretionary | | | | | | | 226,173,321 | |
| | | | | | | | | |
Consumer Staples (10.79%) | | | | | | | | |
| Altria Group, Inc. | | | 623,009 | | | | 46,999,799 | |
| The Coca-Cola Co. | | | 1,125,444 | | | | 51,173,939 | |
| Kimberly-Clark Corp. | | | 357,266 | | | | 46,348,118 | |
| Philip Morris International, Inc. | | | 431,189 | | | | 51,656,442 | |
| The Procter & Gamble Co. | | | 523,146 | | | | 46,083,931 | |
| Total Consumer Staples | | | | | | | 242,262,229 | |
| | | | | | | | | |
Energy (10.00%) | | | | | | | | |
| Chevron Corp. | | | 430,716 | | | | 44,570,492 | |
| Occidental Petroleum Corp. | | | 763,629 | | | | 45,000,657 | |
| ONEOK, Inc. | | | 879,755 | | | | 43,706,228 | |
| Valero Energy Corp. | | | 715,317 | | | | 43,970,536 | |
| The Williams Cos., Inc. | | | 1,653,886 | | | | 47,301,140 | |
| Total Energy | | | | | | | 224,549,053 | |
| | | | | | | | | |
Financials (10.33%) | | | | | | | | |
| Arthur J Gallagher & Co. | | | 844,259 | | | | 47,894,813 | |
| Invesco, Ltd. | | | 1,498,831 | | | | 47,512,943 | |
| Navient Corp. | | | 3,294,970 | | | | 47,546,417 | |
| People's United Financial, Inc. | | | 2,523,690 | | | | 41,817,543 | |
| T. Rowe Price Group, Inc. | | | 667,473 | | | | 47,016,798 | |
| Total Financials | | | | | | | 231,788,514 | |
| | | | | | | | | |
Health Care (10.43%) | | | | | | | | |
| AbbVie, Inc. | | | 722,802 | | | | 47,719,388 | |
| Eli Lilly & Co. | | | 564,695 | | | | 44,932,781 | |
| Johnson & Johnson | | | 378,974 | | | | 48,603,416 | |
| Merck & Co., Inc. | | | 725,884 | | | | 47,262,307 | |
| Pfizer, Inc. | | | 1,396,096 | | | | 45,582,534 | |
| Total Health Care | | | | | | | 234,100,426 | |
| | | | | | | | | |
Industrials (10.83%) | | | | | | | | |
| Caterpillar, Inc. | | | 516,145 | | | | 54,417,167 | |
| Eaton Corp. Plc | | | 659,000 | | | | 50,993,420 | |
| Emerson Electric Co. | | | 800,925 | | | | 47,350,686 | |
| General Electric Co. | | | 1,572,427 | | | | 43,053,051 | |
| United Parcel Service Inc., Class B | | | 446,448 | | | | 47,310,095 | |
| Total Industrials | | | | | | | 243,124,419 | |
| | | | | | | | | |
Information Technology (10.07%) | | | | | | | | |
| Cisco Systems, Inc. | | | 1,389,982 | | | | 43,826,133 | |
| HP, Inc. | | | 2,741,486 | | | | 51,430,277 | |
| International Business Machines Corp. | | | 268,799 | | | | 41,026,791 | |
| Seagate Technology Plc | | | 1,008,768 | | | | 43,952,022 | |
| Security Description | | Shares | | | Value | |
| Information Technology (continued) | | | | | | |
| Xerox Corp. | | | 6,472,965 | | | $ | 45,763,863 | |
| Total Information Technology | | | | | | | 225,999,086 | |
| | | | | | | | | |
Materials (9.78%) | | | | | | | | |
| CF Industries Holdings, Inc. | | | 1,619,348 | | | | 43,560,461 | |
| The Dow Chemical Co. | | | 745,882 | | | | 46,214,849 | |
| International Paper Co. | | | 943,510 | | | | 49,892,809 | |
| LyondellBasell Industries NV, Class A | | | 530,588 | | | | 42,722,946 | |
| The Mosaic Co. | | | 1,639,562 | | | | 37,103,288 | |
| Total Materials | | | | | | | 219,494,353 | |
| | | | | | | | | |
Telecommunication Services (6.22%) | | | | | | | | |
| AT&T, Inc. | | | 1,124,844 | | | | 43,340,239 | |
| CenturyLink, Inc. | | | 2,059,006 | | | | 51,372,200 | |
| Verizon Communications, Inc. | | | 965,569 | | | | 45,034,138 | |
| Total Telecommunication Services | | | | | | | 139,746,577 | |
| | | | | | | | | |
Utilities (11.04%) | | | | | | | | |
| Duke Energy Corp. | | | 590,686 | | | | 50,609,977 | |
| Entergy Corp. | | | 649,300 | | | | 51,333,658 | |
| FirstEnergy Corp | | | 1,529,189 | | | | 44,713,486 | |
| PPL Corp. | | | 1,316,262 | | | | 52,532,016 | |
| The Southern Co. | | | 962,133 | | | | 48,693,551 | |
| Total Utilities | | | | | | | 247,882,688 | |
| | | | | | | | | |
TOTAL COMMON STOCKS (Cost $2,116,908,873) | | | | 2,235,120,666 | |
| | | 7 Day Yield | | | Shares | | | Value | |
| SHORT TERM INVESTMENTS (0.09%) | | | | |
| State Street Institutional Treasury Plus Money Market Fund | | | 0.680 | % | | | 2,057,624 | | | | 2,057,624 | |
| | | | | | | | | | | | | |
TOTAL SHORT TERM INVESTMENTS (Cost $2,057,624) | | 2,057,624 | |
| | | | | | | | | | | | | |
TOTAL INVESTMENTS (99.66%) (Cost $2,118,966,497) | | $ | 2,237,178,290 | |
| | | | | | | | | | | | | |
| NET OTHER ASSETS AND LIABILITIES (0.34%) | | | | 7,534,807 | |
| | | | | | | | | | | | | |
| NET ASSETS (100.00%) | | | | | | | $ | 2,244,713,097 | |
See Notes to Financial Statements.
ALPS International Sector Dividend Dogs ETF
| Schedule of Investments | May 31, 2017 (Unaudited) |
| Security Description | | Shares | | | Value | |
| COMMON STOCKS (99.37%) | | | | | | |
| Australia (15.77%) | | | | | | |
| AMP, Ltd. | | | 1,265,883 | | | $ | 4,750,104 | |
| Aurizon Holdings, Ltd. | | | 1,210,995 | | | | 4,949,066 | |
| Australia & New Zealand Banking Group, Ltd. | | | 200,317 | | | | 4,169,165 | |
| National Australia Bank, Ltd. | | | 193,225 | | | | 4,324,506 | |
| Suncorp Group, Ltd. | | | 473,386 | | | | 4,868,214 | |
| Telstra Corp., Ltd. | | | 1,380,486 | | | | 4,513,390 | |
| Wesfarmers, Ltd. | | | 144,202 | | | | 4,575,276 | |
| Westpac Banking Corp. | | | 181,965 | | | | 4,123,879 | |
| Woolworths, Ltd. | | | 242,422 | | | | 4,692,432 | |
| Total Australia | | | | | | | 40,966,032 | |
| | | | | | | | | |
| Belgium (2.00%) | | | | | | | | |
| Anheuser-Busch InBev SA | | | 44,502 | | | | 5,191,602 | |
| | | | | | | | | |
| Denmark (2.32%) | | | | | | | | |
| Novo Nordisk A/S, Class B | | | 141,774 | | | | 6,025,146 | |
| | | | | | | | | |
| Finland (6.23%) | | | | | | | | |
| Fortum OYJ | | | 312,032 | | | | 4,970,393 | |
| Nokia OYJ | | | 903,358 | | | | 5,728,477 | |
| Stora Enso OYJ, Class R | | | 433,896 | | | | 5,488,319 | |
| Total Finland | | | | | | | 16,187,189 | |
| | | | | | | | | |
| France (10.70%) | | | | | | | | |
| Bouygues SA | | | 118,760 | | | | 5,086,890 | |
| Electricite de France SA | | | 571,596 | | | | 6,159,050 | |
| Engie SA | | | 358,961 | | | | 5,478,003 | |
| Sanofi | | | 54,821 | | | | 5,429,791 | |
| Vivendi SA | | | 259,906 | | | | 5,636,395 | |
| Total France | | | | | | | 27,790,129 | |
| | | | | | | | | |
| Germany (11.73%) | | | | | | | | |
| BASF SE | | | 50,520 | | | | 4,758,060 | |
| Daimler AG, Registered Shares | | | 64,019 | | | | 4,646,479 | |
| E.ON SE | | | 640,464 | | | | 5,603,198 | |
| Evonik Industries AG | | | 152,494 | | | | 5,251,331 | |
| ProSiebenSat.1 Media SE | | | 114,972 | | | | 4,881,371 | |
| Telefonica Deutschland Holding AG | | | 1,074,408 | | | | 5,344,317 | |
| Total Germany | | | | | | | 30,484,756 | |
| | | | | | | | | |
| Hong Kong (1.97%) | | | | | | | | |
| Sands China, Ltd. | | | 1,106,800 | | | | 5,106,090 | |
| | | | | | | | | |
| Italy (6.10%) | | | | | | | | |
| Atlantia SpA | | | 201,498 | | | | 5,609,025 | |
| Eni SpA | | | 308,838 | | | | 4,888,291 | |
| Security Description | | Shares | | | Value | |
| Italy(continued) | | | | | | |
| Snam SpA | | | 1,167,908 | | | $ | 5,355,463 | |
| Total Italy | | | | | | | 15,852,779 | |
| | | | | | | | | |
| Japan (5.96%) | | | | | | | | |
| Canon, Inc. | | | 159,663 | | | | 5,449,446 | |
| Seiko Epson Corp. | | | 221,100 | | | | 4,637,610 | |
| Takeda Pharmaceutical Co., Ltd. | | | 104,689 | | | | 5,394,674 | |
| Total Japan | | | | | | | 15,481,730 | |
| | | | | | | | | |
| Netherlands (3.97%) | | | | | | | | |
| Royal Dutch Shell Plc, Class A | | | 186,691 | | | | 5,064,725 | |
| STMicroelectronics NV | | | 318,541 | | | | 5,249,413 | |
| Total Netherlands | | | | | | | 10,314,138 | |
| | | | | | | | | |
| Norway (1.80%) | | | | | | | | |
| Yara International ASA | | | 126,015 | | | | 4,684,567 | |
| | | | | | | | | |
| Singapore (1.90%) | | | | | | | | |
| Singapore Airlines, Ltd. | | | 681,300 | | | | 4,928,857 | |
| | | | | | | | | |
| Spain (8.47%) | | | | | | | | |
| Abertis Infraestructuras SA | | | 316,411 | | | | 5,788,348 | |
| Gas Natural SDG SA | | | 244,266 | | | | 6,151,967 | |
| Repsol SA | | | 312,290 | | | | 5,232,349 | |
| Telefonica SA | | | 434,114 | | | | 4,834,683 | |
| Total Spain | | | | | | | 22,007,347 | |
| | | | | | | | | |
| Sweden (4.13%) | | | | | | | | |
| Telefonaktiebolaget LM Ericsson, Class B | | | 726,693 | | | | 5,300,911 | |
| Telia Co. AB | | | 1,185,305 | | | | 5,425,067 | |
| Total Sweden | | | | | | | 10,725,978 | |
| | | | | | | | | |
| United Kingdom (16.32%) | | | | | | | | |
| AstraZeneca Plc | | | 83,183 | | | | 5,609,657 | |
| BP Plc | | | 843,667 | | | | 5,073,141 | |
| British American Tobacco Plc | | | 77,548 | | | | 5,525,401 | |
| GlaxoSmithKline Plc | | | 235,839 | | | | 5,176,376 | |
| Imperial Brands Plc | | | 102,921 | | | | 4,812,370 | |
| Pearson Plc | | | 586,449 | | | | 5,338,392 | |
| Rio Tinto, Ltd. | | | 108,636 | | | | 5,070,149 | |
| Vodafone Group Plc | | | 1,946,783 | | | | 5,806,796 | |
| Total United Kingdom | | | | | | | 42,412,282 | |
| | | | | | | | | |
TOTAL COMMON STOCKS (Cost $246,450,124) | | | | 258,158,622 | |
ALPS International Sector Dividend Dogs ETF
| Schedule of Investments | May 31, 2017 (Unaudited) |
| | | 7 Day Yield | | | Shares | | | Value | |
| SHORT TERM INVESTMENTS (0.09%) | | | | |
| State Street Institutional Treasury Plus Money Market Fund | | | 0.680 | % | | | 245,808 | | | $ | 245,808 | |
| | | | | | | | | | | | | |
TOTAL SHORT TERM INVESTMENTS (Cost $245,808) | | | 245,808 | |
| | | | | | | | | | | | | |
TOTAL INVESTMENTS (99.46%) (Cost $246,695,932) | | | $ | 258,404,430 | |
| | | | | | | | | | | | | |
| NET OTHER ASSETS AND LIABILITIES (0.54%) | | | | 1,401,957 | |
| | | | | | | | | | | | | |
| NET ASSETS (100.00%) | | | | | | | $ | 259,806,387 | |
See Notes to Financial Statements.
ALPS Emerging Sector Dividend Dogs ETF
| Schedule of Investments | May 31, 2017 (Unaudited) |
| Security Description | | Shares | | | Value | |
| COMMON STOCKS (99.62%) | | | | | | |
| Brazil (8.02%) | | | | | | |
| BB Seguridade Participacoes SA | | | 86,792 | | | $ | 780,497 | |
| CCR SA | | | 139,308 | | | | 713,771 | |
| Cielo SA | | | 111,809 | | | | 788,134 | |
| Fibria Celulose SA, Sponsored ADR | | | 96,037 | | | | 1,097,703 | |
| Total Brazil | | | | | | | 3,380,105 | |
| | | | | | | | | |
| Chile (1.96%) | | | | | | | | |
| Aguas Andinas SA, Class A | | | 1,488,394 | | | | 826,414 | |
| | | | | | | | | |
| China (8.52%) | | | | | | | | |
| Huadian Power International Corp., Ltd., Class H | | | 1,824,000 | | | | 863,717 | |
| Huaneng Power International, Inc., Sponsored ADR | | | 29,235 | | | | 924,411 | |
| Lenovo Group, Ltd. | | | 1,336,000 | | | | 874,374 | |
| Yangzijiang Shipbuilding Holdings, Ltd. | | | 1,010,600 | | | | 927,591 | |
| Total China | | | | | | | 3,590,093 | |
| | | | | | | | | |
| Colombia (1.98%) | | | | | | | | |
| Almacenes Exito SA | | | 155,984 | | | | 834,368 | |
| | | | | | | | | |
| Czech Republic (4.14%) | | | | | | | | |
| CEZ A.S. | | | 45,859 | | | | 871,922 | |
| Komercni banka A.S. | | | 21,879 | | | | 871,709 | |
| Total Czech Republic | | | | | | | 1,743,631 | |
| | | | | | | | | |
| Hong Kong (1.69%) | | | | | | | | |
| CP Pokphand Co., Ltd. | | | 8,540,000 | | | | 712,347 | |
| | | | | | | | | |
| Hungary (2.17%) | | | | | | | | |
| Richter Gedeon Nyrt | | | 35,785 | | | | 914,715 | |
| | | | | | | | | |
| India (5.72%) | | | | | | | | |
| Dr Reddy's Laboratories, Ltd., ADR | | | 19,784 | | | | 764,454 | |
| Infosys, Ltd., Sponsored ADR | | | 51,679 | | | | 780,353 | |
| Wipro, Ltd., ADR | | | 80,545 | | | | 868,275 | |
| Total India | | | | | | | 2,413,082 | |
| | | | | | | | | |
| Indonesia (8.19%) | | | | | | | | |
| Gudang Garam Tbk PT | | | 168,700 | | | | 936,589 | |
| Kalbe Farma Tbk PT | | | 7,293,300 | | | | 843,219 | |
| Semen Indonesia Persero Tbk PT | | | 1,137,300 | | | | 806,868 | |
| Surya Citra Media Tbk PT | | | 3,956,400 | | | | 864,349 | |
| Total Indonesia | | | | | | | 3,451,025 | |
| Security Description | | Shares | | | Value | |
| Luxembourg (1.92%) | | | | | | |
| Ternium SA, Sponsored ADR | | | 31,170 | | | $ | 811,043 | |
| | | | | | | | | |
| Malaysia (9.79%) | | | | | | | | |
| Astro Malaysia Holdings Bhd | | | 1,245,900 | | | | 739,389 | |
| British American Tobacco Malay Bhd | | | 74,527 | | | | 776,613 | |
| Malayan Banking Bhd | | | 407,400 | | | | 898,565 | |
| Sime Darby Bhd | | | 390,900 | | | | 851,212 | |
| YTL Power International Bhd | | | 2,415,818 | | | | 863,599 | |
| Total Malaysia | | | | | | | 4,129,378 | |
| | | | | | | | | |
| Mexico (1.92%) | | | | | | | | |
| Kimberly-Clark de Mexico SAB de CV, Class A | | | 409,600 | | | | 809,710 | |
| | | | | | | | | |
| Poland (6.71%) | | | | | | | | |
| Bank Pekao SA | | | 24,056 | | | | 892,388 | |
| Polskie Gornictwo Naftowe i Gazownictwo SA | | | 513,857 | | | | 877,137 | |
| Powszechny Zaklad Ubezpieczen SA | | | 89,073 | | | | 1,061,439 | |
| Total Poland | | | | | | | 2,830,964 | |
| | | | | | | | | |
| Russia (9.28%) | | | | | | | | |
Gazprom PAO, Sponsored ADR(a) | | | 185,107 | | | | 770,693 | |
| Lukoil PJSC, Sponsored ADR | | | 15,550 | | | | 742,513 | |
MegaFon PJSC, GDR(b) | | | 77,706 | | | | 835,339 | |
| Mobile Telesystems PJSC, Sponsored ADR | | | 81,640 | | | | 719,248 | |
PhosAgro PJSC, GDR(b) | | | 59,555 | | | | 845,681 | |
| Total Russia | | | | | | | 3,913,474 | |
| | | | | | | | | |
| South Africa (8.69%) | | | | | | | | |
| Imperial Holdings, Ltd. | | | 60,801 | | | | 769,574 | |
| Life Healthcare Group Holdings, Ltd. | | | 339,214 | | | | 722,398 | |
| MTN Group, Ltd. | | | 86,534 | | | | 775,276 | |
| Netcare, Ltd. | | | 342,261 | | | | 703,573 | |
| Truworths International, Ltd. | | | 121,606 | | | | 694,030 | |
| Total South Africa | | | | | | | 3,664,851 | |
| | | | | | | | | |
| Thailand (10.16%) | | | | | | | | |
| Advanced Info Service Pcl | | | 167,300 | | | | 849,762 | |
| BTS Group Holdings Pcl | | | 3,438,020 | | | | 863,038 | |
| Delta Electronics Thailand Pcl | | | 328,724 | | | | 868,619 | |
| Intouch Holdings Pcl, NVDR | | | 532,400 | | | | 840,179 | |
| IRPC Pcl | | | 5,744,400 | | | | 860,142 | |
| Total Thailand | | | | | | | 4,281,740 | |
| | | | | | | | | |
| Turkey (8.76%) | | | | | | | | |
| Eregli Demir ve Celik Fabrikalari TAS | | | 507,216 | | | | 918,708 | |
| Tofas Turk Otomobil Fabrikasi A.S. | | | 108,209 | | | | 898,700 | |
| Tupras Turkiye Petrol Rafinerileri A.S. | | | 33,368 | | | | 898,541 | |
ALPS Emerging Sector Dividend Dogs ETF
| Schedule of Investments | May 31, 2017 (Unaudited) |
| Security Description | | Shares | | | Value | |
| Turkey (continued) | | | | | | |
| Turkiye Sise ve Cam Fabrikalari A.S. | | | 732,900 | | | $ | 978,474 | |
| Total Turkey | | | | | | | 3,694,423 | |
| | | | | | | | | |
TOTAL COMMON STOCKS (Cost $39,871,084) | | | | 42,001,363 | |
| | | | 7 Day Yield | | | Shares | | | Value | |
| SHORT TERM INVESTMENTS (0.23%) | | | | | | | | | |
| State Street Institutional Treasury Plus Money Market Fund | | | 0.680 | % | | | 96,631 | | | | 96,631 | |
| | | | | | | | | | | | | |
TOTAL SHORT TERM INVESTMENTS (Cost $96,631) | | 96,631 | |
| | | | | | | | | | | | | |
TOTAL INVESTMENTS (99.85%) (Cost $39,967,715) | | | $ | 42,097,994 | |
| | | | | | | | | | | | | |
| NET OTHER ASSETS AND LIABILITIES (0.15%) | | | | 64,731 | |
| | | | | | | | | | | | | |
| NET ASSETS (100.00%) | | | | | | | $ | 42,162,725 | |
| (a) | Non-income producing security. |
| (b) | These securities initially sold to other parties pursuant to Regulation S under the 1933 Act and subsequently resold to the Fund. As of May 31, 2017, the aggregate market values of these securities were $1,681,020, representing 3.99% of the Fund’s net assets. |
See Notes to Financial Statements.
ALPS | Dorsey Wright Sector Momentum ETF
| Schedule of Investments | May 31, 2017 (Unaudited) |
| Security Description | | Shares | | | Value | |
| COMMON STOCKS (99.84%) | | | | | | |
Basic Materials (9.12%) | | | | | | |
| Air Products & Chemicals, Inc. | | | 952 | | | $ | 137,145 | |
| Ecolab, Inc. | | | 1,064 | | | | 141,342 | |
| International Paper Co. | | | 2,595 | | | | 137,223 | |
| RPM International, Inc. | | | 2,369 | | | | 128,471 | |
| United States Steel Corp. | | | 3,575 | | | | 74,539 | |
| Total Basic Materials | | | | | | | 618,720 | |
| | | | | | | | | |
Consumer, Cyclical (20.64%) | | | | | | | | |
| Alaska Air Group, Inc. | | | 1,429 | | | | 124,395 | |
Amazon.com, Inc.(a) | | | 156 | | | | 155,161 | |
| CBS Corp., Class B | | | 1,992 | | | | 121,731 | |
| Domino's Pizza, Inc. | | | 721 | | | | 152,650 | |
| Hasbro, Inc. | | | 1,329 | | | | 139,891 | |
The Middleby Corp.(a) | | | 956 | | | | 122,712 | |
The Priceline Group, Inc.(a) | | | 75 | | | | 140,782 | |
| Sirius XM Holdings, Inc. | | | 24,877 | | | | 130,604 | |
| Wyndham Worldwide Corp. | | | 1,582 | | | | 159,766 | |
| Yum! Brands, Inc. | | | 2,088 | | | | 151,672 | |
| Total Consumer, Cyclical | | | | | | | 1,399,364 | |
| | | | | | | | | |
Energy (9.16%) | | | | | | | | |
Cheniere Energy, Inc.(a) | | | 2,922 | | | | 142,360 | |
Diamondback Energy, Inc.(a) | | | 1,271 | | | | 117,898 | |
| Targa Resources Corp. | | | 2,360 | | | | 108,395 | |
| Valero Energy Corp. | | | 1,935 | | | | 118,944 | |
| The Williams Cos., Inc. | | | 4,667 | | | | 133,476 | |
| Total Energy | | | | | | | 621,073 | |
| | | | | | | | | |
Financials (10.20%) | | | | | | | | |
| American Tower Corp. | | | 1,146 | | | | 150,344 | |
Arch Capital Group, Ltd.(a) | | | 1,396 | | | | 135,761 | |
| MarketAxess Holdings, Inc. | | | 701 | | | | 133,596 | |
| MasterCard, Inc., Class A | | | 1,181 | | | | 145,121 | |
| WR Berkley Corp. | | | 1,834 | | | | 126,528 | |
| Total Financials | | | | | | | 691,350 | |
| | | | | | | | | |
Health Care (13.04%) | | | | | | | | |
| Becton Dickinson and Co. | | | 726 | | | | 137,381 | |
| The Cooper Cos., Inc. | | | 683 | | | | 149,406 | |
IDEXX Laboratories, Inc.(a) | | | 877 | | | | 147,678 | |
Mettler-Toledo International, Inc.(a) | | | 276 | | | | 160,856 | |
TESARO, Inc.(a) | | | 889 | | | | 132,737 | |
| West Pharmaceutical Services, Inc. | | | 1,612 | | | | 156,396 | |
| Total Health Care | | | | | | | 884,454 | |
| | | | | | | | | |
Industrials (18.51%) | | | | | | | | |
| AO Smith Corp. | | | 2,559 | | | | 140,412 | |
| Danaher Corp. | | | 1,540 | | | | 130,808 | |
Fiserv, Inc.(a) | | | 1,132 | | | | 141,817 | |
| Huntington Ingalls Industries, Inc. | | | 624 | | | | 122,185 | |
| IDEX Corp. | | | 1,439 | | | | 156,088 | |
| Lockheed Martin Corp. | | | 490 | | | | 137,754 | |
| Security Description | | Shares | | | Value | |
| Industrials (continued) | | | | | | |
| Northrop Grumman Corp. | | | 545 | | | $ | 141,275 | |
| Thermo Fisher Scientific, Inc. | | | 844 | | | | 145,835 | |
| Union Pacific Corp. | | | 1,258 | | | | 138,757 | |
| Total Industrials | | | | | | | 1,254,931 | |
| | | | | | | | | |
Information Technology (19.17%) | | | | | | | | |
Advanced Micro Devices, Inc.(a) | | | 9,886 | | | | 110,624 | |
| Amphenol Corp., Class A | | | 1,867 | | | | 139,278 | |
| Apple, Inc. | | | 954 | | | | 145,733 | |
Aspen Technology, Inc.(a) | | | 2,244 | | | | 137,243 | |
Cadence Design Systems, Inc.(a) | | | 4,188 | | | | 147,166 | |
Facebook, Inc., Class A(a) | | | 954 | | | | 144,493 | |
| Jack Henry & Associates, Inc. | | | 1,402 | | | | 148,907 | |
| NVIDIA Corp. | | | 1,256 | | | | 181,304 | |
| Skyworks Solutions, Inc. | | | 1,361 | | | | 144,851 | |
| Total Information Technology | | | | | | | 1,299,599 | |
| | | | | | | | | |
TOTAL COMMON STOCKS (Cost $6,406,242) | | | | 6,769,491 | |
| | | 7 Day Yield | | | Shares | | | Value | |
| SHORT TERM INVESTMENTS (0.08%) | | | | | | | |
| State Street Institutional Treasury Plus Money Market Fund | | | 0.680 | % | | | 5,482 | | | | 5,482 | |
| | | | | | | | | | | | | |
TOTAL SHORT TERM INVESTMENTS (Cost $5,482) | | | | 5,482 | |
| | | | | | | | | | | | | |
TOTAL INVESTMENTS (99.92%) (Cost $6,411,724) | | | $ | 6,774,973 | |
| | | | | | | | | | | | | |
| NET OTHER ASSETS AND LIABILITIES (0.08%) | | | | 5,263 | |
| | | | | | | | | | | | | |
| NET ASSETS (100.00%) | | | | | | | $ | 6,780,236 | |
| (a) | Non-income producing security. |
See Notes to Financial Statements.
ALPS ETF Trust
| Statements of Assets and Liabilities | May 31, 2017 (Unaudited) |
| | | ALPS Sector Dividend Dogs ETF | | | ALPS International Sector Dividend Dogs ETF | | | ALPS Emerging Sector Dividend Dogs ETF | | | ALPS/Dorsey Wright Sector Momentum ETF | |
| ASSETS: | | | | | | | | | | | | |
| Investments, at value | | $ | 2,237,178,290 | | | $ | 258,404,430 | | | $ | 42,097,994 | | | $ | 6,774,973 | |
| Foreign currency, at value (Cost $–, $41,299, $– and $–) | | | – | | | | 41,465 | | | | – | | | | – | |
| Foreign tax reclaims | | | – | | | | 562,993 | | | | 9,693 | | | | – | |
| Dividends receivable | | | 8,297,960 | | | | 941,502 | | | | 99,243 | | | | 7,302 | |
| Receivable for investments sold | | | 8,460,275 | | | | – | | | | – | | | | – | |
| Receivable for shares sold | | | 6,350,572 | | | | – | | | | – | | | | – | |
| Total Assets | | | 2,260,287,097 | | | | 259,950,390 | | | | 42,206,930 | | | | 6,782,275 | |
| | | | | | | | | | | | | | | | | |
| LIABILITIES: | | | | | | | | | | | | | | | | |
| Payable for investments purchased | | | 6,347,999 | | | | – | | | | 23,945 | | | | – | |
| Payable to adviser | | | 764,547 | | | | 144,003 | | | | 20,260 | | | | 2,039 | |
| Payable for shares redeemed | | | 8,461,454 | | | | – | | | | – | | | | – | |
| Total Liabilities | | | 15,574,000 | | | | 144,003 | | | | 44,205 | | | | 2,039 | |
| NET ASSETS | | $ | 2,244,713,097 | | | $ | 259,806,387 | | | $ | 42,162,725 | | | $ | 6,780,236 | |
| | | | | | | | | | | | | | | | | |
| NET ASSETS CONSIST OF: | | | | | | | | | | | | | | | | |
| Paid-in capital | | $ | 2,187,321,532 | | | $ | 270,378,438 | | | $ | 42,229,909 | | | $ | 6,419,582 | |
| Accumulated net investment income | | | 1,564,683 | | | | 2,981,209 | | | | 406,333 | | | | 8,755 | |
| Accumulated net realized loss | | | (62,384,911 | ) | | | (25,240,984 | ) | | | (2,604,735 | ) | | | (11,350 | ) |
| Net unrealized appreciation | | | 118,211,793 | | | | 11,687,724 | | | | 2,131,218 | | | | 363,249 | |
| NET ASSETS | | $ | 2,244,713,097 | | | $ | 259,806,387 | | | $ | 42,162,725 | | | $ | 6,780,236 | |
| | | | | | | | | | | | | | | | | |
| INVESTMENTS, AT COST | | $ | 2,118,966,497 | | | $ | 246,695,932 | | | $ | 39,967,715 | | | $ | 6,411,724 | |
| | | | | | | | | | | | | | | | | |
| PRICING OF SHARES: | | | | | | | | | | | | | | | | |
| Net Assets | | $ | 2,244,713,097 | | | $ | 259,806,387 | | | $ | 42,162,725 | | | $ | 6,780,236 | |
| Shares of beneficial interest outstanding (Unlimited number of shares authorized, par value $0.01 per share) | | | 53,009,141 | | | | 9,650,000 | | | | 1,750,000 | | | | 250,002 | |
| Net Asset Value, offering and redemption price per share | | $ | 42.35 | | | $ | 26.92 | | | $ | 24.09 | | | $ | 27.12 | |
See Notes to Financial Statements.
ALPS ETF Trust
| Statements of Operations | For the Six Months Ended May 31, 2017 (Unaudited) |
| | | ALPS Sector Dividend Dogs ETF | | | ALPS International Sector Dividend Dogs ETF | | | ALPS Emerging Sector Dividend Dogs ETF | | | ALPS/Dorsey Wright Sector Momentum ETF(a) | |
| INVESTMENT INCOME: | | | | | | | | | | | | |
| Dividends* | | $ | 40,175,192 | | | $ | 5,113,050 | | | $ | 556,275 | | | $ | 20,900 | |
| Securities Lending Income | | | 8,699 | | | | – | | | | – | | | | 406 | |
| Total Investment Income | | | 40,183,891 | | | | 5,113,050 | | | | 556,275 | | | | 21,306 | |
| | | | | | | | | | | | | | | | | |
| EXPENSES: | | | | | | | | | | | | | | | | |
| Investment adviser fees | | | 4,206,107 | | | | 469,225 | | | | 79,934 | | | | 6,667 | |
| Total Expenses | | | 4,206,107 | | | | 469,225 | | | | 79,934 | | | | 6,667 | |
| NET INVESTMENT INCOME | | | 35,977,784 | | | | 4,643,825 | | | | 476,341 | | | | 14,639 | |
| | | | | | | | | | | | | | | | | |
| REALIZED AND UNREALIZED GAIN/(LOSS) | | | | | | | | | | | | | | | | |
| Net realized gain/(loss) on investments | | | 50,320,360 | | | | (4,135,390 | ) | | | (12,560 | ) | | | (11,350 | ) |
| Net realized loss on foreign currency transactions | | | – | | | | (107,122 | ) | | | (12,513 | ) | | | – | |
| Total net realized gain/(loss) | | | 50,320,360 | | | | (4,242,512 | ) | | | (25,073 | ) | | | (11,350 | ) |
| Net change in unrealized appreciation/(depreciation) on investments | | | (58,615,538 | ) | | | 33,302,018 | | | | 2,980,004 | | | | 363,249 | |
| Net change in unrealized appreciation on translation of assets and liabilities denominated in foreign currencies | | | – | | | | 69,113 | | | | 1,531 | | | | – | |
| Total net change in unrealized appreciation/(depreciation) | | | (58,615,538 | ) | | | 33,371,131 | | | | 2,981,535 | | | | 363,249 | |
| NET REALIZED AND UNREALIZED GAIN/(LOSS) ON INVESTMENTS | | | (8,295,178 | ) | | | 29,128,619 | | | | 2,956,462 | | | | 351,899 | |
| NET INCREASE IN NET ASSETS RESULTING FROM OPERATIONS | | $ | 27,682,606 | | | $ | 33,772,444 | | | $ | 3,432,803 | | | $ | 366,538 | |
*Net of foreign tax withholding: | | $ | – | | | $ | 568,145 | | | $ | 49,892 | | | $ | – | |
| (a) | The ALPS/Dorsey Wright Sector Momentum ETF commenced operations on January 10, 2017. |
See Notes to Financial Statements.
ALPS Sector Dividend Dogs ETF
Statements of Changes in Net Assets
| | | For the Six Months Ended May 31, 2017 (Unaudited) | | | For the Year Ended November 30, 2016 | |
| OPERATIONS: | | | | | | |
| Net investment income | | $ | 35,977,784 | | | $ | 39,846,529 | |
| Net realized gain/(loss) | | | 50,320,360 | | | | (43,300,773 | ) |
| Net change in unrealized appreciation/(depreciation) | | | (58,615,538 | ) | | | 216,359,606 | |
| Net increase in net assets resulting from operations | | | 27,682,606 | | | | 212,905,362 | |
| | | | | | | | | |
| Net Equalization Credits | | | 2,342,187 | | | | 1,934,769 | |
| | | | | | | | | |
| DISTRIBUTIONS TO SHAREHOLDERS: | | | | | | | | |
| From net investment income | | | (34,413,101 | ) | | | (41,467,278 | ) |
| From tax return of capital | | | – | | | | (366,916 | ) |
| Total distributions | | | (34,413,101 | ) | | | (41,834,194 | ) |
| | | | | | | | | |
| CAPITAL SHARE TRANSACTIONS: | | | | | | | | |
| Proceeds from sale of shares | | | 1,088,254,792 | | | | 874,355,784 | |
| Cost of shares redeemed | | | (539,216,298 | ) | | | (357,920,532 | ) |
| Net income equalization (Note 2) | | | (2,342,187 | ) | | | (1,934,769 | ) |
| Net increase from share transactions | | | 546,696,307 | | | | 514,500,483 | |
| Net increase in net assets | | | 542,307,999 | | | | 687,506,420 | |
| | | | | | | | | |
| NET ASSETS: | | | | | | | | |
| Beginning of period | | | 1,702,405,098 | | | | 1,014,898,678 | |
| End of period * | | $ | 2,244,713,097 | | | $ | 1,702,405,098 | |
| | | | | | | | | |
| * Including accumulated net investment income of: | | $ | 1,564,683 | | | $ | – | |
| | | | | | | | | |
| OTHER INFORMATION: | | | | | | | | |
| CAPITAL SHARE TRANSACTIONS: | | | | | | | | |
| Beginning shares | | | 40,259,141 | | | | 28,009,141 | |
| Shares sold | | | 25,350,000 | | | | 22,550,000 | |
| Shares redeemed | | | (12,600,000 | ) | | | (10,300,000 | ) |
| Shares outstanding, end of period | | | 53,009,141 | | | | 40,259,141 | |
See Notes to Financial Statements.
ALPS International Sector Dividend Dogs ETF
Statements of Changes in Net Assets
| | | For the Six Months Ended May 31, 2017 (Unaudited) | | | For the Year Ended November 30, 2016 | |
| OPERATIONS: | | | | | | |
| Net investment income | | $ | 4,643,825 | | | $ | 5,904,476 | |
| Net realized loss | | | (4,242,512 | ) | | | (8,681,501 | ) |
| Net change in unrealized appreciation/(depreciation) | | | 33,371,131 | | | | (1,531,282 | ) |
| Net increase/(decrease) in net assets resulting from operations | | | 33,772,444 | | | | (4,308,307 | ) |
| | | | | | | | | |
| Net Equalization Credits | | | 394,343 | | | | 528,824 | |
| | | | | | | | | |
| DISTRIBUTIONS TO SHAREHOLDERS: | | | | | | | | |
| From net investment income | | | (2,175,130 | ) | | | (5,356,978 | ) |
| Total distributions | | | (2,175,130 | ) | | | (5,356,978 | ) |
| | | | | | | | | |
| CAPITAL SHARE TRANSACTIONS: | | | | | | | | |
| Proceeds from sale of shares | | | 81,256,821 | | | | 45,086,015 | |
| Cost of shares redeemed | | | (14,090,139 | ) | | | (10,156,797 | ) |
| Net income equalization (Note 2) | | | (394,343 | ) | | | (528,824 | ) |
| Net increase from share transactions | | | 66,772,339 | | | | 34,400,394 | |
| Net increase in net assets | | | 98,763,996 | | | | 25,263,933 | |
| | | | | | | | | |
| NET ASSETS: | | | | | | | | |
| Beginning of period | | | 161,042,391 | | | | 135,778,458 | |
| End of period * | | $ | 259,806,387 | | | $ | 161,042,391 | |
| | | | | | | | | |
| * Including accumulated net investment income of: | | $ | 2,981,209 | | | $ | 512,514 | |
| | | | | | | | | |
| OTHER INFORMATION: | | | | | | | | |
| CAPITAL SHARE TRANSACTIONS: | | | | | | | | |
| Beginning shares | | | 7,050,000 | | | | 5,600,000 | |
| Shares sold | | | 3,200,000 | | | | 1,900,000 | |
| Shares redeemed | | | (600,000 | ) | | | (450,000 | ) |
| Shares outstanding, end of period | | | 9,650,000 | | | | 7,050,000 | |
See Notes to Financial Statements.
ALPS Emerging Sector Dividend Dogs ETF
Statements of Changes in Net Assets
| | | For the Six Months Ended May 31, 2017 (Unaudited) | | | For the Year Ended November 30, 2016 | |
| OPERATIONS: | | | | | | |
| Net investment income | | $ | 476,341 | | | $ | 441,428 | |
| Net realized loss | | | (25,073 | ) | | | (2,116,664 | ) |
| Net change in unrealized appreciation | | | 2,981,535 | | | | 1,438,248 | |
| Net increase/(decrease) in net assets resulting from operations | | | 3,432,803 | | | | (236,988 | ) |
| | | | | | | | | |
| Net Equalization Credits | | | 44,220 | | | | 239,304 | |
| | | | | | | | | |
| DISTRIBUTIONS TO SHAREHOLDERS: | | | | | | | | |
| From net investment income | | | (177,263 | ) | | | (434,572 | ) |
| Total distributions | | | (177,263 | ) | | | (434,572 | ) |
| | | | | | | | | |
| CAPITAL SHARE TRANSACTIONS: | | | | | | | | |
| Proceeds from sale of shares | | | 22,010,674 | | | | 15,512,093 | |
| Cost of shares redeemed | | | (2,160,243 | ) | | | (5,133,159 | ) |
| Net income equalization (Note 2) | | | (44,220 | ) | | | (239,304 | ) |
| Net increase from share transactions | | | 19,806,211 | | | | 10,139,630 | |
| Net increase in net assets | | | 23,105,971 | | | | 9,707,374 | |
| | | | | | | | | |
| NET ASSETS: | | | | | | | | |
| Beginning of period | | | 19,056,754 | | | | 9,349,380 | |
| End of period * | | $ | 42,162,725 | | | $ | 19,056,754 | |
| | | | | | | | | |
| * Including accumulated net investment income of: | | $ | 406,333 | | | $ | 107,255 | |
| | | | | | | | | |
| OTHER INFORMATION: | | | | | | | | |
| CAPITAL SHARE TRANSACTIONS: | | | | | | | | |
| Beginning shares | | | 900,000 | | | | 450,000 | |
| Shares sold | | | 950,000 | | | | 700,000 | |
| Shares redeemed | | | (100,000 | ) | | | (250,000 | ) |
| Shares outstanding, end of period | | | 1,750,000 | | | | 900,000 | |
See Notes to Financial Statements.
ALPS | Dorsey Wright Sector Momentum ETF
Statement of Changes in Net Assets
| | | For the Period January 10, 2017 (Commencement) to May 31, 2017 (Unaudited) | |
| OPERATIONS: | | | |
| Net investment income | | $ | 14,639 | |
| Net realized loss | | | (11,350 | ) |
| Net change in unrealized appreciation | | | 363,249 | |
| Net Increase in net assets resulting from operations | | | 366,538 | |
| | | | | |
| DISTRIBUTIONS TO SHAREHOLDERS: | | | | |
| From net investment income | | | (5,884 | ) |
| Total distributions | | | (5,884 | ) |
| | | | | |
| CAPITAL SHARE TRANSACTIONS: | | | | |
| Proceeds from sale of shares | | | 6,419,582 | |
| Net increase from share transactions | | | 6,419,582 | |
| Net Increase in Net Assets | | | 6,780,236 | |
| | | | | |
| NET ASSETS: | | | | |
| Beginning of period | | | – | |
| End of period * | | $ | 6,780,236 | |
| | | | | |
| * Including accumulated net investment income of: | | $ | 8,755 | |
| | | | | |
| OTHER INFORMATION: | | | | |
| CAPITAL SHARE TRANSACTIONS: | | | | |
| Beginning shares | | | – | |
| Shares sold | | | 250,002 | |
| Shares redeemed | | | – | |
| Shares outstanding, end of period | | | 250,002 | |
See Notes to Financial Statements.
ALPS Sector Dividend Dogs ETF
| Financial Highlights | For a Share Outstanding Throughout the Periods Presented |
| | | For the Six Months Ended May 31, 2017 (Unaudited) | | | For the Year Ended November 30, 2016 | | | For the Year Ended November 30, 2015 | | | For the Year Ended November 30, 2014 | | | For the Year Ended November 30, 2013 | | | For the Period June 29, 2012 (Commencement) to November 30, 2012 | |
| NET ASSET VALUE, BEGINNING OF PERIOD | | $ | 42.29 | | | $ | 36.23 | | | $ | 38.80 | | | $ | 33.76 | | | $ | 26.71 | | | $ | 25.00 | |
| �� | | | | | | | | | | | | | | | | | | | | | | | | |
| INCOME/(LOSS) FROM INVESTMENT OPERATIONS: | | | | | | | | | |
Net investment income (a) | | | 0.73 | | | | 1.26 | | | | 1.21 | | | | 1.35 | | | | 1.12 | | | | 0.59 | |
| Net realized and unrealized gain/(loss) | | | 0.05 | | | | 6.15 | | | | (2.47 | ) | | | 4.94 | | | | 7.14 | | | | 1.41 | |
| Total from investment operations | | | 0.78 | | | | 7.41 | | | | (1.26 | ) | | | 6.29 | | | | 8.26 | | | | 2.00 | |
| | | | | | | | | | | | | | | | | | | | | | | | | |
| DISTRIBUTIONS: | | | | | | | | | | | | | | | | | | | | | | | | |
| From net investment income | | | (0.72 | ) | | | (1.34 | ) | | | (1.31 | ) | | | (1.25 | ) | | | (1.21 | ) | | | (0.29 | ) |
| Tax return of capital | | | – | | | | (0.01 | ) | | | – | | | | – | | | | – | | | | – | |
| Total distributions | | | (0.72 | ) | | | (1.35 | ) | | | (1.31 | ) | | | (1.25 | ) | | | (1.21 | ) | | | (0.29 | ) |
| | | | | | | | | | | | | | | | | | | | | | | | | |
| Net increase/(decrease) in net asset value | | | 0.06 | | | | 6.06 | | | | (2.57 | ) | | | 5.04 | | | | 7.05 | | | | 1.71 | |
| NET ASSET VALUE, END OF PERIOD | | $ | 42.35 | | | $ | 42.29 | | | $ | 36.23 | | | $ | 38.80 | | | $ | 33.76 | | | $ | 26.71 | |
TOTAL RETURN(b) | | | 1.85 | % | | | 20.86 | % | | | (3.21 | )% | | | 18.96 | % | | | 31.66 | % | | | 7.99 | % |
| | | | | | | | | | | | | | | | | | | | | | | | | |
| RATIOS/SUPPLEMENTAL DATA: | | | | | | | | | | | | | | | | | | | | | | | | |
| Net assets, end of period (000s) | | $ | 2,244,713 | | | $ | 1,702,405 | | | $ | 1,014,899 | | | $ | 1,024,473 | | | $ | 464,277 | | | $ | 62,768 | |
| | | | | | | | | | | | | | | | | | | | | | | | | |
| Ratio of expenses to average net assets | | | 0.40 | %(c) | | | 0.40 | % | | | 0.40 | % | | | 0.40 | % | | | 0.40 | % | | | 0.40 | %(c) |
| Ratio of net investment income to average net assets | | | 3.43 | %(c) | | | 3.23 | % | | | 3.25 | % | | | 3.74 | % | | | 3.58 | % | | | 5.31 | %(c) |
Portfolio turnover rate(d) | | | 37 | % | | | 49 | % | | | 55 | % | | | 12 | % | | | 8 | % | | | 0 | % |
Undistributed net investment income included in price of units issued and redeemed(a)(e) | | $ | 0.05 | | | $ | 0.06 | | | $ | 0.06 | | | $ | 0.09 | | | $ | 0.13 | | | $ | 0.19 | |
| (a) | Based on average shares outstanding during the period. |
| (b) | Total return is calculated assuming an initial investment made at the net asset value at the beginning of the period and redemption at the net asset value on the last day of the period and assuming all distributions are reinvested at reinvestment prices. Total return calculated for a period of less than one year is not annualized. |
| (d) | Portfolio turnover for periods less than one year is not annualized and does not include securities received or delivered from processing creations or redemptions in-kind. |
| (e) | The per share amount of equalization is presented to show the impact of equalization on distributable earnings per share. |
See Notes to Financial Statements.
ALPS International Sector Dividend Dogs ETF
| Financial Highlights | For a Share Outstanding Throughout the Periods Presented |
| | | For the Six Months Ended May 31, 2017 (Unaudited) | | | For the Year Ended November 30, 2016 | | | For the Year Ended November 30, 2015 | | | For the Year Ended November 30, 2014 | | | For the Period June 28, 2013 (Commencement) to November 30, 2013 | |
| NET ASSET VALUE, BEGINNING OF PERIOD | | $ | 22.84 | | | $ | 24.25 | | | $ | 27.33 | | | $ | 29.21 | | | $ | 25.00 | |
| | | | | | | | | | | | | | | | | | | | | |
| INCOME/(LOSS) FROM INVESTMENT OPERATIONS: | | | | | | | | | | | | | | | | | | | | |
Net investment income(a) | | | 0.61 | | | | 1.00 | | | | 1.06 | | | | 1.19 | | | | 0.34 | |
| Net realized and unrealized gain/(loss) | | | 3.78 | | | | (1.47 | ) | | | (3.13 | ) | | | (1.83 | ) | | | 4.08 | |
| Total from investment operations | | | 4.39 | | | | (0.47 | ) | | | (2.07 | ) | | | (0.64 | ) | | | 4.42 | |
| | | | | | | | | | | | | | | | | | | | | |
| DISTRIBUTIONS: | | | | | | | | | | | | | | | | | | | | |
| From net investment income | | | (0.31 | ) | | | (0.94 | ) | | | (0.99 | ) | | | (1.17 | ) | | | (0.21 | ) |
| Tax return of capital | | | – | | | | – | | | | (0.02 | ) | | | (0.07 | ) | | | – | |
| Total distributions | | | (0.31 | ) | | | (0.94 | ) | | | (1.01 | ) | | | (1.24 | ) | | | (0.21 | ) |
| | | | | | | | | | | | | | | | | | | | | |
| Net increase/(decrease) in net asset value | | | 4.08 | | | | (1.41 | ) | | | (3.08 | ) | | | (1.88 | ) | | | 4.21 | |
| NET ASSET VALUE, END OF PERIOD | | $ | 26.92 | | | $ | 22.84 | | | $ | 24.25 | | | $ | 27.33 | | | $ | 29.21 | |
TOTAL RETURN(b) | | | 19.35 | % | | | (1.95 | )% | | | (7.76 | )% | | | (2.53 | )% | | | 17.72 | % |
| | | | | | | | | | | | | | | | | | | | | |
| RATIOS/SUPPLEMENTAL DATA: | | | | | | | | | | | | | | | | | | | | |
| Net assets, end of period (000s) | | $ | 259,806 | | | $ | 161,042 | | | $ | 135,778 | | | $ | 143,461 | | | $ | 77,411 | |
| | | | | | | | | | | | | | | | | | | | | |
| Ratio of expenses to average net assets | | | 0.50 | %(c) | | | 0.50 | % | | | 0.50 | % | | | 0.50 | % | | | 0.50 | %(c) |
| Ratio of net investment income to average net assets | | | 4.95 | %(c) | | | 4.28 | % | | | 4.05 | % | | | 4.05 | % | | | 2.87 | %(c) |
Portfolio turnover rate(d) | | | 35 | % | | | 47 | % | | | 67 | % | | | 19 | % | | | 2 | % |
Undistributed net investment income included in price of units issued and redeemed(a)(e) | | $ | 0.05 | | | $ | 0.09 | | | $ | 0.05 | | | $ | 0.09 | | | $ | 0.14 | |
| (a) | Based on average shares outstanding during the period. |
| (b) | Total return is calculated assuming an initial investment made at the net asset value at the beginning of the period and redemption at the net asset value on the last day of the period and assuming all distributions are reinvested at reinvestment prices. Total return calculated for a period of less than one year is not annualized. |
| (d) | Portfolio turnover for periods less than one year is not annualized and does not include securities received or delivered from processing creations or redemptions in-kind. |
| (e) | The per share amount of equalization is presented to show the impact of equalization on distributable earnings per share. |
See Notes to Financial Statements.
ALPS Emerging Sector Dividend Dogs ETF
| Financial Highlights | For a Share Outstanding Throughout the Periods Presented |
| | | For the Six Months Ended May 31, 2017 (Unaudited) | | | For the Year Ended November 30, 2016 | | | For the Year Ended November 30, 2015 | | | For the Period March 28, 2014 (Commencement) to November 30, 2014 | |
| NET ASSET VALUE, BEGINNING OF PERIOD | | $ | 21.17 | | | $ | 20.78 | | | $ | 26.57 | | | $ | 25.00 | |
| | | | | | | | | | | | | | | | | |
| INCOME/(LOSS) FROM INVESTMENT OPERATIONS: | | | | | | | | | | | | | | | | |
Net investment income(a) | | | 0.41 | | | | 0.67 | | | | 1.26 | | | | 0.64 | |
| Net realized and unrealized gain/(loss) | | | 2.70 | | | | 0.39 | | | | (6.15 | ) | | | 1.59 | |
| Total from investment operations | | | 3.11 | | | | 1.06 | | | | (4.89 | ) | | | 2.23 | |
| | | | | | | | | | | | | | | | | |
| DISTRIBUTIONS: | | | | | | | | | | | | | | | | |
| From net investment income | | | (0.19 | ) | | | (0.67 | ) | | | (0.90 | ) | | | (0.54 | ) |
| Tax return of capital | | | – | | | | – | | | | – | | | | (0.12 | ) |
| Total distributions | | | (0.19 | ) | | | (0.67 | ) | | | (0.90 | ) | | | (0.66 | ) |
| | | | | | | | | | | | | | | | | |
| Net increase/(decrease) in net asset value | | | 2.92 | | | | 0.39 | | | | (5.79 | ) | | | 1.57 | |
| NET ASSET VALUE, END OF PERIOD | | $ | 24.09 | | | $ | 21.17 | | | $ | 20.78 | | | $ | 26.57 | |
TOTAL RETURN(b) | | | 14.73 | % | | | 5.10 | % | | | (18.66 | )% | | | 8.93 | % |
| | | | | | | | | | | | | | | | | |
| RATIOS/SUPPLEMENTAL DATA: | | | | | | | | | | | | | | | | |
| Net assets, end of period (000s) | | $ | 42,163 | | | $ | 19,057 | | | $ | 9,349 | | | $ | 10,629 | |
| | | | | | | | | | | | | | | | | |
| Ratio of expenses to average net assets | | | 0.60 | %(c) | | | 0.60 | % | | | 0.60 | % | | | 0.60 | %(c) |
| Ratio of net investment income to average net assets | | | 3.58 | %(c) | | | 3.11 | % | | | 5.34 | % | | | 3.54 | %(c) |
Portfolio turnover rate(d) | | | 38 | % | | | 68 | % | | | 96 | % | | | 19 | % |
Undistributed net investment income included in price of units issued and redeemed(a)(e) | | $ | 0.04 | | | $ | 0.36 | | | $ | 0.03 | | | $ | 0.16 | |
| (a) | Based on average shares outstanding during the period. |
| (b) | Total return is calculated assuming an initial investment made at the net asset value at the beginning of the period and redemption at the net asset value on the last day of the period and assuming all distributions are reinvested at reinvestment prices. Total return calculated for a period of less than one year is not annualized. |
| (d) | Portfolio turnover for periods less than one year is not annualized and does not include securities received or delivered from processing creations or redemptions in-kind. |
| (e) | The per share amount of equalization is presented to show the impact of equalization on distributable earnings per share. |
See Notes to Financial Statements.
ALPS | Dorsey Wright Sector Momentum ETF
| Financial Highlights | For a Share Outstanding Throughout the Period Presented |
| | | For the Period January 10, 2017 (Commencement) to May 31, 2017 (Unaudited) | |
| NET ASSET VALUE, BEGINNING OF PERIOD | | $ | 24.94 | |
| | | | | |
| INCOME/(LOSS) FROM INVESTMENT OPERATIONS: | | | | |
Net investment income (a) | | | 0.09 | |
| Net realized and unrealized gain | | | 2.13 | |
| Total from investment operations | | | 2.22 | |
| | | | | |
| DISTRIBUTIONS: | | | | |
| From net investment income | | | (0.04 | ) |
| Total distributions | | | (0.04 | ) |
| | | | | |
| Net increase in net asset value | | | 2.18 | |
| NET ASSET VALUE, END OF PERIOD | | $ | 27.12 | |
TOTAL RETURN(b) | | | 8.91 | % |
| | | | | |
| RATIOS/SUPPLEMENTAL DATA: | | | | |
| Net assets, end of period (000s) | | $ | 6,780 | |
| | | | | |
| Ratio of expenses to average net assets | | | 0.40 | %(c) |
| Ratio of net investment income to average net assets | | | 0.88 | %(c) |
Portfolio turnover rate(d) | | | 26 | % |
| (a) | Based on average shares outstanding during the period. |
| (b) | Total return is calculated assuming an initial investment made at the net asset value at the beginning of the period and redemption at the net asset value on the last day of the period and assuming all distributions are reinvested at reinvestment prices. Total return calculated for a period of less than one year is not annualized. |
| (d) | Portfolio turnover for periods less than one year is not annualized and does not include securities received or delivered from processing creations or redemptions in-kind. |
See Notes to Financial Statements.
ALPS ETF Trust
| Notes to Financial Statements | May 31, 2017 (Unaudited) |
1. ORGANIZATION
ALPS ETF Trust (the “Trust”), a Delaware statutory trust, is an open-end management investment company under the Investment Company Act of 1940, as amended (the “1940 Act”). As of May 31, 2017, the Trust consisted of twenty separate portfolios. Each portfolio represents a separate series of the Trust. This report pertains to the ALPS Sector Dividend Dogs ETF, the ALPS International Sector Dividend Dogs ETF, the ALPS Emerging Sector Dividend Dogs ETF, and the ALPS | Dorsey Wright Sector Momentum ETF (each a “Fund” and collectively, the “Funds”). Each Fund has elected to qualify as a diversified series of the Trust under the 1940 Act, except for the ALPS | Dorsey Wright Sector Momentum ETF ALPS, which is a non-diversified series of the Trust under the 1940 Act. As a result, changes in the market value of a single investment could cause greater fluctuations in share price than would occur in a diversified fund.
The ALPS | Dorsey Wright Sector Momentum ETF commenced operations on January 10, 2017.
The investment objective of the ALPS Sector Dividend Dogs ETF is to seek investment results that replicate as closely as possible, before fees and expenses, the performance of the S-Network® Sector Dividend Dogs Index. The investment objective of the ALPS International Sector Dividend Dogs ETF is to seek investment results that replicate as closely as possible, before fees and expenses, the performance of the S-Network® International Sector Dividend Dogs Index. The investment objective of the ALPS Emerging Sector Dividend Dogs ETF is to seek investment results that replicate as closely as possible, before fees and expenses, the performance of the S-Network® Emerging Sector Dividend Dogs Index. The investment objective of the ALPS | Dorsey Wright Sector Momentum ETF is to seek investment results that correspond (before fees and expenses) generally to the performance of the Dorsey Wright US Sector Momentum Index.
The shares of the ALPS Sector Dividend Dogs ETF, the ALPS International Sector Dividend Dogs ETF, and the ALPS Emerging Sector Dividend Dogs ETF (“Shares”) are listed on the NYSE Arca, Inc. (the “NYSE Arca”). The shares of the ALPS | Dorsey Wright Sector Momentum ETF (“Shares”) are listed on the NASDAQ Stock Market LLC (“NASDAQ”). Each Fund issues and redeems Shares, at net asset value (“NAV”) in blocks of 50,000 Shares, each of which is called a “Creation Unit”. Creation Units are issued and redeemed principally in-kind for securities included in the Underlying Index. Except when aggregated in Creation Units, Shares are not redeemable securities of the Fund.
Pursuant to the Trust’s organizational documents, its Officers and Trustees are indemnified against certain liability arising out of the performance of their duties to the Trust. Additionally, in the normal course of business, the Trust enters into contracts with service providers that contain general indemnification clauses. The Trust’s maximum exposure under these arrangements is unknown, as this would involve future claims that may be made against the Trust that have not yet occurred.
2. SIGNIFICANT ACCOUNTING POLICIES
The following is a summary of significant accounting policies consistently followed by the Funds in the preparation of the financial statements. The accompanying financial statements were prepared in accordance with accounting principles generally accepted in the United States of America (“U.S. GAAP”). The preparation of financial statements in conformity with U.S. GAAP requires management to make certain estimates and assumptions that affect the reported amounts of assets and liabilities and disclosures of contingent assets and liabilities at the date of the financial statements and the reported amounts of revenue and expenses during the period. Actual results could differ from those estimates. Each Fund is considered an investment company under U.S. GAAP and follows the accounting and reporting guidance applicable to investment companies in the Financial Accounting Standards Board Accounting Standards Codification Topic 946.
A. Portfolio Valuation
Each Fund’s NAV is determined daily, as of the close of regular trading on the New York Stock Exchange (“NYSE”), normally 4:00 p.m. Eastern time, on each day the NYSE is open for trading. The NAV is computed by dividing the value of all assets of the Fund (including accrued interest and dividends), less all liabilities (including accrued expenses and dividends declared but unpaid), by the total number of shares outstanding.
Portfolio securities listed on any exchange other than the NASDAQ are valued at the last sale price on the business day as of which such value is being determined. If there has been no sale on such day, the securities are valued at the mean of the most recent bid and ask prices on such day. Securities traded on the NASDAQ are valued at the NASDAQ Official Closing Price as determined by NASDAQ. Portfolio securities traded on more than one securities exchange are valued at the last sale price on the business day as of which such value is being determined at the close of the exchange representing the principal market for such securities. Portfolio securities traded in the over-the-counter market, but excluding securities traded on the NASDAQ, are valued at the latest quoted sale price in such market.
The Funds’ investments are valued at market value or, in the absence of market value with respect to any portfolio securities, at fair value according to procedures adopted by the Trust’s Board of Trustees (the “Board”). When market quotations are not readily available or when events occur that make established valuation methods unreliable, securities of the Funds may be valued in good faith by or under the direction of the Board. These securities generally include, but are not limited to, restricted securities (securities which may not be publicly sold without registration under the Securities Act of 1933) for which a pricing service is unable to provide a market price; securities whose trading has been formally suspended; a security whose market price is not available from a pre-established primary pricing source or the pricing source is not willing to provide a price; a security with respect to which an event has occurred that is most likely to materially affect the value of the security after the market has closed but before the calculation of the Fund’s NAV or make it difficult or impossible to obtain a reliable market quotation; or a security whose price, as provided by the pricing service, does not reflect the security’s “fair value” due to the security being de-listed from a national exchange or the security’s primary trading market is temporarily closed at a time when, under normal conditions, it would be open. As a general principle, the current “fair value” of a security would be the amount which the owner might reasonably expect to receive from the sale on the applicable exchange or principal market. A variety of factors may be considered in determining the fair value of such securities.
ALPS ETF Trust
| Notes to Financial Statements | May 31, 2017 (Unaudited) |
B. Fair Value Measurements
Each Fund discloses the classification of its fair value measurements following a three-tier hierarchy based on the inputs used to measure fair value. Inputs refer broadly to the assumptions that market participants would use in pricing the asset or liability, including assumptions about risk. Inputs may be observable or unobservable. Observable inputs reflect the assumptions market participants would use in pricing the asset or liability that are developed based on market data obtained from sources independent of the reporting entity. Unobservable inputs reflect the reporting entity’s own assumptions about the assumptions market participants would use in pricing the asset or liability that are developed based on the best information available.
Valuation techniques used to value the Funds’ investments by major category are as follows:
Equity securities, including restricted securities, for which market quotations are readily available, are valued at the last reported sale price or official closing price as reported by a third party pricing vendor on the primary market or exchange on which they are traded and are categorized as Level 1 in the hierarchy. In the event there were no sales during the day or closing prices are not available, securities are valued at the mean of the most recent quoted bid and ask prices on such day and are generally categorized as Level 2 in the hierarchy. Investments in open-end mutual funds are valued at their closing NAV each business day and are categorized as Level 1 in the hierarchy.
Changes in valuation techniques may result in transfers in or out of an assigned level within the disclosure hierarchy.
Various inputs are used in determining the value of each Fund’s investments as of the end of the reporting period. When inputs used fall into different levels of the fair value hierarchy, the level in the hierarchy within which the fair value measurement falls is determined based on the lowest level input that is significant to the fair value measurement in its entirety. The designated input levels are not necessarily an indication of the risk or liquidity associated with these investments.
These inputs are categorized in the following hierarchy under applicable financial accounting standards:
| Level 1 – | Unadjusted quoted prices in active markets for identical investments, unrestricted assets or liabilities that a Fund has the ability to access at the measurement date; |
| | |
| Level 2 – | Quoted prices which are not active, quoted prices for similar assets or liabilities in active markets or inputs other than quoted prices that are observable (either directly or indirectly) for substantially the full term of the asset or liability; and |
| | |
| Level 3 – | Significant unobservable prices or inputs (including the Fund’s own assumptions in determining the fair value of investments) where there is little or no market activity for the asset or liability at the measurement date. |
The following is a summary of the inputs used to value the Funds’ investments at May 31, 2017:
ALPS Sector Dividend Dogs ETF
| Investments in Securities at Value* | | Level 1 - Unadjusted Quoted Prices | Level 2 - Other Significant Observable Inputs | | | Level 3 - Significant Unobservable Inputs | | | Total | |
| Common Stocks | | $ | 2,235,120,666 | | | $ | – | | | $ | – | | | $ | 2,235,120,666 | |
| Short Term Investments | | | 2,057,624 | | | | – | | | | – | | | | 2,057,624 | |
| TOTAL | | $ | 2,237,178,290 | | | $ | – | | | $ | – | | | $ | 2,237,178,290 | |
ALPS ETF Trust
| Notes to Financial Statements | May 31, 2017 (Unaudited) |
ALPS International Sector Dividend Dogs ETF
| Investments in Securities at Value* | Level 1 - Unadjusted Quoted Prices | | Level 2 - Other Significant Observable Inputs | | Level 3 - Significant Unobservable Inputs | | Total | |
| Common Stocks | | $ | 258,158,622 | | | $ | – | | | $ | – | | | $ | 258,158,622 | |
| Short Term Investments | | | 245,808 | | | | – | | | | – | | | | 245,808 | |
| TOTAL | | $ | 258,404,430 | | | $ | – | | | $ | – | | | $ | 258,404,430 | |
ALPS Emerging Sector Dividend Dogs ETF
| Investments in Securities at Value* | Level 1 - Unadjusted Quoted Prices | | Level 2 - Other Significant Observable Inputs | | Level 3 - Significant Unobservable Inputs | | Total | |
| Common Stocks | | $ | 42,001,363 | | | $ | – | | | $ | – | | | $ | 42,001,363 | |
| Short Term Investments | | | 96,631 | | | | – | | | | – | | | | 96,631 | |
| TOTAL | | $ | 42,097,994 | | | $ | – | | | $ | – | | | $ | 42,097,994 | |
ALPS/Dorsey Wright Sector Momentum ETF
| Investments in Securities at Value* | Level 1 - Unadjusted Quoted Prices | | Level 2 - Other Significant Observable Inputs | | Level 3 - Significant Unobservable Inputs | | Total | |
| Common Stocks | | $ | 6,769,491 | | | $ | – | | | $ | – | | | $ | 6,769,491 | |
| Short Term Investments | | | 5,482 | | | | – | | | | – | | | | 5,482 | |
| TOTAL | | $ | 6,774,973 | | | $ | – | | | $ | – | | | $ | 6,774,973 | |
| * | For a detailed sector/country breakdown, see the accompanying Schedule of Investments. |
The Funds recognize transfers between levels as of the end of the period. For the six months or period ended May 31, 2017, the Funds did not have any transfers between Level 1 and Level 2 securities. The Funds did not have any securities that used significant unobservable inputs (Level 3) in determining fair value.
C. Foreign Securities
The ALPS International Sector Dividend Dogs ETF and the ALPS Emerging Sector Dividend Dogs ETF may directly purchase securities of foreign issuers. Investments in non-U.S. issuers may involve unique risks compared to investing in securities of U.S. issuers, including, among others, less liquidity generally, greater market volatility than U.S. securities and less complete financial information than for U.S. issuers. In addition, adverse political, economic or social developments could undermine the value of the Fund’s investments or prevent the Fund from realizing the full value of its investments. Financial reporting standards for companies based in foreign markets differ from those in the United States. Finally, the value of the currency of the country in which the Fund has invested could decline relative to the value of the U.S. dollar, which may affect the value of the investment to U.S. investors.
Because foreign markets may be open on different days than the days during which investors may purchase the shares of each Fund, the value of each Fund's securities may change on the days when investors are not able to purchase the shares of the Funds. The value of securities denominated in foreign currencies is converted into U.S. dollars using exchange rates determined daily as of the close of regular trading on the NYSE or NASDAQ. Any use of a different rate from the rates used by the Index may adversely affect a Fund's ability to track its Index.
D. Foreign Currency Translation
The books and records of the Funds are maintained in U.S. dollars. Investment valuations and other assets and liabilities initially expressed in foreign currencies are converted each business day into U.S. dollars based upon current exchange rates. The portion of realized and unrealized gains or losses on investments due to fluctuations in foreign currency exchange rates is not separately disclosed and is included in realized and unrealized gains or losses on investments, when applicable.
ALPS ETF Trust
| Notes to Financial Statements | May 31, 2017 (Unaudited) |
E. Securities Transactions and Investment Income
Securities transactions are recorded as of the trade date. Realized gains and losses from securities transactions are recorded on the highest cost basis. Dividend income and capital gains distributions, if any, are recorded on the ex-dividend date, net of any foreign taxes withheld. Interest income, if any, is recorded on the accrual basis, including any amortization of premiums and accretion of discounts.
F. Dividends and Distributions to Shareholders
Dividends from net investment income for each Fund, if any, are declared and paid quarterly or as the Board may determine from time to time. Distributions of net realized capital gains earned by the Funds, if any, are distributed at least annually.
G. Equalization
The ALPS Sector Dividend Dogs ETF, the ALPS International Sector Dividend Dogs ETF, and the ALPS Emerging Sector Dividend Dogs ETF utilize the accounting practice known as “Equalization” by which a portion of the proceeds from sales and costs of reacquiring the Funds’ shares, equivalent on a per share basis to the amount of distributable net investment income on the date of the transaction, is credited or charged to undistributed net investment income. As a result, undistributed net investment income per share is unaffected by sales or reacquisitions of the Funds’ shares. Amounts related to Equalization can be found on the Statement of Changes in Net Assets.
H. Federal Tax and Tax Basis Information
The timing and character of income and capital gain distributions are determined in accordance with income tax regulations, which may differ from U.S. GAAP. Reclassifications are made to the Fund’s capital accounts for permanent tax differences to reflect income and gains available for distribution (or available capital loss carryforwards) under income tax regulations. The amounts and characteristics of tax basis distributions and composition of distributable earnings/(accumulated losses) are finalized at fiscal year-end; accordingly, tax basis balances have not been determined as of May 31, 2017.
The tax character of the distributions paid during the fiscal year ended November 30, 2016 were as follows:
| Fund | | Ordinary Income | | | Return of Capital | |
| November 30, 2016 | | | | | | |
| ALPS Sector Dividend Dogs ETF | | $ | 41,467,278 | | | $ | 366,916 | |
| ALPS International Sector Dividend Dogs ETF | | | 5,356,978 | | | | – | |
| ALPS Emerging Sector Dividend Dogs ETF | | | 434,572 | | | | – | |
At November 30, 2016, capital losses deferred to the next tax year were as follows:
| Fund | | Short-Term | | | Long-Term | |
| ALPS Sector Dividend Dogs ETF | | $ | 20,518,164 | | | $ | 64,757,527 | |
| ALPS International Sector Dividend Dogs ETF | | | 14,788,660 | | | | 2,977,142 | |
| ALPS Emerging Sector Dividend Dogs ETF | | | 1,210,149 | | | | 1,123,022 | |
As of May 31, 2017, the costs of investments for federal income tax purposes and accumulated net unrealized appreciation/(depreciation) on investments were as follows:
| | | Gross Appreciation (excess of value over tax cost) | | | Gross Depreciation (excess of tax cost over value) | | | Net Unrealized Appreciation/ (Depreciation) | | | Cost of Investments for Income Tax Purposes | |
| ALPS Sector Dividend Dogs ETF | | $ | 193,538,316 | | | $ | (91,795,479 | ) | | $ | 101,742,837 | | | $ | 2,135,435,453 | |
| ALPS International Sector Dividend Dogs ETF | | | 21,403,040 | | | | (11,703,409 | ) | | | 9,699,631 | | | | 248,704,799 | |
| ALPS Emerging Sector Dividend Dogs ETF | | | 3,244,713 | | | | (1,300,777 | ) | | | 1,943,936 | | | | 40,154,058 | |
| ALPS/Dorsey Wright Sector Momentum ETF | | | 502,100 | | | | (140,102 | ) | | | 361,998 | | | | 6,412,975 | |
The differences between book-basis and tax-basis are primarily due to the deferral of losses from wash sales.
ALPS ETF Trust
| Notes to Financial Statements | May 31, 2017 (Unaudited) |
I. Income Taxes
No provision for income taxes is included in the accompanying financial statements, as each Fund intends to distribute to shareholders all taxable investment income and realized gains and otherwise comply with Subchapter M of the Internal Revenue Code of 1986, as amended, applicable to regulated investment companies. Each Fund evaluates tax positions taken (or expected to be taken) in the course of preparing the Fund’s tax returns to determine whether these positions meet a “more-likely-than-not” standard that, based on the technical merits, have a more than fifty percent likelihood of being sustained by a taxing authority upon examination. A tax position that meets the “more-likely-than-not” recognition threshold is measured to determine the amount of benefit to recognize in the financial statements.
As of and during the six months ended May 31, 2017, each Fund did not have a liability for any unrecognized tax benefits. Each Fund files U.S. federal, state, and local tax returns as required. Each Fund’s tax returns are subject to examination by the relevant tax authorities until expiration of the applicable statute of limitations, which is generally three years after the filing of the tax return, but may extend to four years in certain jurisdictions. Each Fund’s tax returns for open years have incorporated no uncertain tax positions that require a provision for income taxes. Being that the ALPS | Dorsey Wright Sector Momentum ETF commenced operations on January 10, 2017, no tax returns have been filed as of the date of this report.
J. Lending of Portfolio Securities
The Funds have entered into a securities lending agreement with State Street Bank & Trust Co. (“SSB”), the Funds’ lending agent. Each Fund may lend its portfolio securities only to borrowers that are approved by SSB. Each Fund will limit such lending to not more than 33 1/3% of the value of its total assets. The Fund’s securities held at SSB as custodian shall be available to be lent except those securities the Fund or ALPS Advisors Inc. specifically identifies in writing as not being available for lending. The borrower pledges and maintains with the Fund collateral consisting of cash (U.S. Dollars only), securities issued or guaranteed by the U.S. government or its agencies or instrumentalities, and cash equivalents (including irrevocable bank letters of credit) issued by a person other than the borrower or an affiliate of the borrower. The initial collateral received by the Fund is required to have a value of no less than 102% of the market value of the loaned securities for U.S equity securities and a value of no less than 105% of the market value for non-U.S. equity securities. The collateral is maintained thereafter, at a market value equal to not less than 102% of the current value of the U.S. equity securities on loan and not less than 105% of the current value of the non-U.S. equity securities on loan. The market value of the loaned securities is determined at the close of each business day and any additional required collateral is delivered to the Fund on the next business day. During the term of the loan, each Fund is entitled to all distributions made on or in respect of the loaned securities. Loans of securities are terminable at any time and the borrower, after notice, is required to return borrowed securities within the customary time period for settlement of securities transactions.
Any cash collateral received is reinvested in a money market fund managed by SSB as disclosed in the Fund’s Schedule of Investments and is reflected in the Statements of Assets and Liabilities as a payable for collateral upon return of securities loaned. Non-cash collateral, in the form of securities issued or guaranteed by the U.S. government or its agencies or instrumentalities, is not disclosed in the Fund’s Statements of Assets and Liabilities as it is held by the lending agent on behalf of the Fund, and the Fund does not have the ability to re-hypothecate these securities. Income earned by the Fund from securities lending activity is disclosed in the Statement of Operations.
| | | Market Value of Securities on Loan | | Cash Collateral Received | | Non-Cash Collateral Received | | | Total Collateral Received | |
| ALPS/Dorsey Wright Sector Momentum ETF | | $ | 97,949 | | – | | $ | 102,614 | | | $ | 102,614 | |
The risks of securities lending include the risk that the borrower may not provide additional collateral when required or may not return the securities when due. To mitigate these risks, the Funds benefit from a borrower default indemnity provided by SSB. SSB’s indemnity allows for full replacement of securities lent wherein SSB will purchase the unreturned loaned securities on the open market by applying the proceeds of the collateral, or to the extent such proceeds are insufficient or the collateral is unavailable, SSB will purchase the unreturned loan securities at SSB’s expense. However, the Funds could suffer a loss if the value of the investments purchased with cash collateral falls below the value of the cash collateral received.
ALPS ETF Trust
| Notes to Financial Statements | May 31, 2017 (Unaudited) |
The following table reflects a breakdown of transactions accounted for as secured borrowings, the gross obligation by the type of collateral pledged or securities loaned, and the remaining contractual maturity of those transactions as of May 31, 2017:
| ALPS | Dorsey Wright Sector Momentum ETF | | Remaining contractual maturity of the agreements |
| Securities Lending Transactions | | Overnight & Continuous | | | Up to 30 days | | | 30-90 days | | Greater than 90 days | | | Total | |
| Common Stocks | | $ | – | | | $ | – | | | $ | – | | | $ | – | | | $ | – | |
| Total Borrowings | | | | | | | | | | | | | | | | | | | – | |
| Gross amount of recognized liabilities for securities lending (collateral received) | | | $ | – | |
3. INVESTMENT ADVISORY FEE AND OTHER AFFILIATED TRANSACTIONS
ALPS Advisors, Inc. (the “Adviser”) acts as the Funds’ investment adviser pursuant to advisory agreements with the Trust on behalf of each Fund (the “Advisory Agreement”). Pursuant to the Advisory Agreement, each Fund pays the Adviser a unitary fee for the services and facilities it provides, payable on a monthly basis as a percentage of each Fund’s average daily net assets as set out below. From time to time, the Adviser may waive all or a portion of its fee.
| Fund | Advisory Fee |
| ALPS Sector Dividend Dogs ETF | 0.40% |
| ALPS International Sector Dividend Dogs ETF | 0.50% |
| ALPS Emerging Sector Dividend Dogs ETF | 0.60% |
| ALPS/Dorsey Wright Sector Momentum ETF | 0.40% |
Out of the unitary management fee, the Adviser pays substantially all expenses of each Fund, including the cost of transfer agency, custody, fund administration, legal, audit, independent trustees and other services, except for interest expenses, distribution fees or expenses, brokerage expenses, taxes and extraordinary expenses not incurred in the ordinary course of each Fund's business. The Adviser’s unitary management fee is designed to pay substantially all of each Fund's expenses and to compensate the Adviser for providing services for each Fund.
ALPS Fund Services, Inc., an affiliate of the Adviser, is the administrator for the Funds.
Each Trustee who is not an officer or employee of the Adviser, any sub-adviser or any of their affiliates (“Independent Trustees”) receives (1) a quarterly retainer of $5,000, (2) a per meeting fee for regularly scheduled meetings of $3,750, (3) $1,500 for any special meeting held outside of a regularly scheduled board meeting, and (4) reimbursement for all reasonable out-of-pocket expenses relating to attendance at meetings.
4. PURCHASES AND SALES OF SECURITIES
For the six months or period ended May 31, 2017, the cost of purchases and proceeds from sales of investment securities, excluding short-term investments and in-kind transactions, were as follows:
| Fund | | Purchases | | | Sales | |
| ALPS Sector Dividend Dogs ETF | | $ | 774,941,019 | | | $ | 768,441,665 | |
| ALPS International Sector Dividend Dogs ETF | | | 68,913,677 | | | | 66,583,717 | |
| ALPS Emerging Sector Dividend Dogs ETF | | | 14,691,206 | | | | 10,568,183 | |
| ALPS/Dorsey Wright Sector Momentum ETF | | | 3,734,592 | | | | 1,243,138 | |
For the six months or period ended May 31, 2017, the cost of in-kind purchases and proceeds from in-kind sales were as follows:
| Fund | | Purchases | | | Sales | |
| ALPS Sector Dividend Dogs ETF | | $ | 1,087,764,710 | | | $ | 546,996,068 | |
| ALPS International Sector Dividend Dogs ETF | | | 81,041,918 | | | | 14,101,091 | |
| ALPS Emerging Sector Dividend Dogs ETF | | | 17,606,526 | | | | 1,715,599 | |
| ALPS/Dorsey Wright Sector Momentum ETF | | | 3,926,138 | | | | – | |
ALPS ETF Trust
| Notes to Financial Statements | May 31, 2017 (Unaudited) |
For the six months or period ended May 31, 2017, the in-kind net realized gains/(losses) were as follows:
| Fund | | Net Realized Gain/(Loss) | |
| ALPS Sector Dividend Dogs ETF | | $ | 94,311,107 | |
| ALPS International Sector Dividend Dogs ETF | | | 1,002,529 | |
| ALPS Emerging Sector Dividend Dogs ETF | | | 196,142 | |
| ALPS/Dorsey Wright Sector Momentum ETF | | – | |
Gains on in-kind transactions are not considered taxable for federal income tax purposes and losses on in kind transactions are also not deductible for tax purposes.
5. CAPITAL SHARE TRANSACTIONS
Shares are created and redeemed by each Fund only in Creation Unit size aggregations of 50,000 shares. Only broker-dealers or large institutional investors with creation and redemption agreements called Authorized Participants (“AP”) are permitted to purchase or redeem Creation Units from the Funds. Such transactions are generally permitted on an in-kind basis, with a balancing cash component to equate the transaction to the NAV per unit of each Fund on the transaction date. Cash may be substituted equivalent to the value of certain securities generally when they are not available in sufficient quantity for delivery, not eligible for trading by the AP or as a result of other market circumstances.
6. RELATED PARTY TRANSACTIONS
The ALPS Sector Dividend Dog ETF engaged in cross trades between each other during the six months ended May 31, 2017 pursuant to Rule 17a-7 under the 1940 Act. Cross trading is the buying or selling of portfolio securities between funds to which the Adviser serves as the investment adviser. The Board previously adopted procedures that apply to transactions between the Funds of the Trust pursuant to Rule 17a-7. These transactions related to cross trades during the period complied with the requirements set forth by Rule 17a-7 and the Trust’s procedures.
Transactions related to cross trades during the six months ended May 31, 2017, were as follows:
| Fund | | Purchase cost paid | | | Sale proceeds received | | | Realized gain/ (loss) on sales | |
| ALPS Sector Dividend Dogs ETF | | $ | 793,576 | | | $ | 968,753 | | | $ | 341,293 | |
7. SUBSEQUENT EVENTS
On October 13, 2016, the Securities and Exchange Commission (“SEC”) amended Regulation S-X, which will require standardized, enhanced disclosure about derivatives in investment company financial statements, as well as other amendments. The compliance date for the amendments to Regulation S-X is August 1, 2017. Management is currently evaluating the impact to the financial statements and disclosures.
ALPS ETF Trust
| Additional Information | May 31, 2017 (Unaudited) |
PROXY VOTING POLICIES AND PROCEDURES
Information regarding how the Fund voted proxies relating to portfolio securities during the most recent 12-month period ended June 30 and a description of the Fund’s proxy voting policies and procedures used in determining how to vote for proxies are available without charge on the SEC’s website at www.sec.gov and upon request, by calling (toll-free) 1-866-675-2639.
PORTFOLIO HOLDINGS
The Trust is required to disclose, after its first and third fiscal quarters, the complete schedule of each Fund’s portfolio holdings with the SEC on Form N-Q. Form N-Q for each Fund will be available on the SEC’s website at www.sec.gov. Each Fund’s Form N-Q may also be reviewed and copied at the SEC’s Public Reference Room in Washington, D.C. and information on the operation of the Public Reference Room may be obtained by calling 1-800-SEC-0330. Each Fund’s Form N-Q will be available without charge, upon request, by calling (toll-free) 1-866-675-2639 or by writing to ALPS ETF Trust at 1290 Broadway, Suite 1100, Denver, Colorado 80203.
TAX INFORMATION
The Funds designated the following for federal income tax purposes for distributions made during the calendar year ended December 31, 2016:
| | Qualified Dividend Income | Dividend Received Deduction |
| ALPS Sector Dividend Dogs ETF | 96.35% | 82.83% |
| ALPS International Sector Dividend Dogs ETF | 100.00% | 0.00% |
| ALPS Emerging Sector Dividend Dogs ETF | 100.00% | 0.00% |
In early 2017, if applicable, shareholders of record received this information for the distributions paid to them by the Funds during the calendar year 2016 via Form 1099. The Funds will notify shareholders in early 2018 of amounts paid to them by the Funds, if any, during the calendar year 2017.
LICENSING AGREEMENTS
ALPS Sector Dividend Dogs ETF, ALPS International Sector Dividend Dogs ETF, and ALPS Emerging Sector Dividend Dogs ETF
The Funds are not sponsored, endorsed, sold or promoted by the Index Provider. The Index Provider makes no representation or warranty, express or implied, to the owners of each Fund or any member of the public regarding the advisability of investing in securities generally or in each Fund particularly or the ability of each Fund to track the performance of the physical commodities market. The Index Provider’s only relationship to the Adviser or each Fund is the licensing of certain service marks and trade names of the Index Provider and of each Underlying Index that is determined, composed and calculated by the Index Provider without regard to the Adviser or the Funds. The Index Provider has no obligation to take the needs of the Adviser or the Funds or the owners of each Fund into consideration in determining, composing or calculating each Underlying Index. The Index Provider is not responsible for and has not participated in the determination of the timing of, prices at, or quantities of each Fund to be issued or in the determination or calculation of the equation by which each Fund is to be converted into cash. The Index Provider has no obligation or liability in connection with the administration, marketing or trading of each Fund.
THE INDEX PROVIDER DOES NOT GUARANTEE THE ACCURACY AND/OR THE COMPLETENESS OF EACH UNDERLYING INDEX OR ANY DATA INCLUDED THEREIN AND THE INDEX PROVIDER SHALL HAVE NO LIABILITY FOR ANY ERRORS, OMISSIONS, OR INTERRUPTIONS THEREIN. THE INDEX PROVIDER MAKES NO WARRANTY, EXPRESS OR IMPLIED, AS TO RESULTS TO BE OBTAINED BY THE ADVISER, EACH FUND, OWNERS OF EACH FUND, OR ANY OTHER PERSON OR ENTITY FROM THE USE OF THE UNDERLYING INDEX OR ANY DATA INCLUDED THEREIN. THE INDEX PROVIDER MAKES NO EXPRESS OR IMPLIED WARRANTIES, AND EXPRESSLY DISCLAIMS ALL WARRANTIES OF MERCHANTABILITY OR FITNESS FOR A PARTICULAR PURPOSE OR USE WITH RESPECT TO EACH UNDERLYING INDEX OR ANY DATA INCLUDED THEREIN. WITHOUT LIMITING ANY OF THE FOREGOING, IN NO EVENT SHALL THE INDEX PROVIDER HAVE ANY LIABILITY FOR ANY SPECIAL, PUNITIVE, INDIRECT, OR CONSEQUENTIAL DAMAGES (INCLUDING LOST PROFITS), EVEN IF NOTIFIED OF THE POSSIBILITY OF SUCH DAMAGES.
The Funds are not sponsored, endorsed, sold or promoted by Standard & Poor’s, a division of The McGraw-Hill Companies, Inc. (“S&P”) or its third party licensors. Neither S&P nor its third party licensors make any representation or warranty, express or implied, to the owners of each Fund or any member of the public regarding the advisability of investing in securities generally or in each Fund particularly or the ability of each Underlying Index to track general stock market performance. S&P’s and its third party licensor’s only relationship to the Index Provider is the licensing of certain trademarks, service marks and trade names of S&P and/or its third party licensors and for the providing of calculation and maintenance services related to the Underlying Index. Neither S&P nor its third party licensors is responsible for and has not participated in the determination of the prices and amount of each Fund or the timing of the issuance or sale of each Fund or in the determination or calculation of the equation by which each Fund is to be converted into cash. S&P has no obligation or liability in connection with the administration, marketing or trading of each Fund.
ALPS ETF Trust
| Additional Information | May 31, 2017 (Unaudited) |
NEITHER S&P, ITS AFFILIATES NOR THEIR THIRD PARTY LICENSORS GUARANTEE THE ADEQUACY, ACCURACY, TIMELINESS OR COMPLETENESS OF EACH UNDERLYING INDEX OR ANY DATA INCLUDED THEREIN OR ANY COMMUNICATIONS, INCLUDING BUT NOT LIMITED TO, ORAL OR WRITTEN COMMUNICATIONS (INCLUDING ELECTRONIC COMMUNICATIONS) WITH RESPECT THERETO. S&P, ITS AFFILIATES AND THEIR THIRD PARTY LICENSORS SHALL NOT BE SUBJECT TO ANY DAMAGES OR LIABILITY FOR ANY ERRORS, OMISSIONS OR DELAYS THEREIN. S&P MAKES NO EXPRESS OR IMPLIED WARRANTIES, AND EXPRESSLY DISCLAIMS ALL WARRANTIES OF MERCHANTABILITY OR FITNESS FOR A PARTICULAR PURPOSE OR USE WITH RESPECT TO ITS TRADEMARKS, EACH UNDERLYING INDEX OR ANY DATA INCLUDED THEREIN. WITHOUT LIMITING ANY OF THE FOREGOING, IN NO EVENT WHATSOEVER SHALL S&P, ITS AFFILIATES OR THEIR THIRD PARTY LICENSORS BE LIABLE FOR ANY INDIRECT, SPECIAL, INCIDENTAL, PUNITIVE OR CONSEQUENTIAL DAMAGES, INCLUDING BUT NOT LIMITED TO, LOSS OF PROFITS, TRADING LOSSES, LOST TIME OR GOODWILL, EVEN IF THEY HAVE BEEN ADVISED OF THE POSSIBILITY OF SUCH DAMAGES, WHETHER IN CONTRACT, TORT, STRICT LIABILITY OR OTHERWISE.
Standard & Poor’s® and S&P® are registered trademarks of The McGraw-Hill Companies, Inc.; “Calculated by S&P Custom Indices” and its related stylized mark are service marks of The McGraw-Hill Companies, Inc. These marks have been licensed for use by the Index Provider.
The S&P 500® is the property of Standard and Poor’s Financial Services LLC (“S&P”) and has been licensed by S&P for use by S-Network® Global Indexes, Inc. in connection with the S-Network® Sector Dividend Dogs Index (Ticker: SDOGX), the S-Network® Emerging Sector Dividend Dogs Index (Ticker: EDOGX), and the S-Network® International Sector Dividend Dogs Index (Ticker: IDOGX).
The Adviser does not guarantee the accuracy and/or the completeness of each Underlying Index or any data included therein, and the Adviser shall have no liability for any errors, omissions or interruptions therein. The Adviser makes no warranty, express or implied, as to results to be obtained by each Fund, owners of the Shares of each Fund or any other person or entity from the use of each Underlying Index or any data included therein. The Adviser makes no express or implied warranties, and expressly disclaims all warranties of merchantability or fitness for a particular purpose or use with respect to each Underlying Index or any data included therein. Without limiting any of the foregoing, in no event shall the Adviser have any liability for any special, punitive, direct, indirect or consequential damages (including lost profits) arising out of matters relating to the use of each Underlying Index, even if notified of the possibility of such damages.
ALPS | Dorsey Wright Sector Momentum ETF
The Product(s) is not sponsored, endorsed, sold or promoted by Nasdaq, Inc. or its affiliates (Nasdaq, with its affiliates, are referred to as the “Corporations”). The Corporations have not passed on the legality or suitability of, or the accuracy or adequacy of descriptions and disclosures relating to, the Product(s). The Corporations make no representation or warranty, express or implied to the owners of the Product(s) or any member of the public regarding the advisability of investing in securities generally or in the Product(s) particularly, or the ability of the Dorsey Wright US Sector Momentum Index to track general stock market performance. The Corporations’ only relationship to ALPS Advisors, Inc. (“Licensee”) is in the licensing of the Nasdaq®, Dorsey Wright US Sector Momentum Index, and certain trade names of the Corporations and the use of the Dorsey Wright US Sector Momentum Index which is determined, composed and calculated by Nasdaq without regard to Licensee or the Product(s). Nasdaq has no obligation to take the needs of the Licensee or the owners of the Product(s) www.alpsfunds.com 15 into consideration in determining, composing or calculating the Dorsey Wright US Sector Momentum Index. The Corporations are not responsible for and have not participated in the determination of the timing of, prices at, or quantities of the Product(s) to be issued or in the determination or calculation of the equation by which the Product(s) is to be converted into cash. The Corporations have no liability in connection with the administration, marketing or trading of the Product(s).
THE CORPORATIONS DO NOT GUARANTEE THE ACCURACY AND/ OR UNINTERRUPTED CALCULATION OF DORSEY WRIGHT US SECTOR MOMENTUM INDEX OR ANY DATA INCLUDED THEREIN. THE CORPORATIONS MAKE NO WARRANTY, EXPRESS OR IMPLIED, AS TO RESULTS TO BE OBTAINED BY LICENSEE, OWNERS OF THE PRODUCT(S), OR ANY OTHER PERSON OR ENTITY FROM THE USE OF THE DORSEY WRIGHT US SECTOR MOMENTUM INDEX OR ANY DATA INCLUDED THEREIN. THE CORPORATIONS MAKE NO EXPRESS OR IMPLIED WARRANTIES, AND EXPRESSLY DISCLAIM ALL WARRANTIES OF MERCHANTABILITY OR FITNESS FOR A PARTICULAR PURPOSE OR USE WITH RESPECT TO THE DORSEY WRIGHT US SECTOR MOMENTUM INDEX® OR ANY DATA INCLUDED THEREIN. WITHOUT LIMITING ANY OF THE FOREGOING, IN NO EVENT SHALL THE CORPORATIONS HAVE ANY LIABILITY FOR ANY LOST PROFITS OR SPECIAL, INCIDENTAL, PUNITIVE, INDIRECT, OR CONSEQUENTIAL DAMAGES, EVEN IF NOTIFIED OF THE POSSIBILITY OF SUCH DAMAGES.
Nasdaq® and Dorsey Wright US Sector Momentum Index are registered trademarks of Nasdaq, Inc. (which with its affiliates is referred to as the “Corporations”) and are licensed for use by ALPS Advisors, Inc. The Product(s) have not been passed on by the Corporations as to their legality or suitability. The Product(s) are not issued, endorsed, sold, or promoted by the Corporations. THE CORPORATIONS MAKE NO WARRANTIES AND BEAR NO LIABILITY WITH RESPECT TO THE PRODUCT(S).
ALPS ETF Trust
| Additional Information | May 31, 2017 (Unaudited) |
The Index Provider does not guarantee the accuracy and/or the completeness of the Underlying Index or any data included therein and the Index Provider shall have no liability for any errors, omissions, or interruptions therein. The Index Provider makes no warranty, express or implied, as to results to be obtained by the Adviser, the Fund, owners of the Fund, or any other person or entity from the use of the Underlying Index or any data included therein. The Index Provider makes no express or implied warranties, and expressly disclaims all warranties of merchantability or fitness for a particular purpose or use with respect to the Underlying Index or any data included therein. Without limiting any of the foregoing, in no event shall the Index Provider have any liability for any special, punitive, indirect, or consequential damages (including lost profits), even if notified of the possibility of such damages.
The Adviser does not guarantee the accuracy and/or the completeness of the Underlying Index or any data included therein, and the Adviser shall have no liability for any errors, omissions or interruptions therein. The Adviser makes no warranty, express or implied, as to results to be obtained by the Fund, owners of the Shares of the Fund or any other person or entity from the use of the Underlying Index or any data included therein. The Adviser makes no express or implied warranties, and expressly disclaims all warranties of merchantability or fitness for a particular purpose or use with respect to the Underlying Index or any data included therein. Without limiting any of the foregoing, in no event shall the Adviser have any liability for any special, punitive, direct, indirect or consequential damages (including lost profits) arising out of matters relating to the use of the Underlying Index, even if notified of the possibility of such damages.
ALPS ETF Trust
| Board Considerations Regarding Approval of Investment Advisory Agreement | May 31, 2017 (Unaudited) |
At an in-person meeting held on December 12, 2016, the Board of Trustees of the Trust (the “Board” or the “Trustees”), including the Trustees who are not “interested persons” of the Trust within the meaning of the 1940 Act, as amended (the “Independent Trustees”), evaluated a proposal to approve the Investment Advisory Agreement between the Trust and ALPS Advisors, Inc. (the “Adviser” or “AAI”) with respect to the ALPS/Dorsey Wright Sector Momentum ETF (“SWIN” or the “Fund”). The Independent Trustees also met separately to consider the Investment Advisory Agreement.
In evaluating the Advisory Agreement, the Trustees considered various factors, including (i) the nature, extent and quality of the services expected to be provided by the Adviser to SWIN under the Investment Advisory Agreement; (ii) the advisory fees and other expenses proposed to be paid by SWIN compared to those of similar funds managed by other investment advisers; (iii) the expected profitability to the Adviser of its proposed advisory relationship with SWIN and reasonableness of compensation to the Adviser; (iv) the extent to which economies of scale would be realized if and as SWIN’s assets increase and whether the fee level in the Investment Advisory Agreement reflects these economies of scale; and (v) any additional benefits and other considerations.
With respect to the nature, extent and quality of the services to be provided by the Adviser under the Investment Advisory Agreement, the Trustees considered and reviewed information concerning the services proposed to be provided under the Investment Advisory Agreement, the proposed investment parameters of the index for SWIN, financial information regarding the Adviser and its parent company, information describing the Adviser’s current organizations and the background and experience of the persons who would be responsible for the day-to-day management of SWIN, the anticipated financial support of SWIN, and the nature and quality of services provided to other ETFs, open-end and closed-end funds sponsored by the Adviser. Based upon their review, the Trustees concluded that the Adviser was qualified to oversee the services to be provided by other service providers and that the services to be provided by the Adviser to SWIN are expected to be satisfactory.
With respect to the costs of services to be provided and profits to be realized by the Adviser, the Trustees considered the resources involved in managing SWIN as well as the fact that the Adviser agreed to pay all of SWIN’s expenses (except for interest expenses, distribution fees or expenses, brokerage expenses, taxes and extraordinary expenses such as litigation and other expenses not incurred in the ordinary course of SWIN’s business) out of the unitary advisory fee. Based on their review, the Trustees concluded that the expected profitability of SWIN to the Adviser was not unreasonable.
The Trustees also reviewed comparative fee and expense data provided by Broadridge regarding SWIN. The Trustees noted the proposed advisory fee for services to be provided to SWIN by the Adviser was 0.40% of SWIN’s average daily net assets. The Trustees also considered that the advisory fee with respect to SWIN was a unitary one and that, as set forth above, the Adviser had agreed to pay all of SWIN’s expenses (except for interest expenses, marketing fees, distribution fees or expenses, brokerage expenses, taxes and extraordinary expenses such as litigation and other expenses not incurred in the ordinary course of SWIN’s business) out of the unitary fee. The Trustees considered that, taking into account the impact of SWIN’s unitary advisory fee, SWIN’s expense ratio was equal to the median of its Broadridge expense group. Based on the foregoing and the other information available to them, the Trustees concluded that the advisory fees for SWIN were reasonable under the circumstances and in light of the quality of services provided.
The Trustees also considered other benefits that may be realized by the Adviser from its relationship with SWIN and concluded that the advisory fees were reasonable taking into account such benefits.
The Trustees considered the extent to which economies of scale would be realized as SWIN grows and whether fee levels reflect a reasonable sharing of such economies of scale for the benefit of SWIN investors. Because SWIN is newly organized, the Trustees reviewed SWIN’s proposed unitary advisory fee and anticipated expenses and determined to review economies of scale in the future when SWIN had attracted assets.
In voting to approve the Investment Advisory Agreement, the Trustees concluded that the terms of the Investment Advisory Agreement are reasonable and fair in light of the services to be performed, the fees paid by certain other funds, expenses to be incurred and such other matters as the Trustees considered relevant in the exercise of their reasonable business judgment. The Trustees did not identify any single factor or group of factors as all important or controlling and considered all factors together.
TABLE OF CONTENTS
| Performance Overview | 1 |
| Disclosure of Fund Expenses | 3 |
| Schedule of Investments | 4 |
| Statement of Assets and Liabilities | 9 |
| Statement of Operations | 10 |
| Statements of Changes in Net Assets | 11 |
| Financial Highlights | 12 |
| Notes to Financial Statements | 13 |
| Additional Information | 18 |
| Performance Overview | May 31, 2017 (Unaudited) |
Investment Objective
The Barron’s 400SM ETF (the “Fund”) seeks investment results that correspond generally, before fees and expenses, to the performance of the Barron’s 400 IndexSM (the “Underlying Index”). The Underlying Index is a rules‐based index intended to give investors a means of tracking the overall performance of high performing equity securities of U.S. companies. The Fund will invest at least 80% of its total assets in the equity securities which comprise the Underlying Index.
The Underlying Index generally consists of 400 stocks. The Underlying Index’s stocks are constituents of the MarketGrader U.S. Coverage Universe. In compiling the Underlying Index, MarketGrader Capital, LLC (the “Index Provider”) selects the 400 stocks from the MarketGrader U.S. Coverage Universe by using a methodology that selects components based on the strength of their fundamentals in growth, value, profitability and cash flow and then screens such potential Underlying Index components for certain criteria regarding concentration, market capitalization and liquidity. The eligible stocks that are selected for inclusion in the Underlying Index’s portfolio are equally weighted. The Underlying Index is rebalanced by the Index Provider semiannually, on the third Friday of March and September each year.
Performance (as of May 31, 2017)
| | 6 Months | 1 Year | 3 Year | Since Inception^ |
Barron’s 400SM ETF – NAV | 8.93% | 21.33% | 7.89% | 11.12% |
Barron’s 400SM ETF – Market Price* | 8.93% | 21.36% | 7.87% | 11.12% |
Barron’s 400 IndexSM | 9.25% | 22.10% | 8.61% | 11.87% |
Total Expense Ratio (per the current prospectus) 0.65%
Performance data quoted represents past performance. Past performance does not guarantee future results. The table does not reflect the deduction of taxes that a shareholder would pay on Fund distributions or the redemption of Fund shares. Investment return and principal value of an investment will fluctuate so that an investor’s shares, when sold or redeemed, may be worth more or less than the original cost. Current performance data may be higher or lower than actual data quoted. For the most current month-end performance data please visit www.alpsfunds.com or call 1.855.724.0450.
NAV is an exchange-traded fund’s per-share value. The per-share dollar amount of the Fund is derived by dividing the total value of all the securities in its portfolio, less any liabilities, by the number of Fund shares outstanding. Market Price is the price at which a share can currently be traded in the market. Information detailing the number of days the Market Price of the Fund was greater than the Fund’s NAV and the number of days it was less than the Fund’s NAV can be obtained at www.alpsfunds.com.
| ^ | The Fund commenced Investment Operations on June 4, 2013. |
| * | Market Price is based on the midpoint of the bid/ask spread at 4 p.m. ET and does not represent the returns an investor would receive if shares were traded at other times. |
The Barron’s 400 IndexSM, calculated by NYSE Arca or its affiliates, measures the performance of a diversified group of U.S. companies selected in part based on fundamentals-related rules-based criteria. The index includes companies that have scored highest according to fundamentals-related rankings calculated by MarketGrader Capital, LLC. Additional rules-based screening provides for sector and market cap diversification. The Underlying Index has been licensed by MarketGrader for use with the Barron’s 400SM ETF.
The index is not actively managed and does not reflect any deductions for fees, expenses or taxes. One cannot invest directly in an index. Index performance does not reflect Fund performance.
Funds that emphasize investments in small/mid cap companies will generally experience greater price volatility.
Barron’s 400SM ETF shares are not individually redeemable. Investors buy and sell shares of the Barron’s 400SM ETF on a secondary market. Only market makers or “authorized participants” may trade directly with the Fund, typically in blocks of 50,000 shares.
The Barron’s 400 SM ETF is not suitable for all investors. Investments in the Fund are subject to investment risks, including possible loss of the principal amount invested.
ALPS Portfolio Solutions Distributor, Inc., a FINRA member, is the distributor for the Fund.
| Performance Overview | May 31, 2017 (Unaudited) |
Top 10 Holdings* (as of May 31, 2017)
| Mimedx Group Inc | 0.40% |
| Akorn Inc | 0.37% |
| Ilg Inc | 0.36% |
| Applied Optoelectronics Inc | 0.35% |
| Nvidia Corp | 0.35% |
| Amphastar Pharmaceuticals Inc | 0.34% |
| Hooker Furniture Corp | 0.34% |
| Veeva Systems, Inc., Class A | 0.34% |
| Supernus Pharmaceuticals Inc | 0.34% |
| Universal Display Corp | 0.33% |
| Total % of Top 10 Holdings | 3.52% |
| * | % of Total Investments excluding Short Term Investments. |
Future holdings are subject to change.
Sector Allocation* (as of May 31, 2017)
Growth of $10,000 (as of May 31, 2017)
Comparison of change in value of a $10,000 investment in the Fund and the Underlying Index
The chart above represents historical performance of a hypothetical investment of $10,000 in the Fund over the life of the Fund. Past performance does not guarantee future results. This chart does not reflect the deduction of taxes that a shareholder would pay on Fund distributions or the redemption of Fund shares.
| Disclosure of Fund Expenses | May 31, 2017 (Unaudited) |
Shareholder Expense Example: As a shareholder of the Fund, you incur two types of costs: (1) transaction costs which may include creation and redemption fees or brokerage charges, and (2) ongoing costs, including management fees and other Fund expenses. These examples are intended to help you understand your ongoing costs (in dollars) of investing in the Fund and to compare these costs with the ongoing costs of investing in other funds. It is based on an investment of $1,000 invested at the beginning of the (six month) period and held through May 31, 2017.
Actual Return: The first line of the table provides information about actual account values and actual expenses. You may use the information in this line, together with the amount you invested, to estimate the expenses that you incurred over the period. Simply divide your account value by $1,000 (for example, an $8,600 account value divided by $1,000 = 8.6), then multiply the result by the number in the first line under the heading entitled “Expenses Paid During Period” to estimate the expenses attributable to your investment during this period.
Hypothetical 5% Return: The second line of the table provides information about hypothetical account values and hypothetical expenses based on the Fund’s actual expense ratio and an assumed rate of return of 5% per year before expenses, which is not the Fund’s actual return. The hypothetical account values and expenses may not be used to estimate the actual ending account balance or expenses you paid for the period. You may use this information to compare ongoing costs of investing in the Fund and other funds. To do so, compare this 5% hypothetical example with the 5% hypothetical examples that appear in the shareholder reports of other funds.
The expenses shown in the table are meant to highlight ongoing Fund costs only and do not reflect any transaction costs, such as creation and redemption fees or brokerage charges. Therefore, the second line is useful in comparing ongoing costs only, and will not help you determine the relative total costs of owning different funds. In addition, if these costs were included, your costs would have been higher.
| | Beginning Account Value 12/1/16 | Ending Account Value 5/31/17 | Expense Ratio(a) | Expenses Paid During Period 12/1/16 - 5/31/17(b) |
| Actual | $1,000.00 | $1,089.30 | 0.65% | $3.39 |
| Hypothetical (5% return before expenses) | $1,000.00 | $1,021.69 | 0.65% | $3.28 |
(a) | Annualized, based on the Fund's most recent fiscal half year expenses. |
(b) | Expenses are equal to the Fund's annualized expense ratio multiplied by the average account value over the period, multiplied by the number of days in the most recent fiscal half year (182), divided by 365. |
Barron’s 400SM ETF
| Schedule of Investments | May 31, 2017 (Unaudited) |
| Security Description | | Shares | | | Value | |
| COMMON STOCKS (94.95%) | | | | | | |
| Consumer Discretionary (20.87%) | | | | | | |
American Axle & Manufacturing Holdings, Inc.(a) | | | 23,977 | | | $ | 362,292 | |
American Outdoor Brands Corp.(a)(b) | | | 24,876 | | | | 563,441 | |
Asbury Automotive Group, Inc.(a) | | | 7,635 | | | | 427,178 | |
| Best Buy Co., Inc. | | | 10,764 | | | | 639,274 | |
| Big Lots, Inc. | | | 9,809 | | | | 478,973 | |
Bojangles', Inc.(a) | | | 25,610 | | | | 448,175 | |
| Brunswick Corp. | | | 8,033 | | | | 443,904 | |
| Caleres, Inc. | | | 15,572 | | | | 425,738 | |
| Callaway Golf Co. | | | 44,430 | | | | 566,038 | |
| Carnival Corp. | | | 8,380 | | | | 536,907 | |
| Carter's, Inc. | | | 5,405 | | | | 444,075 | |
Century Communities, Inc.(a) | | | 19,535 | | | | 486,421 | |
| Cheesecake Factory, Inc. | | | 7,771 | | | | 458,334 | |
| Children's Place, Inc. | | | 4,075 | | | | 440,915 | |
Chuy's Holdings, Inc.(a) | | | 17,242 | | | | 463,810 | |
| Coach, Inc. | | | 12,255 | | | | 566,304 | |
| Columbia Sportswear Co. | | | 8,510 | | | | 461,923 | |
| Comcast Corp., Class A | | | 12,767 | | | | 532,256 | |
| Cooper Tire & Rubber Co. | | | 11,055 | | | | 397,980 | |
Cooper-Standard Holding, Inc.(a) | | | 4,258 | | | | 459,907 | |
| Cracker Barrel Old Country Store, Inc. | | | 2,994 | | | | 499,429 | |
| Dana, Inc. | | | 24,670 | | | | 521,030 | |
Dave & Buster's Entertainment, Inc.(a) | | | 8,121 | | | | 541,671 | |
Dorman Products, Inc.(a) | | | 5,998 | | | | 500,233 | |
| DR Horton, Inc. | | | 14,517 | | | | 474,561 | |
The EW Scripps Co., Class A(a) | | | 20,930 | | | | 359,577 | |
Five Below, Inc.(a) | | | 12,464 | | | | 639,403 | |
| Foot Locker, Inc. | | | 6,295 | | | | 373,986 | |
Fox Factory Holding Corp.(a) | | | 17,989 | | | | 590,939 | |
Francesca's Holdings Corp.(a) | | | 29,656 | | | | 375,445 | |
| The Gap, Inc. | | | 20,153 | | | | 453,443 | |
| Gentex Corp. | | | 21,889 | | | | 415,453 | |
Gentherm, Inc.(a) | | | 13,230 | | | | 498,771 | |
Grand Canyon Education, Inc.(a) | | | 7,094 | | | | 556,170 | |
| Hanesbrands, Inc. | | | 23,574 | | | | 486,803 | |
| Hasbro, Inc. | | | 4,864 | | | | 511,985 | |
| Home Depot, Inc. | | | 3,245 | | | | 498,140 | |
| Hooker Furniture Corp. | | | 15,481 | | | | 664,135 | |
| ILG, Inc. | | | 25,957 | | | | 699,282 | |
Installed Building Products, Inc.(a) | | | 9,639 | | | | 478,094 | |
| The Interpublic Group of Cos., Inc. | | | 19,671 | | | | 490,398 | |
Kate Spade & Co.(a) | | | 20,077 | | | | 369,818 | |
| LCI Industries | | | 4,682 | | | | 416,698 | |
| Lear Corp. | | | 3,254 | | | | 484,976 | |
| Leggett & Platt, Inc. | | | 9,704 | | | | 504,802 | |
| Lennar Corp., Class A | | | 9,256 | | | | 474,925 | |
LGI Homes, Inc.(a)(b) | | | 15,293 | | | | 495,493 | |
| Lowe's Cos., Inc. | | | 5,829 | | | | 459,150 | |
Malibu Boats, Inc., Class A(a) | | | 22,689 | | | | 550,208 | |
MarineMax, Inc.(a) | | | 21,563 | | | | 389,212 | |
| MCBC Holdings, Inc. | | | 30,519 | | | | 586,880 | |
Mohawk Industries, Inc.(a) | | | 2,077 | | | | 497,026 | |
Nautilus, Inc.(a) | | | 28,430 | | | | 516,005 | |
| Nexstar Media Group, Inc., Class A | | | 6,808 | | | | 389,418 | |
| Security Description | | Shares | | | Value | |
| Consumer Discretionary (continued) | | | | | | | | |
| NIKE, Inc., Class B | | | 8,338 | | | $ | 441,831 | |
Norwegian Cruise Line Holdings, Ltd.(a) | | | 9,372 | | | | 468,319 | |
| Nutrisystem, Inc. | | | 9,787 | | | | 509,413 | |
NVR, Inc.(a) | | | 237 | | | | 540,924 | |
Ollie's Bargain Outlet Holdings, Inc.(a) | | | 15,139 | | | | 622,970 | |
O'Reilly Automotive, Inc.(a) | | | 1,734 | | | | 419,767 | |
| Oxford Industries, Inc. | | | 8,982 | | | | 482,693 | |
| Pool Corp. | | | 4,052 | | | | 482,715 | |
Potbelly Corp.(a) | | | 37,169 | | | | 427,444 | |
Priceline Group, Inc.(a) | | | 270 | | | | 506,814 | |
| Ross Stores, Inc. | | | 7,099 | | | | 453,768 | |
| Royal Caribbean Cruises, Ltd. | | | 4,978 | | | | 548,476 | |
| Scripps Networks Interactive, Inc., Class A | | | 6,084 | | | | 402,882 | |
Select Comfort Corp.(a) | | | 19,934 | | | | 574,099 | |
Shake Shack, Inc., Class A(a)(b) | | | 15,547 | | | | 575,550 | |
| Signet Jewelers, Ltd. | | | 7,041 | | | | 338,672 | |
| Sinclair Broadcast Group, Inc., Class A | | | 11,606 | | | | 376,034 | |
Skechers U.S.A., Inc., Class A(a) | | | 18,257 | | | | 465,919 | |
| Starbucks Corp. | | | 8,800 | | | | 559,768 | |
| Sturm Ruger & Co., Inc. | | | 9,036 | | | | 575,593 | |
| Thor Industries, Inc. | | | 4,939 | | | | 447,128 | |
| Tiffany & Co. | | | 5,359 | | | | 466,019 | |
| TJX Cos., Inc. | | | 6,101 | | | | 458,856 | |
| Tractor Supply Co. | | | 6,657 | | | | 367,134 | |
| Tupperware Brands Corp. | | | 7,882 | | | | 566,795 | |
Ulta Beauty, Inc.(a) | | | 1,673 | | | | 509,997 | |
| Vail Resorts, Inc. | | | 2,569 | | | | 549,509 | |
| Williams-Sonoma, Inc. | | | 10,050 | | | | 489,033 | |
| World Wrestling Entertainment, Inc., Class A | | | 23,574 | | | | 481,145 | |
| Wyndham Worldwide Corp. | | | 5,800 | | | | 585,742 | |
| Total Consumer Discretionary | | | | | | | 41,062,413 | |
| | | | | | | | | |
| Consumer Staples (3.41%) | | | | | | | | |
| Altria Group, Inc. | | | 6,340 | | | | 478,290 | |
| B&G Foods, Inc. | | | 11,481 | | | | 465,555 | |
| Brown-Forman Corp., Class B | | | 10,307 | | | | 535,449 | |
| Constellation Brands, Inc., Class A | | | 3,001 | | | | 548,433 | |
| Energizer Holdings, Inc. | | | 8,635 | | | | 462,836 | |
Monster Beverage Corp.(a) | | | 10,322 | | | | 521,880 | |
| National Beverage Corp. | | | 6,472 | | | | 620,988 | |
| Omega Protein Corp. | | | 24,556 | | | | 428,502 | |
| Pinnacle Foods, Inc. | | | 8,150 | | | | 507,826 | |
| Reynolds American, Inc. | | | 7,887 | | | | 530,401 | |
| Sanderson Farms, Inc. | | | 5,105 | | | | 605,963 | |
| Spectrum Brands Holdings, Inc. | | | 3,436 | | | | 461,970 | |
USANA Health Sciences, Inc.(a) | | | 8,327 | | | | 536,259 | |
| Total Consumer Staples | | | | | | | 6,704,352 | |
| | | | | | | | | |
| Financials (16.18%) | | | | | | | | |
| American Financial Group, Inc. | | | 4,954 | | | | 494,657 | |
| Ameris Bancorp. | | | 10,271 | | | | 445,248 | |
| Banc of California, Inc. | | | 23,129 | | | | 469,519 | |
| Bank of Hawaii Corp. | | | 5,652 | | | | 439,330 | |
Barron’s 400SM ETF
| Schedule of Investments | May 31, 2017 (Unaudited) |
| Security Description | | Shares | | | Value | |
| Financials (continued) | | | | | | |
| The Bank of NT Butterfield & Son, Ltd. | | | 14,386 | | | $ | 474,450 | |
| Bank of the Ozarks, Inc. | | | 8,754 | | | | 386,927 | |
BofI Holding, Inc.(a)(b) | | | 16,560 | | | | 367,632 | |
| Cathay General Bancorp. | | | 12,240 | | | | 434,520 | |
| CenterState Banks, Inc. | | | 18,570 | | | | 446,423 | |
| Central Pacific Financial Corp. | | | 15,512 | | | | 469,238 | |
| Citizens Financial Group, Inc. | | | 12,842 | | | | 437,912 | |
| Cohen & Steers, Inc. | | | 12,894 | | | | 505,445 | |
Credit Acceptance Corp.(a)(b) | | | 2,408 | | | | 517,768 | |
| Cullen/Frost Bankers, Inc. | | | 5,245 | | | | 480,757 | |
Customers Bancorp, Inc.(a) | | | 14,552 | | | | 406,728 | |
| Dime Community Bancshares, Inc. | | | 23,073 | | | | 438,387 | |
Eagle Bancorp, Inc.(a) | | | 7,868 | | | | 448,869 | |
| East West Bancorp, Inc. | | | 8,662 | | | | 474,071 | |
| Enterprise Financial Services Corp. | | | 10,917 | | | | 437,772 | |
| FactSet Research Systems, Inc. | | | 2,696 | | | | 446,700 | |
| Federated Investors, Inc., Class B | | | 18,064 | | | | 479,780 | |
| Fidelity Southern Corp. | | | 21,351 | | | | 456,698 | |
| First Financial Bancorp | | | 17,118 | | | | 428,806 | |
| First Merchants Corp. | | | 11,982 | | | | 475,566 | |
| First Republic Bank | | | 4,966 | | | | 457,369 | |
Franklin Financial Network, Inc.(a) | | | 12,804 | | | | 499,356 | |
| Glacier Bancorp, Inc. | | | 13,416 | | | | 432,800 | |
| Greenhill & Co., Inc. | | | 16,135 | | | | 326,734 | |
| Hanmi Financial Corp. | | | 15,042 | | | | 400,117 | |
| Heritage Financial Corp. | | | 20,068 | | | | 478,622 | |
| Home BancShares, Inc. | | | 17,024 | | | | 398,532 | |
| Houlihan Lokey, Inc. | | | 14,906 | | | | 500,394 | |
| Independent Bank Group, Inc. | | | 7,539 | | | | 422,938 | |
| Investors Bancorp, Inc. | | | 32,939 | | | | 435,783 | |
| JPMorgan Chase & Co. | | | 5,218 | | | | 428,659 | |
| Kinsale Capital Group, Inc. | | | 15,024 | | | | 544,470 | |
| Lakeland Bancorp, Inc. | | | 23,413 | | | | 438,994 | |
| Lakeland Financial Corp. | | | 10,723 | | | | 454,977 | |
| LegacyTexas Financial Group, Inc. | | | 11,402 | | | | 401,578 | |
| MainSource Financial Group, Inc. | | | 14,189 | | | | 459,440 | |
| MarketAxess Holdings, Inc. | | | 2,497 | | | | 475,878 | |
| Meridian Bancorp, Inc. | | | 25,678 | | | | 415,984 | |
| Moelis & Co., Class A | | | 12,719 | | | | 446,437 | |
| Morningstar, Inc. | | | 6,002 | | | | 439,226 | |
| MSCI, Inc. | | | 4,958 | | | | 504,377 | |
| New Residential Investment Corp., REIT | | | 28,877 | | | | 464,631 | |
Pacific Premier Bancorp, Inc.(a) | | | 12,153 | | | | 413,202 | |
| PacWest Bancorp | | | 8,621 | | | | 402,342 | |
PennyMac Financial Services, Inc., Class A(a) | | | 27,608 | | | | 444,489 | |
| Pinnacle Financial Partners, Inc. | | | 7,102 | | | | 427,185 | |
| Preferred Bank | | | 8,830 | | | | 440,705 | |
| S&P Global, Inc. | | | 3,614 | | | | 516,115 | |
| ServisFirst Bancshares, Inc. | | | 11,911 | | | | 407,833 | |
| Simmons First National Corp., Class A | | | 8,349 | | | | 423,712 | |
| State Bank Financial Corp. | | | 18,126 | | | | 459,494 | |
| Sterling Bancorp | | | 19,415 | | | | 416,452 | |
| Stock Yards Bancorp, Inc. | | | 11,185 | | | | 404,897 | |
| Stonegate Bank | | | 10,027 | | | | 453,621 | |
| Security Description | | Shares | | | Value | |
| Financials (continued) | | | | | | | | |
| TPG Specialty Lending, Inc. | | | 23,989 | | | $ | 496,093 | |
| TriCo Bancshares | | | 13,356 | | | | 465,857 | |
| Umpqua Holdings Corp. | | | 26,330 | | | | 446,162 | |
| Union Bankshares Corp. | | | 13,318 | | | | 447,485 | |
| United Bankshares, Inc. | | | 10,977 | | | | 419,870 | |
| United Community Banks, Inc. | | | 16,624 | | | | 428,400 | |
| United Financial Bancorp, Inc. | | | 28,128 | | | | 455,392 | |
Walker & Dunlop, Inc.(a) | | | 11,649 | | | | 544,125 | |
| Washington Trust Bancorp, Inc. | | | 9,080 | | | | 434,024 | |
| WesBanco, Inc. | | | 12,387 | | | | 460,301 | |
Western Alliance Bancorp(a) | | | 9,233 | | | | 422,133 | |
| Wintrust Financial Corp. | | | 6,609 | | | | 454,435 | |
| WSFS Financial Corp. | | | 10,555 | | | | 465,475 | |
| Total Financials | | | | | | | 31,840,298 | |
| | | | | | | | | |
| Health Care (13.18%) | | | | | | | | |
| AbbVie, Inc. | | | 7,272 | | | | 480,097 | |
Akorn, Inc.(a) | | | 21,495 | | | | 715,139 | |
Alexion Pharmaceuticals, Inc.(a) | | | 3,927 | | | | 384,964 | |
Align Technology, Inc.(a) | | | 4,443 | | | | 645,124 | |
| Amgen, Inc. | | | 2,651 | | | | 411,541 | |
AMN Healthcare Services, Inc.(a) | | | 11,706 | | | | 424,342 | |
Amphastar Pharmaceuticals, Inc.(a) | | | 39,149 | | | | 668,273 | |
| Baxter International, Inc. | | | 9,203 | | | | 545,830 | |
Biogen, Inc.(a) | | | 1,633 | | | | 404,608 | |
BioTelemetry, Inc.(a) | | | 17,821 | | | | 514,136 | |
| Bristol-Myers Squibb Co. | | | 8,424 | | | | 454,475 | |
| Bruker Corp. | | | 20,102 | | | | 546,975 | |
Cambrex Corp.(a) | | | 9,599 | | | | 516,426 | |
Celgene Corp.(a) | | | 3,830 | | | | 438,190 | |
Cerner Corp.(a) | | | 8,670 | | | | 566,585 | |
Charles River Laboratories International, Inc.(a) | | | 5,336 | | | | 491,179 | |
| CR Bard, Inc. | | | 1,916 | | | | 589,036 | |
DaVita, Inc.(a) | | | 6,952 | | | | 460,640 | |
| DENTSPLY SIRONA, Inc. | | | 7,503 | | | | 476,591 | |
Eagle Pharmaceuticals, Inc.(a) | | | 5,969 | | | | 435,439 | |
Edwards Lifesciences Corp.(a) | | | 5,088 | | | | 585,476 | |
| Gilead Sciences, Inc. | | | 7,047 | | | | 457,280 | |
Globus Medical, Inc., Class A(a) | | | 17,419 | | | | 535,634 | |
HealthEquity, Inc.(a) | | | 10,701 | | | | 490,106 | |
Heska Corp.(a) | | | 5,103 | | | | 503,462 | |
ICU Medical, Inc.(a) | | | 3,122 | | | | 503,579 | |
Illumina, Inc.(a) | | | 2,897 | | | | 513,812 | |
Innoviva, Inc.(a) | | | 38,133 | | | | 465,985 | |
Inogen, Inc.(a) | | | 6,487 | | | | 575,008 | |
Intuitive Surgical, Inc.(a) | | | 645 | | | | 589,969 | |
| Johnson & Johnson | | | 3,759 | | | | 482,092 | |
| LeMaitre Vascular, Inc. | | | 20,893 | | | | 638,490 | |
LHC Group, Inc.(a) | | | 9,425 | | | | 567,385 | |
Masimo Corp.(a) | | | 4,984 | | | | 433,807 | |
Medidata Solutions, Inc.(a) | | | 8,408 | | | | 598,481 | |
Mettler-Toledo International, Inc.(a) | | | 992 | | | | 578,148 | |
MiMedx Group, Inc.(a)(b) | | | 56,724 | | | | 775,984 | |
Natus Medical, Inc.(a) | | | 12,873 | | | | 436,395 | |
OraSure Technologies, Inc.(a) | | | 43,146 | | | | 650,210 | |
| Phibro Animal Health Corp., Class A | | | 17,495 | | | | 616,699 | |
Premier, Inc., Class A(a) | | | 15,422 | | | | 532,367 | |
Barron’s 400SM ETF
| Schedule of Investments | May 31, 2017 (Unaudited) |
| Security Description | | Shares | | | Value | |
| Health Care (continued) | | | | | | |
Regeneron Pharmaceuticals, Inc.(a) | | | 1,221 | | | $ | 560,512 | |
SciClone Pharmaceuticals, Inc.(a) | | | 50,542 | | | | 480,149 | |
| Stryker Corp. | | | 3,647 | | | | 521,375 | |
Supernus Pharmaceuticals, Inc.(a) | | | 17,463 | | | | 656,609 | |
United Therapeutics Corp.(a) | | | 3,282 | | | | 396,761 | |
Veeva Systems, Inc., Class A(a) | | | 10,360 | | | | 658,274 | |
Waters Corp.(a) | | | 3,054 | | | | 548,559 | |
Xencor, Inc.(a) | | | 20,050 | | | | 411,025 | |
| Total Health Care | | | | | | | 25,933,223 | |
| | | | | | | | | |
| Industrials (13.16%) | | | | | | | | |
| AAON, Inc. | | | 13,511 | | | | 488,760 | |
| Acuity Brands, Inc. | | | 2,321 | | | | 378,114 | |
| Air Lease Corp. | | | 12,284 | | | | 453,525 | |
| Alaska Air Group, Inc. | | | 5,053 | | | | 439,864 | |
| Allegiant Travel Co. | | | 3,095 | | | | 424,015 | |
American Woodmark Corp.(a) | | | 5,534 | | | | 513,555 | |
| AO Smith Corp. | | | 9,452 | | | | 518,631 | |
| Apogee Enterprises, Inc. | | | 8,363 | | | | 445,581 | |
| Argan, Inc. | | | 7,050 | | | | 416,302 | |
| Barnes Group, Inc. | | | 9,613 | | | | 544,000 | |
Builders FirstSource, Inc.(a) | | | 31,588 | | | | 431,492 | |
| BWX Technologies, Inc. | | | 10,287 | | | | 499,948 | |
| Cintas Corp. | | | 4,032 | | | | 507,548 | |
| Comfort Systems USA, Inc. | | | 13,341 | | | | 459,597 | |
Continental Building Products, Inc.(a) | | | 18,512 | | | | 451,693 | |
Copart, Inc.(a) | | | 15,810 | | | | 493,114 | |
| Donaldson Co., Inc. | | | 10,728 | | | | 514,515 | |
Dycom Industries, Inc.(a) | | | 5,112 | | | | 430,379 | |
| Equifax, Inc. | | | 3,578 | | | | 489,470 | |
| Exponent, Inc. | | | 8,185 | | | | 485,370 | |
| Fortune Brands Home & Security, Inc. | | | 7,957 | | | | 502,087 | |
| Global Brass & Copper Holdings, Inc. | | | 13,121 | | | | 397,566 | |
| Greenbrier Cos., Inc. | | | 11,564 | | | | 511,707 | |
Hawaiian Holdings, Inc.(a) | | | 9,950 | | | | 498,495 | |
HD Supply Holdings, Inc.(a) | | | 11,643 | | | | 469,795 | |
| HEICO Corp., Class A | | | 8,106 | | | | 507,841 | |
| Herman Miller, Inc. | | | 15,481 | | | | 488,426 | |
| Hexcel Corp. | | | 8,907 | | | | 458,087 | |
| Huntington Ingalls Industries, Inc. | | | 2,258 | | | | 442,139 | |
| Insperity, Inc. | | | 5,394 | | | | 406,977 | |
| JB Hunt Transport Services, Inc. | | | 5,057 | | | | 431,767 | |
| John Bean Technologies Corp. | | | 5,424 | | | | 468,091 | |
| Knoll, Inc. | | | 20,784 | | | | 446,856 | |
| Lennox International, Inc. | | | 2,835 | | | | 502,079 | |
Middleby Corp.(a) | | | 3,488 | | | | 447,720 | |
| Nordson Corp. | | | 3,813 | | | | 441,850 | |
| Northrop Grumman Corp. | | | 1,959 | | | | 507,812 | |
On Assignment, Inc.(a) | | | 10,140 | | | | 531,336 | |
Patrick Industries, Inc.(a) | | | 6,861 | | | | 454,198 | |
Ply Gem Holdings, Inc.(a) | | | 25,138 | | | | 411,006 | |
| Rockwell Automation, Inc. | | | 3,133 | | | | 497,270 | |
| Rollins, Inc. | | | 13,067 | | | | 562,796 | |
| Simpson Manufacturing Co., Inc. | | | 11,329 | | | | 455,199 | |
| Snap-on, Inc. | | | 2,818 | | | | 455,558 | |
| Southwest Airlines Co. | | | 9,031 | | | | 542,673 | |
| Supreme Industries, Inc., Class A | | | 24,257 | | | | 429,834 | |
| Security Description | | Shares | | | Value | |
| Industrials (continued) | | | | | | | | |
| Tennant Co. | | | 6,837 | | | $ | 478,590 | |
| Toro Co. | | | 7,865 | | | | 538,674 | |
Trex Co., Inc.(a) | | | 6,758 | | | | 434,337 | |
TriNet Group, Inc.(a) | | | 16,346 | | | | 505,582 | |
United Rentals, Inc.(a) | | | 3,911 | | | | 425,243 | |
| Universal Forest Products, Inc. | | | 5,076 | | | | 446,333 | |
| Wabash National Corp. | | | 23,241 | | | | 464,588 | |
Willdan Group, Inc.(a) | | | 14,110 | | | | 469,440 | |
| Woodward, Inc. | | | 7,028 | | | | 478,747 | |
| Total Industrials | | | | | | | 25,896,172 | |
| | | | | | | | | |
| Information Technology (21.92%) | | | | | | | | |
Acacia Communications, Inc.(a)(b) | | | 9,333 | | | | 439,024 | |
| Activision Blizzard, Inc. | | | 9,731 | | | | 570,042 | |
Adobe Systems, Inc.(a) | | | 3,932 | | | | 557,794 | |
Advanced Energy Industries, Inc.(a) | | | 7,186 | | | | 552,819 | |
Alphabet, Inc., Class C(a) | | | 564 | | | | 544,181 | |
Ambarella, Inc.(a)(b) | | | 8,537 | | | | 499,756 | |
Amkor Technology, Inc.(a) | | | 43,818 | | | | 496,896 | |
| Amphenol Corp., Class A | | | 6,731 | | | | 502,133 | |
| Analog Devices, Inc. | | | 5,707 | | | | 489,432 | |
| Apple, Inc. | | | 3,436 | | | | 524,883 | |
| Applied Materials, Inc. | | | 12,480 | | | | 572,582 | |
Applied Optoelectronics, Inc.(a)(b) | | | 9,911 | | | | 691,986 | |
Arista Networks, Inc.(a) | | | 3,761 | | | | 554,296 | |
| Broadridge Financial Solutions, Inc. | | | 6,945 | | | | 527,056 | |
| Cabot Microelectronics Corp. | | | 6,854 | | | | 517,408 | |
| CDK Global, Inc. | | | 7,195 | | | | 442,205 | |
| CDW Corp. | | | 8,038 | | | | 483,727 | |
Cirrus Logic, Inc.(a) | | | 8,620 | | | | 568,489 | |
Citrix Systems, Inc.(a) | | | 5,823 | | | | 480,630 | |
| Cognex Corp. | | | 5,997 | | | | 548,785 | |
| Cognizant Technology Solutions Corp., Class A | | | 8,073 | | | | 540,164 | |
Coherent, Inc.(a) | | | 2,535 | | | | 629,060 | |
Control4 Corp.(a) | | | 32,579 | | | | 646,693 | |
| Corning, Inc. | | | 17,788 | | | | 517,631 | |
| CTS Corp. | | | 22,010 | | | | 463,310 | |
| Dolby Laboratories, Inc., Class A | | | 9,437 | | | | 475,530 | |
eBay, Inc.(a) | | | 14,534 | | | | 498,516 | |
| Ebix, Inc. | | | 7,697 | | | | 426,029 | |
Electronic Arts, Inc.(a) | | | 5,254 | | | | 595,436 | |
Ellie Mae, Inc.(a) | | | 4,892 | | | | 535,968 | |
Entegris, Inc.(a) | | | 21,909 | | | | 541,152 | |
EPAM Systems, Inc.(a) | | | 6,511 | | | | 546,143 | |
ePlus, Inc.(a) | | | 7,328 | | | | 577,080 | |
Euronet Worldwide, Inc.(a) | | | 5,738 | | | | 500,526 | |
F5 Networks, Inc.(a) | | | 3,290 | | | | 421,548 | |
Fabrinet(a) | | | 12,309 | | | | 433,646 | |
Facebook, Inc., Class A(a) | | | 3,428 | | | | 519,205 | |
| Fair Isaac Corp. | | | 3,676 | | | | 487,658 | |
Fiserv, Inc.(a) | | | 4,068 | | | | 509,639 | |
FleetCor Technologies, Inc.(a) | | | 2,999 | | | | 432,726 | |
| Genpact, Ltd. | | | 20,077 | | | | 548,504 | |
Gigamon, Inc.(a) | | | 13,944 | | | | 531,964 | |
GrubHub, Inc.(a) | | | 14,089 | | | | 612,449 | |
| Hackett Group, Inc. | | | 24,734 | | | | 362,600 | |
II-VI, Inc.(a) | | | 14,473 | | | | 434,190 | |
Barron’s 400SM ETF
| Schedule of Investments | May 31, 2017 (Unaudited) |
| Security Description | | Shares | | | Value | |
| Information Technology (continued) | | | | | | |
Integrated Device Technology, Inc.(a) | | | 19,793 | | | $ | 506,305 | |
| InterDigital, Inc. | | | 5,625 | | | | 455,625 | |
IPG Photonics Corp.(a) | | | 4,037 | | | | 561,304 | |
| j2 Global, Inc. | | | 5,614 | | | | 475,057 | |
| Jack Henry & Associates, Inc. | | | 5,035 | | | | 534,767 | |
| KLA-Tencor Corp. | | | 5,142 | | | | 534,768 | |
| Lam Research Corp. | | | 3,903 | | | | 605,629 | |
| Littelfuse, Inc. | | | 3,029 | | | | 490,547 | |
Logitech International SA(b) | | | 15,665 | | | | 571,303 | |
| LogMeIn, Inc. | | | 1 | | | | 111 | |
Manhattan Associates, Inc.(a) | | | 9,534 | | | | 446,573 | |
| Mastercard, Inc., Class A | | | 4,322 | | | | 531,087 | |
Match Group, Inc.(a)(b) | | | 28,894 | | | | 562,855 | |
| Maxim Integrated Products, Inc. | | | 10,480 | | | | 500,944 | |
| MAXIMUS, Inc. | | | 7,787 | | | | 483,417 | |
MaxLinear, Inc.(a) | | | 18,215 | | | | 567,397 | |
The Meet Group, Inc.(a) | | | 95,334 | | | | 441,396 | |
| Methode Electronics, Inc. | | | 10,830 | | | | 434,824 | |
| Microsoft Corp. | | | 7,414 | | | | 517,794 | |
Nanometrics, Inc.(a) | | | 16,624 | | | | 462,147 | |
NeuStar, Inc., Class A(a) | | | 14,386 | | | | 476,896 | |
| NIC, Inc. | | | 22,907 | | | | 463,867 | |
| NVIDIA Corp. | | | 4,693 | | | | 677,435 | |
Oclaro, Inc.(a)(b) | | | 58,965 | | | | 523,609 | |
| Paychex, Inc. | | | 7,665 | | | | 453,998 | |
Paycom Software, Inc.(a) | | | 8,520 | | | | 557,549 | |
Rogers Corp.(a) | | | 5,875 | | | | 623,984 | |
Rudolph Technologies, Inc.(a) | | | 22,061 | | | | 527,258 | |
Silicon Laboratories, Inc.(a) | | | 6,693 | | | | 500,636 | |
| Skyworks Solutions, Inc. | | | 4,834 | | | | 514,483 | |
Stamps.com, Inc.(a)(b) | | | 3,670 | | | | 506,093 | |
Synopsys, Inc.(a) | | | 6,749 | | | | 505,298 | |
| Texas Instruments, Inc. | | | 5,890 | | | | 485,866 | |
The Trade Desk, Inc.(a) | | | 11,587 | | | | 637,285 | |
Tyler Technologies, Inc.(a) | | | 3,076 | | | | 525,627 | |
Ubiquiti Networks, Inc.(a)(b) | | | 9,365 | | | | 441,653 | |
| Universal Display Corp. | | | 5,761 | | | | 653,297 | |
VMware, Inc., Class A(a)(b) | | | 5,285 | | | | 513,438 | |
WebMD Health Corp.(a) | | | 9,072 | | | | 507,851 | |
| Total Information Technology | | | | | | | 43,131,464 | |
| | | | | | | | | |
| Materials (5.23%) | | | | | | | | |
| Albemarle Corp. | | | 4,594 | | | | 521,878 | |
| Avery Dennison Corp. | | | 5,979 | | | | 503,791 | |
| Cabot Corp. | | | 8,207 | | | | 428,652 | |
| Celanese Corp., Series A | | | 5,262 | | | | 455,426 | |
| Chase Corp. | | | 5,146 | | | | 542,903 | |
Cliffs Natural Resources, Inc.(a) | | | 52,659 | | | | 310,161 | |
| Compass Minerals International, Inc. | | | 6,892 | | | | 442,122 | |
| Eagle Materials, Inc. | | | 4,945 | | | | 466,313 | |
| Hecla Mining Co. | | | 102,495 | | | | 588,321 | |
| Innophos Holdings, Inc. | | | 9,117 | | | | 385,558 | |
| International Flavors & Fragrances, Inc. | | | 3,784 | | | | 521,776 | |
Kraton Corp.(a) | | | 17,015 | | | | 549,584 | |
Louisiana-Pacific Corp.(a) | | | 20,212 | | | | 450,323 | |
| Martin Marietta Materials, Inc. | | | 2,256 | | | | 505,570 | |
| Security Description | | Shares | | | Value | |
| Materials (continued) | | | | | | | | |
| Monsanto Co. | | | 4,191 | | | $ | 492,107 | |
| Neenah Paper, Inc. | | | 6,414 | | | | 500,292 | |
| Rayonier Advanced Materials, Inc. | | | 36,020 | | | | 626,388 | |
| Sealed Air Corp. | | | 10,497 | | | | 466,277 | |
| Sherwin-Williams Co. | | | 1,540 | | | | 510,926 | |
| Tahoe Resources, Inc. | | | 66,614 | | | | 589,534 | |
| Trinseo SA | | | 6,793 | | | | 437,809 | |
| Total Materials | | | | | | | 10,295,711 | |
| | | | | | | | | |
| Real Estate (0.47%) | | | | | | | | |
Marcus & Millichap, Inc.(a) | | | 18,348 | | | | 443,655 | |
| The RMR Group, Inc., Class A | | | 9,757 | | | | 479,069 | |
| Total Real Estate | | | | | | | 922,724 | |
| | | | | | | | | |
| Utilities (0.53%) | | | | | | | | |
| PPL Corp. | | | 13,110 | | | | 523,220 | |
| UGI Corp. | | | 10,063 | | | | 515,025 | |
| Total Utilities | | | | | | | 1,038,245 | |
| | | | | | | | | |
| TOTAL COMMON STOCKS (Cost $161,576,575) | | | 186,824,602 | |
| | | | | | | | | |
| LIMITED PARTNERSHIPS (4.55%) | | | | | | | | |
| Consumer Discretionary (0.25%) | | | | | | | | |
| Cedar Fair LP | | | 7,046 | | | | 500,407 | |
| Total Consumer Discretionary | | | | | | | 500,407 | |
| | | | | | | | | |
| Energy (3.49%) | | | | | | | | |
| Antero Midstream Partners LP | | | 13,760 | | | | 476,646 | |
| Cone Midstream Partners LP | | | 22,529 | | | | 478,291 | |
| Dominion Energy Midstream Partners LP | | | 15,407 | | | | 441,411 | |
| EQT GP Holdings LP | | | 17,495 | | | | 457,494 | |
| EQT Midstream Partners LP | | | 6,193 | | | | 456,796 | |
| Magellan Midstream Partners LP | | | 6,188 | | | | 449,187 | |
| Noble Midstream Partners LP | | | 10,153 | | | | 466,937 | |
| Phillips 66 Partners LP | | | 9,348 | | | | 462,913 | |
| Rice Midstream Partners LP | | | 18,620 | | | | 456,376 | |
| Shell Midstream Partners LP | | | 15,115 | | | | 450,880 | |
| Tallgrass Energy Partners LP | | | 9,062 | | | | 449,475 | |
| TC PipeLines LP | | | 7,889 | | | | 443,914 | |
| Valero Energy Partners LP | | | 10,338 | | | | 467,381 | |
| Western Gas Equity Partners LP | | | 10,699 | | | | 464,230 | |
| Western Gas Partners LP | | | 7,980 | | | | 444,725 | |
| Total Energy | | | | | | | 6,866,656 | |
| | | | | | | | | |
| Financials (0.54%) | | | | | | | | |
| Apollo Global Management LLC, Class A | | | 20,481 | | | | 553,602 | |
| Oaktree Capital Group LLC | | | 10,818 | | | | 501,414 | |
| Total Financials | | | | | | | 1,055,016 | |
Barron’s 400SM ETF
| Schedule of Investments | May 31, 2017 (Unaudited) |
| Security Description | | Shares | | | Value | |
| Materials (0.27%) | | | | | | |
| SunCoke Energy Partners LP | | | 31,319 | | | $ | 521,461 | |
| Total Materials | | | | | | | 521,461 | |
| | | | | | | | | |
TOTAL LIMITED PARTNERSHIPS (Cost $8,690,911) | | | 8,943,540 | |
| | | 7 Day Yield | | | Shares | | | Value | |
| SHORT TERM INVESTMENTS (2.75%) | | | | | | | |
| Money Market Fund (0.47%) | | | | | | | |
| State Street Institutional Treasury Plus Money Market Fund | | | | | | | |
| (Cost $929,477) | | | 0.680 | % | | | 929,477 | | | | 929,477 | |
| | | | | | | | | | | | | |
| Investments Purchased With Collateral | | | | | | | | | |
| From Securities Loaned (2.28%) | | | | | | | | | |
| State Street Navigator Securities Lending Government Money Market Portfolio, 0.78% | | | | | | | | | |
| (Cost $4,484,480) | | | | | | | 4,484,480 | | | $ | 4,484,480 | |
| | | | | | | | | | | | | |
TOTAL SHORT TERM INVESTMENTS (Cost $5,413,957) | | | | 5,413,957 | |
| | | | | | | | | | | | | |
TOTAL INVESTMENTS (102.25%) (Cost $175,681,443) | | | $ | 201,182,099 | |
| | | | | | | | | | | | | |
| NET OTHER ASSETS AND LIABILITIES (-2.25%) | | | | | (4,417,889 | ) |
| | | | | | | | | | | | | |
| NET ASSETS (100.00%) | | | | | | | $ | 196,764,210 | |
| (a) | Non-income producing security. |
| (b) | Security, or a portion of the security position, is currently on loan. The total market value of securities on loan is $4,784,570. |
See Notes to Financial Statements.
Barron’s 400SM ETF
| Statement of Assets and Liabilities | May 31, 2017 (Unaudited) |
| ASSETS: | | | |
| Investments, at value | | $ | 201,182,099 | |
| Foreign tax reclaims | | | 202 | |
| Dividends receivable | | | 175,181 | |
| Total Assets | | | 201,357,482 | |
| | | | | |
| LIABILITIES: | | | | |
| Payable to adviser | | | 108,792 | |
| Payable for collateral upon return of securities loaned | | | 4,484,480 | |
| Total Liabilities | | | 4,593,272 | |
| NET ASSETS | | $ | 196,764,210 | |
| | | | | |
| NET ASSETS CONSIST OF: | | | | |
| Paid-in capital | | $ | 187,365,561 | |
| Accumulated net investment income | | | 398,098 | |
| Accumulated net realized loss | | | (16,500,105 | ) |
| Net unrealized appreciation | | | 25,500,656 | |
| NET ASSETS | | $ | 196,764,210 | |
| | | | | |
| INVESTMENTS, AT COST | | $ | 175,681,443 | |
| | | | | |
| PRICING OF SHARES | | | | |
| Net Assets | | $ | 196,764,210 | |
| Shares of beneficial interest outstanding (Unlimited number of shares authorized, par value $0.01 per share) | | | 5,300,000 | |
| Net Asset Value, offering and redemption price per share | | $ | 37.13 | |
See Notes to Financial Statements.
Barron’s 400SM ETF
| Statement of Operations | For the Six Months Ended May 31, 2017 (Unaudited) |
| INVESTMENT INCOME: | | | |
Dividends(a) | | $ | 1,208,826 | |
| Securities lending income | | | 102,170 | |
| Total investment income | | | 1,310,996 | |
| | | | | |
| EXPENSES: | | | | |
| Investment adviser fees | | | 620,356 | |
| Total expenses | | | 620,356 | |
| NET INVESTMENT INCOME | | | 690,640 | |
| | | | | |
| REALIZED AND UNREALIZED GAIN/(LOSS) | | | | |
| Net realized gain on investments | | | 10,770,464 | |
| Net change in unrealized appreciation on investments | | | 4,692,825 | |
| NET REALIZED AND UNREALIZED GAIN ON INVESTMENTS | | | 15,463,289 | |
| NET INCREASE IN NET ASSETS RESULTING FROM OPERATIONS | | $ | 16,153,929 | |
| (a) | Net of foreign tax withholding in the amount of $629. |
See Notes to Financial Statements.
Barron’s 400SM ETF
Statements of Changes in Net Assets
| | | For the Six Months Ended May 31, 2017 (Unaudited) | | | For the Year Ended November 30, 2016 | |
| OPERATIONS: | | | | | | |
| Net investment income | | $ | 690,640 | | | $ | 1,857,709 | |
| Net realized gain/(loss) | | | 10,770,464 | | | | (4,619,422 | ) |
| Net change in unrealized appreciation | | | 4,692,825 | | | | 15,004,846 | |
| Net increase in net assets resulting from operations | | | 16,153,929 | | | | 12,243,133 | |
| | | | | | | | | |
| DISTRIBUTIONS TO SHAREHOLDERS: | | | | | | | | |
| From net investment income | | | (1,450,001 | ) | | | (1,670,002 | ) |
| Total distributions | | | (1,450,001 | ) | | | (1,670,002 | ) |
| | | | | | | | | |
| CAPITAL SHARE TRANSACTIONS: | | | | | | | | |
| Proceeds from sale of shares | | | 49,338,255 | | | | – | |
| Cost of shares redeemed | | | (45,889,651 | ) | | | (36,766,171 | ) |
| Net increase/(decrease) from share transactions | | | 3,448,604 | | | | (36,766,171 | ) |
| | | | | | | | | |
| Net increase/(decrease) in net assets | | | 18,152,532 | | | | (26,193,040 | ) |
| | | | | | | | | |
| NET ASSETS | | | | | | | | |
| Beginning of period | | | 178,611,678 | | | | 204,804,718 | |
| End of period * | | $ | 196,764,210 | | | $ | 178,611,678 | |
| | | | | | | | | |
| *Including accumulated net investment income of: | | $ | 398,098 | | | $ | 1,157,459 | |
| | | | | | | | | |
| OTHER INFORMATION: | | | | | | | | |
| CAPITAL SHARE TRANSACTIONS: | | | | | | | | |
| Beginning shares | | | 5,200,000 | | | | 6,450,000 | |
| Shares sold | | | 1,350,000 | | | | – | |
| Shares redeemed | | | (1,250,000 | ) | | | (1,250,000 | ) |
| Shares outstanding, end of period | | | 5,300,000 | | | | 5,200,000 | |
See Notes to Financial Statements.
Barron’s 400SM ETF
| Financial Highlights | For a Share Outstanding Throughout the Periods Presented |
| | | For the Six Months Ended May 31, 2017 (Unaudited) | | | For the Year Ended November 30, 2016 | | | For the Year Ended November 30, 2015 | | | For the Year Ended November 30, 2014 | | | For the Period June 4, 2013 (Commencement) to November 30, 2013 | |
| NET ASSET VALUE, BEGINNING OF PERIOD | | $ | 34.35 | | | $ | 31.75 | | | $ | 31.64 | | | $ | 29.30 | | | $ | 25.00 | |
| | | | | | | | | | | | | | | | | | | | | |
| INCOME/(LOSS) FROM INVESTMENT OPERATIONS: | | | | | | | | | | | | | | | | | | | | |
Net investment income(a) | | | 0.13 | | | | 0.33 | | | | 0.32 | | | | 0.23 | | | | 0.10 | |
| Net realized and unrealized gain | | | 2.92 | | | | 2.53 | | | | 0.02 | | | | 2.16 | | | | 4.20 | |
| Total from investment operations | | | 3.05 | | | | 2.86 | | | | 0.34 | | | | 2.39 | | | | 4.30 | |
| | | | | | | | | | | | | | | | | | | | | |
| DISTRIBUTIONS: | | | | | | | | | | | | | | | | | | | | |
| From net investment income | | | (0.27 | ) | | | (0.26 | ) | | | (0.23 | ) | | | (0.05 | ) | | | – | |
| Total distributions | | | (0.27 | ) | | | (0.26 | ) | | | (0.23 | ) | | | (0.05 | ) | | | – | |
| | | | | | | | | | | | | | | | | | | | | |
| NET INCREASE IN NET ASSET VALUE | | | 2.78 | | | | 2.60 | | | | 0.11 | | | | 2.34 | | | | 4.30 | |
| NET ASSET VALUE, END OF PERIOD | | $ | 37.13 | | | $ | 34.35 | | | $ | 31.75 | | | $ | 31.64 | | | $ | 29.30 | |
TOTAL RETURN(b) | | | 8.93 | % | | | 9.12 | % | | | 1.07 | % | | | 8.18 | % | | | 17.20 | % |
| | | | | | | | | | | | | | | | | | | | | |
| RATIOS/SUPPLEMENTAL DATA: | | | | | | | | | | | | | | | | | | | | |
| Net assets, end of period (000s) | | $ | 196,764 | | | $ | 178,612 | | | $ | 204,805 | | | $ | 219,901 | | | $ | 181,652 | |
| | | | | | | | | | | | | | | | | | | | | |
| Ratio of expenses to average net assets | | | 0.65 | %(c) | | | 0.65 | % | | | 0.65 | % | | | 0.65 | % | | | 0.65 | %(c) |
| Ratio of net investment income to average net assets | | | 0.72 | %(c) | | | 1.07 | % | | | 1.00 | % | | | 0.75 | % | | | 0.78 | %(c) |
Portfolio turnover rate(d) | | | 43 | % | | | 88 | % | | | 87 | % | | | 55 | % | | | 11 | % |
| (a) | Based on average shares outstanding during the period. |
| (b) | Total return is calculated assuming an initial investment made at the net asset value at the beginning of the period and redemption at the net asset value on the last day of the period and assuming all distributions are reinvested at actual reinvestment prices. Total return calculated for a period less than one year is not annualized. |
| (d) | Portfolio turnover for periods less than one year is not annualized and does not include securities received or delivered from processing creations or redemptions in-kind. |
See Notes to Financial Statements.
Barron’s 400SM ETF
| Notes to Financial Statements | May 31, 2017 (Unaudited) |
ALPS ETF Trust (the “Trust”), a Delaware statutory trust, is an open-end management investment company registered under the Investment Company Act of 1940, as amended (the “1940 Act”). As of May 31, 2017, the Trust consisted of twenty separate portfolios. Each portfolio represents a separate series of the Trust. This report pertains solely to the Barron’s 400SM ETF (the “Fund”). The investment objective of the Fund is to seek investment results that correspond generally, before fees and expenses, to the performance of the Barron’s 400 IndexSM (the “Underlying Index”). The Fund has elected to qualify as a diversified series of the Trust under the 1940 Act.
The Fund’s Shares (“Shares”) are listed on the NYSE Arca, Inc. (the “NYSE Arca”). The Fund issues and redeems Shares at net asset value (“NAV”) in blocks of 50,000 Shares, each of which is called a “Creation Unit”. Creation Units are issued and redeemed principally in-kind for securities included in the Underlying Index. Except when aggregated in Creation Units, Shares are not redeemable securities of the Fund.
Pursuant to the Trust’s organizational documents, its Officers and Trustees are indemnified against certain liability arising out of the performance of their duties to the Trust. Additionally, in the normal course of business, the Trust enters into contracts with service providers that contain general indemnification clauses. The Trust’s maximum exposure under these arrangements is unknown, as this would involve future claims that may be made against the Trust that have not yet occurred.
| 2. | SIGNIFICANT ACCOUNTING POLICIES |
The following is a summary of significant accounting policies consistently followed by the Fund in the preparation of the financial statements. The accompanying financial statements were prepared in accordance with accounting principles generally accepted in the United States of America (“U.S. GAAP”). The preparation of financial statements in conformity with U.S. GAAP requires management to make certain estimates and assumptions that affect the reported amounts of assets and liabilities and disclosures of contingent assets and liabilities at the date of the financial statements and the reported amounts of revenue and expenses during the period. Actual results could differ from those estimates. The Fund is considered an investment company under U.S. GAAP and follows the accounting and reporting guidance applicable to investment companies in the Financial Accounting Standards Board Accounting Standards Codification Topic 946.
A. Portfolio Valuation
The Fund’s NAV is determined daily, as of the close of regular trading on the New York Stock Exchange (the “NYSE”), normally 4:00 p.m. Eastern time, on each day the NYSE is open for trading. The NAV is computed by dividing the value of all assets of the Fund (including accrued interest and dividends), less all liabilities (including accrued expenses and dividends declared but unpaid), by the total number of shares outstanding.
Portfolio securities listed on any exchange other than the NASDAQ Stock Market LLC (“NASDAQ”) are valued at the last sale price on the business day as of which such value is being determined. If there has been no sale on such day, the securities are valued at the mean of the most recent bid and ask prices on such day. Securities traded on the NASDAQ are valued at the NASDAQ Official Closing Price as determined by NASDAQ. Portfolio securities traded on more than one securities exchange are valued at the last sale price on the business day as of which such value is being determined at the close of the exchange representing the principal market for such securities. Portfolio securities traded in the over-the-counter market, but excluding securities traded on the NASDAQ, are valued at the latest quoted sale price in such market.
The Fund’s investments are valued at market value or, in the absence of market value with respect to any portfolio securities, at fair value according to procedures adopted by the Trust’s Board of Trustees (the “Board”). When market quotations are not readily available or when events occur that make established valuation methods unreliable, securities of the Fund may be valued in good faith by or under the direction of the Board. These securities generally include, but are not limited to, restricted securities (securities which may not be publicly sold without registration under the Securities Act of 1933) for which a pricing service is unable to provide a market price; securities whose trading has been formally suspended; a security whose market price is not available from a pre-established primary pricing source or the pricing source is not willing to provide a price; a security with respect to which an event has occurred that is most likely to materially affect the value of the security after the market has closed but before the calculation of the Fund’s NAV or make it difficult or impossible to obtain a reliable market quotation; or a security whose price, as provided by the pricing service, does not reflect the security’s “fair value” due to the security being de-listed from a national exchange or the security’s primary trading market is temporarily closed at a time when, under normal conditions, it would be open. As a general principle, the current “fair value” of a security would be the amount which the owner might reasonably expect to receive from the sale on the applicable exchange or principal market. A variety of factors may be considered in determining the fair value of such securities.
Barron’s 400SM ETF
| Notes to Financial Statements | May 31, 2017 (Unaudited) |
B. Fair Value Measurements
The Fund discloses the classification of its fair value measurements following a three-tier hierarchy based on the inputs used to measure fair value. Inputs refer broadly to the assumptions that market participants would use in pricing the asset or liability; including assumptions about risk. Inputs may be observable or unobservable. Observable inputs reflect the assumptions market participants would use in pricing the asset or liability that are developed based on market data obtained from sources independent of the reporting entity. Unobservable inputs reflect the reporting entity’s own assumptions about the assumptions market participants would use in pricing the asset or liability that are developed based on the best information available.
Valuation techniques used to value the Fund's investments by major category are as follows:
Equity securities and Limited Partnerships, including restricted securities, for which market quotations are readily available, are valued at the last reported sale price or official closing price as reported by a third party pricing vendor on the primary market or exchange on which they are traded and are categorized as Level 1 in the hierarchy. In the event there were no sales during the day or closing prices are not available, securities are valued at the mean of the most recent quoted bid and ask prices on such day and are generally categorized as Level 2 in the hierarchy. Investments in open-end mutual funds are valued at their closing NAV each business day and are categorized as Level 1 in the hierarchy.
Changes in valuation techniques may result in transfers in or out of an assigned level within the disclosure hierarchy.
Various inputs are used in determining the value of the Fund’s investments as of the end of the reporting period. When inputs used fall into different levels of the fair value hierarchy, the level in the hierarchy within which the fair value measurement falls is determined based on the lowest level input that is significant to the fair value measurement in its entirety. The designated input levels are not necessarily an indication of the risk or liquidity associated with these investments.
These inputs are categorized in the following hierarchy under applicable financial accounting standards:
Level 1 – | Unadjusted quoted prices in active markets for identical investments, unrestricted assets or liabilities that a Fund has the ability to access at the measurement date; |
Level 2 – | Quoted prices which are not active, quoted prices for similar assets or liabilities in active markets or inputs other than quoted prices that are observable (either directly or indirectly) for substantially the full term of the asset or liability; and |
Level 3 – | Significant unobservable prices or inputs (including the Fund’s own assumptions in determining the fair value of investments) where there is little or no market activity for the asset or liability at the measurement date. |
The following is a summary of the inputs used to value the Fund’s investments as of May 31, 2017:
| Investments in Securities at Value* | | Level 1 - Unadjusted Quoted Prices | | | Level 2 - Other Significant Observable Inputs | | | Level 3 - Significant Unobservable Inputs | | | Total | |
| Common Stocks | | $ | 186,824,602 | | | $ | – | | | $ | – | | | $ | 186,824,602 | |
| Limited Partnerships | | | 8,943,540 | | | | – | | | | – | | | | 8,943,540 | |
| Short Term Investments | | | | | | | | | | | | | | | | |
| Money Market Fund | | | 929,477 | | | | – | | | | – | | | | 929,477 | |
| Investments Purchased with Collateral from Securities Loaned | | | 4,484,480 | | | | – | | | | – | | | | 4,484,480 | |
| TOTAL | | $ | 201,182,099 | | | $ | – | | | $ | – | | | $ | 201,182,099 | |
| * | For a detailed sector breakdown, see the accompanying Schedule of Investments. |
The Fund recognizes transfers between levels as of the end of the period. For the six months ended May 31, 2017, the Fund did not have any transfers between Level 1 and Level 2 securities. The Fund did not have any securities that used significant unobservable inputs (Level 3) in determining fair value.
Barron’s 400SM ETF
| Notes to Financial Statements | May 31, 2017 (Unaudited) |
C. Securities Transactions and Investment Income
Securities transactions are recorded as of the trade date. Realized gains and losses from securities transactions are recorded on the highest cost basis. Dividend income and capital gains distributions, if any, are recorded on the ex-dividend date. Interest income, if any, is recorded on the accrual basis.
D. Dividends and Distributions to Shareholders
Dividends from net investment income of the Fund, if any, are declared and paid annually or as the Board may determine from time to time. Distributions of net realized capital gains earned by the Fund, if any, are distributed at least annually.
E. Federal Tax and Tax Basis Information
The timing and character of income and capital gain distributions are determined in accordance with income tax regulations, which may differ from U.S. GAAP. Reclassifications are made to the Fund’s capital accounts for permanent tax differences to reflect income and gains available for distribution (or available capital loss carryforwards) under income tax regulations. The amounts and characteristics of tax basis distributions and composition of distributable earnings/(accumulated losses) are finalized at fiscal year-end; accordingly, tax basis balances have not been determined as of May 31, 2017.
The tax character of the distributions paid during the fiscal year ended November 30, 2016 was as follows:
| | | Ordinary Income | |
| November 30, 2016 | | | |
Barron’s 400SM ETF | | $ | 1,670,002 | |
At November 30, 2016, the Fund had available for tax purposes unused post-enactment capital loss carryforwards as follows:
| Fund | | Short-Term | | | Long-Term | |
Barron’s 400SM ETF | | $ | 18,956,924 | | | $ | 8,472,185 | |
As of May 31, 2017, the cost of investments for federal income tax purposes and accumulated net unrealized appreciation/(depreciation) on investments were as follows:
| | | Barron’s 400SM ETF | |
| Gross appreciation (excess of value over tax cost) | | $ | 31,591,006 | |
| Gross depreciation (excess of tax cost over value) | | | (5,797,005 | ) |
| Net unrealized appreciation (depreciation) | | | 25,794,001 | |
| Cost of investments for income tax purposes | | $ | 175,388,098 | |
The differences between book-basis and tax-basis are primarily due to the deferral of losses from wash sales and investments in partnerships.
F. Income Taxes
No provision for income taxes is included in the accompanying financial statements, as the Fund intends to distribute to shareholders all taxable investment income and realized gains and otherwise comply with Subchapter M of the Internal Revenue Code of 1986, as amended, applicable to regulated investment companies. The Fund evaluates tax positions taken (or expected to be taken) in the course of preparing the Fund’s tax returns to determine whether these positions meet a “more-likely-than-not” standard that, based on the technical merits, have a more than fifty percent likelihood of being sustained by a taxing authority upon examination. A tax position that meets the “more-likely-than-not” recognition threshold is measured to determine the amount of benefit to recognize in the financial statements.
As of and during the six months ended May 31, 2017, the Fund did not have a liability for any unrecognized tax benefits. The Fund files U.S. federal, state, and local tax returns as required. The Fund’s tax returns are subject to examination by the relevant tax authorities until expiration of the applicable statute of limitations, which is generally three years after the filing of the tax return, but may extend to four years in certain jurisdictions. Tax returns for open years have incorporated no uncertain tax positions that require a provision for income taxes.
Barron’s 400SM ETF
| Notes to Financial Statements | May 31, 2017 (Unaudited) |
G. Lending of Portfolio Securities
The Fund has entered into a securities lending agreement with State Street Bank & Trust Co. (“SSB”), the Fund’s lending agent. The Fund may lend its portfolio securities only to borrowers that are approved by SSB. The Fund will limit such lending to not more than 33 1/3% of the value of its total assets. The Fund’s securities held at SSB as custodian shall be available to be lent except those securities the Fund or ALPS Advisors Inc. specifically identifies in writing as not being available for lending. The borrower pledges and maintains with the Fund collateral consisting of cash (U.S. Dollars only), securities issued or guaranteed by the U.S. government or its agencies or instrumentalities, and cash equivalents (including irrevocable bank letters of credit) issued by a person other than the borrower or an affiliate of the borrower. The initial collateral received by the Fund is required to have a value of no less than 102% of the market value of the loaned securities for U.S equity securities and a value of no less than 105% of the market value for non-U.S. equity securities. The collateral is maintained thereafter, at a market value equal to not less than 102% of the current value of the U.S. equity securities on loan and not less than 105% of the current value of the non-U.S. equity securities on loan. The market value of the loaned securities is determined at the close of each business day and any additional required collateral is delivered to the Fund on the next business day. During the term of the loan, the Fund is entitled to all distributions made on or in respect of the loaned securities. Loans of securities are terminable at any time and the borrower, after notice, is required to return borrowed securities within the customary time period for settlement of securities transactions.
Any cash collateral received is reinvested in a money market fund managed by SSB as disclosed in the Fund’s Schedule of Investments and is reflected in the Statements of Assets and Liabilities as a payable for collateral upon return of securities loaned. Non-cash collateral, in the form of securities issued or guaranteed by the U.S. government or its agencies or instrumentalities, is not disclosed in the Fund’s Statements of Assets and Liabilities as it is held by the lending agent on behalf of the Fund, and the Fund does not have the ability to re-hypothecate these securities. Income earned by the Fund from securities lending activity is disclosed in the Statement of Operations.
The following is a summary of the Fund's securities lending agreement and related cash and non-cash collateral received as of May 31, 2017:
| | | Market Value of Securities on Loan | | Cash Collateral Received | | Non-Cash Collateral Received | | Total Collateral Received | |
| Barron's 400 ETF | | $ | 4,784,570 | | | $ | 4,484,480 | | | $ | 411,280 | | | $ | 4,895,760 | |
The risks of securities lending include the risk that the borrower may not provide additional collateral when required or may not return the securities when due. To mitigate these risks, the Fund benefits from a borrower default indemnity provided by SSB. SSB’s indemnity allows for full replacement of securities lent wherein SSB will purchase the unreturned loaned securities on the open market by applying the proceeds of the collateral, or to the extent such proceeds are insufficient or the collateral is unavailable, SSB will purchase the unreturned loan securities at SSB’s expense. However, the Fund could suffer a loss if the value of the investments purchased with cash collateral falls below the value of the cash collateral received.
The following table reflects a breakdown of transactions accounted for as secured borrowings, the gross obligation by the type of collateral pledged or securities loaned, and the remaining contractual maturity of those transactions as of May 31, 2017:
| Barron's 400 ETF | | | | | Remaining contractual maturity of the agreement | | | | |
| | | | | | | | | | |
| Securities Lending Transactions | | Overnight & Continuous | | | Up to 30 days | | | 30-90 days | | | Greater than 90 days | | | Total | |
| Common Stocks | | $ | 4,484,480 | | | $ | – | | | $ | – | | | $ | – | | | $ | 4,484,480 | |
| Total Borrowings | | | | | | | | | | | | | | | | | | | 4,484,480 | |
| Gross amount of recognized liabilities for securities lending (collateral received) | | | $ | 4,484,480 | |
| 3. | INVESTMENT ADVISORY FEE AND OTHER AFFILIATED TRANSACTIONS |
ALPS Advisors, Inc. (the “Adviser”) acts as the Fund’s investment adviser pursuant to an Advisory Agreement with the Trust on behalf of the Fund (the “Advisory Agreement”). Pursuant to the Advisory Agreement, the Fund pays the Adviser a unitary fee for the services and facilities it provides payable on a monthly basis at the annual rate of 0.65% of the Fund’s average daily net assets. From time to time, the Adviser may waive all or a portion of its fee.
Out of the unitary management fee, the Adviser pays substantially all expenses of the Fund, the cost of transfer agency, custody, fund administration, legal, audit, independent trustees and other services, except for interest expenses, distribution fees or expenses, brokerage expenses, taxes and extraordinary expenses not incurred in the ordinary course of the Fund’s business. The Adviser’s unitary management fee is designed to pay substantially all of the Fund’s expenses and to compensate the Adviser for providing services for the Fund.
Barron’s 400SM ETF
| Notes to Financial Statements | May 31, 2017 (Unaudited) |
ALPS Fund Services, Inc., an affiliate of the Adviser, is the administrator of the Fund.
Each Trustee who is not an officer or employee of the Adviser, any sub-adviser or any of their affiliates (“Independent Trustees”) receives (1) a quarterly retainer of $5,000, (2) a per meeting fee for regularly scheduled meetings of $3,750, (3) $1,500 for any special meeting held outside of a regularly scheduled board meeting, and (4) reimbursement for all reasonable out-of-pocket expenses relating to attendance at meetings.
| 4. | PURCHASES AND SALES OF SECURITIES |
For the six months ended May 31, 2017, the cost of purchases and proceeds from sales of investment securities, excluding in-kind transactions and short-term investments, were as follows:
| Fund | | Purchases | | | Sales | |
| Barron's 400 ETF | | $ | 81,821,763 | | | $ | 81,668,158 | |
For the six months ended May 31, 2017, the cost of in-kind purchases and proceeds from in-kind sales were as follows:
| Fund | | Purchases | | | Sales | |
| Barron's 400 ETF | | $ | 48,807,308 | | | $ | 46,347,353 | |
For the six months ended May 31, 2017, the Barron's 400SM ETF had in-kind net realized gain of $11,132,607.
Gains on in-kind transactions are not considered taxable for federal income tax purposes.
| 5. | CAPITAL SHARE TRANSACTIONS |
Shares are created and redeemed by the Fund only in Creation Unit size aggregations of 50,000 Shares. Only broker-dealers or large institutional investors with creation and redemption agreements called Authorized Participants (“AP”) are permitted to purchase or redeem Creation Units from the Fund. Such transactions are generally permitted on an in-kind basis, with a balancing cash component to equate the transaction to the NAV per unit of the Fund on the transaction date. Cash may be substituted equivalent to the value of certain securities generally when they are not available in sufficient quantity for delivery, not eligible for trading by the AP or as a result of other market circumstances.
| 6. | RELATED PARTY TRANSACTIONS |
The Fund engaged in cross trades between other funds in the Trust during the six months ended May 31, 2017 pursuant to Rule 17a-7 under the 1940 Act. Cross trading is the buying or selling of portfolio securities between funds to which the Adviser serves as the investment adviser. The Board previously adopted procedures that apply to transactions between the Funds of the Trust pursuant to Rule 17a-7. These transactions related to cross trades during the period complied with the requirements set forth by Rule 17a-7 and the Trust’s procedures.
Transactions related to cross trades during the six months ended May 31, 2017, were as follows:
| Fund | | Purchase cost paid | | | Sale proceeds received | | | Realized gain/(loss) on sales | |
| Barron's 400 ETF | | $ | 1,477,290 | | | $ | 1,137,727 | | | $ | 144,356 | |
On October 13, 2016, the Securities and Exchange Commission (“SEC”) amended Regulation S-X, which will require standardized, enhanced disclosure about derivatives in investment company financial statements, as well as other amendments. The compliance date for the amendments to Regulation S-X is August 1, 2017. Management is currently evaluating the impact to the financial statements and disclosures.
Barron’s 400SM ETF
| Additional Information | May 31, 2017 (Unaudited) |
PROXY VOTING RECORDS, POLICIES AND PROCEDURES
Information regarding how the Fund voted proxies relating to portfolio securities during the most recent 12-month period ended June 30 and a description of the Fund’s proxy voting policies and procedures used in determining how to vote for proxies are available without charge on the SEC’s website at www.sec.gov and upon request, by calling (toll-free) 1-866-675-2639.
PORTFOLIO HOLDINGS
The Trust is required to disclose, after its first and third fiscal quarters, the complete schedule of the Fund’s portfolio holdings with the SEC on Form N-Q. Forms N-Q for the Fund are available on the SEC’s website at www.sec.gov. The Fund’s Forms N-Q may also be reviewed and copied at the SEC’s Public Reference Room in Washington, D.C. and information on the operation of the Public Reference Room may be obtained by calling 1-800-SEC-0330. The Fund’s Forms N-Q are available without charge, upon request, by calling (toll-free) 1-866-675-2639 or by writing to ALPS ETF Trust at 1290 Broadway, Suite 1100, Denver, Colorado 80203.
TAX INFORMATION
The Fund designated the following for federal income tax purposes for distributions made during the calendar year ended December 31, 2016:
| | | Qualified Dividend Income | | | Dividend Received Deduction | |
Barron's 400SM ETF | | | 100.00 | % | | | 100.00 | % |
In early 2017, if applicable, shareholders of record received this information for the distribution paid to them by the Fund during the calendar year 2016 via Form 1099. The Fund will notify shareholders in early 2018 of amounts paid to them by the Fund, if any, during the calendar year 2017.
LICENSING AGREEMENT
MarketGrader Capital, LLC has entered into a license agreement with Dow Jones & Company to use the “Barron’s” name and certain related intellectual property in connection with the Underlying Index. MarketGrader Capital, LLC also has entered into a license and services agreement with its parent company, MarketGrader.com, to use the methodology for constructing the Underlying Index. MarketGrader Capital, LLC in turn has entered into the Sublicense Agreement with ALPS Advisers, Inc. to use the Underlying Index. The following disclosure relates to such licensing agreements:
The Barron’s 400SM ETF (the “Fund”) is not sponsored, endorsed, sold or promoted by the MarketGrader Capital, LLC (the “Index Provider”). The Index Provider makes no representation or warranty, express or implied, to the owners of the Fund or any member of the public regarding the advisability of investing in securities generally or in the Fund particularly or the ability of the Fund to track the performance of the physical commodities market. The Index Provider’s only relationship to the ALPS Advisors, Inc. (the “Adviser”) or the Fund is the licensing of certain service marks and trade names of the Index Provider and of the Underlying Index that is determined, composed and calculated by the Index Provider without regard to the Adviser or the Fund. The Index Provider has no obligation to take the needs of the Adviser or the Fund or the owners of the Fund into consideration in determining, composing or calculating the Underlying Index. The Index Provider is not responsible for and has not participated in the determination of the timing of, prices at, or quantities of the Fund to be issued or in the determination or calculation of the equation by which the Fund is to be converted into cash. The Index Provider has no obligation or liability in connection with the administration, marketing or trading of the Fund.
THE INDEX PROVIDER DOES NOT GUARANTEE THE ACCURACY AND/OR THE COMPLETENESS OF THE UNDERLYING INDEX OR ANY DATA INCLUDED THEREIN AND THE INDEX PROVIDER SHALL HAVE NO LIABILITY FOR ANY ERRORS, OMISSIONS, OR INTERRUPTIONS THEREIN. THE INDEX PROVIDER MAKES NO WARRANTY, EXPRESS OR IMPLIED, AS TO RESULTS TO BE OBTAINED BY THE ADVISER, THE FUND, OWNERS OF THE FUND, OR ANY OTHER PERSON OR ENTITY FROM THE USE OF THE UNDERLYING INDEX OR ANY DATA INCLUDED THEREIN. THE INDEX PROVIDER MAKES NO EXPRESS OR IMPLIED WARRANTIES, AND EXPRESSLY DISCLAIMS ALL WARRANTIES OF MERCHANTABILITY OR FITNESS FOR A PARTICULAR PURPOSE OR USE WITH RESPECT TO THE UNDERLYING INDEX OR ANY DATA INCLUDED THEREIN. WITHOUT LIMITING ANY OF THE FOREGOING, IN NO EVENT SHALL THE INDEX PROVIDER HAVE ANY LIABILITY FOR ANY SPECIAL, PUNITIVE, INDIRECT, OR CONSEQUENTIAL DAMAGES (INCLUDING LOST PROFITS), EVEN IF NOTIFIED OF THE POSSIBILITY OF SUCH DAMAGES.
“The Barron’s 400 IndexSM” is calculated and published by MarketGrader Capital, LLC (“MarketGrader”). “Barron’s,” “Barron’s 400” and “Barron’s 400 Index” are trademarks or service marks of DJC & Company, Inc. or its affiliates and have been licensed to MarketGrader and sublicensed for certain purposes by Barron’s 400 Exchange Traded Fund, a sub-fund of that certain ALPS ETF Trust, a Delaware Statutory Trust (“Sub-Licensee”).
Barron’s 400SM ETF
| Additional Information | May 31, 2017 (Unaudited) |
The Barron’s 400 ETF (the “Product”) is not sponsored, endorsed, sold or promoted by DJC or its affiliates. DJC and its affiliates make no representation or warranty, express or implied, to the owners of the Fund or any member of the public regarding the advisability of trading in the Fund particularly. DJC and its affiliates’ only relationship to the Licensee is the licensing of certain trademarks and trade names of DJC. DJC has no obligation to take the needs of the Licensee or the owners of the Fund into consideration in connection with its licensing of the Barron’s 400 Index to MarketGrader or the sublicense to Licensee. DJC and its affiliates are not responsible for and have not participated in the determination of the timing of, prices at, or quantities of the Fund to be sold or in the determination or calculation of the equation by which the Product are to be converted into cash. DJC and its affiliates have no obligation or liability in connection with the administration, marketing or trading of the Barron’s 400 Index or the Product.
DOW JONES DOES NOT GUARANTEE THE ACCURACY AND/OR THE COMPLETENESS OF THE BARRON’S 400 INDEX OR ANY DATA INCLUDED THEREIN AND DOW JONES AND ITS AFFILIATES SHALL HAVE NO LIABILITY FOR ANY ERRORS, OMISSIONS, OR INTERRUPTIONS THEREIN. DOW JONESAND ITS AFFILIATES MAKE NO WARRANTY, EXPRESS OR IMPLIED, AS TO RESULTS TO BE OBTAINED BY THE LICENSEE, OWNERS OF THE FUND, OR ANY OTHER PERSON OR ENTITY FROM THE USE OF THE BARRON’S 400 INDEX OR ANY DATA INCLUDED THEREIN. DOW JONES AND ITS AFFILIATES MAKE NO EXPRESS OR IMPLIED WARRANTIES. AND EXPRESSLY DISCLAIM ALL WARRANTIES, OF MERCHANTABILITY OR FITNESS FOR A PARTICULAR PURPOSE OR USE WITH RESPECT TO THE BARRON’S 400 INDEX OR ANY DATA INCLUDED THEREIN. WITHOUT LIMITING ANY OF THE FOREGOING, IN NO EVENT SHALL DOW JONES AND ITS AFFILIATES HAVE ANY LIABILITY FOR ANY LOST PROFITS OR INDIRECT, PUNITIVE, SPECIAL OR CONSEQUENTIAL DAMAGES OR LOSSES, EVEN IF NOTIFIED OF THE POSSIBILITY OF SUCH DAMAGES. THERE ARE NO THIRD PARTY BENEFICIARIES OF ANY AGREEMENTS OR ARRANGEMENTS BETWEEN DJC AND THE LICENSEE, OTHER THAN THE LICENSORS OF MARKETGRADER.
The Adviser does not guarantee the accuracy and/or the completeness of the Underlying Index or any data included therein, and the Adviser shall have no liability for any errors, omissions or interruptions therein. The Adviser makes no warranty, express or implied, as to results to be obtained by the Fund, owners of the Shares of the Fund or any other person or entity from the use of the Underlying Index or any data included therein. The Adviser makes no express or implied warranties, and expressly disclaims all warranties of merchantability or fitness for a particular purpose or use with respect to the Underlying Index or any data included therein. Without limiting any of the foregoing, in no event shall the Adviser have any liability for any special, punitive, direct, indirect or consequential damages (including lost profits) arising out of matters relating to the use of the Underlying Index, even if notified of the possibility of such damages.
Must be accompanied or preceded by a prospectus.
ALPS Portfolio Solutions Distributor, Inc., a FINRA member, is the Distributor for the Barron’s 400SM ETF.
| Performance Overview | 1 |
| Disclosure of Fund Expenses | 3 |
| Schedules of Investments | 4 |
| Statement of Assets and Liabilities | 6 |
| Statement of Operations | 7 |
| Statement of Changes in Net Assets | 8 |
| Financial Highlights | 9 |
| Notes to Financial Statements | 10 |
| Additional Information | 15 |
alpsfunds.com
BUZZ US Sentiment Leaders ETF
| Performance Overview | May 31, 2017 (Unaudited) |
Investment Objective
The BUZZ US Sentiment Leaders ETF (the “Fund”) employs a “passive management” – or indexing – investment approach designed to seek investment results that correspond (before fees and expenses) generally to the performance of its underlying index, the BUZZ NextGen AI US Sentiment Leaders Index (the “Underlying Index”).
The Underlying Index utilizes a rules‐based quantitative methodology developed by BUZZ Indexes Inc. (the “Index Provider”), which is designed to identify the U.S. common stocks with the most “positive insights” collected from social media networks. Such positive insights are a measure of the degree of positive company sentiment as well as the breadth of active discussion about each company by participants on social media networks. The Index Provider then selects the 75 companies with the highest positive insight scores for inclusion in the Underlying Index and weights the 75 constituent common stocks of the Underlying Index based on a proprietary scoring model.
Performance (as of May 31, 2017)
| | 6 Months | 1 Year | Since Inception^ |
| BUZZ US Sentiment Leaders ETF ‐ NAV | 8.45% | 15.66% | 10.16% |
| BUZZ US Sentiment Leaders ETF ‐ Market Price* | 8.45% | 15.61% | 10.16% |
| BUZZ NextGen AI US Sentiment Leaders Total Return Index | 8.66% | 16.16% | 10.63% |
S&P 500® Total Return Index | 10.81% | 17.47% | 15.91% |
Total Expense Ratio (per the current prospectus) 0.75%
Performance data quoted represents past performance. Past performance does not guarantee future results. The table does not reflect the deduction of taxes that a shareholder would pay on Fund distributions or the redemption of Fund shares. Investment return and principal value of an investment will fluctuate so that an investor’s shares, when redeemed, may be worth more or less than their original cost. Current performance may be higher or lower than actual data quoted. For the most current month-end performance data please visit www.alpsfunds.com or call 1.855.215.1425.
NAV is an exchange-traded fund’s per-share value. The per-share dollar amount of the Fund is derived by dividing the total value of all the securities in its portfolio, less any liabilities, by the number of Fund shares outstanding. Market Price is the price at which a share can currently be traded in the market. Information detailing the number of days the Market Price of the Fund was greater than the Fund’s NAV and the number of days it was less than the Fund’s NAV can be obtained at www.alpsfunds.com.
| ^ | The Fund’s Commencement date was April 19, 2016. Total return for a period of less than one year is not annualized. |
| * | Market Price is based on the midpoint of the bid-ask spread at 4 p.m. ET and does not represent the returns an investor would receive if shares were traded at other times. |
BUZZ NextGen AI US Sentiment Leaders Index is comprised of 75 stocks with the highest “positive insight” rankings collected from online forums. These stocks must meet certain market capitalization and average daily trading volume requirements to be included in the index and are weighted based on a proprietary scoring model developed by BUZZ Indexes Inc.
S&P 500® Index is the Standard & Poor’s composite index of 500 stocks, a widely recognized, unmanaged index of common stock prices.
The indexes are reported on a total return basis, which assumes reinvestment of any dividends and distributions realized during a given time period. The indexes are not actively managed and do not reflect any deductions for fees, expenses or taxes. One cannot invest directly in an index. Index performance does not reflect fund performance.
Funds that invest in securities of medium capitalization companies involve greater risk than customarily is associated with investing in larger, more established companies. A medium capitalization company is defined as a company with a market capitalization between $2 billion and $10 billion. These companies’ securities may be more volatile and less liquid than those of more established companies. These securities may have returns that vary, sometimes significantly, from the overall securities market. Often medium capitalization companies and the industries in which they focus are still evolving and, as a result, they may be more sensitive to changing market conditions.
The Fund’s shares are not individually redeemable. Investors buy and sell shares of the Fund on a secondary market. Only market makers or “authorized participants” may trade directly with the Fund, typically in blocks of 50,000 shares.
The BUZZ US Sentiment Leaders ETF is not suitable for all investors. Investments in the Fund are subject to investment risks, including possible loss of the principal amount invested.
ALPS Portfolio Solutions Distributor, Inc., a FINRA member, is the distributor for the BUZZ US Sentiment Leaders ETF.
ALPS Portfolio Solutions Distributor, Inc. is not affiliated with BUZZ Indexes Inc.
BUZZ US Sentiment Leaders ETF
| Performance Overview | May 31, 2017 (Unaudited) |
Top 10 Holdings* (as of May 31, 2017)
Micron Technology, Inc. | 3.29% |
Tesla Motors, Inc. | 3.20% |
NVIDIA Corp. | 3.19% |
Alphabet, Inc., Class A | 3.05% |
Amazon.com, Inc. | 3.05% |
Microsoft Corp. | 3.03% |
Facebook, Inc., Class A | 3.01% |
The Walt Disney Co. | 2.97% |
Apple, Inc. | 2.94% |
Advanced Micro Devices, Inc. | 2.91% |
Total % of Top 10 Holdings | 30.64% |
Sector Allocation* (as of May 31, 2017)
Information Technology | 40.13% |
Consumer Discretionary | 21.66% |
Health Care | 16.18% |
Consumer Staples | 6.04% |
| Financials | 5.43% |
| Industrials | 3.49% |
| Energy | 3.23% |
Telecommunication Services | 3.19% |
| Materials | 0.52% |
Money Market Fund | 0.13% |
| Total | 100.00% |
Future holdings are subject to change.
Growth of $10,000 (as of May 31, 2017)
Comparison of Change in Value of $10,000 Investment in the Fund and the Underlying Index
The chart above represents historical performance of a hypothetical investment of $10,000 in the Fund over the life of the Fund. Past performance does not guarantee future results. This chart does not reflect the deduction of taxes that a shareholder would pay on Fund distributions or the redemption of Fund shares.
BUZZ US Sentiment Leaders ETF
| Disclosure of Fund Expenses | May 31, 2017 (Unaudited) |
Shareholder Expense Example: As a shareholder of the Fund, you incur two types of costs: (1) transaction costs which may include creation and redemption fees or brokerage charges, and (2) ongoing costs, including management fees and other Fund expenses. These examples are intended to help you understand your ongoing costs (in dollars) of investing in a Fund and to compare these costs with the ongoing costs of investing in other funds. It is based on an investment of $1,000 invested at the beginning of the (six month) period and held through May 31, 2017.
Actual Return: The first line of the table provides information about actual account values and actual expenses. You may use the information in this line, together with the amount you invested, to estimate the expenses that you incurred over the period. Simply divide your account value by $1,000 (for example, an $8,600 account value divided by $1,000 = 8.6), then multiply the result by the number in the first line under the heading entitled “Expenses Paid During Period” to estimate the expenses attributable to your investment during this period.
Hypothetical 5% Return: The second line of the table provides information about hypothetical account values and hypothetical expenses based on the Fund’s actual expense ratio and an assumed rate of return of 5% per year before expenses, which is not the Fund’s actual return. The hypothetical account values and expenses may not be used to estimate the actual ending account balance or expenses you paid for the period. You may use this information to compare ongoing costs of investing in the Fund and other funds. To do so, compare this 5% hypothetical example with the 5% hypothetical examples that appear in the shareholder reports of other funds.
The expenses shown in the table are meant to highlight ongoing Fund costs only and do not reflect any transaction costs, such as creation and redemption fees or brokerage charges. Therefore, the second line is useful in comparing ongoing costs only, and will not help you determine the relative total costs of owning different funds. In addition, if these costs were included, your costs would have been higher.
| | Beginning Account Value 12/1/16 | Ending Account Value 5/31/17 | Expense Ratio(a) | Expenses Paid During Period 12/1/16 - 5/31/17(b) |
| Actual | $1,000.00 | $1,084.50 | 0.75% | $3.90 |
Hypothetical (5% return before expenses) | $1,000.00 | $1,021.19 | 0.75% | $3.78 |
(a) | Annualized, based on the Fund's most recent fiscal half year expenses. |
(b) | Expenses are equal to the Fund's annualized expense ratio multiplied by the average account value over the period, multiplied by the number of days in the most recent fiscal half year (182), divided by 365. |
BUZZ US Sentiment Leaders ETF
| Schedule of Investments | May 31, 2017 (Unaudited) |
| Security Description | | Shares | | | Value | |
| COMMON STOCKS (99.76%) | | | | | | |
| Consumer Discretionary (21.64%) | | | | | | |
Amazon.com, Inc.(a) | | | 256 | | | $ | 254,623 | |
Chipotle Mexican Grill, Inc.(a) | | | 172 | | | | 82,104 | |
| Ford Motor Co. | | | 13,320 | | | | 148,118 | |
| The Home Depot, Inc. | | | 355 | | | | 54,496 | |
| Las Vegas Sands Corp. | | | 813 | | | | 48,073 | |
| Mcdonald's Corp. | | | 427 | | | | 64,430 | |
Netflix, Inc.(a) | | | 1,349 | | | | 219,981 | |
| NIKE, Inc., Class B | | | 1,315 | | | | 69,682 | |
The Priceline Group, Inc.(a) | | | 25 | | | | 46,927 | |
Sirius XM Holdings, Inc.(b) | | | 13,035 | | | | 68,434 | |
| Starbucks Corp. | | | 1,210 | | | | 76,968 | |
| Target Corp. | | | 1,254 | | | | 69,158 | |
Tesla, Inc.(a)(b) | | | 782 | | | | 266,670 | |
| The Walt Disney Co. | | | 2,296 | | | | 247,830 | |
| Wynn Resorts Ltd. | | | 697 | | | | 89,704 | |
| Total Consumer Discretionary | | | | | | | 1,807,198 | |
| | | | | | | | | |
| Consumer Staples (6.03%) | | | | | | | | |
| Altria Group, Inc. | | | 779 | | | | 58,768 | |
| The Coca-Cola Co. | | | 1,109 | | | | 50,426 | |
| Costco Wholesale Corp. | | | 431 | | | | 77,765 | |
| CVS Health Corp. | | | 978 | | | | 75,140 | |
| The Kroger Co. | | | 2,017 | | | | 60,066 | |
| Procter & Gamble Co. | | | 474 | | | | 41,754 | |
| Wal-Mart Stores, Inc. | | | 1,368 | | | | 107,525 | |
| Whole Foods Market, Inc. | | | 925 | | | | 32,366 | |
| Total Consumer Staples | | | | | | | 503,810 | |
| | | | | | | | | |
| Energy (3.23%) | | | | | | | | |
Chesapeake Energy Corp.(a)(b) | | | 43,973 | | | | 222,503 | |
| Exxon Mobil Corp. | | | 585 | | | | 47,093 | |
| Total Energy | | | | | | | 269,596 | |
| | | | | | | | | |
| Financials (5.42%) | | | | | | | | |
| Bank of America Corp. | | | 10,771 | | | | 241,378 | |
| Citigroup, Inc. | | | 1,007 | | | | 60,964 | |
| JPMorgan Chase & Co. | | | 804 | | | | 66,049 | |
| Morgan Stanley | | | 921 | | | | 38,442 | |
| Wells Fargo & Co. | | | 900 | | | | 46,026 | |
| Total Financials | | | | | | | 452,859 | |
| | | | | | | | | |
| Health Care (16.16%) | | | | | | | | |
| AbbVie, Inc. | | | 3,122 | | | | 206,114 | |
Alexion Pharmaceuticals, Inc.(a) | | | 498 | | | | 48,819 | |
| Allergan Plc | | | 281 | | | | 62,874 | |
| Amgen, Inc. | | | 308 | | | | 47,814 | |
Biogen, Inc.(a) | | | 227 | | | | 56,244 | |
| Bristol-Myers Squibb Co. | | | 1,321 | | | | 71,268 | |
Celgene Corp.(a) | | | 1,452 | | | | 166,123 | |
Exelixis, Inc.(a) | | | 8,574 | | | | 160,420 | |
| Gilead Sciences, Inc. | | | 3,679 | | | | 238,730 | |
| Johnson & Johnson | | | 615 | | | | 78,874 | |
| Merck & Co., Inc. | | | 827 | | | | 53,846 | |
| Pfizer, Inc. | | | 1,519 | | | | 49,595 | |
Regeneron Pharmaceuticals, Inc.(a) | | | 153 | | | | 70,236 | |
| Security Description | | Shares | | | Value | |
| Health Care (continued) | | | | | | | | |
| UnitedHealth Group, Inc. | | | 221 | | | $ | 38,715 | |
| Total Health Care | | | | | | | 1,349,672 | |
| | | | | | | | | |
| Industrials (3.48%) | | | | | | | | |
| American Airlines Group, Inc. | | | 1,014 | | | | 49,088 | |
| The Boeing Co. | | | 394 | | | | 73,926 | |
| General Electric Co. | | | 2,596 | | | | 71,079 | |
JetBlue Airways Corp.(a) | | | 2,315 | | | | 51,902 | |
| Lockheed Martin Corp. | | | 160 | | | | 44,981 | |
| Total Industrials | | | | | | | 290,976 | |
| | | | | | | | | |
| Information Technology (40.09%) | | | | | | | | |
| Activision Blizzard, Inc. | | | 1,891 | | | | 110,775 | |
Advanced Micro Devices, Inc.(a) | | | 21,723 | | | | 243,080 | |
Alphabet, Inc., Class A(a) | | | 258 | | | | 254,669 | |
| Apple, Inc. | | | 1,606 | | | | 245,333 | |
| Applied Materials, Inc. | | | 1,663 | | | | 76,299 | |
| Broadcom Ltd. | | | 311 | | | | 74,478 | |
| Cisco Systems, Inc. | | | 1,276 | | | | 40,232 | |
Electronic Arts, Inc.(a) | | | 568 | | | | 64,372 | |
Facebook, Inc., Class A(a) | | | 1,659 | | | | 251,272 | |
| Intel Corp. | | | 6,578 | | | | 237,532 | |
| Mastercard, Inc., Class A | | | 1,167 | | | | 143,401 | |
Micron Technology, Inc.(a) | | | 8,913 | | | | 274,253 | |
| Microsoft Corp. | | | 3,617 | | | | 252,611 | |
| NVIDIA Corp. | | | 1,841 | | | | 265,748 | |
Palo Alto Networks, Inc.(a) | | | 913 | | | | 108,273 | |
PayPal Holdings, Inc.(a) | | | 2,534 | | | | 132,300 | |
| QUALCOMM, Inc. | | | 2,191 | | | | 125,479 | |
| Seagate Technology Plc | | | 1,355 | | | | 59,037 | |
| Skyworks Solutions, Inc. | | | 509 | | | | 54,173 | |
Twitter, Inc.(a) | | | 13,232 | | | | 242,410 | |
| Western Digital Corp. | | | 1,024 | | | | 92,221 | |
| Total Information Technology | | | | | | | 3,347,948 | |
| | | | | | | | | |
| Materials (0.52%) | | �� | | | | | | |
Freeport-McMoRan, Inc.(a) | | | 3,796 | | | | 43,616 | |
| Total Materials | | | | | | | 43,616 | |
| | | | | | | | | |
| Telecommunication Services (3.19%) | | | | | | | | |
| AT&T, Inc. | | | 2,641 | | | | 101,758 | |
Sprint Corp.(a) | | | 7,827 | | | | 66,451 | |
T-mobile US, Inc.(a) | | | 762 | | | | 51,374 | |
| Verizon Communications, Inc. | | | 1,001 | | | | 46,687 | |
| Total Telecommunication Services | | | | | | | 266,270 | |
| | | | | | | | | |
TOTAL COMMON STOCKS (Cost $7,972,891) | | | | 8,331,945 | |
BUZZ US Sentiment Leaders ETF
| Schedule of Investments | May 31, 2017 (Unaudited) |
| | | 7 Day Yield | | | Shares | | | Value | |
| SHORT TERM INVESTMENTS (0.12%) | | | | | | | |
| State Street Institutional Treasury Plus Money Market Fund | | | 0.680 | % | | | 10,296 | | | $ | 10,296 | |
| | | | | | | | | | | | | |
TOTAL SHORT TERM INVESTMENTS (Cost $10,296) | | | | 10,296 | |
| | | | | | | | | | | | | |
TOTAL INVESTMENTS (99.88%) (Cost $7,983,187) | | | $ | 8,342,241 | |
| | | | | | | | | | | | | |
| NET OTHER ASSETS AND LIABILITIES (0.12%) | | | | 9,462 | |
| | | | | | | | | | | | | |
| NET ASSETS (100.00%) | | | | | | | | | | $ | 8,351,703 | |
(a) | Non-income producing security. |
(b) | Security, or a portion of the security position, is currently on loan. The total market value of securities on loan is $416,107. |
See Notes to Financial Statements.
BUZZ US Sentiment Leaders ETF
| Statement of Assets and Liabilities | May 31, 2017 (Unaudited) |
| ASSETS: | | | |
| Investments, at value | | $ | 8,342,241 | |
| Dividends receivable | | | 15,030 | |
| Total Assets | | | 8,357,271 | |
| | | | | |
| LIABILITIES: | | | | |
| Payable to adviser | | | 5,568 | |
| Total Liabilities | | | 5,568 | |
| NET ASSETS | | $ | 8,351,703 | |
| | | | | |
| NET ASSETS CONSIST OF: | | | | |
| Paid-in capital | | $ | 7,902,917 | |
| Accumulated net investment income | | | 13,832 | |
| Accumulated net realized gain | | | 75,900 | |
| Net unrealized appreciation | | | 359,054 | |
| NET ASSETS | | $ | 8,351,703 | |
| | | | |
| INVESTMENTS, AT COST | | $ | 7,983,187 | |
| | | | | |
| PRICING OF SHARES | | | | |
| Net Assets | | $ | 8,351,703 | |
| Shares of beneficial interest outstanding (Unlimited number of shares authorized, par value $0.01 per share) | | | 300,002 | |
| Net Asset Value, offering and redemption price per share | | $ | 27.84 | |
See Notes to Financial Statements.
BUZZ US Sentiment Leaders ETF
| Statement of Operations | For the Six Months Ended May 31, 2017 (Unaudited) |
INVESTMENT INCOME: | | | |
| Dividends | | $ | 46,778 | |
Securities lending income | | | 335 | |
Total Investment Income | | | 47,113 | |
| | | | | |
| EXPENSES: | | | | |
Investment adviser fees | | | 22,997 | |
Total Expense | | | 22,997 | |
NET INVESTMENT INCOME | | | 24,116 | |
| | | | | |
REALIZED AND UNREALIZED GAIN | | | | |
Net realized gain on investments | | | 323,681 | |
Net change in unrealized appreciation on investments | | | 203,580 | |
NET REALIZED AND UNREALIZED GAIN ON INVESTMENTS | | | 527,261 | |
NET INCREASE IN NET ASSETS RESULTING FROM OPERATIONS | | $ | 551,377 | |
See Notes to Financial Statements.
BUZZ US Sentiment Leaders ETF
| Statement of Changes in Net Assets |
| | | For the Six Months Ended May 31, 2017 (Unaudited)(a) | | | For the Period April 19, 2016 (Commencement of Operations) to November 30, 2016 | |
| OPERATIONS: | | | | | | | | |
| Net investment income | | $ | 24,116 | | | $ | 26,004 | |
| Net realized gain | | | 323,681 | | | | 17,488 | |
| Net change in unrealized appreciation | | | 203,580 | | | | 155,474 | |
| Net increase in net assets resulting from operations | | | 551,377 | | | | 198,966 | |
| | | | | | | | | |
| DISTRIBUTIONS TO SHAREHOLDERS: | | | | | | | | |
| From net investment income | | | (35,000 | ) | | | – | |
| Total distributions | | | (35,000 | ) | | | – | |
| | | | | | | | | |
| CAPITAL SHARE TRANSACTIONS: | | | | | | | | |
| Proceeds from sale of shares | | | 6,789,473 | | | | 7,542,694 | |
| Cost of shares redeemed | | | (4,123,188 | ) | | | (2,572,619 | ) |
| Net increase from capital share transactions | | | 2,666,285 | | | | 4,970,075 | |
| Net increase in net assets | | | 3,182,662 | | | | 5,169,041 | |
| | | | | | | | | |
| NET ASSETS: | | | | | | | | |
| Beginning of period | | | 5,169,041 | | | | – | |
| End of period * | | $ | 8,351,703 | | | $ | 5,169,041 | |
| | | | | | | | | |
| *Including accumulated net investment income of: | | $ | 13,832 | | | $ | 24,716 | |
| | | | | | | | | |
| OTHER INFORMATION: | | | | | | | | |
| CAPITAL SHARE TRANSACTIONS: | | | | | | | | |
| Beginning shares | | | 200,002 | | | | – | |
| Shares sold | | | 250,000 | | | | 300,002 | |
| Shares redeemed | | | (150,000 | ) | | | (100,000 | ) |
| Shares outstanding, end of period | | | 300,002 | | | | 200,002 | |
(a) | Prior to March 31, 2017 the BUZZ US Sentiment Leaders ETF was known as the Sprott BUZZ Social Media Insights ETF. |
See Notes to Financial Statements.
BUZZ US Sentiment Leaders ETF
| Financial Highlights | For a Share Outstanding Throughout the Period Presented |
| | For the Six Months Ended May 31, 2017 (Unaudited)(a) | | | For the Period April 19, 2016 (Commencement of Operations) to November 30, 2016 | |
| NET ASSET VALUE, BEGINNING OF PERIOD | | $ | 25.84 | | | $ | 25.15 | |
| | | | | | | | | |
| INCOME/(LOSS) FROM INVESTMENT OPERATIONS: | | | | | | | | |
Net investment income (b) | | | 0.11 | | | | 0.13 | |
| Net realized and unrealized gain | | | 2.07 | | | | 0.56 | |
| Total from investment operations | | | 2.18 | | | | 0.69 | |
| | | | | | | | | |
| DISTRIBUTIONS: | | | | | | | | |
| From net investment income | | | (0.18 | ) | | | – | |
| Total distributions | | | (0.18 | ) | | | – | |
| | | | | | | | | |
| Net increase in net asset value | | | 2.00 | | | | 0.69 | |
| NET ASSET VALUE, END OF PERIOD | | $ | 27.84 | | | $ | 25.84 | |
TOTAL RETURN(c) | | | 8.45 | % | | | 2.74 | % |
| | | | | | | | | |
| RATIOS/SUPPLEMENTAL DATA: | | | | | | | | |
| Net assets, end of period (000s) | | $ | 8,352 | | | $ | 5,169 | |
| | | | | | | | | |
| Ratio of expenses to average net assets | | | 0.75 | %(d) | | | 0.75 | %(d) |
| Ratio of net investment income to average net assets | | | 0.79 | %(d) | | | 0.87 | %(d) |
Portfolio turnover rate(e) | | | 125 | % | | | 157 | % |
(a) | Prior to March 31, 2017 the BUZZ US Sentiment Leaders ETF was known as the Sprott BUZZ Social Media Insights ETF. |
(b) | Based on average shares outstanding during the period. |
(c) | Total return is calculated assuming an initial investment made at the net asset value at the beginning of the period and redemption at the net asset value on the last day of the period and assuming all distributions are reinvested at reinvestment prices. Total return calculated for a period of less than one year is not annualized. |
(e) | Portfolio turnover for periods less than one year are not annualized and does not include securities received or delivered from processing creations or redemptions in-kind. |
See Notes to Financial Statements.
BUZZ US Sentiment Leaders ETF
| Notes to Financial Statements | May 31, 2017 (Unaudited) |
1. ORGANIZATION
ALPS ETF Trust (the “Trust”), a Delaware statutory trust, is an open‐end management investment company registered under the Investment Company Act of 1940, as amended (the “1940 Act”). As of May 31, 2017, the Trust consisted of twenty separate portfolios. Each portfolio represents a separate series of the Trust. This report pertains solely to the BUZZ US Sentiment Leaders ETF (the “Fund”). Prior to March 31, 2017, the Fund was known as the Sprott BUZZ Social Media Insights ETF. The investment objective of the Fund is to seek investment results that correspond (before fees and expenses) generally to the performance of the BUZZ NextGen AI US Sentiment Leaders Index (the “Underlying Index”). The BUZZ US Sentiment Leaders ETF is considered a non‐diversified and may invest a greater portion of assets in securities of individual issuers than a diversified fund. As a result, changes in the market value of a single investment could cause greater fluctuations in share price than would occur in a diversified fund.
The Fund’s Shares (“Shares”) are listed on the NYSE Arca, Inc. (the “NYSE Arca”). The Fund issues and redeems Shares at net asset value (“NAV”) in blocks of 50,000 Shares, each of which is called a “Creation Unit”. Creation Units are issued and redeemed principally in‐kind for securities included in the Underlying Index. Except when aggregated in Creation Units, Shares are not redeemable securities of the Fund.
Pursuant to the Trust’s organizational documents, its Officers and Trustees are indemnified against certain liability arising out of the performance of their duties to the Trust. Additionally, in the normal course of business, the Trust enters into contracts with service providers that contain general indemnification clauses. The Trust’s maximum exposure under these arrangements is unknown, as this would involve future claims that may be made against the Trust that have not yet occurred.
2. SIGNIFICANT ACCOUNTING POLICIES
The following is a summary of significant accounting policies consistently followed by the Fund in the preparation of the financial statements. The accompanying financial statements were prepared in accordance with accounting principles generally accepted in the United States of America (“U.S. GAAP”). The preparation of financial statements in conformity with U.S. GAAP requires management to make certain estimates and assumptions that affect the reported amounts of assets and liabilities and disclosures of contingent assets and liabilities at the date of the financial statements and the reported amounts of revenue and expenses during the period. Actual results could differ from those estimates. The Fund is considered an investment company under U.S. GAAP and follows the accounting and reporting guidance applicable to investment companies in the Financial Accounting Standards Board Accounting Standards Codification Topic 946.
A. Portfolio Valuation
The Fund’s NAV is determined daily, as of the close of regular trading on the New York Stock Exchange (the “NYSE”), normally 4:00 p.m. Eastern time, on each day the NYSE is open for trading. The NAV is computed by dividing the value of all assets of the Fund (including accrued interest and dividends), less all liabilities (including accrued expenses and dividends declared but unpaid), by the total number of shares outstanding.
Portfolio securities listed on any exchange other than the NASDAQ Stock Market LLC (“NASDAQ”) are valued at the last sale price on the business day as of which such value is being determined. If there has been no sale on such day, the securities are valued at the mean of the most recent bid and ask prices on such day. Securities traded on the NASDAQ are valued at the NASDAQ Official Closing Price as determined by NASDAQ. Portfolio securities traded on more than one securities exchange are valued at the last sale price on the business day as of which such value is being determined at the close of the exchange representing the principal market for such securities. Portfolio securities traded in the over‐the‐counter market, but excluding securities traded on the NASDAQ, are valued at the latest quoted sale price in such market.
The Fund’s investments are valued at market value or, in the absence of market value with respect to any portfolio securities, at fair value according to procedures adopted by the Trust’s Board of Trustees (the “Board”). When market quotations are not readily available or when events occur that make established valuation methods unreliable, securities of the Fund may be valued in good faith by or under the direction of the Board. These securities generally include, but are not limited to, restricted securities (securities which may not be publicly sold without registration under the Securities Act of 1933) for which a pricing service is unable to provide a market price; securities whose trading has been formally suspended; a security whose market price is not available from a pre‐established primary pricing source or the pricing source is not willing to provide a price; a security with respect to which an event has occurred that is most likely to materially affect the value of the security after the market has closed but before the calculation of the Fund’s NAV or make it difficult or impossible to obtain a reliable market quotation; or a security whose price, as provided by the pricing service, does not reflect the security’s “fair value” due to the security being de‐listed from a national exchange or the security’s primary trading market is temporarily closed at a time when, under normal conditions, it would be open. As a general principle, the current “fair value” of a security would be the amount which the owner might reasonably expect to receive from the sale on the applicable exchange or principal market. A variety of factors may be considered in determining the fair value of such securities.
BUZZ US Sentiment Leaders ETF
| Notes to Financial Statements | May 31, 2017 (Unaudited) | |
B. Fair Value Measurements
The Fund discloses the classification of its fair value measurements following a three‐tier hierarchy based on the inputs used to measure fair value. Inputs refer broadly to the assumptions that market participants would use in pricing the asset or liability; including assumptions about risk. Inputs may be observable or unobservable. Observable inputs reflect the assumptions market participants would use in pricing the asset or liability that are developed based on market data obtained from sources independent of the reporting entity. Unobservable inputs reflect the reporting entity’s own assumptions about the assumptions market participants would use in pricing the asset or liability that are developed based on the best information available.
Valuation techniques used to value the Fund's investments by major category are as follows:
Equity securities and Limited Partnerships, including restricted securities, for which market quotations are readily available, are valued at the last reported sale price or official closing price as reported by a third party pricing vendor on the primary market or exchange on which they are traded and are categorized as Level 1 in the hierarchy. In the event there were no sales during the day or closing prices are not available, securities are valued at the mean of the most recent quoted bid and ask prices on such day and are generally categorized as Level 2 in the hierarchy. Investments in open‐end mutual funds are valued at their closing NAV each business day and are categorized as Level 1 in the hierarchy.
Changes in valuation techniques may result in transfers in or out of an assigned level within the disclosure hierarchy.
Various inputs are used in determining the value of the Fund’s investments as of the end of the reporting period. When inputs used fall into different levels of the fair value hierarchy, the level in the hierarchy within which the fair value measurement falls is determined based on the lowest level input that is significant to the fair value measurement in its entirety. The designated input levels are not necessarily an indication of the risk or liquidity associated with these investments.
These inputs are categorized in the following hierarchy under applicable financial accounting standards:
Level 1 – Unadjusted quoted prices in active markets for identical investments, unrestricted assets or liabilities that a Fund has the ability to access at the measurement date;
Level 2 – Quoted prices which are not active, quoted prices for similar assets or liabilities in active markets or inputs other than quoted prices that are observable (either directly or indirectly) for substantially the full term of the asset or liability; and
Level 3 – Significant unobservable prices or inputs (including the Fund’s own assumptions in determining the fair value of investments) where there is little or no market activity for the asset or liability at the measurement date.
The following is a summary of the inputs used to value the Fund’s investments as of May 31, 2017:
BUZZ US Sentiment Leaders ETF
| Investments in Securities at Value* | Level 1 - Unadjusted Quoted Prices | | Level 2 - Other Significant Observable Inputs | | Level 3 - Significant Unobservable Inputs | | Total | |
| Common Stocks | | $ | 8,331,945 | | $ | – | | $ | – | | $ | 8,331,945 | |
| Short Term Investments | | | 10,296 | | | – | | | – | | | 10,296 | |
| TOTAL | | $ | 8,342,241 | | $ | – | | $ | – | | $ | 8,342,241 | |
| * | For a detailed sector breakdown, see the accompanying Schedule of Investments. |
The Fund recognizes transfers between levels as of the end of the period. For the six months ended May 31, 2017, the Fund did not have any transfers between Level 1 and Level 2 securities. The Fund did not have any securities that used significant unobservable inputs (Level 3) in determining fair value.
C. Securities Transactions and Investment Income
Securities transactions are recorded as of the trade date. Realized gains and losses from securities transactions are recorded on the highest cost basis. Dividend income and capital gains distributions, if any, are recorded on the ex‐dividend date. Interest income, if any, is recorded on the accrual basis.
BUZZ US Sentiment Leaders ETF
| Notes to Financial Statements | May 31, 2017 (Unaudited) |
D. Dividends and Distributions to Shareholders
Dividends from net investment income of the Fund, if any, are declared and paid annually or as the Board may determine from time to time. Distributions of net realized capital gains earned by the Fund, if any, are distributed at least annually.
E. Federal Tax and Tax Basis Information
The timing and character of income and capital gain distributions are determined in accordance with income tax regulations, which may differ from U.S. GAAP. Reclassifications are made to the Fund’s capital accounts for permanent tax differences to reflect income and gains available for distribution (or available capital loss carryforwards) under income tax regulations. The amounts and characteristics of tax basis distributions and composition of distributable earnings/(accumulated losses) are finalized at fiscal year‐end; accordingly, tax basis balances have not been determined as of May 31, 2017.
As of the period ended November 30, 2016, the Buzz US Sentiment Leaders ETF paid no distributions.
At November 30, 2016, the Fund had available for tax purposes unused capital loss carryforwards as follows:
| Fund | | Short-Term | | Long-Term | |
| BUZZ US Sentiment Leaders ETF | | $ | 222,444 | | $ | – | |
As of May 31, 2017, the cost of investments for federal income tax purposes and accumulated net unrealized appreciation/(depreciation) on investments were as follows:
| | | BUZZ US Sentiment Leaders ETF | |
| Gross appreciation (excess of value over tax cost) | | $ | 503,252 | |
Gross depreciation (excess of tax cost over value) | | | (208,862 | ) |
| Net unrealized appreciation (depreciation) | | | 294,390 | |
| Cost of investments for income tax purposes | | $ | 8,047,851 | |
The differences between book‐basis and tax‐basis are primarily due to the deferral of losses from wash sales.
F. Income Taxes
No provision for income taxes is included in the accompanying financial statements, as the Fund intends to distribute to shareholders all taxable investment income and realized gains and otherwise comply with Subchapter M of the Internal Revenue Code of 1986, as amended, applicable to regulated investment companies. The Fund evaluates tax positions taken (or expected to be taken) in the course of preparing the Fund’s tax returns to determine whether these positions meet a “more‐likely‐than‐not” standard that, based on the technical merits, have a more than fifty percent likelihood of being sustained by a taxing authority upon examination. A tax position that meets the “more‐likely‐than‐not” recognition threshold is measured to determine the amount of benefit to recognize in the financial statements.
As of and during the six months ended May 31, 2017, the Fund did not have a liability for any unrecognized tax benefits. The Fund files U.S. federal, state, and local tax returns as required. The Fund’s tax returns are subject to examination by the relevant tax authorities until expiration of the applicable statute of limitations, which is generally three years after the filing of the tax return, but may extend to four years in certain jurisdictions. Tax returns for open years have incorporated no uncertain tax positions that require a provision for income taxes. Being that the Fund commenced operations on April 19, 2016, no tax returns have been filed for the Fund as of the date of this report
G. Lending of Portfolio Securities
The Fund has entered into a securities lending agreement with State Street Bank & Trust Co. (“SSB”), the Fund’s lending agent. The Fund may lend its portfolio securities only to borrowers that are approved by SSB. The Fund will limit such lending to not more than 33 1/3% of the value of its total assets. The Fund’s securities held at SSB as custodian shall be available to be lent except those securities the Fund or ALPS Advisors Inc. specifically identifies in writing as not being available for lending. The borrower pledges and maintains with the Fund collateral consisting of cash (U.S. Dollars only), securities issued or guaranteed by the U.S. government or its agencies or instrumentalities, and cash equivalents (including irrevocable bank letters of credit) issued by a person other than the borrower or an affiliate of the borrower. The initial collateral received by the Fund is required to have a value of no less than 102% of the market value of the loaned securities for U.S equity securities and a value of no less than 105% of the market value for non‐U.S. equity securities. The collateral is maintained thereafter, at a market value equal to not less than 102% of the current value of the U.S. equity securities on loan and not less than 105% of the current value of the non‐U.S. equity securities on loan. The market value of the loaned securities is determined at the close of each business day and any additional required collateral is delivered to the Fund on the next business day. During the term of the loan, the Fund is entitled to all distributions made on or in respect of the loaned securities. Loans of securities are terminable at any time and the borrower, after notice, is required to return borrowed securities within the customary time period for settlement of securities transactions.
BUZZ US Sentiment Leaders ETF
| Notes to Financial Statements | May 31, 2017 (Unaudited) |
Any cash collateral received is reinvested in a money market fund managed by SSB as disclosed in the Fund’s Schedule of Investments and is reflected in the Statements of Assets and Liabilities as a payable for collateral upon return of securities loaned. Non‐cash collateral, in the form of securities issued or guaranteed by the U.S. government or its agencies or instrumentalities, is not disclosed in the Fund’s Statements of Assets and Liabilities as it is held by the lending agent on behalf of the Fund, and the Fund does not have the ability to re‐hypothecate these securities. Income earned by the Fund from securities lending activity is disclosed in the Statement of Operations.
The following is a summary of the Fund's securities lending agreement and related cash and non‐cash collateral received as of May 31, 2017:
| | | Market Value of Securities on Loan | | | | Non-Cash Collateral Received | | | |
| BUZZ US Sentiment Leaders ETF | | $ | 416,107 | | $ | 0 | | $ | 425,325 | | $ | 425,325 | |
The risks of securities lending include the risk that the borrower may not provide additional collateral when required or may not return the securities when due. To mitigate these risks, the Fund benefits from a borrower default indemnity provided by SSB. SSB’s indemnity allows for full replacement of securities lent wherein SSB will purchase the unreturned loaned securities on the open market by applying the proceeds of the collateral, or to the extent such proceeds are insufficient or the collateral is unavailable, SSB will purchase the unreturned loan securities at SSB’s expense. However, the Fund could suffer a loss if the value of the investments purchased with cash collateral falls below the value of the cash collateral received.
The following table reflects a breakdown of transactions accounted for as secured borrowings, the gross obligation by the type of collateral pledged or securities loaned, and the remaining contractual maturity of those transactions as of May 31, 2017:
| BUZZ US Sentiment Leaders ETF | | | Remaining contractual maturity of the agreement |
| Securities Lending Transactions | | | | Up to 30 days | | 30-90 days | | Greater than 90 days | | Total | |
Common Stocks | | $ | 0 | | $ | – | | $ | – | | $ | – | | $ | 0 | |
Total Borrowings | | | | | | | | | | | | | | | 0 | |
Gross amount of recognized liabilities for securities lending (collateral received) | | $ | 0 | |
H. Risks Related to Social Media Analytics
The Underlying Index for the Fund utilizes a rules‐based quantitative methodology developed by BUZZ Indexes Inc. (the “Index Provider”), which is designed to identify the U.S. common stocks with the most “positive insights” collected from social media networks. The ability to invest based on social media analytics is relatively new and untested. “Social media” is an umbrella term that encompasses various activities that integrate technology, social interaction and content creation. Social media may use many technologies, including, but not limited to, blogs, microblogs, wikis, photos and video sharing, podcasts, social networking, and virtual worlds. Some examples of social media sites may include, but are not limited to, the following: Facebook, Twitter, LinkedIn, Digg, Reddit, RSS, blogs, Investopedia, stock forums, etc. Investing in companies based on social media analytics involves the potential for market manipulation because social media posts may be made with an intent to inflate, or otherwise manipulate, the public perception of a stock or other investment. Although the Underlying Index attempts to mitigate the potential for such market manipulation by employing screens to identify posts which may be computer generated or deceptive, and by employing market capitalization and trading volume criteria to remove small and penny‐cap stocks which may be more likely targets for such manipulation, there is no guarantee that the Underlying Index’s model will successfully reduce such risk. Furthermore, text and sentiment analysis of social media postings may prove inaccurate; that is, high positive sentiment may not correlate with positive change in the value of a company’s stock and low positive or negative sentiment may not correlate with negative change in the value of a company’s stock. Additionally, as data suppliers for the Index Provider’s algorithm, social media companies are susceptible to the following risks which may disrupt the Index Provider’s ability to receive meaningful data from such sites: permanent cessation of operations, disruption in service caused by hardware or software failure, interruptions or delays in service by third‐party data center hosting facilities and maintenance providers, security breaches involving certain private, sensitive, proprietary and confidential information managed and transmitted by social media companies, and privacy concerns and laws, evolving Internet regulation and other foreign or domestic regulations that may limit or otherwise affect the operations of social media companies.
BUZZ US Sentiment Leaders ETF
| Notes to Financial Statements | May 31, 2017 (Unaudited) |
3. INVESTMENT ADVISORY FEE AND OTHER AFFILIATED TRANSACTIONS
ALPS Advisors, Inc. (the “Adviser”) acts as the Fund’s investment adviser pursuant to an Advisory Agreement with the Trust on behalf of the Fund (the “Advisory Agreement”). Pursuant to the Advisory Agreement, the Fund pays the Adviser a unitary fee for the services and facilities it provides payable on a monthly basis at the annual rate of 0.75% of the Fund’s average daily net assets. From time to time, the Adviser may waive all or a portion of its fee.
Out of the unitary management fee, the Adviser pays substantially all expenses of the Fund, the cost of transfer agency, custody, fund administration, legal, audit, and other services, except for interest expenses, distribution fees or expenses, brokerage expenses, taxes and extraordinary expenses not incurred in the ordinary course of the Fund’s business. The Adviser’s unitary management fee is designed to pay substantially all of the Fund’s expenses and to compensate the Adviser for providing services for the Fund.
ALPS Fund Services, Inc., an affiliate of the Adviser, is the administrator of the Fund.
Each Trustee who is not an officer or employee of the Adviser, any sub‐adviser or any of their affiliates (“Independent Trustees”) receives (1) a quarterly retainer of $5,000, (2) a per meeting fee for regularly scheduled meetings of $3,750, (3) $1,500 for any special meeting held outside of a regularly scheduled board meeting, and (4) reimbursement for all reasonable out‐of‐pocket expenses relating to attendance at meetings.
4. PURCHASES AND SALES OF SECURITIES
For the six months ended May 31, 2017, the cost of purchases and proceeds from sales of investment securities, excluding in‐kind transactions and short‐term investments, were as follows:
| Fund | | Purchases | | Sales | |
| BUZZ US Sentiment Leaders ETF | | $ | 7,733,874 | | $ | 8,024,069 | |
For the six months ended May 31, 2017, the cost of in‐kind purchases and proceeds from in‐kind sales were as follows:
| Fund | | Purchases | | Sales | |
| BUZZ US Sentiment Leaders ETF | | $ | 6,782,289 | | $ | 3,846,130 | |
For the six months ended May 31, 2017, the BUZZ US Sentiment Leaders ETF had in‐kind net realized gains of $462,480.
Gains on in‐kind transactions are not considered taxable for federal income tax purposes.
5. CAPITAL SHARE TRANSACTIONS
Shares are created and redeemed by the Fund only in Creation Unit size aggregations of 50,000 Shares. Only broker‐dealers or large institutional investors with creation and redemption agreements called Authorized Participants (“AP”) are permitted to purchase or redeem Creation Units from the Fund. Such transactions are generally permitted on an in‐kind basis, with a balancing cash component to equate the transaction to the NAV per unit of the Fund on the transaction date. Cash may be substituted equivalent to the value of certain securities generally when they are not available in sufficient quantity for delivery, not eligible for trading by the AP or as a result of other market circumstances.
6. SUBSEQUENT EVENTS
On October 13, 2016, the Securities and Exchange Commission (“SEC”) amended Regulation S‐X, which will require standardized, enhanced disclosure about derivatives in investment company financial statements, as well as other amendments. The compliance date for the amendments to Regulation S‐X is August 1, 2017. Management is currently evaluating the impact to the financial statements and disclosures.
BUZZ US Sentiment Leaders ETF
| Additional Information | May 31, 2017 (Unaudited) |
PROXY VOTING RECORDS, POLICIES AND PROCEDURES
Information regarding how the Fund voted proxies relating to portfolio securities during the most recent 12‐month period ended June 30 and a description of the Fund’s proxy voting policies and procedures used in determining how to vote for proxies are available without charge on the SEC’s website at www.sec.gov and upon request, by calling (toll‐free) 1‐866‐675‐2639.
PORTFOLIO HOLDINGS
The Trust is required to disclose, after its first and third fiscal quarters, the complete schedule of the Fund’s portfolio holdings with the SEC on Form N‐Q. Forms N‐Q for the Fund are available on the SEC’s website at www.sec.gov. The Fund’s Forms N‐Q may also be reviewed and copied at the SEC’s Public Reference Room in Washington, D.C. and information on the operation of the Public Reference Room may be obtained by calling 1‐800‐SEC‐0330. The Fund’s Forms N‐Q are available without charge, upon request, by calling (toll‐free) 1‐866‐675‐2639 or by writing to ALPS ETF Trust at 1290 Broadway, Suite 1100, Denver, Colorado 80203.
TAX INFORMATION
The Fund designated the following for federal income tax purposes for distributions made during the calendar year ended December 31, 2016:
| | Qualified Dividend Income | Dividend Received Deduction |
| BUZZ US Sentiment Leaders ETF | 81.12 % | 81.12 % |
In early 2017, if applicable, shareholders of record received this information for the distribution paid to them by the Fund during the calendar year 2016 via Form 1099. The Fund will notify shareholders in early 2018 of amounts paid to them by the Fund, if any, during the calendar year 2017.
LICENSING AGREEMENT
BUZZ NextGen AI US Sentiment Leaders Index (the “BUZZ Index”) is a product of BUZZ Indexes Inc. (“BUZZ Indexes”), and has been licensed to ALPS Advisors, Inc. for use in connection with the BUZZ US Sentiment Leaders ETF.
“BUZZ” is a trademark of BUZZ Indexes, which have been licensed by ALPS Advisors, Inc. for use in connection with the BUZZ Index.
BUZZ US Sentiment Leaders ETF is not sponsored, endorsed, sold or promoted by BUZZ Indexes, or its shareholders, or the licensor of the BUZZ Index and/or its affiliates and third party licensors. BUZZ Indexes makes no representation or warranty, express or implied, to the owners of the BUZZ US Sentiment Leaders ETF or any member of the public regarding the advisability of investing in securities generally or in BUZZ US Sentiment Leaders ETF, particularly or the ability of the BUZZ Index to track general market performance.
BUZZ Indexes’ only relationship to ALPS Advisors, Inc. with respect to the BUZZ Index is the licensing of the BUZZ Index and certain trademarks of BUZZ Indexes. The BUZZ Indexes are determined and composed by BUZZ Indexes without regard to ALPS Advisors, Inc. or the BUZZ US Sentiment Leaders ETF. BUZZ Indexes has no obligation to take the needs of ALPS Advisors, Inc. or the owners of BUZZ US Sentiment Leaders ETF into consideration in determining and composing the BUZZ Index.
BUZZ Indexes are not responsible for and have not participated in the determination of the prices of BUZZ US Sentiment Leaders ETF or the timing of the issuance or sale of securities of BUZZ US Sentiment Leaders ETF or in the determination or calculation of the equation by which BUZZ US Sentiment Leaders ETF securities may be converted into cash, surrendered, or redeemed, as the case may be. BUZZ Indexes have no obligation or liability in connection with the administration, marketing or trading of BUZZ US Sentiment Leaders ETF. There is no assurance that investment products based on the BUZZ Index will accurately track index performance or provide positive investment returns.
BUZZ Indexes is not an investment advisor and the inclusion of a security in the BUZZ Index is not a recommendation by BUZZ Indexes to buy, sell, or hold such security, nor should it be considered investment advice.
BUZZ US Sentiment Leaders ETF
| Additional Information | May 31, 2017 (Unaudited) |
BUZZ INDEXES DOES NOT GUARANTEE THE ADEQUACY, ACCURACY, TIMELINESS AND/OR THE COMPLETENESS OF THE BUZZ INDEX OR ANY DATA RELATED THERETO OR ANY COMMUNICATION WITH RESPECT THERETO, INCLUDING BUT NOT LIMITED TO, ORAL OR WRITTEN COMMUNICATION (INCLUDING ELECTRONIC COMMUNICATIONS). BUZZ INDEXES SHALL NOT BE SUBJECT TO ANY DAMAGES OR LIABILITY FOR ANY ERRORS, OMISSIONS, OR DELAYS THEREIN. BUZZ INDEXES MAKES NO EXPRESS OR IMPLIED WARRANTIES, AND EXPRESSLY DISCLAIMS ALL WARRANTIES, OF MERCHANTABILITY OR FITNESS FOR A PARTICULAR PURPOSE OR USE OR AS TO RESULTS TO BE OBTAINED BY ALPS ADVISORS, INC., OWNERS OF THE BUZZ US SENTIMENT LEADERS ETF, OR ANY OTHER PERSON OR ENTITY FROM THE USE OF THE BUZZ INDEX OR WITH RESPECT TO ANY DATA RELATED THERETO. WITHOUT LIMITING ANY OF THE FOREGOING, IN NO EVENT WHATSOEVER SHALL BUZZ INDEXES BE LIABLE FOR ANY INDIRECT, SPECIAL, INCIDENTAL, PUNITIVE, OR CONSEQUENTIAL DAMAGES INCLUDING BUT NOT LIMITED TO, LOSS OF PROFITS, TRADING LOSSES, LOST TIME OR GOODWILL, EVEN IF THEY HAVE BEEN ADVISED OF THE POSSIBILITY OF SUCH DAMAGES, WHETHER IN CONTRACT, TORT, STRICT LIABILITY, OR OTHERWISE. THERE ARE NO THIRD PARTY BENEFICIARIES OF ANY AGREEMENTS OR ARRANGEMENTS BETWEEN BUZZ INDEXES AND ALPS ADVISORS, INC., OTHER THAN THE LICENSORS OF BUZZ INDEXES.
The Adviser does not guarantee the accuracy and/or the completeness of the Underlying Index or any data included therein, and the Adviser shall have no liability for any errors, omissions or interruptions therein. The Adviser makes no warranty, express or implied, as to results to be obtained by the Fund, owners of the Shares of the Fund or any other person or entity from the use of the Underlying Index or any data included therein. The Adviser makes no express or implied warranties, and expressly disclaims all warranties of merchantability or fitness for a particular purpose or use with respect to the Underlying Index or any data included therein. Without limiting any of the foregoing, in no event shall the Adviser have any liability for any special, punitive, direct, indirect, or consequential damages (including lost profits) arising out of matters relating to the use of the Underlying Index, even if notified of the possibility of such damages.

| Performance Overview | 1 |
| Disclosure of Fund Expenses | 3 |
| Schedule of Investments | 4 |
| Statement of Assets & Liabilities | 7 |
| Statement of Operations | 8 |
| Statements of Changes In Net Assets | 9 |
| Financial Highlights | 10 |
| Notes to Financial Statements | 11 |
| Additional Information | 17 |
alpsfunds.com
| Cohen & Steers Global Realty Majors ETF |
| Performance Overview | May 31, 2017 (Unaudited) |
Investment Objective
The Cohen & Steers Global Realty Majors ETF (the “Fund”) seeks investment results that correspond generally to the performance, before the Fund’s fees and expenses, of an index called the Cohen & Steers Global Realty Majors Index (the “Underlying Index”). The Fund will normally invest at least 90% of its total assets in common stocks and other equity securities (which may include American Depositary Receipts (“ADRs”), American Depositary Shares (“ADSs”) and Global Depositary Receipts (“GDRs”)) that comprise the Underlying Index.
The Underlying Index consists of the largest and most liquid securities within the global real estate universe that Cohen & Steers Capital Management, Inc. (“Cohen & Steers” or the “Index Provider”) believes are likely to lead the global securitization of real estate. The Underlying Index is free float and modified market‐capitalization weighted, with a limit of 4.0% on any security’s weighting. Underlying Index constituents must have a free float adjusted market‐capitalization of $750 million or greater for initial inclusion in the Underlying Index. Cohen & Steers considers country weights relative to each country’s GDP share representing the real estate securities universe and share of the private market for real estate, with up to 10% being allocated to securities of emerging markets. The Underlying Index is rebalanced quarterly.
Performance (as of May 31, 2017)
| | 6 Months | 1 Year | 3 Year | 5 Year | Since Inception^ |
| Cohen & Steers Global Realty Majors ETF ‐ NAV | 8.11% | 3.44% | 4.14% | 8.63% | 2.54% |
| Cohen & Steers Global Realty Majors ETF ‐ Market Price* | 7.85% | 3.33% | 4.07% | 8.51% | 2.51% |
| Cohen & Steers Global Realty Majors Index | 8.54% | 4.20% | 4.87% | 9.42% | 3.36% |
| FTSE EPRA/ NAREIT Developed Real Estate Index | 7.64% | 4.01% | 4.73% | 9.55% | 3.49% |
S&P 500® Total Return Index | 10.81% | 17.47% | 10.13% | 15.42% | 8.59% |
Total Expense Ratio (per the current Prospectus) 0.55%
Performance data quoted represents past performance. Past performance does not guarantee future results. The table does not reflect the deduction of taxes that a shareholder would pay on Fund distributions or the redemption of Fund shares. Investment return and principal value of an investment will fluctuate so that an investor’s shares, when sold or redeemed, may be worth more or less than the original cost. Current performance data may be higher or lower than actual data quoted. For the most current month-end performance data please visit www.alpsfunds.com or call 1.866.513.5856.
NAV is an exchange-traded fund’s per-share value. The per-share dollar amount of the Fund is derived by dividing the total value of all the securities in its portfolio, less any liabilities, by the number of Fund shares outstanding. Market Price is the price at which a share can currently be traded in the market. Information detailing the number of days the Market Price of the Fund was greater than the Fund’s NAV and the number of days it was less than the Fund’s NAV can be obtained at www.alpsfunds.com.
| ^ | Fund Inception May 7, 2008. |
| * | Market Price is based on the midpoint of the bid/ask spread at 4p.m. ET and does not represent the returns an investor would receive if shares were traded at other times. |
Cohen & Steers Global Realty Majors® Index: A free-float adjusted, modified market capitalization-weighted index of global real estate equities. The modified market capitalization weighting approach and qualitative screening process emphasize those companies that, in the opinion of the Cohen & Steers investment committee, are leading the securitization of real estate globally.
FTSE EPRA/NAREIT Developed Real Estate Index: An unmanaged market-weighted total return index that consists of many companies from developed markets whose floats are larger than $100 million and which derive more than half of their revenue from property-related activities.
S&P 500® Total Return Index: The Standard & Poor’s composite index of 500 stocks, a widely recognized, unmanaged index of common stock prices.
The indexes are not actively managed and do not reflect any deductions for fees, expenses or taxes. Total return assumes reinvestment of any dividends and distributions realized during a given time period. One cannot invest directly in an index. Index performance does not reflect fund performance.
The Cohen & Steers Global Realty Majors ETF is not suitable for all investors. Investments in the Fund are subject to investment risks, including possible loss of the principal amount invested.
ALPS Portfolio Solutions Distributor, Inc., a FINRA member, is the distributor for the Cohen & Steers Global Realty Majors ETF.
ALPS Portfolio Solutions Distributor, Inc. is not affiliated with Cohen & Steers.
| Cohen & Steers Global Realty Majors ETF |
| Performance Overview | May 31, 2017 (Unaudited) |
Top 10 Holdings* (as of May 31, 2017)
| Equinix Inc | 3.89% |
| Simon Property Group, Inc. | 3.72% |
| Public Storage | 3.66% |
| ProLogis, Inc. | 3.35% |
| Welltower, Inc. | 2.99% |
| AvalonBay Communities, Inc. | 2.99% |
| Mitsubishi Estate Co., Ltd. | 2.95% |
| Unibail‐Rodamco SE | 2.91% |
| Equity Residential | 2.72% |
| Ventas, Inc. | 2.69% |
| Total % of Top 10 Holdings | 31.87% |
Future holdings are subject to change.
Country Allocation* (as of May 31, 2017)
| United States | 53.34% |
| Hong Kong | 11.27% |
| Japan | 8.94% |
| Australia | 7.82% |
| Germany | 4.75% |
| France | 4.60% |
| United Kingdom | 4.06% |
| Singapore | 2.26% |
| Canada | 1.12% |
| Spain | 0.68% |
| Sweden | 0.46% |
| Switzerland | 0.44% |
| Brazil | 0.26% |
| Total | 100.00% |
Growth of $10,000 (as of May 31, 2017)
Comparison of Change in Value of $10,000 Investment in the Fund and the Indexes
The chart above represents historical performance of a hypothetical investment of $10,000 in the Fund over the life of the Fund. Past performance does not guarantee future results. This chart does not reflect the deduction of taxes that a shareholder would pay on Fund distributions or the redemption of Fund shares.
| Cohen & Steers Global Realty Majors ETF |
| Disclosure of Fund Expenses | May 31, 2017 (Unaudited) |
Shareholder Expense Example: As a shareholder of the Fund, you incur two types of costs: (1) transaction costs which may include creation and redemption fees or brokerage charges, and (2) ongoing costs, including management fees and other Fund expenses. These examples are intended to help you understand your ongoing costs (in dollars) of investing in the Fund and to compare these costs with the ongoing costs of investing in other funds. It is based on an investment of $1,000 invested at the beginning of the (six month) period and held through May 31, 2017.
Actual Return: The first line of the table provides information about actual account values and actual expenses. You may use the information in this line, together with the amount you invested, to estimate the expenses that you incurred over the period. Simply divide your account value by $1,000 (for example, an $8,600 account value divided by $1,000 = 8.6), then multiply the result by the number in the first line under the heading entitled “Expenses Paid During Period” to estimate the expenses attributable to your investment during this period.
Hypothetical 5% Return: The second line of the table provides information about hypothetical account values and hypothetical expenses based on the Fund’s actual expense ratio and an assumed rate of return of 5% per year before expenses, which is not the Fund’s actual return. The hypothetical account values and expenses may not be used to estimate the actual ending account balance or expenses you paid for the period. You may use this information to compare ongoing costs of investing in the Fund and other funds. To do so, compare this 5% hypothetical example with the 5% hypothetical examples that appear in the shareholder reports of other funds.
The expenses shown in the table are meant to highlight ongoing Fund costs only and do not reflect any transaction costs, such as creation and redemption fees or brokerage charges. Therefore, the second line is useful in comparing ongoing costs only, and will not help you determine the relative total costs of owning different funds. In addition, if these costs were included, your costs would have been higher.
| | Beginning Account Value 12/1/16 | Ending Account Value 5/31/17 | Expense Ratio(a) | Expenses Paid During Period 12/1/16 - 5/31/17(b) |
| Cohen & Steers Global Realty Majors ETF | | | | |
| Actual | $1,000.00 | $1,081.10 | 0.55% | $2.85 |
| Hypothetical (5% return before expenses) | $1,000.00 | $1,022.19 | 0.55% | $2.77 |
(a) | Annualized, based on the Fund's most recent fiscal half-year expenses. |
(b) | Expenses are equal to the Fund's annualized expense ratio multiplied by the average account value over the period, multiplied by the number of days in the most recent fiscal half year (182), divided by 365. |
Cohen & Steers Global Realty Majors ETF
| Schedule of Investments | May 31, 2017 (Unaudited) |
| Security Description | | Shares | | | Value | |
| COMMON STOCKS (99.73%) | | | | | | |
| Australia (7.81%) | | | | | | |
| Dexus | | | 82,155 | | | $ | 634,261 | |
| Goodman Group | | | 136,197 | | | | 860,210 | |
| The GPT Group | | | 153,474 | | | | 597,564 | |
| Scentre Group, Ltd. | | | 456,193 | | | | 1,444,031 | |
| Stockland | | | 206,648 | | | | 724,755 | |
| Vicinity Centres | | | 279,301 | | | | 572,796 | |
| Westfield Corp. | | | 163,387 | | | | 1,029,512 | |
| Total Australia | | | | | | | 5,863,129 | |
| | | | | | | | | |
| Brazil (0.26%) | | | | | | | | |
| BR Malls Participacoes SA | | | 52,452 | | | | 193,211 | |
| | | | | | | | | |
| Canada (1.12%) | | | | | | | | |
| Allied Properties Real Estate Investment Trust | | | 7,280 | | | | 206,137 | |
| Boardwalk Real Estate Investment Trust | | | 3,199 | | | | 113,552 | |
| RioCan Real Estate Investment Trust | | | 27,782 | | | | 520,328 | |
| Total Canada | | | | | | | 840,017 | |
| | | | | | | | | |
| France (4.59%) | | | | | | | | |
| Gecina SA | | | 3,441 | | | | 528,987 | |
| Klepierre | | | 17,747 | | | | 741,224 | |
| Unibail‐Rodamco SE | | | 8,452 | | | | 2,180,426 | |
| Total France | | | | | | | 3,450,637 | |
| | | | | | | | | |
| Germany (4.75%) | | | | | | | | |
| alstria office REIT‐AG | | | 8,688 | | | | 121,264 | |
| Deutsche EuroShop AG | | | 4,187 | | | | 174,452 | |
| Deutsche Wohnen AG | | | 30,400 | | | | 1,192,342 | |
| LEG Immobilien AG | | | 5,395 | | | | 508,595 | |
| Vonovia SE | | | 39,921 | | | | 1,568,464 | |
| Total Germany | | | | | | | 3,565,117 | |
| | | | | | | | | |
| Hong Kong (11.26%) | | | | | | | | |
| Cheung Kong Property Holdings, Ltd. | | | 234,000 | | | | 1,756,678 | |
| China Overseas Land & Investment, Ltd. | | | 365,000 | | | | 1,096,047 | |
| Hang Lung Properties, Ltd. | | | 176,000 | | | | 455,101 | |
| Hongkong Land Holdings, Ltd. | | | 100,500 | | | | 759,780 | |
| Link REIT | | | 189,164 | | | | 1,492,911 | |
| Sun Hung Kai Properties, Ltd. | | | 136,000 | | | | 2,012,281 | |
| The Wharf Holdings, Ltd. | | | 103,700 | | | | 882,293 | |
| Total Hong Kong | | | | | | | 8,455,091 | |
| | | | | | | | | |
| Japan (8.93%) | | | | | | | | |
| Japan Real Estate Investment Corp. | | | 106 | | | | 557,039 | |
| Japan Retail Fund Investment Corp. | | | 219 | | | | 425,740 | |
| Mitsubishi Estate Co., Ltd. | | | 118,300 | | | | 2,209,513 | |
| Mitsui Fudosan Co., Ltd. | | | 84,400 | | | | 1,997,403 | |
| Nippon Building Fund, Inc. | | | 119 | | | | 633,950 | |
| Nippon Prologis REIT, Inc. | | | 160 | | | | 347,738 | |
Cohen & Steers Global Realty Majors ETF
| Schedule of Investments | May 31, 2017 (Unaudited) |
| Security Description | | Shares | | | Value | |
| Japan (8.93%) (continued) | | | | | | |
| Nomura Real Estate Master Fund | | | 356 | | | $ | 535,527 | |
| Total Japan | | | | | | | 6,706,910 | |
| | | | | | | | | |
| Singapore (2.26%) | | | | | | | | |
| Ascendas Real Estate Investment Trust | | | 206,605 | | | | 391,215 | |
| CapitaLand Mall Trust | | | 231,947 | | | | 333,592 | |
| CapitaLand, Ltd. | | | 221,000 | | | | 568,612 | |
| City Developments, Ltd. | | | 52,700 | | | | 405,634 | |
| Total Singapore | | | | | | | 1,699,053 | |
| | | | | | | | | |
| Spain (0.68%) | | | | | | | | |
| Merlin Properties Socimi SA | | | 40,157 | | | | 509,296 | |
| | | | | | | | | |
| Sweden (0.46%) | | | | | | | | |
| Castellum AB | | | 23,074 | | | | 344,329 | |
| | | | | | | | | |
| Switzerland (0.43%) | | | | | | | | |
| PSP Swiss Property AG | | | 3,458 | | | | 326,145 | |
| | | | | | | | | |
| United Kingdom (4.06%) | | | | | | | | |
| The British Land Co. PLC | | | 87,443 | | | | 714,303 | |
| Derwent London PLC | | | 9,376 | | | | 334,147 | |
| Hammerson PLC | | | 68,243 | | | | 514,817 | |
| Land Securities Group PLC | | | 67,768 | | | | 934,279 | |
| Segro PLC | | | 84,954 | | | | 550,579 | |
| Total United Kingdom | | | | | | | 3,048,125 | |
| | | | | | | | | |
| United States (53.12%) | | | | | | | | |
| Alexandria Real Estate Equities, Inc. | | | 7,577 | | | | 884,084 | |
| American Campus Communities, Inc. | | | 11,271 | | | | 534,922 | |
| AvalonBay Communities, Inc. | | | 11,736 | | | | 2,244,393 | |
| Boston Properties, Inc. | | | 13,147 | | | | 1,594,994 | |
| Digital Realty Trust, Inc. | | | 13,576 | | | | 1,604,547 | |
| Douglas Emmett, Inc. | | | 12,354 | | | | 468,958 | |
| Duke Realty Corp. | | | 30,285 | | | | 868,271 | |
| Equinix, Inc. | | | 6,625 | | | | 2,921,691 | |
| Equity Lifestyle Properties, Inc. | | | 6,922 | | | | 584,217 | |
| Equity Residential | | | 31,376 | | | | 2,042,264 | |
| Essex Property Trust, Inc. | | | 5,598 | | | | 1,438,238 | |
| Extra Space Storage, Inc. | | | 10,755 | | | | 833,190 | |
| Federal Realty Investment Trust | | | 6,123 | | | | 751,537 | |
| GGP, Inc. | | | 49,960 | | | | 1,113,109 | |
| HCP, Inc. | | | 39,993 | | | | 1,253,381 | |
| Highwoods Properties, Inc. | | | 8,611 | | | | 433,994 | |
| Host Hotels & Resorts, Inc. | | | 63,191 | | | | 1,136,806 | |
| Kilroy Realty Corp. | | | 8,359 | | | | 612,046 | |
| Kimco Realty Corp. | | | 36,274 | | | | 636,246 | |
| National Retail Properties, Inc. | | | 12,585 | | | | 482,886 | |
| ProLogis, Inc. | | | 45,242 | | | | 2,512,741 | |
| Public Storage | | | 12,766 | | | | 2,749,158 | |
| Realty Income Corp. | | | 23,173 | | | | 1,272,893 | |
| Regency Centers Corp. | | | 12,487 | | | | 759,959 | |
| Simon Property Group, Inc. | | | 18,090 | | | | 2,790,382 | |
| SL Green Realty Corp. | | | 8,600 | | | | 868,858 | |
Cohen & Steers Global Realty Majors ETF
| Schedule of Investments | May 31, 2017 (Unaudited) |
| Security Description | | Shares | | | Value | |
| United States (53.12%) (continued) | | | | | | |
| UDR, Inc. | | | 22,844 | | | $ | 882,007 | |
| Ventas, Inc. | | | 30,296 | | | | 2,014,381 | |
| Vornado Realty Trust | | | 14,695 | | | | 1,354,879 | |
| Welltower, Inc. | | | 30,970 | | | | 2,246,564 | |
| Total United States | | | | | | | 39,891,596 | |
| | | | | | | | | |
TOTAL COMMON STOCKS (Cost $65,955,042) | | | | | | | 74,892,656 | |
| | | 7 Day Yield | | | Shares | | | Value | |
| SHORT TERM INVESTMENTS (0.17%) | | | | | | | | | | | |
| State Street Institutional Treasury Plus Money Market Fund | | | 0.680 | % | | | 127,920 | | | | 127,920 | |
| | | | | | | | | | | | | |
TOTAL SHORT TERM INVESTMENTS (Cost $127,920) | | | | | | | | | | | 127,920 | |
| | | | | | | | | | | | | |
TOTAL INVESTMENTS (99.90%) (Cost $66,082,962) | | | | | | | | | | $ | 75,020,576 | |
| | | | | | | | | | | | | |
| NET OTHER ASSETS AND LIABILITIES (0.10%) | | | | | | | | | | | 73,208 | |
| | | | | | | | | | | | | |
| NET ASSETS (100.00%) | | | | | | | | | | $ | 75,093,784 | |
See Notes to Financial Statements.
Cohen & Steers Global Realty Majors ETF
| Statement of Assets and Liabilities | May 31, 2017 (Unaudited) |
| ASSETS: | | | |
| Investments, at value | | $ | 75,020,576 | |
| Foreign currency, at value (Cost $34,902) | | | 34,902 | |
| Receivable for investments sold | | | 34,897 | |
| Foreign tax reclaims | | | 46,460 | |
| Dividends receivable | | | 112,498 | |
| Total Assets | | | 75,249,333 | |
| | | | | |
| LIABILITIES: | | | | |
| Payable for investments purchased | | | 120,718 | |
| Payable to adviser | | | 34,831 | |
| Total Liabilities | | | 155,549 | |
| NET ASSETS | | $ | 75,093,784 | |
| | | | | |
| NET ASSETS CONSIST OF: | | | | |
| Paid‐in capital | | $ | 69,900,419 | |
| Accumulated net investment loss | | | (672,570 | ) |
| Accumulated net realized loss | | | (3,071,095 | ) |
| Net unrealized appreciation | | | 8,937,030 | |
| NET ASSETS | | $ | 75,093,784 | |
| | | | | |
| INVESTMENTS, AT COST | | $ | 66,082,962 | |
| | | | | |
| PRICING OF SHARES | | | | |
| Net Assets | | $ | 75,093,784 | |
| Shares of beneficial interest outstanding (Unlimited number of shares authorized, par value $0.01 per share) | | | 1,700,000 | |
| Net Asset Value, offering and redemption price per share | | $ | 44.17 | |
See Notes to Financial Statements.
Cohen & Steers Global Realty Majors ETF
| Statement of Operations | For the Six Months Ended May 31, 2017 (Unaudited) |
| INVESTMENT INCOME: | | | |
Dividends(a) | | $ | 1,351,298 | |
| Total Investment Income | | | 1,351,298 | |
| | | | | |
| EXPENSES: | | | | |
| Investment adviser fees | | | 212,114 | |
| Total Expenses | | | 212,114 | |
| NET INVESTMENT INCOME | | | 1,139,184 | |
| | | | | |
| REALIZED AND UNREALIZED GAIN/(LOSS) | | | | |
| Net realized gain on investments | | | 2,300,538 | |
| Net realized loss on foreign currency transactions | | | (2,203 | ) |
| Total net realized gain | | | 2,298,335 | |
| Net change in unrealized appreciation on investments | | | 2,706,452 | |
| Net change in unrealized appreciation on translation of assets and liabilities denominated in foreign currencies | | | 7,530 | |
| Total net change in unrealized appreciation | | | 2,713,982 | |
| NET REALIZED AND UNREALIZED GAIN ON INVESTMENTS | | | 5,012,317 | |
| NET INCREASE IN NET ASSETS RESULTING FROM OPERATIONS | | $ | 6,151,501 | |
| (a) | Net of foreign tax withholding of $46,030. |
See Notes to Financial Statements.
Cohen & Steers Global Realty Majors ETF
Statements of Changes in Net Assets
| | | For the Six Months Ended May 31, 2017 (Unaudited) | | | For the Year Ended November 30, 2016 | |
| OPERATIONS: | | | | | | |
| Net investment income | | $ | 1,139,184 | | | $ | 2,727,045 | |
| Net realized gain | | | 2,298,335 | | | | 4,074,936 | |
| Net change in unrealized appreciation/(depreciation) | | | 2,713,982 | | | | (5,589,567 | ) |
| Net increase in net assets resulting from operations | | | 6,151,501 | | | | 1,212,414 | |
| | | | | | | | | |
| DISTRIBUTIONS TO SHAREHOLDERS: | | | | | | | | |
| From net investment income | | | (875,001 | ) | | | (2,806,590 | ) |
| Total distributions | | | (875,001 | ) | | | (2,806,590 | ) |
| | | | | | | | | |
| CAPITAL SHARE TRANSACTIONS: | | | | | | | | |
| Cost of shares redeemed | | | (10,733,074 | ) | | | (17,153,596 | ) |
| Net decrease from share transactions | | | (10,733,074 | ) | | | (17,153,596 | ) |
| Net decrease in net assets | | | (5,456,574 | ) | | | (18,747,772 | ) |
| | | | | | | | | |
| NET ASSETS: | | | | | | | | |
| Beginning of period | | | 80,550,358 | | | | 99,298,130 | |
| End of period * | �� | $ | 75,093,784 | | | $ | 80,550,358 | |
| | | | | | | | | |
| *Including accumulated net investment loss of: | | $ | (672,570 | ) | | $ | (936,753 | ) |
| | | | | | | | | |
| OTHER INFORMATION: | | | | | | | | |
| CAPITAL SHARE TRANSACTIONS: | | | | | | | | |
| Beginning shares | | | 1,950,000 | | | | 2,350,000 | |
| Shares sold | | | – | | | | – | |
| Shares redeemed | | | (250,000 | ) | | | (400,000 | ) |
| Shares outstanding, end of year | | | 1,700,000 | | | | 1,950,000 | |
See Notes to Financial Statements.
Cohen & Steers Global Realty Majors ETF
| Financial Highlights | For a Share Outstanding Throughout the Periods Presented |
| | | For the Six Months Ended May 31, 2017 (Unaudited) | | | For the Year Ended November 30, 2016 | | | For the Year Ended November 30, 2015 | | | For the Year Ended November 30, 2014 | | | For the Year Ended November 30, 2013 | | | For the Year Ended November 30, 2012 | |
| NET ASSET VALUE, BEGINNING OF PERIOD | | $ | 41.31 | | | $ | 42.25 | | | $ | 44.07 | | | $ | 39.32 | | | $ | 39.59 | | | $ | 32.53 | |
| | | | | | | | | | | | | | | | | | | | | | | | | |
| INCOME/(LOSS) FROM INVESTMENT OPERATIONS: | | | | | | | | | | | | | | | | | | | | | | | | |
Net investment income(a) | | | 0.63 | | | | 1.24 | | | | 1.41 | | | | 0.92 | | | | 0.94 | | | | 0.91 | |
| Net realized and unrealized gain/(loss) | | | 2.69 | | | | (0.90 | ) | | | (1.57 | ) | | | 4.85 | | | | 1.25 | | | | 6.97 | |
| Total from investment operations | | | 3.32 | | | | 0.34 | | | | (0.16 | ) | | | 5.77 | | | | 2.19 | | | | 7.88 | |
| | | | | | | | | | | | | | | | | | | | | | | | | |
| DISTRIBUTIONS: | | | | | | | | | | | | | | | | | | | | | | | | |
| From net investment income | | | (0.46 | ) | | | (1.28 | ) | | | (1.66 | ) | | | (1.02 | ) | | | (2.27 | ) | | | (0.82 | ) |
| From tax return of capital | | | – | | | | – | | | | – | | | | – | | | | (0.19 | ) | | | – | |
| Total distributions | | | (0.46 | ) | | | (1.28 | ) | | | (1.66 | ) | | | (1.02 | ) | | | (2.46 | ) | | | (0.82 | ) |
| | | | | | | | | | | | | | | | | | | | | | | | | |
| NET INCREASE/(DECREASE) IN NET ASSET VALUE | | | 2.86 | | | | (0.94 | ) | | | (1.82 | ) | | | 4.75 | | | | (0.27 | ) | | | 7.06 | |
| NET ASSET VALUE, END OF PERIOD | | $ | 44.17 | | | $ | 41.31 | | | $ | 42.25 | | | $ | 44.07 | | | $ | 39.32 | | | $ | 39.59 | |
TOTAL RETURN(b) | | | 8.11 | % | | | 0.61 | % | | | (0.38 | )% | | | 14.90 | % | | | 5.60 | % | | | 24.50 | % |
| | | | | | | | | | | | | | | | | | | | | | | | | |
| RATIOS/SUPPLEMENTAL DATA: | | | | | | | | | | | | | | | | | | | | | | | | |
| Net assets, end of period (000s) | | $ | 75,094 | | | $ | 80,550 | | | $ | 99,298 | | | $ | 96,953 | | | $ | 108,137 | | | $ | 71,258 | |
| | | | | | | | | | | | | | | | | | | | | | | | | |
| Ratio of expenses to average net assets | | | 0.55 | %(c) | | | 0.55 | % | | | 0.55 | % | | | 0.55 | % | | | 0.55 | % | | | 0.55 | % |
| Ratio of net investment income to average net assets | | | 2.95 | %(c) | | | 2.86 | % | | | 3.24 | % | | | 2.21 | % | | | 2.31 | % | | | 2.47 | % |
Portfolio turnover rate(d) | | | 5 | % | | | 8 | % | | | 7 | % | | | 11 | % | | | 10 | % | | | 4 | % |
| (a) | Based on average shares outstanding during the period. |
| (b) | Total return is calculated assuming an initial investment made at the net asset value at the beginning of the period and redemption at the net asset value on the last day of the period and assuming all distributions are reinvested at reinvestment prices. |
| (d) | Portfolio turnover for periods less than one year is not annualized and does not include securities received or delivered from processing creations or redemptions in-kind. |
See Notes to Financial Statements.
Cohen & Steers Global Realty Majors ETF
| Notes to Financial Statements | May 31, 2017 (Unaudited) |
1. ORGANIZATION
ALPS ETF Trust (the “Trust”), a Delaware statutory trust, is an open-end management investment company registered under the Investment Company Act of 1940, as amended (the “1940 Act”). As of May 31, 2017, the Trust consisted of twenty separate portfolios. Each portfolio represents a separate series of the Trust. This report pertains solely to the Cohen & Steers Global Realty Majors ETF (the “Fund”). The investment objective of the Fund is to seek investment results that correspond generally to the performance, before the Fund’s fees and expenses, of an index called the Cohen & Steers Global Realty Majors Index (the “Underlying Index”). The investment advisor uses a “passive” or indexing approach to try to achieve the Fund’s investment objective. The Fund is considered non-diversified and may invest a greater portion of assets in securities of individual issuers than a diversified fund. As a result, changes in the market value of a single investment could cause greater fluctuations in share price than would occur in a diversified fund.
The Fund’s Shares (“Shares”) are listed on the NYSE Arca, Inc. (the “NYSE Arca”). The Fund issues and redeems Shares at net asset value (“NAV”) in blocks of 50,000 Shares, each of which is called a “Creation Unit”. Creation Units are issued and redeemed principally in-kind for securities included in the Underlying Index. Except when aggregated in Creation Units, Shares are not redeemable securities of the Fund.
Pursuant to the Trust’s organizational documents, its Officers and Trustees are indemnified against certain liability arising out of the performance of their duties to the Trust. Additionally, in the normal course of business, the Trust enters into contracts with service providers that contain general indemnification clauses. The Trust’s maximum exposure under these arrangements is unknown, as this would involve future claims that may be made against the Trust that have not yet occurred.
2. SIGNIFICANT ACCOUNTING POLICIES
The following is a summary of significant accounting policies consistently followed by the Fund in the preparation of the financial statements. The accompanying financial statements were prepared in accordance with accounting principles generally accepted in the United States of America (“U.S. GAAP”). The preparation of financial statements in conformity with U.S. GAAP requires management to make certain estimates and assumptions that affect the reported amounts of assets and liabilities and disclosures of contingent assets and liabilities at the date of the financial statements and the reported amounts of revenue and expenses during the period. Actual results could differ from those estimates. The Fund is considered an investment company under U.S. GAAP and follows the accounting and reporting guidance applicable to investment companies in the Financial Accounting Standards Board Accounting Standards Codification Topic 946.
A. Portfolio Valuation
The Fund’s NAV is determined daily, as of the close of regular trading on the New York Stock Exchange (the “NYSE”), normally 4:00 p.m. Eastern time, on each day the NYSE is open for trading. The NAV is computed by dividing the value of all assets of the Fund (including accrued interest and dividends), less all liabilities (including accrued expenses and dividends declared but unpaid), by the total number of shares outstanding.
Portfolio securities listed on any exchange other than the NASDAQ Stock Market LLC (“NASDAQ”) are valued at the last sale price on the business day as of which such value is being determined. If there has been no sale on such day, the securities are valued at the mean of the most recent bid and asked prices on such day. Securities traded on the NASDAQ are valued at the NASDAQ Official Closing Price as determined by NASDAQ. Portfolio securities traded on more than one securities exchange are valued at the last sale price on the business day as of which such value is being determined at the close of the exchange representing the principal market for such securities. Portfolio securities traded in the over-the-counter market, but excluding securities traded on the NASDAQ, are valued at the latest quoted sale price in such market.
The Fund’s investments are valued at market value or, in the absence of market value with respect to any portfolio securities, at fair value according to procedures adopted by the Trust’s Board of Trustees (the “Board”). When market quotations are not readily available or when events occur that make established valuation methods unreliable, securities of the Fund may be valued in good faith by or under the direction of the Board. These securities generally include, but are not limited to, restricted securities (securities which may not be publicly sold without registration under the Securities Act of 1933) for which a pricing service is unable to provide a market price; securities whose trading has been formally suspended; a security whose market price is not available from a pre-established primary pricing source or the pricing source is not willing to provide a price; a security with respect to which an event has occurred that is most likely to materially affect the value of the security after the market has closed but before the calculation of the Fund’s NAV or make it difficult or impossible to obtain a reliable market quotation; or a security whose price, as provided by the pricing service, does not reflect the security’s “fair value” due to the security being de-listed from a national exchange or the security’s primary trading market is temporarily closed at a time when, under normal conditions, it would be open. As a general principle, the current “fair value” of a security would be the amount which the owner might reasonably expect to receive from the sale on the applicable exchange or principal market. A variety of factors may be considered in determining the fair value of such securities.
Cohen & Steers Global Realty Majors ETF
| Notes to Financial Statements | May 31, 2017 (Unaudited) |
B. Fair Value Measurements
The Fund discloses the classification of its fair value measurements following a three-tier hierarchy based on the inputs used to measure fair value. Inputs refer broadly to the assumptions that market participants would use in pricing the asset or liability, including assumptions about risk. Inputs may be observable or unobservable. Observable inputs reflect the assumptions market participants would use in pricing the asset or liability that are developed based on market data obtained from sources independent of the reporting entity. Unobservable inputs reflect the reporting entity’s own assumptions about the assumptions market participants would use in pricing the asset or liability that are developed based on the best information available.
Valuation techniques used to value the Fund’s investments by major category are as follows:
Equity securities, including restricted securities, for which market quotations are readily available, are valued at the last reported sale price or official closing price as reported by a third party pricing vendor on the primary market or exchange on which they are traded and are categorized as Level 1 in the hierarchy. In the event there were no sales during the day or closing prices are not available, securities are valued at the mean of the most recent quoted bid and ask prices on such day and are generally categorized as Level 2 in the hierarchy. Investments in open-end mutual funds are valued at their NAV each business day and are categorized as Level 1 in the hierarchy.
Changes in valuation techniques may result in transfers in or out of an assigned level within the disclosure hierarchy.
Various inputs are used in determining the value of the Fund’s investments as of the end of the reporting period. When inputs used fall into different levels of the fair value hierarchy, the level in the hierarchy within which the fair value measurement falls is determined based on the lowest level input that is significant to the fair value measurement in its entirety. The designated input levels are not necessarily an indication of the risk or liquidity associated with these investments.
These inputs are categorized in the following hierarchy under applicable financial accounting standards:
| Level 1 – | Unadjusted quoted prices in active markets for identical investments, unrestricted assets or liabilities that a Fund has the ability to access at the measurement date; |
| Level 2 – | Quoted prices which are not active, quoted prices for similar assets or liabilities in active markets or inputs other than quoted prices that are observable (either directly or indirectly) for substantially the full term of the asset or liability; and |
| Level 3 – | Significant unobservable prices or inputs (including the Fund’s own assumptions in determining the fair value of investments) where there is little or no market activity for the asset or liability at the measurement date. |
The following is a summary of the inputs used to value the Fund’s investments as of May 31, 2017:
| Investments in Securities at Value* | | Level 1- Unadjusted Quoted Prices | | | Level 2- Other Significant Observable Inputs | | | Level 3- Significant Unobservable Inputs | | | Total | |
| Common Stocks | | $ | 74,892,656 | | | $ | – | | | $ | – | | | $ | 74,892,656 | |
| Short Term Investments | | | 127,920 | | | | – | | | | – | | | | 127,920 | |
| TOTAL | | $ | 75,020,576 | | | $ | – | | | $ | – | | | $ | 75,020,576 | |
| * | For a detailed geographical breakdown, see the accompanying Schedule of Investments. |
The Fund recognizes transfers between levels as of the end of the period. For the six months ended May 31, 2017, the Fund did not have any transfers between Level 1 and Level 2 securities. The Fund did not have any securities that used significant unobservable inputs (Level 3) in determining fair value.
C. Foreign Securities
The Fund may directly purchase securities of non-U.S. issuers. Investing in securities of non-U.S. issuers may involve unique risks compared to investing in securities of U.S. issuers, including, among others, less liquidity generally, greater market volatility than U.S. securities and less complete financial information than for U.S. issuers. In addition, adverse political, economic or social developments could undermine the value of the Fund’s investments or prevent the Fund from realizing the full value of its investments. Financial reporting standards for companies based in foreign markets differ from those in the United States. Finally, the value of the currency of the country in which the Fund has invested could decline relative to the value of the U.S. dollar, which may affect the value of the investment to U.S. investors.
Cohen & Steers Global Realty Majors ETF
| Notes to Financial Statements | May 31, 2017 (Unaudited) |
D. Foreign Currency Translation
The books and records of the Fund are maintained in U.S. dollars. Investment valuations and other assets and liabilities initially expressed in foreign currencies are converted each business day into U.S. dollars based upon current exchange rates. The portion of realized and unrealized gains or losses on investments due to fluctuations in foreign currency exchange rates is not separately disclosed and is included in realized and unrealized gains or losses on investments, when applicable.
E. Securities Transactions and Investment Income
Securities transactions are recorded as of the trade date. Realized gains and losses from securities transactions are recorded on the highest cost basis. Dividend income and capital gains distributions, if any, are recorded on the ex-dividend date, net of any foreign taxes withheld. Interest income, if any, is recorded on the accrual basis.
F. Dividends and Distributions to Shareholders
Dividends from net investment income of the Fund, if any, are declared and paid quarterly or as the Board may determine from time to time. Distributions of net realized capital gains earned by the Fund, if any, are distributed at least annually.
G. Real Estate Investment Trusts (“REITs”)
As part of its investments in real estate related securities, the Fund will invest in REITs and is subject to certain risks associated with direct investment in REITs. REITs possess certain risks which differ from an investment in common stocks. REITs are financial vehicles that pool investors’ capital to acquire, develop and/or finance real estate and provide services to their tenants. REITs may concentrate their investments in specific geographic areas or in specific property types, e.g., regional malls, shopping centers, office buildings, apartment buildings and industrial warehouses. REITs may be affected by changes in the value of their underlying properties and by defaults by borrowers or tenants. REITs depend generally on their ability to generate cash flow to make distributions to shareowners, and certain REITs have self-liquidation provisions by which mortgages held may be paid in full and distributions of capital returns may be made at any time.
As REITs generally pay a higher rate of dividends than most other operating companies, to the extent application of the Fund’s investment strategy results in the Fund investing in REIT shares, the percentage of the Fund’s dividend income received from REIT shares will likely exceed the percentage of the Fund’s portfolio that is comprised of REIT shares. Distributions received by the Fund from REITs may consist of dividends, capital gains and/or return of capital.
Dividend income from REITs is recognized on the ex-dividend date. The calendar year-end amounts of ordinary income, capital gains, and return of capital included in distributions received from the Fund’s investments in REITs are reported to the Fund after the end of the calendar year; accordingly, the Fund estimates these amounts for accounting purposes until the characterization of REIT distributions is reported to the Fund after the end of the calendar year. Estimates are based on the most recent REIT distribution information available.
The performance of a REIT may be affected by its failure to qualify for tax-free pass-through of income under the Internal Revenue Code of 1986, as amended (the “Code”), or its failure to maintain exemption from registration under the 1940 Act. Due to the Fund’s investments in REITs, the Fund may also make distributions in excess of the Fund’s earnings and capital gains. Distributions, if any, in excess of the Fund’s earnings and profits will first reduce the adjusted tax basis of a holder’s Common Shares and, after that basis has been reduced to zero, will constitute capital gains to the Common Shareholder.
H. Federal Tax and Tax Basis Information
The timing and character of income and capital gain distributions are determined in accordance with income tax regulations, which may differ from U.S. GAAP. Reclassifications are made to the Fund’s capital accounts for permanent tax differences to reflect income and gains available for distribution (or available capital loss carryforwards) under income tax regulations. The amounts and characteristics of tax basis distributions and composition of distributable earnings/(accumulated losses) are finalized at fiscal year-end; accordingly, tax basis balances have not been determined as of May 31, 2017.
Cohen & Steers Global Realty Majors ETF
| Notes to Financial Statements | May 31, 2017 (Unaudited) |
The tax character of the distribution paid during the fiscal years ended November 30, 2016 was as follows:
| | | Ordinary Income | |
| November 30, 2016 | | | |
| Cohen & Steers Global Realty Majors ETF | | $ | 2,806,590 | |
Under the Regulated Investment Company Modernization Act of 2010 (“the Modernization Act”), net capital losses recognized in tax years beginning after December 22, 2010 may be carried forward indefinitely, and the character of the losses is retained as short-term and/or long-term. Under the law in effect prior to the Modernization Act, net capital losses were carried forward for eight years and treated as short-term. As a transition rule, the Modernization Act requires that post-enactment net capital losses be used before pre-enactment net capital losses. Additionally, post-enactment capital losses that are carried forward will retain their character as either short-term or long-term losses rather than being considered all short-term as under previous law.
At November 30, 2016, the Fund had available for tax purposes unused pre-enactment capital loss carryforwards as follows:
| Fund | | Expiring in 2017 | | | Expiring in 2018 | |
| Cohen & Steers Global Realty Majors ETF | | $ | 809,982 | | | $ | 187,815 | |
At November 30, 2016, the Fund had available for tax purposes unused post-enactment capital loss carryforwards as follows:
| Fund | | Short-Term | | | Long-Term | |
| Cohen & Steers Global Realty Majors ETF | | $ | 1,204,033 | | | $ | 2,460,001 | |
As of May 31, 2017, the cost of investments for federal income tax purposes and accumulated net unrealized appreciation/(depreciation) on investments were as follows:
| Gross appreciation (excess of value over tax cost) | | $ | 11,088,332 | |
| Gross depreciation (excess of tax cost over value) | | | (2,724,994 | ) |
| Net unrealized appreciation (depreciation) | | | 8,363,338 | |
| Cost of investments for income tax purposes | | $ | 66,657,238 | |
The differences between book-basis and tax-basis are primarily due to Passive Foreign Investment Company (“PFIC”) adjustments and the deferral of losses due to wash sales.
I. Income Taxes
No provision for income taxes is included in the accompanying financial statements, as the Fund intends to distribute to shareholders all taxable investment income and realized gains and otherwise comply with Subchapter M of the Internal Revenue Code of 1986, as amended, applicable to regulated investment companies. The Fund evaluates tax positions taken (or expected to be taken) in the course of preparing the Fund’s tax returns to determine whether these positions meet a “more-likely-than-not” standard that, based on the technical merits, have a more than fifty percent likelihood of being sustained by a taxing authority upon examination. A tax position that meets the “more-likely-than-not” recognition threshold is measured to determine the amount of benefit to recognize in the financial statements.
As of and during the six months ended May 31, 2017, the Fund did not have a liability for any unrecognized tax benefits. The Fund files U.S. federal, state, and local tax returns as required. The Fund’s tax returns are subject to examination by the relevant tax authorities until expiration of the applicable statute of limitations, which is generally three years after the filing of the tax return, but may extend to four years in certain jurisdictions. Tax returns for open years have incorporated no uncertain tax positions that require a provision for income taxes.
J. Lending of Portfolio Securities
The Fund has entered into a securities lending agreement with State Street Bank & Trust Co. (“SSB”), the Fund’s lending agent. The Fund may lend its portfolio securities only to borrowers that are approved by SSB. The Fund will limit such lending to not more than 33 1/3% of the value of its total assets. The Fund’s securities held at SSB as custodian shall be available to be lent except those securities the Fund or ALPS Advisors Inc. specifically identifies in writing as not being available for lending. The borrower pledges and maintains with the Fund collateral consisting of cash (U.S. Dollars only), securities issued or guaranteed by the U.S. government or its agencies or instrumentalities, and cash equivalents (including irrevocable bank letters of credit) issued by a person other than the borrower or an affiliate of the borrower. The initial collateral received by the Fund is required to have a value of no less than 102% of the market value of the loaned securities for U.S equity securities and a value of no less than 105% of the market value for non-U.S. equity securities. The collateral is maintained thereafter, at a market value equal to not less than 102% of the current value of the U.S. equity securities on loan and not less than 105% of the current value of the non-U.S. equity securities on loan. The market value of the loaned securities is determined at the close of each business day and any additional required collateral is delivered to the Fund on the next business day. During the term of the loan, the Fund is entitled to all distributions made on or in respect of the loaned securities. Loans of securities are terminable at any time and the borrower, after notice, is required to return borrowed securities within the customary time period for settlement of securities transactions.
Cohen & Steers Global Realty Majors ETF
| Notes to Financial Statements | May 31, 2017 (Unaudited) |
Any cash collateral received is reinvested in a money market fund managed by SSB as disclosed in the Fund’s Schedule of Investments and is reflected in the Statements of Assets and Liabilities as a payable for collateral upon return of securities loaned. Non-cash collateral, in the form of securities issued or guaranteed by the U.S. government or its agencies or instrumentalities, is not disclosed in the Fund’s Statements of Assets and Liabilities as it is held by the lending agent on behalf of the Fund, and the Fund does not have the ability to re-hypothecate these securities. Income earned by the Fund from securities lending activity is disclosed in the Statement of Operations. As of May 31, 2017, the Fund had no securities on loan.
The risks of securities lending include the risk that the borrower may not provide additional collateral when required or may not return the securities when due. To mitigate these risks, the Fund benefits from a borrower default indemnity provided by SSB. SSB’s indemnity allows for full replacement of securities lent wherein SSB will purchase the unreturned loaned securities on the open market by applying the proceeds of the collateral, or to the extent such proceeds are insufficient or the collateral is unavailable, SSB will purchase the unreturned loan securities at SSB’s expense. However, the Fund could suffer a loss if the value of the investments purchased with cash collateral falls below the value of the cash collateral received.
3. INVESTMENT ADVISORY FEE AND OTHER AFFILIATED TRANSACTIONS
ALPS Advisors, Inc. (the “Adviser”) acts as the Fund’s investment adviser pursuant to an Advisory Agreement with the Trust on behalf of the Fund (the “Advisory Agreement”). Pursuant to the Advisory Agreement, the Fund pays the Adviser a unitary fee for the services and facilities it provides payable on a monthly basis at the annual rate of 0.55% of the Fund’s average daily net assets. From time to time, the Adviser may waive all or a portion of its fee.
Out of the unitary management fee, the Adviser pays substantially all expenses of the Fund, including the cost of transfer agency, custody, fund administration, legal, audit, independent trustees and other services, except for interest expenses, distribution fees or expenses, brokerage expenses, taxes and extraordinary expenses such as litigation and other expenses not incurred in the ordinary course of the Fund’s business. The Adviser’s unitary management fee is designed to pay substantially all the Fund's expenses and to compensate the Adviser for providing services for the Fund.
ALPS Fund Services, Inc., an affiliate of the Adviser, is the administrator of the Fund.
Each Trustee who is not an officer or employee of the Adviser, any sub-adviser or any of their affiliates (“Independent Trustees”) receives (1) a quarterly retainer of $5,000, (2) a per meeting fee for regularly scheduled meetings of $3,750, (3) $1,500 for any special meeting held outside of a regularly scheduled board meeting, and (4) reimbursement for all reasonable out-of-pocket expenses relating to attendance at meetings.
4. PURCHASES AND SALES OF SECURITIES
For the six months ended May 31, 2017, the cost of purchases and proceeds from sales of investment securities, excluding in-kind transactions and short-term investments, were as follows:
| | Purchases | | | Sales | |
| | $ | 4,602,010 | | $ | 4,168,036 | |
For the six months ended May 31, 2017, the cost of in-kind purchases and proceeds from in-kind sales were as follows:
| | Purchases | | | Sales | |
| | $ | – | | $ | 10,739,661 | |
Cohen & Steers Global Realty Majors ETF
| Notes to Financial Statements | May 31, 2017 (Unaudited) |
For the six months ended May 31, 2017, the Cohen and Steers Global Realty Majors ETF had in-kind net realized gain of $2,364,518.
Gains on in-kind transactions are not considered taxable for federal income tax purposes.
5. CAPITAL SHARE TRANSACTIONS
Shares are created and redeemed by the Fund only in Creation Unit size aggregations of 50,000 Shares. Only broker-dealers or large institutional investors with creation and redemption agreements called Authorized Participants (“AP”) are permitted to purchase or redeem Creation Units from the Fund. Such transactions are generally permitted on an in-kind basis, with a balancing cash component to equate the transaction to the NAV per unit of the Fund on the transaction date. Cash may be substituted equivalent to the value of certain securities generally when they are not available in sufficient quantity for delivery, not eligible for trading by the AP or as a result of other market circumstances.
6. SUBSEQUENT EVENTS
On October 13, 2016, the Securities and Exchange Commission (“SEC”) amended Regulation S-X, which will require standardized, enhanced disclosure about derivatives in investment company financial statements, as well as other amendments. The compliance date for the amendments to Regulation S-X is August 1, 2017. Management is currently evaluating the impact to the financial statements and disclosures.
Cohen & Steers Global Realty Majors ETF
| Additional Information | May 31, 2017 (Unaudited) |
PROXY VOTING POLICIES AND PROCEDURES
Information regarding how the Fund voted proxies relating to portfolio securities during the most recent 12-month period ended June 30 and a description of the Fund’s proxy voting policies and procedures used in determining how to vote for proxies are available without charge on the SEC’s website at www.sec.gov and upon request, by calling (toll-free) 1-866-675-2639.
PORTFOLIO HOLDINGS
The Trust is required to disclose, after its first and third fiscal quarters, the complete schedule of the Fund’s portfolio holdings with the SEC on Form N-Q. Forms N-Q for the Fund are available on the SEC’s website at www.sec.gov. The Fund’s Forms N-Q may also be reviewed and copied at the SEC’s Public Reference Room in Washington, D.C. and information on the operation of the Public Reference Room may be obtained by calling 1-800-SEC-0330. The Fund’s Forms N-Q are available without charge, upon request, by calling (toll-free) 1-866-675-2639 or by writing to ALPS ETF Trust at 1290 Broadway, Suite 1100, Denver, Colorado 80203.
TAX INFORMATION
The Fund designated the following for federal income tax purposes for distributions made during the calendar year ended December 31, 2016:
| | Qualified Dividend Income | Dividend Received Deduction |
| Cohen and Steers Global Realty Majors ETF | 14.62% | 0.00% |
In early 2017, if applicable, shareholders of record received this information for the distribution paid to them by the Fund during the calendar year 2016 via Form 1099. The Fund will notify shareholders in early 2018 of amounts paid to them by the Fund, if any, during the calendar year 2017.
LICENSING AGREEMENT
Cohen & Steers is the Index Provider for the Cohen & Steers Global Realty Majors ETF. Cohen & Steers is not affiliated with the Trust, the Adviser or the Distributor. ALPS, an affiliate of the Adviser, and the Trust have entered into a license agreement with Cohen & Steers to use the Index.
THE FUND IS NOT SPONSORED, MANAGED OR ADVISED BY COHEN & STEERS CAPTIAL MANAGEMENT, INC. (“C&S”). C&S MAKES NO REPRESENTATION OR WARRANTY, EXPRESS OR IMPLIED, TO THE SHAREHOLDERS OF THE FUND OR ANY MEMBER OF THE PUBLIC REGARDING THE ADVISABILITY OF INVESTING IN SECURITIES GENERALLY OR IN THE FUND PARTICULARLY OR THE ABILITY OF THE COHEN & STEERS GLOBAL REALTY MAJORS INDEX TO TRACK PERFORMANCE OF A MARKET OR SECTOR. C&S’S ONLY RELATIONSHIP TO ALPS IS IN RELATION TO THE LICENSING OF CERTAIN TRADEMARKS AND TRADE NAMES OF C&S AND OF ONE OR MORE C&S INDEXES, INCLUDING THE COHEN & STEERS GLOBAL REALTY MAJORS INDEX WHICH IS DETERMINED, COMPOSED AND CALCULATED BY C&S WITHOUT REGARD TO ALPS OR THE FUND. C&S HAS NO OBLIGATION TO TAKE THE NEEDS OF ALPS, THE FUND OR THE FUND SHAREHOLDERS INTO CONSIDERATION IN DETERMINING, COMPOSING OR CALCULATING THE COHEN & STEERS GLOBAL REALTY MAJORS INDEX. C&S IS NOT RESPONSIBLE FOR AND HAS NOT PARTICIPATED IN THE TIMING OF THE ISSUANCE OR SALE OF FUND SHARES OR IN THE DETERMINATION OR CALCULATION OF THE VALUATION OF THE FUND’S ASSETS. C&S HAS NO OBLIGATION OR LIABILITY IN CONNECTION WITH THE ADMINISTRATION, MARKETING OR PORTFOLIO MANAGEMENT OF THE FUND. C&S DOES NOT GUARANTEE THE ACCURACY AND/OR THE COMPLETENESS OF THE COHEN & STEERS GLOBAL REALTY MAJORS INDEX OR ANY DATA INCLUDED THEREIN AND C&S SHALL HAVE NO LIABILITY FOR ANY ERRORS, OMISSIONS, OR INTERRUPTIONS THEREIN. C&S MAKES NO WARRANTY, EXPRESS OR IMPLIED, AS TO RESULTS TO BE OBTAINED BY ALPS, THE FUND, FUND SHAREHOLDERS, OR ANY OTHER PERSON OR ENTITY FROM THE USE OF THE COHEN & STEERS GLOBAL REALTY MAJORS INDEX OR ANY DATA INCLUDED THEREIN. C&S MAKES NO EXPRESS OR IMPLIED WARRANTIES, AND EXPRESSLY DISCLAIMS ALL WARRANTIES OF MERCHANTABILITY OR FITNESS FOR A PARTICULAR PURPOSE OF USE WITH RESPECT TO THE COHEN & STEERS GLOBAL REALTY MAJORS INDEX OR ANY DATA INCLUDED THEREIN. WITHOUT LIMITING ANY OF THE FOREGOING, IN NO EVENT SHALL C&S HAVE ANY LIABILITY FOR ANY SPECIAL, PUNITIVE, INDIRECT OR CONSEQUENTIAL DAMAGES (INCLUDING LOST PROFITS) RESULTING FROM THE USE OF THE COHEN & STEERS GLOBAL REALTY MAJORS INDEX OR ANY DATA INCLUDED THEREIN, EVEN IF NOTIFIED OF THE POSSIBILITY OF SUCH DAMAGES.
The Advisor does not guarantee the accuracy and/or the completeness of the Index or any data included therein, and the Advisor shall have no liability for any errors, omissions or interruptions therein. The Advisor makes no warranty, express or implied, as to results to be obtained by the Fund, owners of the Shares of the Fund or any other person or entity from the use of the Index or any data included therein. The Advisor makes no express or implied warranties, and expressly disclaims all warranties of merchantability or fitness for a particular purpose or use with respect to the Index or any data included therein. Without limiting any of the foregoing, in no event shall the Advisor have any liability for any special, punitive, direct, indirect or consequential damages (including lost profits) arising out of matters relating to the use of the Index even if notified of the possibility of such damages.

| Performance Overview | 1 |
| Disclosure of Fund Expenses | 3 |
| Schedule of Investments | 4 |
| Statement of Assets and Liabilities | 6 |
| Statement of Operations | 7 |
| Statements of Changes In Net Assets | 8 |
| Financial Highlights | 9 |
| Notes to Financial Statements | 10 |
| Additional Information | 17 |
alpsfunds.com
U.S. Equity High Volatility Put Write Index Fund
| Performance Overview | May 31, 2017 (Unaudited) |
Investment Objective
The U.S. Equity High Volatility Put Write Index Fund (the “Fund”) seeks investment results that correspond generally to the performance, before the Fund’s fees and expenses, of the NYSE Arca U.S. Equity High Volatility Put Write IndexSM (the “Underlying Index”). The Underlying Index reflects the performance of a portfolio of exchange-traded put options on highly volatile stocks.
The Underlying Index measures the return of a hypothetical portfolio consisting of exchange traded put options which have been sold on each of 40 stocks and a cash position. The 40 stocks on which options are sold (“written”) are those 40 stocks from a selection of the largest capitalized (over $5 billion in market capitalization) stocks which also have listed options and which have the highest volatility, as determined by the NYSE Arca, Inc. (the “NYSE Arca”), the Fund’s index provider (the “Index Provider”).
Fund Performance (as of May 31, 2017)
| | 6 Months | 1 Year | 3 Year | Since Inception^ |
| U.S. Equity High Volatility Put Write Index Fund - NAV | 2.03% | 5.05% | 1.40% | 2.62% |
| U.S. Equity High Volatility Put Write Index Fund - Market Price* | 1.67% | 4.90% | 1.42% | 2.65% |
| U.S. Equity High Volatility Put Write Total Return Index | 2.72% | 6.44% | 3.01% | 4.53% |
S&P 500® Total Return Index | 10.81% | 17.47% | 10.13% | 13.90% |
Total Expense Ratio (per the current prospectus) 0.95%.
Performance data quoted represents past performance. Past performance does not guarantee future results. The table does not reflect the deduction of taxes that a shareholder would pay on Fund distributions or the redemption of Fund shares. Investment return and principal value of an investment will fluctuate so that an investor’s shares, when sold or redeemed, may be worth more or less than the original cost. Current performance data may be higher or lower than actual data quoted. For most current month-end performance data please visit www.alpsfunds.com or call 1.855.325.8020.
NAV is an exchange-traded fund’s per-share value. The per-share dollar amount of the Fund is derived by dividing the total value of all the securities in its portfolio, less any liabilities, by the number of Fund shares outstanding. Market Price is the price at which a share can currently be traded in the market. Information detailing the number of days the Market Price of the Fund was greater than the Fund’s NAV and the number of days it was less than the Fund’s NAV can be obtained at www.alpsfunds.com.
Put Options: financial instruments that give the owner/buyer the right, but not the obligation, to sell a specified quantity of a security at a set price called the “strike” price on or before an agreed upon expiration date.
Volatility: the measure of a financial instrument’s price variation over time. Higher volatility suggests that a security’s value could vary over a larger range of values. This means that the price of the security could change dramatically over a short time period in either direction. Lower volatility suggests that a security’s value does not fluctuate dramatically, but changes in value at a steady pace over a period of time.
| ^ | The Fund commenced Investment Operations on February 28, 2013. |
| * | Market Price is based on the midpoint of the bid/ask spread at 4 p.m. ET and does not represent the returns an investor would receive if shares were traded at other times. |
NYSE Arca U.S. Equity High Volatility Put Write IndexSM - Total Return: measures the return of a hypothetical portfolio of listed put options on each of 40 stocks and a cash (U.S. T-Bill) position. The 40 underlying stocks on which options are written are a selection of the largest capitalized (over $5 billion in market cap) U.S. listed stocks which also have listed options and which have the highest volatility, as determined by the NYSE Arca, Inc., the Fund’s Index provider. No more than 17.5% of the Index positions will be from the same sector. Total return assumes reinvestment of any dividends and distributions realized during a given time period.
The NYSE Arca U.S. Equity High Volatility Put Write Total Return IndexSM: is a service mark of NYSE Euronext or its affiliates and has been licensed for use by ALPS Advisors, Inc. in connection with the U.S. Equity High Volatility Put Write Index Fund. Neither the Trust nor the Fund is sponsored, endorsed, sold or promoted by NYSE Euronext. NYSE Euronext makes no representations or warranties regarding the Trust or the Fund or the ability of the NYSE Arca U.S. Equity HighVolatility Put Write IndexSM to track general stock market performance.
S&P 500® Total Return Index: The Standard & Poor’s composite index of 500 stocks, a widely recognized, unmanaged index of common stock prices.
U.S. Equity High Volatility Put Write Index Fund
| Performance Overview | May 31, 2017 (Unaudited) |
The indexes are not actively managed and do not reflect any deductions for fees, expenses or taxes. The indexes are reported on a total return basis, which assumes reinvestment of any dividends and distributions realized during a given time period. One cannot invest directly in an index. Index performance does not reflect fund performance.
The U.S. Equity High Volatility Put Write Index Fund is not suitable for all investors. Investments in the Fund are subject to investment risks, including possible loss of the principal amount invested.
ALPS Portfolio Solutions Distributor, Inc., a FINRA member, is the distributor for the U.S. Equity High Volatility Put Write Index Fund.
Growth Of $10,000 (as of May 31, 2017)
Comparison of change in value of a $10,000 investment in the Fund and the Underlying Index
The chart above represents historical performance of a hypothetical investment of $10,000 in the Fund over the life of the Fund. Past performance does not guarantee future results. This chart does not reflect the deduction of taxes that a shareholder would pay on Fund distributions or the redemption of Fund shares.
Asset Allocation* (as of May 31, 2017)
| Government Bonds | 100.66% |
| Written Options | -0.66% |
| Total | 100.00% |
Holdings are subject to change.
U.S. Equity High Volatility Put Write Index Fund
| Disclosure of Fund Expenses | May 31, 2017 (Unaudited) |
Shareholder Expense Example: As a shareholder of the Fund, you incur two types of costs: (1) transaction costs which may include creation and redemption fees or brokerage charges, and (2) ongoing costs, including management fees and other Fund expenses. These examples are intended to help you understand your ongoing costs (in dollars) of investing in the Fund and to compare these costs with the ongoing costs of investing in other funds. It is based on an investment of $1,000 invested at the beginning of the (six month) period and held through May 31, 2017.
Actual Return: The first line of the table provides information about actual account values and actual expenses. You may use the information in this line, together with the amount you invested, to estimate the expenses that you incurred over the period. Simply divide your account value by $1,000 (for example, an $8,600 account value divided by $1,000 = 8.6), then multiply the result by the number in the first line under the heading entitled “Expenses Paid During Period” to estimate the expenses attributable to your investment during this period.
Hypothetical 5% Return: The second line of the table provides information about hypothetical account values and hypothetical expenses based on the Fund’s actual expense ratio and an assumed rate of return of 5% per year before expenses, which is not the Fund’s actual return. The hypothetical account values and expenses may not be used to estimate the actual ending account balance or expenses you paid for the period. You may use this information to compare ongoing costs of investing in the Fund and other funds. To do so, compare this 5% hypothetical example with the 5% hypothetical examples that appear in the shareholder reports of other funds.
The expenses shown in the table are meant to highlight ongoing Fund costs only and do not reflect any transaction costs, such as creation and redemption fees or brokerage charges. Therefore, the second line is useful in comparing ongoing costs only, and will not help you determine the relative total costs of owning different funds. In addition, if these costs were included, your costs would have been higher.
| | Beginning Account
Value 12/1/16 | Ending Account Value 5/31/17 | Expense Ratio(a) | Expenses Paid During Period 12/1/16 - 5/31/17(b) |
| U.S. Equity High Volatility Put Write Index Fund | | | | |
| Actual | $1,000.00 | $1,020.30 | 0.95% | $4.79 |
Hypothetical (5% return before expenses) | $1,000.00 | $1,020.19 | 0.95% | $4.78 |
(a) | Annualized, based on the Fund’s most recent fiscal half year expenses. |
(b) | Expenses are equal to the Fund’s annualized expense ratio multiplied by the average account value over the period, multiplied by the number of days in the most recent fiscal half year (182), divided by 365. |
U.S. Equity High Volatility Put Write Index Fund
| Schedule of Investments | May 31, 2017 (Unaudited) |
| Security Description | | Principal Amount | | | Value | |
| SHORT TERM INVESTMENTS (100.45%) | | | | | | |
| U.S. Treasury Bill Discount Notes | | | | | | |
0.689%, 06/15/2017(a)(b) | | $ | 14,000,000 | | | $ | 13,996,024 | |
0.753%, 07/20/2017(a) | | | 3,700,000 | | | | 3,695,708 | |
0.730%, 08/17/2017(a) | | | 13,100,000 | | | | 13,074,429 | |
| | | | | | | | | |
| TOTAL SHORT TERM INVESTMENTS | | | | | | | | |
| (Cost $30,772,165) | | | | | | | 30,766,161 | |
| | | | | | | | | |
| TOTAL INVESTMENTS (100.45%) | | | | | | | | |
| (Cost $30,772,165) | | | | | | $ | 30,766,161 | |
| | | | | | | | | |
| NET LIABILITIES LESS OTHER ASSETS (-0.45%) | | | | | | | (138,507 | ) |
| | | | | | | | | |
| NET ASSETS (100.00%) | | | | | | $ | 30,627,654 | |
(a) | Rate shown represents the bond equivalent yield to maturity at date of purchase. |
(b) | All or a portion of this security is being held as collateral for written options. |
SCHEDULE OF WRITTEN OPTIONS
| | | Expiration Date | | Exercise Price | | | Contracts | | | Value | |
| WRITTEN PUT OPTIONS | | | | | | | | | | | | |
| Activision Blizzard, Inc. | | 06/16/2017 | | $ | 43.00 | | | | (177 | ) | | $ | (1,947 | ) |
| Aecom | | 06/16/2017 | | | 30.00 | | | | (253 | ) | | | (4,428 | ) |
| Alcoa Corp. | | 06/16/2017 | | | 28.00 | | | | (272 | ) | | | (1,360 | ) |
| Arconic, Inc. | | 06/16/2017 | | | 22.00 | | | | (346 | ) | | | (692 | ) |
| Bioverativ, Inc. | | 06/16/2017 | | | 50.00 | | | | (152 | ) | | | (3,420 | ) |
| Cabot Oil & Gas Corp. | | 06/16/2017 | | | 20.00 | | | | (380 | ) | | | (4,750 | ) |
| CF Industries Holdings, Inc. | | 06/16/2017 | | | 22.50 | | | | (338 | ) | | | (676 | ) |
| Chemours Co. | | 06/16/2017 | | | 33.00 | | | | (230 | ) | | | (2,300 | ) |
| Diamondback Energy, Inc. | | 06/16/2017 | | | 85.00 | | | | (89 | ) | | | (2,892 | ) |
| DXC Technology Co. | | 06/16/2017 | | | 65.00 | | | | (117 | ) | | | (585 | ) |
| E*TRADE Financial Corp. | | 06/16/2017 | | | 30.00 | | | | (253 | ) | | | (1,138 | ) |
| Exelixis, Inc. | | 06/16/2017 | | | 18.00 | | | | (423 | ) | | | (23,265 | ) |
| Fleetcor Technologies, Inc. | | 06/16/2017 | | | 125.00 | | | | (60 | ) | | | (1,500 | ) |
| FMC Corp. | | 06/16/2017 | | | 60.00 | | | | (126 | ) | | | (945 | ) |
| Gap, Inc. | | 06/16/2017 | | | 22.00 | | | | (346 | ) | | | (12,110 | ) |
| H&R Block, Inc. | | 06/16/2017 | | | 20.00 | | | | (380 | ) | | | (950 | ) |
| Hanesbrands, Inc. | | 06/16/2017 | | | 19.00 | | | | (401 | ) | | | (2,005 | ) |
| Hasbro, Inc. | | 06/16/2017 | | | 87.50 | | | | (87 | ) | | | (217 | ) |
| Incyte Corp. | | 06/16/2017 | | | 105.00 | | | | (72 | ) | | | (1,260 | ) |
| Ionis Pharmaceuticals, Inc. | | 06/16/2017 | | | 39.00 | | | | (195 | ) | | | (8,288 | ) |
| Kohl’s Corp. | | 06/16/2017 | | | 35.00 | | | | (217 | ) | | | (4,340 | ) |
| L Brands, Inc. | | 06/16/2017 | | | 42.50 | | | | (179 | ) | | | (895 | ) |
| Lululemon Athletica, Inc. | | 06/16/2017 | | | 45.00 | | | | (169 | ) | | | (23,914 | ) |
| Mattel, Inc. | | 06/16/2017 | | | 19.00 | | | | (401 | ) | | | (2,005 | ) |
| Newfield Exploration Co. | | 06/16/2017 | | | 30.00 | | | | (253 | ) | | | (5,060 | ) |
| Nordstrom, Inc. | | 06/16/2017 | | | 40.00 | | | | (190 | ) | | | (8,265 | ) |
| NVIDIA Corp. | | 06/16/2017 | | | 90.00 | | | | (84 | ) | | | (126 | ) |
| Olin Corp. | | 06/16/2017 | | | 28.00 | | | | (272 | ) | | | (8,840 | ) |
| Palo Alto Networks, Inc. | | 06/16/2017 | | | 95.00 | | | | (80 | ) | | | (1,800 | ) |
U.S. Equity High Volatility Put Write Index Fund
| Schedule of Investments | May 31, 2017 (Unaudited) |
| | | Expiration Date | | Exercise Price | | | Contracts | | | Value | |
| WRITTEN PUT OPTIONS (continued) | | | | | | | | | | | |
| Parsley Energy, Inc. | | 06/16/2017 | | $ | 25.00 | | | | (304 | ) | | $ | (1,520 | ) |
| Range Resources Corp. | | 06/16/2017 | | | 23.00 | | | | (331 | ) | | | (23,997 | ) |
| Seagate Technology PLC | | 06/16/2017 | | | 42.00 | | | | (181 | ) | | | (7,331 | ) |
| Seattle Genetics, Inc. | | 06/16/2017 | | | 55.00 | | | | (138 | ) | | | (2,070 | ) |
| Steel Dynamics, Inc. | | 06/16/2017 | | | 31.00 | | | | (245 | ) | | | (4,288 | ) |
| TD Ameritrade Holding Corp. | | 06/16/2017 | | | 33.00 | | | | (230 | ) | | | (1,150 | ) |
| TESARO, Inc. | | 06/16/2017 | | | 115.00 | | | | (66 | ) | | | (15,510 | ) |
| Tesla, Inc. | | 06/16/2017 | | | 260.00 | | | | (29 | ) | | | (406 | ) |
| Tripadvisor, Inc. | | 06/16/2017 | | | 37.00 | | | | (205 | ) | | | (10,762 | ) |
| United Rentals, Inc. | | 06/16/2017 | | | 97.50 | | | | (78 | ) | | | (2,925 | ) |
| Vertex Pharmaceuticals, Inc. | | 06/16/2017 | | | 100.00 | | | | (76 | ) | | | (1,330 | ) |
| TOTAL WRITTEN PUT OPTIONS | | | | | | | | | | | | | | |
| (Premiums received $365,297) | | | | | | | | | | | | $ | (201,262 | ) |
See Notes to Financial Statements
U.S. Equity High Volatility Put Write Index Fund
| Statement of Assets and Liabilities | May 31, 2017 (Unaudited) |
| | | U.S. Equity High Volatility Put Write Index Fund | |
| ASSETS: | | | |
| Investments, at value | | $ | 30,766,161 | |
| Cash | | | 87,625 | |
Total Assets | | | 30,853,786 | |
| | | | | |
| LIABILITIES: | | | | |
| Written options, at value (Proceeds $365,297) | | | 201,262 | |
| Payable to adviser | | | 24,864 | |
Payable for shares redeemed | | | 6 | |
| Total Liabilities | | | 226,132 | |
| NET ASSETS | | $ | 30,627,654 | |
| | | | | |
| NET ASSETS CONSIST OF: | | | | |
| Paid-in capital | | $ | 30,410,317 | |
| Accumulated net investment loss | | | (70,673 | ) |
| Accumulated net realized gain | | | 129,979 | |
Net unrealized appreciation | | | 158,031 | |
| NET ASSETS | | $ | 30,627,654 | |
| | | | | |
| INVESTMENTS, AT COST | | $ | 30,772,165 | |
| | | | | |
| PRICING OF SHARES | | | | |
| Net Assets | | $ | 30,627,654 | |
| Shares of beneficial interest outstanding (Unlimited number of shares authorized, par value $0.01 per share) | | | 1,600,000 | |
| Net Asset Value, offering and redemption price per share | | $ | 19.14 | |
See Notes to Financial Statements.
U.S. Equity High Volatility Put Write Index Fund
| Statement of Operations | For the Six Months Ended May 31, 2017 (Unaudited) |
| | | U.S. Equity High Volatility Put Write Index Fund | |
| INVESTMENT INCOME: | | | |
| Interest | | $ | 79,942 | |
Total investment income | | | 79,942 | |
| | | | | |
| EXPENSES: | | | | |
Investment adviser fees | | | 150,615 | |
Total Expenses | | | 150,615 | |
NET INVESTMENT LOSS | | | (70,673 | ) |
| | | | | |
| REALIZED AND UNREALIZED GAIN/(LOSS) | | | | |
| Net realized loss on investments | | | (901,623 | ) |
Net realized gain on written option contracts | | | 1,643,143 | |
| Total realized gain | | | 741,520 | |
| Net change in unrealized depreciation on investments | | | (2,228 | ) |
Net change in unrealized depreciation on written option contracts | | | (21,851 | ) |
| Total change in unrealized depreciation | | | (24,079 | ) |
NET REALIZED AND UNREALIZED GAIN ON INVESTMENTS AND WRITTEN OPTION CONTRACTS | | | 717,441 | |
| NET INCREASE IN NET ASSETS RESULTING FROM OPERATIONS | | $ | 646,768 | |
See Notes to Financial Statements.
U.S. Equity High Volatility Put Write Index Fund
Statements of Changes in Net Assets
| | | For the Six Months Ended May 31, 2017 (Unaudited) | | | For the Year Ended November 30, 2016 | |
| OPERATIONS: | | | | | | |
| Net investment loss | | $ | (70,673 | ) | | $ | (287,463 | ) |
| Net realized gain | | | 741,520 | | | | 364,956 | |
Net change in unrealized depreciation | | | (24,079 | ) | | | (217,526 | ) |
Net increase/(decrease) in net assets resulting from operations | | | 646,768 | | | | (140,033 | ) |
| | | | | | | | | |
| DISTRIBUTIONS TO SHAREHOLDERS: | | | | | | | | |
Tax return of capital | | | (1,469,819 | ) | | | (3,811,090 | ) |
Total distributions | | | (1,469,819 | ) | | | (3,811,090 | ) |
| | | | | | | | | |
| CAPTIAL SHARE TRANSACTIONS: | | | | | | | | |
| Proceeds from sale of shares | | | 3,809,974 | | | | 4,000,077 | |
Cost of shares redeemed | | | (7,699,482 | ) | | | (15,899,656 | ) |
Net decrease from share transactions | | | (3,889,508 | ) | | | (11,899,579 | ) |
| Net decrease in net assets | | | (4,712,559 | ) | | | (15,850,702 | ) |
| | | | | | | | | |
| NET ASSETS: | | | | | | | | |
Beginning of period | | | 35,340,213 | | | | 51,190,915 | |
| End of period* | | $ | 30,627,654 | | | $ | 35,340,213 | |
| | | | | | | | | |
| *Including accumulated net investment loss of: | | $ | (70,673 | ) | | $ | – | |
| | | | | | | | | |
| OTHER INFORMATION: | | | | | | | | |
| CAPTIAL SHARE TRANSACTIONS: | | | | | | | | |
| Beginning shares | | | 1,800,000 | | | | 2,400,000 | |
| Shares sold | | | 200,000 | | | | 200,000 | |
Shares redeemed | | | (400,000 | ) | | | (800,000 | ) |
| Shares outstanding, end of period | | | 1,600,000 | | | | 1,800,000 | |
See Notes to Financial Statements.
U.S. Equity High Volatility Put Write Index Fund
| Financial Highlights | For a Share Outstanding Throughout the Periods Presented |
| | | For the Six Months Ended May 31, 2017 (Unaudited) | | | For the Year Ended November 30, 2016 | | | For the Year Ended November 30, 2015 | | | For the Year Ended November 30, 2014 | | | For the Period February 28, 2013 (Commencement of Operations) to November 30, 2013 | |
| NET ASSET VALUE, BEGINNING OF PERIOD | | $ | 19.63 | | | $ | 21.33 | | | $ | 23.76 | | | $ | 25.80 | | | $ | 25.00 | |
| | | | | | | | | | | | | | | | | | | | | |
| INCOME/(LOSS) FROM INVESTMENT OPERATIONS: | | | | | | | | | | | | | | | | | | | | |
Net investment loss(a) | | | (0.04 | ) | | | (0.14 | ) | | | (0.21 | ) | | | (0.22 | ) | | | (0.18 | ) |
Net realized and unrealized gain/(loss) | | | 0.43 | | | | 0.25 | | | | (0.15 | ) | | | 0.42 | | | | 2.50 | |
Total from investment operations | | | 0.39 | | | | 0.11 | | | | (0.36 | ) | | | 0.20 | | | | 2.32 | |
| | | | | | | | | | | | | | | | | | | | | |
| DISTRIBUTIONS: | | | | | | | | | | | | | | | | | | | | |
| From net investment income | | | – | | | | – | | | | – | | | | – | | | | (1.52 | ) |
Tax return of capital | | | (0.88 | ) | | | (1.81 | ) | | | (2.07 | ) | | | (2.24 | ) | | | – | |
Total distributions | | | (0.88 | ) | | | (1.81 | ) | | | (2.07 | ) | | | (2.24 | ) | | | (1.52 | ) |
| | | | | | | | | | | | | | | | | | | | | |
NET INCREASE/(DECREASE) IN NET ASSET VALUE | | | (0.49 | ) | | | (1.70 | ) | | | (2.43 | ) | | | (2.04 | ) | | | 0.80 | |
| NET ASSET VALUE, END OF PERIOD | | $ | 19.14 | | | $ | 19.63 | | | $ | 21.33 | | | $ | 23.76 | | | $ | 25.80 | |
TOTAL RETURN(b) | | | 2.03 | % | | | 0.79 | % | | | (1.70 | %) | | | 0.84 | % | | | 9.51 | % |
| | | | | | | | | | | | | | | | | | | | | |
| RATIOS/SUPPLEMENTAL DATA: | | | | | | | | | | | | | | | | | | | | |
| Net assets, end of period (000s) | | $ | 30,628 | | | $ | 35,340 | | | $ | 51,191 | | | $ | 52,281 | | | $ | 28,379 | |
| | | | | | | | | | | | | | | | | | | | | |
| Ratio of expenses to average net assets | | | 0.95 | %(c) | | | 0.95 | % | | | 0.95 | % | | | 0.95 | % | | | 0.95 | %(c) |
| Ratio of net investment loss to average net assets | | | (0.45 | %)(c) | | | (0.70 | %) | | | (0.90 | %) | | | (0.92 | %) | | | (0.92 | %)(c) |
Portfolio turnover rate(d) | | | 0 | % | | | 0 | %(e) | | | 0 | %(e) | | | 0 | % | | | 0 | % |
(a) | Based on average shares outstanding during the period. |
(b) | Total return is calculated assuming an initial investment made at the net asset value at the beginning of the period and redemption at the net asset value on the last day of the period and assuming all distributions are reinvested at reinvestment prices. Total return calculated for a period of less than one year is not annualized. |
(d) | Portfolio turnover for periods less than one year is not annualized and does not include securities received or delivered from processing creations or redemptions in-kind. |
(e) | The Fund typically holds no long positions at the end of each month because it is not part of the Fund’s principal investment strategy. The Fund held one long position which was excluded from the portfolio turnover calculation. |
See Notes to Financial Statements.
U.S. Equity High Volatility Put Write Index Fund
| Notes to Financial Statements | May 31, 2017 (Unaudited) |
1. ORGANIZATION
ALPS ETF Trust (the “Trust”), a Delaware statutory trust, is an open-end management investment company under the Investment Company Act of 1940, as amended (the “1940 Act”). As of May 31, 2017, the Trust consists of twenty separate portfolios. Each portfolio represents a separate series of the Trust. This report pertains solely to the U.S. Equity High Volatility Put Write Index Fund (the “Fund”).
The investment objective of the Fund is to seek investment results that correspond generally to the performance, before the Fund’s fees and expenses, of the NYSE Arca U.S. Equity High Volatility Put Write IndexSM (the “Underlying Index”). The Underlying Index reflects the performance of a portfolio of exchange-traded put options on highly volatile stocks. The Fund is considered non-diversified and may invest a greater portion of assets in securities of individual issuers than a diversified fund. As a result, changes in the market value of a single investment could cause greater fluctuations in share price than would occur in a diversified fund.
Shares of the Fund (“Shares”) are listed on the NYSE Arca, Inc. (the “NYSE Arca”). The Fund issues and redeems Shares, at net asset value (“NAV”), in blocks of 100,000 Shares, each of which is called a “Creation Unit.” Creation Units of the Fund are issued and redeemed for cash. Except when aggregated in Creation Units, Shares are not redeemable securities of the Fund.
Pursuant to the Trust’s organizational documents, its Officers and Trustees are indemnified against certain liability arising out of the performance of their duties to the Trust. Additionally, in the normal course of business, the Trust enters into contracts with service providers that contain general indemnification clauses. The Trust’s maximum exposure under these arrangements is unknown, as this would involve future claims that may be made against the Trust that have not yet occurred.
2. SIGNIFICANT ACCOUNTING POLICIES
The following is a summary of significant accounting policies consistently followed by the Fund in the preparation of the financial statements. The accompanying financial statements were prepared in accordance with accounting principles generally accepted in the United States of America (“U.S. GAAP”). The preparation of financial statements in conformity with U.S. GAAP requires management to make certain estimates and assumptions that affect the reported amounts of assets and liabilities and disclosures of contingent assets and liabilities at the date of the financial statements and the reported amounts of revenue and expenses during the period. Actual results could differ from those estimates. The Fund is considered an investment company under U.S. GAAP and follows the accounting and reporting guidance applicable to investment companies in the Financial Accounting Standards Board Accounting Standards Codification Topic 946.
A. Portfolio Valuation
The Fund’s NAV is determined daily, as of the close of the New York Stock Exchange (the “NYSE”), usually 4:00 p.m. Eastern time, each day the NYSE is open for trading. The NAV is computed by dividing the value of the Fund’s portfolio securities, cash and other assets (including accrued interest), less all liabilities (including accrued expenses), by the total number of shares outstanding.
Portfolio securities listed on any exchange other than the NASDAQ Stock Market LLC (“NASDAQ”) are valued at the last sale price on the business day as of which such value is being determined. If there has been no sale on such day, the securities are valued at the mean of the most recent bid and ask prices on such day. Securities traded on the NASDAQ are valued at the NASDAQ Official Closing Price as determined by NASDAQ. Portfolio securities traded on more than one securities exchange are valued at the last sale price on the business day as of which such value is being determined at the close of the exchange representing the principal market for such securities. Portfolio securities traded in the over-the-counter market, but excluding securities traded on the NASDAQ, are valued at the last quoted sale price in such market. Treasury Bills and Treasury Notes are typically valued at the mean between the evaluated bid and ask prices formulated by an independent pricing service.
The Fund’s listed put options are valued at the mean of the most recent bid and ask prices.
The Fund’s investments are valued at market value or, in the absence of market value with respect to any portfolio securities, at fair value according to procedures adopted by the Trust’s Board of Trustees (the “Board”). When market quotations are not readily available or when events occur that make established valuation methods unreliable, securities of the Fund may be valued in good faith by or under the direction of the Board. These securities generally include, but are not limited to, restricted securities (securities which may not be publicly sold without registration under the Securities Act of 1933) for which a pricing service is unable to provide a market price; securities whose trading has been formally suspended; a security whose market price is not available from a pre-established primary pricing source or the pricing source is not willing to provide a price; a security with respect to which an event has occurred that is most likely to materially affect the value of the security after the market has closed but before the calculation of the Fund’s NAV or make it difficult or impossible to obtain a reliable market quotation; or a security whose price, as provided by the pricing service, does not reflect the security’s “fair value” due to the security being de-listed from a national exchange or the security’s primary trading market is temporarily closed at a time when, under normal conditions, it would be open. As a general principle, the current “fair value” of a security would be the amount which the owner might reasonably expect to receive from the sale on the applicable exchange or principal market. A variety of factors may be considered in determining the fair value of such securities.
U.S. Equity High Volatility Put Write Index Fund
| Notes to Financial Statements | May 31, 2017 (Unaudited) |
B. Fair Value Measurements
The Fund discloses the classification of its fair value measurements following a three-tier hierarchy based on the inputs used to measure fair value. Inputs refer broadly to the assumptions that market participants would use in pricing the asset or liability, including assumptions about risk. Inputs may be observable or unobservable. Observable inputs reflect the assumptions market participants would use in pricing the asset or liability that are developed based on market data obtained from sources independent of the reporting entity. Unobservable inputs reflect the reporting entity’s own assumptions about the assumptions market participants would use in pricing the asset or liability that are developed based on the best information available.
Valuation techniques used to value the Fund’s investments by major category are as follows:
Equity securities, including restricted securities, for which market quotations are readily available, are valued at the last reported sale price or official closing price as reported by a third party pricing vendor on the primary market or exchange on which they are traded and are categorized as Level 1 in the hierarchy. In the event there were no sales during the day or closing prices are not available, securities are valued at the mean of the most recent quoted bid and ask prices on such day and are generally categorized as Level 2 in the hierarchy. Investments in open-end mutual funds are valued at their closing NAV each business day and are categorized as Level 1 in the hierarchy. Treasury Bills and Treasury Notes are typically valued at the mean between the evaluated bid and ask prices formulated by an independent pricing service and are categorized as Level 2 in the hierarchy, due to their active trading, short-term maturity and liquidity. Listed put options are valued at the mean between the evaluated bid and ask prices formulated by an independent pricing service and are categorized as Level 1 in the hierarchy, due to their active trading and short-term expiration.
Changes in valuation techniques may result in transfers in or out of an assigned level within the disclosure hierarchy.
Various inputs are used in determining the value of the Fund’s investments as of the end of the reporting period. When inputs used fall into different levels of the fair value hierarchy, the level in the hierarchy within which the fair value measurement falls is determined based on the lowest level input that is significant to the fair value measurement in its entirety. The designated input levels are not necessarily an indication of the risk or liquidity associated with these investments.
These inputs are categorized in the following hierarchy under applicable financial accounting standards:
| Level 1 – | Unadjusted quoted prices in active markets for identical investments, unrestricted assets or liabilities that the Fund has the ability to access at the measurement date; |
| Level 2 – | Quoted prices which are not active, quoted prices for similar assets or liabilities in active markets or inputs other than quoted prices that are observable (either directly or indirectly) for substantially the full term of the asset or liability; and |
| Level 3 – | Significant unobservable prices or inputs (including the Fund’s own assumptions in determining the fair value of investments) where there is little or no market activity for the asset or liability at the measurement date. |
U.S. Equity High Volatility Put Write Index Fund
| Notes to Financial Statements | May 31, 2017 (Unaudited) |
The following is a summary of the inputs used to value the Fund’s investments at May 31, 2017:
U.S. Equity High Volatility Put Write Index Fund
| Investments in Securities at Value | | Level 1 - Unadjusted Quoted Prices | | | Level 2 - Other Significant Observable Inputs | | | Level 3 - Significant Unobservable Inputs | | | Total | |
Short Term Investments | | $ | – | | | $ | 30,766,161 | | | $ | – | | | $ | 30,766,161 | |
| Total | | $ | – | | | $ | 30,766,161 | | | $ | – | | | $ | 30,766,161 | |
| | | | | | | | | | | | | | | | | |
| Other Financial Instruments* | | | | | | | | | | | | | | | | |
| Liabilities | | | | | | | | | | | | | | | | |
Written Option Contracts | | $ | (201,262 | ) | | $ | – | | | $ | – | | | $ | (201,262 | ) |
| Total | | $ | (201,262 | ) | | $ | – | | | $ | – | | | $ | (201,262 | ) |
| * | Other financial instruments are instruments not reflected in the Schedule of Investments, such as written options. |
The Fund recognizes transfers between levels as of the end of the period. For the six months ended May 31, 2017, the Fund did not have any transfers between Level 1 and Level 2 securities. The Fund did not have any securities that used significant unobservable inputs (Level 3) in determining fair value.
C. Securities Transactions and Investment Income
Securities transactions are recorded as of the trade date. Realized gains and losses from securities transactions are recorded on the highest cost basis. Dividend income and capital gains distributions, if any, are recorded on the ex-dividend date. Interest income, if any, is recorded on the accrual basis.
D. Dividends and Distributions to Shareholders
Dividends from net investment income, if any, and any net short-term capital gains are distributed to shareholders following each 60 day period. Any other net income or capital gains will be distributed at least annually. Dividends may be declared and paid more frequently to improve Index tracking or to comply with the distribution requirements of the Internal Revenue Code. In addition, the Fund intends to distribute, at the end of each 60-day period out of net investment income and/or net short-term capital gains, an amount of cash equal to 1.5% of the Fund’s net assets at the end of such 60-day period. If the Fund’s net investment income and net short-term capital gains are insufficient to support a 1.5% distribution in any 60-day period, the distribution will be reduced by the amount of the shortfall. As a result of the Fund’s investment strategy, it is not expected that the Fund will have income from long-term capital gains.
E. Federal Tax and Tax Basis Information
The timing and character of income and capital gain distributions are determined in accordance with income tax regulations, which may differ from U.S. GAAP. Reclassifications are made to the Fund’s capital accounts for permanent tax differences to reflect income and gains available for distribution (or available capital loss carryforwards) under income tax regulations. The amounts and characteristics of tax basis distributions and composition of distributable earnings/(accumulated losses) are finalized at fiscal year-end; accordingly, tax basis balances have not been determined as of May 31, 2017.
The tax character of the distributions paid during the fiscal year ended November 30, 2016 was as follows:
| | | Tax Return of Capital | |
| November 30, 2016 | | | |
| U.S. Equity High Volatility Put Write Index Fund | | $ | 3,811,090 | |
| Notes to Financial Statements | May 31, 2017 (Unaudited) |
At November 30, 2016 the U.S. Equity High Volatility Put Write Index Fund post-enactment capital losses deferred to the next tax year were as follows:
| Fund | | Short-Term | |
| U.S. Equity High Volatility Put Write Index Fund | | $ | 611,541 | |
| | | | | |
As of May 31, 2017, the cost of investments for federal income tax purposes and accumulated net unrealized appreciation/(depreciation) on investments were as follows:
| | | U.S. Equity High Volatility Put Write Index Fund | |
| Gross appreciation (excess of value over tax cost) | | $ | – | |
Gross depreciation (excess of tax cost over value) | | | (6,004 | ) |
| Net unrealized appreciation/ (depreciation) | | | (6,004 | ) |
| Cost of investments for income tax purposes | | $ | 30,772,165 | |
F. Income Taxes
No provision for income taxes are included in the accompanying financial statements, as the Fund intends to distribute to shareholders all taxable investment income and realized gains and otherwise comply with Subchapter M of the Internal Revenue Code of 1986, as amended, applicable to regulated investment companies. The Fund evaluates tax positions taken (or expected to be taken) in the course of preparing the Fund’s tax returns to determine whether these positions meet a “more-likely-than-not” standard that, based on the technical merits, have a more than fifty percent likelihood of being sustained by a taxing authority upon examination. A tax position that meets the “more-likely-than-not” recognition threshold is measured to determine the amount of benefit to recognize in the financial statements.
As of and during the six months ended May 31, 2017, the Fund did not have a liability for any unrecognized tax benefits. The Fund files U.S. federal, state, and local tax returns as required. The Fund’s tax returns are subject to examination by the relevant tax authorities until expiration of the applicable statute of limitations, which is generally three years after the filing of the tax return, but may extend to four years in certain jurisdictions. Tax returns for open years have incorporated no uncertain tax positions that require a provision for income taxes.
G. Derivative Instruments and Hedging Activities
The following discloses the Fund’s use of derivative instruments and hedging activities.
The Fund’s investment objective permits the Fund to purchase derivative contracts including written options. In doing so, the Fund will employ strategies in differing combinations to permit them to increase, decrease, or change the level or types of exposure to market factors. Central to those strategies are features inherent to derivatives that make them more attractive for this purpose than equity or debt securities; they require little or no initial cash investment, they can focus exposure on only certain selected risk factors, and they may not require the ultimate receipt or delivery of the underlying security (or securities) to the contract. This may allow the Fund to pursue their objectives more quickly and efficiently than if they were to make direct purchases or sales of securities capable of affecting a similar response to market factors.
Cash collateral that has been pledged to cover derivative obligations of the Fund and cash collateral received from the counterparty and non-cash collateral pledged by the Fund, if any, is noted in the Fund’s Schedule of Investments.
A written put option on an asset by the Fund obligates the Fund to buy the specified asset from the purchaser at the exercise price if the option is exercised before the expiration date. Premiums received when writing options are recorded as liabilities and are subsequently adjusted to the current value of the options written. Premiums received from writing options that expire are treated as realized gains. Premiums received from writing options, which are either exercised or closed, are offset against the proceeds received or amount paid on the transaction to determine realized gains or losses which are recorded on the Statement of Operations.
Market Risk Factors: In pursuit of the Fund’s investment objectives, the Fund will use derivatives to increase or decrease its exposure to the following market risk factors:
U.S. Equity High Volatility Put Write Index Fund
| Notes to Financial Statements | May 31, 2017 (Unaudited) |
Equity Risk: The value of the options sold by the Fund is based on the value of the instruments directly or indirectly underlying such options. Accordingly, the Fund is exposed to equity risk, which is the risk that the value of the underlying stocks or ETFs underlying options written by the Fund will fall due to general market and economic conditions, perceptions regarding the industries in which the issuers of such stocks or ETFs participate, or factors relating to specific companies. In such event, the value of the options sold by the Fund will likely decline. Additionally, if the value of the stocks or ETFs underlying the options sold by the Fund increases, the Fund’s returns will not increase accordingly.
Put Option Risk: Options are generally subject to volatile swings in price based on changes in value of the underlying instrument, and the options written by the Fund may be particularly subject to this risk because the underlying stocks are selected by the Index Provider to have high volatility. The Fund will incur a form of economic leverage through its use of options, which will increase the volatility of the Fund’s returns and may increase the risk of loss to the Fund. While the Fund will collect premiums on the options it writes, the Fund’s risk of loss if one or more of its options is exercised and expires in-the-money may substantially outweigh the gains to the Fund from the receipt of such option premiums. The Fund will either earmark or segregate sufficient liquid assets to cover its obligations under each option on an ongoing basis. Moreover, the options sold by the Fund may have imperfect correlation to the returns of its underlying stocks or ETFs.
Implied Volatility Risk: When the Fund sells a listed put option, it gains the amount of the premium it receives, but also incurs a corresponding liability representing the value of the option it has sold (until the option is exercised and finishes in the money or expires worthless). The value of the options in which the Fund invests is partly based on the volatility used by market participants to price such options (i.e., implied volatility). Accordingly, increases in the implied volatility of such options will cause the value of such options to increase (even if the prices of the options’ underlying stocks or ETFs do not change), which will result in a corresponding increase in the liabilities of the Fund under such options and thus decrease the Fund’s NAV. The Fund is therefore exposed to implied volatility risk before the options expire or are exercised. This is the risk that the value of the implied volatility of the options sold by the Fund will increase due to general market and economic conditions, perceptions regarding the industries in which the issuers of such stock participate, or factors relating to specific companies.
Transactions in written option contracts during the six months ended May 31, 2017, were as follows:
| | | Written Put Options | |
| | | Number of Contracts | | | Premiums | |
| Options outstanding at November 30, 2016 | | | (8,982 | ) | | $ | (599,619 | ) |
| Options written | | | (26,444 | ) | | | (1,658,587 | ) |
| Options exercised | | | 1,321 | | | | 135,811 | |
| Options expired | | | 23,808 | | | | 1,640,447 | |
| Options closed | | | 1,872 | | | | 116,651 | |
| Options outstanding at May 31, 2017 | | | (8,425 | ) | | | (365,297 | ) |
| Market Value, May 31, 2017 | | | | | | $ | (201,262 | ) |
The effect of derivatives instruments on the Statement of Assets and Liabilities as of May 31, 2017:
| | Liability Derivatives | |
| Risk Exposure | Statement of Assets and Liabilities Location | | Fair Value | |
| U.S. Equity High Volatility Put Write Index Fund | | | | |
| Equity Contracts (Written Options) | Written options, at value | | $ | 201,262 | |
| | | | $ | 201,262 | |
U.S. Equity High Volatility Put Write Index Fund
| Notes to Financial Statements | May 31, 2017 (Unaudited) |
The effect of derivatives instruments on the Statement of Operations for the six months ended May 31, 2017:
| Risk Exposure | Statement of Operations Location | | | Gain/(Loss)on Derivatives Recognized in Income | |
| U.S. Equity High Volatility Put Write Index Fund | | | | | |
| Equity Contracts (Written Options) | Net realized gain on written optioncontracts/Net change in unrealized depreciation on written option contracts | | $ | 1,643,143 | | | $ | (21,851 | ) |
| Total | | | $ | 1,643,143 | | | $ | (21,851 | ) |
The average written option contracts volume for the Fund were 8,333 during the six months ended May 31, 2017.
| 3. | INVESTMENT ADVISORY FEE AND OTHER AFFILIATED TRANSACTIONS |
ALPS Advisors, Inc. (the “Adviser”) acts as the Fund’s investment adviser pursuant to an advisory agreement with the Trust on behalf of the Fund (the “Advisory Agreement”). Pursuant to the Advisory Agreement, the Fund pays the Adviser a unitary fee for the services and facilities it provides payable on a monthly basis at the annual rate of 0.95% of the Fund’s average daily net assets. From time to time, the Investment Adviser may waive all or a portion of its fee.
Out of the unitary management fee, the Investment Adviser pays substantially all expenses of the Fund, including the cost of transfer agency, custody, fund administration, legal, audit, independent trustees and other services, except for interest expenses, distribution fees or expenses, brokerage expenses, taxes and extraordinary expenses such as litigation and other expenses not incurred in the ordinary course of the Fund’s business. The Adviser’s unitary management fee is designed pay substantially all of the Fund’s expenses and to compensate the Adviser for providing services for the Fund.
ALPS Fund Services, Inc., an affiliate of the Adviser, is the administrator of the Fund.
Each Trustee who is not an officer or employee of the Adviser, any sub-adviser or any of their affiliates (“Independent Trustees”) receives (1) a quarterly retainer of $5,000, (2) a per meeting fee for regularly scheduled meetings of $3,750, (3) $1,500 for any special meeting held outside of a regularly scheduled board meeting, and (4) reimbursement for all reasonable out-of-pocket expenses relating to attendance at meetings.
| 4. | PURCHASES AND SALES OF SECURITIES |
For the six months ended May 31, 2017, the cost of purchases and proceeds from sales of common stock related to exercised written put options were as follows:
| Fund | | Purchases | | | Sales | |
| U.S. Equity High Volatility Put Write Index Fund | | $ | 10,639,628 | | | $ | 9,766,166 | |
| 5. | CAPITAL SHARE TRANSACTIONS |
Shares are created and redeemed by the Fund on a cash basis only in Creation Unit size aggregations of 100,000 Shares. Only broker-dealers or large institutional investors with creation and redemption agreements called Authorized Participants (“AP”) are permitted to purchase or redeem Creation Units from the Fund.
U.S. Equity High Volatility Put Write Index Fund
| Notes to Financial Statements | May 31, 2017 (Unaudited) |
On October 13, 2016, the Securities and Exchange Commission (“SEC”) amended Regulation S-X, which will require standardized, enhanced disclosure about derivatives in investment company financial statements, as well as other amendments. The compliance date for the amendments to Regulation S-X is August 1, 2017. Management is currently evaluating the impact to the financial statements and disclosures.
On June 8, 2017, the Board of the Trust authorized an orderly liquidation of the U.S. Equity High Volatility Put Write Index Fund. The Fund closed to new investors on June 21, 2017, and the NYSE ARCA halted trading in the Fund before the opening of trading on June 26, 2017. The effective date of the Fund’s liquidation was June 26, 2017.
U.S. Equity High Volatility Put Write Index Fund
| Additional Information | May 31, 2017 (Unaudited) |
PROXY VOTING RECORDS, POLICIES AND PROCEDURES
Information regarding how the Fund voted proxies relating to portfolio securities during the most recent 12-month period ended June 30 and a description of the Fund’s proxy voting policies and procedures used in determining how to vote for proxies are available without charge on the SEC’s website at www.sec.gov and upon request, by calling (toll-free) 1-866-675-2639.
PORTFOLIO HOLDINGS
The Trust is required to disclose, after its first and third fiscal quarters, the complete schedule of the Fund’s portfolio holdings with the SEC on Form N-Q. Form N-Q for the Fund will be available on the SEC’s website at www.sec.gov. The Fund’s Form N-Q may also be reviewed and copied at the SEC’s Public Reference Room in Washington, D.C. and information on the operation of the Public Reference Room may be obtained by calling 1- 800-SEC-0330. The Fund’s Form N-Q will be available without charge, upon request, by calling (toll-free) 1-866-675-2639 or by writing to ALPS ETF Trust at 1290 Broadway, Suite 1100, Denver, Colorado 80203.
LICENSING AGREEMENT
The U.S. Equity High Volatility Put Write Index Fund is not sponsored, endorsed, sold or promoted by NYSE Group, Inc. or its affiliates (“NYSE Group”). NYSE Group makes no representation or warranty regarding the advisability of investing in securities generally, in The U.S. Equity High Volatility Put Write Index Fund particularly, or the ability of the NYSE Arca U.S. Equity High Volatility Put Write IndexSM to track general stock market performance.
NYSE GROUP MAKES NO EXPRESS OR IMPLIED WARRANTIES, AND HEREBY EXPRESSLY DISCLAIMS ALL WARRANTIES OF MERCHANTABILITY OR FITNESS FOR A PARTICULAR PURPOSE WITH RESPECT TO THE NYSE ARCA U.S. EQUITY HIGH VOLATILITY PUT WRITE INDEXSM OR ANY DATA INCLUDED THEREIN. IN NO EVENT SHALL NYSE GROUP HAVE ANY LIABILITY FOR ANY SPECIAL, PUNITIVE, INDIRECT, OR CONSEQUENTIAL DAMAGES (INCLUDING LOSS OF PROFITS), EVEN IF NOTIFIED OF THE POSSIBLIITY OF SUCH DAMAGES.
The Adviser does not guarantee the accuracy and/or the completeness of the Underlying Index or any data included therein, and the Adviser shall have no liability for any errors, omissions or interruptions therein. The Adviser makes no warranty, express or implied, as to results to be obtained by the Fund, owners of the Shares of the Fund or any other person or entity from the use of the Underlying Index or any data included therein. The Adviser makes no express or implied warranties, and expressly disclaims all warranties of merchantability or fitness for a particular purpose or use with respect to the Underlying Index or any data included therein. Without limiting any of the foregoing, in no event shall the Adviser have any liability for any special, punitive, direct, indirect or consequential damages (including lost profits) arising out of matters relating to the use of the Underlying Index even if notified of the possibility of such damages.
| Performance Overview | |
| RiverFront Dynamic Core Income ETF | 1 |
| RiverFront Dynamic Unconstrained Income ETF | 3 |
| RiverFront Dynamic US Dividend Advantage ETF | 5 |
| RiverFront Dynamic US Flex-Cap ETF | 8 |
| RiverFront Strategic Income Fund | 11 |
| Disclosure of Fund Expenses | 13 |
| Financial Statements | |
| Schedule of Investments | |
| RiverFront Dynamic Core Income ETF | 14 |
| RiverFront Dynamic Unconstrained Income ETF | 16 |
| RiverFront Dynamic US Dividend Advantage ETF | 18 |
| RiverFront Dynamic US Flex-Cap ETF | 20 |
| RiverFront Strategic Income Fund | 23 |
| Statements of Assets and Liabilities | 25 |
| Statements of Operations | 26 |
| Statements of Changes in Net Assets | |
| RiverFront Dynamic Core Income ETF | 27 |
| RiverFront Dynamic Unconstrained Income ETF | 28 |
| RiverFront Dynamic US Dividend Advantage ETF | 29 |
| RiverFront Dynamic US Flex-Cap ETF | 30 |
| RiverFront Strategic Income Fund | 31 |
| Financial Highlights | 32 |
| Notes to Financial Statements | 37 |
| Additional Information | 45 |
alpsfunds.com
RiverFront Dynamic Core Income ETF
| Performance Overview | May 31, 2017 (Unaudited) |
Investment Objective
RiverFront Dynamic Core Income ETF (the “Fund”) seeks total return, with an emphasis on income as the source of that total return. The Fund seeks to achieve its investment objective by investing in a global portfolio of fixed income securities of various maturities, ratings and currency denominations.
Performance Overview
The Fund underperformed its benchmark by 0.11% over the six month period ended 5/31/17, based on its return at market. The primary source of its underperformance was the Fund’s strategy of limiting interest rate risk, by maintaining a shorter duration than its benchmark. As of 5/31/17 the Fund’s duration was about 3.66 years compared to about 5.95 years for its benchmark. Over the preceding six months intermediate (5 year) Treasury yields fell about 9 basis points (“bps”), long-term (10+ years) Treasury yields fell about 17 bps, while short-term (2 year) yields rose about 17 bps. The Fund had limited exposure to maturities beyond 10 years, which negatively impacted performance. The negative impact of the short duration strategy was somewhat offset by the Fund’s strategy of investing primarily in investment grade corporate bonds (with a small percentage in non-investment grade corporate bonds), as spreads on the BofA Merrill Lynch US Corporate Index tightened 17 basis points over this time period. As of 5/31/17, the average credit quality of the Fund was approximately A-, compared to AA for its benchmark.
Performance (as of May 31, 2017)
| | 6 Months | Since Inception^ |
| RiverFront Dynamic Core Income ETF – NAV | 2.37% | 0.56% |
| RiverFront Dynamic Core Income ETF – Market Price* | 2.41% | 0.76% |
| Bloomberg Barclays U.S. Aggregate Bond Total Return Index | 2.52% | 0.50% |
Total Expense Ratio (per the current prospectus) 0.52%.
Performance data quoted represents past performance. Past performance does not guarantee future results. The table does not reflect the deduction of taxes that a shareholder would pay on Fund distributions or the redemption of Fund shares. Investment return and principal value of an investment will fluctuate so that an investor’s shares, when sold or redeemed, may be worth more or less than the original cost. Current performance data may be higher or lower than actual data quoted. For the most current month-end performance data please visit www.alpsfunds.com or call 1.866.759.5679.
NAV is an exchange-traded fund’s per-share value. The per-share dollar amount of the fund is derived by dividing the total value of all the securities in its portfolio, less any liabilities, by the number of fund shares outstanding. Market Price is the price at which a share can currently be traded in the market. Information detailing the number of days the Market Price of the Fund was greater than the Fund’s NAV and the number of days it was less than the Fund’s NAV can be obtained at www.alpsfunds.com.
| ^ | The Fund commenced operations on June 14, 2016. Total return for a period of less than one year is not annualized. |
| * | Market Price is based on the midpoint of the bid-ask spread at 4 p.m. ET and does not represent the returns an investor would receive if shares were traded at other times. |
The Fund is new with limited operating history.
Bloomberg Barclays U.S. Aggregate Bond Index is a broad-based benchmark that measures the investment grade, U.S. dollar-denominated, fixed-rate taxable bond market, including Treasuries, government-related and corporate securities, MBS (agency fixed-rate and hybrid ARM pass-throughs), ABS, and CMBS (agency and non-agency). The index is reported on a total return basis, which assumes reinvestment of any dividends and distributions realized during a given time period. The index is not actively managed and does not reflect any deductions for fees, expenses or taxes. One cannot invest directly in an index. Index performance does not reflect fund performance.
The RiverFront Dynamic Core Income ETF is not suitable for all investors. Investments in the Fund are subject to investment risks, including possible loss of the principal amount invested.
The Fund’s shares are not individually redeemable. Investors buy and sell shares of the Fund on a secondary market. Only market makers or “authorized participants” may trade directly with the Fund, typically in blocks of 50,000 shares.
ALPS Portfolio Solutions Distributor, Inc., a FINRA member, is the Distributor for the RiverFront Dynamic Core Income ETF.
RiverFront Dynamic Core Income ETF
| Performance Overview | May 31, 2017 (Unaudited) |
Top 10 Holdings*^ (as of May 31, 2017)
| The Home Depot, Inc., Sr. Unsec. | 2.73% |
| Morgan Stanley, Sr. Unsec. | 2.68% |
| The Southern Co., Sr. Unsec. | 2.67% |
| Metlife Inc., Sr. Unsec. | 2.51% |
| Flextronics International Ltd., Sr. Unsec. | 2.38% |
| Verizon Communications, Inc., Sr. Unsec. | 2.34% |
| Bank Of New York Mellon Corp., Sr. Unsec. | 2.31% |
| L Brands, Inc., Sr. Unsec. | 2.31% |
Hilton Worldwide Finance LLC/Hilton Worldwide Finance Corp., Sr. Unsec. | 2.29% |
| Charter Communications Operating LLC, First Lien | 2.27% |
| Total% of Top 10 Holdings | 24.49% |
Asset Allocation* (as of May 31, 2017)
| ^ | Excludes Money Market Fund |
Future holdings are subject to change.
Growth of $10,000 (as of May 31, 2017)
Comparison of Change in Value of $10,000 Investment in the Fund and the Fund’s benchmark
The chart above represents historical performance of a hypothetical investment of $10,000 in the Fund over the life of the Fund. Past performance does not guarantee future results. This chart does not reflect the deduction of taxes that a shareholder would pay on Fund distributions or the redemption of Fund shares.
RiverFront Dynamic Unconstrained Income ETF
| Performance Overview | May 31, 2017 (Unaudited) |
Investment Objective
RiverFront Dynamic Unconstrained Income ETF (the “Fund”) seeks total return, with an emphasis on income as the source of that total return. The Fund seeks to achieve its investment objective by investing in a global portfolio of fixed income securities of various maturities, ratings and currency denominations.
Performance Overview
The Fund underperformed its benchmark by 1.6% over the six months ended 5/31/17, based on its return at market. The Fund performed well on an absolute basis however, returning 5.26%. The Fund was mainly invested in high yield bonds over this period. The primary reason for the Fund’s underperformance versus its benchmark was its higher credit quality. The average credit quality of the Fund on 5/31/17 was approximately BB rated, compared to B+ rated for its benchmark. This was due to an underweight to lower rated (CCC and B-) bonds and an overweight to higher quality (BB) bonds. Over the preceding six months, BB rated bonds returned 5.7%, B rated bonds returned 6.8%, and CCC rated bond returned 11.1%.
Performance (as of May 31, 2017)
| | 6 Months | Since Inception^ |
| RiverFront Dynamic Unconstrained Income ETF – NAV | 5.06% | 10.02% |
| RiverFront Dynamic Unconstrained Income ETF – Market Price* | 5.26% | 10.15% |
| BofA Merrill Lynch U.S. High Yield Master II Total Return Index | 6.86% | 13.07% |
Total Expense Ratio (per the current prospectus) 0.53%.
Performance data quoted represents past performance. Past performance does not guarantee future results. The table does not reflect the deduction of taxes that a shareholder would pay on Fund distributions or the redemption of Fund shares. Investment return and principal value of an investment will fluctuate so that an investor’s shares, when sold or redeemed, may be worth more or less than the original cost. Current performance data may be higher or lower than actual data quoted. For the most current month-end performance data please visit www.alpsfunds.com or call 1.866.759.5679.
NAV is an exchange-traded fund’s per-share value. The per-share dollar amount of the fund is derived by dividing the total value of all the securities in its portfolio, less any liabilities, by the number of fund shares outstanding. Market Price is the price at which a share can currently be traded in the market. Information detailing the number of days the Market Price of the Fund was greater than the Fund’s NAV and the number of days it was less than the Fund’s NAV can be obtained at www.alpsfunds.com.
| ^ | The Fund commenced operations on June 14, 2016. Total return for a period of less than one year is not annualized. |
| * | Market Price is based on the midpoint of the bid-ask spread at 4 p.m. ET and does not represent the returns an investor would receive if shares were traded at other times. |
The Fund is new with limited operating history.
BofA Merrill Lynch U.S. High Yield Master II Index tracks the performance of below-investment grade U.S. dollar-denominated corporate bonds issued in the U.S. Domestic market. The index is reported on a total return basis, which assumes reinvestment of any dividends and distributions realized during a given time period. The index is not actively managed and does not reflect any deductions for fees, expenses or taxes. One cannot invest directly in an index. Index performance does not reflect fund performance.
The RiverFront Dynamic Unconstrained Income ETF is not suitable for all investors. Investments in the Fund are subject to investment risks, including possible loss of the principal amount invested.
The Fund’s shares are not individually redeemable. Investors buy and sell shares of the Fund on a secondary market. Only market makers or “authorized participants” may trade directly with the Fund, typically in blocks of 50,000 shares.
ALPS Portfolio Solutions Distributor, Inc., a FINRA member, is the Distributor for the RiverFront Dynamic Unconstrained Income ETF.
RiverFront Dynamic Unconstrained Income ETF
| Performance Overview | May 31, 2017 (Unaudited) |
Top 10 Holdings*^ (as of May 31, 2017)
| Newfield Exploration Co., Sr. Unsec. | 2.72% |
| Iron Mountain, Inc., Sr. Sub. | 2.62% |
| MGM Resorts International, Sr. Unsec. | 2.56% |
| Centene Corp., Sr. Unsec. | 2.40% |
| CIT Group, Inc., Sr. Unsec. | 2.28% |
| ADT Corp., First Lien | 2.11% |
| Weatherford International Ltd., Sr. Unsec. | 2.10% |
| CenturyLink, Inc., Sr. Unsec. | 2.09% |
| International Game Technology PLC, First Lien | 2.07% |
| T-Mobile USA, Inc., Sr. Unsec. | 2.07% |
| Total % of Top 10 Holdings | 23.02% |
Asset Allocation* (as of May 31, 2017)
| ^ | Excludes Money Market Fund |
Future holdings are subject to change.
Growth of $10,000 (as of May 31, 2017)
Comparison of Change in Value of $10,000 Investment in the Fund and the Fund’s benchmark
The chart above represents historical performance of a hypothetical investment of $10,000 in the Fund over the life of the Fund. Past performance does not guarantee future results. This chart does not reflect the deduction of taxes that a shareholder would pay on Fund distributions or the redemption of Fund shares.
RiverFront Dynamic US Dividend Advantage ETF
| Performance Overview | May 31, 2017 (Unaudited) |
Investment Objective
RiverFront Dynamic US Dividend Advantage ETF (the “Fund”) seeks to provide capital appreciation and dividend income. The Fund seeks to achieve its investment objective by investing at least 65% of its net assets in a portfolio of equity securities of publicly traded U.S. companies with the potential for dividend growth. Equity securities include common stocks and common or preferred shares of real estate investment trusts (“REITs”).
Performance Overview
The six-month period ended May 31, 2017 has been a lucrative time to be a U.S. equity investor. Over that time period the S&P 500 rose nearly 11% and the S&P 1500 gained just over 10%. Unfortunately, for the dividend-oriented investor, four out of the five most popular dividend indexes returned less than 8% over the same period. The Fund had a similar experience returning 7.14% versus its S&P 500 benchmark of 10.81%. The underperformance of dividend stocks during a ‘hot market’ is disappointing but not surprising given that dividend-paying stocks are generally viewed as slower growth and more defensive.
Fund-Level Attribution
The Fund trailed its benchmark by 367 bps (“bp” = 1/100 of 1%) for the six-month period ended May 31, 2017. The source of its underperformance largely came from poor security selection.
| 1. | Sector Allocation: Slight Negative: The sector allocations in the Fund are determined through a bottoms-up process that ranks stocks on three fundamental cornerstones: value, quality and momentum/sentiment. If a sector produces more highly ranked stocks relative to another sector, that sector’s allocation is allowed to exceed its benchmark by a tolerable level, and vice versa. Sector allocation was a minor detractor for the Fund’s performance. |
| 2. | Security Selection: Negative: The investment selection process behind the Fund is built on making a number of small bets in the portfolio and avoiding the larger bets that many smart beta products rely on. This means that there are rarely just one or two things contributing to the returns. In 2017, RiverFront’s equity selection posted negative results in aggregate. |
2017 Outlook:
We continue to have a constructive but muted outlook for the US equity markets. As of May 31, our proprietary Price Matters methodology shows U.S. Large-caps between 5-10% above their long-term historical averages and U.S. mid and small-caps 10-20% above their historical averages. Valuations ‘near’ or ‘slightly above’ long-term averages, in our view, are not significantly high enough to end the bull market that began in 2009, but will likely translate to returns below their long-term averages.
While broad market returns in the U.S. are expected to be muted, we continue to anticipate better returns for strategies that favor more selective exposures. Historically, this has been a normal transition that occurs as a bull market matures. Essentially, in the early stages of a bull market, “the rising tide lifts all boats,” making investment strategies that emphasize broad indexes, like the S&P 500, difficult to beat. We believe this stage of the current bull market was extended several years beyond normal by three successive quantitative easing (QE) programs that created an abnormally high tide. As we enter the ninth year of this bull market and money printing is becoming a more distant memory, we believe the baton of investment success will be passed to more selective strategies that differentiate among sectors, industries and stocks.
We believe this transition favors the ‘active’ and ‘fundamental’ stock-picking strategies that are emphasized in RiverFront’s sub-advised U.S. ETFs.
RiverFront Dynamic US Dividend Advantage ETF
| Performance Overview | May 31, 2017 (Unaudited) |
Performance (as of May 31, 2017)
| | 6 Months | Since Inception^ |
| RiverFront Dynamic US Dividend Advantage ETF – NAV | 7.14% | 14.26% |
| RiverFront Dynamic US Dividend Advantage ETF – Market Price* | 7.06% | 14.26% |
S&P 500® Total Return Index | 10.81% | 16.74% |
Total Expense Ratio (per the current prospectus) 0.52%.
Performance data quoted represents past performance. Past performance does not guarantee future results. The table does not reflect the deduction of taxes that a shareholder would pay on Fund distributions or the redemption of Fund shares. Investment return and principal value of an investment will fluctuate so that an investor’s shares, when sold or redeemed, may be worth more or less than the original cost. Current performance data may be higher or lower than actual data quoted. For the most current month-end performance data please visit www.alpsfunds.com or call 1.866.759.5679.
NAV is an exchange-traded fund’s per-share value. The per-share dollar amount of the fund is derived by dividing the total value of all the securities in its portfolio, less any liabilities, by the number of fund shares outstanding. Market Price is the price at which a share can currently be traded in the market. Information detailing the number of days the Market Price of the Fund was greater than the Fund’s NAV and the number of days it was less than the Fund’s NAV can be obtained at www.alpsfunds.com.
| ^ | The Fund commenced operations on June 7, 2016. Total return for a period of less than one year is not annualized. |
| * | Market Price is based on the midpoint of the bid-ask spread at 4 p.m. ET and does not represent the returns an investor would receive if shares were traded at other times. |
The Fund is new with limited operating history.
S&P 500® Index is the Standard & Poor’s composite index of 500 stocks, a widely recognized, unmanaged index of common stock prices. The index is reported on a total return basis, which assumes reinvestment of any dividends and distributions realized during a given time period. The index is not actively managed and does not reflect any deductions for fees, expenses or taxes. One cannot invest directly in an index. Index performance does not reflect fund performance.
The RiverFront Dynamic US Dividend Advantage ETF is not suitable for all investors. Investments in the Fund are subject to investment risks, including possible loss of the principal amount invested.
The Fund’s shares are not individually redeemable. Investors buy and sell shares of the Fund on a secondary market. Only market makers or “authorized participants” may trade directly with the Fund, typically in blocks of 50,000 shares.
ALPS Portfolio Solutions Distributor, Inc., a FINRA member, is the Distributor for the RiverFront Dynamic US Dividend Advantage ETF.
RiverFront Dynamic US Dividend Advantage ETF
| Performance Overview | May 31, 2017 (Unaudited) |
Top 10 Holdings* (as of May 31, 2017)
| Apple, Inc. | 3.10% |
| Wal‐Mart Stores, Inc. | 2.39% |
| Intel Corp. | 2.37% |
| Facebook, Inc., Class A | 2.24% |
| HealthSouth Corp. | 1.93% |
| Pfizer, Inc. | 1.85% |
| Texas Instruments, Inc. | 1.80% |
| International Business Machines Corp. | 1.75% |
| Applied Materials, Inc. | 1.72% |
| Wells Fargo & Co. | 1.62% |
| Total % of Top 10 Holdings | 20.77% |
Asset Allocation* (as of May 31, 2017)
Future holdings are subject to change.
Growth of $10,000 (as of May 31, 2017)
Comparison of Change in Value of $10,000 Investment in the Fund and the Fund’s benchmark
The chart above represents historical performance of a hypothetical investment of $10,000 in the Fund over the life of the Fund. Past performance does not guarantee future results. This chart does not reflect the deduction of taxes that a shareholder would pay on Fund distributions or the redemption of Fund shares.
RiverFront Dynamic US Flex-Cap ETF
| Performance Overview | May 31, 2017 (Unaudited) |
Investment Objective
RiverFront Dynamic US Flex-Cap ETF (the “Fund”) seeks to provide capital appreciation. The Fund seeks to achieve its investment objective by investing at least 65% of its net assets in a portfolio of equity securities of publicly traded U.S. companies. Equity securities include common stocks and common or preferred shares of real estate investment trusts (“REITs”).
Performance Overview
The six-month period ended May 31, 2017 has been a lucrative time to be a U.S. equity investor. Over that time period the S&P 500 rose nearly 11% and the S&P 1500 gained just over 10%.
Fund-Level Attribution
The Fund trailed its benchmark (S&P 1500) by 150 bps (“bp” = 1/100 of 1%) for the six-month period ended May 31, 2017. The source of its underperformance came from poor security selection.
| 1. | Sector Allocation: Positive: The sector allocations in the Fund are determined through a bottoms-up process that ranks stocks on three fundamental cornerstones: value, quality and momentum/sentiment. If a sector produces more highly ranked stocks relative to another sector, that sector’s allocation is allowed to exceed its benchmark by a tolerable level, and vice versa. Sector allocation was a positive contributor to the Fund’s performance. |
| 2. | Security Selection: Negative: The investment selection process behind the Fund is built on making a number of small bets in the portfolio and avoiding the larger bets that many smart beta products rely on. This means that there are rarely just one or two things contributing to the returns. In 2017, RiverFront’s equity selection posted negative results in aggregate. |
2017 Outlook:
We continue to have a constructive but muted outlook for the US equity markets. As of May 31, our proprietary Price Matters methodology shows US Large-caps between 5-10% above their long-term historical averages and U.S. mid and small-caps 10-20% above their historical averages. Valuations ‘near’ or ‘slightly above’ long-term averages, in our view, are not significantly high enough to end the bull market that began in 2009, but will likely translate to returns below their long-term averages.
While broad market returns in the U.S. are expected to be muted, we continue to anticipate better returns for strategies that favor more selective exposures. Historically, this has been a normal transition that occurs as a bull market matures. Essentially, in the early stages of a bull market, “the rising tide lifts all boats,” making investment strategies that emphasize broad indexes, like the S&P 500, difficult to beat. We believe this stage of the current bull market was extended several years beyond normal by three successive quantitative easing (QE) programs that created an abnormally high tide. As we enter the ninth year of this bull market and money printing is becoming a more distant memory, we believe the baton of investment success will be passed to more selective strategies that differentiate among sectors, industries and stocks.
We believe this transition favors the ‘active’ and ‘fundamental’ stock-picking strategies that are emphasized in RiverFront’s sub-advised U.S. ETFs.
RiverFront Dynamic US Flex-Cap ETF
| Performance Overview | May 31, 2017 (Unaudited) |
Performance (as of May 31, 2017)
| | 6 Months | Since Inception^ |
| RiverFront Dynamic US Flex-Cap ETF – NAV | 8.75% | 16.85% |
| RiverFront Dynamic US Flex-Cap ETF – Market Price* | 8.71% | 16.89% |
S&P Composite 1500® Total Return Index | 10.25% | 16.69% |
Total Expense Ratio (per the current prospectus) 0.52%.
Performance data quoted represents past performance. Past performance does not guarantee future results. The table does not reflect the deduction of taxes that a shareholder would pay on Fund distributions or the redemption of Fund shares. Investment return and principal value of an investment will fluctuate so that an investor’s shares, when sold or redeemed, may be worth more or less than the original cost. Current performance data may be higher or lower than actual data quoted. For the most current month-end performance data please visit www.alpsfunds.com or call 1.866.759.5679.
NAV is an exchange-traded fund’s per-share value. The per-share dollar amount of the fund is derived by dividing the total value of all the securities in its portfolio, less any liabilities, by the number of fund shares outstanding. Market Price is the price at which a share can currently be traded in the market. Information detailing the number of days the Market Price of the Fund was greater than the Fund’s NAV and the number of days it was less than the Fund’s NAV can be obtained at www.alpsfunds.com.
| ^ | The Fund commenced operations on June 7, 2016. Total return for a period of less than one year is not annualized. |
| * | Market Price is based on the midpoint of the bid-ask spread at 4 p.m. ET and does not represent the returns an investor would receive if shares were traded at other times. |
The Fund is new with limited operating history.
S&P Composite 1500® Index is the Standard & Poor’s broad-based unmanaged capitalization-weighted index comprising 1,500 stocks of Large-cap, Mid-cap, and Small-cap U.S. companies. The index is reported on a total return basis, which assumes reinvestment of any dividends and distributions realized during a given time period. The index is not actively managed and does not reflect any deductions for fees, expenses or taxes. One cannot invest directly in an index. Index performance does not reflect fund performance.
The RiverFront Dynamic US Flex-Cap ETF is not suitable for all investors. Investments in the Fund are subject to investment risks, including possible loss of the principal amount invested.
The Fund’s shares are not individually redeemable. Investors buy and sell shares of the Fund on a secondary market. Only market makers or “authorized participants” may trade directly with the Fund, typically in blocks of 50,000 shares.
ALPS Portfolio Solutions Distributor, Inc., a FINRA member, is the Distributor for the RiverFront Dynamic US Flex-Cap ETF.
RiverFront Dynamic US Flex-Cap ETF
| Performance Overview | May 31, 2017 (Unaudited) |
Top 10 Holdings* (as of May 31, 2017)
| Apple, Inc. | 3.80% |
| United Rentals, Inc. | 2.77% |
| Facebook, Inc., Class A | 2.37% |
| Amazon.com, Inc. | 2.26% |
| Wells Fargo & Co. | 1.70% |
| International Business Machines Corp. | 1.47% |
| Cigna Corp. | 1.42% |
| Carnival Corp. | 1.36% |
| Royal Caribbean Cruises Ltd. | 1.36% |
| Gilead Sciences, Inc. | 1.30% |
| Total % of Top 10 Holdings | 19.81% |
Asset Allocation* (as of May 31, 2017)
Future holdings are subject to change.
Growth of $10,000 (as of May 31, 2017)
Comparison of Change in Value of $10,000 Investment in the Fund and the Fund’s benchmark
The chart above represents historical performance of a hypothetical investment of $10,000 in the Fund over the life of the Fund. Past performance does not guarantee future results. This chart does not reflect the deduction of taxes that a shareholder would pay on Fund distributions or the redemption of Fund shares.
RiverFront Strategic Income Fund
| Performance Overview | May 31, 2017 (Unaudited) |
Investment Objective
The RiverFront Strategic Income Fund (the “Fund”) seeks total return, with an emphasis on income as the source of that total return. The Fund seeks to achieve its investment objective by investing in a global portfolio of fixed income securities of various maturities, ratings and currency denominations. The Fund intends to utilize various investment strategies in a broad array of fixed income sectors.
Performance Overview
The Fund outperformed its benchmark by 1.27% over the six month period ended 5/31/17, based on its return at market. The primary source of the Fund’s outperformance was assuming a higher level of credit risk than the benchmark. Over the preceding six months, the Fund continued to be invested primarily in shorter-maturity, higher quality, below investment grade rated bonds. The average credit quality of the Fund was approximately BB-rated, compared to AA-rated for its benchmark. This lower credit strategy positively contributed to performance as risk premiums on lower rated bonds tightened significantly more than those on higher quality bonds over the preceding six months. For example, spreads on the BofA Merrill Lynch 1-5 Year BB US High Yield Index narrowed 69 basis points (“bps”) while spreads on the BofA Merrill Lynch US Corporate Bond Index tightened 17 bps over the six months. The significant spread tightening lead to meaningful price appreciation in addition to the incremental income. As of 5/31/17, the duration of the Fund was about 2.4 years compared to about 5.95 years for its benchmark.
Performance (as of May 31, 2017)
| | 6 Months | 1 Year | 3 Year | Since Inception^ |
| RiverFront Strategic Income Fund – NAV | 3.50% | 7.16% | 3.96% | 4.85% |
| RiverFront Strategic Income Fund – Market Price* | 3.79% | 7.37% | 3.92% | 4.90% |
| Bloomberg Barclays U.S. Aggregate Bond Total Return Index | 2.52% | 1.58% | 2.53% | 3.11% |
Total Expense Ratio (per the current prospectus) 0.47%. Net Expense Ratio (per the current prospectus) 0.17%. Net expense ratio reflects the Sub-Adviser’s decision to voluntarily waive its sub-advisory fee until at least March 31, 2018. Please see the prospectus for additional information.
Performance data quoted represents past performance. Past performance does not guarantee future results. The table does not reflect the deduction of taxes that a shareholder would pay on Fund distributions or the redemption of Fund shares. Investment return and principal value of an investment will fluctuate so that an investor’s shares, when sold or redeemed, may be worth more or less than the original cost. Current performance data may be higher or lower than actual data quoted. For most current month-end performance data please visit www.alpsfunds.com or call 1.866.759.5679.
NAV is an exchange-traded fund’s per-share value. The per-share dollar amount of the Fund is derived by dividing the total value of all the securities in its portfolio, less any liabilities, by the number of Fund shares outstanding. Market Price is the price at which a share can currently be traded in the market. Information detailing the number of days the Market Price of the Fund was greater than the Fund’s NAV and the number of days it was less than the Fund’s NAV can be obtained at www.alpsfunds.com.
| ^ | The Fund commenced Investment Operations on October 8, 2013. |
| * | Market Price is based on the midpoint of the bid/ask spread at 4 p.m. ET and does not represent the returns an investor would receive if shares were traded at other times |
Duration is a measure of the sensitivity of the price (the value of principal) of a fixed-income investment to a change in interest rates. Duration is expressed as a number of years. The duration number is a calculation involving present value, yield, coupon, final maturity and call features. The bigger the duration number, the greater the interest-rate risk or reward for bond prices. Rising interest rates mean falling bond prices, while declining interest rates mean rising bond prices.
Bloomberg Barclays U.S. Aggregate Bond Index is a broad-based benchmark that measures the investment grade, U.S. dollar-denominated, fixed-rate taxable bond market, including Treasuries, government-related and corporate securities, MBS (agency fixed-rate and hybrid ARM pass-throughs), ABS, and CMBS (agency and non-agency). The index is reported on a total return basis, which assumes reinvestment of any dividends and distributions realized during a given time period. The index is not actively managed and does not reflect any deductions for fees, expenses or taxes. One cannot invest directly in an index. Index performance does not reflect fund performance.
One cannot invest directly in an index. Index performance does not reflect fund performance.
The RiverFront Strategic Income Fund is not suitable for all investors. Investments in the Fund are subject to investment risks, including possible loss of the principal amount invested.
ALPS Portfolio Solutions Distributor, Inc., a FINRA member, is the distributor for the RiverFront Strategic Income Fund.
RiverFront Strategic Income Fund
| Performance Overview | May 31, 2017 (Unaudited) |
Top 10 Holdings*^ (as of May 31, 2017)
| WESCO Distribution, Inc., Sr. Unsec. | 3.05% |
| Tesoro Corp., Sr. Unsec. | 2.79% |
| Ball Corp., Sr. Unsec. | 2.72% |
| Pinnacle Foods Finance LLC, Sr. Unsec. | 2.69% |
| Celanese US Holdings LLC, Sr. Unsec. | 2.60% |
| Newfield Exploration Co., Sr. Unsec. | 2.50% |
| MGM Resorts International, Sr. Unsec. | 2.46% |
| Goodyear Tire & Rubber Co., Sr. Unsec. | 2.46% |
| DISH DBS Corp., Sr. Unsec. | 2.41% |
| Lear Corp., Sr. Unsec. | 2.39% |
| Total % of Top 10 Holdings | 33.57% |
Asset Allocation* (as of May 31, 2017)
| ^ | Excludes Money Market Fund |
Future holdings are subject to change.
Growth of $10,000 (as of May 31, 2017)
Comparison of Change in Value of $10,000 Investment in the Fund and the Fund’s benchmark
The chart above represents historical performance of a hypothetical investment of $10,000 in the Fund over the life of the Fund. Past performance does not guarantee future results. This chart does not reflect the deduction of taxes that a shareholder would pay on Fund distributions or the redemption of Fund shares.
RiverFront ETFs
| Disclosure of Fund Expenses | May 31, 2017 (Unaudited) |
Shareholder Expense Example: As a shareholder of a Fund, you incur two types of costs: (1) transaction costs which may include creation and redemption fees or brokerage charges, and (2) ongoing costs, including management fees and other Fund expenses. These examples are intended to help you understand your ongoing costs (in dollars) of investing in a Fund and to compare these costs with the ongoing costs of investing in other funds. It is based on an investment of $1,000 invested at the beginning of the (six month) period and held through May 31, 2017.
Actual Return: The first line of the table provides information about actual account values and actual expenses. You may use the information in this line, together with the amount you invested, to estimate the expenses that you incurred over the period. Simply divide your account value by $1,000 (for example, an $8,600 account value divided by $1,000 = 8.6), then multiply the result by the number in the first line under the heading entitled “Expenses Paid During Period” to estimate the expenses attributable to your investment during this period.
Hypothetical 5% Return: The second line of the table provides information about hypothetical account values and hypothetical expenses based on the Fund’s actual expense ratio and an assumed rate of return of 5% per year before expenses, which is not the Fund’s actual return. The hypothetical account values and expenses may not be used to estimate the actual ending account balance or expenses you paid for the period. You may use this information to compare ongoing costs of investing in the Fund and other funds. To do so, compare this 5% hypothetical example with the 5% hypothetical examples that appear in the shareholder reports of other funds.
The expenses shown in the table are meant to highlight ongoing Fund costs only and do not reflect any transaction costs, such as creation and redemption fees or brokerage charges. Therefore, the second line is useful in comparing ongoing costs only, and will not help you determine the relative total costs of owning different funds. In addition, if these costs were included, your costs would have been higher.
| | Beginning Account Value 12/1/16 | Ending Account Value 5/31/17 | Expense Ratio(a) | Expenses Paid During Period 12/1/16 - 5/31/17(b) |
| RiverFront Dynamic Core Income ETF | | | | |
| Actual | $1,000.00 | $1,023.70 | 0.51% | $2.57 |
| Hypothetical (5% return before expenses) | $1,000.00 | $1,022.39 | 0.51% | $2.57 |
| RiverFront Dynamic Unconstrained Income ETF | | | | |
| Actual | $1,000.00 | $1,050.60 | 0.51% | $2.61 |
| Hypothetical (5% return before expenses) | $1,000.00 | $1,022.39 | 0.51% | $2.57 |
| RiverFront Dynamic US Dividend Advantage ETF | | | | |
| Actual | $1,000.00 | $1,071.40 | 0.52% | $2.69 |
| Hypothetical (5% return before expenses) | $1,000.00 | $1,022.34 | 0.52% | $2.62 |
| RiverFront Dynamic US Flex‐Cap ETF | | | | |
| Actual | $1,000.00 | $1,087.50 | 0.52% | $2.71 |
| Hypothetical (5% return before expenses) | $1,000.00 | $1,022.34 | 0.52% | $2.62 |
| RiverFront Strategic Income Fund | | | | |
| Actual | $1,000.00 | $1,035.00 | 0.16% | $0.81 |
| Hypothetical (5% return before expenses) | $1,000.00 | $1,024.13 | 0.16% | $0.81 |
| (a) | Annualized, based on the Fund's most recent fiscal half year expenses. |
| (b) | Expenses are equal to the Fund's annualized expense ratio multiplied by the average account value over the period, multiplied by the number of days in the most recent fiscal half year (182), divided by 365. |
RiverFront Dynamic Core Income ETF
| Schedule of Investments | May 31, 2017 (Unaudited) |
| Security Description | | Principal Amount | | | Value | |
| CORPORATE BONDS (92.14%) | | | | | | |
| Consumer Discretionary (11.77%) | | | | | | |
| Charter Communications Operating LLC, First Lien | | | | | | |
| 3.58%, 07/23/2020 | | $ | 668,000 | | | $ | 694,895 | |
| Comcast Corp., Sr. Unsec. | | | | | | | | |
| 5.15%, 03/01/2020 | | | 637,000 | | | | 694,515 | |
| Hilton Worldwide Finance LLC / Hilton Worldwide Finance Corp., Sr. Unsec. | | | | | | | | |
4.63%, 04/01/2025(a) | | | 675,000 | | | | 700,313 | |
| The Home Depot, Inc., Sr. Unsec. | | | | | | | | |
| 2.63%, 06/01/2022 | | | 818,000 | | | | 835,377 | |
| L Brands, Inc., Sr. Unsec. | | | | | | | | |
| 7.00%, 05/01/2020 | | | 635,000 | | | | 707,758 | |
| Total Consumer Discretionary | | | | | | | 3,632,858 | |
| | | | | | | | | |
| Consumer Staples (8.78%) | | | | | | | | |
| Anheuser‐Busch InBev Finance, Inc., Sr. Unsec. | | | | | | | | |
| 2.65%, 02/01/2021 | | | 668,000 | | | | 678,905 | |
| Constellation Brands, Inc., Sr. Unsec. | | | | | | | | |
| 4.25%, 05/01/2023 | | | 600,000 | | | | 645,711 | |
| 4.75%, 12/01/2025 | | | 100,000 | | | | 109,934 | |
| CVS Health Corp., Sr. Unsec. | | | | | | | | |
| 2.25%, 08/12/2019 | | | 625,000 | | | | 630,157 | |
| PepsiCo, Inc., Sr. Unsec. | | | | | | | | |
| 3.10%, 07/17/2022 | | | 620,000 | | | | 645,719 | |
| Total Consumer Staples | | | | | | | 2,710,426 | |
| | | | | | | | | |
| Energy (5.81%) | | | | | | | | |
| Enterprise Products Operating LLC, Sr. Unsec. | | | | | | | | |
| 3.35%, 03/15/2023 | | | 668,000 | | | | 689,410 | |
| Kinder Morgan, Inc., Sr. Unsec. | | | | | | | | |
| 3.05%, 12/01/2019 | | | 668,000 | | | | 682,719 | |
| Petroleos Mexicanos, Sr. Unsec. | | | | | | | | |
| 8.00%, 05/03/2019 | | | 381,000 | | | | 421,234 | |
| Total Energy | | | | | | | 1,793,363 | |
| | | | | | | | | |
| Financials (23.65%) | | | | | | | | |
| Bank of America Corp., Sr. Unsec. | | | | | | | | |
| 3.30%, 01/11/2023 | | | 668,000 | | | | 680,432 | |
| The Bank of New York Mellon Corp., Sr. Unsec. | | | | | | | | |
| 2.45%, 11/27/2020 | | | 700,000 | | | | 707,764 | |
| Citigroup Inc., Sr. Unsec. | | | | | | | | |
| 2.65%, 10/26/2020 | | | 402,000 | | | | 406,280 | |
| 2.70%, 03/30/2021 | | | 324,000 | | | | 326,875 | |
| The Goldman Sachs Group, Inc., Sr. Unsec. | | | | | | | | |
| 2.55%, 10/23/2019 | | | 668,000 | | | | 675,242 | |
| HSBC Finance Corp., Sub. | | | | | | | | |
| 6.68%, 01/15/2021 | | | 548,000 | | | | 623,883 | |
| Security Description | | Principal Amount | | | Value | |
| Financials (continued) | | | | | | |
| JPMorgan Chase & Co., Sub. | | | | | | |
| 3.38%, 05/01/2023 | | $ | 668,000 | | | $ | 681,005 | |
| MetLife Inc., Sr. Unsec. | | | | | | | | |
| 7.72%, 02/15/2019 | | | 700,000 | | | | 768,058 | |
| Morgan Stanley, Sr. Unsec. | | | | | | | | |
| 5.63%, 09/23/2019 | | | 760,000 | | | | 819,266 | |
| The PNC Financial Services Group Inc., Sr. Unsec. | | | | | | | | |
| 3.15%, 05/19/2027 | | | 150,000 | | | | 150,576 | |
| US Bancorp., Sr. Unsec. | | | | | | | | |
| 2.63%, 01/24/2022 | | | 175,000 | | | | 177,585 | |
| 3.00%, 03/15/2022 | | | 500,000 | | | | 514,682 | |
| Wells Fargo & Co., Sr. Unsec. | | | | | | | | |
| 2.13%, 04/22/2019 | | | 500,000 | | | | 503,153 | |
| 2.55%, 12/07/2020 | | | 231,000 | | | | 233,863 | |
| 4.60%, 04/01/2021 | | | 29,000 | | | | 31,426 | |
| Total Financials | | | | | | | 7,300,090 | |
| | | | | | | | | |
| Health Care (8.41%) | | | | | | | | |
| AbbVie, Inc., Sr. Unsec. | | | | | | | | |
| 2.90%, 11/06/2022 | | | 668,000 | | | | 676,015 | |
| Allergan Funding SCS, Sr. Unsec. | | | | | | | | |
| 3.00%, 03/12/2020 | | | 668,000 | | | | 683,085 | |
| Fresenius Medical Care US Finance II, Inc., Sr. Unsec. | | | | | | | | |
4.13%, 10/15/2020(a) | | | 600,000 | | | | 630,372 | |
| Pfizer, Inc., Sr. Unsec. | | | | | | | | |
| 3.00%, 12/15/2026 | | | 600,000 | | | | 604,184 | |
| Total Health Care | | | | | | | 2,593,656 | |
| | | | | | | | | |
| Industrials (6.61%) | | | | | | | | |
| General Electric Co., Sr. Unsec. | | | | | | | | |
| 2.70%, 10/09/2022 | | | 668,000 | | | | 684,015 | |
| International Lease Finance Corp., Sr. Unsec. | | | | | | | | |
| 8.25%, 12/15/2020 | | | 300,000 | | | | 355,542 | |
| 5.88%, 08/15/2022 | | | 300,000 | | | | 341,216 | |
| USG Corp., Sr. Unsec. | | | | | | | | |
4.88%, 06/01/2027(a) | | | 650,000 | | | | 658,125 | |
| Total Industrials | | | | | | | 2,038,898 | |
| | | | | | | | | |
| Information Technology (9.16%) | | | | | | | | |
| Apple, Inc., Sr. Unsec. | | | | | | | | |
| 2.40%, 05/03/2023 | | | 503,000 | | | | 500,954 | |
| Cisco Systems, Inc., Sr. Unsec. | | | | | | | | |
| 4.95%, 02/15/2019 | | | 561,000 | | | | 592,675 | |
| Flextronics International Ltd., Sr. Unsec. | | | | | | | | |
| 5.00%, 02/15/2023 | | | 668,000 | | | | 728,292 | |
| International Business Machines Corp., Sr. Unsec. | | | | | | | | |
| 2.88%, 11/09/2022 | | | 550,000 | | | | 564,097 | |
See Notes to Financial Statements.
RiverFront Dynamic Core Income ETF
| Schedule of Investments | May 31, 2017 (Unaudited) |
| Security Description | | Principal Amount | | | Value | |
| Information Technology (continued) | | | | | | |
| Microsoft Corp., Sr. Unsec. | | | | | | |
| 2.00%, 08/08/2023 | | $ | 450,000 | | | $ | 439,965 | |
| Total Information Technology | | | | | | | 2,825,983 | |
| | | | | | | | | |
| Materials (4.55%) | | | | | | | | |
| The Dow Chemical Co., Sr. Unsec. | | | | | | | | |
| 4.25%, 11/15/2020 | | | 600,000 | | | | 638,715 | |
| 3.00%, 11/15/2022 | | | 100,000 | | | | 102,056 | |
| The Sherwin‐Williams Co., Sr. Unsec. | | | | | | | | |
| 3.45%, 08/01/2025 | | | 650,000 | | | | 663,323 | |
| Total Materials | | | | | | | 1,404,094 | |
| | | | | | | | | |
| Real Estate (2.38%) | | | | | | | | |
| Boston Properties LP, Sr. Unsec. | | | | | | | | |
| 3.85%, 02/01/2023 | | | 600,000 | | | | 632,621 | |
| 3.13%, 09/01/2023 | | | 100,000 | | | | 101,531 | |
| Total Real Estate | | | | | | | 734,152 | |
| | | | | | | | | |
| Telecommunication Services (4.50%) | | | | | | | | |
| AT&T, Inc., Sr. Unsec. | | | | | | | | |
| 2.45%, 06/30/2020 | | | 668,000 | | | | 671,393 | |
| Verizon Communications, Inc., Sr. Unsec. | | | | | | | | |
| 4.50%, 09/15/2020 | | | 668,000 | | | | 716,603 | |
| Total Telecommunication Services | | | | | | | 1,387,996 | |
| | | | | | | | | |
| Utilities (6.52%) | | | | | | | | |
| Dominion Energy Inc., Sr. Unsec. | | | | | | | | |
| 5.20%, 08/15/2019 | | | 500,000 | | | | 533,691 | |
| Duke Energy Corp., Sr. Unsec. | | | | | | | | |
| 1.80%, 09/01/2021 | | | 675,000 | | | | 660,778 | |
| The Southern Co., Sr. Unsec. | | | | | | | | |
| 2.95%, 07/01/2023 | | | 818,000 | | | | 816,255 | |
| Total Utilities | | | | | | | 2,010,724 | |
| | | | | | | | | |
TOTAL CORPORATE BONDS (Cost $28,191,304) | | | | 28,432,240 | |
| Security Description | | 7 Day Yield | | | Shares | | | Value | |
| SHORT TERM INVESTMENTS (7.08%) | |
| State Street Institutional Treasury Plus Money Market Fund | | | 0.680 | % | | | 2,185,581 | | | $ | 2,185,581 | |
| | | | | | | | | | | | | |
TOTAL SHORT TERM INVESTMENTS (Cost $2,185,581) | | 2,185,581 | |
| | | Value | |
TOTAL INVESTMENTS (99.22%) (Cost $30,376,885) | | $ | 30,617,821 | |
| | | | | |
| NET OTHER ASSETS AND LIABILITIES (0.78%) | | | 240,596 | |
| | | | | |
| NET ASSETS (100.00%) | | $ | 30,858,417 | |
| (a) | Securities exempt from registration under Rule 144A of the Securities Act of 1933. These securities may be sold in the ordinary course of business in transactions exempt from registration, normally to qualified institutional buyers. At period end, the aggregate market value of those securities was $1,988,810, representing 6.44% of net assets. |
See Notes to Financial Statements.
RiverFront Dynamic Unconstrained Income ETF
| Schedule of Investments | May 31, 2017 (Unaudited) |
| Security Description | | Principal Amount | | | Value | |
| CORPORATE BONDS (94.89%) | | | | | | |
| Consumer Discretionary (24.40%) | | | | | | |
| Aramark Services, Inc., Sr. Unsec. | | | | | | |
| 5.13%, 01/15/2024 | | $ | 150,000 | | | $ | 158,625 | |
| Cablevision Systems Corp., Sr. Unsec. | | | | | | | | |
| 5.88%, 09/15/2022 | | | 150,000 | | | | 156,000 | |
| CCO Holdings LLC / CCO Holdings Capital Corp., Sr. Unsec. | | | | | | | | |
5.13%, 05/01/2027(a) | | | 150,000 | | | | 154,031 | |
| Clear Channel Worldwide Holdings, Inc., Sr. Unsec. | | | | | | | | |
| 6.50%, 11/15/2022 | | | 150,000 | | | | 155,813 | |
| DISH DBS Corp., Sr. Unsec. | | | | | | | | |
| 5.88%, 11/15/2024 | | | 150,000 | | | | 160,313 | |
| The Goodyear Tire & Rubber Co., Sr. Unsec. | | | | | | | | |
| 5.00%, 05/31/2026 | | | 150,000 | | | | 154,968 | |
| Hanesbrands, Inc., Sr. Unsec. | | | | | | | | |
4.63%, 05/15/2024(a) | | | 100,000 | | | | 100,500 | |
| Hilton Worldwide Finance LLC / Hilton Worldwide Finance Corp., Sr. Unsec. | | | | | | | | |
4.63%, 04/01/2025(a) | | | 150,000 | | | | 155,625 | |
| International Game Technology PLC, First Lien | | | | | | | | |
6.25%, 02/15/2022(a) | | | 150,000 | | | | 162,974 | |
| KB Home, Sr. Unsec. | | | | | | | | |
| 7.50%, 09/15/2022 | | | 30,000 | | | | 34,170 | |
| KFC Holding Co./Pizza Hut Holdings LLC/Taco Bell of America LLC, Sr. Unsec. | | | | | | | | |
5.00%, 06/01/2024(a) | | | 100,000 | | | | 104,280 | |
| Lennar Corp., Sr. Unsec. | | | | | | | | |
| 4.50%, 04/30/2024 | | | 30,000 | | | | 30,413 | |
| MGM Resorts International, Sr. Unsec. | | | | | | | | |
| 4.63%, 09/01/2026 | | | 200,000 | | | | 201,249 | |
| PulteGroup, Inc., Sr. Unsec. | | | | | | | | |
| 5.50%, 03/01/2026 | | | 30,000 | | | | 31,819 | |
| Service Corp. International, Sr. Unsec. | | | | | | | | |
| 5.38%, 05/15/2024 | | | 150,000 | | | | 158,610 | |
| Total Consumer Discretionary | | | | | | | 1,919,390 | |
| | | | | | | | | |
| Consumer Staples (4.90%) | | | | | | | | |
| Pinnacle Foods Finance LLC / Pinnacle Foods Finance Corp., Sr. Unsec. | | | | | | | | |
| 5.88%, 01/15/2024 | | | 100,000 | | | | 107,000 | |
| Spectrum Brands, Inc., Sr. Unsec. | | | | | | | | |
| 5.75%, 07/15/2025 | | | 110,000 | | | | 117,436 | |
| Security Description | | Principal Amount | | | Value | |
| Consumer Staples (continued) | | | | | | |
| TreeHouse Foods, Inc., Sr. Unsec. | | | | | | |
6.00%, 02/15/2024(a) | | $ | 150,000 | | | $ | 160,875 | |
| Total Consumer Staples | | | | | | | 385,311 | |
| | | | | | | | | |
| Energy (10.21%) | | | | | | | | |
| Cheniere Corpus Christi Holdings LLC, First Lien | | | | | | | | |
| 7.00%, 06/30/2024 | | | 100,000 | | | | 112,500 | |
| Continental Resources, Inc., Sr. Unsec. | | | | | | | | |
| 5.00%, 09/15/2022 | | | 100,000 | | | | 100,500 | |
| Newfield Exploration Co., Sr. Unsec. | | | | | | | | |
| 5.75%, 01/30/2022 | | | 200,000 | | | | 214,000 | |
| Southwestern Energy Co., Sr. Unsec. | | | | | | | | |
5.80%, 01/23/2020(b) | | | 100,000 | | | | 101,750 | |
| Tesoro Logistics LP / Tesoro Logistics Finance Corp., Sr. Unsec. | | | | | | | | |
| 6.38%, 05/01/2024 | | | 100,000 | | | | 109,250 | |
| Weatherford International Ltd., Sr. Unsec. | | | | | | | | |
| 9.63%, 03/01/2019 | | | 150,000 | | | | 165,375 | |
| Total Energy | | | | | | | 803,375 | |
| | | | | | | | | |
| Financials (3.55%) | | | | | | | | |
| CIT Group, Inc., Sr. Unsec. | | | | | | | | |
| 5.00%, 08/15/2022 | | | 165,000 | | | | 178,976 | |
| Navient Corp., Sr. Unsec. | | | | | | | | |
| 6.13%, 03/25/2024 | | | 100,000 | | | | 100,280 | |
| Total Financials | | | | | | | 279,256 | |
| | | | | | | | | |
| Health Care (9.64%) | | | | | | | | |
| Centene Corp., Sr. Unsec. | | | | | | | | |
| 4.75%, 05/15/2022 | | | 76,000 | | | | 79,648 | |
| 6.13%, 02/15/2024 | | | 100,000 | | | | 108,905 | |
| DaVita, Inc., Sr. Unsec. | | | | | | | | |
| 5.00%, 05/01/2025 | | | 150,000 | | | | 149,438 | |
| HCA, Inc., Sec. | | | | | | | | |
| 5.00%, 03/15/2024 | | | 150,000 | | | | 161,085 | |
| HealthSouth Corp., Sr. Unsec. | | | | | | | | |
| 5.75%, 11/01/2024 | | | 100,000 | | | | 103,750 | |
| Tenet Healthcare Corp., Sec. | | | | | | | | |
| 4.75%, 06/01/2020 | | | 150,000 | | | | 155,813 | |
| Total Health Care | | | | | | | 758,639 | |
| | | | | | | | | |
| Industrials (17.72%) | | | | | | | | |
| ADT Corp., First Lien | | | | | | | | |
| 6.25%, 10/15/2021 | | | 150,000 | | | | 165,749 | |
| CNH Industrial NV, Sr. Unsec. | | | | | | | | |
| 4.50%, 08/15/2023 | | | 100,000 | | | | 103,500 | |
| Icahn Enterprises LP / Icahn Enterprises Finance Corp., Sr. Unsec. | | | | | | | | |
| 6.00%, 08/01/2020 | | | 150,000 | | | | 154,313 | |
See Notes to Financial Statements.
RiverFront Dynamic Unconstrained Income ETF
| Schedule of Investments | May 31, 2017 (Unaudited) |
| Security Description | | Principal Amount | | | Value | |
| Industrials (continued) | | | | | | |
| Owens‐Brockway Glass Container, Inc., Sr. Unsec. | | | | | | |
5.00%, 01/15/2022(a) | | $ | 150,000 | | | $ | 157,125 | |
| Park Aerospace Holdings Ltd., Sr. Unsec. | | | | | | | | |
5.25%, 08/15/2022(a) | | | 100,000 | | | | 105,313 | |
| Terex Corp., Sr. Unsec. | | | | | | | | |
5.63%, 02/01/2025(a) | | | 100,000 | | | | 102,625 | |
| TransDigm, Inc., Sr. Sub. | | | | | | | | |
| 6.00%, 07/15/2022 | | | 30,000 | | | | 31,159 | |
| United Rentals North America, Inc., Sr. Unsec. | | | | | | | | |
| 5.88%, 09/15/2026 | | | 150,000 | | | | 159,561 | |
| USG Corp., Sr. Unsec. | | | | | | | | |
4.88%, 06/01/2027(a) | | | 150,000 | | | | 151,875 | |
| WESCO Distribution, Inc., Sr. Unsec. | | | | | | | | |
| 5.38%, 06/15/2024 | | | 150,000 | | | | 156,750 | |
| XPO Logistics, Inc., Sr. Unsec. | | | | | | | | |
6.50%, 06/15/2022(a) | | | 100,000 | | | | 106,545 | |
| Total Industrials | | | | | | | 1,394,515 | |
| | | | | | | | | |
| Information Technology (3.83%) | | | | | | | | |
| First Data Corp., First Lien | | | | | | | | |
5.38%, 08/15/2023(a) | | | 100,000 | | | | 105,250 | |
| SS&C Technologies Holdings, Inc., Sr. Unsec. | | | | | | | | |
| 5.88%, 07/15/2023 | | | 150,000 | | | | 161,044 | |
| Western Digital Corp., Sr. Unsec. | | | | | | | | |
| 10.50%, 04/01/2024 | | | 30,000 | | | | 35,235 | |
| Total Information Technology | | | | | | | 301,529 | |
| | | | | | | | | |
| Materials (12.27%) | | | | | | | | |
| AK Steel Corp., First Lien | | | | | | | | |
| 7.50%, 07/15/2023 | | | 100,000 | | | | 108,625 | |
| ArcelorMittal, Sr. Unsec. | | | | | | | | |
6.75%, 02/25/2022(b) | | | 100,000 | | | | 113,000 | |
| Ashland LLC, Sr. Unsec. | | | | | | | | |
| 4.75%, 08/15/2022 | | | 150,000 | | | | 156,750 | |
| Cascades, Inc., Sr. Unsec. | | | | | | | | |
5.50%, 07/15/2022(a) | | | 150,000 | | | | 153,375 | |
| Freeport‐McMoRan, Inc., Sr. Unsec. | | | | | | | | |
6.50%, 11/15/2020(a) | | | 100,000 | | | | 104,008 | |
| Graphic Packaging International, Inc., Sr. Unsec. | | | | | | | | |
| 4.88%, 11/15/2022 | | | 100,000 | | | | 105,625 | |
| Teck Resources Ltd., Sr. Unsec. | | | | | | | | |
8.50%, 06/01/2024(a) | | | 100,000 | | | | 115,750 | |
| Vale Overseas Ltd., Sr. Unsec. | | | | | | | | |
| 5.88%, 06/10/2021 | | | 100,000 | | | | 107,972 | |
| Total Materials | | | | | | | 965,105 | |
| Security Description | | Principal Amount | | | Value | |
| Real Estate (3.03%) | | | | | | |
| Equinix, Inc., Sr. Unsec. | | | | | | |
| 5.75%, 01/01/2025 | | $ | 30,000 | | | $ | 32,550 | |
| Iron Mountain, Inc., Sr. Sub. | | | | | | | | |
| 5.75%, 08/15/2024 | | | 200,000 | | | | 206,250 | |
| Total Real Estate | | | | | | | 238,800 | |
| | | | | | | | | |
| Telecommunication Services (5.34%) | | | | | | | | |
| CenturyLink, Inc., Sr. Unsec. | | | | | | | | |
| 7.50%, 04/01/2024 | | | 150,000 | | | | 164,624 | |
| Level 3 Financing, Inc., Sr. Unsec. | | | | | | | | |
| 5.38%, 01/15/2024 | | | 30,000 | | | | 31,519 | |
| Sprint Communications, Inc., Sr. Unsec. | | | | | | | | |
9.00%, 11/15/2018(a) | | | 56,000 | | | | 61,530 | |
| T‐Mobile USA, Inc., Sr. Unsec. | | | | | | | | |
| 6.50%, 01/15/2024 | | | 150,000 | | | | 162,788 | |
| Total Telecommunication Services | | | | | | | 420,461 | |
| | | | | | | | | |
TOTAL CORPORATE BONDS (Cost $7,220,034) | | | | 7,466,381 | |
| Security Description | | 7 Day Yield | | | Shares | | | Value | |
| SHORT TERM INVESTMENTS (5.08%) | |
| State Street Institutional Treasury Plus Money Market Fund | | | 0.680 | % | | | 399,378 | | | $ | 399,378 | |
| | | | | | | | | | | | | |
TOTAL SHORT TERM INVESTMENTS (Cost $399,378) | | 399,378 | |
| | | | | | | | | | | | | |
TOTAL INVESTMENTS (99.97%) (Cost $7,619,412) | $ | 7,865,759 | |
| | | | | | | | | | | | | |
| NET OTHER ASSETS AND LIABILITIES (0.03%) | | | | 2,515 | |
| | | | | | | | | | | | | |
| NET ASSETS (100.00%) | | | | | | | $ | 7,868,274 | |
(a) | Securities exempt from registration under Rule 144A of the Securities Act of 1933. These securities may be sold in the ordinary course of business in transactions exempt from registration, normally to qualified institutional buyers. At period end, the aggregate market value of those securities was $2,001,681, representing 25.44% of net assets. |
(b) | Represents a step bond. Rate disclosed is as of May 31, 2017. |
See Notes to Financial Statements.
RiverFront Dynamic US Dividend Advantage ETF
| Schedule of Investments | May 31, 2017 (Unaudited) |
| Security Description | | Shares | | | Value | |
| COMMON STOCKS (99.66%) | | | | | | |
| Consumer Discretionary (10.94%) | | | | | | |
Amazon.com, Inc.(a) | | | 392 | | | $ | 389,891 | |
| Best Buy Co., Inc. | | | 4,790 | | | | 284,478 | |
| Carnival Corp. | | | 4,771 | | | | 305,678 | |
| CBS Corp., Class B | | | 2,354 | | | | 143,853 | |
| Darden Restaurants, Inc. | | | 3,815 | | | | 339,268 | |
| Dunkin' Brands Group, Inc. | | | 2,947 | | | | 172,429 | |
| Ford Motor Co. | | | 38,345 | | | | 426,396 | |
| Garmin Ltd. | | | 3,251 | | | | 169,182 | |
| International Game Technology PLC | | | 18,691 | | | | 331,765 | |
| Jack in the Box, Inc. | | | 2,938 | | | | 313,132 | |
| Mattel, Inc. | | | 584 | | | | 13,379 | |
| McDonald's Corp. | | | 1,322 | | | | 199,477 | |
| Meredith Corp. | | | 5,243 | | | | 283,646 | |
| Scripps Networks Interactive, Inc., Class A | | | 2,366 | | | | 156,677 | |
| Target Corp. | | | 3,090 | | | | 170,414 | |
| Total Consumer Discretionary | | | | | | | 3,699,665 | |
| | | | | | | | | |
| Consumer Staples (9.02%) | | | | | | | | |
| Altria Group, Inc. | | | 3,200 | | | | 241,408 | |
| CVS Health Corp. | | | 3,013 | | | | 231,489 | |
| Flowers Foods, Inc. | | | 23,584 | | | | 435,832 | |
| Kimberly‐Clark Corp. | | | 605 | | | | 78,487 | |
| PepsiCo, Inc. | | | 2,940 | | | | 343,598 | |
| Sysco Corp. | | | 6,331 | | | | 345,419 | |
| Unilever NV | | | 7,456 | | | | 423,352 | |
| Walgreens Boots Alliance, Inc. | | | 1,799 | | | | 145,755 | |
| Wal‐Mart Stores, Inc. | | | 10,247 | | | | 805,414 | |
| Total Consumer Staples | | | | | | | 3,050,754 | |
| | | | | | | | | |
| Energy (5.13%) | | | | | | | | |
| Chevron Corp. | | | 3,416 | | | | 353,488 | |
| Exxon Mobil Corp. | | | 5,904 | | | | 475,273 | |
| Kinder Morgan, Inc. | | | 3,144 | | | | 58,981 | |
| Occidental Petroleum Corp. | | | 2,422 | | | | 142,728 | |
| ONEOK, Inc. | | | 5,143 | | | | 255,504 | |
| Phillips 66 | | | 2,339 | | | | 178,021 | |
| The Williams Cos, Inc. | | | 9,481 | | | | 271,157 | |
| Total Energy | | | | | | | 1,735,152 | |
| | | | | | | | | |
| Financials (15.89%) | | | | | | | | |
| Bank of America Corp. | | | 14,583 | | | | 326,805 | |
Berkshire Hathaway, Inc., Class B(a) | | | 3,189 | | | | 527,078 | |
| Federated Investors, Inc., Class B | | | 7,757 | | | | 206,026 | |
| First American Financial Corp. | | | 8,696 | | | | 378,450 | |
| Greenhill & Co., Inc. | | | 12,541 | | | | 253,955 | |
| The Hartford Financial Services Group, Inc. | | | 10,340 | | | | 510,693 | |
| JPMorgan Chase & Co. | | | 5,874 | | | | 482,549 | |
| Old Republic International Corp. | | | 12,366 | | | | 244,599 | |
| PacWest Bancorp | | | 3,633 | | | | 169,552 | |
| People's United Financial, Inc. | | | 10,442 | | | | 173,024 | |
| Security Description | | Shares | | | Value | |
| Financials (continued) | | | | | | |
| The Progressive Corp. | | | 4,136 | | | $ | 175,490 | |
| S&P Global, Inc. | | | 1,913 | | | | 273,196 | |
| T Rowe Price Group, Inc. | | | 6,432 | | | | 453,070 | |
| Umpqua Holdings Corp. | | | 21,355 | | | | 361,860 | |
| Wells Fargo & Co. | | | 10,698 | | | | 547,096 | |
| XL Group Ltd. | | | 6,639 | | | | 290,058 | |
| Total Financials | | | | | | | 5,373,501 | |
| | | | | | | | | |
| Health Care (12.48%) | | | | | | | | |
| AbbVie, Inc. | | | 2,698 | | | | 178,122 | |
| Aetna, Inc. | | | 2,432 | | | | 352,300 | |
| AmerisourceBergen Corp. | | | 4,852 | | | | 445,268 | |
| Anthem, Inc. | | | 414 | | | | 75,493 | |
| Cardinal Health, Inc. | | | 2,245 | | | | 166,781 | |
| Cigna Corp. | | | 2,349 | | | | 378,729 | |
| Gilead Sciences, Inc. | | | 7,350 | | | | 476,942 | |
| HealthSouth Corp. | | | 14,361 | | | | 650,983 | |
| McKesson Corp. | | | 1,695 | | | | 276,438 | |
| Merck & Co., Inc. | | | 4,810 | | | | 313,179 | |
| PDL BioPharma, Inc. | | | 118,486 | | | | 283,182 | |
| Pfizer, Inc. | | | 19,113 | | | | 624,039 | |
| Total Health Care | | | | | | | 4,221,456 | |
| | | | | | | | | |
| Industrials (6.60%) | | | | | | | | |
| The Boeing Co. | | | 2,226 | | | | 417,664 | |
| Eaton Corp. PLC | | | 6,215 | | | | 480,916 | |
| Emerson Electric Co. | | | 4,675 | | | | 276,386 | |
| Expeditors International of Washington, Inc. | | | 2,632 | | | | 140,496 | |
| General Cable Corp. | | | 15,595 | | | | 258,097 | |
| Honeywell International, Inc. | | | 1,232 | | | | 163,844 | |
| MSA Safety, Inc. | | | 2,836 | | | | 230,000 | |
| United Parcel Service, Inc., Class B | | | 2,511 | | | | 266,091 | |
| Total Industrials | | | | | | | 2,233,494 | |
| | | | | | | | | |
| Information Technology (24.77%) | | | | | | | | |
Alphabet, Inc., Class C(a) | | | 290 | | | | 279,809 | |
| Analog Devices, Inc. | | | 2,014 | | | | 172,721 | |
| Apple, Inc. | | | 6,836 | | | | 1,044,268 | |
| Applied Materials, Inc. | | | 12,612 | | | | 578,639 | |
| Cognizant Technology Solutions Corp., Class A | | | 7,687 | | | | 514,337 | |
Facebook, Inc., Class A(a) | | | 4,979 | | | | 754,119 | |
| HP, Inc. | | | 14,301 | | | | 268,287 | |
| Intel Corp. | | | 22,173 | | | | 800,667 | |
| InterDigital, Inc. | | | 3,921 | | | | 317,601 | |
| International Business Machines Corp. | | | 3,861 | | | | 589,304 | |
| Leidos Holdings, Inc. | | | 7,884 | | | | 438,035 | |
| Microchip Technology, Inc. | | | 3,801 | | | | 316,623 | |
Micron Technology, Inc.(a) | | | 10,492 | | | | 322,839 | |
| NetApp, Inc. | | | 6,026 | | | | 243,993 | |
| NVIDIA Corp. | | | 2,656 | | | | 383,394 | |
| QUALCOMM, Inc. | | | 3,263 | | | | 186,872 | |
See Notes to Financial Statements.
RiverFront Dynamic US Dividend Advantage ETF
| Schedule of Investments | May 31, 2017 (Unaudited) |
| Security Description | | Shares | | | Value | |
| Information Technology (continued) | | | | | | |
| Science Applications International Corp. | | | 2,171 | | | $ | 164,974 | |
| Texas Instruments, Inc. | | | 7,379 | | | | 608,694 | |
| Western Digital Corp. | | | 4,340 | | | | 390,860 | |
| Total Information Technology | | | | | | | 8,376,036 | |
| | | | | | | | | |
| Materials (4.45%) | | | | | | | | |
| Avery Dennison Corp. | | | 2,483 | | | | 209,218 | |
| Cabot Corp. | | | 3,392 | | | | 177,164 | |
| Compass Minerals International, Inc. | | | 2,764 | | | | 177,311 | |
| International Paper Co. | | | 5,764 | | | | 304,800 | |
| LyondellBasell Industries NV, Class A | | | 4,506 | | | | 362,823 | |
| Rayonier Advanced Materials, Inc. | | | 15,719 | | | | 273,353 | |
| Total Materials | | | | | | | 1,504,669 | |
| | | | | | | | | |
| Real Estate (2.56%) | | | | | | | | |
| LaSalle Hotel Properties | | | 11,592 | | | | 329,792 | |
| The Macerich Co. | | | 2,181 | | | | 125,211 | |
| Washington Prime Group, Inc. | | | 53,926 | | | | 411,456 | |
| Total Real Estate | | | | | | | 866,459 | |
| | | | | | | | | |
| Telecommunication Services (3.52%) | | | | | | | | |
| AT&T, Inc. | | | 11,884 | | | | 457,890 | |
| CenturyLink, Inc. | | | 15,307 | | | | 381,910 | |
| Verizon Communications, Inc. | | | 7,548 | | | | 352,039 | |
| Total Telecommunication Services | | | | | | | 1,191,839 | |
| | | | | | | | | |
| Utilities (4.30%) | | | | | | | | |
| American Electric Power Co., Inc. | | | 1,956 | | | | 140,402 | |
| Consolidated Edison, Inc. | | | 4,865 | | | | 402,773 | |
| Duke Energy Corp. | | | 1,987 | | | | 170,246 | |
| Entergy Corp. | | | 4,083 | | | | 322,802 | |
| FirstEnergy Corp. | | | 4,436 | | | | 129,709 | |
| The Southern Co. | | | 5,708 | | | | 288,882 | |
| Total Utilities | | | | | | | 1,454,814 | |
| | | | | | | | | |
TOTAL COMMON STOCKS (Cost $32,419,527) | | 33,707,839 | |
| Security Description | 7 Day Yield | | Shares | | | Value | |
| SHORT TERM INVESTMENTS (0.06%) | |
| State Street Institutional Treasury Plus Money Market Fund | 0.680% | | | 19,858 | | | $ | 19,858 | |
| | | | | | | | | | |
TOTAL SHORT TERM INVESTMENTS (Cost $19,858) | | 19,858 | |
| | | Value | |
TOTAL INVESTMENTS (99.72%) (Cost $32,439,385) | | $ | 33,727,697 | |
| | | | | |
| NET OTHER ASSETS AND LIABILITIES (0.28%) | | | 95,018 | |
| | | | | |
| NET ASSETS (100.00%) | | $ | 33,822,715 | |
(a) | Non income producing security. |
See Notes to Financial Statements.
RiverFront Dynamic US Flex-Cap ETF
| Schedule of Investments | May 31, 2017 (Unaudited) |
| Security Description | | Shares | | | Value | |
| COMMON STOCKS (99.84%) | | | | | | |
| Consumer Discretionary (14.86%) | | | | | | |
Amazon.com, Inc.(a) | | | 593 | | | $ | 589,810 | |
American Axle & Manufacturing Holdings, Inc.(a) | | | 4,463 | | | | 67,436 | |
American Public Education, Inc.(a) | | | 2,561 | | | | 56,342 | |
| Best Buy Co., Inc. | | | 3,325 | | | | 197,472 | |
Boyd Gaming Corp.(a) | | | 3,032 | | | | 77,043 | |
| Brunswick Corp. | | | 1,417 | | | | 78,303 | |
| Carnival Corp. | | | 5,562 | | | | 356,357 | |
Cooper‐Standard Holdings, Inc.(a) | | | 795 | | | | 85,868 | |
| Darden Restaurants, Inc. | | | 3,724 | | | | 331,175 | |
| Delphi Automotive PLC | | | 1,944 | | | | 171,014 | |
| Dollar General Corp. | | | 1,888 | | | | 138,560 | |
| Entercom Communications Corp., Class A | | | 4,797 | | | | 49,409 | |
| Ford Motor Co. | | | 12,764 | | | | 141,936 | |
| GameStop Corp., Class A | | | 2,333 | | | | 51,653 | |
| International Game Technology PLC | | | 10,797 | | | | 191,647 | |
Kate Spade & Co.(a) | | | 6,274 | | | | 115,567 | |
| McDonald's Corp. | | | 1,998 | | | | 301,478 | |
| Office Depot, Inc. | | | 12,329 | | | | 63,001 | |
The Priceline Group, Inc.(a) | | | 52 | | | | 97,609 | |
| Rent‐A‐Center, Inc. | | | 6,180 | | | | 70,514 | |
| Royal Caribbean Cruises Ltd. | | | 3,224 | | | | 355,220 | |
Ulta Beauty, Inc.(a) | | | 770 | | | | 234,727 | |
| Williams‐Sonoma, Inc. | | | 1,277 | | | | 62,139 | |
| Total Consumer Discretionary | | | | | | | 3,884,280 | |
| | | | | | | | | |
| Consumer Staples (6.50%) | | | | | | | | |
Alliance One International, Inc.(a) | | | 4,100 | | | | 43,050 | |
| Altria Group, Inc. | | | 1,944 | | | | 146,655 | |
The Boston Beer Co., Inc., Class A(a) | | | 704 | | | | 100,496 | |
| CVS Health Corp. | | | 1,387 | | | | 106,563 | |
| Flowers Foods, Inc. | | | 5,928 | | | | 109,549 | |
The Hain Celestial Group, Inc.(a) | | | 1,952 | | | | 68,183 | |
| Kimberly‐Clark Corp. | | | 468 | | | | 60,714 | |
| The Kroger Co. | | | 3,318 | | | | 98,810 | |
| PepsiCo, Inc. | | | 1,417 | | | | 165,605 | |
| Unilever NV | | | 2,731 | | | | 155,066 | |
United Natural Foods, Inc.(a) | | | 2,839 | | | | 113,390 | |
| Walgreens Boots Alliance, Inc. | | | 3,041 | | | | 246,382 | |
| Wal‐Mart Stores, Inc. | | | 3,626 | | | | 285,004 | |
| Total Consumer Staples | | | | | | | 1,699,467 | |
| | | | | | | | | |
| Energy (4.04%) | | | | | | | | |
Bill Barrett Corp.(a) | | | 8,046 | | | | 27,839 | |
| Chevron Corp. | | | 2,266 | | | | 234,486 | |
| Ensco PLC, Class A | | | 11,251 | | | | 70,206 | |
| Exxon Mobil Corp. | | | 1,815 | | | | 146,108 | |
| Kinder Morgan, Inc. | | | 10,148 | | | | 190,376 | |
| Noble Corp. PLC | | | 7,734 | | | | 31,323 | |
| Occidental Petroleum Corp. | | | 1,567 | | | | 92,343 | |
Rowan Cos PLC, Class A(a) | | | 3,830 | | | | 46,113 | |
Transocean Ltd.(a) | | | 6,115 | | | | 55,585 | |
| Security Description | | Shares | | | Value | |
| Energy (continued) | | | | | | |
Unit Corp.(a) | | | 1,966 | | | $ | 35,054 | |
| The Williams Cos, Inc. | | | 4,455 | | | | 127,413 | |
| Total Energy | | | | | | | 1,056,846 | |
| | | | | | | | | |
| Financials (15.95%) | | | | | | | | |
| American Express Co. | | | 4,157 | | | | 319,840 | |
| Banc of California, Inc. | | | 4,152 | | | | 84,286 | |
| Bank of the Ozarks, Inc. | | | 786 | | | | 34,741 | |
Berkshire Hathaway, Inc., Class B(a) | | | 1,066 | | | | 176,188 | |
| Brookline Bancorp, Inc. | | | 5,057 | | | | 69,787 | |
| Capital One Financial Corp. | | | 1,418 | | | | 109,073 | |
| Capstead Mortgage Corp. | | | 7,328 | | | | 77,237 | |
| Citigroup, Inc. | | | 3,770 | | | | 228,236 | |
E*Trade Financial Corp.(a) | | | 1,493 | | | | 51,673 | |
| Fifth Third Bancorp. | | | 10,559 | | | | 250,671 | |
| First American Financial Corp. | | | 6,437 | | | | 280,138 | |
| First Horizon National Corp. | | | 1,478 | | | | 25,037 | |
| The Goldman Sachs Group, Inc. | | | 1,444 | | | | 305,059 | |
| The Hartford Financial Services Group, Inc. | | | 5,919 | | | | 292,339 | |
| Northern Trust Corp. | | | 2,986 | | | | 261,096 | |
| Old Republic International Corp. | | | 3,233 | | | | 63,949 | |
| PrivateBancorp, Inc. | | | 1,344 | | | | 80,089 | |
| The Progressive Corp. | | | 3,988 | | | | 169,211 | |
Signature Bank(a) | | | 1,582 | | | | 226,258 | |
| T Rowe Price Group, Inc. | | | 2,880 | | | | 202,867 | |
| Virtus Investment Partners, Inc. | | | 412 | | | | 41,488 | |
| Wells Fargo & Co. | | | 8,671 | | | | 443,434 | |
| Wintrust Financial Corp. | | | 616 | | | | 42,356 | |
| XL Group Ltd. | | | 7,705 | | | | 336,631 | |
| Total Financials | | | | | | | 4,171,684 | |
| | | | | | | | | |
| Health Care (12.77%) | | | | | | | | |
| Aetna, Inc. | | | 2,141 | | | | 310,145 | |
| AmerisourceBergen Corp. | | | 2,033 | | | | 186,568 | |
ANI Pharmaceuticals, Inc.(a) | | | 734 | | | | 32,068 | |
Cambrex Corp.(a) | | | 1,560 | | | | 83,928 | |
| Cigna Corp. | | | 2,298 | | | | 370,508 | |
Community Health Systems, Inc.(a) | | | 6,449 | | | | 57,074 | |
DaVita, Inc.(a) | | | 2,928 | | | | 194,009 | |
Endo International PLC(a) | | | 14,816 | | | | 195,275 | |
Express Scripts Holding Co.(a) | | | 1,813 | | | | 108,327 | |
| Gilead Sciences, Inc. | | | 5,226 | | | | 339,116 | |
HCA Healthcare, Inc.(a) | | | 1,653 | | | | 135,397 | |
Hologic, Inc.(a) | | | 1,387 | | | | 60,071 | |
Lannett Co., Inc.(a)(b) | | | 2,143 | | | | 43,074 | |
Mallinckrodt PLC(a) | | | 5,901 | | | | 254,510 | |
| McKesson Corp. | | | 1,992 | | | | 324,875 | |
Molina Healthcare, Inc.(a) | | | 3,693 | | | | 238,457 | |
Mylan NV(a) | | | 1,004 | | | | 39,136 | |
| Perrigo Co. PLC | | | 613 | | | | 44,657 | |
Supernus Pharmaceuticals, Inc.(a) | | | 3,159 | | | | 118,778 | |
| Teleflex, Inc. | | | 508 | | | | 101,610 | |
United Therapeutics Corp.(a) | | | 552 | | | | 66,731 | |
See Notes to Financial Statements.
RiverFront Dynamic US Flex-Cap ETF
| Schedule of Investments | May 31, 2017 (Unaudited) |
| Security Description | | Shares | | | Value | |
| Health Care (continued) | | | | | | |
| Universal Health Services, Inc., Class B | | | 304 | | | $ | 34,553 | |
| Total Health Care | | | | | | | 3,338,867 | |
| | | | | | | | | |
| Industrials (11.04%) | | | | | | | | |
| Allegiant Travel Co. | | | 217 | | | | 29,729 | |
| AO Smith Corp. | | | 893 | | | | 48,999 | |
| Apogee Enterprises, Inc. | | | 975 | | | | 51,948 | |
| The Boeing Co. | | | 813 | | | | 152,543 | |
Civeo Corp.(a) | | | 54,821 | | | | 101,967 | |
| Curtiss‐wright Corp. | | | 1,570 | | | | 141,347 | |
| Expeditors International of Washington, Inc. | | | 4,017 | | | | 214,427 | |
| General Cable Corp. | | | 3,292 | | | | 54,483 | |
| The Greenbrier Cos, Inc. | | | 2,301 | | | | 101,819 | |
Hub Group, Inc., Class A(a) | | | 881 | | | | 31,584 | |
| Illinois Tool Works, Inc. | | | 1,168 | | | | 164,945 | |
| Insperity, Inc. | | | 466 | | | | 35,160 | |
JetBlue Airways Corp.(a) | | | 3,842 | | | | 86,138 | |
| L3 Technologies, Inc. | | | 990 | | | | 166,904 | |
| LSC Communications, Inc. | | | 2,297 | | | | 48,857 | |
| ManpowerGroup, Inc. | | | 784 | | | | 79,866 | |
| Powell Industries, Inc. | | | 1,459 | | | | 48,045 | |
| Regal Beloit Corp. | | | 594 | | | | 47,045 | |
| Simpson Manufacturing Co., Inc. | | | 1,370 | | | | 55,047 | |
| The Timken Co. | | | 4,332 | | | | 199,922 | |
| Trinity Industries, Inc. | | | 1,215 | | | | 31,007 | |
United Rentals, Inc.(a) | | | 6,648 | | | | 722,836 | |
| Wabash National Corp. | | | 1,888 | | | | 37,741 | |
| Waste Management, Inc. | | | 3,203 | | | | 233,531 | |
| Total Industrials | | | | | | | 2,885,890 | |
| | | | | | | | | |
| Information Technology (26.26%) | | | | | | | | |
| Alliance Data Systems Corp. | | | 253 | | | | 61,006 | |
Alphabet, Inc., Class A(a) | | | 292 | | | | 288,230 | |
Alphabet, Inc., Class C(a) | | | 293 | | | | 282,704 | |
| Analog Devices, Inc. | | | 3,031 | | | | 259,939 | |
| Apple, Inc. | | | 6,492 | | | | 991,717 | |
| Applied Materials, Inc. | | | 6,901 | | | | 316,618 | |
| Belden, Inc. | | | 983 | | | | 69,793 | |
Benchmark Electronics, Inc.(a) | | | 2,568 | | | | 82,946 | |
Cirrus Logic, Inc.(a) | | | 1,630 | | | | 107,499 | |
| Cognex Corp. | | | 1,851 | | | | 169,385 | |
DHI Group, Inc.(a) | | | 13,487 | | | | 38,438 | |
Electronic Arts, Inc.(a) | | | 2,790 | | | | 316,191 | |
Facebook, Inc., Class A(a) | | | 4,086 | | | | 618,865 | |
Faro Technologies, Inc.(a) | | | 881 | | | | 30,615 | |
| Hewlett Packard Enterprise Co. | | | 10,651 | | | | 200,345 | |
| InterDigital, Inc. | | | 1,670 | | | | 135,270 | |
| International Business Machines Corp. | | | 2,512 | | | | 383,407 | |
| Lam Research Corp. | | | 1,970 | | | | 305,685 | |
| Microchip Technology, Inc. | | | 2,194 | | | | 182,760 | |
Micron Technology, Inc.(a) | | | 9,403 | | | | 289,330 | |
| Security Description | | Shares | | | Value | |
| Information Technology (continued) | | | | | | |
| Microsoft Corp. | | | 4,012 | | | $ | 280,198 | |
MoneyGram International, Inc.(a) | | | 9,560 | | | | 166,535 | |
| NetApp, Inc. | | | 3,871 | | | | 156,737 | |
NETGEAR, Inc.(a) | | | 1,349 | | | | 56,591 | |
| NVIDIA Corp. | | | 1,707 | | | | 246,405 | |
| Seagate Technology PLC | | | 5,791 | | | | 252,314 | |
| SYNNEX Corp. | | | 1,020 | | | | 113,485 | |
TTM Technologies, Inc.(a) | | | 4,289 | | | | 69,653 | |
| Western Digital Corp. | | | 3,267 | | | | 294,226 | |
WEX, Inc.(a) | | | 472 | | | | 48,220 | |
| Xperi Corp. | | | 1,720 | | | | 52,718 | |
| Total Information Technology | | | | | | | 6,867,825 | |
| | | | | | | | | |
| Materials (2.42%) | | | | | | | | |
AK Steel Holding Corp.(a) | | | 15,683 | | | | 95,666 | |
| Cabot Corp. | | | 3,219 | | | | 168,129 | |
Owens‐Illinois, Inc.(a) | | | 6,972 | | | | 157,358 | |
| Rayonier Advanced Materials, Inc. | | | 7,158 | | | | 124,478 | |
| Stepan Co. | | | 382 | | | | 32,325 | |
TimkenSteel Corp.(a) | | | 4,174 | | | | 54,679 | |
| Total Materials | | | | | | | 632,635 | |
| | | | | | | | | |
| Real Estate (1.86%) | | | | | | | | |
| DiamondRock Hospitality Co. | | | 6,080 | | | | 67,427 | |
Forestar Group, Inc.(a) | | | 2,689 | | | | 38,049 | |
| Jones Lang LaSalle, Inc. | | | 505 | | | | 58,312 | |
Quality Care Properties, Inc.(a) | | | 8,074 | | | | 136,613 | |
| The RMR Group, Inc., Class A | | | 1,388 | | | | 68,151 | |
| Summit Hotel Properties, Inc. | | | 4,402 | | | | 78,796 | |
| Washington Prime Group, Inc. | | | 5,105 | | | | 38,951 | |
| Total Real Estate | | | | | | | 486,299 | |
| | | | | | | | | |
| Telecommunication Services (2.43%) | | | | | | | | |
| AT&T, Inc. | | | 7,436 | | | | 286,509 | |
Iridium Communications, Inc.(a) | | | 4,496 | | | | 44,510 | |
| Telephone & Data Systems, Inc. | | | 2,641 | | | | 75,348 | |
| Verizon Communications, Inc. | | | 4,904 | | | | 228,723 | |
| Total Telecommunication Services | | | | | | | 635,090 | |
| | | | | | | | | |
| Utilities (1.71%) | | | | | | | | |
| Avangrid, Inc. | | | 921 | | | | 41,841 | |
| Consolidated Edison, Inc. | | | 1,114 | | | | 92,228 | |
| Dominion Resources, Inc. | | | 560 | | | | 45,231 | |
| Duke Energy Corp. | | | 794 | | | | 68,030 | |
| Great Plains Energy, Inc. | | | 1,746 | | | | 50,163 | |
| PG&E Corp. | | | 1,351 | | | | 92,381 | |
| The Southern Co. | | | 1,121 | | | | 56,734 | |
| Total Utilities | | | | | | | 446,608 | |
| | | | | | | | | |
TOTAL COMMON STOCKS (Cost $25,120,641) | | | 26,105,491 | |
See Notes to Financial Statements.
RiverFront Dynamic US Flex-Cap ETF
| Schedule of Investments | May 31, 2017 (Unaudited) |
| Security Description | | 7 Day Yield | | | Shares | | | Value | |
| SHORT TERM INVESTMENTS (0.04%) | | | | |
| State Street Institutional Treasury Plus Money Market Fund | | | 0.680 | % | | | 10,442 | | | $ | 10,442 | |
| | | | | | | | | | | | | |
TOTAL SHORT TERM INVESTMENTS (Cost $10,442) | | 10,442 | |
| | | | | | | | | | | | | |
TOTAL INVESTMENTS (99.88%) (Cost $25,131,083) | | | $ | 26,115,933 | |
| | | | | | | | | | | | | |
| NET OTHER ASSETS AND LIABILITIES (0.12%) | | | | 30,988 | |
| | | | | | |
| NET ASSETS (100.00%) | | | $ | 26,146,921 | |
(a) | Non income producing security. |
(b) | Security, or a portion of the security position, is currently on loan. The total market value of securities on loan is $26,914. |
See Notes to Financial Statements.
RiverFront Strategic Income Fund
| Schedule of Investments | May 31, 2017 (Unaudited) |
| Security Description | | Principal Amount | | | Value | |
| CORPORATE BONDS (88.99%) | | | | | | |
| Consumer Discretionary (24.58%) | | | | | | |
| Aramark Services, Inc., Sr. Unsec. | | | | | | |
| 5.13%, 01/15/2024 | | $ | 2,000,000 | | | $ | 2,115,000 | |
| Cablevision Systems Corp., Sr. Unsec. | | | | | | | | |
| 8.63%, 09/15/2017 | | | 2,038,000 | | | | 2,076,213 | |
| CCO Holdings LLC / CCO Holdings Capital Corp., Sr. Unsec. | | | | | | | | |
5.13%, 05/01/2027(a) | | | 3,400,000 | | | | 3,491,375 | |
| DISH DBS Corp., Sr. Unsec. | | | | | | | | |
| 7.88%, 09/01/2019 | | | 6,500,000 | | | | 7,223,125 | |
| Dollar Tree, Inc., Sr. Unsec. | | | | | | | | |
| 5.75%, 03/01/2023 | | | 6,000,000 | | | | 6,384,000 | |
| DR Horton, Inc., Sr. Unsec. | | | | | | | | |
| 4.38%, 09/15/2022 | | | 6,640,000 | | | | 7,080,962 | |
| Goodyear Tire & Rubber Co., Sr. Unsec. | | | | | | | | |
| 5.13%, 11/15/2023 | | | 7,000,000 | | | | 7,385,000 | |
| Hanesbrands, Inc., Sr. Unsec. | | | | | | | | |
4.63%, 05/15/2024(a) | | | 2,000,000 | | | | 2,010,000 | |
| Hilton Worldwide Finance LLC /Hilton Worldwide Finance Corp., Sr. Unsec. | | | | | | | | |
4.63%, 04/01/2025(a) | | | 5,050,000 | | | | 5,239,375 | |
| International Game Technology PLC, First Lien | | | | | | | | |
6.25%, 02/15/2022(a) | | | 3,000,000 | | | | 3,259,500 | |
| KFC Holding Co./Pizza Hut Holdings LLC/Taco Bell of America LLC, Sr. Unsec. | | | | | | | | |
5.00%, 06/01/2024(a) | | | 4,087,000 | | | | 4,261,924 | |
| Lamar Media Corp., Sr. Sub. | | | | | | | | |
| 5.00%, 05/01/2023 | | | 4,500,000 | | | | 4,713,750 | |
| Lear Corp., Sr. Unsec. | | | | | | | | |
| 4.75%, 01/15/2023 | | | 6,909,000 | | | | 7,175,708 | |
| MGM Resorts International, Sr. Unsec. | | | | | | | | |
| 6.75%, 10/01/2020 | | | 6,640,000 | | | | 7,395,299 | |
| Service Corp. International, Sr. Unsec. | | | | | | | | |
| 5.38%, 01/15/2022 | | | 3,000,000 | | | | 3,101,250 | |
| 5.38%, 05/15/2024 | | | 1,675,000 | | | | 1,771,145 | |
| Total Consumer Discretionary | | | | | | | 74,683,626 | |
| | | | | | | | | |
| Consumer Staples (5.94%) | | | | | | | | |
| Pinnacle Foods Finance LLC /Pinnacle Foods Finance Corp., Sr. Unsec. | | | | | | | | |
| 5.88%, 01/15/2024 | | | 6,189,000 | | | | 6,622,230 | |
| Pinnacle Foods Finance LLC, Sr. Unsec. | | | | | | | | |
| 4.88%, 05/01/2021 | | | 1,400,000 | | | | 1,438,500 | |
| Security Description | | Principal Amount | | | Value | |
| Consumer Staples (continued) | | | | | | |
| Spectrum Brands, Inc., Sr. Unsec. | | | | | | |
| 6.63%, 11/15/2022 | | $ | 645,000 | | | $ | 682,088 | |
| 5.75%, 07/15/2025 | | | 3,700,000 | | | | 3,950,120 | |
| TreeHouse Foods, Inc., Sr. Unsec. | | | | | | | | |
6.00%, 02/15/2024(a) | | | 5,000,000 | | | | 5,362,500 | |
| Total Consumer Staples | | | | | | | 18,055,438 | |
| | | | | | | | | |
| Energy (10.72%) | | | | | | | | |
| Concho Resources, Inc., Sr. Unsec. | | | | | | | | |
| 5.50%, 04/01/2023 | | | 346,000 | | | | 359,408 | |
| Continental Resources, Inc., Sr. Unsec. | | | | | | | | |
| 5.00%, 09/15/2022 | | | 2,500,000 | | | | 2,512,500 | |
| Kinder Morgan Energy Partners LP, Sr. Unsec. | | | | | | | | |
| 5.00%, 10/01/2021 | | | 6,500,000 | | | | 7,053,943 | |
| MPLX LP, Sr. Unsec. | | | | | | | | |
| 5.50%, 02/15/2023 | | | 2,000,000 | | | | 2,071,000 | |
| Newfield Exploration Co., Sr. Unsec. | | | | | | | | |
| 5.75%, 01/30/2022 | | | 7,000,000 | | | | 7,490,000 | |
| Southwestern Energy Co., Sr. Unsec. | | | | | | | | |
5.80%, 01/23/2020(b) | | | 2,000,000 | | | | 2,035,000 | |
| Tesoro Corp., Sr. Unsec. | | | | | | | | |
| 5.38%, 10/01/2022 | | | 8,044,000 | | | | 8,385,869 | |
| Tesoro Logistics LP / Tesoro Logistics Finance Corp., Sr. Unsec. | | | | | | | | |
| 5.88%, 10/01/2020 | | | 1,585,000 | | | | 1,628,588 | |
| 6.13%, 10/15/2021 | | | 1,000,000 | | | | 1,045,625 | |
| Total Energy | | | | | | | 32,581,933 | |
| | | | | | | | | |
| Financials (5.25%) | | | | | | | | |
| AerCap Ireland Capital Ltd. / AerCap Global Aviation Trust, Sr. Unsec. | | | | | | | | |
| 4.63%, 10/30/2020 | | | 3,881,000 | | | | 4,134,557 | |
| Ally Financial, Inc., Sr. Unsec. | | | | | | | | |
| 4.75%, 09/10/2018 | | | 3,200,000 | | | | 3,299,200 | |
| CIT Group, Inc., Sr. Unsec. | | | | | | | | |
5.50%, 02/15/2019(a) | | | 2,339,000 | | | | 2,473,493 | |
| Navient Corp., Sr. Unsec. | | | | | | | | |
| 8.45%, 06/15/2018 | | | 900,000 | | | | 956,880 | |
| 5.50%, 01/15/2019 | | | 4,900,000 | | | | 5,096,000 | |
| Total Financials | | | | | | | 15,960,130 | |
| | | | | | | | | |
| Health Care (6.45%) | | | | | | | | |
| DaVita HealthCare Partners, Inc., Sr. Unsec. | | | | | | | | |
| 5.75%, 08/15/2022 | | | 6,000,000 | | | | 6,228,750 | |
| HCA, Inc., First Lien | | | | | | | | |
| 5.88%, 03/15/2022 | | | 2,500,000 | | | | 2,781,250 | |
| Hologic, Inc., Sr. Unsec. | | | | | | | | |
5.25%, 07/15/2022(a) | | | 5,000,000 | | | | 5,268,750 | |
See Notes to Financial Statements.
RiverFront Strategic Income Fund
| Schedule of Investments | May 31, 2017 (Unaudited) |
| Security Description | | Principal Amount | | | Value | |
| Health Care (continued) | | | | | | |
| Tenet Healthcare Corp., First Lien | | | | | | |
4.63%, 06/15/2020(c) | | $ | 5,265,000 | | | $ | 5,330,813 | |
| Total Health Care | | | | | | | 19,609,563 | |
| | | | | | | | | |
| Industrials (13.29%) | | | | | | | | |
| ADT Corp., First Lien | | | | | | | | |
| 6.25%, 10/15/2021 | | | 5,390,000 | | | | 5,955,950 | |
| Aircastle Ltd., Sr. Unsec. | | | | | | | | |
| 6.25%, 12/01/2019 | | | 3,000,000 | | | | 3,262,500 | |
| Owens-Brockway Glass Container, Inc., Sr. Unsec. | | | | | | | | |
5.00%, 01/15/2022(a) | | | 6,145,000 | | | | 6,436,888 | |
| Park Aerospace Holdings Ltd., Sr. Unsec. | | | | | | | | |
5.25%, 08/15/2022(a) | | | 5,800,000 | | | | 6,108,125 | |
| United Rentals North America, Inc., Sr. Unsec. | | | | | | | | |
| 7.63%, 04/15/2022 | | | 1,434,000 | | | | 1,500,323 | |
| 5.75%, 11/15/2024 | | | 3,000,000 | | | | 3,183,780 | |
| WESCO Distribution, Inc., Sr. Unsec. | | | | | | | | |
| 5.38%, 12/15/2021 | | | 8,750,000 | | | | 9,143,749 | |
| XPO Logistics, Inc., Sr. Unsec. | | | | | | | | |
6.50%, 06/15/2022(a) | | | 4,500,000 | | | | 4,794,525 | |
| Total Industrials | | | | | | | 40,385,840 | |
| | | | | | | | | |
| Information Technology (3.77%) | | | | | | | | |
| Flextronics International Ltd., Sr. Unsec. | | | | | | | | |
| 5.00%, 02/15/2023 | | | 5,682,000 | | | | 6,194,840 | |
| SS&C Technologies Holdings, Inc., Sr. Unsec. | | | | | | | | |
| 5.88%, 07/15/2023 | | | 4,900,000 | | | | 5,260,763 | |
| Total Information Technology | | | | | | | 11,455,603 | |
| | | | | | | | | |
| Materials (14.06%) | | | | | | | | |
| AK Steel Corp., First Lien | | | | | | | | |
| 7.50%, 07/15/2023 | | | 1,000,000 | | | | 1,086,250 | |
| Ball Corp., Sr. Unsec. | | | | | | | | |
| 5.00%, 03/15/2022 | | | 7,606,000 | | | | 8,157,434 | |
| Cascades, Inc., Sr. Unsec. | | | | | | | | |
5.50%, 07/15/2022(a) | | | 4,889,000 | | | | 4,999,003 | |
| Celanese US Holdings LLC, Sr. Unsec. | | | | | | | | |
| 5.88%, 06/15/2021 | | | 6,920,000 | | | | 7,803,206 | |
| Graphic Packaging International, Inc., Sr. Unsec. | | | | | | | | |
| 4.75%, 04/15/2021 | | | 645,000 | | | | 678,863 | |
| 4.88%, 11/15/2022 | | | 4,615,000 | | | | 4,874,593 | |
| Huntsman Intl LLC, Sr. Unsec. | | | | | | | | |
| 4.88%, 11/15/2020 | | | 6,000,000 | | | | 6,390,000 | |
| Silgan Holdings, Inc., Sr. Unsec. | | | | | | | | |
| 5.00%, 04/01/2020 | | | 4,332,000 | | | | 4,411,969 | |
| Security Description | | Principal Amount | | | Value | |
| Materials (continued) | | | | | | |
| Vale Overseas Ltd., Sr. Unsec. | | | | | | |
| 5.88%, 06/10/2021 | | $ | 4,000,000 | | | $ | 4,318,880 | |
| Total Materials | | | | | | | 42,720,198 | |
| | | | | | | | | |
| Telecommunication Services (3.20%) | | | | | | | | |
| CenturyLink, Inc., Sr. Unsec., Series V | | | | | | | | |
| 5.63%, 04/01/2020 | | | 6,000,000 | | | | 6,382,500 | |
| Sprint Communications, Inc., Sr. Unsec. | | | | | | | | |
9.00%, 11/15/2018(a) | | | 1,113,000 | | | | 1,222,909 | |
| T-Mobile USA, Inc., Sr. Unsec. | | | | | | | | |
| 6.13%, 01/15/2022 | | | 2,000,000 | | | | 2,112,500 | |
| Total Telecommunication Services | | | | | | | 9,717,909 | |
| | | | | | | | | |
| Utilities (1.73%) | | | | | | | | |
| AES Corp., Sr. Unsec. | | | | | | | | |
| 8.00%, 06/01/2020 | | | 3,481,000 | | | | 4,011,853 | |
| AmeriGas Partners LP / AmeriGas Finance Corp., Sr. Unsec. | | | | | | | | |
| 5.63%, 05/20/2024 | | | 1,200,000 | | | | 1,238,880 | |
| Total Utilities | | | | | | | 5,250,733 | |
| | | | | | | | | |
TOTAL CORPORATE BONDS (Cost $260,628,358) | | | 270,420,973 | |
| Security Description | | 7 Day Yield | | | Shares | | | Value | |
| SHORT TERM INVESTMENTS (9.77%) | | | | |
| State Street Institutional Treasury Plus Money Market Fund | | | 0.680 | % | | | 29,682,644 | | | $ | 29,682,644 | |
| | | | | | | | | | | | | |
TOTAL SHORT TERM INVESTMENTS (Cost $29,682,644) | | 29,682,644 | |
| | | | | | | | | | | | | |
TOTAL INVESTMENTS (98.76%) (Cost $290,311,002) | | $ | 300,103,617 | |
| | | | | | | | | | | | | |
| NET OTHER ASSETS AND LIABILITIES (1.24%) | | | | 3,789,563 | |
| | | | | | | | | | | | | |
| NET ASSETS (100.00%) | | | | | | | $ | 303,893,180 | |
(a) | Securities exempt from registration under Rule 144A of the Securities Act of 1933. These securities may be sold in the ordinary course of business in transactions exempt from registration, normally to qualified institutional buyers. At period end, the aggregate market value of those securities was $54,928,367, representing 18.07% of net assets. |
(b) | Represents a step bond. Rate disclosed is as of May 31, 2017. |
(c) | Interest rate will change at a future date. Interest rate shown reflects the rate in effect at May 31, 2017. |
See Notes to Financial Statements.
RiverFront ETFs
| Statement of Assets and Liabilities | May 31, 2017 (Unaudited) |
| | | RiverFront Dynamic Core Income ETF | | | RiverFront Dynamic Unconstrained Income ETF | | | RiverFront Dynamic US Dividend Advantage ETF | | | RiverFront Dynamic US Flex-Cap ETF | | | RiverFront Strategic Income Fund | |
| ASSETS: | | | | | | | | | | | | | | | |
| Investments, at value | | $ | 30,617,821 | | | $ | 7,865,759 | | | $ | 33,727,697 | | | $ | 26,115,933 | | | $ | 300,103,617 | |
| Interest receivable | | | 253,611 | | | | 104,260 | | | | – | | | | – | | | | 3,805,342 | |
| Dividend receivable | | | – | | | | – | | | | 109,693 | | | | 40,870 | | | | – | |
| Receivable for shares sold | | | – | | | | – | | | | – | | | | 1,453,989 | | | | 1,266,221 | |
| Total Assets | | | 30,871,432 | | | | 7,970,019 | | | | 33,837,390 | | | | 27,610,792 | | | | 305,175,180 | |
| | | | | | | | | | | | | | | | | | | | | |
| LIABILITIES: | | | | | | | | | | | | | | | | | | | | |
| Payable to adviser | | | 13,015 | | | | 3,396 | | | | 14,675 | | | | 10,605 | | | | 41,057 | |
| Payable for investments purchased | | | – | | | | 98,349 | | | | – | | | | 1,453,266 | | | | 1,240,943 | |
| Total Liabilities | | | 13,015 | | | | 101,745 | | | | 14,675 | | | | 1,463,871 | | | | 1,282,000 | |
| NET ASSETS | | $ | 30,858,417 | | | $ | 7,868,274 | | | $ | 33,822,715 | | | $ | 26,146,921 | | | $ | 303,893,180 | |
| | | | | | | | | | | | | | | | | | | | | |
| NET ASSETS CONSIST OF: | | | | | | | | | | | | | | | | | | | | |
| Paid-in capital | | $ | 30,680,626 | | | $ | 7,613,664 | | | $ | 32,239,272 | | | $ | 24,945,601 | | | $ | 302,957,216 | |
| Accumulated net investment income | | | 13,442 | | | | 4,256 | | | | 20,329 | | | | 3,141 | | | | 50,835 | |
| Accumulated net realized gain/(loss) | | | (76,587 | ) | | | 4,007 | | | | 274,802 | | | | 213,329 | | | | (8,907,486 | ) |
| Net unrealized appreciation | | | 240,936 | | | | 246,347 | | | | 1,288,312 | | | | 984,850 | | | | 9,792,615 | |
| NET ASSETS | | $ | 30,858,417 | | | $ | 7,868,274 | | | $ | 33,822,715 | | | $ | 26,146,921 | | | $ | 303,893,180 | |
| | | | | | | | | | | | | | | | | | | | | |
| INVESTMENTS, AT COST | | $ | 30,376,885 | | | $ | 7,619,412 | | | $ | 32,439,385 | | | $ | 25,131,083 | | | $ | 290,311,002 | |
| | | | | | | | | | | | | | | | | | | | | |
| PRICING OF SHARES | | | | | | | | | | | | | | | | | | | | |
| Net Assets | | $ | 30,858,417 | | | $ | 7,868,274 | | | $ | 33,822,715 | | | $ | 26,146,921 | | | $ | 303,893,180 | |
| Shares of beneficial interest outstanding (Unlimited number of shares authorized, par value $0.01 per share) | | | 1,250,000 | | | | 300,000 | | | | 1,200,002 | | | | 900,002 | | | | 12,000,000 | |
| Net Asset Value, offering and redemption price per share | | $ | 24.69 | | | $ | 26.23 | | | $ | 28.19 | | | $ | 29.05 | | | $ | 25.32 | |
See Notes to Financial Statements.
RiverFront ETFs
| Statement of Operations | For the Six Months Ended May 31, 2017 (Unaudited) |
| | | RiverFront Dynamic Core Income ETF | | | RiverFront Dynamic Unconstrained Income ETF | | | RiverFront Dynamic US Dividend Advantage ETF | | | RiverFront Dynamic US Flex-Cap ETF | | | RiverFront Strategic Income Fund | |
| INVESTMENT INCOME: | | | | | | | | | | | | | | | |
| Interest | | $ | 220,511 | | | $ | 194,951 | | | $ | – | | | $ | – | | | $ | 7,361,497 | |
| Dividends | | | 4,374 | | | | 998 | | | | 353,141 | | | | 140,876 | | | | 54,509 | |
| Securities Lending Income | | | – | | | | – | | | | – | | | | 578 | | | | – | |
| Foreign taxes withheld on dividends | | | – | | | | – | | | | (641 | ) | | | (221 | ) | | | – | |
| Total Investment Income | | | 224,885 | | | | 195,949 | | | | 352,500 | | | | 141,233 | | | | 7,416,006 | |
| | | | | | | | | | | | | | | | | | | | | |
| EXPENSES: | | | | | | | | | | | | | | | | | | | | |
| Investment adviser and sub-adviser fees (note 3) | | | 46,052 | | | | 18,829 | | | | 63,078 | | | | 46,029 | | | | 726,860 | |
| Total Expenses before waiver/reimbursement | | | 46,052 | | | | 18,829 | | | | 63,078 | | | | 46,029 | | | | 726,860 | |
| Less fees waived/reimbursed by sub-adviser (note 3) | | | – | | | | – | | | | – | | | | – | | | | (474,039 | ) |
| Net Expenses | | | 46,052 | | | | 18,829 | | | | 63,078 | | | | 46,029 | | | | 252,821 | |
| NET INVESTMENT INCOME | | | 178,833 | | | | 177,120 | | | | 289,422 | | | | 95,204 | | | | 7,163,185 | |
| | | | | | | | | | | | | | | | | | | | | |
| REALIZED AND UNREALIZED GAIN/(LOSS) | | | | | | | | | | | | | | | | | | | | |
| Net realized gain/(loss) on investments | | | (28,576 | ) | | | 12,814 | | | | 394,909 | | | | 328,925 | | | | 1,010,538 | |
| Net realized loss on foreign currency transactions | | | – | | | | – | | | | – | | | | (105 | ) | | | – | |
| NET REALIZED GAIN/(LOSS) | | | (28,576 | ) | | | 12,814 | | | | 394,909 | | | | 328,820 | | | | 1,010,538 | |
| Net change in unrealized appreciation on investments | | | 364,527 | | | | 128,339 | | | | 789,091 | | | | 670,690 | | | | 2,477,889 | |
| Net change in unrealized appreciation on translation of assets and liabilities denominated in foreign currencies | | | – | | | | – | | | | – | | | | 5 | | | | – | |
| NET CHANGE IN UNREALIZED APPRECIATION | | | 364,527 | | | | 128,339 | | | | 789,091 | | | | 670,695 | | | | 2,477,889 | |
| NET REALIZED AND UNREALIZED GAIN ON INVESTMENTS | | | 335,951 | | | | 141,153 | | | | 1,184,000 | | | | 999,515 | | | | 3,488,427 | |
| NET INCREASE IN NET ASSETS RESULTING FROM OPERATIONS | | $ | 514,784 | | | $ | 318,273 | | | $ | 1,473,422 | | | $ | 1,094,719 | | | $ | 10,651,612 | |
See Notes to Financial Statements.
RiverFront Dynamic Core Income ETF
Statements of Changes in Net Assets
| | | For the Six Months Ended May 31, 2017 (Unaudited) | | | For the Period June 14, 2016 (Commencement) to November 30, 2016 | |
| OPERATIONS: | | | | | | |
| Net investment income | | $ | 178,833 | | | $ | 33,215 | |
| Net realized loss | | �� | (28,576 | ) | | | (47,984 | ) |
| Net change in unrealized appreciation/(depreciation) | | | 364,527 | | | | (123,591 | ) |
| Net Increase/(Decrease) in net assets resulting from operations | | | 514,784 | | | | (138,360 | ) |
| | | | | | | | | |
| DISTRIBUTIONS TO SHAREHOLDERS: | | | | | | | | |
| From net investment income | | | (165,583 | ) | | | (33,050 | ) |
| Total distributions | | | (165,583 | ) | | | (33,050 | ) |
| | | | | | | | | |
| CAPITAL SHARE TRANSACTIONS: | | | | | | | | |
| Proceeds from sale of shares | | | 24,428,065 | | | | 6,252,561 | |
| Net increase from share transactions | | | 24,428,065 | | | | 6,252,561 | |
| | | | | | | | | |
| Net increase in net assets | | | 24,777,266 | | | | 6,081,151 | |
| | | | | | | | | |
| NET ASSETS: | | | | | | | | |
| Beginning of period | | | 6,081,151 | | | | – | |
| End of period* | | $ | 30,858,417 | | | $ | 6,081,151 | |
| | | | | | | | | |
| *Including accumulated net investment income of: | | $ | 13,442 | | | $ | 192 | |
| | | | | | | | | |
| OTHER INFORMATION: | | | | | | | | |
| CAPITAL SHARE TRANSACTIONS: | | | | | | | | |
| Beginning shares | | | 250,000 | | | | – | |
| Shares sold | | | 1,000,000 | | | | 250,000 | |
| Shares redeemed | | | – | | | | – | |
| Shares outstanding, end of period | | | 1,250,000 | | | | 250,000 | |
See Notes to Financial Statements.
RiverFront Dynamic Unconstrained Income ETF
Statements of Changes in Net Assets
| | | For the Six Months Ended May 31, 2017 (Unaudited) | | | For the Period June 14, 2016 (Commencement) to November 30, 2016 | |
| OPERATIONS: | | | | | | |
| Net investment income | | $ | 177,120 | | | $ | 126,700 | |
| Net realized gain/(loss) | | | 12,814 | | | | (8,757 | ) |
| Net change in unrealized appreciation | | | 128,339 | | | | 118,008 | |
| Net increase in net assets resulting from operations | | | 318,273 | | | | 235,951 | |
| | | | | | | | | |
| DISTRIBUTIONS TO SHAREHOLDERS: | | | | | | | | |
| From net investment income | | | (173,491 | ) | | | (126,123 | ) |
| Total distributions | | | (173,491 | ) | | | (126,123 | ) |
| | | | | | | | | |
| CAPITAL SHARE TRANSACTIONS: | | | | | | | | |
| Proceeds from sale of shares | | | 5,190,646 | | | | 5,000,000 | |
| Shares redeemed | | | (2,576,982 | ) | | | – | |
| Net increase from share transactions | | | 2,613,664 | | | | 5,000,000 | |
| | | | | | | | | |
| Net increase in net assets | | | 2,758,446 | | | | 5,109,828 | |
| | | | | | | | | |
| NET ASSETS: | | | | | | | | |
| Beginning of period | | | 5,109,828 | | | | – | |
| End of period* | | $ | 7,868,274 | | | $ | 5,109,828 | |
| | | | | | | | | |
| *Including accumulated net investment income of: | | $ | 4,256 | | | $ | 627 | |
| | | | | | | | | |
| OTHER INFORMATION: | | | | | | | | |
| CAPITAL SHARE TRANSACTIONS: | | | | | | | | |
| Beginning shares | | | 200,000 | | | | – | |
| Shares sold | | | 200,000 | | | | 200,000 | |
| Shares redeemed | | | (100,000 | ) | | | – | |
| Shares outstanding, end of period | | | 300,000 | | | | 200,000 | |
See Notes to Financial Statements.
RiverFront Dynamic US Dividend Advantage ETF
Statements of Changes in Net Assets
| | | For the Six Months Ended May 31, 2017 (Unaudited) | | | For the Period June 7, 2016 (Commencement) to November 30, 2016 | |
| OPERATIONS: | | | | | | |
| Net investment income | | $ | 289,422 | | | $ | 73,653 | |
| Net realized gain/(loss) | | | 394,909 | | | | (22,926 | ) |
| Net change in unrealized appreciation | | | 789,091 | | | | 499,221 | |
| Net increase in net assets resulting from operations | | | 1,473,422 | | | | 549,948 | |
| | | | | | | | | |
| DISTRIBUTIONS TO SHAREHOLDERS: | | | | | | | | |
| From net investment income | | | (271,468 | ) | | | (71,278 | ) |
| Total distributions | | | (271,468 | ) | | | (71,278 | ) |
| | | | | | | | | |
| CAPITAL SHARE TRANSACTIONS: | | | | | | | | |
| Proceeds from sale of shares | | | 24,851,861 | | | | 14,111,104 | |
| Shares redeemed | | | (5,527,782 | ) | | | (1,293,092 | ) |
| Net increase from share transactions | | | 19,324,079 | | | | 12,818,012 | |
| | | | | | | | | |
| Net increase in net assets | | | 20,526,033 | | | | 13,296,682 | |
| | | | | | | | | |
| NET ASSETS: | | | | | | | | |
| Beginning of period | | | 13,296,682 | | | | – | |
| End of period* | | $ | 33,822,715 | | | $ | 13,296,682 | |
| | | | | | | | | |
| *Including accumulated net investment income of: | | $ | 20,329 | | | $ | 2,375 | |
| | | | | | | | | |
| OTHER INFORMATION: | | | | | | | | |
| CAPITAL SHARE TRANSACTIONS: | | | | | | | | |
| Beginning shares | | | 500,002 | | | | – | |
| Shares sold | | | 900,000 | | | | 550,002 | |
| Shares redeemed | | | (200,000 | ) | | | (50,000 | ) |
| Shares outstanding, end of period | | | 1,200,002 | | | | 500,002 | |
See Notes to Financial Statements.
RiverFront Dynamic US Flex-Cap ETF
Statements of Changes in Net Assets
| | | For the Six Months Ended May 31, 2017 (Unaudited) | | | For the Period June 7, 2016 (Commencement) to November 30, 2016 | |
| OPERATIONS: | | | | | | |
| Net investment income | | $ | 95,204 | | | $ | 34,328 | |
| Net realized gain | | | 328,820 | | | | 29,610 | |
| Net change in unrealized appreciation | | | 670,695 | | | | 314,155 | |
| Net increase in net assets resulting from operations | | | 1,094,719 | | | | 378,093 | |
| | | | | | | | | |
| DISTRIBUTIONS TO SHAREHOLDERS: | | | | | | | | |
| From net investment income | | | (92,063 | ) | | | (34,580 | ) |
| Total distributions | | | (92,063 | ) | | | (34,580 | ) |
| | | | | | | | | |
| CAPITAL SHARE TRANSACTIONS: | | | | | | | | |
| Proceeds from sale of shares | | | 19,897,502 | | | | 10,289,247 | |
| Shares redeemed | | | (2,806,120 | ) | | | (2,579,877 | ) |
| Net increase from share transactions | | | 17,091,382 | | | | 7,709,370 | |
| | | | | | | | | |
| Net increase in net assets | | | 18,094,038 | | | | 8,052,883 | |
| | | | | | | | | |
| NET ASSETS: | | | | | | | | |
| Beginning of period | | | 8,052,883 | | | | – | |
| End of period* | | $ | 26,146,921 | | | $ | 8,052,883 | |
| | | | | | | | | |
| *Including accumulated net investment income of: | | $ | 3,141 | | | $ | – | |
| | | | | | | | | |
| OTHER INFORMATION: | | | | | | | | |
| CAPITAL SHARE TRANSACTIONS: | | | | | | | | |
| Beginning shares | | | 300,002 | | | | – | |
| Shares sold | | | 700,000 | | | | 400,002 | |
| Shares redeemed | | | (100,000 | ) | | | (100,000 | ) |
| Shares outstanding, end of period | | | 900,002 | | | | 300,002 | |
See Notes to Financial Statements.
RiverFront Strategic Income Fund
Statements of Changes in Net Assets
| | | For the Six Months Ended May 31, 2017 (Unaudited) | | | For the Year Ended November 30, 2016 | |
| OPERATIONS: | | | | | | |
| Net investment income | | $ | 7,163,185 | | | $ | 16,277,993 | |
| Net realized gain/(loss) | | | 1,010,538 | | | | (1,305,008 | ) |
| Net change in unrealized appreciation | | | 2,477,889 | | | | 13,124,646 | |
| Net increase in net assets resulting from operations | | | 10,651,612 | | | | 28,097,631 | |
| | | | | | | | | |
| DISTRIBUTIONS TO SHAREHOLDERS: | | | | | | | | |
| From net investment income | | | (7,134,049 | ) | | | (16,281,197 | ) |
| Total distributions | | | (7,134,049 | ) | | | (16,281,197 | ) |
| | | | | | | | | |
| CAPITAL SHARE TRANSACTIONS: | | | | | | | | |
| Proceeds from sale of shares | | | 13,862,659 | | | | 106,134,969 | |
| Shares redeemed | | | (40,002,027 | ) | | | (255,443,492 | ) |
| Net decrease from share transactions | | | (26,139,368 | ) | | | (149,308,523 | ) |
| | | | | | | | | |
| Net decrease in net assets | | | (22,621,805 | ) | | | (137,492,089 | ) |
| | | | | | | | | |
| NET ASSETS: | | | | | | | | |
| Beginning of period | | | 326,514,985 | | | | 464,007,074 | |
| End of period* | | $ | 303,893,180 | | | $ | 326,514,985 | |
| | | | | | | | | |
| *Including accumulated net investment income of: | | $ | 50,835 | | | $ | 21,699 | |
| | | | | | | | | |
| OTHER INFORMATION: | | | | | | | | |
| CAPITAL SHARE TRANSACTIONS: | | | | | | | | |
| Beginning shares | | | 13,050,000 | | | | 19,050,000 | |
| Shares sold | | | 550,000 | | | | 4,400,000 | |
| Shares redeemed | | | (1,600,000 | ) | | | (10,400,000 | ) |
| Shares outstanding, end of period | | | 12,000,000 | | | | 13,050,000 | |
See Notes to Financial Statements.
RiverFront Dynamic Core Income ETF
| Financial Highlights | For a share outstanding throughout the periods presented |
| | | For the Six Months Ended May 31, 2017 (Unaudited) | | | For the Period June 14, 2016 (Commencement) to November 30, 2016 | |
| NET ASSET VALUE, BEGINNING OF PERIOD | | $ | 24.32 | | | $ | 25.00 | |
| | | | | | | | | |
| INCOME/(LOSS) FROM INVESTMENT OPERATIONS: | | | | | | | | |
Net investment income(a) | | | 0.24 | | | | 0.24 | |
| Net realized and unrealized gain/(loss) | | | 0.33 | | | | (0.68 | ) |
| Total from investment operations | | | 0.57 | | | | (0.44 | ) |
| | | | | | | | | |
| DISTRIBUTIONS: | | | | | | | | |
| From net investment income | | | (0.20 | ) | | | (0.24 | ) |
| Total distributions | | | (0.20 | ) | | | (0.24 | ) |
| | | | | | | | | |
| NET INCREASE/(DECREASE) IN NET ASSET VALUE | | | 0.37 | | | | (0.68 | ) |
| NET ASSET VALUE, END OF PERIOD | | $ | 24.69 | | | $ | 24.32 | |
TOTAL RETURN(b) | | | 2.37 | % | | | (1.77 | )% |
| | | | | | | | | |
| RATIOS/SUPPLEMENTAL DATA: | | | | | | | | |
| Net assets, end of period (000s) | | $ | 30,858 | | | $ | 6,081 | |
| | | | | | | | | |
| Ratio of expenses excluding waiver/reimbursement to average net assets | | | 0.51 | %(c) | | | 0.51 | %(c) |
| Ratio of expenses including waiver/reimbursement to average net assets | | | 0.51 | %(c) | | | 0.51 | %(c) |
| Ratio of net investment income including expenses waiver/reimbursement to average net assets | | | 1.98 | %(c) | | | 2.12 | %(c) |
Portfolio turnover rate(d) | | | 16 | % | | | 26 | % |
| (a) | Based on average shares outstanding during the period. |
| (b) | Total return is calculated assuming an initial investment made at the net asset value at the beginning of the period and the redemption at the net asset value on the last day of the period and assuming all distributions are reinvested at the actual reinvestment prices. Total return calculated for a period of less than one year is not annualized. |
| (d) | Portfolio turnover for periods less than one year are not annualized and does not include securities received or delivered from processing creations or redemptions in-kind. |
See Notes to Financial Statements.
RiverFront Dynamic Unconstrained Income ETF
| Financial Highlights | For a share outstanding throughout the periods presented |
| | | For the Six Months Ended May 31, 2017 (Unaudited) | | | For the Period June 14, 2016 (Commencement) to November 30, 2016 | |
| NET ASSET VALUE, BEGINNING OF PERIOD | | $ | 25.55 | | | $ | 25.00 | |
| | | | | | | | | |
| INCOME/(LOSS) FROM INVESTMENT OPERATIONS: | | | | | | | | |
Net investment income(a) | | | 0.62 | | | | 0.63 | |
| Net realized and unrealized gain | | | 0.66 | | | | 0.55 | |
| Total from investment operations | | | 1.28 | | | | 1.18 | |
| | | | | | | | | |
| DISTRIBUTIONS: | | | | | | | | |
| From net investment income | | | (0.60 | ) | | | (0.63 | ) |
| Total distributions | | | (0.60 | ) | | | (0.63 | ) |
| | | | | | | | | |
| NET INCREASE IN NET ASSET VALUE | | | 0.68 | | | | 0.55 | |
| NET ASSET VALUE, END OF PERIOD | | $ | 26.23 | | | $ | 25.55 | |
TOTAL RETURN(b) | | | 5.06 | % | | | 4.72 | % |
| | | | | | | | | |
| RATIOS/SUPPLEMENTAL DATA: | | | | | | | | |
| Net assets, end of period (000s) | | $ | 7,868 | | | $ | 5,110 | |
| | | | | | | | | |
| Ratio of expenses excluding waiver/reimbursement to average net assets | | | 0.51 | %(c) | | | 0.51 | %(c) |
| Ratio of expenses including waiver/reimbursement to average net assets | | | 0.51 | %(c) | | | 0.51 | %(c) |
| Ratio of net investment income including expenses waiver/reimbursement to average net assets | | | 4.80 | %(c) | | | 5.31 | %(c) |
Portfolio turnover rate(d) | | | 20 | % | | | 11 | % |
| (a) | Based on average shares outstanding during the period. |
| (b) | Total return is calculated assuming an initial investment made at the net asset value at the beginning of the period and the redemption at the net asset value on the last day of the period and assuming all distributions are reinvested at the actual reinvestment prices. Total return calculated for a period of less than one year is not annualized. |
| (d) | Portfolio turnover for periods less than one year are not annualized and does not include securities received or delivered from processing creations or redemptions in-kind. |
See Notes to Financial Statements.
RiverFront Dynamic US Dividend Advantage ETF
| Financial Highlights | For a share outstanding throughout the periods presented |
| | | For the Six Months Ended May 31, 2017 (Unaudited) | | | For the Period June 7, 2016 (Commencement) to November 30, 2016 | |
| NET ASSET VALUE, BEGINNING OF PERIOD | | $ | 26.59 | | | $ | 25.14 | |
| | | | | | | | | |
| INCOME/(LOSS) FROM INVESTMENT OPERATIONS: | | | | | | | | |
Net investment income(a) | | | 0.33 | | | | 0.26 | |
| Net realized and unrealized gain | | | 1.56 | | | | 1.40 | |
| Total from investment operations | | | 1.89 | | | | 1.66 | |
| | | | | | | | | |
| DISTRIBUTIONS: | | | | | | | | |
| From net investment income | | | (0.29 | ) | | | (0.21 | ) |
| Total distributions | | | (0.29 | ) | | | (0.21 | ) |
| | | | | | | | | |
| NET INCREASE IN NET ASSET VALUE | | | 1.60 | | | | 1.45 | |
| NET ASSET VALUE, END OF PERIOD | | $ | 28.19 | | | $ | 26.59 | |
TOTAL RETURN(b) | | | 7.14 | % | | | 6.64 | % |
| | | | | | | | | |
| RATIOS/SUPPLEMENTAL DATA: | | | | | | | | |
| Net assets, end of period (000s) | | $ | 33,823 | | | $ | 13,297 | |
| | | | | | | | | |
| Ratio of expenses excluding waiver/reimbursement to average net assets | | | 0.52 | %(c) | | | 0.52 | %(c) |
| Ratio of expenses including waiver/reimbursement to average net assets | | | 0.52 | %(c) | | | 0.52 | %(c) |
| Ratio of net investment income including expenses waiver/reimbursement to average net assets | | | 2.39 | %(c) | | | 2.13 | %(c) |
Portfolio turnover rate(d) | | | 38 | % | | | 45 | % |
| (a) | Based on average shares outstanding during the period. |
| (b) | Total return is calculated assuming an initial investment made at the net asset value at the beginning of the period and the redemption at the net asset value on the last day of the period and assuming all distributions are reinvested at the actual reinvestment prices. Total return calculated for a period of less than one year is not annualized. |
| (d) | Portfolio turnover for periods less than one year are not annualized and does not include securities received or delivered from processing creations or redemptions in-kind. |
See Notes to Financial Statements.
RiverFront Dynamic US Flex-Cap ETF
| Financial Highlights | For a share outstanding throughout the periods presented |
| | | For the Six Months Ended May 31, 2017 (Unaudited) | | | For the Period June 7, 2016 (Commencement) to November 30, 2016 | |
| NET ASSET VALUE, BEGINNING OF PERIOD | | $ | 26.84 | | | $ | 25.13 | |
| | | | | | | | | |
| INCOME/(LOSS) FROM INVESTMENT OPERATIONS: | | | | | | | | |
Net investment income(a) | | | 0.15 | | | | 0.17 | |
| Net realized and unrealized gain | | | 2.20 | | | | 1.70 | |
| Total from investment operations | | | 2.35 | | | | 1.87 | |
| | | | | | | | | |
| DISTRIBUTIONS: | | | | | | | | |
| From net investment income | | | (0.14 | ) | | | (0.16 | ) |
| Total distributions | | | (0.14 | ) | | | (0.16 | ) |
| | | | | | | | | |
| NET INCREASE IN NET ASSET VALUE | | | 2.21 | | | | 1.71 | |
| NET ASSET VALUE, END OF PERIOD | | $ | 29.05 | | | $ | 26.84 | |
TOTAL RETURN(b) | | | 8.75 | % | | | 7.45 | % |
| | | | | | | | | |
| RATIOS/SUPPLEMENTAL DATA: | | | | | | | | |
| Net assets, end of period (000s) | | $ | 26,147 | | | $ | 8,053 | |
| | | | | | | | | |
| Ratio of expenses excluding waiver/reimbursement to average net assets | | | 0.52 | %(c) | | | 0.52 | %(c) |
| Ratio of expenses including waiver/reimbursement to average net assets | | | 0.52 | %(c) | | | 0.52 | %(c) |
| Ratio of net investment income including expenses waiver/reimbursement to average net assets | | | 1.08 | %(c) | | | 1.34 | %(c) |
Portfolio turnover rate(d) | | | 51 | % | | | 41 | % |
| (a) | Based on average shares outstanding during the period. |
| (b) | Total return is calculated assuming an initial investment made at the net asset value at the beginning of the period and the redemption at the net asset value on the last day of the period and assuming all distributions are reinvested at the actual reinvestment prices. Total return calculated for a period of less than one year is not annualized. |
| (d) | Portfolio turnover for periods less than one year are not annualized and does not include securities received or delivered from processing creations or redemptions in-kind. |
See Notes to Financial Statements.
RiverFront Strategic Income Fund
| Financial Highlights | For a share outstanding throughout the periods presented |
| | | For the Six Months Ended May 31, 2017 (Unaudited) | | | For the Year Ended November 30, 2016 | | | For the Year Ended November 30, 2015 | | | For the Year Ended November 30, 2014 | | | For the Period October 8, 2013 (Commencement) to November 30, 2013 | |
| NET ASSET VALUE, BEGINNING OF PERIOD | | $ | 25.02 | | | $ | 24.36 | | | $ | 25.02 | | | $ | 24.90 | | | $ | 24.42 | |
| | | | | | | | | | | | | | | | | | | | | |
| INCOME/(LOSS) FROM INVESTMENT OPERATIONS: | | | | | | | | | | | | | | | | | | | | |
Net investment income(a) | | | 0.57 | | | | 1.05 | | | | 0.88 | | | | 0.83 | | | | 0.11 | |
| Net realized and unrealized gain/(loss) | | | 0.30 | | | | 0.71 | | | | (0.65 | ) | | | 0.11 | | | | 0.40 | |
| Total from investment operations | | | 0.87 | | | | 1.76 | | | | 0.23 | | | | 0.94 | | | | 0.51 | |
| | | | | | | | | | | | | | | | | | | | | |
| DISTRIBUTIONS: | | | | | | | | | | | | | | | | | | | | |
| From net investment income | | | (0.57 | ) | | | (1.10 | ) | | | (0.87 | ) | | | (0.82 | ) | | | (0.03 | ) |
| From net realized gains | | | – | | | | – | | | | (0.02 | ) | | | – | | | | – | |
| Total distributions | | | (0.57 | ) | | | (1.10 | ) | | | (0.89 | ) | | | (0.82 | ) | | | (0.03 | ) |
| | | | | | | | | | | | | | | | | | | | | |
| NET INCREASE/(DECREASE) IN NET ASSET VALUE | | | 0.30 | | | | 0.66 | | | | (0.66 | ) | | | 0.12 | | | | 0.48 | |
| NET ASSET VALUE, END OF PERIOD | | $ | 25.32 | | | $ | 25.02 | | | $ | 24.36 | | | $ | 25.02 | | | $ | 24.90 | |
TOTAL RETURN(b) | | | 3.50 | % | | | 7.38 | % | | | 0.91 | % | | | 3.80 | % | | | 2.08 | % |
| | | | | | | | | | | | | | | | | | | | | |
| RATIOS/SUPPLEMENTAL DATA: | | | | | | | | | | | | | | | | | | | | |
| Net assets, end of period (000s) | | $ | 303,893 | | | $ | 326,515 | | | $ | 464,007 | | | $ | 369,065 | | | $ | 97,102 | |
| | | | | | | | | | | | | | | | | | | | | |
| Ratio of expenses excluding waiver/reimbursement to average net assets | | | 0.46 | %(c) | | | 0.46 | % | | | 0.46 | % | | | 0.46 | % | | | 0.46 | %(c) |
| Ratio of expenses including waiver/reimbursement to average net assets | | | 0.16 | %(c) | | | 0.17 | %(d) | | | 0.22 | % | | | 0.22 | % | | | 0.22 | %(c) |
| Ratio of net investment income including expenses waiver/reimbursement to average net assets | | | 4.53 | %(c) | | | 4.26 | % | | | 3.54 | % | | | 3.30 | % | | | 3.28 | %(c) |
Portfolio turnover rate(e) | | | 17 | % | | | 52 | % | | | 36 | % | | | 27 | % | | | 0 | % |
| (a) | Based on average shares outstanding during the period. |
| (b) | Total return is calculated assuming an initial investment made at the net asset value at the beginning of the period and the redemption at the net asset value on the last day of the period and assuming all distributions are reinvested at the actual reinvestment prices. Total return calculated for a period of less than one year is not annualized. |
| (d) | Effective July 1, 2016, the Fund’s management fee consists of a fee of 0.16% paid to the Fund’s investment adviser and a fee of 0.30% paid to the Fund’s sub-adviser. The Fund’s sub-adviser will voluntarily waive all of its 0.30% annual sub-advisory fee payable by the Fund until March 31, 2018. |
| (e) | Portfolio turnover for periods less than one year are not annualized and does not include securities received or delivered from processing creations or redemptions in-kind. |
See Notes to Financial Statements.
RiverFront ETFs
| Notes to Financial Statements | May 31, 2017 (Unaudited) |
1. ORGANIZATION
ALPS ETF Trust (the “Trust”), a Delaware statutory trust, is an open-end management investment company registered under the Investment Company Act of 1940, as amended (the “1940 Act”). As of May 31, 2017, the Trust consists of twenty separate portfolios. Each portfolio represents a separate series of the Trust. This report pertains solely to the RiverFront Dynamic Core Income ETF, the RiverFront Dynamic Unconstrained Income ETF, the RiverFront Dynamic US Dividend Advantage ETF, the RiverFront Dynamic US Flex-Cap ETF, and the RiverFront Strategic Income Fund (each a “Fund” and collectively, the “Funds”).
The investment objective of the RiverFront Dynamic Core Income ETF Fund is to seek total return, with an emphasis on income as the source of that total return. The Fund is considered non-diversified and may invest a greater portion of assets in securities of individual issuers than a diversified fund. As a result, changes in the market value of a single investment could cause greater fluctuations in share price than would occur in a diversified fund.
The investment objective of the RiverFront Dynamic Unconstrained Income ETF Fund is to seek total return, with an emphasis on income as the source of that total return. The Fund is considered non-diversified and may invest a greater portion of assets in securities of individual issuers than a diversified fund. As a result, changes in the market value of a single investment could cause greater fluctuations in share price than would occur in a diversified fund.
The investment objective of the RiverFront Dynamic US Dividend Advantage ETF Fund is to seek to provide capital appreciation and dividend income. The Fund is considered non-diversified and may invest a greater portion of assets in securities of individual issuers than a diversified fund. As a result, changes in the market value of a single investment could cause greater fluctuations in share price than would occur in a diversified fund.
The investment objective of the RiverFront Dynamic US Flex-Cap ETF Fund is to seek to provide capital appreciation. The Fund is considered non-diversified and may invest a greater portion of assets in securities of individual issuers than a diversified fund. As a result, changes in the market value of a single investment could cause greater fluctuations in share price than would occur in a diversified fund.
The investment objective of the RiverFront Strategic Income Fund is to seek total return, with an emphasis on income as the source of that total return. The Fund is considered non-diversified and may invest a greater portion of assets in securities of individual issuers than a diversified fund. As a result, changes in the market value of a single investment could cause greater fluctuations in share price than would occur in a diversified fund.
Each Fund’s Shares (“Shares”) are listed on the NYSE Arca, Inc. (the “NYSE Arca”). Each Fund issues and redeems Shares at net asset value (“NAV”) in blocks of 50,000 Shares, each of which is called a “Creation Unit”. Creation Units are issued and redeemed principally in-kind for securities and/or cash. Except when aggregated in Creation Units, Shares are not redeemable securities of a Fund.
Pursuant to the Trust’s organizational documents, its Officers and Trustees are indemnified against certain liability arising out of the performance of their duties to the Trust. Additionally, in the normal course of business, the Trust enters into contracts with service providers that contain general indemnification clauses. The Trust’s maximum exposure under these arrangements is unknown, as this would involve future claims that may be made against the Trust that have not yet occurred.
2. SIGNIFICANT ACCOUNTING POLICIES
The following is a summary of significant accounting policies consistently followed by the Funds in the preparation of the financial statements. The accompanying financial statements were prepared in accordance with accounting principles generally accepted in the United States of America (“U.S. GAAP”). The preparation of financial statements in conformity with U.S. GAAP requires management to make certain estimates and assumptions that affect the reported amounts of assets and liabilities and disclosures of contingent assets and liabilities at the date of the financial statements and the reported amounts of revenue and expenses during the period. Actual results could differ from those estimates. Each Fund is considered an investment company under U.S. GAAP and follows the accounting and reporting guidance applicable to investment companies in the Financial Accounting Standards Board Accounting Standards Codification Topic 946.
A. Portfolio Valuation
Each Fund’s NAV is determined daily, as of the close of regular trading on the New York Stock Exchange (the “NYSE”), normally 4:00 p.m. Eastern time, on each day the NYSE is open for trading. The NAV is computed by dividing the value of all assets of each Fund (including accrued interest and dividends), less all liabilities (including accrued expenses and dividends declared but unpaid), by the total number of shares outstanding.
RiverFront ETFs
| Notes to Financial Statements | May 31, 2017 (Unaudited) |
Portfolio securities listed on any exchange other than the NASDAQ Stock Market LLC (“NASDAQ”) are valued at the last sale price on the business day as of which such value is being determined. If there has been no sale on such day, the securities are valued at the mean of the most recent bid and ask prices on such day. Securities traded on the NASDAQ are valued at the NASDAQ Official Closing Price as determined by NASDAQ. Portfolio securities traded on more than one securities exchange are valued at the last sale price on the business day as of which such value is being determined at the close of the exchange representing the principal market for such securities. Portfolio securities traded in the over-the-counter market, but excluding securities traded on the NASDAQ, are valued at the last quoted sale price in such market.
Corporate bonds and United States government bonds are typically valued at the mean between the evaluated bid and ask prices formulated by an independent pricing service.
Each Fund’s investments are valued at market value or, in the absence of market value with respect to any portfolio securities, at fair value according to procedures adopted by the Trust’s Board of Trustees (the “Board”). When market quotations are not readily available or when events occur that make established valuation methods unreliable, securities of the Funds may be valued in good faith by or under the direction of the Board. These securities generally include, but are not limited to, restricted securities (securities which may not be publicly sold without registration under the Securities Act of 1933) for which a pricing service is unable to provide a market price; securities whose trading has been formally suspended; a security whose market price is not available from a pre-established primary pricing source or the pricing source is not willing to provide a price; a security with respect to which an event has occurred that is most likely to materially affect the value of the security after the market has closed but before the calculation of a Fund’s NAV or make it difficult or impossible to obtain a reliable market quotation; or a security whose price, as provided by the pricing service, does not reflect the security’s “fair value” due to the security being de-listed from a national exchange or the security’s primary trading market is temporarily closed at a time when, under normal conditions, it would be open. As a general principle, the current “fair value” of a security would be the amount which the owner might reasonably expect to receive from the sale on the applicable exchange or principal market. A variety of factors may be considered in determining the fair value of such securities.
B. Fair Value Measurements
Each Fund discloses the classification of its fair value measurements following a three-tier hierarchy based on the inputs used to measure fair value. Inputs refer broadly to the assumptions that market participants would use in pricing the asset or liability, including assumptions about risk. Inputs may be observable or unobservable. Observable inputs reflect the assumptions market participants would use in pricing the asset or liability that are developed based on market data obtained from sources independent of the reporting entity. Unobservable inputs reflect the reporting entity’s own assumptions about the assumptions market participants would use in pricing the asset or liability that are developed based on the best information available.
Valuation techniques used to value the Funds’ investments by major category are as follows:
Equity securities, including restricted securities, for which market quotations are readily available, are valued at the last reported sale price or official closing price as reported by a third party pricing vendor on the primary market or exchange on which they are traded and are categorized as Level 1 in the hierarchy. In the event there were no sales during the day or closing prices are not available, securities are valued at the mean of the most recent quoted bid and ask prices on such day and are generally categorized as Level 2 in the hierarchy. Investments in open-end mutual funds are valued at their closing NAV each business day and are categorized as Level 1 in the hierarchy.
Debt securities, including restricted securities, are valued based on evaluated prices received from third party pricing vendors or from brokers who make markets in such securities. For corporate bonds, pricing vendors utilize matrix pricing which considers yield or price of bonds of comparable quality, coupon, maturity and type as well as broker-supplied prices. When independent prices are unavailable or unreliable, debt securities may be valued utilizing pricing methodologies which consider similar factors that would be used by third party pricing vendors. Debt securities are generally categorized as Level 2 in the hierarchy but may be Level 3 depending on the circumstances. The RiverFront Dynamic Core Income ETF, the RiverFront Dynamic Unconstrained Income ETF, and the RiverFront Strategic Income Fund may invest a significant portion of their assets in below investment grade securities. The value of these securities can be more volatile due to changes in the credit quality of the issuer and is sensitive to changes in economic, market and regulatory conditions.
Changes in valuation techniques may result in transfers in or out of an assigned level within the disclosure hierarchy.
Various inputs are used in determining the value of each Fund’s investments as of the end of the reporting period. When inputs used fall into different levels of the fair value hierarchy, the level in the hierarchy within which the fair value measurement falls is determined based on the lowest level input that is significant to the fair value measurement in its entirety. The designated input levels are not necessarily an indication of the risk or liquidity associated with these investments.
RiverFront ETFs
| Notes to Financial Statements | May 31, 2017 (Unaudited) |
These inputs are categorized in the following hierarchy under applicable financial accounting standards:
| Level 1 – | Unadjusted quoted prices in active markets for identical investments, unrestricted assets or liabilities that a Fund has the ability to access at the measurement date; |
| Level 2 – | Quoted prices which are not active, quoted prices for similar assets or liabilities in active markets or inputs other than quoted prices that are observable (either directly or indirectly) for substantially the full term of the asset or liability; and |
| Level 3 – | Significant unobservable prices or inputs (including the Fund’s own assumptions in determining the fair value of investments) where there is little or no market activity for the asset or liability at the measurement date. |
The following is a summary of the inputs used to value the Funds’ investments as of May 31, 2017:
RiverFront Dynamic Core Income ETF
| Investments in Securities at Value | | Level 1 - Unadjusted Quoted Prices | | | Level 2 - Other Significant Observable Inputs | | | Level 3 - Significant Unobservable Inputs | | | Total | |
| Corporate Bonds* | | $ | – | | | $ | 28,432,240 | | | $ | – | | | $ | 28,432,240 | |
| Short Term Investments | | | 2,185,581 | | | | – | | | | – | | | | 2,185,581 | |
| TOTAL | | $ | 2,185,581 | | | $ | 28,432,240 | | | $ | – | | | $ | 30,617,821 | |
RiverFront Dynamic Unconstrained Income ETF
| Investments in Securities at Value | | Level 1 - Unadjusted Quoted Prices | | | Level 2 - Other Significant Observable Inputs | | | Level 3 - Significant Unobservable Inputs | | | Total | |
| Corporate Bonds* | | $ | – | | | $ | 7,466,381 | | | $ | – | | | $ | 7,466,381 | |
| Short Term Investments | | | 399,378 | | | | – | | | | – | | | | 399,378 | |
| TOTAL | | $ | 399,378 | | | $ | 7,466,381 | | | $ | – | | | $ | 7,865,759 | |
RiverFront Dynamic US Dividend Advantage ETF
| Investments in Securities at Value | | Level 1 - Unadjusted Quoted Prices | | | Level 2 - Other Significant Observable Inputs | | | Level 3 - Significant Unobservable Inputs | | | Total | |
| Common Stocks* | | $ | 33,707,839 | | | $ | – | | | $ | – | | | $ | 33,707,839 | |
| Short Term Investments | | | 19,858 | | | | – | | | | – | | | | 19,858 | |
| TOTAL | | $ | 33,727,697 | | | $ | – | | | $ | – | | | $ | 33,727,697 | |
RiverFront Dynamic US Flex-Cap ETF
| Investments in Securities at Value | | Level 1 - Unadjusted Quoted Prices | | | Level 2 - Other Significant Observable Inputs | | | Level 3 - Significant Unobservable Inputs | | | Total | |
| Common Stocks* | | $ | 26,105,491 | | | $ | – | | | $ | – | | | $ | 26,105,491 | |
| Short Term Investments | | | 10,442 | | | | – | | | | – | | | | 10,442 | |
| TOTAL | | $ | 26,115,933 | | | $ | – | | | $ | – | | | $ | 26,115,933 | |
RiverFront ETFs
| Notes to Financial Statements | May 31, 2017 (Unaudited) |
RiverFront Strategic Income Fund
| Investments in Securities at Value | | Level 1 - Unadjusted Quoted Prices | | | Level 2 - Other Significant Observable Inputs | | | Level 3 - Significant Unobservable Inputs | | | Total | |
| Corporate Bonds* | | $ | – | | | $ | 270,420,973 | | | $ | – | | | $ | 270,420,973 | |
| Short Term Investments | | | 29,682,644 | | | | – | | | | – | | | | 29,682,644 | |
| TOTAL | | $ | 29,682,644 | | | $ | 270,420,973 | | | $ | – | | | $ | 300,103,617 | |
| * | For a detailed sector breakdown, see the accompanying Schedule of Investments. |
The Funds recognize transfers between levels as of the end of the period. For the six months ended May 31, 2017, the Funds did not have any transfers between Level 1 and Level 2 securities. The Funds did not have any securities that used significant unobservable inputs (Level 3) in determining fair value.
C. Securities Transactions and Investment Income
Securities transactions are recorded as of the trade date. Realized gains and losses from securities transactions are recorded on the highest cost basis. Dividend income and capital gains distributions, if any, are recorded on the ex-dividend date. Interest income, if any, is recorded on the accrual basis, including amortization of premiums and accretion of discounts.
D. Dividends and Distributions to Shareholders
Dividends from net investment income for each Fund, if any, are declared and paid monthly or as the Board may determine from time to time. Distributions of net realized capital gains earned by the Funds, if any, are distributed at least annually.
E. Federal Tax and Tax Basis Information
The timing and character of income and capital gain distributions are determined in accordance with income tax regulations, which may differ from U.S. GAAP. Reclassifications are made to the Funds’ capital accounts for permanent tax differences to reflect income and gains available for distribution (or available capital loss carryforwards) under income tax regulations. The amounts and characteristics of tax basis distributions and composition of distributable earnings/(accumulated losses) are finalized at fiscal year-end; accordingly, tax basis balances have not been determined as of May 31, 2017.
The tax character of the distributions paid by the Funds during the fiscal year or period ended November 30, 2016 were as follows:
| | | Ordinary Income | |
| November 30, 2016 | | | |
| RiverFront Dynamic Core Income ETF | | $ | 33,050 | |
| RiverFront Dynamic Unconstrained Income ETF | | | 126,123 | |
| RiverFront Dynamic US Dividend Advantage ETF | | | 71,278 | |
| RiverFront Dynamic US Flex-Cap ETF | | | 34,555 | |
| RiverFront Strategic Income Fund | | | 16,281,197 | |
RiverFront ETFs
| Notes to Financial Statements | May 31, 2017 (Unaudited) |
As of May 31, 2017, the cost of investments for federal income tax purposes and accumulated net unrealized appreciation/(depreciation) on investments were as follows:
| | | RiverFront Dynamic Core Income ETF | | | RiverFront Dynamic Unconstrained Income ETF | | | RiverFront Dynamic US Dividend Advantage ETF | | | RiverFront Dynamic US Flex-Cap ETF | | | RiverFront Strategic Income Fund | |
| Gross appreciation (excess of value over tax cost) | | $ | 266,060 | | | $ | 249,392 | | | $ | 2,293,744 | | | $ | 1,940,627 | | | $ | 9,858,821 | |
| Gross depreciation (excess of tax cost over value) | | | (25,124 | ) | | | (3,045 | ) | | | (1,005,572 | ) | | | (956,303 | ) | | | (73,767 | ) |
| Net unrealized appreciation (depreciation) | | | 240,936 | | | | 246,347 | | | | 1,288,172 | | | | 984,324 | | | | 9,785,054 | |
| Cost of investments for income tax purposes | | $ | 30,376,885 | | | $ | 7,619,412 | | | $ | 32,439,525 | | | $ | 25,131,609 | | | $ | 290,318,563 | |
The differences between book-basis and tax-basis are primarily due to the deferral of losses from wash sales.
F. Income Taxes
No provision for income taxes is included in the accompanying financial statements, as each Fund intends to distribute to shareholders all taxable investment income and realized gains and otherwise comply with Subchapter M of the Internal Revenue Code of 1986, as amended, applicable to regulated investment companies. Each Fund evaluates tax positions taken (or expected to be taken) in the course of preparing the Funds’ tax returns to determine whether these positions meet a “more-likely-than-not” standard that, based on the technical merits, have a more than fifty percent likelihood of being sustained by a taxing authority upon examination. A tax position that meets the “more-likely-than-not” recognition threshold is measured to determine the amount of benefit to recognize in the financial statements.
As of and during the six months ended May 31, 2017, the Funds did not have a liability for any unrecognized tax benefits. Each Fund files U.S. federal, state, and local tax returns as required. Each Fund’s tax returns are subject to examination by the relevant tax authorities until expiration of the applicable statute of limitations, which is generally three years after the filing of the tax return, but may extend to four years in certain jurisdictions. Tax returns for open years have incorporated no uncertain tax positions that require a provision for income taxes. Being that the RiverFront Dynamic US Dividend Advantage ETF and the RiverFront Dynamic US Flex-Cap ETF commenced operations on June 7, 2016 and the RiverFront Dynamic Core Income ETF and the RiverFront Dynamic Unconstrained Income ETF commenced operations on June 14, 2016, no tax returns have been filed for those Funds as of the date of this report.
G. Lending of Portfolio Securities
The Funds have entered into a securities lending agreement with State Street Bank & Trust Co. (“SSB”), the Funds’ lending agent. Each Fund may lend its portfolio securities only to borrowers that are approved by SSB. Each Fund will limit such lending to not more than 33 1/3% of the value of its total assets. Each Fund’s securities held at SSB as custodian shall be available to be lent except those securities the Fund or ALPS Advisors Inc. specifically identifies in writing as not being available for lending. The borrower pledges and maintains with the Fund collateral consisting of cash (U.S. Dollars only), securities issued or guaranteed by the U.S. government or its agencies or instrumentalities, and cash equivalents (including irrevocable bank letters of credit) issued by a person other than the borrower or an affiliate of the borrower. The initial collateral received by each Fund is required to have a value of no less than 102% of the market value of the loaned securities for U.S equity securities and a value of no less than 105% of the market value for non-U.S. equity securities. The collateral is maintained thereafter, at a market value equal to not less than 102% of the current value of the U.S. equity securities on loan and not less than 105% of the current value of the non-U.S. equity securities on loan. The market value of the loaned securities is determined at the close of each business day and any additional required collateral is delivered to each Fund on the next business day. During the term of the loan, each Fund is entitled to all distributions made on or in respect of the loaned securities. Loans of securities are terminable at any time and the borrower, after notice, is required to return borrowed securities within the customary time period for settlement of securities transactions.
Any cash collateral received is reinvested in a money market fund managed by SSB as disclosed in the Fund’s Schedule of Investments and is reflected in the Statements of Assets and Liabilities as a payable for collateral upon return of securities loaned. Non-cash collateral, in the form of securities issued or guaranteed by the U.S. government or its agencies or instrumentalities, is not disclosed in the Fund’s Statements of Assets and Liabilities as it is held by the lending agent on behalf of the Fund, and the Fund does not have the ability to re-hypothecate these securities. Income earned by the Fund from securities lending activity is disclosed in the Statement of Operations.
RiverFront ETFs
| Notes to Financial Statements | May 31, 2017 (Unaudited) |
The following is a summary of the securities lending agreement and related cash and non-cash collateral received as of May 31, 2017:
| | | Market Value of Securities on Loan | | | Cash Collateral Received | | | Non-Cash Collateral Received | | | Total Collateral Received | |
| RiverFront Dynamic US Flex-Cap ETF | | $ | 26,914 | | | $ | – | | | $ | 27,784 | | | $ | 27,784 | |
The risks of securities lending include the risk that the borrower may not provide additional collateral when required or may not return the securities when due. To mitigate these risks, the Funds benefit from a borrower default indemnity provided by SSB. SSB’s indemnity allows for full replacement of securities lent wherein SSB will purchase the unreturned loaned securities on the open market by applying the proceeds of the collateral, or to the extent such proceeds are insufficient or the collateral is unavailable, SSB will purchase the unreturned loan securities at SSB’s expense. However, the Funds could suffer a loss if the value of the investments purchased with cash collateral falls below the value of the cash collateral received.
The following table reflects a breakdown of transactions accounted for as secured borrowings, the gross obligation by the type of collateral pledged or securities loaned, and the remaining contractual maturity of those transactions as of May 31, 2017:
| RiverFront Dynamic US Flex-Cap ETF | Remaining contractual maturity of the agreement | |
| | | |
| Securities Lending Transactions | | Overnight & Continuous | | Up to 30 days | | | 30-90 days | | Greater than 90 days | | Total | |
| Common Stocks | | $ | – | | | $ | – | | | $ | – | | | $ | – | | $ | – | |
| Total Borrowings | | | | | | | | | | | | | | | | | | – | |
| Gross amount of recognized liabilities for securities lending (collateral received) | | $ | – | |
| 3. | INVESTMENT ADVISORY FEE AND OTHER AFFILIATED TRANSACTIONS |
ALPS Advisors, Inc. (the “Adviser”) acts as each Fund’s investment adviser pursuant to an Advisory Agreement with the Trust on behalf of each Fund (the “Advisory Agreement”). Pursuant to the Advisory Agreement, each Fund pays the Adviser an annual management fee for the services and facilities it provides as a percentage of the relevant Fund’s average daily net assets as set out below:
| Fund | Advisory Fee |
| RiverFront Dynamic Core Income ETF | 0.51%(a) |
| RiverFront Dynamic Unconstrained Income ETF | 0.51%(a) |
| RiverFront Dynamic US Dividend Advantage ETF | 0.52%(b) |
| RiverFront Dynamic US Flex-Cap ETF | 0.52%(b) |
| RiverFront Strategic Income Fund | 0.46% |
| (a) | The unitary advisory fee as a percentage of net assets is subject to the following breakpoints: (i) 0.51% for average net assets up to $600 million, (ii) 0.48% for average net assets equal to or greater than $600 million. |
| (b) | The unitary advisory fee as a percentage of net assets is subject to the following breakpoints: (i) 0.52% for average net assets up to $600 million, (ii) 0.49% for average net assets equal to or greater than $600 million. |
Out of the advisory fee, the Adviser pays substantially all expenses of each Fund, including the cost of transfer agency, custody, fund administration, legal, audit, independent trustees and other services, except for interest expenses, distribution fees or expenses, brokerage expenses, taxes and extraordinary expenses such as litigation and other expenses not incurred in the ordinary course of the Fund’s business. The Adviser’s unitary management fee is designed to pay substantially all of each Fund’s expenses and to compensate the Adviser for providing services for the Funds.
RiverFront ETFs
| Notes to Financial Statements | May 31, 2017 (Unaudited) |
RiverFront Investment Group, LLC acts as each Fund’s sub-adviser (“Sub-Adviser”) pursuant to a sub-advisory agreement with the Trust (the “Sub-Advisory Agreement”). Pursuant to the Sub-Advisory Agreement, the Adviser pays the Sub-Adviser a sub-advisory fee out of the Adviser’s advisory fee for the services it provides, payable on a monthly basis at the annual rate of the relevant Fund’s average daily net assets as set out below:
| Fund | Sub-Advisory Fee |
| RiverFront Dynamic Core Income ETF | 0.35% |
| RiverFront Dynamic Unconstrained Income ETF | 0.35% |
| RiverFront Dynamic US Dividend Advantage ETF | 0.35% |
| RiverFront Dynamic US Flex-Cap ETF | 0.35% |
| RiverFront Strategic Income Fund | 0.30% |
For the RiverFront Strategic Income Fund, the Sub-Adviser has agreed to waive all of its sub-advisory fee until at least March 31, 2018. This waiver may only be terminated by the Fund’s Board (and not by the Fund’s Sub-Adviser) prior to such date.
ALPS Fund Services, Inc., an affiliate of the Adviser, is the administrator of the Funds.
Each Trustee who is not an officer or employee of the Adviser, any sub-adviser or any of their affiliates (“Independent Trustees”) receives (1) a quarterly retainer of $5,000, (2) a per meeting fee for regularly scheduled meetings of $3,750, (3) $1,500 for any special meeting held outside of a regularly scheduled board meeting, and (4) reimbursement for all reasonable out-of-pocket expenses relating to attendance at meetings.
| 4. | PURCHASES AND SALES OF SECURITIES |
For the six months ended May 31, 2017, the cost of purchases and proceeds from sales of investment securities, excluding in-kind transactions and short-term investments, were as follows:
| Fund | | Purchases | | | Sales | |
| RiverFront Dynamic Core Income ETF | | $ | 2,819,206 | | | $ | 3,966,420 | |
| RiverFront Dynamic Unconstrained Income ETF | | | 2,548,836 | | | | 1,325,424 | |
| RiverFront Dynamic US Dividend Advantage ETF | | | 9,195,335 | | | | 9,245,070 | |
| RiverFront Dynamic US Flex-Cap ETF | | | 9,164,843 | | | | 9,182,660 | |
| RiverFront Strategic Income Fund | | | 49,686,440 | | | | 54,561,479 | |
For the six months ended May 31, 2017, the cost of in-kind purchases and proceeds from in-kind sales were as follows:
| Fund | | Purchases | | | Sales | |
| RiverFront Dynamic Core Income ETF | | $ | 23,645,755 | | | $ | – | |
| RiverFront Dynamic Unconstrained Income ETF | | | 3,742,283 | | | | 2,511,863 | |
| RiverFront Dynamic US Dividend Advantage ETF | | | 24,840,875 | | | | 5,527,772 | |
| RiverFront Dynamic US Flex-Cap ETF | | | 19,888,802 | | | | 2,805,228 | |
| RiverFront Strategic Income Fund | | | 11,099,805 | | | | 38,268,769 | |
For the six months ended May 31, 2017, the in-kind net realized gains/(losses) were as follows:
| Fund | | Net Realized Gain/(Loss) | |
| RiverFront Dynamic Core Income ETF | | $ | _ | |
| RiverFront Dynamic Unconstrained Income ETF | | | (7,258 | ) |
| RiverFront Dynamic US Dividend Advantage ETF | | | 612,747 | |
| RiverFront Dynamic US Flex-Cap ETF | | | 368,542 | |
| RiverFront Strategic Income Fund | | | 415,576 | |
Gains on in-kind transactions are not considered taxable for federal income tax purposes.
RiverFront ETFs
| Notes to Financial Statements | May 31, 2017 (Unaudited) |
| 5. | CAPITAL SHARE TRANSACTIONS |
Shares are created and redeemed by each Fund only in Creation Unit size aggregations of 50,000 Shares. Only broker-dealers or large institutional investors with creation and redemption agreements called Authorized Participants (“AP”) are permitted to purchase or redeem Creation Units from each Fund. Such transactions are generally permitted on an in-kind basis, with a balancing cash component to equate the transaction to the NAV per unit of each Fund on the transaction date. Cash may be substituted equivalent to the value of certain securities generally when they are not available in sufficient quantity for delivery, not eligible for trading by the AP or as a result of other market circumstances.
On October 13, 2016, the Securities and Exchange Commission (“SEC”) amended Regulation S-X, which will require standardized, enhanced disclosure about derivatives in investment company financial statements, as well as other amendments. The compliance date for the amendments to Regulation S-X is August 1, 2017. Management is currently evaluating the impact to the financial statements and disclosures.
RiverFront ETFs
| Additional Information | May 31, 2017 (Unaudited) |
PROXY VOTING RECORDS, POLICIES AND PROCEDURES
Information regarding how each Fund voted proxies relating to portfolio securities during the most recent 12-month period ended June 30 and a description of the Funds’ proxy voting policies and procedures used in determining how to vote for proxies are available without charge on the SEC’s website at www.sec.gov and upon request, by calling (toll-free) 1-866-675-2639.
PORTFOLIO HOLDINGS
The Trust is required to disclose, after its first and third fiscal quarters, the complete schedule of each Fund’s portfolio holdings with the SEC on Form N-Q. Forms N-Q for each Fund are available on the SEC’s website at www.sec.gov. Each Fund’s Forms N-Q may also be reviewed and copied at the SEC’s Public Reference Room in Washington, D.C. and information on the operation of the Public Reference Room may be obtained by calling 1-800-SEC-0330. Each Fund’s Forms N-Q are available without charge, upon request, by calling (toll-free) 1-866-675-2639 or by writing to ALPS ETF Trust at 1290 Broadway, Suite 1100, Denver, Colorado 80203.
TAX INFORMATION
The Funds designated the following for federal income tax purposes for distributions made during the calendar year ended December 31, 2016:
| | Qualified Dividend Income | Dividend Received Deduction |
| RiverFront Dynamic US Dividend Advantage ETF | 92.45% | 90.62% |
| RiverFront Dynamic US Flex-Cap ETF | 100.00% | 100.00% |
In early 2017, if applicable, shareholders of record received this information for the distributions paid to them by the Funds during the calendar year 2016 via Form 1099. The Funds will notify shareholders in early 2018 of amounts paid to them by the Funds, if any, during the calendar year 2017.
| Performance Overview | |
| Sprott Gold Miners ETF | 1 |
| Sprott Junior Gold Miners ETF | 3 |
| Disclosure of Fund Expenses | 5 |
| Financial Statements | |
| Schedules of Investments | |
| Sprott Gold Miners ETF | 6 |
| Sprott Junior Gold Miners ETF | 7 |
| Statements of Assets and Liabilities | 8 |
| Statements of Operations | 9 |
| Statements of Changes in Net Assets | |
| Sprott Gold Miners ETF | 10 |
| Sprott Junior Gold Miners ETF | 11 |
| Financial Highlights | 12 |
| Notes to Financial Statements | 14 |
| Additional Information | 21 |
alpsfunds.com
Sprott Gold Miners ETF
| Performance Overview | May 31, 2017 (Unaudited) |
Investment Objective
Sprott Gold Miners ETF (the “Fund”) employs a “passive management”—or indexing—investment approach designed to seek investment results that correspond (before fees and expenses) generally to the performance of the Sprott Zacks Gold Miners Index (the “Underlying Index”).
The Underlying Index was created by Zacks Index Services to provide a means of generally tracking the performance of gold and silver mining companies whose stocks are traded on major U.S. exchanges. The Underlying Index uses a transparent, rules‐based methodology that is designed to identify the stocks of 25 gold and silver mining companies with the highest beta† to the spot price of gold, with each stock’s weighting in the index adjusted based on its quarterly revenue growth on a year‐over‐year basis and the quality of its balance sheet, as measured by long‐term debt to equity. The Underlying Index is rebalanced on a quarterly basis to incorporate the latest financial data into the screening process. At least 80% of the Underlying Index (by weight) must consist of gold mining companies while no more than 20% may consist of silver mining companies.
Performance (as of May 31, 2017)
| | 6 Months | 1 Year | Since Inception^ |
| Sprott Gold Miners ETF ‐ NAV | 5.66% | ‐3.00% | ‐6.53% |
| Sprott Gold Miners ETF ‐ Market Price* | 5.56% | ‐3.14% | ‐6.56% |
| Sprott Zacks Gold Miners Total Return Index | 6.00% | ‐2.35% | ‐5.83% |
S&P 500® Total Return Index | 10.81% | 17.47% | 9.44% |
Total Expense Ratio (per the current prospectus) 0.57%
Performance data quoted represents past performance. Past performance does not guarantee future results. The table does not reflect the deduction of taxes that a shareholder would pay on Fund distributions or the redemption of Fund shares. Investment return and principal value of an investment will fluctuate so that an investor’s shares, when sold or redeemed, may be worth more or less than the original cost. Current performance data may be higher or lower than actual data quoted. For the most current month-end performance data please visit www.alpsfunds.com or call 1.855.215.1425.
NAV is an exchange-traded fund’s per-share value. The per-share dollar amount of the Fund is derived by dividing the total value of all the securities in its portfolio, less any liabilities, by the number of Fund shares outstanding. Market Price is the price at which a share can currently be traded in the market. Information detailing the number of days the Market Price of the Fund was greater than the Fund’s NAV and the number of days it was less than the Fund’s NAV can be obtained at www.alpsfunds.com.
| † | Beta is defined as a sensitivity measure based on regression against the spot gold price movement during the trailing 36 months. |
| ^ | The Fund’s Commencement date was July 15, 2014. |
| * | Market Price is based on the midpoint of the bid-ask spread at 4 p.m. ET and does not represent the returns an investor would receive if shares were traded at other times. |
Sprott Zacks Gold Miners Total Return Index is comprised of approximately 25 stocks selected, based on investment and other criteria, from a universe of gold and silver mining companies whose stock is listed on a major U.S. exchange. The stocks are selected using a proprietary, quantitative rules-based methodology developed by Zacks Index Services.
S&P 500® Index is the Standard & Poor’s composite index of 500 stocks, a widely recognized, unmanaged index of common stock prices.
The indexes are reported on a total return basis, which assumes reinvestment of any dividends and distributions realized during a given time period. The indexes are not actively managed and do not reflect any deductions for fees, expenses or taxes. One cannot invest directly in an index. Index performance does not reflect fund performance.
The Fund is concentrated in the gold and silver mining industry. As a result, the Fund will be sensitive to changes in, and its performance will depend to a greater extent on, the overall condition of the gold and silver mining industry. Also, gold and silver mining companies are highly dependent on the price of gold and silver bullion. These prices may fluctuate substantially over short periods of time so the Fund’s Share price may be more volatile than other types of investments.
Funds that emphasize investments in small-cap and mid-cap companies will generally experience greater price volatility.
Funds investing in foreign and emerging markets will also generally experience greater price volatility.
The Fund’s shares are not individually redeemable. Investors buy and sell shares of the Fund on a secondary market. Only market makers or “authorized participants” may trade directly with the Fund, typically in blocks of 50,000 shares.
The Sprott Gold Miners ETF is not suitable for all investors. Investments in the Fund are subject to investment risks, including possible loss of the principal amount invested.
Sprott Gold Miners ETF
| Performance Overview | May 31, 2017 (Unaudited) |
ALPS Portfolio Solutions Distributor, Inc., a FINRA member, is the distributor for the Sprott Gold Miners ETF.
ALPS Portfolio Solutions Distributor, Inc. is not affiliated with Sprott or Zacks Index Services, a division of Zacks Investment Management.
Top 10 Holdings* (as of May 31, 2017) | |
| | |
| Randgold Resources Ltd., ADR | 16.91% |
| Newmont Mining Corp | 13.70% |
| Agnico Eagle Mines Ltd | 13.33% |
| Kinross Gold Corp | 4.67% |
| Royal Gold Inc | 4.65% |
| Pan American Silver Corp. | 4.59% |
| Cia de Minas Buenaventura SAA, ADR | 4.54% |
| Barrick Gold Corp | 4.43% |
| Hecla Mining Co. | 3.90% |
| Alamos Gold, Inc., Class A | 3.60% |
| Total % of Top 10 Holdings | 74.32% |
Country Allocation* (as of May 31, 2017) | |
| Canada | 46.88% |
| United States | 25.23% |
| Jersey | 16.91% |
| South Africa | 6.45% |
| Peru | 4.53% |
| Total | 100.00% |
Future holdings are subject to change.
Growth of $10,000 (as of May 31, 2017)
Comparison of Change in Value of $10,000 Investment in the Fund and the Underlying Index
The chart above represents historical performance of a hypothetical investment of $10,000 in the Fund over the life of the Fund. Past performance does not guarantee future results. This chart does not reflect the deduction of taxes that a shareholder would pay on Fund distributions or the redemption of Fund shares.
Sprott Junior Gold Miners ETF
| Performance Overview | May 31, 2017 (Unaudited) |
Investment Objective
Sprott Junior Gold Miners ETF (the “Fund”) employs a “passive management”—or indexing—investment approach designed to seek investment results that correspond (before fees and expenses) generally to the performance of the Sprott Zacks Junior Gold Miners Index (the “Underlying Index”).
The Underlying Index was created by Zacks Index Services to provide a means of generally tracking the performance of “junior” gold and silver mining companies whose stocks are traded on major U.S. or Canadian exchanges. Junior companies include early stage mining companies that are in the exploration stage only or that hold properties that might not ultimately produce gold or silver. The Underlying Index uses a transparent, rules-based methodology that is designed to identify between 30 to 40 junior gold and silver stocks with market capitalization between $250 million and $2 billion. Excluding companies with market capitalization below $250 million aims to exclude very early stage exploration companies whose historical success rate is low. Each stock’s weighting in the Underlying Index is adjusted based on 2 company factors: 1) Revenue Growth and 2) Price Momentum. The Underlying Index is reconstituted on a semi-annual basis, in November and May, to incorporate the latest factor scores into the selection and weighting process. At least 80% of the Underlying Index (by weight) must consist of junior gold mining companies while no more than 20% may consist of junior silver mining companies.
Performance (as of May 31, 2017)
| | 6 Months | 1 Year | Since Inception^ |
| Sprott Junior Gold Miners ETF - NAV | -4.04% | -3.34% | 13.67% |
| Sprott Junior Gold Miners ETF - Market Price* | -4.13% | -3.28% | 13.67% |
| Sprott Zacks Junior Gold Miners Total Return Index | -3.47% | -2.38% | 14.81% |
S&P 500® Total Return Index | 10.81% | 17.47% | 9.23% |
Total Expense Ratio (per the current prospectus) 0.57%
Performance data quoted represents past performance. Past performance does not guarantee future results. The table does not reflect the deduction of taxes that a shareholder would pay on Fund distributions or the redemption of Fund shares. Investment return and principal value of an investment will fluctuate so that an investor’s shares, when sold or redeemed, may be worth more or less than the original cost. Current performance data may be higher or lower than actual data quoted. For the most current month-end performance data please visit www.alpsfunds.com or call 1.855.215.1425.
NAV is an exchange-traded fund’s per-share value. The per-share dollar amount of the Fund is derived by dividing the total value of all the securities in its portfolio, less any liabilities, by the number of Fund shares outstanding. Market Price is the price at which a share can currently be traded in the market. Information detailing the number of days the Market Price of the Fund was greater than the Fund’s NAV and the number of days it was less than the Fund’s NAV can be obtained at www.alpsfunds.com.
| ^ | The Fund’s Commencement date was March 31, 2015. Total return for a period of less than one year is not annualized. |
| * | Market Price is based on the midpoint of the bid-ask spread at 4 p.m. ET and does not represent the returns an investor would receive if shares were traded at other times. |
Sprott Zacks Junior Gold Miners Total Return Index is comprised of between 30 to 40 stocks selected, based on investment and other criteria, from a universe of gold and silver mining companies whose stocks are listed on a major U.S. or Canadian exchange. The stocks are selected using a proprietary, quantitative rules-based methodology developed by Zacks Index Services.
S&P 500® Index is the Standard & Poor’s composite index of 500 stocks, a widely recognized, unmanaged index of common stock prices.
The indexes are reported on a total return basis, which assumes reinvestment of any dividends and distributions realized during a given time period. The indexes are not actively managed and do not reflect any deductions for fees, expenses or taxes. One cannot invest directly in an index. Index performance does not reflect fund performance.
The Fund is concentrated in the gold and silver mining industry. As a result, the Fund will be sensitive to changes in, and its performance will depend to a greater extent on, the overall condition of the gold and silver mining industry. Also, gold and silver mining companies are highly dependent on the price of gold and silver bullion. These prices may fluctuate substantially over short periods of time so the Fund’s Share price may be more volatile than other types of investments.
Funds that emphasize investments in small-cap and mid-cap companies will generally experience greater price volatility. Micro-cap stocks involve substantially greater risks of loss and price fluctuations because their earnings and revenues tend to be less predictable. These companies may be newly formed or in the early stages of development, with limited product lines, markets or financial resources and may lack management depth.
Funds investing in foreign and emerging markets will also generally experience greater price volatility.
The Fund’s shares are not individually redeemable. Investors buy and sell shares of the Fund on a secondary market. Only market makers or “authorized participants” may trade directly with the Fund, typically in blocks of 50,000 shares.
The Sprott Junior Gold Miners ETF is not suitable for all investors. Investments in the Fund are subject to investment risks, including possible loss of the principal amount invested.
ALPS Portfolio Solutions Distributor, Inc., a FINRA member, is the distributor for the Sprott Junior Gold Miners ETF.
ALPS Portfolio Solutions Distributor, Inc. is not affiliated with Sprott or Zacks Index Services, a division of Zacks Investment Management.
Sprott Junior Gold Miners ETF
| Performance Overview | May 31, 2017 (Unaudited) |
Top 10 Holdings* (as of May 31, 2017)
| IAMGOLD Corp. | 8.49% |
| Alamos Gold, Inc., Class A | 8.41% |
| New Gold, Inc. | 6.98% |
| Centerra Gold, Inc. | 6.97% |
| Coeur Mining, Inc. | 6.97% |
| Endeavour Mining Corp | 6.49% |
| Kirkland Lake Gold Ltd | 5.04% |
| First Majestic Silver Corp. | 4.39% |
| Silver Standard Resources, Inc. | 4.31% |
| Torex Gold Resources, Inc. | 4.16% |
| Total % of Top 10 Holdings | 62.21% |
Future holdings are subject to change.
Country Allocation* (as of May 31, 2017)
| Canada | 83.65% |
| United States | 7.02% |
| United Kingdom | 6.49% |
| South Africa | 2.84% |
| Total | 100.00% |
Growth of $10,000 (as of May 31, 2017)
Comparison of Change in Value of $10,000 Investment in the Fund and the Underlying Index
The chart above represents historical performance of a hypothetical investment of $10,000 in the Fund over the life of the Fund. Past performance does not guarantee future results. This chart does not reflect the deduction of taxes that a shareholder would pay on Fund distributions or the redemption of Fund shares.
Sprott ETFs
| Disclosure of Fund Expenses | May 31, 2017 (Unaudited) |
Shareholder Expense Example: As a shareholder of a Fund, you incur two types of costs: (1) transaction costs which may include creation and redemption fees or brokerage charges, and (2) ongoing costs, including management fees and other Fund expenses. These examples are intended to help you understand your ongoing costs (in dollars) of investing in a Fund and to compare these costs with the ongoing costs of investing in other funds. It is based on an investment of $1,000 invested at the beginning of the (six month) period and held through May 31, 2017.
Actual Return: The first line of the table provides information about actual account values and actual expenses. You may use the information in this line, together with the amount you invested, to estimate the expenses that you incurred over the period. Simply divide your account value by $1,000 (for example, an $8,600 account value divided by $1,000 = 8.6), then multiply the result by the number in the first line under the heading entitled “Expenses Paid During Period” to estimate the expenses attributable to your investment during this period.
Hypothetical 5% Return: The second line of the table provides information about hypothetical account values and hypothetical expenses based on each Fund’s actual expense ratio and an assumed rate of return of 5% per year before expenses, which is not the Fund’s actual return. The hypothetical account values and expenses may not be used to estimate the actual ending account balance or expenses you paid for the period. You may use this information to compare ongoing costs of investing in each Fund and other funds. To do so, compare this 5% hypothetical example with the 5% hypothetical examples that appear in the shareholder reports of other funds.
The expenses shown in the table are meant to highlight ongoing Fund costs only and do not reflect any transaction costs, such as creation and redemption fees or brokerage charges. Therefore, the second line is useful in comparing ongoing costs only, and will not help you determine the relative total costs of owning different funds. In addition, if these costs were included, your costs would have been higher.
| | Beginning Account Value 12/1/16 | Ending Account Value 5/31/17 | Expense Ratio(a) | Expenses Paid During Period 12/1/16 - 5/31/17(b) |
| Sprott Gold Miners ETF | | | | |
| Actual | $1,000.00 | $1,056.60 | 0.57% | $2.92 |
| Hypothetical (5% return before expenses) | $1,000.00 | $1,022.09 | 0.57% | $2.87 |
| Sprott Junior Gold Miners ETF | | | | |
| Actual | $1,000.00 | $959.60 | 0.57% | $2.78 |
| Hypothetical (5% return before expenses) | $1,000.00 | $1,022.09 | 0.57% | $2.87 |
(a) | Annualized, based on the Fund's most recent fiscal half year expenses. |
(b) | Expenses are equal to the Fund's annualized expense ratio multiplied by the average account value over the period, multiplied by the number of days in the most recent fiscal half year (182), divided by 365. |
Sprott Gold Miners ETF
| Schedule of Investments | May 31, 2017 (Unaudited) |
| Security Description | | Shares | | | Value | |
| COMMON STOCKS (99.94%) | | | | | | |
| Gold Mining (84.64%) | | | | | | |
| Agnico Eagle Mines Ltd. | | | 498,512 | | | $ | 24,132,966 | |
| Alamos Gold, Inc., Class A | | | 969,674 | | | | 6,516,209 | |
| AngloGold Ashanti Ltd., Sponsored ADR | | | 484,285 | | | | 5,516,006 | |
B2gold Corp.(a)(b) | | | 2,178,470 | | | | 5,467,960 | |
| Barrick Gold Corp. | | | 485,096 | | | | 8,023,488 | |
| Cia de Minas Buenaventura SAA, ADR | | | 660,162 | | | | 8,212,415 | |
| Gold Fields Ltd., Sponsored ADR | | | 916,250 | | | | 3,280,175 | |
| Harmony Gold Mining Co. Ltd., Sponsored ADR | | | 405,351 | | | | 810,702 | |
IAMGOLD Corp.(a) | | | 1,050,582 | | | | 4,696,101 | |
Kinross Gold Corp.(a) | | | 1,959,550 | | | | 8,445,660 | |
Mcewen Mining, Inc.(b) | | | 618,980 | | | | 1,578,399 | |
| Newmont Mining Corp. | | | 726,224 | | | | 24,800,550 | |
Pretium Resources, Inc.(a)(b) | | | 206,568 | | | | 1,848,784 | |
| Randgold Resources Ltd., ADR | | | 322,839 | | | | 30,611,594 | |
| Royal Gold, Inc. | | | 104,753 | | | | 8,424,236 | |
Sandstorm Gold Ltd.(a)(b) | | | 695,198 | | | | 2,356,721 | |
Seabridge Gold, Inc.(a)(b) | | | 83,279 | | | | 853,610 | |
Sibanye Gold Ltd., Sponsored ADR(b) | | | 408,429 | | | | 2,066,651 | |
| Yamana Gold, Inc. | | | 2,150,924 | | | | 5,613,912 | |
| Total Gold Mining | | | | | | | 153,256,139 | |
| | | | | | | | | |
| Silver Mining (15.30%) | | | | | | | | |
Coeur Mining, Inc.(a) | | | 401,368 | | | | 3,724,695 | |
First Majestic Silver Corp.(a)(b) | | | 494,785 | | | | 4,141,351 | |
Fortuna Silver Mines, Inc.(a) | | | 202,223 | | | | 952,470 | |
| Hecla Mining Co. | | | 1,229,610 | | | | 7,057,961 | |
| Pan American Silver Corp. | | | 476,587 | | | | 8,311,677 | |
Silver Standard Resources, Inc.(a)(b) | | | 369,867 | | | | 3,513,737 | |
| Total Silver Mining | | | | | | | 27,701,891 | |
| | | | | | | | | |
| TOTAL COMMON STOCKS (Cost $176,977,129) | | 180,958,030 | |
| | | 7 Day Yield | | | Shares | | | Value | |
| SHORT TERM INVESTMENTS (4.70%) | | | | | |
| Money Market Fund (0.05%) | | | | | | | |
| State Street Institutional Treasury Plus Money Market Fund | | | | | | | | | |
| (Cost $84,747) | | | 0.680 | % | | | 84,747 | | | | 84,747 | |
| | | | | | | | | | | | | |
| Investments Purchased with Collateral from Securities Loaned (4.65%) | | | | | | | | | |
| State Street Navigator Securities Lending Government Money Market Portfolio, 0.78% | | | | | | | | | |
| (Cost $8,422,405) | | | | | | | 8,422,405 | | | | 8,422,405 | |
| | | | | | | | | | | | | |
TOTAL SHORT TERM INVESTMENTS (Cost $8,507,152) | | 8,507,152 | |
| | | Value | |
TOTAL INVESTMENTS (104.64%) (Cost $185,484,281) | | $ | 189,465,182 | |
| | | | | |
| NET OTHER ASSETS AND LIABILITIES (-4.64%) | | | (8,401,937 | ) |
| | | | | |
| NET ASSETS (100.00%) | | $ | 181,063,245 | |
(a) | Non-income producing security. |
(b) | Security, or a portion of the security position, is currently on loan. The total market value of securities on loan is $11,533,013. |
See Notes to Financial Statements.
Sprott Junior Gold Miners ETF
| Schedule of Investments | May 31, 2017 (Unaudited) |
| Security Description | | Shares | | | Value | |
| COMMON STOCKS (99.97%) | | | | | | |
| Gold Mining (77.89%) | | | | | | |
Alacer Gold Corp.(a)(b) | | | 654,445 | | | $ | 959,249 | |
| Alamos Gold, Inc., Class A | | | 1,716,085 | | | | 11,532,091 | |
Argonaut Gold, Inc.(a)(b) | | | 748,221 | | | | 1,063,467 | |
Asanko Gold, Inc.(a)(b) | | | 907,352 | | | | 1,471,000 | |
| Centerra Gold, Inc. | | | 1,682,673 | | | | 9,554,060 | |
China Gold International Resources Corp. Ltd.(a)(b) | | | 1,707,784 | | | | 2,452,605 | |
Continental Gold, Inc.(a)(b) | | | 318,404 | | | | 808,473 | |
Endeavour Mining Corp.(a) | | | 564,452 | | | | 8,900,194 | |
Gold Standard Ventures Corp.(a)(b) | | | 490,955 | | | | 810,076 | |
Golden Star Resources Ltd.(a) | | | 794,784 | | | | 517,484 | |
Guyana Goldfields, Inc.(a) | | | 758,003 | | | | 3,035,716 | |
| Harmony Gold Mining Co. Ltd., Sponsored ADR | | | 1,946,092 | | | | 3,892,184 | |
IAMGOLD Corp.(a) | | | 2,603,506 | | | | 11,637,672 | |
Kirkland Lake Gold Ltd.(a) | | | 888,994 | | | | 6,910,047 | |
Klondex Mines Ltd.(a) | | | 507,386 | | | | 1,517,444 | |
New Gold, Inc.(a) | | | 3,312,100 | | | | 9,571,969 | |
NOVAGOLD RESOURCES, Inc.(a)(b) | | | 700,772 | | | | 2,754,034 | |
| Osisko Gold Royalties Ltd. | | | 455,209 | | | | 4,805,330 | |
Premier Gold Mines Ltd.(a)(b) | | | 1,094,358 | | | | 2,235,946 | |
Pretium Resources, Inc.(a)(b) | | | 385,450 | | | | 3,449,778 | |
Richmont Mines, Inc.(a)(c) | | | 268,511 | | | | 1,896,284 | |
Roxgold, Inc.(a)(b) | | | 1,566,692 | | | | 1,414,935 | |
Sandstorm Gold Ltd.(a)(b) | | | 645,259 | | | | 2,187,428 | |
Seabridge Gold, Inc.(a)(b) | | | 119,377 | | | | 1,223,614 | |
SEMAFO, Inc.(a) | | | 753,715 | | | | 1,534,379 | |
Teranga Gold Corp.(a)(b) | | | 494,291 | | | | 1,101,392 | |
TMAC Resources, Inc.(a)(b)(c) | | | 171,097 | | | | 2,082,270 | |
Torex Gold Resources, Inc.(a) | | | 341,067 | | | | 5,701,072 | |
Wesdome Gold Mines Ltd.(a)(b) | | | 739,001 | | | | 1,712,309 | |
| Total Gold Mining | | | | | | | 106,732,502 | |
| | | | | | | | | |
| Silver Mining (22.08%) | | | | | | | | |
Coeur Mining, Inc.(a) | | | 1,028,898 | | | | 9,548,173 | |
Endeavour Silver Corp.(a)(b) | | | 264,201 | | | | 768,825 | |
First Majestic Silver Corp.(a)(b) | | | 719,080 | | | | 6,018,700 | |
Fortuna Silver Mines, Inc.(a)(b) | | | 673,844 | | | | 3,173,805 | |
MAG Silver Corp.(a) | | | 172,011 | | | | 2,070,473 | |
Silver Standard Resources, Inc.(a)(b) | | | 621,220 | | | | 5,901,590 | |
Silvercorp Metals, Inc.(b) | | | 949,533 | | | | 2,769,486 | |
| Total Silver Mining | | | | | | | 30,251,052 | |
| | | | | | | | | |
TOTAL COMMON STOCKS (Cost $139,618,550) | | 136,983,554 | |
| | 7 Day Yield | | | Shares | | | Value | |
| SHORT TERM INVESTMENTS (9.39%) | | | | | | | |
| Money Market Fund (0.05%) | | | | | | | |
| State Street Institutional Treasury Plus Money Market Fund (Cost $74,489) | | | 0.680 | % | | | 74,489 | | | | 74,489 | |
| | | 7 Day Yield | | | Shares | | | Value | |
| Investments Purchased with Collateral from Securities Loaned (9.34%) | | | | | | | |
| State Street Navigator Securities Lending Government Money Market Portfolio, 0.78% | | | | | | | |
| (Cost $12,795,581) | | | | | | | 12,795,581 | | | $ | 12,795,581 | |
| | | | | | | | | | | | | |
TOTAL SHORT TERM INVESTMENTS (Cost $12,870,070) | | 12,870,070 | |
| | | | | | | | | | | | | |
TOTAL INVESTMENTS (109.36%) (Cost $152,488,620) | | $ | 149,853,624 | |
| | | | | | | | | | | | | |
| NET LIABILITIES LESS OTHER ASSETS (-9.36%) | | | (12,829,619 | ) |
| | | | | | | | | | | | | |
| NET ASSETS (100.00%) | | | | | | | $ | 137,024,005 | |
(a) | Non-income producing security. |
(b) | Security, or a portion of the security position, is currently on loan. The total market value of securities on loan is $16,363,667. |
(c) | Securities were purchased pursuant to Regulation S under the Securities Act of 1933, which exempts securities offered and sold outside of the United States from registration. Such securities cannot be sold in the United States without either an effective registration statement filed pursuant to the Securities Act of 1933, or pursuant to an exemption from registration. As of May 31, 2017, the market value of those securities was $3,978,554, representing 2.90% of net assets. |
See Notes to Financial Statements.
Sprott ETFs
| Statements of Assets and Liabilities | May 31, 2017 (Unaudited) |
| | | Sprott Gold Miners ETF | | | Sprott Junior Gold Miners ETF | |
| ASSETS: | | | | | | |
| Investments, at value | | $ | 189,465,182 | | | $ | 149,853,624 | |
| Foreign tax reclaims | | | 3,836 | | | | 1,335 | |
| Dividends receivable | | | 103,441 | | | | 29,162 | |
| Total Assets | | | 189,572,459 | | | | 149,884,121 | |
| | | | | | | | | |
| LIABILITIES: | | | | | | | | |
| Payable to adviser | | | 86,809 | | | | 64,535 | |
| Payable for collateral upon return of securities loaned | | | 8,422,405 | | | | 12,795,581 | |
| Total Liabilities | | | 8,509,214 | | | | 12,860,116 | |
| NET ASSETS | | $ | 181,063,245 | | | $ | 137,024,005 | |
| | | | | | | | | |
| NET ASSETS CONSIST OF: | | | | | | | | |
| Paid-in capital | | $ | 242,968,670 | | | $ | 149,362,164 | |
| Accumulated net investment income/(loss) | | | 264,817 | | | | (1,002,600 | ) |
| Accumulated net realized loss | | | (66,151,143 | ) | | | (8,700,512 | ) |
| Net unrealized appreciation/(depreciation) | | | 3,980,901 | | | | (2,635,047 | ) |
| NET ASSETS | | $ | 181,063,245 | | | $ | 137,024,005 | |
| | | | | | | | | |
| INVESTMENTS, AT COST | | $ | 185,484,281 | | | $ | 152,488,620 | |
| | | | | | | | | |
| PRICING OF SHARES | | | | | | | | |
| Net Assets | | $ | 181,063,245 | | | $ | 137,024,005 | |
| Shares of beneficial interest outstanding (Unlimited number of shares authorized, par value $0.01 per share) | | | 8,950,000 | | | | 4,400,000 | |
| Net Asset Value, offering and redemption price per share | | $ | 20.23 | | | $ | 31.14 | |
See Notes to Financial Statements.
Sprott ETFs
| Statements of Operations | For the Six Months Ended May 31, 2017 (Unaudited) |
| | | Sprott Gold Miners ETF | | | Sprott Junior Gold Miners ETF | |
| INVESTMENT INCOME: | | | | | | |
Dividends(a) | | $ | 821,942 | | | $ | 42,234 | |
| Securities lending income | | | 123,592 | | | | 61,787 | |
| Total Investment Income | | | 945,534 | | | | 104,021 | |
| | | | | | | | | |
| EXPENSES: | | | | | | | | |
| Investment adviser fees | | | 552,427 | | | | 189,530 | |
| Total Expense | | | 552,427 | | | | 189,530 | |
| NET INVESTMENT INCOME/(LOSS) | | | 393,107 | | | | (85,509 | ) |
| | | | | | | | | |
| REALIZED AND UNREALIZED GAIN/(LOSS) | | | | | | | | |
| Net realized loss on investments | | | (18,035,045 | ) | | | (770,416 | ) |
| Net realized gain/(loss) on foreign currency transactions | | | 171 | | | | (1,133 | ) |
| Net realized loss | | | (18,034,874 | ) | | | (771,549 | ) |
| Net change in unrealized appreciation/(depreciation) on investments | | | 27,536,072 | | | | (3,339,531 | ) |
| Net change in unrealized appreciation on translation of assets and liabilities denominated in foreign currencies | | | – | | | | 3,011 | |
| Net change in unrealized appreciation/(depreciation) | | | 27,536,072 | | | | (3,336,520 | ) |
| NET UNREALIZED GAIN/LOSS ON INVESTMENTS | | | 9,501,198 | | | | (4,108,069 | ) |
| NET INCREASE/(DECREASE) IN NET ASSETS RESULTING FROM OPERATIONS | | $ | 9,894,305 | | | $ | (4,193,578 | ) |
| (a) | Net of foreign tax withholding in the amounts of $99,165 and $8,110 respectively. |
See Notes to Financial Statements.
Sprott Gold Miners ETF
Statements of Changes in Net Assets
| | | For the Six Months Ended May 31, 2017 (Unaudited) | | | For the Year Ended November 30, 2016 | |
| OPERATIONS: | | | | | | |
| Net investment income/(loss) | | $ | 393,107 | | | $ | (22,365 | ) |
| Net realized gain/(loss) | | | (18,034,874 | ) | | | 28,894,011 | |
| Net change in unrealized appreciation | | | 27,536,072 | | | | 18,872,591 | |
| Net increase in net assets resulting from operations | | | 9,894,305 | | | | 47,744,237 | |
| | | | | | | | | |
| DISTRIBUTIONS TO SHAREHOLDERS: | | | | | | | | |
| From net investment income | | | (35,497 | ) | | | (1,513,542 | ) |
| Total distributions | | | (35,497 | ) | | | (1,513,542 | ) |
| | | | | | | | | |
| CAPITAL SHARE TRANSACTIONS: | | | | | | | | |
| Proceeds from sale of shares | | | 27,169,576 | | | | 177,943,316 | |
| Cost of shares redeemed | | | (39,830,089 | ) | | | (152,466,664 | ) |
| Net increase/(decrease) from capital share transactions | | | (12,660,513 | ) | | | 25,476,652 | |
| Net increase/(decrease) in net assets | | | (2,801,705 | ) | | | 71,707,347 | |
| | | | | | | | | |
| NET ASSETS: | | | | | | | | |
| Beginning of period | | | 183,864,950 | | | | 112,157,603 | |
| End of period * | | $ | 181,063,245 | | | $ | 183,864,950 | |
| | | | | | | | | |
| *Including accumulated net investment income/(loss) of: | | $ | 264,817 | | | $ | (92,793 | ) |
| | | | | | | | | |
| OTHER INFORMATION: | | | | | | | | |
| CAPITAL SHARE TRANSACTIONS: | | | | | | | | |
| Beginning shares | | | 9,600,000 | | | | 8,650,000 | |
| Shares sold | | | 1,350,000 | | | | 7,650,000 | |
| Shares redeemed | | | (2,000,000 | ) | | | (6,700,000 | ) |
| Shares outstanding, end of period | | | 8,950,000 | | | | 9,600,000 | |
See Notes to Financial Statements.
Sprott Junior Gold Miners ETF
Statements of Changes in Net Assets
| | | For the Six Months Ended May 31, 2017 (Unaudited) | | | For the Year Ended November 30, 2016 | |
| OPERATIONS: | | | | | | |
| Net investment loss | | $ | (85,509 | ) | | $ | (59,387 | ) |
| Net realized gain/(loss) | | | (771,549 | ) | | | 10,172,424 | |
| Net change in unrealized appreciation/(depreciation) | | | (3,336,520 | ) | | | 2,281,995 | |
| Net increase/(decrease) in net assets resulting from operations | | | (4,193,578 | ) | | | 12,395,032 | |
| | | | | | | | | |
| DISTRIBUTIONS TO SHAREHOLDERS: | | | | | | | | |
| From net investment income | | | (815,000 | ) | | | (195,292 | ) |
| Total distributions | | | (815,000 | ) | | | (195,292 | ) |
| | | | | | | | | |
| CAPITAL SHARE TRANSACTIONS: | | | | | | | | |
| Proceeds from sale of shares | | | 100,480,465 | | | | 53,843,641 | |
| Cost of shares redeemed | | | (6,304,578 | ) | | | (41,765,613 | ) |
| Net increase from capital share transactions | | | 94,175,887 | | | | 12,078,028 | |
| Net increase in net assets | | | 89,167,309 | | | | 24,277,768 | |
| | | | | | | | | |
| NET ASSETS: | | | | | | | | |
| Beginning of period | | | 47,856,696 | | | | 23,578,928 | |
| End of period * | | $ | 137,024,005 | | | $ | 47,856,696 | |
| | | | | | | | | |
| *Including accumulated net investment loss of: | | $ | (1,002,600 | ) | | $ | (102,091 | ) |
| | | | | | | | | |
| OTHER INFORMATION: | | | | | | | | |
| CAPITAL SHARE TRANSACTIONS: | | | | | | | | |
| Beginning shares | | | 1,450,000 | | | | 1,200,000 | |
| Shares sold | | | 3,150,000 | | | | 1,500,000 | |
| Shares redeemed | | | (200,000 | ) | | | (1,250,000 | ) |
| Shares outstanding, end of period | | | 4,400,000 | | | | 1,450,000 | |
See Notes to Financial Statements.
Sprott Gold Miners ETF
| Financial Highlights | For a Share Outstanding Throughout the Periods Presented |
| | | For the Six Months Ended May 31, 2017 (Unaudited) | | | For the Year Ended November 30, 2016 | | | For the Year Ended November 30, 2015 | | | For the Period July 15, 2014 (Commencement of Operations) to November 30, 2014 | |
| NET ASSET VALUE, BEGINNING OF PERIOD | | $ | 19.15 | | | $ | 12.97 | | | $ | 17.44 | | | $ | 25.00 | |
| | | | | | | | | | | | | | | | | |
| INCOME/(LOSS) FROM INVESTMENT OPERATIONS: | | | | | | | | | | | | | | | | |
Net investment income (a) | | | 0.04 | | | | (0.00 | )(b) | | | 0.10 | | | | 0.02 | |
| Net realized and unrealized gain/(loss) | | | 1.04 | | | | 6.37 | | | | (4.52 | ) | | | (7.58 | ) |
| Total from investment operations | | | 1.08 | | | | 6.37 | | | | (4.42 | ) | | | (7.56 | ) |
| | | | | | | | | | | | | | | | | |
| DISTRIBUTIONS: | | | | | | | | | | | | | | | | |
| From net investment income | | | (0.00 | )(b) | | | (0.19 | ) | | | (0.05 | ) | | | – | |
| Total distributions | | | (0.00 | )(b) | | | (0.19 | ) | | | (0.05 | ) | | | – | |
| | | | | | | | | | | | | | | | | |
| Net increase/(decrease) in net asset value | | | 1.08 | | | | 6.18 | | | | (4.47 | ) | | | (7.56 | ) |
| NET ASSET VALUE, END OF PERIOD | | $ | 20.23 | | | $ | 19.15 | | | $ | 12.97 | | | $ | 17.44 | |
TOTAL RETURN(c) | | | 5.66 | % | | | 49.82 | % | | | (25.44 | )% | | | (30.24 | )% |
| | | | | | | | | | | | | | | | | |
| RATIOS/SUPPLEMENTAL DATA: | | | | | | | | | | | | | | | | |
| Net assets, end of period (000s) | | $ | 181,063 | | | $ | 183,865 | | | $ | 112,158 | | | $ | 88,956 | |
| | | | | | | | | | | | | | | | | |
| Ratio of expenses to average net assets | | | 0.57 | %(d) | | | 0.57 | % | | | 0.57 | % | | | 0.57 | %(d) |
| Ratio of net investment income/(loss) to average net assets | | | 0.41 | %(d) | | | (0.01 | )% | | | 0.61 | % | | | 0.31 | %(d) |
Portfolio turnover rate(e) | | | 60 | % | | | 74 | % | | | 78 | % | | | 36 | % |
| (a) | Based on average shares outstanding during the period. |
| (b) | Less than $0.005 per share. |
| (c) | Total return is calculated assuming an initial investment made at the net asset value at the beginning of the period and redemption at the net asset value on the last day of the period and assuming all distributions are reinvested at reinvestment prices. Total return calculated for a period of less than one year is not annualized. |
| (e) | Portfolio turnover for periods less than one year are not annualized and does not include securities received or delivered from processing creations or redemptions in-kind. |
See Notes to Financial Statements.
Sprott Junior Gold Miners ETF
| Financial Highlights | For a Share Outstanding Throughout the Periods Presented |
| | | For the Six Months Ended May 31, 2017 (Unaudited) | | | For the Year Ended November 30, 2016 | | | For the Period March 31, 2015 (Commencement of Operations) to November 30, 2015 | |
| NET ASSET VALUE, BEGINNING OF PERIOD | | $ | 33.00 | | | $ | 19.65 | | | $ | 24.18 | |
| | | | | | | | | | | | | |
| INCOME/(LOSS) FROM INVESTMENT OPERATIONS: | | | | | | | | | | | | |
Net investment income/(loss) (a) | | | (0.04 | ) | | | (0.05 | ) | | | 0.04 | |
| Net realized and unrealized gain/(loss) | | | (1.26 | ) | | | 13.56 | | | | (4.57 | ) |
| Total from investment operations | | | (1.30 | ) | | | 13.51 | | | | (4.53 | ) |
| | | | | | | | | | | | | |
| DISTRIBUTIONS: | | | | | | | | | | | | |
| From net investment income | | | (0.56 | ) | | | (0.16 | ) | | | – | |
| Total distributions | | | (0.56 | ) | | | (0.16 | ) | | | – | |
| | | | | | | | | | | | | |
| Net increase/(decrease) in net asset value | | | (1.86 | ) | | | 13.35 | | | | (4.53 | ) |
| NET ASSET VALUE, END OF PERIOD | | $ | 31.14 | | | $ | 33.00 | | | $ | 19.65 | |
TOTAL RETURN(b) | | | (4.04 | )% | | | 69.35 | % | | | (18.73 | )% |
| | | | | | | | | | | | | |
| RATIOS/SUPPLEMENTAL DATA: | | | | | | | | | | | | |
| Net assets, end of period (000s) | | $ | 137,024 | | | $ | 47,857 | | | $ | 23,579 | |
| | | | | | | | | | | | | |
| Ratio of expenses to average net assets | | | 0.57 | %(c) | | | 0.57 | % | | | 0.57 | %(c) |
| Ratio of net investment income/(loss) to average net assets | | | (0.26 | )%(c) | | | (0.14 | )% | | | 0.29 | %(c) |
Portfolio turnover rate(d) | | | 40 | % | | | 61 | % | | | 71 | % |
| (a) | Based on average shares outstanding during the period. |
| (b) | Total return is calculated assuming an initial investment made at the net asset value at the beginning of the period and redemption at the net asset value on the last day of the period and assuming all distributions are reinvested at reinvestment prices. Total return calculated for a period of less than one year is not annualized. |
| (d) | Portfolio turnover for periods less than one year are not annualized and does not include securities received or delivered from processing creations or redemptions in-kind. |
See Notes to Financial Statements.
Sprott ETFs
| Notes to Financial Statements | May 31, 2017 (Unaudited) |
1. ORGANIZATION
ALPS ETF Trust (the “Trust”), a Delaware statutory trust, is an open-end management investment company under the Investment Company Act of 1940, as amended (the “1940 Act”). As of May 31, 2017, the Trust consisted of twenty separate portfolios. Each portfolio represents a separate series of the Trust. This report pertains to the Sprott Gold Miners ETF and the Sprott Junior Gold Miners ETF (each a “Fund” and collectively, the “Funds”).
The investment objective of the Sprott Gold Miners ETF is to seek investment results that correspond (before fees and expenses) generally to the performance of its underlying index, the Sprott Zacks Gold Miners Index (the “Underlying Index”). The investment advisor uses a “passive” or indexing approach to try to achieve the Fund’s investment objective. The Sprott Gold Miners ETF is considered non-diversified and may invest a greater portion of assets in securities of individual issuers than a diversified fund. As a result, changes in the market value of a single investment could cause greater fluctuations in share price than would occur in a diversified fund.
The investment objective of the Sprott Junior Gold Miners ETF is to seek investment results that correspond (before fees and expenses) generally to the performance of its underlying index, the Sprott Zacks Junior Gold Miners Index (the “Underlying Index”). The investment advisor uses a “passive” or indexing approach to try to achieve the Fund’s investment objective. The Sprott Junior Gold Miners ETF is considered non-diversified and may invest a greater portion of assets in securities of individual issuers than a diversified fund. As a result, changes in the market value of a single investment could cause greater fluctuations in share price than would occur in a diversified fund.
The Funds’ Shares (“Shares”) are listed on the New York Stock Exchange (“NYSE”) Arca. Each Fund issues and redeems Shares, at net asset value (“NAV”) in blocks of 50,000 Shares, each of which is called a “Creation Unit”. Creation Units are issued and redeemed principally in-kind for securities included in the specified Underlying Index. Except when aggregated in Creation Units, Shares are not redeemable securities of the Fund.
Pursuant to the Trust’s organizational documents, its Officers and Trustees are indemnified against certain liability arising out of the performance of their duties to the Trust. Additionally, in the normal course of business, the Trust enters into contracts with service providers that contain general indemnification clauses. The Trust’s maximum exposure under these arrangements is unknown, as this would involve future claims that may be made against the Trust that have not yet occurred.
2. SIGNIFICANT ACCOUNTING POLICIES
The following is a summary of significant accounting policies consistently followed by the Funds in the preparation of the financial statements. The accompanying financial statements were prepared in accordance with accounting principles generally accepted in the United States of America (“U.S. GAAP”). The preparation of financial statements in conformity with U.S. GAAP requires management to make certain estimates and assumptions that affect the reported amounts of assets and liabilities and disclosures of contingent assets and liabilities at the date of the financial statements and the reported amounts of revenue and expenses during the period. Actual results could differ from those estimates. Each Fund is considered an investment company under U.S. GAAP and follows the accounting and reporting guidance applicable to investment companies in the Financial Accounting Standards Board Accounting Standards Codification Topic 946.
A. Portfolio Valuation
Each Fund’s NAV is determined daily, as of the close of regular trading on the NYSE, normally 4:00 p.m. Eastern time, on each day the NYSE is open for trading. The NAV is computed by dividing the value of all assets of the Fund (including accrued interest and dividends), less all liabilities (including accrued expenses and dividends declared but unpaid), by the total number of shares outstanding.
Portfolio securities listed on any exchange other than the NASDAQ Stock Market LLC (“NASDAQ”) are valued at the last sale price on the business day as of which such value is being determined. If there has been no sale on such day, the securities are valued at the mean of the most recent bid and ask prices on such day. Securities traded on the NASDAQ are valued at the NASDAQ Official Closing Price as determined by NASDAQ. Portfolio securities traded on more than one securities exchange are valued at the last sale price on the business day as of which such value is being determined at the close of the exchange representing the principal market for such securities. Portfolio securities traded in the over-the-counter market, but excluding securities traded on the NASDAQ, are valued at the last quoted sale price in such market.
The Funds’ investments are valued at market value or, in the absence of market value with respect to any portfolio securities, at fair value according to procedures adopted by the Trust’s Board of Trustees (the “Board”). When market quotations are not readily available or when events occur that make established valuation methods unreliable, securities of the Funds may be valued in good faith by or under the direction of the Board. These securities generally include, but are not limited to, restricted securities (securities which may not be publicly sold without registration under the Securities Act of 1933) for which a pricing service is unable to provide a market price; securities whose trading has been formally suspended; a security whose market price is not available from a pre-established primary pricing source or the pricing source is not willing to provide a price; a security with respect to which an event has occurred that is most likely to materially affect the value of the security after the market has closed but before the calculation of the Fund’s NAV or make it difficult or impossible to obtain a reliable market quotation; or a security whose price, as provided by the pricing service, does not reflect the security’s “fair value” due to the security being de-listed from a national exchange or the security’s primary trading market is temporarily closed at a time when, under normal conditions, it would be open. As a general principle, the current “fair value” of a security would be the amount which the owner might reasonably expect to receive from the sale on the applicable exchange or principal market. A variety of factors may be considered in determining the fair value of such securities.
| Notes to Financial Statements | May 31, 2017 (Unaudited) |
B. Fair Value Measurements
Each Fund discloses the classification of its fair value measurements following a three-tier hierarchy based on the inputs used to measure fair value. Inputs refer broadly to the assumptions that market participants would use in pricing the asset or liability, including assumptions about risk. Inputs may be observable or unobservable. Observable inputs reflect the assumptions market participants would use in pricing the asset or liability that are developed based on market data obtained from sources independent of the reporting entity. Unobservable inputs reflect the reporting entity’s own assumptions about the assumptions market participants would use in pricing the asset or liability that are developed based on the best information available.
Valuation techniques used to value the Funds’ investments by major category are as follows:
Equity securities, including restricted securities, for which market quotations are readily available, are valued at the last reported sale price or official closing price as reported by a third party pricing vendor on the primary market or exchange on which they are traded and are categorized as Level 1 in the hierarchy. In the event there were no sales during the day or closing prices are not available, securities are valued at the mean of the most recent quoted bid and ask prices on such day and are generally categorized as Level 2 in the hierarchy. Investments in open-end mutual funds are valued at their closing NAV each business day and are categorized as Level 1 in the hierarchy.
Changes in valuation techniques may result in transfers in or out of an assigned level within the disclosure hierarchy.
Various inputs are used in determining the value of each Fund’s investments as of the end of the reporting period. When inputs used fall into different levels of the fair value hierarchy, the level in the hierarchy within which the fair value measurement falls is determined based on the lowest level input that is significant to the fair value measurement in its entirety. The designated input levels are not necessarily an indication of the risk or liquidity associated with these investments.
These inputs are categorized in the following hierarchy under applicable financial accounting standards:
| Level 1 – | Unadjusted quoted prices in active markets for identical investments, unrestricted assets or liabilities that a Fund has the ability to access at the measurement date; |
| Level 2 – | Quoted prices which are not active, quoted prices for similar assets or liabilities in active markets or inputs other than quoted prices that are observable (either directly or indirectly) for substantially the full term of the asset or liability; and |
| Level 3 – | Significant unobservable prices or inputs (including the Fund’s own assumptions in determining the fair value of investments) where there is little or no market activity for the asset or liability at the measurement date. |
The following is a summary of the inputs used to value the Funds’ investments at May 31, 2017:
| Sprott Gold Miners ETF | | | | | | | | | | | | |
| Investments in Securities at Value* | | Level 1 - Unadjusted Quoted Prices | | | Level 2 - Other Significant Observable Inputs | | | Level 3 - Significant Unobservable Inputs | | | Total | |
| Common Stocks | | $ | 180,958,030 | | | $ | – | | | $ | – | | | $ | 180,958,030 | |
| Short Term Investments | | | | | | | | | | | | | | | | |
| Money Market Fund | | | 84,747 | | | | – | | | | – | | | | 84,747 | |
Investments Purchased with Collateral from Securities Loaned | | | 8,422,405 | | | | – | | | | – | | | | 8,422,405 | |
| TOTAL | | $ | 189,465,182 | | | $ | – | | | $ | – | | | $ | 189,465,182 | |
Sprott ETFs
| Notes to Financial Statements | May 31, 2017 (Unaudited) |
| Sprott Junior Gold Miners ETF | | | | | | | | | | | | |
| Investments in Securities at Value* | | Level 1 - Unadjusted Quoted Prices | | | Level 2 - Other Significant Observable Inputs | | | Level 3 - Significant Unobservable Inputs | | | Total | |
| Common Stocks | | $ | 136,983,554 | | | $ | – | | | $ | – | | | $ | 136,983,554 | |
| Short Term Investments | | | | | | | | | | | | | | | | |
| Money Market Fund | | | 74,489 | | | | – | | | | – | | | | 74,489 | |
Investments Purchased with Collateral from Securities Loaned | | | 12,795,581 | | | | – | | | | – | | | | 12,795,581 | |
| TOTAL | | $ | 149,853,624 | | | $ | – | | | $ | – | | | $ | 149,853,624 | |
| * | For a detailed sector breakdown, see the accompanying Schedule of Investments. |
The Funds recognize transfers between levels as of the end of the period. For the six months ended May 31, 2017, the Funds did not have any transfers between Level 1 and Level 2 securities. The Funds did not have any securities that used significant unobservable inputs (Level 3) in determining fair value.
C. Gold and Silver Mining Industry Risk
The Funds are concentrated in the gold and silver mining industry. As a result, these Funds will be sensitive to changes in, and their performance will depend to a greater extent on, the overall condition of the gold and silver mining industry. Competitive pressures may have a significant effect on the financial condition of such companies in the gold and silver mining industry. Also, gold and silver mining companies are highly dependent on the price of gold and silver bullion. These prices may fluctuate substantially over short periods of time so a Fund’s Share price may be more volatile than other types of investments. In times of significant inflation or great economic uncertainty, gold, silver and other precious metals may outperform traditional investments such as bonds and stocks. However, in times of stable economic growth, traditional equity and debt investments could offer greater appreciation potential and the value of gold, silver and other precious metals may be adversely affected, which could in turn affect a Fund’s returns. The production and sale of precious metals by governments or central banks or other large holders can be affected by various economic, financial, social and political factors, which may be unpredictable and may have a significant impact on the supply and prices of precious metals. Economic and political conditions in those countries that are the largest producers of gold may have a direct effect on the production and marketing of gold and on sales of central bank gold holdings. Some gold and precious metals mining operation companies may hedge their exposure to falls in gold and precious metals prices by selling forward future production, which may result in lower returns during periods when the price of gold and precious metals increases. The gold and precious metals industry can be significantly affected by events relating to international political developments, the success of exploration projects, commodity prices and tax and government regulations. If a natural disaster or other event with a significant economic impact occurs in a region where the companies in which each Fund invests operate, such disaster or event could negatively affect the profitability of such companies and, in turn, the Funds’ investment in them.
D. Foreign Investment Risk
The Funds’ investments in non-U.S. issuers may involve unique risks compared to investing in securities of U.S. issuers, including, among others, greater market volatility than U.S. securities and less complete financial information than for U.S. issuers. In addition, adverse political, economic or social developments could undermine the value of a Fund’s investments or prevent a Fund from realizing the full value of its investments. Financial reporting standards for companies based in foreign markets differ from those in the United States. Finally, the value of the currency of the country in which a Fund has invested could decline relative to the value of the U.S. dollar, which may affect the value of the investment to U.S. investors. The Funds will not enter into transactions to hedge against declines in the value of a Fund’s assets that are denominated in a foreign currency.
Countries with emerging markets may have relatively unstable governments and may present the risks of nationalization of businesses, restrictions on foreign ownership and prohibitions on the repatriation of assets. The economies of emerging markets countries also may be based on only a few industries, making them more vulnerable to changes in local or global trade conditions and more sensitive to debt burdens or inflation rates.
E. Foreign Currency Translation
The books and records of the Funds are maintained in U.S. dollars. Investment valuations and other assets and liabilities initially expressed in foreign currencies are converted each business day into U.S. dollars based upon current exchange rates. The portion of realized and unrealized gains or losses on investments due to fluctuations in foreign currency exchange rates is not separately disclosed and is included in realized and unrealized gains or losses on investments, when applicable.
| Notes to Financial Statements | May 31, 2017 (Unaudited) |
F. Concentration Risk
Each Fund seeks to track its respective Underlying Index, which itself may have concentration in certain regions, economies, countries, markets, industries or sectors. Based on the current composition of their respective Underlying Indexes, the Funds will be concentrated in the gold and silver mining industry. Underperformance or increased risk in such concentrated areas may result in underperformance or increased risk in each Fund.
G. Securities Transactions and Investment Income
Securities transactions are recorded as of the trade date. Realized gains and losses from securities transactions are recorded on the highest cost basis. Dividend income and capital gains distributions, if any, are recorded on the ex-dividend date. Interest income, if any, is recorded on the accrual basis.
H. Dividends and Distributions to Shareholders
Dividends from net investment income for each Fund, if any, are declared and paid annually or as the Board may determine from time to time. Distributions of net realized capital gains earned by the Funds, if any, are distributed at least annually.
I. Federal Tax and Tax Basis Information
The timing and character of income and capital gain distributions are determined in accordance with income tax regulations, which may differ from U.S. GAAP. Reclassifications are made to the Funds’ capital accounts for permanent tax differences to reflect income and gains available for distribution (or available capital loss carryforwards) under income tax regulations. The amounts and characteristics of tax basis distributions and composition of distributable earnings/(accumulated losses) are finalized at fiscal year-end; accordingly, tax basis balances have not been determined as of May 31, 2017.
The tax character of the distributions paid by the Funds were as follows:
| | | Ordinary Income | |
| November 30, 2016 | | | |
| Sprott Gold Miners ETF | | $ | 1,513,542 | |
| Sprott Junior Gold Miners ETF | | | 195,292 | |
At November 30, 2016, the Funds had available for tax purposes unused capital loss carryforwards as follows:
| Fund | | Short-Term | | | Long-Term | |
| Sprott Gold Miners ETF | | $ | 33,438,184 | | | $ | 14,410,663 | |
| Sprott Junior Gold Miners ETF | | | 7,620,754 | | | | 49,903 | |
As of May 31, 2017, the costs of investments for federal income tax purposes and accumulated net unrealized appreciation/(depreciation) on investments were as follows:
| | | Sprott Gold Miners ETF | | | Sprott Junior Gold Miners ETF | |
| Gross appreciation (excess of value over tax cost) | | $ | 15,648,855 | | | $ | 3,945,844 | |
Gross depreciation (excess of tax cost over value) | | | (11,929,745 | ) | | | (7,285,862 | ) |
| Net unrealized appreciation (depreciation) | | | 3,719,110 | | | | (3,340,018 | ) |
| Cost of investments for income tax purposes | | $ | 185,746,072 | | | $ | 153,193,642 | |
The differences between book-basis and tax-basis are due to the deferral of losses from wash sales and Passive Foreign Investment Company (“PFIC”) adjustments.
J. Income Taxes
No provision for income taxes is included in the accompanying financial statements, as each Fund intends to distribute to shareholders all taxable investment income and realized gains and otherwise comply with Subchapter M of the Internal Revenue Code of 1986, as amended, applicable to regulated investment companies. Each Fund evaluates tax positions taken (or expected to be taken) in the course of preparing the Fund’s tax returns to determine whether these positions meet a “more-likely-than-not” standard that, based on the technical merits, have a more than fifty percent likelihood of being sustained by a taxing authority upon examination. A tax position that meets the “more-likely-than-not” recognition threshold is measured to determine the amount of benefit to recognize in the financial statements.
As of and during the six months ended May 31, 2017, the Funds did not have a liability for any unrecognized tax benefits. Each Fund files U.S. federal, state, and local tax returns as required. Each Fund’s tax returns are subject to examination by the relevant tax authorities until expiration of the applicable statute of limitations, which is generally three years after the filing of the tax return, but may extend to four years in certain jurisdictions. Tax returns for open years for the Sprott Gold Miners ETF and the Sprott Junior Gold Miners ETF have incorporated no uncertain tax positions that require a provision for income taxes.
Sprott ETFs
| Notes to Financial Statements | May 31, 2017 (Unaudited) |
K. Lending of Portfolio Securities
The Funds have entered into a securities lending agreement with State Street Bank & Trust Co. (“SSB”), the Funds’ lending agent. The Funds may lend their portfolio securities only to borrowers that are approved by SSB. Each Fund will limit such lending to not more than 33 1/3% of the value of its total assets. Each Fund’s securities held at SSB as custodian shall be available to be lent except those securities the Fund or ALPS Advisors Inc. specifically identifies in writing as not being available for lending. The borrower pledges and maintains with each Fund collateral consisting of cash (U.S. Dollars only), securities issued or guaranteed by the U.S. government or its agencies or instrumentalities, and by cash equivalents (including irrevocable bank letters of credit issued by a person other than the borrower or an affiliate of the borrower). The initial collateral received by each Fund is required to have a value of no less than 102% of the market value of the loaned securities for U.S. equity securities and a value of no less than 105% of the market value for non-U.S. equity securities. The collateral is maintained thereafter, at a market value equal to not less than 102% of the current value of the U.S. equity securities on loan and not less than 105% of the current value of the non-U.S. equity securities on loan. The market value of the loaned securities is determined at the close of each business day and any additional required collateral is delivered to each Fund on the next business day. During the term of the loan, each Fund is entitled to all distributions made on or in respect of the loaned securities. Loans of securities are terminable at any time and the borrower, after notice, is required to return borrowed securities within the customary time period for settlement of securities transactions.
Any cash collateral received is reinvested in a money market fund managed by SSB as disclosed in each Fund’s Schedule of Investments and is reflected in the Statements of Assets and Liabilities as a payable for collateral upon return of securities loaned. Non-cash collateral, in the form of securities issued or guaranteed by the U.S. government or its agencies or instrumentalities, is not disclosed in a Fund’s Statements of Assets and Liabilities as it is held by the lending agent on behalf of each Fund, and each Fund does not have the ability to re-hypothecate these securities. Income earned by the Fund from securities lending activity is disclosed in the Statement of Operations.
The following is a summary of each Fund’s securities lending agreements and related cash and non-cash collateral received as of May 31, 2017:
| | | Market Value of Securities on Loan | | | Cash Collateral Received | | | Non-Cash Collateral Received | | | Total Collateral Received | |
| Sprott Gold Miners ETF | | $ | 11,533,013 | | | $ | 8,422,405 | | | $ | 3,646,011 | | | $ | 12,068,416 | |
| Sprott Junior Gold Miners ETF | | | 16,363,667 | | | | 12,795,581 | | | | 4,527,894 | | | | 17,323,475 | |
The risks of securities lending include the risk that the borrower may not provide additional collateral when required or may not return the securities when due. To mitigate these risks, each Fund benefits from a borrower default indemnity provided by SSB. SSB’s indemnity allows for full replacement of securities lent wherein SSB will purchase the unreturned loaned securities on the open market by applying the proceeds of the collateral, or to the extent such proceeds are insufficient or the collateral is unavailable, SSB will purchase the unreturned loan securities at SSB’s expense. However, the Funds could suffer a loss if the value of the investments purchased with cash collateral falls below the value of the cash collateral received.
The following tables reflect a breakdown of transactions accounted for as secured borrowings, the gross obligation by the type of collateral pledged or securities loaned, and the remaining contractual maturity of those transactions as of May 31, 2017:
| Sprott Gold Miners ETF | | | | | Remaining contractual maturity of the agreements | | | | |
| | | | | | | | | | |
| Securities Lending Transactions | | Overnight & Continuous | | | Up to 30 days | | | 30-90 days | | | Greater than 90 days | | | Total | |
Common Stocks | | $ | 8,422,405 | | | $ | – | | | $ | – | | | $ | – | | | | 8,422,405 | |
Total Borrowings | | | | | | | | | | | | | | | | | | | 8,422,405 | |
Gross amount of recognized liabilities for securities lending (collateral received) | | | | | 8,422,405 | |
| Sprott Junior Gold Miners ETF | | | | | Remaining contractual maturity of the agreements | | | | |
| | | | | | | | | | |
| Securities Lending Transactions | | Overnight & Continuous | | | Up to 30 days | | | 30-90 days | | | Greater than 90 days | | | Total | |
Common Stocks | | $ | 12,795,581 | | | $ | – | | | $ | – | | | $ | – | | | $ | 12,795,581 | |
Total Borrowings | | | | | | | | | | | | | | | | | | | 12,795,581 | |
Gross amount of recognized liabilities for securities lending (collateral received) | | | | $ | 12,795,581 | |
Sprott ETFs
| Notes to Financial Statements | May 31, 2017 (Unaudited) |
3. INVESTMENT ADVISORY FEE AND OTHER AFFILIATED TRANSACTIONS
ALPS Advisors, Inc. (the “Adviser”) acts as the Funds’ investment adviser pursuant to an advisory agreement with the Trust on behalf of each Fund (the “Advisory Agreement”). Pursuant to the Advisory Agreement, each Fund pays the Adviser a unitary fee for the services and facilities it provides, payable on a monthly basis as a percentage of each Fund’s average daily net assets as set forth below. From time to time, the Adviser may waive all or a portion of its fee.
| Fund | Advisory Fee |
| Sprott Gold Miners ETF | 0.57% |
| Sprott Junior Gold Miners ETF | 0.57% |
Out of the unitary management fee, the Adviser pays substantially all expenses for each Fund, including the cost of transfer agency, custody, fund administration, legal, audit, independent trustees and other services, except for interest expenses, distribution fees or expenses, brokerage expenses, taxes and extraordinary expenses, such as litigation, not incurred in the ordinary course of each Fund’s business. The Adviser’s unitary management fee is designed to pay substantially all of the Funds’ expenses and to compensate the Adviser for providing services for the Funds.
ALPS Fund Services, Inc., an affiliate of the Adviser, is the administrator to the Funds.
Each Trustee who is not an officer or employee of the Adviser, any sub-adviser or any of their affiliates (“Independent Trustees”) receives (1) a quarterly retainer of $5,000, (2) a per meeting fee for regularly scheduled meetings of $3,750, (3) $1,500 for any special meeting held outside of a regularly scheduled board meeting, and (4) reimbursement for all reasonable out-of-pocket expenses relating to attendance at meetings.
4. PURCHASES AND SALES OF SECURITIES
For the six months ended May 31, 2017, the cost of purchases and proceeds from sales of investment securities, excluding short-term investments and in-kind transactions, were as follows:
| Fund | | Purchases | | | Sales | |
| Sprott Gold Miners ETF | | $ | 114,655,947 | | | $ | 114,228,373 | |
| Sprott Junior Gold Miners ETF | | | 30,103,270 | | | | 29,116,533 | |
For the six months or period ended May 31, 2017, the cost of in-kind purchases and proceeds from in-kind sales were as follows:
| Fund | | Purchases | | | Sales | |
| Sprott Gold Miners ETF | | $ | 27,169,756 | | | $ | 39,829,992 | |
| Sprott Junior Gold Miners ETF | | | 98,586,350 | | | | 6,320,799 | |
For the six months ended May 31, 2017, the Sprott Gold Miners ETF and the Sprott Junior Gold Miners ETF had in-kind net realized gains of $5,806,614 and $1,553,875 respectively.
Gains on in-kind transactions are not considered taxable for federal income tax purposes.
5. CAPITAL SHARE TRANSACTIONS
Shares are created and redeemed by each Fund only in Creation Unit size aggregations of 50,000 Shares. Only broker-dealers or large institutional investors with creation and redemption agreements called Authorized Participants (“AP”) are permitted to purchase or redeem Creation Units from the Funds. Such transactions are generally permitted on an in-kind basis, with a balancing cash component to equate the transaction to the NAV per unit of each Fund on the transaction date. Cash may be substituted equivalent to the value of certain securities generally when they are not available in sufficient quantity for delivery, not eligible for trading by the AP or as a result of other market circumstances.
Sprott ETFs
| Notes to Financial Statements | May 31, 2017 (Unaudited) |
6. RELATED PARTY TRANSACTIONS
The Funds engaged in cross trades between each other during the six months ended May 31, 2017 pursuant to Rule 17a-7 under the 1940 Act. Cross trading is the buying or selling of portfolio securities between funds to which the Adviser serves as the investment adviser. The Board previously adopted procedures that apply to transactions between the Funds of the Trust pursuant to Rule 17a-7. These transactions related to cross trades during the period complied with the requirements set forth by Rule 17a-7 and the Trust’s procedures.
Transactions related to cross trades during the six months ended May 31, 2017 was as follows:
| Fund | | Purchase cost paid | | | Sale proceeds received | | | Realized gain/(loss) on sales | |
| Sprott Gold Miners ETF | | $ | 656,134 | | | $ | 3,098,685 | | | $ | (1,499,947 | ) |
| Sprott Junior Gold Miners ETF | | $ | 3,098,685 | | | $ | 656,134 | | | $ | (293,405 | ) |
7. SUBSEQUENT EVENTS
On October 13, 2016, the Securities and Exchange Commission (“SEC”) amended Regulation S-X, which will require standardized, enhanced disclosure about derivatives in investment company financial statements, as well as other amendments. The compliance date for the amendments to Regulation S-X is August 1, 2017. Management is currently evaluating the impact to the financial statements and disclosures.
Sprott ETFs
| Additional Information | May 31, 2017 (Unaudited) |
PROXY VOTING RECORDS, POLICIES AND PROCEDURES
Information regarding how each Fund voted proxies relating to portfolio securities during the most recent 12-month period ended June 30 and a description of the Funds’ proxy voting policies and procedures used in determining how to vote for proxies are available without charge on the SEC’s website at www.sec.gov and upon request, by calling (toll-free) 1-866-675-2639.
PORTFOLIO HOLDINGS
The Trust is required to disclose, after its first and third fiscal quarters, the complete schedule of each Fund’s portfolio holdings with the SEC on Form N-Q. Form N-Q for each Fund will be available on the SEC’s website at www.sec.gov. Each Fund’s Form N-Q may also be reviewed and copied at the SEC’s Public Reference Room in Washington, D.C. and information on the operation of the Public Reference Room may be obtained by calling 1-800-SEC-0330. Each Fund’s Form N-Q will be available without charge, upon request, by calling (toll-free) 1-866-675-2639 or by writing to ALPS ETF Trust at 1290 Broadway, Suite 1100, Denver, Colorado 80203.
TAX INFORMATION
The Funds designated the following for federal income tax purposes for distributions made during the calendar year ended December 31, 2016:
| | Qualified Dividend Income | Dividend Received Deduction |
| Sprott Gold Miners ETF | 0.00% | 0.00% |
| Sprott Junior Gold Miners ETF | 0.00% | 0.00% |
In early 2017, if applicable, shareholders of record received this information for the distribution paid to them by the Fund during the calendar year 2016 via Form 1099. The Funds will notify shareholders in early 2018 of amounts paid to them by the Fund, if any, during the calendar year 2017.
LICENSING AGREEMENTS
Sprott Gold Miners ETF
Zacks Investment Management, Inc. (the “Licensor”) has entered into a license agreement with Sprott Asset Management LP (“Sprott”) to use the “Sprott” name and certain related intellectual property in connection with the underlying index, the Sprott Zacks Gold Miners Index (the “Underlying Index”) (the “Sprott License Agreement”). Pursuant to the Sprott License Agreement, Sprott in turn has entered into a sublicense agreement with ALPS Advisers, Inc. to use the Underlying Index (the “Sublicense Agreement”) in connection with the Sprott Gold Miners ETF (the “Product”).
The following disclosure relates to the Licensor and Sprott:
The Product(s) is not sponsored, endorsed, sold or promoted by ZACKS INVESTMENT MANAGEMENT, INC. (“Licensor”) Licensor makes no representation or warranty, express or implied, regarding the advisability of investing in securities generally or in the Product(s) particularly or the ability of the Index to track general market performance. Licensor’s only relationship to the Licensee is the licensing of the Index which is determined and composed by Licensor without regard to the Licensee or the owners of the Product(s). Licensor has no obligation to take the needs of the Licensee or the owners of the Product(s) into consideration in determining or composing the Index. Licensor shall not be liable to any person for any error in the Index nor shall it be under any obligation to advise any person of any error therein.
The Fund is not sponsored by Sprott. Sprott makes no representation or warranty, express or implied, to the owners of the Fund or any member of the public regarding the advisability of investing in securities or commodities generally or in the Fund particularly and does not guarantee the quality, accuracy or completeness of the Underlying Index or any Underlying Index data included herein or derived therefrom and assume no liability in connection with their use. The Underlying Index is determined and composed without regard to the Adviser or the Fund. Sprott has no obligation to take the needs of the Adviser, the Fund or the shareholders of the Fund into consideration in connection with the foregoing. Sprott is not responsible for and has not participated in the determination of pricing or the timing of the issuance or sale of the Shares of the Fund or in the determination or calculation of the NAV of the Fund. Sprott has no obligation or liability in connection with the administration or trading of the Fund.
Sprott does not guarantee the accuracy and/or completeness of the Underlying Index or any data included therein, and Sprott shall have no liability for any errors, omissions, or interruptions therein. Sprott makes no warranty, express or implied, as to results to be obtained by the Adviser, the Fund, Fund shareholders or any other person or entity from the use of the Underlying Index or any data included therein. Sprott makes no express or implied warranties, and expressly disclaims all warranties of merchantability or fitness for a particular purpose or use with respect to the Underlying Index or any data included therein. Without limiting any of the foregoing, in no event shall Sprott have any liability for any special, punitive, indirect, or consequential damages (including lost profits) arising out of matters relating to the use of the Underlying Index, even if notified of the possibility of such damages.
Sprott ETFs
| Additional Information | May 31, 2017 (Unaudited) |
Sprott Junior Gold Miners ETF
Zacks Investment Management, Inc. (the “Licensor”) has entered into a license agreement with Sprott Asset Management LP (“Sprott”) to use the “Sprott” name and certain related intellectual property in connection with the underlying index, the Sprott Zacks Junior Gold Miners Index (the “Underlying Index”) (the “Sprott License Agreement”). Pursuant to the Sprott License Agreement, Sprott in turn has entered into a sublicense agreement with ALPS Advisers, Inc. to use the Underlying Index (the “Sublicense Agreement”) in connection with the Sprott Junior Gold Miners ETF (the “Product”).
The following disclosure relates to the Licensor and Sprott:
The Product(s) is not sponsored, endorsed, sold or promoted by ZACKS INVESTMENT MANAGEMENT, INC. (“Licensor”) Licensor makes no representation or warranty, express or implied, regarding the advisability of investing in securities generally or in the Product(s) particularly or the ability of the Index to track general market performance. Licensor’s only relationship to the Licensee is the licensing of the Index which is determined and composed by Licensor without regard to the Licensee or the owners of the Product(s). Licensor has no obligation to take the needs of the Licensee or the owners of the Product(s) into consideration in determining or composing the Index. Licensor shall not be liable to any person for any error in the Index nor shall it be under any obligation to advise any person of any error therein.
The Fund is not sponsored by Sprott. Sprott makes no representation or warranty, express or implied, to the owners of the Fund or any member of the public regarding the advisability of investing in securities or commodities generally or in the Fund particularly and does not guarantee the quality, accuracy or completeness of the Underlying Index or any Underlying Index data included herein or derived therefrom and assume no liability in connection with their use. The Underlying Index is determined and composed without regard to the Adviser or the Fund. Sprott has no obligation to take the needs of the Adviser, the Fund or the shareholders of the Fund into consideration in connection with the foregoing. Sprott is not responsible for and has not participated in the determination of pricing or the timing of the issuance or sale of the Shares of the Fund or in the determination or calculation of the NAV of the Fund. Sprott has no obligation or liability in connection with the administration or trading of the Fund.
Sprott does not guarantee the accuracy and/or completeness of the Underlying Index or any data included therein, and Sprott shall have no liability for any errors, omissions, or interruptions therein. Sprott makes no warranty, express or implied, as to results to be obtained by the Adviser, the Fund, Fund shareholders or any other person or entity from the use of the Underlying Index or any data included therein. Sprott makes no express or implied warranties, and expressly disclaims all warranties of merchantability or fitness for a particular purpose or use with respect to the Underlying Index or any data included therein. Without limiting any of the foregoing, in no event shall Sprott have any liability for any special, punitive, indirect, or consequential damages (including lost profits) arising out of matters relating to the use of the Underlying Index, even if notified of the possibility of such damages.
Intentionally Left Blank

table of
CONTENTS
| Performance Overview | 1 |
| Disclosure of Fund Expenses | 3 |
| Financial Statements | |
| Schedule of Investments | 4 |
| Statement of Assets and Liabilities | 7 |
| Statement of Operations | 8 |
| Statements of Changes in Net Assets | 9 |
| Financial Highlights | 10 |
| Notes to Financial Statements | 11 |
| Additional Information | 16 |
www.alpsfunds.com
Workplace Equality Portfolio
| Performance Overview | May 31, 2017 (Unaudited) |
Investment Objective
The Workplace Equality Portfolio (the “Fund”) seeks investment results that correspond (before fees and expenses) generally to the price and yield performance of its underlying index, the Workplace Equality Index™ (the “Underlying Index”).
The Underlying Index is designed to provide a means of tracking the performance of companies which support workplace equality for lesbian, gay, bisexual and transgender (“LGBT”) employees. The Underlying Index consists of approximately 200 publicly traded stocks of U.S. and foreign companies which support equality for LGBT employees through their workplace practices, including non‐discrimination policies regarding sexual orientation and gender identity and providing full benefits to for same‐sex spouses, domestic partners and transgender individuals. The Underlying Index is compiled by Denver Investment Advisors LLC (“Denver Investments” or the “Index Provider”). The Index Provider uses publicly available lists and screening sources such as the National Gay & Lesbian Chamber of Commerce® Diversity Inc. Top 50®, Stonewall® or other screening sources, to identify companies with workplace policies that meet the Underlying Index’s criteria for equality for LGBT employees as described above (as well as market capitalization and liquidity requirements). The Index Provider also utilizes its own proprietary database for LGBT screening. The criteria are subject to change in response to changes in law.
Performance (as of May 31, 2017)
| | 6 Months | 1 Year | Since Inception^ |
| Workplace Equality Portfolio – NAV | 10.18% | 21.13% | 9.97% |
| Workplace Equality Portfolio – Market Price* | 10.14% | 21.09% | 9.97% |
Workplace Equality IndexTM | 10.61% | 22.05% | 10.82% |
S&P 500® Total Return Index | 10.81% | 17.47% | 10.13% |
Total Expense Ratio (per the current prospectus) 0.75%
Performance data quoted represents past performance. Past performance does not guarantee future results. The table does not reflect the deduction of taxes that a shareholder would pay on Fund distributions or the redemption of Fund shares. Investment return and principal value of an investment will fluctuate so that an investor’s shares, when sold or redeemed, may be worth more or less than the original cost. Current performance data may be higher or lower than actual data quoted. For the most current month-end performance data please visit www.alpsfunds.com or call 1.844.375.8383.
NAV is an exchange-traded fund’s per-share value. The per-share dollar amount of the Fund is derived by dividing the total value of all the securities in its portfolio, less any liabilities, by the number of Fund shares outstanding. Market Price is the price at which a share can currently be traded in the market. Information detailing the number of days the Market Price of the Fund was greater than the Fund’s NAV and the number of days it was less than the Fund’s NAV can be obtained at www.alpsfunds.com.
| ^ | The Fund Commencement date was February 25, 2014. |
| * | Market Price is based on the midpoint of the bid-ask spread at 4 p.m. ET and does not represent the returns an investor would receive if shares were traded at other times. |
The Workplace Equality IndexTM: an equal weighted index of companies that support lesbian, gay, bisexual and transgender (LGBT) equality in their workplace.
The S&P 500® Total Return Index: the Standard & Poor’s composite index of 500 stocks, a widely recognized, unmanaged index of common stock prices.
The indexes are not actively managed and do not reflect any deductions for fees, expenses or taxes. The indexes are reported on a total return basis, which assumes reinvestment of any dividends and distributions realized during a given time period. One cannot invest directly in an index. Index performance does not reflect Fund performance.
The Fund invests in stocks of companies which meet the Underlying Index's criteria for supporting workplace equality for LGBT employees. The trend of companies supporting workplace equality in this fashion is relatively recent, and there may be a limited number of companies which meet the Underlying Index's criteria.
The Workplace Equality Portfolio is not suitable for all investors. Investments in the Fund are subject to investment risks, including possible loss of the principal amount invested.
ALPS Portfolio Solutions Distributor, Inc., a FINRA member, is the distributor for the Workplace Equality Portfolio.
ALPS Portfolio Solutions Distributor, Inc. is not affiliated with Denver Investments.
Workplace Equality Portfolio
| Performance Overview | May 31, 2017 (Unaudited) |
Top 10 Holdings* (as of May 31, 2017)
| Nvidia Corp. | 0.54% |
| Best Buy Co., Inc. | 0.52% |
| Tesla Motors, Inc. | 0.51% |
| Electronic Arts, Inc. | 0.50% |
| Hilton Grand Vacations, Inc. | 0.49% |
| Paypal Holdings, Inc. | 0.48% |
| Marriott International, Inc., Class A | 0.48% |
| Twitter, Inc. | 0.47% |
| Wynn Resorts Ltd. | 0.47% |
| Wyndham Worldwide Corp. | 0.47% |
| Total % of Top 10 Holdings | 4.93% |
Sector Allocation* (as of May 31, 2017)
| Consumer Discretionary | 21.97% |
| Financials | 19.92% |
| Information Technology | 16.18% |
| Health Care | 11.15% |
| Industrials | 10.95% |
| Consumer Staples | 8.77% |
| Materials | 3.31% |
| Utilities | 2.91% |
| Telecommunication Services | 2.34% |
| Real Estate | 1.57% |
| Energy | 0.79% |
| Money Market Fund | 0.14% |
| Total | 100.00% |
Future holdings are subject to change.
Growth of $10,000 (as of May 31, 2017)
Comparison of Change in Value of $10,000 Investment in the Fund and the Indexes
The chart above represents historical performance of a hypothetical investment of $10,000 in the Fund over the life of the Fund. Past performance does not guarantee future results. This chart does not reflect the deduction of taxes that a shareholder would pay on Fund distributions or the redemption of Fund shares.
Workplace Equality Portfolio
| Disclosure of Fund Expenses | May 31, 2017 (Unaudited) |
Shareholder Expense Example: As a shareholder of the Fund, you incur two types of costs: (1) transaction costs which may include creation and redemption fees or brokerage charges, and (2) ongoing costs, including management fees and other Fund expenses. These examples are intended to help you understand your ongoing costs (in dollars) of investing in the Fund and to compare these costs with the ongoing costs of investing in other funds. It is based on an investment of $1,000 invested at the beginning of the (six month) period and held through May 31, 2017.
Actual Return: The first line of the table provides information about actual account values and actual expenses. You may use the information in this line, together with the amount you invested, to estimate the expenses that you incurred over the period. Simply divide your account value by $1,000 (for example, an $8,600 account value divided by $1,000 = 8.6), then multiply the result by the number in the first line under the heading entitled “Expenses Paid During Period” to estimate the expenses attributable to your investment during this period.
Hypothetical 5% Return: The second line of the table provides information about hypothetical account values and hypothetical expenses based on the Fund’s actual expense ratio and an assumed rate of return of 5% per year before expenses, which is not the Fund’s actual return. The hypothetical account values and expenses may not be used to estimate the actual ending account balance or expenses you paid for the period. You may use this information to compare ongoing costs of investing in the Fund and other funds. To do so, compare this 5% hypothetical example with the 5% hypothetical examples that appear in the shareholder reports of other funds.
The expenses shown in the table are meant to highlight ongoing Fund costs only and do not reflect any transaction costs, such as creation and redemption fees or brokerage charges. Therefore, the second line is useful in comparing ongoing costs only, and will not help you determine the relative total costs of owning different funds. In addition, if these costs were included, your costs would have been higher.
| | Beginning Account Value 12/1/16 | Ending Account Value 5/31/17 | Expense Ratio(a) | Expenses Paid During Period 12/1/16 - 5/31/17(b) |
| Workplace Equality Portfolio | | | | |
| Actual | $ 1,000.00 | $ 1,101.80 | 0.75% | $ 3.93 |
| Hypothetical (5% return before expenses) | $ 1,000.00 | $ 1,021.19 | 0.75% | $ 3.78 |
| (a) | Annualized, based on the Fund's most recent fiscal half year expenses. |
| (b) | Expenses are equal to the Fund's annualized expense ratio multiplied by the average account value over the period, multiplied by the number of days in the most recent fiscal half year (182), divided by 365. |
Workplace Equality Portfolio
| Schedule of Investments | May 31, 2017 (Unaudited) |
| Security Description | | Shares | | | Value | |
| COMMON STOCKS (99.71%) | | | | | | |
| Consumer Discretionary (21.94%) | | | | | | |
| Abercrombie & Fitch Co., Class A | | | 4,836 | | | $ | 63,787 | |
| American Eagle Outfitters, Inc. | | | 4,138 | | | | 47,587 | |
| Aramark | | | 1,557 | | | | 58,014 | |
| Barnes & Noble, Inc. | | | 6,429 | | | | 43,074 | |
| Best Buy Co., Inc. | | | 1,307 | | | | 77,623 | |
Caesars Entertainment Corp.(a)(b) | | | 6,169 | | | | 67,551 | |
| CBS Corp., Class B | | | 874 | | | | 53,410 | |
| Choice Hotels International, Inc. | | | 926 | | | | 60,144 | |
| Coach, Inc. | | | 1,469 | | | | 67,882 | |
| Comcast Corp., Class A | | | 1,571 | | | | 65,495 | |
| Darden Restaurants, Inc. | | | 772 | | | | 68,654 | |
| Ford Motor Co. | | | 4,816 | | | | 53,554 | |
| GameStop Corp., Class A | | | 2,398 | | | | 53,092 | |
| Gap, Inc. | | | 2,436 | | | | 54,810 | |
| General Motors Co. | | | 1,612 | | | | 54,695 | |
Groupon, Inc.(b) | | | 14,466 | | | | 43,543 | |
Hilton Grand Vacations, Inc.(b) | | | 2,037 | | | | 72,863 | |
| Hilton Worldwide Holdings, Inc. | | | 1,010 | | | | 67,135 | |
| The Home Depot, Inc. | | | 392 | | | | 60,176 | |
Hyatt Hotels Corp., Class A(b) | | | 1,099 | | | | 63,412 | |
| InterContinental Hotels Group PLC, ADR | | | 1,235 | | | | 69,827 | |
| Interpublic Group of Cos., Inc. | | | 2,369 | | | | 59,059 | |
| L Brands, Inc. | | | 1,169 | | | | 60,320 | |
| Macy's, Inc. | | | 1,935 | | | | 45,473 | |
| Marriott International, Inc., Class A | | | 662 | | | | 71,264 | |
| Mattel, Inc. | | | 2,295 | | | | 52,578 | |
| Mcdonald's Corp. | | | 454 | | | | 68,504 | |
| MGM Resorts International | | | 2,168 | | | | 68,769 | |
Netflix, Inc.(b) | | | 403 | | | | 65,717 | |
| Newell Rubbermaid, Inc. | | | 1,208 | | | | 63,964 | |
| NIKE, Inc., Class B | | | 1,011 | | | | 53,573 | |
| Nordstrom, Inc. | | | 1,333 | | | | 55,719 | |
| Office Depot, Inc. | | | 12,481 | | | | 63,778 | |
| Pearson PLC, Sponsored ADR | | | 7,622 | | | | 68,979 | |
| Royal Caribbean Cruises Ltd. | | | 600 | | | | 66,108 | |
Sears Holdings Corp.(a)(b) | | | 6,524 | | | | 48,212 | |
Sirius XM Holdings, Inc.(a) | | | 10,931 | | | | 57,388 | |
| Sony Corp., Sponsored ADR | | | 1,826 | | | | 66,868 | |
| Staples, Inc. | | | 6,645 | | | | 60,337 | |
| Starbucks Corp. | | | 1,061 | | | | 67,490 | |
| Target Corp. | | | 1,071 | | | | 59,066 | |
| Tegna, Inc. | | | 2,238 | | | | 53,130 | |
Tesla Motors, Inc.(a)(b) | | | 224 | | | | 76,386 | |
| Tiffany & Co. | | | 646 | | | | 56,176 | |
| Time Warner, Inc. | | | 592 | | | | 58,898 | |
| Time, Inc. | | | 3,058 | | | | 38,225 | |
| TJX Cos., Inc. | | | 739 | | | | 55,580 | |
| Toyota Motor Corp., Sponsored ADR | | | 521 | | | | 56,028 | |
| Viacom, Inc., Class B | | | 1,340 | | | | 46,619 | |
Visteon Corp(b) | | | 588 | | | | 58,971 | |
| Walt Disney Co. | | | 521 | | | | 56,237 | |
| Whirlpool Corp. | | | 337 | | | | 62,527 | |
| Wyndham Worldwide Corp. | | | 692 | | | | 69,885 | |
| Security Description | | Shares | | | Value | |
| Consumer Discretionary (continued) | | | | | | |
| Wynn Resorts Ltd. | | | 546 | | | $ | 70,270 | |
| Total Consumer Discretionary | | | | | | | 3,248,426 | |
| | | | | | | | | |
| Consumer Staples (8.76%) | | | | | | | | |
| Altria Group, Inc. | | | 774 | | | | 58,391 | |
Avon Products, Inc.(b) | | | 13,550 | | | | 46,070 | |
| Brown‐Forman Corp., Class B | | | 1,250 | | | | 64,938 | |
| Campbell Soup Co. | | | 991 | | | | 57,131 | |
| Clorox Co. | | | 423 | | | | 57,414 | |
| Coca‐Cola Co. | | | 1,393 | | | | 63,340 | |
| Colgate‐Palmolive Co. | | | 789 | | | | 60,248 | |
| CVS Health Corp. | | | 743 | | | | 57,085 | |
| Diageo PLC, Sponsored ADR | | | 506 | | | | 61,692 | |
| The Estee Lauder Cos., Inc., Class A | | | 681 | | | | 64,109 | |
| General Mills, Inc. | | | 973 | | | | 55,208 | |
| Hershey Co. | | | 537 | | | | 61,900 | |
| Hormel Foods Corp. | | | 1,667 | | | | 56,061 | |
| Kellogg Co. | | | 779 | | | | 55,776 | |
| Kimberly‐clark Corp | | | 439 | | | | 56,951 | |
| The Kraft Heinz Co. | | | 637 | | | | 58,731 | |
| The Kroger Co. | | | 2,004 | | | | 59,679 | |
| Mondelez International, Inc., Class A | | | 1,314 | | | | 61,219 | |
| Pepsi Co., Inc. | | | 523 | | | | 61,123 | |
| Procter & Gamble Co. | | | 644 | | | | 56,730 | |
| Unilever NV, NY Shares | | | 1,189 | | | | 67,511 | |
| Walgreens Boots Alliance, Inc. | | | 680 | | | | 55,094 | |
| Total Consumer Staples | | | | | | | 1,296,401 | |
| | | | | | | | | |
| Energy (0.79%) | | | | | | | | |
| Chevron Corp. | | | 540 | | | | 55,879 | |
| Royal Dutch Shell PLC, Class A ‐ Sponsored ADR | | | 1,111 | | | | 60,450 | |
| Total Energy | | | | | | | 116,329 | |
| | | | | | | | | |
| Financials (19.89%) | | | | | | | | |
| American Express Co. | | | 742 | | | | 57,089 | |
| American International Group, Inc. | | | 938 | | | | 59,685 | |
| Ameriprise Financial, Inc. | | | 443 | | | | 53,510 | |
| Aon PLC | | | 489 | | | | 64,015 | |
| Aviva PLC, Sponsored ADR | | | 4,530 | | | | 61,789 | |
| Bank of America Corp. | | | 2,365 | | | | 53,000 | |
| Bank of Montreal | | | 774 | | | | 51,966 | |
| Bank of New York Mellon Corp. | | | 1,222 | | | | 57,581 | |
| Barclays PLC, Sponsored ADR | | | 5,130 | | | | 55,250 | |
| BlackRock, Inc. | | | 154 | | | | 63,023 | |
| Capital One Financial Corp. | | | 660 | | | | 50,767 | |
| Charles Schwab Corp. | | | 1,359 | | | | 52,661 | |
| Chubb Corp. | | | 425 | | | | 60,856 | |
| Citigroup, Inc. | | | 964 | | | | 58,361 | |
| CNA Financial Corp | | | 1,315 | | | | 59,964 | |
| Comerica, Inc. | | | 820 | | | | 56,219 | |
| Credit Suisse Group AG, Sponsored ADR | | | 3,992 | | | | 56,447 | |
| Deutsche Bank AG | | | 3,416 | | | | 59,712 | |
| Discover Financial Services | | | 833 | | | | 48,897 | |
| Factset Research Systems, Inc. | | | 324 | | | | 53,684 | |
| Fifth Third Bancorp | | | 2,242 | | | | 53,225 | |
Workplace Equality Portfolio
| Schedule of Investments | May 31, 2017 (Unaudited) |
| Security Description | | Shares | | | Value | |
| Financials (continued) | | | | | | |
| Franklin Resources, Inc. | | | 1,384 | | | $ | 57,837 | |
Genworth Financial, Inc., Class A(b) | | | 14,200 | | | | 51,972 | |
| Goldman Sachs Group, Inc. | | | 240 | | | | 50,702 | |
| Hartford Financial Services Group, Inc. | | | 1,194 | | | | 58,972 | |
| HSBC Holdings PLC, Sponsored ADR | | | 1,424 | | | | 61,930 | |
| Huntington Bancshares, Inc. | | | 4,244 | | | | 53,220 | |
| JPMorgan Chase & Co. | | | 649 | | | | 53,315 | |
| KeyCorp | | | 3,192 | | | | 55,764 | |
| M&t Bank Corp. | | | 359 | | | | 56,173 | |
| Marsh & McLennan Cos., Inc. | | | 780 | | | | 60,497 | |
| MetLife, Inc. | | | 1,110 | | | | 56,155 | |
| Moody's Corp. | | | 519 | | | | 61,475 | |
| Morgan Stanley | | | 1,292 | | | | 53,928 | |
| Northern Trust Corp. | | | 658 | | | | 57,535 | |
| PNC Financial Services Group, Inc. | | | 469 | | | | 55,670 | |
| Principal Financial Group, Inc. | | | 919 | | | | 57,814 | |
| Progressive Corp. | | | 1,455 | | | | 61,736 | |
| Prudential Financial, Inc. | | | 532 | | | | 55,780 | |
| Royal Bank of Canada | | | 807 | | | | 55,764 | |
| S&p Global, Inc. | | | 448 | | | | 63,979 | |
| State Street Corp. | | | 744 | | | | 60,606 | |
| Sun Life Financial, Inc. | | | 1,584 | | | | 51,860 | |
| SunTrust Banks, Inc. | | | 1,015 | | | | 54,171 | |
| T Rowe Price Group, Inc. | | | 838 | | | | 59,029 | |
| Thomson Reuters Corp. | | | 1,348 | | | | 58,854 | |
| Toronto‐Dominion Bank | | | 1,194 | | | | 56,954 | |
| The Travelers Cos., Inc. | | | 474 | | | | 59,179 | |
| UBS Group AG | | | 3,830 | | | | 60,859 | |
| US Bancorp | | | 1,077 | | | | 54,808 | |
| Voya Financial, Inc. | | | 1,474 | | | | 50,381 | |
| Wells Fargo & Co. | | | 998 | | | | 51,038 | |
| Total Financials | | | | | | | 2,945,658 | |
| | | | | | | | | |
| Health Care (11.13%) | | | | | | | | |
| Abbvie, Inc. | | | 892 | | | | 58,890 | |
| Aetna, Inc. | | | 443 | | | | 64,173 | |
| Anthem, Inc. | | | 346 | | | | 63,093 | |
| AstraZeneca PLC, Sponsored ADR | | | 1,908 | | | | 65,616 | |
Athenahealth Inc(b) | | | 509 | | | | 68,196 | |
| Baxter International, Inc. | | | 1,132 | | | | 67,139 | |
Biogen, Inc.(b) | | | 212 | | | | 52,527 | |
Bioverativ, Inc.(b) | | | 1,179 | | | | 64,951 | |
Boston Scientific Corp.(b) | | | 2,398 | | | | 64,818 | |
| Bristol‐Myers Squibb Co. | | | 1,048 | | | | 56,540 | |
| Cardinal Health, Inc. | | | 704 | | | | 52,300 | |
| Cigna Corp. | | | 384 | | | | 61,912 | |
| Danaher Corp. | | | 674 | | | | 57,250 | |
| Eli Lilly & Co. | | | 696 | | | | 55,381 | |
Express Scripts Holding Co.(b) | | | 898 | | | | 53,655 | |
| GlaxoSmithKline PLC, Sponsored ADR | | | 1,409 | | | | 62,320 | |
Henry Schein, Inc.(b) | | | 340 | | | | 62,550 | |
| Humana, Inc. | | | 268 | | | | 62,246 | |
| Johnson & Johnson | | | 454 | | | | 58,225 | |
| McKesson Corp. | | | 396 | | | | 64,584 | |
| Medtronic PLC | | | 712 | | | | 60,007 | |
| Merck & Co., Inc. | | | 916 | | | | 59,641 | |
| Security Description | | Shares | | | Value | |
| Health Care (continued) | | | | | | |
| Novartis AG, Sponsored ADR | | | 770 | | | $ | 62,963 | |
| Pfizer, Inc. | | | 1,743 | | | | 56,909 | |
| Sanofi, Sponsored ADR | | | 1,367 | | | | 67,789 | |
| Thermo Fisher Scientific, Inc. | | | 368 | | | | 63,587 | |
| UnitedHealth Group, Inc. | | | 345 | | | | 60,437 | |
| Total Health Care | | | | | | | 1,647,699 | |
| | | | | | | | | |
| Industrials (10.93%) | | | | | | | | |
| 3M Co. | | | 306 | | | | 62,568 | |
| Alaska Air Group, Inc. | | | 626 | | | | 54,493 | |
| American Airlines Group, Inc. | | | 1,394 | | | | 67,483 | |
| Arconic, Inc. | | | 2,132 | | | | 58,566 | |
| Boeing Co. | | | 326 | | | | 61,167 | |
| Cummins, Inc. | | | 378 | | | | 59,611 | |
| Eaton Corp. PLC | | | 814 | | | | 62,987 | |
| Fortive Corp. | | | 980 | | | | 61,201 | |
| General Electric Co. | | | 1,958 | | | | 53,610 | |
| Herman Miller, Inc. | | | 1,939 | | | | 61,175 | |
Huron Consulting Group, Inc.(b) | | | 1,402 | | | | 58,253 | |
Ihs Markit Ltd.(b) | | | 1,444 | | | | 66,207 | |
JetBlue Airways Corp.(b) | | | 2,909 | | | | 65,220 | |
| Lockheed Martin Corp. | | | 217 | | | | 61,005 | |
| Manpowergroup, Inc. | | | 565 | | | | 57,557 | |
Navigant Consulting, Inc.(b) | | | 2,532 | | | | 49,349 | |
| Nielsen Holdings, Plc. | | | 1,367 | | | | 52,602 | |
| Northrop Grumman Corp. | | | 243 | | | | 62,990 | |
| Owens Corning | | | 944 | | | | 58,906 | |
| Raytheon Co. | | | 378 | | | | 61,996 | |
| Rockwell Automation, Inc. | | | 374 | | | | 59,361 | |
| Rockwell Collins, Inc. | | | 592 | | | | 64,558 | |
| Southwest Airlines Co. | | | 1,095 | | | | 65,799 | |
| Steelcase, Inc., Class A | | | 3,491 | | | | 58,474 | |
United Continental Holdings, Inc.(b) | | | 874 | | | | 69,632 | |
| United Technologies Corp. | | | 520 | | | | 63,066 | |
| WW Grainger, Inc. | | | 240 | | | | 41,347 | |
| Total Industrials | | | | | | | 1,619,183 | |
| | | | | | | | | |
| Information Technology (16.16%) | | | | | | | | |
| Accenture PLC, Class A | | | 470 | | | | 58,501 | |
Adobe Systems, Inc.(b) | | | 474 | | | | 67,242 | |
Alphabet, Inc., Class C(b) | | | 69 | | | | 66,575 | |
| Apple, Inc. | | | 417 | | | | 63,701 | |
| Automatic Data Processing, Inc. | | | 559 | | | | 57,225 | |
| Booz Allen Hamilton Holding Corp. | | | 1,556 | | | | 61,369 | |
| Broadridge Financial Solutions, Inc. | | | 841 | | | | 63,823 | |
| CA, Inc. | | | 1,801 | | | | 57,218 | |
| Cisco Systems, Inc. | | | 1,726 | | | | 54,421 | |
Conduent, Inc.(b) | | | 3,734 | | | | 61,275 | |
| Convergys Corp. | | | 2,783 | | | | 67,655 | |
| Corning, Inc. | | | 2,137 | | | | 62,187 | |
eBay, Inc.(b) | | | 1,757 | | | | 60,265 | |
Electronic Arts, Inc.(b) | | | 654 | | | | 74,118 | |
Facebook, Inc., Class A(b) | | | 416 | | | | 63,007 | |
| Harris Corp. | | | 521 | | | | 58,435 | |
| Hewlett Packard Enterprise Co. | | | 2,571 | | | | 48,360 | |
| HP, Inc. | | | 3,336 | | | | 62,583 | |
| Intel Corp. | | | 1,658 | | | | 59,870 | |
Workplace Equality Portfolio
| Schedule of Investments | May 31, 2017 (Unaudited) |
| Security Description | | Shares | | | Value | |
| Information Technology (continued) | | | | | | |
| International Business Machines Corp. | | | 333 | | | $ | 50,826 | |
| Intuit, Inc. | | | 474 | | | | 66,663 | |
| MasterCard, Inc., Class A | | | 517 | | | | 63,529 | |
| Microsoft Corp. | | | 901 | | | | 62,926 | |
NCR Corp.(b) | | | 1,312 | | | | 50,551 | |
| NetApp, Inc. | | | 1,399 | | | | 56,646 | |
| Nokia OYJ, Sponsored ADR | | | 10,694 | | | | 67,586 | |
| Nvidia Corp. | | | 554 | | | | 79,970 | |
| Oracle Corp. | | | 1,275 | | | | 57,872 | |
Paypal Holdings, Inc.(b) | | | 1,372 | | | | 71,632 | |
| QUALCOMM, Inc. | | | 1,010 | | | | 57,843 | |
Salesforce.com, Inc.(b) | | | 705 | | | | 63,196 | |
| Symantec Corp. | | | 1,897 | | | | 57,498 | |
Tech Data Corp.(b) | | | 615 | | | | 59,637 | |
| Texas Instruments, Inc. | | | 712 | | | | 58,733 | |
Twitter, Inc.(b) | | | 3,851 | | | | 70,550 | |
| Visa, Inc., Class A | | | 647 | | | | 61,614 | |
| Xerox Corp. | | | 7,967 | | | | 56,327 | |
Yahoo!, Inc.(b) | | | 1,250 | | | | 62,900 | |
Yelp, Inc.(b) | | | 1,717 | | | | 47,939 | |
| Total Information Technology | | | | | | | 2,392,268 | |
| | | | | | | | | |
| Materials (3.30%) | | | | | | | | |
| Alcoa, Inc. | | | 1,674 | | | | 55,142 | |
| Ball Corp | | | 1,558 | | | | 63,722 | |
| The Chemours Company | | | 1,682 | | | | 67,263 | |
| Dow Chemical Co. | | | 920 | | | | 57,003 | |
| Ecolab, Inc. | | | 467 | | | | 62,036 | |
| EI du Pont de Nemours & Co. | | | 722 | | | | 56,980 | |
| Monsanto Co. | | | 518 | | | | 60,824 | |
| Praxair, Inc. | | | 497 | | | | 65,748 | |
| Total Materials | | | | | | | 488,718 | |
| | | | | | | | | |
| Real Estate (1.57%) | | | | | | | | |
CBRE Group, Inc., Class A(b) | | | 1,611 | | | | 56,192 | |
| Jones Lang Lasalle, Inc. | | | 529 | | | | 61,083 | |
| Park Hotels & Resorts, Inc. | | | 2,236 | | | | 57,555 | |
| Weyerhaeuser Co., REIT | | | 1,755 | | | | 57,845 | |
| Total Real Estate | | | | | | | 232,675 | |
| | | | | | | | | |
| Telecommunication Services (2.34%) | | | | | | | | |
| AT&T, Inc. | | | 1,391 | | | | 53,595 | |
| BT Group PLC, Sponsored ADR | | | 2,840 | | | | 56,715 | |
Level 3 Communications, Inc.(b) | | | 1,020 | | | | 60,710 | |
Sprint Corp.(b) | | | 6,795 | | | | 57,690 | |
T‐Mobile US, Inc.(b) | | | 932 | | | | 62,835 | |
| Verizon Communications, Inc. | | | 1,176 | | | | 54,849 | |
| Total Telecommunication Services | | | | | | | 346,394 | |
| | | | | | | | | |
| Utilities (2.90%) | | | | | | | | |
| American Electric Power Co., Inc | | | 880 | | | | 63,166 | |
| Edison International | | | 736 | | | | 60,035 | |
| Exelon Corp. | | | 1,620 | | | | 58,822 | |
| PG&E Corp. | | | 883 | | | | 60,380 | |
| Portland General Electric Co. | | | 1,311 | | | | 62,063 | |
| PPL Corp. | | | 1,594 | | | | 63,617 | |
| Security Description | | Shares | | | Value | |
| Utilities (continued) | | | | | | |
| Sempra Energy | | | 529 | | | $ | 61,623 | |
| Total Utilities | | | | | | | 429,706 | |
| | | | | | | | | |
| TOTAL COMMON STOCKS (Cost $12,660,221) | | 14,763,457 | |
| | | 7 Day Yield | | | Shares | | | Value | |
| SHORT TERM INVESTMENTS (0.14%) | | | | |
| State Street Institutional Treasury Plus Money Market Fund | | | 0.680 | % | | | 20,862 | | | | 20,862 | |
TOTAL SHORT TERM INVESTMENTS (Cost $20,862) | | 20,862 | |
| | | | | | | | | | | | | |
TOTAL INVESTMENTS (99.85%) (Cost $12,681,083) | | $ | 14,784,319 | |
| | | | | | | | | | | | | |
| NET OTHER ASSETS AND LIABILITIES (0.15%) | | | 22,521 | |
| | | | | | | | | | | | | |
| NET ASSETS (100.00%) | | | | | | | $ | 14,806,840 | |
| (a) | Security, or a portion of the security position, is currently on loan. The total market value of securities on loan is $187,143. |
| (b) | Non-income producing security. |
See Notes to Financial Statements.
Workplace Equality Portfolio
| Statement of Assets and Liabilities | May 31, 2017 (Unaudited) |
| ASSETS: | | | |
| Investments, at value | | $ | 14,784,319 | |
| Foreign tax reclaims | | | 82 | |
| Dividends receivable | | | 31,794 | |
| Total Assets | | | 14,816,195 | |
| | | | | |
| LIABILITIES: | | | | |
| Payable to adviser | | | 9,355 | |
| Total Liabilities | | | 9,355 | |
| NET ASSETS | | $ | 14,806,840 | |
| | | | | |
| NET ASSETS CONSIST OF: | | | | |
| Paid‐in capital | | $ | 12,376,421 | |
| Accumulated net investment income | | | 79,945 | |
| Accumulated net realized gain on investments | | | 247,238 | |
| Net unrealized appreciation on investments | | | 2,103,236 | |
| NET ASSETS | | $ | 14,806,840 | |
| | | | | |
| INVESTMENTS, AT COST | | $ | 12,681,083 | |
| | | | | |
| PRICING OF SHARES | | | | |
| Net Assets | | $ | 14,806,840 | |
| Shares of beneficial interest outstanding (Unlimited number of shares authorized, par value $0.01 per share) | | | 450,000 | |
| Net Asset Value, offering and redemption price per share | | $ | 32.90 | |
See Notes to Financial Statements.
Workplace Equality Portfolio
| Statement of Operations | For the Six Months Ended May 31, 2017 (Unaudited) |
| INVESTMENT INCOME: | | | |
Dividends(a) | | $ | 144,085 | |
| Securities lending income | | | 1,016 | |
| Total Investment Income | | | 145,101 | |
| | | | | |
| EXPENSES: | | | | |
| Investment adviser fees | | | 48,770 | |
| Total Expenses | | | 48,770 | |
| NET INVESTMENT INCOME | | | 96,331 | |
| | | | | |
| REALIZED AND UNREALIZED GAIN/(LOSS) | | | | |
| Net realized gain on investments | | | 473,895 | |
| Net realized loss on foreign currency transactions | | | (13 | ) |
| Net realized gain | | | 473,882 | |
| Net change in unrealized appreciation on investments | | | 705,733 | |
| NET UNREALIZED GAIN ON INVESTMENTS | | | 1,179,615 | |
| NET INCREASE IN NET ASSETS RESULTING FROM OPERATIONS | | $ | 1,275,946 | |
| (a) | Net of foreign tax withholding $1,954. |
See Notes to Financial Statements.
Workplace Equality Portfolio
Statements of Changes in Net Assets
| | | For the Six Months Ended May 31, 2017 (Unaudited) | | | For the Year Ended November 30, 2016 | |
| OPERATIONS: | | | | | | |
| Net investment income | | $ | 96,331 | | | $ | 174,248 | |
| Net realized gain/(loss) | | | 473,882 | | | | (201,456 | ) |
| Net change in unrealized appreciation | | | 705,733 | | | | 1,251,679 | |
| Net increase in net assets resulting from operations | | | 1,275,946 | | | | 1,224,471 | |
| | | | | | | | | |
| DISTRIBUTIONS: | | | | | | | | |
| Dividends to shareholders from net investment income | | | (183,001 | ) | | | (135,078 | ) |
| Net decrease in net assets from distributions | | | (183,001 | ) | | | (135,078 | ) |
| | | | | | | | | |
| CAPITAL SHARE TRANSACTIONS: | | | | | | | | |
| Proceeds from sale of shares | | | 3,144,500 | | | | 1,342,125 | |
| Cost of shares redeemed | | | (1,553,228 | ) | | | – | |
| Net increase from capital share transactions | | | 1,591,272 | | | | 1,342,125 | |
| Net increase in net assets | | | 2,684,217 | | | | 2,431,518 | |
| | | | | | | | | |
| NET ASSETS: | | | | | | | | |
| Beginning of period | | | 12,122,623 | | | | 9,691,105 | |
| End of period* | | $ | 14,806,840 | | | $ | 12,122,623 | |
| | | | | | | | | |
| *Including accumulated net investment income of: | | $ | 79,945 | | | $ | 166,615 | |
| | | | | | | | | |
| OTHER INFORMATION: | | | | | | | | |
| CAPITAL SHARE TRANSACTIONS: | | | | | | | | |
| Beginning shares | | | 400,000 | | | | 350,000 | |
| Shares sold | | | 100,000 | | | | 50,000 | |
| Shares redeemed | | | (50,000 | ) | | | – | |
| Shares outstanding, end of period | | | 450,000 | | | | 400,000 | |
See Notes to Financial Statements.
Workplace Equality Portfolio
| Financial Highlights | For a Share Outstanding Throughout the Periods Presented |
| | | For the Six Months Ended May 31, 2017 (Unaudited) | | | For the Year Ended November 30, 2016 | | | For the Year Ended November 30, 2015 | | | For the Period February 25, 2014 (Commencement of Operations) to November 30, 2014 | |
| NET ASSET VALUE, BEGINNING OF PERIOD | | $ | 30.31 | | | $ | 27.69 | | | $ | 27.92 | | | $ | 25.00 | |
| | | | | | | | | | | | | | | | | |
| INCOME/(LOSS) FROM INVESTMENT OPERATIONS: | | | | | | | | | | | | | | | | |
Net investment income(a) | | | 0.23 | | | | 0.46 | | | | 0.36 | | | | 0.28 | |
| Net realized and unrealized gain/(loss) | | | 2.82 | | | | 2.55 | | | | (0.20 | ) | | | 2.64 | |
| Total from investment operations | | | 3.05 | | | | 3.01 | | | | 0.16 | | | | 2.92 | |
| | | | | | | | | | | | | | | | | |
| DISTRIBUTIONS: | | | | | | | | | | | | | | | | |
| From net investment income | | | (0.46 | ) | | | (0.39 | ) | | | (0.39 | ) | | | – | |
| Total distributions | | | (0.46 | ) | | | (0.39 | ) | | | (0.39 | ) | | | – | |
| | | | | | | | | | | | | | | | | |
| Net increase/(decrease) in net asset value | | | 2.59 | | | | 2.62 | | | | (0.23 | ) | | | 2.92 | |
| NET ASSET VALUE, END OF PERIOD | | $ | 32.90 | | | $ | 30.31 | | | $ | 27.69 | | | $ | 27.92 | |
TOTAL RETURN(b) | | | 10.18 | % | | | 11.04 | % | | | 0.59 | % | | | 11.68 | % |
| | | | | | | | | | | | | | | | | |
| RATIOS/SUPPLEMENTAL DATA: | | | | | | | | | | | | | | | | |
| Net assets, end of period (000s) | | $ | 14,807 | | | $ | 12,123 | | | $ | 9,691 | | | $ | 6,979 | |
| | | | | | | | | | | | | | | | | |
| Ratio of expenses to average net assets | | | 0.75 | %(c) | | | 0.75 | % | | | 0.75 | % | | | 0.75 | %(c) |
| | | | | | | | | | | | | | | | | |
| Ratio of net investment income to average net assets | | | 1.48 | %(c) | | | 1.69 | % | | | 1.31 | % | | | 1.42 | %(c) |
Portfolio turnover rate(d) | | | 12 | % | | | 34 | % | | | 26 | % | | | 8 | % |
| (a) | Based on average shares outstanding during the period. |
| (b) | Total return is calculated assuming an initial investment made at the net asset value at the beginning of the period and redemption at the net asset value on the last day of the period and assuming all distributions are reinvested at reinvestment prices. Total return calculated for a period of less than one year is not annualized. |
| (d) | Portfolio turnover for periods less than one year are not annualized and does not include securities received or delivered from processing creations or redemptions in-kind. |
See Notes to Financial Statements.
Workplace Equality Portfolio
| Notes to Financial Statements | May 31, 2017 (Unaudited) |
1. ORGANIZATION
ALPS ETF Trust (the “Trust”), a Delaware statutory trust, is an open-end management investment company registered under the Investment Company Act of 1940, as amended (the “1940 Act”). As of May 31, 2017, the Trust consisted of twenty separate portfolios. Each portfolio represents a separate series of the Trust. This report pertains solely to the Workplace Equality Portfolio (the “Fund”). The investment objective of the Fund is to seek investment results that correspond generally, before fees and expenses, to the price and yield of the Workplace Equality IndexTM. The investment advisor uses a “passive” or indexing approach to try to achieve the Fund’s investment objective. The Fund has elected to qualify as a diversified series of the Trust under the 1940 Act.
The Fund’s Shares (“Shares”) are listed on the NYSE Arca, Inc. (the “NYSE Arca”). The Fund issues and redeems Shares at net asset value (“NAV”) in blocks of 50,000 Shares, each of which is called a “Creation Unit”. Creation Units are issued and redeemed principally in-kind for securities included in the Underlying Index. Except when aggregated in Creation Units, Shares are not redeemable securities of the Fund.
Pursuant to the Trust’s organizational documents, its Officers and Trustees are indemnified against certain liability arising out of the performance of their duties to the Trust. Additionally, in the normal course of business, the Trust enters into contracts with service providers that contain general indemnification clauses. The Trust’s maximum exposure under these arrangements is unknown, as this would involve future claims that may be made against the Trust that have not yet occurred.
2. SIGNIFICANT ACCOUNTING POLICIES
The following is a summary of significant accounting policies consistently followed by the Fund in the preparation of the financial statements. The accompanying financial statements were prepared in accordance with accounting principles generally accepted in the United States of America (“U.S. GAAP”). The preparation of financial statements in conformity with U.S. GAAP requires management to make certain estimates and assumptions that affect the reported amounts of assets and liabilities and disclosures of contingent assets and liabilities at the date of the financial statements and the reported amounts of revenue and expenses during the period. Actual results could differ from those estimates. The Fund is considered an investment company under U.S. GAAP and follows the accounting and reporting guidance applicable to investment companies in the Financial Accounting Standards Board Accounting Standards Codification Topic 946.
A. Portfolio Valuation
The Fund’s NAV is determined daily, as of the close of regular trading on the New York Stock Exchange (the “NYSE”), normally 4:00 p.m. Eastern time, on each day the NYSE is open for trading. The NAV is computed by dividing the value of all assets of the Fund (including accrued interest and dividends), less all liabilities (including accrued expenses and dividends declared but unpaid), by the total number of shares outstanding.
Portfolio securities listed on any exchange other than the NASDAQ Stock Market LLC (“NASDAQ”) are valued at the last sale price on the business day as of which such value is being determined. If there has been no sale on such day, the securities are valued at the mean of the most recent bid and ask prices on such day. Securities traded on the NASDAQ are valued at the NASDAQ Official Closing Price as determined by NASDAQ. Portfolio securities traded on more than one securities exchange are valued at the last sale price on the business day as of which such value is being determined at the close of the exchange representing the principal market for such securities. Portfolio securities traded in the over-the-counter market, but excluding securities traded on the NASDAQ, are valued at the latest quoted sale price in such market.
The Fund’s investments are valued at market value or, in the absence of market value with respect to any portfolio securities, at fair value according to procedures adopted by the Trust’s Board of Trustees (the “Board”). When market quotations are not readily available or when events occur that make established valuation methods unreliable, securities of the Fund may be valued in good faith by or under the direction of the Board. These securities generally include, but are not limited to, restricted securities (securities which may not be publicly sold without registration under the Securities Act of 1933) for which a pricing service is unable to provide a market price; securities whose trading has been formally suspended; a security whose market price is not available from a pre-established primary pricing source or the pricing source is not willing to provide a price; a security with respect to which an event has occurred that is most likely to materially affect the value of the security after the market has closed but before the calculation of the Fund’s NAV or make it difficult or impossible to obtain a reliable market quotation; or a security whose price, as provided by the pricing service, does not reflect the security’s “fair value” due to the security being de-listed from a national exchange or the security’s primary trading market is temporarily closed at a time when, under normal conditions, it would be open. As a general principle, the current “fair value” of a security would be the amount which the owner might reasonably expect to receive from the sale on the applicable exchange or principal market. A variety of factors may be considered in determining the fair value of such securities.
Workplace Equality Portfolio
| Notes to Financial Statements | May 31, 2017 (Unaudited) |
B. Fair Value Measurements
The Fund discloses the classification of its fair value measurements following a three-tier hierarchy based on the inputs used to measure fair value. Inputs refer broadly to the assumptions that market participants would use in pricing the asset or liability; including assumptions about risk. Inputs may be observable or unobservable. Observable inputs reflect the assumptions market participants would use in pricing the asset or liability that are developed based on market data obtained from sources independent of the reporting entity. Unobservable inputs reflect the reporting entity’s own assumptions about the assumptions market participants would use in pricing the asset or liability that are developed based on the best information available.
Valuation techniques used to value the Fund's investments by major category are as follows:
Equity securities, including restricted securities, for which market quotations are readily available, are valued at the last reported sale price or official closing price as reported by a third party pricing vendor on the primary market or exchange on which they are traded and are categorized as Level 1 in the hierarchy. In the event there were no sales during the day or closing prices are not available, securities are valued at the mean of the most recent quoted bid and ask prices on such day and are generally categorized as Level 2 in the hierarchy. Investments in open‐end mutual funds are valued at their closing NAV each business day and are categorized as Level 1 in the hierarchy.
Changes in valuation techniques may result in transfers in or out of an assigned level within the disclosure hierarchy.
Various inputs are used in determining the value of the Fund’s investments as of the end of the reporting period. When inputs used fall into different levels of the fair value hierarchy, the level in the hierarchy within which the fair value measurement falls is determined based on the lowest level input that is significant to the fair value measurement in its entirety. The designated input levels are not necessarily an indication of the risk or liquidity associated with these investments.
These inputs are categorized in the following hierarchy under applicable financial accounting standards:
| Level 1 – | Unadjusted quoted prices in active markets for identical investments, unrestricted assets or liabilities that a Fund has the ability to access at the measurement date; |
| Level 2 – | Quoted prices which are not active, quoted prices for similar assets or liabilities in active markets or inputs other than quoted prices that are observable (either directly or indirectly) for substantially the full term of the asset or liability; and |
| Level 3 – | Significant unobservable prices or inputs (including the Fund’s own assumptions in determining the fair value of investments) where there is little or no market activity for the asset or liability at the measurement date. |
The following is a summary of the inputs used to value the Fund’s investments as of May 31, 2017:
| Investments in Securities at Value | | Level 1 - Unadjusted Quoted Prices | | | Level 2 - Other Significant Observable Inputs | | | Level 3 - Significant Unobservable Inputs | | | Total | |
| Common Stocks* | | $ | 14,763,457 | | | $ | – | | | $ | – | | | $ | 14,763,457 | |
| Short Term Investments | | | 20,862 | | | | – | | | | – | | | | 20,862 | |
| TOTAL | | $ | 14,784,319 | | | $ | – | | | $ | – | | | $ | 14,784,319 | |
| * | For a detailed sector breakdown, see the accompanying Schedule of Investments. |
The Fund recognizes transfers between levels as of the end of the period. For the six months ended May 31, 2017, the Fund did not have any transfers between Level 1 and Level 2 securities. The Fund did not have any securities that used significant unobservable inputs (Level 3) in determining fair value.
C. Securities Transactions and Investment Income
Securities transactions are recorded as of the trade date. Realized gains and losses from securities transactions are recorded on the highest cost basis. Dividend income and capital gains distributions, if any, are recorded on the ex-dividend date. Interest income, if any, is recorded on the accrual basis.
D. Dividends and Distributions to Shareholders
Dividends from net investment income of the Fund, if any, are declared and paid annually or as the Board may determine from time to time. Distributions of net realized capital gains earned by the Fund, if any, are distributed at least annually.
Workplace Equality Portfolio
| Notes to Financial Statements | May 31, 2017 (Unaudited) |
E. Federal Tax and Tax Basis Information
The timing and character of income and capital gain distributions are determined in accordance with income tax regulations, which may differ from U.S. GAAP. Reclassifications are made to the Fund’s capital accounts for permanent tax differences to reflect income and gains available for distribution (or available capital loss carryforwards) under income tax regulations. The amounts and characteristics of tax basis distributions and composition of distributable earnings/(accumulated losses) are finalized at fiscal year-end; accordingly, tax basis balances have not been determined as of May 31, 2017.
At November 30, 2016, the Fund had available for tax purposes unused post-enactment capital loss carryforwards as follows:
| Fund | | Short-Term | | | Long-Term | |
| Workplace Equality Portfolio | | $ | 50,427 | | | $ | 129,844 | |
The tax character of the distributions paid during the fiscal year ended November 30, 2016 were as follows:
| | | Ordinary Income | | | Long-Term Capital Gain | | | Return of Capital | |
| November 30, 2016 | | | | | | | | | |
| Workplace Equality Portfolio | | $ | 135,078 | | | $ | – | | | $ | – | |
As of May 31, 2017, the cost of investments for federal income tax purposes and accumulated net unrealized appreciation/(depreciation) on investments were as follows:
| | | Workplace Equality Portfolio | |
| Gross appreciation (excess of value over tax cost) | | $ | 2,566,468 | |
| Gross depreciation (excess of tax cost over value) | | | (512,522 | ) |
| Net unrealized appreciation (depreciation) | | $ | 2,053,946 | |
| Cost of investments for income tax purposes | | $ | 12,730,373 | |
The differences between book-basis and tax-basis are primarily due to the deferral of losses from wash sales.
F. Income Taxes
No provision for income taxes is included in the accompanying financial statements, as the Fund intends to distribute to shareholders all taxable investment income and realized gains and otherwise comply with Subchapter M of the Internal Revenue Code of 1986, as amended, applicable to regulated investment companies. The Fund evaluates tax positions taken (or expected to be taken) in the course of preparing the Fund’s tax returns to determine whether these positions meet a “more-likely-than-not” standard that, based on the technical merits, have a more than fifty percent likelihood of being sustained by a taxing authority upon examination. A tax position that meets the “more-likely-than-not” recognition threshold is measured to determine the amount of benefit to recognize in the financial statements.
As of and during the six months ended May 31, 2017, the Fund did not have a liability for any unrecognized tax benefits. The Fund files U.S. federal, state, and local tax returns as required. The Fund’s tax returns are subject to examination by the relevant tax authorities until expiration of the applicable statute of limitations, which is generally three years after the filing of the tax return, but may extend to four years in certain jurisdictions. Tax returns for open years have incorporated no uncertain tax positions that require a provision for income taxes.
G. Lending of Portfolio Securities
The Fund has entered into a securities lending agreement with State Street Bank & Trust Co. (“SSB”), the Fund’s lending agent. The Fund may lend its portfolio securities only to borrowers that are approved by SSB. The Fund will limit such lending to not more than 33 1/3% of the value of its total assets. The Fund’s securities held at SSB as custodian shall be available to be lent except those securities the Fund or ALPS Advisors Inc. specifically identifies in writing as not being available for lending. The borrower pledges and maintains with the Fund collateral consisting of cash (U.S. Dollars only), securities issued or guaranteed by the U.S. government or its agencies or instrumentalities, and cash equivalents (including irrevocable bank letters of credit) issued by a person other than the borrower or an affiliate of the borrower. The initial collateral received by the Fund is required to have a value of no less than 102% of the market value of the loaned securities for U.S equity securities and a value of no less than 105% of the market value for non-U.S. equity securities. The collateral is maintained thereafter, at a market value equal to not less than 102% of the current value of the U.S. equity securities on loan and not less than 105% of the current value of the non-U.S. equity securities on loan. The market value of the loaned securities is determined at the close of each business day and any additional required collateral is delivered to the Fund on the next business day. During the term of the loan, the Fund is entitled to all distributions made on or in respect of the loaned securities. Loans of securities are terminable at any time and the borrower, after notice, is required to return borrowed securities within the customary time period for settlement of securities transactions.
Workplace Equality Portfolio
| Notes to Financial Statements | May 31, 2017 (Unaudited) |
Any cash collateral received is reinvested in a money market fund managed by SSB as disclosed in the Fund’s Schedule of Investments and is reflected in the Statements of Assets and Liabilities as a payable for collateral upon return of securities loaned. Non-cash collateral, in the form of securities issued or guaranteed by the U.S. government or its agencies or instrumentalities, is not disclosed in the Fund’s Statements of Assets and Liabilities as it is held by the lending agent on behalf of the Fund, and the Fund does not have the ability to re-hypothecate these securities. Income earned by the Fund from securities lending activity is disclosed in the Statement of Operations.
The following is a summary of the Fund's securities lending agreement and related cash and non-cash collateral received as of May 31, 2017:
| | | Market Value of Securities on Loan | | | Cash Collateral Received | Non-Cash Collateral Received | | | Total Collateral Received | |
| Workplace Equality Portfolio | | $ | 187,143 | | | $ | – | | $ | 193,665 | | | $ | 193,665 | |
The risks of securities lending include the risk that the borrower may not provide additional collateral when required or may not return the securities when due. To mitigate these risks, the Fund benefits from a borrower default indemnity provided by SSB. SSB’s indemnity allows for full replacement of securities lent wherein SSB will purchase the unreturned loaned securities on the open market by applying the proceeds of the collateral, or to the extent such proceeds are insufficient or the collateral is unavailable, SSB will purchase the unreturned loan securities at SSB’s expense. However, the Fund could suffer a loss if the value of the investments purchased with cash collateral falls below the value of the cash collateral received.
The following table reflects a breakdown of transactions accounted for as secured borrowings, the gross obligation by the type of collateral pledged or securities loaned, and the remaining contractual maturity of those transactions as of May 31, 2017:
| Workplace Equality Portfolio | Remaining contractual maturity of the agreement |
| Securities Lending Transactions | | Overnight & Continuous | | | Up to 30 days | | | 30-90 days | | | Greater than 90 days | | | Total | |
| Common Stocks | | $ | – | | | $ | – | | | $ | – | | | $ | – | | | $ | – | |
| Total Borrowings | | | | | | | | | | | | | | | | | | | – | |
| Gross amount of recognized liabilities for securities lending (collateral received) | | | $ | – | |
3. INVESTMENT ADVISORY FEE AND OTHER AFFILIATED TRANSACTIONS
ALPS Advisors, Inc. (the “Adviser”) acts as the Fund’s investment adviser pursuant to an Advisory Agreement with the Trust on behalf of the Fund (the “Advisory Agreement”). Pursuant to the Advisory Agreement, the Fund pays the Adviser a unitary fee for the services and facilities it provides payable on a monthly basis at the annual rate of 0.75% of the Fund’s average daily net assets. From time to time, the Adviser may waive all or a portion of its fee.
Out of the unitary management fee, the Adviser pays substantially all expenses of the Fund, including the licensing fees to the Index provider, the cost of transfer agency, custody, fund administration, legal, audit, independent trustees and other services, except for interest expenses, distribution fees or expenses, brokerage expenses, taxes and extraordinary expenses not incurred in the ordinary course of the Fund’s business. The Adviser’s unitary management fee is designed to pay substantially all the Fund’s expenses and to compensate the Adviser for providing services for the Fund.
ALPS Fund Services, Inc., an affiliate of the Adviser, is the administrator of the Fund.
Each Trustee who is not an officer or employee of the Adviser, any sub-adviser or any of their affiliates (“Independent Trustees”) receives (1) a quarterly retainer of $5,000, (2) a per meeting fee for regularly scheduled meetings of $3,750, (3) $1,500 for any special meeting held outside of a regularly scheduled board meeting, and (4) reimbursement for all reasonable out-of-pocket expenses relating to attendance at meetings.
Workplace Equality Portfolio
| Notes to Financial Statements | May 31, 2017 (Unaudited) |
4. PURCHASES AND SALES OF SECURITIES
For the six months ended May 31, 2017, the cost of purchases and proceeds from sales of investment securities, excluding in-kind transactions and short-term investments, were as follows:
| Fund | | Purchases | | | Sales | |
| Workplace Equality Portfolio | | $ | 1,539,217 | | | $ | 1,696,316 | |
For the six months ended May 31, 2017, the cost of in-kind purchases and proceeds from in-kind sales were as follows:
| Fund | | Purchases | | | Sales | |
| Workplace Equality Portfolio | | $ | 3,145,303 | | | $ | 1,499,571 | |
For the six months ended May 31, 2017, the Workplace Equality Portfolio had in-kind net realized gain of $467,389.
Gains on in-kind transactions are not considered taxable for federal income tax purposes.
5. CAPITAL SHARE TRANSACTIONS
Shares are created and redeemed by the Fund only in Creation Unit size aggregations of 50,000 Shares. Only broker-dealers or large institutional investors with creation and redemption agreements called Authorized Participants (“AP”) are permitted to purchase or redeem Creation Units from the Fund. Such transactions are generally permitted on an in-kind basis, with a balancing cash component to equate the transaction to the NAV per unit of the Fund on the transaction date. Cash may be substituted equivalent to the value of certain securities generally when they are not available in sufficient quantity for delivery, not eligible for trading by the AP or as a result of other market circumstances.
6. SUBSEQUENT EVENTS
On October 13, 2016, the Securities and Exchange Commission (“SEC”) amended Regulation S-X, which will require standardized, enhanced disclosure about derivatives in investment company financial statements, as well as other amendments. The compliance date for the amendments to Regulation S-X is August 1, 2017. Management is currently evaluating the impact to the financial statements and disclosures.
Workplace Equality Portfolio
| Additional Information | May 31, 2017 (Unaudited) |
PROXY VOTING RECORDS, POLICIES AND PROCEDURES
Information regarding how the Fund voted proxies relating to portfolio securities during the most recent 12-month period ended June 30 and a description of the Fund’s proxy voting policies and procedures used in determining how to vote for proxies are available without charge on the SEC’s website at www.sec.gov and upon request, by calling (toll-free) 1-866-675-2639.
PORTFOLIO HOLDINGS
The Trust is required to disclose, after its first and third fiscal quarters, the complete schedule of the Fund’s portfolio holdings with the SEC on Form N-Q. Forms N-Q for the Fund are available on the SEC’s website at www.sec.gov. The Fund’s Forms N-Q may also be reviewed and copied at the SEC’s Public Reference Room in Washington, D.C. and information on the operation of the Public Reference Room may be obtained by calling 1-800-SEC-0330. The Fund’s Forms N-Q are available without charge, upon request, by calling (toll-free) 1-866-675-2639 or by writing to ALPS ETF Trust at 1290 Broadway, Suite 1100, Denver, Colorado 80203.
TAX INFORMATION
The Fund designates the following for federal income tax purposes for distributions made during the calendar year ended December 31, 2016:
| | Qualified Dividend Income | Dividend Received Deduction |
| Workplace Equality Portfolio | 100.00% | 99.92% |
In early 2017, if applicable, shareholders of record received this information for the distributions paid to them by the Fund during the calendar year 2016 via Form 1099. The Fund will notify shareholders in early 2018 of amounts paid to them by the Fund, if any, during the calendar year 2017.
LICENSING AGREEMENT
Denver Investments has entered into an index licensing agreement with ALPS Advisors Inc. (the “Adviser”) to allow the Adviser’s use of the Workplace Equality Index™, the underlying index of the Workplace Equality Portfolio (the “Fund”). The following disclosure relates to such licensing agreement:
Denver Investments is the designer of the construction and methodology for the Index. “Denver Investments” and “Workplace Equality Index™” are service marks or trademarks of Denver Investments. Denver Investments acts as brand licensor for the Index. Denver Investments is not responsible for the descriptions of the Index or the Fund that appear herein. Denver Investments is not affiliated with the Trust, the Adviser or the Distributor.
The Fund is not sponsored, endorsed or promoted by Denver Investments. Denver Investments makes no representation or warranty, express or implied, to the owners of the Fund or any member of the public regarding the advisability of investing in securities or commodities generally or in the Fund particularly and does not guarantee the quality, accuracy or completeness of the Index or any Index data included herein or derived there from and assume no liability in connection with their use. The Index is determined and composed without regard to the Adviser or the Fund. Denver Investments has no obligation to take the needs of the Adviser, the Fund or the shareholders of the Fund into consideration in connection with the foregoing. Denver Investments is not responsible for and has not participated in the determination of pricing or the timing of the issuance or sale of the Shares of the Fund or in the determination or calculation of the NAV of the Fund. Denver Investments has no obligation or liability in connection with the administration or trading of the Fund.
Denver Investments does not guarantee the accuracy and/or completeness of the Index or any data included therein, and Denver Investments shall have no liability for any errors, omissions, or interruptions therein. Denver Investments makes no warranty, express or implied, as to results to be obtained by the Adviser, the Fund, Fund shareholders or any other person or entity from the use of the Index or any data included therein. Denver Investments makes no express or implied warranties, and expressly disclaims all warranties of merchantability or fitness for a particular purpose or use with respect to the Index or any data included therein. Without limiting any of the foregoing, in no event shall Denver Investments have any liability for any special, punitive, indirect, or consequential damages (including lost profits) arising out of matters relating to the use of the Index, even if notified of the possibility of such damages.
The Adviser does not guarantee the accuracy and/or the completeness of the Index or any data included therein, and the Adviser shall have no liability for any errors, omissions or interruptions therein. The Adviser makes no warranty, express or implied, as to results to be obtained by the Fund, owners of the Shares of the Fund or any other person or entity from the use of the Index or any data included therein. The Adviser makes no express or implied warranties, and expressly disclaims all warranties of merchantability or fitness for a particular purpose or use with respect to the Index or any data included therein. Without limiting any of the foregoing, in no event shall the Adviser have any liability for any special, punitive, direct, indirect, or consequential damages (including lost profits) arising out of matters relating to the use of the Index, even if notified of the possibility of such damages.
Not Applicable to this Report.
| Item 3. | Audit Committee Financial Expert. |
Not Applicable to this Report.
| Item 4. | Principal Accountant Fees and Services. |
Not Applicable to this Report.
| Item 5. | Audit Committee of Listed Registrants. |
Not applicable to Registrant.
(a) Schedule of Investments is included as part of the Report to Stockholders filed under Item 1 of this Form N-CSR.
(b) Not applicable
| Item 7. | Disclosure of Proxy Voting Policies and Procedures for Closed-End Management Investment Companies. |
Not applicable to Registrant.
| Item 8. | Portfolio Managers of Closed-End Management Investment Companies. |
Not applicable to Registrant.
| Item 9. | Purchases of Equity Securities by Closed-End Management Investment Company and Affiliated Purchasers. |
Not applicable to Registrant.
| Item 10. | Submission of Matters to a Vote of Security Holders. |
No material changes to the procedures by which the shareholders may recommend nominees to the Registrant’s Board of Trustees have been implemented after the Registrant’s last provided disclosure in response to the requirements of Item 407(c)(2)(iv) of Regulation S-K (17 CFR 229.407) (as required by Item 22(b)(15) of Schedule 14A (17 CFR 240.14a-101)), or this Item.
| Item 11. | Controls and Procedures. |
| (a) | The Registrant’s principal executive officer and principal financial officer have concluded that the Registrant’s disclosure controls and procedures (as defined in Rule 30a-3(c) under the Investment Company Act of 1940, as amended) are effective based on their evaluation of these controls and procedures as of a date within 90 days of the filing date of this report. |
| (b) | There was no change in the Registrant's internal control over financial reporting (as defined in Rule 30a-3(d) under the Investment Company Act of 1940, as amended) during the second fiscal quarter of the period covered by this report that has materially affected, or is reasonably likely to materially affect, the Registrant's internal control over financial reporting. |
| (a)(1) | Not applicable to this Report. |
| (a)(2) | The certifications required by Rule 30a-2(a) of the Investment Company Act of 1940, as amended, and Section 302 of the Sarbanes-Oxley Act of 2002 are attached hereto as Exhibit 99.Cert. |
(a)(3) Not applicable.
| (b) | The certifications by the Registrant’s principal executive officer and principal financial officer, as required by Rule 30a-2(b) of the Investment Company Act of 1940, as amended, and Section 906 of the Sarbanes-Oxley Act of 2002 are attached hereto as Exhibit 99.906Cert. |
SIGNATURES
Pursuant to the requirements of the Securities Exchange Act of 1934 and the Investment Company Act of 1940, the Registrant has duly caused this report to be signed on its behalf by the undersigned, thereunto duly authorized.
ALPS ETF TRUST
| By: | /s/ Thomas A. Carter | |
| | Thomas A. Carter (Principal Executive Officer) | |
| | President | |
| | | |
| Date: | August 3, 2017 | |
Pursuant to the requirements of the Securities Exchange Act of 1934 and the Investment Company Act of 1940, this report has been signed below by the following persons on behalf of the Registrant and in the capacities and on the dates indicated.
| By: | /s/ Thomas A. Carter | |
| | Thomas A. Carter (Principal Executive Officer) | |
| | President | |
| | | |
| Date: | August 3, 2017 | |
| | | |
| By: | /s/ Patrick D. Buchanan | |
| | Patrick D. Buchanan (Principal Financial Officer) | |
| | Treasurer | |
| | | |
| Date: | August 3, 2017 | |